angler survey south river augusta county and waynesboro
TRANSCRIPT
Angler Survey South River
Augusta County and Waynesboro, VA May – September, 2011
F-111-R
Participants: DuPont
URS Virginia Department of Game and Inland Fisheries
Report Preparation:
Paul E. Bugas, Jr. Fisheries Biologist
Virginia Department of Game and Inland Fisheries
Overview Purpose:
The South River Science Team (SRST) determined the need to quantify use, effort, catch, and harvest in South River through an interview-driven angler survey during the 2011 fishing season. Until 2005, an angler survey had never been conducted on this body of water. This report captures some of the attitude toward fishing, knowledge of the consumption advisory, as well as capturing important angling statistics for fisheries management purposes.
Background: South River has played an important part in the cultural, historical, recreational, and economic growth of Waynesboro and eastern Augusta County. A bustling waterfront economic hub developed in the 1800’s at Port Republic, and the massive springs and aquifers that underlie the western foot of the Blue Ridge Mountains
2 supply vast quantities of water for commerce, agriculture, development, and recreation. The primary recipient of these springs and mountain runoff is the South River. Its origins are in the mountain range southwest of Waynesboro. Native trout streams such as Coles Run, Mills Creek, and others supply cold water to the upper reaches of South River near Stuarts Draft. Back Creek, the largest tributary to enter South River upstream of Waynesboro, supports a stocked trout fishery and a popular recreational destination: Sherando Lake. There are 13 flood control dams distributed throughout the Big Levels area near Stuarts Draft. The watershed upstream of Waynesboro can be described as low-gradient, meandering, and spring-fed. A four mile reach of upper South River has been developed into a special regulation brown trout fishery by Trout Unlimited, Waynesboro Nurseries, and the Virginia Department of Game and Inland Fisheries (DGIF). As South River enters Waynesboro, the gradient increases and large springs continue to feed it. Waynesboro is home to industrial development, some of which are still viable (Invista) and several which have closed their doors over the years (Crompton, Genicom). Industrial effluent has plagued the quality of South River’s water over time, but stricter standards and better technology has ushered in a new era of improved water quality. In response to a cleaner aquatic environment, the City of Waynesboro, Trout Unlimited, and DGIF established the first delayed harvest trout fishery in the Commonwealth of Virginia. From the DuPont footbridge downstream to North Park, catchable rainbow, brook, and brown trout have been stocked three times a year since 1989. Anglers are required to release their catch from October 1 through May 31, and may take home a limit of six fish during the summer months. In 1997, DGIF began stocking catchable trout from Grand Caverns Park through Grottoes. Subsequently, the Town of Grottoes has developed a boat landing and a town park and has hosted an annual children’s fishing day. Table 1 summarizes fishing regulations and advisories for the survey area in this report. In 2000, the SRST was formed to focus on the presence of elevated mercury levels in fish tissue from South River. The goal of the SRST is to determine the pathway(s) of environmental mercury into fish tissue, mitigate the pathways, and then remove South River from the Commonwealth’s list of impaired streams. The SRST has invested significant manpower and capital into understanding the persistence of this metal in the aquatic environment, and part of understanding the problem is fishing and fish consumption. Since an angler (creel) survey had never been undertaken on this river until 2005, DuPont and DGIF embarked on a cooperative, follow-up project in spring, 2011 to obtain additional information regarding the recreational component of South River. Design: A stratified “roving” survey was picked to best obtain the data we needed. The primary reason for choosing a roving survey over an “access” survey was that not many developed canoe/boat/kayak launch points are available for the area we were interested in covering. The roving survey engages anglers by clerks in kayaks when floating from point A to point B. River users are asked a set of questions (Figure 1), given a fish consumption advisory card, and thanked. Any fish caught and kept was identified and measured. The survey itself was split into several strata. Days of the week, river sections,
3 and time of day (morning, mid-day, and evening) were randomly selected using non-uniform probabilities to ensure statistical validity (Tables 2 and 3). To expand the empirical data, we used a Statistical Analysis System (SAS) program, designed by fisheries consultant Steve Malvestuto. It was decided that the survey would cover the area from Constitution Park in Waynesboro to Port Republic in Rockingham County. This river reach covered 24.5 miles of river and was divided into 5 sampling units, ranging from 4.2 to 5.8 miles in length. The survey began on May 21, 2011 and concluded on September 4, with an average of 12 days sampled each month, including weekdays and weekends. An example of the interview form is included in the appendix of this report.
Results
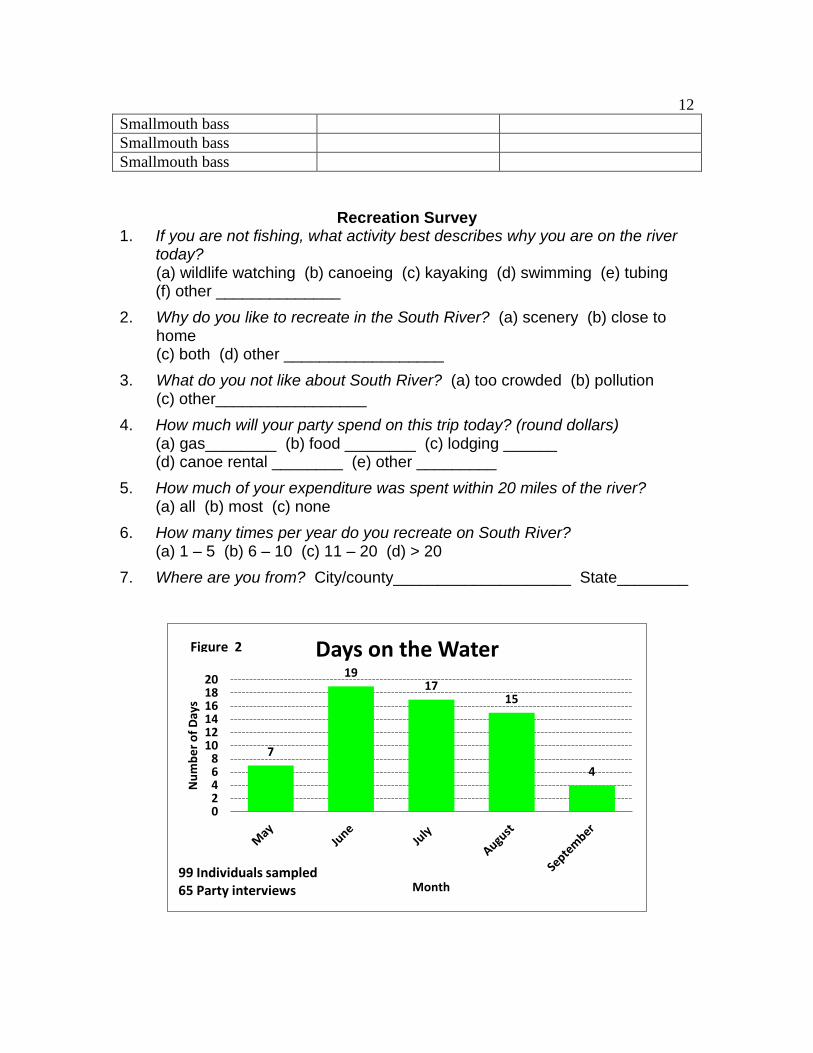
Days on the Water:
Figure 2 depicts the number of days spent by our survey team each month from May – September, 2011. June was most heavily sampled, with 19 trips; May and September had a limited number of samples. Our survey did not get started until late May due to unsafe river conditions and the design of the survey only included until Labor Day. During the five month period, 65 angling party interviews were conducted and 12 recreational (other than fishing) party surveys were documented. A total of 158 individuals were counted; 99 were fishing and 59 were enjoying other forms of water-based recreation.
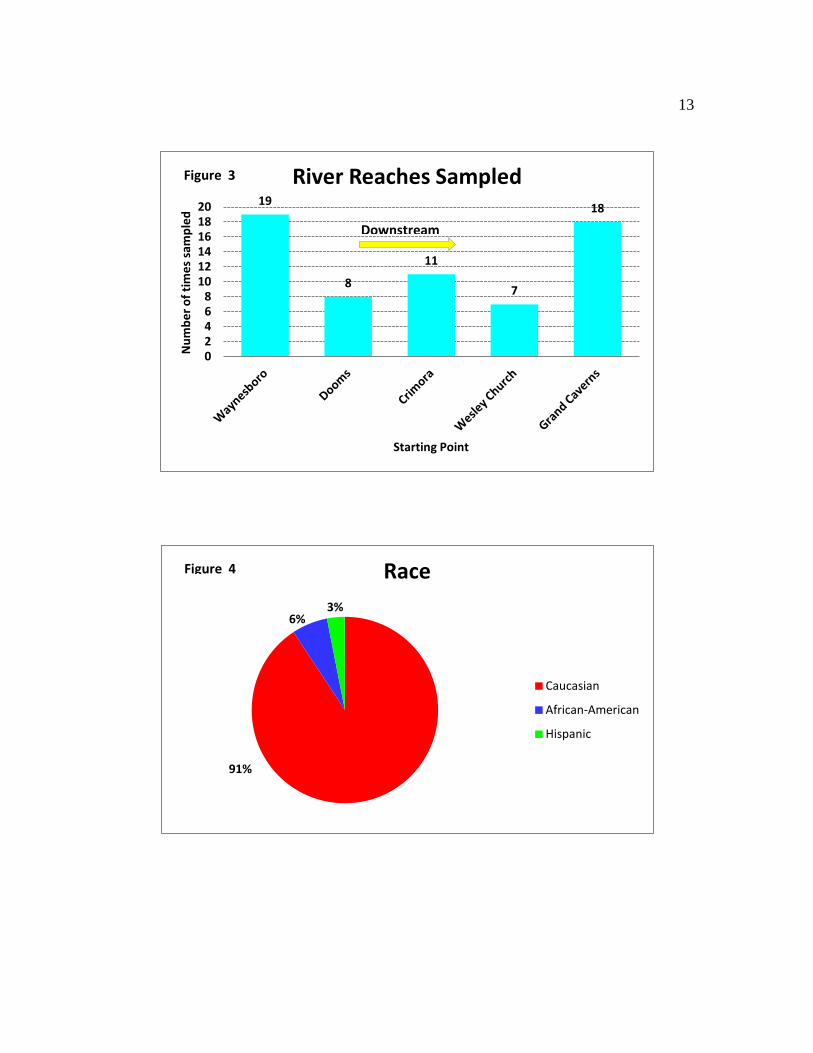
The survey team covered five river reaches (Figure 3) of varying distance. The most intensely surveyed reach was from Waynesboro to Dooms (19 times). This occurred because it was assigned a higher probability of encountering river users, due to the delayed harvest trout fishery near Constitution Park. Similarly, the reach between Grand Caverns and Port Republic was covered 18 times. This again was due to the chance of getting interviews in an area stocked with trout. In total, the survey team spent 63 days on the water. Of the 63 days, 29 (46%) were spent with no angler contacts. There were no interviews on popular fishing days such as Memorial Day and the Fourth of July.
River User Characteristics:
The dominant angler type on South River in 2011 was an adult, Caucasian (91%) male (88%). Figure 4 shows the breakdown of ethnic groups that used the river for fishing. The next largest representation was African Americans (6%), then Hispanics (3%).
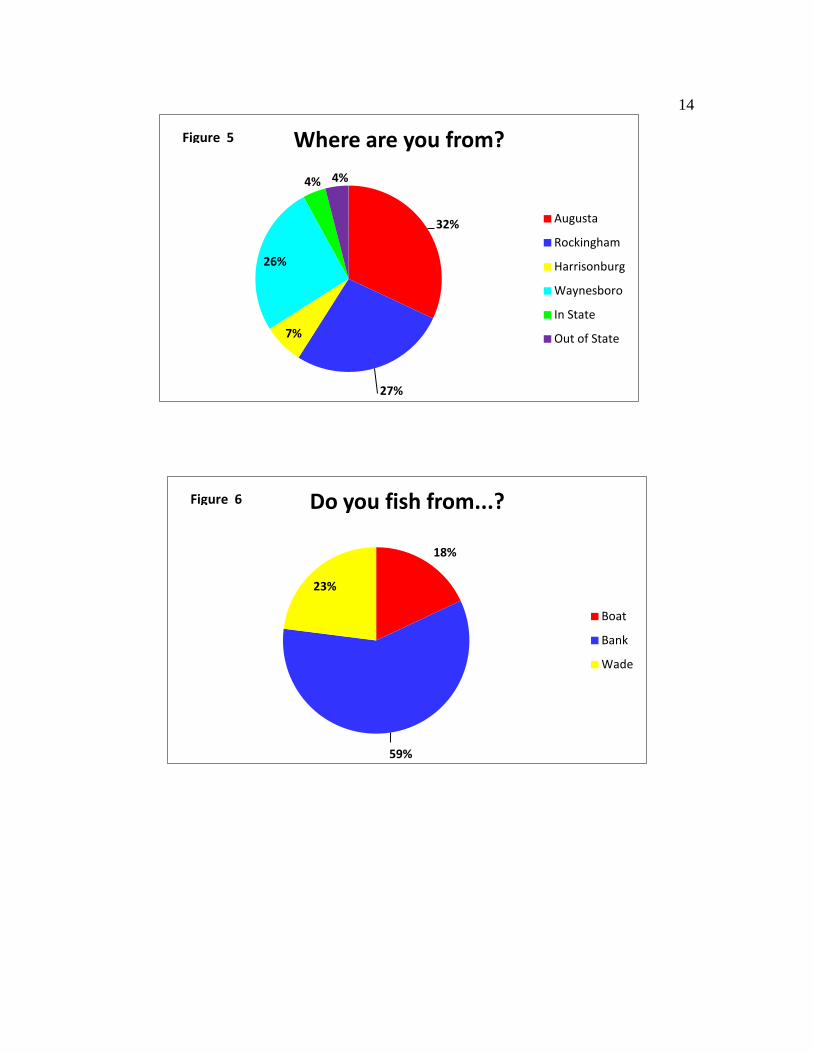
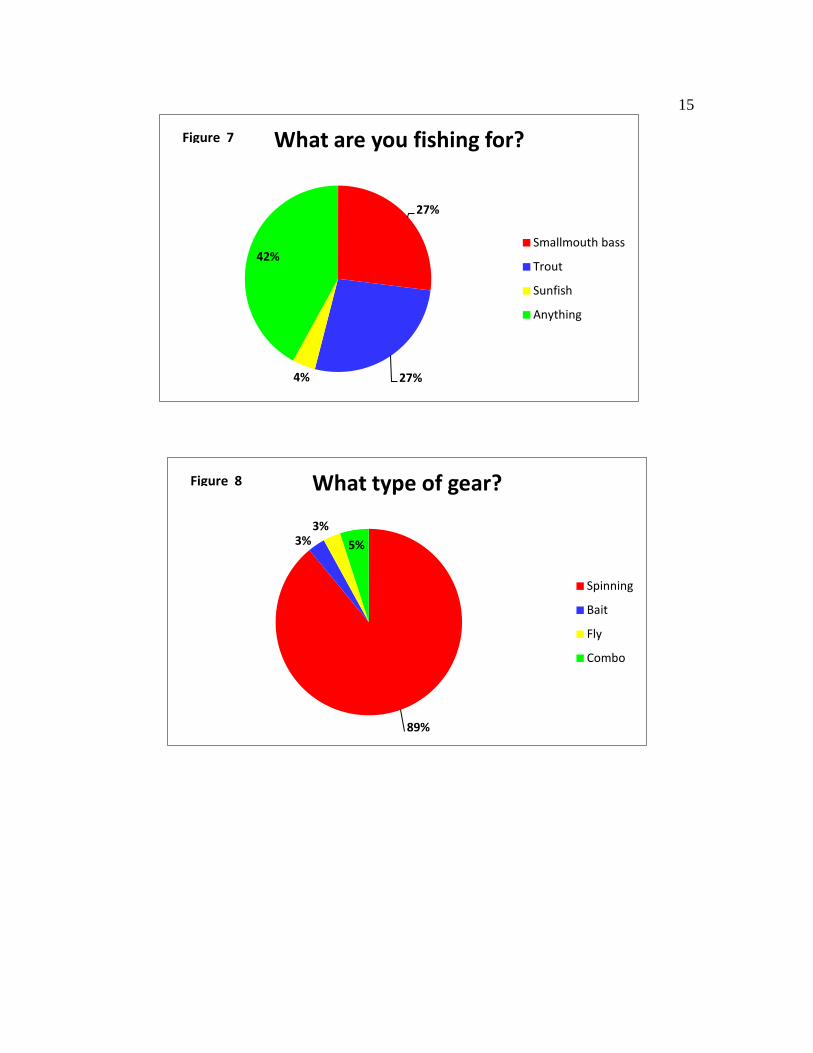
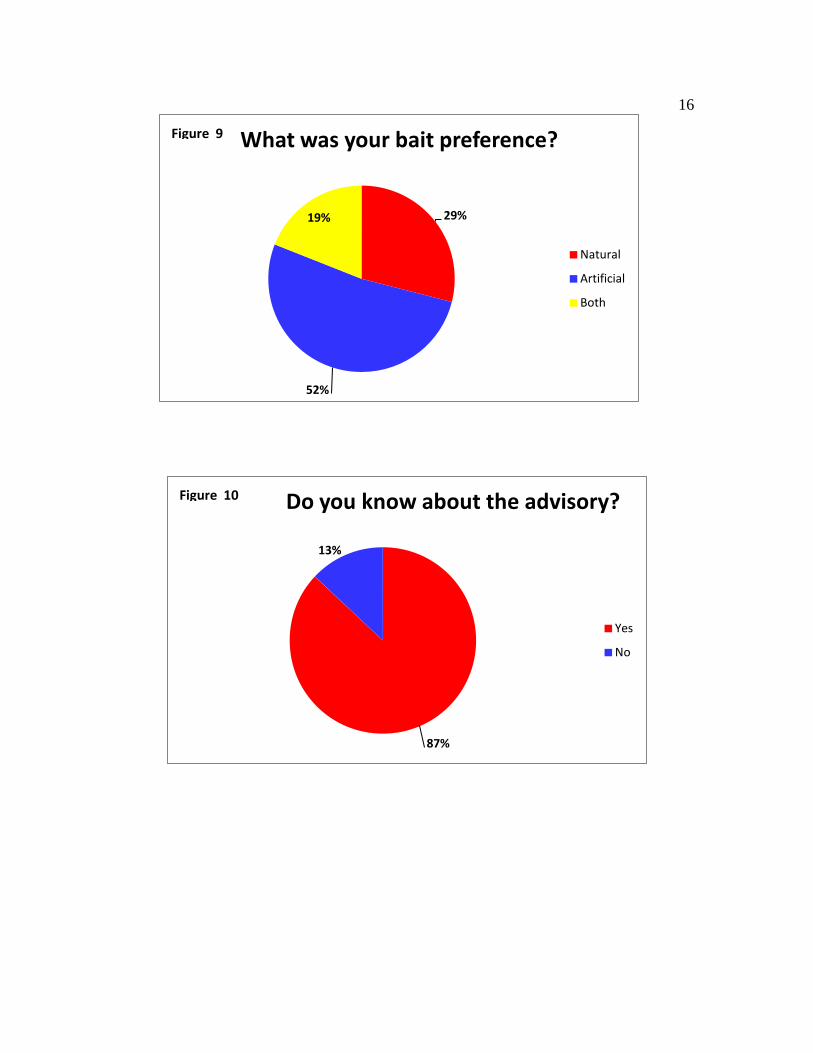
Anglers: When asked where their fishing trip originated, 85 % of anglers came from Augusta County, Rockingham County, and Waynesboro (Figure 5). Most fished from the bank (59%), followed by wading (23%), and from a boat (18%). Most fishermen targeted anything that was biting (Figure 7). The most sought after species was even between smallmouth bass (27%) and trout (27%). Most (89%) anglers used spinning gear, while 3% used fly fishing gear and 3% used baitcasting gear. A majority of 52% used artificial lures (including flies), 29% used natural baits, and the remaining 19% used both. Most
4 anglers (47%) fished South River over 20 times in a year, while 26% came from 1 to 5 times. The remaining 27% visited from 6 to 20 times annually. Other Users: South River attracts many other types of recreational users other than anglers. This part of the survey was not designed to be expanded like the angling section, so all of the data associated with this report is empirical information. The survey team documented 12 recreational parties and 59 individuals during the study time frame. When asked what sort of activities they were involved with, 67% said swimming and the remainder said boating. None responded that they were wildlife watching. It was primarily visited by people living in Crimora, Waynesboro, and Grottoes. Most users liked the fact that the river is close to home. Over 50% said that they did not like pollution problems. A total of $1,017 was spent locally on recreating in 2011. Fish Consumption Advisory:
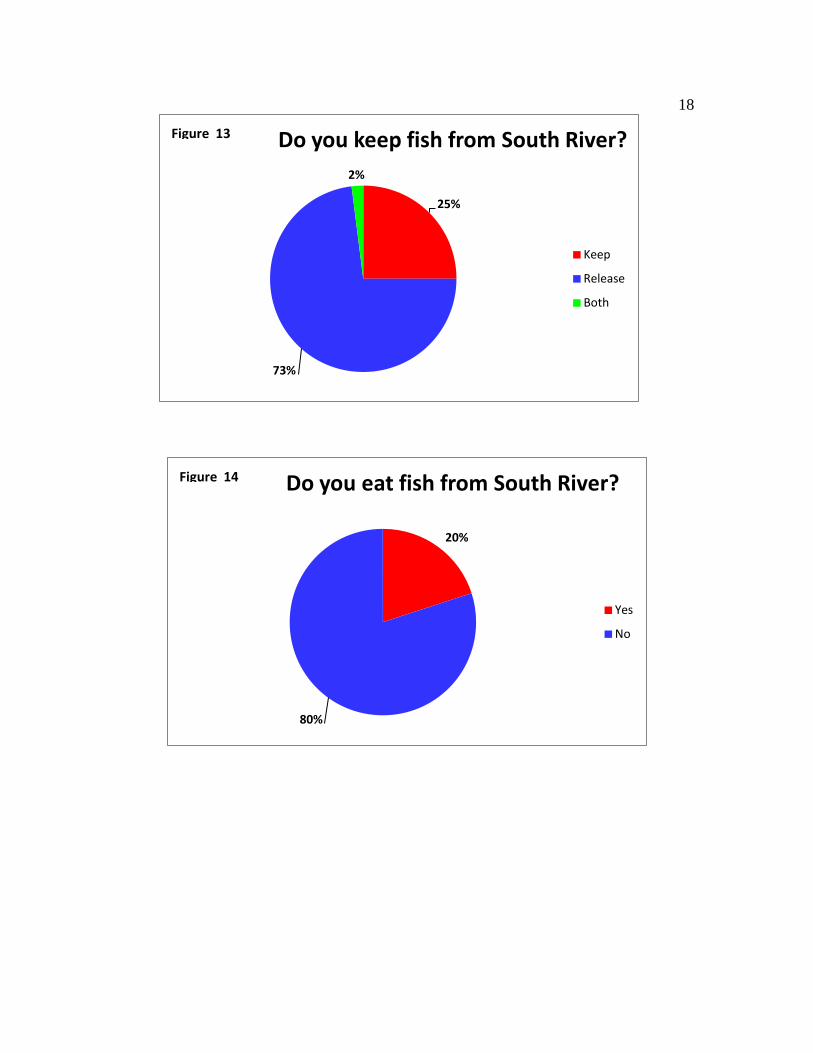
One of the main objectives of this study was to glean fishermen knowledge of the fish consumption advisory that has been imposed on South River (downstream of the DuPont footbridge) since 1977. When asked if they keep their catch, 25% responded affirmatively. Seventy-three percent said they released what they caught, and 2% do both. When asked if they ate fish, 80% said no.
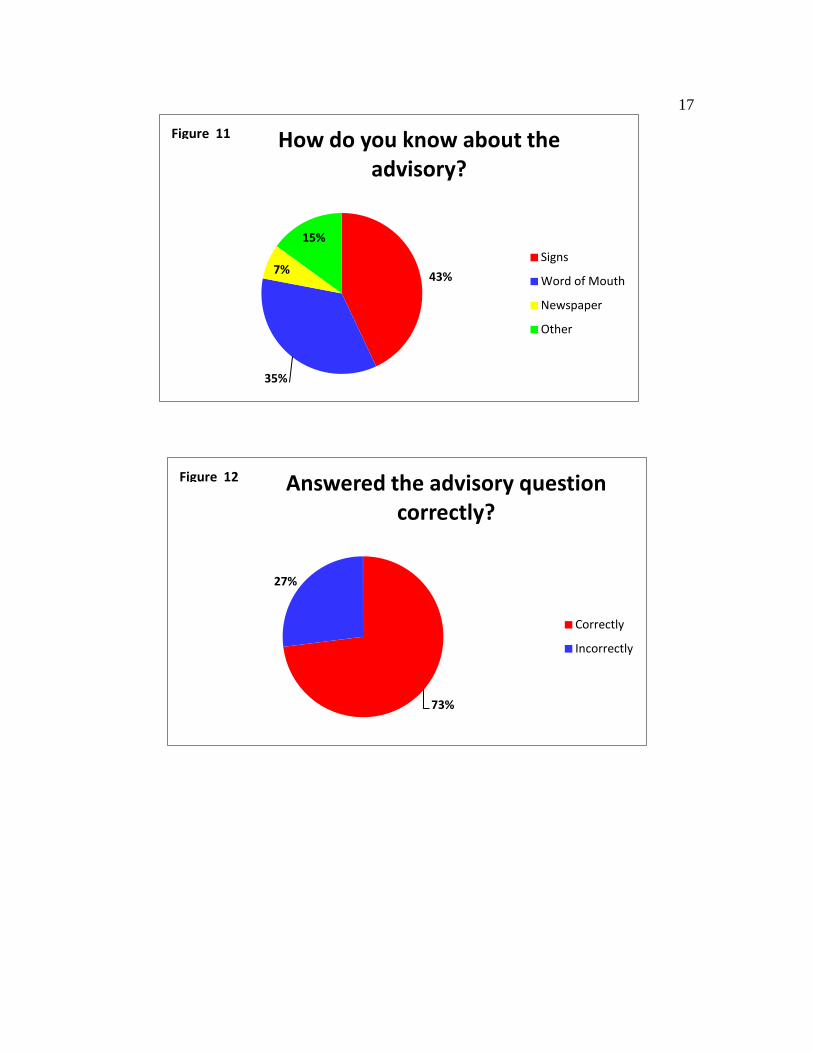
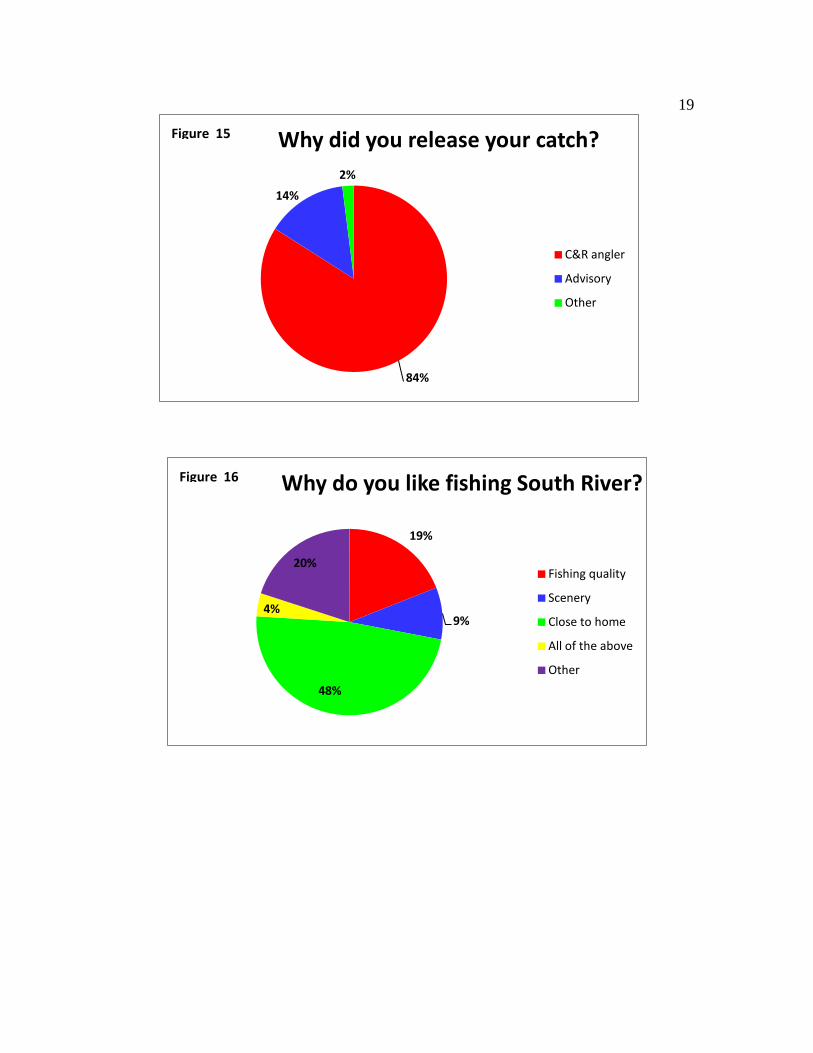
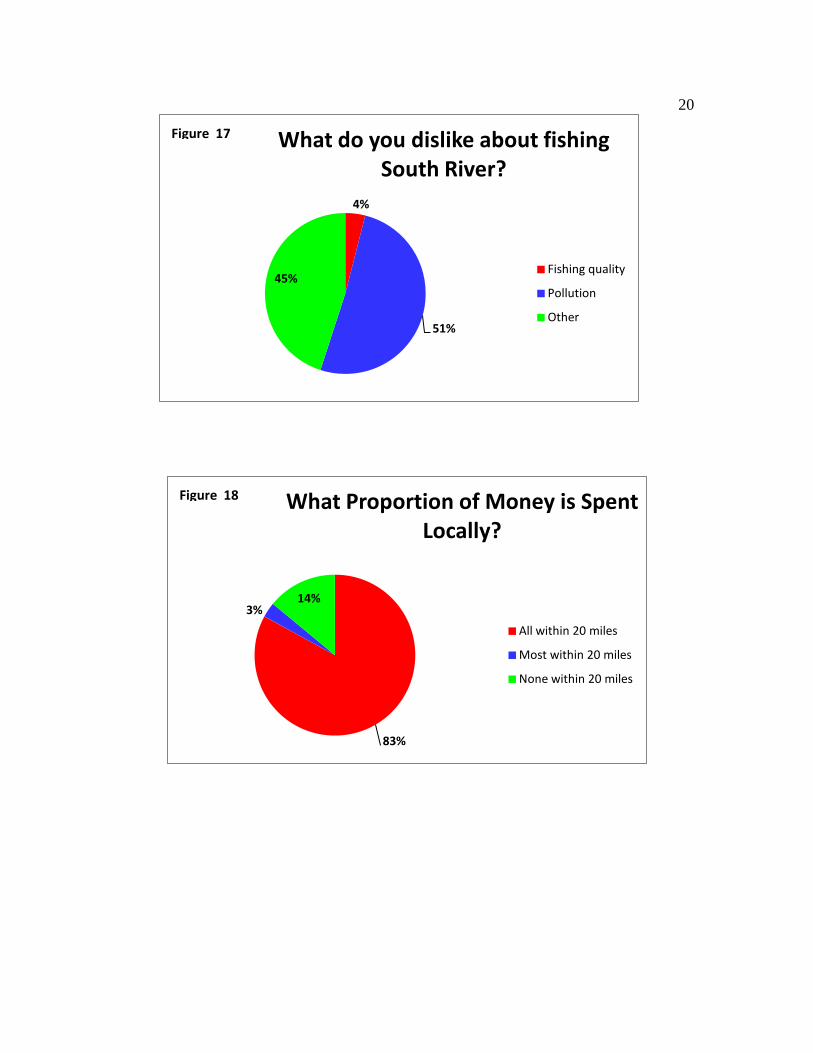
Eighty-seven percent of the fishing public knew about the consumption advisory (Figure 10) and, when asked whether they knew what the advisory was about, 27% answered incorrectly (Figure 12). Asked how they knew about the advisory, 43% got their information off of signs posted along the river, 35% by word of mouth, 7% by newspaper, and 15% by other means. Other sources for information about the advisory include fishing regulations, websites, or television. Of those that released their catch, 84% stated that they practiced catch-and-release fishing, while 14% stated it was from the advisory warnings, 2% stated other reasons. What did anglers like about fishing South River? Over half, 48%, liked the fact that it was close to home. This was followed by quality of fishing (19%). Nine percent fished for the scenery, 4% liked all of the above, and 20% liked it for other reasons. Asked what they disliked about angling in South River, 51% stated pollution and 45 % stated other unspecified reasons. Only 4% stated that fishing quality was poor. Angler Expenditures:
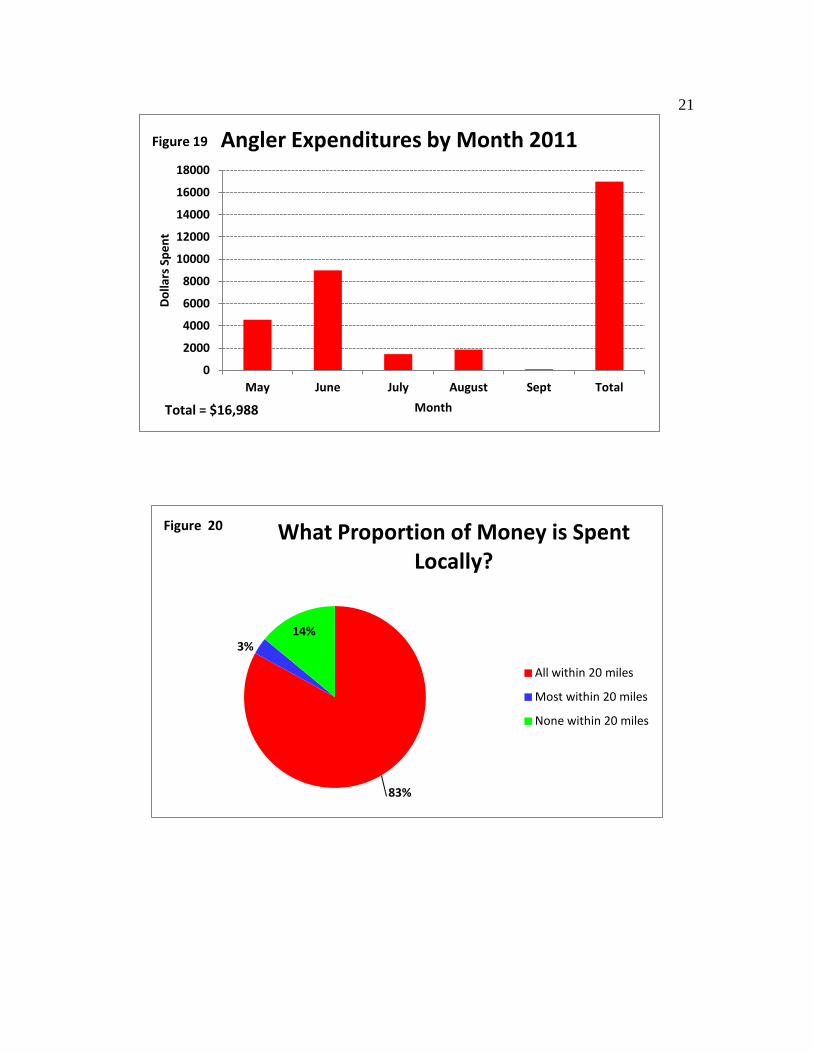
Fishermen were asked two questions about their spending habits regarding South River: how much they spent per day on all commodities and how much they contributed to the local economy? Figure 19 summarizes the amount, by month, of angling dollars associated with gas, food, bait, lodging, equipment rental, and other items. The highest amount was spent in June, followed by May and August. The estimated total spent by South River anglers over six months in 2011 was $16,988. Eighty-three percent was spent within 20 miles of the river, further defining it as a local fishery.
5 Angling Effort:
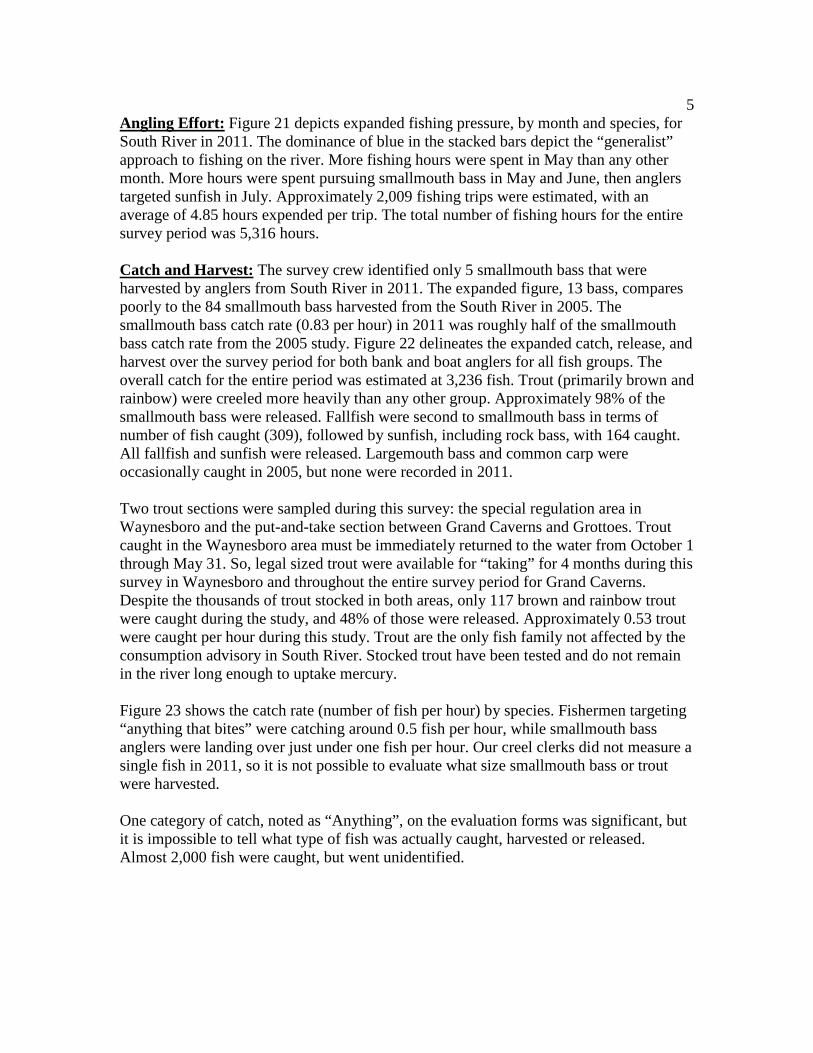
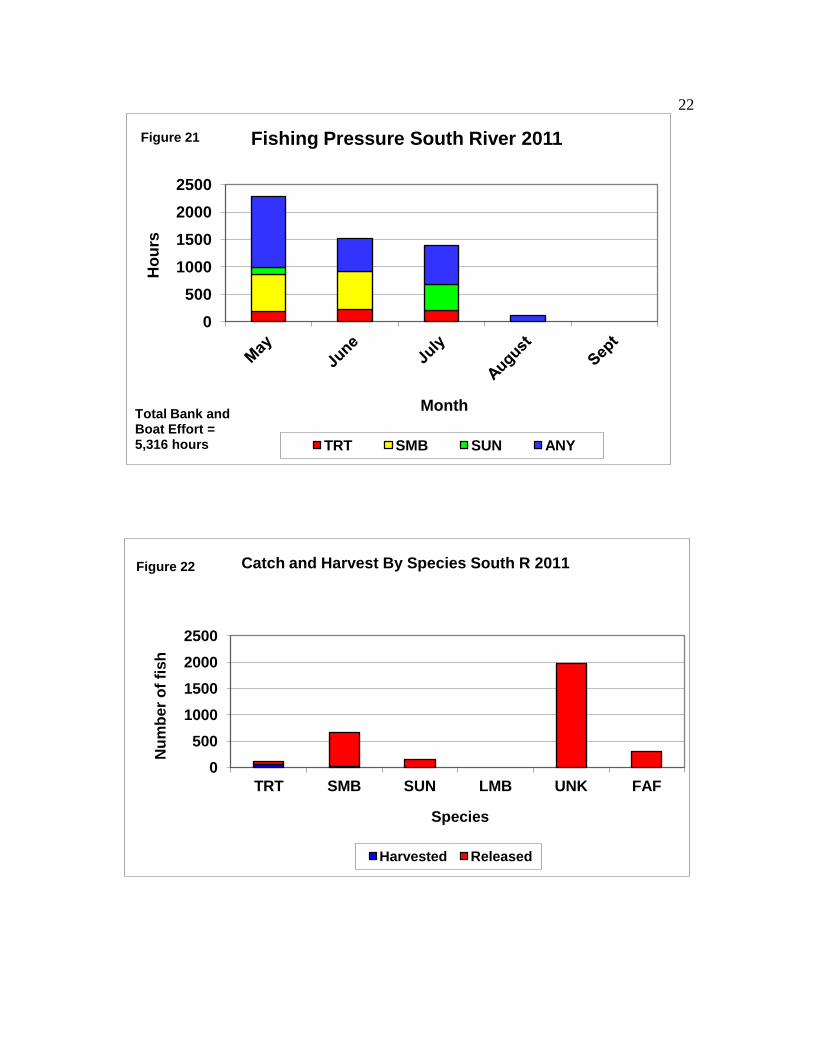
Figure 21 depicts expanded fishing pressure, by month and species, for South River in 2011. The dominance of blue in the stacked bars depict the “generalist” approach to fishing on the river. More fishing hours were spent in May than any other month. More hours were spent pursuing smallmouth bass in May and June, then anglers targeted sunfish in July. Approximately 2,009 fishing trips were estimated, with an average of 4.85 hours expended per trip. The total number of fishing hours for the entire survey period was 5,316 hours.
Catch and Harvest:
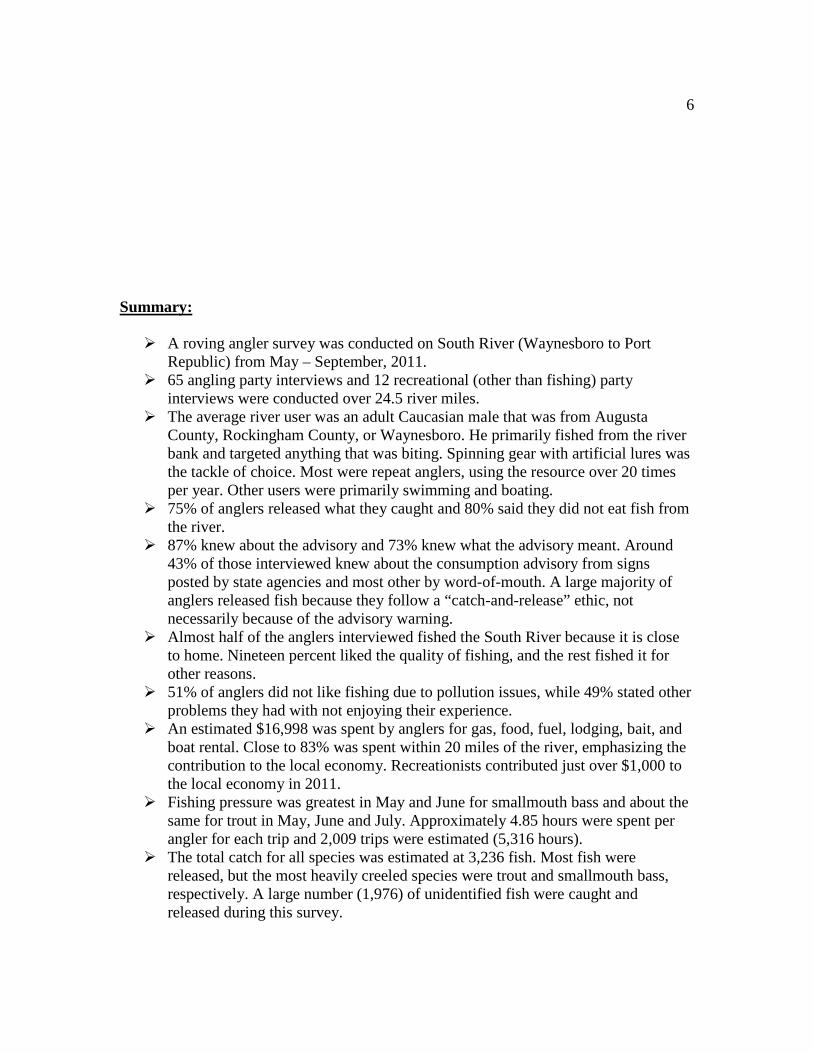
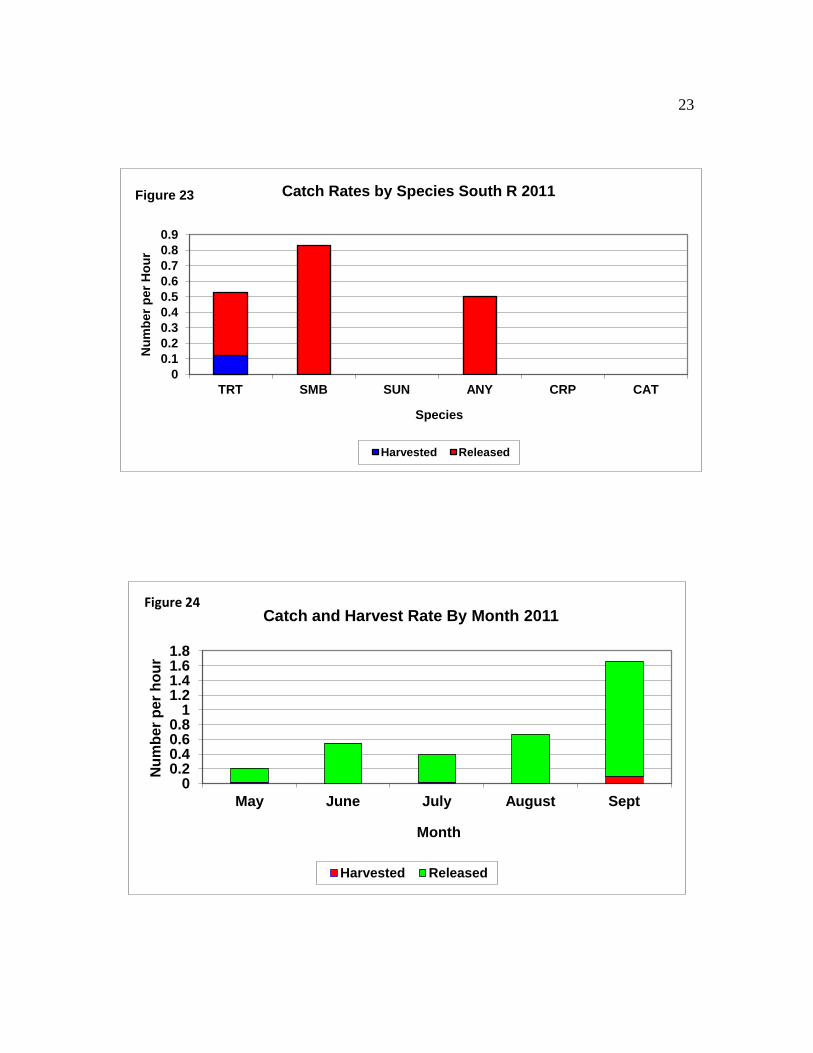
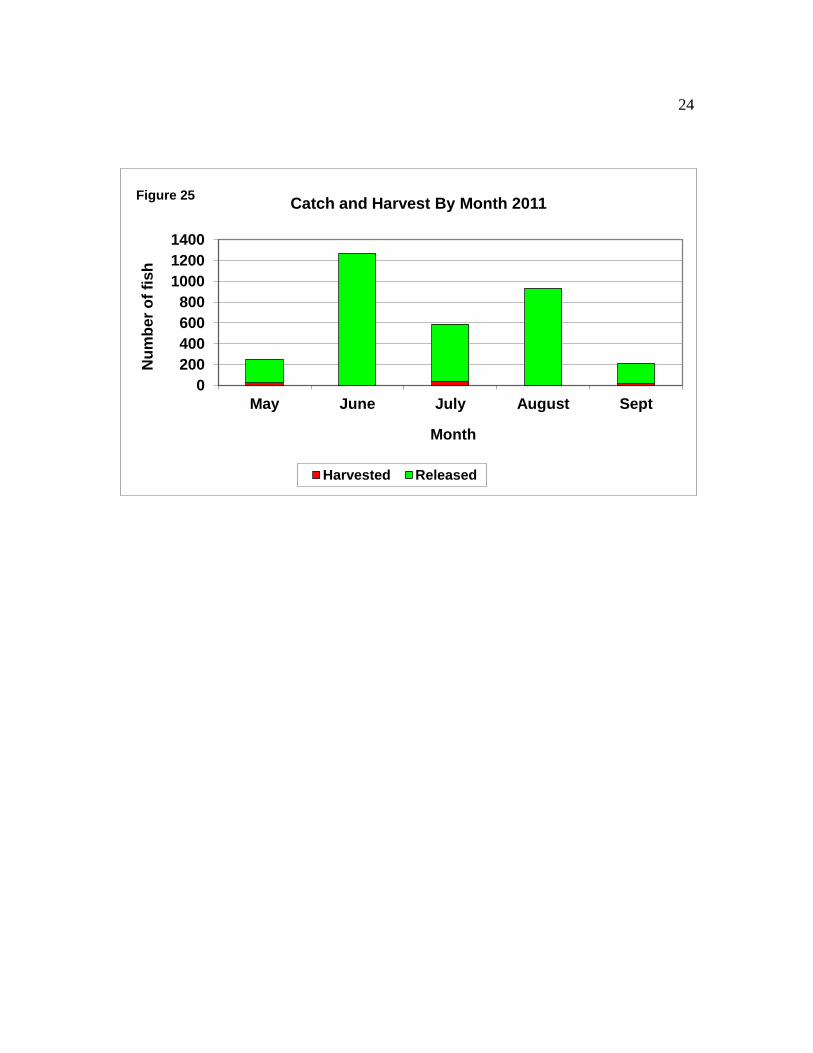
The survey crew identified only 5 smallmouth bass that were harvested by anglers from South River in 2011. The expanded figure, 13 bass, compares poorly to the 84 smallmouth bass harvested from the South River in 2005. The smallmouth bass catch rate (0.83 per hour) in 2011 was roughly half of the smallmouth bass catch rate from the 2005 study. Figure 22 delineates the expanded catch, release, and harvest over the survey period for both bank and boat anglers for all fish groups. The overall catch for the entire period was estimated at 3,236 fish. Trout (primarily brown and rainbow) were creeled more heavily than any other group. Approximately 98% of the smallmouth bass were released. Fallfish were second to smallmouth bass in terms of number of fish caught (309), followed by sunfish, including rock bass, with 164 caught. All fallfish and sunfish were released. Largemouth bass and common carp were occasionally caught in 2005, but none were recorded in 2011.
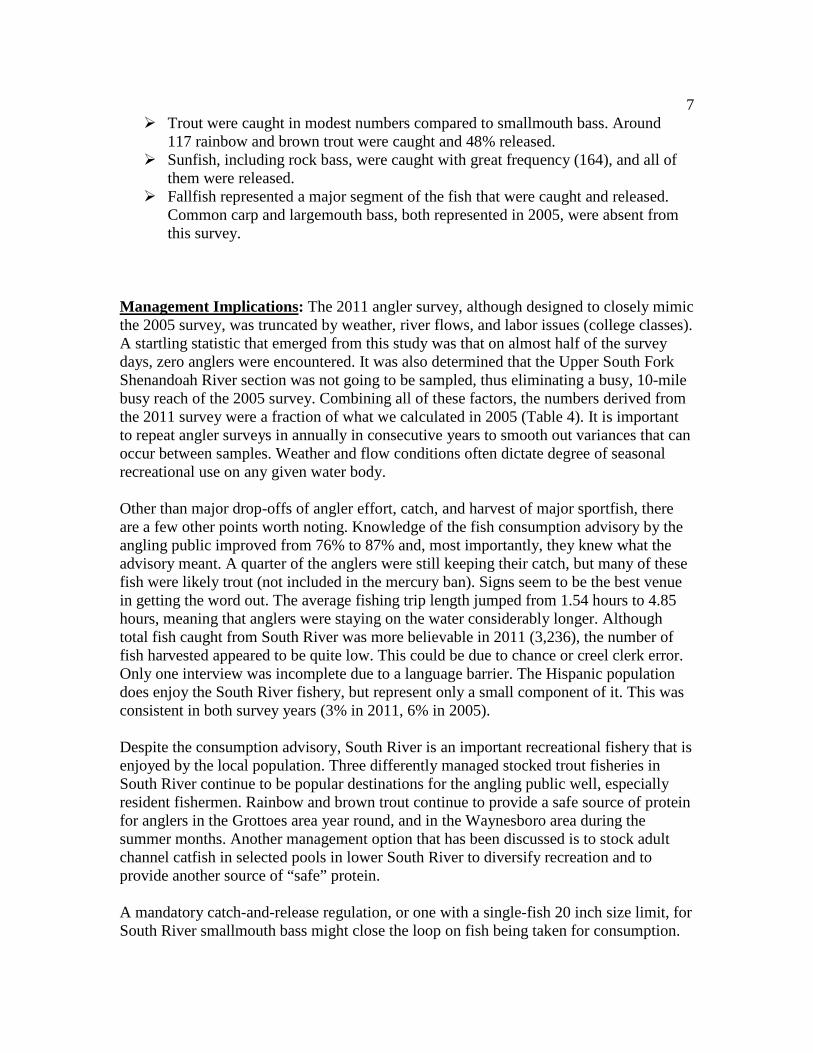
Two trout sections were sampled during this survey: the special regulation area in Waynesboro and the put-and-take section between Grand Caverns and Grottoes. Trout caught in the Waynesboro area must be immediately returned to the water from October 1 through May 31. So, legal sized trout were available for “taking” for 4 months during this survey in Waynesboro and throughout the entire survey period for Grand Caverns. Despite the thousands of trout stocked in both areas, only 117 brown and rainbow trout were caught during the study, and 48% of those were released. Approximately 0.53 trout were caught per hour during this study. Trout are the only fish family not affected by the consumption advisory in South River. Stocked trout have been tested and do not remain in the river long enough to uptake mercury. Figure 23 shows the catch rate (number of fish per hour) by species. Fishermen targeting “anything that bites” were catching around 0.5 fish per hour, while smallmouth bass anglers were landing over just under one fish per hour. Our creel clerks did not measure a single fish in 2011, so it is not possible to evaluate what size smallmouth bass or trout were harvested. One category of catch, noted as “Anything”, on the evaluation forms was significant, but it is impossible to tell what type of fish was actually caught, harvested or released. Almost 2,000 fish were caught, but went unidentified.
6 Summary:
A roving angler survey was conducted on South River (Waynesboro to Port Republic) from May – September, 2011.
65 angling party interviews and 12 recreational (other than fishing) party interviews were conducted over 24.5 river miles.
The average river user was an adult Caucasian male that was from Augusta County, Rockingham County, or Waynesboro. He primarily fished from the river bank and targeted anything that was biting. Spinning gear with artificial lures was the tackle of choice. Most were repeat anglers, using the resource over 20 times per year. Other users were primarily swimming and boating.
75% of anglers released what they caught and 80% said they did not eat fish from the river.
87% knew about the advisory and 73% knew what the advisory meant. Around 43% of those interviewed knew about the consumption advisory from signs posted by state agencies and most other by word-of-mouth. A large majority of anglers released fish because they follow a “catch-and-release” ethic, not necessarily because of the advisory warning.
Almost half of the anglers interviewed fished the South River because it is close to home. Nineteen percent liked the quality of fishing, and the rest fished it for other reasons.
51% of anglers did not like fishing due to pollution issues, while 49% stated other problems they had with not enjoying their experience.
An estimated $16,998 was spent by anglers for gas, food, fuel, lodging, bait, and boat rental. Close to 83% was spent within 20 miles of the river, emphasizing the contribution to the local economy. Recreationists contributed just over $1,000 to the local economy in 2011.
Fishing pressure was greatest in May and June for smallmouth bass and about the same for trout in May, June and July. Approximately 4.85 hours were spent per angler for each trip and 2,009 trips were estimated (5,316 hours).
The total catch for all species was estimated at 3,236 fish. Most fish were released, but the most heavily creeled species were trout and smallmouth bass, respectively. A large number (1,976) of unidentified fish were caught and released during this survey.
7 Trout were caught in modest numbers compared to smallmouth bass. Around
117 rainbow and brown trout were caught and 48% released. Sunfish, including rock bass, were caught with great frequency (164), and all of
them were released. Fallfish represented a major segment of the fish that were caught and released.
Common carp and largemouth bass, both represented in 2005, were absent from this survey.
Management Implications
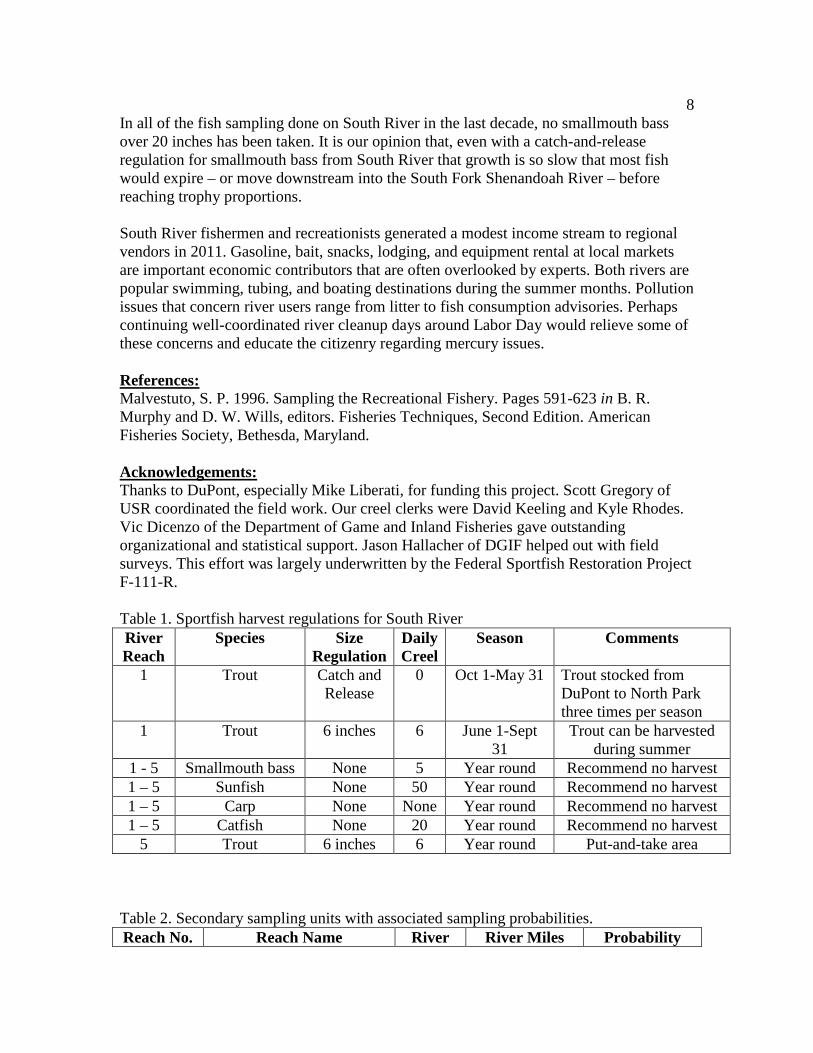
: The 2011 angler survey, although designed to closely mimic the 2005 survey, was truncated by weather, river flows, and labor issues (college classes). A startling statistic that emerged from this study was that on almost half of the survey days, zero anglers were encountered. It was also determined that the Upper South Fork Shenandoah River section was not going to be sampled, thus eliminating a busy, 10-mile busy reach of the 2005 survey. Combining all of these factors, the numbers derived from the 2011 survey were a fraction of what we calculated in 2005 (Table 4). It is important to repeat angler surveys in annually in consecutive years to smooth out variances that can occur between samples. Weather and flow conditions often dictate degree of seasonal recreational use on any given water body.
Other than major drop-offs of angler effort, catch, and harvest of major sportfish, there are a few other points worth noting. Knowledge of the fish consumption advisory by the angling public improved from 76% to 87% and, most importantly, they knew what the advisory meant. A quarter of the anglers were still keeping their catch, but many of these fish were likely trout (not included in the mercury ban). Signs seem to be the best venue in getting the word out. The average fishing trip length jumped from 1.54 hours to 4.85 hours, meaning that anglers were staying on the water considerably longer. Although total fish caught from South River was more believable in 2011 (3,236), the number of fish harvested appeared to be quite low. This could be due to chance or creel clerk error. Only one interview was incomplete due to a language barrier. The Hispanic population does enjoy the South River fishery, but represent only a small component of it. This was consistent in both survey years (3% in 2011, 6% in 2005). Despite the consumption advisory, South River is an important recreational fishery that is enjoyed by the local population. Three differently managed stocked trout fisheries in South River continue to be popular destinations for the angling public well, especially resident fishermen. Rainbow and brown trout continue to provide a safe source of protein for anglers in the Grottoes area year round, and in the Waynesboro area during the summer months. Another management option that has been discussed is to stock adult channel catfish in selected pools in lower South River to diversify recreation and to provide another source of “safe” protein. A mandatory catch-and-release regulation, or one with a single-fish 20 inch size limit, for South River smallmouth bass might close the loop on fish being taken for consumption.
8 In all of the fish sampling done on South River in the last decade, no smallmouth bass over 20 inches has been taken. It is our opinion that, even with a catch-and-release regulation for smallmouth bass from South River that growth is so slow that most fish would expire – or move downstream into the South Fork Shenandoah River – before reaching trophy proportions. South River fishermen and recreationists generated a modest income stream to regional vendors in 2011. Gasoline, bait, snacks, lodging, and equipment rental at local markets are important economic contributors that are often overlooked by experts. Both rivers are popular swimming, tubing, and boating destinations during the summer months. Pollution issues that concern river users range from litter to fish consumption advisories. Perhaps continuing well-coordinated river cleanup days around Labor Day would relieve some of these concerns and educate the citizenry regarding mercury issues.
Malvestuto, S. P. 1996. Sampling the Recreational Fishery. Pages 591-623 in B. R. Murphy and D. W. Wills, editors. Fisheries Techniques, Second Edition. American Fisheries Society, Bethesda, Maryland.
References:
Thanks to DuPont, especially Mike Liberati, for funding this project. Scott Gregory of USR coordinated the field work. Our creel clerks were David Keeling and Kyle Rhodes. Vic Dicenzo of the Department of Game and Inland Fisheries gave outstanding organizational and statistical support. Jason Hallacher of DGIF helped out with field surveys. This effort was largely underwritten by the Federal Sportfish Restoration Project F-111-R.
Acknowledgements:
Table 1. Sportfish harvest regulations for South River River Reach
Species Size Regulation
Daily Creel
Season Comments
1 Trout Catch and Release
0 Oct 1-May 31 Trout stocked from DuPont to North Park three times per season
1 Trout 6 inches 6 June 1-Sept 31
Trout can be harvested during summer
1 - 5 Smallmouth bass None 5 Year round Recommend no harvest 1 – 5 Sunfish None 50 Year round Recommend no harvest 1 – 5 Carp None None Year round Recommend no harvest 1 – 5 Catfish None 20 Year round Recommend no harvest
5 Trout 6 inches 6 Year round Put-and-take area Table 2. Secondary sampling units with associated sampling probabilities. Reach No. Reach Name River River Miles Probability
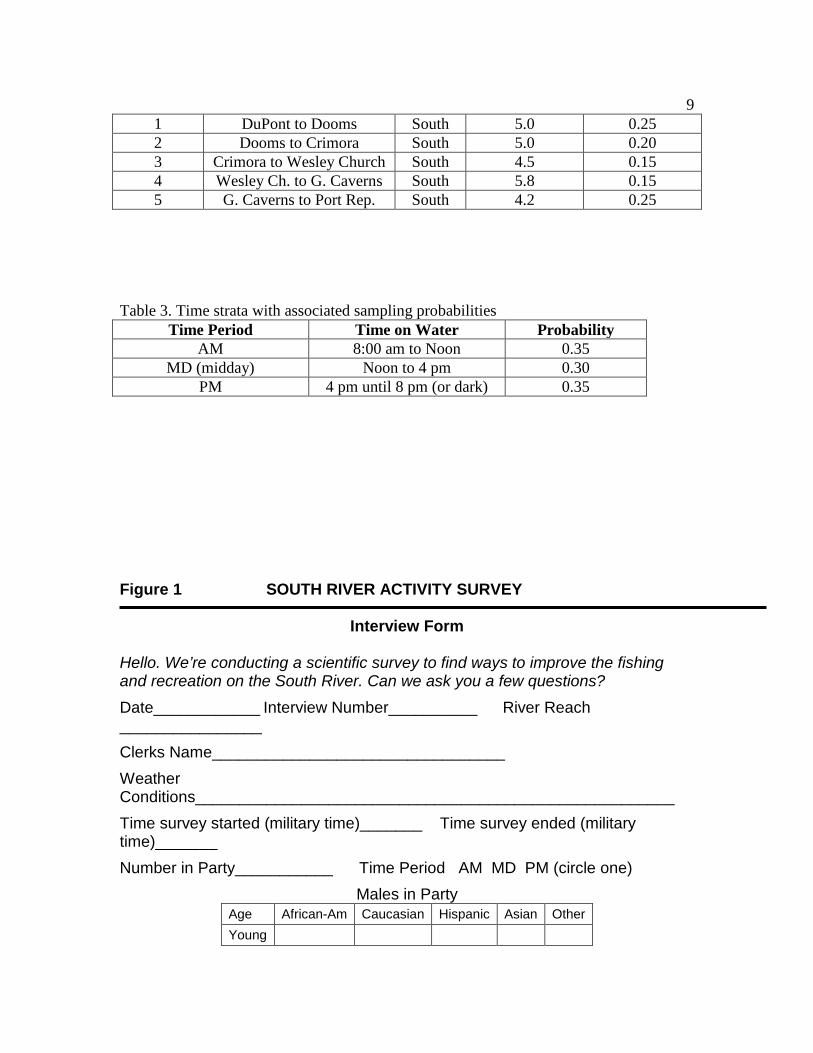
9 1 DuPont to Dooms South 5.0 0.25 2 Dooms to Crimora South 5.0 0.20 3 Crimora to Wesley Church South 4.5 0.15 4 Wesley Ch. to G. Caverns South 5.8 0.15 5 G. Caverns to Port Rep. South 4.2 0.25
Table 3. Time strata with associated sampling probabilities
Time Period Time on Water Probability AM 8:00 am to Noon 0.35
MD (midday) Noon to 4 pm 0.30 PM 4 pm until 8 pm (or dark) 0.35
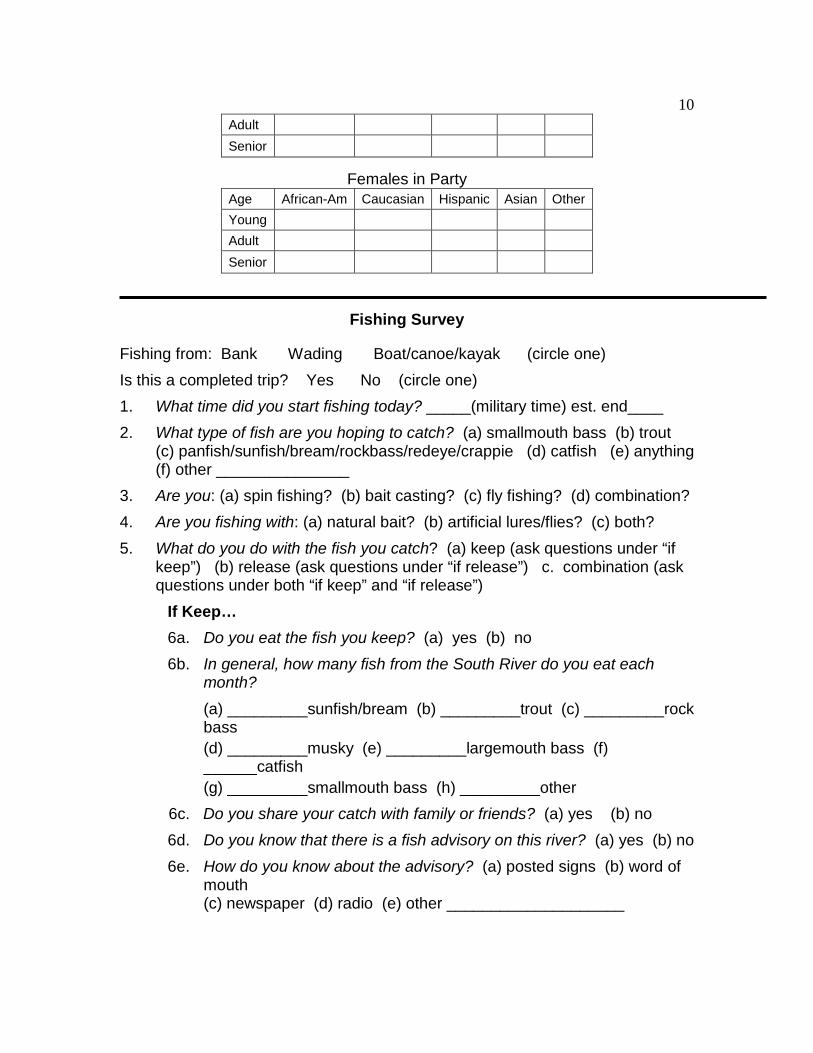
Figure 1 SOUTH RIVER ACTIVITY SURVEY
Interview Form
Hello. We’re conducting a scientific survey to find ways to improve the fishing and recreation on the South River. Can we ask you a few questions?
Date____________ Interview Number__________ River Reach ________________ Clerks Name_________________________________ Weather Conditions______________________________________________________ Time survey started (military time)_______ Time survey ended (military time)_______ Number in Party___________ Time Period AM MD PM (circle one)
Males in Party Age African-Am Caucasian Hispanic Asian Other Young
10 Adult Senior
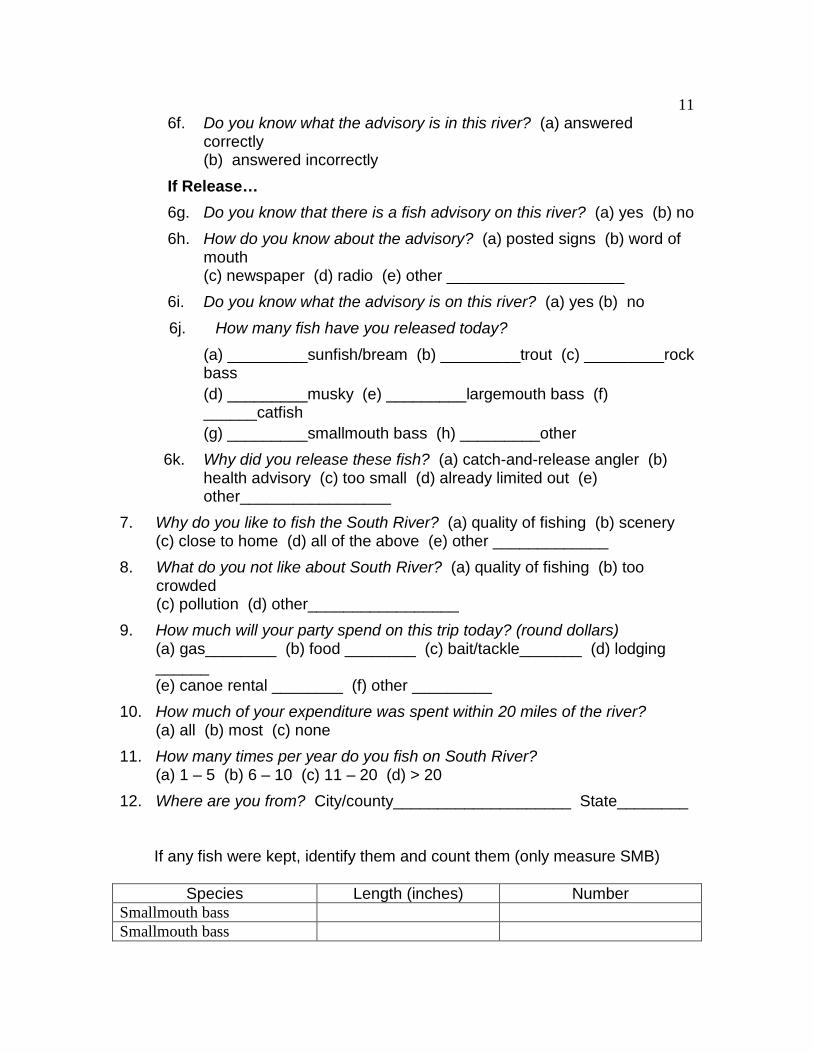
Females in Party
Age African-Am Caucasian Hispanic Asian Other Young Adult Senior
Fishing Survey
Fishing from: Bank Wading Boat/canoe/kayak (circle one) Is this a completed trip? Yes No (circle one) 1. What time did you start fishing today? _____(military time) est. end____ 2. What type of fish are you hoping to catch? (a) smallmouth bass (b) trout
(c) panfish/sunfish/bream/rockbass/redeye/crappie (d) catfish (e) anything (f) other _______________
3. Are you: (a) spin fishing? (b) bait casting? (c) fly fishing? (d) combination? 4. Are you fishing with: (a) natural bait? (b) artificial lures/flies? (c) both? 5. What do you do with the fish you catch? (a) keep (ask questions under “if
keep”) (b) release (ask questions under “if release”) c. combination (ask questions under both “if keep” and “if release”)
If Keep… 6a. Do you eat the fish you keep? (a) yes (b) no 6b. In general, how many fish from the South River do you eat each
month? (a) _________sunfish/bream (b) _________trout (c) _________rock bass (d) _________musky (e) _________largemouth bass (f) ______catfish (g) _________smallmouth bass (h) _________other
6c. Do you share your catch with family or friends? (a) yes (b) no 6d. Do you know that there is a fish advisory on this river? (a) yes (b) no 6e. How do you know about the advisory? (a) posted signs (b) word of
mouth (c) newspaper (d) radio (e) other ____________________
11 6f. Do you know what the advisory is in this river? (a) answered
correctly (b) answered incorrectly
If Release… 6g. Do you know that there is a fish advisory on this river? (a) yes (b) no 6h. How do you know about the advisory? (a) posted signs (b) word of
mouth (c) newspaper (d) radio (e) other ____________________
6i. Do you know what the advisory is on this river? (a) yes (b) no 6j. How many fish have you released today?
(a) _________sunfish/bream (b) _________trout (c) _________rock bass (d) _________musky (e) _________largemouth bass (f) ______catfish (g) _________smallmouth bass (h) _________other
6k. Why did you release these fish? (a) catch-and-release angler (b) health advisory (c) too small (d) already limited out (e) other_________________
7. Why do you like to fish the South River? (a) quality of fishing (b) scenery (c) close to home (d) all of the above (e) other _____________
8. What do you not like about South River? (a) quality of fishing (b) too crowded (c) pollution (d) other_________________
9. How much will your party spend on this trip today? (round dollars) (a) gas________ (b) food ________ (c) bait/tackle_______ (d) lodging ______ (e) canoe rental ________ (f) other _________
10. How much of your expenditure was spent within 20 miles of the river? (a) all (b) most (c) none
11. How many times per year do you fish on South River? (a) 1 – 5 (b) 6 – 10 (c) 11 – 20 (d) > 20
12. Where are you from? City/county____________________ State________
If any fish were kept, identify them and count them (only measure SMB)
Species Length (inches) Number Smallmouth bass Smallmouth bass
12 Smallmouth bass Smallmouth bass Smallmouth bass
Recreation Survey 1. If you are not fishing, what activity best describes why you are on the river
today? (a) wildlife watching (b) canoeing (c) kayaking (d) swimming (e) tubing (f) other ______________
2. Why do you like to recreate in the South River? (a) scenery (b) close to home (c) both (d) other __________________
3. What do you not like about South River? (a) too crowded (b) pollution (c) other_________________
4. How much will your party spend on this trip today? (round dollars) (a) gas________ (b) food ________ (c) lodging ______ (d) canoe rental ________ (e) other _________
5. How much of your expenditure was spent within 20 miles of the river? (a) all (b) most (c) none
6. How many times per year do you recreate on South River? (a) 1 – 5 (b) 6 – 10 (c) 11 – 20 (d) > 20
7. Where are you from? City/county____________________ State________
7
19 17
15
4
0 2 4 6 8
10 12 14 16 18 20
Num
ber o
f Day
s
Month
Days on the Water Figure 2
99 Individuals sampled 65 Party interviews
13
19
8
11
7
18
0 2 4 6 8
10 12 14 16 18 20
Num
ber o
f tim
es s
ampl
ed
Starting Point
River Reaches Sampled Figure 3
Downstream
91%
6% 3%
Race
Caucasian
African-American
Hispanic
Figure 4
14
32%
27%
7%
26%
4% 4%
Where are you from?
Augusta
Rockingham
Harrisonburg
Waynesboro
In State
Out of State
Figure 5
18%
59%
23%
Do you fish from...?
Boat
Bank
Wade
Figure 6
15
27%
27% 4%
42%
What are you fishing for?
Smallmouth bass
Trout
Sunfish
Anything
Figure 7
89%
3% 3%
5%
What type of gear?
Spinning
Bait
Fly
Combo
Figure 8
16
29%
52%
19%
What was your bait preference?
Natural
Artificial
Both
Figure 9
87%
13%
Do you know about the advisory?
Yes
No
Figure 10
17
43%
35%
7%
15%
How do you know about the advisory?
Signs
Word of Mouth
Newspaper
Other
Figure 11
73%
27%
Answered the advisory question correctly?
Correctly
Incorrectly
Figure 12
18
25%
73%
2%
Do you keep fish from South River?
Keep
Release
Both
Figure 13
20%
80%
Do you eat fish from South River?
Yes
No
Figure 14
19
84%
14%
2%
Why did you release your catch?
C&R angler
Advisory
Other
Figure 15
19%
9%
48%
4%
20%
Why do you like fishing South River?
Fishing quality
Scenery
Close to home
All of the above
Other
Figure 16
20
4%
51%
45%
What do you dislike about fishing South River?
Fishing quality
Pollution
Other
Figure 17
83%
3% 14%
What Proportion of Money is Spent Locally?
All within 20 miles
Most within 20 miles
None within 20 miles
Figure 18
21
0
2000
4000
6000
8000
10000
12000
14000
16000
18000
May June July August Sept Total
Dol
lars
Spe
nt
Month
Angler Expenditures by Month 2011 Figure 19
Total = $16,988
83%
3% 14%
What Proportion of Money is Spent Locally?
All within 20 miles
Most within 20 miles
None within 20 miles
Figure 20
22
0 500
1000 1500 2000 2500
Hou
rs
Month
Fishing Pressure South River 2011
TRT SMB SUN ANY
Total Bank and Boat Effort = 5,316 hours
Figure 21
0 500
1000 1500 2000 2500
TRT SMB SUN LMB UNK FAF
Num
ber o
f fis
h
Species
Catch and Harvest By Species South R 2011
Harvested Released
Figure 22
23
0 0.1 0.2 0.3 0.4 0.5 0.6 0.7 0.8 0.9
TRT SMB SUN ANY CRP CAT
Num
ber p
er H
our
Species
Catch Rates by Species South R 2011
Harvested Released
Figure 23
0 0.2 0.4 0.6 0.8
1 1.2 1.4 1.6 1.8
May June July August Sept
Num
ber p
er h
our
Month
Catch and Harvest Rate By Month 2011
Harvested Released
Figure 24
24
0 200 400 600 800
1000 1200 1400
May June July August Sept
Num
ber o
f fis
h
Month
Catch and Harvest By Month 2011
Harvested Released
Figure 25
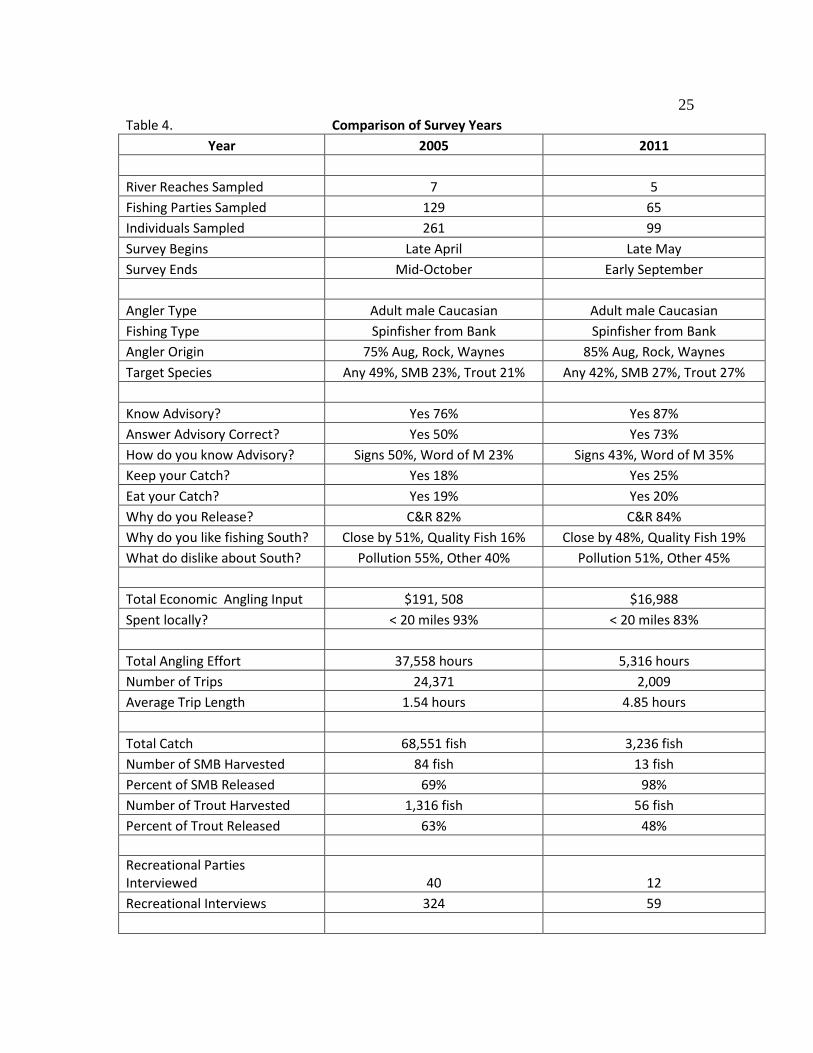
25 Table 4. Comparison of Survey Years
Year 2005 2011 River Reaches Sampled 7 5 Fishing Parties Sampled 129 65 Individuals Sampled 261 99 Survey Begins Late April Late May Survey Ends Mid-October Early September Angler Type Adult male Caucasian Adult male Caucasian Fishing Type Spinfisher from Bank Spinfisher from Bank Angler Origin 75% Aug, Rock, Waynes 85% Aug, Rock, Waynes Target Species Any 49%, SMB 23%, Trout 21% Any 42%, SMB 27%, Trout 27% Know Advisory? Yes 76% Yes 87% Answer Advisory Correct? Yes 50% Yes 73% How do you know Advisory? Signs 50%, Word of M 23% Signs 43%, Word of M 35% Keep your Catch? Yes 18% Yes 25% Eat your Catch? Yes 19% Yes 20% Why do you Release? C&R 82% C&R 84% Why do you like fishing South? Close by 51%, Quality Fish 16% Close by 48%, Quality Fish 19% What do dislike about South? Pollution 55%, Other 40% Pollution 51%, Other 45% Total Economic Angling Input $191, 508 $16,988 Spent locally? < 20 miles 93% < 20 miles 83% Total Angling Effort 37,558 hours 5,316 hours Number of Trips 24,371 2,009 Average Trip Length 1.54 hours 4.85 hours Total Catch 68,551 fish 3,236 fish Number of SMB Harvested 84 fish 13 fish Percent of SMB Released 69% 98% Number of Trout Harvested 1,316 fish 56 fish Percent of Trout Released 63% 48% Recreational Parties Interviewed 40 12 Recreational Interviews 324 59