annali di statistica · annali di statistica anno 122 serie x - vol. 2 the underground economy in...
TRANSCRIPT

ANNALI DI STATISTICA Anno 122 Serie X - vol. 2
THE UNDERGROUND ECONOMY IN ITALIAN ECONOMIC ACCOUNTS
SISTEMA STATISTICO NAZIONALE
ISTITUTO NAZIONALE DI STATISTICA
Roma 1993

~------- i Istat permits the reproduction, partial.or total, of the contents
of this volume; the source must be clearly indicated.

INDEX
PREFACE
PART I - Theoretlcal Aspects
1. Concepts and definition 2. Estimative methods 3. labour market aspects - Statistical problems 4. Work volume measurements - Generai principles 5. Delimitation 01 the field of observation 6. Statistical sources for measuring employment
6.1 Inventory 01 statistical sources 6.2 Criticai analysis of principal sources
PART Il - Measurlng the quantlty of work
7. Operations on principal sources 7.1 Standardisation with national accounting definitions 7.2 Comparison of standardised data 7.3 Data integration at a geographical level 7.4 Correction 01 classification errors by economie activity
8. Data processing 10r measuring employment in the industry and service sectors in 1981 8.1 Comparison 01 data from main sources with data from other sources
and their integration 8.2 Processing 01 standardised data 8.3 Methodology adopted for estimating 'secondary activities' performed in
particular branches of industry and services 8.4 Aggregated data 8.5 Considerations on the classification by to economie activity
9. Data processing for measuring employment in the agricultural sector 10. Comparison 01 1987 revision estimates with previous national accounting data 11. Estimates 01 Iabour units benefiting Cassa Integrazione Guadagni (Wage Sup
plementation fund) 12. Re-Construction of historical series
12.1 Generai criteria 12.2 Statistical sources 12.3 Methodology
PART III - Other estImates
13. Revaluation 01 underdeclared income 14. Sample surveys carried out on families and enterprises 15. ACCOunt balancing
Appendlx
Blbllography
Pago 11 » 14 » 15 » 16 » 19 » 20 » 20 » 21
» 27 » 27 » 28 » 30 » 30
» 35
» 35 » 36
» 38 » 41 » 41
» 41 » 44
» 49 » 49 » 49 » 50 » 50
» 55 » 57 » 57
» 59
» 64


PREFACE
This study contains researches, statistica/-economie . ana/yses and method%gies produced by the Department for Nationa/ Accounts and Economie Ana/ysis to quantify underground economy, on the occasion of the revision re/ating to 1982.1
Measurement method%gies iIIustrated are those contained in the pub/ication of the Nationa/ Statistica, Serie IX, Vo/.9, and in subsequent updated versions. 2
1 The studies were collected and organised by Dr. Antonella Baldassarini who also contributed her ideas to Chapter 1 - Concepts and definitions.
2 The updated versions are contained in the "Inventory of statistical sources and methods for estimating GNP and its components", which was compiled for ISCE in compliance with Art. 4 of the Councìl Directive of 13 Februa,ry1$89 No. 89/130/EEC, Euratom, on harmonisation of gross nationaf product at market pric~.


PARTI
THEORETICAL ASPECTS


1. CONCEPTS AND DEFfNITIONS
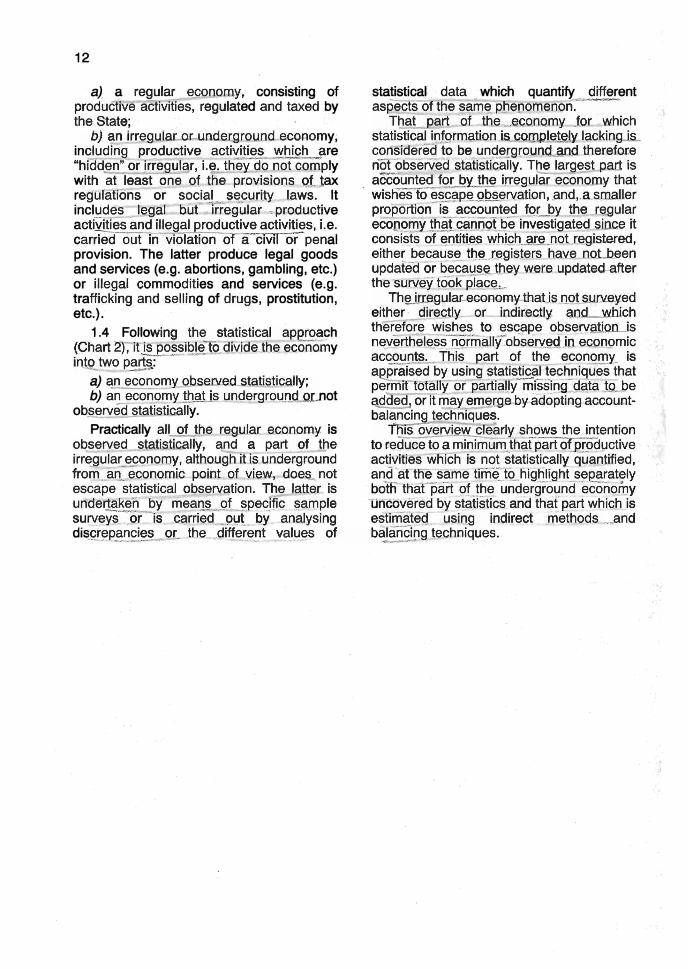
1.1 Ttte underground economy. forms part of the ecoQQ!!!Y: !!s dimenSiOiììS'defirì!d
~ttfjfnlliU;~~ìo~~JJffi;S s~;~m~~=~ tlfe:sfzEr·ofTJnn~~Jis~.,r.,e{,wlmiQD§; ~ contrOr .... ~lhe· e historically consolidated bèiiàViOur of entities and the beh5!viQULOf new entities. etc. UnderglQlJud,eCQIlOrmCCan ~ d~lilJ~(Lwifnill_tbe production bOUlldaries. esta~t~l!e"d, ..... p'j{.,Jne, .. ,,~I;Y(QPe~D.,.,§}!§tem" of int~gr9:jed,eCoQQIDjc,a&CQunts, (SNA).
. Mproduction is the creation oLQ.oods and ,~~ljfj~,es that maYSatisf}nllinmn needs, and in _ the _lJaYQD13J""i!C~ouflljD9 model.,,~ produ9five,.,.~9çJ19mjc-,.,.activiijes".for, .. which som~,mQPetary r~P,en~eJ~,mç}de fqC"factor.s"".empIQyed .. ".come.,,,lImteL,tbi~
Chart1 - SOClO-ECONOMIC APPROACH
11
heading. ComaimiQ!lé!!'~,_~~me " . other acfMfies are added, suchas:=tlle~mily consumpnonof'roOastUffsgrown by members of the same family in charge of agricultural holdings; the direct use of dwellings in ownership ; the self-production of investment goods. Within the. prod• ,aiOD· tramework, a~i!1!i,~§~~§iblEt9.L!L~~1 QLHI~9é!t. TQe old "ESA", stili in force today, made nq,JD~=-~~O~o.Ot
.... _-", 1bem Th "SNA" e~~!L,,!!L,,~~çluc:1EL, ' .. e"Jle'«."". ,. inc!':Iq~~Jh~e,$,$ly.
1.2 In the frame~_ e~omic activitiesas ruIDned;abmte.,the.lJDder:gtQWld ~~YJ:),~J<!~[I!i:fi,ed~adQpJi(l~jper a '§'QQi9:,~onOm~,WlP!Qach~.Qr, .•... statiStical arml~
1 Legai activities that become il/aga! if performed by an operator not authorised by law (e.g. clandestine. abortion and gambling). 2 Prostitution, production and sale of drugs, etc.
12
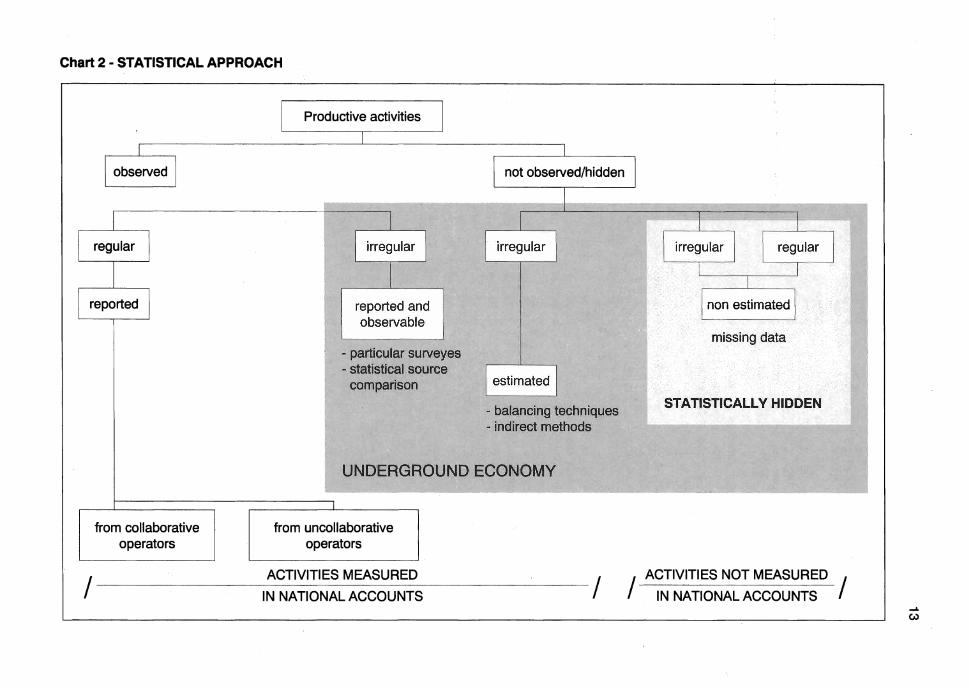
Chart2 - STATISTICAL APPROACH
from collaborative operators
Productive actìvities
from uncollaborative operators
ACTIVITIES MEASURED
/ IN NATIONALACCOUNTS / /
ACTIVITIES NOT MEASURED /
IN NATIONAL ACCOUNTS ..... CN

14
2. ESTIMATIVE METHODS
2.1 Economisfs and éConomicstatistlcians havéused various methods for estirnating the underground economy,and theycan· be divided i!!!()JI}(efLc:at~Qri~: directmèthod§, indlr~tm~thod~and mixedm~tt10ds.
"Qii~cr' métIiOds"~~~'.:ji§~ia~~:~~Hl«J1ata gatl]QrjtJgJtii.Q!!9IL~~n~!!géil.!!!!!R~~~!!Jrveys CO[ld~ on .. t~mlJm~,_JllQMQ.Y91~ .. {lnd blt!!!!~!~!J9j[lye~tigateJ.nto ·their activ~,,"pr P!lS!.~~_!>ilmçipgtiQo in~~the,JJJlaru:omund econQIDY. T ex evasion controls. andsatTJP1e sUrveys ()n -DatancEFfrmf·~com~TritÒ .. ,this C9f~g9n!:"" '. ,,~-=~-""'" .• '~" '~nutTlbe~()f t~bn!q!tesare .• usedin the
~ndir~c:!r!1~fuQg~~~Q~ry: t~~!,~~!ql)~!m~ to Idenbf)f., .. Jbe. ,., .. "QI}~nQmenQn ..... thro14gh dì~t~pgnçJ~s ·amQOg,.~.o:us ... Jlbsewed soùtces; mOfl@té!!YJ.~ç~n!9!Jes, based on the relationship between C9sh avallability and ballk deposits orbetweencash aVaitability and income; techniques .~~§!!1gJl}egctivity ratea .. C'f . tJ1~:::'"ì)oPiiIation; .gnit~~,4ll"the a~~.~EtOO$~.,Qt.J.he .... under{}tQUfld •. eçonomy problEm'l and other · .. ,Dar,.te.cbfÙqUJ~S.
"MiX~(f .......... s ... :are, .. thosexwt1~hmake u~~2t,tiQtb.dlfectanct,indir~ct.iJ)!Q(roattQn, or tho$è that· use the mè~pod .QL:~ti.ma1~. FS' madeff ;eerts.P'-"~F" ..... '.' ..... ,. >. ", .. ~. y ... ~ ... ". .. ' ihasemettiQd,saU.ow .. to.esUmate note onfy obs~!'I,~Qeconomy •. butals.o.the,underground eoonomy, whjçbp.is.,~Q~r.alOC,.~9geclt.·.but notInt?gratedwitbintbeaçc'OUfliing.$~stem.
2.2. Na~i91'l~I~ççpY01~[lJ}.authQt:itiesjnJtafy ha.~~ .. !:,9~.~\{erad.op:ted .. aQ.origl0al .. g,pp(oach. The .,:"undergroun~LeQoI1Qrny.'~phenomenon hasbeen dèaltwith ex anteand iamt.erall terms"'wnfr'iEf'~ard ... iothé""'robte of ............... , .. ~" ..... _ g ........•.. "'"~ •...•..... J;I! •... l!.§JllS Ql~a.$yripg. dif!~f~I'lL ....•.. aggregatès, ~ therefo'J;t ...• J!1.~ ..... ro§!bQdQlogjc~ ..• §.Ql!:'J!9ns ag9f!!è9.JQ ... Qyap~ffy thi~,.E~.2!1oroenonare inC4rQ!Qj.nJne.~}(S.tem .. rt iS thus only p()ssible ex post to carryout a conceptualisation ()ftf1e èéiltegorlescontalned in the. sys:tem and analyse the singte e/ement$. inc/uded therein.
Before descrjbing the methodotogies' we adopted, .. We .• ~QJJJ.!;t.JI~e ... 1Q.,.gJv.e •.• a .. .brief Qy!D!.!è.~.,·Qt.ttre··criteria..used.for.·.estimating prQgY~lipn3. These"criteria,.canb.e··9fOUped int9..fgYr.çat~Qn~:
3 A detailecl description may befound in "Nuova contabititanazionaleu and in "Inventario delle procedure e delle basi statistiche utilizzate'per il calcolo.del.PNL e clei suotcomponenti". See note 2.
.,/""'."\
( a)) criteria which. foresee. the direct gàt~rin~rofcosts<;U1d earnings trom balance sheets . and administrative documents. Jhis data isoomplete and is not underdeclared;it refers to activities of large-size en:terprises, pubUc enterprisesand public administration i 'ons;
, '. riteria which foresee the aggregation of estirnates relating to quantity of output and relative prices; these criteria are used for estimating the activities of the agricuUurai and construction sectors as we" as the branch of energetic products;
(@\criteriawhich foresee the expansion of p~pita values for labour units,after having estimated the overall /abour underlying the product and. after having oorrected the. per capltçl valuesfor eventuat undervaluations;
,d",.criteria which. estimate the product, by ,I mÈ!arls of information ooncerning the ( utiHsation; these criteria are usually adopted \ to estimate the activity carried out by the soI caLled "invisible" units or by very smaJI· units l which want to stayhidden andtherefore do ì no.1r.eg .. ularly ...•. reg.ister their·product. t/ f Jhese criteria cfeàrly snow thefun<iamèntal
role played by employment. in methOds which / estimate the proQuctfromthePoint of view of
fQrmation; as a reStllt the /tanan acoountants designeda methodology enabtìng them to identityand anatysethe various segments of regular and irregu/ar eoonomy within the laboùr. market, by choosing a disaggregation level by economie .activity and by territory, which opUmises results.
The per capitavafues have moreoverbeen controlledand 'reva'fuations are carried. out in order to avoid thephenomenon of underdeclarationby entr:epreneurs .
It may be notedthat, inorder to estimate thecreated . prQduct,. ltalian accountants considerthefolfowingt0be themajor aspectS cf underground economy:. th,eutUisatlon of irregufar/abourwithintheproductive proceS's and underdeclaration6fthe product obtained by means of regularlabour.
As far' as· other branches of economie activity are eoneerned, particularly those in which the prpportion reatisedby very smalt units is highly important, directsample surveys were carried Qut with thealm 01 unoovering aspects of irreguler and undergroundeconomy.
The who.le rangeof the above describe<f m~thQdologies enabled us to integrate thé underground' activities with the data which
makes up the statistical base used to estimate· the various economicand financial fIows .which· describe .the different phases of the income circuit.
Finally, the account balancing has made thesystem coherent, and in addition it uncovered other activities not symmetrically registered.
In other terms, we may formalise what has been said in the following way:
v = ~~:1 ~~1 Xbc· Ubc + ~:m+l Vb
where: b = indicatorof branch of economie
activity (44) c = indicator of class of firm based on
size y = total value added x = mean value added u=labourunit
= part of the value added not measured via labour units
2.3 The following chapters will analyse in greater detail the single criteria used for estimating underground production. In particular the_ follo~in~~çta--Will be discussed: tQe estimate of .irr~gular s~ts within-lfie -raDòlR:~fu~rfçet. " the re'!.aluab~.~.gI:J!~f<.f~ç.~ed ~gdu~ion, SlL'Y.~'y§.QgrrJfu1 . .ouLm.J)tçl..@L to JOV§stlgate
~~~~~~~~~~i§~[~~~~:~ t~~Jlnig~~!>.
2.4 Before going into greater depth on the eswtimates of the irregular segments of labour, it appears necessary at this point to define and understand the ways in which thEJ I~bour .market ispresent in. the country's economie system, and to highlight ali. the statistical problems which arise when an exhaustive and coherent description of reality is undertaken.
3. LABOUR MARKET ASPECTS STATISTICAlPROSlEMS
3.1 Inlta'yin thelate1~70s, rese.a:rcbes carried:~t=§:~_.~ir:ti::~nii., . .specialiseèf orfl§t!2~~tionsjndi~ted aJabilYLI'TI~et selit uP.,},nto '. differenf hetEJrQQ~I1.EJolJs .... reatities (cottàgé~'ìridtistry"labour, iIIEJgal immigrant labour, seoondary activities)tl"lalmay .not eas!!Yf:l~r~pr~§ftl)led ,ina,single:categQry.
15
Thesa,realfties~nnot . beeasfty .. id~ified ~d_q1!~t!!!~.Lb,Q!h" beçsiii§~':Qnfifj])~~i~!ar nab,JI~tQ1.Jn~l .. ~D:tttQDm~nt (extremely small businesses, indiViduals' not having a fixed piace of work, families that work at home on behalf of firrns,etc.)andbeèause economic
~u~~~.,!~!:lfL!~th.I~~~e t~-!~l!IQ~rj!i~~lm!!l§,~lçé!Ij!l~1!!!Jt~s. It is for this r Ued Uf1(/Jl({Jlg!Jl)çU{iJbQlJlQLU!JJJ.~IQ,[f1!;:l r.
3,2 The Nationallnstitute of Statistics, well aware of these phenomena, has broadened the field of observation and has begun to devote particular attention to the way questions are set out on statistical questionnaires, as well as undertaking a more effective qualitative. control. of. data gathered.
Only if d(ita is more detailed, complete and of higher quality can nationalaccountants use avaiJable statistical data to paint· a precise picture of the complex segmentation of the labour market in allits activities, making use of ali sources at its disposal to form a coherent picture, and creating methodologies to ensure, through systematicobservation, that varying aspects of the economy are adequately represented.
3.3 If one looks at the actual situation and reads in. greater detai! the basic data, one is led to re-consider the conceptof "employed", Th~employed wQr;Ker". talseno to me~n_Jln inQM~al t~t~e~r!T~~,!t~Qrking,~cti~~!!~_ 10ng~L~QQ.~é!flL,S:L,.egj,J~t,e !Q .. ,Q~§çriQ.~~Jhe CO((l.R!~?(,!tY~Dn~.~é:l!19l!!)Q~tegOlies~tw.or~r tl]~ . .<tQ~~~j~!jl1.Jbe~.JI;lQQYC.OlarKet. These rac:fg,e .. ..frQrrl .. ttlose~pwhQ .. de\lote ..•. only .. afew hQ~rs, <!l<!!!2t~~l!lgrty~.to.pmduc.tiy!=t~çtÌ\':ity. to th~~~~~~,e~rtE!nlAJnul~!ud~~s a!1(;t:a.ey,Qle~~!b~l! .. l't.MI~1., . .J;iJ~)! .. !.(t .. ~Qt~log, ~'iç~Q;Ilg.the:'~.JQ ... ~: till1~~Rle.x~!!f~l'Ljs d~i~t~st.!«;ttIJt?!r .. ,p.ctl)~pa!~,ct.Jp~!i,~n. .~ clear ìhat these "extreme" cases are. both in~~~~~l~!~~~L~~r[r!9:.çQijli%Y:tIQiilS, at ~ej\SLtiJ.JfH:m~,.ofgl.lii,l!'.l\itY, \lt)!y""çIji{erenL In other words, il may be said' that tI)~l: arenot ~Qmggm~QY~}!yit.b .... regard._tQ~lbeJàiilF'of la.b9ur~iQte.o~iJ:v. In a bid to measure correctly the Jevelof employment belonging to thesocallaci undergroundeconomy, where the phenomena of secondary' activities, work pertormect within invisible establishments and part~time work are mosi widespread, it is absolutely neCeSsary forsome concepts fundamental to the measurement of employment to be reviewed.
16
4. WORK VOLUMEMEASUREMENTS -GENERA L PRINCIPLES
4.1 In national accountsstatistics, the total number . of'11nternal .. ··":wor1<~fs···il1~tmt~s ali worRers;·"{joffi'··'·'"'u"." ...... "'''mPlO' ed I that:pm:fQ®, •. ,~.Jlt:.ç.Jyç . ltY,·"tfieir number i~.,!>mt~~~.IttllJ~.!Q(mJ?f .. ~,,':~an number' ina ~iveneeriod(quarterly or yearly) oJ::pe;SQo.$..:,!J:ìiì:::.t:iàv,è:".takeR .... ··f)ar'Ì·,·in···· the pr~ti~~;.§,.J;.QOliJ1YOuS form, In the carculation of this number, particula! atten~!RI),J§,llaid,Jo,JlC.casional .9[: s~~wal workers, especially when the averag.e level of em~io' menr"iSYn~Ufoo"ortffie'6asis of sfJ~=~difigLqQii~i(!h[m:òfithi..9fthe perr~,.\!OQ~t~Q§~ryJlfoi9n. .'
The meannumber of employed persons, both. employees and self-employed, as defined by theESA, undoubtedly,. represents thenumberofnatural persons that participate inthe production process . in a continuous formo It does not however seem to consider fullythenumber of activities thateach person mayperform or, in other words,the working positions that a person may QCcupy.
4.2 As regards ,tbe,acW/ii.t"econol)lic si1uati~!:l,.!.'l.9uL.CQuntry,. tbe j>-1)~nQmfUlahOf OC~~'OflEl.I,;§lf!Q.xoargl!l@! .. J.abouLha\{§I .. ~peen jolQe~;(!o·a[\JnQtegsing§~~D1J?yJht!.ele!]1ent ofth,~ worker wh(4 in the.same peri~d()ftime, pèffcirms§9iti tt"1E1.!1qn~~~ç!fY1!Y~iffi:nl1~iéfore 0cCtlPì~s moreth~p o~'Nqr~jng .. ~.position ev~n fn}fitfererl[~r#to.çba~LoUhe,economy.lt istnereTore ~~Deflevedthat the definition of "worker" should be broadenéd. Jl",J~.JhllS neces§élry tO.~·~~ ... u.RJb~)V,orl<er,..empIDyment identity:;:iflCf.rather.K.take .T.into· ... acQQoot·4he nUn}l:ier of !g!~llii!~#,2ti.WQrkiog,positionsthat eaçb.( .• ~.p.e($On •. o.~cupl.es .... jQ···,~··· .• prodt1ction ;,Plgç~s. \From thisalternati'1e potnt of view,the ;quantityof work performed is representedby \~group of working positionsidentiffed bythe number of workers ("heads"} only upto the ipomtin which that position is theonty or,at . least,·the main employment. .!?~~g.~~.J.IJ!s lifnit, the quantity of WOrk' is .. representi~fLby th~igrO ;·gpoaiflonsCòoSliffng.of a ca:~~Q ..a$·i':~~òn(Laétivity". The volume~orworkPef:{orrrieoTil1hÈtproduction proCéss. illijSfafsOìncluCle1hatlaftefgroup.
ThìS~means·lftarnelffief-thénumber of "pe~~~~~=~~~~JiLOHC.J:ìgLJ~i;C}'.':i'!ì~t:)~ of "worR'[email protected]!L@~~ max.e~~mlta .. ~tlàf,~çtory calculation of me'" vOlume of work 1hat
"~C'""''''''_~«_'~'~C~_~'''.c_~~..;.~,""", .. "<--,." ,,'" '--~"'-".''''''''''-~ --'''''''''-''~"'~<'_"''''_''~<'~"''''''' _ --"'''--",'c"_"""",,,
contrìbutes to the.· production processo It foUows'tnerefore·fhat'à'new''(;oncèpt. and··a new group needsto beJntroduced by l'laticinal accounting authorities, which .is the ··work volut:!!~ ... ~P!.f!SS!2 .. !!!~.:I~:~~çMCYilHSìJ;11leSe url!fS,cnaracterìsed. bYJt'le (approximate) ~~gf.eI[òrnn:J[t~J)roauction·.processes oi sil1gtEtJ;~~QQ2-rnl~L@-9!&i!I§~;,' ~~=QlWnedby red!J.Q![\g,~a."seri~§,(>f. '. so~called :working positi911,[' to roughly hcimog~rj~§.iJi urnts. ·In crefatr:1abour'Uiììfs' aremeasuréSJ' wittliD.Jhe fram~wòtK:Qf':~~~5.',~li~ç,:K.:by'.,"bdoging, thrQl,!gb .. ~.çQ~g[eJlt,gLxeg'y,çUQ!h· noncontinuous anQ.part:-tjmeworking, positions (mainand secondary) UP19ttl.~f§.am~<iuantity of labm.u:.as.calculated,for.units·occupied.full-
.~iIJlJ~· '. 'This co~tçl~fl!Jl~§,.b.OOn;,ca!cu!ated,.asj:he
r§!~~,,~~~~!1~rt~7·~'·i~qUr~··~~~!l!X·~!e;!lt wQL!mL~!J,?~,,:.J.m~i1mL.~r tn.aQY"i~Q.r.Nng p()siY9.n .... é:lJlQJI)~,.I)QU~.,~çt!Jal!y 'w()rk~gb,)' a p~rsgn.<!~C?!~!:~~L~§i~mgt()yed";.iniith~t§!J.ry~y on [email protected]()r~st()rl!lgiystr:yJiWSLs~(yi)çeP. As regards agriculture this ratio is calculated by using the number of days worked. as an indicator.
Bneily ,i~ be said thatin natianal accounts,.employrneiìtTsmeaSiJredin terrris of·',abour·.ùnitSii'~w~iènii~reduces-· lo ap.Q~~)('fil~IE!1Y~.:,JiQinQge'1~.Q!!K .. i· ...• ·ynui,Jn in!f!r.m~9jgt~'i~J~<éries (obtained trom various sources' and subject to duplications) tbaLis
J7 cal~.9,~~ln~!l$!2!l§"· 4.3ltshould be pointed o!-'tthat the most
complete and correct measurement of the volume of work performed ina given period is to beobtained from the sumof alI hQtJrs worked by employees an~.~~lf-employ~d workers in any working pòslt~rI (main' or secc>ndary). '. . '.. .. ......'
This may be true in theory."butV'/henit comes to drawing upa mmhddology'which encompasses allexìstil1gsources, some prQbfems arise. Th§I.,QIl!yg!oba.Lg~~, r~l~ting to theJl.umbecofJlQUrs}wOfkedis.·suPptIed.by thès~~Y,,9I1J~9!J(JOJ;ç~s.BIJ!Jhe pr~m with Uils dataj··.according toanalYsescarried out, isJ!L.aun~?!~.cane~Jnt999~~iOl]J?!!!ng to their "instìtutiòlÌal'" nature, nall'1e1y the comp{ter:~iif1haJ:J.~Stioni:t~re .. lJs~IJYJ~fers tOJQ!L!ll:lmgeL~gtjjOJ.$r:s,.aslai~_çg.~ .. :by contracttnstead.oftheactual<mean~~ibf wQrkrog .. l1ours .... for ..... 1biitpedo~in ... question. Secot:Ktbt",.tfilidata.jRi!'i\aIlY .. ça~.available with. ar~s!ript~8. artaf,ysisJotonl.y;t~branches of,~ç.QQ.gmica.etivity. Oth~rstctti$tiçal sou[pes

dealing with working hours. do f'!9Jj~.Y~!l.CQ.~r global groups, which at least is the case for the"'aforesaid""Qàtà:""Surveysconductea at firms. sucti' àS-tne survey on the gross produot, while grasping more precisely the nature' of the "actual" number of working hours, limit the scope of their action to obtaining data for employees possessing working skills and, of course, to the economie activities included in the ''field of observation" of the survey. Therefore, due to the lack of precision and/or the parti al nature of statistical sources, j!.~~Q!1la.e.a~to eXpr.~:ttle.-YAlume of work ,io. terms of ''wO~LQgJ10W:S~~.
FUWLproblem~rOeJfpif .. )!J~.~~~d that in. n~ti9I!SlL9è~QIl:lWng, IfittJ!lliliIJRY!RQ3.e fè~CIfiii§il,l!1!!9~~.~QIK.V2JlJJ1le, . a~ \.!Wl! as pravìding.an· JmpadaDLm~syr,q~ut ill,. i1s o~t, . is lhat _ of ~SQlJtri~~!n9J91f!!~X9.~.Jhe measurement of other eco.nomìc~ates, su~~el~c;m~l1:~!J[id:~~~~llmIoyees' i ncomes , etc. Measuring work volume in terms'oTIhe number ofhours worked would make it necessary to have basic data (taken from statistical surveys) expressed in terms of me.an hourly values (e.g. productivity per hour), with which to bring these mean hourly values up to the whole population these mean hourly values via the product with the "total number of working hours" . An operation of this sort, as is welf-known, is quite impossible \ from an operative viewpoint, because of the l continued lack of information source~l Indeed, as well as not having satisfactory sourcesfor the measurement .. of the. "total number of working hours" , no statistical survey currently offers the possibility of being able to measure accurately aoy "mean hourly value" whatsoever, since ffrrns relesse economie data that refers to the whole labour force (e.g. th~ gross produot of a company derives trom the productive. contribution of ali employees), while working hour values refer only to blue collar workers. From these same surveys, however, the "mean values per employee"may be obtained, and onfy by usiog this data: correctly it is possible to bring this date up to_, whole-- popu-tation values in t order to measure economie aggregates for)\ national accounts. ./"
After this introduction to theproblem, it is now importantto spend a few words 00 the degree of accuracy achieved by using mean per ca:pi·ta values specifically for the measurement of an aggregate.
17
To use the mean per capita values "correctly", they need to be attributed to working positions that have been occupied for a working period which is on average of a durationequivalent to the average period for workers to whom the per capita vafue refers .. If on the other hand these working positions'~ have been occupied for a different period, the fl mean values must be corrected through a)) coefficient produced by the 'atio between the W actual working period of the perso n occupying thepart-time working position and the actual period of the person occupying the working positionin question (assuming that the mean value refers to the worker employed "full-time") .
_If the correction~.Q~[I'!1LQ!l !l]rQyg!LJl1is ~J[jpQn.~*instead of themean per capita value,. ~.!:I.!:!m.Q§!L .. .QL.wQr~lng positlons-onwhiçI1Jh~m~atlp.e[ cg.B!~..Y!llue i.§J2a~ed, th~_.fi'1gLr~§yltQfthemeasw:~m~nt of . t~_§l.ggr§tg~t:e,._Jor.,.natiDnaL acccwnting pyrpQ§~§J;1J~~~J1QlJ;b.ange ... bjJ.ta way would b~_ ....... foun,d , .... !o ....exp,r~_~~.,çQ.!l.2t~~Land aP,Rt~.~~~f~!i~~J1iL~YiQl~.,_~.~Q!!!me.. . This ... operatlon,. whichcarries ali \I\IQrl.<tf!9..pQ.~~ions to a fulT~timesçaHùind P:liiducesJh.a~um of these posttLQnaandlhe,estimatedCQefl'içjeot, gives 'liSé . to what we have ca/lèg .':Iabour unit~rnlfi1s·way:~eacn·worKìn':ositioh········ . be"worth o , ,nv 11-time emplOyment) O-tà](~~tion of a Jabour unit (if it involves a mainor second"ary-pair:trrne activity).
r It may be deduced that thEL!Qtal.9.i~!L!De) \ first~~r~~!lJ;},J?Q~!!tQl1§,_~S;Qlnci~§ ,~jttLJh~ I
( ~~~~Ttfi~t~~~~~~~J~~~Jhi!~I.<TWj:~ \ I ..... . .. __ y~~ .•. o' .......... "._.,JQ!9~, I pérsons·an~JSlbQjJr.UJìit$,.is,.theJoUawing: ~ ) eitiQ!Qi~?,Ltl.e.tsQJ:IJ~.QuaIs,ooe,JabouJ;>unj;Lit. he ? w2rk~,!~I.I:~!!'.~1!J .. ~!!.~ .. ~Q!:~i.Qgi·g9;:;.i!i~n;Jl~js ) w~ll~9!!2Q~Qt@Jabl;tvr, .. l)IJI! .. 'Ul~.~Q!!:$§ .. lJart\.. ti!!'J!jlc!·~!{1gf~"·WQs1:s.iD.9,,{lp{3i~gpL~~i~ .. l'i~.!1h ) o'1~.IaJ:mur ... unlt.JltuSjiJ!,~g,QJtQ~.lJgrq~more \ t~_9[!stWg(~il}g.l?g~!ti9n.gf.)'It!Jiçhof1e is fullI tlllJ~J!!l!1.QlJe •. tlart-rtme.
Th.~Lii}gY~t~~;Q!..~~r~~.sil!t!~~!!!me of. work. in . tlJJ.~l..Jltay,~.aod_.~uring ag~gatés~for national accounting purposes thr(}u.QTI::ì:TI~N'!:geJ: ... Capffa_y~J.iji~]6~!
18
VA = VRr + vSr+ V&
The three oomponents ~may aIso· be expressed as products . of the working posIions Md the productivity relative to the single working position. -
VA == vPRr+ zPSr + yP& (2)
The mean protIt.Jdivity v may . evidently be
obtainèd froìn the ratio: . ~but il may be
divided into its elementary~:
(3)
y = VRr OSO _1_ ORr PSn
(4)
This formula can also be written in the following way:
OSn
y = V PSn ORr PRr
OSn
(5)
where the term PSn is the ratio beetween ORr PRr
the actualnumber of working hours of those occupying an irregular working position and the actual number of hours worked by those occupying a regular working position. If we indicate this term by K, itis possible to re-write (2) in the following way:
VA = vPRr + VPSr+ KvPSn (6)
in whichit is clearly necessary to convert the irregular working positions through the etement K so as to obtain a correct estimate ofVA.
In reality, what distinguishes the per capita value added of the various· occupational components of an economie branch is not of course on/y the duration of the working timetable but a/so the quafity of work performed (includingtherein the professional contentland the unitary valiJe of the. goods ano servicesproduced. With reference to the above formalisation, it shouJdbe asked ìf it is correct ·to assume the· per capita.·productivity "v" as being equa' forali three components of employment,or rather, given that productivity "y" is applied to tabour units KPSnandnot to working positions PSn, if it iscorrect to assume the hourly productivity implicit in "y" as being equal for ali components.
This problem obviousJy affects estimates of nalionaI accounting rnonetary aggregates ano goes beyondthose aspectsregarding the measurement of work volume.· It is however worth mentioning that, as wifl be seen later on, the volume of work, in its practical appfication,is sub-divided not only into occupational categories that have differing working periods (regufar, irregular,
19
undecfared workers, etc.),. but also into classes of firm size based on the number of employees.Also, the irregular occupational components are ali to be found among srJ1aIler-sized firms, considering that most "unoerground"activity is undertaken in these. This means that for every sector of the economy, there is not only one type of equation as far type (6); there are in fact as many as tha classes of firm size, and that in measuring the value added of a branch using per capita values divided at least into firm size classes,it is possible to attribute to undeclared labour the mean productivity of smaller-sized firms, whichusually provesto be the lowest among the various production units of a branch.
The reasoning followed up to this point is obviously· valid 10r the calculation of other aggregates: fOr. employees' incomes, 10r example, not only isit possible toassign the Jowest per . capita saiaries of smaHer~sized firms, but it isatso possibte to excfUdesome iterns that are certainty not paid· with irregular wOrk, such as social security· contributions, etc., and so the labourcosts ofa branch are measured not only with a "v" whichvaries according to the size of the firm, but also within firms based on occupational activity segments.
Going back to the problems of the quantltative measurement of work votumes, we may obseNe that when applying the aforesaid generai principles in practice, there are many fult-time reducing coefficients, according to the branch and the single occupational segment.
Later we ghaU.go on to look at how these coefficients have been obtainedand used, ano the various methodologies adopted·for the measurement· of labour units in different sectors wìft be specified.
Further considerations pertaining to the generai theoryand relative definitions have stili to be developed.
5. DeUMITATION OF THE FIELD OF OSSERVATION
5.1 For national accounting, quantitative data on employment must necessarily be referable to production and ali other aggregates relative to the various phases of distribution and_ use 01 income. Thisis so as to give meaning· to the.n~lationship betwe6n the result of economic activity of production

20
l1nits and the group of human resources that hasproduced this result.
Thefield of observation covered by employment must therefore be the. same as that of production as defined by the ESA, with regard to both territory and economie activity.
As far as territory is concerned, employment data includes ali resident and non-resident workers that performan activity at resident production units, that is units that have been for over a year of centrai interest to the country's economie territory. The concept of "internai" worker differs from the national concept normally used by labour statistlcs. Compared with national employment, "internai" employment also includes non-residents that work in resident production units and, to a lesser extent, residents working in non-resident production units.
FUl'thermore, as regards activity, the concept of production as understood for national accounting purposes excludes from the field of observation, and therefore trom ther:neasurementof employment: work performed by housewives, the work of the individuaI who performs ordinary maintenance work in hjs own home . or constructs objects for his personal use; unpaid voluntary work undertaken asan expression of loyalty to ideals or solidafity towards certain categories ofcitizens. megal worl<, as mentioned previously, is a peripheral part .01 production, but is not inc/uded in estimates due to the difficu/ty of quantifying these items and relative production.
5.2 The statistical unit with which employment is observedis the local unitthat represertts a "proxy" of the homogeneous unit ofproduction, an elementary unit definedby the ESA for input-output analyses.
5.3 The classificati!)n adopted to separate work performed by employees and theselfemployed according to the Italian economie activities (ATECO) is the NACE-CLIO classification.
5.4 Finally, in order to correctly express the quantity of work applied to the crsation of income, those warkers that have not partiçipated in the production process, because they have beenlaidoff and placed undar the care of the Cassa Integrazione Guadagni (CIG, that is wage supplementation fund) have bean eliminated trom the calculation.
6. STA11S11CAL SOURCES FOR MEASURING EMPLOYMENT
6.1 Inventory of statistical sources
The most important statistical sources available for measuring employment are:
a) for labour supply. flows, the number of workers obtained from:
- the population census (CP); - the sample survey on labour forces; b) for labour demand flows, the number of
workers supplied by ISTAT and from external sources.
The ISTAT sources that have a bearing on labour demand are:
• the census for industry, trade, and crafts (CfC);
• the census for agriculture (CA); • the survey on gross product; • the survey on· financial companies (loan
and investment companies, trust companies and. equity investment companies, investmentfund còmpanies);
• the survey on public and private hospitals;
• the survey on the whole range of state and private schools;
• the survey on scientific research; • the survey on national and local welfare bodj~Sf on national and local economie bodies, onresearch institutes and social security bodies;
• the survey on family expenditure for the ordinary and extraordinary maintenance of dwellings.
As regards labour demand, ISTAT data has been . compared with the following external sources:
• ENEL (National Electricity Company), whiqh supplies the·. number of its employees,. distributedaccorciing to econ9mic activity;
• The Transport . Ministry, which. supplies the number ofemployees of the State Railways Etna of railway licensees;
• Post Office, Telecommunications ·and telephone service companies, State Monopolies and the MI (Public Broadcasting ... Company), ·which supply the number of their employees according to economie actMty;
• . CISPEL, which supplìes the number of employees of .. Iocal authority utility companies according to economie

actMty (etectricity, gas, water, transport, etc.); , ,
·'fhe'MiniStfy of ,'thelnterfor,: WhiCh 'supplieS thenumber of etnployees beIonging lo the PrOVinces , and Municipalitiès, 'as well as infòrmatìon on the number of foreigners present;
·,The HeaIth Ministfy, whiCh sUppliès the ntimber of employees workil'lg in "Iocal health authorities;
• The Treasury Ministfy (Generai Accountancy far the State), which supplies the number of public sector ~Ioy_; ,,'
• The Finance Ministfy, ,WhiCfl suppliès the number of VAT registratìcJn nUflftbers;
• The Bank of 'taly, , whiCh supplies the number of itsempJoyees" those;Qf the ttali~ Ex~ge R_ Qffkle, as weI as ihoseof ~fe,,11eId credit,instìt~ .. otIletr creditflrms.relative ceqtral~, ,~;Qf Institutesand~ons for~ credit;
• ~lA.which su~, the n~ ,of À_nf~u.· '.,'. ' ",,"~v~_' '~~es;
• SCAU, wAUçh,~' the nurnber of workers,$ldthen~ of working~ys perfor~ in agricuhWal holdings~,
6.2 Criticai, anatJsfsof 'prtncipàt'aources
'fhe principal sources of ir1formatìon for measurin9 empioyment, are taken lo be the data obtainèd' tram ',the three cenSuses
• <PoPulatìon; industry, 'trade;1 ','SeMces,n ctafts;' "agricUftt.Ire) ptus l, thè Hata'" ~hed tronf'thesurVèyoo labdurtorces. , .' l, '1
EaCh source hati:lt$ l>WO' spetifie capacity of ~nting thé dlfertl'lg"'8 Ma 1aboUr maff(èt lhat presentS thé· abOve-mentIoned features. ' ,
21
Briefty, sources from the supply slde: 1"wavem~,IirnitS!'wflen itcomes to ~t1ftne~yment;mthàtitàta Is gathered from theperson's ftome;
• canoount the ofìly or principal working positìonS, but<boot éOUnt the seoond or third workingpositions 4;
• may however lunCòVer irregular dependentlabour, asthe compiler of the questionnaire Is fess Interestedin hiding
"his actìvity; • do not conslder fareign workers entering
the countfy on a dalybasis,aslhey are overseasresldents. but, oothe other fin include resIdents Who perform their activitY:innon..resfd$nt unitS;
• encompass,àll ecooomic actìVities. but the diStribUtion of workers in diffeòl'IgactiVlies isprobably urireliabte. at·feéSt as regardsi empIoyee-based ~."'"
On tf1e other harid. 'saurcès trPm 'the dernalJd sic;te; , ' "
• ob\I'k)US 'enoo1ythè èOOoomic • ,~ in that sUrVey's fieId Ot
(lbSe , , '" QhU$' ,tte:~lçCl9es ".fKjt iI1èIuded ~~ '.~j '.~~ nor ~S~actiVttìes) 5;'( "'" " ',' .
• 'enCOrr1PaSS tìHf1i1lat pàrtof ~l9ymeQt whicl;!iSiden.tified thro~ghthe local unit in wtiCftthe person works' • eo~nt1y···. do ,riot'm.cfUde. thos~ workers, lIsu~ siIIf-empl()y~" ... wtm perform' thèiract~ '. in. ,théit()~ hofIfte. narnely thOSe workers who' do not hàie a fixed link with· a TeSident 1OCàI' unII; ,
• Otl thè· other.band" ar8'ible toprovtde,a measu,e,~f ofthe '~' a~ of seIf:~pkJyed workers.,If'in ,éllerJ' firm tI't&"hOlder' òf the working J)òsiti.on is reeotdid; ,
22
• identify the occupation of the firm's employees as registeredin the wages books, which·are therefore regularised;
• are not able to include extra activity within the firmsince, in ali probability, this activity is not regularised or recorded in wages books;
• supply a reliable classification of workers according to economic activity, sioca the compiler of the quest/onnaire is the owner of the business or a person within the organisation or within the administration of the firm.
The variety of information sources as regards employment brings up the question 01 the ex/stence 01 profoundly differing concepts and relative empirical aggregates.
Sources that gather information trom the labour supply side (CPand family sample surveys) lead to a·c&fculation 01 the number 01 employed persons, and each person is counted only in relation to his single or principal working activity.
Statistical sources on the labour demand side (that is·surveys in whieh businesses are interviewed) appear to count !he. number of employed per~ons, but in reality they indicate the number 01 working positions existing in fìrms, or rather the positions that they wish to declare.
Theoretically, in census-type surveys. the two different types of data (employed persons and working· positions) fIlight coincide, assuming the field of observation and the date the censuses were carried out were the same,only if each person has a single working position, If this position is regular (~ is the labour. contract is .regulated in accordance w/th the relative norms in force, so that the firm is not interested in hiding in10rmation) and if the working ··positlon may be referable to a physical location (the fìrm's premises, plant, local unit, etc.). Il the single position condition is not respected (some people perform second activities), the numberof working positions is greaterthan the number ofemployed persons. If however Jabour contracts are notall regular and if some activities are not. performed in identifiablè p1élces (for.· example . cottage industry work), the number 01 persons proves to be higher than the number of working poSitions dèclared by thefìrm.
By comparlng census data, it is therefore theoreticalty possible to sing/e out three components of employment:
1) persons in possession of a regular labour contract represented by those who in populationcensuses declarethemselves to be employed. which is confìrmed numerically by the number of workìng positions revealed by censuses undertaken at firms;
2) persons performingirregular work, represented by declared employed workers in the CP exceedingthe number of working positions declared by businesses;
3) second activities resulting from the excess of working positions, obtained trom censuses carried outat firms, compared with the number of persons who dec/ared themselves to be employed in the CP.
In addition to these components, others need to be considered to get a better idea of the phenomena relating to the labour marl<et.
First of all, there are varying degrees of j(reguÌélrity as regards the working relatianship, and by comparing data from the demographic census with that trom fìrmbased censuses, it is possible lo show up that part òf irrègular actMty for which compiters of the questioflnaire oonsider themsefves in every respect full-time workers.
Along with these, however, there are workers who do not consider themselvès as such, but rather as housewives, students, pensioners, etc., even though they have worked a certain number of hours; there are moreover iIIaga' immigrant workers whose "degree of irregularity" is such (in ali senses) that they "refuse to answer" any statistical survey in an attempt to hide their very presence in the country. It should then be considered that second activity working positions shown up fhrough a comparison of census data are revealed only if theyare performed within fixed physicallocationsthat may be identified by compilers of firm-based censuses, and they should .inany case be included to take into account alI activities performed with"different modalities" (e.g. small commerciai agencies, professional consultancy, repairs and maintenance 01 dwelUngs, the road transport of persons and goocfs, etc.).
It should be empl'lasisedtherefore that none of these. statisticalsurveyspel11lits an exact measurement of one or the other aggregate (employed persons or working positions). Inparticular, censuses and periodica! surveys, such as thequarterly surveys, countthe number of workersor working positions at a given moment, but in ali
probability they do not fully reveal the incidence in the labour market of ftuctuating masses of occasionai and seasonaf workers.
What has been iIIustrated up to this point at a theoretical level implicitly contains the course of ali the methodological steps followed to measure the mean yearly work volume in 1981 in terms of labour units. This may be summed up in the following phases:
a) preliminary standardisation of principal sources, so as to render them coherent and comparable, and in compliance with national accounting definitions;
b) integration and correction of principal sources, so as to eliminate or reduce to a minimum faults in data, limitations due to the different fieldsof observation and the fikely errors inherent to each of these sources;
c) quantification of working positions in reference to the three segments of employment that may be identified by comparing principal sources (regular,
23
irregular and second activities), once the minimum level of classifications has been fixed forterritorial and sectorial analyses;
d) measurement of the positions referring to the segment of undeclared workers;
e) integrative estimate of second activity positions for activities not carried out in easily identifiable fixed Iocations, by means of censuses of companies and local units;
f) estimate of coefficients to bring data pertaining to part-time positions up to full-time scale, and calculation of labour units;
g) data taken as a yearly average so as to eliminate seasonal phenomena implicit in principal sources;
h) estimate of number of labour units corresponding to the hours of CIG (wage supplementation fund) payments, and their deduction from the total number of labour units, so as to arrive at an estimate of the volume of work that has gone to produce the gross domestic product.


PART Il
MEASURING THE QUANTITV OF WORK


27
7. OPERATIONS OH PRlNCIPALSOURCES
7.1 Standardisation with national
survey on labour forces, did not need to be standardised· .. · sioce they ali referred to October 1981, and SO the data pertaining to each of thesesources was processed in accordance with the criteria as laid out below. acçounting deflnltlons
The pheoomenon "employment" was interpreted by unifying and standardising ali sources within a coherent framework. It was first/y necessary to refer data obtained from the principal information sources back to the concepts, definitions and field of observation of national accounting, and then to ensure the same degree of coverage for the phenomenon under observation. From a temperai point of view, the three main sources used, namely the industriaI and trade census,demographic census and sample
As far as the population census (CP) is concerned, employed personsidentified in the area of residence were firstly classified according to the rank in their profession and the economie activity of the industriai business, agricuftural holding, shop, office or body at which they performed their working activity. Then each person was identified· in relation to the· pIace of work. This· operation transformed resident employment into "presenf employment and thuseliminated personsemployed overseas. The results of this operation are contained in Table 1.
Table 1 -Employed persons in the 1981 Population Census
Employed persons
that work' that thatcome Regions Re$idents in other work fromother Presents
regions overseas regions
PIEMONTE 1,778,385 29,099 9,640 30,990 1,770,636
VALLE D'AOSTA 43,879 1,647 147 2,024 44,109
LOMBARDIA 3,585,616 30,324 40,416 85,149 3,600,025
TRENTINO A.A 331,771 4,345 3,531 7,777 331,67'2
VENETO 1,639,703 31,095 10,335 21,740 1,620,013
FRIUlI-V.G. 459,064 7,779 3,510 17,822 465,597
LIGURIA 615,491 14,081 6,806 24,887 619,491
EMILIA ROMAGNA 1,658,673 23,405 2,993 34,009 1,666,284
TOSCANA 1,365,929 20,087 3,818 21,757 1,363,781
UMBRtA 290,930 10,857 1,088 5,044 284,029
MARCHE 547,191 12,312 2,099 8,371 541,151
LAZIO 1,614,130 20,832 5,922 38,623 1,625,999
ABRUZZI 390,465 14,599 6,112 7,551 377,305
MOLISE 104,237 4,062 3,997 3,719 99,897
CAMPANIA 1,381,775 37,400 24,337 11,317 1,331,355
PUGLIA 1,087,353 24,747 16,982 7,553 1,053,177
BASILICATA 178,339 8,986 9,279 6,474 166,548
CAlABRIA 522,459 21,091 24,238 5,567 482,697
SICILIA 1,194,767 22,990 23,956 4,787 1,152,608
SARDEGNA 433,394 8,284 4,565 2,861 423,406
ITALIA 19.223,551 348,022 203,771 348,022 19,019,780
28
This shows thm inOctober 1981, ltafian workersthat undertook li'" actMtyin ,non.feskfent unitS .re 204.000clrC8, andthè number of workers thm moved1rom their r$§ÌOns of resiclence lo work in otherreg,ior1s, without changing their registered address, was 348,000 circa.
In order to standardise the number of employed persons as identified in theCP with the concept of "intf,mlal employmenf' as define,d by the ESA:, persons employed. jn diplclmatip se~ices, intemational o . an~tions and atlied armed forces (as
.... in the clàssificatiOf) by ATECQ of .$)9,0) . wer~ . removed, whiJe consa;Pts
at!tò an estimafe of non"-resident or iHegatly present foreigners that.perfOrmed their activity in resid8rit uOitS .re iooluaed.
AB is weU~n;foreigners Who perform a working activity· in ltafy are, on account of thèir characteristics. not included either in the CP nor in the survey on labour force8, and onIy marginallyin .. the CIC. It was therefore necessary to estimate their numbers by using in:P!UibilSicQataafl(j inòicatiòrl!. SIJ.PPI~ !:1y thè Ministryof thè·· ,~or and. afSOinòirect inclìcatPrs. suchas the number of ltafian carners that perform a matlti~ transport service to other countries. .
From this information it was possible to . calootate the amount of emplòyment arnòng oon-rfikient foreign workers .performing activity in resident unitS for October 1981. tbilt i.s321 .. ,000 unfts. This figure was then òistribtited in the branches of agriculture,
. fishing, mechahical engineering, construction. repélÙrs, commerce.hotels and rE,lStaurants, tn~nsport anQ,; oomestic services, adopting a parameter basecJ· on
6 et. note (5).
information obtained trom several reseatches conducted on the phenomenon. reterted lo in the generai section.
Datatrom the survey on IabOur forces was standardised witb· CP data •. Qv. ·adding the number of declared employed persons (that is excluòing those who çJiÒ . noi declare themselves as employed·. yet ,n. another question rep~ed that they h~ undertaken hours of work in the week of reference), the workers who ,Iiyed in. cohabitation, military conscrlpts and non-residenttoreign workers.
Finally, as regards. data. on . persons employed in.locaI units .obtain,d··from the Census on Int/lJ.S!ty and ttade (C)C) , the data on economie activmes not .inèluded in. the fi$ld. of obsef\lation6 . Wcils" Obtained by r~ng lo datacontàinedin the CP for the corres~ding ÀTeèO's,at!tdto irifOrmation trom social seoority Institutes regarding female domestic workers, . By incluòing the nutaQer. of .emplo)'t1d OOll-residem . foreign workers and inilitary conscripts, the CIC was afSO harmonised with the concept of "domestic occupied population".
7.2 Comparllon of standardlsed data
The first overàll.com.parison among data of thè popUlation èertfUS (CP), the census fòr tndUstry· 'Trade Md Crafts· (CIC) .and th~ L.abour force Survey (FdL) (extiuding nonresident forC9!gnworkers an~. perSOflS who were not registered as employed although they had· perfOrmed working hours)'shoYled the diff~sbetween the SQurces, appearing ~rately tor employees Md selfemployed wOrk~rs (Table 2) .
• ".::,'1 '1
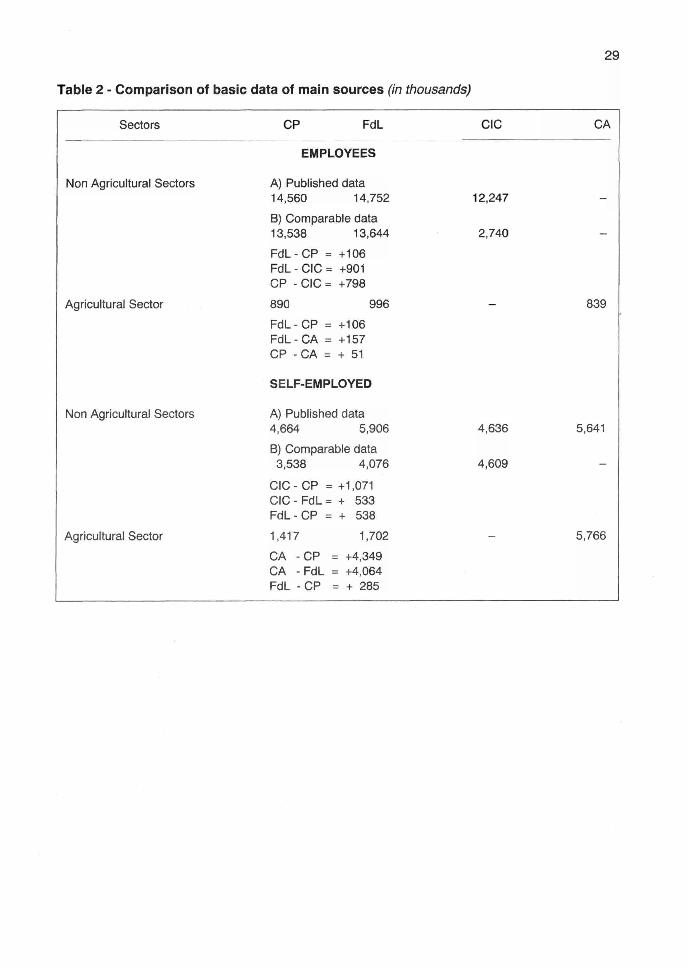
Table 2 -Comparisonof basic dataof main sources (in thousands)
Sectors
Non Agricultural Sectors
I Agricu!tural Sector
I
I
I Non Agricultucaj Sèctocs
I
I
CP FdL
EMPlOVEES
A) Published data 14,560 14,752
B) Comparable data 13,538 13,644
Fdl- CP =: +106 FdL - CtC:= +901 CP - CIC:::: +798
890 996
FdL - CP '" +106 FdL - CA '" +157 CP - CA == + 51
SElF·EMPLOVED
A) Published data 4,664 5,906
8) Comparable data 3,538 4,076
C!C· CP := +1,071 CIC - FdL '" + 533 FdL- CP ;;:; + 538
I Agricultural Sector 1 ,417 1 ,702
I, CA - CP :: +4,349 CA • FdL := +4,064
1 _____ ". ______ . ____ . ____ ~dL - CP '"' +_2_85 __ _
29
CIC
12,247
2,740
839
4,636 5,641 I - I 4,609
5,766
_ __ ..J
30
It can be seen trom this tOOt thelabaur force survey reveafed a larger number of employees and self-employed workers than the population census both in agricultural and non-agricultural sectors, whereas it revealed a fewer number of self-employed workers compared with the censuses conducted at firms (CIC, CA).
As mentioned above, the CP counted fewer workers than the labaur force su rvey , but it revealed 798,000 more workers than the CIC in non-agricultura! sectors and 51,000 more than tOO CA in the agricultural sector. In the same way as the labaur force survey, it counted a 1ewer number of self-employed workers in ali sectors of economie actMty compared with censuses carried out at production units.
An anatysis of the quality of census data, carried out on a sample of 2% of family survey sheets, showed that the error in responses conceming the position of the profession was minimum, which enabled the possibitity 01 a significant classification error on account 01 this 1eature to be ruled out.
Thacomparison by ATECO also brought to light numerous positive and negative diffarences betwean the number of employed workars in tha CP and the CIC.
from these first comparisons, it was deduced that on tha whole, the labour force survey managed to reveal a greater quantity 01 employment compared with the CP by virtue 01 the intervìew technique employed, and that the classification according lo economie activityofthe CPwas less accurate than tha CIC.
These conc1usions brought aoout two requirements:
a) lo single out tOO regions in which the CP revealed a fewer number of employees and self-employed workers compared with that resulting trom labaur force surveys;
b) to correctCP data on economie activity, assuming that the ATECO's included in the CIC are less affected by errors since, as already pointed out, in the industrial census tOO interviewee was the owner of the firm and, in aft likelihood, is expected to supply a less approximative answer than that given by the compilers of questionnaires for the population census 7.
TThe classiftcatJofl error according to ATECO, due to the poor interpfetatioo ofthe ecoi1omic activity, may in any caSe be present in borh censuses.
7.3 Data integration at a geographicallevel
The regions in which the CP did not reveal the full amount of employment were identified by observing in which regions the trequencies 01 employees and self-employed workers included in the CP fell outside the confidence interval, with a confldence level equal to 95%, compared wìth the results of the labour force survey. The basic assumption is that the latter survey reveals a greater amount of employment more on account of its interviewbased survey technique(that is due to the method with which the survey is conducted) than because of the sample nature of the technique. In the regions identifiedusing the aforementioned criterion, frequencies were brought within the limits of the confidence interval, and so the number of workers included in the CP were brought up to a level compatibte with numbers deriving trom the labaur force survey. This level was calcutated also bearing in mind that trom comparative analyses 01 regional data of the two surveys, it emer~d that labaur forcedata, in keeping with tOO nature of the survey, did notfutly reveal the amount ofemployrnent present in the piace of work, but continued to cJassify a part offi (about 20%) in the place 01 residence.
The integration of employees datafor the CP concemed the regions 01 Campania, Calabria and Sicilia. The integration· of data on self-emptoyed workers affected ali the regions of ltaty, but only partialty, that is only for household collaborators, in Friuli VeneziaGiulia, Emilia Romagna, Toscana and Marche. Modified data within each region was evenly distributed among ali the ATECQ's.
1.4 Correction of classification errorsby economie activity
In order to apply the criteria as laid out in paragraph 6.2 for the identification of some occupational segments (regular, irregufar and secorld activities) by comparing the main sourcesof data trom the labaur supply side with those trom the demand side, it is necessary, apart 1rom standardising these sources with nationat accounting definitions and integrating reciprocal data, to eliminate errors, at least the most probable errors, that rnay create numerical discrepancies when anatysing and comparing the aoovementioned data.
Tnere are !wo basie elements undertying the differences that emerge between sources fromthe demand sideand sources from·the supply side at the minimum level of analysis; one is due to the fact that !wo statistical surveys concemed witn the same phenomenon (emptoyment) may give a different measurement of the phenomenon. because both are subject to errors, and as a result, when the !wo are compared, "statistical discrepaneies" are observed; the second is due to the fact that tne!wo surveys,
. addressing different subjects (families and businesses) in order to measure tne same phenomenon (employment), have the inherent capaeity of observing different aspeets, so that once tnat part of the phenornenon revealed by both surveys has been removed, namely "emptoyment regufarly entered in firms' wages books" , residua' elements may be interpreted as "statistica! measurements" of particular phenornena {irregutar emptoyment, that is, notentered in wages books, and seeond aetMties).Jt is elearthat inorderto be able to quantify "precisely" inese pnenomena,it is necessary to trylo eliminate the element of error, so as not to run the risk of fafsely inffating theseresults.
The minimum levels of analysis should therefore bedefined in relatioo to three aspeets: the capacity of sources to "pin-point phenomena", tne possibìfity of automaticatJy compensating far errors due to tne aggregation of data, the possibility of correeting errors that cannot be offset with theabove-mentioned mechanism. After several. . experiments at very analytical Jevels, the levels whieh appeared most satisfaetory were: three professional positions (employees. household eoltaborators, otner self-employed workers), 20regions and 674 categories of economie activity (A TECO), in accordanee with the ISTAT elassification.
Corrective measures in relation to tne first !WO levels of anatysis have afready been dealt with.
With regard to the sectorial level of anafysis (ATECO), it should be pointed out that,according to the considerations outlined in paragraph 6.2, eorrections were necessary only regarding employees trom famity-based sourees. As regards self-emptoyed workers, it is probable that. the same person answered the questions in the CtC and the CP and gave
31
the same informationas regards his/her own aetivity and that ofthefamily collaborator.
Correction of the distributlon of employment for employees according lo ATECO based on the CP was carried out by grouping together the data trom CP and CtC in 45 macro~filières (from the French word fiJière) classmed by region and by singte categories of economie aètivity. These filières were based on the basic raw material of a product or of a group of products, with a fist of derived products: that is, ali the produets obtained trom transformations of the raw material during the course of its economie lifeeyele until it is transported and sold onthe marketa The basie assumption is that economie activity classification erro~. resulting trom information given by individuai workers intheCP, will in ali probabUity remain within the same fiJjère of production, thus nullHying the error.
In other words,it has been supposed lhat an employee might have classified himself in the CP in oneofthe foUowing ways: a) correetly, in. the same ATECO·in which the employer has inserted him in the CfC; b) in an actlvity tl1al is very similar and.tnereforemay be confused with the exact actMty; c) in another ATECO connected withthe. exact one, in those· cases in·which theproduetion process of the firrn far which. the employee worksis a long one andcovers a vasì range of ATECO's, trom production of. the raw material to its transformation, and commereiafisation ·of the finished product.
In cases b} and cl, the difference between the totals of data trom the CP and CfC included in each segmentshould lend to zero. This result was in fact the casetor atmost ali the 9OOgroupings(45 filières x 20 regions) , even though there were sigl1ificant discrepancies within each ATECO. By correcting the discrepancies be!ween CP and CIC data so as to bring the former as dose as possible to the fatter {which, as has been sald, probably gave a mare reJiable classification), one obtains amueh smaller quantity of residual information, which may be
8 In the appendix, the A TECO codes ineluded in each fllière are Iìs!:e<!, giving the reader o,tereste<! inthe argument the possibility of re-Iinking these codes to their economie content$. by U$Ìng the "Classificatìon of economie activities' publisfled by Istal in "Classificazione delle attività economiche", in "Metodi e Norme" - maggio 1981.

32 '
interpreted as measurements ·of particular segments cf employment, as suggested in point 6.2. The criterron adoptedfor the approximation of data will be illustrated later, once some aspects pertainìng to the grouping into filìères of employmentdata have been dealt with.
Spécific applìcation of this method required two modifications which arose both tram the nature of available elementary data and trom the fact that in the CIC not ali ATECO's were investigated. With regard to the nature of available elementary data, it is to be recalled that data does not representthe number of persons employed in the manufacturìng process of a product, but rather the number of persons employed in the production process of an activity, which In some caS6S may involva more than ooe product. This means that an ATECO must be fragmented soas to be inciuded in more than one segment.
In this case, the ATECO becomes a "pivot" variable which, béing used to minimise the differences wlthin the segment, assigns to e8ch segment in which It isplaced the game number of employees as that necassary to rectify classification errors.
Wjth regard to the second point, it should be said that in order to correct GP classification errol"s present in agricultural activlties and in foodstuff activities connecfed with it or aì ieast Ilnked to it in the production process, a number of agrieultural employees had to be' assigned to theCIC. In order to calculate this number, only a part of the CP data was taken tnto account, whose estimate was undertaken by assuming that if the CIC had investigated this economie activity, the
CIC DATA CP-CiC
P1 Cl di
P2 C2 d2
Pa Cs da
P4 C4 d4
Ps Cs ds
corresponding number of employed workers would have registered the same mean deviation existing between the total number of workers revealed by the two censuses in the field.of observation common to both (that is in allagricultural-foodstuff and manu'facturing(ilctivities deriving directly or indirectlyfrom agriculture).
It may safely be considered that if ali the agricultural workers counted in the CP had been transferred to the CIC, then a part of the CP errors would al so have been transferred, and it would have been impossible to correct errors usìng the filières.
In order to make this clearar, ali the operations accomplished to correet CP classification errors within each region have been set forto as follows:
a) Within each segment, the differences betvJeen CP and ClC data nave been calculated 1m each sìngle ATECO;
b) Assuming CIC data Is classified correctfy, ali negatlvedifferences(that ìs whera the CIC dats proved to be greater than the CP data) were brought to zero, taking employment away from those ATECO's in which differences were positive (CP> CIC) in proportion to the importance that these ATECQ's had onthe tota! amount of positive differences;
c) Corrected CP data was obtained by taking awayfrom the basie CPthe differences vis .. à-vis the CIC, and adding to it the corrected differences.
The following framegives an example of this procedure. In order to simplify matters, lt ìs assumed tl1at a segmentis made up of just five ATECO's. Thus for the single region we willhave:
CORRECTED CP CORRECTED DIFFERENCES
d'i P'l '" P1-dl + d'l
d'" P'2 = P2-d2 + d'2
d'a p'a ;;: Pa-da + d'a
d'4 P'4 '" P4"d4 + d'4
d's P's ::: Ps-ds + d'!; ,

Assuming that d2 and d4 are negative, namely C2>R2 .andC4>R4 the values assumed by corrected differences will clearly be equal to zero if
since the positive differences will ali be "absorbed" by the negative differences. If however the sum of CR data is greater than CIC data (2:P> 2: C) , we will have:
d'2 = O; d'4 = O
and the generai corrected positive difference will be given by:
that is, the A TECO 'j' will yield employment in proportion to the importance that its (positive) difference has on the total number of positive differences.
Finally, if the sum of CR data is less than CfC data (2:R<2:c), it is clearly not possible to eliminate the internaI negative differences, and so:
rather, the generai corrected negative difference is given by:
that is, the ATECO 'j' will absorb employment in proportion to the importance that· the
33
negative difference·has on thetotal number of negative differences, and the corrected positive differences will ali equal zero, with corresponding ATECO's having to yield "ali extra employment to carry negative differences to zero. A concrete example of the procedure is illustrated in table 3, concerning the filière of milk, meat and derived products in the EmiliaRomagna region.
In column 1 are the ATECO codes included in the filière; it is to be observed that theyinvolve breeding activities (from 0121 to 0140), re/ated activitles regarding the transformation of products in zootechnic holdings (from 0412 to 0437), industriai transformation act/vities (from 4121 to 4236} , wholesafe trade activities (from 6115 to 6179) and retail trade (from 6412 to 6546).
In columns 2 and 3 are CR and CIC data pertainingto these ATECO's (basic data).
In columns 4 and 5 appear the data pertaining to filières. They are either: equal to basic data; or less than basic data (according to previously mentioned criteria) since. the ATECO's to which they refer are also included in other filières;or greater than basic data, inthe case ofthe CIC for ATECO's fram 0121 to 0140 which. not appearlng in the field ofobservation of that census, have been integrated according to prevìous/y mentioned criteria.
Incolumn 6 are the CR-CIC differences. In cotumn 7 appearthe results ofthe corrections of these differences, clearly showing the carrying of negative differences to zeroand the praportional reduction of positive differences.
Fìnally, column 8 contains corrected. CP data. It is clearthat the overall CR value was not changed and that the whole operation served to render the internaI differences in each segment between CR and CIC data as smal. as possible.

34
Table 3 • Correctioo of data pertaining to employee empfoyment in the PopuJation census in the filière of milk, meat and derived products in theEmllia-Romagna Region
Ateco BasicCP Basic CPin CICin Differences Corrected Corrected Total CtC Filìère Filière in Filière Differences in
Total Filière 2 3 4 5 6=4-5 7 8=4-6+7
0121 3,294 O 3,294 2,966 328 10 2,976 0122 1,231 O 1,231 1,109 122 4 1,113 0123 1,043 O 1,043 939 104 3 942 0124 275 O 275 247 28 1 248 0125 168 O 168 151 17 1 152 0126 183 O 183 165 18 1 166 0128 379 O 379 341 38 1 342 0131 273 O 273 246 27 1 247 0133 94 O 94 85 9 O 85 0140 101 O 101 91 10 O 91 0412 275 8 275 8 267 8 16 0413 653 107 653 107 546 17 124 0423 733 846 733 846 -113 O 846 0424 383 930 383 930 -547 O 930 0425 1,426 2,631 1,426 2,631 -1,205 O 2,631 0431 1,210 1,387 1,210 1,387 -177 O 1,387 0437 216 188 69 60 9 O 60 4121 2,144 1,904 2,144 1,904 240 7 1,911 4122 6,426 7,400 6,426 7,400 -974 O 7,400 4131 1,394 1,261 1,394 1,261 133 4 1,265 4132 1,847 1,048 1,847 1,048 799 24 1,072 4232 212 180 212 180 32 1 181 4236 120 89 35 26 9 O 26 6115 158 125 158 125 33 1 126 6172 1,313 1,529 1,313 1,529 -216 O 1,529 6173 731 1,131 731 1,131 -400 O 1,131 6179 1,751 2,543 297 416 -119 O 416 6412 267 122 267 122 145 4 126 6413 1,222 808 1,222 808 414 13 821 6414 351 34 351 34 317 10 44 6416 169 120 169 120 49 1 121 6417 1,911 1,309 292 200 92 3 203 6419 2,338 1,143 360 176 184 6 182 6423 305 103 51 17 34 1 18 6424 4,322 5,461 660 834 -174 O 834 6546 88 44 88 44 44 1 45
TOT. 39,006 32,361 29,807 29,684 123 123 29,807

The metnod described up to thls point permitted the correctìon of CP data regarding the distribution of employees according to ATECO's, and this corrected distribution represented an indicator used to rectify data in the survey on labour forces, which was subject to the same errors observed in the CP. From a comparative ana/ysisof data it was observed, for example, that there wasan inflated number of workers revealed by the (abour force survey in repair workshops to the detriment of the number ofemployees in mechanical industries,a greater number of workers in family services to tne detriment of the number of workers in business services etc. This distortion was also bome in mind when adjusting estimates on ragionai employment, as mentìoned above.
Having standardised data regarding both national accounting definitions and the degree of coverage of main sources and having corrected classificanon or errors by appfying the "filìère" method, data processing was then carried out, separating industry and service actìvities trom agriculture.
8. DATA PROCESSINO FOR MEASURINO EMPLOYMENT IN THE INDUSTRY ANO SERVICE SECTORS IN 1981
8.1 Comparison of data from maln sources with data from other sources and their integratlon
The first operat/on performed in thls phase ofthe work consisted of verifying the data contained in principal sources by comparìng it with other specific sources, namely Sòurces dealing specJfically with single branches or sectors, made up of special surveys or of information obtained direct/y trom vatious bodies.
These sources concern the following sectors:
• Tobacco industry (data from State Monopolies);
• Public and private health (ISTAT survey on public hospitals and private clinics);
• State and private feaching (1ST AT survey on the wholerange of scnools);
• Scientific research (lSTAT survey on scientific research);
• Credit (numerous sources covering the whole sector, as indicated below);
35
• Insurance (AN lA data); • ENE.L (National Ef'éCtricity Company); • State raUways; • Ucensee railways (datafrom Transport
Ministry); • Post Office and T elecommunications
(data from P.T.T. Ministry); • Telephone servìces (SIP and A.S.S.T.
telephone eompanies); • RAI (Public Broadcasting Company) • CISPEL (ltalian association of local
authority public services) ; • Public Adminìstration (data concerning
the number of employees ·01 the various bodies contained therein).
By comparing data. it was possible to correet basic data where necessary, replacing incor:reet data wifh that obtained from administrative sources and trom companies. This wasespecialty the case for the sectors of Public Administration, Credit and Insurance.
In the branchof Public Administration, the number cf employees appearing in CP and CIC surveys was replaced, according tothe singlecategory of economie activity (ATECO), with the figure resulting from statistics drawn up by the Ministries for Treasury, for Interior and for Health, and by /STAT surveys on public bodies. In addition, military conscripts were included among employees in accordance with ESAnorms. Data was replaced since some ana/yses conducted at a regional leve/ showed up several c1assification errors in CP data.
In fhe Credit and lnsurance branches, comparative analyses pin-pointed classification errors between the data of these branches and credit intermediary and ìnsurance data. lì was therefore decided to estabUsh the former by using data obtained trom specific sources and to. modify data where necessary when differences in ATECO's were observed bythe abovementioned intermediaries.
As ragards the Credit sector, data was obtainedfrom the Bank of Italy survey on creditfirms and spedal credit Jnstitutes, from. the Bank of !taly's annual report, trom direct contact wìth the ltalian Exchange RateOffice, from balance reports of the "Mediocredito Centrale", "Artigiancàssa" and from the fSTAT survey on ftnancial companies.
As regards the Insurance sector, data was obtalned trom an AMA survey regarding personnel in insurance companies.

36
Data was integrated and corrected at ragionai level separatély for employees and self·employed workers.lntegrations and correetions have not led to modifications in the totals pertaining to basic data, but only to changes in distribution according to the ATECO.
Below is the number of employees as revealed by the aforesaid specific sourees, recalling that for some sectors thé data was in line with data obtained from censuses.
8.2 Processing of standardised data
Once the mai n sources. had been standardised, it was possible to go on to undertake a comparative analysis within each ATECO and regio n , separately for employees, household·collaborators and other self.amployed workers. This analysis
showed up any similarities or differences between data whieh, thanks to the work of standardisation and correction, no longer took on the aspeet of statistical diserepancy but assumed economie significance.
In practice, the analysis showed up: a) regular workers (that is, regularly
entered in wages books), the workers in the CP that were the same as those in the CIC;
b) fulJ.time irregular workers (that is workers not regularly or continuously entered in wages books, or 'cottage industry' workers): the workers in the CP that exceéded the number of workers in the CIC. lt is to be pointed out that workers insertéd into the CP as a result of the comparison with data in the laboUr force survey are also included in this segment (see point 4.3);
c) secondaryactivities, that is the working positions of the C/C which exceeded the number of those in the CP.
Table 4 - Number of employees resulting from specific sources (in thousands)
Sectors Sources Employees
Industry Monopolies (T obaeco) 12 Enel (Electricity) 120
Credit B.I. etc. 311
Insuranee AN.I.A 45
Public Treasury, Interior, Health, Administration Istat military conscripts 3,260
Transport and lIicenseerailways, bus Comunication and underground eompanies,
P.T., S.I.P., AS.S.T. 428 RAI 14 State Railways 208
Private educational Private teaching 122 and reserarch services Researeh institutes 18

The following were also identified: d) persons notregistered as employed but
who performed hours ofwork as employees orself-employed workers, taking the fabour force survey as the sQurce. As Is well-known this survey suppties the number of thes~ persons for only 12 branches of economic actlvity; therefore, these had to be distributed throughout the 674 ATECO's. This operation was performed by assuming initially that these . persons were distributed in the ATECO's contained in each of the twelve branches surveyed in a similar way to the distribution . of irregular workers. Subsequentfy, after having standardised the 674 ATECO's with the NACE-CUO groups, som? oth~r t~~nsfers were: performed, largely of mmor slgmflcance and In any case without altering the basic data for the originaI twelve branches. These transfers were rendered necessary when the input-output table was adjusted in 1982;
e) non-resident foreigners who perform their activity in resident units, on the basis of data and information already mentioned in point 4.1.
The~e five segments, or working categon~s, formed the basis for subsequent processmg. Once the various groups of working positions for work segments had been estimated, it was possible to recompose the aggregates which combine best with the concepts and definitiol1s Hfustrated in previous paragraphs and to quantify the volume of work in terms of "Iabour units".
This operation, as mentioned in paragraph 2.1, consists of the conversion to a full-time scale, by means of a coefficient of reduction, of working positions. occupied for a period less than full-time. This operation therefore concerned ali second actMties and, first of all, those people who dìd not declare themselves as employed but whohowever undertook some hours of workingactivity.
T~e. main source . for measuring coefflClents to convért part-time work to a fulltimescale was the survey on labour forces. Fromthis survey, in fact, it is possible to obtain separately, since it was directly surveyed, the number of working homs in the main or single activity, both for persons that decfared themselves· as employed and for others who declared their position to be another, as well as the number of hours worked in the possible secondary activity. So, compartng the number of hours declared by
37
",:on-employed persons with working hours" wlththose hoursdevofedto the· principal or single activity worked by those persons who déclared themselves asemployed, it is possible to calculate a coefficient in order to convert the working positions of the former to a full-ti.me scale. In the same way, by companng the number of hoursdedicated to a second activity by persons who admit the fact with the hours dedicated to the main or only activity of persons who declared themselves to be employed, a coefficìent may be obtaìned to convert the secondary working positions to a full-time scale.
However, whereas for "undeclared workers" and for principalor single activities C?f declared workers, the relative working trmetables are analysed according to position in !he. professìon and economic activity (whlch IO the survey, we recall, is analysed in only 12 branches), these details are not available as far as second activitiesare concerned, since the survey only asked questions about the existence of a second activity and the time devoted to it, withùut investigating Into the branch or the professìonal position in which it is performed.
As regardsthe second activity, therefore, the coefficient adopted was the same. for ali ATECO's in industriai and servi ce branches and for ali professional positions, based only on average generai ìndìcations which essentialty, brought about a reduction of second working positions by around 60% in order to obtain the corresponding labour units.
For undeclared workers, however, the coefficients are specific, according to professional position and. branch, and are consldered equal in ali ATECO's that make up single branchesof the twelve surveyed for the labour force survey.
It may beuseful to provide anexample with some numbers: trom the survey on labour forces, it emerged that those who declared themselves as employeesin the "transport andcommunicaUon~' branch work onaverage 38 hours per week, while those who, no! declartng themselves as employed, saìd in response toanother questionthat they had worked for 18hours per week, that is for a working peri od which is 47%· of that of an employed worker who considers hìmself/herself as. such in every respect. The
. working positions of employees that do not declare themselves as being part of that
38
sector musttherefore be reduced by 53% so as to be "worth" as much as those positions occupied full-time.
Thus, for example, the 8,157 unregistered workers calculated in ATECO 723 (road transport of goods), make up the equivalent of 3,864 labour units.
For self-employed workers, the coefficient is obviously different, being obtained from the ratio between the 25 hours worked on average by those who did not declare officially this professional position in the ''Transport and communication" branch, and the 44 hours of those who consider themselves as employed in every respect; thus the 630 autonomous unregisterecl workers in the ATECO 723 sector make up 359 Jabour units, that is 43%.
The volume of work calculated for October 1981 was brought to the 1981 yearly average for each single work segment, using the corresponding variations between the annual mean and October 1981 data in order to remove seasonal factors, based on the survey on labour forces.
The calculated mean annual volume of work stili did not represent the total volume, as it did not include, in terms of working units, the· number of activities or working positions occupied as a secondary activity, or some particular activities performed in not easily visible operative units that may escape attention. It was therefore deemed necessary to bridge this gap in information, present toa largeextent in the construction industry and in services, by using indirect indicators according to the methodology illustrateci below,
8.3 Methodology adopted for estimating 'secondary activitles' performed in particular branches of industry and services
(I) In order to estimate the number of second activities undertaken in the Construction industry, the expenditure borne by families for the ordinary and extraordinary maintenanceof dwellings carried out by persons performing a second activity was taken into consideration.
The information was taken from the special survey conducted by 1ST AT on this phenomenon with reference to 1985. These expenses, brought to 1981 values by means
of an index on values obtained as the product of. a quantityindex (given by the variation in the average numberof rooms of a house and by the variation in the level of maintenance undertaken by families) and a price index (given by the variation in the cost of construction ofa residential building) representecl the revenue produced.
The per capita revenue of construction companies, having a workforce of from 6 to 9 units, was then taken trom the survey on small-sized firms, conducted by 1ST AT in 1983. This per capita revenue was then brought to 1981 values via the index for the cost of construction of a residential building (assuming constant productivity) and was relieved of some costs, such as social security contributions and generai expenditure (legai, trade union costs, etc.) which are not believed to be borne by those who performa second activity and whose incidence may be valued at around 13% 01 the per capita revenue according to the same survey.
By dividing the revenue produced by those who perform a second activity by the presumed per capita revenue the number of labour units was estimated, subsequently converted into the number 01 working positions occupied by self-employed workers as a second activity.
(II) To estimate the number of second activities performed in the branch 01 Hotels and Restaurants, the total demand was taken into consideration, made up of the expenditure, in terms of final internai c9nsumption, borne by familtes for the services of this branch, and 01 the intermediate consumplion of businesses, taken from the 1980 input-output table (brought to 1981 values with the variation in GDP, assuminga constant coefficient over thetwo years between this aggregate and the intermediate costs·. borne by businessesfor these services).
This data was considered as the total revenue of the branch. The revenue of smallsized firms was calculated by deducting from the total revenue, as defined, the revenue of firms having more than 20 employees. The revenue per employee in small-sized firms was then calculated (obtaining this value from the 1983 survey on small-sized firms, brought to 1981 values with the variation in value added per employee in the same branch, as it appearsin the old series of national

accounts)9, followed by the revenueper employee of firms having more than 20 emptoyees. By comparing ihe revenue Of small, medium and large-sized firms with their relative per capita revenues, the corresponding number of labour units was obtained. The total proved to be greater than the number of labour units calculated previouslywith the generai methodology applied to other branches by around 509,000 units.
This procedure may be outlined as follows:
D = Total demand Dg = Revenue of firms with 20 or more
emptoyees (survey on gross product) Dp = D - Dg Revenue of firms with fewer than
20 employees Pp = Revenue· per employee in firms with
fewer than 20 employees (survey on gross product of small-sized firms)
Pg = Revenue per employee in firms with 20 or more employees(current survey on gross product)
Ap = Op IPp Labour units in small-sized firms Ag = Dg IPg Labour units infirms with 20 or
more employees U = Labour units previously estimated
(resulting less than Ap + Ag by 509,000 units).
This number of labour units to be added to the tolal appeared rather unreliable, or at least needed to be verified. So the total revenue, calculated as we have seen from the demand side, was compared with the figure that would be obtained from the supply side, by considering the product of per capita revenue of small, medium and Jarge-sized firms for respective labour units. that had previously been estimated. The estimated total revenue proved to be less than the revenue obtained from the demand side to the tune of 11,000 billion lire.
As the amount of estimated revenue from the total demand side was consideredas reliable,it was assumed that both the revenue and the number of labour units on the supply side were under-estimated. In the absence of direct or indirect information on relative under-estimations, it was supposed that both were under"estimated by a proportionally identical factor. This assumption led to the
9 Resorting to the old series 01 national accounts could not be avoided, since at this stage of the work, the data from the series was stili not available.
39
final estimate of secondactivities in terms of labour units, as iIIustrated below.
Formalising vvhat has beensaid thus far, and picking up the symbolsused previously:
a) The previously estimated labour units U are made up ofthe·two quantities:
Up = Labour units in firms with 1 to 19 employees
Ug = Labour units in firms with 20 or more employees'
b) The total demand "O" is, in theory, composed of D = (PpUp) + (PgUg)
In reality, the estimate (PpUp) + (PgUg) is less than the total demand "D", believed to be reliable, for which reason both the per capita (Pp, Pg) and the number of labour units Up, Ug are considered as under-estimated.
In order to obtain equal values, a correction factor K is applied, rectifying both per capita and labour unit values.
D = (KPp KUp) + (KPg KUg) D = (K2PpUp) + (K2PgUg) O = K2[(PpUp) + (PgUg)]
K=
therefore the K factor must be applied to the estimated labour units "U" to obtain the integration needed to reach a quantity of labourinput congruent with production "D", given the mean productivities KPp and KPg.
The labour units will thus be Ut = KU, of which ihe quantity Uf - U like second activity workers.
(III) An estimate of second activities in the branch of "Internai transport" was carried out by assuming that there was at least one driver for every vehicle in circulation and at least two persons for every trailer truck or semi-trailer truck.
Information on vehicles in circulation were taken from the ANFIA ( a national transport sector association), thought to be amore exhaustive source compared with census data. The division between means of goods transport used for one's own activity and those used on behalf of third parties was performed on the basis of C'C data.
The number of vehicles in circulation for the transport of persons and for the transport

40
ofgoods OR behalf of third parties was compared wlth the working positions resulting from previoussurveys. Thiscomparlson enabled us toobserve an under-estimation of second working positions for employees and self-employed workers, in units that performed services for the transport of both persons and goods. The distribution of employees and self-employed workers in working positioriS that ernerged from the new calculation was carried out in proportion to the working positions already surveyed in the branch.
(IV) After having carried out the modifications to data as described in the three previous points both in terms of "Iabour units" and working positions, the total nlJmber of workìng positions of self-employed categories in the strict sense of. the word (employers, self-employed workers and qualified professionals) was compared with the nurnber of VA T registrations.
When the !atter proved to be greater in number, the difference constituted the sum of the newfy-calculated number of second working positionS occupied by self-employed workers in the strict sense of the word. This was the case in the following branches:
wholasale trade, retai! trade, transpòrt, company services, medicai market services and recreational and cultural services.
lì was assumed that the numbar of VA T registrations provided a satisfactory value of the total number of working positions occupi ed by self-employed workers, bearing inmind that the openìng of a VAT register brings about numerous' advantages (for example the declaration of costsfor tax: purposes, the possibility of stipulating leasing contracts, etc.), especìally important for persons whose primary activity is performed as employees.
(V) A calculatìon of the number of second activity workers performing domestic services shou/d a/so be included. The overall numbar of working positjons, calculated according to the generai methodology previously illustrated, was compared with the data regarding those persons registered with social. security Institutes. The difference between the calculated figures and the number of registered persons was attributed to the number of second activity workers.
The following are the results ofthe abovementioned estimates on . second working positions.
Secondary activity data (in thousands)
-: Positions
I _._-_. Emp!oyees Seti· Tola! Labourl
employed uni~ --------
Building and construction 87 87 35 I I
Lodging anda catering 440 110 550 220 i i
Transport 184 80 264 106 I
I I
Other services 475 475 190
Domestic services 185 185 74 ----------~_._._-_._~--------
41
This sectìon concludes with a·brief summary of operations performed to calculate the level of employment in various segments.
Positions
Regular
Irregular
Unregistered workers
Irregular and unregistered foreign workers
Second working positions
8.4 Aggregated data
Havìng performed the specific calculations for the various sectors of industry and services, asin the previous point 8.3, the total numberof working positions for 1981 was calculated. Numbers obtained were then divided according to the various classes of firm based onsize: 1-9 empioyees; 10-19; 20-49; 50+.
The set-up offirms as described in tM CIC was taken as the basis for the division of firms. A sub-division of labour units according to the economic activity of loca! units and to the size of firms was thus obtained. This twofold classification is the most functional for the purpQses of calculating GDP and other nationalaccounting aggregates for which the surveys on the gross product of businesses (the annual survey on firms with 20 or more employees and the periodical survey on small-sized firms) are used as maln sources. In the classes trom 1 to 19 employees, the number of regular workersis integrated with the number of irregylar workers (that is those who perform workinghours but are not registered as employed), non-resident foreigners and second aetivity workers, estimated usìng the aforementioned processes.
8.5 Considerations on the classification by economie activity
Estimates of labour units were carried out for 674 categories of economie activity,in
Sources
CP = CIC
CP and FdL > CIC
FdL Minìstry of lnterior and University
CIC > CP and FdL estimates VA T registration numbers Social security registrations
accordance with the ISTAT classìfication used in the censuses. These categories of economie activity were then standardised with the NACE-CLIO classification.
It should be poìnted out that when undertaking the aforesald re-classification for NACE-CLIO branches, repair workshòps for goods (excluding the repair of consumer goods and vehicles) were not classif.ied among market services, whereas before the revision they had been calculated in the industriai sector. This re-cfassification operation, implemented in order to comply with the ESA classification, brought about the transfer of 149,000 labour units circa from the branch of "recovery and repair services", included in marketservices, to the branches of mechanical industry.
9. DATA PROCESSING FOR MEASURING EMPLOYMENT IN THEAGRICULTURAl SECTOR
The particular nature of the agricultural sector and the partial diversity of sources used made it necessary to process agricultural data separately.
Occupation pertaining to employees was first considered. By virtue of a. comparative analysis between data from the CensLJs of agriculture (CA),the SCAU andthe CIC. from the labour demand side, and GP data integrated with the data from the survey on (abour forces corrected with the filière method (see points 4.3and 4.4) trom the labour supply side, the following resultsemerged:

42
a) lo consider as regolar employees those wt10 receive a fixed salary and· whose contract provides for aver 180 working days per year, as contained in the CA and the SCAU;
b) to consider farm labourers and rural day labourers as irregular employees, with data taken trom tOO difference between the total number of agricultural employees resulting tram the integrated and corrected OP and the number of regular workers as defined above;
c) ID quantify, on tOO basis of the survey on labour forces, the number of persons that are not registered as employed, but who have admitted performing. working hours in the agricultural sector.
d) to estimate, according lo abovemeritioned criteria (see point 4.1), the numbèr of non-resident foreigners who undertake their workingactivity in agriculture.
A totaI of about1 million primary working positions was calculated.
The corresponding labour units were estimated by reducing the tota! number of primary working positions by.~sof a coeffiCient of reduction which was taken tobe egual.ID the ratio between the mean number ofdays worked by part-time employees. and tOO mean number of days (200) worked by regular emptoyees. Data was taken trom the CA and tram the SCAU whicb,observing the phenomenon trom thedemand side, tended to express more the regolar than the irregular aspects of labour.
This feature made it necessary to control the degree ofreliabilityof the coeffiCient ·of reduction by anaIysing ,foreach reglon and among various regions the degree of deviation betYieen the number.of labour units ~timated according .ID thE:l above mentioned ciitena and the number of working flOsitions indicated by the intE:lgrated and corrècted CP, considering the fact that tOO degree of irregular work varied consideFabty tram region.to regioll.
From this CÒJnparison, it emergeq tht;lt in the regions of the centre-north of the~, tha variation between the estimated number of labour units and the.· number ofworking positions is minimal, whereas in southem regions, estimated labour units proved to be consideFabty fewer than the number of workingpositions occupied by employees.
According ID specialisedstudies ORthe matter and tosoclological analySes, it didmt
appear thatthis variation could bejustified by a greater presence of irregular workers and of undecIared farrn recruitment (the so-catled co~ès) in these regions than elsewhere, because along with this phenomenon there is also the supposed phenomenon of workers whointend onty to take advantage of special treatrnent for unemployment and other benefits.
These considerations Ied to the conclusion that CA data on working days gathered in these regions was not very reliable.
As it was however impossible to find an altemative indicator, aven Intiirect, for the measurement of working days performed per year by irreguJar workers in these. regions, it was decided to calçulate directty the number of "Iabour units". This was calculated by taking the medium value· situated between the minimum number, tht;ltis the estimatE;ld number of labour units as abO'Je, and the maximum value, represented by the working positions resulting trom the integrated and COfrected CP.
By putting together the estimates trom éÙl regions,.a total number of.876.000employee labour units was obtained(1~tOOO fewer c~pared withprE:lviou~ E;lstimates of employment).
The next step was to estimate selfemploymed employment.
The agriculture .census revealed about 5,700,000 peF.SOns thal worked independently, performing on average 88 wo~ing daYS per year. In the sarne census, ìhose workingover 180 days per year in the agricultura! ho~ng ..• were consIdered as regolar self-employed workers, which Was the case ff:>r a littIe more than a. mUlion peopte (a figure that is confirrned by correct~ .CP data, but noi if cot1lPf:lled)"l1th the survey onl~bour forces). T~. nu~ of irregular workers, estimateci t;lt ~14.000units, was calcUlated by ~ . ~ dlfference. betweenthe . total Dumber of self-employed 'workers resulting frornthe inlegratec1 an(jporrected CP and the number ofregular .wOrkers as estimated sbove. Then, on the basis of the labour force survey, the number of those not registered as employed, but who perforrned working hours, was caJculated and taken to be 272,000.
This ìne8nta total numberof natural persons (heads) ocçupied jn,the agricultural sectòr of 1 ,f)87,OOO persons circa.
The diffèrencebetweeD the total number of agriclJlturSt working positions· revealed by

the CA and the number of individuals (heads), namely those who performed their prima!)' or single actìvity inagriculture, revealed the number of second workìng positions of selfemployed workers present in the sector, which carne to 4·million circa.
The "working positions" were then converted to "Iabour units" by means of a coefficient of reduction, taken to be the ratio between the total number of working days
43
performed in the agricultural sector, as indicated1n the CA, and tOO mean number of working dàys performed by an agricultural worker on a full-Ume basis, assumed to be 280 in accordance with European Community norms.
The number of self-employed labour units performing work in agriculture was estimated to be 1,970,000 {350,OOO units more !han the previous national accounting estimates}.

44
10. COMPARISON OF 1887 RetlStON amMATfiS .. ·.·WITff ... "REVIOOS fa.. TlQNAl ACCOtiIN'fIrIG DA'~
Standardi$atiòn of differentsQurces, taken frorn the demanc\ side and from the supply
side,an overall. evaluation of the volume of worldn 1981 wasoblained.whid1wasG.6% abovepreviOus; Etstjmat$S. ,111& .volume of work perform~ .. by employ~ was up. by 3.0% and. that .. regardingself-employed workers by 15.8% (Cf. Table 5).
Tabl.5 - Labour unita by sector of economie· activlty and posltlon in the professlon, accordlng to newand prevlous estlmates. Vear 1981 (in thousands)
Sectors EmpIoyee
Naw 0Id estimates estimates
Agriculture 876 1,035
Industry 6,657 6,470
- industry (not including
oonstruction) 5,346 4,995
- building and oonstruction 1,311 1,475
Market services 4,314 3,907
Not-market services 3,734 3,712
Total 15,581 15,124
As regards single sectors of the economy, the new estimates for employment in national accounting data brought about the following variations compared with previous estimates:
• in agriculture, the volume of work went up by 7.2% averall, whiçh is Ile result of a 15.3% reductiOIi in· workperformed by employees and an increase in the voJume of Work carried out by selfemployed workers of 21.6%;
• in industry (net including con-struction), an overall increase of 7.2% in work volume was registered, due to a 7.0% rise in the work volume for employees and an 8.5% rise for seIf-employed workers;
• in Ile building aod construction industry, the overall rise in work volume
0If!erence %
-15.3
+2.9
+7.0
-11.1
+10.4
+0.6
+3.0
Position in the profession
SeIf-employed Totai
Naw 0Id Oifference New Old Oifference estimates estimates % estimates estimates %
1,970 1,620 +21.6 2,846 2,655 +7.2
1,353 1,062 +27.4 8,010 7,532 +6.3
832 767 +8.5 6,178 5,762 +7.2
521 295 +76.6 1,832 1,770 +3.5
3,436 3,154 +8.9 7,750 7,061 9.8
- 3,734 3,712 +0.6
6,759 5,836 +15.8 22,340 20,960 +6.6
was 3.5%, made up of an 11.1 % drop in work performed by employees anda rise of 76.6% in work performed by selfemptoyed workers;
• in market services, there was an overall rise of 9.8%, due to a rise in.volume far both emptoyees and setf.,employed workers of 10.4% and8.9% r~ely;
• in non market services. there was a 0.6% rise in work volume" due entirely to work performed byemployees.
The data on employment, expressed in terms of working positions and labour units, classified according to Ile condition (regular. itregular work,etc.J and position in the profession (employee or seff-employed), is iIIustrated in Tables 6-9, showing overall totats and Ile figures for the three main sectors of actMty.

45
TabIe 6 .. WorIdng posttlonSand labourunits by condltlonandpositlon In lite professlon. Totai Economy. Vesr 1981 (in thousands)
Condition Position in the profession
seIf-employed totaI
Working positions
1. Principal or single activities
1.1 Regular workers 13,234 4,445 17,679
1 .2 Irregular workers 1,575 1,018 2,593
1.3 Unregistered workers 318 438 756
1.4 Non-resident foreigners 321 321
Total.Qf domestlc workers 15,448 5,901 21,349·
2. Secondary activities
2.:1,Second job 846 5,590 10 6,43610
3;.1'otal 16,294 11,491 21,785
Labourunits
1. Regular 13,234 4,445 17,679
2. frregular 11 1,438 907 2,345
3. Unregisteredworkers 249 288 537
4. Non':resident foreigners 321 321
5.Second job 338 1,120 1,458
Totallncludlng CIO (wage SUfIPlementation fund) 15,580 6,160 22,340
Totai ftOttncludlllg CIO 15,301 6,160 22,061
10 Includiflg 4,002 in agricultute. . 11 The reduction in the number or irregular workers is due to the influence or workers in agriculture.

46
Table 7 -Working positionsand labour units by condition and position in the profession. Agriculture. Vear 1981 (in thousands)
Position in the profession Condition
empleyee sell-employoo telai
Working posìtions
1. Principal or sìngle activitìes
1.1 Regular workers 211 1,041 1,252
1 .2 Irregular workers 724 374 1,098
1 .3 Unregistered workers 46 272 318
1.4 Non-resident foreigners 41 41
Total·of domestic workers 1,022 1,687 2,709
2. Secondary actìvities
2.1 Second job 4,002 4,002
3. Total 1,022 5,689 6,711
Labour units
1. Regular 211 1,041 1,252
2. Irregular 587 263 850
3. Unregistered workers 37 181 218
4. Non-resident foreigners 41 41
5. Second job 485 485
Total including elG (wage supplementation fund) 876 1,970 2,846
Total not including erG 875 1,970 2,845

47
Table 8 - Working positionsand labour units by condition and postuon in the profession. Industry. Year 1981 (in thousands)
Condition Position in the profession
employee se/f-employed totaI
Working positions
1. Principal or single activities
1.1 Regular workers 5,924 955 6,879
1 .2 Irregular workers 608 233 841
1.3 Unregistered workers 102 38 140
1.4 Non-resident foreigners 38 38
Total of domestic workers 6,672 1,226 7,898
2. Secondary activities
2.1 Second job 354 354
3. Total 6,672 1,580 8,252
Labour units
1. Regular 5,924 955 6,879
2. Irregular 608 233 841
3. Unregistered workers 86 25 111
4. Non-resident foreigners 38 38
5.Secondjob 141 141
Total includlng elG (wage supplementation fund) 6,656 1,354 8,010
Total not including CIG 6,380 1,354 7,734
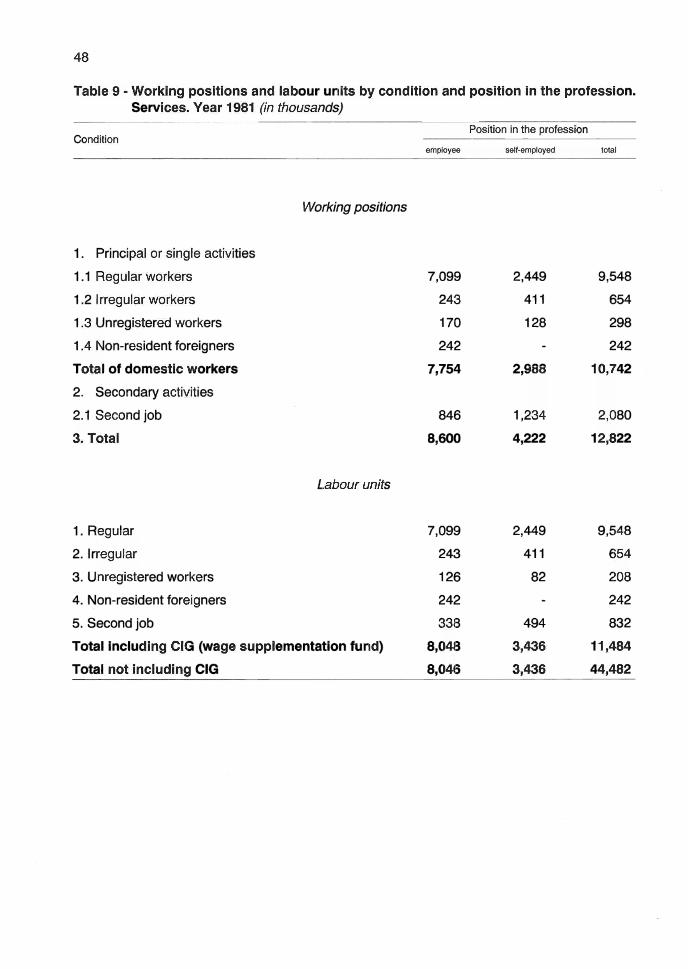
TaltJe 9 .. WOI'king posItionS. anei labOllr unita QY condItIonaneiposItIonIn the profe6sion~ Servlces. V_r 1981 (in thousands)
Condition Posltion in the profession
seIf-employed totaI
Working positions
1. Principal or single activities
1.1 Regular workers 7,099 2,449 9,548
1.2 Irregular workers 243 411 654
1.3 Unregisteredworkers 170 128 298
1.4;Non-resident foreigners 242 242
Totalof domestIC workers 7,754 2,988 10,742
2. Secondary activities
2.1 Second job 846 1,234 2,080
3..Total 8,600 4,222 12_
Labourunits
1. Regular 7,099 2,449 9,548
2. frregular 243 411 654
3. Unregisteredworkers 126 82 208
4i Non-resident foreigners 242 242
5. Secondjob 338 494 832.
TotaUnciudingelG <wage suppJementatlonfund) 8,048 3,436c 11~
Totai ìIOt Includi .. g CIO 8,046 3,438 ;44;482

11.ESTIMATES OF LABOUR UNtTS BENEFITING CASSA. INTEGRAZIONE GUADAGNI (Wage Supplementatiol'l Fund)
The data obtained up to this point can now be compared with the old-style. national accounting data, and it is correctly used· for applying added values obtained with the survey on the gross product of firms to the economy as a whole.
However, in order to calculate correctlythe volume of work applied to the creation of GDP soas to be able to quantify productivity with a higher degree of accuracy, the number of workers that are laid off work and receive wage supplementation fund (Cassa Integrazione Guadagni, CIG), and consequently have not played a part in the production process, should be omitted from data. Before outlining the methodology adopted for estimating the number of workers benefiting trom the "CIG", it is important to make some considerations about ìhe basic data used for this purpose.ln particular, it is necessary to distinguish between employees made redundantat productive firms and those trom firms that have been wound up. The former tend to remain included among the personnel of the firm, which does not consider workers to have been dismissed. It is therefore supposed that they are classified as employed in both the CP and the Jabour force survey. The latter however do not appear in statistical sources. It is indeed logical for a bankrupt firm not to compile ~atisticaJ surveys and it may therefore. be surmised that the worker in this type of firm is not registered as employed in the CP and in the labourforce survey, evenif he ~nefits trom the CIG.
The procedure for estimaUng the number of labour units in GIG is based on the data pertaining to the number of hours of CIG as published by the National Institute of Social Security (lNPS).
INPS calculates the number of hours by adding togetherthe hours authorised . by the Employment Ministry to firms that request this sort of benefit. For each company,. the number of authorised hours(GIGt) isobtained trom t~ product of the number of employees (L) benefiting trom the provision by the number of weeks of. vaUdity (S)and by the number of working hours per week as envisaged byspecific work contracts (H).
49
With reference to Ume (t), we may create the formula:
n GIGt = h ILti Sti HtiJ
t=1
where the number trom 1 to n is the number of models with which CtG hours are authorised (during a year, and in compliance with the law, the single firm may therefore present different models referring to various sub-periods).
By way of example, if a company makes 4 requests for the payment of wage supplementation fund to 1employee having a contractual timetable of 40hours per week for a period of 3 months (13 weeks), the number of authorisedhours is ca/culated as:
H h(1 X13X40} = 2.080 i=1
In this case, therefore1 a total of 2,080 hours are counted for one labour unit in CIG for one year.
Another important aspect that needs to be considered is that for ordinary and extraordinary GIG there is aconsiderab/e distance in time between the actual placement in CIG and when these GIG hours are authorised' which is due to bureaucratic delays that are calculated at twc months for ordinary CIG and6 months for extraordinary C/G.
Bearing these particular aspects in mind, the number of workers in GIG is estimated by dividing the· number of authorised hours, regarding active firms only for the period of reference, by the product between the number of weeks of CIG in a year and the number of working hours per week as indicated in the contracts of different sectors.
12. RE-CONSTRUCTlONOF HISTORICAL SERIES
12.1 Generai criteria
The numbers of working posiUons and labour units for ·1980 and the period1982-86 were estimated by assigning to the estimated data for 1981 (based on census information andaccording tothe method described in previous points)the percentage changes on the previous year affecting the corresponding features of thephenomenon, estimated trom statistical data obtained from current surveys

50
and specific sources from both the labour demand side andthe labour supply side.
In order t() àdopt this method, it was first of ali necessary to create new data banks concerning the measurement of employment from both the labour demand and labour supply sides. This was to comply with two essential requirements:
a) to keep information on single labour market segments (regular, irregular, unregistered workers, non-resident foreigners, second work) classified according to the position in the profession (employees, household collaborators, entrepreneurs· and self~empfoyed professionals), the economie activity of the local unit and the size of the firm represented by the local unit (1-9; 10-19; 20-49; 50+);
b) to beable to calculate those indicators used to observe the evolution and structural variations of single sub-aggregates over set periods of time.
12.2 Statistical sources
The main sources used for calculating data on the number of worl<ers from the labour demand side were:
• the survey on the gross product of firms; • the survey on employment in firms with
more than 10 employees, available for the ye~rs 1983 to 1985, and the survey on employment in industriai plants, the fìrst of which conducted in 1987, referring to 1986;
• the 1983 sample survey on the gross product of small-sized firms; this survey wìU be conducted every three years (the 1985 survey is beìng drawn up);
• the survey on the set-up of agricultural holdings conductedby Istat for the European Community in 1982 and 1985 (three- yearly);
• specific sources already described for 1981 (see section 6).
The mainsourcès for calculating data on the number ofworkersfrom the labour supply side, WaS the sample survey on labour forces.
These sources provide the number of workers classmed accordingto the "ATE CO" of the firm, if the size of firm is in one of the
. classes: 1-9, 10-19,20-49, andaccordingto the "ATECO" of the functional unit if the firm employs SO or more workers. Since this basic
data was used to estimate the variations in census dataon labour which, as has already been writtèn, is classified according to the "ATE CO" of the local unit, it was necessary to assume that in companies employing fewer than 50 workers, the ATECO of loeal units was identical to that of the firm, and that in large-sized firms (+50 workers)the functional units corresponded to local units or a group of focal units, and therefore the A TECO was identica!.
This assumption may be eriminated in the next few years when data becomes avai!able onemployment level$ in single industriai plants and if, of course. this data is deemed to be quantitativelyand qualitatively valid.
This assumption however necessitates the use of analytical data for each· sing!e economicactivity.
12.3 Methodology
As we saw in previously mentioned concepts, demand side sources . provide information on single or prìncipal regular worl<ing positìons and on secondary activities. The sectors covered by these sources are: agriculture and related activities, ali industriai activities, consumer gòOd repair workshops, the activities of commerce, lodging and catering, transport, communicatìons, credit and insurance, some company service activities, some activities of non-market services and Public Administration activities.
Within each sector, sources usualiy refer to firms that employ 10 or more workers. It is only possible to measure indicators thàt refer to· the whole· range of companies for establishments whose data is provided by specific sources and for agricultural activitles subjected to surveys on the set-up of that sector.
For small-sized firms ( less than 10 employees), the number ofworkers pers!ngle ATECO was calculated as follows: in 1983, on the basìs of information gained from the survey on srnall-sìzed firms in the sectors of rndustry and services; in 1982, as anintermedlate vafue between the two points estimated for 1981 and 1983; in other yearS, by extrapolating va!ues trom these fixed points.
From· the information obtained from production unlts or estimated, it is possible to create a year by year series ofchange

i~ o.Hhe previoosyear&;mthe fluml!Jer ~~I'JfJJothe~·
i ... ;~,theAiI'SJ0"ò"'*eef finrirwftid't Mobe C()mpareawith a 'SfmiJaf ml1ìtriX prepared ftomcensuedàta,whidl réfin to reguJar employmeflt in the singleor principal working position and to secondary activities.
In other words, this matrix gives an indication for each position in the profession of the variation coeffieients from year to year in the number of working positions by ATECO and the size 01 firmo
Starting from abasie matrix 01 unitary coeffieients, the series Is bullt up in stages through the adding 01 as many matriees as the. number 01 information sources from the dernand side. Information is added by superilllPOStng . in the basie rnatrix those variation coeffieients obtalned from statistical sourcesthat guarantee a hight':lr quaiity of information.
By way 01 example, 10r the same firm size and the same ATECO, the coeffieient 01 variation caleulated from data deriving from the survey on the gross product 01 firms is deemed to be more reliable than that from the survey on employmeflt in firms employing 10 or more wOrkers, sinee the data Is eofltrolled within a framework 01 aggregates that must be statistically and ecooomically coherent.
For brandles not covered by surveys, the variation in~x (provisionalJy assigned to the relative cefls 01.the matrix) 10r 1980 and 1982 is equaltb the unit cornpared with 1,981 ; 10r .. years a~ ·1983, the.indeX 01 variation attribyted torefative celis has been estimated byextrEP>fating the dàta pertaining to previousyears according to eriteriathat will be illustrated hereafter.
Intormation obtainedfrom the survey on labour 10rees conceming the number 01 registered workt':}rs gives an indieation eftbe number 01 natural persons or' single or priooipal working positions occupied regularly and irregularly, elassifled according to the position in the professiOn and accordlng to the twelve branches 01 economie activity.
From thls data, it is possible to estimate, ·10r . eaeh position in the profes8ion and 10r each branch, ehange inÒ9Xes on previoos year (calcUiated from 5-term. annual averages) 10r the whole range 01 the two labòur market segments Under study.
51
The .. coefficjem ;matrix· ·constructedfrom
Iabourdernand '. ~on. ·ìs usedto esti~'''~·tG\ __ the'''referrittg to regular.!workets and seeOnd working positions as indiCated in the CIC, wherèas the matrix1>f GOéfficients constructed from labour
. suppty inforrnation is used toestirnate the data pertaining to regular and irregular workers resulting from the CP.
. By juxtaposing the matrices 01 variation indices constructed from both labour demand side and laboursupply side survf:lyS,it is possible to quantify the distance separating the two indicators 10r eaeh set 01 elassification 1eatures.
It is assumed that the indicator constructed from labour suppty inforrnation Is more reliabte .
... The differenee in values (i1 tllere is a difference) Is then distributed among Irregular and regular workers 10r the firm si~e 1-19 (assuming in10rmation from the survey on gross product for firms having plus of 20 employees is reliable); i1 no information Is available 10r eonstructing an inde~ 1romthe demand skkiJ. the differenee Is distributed among irregular workers for ali 11rm sizes.
Having thus estirnatedfor eaeh year, via the above-mentioned meth09. the historical series of regular and irregular single or principal wòrking positions and 01 secondary working positions, elassjfi~ . according lo position in the profession, ATECO, andsize 01 firm. other labour market segments were then evaluated (unreglsteredpersons performing working hours and non-resident 10reigners), in accordance withthe same eritèria already described for 1981.
From particular data 10rthe branehes 01 Construction,· Lodging and Catering a.nd Intand Transport, anda comparison 01 estirnated working positions with the number of VAT registrations, it was possible to ealculì\te· the number of secondary working positiof1s.
After having esttmatedfor e~ch .year the working positions in each labourrnarket segment, classified according to position in theprofession~dfor the 44 branehes 01 the NAGE"'CUO ctassifièation, the number01 labour units Was caleulated from data on wo,-kingpositions.
This procedure, carried out usingthe same eriteria adopted for1981, initially.involved irregufar workers in the sector 01 agriculture,

52
those persons not registered asemployed but Whoperformed working hours, and finally those occupying asecond working pasition.
Once other natìonal accounting aggregates. had bean estJmated (value added, employees' incomes, etc.), those
workers benefiting from the wage supplementationfund were· deducted tram the numberof labour units, and parHime workers were brought up to a full-Ume scale, including regular part-time workers present since 1984.

PART III
OTHERESTIMATES

13. REVALUATION OF UNDERDECLARED INCOME
As we have already pointed out, the second major aspect of underground economy is the underdeclaration of output obtained by means of regular labour, generalty present in accounting documents of small enterprises.
An underdeclaration of the income produced can be assumed if the hourJy pay of the self-employed worker is lower than the one of the employee who, given the same amount of working hours, operates in the same activity sector.
Should this be the case, the originai data, relating to the value of production and income, is rectified by means of a procedure based on the Frànz method. This procedure, which is carried out by subclass of economie actMty and by employee-number elass, is dMded lnto the following phases:
a) the per capita earnings of employees (managers, white and blue collars) is revaluatedon the. basisof the same working hours of self-employed workers (entrepreneurs and household collaborators);
b) for each firm the net income is calculated (by subtracting tMe employees' earnings, the passive interests, bank expenses, fìxed capitai amortizations, renting and insurance expenses from the gross
55
earnings) tMus calculatìngthe per capita net earningsof self-employed workers;
c) If tMe per capita earnings of selfemployed workers is lower than the one of employees, the latter is then attributed to selfemptòyed workers.
Table 10 shqws thecoefficients used to adjust the data pertaining to small enterprises by branch of economie activity, trom 1983 to 1989.
It is interestìng to nòte that the number of corrective actions performed for the different branches has fallen sharply also due to. the new, more efficient measures applied against fax evasion, end particularly the one foreseeing the mandatory use of cash registers in ali shops.
This method, as can be easily understood, considers tax evasion to be the maìn cause of anomaHes found in the behaviour of the entrepreneurs. Even though this principle holds true in the case of strong growth, it appears to beless so when the economie cyçle is. undergoing a decline; in the latter case the production function should be structuredìn a way enablingthe behaviour of the operator and the underiying causes to be more efficient/y analysed. These aspects are the object of the research projects which are being carried out in order to improve information for the 1992 benchmark.

56
Table 10 - Revaluation coefficients of Gross Product .forfirms withless than 20 workers. --"~--'_.~---~--~.-".-'---.-.-.-~'_._--.-----._.----~--------~--------------~--
Branches 1983 1985 1986 1987 1988 1989 ~~------_._'------~--"----"------'-'----"~--'-- -~-'-----'-'-------~--'----------------~-"-------
Agricultural, forestry and fishery products 5.1 5.9 6.0 3.8 3.1 3.7
Ferrous and non-ferrous oresand metals 6.8 3.1 5.5 3.6 4.0 2.3
Non-metallic minerai products 6.6 5.8 8.3 4.8 3.6 3.2
Chemical and pharmaceutical products 2.9 4.0 4.0 2.8 2.1 1.6
Metal products except mach. andtransp. equipm. 9.2 5.1 5.3 3,4 2.7 2.5
Agricultural and industriai machinery 6.6 5.8 3.9 2.5 2,4 2.1
Office and data processo machines; precis.and optic. instr. 6.7 3.5 4.0 2.8 3.2 1.8
Et.ectrical goods 3.7 4.5 4.1 2.6 2.5 2.1
Motor vehicles 8.6 5A 6.1 5.1 3.8 2.5
Other transport equipment 10.8 7.9 11,4 6.5 6;0 3.7
Meats, meat prep. and preserv., other prod. from slaughtered animals 7.4 9.4 4.4 3.3 3.7 4.3
Milkanddairy products 5.7 6.2 5,4 3.8 5.2 2.6
Other food products 8.3 7.3 8.1 3.9 4.5 4.2
Beverages(alcoh. and non-alcoh.) 8.0 11.1 4.7 5.3 3.9 2.8
Textiles and clothing 7.3 5.0 6A 4.1 4.0 3.5
Leathers, leather and skin goods, footwear 5.0 4.4 5.5 5;5 5.0 3.2
Timber, wooden products and furniture 11.8 7.1 9.9 6.9 5.3 4.7
Paper and printing products 7.0 3.4 3.7 2.5 2.8 2:8
Rubber and plastic products 5.2 5.0 4.'1 2.8 2.9 2.3
Other manufacturing products 7.1 5.0 5:8 3.1 2.9 2.4
Building and construction 7.3 5.6 8.7 5.i 4.1 3.4
Hecovery and repaìrservice 19.8 6.9 17.1 7.0 12.4 4.2
Wholesale and retai! trade 14.9 7.2 9.3 4.7 6.4 3:6
Lodging and catering services 30.1 9.7 21.8 7.3 11.0 5.2
!nland transport services 21.9 10.5 17.2 6.0 10.1 6.4
Maritime and air transport services 7.2 4.6 6.6 6.0 8.1 3,4
Auxiliary transport services 15.8 8.5 '12.4 6.5 9.4 5.6
Communication services 42.4 3.7 12.5 3.5 8.4 3.2
Business services provided to enterprises 15.9 "15.9 11:6 .<. _____ , ______ ._._~ ______ , _________ ._. ___ ._. ___ . ____ . __ . ___ " .. __ "_'_r __ "_' , _______________________ • __ • ___ .•.•• __ • __ ... __ ., __ •• _ • - • ______ •• ____ ._._.,.,_. __ • ___ ,,_. __ • _H",_' __ ""' ___ ._., __ .. __________ .,_ •• _"_._~

14. SAMP1..E SURVEYS CARRIED OUT ON FAMfUES ANO ENTERPRfSES
(I) Some operating units which are not ''visible'', or units characterised by a small number of workers, tendto hide part or ali of their activities, being facilitated by thescarcity of generai controls and by the possibility of avoiding statistical surveys. The data gathered on the side of supply and income formation do not generally cover the total product created, even though they are integrated with the revaluated activity of irregu,ar sectors of the market.
For theseactivities, the product estimate is there10re independent of the underlying quantity oflabour and is instead obtained by means of data on family expenditure, gathered in "ad hoc" surveys, and by integrating this data with data trom other sources. The underlying hypothesis is that families have no interest in hiding data.
Phenomena which are observed in "ad hoc" sample surveys represent fami/y expenditure for:
-holidays; - meals in restaurants, food and bever-
ages; - household maintenance. The results of surveys on holidays and
restaurant meals, food and beverages, adequately integrated with expenditure of foreign tourists in lodging and catering faciUties, enabje us to estimate the product of the "Lodging and catering services" branch.
The results of the survey on ordinary and extraordinary maintenance of households which, as we have already sean, has also drawn attention to secondary activities, was aimed at completing the evaluation of the product of the construction industry.
Finatly, the product of the construction branch has been completed in order to uncover another part of underground economy, Le. iIIegal construction. This
57
activity, which cannot be identified by means of.surveys 00 "building Ucences" issued by City Councils, wasidentified by comparing data trom the latter survey with Census data.
(II) The surveys described above enable us to quantify the overall product of different branches, but cannot help us to identify the proportion of underground economy pertaining to the product. These proportions can only be estimated "ex post", using as direct indicators the estimates relating to irregular employment which have bean considered above.
15. ACCOUNT BALANCtNG
The balancing method adopted by ltalian accountants permits the integration between flow estimates of sectorialinterdependence tables (available in benchmàrk years) and current estimates of national economic accounts.
This method is based on an adaptation of the Stone, Champernawne, Meade (1942) method. It is a procedure which integrates a manual, error-correction approach with a more sophisticated approach which enables the correction of unbalances highlighted in the accounting system, by distributing discrepancies between various aggregates forming part of the accounts, according to the degree of reliability. The latter can be expressed as the variance of direct estimates of each component of the system (value added, intermediate consumption, etc.).
This method, used in the rebatancing proceSS, not only corrects statistical. errors, but can also show proportions of products which the techniques analysed so far have not been able to show. These are usually proportìons of product record ed under the "utilisation" heading, but not under the "formation" one.


APPEND'X

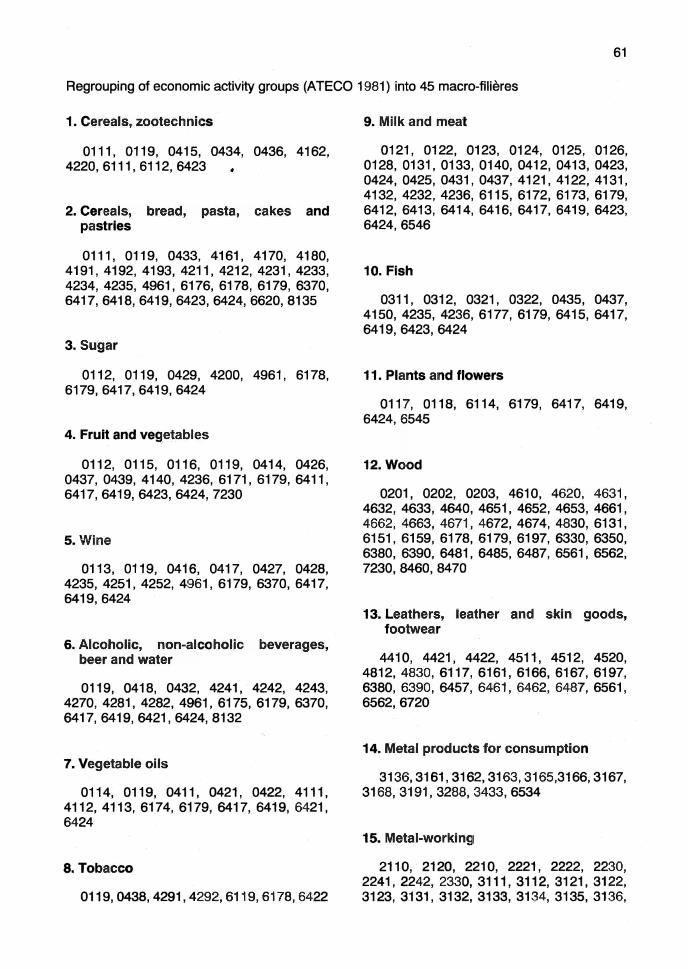
1. Cereala,~mcs
011" 0119, 0415, 0434, 0436. 4162, 4220, 611" 611'2,6423 •
2. c.reaas, bread, pasta, Càkes aNI pastrles
0111, 0119, 0433, 4161, 4170, 4100, 4191,4192,4193,4211,4212,4231,4233, 4234, 4235, 4961, 6176, 6178, 6179, 6370, 6417,6418,6419,6423,6424,6620,8135
3.·SUgar
0112, 0119, 0429, 4200, 4961, 6178, 6179,6417,6419,6424
4. Frult and vegetabIes
0112, 0115, 011'6, 0119, 0414, 0426, 0437,0439,4140,4236,6'7',6'79,641', 6417,6419.6423,6424,7230
s~··~.
0113, 0119, 0416, 0417, 0427, 0428, 4235, 4251, 4252~ 4981, 6179, 6370, 6417, 6419,6424
6. ~ non-afcotIoIJc ~ beerand water .. .,
0119, 0418, 0432, 4241,:4242, 4243, 4270,4281,4282,4961,6175,6179,6370. 6417,6419,6421.6424,8132
7.·Végetable 011$
OH4,Q1f9. 0411,0421, 0422, 4111. 4112, 4113, 6174, 6179, 64.11, 64:19, 642f. 6424
61
9~"."_t
0·121, 0122;0123, 0124, 0125:, 0126, 0128, 0131,0133, 0140, 0412, 0413,0423, 0424, 0425, 0431,0437, 4121, 4122,4131, 4132, 42la; 4236,6115, 6172, 6173, 6179, 6412,6413,6414, 6416, 6417, 6419, 6423, 6424,6546
1a. FIsb
0311,0312.0321, 0322, 0435, 0437, 415a, 423S. 42S. 6177, 6179, 6415, 6417, 6419, 6423, 6424
11. PIanta and fIowers
G,H7, OHI." 6114, 6179, 6417, 64.19, 6424,6545
12.·WOOtt
Q2Q1,. ~02, 0203. ~1 0, 4620, 463,1, 4682, 4633, 4640, 4651, 4652. 4653, 4661, 4662, 4663~ 4671, 4672,4674, 4830,61.31, 6151,6159, 6118, 611$. 61~7, 6330,Eì35C, 6300, 6390, 648', 6485~ 6487, 6561, ·6562, 7230, 8460, 8470
4410, 4421, 4422. 4511, 4512, 4520, 411.2, 48aO. 6117,6161,6166,6167,6197, 6300, ~ 6457,6481,64$2; EkcW;è561, 6562.6720
1.,. .............. ~~ 3136,. a161~ 3162. 3163.3'65,3166,3167,
$1.;.3191, 3Z38, 3433,.6534
2110, 2120;2210;2221, .~ 2230, 2241; 22U~ 2330t3101it, 3112, 3121, 3122, 3123. 3131,.3132,.·31.; 3134. 3135, 3136;
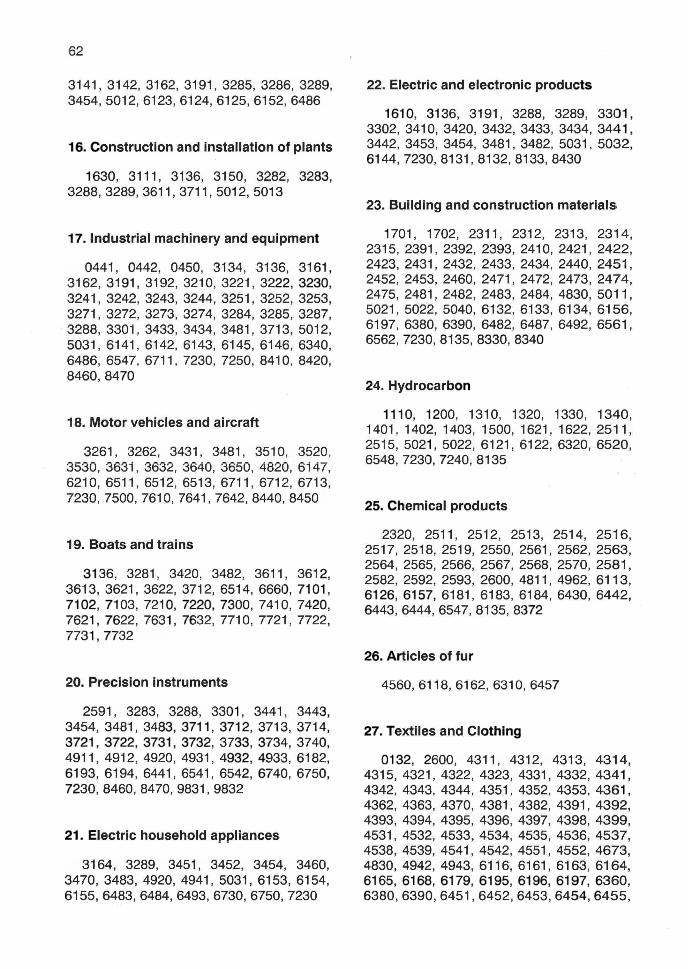
3141,3142,3162,3191,3285,3286,3289, 3454,5012,6123,6124,6125,6152,6486
16. Construction and installatlon of plants
1630,3111, 3136, 3150, 3282, 3283, 3288,3289,3611,3711,5012,5013
17. Industriai machinery and equlpment
0441, 0442, 0450, 3134, 3136, 3161, 3162,3191,3192,3210,3221,3222,3230, 3241, 3242, 3243, 3244, 3251, 3252, 3253, 3271,3272,3273,3274,3284,3285,3287,
'3288,3301,3433,3434,3481,3713,5012, 5031,6141,6142,6143,6145,6146,6340, 6486,6547,6711,7230,7250,8410,8420, 8460,8470
18. Motor vehicles and alrcraft
3261, 3262, 3431, 3481, 3510, 3520, 3530, 3631, 3632, 3640, 3650, 4820, 6147, 6210, 6511, 6512, 6513, 6711, 6712, 6.113, 1230,7500,7610,7641,7642,8440,8450
19. Boats and tralns
3136, 3281, 3420, 3482, 3611, 3612, 3613,3621,3622,3712,6514,6660,7101, 71Q2, 7103, 7210, 7220, 7300, 7410, 7420, 7621,7622, 7631, 7632, 7710, 7721, 7722, 7731, 7732
20. Preclslon instruments
2591, 3283, 3288, 3301, 3441, 3443, 3454,3.481,3483,3711,3712,3713,3714, 3121,3722,3731,3732,3733,3734,3740, 4911,4912,4920,4931,4932,4933,6182, 6193, ~194, 6441, 6541, 6542, 6740, 6750, 7230,8460,8470,9831,9832
2,1. Electrlc household appliances
3164, 3289, 3451, 3452, 3454, 3460, 3410; 3483, 4920, 4941, 5031, 6153, 6154, 615:5,6483,6484,6493,6730,6750,7230
22. Electric and electronlc products
1610, 3136, 3191, 3288, 3289, 3301, 3302,3410,3420,3432,3433,3434,3441, 3442,3453,3454, 3481, 3482, 5031, 5032, 6144,7230,8131,8132,8133,8430
23. Bulldlng and constructiQl1 materials
1701, 1702, 2311, 2312, 2313, 2314, 2315,2391,2392,2393,2410,2421,2422, 2423,2431,2432,2433,2434,2440,2451, 2452, 2453, 2460, 2471, 2472, 2473, 2474, 2475,2481,2482,2483,2484,4830,5011, 5021,5022,5040,6132,6133,6134,6156, 6197,6380,6390,6482,6487,6492,6561, 6562,7230,8135,8330,8340
24. Hydrocarbon
1110, 1200, 1310, 1320, 1330, 1340, 1401,1402,1403,1500,1621,1622,2511, 2515,5021,5022,6121,6122,6320,6520, 6548,7230,7240,8135
25. Chemlcal products
2320, 2511, 2512, 2513, 2514, 2516, 2517, 2518, 2519, 2550, 2561, 2562, 2563, 2564,2565,2566,2567,2568,2570,2581, 2582,2592,2593,2600,4811,4962,6113, 6126,6157,6181,6183, 6184, 6430, 6442, 6443,6444,6547,8135,8372
26. Artlcles of fur
4560,6118,6162,6310,6457
27. Textlles and Clothing
0132, 2600, 4311, 4312, 4313, 4314, 4315, 4321, 4322, 4323, 4331, 4332,4341, 4342,4343,4344,4351,4352,4353,4361, 4362,4363,4370,4381,4382,4391,4392, 4393,4394,4395,4396,4397,4398,4399) 4531,4532,4533,4534,4535,4536,4537. 4538,4539,4541,4542,4551, 4552, 4673~ 4830, 4942, 4943, 6116, 6161, 6163,6164. 6165,6168,6179,6195,6196,6197,6360, 6380,6390,6451,6452,6453,6454,6455,

6456, 6471, 6472, 6487, 6543,6544. 6549, 6561,6562,8460,8470
28.Paper and· printing products
• 4710, 4720, 4731, 4732, 4733, 4734, 4740,6158, 6191, 6192, 6197, 6220, 6380, 6390,6487,6491,6531,6532,6533,6561, Q562,8396,8397
29. other miscellaneous products (gadgets, fancy goods,· objects d'art, etc.)
4950, 6197, 6380, 6390, 6487, 6494, 6495,6535,6550,6561,6562
30. Lodging and catering
6610, 6620, 6651, 6640, 6652, 6653, 6611,6672,6673,6674,9113,9670,9791, 9822
31. Credit
8110, 8121, 8122, 8131, 8132, 8133, 8134,8135,8310
32. Insurance
8210,8220,8230,8320,8350
33. Business services
5011, 8350, 8360, 8371, 8381, 8382, 8391, 8392, 8393, 8394, 8395, 8398, 8399, 9112,9113,9230,9402
34. Personal services
9212, 9360, 9781, 9783, 9784, 9810, 9821,9822,9841,9842
35. State education
9311,9321,9322,9323,9331,9341,9771
63
36. Private education
9312,9324,9325,9326,9332,9342,9772
37. Publtc health services
9511,9512,9513,9514,9515,9521,9522, 9523,9524,9525,9561
38. Private health services
9516, 9517, 9518, 9519, 9526, 9527, 9528,9529,9531,9532,9540,9562
39. Centrai administration
9111, 9112, 9121, 9122, 9130, 9140, 9150
40. National and local authorities
9113, 9190, 9211,9220, 9611, 9621, 9631,9782
41. Private assistance
9612,9622,9660
42. Post and telecommunications
7901,7902,7903
43. Various social institutions
9632,9640,9651,9652,9680
44. Public broadca~ting
9741,9742
45. Entertainment
9720,9730,9750,9792,9793

64
BIBLIOGRAPHV
ALESSANDRINI L., (1978), Lavoro irregolare e lavoro nero, Il Mulino, Bologna.
BECKER G.S., (1965), "A Theory of the altocation of Time", in Economie Journal, VoI. 75.
BLADES D., (1982), "The hidden economy and the national accounts", in Occasionai Studies, OECD, pp. 28-45.
CONTINI B., (1989), "The irregular economy of Italy: a survey of contributions", in The underground economies: tax evasion and information distortion, Cambridge, pp. 237-250;
DEAGLIO M., (1978), "L'occupazione irregolare in Piemonte", in Collana ricerche e documentazione, n. 9, Camera di commercio, industria e artigianato di Torino.
D!;AGLIO M., (1982), "Microeconomia del lavoro irregolare", in Micros, n.5.
DeNISON E.F., (1982), Is US growth understated because of the underground economy? Employment ratios suggest not" 8ureau of Economie Ana/ysis, Washington.
EUROSTAT (1992), Report on thesources and methods used for compiling GNP and its components in Ita/y, "GNP Committee meeting", 9-10 July.
EUROSTAT (1982), Inventario delle fonti statistiche e dei metodi del PNL.
FEIGE E. L. , (1982), "Le malaise de la macroéconomie et l'economie invisible", dans Consommation, Revue de SocioEconomie, n.4.
FRANZ A., (1985), "Estimates of the hidden economy in Austria on the basis of the offidal statistics", Review of Income and Wealth, vol.31 , 4.
FREY 8.S. e WECK H., (1983), "Estimating a shadow: a (laive approach to hidden economy measuremenf', in Oxford Economie Papers, voi, 35, n. 1.
GALLINO L., (1985), II/avoro e il suo doppio, Il Mulino, Bologna.
ISTAT, (1990), "Nuova Contabilita' nazionale", in Annali di Statistica, Serie IX, Volume 9.
PACI M., (1973), Mercato del lavoro e classi sociali in Italia, Il Mulino, Bologna.
PEDUlLÀ M.G.,(1987), "Concetti e metodi utilizzati in contabilita' nazionale per la stima delle unita' di lavoro", in Economia e Lavoro, n.3, luglio-settembre.
PEDUlLÀ G., PASCARElLA C., ABBATE C., (1990), "Situation actuelle de l'emploi. Concepts et méthods", in Inventaire des sources statistiques et méthodes d'estimation du produit national brut, Eurostat, 1992.
REY G.M., (1988), La revisione delle serie di Contabilità nazionale, "Report for the International Monetary Fund", September.
REY G.M., (1992), Analisi economica ed evidenza empirica dell'attività iIIega/e in Italia, Paper for the 33rd Annual Scientific Meeting of the ltatian Society of Economists, 30-31 October.
SIESTO V. (1988), I problemi di misurazione dell'economia sommersa, Extract trom the minutes of the 34th Scientific Meeting of the ltalian Society od Statistics.
SVlOS LABINI P., (1986), Le classi sociali negli anni '80, Edizioni Laterza.
STONE R., CHAMPERNOWNE D.G, MEADE J.E. (1942) "The precision of national income estimates", in The Review of Economie Studies, vol. IX, n. 2.
TANZI V., (1983), "The underground economy in the United States: annual estimates 1930-1980", in International Monetary Fund Staff Papers.
UNITED NATIONS (1992), "Guide-book to statistics on the hidden economy", Economie Commission for Europe ..
WllLARD, J.C.,(1989), "The underground economy in the National Accounts", in United Nations (1992).
Le pubblicazioni dell'ISTAT BOLLETIINO MENSILE DI STATISTICA La più completa ed autorevole raccolta di dati congiunturali concernenti l'evoluzione dei fenomeni demografici, sociali, economici e finanziari Abbonamento annuo L 130.000 (Estero L 160.000) Ogni fascicolo L 17.000
STATISTICA DEL COMMERCIO CON L'ESTERO Documentazione statistica ufficiale, aperiodicità trimestrale; fornisce, per tutte le merci comprese nella classificazione merceologica della tariffa dei dazi doganali, l'andamento delle importazioni e delle esportazioni da e per i principali Paesi Abbonamento annuo L 105.000 (Estero L 120.000) Ogni fascicolo L. 35.000
ANNUARIO STATISTICO ITALIANO Edizione 1992 - L. 52.000 I dati fondamentali della vita economica, demografica e sociale in semplici tabelle numeriche di facile lettura ed attraverso appropriate note illustrative e rappresentazioni grafiche. FQrnisce, inoltre, un quadro panoramico della corrispondente situazione degli altri principali Paesi del mondo.
ITALIAN STATISTICAL ABSTRACT Edition 1993 - L. 27.000 (in corso di stampa) I principali risultati delle rilevazioni ed elaborazioni statistiche concernenti la situazione sociale ed economica italiana Edizione in lingua inglese.
POPOLAZIONE E MOVIMENTO ANAGRAFICO DEI COMUNI N. 3 - Anno 1990 - L. 23.000
MATRIMONI, SEPARAZIONI E DIVORZI N. 2 - Anno 1989 - L. 18.000
MOVIMENTO MIGRATORIO DELLA POPOLAZIONE RESIDENTE - Iscrizioni e cancellazioni anagrafiche N. 2 - Anno 1989 - L. 14.000
NASCITE E DECESSI N. 1- Anno 1988 - L. 50.000 (in corso di stampa)
STATISTICHE DELLA SANITÀ N. 5 - Anno 1989 - L. 27.000
CAUSE DI MORTE N. 4 - Anno 1988 - L. 29.000
INDICATORI MENSILI Forniscono dati riassuntivi e tempestivi sul!' andamento mensile dei principali fenomeni interessanti la vita nazionale Abbonamento annuo L 33.000 (Estero L 43.000) Ogni fascicolo L. 4.200
NOTIZIARIO ISTAT Fornisce i primi risultati delle principali rilevazioni ed elaborazioni statistiche Ogni fascicolo L 1.800
CONTI ECONOMICI TRIMESTRALI Abbonamento annuo L. 13.000 (Estero L. 17.000) Ogni fascicolo L 4.200
COMPENDIO STATISTICO ITALIANO Edizione 1993 - L. 27.000. (in corso di stampa) La sintesi dei. risultati dellerilevazioni ed elaborazioni.statistiche di maggior interesse nazionale.
LE REGIONI IN CIFRE Edizione 1993 - Distribuzione gratuita Fornisce i dati delle singole regioni e delle due grandi ripartizioni geografiche: Nord - Centro e Mezzogiorno.
I CONTI DEGLI ITALIANI VoI. 27, edizione 1993 - L. 19.000 (in corso di stampa) Illustra in forma divulgativa i principali aspetti quantitativi dell' economia italiana.
STATISTICHE DELLA PREVIDENZA, DELLA SANITÀ E DELL' ASSISTENZA SOCIALE N. 30 - Anni 1989, 1990 -L. 18.000
STATISTICHE DELLA SCUOLA MATERNA ED ELEMENTARE N. 1 - Anno scolastico 1989-90 - L. 25.000 (in corso di stampa)
STATISTICHE DELLA SCUOLA MEDIA INFERIORE N. 1 - Anno scolastico 1987-88 - L. 13.000
STATISTICHE DELLE SCUOLE SECONDARIE SUPERIORI N. 2 - Anno scolastico 1990-91 - L. 50.000 (in corso di stampa)

STA TlSTlCHE CULTURALI N. 32 - Anno 1990 - L. 18.000
STATISTICHE GIUDIZIARIE N. 38 - Anno 1990- L. 50.000 (in corso di stampa)
STATISTICHE DELL'AGRICOLTURA, ZOOnCNIA E MEZZI DI PRODUZIONE N. 38 - Anno 1990 - L. 50.000
STATISTICHE FORESTALI N. 43 - Anno 1990 - L. 18.000 (in corso di stampa)
STATISTICHE DELLA CACCIA E DELLA PESCA N. 6 - Anno 1990 - L. 14.000
Anno 1992
N. 17 - Rilevazione delle forze di lavoro - Aprile 1991 - L. 13.000
N. 18 - La distribuzione quantitativa del reddito in Italia nelle indagini sui bìlanci di famiglia - Anno 1990 - L. 13.000
N. 19 - Statistiche della riceTCll scientifica -Consuntivo 1989 - Previsione 1990 e 1991 -L. 13.000
N. 20 - Valore aggiunto dell'agricoltura per regione - Anni 1980-91 - L. 13.000
N. 21 - Conti economici delle imprese con addetti da lOa 19~ Anno 1989 -L, 13.000
N. 22 - Statistiche sui trattamenti pensionistici al 31 dicembre 1990 - L. 13.000
N. 23 - Trasporto merci su strada - Anno 1989 -L, 13.000
N. 24 - Statistiche dell'istruzione universitaria -Anno accademico 1990-91 - L. 13.000
N. 25 - La distribuzione quantitativa del reddito in .Italia nelle indagini sui bilanci di famiglia - Anno 1991 - L. 13.000
N. 26 - Occupazione e reddìtida lavoro dipendente -Ànni 19so:.91 - L. 23.000
N. 27 - Statistiche dei trasporti marittimi nei portiitaliani- Anno l~n- L. 13.000
N. 28 - I consumi delle famiglie - Anno 1991· -L. 31.000
N. 29 - Rilevazione delle forze di lavoro - Luglio 1991 - L. 13.000
N. 30 - Rilevazione delle forze di lavoro - Gennaio 1992 - L. 13.000
Anno 1993
N. 1 c Statistica annuale della produzione industriale - Annol989 - L. 14.000
STATISTICHEDELL' ATTIVITÀ EDILIZIA N. 5 - Anno 1990 - L. 23.000
STA TlSTlClfE DELLE OPEREPUBBLlCHE N. 5 - Anno 1990 - L. 13..000
STATISTICHE DEL COMMERCIO INTERNO N. 32 - Anni 1989, 1990 - L. 13.000
STATISTICHE DEL TURISMO N. 6 - Anno 1991- L. 14.000 (in corso di stampa)
STATISTICHE DEI TRASPORTI MARITTIMI N. 46 - Anno 1991 - L. 25.000 (in corso di stampa)
STATISTICHE DEGLI INCIDENTI STRADALI N. 39 - Anno 1991 - L. 23.000
N. 2 - Statistiche dell'agricoltura, zoofecnia e mezzi di produzione - Anni 1990, 1991 -Dati provvisori - L. 14.000
N. 3 - Statistiche della ricerca scientifica -Consuntivo 1990 - Previsione 1991 e 1992 -L. 14.000
N. 4 - Statistiche sul trasporto aereo - Anni 1990, 1991 . - L. 18.000
N. 5 - Rilevazione delle forze dUavoro - Luglio 1992 c L. 14.000
N. 6 - Struttura de.lle aziende agricole - Anno 1988 - L. 29.000
N. 7 - Lavoro e retribuzioni - Anno 1991 L. 14.000
N. 8 - Statistiche dell'istruzione universitaria -Anno accademico 1991-92 - L. 14.000
N. 9 - Rilevazione delle forze di lavoro - Aprile 1992 - L. 14.000
N. lO - Conti nazionali economici dei liettori.istituzionali - Anni 1980-1991 - L. 25.000
N. 11 - Statistiche della cooperazione agricola -Anno 1990 - L. 14.000
N. 12 - Rilevazione delle forze di lavoro - Media 1990 .-.L. 18.000
N. 13 - Conti del.le amministrazioni pubbliche e della protezione sociale - Anni 1986-91 -L 18.000
N. 14 - Statistiche sui trattamenti pensionistici al 31 dicembre 1991 - L. 14.000 (in corso di stampa)
N. 15 - Statistiche dell'agricoltura, zootecnia e mezzi di produzione - Anni 1991, 1992-Dati provvisori • L 14.000 (in corso di stampa)
N. 16 -Rilevazione delle forzedilavoro - Ottobre 1991- L 14.000 (in corso di stampa) •
N. 17 - Statistiche .dellazootecnia e dei mezzi di produzione in agricoltura - Anni 1991, 1992 - Dati provvisori - L. 14.000 (in corso di stampa)
MANUALE DITECNICHE DÌ INDAGINE (n. 7fasCÌcoli) - Afutol989 n. 1 1. Pianificazione della produzione dei dati c L. 10.000; 2. Il questionario: progettaziòne, rédazione e verifica -L. 11.000; 3. Tecniche di somministrazione del questionario - L. 11.000i 4, Tecniche di campionamento: teoria e pratica -L. 20.000; 5. Tecniche di stima della varianza campionaria - L. 16.000; 6. Il sistema di controllo della qualità dei dati -L. 23.000; 7. Le rappresentazioni grafiche di dati statistici - L. 15.000.
Anno 1991 Anno 1992
N. 1 - Gli immigrati presenti in Italia - Una stima per l'anno 1989 - L. 12.000
N. 2 - Indagine statistica sulle condizioni di salute della popolazione e sul ricorso ai servizi sanitari (Novembre 1986 - Aprile 1987) - L. 22.000
Serie A
N. 18 - Nùmeri indici det costo di costruzione di un fabbricato residenziale: Base 1976 ;:: 100 - L. 1.500
N. 20 - Numeri indici dei prezzi: Base 1980 ;:: 100 -L. 4.500
N. 21 - Numeri indici dei prezzi dei prodotti vendutiedei beni acquìstatidagli agricoltori: B.ase 1980 ;:: 100 " L. 5.000
N. 23 - Nuineri indici dei prezzi al consùmo: Base 1985 == 100 - L. 6.300
N. 25 - Numeri indici della produzione industriale: BaSe 1985= 100 - L. 11.000
N. 26 - Numeri indici dei prezzi alla produzione dei prodotti industriali: Base 1980;:: 100 -L, 11.000
N.' 27 - Numeri indici del fatturato, degli ordina:" tivi e della consistenza degli ordinativi: Base 1985 ;:: 100 - L. 11.000
N. 28 - Numeri indici dei prezzi praticati dai grossisti: Base 1989 = 100 - L. 12.000
Serie B
N. 21 - Istruzioni pet la rilevazicme statistica. del movimento. della popolazione - Edizione 1981 - L. 4.000
N. 22c Istruzioni per fa riLevazione dei dati delle statistiche forestali - Ristampa 1992-L. 17.000
Serie IX
VoL 8 - Atti. del seminario sulle statistiche ecologiche (Roma, 28 marzo _lO aprile 1988) • L. 23.000
Vol 9 -NU01Jà contabilità nazionale - L, 23.000 VoI. lO - Atti. della giornata di studio sulcampio
namento statistico (Roma, 27 aprile 1989) - L, 25.000
VoI. 11- forze di lavoro: disegno dell'indagine e analisi strutturali - L. 29.000
N. 1 - I conti economici trimestrali con base 1980 - L. 13.000
N. 2 - L'incidentalità stradale attraverso le statistiche - Anni 1970-91- L. 13.000
N. 23 - Istruzioni per la rilevazione dell'attività edilizia - Edizione 1988 - L. 8.400
N. 24 - Istruzioni per le rilevazioni delle statistiche giudiziarie - Edizione 1988 Tomo 1 - Procedura di rilevazione - L. 15.800 Tomo :4 - Modelli di rilevazione - L. 15.800
N. 25 - Manuale per la progettazione concettuale dei dati statistici - Edizione 1989 -L. 10.000
N. 26 - Istruzioni per le commiSsioni com{lnali di controllo delle rilevazioni dei prezzi al consumo - Edizione 1989 - L. 10.000
N. 27 - Istruzioni perla rilevazione delle opere pu:bblicht - Edizione 1990 - L. 11.000
N. 28 - Istruzioni perla rilevazione statistica degli incidenti stradali - Edizione 1990 • L,lLooo
N. 29 - Magrafe.della popolazione - Edizione 1992 - L. 13.;000
Serie C
N. lO - Classificazioni delle malattie, trauma tismi e cause di morte - Ristampa 1986 VoL 1: Introduzione e parte sistematica •
L. 16.000 VoI. 2: Indici alfabetici - L. 25.000
N. 11 - Classificazione delle attività economiche - Edizione 1991 - L. 25.000
N. 12 - Classificazione dèllé professioni Edizione 1991 - L. 22.000
Serie X
VoI. 1 - Atti della conferenza internazionale sugli indicatori del mercato del lavoro per la transizione (Roma, 8 luglio 1991) -Proceedings of the intemational Conference on labour market indicators for transition. Testo in lingua ingle.s~ e frall~se~ -L. 25.000
Clltfltterlstiche delle llziende agricole Fascicolo nazionale -Risùltati provvisori- L. 30.000
Cllra#teristiche strutturllli delle llziende agricole Fascicoli provinciali n prezzo di ciascun fascicolo varia da L. 19.500 a L. 28.000 in rapporto al numero delle pagine Fascicoli regionali: Umbria, Piemonte, Sicilia, Puglia, Abruzzo, Friuli-Venezia Giulia, Lazio, Emilia-Romagna, Sardegna, Basilicata, Marche,
13° Censimento generale del/a popolllzione -20 ottobre 1991 Risultati provvisori provinciali e comunali sulla popolazione e sulle abitazioni -L. 30.000
La progettllzione dei censimenti 1991 l - Basi territoriali, organizzazione, campagna di informazione,
piano dei controlli (in preparazione) 2 -Censimento della popolazione: il piano di rilevazione -
L.22.ooo 3 - Censimento dell' industria e dei servizi: il piano di rilevazio
ne (in preparazione) 4 - I Gocumenti (in preparazione)
N .. 1- Obiettivi, disegno e metodologia dell'ùidagine -L. 29.000 N.2 -Fllmiglie, popolazione e abitazioni -L. 33.000
Conoscere l'Italia - Introducing ltaly - Edizione 1993 -Distribuzione gratuita (in corso di stampa)
Sommario di statistiche storiche - 1926 - 1985 - L. 35.000
Jtt/ontè statistico italiano 1988 - L. 50.000
At/onte statistico italiano: analisi geostatistica - Edizione 1992 - L. 70.000
Comuni, comunità montane, regioni agrarie al 31 dicembre 1988 - Edizione 1990 -L. 20.000
Elenco dIIi comuni al 31 maggio 1991- Edizione 1991- L. 15.000
Stlltistiche 11mbienta/i -Vol. 2 - Edizione 1991- L. 22.000
Popolazione residente e presente dei comuni - Censimenti dal 1861 al 1981- L. 14.000
Sommario storico di statistiche sulla popolazione - Amù 1951-1987 - L 41.000
Sitttesi della vita sociale italiana -Edizione 1990 - L 15.000
Toscana, Lombardia, Liguria, Calabria, . Molise, Trentino-AIto Adige, Valle.d'Aost<i-L2O.500 Fascicolo IUlZwnale - Italia - L. 20.500
Censusdataproduction pian -4'" genetlll censusof agri.culture, 1990 Pianiticazione della produzionè dei dati censuari - Roma 1993-Edito in lingua inglese -Distribuzione gratuita
Struttura delle tavole statistiche Distribuzione gratuita
Popolazione legale (in corso di stampa)
Popolazione e abitllzioni Fascicoli provinciali: Viterbo (in corso di stampa) -L. 30.000
7° Censimento generllle dell'industria e dei servizi - 21 ottobre 1991 Risultati provvisori provinciali e comunali sulle imprese, sulle istituzioni e sulle unità locali - L. 22.000
N. 3 - Gli incidenti in ambiente domestico (in corso di stampa) N. 4 -L'uso del tempo in Italia (incorso di slampa)
Statistiche e indiclltorisociali - Anno 1990 -L 25.000
Censimento degli impianti sportivi 1989 -Edizione 1991 Volume l - Italia - L. 22.000 Volume 2 - Fascicoli regionali - L. 12.000
Elezioni della CllIfJera dei Deputati e del Senato della Repubblica, 14 giugno 1987 -L. lO.ooo
45 anni di elezioni in Italia 1946-90 -Edizione 1990 - L. 20.000
Statistiche sulla Amministrllzione pubblica - Anni 1988-89 -L. 27.000
Conti economici regivnali - Anno 1988 -Edizione 1991- L. 3.700
Mllnuale per gli utenti degli archivi PDG - Edizione 1991 -L. 12.000
Avanzamenti metodologici e stlltistiche ufficiali (Roma, 13-14 dicembre 1990) - L. 31.000
Rapporto llnnuale - La situazione del Paese - Anno 1992 ' Edizione 1993