annexes to the impact assessment - european...
TRANSCRIPT
EN EN
EUROPEAN COMMISSION
Strasbourg, 7.6.2016
SWD(2016) 193 final
PART 6/6
COMMISSION STAFF WORKING DOCUMENT
IMPACT ASSESSMENT
Annexes to the Impact Assessment
Accompanying the document
Proposal for a Directive of the European Parliament and the Council on the conditions
of entry and residence of third-country nationals for the purposes of highly skilled
employment
{COM(2016) 378 final}
{SWD(2016) 194 final}

2
Table of Contents
ANNEX 8 INTERNATIONAL PERSPECTIVES AND BENCHMARKING .................. 6
1. THE "GLOBAL RACE FOR TALENT”..................................................................... 6
2. OVERVIEW OF INTERNATIONAL COMPETITOR SCHEMES ........................... 8
United States ..................................................................................................... 9 2.1.
Canada ............................................................................................................. 12 2.2.
China ............................................................................................................... 15 2.3.
Australia .......................................................................................................... 17 2.4.
Switzerland ...................................................................................................... 21 2.5.
Russia .............................................................................................................. 23 2.6.
New Zealand ................................................................................................... 24 2.7.
3. ANALYSIS AND CONCLUSION ............................................................................ 27
4. POTENTIAL IMPACTS ON COUNTRIES OF ORIGIN ........................................ 29
The safeguard measures of directive 2009/50/EC ........................................... 29 4.1.
The impact of directive 2009/50/EC on countries of origin ............................ 31 4.2.
The specific sensitivity of brain drain of healthcare workers ......................... 38 4.3.
5. COUNTRY FICHES OF SELECTED COMPETITORS .......................................... 39
Country Fiche: United States .................................................................................... 40
Country Fiche: Canada .............................................................................................. 50
Country Fiche: Australia ........................................................................................... 72
Country Fiche: China ................................................................................................ 84
ANNEX 9 INTRA-EU MOBILITY OF THIRD COUNTRY NATIONALS .................. 91
1. INTRODUCTION ...................................................................................................... 91
2. INTRA-EU MOBILITY IN THE BLUE CARD DIRECTIVE ................................. 92
3. INTRA-EU MOBILITY IN OTHER LEGAL MIGRATION DIRECTIVES ........... 93
4. THE ROLE OF INTRA-EU MOBILITY FOR EU BLUE CARD HOLDERS ........ 95
5. DATA ON INTRA-EU MOBILITY .......................................................................... 95
6. DATA ON THE NEED OF INTRA-EU MOBILITY FOR BUSINESS .................. 96
ANNEX 10 THIRD-COUNTRY NATIONAL ENTREPRENEURS ............................ 105
1. INTRODUCTION .................................................................................................... 105
2. THE NEED FOR TCN INNOVATIVE ENTREPRENEURS ................................ 105
3. THE PARTICULARITIES OF TCN ENTREPRENEURS ..................................... 107
4. OVERVIEW OF EXISTING POLICIES AIMING AT ATTRACTING
INNOVATIVE ENTREPRENEURS ...................................................................... 109
3
Denmark - "Start-Up Denmark" .................................................................... 109 4.1.
France - "French tech Ticket" ....................................................................... 110 4.2.
Ireland -"STEP" Program .............................................................................. 111 4.3.
UK - Graduate and Entrepreneur Visas ......................................................... 112 4.4.
Italy - "Start-up Visa Italia" ........................................................................... 113 4.5.
The Netherlands - "Start-up Visa" ................................................................. 114 4.6.
Spain - Ley de Emprendedores ..................................................................... 115 4.7.
5. OVERVIEW OF EXISTING POLICIES AIMING AT ATTRACTING
INNOVATIVE ENTREPRENEURS OUTSIDE THE EU .................................... 116
Australia - "Business Innovation and Investment Programme" .................... 116 5.1.
Canada - "Start-up Visa Program" ................................................................ 117 5.2.
Chile - "Start-up Chile" ................................................................................. 117 5.3.
New Zealand - Entrepreneur Work Visa ....................................................... 118 5.4.
Singapore - Entrepass .................................................................................... 119 5.5.
Taiwan - Entrepreneur Visa Promotion Plan ................................................ 119 5.6.
USA - Start-up Visa ...................................................................................... 119 5.7.
6. ATTEMPT OF CATEGORIZATION AND CONCLUSIONS ............................... 120
ANNEX 11 INTERNATIONAL SERVICE PROVIDERS ............................................ 126
1 CONTEXT ................................................................................................................ 126
2 RELATION BETWEEN TRADE AGREEMENTS AND MIGRATION
POLICIES ............................................................................................................... 128
ANNEX 12 STATISTICS ............................................................................................... 133
1. DATA AVAILABILITY AND LIMITATIONS ..................................................... 133
2. PERMITS OF BLUE CARD HOLDERS AND THEIR FAMILY MEMBERS,
AND SALARY THRESHOLDS ............................................................................ 135
3. NATIONAL SCHEMES FOR HIGHLY SKILLED EMPLOYMENT .................. 146
ANNEX 13 ANALYTICAL DESCRIPTION OF POLICY OPTIONS ......................... 151
1. POLICY OPTION PACKAGES .............................................................................. 151
Policy Option Package 1 (POP1) .................................................................. 151 1.1.
Policy Option Package 2 (POP2) .................................................................. 156 1.2.
1.2.1. Policy Option Package 2 - Sub-option (a) ........................................ 160
1.2.2. Policy Option Package 2 – Sub-option (b) ....................................... 163
1.2.3. Policy Option Package 2 – Sub-option (c) ....................................... 165
Policy Option Package 3 (POP3) .................................................................. 166 1.3.
2. HORIZONTAL OPTIONS ...................................................................................... 168
Non-legislative actions (PO-A) ..................................................................... 168 2.1.
Extending the EU Blue Card scheme to innovative entrepreneurs (PO-B) .. 170 2.2.
Making the EU Blue Card available for highly-skilled beneficiaries of 2.3.
international protection and asylum applicants (PO-C) ................................ 171

4
ANNEX 14 CALCULATION OF ECONOMIC IMPACTS: ANALYTICAL
MODEL, ASSUMPTIONS AND RESULTSANALYTICAL DESCRIPTION OF
POLICY OPTIONS................................................................................................. 172
DISCLAIMER ON THE NUMBERS OF BLUE CARDS USED IN THE KEY
ASSUMPTIONS ..................................................................................................... 172
1. ASSUMPTIONS REGARDING THE NUMBER OF PERMITS FOR HIGHLY-
QUALIFIED WORK .............................................................................................. 172
Baseline ......................................................................................................... 172 1.1.
Additional permits for highly-qualified work ............................................... 174 1.2.
2. DETERMINING THE NUMBER OF ADDITIONAL EU BLUE CARDS
UNDER DIFFERENT POLICY OPTIONS ........................................................... 177
POP 1 ............................................................................................................. 178 2.1.
POP 2A .......................................................................................................... 180 2.2.
POP 2B .......................................................................................................... 183 2.3.
POP 3 ............................................................................................................. 184 2.4.
3. ASSUMPTIONS REGARDING THE SALARY LEVELS FOR DETERMINING
ECONOMIC IMPACT ........................................................................................... 185
4. APPLICABLE SALARY THRESHOLDS .............................................................. 187
5. DISPLACEMENT EFFECT ON LOCAL WORKERS .......................................... 189
6. INTRA-EU MOBILITY OF BLUE CARD HOLDERS ......................................... 189
7. ADMINISTRATIVE COSTS AND GAINS ........................................................... 190
8. REMITTANCES ...................................................................................................... 190
9. ADDITIONAL REVENUE FOR HIGHER EDUCATION .................................... 191
10. IMPACT ON INNOVATION AND RESEARCH ................................................. 192
11. OVERALL ADMINISTRATIVE COSTS AND GAINS ACROSS POPS............ 192
ANNEX 15 ADMINISTRATIVE BURDEN ................................................................. 196
1. ADMINISTRATIVE BURDEN ON APPLICANTS .............................................. 196
Reduced processing times and fees, and easier procedures .......................... 196 1.1.
Facilitation of the recognition of qualifications ............................................ 198 1.2.
2. ADMINISTRATIVE BURDEN ON MEMBER STATES' ADMINISTRATION . 199
ANNEX 16 HIGHLY SKILLED WORKERS AND INTERNATIONAL
PROTECTION ........................................................................................................ 206
1. CONTEXT ............................................................................................................... 206
2. SKILL LEVELS OF ASYLUM SEEKERS AND BENEFICIARIES OF
INTERNATIONAL PROTECTION IN THE EU .................................................. 208
3. IMPLICATIONS OF A POSSIBLE EXTENSION OF THE BLUE CARD TO
THIRD COUNTRY NATIONALS SEEKING OR ENJOYING
INTERNATIONAL PROTECTION....................................................................... 209

5
4. THE SPECIFIC CASE OF POTENTIAL BENEFICIARIES OF
INTERNATIONAL PROTECTION OUTSIDE OF THE EU TERRITORY ........ 211
5. STAKEHOLDER AND EXPERT OPINIONS ....................................................... 212

6
ANNEX 8
INTERNATIONAL PERSPECTIVES AND BENCHMARKING
1. THE "GLOBAL RACE FOR TALENT”
Along with globalisation, the intensity of movement of people has increased and economic
activity has become more and more interconnected. As our societies are increasingly
knowledge-based, they are also more and more reliant on highly skilled workers (HSW). This
annex will firstly analyse the global competition for skills, in which the EU needs to be
attractive for HSW. Secondly, it will describe different schemes for HSW in the US, Canada,
China, Australia, Switzerland, Russia and New Zealand. Thirdly, it will discuss potential
impacts on countries of origin when HSW emigrate, highlighting the issue of “brain-drain”
and the recruitment of health workers in particular. Four detailed country fiches (US, Canada,
Australia and China), are attached at the end of the annex, prepared by an external contractor
assigned to carry out a study to support the drafting of the Impact Assessment.
Different factors influence the global competition for skills
There are a number of circumstances that come into play when assessing the attractiveness of
the EU in the global competition for skills. At macro level, economic factors such as the
growth rate and economic characteristics determine a destination’s attractiveness. As
economic growth has shifted from the advanced economies to middle-income and low-income
countries, many traditional destination countries have become less attractive for migrant
workers and their families.
Furthermore, at micro level, actual migration decisions are made by individuals taking into
account multiple factors. Some are related to migration policies, while others are economic
and non-economic factors that do not depend and cannot be altered by migration policy.
Economic incentives that can influence the flows of human resources are e.g. opportunities
for better salary and career advancement. Factors that are less tangible to migration policies
are e.g. language, living standards, GDP, entrepreneurial environment and taxes. There is also
evidence that institutional quality and governance effectiveness increases a destination's
attractiveness for highly-qualified migrants.1
Indicators of EU attractiveness
In light of the various factors listed in the previous section, any objective measurement of EU
attractiveness is difficult to establish. The Gallup World Poll on the opinions and aspirations
of people around the globe shows that the EU is more attractive than other developed regions
among highly-qualified respondents with a clear intention to migrate. According to the
Gallup worldwide survey, 33 % of all highly-educated workers intending to migrate prefer the
EU/EEA, compared to 19 % that prefer the United States. However, of all non-EU migrants
coming to OECD countries, 48% of low-educated migrants choose a EU27 and 68% of the
high-educated ones a non-European OECD destination. 2
1 See for example, Reinhard Weisser, The impact of international students and post-graduation internal
mobility: an analysis of student mobility and retention rate, OECD 2016, forthcoming. 2 Flore Gubert, Jean-Noël Senne, Europe as a Single Labour Market Destination, OECD, 2016, forthcoming.

7
Global supply and demand for HSW
International highly skilled labour migration has been moved up on the policy agenda of
medium and high-income countries since the late 1990s. Countries like the United States,
Canada, Australia, France, the UK and Germany are net importers of highly-educated
workers.3 A highly-skilled workforce is acknowledged as a fundamental building block of
knowledge-based societies and essential in supporting economic and technological
development. As a result, the promotion and attraction of so-called STEM4 skills has become
a high priority across both developed and developing countries.
Since the 1990s, international migration among the highly-skilled is characterised by two
main trends: increasing flows from Asia towards major OECD countries and an increasing
exchange of skilled workers among developed countries.5 The main sending countries are
Asian, led by India, the Philippines and China.6 Among the top ten sending countries of high-
skilled professionals in 2010/11, there are also a number of EU/OECD countries, including
the United Kingdom, Germany and Poland.
In 2000, there were 90 million 25-34 year-olds with higher education (tertiary) degrees, of
which 51 million were in OECD countries and 39 million in non-OECD G20 countries. By
2010, the total had increased to 130 million, of which 66 million in OECD countries,
compared to 64 million in non-OECD G20 countries.
Over the next twenty years the demand for higher education is expected to grow sharply. By
2020, more than 200 million 25-34 year-olds are projected to have higher education degrees
across all OECD and G20 countries. Significantly, 40 % of them will be from China and India
alone, while the United States and the EU will account for just over 25 %.7 By 2030, the
number of students worldwide is projected to reach 414 million, with China showing by far
the highest increase, followed by Brazil and India.8
It is important to make the EU attractive also for international students, and consider them as
potential future workforce. The EU is the world's most popular destination for international
students. There are currently around 1 million non-EU students studying in the EU (in
addition to 0,5 million EU students studying in another Member State). Retention rates vary,
and are estimated to be between 16 and 29 %.9
While future trends of skilled labour migration are difficult to forecast10
, the global labour
market is likely to continue to absorb the increasing supply of highly-educated workers as the
demand for employees in “knowledge economy” fields is expected to continue to grow. As a
result, highly skilled foreign professionals are ever more sought after and the growing
3 See Database on Immigrants in OECD countries (DIOC). 4 Scientific, technological, engineering and mathematical skills. 5 OECD, The Global Competition for Talent. Mobility of the Highly Skilled, OECD Publishing, Paris, 2008, p.
19. 6 Between 2001-2011, the three major sending countries of skilled labour remained the same. In 2010/11, India
was still the main sender, while China had moved into second position, with the Philippines in third place. 7 OECD, Education Indicators in Focus-No 36, 2012/05, OECD Publishing, Paris, 2012. 8 Commission Communication of 11 July 2013, European higher education in the world, COM(2013) 499 final. 9 Reinhard Weisser, The impact of international students and post-graduation internal mobility: an analysis of
student mobility and retention rate, OECD 2016, forthcoming. 10 Given the projected changes in the rapidly growing size of the global talent pool and its changing composition
and the expected increased economic weight and domestic demand for highly skilled labour of China and
India.

8
internationalisation of the highly-skilled labour market has led to an increasing global
competition for talent.11
Europe is therefore in an increasingly fierce competition with an increasing number of other
economies to attract workers with the skills it needs. Around 25 % of migrants currently in the
EU are highly-educated compared to more than 35 % in non-EU OECD countries.12
In
Europe, 22 % of the migrants that arrived between 2006 and 2011 were between 25 and 29
years old, and 53 % were between 25 and 39 years old.13
Furthermore, a bulk of migrants is
found among the (prime-age) working population, aged 25-64, that accounts for almost three
fourths of the total stock. However, the EU27 tend to attract low-educated migrants while
non-Europe OECD countries tend to be more selective for the high-educated migrants. More
than 60 % of non-European low-educated migrants choose a European destination and more
than 60 % of the high-educated ones a non-European OECD destination.14
Recent surveys on immigration intentions point to a relatively strong attractiveness of the EU
for highly-educated potential migrants, compared notably to the United States.15
Also in the
public consultation carried out for the purposes of the Blue Card review, potential and actual
migrants indicated a strong attractiveness of several Member States, notably Germany (32 %),
France (11 %), the Netherlands (8 %) and the United Kingdom (7 %), on par with the United
States (30 %), Canada (27 %), Norway (14 %) and Australia (11 %).16
The EU as a whole
rates high on factors of attractiveness such as its welfare and healthcare system, level of
wages and job opportunities. However, the EU appears much less successful both in retaining
talents and in converting its attractiveness into higher numbers of highly-skilled migrants
being admitted.
2. OVERVIEW OF INTERNATIONAL COMPETITOR SCHEMES
Most OECD countries are net beneficiaries of international mobility, with inflows exceeding
outflows. The United States, Canada, Australia and France in particular, have experienced
strongly positive net inflows of tertiary-educated migrants.17
From a mere quantitative perspective, international competitive schemes for HSW such as
those in Canada and the United States, attract more HSW than the EU Blue Card and parallel
national schemes for HSW. However, relative to population, labour migration to the United
States is much lower than the EU OECD average. The US' labour force is around two-thirds
of that of the EU and it has relatively low labour migration rates (around one fourth of the EU
rate, per 1000 inhabitants), yet it admits around 200 000 skilled labour migrants every year
(permanent green cards for extraordinary talents — EB-1 — and H-1B visas for temporary
specialised work). Labour migration to Canada, New Zealand and Australia (all of which
apply selective labour migration programmes, with limited access to permanent migration for
11 Rinne, U., The Evaluation of Immigration Policies, IZA Discussion Paper Series, IZA DP No.6369, Bonn,
2012. 12 Jean-Noël Senne and Anda David, ‘General Context and Contribution of Labour Migration in Europe', OECD
2016, forthcoming. 13 OECD/European Union, Matching Economic Migration with Labour Market Needs, OECD Publishing, Paris,
2014. 14 Jean-Noël Senne and Anda David, ‘General Context and Contribution of Labour Migration in Europe', OECD 2016,
forthcoming. 15 Based on Gallup Surveys 2011-2014 analysed by Jean-Noël Senne and Anda David in 'Europe as a Single Labour
Market Destination', OECD 2016, forthcoming. 16 See Annex 2. 17 OECD, The Global Competition for Talent, Policy Brief - February 2009, OECD Publishing, Paris, 2009.

9
low-educated migrants or those in low-skill occupations) is around twice the EU average
relative to the size of their labour markets. This reflects these countries’ commitments to
ensuring that a substantial part of new entries to the skilled labour force stems from migration.
Within the EEA, Switzerland has relatively low inflows of non-EEA permanent-type
migration, and the levels of free movement for employment are much higher (at least ten
times the level of third-country labour migration). A substantial share of free movement is for
skilled employment.18
The following section will describe and analyse the migration schemes,
including those for HSW, in the United States, Canada, China, Australia, Russia, Switzerland
and New Zealand. Each subsection will describe the legal framework, present key statistics
and analyse the effectiveness of the respective schemes. At the end of the annex, country
fiches produced by an external contractor are included, focussing on the United States,
Canada, China and Australia.
United States 2.1.
According to the Gallup worldwide survey, 33 % of all highly-educated workers intending to
migrate prefer the EU/EEA, compared to 19 % that prefer the United States. As regards
labour migration, the United States applies a demand-driven policy. Highly skilled migrant
workers can enter the US labour market on temporary grounds or as lawful permanent
residents (with the so-called Green Card). Workers are more often admitted on temporary
visas, from which they may subsequently acquire permanent resident status. In practice, this
means that most labour migrants enter the United States through sponsorship by an employer,
and their right to remain in the country depends on continued employment by their sponsor
(or on securing a new one). This selection mechanism aims to ensure that migrants cannot
enter in the absence of a concrete demand for their skills and abilities.
The Permanent immigration system
Holders of the Green Card are known as lawful permanent residents (LPR). LPR status is
mainly granted on the basis of so-called ‘family-sponsored preference’ and ‘employment-
based preference’. Employment-based preferences consist of five categories of workers (and
their spouses and children). Only EB1 and EB2 workers can be considered as highly skilled or
qualified workers, as per the EU Blue Card definition19
. Employment First Preference (EB1)
include: (1) Persons with extraordinary ability in sciences, arts, education, business, or
athletics20
; (2) Outstanding internationally recognized professors and researchers with at least
three years’ experience in teaching or research; (3) Multinational managers or executives who
have been employed for at least one of the three preceding years by the overseas affiliate,
parent, subsidiary, or branch of the US company employing the HSW. Employment Second
Preference (EB2) covers professionals with advanced degrees21
or aliens of exceptional
18 Jonathan Chaloff, Labour Migration Policy Development in the EU: Policy Features and Influence of
Directives, p 3, OECD 2016, forthcoming. 19 The definition includes: (1) evidence of higher education qualifications: any diploma or other evidence of
formal qualifications issued by a higher education institution attesting the successful completion of a post-
secondary education programme of at least three years; (2) when provided by national law: by at least five years
of professional experience of a level comparable to higher education qualifications relevant for the
profession/sector. 20 Applicants in this category must have extensive documentation showing sustained national or international
acclaim and recognition in their fields of expertise. Such applicants do not have to have specific job offers, as
long as they are entering the U.S. to continue work in the fields in which they have extraordinary ability. 21 Professionals with advanced degrees concern those who hold degrees beyond a baccalaureate degree, or a
baccalaureate degree and at least five years progressive experience in the profession.

10
ability22
. The permanent immigration system allocates 140 000 visas annually for high-skilled
immigrant and their families.
In 2013, 158 466 persons accessed LPR status through the employment-based preference.23
This represented 16 % of the total LPR flow of that year.24
Out of the total of employment-
based preference LPRs, 28,6 % are allocated to each of the first three employment
preferences; EB1 and EB2 included.25
The visas are allocated according to a cascading
system, i.e. when the number of visas available under the highest preference category are not
used, they can be used for the next preference category. Generally, there are more EB1 visas
available than used. The first preference (EB1 priority workers) accounted for 24 % of new
employment-based LPRs. Most of the unused EB1 visas (extraordinary ability visas) in 2013
were used in the second preference (EB2 professionals with advanced degrees) which
represented 39 % of new employment-based preference LPRs.
H-1B visa
The H-1B visa is the most comparable to the EU Blue Card. H-1B visas are temporary (three-
year, one-time-renewable) visas issued to high-skilled foreign workers. It requires the migrant
worker to hold a higher education degree (or its equivalent) and to be sponsored by a US
employer. The employer must submit a Labor Condition Application (LCA) to the
Department of Labor26
There is no labour market test under this category, whereas this is the
case under other entry routes. In terms of salary requirements, the Labor Condition
Application (LCA) requires employers to attest that they will pay H-1B workers the higher of
(1) actual wage level they pay other employees with similar experience and qualifications or
(2) the prevailing wage. The prevailing wage is determined based on the position in which the
applicant will be employed and the relevant geographic location (among other factors). The
US Department of Labor (DOL) maintains a database with applicable current prevailing wage
levels based on occupation and work location. In principle, H-1B dependent firms are
required to hire equally qualified US workers, and to refrain from laying off similar US
workers. However there can be exceptions to this principle. Firms are not prohibited from
displacing US workers as long as they pay the H-1B workers a minimum of USD 60 000 per
year or the workers have a relevant master's degree. Furthermore, the employer has to give
public notice at the place of employment about their wish to hire an H-1B worker. In terms of
rights, the H-1B does not offer as extensive rights as the EU Blue Card. While H-1B workers
may be accompanied or joined by a spouse and unmarried children under the age of 21, these
family members may not engage in employment under this visa and must change status to a
category for which employment is authorized. An H-1B holder may not be granted permanent
residency independently, but the employer may sponsor the applicant for permanent residency
immediately under another scheme. H-1B holders are the main applicants for EB-3
employment visa, which is grants permanent residency to professionals or other type of
workers including HSW. In case of unemployment, the HSW may not stay in the country to
search for a job.
22 Persons with exceptional ability in sciences, arts, or business. Exceptional ability means having a degree of
expertise significantly above that ordinarily encountered in these fields. 23 Monger, R. and Yankay, J., Annual Flow report, U.S. Lawful Permanent Residents: 2013, Office of
Immigration Statistics policy directorate, May 2014. 24 Ibid. 25 Ibid. 26 U.S Citizenship and Immigration Services, H-1B Specialty Occupations, DOD Cooperative Research and
Development Project Workers, and Fashion Models.

11
In 2014, the H-1B visas were capped at 65 000. In general, the annual quota for H-1B visas is
filled in the first months of the year, and no new H-1B visas are issued thereafter. A
problematic effect of applying such numerical limits is that when these are reached rapidly,
admissions become less selective and highly qualified candidates may be turned away
because there are no visas left. There are however exemptions for HSW in STEM fields and
non-profit organisations (such as universities, research labs and think tanks) that are not
subject to H-1B caps. In reality, the total number of H-1B visas issued is thus much higher
than the official cap.
As mentioned above, the H-1B visa allows foreigners to enter the US for a specific limited
stay but it also allows employers to apply immediately for permanent resident status for their
sponsored foreign-born employee. According to another 2012 study, 90 % of employment-
based Green Cards (permanent visas) were granted to individuals who originally entered the
US as foreign students and temporary workers, many of whom held H-1B and L visas.27
The
temporary-to-permanent resident transition amongst highly qualified migrants is a key
characteristic of the US immigration system.
Recent policy debates in the United States have focused on the need to make permanent status
more easily accessible to successful students and skilled workers. Employers have pushed for
this especially in STEM fields (science, technology, engineering and maths).28
Legislators
have proposed a piecemeal approach to immigration reform, and Congress is currently
considering the following legislation concerning highly skilled migrants29
:
Immigration Innovation Act: A bipartisan bill introduced in the Senate in January 2015
that would almost double the number of visas for temporary high-skilled workers (H-1B
visas), from 65 000 to 115 000, and eliminate annual per-country limits for employment-
based Green Cards.
Start-Up Act: A bipartisan bill introduced in the Senate in January 2015 (three prior
versions had been introduced) that proposes to create an entrepreneur visa for self-
employed immigrants and a STEM visa for US-educated workers with advanced degrees
in science, technology, engineering or mathematics, and to eliminate per-country caps on
employment-based immigration visas.
Key statistics
A significant portion of immigrants to the US, especially recent arrivals, tend to be highly
educated, with 37 % of those of working age having at least a college degree, compared to
26 % in the EU. In 2013, 2.1 million persons were issued temporary (non-immigrant) visas
(excl. tourists), an increase of five percentage points compared to 2012. A significant share of
those consisted of speciality occupations (H-1B), which accounted for 153 223 issuances in
2013 (see USA Country fiche in annex). H-1B visas went mostly to nationals of India (64 %)
and China (10 %). About half (54 %) of all approved H-1B visa applications for initial
employment were filed abroad. Demand for H-1B visas was strong in both 2013 and 2014,
with the annual cap of 65 000 being reached in the first week of filing. Most permanent
27 CRS Report 7-5700, Immigration of Foreign Nationals with Science, Technology, Engineering, and
Mathematics (STEM) Degrees, Congressional Research Service, 11 May 2012 cited in Koslowski, R., Selective
migration policy models and changing realities of implementation, International Migration Vol. 52 (3) 2014. 28 Martin, P., Attracting Highly Skilled Migrants: US Experience and Lessons for the EU, Robert Schuman
Centre for Advanced Studies, European University Institute, Florence, 2012. 29 Renswick, P., The U.S. Immigration Debate, The Council on Foreign Relations (CFR), New York, 2015.

12
migration to the US is for family reasons, which accounted for 735 000 people or 74 % of the
total immigration in 2014.30
Permanent residence, through employment-based Green Cards,
was mostly given to migrants who had already been admitted as temporary workers (140
000). The number of new arrivals who were granted permanent resident status was 21 000 in
the same year (2013).31
Canada 2.2.
Legal and policy framework
Canada has put in place multiple schemes supporting the entry of different categories of
skilled workers. This section will first look at the permanent programs, including the Express
Entry system introduced in 2015. Secondly, it will describe the temporary schemes.
Thereafter, some key statistics will be presented.
Permanent Residence Programs
To date, Canada grants permanent residence under two streams: the Family Class and the
Economic Class. Under the Economic Class, the skilled migration programs for permanent
residence are the Federal Skilled Trades Program (FSTP), the Federal Skilled Worker
Program (FSWP) and the Canadian Experience Class (CEC). These programs assess
applicants based on a range of 'human capital factors', such as age, education, language
proficiency and work experience. Applicants who possess the sought-after characteristics earn
points under a points based system at a later stage. Skilled work experience and minimum
language proficiency in English and/or French are the minimum requirements across all
programs. However, applicants are not always required to have a formal job offer or Canadian
work experience, although such features might increase their prospects of success, depending
on the program through which they apply.
These programs place greater emphasis on the skilled work experience of candidates than on
their formal educational attainment, and therefore all include minimum requirements on
skilled work experience. While the educational requirements are low or non-existent for the
FSTP, FSWP and CEC, candidates can gain additional points for their education during the
Express Entry stage if they have either a Canadian post-secondary diploma or equivalent
foreign credentials that are supported by an Educational Credential Assessment (ECA).32
The Federal Skilled Worker Programme (FSWP) covers more than 80 % of all admissions for
economic purposes and is specifically designed to attract HSW.33
The selection of labour
migrants under the FSWP is based on a points based system. While the FSWP is capped, the
number of permits issued has increased in recent years. With 5 000 permits issued in 2013, it
was increased to 25 000 in 2014, i.e. more than five times as many. Moreover, the number of
30 OECD, International Migration Outlook 2015, OECD Publishing, Paris, 2015, p 258. 31 US Department of Homeland Security. 32 The ECA certifies that their educational level is equivalent to Canadian post-secondary level. Note that
education can be important for meeting the minimum number of points in Express Entry but is more important
for moving into the pool of candidates, which is filled by the top candidates only. 33 CanadaVisa, Canada Federal Skilled Worker (Professional) Immigration).

13
occupations that are open to foreign workforce more than doubled, from 24 in 2013 to 50 in
May 2014.34
Express Entry
Canada uses a centralised online application system for all permanent residence applications
(Express Entry) and online application processes for the temporary residence applications
(TFWP and IMP, see below). Express Entry was introduced in the beginning of 2015. All
applicants to the economic stream must make an initial application through the Express Entry
system. This is used as a 'first filter' for establishing whether applicants are eligible for one or
more of the three federal programs (FSWP, FSTP, CEC), or the Provincial Nominee Program
(PNP).35
Those who fulfil the eligibility criteria are then moved into a 'pool of candidates',
where they are ranked using the (points-based) Comprehensive Ranking System.36
Only those
candidates who are ranked above a certain threshold are issued with an Invitation to Apply
(ITA) for permanent residence, at which point they can begin the application process for the
individual programs. There is no defined quota for Express Entry applications and candidates
are free to make applications whenever they wish. However, this does not mean that all
applicants for Express Entry receive an invitation to apply (see statistics below).
As previously mentioned, the features that are attributed most weight within the ranking
systems are, firstly, the candidates' human capital, assessed based on their age, level of
education, official language proficiency and Canadian work experience and, secondly, a pre-
existing job offer (supported by a Labour Market Impact Assessment) or the provincial
nomination (if held). However, applicants may also gain some additional points for other
features, such as the language proficiency of their spouses or common-law partners and the
transferability of their skills. Citizenship and Immigration Canada (CIC) aims to process 80 %
of the applications through Express Entry within 6 months. After receiving the ITA,
candidates have 60 days to apply for permanent residence and fulfil the entry criteria specified
under the individual program requirements. For more details, see Summary table of entry
requirements in the attached Country Fiche on Canada.
The Express Entry application management system was adopted partly in response to the
excess supply of eligible candidates. Due to the many eligible applicants, the CIC faced
backlogs and was forced to take either a 'first come, first served' approach (entailing long
processing times) or to consider other policy tools, which all had their own draw-backs. By
introducing Express Entry as a 'first filter' selecting the most appropriate candidates from a
'pool', the government could control and select intake more effectively. Another reason for
introducing Express Entry was to reduce processing times. Indeed, while it is still too early to
draw final conclusions, the CIC seems to be on track to meet the official target of processing
80 % of applications within six months.37
Furthermore, the ranking system is considered
transparent and is widely known and understood. Significant efforts have also been made by
the CIC to engage employers in the system (via e.g. employer liaison network, Employer
34 For more details, see attached Country Fiche on Canada. 35 The PNP is a system of provincial/territorial nomination of immigrants. Only the federal programs will be
presented in this analysis. 36 This takes into account factors such as skills and experience; whether they have a job offer; whether they have
a nomination from a province or territory. Extra points are available for a job offer backed by a Labour Market
Impact Assessment (LMIA) and/or provincial nominations. 37 See Country Fiche: Canada, in annex.
14
Portal, Job Bank). While the system seems to work well, it remains early to assess the full
impact of Express Entry.
Temporary Residence Programs
There are two temporary residence schemes for skilled workers: the Temporary Foreign
Worker Program (TFWP) and the International Mobility Program (IMP). Applications
through the TFWP must always be supported by a job offer and a positive Labour Market
Impact Assessment (LMIA). The IMP, being largely regulated by international agreements,
does not require LMIAs. Workers under the TFWP normally receive employer-specific work
permits, whereas IMP workers generally have greater labour market mobility.
Under the TFWP, there are two forms of entry: the 'high-wage' and 'low-wage' stream. Most
migrant workers under the TFWP are low-skilled. Under the high-wage stream, employers
must obtain a positive LMIA, also sometimes referred to as a 'confirmation letter' from
Employment and Social Development Canada (ESDC), proving that the worker is needed for
a specific position.38
Employers can use either the Temporary Foreign Worker Web Service
or a paper application form to apply for the LMIA. The cost of each LMIA (for each position
requested) is CAD 1 000. The temporary worker must then apply for a work permit, using
their LMIA-supported confirmation letter (provided by the employer). LMIAs remain valid
for six months. Unless the position is of a limited duration, employers must submit a
Transition Plan showing how they will recruit and train Canadians and how they will support
the TFWs to become permanent residents. These activities must be undertaken over the
course of the employment period.39
If employers are inspected, or apply for an additional
LMIA later on under similar circumstances, they will have to report on their progress
concerning the commitments they made in the Transition Plan. For more details on the
numbers of temporary work permit holders in 2013, see Country Fiche: Canada in annex.
Rights
All foreign nationals working in Canada (both temporary and permanent) must be granted
equal labour rights and benefit from the same working conditions as native Canadians. Once
they become permanent residents, skilled foreign workers face no longer any restrictions to
their labour market access or mobility. For permanent residence programs, provincial and
territorial governments have the responsibility to uphold a certain level of labour standards
(applicable on equal terms as to native Canadians and immigrants with a right to permanent
residence). For temporary foreign workers, Employment and Social Development Canada
(ESDC) is responsible for following up with employers who may be subject to inspection.
Key statistics
The expansion of economic migration programmes in Canada has led to a change in the
categories of migrants entering the country. In the mid-1980s, 50 % of migrants were
admitted based on family preferences, 30 % were economic migrants and 18 % were refugees.
By 2009, these proportions changed to 38 %, 47 % and 9 % respectively. In 2013, this pattern
was yet more pronounced: out of the 258 953 permanent residents admitted, 148 181 (57 %)
were under the economic class of migration programs, whereas 81 831 (32 %) came under the
38 Employment and Social Development Canada, Temporary Foreign Workers, Streams for High-wage or Low-
wage Positions. 39 Employment and Social Development Canada, Temporary Foreign Workers, Stream for High-wage positions.

15
family class and 28 941 (11 %) came as refugees.40
However, it should be noted that the
group of migrants under the economic class also includes dependents.
In 2013, migrants in Canada continued to be well qualified: 46 % (75 000) of permanent
residents between 25 and 64 years of age had completed post-secondary studies with a
bachelor’s, master’s or doctorate degree as their highest level of education, a 10 % increase
from 2012 (68 000).41
The number of applicants for the permanent economic programs currently exceeds the
number of available places. Between 1 January and 6 July 2015, 41 218 of those who applied
through Express Entry were deemed to fulfil the conditions for one or more permanent
economic programs. However, only 12 017 (11 % of all applicants and 29 % of those in the
pool) have been issued with an invitation to apply for permanent residence.
Data on work permits issued by nationality is not available, but the same kind of data does
exist on candidates invited through the Express Entry scheme. As of 6 July 2015 the top ten
countries of citizenship were: India (2 687 invited candidates), the Philippines (2 514), United
Kingdom (951), Ireland (682), China (531), United States (521), South Korea (327), France
(258), Australia (257) and Mexico (249). It should, however, be noted that invited candidates
do not necessarily gain permanent residence.
China 2.3.
Legal and policy framework
In the past decades, China has undergone significant political, economic, and demographic
changes that have influenced migration both to and from the country. In 2011, the country
was ranked as the fourth largest country of emigration in the world by the World Bank. In
addition to large flows of emigrants leaving in search of better opportunities elsewhere, and
the recurrent, more traditional flows of internal migration, a new trend of immigration into
China is emerging. This phenomenon is partly driven by the country’s rapid economic growth
as well as its demographic transition. At a time of increasing labour demand, the growth of
the Chinese labour force is slowing down, which in turn increases pressure on wages and the
China’s aging population.42
In June 2012, the new Exit and Entry Administration Law (Chujing Rujing Guanli Fa) was
passed. It entered into force in July 2013 and replaced both the Law on the Control of the Exit
and Entry of Citizens and the Law on the Control of the Entry and Exit of Aliens. Under this
law, four categories of visas exist: diplomatic visas, courtesy visas, issued to foreigners who
are given courteous treatment due to their status, service visas, issued to foreigners entering
China for official service reasons, and ordinary visas. As part of China’s efforts to attract
highly skilled and talented workers, the new Exit and Entry Law added 'attracting talent' as
one of the purposes of the ordinary visa.43
This talented person visa, the so called R-visa, is a
residence permit valid up to 5 years, 4 years longer than regular working visas, valid for 1
year only. Eligible TCNs are highly qualified workers or much-needed talent. Exactly how
these two categories are defined is left to the discretion of the government departments
40 Government of Canada, 2014 Annual Report to Parliament on Immigration, 2014. 41 OECD, International Migration Outlook 2015, p 194. 42 Skeldon, R., China: An emerging destination for economic migration, Migration Information Source,
Migration Policy Institute, 2011. 43 Exit and Entry Administration Law, Article 16.

16
responsible for administering the system. In terms of salary, equal pay conditions are not
specified; foreign applicants tend to receive higher salaries than their Chinese counterparts.
Recipients can bring their spouse, parents, spouse's parents and any children under the age of
18 with them on the same visa. The R-visa offers equal rights to social security (healthcare,
pension, workplace insurance, and education for children) as Chinese nationals, and the right
to buy one residential property.
The R-visa is complemented by a national scheme called the Thousand Talents Plan (TTP), an
incentive scheme launched in 2008 with the aim of attracting 2 000 highly talented
individuals to China within its first 5 to 10 years. The rights granted by the R-visa are
comparable to the EU Blue Card. In addition, the scheme provides generous financial
incentives such as a resettlement subsidies and subsidies and research grants from local
governments. For more details on these financial incentives, see attached Country Fiche:
China, in annex.
As for the R-visa there are no published guidelines spelling out in which specific fields or for
which roles applications are encouraged, but participants move to China as either
‘researchers’ or an ‘entrepreneurs’ and applicants are supposed to work in the fields of
innovation, science and research. The national TTP is further complemented by various
similar schemes at regional level and applicants admitted under these schemes are likewise
granted an R-visa.44
R-visa holders appear to fall under the same employment law as regular working visa holders.
They may change employers as long as their former employer provides them a letter of
release and they have a formal job offer from their new organisation. If they do not receive a
letter of release, they have to leave the country within 30 days and are then required to apply
for a new visa if they wish to return to China. The same applies to those whose employment is
terminated, but who are unable to find new employment. The law does not appear to place
restrictions on the kind of position that a HSW may fill, but if they cease to work in an area
deemed to be in need of high-skilled talent they will no longer be eligible for the R-visa.
Upon renewal they would then only be able to apply for a one-year residence permit.
Key Statistics
In 2011, China’s high-skilled workforce amounted to an impressive 31.2 million
individuals.45
Nevertheless, the country is likely to face a shortage of 8 million graduates by
2020, due mostly to growing demand for HSW.46
Relative to the size of China’s native
workforce, the number of foreigners working in China (either on an R- or a regular working
visa) is very low, making up less than 1 % of the labour supply. This is especially obvious for
HSW. Even according to the most generous estimates, TCNs only make up 0, 01 % of the
country’s high-skilled workforce.
At the time of the 2010 census, of a work force of 802 million, only 134 889 were foreigners
on working visas. Publicly available data does not give any detailed information on recipients
or uptake of the R-visa. However, given the unclear application procedures and requirements,
it is likely that a significant proportion of recipients have entered China via the TTP scheme
(which brings participants to China on an R-visa). The number of TTP participants can
44 See Country Fiche: China, in annex. 45 China Daily, China’s workforce goes more skilful, 2012. 46 McKinsey China, The $250 billion question: Can China close the skills gap?, Insights – Talent and
Leadership, 2013.

17
therefore be used as a proxy for R-visa recipients, in order to get a general idea of how many
TCN HSWs are moving to China under the R-visa.
The TTP scheme has exceeded its target of attracting 2 000 individuals during the first 5 to 10
years of its implementation. During the first 6 years it has brought 4 180 HSW to China.
Furthermore, figures show that during the first 5 years of the program, 1 306 of TTP
participants, i.e. roughly one-third, became permanent residents. For more details on the
uptake of permits under the TTP scheme, see the attached Country Fiche in annex.
Success of the scheme
In comparison to the EU Blue Card, the effects of the R-visa and its associated schemes have
been limited. Overall numbers of foreign HSW moving to and settling in China as a result of
the introduction of the scheme are significantly lower than the number of TCN HSW taking
up work in the EU as a result of the Blue Card scheme, both in absolute terms and as a
proportion of the HSW workforce. Up until now, the Chinese schemes have not had a
significant impact upon labour shortages in the country.
It seems that, initially, the advantages offered by the TTP program have persuaded some
foreign HSW to move to China on a long-term basis. Whether or not this has contributed to
technological breakthroughs or the enhancement of China’s high-tech sector and other
emerging industries (the stated purpose of the TTP), however, is yet to be ascertained, as the
impact of the program has not yet been assessed.
Australia 2.4.
In 1996, Australia shifted from a human capital model targeting highly skilled migrants, to an
approach more sensitive to skills shortages and labour market needs. In 2008/09, the
government carried out a review on permanent skilled migration and approved a more
demand-driven approach based on employment being arranged prior to arrival. The aim of
this reform was to enable migration to better respond to national skills shortages and to ensure
a better labour market integration of migrants.
Legal and policy framework
The Australian permanent immigration program is divided into two distinct streams: the
Migration Programme for Skilled and Family Migrants and the Humanitarian Programme for
Refugees. Within the Migration Programme for Skilled and Family Migrants, the skill stream
is linked to the needs of the national labour market, while the family stream aims at
facilitating the entry of family members wishing to join their relatives in Australia. Together,
the programmes contribute to the national goal of sustained population growth, in a context of
great diversity: in 2011 26 % of Australia’s population were first generation immigrants. This
rate is substantially exceeding those of other major immigrant-receiving countries. In 2011
and 2012, the Skilled Stream accounted for 68 % of the total permanent migration intake.47.
In
2014, the OECD reported that the Skilled Stream accounted for about two-thirds of the
migration visas issued in 2012.48
The late 1990s saw a shift in policy focus that culminated in a series of policy reforms.
Further criteria were introduced in order to ensure better employment outcomes for migrants,
47 Australian Government, Department of Immigration and Citizenship, 2011-12 Migration Program Report. 48 OECD, International Migration Outlook 2014, OECD Publishing, Paris, 2014.

18
such as a nominated skills list, tighter English language requirements, and more stringent
rules concerning the recognition of overseas qualifications. Following a first wave of reforms,
effective as from 1 January 2009, skilled migrants sponsored by an employer were given
higher processing priority over independent migrants. Priority processing was also granted to
migrant with skills considered to be in critical shortage within the Australian labour market
(including medical and IT professionals, engineers, and construction workers). Furthermore,
the age distribution among skilled migrants is influenced by the requirement to be below 50
years of age.
In 2010, the government announced a phasing-out of the Critical Skills List, which had only
been introduced in 2009. A new ‘more targeted’ Skilled Occupations List (SOL) entered into
force in July 2010, including 181 identified shortage occupations. It is important to note that
the Skilled Occupations List includes a variety of professions, both highly skilled (such as
nuclear engineers and surgeons) and medium-skilled (such as plumbers and joiners).
Likewise, the Consolidated Sponsored Occupations List (CSOL) includes both highly skilled
professions and medium and low-skilled professions (like flower growers and pig farmers). It
is updated annually by the Department of Immigration and Citizenship in consultation with
employers and unions.49
Independent skilled migration applicants must hold relevant
qualifications in occupations listed on the SOL. In 2011-12, the top five professions for the
Skill Stream were accountants, cooks, software and applications programmers, software
engineers and program developers.
To date, the selection of labour migrants is a shared undertaking of government and business.
The Skill Stream migration programme is divided into several categories. Some categories
require a points-based assessment whereas other categories do not. The categories that do not
require a points-based assessment are the following:
The Temporary Skilled Visa (subclass 457) allows skilled people to work for an
approved sponsor for up to 4 years. It is the most comparable to the EU Blue Card. The
migrant is required to work in one of the occupations included on the SOL, have a
sponsored employer, show evidence of recent relevant skills and experience, and have a
level of English proficiency in accordance with the occupational requirements (for
example to secure vocational registration).50
After two years of employment in the same
position, an employer can sponsor a subclass 457 visa holder through the Temporary
Residence Transition stream, thereby allowing the migrant worker to switch category to
permanent resident status. A high proportion of applicants that switch category this way
are international graduates of Australian universities, who first secured employment
through the 457 visa.51
It should be noted that, since 2012, degree-qualified international
students have been guaranteed the right to stay and search for employment in Australia for
2-4 years upon course completion (with 4 years allocated to those holding a postgraduate
degree).
The categories that do require a points-based assessment are the following:
49 Australian Government, Department of Immigration and Border Protection, The Skilled Occupation List. 50 Most Australian professional and trade regulatory bodies require specific English language levels as a
condition to ensure registration to practice, most ranging from International English Language Testing System
Band 6 to Band 8 (for example IELTS Band 6 for professional engineers, Band 7 for all medical and allied
health practitioners, and higher levels for lawyers). See Country Fiche: Australia in annex. 51 See Country Fiche: Australia, in annex.

19
The Skilled-Independent Visa (subclass 189) is a permanent visa that requires an
expression of interest by the applicant, before he or she can apply through SkillSelect. A
sponsor is not necessary; however the applicant must select an occupation in the relevant
SOL and his or her skills are thereafter assessed by a relevant authority. Moreover, the
applicant must be under 50 years of age and be proficient in English. Those who cannot
demonstrate the specified English level for their field, and/or those whose qualifications
are unlikely to be recognised are not eligible to proceed with their application. Points are
granted for the number of years worked in skilled employment, the level of qualifications,
qualifications obtained in Australia, working experience in Australia and partner’s skills.
The Skilled-Nominated Visa (subclass 190) is a permanent visa that requires the
applicant to express his/her interest before the start of the application procedure.
Furthermore, the applicant has to have a sponsor and be nominated by a state/territory
government. The applicant's skills are assessed by the relevant authority against the
relevant CSOL occupation, i.e. the one indicated by the applicant.52
Moreover, the
applicant must be under 50 years of age and be proficient in English (same as under
subclass 189). Points are granted for years worked in skilled employment, qualifications,
qualifications obtained in Australia, working experience in Australia and partner’s skills.
The Skilled-Regional (Provisional) Visa (subclass 489) is a temporary entry channel that
grants residence for up to 4 years and for which the applicant must express interest before
being invited to apply. The applicant can be sponsored by either an eligible relative or by
a state/territory government and the occupation must be listed either in the SOL or in the
CSOL. Moreover, the applicant must be under 50 years of age and proficient in English.
The Employer Nomination Scheme (subclass 186) is a permanent scheme for applicants
sponsored by an employer. It requires a skill assessment by the relevant authority and 3
years of work experience within a profession listed in the CSOL.
The Regional Sponsored Migration Scheme (subclass 187) is a permanent scheme that
requires the applicant to be sponsored by a regional employer and to hold a qualification at
level 1, 2 or 3 within the Australia New Zealand Standard Classification of Occupations
(ANZCO).
The Skilled-Independent Visa (subclass 189) requires the applicant to express his or her
interest and to be invited to apply in order to be granted permanent residence. A sponsor is
not necessary; however the applicant must select an occupation in the relevant SOL.
The Skilled-Nominated Visa (subclass 190) requires the applicant to express his or her
interest and to be invited to apply in order to be granted permanent residence. It requires
the applicant to be nominated by a state/territory government and to select an occupation
in the CSOL.
The Skilled-Regional (Provisional) Visa (subclass 489) is a temporary entry channel that
grants residence for up to 4 years and for which the applicant must express interest before
being invited to apply. The applicant can be sponsored by either an eligible relative or by a
state/territory government and the occupation must be listed either in the SOL or in the
CSOL.
52 Australian Government, Department of Immigration and Border Protection, The Consolidated Sponsored
Occupation List

20
Temporary Skilled Visa (457)
Other than the permanent skilled migration programme, it is however essential to recognise
that the vast majority of skilled applicants now enter Australia as temporary long-stay
workers. This is a category with no annual quota and only minimal requirement for labour
market testing that reflects the priorities of sponsoring employers.53
The Temporary Skilled
Visa (subclass 457) is the most comparable to the EU Blue Card as it is temporary and
sponsor-based. It is of interest to Australian employers in multiple fields as it allows them to
select migrants based on their personal attributes and grants relatively speedy access to work
in under-supplied sectors and sites for up to 4 years (with scope for extension). Subclass 457
visa plays a vital role in assuring workforce supply in selected fields, including medicine and
nursing. From the migrant’s perspective, subclass 457 offers attractive benefits such as
facilitated priority processing, immediate access to work, the possibility to change employer,
and the possibility to switch to a permanent skilled migration permit.
The selection of most applicants was tightened in July 2013, as the skills assessment was
reinforced, the English requirements were increased and the sponsor was required to
demonstrate that there was actually a vacancy and had to commit to train local workers. In
2013-2014, demand for these visas decreased significantly, and visa grants fell by 22 % to
98 600. For the second year in a row, India was the top source country with 24 500 grants,
followed by the United Kingdom and China with 16 700 and 6 200 grants respectively.54
By
June 2014 the number of temporary 457 visa professionals far exceeded the scale of points-
tested permanent skilled migrant arrivals in key sectors such as IT, engineering and medicine.
By this time, around 50 % of permanent skilled migrants were also selected onshore i.e.
among international graduates of Australian universities (for example in accounting and
nursing), or among previously temporary foreign workers.55
.
SkillSelect
The dividing line between ‘permanent’ and ‘temporary’ migrants has become increasingly
blurred over time, but temporary migration continues to dominate. In a typical year up to 130
000 ‘457’ visa primary applicants become permanent residents – exceeding the number of
primary applicants in the 128 550 permanent skilled migration quota (where stated numbers
include all accompanying family members). Reflecting this trend, a new model to select
skilled migrants called the Skilled Migrant Selection Model (SkillSelect) was introduced in
Australia in July 2012, following an internal review of the points-based system.56
The
model is an electronic system whereby prospective applicants must first submit an
expression of interest (EoI) for an initial review of their skills through the Department of
Immigration and Citizenship before being invited to make a visa application57
. SkillSelect
can be used for both temporary and permanent primary applicants. Lodged applications can
be screened online, by both prospective employer and state/ territory government sponsors.
Applicants can be offered a permanent highly skilled job immediately, or (alternatively) a
53 Khoo, S-E., McDonald, P., Hugo, G., Temporary Skilled Migrants in Australia: Employment Circumstances
and Migration Outcomes, Department of Immigration Multicultural and Indigenous Affairs, Canberra, 2005. 54 OECD, International Migration Outlook 2015, OECD Publishing, Paris, 2014, p 184. 55 Hawthorne, L., The Impact of Skilled Migration on Foreign Qualification Recognition Reform in Australia,
Canadian Public Policy Journal, Volume 41 Issue Supplement 1, 2015. 56 Department of Immigration and Citizenship, Introduction of a New Points Test, DIAC, 2010. 57 Australian Government, Department of Immigration and Border Protection, Fact Sheet – Managing the
Migration Programme.

21
temporary sponsored position at first, while sponsored applicants are fast-tracked thereafter.
The applications remain in the ‘pool’ for a defined period of time. If they are not selected
within that period, they must submit a new application to ensure that all information is
accurate and to prevent processing backlogs.
Key statistics
In 1996-1997, skilled migration represented 47 % of the Migration Programme. By
2011/2012, this share had risen to 68 %58
. Since 2009, the share of the employer-sponsored
category of the Skill stream has been rising steadily, reaching 37 % of the Skill stream in
2011/2012.59
From a quantitative perspective, the Skill stream attracts a significant number of
applicants, with around 125 000 skilled migrants arriving per year. In 2013/2014, the Skill
stream accounted for about two-thirds of the visas issued.60
For figures of migrants according
to different categories of Australia’s immigration skilled stream (2011/2012), see Country
Fiche: Australia in annex.
Recent statistics show that temporary migration, for work or study purposes, is increasingly
becoming the first step toward permanent settlement in Australia. In 2011-2012, around 40 %
of applicants for permanent visas were already residing in Australia, and half of these
applicants had a temporary skilled permit.61
By 2015, this had risen to around 50 %.
Immigration policy in Australia distinguishes between on- and off-shore applications, and
provides bridging visas between the two. For more details, see Country Fiche: Australia in
annex.
During the 2014/15 program year, in the three months (quarterly publication) up to 31
December 2014, 27 660 subclass 457 primary visa applications were lodged. The acceptance
rate was very high (92 %) and 25 530 visas were granted. In 2014-15, there were 130 000
primary applicants. On 30 September 2015, 103 860 subclass 457 primary visa holders
resided in Australia. Of those individuals approximately half had launched their application
onshore and half had done so before their arrival. In 2012-13, 40 450 subclass 457 visa
holders were granted permanent residence.
A comparison between the number of Blue Cards and the number of 457 visas reveals that
Australia grants almost twice as many high skilled permits in three months as the EU grants in
one year. In terms of coverage, the majority of Blue Cards have been issued in Germany, but
Australia also suffers from an uneven geographical distribution of migrants, whereby
migrants tend to gravitate towards the top four metropolitan cities. To tackle this uneven
distribution, Australia has devised specific permits for rural Australia.
Switzerland 2.5.
Legal framework
The Aliens Act was approved by the Swiss voters on the 24 September 2006 and entered into
force on the 1 January 2008. The law regulates the access to the Swiss labour market for
third-country national HSW. It mainly covers the entry and residence of persons who are
58 The most updated statistics available from national official sources date from 2011/2012 (including the
national statistical institute and the Department of Immigration and Citizenship sources). 59 DIAC, 2011–12 Migration Program report, Canberra, 2012. 60 OECD, International Migration Outlook 2015, OECD Publishing, Paris, 2015, p 184. 61 Parliamentary Library, Temporary skilled migration, 2014.

22
neither citizens of either the EU or the European Free Trade Association (EFTA), nor asylum
seekers.62
Switzerland has a dual system of work permits for TCNs. The first concerns citizens from EU
and/or EFTA countries, who are generally allowed to come to Switzerland for up to three
months to look for work, a period that can be extended to six months if proof of an active job
search can be provided. The second concerns third-country nationals. Citizens from these
countries must have a binding work contract as well as the appropriate work visa before
entering the country. A job offer alone is not enough to ensure that a permit is granted.
Application forms and specific requirements differ from canton to canton, but, in general,
non-EU/EFTA citizens need a specific residence permit with authorisation to work in
Switzerland. This applies whether the employment contract is with a Swiss or a foreign
company and whether the work is paid or unpaid. Whether or not the authorisation to work is
granted or not generally depends on existing quotas, educational level and work experience
and the outcome of a labour market test.
The B-permit is a residence permit that is granted to persons who have a permanent
employment relationship or one lasting for a minimum of 12 months. The permit is valid for
five years and is automatically extended for another five years as long as the employment
relationship lasts. However, the extension may be limited to one year if the person is
unemployed for longer than 12 consecutive months. The B-permits are issued on a quota basis
and tie the permit holder to the initial employer. The permits often specify that the holder
lives in the canton where the permit is issued, and that he or she cannot leave the canton.
Persons wishing to be self-employed can get a B-permit valid for five years if they can prove
they have sufficient financial resources while being self-employed. Persons who settle in the
country without gainful employment can also be granted a B-permit provided they have
sufficient resources.63
After an uninterrupted stay of at least 10 years, the TCN may obtain a C-permit, i.e. a
permanent residence permit. Nationals from the US and Canada only have to stay for 5
consecutive years to obtain the C-permit. With this permit, the visa holder can change
employer freely and live in any canton in Switzerland. Cantons are responsible for issuing
permits, subject to federal approval.
Quotas
Switzerland is among the OECD countries with the largest immigrant populations – 27 % of
the working-age population are foreign-born. More than 60 % of the migrants come from
high-income OECD countries, more than half of whom are from the neighbouring
German/French and Italian-speaking countries with which Switzerland shares the same
national languages. Among the other immigrants, the majority are from the successor
countries of former Yugoslavia and from Turkey.64
The issue of immigration is both high on the policy agenda and vividly discussed in the public
debate. Against this backdrop, the Swiss government decided on 28 November 2014 to reduce
62 142.201 Ordonnance relative à l'admission, au séjour et à l'exercice d'une activité lucrative (OASA) du 24
octobre 2007 (Etat le 1er janvier 2016). 63 Swissinfo.ch, Work Permits, Article published 20th August 2013. 64OECD, Jobs for Immigrants Vol 3: Labour Market integration in Austria, Norway and Switzerland, ,OECD
Publishing, Paris, 2012, p 41.
23
the number of work permit for inter alia non-EU/EFTA nationals, a decision that took effect
on 1 January 2015. The quota for B-permits for TCN workers was set at 2 500 permits in
2015, and will be kept at the same number for 2016. This can be compared with the quotas in
2013 and 2014 that was set at 3 500 in both years. A large number of cantons and business
representatives had expressed hopes that the quotas would be increased, yet the Swiss
government considered that such an increase would undermine the country’s goal of
favouring local workers whenever possible.65
Key statistics
In 2014, 152 000 foreigners came to Switzerland for long-term stays, i.e. 2 % less than in
2013. This was the first decline since 2009. Citizens from EU/EFTA countries represented
almost three-quarters of the inflow. While 64 % of the EU/EFTA nationals came for
employment purposes, the main reason for immigration of non-EU/EFTA citizens was family
reunification (47 % of the inflow).66
Russia 2.6.
One of the main challenges in Russia in terms of migration is the significant brain drain.
Almost 1 million people have left Russia in the past decade, out of which 80 % were highly
qualified.67
In 2011, consular statistics estimated that 1.7 million Russian citizens were
residing permanently abroad. At the same time, Russia is a main country of destination for
citizens of the former Soviet republics. Between 1993 and 2011, more than 13 million
individuals arrived in Russia to settle permanently. Legal framework
Migration legislation in the Russian Federation emerged in the early 1990s, when the Federal
Migration Service (FMS) was established. The dissolution of the USSR and subsequent large-
scale migration across what was formerly a unified country led to a need to legislate and
regulate many aspects of migration. Against this backdrop, Russia started to develop a
migration policy in 2010, with a view to, inter alia, attracting highly qualified labour
migration to Russia. A bill to that effect was signed in July 2010, and in 2010/2011, 12 500
highly qualified professionals received work permits on preferential terms.68
The law includes a fast-track for the target category, which is the main advantage granted to
them. HSWs may apply for a three-year work visa, which can subsequently be extended if the
applicant receives an annual salary exceeding the statutory level of RUB 1-2 million (or an
equivalent of 25 000-50 000 EUR per year or 6000 EUR per month) from a Russian company.
The visa also allows for family reunification. Moreover, the deadline for migrant registration
is extended and HSW are granted a grace period of 90 days to choose their place of
registration, which can be either a company office or a residential building.69
65 Bal Corporate Immigration, 2016 quotas on highly skilled foreign workers announced, News Detail:
Switzerland, published 11th November 2015. 66 OECD, International Migration Outlook 2015, OECD Publishing, Paris, 2015, p 252. 67 Focus Migration, Russian Federation, Country Profile: Russian Federation, No 20, July 2010. 68 Migration Policy Centre, Migration Profile Russia, June 2013. 69 World Economic Forum, Russia Eases Immigration Controls for Highly Skilled Workers, Repository of Talent
Mobility Good Practices.

24
Key statistics
Temporary labour migration to Russia continued to grow in 2014. After 2.9 million work
permits issued in 2013, more than 3.7 million permits were issued in 2014. About 1.3 million
foreigners obtained regular work permits, mostly based on quotas. An additional 159 000
work permits were issued outside of the quota system in 2014, which again represented an
increase compared to 2013. The number of special permits for HSWs rose strongly from 26
000 to 34 000. Most HSWs came from countries such as China, Vietnam, Turkey and the
Philippines.70
Permits issued to Highly Qualified Specialists71
2010 1 000
2011 10 000
2012 12 000
2013 26 000
2014 34 000
New Zealand 2.7.
Temporary labour migration
Throughout the history of New Zealand (NZ), immigration has been a main driver of its
national and economic development, and the country continues to receive larger immigration
flows than most other OECD countries. Temporary labour migration, the main entry route for
labour migrants, has expanded significantly since the late 1990s and has reached a level that
is, compared to the size of the population, not matched by any other country within the
OECD. New Zealand offers a range of work visas that are all temporary at first, although
some can lead to permanent residence. Currently, the single largest component of temporary
flows is comprised of Working Holiday Schemes.
Traditionally, the main category of admission for temporary labour migration has been the
Essential Skills visa (ES). The firmly established, essential proposition of this visa, often
referred to as the 'New Zealanders first' policy of this visa, is to attract only those migrants
that fill jobs for which no New Zealander or permanent resident is available. To ensure that
priority is given to the local workforce, a labour market test is applied, with the exception of
those occupations on the shortage list.72
The application for a work visa can be lodged either
on- or offline. In practice, the process tends to be largely employer-driven. Not only do
applicants need to have a job offer before applying, but, where a labour market test must be
passed, it is also up to the employer to make the case with Immigration New Zealand. In
principle the duration of the visa is equal to the length of the work contract, but it also
depends on the skill level of the job. The ES visa can be granted for a maximum period of 1
year for low-skilled jobs (corresponding to ANZCO levels 4 and 5) to 5 years for high-skilled
jobs (ANZCO level 1), in which case the annual salary has to be at least NZD 55 000. The
visas can be renewed indefinitely, for as long as the employer can demonstrate that no
domestic workforce is available. In reality, however, migrants tend to stay on the ES visa only
70 OECD, International Migration Outlook 2015, OECD Publishing, Paris, 2015, p 242. 71 OECD, International Migration Outlook 2011;2012;2013;2014;215, OECD Publishing, Paris. 72 OECD, Recruiting Immigrant Workers: New Zealand, OECD Publishing, Paris, 2014, p 53.

25
for short periods. Half of those that receive an ES visa for the first time keep it for less than a
year. The ES visas also grants labour market access to accompanying family members of
primary applicants.73
If the TCN has an ES visa based on a skilled job, he or she may qualify
for residence visa under the Skilled Migrant Category (SMC) (see below).
Permanent labour migration policy
As regards permanent migration to NZ, the Immigration Amendment Act from 1991 shifted
the policy focus from addressing short-term skill shortages to a medium-term human capital
model of skilled migration. The previous Occupational stream was replaced by the so-called
General Category which selected migrants using a points system instead of the previously
used Occupations Priority List. The objective of the government was to make the selection of
skilled migrants more transparent and consistent.
The 1991 law also introduced an immigration target in line with similar targets introduced in
Canada and Australia, where the target is a goal rather than a limit, meaning that it is possible
for overall acceptances to exceed the limit. This limit has since then been raised and the
margin of tolerance has been increased. The policy changes implemented in 1991 and
favourable economic conditions in the early 90s resulted in a sharp increase in applicants
through the General Category, from less than 10 000 in 1992/93 to nearly 35 000 in 1994/95.
The number of applications accepted from all immigration streams exceeded NZ’s annual
immigration target of 25 000 migrants in each of the 4 years following the introduction of the
points system in 1991.In 1994 and 1995 actual numbers overshot the target by more than 100
percentage points.74
Simultaneously; there was some evidence that the lack of a consistent
English language assessment and a general difficulty in getting migrant qualifications
recognized by local industry bodies were causing settlement difficulties for skilled migrants
and leading to a discount of their qualifications on the NZ labour market. These concerns and
the overflow of the General Category lead to a review of the residence schemes in 1994.
Following the 1994 review, the General Category was replaced with the General Skills
Category (GSC) in 1995. The reform reinforced the English language requirement and
extended it to secondary as well as principal applicants.
In 2001, an annual numeric target for permanent residence approvals was set at 45 000, with a
goal of accepting about 60 % through the Skilled/Business Stream, 30 % through the Family
stream, and 10 % through the international/humanitarian stream.75
The next major shift in
immigration policy took place in 2003. Due to shortages in many industries, it was considered
that the current human capital model of the General Skills Category had to be modified. As a
result, the government replaced the General Skills Category with the Skilled Migrant
Category (SMC) which, with some modifications, is still used today.
Skilled Migrant Category (SMC)
The Skilled Migrant Category is a permanent residence permit for those that hold a job offer,
are coming to NZ for a specific purpose or event, want to gain experience or work after
73 New Zealand Immigration, Work Visa Guide, (INZ) 1016, December 2015, p 6. 74 The increases in the number of applications, coupled with an overall improvement in the quality of applicants,
resulted in such a large number of applicants exceeding the automatic pass-mark that there were not any spots
left over for pool applicants (those with enough points to be considered, but not enough to be automatically
accepted). Since Immigration New Zealand was obliged by law to accept these migrants, it lost, in effect, the
ability to limit the number of accepted General Category migrants. 75 OECD, Recruiting Immigrant Workers: New Zealand, OECD Publishing, Paris, 2014, p 38.
26
studying in NZ or want to join a partner and work.76
Since 2004, the SMC operates via a two-
step application process. The TCN worker first has to submit an Expression of Interest (EoI)
for a permanent residence permit to the SMC pool. This can be done either on paper or online,
although the vast majority choses the latter option which is also cheaper. No supporting
documents are required at this stage. Thereafter, the applicants are ranked using a points-
based system.77
They are awarded points based on their skills, work experience,
qualifications, age, and whether they have a job offer. Applicants with over 100 points are
thereafter placed in a selection pool. Applicants with 140 points or more are automatically
selected. Applicants fewer than 140 points are pre-selected or not according to current quotas
and policies, and a certain number of applicants from the pool are then invited to apply for
residence through the SMC. Applicants who are selected and have been assessed as having
sufficient points are then assessed according to their ability to integrate into society and the
labour market. In these situations, holding an offer for a skilled job serves a proxy for
settlement and contribution. Migrants without skilled jobs are interviewed to determine their
suitability. As a result of the interview, applicants that are selected and apply but who do not
have a skilled job offer can be offered job search visas to help them find skilled work in NZ
and this way be granted a residence permit.78
Following the shift in focus, which partly implied a return to demand-driven policies, the
points granted to applicants who already hold a job offer or work contracts increased from
17 % of the pass mark to 54 % of the pass mark. Bonus points are given to migrants who have
work experience, needed qualifications or a job offer in a 'future growth area' or an 'area of
shortage'. Applicants eligible to claim the maximum number of these bonus points can earn
up to 65 points, or 46 % of the auto-pass mark. The points granted for other characteristics
were reduced. The importance of age, for instance, was reduced, with the maximum points
available falling from 38 % to 21 % of the pass mark. Points for settlement funds and family
sponsorship were initially removed entirely, but family sponsorship was reinstated in
2005/06.79
Further changes to the point system were implemented in 2007. The bonus points
awarded for educational qualifications obtained in Australia were increased and the points for
qualifications and/or job offers held by the partner of the principle applicants were doubled.
New Zealand’s immigration policy has remained relatively unchanged in the recession
following the 2007 global financial crisis, which was still less severe than in many other
OECD countries. A new immigration act was passed in 2009, which newly differentiated the
number of points granted based on the level of the qualification obtained, reducing the bonus
points for vocational training received in New Zealand.80
Key statistics
In 2013/2014, 20 300 persons (or 46 % of all residence approvals) were admitted through the
SMC, a 12 % increase compared to 2012/2013. This first increase since 2009/2010 could be
interpreted as a trickle-down effect of the increase in Essential Skills (temporary) workers. In
fact, most principal applicants in 2013/2014 had a job in New Zealand, and 92 % were
awarded points for a job or a job offer. India was, with 20 % of the total, the most important
country of origin among those admitted to the SMC, followed by the United Kingdom (13 %).
Reflecting a long-term trend, the increase from India (up from 17 % in the previous year) is
76Immigration New Zealand, Working Temporarily in New Zealand. 77 OECD, Recruiting Immigrant Workers: New Zealand, OECD Publishing, Paris, 2014, p 103. 78 OECD, Recruiting Immigrant Workers: New Zealand, OECD Publishing, Paris, 2014, p 103. 79 Ibid, p 39. 80 Ibid, p 40.

27
mainly due to the transition of former Indian international students to temporary work and
then to permanent residence. In 2013/2014, 26 500 persons were granted work permits in
New Zealand under the Essential Skills visa, an increase of 18 % compared to 2012/2013 and
the second year increase since the start of the global economic slowdown.81
3. ANALYSIS AND CONCLUSION
The more Member States have positioned themselves to compete for talent worldwide, the
more their labour migration policy frameworks have been adapted to attract skilled migrants
and ensure that they stay. This is evident as regards international students, permanent
residence, family reunification and naturalisation. Foreign students may initially sustain
university enrolment figures, but they are also prospective future workers with the potential to
rejuvenate the work force. Thus, most EU countries have looked at various ways to attract
them. Moreover, maximizing the retention rate of skilled migrants in the host country requires
attractive policy frameworks, allowing a smooth transition towards permanent residency,
coupled with good conditions for family reunification.82
Comparing the schemes examined in the previous sections, one can identify a number of
similarities and differences compared to the EU Blue Card. The following section will
compare some key features of the schemes that differ across the countries.
Salary requirements
Salary thresholds are applied differently across the countries analysed. They can exempt
certain applicants from labour market tests (US) or other perquisites (AUS), or extensions
(CAN).83
The salary thresholds vary widely across the EU Member States, which is why it is
difficult to compare the salary threshold of the EU Blue Card directly with international
competitors. While the EU Blue Card sets a relatively high threshold, other HSW schemes,
for example in Canada84
, do not apply an explicit salary threshold, but rely on alternative
minimum salary requirements instead. In Russia, the HSW has to earn an annual salary of at
least RUB 1-2 million per year (or around EUR 6000 per month). The salary threshold in
Russia can be compared to the annual salary threshold in LU (71 946 € in 2015). This is
however significantly higher than the EU Blue Card salary threshold in RO, which was €
2152,36 in 2015.
Expression of interest system
CAN, NZ and AUS all use Expression of Interest systems, a tool that is credited with a
potential to reduce backlogs and involve employers in the recruitment process. These online
tools are usually coupled with Points Based Systems that assess and rank the candidates
according to a number of parameters, linked to the needs of the labour market and the migrant
worker’s potential to integrate. Creating such a system with a pool of talent at EU level could
help facilitating access to labour market information; however it would require extensive
cooperation and coordination with Member States and employers. The implementation of
81 OECD, International Migration Outlook 2015, OECD Publishing, Paris, 2015, p 232. 82 Chaloff, J., The framework for labour migration in European Union countries and the policy impact of the EU
Blue Card Directive, DELSA/ELSA/MI(2015)3, OECD Publishing, Paris, 2016, p 15. 83 Chaloff, J, Understanding salary thresholds as they are applied in the EU Blue Card scheme(s), Presentation
7/12/2015, Expert Group Economic Migration Second Meeting, Brussels, 2015. 84 No explicit salary thresholds apply under the Federal Skilled Worker Program and the Provincial Nominee
Program.
28
such a system at the EU-level could therefore be an option to be explored for the medium or
long-term.
Employer sponsorship
Employer sponsorship is another way of involving employers in the selection of foreign
workers, while also boosting compliance with the immigration system, by holding the
employer liable for any breaches. Australia for example, puts a greater responsibility on the
employer through sponsorship. There are both temporary and permanent employer
sponsorship systems85
.
In-country status changes
Most EU countries do not allow in-country status changes, and require the applicant to be
recruited directly from abroad.86
This is different from many other schemes studied in this
annex, such as CAN, US and NZ. In these countries, there are possibilities to switch between
visas through a combined track of permanent and temporary residence permits. This may
open up greater opportunities for transitions from e.g. a student visa to an employment visa,
as is the case in Australia. In NZ, most HSW have been in the country for some time before
they are admitted to the Skilled Migrants Category, and are generally in an employment
commensurate with their formal qualification level. Another tool is to offer bridging visas,
which is also something that Australia is doing.
Caps and limits
While al limits to the schemes are capped e.g. in CAN, US, UK, NZ and Switzerland, these
countries generally attract more prospective candidates than there are places available. This is
not the case for the EU Blue Card. Furthermore, a number of these schemes operate through
points-based systems (e.g. CAN and UK), which does not exist on EU-level today. Similar
methods would therefore not be suitable within the current European context.
Changes in employment
International competitors do to a varying extend restrict migrant workers freedom to change
employer, occupation and location. In the US, for instance, an H-1B worker who wishes to
change employer needs to provide a new petition filed by the prospective employer before the
expiration of the visa. In AUS on the other hand, the subclass 457 allows a foreign national to
change employer without having to obtain a new visa. Under the Provincial Nominee
Program in Canada, Provincial Nominees are expected to live in the province that nominated
them, but all permanent residents gain unlimited mobility rights upon entry.
Permanent residency
The H-1B visa in the US does not grant immediate permanent residence, but the employer
may sponsor the applicant for a Green Card. In AUS, it is possible, under certain conditions,
to switch from the subclass 457 to a permanent residence permit. In NZ, the transition of
85 Temporary Skilled Visa (subclass 457), Employer Nomination Scheme (subclass 186) and Regional
Sponsored Migration Scheme (subclass 187). 86 Chaloff, J., The framework for labour migration in European Union countries and the policy impact of the EU
Blue Card Directive, DELSA/ELSA/MI(2015)3, OECD Publishing, Paris, 2016, p 4.

29
foreign workers from temporary visas to permanent residence occurs frequently. It is
facilitated through the allocation of additional points under the Skilled Migrant Category.
Family reunification
While most international competitors grant the right to family reunification, they do not
always allow family members to work. The US allows H-1B workers to be accompanied or
joined by a spouse and unmarried children under the age of 21. Yet, the H-4 visa they receive,
grants no access to the labour market. Consequently, if the family members of an H-1B visa
holder wish to work, they are ought to apply for an independent work visa. In AUS, an
Australian Spouse Visa allows married and registered partners of Australian permanent
residents to enter and/or remain in the country, and accompanying family members have full
employment rights. An Australian Spouse visa is initially granted as a temporary visa. After
two years, the relationship is reassessed and if deemed genuine a permanent visa will be
granted. Dependants of Subclass 457 visa applicants are also eligible to accompany the
primary permit holder to Australia. Canadian permanent residents may sponsor Family Class
immigrants (spouses or partners, dependent children, parents, grandparents and other close
relatives) to become permanent residents. Once they have become permanent residents, they
have the right to study and work, but until that moment eligible family members must be
sponsored.
4. POTENTIAL IMPACTS ON COUNTRIES OF ORIGIN
'Brain drain' is, like migration itself, part and parcel of human development
and history. Talented and skilled people have always been attracted by the prospect of better
career opportunities and a higher quality of life. Nevertheless, the European Commission
recognises that 'brain drain' can be damaging to developing countries because skilled workers,
scientists, engineers and doctors play essential roles in a state’s economic growth and
development.
The EU’s immigration policy aims to be a well-monitored and well-managed system which
brings about an added-value and leads to the proverbial 'win-win-win' results, i.e. benefits for
receiving countries through meeting labour market shortages, for sending countries through
guaranteeing remittances for development, and for migrants themselves through offering
employment and control over the use of their wages. The overall objective is to turn 'brain
drain' into 'brain gain', both for receiving countries and for countries of origin.
At the same time, it must be noted that brain drain is not caused by the EU migration policy. It
is clear, however, that EU migration policies can potentially have an impact on the migration
decisions of individuals. The EU Blue Card may reduce human capital, knowledge capital,
and hence growth and development prospects, if not accompanied by appropriate policy
measures.87
EU migration policy measures may also offer an opportunity to tackle some of the
challenges involved.
The safeguard measures of directive 2009/50/EC 4.1.
Research suggests that policies addressing the supply side of the labour market for HSW
(such as direct education or skills subsidies) are the least efficient. This is especially the case
87 Kancs, A., Ciaian, P., The EU Blue Card – Managing Migration Challenges and Opportunities for Developing
Countries, Report EUR 27080 EN, Joint Research Centre, European Commission, Brussels, 2015, p 2.

30
for Least Developed Countries (LDCs) that are small relative to the EU, since these policies
can enhance migration while not having a direct impact on the skilled labour stock in the
LDC. Only if the LDC is large enough compared to the EU, the supply side policies may
increase the stock of skilled labour in the LDC, as skilled migration decreases the
international wage rate for skilled labour.88
By contrast, policies implemented on the demand side of the labour market are more
efficient.89
In terms of feasibility, these policies targeting the labour market for HSW also
appear to be less costly.90
Indeed, some of the measures foreseen in the EU Blue Card
Directive aim at addressing the issue of 'brain-drain' from the demand side by regulating
ethical recruitment and encouraging circular migration.
Ethical Recruitment
Article 3(3) explicitly allows the EU and/or its Member States and one or more third countries
to enter into agreements to protect the human resources of the developing countries which are
signatories to these agreements. To this end, these agreements may list the professions which
should not fall under the Blue Card Directive, in order to ensure ethical recruitment in sectors
suffering from a lack of personnel. However it is true that currently, no Member State has
entered into such an agreement with a third country.
Furthermore, the Blue Card Directive for highly qualified migrants foresees the possibility for
Member States to include a mechanism under which they may reject an application for an EU
Blue Card in order to ensure ethical recruitment in sectors suffering from a lack of qualified
workers in the countries of origin, for example the healthcare, education and engineering
sectors (Article 8(4)). BE, CY, DE91
, EL, LU and MT have transposed this Article, but no
rejections on these grounds have been reported.
Circular Migration
The Blue Card directive facilitates circular migration, the mobility of highly qualified third-
country workers between the EU and their countries of origin. It gives migrants the possibility
of longer 'time-outs', enabling them to return to their country of origin without being
penalised with a loss of their residence permit, or expiration of the years of residence that
count towards the right to long-term resident status. Firstly, derogations from Long-Term
Residents Directive 2003/109/EC extend the maximum period of absence from the territory of
the Community that will not lead to an interruption of the continuous residence necessary to
be eligible for EC long-term resident status. Secondly, longer periods of absence than those
provided for in directive 2003/109/EC are allowed after highly qualified third-country
workers have acquired EC long-term resident status.
Circular migration is primarily considered as a spontaneous movement to achieve goals set
within the migrant household. While circular migration may not provide a definite pathway to
a more prosperous future, it is likely to support subsistence activities in areas of origin. The
critical role played by circular migration is that it allows access to a more diverse resource
88 Ibid, p 38. 89 Ibid, p 2. 90 Ibid, p 39. 91 DE foresees the option to use this derogation through a regulation (currently not).

31
base that improves well-being, thereby allows people to survive or even improve their
circumstances.92
Reporting Requirement
The Blue Card directive provides specific reporting provisions to monitor the implementation
of this Directive, with a view to identifying and possibly counteracting its possible impacts in
terms of 'brain drain' in developing countries and in order to avoid 'brain waste'. The Member
States have to transmit the relevant data annually to the Commission.
Finally, in addition to the above, some Member States address brain drain and brain
circulation through national legislation, bilateral agreements and/or cooperation with
countries of origin.93
The impact of directive 2009/50/EC on countries of origin 4.2.
Policies specifically focused on circular migration are in their infancy and conclusions cannot
be drawn concerning their impact or effects on source countries, destination countries and the
migrants themselves. 94
Even though it is hard to estimate the real benefits or damages of
'brain drain' it can be assumed that small LDCs95
close to powerful economic regions are
more likely to suffer from 'brain drain' than larger countries. This type of emigration may put
the state’s economy at risk, and more directly, may affect the education system as well as the
healthcare and engineering sector.
In 2013, 188 out of 12 963 Blue Cards (1,45 %) were granted to citizens of LDCs. The top
three LDCs among the countries of origin in 2013 were Yemen (51), Bangladesh (39), and
Nepal (30). In 2014, 203 out of 13 722 Blue Cards (1,48 %) were granted to citizens of LDCs.
The top three least developed countries of origin in 2014 were Bangladesh (47), Yemen (39)
and Nepal (34).
Given the low number of EU Blue Cards currently granted to highly qualified migrants from
LDCs, the potential negative impacts of brain drain are likely limited for these countries.
Middle-income developing countries (DCs) may, however, be exposed to a somewhat higher
risk. In 2013, 9 978 Blue Cards (76,97 %) were granted to citizens of DCs. In 2014, this
number increased to 10 455 (76,19 %). Nevertheless, in absolute terms the number of Blue
Cards granted to citizens of DCs remains relatively low.
92 Skeldon, R., Going round in circles: Circular migration, poverty alleviation and marginality, IOM, 2012, p
53. 93 European Migration Network (EMN), Attracting Highly Qualified and Qualified Third-Country Nationals,
Synthesis Report, Brussels, 2013, p. 23. 94 Joint Action Health Workforce Planning and Forecasting, WP7 Report on Circular Migration of the Health
Workforce, Report-Version -02, Catholic University of Leuven, Belgium, Medical University of Varna,
Bulgaria, 2015, p 31. 95 LDC: least developed country as established by Committee for Development Policy (CDP) of the UN
Economic and Social Council (ECOSOC).

32
EU Blue Cards by citizenship 201396
LDCs97
: DCs98
: OECD
Total99
12.963 1,45% 76,97% 18,07%
Asia 6.970 Southern Asia
3.314 188 9.978 2.342
India 2.644 2.644
Iran 394 394
Pakistan 189 189
Bangladesh 39 39 39
Nepal 30 30 30
Sri Lanka 15 15
Afghanistan 3 3 3
Eastern Asia 1.511
China (including Hong Kong)
1.011
1.011
Japan 246 246
South Korea 180 180
Taiwan 63
Mongolia 10 10
North Korea 1 1
Western Asia 1.703
Syria 547 547
Turkey 409 409 409
Jordan 290 290
Israel 96 96
Lebanon 95 95
Georgia 71 71
Azerbaijan 62 62
Yemen 51 51 51
Armenia 47 47
Iraq 30 30
Saudi Arabia 3
United Arab Emirates
1
Bahrain 1
South Eastern Asia
350
Indonesia 120 120
Malaysia 68 68
96 EUROSTAT: EU Blue Cards by type of decision, occupation and citizenship [migr_resbc1] 97 Least Developed Country (LDC) as established by Committee for Development Policy (CDP) of the UN
Economic and Social Council (ECOSOC). 98 Developing countries are defined as countries with a GNI of US$ 11,905 and less (World Bank, 2013). There
is no established convention for the designation of "developed" and "developing" countries or areas in the United
Nations system. In common practice, Japan in Asia, Canada and the United States in northern America, Australia
and New Zealand in Oceania, and Europe are considered "developed" regions or areas. In international trade
statistics, the Southern African Customs Union is also treated as a developed region and Israel as a developed
country; countries emerging from the former Yugoslavia are treated as developing countries; and countries of
eastern Europe and of the Commonwealth of Independent States (code 172) in Europe are not included under
either developed or developing regions. 99 Regional groupings according to the UN Statistics Division - Standard Country and Area Code Classification
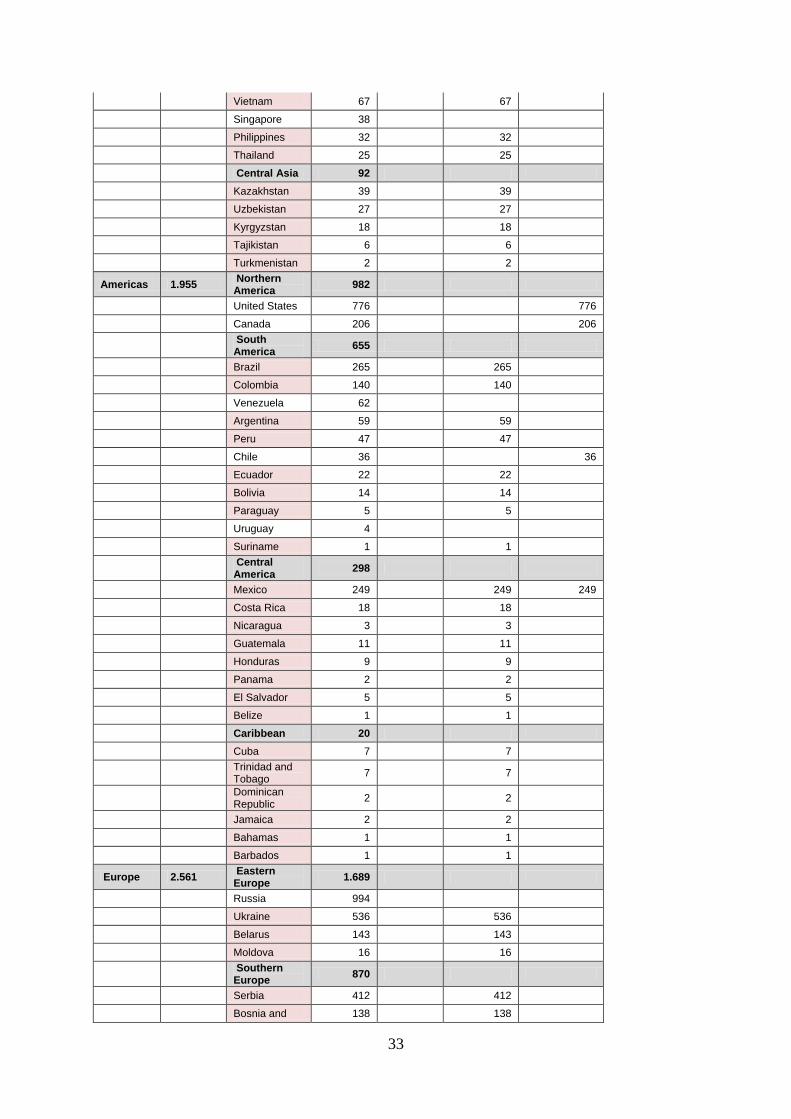
33
Vietnam 67 67
Singapore 38
Philippines 32 32
Thailand 25 25
Central Asia 92
Kazakhstan 39 39
Uzbekistan 27 27
Kyrgyzstan 18 18
Tajikistan 6 6
Turkmenistan 2 2
Americas 1.955 Northern America
982
United States 776 776
Canada 206 206
South America
655
Brazil 265 265
Colombia 140 140
Venezuela 62
Argentina 59 59
Peru 47 47
Chile 36 36
Ecuador 22 22
Bolivia 14 14
Paraguay 5 5
Uruguay 4
Suriname 1 1
Central America
298
Mexico 249 249 249
Costa Rica 18 18
Nicaragua 3 3
Guatemala 11 11
Honduras 9 9
Panama 2 2
El Salvador 5 5
Belize 1 1
Caribbean 20
Cuba 7 7
Trinidad and Tobago
7
7
Dominican Republic
2
2
Jamaica 2 2
Bahamas 1 1
Barbados 1 1
Europe 2.561 Eastern Europe
1.689
Russia 994
Ukraine 536 536
Belarus 143 143
Moldova 16 16
Southern Europe
870
Serbia 412 412
Bosnia and 138 138

34
Herzegovina
Former Yugoslav Republic of Macedonia, the
116
116
Kosovo (under United Nations Security Council Resolution 1244/99)
88
88
Albania 89 89
Montenegro 13 13
Croatia 14
Western Europe
2
Monaco 1
Andorra 1
Africa 1.214 Northern Africa
859
Egypt 450 450
Libya 148 148
Tunisia 130 130
Morocco 88 88
Algeria 28 28
Sudan 15 15 15
Middle Africa 150
Cameroon 136 136
Gabon 6 6
Rwanda 3 3 3
Chad 2 2 2
Congo 1 1
Democratic Republic of the Congo
1 1 1
Equatorial Guinea
1 1 1
Southern Africa
75
South Africa 74 74
Swaziland 1 1
Western Africa
67
Nigeria 36 36
Benin 6 6 6
Côte d'Ivoire 6 6
Ghana 5 5
Senegal 4 4 4
Mauritania 3 3 3
Sierra Leone 2 2 2
Togo 2 2 2
Guinea 1 1 1
Mali 1 1 1
Burkina Faso 1 1 1
Eastern Africa
63
Mauritius 31 31
Ethiopia 15 15 15

35
Kenya 8 8
Madagascar 4 4 4
Tanzania 2 2 2
Eritrea 1 1 1
Malawi 1 1 1
Seychelles 1 1
Oceania 144 144
Australia 106 106
New Zealand 38 38
Rest 119 119
Unknown 119
Stateless -
EU Blue Cards by citizenship 2014 (Source: Eurostat100
)
LDCs: DCs: OECD
Total 13.722 1,48% 76,19% 18,19%
Asia 6.946 Southern
Asia 3.332 203 10.455 2.496
India 2.585 2.585
Iran 426 426
Pakistan 219 219
Bangladesh 47 47 47
Nepal 34 34 34
Sri Lanka 13 13
Afghanistan 8 8 8
Eastern Asia 1.420
China (including Hong Kong)
998
998
Japan 199 199
South Korea 150 150
Taiwan 66
Mongolia 5 5
North Korea 2 2
Western
Asia 1.739
Syria 554 554
Turkey 442 442 442
Jordan 176 176
Israel 121 121
Azerbaijan 107 107
Lebanon 105 105
Armenia 82 82
Georgia 63 63
Yemen 39 39 39
Iraq 35 35
Saudi Arabia 10
Oman 2
Kuwait 1
United Arab 1
100 EUROSTAT: EU Blue Cards by type of decision, occupation and citizenship [migr_resbc1].

36
Emirates
Bahrain 1
South
Eastern Asia 358
Indonesia 118 118
Vietnam 79 79
Malaysia 59 59
Philippines 39 39
Singapore 35
Thailand 28 28
Central
Asia 97
Kazakhstan 41 41
Uzbekistan 36 36
Kyrgyzstan 9 9
Turkmenistan 6 6
Tajikistan 5 5
Americas 2.103 Northern America
1.060
United States 837 837
Canada 223 223
South
America 705
Brazil 289 289
Colombia 144 144
Venezuela 74
Argentina 65 65
Peru 41 41
Chile 49 49
Ecuador 18 18
Bolivia 18 18
Paraguay 6 6
Uruguay 1
Central America
306
Mexico 269 269 269
Costa Rica 9 9
Guatemala 9 9
Nicaragua 2 2
Honduras 5 5
Panama 5 5
El Salvador 7 7
Caribbean 32
Cuba 14 14
Trinidad and Tobago
7
Dominican Republic
9 9
Jamaica 1 1
Bahamas 1
Europe 3.024 Eastern Europe
2.117
Russia 1.175
Ukraine 761 761
Belarus 163 163
Moldova 18 18

37
Southern
Europe 905
Serbia 402 402
Bosnia and Herzegovina
149 149
Former Yugoslav Republic of Macedonia, the
169
169
Kosovo (under United Nations Security Council Resolution 1244/99)
73
73
Albania 103 103
Montenegro 9 9
Western Europe
2
Andorra 2
Africa 1.336 Northern
Africa 1.000
Egypt 464 464
Libya 156 156
Tunisia 260 260
Morocco 84 84
Algeria 23 23
Sudan 13 13 13
Middle Africa
115
Cameroon 107 107
Gabon 4 4
Angola 1 1 1
Central African Republic
1 1 1
São Tomé and Príncipe
1 1
Democratic Republic of the Congo
1 1 1
Southern
Africa 59
South Africa 54 54
Botswana 3 3
Swaziland 2 2
Western
Africa 84
Nigeria 38 38
Benin 4 4 4
Côte d'Ivoire 2 2
Cape Verde 1 1
Ghana 13 13
Liberia 1 1 1
Niger 1 1 1
Senegal 9 9 9
Mauritania 6 6 6
Sierra Leone 2 2 2
Togo 3 3 3
Guinea 1 1 1

38
Burkina Faso 3 3 3
Eastern
Africa 78
Mauritius 20 20
Ethiopia 17 17 17
Rwanda 6 6 6
Zambia 1 1
Zimbabwe 9 9
Kenya 15 15
Uganda 3 3
Somalia 1 1
Madagascar 2 2 2
Tanzania 4 4 4
Oceania 207 207
Tonga 1 1
Australia 162 162
New Zealand 44 44
Rest 106 106
Unknown 82
Stateless 24
The specific sensitivity of brain drain of healthcare workers 4.3.
The risk of 'brain-drain' is particularly pronounced in the health care sector. According to the
WHO, the global number of healthcare workers falls short of global demand. Both developed
and developing countries are struggling to cope with the huge challenges posed by the
imbalance between increasing demand and faltering supply.101
As regards doctors and nurses, most OECD countries have stepped up their education and
training efforts since 2000/01 in response to expected shortages in the context of population
ageing, (increasing the demand) and the parallel ageing of the medical and nursing workforce
(reducing the supply). These efforts have partly slowed down the increase in international
recruitment. It appears that within the EU, mobility actually exerted a balancing effect on
labour markets by reducing the risks of under-employment within this group in countries
sorely hit by the economic crisis.102
The WHO Global Code of Practice on International Recruitment of Health Personnel
Where countries encourage circular migration of health workers, they should take into
account the WHO Global Code of Practice (The Code) as a starting point for developing
circular migration initiatives. The Code is an example of an initiative to reduce brain drain in
the health sector. It is a multilateral framework for tackling shortages in the global health
workforce and addresses challenges associated with the international mobility of health
workers. The Code does not aim at stopping migration, but rather to guide countries to
address some of the aspects of health workforce migration that may have a detrimental impact
upon countries, and source countries in particular. It establishes and promotes voluntary
principles and practices for ethical international recruitment of health personnel. Key
principles governing the Code include the right of all people to the highest attainable standard
101 Migration and Health Workers – WHO Code of practice and the global economic crisis, p 1. 102 OECD, International Migration Outlook 2015, OECD Publishing, Paris, 2015, p 108.

39
of health care and the right for any individual, including health personnel, to leave any
country and to migrate to any other country that wishes to admit and employ them.103
Another
key principle of the WHO’s Code of Practice is to train sufficiently large numbers of health
workers in order to curb dependence on immigration. Hence, receiving countries' chief means
of expanding the supply of doctors and nurses should be to boost their education and training
capacities. Policies by sending countries to improve wages and working conditions can also
serve as incentives to come home or not to migrate.104
The Code has been adopted by all 192 WHO Member States and already implemented by 24
EU Member States. Several EU policies in the fields of education, development aid and
migration policy support the implementation of the WHO Global Code and reinforce Member
States' commitment to the Code to help reduce the negative impact of migration flows on
fragile healthcare systems. The EU promotes Member States’ endeavours to facilitate circular
migration of health personnel, so that skills and knowledge can be acquired to the benefit of
both source and destination countries.
Overall, 37 countries have taken a range of steps towards implementing the Code. Already, 33
have reported taking actions to communicate and share information on the recruitment of
health workers, related migration issues and the Code among relevant ministries, departments
and agencies. In some cases, the Code has been translated into the national language (e.g. in
Finland, Norway and Thailand). Some changes to relevant laws or policies are being
considered. However, only 10 countries say they maintain records of all recruiters authorized
by competent authorities to operate within their jurisdiction, and only nine say that good
practices are encouraged and promoted among recruitment agencies.105
Countries have adopted multiple approaches to raise awareness of the Code and promote
dialogue concerning it. For example, the Canadian government is working on disseminating
awareness materials for foreign workers entering the country at embassies and high
commissions abroad. Norway has reported a number of strategic objectives aimed at
addressing its health workforce challenges. The Philippines have adopted a participatory
multi-stakeholder assessment process.
As a voluntarily adopted instrument, the Code is still in its early years. Yet, its
implementation has stimulated small but encouraging moves from principles to actions.106
The European Commission has followed these developments closely, has lent its support to
the Code and continues to carefully follow its implementation.
5. COUNTRY FICHES OF SELECTED COMPETITORS
This chapter presents in detail the national schemes of four selected international competitors
having relevant systems in place to attract highly qualified workers, namely: the United
States, Canada, Australia and China. The fiches are prepared by an external contractor (ICF
International) as a part of a study to support the Impact Assessment. The contractor remains
responsible for the data included in the fiches and the accuracy thereof.
103 Migration and Health Workers – WHO Code of practice and the global economic crisis, p 10. 104 OECD, International Migration Outlook 2015, OECD Publishing, Paris, 2015. 105 Migration and Health Workers – WHO Code of practice and the global economic crisis, p 11. 106 Ibid, p 14.

40
National schemes for attracting highly qualified workers Country Fiche: United States

41
Key Points to note:
■ The labour market immigration policy in the United States (US) is demand-
driven and employer-led.
■ Highly qualified third country nationals (TCNs) can enter the US either through
temporary admission for employment purposes (temporary workers visas H-1B
and O-1) or through lawful permanent residence status (employment-based
‘Green Cards’).
■ The H-1B visa is comparable to the EU Blue Card and is thus discussed in
detail.
■ To be eligible for an H-1B visa, a TCN must hold a higher education degree (or
equivalent) and be sponsored by an US employer.
■ No labour market test is applied for the H-1B visa.
■ The number of H-1B visas issued is set to a maximum of 65,000 visas annually.
■ In the 1990s (economic boom years), the US Congress periodically, and only for
a limited period of time, increased the cap, which went as high as 195,000 H-1B
visas issued annually.
■ As of 2015, the US Congress is debating on new legislation on highly qualified
TCNs.

42
1. Overview of the scheme
The United States (US) attract a high level of interest from highly qualified third country
nationals (TCNs). The public debate on labour immigration, rather than being dominated by
attracting foreign talent, is focused on illegal migration and regularisation issues.
The labour market immigration policy in the US is demand-driven and employer-led107
.
Almost all persons that enter the US for employment purposes, may only enter through an
employer sponsor, and their right to remain in the country depends on continued employment
with their sponsor (or on securing a new one). Also caps on legal migration influxes are
implemented.
Highly qualified TCNs can enter the US either through:
■ lawful permanent residence status (employment-based ‘Green Cards’);
■ temporary admission for employment purposes (temporary workers visas H-1B
and O-1).
1.1 Entry through lawful permanent residence status
Entry to the US is possible through employment-based ‘Green Cards’ which grant the TCN
lawful permanent residence (LPR) status. LPR status is mainly granted on the basis of so-
called ‘family-sponsored preference’ and ‘employment-based preference’. Employment-based
preferences consist of five categories of workers (and their spouses and children). Only the
categories EB1 (Employment First Preference) and EB2 (Employment Second Preference)
workers can be considered as highly qualified workers (HQWs), as per the EU Blue Card
definition108
. EB1 include:
■ Persons with extraordinary ability in the sciences, arts, education, business, or
athletics109
;
■ Outstanding professors and researchers with at least three years’ experience in
teaching or research, who are recognized internationally;
■ Multinational managers or executives who have been employed for at least one of
the three preceding years by the overseas affiliate, parent, subsidiary, or branch of
the U.S. employer.
■ (EB2) cover professionals with advanced degrees110
or aliens of exceptional
ability111
.
107 Papademetriou, D. et al (2009), “Aligning Temporary Immigration Visas with US Labour Market Needs: The
Case for a new System of Provisional Visas”, Washington DC: Migration Policy Institute 108 Higher professional qualifications: (1) evidence of higher education qualifications: any diploma or other
evidence of formal qualifications issued by a higher education institution attesting the successful completion of a
post-secondary education programme of at least three years; (2) when provided by national law: by at least five
years of professional experience of a level comparable to higher education qualifications relevant for the
profession/sector. 109 Applicants in this category must have extensive documentation showing sustained national or international
acclaim and recognition in their fields of expertise. Such applicants do not have to have specific job offers, so
long as they are entering the U.S. to continue work in the fields in which they have extraordinary ability. 110 Professionals with advanced degrees concern those who hold degrees beyond a baccalaureate degree, or a
baccalaureate degree and at least five years progressive experience in the profession. 111 Persons with exceptional ability in the sciences, arts, or business. Exceptional ability means having a degree
of expertise significantly above that ordinarily encountered in the sciences, arts, or business.

43
Since 1990, the annual employment-based preference is capped to 140,000 (plus any unused
visas in the family-sponsored preferences from the previous year). This cap also covers the
family members of the primary worker112
.
In 2013, 158,466 persons accessed LPR status through the employment-based preference113
,
i.e. 16% of the total LPR flow114
. Around 28% of the total of employment-based preference
LPR is allocated to each of the first three employment preferences, EB1 and EB2 included115
.
The visas are allocated according to a cascading system, i.e. when there is a number of visas
available under the highest preference category, they can be used by the next preference
category.
The first preference (EB1 priority workers) accounted for 24 percent of new employment-
based LPRs. There are more EB1 visas available than used. Most of the unused EB1 visas
(extraordinary ability visas) in 2013 were used in the second preference (EB2 professionals
with advanced degrees) which represented 39 percent of new employment-based preference
LPRs116
.
1.2 Entry via temporary admission for employment purposes
Amongst the temporary workers visas, the H-1B visa for temporary workers in “specialty
occupations” is a visa of a duration of up to three years. The visa is one-time-renewable. It
was included in the Immigration Act of 1990 to help employers deal with what was perceived
to be temporary labour market mismatches. It was created to give employers easy access to
foreign workers to fill jobs that “require theoretical and practical application of highly
specialized knowledge to perform fully.” To be eligible for this visa, the HQW must hold a
higher education degree or its equivalent and be sponsored by an US employer117
. Since 1990,
the number of H1-B visas to be issued has been capped to 65,000 visas annually. In 2005, the
US Congress created an “advanced degrees exemption” excluding from the cap the first
20,000 petitions filed on behalf of beneficiaries with an US master’s degree or higher.
Additional exemptions were created for foreign employees of non-profit organisations,
educational and research organisations, thus bringing the total annual number of H1-B visas
to about 130,000. Due to high demand H1-B visas are allocated by the US Citizenship and
Immigration Services (USCIS) on the basis of a random selection of the petitions needed to
meet the cap.
The O-1 visa is for individuals who possesses extraordinary ability in the sciences, arts,
education, business, or athletics, or who demonstrated record of extraordinary achievement in
the motion picture or television industry and have been recognized nationally or
internationally for those achievements. Special visas exist for workers accompanying and
assisting O-1 workers (O2) and for spouses and children of O-1 and O2 (O3). This is the only
category which doesn’t require the HQW to hold a job offer.
112 There were 18,466 unused numbers in the family-sponsored preferences in 2012. The annual limit was higher
in 2013 than 2012 because there were more unused family preference visas in 2012 than in 2011; from Office of
Immigration Statistics, Annual Flow report, U.S. Lawful Permanent Residents: 2013, May 2014. 113 Office of Immigration Statistics policy directorate, Randall Monger and James Yankay, Annual Flow report,
U.S. Lawful Permanent Residents: 2013, May 2014.
http://www.dhs.gov/sites/default/files/publications/ois_lpr_fr_2013.pdf 114 Ibid 115 Ibid 116 ibid 117 Before an application for a temporary worker visa (H1-B) at an U.S. Embassy or Consulate can be launched,
a Petition for a Non-immigrant Worker, Form I-129, must be completed by the prospective employer of the
HQW. This form includes fields on the job offer.
44
H1-B visa allows foreigners to enter the US for a specific limited stay but it also permits
employers to apply immediately for permanent resident status for their sponsored foreign-
born employee. According a study conducted by the US Congressional Research Service,
90% of employment-based green cards (permanent visas) were awarded to individuals who
originally entered the US as foreign students and temporary workers, many of whom hold H1-
B and L visas. The temporary-to-permanent resident transition amongst highly-qualified
TCNs is a key characteristic of the US labour market immigration system. This being said,
this transition is much more difficult, from an administrative point of view, for holders of the
O visas or other temporary visas118
.
Further temporary visas are:
■ Visas for intra-company transfers of high-level managers in multinational
companies (L1). Profiles of L1 visa holders are, according to an expert
interviewed, similar to those coming under a H1-B category. Around 50,000 –
70,000 L category visas are issued on an annual basis. L visas permit corporate
transferees to apply for permanent resident status.
■ Exchange visitors visas (J1) which concerns professionals in an exchange
situation which can last up to several years, i.e. University professors,
researchers.
The following sections focus on the H1-B visa, as it was identified as the permit best
comparable with the EU Blue Card.
1.3 Design of the scheme
To benefit from a H1-B visa, the foreign national must hold a higher education degree (or its
equivalent) and be sponsored by a US employer. The employer must submit a Labour
Condition Application (LCA) to the Department of Labour119
.
There is no labour market test under the H1-B visa category (contrary to other entry routes).
However, the Department of Labour requires that employers asking for an H1-B visa must
certify in a Labour Condition Application stating that:
■ they meet the wage requirement;
■ the admission of the temporary foreign worker will not affect the outcome of a
labour dispute120
;
■ the employer gives public notice at the place of employment about their wish to
hire a H1-B worker.
The Department of Labour checks whether the LCA is complete and the three requirements
are met. Once the LCA is accepted by the Department of Labour, the employer is able to
submit a completed ‘Form I-129’ or Petition for a Non-immigrant Worker – which is the
application form for the temporary visa for the qualified worker - to USCIS. Once the Form I-
129 petition has been approved, the prospective H-1B worker who is outside the United States
may apply with the US Department of State (DOS) at a US embassy or consulate abroad for
118 Koslowski, Rey (2014) “Selective migration policy models and changing realities of implementation”, International
Migration Vol. 52 (3). 119 Website of the Department of Homeland Security (2015), “Webpage presenting the overview of Temporary
Worker Visas”, available at http://www.uscis.gov/working-united-states/temporary-workers/h-1b-specialty-
occupations-dod-cooperative-research-and-development-project-workers-and-fashion-models (accessed mid
November 2015) 120 That the employer does not bring in a foreign worker in the case of a Labour dispute with a Trade union /
employee.

45
an H-1B visa. The prospective H-1B worker must then apply to US Customs and Border
Protection (CBP) for admission to the US in H-1B classification. There are several steps in
the visa application process. The order of these steps and how the TCN completes them may
vary from one US Embassy or Consulate to another. Consular officers have the discretion to
require an interview of any applicant. There is a non-refundable visa application fee of
$190121
.
The Immigration and Nationality Act (INA) requires that the hiring of a foreign worker will
not adversely affect the wages and working conditions of US workers comparably employed.
To comply with the statute, the Department's regulations require that the wages offered to a
foreign worker must be the prevailing wage rate for the occupational classification in the area
of employment122
. Since 2010, employers can obtain this wage rate by submitting a request to
the National Prevailing Wage Centre (NPWC), or by accessing other legitimate sources of
information such as the Online Wage Library, available for use in some programs123
.
There are four visa processing application centres in the US. Additional fees can be paid to
speed decision-making on an application. Immigration lawyers can also be paid by employers
to conduct the visa application process (approx. $5-7,000). In some cases the prospective
employee has to bear the costs124
.
H-1B holders are upon dismissal from employment immediately considered as illegally
present in the US, unless an application for another temporary visa is currently pending125
.
Spouses have no access to the labour market, unless they successfully apply themselves for a
new H-1B visa. This is an important difficulty for HQWs126
.
1.4 Statistical overview
The number of H-1B visas issued was capped in legislation to 65,000 H1-B. In the 1990s
(economic boom years), the US Congress periodically, and only for a limited period of time,
increased the cap, which went as high as 195,000.
It has been extremely difficult to reach an agreement in the US Congress on the change in the
cap number, despite pressure from certain employers, especially in STEM (science,
technology, engineering and math) fields127
. As a result, exemptions, as a default solution,
have been created, thus allowing highly qualified workers to be granted an H1-B visa. In 2005
for example, an extra 20,000 H-1B visas were allowed for those with advanced degrees
mainly in STEM fields128
. Foreign nationals working for non-for- profit organisations (this
includes universities, research labs, think tanks) are also not subject to H1-B caps.
121 Website of the US Department of State – Bureau of Consular Services, available at
http://www.travel.state.gov/content/visas/en/employment/temporary.html#overview (accessed mid November
2015) 122 Website of the US Department of Labor, available at http://www.foreignlaborcert.doleta.gov/pwscreens.cfm
(accessed mid November 2015) 123 ibid 124 Interview with Dimitri Papademetriou on 30 November 2015 125 Lucy Haley, “The Challenges to Lawmaking With Respect to Highly Qualified Immigration: A Comparison
of the European Union and United States”, European Union Law Working Papers - No. 8, Stanford Law School
and University of Vienna School of Law, 2012. 126 Interview with Dimitri Papademetriou on 30 November 2015 127 Martin, P. (2012) Attracting Highly Skilled Migrants: US Experience and Lessons for the EU. Robert
Schuman Centre for Advanced Studies. 128 Kaushal, N. and Fix, M. (2006), “The Contributions of High-Skilled Immigrants”, Migration Policy Institute
Insight, July 2006, No. 16

46
Considering all of the existing exemptions, the total number of H-1B visas issued is in reality
close to double the official cap at 65,000, as shown in the table below. The table presents the
main class of temporary visas issued to highly qualified or qualified TCNs. Most TCNs were
from Asia, specifically from India (108,817 in 2014)129
.
Table 1. Number of temporary visas issued to foreign nationals - 2012-2014
2012 2013 2014130
Temporary workers in specialty occupations (H1-B) 135,53
0
153,22
3
161,36
9
Workers with extraordinary ability or achievement (O-
1)
10,590 12,359 12,706
Intra-company transferees (L1) 62,430 66,700 71,513
Temporary visitors for business (B1) 35,341 41,956 44,880
Source: US Department of State, Bureau of Consular Affairs, available at
http://travel.state.gov/content/visas/en/law-and-policy/statistics/non-immigrant-visas.html (accessed
mid November 2015)
The table below presents the total number of persons who received lawful permanent resident
status from 2010 to 2013 and how many, out of those, obtained it via the employment-based
preferences, and specifically via the First Preference (EB1): Priority workers and Second
Preference (EB2): Professionals with advanced degrees or aliens of exceptional ability.
The table also shows whether LPR status was obtained via a status adjustment process or
directly upon arrival to the US.
Table 2. Persons obtaining lawful permanent resident status by type and major class of admission: fiscal
years 2010 to 2013 - new arrivals and adjustments of status included
Type and class of admission 2010 2011 2012 2013
Total Persons obtaining lawful
permanent resident status
1,042,625 1,062,040 1,031,631 990,553
Total Employment-based preferences 148,343 139,339 143,998 161,110
EB1 : Priority workers 41,055 25,251 39,316 38,978
EB2 : Professionals with advanced degrees
or aliens of exceptional ability
53,946 66,831 50,959 63,026
Out of which: total adjustment of status 136,010 124,384 126,016 140,009
EB1 First: Priority workers 39,070 23,605 37,799 37,283
EB2 Second: Professionals with advanced
degrees or aliens of exceptional ability
52,388 65,140 49,414 60,956
Out of which: total new arrivals 12,333 14,955 17,982 21,101
EB1 First: Priority workers 1,985 1,646 1,517 1,695
EB2 Second: Professionals with advanced
degrees or aliens of exceptional ability
1,558 1,691 1,545 2,070
Source: U.S. Department of Homeland Security
129 Non-immigrant Visa Issuances by Visa Class and by Nationality http://travel.state.gov/content/visas/en/law-
and-policy/statistics/non-immigrant-visas.html 130 Data as of 09/30/2014.
47
1.5 Comparative overview of the national scheme and the EU Blue Card
The United States is one of the countries which attracts the most interest from highly qualified
TCNs, for cultural and economic (prospects) reasons. Canada and Australia are the main
competitors to the US in terms of attracting TCNs who otherwise might have migrated to the
USA. This is also due to the fact that both countries aim specifically to attract close to two
thirds of TCNs through the employment category.
The Blue Card system provides for more protection for the foreign workers: it allows for
family reunification and unlike the H1-B programme, it gives EU Blue Card holders
dismissed by their employers a three months period for them to secure new employment.
Also, unlike under the H1-B programme, EU Blue Card holders are not dependent on their
employers to apply for long-term residence131
.
2 Evaluation of the US schemes for attracting highly qualified workers
2.1 Advantages
The temporary-to-permanent resident transition which is a key characteristic of the qualified
US labour market immigration system has the advantage of allowing immigration services
and employers to use information about economic and other forms of integration during the
initial, temporary residence period in order to decide on permanent residence132
.
2.2. Disadvantages
The qualified US legal labour migration system is known to be complex and constraining.
The system has been criticized as giving too much power to employers. The bonus on
applying for permanent resident status is on employers who send the application for their
sponsored foreign-born employee.
A study by the Robert Schuman Centre for Advanced Studies in 2012 indicated that the
employer-led H-1B program has the potential of leading to abuses of workers hard to detect
and correct: “since many H-1B visa-holders hope to be sponsored by their employers for
immigrant visas, they rarely complain, giving DOL few opportunities to investigate.”133
Similarly, the prevailing wages concept is a hard one to implement as its accuracy relies on
proprietary information on wages from employers134
. The labour department therefore relies
on figures which may not be close enough to reality to establish when an employer is
underpaying the worker. In addition there is no obligation to increase the worker’s wage
during the maximum duration of three years of the H-1B visa. Also, an immigrant who
changes employers – or accepts a raise or promotion from a current employer – will have to
start over the application to LPR status135
.
131 Lucy Haley, “The Challenges to Lawmaking With Respect to Highly Qualified Immigration: A Comparison
of the European Union and United States”, European Union Law Working Papers - No. 8, Stanford Law School
and University of Vienna School of Law, 2012. 132IOM Labour Shortages and Migration Policy 2012. 133 Martin, P. Attracting Highly Skilled Migrants: US Experience and Lessons for the EU. Robert Schuman
Centre for Advanced Studies, 2012. 134 Interview with Dimitri Papademetriou on 30 November 2015. 135 Puneet Arora, Congress must address employment-based Green Card backlog, THE HILL (July 28, 2011)
http://thehill.com/blogs/congress-blog/civil-rights/174049-congress-must-address-employment-based-green-
cardbacklog, cited in Lucy Haley, “The Challenges to Lawmaking With Respect to Highly Qualified

48
The lottery system for the allocation of the H1-B visas was designed by default. It is a
reflection of unresolved issues between the supply of visas and the demand for workers by
employers and the US Congress’ unwillingness to create flexible quotas. It incentivizes
employers to apply for more visa applications than they need. This creates a higher
administrative burden for employers and the lawyers they employee to file those applications
before 1 April.
This system creates a fundamental problem: admissions are random rather than selective, and
very highly qualified candidates may be turned away simply because there were not selected
due to the random nature of the selection136
.
The cap system, which has not changed much since the 1990s, does not allow fluctuating
economic needs to be reflected and addressed in the migration system. There is a political
deadlock preventing the cap system to be revisited: the Republican Party and large companies
are in favour of attracting a higher number of HQWs, whilst labour unions and some
engineering professions supported by key senators from both political parties are against
raising the cap. Whilst some employers argue that labour shortages persist in the STEM
fields, those are occupations where unemployment rates are low (3-4%) but considered
nonetheless significant. In addition, this issue has been politically tied to the issue of the
regularization of millions of illegal migrants in the US137
.
2.3. Recent developments
At present, the US Congress is currently considering the following legislation on highly
qualified TCNs138
:
■ Immigration Innovation Act: A bipartisan bill introduced in the US Senate in
January 2015 that would almost double the number of visas for temporary high
qualified TCNs (H-1B visas), from 65,000 to 115,000, and eliminate annual per-
country limits for employment-based green cards.
■ Start-Up Act: A bipartisan bill introduced in the Senate in January 2015 (three
prior versions had been introduced) that proposes creating an entrepreneurs visa
for TCNs and a STEM visa for US-educated foreign-born workers with advanced
degrees in science, technology, engineering or mathematics, and eliminating per-
country caps on employment-based immigration visas.
Difficulties in building a consensus across partisan lines make it unlikely for either bills to go
through at least until the next presidential elections139
.
2.4 References
■ Expert input by Ana Gazarian
■ Expert interview with Dimitri Papademetriou on 30 November 2015
■ Haley, L. (2012), “The Challenges to Lawmaking With Respect to Highly
Qualified Immigration: A Comparison of the European Union and United States”,
Immigration: A Comparison of the European Union and United States”, European Union Law Working Papers -
No. 8, Stanford Law School and University of Vienna School of Law, 2012. 136 IOM Labour Shortages and Migration Policy 2012. 137 Interview with Dimitri Papademetriou on 30 November 2015 138 “The U.S. Immigration Debate”, Author: Danielle Renwick, The Council on Foreign Relations,
http://www.cfr.org/immigration/us-immigration-debate/p11149 139 Interview with Dimitri Papademetriou on 30 November 2015
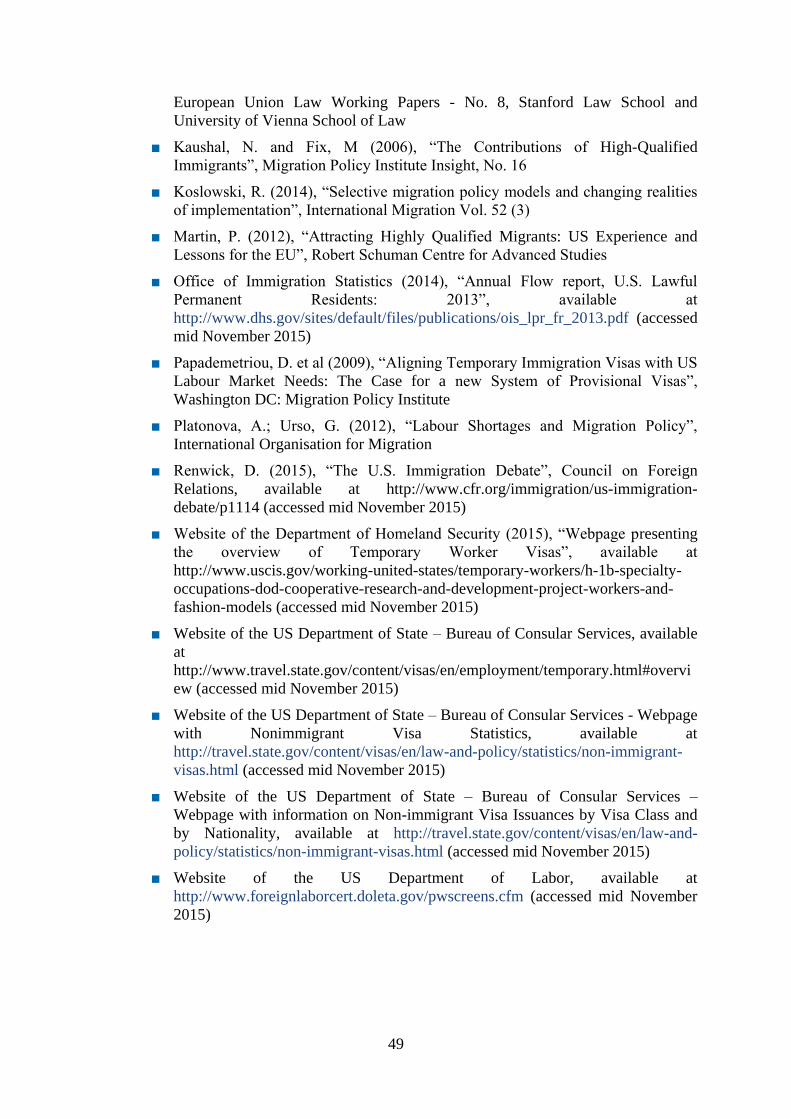
49
European Union Law Working Papers - No. 8, Stanford Law School and
University of Vienna School of Law
■ Kaushal, N. and Fix, M (2006), “The Contributions of High-Qualified
Immigrants”, Migration Policy Institute Insight, No. 16
■ Koslowski, R. (2014), “Selective migration policy models and changing realities
of implementation”, International Migration Vol. 52 (3)
■ Martin, P. (2012), “Attracting Highly Qualified Migrants: US Experience and
Lessons for the EU”, Robert Schuman Centre for Advanced Studies
■ Office of Immigration Statistics (2014), “Annual Flow report, U.S. Lawful
Permanent Residents: 2013”, available at
http://www.dhs.gov/sites/default/files/publications/ois_lpr_fr_2013.pdf (accessed
mid November 2015)
■ Papademetriou, D. et al (2009), “Aligning Temporary Immigration Visas with US
Labour Market Needs: The Case for a new System of Provisional Visas”,
Washington DC: Migration Policy Institute
■ Platonova, A.; Urso, G. (2012), “Labour Shortages and Migration Policy”,
International Organisation for Migration
■ Renwick, D. (2015), “The U.S. Immigration Debate”, Council on Foreign
Relations, available at http://www.cfr.org/immigration/us-immigration-
debate/p1114 (accessed mid November 2015)
■ Website of the Department of Homeland Security (2015), “Webpage presenting
the overview of Temporary Worker Visas”, available at
http://www.uscis.gov/working-united-states/temporary-workers/h-1b-specialty-
occupations-dod-cooperative-research-and-development-project-workers-and-
fashion-models (accessed mid November 2015)
■ Website of the US Department of State – Bureau of Consular Services, available
at
http://www.travel.state.gov/content/visas/en/employment/temporary.html#overvi
ew (accessed mid November 2015)
■ Website of the US Department of State – Bureau of Consular Services - Webpage
with Nonimmigrant Visa Statistics, available at
http://travel.state.gov/content/visas/en/law-and-policy/statistics/non-immigrant-
visas.html (accessed mid November 2015)
■ Website of the US Department of State – Bureau of Consular Services –
Webpage with information on Non-immigrant Visa Issuances by Visa Class and
by Nationality, available at http://travel.state.gov/content/visas/en/law-and-
policy/statistics/non-immigrant-visas.html (accessed mid November 2015)
■ Website of the US Department of Labor, available at
http://www.foreignlaborcert.doleta.gov/pwscreens.cfm (accessed mid November
2015)

50
■
National schemes for attracting highly qualified workers Country Fiche: Canada

51
Key Points to note140
:
Permanent residence programs:
There are three federal-level programs that support the permanent residence
of skilled migrants: the Federal Skilled Trades Program (FSTP), the Federal
Skilled Worker Program (FSWP) and the Canadian Experience Class (CEC).
These include a points-based assessment of candidates' 'human capital
factors', such as age, education, language proficiency and work experience.
Since 1 January 2015, all applicants for the three programs must apply
through 'Express Entry', an online 'filtering and ranking' stage. The highest-
ranked candidates then receive an Invitation to Apply (ITA) to individual
programs.
Having skilled work experience and minimum language proficiency in
English and/or French are conditions of entry for all programs (FSWP, FSTP
and CEC).
Temporary residence programs
There are two temporary residence schemes for skilled workers: the
Temporary Foreign Worker Program (TFWP) and the International Mobility
Program (IMP).
Applications through the TFWP must always be supported by a job offer and
a positive Labour Market Impact Assessment (LMIA). The IMP is mostly
regulated by international agreements and applications do not require LMIAs.
Most entrants under the TFWP are low-skilled, although there is a 'high-
wage' stream within the scheme. Workers under the TFWP normally receive
employer-specific work permits, whereas IMP workers generally have greater
labour market mobility.
Key points:
Under Express Entry (EE), the government has high control over intake.
There are no longer any caps for new applicants to permanent residence
programs.
Although having a job offer is not necessary to apply through EE, individuals
with pre-arranged employment are far more likely to gain entry to Canada.
The new system of EE gives the employers and provincial governments’
greater role in the process.
It is too early to assess the full impacts of Express Entry. However, according
to Citizenship and Immigration Canada (CIC), this acts as a "means of
selecting those best placed to succeed" and having a "managed migration
system" is one of the strengths of Canada's approach to skilled migration141.
In terms of unemployment rates, 'landed immigrants' appear relatively well-
integrated into the labour market. However, the underemployment of skilled
140 While this research was being conducted, the government department responsible for immigration,
Citizenship and Immigration Canada (CIC), was renamed as Immigration, Refugees and Citizenship Canada
(November 2015). This change is in the process of being applied to the CIC website and resources, but is not yet
complete. For ease, the acronym 'CIC' has been used throughout this document. 141 Citizenship and Immigration Canada (CIC). Phone interview, 20 Nov 2015.

52
immigrants (i.e. entry in low-income/low-skill jobs) can be an issue (hence the
emphasis on employer involvement under EE).
The target to process 80% EE applications in six months seems on track.
Amongst high-skilled permanent residents, roughly half have previous work
experience as temporary workers in Canada142.
2. Overview of the scheme
The economic stream of Canada’s migration system is built on a points-based assessment of
candidates, considering a range of human capital factors to determine immigrant eligibility
and impacted by a range of additional variables, such as employer or provincial nomination.
Since the introduction of the points system in 1967, Canada has sought to ensure that
immigration coincides with the country’s evolving needs and interests143
.
Skilled migration programs that support permanent residence include the Federal Skilled
Trades Program (FSTP), the Federal Skilled Worker Program (FSWP) and the Canadian
Experience Class (CEC). These programs assess applicants against a range of 'human capital
factors', such as age, education, language proficiency and work experience. Having skilled
work experience is a condition of entry for all three programs. Applicants are not always
required to have a formal job offer or Canadian work experience, although such features
dramatically strengthen the chances of their application being successful, depending on the
program through which they apply. Since 1 January 2015, all applicants for permanent
residence under the skilled migration programs must apply through Canada's new online
application management system, 'Express Entry'144
, rather than applying directly to individual
programs. Express Entry serves as an additional 'filtering and ranking' stage, introduced to
respond to an excessive supply of applicants for the places available145
.
In addition to the permanent residence programs, there are two temporary schemes through
which skilled workers can enter Canada: the Temporary Foreign Worker Program (TFWP)
and the International Mobility Program (IMP). Applications through the TFWP must always
be supported by a job offer and a positive Labour Market Impact Assessment (LMIA) (see
below for more details). In contrast, the IMP is mostly regulated by international agreements
and applications are exempt from the requirement for LMIAs. The majority of entrants under
the TFWP are low-skilled, although there is a stream for 'high-wage' workers.
2.1 Design of the scheme
Permanent residence programs
All applicants to the economic stream of the permanent residence programs (FSWP, FSTP
and CEC) must make an initial application through the Express Entry system. This is used as
a 'first filter' for establishing whether applicants are eligible for one or more of the three
federal programs (FSWP, FSTP, CEC), or the Provincial Nominee Program (PNP)146
. Those
142 Estimate by CIC. Phone interview, 20 November 2015. 143 Challinor, A.E. (2011), “Canada’s Immigration Policy: a focus on Human Capital”, Migration Policy
Institute, available at http://www.migrationpolicy.org/article/canadas-immigration-policy-focus-human-capital 144 http://www.cic.gc.ca/english/express-entry/index.asp 145 CIC. Phone interview, 20 November 2015. See full interview citation in references at the end. 146 The PNP is a system of provincial/territorial nomination of immigrants. Only the federal programs will be
presented in this analysis. For more information on the PNP, see
http://www.cic.gc.ca/english/immigrate/provincial/

53
who fulfil the eligibility criteria will be moved into a 'pool of candidates', where they will be
ranked using the Comprehensive Ranking System (points-based)147
. Only those candidates
who are ranked highly enough will be issued with an Invitation to Apply (ITA) for permanent
residence, at which point they can begin the application process for the individual programs
mentioned above (FSWP, FSTP and CEC).
During the ranking of candidates through Express Entry, the features that receive the most
weight are the candidates' core human capital factors (age, level of education, official
language proficiency and Canadian work experience) and (if held) an offer of arranged
employment (supported by a Labour Market Impact Assessment) or the provincial
nomination. However, applicants may also gain some (minor) points for a range of additional
features, such as the language proficiency of their spouse or common-law partner and the
transferability of their skills148
. The CIC aims to process 80% applications through Express
Entry within six months. After receiving the ITA, candidates have 60 days to apply for
permanent residence, and fulfil the entry criteria specified under individual programs (see
below).
Temporary residence programs
There are two forms of entry for the Temporary Foreign Worker Program: the 'high-wage' and
'low-wage' stream149
. Only the procedure for the 'high-wage' stream is presented here, as this
is more likely to cover the skilled category of workers.
Under the high-wage stream, employers must obtain a positive Labour Market Impact
Assessment (LMIA) from Employment and Social Development Canada (ESDC), proving
that the worker is needed for a specific position150
. A positive LMIA shows that there is a
need for a foreign worker for a specific position, and that no Canadian worker is available to
take up the position. A positive LMIA is occasionally referred to as a confirmation letter.
Employers can use either the Temporary Foreign Worker Web Service or a paper application
form to apply for the LMIA. The cost of each LMIA (for each position requested) is CAN
$1000. The temporary worker must then apply for a work permit, using their LMIA-supported
confirmation letter (provided by the employer). Once an LMIA is issued, it is valid for six
months. Employers can only apply for the TFWP with a valid LMIA.
As part of the high-wage stream, unless the position is of a limited duration, employers must
submit a Transition Plan showing how they will recruit and train Canadians and how they will
support the TFWs to become permanent residents. These activities must be undertaken over
the course of the employment period151
. In future, if employers are inspected or apply for an
additional LMIA in similar circumstances, they will have to report back on their progress
against the commitments they made in the Plan.
In order for the foreign national to apply for a temporary work permit through the
International Mobility Program, employers first need to submit an Offer of Employment form
and compliance fee (CAN $230) through the 'Employer Portal'. Since February 2015,
147 This takes account skills and experience factors; whether they have a job offer; whether they have a
nomination from a province or territory. Extra points are available for a job offer backed by a Labour Market
Impact Assessment (LMIA) and/or provincial nominations. 148 For more information, see the Express Entry Comprehensive Ranking System:
http://www.cic.gc.ca/english/express-entry/grid-crs.asp#a1 149 The high-wage stream covers those earning at or above the provincial/territorial median hourly wage. 150 Government of Canada Website, Employment and Social Development Canada;
http://www.esdc.gc.ca/eng/jobs/foreign_workers/high_low_wage/low_wage/index.shtml#tab5 151 Government of Canada Website, Employment and Social Development Canada;
http://www.esdc.gc.ca/eng/jobs/foreign_workers/high_low_wage/high_wage/index.shtml

54
employers of foreign nationals are required to fill in the new compliance form (IMM5802),
making declarations about the employee. After an offer of employment has been successfully
added to the Employer Portal, an employment ID number will be provided to the employer,
who will pass this on to foreign national to include in their work permit application form152
.
2.2 Application procedure
The following table provides on overview of the entry requirements for the main federal
programs in Canada for skilled migration. Full details of the precise entry requirements for
individual programs are given in the Annexes at the end of this document. In addition, the
Annexes include the 'Comprehensive Ranking System' of Express Entry, which is used as a
first filter before individuals are judged against the entry requirements of individual programs.
152 Government of Canada Website, International Mobility Program: Employer-specific work permits with
Labour Market Impact Assessment exemptions;
http://www.cic.gc.ca/english/resources/tools/temp/work/admissibility/specific.asp

55
Table 1: Summary table of entry requirements Name of program
Entry
requirements
Federal Skilled
Worker Program
(permanent)
Federal Skilled Trade
Program
(permanent)
Canadian
Experience Class
(permanent)
Temporary
Foreign Worker
Program
(temporary)
High skills
requirements
E E E N (employers'
responsibility)
Minimum language
proficiency (English
and/or French)
E E E N (employers'
responsibility)
Minimum
educational
requirements
E A (certificate of
qualification in the
skilled trade issued
by territorial or
provincial body)
A N (employers'
responsibility)
Formal job offer A (although to be
valid it must be
supported by
LMIA and fulfil
conditions)
A (although to be
valid it must be
supported by LMIA
and fulfil conditions)
A (although to be
valid it must be
supported by LMIA
and fulfil
conditions)
E (must always be
supported by
LMIA and fulfil
conditions)
Labour market
impact assessment
(LMIA)
A (LMIA is
essential if job
offer is used to
support entry)
A (LMIA is essential
if job offer is used to
support entry)
A (LMIA is
essential if job offer
is used to support
entry)
E (always
essential to
support job offer)
Canadian work
experience
A A E N
Skilled work
experience
E E E N
Upper salary
threshold
N N N N
Other conditions Candidates must fulfil 'admissibility requirements' 153
Applicants must plan to live outside the province of Quebec. The
province has its own rules for choosing immigrants who will
adapt well to living there154.
n/a
Key: E = essential; A = advantageous; N = not needed. Note that the International Mobility
Program is excluded from this table, due to the diversity of the sub-programs it covers.
Language, education and skilled work experience
Permanent residence programs
All applicants for permanent residence under FSTP, FSWP and CEC are expected to fulfil
minimum language requirements in English and/or French. Candidates must prove their
ability in listening, speaking, reading and writing by taking a language test through CIC,
assessing their level based on the Canadian Language Benchmark (CLB). The precise
language requirements depend on the program through which candidates apply. The expected
language proficiency of applicants for the Federal Skilled Worker Program is higher than that
153 Amongst others, applicants may be deemed inadmissable for security reasons (e.g. espionage, subversion,
terrorism), human or international rights violations, criminal convictions, health grounds, financial reasons (e.g.
lacking the resources to support themselves and their family members) etc. For a full list, see
http://www.cic.gc.ca/english/information/inadmissibility/who.asp 154 More info at Government of Canada Website, Home, Immigration and citizenship, Immigrate, Quebec-
selected skilled workers; http://www.cic.gc.ca/english/immigrate/quebec/index.asp

56
for the Federal Skilled Trades Program. However, the language requirements for Canadian
Experience Class depends on the skill type of their Canadian work experience155
.
Canada's skilled migration programs for permanent residence place greater emphasis on the
skilled work experience of candidates than on their formal educational attainment. All of the
main permanent residence programs (Federal Skilled Worker Program, Canadian Experience
Class and Federal Skilled Trades Program) have minimum skilled work experience
requirements (see full details in Annex table at the end of this document). Despite the
low/non-existent educational requirements for the FSTP, FSWP and CEC, candidates under
all these programs can gain additional points for their education during the Express Entry
stage if they have either a Canadian post-secondary certificate, diploma or degree or an
equivalent foreign credential that is supported by an Educational Credential Assessment
(ECA)156
.
Furthermore, one of the core entry conditions for FSTP candidates is that they have either a
provincial certification, or a valid job offer, covering one of eligible skilled trades (all NOC
skill type B). As of November 2015, these trades are: industrial, electrical and construction
trades (Major Group 72); maintenance and equipment operation trades (Major Group 73);
supervisors and technical jobs in natural resources, agriculture and related production (Major
Group 82); processing, manufacturing and utilities supervisors and central control operators
(Major Group 92), chefs and cooks (Minor Group 632), and butchers and bakers (Minor
Group 633)157
.
Temporary residence programs
Under the Temporary Foreign Worker Program, employers have responsibility for ensuring
that the workers they sponsor have the appropriate level of training, education and experience
to perform the role for which they are being recruited158
. As explained in the table above, the
International Mobility Program does not set a common minimum requirement across sub-
programs when it comes to education, work experience, skills, etc. For intra-company
transferees coming through the IMP, it is possible for them to transfer to a position in a
specialised knowledge capacity (amongst other things)159
.
Job offer and salary threshold
Permanent residence programs
Unlike the Blue Card, applications to the permanent residence programs do not require
candidates to have a formal job offer. However, it is a fundamental asset for candidates, as it
155 Government of Canada Website, Home, Immigration and citizenship, Immigrate, Express Entry, Candidate,
Eligibility, Language requirements — Skilled immigrants (Express Entry);
http://www.cic.gc.ca/english/immigrate/skilled/language.asp 156 The ECA certifies that their educational level is equivalent to Canadian post-secondary level. Note that
education can be important for meeting the minimum number of points in Express Entry but is more important
for moving into the pool of candidates, which is filled by the top candidates only 157 Government of Canada Website, Home, Immigration and citizenship, Immigrate, Express Entry, Candidate,
Eligibility, Determine your eligibility – Skilled trades; http://www.cic.gc.ca/english/immigrate/trades/apply-
who.asp#noc 158 Government of Canada Website, Employment and Social Development Canada, Home, Jobs and Training,
Temporary Foreign Workers, Stream for Low-wage Positions;
http://www.esdc.gc.ca/eng/jobs/foreign_workers/high_low_wage/low_wage/index.shtml 159 According to the group Pro-link Global, in 2014, "the “Specialized Knowledge” requirement [was]
strengthened to requiring an employee to hold both proprietary knowledge and an advanced level of expertise,
both of which must be considered “unique and uncommon” within the industry". https://pro-
linkglobal.com/canada-significant-changes-throughout-canadian-temporary-foreign-worker-programs/

57
makes them much more likely to receive an Invitation to Apply (ITA) for permanent
residence160
. Specifically, in Express Entry, 600 out of 1200 points in the Comprehensive
Ranking System are based upon having either "arranged employment with a positive Labour
Market Assessment" or a provincial or territorial nomination. According to CIC, without a
valid job offer, applicants may not score enough points for entry, as they could lose additional
points based on age, education level, etc.161
. Indeed, part of the rationale for introducing
Express Entry was to put employers and the provincial/territorial authorities "front and
centre" under the new system162
. Furthermore, having a valid job offer is a specific way for
candidates to demonstrate eligibility for the FSTP.
In order to be valid for points, job offers must be supported by a positive Labour Market
Impact Assessment (LMIA) from Employment and Social Development Canada. They must
also fulfil some core criteria under each individual program, as outlined below. There is no
LMIA fee for permanent residency applications.
Federal Skilled Worker Program and the
Canadian Experience Class
Federal Skilled Trade Program
Valid job offers must be:
Permanent, non-seasonal, full time;
Supported by a positive LMIA; and
One of the following skill types: Skill Type
0 (managerial occupations), Skill Level A
(professional occupations) or B (technical
occupations and skilled trades) on the
Canadian National Occupational
Classification (NOC) list.
Valid job offers must be:
For at least one year of full-time work;
Supported by a positive LMIA; and
At Skill Level B (technical occupations and skilled
trades) in one of the eligible occupations under the
National Occupational Classification (NOC)163.
They must also have wages and working conditions
comparable to those offered to Canadians working in
the occupation.
There are no minimum salary requirements for the FSTP, FSWP or CEC, although applicants
who are not currently authorized to work in Canada or who lack a valid job offer from an
employer in Canada must prove that they have sufficient funds to support themselves and
their family on arrival. The amounts range from $CAN 11,931 for a family of 1 to $CAN
31,574 for a family of 7 or more164
.
160 In Express Entry, 600 out of 1200 points in the Comprehensive Ranking System are based upon having either
"arranged employment with a positive Labour Market Assessment" or a provincial or territorial nomination
According to CIC, without a valid job offer, applicants may not score enough points for entry, as they could lose
additional points based on age, education level, etc. CIC. Phone interview, 20 November 2015 161 CIC. Phone interview, 20 November 2015 162 Demetri Papademetriou, President of Migration Policy Institute (MPI) Europe, Phone call, 17 December
2015. 163 As explained above, these are: industrial, electrical and construction trades (Major Group 72); maintenance
and equipment operation trades (Major Group 73); supervisors and technical jobs in natural resources,
agriculture and related production (Major Group 82); processing, manufacturing and utilities supervisors and
central control operators (Major Group 92), chefs and cooks (Minor Group 632), and butchers and bakers (Minor
Group 633) 164 Government of Canada Website, Home, Immigration and citizenship, Immigrate, Express Entry, Candidate,
Eligibility Proof of funds – Skilled immigrants (Express Entry);
http://www.cic.gc.ca/english/immigrate/skilled/funds.asp

58
Temporary residence programs
As explained above, employers wishing to bring skilled foreign workers into Canada
temporarily must generally submit a formal job offer to the CIC, when applying under the
TFWP. Although it differs by sub-program, this is generally also true of the IMP. However,
job offers through the TFWP must be LMIA-supported, whereas this is not a requirement for
the IMP. Furthermore, job offers under the TFWP must be full-time positions (minimum 30
hours of work each week)165
.
Through the TFWP, employers must commit to paying the TFW at least the 'prevailing wage'
for the occupation and work location of the job166
. If they pay the foreign national a wage that
is above the prevailing wage, this must be in the same range as the wages of their current
equivalent employees. Generally speaking, IMP represents a collection of several different
programs and there is no common salary threshold. However, all ICT applicants must receive
at least the provincial/territorial prevailing wage for their specific occupation167
.
2.3 Rights granted under the scheme
All foreign nationals working in Canada (both temporary and permanent residents) should
have the same working standards and equal labour rights to residents born in Canada. Once
permanent residents, skilled foreign workers do not face any restrictions to their labour
market access or mobility.
For permanent residence programs, provincial and territorial governments have responsibility
for enforcing labour standards (applicable on equal terms to those born in Canada and landed
immigrants, i.e. immigrants with a right to permanent residence). The CIC would only get
involved when working with its provincial counterparts. For temporary foreign workers,
ESDC has responsibility for following up with employers, who may be subject to inspection.
The length of the work permit issued to temporary foreign workers tends to depend on the
judgement of Service Canada and the ESDC. Workers under the TFWP normally receive
employer-specific work permits168
, whereas IMP workers generally have open work permits,
which give them greater mobility and do not tie them to specific employers. In some cases,
IMP entrants will have 'open restricted permits', which do not limit them to particular
employers but may restrict the occupations or locations in which they can work.
According to the CIC, there are different kinds of 'settlement services' for foreign nationals,
but these tend to be fairly limited for high-skilled entrants. For instance, they already have to
meet the minimum language requirements before they come (at least average level language
skills in English and/or French), so access to language training is fairly limited. Experience
shows that they do not normally require access to other kinds of support. Indeed, the majority
of integration support goes to refugees or those needing other kinds of social assistance. As
opposed to formal governmental provision, support is normally offered through a system of
grants and contributions to service-providing organisations.
165 However, an offer of employment is not needed if employers are hiring a temporary worker with an open
work permit. 166 Under the Temporary Foreign Worker Program, the prevailing wage rate is the median hourly wage (or
annual salary) for the work location and occupation, as published on Job Bank. 167 Pro-Link GLOBAL Website; https://pro-linkglobal.com/canada-significant-changes-throughout-canadian-
temporary-foreign-worker-programs/" 168 Government of Canada Website, Employment and Social Development Canada;
http://www.esdc.gc.ca/eng/jobs/foreign_workers/reform/index.shtml

59
2.4 Statistical overview
The 'economic class' under Canada's permanent residence programs have the primary
objective of ensuring the entry and integration of highly-skilled people into the country169
.
The expansion of the economic class in Canada has led to a change in the types of immigrants
entering. In the mid-1980s, 50% of immigrants were admitted based on family preferences,
30% were economic migrants and 18% were refugees. By 2009, these proportions changed to
38%, 47% and 9% respectively. In other words, the largest single bloc of entrants were skilled
persons. In 2013, this pattern was yet more pronounced: of the 258,953 permanent residents
admitted in this year, 148,181 (57%) came under the economic class of migration programs,
whereas 81,831 (32%) came under the family class and 28,941 (11%) came as refugees, for
humanitarian and compassionate grounds or in an 'other' way170
. However, it is worth noting
that the economic class also includes dependents.
Since the establishment of the Express Entry system on 1 January 2015, there are no longer
any caps in place for the permanent economic immigration programs, although those
previously in place for the FSTP and FSWP are being applied to pre-2015 candidates171
.
Under the new system, the government has a high level of control over intake, as it can
determine the frequency of draws/rounds from the 'pool of applicants' and the number of
invitations issued. According to CIC, Express Entry acts as a "means of selecting those best
placed to succeed or economically establish"172
.
In 2014, there were 165,089 economic immigrants (permanent residents) to Canada, of which
28,773 were skilled workers (principal applicants) and a further 38,712 were skilled workers
who applied as spouses and dependents. Overall, men were slightly more likely to enter as
skilled workers, although women were more likely to be amongst the skilled applicants who
applied as spouses and dependents. Of the 28,773 skilled workers (principal applicants),
11,293 were female and 17,480 were male. Of the 38,712 skilled workers (spouses and
dependents), 17,514 were male and 21,197 were female173
.
There are strong signs that Canada's programs for economic immigration attract far more
interest from highly-skilled workers than there are places available. As shown by the table
below, nearly 37% (41,218) of those who applied through Express Entry between 1 January
and 6 July 2015 were deemed eligible to enter the 'pool of candidates', meaning these
individuals fulfil the conditions for one or more economic programs. However, only (12,017)
(11% of all applicants, 29% of those in the pool) had so far been issued with an invitation to
apply for permanent residence174
.
169 CIC. Phone interview, 20 November 2015. 170 Government of Canada Website, Departments and agencies, Citizenship and Immigration Canada,
Publications and manuals; http://www.cic.gc.ca/english/resources/publications/annual-report-
2014/index.asp#sec-1 171 In other words, those who applied prior to 1 Jan 2015 are being processed according to the requirements that
were in place when the application was received. Between 1 May 2014 and 31 December 2014, the government
was applying a cap of 25,000 new applications for the FSWP, 8.000 applications for the CEC and 5,000
applications for the FSTP. http://www.cicnews.com/2014/04/breaking-news-reopening-federal-skilled-worker-
program-043382.html#sthash.EFUznUqI.dpuf%22 172 CIC. Phone interview, 20 November 2015. 173 Government of Canada Website, Departments and agencies, Citizenship and Immigration Canada, Research
and statistics; http://www.cic.gc.ca/english/resources/statistics/facts2014/permanent/02.asp 174 However, some of those in the pool may receive an invitation at a later stage.

60
Table 2: Overview of applications through Express Entry (covering FSWP, FSTP, CEC
and PNP, 1 January - 6 July 2015)175
Ap
pli
cati
on
s re
ceiv
ed (
'Exp
ress
En
try
' p
rofi
les
crea
ted
)
Nu
mb
er
of
ind
ivid
ua
ls
no
t
elig
ible
th
rou
gh
Ex
pre
ss E
ntr
y
Nu
mb
er o
f in
div
idu
als
act
ive
in
the
'po
ol
of
can
did
ate
s'
Nu
mb
er
of
ind
ivid
ua
ls
in
Ex
pre
ss E
ntr
y i
nv
ited
to
ap
ply
for
per
ma
nen
t re
sid
ence
Nu
mb
er
of
ap
pli
cati
on
s fo
r
per
man
ent
resi
den
ce r
ecei
ved
Nu
mb
er o
f p
erm
an
ent
resi
den
ce
ap
pli
cati
on
s a
pp
rov
ed
for
pri
nci
pa
l a
pp
lica
nts
/
Nu
mb
er
of
per
ma
nen
t re
sid
ence
v
isa
s
issu
ed
for
pri
nci
pa
l a
pp
lica
nts
an
d t
hei
r d
epen
den
ts.
112,701 48,723 41,218 12,017 7,528 655 / 844
This aggregate data covers Federal Skilled Worker Program (FSWP); Federal Skilled Trades
Program (FSTP); Canadian Experience Class (CEC); and a portion of the Provincial Nominee
Programs (PNP). Some program-specific data is available on the number of invitations: of the
12,928 ITAs issued, 5,534 were for the CEC, 4,809 were for the FSWP, 1,887 were for the
FSTP and 698 were for provincial nominees176
. However, it is not known if which of these
recipients were amongst those who applied for or gained permanent residence.
Data by nationality on issued work permits is not available, although there is data on invited
candidates through the Express Entry scheme (again, note that invited candidates do not
necessarily gain permanent residence). Through Express Entry, the top ten countries of
citizenship of invited candidates, as of 6 July 2015, were India (2,687 invited candidates),
Philippines (2,514), UK (951), Ireland (682), China (531), US (521), South Korea (327),
France (258), Australia (257) and Mexico (249).177
Expenditure by program reflects that the Federal Skilled Workers Program is by far the
largest permanent residence program, followed by the Provincial Nominee Program and the
Canadian Experience Class. In the year 2014-2015, the FSWP accounted for around 47% of
program expenditure. By way of contrast, the Federal Skilled Trades Program represented
only 1.2% of actual program expenditure in this period.
Table 3: Actual Program Expenditures (CAN $) 1.1 Permanent Economic Residents 2013-14 2014-15
6901 Federal Skilled Workers 19,685,862 25,400,719
6902 Federal Skilled Trades - 647,866
6909 Canadian Experience Class 2,457,886 4,424,254
175 Government of Canada Website, Departments and agencies, Citizenship and Immigration Canada, Reports
and statistics; http://www.cic.gc.ca/english/resources/reports/ee-midyear-2015.asp 176 "The number of candidates invited is lower than the number of invitations sent because some candidates have
received more than one invitation. Express Entry candidates may decline an invitation, return to the Express
Entry pool and may be eligible to receive another invitation." http://www.cic.gc.ca/english/resources/reports/ee-
midyear-2015.asp 177 Government of Canada Website, Departments and agencies, Citizenship and Immigration Canada, Reports
and statistics; http://www.cic.gc.ca/english/resources/reports/ee-midyear-2015.asp
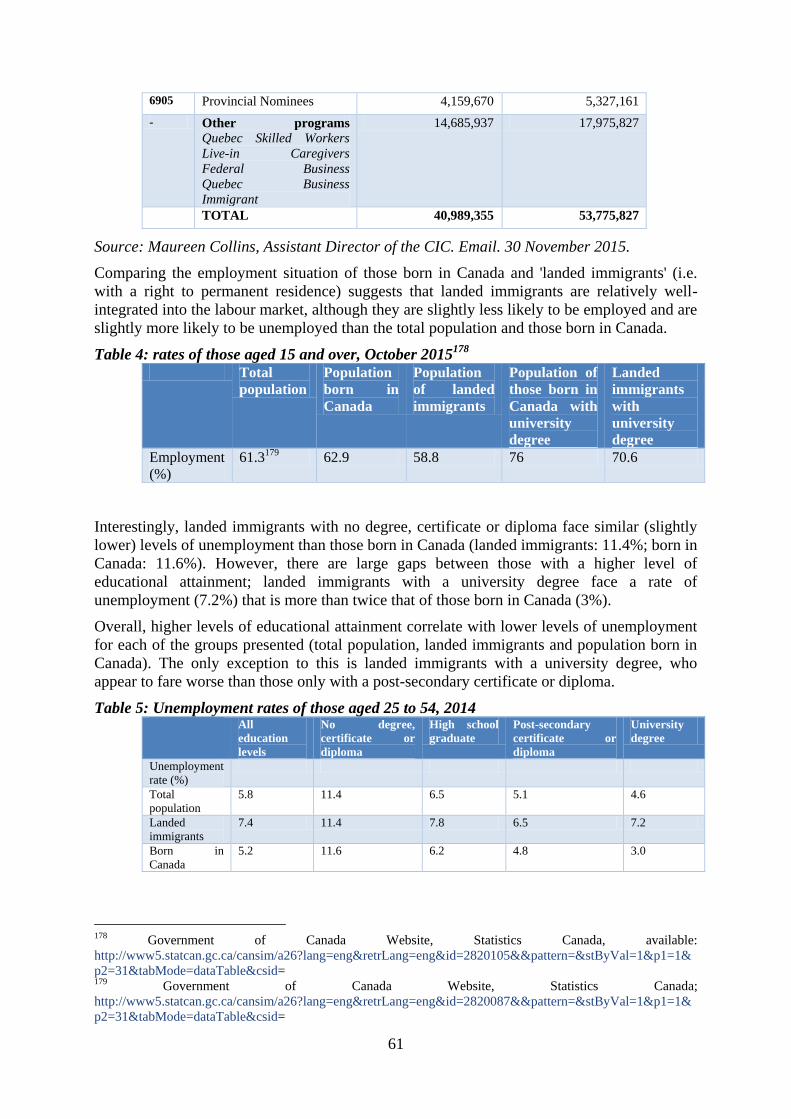
61
6905 Provincial Nominees 4,159,670 5,327,161
- Other programs Quebec Skilled Workers
Live-in Caregivers
Federal Business
Quebec Business
Immigrant
14,685,937 17,975,827
TOTAL 40,989,355 53,775,827
Source: Maureen Collins, Assistant Director of the CIC. Email. 30 November 2015.
Comparing the employment situation of those born in Canada and 'landed immigrants' (i.e.
with a right to permanent residence) suggests that landed immigrants are relatively well-
integrated into the labour market, although they are slightly less likely to be employed and are
slightly more likely to be unemployed than the total population and those born in Canada.
Table 4: rates of those aged 15 and over, October 2015178
Total
population
Population
born in
Canada
Population
of landed
immigrants
Population of
those born in
Canada with
university
degree
Landed
immigrants
with
university
degree
Employment
(%)
61.3179 62.9 58.8 76 70.6
Interestingly, landed immigrants with no degree, certificate or diploma face similar (slightly
lower) levels of unemployment than those born in Canada (landed immigrants: 11.4%; born in
Canada: 11.6%). However, there are large gaps between those with a higher level of
educational attainment; landed immigrants with a university degree face a rate of
unemployment (7.2%) that is more than twice that of those born in Canada (3%).
Overall, higher levels of educational attainment correlate with lower levels of unemployment
for each of the groups presented (total population, landed immigrants and population born in
Canada). The only exception to this is landed immigrants with a university degree, who
appear to fare worse than those only with a post-secondary certificate or diploma.
Table 5: Unemployment rates of those aged 25 to 54, 2014 All
education
levels
No degree,
certificate or
diploma
High school
graduate
Post-secondary
certificate or
diploma
University
degree
Unemployment
rate (%)
Total
population
5.8 11.4 6.5 5.1 4.6
Landed
immigrants
7.4 11.4 7.8 6.5 7.2
Born in
Canada
5.2 11.6 6.2 4.8 3.0
178 Government of Canada Website, Statistics Canada, available:
http://www5.statcan.gc.ca/cansim/a26?lang=eng&retrLang=eng&id=2820105&&pattern=&stByVal=1&p1=1&
p2=31&tabMode=dataTable&csid= 179 Government of Canada Website, Statistics Canada;
http://www5.statcan.gc.ca/cansim/a26?lang=eng&retrLang=eng&id=2820087&&pattern=&stByVal=1&p1=1&
p2=31&tabMode=dataTable&csid=

62
It is important to note that unemployment is not the only issue that highly skilled immigrants
may face, however. Studies have attested to the significant phenomenon of underemployment
of immigrants in Canada – in other words, their employment in jobs that are not
commensurate with their skills and qualifications. For instance, a 2008 study revealed that
42% of immigrants (25-54) held educational qualifications that were not necessary for the
jobs they held.180
Entrants with tertiary education who entered within the last five years are
particularly likely to go into low-skill, low-income occupations181
. Many factors can lead to
skilled immigrants being unemployed or underemployed, such as difficulties in having their
qualifications recognised, employer preferences for Canadian-born applicants, lack of
Canadian work experience or language skills on the part of applicants, discrimination, lack of
employer awareness and others182
. To some degree, these challenges explain why the new
system of Express Entry places greater emphasis on employer or provincial nomination of
candidates: to avoid a waste of human capital183
.
Some earlier data is available on temporary permit holders, as presented in the table below.
This shows that in 2013 it was more common for foreign nationals to enter through the
International Mobility Program than the TFWP. The profile of entrants appears to be
different; approximately a third of those coming in through the TFWP were highly qualified
workers (HQW) , whereas a majority of workers that enter through the IMP are believe to be
high-skilled. Potentially due to Canada's emphasis on skilled migration, a higher number of
foreign nationals came in through the IMP (137,533) than the TFWP (83,740)184
.
180 Cited in Challinor, A.E. (2011), “Canada’s Immigration Policy: a focus on Human Capital”, Migration Policy
Institute, available at http://www.migrationpolicy.org/article/canadas-immigration-policy-focus-human-capital 181 Challinor, A.E. (2011), “Canada’s Immigration Policy: a focus on Human Capital”, Migration Policy
Institute, available at http://www.migrationpolicy.org/article/canadas-immigration-policy-focus-human-capital 182 See Penny Becklumb, Law and Governement Division, Sandra Elgersma, Political and Social Affairs
Division (Revised 8 October 2008), Recognition of the Foreign Credentials of Immigrants.
http://www.parl.gc.ca/Content/LOP/researchpublications/prb0429-e.htm#fn21 183 Demetri Papademetriou, President of Migration Policy Institute (MPI) Europe. Phone call. 17 December
2015. 184 Indeed, the president of the CFIB argued that access to the TFWP has become more restricted in recent years.
CFIB. Phone interview. 19 November 2015.

63
Table 5: Temporary work permit holders, 2013185 Program Number
of
entrants
(all skills
level),
2013
Number of
high-skilled
entrants, 2013
Details on countries of
citizenship of permit
holders
Extra details
TFWP186
83,740
entrants
with work
permits
27,672 high-
skilled entrants
with a work
permanent
Of the TFW work permit
holders with permits signed
in 2013, the top countries of
citizenship were:
Philippines (30,193),
Mexico (21,842), US
(10,701). Jamaica (9,116),
India (5,906), Guetemala
(5,326), UK and colonies
(4,449), France (2,223),
Republic of Korea (2,204),
Ireland (1,559).
-
IMP 137,533 Unavailable,
most are
considered to
be high-skilled
Of the IMP work permit
holders whose permits were
signed in 2013, the top
countries of citizenship of
holders were: US (30,399),
France (19,971), India
(14,251), UK and colonies
(10,189), Australia (9,840),
Ireland (7,076), Japan
(6,723), Philippines (6,703),
Germany (6,386), Republic
of Korea (5,885)
Of the 137,533 foreign
nationals who entered as
temporary residents
through the IMP program
in 2013, 28,073 came
through international
arrangements (e.g.
Bilateral agreements),
107,856 came for
"Canadian interests" (i.e.
because they offer social,
cultural or economic
benefit to Canada) and
1,604 were permanent
resident applicants.
The TWFP sets a limit on the proportion of low-wage TFWs (10%) that can make up an
employer's workforce, but these do not apply to high-wage workers or the IMP.
Comparative overview between the national scheme and the EU Blue Card
Canada has a long history of assessing potential immigrants on the basis of 'human capital
factors'. By taking a points-based approach and considering a range of attributes alongside
each other, the system widens the potential talent pool, as well as leaving the government
greater flexibility to select the candidates it deems best-placed to have economic success in
the country.
Table 6: Comments against the objectives of a 'successful' scheme
185 Government of Canada Website, Employment and Social Development Canada;
http://www.esdc.gc.ca/eng/jobs/foreign_workers/reform/index.shtml 186 Government of Canada Website, Employment and Social Development Canada;
http://www.esdc.gc.ca/eng/jobs/foreign_workers/reform/index.shtml

64
Objective
s of
scheme
Comments on the Canadian programs
Increase the
number of TC
HQWs
arriving in the
country
Given the number of applicants, increasing the number of HQW is not a precise
objective of Canada's programs; instead the focus is on ensuring that the 'correct'
workers are selected to enter. To some degree, the need to consider the quality of
the applicant pool arose from concerns about the underemployment and slower
upwards mobility of migrants with higher education187.
The Express Entry application management system was adopted partly in response
to the excessive supply of people eligible to apply to Canada. Because the supply
of applicants under the previous system was too great, the CIC faced backlogs and
were forced to take either a 'first come, first served' approach (entailing long
processing times) or to consider other policy tools (for example, a system of caps
and occupational filters on federal programs, which would be highly dependent on
having up to date labour market information). Through introducing Express Entry
as a 'first bar' selecting the most appropriate candidates from a 'pool', the
government can control intake more effectively. In an interview, the CIC argued
that Canada's "managed migration system" represents one of the system's strengths.
Labour
market
shortages in
HS sectors are
filled by
foreign
nationals
Contributing
to the national
economy’s
competitivenes
s
All applications through the Temporary Foreign Worker Program must be
supported by a Labour Market Impact Assessment, aligning the profile of entrants
to the needs of the labour market. Furthermore, when job offers are used to support
permanent residence applications, these must also include a positive LMIA.
In December 2012, a relevant Parliamentary Standing Committee warned of labour
and skills shortages in these areas: A. Sciences, technology, engineering and
mathematics occupations; B. Occupations in the Information and Communications
Technology field; C. Health occupations; D. Skilled trades188. Employer witnesses
from these occupations gave evidence to the Standing Committee, attesting to the
importance of migration programs in supporting them to recruit workers to fill
shortages, whilst also highlighting the need for long-term skills training programs
for Canadian residents.
Some issues raised in the report (2012) of the Committee in integrating foreign
nationals into HS sectors with shortages were: lack of knowledge/awareness of
newcomers of the requirements of the position available; difficulties and delays in
validating foreign educational credentials; and language issues189. However, it is
worth noting that there have been reforms to the TFWP and permanent immigration
programs since 2012, and the Federal Skills Trade Program (first launched July
2012) has had more time to become established.
Skills and labour shortages continue to be an issue in Canada. According to the
CFIB Business Barometer, the percentage of business owners concerned about the
shortage of skilled labour has risen over the period 2009-2014190. This is a
particular issue for small independent business owners191. According to the Digital
Adoption Compass Community, the ICT sector is particularly reliant on the entry
187 Demetri Papademetriou, President of Migration Policy Institute (MPI) Europe. Phone call. 17 December
2015. 188 Report of the Standing Committee on Human Resources, Skills and Social Development and the Status of
Persons with Disabilities (December 2012), 41st Parliament, First Session, 'Labour and Skills Shortages in
Canada: Addressing Current and Future Challenges'. Note that the report also warned of shortages in low-skilled
occupations. 189 Ibid, pp.37-41. 190 CFIB (December 2014), Taking the Temporary Out of the TFW Program, pp. 3-6. 191 Ibid.

65
Objective
s of
scheme
Comments on the Canadian programs
of high-skilled workers to fill shortages; over a third of the ICT workforce are
immigrants (a higher share than in other sectors)192. A "conservative forecast" of
the ICTC is that 182,000 more workers will be needed in the ICT sector by 2019193.
Employers see the immigration of high-skilled workers as "critical" for responding
to shortages194. According to the president of the CFIB, Canada's programs work
quite well to address skills shortages, although more could be done to support
'bridging aspect' of migration programs (see below). In his opinion, the creation of
Express Entry has been an important move towards increasing the involvement of
employers in Canada's migration policy. Likewise, the ICTC argued migration
programs have moved towards becoming labour market-driven with the
introduction of Express Entry and the enhanced ability of provinces and employers
to focus on their needs. However, it is too early to assess the full impacts.
Attractiveness of
the scheme As shown above, the supply of applicants for the permanent economic programs
exceeds the number of places available.
Between 1 January and 6 July 2015, 41,218 of those who applied through Express
Entry were deemed to fulfil the conditions for one or more permanent economic
programs. However, only 12,017 (11% of all applicants, 29% of those in the pool)
had so far been issued with an invitation to apply for permanent residence. To some
extent, this may imply a 'creaming off effect' of the invitation to apply195.
Employers are also quite positive about the Express Entry scheme and the level of
input they have196.
The target to process 80% Express Entry applications within six months appears to
be on track.
Pathways to permanent residence within the systems
The CIC estimates that, amongst high-skilled permanent residents, roughly half have previous
work experience as temporary workers in Canada (estimated)197
. According to the CIC,
historic research indicates that permanent residents with previous work experience were more
successful, as they had "already had an opportunity to establish themselves in the labour
market" and "to establish a reputation with the employer or in the sector", as well as having
"made the decision to attempt to become a permanent resident based on their desire and
experience having lived in Canada on a temporary basis"198
. The Canadian Experience Class
program is clearly targeted at such individuals.
The Canadian Federation of Independent Business has recommended that the 'bridging aspect'
could be a useful part of the national immigration structure. To demonstrate this, the CFIB
192 Digital Adoption Compass Community Website ; http://www.digcompass.ca/labour-market-outlook-2015-
2019/highlights/ 193 Estimate based on ICTC research; cited in: ICTC. Phone interview. 3 December 2015. 194 ICTC, Phone interview,
3 December 2015. 195 Demetri Papademetriou, President of Migration Policy Institute (MPI) Europe. Phone call. 17 December
2015. 196 Phone interviews with CFIB (19 November 2015) and ICTC (3 December 2015). 197 CIC. Phone interview, 20 November 2015. 198 CIC. Phone interview, 20 November 2015.

66
cited the example of the Provincial Nominee Program (PNP), which enables provincial
governments to support the permanent residence of workers that support their regional labour
market needs. According to the CFIB, there are signs that this is effective; research in
Manitoba shows that if people immigrate to a particular region, they are likely to stay there,
bringing longer-term benefits and spreading the immigrant population across the country. The
CFIB believes that this should be the model for the future, putting people onto the pathway
towards permanent residence through a new 'Introduction to Canada' visa199
.
Specific advantages and disadvantages of the Canadian schemes
Advantages:
■ In Canada, there are multiple schemes supporting the entry of different categories
of skilled workers
■ Despite existence of multiple schemes, there is a centralised online application
system for all permanent residence applications (Express Entry) and online
application processes for the TFWP and IMP
■ Extensive efforts have been made by the CIC to engage employers in the system
(employer liaison network, Employer Portal, Job Bank). For example,
representatives from the Canadian Federation of Independent Business (CFIB)
and the Information and Communications Technology Council (ICTC) are
relatively positive about, and aware of, the new system of Express Entry,
believing that it gives employers a greater role in the system200
.
■ The attractiveness of Canada's schemes leaves the government well-placed to
choose the best candidates to respond to its skills/labour shortages.
■ Express Entry serves as a key filter for applicants, removing the need for caps on
occupations.
■ One reason for the introduction of Express Entry was to improve processing
times. It is early to assess, but early evidence is favourable. So far, the CIC seems
to be on track to meet government target of processing 80% of applications
within 6 months201
.
■ Emphasis on minimum levels of skilled work experience in the permanent
residence programs, as opposed to meeting minimum educational requirements,
fulfilling a salary threshold or having a binding job offer. This may enable a
wider pool of skilled candidates to apply, although not to gain entry (except in
certain circumstances, such as through a skilled trade or with a provincial
nomination).
■ Language requirements for Express Entry mean that few individuals who gain
permanent residence require language training202
.
■ No restrictions to labour market access of skilled foreign workers once they are
permanent residents.
■ There is an option for 'bridging open work permits' for temporary foreign workers
who are close to having their permanent residence applications approved
199 For more information, see CFIB (December 2014), Taking the Temporary Out of the TFW Program. 200 Phone interviews with CFIB (19 November 2015) and ICTC (3 December 2015). 201 CIC. Phone interview, 20 November 2015. 202 CIC. Phone interview, 20 November 2015.

67
Final observations:
■ It is too early to assess full impacts of Express Entry scheme.
■ According to the president of the CFIB, the concept of Job Bank, Employer
Portal is a good idea, but is less successful in the more 'passive' sense, i.e.
employers are unlikely to 'mine' the list of applicants and are more far likely to
support the applications of pre-selected candidates203
. The ICTC representative
also made similar remarks204
. This reflects that the fact that not all skilled
workers who are eligible for permanent economic programs will receive an ITA
through Express Entry. Some employers believe that there should be an expedited
process for bringing in skilled workers to fulfil urgent needs. For instance, the
pilot Facilitated Process for IT workers from the 1990s (now abolished) fast-
tracked IT workers' applications, and some ICT employers would like to see
something similar re-introduced205
. More may need to be done to engage small
and medium enterprises in the immigration processes206
.
Table 7: In-depth entry requirements for skilled migration programs
Program name Detailed entry requirements
Federal Skilled
Worker Program
(permanent residence)
Candidates must first receive an Invitation to Apply (ITA) through Express Entry,
judged against the extensive ranking criteria described above.
To be eligible for the FSWP, candidates must fulfil these conditions:
■ Skilled work experience of at least one year full-time (1,560 hours total / 30 hours
per week), which was paid; within the last 10 years, and at skill type 0, or skill
levels A or B of the 2011 National Occupational Classification (NOC);
■ Minimum language requirements in English and/or French (CLB 7, proven by CIC
test)
■ Minimum educational attainment of either a Canadian secondary (high school) or
post-secondary certificate, diploma or degree or a completed foreign credential that
is supported by an Educational Credential Assessment (ECA) report.
Assuming they meet all the detailed entry requirements for FSWP, they will then be
ranked against a points-based selection criteria (maximum 100 points). The selection
factors207 are:
■ Their language skills in English and/or French;
■ Their education;
■ Their work experience;
■ Their age;
■ Whether they have a valid (LMIA-supported) job offer; and
■ Their adaptability (how well they are likely to settle in Canada).
To qualify, FWSP applicants must receive the pass mark of 67 out of 100 and fulfil the
admissibility requirements.
Federal Skilled Trades
Program (permanent)
Candidates must first receive an Invitation to Apply (ITA) through Express Entry,
judged against the extensive ranking criteria described above.
To be eligible for FSTP, candidates must fulfil these requirements208:
■ Either have an offer of full-time employment for a total period of at least one year
or a certificate of qualification in that skilled trade issued by a provincial or
203 CFIB. Phone interview, 19 November 2015. 204 ICTC. Phone interview, 3 December 2015. 205 ICTC. Phone interview, 3 December 2015. 206 ICTC. Phone interview, 3 December 2015. 207 Government of Canada Website, Immigration and Citizenship;
http://www.cic.gc.ca/english/immigrate/skilled/apply-who.asp 208Government of Canada Website, Immigration and Citizenship; http://www.cic.gc.ca/english/hire/fstp.asp

68
Program name Detailed entry requirements
territorial body;
■ Have valid third-party language test results (that show they meet the minimum
language threshold),
■ Have at least two years of full-time experience in a skilled trade within the five
years before they apply, and
■ Meet all job requirements for the skilled trade as set out in the National
Occupational Classification (NOC).
Canadian Experience
Class (permanent)
Candidates must first receive an Invitation to Apply (ITA) through Express Entry,
judged against the extensive ranking criteria described above.
To be eligible for CEC, candidates must fulfil these requirements209:
■ Have at least 12 months of full-time (or an equal amount in part-time) skilled work
experience in Canada in the three years before application;
■ have gained the work experience in Canada with the proper authorization;
■ meet the required language levels needed for your job for each language ability
(speaking, reading, writing and listening)210;
■ plan to live outside the province of Quebec.
Note that the self-employed are not eligible.
Skilled work experience must be in one of the following areas: Managerial jobs (NOC
skill level 0); Professional jobs (NOC skill type A); Technical jobs and skilled trades
(NOC skill type B)
Temporary Foreign
Worker Program
(temporary)
Employer must obtain a positive Labour Market Impact Assessment (LMIA) from
Employment and Social Development Canada (ESDC), proving that the worker is
needed for a specific position. The temporary worker must then obtain a copy of the
confirmation letter and apply for a work permit.
The TFWP was reformed in 2015, meaning that the provincial or territorial median
hourly wage is now used to set program requirements, rather than the National
Occupational Classification (NOC) skill levels211. Employers must now apply for the
TFWP under one of two streams: the Stream for High-wage positions or the Stream for
low-wage positions212.
International Mobility
Program (temporary)
The IMP acts as a collection of several different programs, regulated by international
agreements. There is not a common minimum requirement across the IMP (education,
experience, etc.), as these factors depend on the purpose and features of the sub-
program in use213. One common feature of IMP applications is that they never require a
LMIA from the ESDC.
Generally speaking, workers that enter through the IMP are expected to bring "broader
economic, cultural or other competitive advantages for Canada"214. The IMP is normally
used to bring in high-skilled workers, such as intra-company transferees.
'Comprehensive Ranking System' of Express Entry
Applicants through Express Entry can gain a maximum of 1,200 points and are ranked against
four main criteria:
209 Government of Canada Website, Immigration and Citizenship;
http://www.cic.gc.ca/english/immigrate/cec/apply-who.asp 210 Minimum language level of Canadian Language Benchmark (CLB) 7 for NOC 0 or A jobs OR Canadian
Language Benchmark (CLB) 5 for NOC B jobs. 211 Government of Canada Website, Employment and Social Development Canada;
http://www.esdc.gc.ca/eng/jobs/foreign_workers/reform/restrict.shtml 212 Applications are not permitted in the Accommodation, Food Services and Retail Trade sectors. Furthermore,
applications for positions with little or no education or training required will not be processed in economic
regions that have an unemployment rate of 6% or higher. 213 CIC. Phone interview, 20 November 2015. 214 Government of Canada Website, Immigration and Citizenship;
http://www.cic.gc.ca/english/work/employers/apply-who.asp

69
■ Core / human capital factors (maximum of 500 points, or 460 points if applying
with spouse or common-law partner)
■ Spouse or common-law partner factors (maximum 40 points)
■ Skills transferability factors: education and/or foreign work experience
(maximum 100 points)
■ Additional points, for either provincial nomination or arranged offer of
employment (i.e. LMIA-supported job offer) (maximum 600 points)
Those who score the most highly will receive an Invitation to Apply (ITA) for permanent
residence. According to the CIC, "a goal of Express Entry is to ensure strong links between
economic immigration and the Canadian labour market. For that reason, qualified candidates
who also have a job offer will get enough points to ensure they are ranked high enough to get
an invitation to apply... Similarly, a nomination by a province or territory, will give a
candidate additional points to rank high enough to be invited to apply at the next eligible
round of invitations"215
. The full sub-criteria are listed below216
.
A. Core / human capital factors
Factors Points per factor - With a spouse or
common-law partner
Points per factor - Without a spouse or
common-law partner
Age 100 110
Level of education 140 150
Official languages
proficiency
150 160
Canadian work
experience
70 80
B. Spouse or common-law partner factors
Factors Points per factor
(Maximum 40 points)
Level of education 10
Official language
proficiency
20
Canadian Work
Experience
10
A. Core/human capital + B. Spouse or common-law partner factors = Maximum 500 points (with OR without a spouse or common-law partner)
C. Skill Transferability factors (Maximum 100 points)
Education Points per factor
(Maximum
50 points)
With good/strong official languages proficiency and a post-secondary
degree
50
With Canadian work experience and a post-secondary degree 50
Foreign work experience Points per factor
(Maximum
215 Government of Canada Website; http://www.cic.gc.ca/english/express-entry/criteria-crs.asp 216 Lifted directly from the CIC website: http://www.cic.gc.ca/english/express-entry/grid-crs.asp
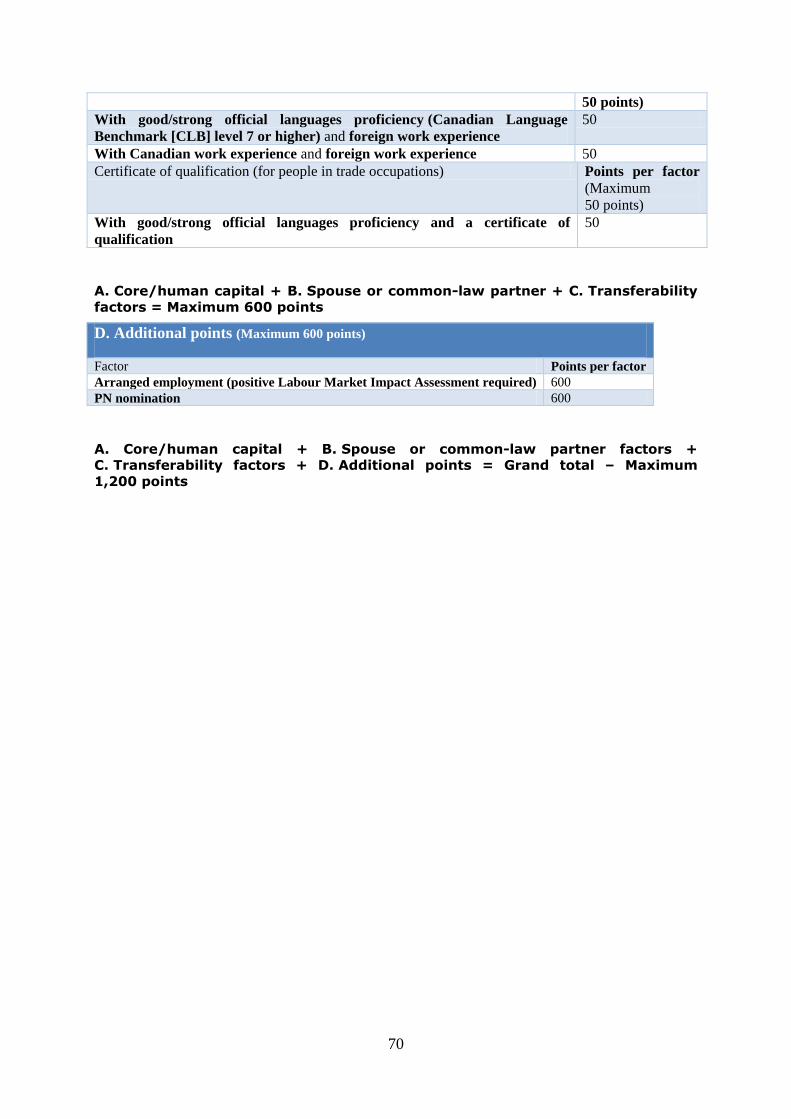
70
50 points)
With good/strong official languages proficiency (Canadian Language
Benchmark [CLB] level 7 or higher) and foreign work experience
50
With Canadian work experience and foreign work experience 50
Certificate of qualification (for people in trade occupations) Points per factor
(Maximum
50 points)
With good/strong official languages proficiency and a certificate of
qualification
50
A. Core/human capital + B. Spouse or common-law partner + C. Transferability
factors = Maximum 600 points
D. Additional points (Maximum 600 points)
Factor Points per factor
Arranged employment (positive Labour Market Impact Assessment required) 600
PN nomination 600
A. Core/human capital + B. Spouse or common-law partner factors + C. Transferability factors + D. Additional points = Grand total – Maximum
1,200 points

71
References
■ Becklumb, Law and Governement Division, Sandra Elgersma, Political and
Social Affairs Division (Revised 8 October 2008), Recognition of the Foreign
Credentials of Immigrants.
http://www.parl.gc.ca/Content/LOP/researchpublications/prb0429-e.htm#fn21
■ 'CFIB interview': Dan Kelly (President), Canadian Federation of Independent
Business (CFIB). Phone interview. 19 November 2015.
■ Challinor, A.E. (2011), “Canada’s Immigration Policy: a focus on Human
Capital”, Migration Policy Institute, available at
http://www.migrationpolicy.org/article/canadas-immigration-policy-focus-
human-capital
■ 'CIC interview': Philip Somogyvari, (Director); Maureen Tyler (Assistant
Director), Scott Turbett (Acting Director of Economic Policy and Programs),
Maureen Collins (Assistant Director), Citizenship and Immigration Canada (CIC)
(now Immigration, Refugees and Citizenship Canada). Phone interview. 20
November 2015.
■ Digital Adoption Compass Community Website;
http://www.digcompass.ca/labour-market-outlook-2015-2019/highlights/
■ Government of Canada Website
■ Government of Canada Website, Departments and agencies, Citizenship and
Immigration Canada, Publications and manuals;
http://www.cic.gc.ca/english/resources/publications/annual-report-
2014/index.asp#sec-1
■ 'ICTC interview': Sandra Saric, VP for Talent Initiatives, Information and
Communications Technology Council (ICTC). Phone interview. 3 December
2015
■ Pro-link Global Website (2014), https://pro-linkglobal.com/canada-significant-
changes-throughout-canadian-temporary-foreign-worker-programs/
■ Standing Committee on Human Resources, Skills and Social Development and
the Status of Persons with Disabilities (December 2012), 41st Parliament, First
Session, 'Labour and Skills Shortages in Canada: Addressing Current and Future
Challenges'

72
National schemes for attracting highly qualified workers Country Fiche: Australia

73
Country Fiche: Australia217
Key Points to note:
■ The Skilled Stream (vis-à-vis the Family and Humanitarian Stream) of migration accounts
for about two-thirds of the migration visas issued (in 2014-15, 128,550 places were
allocated to the permanent skilled migration stream, including all accompanying family
members). It includes a variety of visas.
■ Visas are both temporary and permanent. The main temporary visa is ‘the temporary
skilled visa’ (457), which is temporary and sponsor-based. Permanent visas are either
sponsor-based, whereby the sponsor can be an employer (employer nomination scheme -
186), or can be the regional Australia (regional sponsor scheme – 187), or sponsor-free.
This is the case of the Skilled-Independent Visa (189), which requires an expression of
interest system and a points-based assessment.
■ The most comparable visa with the EU Blue Card is the Skilled Temporary Visa (457): it
is valid up to 4 years, but migrants have the possibility to move after two years on a
permanent visa.
■ Australia makes an extensive use of Skilled Occupation List to select skilled both
temporary and permanent migrants and employs bridging visas from one category to
another.
■ Traditionally, migration visas have been permanent. Since the mid-90s, however, a
considerable number of temporary skilled visas started to be issued.
■ Permanent migration is usually capped by the government and a processing priority is
indicated.
■ Permanent migrants are more commonly selected onshore and the importance of sponsor-
free immigration has decreased over time. In fact, the majority of skilled category
applicants now enter Australia as temporary long-stay workers (457) - 130,000 primary
applicants in 2014-15.
■ Labour migration policy in Australia is under constant monitoring and informed by well-
developed skilled migration research.
1. Overview of the scheme
The Australian permanent immigration program218
is divided into two distinct
streams: the “Migration Programme for Skilled and Family Migrants” and the
“Humanitarian Programme for Refugees”. Within the Migration Programme for
Skilled and Family Migrants, the skill stream is linked to the needs of the national
labour market, while the family stream facilitates the entry of family members
wishing to join their relatives in Australia. Combined, both programmes also address
the national goal of sustained population growth, in a context where by 2011 26% of
Australia’s population were first generation immigrants, substantially exceeding
national rates for the other major immigrant-receiving countries.
217 This country fiche has been co-written by Prof. Lesleyanne Hawthorne, on 12 December 2015. 218 For more information, see Parliament of Australia 2012, Background Note, “Skilled migration: temporary and
permanent flows to Australia”,
http://www.aph.gov.au/About_Parliament/Parliamentary_Departments/Parliamentary_Library/pubs/BN/2012-
2013/SkilledMigration

74
Australia’s labour migration policy consists of a plurality of schemes, responding to
specific needs and contemporary labour market demands. All schemes, however,
albeit to a different degree, feature a detailed labour market analysis, selection of
specific skills, and informed by geographical considerations (through the
state/territory regional sub-category which has grown rapidly in recent years). It is
important to note, that not only highly qualified migrants are covered, but also
medium and low skilled workers deemed to be necessary for the Australian labour
market. However, around two-thirds of primary applicants selected are professionals
and managers.
The Minister for Immigration and Border Protection has the power to cap the
number of permanent visas which can be granted each year in a particular visa
subclass. When a cap is reached, no further visas will be granted in that visa class in
the programme year. Although a visa can no longer be granted until the start of the
new programme year, processing of applications may continue and applicants who
meet the requirements can wait in a queue for the following year (cap and queue).
The option ‘cap and cease’ is also available in exceptional circumstances, and means
that when a cap has been reached for a particular visa class, work on all applications
which have not been processed to decision stops, the files are closed and application
fees are refunded. These applications are treated as if they have not been submitted.
The Minister can also give written directions on the order of priority for processing
visa requests. For skilled migration, the highest priority is afforded to those seeking
migration to a regional area, followed by applicants who are sponsored by an
employer. The next priority is afforded to people who have been nominated by a
state or territory government agency. Lower priority is afforded to applications from
people who have not been sponsored by an employer or nominated by a state or
territory government. By 2011 the government had introduced a more demand-
driven approach, favouring the admission of skilled migrants whose employment
had been arranged prior to their arrival. The empirical basis for this decision was
compelling as 92% of employer-sponsored applicants were employed full-time
within 6 months of arrival from 2009-11, compared to 76% of points-tested
‘Independent’ migrants selected offshore.
Beyond the permanent skilled migration programme, however, it is essential to
recognise that the majority of skilled category applicants now enter Australia as
temporary long-stay workers – a category with no annual quota, and one which
wholly reflects the priorities of sponsoring employers. with minimal requirement for
labour market testing219
,.The temporary skilled visa (457, see below for description)
‘visa is of interest to Australian employers in multiple fields – allowing them direct
choice over migrants’ selection, personal attributes, speed of entry, and access to
work in under-supplied sectors and sites for up to 4 years (with scope for extension).
From the migrant’s perspective, the 457 visa has similar benefits – facilitating
priority processing, immediate access to work, opportunity to change employers, and
scope to ‘category-switch’ in Australia by applying for permanent skilled migration.
The 457 visa plays a vital role in assuring workforce supply in select fields,
including medicine and nursing.
219 Khoo, S-E, McDonald, P & Hugo, G (2005), Temporary Skilled Migrants in Australia: Employment
Circumstances and Migration Outcomes, Department of Immigration Multicultural and Indigenous Affairs,
Canberra.

75
1.1 Design of the Scheme
The Skills Stream Migration Programme is divided into several categories. Some
categories require a points-based assessment (2), whereas other categories do not
(1)220
. The work visas can be permanent or temporary, and sponsored-based or not
sponsored-based.
■ The categories that do not require a points-based assessment are the following:
– The Temporary Skilled Visa (subclass 457) The requirement is that the
migrants will work in one of the occupations included on the regularly
updated Skilled Occupations List, have a sponsored employer, show evidence
of recent relevant skills and experience, and have a level of English
proficiency matched to their occupational requirements (for example to secure
vocational registration)221
. A high proportion of applicants category-switching
to stay are former international students qualified in Australia, who first
secure employment through the 457 visa222
.
– The Employer Nomination Scheme (subclass 186) is a permanent scheme
for applicants sponsored by an employer. It requires a skill assessment carried
out by the relevant authority and three years of working experience, unless
exempt. The profession should be listed in the Consolidated Sponsored
Occupations List and the worker should be paid at least the same as an
Australian in the same occupation in the same location (market salary rate
defined as the salary of an Australian in the same occupation in the same
location also considering competitor companies in the same sector).
Applicants must be younger than 50, unless exempt. The scheme consists of
two steps: a nomination by an approved Australian employer and an
application under the scheme. There are three streams: the transition scheme
from the temporary skilled visa (457), a direct stream for people outside
Australia or in Australia on a permit different from 457, and an agreement
stream, for people sponsored by an employer through a labour migration
agreement.
– The Regional Sponsored Migration Scheme (subclass 187) is a permanent
scheme that requires the applicant to be sponsored by a regional employer.
’Regional Australia’ for the purpose of this category is defined as the non-
metropolitan areas of the nation that lie beyond most of the major capital
cities and their immediate surrounding suburbs. However selected capital
cities, which seek a higher proportion of skilled migrants than they attract,
have secured permission to be categorised as ‘regions’ under the scheme223
.
220 For more information, see the website of the Australian Government, Department of Immigration and Border
Protection, viewed on 14th October 2015, http://www.border.gov.au/Trav/Work/Empl/Visa-options-comparison-
charts 221 Most Australian professional and trade regulatory bodies have mandated specific English language levels as a
condition of securing registration to practice, most ranging from International English Language Testing System
Band 6 to Band 8 (for example IELTS Band 6 for professional engineers, Band 7 for all medical and allied
health practitioners, and higher levels for lawyers) 222 Hawthorne, L & To, A (2014), ‘Employer Response to the Study-Migration Pathway: The Australian
Evidence 2007-2011’, Highly Skilled Migration: Policies, Processes and Politics, Special Issue, International
Migration (Geneva), 52(3): 99-115, August 223 The state capital cities of Adelaide (South Australia) and Hobart (Tasmania) have sought ‘regional’
categorization in the past decade, to boost their scope to recruit skilled migrants.

76
The applicant should hold a qualification at the 1, 2 or 3 level of the ANZCO
classification. The ANZCO includes 5 occupational levels, and 1 and 2 are
considered skilled, while level 3, 4 and 5 are considered semi, low or
unskilled respectively224
.The salary is required to be equivalent to the salary
of an Australian in the same occupation and location. Moreover, the
applicants should be younger than 50 years and be competent in English.
■ The categories that do require a points-based assessment are the following:
– The Skilled-Independent Visa (subclass 189) is a permanent permit that
requires the applicant to express her interest, before applying through
SkillSelect. A sponsor is not necessary; however the applicant must nominate
an occupation in the relevant Skilled Occupations List225
and her skills are
assessed by a relevant authority. Moreover, the applicants must be under 50
and be competent in English. Those who cannot demonstrate the specified
English standard for their field, and/ or those whose qualifications are
unlikely to be recognised are excluded from eligibility to proceed. Points are
granted for the number years worked in skilled employment, level of
qualifications, qualifications obtained in Australia, working experience in
Australia and partner’s skills.
– The Skilled-Nominated Visa (subclass 190) is a permanent permit that
requires the applicant to express her interest, before applying. A sponsor is
necessary and the applicant must be nominated by a state/territory
government. The applicant must nominate an occupation in the relevant
Consolidated Sponsored Occupations List226
and her skills are assessed by a
relevant authority. Moreover, the applicant must be under 50 and be
competent in English (as above). Points are granted for years worked in
skilled employment, qualifications, qualifications obtained in Australia,
working experience in Australia and partner’s skills.
The Skilled-Regional (Provisional) Visa (subclass 489) is a temporary entry channel that
grants residence for up to 4 years and for which the applicant must express interest before
being invited to apply. The applicant can be sponsored by either an eligible relative or by a
state/territory government and the occupation must be respectively either in the Skilled
Occupations List or in the Consolidated Sponsored Occupation List. Moreover, the applicants
must be under 50 and competent in English.
It is important to note that the Skilled Occupations List includes a variety of professions, both
highly qualified, like nuclear engineers and surgeons, and medium-skilled, like plumbers and
joiners. Likewise, the Consolidated Occupations List includes both highly qualified
professions and medium/low-skilled professions, like flower growers and pig farmers.
1.2 Application procedure
224 http://www.immigration.govt.nz/migrant/general/generalinformation/anzsco, viewed on 10th December 2015. 225 The Skilled Occupation List can be consulted on the website of the Australian Government, Department of
Immigration and Border Protection, viewed on the 15th October 2015
http://www.border.gov.au/Trav/Work/Work/Skills-assessment-and-assessing-authorities/skilled-occupations-
lists/SOL 226 The Consolidated Skilled Occupation List can be consulted on the website of the Australian Government,
Department of Immigration and Border Protection, viewed on the 15th October 2015
http://www.border.gov.au/Trav/Work/Work/Skills-assessment-and-assessing-authorities/skilled-occupations-
lists/CSOL

77
The dividing line between ‘permanent’ and ‘temporary’ migrants has become increasingly
unclear over time, with temporary migration dominating. In a typical year up to 130,000 ‘457’
visa primary applicants become residents – far exceeding the number of primary applicants in
the 128,550 permanent skilled migration quota (where stated numbers include all
accompanying family members). Reflecting this trend, in July 2012 a new model to select
skilled migrants – the Skilled Migrant Selection Model (SkillSelect) – was introduced in
Australia, following an internal review of the points-based system227
. The model is an
electronic system whereby prospective applicants must first submit an expression of interest
(EoI) for an initial review of their skills from the Department of Immigration and citizenship
before being invited to make a visa application228
. Four key points should be noted in relation
to this:
■ This application process can be used for both temporary and permanent primary
applicants.
■ Lodged applications can be screened online, by both prospective employer and
state/ territory government sponsors.
■ Applicants may be immediately offered a permanent skilled migration place, or
(alternatively) a temporary sponsored position in the first instance, with
sponsored applicants then fast-tracked.
■ Applications remain in the ‘pool’ for a defined period of time. If not selected
within that period, migrants must lodge a new application to ensure all
information is current, and to prevent the development of processing backlogs.
1.3 Rights granted under the scheme
The Temporary Skilled Visa (subclass 457) allows skilled people to work for their
approved sponsor for up to four years. After a period of employment of two years in
the same position, an employer may be able to sponsor a subclass 457 visa holder
through the Temporary Residence Transition stream, allowing ‘category-switching’
to permanent resident status. Since 2012 degree-qualified international students have
been guaranteed the right to stay and seek employment in Australia for 2-4 years on
course completion (with 4 years allocated to those qualified by doctoral
qualifications). This is uniquely generous in global terms, in a context where very
substantial numbers of international students elect to study in Australia (for example
78% of recent medical graduates).
■ The Employer Nomination Scheme (subclass 186) is a permanent scheme for
applicants sponsored by an employer.
■ The Regional Sponsored Migration Scheme (subclass 187) is a permanent
scheme that requires the applicant to be sponsored by a regional employer. .The
salary is required to be equivalent to the salary of an Australian in the same
occupation and location.
227 Department of Immigration and Citizenship, 2010 “Introduction of a New Points Test”, DIAC,,
http://www.immi.gov.au/skilled/general-skilled-migration/pdf/points-fact.pdf, accessed 27 December 2010. 228 Expression of interest, otherwise called express entry or SkillSelect is a stage which precedes the application
itself, and serves the purpose of pre-filtering migrants. It is an efficiency-oriented instrument that is particularly
relevant when the number of applicants exceed the capped number. For more information on cap,
https://www.border.gov.au/about/corporate/information/fact-sheets/21managing viewed on 10th December 2015.
It further provides scope for employers and states/ territories to assess pre-screened applicants for sponsorship
purposes.

78
■ The Skilled-Independent Visa (subclass 189) is a permanent permit.
■ The Skilled-Nominated Visa (subclass 190) is a permanent permit.
■ The Skilled-Regional (Provisional) Visa (subclass 489) is a temporary entry
channel that grants residence for up to 4 years.
1.4 Statistical overview
In 1997, people migrating under the Skilled Stream overtook the arrivals under the family
stream (see Figure 1). In 1996-97, skilled migration represented 47% of the Migration
Programme, but by 2011-2012, this share had risen to 68%.
Table 1: Permanent migrants by eligibility category in Australia 1996–97 to 2010–11229
The recent statistics show that temporary migration, for work or study purposes, is
increasingly becoming the first step towards permanent settlement in Australia. In 2011-2012,
around 40% of applicants for permanent visas were already residing in Australia, and half of
these had a temporary skilled permit230
. By 2015 this had risen to around 50%. Immigration
policy in Australia distinguishes among on- and off-shore applications, and provides bridging
visas between the two. The number of permanent / provisional visas in 2012-13 to 30 June
2013 where the previous visa was held by a migrant on a temporary skilled visa was
38,470231
. For the past decade former international students have been the dominant group
participating in what is termed ‘two-step migration’, far exceeding the number of ‘457’
temporary workers category-switching to stay.
As demonstrated by Table 2, by June 2014, the number of temporary ‘457’ visa professionals
far exceeded the scale of points-tested permanent skilled migrant arrivals in key fields such as
IT, engineering and medicine. Around 50% of permanent skilled migrants by this time were
also selected onshore – the majority as former international students who had qualified in
Australia (for example in accounting and nursing), but also as former temporary foreign
workers232
.
229 G Hugo, Australia’s changing population and the future, presentation to the Migration Institute of Australia
Migration 2010 conference, Sydney, 8 October 2010. Data sources: ABS 2007, Australian Social Trends; DIAC
2009 and 2011. 230 Parliamentary Library, Temporary skilled migration, 2014, viewed on 14th October 2015,
http://www.aph.gov.au/About_Parliament/Parliamentary_Departments/Parliamentary_Library/pubs/BriefingBoo
k44p/TempSkilledMigration 231 Australian Government, Department of immigration and Borders Protection, Subclass 457 State/Territory
summary report, 2013. Viewed on 14th October 2015,
http://www.border.gov.au/ReportsandPublications/Documents/statistics/457-stats-state-territory-june13.pdf

79
Table 2: Australian Employer Demand for Skilled Migrants, Temporary Compared to Permanent Points-
Tested Categories, by Major Field and Selection Location (30 June 2008 to 30 June 2014) 233
Skilled Migration
Category 2008-09
2009-10
2010-11
2011-12
2012-13
2013-14 % Selected Onshore
2013-14
Temporary Stock
Resident (457 Visa)
% New 2013-14
Approvals Only
Computing/ IT 7,150 7,360 9,010 10,490 11,050 10,880 22.2%
Engineering 6,670 5,620 6,210 8,280 8,070 6,160 39.8%
Accounting 2,580 2,470 2,710 3,330 3,840 4,010 48.9%
Nursing 4,560 3.850 3,300 4,070 4,770 3,810 61.6%
Medicine 5,060 4,600 4,990 5,030 4,590 4,160 34.7%
Education 1,220 1,130 1,420 2,190 2,830 2,910 50.8%
Total (all fields) 77,300 68,400 72,030 91,050 107,970 108,870 50.9%
Permanent Arrivals
(GSM Visa)
% + No. Total 2008-14
Approvals
Computing/ IT 4,774 5,205 4,468 8,538 8,389 7,975 37.2 (39,349)
Engineering 4,319 5,907 4,112 4,891 3,898 4,160 35.2 (27,287)
Accounting 6,642 6,783 14,949 7,303 6,022 6,880 70.1 (48,579)
Nursing 1,357 1,700 1,374 1,174 1,404 2,761 57.5 (9,770)
Medicine 446 1,070 508 1,037 1,289 1,134 28.8% (5,484)
Education 883 754 467 730 912 961 37.5 (4,707)
Total (all fields) 33,604 28,042 34,913 36,893 39,147 38,130 50.0 (210,729)
Source: Hawthorne, L (2015), ‘The Impact of Skilled Migration on Foreign Qualification Recognition Reform in Australia’,
Canadian Public Policy Journal, August, http://www.utpjournals.press/toc/cpp/41/Supplement+1. , based on analysis of
unpublished Department of Immigration and Border Control immigration arrivals data for permanent compared to temporary
skilled migration categories, provided August 2014.
In 2012, 48,995 new migrants arrived under the temporary work skilled programme, whereas
40,607 were the new arrivals under the skill scheme who were granted permanent residency.
That year the main source countries for permanent migration to Australia as Subclass ‘457’
were the India, China and the UK; whereas the top origin countries for temporary migration
were the India, United Kingdom, Ireland, Philippines, US, China and South Africa .
In the year to June 2014, 38,130 primary applicants were selected in Australia’s permanent
skilled migration programme (at a time when the quota including family members was
128,550). Of these 77% were professionals, 20% technicians or trade workers, and 2%
managers. The great majority of primary applicants at this time were selected onshore (for
example 24,709 professionals compared to 14,139 selected outside Australia). The primary
professional fields at this time were computing (21%), accounting (18%), health (12%) and
engineering (11%). It is important to note that source countries also varied markedly by field.
For professional engineers, for instance, India (21%), China (12%), Iran (10%), Malaysia
(9%) and the UK (5%) were the top 5 source countries, while in medicine the main source
countries were the UK (19%), Malaysia (17%), India (16%), Canada (4%) and Sri Lanka.234
By June 2014 108,870 primary applicant ‘stock’ were resident, derived from multiple
occupations. 49% percent of arrivals that year were professionals, 25% technicians/ trade
233 Although official immigration statistics include also the family members, the figures provided in this table
and the tables below on primary applicants for the 457 visa compared to the points-tested permanent primary
applicants refer to primary applicants and are based on unpublished data provided to Lesleyanne Hawthorne
directly by DIBP. 234 Hawthorne, L (2015), ‘The Impact of Skilled Migration on Foreign Qualification Recognition Reform in
Australia’, Canadian Public Policy Journal, August, http://www.utpjournals.press/toc/cpp/41/Supplement+1

80
workers, and 20% managers. Half were selected onshore (many as former international
students), with the main professions that year computing (16%), health (5%), engineering
(4%) and accounting (4%). In relation to policy and employment outcomes, it is important to
note the impact of employer choice on skilled migrants’ selection. Within the professions,
Australian employers demonstrate a marked preference to select migrants with advanced
English language ability, training in OECD countries, and/or local qualifications. As
demonstrated by Table 2, showing the top ten source countries for employer-sponsored
temporary applicants compared to permanent skilled migrants in the year to 30 June 2014,
54% of the 457 visa engineers had qualified in OECD countries, and 50% were native English
speakers from the UK, Ireland, the USA and Canada. The comparable figure for permanent
points-tested migrants (selected by government) was 7%.
Table 3: Top 10 Source Countries for Skilled Category Temporary Compared to Permanent Migrant
Engineer Primary Applicants (30 June 2009-2014)
S
o
u
r
c
e
:
H
a
w
t
h
o
r
n
e
,
L (2015), ‘The Impact of Skilled Migration on Foreign Qualification Recognition Reform in Australia’, Canadian
Public Policy Journal, August, http://www.utpjournals.press/toc/cpp/41/Supplement+1
As shown by multiple Australian studies in recent decades, English ability is the key
determinant of registration for migrants in regulated fields, and of migrants’ early
employment outcomes (including their likelihood of utilising qualifications in work). Those
with low English language ability face years of occupational displacement.
1.5 Comparative overview between the national scheme and EU Blue Card
In global terms, Australia achieves excellent outcomes from its permanent skilled migration
programme, with employer sponsored and offshore independent applicants securing the
highest full-time employment rates (92% and 76% employed at 6 months respectively, with
employer-sponsored migrants most likely to use their qualifications in work (see Table 1).
The Australian system for HQW is complex and layered, but when comparing the Blue Card,
the visa 457 Temporary Skilled Visa is the best comparative candidate because it is a
temporary and sponsor-based scheme. Quarterly statistics on visa 457 are available online235
.
It has to be noted that, in general, the statistics on the number of permits issued include family
members.
235 Australian Government, Department of immigration and Borders Protection (2014), Subclass 457 quarterly report;
http://www.border.gov.au/ReportsandPublications/Documents/statistics/457-quarterly-report-2014-12-31.pdf
Temporary ‘457’ Visa Stock Resident Year
to 30 June 2014 (All Sources = 6,160)
Permanent Skilled Category Total Selected Year to 30
June 2014 (All Sources = 4,160)
UK (24%) India (18%)
Ireland (13%) China (15%)
USA (9%) Iran (9%)
India (6%) Pakistan (7%)
Philippines (5%) Malaysia (6%)
Canada (4%) UK (5%)
China (4%) Sri Lanka (3%)
France (4%) Philippines (3%)
Malaysia (2%) South Africa (2%)
South Africa (2%) Bangladesh (3%)

81
In the 2014-15 programme year, in the three months (quarterly publication) up to
31stDecember 2014, 27,660 subclass 457 primary visa applications were lodged. The
acceptance rate was very high - 92% - and 25,530 visas were granted, seemingly pointing out
that the system is efficient. In 2014-15, there were 130,000 primary applicants.
In the EU, the number of Blue Cards issued in 2014 were 13,724, although 88% (12,108)
were issued in Germany. If family members are included in the figures (6,380), the total
number in 2014 reached 20,104. Data on the number of the applications for the Blue Card are
not available at the EU level, so no acceptance rate can be calculated.
By comparing the number of the Blue Cards and the 457 visas, it emerges that Australia
grants in three months almost twice as much as the EU grants in one year. And
geographically, the vast majority of Blue Cards have been issued in Germany so far. Australia
suffers from an uneven geographical distribution of migrants, whereby migrants tend to gather
around the top four metropolitan cities. For tackling this uneven distribution, Australia has
devised specific permits for regional Australia.
On 30th
September 2015, 103,860 subclass 457 primary visa holders resided in Australia. As
for the origin of the applications, approximately half of the applications were launched
onshore and half offshore. In 2012-13, 40,450 457 visa holders were granted permanent
residence.
The first element of success of the Australian system is that it is diversified and offers several
pathways to migrate to Australia for work purposes. It is also designed to facilitate ‘two-step
migration’, allowing temporary foreign workers and international students to transition to
permanent resident status. The system is tailored to the needs of the labour market, and offers
a variety of options to migrants at different skill levels.
Moreover, the percentage of migrants who obtain immediate permanent entry is very high
compared to the EU, despite the growing dominance of temporary migration. Temporary
skilled migrants can also apply for a permanent permit after 2 years, if they are sponsored by
their employer through a bridging visa.
In general, Australian schemes foresee less strict requirements than the Blue Card: there is no
salary requirement, except the market conformity, and a formal qualification is required only
if the job itself requires a qualification. Employers play an increasingly important role and,
while sponsoring the migrant undertake to ascertain on behalf of the government that the
migrant is qualified for the job.
Further, Australia does not implement a selection for highly qualified migrants according to
an ex ante definition; rather it tailors its definition of (highly) skilled migrants to the labour
market needs, through occupational lists and through the flexibility the points-based
assessment grants. There is no defined quota for medium and low skilled workers, if they are
needed by the Australian labour market. To this end, the labour market assessment the
government carries out along with social partners is essential.
Family members apply with the main applicant, and when a points-based assessment is
carried out, their skills can be taken into account to score more points.
Compared to the Blue Card, the Australian schemes emphasise the importance of age (often
people over 50 cannot not apply), of language competence (independent English language
assessment is always required, matched to the vocational requirements of specific
occupational fields) and to address worker maldistribution, select schemes require migrants to
work for a defined period in regional Australia. Moreover, employers play a more important
82
role in sponsoring migrants than they do in Europe, not only when migrants are on their first
permit, but also when they change permit, and transfer to a permanent one236
.
Finally, to inform effective policy development, the Australian government has made a
sustained commitment to skilled migration research, including longitudinal and continuous
surveys of different temporary and permanent sub-categories.
1.6 References
■ ABS 2007, Australian Social Trends; DIAC 2009 and 2011
■ Australian Bureau of statistics;
http://www.abs.gov.au/ausstats/[email protected]/Latestproducts/3412.0Main%20Features52013-
14?opendocument&tabname=Summary&prodno=3412.0&issue=2013-14&num=&view=
■ Australian Government, Department of Immigration and Border protection Website;
http://www.immi.gov.au/media/publications/research/gsm-report/index.htm
■ Australian Government, Department of Immigration and Border Protection Website, Skilled
Occupation List; http://www.border.gov.au/Trav/Work/Work/Skills-assessment-and-assessing-
authorities/skilled-occupations-lists/SOL
■ Australian Government, Department of Immigration and Border Protection Website, Consolidated
Skilled Occupation List; http://www.border.gov.au/Trav/Work/Work/Skills-assessment-and-
assessing-authorities/skilled-occupations-lists/CSOL
■ Australian Government, Department of immigration and Borders Protection, Subclass 457
State/Territory summary report, 2013;
http://www.border.gov.au/ReportsandPublications/Documents/statistics/457-stats-state-territory-
june13.pdf
■ Australian Government, Department of immigration and Borders Protection (2014), Subclass 457
quarterly report; http://www.border.gov.au/ReportsandPublications/Documents/statistics/457-
quarterly-report-2014-12-31.pdf
■ Birrell, B, Hawthorne, L & Richardson, S (2006). Review of the General Skilled Migration
Program, Commonwealth of Australia, Canberra, p. 296
■ Birrell, R & Hawthorne, L (1999), ‘Australia’s Skilled Migration Program Outcomes as of 1996’,
The Review of the Independent and Skilled-Australian Linked Categories, Department of
Immigration and Multicultural Affairs, Canberra
■ For more information, see the website of the Australian Government, Department of Immigration
and Border Protection; http://www.border.gov.au/Trav/Work/Empl/Visa-options-comparison-
charts
■ G Hugo, Australia’s changing population and the future, presentation to the Migration Institute of
Australia Migration 2010 conference, Sydney, 8 October 2010.
■ Hawthorne, L & To, A (2014), ‘Employer Response to the Study-Migration Pathway: The
Australian Evidence 2007-2011’, Highly Skilled Migration: Policies, Processes and Politics,
Special Issue, International Migration (Geneva), 52(3): 99-115, August
■ Hawthorne, L (2015), ‘The Impact of Skilled Migration on Foreign Qualification Recognition
Reform in Australia’, Canadian Public Policy Journal, August;
http://www.utpjournals.press/toc/cpp/41/Supplement+1
■ Immigration New Zealand Website;
http://www.immigration.govt.nz/migrant/general/generalinformation/anzsco
236 Hawthorne, L (2015), ‘The Impact of Skilled Migration on Foreign Qualification Recognition Reform in
Australia’, Canadian Public Policy Journal, August; http://www.utpjournals.press/toc/cpp/41/Supplement+1

83
■ Khoo, S-E, McDonald, P & Hugo, G (2005), Temporary Skilled Migrants in Australia:
Employment Circumstances and Migration Outcomes, Department of Immigration Multicultural
and Indigenous Affairs, Canberra
■ OECD, International Migration Outlook (2014)
■ Parliamentary Library, Temporary skilled migration (2014);
http://www.aph.gov.au/About_Parliament/Parliamentary_Departments/Parliamentary_Library/pu
bs/BriefingBook44p/TempSkilledMigration

84
■
National schemes for attracting highly qualified workers
Country Fiche: China

85
Key Points to note: China
■ China introduced a new visa category – the R Visa, or ‘talented person visa’ - in
2012, under the Exit and Entry Administration Law. This new visa category
created a specific entry route for individuals who are classified as ‘high-level
personnel’ or ‘much-needed talent’.
■ The R visa has been adopted recently, and take-up has been relatively low so far
(in comparison to similar schemes in other countries);
■ There are also generous financial incentives on offer – the scheme offers a
resettlement subsidy of 500,000 Yuan (70,000EUR), which is often
complemented by additional subsidies and research grants from local
governments that in some cases have been worth an additional 1-3 million Yuan;
■ However, the application process is unclear and likely acts as a disincentive to
third-country nationals (TCNs);
■ The associated schemes for attracting highly skilled workers (HSWs) have
brought in the number of HSWs that they intend to, but as yet it is not clear
whether this will have the desired impact upon national technological output.

86
1 Overview of the scheme
China introduced a new visa category – the R Visa, or ‘talented person visa’ - in 2012, under
the Exit and Entry Administration Law237
. This new visa category created a specific entry
route for individuals who are classified as ‘high-level personnel’ or ‘much-needed talent’,
with recognition as meeting the requirements for one of these two categories dependent on
being given a statement of eligibility from the government departments responsible for
applying the scheme (usually the Ministry of Human Resources and Social Security or the
State Administration of Foreign Experts). Eligibility is ultimately at the discretion of these
government bodies, as neither a list of the fields and sectors in which applicants should be
experienced nor the criteria they will be assessed against are publicly available.
This new visa category is complemented by a national scheme called the Thousand Talents
Plan (TTP), an incentive scheme launched in 2008 with the aim of attracting 2,000 highly-
talented individuals to China within its first 5-10 years. Participants move to China as either a
‘researcher’ or an ‘entrepreneur’ and are awarded generous financial incentives – the scheme
offers a resettlement subsidy of 500,000 Yuan (70,000EUR), which is often complemented by
additional subsidies and research grants from local governments that in some cases have been
worth an additional 1-3 million Yuan. Like the R Visa there are no published guidelines
spelling out which specific fields or roles applicants are sought in, but applicants are supposed
to work in the fields of innovation, science and research. As well as the national TTP there are
also various regional-level schemes of a similar nature. Award recipients are given an R visa
to China238
.
1.1 Design of the scheme
Qualification for an R visa – as opposed to a regular working Z visa – is dependent on
receiving recognition from a relevant government department as being eligible. However, no
government departments publish information on how they assess applicants and no
specifications are written down in the law. Using TTP requirements as a proxy for the R visa,
applicants are generally expected to possess a doctorate and be professors in renowned
research institutes/universities (if they are researchers) or possess an undergraduate degree
and have spent at least 3 years as a middle or senior manager at a major company. As with the
legislation, there are no specific definitions of what constitutes ‘renowned’ or ‘major’.
Other than this, requirements for the R visa are the same as requirements for the regular
working visa. A binding job offer is required, usually with no salary threshold239
, and there
are no requirements for a labour market test to be carried out. Applicants for TTP have to be
under 55 years of age, 5 years lower than the usual limit of 60 years for a regular working
visa240
.
1.2 Application Procedure
The application process is the same as for other visas. Documentation proving eligibility for
an R visa must be submitted to a visa centre outside of China, with successful applicants
receiving a visa within 4 days. For long-term arrivals in China (those coming for more than
237 English version at: http://cs.mfa.gov.cn/wgrlh/lhqz/lhqzjjs/t1120988.shtml. 238 SCMP, 2014. “qianren jihua”, na lingren chuixiande yaoyue beihou (the Thousand Talents Program, behind
the coveted invitation), http://www.nanzao.com/sc/national/14c3169f9022412/qian-ren-ji-hua-na-ling-ren-chui-
xian-di-yao-yue-bei-hou 239 Local jurisdictions can apply their own restrictions on top of the national requirements. Nowhere appears to
set a salary threshold for R visas at present. 240 All eligibility requirements in English on the TTP website: http://www.1000plan.org/en/
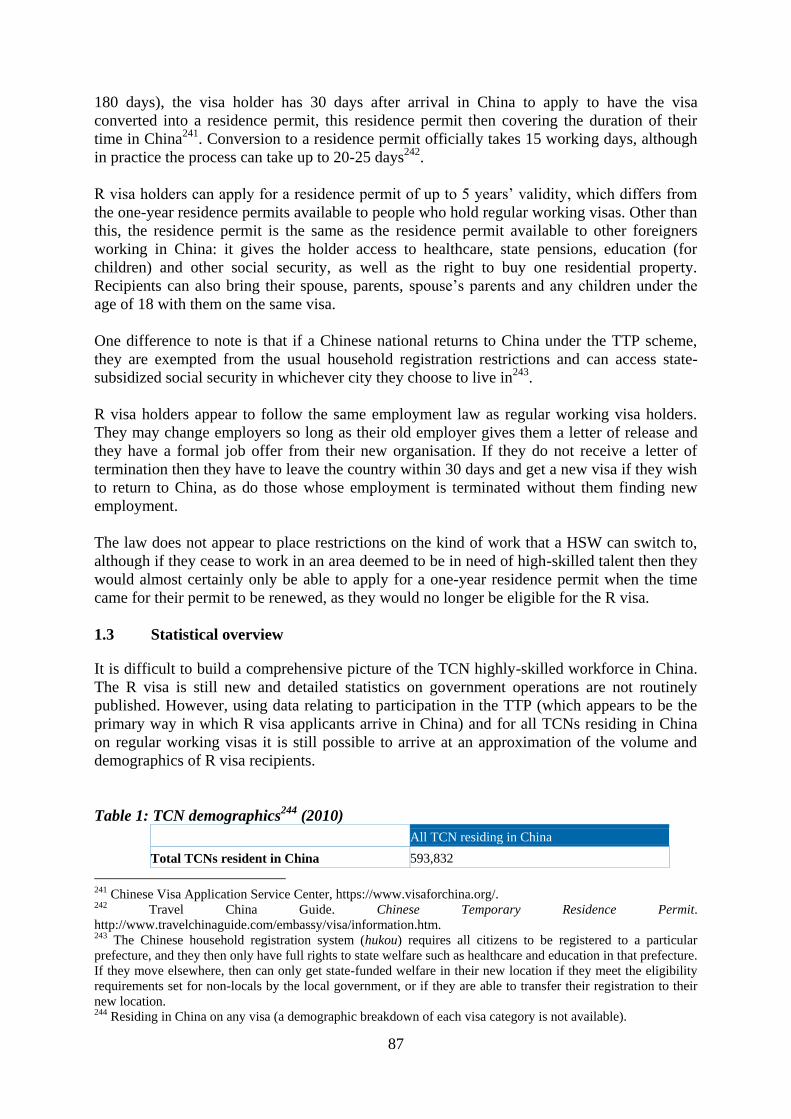
87
180 days), the visa holder has 30 days after arrival in China to apply to have the visa
converted into a residence permit, this residence permit then covering the duration of their
time in China241
. Conversion to a residence permit officially takes 15 working days, although
in practice the process can take up to 20-25 days242
.
R visa holders can apply for a residence permit of up to 5 years’ validity, which differs from
the one-year residence permits available to people who hold regular working visas. Other than
this, the residence permit is the same as the residence permit available to other foreigners
working in China: it gives the holder access to healthcare, state pensions, education (for
children) and other social security, as well as the right to buy one residential property.
Recipients can also bring their spouse, parents, spouse’s parents and any children under the
age of 18 with them on the same visa.
One difference to note is that if a Chinese national returns to China under the TTP scheme,
they are exempted from the usual household registration restrictions and can access state-
subsidized social security in whichever city they choose to live in243
.
R visa holders appear to follow the same employment law as regular working visa holders.
They may change employers so long as their old employer gives them a letter of release and
they have a formal job offer from their new organisation. If they do not receive a letter of
termination then they have to leave the country within 30 days and get a new visa if they wish
to return to China, as do those whose employment is terminated without them finding new
employment.
The law does not appear to place restrictions on the kind of work that a HSW can switch to,
although if they cease to work in an area deemed to be in need of high-skilled talent then they
would almost certainly only be able to apply for a one-year residence permit when the time
came for their permit to be renewed, as they would no longer be eligible for the R visa.
1.3 Statistical overview
It is difficult to build a comprehensive picture of the TCN highly-skilled workforce in China.
The R visa is still new and detailed statistics on government operations are not routinely
published. However, using data relating to participation in the TTP (which appears to be the
primary way in which R visa applicants arrive in China) and for all TCNs residing in China
on regular working visas it is still possible to arrive at an approximation of the volume and
demographics of R visa recipients.
Table 1: TCN demographics244
(2010)
All TCN residing in China
Total TCNs resident in China 593,832
241 Chinese Visa Application Service Center, https://www.visaforchina.org/. 242 Travel China Guide. Chinese Temporary Residence Permit.
http://www.travelchinaguide.com/embassy/visa/information.htm. 243 The Chinese household registration system (hukou) requires all citizens to be registered to a particular
prefecture, and they then only have full rights to state welfare such as healthcare and education in that prefecture.
If they move elsewhere, then can only get state-funded welfare in their new location if they meet the eligibility
requirements set for non-locals by the local government, or if they are able to transfer their registration to their
new location. 244 Residing in China on any visa (a demographic breakdown of each visa category is not available).

88
Gender Male: 57%
Female: 43%
Nationality (top 5) South Korea: 20%
USA: 12%
Japan: 11%
Myanmar: 7%
Vietnam: 6%
Young working age (20-34 years old) 47%
Census data 2010 (National Bureau of Statistics)
At the time of the 2010 census there were 598,832 TCNs residing in China, 134,889 of whom
were on a working visa. The working population of China as a whole was 802 million at this
point.
Publicly available data does not give any information on uptake of the R visa or any detailed
information on exactly who has received R visas so far. However, given the unclear
procedures and requirements involved in being declared eligible for the R visa, it is likely that
a significant proportion of recipients are people brought to China via the TTP scheme (which
brings participants to China on an R visa). We can therefore use the number of TTP
participants as a proxy for R visa recipients in order to get a rough idea of how many TCN
HSWs are moving to China under the R visa.
Table 2: The workforce in China245
Total workforce Total number/share
Highly skilled workforce 31.2 million
Unemployment rate highly-educated persons 16%
TCN HSW in the workforce
HSW admitted, total246 (2008-2014) 4,180
HSW admitted, annual (average) 597
TTP participants / regular working visa holders 0.5%247
TTP participants/ domestic highly-skilled
workforce
<1%
TTP participants / high-skilled labour shortages <1%
Source: China Daily, 2012 (domestic HSW); McKinsey, 2013 (unemployment and labour
shortages); Chinese census data, 2010 (working visas); TTP website (HSW admitted figures).
China’s high-skilled workforce contained 31.2 million people in 2011248
and growing demand
for high-skilled workers means the country is likely to face a shortage of 8 million graduates
by 2020249
. Relative to the size of China’s native workforce, the number of TNCs working in
China (on either R or regular working visas) is very low, making up less than 1% of the
labour supply. This is particularly evident for HSW - even using generous estimates, foreign
HSW only make up 0.01% of the country’s high-skilled workforce.
245 All figures excluding Hong Kong, Macau and Taiwan. 246 Number of total TTP participants, 2008-2014 247 0.5% is the 597 annual TTP figure as a percentage of total working foreigners in China. 248 China Daily, 2012. China’s workforce goes more skilful. 249 McKinsey, 2013. The $250 billion question: Can China close the skills gap?

89
Table 3: TCNs relocating to China
Acquisition Per year (average)
Citizenship 248
Permanent residence 556
Source: Chinese Census statistics 2010 (citizenship); China Daily, 2015 (permanent
residence).
The number of foreign nationals becomes permanent residents or citizens of China is low,
amounting to less than 1% of TCNs of China in total. Official statistics do not identify the
routes via which TCNs have acquired citizenship or permanent residence, so an examination
of exactly how many TCNs in China on working visas become permanent residents or
citizens is not possible. Figures on TCNs changing jobs, moving between visa categories
and/or leaving the country are also not publicly available.
2 Success of the scheme
As no data on participation in the R visa scheme is currently available, other information
needs to be used to assess the take up and success of the scheme. The best way to do this is by
using data on participation in TTP. TCNs recruited by the TTP program are awarded R visas
for China, and given the difficulty of applying for an R visa directly it is likely that TTP
participants make up the majority of TCNs awarded R visas into China.
Using TTP data as a measure, the effects of the R visa and its associated schemes have been
limited in comparison to the EU Blue Card. Overall numbers of TCN HSW moving to and
settling in China as a result of the introduction of the scheme are significantly lower than the
number of TCN HSW taking up work in the EU as a result of the EU Blue Card scheme, both
in absolute terms and as a proportion of the HSW workforce. Up until now the schemes have
not operated on such a scale as to have a significant impact upon labour shortages in the
country.
Looking at TTP specifically, the scheme has exceeded its target for take up, bringing 4,180
HSW to China in its first 6 years against an initial target of 2,000 over its first 5-10 years.
Figures show that 1,306 of TTP participants became permanent residents of China during the
first five years of the program, roughly one third of the 4,130 participants. Using the average
figure for successful permanent residence applications over this same period, 47% of all
TCNs who became permanent residents between 2008-2013 did so after moving to China as
part of the TTP.
The generous packages offered by the program appear to have been initially successful at
persuading TCNs to move to China on a long-term basis, but whether or not this has
contributed to technological breakthroughs or the enhancement of China’s high-tech and
emerging disciplines (the stated purpose of the TTP) is yet to be ascertained, as the impact of
the program has not been assessed.
2.1 Advantages and disadvantages of the R visa
Some of the requirements for an R visa are less strict than those for an EU Blue Card:
■ The R Visa has no minimum salary threshold, and there is no apparent labour market test
carried out before a TCN may be offered a visa.

90
■ The application process for both the visa and residence permit are also faster than for the EU
Blue Card as outlined in the EU Blue Card Directive.
■ The maximum length of the residence permit available to R visa holders is one year longer
than the EU Blue Card’s maximum of four years.
There is, however, a crucial disadvantage to the R visa, which is the lack of clear guidelines
available about how to successfully apply for one. How to apply to the ‘relevant government
departments’, what criteria the applicant will be assessed against, or even exactly which
departments to apply to are not spelled out anywhere in official government documentation.
This means that there is a large degree of uncertainty surrounding eligibility, and this coupled
with the necessity to either be able to speak Chinese or to get help from a Chinese contact
during the process of establishing eligibility is likely to act as a significant deterrent to many
who would otherwise be interested.
The residence permit offered by the R visa also offers a little less residence security than the
EU Blue Card. If a TCN becomes unemployed and has no new job offer, the law states that
their residence permit is to be terminated with immediate effect (in contrast to the three
months permitted by the EU Blue Card). While in practice employment terminations are often
not reported properly and TCNs will be able to remain in China even though unemployed, this
is illegal and prevents the TCN from being able to find new legal employment without first
leaving mainland China and then re-entering with a new visa upon securing a new formal job
offer. Changing employers can be done if a release letter is received from the TCN’s previous
employer, but this can be hard to obtain if the TCN’s employment ends on bad terms. This
means that HSW’s flexibility in terms of changing employers is significantly lower than
HSWs with an EU Blue Card.
The TTP (not the R visa) has also been relatively costly to run, with the standard package of
incentives offered to HSWs exceeding 150,000EUR and complementary schemes offering
even more. For a scheme designed to attract larger numbers of HSW, this would most likely
be far too costly to be sustainable.

91
ANNEX 9
INTRA-EU MOBILITY OF THIRD COUNTRY NATIONALS
1. INTRODUCTION
National policies aimed at attracting highly-qualified workers do not grant third-country
nationals the right to reside and work in other Member States. EU-wide mobility rights
are one of the main benefits which EU legislation can provide, and which national
legislation cannot. Employers may have a legitimate interest in being able to move their
staff around the single market without undue constraints. For migrant workers, the
prospect of being able to build a career anywhere in the EU, for example by changing
employer or branch within the same employer including in a different Member State, is
one of the most attractive features of EU level legislation on migration. Consequently,
the more the intra-EU mobility possibilities of a particular category of third-country
nationals are facilitated and made easy, the higher the attractiveness of the scheme.
When asked to identify the main advantages of a unified EU-wide scheme for admitting
highly-qualified works, more than half of the respondents chose easier mobility between
Member States.250
This call for enhanced intra-EU mobility rights has been echoed by
various stakeholders, including business representatives and trade unions.251
The
European Trade Union Confederation's Action Plan on Migration specifically calls for
EU legislation to "remove obstacles to the intra-EU mobility of third country nationals
regularly residing in a Member State, but without a long-term resident status".252
BusinessEurope has consistently argued the benefits of intra-EU mobility of specific
categories of third-country national workers.253
The Europe 2020 Strategy for growth recognised the role of intra-EU mobility of workers
— including EU nationals moving to other Member States — within the EU single
market in improving the matching of labour supply and demand.254
The European
Commission Communication ‘An open and secure Europe: making it happen’ within the
‘Strategic Guidelines for the area of Freedom, Security and Justice (2014–2019)’ aims to
facilitate intra-EU mobility of third country nationals, including through mutual
recognition of national permits.255
The European Agenda on Migration specifically
proposed to look at how to improve possibilities for intra-EU mobility for EU Blue Card
holders.256
250 Public consultation on the EU Blue Card and the EU's labour migration policies, European Commission DG Home
Affairs and Migration 251 European Trade Union Confederation, "A new Narrative for the Migration Phenomenon in Europe".
https://www.etuc.org/documents/etuc-position-new-european-commissions-five-year-programme-migration-ec-
communication-%E2%80%9C#.VnPP8v7lv2x 252 European Trade Union Confederation, Action plan on migration, 5-6 March 2013.
https://www.etuc.org/documents/action-plan-migration 253 BusinessEurope note on Labour Market Mobility. 28 June 2013.
https://www.businesseurope.eu/sites/buseur/files/media/imported/2015-00109-E.pdf 254 European Commission’s Communication COM(2010) 2020 final, Europe 2020: A strategy for smart, sustainable
and inclusive growth, 3 March 2010. http://eur-
lex.europa.eu/LexUriServ/LexUriServ.do?uri=COM:2010:2020:FIN:EN:PDF 255 European Commission’s Communication COM(2014) 154 final, An open and secure Europe: making it happen, 11
March 2014. http://ec.europa.eu/dgs/home-affairs/e-library/documents/basic-
documents/docs/an_open_and_secure_europe_-_making_it_happen_en.pdf 256 European Commission’s Communication COM(2015) 240 final, A European Agenda on Migration, 13 May 2015.
http://ec.europa.eu/dgs/home-affairs/what-we-do/policies/european-agenda-migration/background-
information/docs/communication_on_the_european_agenda_on_migration_en.pdf

92
2. INTRA-EU MOBILITY IN THE BLUE CARD DIRECTIVE
Based on the Schengen acquis, Blue Card holders and other highly-qualified labour
migrants can travel up to 90 days in any 180 period within the Schengen area if their
Blue Card or national residence permit is issued by a Schengen state. This is not specific
to these categories but applies to all TCNs with a residence title issued by a Schengen
State (i.e. a country fully implementing the Schengen acquis). As a general rule, they are
not, however, allowed to work or reside in another Member State, with some exceptions
(e.g. short business meetings are usually allowed, subject to national rules, and third-
country nationals can be posted under Directive 96/71/EC257
– see below).
Blue Card holders who have been admitted as highly-qualified workers in one Member
State and have been legally residing and working there for 18 months are allowed to
move to a second Member State and apply for a new EU Blue Card. All regular
admission conditions applicable in the second Member State have to be met (Art 18.2),
which makes the advantages over a regular new application very limited. Both a labour
market test (Art 18.4 referring back to Art 8.2) and numerical limits (Art 18.7) can be
applied. The advantages lie in the fact that some Member States allow the Blue Card
holder to work pending the decision (Art 18.2), that the period of residence in the first
Member State will count towards the 5-year requirement for obtaining a long-term
residence permit under Directive 2003/109/EC258
, and that family members may join
immediately when the family was already constituted in the first Member State (Art.
19.1).
The EU Blue Card Directive contains some safeguards for the benefit of the second
Member State in case the mobile EU Blue Card holder is not granted an EU Blue Card in
the second Member State and is no longer allowed to stay on its territory. In such cases,
the first Member State shall readmit without formalities the EU Blue Card holder with
possible family members, even if the permit has already expired. Furthermore, the costs
for doing so may be recovered from the applicant or the employer.
The EU Blue Card Directive has facilitated access to EU long-term resident status for
(former) Blue Card holders. It has also increased the rights associated with permanent
residency and created the special category of "EU long-term resident – former EU Blue
Card holder". In particular, stays as an EU Blue Card holder in different EU Member
States can be aggregated to count towards the 5-year required for obtaining long-term
resident status.
Research by the OECD shows that there is a positive causal effect of long-term residence
on the mobility of third-country nationals in the EU. However, it also showed that the
mobility of third-country nationals is still hampered by legal and practical constraints.259
At least one Member State, Germany, provides fast access to the national permanent
residence status — 33 months for EU Blue Card holders, reduced to 21 months if basic
German language skills are demonstrated (level B1). The EU long-term residents
Directive, which imposes a mandatory five-year residency, did not allow Germany to
257 Directive 96/71/EC of the European Parliament and of the Council of 16 December 1996 concerning the posting of
workers in the framework of the provision of services, OJ L 018 , 21/01/1997 P. 0001 - 0006 258 Council Directive 2003/109/EC of 25 November 2003 concerning the status of third-country nationals who are
long-term residents, OJ L 16, 23.1.2004, p. 44–53 259 DELSA/ELSA/MI(2015)5, Mobility of Third-Country Nationals in the EU: the Role of Long-Term Residence and
Naturalisation. Jonathan Chaloff and Friedrich Poeschel.

93
provide similar speedy access to EU long-term resident status. At the end of October
2015, 1 935 EU Blue Card holders had obtained a national permanent residence title after
33 months of residence, 4 601 after 21 months and 883 without time specification260
.
Former EU Blue Card holders who change status to a national permanent residence lose
their rights under the EU Blue Card, including the mobility provisions, and the facilitated
access to EU long-term residence.
The conditions for intra-EU mobility in the current EU Blue Card Directive are in
general considered not substantial and not attractive for potential migrants. This emerged
from the impact assessment study261
as well as the public consultation on the EU Blue
Card and the EU's labour migration policies.
3. INTRA-EU MOBILITY IN OTHER LEGAL MIGRATION DIRECTIVES
Article 79(2)(b) TFEU specifically endows the EU to adopt measures covering the right
to mobility and of residence of third-country nationals in other Member States. Several
existing Directives include provisions on intra-EU mobility for permit holders.
Third-country nationals holding long-term residency status according to Directive
2003/109/EC in one Member State – acquired after five years of legal residence in a
Member State – have the right to reside for more than three months in a second Member
State to exercise an economic activity, to pursue studies or for any other purpose, subject
to certain conditions. Stable resources and proof of accommodation as well as sickness
insurance may be required. An employment-based permit in the second Member State
requires a work contract there, and can be subject to a labour market test. A visa may also
be required. The procedure to apply for a permit in the second Member State takes up to
4 months, during which the third-country national may not be allowed to work.
The Directive on Intra-Corporate Transferees262
introduces schemes for short term
mobility (up to 90 days in any second Member State, so multiple periods of mobility in
different Member States are possible) and long term mobility (more than 90 days in any
second Member State) for third-country nationals employed by a group of undertakings
based in a third country and posted to a host entity/subsidiary based in an EU Member
State. The mobility provisions regulate subsequent stays in Member States other than the
one where they are posted first. No visa can be required or labour market test applied.
The short-term rules are flexible and based on a notification. The long-term rules allow
Member States to issue permits for that purpose, in which case the procedure resembles
an initial admission, with more limited conditions being checked. However, the
transferee is allowed to stay and work in the second Member State pending a decision.
The recast Directive on Students, Researchers and other categories (to be formally
adopted early 2016) facilitates movement between Member States for up to six months to
carry out research or for study purposes. It shares several elements with the mobility
rules applicable to Intra-Corporate Transferees. Applying for a new permit in such cases
is not required. For students the situation is more complex than for researchers as they
benefit from real intra EU-mobility rights only if covered by programmes (EU,
multilateral or agreements between higher education institutions). For "individual"
260 Data directly obtained from the BAMF. 261 Reference to ICF study, A3.4.1. 262 Directive 2014/66/EU of the European Parliament and of the Council of 15 May 2014 on the conditions of entry
and residence of third-country nationals in the framework of an intra-corporate transfer, OJ L 157, 27.5.2014, p. 1–22.

94
students, being mobile in the EU implies to submit to the second MS an application equal
to the one which is necessary for first entry in the EU.
Third-country nationals can also be posted under Directive 96/71/EC by undertakings
based in an EU Member State active in the transnational provision of services. Whilst no
specific provisions for posted third-country nationals are included in the Directive,
relevant case-law makes clear that the host Member State may not impose administrative
formalities or additional conditions on posted workers who are third-country nationals
when they are lawfully employed by a service provider established in another Member
State (e.g. judgments of 9.8.1994, Vander Elst, case C-43/93, of 21.10.2004, Commission
v Luxembourg, case C-445/03, and of 19.1.2006, Commission v Germany, case C-
224/04. Idem judgment of 21.9.2006, Commission v Austria, case C-168/04).263
However, the Posted Workers Directive does not regulate the admission conditions –
including whether a visa is required or not – of third-country nationals in EU Member
States, but it focuses on rights of workers during the posting and practical cooperation
between Member States.
There are three specific groups of situations envisaged in Directive 96/71/EC: (a)
provision of services under a contract concluded between the employer organisation and
another party in another Member State, (b) transfer of an employee to an undertaking or
establishment owned by the employer group in another Member State and (c) hiring out
of employees from a temporary employment agency to a client company in another
Member State. Therefore, EU Blue Card holders can in some cases fall under the scope
of application of Directive 96/71/EC; especially the intra-corporate transfer within the
EU can be a relevant option for both highly qualified workers and their employers.
However, some situations of professional mobility are clearly excluded, such as e.g.
purely sales-oriented participation in events, or fact-finding missions to explore business
opportunities in a new Member State.
In Article 3(2)(j) of the current Blue Card Directive there is an exclusion stating that
persons who are covered by Directive 96/71/EC do not fall within the scope of the Blue
Card Directive as long as they are posted on the territory of the Member State concerned.
This means that a posted worker cannot apply for an EU Blue Card and become a
beneficiary of that scheme during the posting. Contrarily, there is nothing to suggest that
EU Blue Card holders could not be posted under Directive 96/71/EC, on which occasion
their rights in the Member State of posting would also be determined by this instrument.
The position of an EU Blue Card holder would naturally persist in the initial Member
State having granted the permit for as long as it remains valid.
Moreover, it should be noted that family members of EU mobile workers, regardless of
their nationality, i.e. including family members third country nationals, or whether they
are dependent on the EU citizen, have the right to work in the host Member State.264
Mobile workers’ children, whatever their nationality, have the right to education in the
host Member State on the same terms as its nationals,265
as well as access to social
advantages on an equal basis as family members of nationals.
263 Intra-EU Mobility of third-country nationals, European Migration Network Study, 2013. 264 Article 23 of Directive 2004/38/EC. 265 Article 10 of the Regulation 492/2011.

95
4. THE ROLE OF INTRA-EU MOBILITY FOR EU BLUE CARD HOLDERS
Employers may have a legitimate interest in being able to move their staff around the
single market without undue constraints, particularly highly skilled workers and
professionals. Workers will be attracted to the scheme if it gives the prospect of being
able to build a career anywhere in the EU, for example by being able to change employer
easily. Improved intra-EU mobility for third-country nationals could enable the creation
of an EU-wide labour market that could effectively and promptly respond to existing and
arising demands for highly qualified labour, and to offset skill shortages, by enhancing
the inflows and circulation of third-countries highly skilled workers between jobs and
Member States and promoting their efficient allocation and re-allocation on the EU
labour market.
The importance of intra-EU mobility to the attractiveness of the Blue Card is confirmed
by the results of the public consultation, where it was found that more than half of all
respondents indicated that mobility would be a major added value of a unified EU-wide
scheme. A survey among EU Blue Card holders by the German BAMF showed that
87.4 % of respondents consider visa-free travel and the possibility of moving to another
MS important. 66.6 % would consider an extension of the possibility for easy "short-
term" mobility to 12 months useful, another 27 % simply do not know if this could prove
useful, but very few oppose this.266
5. DATA ON INTRA-EU MOBILITY
Data on intra-EU mobility of third-country nationals is scarce, as in most Member States
it is not collected systematically. It is therefore not possible to provide overall figures. A
2013 study by the European Migration Network267
revealed that between 1.2 % and
3.7 % of all mobile persons are third-country nationals, i.e. considerably less than the
share of third-country nationals in the entire population (4 %). The study highlighted
several barriers to intra-EU mobility which could explain the relatively low mobility
rates witnessed among third-country nationals, but also stated that the overall mobility of
third-country nationals appears to be growing.
Calculations by the OECD using EU Labour Force Survey data (Eurostat) put the
number of TCN who are mobile within the EU at only tens of thousands, but rising faster
than the total third-country national population.268
According to the EMN study, third-country nationals mainly move to neighbouring
Member States. This pattern would be consistent with intra-EU movements of EU
citizens, such as service providers. Where statistics are available, it appears a large share
of mobile TCN is highly-qualified (France: 30 %) and/or moves for the purposes of
highly-qualified work (The Netherlands: 44 %). Calculations by the OECD using EU
Labour Force Survey data (Eurostat) confirm that intra-EU mobility of tertiary-educated
266 Hanganu, E. and Heß, B., ‘Die Blaue Karte EU in Deutschland: Kontext und Ergebnisse der BAMF-Befragung’,
Forschungsbericht 27, Bundesamt für Migration und Flüchtlinge, Nürnberg, 2016, forthcoming. 267 Intra-EU Mobility of third-country nationals, European Migration Network Study, 2013. 268 DELSA/ELSA/MI(2015)5, Mobility of Third-Country Nationals in the EU: the Role of Long-Term Residence and
Naturalisation. Jonathan Chaloff and Friedrich Poeschel.

96
third-country nationals is significantly higher (2.5 to 4 times over the period 2008-2012)
than mobility of third-country nationals as a whole.269
6. DATA ON THE NEED OF INTRA-EU MOBILITY FOR BUSINESS
A. Large-scale international survey on intra-EU mobility
A 2015 survey on Intra-European Mobility of 85 multinational employers270
by
Worldwide ERC271
sought answers from them on their drivers, needs, challenges,
strategies, volumes, and costs. While their responses do not exclusively cover TCN, the
needs and challenges for TCN can be considered to be similar, if not greater, than for EU
citizens when it comes to intra-EU mobility. The findings of the survey can therefore be
informative. The respondents to they survey report a wide range of mobility volumes –
ranging from one to 2 500 employees per year over different types for mobility.
269 DELSA/ELSA/MI(2015)5, Mobility of Third-Country Nationals in the EU: the Role of Long-Term Residence and
Naturalisation. Figure 1 — Mobility rates of third-country nationals and EU citizens, 2008-2012. Jonathan Chaloff and
Friedrich Poeschel. 270 Abbott Laboratories, Accenture, Albemarle Corporation, Allegion, Allnex, Avery Dennison Corporation, Avon
Products, Inc., Bank of America, Bechtel Corporation, Biogen Idec, BorgWarner, Inc., Brambles, Bravura Solutions,
Broadcom Corporation, CABI, Careerbuilder, Cargotec Holding, Inc., Cegelec, Cerberus European Capital Advisors,
LLP, Cerner Corporation, CEVA Group PLC, CH2M HILL, Inc., Chatham Financial, Cimpress N.V., Covance, Inc.,
Cytec, Dana Holding Corporation, Deere & Company, Dell, Inc., Delphi, DHL Express A/S, Eli Lilly and Company,
Enterprise Holdings, Inc., Flextronics International USA, Inc., Foot Locker, Inc., FrieslandCampina Nederland BV,
Frontica Business Solutions, Granite Services International, Inc., Grant Thornton UK LLP, Herbalife, IHS, Inc., ING
Group, Ingersoll-Rand Company, Intercontinental Hotels Group, Inteva Products, Kinross Gold Corporation, Lenovo,
Lumos, LyondellBasell, Mayer Brown International LLP, McCain Foods Limited, MeadWestvaco Corporation,
MediaCom, MFS Investment Management, Micron Technology, Inc., Natura, Naturedao Information Science &
Technology Ltd., Nissan, Nomura, Novelis Incorporated, Omnicell, Owens-Illinois, Inc., Parker Hannifin Corporation,
Pearson Education, PwC Poland, Rockwell Automation, Samsung, SanDisk Corporation, SAP, Shell Oil Company,
SKF SA, SPX, The Body Shop International, The Manitowoc Company, The Walt Disney Company, TIBCO Software
Inc., TNT Express France SNC, Tom West Company, Inc., TRUMPF, Inc., Tupperware Brands Corporation,
Videology, Inc., W. W. Grainger, Inc., Warner Brothers, Wells Fargo & Company, Western Union Holdings, Inc. 271 A workforce mobility association for professionals who oversee, manage, or support U.S. domestic and
international employee transfer. http://www.worldwideerc.org/Pages/index.aspx

97
Graph 1 – 2014 Intra-European Mobility
For 49% of the surveyed companies at least 20% of their cross-border activity takes place
in the EU, for 19% even more than 50% takes place in the EU.
Graph 2 –Intra-European Mobility as a percentage of total cross-border mobility (percentage of
organisations)
The survey asked the participating companies to estimate the average cost per mobile
employee of five different types of cross-border mobility within Europe272
. By far, the
most expensive assignment type is a traditional long-term assignment of more than one
year, which represents an average cost per assignee of $378,167. Intra-European
permanent moves and short-term assignments cost less, with averages of $65,162 and
$57,618, respectively. Commuter arrangements and extended business travel are the least
272 These costs represent the averages experienced by the pool of respondents to this survey. Programs can vary in
many ways causing higher or lower costs. The reported figures repre- sent only general trends.

98
costly, with an average cost of $28,238 for commuter arrangements and $20,847 for
extended business travellers.
Graph 3 – Average Cost of Intra-European Mobility
The respondents were also asked to identify the primary drivers for each of the various
types of mobility.
Graph 4 – Primary Drivers of Intra-European Mobility (percentage of organisation)273
The survey also asked about the challenges of intra-EU mobility. For short-term and
long-term assignments, top challenges tend to be related to housing and living costs and
compliance issues. For the more transient mobility of short-term assignments, commuter
arrangements and extended business travel, immigration compliance is identified as a top
challenge along with employee tracking. For permanent moves, the most pressing
challenges are less compliance-related, though still relatively high, and more tied to
compensation, high housing costs and pensions. Recruiting and retaining skilled talent
ranks as a high challenge for long-term assignments, and slightly lower for short-term
assignments and permanent moves.
273 Percentages do not total 100% due to multiple responses.

99
Graph 5 – Challenges of Intra-European Mobility (Rankings ranged from 1 = least challenging to 5 =
most challenging)
The survey also showed that just shy of three-quarters of companies fully outsource their
visa and immigration issues.

100
Graph 6 – Fully Outsourcing Mobility Services274
The survey concludes:
With the increase in the number of employees living and working in European
countries other than their own, companies will need to remain robust in the
management of their mobile talent. The close proximity of European countries
lends itself to more short-term assignments, commuter arrangements and
business travel. These various forms of mobility have their own challenges and
drivers that must be considered. Likewise, countries within Europe have their
own government regulations, which if not followed, present many complications
and associated costs. Clear and open communication, education about the issues
for both the businesses and employees, effective partnering with service
providers, and more precise tracking of assignees are all vital to achieving
success in the complex arena of mobility within Europe.
B. Testimonials from business
The Commission also received a number of testimonials from companies on their
specific needs for intra-EU mobility and its cost (some have been anonymised where
requested).
Testimonial 1 - Oracle
Oracle has 555 third country nationals locally employed across the EU. Of these circa
100 would travel to other EU countries for various business reasons.
Testimonial 2 - Heitkamp & Thumann Group
The Heitkamp & Thumann Group is a family-owned group of 21 small and medium-
sized enterprises located in 9 different countries and employing 2.045 people. 909
employees are located at our European locations (UK, ES, DE, CZ). At their European
locations they only have about 15 third-country nationals that are locally hired (mostly at
our UK subsidiaries) and that frequently travel to other EU Member States for business.
274 Percentages do not total 100% due to multiple responses.

101
These third-country nationals are high-qualified employees, many of them from India,
working as R&D engineers or in IT.
Testimonial 3 - Large global company
In a large global company that has third-country nationals employed in the UK, Belgium
and Switzerland, approximately 500 third-country nationals travel on an annual basis275
.
This is the number of people, not trips, which means that if on average a person takes 5
business trips a year, this would equal 2500 trips just out of those countries.
Testimonial 4 – Large multinational media and information services firm
(1) Evidence and examples of the administrative cost and burden of immigration
procedures and rules to companies (with an EU focus)
(2) Data and evidence on the need for mobility for highly skilled workers from and
275 Hired locally in the EU and travelling to other EU Member States

102
employers perspective, specifically intra-EU mobility of TCNs residing in a Member
State to other Member States
Testimonial 5 - Large multinational IT service firm
(1) Evidence and examples of the administrative cost and burden of immigration
procedures and rules to companies (with an EU focus)

103
(2) Data and evidence on the need for mobility for highly skilled workers from and
employers perspective, specifically intra-EU mobility of TCNs residing in a Member
State to other Member States

104

105
ANNEX 10
THIRD-COUNTRY NATIONAL ENTREPRENEURS
1. INTRODUCTION
The attraction of third country nationals (TCN) or migrant entrepreneurs276
, particularly
innovative ones, has been high on the political agenda of national governments of both sides of
the Atlantic for the past years. This is explained by the expectancy that this category of migrants
will bring significant rewards for host countries, both thanks to migrants' propensity to start new
businesses, thus creating jobs, and their more recently recognized capacity to expand beyond the
ethnic markets into more innovative and high-value sectors. At the same time, migrant
entrepreneurship is also seen as a potential way to counteract both demographic and economic
decline and to contribute to social inclusion as an alternative way to access the labour market,
also increasing the attractiveness of the areas and countries where it is fostered, and to capitalize
on the expansion of innovative trends of the economy277
. This has led governments to recently
adopt policies targeting migrant entrepreneurs, both those already residing in the country
(through mainstream or targeted business support programs), and those willing to immigrate
(through specific admission policy that regulate the entry and stay in the country). These very
recent developments led to reflections at EU level and political announcements to maintain the
EU "as an attractive destination for migrants"278
.
2. THE NEED FOR TCN INNOVATIVE ENTREPRENEURS
A higher entrepreneurial spirit
Literature repeatedly reports that migrants may have a somewhat higher entrepreneurial spirit
than natives do. The reasons usually put forward to account for such a propensity are first the
selective dimension of migration processes and the immigrants' tendency to take greater risks.
Business creation among migrants is also sometimes depicted as a means to support labour
market integration and employment. Focusing on this trend, the OECD concluded for the period
2007-2008 that 12.6 % of migrants of working age were involved in non-agricultural
entrepreneurship activities, compared with 12.0 % among native.279
The share of entrepreneurs in
total employment can be 1.5 to 2.9 percentage points higher for migrants compared to natives
(United Kingdom, France, Sweden, Norway).
The contribution of migrant entrepreneurs to employment, innovation and economic growth
Against this background, various economic sources have analysed the contribution of migrant
entrepreneurship to employment, innovation and economic growth.
276 For the current exercise, the definition of entrepreneurs is that adopted by the OECD and covering “those
foreign-born business owners who seek to generate value through the creation or expansion of economic
activity, by identifying new products, processes and markets” (OECD, 2008a). 277 In particular, the digital economy, the green economy and the social economy. 278 A European Agenda on Migration, COM(2015) 240 final, 13 May 2015, p. 14. 279 Migrant entrepreneurship in OECD countries, International Migration Outlook (IMO), OECD 2011, p.142.
106
In terms of total employment, the OECD concluded for instance that this contribution was on
average 2.4 % of the total employment during the period 1998-2008280
and has steadily increased
over this period. In 2011, in relative terms, this contribution to employment was equivalent to
between 1.5-3 % of the total employed labour force in most OECD countries. Between 25 % to
50 % of migrant entrepreneurs employ other individuals in addition to themselves281
.The number
of individuals employed by migrant entrepreneurs represented in both 2007 and 2008 more than
750 000 individuals in Germany, around half a million in the UK and Spain, almost 400 000 in
France and around 300 000 in Italy282
. Furthermore, the average number of additional jobs that
each single migrant entrepreneur creates is set on average between 1.4 and 2.1283
. A more
particular focus on the United States has shown for instance that between 2006 and 2012, the 458
immigrant-founded companies sampled collectively created a total of 9 682 jobs. They employed
an average of 21.37 workers.284
Overall, the proportion of migrant entrepreneurs in the active
population is much higher than for natives. In particular, in Belgium and in Spain, in 2007-2008,
the proportion of migrants that became self-employed was almost the double the proportion of
natives in most OECD countries.
The added-value of innovative entrepreneurship
Migrant entrepreneurs' contribution to their host country is not limited to job creation. Their
potential on innovation285
has also been analysed by economic literature both regarding certain
sectors of economy and regarding the overall capacity of a given country to innovate. Economic
literature has found that immigrant entrepreneurship had a significant impact on innovative
sectors. For instance, 25 % of all engineering and technological companies founded in the US in
the last ten years were founded by migrants286
. Similarly, the link between skilled migration and
innovation and entrepreneurship was analysed from a European perspective. Through two
indicators of innovation (patenting and published articles), it has been shown that immigrants
outperformed skilled natives on all these measures and that efforts aiming at attracting skilled
migrants to Europe and employing them in skilled professions such as those put forward in the
2020 Strategy, will indeed foster EU competitiveness in innovation287
. This link was also
280 Open for Business, Migrant Entrepreneurship in OECD Countries, p.15, OECD, 2010 281 IMO, 2011, p.156. 282 IMO, 2011, p.157. 283 IMO, 2011, p.158 284 "Then and Now: America’s new immigrant entrepreneurs", Part VII, V. Wadhwa, A. Saxenian, F. D.
Siciliano, October 2012 285 Innovation is defined in the Innovation Union as "Change that speeds up and improves the way we
conceive, develop, produce and access new products, industrial processes and services. Changes that create
more jobs, improve people's lives and build greener and better societies." (http://europa.eu/rapid/press-
release_MEMO-10-473_en.htm?locale=en) 286 "Then and Now: America’s new immigrant entrepreneurs", Part VII, V. Wadhwa, A. Saxenian, F. D.
Siciliano, October 2012 287 More precisely, empirical findings show that a larger pool of migrants in the skilled professions is
associated with higher levels of knowledge creation. Skilled migrants contribute both to the creation of
“private” knowledge measures by the number of patent applications, and to more “public” basic research,
measured by the number of citations to published articles. Foreign skilled labour exerts a positive effect on
the innovative capacity of the recipient countries both for industrially applicable innovations and for more
general abstract knowledge. Source: “Migration of skilled workers and innovation: A European
perspective”, V; Bosetti, C. Cattaneo, E. Verdolini, Journal of International Economics 96 (2015) 311-322.

107
analysed for the United States where evidence shows that skilled migration to the United States is
likely to have raised total factor productivity considerably288
.
This potential on innovation and job creation boosts productivity growth and finally economic
growth, which can be measured both in quantitative and qualitative terms. They contribute to the
economic and social regeneration of disadvantaged rural and urban areas and contribute to the
revival of crafts, trades and business activities. Through their connections with their home
country, they also help expand countries’ foreign trade289
.
3. THE PARTICULARITIES OF TCN ENTREPRENEURS
Vulnerability of migrant enterprises
While the specific ability of migrants for business creation has been steadily recognized, it is
worth mentioning that the success rate of this entrepreneurship is in general lower than that of
native-born. In 2011, the OECD has concluded that the year-to-year self-employment persistence
rate over the period 1998-2008 was 94.3 % for native-born and 91.3 for foreign-born290
. Data has
shown for instance in 2010 in France that while the five-year survival rate for firms stand at 54
%, it falls to around 49 % when the entrepreneur is from an EU-15-member state and to only 40.5
% for non-EU nationals; this led to conclude that “[r]egardless of the entrepreneurial
environment, whether or not the project was set up with financial resources, alone or with a third
party, whether or not it received financial support, the firms set up by third country nationals
have a markedly lower chance of surviving the first five years than those set up by French or EU
entrepreneurs”291
. Importantly, even if businesses fail, there is however still direct economic
benefit to the country as “for as long as a company is active, it may create employment, bring tax
benefits to the State and enable the sharing of knowledge”292
. In addition, the employability of
the former entrepreneur has been enhanced by the entrepreneurial experience.
Mainstream and specific obstacles faced by migrant entrepreneurs
This vulnerability is accounted for by several factors that hamper the capacity of immigrant
entrepreneurship to unleash its full potential in contributing to the socioeconomic welfare and
competitiveness of host countries. While migrant entrepreneurs are faced with the same obstacles
that natives are when deciding to set up a business — albeit more severely — they are also faced
with specific hurdles due to their migrant background293
.
288 The important boost in innovation provided by skilled immigration in the USA in 1940-2000 period was
analyzed in “How much does immigration boost innovation”, J. Hunt and M. Gauhtier-Loiselle,, American
Economic Journal: Macroeconomics 2 (April 2010), 31-56. 289 See in this sense « The contribution of migrants in enhancing foreign trade » A. Hatzigeorgiou, Ministry for
Foreign Affairs, Sweden, in Migrant Entrepreneurship in OECD countries. 290 IMO, 2011, p. 146. 291 IMO, 2010, p.283, "Entreprises created in 2002 by non-EU nationals in France: finding it harder to
survive" Y. Breem. 292 "The Start-up visa : key to job growth and economic prosperity in America", T. Watson, L. Turnbull, V.
Wadhwa, 2015. 293 This might explain that almost two thirds of migrant entrepreneurs of OECD countries have been in the host
country more than ten years compared with just above 50% for migrant wage earners, IMO 2011, p.147.

108
The access to funding is repeatedly reported as a major obstacle294
, because of the mainstream
credit institutions’ lack of familiarity with immigrant entrepreneurs and sometimes because of the
characteristics of their enterprises. All this expose the credit institutions to a higher default risks
hence explaining their reluctance and the possible concentration of immigrant enterprises in
limited value-added activities, which do not require an important initial financial support. The
lack of familiarity with the host country language, the country-specific human capital and
networks, administrative, business and legal environments are also reported as major hurdles295
.
Response by governments: mainstream business support programs and targeted support
programs
Against this background, governments have developed both mainstream and targeted business
programs aiming at facilitating and supporting the sustainability of these businesses.
Mainstream business support services include for instance entrepreneurship training, help with
fulfilment of administrative procedures, counselling, legal advice, mentoring and access to
relevant networks, help in raising start-up or expansion capital. They are addressed to all
entrepreneurs-to-be of a country including migrants. In addition to these, countries have also
sometimes developed targeted business support programs for immigrant entrepreneurs, which
help them to overcome the specific challenges that they may face as entrepreneurs. When in
place, they are part of comprehensive integration plans. They can stem from public initiative or
private actors (civil society associations, private foundations, banks and big companies). They
include measures such as “knowledge-based” services to help develop country-specific human
capital and business skills, mentoring and networking to foster the acquisition of country-specific
business skills, tailored counselling and assistance in obtaining professional permits or registering
businesses, measures to facilitate access to finance.
While these two sets of programs are to be seen as complementary, it should also be stressed that
the decision to immigrate in a certain country to open up a business is reportedly linked with the
pro-business environment of this country. This relates to the structural economic policies that
governments put in place and which can consist in simplifying and accelerating administrative
procedures required to set up businesses, registration, creating favourable tax regimes for
businesses and investment, creating flexibility in the labour market to facilitate recruitment etc.
As a consequence, these programs, as any other kind of action aiming at attracting migrant
entrepreneurs, including specific admission policies, should be embedded in a broader policy
strategy to create an entrepreneurship-friendly environment. Structural policy interventions in the
areas of business law, general administration, taxation, labour market and regulation are key to
such a strategy. Consequently, any action taken at EU level to foster the attraction of skilled or
innovative entrepreneurs should be tightly linked with broader policy measures aiming at
ensuring the fairest conditions for them.
Recently, some countries have put in place migration policy measures dedicated to attract
migrants willing to create or operate their own business. These policies aim to select and
sometimes support immigrant entrepreneurs showing potential to contribute actively to the
294 See in this sense IMO, 2011, p.162-164. 295 For a more comprehensive description of obstacles faced by migrant entrepreneurs, see for instance "The
Missing Entrepreneurs 2014", Policies for inclusive entrepreneurship in Europe, OECD/EC, 2014.

109
domestic economic growth. The emergence of these policies is only recent296
– and to date, 7
Member States are concerned and 6 countries outside the EU297
. The attraction of this category of
migrants is ensured through several measures which do not always imply the creation of a
specific category of visa for entrepreneurs, accounting for the diversity of possibilities as
described in the section below.
4. OVERVIEW OF EXISTING POLICIES AIMING AT ATTRACTING INNOVATIVE
ENTREPRENEURS
Denmark - "Start-Up Denmark" 4.1.
In February 2015, Denmark introduced the "Start-up Denmark"298
initiative to help talented
entrepreneurs relocate and grow high-impact start-ups in Denmark. Led by the Danish Ministry
of Business and Growth and the Ministry of Employment, the program is meant as a gateway for
talented foreign entrepreneurs to Denmark’s vast start-up opportunities, such as accelerators, co-
working spaces, investment funds, research centres, as well as grassroots initiatives.
Conditions:
The targeted businesses are those that are “scalable and, ideally tech-driven start-ups”299
mainly
in the fields of life science, ICT, design and clean-tech & sustainable energy. Businesses such as
restaurants, retail shops, consultancy firms, import or export enterprises or similar are not eligible
for the permit. Applicants must be approved by a panel of experts. The program is for early-stage
businesses and can accept up to two founders. No prior investment is required to qualify to the
program but proof of subsistence is required.
Participants must participate actively in the day-to-day operation of the company, and presence
and involvement must be vital to the establishment of the business300
.
Procedure
Entry is reviewed within 6 weeks by a panel of experts appointed by the Danish Business
Authority. There must be particular Danish professional or labour market interests in the
296 This is explained by the fact that, while in the 1960’s western economies did not have a selective
immigration system as they needed workers to fill positions, this radically changed after the oil crisis of the
1970’s and the subsequent slow-down of national economies. "Immigration systems started then to become
more restrictive and governments increased the scrutiny of migrants. Countries have recognized the issue of
their overly selective general work visa systems, hence the current trend of policies dedicated to
entrepreneurs", "Worlwide Start-Up Visa Policies Compared", J. Goube, Migreat, Open to entrepreneurs:
Startup Visas Policies Report - May 2015. 297 Countries where entrepreneurial culture is traditionally widespread have been the first to put in place
policies to attract migrant entrepreneurs (Canada, Australia, the United States and New Zealand). This is
also strongly linked to the fact that these countries are also traditionally receiving countries. 298 See http://www.startupdenmark.info/ and https://www.nyidanmark.dk/en-us/coming_to_dk/work/Start-up-
denmark/
299 http://www.startupdenmark.info/faq/ 300 Shareholders are excluded.

110
establishment of the company in Denmark301
. Once the evaluation is positive, application for the
entrepreneur residence permit under the Start-up Denmark scheme is allowed302
. The procedure
length as a whole is 10 weeks. A maximum of 50 residence and work permits are granted under
the Start-up Denmark scheme per year, that is, from 1 January to 31 December.
Duration
Residence and work permanent for up to 2 years, with the possibility of extending for an
additional 3 years.
Rights
Some members of the family can also come to the country.
The success of the scheme is yet to be evaluated.
France - "French tech Ticket" 4.2.
The French Tech Ticket is a program designed for non-French entrepreneurs from all over the
world who want to create their start-up in Paris. It is targeted at innovative and scalable start-ups
to contribute to a fast development of innovation and start-up ecosystems in the country. This 6-
month program, started in January 2016, offers end-to-end support on the journey from early
stage start-up to successful business – from financial support and training to first customer
acquisition. Selected entrepreneurs work closely with one of nine leading French Incubators
providing among others mentoring, fundraising strategy, expert advice and pitch practice. At the
end of the six months, entrepreneurs have the option to renew this ticket for another six months to
further fast track their growth.
Conditions:
In order to be eligible for the Paris French Tech Ticket, applicants must be an early stage start-up
or have a project of start-up and plan to develop their business in France. Teams can be formed of
3 persons maximum (with maximum one French citizen in the team). The programme has a quota
of 50 entrepreneurs for six months up to one year.
Applicants must be based in Paris during at least 6-month starting January 2016, have a valid visa
to enter France, be fully dedicated to their project, which means commit to the program on a full
time basis (no other side professional activity). They must open a bank account in France.
Review of applications is made by an independent panel which assesses the following: team
members and entrepreneurial skills, feasibility of the product, market potential, marketing
strategy, impact of the business being in Paris and financial growth. The duration of the review
process is 4 months.
301 Consequently, residence and work permit in order to establish a restaurant, retail shop, small business,
import or export enterprise or similar are excluded. 302 A positive evaluation from our panel of experts does not guarantee the approval for the entrepreneur
residence permit itself.

111
Entrepreneurs who are selected to the Paris French Tech Ticket and who require a Visa must
apply for and be granted a VLS-TS Visa303
. Teams who are not granted a Visa cannot take part in
the program until all the visa paperwork has been submitted and approved.
Benefits:
The main benefit of being selected to the program is an award of €12,500. It will be possible to
get a second prize of 12 500€ at the end of the 6 months (for a total of 25 000€ for 12 months).
While the visa is not a specific visa but a "long stay" visa (duration of one year), it is obtained
through a fast-track procedure.
Free space in a partner incubator and dedicated workspace is made available. The program also
includes access to events and training sessions provided by the incubator network., access to a
senior mentor to support the start-up’s growth, tailored programme of events, a Help Desk to
provide assistance with red tape, a Paris Landing Pack to help foreign entrepreneurs relocating to
Paris, lower prices on Air France flights, a Gold loyalty card and advertising for the start-up via
Air France.
In the period of June – September 2015, 722 start-up projects were submitted, for a total of 1,372
applicants and 5,677 expressions of interest from over 100 countries304
.
Ireland -"STEP" Program 4.3.
A Start-up entrepreneur Program called STEP was introduced in April 2012 to stimulate
productive investment in Ireland and to attract high potential start-ups in the field of information
and communication technology (ICT). The program was reviewed in March 2014 to refine its
target applicants and in May 2015. This resulted in the introduction of a pre-track of STEP which
is a 12-month visa for start-ups that attend incubators or innovation boot camps in order to
prepare a STEP application. The STEP facilitates residence in Ireland for foreign national
entrepreneurs who have a viable proposal for a High Potential Start-up (HPSU) Company.
Conditions:
STEP applies the definition of a HPSU as used by Enterprise Ireland, which classifies a HPSU as
a start-up venture that is:
Introducing a new or innovative product or service to international markets
Involved in manufacturing or internationally traded services.
Capable of creating 10 jobs in Ireland and realising €1 million in sales within three
to four years of starting up.
Led by an experienced management team
Headquartered and controlled in Ireland.
303 "Visa de long séjour valant titre de séjour", Art. L-211-2 and L-211-2-1 Code de l'entrée et du séjour des
étrangers.
304 Study for an impact assessment on a proposal for a revision of the Council Directive 2009/50/EC of 25 May
2009 on the conditions of entry and residence of third-country nationals for the purposes of highly qualified
employment ("EU Blue Card Directive").

112
Less than six years old.
The required minimum investment is €50,000. Where more than one principal is involved in
establishing the business the minimum investment for second and subsequent entrepreneur will
be €30,000 per principal.
The applications are evaluated by an application committee chaired by the Department of Justice
and Equality in Ireland. Documents required by the application committee include the most
recent audited accounts (if the business is relocating to Ireland), a comprehensive business plan
for the innovation start-up proposal (a template is provided), and evidence of funding through
either own resources, business loan, Business Angel/Venture Capital funding or a grant from an
Irish State Agency.
Duration:
The visa grants residency for two years and renewable for three more years.
In addition, a 12-month immigration permission has been made available for entrepreneurs
attending incubators or innovation boot camps in Ireland and non-EEA students who graduate
with advanced STEM (Science, Technology, Engineering, and Mathematics) degrees. It allows
entrepreneurs to prepare an application to the Start-up Entrepreneur programme.
Since its introduction April 2012 and until 1 January 2015, 52 applications for STEP have been
introduced and 30 were approved305
.
UK - Graduate and Entrepreneur Visas 4.4.
UK Entrepreneur visas were introduced in 2008 replacing the tier 1 general category for highly
skilled migrants and the highly skilled program that allowed highly skilled migrant to come to the
UK for two years without the need for a job offer.
The two main schemes are: Tier 1 Entrepreneur and Tier 1 Graduate Entrepreneur. Migrants
under the Tier 1 Entrepreneur route are defined as applicants wanting to invest in the UK by
setting up or taking over, and being actively involved in the running of, one or more businesses in
the UK. Migrants under the Tier 1 Graduate Entrepreneur route are defined as having strong
business skills and/or ideas, and are endorsed by a UK Higher Education Institution (HEI) or UK
Trade and Investment (UKTI).
Eligibility criteria for Tier 1 Entrepreneur visas includes a minimum investment of £200,000, or,
£50,000 if applicants have access to funds in a registered venture capital firm, a UK government
body, or, from approved seed funding under UKTI competitions. Applicants are subject to a
genuine entrepreneur test, consisting of a written application with evidence of funds and a
business plan, and an interview if required. With regard to Tier 1 Graduate Entrepreneurs, there
305 Study for an impact assessment on a proposal for a revision of the Council Directive 2009/50/EC of 25 May
2009 on the conditions of entry and residence of third-country nationals for the purposes of highly qualified
employment ("EU Blue Card Directive").

113
are no investment requirements, and applicants have to meet the eligibility criteria set out by the
endorsing organisation.
The Entrepreneur visa maximum duration is 3 years and 4 months and can be extended for 2
years if the applicant is already in this category and 3 years the person is switching to it from
another category. The duration of the Graduate Entrepreneur Visa is one year.
Family members (‘dependants’) can also enter and reside in the country under both permits.
In 2014, there were 5,488 Tier 1 Entrepreneur visas granted, with the majority being in-country
visas. The number of Tier 1 Graduate Entrepreneur visas was 564, with the majority being in-
country visa switches from the Tier 4 General Student Visa306
.
Italy - "Start-up Visa Italia" 4.5.
The "Start-up Visa Italia" was launched in June 2014 and it aims at attracting innovative
entrepreneurs to Italy’s regional start-up hubs. The Start-up policy is designed to promote
technological development, employment, and entrepreneurial culture in Italy by granting
residency permits to non-EU talents determined to establish innovative start-ups in Italy. It
enables innovative entrepreneurs to apply for a residence permit from outside Italy. Applications
from within the country are also possible under "Start-up Hub". The scheme is one element of a
wider policy package aimed at boosting the Italian economy.
Conditions and procedure:
The target companies are start-ups with an innovative element, defined either by the spending on
research and development, or by the qualifications of the personnel, or by the patents. In terms of
eligibility, the minimum capital has been set to €50,000 and the applicant must introduce an
innovative business idea, which is evaluated by a specific Committee.
In terms of procedure, there are two routes to apply for the Italian visa:
1. Direct start-up visa application; the applicant submits a request to the above mentioned
Committee which evaluates the innovative business plan and verify other requirements. After this
procedure the Committee may or may not issue a Certificate of No Impediment
2. Application through a licensed business incubator: if a certified incubator is willing to host the
non-EU national on its premises to establish an innovative start-up, and has signed an invitation
letter, it is sufficient for the Committee to issue its Certificate of No Impediment without further
evaluation.
When the Committee has issued the Certificate of No Impediment, it informs the local police
headquarter (questura). When the police has accepted the visa request, the Committee notifies the
applicant and informs the consulate or embassy in the country of origin, along with the Italia
Start-up Visa contact points within the Ministry of Foreign Affairs, the Ministry of Interior and
the Ministry of Labour. Once received the No Impediment Certificate, the applicant can apply for
306 Ibid.

114
a Start-up Visa to the consulate, which will then inform the Committee once the visa has been
issued.
As for any foreign worker, the start-up entrepreneur has to apply for a residence permit within 8
days after his/her arrival to Italy. The applicant has to show up at the local post office to present
the application along with the fees. The entrepreneur may then apply for a work permit.
The decision process takes 30 days maximum. The maximum duration of the residence permit is
two years.
The Start-up residence permit is valid for 1 year, and can be renewed under the condition that the
third-country national has successfully set up an innovative start-up. The success of the start-up is
proven by the company’s registration in the innovative start-up register to the local police
headquarter, and the registration certification, along with the self-assessment tax return, have to
be presented for renewal.
The attractive feature of the Start-up visa programme for third-country nationals, as well as
Italian start-up entrepreneurs, consists in a range of financial and work-related incentives. These
include, inter alia, exemption from registration fees due to the Chamber of Commerce and stamp
duties; flexible corporate governance, especially for Ltd (in Italian, Srl), for which the creation of
categories of shares with specific rights, the possibility of carrying out operations on one’s
shares, the possibility of issuing participative financial instruments, offer to the public of capital
shares become possible; exemption from the regulations on companies reporting systematic
losses; exemption from the duty to affix the compliance visa for compensation of VAT credit; tax
credit for the employment of highly qualified staff; tax incentives for corporate and private
investments in start-ups; fast-track, simplified and free-of-charge access for innovative start-ups
and certified incubators to the Fondo Centrale di Garanzia, a Government Fund that supports
access to credit through guarantees on bank loans;
In the period 24th June 2014 - 31st December 2015 (18 months), the total number of applications
received for the Start-up Visa was 61. From these, 40 received a positive response and the
success rate was 66%. Five applications were received and approved for conversion into Start-up
Visa, and the success rate was 100%307
.
The Netherlands - "Start-up Visa" 4.6.
There are two admission schemes for entrepreneurs in the Netherlands: a general self-
employment scheme (points-based system) which entered into force in 2008 and a special scheme
for start-up entrepreneurs which entered into force on 1 January 2015. The two schemes are
closely interlinked since after one year on the residence permit for start-up entrepreneurs, the
entrepreneur may have the duration of their residence permit extended on the basis of the self-
employment scheme.
Visa and requirements:
307 Ibid.

115
The Dutch policy makes it possible for ambitious entrepreneurs to apply for a temporary
residence permit in the Netherlands.
No financial requirement exists, except the proof to have sufficient financial resources for living
and housing expenses. Other conditions include: working together with a reliable expert
facilitator; an innovative product or service; both start-up entrepreneurs and the facilitator are
registered in the Commercial Register of the Chamber of Commerce.
When the visa application is approved, the applicant is referred to Start-up Delta, a collaboration
organisation between government, accelerators, investment groups and start-ups, to provide them
with guidance on starting a business in the Netherlands.
Start-up visa applicants are exempt from the entry clearance visa requirement. This means that
they can apply and await the decision on their application in the Netherlands without having to
travel back to their country of origin. Family members can also reside in the Netherlands and are
given the same employment status.
About 30 residence permits for self-employment are issued on average every year, which
represents about 15% of the total applications. With regard to the residence permit for start-up
entrepreneurs, in total 95 applications were submitted in 2015 from which 21 residence permits
were granted, 26 are in progress, 28 were denied and 20 were retracted308
.
Spain - Ley de Emprendedores 4.7.
Launched in September 2013, the Ley de Emprendedores was created to attract foreign
investment and entrepreneurs in order to improve the competitiveness and innovation in Spain.
Visa and requirements:
The start-up policy offers five visa categories from investors to entrepreneurs and highly skilled
workers. The policy is designed to eliminate the obstacles for foreign entrepreneurship and to
establish a regulatory framework that is conducive to this entrepreneurial activity. It introduces a
flexible and fast application procedure with a single authority by Large Business and Strategic
Groups Unit (UGE).
The visa criteria for entrepreneurs require them mainly to have a government-vetted business
plan in Spanish that demonstrates the economic benefits for Spain and applicants are to be able to
sustain themselves only. No minimum financial requirement is therefore required.
The procedure is streamlined and made faster as the process and decision are made within 10
working days and the residence permit provided within 20 working days. The permit duration is 1
year.
The visa comes with access to a government unsecured lending program, which has about €100
million, or $125 million, to lend to innovative small and midsize companies each year. The loans,
from €25,000 to €1.5 million, are available to all entrepreneurs, regardless of nationality, who
308 Ibid.
116
have a business based in Spain (except for those running real estate or financial ventures). The
scheme allows the simultaneous application for a permit (for residence and work) by family
members.
More than a year since the entry into force of the national scheme, the total number of visas and
permits issued for entrepreneurs amounts to 82. The estimated value of entrepreneurial activities
until the end of 2014, was considered to be approximately €234 million309
. It is also estimated
that a total of 2,624 jobs310
will be created in the forthcoming years thanks to these
entrepreneurial activities of special economic interest for Spain.
5. OVERVIEW OF EXISTING POLICIES AIMING AT ATTRACTING INNOVATIVE
ENTREPRENEURS OUTSIDE THE EU
Australia - "Business Innovation and Investment Programme" 5.1.
The Australian "Business Innovation and Investment Programme" was introduced in July 2012 to
supersede the Business Skills Programme set up in 1992. The programme is designed to attract
high quality investors and entrepreneurs to Australia. It grants a residence permit up to 4 years to
migrants who expressed an interest, passed a points-based assessment and were subsequently
nominated by the state or territory
Visas and requirements:
The programme offers three visas subclasses (two providing permanent visas and one temporary
visas) and substreams within it with different requirements for each - bringing the number of
“visa” options to a total of ten. The selection criteria are both general human capital criteria (age,
education, languages, and experience) and business-related (turnover, assets and business shares).
More precisely, the applicant and her/his family members (even if they are not migrating) must
meet some health and character requirements, which consist in health examinations, health
insurance and the police clearance certificate. Moreover, the foreigner must sign the Australian
Values Statement and must have no debts towards the Australian government. With regard to the
business-related requirements, the applicant must, for two out of four previous fiscal years before
the application, show to have had an ownership interest in an established business(es) that had at
least AUD 500,000 turnover per year. The applicant must also have a certain percentage of the
nominated business, which equals to 51% if the business has a turnover of less than AUD
400,000 per year, to 30% if more than AUD 400,000 and 10% is the business is a publicly listed
company. In general, the business career of the applicant must prove successful and his/her desire
to continue running the business in Australia needs to be genuine
The Business Innovation visa is a temporary visa which has a validity of 4 years and 3 months
and can be converted after a certain period of successful business in a permanent visa.
Family members apply for the same visas held by the main applicant, therefore having the same
rights, also with regard to access to permanent visas.
309 Discussion paper for the experts meeting on A possible scheme at European Level to attract, retain and
support the non-EU Highly Skilled entrepreneurial innovators 20 May 2015. 310 Ibid.

117
In the period 2012-13, 429 applications were lodged and 46 were granted, whereas in the period
2013-14 (up to March 2014), 739 applications were lodged and 342 granted311
.
Canada - "Start-up Visa Program" 5.2.
In April 2013, the "Start-up Visa Program" replaced the old Entrepreneur visa that only required
the foreigner to recruit one Canadian for one year. It is a pilot programme for five years granting
permanent residence to immigrant entrepreneurs. It targets immigrant entrepreneurs with the
necessary skills to build innovative businesses in Canada that can create new jobs and compete
on a global level.
Visa and requirements:
Under this Programme, applicants must be admitted into a business incubator, secure at least
CA$75,000 in investments from an angel investor group, or secure at least CA$200,000 in
investments from a venture capital fund. The system therefore heavily relies on the support of
one of several designated Canadian organizations (angel investor group, venture capital fund or
business incubator). The investor organization has to provide a Commitment Certificate directly
to Citizenship and Immigration Canada, summarizing the details of the commitment made with
the applicant. A peer Review Process has been introduced so as to make sure that the deals made
between the investment organizations and immigrant entrepreneurs are legitimate.
The program has set a quota of 2,750 visas per year.
Since the launch of the program, 16 applicants have been approved for permanent residency,
helping launch eight companies312
. In 2015, nearly 60 applications were at various stages of the
process. These entrepreneurs are behind 34 business projects. An additional 25 projects have
secured financial support from dedicated investment groups under the program.
Chile - "Start-up Chile" 5.3.
The Chilean government launched a pilot program in 2010. The aim of Start-Up Chile is to attract
early-stage, high-potential entrepreneurs worldwide. The ultimate objective of this scheme to
position Chile as the innovation and entrepreneurship hub of Latin America.
The program runs like a competition for funding, with three competitions each year. Each
competition results in the selection of 100 start-ups with on average two founders per start-up.
The scheme selects promising young firms and gives their founders capital, space networking
mentoring, and a year’s visa to come and work on their ideas in Chile. Chile also has one of the
fastest incorporation rates in the world, allowing a new start-up to incorporate almost in one day.
The scheme is divided in three programs based on the stage of the start-up.
311 Study for an impact assessment on a proposal for a revision of the Council Directive 2009/50/EC of 25 May
2009 on the conditions of entry and residence of third-country nationals for the purposes of highly qualified
employment ("EU Blue Card Directive"). 312 http://news.gc.ca/web/article-en.do?nid=981649

118
– S Factory: Pre-acceleration program for start-ups in early stage focusing in female
founders. Selected companies benefit a financial support of $10 million CLP (€13.000)
and three months acceleration.
–Seed: Acceleration program for start-ups with an efficient product. Selected companies
receive 20 million CLP (around €26.000) equity free and six months acceleration.
– Scale: Subsequent fund for start-ups that are already incorporated in Chile and proved to
be performant. Selected companies receive $60 million CLP (around €78.000) equity free
under the condition that they incorporate and operate in Chile.
Since its introduction, around 500 companies and almost 900 entrepreneurs from a total of 37
countries have benefited from it313
. Start-Up Chile has attracted a lot of global high-tech
companies. In addition, the influx of start-ups is boosting local interest in entrepreneurship. The
introduction of the Start-Up Chile has also change Chileans’ attitudes and provided them with a
global network of business contacts.
New Zealand - Entrepreneur Work Visa 5.4.
A new "Entrepreneur Work visa" was introduced in March 2014 and replaced the old
Entrepreneur visa routes called Long Term Business. The aim of the Entrepreneur Visa review
was to better target businesses with high export and growth potential.
Visas and requirements:
Three visas for entrepreneurs exist, one temporary (Entrepreneur Work Visa) and two permanent
(Entrepreneur Residence Category) providing residency in six or two years depending on how
well the business has performed under the previous temporary visa.
The requirements for the Entrepreneur Work Visa include having a business plan, scoring 120
points on the entrepreneurs’ points scale, showing an intermediate level of English, and
acceptable health conditions and good character. The applicants are required to do a minimum
investment of NZ$ 100,000 (approx. €60,000); however, for innovative start-ups, this
requirement can be waived.
The visa is valid for 3 years, but only if the entrepreneur shows that s/he has made steps to
establish the business, the visa validity is confirmed after 12 months.
The introduction of the new visa marked a drop in the number of applications received and
positive decisions made: from 1,057 applications (first-stage) and 562 positive decisions in
2013/14, to 491 applications and 171 positive decisions in 2014/15314
.
313 Study for an impact assessment on a proposal for a revision of the Council Directive 2009/50/EC of 25 May
2009 on the conditions of entry and residence of third-country nationals for the purposes of highly qualified
employment ("EU Blue Card Directive"). 314 Ibid.

119
Singapore - Entrepass 5.5.
Singapore Entrepass was created in 2004. It went through several updates in order to better target
innovative entrepreneurs. The scheme is part of Singapore’s general plan to become a regional
business hub and attract the best entrepreneurial minds to the country. The scheme was lastly
revised in 2013.
Visa and requirements:
The company must be less than 6 months old, own at least 50,000 in paid-up capital and the
applicant must hold at least 30% of the shares in the company.
EntrePass’ admission conditions were restricted in 2013. From 1 September 2013 only businesses
with funding from a recognised venture capitalist firm or angel, businesses holding registered
intellectual property or businesses supported by a Government agency, are eligible for an
EntrePass. The business must satisfy the ‘innovativeness’ requirement which was introduced in
September 2013. In selected cases for particularly promising businesses, the government will
match investment form the private sector
The visa is granted for a year and renewal criteria are based on progressive targets for local job
creation, revenues and spending
The EntrePass allows the applicant to bring family members (spouse and unmarried children
under 21) to Singapore by applying for their Dependant’s Passes. EntrePass holders are also
eligible to apply for Singapore permanent residence.
There is no official quota of the number of EntrePass to be granted. In 2012, there were 1,300
EntrePass visa applications and 1,000 applications in 2013, 50% of which were accepted315
.
Taiwan - Entrepreneur Visa Promotion Plan 5.6.
In July 2015, Taiwan has introduced an Entrepreneur Visa Promotion Plan to attract foreign
entrepreneurs. The plan offers an initial visa for 1 year which can be renewed up to two years if
evidence shows that the visa holder runs a bona fide business. Permanent residence can be
granted after 5 consecutive years.
The focus is set on innovative businesses that have been created for less than 5 years, through the
identification of 5 principles: funds received registration in an incubator, patent or intellectual
property rights hold, participation in a government-accredited incubator, won major competitions.
USA - Start-up Visa 5.7.
The US Start-up Visa is a proposed amendment to the U.S. immigration law to create a visa
category for foreign entrepreneurs who have raised capital from qualified American investors It
aims at addressing the absence of a visa category for entrepreneurs raising outside funding316
.
315 Ibid. 316 Note that currently, in the United States there is no stand-alone, dedicated visa for innovative start-ups.
However, there are a number of other types of visas that can be used for such purposes.

120
The Start-up Visa Act of 2013 has been introduced in the Senate on January 30, 2013 (and
follows two previous versions) and is currently awaiting Committee review.
It was found that Temporary visas, including H-1B visas, were ill-suited for entrepreneurs and
could be disallowed for use by a foreign national who controls a company. Start-ups have been
shown to be responsible for much of the net increase in employment in some recent years and
discussions in the U.S Congress concluded that “The Startup Act,” could create 500,000 to 1.6
million jobs over the next 10 years if it becomes law317
.
The Start-up Visa would be a temporary immigrant visa, or conditional permanent resident visa
(conditional green card) which converts to a permanent residency (green card) after two years if
certain conditions are met.
Requirements:
The latest proposal Start-up Act 3.0 bill introduced in the U.S. Senate entailed a fixed pool of
75,000 foreign-born individuals who already hold H-1B visas or F-1 student visas and who start
companies in the US.
In the first year of business, these entrepreneurs would be required to employ at least two full-
time, non-family workers and to invest or raise an investment of $100,000 or more. By meeting
the first-year requirements, recipients would be granted a three-year visa extension. If, over that
three-year period, the business owner has hired, on average, one additional employee each year,
they may apply for permanent status.
6. ATTEMPT OF CATEGORIZATION AND CONCLUSIONS
The two previous sections show that the attraction of migrant entrepreneurs is ensured through
several measures that do not necessarily imply the creation of a specific category of visa for
entrepreneurs, accounting for the diversity of possibilities.
Attempt of categorization
The wide range of measures spans indeed from the creation of a visa specific to entrepreneurs
with corresponding entry requirements and rights (which could be referred to as a real "Start-up
Visa" or "Entrepreneur Visa"), to the establishment of incubating programs, where the enrolment
is made usually on the basis of a regular work and residence permit, or even competitions where
money can be directly granted to selected applicants. Some countries also chose an intermediary
road, enabling the granting of a general work visa with some facilitation in the procedure
dedicated to entrepreneurs (such as a fast track procedure).
While the overarching goal is the same, governments have therefore enacted very different
policies to achieve these goals and terms such as "Entrepreneurs Visa" or "Start-up Visa" refer
actually to a myriad of realities as all these options can be combined and are not mutually
exclusive.
317 National Foundation for American Policy, Policy Brief 2016 .

121
Three main measures emerge:
Specific permit regimes
The design of a permit regime dedicated to entrepreneurs is probably the most targeted measure
in as much as it creates specific rules and requirements that are meant to correspond to the
specificities of this category of migrants and grants them corresponding rights.
In the EU, this measure has been introduced in the UK, NL and ES. Outside the EU, it concerns
Australia, Canada, New Zealand, Singapore and Taiwan.
While entry conditions and definition of success vary between countries, there are two key
elements:
• Financial requirements to entry (initial investment).
• The timeframe and the number of jobs that must be created by the business or the amount
of revenues that must be generated (this is the yardstick for success).
Worth noting is that criteria are often modulated as usually the system is made as flexible as
possible to reflect the diversity of entrepreneurial profiles. Further analysis and data are required
to have a clear overview. Regarding the renewal, it is usually based on the assessment of the
success of the business, but the criteria used also differ (the number of jobs created or the amount
of revenues generated) as well as the timeframe set to achieve this.
Facilitated procedure
Another measure adopted to attract innovative entrepreneurs consists in facilitating the
acquisition of residence permits. This relates mainly to the creation of a fast-track procedure and
is for instance in place in FR, ES, IT, NL.318
The entry requirements vary within this category, some countries having chosen to set minimum
financial requirements, others not. The selection process is also different according to countries
as it is based on a review by an expert panel (the composition of which differs according to
countries) on the impact of a project in terms of dedicated investment, jobs created and economic
impact. No information is available at this stage on the criteria used to assess the projects.
Incubation programs
This option is the most integrated one. It creates an aggressive start-up policy through selective
programs that target high-profile entrepreneurs. Quotas are strict (50 for France and Denmark per
year, 300 for Chile, 2,750 for Canada) and a selective process is designed. Programs are aimed
specifically at engineering innovation and entrepreneurship and can include significant funding.
318 No data available for DK, UK, IE.

122
This model relies usually on the concept of small teams, building on the conclusion that team-
based start-ups are more likely to grow than those of single entrepreneurs319
.
In the EU, this is in place in FR, NL, and DK. Outside the EU, it concerns Chile and Canada.
EU level perspective
The fragmentation of very recent existing policies aiming at attracting innovative entrepreneurs,
the topicality of the issue, especially for what relates to innovative start-ups, and the opportunity
to create a legal migration route for innovative entrepreneurs prompt reflection at EU level. This
is all the more relevant as the contribution of entrepreneurship to employment, innovation and
economic and inclusive growth must also be seen in the light of the EU's competitiveness as
highlighted in the Entrepreneurship 2020 Action Plan320
, anchored in the overarching Europe
2020 Strategy. While the potential of this specific category of persons is widely acknowledged, it
is however also often decried that the EU lags behind the traditional immigration countries in
terms of offering opportunities for highly-skilled migrants to start new businesses321
and that this
potential should be unleashed, which could contribute to boost the EU's competitiveness. While
measures have been adopted recently, they exist in a very limited number of Member States,
show a great deal of discrepancy and they cannot grant third-country nationals any intra-EU
mobility rights. This hampers both migrants and the EU as whole to make full use of the growth
potential from a 500 million inhabitant single market.
Gathering data on the efficiency of the policies in place so as to feed reflection at EU level,
including on the added value of an action at EU level, is required and extending the scope of the
EU Blue Card to entrepreneurs does not appear as the appropriate step at this stage. Legislative
action aiming at attracting entrepreneurial innovators should answer the following issues..
Firstly, innovative entrepreneurs form a totally different category which cannot be encompassed
by the conditions set up by the Directive. Extending the scope of the Blue Card Directive to
entrepreneurs requires allowing self-employed activity within the Blue Card for which the
existing entry conditions cannot be used as these are targeted at situations of employment.
Similarly, the Blue Card targets high-skilled employment. It therefore enshrines yardsticks to
measure this and relies on a university degree or a relevant professional experience. Such
indicators would not be relevant for innovative entrepreneurs, and probably sometimes
contradictory to the aim of fostering innovation where the focus should be set rather on the
feasibility and soundness of the business plan considered as well as on its impact on economic
growth and employment, thus also undermining the use of the salary threshold criteria. This is the
319 See in this sense M. Shrivastavay and J. Tamvada, Entrepreneurial teams, Optimal team size and founder
exits, 2011, available at http://www.iza.org/conference_files/EntreRes2011/tamvada_j3400.pdf 320 Communication from the Commission to the European Parliament, the Council, the European Economic
and Social Committee and the Committee of the Regions, ENTREPRENEURSHIP 2020 ACTION PLAN
Reigniting the entrepreneurial spirit in Europe COM/2012/0795 final. 321 Ruby Gropas, 'Migration and Innovation: why is Europe failing to attract the best and brightest,' March
2013.

123
reason why when schemes already in place refer to identified skills or qualifications, the
evaluation of the business plan is still a predominant criterion322
.
Secondly, we have seen the particularities of migrant entrepreneurship and the importance of
supporting measures aiming at facilitating the sustainability of the businesses created by migrant
entrepreneurs. Setting the right framework conditions can indeed both boost the attraction of
foreign innovative entrepreneurs and give them the right conditions to expand their businesses in
a sustainable way. These measures are not always legislative, are addressed at EU level and
cannot be addressed in the present revision exercise. Forcing the current structure of the Blue
Card in order to make it fit to attract entrepreneurs at this stage would not give the right signal,
neither for potential entrepreneurs willing to settle in the EU, nor to the Member States. A
holistic approach is required. Against this background, any action aiming at facilitating the entry
and residence of innovative migrant entrepreneurs should be coordinated with the efforts already
and currently put in place in the different policy areas (migration, research and innovation,
industrial and digital policies) and with the scheme to be designed in the coming months through
a study commissioned by DG RTD This would enable to present a comprehensive and single
"entrepreneurship/start up package" aimed at fostering migrant innovative entrepreneurship.
Thirdly, additional data is also required to be able to present a comprehensive analysis. The
analysis should focus on the need of action at EU level, especially in terms of EU-wide rights to
be granted, such as intra-EU mobility. This data should also include the results of the admission
policies put in place, which is scarcely available at the moment, both because of the recent nature
of these policies and of the lack of literature on this emerging matter. In May 2015, J. Goube
wrote “At present, the effectiveness of entrepreneurial visas in attracting the best and brightest
has not been proven. Start-up visa policies have not caused a surge in the number of applications
and companies for most countries – so far most programs in Europe approved fewer than 100
applications a year, except for the UK (though strong anecdotal evidence seems to indicate abuse
and failure of the entrepreneurs under the first iteration of the visa). Additionally, strong
anecdotal evidence are suggesting that flexible visa requirements form an essential foundation
that supports the growth of an innovative and international business creation hub – but alone
cannot make global entrepreneurs want to move to another country to settle”.323
However, the
schemes at Member States level are recent and 'going down their learning curve' and it might be
too soon to draw any conclusions.
322 See for instance Ireland, where the project must be "led by an experienced management team" and where
the review process does not focus on such an element:
http://www.inis.gov.ie/en/INIS/Guidelines%20for%20Start-
up%20Entrepreneur%20Programme.pdf/Files/Guidelines%20for%20Start-
up%20Entrepreneur%20Programme.pdf
The scheme explicitly excludes retail, personal services, catering or other businesses of this nature out of its
scope.
Similarly, in Spain the report on the business and entrepreneurial activity is the most important element:
http://extranjeros.empleo.gob.es/es/UnidadGrandesEmpresas/folletos/Folleto_ley_emprendedores_Emprend
edores_EN.pdf
In the UK, even the "graduate entrepreneur visa" are a graduate who has been officially endorsed as having
a genuine and credible business idea 323 "Worldwide start-up via policies compared", J. Goube, Migreat, May 2015.

124
In addition, before gathering the relevant data required to have a comprehensive analysis of the
effectiveness of measures to attract innovative entrepreneurs, it could be useful to allow Blue
Card holders to have a minor entrepreneurial activity on the side of the primary employment as
Blue Card holders.
In the beginning of a new business venture, many entrepreneurs continue to work their "day job"
to support their personal expenses while developing their entrepreneurial activity in their private
time. Latest research324
shows indeed that a significant number of start-ups commence in the
informal economy primarily to test the viability of the business, often started as a hobby. And,
about 22% of men and 13% traded informally when starting their business, whereby 66% of men
and 53% of women assert that the main reason was to test the viability of their business325
.
Research also suggests that the risk and uncertainty associated with entrepreneurial activity deters
entry and contributes to the high rates of new business failure326
. While nationals do not have
specific constraints to start this venture as long as the applicable fiscal and corporate law rules are
respected, the situation of third country nationals appears very different as in most cases (i) their
work permit usually only grants the possibility of economic activities as an employee,
specifically excluding any self-employed activities and (ii) their work permit is explicitly linked
to a specific job, even to a specific employer. Consequently, any self-employed activity besides a
main job as an employee takes place, at best, in a grey zone or is not allowed. Often there is no
explicit prohibition in the law, but it is a logical implication of a system based on a job or
employer specific work permit for employed activities. And, when the labour access status is not
respected (and the dependant residence status), neither are the fiscal, social security and corporate
law rules.
Under the current Blue Card Directive, this possibility is forbidden as the third country national
must be an employee according to Article 2(b). This situation could be changed by explicitly
allowing a secondary professional activity as a self-employed besides the main job on which the
Blue Card is dependent providing that the following conditions are met:
o The self-employed is clearly defined as secondary (supplementary) to the employed job
for which the Blue Card has been granted;
o All conditions of the Blue Card remain fulfilled at all the time;
o The self-employed venture respects all fiscal and corporate rules.
Whether the employer of the Blue Card holder allows this or not could be arranged in the private
employment relationship between the Blue Card holder and the employer. However, the permit
should not be the (legal) obstacle that prevents entrepreneurial activity.
This would provide added flexibility to high-skilled persons and in some cases favour a gradual
transfer to entrepreneurship, without distorting the current legal framework. Benefits could be
seen in economic terms as research shows that "hybrid entrepreneurs who subsequently enter
full-time self-employment (ie. quit their day job) have much higher rates of survival relative to
324 William C and Martinez A. 'Is the informal economy an incubator for new enterprise creation? A gender
perspective", International Journal of Entrepreunarial Behaviour and Research, Vol. 20, No 1, 2014, pp.4-19 325 Id. 326 "Should I quit my day job?: a hybrid path to entrepreneurship" J. Raffiee and J. Feng, Academy of
Management Journal, 2014, Vol. 57, No 4, 936-963.

125
individuals who enter full-time self-employment directly from paid employment"327
, thus
addressing the specificity of the vulnerability of migrants enterprises. Such a route could
therefore provide the certainty and security required for high-skilled migrants who wish to start
their own business, improving their sustainability, add value to the Blue Card, and be part of a
more flexible approach which could foster promising innovation and businesses.
327 Id.

126
ANNEX 11 INTERNATIONAL SERVICE PROVIDERS
1 CONTEXT
Services are increasingly important in the global economy and a central part of the
economy of every EU country. The EU is the world's largest exporter of services with
tens of millions of jobs throughout Europe in the services sector. It accounts for over
22 % of global trade in services — compared to 15 % for the US and 8 % for China —
and has a positive services trade balance with the rest of the world of over 150 billion
EUR per year.328
Opening up foreign markets for services means more growth and jobs
in the EU, while the admission of well-trained, high skilled and qualified foreign
professionals who move to the EU to provide services would contribute to enhancing EU
competitiveness.
To maintain or increase its global lead, the EU concludes free trade agreements with
international partners. It uses trade agreements to achieve mutual economic benefits, but
also to promote established international governance structures (such as the WTO) and to
encourage standards and best practices in partner countries.329
In doing so, it is in
competition with other large trading nations, who may not share the aims or practices of
the EU. It is therefore essential that the EU remains a reliable partner, and that it lives up
to the commitments which it has taken in past agreements, so as to be able to continue to
set the agenda worldwide.
Trade in services can take several forms and is therefore categorised, in accordance with
the General Agreement on Trade in Services (GATS), in four distinct "modes of
supply"330
. "Mode 4" requires the presence of a natural person in the territory of the
trading partner, and hence touches upon migration policy.
Within Mode 4, the EU usually negotiates a number of categories of professionals for
whom temporary presence on the territory is essential and for whom adequate admission
channels need to be in place: business visitors for establishment purposes (BVEPs) or
business service sellers (SeSe); intra-corporate transferees (ICTs), including graduate
trainees/trainee employees (GTs), contractual service suppliers (CSSs) and independent
professionals (IPs). The relevant categories in the context of this Impact Assessment331
are contractual service suppliers (CSSs) and independent professionals (IPs), who -
with very limited exceptions332
-need to possess university-level qualifications as well as
three to six years of professional experience. They are generally admitted for a
cumulative period of not more than 6 months or for the duration of the contract,
whichever is less.
The table below provides an overview of the different "Mode 4"categories.
328 European Commission, DG Trade, "European Union trade in the World: Index", published 6 November 2015.
http://trade.ec.europa.eu/doclib/docs/2006/september/tradoc_122532.pdf 329 See, for example, "Trade for all — Towards a more responsible trade and investment policy", Communication
outlining the European Commission's new trade & investment strategy.
http://trade.ec.europa.eu/doclib/docs/2015/october/tradoc_153846.pdf 330 Cross-border supply (mode 1), Consumption abroad (mode 2), Commercial presence (mode 3) and Presence of a
natural person (mode 4). 331 Other categories such as business visitors or business service sellers only stay for a very limited time (up to 90
days); the status of Intra-corporate transferees (including Graduate trainees) is regulated under the Intra-Corporate
Transferee Directive. 332 Exceptionally, the EU granted entry and temporary stay to contractual services suppliers in fashion model services,
chef de cuisine services, and entertainment services other than audio-visual services without the requirement of
possessing of a university degree or a qualification demonstrating knowledge of an equivalent level under Economic
Partnership Agreement (EPA) with Cariforum states.

127
Due to the rising importance of services worldwide, as well as the EU's pre-eminent
position and clear offensive interests in this field, all recent EU trade agreements dealing
with trade in services include (or will include) provisions on Mode 4. Some past
examples are the EU Free Trade Agreements (FTAs) with South Korea, Cariforum, and
Canada, whilst similar provisions are likely to be included in future agreements such as
with the USA, Japan, Australia, or the plurilateral Trade in Services Agreement (TiSA).
Since CSSs and IPs are rarely recognised as a distinct category in the EU Member State's
migration legislation, statistics are incomplete. Some Member States can provide
statistics on third-country nationals who receive posting permits. It cannot be assumed,
"Mode 4" categories in the context of the General Agreement on Trade in Services (GATS)
- Business visitors for
establishment purposes
(BVEPs)
Natural persons working in a senior position who:
- are responsible for setting up an enterprise,
- do not offer or provide services or engage in any other economic
activity than required for establishment purposes.
- do not receive remuneration from a source located within the host
Party.
Up to 90 days in
any twelve month
period
- Intra-corporate
transferees (ICTs)
Natural persons who:
- have been employed by a juridical person or have been partners in it
for at least one year
- are temporarily transferred to an enterprise, the host entity, that may
be a subsidiary, branch or head company of the juridical person in the
territory of the other Party,
- are either managers or specialists.
Up to 3 years
- Graduate trainees/trainee
employees (GTs)
Natural persons who:
- have been employed by a juridical person of one Party or its branch
for at least one year,
-possess a university degree
- are temporarily transferred to a subsidiary, branch or representative
office of the juridical person in the territory of the other Party, for
career development purposes or to obtain training in business
techniques or methods.
Up to 1 year
- Business sellers (BS) or
Business Service Sellers
(SeSe)
Natural persons who:
- are representatives of a services or goods supplier of one Party,
- seeking entry and temporary stay in the territory of the other Party
for the purpose of negotiating the sale of services or goods, or
entering into agreements to sell services or goods for that supplier
- do not engage in making direct sales to the general public
- do not receive remuneration from a source located within the host
Party
- are not they commission agents.
Up to 90 days in
any twelve month
period
- Contractual service
suppliers (CSSs)
A person employed by a company based outside of the EU which has
concluded a contract to supply services with a final consumer in the
EU, requiring the presence on a temporary basis of its employees in
the EU in order to fulfil the contract to provide services. They must
have:
- at least three years of relevant professional experience,
- a university degree or an equivalent qualification, and,
- if required for regulated professions, the professional qualifications
required to exercise this activity in the Member State where the
service is supplied.
Cumulative period
of max. 6 months
or the duration of
contract, whichever
is less
- Independent
professionals (IPs)
Natural person established as self-employed outside of the EU. They
must have:
- at least six years of relevant professional experience,
- a university degree or an equivalent qualification and,
- if required for regulated professions, the professional qualifications
required to exercise this activity in the Member State where the
service is supplied.
Cumulative period
of max. 6 months
or the duration of
contract, whichever
is less
128
however, that these figures are indicative of the number of CSSs and IPs, as they can also
relate to several other categories.
2 RELATION BETWEEN TRADE AGREEMENTS AND MIGRATION POLICIES
The GATS Annex on Movement on Natural Persons Supplying Services specifies that
the agreement does not apply to measures affecting access to the employment market or
to rules on citizenship, residence or employment on a permanent basis.
It is clear that trade agreements, and in particular those negotiated by the EU, aim to steer
clear of migration policies, by adopting a different vocabulary (professionals vs. workers,
mobility vs. migration) and by underlining the temporary nature and specific purpose of
stays.
However, it is also clear that the liberalisation agreed in those trade agreements cannot
have any effect as regards entry and temporary stay of natural persons for business
purposes if no adequate admission policies are put in place in the host countries.
In spite of the EU's exclusive competence in the field of international trade,333
the rules
on admitting Mode 4 service suppliers remain fragmented and incomplete. The ICTs and
GTs have been incorporated in the EU acquis through the adoption of a specific
Directive, the Directive on Intra-Corporate Transfers,334
adopted in 2014 and which is to
be implemented in all 25 participating Member States by 29 November 2016. The rules
on admitting CSSs and IPs remain national policy.
A 2015 study by the European Migration Network335
showed the large variance in
national admission policies for CSSs and IPs. This information has been recently
complemented by a survey among Member States (through a questionnaire sent to the
Trade Policy Committee), specifically aimed at supporting this Impact Assessment.
The main findings of the EMN study and of the above-mentioned survey are explained
below.
Most Member States do not have dedicated programmes in place for admitting CSSs
or IPs. In many cases, where the period of stay is short (90 days under Schengen rules),
the relevant professionals will enter those Member States by using the procedures laid
down for tourists. For longer periods of stay, the standard procedures for admitting
highly-qualified migrant workers or self-employed migrants are used instead. As service
providers are linked to their EU clients by a service contract, rather than an employment
contract, their admission can be hindered due to a lack of dedicated provisions.
CSSs and IPs are not defined separately in relevant legislation in the vast majority of
Member States. As a result, existing definitions in national law do not always clearly
distinguish between the various types of business persons and can overlap in several
cases.
The duration of stay on the basis of the first permit varies significantly between
Member States, as shown in the table below.336
333 Common Commercial Policy, Art 207 TFEU. 334 Directive 2014/66/EU of 15 May 2014 on the conditions of entry and residence of third-country nationals in the
framework of an intra-corporate transfer. 335 EMN Study, Admitting third-country nationals for business purposes, European Migration Network, 2015,
Synthesis Report. 336 EMN Study 2015.

129
IPs CSSs
Up to 3 months FI, HR, HU FI, HR, HU
3-6 months HU, LU, PT, SE, UK BE, HU, LU, PT, UK
6-12 months AT, FR, HU, LV, PL BE, EL, HU, FR, PL
1-2 years EL, ES, SK ES, IE, SE, SK
Over 2 years BE, HU HU, LV, NL
The length of procedures varies significantly (between 3 days and 3 months), as does
the cost (45-1000 EUR). Speed and cost are not correlated.
Most Member States allow the family of the service provider to join (PL, SI, SE, BG,
DK, SK, HR, CZ, BE, ES, EE, DE) and to work (PL, SE, BG, DK, CZ, BE, ES, FR, EE,
DE, and – subject to a labour market test – SI).
Service providers are excluded from the scope of the EU Long-Term Residents'
Directive. Furthermore, periods spent as a temporary worker or service provider do not
count towards the 5-year minimum stay to be eligible for EU Long-term resident
status.337
Nevertheless, several Member States allow service providers to build up
eligibility for long-term residency under national rules (SI, SE, DK, SK for CSSs, HR,
CZ, BE, ES, EE, DE).
Currently, CSSs and IPs enjoy limited professional mobility within the EU. Their
mobility is limited to Schengen rules (90 days within any 180 days period), if their
residence permit was issued by a Schengen state. Any right to work, however little, is
subject to national rules in the second Member State. Some Member States have
introduced pragmatic rules which allow non-EU professionals who are staying legally in
another Member State to engage in limited activities, e.g. attending business meetings.
According to the information provided by the Trade Policy Committee, most Member
States do not see the need to provide for (professional) intra-EU mobility for CSSs or
IPs.
In conclusion, the current situation, in which CSS and IPs mode 4 categories are not
recognised in EU law and only partially at national level, produces several adverse
situations, such as problems with proper implementation of the EU commitments, or
the risk that international disputes will increase as agreements with key partner
(Canada, the US, Japan, and in the future possibly Australia) enter into force. A detailed
report on the implementation of the EU-Cariforum agreement contains several
allegations of legitimate service providers being denied appropriate access.338
The EU’s
negotiating leverage will decrease if current and future agreements cannot be
implemented properly. As more commitments are taken on mode 4, fragmented and
incomplete legislation will lead to high numbers of unfounded applications and
337 Council Directive 2003/109/EC of 25 November 2003 concerning the status of third-country nationals who are
long-term residents, Articles 3.2.e and 4.2. 338 http://trade.ec.europa.eu/doclib/docs/2014/october/tradoc_152825.pdf (executive summary).
http://trade.ec.europa.eu/doclib/docs/2014/october/tradoc_152824.pdf (full report, see pp 40-49).

130
increase the risk of abuse. The economic potential of the trade agreements will remain
unfulfilled as regards mode 4.

131
Background information
1. Policy documents, consultations and studies
The European Agenda for Migration noted that the services sector is economically
significant, and suggested to assess possible ways to provide legal certainty to these
categories of people, also in order to strengthen the EU’s position to demand reciprocities
when negotiating Free Trade Agreements (FTAs).339
The Communication on New EU Trade and Investment Strategy "Trade for All"340
emphasises the importance of mobility of professionals as a key element to conduct
business internationally. Benefits envisaged in numerous service sectors covered by trade
agreements would be enhanced significantly if highly qualified service providers were
able to move more seamlessly to provide their services across borders. The
Communication announces that the Commission will use the review of the EU Blue Card
directive to assess the possibility of including conditions of entry and residence of third-
country nationals providing a service on a temporary basis in line with EU commitments
in trade agreements.
DGs HOME and TRADE, as well as Member States trade and home affairs experts
have collaborated closely to redefine the EU's strategy on Mode 4, in view of the clear
commercial interests of the EU and its Member States set out in the "Trade for all"
Communication.
The Trade Policy Committee (Services and Investments) was consulted to gather
extensive information on how the Mode 4 commitments on CSSs and IPs are
implemented, with a view to conducting this Impact Assessment.
In 2015, the European Migration Network conducted a study on "Admitting third-
country nationals for Business Purposes", which includes a review of the admission of
other third-country nationals who travel to the EU for business reasons under the EU
Free Trade Agreements. It was based on the contributions of the 24 of the network's
national contact points.341
2. List of EU trade negotiations containing provisions on "Mode 4":
A. Concluded and in force
1. General Agreement on Trade in Services (GATS) 342
2. EU - Korea343
3. EU - CARIFORUM344
339 COM(2015) 240 final, A European Agenda On Migration. http://ec.europa.eu/dgs/home-affairs/what-we-
do/policies/european-agenda-migration/background-
information/docs/communication_on_the_european_agenda_on_migration_en.pdf 340Communication outlining the European Commission's new trade & investment strategy.
http://trade.ec.europa.eu/doclib/docs/2015/october/tradoc_153846.pdf 341 Austria, Belgium, Croatia, Cyprus, Czech Republic, Estonia, Finland, France, Germany, Greece, Hungary, Ireland,
Italy, Latvia, Lithuania, Luxembourg, Netherlands, Poland, Portugal, Slovak Republic, Slovenia, Spain, Sweden,
United Kingdom). 342 http://www.wto.org/english/docs_e/legal_e/26-gats_01_e.htm 343 http://eur-lex.europa.eu/LexUriServ/LexUriServ.do?uri=OJ:L:2011:127:0006:1343:EN:PDF 344 http://trade.ec.europa.eu/doclib/docs/2008/february/tradoc_137971.pdf

132
4. EU - Central America345
5. EU – Colombia And Peru346
6. EU - Chile347
7. EU - Mexico348
B. Concluded but not in force
8. EU – Singapore349
9. EU – Moldova (Deep and Comprehensive Free Trade Agreement)
10. EU – Armenia (Deep and Comprehensive Free Trade Agreement)
11. EU – Georgia (Deep and Comprehensive Free Trade Agreement)
12. EU – Ukraine (Deep and Comprehensive Free Trade Agreement)
13. EU – Canada (Comprehensive Economic and Trade Agreement)
C. Under negotiations
14. EU – India
15. EU – MERCOSUR
16. EU – Ecuador (integration in EU-COLOMBIA AND PERU)
17. EU – Japan
18. EU – Malaysia
19. EU – Thailand
20. EU – Vietnam
21. EU – Morocco
22. EU - Tunisia
23. EU – China investment agreement
24. European Partnership Agreements (EPAs) with Central Africa, SADC, West
Africa, East Africa and the Pacific regions.
25. EU – United States of America (Transatlantic Trade and Investment
Partnership (TTIP)
26. Plurilateral "Trade In Services Agreement"350
(TiSA)
345 http://trade.ec.europa.eu/doclib/press/index.cfm?id=689 346 http://trade.ec.europa.eu/doclib/press/index.cfm?id=691 347 http://eur-lex.europa.eu/LexUriServ/LexUriServ.do?uri=OJ:L:2002:352:0003:1439:EN:PDF 348 http://eur-lex.europa.eu/LexUriServ/LexUriServ.do?uri=OJ:L:2000:276:0045:0061:EN:PDF 349 http://trade.ec.europa.eu/doclib/press/index.cfm?id=961 350 Australia, Canada, Chile, Chinese Taipei, Colombia, Costa Rica, the EU, Hong Kong China, Iceland, Israel, Japan,
Korea, Liechtenstein, Mexico, New Zealand, Norway, Pakistan, Panama, Peru, Switzerland, Turkey, the United States.

133
ANNEX 12
STATISTICS
1. DATA AVAILABILITY AND LIMITATIONS
The following analysis has been constrained partly by limitations in data availability and
partly by significant lack of comparability in migration statistics. Despite the significant
efforts made to collect sound and reliable figures to underpin all aspects discussed in this
evaluation, a satisfactory quantitative analysis is still lacking for several of them. Recent
studies and researches have also revealed little empirical evidence on several of the analysed
issues. Therefore it has been difficult to estimate and quantify the scale of effects of certain
proposals (particularly the economic and financial impacts) in a reliable manner. This is
particularly relevant when it comes to statistics that could help quantifying the volume of the
problems and the potential impacts of the policy options.
In general, figures on the national schemes are not always directly comparable. This is
due, primarily, to variations in the definition of a highly skilled worker, to the particularities
of the different national migration systems, some of which do not have distinct categories for
highly skilled workers, and to the way in which the statistics may be collected.
One of the main issue in relation to data availability concern the the numbers of permits
issued for highly qualified third country nationals under national schemes and the number of
Blue Cards issued, which are not readily comparable due to several gaps or imprecisions in
the data collected at national level.
Firstly, some Member States351
have national schemes which do not differentiate
according to the skill level. As a result, they do not register the skill or wage level of a
permit holder. This complicates the identification of the numbers of third-country workers
receiving national permits who might also be eligible for the Blue Card.
Secondly, even where data is available, further problems might arise due to differences in the
ways permits granted are recorded in Member States and at the European level. While the
numbers for one given year sometimes refer only to the numbers of first permits granted,
others include status changes or renewals. This is a broader problem that concerns several
type of residence permit.
Thirdly, problems arise as regards the comparison between the yearly or monthly salary
thresholds set by the Member States and 1.5 times the gross average wage as recorded
by Eurostat. As for the comparison, reference can be made to the Structure of Earnings
Survey. However, not only does the most recent version of this Survey date back to 2010, but
the Survey is also limited regarding the coverage of certain sectors and company sizes.
Looking into alternative sources, the average gross earnings per employee can be calculated
on the basis of the Eurostat National Accounts data, as it has been done, based on the total
amount of wages and salaries among the main components of GDP divided by the number of
employees according to the domestic concept, which captures the employment in resident
production units. This, however, also includes those employed on a part-time basis and
therefore does not produce an exact full time equivalent. Finally, information on the salary
threshold set in 2014 is missing for PT, while in EL no salary threshold was set because the
351 See Annex 6.

134
country decided to issue no Blue Card pursuant to its right to control the numbers of
admission, as set out in Article 6 of the Directive352
. For HR no Eurostat data is available on
the share of wages and salaries of total GDP353
.
With regard to the issues of costs and length of the procedure and on the subject of
administrative burdens for national authorities, even less reliable data is available.
Applicable EU legislation does not require Member States to collect such data and many of
them do not have them easily available.
Finally, a different problem concerns comparability of data, which often vary considerably
or cannot be considered entirely representative for all Member States and all labour market
sectors.
352 According to Art. 6 on volumes of admission, "This Directive shall not affect the right of a Member State to determine the
volume of admission of third-country nationals entering its territory for the purposes of highly qualified employment." 353 Eurostat: [nama_10_gdp]

135
2. PERMITS OF BLUE CARD HOLDERS AND THEIR FAMILY MEMBERS, AND SALARY
THRESHOLDS
Blue Cards granted, renewed and withdrawn by MS (EU25) – Table
Granted Renewed Withdrawn
2012 2013 2014 2012 2013 2014 2012 2013 2014
BE 0 0,00% 5 0,04% 19 0,14% n/a 0 7 n/a 0 0
BG 15 0,41% 14 0,11% 21 0,15% 0 12 25 n/a n/a 0
CZ 62 1,69% 72 0,56% 104 0,75% 1 20 40 0 0 2
DE 2 584 70,52% 11 580 89,32% 12 108 87,41% 0 1 0 n/a n/a 0
EE 16 0,44% 12 0,09% 15 0,11% 0 0 11 0 0 0
EL 0 0,00% n/a 0,00% n/a 0 n/a n/a 0 n/a n/a
ES 461 12,58% 313 2,41% 39 0,28% 91 310 283 n/a n/a 0
FR 126 3,44% 371 2,86% 597 4,31% 49 182 243 0 0 0
HR n/a 0,00% 10 0,08% 7 0,05% n/a 0 3 n/a 0 4
IT 6 0,16% 87 0,67% 165 1,19% n/a 0 0 n/a 0 0
CY 0 0,00% 0 0,00% 0 0,00% 0 0 0 0 0 0
LV 17 0,46% 10 0,08% 32 0,23% 0 70 29 0 0 1
LT n/a 0,00% 26 0,20% 92 0,66% n/a 1 58 1 0 0
LU 183 4,99% 236 1,82% 262 1,89% 0 18 219 1 7
HU 1 0,03% 4 0,03% 5 0,04% 0 0 2 0 0 0
MT 0 0,00% 4 0,03% 2 0,01% 0 18 4 0 7 8
NL 1 0,03% 3 0,02% 0 0,00% 0 0 0 0 0 0
AT 124 3,38% 108 0,83% 128 0,92% 5 9 8 n/a n/a n/a
PL 2 0,05% 16 0,12% 46 0,33% 0 0 0 0 0 0
PT 2 0,05% 4 0,03% 3 0,02% n/a 0 0 0 0 0
RO 46 1,26% 71 0,55% 190 1,37% 0 1 41 n/a 0
SI 9 0,25% 3 0,02% 8 0,06% 0 0 2 0 0 0
SK 7 0,19% 8 0,06% 6 0,04% 0 0 0 0 0 0
FI 2 0,05% 5 0,04% 3 0,02% 0 0 1 0 0 0
SE 0 0,00% 2 0,02% 0 0,00% 0 0 0 0 6 9
EU25 3 664 12 964 13 852 146 642 968 1 14 31
Source: Eurostat EU Blue Cards by type of decision, occupation and citizenship [migr_resbc1]; Last updated on
12/02/2016 and extracted on 18/02/2016

136
Blue Cards granted, renewed and withdrawn by MS (EU25) – Graph
Source: Eurostat EU Blue Cards by type of decision, occupation and citizenship [migr_resbc1]; Last updated on 12/02/2016 and extracted on 18/02/2016

137
Blue Cards granted in DE in 2014 and the first half of 2015 by time of arrival and salary threshold applied
Source: BAMF, "Wanderungsmonitor Erwerbsmigration nach Deutschland", Jahresbericht 2014 and 1. Halbjahr 2015(2014 and January to September 2015)
2014 January to September 2015
Time of arrival Salary threshold applied Time of arrival Salary threshold applied
In 2014 4 673 39% 1,5 (regular) 5 954 45% In 2015 2 372 32% 1.5 (regular) 3 301 45%
Before 2014 7 175 61% 1,2 (shortage occupations) 5 894 55% Before 2015 4 991 68% 1.2 (shortage occupations) 4 062 55%
Total 11 848 Total 11 848 Total 7 363 7 363
Increase above the last year (2013) 558 5% Increase above the same period of the last year (first half 2014) 1 439 20%

138
3. Permits for family members granted, renewed and withdrawn by MS (EU25)
Granted Renewed Withdrawn
2012 2013 2014 2012 2013 2014 2012 2013 2014
BE 0 0,00% 4 0.10% 9 0.13% 0 0 9 0 0 0
BG 5 0,45% 4 0.10% 0 0.00% 0 4 10 n/a n/a 0
CZ 35 3,16% 21 0.55% 64 0.96% 0 0 10 0 0 n/a
DE 270 24,39% 2 998 78.46% 5 099 76.31% 0 0 0 n/a n/a 0
EE 18 1,63% 2 0.05% 14 0.21% 0 0 13 0 0 0
EL 0 0,00% n/a n/a 0 n/a n/a 0 n/a n/a
ES 385 34,78% 358 9.37% 60 0.90% 82 354 326 0 n/a n/a
FR n/a: n/a 43 0.64% n/a n/a 9 n/a n/a 0
HR n/a n/a 0 0.00% n/a n/a 2 n/a n/a 0
IT n/a 5 0.13% 1 0.01% n/a 0 0 n/a 0 0
CY 0 0,00% 0 0.00% 0 0.00% 0 0 0 0 0 0
LV 8 0,72% 2 0,05% 23 0,34% 0 11 13 0 2 4
LT n/a 0 0,00% n/a n/a 0 n/a n/a 0 n/a
LU 223 20,14% 207 5,42% 245 3,67% 0 118 395 0 0 0
HU 0 0,00% 0 0,00% n/a 0 0 n/a 0 0 n/a
MT n/a 10 0,26% 4 0,06% n/a 0 10 0 0 n/a
NL 0 0,00% 0 0,00% 8 0,12% 0 0 0 0 0 0
AT 155 14,00% 136 3,56% 174 2,60% 25 79 91 0 n/a n/a
PL 0 0,00% 0 0,00% 778 11,64% 0 0 0 0 0 0
PT 0 0,00% 0 0,00% 3 0,04% n/a 0 0 n/a n/a 0
RO 0 0,00% 65 1,70% 135 2,02% 0 0 0 n/a 0 2
SI 3 0,27% 1 0,03% 12 0,18% 1 1 0 0 0 0
SK 5 0,45% 8 0,21% 10 0,15% n/a 0 0 n/a 0 0
FI n/a : n/a
0 4 : 0 n/a n/a
SE 0 0,00% 0 0,00% 0 0,00% n/a 0 0 n/a 0 0
EU25 1 107 3 821 6 682 108 571 888 0 2 6
Source: Eurostat Admitted family members of EU Blue Cards holders by type of decision and citizenship [migr_resbc2], Last updated on 18/01/2016 and extracted on
25/02/16

139
4. Top-20 countries of origin of Blue Card holders – Table
2012 2013 2014
Country Permits Country Permits Country Permits
1 India 699 China 1 011 India 2 595
2 China 324 Russia 994 Russia 1 212
3 United States 313 United States 776 China 1 002
4 Russia 271 Syria 547 United States 845
5 Ukraine 149 Ukraine 536 Ukraine 781
6 Turkey 112 Egypt 450 Syria 554
7 Egypt 105 Serbia 412 Egypt 467
8 Mexico 105 Turkey 409 Turkey 447
9 Syria 104 Iran 394 Iran 426
10 Japan 93 Jordan 290 Serbia 410
11 Serbia 79 Brazil 265 Brazil 289
12 Brazil 78 Mexico 249 Mexico 269
260
13 Iran 75 Japan 246 Tunisia 260
14 Canada 67 Canada 206 Canada 225
15 Pakistan 60 Pakistan 189 Pakistan 219
16 South Korea 59 South Korea 180 Japan 204
17 Colombia 53 Libya 148 Jordan 176
18 Venezuela 50 Belarus 143 Macedonia 171
19 Jordan 47 Colombia 140 Australia 165
20 Croatia 46 Bosnia & Herz, 138 Belarus 163
Top-20 2 889 7 723 10 882
Total 3 664 12 964 13 852
Source: Eurostat EU Blue Cards by type of decision, occupation and citizenship [migr_resbc1], Last updated on
12/02/2016 and extracted on 25/02/2016,

140
5. Countries of origin of Blue Card holders – Map
Source: Eurostat EU Blue Cards by type of decision, occupation and citizenship [migr_resbc1]; Last updated on 08/10/2015 and extracted on 18/01/2016,
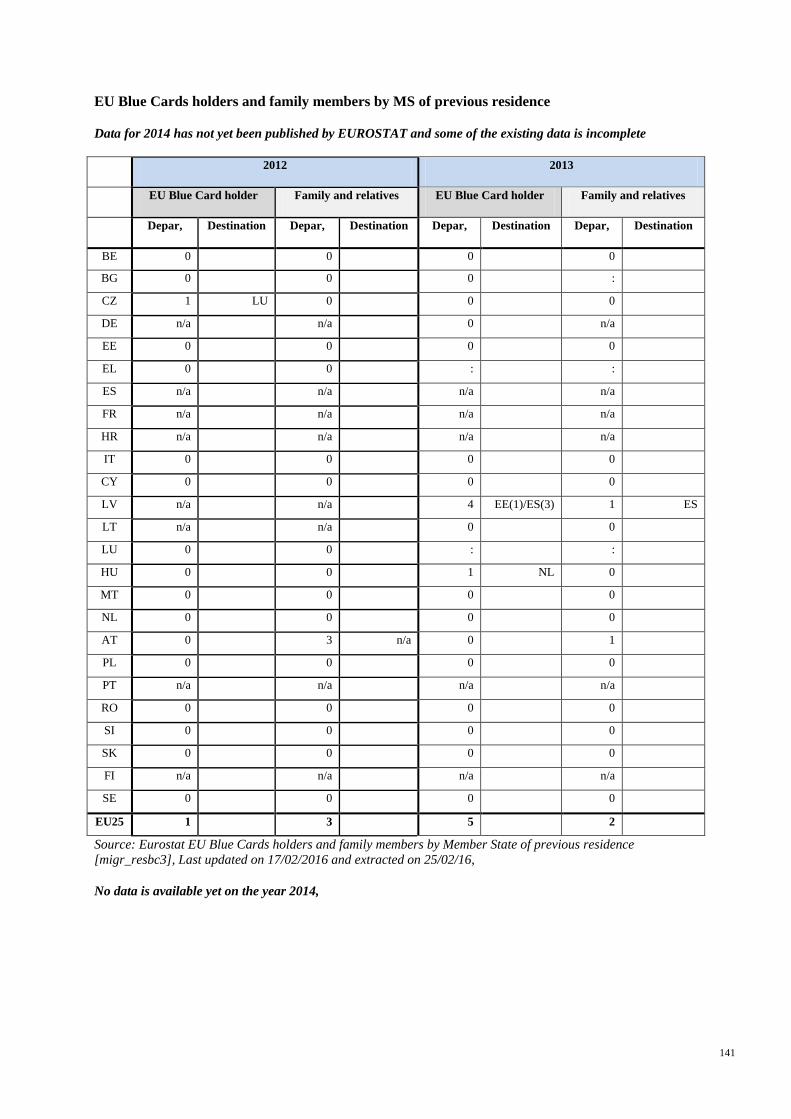
141
EU Blue Cards holders and family members by MS of previous residence
Data for 2014 has not yet been published by EUROSTAT and some of the existing data is incomplete
2012 2013
EU Blue Card holder Family and relatives EU Blue Card holder Family and relatives
Depar, Destination Depar, Destination Depar, Destination Depar, Destination
BE 0
0
0
0
BG 0
0
0
:
CZ 1 LU 0
0
0
DE n/a
n/a
0
n/a
EE 0
0
0
0
EL 0
0
:
:
ES n/a
n/a
n/a
n/a
FR n/a
n/a
n/a
n/a
HR n/a
n/a
n/a
n/a
IT 0
0
0
0
CY 0
0
0
0
LV n/a
n/a
4 EE(1)/ES(3) 1 ES
LT n/a
n/a
0
0
LU 0
0
:
:
HU 0
0
1 NL 0
MT 0
0
0
0
NL 0
0
0
0
AT 0
3 n/a 0
1
PL 0
0
0
0
PT n/a
n/a
n/a
n/a
RO 0
0
0
0
SI 0
0
0
0
SK 0
0
0
0
FI n/a
n/a
n/a
n/a
SE 0
0
0
0
EU25 1 3 5 2
Source: Eurostat EU Blue Cards holders and family members by Member State of previous residence
[migr_resbc3], Last updated on 17/02/2016 and extracted on 25/02/16,
No data is available yet on the year 2014,

142
Salary thresholds set by Member States, comparison with Eurostat data
2014 2015
Salary threshold set by
MS (€)
1,5 * average annual
salary (Eurostat data, €)
Ratio threshold / salary
(Eurostat data)
Salary threshold set by
MS (€)
IT 24 789 38 958 0,95 n/a
CY 23 964 31 849 1,13 n/a
LV 12 888 16 213 1,19 13 776
MT 24 054 29 548 1,22 n/a
BG * 7 519 8 959 1,26 * 8 007
LU 69 858 83 138 1,26 71 946
SI 27 516 31 727 1,30 27 648
SK 15 102 17 358 1,31 15 102
BE 50 974 58 213 1,31 51 466
ES 33 909 37 481 1,36 33 909
EE 17 088 18 731 1,37 18 096
HU * 12 955 13 713 1,42 * 13 419
PL * 15 140 15 629 1,45 * 15 692
DE 47 600 47 422 1,51 48 400
CZ * 16 604 16 338 1,52 * 16 973
LT 15 078 14 767 1,53 11 580
SE * 58 941 57 562 1,54 n/a
FI 57 708 56 180 1,54 59 112
FR 52 750 50 182 1,58 53 331
AT 55 976 52 983 1,58 57 405
NL 61 469 52 604 1,75 63 608
RO 24 576 10 113 3,65 25 828
HR * 18 724 n/a n/a * 30 675
EL n/a 24 782 n/a 19 171
PT n/a 23 606 n/a n/a
Sources: Eurostat the total amount of "wages and salaries" (D11 in GDP and main components (output,
expenditure and income) [nama_10_gdp]); Last updated on 15/01/2016, extracted on 19/01/2016, Number of
employees (SAL_NC in Population and employment [nama_10_pe]); Las updated on 15/01/2016, extracted on
19/01/2016, National thresholds as reported by Member States, The average annual salary used as a reference
for the comparison with the salary threshold set by the Member States has been calculated as a ratio between the
"Wages and salaries" and the "Number of employees", according to National accounts data, Using this data
source ensures that the definitions are harmonised across EU Member States and that the data is up-to-date
(2014) and covers the whole economy (compared for instance to the Structure of Earnings Survey for which the
latest data still dates (as of February 2016) from 2010 and which does not cover all sectors or establishments),
Nevertheless, using the National accounts implies a bias for Member States where a significant share of the
employees work part-time as the ratio is calculated by dividing the number of employees in headcount and
therefore is not adjusted for the volume of hours worked,
* Currency has been converted
Exchange rates based on the average rate from 19 January 2015 to 20 January 2016 (EZB)
BGN 1 = EUR 0,5113; CZK 1 = EUR 0,03671; HRK 1 = EUR 0,1314; HUF 1 = EUR 0,003228; PLN 1 =
EUR 0,2389; SEK 1 = EUR 0,1070
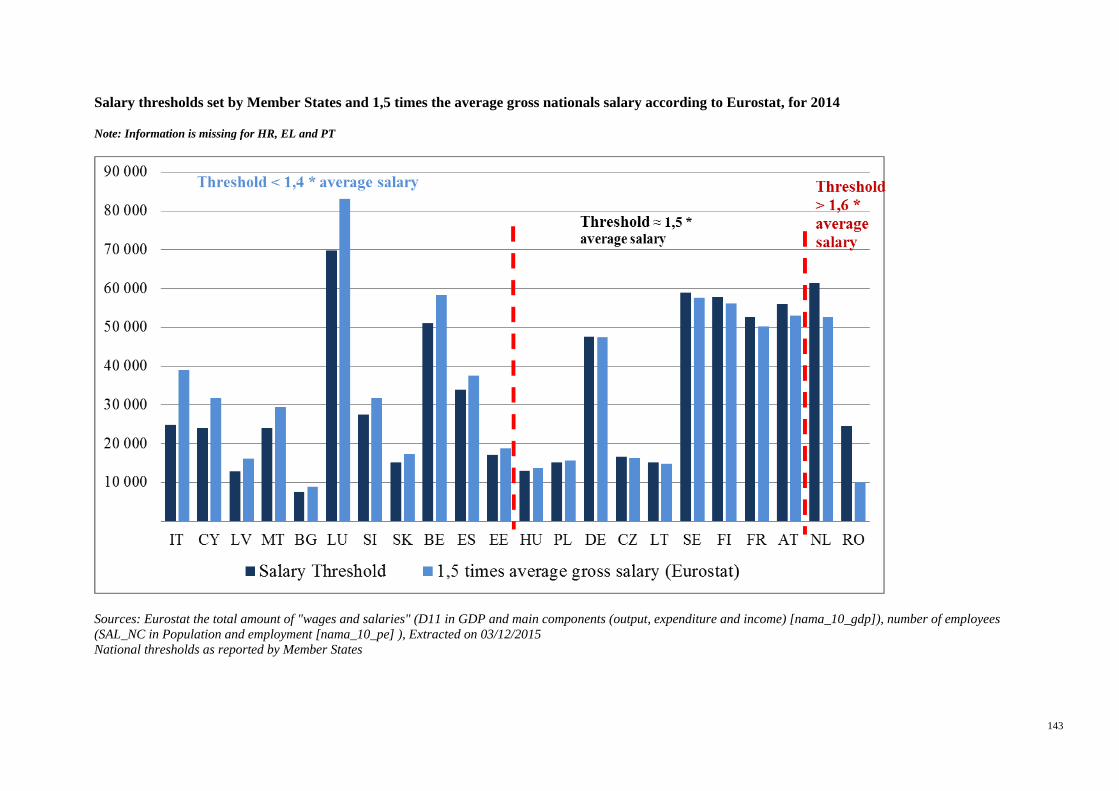
143
Salary thresholds set by Member States and 1,5 times the average gross nationals salary according to Eurostat, for 2014
Note: Information is missing for HR, EL and PT
Sources: Eurostat the total amount of "wages and salaries" (D11 in GDP and main components (output, expenditure and income) [nama_10_gdp]), number of employees
(SAL_NC in Population and employment [nama_10_pe] ), Extracted on 03/12/2015
National thresholds as reported by Member States

144
Professions of Blue Card holders
Note: information is not available for DE in EUROSTAT
2013 2014
Total 12.964 13.852
Unknown 12.131 93,57% 12.437 89,78%
ISCO08 Known occupation 833 6,43% 1.415 10,22%
OC1 Managers 262 31,45% 434 30,67%
OC11 Chief executives, senior officials and
legislators
22 2,64% 32 2,26%
OC12 Administrative and commercial managers 106 12,73% 163 11,52%
OC13 Production and specialised services
managers
130 15,61% 232 16,40%
OC14 Hospitality, retail and other services
managers
4 0,48% 7 0,49%
OC2 Professionals 571 68,55% 981 69,33%
OC21 Science and engineering professionals 367 44,06% 576 40,71%
OC22 Health professionals 18 2,16% 15 1,06%
OC23 Teaching professionals 4 0,48% 12 0,85%
OC24 Business and administration professionals 96 11,52% 162 11,45%
OC25 Information and communications
technology professionals
66 7,92% 136 9,61%
OC26 Legal, social and cultural professionals 20 2,40% 80 5,65%
Source: Eurostat EU Blue Cards by type of decision, occupation and citizenship [migr_resbc1], Last updated on
12/02/2016 and extracted on 07/03/2016
In Germany, out of the about 25 800 TCN Blue Card holders living in Germany on 31
October 2015, nearly 13 100 applied for a Blue Card with the general salary threshold, while
12.700 applied with the lower threshold for shortage occupations. This seems to suggest that
51% of Blue Card holders works in a general occupation and 49% in a shortage occupation.
However, in Germany, when registering an application in the Central Register of Foreigners
(AZR), the salary threshold (not the profession) is the detection criterion. Blue Card holders
who earn at least the general salary threshold are accordingly registered under the general
professions, regardless of their actual profession. Those Blue Card holders who have a
contract meeting the lower salary threshold for shortage occupations, are registered as EU
Blue Card holders under the shortage professions. This suggests that there might be a
statistical bias.
A representative survey of Blue Card holders in Germany shows that in fact many more Blue
Card holders are employed in shortage occupations (88 %) than those registered in the
Central Register of Foreigners suggested because many of them have a salary that meets the
general salary threshold. For this survey about 18 000 Blue Card holders were contacted and a
total of 4 340 (approximately 27 %) responded. The majority of the respondents had an EU
Blue Card, while about 15 % were former Blue Card holders who had already received a
permanent residence card.

145
Professional groups of respondents in German survey of Blue Card holders
Shortage occupations in
Germany
Medical
professions MINT Total Other
19,60% 68,50% 88,10% 9,40%
ISCO Major Group 1 6,70%
ISCO 1: Chief executives, senior officials, other
managers 3,70%
3,70%
ISCO 1-MINT: Chief executives, senior
officials, other managers 3,00%
3,00%
ISCO Major Group 2 90,50%
ISCO2-MINT: Engineers 31,40%
31,40%
ISCO2-Health professionals 19,60% 19,60%
ISCO2-MINT: Computing professionals 18,90%
18,90%
ISCO2-MINT: Engineering science
professionals 6,70%
6,70%
ISCO2: Business professionals 3,60%
3,60%
ISCO2-MINT: Life science professionals 2,50%
2,50%
ISCO2-MINT: Other (mathematicians,
architects, teachers, management consultants) 2,50%
2,50%
ISCO2: Other (teachers, artists, lawyers,
Humanities, Social Sciences, Other medical
doctors)
2,40%
ISCO2-MINT: physicist 1,80%
1,80%
ISCO2-MINT: Chemist 1,10%
1,10%
ISCO Major Group 3/4 2,70%
ISCO3 / 4 Other 2,10%
2,10%
ISCO3 / 4-MINT 0,60%
0,60%
MINT (mathematics, information sciences, natural sciences, and technology) is a term used more often in
Germany, yet with a similar meaning than MINT (mathematics, information sciences, natural sciences, and
technology) which is more used in English-speaking countries. Percentages may not add up to 100% due to
statistical rounding.
Source: Hanganu, E. and Heß, B., ‘Die Blaue Karte EU in Deutschland: Kontext und Ergebnisse der BAMF-
Befragung’, Forschungsbericht 27, Bundesamt für Migration und Flüchtlinge, Nürnberg, 2016, forthcoming.

146
3. NATIONAL SCHEMES FOR HIGHLY SKILLED EMPLOYMENT
EU Blue Cards and national schemes for highly qualified employment - Table
Disclaimer: When reading this table please bear in mind that the figures of the national schemes are not always
directly comparable, This is due, primarily, to variations in the definition of a highly skilled workers, to the
particularities of the different national migration systems, some of which do not have distinct categories for
highly skilled workers, and established methods to collect statistics to this end,
2012 2013 2014
Blue Cards National
schemes Blue Cards National
schemes Blue Cards National
schemes
BE 0 95 5 73 19 2 484
BG 15 0 14 0 21 0
CZ 62 69 72 69 104 46
DE 2 584 210 11 580 11 12 108 13
EE 16 0 12 0 15 0
EL 0 0 n/a 0 n/a 0
ES 461 1 231 313 1 480 39 2 137
FR 126 3 037 371 2 667 597 2 567
HR in force: 2013 n/a 10 565 7 0
IT 6 1 695 87 1 543 165 1 066
CY 0 600 0 385 0 469
LV 17 106 10 82 32 122
LT in force: 2013 0 26 0 92 0
LU 183 21 236 0 262 0
HU 1 0 4 0 5 0
MT 0 0 4 0 2 0
NL 1 5 514 3 7 046 0 7 123
AT 124 1 158 108 1 228 128 1 083
PL 2 206 16 387 46 691
PT 2 313 4 767 3 989
RO 46 0 71 0 190 0
SI 9 0 3 0 8 0
SK 7 0 8 0 6 0
FI 2 749 5 971 3 1 120
SE in force: 2013 4 751 2 4 666 0 5 012
EU25 3 664 19 755 12 964 21 940 13 852 24 922
DK not applicable 4 088 not applicable 5 730 not applicable 5 698
IE not applicable 1 408 not applicable 1 707 not applicable 2 438
UK not applicable 8 070 not applicable 3 081 not applicable 2 478
EU28 33 321 32 458 35 527
Sources: Eurostat EU Blue Cards by type of decision, occupation and citizenship [migr_resbc1]; Last updated
on 12/02/2016 and extracted on 28/04/2016

147
Data national schemes: Eurostat, Remunerated activities reasons: Highly skilled workers, First permits issued
for remunerated activities by reason, length of validity and citizenship [migr_resocc], Last update on
27/04/2016, extracted on 28/04/2016,
EU25 Blue Card and National Schemes for highly qualified employment – Graph
Sources: Eurostat EU Blue Cards by type of decision, occupation and citizenship [migr_resbc1]; Last updated
on 12/02/2016 and extracted on 15/02/2016 Data national schemes: Eurostat, Remunerated activities reasons: Highly skilled workers, First permits issued
for remunerated activities by reason, length of validity and citizenship [migr_resocc], Last update on 30/11/15,
extracted on 25/02/2016
EU Blue Cards and national schemes by Member State in 2015 – Graph
Sources: Eurostat EU Blue Cards by type of decision, occupation and citizenship [migr_resbc1]; Last updated
on 12/02/2016 and extracted on 15/02/2016
Data national schemes: Eurostat, Remunerated activities reasons: Highly skilled workers, First permits issued
for remunerated activities by reason, length of validity and citizenship [migr_resocc], Last update on 30/11/15,
extracted on 25/02/2016
First permits issued under national schemes by period of validity in 2014 – Table
Period of Validity
Total 3-5months
6-
11months
12 months
or over
BE 2 484 160 6.44% 288 11.59% 2 036 81.96%
BG 0 0
0
0
CZ 46 4 8.70% 3 6.52% 39 84.78%
DE 13 0 0.00% 0 0.00% 13 100.00%
EE 0 0
0
0

148
EL 0 0
0
0
ES 2 137 201 9.41% 144 6.74% 1 792 83.86%
FR 2 567 13 0.51% 136 5.31% 2 412 94.18%
HR 0 0
0
0
IT 1 066 17 1.59% 557 52.25% 492 46.15%
CY 469 9 1.92% 130 27.72% 330 70.36%
LV 122 0 0.00% 121 99.18% 1 0.82%
LT 0 0
0
0
LU 0 0
0
0
HU 0 0
0
0
MT 0 0
0
0
NL 7 123 5 48 7.69% 1 254 17.60% 5 321 74.70%
AT 1 083 6 0.55% 1 074 99.17% 3 0.28%
PL 691 254 36.76% 308 44.57% 129 18.67%
PT 989 5 0.51% 47 4.75% 937 94.74%
RO 0 0
0
0
SI 0 0
0
0
SK 0 0
0
0
FI 1 120 103 9.20% 330 29.46% 687 61.34%
SE 5 012 674 13.45% 1 320 26.34% 3 018 60.22%
EU 25 24 922 1 994 8.00% 5 712 22.93% 17 210 69.07%
EU28 35 527 2 684 7.55% 7 420 20.89% 25 423 71.56%
Sources: Eurostat, First permits issued for remunerated activities by reason, length of validity and
citizenship [migr_resocc], Last update on 30/11/15, extracted on 18/01/2016.
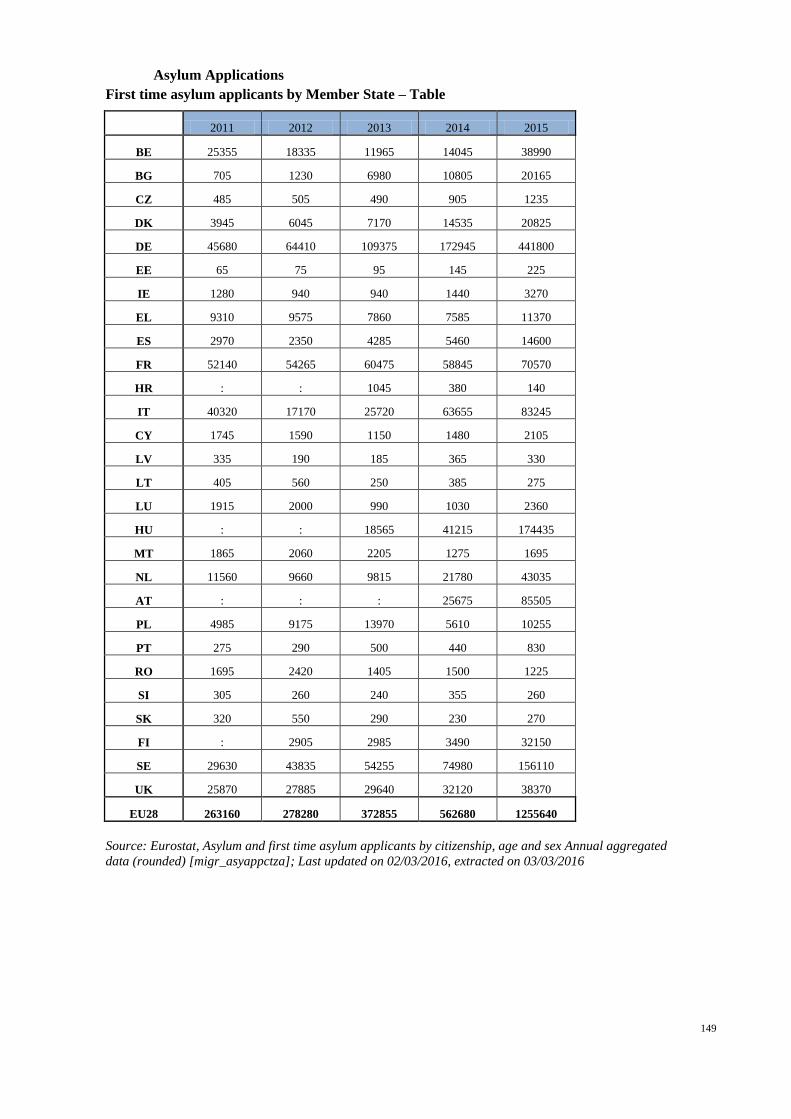
149
Asylum Applications
First time asylum applicants by Member State – Table
2011 2012 2013 2014 2015
BE 25355 18335 11965 14045 38990
BG 705 1230 6980 10805 20165
CZ 485 505 490 905 1235
DK 3945 6045 7170 14535 20825
DE 45680 64410 109375 172945 441800
EE 65 75 95 145 225
IE 1280 940 940 1440 3270
EL 9310 9575 7860 7585 11370
ES 2970 2350 4285 5460 14600
FR 52140 54265 60475 58845 70570
HR : : 1045 380 140
IT 40320 17170 25720 63655 83245
CY 1745 1590 1150 1480 2105
LV 335 190 185 365 330
LT 405 560 250 385 275
LU 1915 2000 990 1030 2360
HU : : 18565 41215 174435
MT 1865 2060 2205 1275 1695
NL 11560 9660 9815 21780 43035
AT : : : 25675 85505
PL 4985 9175 13970 5610 10255
PT 275 290 500 440 830
RO 1695 2420 1405 1500 1225
SI 305 260 240 355 260
SK 320 550 290 230 270
FI : 2905 2985 3490 32150
SE 29630 43835 54255 74980 156110
UK 25870 27885 29640 32120 38370
EU28 263160 278280 372855 562680 1255640
Source: Eurostat, Asylum and first time asylum applicants by citizenship, age and sex Annual aggregated
data (rounded) [migr_asyappctza]; Last updated on 02/03/2016, extracted on 03/03/2016

150
First time asylum applicants by citizenship (Top 20, EU-28) – Table
2010 2011 2012 2013 2014 2015
Syria 3775 6455 20805 46450 119000 362775
Afghanistan 16180 22270 21080 21030 37855 178230
Iraq 12550 12785 11360 8775 14845 121535
Kosovo (under UNSCR 1244/99) 11725 7550 7165 16905 34115 66885
Pakistan 5800 14805 17100 19125 20550 46400
Russia 12725 12650 17445 35120 14030 18385
Albania 1075 2860 6875 10555 16145 65935
Eritrea 4325 5575 6235 14235 36250 33095
Serbia 14615 10650 13635 15060 20095 19090
Somalia 12920 10600 12850 15525 14805 19575
Nigeria 5435 12225 6725 10220 18895 29915
Iran 8500 10285 11740 10885 9700 25360
Bangladesh 4495 7725 5035 7275 10005 17695
Stateless 1805 2135 3190 9275 15170 18940
Georgia 4370 6045 9785 7995 7445 6560
Former Yugoslav Republic of
Macedonia, the 6120 4535 6705 7380 6730 10545
Unknown 2595 2480 2400 3560 8605 21345
Democratic Republic of the Congo 5000 5795 7475 7515 6790 5720
Ukraine 540 725 865 835 13550 20830
Mali 885 3980 2325 6435 12790 8315
Source: Eurostat, Asylum and first time asylum applicants by citizenship, age and sex Annual aggregated
data (rounded) [migr_asyappctza]; Last updated on 02/03/2016, extracted on 03/03/2016. The countries of
citizenship are sorted according to the average number of asylum seekers over 2010-2015.

151
ANNEX 13
ANALYTICAL DESCRIPTION OF POLICY OPTIONS
1. POLICY OPTION PACKAGES
Policy Option Package 1 (POP1) 1.1.
POP1: EU legislative action to extend the scope of the EU Blue Card by making it accessible
to a significantly wider group of workers, including (some) medium-skilled
This option would make the EU Blue Card available also to some medium-skilled workers, as
salary and qualifications would be set as alternative instead of cumulative conditions. The level of
rights would not be significantly enhanced from the current level. The package would entail the
following elements:
a) For unregulated professions, the salary threshold and higher professional qualifications are
no longer cumulative but instead alternative conditions, and the applicant has to fulfil one
or the other according to their choice.
i. On the one hand, this opens the EU Blue Card scheme to all workers whose salary
is high enough, regardless of the level of education or professional expertise.
ii. On the other hand, if the required higher professional qualifications are met, there is
no salary threshold to fulfil but the allowed occupations would be limited to ISCO
major groups 1-2. The higher professional qualifications would be either higher
education qualifications (at ISCED2011 level 6 and above) or work experience of at
least five years at a level comparable to higher education qualifications and which
is relevant in the profession or sector specified in the work contract or binding job
offer;
b) The general salary threshold is made more adaptable by providing Member States with the
possibility to set a national threshold within a fork of possible thresholds between 1.4 and
1.7 times the average gross annual salary in the Member State concerned.
c) The lower salary threshold for workers in certain shortage occupations (limited to ISCO
major groups 1-3, i.e. managers, professionals, and technicians and associate professionals)
is revised to be a mandatory provision at factor 0.8 of the general salary threshold chosen
by the Member State in question.
d) For regulated professions, the mandatory requirements to be fulfilled for the exercise of the
regulated profession in the Member State in question remain in place, but the salary
threshold is not applied if the occupation in question falls under ISCO major groups 1-2.
e) Mandatory safeguard mechanisms (to be determined at national level) are introduced to
prevent social dumping and abuse. These can include collective agreements, prevailing
wage databases and consultations with social partners. In addition, labour market tests
continue to be generally allowed.
f) Required length of work contract is shortened from 12 to 6 months, thus including also
shorter working relationships within the scheme.
g) Member States facilitate the transition from highly skilled employment to entrepreneurship
by allowing highly skilled workers some secondary self-employed activity on the side of
employment as an EU Blue Card holder.
h) Any parallel national schemes are abolished and merged into the EU Blue Card: all
applicants who qualify will be granted an EU Blue Card, while there can be national
schemes for other categories of workers not falling under the scope of the Blue Card.

152
a) Introducing the salary threshold and formal qualifications as alternative
conditions
According to the Blue Card Directive the applicant for an EU Blue Card has to present the
necessary qualifications for the profession specified in the work contract or job offer. If the
profession in question is regulated in the Member State, the applicant has to present the
documents showing that he or she fulfils the conditions for exercising that profession in the
Member State. If the profession is unregulated (meaning that there are no specific criteria for
the qualifications needed to exercise it), the applicant has to present higher professional
qualifications, which means either a higher education diploma or corresponding professional
experience of at least five years, if the Member State in question has transposed this option. In
contrast to regulated professions, the purpose is not to assess the competence for the position
in question, but to verify that the person is highly skilled in terms of the Directive.
In the current Blue Card Directive, applicants need to meet a salary threshold of at least 1.5
times (factor) the average gross annual salary (reference figure) in the Member State
concerned. The salary threshold has two main functions: it protects TCN workers against
wage dumping and distinguishes - to some extent - the highly skilled from other categories of
workers. Some Member States apply a flexible interpretation of the salary threshold and set it
lower than what is foreseen in the Directive, while others set it higher than the minimum,
possibly to favour the national system. There are major differences in the distribution of
wages across Member States, which complicates the harmonising effect of the salary
threshold (see Charts 4 and 5 in Annex 7).
Under POP1, the two currently cumulative conditions of presenting the qualifications and
meeting a salary threshold would be made alternative. In such case, the applicant could be
admitted when fulfilling one or the other criterion according to his/her choice. This option
would open up the EU Blue Card scheme to a wider audience and give up the idea that both
qualifications and salary are required simultaneously as proxies for skills. Some of the issues
related to the current scheme would be duly addressed: Applicants meeting the salary
threshold would not need to go through the burdensome procedure of recognition of
qualifications. Recent graduates could be admitted without attaining the salary of a more
experienced expert, which would solve many problems currently faced by young
professionals. There are examples in the national schemes of both options being used without
the other one, although not as alternatives (see Annex 6).
Many national schemes for the highly skilled seem to operate without a salary threshold and
instead, rely on minimum wages, collective agreements and the possible checking of market
conformity of the salary354
. On the other hand, salary threshold is a clear-cut condition for
migrants to understand and authorities to apply, and it prevents certain types of abuse. If
salary threshold was to be abandoned even partially, it would be necessary to require that the
salary is checked for market conformity as an additional safeguard to prevent abuse and lower
the risk of social dumping. This would imply controlling that the salary promised for the job
corresponds to what is regularly paid to persons in similar positions.
Giving up the salary threshold and qualifications as cumulative conditions would open up the
scheme to different skills levels. If the applicant fulfils the salary threshold (either the general
one or the lower one for shortage occupations) there would be no requirement to have attained
any specific level of education or professional expertise. However, in order to avoid opening
up the scheme too radically, the salary threshold would be relatively high, the fork of possible
354 See Annex 6.

153
factors ranging from 1.4 to 1.7. This approach relies on the idea that a high enough salary
indicates that the worker has skills valued by the employer. There would be a lower threshold
in place for shortage occupations that would be 80 % of the regular threshold. However, as
access would otherwise be too liberalised, possible occupations would be limited to ISCO
major groups 1 to 3 (managers, professionals, technicians and associate professionals). Group
3 would be included to reach also more medium skilled workers necessary for filling
shortages.
Correspondingly, if the applicant has the required qualifications (the level would be the same
as in the current Directive) and intends to work in an ISCO 1-2 occupation (managers and
professionals), there would be no salary threshold applicable. The salary would only have to
meet the minimum requirements such as minimum salary or wage determined in collective
agreements in each Member State and be conform to regular salaries in the market for that
position. This option could be particularly attractive for highly skilled workers in lower-
paying sectors.
b) Introducing an adaptable general salary threshold
As explained in point a), under POP1 Member States would be provided with a fork of
possible salary thresholds, instead of only a minimum level as in the current Directive. A
higher level of harmonisation would be attained without depriving Member States of the
possibility to adapt the threshold to their national labour market circumstances and needs.
Member States could set their threshold between 1.4 and 1.7 times the national average
salary. A relatively high threshold would be necessary to limit the group of persons who
could be admitted without presenting the qualifications. The aim would be to target mainly
highly skilled persons and some of the medium skilled. For added transparency, Member
States would be obliged to use EUROSTAT data (national accounts) as the reference figure.
In practice, Member States could choose a lower threshold than what is allowed by the current
Directive (which sets only a minimum factor of 1.5.), but they could also go higher than most
Member States currently do, as most have set the threshold at the minimum level allowed, as
indicated in Annex 5.
c) Introducing a lower salary threshold for workers in certain shortage occupations
as a mandatory provision
According to the current Directive, Member States may choose to apply a lower threshold of
1.2 times the average gross annual salary in the Member State concerned for certain shortage
occupations belonging to ISCO major groups 1 and 2.355
This option has been transposed by 9
Member States but not all of them effectively apply it. Germany, however, which issues
almost 90% of all Blue Cards, applies the lower threshold extensively356
.
Under POP1, the lower threshold would continue to apply to workers in occupations on
shortage occupation lists, which are normally set by Member States on a yearly basis.
Occupations would have to belong to ISCO major groups 1, 2 or 3. The provision would be
mandatory which means that if Member States have shortage lists in place, they would be
obliged to apply the lower threshold on occupations on the list. The lower threshold would be
0.8 times the general threshold applicable in the concerned Member State. This corresponds to
355 ISCO (International Standard Classification of Occupations) major groups 1 and 2 include managers and professionals
respectively. http://www.ilo.org/public/english/bureau/stat/isco/intro.htm 356 There were 25.104 Blue Card holders residing in Germany as of 30 September 2015 of which 12.774 (50,9 %) fulfilled
the normal threshold and 12.330 (49,1 %) were given Blue Cards according to the shortage list to which a lower threshold
applies.

154
the current Directive where the lower minimum threshold amounts to 80 % of the general
minimum threshold.
d) Admission of applicants in regulated professions
The model of alternative admission conditions would not be applicable to workers in
regulated professions. If these persons were admitted on grounds of fulfilling the salary
threshold alone, there would be no guarantees that they have the necessary qualifications to
exercise the profession in the Member State concerned. This would go against the purpose of
admitting these workers in the first place. Instead, under this option they could obtain an EU
Blue Card without fulfilling the salary threshold if they have the necessary documents proving
they are qualified to exercise the regulated profession in the Member State of destination. In
addition, the occupation should fall under ISCO major groups 1 and 2. In a way, they would
profit partially from the alternative admission conditions as they could be admitted without
the salary threshold applying, but not without presenting the necessary qualifications attached
to the regulated profession in the concerned Member State.
e) Introducing mandatory safeguard mechanisms against social dumping
As the admission conditions would be a lot more flexible than in the current EU Blue Card,
there would be an emphasized need to guarantee that the potentially added supply of TCNs
would not lead to the weakening of working conditions, especially salaries, in the Member
States. The simplest way would be to require that prior to issuing an EU Blue Card, Member
States would make sure that the salary as determined in the work contract or binding job offer
meets relevant minimum requirements. The minimum wage applied in the Member State
should naturally be complied with, but also requirements included in collective agreements
and comparable instruments. Prevailing wages per region, sector or occupation could be
applied, if available, and consultations with social partners could be envisaged.
The current possibility to carry out labour market tests before issuing an EU Blue Card would
be maintained in the Directive. This means that Member States would retain the possibility to
only admit highly skilled TCNs in case there is no locally available workforce to fill the
vacancy in question.
f) Shortening the required length of work contract from 12 to 6 months
In a demand-driven system the condition of presenting a work contract or job offer is intended
to guarantee a certain level of continuity of residence and employment. Currently, in order to
be able to apply for an EU Blue Card, the highly skilled worker has to have a work contract or
a binding job offer for at least one year. This provision categorically excludes persons wishing
to carry out work for a shorter duration. There may be an interest for the employer to first sign
a contract with a shorter duration to be able to ensure that the employee is suitable for the
position in question. Naturally, many of the workers whose initial work contract is for
duration between 6 and 12 months may end up getting an extension to their contract and
residing in the EU continuously, even permanently, after a "trial period" has been successfully
completed.
Under POP1 the required length of work contract would be shortened from 12 to 6 months, a
change which would include a larger variety of work relationships within the scheme. As
demonstrated in Chapter 2 of Annex 7, an important share of national residence permits for
highly skilled workers are issued for a validity period of less than 12 months. Therefore,
lowering the bar for the EU Blue Card seems to be a logical step in making the scheme more
inclusive and relevant for different stakeholders. Reducing the required length to six months

155
seems coherent taking into account the more recent Single Permit Directive357
, where the
applicability of procedural safeguards as well as access to certain social security rights can be
limited to workers whose (intended) employment in the Member State lasts at least six
months.
g) Facilitating transition from highly skilled employment to entrepreneurship by
allowing secondary self-employed activity on the side of employment as an EU
Blue Card holder
In the current Directive, the access to labour market of EU Blue Card holders is only
regulated in terms of employment, and there is no mention on how to address self-employed
activity. Therefore, there is no harmonised approach on the issue across Member States and it
can be perceived as something of a grey area. Under POP1, EU Blue Card holders would be
allowed to start a subsidiary self-employed activity in parallel with employment, without
losing their rights and status as highly skilled employed workers. This would facilitate the
transition into entrepreneurship for highly skilled workers already residing in the EU. For
details of this option, see Chapter 6 of Annex 10.
h) Abolishing parallel national schemes and merging them into the EU Blue Card
Under the current Directive Member States are explicitly allowed to continue to issue
residence permits other than an EU Blue Card for any purpose of employment (Article 3(4) of
Directive 2009/50/EC). This possibility to grant national permits to those highly skilled
workers who at the same time enter into the scope of the EU Blue Card has led to a
parallelism of applicable regimes to the same category of migrants.
The continued simultaneous existence of both the EU Blue Card scheme, transposed into the
national legislation of 25 Member States in diverging ways, and separate national schemes
targeting highly skilled workers in those same Member States, has led to a proliferation of
applicable regimes between Member States but also within the same Member State.
On the one hand, the national schemes could arguably be complementary, better adapted to
the specificities of the national labour markets, and introduce an element of positive
competition between Member States. Member States need tailored systems to respond to their
specific labour market needs. For instance, labour shortages and needs of companies
recruiting TCNs vary across and even within Member States. Therefore, any EU level
instrument that would replace national schemes and take into account such variations, would
need a sufficient level of inclusiveness and substantial flexibility for Member States to adapt
to their national situation. Currently, many Member States issue more national permits than
EU Blue Cards (see Table 1 in Annex 6) while the share of Blue Cards in the overall numbers
of permits for highly skilled workers has risen substantially. However, the comparison
between the different schemes – and the numbers of residence permits issued under them –
has to be done with some caveats in mind. An exact comparison is impossible as Member
States have different definitions for highly skilled and some do not have a targeted scheme for
this group at all (see Annex 6), and there are no national schemes that precisely correspond to
the EU Blue Card either.
On the other hand, the competition effect also has a negative side as Member States may
compete with only a national interest in mind, potentially luring highly skilled workers away
from labour markets in greater need of them or where their application as an economic
357 Directive 2011/98/EU of the European Parliament and of the Council of 13 December 2011 on a single application
procedure for a single permit for third-country nationals to reside and work in the territory of a Member State and on a
common set of rights for third-country workers legally residing in a Member State, OJ L 343, 23.12.2011, p. 1–9.

156
resource would be more efficient, thus leading to an overall loss at EU level. In addition, the
many national schemes and the parallelism with the EU Blue Card has resulted in a complex
and confusing358
overall EU immigration system for highly skilled workers with different
administrative procedures for the same category of migrants that both applicants and
enterprises have to deal with. Moreover, a minimum level of harmonisation and coherence is
required in order for the EU’s immigration system to be promotable to potential applicants
and employers, and thus provide added value compared to purely national solutions. For an
EU–wide scheme to be effective there is Member State input required both for the continued
development and the promotion of the scheme. If many Member States continue to invest in
their national schemes instead of the EU Blue Card, the branding value of the latter remains
low.In order to reach a clear, coherent EU approach on attracting the highly skilled, and
following the example of the Directive on Intra-Corporate Transferees and other legal
migration Directives, this option proposes merging all parallel national schemes into the EU
Blue Card. This requires a high level of inclusiveness, substantial flexibility for Member
States to adapt to their national situation, and a high substitution potential for parallel national
schemes. The purpose is to replicate and substitute the positive aspects of the national
schemes, while addressing the negative dimension of the national scheme-Blue Card
relationship, and maintaining and reinforcing the positive aspects of the EU Blue Card.
This would mean that all applicants qualifying for an EU Blue Card would be issued one, and
there would be no competing national schemes targeting the same category of third-country
nationals as those falling under the scope of the Blue Card. This means that there would still
be room for complementary national permit categories addressing other groups of TCNs,
including some highly skilled workers who do not enter into the scope of the EU Blue Card.
For instance, national residence permits available for workers with lower skill levels not
covered by the Blue Card Directive would continue to be allowed, as well as for very specific
highly skilled workers or for self-employed skilled professionals.
Policy Option Package 2 (POP2) 1.2.
358 Potentially even conflicting, as it could be that elements of two separate schemes would be desirable at the same time, e.g.
faster procedure and lower threshold of a national scheme yet intra-EU mobility of the Blue Card.
POP2: EU legislative action to modify the admission conditions and rights within the EU
Blue Card without extending the scope beyond highly skilled workers
This policy option package addresses modifications that could be envisaged within the current
scope and basic framework of the Directive, but with substantial facilitation as regards
conditions, procedures and rights, in order to better meet its goals. The option has been
divided into three sub-options (a), (b) and c)) depending on the target group (e.g. wider/more
selective, but still within the current 'highly skilled' workers definition) of the amended
Directive.
There are some common elements to all sub-options of POP2 (and also, to a certain extent
to POP1 and POP3) to improve the attractiveness of the scheme for migrants and employers,
namely:
a) Required length of work contract is shortened from 12 to 6 months, thus including also
shorter working relationships within the scheme.

157
a) Shortening the required length of work contract from 12 to 6 months
This option would be the same as under POP1.
b) Adding flexibility to recognising professional qualifications
Fulfilling the conditions set out under national law for the exercise of regulated professions is
a necessarily strict criterion in the Directive, as otherwise the admitted TCN could not
exercise the profession in the Member State concerned. While the problems related to this
condition cannot be addressed within the Blue Card Directive, there may be scope for non-
legislative measures such as facilitation of the recognition of equivalent qualifications or
conversion and up-scaling of similar qualifications (see non-legislative options).
As regards unregulated professions, the concept of 'higher education qualifications' entails any
diploma, certificate or other evidence of formal qualifications issued by a competent authority
attesting the successful completion of a post-secondary higher education programme with a
duration of at least three years. This corresponds, by and large, with Bachelor level or
equivalent and higher. It is not specified in the Directive how the qualifications are supposed
to be verified or assessed for the purposes of acquiring an EU Blue Card, and there is no
uniform practice in this regard across Member States.
Under this option, for unregulated professions, Member States would be encouraged not to
apply the full recognition procedure for the purposes of the EU Blue Card, but to rely instead
on simple translations of foreign certificates, where appropriate. It is also essential to develop
the methodology of validating and recognising foreign certificates and other qualifications.
Computerised systems such as the Anabin359
database in Germany are a good example of
ways to simplify recognition.
359 In practice, if a particular foreign diploma is already inserted in the database, it is a matter of minutes to get the results on
recognition. New diplomas are continuously added as assessments are carried out. http://anabin.kmk.org/
b) Member States are encouraged to be more flexible when recognising professional
qualifications for unregulated professions for the purposes of the EU Blue Card.
c) The application process is speeded up: a target time limit of 30 days is introduced and the
maximum processing time is shortened from 90 to 60 days.
d) Member States grant permits to family members of workers simultaneously with the EU
Blue Card to enable family members to follow the worker to the Member State without
any waiting period.
e) EU Blue Card holders are granted quicker access to long-term resident status under
Directive 2003/109/EC by shortening the required period of residence from 5 to 3 years.
f) EU Blue Card holders are given full access to highly skilled employment in the Member
State concerned. Member States apply a simple system of notification of changes to
enable competent authorities to check that the EU Blue Card conditions are continuously
fulfilled.
g) Member States are allowed to introduce a system of recognised or trusted employers.
These employers, in exchange for committing to a scrupulous obedience of common rules,
can benefit from a faster procedure and a waiver of some conditions for their workers,
such as the qualification requirement for unregulated professions.
h) Member States facilitate the transition from highly skilled employment to
entrepreneurship by allowing highly skilled workers some secondary self-employed
activity on the side of employment as an EU Blue Card holder.

158
c) Speeding up the process: introducing a target time limit and shortening the
maximum processing time
The current time limit for processing an EU Blue Card application is "as soon as possible and
at the latest within 90 days of the application being lodged". This is an obligation directed at
Member State authorities, and there shall be consequences determined in national law for not
respecting this deadline. POP2 proposes providing a target processing time of 30 days and a
maximum time of 60 days. This type of provision would clearly indicate what the EU
legislator considers as a suitable typical processing time, while also the maximum tolerable
time limit would still be determined.
d) Granting permits to family members simultaneously with the EU Blue Card
Under the current Blue Card Directive Member States are allowed the maximum of six
months to process the applications of family members after the EU Blue Card holder has been
granted the permit and the family members have lodged their subsequent applications. This
may result in a significant practical waiting period for the workers' families to join them. In
the Directive for intra-corporate transferees (ICT)360
, the applications for both the ICT permit
and the permits for family members can be lodged simultaneously, in which case also the
permits are granted at the same time. Extending this facility to the EU Blue Card scheme
would contribute to enhancing the attractiveness of the migration option for highly skilled
workers with accompanying family. The conditions for family reunifications as such would
not change and Directive 2003/86/EC on the right to family reunification361
would continue to
apply with the derogations already foreseen in the Blue Card Directive.
e) Providing quicker access to long-term resident status
Under Directive 2003/109/EC on long-term residents362
TCNs may apply for a long-term
resident status after five years of legal and continuous residence in the Member State
concerned. The long-term resident status provides for security of continuous residence in the
host country and some mobility rights within the EU. In Directive 2003/109/EC, there are
provisions on periods of absence allowed without affecting the count towards five years and
also on absences allowed once the status has been acquired.
In the current Blue Card Directive, EU Blue Card holders are granted more favourable
treatment vis-à-vis the long-term resident scheme: they are allowed longer absences from the
Member State territory and they can also cumulate periods of residence gathered in different
Member States according to certain rules. However, the regular five years of continuous legal
residence is required also from EU Blue Card holders. If further preferential treatment was
granted and the required residence period was shortened from 5 to 3 years, there would be an
additional incentive for highly skilled workers to choose the EU Blue Card instead of a
national permit.363
f) Giving immediate full access to highly skilled employment in the MS concerned
360 Directive 2014/66/EU of the European Parliament and of the Council of 15 May 2014 on the conditions of entry and
residence of third-country nationals in the framework of an intra-corporate transfer, OJ L 157, 27.5.2014, p. 1–22. 361 Council Directive 2003/86/EC of 22 September 2003 on the right to family reunification, OJ L 251, 3.10.2003, p. 12–18 362 Council Directive 2003/109/EC of 25 November 2003 concerning the status of third-country nationals who are long-term
residents, OJ L 16, 23.1.2004, p. 44–53. 363 DE gives access to national permanent residence to Blue Card holders after 33 months or even after 21 months to persons
with language skills at level B1. On 31/10/2015, 25 800 Blue Card holders were living in Germany while national permanent
residence titles had already been granted to 1 935 former Blue Card holders after 33 months, to 4 601 after 21 months, and
883 without time specification.

159
Rights enjoyed by Blue Card holders are fairly extensive, especially regarding equal treatment
with Member State nationals in numerous fields. However, access to the labour market in the
host country is restricted and planned changes in employment may meet administrative
obstacles. According to current provisions, access remains conditional upon fulfilling the
requirements for an EU Blue Card during the first two years, and even after that Member
States are not obliged to grant full access. Also, the provisions related to the administrative
formalities are complicated.
POP2 would simplify and modernise the provisions on access to the labour market by
granting EU Blue Card holders an immediate access to all highly skilled employment. This
approach may seem far-reaching, but it is conditioned by the fact that EU Blue Card holders
still have to fulfil the conditions for the permit throughout their residence. The underlying
idea in this approach is that workers should notify relevant changes to competent authorities
so that the fulfilment of EU Blue Card conditions could be checked, but the procedure would
not have a suspending effect to the right to work as long as the EU Blue Card remains valid.
Consequently, there would be clear and worker-friendly provisions for the change of
circumstances, but people admitted as highly skilled could still not switch to a low-qualified
job without losing their status as an EU Blue Card holder.
g) Giving Member States the possibility to introduce a system of recognised or
trusted employers
To simplify and streamline the EU Blue Card process, one option would be to increase the
role of the private sector in the admission of highly skilled workers. Some national systems
foresee fast-track procedures for certified or trusted employers with the aim of easing the
administrative burden linked to hiring TCNs (see Annex 6). This approach has already been
introduced as an option in some of the more recent legal migration directives364
; it is
characterised by more flexible admission conditions for certified entities, combined with
control mechanisms to avoid fraud and abuse. Such as system would be allowed as an
optional and complementary route, whereas the regular admission scheme would remain
principal. Member States having chosen to take up this option would grant to trusted
employers (and TCNs recruited by them) certain facilitations: at least a fast-track application
procedure and waiver of the requirement to present formal qualifications for unregulated
professions. Specific safeguards would be put in place (e.g. criteria related to the transparency
of the procedure and the proportionality of the costs) to ensure that also SMEs have the
financial and practical means to become recognised.
h) Facilitating transition from highly skilled employment to entrepreneurship by
allowing secondary self-employed activity on the side of employment as an EU
Blue Card holder
This option would be the same as under POP1.
364 Directive 2014/66/EU of the European Parliament and of the Council of 15 May 2014 on the conditions of entry and residence of TCNs in the framework of an intra-corporate transfer; as well as the proposal for a Directive of
the European Parliament and of the Council on the conditions of entry and residence of third-country nationals for the
purposes of research, studies, pupil exchange scheme or educational project, training, voluntary service and au pairing
(recast).

160
1.2.1. Policy Option Package 2 - Sub-option (a)
POP2(a): Making the EU Blue Card accessible to a wider group of highly skilled
workers (wider and more inclusive Blue Card scheme)
This sub-option would extend the scope of highly skilled workers eligible for the EU Blue
Card, facilitate admission and provide further residence and mobility rights. Member
States would reserve some leeway for national adaptation of the scheme. The package
would entail the following elements, in addition to the horizontal ones:
a) The general salary threshold is lowered and made more adaptable by providing
Member States with the possibility to set a national threshold within a fork of
possible thresholds between 1.0 and 1.4 times the average gross annual salary in
the Member State concerned.
b) The lower salary threshold for workers in certain shortage occupations (limited to
ISCO major groups 1-2, i.e. managers and professionals) is revised to be a
mandatory provision at factor 0.8 of the general salary threshold chosen by the
Member State in question.
c) A lower threshold at factor 0.8 of the general salary threshold is introduced for
recent graduates, enabling young professionals to be issued an EU Blue Card with
a lower salary.
d) Member States are allowed to apply a labour market test (i.e. making the issuance
of an EU Blue Card conditional upon whether there is national or EU workforce
available for the job) to EU Blue Card applicants only in exceptional
circumstances occurring in their national labour market.
e) The recognition of professional experience is promoted as equal alternative to an
education certificate as the required qualification for unregulated professions.
f) EU Blue Card holders get more extensive intra-EU mobility rights: the required
period of residence in the first Member States is shortened from 18 to 12 months,
several conditions for an EU Blue Card in the second Member State are waived
(labour market test, qualifications for unregulated professions), the maximum
processing time is shorter, and working in the second Member State can begin
immediately after applying for an EU Blue Card in that Member State.
g) Any parallel national schemes are abolished and merged into the EU Blue Card: all
applicants who qualify will be granted an EU Blue Card, while there can be
national schemes for other categories of workers not falling under the scope of the
Blue Card.
The underlying idea in POP2(a) is to enhance and make the current Blue Card Directive more
attractive and accessible to applicants (i.e. a wider group of workers while remaining within
the category of highly skilled).
a) Introducing a lower and more adaptable general salary threshold
Overall, it appears that the current threshold is relatively high, and thus more restrictive,
compared to the salary thresholds applied in the national schemes. It can be noted that not
many national schemes have specific thresholds in place on top of safeguards related to
minimum wages, prevailing wages or other criteria (see Annex 6).
A lower (minimum) salary threshold would be a relatively simple way to extend the number
of potential beneficiaries of the EU Blue Card. It would be more inclusive still if it was no
longer set as a minimum threshold but instead, as the only possible threshold (consisting of a

161
factor and a reference figure) to be applied. This would limit the leeway for Member States to
favour their national scheme compared to the EU Blue Card, but at the same time, no
adaptation to national circumstances would be possible. Currently, only the minimum
threshold is regulated, which has led a few Member States to set their threshold using a higher
multiplier than 1.5. At the same time, for reasons related to wage distribution, already the
minimum threshold is restrictive in some Member States (see Charts 4 and 5 in Annex 7).
Similarly as under POP1, a fork of possible thresholds would be offered to Member States.
The fork would be set at a lower level compared to both POP1 and the current Directive with
a minimum factor of 1.0 and a maximum of 1.4. The purpose would be to include more
highly skilled workers within the scheme, also those with less experience and those working
in lower paid sectors or occupations. The qualifications requirement would however still
guarantee that the scheme is reserved for the highly skilled. As in POP1, Member States
would be obliged to use Eurostat data (national accounts) as the reference figure.
b) Introducing a lower salary threshold for workers in certain shortage occupations
as a mandatory provision
This option would be similar as under POP1 with the difference that only occupations
belonging to ISCO major groups 1 and 2 (and not 3) would be included.
c) Introducing a lower threshold for recent graduates
There is a specific group of highly skilled migrants who could be better reached with a lower
salary threshold: information on wage distribution suggests that highly skilled young
professionals risk failing to fulfil the general salary threshold (see Chart 6 in Annex 7). The
lower threshold could amount to 0.8 times the regular threshold, similarly as for shortage
occupations. International students graduated from EU educational institutions represent a
great skills potential to be retained, and they are often already well advanced in their
integration to the host society. Also recent graduates from (at least highly ranking) third-
country universities could provide for an interesting target group. The scope of the more
favourable scheme could be linked to age of the applicant or the moment of graduation or
both.365
In the public consultation, facilitating the access to the labour market of recent graduates of
higher education institutions and long-term trainees who finished their traineeship received
strong backing from the respondents. Of the 80 % of respondents who identified any scope for
improvement within the current Blue Card scheme almost 60 % suggested facilitations for
international graduates. In addition, such facilitation would be a logical connection to recent
amendments to EU legislation on students366
, where graduates are allowed at least nine
months to look for employment in the host Member State.
d) Allowing Member States to apply a labour market test only in exceptional
circumstances
The current Directive allows Member States to refuse an application after examining the
situation in their labour market; they may apply their national procedures on requirements for
filling a vacancy and ensure that it could not be filled by existing available workforce before
365 E.g. The Dutch system foresees a lower threshold for both those under 30 and for a certain period after graduation. 366 The proposal for a Directive of the European Parliament and of the Council on the conditions of entry and residence of
third-country nationals for the purposes of research, studies, pupil exchange scheme or educational project, training,
voluntary service and au pairing (recast).

162
issuing an EU Blue Card. This option has been taken up by numerous Member States, some
of which are favouring their national scheme at the expense of the EU Blue Card (see Annex
6). Furthermore, the concept and practices of labour market testing seem to vary across
Member States, and in many cases it is not carried out European-wide as it in principle
should.
Under POP2(a) Member States would be generally precluded from applying a labour market
test to EU Blue Card applicants. The only leeway would be that labour market tests could be
temporarily re-introduced in exceptional circumstances occurring in the national labour
market. An example of such circumstances could be an exceptionally high level of
unemployment. This option would reduce Member States’ possibilities to control access to
their labour market, even though they would retain the possibility to determine the volumes of
admission of TCNs under Article 79(5) of the Treaty on the Functioning of the EU (TFEU).
The aim of lifting the labour market test would be to make the procedure quicker and the
outcome more predictable for the employer and TCN worker.
e) Promoting the recognition of professional experience as alternative to an
education certificate
In the current Directive, recognising at least 5 years of professional experience is a possibility
given to Member States as derogation from the "main" option of requiring education
certificates. Professional experience to be taken into account refers to the actual and lawful
pursuit of the profession concerned. While around half of the Member States have transposed
the possibility for this derogation into national law, it appears that this option has been
underused to date (see Annex 5). Member States have expressed difficulties in validating
experience, especially if it has been obtained in a third country. Making professional
experience a mandatory, equal alternative to education certificates in this respect could make
experience a more workable criterion in establishing the status of highly skilled. Shortened
period of required experience could be envisaged and linked to shortage occupations, if
deemed necessary. Practical challenges in recognising experience would have to be addressed
also at EU level by exchanging best practices among Member State experts, and possibly by
developing common guidelines.
f) Facilitating intra-EU mobility
The current mobility provisions in the Directive allow the EU Blue Card holder to apply for a
new Blue Card in the territory of a second Member State, but without any of the conditions
being waived or procedure otherwise facilitated. Also, the Directive does not affect the right
of the second Member State to determine the volumes of admission of highly skilled workers.
The mobility provisions in the various EU instruments have been assessed in detail in Annex
9.
This option would entail a system where the second Member State would still issue a national
EU Blue Card, but with a considerably shorter and simplified procedure (taking inspiration
from the provision on long term mobility included in the Intra-Corporate Transferee
Directive): labour market test or pre-determined volumes of admission would not be applied,
processing time would be shorter than for the initial EU Blue Card and higher professional
qualifications for unregulated professions would not be re-checked. Meeting the salary
threshold, however, would always be required in the second Member State. The required
period of residence in the first Member State before mobility rights can be invoked would be
shortened from 18 to 12 months. Work in the second Member State could begin immediately
after lodging the application for an EU Blue Card in that Member State.

163
g) Abolishing parallel national schemes and merging them into the EU Blue Card
This option would be the same as under POP1.
1.2.2. Policy Option Package 2 – Sub-option (b)
POP2(b): Making the EU Blue Card a tool to attract a selected group of the most
highly skilled
This sub-option would make the EU Blue Card a selective instrument for the very highly
skilled. Eligible workers would benefit from fast and easy admission and from extensive
rights. Details of the package would include the following, in addition to the horizontal
elements:
a) The salary threshold is maintained as exclusive by providing Member States with
the possibility to set a national threshold within a fork of possible thresholds
between 1.5 and 1.7 times the average gross annual salary in the Member State in
question.
b) The lower salary threshold for shortage occupations is eliminated and the general
threshold is applied to all applicants.
c) The current level of required qualifications is maintained.
d) Member States are not allowed to apply a labour market test (i.e. making the
issuance of an EU Blue Card conditional upon whether there is national or EU
workforce available for the job) to EU Blue Card applicants in any situation.
e) The EU Blue Card is issued for a standard validity of three years regardless of the
length of the work contract, and after three years it will be directly possible to
apply for a long-term resident status.
f) EU Blue Card holders get very extensive intra-EU mobility rights: the required
period of residence in the first Member States is shortened from 18 to 12 months,
the maximum processing time is shorter, working in the second Member State can
begin immediately after applying for an EU Blue Card in that Member State, and
the second Member State issuing an EU Blue Card can only check that the salary
corresponds to the regular level in that labour market.
g) Member States are allowed to have national schemes for TCN workers as in status
quo.
a) Introducing an exclusive but adaptable salary threshold
Under this option there would also be a fork of possible factors provided for Member States,
but it would be higher than in option POP2(a), namely from 1.5 to 1.7 times the national
average salary. The threshold would be calculated similarly as in option POP2(a), i.e. the
reference salary would be the gross average salary according to EUROSTAT data. The
resulting salary threshold could be either more inclusive or exclusive than the current one
applied in each individual Member State, as the current Directive only sets a minimum factor
of 1.5 but no maximum. The purpose of the higher threshold would be to select migrants in a
way to include only the most highly skilled, who could then be granted extensive rights.
However, Member States would still be limited in how high they can set the threshold, as
unlike in the current system, a maximum would be determined. Therefore, the level of
harmonisation would increase.
b) Eliminating the lower threshold for shortage occupations

164
As this option would focus only on attracting the very highly skilled, there would be no
reason to set a lower salary threshold for shortage occupations and this existing option would
be deleted from the Directive. Instead, there would be only one threshold applicable in each
Member State.
c) Maintaining the current level of required qualifications
As the idea would be to address only the very highly skilled workers, the current approach to
the assessment of qualifications would be justified. Member States would continue to require
a higher education diploma or if they wish, alternatively accept five years of professional
experience.
d) Preventing Member States from applying a labour market test to EU Blue Card
applicants
This option would be the same as under POP2(a), but without the possibility of re-introducing
labour market tests for any reason. The control measure left for Member States would be to
determine the volumes of admission under Article 79(5) TFEU.
e) Introducing a standard 3-year validity for the initial EU Blue Card
According to the current Directive, Member States have to determine a standard validity for
the EU Blue Card which has to be between 1 and 4 years. However, if the work contract or
job offer covers a shorter period than this standard validity, the EU Blue Card shall be issued
for the validity of the contract plus three months. Therefore, the standard validity has only
limited impact and there is great variety across Member States as to how many times a person
has to renew the EU Blue Card before being eligible for long-term or permanent residence
under EU or national law. This could be addressed by harmonising the standard validity of the
EU Blue Card across the EU to match the residence period required for long-term residence
(which would be shortened from 5 to 3 years under POP2), without paying attention to the
validity of the work contract.
For Member States there is interest in having migrant workers renew their permits at regular
intervals in order to provide occasions for competent authorities to check that the conditions
for the permit are still fulfilled. The justification for the more liberal approach under POP2(b)
is that the very highly skilled are unlikely to end up in a situation (apart from very short-term
unemployment between jobs) where the conditions for the EU Blue Card would no longer be
fulfilled, and therefore the need for Member States to have regular checks would be less
pronounced.
f) Providing extensive intra-EU mobility
One of the most pronounced characteristics of the scheme for the very highly skilled under
POP2(b) would be the extensive right to intra-EU mobility. Also in this scenario, the required
period of residence in the first Member State would be shortened from 18 to 12 months –
similarly to sub-option POP2(a). The difference would be that the second Member State could
not re-check any of the specific conditions of the EU Blue Card, but only the general
conditions for a residence permit, such as having a valid travel document and not being a
threat to public policy, public security, and public health. Furthermore, the market conformity
of the salary would be examined, which aims at avoiding social dumping by guaranteeing that
the mobile TCN is being paid a corresponding amount to what a person in a similar position is
regularly paid. However, the national salary threshold for the EU Blue Card would not be
applied in the second Member State.
g) Allowing parallel national schemes as in status quo

165
As POP2(b) would only address the very highly skilled workers, there would be a lot of room
left for national schemes to address workers at different skills levels. It is a more selective,
elite scheme that is more pan-EU and would limit the number of HSW, especially in shortage
occupations, and be less adaptable to the national labour markets. The rationale would be to
make the EU Blue Card attractive enough to be competitive in the eyes of employers and
workers and to become the primary scheme in the EU to address very top talent on an EU
wide basis. Therefore, Member States would retain the liberty to have subsidiary national
schemes in place according to their choice and complement the EU wide scheme.
1.2.3. Policy Option Package 2 – Sub-option (c)
POP2(c): Creating a two-tiered EU Blue Card for different categories of highly
skilled
This sub-option would be a combination of sub-options POP2(a) and (b) by creating an
EU Blue Card with two levels to address different categories of highly skilled workers
(most of the horizontal elements of POP2 would apply to both):
a) POP2(a) represents the first level of EU Blue Card accessible to a wide group of
highly skilled workers, including recent graduates, with facilitated access to
shortage occupations. In contrast to POP2(a), accelerated access to long-term
residence is not granted to level 1 Blue Card holders.
b) POP2(b) is a more advanced level which some applicants could reach right away
and others over time in transition from the first stage. The salary threshold is
higher and the rights more advanced than in level 1.
c) Intra-EU mobility is more facilitated for level 2 (only check that the salary meets
relevant minimum requirements, such as collective agreements, prevailing wage
etc.) than for level 1 (waiving some conditions in the second Member State, e.g.
qualifications, labour market test, but maintaining the other conditions, e.g. salary
threshold). Both levels benefit from the shorter period in the first Member State,
shorter maximum processing time, and the right to start working immediately after
applying for an EU Blue Card in that Member State.
d) Any parallel national schemes are abolished and merged into the EU Blue Card: all
applicants who qualify will be granted an EU Blue Card, while there can be
national schemes for other categories of workers not falling under the scope of the
Blue Card
The rationale behind this option would be to create a tiered scheme combining the different
approaches foreseen under POP2(a) and POP2(b) respectively. There would no longer be one
single EU Blue Card but instead, two levels with different admission conditions and different
rights. It can be noted that already the lower level would be more advantageous than the
current scheme. In terms of admission conditions, the main difference between the levels
would be the salary requirement: for the first level the general threshold would be lower and
there would be a specific, even lower threshold for recent graduates and workers in shortage
occupations.
a) First level of EU Blue Card accessible to a wide group of highly skilled workers
The first level of EU Blue Card would address the group of "regular" highly skilled workers
as specified under option POP2(a), including facilitated admission for workers in shortage
occupations and for recent graduates. In derogation from the list of common elements listed

166
for POP2, the first level EU Blue Card holders would not get quicker access to long-term
residence but instead, the regular five-year residence period would be required from them.
b) Second, more selective level of EU Blue Card
The second level of EU Blue Card would be reserved for very highly skilled workers as
defined in option POP2(b). The idea would be that the second level could also be attained
over time after being admitted as a first level EU Blue Card holder.
c) Intra-EU mobility is more facilitated for level 2
The main difference between the different levels of EU Blue Card would be the mobility
rights. For level 1 Blue Card holders the national salary threshold would still be applied in the
second Member State, whereas for level 2 Blue Card holders only the fulfilment of the
minimum standards of that Member State would be required to avoid social dumping.
d) Abolishing parallel national schemes and merging them into the EU Blue Card
This option would be the same as under POP1.
Policy Option Package 3 (POP3) 1.3.
POP3: EU legislative action that introduces a standard EU-wide Blue Card
This policy option package would introduce a standard EU-wide set of Blue Card rules
applicable across the Member States. There would be no scope for the Member States to adapt
any of the conditions or other rules of the EU Blue Card to national labour market
circumstances or to apply a labour market test. An EU Blue Card issued by one Member State
would be mutually recognised by all Member States and provide unlimited intra-EU mobility.
The legislative actions would entail the following:
a) An EU-wide salary threshold is introduced at a more exclusive level set by the
Commission at a yearly basis. The same nominal salary threshold would apply EU-
wide in all participating Member States and calculated as at least 1.4 times the average
of the highest one-third (33%) of the average gross annual salaries of the Member
States applying the Blue Card Directive. It would be set by the Commission by
implementing measure via comitology (consulting Member States using the advisory
procedure) taking into account of the economic and employment situation in the
Member States applying the Blue Card Directive.
b) The common elements of POP2 are included.
c) An EU level online application management portal for applicants is created. This
means that employers or TCN workers can lodge their application online using the
portal which then forwards the application to national authorities to be further
processed.
d) Intra-EU mobility rights of EU Blue Card holders are made comparable to the free
movement of EU citizens. The single EU Blue Card enables TCNs to reside and work
under the Blue Card conditions in any Member State.
e) Any parallel national schemes are abolished and merged into the EU Blue Card: all
applicants who qualify will be granted an EU Blue Card, while there can be national
schemes for other categories of workers not falling under the scope of the Blue Card.
a) Introducing one EU-wide salary threshold set by the Commission at a yearly basis
Under this option the salary threshold would be determined annually by the Commission and
there would be no room for Member States to adjust it according to national specificities. In

167
order for the EU-wide Blue Card to be feasible, the salary threshold would have to be the
same across the EU and correspond to the salaries of Member States with higher income. Any
other solution would create major risks of social dumping and largely deprive the salary
threshold of its purpose, if workers admitted under a low salary threshold in a low-income
Member State would be able to use the same EU Blue Card to go and work in a higher-
income Member State.
In practice, the Commission would first use Eurostat data to determine the average salaries of
the highest one-third of Member States applying the Blue Card Directive (currently 8 Member
States, which were LU, BE, SE, FI, AT, NL, FR and DE according to 2014 data). Then, the
average of these salaries would be calculated to serve as a basis for the uniform salary
threshold. The minimum factor would be 1.4, but the Commission would be able to adapt the
applicable threshold to the EU-wide labour market situation. Member States would participate
in setting the threshold though the advisory procedure, which would enable taking into
account the existing labour market situations across the EU. However, as the threshold would
be uniform for all issued EU Blue Cards, the labour market situations of individual Member
States could not be directly reflected in the level of the threshold.
b) Introducing the common elements of POP2
All the elements aimed at making the scheme more streamlined and attractive as proposed for
POP2 would apply to this option; see POP2 for details.
c) Creating a single EU level online application management portal for applicants
In order for the EU to be able to manage and monitor the inflow of applications, there would
be a new online application portal created at EU level where employers or TCNs could lodge
the application for an EU Blue Card. It would still be the competent authorities of the Member
State concerned (where the employment would take place) who would actually process the
application and issue the permit.
Currently, there are some Member States providing for online application facilities for
residence permit applicants, whereas some rely on traditional paper-based procedures. The
EU portal would practically push Member States to adopt online tools as the applications
lodged in the EU-wide portal would be forwarded to competent national authorities of the
(first) Member State of destination to be further examined.
d) Introducing intra-EU mobility comparable to the level of free movement for EU
citizens
As the EU Blue Card would be issued as an EU-wide instrument, there would not be any
specific conditions for intra-EU mobility: the permit would enable the TCN worker to reside
and work freely in the territories of Member States applying the Blue Card Directive.
However, the Blue Card conditions would still have to be continuously fulfilled and they
would be the same across the EU. It would require some system of notification to keep track
of the place of residence of EU Blue Card holders in order to know which Member State is
responsible for renewing the permit or otherwise reviewing the grounds for residence at a
given moment. As there are no EU-level residence permits in this sense yet, there are no
direct models to base this system on.
e) Abolishing parallel national schemes and merging them into the EU Blue Card
This option would be the same as in POP1.

168
2. HORIZONTAL OPTIONS
These horizontal options could be combined with any of the policy option packages or
introduced as self-standing changes.
Non-legislative actions (PO-A) 2.1.
Non-legislative actions to improve the effectiveness of the EU Blue Card
This policy option would involve non-legislative actions aimed at enhancing the
implementation of the EU Blue Card and the promotion of the brand. Key elements:
a) The Commission enhances the implementation of the Blue Card Directive and
supports practical cooperation between Member States. Member State experts
exchange information on best practices and perceived trends, as well as on
possible fraud and abuse of the Blue Card system.
b) The use of the EU Blue Card scheme is made easier by improving – by practical
measures - recognition of foreign qualifications between Member States and in
cooperation with third countries.
c) EU and Member States increase the visibility and attractiveness of the EU Blue
Card brand through information sharing, promotion, and advertisement activities.
The Commission launches a dedicated, user-friendly website on the EU Blue Card
within the EU Immigration Portal. Possible promotion tours in third countries can
be organised in cooperation with different stakeholders.
d) Measures are developed to improve skills and job matching to make EU employers
and TCN (TCN) highly skilled workers more attainable to each other.
A number of non-legislative initiatives could be undertaken to either optimise the status quo
without legislative changes or to be combined with any legislative changes. Some of the
considered actions imply reinforcing measures already taken and others would require
completely new initiatives.
a) Enhancing the implementation of the Blue Card Directive and supporting practical
cooperation between Member States
Details on the transposition of the current Directive in Member States are provided in Annex
5; there are some conformity issues to be noted and especially, many Member States were late
in their transposition. Infringement proceedings were opened against all Member States that
were late in transposing the Directive. A letter of formal notice was sent to 20 Member States
and a reasoned opinion to 11 Member States. By October 2013 all cases were closed, as in
August 2013 the Directive was transposed and entered into force in all Member States that
apply the Directive.
The first implementation report on the application of the Blue Card Directive was adopted in
May 2014, based on a detailed conformity assessment of national transposition, and statistics
provided by Member States. The report identified a general lack of communication by
Member States of data and measures taken in application of the Directive, while the
availability of reliable information is essential for the functioning of the EU Blue Card and to
evaluate its attractiveness. Therefore, after the adoption of the report the Commission has
actively organised the collection and exchange of information between Member States. The
Commission requests Member States to regularly submit specific information on topics such
as salary thresholds, volumes of admission, labour market tests, return and readmission, and

169
ethical recruitment via the National Contact Points on the Blue Card Directive. This
information is then distributed to Member States.
In order to improve coherence in practices across the EU, these exchanges could be still
reinforced, either within the Contact Group Legal Migration or in dedicated expert meetings
with the National Contact Points. The exchange of best practices would be useful to make
sure that the EU Blue Card scheme is applied effectively and efficiently across the EU, but
also to combat possible fraud and abuse. The Commission could contribute to a better
implementation of the Directive also by developing guidelines on the interpretation of the
different provisions.
b) Improving by practical measures the recognition of foreign qualifications between
Member States and in cooperation with third countries
The recognition of foreign qualifications is a broad issue of clear relevance also for the EU
Blue Card, as applicants may face problems trying to validate their qualifications necessary
for obtaining the permit. While often not included in the formal processing time of the
application (which is currently limited to 90 days), the recognition procedure adds weeks or
even months to the overall time required for obtaining a permit. It is necessary to distinguish
unregulated professions from the regulated ones. For regulated professions367
the required
qualifications are mandatory for being able to exercise the profession in the Member State in
question. On the contrary, unregulated professions are free of such requirements and in
practice it is up to the employer to assess whether the applicant is qualified for the position at
hand. Therefore, the significance of the recognition procedure differs greatly depending on
whether the profession for which the EU Blue Card is applied for is regulated or not in the
Member State concerned.
Whereas there is already a Directive368
in place regarding the recognition of qualifications
obtained in the EU (for the purposes of regulated professions)369
, it is largely up to the
Member States to regulate on qualifications obtained in third countries. The recognition of
qualifications could be improved by non-legislative measures such as supporting practical
cooperation and exchange of information between Member States. There are well-functioning
databases and other mechanisms at national level which could be spread further. Cooperation
with third countries would be necessary to get a better understanding of different educational
systems and other factors relevant for the evaluation of diplomas and other qualifications.
Recognition of qualifications is a long-standing issue going well beyond the scope of the EU
Blue Card review; actions foreseen in the context of the forthcoming EU Skills Initiative (e.g.
the revision of the Recommendation on the European Qualification Framework) will also be
relevant in this context.
c) Increasing the visibility and attractiveness of the EU Blue Card brand through
information sharing, promotion, and advertisement
367 Professions to which access is conditional upon the possession of specific qualifications or for which the use of a specific
title is protected, e.g. pharmacists or architects. 368 Directive 2005/36/EC of the European Parliament and of the Council of 7 September 2005 on the recognition of
professional qualifications, OJ L 255, 30.9.2005, p. 22–142. 369 The recognition of professional qualifications as laid down in Directive 2005/36/EC enables the free movement of
professionals such as doctors or architects within the EU. Other professions such as sailors or aircraft controllers do not fall
under Directive 2005/36/EC and are governed by specific legislation. Special laws also exist for lawyers and commercial
agents. There is an EU database of regulated professions across Member States: http://ec.europa.eu/growth/tools-
databases/regprof/index.cfm?newlang=en

170
The EU Blue Card could be more effectively promoted to make it a better-known and more
workable tool for all relevant stakeholders: migrants, employers and competent authorities.
Currently, information on the EU Blue Card can be found on a few EU level webpages with
general information on the Blue Card Directive, on a number of websites of the immigration
authorities of several Member States with specific information on the nationally set entry
conditions, procedures and rights in the Member State concerned, and on the separate
Member State specific pages of the EU Immigration Portal that are drafted by the Member
States in collaboration with the Commission. Furthermore, there are a number of private
websites that provide general information on the Blue Card and also some Member State
specific information on entry conditions, procedures and rights. These private initiatives are
often for-profit, sometimes inaccurate and not up-to-date, and sometimes have unclear or
confusing affiliations.
Consequently, there is currently no single official and easy-to-use website that provides
reliable and up-to-date information on the EU Blue Card in general and practical information
on specific entry conditions, procedures and rights the 25 Member States that apply the Blue
Card. A first step to improve the visibility of the Blue Card would be to develop a dedicated
and extensive section within the EU Immigration Portal, which provides up-to-date
information on the EU Blue Card and details of its application in all relevant Member States
in a user-friendly format. The maintenance of the website, including the national pages, would
be carried out at EU level to ensure full coverage. Visibility could be enhanced with online
banner campaigns to target groups.
As a completely new concept, joint EU Blue Card "road shows" could be organised in key
third countries to reach potential applicants. These would be coordinated by the Commission
with possible participation by Member States, recruiters, employers, and sector organisations.
The road shows could offer information sessions on the EU Blue Card, presentations of
employment opportunities and living conditions in the EU, and possibilities for job interviews
on the spot.
d) Developing measures to improve skills and job matching
In a demand-driven system such as the EU Blue Card, the first prerequisite is the employment
relationship between a TCN worker and an EU employer. Therefore, skills and job matching
is extremely relevant if the EU is to attract more highly skilled workers. The skills and job
matching could include different action going beyond the scope of the Blue Card review, for
example cooperation with third countries to improve the visibility and attainability of the EU-
wide labour market to TCN workers. Information campaigns targeted to EU employers could
be envisaged to make them better aware of practicalities linked to searching for and hiring
TCN workforce.
Extending the EU Blue Card scheme to innovative entrepreneurs (PO-B) 2.2.
The European Agenda on Migration indicated that the Blue Card review would examine the
possibility to cover entrepreneurs willing to invest in Europe. This option would entail
creating a new EU legal migration route within the scope of the Blue Card directive for this
professional category, which could – especially if the focus is on innovative entrepreneurs –
contribute to economic growth. Some Member States have schemes in place to allow the entry
and residence of entrepreneurs. These schemes however diverge widely in terms of both
admission conditions and supporting measures.

171
Extending the scope of the Blue Card Directive to entrepreneurs would bring self-employed
activity within the EU Blue Card, which now only covers employed workers. The existing
admission conditions or rights would not be directly applied on entrepreneurs as they are
targeted at situations of employment. Therefore, an entirely new scheme would have to be
created within the existing Directive.
Making the EU Blue Card available for highly-skilled beneficiaries of 2.3.
international protection and asylum applicants (PO-C)
This option would make the EU Blue Card accessible to highly skilled migrants who have
applied for or received international protection and who are already present in the EU
territory. These categories of migrants are currently explicitly excluded from the scope, which
means that they cannot apply for an EU Blue Card even if they fulfil the conditions.
The different variations of this option and their implications are described in detail in Annex
16. Apart from beneficiaries of international protection, asylum seekers and rejected asylum
seekers present in the EU, a fourth group to be discussed there are potential beneficiaries of
protection who still reside outside the EU. For them, there is no legal impediment to apply for
an EU Blue Card, as they do not have any specific status in the EU and are treated as any
other third-country nationals. For them, however, targeted non-legislative support could be
needed, and some of the actions envisaged under PO-A could be particularly relevant.
a) Extend the scope to beneficiaries of international protection
Beneficiaries of international protection are currently excluded from the personal scope of the
Blue Card Directive, so they cannot apply for an EU Blue Card. It is clear that a protection
status is more favourable in many aspects (especially social rights, security of residence and
protection against return) than the status of an EU Blue Card holder. However, the latter does
offer the possibility for intra-EU mobility and it also gives the signal to potential employers
that its holder is a person of interest. In any case, it would be crucial to maintain the high level
of protection enjoyed by these individuals, and the acquired EU Blue Card should in no way
jeopardise the parallel protection status.
b) Extend the scope to asylum seekers
Asylum seekers whose process in the EU is pending cannot apply for an EU Blue Card, as
they are excluded from the scope of the Directive. According to Directive 2013/33/EU370
,
Member States are obliged to grant asylum seekers access to the labour market at the latest
after nine months from lodging the application. However, no given job opportunity can lead
to obtaining an EU Blue Card, which may deter employers from engaging highly skilled
asylum seekers, whose future status in the country is still uncertain. If filing an application for
an EU Blue Card was to be allowed during the asylum procedure, an important issue to be
addressed would be how to deal with the pending asylum request.
Finally, if an asylum seeker receives a negative decision on the asylum application, he or she
becomes an irregular migrant having no legal status in the country. Therefore, applying for an
EU Blue Card in the Member State territory is not possible, as this facility is only reserved for
those staying legally in the country. No changes to that principle are proposed under this
option.
370 Directive 2013/33/EU of the European Parliament and of the Council of 26 June 2013 laying down standards for the
reception of applicants for international protection (recast), OJ L 180, 29.6.2013, p. 96–116.

172
ANNEX 14
CALCULATION OF ECONOMIC IMPACTS: ANALYTICAL MODEL,
ASSUMPTIONS AND RESULTSANALYTICAL DESCRIPTION OF
POLICY OPTIONS
DISCLAIMER ON THE NUMBERS OF BLUE CARDS USED IN THE KEY ASSUMPTIONS
The numbers of Blue Cards used in the key assumptions in the analysis of impacts (chapter 6)
are not target numbers for Blue Cards to be issued but technical assumptions, based on a
number of elements such as variations in admission conditions, to be able to generate
scenarios to quantify the potential economic impacts and the variations of magnitude
according to the various Policy Options Packages.
The calculations in this annex are based on the methodology used by an external contractor in
the impact assessment study commissioned by DG Home Affairs in preparation of this impact
assessment.
1. ASSUMPTIONS REGARDING THE NUMBER OF PERMITS FOR HIGHLY-QUALIFIED WORK
Baseline 1.1.
As shown in Annex 12 of this Impact Assessment (Statistics), there were 13 724 Blue Cards
and 24 913 national permits for highly-qualified work issued in 2014 by Member States
applying the EU Blue Card, totalling 38 637 permits. These figures represent a lower bound
on the estimated number of highly-qualified workers admitted to these Member States, since
some highly-qualified migrants admitted for the purposes of work are not designated as such
by Member States and/or Eurostat and are not included in the statistics on permits for highly-
qualified employment. They are instead included in the overall number of permits issued for
the purposes of work – but cannot be distinguished from the other permits.371
(see Annex 12
on statistics for detailed figures per Member State).
Eurostat data on the first issuance of long-term (1 year and longer) permits do not capture
situations in which the TCN worker is given a shorter-term permit which is subsequently
extended. However, data on shorter-term permits, in particular those for work, include a large
share of seasonal workers, rendering such data unusable for the purposes of this study. Data
on first issuance of permits issued for highly-qualified work excludes those highly-qualified
workers which were admitted to Member States which do not have a dedicated admissions
scheme in place, which do not identify highly-qualified workers as a separate category or
which do not report them consistently
An alternative estimate for the number of permits issued to highly-qualified workers can be
obtained by crossing the total number of permits issued for work372
with the share of high-
educated migrants among all those coming for work purposes (and with a job offer) as derived
from the 2014 EU Labour Force Survey ad hoc module on migrants.373
In 2014 there were
371 First permits issued for remunerated activities by reason, length of validity and citizenship [migr_resocc],
Eurostat. 372 Source: Eurostat. First permits issued for remunerated activities by reason, length of validity and citizenship
[migr_resocc] 373 2014 EU Labour Force Survey ad hoc module on migrants.

173
just over 173 000 long-duration permits374
issued for the purposes of work in the 25
Member States that currently apply the EU Blue Card.375
The Labour Force Survey module
shows around 40 percent of TCN in employment who had found a job before migrating have
high qualifications. People with medium and low qualification each make up 30 percent.376
As
a consequence, we can assume around 69 000 highly-qualified workers, or 40 % of
173 000, are admitted every year.
It is assumed that the baseline for admitting highly-qualified workers consists of 60 % regular
highly-skilled workers, 20 % recent graduates and 20 % permits issued for shortage
occupations. It is assumed this holds true at the baseline salary threshold. Lowering the salary
threshold for selected categories will increase their share. This distribution is a technical
assumption for the purposes of this impact assessment, justified by the BC scheme's overall
objectives under the different policy options and how these may affect the flow of highly-
skilled workers.377
The distribution of permits for highly-qualified work per Member State is shown in the table
below. It is based on Member States' reports of both national permits for highly-qualified
work and EU Blue Cards issued in the past three years (2012-2014). The table also contains
the Member States' share of highly-qualified workers in the total employment of all EU
Member States implementing the EU Blue Card.378
This dataset takes into account all
workers, native and foreign, and is considered more indicative of a country's labour market
needs for high qualifications. A third column contains the anticipated share in job
opportunities for highly-qualified workers between 2013 and 2025, based on replacement and
expansion demand (CEDEFOP). For the purposes of this impact assessment, the distribution
of any additional EU Blue Cards is based on the average of these three distributions.
Table 1 — Estimating the distribution of future permits for highly-qualified workers in EU Blue Card countries
A. Share in permits issued to TCN for highly-qualified employment
B. Share in highly-qualified employment (all workers)
C. Share in job opportunities for HQ workers 2013-2025
Share in additional Blue Cards
A. B. C. Average A, B and C
DE 27.3% 20.3% 14.7% 20.8%
FR 9.7% 17.2% 20.4% 15.7%
NL 20.3% 5.4% 6.5% 10.7%
ES 5.8% 10.5% 13.1% 9.8%
374 Long-duration is understood as one year and longer. 375 Source: Eurostat. First permits issued for remunerated activities by reason, length of validity and citizenship
[migr_resocc] 376 Source: specific data extraction based on the 2014 EU Labour Force Survey ad hoc module on migrants. The
distribution by education level is calculated among TCN in employment, having arrived in 2014 since less than 6
years for reason of employment and with a job offer prior to migration; data covering all “Blue card countries”
except DE, NL, IE who did not implement the survey. 377 While these shares are technical assumptions, Blue Card statistics from Germany show that nearly half of all
Blue Cards are issued at the lower salary threshold (i.e. for shortage occupations), and several of those are
benefiting recent graduates. EU Blue Card Directive Implementation Report, COM(2014) 287. Available at: 378 Source: Eurostat. EU Labour Force Survey 2014.

174
IT 4.7% 8.4% 9.9% 7.7%
SE 14.9% 3.4% 2.7% 7.0%
PL 1.4% 9.3% 9.2% 6.6%
BE 2.8% 3.6% 3.0% 3.1%
AT 3.8% 2.1% 1.9% 2.6%
RO 0.3% 2.9% 3.5% 2.2%
FI 2.9% 1.9% 1.8% 2.2%
PT 2.1% 2.1% 1.4% 1.9%
CZ 0.4% 2.2% 2.2% 1.6%
HU 0.0% 2.1% 2.5% 1.6%
EL 0.0% 1.9% 2.0% 1.3%
BG 0.1% 1.6% 1.6% 1.1%
HR 0.6% 0.8% 0.9% 0.8%
SK 0.0% 1.0% 1.1% 0.7%
CY 1.5% 0.2% 0.2% 0.7%
LV 0.7% 0.6% 0.7% 0.7%
LT 0.4% 1.0% 0.5% 0.6%
SI 0.0% 0.6% 0.5% 0.4%
EE 0.0% 0.4% 0.4% 0.3%
LU 0.1% 0.3% 0.3% 0.2%
MT 0.0% 0.1% 0.1% 0.1%
Additional permits for highly-qualified work 1.2.
Additional permits for highly-qualified work are calculated using the baseline figures
described above, and by applying a percentage increase based on the hypotheses below. The
number of additional Blue Card permits which can be expected under the different policy
options will be mainly driven by:
The salary threshold. The effect of a change in salary threshold on the number of
permits is calculated using the salary data of the EU SILC379
for the 25 Member States
which currently apply the EU Blue Card Directive, in the same way as in Annex 7.
Lowering the threshold enlarges the group of potential jobs which would qualify for
an EU Blue Card; the number of Blue Cards issued is expected to increase
proportionally. This applies if the salary threshold is set in relation to the prevailing
salary in the host country (so, in effect, having 25 different thresholds) as it is the case
with the current Blue Card Directive.
Where a single, EU-wide salary threshold is set (POP 3), the impact on the number of
Blue Cards issued can also be determined using the same method. However, the
number of additional cards may be very low in lower-income countries while it may
be high in the wealthiest of Member States.
The minimum duration of the Blue Card permit. The Blue Card is currently issued
for persons with a work contract of 1 year or more. If the minimum duration is
lowered, it is expected that a larger number of assignments will qualify for an EU Blue
379 EU-Survey on Income and Living Conditions. Specific extractions based on micro-data. For Germany, data
source is GSOEP 2013.

175
Card. Current permit data, included in Annex 7 of this Impact Assessment, shows a
ratio of 3:1 between permits for highly-qualified work issued for more than one year
(17 210) and permits issued for 6 months to 1 year (5 712). Past years have shown
significantly smaller differences, with ratios as low as of 1.4:1. 380
Also, there may be
a significant overlap between jobs for which a shorter-term national permit is issued
initially and those for which Blue Cards are currently issued. The effect of a reduction
in the minimum duration of the Blue Card is therefore difficult to anticipate. For the
purposes of this impact assessment, it is assumed the number of eligible jobs will
increase by 25 percent. The baseline number of permits (69 000) was estimated using
only data on long-term permits. This figure is increased by 25 percent (17 250
permits) in all scenarios to take into account the impact of including shorter-term
permits, thereby totalling 86 250 (POP1, POP2A-B-C and POP3). This leads to a
corresponding increase in the number of cards issued under all scenarios.
In the current Blue Card Directive, the minimum qualification level required is post-
secondary education corresponding to ISCED(97) 5A or higher (see Annex 7 for more
details on ISCED levels) as well as an adequate salary. Equivalent professional
experience can also be recognised, though this is optional for Member States to apply.
If the qualification requirement is maintained as the sole admission condition (as in
POP1), without the salary threshold and subject to safeguards, one can expect the
number of additional Blue Cards to increase considerably. This increase is estimated
by calculating the share of jobs held by highly-qualified workers below the current
threshold of 1.5 times the average salary and applying this to the baseline. Given that
in POP1 highly qualified workers are admitted without salary threshold only in ISCO
groups 1-2, the increase was restricted by applying the share of highly qualified
workers working in ISCO 1-2 in each Member State.
For scenario's where the salary threshold is maintained but no qualifications are
required, the estimated baseline cannot be used. The number of jobs which would be
eligible cannot be estimated.
The possible removal of the labour market test is also considered in certain policy options,
but its impact is not quantified and is assumed to be relatively small. Indeed, according to the
OECD, a labour market test may not represent a real restriction on hiring foreign workers,
because such a test is rarely the basis of a rejected application.381
On the other hand, the
labour market test may serve as a deterrent to potential applicants and may prevent some (or
many) from applying for a permit in the first place. This effect is however hard to quantify.
Another potential source of Blue Card applicants is highly-qualified migrants already
present in the EU, in particular if applications on the territory are allowed. According to the
EU Labour Force Survey, there are currently around ninety thousand third-country nationals
employed in ISCO 1-3 occupations among the 10% highest salary earners in the Member
States which are using the EU Blue Card. This is a stock figure, so not an annual flow but the
total number of people in the group. This group can be considered to consist of TCN who
would qualify for an EU Blue Card and who may have an interest in applying from the EU
territory. The pool is enlarged significantly if one adds the second-highest 10 percent earners,
who may also qualify for an EU Blue Card depending on the salary threshold: over 155 000
380 Sources: Eurostat, First permits issued for remunerated activities by reason, length of validity and citizenship
[migr_resocc], Extracted on 11/12/2015. 381 OECD (2011), Recruiting Immigrant Workers: Sweden 2011, OECD Publishing, p. 69. Available at:
http://dx.doi.org/10.1787/9789264000000-en and OECD/European Union (2014), Matching Economic
Migration with Labour Market Needs, OECD Publishing, pp. 372-373. Available at:
http://dx.doi.org/10.1787/9789264216501-en

176
TCN currently working in the EU fall into that category. If one looks only at those having
arrived recently, a group which is particularly likely to be interested in the additional benefits
offered by the EU Blue Card, the pool of potential applicants amounts to 40 700 (highest
decile of earnings) or 61 700 (9th
and 10th
decile). The impact of highly-qualified migrants
already present in the EU but switching to an EU Blue Card is not estimated. Replacing
national permits with EU Blue Cards is expected to increase the overall attractiveness and
recognition of the scheme. While this may lead to an increase in applications and cards being
issued, the effect of this increase is not estimated for the purposes of this impact assessment.
However, the additional mobility rights from which former national permit holders would
benefit would have a positive economic impact and are taken into account (see below: intra-
EU mobility).
An alternative way of estimating an upper bound for the number of additional EU Blue Cards
which could be issued in the EU is to look at unfilled vacancies in shortage occupations
which would meet the requirements of the EU Blue Card (qualifications, salary). Statistics on
shortages are explored in depth in Annex 4 of this Impact Assessment (point 1.2 Skills needs
and shortages in the EU). For instance, it is estimated that there will be 800 000 unfilled
vacancies for ICT professionals in the EU between 2015 and 2020, amounting to 130 000 per
year. This figure includes Member States not implementing the EU Blue Card such as the
United Kingdom, which has reported relatively large shortages in the ICT sector compared to
other Member States.382
However, data on shortages are not fully available across countries
and sectors (notably due to the difficulty of defining and measuring them in a harmonised
manner) and can therefore not be used directly for the purpose of this impact assessment.
Rather than shortages, analysing Member States' overall labour needs (due to expansion of
certain sectors and replacement demand) can provide some indication of the potential. The
table below gives an overview of the estimated number of vacancies which will arise by 2025
(according to CEDEFOP estimates) in the 25 Member States implementing the EU Blue Card
, including for highly-qualified workers and for the ISCO categories 1 to 3. Note that this
forecast only looks at expected labour demand, and does not compare it to the labour supply.
Table 2 — Job opportunities in absolute numbers (thousands) for 25 Member States - 2013-2025 - Cedefop 2015 Skills
Forecast
ALL JOB OPENINGS
HIGHLY QUALIFIED
(ISCED11 level 6 or above)
MANAGERS
(ISCO 1)
PROFESSIONALS
(ISCO 2)
TECHNICIANS AND ASSOCIATE
PROFESSIONALS
(ISCO 3)
Value Share Value Share Value Share Value Share Value Share
TOTAL 89347.8 100.0% 37679.2 100.0% 6447 100.0% 20823.8 100.0% 11978.3 100.0%
AT 1649.6 1.8% 728.2 1.9% 117.4 1.8% 352.8 1.7% 270.8 2.3%
BE 1959.3 2.2% 1123.3 3.0% 176.3 2.7% 581.7 2.8% 280.4 2.3%
BG 1961.4 2.2% 586.6 1.6% 61.6 1.0% 315 1.5% 128.4 1.1%
CY 179.5 0.2% 93.2 0.2% 6.8 0.1% 37.8 0.2% 18.5 0.2%
CZ 1978.3 2.2% 814.7 2.2% 98.4 1.5% 455.3 2.2% 389.4 3.3%
382 Synthesis Report for the EMN Focussed Study 2015. Determining labour shortages and the need for labour
migration from third countries in the EU.

177
DE 17911.4 20.0% 5523.4 14.7% 679.4 10.5% 4576.8 22.0% 2983.9 24.9%
EE 382.9 0.4% 142.3 0.4% 10.1 0.2% 94 0.5% 40.6 0.3%
EL 2119.5 2.4% 763 2.0% 73.8 1.1% 386.2 1.9% 158.3 1.3%
ES 8846.1 9.9% 4922.1 13.1% 632.2 9.8% 1188.8 5.7% 1309.2 10.9%
FI 1485.7 1.7% 687.6 1.8% 70 1.1% 419.2 2.0% 169.7 1.4%
FR 13570.9 15.2% 7702.8 20.4% 1254.9 19.5% 3029.1 14.5% 2271.6 19.0%
HR 930.9 1.0% 348.8 0.9% 38.2 0.6% 237.7 1.1% 121.4 1.0%
HU 1979.1 2.2% 949.2 2.5% 191.6 3.0% 514.3 2.5% 201.9 1.7%
IT 11724.2 13.1% 3743.5 9.9% 1713.5 26.6% 2514.1 12.1% 2024.9 16.9%
LT 660.8 0.7% 172.5 0.5% 30.9 0.5% 193.3 0.9% 70.7 0.6%
LU 248.7 0.3% 124.9 0.3% 12.9 0.2% 108.4 0.5% 26.1 0.2%
LV 583.4 0.7% 265.1 0.7% 38.6 0.6% 162.4 0.8% 72.4 0.6%
MT 87.1 0.1% 37.7 0.1% 10.6 0.2% 22.4 0.1% 9.9 0.1%
NL 4285.1 4.8% 2438.5 6.5% 364.7 5.7% 1464.7 7.0% 411.6 3.4%
PL 5524.8 6.2% 3453.8 9.2% 477.5 7.4% 1874.5 9.0% 418.9 3.5%
PT 2303.1 2.6% 541.3 1.4% 198.1 3.1% 333.6 1.6% 113.2 0.9%
RO 4961.3 5.6% 1326.9 3.5% 17.5 0.3% 993.3 4.8% 142.8 1.2%
SE 2733.6 3.1% 1003.8 2.7% 117.2 1.8% 851.1 4.1% 302.2 2.5%
SI 361.9 0.4% 186 0.5% 54.8 0.9% 117.3 0.6% 41.5 0.3%
SK 919.2 1.0% 427.6 1.1% 79.8 1.2% 160.9 0.8% 176.8 1.5%
2. DETERMINING THE NUMBER OF ADDITIONAL EU BLUE CARDS UNDER DIFFERENT
POLICY OPTIONS
The salary threshold is one of the main admission criteria in all policy options considered in
this impact assessment. The level of the salary threshold will determine how many jobs could
in theory be filled by a Blue Card holder in any scenario, and will thus help to determine the
number of Blue Cards to be assumed for the purposes of this impact assessment.
The salary distribution of Blue Card jobs is assumed to be similar to that of the all jobs which
would meet the Blue Card salary criteria (so, the salary distribution curves follow a similar
pattern beyond/above the salary threshold, which is the tail end of a bell-shaped curve). This
ignores the fact that salaries of highly-skilled migrant workers may tend to cluster just above
the salary threshold – a result of employers setting the salary of TCN in such a way so as to
just meet the entry conditions but not exceed them. The data used for determining salary
distribution is based on full-time employees (see also data sources in Annex 7).
The salary distribution in each of the Member States implementing the EU Blue Card allows
calculating the share of jobs held by highly-qualified employees which sits above a certain
threshold. The table below shows these shares per Member State, for values such as 0.8, 1.0,
1.2, 1.4 or 1.5 times the average salary. The table also shows the increase in this share, if the
threshold is lowered from currently 1.5 to certain values. Annex 7 contains a graphical
representation of the effects of national thresholds at various levels.
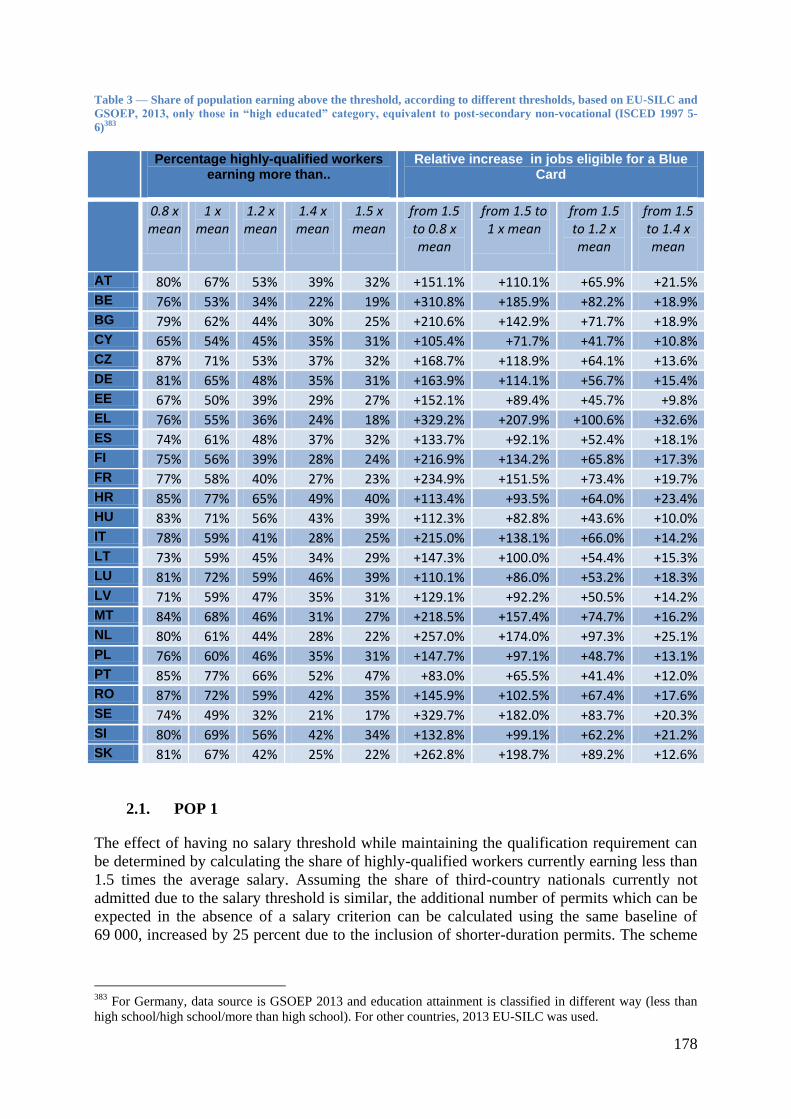
178
Table 3 — Share of population earning above the threshold, according to different thresholds, based on EU-SILC and
GSOEP, 2013, only those in “high educated” category, equivalent to post-secondary non-vocational (ISCED 1997 5-
6)383
Percentage highly-qualified workers earning more than..
Relative increase in jobs eligible for a Blue Card
0.8 x mean
1 x mean
1.2 x mean
1.4 x mean
1.5 x mean
from 1.5 to 0.8 x mean
from 1.5 to 1 x mean
from 1.5 to 1.2 x mean
from 1.5 to 1.4 x mean
AT 80% 67% 53% 39% 32% +151.1% +110.1% +65.9% +21.5% BE 76% 53% 34% 22% 19% +310.8% +185.9% +82.2% +18.9% BG 79% 62% 44% 30% 25% +210.6% +142.9% +71.7% +18.9% CY 65% 54% 45% 35% 31% +105.4% +71.7% +41.7% +10.8% CZ 87% 71% 53% 37% 32% +168.7% +118.9% +64.1% +13.6% DE 81% 65% 48% 35% 31% +163.9% +114.1% +56.7% +15.4% EE 67% 50% 39% 29% 27% +152.1% +89.4% +45.7% +9.8% EL 76% 55% 36% 24% 18% +329.2% +207.9% +100.6% +32.6% ES 74% 61% 48% 37% 32% +133.7% +92.1% +52.4% +18.1% FI 75% 56% 39% 28% 24% +216.9% +134.2% +65.8% +17.3% FR 77% 58% 40% 27% 23% +234.9% +151.5% +73.4% +19.7% HR 85% 77% 65% 49% 40% +113.4% +93.5% +64.0% +23.4% HU 83% 71% 56% 43% 39% +112.3% +82.8% +43.6% +10.0% IT 78% 59% 41% 28% 25% +215.0% +138.1% +66.0% +14.2% LT 73% 59% 45% 34% 29% +147.3% +100.0% +54.4% +15.3% LU 81% 72% 59% 46% 39% +110.1% +86.0% +53.2% +18.3% LV 71% 59% 47% 35% 31% +129.1% +92.2% +50.5% +14.2% MT 84% 68% 46% 31% 27% +218.5% +157.4% +74.7% +16.2% NL 80% 61% 44% 28% 22% +257.0% +174.0% +97.3% +25.1% PL 76% 60% 46% 35% 31% +147.7% +97.1% +48.7% +13.1% PT 85% 77% 66% 52% 47% +83.0% +65.5% +41.4% +12.0% RO 87% 72% 59% 42% 35% +145.9% +102.5% +67.4% +17.6% SE 74% 49% 32% 21% 17% +329.7% +182.0% +83.7% +20.3% SI 80% 69% 56% 42% 34% +132.8% +99.1% +62.2% +21.2% SK 81% 67% 42% 25% 22% +262.8% +198.7% +89.2% +12.6%
POP 1 2.1.
The effect of having no salary threshold while maintaining the qualification requirement can
be determined by calculating the share of highly-qualified workers currently earning less than
1.5 times the average salary. Assuming the share of third-country nationals currently not
admitted due to the salary threshold is similar, the additional number of permits which can be
expected in the absence of a salary criterion can be calculated using the same baseline of
69 000, increased by 25 percent due to the inclusion of shorter-duration permits. The scheme
383 For Germany, data source is GSOEP 2013 and education attainment is classified in different way (less than
high school/high school/more than high school). For other countries, 2013 EU-SILC was used.

179
would be limited to ISCO 1 or 2 occupations, which make up between 46 and 85 percent of
all jobs held by highly-qualified workers (according to 2014 Labour force survey data).
Compared to other options, the effect is large in all Member States. It would lead to 142 610
additional cards across the 25 Member States applying the EU Blue Card.
Table 4 — Increase in EU Blue Cards for highly-qualified workers without salary threshold
Share in additional Blue Cards
Calculated baseline for all HSW
Additional Blue Cards of short duration at 1.5 x mean
Share of HSW below 1.5 x mean (%)
Share of highly-qualified working in ISCO 1-2
Additional Blue Cards without salary threshold (%)
Additional Blue Cards without salary threshold (number)
A B C D E F = D / (1-D) G = E and F
applied to B + C
AT 2.6% 1 808 452 68.3% 49% +215.5% 2 389
BE 3.1% 2 135 534 81.5% 61% +440.5% 7 129
BG 1.1% 742 185 74.6% 60% +293.7% 1 646
CY 0.7% 458 114 68.6% 47% +218.5% 592
CZ 1.6% 1 108 277 67.7% 66% +209.6% 1 905
DE 20.7% 14 291 3 573 69.5% 55% +227.9% 22 339
EE 0.3% 193 48 73.5% 54% +277.4% 362
EL 1.3% 900 225 82.2% 46% +461.8% 2 909
ES 9.8% 6 731 1 683 68.5% 54% +217.5% 8 468
FI 2.2% 1 523 381 76.3% 50% +321.9% 3 310
FR 15.7% 10 814 2 703 77.1% 56% +336.7% 22 971
HR 0.8% 536 134 60.3% 68% +151.9% 696
HU 1.5% 1 065 266 61.0% 68% +156.4% 1 414
IT 7.6% 5 266 1 317 75.3% 52% +304.9% 10 450
LT 0.6% 429 107 70.6% 70% +240.1% 903
LU 0.2% 163 41 61.3% 85% +158.4% 273
LV 0.7% 454 113 69.1% 60% +223.6% 761
MT 0.1% 45 11 73.5% 73% +277.4% 113
NL 10.7% 7 382 1 845 77.7% 66% +348.4% 21 114
PL 6.6% 4 551 1 138 69.4% 66% +226.8% 8 552
PT 1.9% 1 309 327 53.4% 74% +114.6% 1 396
RO 2.2% 1 541 385 64.7% 73% +183.3% 2 562
SE 7.0% 4 820 1 205 82.8% 65% +481.4% 18 783
SI 0.4% 248 62 65.6% 74% +190.7% 439
SK 0.7% 489 122 77.7% 53% +348.4% 1 133
TOTAL
69 000
142 610
The effect of having a salary threshold but no qualification requirements cannot be reliably
estimated using the method described above. However, as above, SILC data can show the
share of medium-skilled jobs which surpass a certain salary threshold. This shows the size of

180
the labour market which would be open to the scheme as proposed in POP1: between 3.8 and
8 million jobs.
Table 5 — Medium-skilled jobs surpassing a certain salary threshold (share and absolute numbers)384
Total number of medium-skilled jobs
1.4*mean 1.7*mean 1.4*mean 1.7*mean
AT 1 966 346 14% 7% 269 389 131 745
BE 1 519 431 5% 2% 71 413 24 311
BG 1 512 209 11% 5% 164 831 72 586
CY 114 750 13% 7% 14 344 7 573
CZ 2 975 378 10% 4% 282 661 116 040
DE 21 833 683 10% 5% 2 248 869 1 048 017
EE 293 181 14% 8% 40 752 23 161
EL 3 363 484 8% 4% 262 352 141 266
ES 961 483 15% 7% 142 300 67 304
FI 10 249 615 5% 2% 512 481 204 992
FR 942 380 7% 3% 66 909 29 214
HR 841 380 11% 4% 89 186 30 290
HU 2 255 229 9% 4% 198 460 99 230
IT 8 278 890 13% 6% 1 092 813 529 849
LT 600 019 10% 5% 60 002 28 201
LU 77 856 13% 5% 10 277 3 737
LV 452 463 13% 7% 57 010 30 315
MT 51 093 13% 7% 6 642 3 423
NL 2 964 856 7% 2% 198 645 68 192
PL 7 493 638 10% 6% 734 377 419 644
PT 956 698 16% 10% 155 942 99 497
RO 3 755 364 8% 4% 281 652 135 193
SE 2 019 681 10% 5% 203 988 92 905
SI 423 289 5% 2% 22 434 10 159
SK 1 454 700 10% 4% 142 561 53 824
Total 77 357 095 10% 5% 8 045 138 3 790 498
POP 2A 2.2.
The figures in Table 3 above can be combined with the baseline figure of 69 000 permits —
separated into 60 % regular Blue Cards, 20 % for shortage occupations and 20 % for recent
graduates — and the distribution per Member State calculated in Table 1, as well as the
25 percent increase across the board due to the inclusion of shorter-duration permits. This
shows the impact on the number of EU Blue Cards which can be expected from a decrease in
the salary threshold — all other effects being equal — included in the table below. This
384 The total number of jobs held by workers with medium level of education in table 8 (first column) is taken
from the EU Labour force survey (2014).

181
method does entail some double-counting: some national schemes for admitting highly-
qualified workers do not currently have a salary threshold, or have one which is below the one
set for the EU Blue Card (see Annex 7). In such cases, the increase in admissions resulting
from lowering the EU Blue Card threshold is likely to be lower. The extent of this double-
counting is not estimated.
Table 6 shows the effect on the number of permits for highly-skilled work. The combined
effect of a decrease in salary threshold and an extension of the scope to shorter-duration
permits would be an increase in the number of cards issued between 9 278 (if the salary
threshold is lowered to 1.4 times the average salary in each Member State) and 68 280 (with
the threshold set at the average salary in each Member State). This wide range stems from the
flexible fork from 1.0 to 1.4 to be applied in POP 2A and the uncertainty about what decisions
Member States would take.
Table 7 shows the effect of applying the lower threshold range to shortage occupations and jobs
for recent graduates. The baseline is lower — 40 percent of the total baseline — but the lower
salary thresholds result in a larger impact. As above, the effect of extending of the scope to
shorter-duration permits is also taken into account. Lowering the threshold to between 1.2 and
0.8 times (i.e. 80% of respectively 1.4 and 1.0) the average salary would result in between
23 206 and 69 410 cards being issued additionally.
Table 6 — Increase in regular EU Blue Cards for highly-qualified workers with thresholds at 1.4 and 1.0 times the
average salary instead of the current 1.5
Share in additional Blue Cards
Estimated baseline
Additional Blue Cards of short duration at 1.5 x mean
Additional Blue Cards at 1.0 x mean (%)
Additional Blue Cards at 1.4 x mean (%)
Additional Blue Cards at or above 1.0 x mean (number)
Additional Blue Cards at or above 1.4 x mean (number)
A B C D E F = applying D
to B and C G = applying E to B and C
AT 2.6% 1 085 271 +110.1% +21.5% 1 493 291
BE 3.1% 1 281 320 +185.9% +18.9% 2 978 303
BG 1.1% 445 111 +142.9% +18.9% 795 105
CY 0.7% 275 69 +71.7% +10.8% 246 37
CZ 1.6% 665 166 +118.9% +13.6% 988 113
DE 20.7% 8 575 2 144 +114.1% +15.4% 12 229 1 652
EE 0.3% 116 29 +89.4% +9.8% 129 14
EL 1.3% 540 135 +207.9% +32.6% 1 404 220
ES 9.8% 4 038 1 010 +92.1% +18.1% 4 647 913
FI 2.2% 914 228 +134.2% +17.3% 1 533 198
FR 15.7% 6 488 1 622 +151.5% +19.7% 12 289 1 594
HR 0.8% 322 80 +93.5% +23.4% 376 94 HU 1.5% 639 160 +82.8% +10.0% 662 80
IT 7.6% 3 160 790 +138.1% +14.2% 5 453 560
LT 0.6% 258 64 +100.0% +15.3% 322 49
LU 0.2% 98 24 +86.0% +18.3% 105 22
LV 0.7% 272 68 +92.2% +14.2% 314 48
MT 0.1% 27 7 +157.4% +16.2% 53 5

182
NL 10.7% 4 429 1 107 +174.0% +25.1% 9 633 1 390
PL 6.6% 2 730 683 +97.1% +13.1% 3 313 446
PT 1.9% 785 196 +65.5% +12.0% 643 118
RO 2.2% 925 231 +102.5% +17.6% 1 185 203
SE 7.0% 2 892 723 +182.0% +20.3% 6 578 736
SI 0.4% 149 37 +99.1% +21.2% 184 39
SK 0.7% 293 73 +198.7% +12.6% 728 46
TOTAL
41 400 10 350
68 280 9 278
Table 7 — Increase in EU Blue Cards for highly-qualified recent graduates and workers in shortage occupations with
thresholds at 0.8 and 1.2 times the average salary (i.e. 80% of the 1 - 1.4 fork)
Share in additional Blue Cards
Calculated baseline for graduates and shortage
Additional Blue Cards of short duration at 1.5 x mean
Additional Blue Cards at 0.8 x mean (%)
Additional Blue Cards at 1.2 x mean (%)
Additional Blue Cards at or above 0.8 x mean (number)
Additional Blue Cards at or above 1.2 x mean (number)
A B C D E
F = applying D to B + C
G = applying E to B + C
AT 2.6% 723 181 +151.1% +65.9% 1 366 596
BE 3.1% 854 214 +310.8% +82.2% 3 318 877
BG 1.1% 297 74 +210.6% +71.7% 781 266
CY 0.7% 183 46 +105.4% +41.7% 241 95
CZ 1.6% 443 111 +168.7% +64.1% 935 355
DE 20.7% 5 716 1 429 +163.9% +56.7% 11 714 4 053
EE 0.3% 77 19 +152.1% +45.7% 147 44
EL 1.3% 360 90 +329.2% +100.6% 1 482 453
ES 9.8% 2 692 673 +133.7% +52.4% 4 498 1 763
FI 2.2% 609 152 +216.9% +65.8% 1 652 501
FR 15.7% 4 326 1 081 +234.9% +73.4% 12 703 3 967
HR 0.8% 214 54 +113.4% +64.0% 304 172 HU 1.5% 426 107 +112.3% +43.6% 598 232
IT 7.6% 2 107 527 +215.0% +66.0% 5 661 1 738
LT 0.6% 172 43 +147.3% +54.4% 316 117
LU 0.2% 65 16 +110.1% +53.2% 90 43
LV 0.7% 181 45 +129.1% +50.5% 293 115
MT 0.1% 18 4 +218.5% +74.7% 49 17
NL 10.7% 2 953 738 +257.0% +97.3% 9 484 3 592
PL 6.6% 1 820 455 +147.7% +48.7% 3 361 1 108
PT 1.9% 524 131 +83.0% +41.4% 544 271
RO 2.2% 616 154 +145.9% +67.4% 1 124 520
SE 7.0% 1 928 482 +329.7% +83.7% 7 945 2 018
SI 0.4% 99 25 +132.8% +62.2% 165 77
SK 0.7% 195 49 +262.8% +89.2% 642 218

183
TOTAL
27 600
69 410 23 206
POP 2B 2.3.
Policy option package 2B entails setting the salary threshold at between 1.5 and 1.7 times the
average salary. In this analysis, any salary threshold above 1.5 times the average has a
negative impact on the number of cards issued. The positive effect (+ 25 percent) of extending
the scope of the EU Blue card to shorter-duration permits remains and, in some countries,
outweighs the negative impact of the higher salary threshold.
The net impact of this scenario ranges from an increase in the number of cards of 17 250 (if
the threshold is kept at 1.5 times the average salary) to a slight decrease (- 8 149) compared to
the baseline (if the threshold is moved to 1.7 the average salary). The total number of Blue
Cards issued would be between 86 250 and 60 851.
A positive impact can be expected from the increase in intra-EU mobility for the remaining
Blue Cards which would be issued (see further). If Member States maintain national schemes
for admitting highly-qualified employees, the negative impact (fewer cards) resulting from
any exclusion of lower-paid TCN workers (i.e. not meeting the threshold) could be mitigated.
Table 8 — Number of permits being issued with threshold for EU Blue Card set at 1.5 and 1.7 times the average
salary
Share in additional Blue Cards
Calculated baseline for regular threshold
Additional Blue Cards of short duration at 1.5 x mean
Net number of Blue Cards being issued at or above 1.5 x mean
Additional permits for HSW at 1.7 x mean (%)
Additional permits for HSW at or above 1.7 x mean (number)
Net number of Blue Cards being issued at or above 1.7 x mean
A B A+B
C.
Applied to A+B
Effect B and C Compared to
A
AT 2.6% 1 808 452 2 260 -26.2% - 140 1 668
BE 3.1% 2 135 534 2 669 -31.9% - 317 1 818
BG 1.1% 742 185 927 -29.5% - 88 653
CY 0.7% 458 114 572 -21.7% - 9 448
CZ 1.6% 1 108 277 1 385 -28.5% - 117 991
DE 20.7% 14 291 3 573 17 864 -31.8% -2 109 12 182
EE 0.3% 193 48 241 -34.0% - 34 159
EL 1.3% 900 225 1 125 -25.8% - 66 835
ES 9.8% 6 731 1 683 8 413 -33.3% -1 122 5 609
FI 2.2% 1 523 381 1 904 -32.5% - 238 1 285
FR 15.7% 10 814 2 703 13 517 -27.1% - 956 9 858
HR 0.8% 536 134 670 -37.8% - 119 417 HU 1.5% 1 065 266 1 331 -24.6% - 61 1 004
IT 7.6% 5 266 1 317 6 583 -19.8% 11 5 277

184
LT 0.6% 429 107 537 -28.6% - 46 383
LU 0.2% 163 41 204 -35.9% - 32 131
LV 0.7% 454 113 567 -23.6% - 21 433
MT 0.1% 45 11 56 -23.4% - 2 43
NL 10.7% 7 382 1 845 9 227 -35.4% -1 423 5 959
PL 6.6% 4 551 1 138 5 688 -24.8% - 275 4 275
PT 1.9% 1 309 327 1 636 -18.9% 18 1 327
RO 2.2% 1 541 385 1 926 -26.3% - 122 1 419
SE 7.0% 4 820 1 205 6 025 -32.0% - 722 4 098
SI 0.4% 248 62 310 -26.5% - 20 228
SK 0.7% 489 122 611 -42.6% - 138 351
TOTAL
69 000 86 250
- 8 149 60 851
POP 3 2.4.
The effect of setting an EU-wide salary threshold based on the average salary in the top-third
wealthiest Member States applying the EU Blue Card (POP 3) can be done using the same
method as before. For the purposes of this calculation, the threshold is set at 49 700 EUR,
equalling 1.4 times the average salary of the 7 highest-income countries as reported in SILC.
The average salary of Germany is not taken into account since there was no corresponding
value in the SILC data extraction used. As can be expected given the large differences in
average salaries between Member States, the effect of a single EU-wide threshold on the
number of eligible jobs compared to the baseline varies significantly. While nearly 56 percent
of highly-qualified workers earn more than this threshold in Luxemburg, this share is less than
1 percent in 9 out of 25 Member States. If Member States maintain national schemes for
admitting highly-qualified employees, the (in some Member States substantial) negative
impact resulting from the exclusion of lower-paid TCN workers could be mitigated.
The introduction of an EU-wide salary threshold would reduce the number of cards issued by
24 926. Combined with the (positive) effect of lowering the minimum duration, this would
lead to 61 324 Blue Cards being issued.
Table 9 — Number of EU Blue Cards per Member State if one EU-wide salary threshold, based on the wealthiest one-
third of Member States, is applied. (*) SILC data for Germany was not available & an approximation was made based
on GSOEP. The salary threshold for this exercise was set at 49 700 EUR.
Share in additional Blue Cards
Calculated baseline
Additional Blue Cards of short duration at 1.5 x mean
Share of jobs at or above the set EU wide threshold
Change in eligible jobs compared to baseline
Additional permits at set EU-wide threshold
Net number of Blue Cards being issued at or above set EU-wide threshold
AT 2.6% 1 808 452 29.0% -9% -193 2 068
BE 3.1% 2 135 534 20.7% 12% 317 2 986
BG 1.1% 742 185 0.1% -100% -923 4
CY 0.7% 458 114 11.6% -63% -361 211
CZ 1.6% 1 108 277 1.0% -97% -1 342 43

185
DE (*) 20.7% 14 291 3 573 29.0% 41% -879 16 985
EE 0.3% 193 48 0.6% -98% -236 5
EL 1.3% 900 225 2.4% -87% -974 152
ES 9.8% 6 731 1 683 8.0% -75% -6 277 2 137
FI 2.2% 1 523 381 27.2% 15% 281 2 185
FR 15.7% 10 814 2 703 14.1% -38% -5 194 8 323
HR 0.8% 536 134 0.4% -99% -664 7 HU 1.5% 1 065 266 0.1% -100% -1 328 3
IT 7.6% 5 266 1 317 12.7% -49% -3 198 3 385
LT 0.6% 429 107 0.0% -100% -537 0
LU 0.2% 163 41 55.9% 44% 91 294
LV 0.7% 454 113 0.7% -98% -554 13
MT 0.1% 45 11 5.1% -81% -45 11
NL 10.7% 7 382 1 845 35.7% 60% 5 545 14 772
PL 6.6% 4 551 1 138 0.6% -98% -5 577 112
PT 1.9% 1 309 327 4.0% -91% -1 496 140
RO 2.2% 1 541 385 0.0% -100% -1 926 0
SE 7.0% 4 820 1 205 21.2% 23% 1 401 7 426
SI 0.4% 248 62 6.6% -81% -250 59
SK 0.7% 489 122 0.1% -100% -608 3
TOTAL
69 000
-24 926 61 324
3. ASSUMPTIONS REGARDING THE SALARY LEVELS FOR DETERMINING ECONOMIC IMPACT
The economic impact of an additional EU Blue Card is determined by the salary which the
corresponding job will pay. This figure will be corrected (reduced) to take into account
remittances. Newly admitted workers are assumed to be net additions to the economy, with no
displacement effect as far as highly-qualified workers is concerned.
Salary levels differ significantly between the Member States implementing the EU Blue Card.
Therefore, the impact of any additional Blue Cards will be based on average salary levels per
Member State, except for those policy options where an EU-wide salary threshold is set. The
salary used in this calculation of impacts should be above the relevant salary threshold. The
salary levels used in the impact calculations are derived from the Structure of Earnings
Survey (SES), which is a 4-yearly survey which provides EU-wide harmonised structural data
on gross earnings, hours paid and annual days of paid holiday leave. Member States' average
salaries in each of the Blue Card's target groups can be derived from the survey's results and
are listed in the table below.
Three categories of reference salaries are calculated per Member State, and shown in Table 10
below. The policy options for which the salaries are relevant are mentioned between brackets.
For highly-qualified workers, based on the average salary for ISCED97 5a and
(where available) ISCED97 6 workers as reported in the 2010 SES,385
weighted
385 No salary data for ISCED97 level 6 were available for AT, DE, HU in the dataset (Mean annual earnings by
sex, economic activity and educational attainment [earn_ses10_30]). ISCED97 level 5A salaries were used
instead.

186
according to the sizes of the respective populations of ISCED 5a and ISCED 6
workers in that Member State.386
If the salaries of ISCED 6 were not reported, the
salary for 5A is taken by itself. These values are shown in italic and marked by (*) in
the table below. [POP2(a), POP2(c)]
A separate calculation shows the average salary for highly-qualified workers admitted
under a scheme with a higher salary threshold (1.7 x average salary, with their average
salary estimated at 1.8 x the average salary as reported in SES), as well as the salary of
those highly-qualified workers excluded from such a scheme (estimated at around 1.6
times the average salary as reported in SES) [POP2(b)]
For the scenario where an EU-wide salary threshold is taken, the average salary of the
admitted workers is assumed to be equal to the average salary for highly-qualified
workers in the Member State concerned if this is above the EU-wide threshold. In
countries where the average salary of highly-qualified workers is below the EU-wide
threshold, the threshold itself is used to calculate the economic impact; this is an
underestimation, since some cards would be issued for jobs offering wages above the
threshold. [POP3].
For managers, professionals, technicians and associate professionals (ISCO 1, 2 &
3), by taking the weighted average of salaries of the relevant jobs in that Member
State. If the salaries of occupational categories were not given, the ISCO 1-2 salary is
estimated at 130 percent of the average salary for workers in that Member State, while
ISCO 1-3 is estimated at 120 percent.387
The latter are shown in italic and marked by a
(**) in the table below. [POP2(a), POP2(c), POP(1)]
For recent graduates, by reducing the average wage for highly-qualified workers in a
Member State with the age penalty evident from SES data. SES data shows wages on
under-30s are between 66 and 99 percent of average wages.388
Although these figures
show there is a large variety across countries, the age penalty is fairly stable between
job categories within the same country.389
[POP2(a), POP2(c), POP(1)]
An EU-wide reference salary, based on the salary of highly-qualified workers in the
top-third most prosperous Blue Card Member States. This sits above the EU-wide
threshold of 49 700 EUR and is estimated at 61 596 EUR, based on SES data
[POP(3)] Table 10 — Average / Reference salaries in the Blue Card Member States according to the Structure of Earnings
Survey
All workers
Highly-qualified workers Managers and professionals
Managers, professionals, associate professionals and technicians
Recent graduates
Average highly-
qualified
1.6 x average
all
1.8x average
all
ISCO 1-2 ISCO 1-3
386 Level 5A according to ISCED97 as reported in dataset "Mean annual earnings by sex, size class of the
enterprise and occupation" [earn_ses10_30] of the Structure of Earnings Survey 2010. 387 Source: Eurostat, Structure of Earnings Survey 2010. Mean annual earnings by sex, size class of the
enterprise and occupation [earn_ses10_32] 388 Source: Eurostat, Structure of Earnings Survey 2010. Mean annual earnings by sex, age and occupation -
NACE Rev. 2, B-S excluding O [earn_ses10_28] 389 Source: Eurostat, Structure of Earnings Survey 2010. Mean annual earnings by sex, age and economic
activity [earn_ses10_27] and Mean annual earnings by sex, age and occupation - NACE Rev. 2, B-S excluding O
[earn_ses10_28]

187
workers workers
AT 38 895 68 020* 62 232 70 011 50 564** 46 674** 46 511
BE 43 388 69 365 69 421 78 098 56 404** 52 066** 53 099
BG 4 618 7 599 7 389 8 312 6 033 5 477 6 940
CY 26 927 41 147 43 083 48 469 35 005** 32 312** 27 267
CZ 12 592 21 665 20 147 22 666 18 611 15 866 18 522
DE 38 735 62 873* 61 976 69 723 55 681 48 803 39 654
EE 10 395 15 900 16 632 18 711 13 708 12 876 15 109
EL 25 669 33 180 41 070 46 204 33 370** 30 803** 22 572
ES 27 057 37 670 43 291 48 703 34 847 31 006 27 781
FI 40 281 51 587 64 450 72 506 55 711 48 764 43 108
FR 33 897 49 172 54 235 61 015 53 451 47 215 34 601
HR 12 494 21 769 19 990 22 489 16 242** 14 993** 16 997 HU 9 916 17 056* 15 866 17 849 12 707 10 978 14 141
IT 31 680 52 261 50 688 57 024 41 184** 38 016** 37 726
LT 7 138 10 494 11 421 12 848 8 602 7 965 10 342
LU 51 663 86 058 82 661 92 993 66 958 61 861 59 724
LV 8 357 12 582 13 371 15 043 9 809 9 260 12 478
MT 18 744 24 635 29 990 33 739 24 367** 22 493** 20 762
NL 41 149 62 355 65 838 74 068 53 494** 49 379** 43 237
PL 10 426 15 660 16 682 18 767 12 191 11 394 12 462
PT 18 354 35 920 29 366 33 037 23 860** 22 025** 23 684
RO 5 991 10 845 9 586 10 784 6 451 5 435 9 173
SE 38 716 43 339 61 946 69 689 49 535 47 258 39 293
SI 21 135 35 062 33 816 38 043 27 476** 25 362** 28 007
SK 10 232 16 421 16 371 18 418 12 814 11 865 14 646
Wealthiest 1/3 of MS
40 841 61 596
4. APPLICABLE SALARY THRESHOLDS
The average salaries calculated above are based on survey data and give an idea of what an
average employee will earn and hence the impact he or she will have on the host country's
economy. It should be noted that for the purposes of the implementation of the EU Blue Card,
it is unlikely that survey data will be used to set the salary threshold. Instead, the salary
threshold is likely to be set based on actual labour market data (administrative data or
National accounts). The wage thresholds can be calculated based on the actual average salary
— dividing a Member State's wages and salaries390
by the number of employees.391
These
thresholds are not used in calculation of impacts. However, they do place a lower bound on
the salaries calculated before and can serve as a reality check. Thresholds which are
underlined are at a level which risks excluding a (significant) part of their target population
(see salary levels in Table 10).
390 Wages and salaries — current prices [nama_10_gdp]. Eurostat. Data from Croatia is missing. 391 Employees domestic concept [naida_10_pe]. Eurostat.

188
The salary threshold of POP2a and POP1 for HSW are set at 1.0 – 1.4 times the
average salary in the Member State concerned. The salary threshold for shortage
occupations is set at 80 percent of the same range (i.e. 0.8 to 1.2 times the average).
The salary threshold of POP2b is set at 1.5 to 1.7 times the average salary.
The salary threshold for POP3 should be at least 1.4 times the average salary in the
third most prosperous EU Member States implementing the EU Blue Card (8 Member
States: LU, BE, SE, FI, AT, NL, FR, DE).
Table 11 — Salary threshold ranges using national accounts (high to low)
Regular occupations
Shortage occupations and recent graduates
Selective scheme
1.0 x mean
1.4 x mean
0.8 x mean
1.2 x mean
1.5 x mean
1.7 x mean
LU € 55 426 € 77 596 € 44 341 € 62 077 € 83 138 € 94 224
BE € 38 809 € 54 332 € 31 047 € 43 466 € 58 213 € 65 974
SE € 38 373 € 53 722 € 30 698 € 42 978 € 57 559 € 65 234
FI € 37 453 € 52 435 € 29 963 € 41 948 € 56 180 € 63 671
AT € 35 322 € 49 451 € 28 258 € 39 561 € 52 983 € 60 048
NL € 35 070 € 49 097 € 28 056 € 39 278 € 52 604 € 59 618
FR € 33 455 € 46 837 € 26 764 € 37 469 € 50 182 € 56 873
DE € 31 615 € 44 260 € 25 292 € 35 408 € 47 422 € 53 745
Average top-8 € 53 466
IT € 25 972 € 36 360 € 20 777 € 29 088 € 38 958 € 44 152
ES € 25 244 € 35 341 € 20 195 € 28 273 € 37 866 € 42 915
CY € 21 229 € 29 721 € 16 983 € 23 777 € 31 844 € 36 090
SI € 21 151 € 29 612 € 16 921 € 23 690 € 31 727 € 35 957
MT € 19 552 € 27 373 € 15 642 € 21 898 € 29 328 € 33 239
EL € 16 521 € 23 130 € 13 217 € 18 504 € 24 782 € 28 086
PT € 15 738 € 22 033 € 12 590 € 17 626 € 23 606 € 26 754
EE € 12 487 € 17 482 € 9 990 € 13 986 € 18 731 € 21 228
SK € 11 572 € 16 201 € 9 258 € 12 961 € 17 358 € 19 673
CZ € 10 892 € 15 249 € 8 714 € 12 199 € 16 338 € 18 517
LV € 10 808 € 15 132 € 8 647 € 12 105 € 16 213 € 18 374
PL € 10 422 € 14 591 € 8 338 € 11 673 € 15 633 € 17 718
LT € 9 845 € 13 783 € 7 876 € 11 026 € 14 767 € 16 736
HU € 9 142 € 12 798 € 7 313 € 10 239 € 13 713 € 15 541
RO € 6 431 € 9 004 € 5 145 € 7 203 € 9 647 € 10 933
BG € 5 973 € 8 362 € 4 778 € 6 689 € 8 959 € 10 153
189
5. DISPLACEMENT EFFECT ON LOCAL WORKERS
Some studies indicate labour migration may lead to displacement of local workers,392
while
others find no such effect. Leaving aside the obvious concerns this would raise with policy
makers and stakeholders, any displacement would affect the economic benefit as calculated
here for the purposes of this impact assessment.
In light of existing research, it seems reasonable to distinguish between displacement effect
on (and by) highly-skilled workers on the one hand, and the effect on the medium-skilled job-
market. The Blue Card scheme is aimed at highly-qualified (tertiary-educated) and relatively
well-paid employees. However, at least one option proposes to apply a salary threshold
without additional requirements as regards the person's qualifications.
Studies on displacement which disaggregate according to levels of skill or qualification show
impacts vary considerably. At least one study has found the negative impact on natives'
employment is limited to workers with O-level (or secondary) qualifications, while finding no
effect for graduates.393
Several studies find a positive effect of highly skilled migration on
productivity, investment, innovation394
and, ultimately, growth.395
There are a number of elements specific to the EU Blue Card scheme which would limit any
displacement effect. The salary threshold acts as a barrier to labour market entry and as a
proxy for skills, and will therefore provide some protection against labour competition, above
and beyond schemes which do not have a salary threshold. Where lower-level qualifications
are considered in the revised Blue Card proposal, it would be limited to the highest ISCO
categories, further limiting the scope for displacement.
The EU Blue Card requires the applicant to have a binding job offer before being granted a
permit. In the absence of a displacement effect for highly-qualified jobs, no downward
pressure of wages is to be expected.
For the purposes of this impact assessment, it is assumed highly-qualified workers do not
displace native workers. The economic impact of admitting medium-skilled workers (one
element of POP 1) could not be calculated.
6. INTRA-EU MOBILITY OF BLUE CARD HOLDERS
The impact study includes an estimate of the share of BC holders which will avail themselves
of intra-EU mobility rights. The impact of intra-EU mobility is calculated by multiplying the
number of Blue Card holders who make use of this facility with the expected rise in pay.
The upper bound of the mobility rate, applicable to the most mobile of HSW, is based on the
rate which was assumed for intra-corporate transferees.396
The impact assessment for the
proposal for a Directive on intra-corporate transferees, a highly-mobile kind of employee,
392 UK Migration Advisory Committee. Analysis of the Impacts of Migration. January 2012. Available at:
https://www.gov.uk/government/uploads/system/uploads/attachment_data/file/257235/analysis-of-the-impacts.pdf 393 Christian Dustmann, Francesca Fabbri and Ian Preston. The impact of immigration on the British labour market. The
Economic Journal, 115 (November), F324–F341. Available at: http://www.ucl.ac.uk/~uctpb21/Cpapers/ecoj_1038.pdf 394 Claudio Fassio, Fabio Montobbio and Alessandra Venturini. How Do Native and Migrant Workers Contribute to
Innovation? A Study on France, Germany and the UK. IZA Discussion Paper No. 9062, May 2015. 395 European Commission, Employment and Social Developments in Europe 2015. 396 Covered by Directive 2014/66/EU

190
assumed around 10-25 percent of these ICT permit holders would need mobility.397
Actual
mobility by ICT permit holders can be assumed to be a bit lower given the constraints which
remain.
The lower bound for mobility rates is based on mobility figures of EU citizens. Annual cross-
border mobility rates of EU citizens is estimated to be around 0.2 – 0.3 percent, but recently-
arrived TCN holding intra-EU mobility rights can be assumed to be more mobile than the
general population.
In light of the evidence above, mobility of Blue Card holders is estimated at 2 percent
annually, increasing to 4 percent if far-reaching mobility rights are given to a select group of
workers (POP 2b and POP 3).
Intra-EU mobility by Blue Card holders for the purposes of taking up employment in a second
Member State is expected to be accompanied or driven by an increase in salary. For the
purposes of this impact assessment, it is assumed that EU Blue Card holders who decide to
take up a job in another Member State will benefit from a 15 % pay rise on average. Although
this is a technical assumption for the purposes of this impact assessment, it seems unlikely a
HSW would wish to relocate for a smaller increase.
Some policy options presume the EU Blue Card scheme will replace national schemes for
highly-qualified workers, which do not offer mobility. Under such scenarios, the positive
impact from intra-EU mobility derives from all admissions (and not just the additional Blue
Cards resulting from the new EU Blue Card scheme).
7. ADMINISTRATIVE COSTS AND GAINS
Administrative costs are explored and detailed in Annex 15 and are included in the overall
calculations of impacts.
In terms of gains for public authorities, additional income tax revenue linked to the increase
in HSW paying taxes per policy option is included in table 12.
8. REMITTANCES
In 2014, the World Bank estimated that the total remittance flow to developing countries to be
$ 436 billion.398
This was three times the official development aid to developing countries.399
However remittances mainly originate from low skilled migration. It has been argued that
HSW are more likely to come from wealthier families in the sending countries so the need to
397 European Commission, SEC(2010) 884. Available at: http://ec.europa.eu/smart-
regulation/impact/ia_carried_out/docs/ia_2010/sec_2010_0884_en.pdf 398 Vidal, P. (2015). ‘The emigration of health-care workers: Malawi’s recurring challenges’. Migration Policy Institute.
Available at http://www.migrationpolicy.org/article/emigration-health-care-workers-malawis-recurring-challenges 399 Vidal, P. (2015). ‘The emigration of health-care workers: Malawi’s recurring challenges’. Migration Policy Institute.
Available at http://www.migrationpolicy.org/article/emigration-health-care-workers-malawis-recurring-challenges

191
remit is lower400
and that HSW tend to bring their families with them to the host countries
reducing the need to remit.401
In light of these findings, remittances are estimated at 10 % for highly skilled workers and
20 % for medium-skilled workers.
Remittances constitute a transfer from the host country to the country of origin. They are
reduced from the economic impact calculated here.
9. ADDITIONAL REVENUE FOR HIGHER EDUCATION
The impact assessment assumes the revised EU Blue Card may attract additional foreign
students to the EU, who will generate revenue through tuition fees. The EU is the world's
most attractive destination for international students, with around 1 million non-EU students
residing here. Therefore, a small positive effect on the EU's attractiveness may result in a
significant increase in the number of students.
The lower requirements for young graduates are likely to attract foreign students. The number
of additional students is estimated to equal the number of additional EU Blue Cards which
will be issued to recent graduates. While these may not necessarily be the same people, the
size of both groups can be expected to be correlated.
The increase in student admissions generates revenue for the Member States, both through
tuition and through sustenance spending by the student. Tuition fees are estimated at € 8 600
per year,402
while living costs are estimated at € 10 400 per year.403
It is assumed that all additional students complete their three years of study. Only direct
economic benefits — tuition fees and sustenance spending — are taken into account. Indirect
economic benefits such as visitor spending are not considered. Financial assistance received
by students is not considered, but use of public services is. Evidence from the UK indicates
that public expenditure may be about five times less than the income international students
help to generate.404
We assume a similar ratio for the EU (i.e. 20% of income generated are
spent on the provision of public services).
400 Faini, R. (2006). ‘Remittances and the Brain Drain’. University of Rome Tor Vergata, LdA, CEPR and IZE Bonn.
Available at: http://ftp.iza.org/dp2155.pdf 401 Faini, R. (2006). ‘Remittances and the Brain Drain’. University of Rome Tor Vergata, LdA, CEPR and IZE Bonn.
Available at: http://ftp.iza.org/dp2155.pdf 402 EU average - tuition fees is based on data from mastersportal.eu which indicate that average tuition fees for a Bachelors
programme in the EU is about € 8,600 for non-EEA students per annum. See
http://www.mastersportal.eu/articles/405/tuition-fees-at-universities-in-europe-overview-and-comparison.html 403 Data on students' living expenses are based on averages in the four MS where uptake of permits for HSW scheme was
highest, i.e. DE, NL and SE. See below. Living costs are estimated to be an average of €865 per month or 10,400 per annum.
Data from study-in.de suggest that living costs for students in Germany is in line with the EU average which are
estimated at about €800 per month or €9,600 per annum; https://www.study-in.de/en/plan-your-stay/money-and-
costs/cost-of-living_28220.php
Data from studyinholland.nl suggest that living costs for students in the Netherlands are an estimated €1,000 per
month or €12,000 per annum; https://www.studyinholland.nl/practical-matters/daily-expenses
Data from Lund University suggest that living costs for students in Sweden are an estimated €860 per month or
€10,320 per annum http://www.lunduniversity.lu.se/student-life/preparing-to-come/money-and-living-costs 404 http://www.consultancy.uk/news/2115/international-students-add-23-billion-to-uk-economy

192
10. IMPACT ON INNOVATION AND RESEARCH
Overall, increased numbers of HSW would have a positive impact on the capacity of
companies for R&D and would benefit the EU’s overall capacity for innovation and research.
Especially for companies in highly innovative sectors the capacity for recruiting HSW would
increase for much-in-demand STEM (science, technology, engineering and mathematics)
fields which would increase their capacity for innovation and entrepreneurship405
.
Also, research suggests that HSW have a small yet positive net effect on innovation in
receiving countries due to increased workforce diversity, especially seen in export intensive
sectors406
. Various studies suggest a positive contribution to technological development
measured through patent indicators in host countries407
, exceptional scientific contributions408
,
and a positive contribution on the innovative performance of European regions409
. In addition,
allowing entrepreneurship on the side of employed activity sends a clear message of favouring
entrepreneurial spirit (i.e. allowing entrepreneurial activities in the own time while keeping a
day job). Research suggests that the risk and uncertainty associated with entrepreneurial
activity deters entry and contributes to high rates of new business failure. Reduce these risks
influences entrepreneurial entry and survival; the chances on failure would be 33% lower410
.
11. OVERALL ADMINISTRATIVE COSTS AND GAINS ACROSS POPS
The overall administrative costs and gains across the POPs are summarised in table 12 below.
POP 1
The impact is calculated for additional permits to highly-qualified workers who do not
meet the salary threshold in the baseline scenario
The benefits from mobility are calculated assuming the lower rate of mobility (2%)
The number of students attracted by the new scheme is equal to the maximum impact
scenario under POP 2A
405 Kerr, W. R. (2013). ‘U.S. High-Skilled Immigration, Innovation, and Entrepreneurship: Empirical Approaches and
Evidence.’ National Bureau of Economic Research Working Paper Series No. 19377. 406 Nathan, M. (2013). ‘The wider economic impacts of high-skilled migrants: A survey of the literature’. National Institute
of Economic and Social Research. 407 Hunt, J. 2013. Are Immigrants the Best and Brightest U.S. Engineers? National Bureau of Economic Research Working
Paper Series, No. 18696; Breschi, S., Lissoni, F., Tarasconi, G., 2013, Inventor Data for Research on Migration &
Innovation, ‘WIPO Experts Meeting on Intellectual Property, the International Mobility of Knowledge Workers and the
Brain Drain’, World Intellectual Property Organization, Geneva 408 Stephan, P.E., Levin, S.G., 2001. Exceptional contributions to US science by the foreign-born and foreign-educated.
Population Research and Policy Review, 20, 59-79; Hunt, J. 2013. Are Immigrants the Best and Brightest U.S. Engineers?
National Bureau of Economic Research Working Paper Series, No. 18696. 409 Ozgen, C., Nijkamp, P., Poot, J. Immigration and innovation in European regions. Discussion paper, Forschungsinstitut
zur Zukunft der Arbeit; Niebuhr, A. 2010. Migration and Innovation: Does Cultural Diversity Matter for Regional R&D
Activity? Papers in Regional Science, 89, 563-85. 410 Raffiee, J. & Feng, J. (2014). ‘Should I quit my day job? A hybrid path to entrepreneurship’, Academy of Management
Journal, 57, p. 936-963.

193
POP 2A
The minimal impact is obtained with the salary threshold at 1.4 x average salary for
regular highly-skilled workers and 1.2 x average salary for graduates and workers in
shortage occupations
The maximum impact is obtained with the salary threshold at 1.0 x average salary for
regular highly-skilled workers and 0.8 x average salary for graduates and workers in
shortage occupations
The benefits from mobility are calculated assuming the lower rate of mobility (2%)
POP 2B:
The minimal impact is obtained with the salary threshold at 1.7 x average salary for all
highly-skilled workers. The salary on which basis the impact is calculated corresponds
to 1.8 x the average salary.
The maximum impact is obtained with the salary threshold at 1.5 x average salary for
all highly-skilled workers. The salary on which basis the impact is calculated
corresponds to the average salary of a highly-skilled worker, as in other POPs.
No additional third-country students are attracted as the scheme does not provide any
advantages to them
The benefits from mobility are calculated assuming the higher rate of mobility (4%)
POP 2C:
The impacts from POP 2A and POP 2B are combined
POP 3
Salary threshold is set at € 49 700 for all Member States applying the EU Blue Card.
The benefits from mobility are calculated assuming the higher rate of mobility (4%)

194
Table 12 — Overall administrative costs and gains across POPs
POP 1 POP 2A POP 2B POP 2C POP 3
min Max min max min max
Baseline permits 69000 69000
69000
0
for HSW 41400
41400
for shortage occupations 13800
13800
for recent graduates 13800
13800
New permits 142 610 32 484 137 690 - 8 149 17 250 24 334 154 940 61 324
for HSW 142 610 9 278 68 280 - 8 149 17 250 1 129 85 530 61 324
for shortage occupations n.a. 11 603 34 705 n.a. n.a. 11 603 34 705 n.a.
for recent graduates n.a. 11 603 34 705 n.a. n.a. 11 603 34 705 n.a.
Additional TCN students 34 705 11 603 34 705 0 0 11 603 34 705 0
Wages paid to additional permits € 6 868 477 298 € 1 377 426 238 € 6 151 956 003 - € 491 376 338 € 816 547 863 € 886 049 900 € 6 968 503 866 € 3 578 598 683
Impact of add HSW € 6 868 477 298 € 449 918 206 € 3 335 742 226 - € 491 376 338 € 816 547 863 - € 41 458 132 € 4 152 290 089 € 3 578 598 683
Impact of add shortages 0 € 524 006 821 € 1 592 873 503 € 524 006 821 € 1 592 873 503
Impact of add grad students 0 € 403 501 211 € 1 223 340 274 € 403 501 211 € 1 223 340 274
Impact of mobility € 20 605 432 € 29 478 427 € 43 802 016 - € 2 948 258 € 4 899 287 € 6 875 115 € 48 701 303 € 21 471 592
baseline permits € 20 605 432 € 25 346 148 € 25 346 148 € 25 346 148 € 25 346 148
regular mobility rights € 4 132 279 € 18 455 868 € 4 132 279 € 18 455 868
enhanced mobility rights - € 2 948 258 € 4 899 287 - € 2 948 258 € 4 899 287 € 21 471 592
Reduction for remittances - € 686 847 730 - € 137 742 624 -€ 615 195 600 € 49 137 634 -€ 81 654 786 - € 88 604 990 - € 696 850 387 - € 357 859 868

195
Added higher education revenue € 659 398 596 € 220 453 692 € 659 398 596 €0 €0 € 220 453 692 € 659 398 596
From tuition fees € 298 464 628 € 99 784 302 € 298 464 628 € 99 784 302 € 298 464 628 0
From sustenance € 360 933 968 € 120 669 389 € 360 933 968 € € € 120 669 389 € 360 933 968 0
Administrative impact on Member States
- € 28 703 995 - € 6 534 881 - € 27 864 864 € 1 674 373 - € 3 367 907 - € 4 860 509 - € 31 232 771 €2,843,324
TOTAL € 6 832 929 601 € 1 483 080 851 € 6 212 096 151 -€ 443 512 590 € 736 424 456 € 1 039 568 262 € 6 948 520 608 € 3 245 053 730
Of which income tax revenue € 1 575 134 126 € 310 338 210 € 1 404 058 750 -€ 110 720 251 € 184 509 792 € 199 617 958 € 1 588 568 541 € 839 074 775

196
ANNEX 15
ADMINISTRATIVE BURDEN
DISCLAIMER ON THE NUMBERS OF BLUE CARDS USED IN THE KEY ASSUMPTIONS
The numbers of Blue Cards used in the key assumptions in the analysis of costs (in section 2)
are not target numbers for Blue Cards to be issued but technical assumptions, based on a
number of elements such as variations in admission conditions, to be able to generate
scenarios to quantify the potential economic impacts and the variations of magnitude
according to the various Policy Options Packages (POP).
The calculations in Section 2 of this annex are broadly based on the methodology used by an
external contractor in the impact assessment study commissioned by DG Home Affairs.
1. ADMINISTRATIVE BURDEN ON APPLICANTS
Administrative costs to applicants, third-country nationals and/or employers, would be
broadly in line with existing practices for issuing permits for work. The main benefits
stemming from several of the options are due to:
1) reduced processing times in general and even more for options that foresee a "trusted
employers scheme" and, to a certain extent, reduced fees;
2) easier and quicker procedures when moving to a second Member State— or no procedure
at all if there is no second Blue Card needed as in POP3— as well as limited to no possibility
to carry out a labour market test;
3) practical simplifications in the procedure for recognition of qualifications and skills.
Such benefits entail first of all time savings for applicants and employers, but also reduced
administrative formalities. It was not possible to provide a monetary estimation of such
benefits due to a lack of comprehensive data, but a qualitative assessment is provided below
based on stakeholders' input.
Reduced processing times and fees, and easier procedures 1.1.
The time required to submit and have applications processed is one of the critical issues for
employers, as raised by several business' stakeholders. According to a survey by the Council
for Global Immigration, 86 % of employers report that ability to obtain permits in a timely,
predictable, and flexible manner is critical to their business objectives.411
In another survey
conducted by PwC, 63% of the responding CEO’s were concerned about prompt skills
availability.412
Long processing times run counter to these employers' requirements and
constitute a clearly identifiable burden hampering international recruitment. This is also
confirmed in the public consultation launched by the Commission on labour migration and the
411 CGI, 2014 Employer Immigration Metrics Survey (EIM). 412 PwC, Skills gap is hampering businesse’s recruitment efforts, 20th May 2014.

197
Blue Card (see annex 2) where 25 % of the employers who had never before employed a
TCN explained that this was due to the high administrative burden involved.
The current Blue Card Directive imposes a maximum processing time of 90 days, with an
obligation to decide as soon as possible. The same procedural deadline applies to intra-EU
mobility of EU Blue Card holders. This deadline is often shorter under national schemes.
POP2 (all sub-options) and POP3 would propose reducing processing times compared to the
baseline by setting the target deadline regarding all applicants to 30 days, and the maximum
processing time would be shortened to 60 days. Moreover, under those POPs Member States
could introduce a system of recognised employers who would be guaranteed quicker
processing, and the same goes for applications for an EU Blue Card in a second Member State
(intra-EU mobility). POP3, which entails an EU-wide permit recognised by all Member
States, would bring further time savings and no additional administrative formality in that no
application would be necessary in any second Member State in case of intra-EU mobility.
Moreover, in POP2 (all sub-options) and POP3, Member States would no longer be allowed
to impose a labour market test on EU Blue Card applicants as a general measure: in POP
2(b) and POP3 they cannot be imposed even in exceptional circumstances (contrary to
POP2(a) and(c)). In addition, in those options facilitating intra-EU mobility (POP 2(all sub-
options) and POP 3), the labour market test would not be applied in the second Member State
in any situation. Even if the timing and modalities for carrying out the labour market test are
not harmonised and vary across Member States, this would greatly contribute to reducing
processing times, especially given that the labour market test is often carried out by a different
authority than the one issuing the permit.
Legal fees paid by employers or individuals to obtain legal assistance when applying for an
EU Blue Card, are an equally significant burden, particularly for SMEs. The public
consultation showed that 23 % of the responding employers used third party help with the
immigration procedures (e.g. a lawyer or specialised firm) when recruiting from abroad. The
majority of the respondents who relied on professional help reportedly did so because the
application procedures are too complex and the consequences in the case of non-compliance
with the requirements (even when involuntary) are severe. In addition, using a third party
saves time. For instance, one major company explained that they used a global service
provider because legal requirements are complicated and in-house legal professionals often do
not have enough expertise. TCN workers residing in the EU also reported to be relying on
third-part help (24 % of respondents). According to the KPMG’s Global assignment Policies
and Practices (GaPP) Survey, 44 % of the employers highlight that there has been an increase
in the overall number of international assignments for the last two years and expect long-term
overseas assignments to increase.413
Application fees (i.e. the fees paid directly to Member States authorities for the issuance of a
residence permit) charged by Member States vary considerably according to data collected by
413 KPMG, Global Assignment Policies and Practices, Survey 2015

198
the European Migration Network as well as the impact assessment study by ICF consulting.414
The Blue Card Directive does not harmonise the level of application fees, nor is this proposed
in any of the policy options. However, under POP3 a single, EU-wide Blue Card would
preclude having to apply for a new EU Blue Card in case of intra-EU mobility. Under this
policy option, mobility is assumed to be high (4 % of EU Blue Card holders per year) given
the favourable regime that would apply. As shown in Annex 14, this would amount to more
than 2 500 EU Blue Card holders yearly who would not be subject to a second application fee.
Application fees are also relevant in terms of gains for public administration (see section 2
below).
Facilitation of the recognition of qualifications 1.2.
The EU Blue Cards targets highly skilled third-country nationals, which imply that applicants
will have to demonstrate they possess the required qualifications. The maximum time for
examining the application for an EU Blue Card (currently 90 days) does not include the time
needed for the possible recognition of professional qualifications.
The length of the procedure for getting foreign qualifications recognised — which remains a
national competence — varies considerably between Member States and between individual
cases. For instance in Germany, if an applicant requests the recognition of a degree which has
been previously recognised and exists in the database (Anabin), the procedure takes mere
minutes. However, if the degree is previously unknown to the German authorities, the
procedure takes from 4 to 12 weeks. The latter timeline is similar to several other EU Member
States' practices, where processing times for recognition range between 1 and 4 months.415
The recognition of foreign qualifications in the destination country is often cited by applicants
and employers as a major source of administrative burden. In the public consultation,
employers considered that the recognition of foreign qualifications remains a lengthy
procedure. Of all respondents who stated that they had to have their qualifications
recognised, more than half said it took more than 3 months.416
While none of the different policy options harmonises the recognition procedure — as this
would go beyond the EU competence — in several of them Member States are encouraged to
facilitate this recognition procedure at least for unregulated professions417
.
For example, the fact of considering the recognition of professional experience as equivalent
to formal qualifications (as in POPs 2(a) and 2(c)) is an important element of simplification.
414 See EMN Inform, Applicable fees for issuance of residence permits to third-country nationals. European Migration
Network,2014. Available at http://ec.europa.eu/dgs/home-affairs/what-we-
do/networks/european_migration_network/reports/docs/emn-studies/emn-
informs/emn_inform_applicable_fees_in_member_states_october2014_en.pdf 415 EMN Ad Hoc Query 465/2013. In total, 22 Member States responded to the query, however not all specified
the timeframe for the procedure of the recognition of foreign qualifications specifically. 416 See Annex 2 417 For regulated professions (e.g. lawyers, doctors) this is not feasible since, given that this usually involves
professional bodies that have to check that the person fulfils the conditions for exercising that profession in the
Member State.

199
POP1 goes even further: in case the applicant fulfils the relevant salary threshold, there is no
longer the need to present formal qualifications.
Moreover, in case of recognised employers (POP2 (all sub-options) and POP3) this aspect is
even further simplified, i.e. Member States cannot ask the applicant to present qualifications
in case of unregulated professions if the employer is recognised, leading to considerable time
savings for the applicant.
In case of intra-EU mobility, for unregulated professions, in POP2 (all sub-options) it is
proposed that an EU Blue Card holder will not need to re-submit his or her qualifications
when applying for a new EU Blue Card in a second Member State. The EU Blue Card issued
by the first Member State and the period of work already carried out there would provide
sufficient guarantees that the TCN is highly skilled. In light of the lengthy procedures cited
above, this facilitation would result in considerable time savings for the applicant and the
employer. Under POP3, no new Blue Card would have to be applied for in the second
Member State so the savings would be even higher.
2. ADMINISTRATIVE BURDEN ON MEMBER STATES' ADMINISTRATION
Administrative costs to Member States in all legislative options consist of the transposition
and implementation of the revised Directive, as well as variable costs related to the issuance
of the EU Blue Cards (see 2.1).
Member States already have implemented the EU Blue Card Directive in its current form and
organisational or administrative changes would therefore be minimal. The EU Blue Card
would be built on existing provisions for residence permits (Council Regulation 1030/2002)
and mirror the provisions of the Single Permit Directive (Directive 2011/98/EU), further
limiting the costs of introducing the new EU Blue Card.
The implementation of the revised Directive may entail costs of providing information, such
as on a government website. This is not estimated for the purposes of this impact assessment.
The revised Directive may also require closer cooperation between Member States to
facilitate the implementation of the intra-EU mobility provisions and to fight abuses. Where
intra-EU mobility rights of Blue Card holders are based on nationally-issued Blue Cards,
rather than a mutual recognition of permits, this cost is not estimated and is likely to be small.
Where a mutual recognition is envisaged (POP3), efforts would be comparable to those
needed for the implementation of the Directive on intra-corporate transferees.418
Cost savings compared to the status quo would be due to both the simplification linked to
further harmonisation and reduced fragmentation — particularly in POP1, POP2(a) and POP3
— to the additional income provided by the taxes paid by additional HSW (the fiscal impact
418 See financial and administrative costs of policy option 3, as outlined in paragraph 5.2 of the Impact Assessment
accompanying the proposal for the ICT Directive the framework of an intra-corporate transfer. European Commission,
SEC(2010) 884, 13 July 2010. http://ec.europa.eu/smart-
regulation/impact/ia_carried_out/docs/ia_2010/sec_2010_0884_en.pdf

200
for this category being generally positive)419
and to the fees paid by applicants that would
partly compensate the additional administrative burden due to an increased number of
applications and permits issued in several options. While it was not possible to quantify the
savings related to simplification, an estimate is made as regards gains deriving from fees paid
by the applicants and form additional income deriving from taxes paid by HSW. Calculation
of administrative costs to Member States420
.
The cost for processing an individual application and issuing an EU Blue Card was calculated
on the duration (in minutes) of related activities and the labour cost per minute in each
Member State's administration.
The duration of processing an individual application is expected to vary depending on the
number of applications a Member State receives each year. If the Member State receives less
than 100 applications every year (i.e. less than two per week), processing times are assumed
to be significantly longer due to a lack of economies of scale (e.g. learning effects, routine,
automation).
The following assumptions were made:
Volume:
The number of Blue Cards per POP is taken from the calculations in Annex 14
Rejection rates for highly skilled applicants tend to be lower than for other categories of
labour migrants; for every 100 successful applicants, there are assumed to be 5 non-
successful ones.421
It is assumed rejected applicants do not resubmit an application for the
Blue Card in the same year nor appeal the decision via the courts.
Time:
The average time to receive and acknowledge receipt of an application is estimated at 15
minutes. This time is applicable to all applications, successful or unsuccessful.
For different POPs, the average time to examine and decide on an application has been
assumed to be 6 hours for Member States processing less than 100 applications and 2
hours for Member States processing more than 100 applications. This time is applicable to
all applications, successful or unsuccessful. Actual processing times may vary
significantly from case to case and between Member States. They will be influenced by
the complexity of the file and/or the nature of the checks to be carried out in each Member
State.
419 OECD (2013), “The fiscal impact of immigration in OECD countries”, in International Migration Outlook
2013, OECD Publishing. http://dx.doi.org/10.1787/migr_outlook-2013-6-en, p. 128 420 The external contractor in the impact assessment study commissioned by DG Home Affairs in preparation of
this impact assessment developed a cost model for estimating the cost implications of amending the EU Blue
Card Directive. 421 This success rate is derived from data on labour migration to Germany, as reported in OECD (2013),
Recruiting Immigrant Workers: Germany, OECD Publishing. http://dx.doi.org/10.1787/9789264189034-en, p.
93.

201
Average time to produce the Blue Card and notify the applicants of the decision is
estimated at 1 hour. This time is applicable to all applications, successful or unsuccessful.
Unit cost:
The per-minute costs of processing Blue Card applications are estimated to be
commensurate to the Hourly Labour cost, wages and salaries in 2012 - NACE Rev. 2
[lc_ncostot_r2] for Public administration and defence for each Member States. This cost is
relevant for all applications, including those which are unsuccessful.
The costs of producing and sending the Blue Card and are estimated at €35 per EU Blue
Card. This cost is relevant for successful applicants only.
By multiplying the unit cost with the time spent at each stage of the application, it is possible
to calculate a cost per card issued. The cost of 5% non-successful applications is also included
in this.
Table 12 — Unit labour cost and administrative cost per EU Blue Card issued, estimated for the purposes of this
impact assessment (Source: ICF impact assessment study)
Unit labour cost
Cost per card issued
Per minute If > 100 applications per
year
If =< 100 applications
per year
AT €0.50 €212 €407
BE €0.50 €212 €407
BG €0.07 €75 €102
CY €0.31 €150 €268
CZ €0.18 €109 €178
DE €0.55 €226 €438
EE €0.16 €105 €168
EL €0.20 €118 €197
ES €0.37 €171 €315
FI €0.59 €238 €466
FR €0.50 €211 €405
HR €0.18 €97 €150
HU €0.14 €97 €150
IT €0.50 €210 €402
LT €0.12 €93 €141
LU €0.50 €212 €407
LV €0.12 €92 €139
MT €0.44 €191 €360
NL €0.69 €271 €538
PL €0.16 €103 €163
PT €0.23 €126 €214
RO €0.07 €77 €105
SE €0.50 €212 €407
SI €0.31 €150 €269
SK €0.14 €99 €154

202
The total administrative cost of the different policy options depends on the number of
additional EU Blue Cards assumed to be issued under each scenario (taken from Annex 14).
The cost also depends on whether national schemes are maintained in parallel (as is the case
in POP 2b); this would reduce the economies of scale which can be achieved when issuing
permits of one kind, i.c. EU Blue Cards. Where no national schemes are foreseen, the total
number of EU Blue Cards is taken into account to determine whether economies of scale are
present or not, while the additional administrative burden is obtained by considering only to
the number of additional EU Blue Cards.
Below is an overview of the number of additional cards assumed to be issued under each of
the policy options. Scenario's leading to 100 cards or fewer being issued per year are
underlined.
Table 13 — Additional number of EU Blue Cards estimated, for the purposes of this impact assessment, to be issued
under the different POPs
POP1 POP 2a POP 2b POP2c POP3
low high low high low high
AT 2389 887 2859 -140 452 747 3311 -193
BE 7129 1180 6296 -317 534 863 6830 317
BG 1646 371 1576 -88 185 282 1761 -923
CY 592 133 487 -9 114 123 602 -361
CZ 1905 468 1923 -117 277 351 2200 -1342
DE 22339 5705 23943 -2109 3573 3596 27516 -879
EE 362 58 276 -34 48 25 324 -236
EL 2909 673 2885 -66 225 607 3110 -974
ES 8468 2676 9145 -1122 1683 1554 10828 -6277
FI 3310 699 3185 -238 381 461 3565 281
FR 22971 5560 24992 -956 2703 4604 27696 -5194
HR 696 266 680 -119 134 147 814 -664
HU 1414 312 1260 -61 266 251 1526 -1328
IT 10450 2297 11114 11 1317 2308 12430 -3198
LT 903 166 638 -46 107 120 746 -537
LU 273 66 195 -32 41 33 236 91
LV 761 163 607 -21 113 142 720 -554
MT 113 22 102 -2 11 20 113 -45
NL 21114 4982 19117 -1423 1845 3559 20962 5545
PL 8552 1554 6673 -275 1138 1279 7811 -5577
PT 1396 389 1186 18 327 407 1513 -1496
RO 2562 723 2309 -122 385 600 2695 -1926
SE 18783 2753 14523 -722 1205 2032 15728 1401
SI 439 117 349 -20 62 97 411 -250
SK 1133 264 1370 -138 122 126 1492 -608
142 610 32 484 137 690 -8 149 17 250 24 334 154 940 -24 926

203
The additional administrative cost per Member State of the policy options is given in the table
below. The main factor is the volume of cards issued under each scenario. Application fees
levied by Member States will reduce or fully offset the total burden on Member States'
finances.
Table 14 — Administrative cost for issuing EU Blue Cards under various POPs
POP1 POP 2a POP 2b POP2c POP3
low high low high low high
AT € 505 960 € 187 820 € 605 433 -€29 592 € 95 722 € 158 228 € 701 155 -€40 765
BE € 1 509 680 € 249 908 € 1 333 251 -€67 212 € 113 039 € 182 696 € 1 446 290 € 67 212
BG € 123 605 € 27 840 € 118 322 -€6 631 € 13 920 € 21 209 € 132 242 -€69 327
CY € 88 642 € 19 848 € 72 902 -€1 418 € 17 121 € 18 430 € 90 023 -€53 981
CZ € 207 898 € 51 114 € 209 885 -€12 825 € 30 238 € 38 289 € 240 122 -€146 507
DE € 5 050 962 € 1 289 827 € 5 413 564 -€476 733 € 807 797 € 813 094 € 6 221 361 -€198 639
EE € 38 015 € 6 111 € 28 971 -€3 533 € 5 061 € 2 578 € 34 032 -€24 731
EL € 342 547 € 79 207 € 339 755 -€7 742 € 26 502 € 71 465 € 366 257 -€114 641
ES € 1 444 122 € 456 387 € 1 559 551 -€191 300 € 286 950 € 265 087 € 1 846 501 -€1070 369
FI € 788 611 € 166 511 € 758 679 -€56 652 € 90 720 € 109 859 € 849 399 € 66 987
FR € 4 851 173 € 1 174 283 € 5 278 042 -€201 947 € 570 936 € 972 336 € 5 848 978 -€1096 995
HR € 67 221 € 25 685 € 65 697 -€11 521 € 12 957 € 14 164 € 78 653 -€64 130
HU € 136 641 € 30 155 € 121 740 -€5 939 € 25 734 € 24 216 € 147 474 -€128 339
IT € 2 193 198 € 482 167 € 2 332 526 € 2 237 € 276 323 € 484 405 € 2 608 849 -€671 230
LT € 83 583 € 15 378 € 59 078 -€4 258 € 9 936 € 11 119 € 69 015 -€49 682
LU € 57 899 € 13 934 € 41 268 -€6 867 € 8 628 € 7 067 € 49 896 € 19 174
LV € 69 848 € 14 950 € 55 660 -€1 886 € 10 405 € 13 065 € 66 065 -€50 845
MT € 21 554 € 4 239 € 19 451 -€ 363 € 2 140 € 3 876 € 21 591 -€8 639
NL € 5 717 262 € 1 349 056 € 5 176 609 -€385 444 € 499 733 € 963 611 € 5 676 342 € 1 501 441
PL € 878 875 € 159 708 € 685 825 -€28 274 € 116 915 € 131 434 € 802 740 -€573 113
PT € 175 507 € 48 897 € 149 075 € 2 295 € 41 130 € 51 192 € 190 205 -€187 999
RO € 196 007 € 55 276 € 176 682 -€9 352 € 29 475 € 45 924 € 206 157 -€147 374
SE € 3 977 608 € 583 047 € 3 075 463 -€152 809 € 255 176 € 430 238 € 3 330 639 € 296 716
SI € 65 968 € 17 516 € 52 441 -€3 005 € 9 313 € 14 511 € 61 754 -€37 632
SK € 111 607 € 26 017 € 134 995 -€13 602 € 12 037 € 12 415 € 147 032 -€59 914
€ 28 703 995 € 6 534 881 € 27 864 864 -€1 674 373 € 3 367 907 € 4 860 509 € 31 232 771 -€2 843 324
2.1 Cost savings
2.1.1 Fees perceived by public administration
While the number of cards issued drives the administrative cost for Member States, it also
drives the revenue generated from application fees. There is a large variety in application fees

204
currently charged by Member States422
which cannot be explained by differences in cost
structure (e.g. salaries of officials) alone. Permits for workers can be subject to relatively high
fees, since the administration may decide that the economic actors recruiting from abroad
should (fully) bear the costs linked to the process. Some Member States offer expedited
procedures, at an additional cost. This approach reflects the concerns of employers, confirmed
in the public consultation, that fast and simple procedures are important, while fees
considered less relevant in light of other expenses linked to international recruitment and the
salaries to be paid to the highly-qualified worker.
The table below gives a partial overview of the standard fees currently in place in selected
Member States, collected through the European Migration Network. These generally concern
first applications (not extensions) and do not visa fees.
Table 15 — Reported application fees for a permit for highly-qualified work (EU Blue card or equivalent national
permit, source: European Migration Network)
AT 100 EUR
BE 215 EUR
CY 200 EUR
CZ 92.50 EUR
DE 100 – 110 EUR
EE 96 – 100 EUR
EL 150 EUR
ES 85.85 EUR
FI 450 – 500 EUR
FR 260 EUR
HR ca. 137 EUR
IT 273.50 EUR
LT 142 EUR
LU 80 EUR
LV 99.60 EUR
NL 870 EUR
PL 113 EUR
SE 214 EUR
SK 0 EUR
2.1.2. Revenue from income tax
Member States will also generate revenue from income tax on the highly-qualified workers.
Since the revised Blue Card would remain a demand-driven system, requiring the TCN to be
employed, this tax revenue is significant. The following table shows the estimated income tax
rates which would apply to the salary of an average highly-qualified worker. This revenue is

205
included in the overview of impacts in Annex 14. In order to gauge the impact on national
administrations, it includes only income taxes and not social contributions, which is an
additional source of revenue. This income tax rate can be applied to the relevant salaries
included in Annex 14 to calculate the total income tax revenue under each of the POPs (see
section 7 of Annex 14.
Table 16 — estimated income tax rates at average salary of a highly-qualified worker (source: calculations based on
OECD Tax-Benefit Calculator, available at http://www.oecd.org/els/soc/benefitsandwagestax-benefitcalculator.htm)
AT 22%
BE 34%
BG 9%
CY n/a
CZ 16%
DE 24%
EE n/a
EL 18%
ES 20%
FI 28%
FR 18%
HR 15%
HU 17%
IT 29%
LT 15%
LU 25%
LV 20%
MT 15%
NL 22%
PL 8%
PT 26%
RO 13%
SE 24%
SI 18%
SK 12%
EU-25 average 18%

206
ANNEX 16
HIGHLY SKILLED WORKERS AND INTERNATIONAL PROTECTION
1. CONTEXT
The lives of many resourceful, highly-skilled and entrepreneurial people are uprooted due to
conflict and other hardship. For reasons out of their control they may look at years of great
adversity and professional inactivity before acquiring some degree of certainty again.
To date international protection and other, especially economically driven channels of
migration have been kept rather separate. This is also the approach taken by the EU in all
labour migration directives in not allowing asylum seekers or beneficiaries of international
protection to apply for residence permits under these instruments423
. However, even for those
persons who do or might qualify for international protection, choosing a labour migration
route or opting to get a labour migrant status in addition to the protection status can be a
relevant option, enabling them to avoid some negative aspects associated with the asylum
route/status, such as the hazardous initial journey, long processing times as well as the
sometimes perceived stigmatisation effect.
The Blue Card is a specific and relatively selective scheme for the admission of highly skilled
workers and as such, it does not serve as a large-scale alternative to asylum seeking. The
review of the Blue Card Directive should therefore not be seen as a measure to address the
refugee crisis. However, particularly as the EU is faced with unprecedented numbers of
asylum seekers424
, it is a legitimate question to ask whether the highly skilled persons
amongst the third-country nationals seeking or enjoying international protection should not
have the possibility to apply for a Blue Card and benefit from the rights and advantages linked
to that status (for example, facilitated intra-EU mobility). This is especially relevant as almost
75 % of the asylum seekers who arrived in the EU during 2015 were of working age (between
18 and 64 years old)425
. In terms of family reunification, there is already a very favourable
scheme in place for refugees' family members in certain situations426
, but for those who do not
qualify for that, the facilitations under the Blue Card Directive (e.g. no waiting period, shorter
maximum processing time) might be welcome.
The table below shows the different categories of third-country nationals concerned, and the
rights they enjoy under the asylum acquis427
, compared to those associated with the status of a
Blue Card holder. Beneficiaries of international protection have no intra-EU mobility rights
(apart from regular mobility under the Schengen acquis) before they acquire the EU long-term
423 Apart from the Blue Card Directive 2009/50/EC, asylum seekers and beneficiaries of international protection in the EU
are also excluded from the scope of Directives 2011/98/EU (Single Permit), 2014/36/EU (Seasonal Workers), and
2014/66/EU (Intra-Corporate Transferees). For the last two the exclusion is not explicit, but only persons residing outside the
EU can apply for admission under those Directives. 424 According to Eurostat data [migr_asyapp], during 2015, 1 255 640 persons sought asylum in the EU for the first time –
more than twice as much as during 2014 (562 680). 425 Eurostat [migr_asyappctzm] 426 Council Directive 2003/86/EC of 22 September 2003 on the right to family reunification, Chapter V; OJ L 251, 3.10.2003,
p. 12–18 427 Directive 2011/95/EU of the European Parliament and of the Council of 13 December 2011 on standards for the
qualification of third-country nationals or stateless persons as beneficiaries of international protection, for a uniform status
for refugees or for persons eligible for subsidiary protection, and for the content of the protection granted (recast), OJ L 337,
20.12.2011, p. 9–26; Directive 2013/33/EU of the European Parliament and of the Council of 26 June 2013 laying down
standards for the reception of applicants for international protection (recast), OJ L 180, 29.6.2013, p. 96–116

207
resident status, for which they can apply after five years of residence in the Member State
concerned.
RIGHTS OF DIFFERENT CATEGORIES OF THIRD-COUNTRY NATIONALS LINKED TO
INTERNATIONAL PROTECTION AND POSSIBLE ADDED VALUE OF THE BLUE CARD
Residence rights Access to the
labour market
Intra-EU
mobility rights
Benefits from obtaining
an EU Blue Card**
(accessible to highly
skilled worker)
Asylum seekers Right to stay while
their application is
being processed
Access at the latest
after 9 months from
lodging the
application, if no
first instance
decision has been
taken*
No rights Right of residence
(possibly parallel to
future protection
status)
Access to highly
skilled employment
Mobility rights after
18 months
Favourable family
reunification scheme
Rejected asylum
seekers
No right to reside No access No rights Same as for asylum
seekers
Beneficiaries of
international
protection
Temporary or
permanent
residence permit,
high level of
protection against
expulsion, access to
long-term resident
status after 5 years
of residence
Immediate access to
the labour market
Mobility rights
only after
obtaining the
long-term
resident status
Right of residence
parallel to the
protection status
Mobility rights after
18 months
Favourable family
reunification scheme
for those who do not
profit from the most
advantageous refugee
regime
Potential
beneficiaries of
international
protection
residing outside
the EU
No residence right
yet in the EU,
possibility to apply
for any residence
permit for which
they qualify
No access No rights Same as for asylum
seekers
* The period of 9 months is the maximum allowed by Directive 2013/33/EU. In practice, the 25 Member States
applying the Blue Card Directive (excluding DK, IE, UK) currently have various periods in place:
three Member States give immediate labour market access
five Member States apply a period between 2 and 4 months
seven Member States apply a period of 6 months
nine Member States apply the maximum period of 9 months
one Member State gives no labour market access to asylum seekers
As further conditions for access Member States may e.g. require obtaining a work permit, apply a labour
market test, or limit accessible professions.
** Reference is made to the current Blue Card scheme; changes are envisaged to grant e.g. more extensive
mobility rights to EU Blue Card holders.

208
2. SKILL LEVELS OF ASYLUM SEEKERS AND BENEFICIARIES OF INTERNATIONAL
PROTECTION IN THE EU
Persons having arrived in the EU to seek protection have a variety of educational and
professional backgrounds. Information on education level and actual skill sets of asylum
seekers and beneficiaries of international protection is heterogeneous and different studies
provide contradicting results. Anecdotal evidence suggests that the majority of these people -
whose reason for migration is primarily not work but escaping war and persecution - are not
highly educated, their skill set is comparatively low428
, and they usually do not speak the
language of the host country. However, other anecdotal information suggests that there are
differences across countries of origin. Syrians in particular seem to have a higher level of
education, but even in those cases there are contradicting accounts. In any case Syrian
nationals, who filed the highest number of asylum claims in the EU in 2014, were in sixth
place among accepted Blue Card applicants during the same year with 554 issued permits429
.
As there is no extensive data on the professions and skill sets of asylum seekers or
beneficiaries of international protection in the EU, it is not possible to reliably predict how
many such persons would be interested in applying for a Blue Card or end up qualifying for it.
However, in the following there are some examples of information gathered on the issue of
education and skill levels:
In Sweden, statistics from 2014 show that over 40 % of Syrians have at least upper secondary
education, compared to 20 % of Afghans, 10 % of Eritreans and 68 % of Swedes430
. Surveys
of refugees arriving in the Netherlands show that, in the first half of 2015, over 1/3 of
registered refugees aged between 18 and 65 had university-level education, and up to 70 %
had concluded secondary schooling, especially those fleeing the conflict in Syria. A
significant proportion has skills and experience in various professions and trades.431
According to a UNHCR survey with 1 139 respondents, 43% of Syrians arriving in Greece
had secondary education and 43 % had university level education. In terms of occupations, 16
% were students, 9 % merchants or working in trade, 8 % worked in the private sector, 7 %
represented technical professions (carpenters, electricians etc.), 5 % were engineers and
architects, 5 % were teachers, and 4 % were pharmacists, doctors, veterinarians, biologists or
chemists. A total of 78 % were under the age of 35, and 21 % were aged between 36 and
59.432
Eurostat data shows that newcomers are typically younger than the populations of the
countries they are fleeing to: of the 729 000 asylum seekers registered between May and
October 2015 in the EU, 82% were younger than 34 years of age. Their median age is around
half of that of Germany, the latter being 46 years.433
.
In a German survey, 81 % of unemployed refugees had no professional qualifications or even
high school diploma. Illiteracy and non-literacy in the Latin alphabet were identified as major
problems.434
In another survey, 63 % of German employers saw little chance of hiring
refugees as trainees, 78 % for skilled positions and 97 % for management roles. Employers
428 Institut für Arbeitsmarkt- und Berufsforschung (IAB), ‘Asyl- und Flüchtlingsmigration in die EU und nach Deutschland.’
Aktuelle Berichte 8/2015; IAB, ‘Flüchtlinge und andere Migranten am deutschen Arbeitsmarkt: Der Stand im September
2015.’ Aktuelle Berichte, 14/2015 429 Eurostat [migr_resbc1] 430 Statistics Sweden 431 Dutch Central Agency Asylum Seekers Reception (COA) in 'Getting the new arrivals to work', Economist, 12/12/2015 432 UNHCR, Syrian Refugee Arrivals in Greece, April - September 2015 433 Eurostat data 434 Survey of the German Federal Labour Agency, October 2015 in ‘Frustrations mount for refugees navigating Germany’s
jobs market’, Financial Times, 3/1/2016
209
mentioned barriers such as lacking knowledge of German, low qualifications, strict
employment rules, and the German minimum wage. Yet, those who are educated are more
likely to have a degree than the domestic population (37 % versus 21 %).435
3. IMPLICATIONS OF A POSSIBLE EXTENSION OF THE BLUE CARD TO THIRD COUNTRY
NATIONALS SEEKING OR ENJOYING INTERNATIONAL PROTECTION
This Section presents the different groups of third-country nationals who have either applied
for or been granted international protection in the territory of a Member State and who are
currently excluded from the scope of the Blue Card. The inclusion of asylum seekers and
beneficiaries of international protection is covered in the Impact Assessment report under
policy option PO-C. However, rejected asylum seekers have not been included in that policy
option as it seems sufficient to address the applicants still in process; with the latter also the
risk of creating a pull factor for irregular migration is likely to be smaller.
3.1 Asylum seekers in the territory of the EU
As a result of the substantial influx of asylum seekers into the EU, the question of labour
market integration of these migrants has become ever more topical. Some of the newcomers
may have specific skills immediately relevant for the labour market of the host country, but
this resource may be lost if the skills are not used from the outset. According to the recently
recast Directive 2013/33/EU, Member States are obliged to grant asylum seekers access to the
labour market at the latest within nine months from lodging the application. Asylum seekers
may provide for valuable workforce and their integration is likely to get a swift start through
entering the labour market quickly. The sooner the skills are identified, the sooner they can be
put to full use. Obviously, not all asylum seekers will get recognised as refugees or other
beneficiaries of international protection, and those rejected might be eventually returned.
While the question of labour market access for asylum seekers is regulated by the asylum
acquis (see details in the table above), the current Blue Card Directive explicitly excludes
asylum applicants from its scope (points (a) to (c) of first subparagraph of Article 3(2)). This
means that even if they have access to the labour market of the Member State concerned, they
cannot apply for a Blue Card while awaiting a decision on their application.
If submitting an application for a Blue Card was to be allowed during the asylum procedure,
an important issue to be addressed would be how to deal with the pending asylum request.
The main options would be to:
a) Examine both applications in parallel and grant both permits to eligible applicants
This would be the most flexible option for applicants as no choice would have to be made
between the two tracks. The two applications would be processed in parallel and if both
applications were successful, two distinct permits would be granted.
b) Suspend the examination of the asylum claim and resume it in case the Blue Card
application is rejected or the initially granted Blue Card is subsequently withdrawn or not
renewed
In this option no double processing or double status would be envisaged, but instead, the
Blue Card application would take priority over the asylum claim at the first stage. Member
States should find a practical solution for suspending the asylum application and
435 Survey of Ifo institute in ‘German companies gloomy on employing refugees, survey says’, Financial Times, 26/11/2015

210
reactivating it in case the Blue Card application either is not successful or the permit is
subsequently withdrawn or not renewed. It would be particularly important to guarantee
that the asylum claim is properly examined before any expulsion measure is taken.
c) Suspend the examination of the Blue Card application and pursue it only in case the
asylum request is rejected
Under this option the application for a Blue Card would have to be submitted while the
asylum request is still pending, but the application would only become effective in case
the asylum claim was rejected. This option would enable access to international protection
for those who qualify, however without providing for a double status. The Blue Card
would become accessible only after being rejected in the asylum process.
d) Discontinue the examination of the asylum claim
In this option no system of parallel or suspended applications would be created. It would
still be possible for a Blue Card holder to subsequently seek asylum, and it should be
ensured that the first claim set aside by the Blue Card application would not negatively
affect the assessment of the second claim.
3.2 Rejected asylum seekers
Third-country nationals whose expulsion decision has been suspended for reasons of fact or
law (point (i) of first subparagraph of Article 3(2)) as well as those whose stay is not legal
(Article 10(3)) may not apply for a Blue Card in the territory of Member States. This means
that a rejected asylum applicant cannot immediately apply for a Blue Card even if he or she
had a highly skilled job, but has to exit the Member State territory before doing so. If asylum
seekers still in process were granted the possibility to apply for a Blue Card, it could be
considered to extend this right to rejected applicants as well. This could be limited to cases
where the relevant employment relationship began already during the asylum-seeking period,
and there would only be a short grace period for applying for a Blue Card after being rejected
as an asylum seeker. Some minimum period of preceding work and other conditions could be
envisaged. In practice, this would be close to option c) under 2.2.
3.3 Beneficiaries of international protection in the EU
Beneficiaries of international protection are currently excluded from the personal scope of the
Blue Card Directive (points (b) to (c) of first subparagraph of Article 3(2)); this means that
they cannot apply for a Blue Card. This group consists of persons whose right of residence in
the host country is already well secured and access to rights and benefits is extensive. They
already have immediate access to employment under Article 26(1) of Directive 2011/95/EU.
Therefore, the main added value of the Blue Card for this group would be facilitated intra-EU
mobility, which is under the current EU rules only accessible to them only after obtaining the
status of long-term resident under Directive 2003/109/EC436
(i.e. after at least five years of
continuous residence in the host Member State) .
The main options would be either to (1) allow applying for a Blue Card in any Member State
or (2) allow it in any other Member State apart from the one having granted international
protection. Under the first option the third-country national could choose to apply for an EU
Blue Card already in the Member State having granted the protection status, which would
mean that in case the application is successful, he or she would have a double status in that
436 Directive 2003/109/EC concerning the status of third-country nationals who are long-term residents, OJ L 16, 23.1.2004,
p. 44–53

211
Member State. The person could profit from the mobility scheme of the Blue Card Directive
similarly to any other EU Blue Card holder, which means that moving to a second Member
State under the mobility rules would be possible after having been employed as highly skilled
for a certain period in the first Member State. Alternatively, the person could directly apply
for a first EU Blue Card in another Member State like any first applicant. Under the second
option the double status would not be possible, but instead, only applying in other Member
States than the one having granted protection would be allowed. In either case, this extension
would make the highly skilled labour markets of different Member States accessible to
beneficiaries of international protection.
As Member States do not mutually recognise asylum decisions, if the beneficiary of
international protection obtained a Blue Card in a second Member State or a double status
holder moved to a second Member State under the Blue Card mobility scheme, he/she would
not enjoy international protection in that Member State. Therefore, the first Member State
(having granted the protection status) would necessarily remain obliged to readmit the person
who would otherwise be expelled to his or her country of origin or other third country against
which the protection has been granted. This kind of system was already envisaged when the
EU long-term resident status was opened to beneficiaries of international protection upon a
modification of Directive 2003/109/EC437
.
Furthermore, the rationale behind including beneficiaries of international protection in the
Blue Card scheme would also be to promote their labour market integration by making them
more visible to employers. Currently, many highly skilled third-country nationals residing in
the EU end up unemployed or in positions not corresponding to their level of education and
expertise438
. Naturally, this problem has many other dimensions than those related to the type
of residence permit, such as the recognition of qualifications and integration challenges.
4. THE SPECIFIC CASE OF POTENTIAL BENEFICIARIES OF INTERNATIONAL PROTECTION
OUTSIDE OF THE EU TERRITORY
This group of third-country nationals has not been explicitly mentioned under any of the
policy options in the Impact Assessment report, as addressing challenges faced by them is not
primarily a question of amending the Blue Card scheme as such, but rather of practical
facilitation, which is dealt with at a general level in policy option PO-A. Many of the non-
legislative actions under that policy option could have a specific significance for this group of
potential Blue Card applicants.
For persons outside the EU who are potentially in need of international protection there is no
legal impediment to apply for a Blue Card. These persons are treated like any applicant
residing outside the EU under the current scheme. However, they may experience pronounced
practical obstacles related to e.g. matching with potential employers in the EU and presenting
the required formal qualifications. Verification of diplomas can be difficult in countries where
basic infrastructure has been compromised because of war or conflict, or where there is
persecution or systematic discrimination of certain population groups by relevant authorities.
It may also be the case that due to periods of professional inactivity some re-training would be
required in order for these people to be able to resume their career in the EU – this is
especially relevant for regulated professions.
437 Directive 2011/51/EU of the European Parliament and of the Council of 11 May 2011 amending Council Directive
2003/109/EC to extend its scope to beneficiaries of international protection; OJ L 132, 19.5.2011, p. 1–4; 438 See e.g. a joint OECD/EC publication Indicators of Immigrant Integration 2015: Settling In, table 1.3., p. 31.

212
In principle, existing resettlement programmes could provide a framework for giving
information and assistance to those who wish to enter the EU under the Blue Card umbrella.
However, any access based on employment and skills should not replace or compromise the
resettlement of refugees with specific protection needs and vulnerability.
It is clear that if third-country nationals are admitted as Blue Card holders to the EU, even if
they had been previously recognised as refugees by UNHCR or by other actors outside the
EU, they will not be ipso facto considered as beneficiaries of international protection by the
Member States. On the other hand, it is equally clear that every person admitted in the EU
territory has the right to apply for asylum to get his/her need of protection examined.
Therefore, these persons might also end up as double status holders, if this was to be allowed
in the Blue Card Directive. In any case, the initial Blue Card application or permit should not
have the effect of hindering subsequent access to international protection, if the grounds are
present.
Waiving the condition of presenting formal qualifications in the Blue Card Directive for a
defined group of migrants (e.g. refugees recognised by the UNHCR or other relevant body or
authority) and if necessary, replacing it with less burdensome safeguards might help to bring
more people within the scheme. However, there would be equal treatment and non-
discrimination concerns to take into account. In any case, non-legislative measures such as
better skills validation and matching with potential employers are a big part of the solution.
Also other practical ways and means could be sought to enhance this additional legal avenue
for highly skilled people in refugee camps outside the EU. It could for example be promoted
as a possible part of the social responsibility strategies of European companies to recruit
highly skilled people from refugee camps or similar circumstances, and projects for the
involvement of private recruitment companies operating in third countries could also be
envisaged.
5. STAKEHOLDER AND EXPERT OPINIONS
The United Nations Refugee Agency (UNHCR) has in its position paper on the Blue Card
review stated that this instrument could provide for a pertinent legal avenue for highly
qualified persons having fled from conflict or other hardship. It is recognised that the labour
market integration of this group can be challenging, and specific support measures should be
designed for different stages of the process. These may include matching with employers,
facilitation of the recognition of qualifications, targeted skills development, issuance of travel
documents, and the guaranteed respect for family unity. UNHCR stresses that persons
recognised as refugees outside the EU should not end up in a less favourable position than
they previously were, if they take the Blue Card route to enter the EU. Essentially, non-
refoulement439
and other principles of international and refugee law should be respected. In
addition, opting for the labour migration route should be based on correct information on
relevant rights and obligations, and the final decision to participate should always be the
migrant's own.440
439 The principle of non-refoulement has first been laid out in 1954 in the United Nations Convention relating to the Status of
Refugees( Article 33(1)): "No Contracting State shall expel or return ('refouler') a refugee in any manner whatsoever to the
frontiers of territories where his life or freedom would be threatened on account of his race, religion, nationality, membership
of a particular social group or political opinion." 440 UNHCR's Contribution to the EU's New European Policy on Legal Migration and the Review of the Blue Card Directive,
p. 3-4

213
In its position paper a German Employers' Association BDA is in favour of allowing rejected
asylum seekers access to the Blue Card, if they fulfil the conditions and especially if they are
to work in a shortage occupation441
. In a written contribution replying to the Public
Consultation on labour migration carried out by the Commission (described in Annex 2), the
Confederation of German Trade Unions (DGB) advocates the inclusion of beneficiaries of
international protection in the Blue Card scheme.
The issue of making the Blue Card more accessible to migrants either applying for or
enjoying international protection has been discussed in the first and second meeting of the
Expert Group on Economic Migration in March and December 2015 respectively. Concerning
the possibility of opening access to the Blue Card for highly skilled asylum seekers,
participants expressed some concerns, related e.g. to picking and choosing people based on
skills. It was often felt that the two tracks should be kept separate. Also, it was pointed out
that if this option was to be opened in terms of the Blue Card, there would be pressure to give
asylum seekers access to other residence permit categories as well. Some found that any
inclusion could become a pull factor, creating incentives for more people to apply for asylum.
However, others suggested that schemes that allow an application change from asylum to
work, and possibly back to asylum in case of unemployment, could be taken into
consideration. This is particularly pertinent as it seems that Europe will continue to face
important numbers of asylum seekers and their (labour market) integration is a big task at
hand.442
Regarding the group of beneficiaries of international protection, most experts were in favour
of including them in the Blue Card scheme as double status holders. It was agreed that the
added value might be limited, but there seems to be no major objections to the inclusion,
either. It was underlined that no separate category of Blue Card holders should be created, but
grant double status holders all the same rights as the "regular" Blue Card holders enjoy. Also,
any contribution to the creation of a specific labour market with inferior work conditions and
pay should be carefully avoided. There were also more general views expressed that all third-
country nationals legally residing in Member States should be granted access to apply for any
kind of permit without undue restrictions.
441Make future-oriented use of labour market potential of asylum seekers and tolerated residents; Updated position paper on
labour market access for asylum seekers and tolerated residence, BDA, 12 June 2015 442 http://ec.europa.eu/transparency/regexpert/index.cfm?do=groupDetail.groupDetailDoc&id=19237&no=2, Summary of
discussions, p. 5 (+second meeting once uploaded)