annual detailed report - home - hr metrics service ... · pdf filethis report is provided by...
TRANSCRIPT

Report Provided by the HR Metrics Service
HR Annual Metrics Report
Sector: Income Change: HR Budget:
All All All
All All All
All
HR Top Positions:
Comparison Group
Province: Industry: Workforce Change:
Region: Size: Geographic Range:
All All All
Reporting Period 2012
Sample

HR Metrics Service - Annual Detailed Report
© HRMS.This material is copyright by HRMS and cannot be shared with a third party or reproduced for financial gain without our written permission
Page 2 of 31
This report is provided by the HR Metrics Service (HRMS), owned and operated by the British Columbia Human Resources Management Association (BC HRMA). The HRMS is a shared service offering with the Human Resources Management Association of Manitoba (HRMAM), the Human Resources Institute of Alberta (HRIA) and the Saskatchewan Association of Human Resource Professionals (SAHRP).
About the Report
Your report is organized into three main sections: an About the Report / Interpreting your Results section, the tables of your resultsagainst your comparison group organized by metrics categories, and a listing of the organizations that make up your comparatorgroup.This report provides a detailed view of key HR metrics relating to your organization. These numbers have been calculated througha carefully managed process to ensure that any comparison made is as accurate as possible. Included in the report is the name ofthe specific HR metric and a description of what has been measured and reported. Further details of the exact ways in which thedata components, which lead to these metrics, are gathered can be found in the HR Metrics Standards & Glossary.The numbers presented are aggregated numbers and therefore do not represent any single organization. The aggregated resultsare reported as accurately as possible and rounding or averaging errors are kept to a minimum. The benchmarks are reported asthe 10th, 25th, 50th (median), 75th and 90th percentiles, as well as the mean (or average) to provide enough data to allow formeaningful comparison.The metrics are arranged in categories for ease of interpretation. Each category is tabulated and shown in a separate section. Ifyou have not provided data for a particular metric, the metric will not appear on your report. HRMS only produces a report wherethere is a minimum sample size of five organizations.
The usefulness of the data presented is tightly connected to the approach you use to interpret this information. In many instancesthe number itself is interesting, however it is more important to consider what this number tells you about your organization, theenvironment you are working in and whether or not action is required. For example, you may notice that your External Time-to-Fillis increasing. If the median/average External Time-to-Fill is also increasing then you are looking at a change in the dynamics ofthe recruitment market. A sign of success is that your score grows more slowly than the overall average, not that your score doesnot change. Each metric should be considered in this perspective by relating your score to the changes to the range.Further information on interpreting your scores is provided in the HR Metrics Interpretation Guide.
Interpreting Your Results
Should you have any questions regarding this report please contact the HR Metrics team @ [email protected]
Sample

HR Metrics Service - Annual Detailed Report
© HRMS.This material is copyright by HRMS and cannot be shared with a third party or reproduced for financial gain without our written permission
Page 3 of 31
Total Average Direct Cost of Absenteeism per FTE
The average total direct labour costs per FTE for time not worked due to illness.
$5,466 $7,156 $9,923 $14,073 $18,793 $11,100 41
Absenteeism Rate
The number of work days missed due to illness per FTE. 4.3 5.3 6.9 9.7 11.3 7.4 41
Revenue per FTE
The number of dollars of revenue from operations generated per FTE. $128,722 $160,189 $203,631 $312,258 $920,371 $347,044 65
Profit per FTE
The number of dollars of profit generated per FTE. (Based on pre-tax profit). $2,397 $27,693 $46,081 $81,448 $239,477 $133,779 38
Human Capital Return on Investment
The rate of return for each dollar invested in employee pay and benefits. (Based on pre-tax profit.)
3.8% 33.6% 67.7% 92.5% 306% 149.7% 38
Metric Category: Productivity Your Results
Date Range: 2012
Metric Name Score 10th 25th Median 75th 90th Average n
Sample

HR Metrics Service - Annual Detailed Report
© HRMS.This material is copyright by HRMS and cannot be shared with a third party or reproduced for financial gain without our written permission
Page 4 of 31
Overtime per Individual Contributor Headcount
The average number of overtime hours worked by each Individual Contributor. (Based on headcount.)
5.5 7.5 10.6 37.8 45.6 23.7 23
Metric Category: Productivity Your Results
Date Range: 2012
Metric Name Score 10th 25th Median 75th 90th Average n
Sample
HR Metrics Service - Annual Detailed Report
© HRMS.This material is copyright by HRMS and cannot be shared with a third party or reproduced for financial gain without our written permission
Page 5 of 31
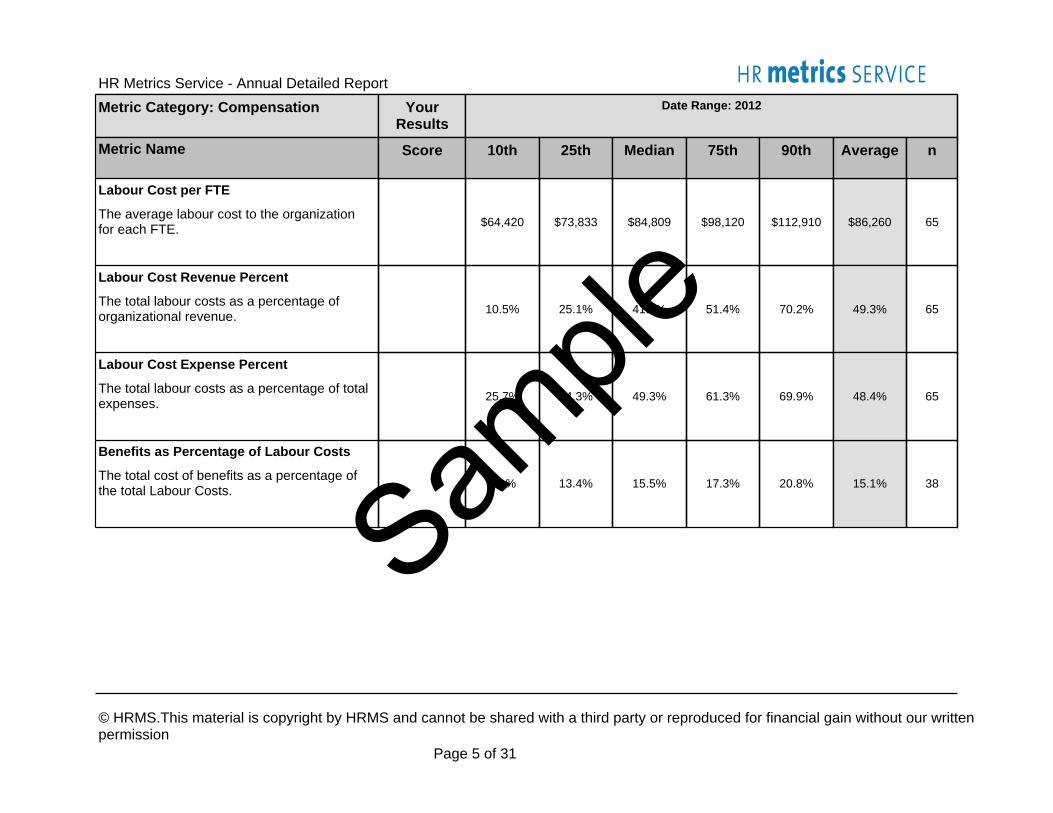
Benefits as Percentage of Labour Costs
The total cost of benefits as a percentage of the total Labour Costs. 8.1% 13.4% 15.5% 17.3% 20.8% 15.1% 38
Labour Cost per FTE
The average labour cost to the organization for each FTE. $64,420 $73,833 $84,809 $98,120 $112,910 $86,260 65
Labour Cost Revenue Percent
The total labour costs as a percentage of organizational revenue. 10.5% 25.1% 41.1% 51.4% 70.2% 49.3% 65
Labour Cost Expense Percent
The total labour costs as a percentage of total expenses. 25.7% 34.3% 49.3% 61.3% 69.9% 48.4% 65
Metric Category: Compensation Your Results
Date Range: 2012
Metric Name Score 10th 25th Median 75th 90th Average n
Sample

HR Metrics Service - Annual Detailed Report
© HRMS.This material is copyright by HRMS and cannot be shared with a third party or reproduced for financial gain without our written permission
Page 6 of 31
90 Day Involuntary Turnover Rate
The percentage of new employees leaving the organization on an involuntary basis within 90 days of starting their employment.
0% 0% 8.1% 17.8% 30.6% 11.1% 34
1st Year Turnover Rate
The percentage of employees with less than 1 year of service who left the organization. 4.2% 11.5% 18.2% 26% 45.1% 20.6% 36
90 Day Resignation Rate
The percentage of new employees who resigned within 90 days of starting their employment.
0% 0% 9% 18.9% 34.5% 12.9% 40
Vacancy Rate
The percentage of positions being actively recruited for at the end of the reporting period.
1.3% 1.6% 2.9% 5% 7.5% 3.8% 65
90 Day Turnover Rate
The percentage of new employees leaving the organization within 90 days of starting their employment.
0% 3.5% 19.2% 38.8% 58.8% 25.7% 34
Metric Category: Recruitment Your Results
Date Range: 2012
Metric Name Score 10th 25th Median 75th 90th Average n
Sample
HR Metrics Service - Annual Detailed Report
© HRMS.This material is copyright by HRMS and cannot be shared with a third party or reproduced for financial gain without our written permission
Page 7 of 31
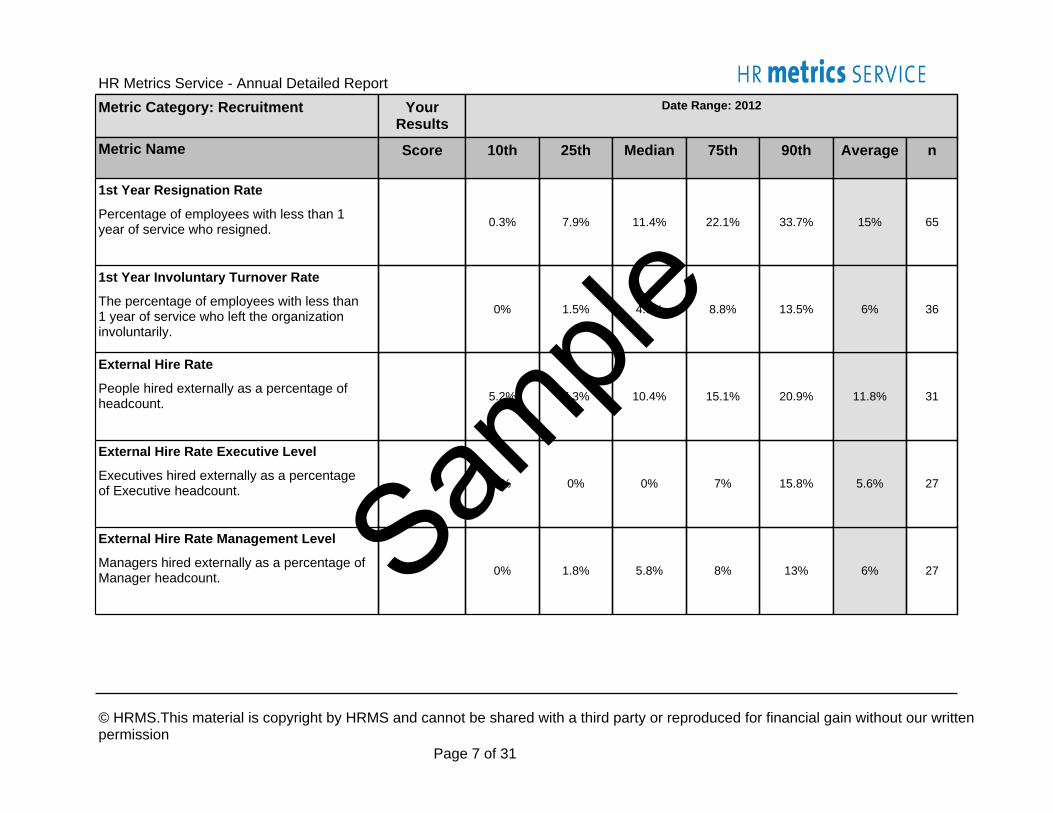
External Hire Rate Management Level
Managers hired externally as a percentage of Manager headcount. 0% 1.8% 5.8% 8% 13% 6% 27
External Hire Rate Executive Level
Executives hired externally as a percentage of Executive headcount. 0% 0% 0% 7% 15.8% 5.6% 27
External Hire Rate
People hired externally as a percentage of headcount. 5.2% 7.3% 10.4% 15.1% 20.9% 11.8% 31
1st Year Resignation Rate
Percentage of employees with less than 1 year of service who resigned. 0.3% 7.9% 11.4% 22.1% 33.7% 15% 65
1st Year Involuntary Turnover Rate
The percentage of employees with less than 1 year of service who left the organization involuntarily.
0% 1.5% 4.8% 8.8% 13.5% 6% 36
Metric Category: Recruitment Your Results
Date Range: 2012
Metric Name Score 10th 25th Median 75th 90th Average n
Sample

HR Metrics Service - Annual Detailed Report
© HRMS.This material is copyright by HRMS and cannot be shared with a third party or reproduced for financial gain without our written permission
Page 8 of 31
30-34 Years Hire Ratio
The percentage of employees hired externally who are between the ages of 30 and 34. 9.5% 11.2% 15.5% 18.2% 22.3% 15.3% 26
25-29 Years Hire Ratio
The percentage of employees hired externally who are between the ages of 25 and 29. 4.8% 14.9% 19.3% 26.1% 27.2% 18.4% 26
Under 25 Years Hire Ratio
The percentage of employees hired externally who are under the age of 25. 3.9% 5.7% 11.9% 22.7% 34.5% 15.8% 26
External Hire Rate Individual Contributor Level
Individual Contributors hired externally as a percentage of Individual Contributor headcount.
7.2% 9% 12.3% 16.5% 21.9% 13.6% 27
Female Hire Ratio
The percentage of employees hired externally and who are female. 38.8% 49.7% 56.3% 70% 74.9% 57.8% 25
Metric Category: Recruitment Your Results
Date Range: 2012
Metric Name Score 10th 25th Median 75th 90th Average n
Sample

HR Metrics Service - Annual Detailed Report
© HRMS.This material is copyright by HRMS and cannot be shared with a third party or reproduced for financial gain without our written permission
Page 9 of 31
55-59 Years Hire Ratio
The percentage of employees hired externally who are between the ages of 55 and 59. 0.5% 2% 2.8% 5.1% 8.7% 4.3% 26
50-54 Years Hire Ratio
The percentage of employees hired externally who are between the ages of 50 and 54. 2.9% 3.7% 4.8% 7.5% 13.2% 6.1% 26
45-49 Years Hire Ratio
The percentage of employees hired externally who are between the ages of 45 and 49. 4.2% 5.7% 9.6% 14.3% 22.2% 10.6% 26
35-39 Years Hire Ratio
The percentage of employees hired externally who are between the ages of 35 and 39. 6% 7.7% 13.2% 16.7% 21.7% 13.4% 26
40-44 Years Hire Ratio
The percentage of employees hired externally who are between the ages of 40 and 44. 5.6% 8.8% 12.8% 17.5% 23.6% 14.3% 26
Metric Category: Recruitment Your Results
Date Range: 2012
Metric Name Score 10th 25th Median 75th 90th Average n
Sample

HR Metrics Service - Annual Detailed Report
© HRMS.This material is copyright by HRMS and cannot be shared with a third party or reproduced for financial gain without our written permission
Page 10 of 31
External Offer Acceptance Rate
External people accepting positions as a percentage of total external job offers. 88.1% 90.9% 95.8% 100% 100% 95.3% 11
External Cost per Hire
The average direct costs for external hiring per external hire. $802 $1,317 $1,458 $4,091 $6,000 $2,635 11
60-64 Years Hire Ratio
The percentage of employees hired externally who are between the ages of 60 and 64. 0% 0% 0.3% 1.6% 3.3% 1.4% 26
65 Years or Older Hire Ratio
The percentage of employees hired externally who are between the ages of 65 and older. 0% 0% 0% 0.4% 0.6% 0.4% 26
External Time-to-Fill
The average number of calendar days taken to fill a position from outside the organization. 15.9 35.9 52.1 57.5 62.0 44.3 9
Metric Category: Recruitment Your Results
Date Range: 2012
Metric Name Score 10th 25th Median 75th 90th Average n
Sample

HR Metrics Service - Annual Detailed Report
© HRMS.This material is copyright by HRMS and cannot be shared with a third party or reproduced for financial gain without our written permission
Page 11 of 31
Management Voluntary Turnover Rate
Managers who voluntarily left the organization as a percentage of Management headcount.
3.5% 4% 5% 11.7% 13% 7% 18
Individual Contributor Voluntary Turnover Rate
Individual Contributors who voluntarily left the organization as a percentage of Individual Contributor headcount.
3.6% 5.9% 8.8% 12.1% 12.8% 8.7% 18
Executive Voluntary Turnover Rate
Executives who voluntarily left the organization as a percentage of Executive headcount.
0% 0% 3.4% 12.6% 18.2% 6.9% 18
Turnover
Employees who left the organization, either voluntarily or involuntarily, as a percentage of headcount.
5% 6.5% 11.3% 16.5% 21.9% 12.7% 63
Voluntary Turnover Rate
Employees who left the organization voluntarily as a percentage of headcount. 3.8% 5.6% 8.9% 11.8% 15.8% 9.6% 63
Metric Category: Retention Your Results
Date Range: 2012
Metric Name Score 10th 25th Median 75th 90th Average n
Sample

HR Metrics Service - Annual Detailed Report
© HRMS.This material is copyright by HRMS and cannot be shared with a third party or reproduced for financial gain without our written permission
Page 12 of 31
Individual Contributor Involuntary Turnover Rate
Individual Contributors who left the organization involuntarily as a percentage of Individual Contributor headcount.
1.2% 1.6% 3% 4.9% 7.8% 3.7% 27
Management Involuntary Turnover Rate
Managers who left the organization involuntarily as a percentage of Manager headcount.
0% 0.3% 2.2% 3.7% 7.7% 3% 27
Executive Involuntary Turnover Rate
Executives who left the organization involuntarily as a percentage of Executive headcount.
0% 0% 0% 4.9% 13.1% 3.6% 27
Cost of Voluntary Turnover
The average cost to replace each employee who left voluntarily. $33,679 $47,107 $61,622 $77,438 $94,666 $62,384 58
Involuntary Turnover Rate
Employees who left the organization involuntarily as a percentage of headcount. 0.6% 1.2% 2.2% 4.4% 6.6% 3.1% 65
Metric Category: Retention Your Results
Date Range: 2012
Metric Name Score 10th 25th Median 75th 90th Average n
Sample

HR Metrics Service - Annual Detailed Report
© HRMS.This material is copyright by HRMS and cannot be shared with a third party or reproduced for financial gain without our written permission
Page 13 of 31
Three to Five Years of Service Resignation Rate
The percentage of employees with between three and five years service who resigned.
2.6% 4.4% 9.5% 14.1% 20.5% 11% 40
Two to Three Years of Service Resignation Rate
The percentage of employees with between two and three years of service who resigned.
0% 3.4% 7.3% 18.4% 23.6% 10.5% 40
First Two Years of Service Resignation Rate
The percentage of employees with less than two years of service who resigned.
4.2% 7% 11.2% 15.5% 25.7% 13% 40
Succession Planning Rate
The percentage of Executive roles for which there is a succession candidate. 21.3% 60.9% 100% 105.9% 211.2% 123.2% 9
Resignation Rate
Employees who resigned from the organization as a percentage of headcount. 1.7% 3.1% 6.3% 11.2% 13.4% 7.9% 65
Metric Category: Retention Your Results
Date Range: 2012
Metric Name Score 10th 25th Median 75th 90th Average n
Sample

HR Metrics Service - Annual Detailed Report
© HRMS.This material is copyright by HRMS and cannot be shared with a third party or reproduced for financial gain without our written permission
Page 14 of 31
30-34 Years Resignation Rate
The percentage of employees between the ages of 30 to 34 who resigned. 0.4% 3.9% 8.4% 13.8% 23.1% 10% 38
25-29 Years Resignation Rate
The percentage of employees between the ages of 25 to 29 who resigned. 0% 3.9% 12.6% 22.7% 36.6% 14.8% 38
Under 25 years Resignation Rate
The percentage of employees under 25 years of age who resigned. 0% 0% 10.1% 23.3% 38.5% 14.5% 38
Five to Ten Years of Service Resignation Rate
The percentage of employees with between five to ten years of service who resigned.
1% 2.1% 4% 7.2% 11.3% 5.3% 40
More than Ten Years of Service Resignation Rate
The percentage of employees with more than ten years of service who resigned.
0% 0.6% 1.2% 3.3% 5.4% 2.1% 40
Metric Category: Retention Your Results
Date Range: 2012
Metric Name Score 10th 25th Median 75th 90th Average n
Sample

HR Metrics Service - Annual Detailed Report
© HRMS.This material is copyright by HRMS and cannot be shared with a third party or reproduced for financial gain without our written permission
Page 15 of 31
55-59 Years Resignation Rate
The percentage of employees between the ages of 55 to 59 who resigned. 0% 0.3% 2% 4.2% 7.6% 3% 38
50-54 Years Resignation Rate
The percentage of employees between the ages of 50 to 54 who resigned. 0% 1.3% 3% 5.9% 7.6% 4.1% 38
45-49 Years Resignation Rate
The percentage of employees between the ages of 45 to 49 who resigned. 0.2% 1.8% 3.7% 7.1% 12.7% 5.4% 38
35-39 Years Resignation Rate
The percentage of employees between the ages of 35 to 39 who resigned. 0.8% 3.6% 7% 11.1% 14.4% 8% 38
40-44 Years Resignation Rate
The percentage of employees between the ages of 40 to 44 who resigned. 1.3% 2.3% 5.7% 7.9% 16.6% 6.9% 38
Metric Category: Retention Your Results
Date Range: 2012
Metric Name Score 10th 25th Median 75th 90th Average n
Sample
HR Metrics Service - Annual Detailed Report
© HRMS.This material is copyright by HRMS and cannot be shared with a third party or reproduced for financial gain without our written permission
Page 16 of 31
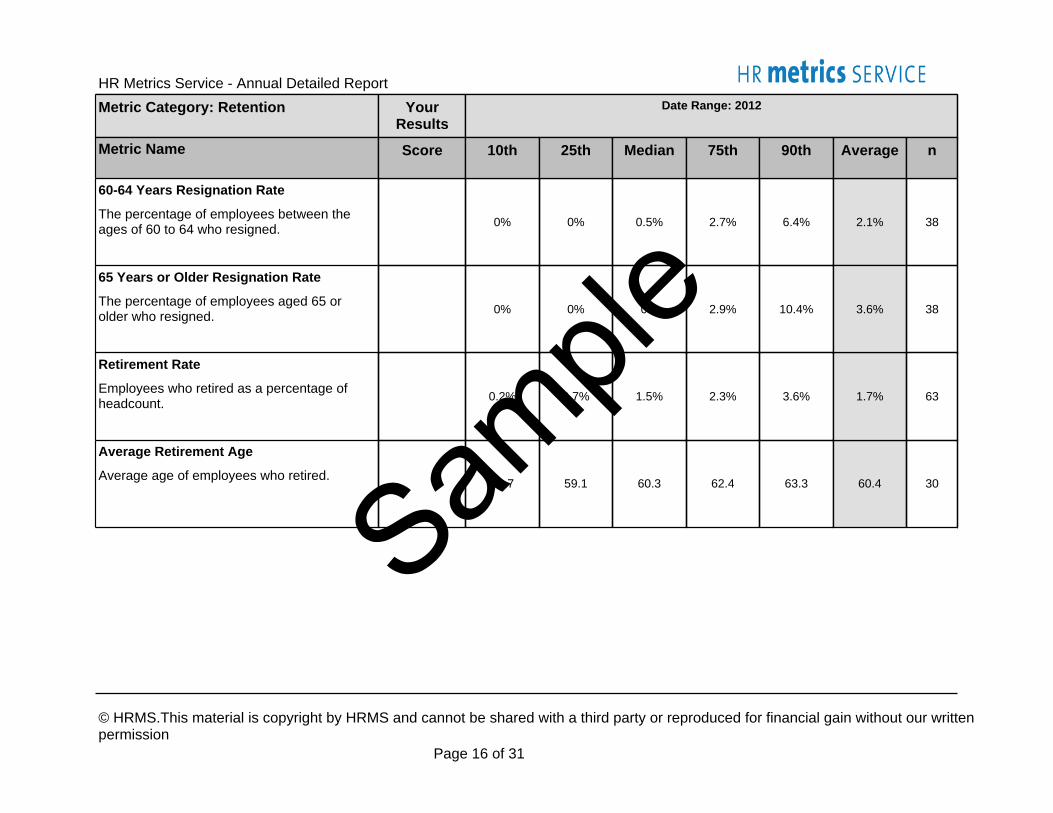
Average Retirement Age
Average age of employees who retired.56.7 59.1 60.3 62.4 63.3 60.4 30
Retirement Rate
Employees who retired as a percentage of headcount. 0.2% 0.7% 1.5% 2.3% 3.6% 1.7% 63
60-64 Years Resignation Rate
The percentage of employees between the ages of 60 to 64 who resigned. 0% 0% 0.5% 2.7% 6.4% 2.1% 38
65 Years or Older Resignation Rate
The percentage of employees aged 65 or older who resigned. 0% 0% 0% 2.9% 10.4% 3.6% 38
Metric Category: Retention Your Results
Date Range: 2012
Metric Name Score 10th 25th Median 75th 90th Average n
Sample
HR Metrics Service - Annual Detailed Report
© HRMS.This material is copyright by HRMS and cannot be shared with a third party or reproduced for financial gain without our written permission
Page 17 of 31
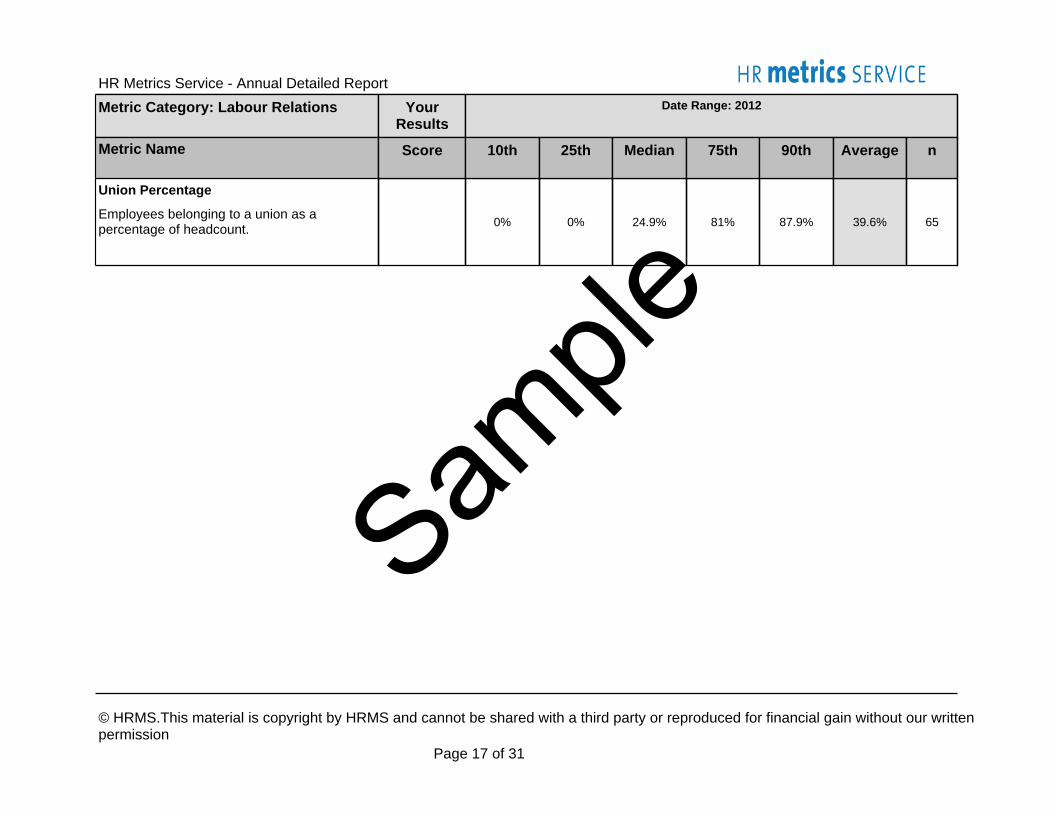
Union Percentage
Employees belonging to a union as a percentage of headcount. 0% 0% 24.9% 81% 87.9% 39.6% 65
Metric Category: Labour Relations Your Results
Date Range: 2012
Metric Name Score 10th 25th Median 75th 90th Average n
Sample

HR Metrics Service - Annual Detailed Report
© HRMS.This material is copyright by HRMS and cannot be shared with a third party or reproduced for financial gain without our written permission
Page 18 of 31
HR Costs per FTE
The cost of HR for each FTE. (Based on FTE.) $1,100 $1,908 $2,622 $3,389 $5,227 $2,862 65
Total HR Costs as a % of overall Operating Costs
The total cost of HR as a percentage of the total operating costs.
0.5% 0.9% 1.5% 2.2% 2.8% 1.6% 65
HR Costs per Employee
The HR cost for each employee. (Based on headcount.) $926 $1,697 $2,436 $3,411 $4,886 $2,694 65
HR FTE Ratio
The number of FTE per individual HR FTE.31.6 45.9 57.7 76.7 125.4 68.5 65
HR Headcount Ratio
The number of staff per individual HR staff person. 32.1 44.2 58.8 72.7 86.1 66.6 42
Metric Category: HR Efficiency Your Results
Date Range: 2012
Metric Name Score 10th 25th Median 75th 90th Average n
Sample

HR Metrics Service - Annual Detailed Report
© HRMS.This material is copyright by HRMS and cannot be shared with a third party or reproduced for financial gain without our written permission
Page 19 of 31
Total HR Costs as a % of overall Labour Costs
The total cost of HR as a percentage of total Labour Costs
1.5% 2.1% 3.1% 4.3% 5.7% 3.4% 65
HR Turnover
The number of HR staff leaving as a percentage of all HR staff. 0% 0% 11.4% 24.4% 40.9% 16.4% 39
Metric Category: HR Efficiency Your Results
Date Range: 2012
Metric Name Score 10th 25th Median 75th 90th Average n
Sample

HR Metrics Service - Annual Detailed Report
© HRMS.This material is copyright by HRMS and cannot be shared with a third party or reproduced for financial gain without our written permission
Page 20 of 31
Total HR Costs per Employee
Permanent & Non Permanent Employees
The cost of HR for each employee.$431 $656 $1,660 $2,629 $3,838 $1,852 38
Metric Category: HR Efficiency – Non Permanent / Combined Permanent & Non Permanent
Your Results
Date Range: 2012
Metric Name Score 10th 25th Median 75th 90th Average n
Sample
HR Metrics Service - Annual Detailed Report
© HRMS.This material is copyright by HRMS and cannot be shared with a third party or reproduced for financial gain without our written permission
Page 21 of 31
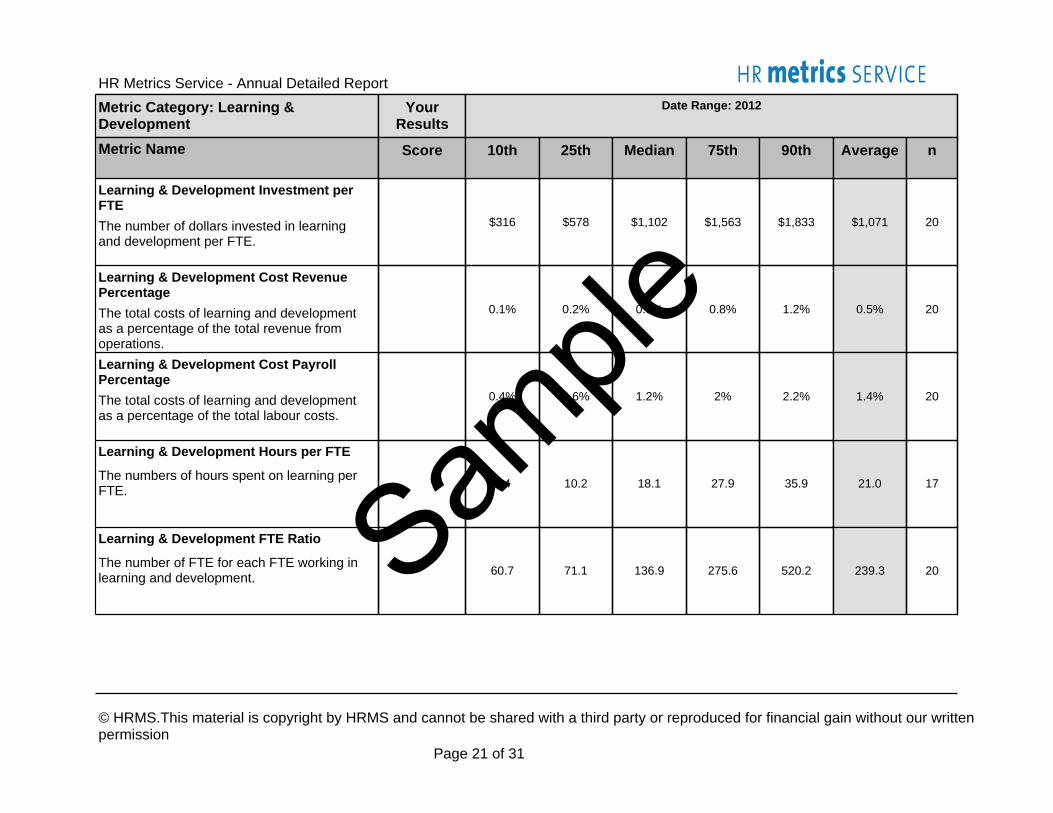
Learning & Development Hours per FTE
The numbers of hours spent on learning per FTE. 5.4 10.2 18.1 27.9 35.9 21.0 17
Learning & Development FTE Ratio
The number of FTE for each FTE working in learning and development. 60.7 71.1 136.9 275.6 520.2 239.3 20
Learning & Development Investment per FTE
The number of dollars invested in learning and development per FTE.
$316 $578 $1,102 $1,563 $1,833 $1,071 20
Learning & Development Cost Revenue Percentage
The total costs of learning and development as a percentage of the total revenue from operations.
0.1% 0.2% 0.5% 0.8% 1.2% 0.5% 20
Learning & Development Cost Payroll Percentage
The total costs of learning and development as a percentage of the total labour costs.
0.4% 0.6% 1.2% 2% 2.2% 1.4% 20
Metric Category: Learning & Development
Your Results
Date Range: 2012
Metric Name Score 10th 25th Median 75th 90th Average n
Sample

HR Metrics Service - Annual Detailed Report
© HRMS.This material is copyright by HRMS and cannot be shared with a third party or reproduced for financial gain without our written permission
Page 22 of 31
Female Percent
Employees who are female as a percentage of headcount. 32.8% 45.9% 69.8% 77.4% 84.8% 62.9% 30
Percentage Female at Executive Level
Executives who are female as a percentage of Executive headcount. 16.4% 25.7% 39.6% 47.6% 53.4% 37.2% 27
Churnover
Rate of internal movement by employees as percentage of headcount. 4.7% 11% 18.7% 24.1% 34% 19.6% 27
Promotion Rate
Employees promoted as a percentage of headcount. 2.7% 3.6% 6.2% 10.6% 15.1% 7.5% 65
Career Path Ratio
Employees moving upward in the organization as a percentage of all employee movement.
19.5% 25% 41.1% 65.8% 78.5% 46.9% 29
Metric Category: Workforce Demographics
Your Results
Date Range: 2012
Metric Name Score 10th 25th Median 75th 90th Average n
Sample

HR Metrics Service - Annual Detailed Report
© HRMS.This material is copyright by HRMS and cannot be shared with a third party or reproduced for financial gain without our written permission
Page 23 of 31
Average Length of Service
Average length of employee service. (Based on headcount.) 5.2 7.4 9.0 10.9 12.5 8.9 65
Average Age
Average age of organizations' total employee population. 38.6 41.4 44.3 45.8 47.1 43.4 65
Percentage Female at Management Level
Managers who are female as a percentage of Manager headcount. 37.6% 48.5% 58.9% 66.6% 72.4% 56.9% 27
Percentage Female at Individual Contributor Level
Individual Contributors who are female as a percentage of Individual Contributor headcount.
37.1% 58.9% 72.7% 80.2% 91.9% 67.6% 27
Management Span of Control
Average number of employees per Manager /Executive. 3.3 4.3 5.7 8.8 19.1 8.7 33
Metric Category: Workforce Demographics
Your Results
Date Range: 2012
Metric Name Score 10th 25th Median 75th 90th Average n
Sample

HR Metrics Service - Annual Detailed Report
© HRMS.This material is copyright by HRMS and cannot be shared with a third party or reproduced for financial gain without our written permission
Page 24 of 31
Part-time Percent
Permanent employees who work part-time as a percentage of headcount. 1.3% 3.1% 11.5% 21.4% 44.5% 17% 39
Metric Category: Workforce Demographics
Your Results
Date Range: 2012
Metric Name Score 10th 25th Median 75th 90th Average n
Sample

HR Metrics Service - Annual Detailed Report
© HRMS.This material is copyright by HRMS and cannot be shared with a third party or reproduced for financial gain without our written permission
Page 25 of 31
Non Permanent Employee Percentage
Non-permanent employees as a percentage of headcount. 7.6% 22.1% 39.1% 83.1% 213.1% 83% 38
Metric Category: Workforce Demographics – Non Permanent / Combined Permanent & Non Permanent
Your Results
Date Range: 2012
Metric Name Score 10th 25th Median 75th 90th Average n
Sample

HR Metrics Service - Annual Detailed Report
© HRMS.This material is copyright by HRMS and cannot be shared with a third party or reproduced for financial gain without our written permission
Page 26 of 31
Sample

HR Metrics Service - Annual Detailed Report
© HRMS.This material is copyright by HRMS and cannot be shared with a third party or reproduced for financial gain without our written permission
Page 27 of 31
About this Information
This information is provided as is. It is provided for the purposes of monitoring and improving organizational performance. Whileevery effort is made to ensure and maintain the accuracy of the information, HRMS relies on quality data input from allorganizations and therefore cannot guarantee that the information presented is definitive.
HRMS is the provider of the information and does not intend to shape or influence decisions that individuals or organizations maymake based on this information. HRMS will not be responsible for how this information is used or for any loss or damage causedthrough the interpretation and use of this information.
The information is provided in good faith on the understanding that the recipients have the knowledge, skills, judgment andcontrols to make effective use of this information for their organization. Although this information is intended to support individualsand organizations to improve their performance, as the provider of this information HRMS is not responsible for any failure toimprove, business loss or damage that comes about through the use of this information.
Questions
Should you have any questions regarding this report please contact the HR Metrics team [email protected]
Sample

HR Metrics Service - Annual Detailed Report
© HRMS.This material is copyright by HRMS and cannot be shared with a third party or reproduced for financial gain without our written permission
Page 28 of 31
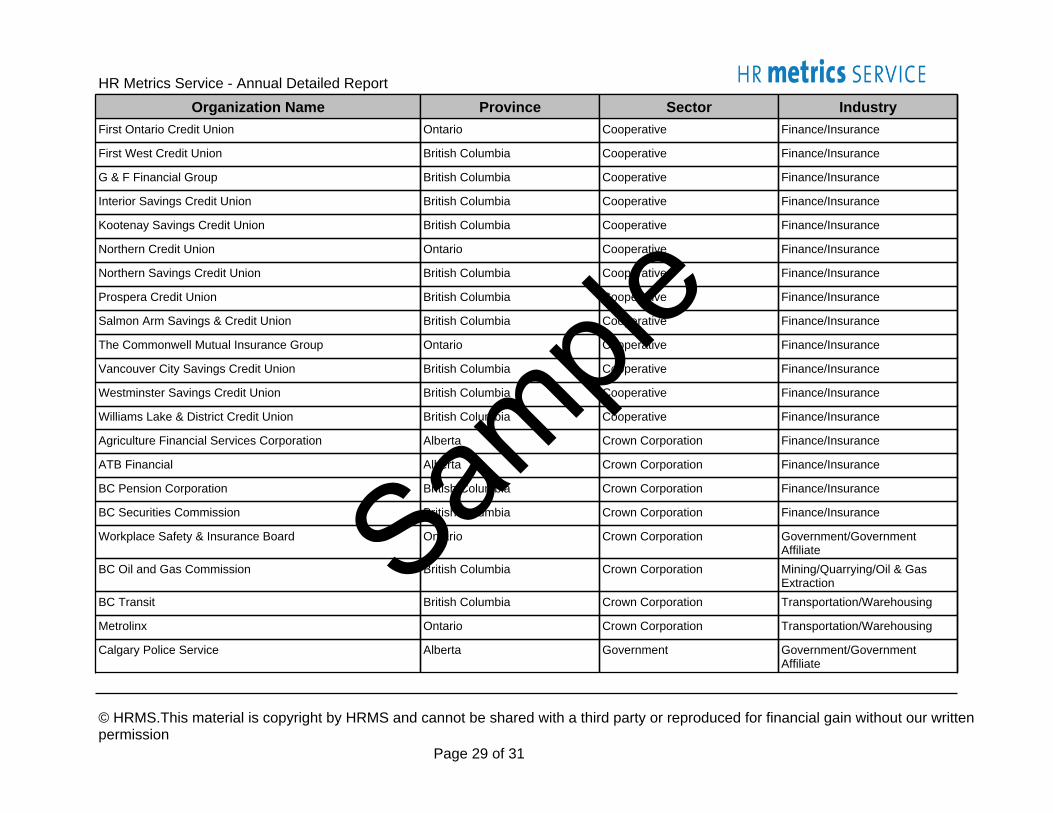
Participating Organizations
The following organizations created the benchmark for this report:
Coastal Community Credit Union British Columbia Cooperative Finance/Insurance
First Calgary Financial Alberta Cooperative Finance/Insurance
Family Insurance Solutions British Columbia Business - privately owned Finance/Insurance
Moneris Solutions Corp Ontario Business - privately owned Finance/Insurance
LifeLabs Ontario Business - privately owned Healthcare - Other
Golder Associates Ltd Ontario Business - privately owned Engineering/Architectual/Related Services
Coast Capital Savings Credit Union British Columbia Cooperative Finance/Insurance
BDO Canada LLP Ontario Business - privately owned Accounting/Bookkeeping
Eminata Group British Columbia Business - privately owned Education - Post Secondary/Trade/Support Services
Samuel, Son & Co., Limited Ontario Business - privately owned Manufacturing - Metal/Petroleum/Chemicals/Plastics
Secure Energy Services Alberta Business - publicly owned Mining/Quarrying/Oil & Gas Extraction
MDA Systems Ltd. British Columbia Business - publicly owned Technology Services
BlueShore Financial British Columbia Cooperative Finance/Insurance
Marquis Alliance Energy Group Inc Alberta Business - publicly owned Mining/Quarrying/Oil & Gas Extraction
Aquatera Utilities Alberta Business - privately owned Utilities
Morneau Shepell Inc Ontario Business - publicly owned Business Service Industries
Andrew Peller Limited Ontario Business - publicly owned Manufacturing - Food/Beverage
Organization Name Province Sector Industry
Sample
HR Metrics Service - Annual Detailed Report
© HRMS.This material is copyright by HRMS and cannot be shared with a third party or reproduced for financial gain without our written permission
Page 29 of 31
BC Securities Commission British Columbia Crown Corporation Finance/Insurance
Workplace Safety & Insurance Board Ontario Crown Corporation Government/Government Affiliate
BC Oil and Gas Commission British Columbia Crown Corporation Mining/Quarrying/Oil & Gas Extraction
Agriculture Financial Services Corporation Alberta Crown Corporation Finance/Insurance
ATB Financial Alberta Crown Corporation Finance/Insurance
BC Pension Corporation British Columbia Crown Corporation Finance/Insurance
BC Transit British Columbia Crown Corporation Transportation/Warehousing
Metrolinx Ontario Crown Corporation Transportation/Warehousing
Calgary Police Service Alberta Government Government/Government Affiliate
G & F Financial Group British Columbia Cooperative Finance/Insurance
Interior Savings Credit Union British Columbia Cooperative Finance/Insurance
Kootenay Savings Credit Union British Columbia Cooperative Finance/Insurance
Williams Lake & District Credit Union British Columbia Cooperative Finance/Insurance
First Ontario Credit Union Ontario Cooperative Finance/Insurance
First West Credit Union British Columbia Cooperative Finance/Insurance
Northern Credit Union Ontario Cooperative Finance/Insurance
The Commonwell Mutual Insurance Group Ontario Cooperative Finance/Insurance
Vancouver City Savings Credit Union British Columbia Cooperative Finance/Insurance
Westminster Savings Credit Union British Columbia Cooperative Finance/Insurance
Northern Savings Credit Union British Columbia Cooperative Finance/Insurance
Prospera Credit Union British Columbia Cooperative Finance/Insurance
Salmon Arm Savings & Credit Union British Columbia Cooperative Finance/Insurance
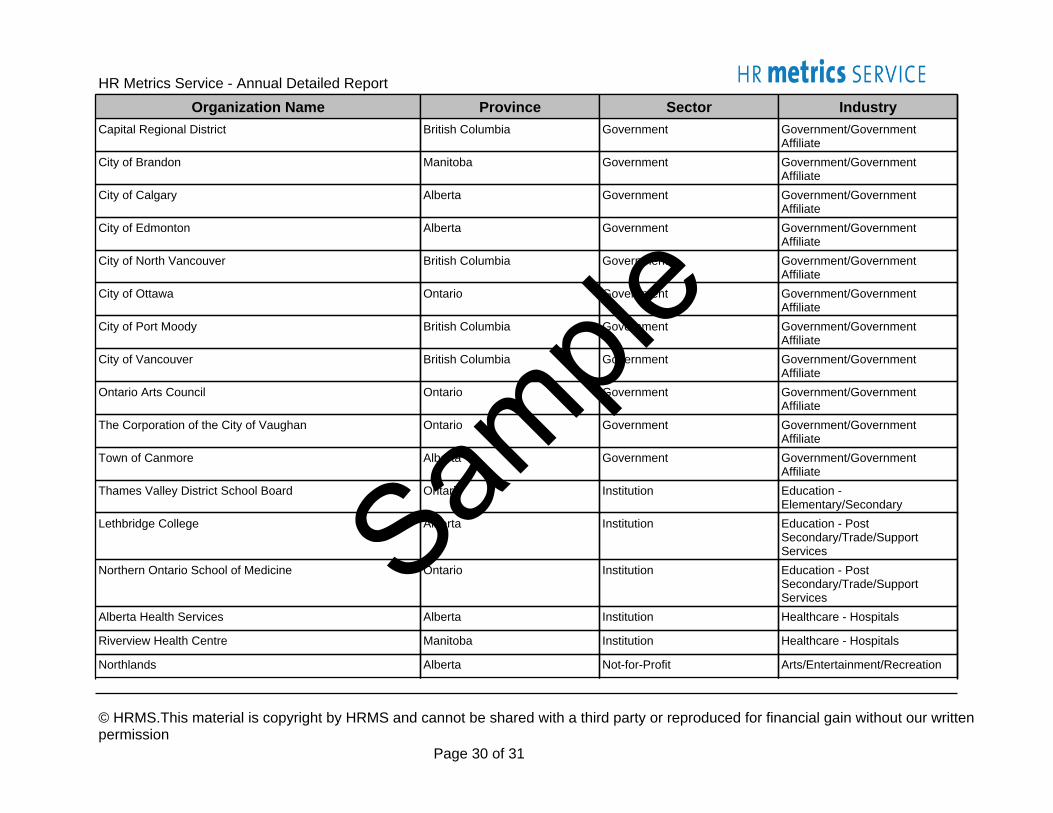
Organization Name Province Sector Industry
Sample
HR Metrics Service - Annual Detailed Report
© HRMS.This material is copyright by HRMS and cannot be shared with a third party or reproduced for financial gain without our written permission
Page 30 of 31
Riverview Health Centre Manitoba Institution Healthcare - Hospitals
Northlands Alberta Not-for-Profit Arts/Entertainment/Recreation
Lethbridge College Alberta Institution Education - Post Secondary/Trade/Support Services
Northern Ontario School of Medicine Ontario Institution Education - Post Secondary/Trade/Support Services
Alberta Health Services Alberta Institution Healthcare - Hospitals
City of Calgary Alberta Government Government/Government Affiliate
City of Edmonton Alberta Government Government/Government Affiliate
City of North Vancouver British Columbia Government Government/Government Affiliate
Thames Valley District School Board Ontario Institution Education - Elementary/Secondary
Capital Regional District British Columbia Government Government/Government Affiliate
City of Brandon Manitoba Government Government/Government Affiliate
Ontario Arts Council Ontario Government Government/Government Affiliate
The Corporation of the City of Vaughan Ontario Government Government/Government Affiliate
Town of Canmore Alberta Government Government/Government Affiliate
City of Ottawa Ontario Government Government/Government Affiliate
City of Port Moody British Columbia Government Government/Government Affiliate
City of Vancouver British Columbia Government Government/Government Affiliate
Organization Name Province Sector Industry
Sample

HR Metrics Service - Annual Detailed Report
© HRMS.This material is copyright by HRMS and cannot be shared with a third party or reproduced for financial gain without our written permission
Page 31 of 31
Canadian Blood Services Ontario Not-for-Profit Healthcare - Other
Bethany Care Society Alberta Not-for-Profit Healthcare - Other
Ontario Hospital Association Ontario Not-for-Profit Healthcare - Other
College of Registered Nurses of BC British Columbia Not-for-Profit Healthcare - Other
BC Safety Authority British Columbia Not-for-Profit Other
CGA - Canada British Columbia Not-for-Profit Association/Professional Organization
Property Valuation Services Corporation (PVSC) Nova Scotia Not-for-Profit Government/Government Affiliate
CAA South Central Ontario Ontario Not-for-Profit Finance/Insurance
Mitacs Inc British Columbia Not-for-Profit Education - Post Secondary/Trade/Support Services
Organization Name Province Sector Industry
Sample