annual environmental report - environmental · pdf fileannual environmental report waste...
TRANSCRIPT

1
ANNUAL ENVIRONMENTAL
REPORT
Waste Licence Registration No.: W0167-03
Licensee: Indaver Ireland Limited Location of Activity: Carranstown, Duleek, Co-Meath Attention: Environmental Protection Agency
Office of Environmental Enforcement McCumiskey House, Richview Clonskeagh Road Dublin 14

1
Table of Contents
Contents
1. Waste Recovery Report 3
2. Emissions from the installation 4
3. Waste Management Record, including summary of rejected waste loads 4
4. Resource consumption summary 6
5. Complaints Summary 7
6. Schedule of Environmental Objectives and Targets 7
7. Environmental Management Programme-report for 2016 7
8. Environmental Management Programme-proposal for 2017 8
9. PRTR-report for previous year 9
10. PRTR-proposal for current year 9
11. Noise Monitoring Report Summary 9
12. Ambient Monitoring Summary 12
13. Tank and pipeline testing and inspection report 14
14. Reported incidents summary 14
15. Energy Efficiency audit report summary 15
16. Report on the assessment of the efficiency of use of raw materials in processes and the reduction of waste generated 15
17. Report on progress made and proposals being developed to minimise water demand and the volume of trade effluent discharges 16
18. Development/Infrastructural works summary (completed in previous year or prepared for current year) 16
19. Reports on financial provision made under this licence, management and staffing structure of the installation and a programme for public information 17

2
20. Review of decommissioning plan 17
21. Statement of measures in relation to prevention of environmental damage and remedial actions (Environmental liabilities) 17
22. Environmental Liabilities Risk assessment review 17
23. Summary record of the use of the emergency generator 18
24. Summary of audits of waste disposal, treatment and recovery sites for the incinerator residues from the installation 18
25. Report on particulates monitoring 18
26. Waste activities carried out at the facility 18
27. Quantity and composition of waste received, recovered and disposed of during the reporting period and each previous year (relevant ewc codes to be used) 19
28. Full title and a written summary of any procedures developed by the licensee in the year which relates to the facility operation 23
29. Review of nuisance controls 34
Appendix 1: E-PRTR 2016
Appendix 2: Energy Efficiency Report 2016

3
1. Waste Recovery Report As a recovery option, the waste-to-energy facility can contribute to packaging recovery targets set out under the Packaging Directive (currently 60% recovery). It is estimated that up to 48,000t residual packaging waste in the MSW accepted will be recovered at the facility. The facility contributed to the national target of diverting 50% household waste from landfill. Approximately 156,582 tonnes of municipal type waste (EWC code Chapter 20) was treated at the facility in 2016, compared with 589,693 tonnes
1 household waste disposed of to landfill in the
country. The End of Life Vehicles Directive sets a minimum reuse and recovery target of 85% from 2006 increasing to 95% reuse and recovery by 2015. Up to 10% of this target may be met through energy recovery. The Meath waste-to-energy facility is positioned to accept End of Life Vehicle residue in the form of car shred and contribute to this recovery target from 2011 onwards. In the reporting year 2016, a figure of 1,000Kg of automotive shredder waste was accepted and recovered. Flue Gas Residue and Boiler ash are removed from site and where possible sent to an underground salt mine in Germany. This is considered a recovery operation, R5/R11, as the mine is being back-filled with this material in order to stabilise the ground above. There are plans in 2017 to build a solidification plant at the site in order to treat the material for onward use in an Irish mine. Ferrous metals are recovered from the bottom ash on site using a magnet and sent to metal brokers within Ireland. Indaver are also recovering non ferrous metal from the bottom ash on site using an eddy current system. This began in June 2014 and has been a successful project with good yields of non ferrous metals.
Residue Tonnage Recovery Option Ferrous Metal 2923 R4
Non Ferrous Metal 695.2 R4
Flue Gas Residue 9145 R5/R11
Boiler Ash 1804 R5
Bottom Ash 15704 R11a
Bottom ash is currently being landfilled. The bottom ash is generally being used for cover or road making within the landfill which allows the recovery code R11a to be assigned. 1 Figures from 2012, From the National Waste Report 2012, EPA

4
2. Emissions from the installation
The E-PRTR attached as appendix 1 gives an account of the emissions from the installation.
Surface Water Emissions Surface Water/Pond The system is monitored continuously at the DCS by the operators. The discharge is checked daily in accordance with the licence. There have been no unusual discharges in 2016. Also, no water can be discharged when the readings are over the trigger levels. Surface Water Agreed Trigger Levels:
pH TOC
Conductivity
6-9 Warning Level 25 mg/L Action Level 30mg/L
Warning Level 1000 µScm-1
Action Level 1200 µScm
-1
Average Results per quarter for 2016:
Quarter pH TOC mg/L
Conductivity µScm
-1
Discharge Volume m
3
Quarter 1 7.18 7.72 733 3,289
Quarter 2 7.44 12.16 364 2,434
Quarter 3 7.51 11.50 215 1,913
Quarter 4 7.10 8.70 411 1,690
3. Waste Management Record, including summary of rejected waste loads
All waste that arrives at the site is planned in advance. It is tracked through our SAP system. It is weighed prior to entry on the weighbridge and this weight is updated within the sales order on SAP. There were 3 tanker loads rejected in 2016.

5
Waste accepted in 2016:
Waste Type Weight (T)
020304 WASTE UNFIT FOR CONSUMPTION 17.8
020501 FOOD UNSUITABLE FOR CONSUMPTION 80.2
070511* WWTP SLUDGE 0.06
070512 WWTP SLUDGE 4708.9
070513* PHARMA WASTE SOLID 597.852
070514 NON HAZ SOLID WASTE 21.74
070514 PHARMA WASTE SOLID 616.846
110110 SLUDGES AND FILTERCAKES 2.76
150102 EMPTY PLASTIC PACKAGING 1.792
150110* EMPTY PACKAGING WASTE 131.128
150202* FILTERS/ABSORBENTS/WIPES ORG 109.334
150203 FILTERS/ABSORBENTS/WIPES 92.74
160216 WEEE (NON HAZARDOUS) 38.46
160303* OFF SPEC LIQUID 0.001
160303* OFF SPEC SOLID 0.3
160304 OFF SPEC LIQUID 12.764
160304 OFF SPEC SOLID 3.54
160305* OFF SPEC LIQUID 136.951
160305* OFF SPEC SOLID 101.307
160306 OFF SPEC LIQUID 66.64
160306 OFF SPEC SOLID 226.098
160508* DISCARDED CHEMICALS LIQUID 3.997
161002 AQUEOUS WASTE 11.3
170204* MIXED WOOD/PLASTIC/GLASS 1
170503* SOIL AND STONES 0.5
170505* DREDGING SPOIL 0.5
170604 INSULATION 990.18
170903* C&D WASTE MIXED 0.76
180104 NON-INFECTIOUS MEDICAL WASTE 9.24
190203 PREMIXED NON HAZ WASTE 6746.76
190805 SLUDGES FROM URBAN WASTE WATER 19.96
191003* AUTOMOTIVE SHREDDER RESIDUE 1
191206* WOOD CONTAINING DANGEROUS SUBST. 0.5
191210 RDF 8041.26
191212 RESIDU FROM MECH. TREATM. 45024.62
191303* SLUDGES FROM SOIL REMEDIATION 0.498
200101 PAPER AND CARDBOARD 0.26
200127* PAINT/INK/ADHESIVES/RESINS 111.052
200128 PAINT/INK/ADHESIVE/RESIN LIQUID 0.66

6
200137* WOOD CONTAINING DANGEROUS SUBST. 0.64
200138 TIMBER 1.56
200139 PLASTICS 27.52
200140 METALS 26.551
200301 MUNICIPAL WASTE 154822.14
200307 BULKY WASTE 1591.392
07 05 12 NON HAZ ORGANIC SLUDGE 66.38
07 01 01* Aqueous washing liquids and mother liquors 26.24
07 05 01* Aqueous washing liquids and mother liquors 4103.734
07 05 11* Sludges from on-site effluent treatment containing hazardous substances
600.18
08 03 08 Aqueous sludges containing ink 381.56
Total 229579
Waste removed from facility in 2016:
Waste Description Tonnage
13 08 99 Waste otherwise not specified 0.64
16 10 02 Aqueous liquids 88.71
17 09 04 Mixed Construction and Demolition Waste 13.322
19 01 02 Ferrous Metals 2922.76
19 01 07* Flue Gas Residue 9169.43
19 01 12 Bottom Ash 35565.732
19 01 13* Boiler Ash 1934.61
19 12 03 Non-Ferrous Metal 695.2
20 01 36 WEEE Equipment 0.29
20 01 38 Wood 6.96
20 03 01 Mixed Municipal Waste 5.2
20 03 04 Septic Tank Sludge 118.33
Total 50521.184
*=Hazardous waste classification

7
4. Resource consumption summary
Resource Consumption in 2016
IN
Waste ton 229,579
Energy
Fuel (diesel) m3 247
Steam to use in the process GJ 721,616
Electricity MWh 18,037
Additives
Quicklime Ton 2,653
Hydrated lime Ton 1,939
Activated carbon Ton 108
Expanded Clay Ton 213
ammonia Ton 395
Water
well water m³ 59,256
5. Complaints Summary
All Environmental Complaints are dealt with as per the Environmental Complaints Procedure. There were 12 environmental complaints registered in 2016. However, only 4 of these were attributable to our activities. All 2016 complaints have been closed out.
6. Schedule of Environmental Objectives and Targets
A schedule of environmental objectives and targets were set for 2016 as per section 7. A new schedule has been set up for 2017 as outlined under section 8.

8
7. Environmental Management Programme-report for 2016 2016 Schedule of Environmental Objectives and Targets
Item Status Responsible Completion Status
Radiation Detector to be installed at the entrance to the facility
Proposal was issued to the EPA. It was rejected. Further discussions between EPA/ORP and Indaver.
Joe Crawley NC received from EPA. New building to be installed prior to installation of detector. Ongoing discussions between EPA, ORP and Indaver
Install the pre-treatment plant for the treatment of hazardous residues
Awaiting planning permission. To be complete by end of 2016
Oliver Kelly Planning permission and licence agreement have been received. The Outlet is awaiting their permit. Will be moved into 2017 targets.
Audit of external outlet which is used by the facility
Included in audit schedule for 2016
Grace McCormack
Complete
Complete energy audit of the facility
Proposals received and are being reviewed. Report to be reviewed and any findings followed up by including in the schedule of objectives and targets. These will include any of the actions raised during the 2015 energy audit report also.
Grace McCormack
Complete
Develop and implement an action plan for transition to ISO 14001:2015
Action plan for ISO 2015. Assess the requirements, complete gap analysis and action plan.
Mary Miller Ongoing. Will be brought forward into 2017

9
8. Environmental Management Programme-proposal for 2017
2017 Schedule of Environmental Objectives and Targets
Item Status Responsible Time frame
Radiation Detector to be installed at the entrance to the facility
New building to be installed prior to installation of detector. Ongoing discussions between EPA, ORP and Indaver
Joe Crawley Planning and licence review required. End of 2018
Install the pre-treatment plant for the treatment of hazardous residues
Currently waiting for the outlet to receive their planning and permit.
Oliver Kelly Q4 2017
Audit of external outlet which is used by the facility
Included in audit schedule for 2017
Grace McCormack
Q4 2017
Complete energy audit of the facility
In goals for maintenance department
Rory Murphy Q4 2017
Develop and implement an action plan for transition to ISO 14001:2015
Action plan for ISO 2015. Assess the requirements, complete gap analysis and action plan.
Mary Miller Q2 2017
New speciation study for bottom ash
After meeting with the EPA a new speciation study is to be completed
Grace McCormack
Q4 2017
Lighting Lights to be replaced by energy efficient LED bulbs
Rory Murphy Q4 2017
Upgrade of the surface water network
Must pass hydrostatic tests
Rory Murphy Q4 2017
9. PRTR-report for previous year As per the PRTR regulations, S.I. No 123 of 2007 requires that Indaver report to the Agency on an annual basis. Indaver submitted their E-PRTR on 28
th March 2016 and this is attached in
Appendix 1.
10. PRTR-proposal for current year It is anticipated that Indaver will continue to monitor the air emissions as in 2016. These are TOC, HCl, HF, SO2, NOx, CO, dust and dioxins.

10
11. Noise Monitoring Report Summary Noise level results
11
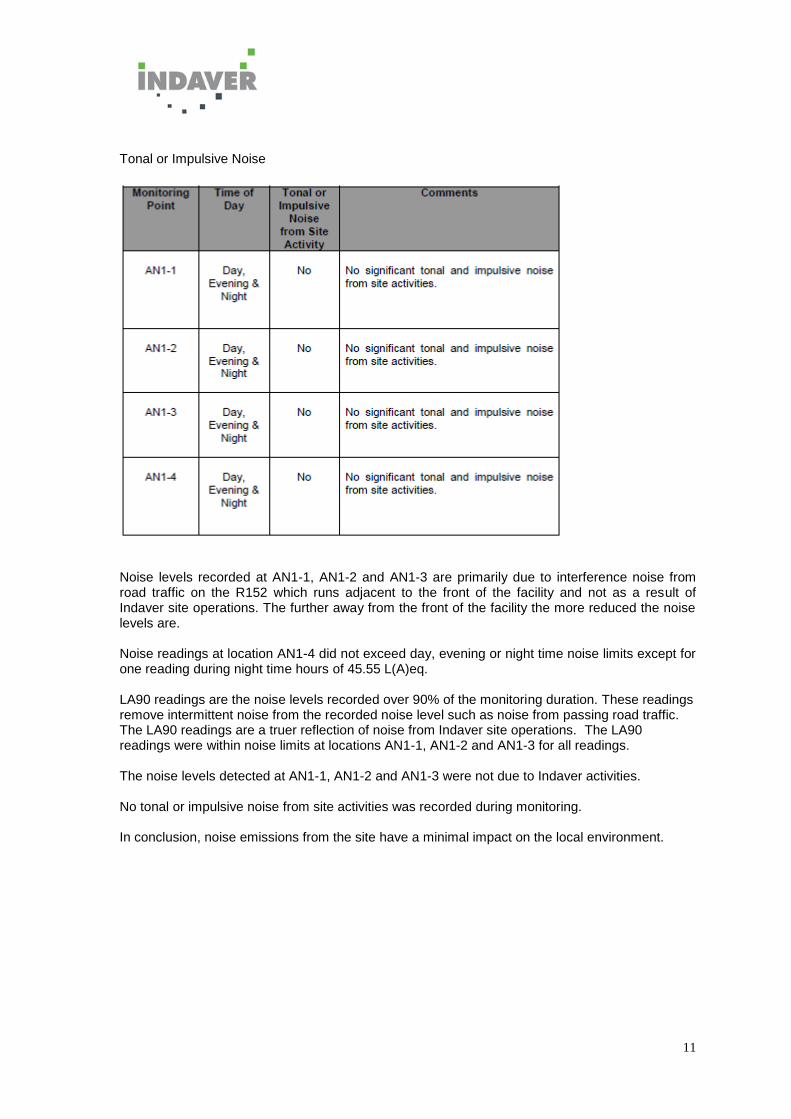
Tonal or Impulsive Noise
Noise levels recorded at AN1-1, AN1-2 and AN1-3 are primarily due to interference noise from road traffic on the R152 which runs adjacent to the front of the facility and not as a result of Indaver site operations. The further away from the front of the facility the more reduced the noise levels are. Noise readings at location AN1-4 did not exceed day, evening or night time noise limits except for one reading during night time hours of 45.55 L(A)eq. LA90 readings are the noise levels recorded over 90% of the monitoring duration. These readings remove intermittent noise from the recorded noise level such as noise from passing road traffic. The LA90 readings are a truer reflection of noise from Indaver site operations. The LA90 readings were within noise limits at locations AN1-1, AN1-2 and AN1-3 for all readings. The noise levels detected at AN1-1, AN1-2 and AN1-3 were not due to Indaver activities. No tonal or impulsive noise from site activities was recorded during monitoring.
In conclusion, noise emissions from the site have a minimal impact on the local environment.

12
12. Ambient Monitoring Summary It is a requirement of Schedule C.6.1 of W0167-03 that monthly groundwater monitoring and biannual monitoring of the groundwater monitoring boreholes takes place. Please see below a summary of the results for the same. AGW1-1 Upgradient Monitoring Point
AGW1-2 Downgradient Monitoring Point
Monitoring Frequency TOC(mg/L)
Ammonia (NH4) µg/L as N
Conductivity uscm-1@25C
Jan-16 0.73 10 633
Feb-16 0.7 13 683
Mar-16 0.82 13 707
Apr-16 0.48 30 767
May-16 2.276 10 752
Jun-16 0.65 10 785
Jul-16 2.3 10 803
Aug-16 0.47 10 806
Sep-16 3.71 10 777
Oct-16 17.77 10 765
Nov-16 4.6 10 750
Dec-16 0.63 10 743
Monitoring Frequency TOC(mg/L)
Ammonia (NH4) µg/L as N
Conductivity uscm-1@25C
Jan-16 1.69 10 610
Feb-16 1.47 15 596
Mar-16 1.92 12 594
Apr-16 1.51 22 588
May-16 3.289 10 593
Jun-16 1.53 10 588
Jul-16 3.1 10 605
Aug-16 1.68 10 614
Sep-16 5.97 10 610
Oct-16 20.32 12 602
Nov-16 4.5 10 603
Dec-16 1.7 10 606

13
AGW1-3 Downgradient Monitoring Point
Monitoring Frequency TOC(mg/L)
Ammonia (NH4) µg/L as N
Conductivity uscm-1@25C
Jan-16 0.5 10 617
Feb-16 0.59 10 624
Mar-16 0.65 10 631
Apr-16 0.5 10 624
May-16 2.197 10 628
Jun-16 0.69 10 619
Jul-16 3.44 10 609
Aug-16 0.43 10 616
Sep-16 4.26 10 621
Oct-16 20.97 10 631
Nov-16 5 10 624
Dec-16 0.64 10 624 Biannual Results
AGW1-1 AGW1-2 AGW1-3 AGW1-1 AGW1-2 AGW1-3
Date 05/05/16 05/05/16 05/05/16 17/10/16 17/10/16 17/10/16
pH 7.3 7.3 7.2 7.4 7.4 7.4
Nitrate(mg/L as N) 2.2 7.05 7.69 6.64 1.62 8.52
Nitrite(mg/L as N) <0.002 <0.002 0.002 6.64 1.62 8.29
Chloride (mg/L) 31.17 92.4 37.66 25.09 111.67 39.12
Fluoride (mg/L) <0.02 <0.02 <0.02 0.17 0.18 0.23
Metals-Cd (ug/L) <0.09 <0.09 <0.09 <0.09 <0.09 0
Metals Tl (ug/L) <0.06 <0.06 <0.06 <0.06 <0.06 0.209
Metals Hg (ug/L) <0.04 <0.04 <0.04 <0.04 <0.04 <0.04
Metals Pb (ug/L) <0.02 0.023 <0.02 0.93 0.202 1.158
Metals Cr (ug/L) 5.483 6.183 3.839 <2.14 4.134 <2.14
Metals Cu (ug/L) 0.456 0.527 0.775 1.075 1.024 3.406
Metals Mn (ug/L) 0.262 0.349 0.151 23.48 3.164 60.41
Metals Ni (ug/L) 0.951 0.804 0.812 0.852 0.542 2.429
Metals As (ug/L) 0.302 0.301 0.25 0.615 0.268 0.847
Metals CO (ug/L) 0.237 0.316 0.168 0.277 0.076 0.733
Metals V (ug/L) 0.835 0.413 0.211 0.594 0.911 2.2
Metals Sn (ug/L) <2.8 <2.8 <2.8 <2.8 <2.8 <2.8
Organohalogens <5 <5 30.23 41.091 <5 <5 Total coliforms(no/100ml)
170 0 0 640 <10 <10
Faecal Coliforms(no/100ml)
0 0 0 30 <10 <10

14
Overall it can be stated the activities on the site at W0167-03 has no significant impact on the groundwater quality as can be shown by the above results.
13. Tank and pipeline testing and inspection report
Please see below for summary of bunds tested in 2016. This testing is followed up on the maintenance programme in SAP.
Tank ID Item SAP Description Bund Tag Serial Number
Last Test
Next Test
1 Main diesel tank Main Diesel Tank UYA99-BB001
EGB10 BB001 Sep-16
Sep-19
2 3 * diesel for pump house Fuel Tank in Diesel Pump House
UYA99-BB002 IFP-C013714-001/002/003
Jul-16
Jul-19
3 3 * diesel for pump house Fuel Tank in Diesel Pump House
UYA99-BB003 IFP-C013714-001/002/003
Jul-16
Jul-19
4 3 * diesel for pump house Fuel Tank in Diesel Pump House
UYA99-BB004 IFP-C013714-001/002/003
Jul-16
Jul-19
5 Back up diesel generator tank Back up diesel generator tank
UYA99-BB005 MTD 0842
Sep-16
Sep-19
6
Transformer bunds 1 under electrical rooms (T1, T2, T3, ) T1 bund under electrical rooms
UYA99-BB006
Oct-16
Oct-19
7
Transformer bunds 1 under electrical rooms (T1, T2, T3, ) T2 bund under electrical rooms
UYA99-BB007
Oct-16
Oct-19
8
Transformer bunds 1 under electrical rooms (T1, T2, T3, ) T3 bund under electrical rooms
UYA99-BB008
Oct-16
Oct-19
12 Nitric acid spill containment Nitric acid spill containment
UYA99-BB012 00031/TSUS/P/2010
Jan-16
Jan-19
13
Ammonia solution tank spill containment Ammonia Tank
UYA99-BB013 EVC 056-07-09
Jan-16
Jan-19
14. Reported incidents summary
All Environmental Incidents are dealt with as per the Environmental Incident Investigation and Reporting Procedure. There were 4 minor incidents reported in 2016. These relate to CO and low temperature.

15
15. Energy Efficiency audit report summary An energy audit was completed at the facility in 2016 as required by Condition 7.1.3 of W0167-03. This year the report was combined with another requirement under SI 426 of 2014. Indaver has surpassed the requirement for 0.65 for energy efficiency and so the plant is deemed a recovery facility. The full report is attached in appendix 2. Actions arising out of this audit report have been included in our schedule of objectives and targets. For the reporting year 2016 Indaver exported 128,513 MWh of electricity to the national grid and imported just 1,033 MWh. This is a slight decrease in the amount of electricity exported and a slight increase in the amount of energy imported. This was due to the fact that there was a 3 week maintenance outage where we need to import electricity. During this time no electricity was being exported. Indaver produce electricity to run the facility and only import electricity when in shutdown.
16. Report on the assessment of the efficiency of use of raw materials in processes
and the reduction of waste generated
Indaver strive to ensure that raw consumables are used to their full effect and this is monitored continuously by the management and staff at the facility. The process engineer is tasked with reviewing this data to ensure that raw materials are used as efficiently as possible. Below is a graph showing the weight of consumable used per tonne of waste processed. The spike in diesel consumption (May 2016) was due to planned shutdown for a 3 week period in May 2016.The consumables figure for lime milk (Ca(OH)2) has reduced since 2016 with improvements in process controls.

16
Indaver also strive to ensure that residues are monitored to ensure that the production of residues is kept to a minimum. This is again tracked by the process engineer at the site. The graph below shows the percentage of residues produced per tonne of waste treated. The spike in May 2016 in bottom ash is due to complete emptying of all bottom ash during maintenance works. Some residues are of benefit for example the ferrous metal and non ferrous metal. These residues are sent on to recovery outlets for further treatment. The majority of the other residues, bottom ash, boiler ash and flue gas residue, are used as a recovery material.
17. Report on progress made and proposals being developed to minimise water
demand and the volume of trade effluent discharges
Indaver do not have any effluent discharges from the site. Any water that is generated in the process is re-used within the process. The water demand from the site is not large and water that is used for cleaning purposes on the site is re-used.
18. Development/Infrastructural works summary (completed in previous year or
prepared for current year) The area for the unloading of aqueous tankers on site was re-structured in 2015. This now allows two tankers to offload into the storage tank on site. These tankers can also unload directly into the aqueous injection point. The ground was demarcated to show that any spillage in this area goes towards the underground pits which are re-used in the process. Additional drainage to contain potential spillages is due for completion by end of April 2017. In 2016 it was planned to develop an ash pre-treatment facility, subject to planning amendment permission. Indaver received an agreement from the Agency prior to infrastructural works taking place. Current projections are that works will be completed by Q4 2017.

17
19. Reports on financial provision made under this licence, management and
staffing structure of the installation and a programme for public information A bond is in place for the CRAMP costs at W0167-03 and was approved on 02 October 2015 and is in place until 19 June 2021. An insurance policy is in place for the ELRA costings and was approved by the Agency on the 08 March 2017. Management structure at the site has changed and was notitifed to the Agency on 13th January 2017. The plant is run by a plant manager with a production manager (deputy plant manager), process engineer, maintenance manager and the site is supported by the quality & environmental manager, the health & safety manager and the regional project engineer. The site has production staff of 20 people on a 5-shift pattern which allows the site to run 24/7. There is also a maintenance department of 10 people and these employees comprise the Emergency Response Team. All communications with interested parties are dealt with as per P0184 Internal & External Communications Procedure. Indaver has several visits per year from interested parties e.g. schools, universities etc. Customers and interested parties also audit the site to assess Indaver’s systems and treatment of their waste streams. Environmental information is made available to interested parties upon request.
Indaver’s website, www.indaver.ie, is a valuable source of information for customers and interested parties.
20. Review of decommissioning plan
The decommissioning plan or CRAMP was updated in September 2015 to incorporate hazardous waste being accepted at the facility under the new revision licence W0167-03. This was approved by the Agency prior to the acceptance of hazardous waste at the site. This was reviewed and is still applicable.
21. Statement of measures in relation to prevention of environmental damage and
remedial actions (Environmental liabilities) The output of the risk treatment process is the development of a statement of measures to be taken to minimise the environmental risk of the activity. Since its development, the facility has been designed constructed and operated to minimise risk in every aspect of its operations. Though additional suitable hazardous waste streams will be accepted at the facility, the same mitigation measures are in place to ensure the risk of an accident or environmental incident at the site is minimised. On the basis of the risks identified above, a statement of measures is not presently considered necessary but Indaver will continue to review operations to identify additional environmental mitigation as the need arises.
22. Environmental Liabilities Risk assessment review The ELRA was reviewed and updated to take account of hazardous waste at the facility. This was approved by the Agency in September 2015. There is an insurance policy in place to cover the financial risks and this was agreed with the Agency in 08 March 2017.

18
23. Summary record of the use of the emergency generator The emergency generator was used a total of 68 hours in 2016. It is tested weekly and these records are stored at the facility.
24. Summary of audits of waste disposal, treatment and recovery sites for the
incinerator residues from the installation During 2011, Indaver Group audited K&S, the facility for the recovery of our flue gas residues and boiler ash. The facility was approved for use and continued use. Hammond Lane, the facility which accepts the ferrous metal from the site was audited in March 2014. The facility was approved for continued use. United Metal, the facility which accepts the ferrous metal from the site was audited in May 2016. The facility was approved for continued use. Rilta, the facility which accepts oil from the site was audited in December 2016. The facility was approved for continued use.
25. Report on particulates monitoring
Please refer to Appendix 1-E-PRTR.
26. Waste activities carried out at the facility The primary operation on the Meath Waste-to-Energy Facility is the incineration of non hazardous wastes with associated energy recovery in the form of steam which is used to generate electricity. In 2015 the licence was reviewed and this now allows the acceptance and treatment of 10,000 tonnes of some suitable hazardous waste annually.
In general terms, the Meath WtE Facility is designed to incinerate and recover energy from the residual fraction of non-hazardous household, commercial and industrial waste, non-hazardous wastewater sludge and some suitable hazardous waste also. It consists of an incineration plant with energy recovery and ancillary services, and the throughput of the facility for incineration is 235,000tpa. The facility comprises of the following main elements:
The main process building (comprising of tipping hall, waste bunker, furnace, boiler, steam turbine, flue gas treatment and ash storage) including the control room and administration offices
A building housing the air cooled condenser
A contractors’ compound and office accommodation
A warehouse building with a workshop
A transformer compound and ESB substation with emergency generator
A security building with weighbridge at facility entrance
A process/firewater water storage tank and fire pump house. The main process building is approximately 160 m long, 40 m wide at the widest point and 40 m above ground at the highest point. The stack is 65 m tall and vents the treated combustion gases to atmosphere. The plant is based on conventional grate furnace technology with a horizontal steam boiler and an advanced flue gas treatment system designed to meet the current emissions regulations. The plant will produce up to 21 MW electricity of which approximately 18MW is exported to the national grid.

19
Waste is transported to the site by waste contractors in accordance with the site’s licensed opening hours. On entering the site, waste contractors follow a well marked two-way route to the tipping hall where inspections on the waste are conducted by Indaver on a routine basis. There is a large turning area outside the tipping hall to allow the waste delivery vehicles turn safely before entering the hall and a maximum speed limit of 15 km/h. In the tipping hall, waste is deposited into the waste bunker where it is mixed by the crane before being placed in the hopper for the furnace. Liquids are incinerated by way of the direct injection point at the aqueous unloading station or from the storage tank. In the furnace, the waste is incinerated at temperatures exceeding 850ºC T2S. The ash collected from the bottom of the furnace passes through a wet bath before being stored for collection and removal from the site. The combustion gases from the process pass through a number of treatment stages. This includes two stages of dosing (lime milk and lime) for acid removal and two stages of dosing (expanded clay and activated carbon) for dioxin removal, before passing through filter bags and being discharged to atmosphere via the emissions stack. The emissions to air are continuously monitored and fed back to the control room for the facility where the levels of dosing can be adjusted if required.
27. Quantity and composition of waste received, recovered and disposed of during
the reporting period and each previous year (relevant ewc codes to be used)
The figures below are for incoming waste to the site. All these wastes were received and recovered at W0167-03.
Waste accepted to site in 2016
Waste Type Weight (T)
020304 WASTE UNFIT FOR CONSUMPTION 17.8
020501 FOOD UNSUITABLE FOR CONSUMPTION 80.2
070511* WWTP SLUDGE 0.06
070512 WWTP SLUDGE 4708.9
070513* PHARMA WASTE SOLID 597.852
070514 NON HAZ SOLID WASTE 21.74
070514 PHARMA WASTE SOLID 616.846
110110 SLUDGES AND FILTERCAKES 2.76
150102 EMPTY PLASTIC PACKAGING 1.792
150110* EMPTY PACKAGING WASTE 131.128
150202* FILTERS/ABSORBENTS/WIPES ORG 109.334
150203 FILTERS/ABSORBENTS/WIPES 92.74
160216 WEEE (NON HAZARDOUS) 38.46
160303* OFF SPEC LIQUID 0.001
160303* OFF SPEC SOLID 0.3
160304 OFF SPEC LIQUID 12.764
160304 OFF SPEC SOLID 3.54
160305* OFF SPEC LIQUID 136.951
160305* OFF SPEC SOLID 101.307
160306 OFF SPEC LIQUID 66.64

20
160306 OFF SPEC SOLID 226.098
160508* DISCARDED CHEMICALS LIQUID 3.997
161002 AQUEOUS WASTE 11.3
170204* MIXED WOOD/PLASTIC/GLASS 1
170503* SOIL AND STONES 0.5
170505* DREDGING SPOIL 0.5
170604 INSULATION 990.18
170903* C&D WASTE MIXED 0.76
180104 NON-INFECTIOUS MEDICAL WASTE 9.24
190203 PREMIXED NON HAZ WASTE 6746.76
190805 SLUDGES FROM URBAN WASTE WATER 19.96
191003* AUTOMOTIVE SHREDDER RESIDUE 1
191206* WOOD CONTAINING DANGEROUS SUBST. 0.5
191210 RDF 8041.26
191212 RESIDU FROM MECH. TREATM. 45024.62
191303* SLUDGES FROM SOIL REMEDIATION 0.498
200101 PAPER AND CARDBOARD 0.26
200127* PAINT/INK/ADHESIVES/RESINS 111.052
200128 PAINT/INK/ADHESIVE/RESIN LIQUID 0.66
200137* WOOD CONTAINING DANGEROUS SUBST. 0.64
200138 TIMBER 1.56
200139 PLASTICS 27.52
200140 METALS 26.551
200301 MUNICIPAL WASTE 154822.14
200307 BULKY WASTE 1591.392
07 05 12 NON HAZ ORGANIC SLUDGE 66.38
07 01 01* Aqueous washing liquids and mother liquors 26.24
07 05 01* Aqueous washing liquids and mother liquors 4103.734
07 05 11* Sludges from on-site effluent treatment containing hazardous substances 600.18
08 03 08 Aqueous sludges containing ink 381.56
Total 229579

21
Waste accepted in 2015

22
Waste accepted in 2014
Material Accepted Quantity/Tonnes
020203 MATERIALS UNFIT FOR CONSUMPTION 14.12
020501 FOOD UNSUITABLE FOR CONSUMPTION 194.04
040222 WASTE FROM PROCESSED TEXTILE 44.68
070512 WWTP SLUDGE 5737.26
070514 NON HAZ SOLID WASTE 32.78
070514 PHARMA WASTE SOLID 230.06
080318 WASTE PRINTING TONER 136.76
110110 SLUDGES AND FILTERCAKES 4.2
150102 EMPTY PLASTIC PACKAGING 0.6
150103 TIMBER PALLETS 0.18
150203 FILTERS/ABSORBENTS/WIPES 39.46
160304 OFF SPEC LIQUID 0.22
160306 OFF SPEC SOLID 333.28
170604 INSULATION 741.38
190203 PREMIXED NON HAZ WASTE 7283.3
190805 SLUDGES FROM URBAN WASTE WATER 56.4
191006 SHREDDINGS FROM METAL CTG WASTE 498.22
191212 RESIDU FROM MECH. TREATM. 59789.52
200111 TEXTILE 19.46
200139 PLASTICS 37.78
200140 METALS 8.54
200301 MUNICIPAL WASTE 155808.42
200307 BULKY WASTE 772.18
080308 WASTE INK SOLUTION 301.41

23
28. Full title and a written summary of any procedures developed by the licensee
in the year which relates to the facility operation
P0104 Sampling of Residues at ME1.docx
QESH Describes the procedure for the sampling of residues at the Meath site
P0300 Radiation Procedure.docx QESH Covers the radiation sources at the site used for level detection
P0441 Fire Protection Systems.docx Plant Meath Covers the fire protection systems in place at the site
P0037 Approval and Monitoring of General Contractors.docx
QESH Describes the procedure for the approving and monitoring general contractors that are used by the company
P0038 Approval and Monitoring of Waste Facilities.docx
QESH Describes the procedure for the approving and monitoring of waste facilities that are used by the company
P0070 Customer Complaints and Comments.docx
QESH Describes how to record and investigate customer complaints and comments
P0072 Customer Surveys by Means of Post Collection Questionnaires, Balance Score cards and Driver Comment Cards.docx
QESH Part of the quality of service provision for the customer
P0093 DGSA-Non Regulated Material Incident Investigation and Reporting.docx
QESH Describes how to investigate and report any incidents with dangerous good or non dangerous goods
P0111 Environmental Complaints.docx QESH Describes how to record and investigate environmental complaint
P0112 Environmental Incident Investigation and Reporting.docx
QESH Describes how to record and investigate environmental incidents
P0113 Environmental Non Compliance.docx
QESH Describes how to record and investigate environmental non compliance

24
P0171 Approval and Monitoring of Hauliers.docx
QESH Describes the procedure for the approving and monitoring of haulage companies that are used by the company
P0184 Internal and External Communications.docx
Communications Describes how Indaver issue communications internally and externally
P0185 Internal External and Customer Audits.docx
QESH Describes the process of internal and external customer audits
P0201 Maintenance Of Equipment.docx QESH Describes how equipment is maintained
P0205 Monitoring and Measurement of Environmental Emissions.docx
QESH Describes how environmental emissions are monitored and measured
P0278 Pre Invoicing and Invoicing MSW Customers to Meath WTE.docx
Regional Sales Describes how customers are preinvoiced and invoiced
P0288 Processing Corrective Actions and Preventive Actions - OFIs.docx
QESH Decribes our preventative action system
P0289 Purchase Hire and Decommissioning of Equipment.docx
QESH Describes how to buy/hire or decommission equipment
P0292 Management of Records.docx QESH Describes how documents are managed within the document management system
P0359 Site Security Meath Plant.docx Plant Meath Describes the security on site at the Meath plant
P0360 Electricity Profiles Nomination.docx
Plant Meath This procedure defines the actions needed to nominate electricity profiles for Meath Waste to Energy.
P0362 Waste Acceptance.docx Plant Meath This procedure gives clear guidelines on the type of waste that can be accepted at Meath Waste-to-Energy and the checks that are required prior to setting up the waste on Indavers systems.

25
P0363 Waste Handling.docx Plant Meath This procedure covers waste handling in the Meath Waste to Energy facility. It covers all movements of waste from the security gate to the feeding hopper.
P0348 Meath Maintenance Warehouse Management.docx
Plant Meath The purpose of this procedure is to describe the warehouse management concept and the link with all applicable maintenance procedures.
P0383 Completing WTF and TFS Paperwork.docx
Operations The Purpose of this procedure is to outline the steps to correctly complete WTF and TFS paperwork for shipments of waste from a customers site.
P0394 Bunker Management.docx Plant Meath The Purpose of this procedure isto provide an overview of Bunker Management, what is involved and who is responsible for it.
P0397 Common Shut Down.docx Plant Meath The purpose of this procedure is to assist the DCS/field operator when shutting down the plant from fully operational conditions to cold conditions and to outline the main responsibilities of the relevant people.
P0398 Common Start Up.docx Plant Meath The purpose of this procedure is to provide a guide for the process operators at the Meath waste to energy facility as to how to start the equipment on site from a complete plant shutdown.
P0399 Compressed Air.docx Plant Meath It describes its operational Procedures to the Operator, providing an overview of the Compressed Air Generation and Delivery system.
P0402 De-mineralised Water Plant.docx Plant Meath This procedure sets out how the de-mineralised water (Demin) generation plant is designed to produce the correct quality of water at a flow rate of 5m3/h to the DIW storage tanks and how this is

26
achieved via plant control and DCS.
P0404 Emergency Diesel Generator Weekly Test.docx
Plant Meath The purpose of this procedure is to explain how the Diesel Generator Weekly Test is to be completed in cooperation with the E&I maintenance team.
P0407 Fabric Filter.docx Plant Meath This procedure defines the actions to be taken during the operation of the Fabric Filter.
P0411 HVAC Utilities.docx Plant Meath The purpose of this document is to explain how the Sygma HVAC Unit works and to show how a process operator should operate it and allow the operator to monitor air handling units for the entire building.
P0413 Hydrated Lime.docx Plant Meath Defines the actions to be taken during the Running/Injection of Ca(OH)2 Hydrated Lime to the Lab Loop.
P0418 Monthly Evacuation Alarm Test.docx
Plant Meath To explain the procedure for carrying out the monthly fire alarm test done by shift leader/deputy shift leader.
P0420 Nitric Acid.docx Plant Meath To define the actions to be taken during the replacing of the nitric acid IBC.
P0423 Process Water and Mains Water.docx
Plant Meath This procedure provides an overview of the Process Water and Mains Water System and describes its Operational Procedures to the Operator.
P0426 Restart Following Power Failure.docx
Plant Meath The purpose of this procedure is to explain how to restore mains power to the plant following a complete power failure.

27
P0431 Steam and Condensate DCS Hot Start Up.docx
Plant Meath This procedure instructs operations personnel on the actions that must be carried out by the DCS operator when starting the steam and condensate system while the process is heating up after a complete plant shutdown.
P0432 Steam and Condensate Field Hot Start Up.docx
Plant Meath This procedure sets out to instruct operators in the Meath waste to energy facility what actions are required to start the steam and condensate cycle from a hot condition when the system is heating up to operational temperature after a shutdown for maintenance work.
P0433 Steam and Condensate System DCS Cold Start Up.docx
Plant Meath This procedure instructs operators in the Meath waste to energy facility what actions are required to start the steam and condensate cycle from a cold condition where all system components have been completely cooled, isolated and drained for maintenance work during a plant shutdown.
P0434 Steam and Condensate System Operating.docx
Plant Meath This procedure is to instruct operations personnel working in the plant on the actions that must be carried out on items of equipment by the operator when the steam and condensate cycle is in normal operation.
P0435 Steam and Condensate System Shutdown.docx
Plant Meath The purpose of this procedure is to instruct operations personnel working in the plant on the actions that must be carried out on items of equipment by the operators when the steam and condensate cycle is being shutdown.
P0436 Steam Sootblowers.docx Plant Meath The purpose of this procedure is to outline the steps to be taken in the operation of the steam sootblowers.

28
P0437 Surface Water Attenuation Pond and Fire Water Retention Tank.docx
Plant Meath This procedure provides an overview of the Surface & Fire Water System, and describes its Operational Procedures to the Operator.
P0439 Turbine Operation.docx Plant Meath This procedure is to instruct Indaver operations personnel in the basic functions of each of the turbine components, the safety measures that must be taken when working with the turbine and the actions that must be carried out by the DCS and field operators in order to start, operate and shutdown the turbine.
P0442 Checklists.docx Plant Meath This procedure details what checklists need to be filled out, by whom and how often for the Meath Waste to Energy facility.
P0443 Pump Change Over.docx Plant Meath The purpose of this procedure is to detail what pumps need to be switched between duty and stand by, who can switch them out and when they can be switched out.
P0455 Working at Height.docx QESH This procedure describes the measures used to prevent accidents from working at height or above a depth and applies to all sites.
P0057 Classification and Identification of Waste.docx
Operations This procedure defines the steps to be taken when a waste item or list of waste items, requiring identification & classification, is received by the technical department or from a customer or any other route and how the identification & classification is recorded. It includes both waste produced by Indaver clients and waste produced at any Indaver facilities.

29
P0353 Control of Hot Work Procedure.docx
QESH This procedure is to specify the manner in which hot work is managed and controlled at the Indaver Ireland & UK facilities to prevent/minimise the potential for fire or other risks to health and safety associated with hot works and ensure the safety, health & welfare of persons involved in hot works and any other persons that may be affected by the activity.
P0355 Excavations and Underground Works.docx
QESH The purpose of this procedure is to provide a standard operating procedure and permit system for excavation and underground works at Indaver Ireland’s facilities to ensure such works are properly controlled to prevent personnel injury and/or damage to Indaver’s facility or the environment.
P0356 Facility Safety Induction Meath .docx
QESH The purpose of this procedure is to clarify the Site Safety Induction process for Contractors, Hauliers and Visitors to the Meath Plant.
P0367 Financial Procedure for Electricity Charges – Supply and Generation.docx
Finance & Administration IE/UK
This procedure describes the process for ensuring all payments relating to electricity generation & supply, and ensure that they are made on time and in line with requirements.
P0352 General Permit to Work Procedure.docx
QESH This procedure describes the General Permit to Work system in operation at Indaver Ireland & UK and sets out scope and requirements of the permit to work system so that employees, contractors, plant and environment are protected and work is carried out in a safe, environmentally sound and controlled manner.

30
P0173 HazID Safety Study.docx QESH The purpose of this procedure is to: • Describe the system by which hazards that could lead to Major Accidents • Ensure that the process for Hazard Identification and Risk Assessment (HAZID) is sufficiently comprehensive to identify all potential Major Accident Hazards associated with Indaver’s activities • Ensure that the Indaver management is aware of the hazards with potential for Major Accidents on-site. • Fulfil the requirements for demonstrating that Major Accident Hazards have been identified, that the risk of occurrence and severity are assessed and that installations and systems of work at Indaver are, so far as is reasonably practical, without risk for man and the environment • Identify essential inputs for emergency planning purposes.
P0174 Health and Safety Checks.docx QESH The purpose of this procedure is to ensure that the relevant Health & Safety Checks are carried out at the following locations: Dublin Port Hazardous Waste Facility, Civic Amenity Sites ,Office Environment,At any of the workstations where Indaver Employees work, Any other work location to which the procedure applies.
P0175 Health and Safety Incident Investigation and Reporting.docx
QESH This procedure outlines the reporting and investigation procedure to be followed in the event of a health and safety incident.
31
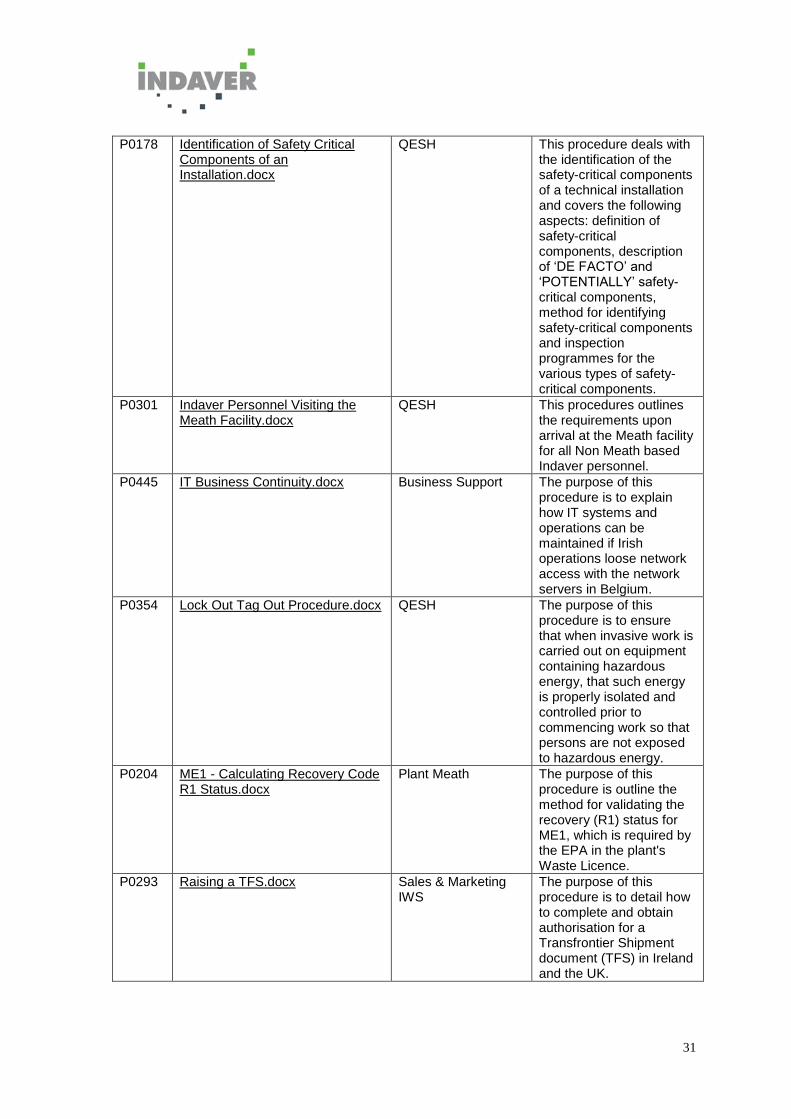
P0178 Identification of Safety Critical Components of an Installation.docx
QESH This procedure deals with the identification of the safety-critical components of a technical installation and covers the following aspects: definition of safety-critical components, description of ‘DE FACTO’ and ‘POTENTIALLY’ safety-critical components, method for identifying safety-critical components and inspection programmes for the various types of safety-critical components.
P0301 Indaver Personnel Visiting the Meath Facility.docx
QESH This procedures outlines the requirements upon arrival at the Meath facility for all Non Meath based Indaver personnel.
P0445 IT Business Continuity.docx Business Support The purpose of this procedure is to explain how IT systems and operations can be maintained if Irish operations loose network access with the network servers in Belgium.
P0354 Lock Out Tag Out Procedure.docx QESH The purpose of this procedure is to ensure that when invasive work is carried out on equipment containing hazardous energy, that such energy is properly isolated and controlled prior to commencing work so that persons are not exposed to hazardous energy.
P0204 ME1 - Calculating Recovery Code R1 Status.docx
Plant Meath The purpose of this procedure is outline the method for validating the recovery (R1) status for ME1, which is required by the EPA in the plant's Waste Licence.
P0293 Raising a TFS.docx Sales & Marketing IWS
The purpose of this procedure is to detail how to complete and obtain authorisation for a Transfrontier Shipment document (TFS) in Ireland and the UK.

32
P0318 Shipment of Controlled Drugs and Scheduled Substances.docx
Operations The purpose of this procedure is to outline the steps needed to identify controlled drugs and scheduled substances, detail the documentation required for their shipment and to outline the steps involved in obtaining this documentation.
P0327 The HAZOP Safety Study.docx QESH This procedure outlines how HAZOP Safety Studies are conducted.
P0477 Maintain Technical File.docx Plant Meath The purpose of this procedure is to describe the system to maintain the technical files for the Meath WTE Facility.
P0478 Scaffolding Management.docx Plant Meath This procedure is to ensure the safe use of scaffolds, including checks and use by workers, supervisors, and scaffold qualified persons.
P0487 Injection Of Polluted Water into the Furnace.docx
Plant Meath This sets out an overview of the Polluted Water Injection process, operations and who is responsible for it.
P0489 Electricity Permits and Licence Compliance Procedure.docx
Plant Meath This procedure outlines Indaver Meath Plant’s obligations and procedures for meeting obligations set out in licences, agreements and codes applicable to electricity exports and imports for the Meath waste-to-energy facility.
P0525 Electricity Permits and Licence Compliance Procedure-QESH.docx
QESH This procedure outlines obligations and procedures for meeting obligations as set out in licences, agreements and codes applicable to electricity exports and imports for the Meath waste-to-energy facility as they relate to QESH activities.
P0536 Isolation of the Hydraulic Accumulators.docx
Plant Meath This procedure defines how to carry out the de-energising and isolation of the hydraulic accumulators for the chute dampers.

33
P0357 Analysis of liquid samples for ME 1 Indaver Waste to Energy Facility.docx
QESH This procedure describes all analysis necessary for tankers going to Indaver’s waste to energy facility ME 1.
P0540 Boiler pressure test (40 bar).docx Plant Meath This procedure is describes the steps required to perform a 40 bar pressure test of the boiler, after boiler repairs.
P0560 SEAI Monthly Electricity Generator Survey.docx
Plant Meath This document sets out how Indaver submit monthly statistical data relating to the Energy Policy Statistical Support Unit of the Sustainable Energy Authority of Ireland.
P0558 Turbine over-speed test.docx Plant Meath The purpose of this procedure is detail how the annual over-speed test on the turbine is to be carried out.
P0562 Acceptance of controlled and scheduled substances at ME1.docx
Plant Meath The purpose of this procedure is to; • outline the steps needed to identify controlled and scheduled substances; • detail the documentation required for their shipment; • outline the steps involved in obtaining this documentation; • outline the transport arrangements for moving the waste to the outlet for destruction; and • outline the supervision required and security measures to be taken at the outlet should it be an Indaver facility.
P0566 Completing a Test Programme.docx
QESH The procedures details the steps and timelines for completing a test programme under W0167 and any of its associated revisions.
P0568 REFIT (electricity) procedure.docx Regional Sales This procedure outlines obligations and procedures for receiving the Renewable Energy Feed in Tariff for the Meath waste-to-energy facility.

34
29. Review of nuisance controls Indaver ensures that the following do not cause nuisance at the site. Vermin, birds, flies, mud, dust, litter and odour. Vermin is controlled by an external contractor who comes to site monthly and reviews the status of the site. There is no issue with vermin at the site. Birds are monitored to ensure they are not causing nuisance. Flies are not an issue at the site. Mud, dust, litter and odour are taken care of through good operational practices at the site. Negative pressure in the tipping hall and bunker area ensures that no odours escape. It also ensures that dust and windswept litter are minimised. A road sweeper comes to site on a monthly basis as a minimum which ensures no mud and dust is present to cause a nuisance. Litter picks are completed as and when necessary. Routine odour assessments are also undertaken at the site.

Appendix 1: E-PRTR plus acceptance verification

| PRTR# : W0167 | Facility Name : Indaver Ireland Limited (Duleek) | Filename : W0167_2016.xls | Return Year : 2016 | 103 29/03/2017 14:23
Guidance to completing the PRTR workbook
Version 1.1.19
REFERENCE YEAR 2016
1. FACILITY IDENTIFICATION
Parent Company Name Indaver Ireland Limited
Facility Name Indaver Ireland Limited (Duleek)
PRTR Identification Number W0167
Licence Number W0167-03
Classes of Activity
No. class_name
- Refer to PRTR class activities below
Address 1 Carranstown
Address 2 Duleek
Address 3 Meath
Address 4
Meath
Country Ireland
Coordinates of Location -6.39215 53.6765
River Basin District IEEA
NACE Code 3821
Main Economic Activity Treatment and disposal of non-hazardous waste
AER Returns Contact Name Grace McCormack
AER Returns Contact Email Address [email protected]
AER Returns Contact Position Quality and Environmental Manager
AER Returns Contact Telephone Number 041 213 4005
AER Returns Contact Mobile Phone Number 086 046 4224
AER Returns Contact Fax Number N/a
Production Volume 0.0
Production Volume Units
Number of Installations 0
Number of Operating Hours in Year 0
Number of Employees 39
User Feedback/Comments There has been some changes of over 50% in the emissions to air, some are higher and some are reduced, it is based on the acid load that is present in the
waste that the SO2 is higher, lower for others but essentially the waste controls a lot of the results for the emissions. For PM10, the result is an average result for
2016 multiplied by the flow rate and run hours. The measurement uncertainty on the result is very close to the average result for 2016.
Web Address www.indaver.ie
2. PRTR CLASS ACTIVITIES
Activity Number Activity Name
5(b)
Installations for the incineration of non-hazardous waste in the scope of Directive 2000/76/EC of the European Parliament and of the Council of 4 December 2000
on the incineration of waste
5(c) Installations for the disposal of non-hazardous waste
50.1 General
3. SOLVENTS REGULATIONS (S.I. No. 543 of 2002)
Is it applicable? No
Have you been granted an exemption ?
If applicable which activity class applies (as per
Schedule 2 of the regulations) ?
Is the reduction scheme compliance route being
used ?
4. WASTE IMPORTED/ACCEPTED ONTO SITE Guidance on waste imported/accepted onto site
Do you import/accept waste onto your site for on-
site treatment (either recovery or disposal
activities) ?
This question is only applicable if you are an IPPC or Quarry site
PRTR Returns Workbook

4.1 RELEASES TO AIR Link to previous years emissions data | PRTR# : W0167 | Facility Name : Indaver Ireland Limited (Duleek) | Filename : W0167_2016.xls | Return Year : 2016 | 29/03/2017 14:23
8 17 25 25 33 35 6 6 6 6 6 6 35
SECTION A : SECTOR SPECIFIC PRTR POLLUTANTS
Please enter all quantities in this section in KGs
QUANTITY
No. Annex II Name M/C/E Method Code Designation or Description Emission Point 1 T (Total) KG/Year A (Accidental) KG/Year F (Fugitive) KG/Year
02 Carbon monoxide (CO) M OTH
EN 14181 (Continuous
monitoring using FTIR) 9211.85 9211.85 0.0 0.0
03 Carbon dioxide (CO2) M OTH
EN 14181 (Continuous
monitoring using FTIR) 324845880.0 324845880.0 0.0 0.0
80 Chlorine and inorganic compounds (as HCl) M OTH
EN 14181 (Continuous
monitoring using FTIR) 2010.77 2010.77 0.0 0.0
84 Fluorine and inorganic compounds (as HF) M OTH
EN 14181 (Continuous
monitoring using FTIR) 228.7 228.7 0.0 0.0
21 Mercury and compounds (as Hg) M EN 13211:2001 6.91 6.91 0.0 0.0
08 Nitrogen oxides (NOx/NO2) M OTH
EN 14181 (Continuous
monitoring using FTIR) 218880.62 218880.62 0.0 0.0
86 Particulate matter (PM10) M OTH US EPA M01A 625.08 625.08 0.0 0.0
47 PCDD + PCDF (dioxins + furans)(as Teq) M EN 1948-1 to3:2003 0.0000049 0.0000049 0.0 0.0
11 Sulphur oxides (SOx/SO2) M OTH
EN 14181 (Continuous
monitoring using FTIR) 53297.86 53297.86 0.0 0.0
05 Nitrous oxide (N2O) M OTH TGN M22 2058.1 2058.1 0.0 0.0
* Select a row by double-clicking on the Pollutant Name (Column B) then click the delete button
SECTION B : REMAINING PRTR POLLUTANTS
Please enter all quantities in this section in KGs
QUANTITY
No. Annex II Name M/C/E Method Code Designation or Description Emission Point 1 T (Total) KG/Year A (Accidental) KG/Year F (Fugitive) KG/Year
0.0 0.0 0.0 0.0
* Select a row by double-clicking on the Pollutant Name (Column B) then click the delete button
SECTION C : REMAINING POLLUTANT EMISSIONS (As required in your Licence)
Please enter all quantities in this section in KGs
QUANTITY
Pollutant No. Name M/C/E Method Code Designation or Description Emission Point 1 T (Total) KG/Year A (Accidental) KG/Year F (Fugitive) KG/Year
210 Dust M OTH EN 14181 107.38 107.38 0.0 0.0
351 Total Organic Carbon (as C) M OTH
EN 14181 (Continuous
monitoring using FID) 707.78 707.78 0.0 0.0
347 Total heavy metals M EN 14385:2004 0.000962 0.000962 0.0 0.0
* Select a row by double-clicking on the Pollutant Name (Column B) then click the delete button
Additional Data Requested from Landfill operators
Landfill: Indaver Ireland Limited (Duleek)
Please enter summary data on the
quantities of methane flared and / or utilised
additional_pollutant_no T (Total) kg/Year M/C/E Method Code
Designation or
Description
Facility Total Capacity m3
per hour
Total estimated methane generation (as per
site model) 0.0 N/A
Methane flared 0.0 0.0 (Total Flaring Capacity)
Methane utilised in engine/s 0.0 0.0 (Total Utilising Capacity)
Net methane emission (as reported in Section A
above) 0.0 N/A
Method Used
For the purposes of the National Inventory on Greenhouse Gases, landfill operators are requested to provide summary data on landfill gas (Methane)
flared or utilised on their facilities to accompany the figures for total methane generated. Operators should only report their Net methane (CH4)
emission to the environment under T(total) KG/yr for Section A: Sector specific PRTR pollutants above. Please complete the table below:
Method Used
Method Used
RELEASES TO AIR
POLLUTANT METHOD
Method Used
POLLUTANT
RELEASES TO AIR
RELEASES TO AIR
METHOD
POLLUTANT METHOD

4.2 RELEASES TO WATERS Link to previous years emissions data
8 8
SECTION A : SECTOR SPECIFIC PRTR POLLUTANTS
No. Annex II Name
* Select a row by double-clicking on the Pollutant Name (Column B) then click the delete button
SECTION B : REMAINING PRTR POLLUTANTS
No. Annex II Name
* Select a row by double-clicking on the Pollutant Name (Column B) then click the delete button
SECTION C : REMAINING POLLUTANT EMISSIONS (as required in your Licence)
Pollutant No. Name
* Select a row by double-clicking on the Pollutant Name (Column B) then click the delete button
POLLUTANT
POLLUTANT
POLLUTANT
RELEASES TO WATERS
RELEASES TO WATERS
RELEASES TO WATERS

| PRTR# : W0167 | Facility Name : Indaver Ireland Limited (Duleek) | Filename : W0167_2016.xls | Return Year : 2016 |
16 16 24 24 6
Data on ambient monitoring of storm/surface water or groundwater, conducted as part of your licence requirements, should NOT be submitted under AER / PRTR Reporting as this only concerns Releases from your facility
Please enter all quantities in this section in KGs
M/C/E Method Code Designation or Description Emission Point 1 T (Total) KG/Year
0.0 0.0
* Select a row by double-clicking on the Pollutant Name (Column B) then click the delete button
Please enter all quantities in this section in KGs
M/C/E Method Code Designation or Description Emission Point 1 T (Total) KG/Year
0.0 0.0
* Select a row by double-clicking on the Pollutant Name (Column B) then click the delete button
Please enter all quantities in this section in KGs
M/C/E Method Code Designation or Description Emission Point 1 T (Total) KG/Year
0.0 0.0
* Select a row by double-clicking on the Pollutant Name (Column B) then click the delete button
Method Used
Method Used
RELEASES TO WATERS
Method Used
RELEASES TO WATERS
RELEASES TO WATERS

29/03/2017 14:23
6 6 6 6 6
Data on ambient monitoring of storm/surface water or groundwater, conducted as part of your licence requirements, should NOT be submitted under AER / PRTR Reporting as this only concerns Releases from your facility
QUANTITY
A (Accidental) KG/Year F (Fugitive) KG/Year
0.0 0.0
QUANTITY
A (Accidental) KG/Year F (Fugitive) KG/Year
0.0 0.0
QUANTITY
A (Accidental) KG/Year F (Fugitive) KG/Year
0.0 0.0

4.3 RELEASES TO WASTEWATER OR SEWER Link to previous years emissions data | PRTR# : W0167 | Facility Name : Indaver Ireland Limited (Duleek) | Filename : W0167_2016.xls | Return Year : 2016 |29/03/2017 14:23
8 8 16 16 6 6 6 6
SECTION A : PRTR POLLUTANTS
Please enter all quantities in this section in KGs
QUANTITY
No. Annex II Name M/C/E Method Code Designation or Description Emission Point 1 T (Total) KG/Year A (Accidental) KG/Year F (Fugitive) KG/Year
0.0 0.0 0.0 0.0
* Select a row by double-clicking on the Pollutant Name (Column B) then click the delete button
SECTION B : REMAINING POLLUTANT EMISSIONS (as required in your Licence)
Please enter all quantities in this section in KGs
QUANTITY
Pollutant No. Name M/C/E Method Code Designation or Description Emission Point 1 T (Total) KG/Year A (Accidental) KG/Year F (Fugitive) KG/Year
0.0 0.0 0.0 0.0
* Select a row by double-clicking on the Pollutant Name (Column B) then click the delete button
OFFSITE TRANSFER OF POLLUTANTS DESTINED FOR WASTE-WATER TREATMENT OR SEWER
OFFSITE TRANSFER OF POLLUTANTS DESTINED FOR WASTE-WATER TREATMENT OR SEWER
Method Used
Method Used
POLLUTANT METHOD
POLLUTANT METHOD

4.4 RELEASES TO LAND Link to previous years emissions data
8 8
SECTION A : PRTR POLLUTANTS
No. Annex II Name
* Select a row by double-clicking on the Pollutant Name (Column B) then click the delete button
SECTION B : REMAINING POLLUTANT EMISSIONS (as required in your Licence)
Pollutant No. Name
* Select a row by double-clicking on the Pollutant Name (Column B) then click the delete button
POLLUTANT
RELEASES TO LAND
RELEASES TO LAND
POLLUTANT

| PRTR# : W0167 | Facility Name : Indaver Ireland Limited (Duleek) | Filename : W0167_2016.xls | Return Year : 2016 |
16 16 6 6
Please enter all quantities in this section in KGs
M/C/E Method Code Designation or Description Emission Point 1
0.0
* Select a row by double-clicking on the Pollutant Name (Column B) then click the delete button
Please enter all quantities in this section in KGs
M/C/E Method Code Designation or Description Emission Point 1
0.0
* Select a row by double-clicking on the Pollutant Name (Column B) then click the delete button
METHOD
Method Used
RELEASES TO LAND
RELEASES TO LAND
METHOD
Method Used

| PRTR# : W0167 | Facility Name : Indaver Ireland Limited (Duleek) | Filename : W0167_2016.xls | Return Year : 2016 | 29/03/2017 14:23
6 6
Please enter all quantities in this section in KGs
QUANTITY
T (Total) KG/Year A (Accidental) KG/Year
0.0 0.0
Please enter all quantities in this section in KGs
QUANTITY
T (Total) KG/Year A (Accidental) KG/Year
0.0 0.0

5. ONSITE TREATMENT & OFFSITE TRANSFERS OF WASTE | PRTR# : W0167 | Facility Name : Indav er Ireland Limited (Duleek) | Filename : W0167_2016.xls | Return Year : 2016 | 29/03/2017 14:23
5 57 Please enter all quantities on this sheet in Tonnes 0
Quantity
(Tonnes per
Year)
Haz Waste : Name and Licence/Permit
No of Next Destination Facility
Non Haz Waste: Name and
Licence/Permit No of
Recov er/Disposer
Haz Waste : Address of Next
Destination Facility
Non Haz Waste: Address of
Recov er/Disposer
Name and License / Permit No. and
Address of Final Recov erer / Disposer
(HAZARDOUS WASTE ONLY)
Actual Address of Final Destination i.e.
Final Recov ery / Disposal Site
(HAZARDOUS WASTE ONLY)
Transfer Destination
European Waste
Code Hazardous Q uant it y T/ Year Description of Waste
Waste
Treatment
Operation M/C/E Method Used
Location of
Treatment Nam e and Licence / Per m it No. of Recover er / Disposer / Br oker Addr ess of Recover er / Disposer / Br oker Nam e and Addr ess of Final Dest inat ion i. e. Final Recover y / Disposal Sit e ( HAZARDO US WASTE O NLY) Licence / Per m it No. of Final Dest inat ion i. e. Final Recover y / Disposal Sit e ( HAZARDO US WASTE O NLY)
To Other Countries 06 01 05 Yes 0.0 nitric acid and nitrous acid D10 M Weighed Abroad
Indaver Ireland
Limited,W0036-02
Tolka Quay Road,Dublin
Port,D1,D1,Ireland
Abfall Verwertungs
Gesellschaft Gmb
(AVG),IB2234/AVG-GENB-
2,Borsigstr. 2,D-22113
Hamburg,Hamburg,D-22113
Hamburg,Germany
Borsigstr. 2,D-22113
Hamburg,Hamburg,D-22113
Hamburg,Germany
To Other Countries 06 01 06 Yes 0.0 other acids D10 M Weighed Abroad
Indaver Ireland
Limited,W0036-02
Tolka Quay Road,Dublin
Port,D1,D1,Ireland
Abfall Verwertungs
Gesellschaft Gmb
(AVG),IB2234/AVG-GENB-
2,Borsigstr. 2,D-22113
Hamburg,Hamburg,D-22113
Hamburg,Germany
Borsigstr. 2,D-22113
Hamburg,Hamburg,D-22113
Hamburg,Germany
To Other Countries 06 02 03 Yes 0.0 ammonium hydroxide D10 M Weighed Abroad
Indaver Ireland
Limited,W0036-02
Tolka Quay Road,Dublin
Port,D1,D1,Ireland
Abfall Verwertungs
Gesellschaft Gmb
(AVG),IB2234/AVG-GENB-
2,Borsigstr. 2,D-22113
Hamburg,Hamburg,D-22113
Hamburg,Germany
Borsigstr. 2,D-22113
Hamburg,Hamburg,D-22113
Hamburg,Germany
To Other Countries 06 02 04 Yes 0.0 sodium and potassium hydroxide D10 M Weighed Abroad
Indaver Ireland
Limited,W0036-02
Tolka Quay Road,Dublin
Port,D1,D1,Ireland
Abfall Verwertungs
Gesellschaft Gmb
(AVG),IB2234/AVG-GENB-
2,Borsigstr. 2,D-22113
Hamburg,Hamburg,D-22113
Hamburg,Germany
Borsigstr. 2,D-22113
Hamburg,Hamburg,D-22113
Hamburg,Germany
To Other Countries 13 02 08 Yes 0.0 other engine, gear and lubricating oils D10 M Weighed Abroad
Indaver Ireland
Limited,W0036-02
Tolka Quay Road,Dublin
Port,D1,D1,Ireland
Abfall Verwertungs
Gesellschaft Gmb
(AVG),IB2234/AVG-GENB-
2,Borsigstr. 2,D-22113
Hamburg,Hamburg,D-22113
Hamburg,Germany
Borsigstr. 2,D-22113
Hamburg,Hamburg,D-22113
Hamburg,Germany
Within the Country 13 05 07 Yes 0.0 oily water from oil/water separators D9 M Weighed Offsite in Ireland Enva Ireland Ltd,196-1
MacAnulty Clear Drains,John
F Kennedy Industrial Estate
John F Kennedy Road,Naas
Road,Dublin 12,Ireland
Enva Ireland Ltd,196-
1,MacAnulty Clear
Drains,John F Kennedy
Industrial Estate John F
Kennedy Road,Naas
Road,Dublin 12,Ireland
MacAnulty Clear Drains,John
F Kennedy Industrial Estate
John F Kennedy Road,Naas
Road,Dublin 12,Ireland
To Other Countries 13 07 01 Yes 0.0 fuel oil and diesel D10 M Weighed Abroad
Indaver Ireland
Limited,W0036-02
Tolka Quay Road,Dublin
Port,D1,D1,Ireland
Abfall Verwertungs
Gesellschaft Gmb
(AVG),IB2234/AVG-GENB-
2,Borsigstr. 2,D-22113
Hamburg,Hamburg,D-22113
Hamburg,Germany
Borsigstr. 2,D-22113
Hamburg,Hamburg,D-22113
Hamburg,Germany
Within the Country 13 08 99 Yes 0.64 wastes not otherwise specified R9 M Weighed Offsite in Ireland
Rilta Environmental,W0192-
03
Block 402,Greenogue
Business
Park,Rathcoole,Dublin,Ireland
Rilta Environmental,W0192-
03,Block 402,Greenogue
Business
Park,Rathcoole,Dublin,Ireland
Block 402,Greenogue
Business
Park,Rathcoole,Dublin,Ireland
To Other Countries 15 02 02 Yes 0.0
absorbents, filter materials (including oil
filters not otherwise specified), wiping cloths,
protective clothing contaminated by
dangerous substances D10 M Weighed Abroad
Indaver Ireland
Limited,W0036-02
Tolka Quay Road,Dublin
Port,D1,D1,Ireland
Abfall Verwertungs
Gesellschaft Gmb
(AVG),IB2234/AVG-GENB-
2,Borsigstr. 2,D-22113
Hamburg,Hamburg,D-22113
Hamburg,Germany
Borsigstr. 2,D-22113
Hamburg,Hamburg,D-22113
Hamburg,Germany
To Other Countries 16 05 04 Yes 0.0
gases in pressure containers (including
halons) containing dangerous substances D10 M Weighed Abroad
Indaver Ireland
Limited,W0036-02
Tolka Quay Road,Dublin
Port,D1,D1,Ireland
Abfall Verwertungs
Gesellschaft Gmb
(AVG),IB2234/AVG-GENB-
2,Borsigstr. 2,D-22113
Hamburg,Hamburg,D-22113
Hamburg,Germany
Borsigstr. 2,D-22113
Hamburg,Hamburg,D-22113
Hamburg,Germany
Within the Country 16 10 01 Yes 0.0
aqueous liquid wastes containing dangerous
substances D9 M Weighed Offsite in Ireland
Rilta Environmental,W0192-
03
Block 402,Greenogue
Business
Park,Rathcoole,Dublin,Ireland
Rilta Environmental,W0192-
03,Block 402,Greenogue
Business
Park,Rathcoole,Dublin,Ireland
Block 402,Greenogue
Business
Park,Rathcoole,Dublin,Ireland
Within the Country 16 10 02 No 88.71
aqueous liquid wastes other than those
mentioned in 16 10 01 D9 M Weighed Offsite in Ireland
EPS Dundalk and Drogheda
WWTW,EPS Pumping &
Treatment Systems
Dundalk WWTW,Lower point
road,Co-Louth,Co-
Louth,Ireland
Within the Country 16 10 02 No 0.0
aqueous liquid wastes other than those
mentioned in 16 10 01 D9 M Weighed Offsite in Ireland
Rilta Environmental,W0192-
03
Block 402,Greenogue
Business
Park,Rathcoole,Dublin,Ireland
Within the Country 17 02 01 No 0.0 wood R13 M Weighed Offsite in Ireland
Nurendale Limited trading as
Panda Waste Services
Limited,W0140 - 03
Rathdrinagh,Beauparc,Navan
,Co Meath ,Ireland
Within the Country 17 04 05 No 0.0 iron and steel R13 M Weighed Offsite in Ireland
Nurendale Limited trading as
Panda Waste Services
Limited,W0140 - 03
Rathdrinagh,Beauparc,Navan
,Co Meath ,Ireland
Within the Country 17 05 04 No 0.0
soil and stones other than those mentioned
in 17 05 03 D15 M Weighed Offsite in Ireland
Nurendale Limited trading as
Panda Waste Services
Limited,W0140 - 03
Rathdrinagh,Beauparc,Navan
,Co Meath ,Ireland
Within the Country 17 06 04 No 0.0
insulation materials other than those
mentioned in 17 06 01 and 17 06 03 D15 M Weighed Offsite in Ireland
Nurendale Limited trading as
Panda Waste Services
Limited,W0140 - 03
Rathdrinagh,Beauparc,Navan
,Co Meath ,Ireland
Within the Country 17 09 04 No 13.322
mixed construction and demolition wastes
other than those mentioned in 17 09 01, 17
09 02 and 17 09 03 R13 M Weighed Offsite in Ireland
Nurendale Limited trading as
Panda Waste Services
Limited,W0140 - 03
Rathdrinagh,Beauparc,Navan
,Co Meath ,Ireland
Within the Country 19 01 02 No 0.0 ferrous materials removed from bottom ash R4 M Weighed Offsite in Ireland
Hammond Lane Metal
Company Limited,WFP-DC-
0013-01
Pigeon House
Road,Ringsend,Dublin
4,Ringsend,Ireland
Within the Country 19 01 02 No 0.0 ferrous materials removed from bottom ash R4 M Weighed Offsite in Ireland
Clearcircle Metals (Limerick)
Limited,WFP-LC+KC-11-001-
01
Ballysimon Road,Ballysimon
Road,Limerick,Limerick,Irelan
d
Within the Country 19 01 02 No 0.0 ferrous materials removed from bottom ash R12 M Weighed Offsite in Ireland
AES t/A Midland Waste
Disposal Company
Limited,W0131-02
Clonmagadden,Proudstown,
Navan,Co-Meath,Ireland
Within the Country 19 01 02 No 0.0 ferrous materials removed from bottom ash R4 M Weighed Offsite in Ireland
Multimetal Recycling,WFP-
WW-10-0014-02
Conway Port Industrial
Estate,Bollarney,Murrough,Wi
cklow,Ireland
To Other Countries 19 01 02 No 0.0 ferrous materials removed from bottom ash R4 M Weighed Abroad
Indaver
NV,MLAV1/9800000485/MV/bd
Industriele
Afvalverwerking,Poldervlietwe
g,B-2030 Antwerpen 3,B-2030
Antwerpen 3,Belgium
Within the Country 19 01 02 No 2922.76 ferrous materials removed from bottom ash R4 M Weighed Offsite in Ireland
United Metals,WFP LK 2013
147A R1
Eastway Business
Park,Ballysimon,Ballysimon,L
imerick,Ireland
Within the Country 19 01 02 No 0.0 ferrous materials removed from bottom ash R4 M Weighed Offsite in Ireland
Wilton Waste Recycling
Limited ,WFP CN 15-003-01
Kiffagh,Crosserlough,Ballyja
mesduff,Cavan,Ireland
To Other Countries 19 01 07 Yes 7278.01 solid wastes from gas treatment R5 M Weighed Abroad
K&S Kali
GmBH,LicenceM76D310/57
Reutilisation Salt
Mines(Phillippstaal),Nipper
StraBe 33,36269
Philippsthal,36269,Germany
K&S Kali
GmBH,LicenceM76D310/57,R
eutilisation Salt
Mines(Phillippstaal),Nipper
StraBe 33,36269
Philippsthal,36269
Philippsthal,Germany
Reutilisation Salt
Mines(Phillippstaal),Nipper
StraBe 33,36269
Philippsthal,36269
Philippsthal,Germany
To Other Countries 19 01 07 Yes 24.68 solid wastes from gas treatment D9 M Weighed Abroad
Indaver
NV,MLAV1/9800000485/MV/bd
Industriele
Afvalverwerking,Poldervlietwe
g,B-2030 Antwerpen 3,B-2030
Antwerpen 3,Belgium
Indaver
NV,MLAV1/9800000485/MV/bd
,Industriele
Afvalverwerking,Poldervlietwe
g,B-2030 Antwerpen 3,B-2030
Antwerpen 3,Belgium
Industriele
Afvalverwerking,Poldervlietwe
g,B-2030 Antwerpen 3,B-2030
Antwerpen 3,Belgium
To Other Countries 19 01 07 Yes 26.86 solid wastes from gas treatment R5 M Weighed Abroad K&S,34/Hef-79 n 330-51/153
Werk Werra,Standort
Wintershall
Herfagrund,36266 Herfa
,36266 Herfa ,Germany
Indaver
NV,MLAV1/9800000485/MV/bd
,Industriele
Afvalverwerking,Poldervlietwe
g,B-2030 Antwerpen 3,B-2030
Antwerpen 3,Belgium
Industriele
Afvalverwerking,Poldervlietwe
g,B-2030 Antwerpen 3,B-2030
Antwerpen 3,Belgium
To Other Countries 19 01 07 Yes 1839.88 solid wastes from gas treatment R11 M Weighed Abroad
K&S Kali GmbH Werk
Werra,AZ.1325/98 AZ6631/99
Standort
Unterbreizbach,Untertagaever
wertung Schaet
11,Unterbreizbach,D36414,G
ermany
K&S Kali GmbH Werk
Werra,AZ.1325/98
AZ6631/99,Standort
Unterbreizbach,Untertagaever
wertung Schaet
11,Unterbreihbach,D36414,G
ermany
Standort
Unterbreizbach,Untertagaever
wertung Schaet
11,Unterbreihbach,D36414,G
ermany
Within the Country 19 01 12 No 0.0
bottom ash and slag other than those
mentioned in 19 01 11 D1 M Weighed Offsite in Ireland
Whiteriver Landfill[Louth
County Council]
,W0060-03
Whiteriver and Gunstown
Townland
,Dunleer,Co-Louth,Co-
Louth,Ireland
Within the Country 19 01 12 No 19861.38
bottom ash and slag other than those
mentioned in 19 01 11 D1 M Weighed Offsite in Ireland
Scotchcorner Landfill
Monaghan County
Council,W0020-02
Letterbane,Annyalla,Castlebla
yney,Co-Monaghan,Ireland
Within the Country 19 01 12 No 423.7
bottom ash and slag other than those
mentioned in 19 01 11 R11a M Weighed Offsite in Ireland
Greenstar Holdings
Limited,W0165-02
Ballynagran Residual
Landfill,Ballynagran,Coolbeg
and Kilcandra,Wicklow,Ireland
Within the Country 19 01 12 No 52.32
bottom ash and slag other than those
mentioned in 19 01 11 R11a M Weighed Offsite in Ireland
Drehid Landfill(Bord Na Mona
PLC),W201-03
Drehid Landfill(Bord Na Mona
PLC),Killinagh
Upper,Carbury,Co-
Kildare,Ireland
To Other Countries 19 01 13 Yes 27.34 fly ash containing dangerous substances D9 M Weighed Abroad
Indaver
NV,MLAV1/9800000485/MV/bd
Industriele
Afvalverwerking,Poldervlietwe
g,B-2030 Antwerpen 3,B-2030
Antwerpen 3,Belgium
Indaver
NV,MLAV1/9800000485/MV/bd
,Industriele
Afvalverwerking,Poldervlietwe
g,B-2030 Antwerpen 3,B-2030
Antwerpen 3,Belgium .,.,.,.,Belgium
To Other Countries 19 01 13 Yes 0.0 fly ash containing dangerous substances R5 M Weighed Abroad
K&S Kali
GmBH,LicenceM76D310/57
Reutilisation Salt
Mines(Phillippstaal),Nipper
StraBe 33,36269
Philippsthal,36269,Germany
K&S Kali
GmBH,LicenceM76D310/57,R
eutilisation Salt
Mines(Phillippstaal),Nipper
StraBe 33,36269
Philippsthal,36269
Philippsthal,Germany
Reutilisation Salt
Mines(Phillippstaal),Nipper
StraBe 33,36269
Philippsthal,36269
Philippsthal,Germany
To Other Countries 19 01 13 Yes 1803.46 fly ash containing dangerous substances R5 M Weighed Abroad K&S,34/Hef-79 n 330-51/153
Werk Werra,Standort
Wintershall
Herfagrund,36266 Herfa
,36266 Herfa ,Germany
K & S,34/Hef-79 n 330-
51/153,Werk Werra,Standort
Wintershall
Herfagrund,36266 Herfa
,36266 Herfa ,Germany
Werk Werra,Standort
Wintershall
Herfagrund,36266 Herfa
,36266 Herfa ,Germany
To Other Countries 19 01 13 Yes 103.81 fly ash containing dangerous substances D12 M Weighed Abroad K & S ,34/Hef-79n330-51/153
Werra Plant Underground
Waste Disposal Plant,Herfa-
Neurode,36266 Heringen
,36266 Heringen ,Germany
K & S ,34/Hef-79n330-
51/153,Werra Plant
Underground Waste Disposal
Plant,Herfa- Neurode,36266
Heringen ,36266 Heringen
,Germany
Werra Plant Underground
Waste Disposal Plant,Herfa-
Neurode,36266 Heringen
,36266 Heringen ,Germany
To Other Countries 19 12 03 No 361.6 non-ferrous metal R4 M Weighed Abroad
CRAENHALS METAL
TERMINAL,10088
Van Patraestraat 90 ,2660
HOBOKEN
(Antwerpen),Antwerp,2660,Bel
gium
To Other Countries 19 12 03 No 190.02 non-ferrous metal R4 M Weighed Abroad Galloo,IHM-AFVAL4024
Wervikstraat 320,8930
Menen,Menen,8930,Belgium
Within the Country 20 01 36 No 0.29
discarded electrical and electronic equipment
other than those mentioned in 20 01 21, 20
01 23 and 20 01 35 R13 M Weighed Offsite in Ireland
Nurendale Limited trading as
Panda Waste Services
Limited,W0140 - 03
Rathdrinagh,Beauparc,Navan
,Co Meath ,Ireland
Within the Country 20 01 38 No 6.96 wood other than that mentioned in 20 01 37 R12 M Weighed Offsite in Ireland
Nurendale Limited trading as
Panda Waste Services
Limited,W0140 - 03
Rathdrinagh,Beauparc,Navan
,Co Meath ,Ireland
Within the Country 20 01 39 No 0.0 plastics R13 M Weighed Offsite in Ireland
Nurendale Limited trading as
Panda Waste Services
Limited,W0140 - 03
Rathdrinagh,Beauparc,Navan
,Co Meath ,Ireland
Within the Country 20 03 01 No 0.0 mixed municipal waste R13 M Weighed Offsite in Ireland
Nurendale Limited trading as
Panda Waste Services
Limited,W0140 - 03
Rathdrinagh,Beauparc,Navan
,Co Meath ,Ireland
Within the Country 20 03 01 No 0.0 mixed municipal waste D15 M Weighed Offsite in Ireland
Nurendale Limited trading as
Panda Waste Services
Limited,W0140 - 03
Rathdrinagh,Beauparc,Navan
,Co Meath ,Ireland
Within the Country 20 03 01 No 5.2 mixed municipal waste R1 E Volume Calculation Onsite of generation
Indaver Ireland
Limited,W0167-02
Carranstown,Duleek,Co-
Meath,N/A,Ireland
Within the Country 20 03 03 No 0.0 street-cleaning residues R1 M Weighed Onsite of generation
Indaver Ireland
Limited,W0167-02
Carranstown,Duleek,Co-
Meath,N/A,Ireland
Within the Country 20 03 04 No 18.0 septic tank sludge D9 M Weighed Offsite in Ireland
EPS Dundalk and Drogheda
WWTW,EPS Pumping &
Treatment Systems
Dundalk WWTW,Lower point
road,Co-Louth,Co-
Louth,Ireland
Within the Country 20 03 04 No 100.33 septic tank sludge D9 M Weighed Offsite in Ireland
Dublin City Council Ringsend
Waste Water Treatment
Plant,D0034-01
Drainage Services
Environmental and
Engineering Dept,Civic
Office,Wood Quay,Dublin
8,Ireland
Within the Country 20 03 07 No 0.0 bulky waste D1 M Weighed Offsite in Ireland
Whiteriver Landfill[Louth
County Council]
,W0060-03
Whiteriver and Gunstown
Townland
,Dunleer,Co-Louth,Co-
Louth,Ireland
Within the Country 16 10 02 No 0.0
aqueous liquid wastes other than those
mentioned in 16 10 01 D9 M Weighed Offsite in Ireland
Dublin City Council Ringsend
Waste Water Treatment
Plant,D0034-01
Drainage Services
Environmental and
Engineering Dept,Civic
Office,Wood Quay,Dublin
8,Ireland
To Other Countries 19 12 03 No 143.6 non-ferrous metal R4 M Weighed Abroad
Recco Non Ferro Metals
BV,OLO Number 1016711
Montage Weg 2,8304 BG
Emmeloord,Emmeloord,.,Net
herlands
Within the Country 19 01 12 No 15228.332
bottom ash and slag other than those
mentioned in 19 01 11 R11a M Weighed Offsite in Ireland
Greenstar
Knockharley,W0146-01
Knockharley,Navan,Co-
Meath,.,Ireland
* Select a row by double-clicking the Description of Waste then click the delete button
Link to previous years waste data
Link to previous years waste summary data & percentage change
Link to Waste Guidance
Method Used


Appendix 2: Energy Efficiency Report

Indaver Ireland
Energy Audit
Waste Licence W0167-03
2016 Energy Audit

Indaver Ireland
Energy Audit
Page 2 of 5
Introduction This document reflects the licence requirement in Condition 7.1.3 to demonstrate the energy efficiency of the site. Energy Efficiency must be, as a minimum, 0.65. This document reports the result of 0.72.
Audit
Audit period
1st January 2016 to 31
st December 2016.
Audit personnel
The persons involved in the audit were the Process Engineer Joe Crawley, the Maintenance Manager, Rory Murphy, Electrical and Instrumentation Supervisor Eoin Wright and the Quality and Environmental Manager, Grace McCormack.
Scope of audit
The scope of the required energy audit is as defined by the ‘Guidance Note on Energy Efficiency Auditing’, published by the EPA, Johnstown Castle, Co. Wexford, Ireland. Additional requirements re the energy audit are contained in Condition 7.1.2 and Condition 7.1.3 of the Waste Licence. The scope of the audit includes these conditions which reads as follows:
7.1.2 The licensee shall build and operate the facility to achieve an energy efficiency of, as a
minimum, 0.65 using the formulae below to calculate Energy Efficiency:
Energy Efficiency = [Ep– (Ef + Ei)]/0/97 x (Ew + Ef] where
Emission point = annual energy produced as heat or electricity (GJ/year) (heat produced
for commercial use is multiplied by 1.1 and electricity is multiplied by 2.6)
Ef = annual energy input to the system from fuels contributing to the production of steam
(GJ/year)
Ew = annual energy contained in the waste input using the net calorific value of the waste
(GJ/year)
Ei = annual energy imported excluding Ew and Ei

Indaver Ireland
Energy Audit
Page 3 of 5
Energy Efficiency
Condition 7.1.2 of the Waste Licence sets minimum energy efficiency. The achievement of this parameter is reviewed.
Energy Performance Condition 7.1.3 requires a calculation to be determined for the net usable energy produced per tonne of waste. This calculation was performed and the result is as shown:
Net Usable Energy Per Tonne of Waste Processed 0.64 M Wh/Tonne
Condition 7.1.3 also requires a full breakdown of the calculation of each parameter in the equation and the results for this is shown below:

Indaver Ireland
Energy Audit
Page 4 of 5
Data used: 1st January 2016 to 31st December 2016.
Total waste treated 01/01/16 to 31/12/16 229122 Tonnes
Total electricity produced 01/01/16 to 31/12/16 146550 MWh
Type of energy Unit Tonne NCV
(kJ/kg)
Energy (MWh)
1.1 Adjusted amount incinerated waste 226,327 9,568 601,528
1.2 Ew Energy input of waste MWh 601,528
1.3 Ef: Light fuel oil used for startup / keeping temperature tonne 120.52 42,000 1,406
2 Ef: Natural gas used - - -
2.1 + 2.2 Ef: Energy input by imported energy with steam MWh 1,406
2.3 Ei: Light fuel oil used for startup / shutdown tonne 120.52 42,000 1,406
3 Ei: Natural gas used - - - -
3.1 Ei: imported electricity (multiplied with equivalence
factor 2.6)
- - -
3.2 Ei: imported heat - - - -
3.3 Ei: Energy input by imported energy without steam MWh 1,406
3.4 Ep: Adjusted electricity produced and internally used for
incineration process
MWh 18,037.00 -
4 Ep: electricity delivered to a third party MWh 128,514.00 -
4.1 Ep: Electricity produced adjusted for curtailment MWh 145,926.28 145,926.28
4.2 Ep: Heat exported MWh - - -
5 Ep: Heat exported MWh - - -
5.1 + 5.2 Ep: heat used internally for steam driven pumps,
backflow, heating flue gas, liquid APC residues
- - -
6 Ep: for soot blowing without backflow - -
6.1 to
6.3
Ep: for heating buildings, deaeration, NH4OH injection - - -
6.4 Ep: Heat used internally MWh - - -
6.5 to
6.7
Ep MWh 379,408
7 R1 0.720

Indaver Ireland
Energy Audit
Page 5 of 5
R1 Adjustments: Curtailment
Objective: Omit periods where NCC constrains / curtails plant as energy must be spilt during these periods.
Data affected: MWh produced, waste tonnes processed
Obtaining data: MWh produced and waste treated during constraints from NCC
affect of data Tonnes of waste in 1.1 reduced to exclude contraint periods
Ep Electrity produced in 5 reduced by electricity producted during contraint
Frequency of processsing data: monthly
MWh t waste
Jan-16 9.863 28
Feb-16 69.32 301
Mar-16 36.431 150
Apr-16
May-16 53.539 313
Jun-16 34.15 205
Jul-16
Aug-16 42.288 127
Sep-16 131.306 510
Oct-16 15.721 71
Nov-16 61.572 230
Dec-16 169.53 859
Total 623.7 2794.6
Curtailment

Energy Auditing Scheme Report
for

EAS Report Page 2 of 35 PowerTherm Solution©
Revision Control
Energy Consultants
Document Title: EAS Report
Revision number: 170320
Status: Final (comments incorporated)
Issue Date: 20th March 2017
Prepared by: Steven Roycroft
Checked by: Cian O’Riordan
Supporting Spreadsheets
(retained by PowerTherm)
161108 Indaver calculation spreadsheet

EAS Report Page 3 of 35 PowerTherm Solution©
Executive Summary
This Energy Audit has been prepared for Indaver Ireland Ltd to ensure compliance with S.I. 426 (2014),
which requires large enterprises to carry out an Energy Audit of their operations every four years.
Indaver provide waste management solutions to large scale industry and public authorities, including the
operation of a Waste-to-Energy plant located in Meath which treats more than 200,000 tonnes of municipal
solid waste every year.
S.I. 426 states that “Companies that are not SMEs shall carry out an energy audit…” Indaver is not an SME
and so is undertaking an audit of the facilities it owns or occupies. In 2015 Indaver owned the following
facilities and vehicles, which fall within the scope of this energy audit:
Cork Office, South Ring Business Park
Dublin Office, Dun Laoghaire
Dublin Port Waste Transfer Station
Meath WTE Plant
Civic Amenity Centre, Newcastlewest
Civic Amenity Centre, Glenfield
Civic Amenity Centre, Bunlicky
Company Car Fuel Use
The audit must include 70% of total primary energy use in order to comply. This includes all forms of
energy used, including transport fuel. In this instance MSW is included as energy used by Indaver. The
below table summarises the energy used in each area.
Primary energy includes the energy requirements for the conversion of primary sources of energy into
forms that are useful for the final consumer, for example electricity generation and oil refining. From the
initial analysis it was found the Meath WTE plant uses over 99% of Invader’s energy use. It was thus
concluded that the scope of the assessment would be limited to the WTE plant.
In 2015 the energy used by Indaver resulted in 70,621 tonnes of CO2 being emitted.
Analysis of Energy Use
As the facility runs 24x7, its energy inputs and outputs are relatively constant. The MSW is mixed in the
bunker to ensure an even calorific value is maintained going into the furnace. The below chart shows the
monthly breakdown of the MSW energy input into the system.
Final Energy
Consumpton 2015
(kWh) Electricity Natural Gas Propane Diesel Petrol MSW1 Total Comments
Cork Office 45,936 8,411 26,554 427 81,328
Dublin Office 57,276 72,348 106,833 4,025 240,482 Utility use based on CIBSE floor area benchmark
Dublin Port 412,925 6,922 11,940 431,787
WTE Plant 17,755,000 69,907 2,342,673 389 600,135,876 620,303,845 Elec use is considered as total consumed onsite
Newcastlewest 12,827 12,827 Annualised based on 10 months of data
Kilmallock 10,050 10,050 Annualised based on 10 months of data
Bunlicky 20,846 20,846 Annualised based on 10 months of data
Other Vehicles 709,610 709,610 Vehicles unassigned to a location
Total 18,314,860 80,759 69,907 3,192,592 16,781 600,135,876 621,810,775
1 - Municipal Solid Waste burned in the incinerator

EAS Report Page 4 of 35 PowerTherm Solution©
The site is capable, and has an license to export 19MW of electricity at any time. Although the turbine
generates 21MW, there are site loads of approximately 2MW which reduce the export amount.
As the process of incineration is a specialist area the focus of the audit was around the balance of plant, in
an effort to reduce the site load consumption.
Energy Savings and Conservation Measures
At the early stages of the audit process, meetings were conducted with site staff to establish areas where
scope for energy savings may be possible and to develop a better understanding of the operation of the
facility. Much of the opportunities explored were outside of the core process, in areas where there was
better scope to implement changes. The areas of focus which were agreed upon were:
Heat recovery of boiler blowdown steam
o Steam is blown down to control the level of contaminates in the boiler. The heat from this
steam could be recovered and used to preheat boiler feed water
Compressed air opportunities
o Quantify benefits of reducing supply pressure setpoint
Every 1 bar in pressure reduction produces a 6 – 7 % power saving
o Quantify costs of drying air with subsequent recommendations for improvements
The refrigerated dryers are doing 11% of their rated capacity but they are using
65% of their rated power, indicating they have a very poor part load energy
performance. The measured specific power consumption of the dryer as it is
currently configured is 1.7 kW/m3/min. Their rated specific power consumption is
0.16 kW/m3/min. Allowing a single dryer to handle the air volume requirements
would significantly reduce electricity consumption
It was found that 36% of the compressors air output is used to purge the
regenerating tower of the desiccant dryer due to the fact that they are so oversized.
The measured specific power consumption of the desiccant dryer as it is currently
configured is 9.18 kW/m3/min. Their rated specific power consumption is 0.98
kW/m3/min at current system pressure. A smaller dryer should be installed, or a
dryer that uses the hot discharge gas of the compressor to regenerate the tower
could be purchased
o Investigate effects of exhaust and intake air short circuiting on compressor performance

EAS Report Page 5 of 35 PowerTherm Solution©
A 1% reduction in compressor power consumption can be achieved through a 4 °C
reduction in inlet temperature. The air entering the compressors are significantly
hotter than the ambient air and ductwork modifications are required to remedy this
o Heat recovery possibilities
Up to 85% of the electrical energy supplied to a compressor can be recovered as
heat. This could be recovered to preheat boiler feed water
Free cooling in the VSD MCC Room
o Due to the moderate climate in Ireland, free cooling is possible for a high % of the year.
Ambient air could be used to cool the room when temperatures are below 16oC which is
approximately 80% of the time
Improved control of turbine hall extractor fan
o The fan could be used to maintain a room setpoint temp, rather than running at a fixed
speed. During colder months this would result in savings and the infrastructure to
implement the measure is already in place
Control of Admin Building AHU
o Many control issues were found during the audit. The heating coil appears to be on at the
same time as the cooling coil. The heat being recovered from the boiler hall could be
increased. The AHU runs 24x7 and at night there is only the control room which is occupied
– local ventilation and heating should be considered. The return fan speed should be
ramped rather than using the bypass damper to achieve fan savings. Changes in supply
setpoint control and deadbands were suggested. See section 3.3.8. for more detail
LED lighting and controls upgrades
o Significant savings could be achieved by upgrading the 400W SON and T8 fittings to LED
with daylight controls where appropriate
There were 2no. site visits conducted to investigate these opportunities, take measurements and where
appropriate log electricity power usage of specific pieces of equipment. The detailed analysis can be found
in the body of the report, but below summaries the energy and cost savings calculated.
Note that as some of the measures involved specialist items of equipment budget costs could not be
established for all measures.
Annual Energy Use Potential Savings % Savings Cost Savings Budget Cost Simple Payback
kWh elec kWh elec % € € Years
Heat Recovery from Boiler Blowdown 2,861,050 2,506,775 87.6% 67,285€ TBC
Compressed Air - Reduce Supply Pressure Setpoint 654,810 40,296 6.2% 3,425€ -€ Immediate
Compressed Air - Dryer Energy Saving 319,722 274,589 85.9% 23,340€ TBC
Compressed Air - Exhaust and Intake Air Cross Circuiting 654,810 15,388 2.4% 1,308€ 17,500€ 13.4
Compressed Air - Heat Recovery 625,098 500,078 80.0% 13,423€ TBC
VSD MCC Room Free Cooling 141,309 113,434 80.3% 9,642€ 50,000€ 5.2
Turbine Hall Extract Fan Control 157,680 81,468 51.7% 6,478€ -€ Immediate
Admin Building AHU Controls 116,360 9,891€ 15,000€ 1.5
LED Lighting and Controls Upgrade 654,012 454,822 69.5% 38,660€ 59,000€ 1.5
Total 4,103,210 173,451€

PowerThermSOLUTIONS
CEO/Senior Dir ign Off
Cn*r- ã=^ss
QSdr-tuq- 6*lc".sl^vc D,^ø¡orn-
Signature:
Name:
Position
Date: t/"" /bt?
EAS Report Page 6 of 35 PowerTherm Solution(0

EAS Report Page 7 of 35 PowerTherm Solution©
Table of Contents
1. INTRODUCTION........................................................................................................................................................ 8
1.1. CORPORATE STRUCTURE & SCOPE OF AUDIT ..................................................................................................................... 8
2. ANALYSIS OF ENERGY CONSUMPTION & PERFORMANCE ........................................................................................ 8
2.1. INTRODUCTION ............................................................................................................................................................ 8
2.2. FACILITIES AND UTILITY SUPPLY POINTS ............................................................................................................................ 8
2.3. FINAL ENERGY CONSUMPTION ........................................................................................................................................ 9
2.4. PRIMARY ENERGY CONSUMPTION ................................................................................................................................. 10
2.5. ENERGY COSTS .......................................................................................................................................................... 11
2.6. GREENHOUSE GAS (CO2) EMISSIONS ............................................................................................................................. 11
2.7. SCOPE OF DETAILED SURVEY ........................................................................................................................................ 12
3. DETAILED ENERGY SURVEY OF THE MEATH WTE FACILITY ..................................................................................... 13
3.1. INTRODUCTION .......................................................................................................................................................... 13
3.2. ANALYSIS OF ENERGY USE ........................................................................................................................................... 13
3.3. ENERGY SAVINGS AND CONSERVATION MEASURES ........................................................................................................... 14
3.3.1. Heat Recovery from Boiler Blowdown .......................................................................................................... 15
3.3.2. Compressed Air – Reduce Supply Pressure Setpoint ..................................................................................... 16
3.3.3. Compressed Air – Dryer Energy Use and Opportunities ............................................................................... 18
3.3.4. Compressed Air – Exhaust and Intake Air Cross Circuiting ........................................................................... 22
3.3.5. Compressed Air – Heat Recovery .................................................................................................................. 23
3.3.6. VSD MCC Room Free Cooling ........................................................................................................................ 25
3.3.7. Turbine Hall Extract Fan Control .................................................................................................................. 27
3.3.8. Admin Building AHU Control ........................................................................................................................ 27
3.3.9. LED Lighting and Controls Upgrade .............................................................................................................. 31
APPENDIX A – WELL WATER CONTROL ENERGY SAVING TESTING METHODOLOGY ........................................................ 33
APPENDIX B – REFRIGERATED DRYER SPEC SHEET .......................................................................................................... 34
APPENDIX C – DESICCANT DRYER SPEC. SHEET ............................................................................................................... 35
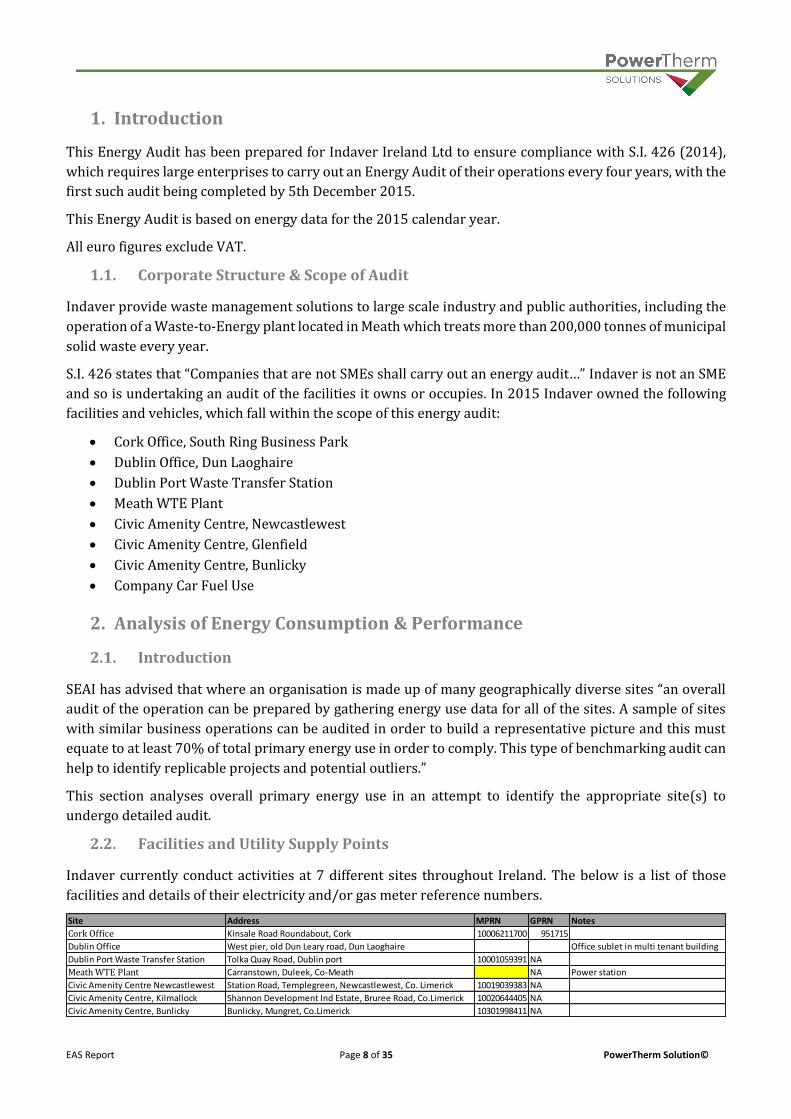
EAS Report Page 8 of 35 PowerTherm Solution©
1. Introduction
This Energy Audit has been prepared for Indaver Ireland Ltd to ensure compliance with S.I. 426 (2014),
which requires large enterprises to carry out an Energy Audit of their operations every four years, with the
first such audit being completed by 5th December 2015.
This Energy Audit is based on energy data for the 2015 calendar year.
All euro figures exclude VAT.
1.1. Corporate Structure & Scope of Audit
Indaver provide waste management solutions to large scale industry and public authorities, including the
operation of a Waste-to-Energy plant located in Meath which treats more than 200,000 tonnes of municipal
solid waste every year.
S.I. 426 states that “Companies that are not SMEs shall carry out an energy audit…” Indaver is not an SME
and so is undertaking an audit of the facilities it owns or occupies. In 2015 Indaver owned the following
facilities and vehicles, which fall within the scope of this energy audit:
Cork Office, South Ring Business Park
Dublin Office, Dun Laoghaire
Dublin Port Waste Transfer Station
Meath WTE Plant
Civic Amenity Centre, Newcastlewest
Civic Amenity Centre, Glenfield
Civic Amenity Centre, Bunlicky
Company Car Fuel Use
2. Analysis of Energy Consumption & Performance
2.1. Introduction
SEAI has advised that where an organisation is made up of many geographically diverse sites “an overall
audit of the operation can be prepared by gathering energy use data for all of the sites. A sample of sites
with similar business operations can be audited in order to build a representative picture and this must
equate to at least 70% of total primary energy use in order to comply. This type of benchmarking audit can
help to identify replicable projects and potential outliers.”
This section analyses overall primary energy use in an attempt to identify the appropriate site(s) to
undergo detailed audit.
2.2. Facilities and Utility Supply Points
Indaver currently conduct activities at 7 different sites throughout Ireland. The below is a list of those
facilities and details of their electricity and/or gas meter reference numbers.
Site Address MPRN GPRN Notes
Cork Office Kinsale Road Roundabout, Cork 10006211700 951715
Dublin Office West pier, old Dun Leary road, Dun Laoghaire Office sublet in multi tenant building
Dublin Port Waste Transfer Station Tolka Quay Road, Dublin port 10001059391 NA
Meath WTE Plant Carranstown, Duleek, Co-Meath NA Power station
Civic Amenity Centre Newcastlewest Station Road, Templegreen, Newcastlewest, Co. Limerick 10019039383 NA
Civic Amenity Centre, Kilmallock Shannon Development Ind Estate, Bruree Road, Co.Limerick 10020644405 NA
Civic Amenity Centre, Bunlicky Bunlicky, Mungret, Co.Limerick 10301998411 NA

EAS Report Page 9 of 35 PowerTherm Solution©
The Dublin Office is a single floor of a multi-tenant building and the utility consumption is not sub-metered
and is charged on a pro rata basis. Therefore there are no meter reference numbers associated with it.
2.3. Final Energy Consumption
The propane, diesel and petrol usage was broken out per site where possible. Not every vehicle was based
at a particular site and so the usage associated with these were designated as ‘Other Vehicles’.
The utility usage for the Dublin office was estimated based on its floor area which was obtained from floor
plan drawings1 and CIBSE benchmark figures2 as follows. The landlord could not provide the energy
consumption details that were requested so this approach was taken.
A stacked bar chart showing the energy used per site can be seen as follows.
1 Drawing number 5923-001 – BKD Architects 2 Energy benchmarks, TM46:2008, Table 1(b)
Final Energy
Consumpton 2015
(kWh) Electricity Natural Gas Propane Diesel Petrol MSW1 Total Comments
Cork Office 45,936 8,411 26,554 427 81,328
Dublin Office 57,276 72,348 106,833 4,025 240,482 Utility use based on CIBSE floor area benchmark
Dublin Port 412,925 6,922 11,940 431,787
WTE Plant 17,755,000 69,907 2,342,673 389 600,135,876 620,303,845 Elec use is considered as total consumed onsite
Newcastlewest 12,827 12,827 Annualised based on 10 months of data
Kilmallock 10,050 10,050 Annualised based on 10 months of data
Bunlicky 20,846 20,846 Annualised based on 10 months of data
Other Vehicles 709,610 709,610 Vehicles unassigned to a location
Total 18,314,860 80,759 69,907 3,192,592 16,781 600,135,876 621,810,775
1 - Municipal Solid Waste burned in the incinerator
Office area 602.9 m2
Electricity typical Benchmark 95 kWh/m2
Fossil Fuel typical Benchmark 120 kWh/m2
Estimated Electricity Use 57,276 kWh
Estimated Gas Use 72,348 kWh

EAS Report Page 10 of 35 PowerTherm Solution©
2.4. Primary Energy Consumption
Under the EU Energy Efficiency Directive (2012/27/EU) that has been imposed into Irish Law through the
guidance of the Sustainable Energy Authority of Ireland (SEAI), it is required that the Energy Audit must
cover at least 70% of the Primary Energy Consumption. Primary Energy consumption evaluates the energy
that is consumed at the source and the energy needed to transport to the end user. For the generation and
transmission of electricity, losses are incurred at the generation station and in the losses of transmitting
the electricity through the network. As generating station and transmission distribution become more
efficient, the losses are reduced.
The Final Energy Consumption of Electricity, Gas and Diesel, when multiplied by the primary energy
conversion factors3 results with the Primary Energy Consumption breakdown as tabulated below.
The above table and below chart shows that the Meath Waste to Energy plant consumes over 99% of the
primary energy used by Indaver in Ireland. It was therefore concluded that the scope of the audit would be
limited to this location.
3 Source: SEAI
Primary Energy
Consumpton 2015
(kWh) Electricity Natural Gas Propane Diesel Petrol MSW Total Comments
Cork Office 100,140 9,252 - 26,554 427 - 136,374
Dublin Office 124,861 79,583 - 106,833 4,025 - 315,302 Utility use based on CIBSE floor area benchmark
Dublin Port 900,177 - - 6,922 11,940 - 919,039
WTE Plant 38,705,900 - 69,907 2,342,673 389 600,135,876 641,254,745 Elec use is considered as total consumed onsite
Newcastlewest 27,962 - - - - - 27,962 Annualised based on 10 months of data
Kilmallock 21,909 - - - - - 21,909 Annualised based on 10 months of data
Bunlicky 45,445 - - - - - 45,445 Annualised based on 10 months of data
Other Vehicles - - - 709,610 - - 709,610 Vehicles unassigned to a location
Total 39,926,394 88,835 69,907 3,192,592 16,781 600,135,876 643,430,385

EAS Report Page 11 of 35 PowerTherm Solution©
2.5. Energy Costs
Energy costs are tabulated below.
Note MSW is not purchased as a fuel and so its value has been left blank.
The assumed Average Utility Prices (AUPs) used to establish costs are as follows:
The AUP for electricity generated and used on the Meath site has a value of 0.085 €/kWh as this is the
average price paid for export of electricity, as advised by the client. This electricity is not bought from the
grid, hence the lower value.
2.6. Greenhouse Gas (CO2) Emissions
Greenhouse gases are produced in the generation of electricity and the combustion of other fuels. This
contributes to global warming. The below table shows the amount of greenhouse gases produced by
Indaver in Ireland.
Note that there was no emissions factor available from SEAI for the combustion of MSW at the time of
writing. In order to arrive at a figure for MSW emissions the total amount of electricity exported was used
and multiplied by the relevant factor.
The emissions factors used are as follows:
Energy Cost 2015 (€) Electricity Natural Gas Propane Diesel Petrol MSW Total Comments
Cork Office 8,268€ 378€ -€ 3,135€ 60€ 11,842€
Dublin Office 10,310€ 3,256€ -€ 12,612€ 565€ 26,742€ Utility use based on CIBSE floor area benchmark
Dublin Port 74,327€ -€ -€ 817€ 1,675€ 76,818€
WTE Plant 1,509,175€ -€ 8,389€ 276,558€ 55€ -€ 1,794,176€ MSW is not purchased
Newcastlewest 2,309€ -€ -€ -€ -€ 2,309€ Annualised based on 10 months of data
Kilmallock 1,809€ -€ -€ -€ -€ 1,809€ Annualised based on 10 months of data
Bunlicky 3,752€ -€ -€ -€ -€ 3,752€ Annualised based on 10 months of data
Other Vehicles -€ -€ -€ 83,771€ -€ 83,771€ Vehicles unassigned to a location
Total 1,609,950€ 3,634€ 8,389€ 376,892€ 2,354€ -€ 2,001,219€
Fuel Types AUP (€/kWh) Notes
WTE Plant Elec 0.085 advised by client
General Elec 0.18 SEAI commerical fuel cost comparision Oct 2016
Gas 0.045 SEAI commerical fuel cost comparision Oct 2016
Propane 0.12 SEAI commerical fuel cost comparision Oct 2016
Diesel 0.12 Based on cost per L of €1.2
Petrol 0.14 Based on cost per L of €1.3
Emissions 2015 (Tonnes
CO2) Electricity Natural Gas Propane Diesel Petrol MSW Total Comments
Cork Office 21.0 1.7 - 7.0 0.1 29.8
Dublin Office 26.2 14.8 - 28.2 1.0 70.2 Utility use based on CIBSE floor area benchmark
Dublin Port 188.5 - - 1.8 3.0 193.4
WTE Plant 8,106.9 - 8.4 618.2 0.1 61,387.6 70,121.2 MSW is based on elec export of 134,445,000 kWh
Newcastlewest 5.9 - - - - 5.9 Annualised based on 10 months of data
Kilmallock 4.6 - - - - 4.6 Annualised based on 10 months of data
Bunlicky 9.5 - - - - 9.5 Annualised based on 10 months of data
Other Vehicles - - - 187.3 - 187.3 Vehicles unassigned to a location
Total 8,362.6 16.5 8.4 842.5 4.2 61,387.6 70,621.8
Fuel Types kg CO2/kWh Notes
Electricity (2014) 0.457 SEAI Emissions Factors
Gas 0.205 SEAI Emissions Factors
Propane 0.229 SEAI Emissions Factors
Diesel 0.264 SEAI Emissions Factors
Petrol 0.252 SEAI Emissions Factors

EAS Report Page 12 of 35 PowerTherm Solution©
2.7. Scope of Detailed Survey
The guidance supplied by the SEAI for conducting an Energy Audit is that is must cover at least 70% of the
total primary energy used by the organization as a whole in order to comply with the law.
Based on the analysis of primary energy use in Section 2.4, it was decided to focus the audit on energy use
by the WTE facility in Meath. The energy audit will therefore cover 99% of primary energy.

EAS Report Page 13 of 35 PowerTherm Solution©
3. Detailed Energy Survey of the Meath WTE Facility
3.1. Introduction
The WTE facility in Duleek, Co. Meath processes approximately 230,000 tonnes of waste on an annual basis
and exports 19MW of electricity to the grid, using 2MW on the site on a continual basis (except planned
maintenance shutdowns). It treats the waste in a boiler to generate steam to be used in a turbine to produce
electricity.
3.2. Analysis of Energy Use
As the facility runs 24x7, its energy inputs and outputs are relatively constant. The MSW is mixed in the
bunker to ensure an even calorific value is maintained going into the furnace. The below chart shows the
monthly breakdown of the MSW energy input into the system.
The site is capable, and has a license to export 19MW of electricity at any time. Although the turbine
generates 21MW, there are site loads of approximately 2MW which reduce the export amount.
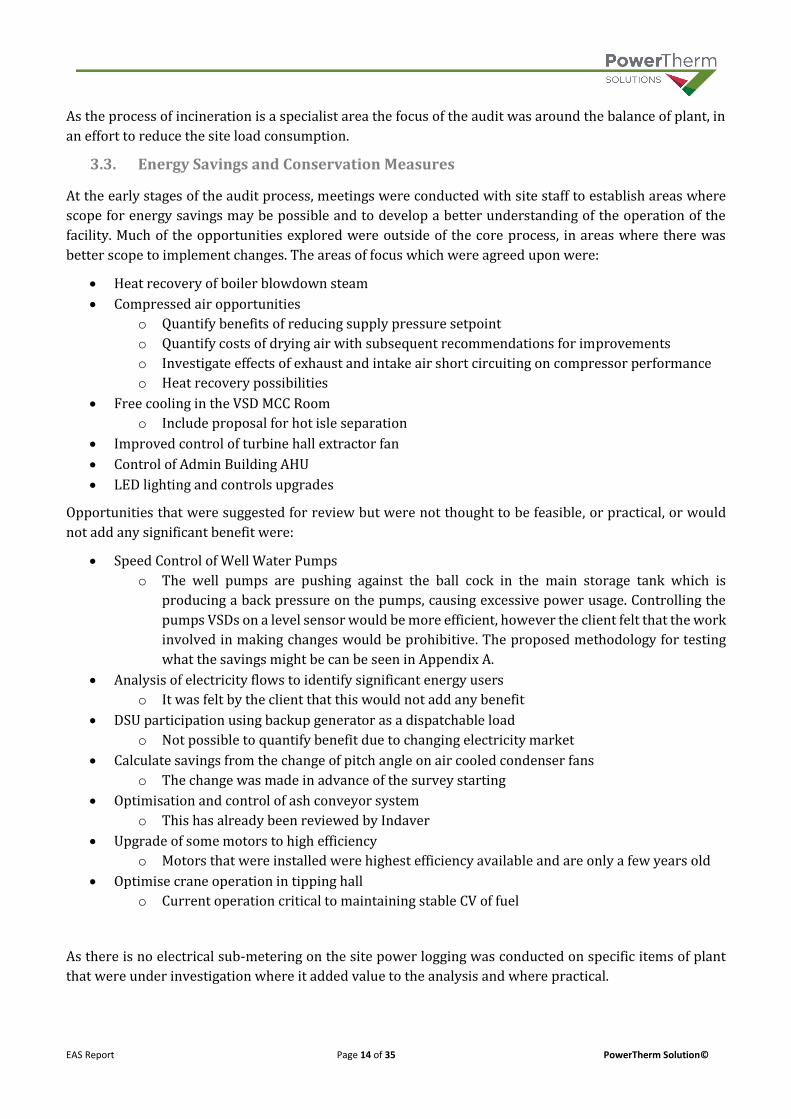
EAS Report Page 14 of 35 PowerTherm Solution©
As the process of incineration is a specialist area the focus of the audit was around the balance of plant, in
an effort to reduce the site load consumption.
3.3. Energy Savings and Conservation Measures
At the early stages of the audit process, meetings were conducted with site staff to establish areas where
scope for energy savings may be possible and to develop a better understanding of the operation of the
facility. Much of the opportunities explored were outside of the core process, in areas where there was
better scope to implement changes. The areas of focus which were agreed upon were:
Heat recovery of boiler blowdown steam
Compressed air opportunities
o Quantify benefits of reducing supply pressure setpoint
o Quantify costs of drying air with subsequent recommendations for improvements
o Investigate effects of exhaust and intake air short circuiting on compressor performance
o Heat recovery possibilities
Free cooling in the VSD MCC Room
o Include proposal for hot isle separation
Improved control of turbine hall extractor fan
Control of Admin Building AHU
LED lighting and controls upgrades
Opportunities that were suggested for review but were not thought to be feasible, or practical, or would
not add any significant benefit were:
Speed Control of Well Water Pumps
o The well pumps are pushing against the ball cock in the main storage tank which is
producing a back pressure on the pumps, causing excessive power usage. Controlling the
pumps VSDs on a level sensor would be more efficient, however the client felt that the work
involved in making changes would be prohibitive. The proposed methodology for testing
what the savings might be can be seen in Appendix A.
Analysis of electricity flows to identify significant energy users
o It was felt by the client that this would not add any benefit
DSU participation using backup generator as a dispatchable load
o Not possible to quantify benefit due to changing electricity market
Calculate savings from the change of pitch angle on air cooled condenser fans
o The change was made in advance of the survey starting
Optimisation and control of ash conveyor system
o This has already been reviewed by Indaver
Upgrade of some motors to high efficiency
o Motors that were installed were highest efficiency available and are only a few years old
Optimise crane operation in tipping hall
o Current operation critical to maintaining stable CV of fuel
As there is no electrical sub-metering on the site power logging was conducted on specific items of plant
that were under investigation where it added value to the analysis and where practical.

EAS Report Page 15 of 35 PowerTherm Solution©
3.3.1. Heat Recovery from Boiler Blowdown
As water is boiled within the boiler, and steam is produced, impurities in the feed water concentrate in the
boiler water. The concentration of these impurities is called Total Dissolved Solids (TDS). These impurities
need to be removed to ensure good quality dry steam is produced.
There are many ways of controlling the removal of these impurities. Indaver have adopted the method of
periodic blowdown for a set time period. Other, more efficient methods involve continual controlled
blowdown with a flowrate based on the % of TDS present in the boiler. Generally speaking this results in
less steam blowdown over the course of a day as it is based on actual requirements, meaning less heat is
sent to drain.
The current regime involves a 10 minute blowdown, three times a day. The blowdown is injected into a
flash vessel at 250°C (50 Barg) where it is mixed with process water until a temperature of 60 °C is achieved.
The mixed water is then sent to the ‘clean water pit’. The associated volumes of water are not all measured
and the only detail that is recorded is the total boiler daily makeup water which includes trap losses as well
as blowdown. This volume is typically 26,000 litres a day.
Up to 75% of the heat in blowdown water can typically be recovered (50% from the flash stem and 25%
from the remaining water)4. The flash steam is clean and can be injected back into the boiler feedwater
tank and the remaining, hot water can be passed through a heat exchanger to recover heat from it. The
below diagram shows an indicative schematic of such an arrangement.
As the blowdown is periodic it is necessary to install a break tank with a circulating pump which is operated
on a thermostat to take the heat when it becomes available.
Savings
The SEAI figures are approximate, and a more accurate savings figure can be achieved by using the actual
enthalpies of steam at the relevant points in the system.
4 Source - SEAI

EAS Report Page 16 of 35 PowerTherm Solution©
This analysis shows that up to 88% of the blowdown heat can be recovered and used to heat boiler
feedwater. To put a value on this it is easier to consider this saving in terms of potential additional
generation capacity. Trying to put a value on offset MSW does not work in this situation as Indaver are paid
to receive the waste.
The calculated system efficiency (Electricity generated / MSW energy input) for 2015 was 25.3%. To
convert heat savings from blowdown to MSW fuel savings a boiler efficiency of 80% was used. The below
calculation shows that the system could potentially deliver an additional 791,586 kWh of electricity for the
same MSW fuel input.
Estimation of budget costs for this measure are not provided as this is specialised work that Indaver would
need to be involved in pricing.
3.3.2. Compressed Air – Reduce Supply Pressure Setpoint
There are 3no. compressors on the site, two of which are fixed speed and one is variable speed. The VSD
controlled compressor acts as the lead and is typically 40% loaded.
Every 1 bar in pressure reduction produces a 6 – 7 % power saving5. The spec sheet for the variable speed
compressor provides details on specific power consumption as per the below chart.
5 SEAI, Energy Agreements Programme 2007 – Compressed Air Technical Guide
Enthalpy of blowdown at 50barg, 250degC hf 1,085 kJ/kg
Enthalpy of water at 1.7 barg hf 547 kJ/kg
hg 2,721 kJ/kg
hfg 2,174 kJ/kg
Enthalpy of water at 0 barg, saturation temp hf 419 kJ/kg
Enthalpy of water at 0 barg, 12degC hf 50 kJ/kg
% of total blowdown mass flow rate as flash steam 24.8%
Mass flowrate flash steam 2,349,862 kg/year
Energy recoverable from flash steam 1,775,888 kWh/year 62% of total heat available for recovery
Mass flowrate of contaminated blowdown water 7,140,138 kg/year
Energy in contaminated water 419 kJ/kg
Enthalpy of water at 12deg 50 kJ/kg
Energy available to heat makeup water 369 kJ/kg
Energy recoverable from condensate 730,887 kWh/year 26% of total heat available for recovery
Total energy available 2,861,050 kWh/year
Total energy recoverable 2,506,775 kWh/year 88% of total heat available for recovery
Electricity generated and used onsite 17,163,000 kWh
Electricity exported 134,445,000 kWh
Total electricity generated 151,608,000 kWh
MSW fuel used 600,135,876 kWh
System efficiency 25.3%
Heat recovered from blowdown 2,506,775 kWh
Assumed Boiler Efficiency 80%
Increased potential electrical output 791,586 kWh
Value of increased output 67,285€
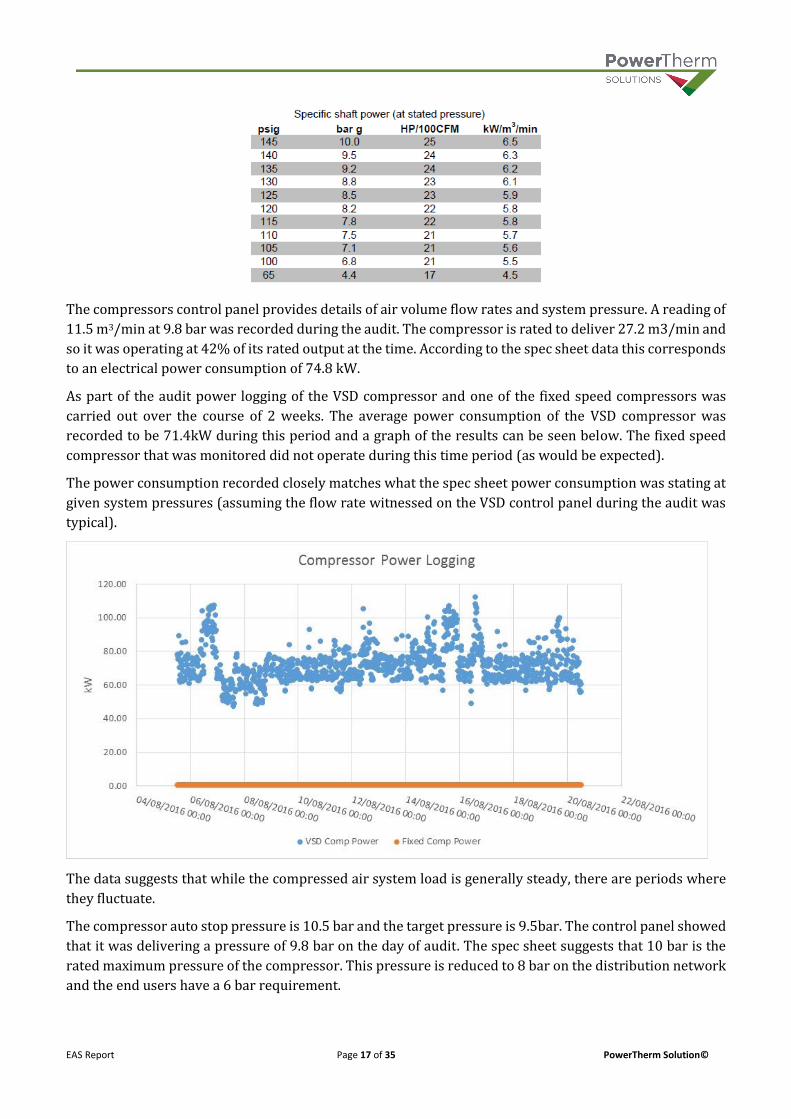
EAS Report Page 17 of 35 PowerTherm Solution©
The compressors control panel provides details of air volume flow rates and system pressure. A reading of
11.5 m3/min at 9.8 bar was recorded during the audit. The compressor is rated to deliver 27.2 m3/min and
so it was operating at 42% of its rated output at the time. According to the spec sheet data this corresponds
to an electrical power consumption of 74.8 kW.
As part of the audit power logging of the VSD compressor and one of the fixed speed compressors was
carried out over the course of 2 weeks. The average power consumption of the VSD compressor was
recorded to be 71.4kW during this period and a graph of the results can be seen below. The fixed speed
compressor that was monitored did not operate during this time period (as would be expected).
The power consumption recorded closely matches what the spec sheet power consumption was stating at
given system pressures (assuming the flow rate witnessed on the VSD control panel during the audit was
typical).
The data suggests that while the compressed air system load is generally steady, there are periods where
they fluctuate.
The compressor auto stop pressure is 10.5 bar and the target pressure is 9.5bar. The control panel showed
that it was delivering a pressure of 9.8 bar on the day of audit. The spec sheet suggests that 10 bar is the
rated maximum pressure of the compressor. This pressure is reduced to 8 bar on the distribution network
and the end users have a 6 bar requirement.

EAS Report Page 18 of 35 PowerTherm Solution©
The system contains large receivers which are used to buffer demand peaks and ensure reliable operation
of equipment. If these receivers, and system pipework are sized to deal with much larger flow rates than
what is being witnessed, then this means that there should be scope for pressure reduction while
maintaining reliable operation of equipment.
Savings
If the pressure setpoint could be safely reduced to 8.8 bar (2.8 bar above the requirement of the equipment)
it would result in annual savings of 40,100 kWh, saving €3,400. Further reduction in pressures may be
possible but any changes should be made incrementally. There is no capital expenditure required for this
measure.
3.3.3. Compressed Air – Dryer Energy Use and Opportunities
Broadly speaking the compressed air system serves three separate circuits:
Compressed air – Not dried
Plant air – Dried using a refrigeration circuit to a dew point of 3 °C
Instrument air – Once passed through the refrigerated drier, it is passed through a desiccant dryer
to a dew point of -40 °C
The first step in this analysis was to establish the cost of refrigeration per m3 of compressed air and map
the air flows. There is air flow meters on the system which is logged on the DCS (Distributed Control
System). The below simple schematic shows typical flow rates through the system as found on the day of
audit. It also shows the % of total flow at each point and the equipment rated capacity.
Specific energy use at 10 bar 6.5 kW/m3/min
Specific energy use at 8.8 bar 6.1 kW/m3/min
Volume flow rate 11.5 m3/min
Annual run hours 8,760
Current annual energy use at 9.2 bar 654,810
Annual energy use at 8.2 bar 614,514
Saving kWh 40,296
Saving € 3,425€

EAS Report Page 19 of 35 PowerTherm Solution©
Refrigerated Dryers
There are 2 dryers installed and both are running at the same time. The power consumption of both dryers
was logged over the course of a week and the results are as follows
The results show that both dryers have a steady power consumption throughout the course of the week.
There were small fluctuations on the 15th and 16th of August which corresponds to the fluctuations in the
compressor power on those dates (see section 3.3.2).
An important observation is that the combined capacity of the dryers is 84 m3/min, while on the day of the
audit the requirement was 9.2 m3/min meaning they are only 11% loaded. However, the combined average
power consumption over the week of logging was 9 kW, while the combined nominal power consumption
is 13.8 kW from the spec sheet. So while they are doing 11% of their rated capacity they are using 65%
of their rated power, indicating they have a very poor part load energy performance. The spec for
this dryer can be seen in Appendix B.
The measured specific power consumption of the dryer as it is currently configured is 1.7
kW/m3/min. Their rated specific power consumption is 0.16 kW/m3/min.

EAS Report Page 20 of 35 PowerTherm Solution©
Savings
A simple measure which could be performed is to simply put one of the dryers into standby as a single
dryer would be sufficient to deal with the load and its energy consumption would only increase a small
amount. The measure could save up to 42,000 kWh of electricity. This would reduce the specific power
consumption of the dryers by almost 50%. This requires no capital investment.
It should also be noted that Indaver are experiencing issues on their compressed air lines from water in the
untreated air. This analysis seems to suggest that increasing the load on the refrigerated dryer by 2m3/min
will not have a significant effect on energy consumption and so reconfiguration of the pipework to dry the
compressed air line may be worth considering.
Desiccant Dryers
Desiccant dryers are used where the end compressed air user requires a high quality, dry air. There are
many types of desiccant dryers, but the ones installed at Indaver are known as heatless dryers and are one
of the more basic models available with low initial capital costs but higher operational costs. They are
capable of delivering air with a dew point of -40 °C. Indaver have 2 dryers, but only operate one at a time.
Like all desiccant dryers, the units at Indaver have 2 towers filled with a desiccant material which absorbs
moisture. Heatless dryers rely on dried air from the drying tower to purge the regenerating tower. This
purged, wet air is then blown out to atmosphere. The below sketch describes the basic operating principles.
The spec of the existing desiccant dryer can be seen on Appendix C.
Each of the dryer’s onsite have the capacity to dry 28.2 m3/min of compressed air. The spec sheet also
notes that the nominal purge rate for the regenerating tower is 15% of total capacity, or 4.23 m3/min.
However, the demand for instrument air at the time of audit was only 3m3/min which indicates the towers

EAS Report Page 21 of 35 PowerTherm Solution©
are significantly oversized. It also appears that by subtraction of the measured end user airflow
requirements from the overall compressor output there is 4.2 m3/min of air unaccounted for. This is the
same as the nominal purge flow rate of the dryer and indicates that the purge function is a time based
operation, not condition based. This means that 36% of the compressors output from the compressor
is used to purge the regenerating tower.
The measured specific power consumption of the desiccant dryer as it is currently configured is
9.18 kW/m3/min. Their rated specific power consumption is 0.98 kW/m3/min at current system
pressure.
Savings
As mentioned previously there are other models of desiccant dryer that are more efficient. The most
efficient type of desiccant dryer is a ‘Waste Heat Regenerative Dryer’. Its principle of operation as described
from a Spirax Sarco brochure is as follows. It does not require any compressed air to be purged and instead
uses a water cooled heat exchanger to remove moisture from the air.
This system would require some pipework reconfiguration so that the refrigerated dryer is bypassed
allowing hot compressed air to be sent to the desiccant dryer and a water cooled heat exchanger would be
required. However, the annual savings from this measure would be 232,600 kWh, or €19,700.

EAS Report Page 22 of 35 PowerTherm Solution©
A less capital intensive alternative solution would be to replace the existing standby dryer with a more
appropriately sized heatless dryer. This smaller unit could then be made the lead dryer. Ingersoll Rand
supply a unit with a 3.4 m3/min capacity which would require a purge rate of 0.5 m3/min, an 88% saving.
This would result in annual savings of 210,000 kWh, or €18,000.
It should also be noted that the desiccant material in these dryers must be changed periodically. This is a
costly maintenance procedure and so presents an opportunity to replace the unit entirely with a smaller
one at this time and offset the cost of this maintenance against this. Subsequent maintenance costs would
also be reduced as the volume of desiccant in this unit would be lower, costing less to replace.
3.3.4. Compressed Air – Exhaust and Intake Air Cross Circuiting
Compressors should be located in a well ventilated area, or capable of drawing inlet air from ambient
conditions where possible. A 1% reduction in compressor power consumption can be achieved through a
4 °C reduction in inlet temperature6.
At the Indaver site the inlet temperature of the air being compressed at the day of audit was measured at
27.4 °C, on a day when ambient conditions were 18 °C. This is a difference of 9.4 °C and as a result the
compressor was drawing 2.4% more power than required.
The cause of this short circuiting of hot air to the inlet of the compressor is from 3 sources:
1. The air which is used to cool the compressor is blown out of a grille which is very close to the
compressor inlet grille on the exterior of the building. There is also another discharge grille from
the turbine hall extract fan which is nearby. Hot discharge air is likely being drawn in the inlet
grilles.
2. Inside the compressor plant room there is a motorised damper on a branch off the main extract
duct. Its intent appears to be to let hot air into the plantroom to prevent against frost damage as the
room has large grilles along one side and so is open to atmosphere. The below screenshot of the
BMS shows a room setpoint of 2 °C and the damper position as being fully closed. The room
temperature is shown as being 24.6 °C. However, on visual inspection of the damper from ground
level it appears to be partially open allowing hot discharge air into the room.
3. Hot air from the lead VSD compressor is flowing out of the 2 fixed speed compressors which are off.
They are all connected on the same ductwork header but there is no dampers in place to isolate
them when they are off. This means hot air is escaping out of the inlets of the fixed speed
compressors and short circuiting into the lead compressor inlet.
6 SEAI Energy Agreements Programme 2007, Compressed Air Technical Guide
% of compressor power required (from spec) 5%
Specific comp energy use at 10 bar 6.5 kW/m3/min
Annual energy requirement of proposed dryer 0.325 kW/m3/min
Measured average dryer demand 3 m3/min
Power required 0.975 kW
Annual energy use 8,541
Origional annual dryer energy use 241,141
Saving (kWh) 232,600
Saving (€) 19,771€

EAS Report Page 23 of 35 PowerTherm Solution©
In order to prevent this short circuiting:
1. The damper which does not appear to be fully closing should be examined and the issue rectified.
2. Each compressor should have a motorised damper which would enable it to be isolated from the
main header when offline.
3. Consider supplying the hot air up into the boiler hall rather than out through external cladding.
This may have a knock on positive effect of raising the secondary air temperature which is taken
from the top of the hall, improving combustion efficiency.
Savings
The potential savings from these actions is 15,400 kWh or €1,300. The budget cost to implement the
recommendations are:
1. Repair the faulty damper - €1,000 (depending on issue identified)
2. Install motorised dampers and alter controls - €9,500
3. Re-route ductwork into the boiler hall - €7,000
A summary of the calculations can be seen as follows:
3.3.5. Compressed Air – Heat Recovery
Up to 85% of the electrical energy supplied to a compressor can be recovered as heat. The below Sankey
diagram illustrates the energy flow of a typical compressor system.
Inlet temp measured on day of test 27.4 oC
Ambient 18 oC
Difference 9.4 oC
% reduction in power usage 2.4%
Saving (kWh) 15,388
Saving (€) 1,308€
Total cost to impliment changes (€) 17,500€
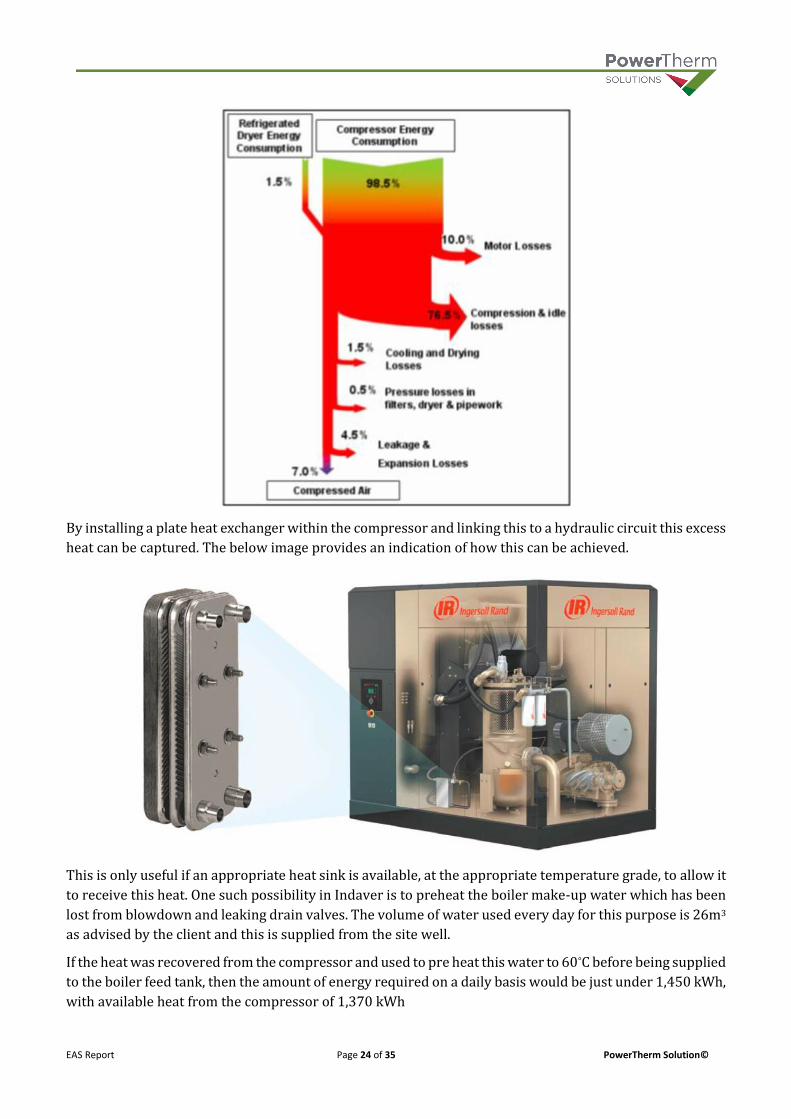
EAS Report Page 24 of 35 PowerTherm Solution©
By installing a plate heat exchanger within the compressor and linking this to a hydraulic circuit this excess
heat can be captured. The below image provides an indication of how this can be achieved.
This is only useful if an appropriate heat sink is available, at the appropriate temperature grade, to allow it
to receive this heat. One such possibility in Indaver is to preheat the boiler make-up water which has been
lost from blowdown and leaking drain valves. The volume of water used every day for this purpose is 26m3
as advised by the client and this is supplied from the site well.
If the heat was recovered from the compressor and used to pre heat this water to 60°C before being supplied
to the boiler feed tank, then the amount of energy required on a daily basis would be just under 1,450 kWh,
with available heat from the compressor of 1,370 kWh

EAS Report Page 25 of 35 PowerTherm Solution©
If this heat was recovered to the system the potential additional electricity that could be generated for the
same MSW input would be 158,000 kWh, with a value of €13,400.
3.3.6. VSD MCC Room Free Cooling
The VSD MCC room is currently cooled by:
1no. Edpac Upflow unit with twin 50kW (100kW of total cooling capacity) circuits with fixed
compressor speed.
2no. Mitsubishi ducted ceiling units, each with 25kW capacity (cooling), inverter driven. Added
after the facility was constructed.
The power consumption of these units was logged over the course of a week at 15 minute intervals. The
results are as follows:
Based on a notional COP of 3 for the Edpac, and 3.5 for the Mitsubishi units, the total cooling load for the
room is approximately 42kW. These COPs are estimates and were used to get an order of magnitude cooling
load to see if the cooling units were appropriately sized. This does indicate that the Edpac unit should have
enough capacity to cool the room on its own with full redundancy as was the original design intent, but the
distribution of airflow is not ideal which restricts its effectiveness and this will be discussed later.
% of heat recoverable from compressor 80%
Average compressor power input (kW) 71.4
Daily heat available (kWh) 1,370
Daily makeup water volume (Litres) 26,000
Temp lift - 12 to 60 (oC) 48
Energy required to raise water temp (kWh) 1,449
Note supply and demand are approximately equal
Annual recoverable heat (kWh) 500,078

EAS Report Page 26 of 35 PowerTherm Solution©
The graph shows that the load is relatively stable and it also demonstrates the difference between an
inverter driven compressor and a fixed speed unit. The Mitsubishi units have a much smoother power
consumption profile, while the Edpac has a ‘choppy’ profile as a result of compressors kicking in and out.
One way of reducing the cooling power consumption in the room is to use ambient air to ‘free cool’ in times
where the ambient air temperatures are below 16 °C. Ambient air could be drawn in through an opening in
the back wall of the room, behind where the existing Edpac unit is. The hot return air could be blown up
through the above slab, into the boiler hall. The below sketch shows a typical configuration.
Due to the moderate climate in Ireland, free cooling is possible for a high % of the year. Based on 2014
weather data, the number of hours the weather was below 16 °C was 7,030 hours, or 80% of the time. The
potential electrical savings from installing a free cooling unit, and using the Mitsubishi units as standby
units only, would be approximately 113,000 kWh, or €9,600.
The budget cost to supply and install 2no. 50kW free cooling Edpac units is €60,000. These units can also
incorporate humidly control if required.
The configuration shown is a downflow unit, with cold air being supplied at low level. This is better than
supplying cold air at high level and drawing in hot air at low level as is currently the case. The racks and
panels are designed to draw in air at low level with their own fan and dump hot air to high level. By
supplying cold air at low level this helps deliver the cold air to where it is required. The hot air at the top of
the units should be ducted back to the Edpac to prevent short circuiting of cold supply to hot return. This
will improve the performance of the cooling system and improve the distribution of airflow.
It is also recommended that the return air be ducted from the VSDs back to the Edpac unit, provide proper
hot aisle / cold aisle separation. This is best practice and will ensure the Edpac units can operate at the
highest acceptable temperature, thereby minimising energy use.
Mechanical dampers will have to be installed on any new openings to the room due to the presence of an
Inergen gas suppression system. When an alarm is activated the dampers would have to close to prevent
the escape of this gas.

EAS Report Page 27 of 35 PowerTherm Solution©
3.3.7. Turbine Hall Extract Fan Control
The Turbine Hall and the Steam & Condensate Area are cooled by a large fan which draws out hot air
through ductwork at high level and passively pulls air in from outside through openings in the building
fabric.
This fan is connected to the BMS and the room temperatures are monitored but the fan does not appear to
be controlled, and is running at a constant speed of 50 Hz, drawing 18 kW of power according to its VSD.
The fan is at full speed, although he BMS is providing a 75% signal – this requires some investigation to
determine why this is.
The room temperatures at the time of audit as can be seen in the above screenshots was 29.5 and 27.3 °C
respectively. The ambient air temperature was approximately 18 °C.
If the strategy was changed to control the fan speed to a room setpoint of, for instance, 35 °C, then the fan
speed could reduce. The BMS would control the fan speed to maintain the temperature in whichever the
hotter room is. The power savings would be highest in the winter where the ambient air temperatures are
lower, providing more cooling capability.
To establish indicative from reducing the fan speed site testing was conducted. The fan speed was manually
controlled on the VSD for a short period and power readings were taken from the VSD.
@ 50Hz power consumption was 18 kW
@ 45Hz power consumption was 13.2 kW – Annual savings of 42,050 kWh possible
@ 40 Hz power consumption was 9.3 kW – Annual savings of 76,200 kWh possible
The potential annual energy savings have also been calculated above based on maintaining different
average fan speeds. The capital costs will be small as it just requires some strategy changes and could be
done as part of routine maintenance.
3.3.8. Admin Building AHU Control
The Admin building is supplied with tempered fresh air on a continual basis from an AHU with a 66 kW
electrical heating coil, a DX cooling coil and a heat recovery section which recovers heat by extracting hot
air from the top of the boiler and passing it over a cross flow heat exchanger, fitted with a bypass. The unit
is controlled on the BMS and is currently set to supply air at 15 °C, with local duct electrical reheats where
required. The fans are VSD driven but are currently controlled to fixed setpoints as follows:
Supply fan @ 75% speed, drawing 3.9 kW
Return fan (from boiler hall) @ 65%, drawing 1.8 kW
The building also has ceiling cassette split units for cooling and heating. A separate extract system dumps
stale air at roof level. The building must be positively pressurised to prevent the ingress of smells from the
waste which is stored onsite and so the supply and extract systems are balanced.

EAS Report Page 28 of 35 PowerTherm Solution©
During the audit a number of datalogs which were available on the BMS were downloaded and
subsequently plotted against each other to examine how the AHU was controlling. The default amount of
data stored on the BMS is 10 days.
From the above graph it can be seen that the supply temperature is in general controlled to very tight limits
as can be seen by the flat line. Where there are deviations in this temperature (such as on the 15th of August)
the heating coil output tends to react very slowly, but over a wide range. This suggests that the control
response time needs to be altered.

EAS Report Page 29 of 35 PowerTherm Solution©
It is beneficial to look at a shorter time period where it is easier to look at the detail of what is occurring.
The below chart looks at the 24th and 25th of August, when the bypass damper is modulating.
Some points to note are as follows:
1. When the system is in full heat recovery mode (bypass damper is at 100%) the temperature pick
up is approximately 2 °C. Considering the temperature of the air coming from the boiler hall was 10 °C higher than the ambient one would expect a greater temperature uplift.
2. The ambient temperature was above the 15 °C setpoint at the time, however the AHU was still
recovering heat, and the heating coil output was 40%. Unfortunately there was no facility to
download the datalog for cooling demand, but one can only deduce that the cooling coil must also
have been on to bring the temperature down to its setpoint. This shows a conflict between the
cooling coil, heat recovery and heating coil.
3. When the ambient air temperature goes below the setpoint the first thing that should have reacted
was the heating coil, not the heat recovery damper. The priority should be to recover heat first and
then to use the heating coil.
The above indicates significant energy wastage is occurring due to poor control.
Recommendations and Savings
1. Turn off the AHU and extract fans outside of normal office hours and install a dedicated heat
recovery ventilation system in the control room as this is the only area requiring ventilation at
night. Openings in the walls could be made at the control room level to allow for local supply and
extract of air. This will save on AHU fan and heating coil power.
Item
Power
Consumption
kW
Annual
Energy Use
Proposed
Run
Hours
Savings
kWh Savings €
Supply Fan 3.9 34,164 5,110 14,235 1,210€
Return Fan 1.8 15,768 5,110 6,570 558€
Other 5no. Extract fans 1.5 13,140 5,110 5,475 465€
Heating Coil savings 84259 5,110 40,774 3,466€
Total 67,054 5,700€

EAS Report Page 30 of 35 PowerTherm Solution©
Note: The heating coil savings figure assumes the AHU is performing as expected. This results in a
conservative savings figure. There will also be a small added electrical load from the installed heat
recovery unit but its impact would be negligible. The cost to make the strategy changes and install
a heat recovery unit would be approximately €15,000.
2. The AHU heating coil output control response time should be faster. This is primarily a measure
which will improve performance but some energy savings may also be achieved by ramping back
the heating coil faster to avoid having it on as well as bypassing the heat recovery section.
3. When there is heat available for recovery this should take priority over the heating coil. The control
strategy does not seem to be set up like this as one would expect. As the system is performing
outside of the normal parameters, accurate calculation of savings is not possible.
4. There should be a dead band of 2 °C put in place, i.e. 1 °C either side of the setpoint. The heating coil
should only be enabled when below this dead band and the cooling coil only enabled when above
it. This should prevent simultaneous heating and cooling. This may result in slight fluctuations in
supply temperatures but this is not a critical temperature and so should be acceptable. This will
result in savings but as the information on the performance of the AHU is limited to the 10 day log
that was captured during the audit the calculation of effect of making this change over the course
of the year is difficult. The cost to implement this change in strategy is small.
5. The supply setpoint should be dynamic rather than fixed to reduce the amount of electrical
reheating. The areas of the building with reheat control have space temperatures logging on the
BMS. If an area is starting to overheat, and its reheat is off, then the AHU supply temperature should
reduce. There should never be a requirement for all reheats to be on at the same time. This will save
energy as the AHU recovers heat from the boiler hall.
Without detailed design data and logging of reheat energy demand over a period of time it is difficult
to calculate savings accurately. As this is a change in strategy the cost to implement is small.
6. The AHU return fan should be ramped up to increase the fan speed when heat recovery is required
and ramp the speed down when the ambient temperature approaches the setpoint, shutting it down

EAS Report Page 31 of 35 PowerTherm Solution©
when the ambient is higher. This would effectively mean the bypass damper should always be at
100%, and the fan speed would ramp rather than modulating the damper. It should be possible to
recover more than 2 °C from the return fan given its relatively high temperature of approximately
30 °C. If the flow rates between the supply and the return were equal, and the heat exchanger was
90% efficient then there should be no need for electrical heating until the ambient conditions are
below approximately 5 °C.
By changing the control strategy to switch off the return fan when the ambient is above 15°C the
savings were calculated to be 4,266 kWh, or €363. The savings from increasing the amount of heat
being recovered from the boiler could be significant. The estimated total annual consumption of the
heating coil is 84,259 kWh. The cost to implement the control strategy change is small and the
savings could be 30 – 60%.
3.3.9. LED Lighting and Controls Upgrade
When the facility was built LED fittings were not installed. In recent years LEDs have decreased in price
and the quality has improved. There is a significant lighting load onsite and there is potential for controls
improvements also.
The existing lighting within the facility is made up of twin, 5ft fluorescent fittings which are left on 24x7.
As the building has a lot of clear roof and cladding sections there is a good deal of ambient light available.
Depending on how the lighting circuits are configured, it may be possible to only leave the lights above
access ways on, and operate the remaining lighting on a photocell.
Outside the building there are 400W son fittings installed which are operated on a photocell.
The client has provided an estimated number of fittings and these have been used to calculate savings
figures as per the below table.
The estimated costs and paybacks to implement this upgrade are as follows:
Pre Retrofit fittings No.
fittings
Watts
per
fitting
Load kW Control Hrs per
year
Electricity
per year,
kWh
Outside Lighting 400W SON 40 420 16.80 Photocell 4,150 69,720
Inside Lighting - Main
Access Routes
Twin 5ft T8 flourescent 150 133.4 20.01 Switch 8,760 175,288
Inside Lighting - All
Other Areas
Twin 5ft T8 flourescent 350 133.4 46.69 Switch 8,760 409,004
Grand Total 654,012
Area
Pre Retrofit
Savings
Post Retrofit
fittings
No.
fittings
Watts
per
fitting
Full Load
kW
Control Hrs p.a. at
Full Load
Electricity
per year,
kWh
kWh saving
p.a. incl.
controls
Comments
Outside Lighting 200 W LED 40 200 8.0 Photocell 4,150 33,200 36,520 Default control gear loss 5% per seai EEOS
guidance
Inside Lighting - Main
Access Routes
60 W LED 150 60 9.0 Switch 8,760 78,840 96,448 Default control gear loss 15% per seai EEOS
guidance
Inside Lighting - All
Other Areas
60 W LED 350 60 21.0 Photocell 4,150 87,150 321,854 Default control gear loss 15% per seai EEOS
guidance.
Grand Total 199,190 454,822
Area
Post Retrofit

EAS Report Page 32 of 35 PowerTherm Solution©
Note: The implementation cost does not include labour and it is assumed this could be carried out under
maintenance over an extended period.
Area Post Retrofit fittings No.
fittings
Cost Per
fitting
Control Cost Energy
cost
savings
Payback
Outside Lighting 200 W LED 40 350€ Photocell 14,000€ 3,104€ 4.51
Inside Lighting - Main
Access Routes
60 W LED 150 90€ Switch 13,500€ 8,198€ 1.65
Inside Lighting - All
Other Areas
60 W LED 350 90€ Photocell 31,500€ 27,358€ 1.15
Totals 59,000€ 38,660€ 1.53

EAS Report Page 33 of 35 PowerTherm Solution©
Appendix A – Well Water Control Energy Saving Testing Methodology
It was noted that the pumps appear to be pumping against the ball cock which is reducing the flow as the
pressure at the top of the well according to a gauge was at 6.5 bar, and it cuts out at 8bar. The pump is
drawing 7.2kW at a fixed 60% speed and delivering 7 m3/hr. The pump is working to overcome the back
pressure on the ball cock and it would be more efficient to control the pump speed to a level based on a
sensor, with the ball cock acting as a last resort. To test what the elec savings would be the following test
should be conducted.
1. Take note of the flow rate, head pressure (on a gauge at the top of the well), ball cock position
(partially closed or fully open), pump speed (%) and power consumption (kW).
2. Ramp back the well pump and allow the tank level to drop below the point where the ball cock is
fully open (assuming it is partially closed to begin with).
3. Continually monitor the tank level (to make sure there is no risk to the process) and flow rate in
the pipe.
4. Once the level of the water has dropped sufficiently ramp the pump speed up until a flow rate
similar to that of before the test is achieved, ensuring the ball cock is fully open. Also check that this
figure is typical for a standard day of operation by looking back at the logs.
5. Once the correct flow rate is achieved, and at least 10 minutes has passed, note the pump speed
(%), pressure at the head of the well (bar - there is manual gauge there) and the power consumption
(kW – this can done by scrolling through the parameters menu).
The pump should be drawing less power than when it was pushing against the ball cock. The pressure at
the head of the well should also be lower. The level of saving will influence the decision on whether to
implement the new control measure or not.

EAS Report Page 34 of 35 PowerTherm Solution©
Appendix B – Refrigerated Dryer Spec Sheet

EAS Report Page 35 of 35 PowerTherm Solution©
Appendix C – Desiccant Dryer Spec. Sheet