annual general meeting june 7, 2016 -...
TRANSCRIPT

ANNUAL GENERAL MEETING
JUNE 7, 2016
TSX:TGZ / ASX:TGZ

2
ALAN R. HILLCHAIRMAN

3
Receive 2015 Financial Statements
Re-appointment of Auditors
BUSINESS OF THE MEETING
Election of Directors

4
RICHARD YOUNGPRESIDENT & CEO

5
This presentation contains certain statements that constitute forward-looking information within the meaning of applicable securities laws (“forward-looking statements”),
which reflects management’s expectations regarding Teranga Gold Corporation’s (“Teranga” or the “Company”) future growth, results of operations (including, without
limitation, future production and capital expenditures), performance (both operational and financial) and business prospects (including the timing and development of new
deposits and the success of exploration activities) and opportunities. Wherever possible, words such as “plans”, “expects”, “does not expect”, “budget”, “scheduled”,
“estimates”, “forecasts”, “anticipate” or “does not anticipate”, “believe”, “intend”, “ability to” and similar expressions or statements that certain actions, events or results “may”,
“could”, “would”, “might” or “will” be taken, occur or be achieved, have been used to identify such forward looking information. Although the forward-looking information
contained in this presentation reflect management’s current beliefs based upon information currently available to management and based upon what management believes to
be reasonable assumptions, Teranga cannot be certain that actual results will be consistent with such forward looking information. Such forward-looking statements are
based upon assumptions, opinions and analysis made by management in light of its experience, current conditions and its expectations of future developments that
management believe to be reasonable and relevant. These assumptions include, among other things, the ability to obtain any requisite Senegalese governmental approvals,
the accuracy of mineral reserve and mineral resource estimates, gold price, exchange rates, fuel and energy costs, future economic conditions, anticipated future estimates of
free cash flow, and courses of action. Teranga cautions you not to place undue reliance upon any such forward-looking statements
The risks and uncertainties that may affect forward-looking statements include, among others: the inherent risks involved in exploration and development of mineral
properties, including government approvals and permitting, changes in economic conditions, changes in the worldwide price of gold and other key inputs, changes in mine
plans and other factors, such as project execution delays, many of which are beyond the control of Teranga, as well as other risks and uncertainties which are more fully
described in the Company’s Revised Annual Information Form dated September 1, 2015, and in other company filings with securities and regulatory authorities which are
available at www.sedar.com. Teranga does not undertake any obligation to update forward-looking statements should assumptions related to these plans, estimates,
projections, beliefs and opinions change. Nothing in this report should be construed as either an offer to sell or a solicitation to buy or sell Teranga securities.
This presentation is dated as of the date on the front cover. All references to the Company include its subsidiaries unless the context requires otherwise.
This presentation contains references to Teranga using the words “we”, “us”, “our” and similar words and the reader is referred to using the words “you”, “your” and similar
words.
All dollar amounts stated are denominated in U.S. dollars unless specified otherwise.
FORWARD-LOOKING STATEMENTS

6
Replaced reserves
& improved mine life
Advanced organic
growth initiatives
Reduced costs by
$20 million
Strengthened balance sheet
& improved liquidity
Brought on strategic
cornerstone investor
Missed 2015
guidance of
200K-230Koz
MAJOR ACHIEVEMENTS IN 2015 . . . BUT MISSED PRODUCTION GUIDANCE

7
MAJOR ACHIEVEMENTS IN 2015
Replaced reserves
& improved mine life
Advanced organic
growth initiatives
Reduced costs by
$20 million
Strengthened balance sheet
& improved liquidity
Brought on strategic
cornerstone investor

8
CORNERSTONE INVESTOR SUPPORTS EXECUTION OF GROWTH STRATEGY
Unique strategic cornerstone investor owns ~13% of Teranga
Increase
Production
Grow
Reserve
Base
New Strategic Cornerstone Investor
David Mimran (Tablo Corporation) completed strategic
private placement for 39.2M shares in Q4 2015 and has
since purchased more than 11M additional shares in the
open market
David Mimran is Considered a “Local” in Senegal
With homes in Geneva, Senegal and Ivory Coast, David
spends nearly 20 days out of every month in Africa
Strong Partner with In-Depth Local Knowledge
Mimran Group has a long history of operating successfully
and responsibly in Africa and is the largest private sector
employer in Senegal
Expand
Margins

9
Mitigating Our Impacts Sharing the Benefits
of MiningGood Governance
Our People and
Culture
Working with our partners to have a positive long-term impact on local and regional communities
MINING RESPONSIBLY
Our CSR Approach
Integrating responsible mining into all aspects of the mine life

10
UPDATED LIFE OF MINE PLAN

11
(8)
90
180
330
390
350
730
2.6M Proven & Probable Reserves(1) at $1,100 gold.
Average mined grade of 1.59 grams per tonne*(As at December 31, 2015)
Proven & Probable Reserves(1)
(in Moz)
Refer to endnote (1) on the last slide
LARGE RESERVE BASE WITH 13.5-YEAR MINE LIFE
310
220
30
Since 2010, increased reserve base by 80% and this is after producing 1 million ounces
80% increase in reserves since IPO
*Not including stockpile of 0.39Moz

12
SOLID BASE CASE PRODUCTION PROFILE(2)
00
0’s
oz A
u
Opportunity to grow
production by increasing
material movement
Opportunity to increase
production through resource
conversion and new discoveries(3)
+200Koz average annual production from 2012- 2024(2)
Significant potential upside to life of mine base case production profile(3)
2016 Outlook
200K-215Koz
Refer to endnote (2) and (3) on the last slide

13
ORGANIC GROWTH: SIGNIFICANT INCREASE IN THROUGHPUT DUE TO MILL OPTIMIZATION
2016 LOM Mill Rate vs 2014 LOM Mill Rate
Leveraging existing mill and related infrastructure to increase organic growth
Up to 15% increase in throughput
5% reduction in costs
+50% IRR

14
FUTURE ORGANIC GROWTH: HEAP LEACHING
Heap Leach Flow Sheet
Heap leaching has potential to increase Teranga’s annual production by 10% - 20%
GRIZZLY
FEEDER
SCALPING
SCREEN
JAW
CRUSHER
SECONDARY
CRUSHER
GOLD
ROOM
AGGLOMERATOR
CIS
TANKS
HEAP LEACH
PREGNANT LIQUOR
STACKER
Technically Viable For Processing Low-grade Ore
Confirmed by pre-feasibility study,
which was completed in Q4 2015
High Ore Recovery Range
Oxide 78% - 83%
Transition 61% - 66%
Current Economic Estimates
Capital cost: $50M
Processing costs: ~$7 per tonne
Valuable Stockpile
~150,000 ounces of low-grade inventory
available for heap leaching

15
DECLINING COSTS & ATTRACTIVE CASH FLOW PROFILE
Life of Mine
Cash Flow(5)
$240/ozat $1,200 gold
23% decrease in mining costs since 2014
40% decrease in milling costs since 2014
Benefitting from lower fuel prices, favourable FX rates
and mill optimization
40-50% of costs are Euro-denominated
Cost saving initiatives are ongoing
LOM 2016 - 2020
Gold Price $ 1,200 $ 1,200
All-in Sustaining Cost(4) $ 887 $ 914
$ 313 $ 286
Franco-Nevada Stream* $ 73 $ 92
Cash flow/oz(5) $ 240 $ 194
*Fixed portion of Franco-Nevada gold stream ends in 2019 and will be replaced by
variable stream, estimated to be $58/oz LOMRefer to endnotes (4) and (5) on the last slide
16
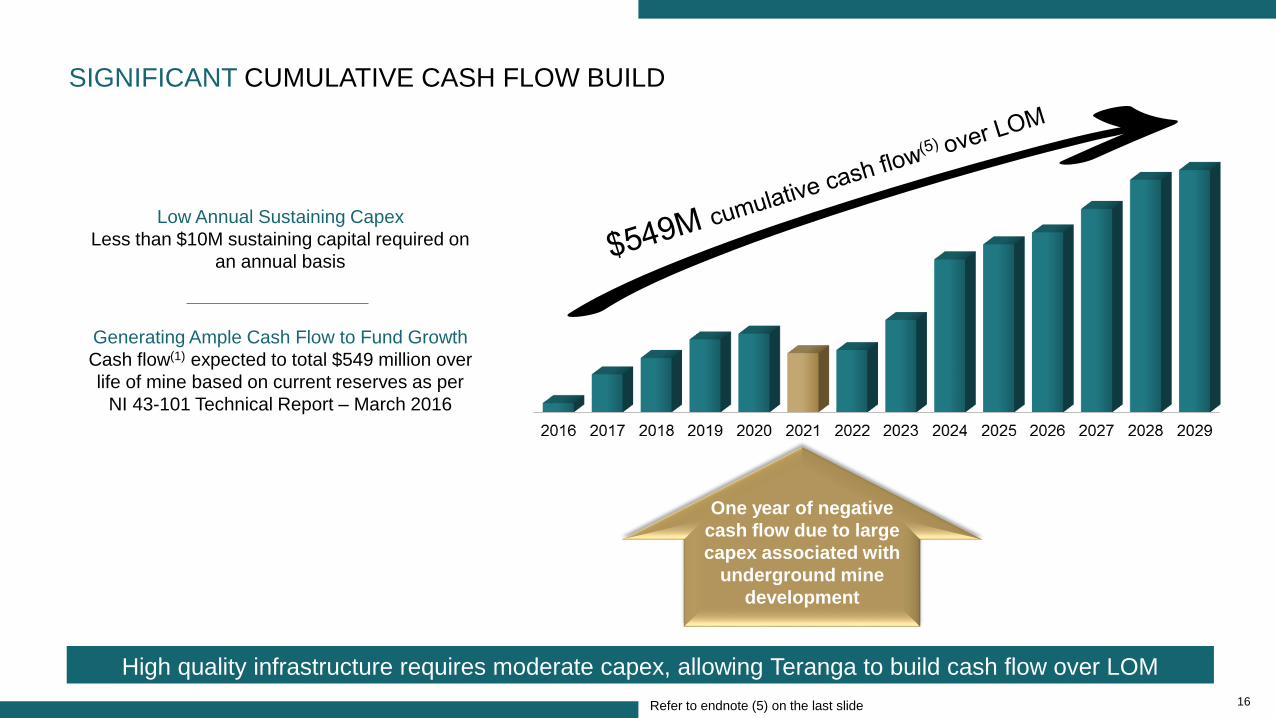
SIGNIFICANT CUMULATIVE CASH FLOW BUILD
High quality infrastructure requires moderate capex, allowing Teranga to build cash flow over LOM
Refer to endnote (5) on the last slide
One year of negative
cash flow due to large
capex associated with
underground mine
development
Low Annual Sustaining Capex
Less than $10M sustaining capital required on
an annual basis
Generating Ample Cash Flow to Fund Growth
Cash flow(1) expected to total $549 million over
life of mine based on current reserves as per
NI 43-101 Technical Report – March 2016

17
Senegal
12M+ ounces Au
discovered over
last 10 years
Mali
40M+ ounces Au
discovered over
last 25 years
Africa
Emerging
Gold Belt
Potential for Major Discoveries
Emerging gold belt straddles border between
Senegal and Mali where +50 million ounces have
been discovered(6)
Only Commercial Gold Mill in Senegal
Ability to process regional discoveries and enter
into strategic combinations to process
neighbouring deposits
Safe, Stable, Mining-Friendly Jurisdiction
Democratic government strongly supports mining
and views it as a key pillar for Senegal’s
economic growth
EARLY DAYS ON EMERGING WORLD-CLASS GOLD BELT
Mine License
Regional Land PackageRefer to endnote (6) on the last slide

18
GROWING RESERVES ON MINE LICENSE
Mine License of 291km2
Focus on increasing reserves on mine license, which
are within close proximity to mill
Reserves of 2.6Moz at $1,100 Gold(1)
Average mined grade of 1.59 grams per tonne (not
including stockpile of 0.39Moz)
Multi-year Development ProgramFocused on adding higher grade mill material and
lower grade material for potential heap leach
Refer to endnote (1) on the last slide
Masato
Au 730 (Koz)
Niakafiri Main
Au 260 (Koz)
Niakafiri SW
Au 10 (Koz)
Maki Medina
Au 30 (Koz)
Niakafiri SE
Au 40 (Koz)
Kerekounda
Au 90 (Koz)
Golouma West
Au 200 (Koz)
Golouma South
Au 130 (Koz)
Golouma South
Au 60 (Koz) Golouma West
1 - Au 120 (Koz)
2- Au 60 (Koz)
Sabodala
Au 180 (Koz)
Kerekounda
Au 100 (Koz)
Reserves – Open Pit
Reserves – U/G
Increasing Exploration Spend & Bench StrengthFocused on large discoveries – Increased focus in the
last six months has advanced a number of prospects
that are currently in drilling phase

19
FOCUSED ON BIG TARGETS ON LARGE REGIONAL LAND PACKAGE
Soreto-Soreto North
DDH Drilling
Program &
Trenching
Cinnamon North
Prospect
Trenching & DDH
Drilling Program
Leoba-Lerinde Granite
DDH Program &
Trenching
Leocounda Prospect
DDH Drilling Program
& Trenching
Marougou
Prospect
DDH Drilling
Program
Nienienko Main
RC Drilling Program
Marougou West
Prospect
Trenching & DDH
Drilling Program
Bransan
Trenching &
Drilling Program
KA Prospect
DDH Drilling
Program
~1,000km² Regional Land PackageExploration permits encompassing large of land
surrounding Teranga’s mine license
First Discovery: High-Grade Gora~5 grams per tonne deposit developed in 2015

20
-30%
-10%
10%
30%
50%
70%
90%
110%
130%
150%
Teranga Gold (TSX:TGZ) Market Vectors Global Junior Gold Miners Index (MVGDXJ) Gold Price (XAU)
Data Source: Thomson Reuters as at June 6, 2016
February 25:
Released full life of mine opexand capex detail
March 23:Filed new life of mine plan
(43-101 Technical Report)
January 29: Issued Q4 operating resultsReleased life of mine
production schedule
April 11:Pre-released Q1
production results
April 28: Released Q1 financial
and operating results
TGZ:
+118%
GDXJ:
+99%
Gold:
+17%
TGZ Share Price Performance vs Index and Gold Price
(52-Week Range: C$0.38 - $1.18)
OUTPERFORMING BOTH GOLD AND THE GDXJ INDEX

21
Data Source: BMO GoldPages published June 6, 2016
RELATIVE UNDERVALUATION PROVIDES ATTRACTIVE INVESTMENT OPPORTUNITY
Enterprise Value
($M)
EV/Production
(BMO based on gold sold, $/oz)
EV/2P Reserves
($/oz)EV/2016E EBITDA
($/oz)
*Project Developers

22
$1.02 $1.02 $1.02 $1.02$1.18
$1.30
$1.54
$1.89
SIGNIFICANT POTENTIAL UPSIDE REMAINS DESPITE SHARE PRICE APPRECIATION
Based on Teranga’s updated NI 43-101 and the 1.6x average NPV multiple for its peer group, Teranga’s share price should be C$1.89(7)
27% 51%
Revalued
Share Price
NPV Multiple 0.9x 1.1x 1.3x 1.6x
Teranga’s Share Price vs.
Teranga Net Present Value (NPV)(7)
per Share
Share
Price
85%
Revalued
Share Price
Share
PriceBMO NPV
per Share
Share
Price
Refer to endnote (7) the last slide
Average
Multiple
for Medium
Producers
1.6x NPV(7)
Revalued
Share PriceShare
Price
TGZ
Currently
Trading at
0.9x NPV(7)
Data Source: BMO GoldPages published June 6, 2016 – all figures are in Canadian dollars

23
23
Q & A

24
EMERGING
World-Class Gold Belt
in a Safe & Stable
Jurisdiction
SOLID
Balance Sheet &
Significant Insider
Ownership
LARGE LONG-LIFE
Reserve & Resource
Base(1)
LOW
All-in Sustaining
Costs per Ounce(4)
SIGNIFICANT
Organic Growth
Potential
STRONG
Life of Mine
Cash Flow(5)
Refer to endnotes (1) (4) and (5) on the last slide
STRONG VALUE PROPOSITION
Strong value proposition and undervalued relative to peer group = compelling investment opportunity

25
ENDNOTES
1. Mineral Reserves and Mineral Resources estimates as at December 31, 2015 as per Company disclosure. For more information regarding Teranga Gold’s Mineral Reserves and
Resources, please refer to Teranga Gold’s December Quarter and Year-end 2015 Report accessible on the Company's website at www.terangagold.com.
2. This production profile is based on existing proven and probable reserves only from the Sabodala mining license as disclosed in Teranga Gold’s December Quarter and Year-end
2015 Report accessible on the Company's website at www.terangagold.com.
3. Over the past several years more than twelve million ounces of measured and indicated resources have been identified within the south eastern Senegal region, including the
Massawa, Golouma, Makabingui and Mako projects, along with the Company’s own Sabodala gold mine. With exploration work completed to date and the prior exploration success
seen in the area Management believes there is a reasonable basis to anticipate future resource to reserve conversion.
4. Total cash costs per ounce and all-in sustaining costs per ounce are non-IFRS financial measures and do not have standard meanings under IFRS. All-in sustaining costs per ounce
sold include total cash costs per ounce, administration expenses (excluding Corporate depreciation expense), Regional Administration Costs, capitalized deferred stripping,
capitalized reserve development and mine site & development capital expenditures as defined by the World Gold Council. For more information regarding these measures, please
refer to Non-IFRS Performance Measures in the Company’s Management’s Discussion and Analysis for the three months ended March 31, 2016 accessible on the Company’s
website at www.terangagold.com.
5. Cash flow is the Life of Mine net cash flow based on the Company’s most recent NI 43-101 Technical Report (“43-101 plan”) filed in March 2016, before income taxes, interest, debt
repayments, closure costs, dividends and working capital.
6. Identified ounces on Birimian greenstone belt, which straddles the border of Senegal and Mali, West Africa, refers to gold ounces historically mined in addition to gold ounces
currently reported as Measured and Indicated Resources, as available on GFMS Thomson Reuters and latest company reserve and resource statements as of March 23, 2016.
7. Net Present Value (“NPV”) per share is a Non-IFRS financial measure. NPV per share, average NPV multiple of medium producers, and Teranga’s share price is as per BMO
GoldPages published June 6, 2016. According to BMO GoldPages, NPV per share is calculated using the net present value of the life of mine cash flows based on the NI 43-101
plan, less cash flow of corporate costs, less net debt per share, using the model at SPOT commodity prices and exchange rates. The “Revalued Share Price” is calculated using the
NPV per share at SPOT times the NPV multiples as listed. The BMO NPV calculation assumes a US$1,241 SPOT gold price per ounce, 5% discount, 0.77 USD/CAD exchange rate.
For more information regarding Non-IFRS financial measures, please refer to Non-IFRS Performance Measures in the Company’s Management’s Discussion and Analysis for the
three months ended March 31, 2016 accessible on the Company’s website at www.terangagold.com.