annual groundwater monitoring and corrective action report
TRANSCRIPT
ANNUAL GROUNDWATER MONITORING AND
CORRECTIVE ACTION REPORT
JOHN TWITTY ENERGY CENTER (JTEC)
Prepared for:
City Utilities of Springfield 301 E. Central Street Springfield, Missouri
Prepared by:
125 Broadway Avenue
Oak Ridge, Tennessee, 37830
January 2018


ii
Table of Contents
1.0 INTRODUCTION .......................................................................................................................................... 1
1.1 Background ...................................................................................................................................... 1
2.0 GROUNDWATER SAMPLING AND ANALYSIS ............................................................................................ 2
2.1 Groundwater Field Quality Control ................................................................................................. 2
3.0 HANDLING OF INVESTIGATIVE-DERIVED WASTE ...................................................................................... 3
4.0 DATA VALIDATION AND STATISTICAL ANALYSIS ....................................................................................... 3
5.0 SUMMARY OF FINDINGS ........................................................................................................................... 4
5.1 CCR Appendix III Constituents Analytical Results .......................................................................... 4
5.2 CCR Appendix IV Constituents Analytical Results .......................................................................... 4
5.3 Conclusion and Recommendations ............................................................................................... 4
6.0 REFERENCES ............................................................................................................................................. 4
List of Tables Table 1 CCR Analytical Constituents Table 2 Analytical Results for Appendix III Constituents in Groundwater at JTEC Table 3 Analytical Results for Appendix IV Constituents in Groundwater at JTEC
List of Figures
Figure 1 JTEC Site Diagram Figure 2 Potentiometric Elevation 11/21/2016 Figure 3 Potentiometric Elevation 12/07/2016 Figure 4 Potentiometric Elevation 01/06/2017 Figure 5 Potentiometric Elevation 02/22/2017 Figure 6 Potentiometric Elevation 04/04/2017 Figure 7 Potentiometric Elevation 06/11/2017 Figure 8 Potentiometric Elevation 07/19/2017 Figure 9 Potentiometric Elevation 08/16/2017
Appendices Appendix A Analytical Data Validation Reports Appendix B Statistical Analysis Report

1
1.0 INTRODUCTION
This initial Annual Groundwater Monitoring and Corrective Action Report describes the results of the groundwater monitoring activities for City Utilities of Springfield Missouri (CU) John Twitty Energy Center (JTEC) Utility Waste Landfill (UWL). This report has been prepared for CU in accordance with the requirements of 40 CFR 257.90(e), also known as the Coal Combustion Residuals (CCR) Rule. The monitoring activities described in this report were conducted in accordance with the Groundwater Sampling and Analysis Plan (GeoEngineers 2016).
1.1 Background
JTEC is a coal-fired power station located in Greene County, Missouri. The JTEC UWL is a 42-acre landfill operated under a solid waste disposal area operating permit No. 707702 issued November 12, 1980 by the Missouri Department of Natural Resources.
The initial step in the CCR regulation requires the implementation of a groundwater monitoring program at the landfill to determine if metals or other coal combustion residual constituents in downgradient groundwater show a statistically significant increase over concentrations found in upgradient groundwater. The groundwater investigation at JTEC is being conducted pursuant to the requirements of the CCR regulation, 40 CFR 257.90 and 40 CFR 257.91. The groundwater monitoring program includes determination of depth to groundwater, general direction of groundwater flow, site-specific geologic information of the soil and bedrock beneath the landfill, and collection of eight (8) rounds of groundwater samples at upgradient and downgradient wells. This report presents the analytical results and statistical prediction limits that have been calculated in accordance with 40 CFR 257.93 for the constituents listed in Appendix III and IV of 40 CFR 257.
JTEC has a groundwater monitoring well network of 11 monitoring wells in the Springfield aquifer. Background information on the monitoring wells can be found in the Groundwater Characterization Phase I – Monitoring Well Siting and Installation Report (GeoEngineers, 2017). Two (2) of these wells are upgradient wells and nine (9) are downgradient wells. Refer to Figure 1 for the site location map and monitoring well locations. The potentiometric surface was contoured for each of the eight (8) detection monitoring events, and is included as Figures 2 through 9. Figure 1 depicts an aerial map showing the CCR unit (i.e. UWL) including all the background and downgradient monitoring well locations as required by 40 CFR 257.90(e)(1). In general, groundwater flow is from the northwest to the southeast, towards Wilson’s Creek. The potentiometric mapping also indicates that there has been mounding of groundwater at monitoring wells MW-SA-4, MW-PZ-08D, and MW-PZ-09D. MW-SA-4 has shown a 13 to 19 foot mound of groundwater compared to the nearest well MW-SA-3. MW-SA-4 lies near the center of a bedrock valley, immediately downgradient of the storm water detention basin. Mounding of groundwater indicates that the bedrock valley extending to the southern end of the UWL channels groundwater flowing along the soil-bedrock interface and routes it vertically to the uppermost aquifer. As seen on Figures 7 and 8, monitoring well MW-PZ-09D indicated a similar groundwater mound. This mound is likely due to surface water runoff from the UWL and infiltration during high precipitation events. As seen on Figure 9, monitoring well PZ-08D indicates a groundwater mound. This mound is likely due to surface water ponding west of PZ-08D where surface water runoff is channeled through a culvert under the landfill access road. Groundwater mounding at MW-PZ-08D and MW-PZ-09D appears to be a seasonal occurrence. CU will continue monitoring the water levels to determine season fluctuations of groundwater levels.

2
2.0 GROUNDWATER SAMPLING AND ANALYSIS
Some minor deviations were noted from the sampling and analysis procedures outlined in the Groundwater Sampling and Analysis Plan (GeoEngineers 2016). These deviations are summarized in the section 2.1 below. As a part of the initial groundwater collection phase of CCR, eight (8) groundwater sampling events were conducted at JTEC over an 11-month period between October 2016 and August 2017. All sample collection events were conducted by GeoEngineers field personnel.
Groundwater sampling activities included measuring depth to groundwater and calculating groundwater elevations, downloading continuous water-level monitoring data from data-logging pressure transducers installed in the monitoring wells, and collecting water quality parameters prior to sampling groundwater for laboratory analysis of the constituents listed in Table 1, below. The procedure for collecting groundwater samples is as follows:
1. Measure the depth of water in the monitoring wells using a decontaminated electronic water-level indicator.
2. Purge well following guidance of the U.S. Environmental Protection Agency (EPA) low stress/minimal drawdown procedure. Measure and record water-quality parameters during purging including: pH, dissolved oxygen (DO), specific conductivity, temperature, oxidation-reduction potential (ORP), and turbidity.
3. Collect groundwater samples from monitoring wells when water-quality parameters have stabilized using low‐flow sampling methods and dedicated sampling equipment.
4. Submit samples under proper Chain-of-Custody to PDC Analytical Services, Inc. for the following analyses:
a. Total Metals (As, B, Ba, Be, Ca, Cd, Cr, Co, Hg, Li, Mo, Pb, Se, Sb, and Tl) by EPA Method 6010B/6020A;
b. Anions (Chloride, Fluoride Sulfate) by EPA Method 300.0;
c. pH by SM 4500‐H+B;
d. Radium 226/228 by EPA method 903.1/904 analyzed at Pace Laboratories; and
e. Total dissolved solids by EPA Method SM 2540C.
5. Collect and submit one duplicate groundwater sample per round for the same analyses as the other groundwater samples.
6. Measure and record the water-quality parameters during sampling: pH, DO, specific conductivity, temperature, ORP, and turbidity.
2.1 Groundwater Field Quality Control
All wells were sampled using permanently-installed low-flow bladder pumps controlled by either an In-Situ MP-10H or MP-50 pump controller with an air compressor or compressed nitrogen pressure source. All groundwater sampling activities were conducted in accordance with the Sampling and Analysis Plan (SAP). Minor deviations from SAP procedures and other notable observations for each of the sampling events are summarized in the following paragraphs.
3
During the first day of sampling, the HORIBA water quality meter was found to be producing inaccurate turbidity readings. The water quality meter was recalibrated prior to well stabilization and sampling of the first monitoring well sampled that day and produced acceptable water quality data for the remainder of the sampling event. During the first sampling event, the sampling crew had difficulty lowering the turbidity of monitoring wells MW-SA-2A and MW-PZ-03D to a level below 10 Nephelometric Turbidity Unit (NTU). The crew was able to get the turbidity to stabilize for both wells, however only MW-PZ-03D had a turbidity below 10 NTUs.
During the second and third sampling events, the crew had difficulty lowering the turbidity of monitoring wells MW-SA-2A and MW-PZ-03D despite additional attempts to develop the wells. Therefore, these higher NTU values were evident in the field logs, but it is our professional opinion that this does not affect the analytical results. Ultimately, the NTU readings in all wells were determined to be below the standard.
In February 2017, the pumping rates for all wells were reduced to roughly half of what was employed in previous sampling events to minimize drawdown, particularly in slower recharging wells, and to maintain turbidities of 5 NTU or less. In general, faster recharging wells were allowed 25-30 seconds per cycle to recharge and slower recharging wells were allowed 50-55 seconds per cycle to recharge. The field crew noted that turbidity prior to sampling was low for all onsite wells.
In May 2017 we began using two pump controllers which allowed two wells to be purged simultaneously. This allowed wells to be purged at a lower rate, minimized drawdown and reduced turbidity. There were no other deviations noted from the SAP in the first eight rounds of groundwater sampling.
3.0 HANDLING OF INVESTIGATIVE-DERIVED WASTE
Investigative-derived waste (IDW) were generated and handled appropriately during each sampling event. Waste consisted of decontamination water and purge water. IDW generated were containerized in buckets and disposed of onsite. Purge water and decontamination water were returned to the local storm water retention pond within the landfill boundary. Disposable items, such as gloves, paper towels, and etc., were disposed of as municipal waste.
4.0 DATA VALIDATION AND STATISTICAL ANALYSIS
After all eight (8) rounds of groundwater samples were collected; the data were validated in accordance with Appendix A of the Groundwater Sampling and Analysis Plan (GeoEngineers 2016). Data validation reports are included in Appendix A of this report. Upon completion of validation, statistical analyses were conducted using the Sanitas software. The calculations to test for statistically significant increases over background were performed for each constituent using the prediction interval module. The prediction interval approach for determining statistical significance is included in section 40 CFR 257.93(f)(3) of the CCR rule, as one of five acceptable statistical approaches. The prediction interval approach is well suited to using the Sanitas software. The data from all eight sampling rounds from the upgradient background wells were input into the prediction interval module in the Sanitas software and the prediction limits were calculated for each constituent of concern. The prediction limits are the screening values that concentrations from the downgradient wells were compared to determine if a statistically significant increase had occurred. By default, the prediction interval module in Sanitas first performs a Shapiro-Wilk/Francia test to determine if the data have a normal distribution. If the data have a normal
4
distribution, then a parametric prediction interval is calculated. If the data did not have a normal distribution, then a non-parametric prediction interval is calculated.
5.0 SUMMARY OF FINDINGS
5.1 CCR Appendix III Constituents Analytical Results
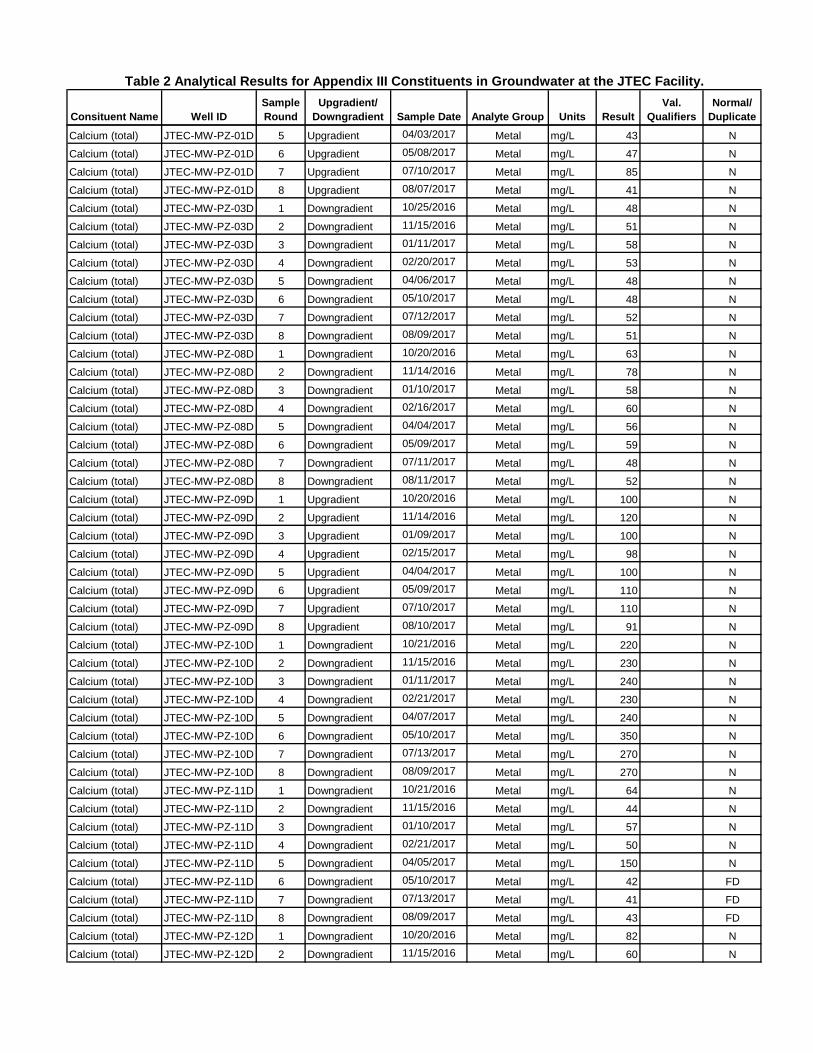
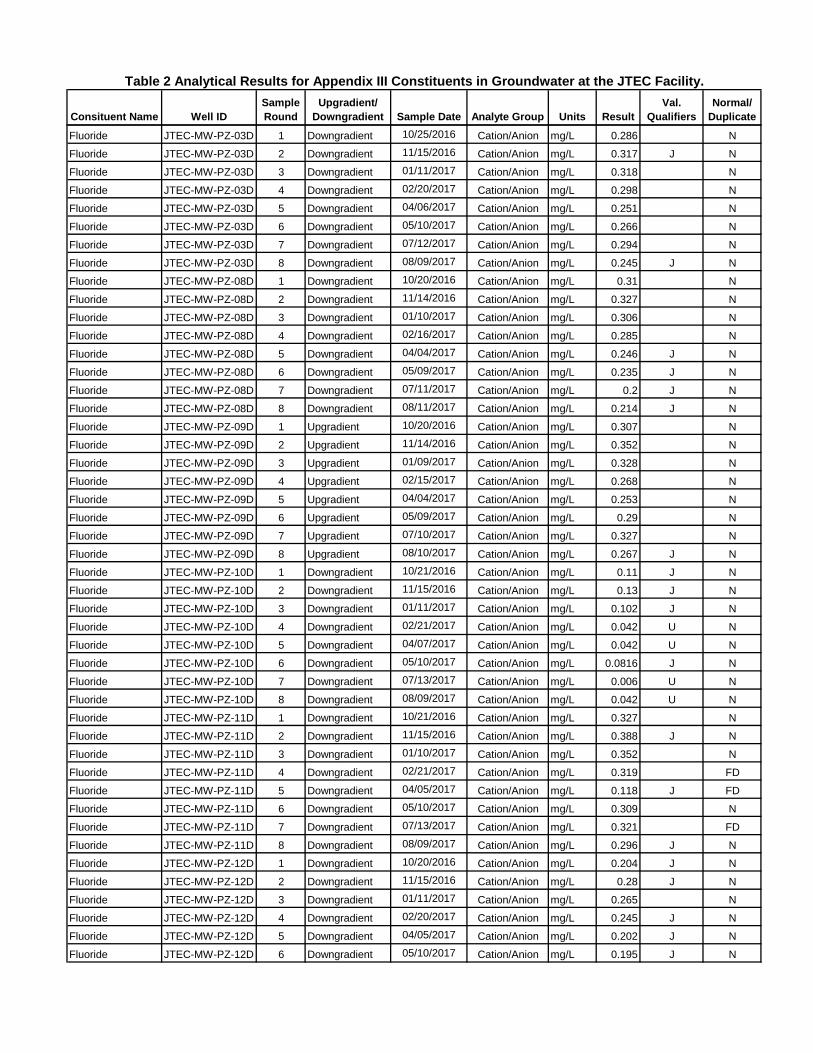
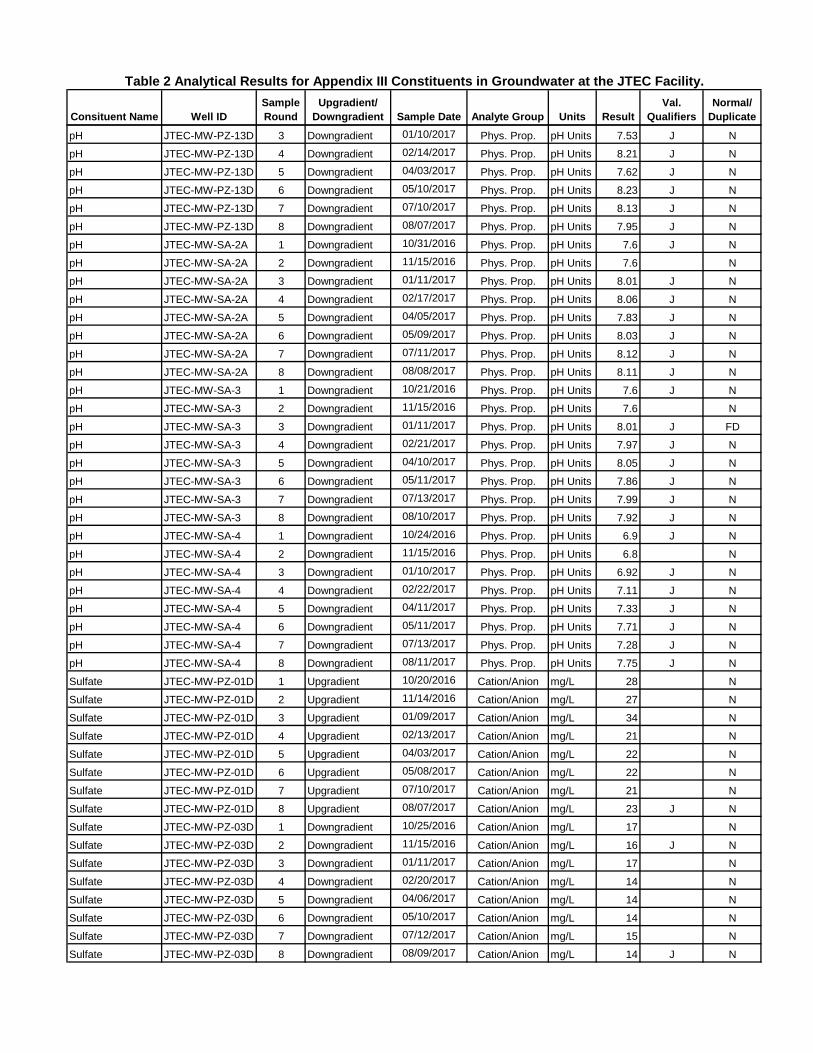
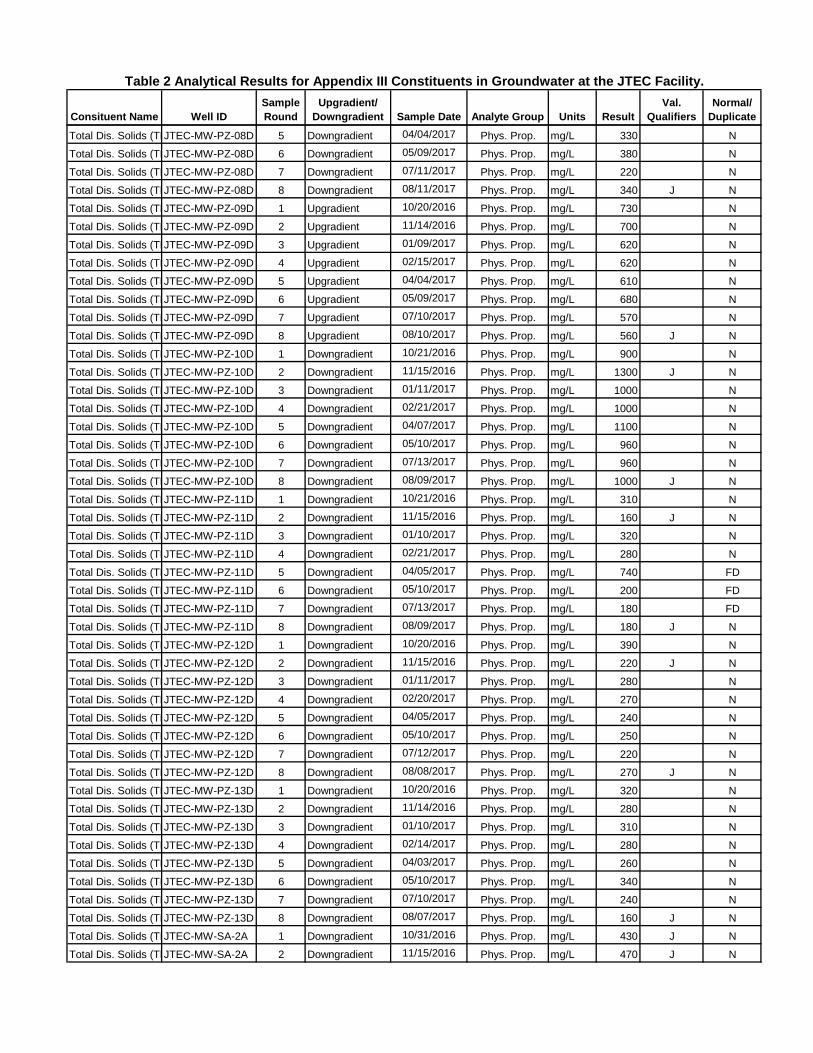
Analytical results for CCR Appendix III are included in Table 2. The statistical analyses presented in Appendix B incorporated the data from the upgradient (background) wells MWPZ01D and MWPZ09D, and downgradient wells MWPZ13D, MWSA2A, MWPZ12D, MWPZ03D, MWPZ11D, MWPZ10D, MWSA3, MWSA4, and MWPZ08D. Statistical prediction limits were calculated for boron, calcium, chloride, fluoride, pH, sulfate, and total dissolved solids. All constituents except pH had one or more downgradient sampling result that exceeded the statistical prediction limit.
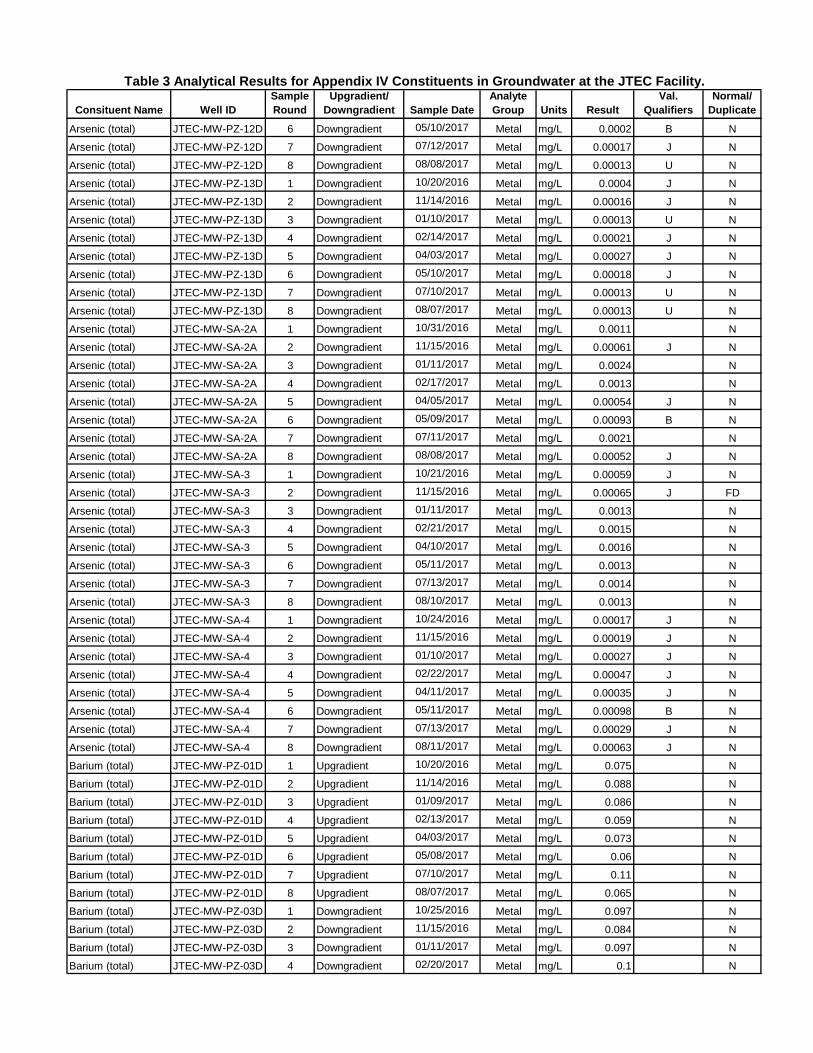
5.2 CCR Appendix IV Constituents Analytical Results
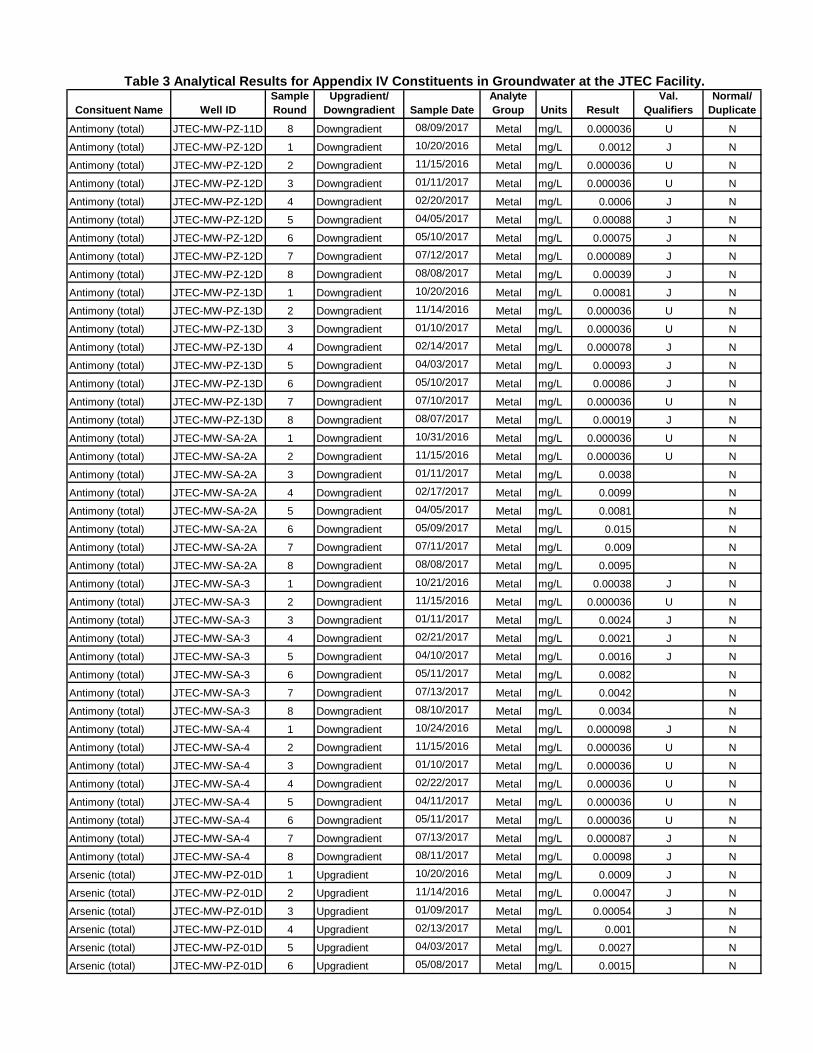
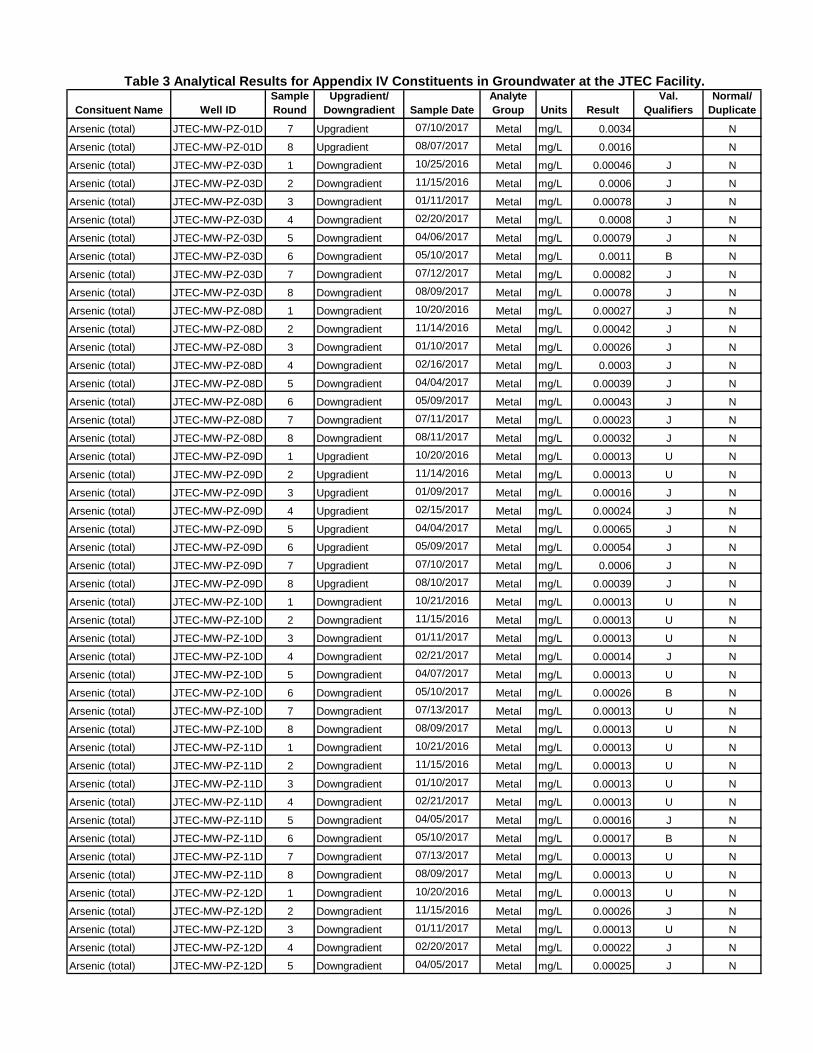
Analytical results for CCR Appendix IV are included in Table 3. The statistical analyses in Appendix B incorporated the data from the upgradient wells MWPZ01D and MWPZ09D, and downgradient wells MWPZ13D, MWSA2A, MWPZ12D, MWPZ03D, MWPZ11D, MWPZ10D, MWSA3, MWSA4, and MWPZ08D. Statistical prediction limits were calculated for antimony, arsenic, barium, beryllium, cadmium, chromium, cobalt, fluoride, lead, lithium, mercury, molybdenum, selenium, thallium, and radium 226/228 combined. All constituents except barium, cobalt, mercury, and thallium had one or more downgradient sampling result that exceeded the statistical prediction limit. The concentrations of all constituents were less than their respective maximum contaminant levels with the exception of antimony. Additional confirmatory sampling is required once the assessment monitoring program has been established.
5.3 Conclusion and Recommendations
As a result of exceeding the statistical prediction limits on all but one constituent in CCR Appendix III constituent list, assessment monitoring will begin in 2018. Beginning in the second quarter of 2018, groundwater will be sampled for all Appendix IV parameters and a statistical analysis of the data will be conducted to determine if the results exceed a groundwater protection standard.
6.0 REFERENCES
GeoEngineers, 2016 (16 September). Groundwater Sampling and Analysis Plan. John Twitty Energy Center Utility Waste Landfill, Green County, Missouri.
GeoEngineers, 2017 (12 January). Groundwater Characterization Phase I – Monitoring Well Siting and Installation Report. John Twitty Energy Center Utility Waste Landfill, Greene County, Missouri.

Tables
Table 1 CCR Analytical Constituents

Table 1 CCR Analytical Constituents
CCR 40 CFR 257 Appendix III Constituents
Boron Calcium Chloride Fluoride
pH Sulfate
Total Dissolved Solids
CCR 40 CFR 257 Appendix IV Constituents Antimony Arsenic Barium
Beryllium Cadmium Chromium
Cobalt Fluoride
Lead Lithium Mercury
Molybdenum Selenium Thallium
Radium 226 and 228 combined
Table 2 Analytical Results for Appendix III Constituents in Groundwater at JTEC

Consituent Name Well IDSample Round
Upgradient/Downgradient Sample Date Analyte Group Units Result
Val. Qualifiers
Normal/Duplicate
Boron (total) JTEC-MW-PZ-01D 1 Upgradient 10/20/2016 Metal mg/L 0.02 N
Boron (total) JTEC-MW-PZ-01D 2 Upgradient 11/14/2016 Metal mg/L 0.02 N
Boron (total) JTEC-MW-PZ-01D 3 Upgradient 01/09/2017 Metal mg/L 0.019 N
Boron (total) JTEC-MW-PZ-01D 4 Upgradient 02/13/2017 Metal mg/L 0.077 N
Boron (total) JTEC-MW-PZ-01D 5 Upgradient 04/03/2017 Metal mg/L 0.02 N
Boron (total) JTEC-MW-PZ-01D 6 Upgradient 05/08/2017 Metal mg/L 0.0056 J N
Boron (total) JTEC-MW-PZ-01D 7 Upgradient 07/10/2017 Metal mg/L 0.013 J N
Boron (total) JTEC-MW-PZ-01D 8 Upgradient 08/07/2017 Metal mg/L 0.01 N
Boron (total) JTEC-MW-PZ-03D 1 Downgradient 10/25/2016 Metal mg/L 0.031 N
Boron (total) JTEC-MW-PZ-03D 2 Downgradient 11/15/2016 Metal mg/L 0.03 N
Boron (total) JTEC-MW-PZ-03D 3 Downgradient 01/11/2017 Metal mg/L 0.025 N
Boron (total) JTEC-MW-PZ-03D 4 Downgradient 02/20/2017 Metal mg/L 0.021 B N
Boron (total) JTEC-MW-PZ-03D 5 Downgradient 04/06/2017 Metal mg/L 0.029 N
Boron (total) JTEC-MW-PZ-03D 6 Downgradient 05/10/2017 Metal mg/L 0.029 N
Boron (total) JTEC-MW-PZ-03D 7 Downgradient 07/12/2017 Metal mg/L 0.024 N
Boron (total) JTEC-MW-PZ-03D 8 Downgradient 08/09/2017 Metal mg/L 0.025 N
Boron (total) JTEC-MW-PZ-08D 1 Downgradient 10/20/2016 Metal mg/L 0.029 N
Boron (total) JTEC-MW-PZ-08D 2 Downgradient 11/14/2016 Metal mg/L 0.039 N
Boron (total) JTEC-MW-PZ-08D 3 Downgradient 01/10/2017 Metal mg/L 0.019 N
Boron (total) JTEC-MW-PZ-08D 4 Downgradient 02/16/2017 Metal mg/L 0.03 B N
Boron (total) JTEC-MW-PZ-08D 5 Downgradient 04/04/2017 Metal mg/L 0.024 N
Boron (total) JTEC-MW-PZ-08D 6 Downgradient 05/09/2017 Metal mg/L 0.021 N
Boron (total) JTEC-MW-PZ-08D 7 Downgradient 07/11/2017 Metal mg/L 0.011 N
Boron (total) JTEC-MW-PZ-08D 8 Downgradient 08/11/2017 Metal mg/L 0.024 N
Boron (total) JTEC-MW-PZ-09D 1 Upgradient 10/20/2016 Metal mg/L 0.071 N
Boron (total) JTEC-MW-PZ-09D 2 Upgradient 11/14/2016 Metal mg/L 0.081 N
Boron (total) JTEC-MW-PZ-09D 3 Upgradient 01/09/2017 Metal mg/L 0.068 N
Boron (total) JTEC-MW-PZ-09D 4 Upgradient 02/15/2017 Metal mg/L 0.11 N
Boron (total) JTEC-MW-PZ-09D 5 Upgradient 04/04/2017 Metal mg/L 0.072 N
Boron (total) JTEC-MW-PZ-09D 6 Upgradient 05/09/2017 Metal mg/L 0.07 N
Boron (total) JTEC-MW-PZ-09D 7 Upgradient 07/10/2017 Metal mg/L 0.065 N
Boron (total) JTEC-MW-PZ-09D 8 Upgradient 08/10/2017 Metal mg/L 0.065 N
Boron (total) JTEC-MW-PZ-10D 1 Downgradient 10/21/2016 Metal mg/L 0.66 N
Boron (total) JTEC-MW-PZ-10D 2 Downgradient 11/15/2016 Metal mg/L 0.67 N
Boron (total) JTEC-MW-PZ-10D 3 Downgradient 01/11/2017 Metal mg/L 0.61 N
Boron (total) JTEC-MW-PZ-10D 4 Downgradient 02/21/2017 Metal mg/L 0.58 N
Boron (total) JTEC-MW-PZ-10D 5 Downgradient 04/07/2017 Metal mg/L 0.62 N
Boron (total) JTEC-MW-PZ-10D 6 Downgradient 05/10/2017 Metal mg/L 0.62 N
Boron (total) JTEC-MW-PZ-10D 7 Downgradient 07/13/2017 Metal mg/L 0.57 N
Boron (total) JTEC-MW-PZ-10D 8 Downgradient 08/09/2017 Metal mg/L 0.59 N
Boron (total) JTEC-MW-PZ-11D 1 Downgradient 10/21/2016 Metal mg/L 0.066 N
Boron (total) JTEC-MW-PZ-11D 2 Downgradient 11/15/2016 Metal mg/L 0.06 N
Boron (total) JTEC-MW-PZ-11D 3 Downgradient 01/10/2017 Metal mg/L 0.071 N
Boron (total) JTEC-MW-PZ-11D 4 Downgradient 02/21/2017 Metal mg/L 0.069 N
Boron (total) JTEC-MW-PZ-11D 5 Downgradient 04/05/2017 Metal mg/L 0.13 N
Boron (total) JTEC-MW-PZ-11D 6 Downgradient 05/10/2017 Metal mg/L 0.061 N
Table 2 Analytical Results for Appendix III Constituents in Groundwater at the JTEC Facility.

Consituent Name Well IDSample Round
Upgradient/Downgradient Sample Date Analyte Group Units Result
Val. Qualifiers
Normal/Duplicate
Table 2 Analytical Results for Appendix III Constituents in Groundwater at the JTEC Facility.
Boron (total) JTEC-MW-PZ-11D 7 Downgradient 07/13/2017 Metal mg/L 0.05 N
Boron (total) JTEC-MW-PZ-11D 8 Downgradient 08/09/2017 Metal mg/L 0.047 FD
Boron (total) JTEC-MW-PZ-12D 1 Downgradient 10/20/2016 Metal mg/L 0.016 N
Boron (total) JTEC-MW-PZ-12D 2 Downgradient 11/15/2016 Metal mg/L 0.016 N
Boron (total) JTEC-MW-PZ-12D 3 Downgradient 01/11/2017 Metal mg/L 0.016 N
Boron (total) JTEC-MW-PZ-12D 4 Downgradient 02/20/2017 Metal mg/L 0.019 B N
Boron (total) JTEC-MW-PZ-12D 5 Downgradient 04/05/2017 Metal mg/L 0.02 N
Boron (total) JTEC-MW-PZ-12D 6 Downgradient 05/10/2017 Metal mg/L 0.022 N
Boron (total) JTEC-MW-PZ-12D 7 Downgradient 07/12/2017 Metal mg/L 0.01 N
Boron (total) JTEC-MW-PZ-12D 8 Downgradient 08/08/2017 Metal mg/L 0.013 N
Boron (total) JTEC-MW-PZ-13D 1 Downgradient 10/20/2016 Metal mg/L 0.0086 J N
Boron (total) JTEC-MW-PZ-13D 2 Downgradient 11/14/2016 Metal mg/L 0.013 N
Boron (total) JTEC-MW-PZ-13D 3 Downgradient 01/10/2017 Metal mg/L 0.0073 J N
Boron (total) JTEC-MW-PZ-13D 4 Downgradient 02/14/2017 Metal mg/L 0.017 N
Boron (total) JTEC-MW-PZ-13D 5 Downgradient 04/03/2017 Metal mg/L 0.011 N
Boron (total) JTEC-MW-PZ-13D 6 Downgradient 05/10/2017 Metal mg/L 0.0052 J N
Boron (total) JTEC-MW-PZ-13D 7 Downgradient 07/10/2017 Metal mg/L 0.0055 J N
Boron (total) JTEC-MW-PZ-13D 8 Downgradient 08/07/2017 Metal mg/L 0.0064 J N
Boron (total) JTEC-MW-SA-2A 1 Downgradient 10/31/2016 Metal mg/L 0.032 N
Boron (total) JTEC-MW-SA-2A 2 Downgradient 11/15/2016 Metal mg/L 0.034 N
Boron (total) JTEC-MW-SA-2A 3 Downgradient 01/11/2017 Metal mg/L 0.034 N
Boron (total) JTEC-MW-SA-2A 4 Downgradient 02/17/2017 Metal mg/L 0.034 N
Boron (total) JTEC-MW-SA-2A 5 Downgradient 04/05/2017 Metal mg/L 0.031 N
Boron (total) JTEC-MW-SA-2A 6 Downgradient 05/09/2017 Metal mg/L 0.035 N
Boron (total) JTEC-MW-SA-2A 7 Downgradient 07/11/2017 Metal mg/L 0.029 N
Boron (total) JTEC-MW-SA-2A 8 Downgradient 08/08/2017 Metal mg/L 0.038 N
Boron (total) JTEC-MW-SA-3 1 Downgradient 10/21/2016 Metal mg/L 0.049 N
Boron (total) JTEC-MW-SA-3 2 Downgradient 11/15/2016 Metal mg/L 0.045 FD
Boron (total) JTEC-MW-SA-3 3 Downgradient 01/11/2017 Metal mg/L 0.04 FD
Boron (total) JTEC-MW-SA-3 4 Downgradient 02/21/2017 Metal mg/L 0.042 N
Boron (total) JTEC-MW-SA-3 5 Downgradient 04/10/2017 Metal mg/L 0.046 N
Boron (total) JTEC-MW-SA-3 6 Downgradient 05/11/2017 Metal mg/L 0.043 N
Boron (total) JTEC-MW-SA-3 7 Downgradient 07/13/2017 Metal mg/L 0.036 N
Boron (total) JTEC-MW-SA-3 8 Downgradient 08/10/2017 Metal mg/L 0.045 N
Boron (total) JTEC-MW-SA-4 1 Downgradient 10/24/2016 Metal mg/L 1.1 N
Boron (total) JTEC-MW-SA-4 2 Downgradient 11/15/2016 Metal mg/L 1.1 N
Boron (total) JTEC-MW-SA-4 3 Downgradient 01/10/2017 Metal mg/L 1.1 N
Boron (total) JTEC-MW-SA-4 4 Downgradient 02/22/2017 Metal mg/L 1.1 N
Boron (total) JTEC-MW-SA-4 5 Downgradient 04/11/2017 Metal mg/L 0.76 N
Boron (total) JTEC-MW-SA-4 6 Downgradient 05/11/2017 Metal mg/L 0.47 N
Boron (total) JTEC-MW-SA-4 7 Downgradient 07/13/2017 Metal mg/L 0.75 N
Boron (total) JTEC-MW-SA-4 8 Downgradient 08/11/2017 Metal mg/L 1.5 N
Calcium (total) JTEC-MW-PZ-01D 1 Upgradient 10/20/2016 Metal mg/L 46 N
Calcium (total) JTEC-MW-PZ-01D 2 Upgradient 11/14/2016 Metal mg/L 52 N
Calcium (total) JTEC-MW-PZ-01D 3 Upgradient 01/09/2017 Metal mg/L 53 N
Calcium (total) JTEC-MW-PZ-01D 4 Upgradient 02/13/2017 Metal mg/L 44 N
Consituent Name Well IDSample Round
Upgradient/Downgradient Sample Date Analyte Group Units Result
Val. Qualifiers
Normal/Duplicate
Table 2 Analytical Results for Appendix III Constituents in Groundwater at the JTEC Facility.
Calcium (total) JTEC-MW-PZ-01D 5 Upgradient 04/03/2017 Metal mg/L 43 N
Calcium (total) JTEC-MW-PZ-01D 6 Upgradient 05/08/2017 Metal mg/L 47 N
Calcium (total) JTEC-MW-PZ-01D 7 Upgradient 07/10/2017 Metal mg/L 85 N
Calcium (total) JTEC-MW-PZ-01D 8 Upgradient 08/07/2017 Metal mg/L 41 N
Calcium (total) JTEC-MW-PZ-03D 1 Downgradient 10/25/2016 Metal mg/L 48 N
Calcium (total) JTEC-MW-PZ-03D 2 Downgradient 11/15/2016 Metal mg/L 51 N
Calcium (total) JTEC-MW-PZ-03D 3 Downgradient 01/11/2017 Metal mg/L 58 N
Calcium (total) JTEC-MW-PZ-03D 4 Downgradient 02/20/2017 Metal mg/L 53 N
Calcium (total) JTEC-MW-PZ-03D 5 Downgradient 04/06/2017 Metal mg/L 48 N
Calcium (total) JTEC-MW-PZ-03D 6 Downgradient 05/10/2017 Metal mg/L 48 N
Calcium (total) JTEC-MW-PZ-03D 7 Downgradient 07/12/2017 Metal mg/L 52 N
Calcium (total) JTEC-MW-PZ-03D 8 Downgradient 08/09/2017 Metal mg/L 51 N
Calcium (total) JTEC-MW-PZ-08D 1 Downgradient 10/20/2016 Metal mg/L 63 N
Calcium (total) JTEC-MW-PZ-08D 2 Downgradient 11/14/2016 Metal mg/L 78 N
Calcium (total) JTEC-MW-PZ-08D 3 Downgradient 01/10/2017 Metal mg/L 58 N
Calcium (total) JTEC-MW-PZ-08D 4 Downgradient 02/16/2017 Metal mg/L 60 N
Calcium (total) JTEC-MW-PZ-08D 5 Downgradient 04/04/2017 Metal mg/L 56 N
Calcium (total) JTEC-MW-PZ-08D 6 Downgradient 05/09/2017 Metal mg/L 59 N
Calcium (total) JTEC-MW-PZ-08D 7 Downgradient 07/11/2017 Metal mg/L 48 N
Calcium (total) JTEC-MW-PZ-08D 8 Downgradient 08/11/2017 Metal mg/L 52 N
Calcium (total) JTEC-MW-PZ-09D 1 Upgradient 10/20/2016 Metal mg/L 100 N
Calcium (total) JTEC-MW-PZ-09D 2 Upgradient 11/14/2016 Metal mg/L 120 N
Calcium (total) JTEC-MW-PZ-09D 3 Upgradient 01/09/2017 Metal mg/L 100 N
Calcium (total) JTEC-MW-PZ-09D 4 Upgradient 02/15/2017 Metal mg/L 98 N
Calcium (total) JTEC-MW-PZ-09D 5 Upgradient 04/04/2017 Metal mg/L 100 N
Calcium (total) JTEC-MW-PZ-09D 6 Upgradient 05/09/2017 Metal mg/L 110 N
Calcium (total) JTEC-MW-PZ-09D 7 Upgradient 07/10/2017 Metal mg/L 110 N
Calcium (total) JTEC-MW-PZ-09D 8 Upgradient 08/10/2017 Metal mg/L 91 N
Calcium (total) JTEC-MW-PZ-10D 1 Downgradient 10/21/2016 Metal mg/L 220 N
Calcium (total) JTEC-MW-PZ-10D 2 Downgradient 11/15/2016 Metal mg/L 230 N
Calcium (total) JTEC-MW-PZ-10D 3 Downgradient 01/11/2017 Metal mg/L 240 N
Calcium (total) JTEC-MW-PZ-10D 4 Downgradient 02/21/2017 Metal mg/L 230 N
Calcium (total) JTEC-MW-PZ-10D 5 Downgradient 04/07/2017 Metal mg/L 240 N
Calcium (total) JTEC-MW-PZ-10D 6 Downgradient 05/10/2017 Metal mg/L 350 N
Calcium (total) JTEC-MW-PZ-10D 7 Downgradient 07/13/2017 Metal mg/L 270 N
Calcium (total) JTEC-MW-PZ-10D 8 Downgradient 08/09/2017 Metal mg/L 270 N
Calcium (total) JTEC-MW-PZ-11D 1 Downgradient 10/21/2016 Metal mg/L 64 N
Calcium (total) JTEC-MW-PZ-11D 2 Downgradient 11/15/2016 Metal mg/L 44 N
Calcium (total) JTEC-MW-PZ-11D 3 Downgradient 01/10/2017 Metal mg/L 57 N
Calcium (total) JTEC-MW-PZ-11D 4 Downgradient 02/21/2017 Metal mg/L 50 N
Calcium (total) JTEC-MW-PZ-11D 5 Downgradient 04/05/2017 Metal mg/L 150 N
Calcium (total) JTEC-MW-PZ-11D 6 Downgradient 05/10/2017 Metal mg/L 42 FD
Calcium (total) JTEC-MW-PZ-11D 7 Downgradient 07/13/2017 Metal mg/L 41 FD
Calcium (total) JTEC-MW-PZ-11D 8 Downgradient 08/09/2017 Metal mg/L 43 FD
Calcium (total) JTEC-MW-PZ-12D 1 Downgradient 10/20/2016 Metal mg/L 82 N
Calcium (total) JTEC-MW-PZ-12D 2 Downgradient 11/15/2016 Metal mg/L 60 N

Consituent Name Well IDSample Round
Upgradient/Downgradient Sample Date Analyte Group Units Result
Val. Qualifiers
Normal/Duplicate
Table 2 Analytical Results for Appendix III Constituents in Groundwater at the JTEC Facility.
Calcium (total) JTEC-MW-PZ-12D 3 Downgradient 01/11/2017 Metal mg/L 64 N
Calcium (total) JTEC-MW-PZ-12D 4 Downgradient 02/20/2017 Metal mg/L 56 N
Calcium (total) JTEC-MW-PZ-12D 5 Downgradient 04/05/2017 Metal mg/L 59 N
Calcium (total) JTEC-MW-PZ-12D 6 Downgradient 05/10/2017 Metal mg/L 56 N
Calcium (total) JTEC-MW-PZ-12D 7 Downgradient 07/12/2017 Metal mg/L 47 N
Calcium (total) JTEC-MW-PZ-12D 8 Downgradient 08/08/2017 Metal mg/L 77 N
Calcium (total) JTEC-MW-PZ-13D 1 Downgradient 10/20/2016 Metal mg/L 66 N
Calcium (total) JTEC-MW-PZ-13D 2 Downgradient 11/14/2016 Metal mg/L 54 N
Calcium (total) JTEC-MW-PZ-13D 3 Downgradient 01/10/2017 Metal mg/L 66 N
Calcium (total) JTEC-MW-PZ-13D 4 Downgradient 02/14/2017 Metal mg/L 56 N
Calcium (total) JTEC-MW-PZ-13D 5 Downgradient 04/03/2017 Metal mg/L 57 N
Calcium (total) JTEC-MW-PZ-13D 6 Downgradient 05/10/2017 Metal mg/L 57 N
Calcium (total) JTEC-MW-PZ-13D 7 Downgradient 07/10/2017 Metal mg/L 62 N
Calcium (total) JTEC-MW-PZ-13D 8 Downgradient 08/07/2017 Metal mg/L 43 N
Calcium (total) JTEC-MW-SA-2A 1 Downgradient 10/31/2016 Metal mg/L 60 N
Calcium (total) JTEC-MW-SA-2A 2 Downgradient 11/15/2016 Metal mg/L 54 N
Calcium (total) JTEC-MW-SA-2A 3 Downgradient 01/11/2017 Metal mg/L 69 N
Calcium (total) JTEC-MW-SA-2A 4 Downgradient 02/17/2017 Metal mg/L 54 N
Calcium (total) JTEC-MW-SA-2A 5 Downgradient 04/05/2017 Metal mg/L 46 N
Calcium (total) JTEC-MW-SA-2A 6 Downgradient 05/09/2017 Metal mg/L 44 N
Calcium (total) JTEC-MW-SA-2A 7 Downgradient 07/11/2017 Metal mg/L 56 N
Calcium (total) JTEC-MW-SA-2A 8 Downgradient 08/08/2017 Metal mg/L 49 N
Calcium (total) JTEC-MW-SA-3 1 Downgradient 10/21/2016 Metal mg/L 46 N
Calcium (total) JTEC-MW-SA-3 2 Downgradient 11/15/2016 Metal mg/L 46 FD
Calcium (total) JTEC-MW-SA-3 3 Downgradient 01/11/2017 Metal mg/L 49 N
Calcium (total) JTEC-MW-SA-3 4 Downgradient 02/21/2017 Metal mg/L 48 N
Calcium (total) JTEC-MW-SA-3 5 Downgradient 04/10/2017 Metal mg/L 48 N
Calcium (total) JTEC-MW-SA-3 6 Downgradient 05/11/2017 Metal mg/L 48 N
Calcium (total) JTEC-MW-SA-3 7 Downgradient 07/13/2017 Metal mg/L 47 N
Calcium (total) JTEC-MW-SA-3 8 Downgradient 08/10/2017 Metal mg/L 47 N
Calcium (total) JTEC-MW-SA-4 1 Downgradient 10/24/2016 Metal mg/L 320 N
Calcium (total) JTEC-MW-SA-4 2 Downgradient 11/15/2016 Metal mg/L 330 N
Calcium (total) JTEC-MW-SA-4 3 Downgradient 01/10/2017 Metal mg/L 400 N
Calcium (total) JTEC-MW-SA-4 4 Downgradient 02/22/2017 Metal mg/L 370 N
Calcium (total) JTEC-MW-SA-4 5 Downgradient 04/11/2017 Metal mg/L 300 N
Calcium (total) JTEC-MW-SA-4 6 Downgradient 05/11/2017 Metal mg/L 210 N
Calcium (total) JTEC-MW-SA-4 7 Downgradient 07/13/2017 Metal mg/L 280 N
Calcium (total) JTEC-MW-SA-4 8 Downgradient 08/11/2017 Metal mg/L 330 N
Fluoride JTEC-MW-PZ-01D 1 Upgradient 10/20/2016 Cation/Anion mg/L 0.319 N
Fluoride JTEC-MW-PZ-01D 2 Upgradient 11/14/2016 Cation/Anion mg/L 0.344 N
Fluoride JTEC-MW-PZ-01D 3 Upgradient 01/09/2017 Cation/Anion mg/L 0.311 J N
Fluoride JTEC-MW-PZ-01D 4 Upgradient 02/13/2017 Cation/Anion mg/L 0.258 N
Fluoride JTEC-MW-PZ-01D 5 Upgradient 04/03/2017 Cation/Anion mg/L 0.262 N
Fluoride JTEC-MW-PZ-01D 6 Upgradient 05/08/2017 Cation/Anion mg/L 0.236 J N
Fluoride JTEC-MW-PZ-01D 7 Upgradient 07/10/2017 Cation/Anion mg/L 0.233 J N
Fluoride JTEC-MW-PZ-01D 8 Upgradient 08/07/2017 Cation/Anion mg/L 0.231 J N
Consituent Name Well IDSample Round
Upgradient/Downgradient Sample Date Analyte Group Units Result
Val. Qualifiers
Normal/Duplicate
Table 2 Analytical Results for Appendix III Constituents in Groundwater at the JTEC Facility.
Fluoride JTEC-MW-PZ-03D 1 Downgradient 10/25/2016 Cation/Anion mg/L 0.286 N
Fluoride JTEC-MW-PZ-03D 2 Downgradient 11/15/2016 Cation/Anion mg/L 0.317 J N
Fluoride JTEC-MW-PZ-03D 3 Downgradient 01/11/2017 Cation/Anion mg/L 0.318 N
Fluoride JTEC-MW-PZ-03D 4 Downgradient 02/20/2017 Cation/Anion mg/L 0.298 N
Fluoride JTEC-MW-PZ-03D 5 Downgradient 04/06/2017 Cation/Anion mg/L 0.251 N
Fluoride JTEC-MW-PZ-03D 6 Downgradient 05/10/2017 Cation/Anion mg/L 0.266 N
Fluoride JTEC-MW-PZ-03D 7 Downgradient 07/12/2017 Cation/Anion mg/L 0.294 N
Fluoride JTEC-MW-PZ-03D 8 Downgradient 08/09/2017 Cation/Anion mg/L 0.245 J N
Fluoride JTEC-MW-PZ-08D 1 Downgradient 10/20/2016 Cation/Anion mg/L 0.31 N
Fluoride JTEC-MW-PZ-08D 2 Downgradient 11/14/2016 Cation/Anion mg/L 0.327 N
Fluoride JTEC-MW-PZ-08D 3 Downgradient 01/10/2017 Cation/Anion mg/L 0.306 N
Fluoride JTEC-MW-PZ-08D 4 Downgradient 02/16/2017 Cation/Anion mg/L 0.285 N
Fluoride JTEC-MW-PZ-08D 5 Downgradient 04/04/2017 Cation/Anion mg/L 0.246 J N
Fluoride JTEC-MW-PZ-08D 6 Downgradient 05/09/2017 Cation/Anion mg/L 0.235 J N
Fluoride JTEC-MW-PZ-08D 7 Downgradient 07/11/2017 Cation/Anion mg/L 0.2 J N
Fluoride JTEC-MW-PZ-08D 8 Downgradient 08/11/2017 Cation/Anion mg/L 0.214 J N
Fluoride JTEC-MW-PZ-09D 1 Upgradient 10/20/2016 Cation/Anion mg/L 0.307 N
Fluoride JTEC-MW-PZ-09D 2 Upgradient 11/14/2016 Cation/Anion mg/L 0.352 N
Fluoride JTEC-MW-PZ-09D 3 Upgradient 01/09/2017 Cation/Anion mg/L 0.328 N
Fluoride JTEC-MW-PZ-09D 4 Upgradient 02/15/2017 Cation/Anion mg/L 0.268 N
Fluoride JTEC-MW-PZ-09D 5 Upgradient 04/04/2017 Cation/Anion mg/L 0.253 N
Fluoride JTEC-MW-PZ-09D 6 Upgradient 05/09/2017 Cation/Anion mg/L 0.29 N
Fluoride JTEC-MW-PZ-09D 7 Upgradient 07/10/2017 Cation/Anion mg/L 0.327 N
Fluoride JTEC-MW-PZ-09D 8 Upgradient 08/10/2017 Cation/Anion mg/L 0.267 J N
Fluoride JTEC-MW-PZ-10D 1 Downgradient 10/21/2016 Cation/Anion mg/L 0.11 J N
Fluoride JTEC-MW-PZ-10D 2 Downgradient 11/15/2016 Cation/Anion mg/L 0.13 J N
Fluoride JTEC-MW-PZ-10D 3 Downgradient 01/11/2017 Cation/Anion mg/L 0.102 J N
Fluoride JTEC-MW-PZ-10D 4 Downgradient 02/21/2017 Cation/Anion mg/L 0.042 U N
Fluoride JTEC-MW-PZ-10D 5 Downgradient 04/07/2017 Cation/Anion mg/L 0.042 U N
Fluoride JTEC-MW-PZ-10D 6 Downgradient 05/10/2017 Cation/Anion mg/L 0.0816 J N
Fluoride JTEC-MW-PZ-10D 7 Downgradient 07/13/2017 Cation/Anion mg/L 0.006 U N
Fluoride JTEC-MW-PZ-10D 8 Downgradient 08/09/2017 Cation/Anion mg/L 0.042 U N
Fluoride JTEC-MW-PZ-11D 1 Downgradient 10/21/2016 Cation/Anion mg/L 0.327 N
Fluoride JTEC-MW-PZ-11D 2 Downgradient 11/15/2016 Cation/Anion mg/L 0.388 J N
Fluoride JTEC-MW-PZ-11D 3 Downgradient 01/10/2017 Cation/Anion mg/L 0.352 N
Fluoride JTEC-MW-PZ-11D 4 Downgradient 02/21/2017 Cation/Anion mg/L 0.319 FD
Fluoride JTEC-MW-PZ-11D 5 Downgradient 04/05/2017 Cation/Anion mg/L 0.118 J FD
Fluoride JTEC-MW-PZ-11D 6 Downgradient 05/10/2017 Cation/Anion mg/L 0.309 N
Fluoride JTEC-MW-PZ-11D 7 Downgradient 07/13/2017 Cation/Anion mg/L 0.321 FD
Fluoride JTEC-MW-PZ-11D 8 Downgradient 08/09/2017 Cation/Anion mg/L 0.296 J N
Fluoride JTEC-MW-PZ-12D 1 Downgradient 10/20/2016 Cation/Anion mg/L 0.204 J N
Fluoride JTEC-MW-PZ-12D 2 Downgradient 11/15/2016 Cation/Anion mg/L 0.28 J N
Fluoride JTEC-MW-PZ-12D 3 Downgradient 01/11/2017 Cation/Anion mg/L 0.265 N
Fluoride JTEC-MW-PZ-12D 4 Downgradient 02/20/2017 Cation/Anion mg/L 0.245 J N
Fluoride JTEC-MW-PZ-12D 5 Downgradient 04/05/2017 Cation/Anion mg/L 0.202 J N
Fluoride JTEC-MW-PZ-12D 6 Downgradient 05/10/2017 Cation/Anion mg/L 0.195 J N

Consituent Name Well IDSample Round
Upgradient/Downgradient Sample Date Analyte Group Units Result
Val. Qualifiers
Normal/Duplicate
Table 2 Analytical Results for Appendix III Constituents in Groundwater at the JTEC Facility.
Fluoride JTEC-MW-PZ-12D 7 Downgradient 07/12/2017 Cation/Anion mg/L 0.203 J N
Fluoride JTEC-MW-PZ-12D 8 Downgradient 08/08/2017 Cation/Anion mg/L 0.115 J N
Fluoride JTEC-MW-PZ-13D 1 Downgradient 10/20/2016 Cation/Anion mg/L 0.234 J N
Fluoride JTEC-MW-PZ-13D 2 Downgradient 11/14/2016 Cation/Anion mg/L 0.31 N
Fluoride JTEC-MW-PZ-13D 3 Downgradient 01/10/2017 Cation/Anion mg/L 0.271 N
Fluoride JTEC-MW-PZ-13D 4 Downgradient 02/14/2017 Cation/Anion mg/L 0.213 J N
Fluoride JTEC-MW-PZ-13D 5 Downgradient 04/03/2017 Cation/Anion mg/L 0.198 J N
Fluoride JTEC-MW-PZ-13D 6 Downgradient 05/10/2017 Cation/Anion mg/L 0.183 J N
Fluoride JTEC-MW-PZ-13D 7 Downgradient 07/10/2017 Cation/Anion mg/L 0.16 J N
Fluoride JTEC-MW-PZ-13D 8 Downgradient 08/07/2017 Cation/Anion mg/L 0.185 J N
Fluoride JTEC-MW-SA-2A 1 Downgradient 10/31/2016 Cation/Anion mg/L 0.202 J N
Fluoride JTEC-MW-SA-2A 2 Downgradient 11/15/2016 Cation/Anion mg/L 0.239 J N
Fluoride JTEC-MW-SA-2A 3 Downgradient 01/11/2017 Cation/Anion mg/L 0.248 J N
Fluoride JTEC-MW-SA-2A 4 Downgradient 02/17/2017 Cation/Anion mg/L 0.205 J N
Fluoride JTEC-MW-SA-2A 5 Downgradient 04/05/2017 Cation/Anion mg/L 0.167 J N
Fluoride JTEC-MW-SA-2A 6 Downgradient 05/09/2017 Cation/Anion mg/L 0.221 J N
Fluoride JTEC-MW-SA-2A 7 Downgradient 07/11/2017 Cation/Anion mg/L 0.217 J N
Fluoride JTEC-MW-SA-2A 8 Downgradient 08/08/2017 Cation/Anion mg/L 0.183 J N
Fluoride JTEC-MW-SA-3 1 Downgradient 10/21/2016 Cation/Anion mg/L 0.305 N
Fluoride JTEC-MW-SA-3 2 Downgradient 11/15/2016 Cation/Anion mg/L 0.373 J FD
Fluoride JTEC-MW-SA-3 3 Downgradient 01/11/2017 Cation/Anion mg/L 0.41 FD
Fluoride JTEC-MW-SA-3 4 Downgradient 02/21/2017 Cation/Anion mg/L 0.379 N
Fluoride JTEC-MW-SA-3 5 Downgradient 04/10/2017 Cation/Anion mg/L 0.406 N
Fluoride JTEC-MW-SA-3 6 Downgradient 05/11/2017 Cation/Anion mg/L 0.358 N
Fluoride JTEC-MW-SA-3 7 Downgradient 07/13/2017 Cation/Anion mg/L 0.366 N
Fluoride JTEC-MW-SA-3 8 Downgradient 08/10/2017 Cation/Anion mg/L 0.317 J N
Fluoride JTEC-MW-SA-4 1 Downgradient 10/24/2016 Cation/Anion mg/L 0.166 J N
Fluoride JTEC-MW-SA-4 2 Downgradient 11/15/2016 Cation/Anion mg/L 0.178 J N
Fluoride JTEC-MW-SA-4 3 Downgradient 01/10/2017 Cation/Anion mg/L 0.138 J N
Fluoride JTEC-MW-SA-4 4 Downgradient 02/22/2017 Cation/Anion mg/L 0.0838 J N
Fluoride JTEC-MW-SA-4 5 Downgradient 04/11/2017 Cation/Anion mg/L 0.102 J N
Fluoride JTEC-MW-SA-4 6 Downgradient 05/11/2017 Cation/Anion mg/L 0.103 J N
Fluoride JTEC-MW-SA-4 7 Downgradient 07/13/2017 Cation/Anion mg/L 0.116 J N
Fluoride JTEC-MW-SA-4 8 Downgradient 08/11/2017 Cation/Anion mg/L 0.072 J N
pH JTEC-MW-PZ-01D 1 Upgradient 10/20/2016 Phys. Prop. pH Units 7.6 J N
pH JTEC-MW-PZ-01D 2 Upgradient 11/14/2016 Phys. Prop. pH Units 7 N
pH JTEC-MW-PZ-01D 3 Upgradient 01/09/2017 Phys. Prop. pH Units 7.59 J N
pH JTEC-MW-PZ-01D 4 Upgradient 02/13/2017 Phys. Prop. pH Units 8.01 J N
pH JTEC-MW-PZ-01D 5 Upgradient 04/03/2017 Phys. Prop. pH Units 7.91 J N
pH JTEC-MW-PZ-01D 6 Upgradient 05/08/2017 Phys. Prop. pH Units 8.03 J N
pH JTEC-MW-PZ-01D 7 Upgradient 07/10/2017 Phys. Prop. pH Units 7.89 J N
pH JTEC-MW-PZ-01D 8 Upgradient 08/07/2017 Phys. Prop. pH Units 8.1 J N
pH JTEC-MW-PZ-03D 1 Downgradient 10/25/2016 Phys. Prop. pH Units 7.3 J N
pH JTEC-MW-PZ-03D 2 Downgradient 11/15/2016 Phys. Prop. pH Units 7.1 N
pH JTEC-MW-PZ-03D 3 Downgradient 01/11/2017 Phys. Prop. pH Units 7.78 J N
pH JTEC-MW-PZ-03D 4 Downgradient 02/20/2017 Phys. Prop. pH Units 7.95 J N

Consituent Name Well IDSample Round
Upgradient/Downgradient Sample Date Analyte Group Units Result
Val. Qualifiers
Normal/Duplicate
Table 2 Analytical Results for Appendix III Constituents in Groundwater at the JTEC Facility.
pH JTEC-MW-PZ-03D 5 Downgradient 04/06/2017 Phys. Prop. pH Units 7.82 J N
pH JTEC-MW-PZ-03D 6 Downgradient 05/10/2017 Phys. Prop. pH Units 7.95 J N
pH JTEC-MW-PZ-03D 7 Downgradient 07/12/2017 Phys. Prop. pH Units 8.05 J N
pH JTEC-MW-PZ-03D 8 Downgradient 08/09/2017 Phys. Prop. pH Units 7.94 J N
pH JTEC-MW-PZ-08D 1 Downgradient 10/20/2016 Phys. Prop. pH Units 7.4 J N
pH JTEC-MW-PZ-08D 2 Downgradient 11/14/2016 Phys. Prop. pH Units 7.2 N
pH JTEC-MW-PZ-08D 3 Downgradient 01/10/2017 Phys. Prop. pH Units 7.59 J N
pH JTEC-MW-PZ-08D 4 Downgradient 02/16/2017 Phys. Prop. pH Units 8.11 J N
pH JTEC-MW-PZ-08D 5 Downgradient 04/04/2017 Phys. Prop. pH Units 7.78 J N
pH JTEC-MW-PZ-08D 6 Downgradient 05/09/2017 Phys. Prop. pH Units 7.86 J N
pH JTEC-MW-PZ-08D 7 Downgradient 07/11/2017 Phys. Prop. pH Units 8.14 J N
pH JTEC-MW-PZ-08D 8 Downgradient 08/11/2017 Phys. Prop. pH Units 7.97 J N
pH JTEC-MW-PZ-09D 1 Upgradient 10/20/2016 Phys. Prop. pH Units 7.2 J N
pH JTEC-MW-PZ-09D 2 Upgradient 11/14/2016 Phys. Prop. pH Units 7.1 N
pH JTEC-MW-PZ-09D 3 Upgradient 01/09/2017 Phys. Prop. pH Units 7.43 J N
pH JTEC-MW-PZ-09D 4 Upgradient 02/15/2017 Phys. Prop. pH Units 7.68 J N
pH JTEC-MW-PZ-09D 5 Upgradient 04/04/2017 Phys. Prop. pH Units 7.48 J N
pH JTEC-MW-PZ-09D 6 Upgradient 05/09/2017 Phys. Prop. pH Units 7.68 J N
pH JTEC-MW-PZ-09D 7 Upgradient 07/10/2017 Phys. Prop. pH Units 7.66 J N
pH JTEC-MW-PZ-09D 8 Upgradient 08/10/2017 Phys. Prop. pH Units 7.61 J N
pH JTEC-MW-PZ-10D 1 Downgradient 10/21/2016 Phys. Prop. pH Units 6.9 J N
pH JTEC-MW-PZ-10D 2 Downgradient 11/15/2016 Phys. Prop. pH Units 7 N
pH JTEC-MW-PZ-10D 3 Downgradient 01/11/2017 Phys. Prop. pH Units 7.54 J N
pH JTEC-MW-PZ-10D 4 Downgradient 02/21/2017 Phys. Prop. pH Units 7.47 J N
pH JTEC-MW-PZ-10D 5 Downgradient 04/07/2017 Phys. Prop. pH Units 7.37 J N
pH JTEC-MW-PZ-10D 6 Downgradient 05/10/2017 Phys. Prop. pH Units 7.49 J N
pH JTEC-MW-PZ-10D 7 Downgradient 07/13/2017 Phys. Prop. pH Units 7.71 J N
pH JTEC-MW-PZ-10D 8 Downgradient 08/09/2017 Phys. Prop. pH Units 7.74 J N
pH JTEC-MW-PZ-11D 1 Downgradient 10/21/2016 Phys. Prop. pH Units 7.3 J N
pH JTEC-MW-PZ-11D 2 Downgradient 11/15/2016 Phys. Prop. pH Units 7.6 N
pH JTEC-MW-PZ-11D 3 Downgradient 01/10/2017 Phys. Prop. pH Units 7.67 J N
pH JTEC-MW-PZ-11D 4 Downgradient 02/21/2017 Phys. Prop. pH Units 7.99 J N
pH JTEC-MW-PZ-11D 5 Downgradient 04/05/2017 Phys. Prop. pH Units 7.39 J FD
pH JTEC-MW-PZ-11D 6 Downgradient 05/10/2017 Phys. Prop. pH Units 7.98 J N
pH JTEC-MW-PZ-11D 7 Downgradient 07/13/2017 Phys. Prop. pH Units 8.21 J N
pH JTEC-MW-PZ-11D 8 Downgradient 08/09/2017 Phys. Prop. pH Units 8.02 J FD
pH JTEC-MW-PZ-12D 1 Downgradient 10/20/2016 Phys. Prop. pH Units 7.1 J N
pH JTEC-MW-PZ-12D 2 Downgradient 11/15/2016 Phys. Prop. pH Units 7.4 N
pH JTEC-MW-PZ-12D 3 Downgradient 01/11/2017 Phys. Prop. pH Units 7.86 J N
pH JTEC-MW-PZ-12D 4 Downgradient 02/20/2017 Phys. Prop. pH Units 7.96 J N
pH JTEC-MW-PZ-12D 5 Downgradient 04/05/2017 Phys. Prop. pH Units 7.69 J N
pH JTEC-MW-PZ-12D 6 Downgradient 05/10/2017 Phys. Prop. pH Units 7.86 J N
pH JTEC-MW-PZ-12D 7 Downgradient 07/12/2017 Phys. Prop. pH Units 8.12 J N
pH JTEC-MW-PZ-12D 8 Downgradient 08/08/2017 Phys. Prop. pH Units 7.67 J N
pH JTEC-MW-PZ-13D 1 Downgradient 10/20/2016 Phys. Prop. pH Units 7.3 J N
pH JTEC-MW-PZ-13D 2 Downgradient 11/14/2016 Phys. Prop. pH Units 7.2 N
Consituent Name Well IDSample Round
Upgradient/Downgradient Sample Date Analyte Group Units Result
Val. Qualifiers
Normal/Duplicate
Table 2 Analytical Results for Appendix III Constituents in Groundwater at the JTEC Facility.
pH JTEC-MW-PZ-13D 3 Downgradient 01/10/2017 Phys. Prop. pH Units 7.53 J N
pH JTEC-MW-PZ-13D 4 Downgradient 02/14/2017 Phys. Prop. pH Units 8.21 J N
pH JTEC-MW-PZ-13D 5 Downgradient 04/03/2017 Phys. Prop. pH Units 7.62 J N
pH JTEC-MW-PZ-13D 6 Downgradient 05/10/2017 Phys. Prop. pH Units 8.23 J N
pH JTEC-MW-PZ-13D 7 Downgradient 07/10/2017 Phys. Prop. pH Units 8.13 J N
pH JTEC-MW-PZ-13D 8 Downgradient 08/07/2017 Phys. Prop. pH Units 7.95 J N
pH JTEC-MW-SA-2A 1 Downgradient 10/31/2016 Phys. Prop. pH Units 7.6 J N
pH JTEC-MW-SA-2A 2 Downgradient 11/15/2016 Phys. Prop. pH Units 7.6 N
pH JTEC-MW-SA-2A 3 Downgradient 01/11/2017 Phys. Prop. pH Units 8.01 J N
pH JTEC-MW-SA-2A 4 Downgradient 02/17/2017 Phys. Prop. pH Units 8.06 J N
pH JTEC-MW-SA-2A 5 Downgradient 04/05/2017 Phys. Prop. pH Units 7.83 J N
pH JTEC-MW-SA-2A 6 Downgradient 05/09/2017 Phys. Prop. pH Units 8.03 J N
pH JTEC-MW-SA-2A 7 Downgradient 07/11/2017 Phys. Prop. pH Units 8.12 J N
pH JTEC-MW-SA-2A 8 Downgradient 08/08/2017 Phys. Prop. pH Units 8.11 J N
pH JTEC-MW-SA-3 1 Downgradient 10/21/2016 Phys. Prop. pH Units 7.6 J N
pH JTEC-MW-SA-3 2 Downgradient 11/15/2016 Phys. Prop. pH Units 7.6 N
pH JTEC-MW-SA-3 3 Downgradient 01/11/2017 Phys. Prop. pH Units 8.01 J FD
pH JTEC-MW-SA-3 4 Downgradient 02/21/2017 Phys. Prop. pH Units 7.97 J N
pH JTEC-MW-SA-3 5 Downgradient 04/10/2017 Phys. Prop. pH Units 8.05 J N
pH JTEC-MW-SA-3 6 Downgradient 05/11/2017 Phys. Prop. pH Units 7.86 J N
pH JTEC-MW-SA-3 7 Downgradient 07/13/2017 Phys. Prop. pH Units 7.99 J N
pH JTEC-MW-SA-3 8 Downgradient 08/10/2017 Phys. Prop. pH Units 7.92 J N
pH JTEC-MW-SA-4 1 Downgradient 10/24/2016 Phys. Prop. pH Units 6.9 J N
pH JTEC-MW-SA-4 2 Downgradient 11/15/2016 Phys. Prop. pH Units 6.8 N
pH JTEC-MW-SA-4 3 Downgradient 01/10/2017 Phys. Prop. pH Units 6.92 J N
pH JTEC-MW-SA-4 4 Downgradient 02/22/2017 Phys. Prop. pH Units 7.11 J N
pH JTEC-MW-SA-4 5 Downgradient 04/11/2017 Phys. Prop. pH Units 7.33 J N
pH JTEC-MW-SA-4 6 Downgradient 05/11/2017 Phys. Prop. pH Units 7.71 J N
pH JTEC-MW-SA-4 7 Downgradient 07/13/2017 Phys. Prop. pH Units 7.28 J N
pH JTEC-MW-SA-4 8 Downgradient 08/11/2017 Phys. Prop. pH Units 7.75 J N
Sulfate JTEC-MW-PZ-01D 1 Upgradient 10/20/2016 Cation/Anion mg/L 28 N
Sulfate JTEC-MW-PZ-01D 2 Upgradient 11/14/2016 Cation/Anion mg/L 27 N
Sulfate JTEC-MW-PZ-01D 3 Upgradient 01/09/2017 Cation/Anion mg/L 34 N
Sulfate JTEC-MW-PZ-01D 4 Upgradient 02/13/2017 Cation/Anion mg/L 21 N
Sulfate JTEC-MW-PZ-01D 5 Upgradient 04/03/2017 Cation/Anion mg/L 22 N
Sulfate JTEC-MW-PZ-01D 6 Upgradient 05/08/2017 Cation/Anion mg/L 22 N
Sulfate JTEC-MW-PZ-01D 7 Upgradient 07/10/2017 Cation/Anion mg/L 21 N
Sulfate JTEC-MW-PZ-01D 8 Upgradient 08/07/2017 Cation/Anion mg/L 23 J N
Sulfate JTEC-MW-PZ-03D 1 Downgradient 10/25/2016 Cation/Anion mg/L 17 N
Sulfate JTEC-MW-PZ-03D 2 Downgradient 11/15/2016 Cation/Anion mg/L 16 J N
Sulfate JTEC-MW-PZ-03D 3 Downgradient 01/11/2017 Cation/Anion mg/L 17 N
Sulfate JTEC-MW-PZ-03D 4 Downgradient 02/20/2017 Cation/Anion mg/L 14 N
Sulfate JTEC-MW-PZ-03D 5 Downgradient 04/06/2017 Cation/Anion mg/L 14 N
Sulfate JTEC-MW-PZ-03D 6 Downgradient 05/10/2017 Cation/Anion mg/L 14 N
Sulfate JTEC-MW-PZ-03D 7 Downgradient 07/12/2017 Cation/Anion mg/L 15 N
Sulfate JTEC-MW-PZ-03D 8 Downgradient 08/09/2017 Cation/Anion mg/L 14 J N

Consituent Name Well IDSample Round
Upgradient/Downgradient Sample Date Analyte Group Units Result
Val. Qualifiers
Normal/Duplicate
Table 2 Analytical Results for Appendix III Constituents in Groundwater at the JTEC Facility.
Sulfate JTEC-MW-PZ-08D 1 Downgradient 10/20/2016 Cation/Anion mg/L 120 N
Sulfate JTEC-MW-PZ-08D 2 Downgradient 11/14/2016 Cation/Anion mg/L 130 N
Sulfate JTEC-MW-PZ-08D 3 Downgradient 01/10/2017 Cation/Anion mg/L 94 N
Sulfate JTEC-MW-PZ-08D 4 Downgradient 02/16/2017 Cation/Anion mg/L 98 N
Sulfate JTEC-MW-PZ-08D 5 Downgradient 04/04/2017 Cation/Anion mg/L 87 N
Sulfate JTEC-MW-PZ-08D 6 Downgradient 05/09/2017 Cation/Anion mg/L 83 N
Sulfate JTEC-MW-PZ-08D 7 Downgradient 07/11/2017 Cation/Anion mg/L 46 N
Sulfate JTEC-MW-PZ-08D 8 Downgradient 08/11/2017 Cation/Anion mg/L 86 J N
Sulfate JTEC-MW-PZ-09D 1 Upgradient 10/20/2016 Cation/Anion mg/L 270 N
Sulfate JTEC-MW-PZ-09D 2 Upgradient 11/14/2016 Cation/Anion mg/L 310 N
Sulfate JTEC-MW-PZ-09D 3 Upgradient 01/09/2017 Cation/Anion mg/L 250 N
Sulfate JTEC-MW-PZ-09D 4 Upgradient 02/15/2017 Cation/Anion mg/L 270 N
Sulfate JTEC-MW-PZ-09D 5 Upgradient 04/04/2017 Cation/Anion mg/L 250 N
Sulfate JTEC-MW-PZ-09D 6 Upgradient 05/09/2017 Cation/Anion mg/L 250 N
Sulfate JTEC-MW-PZ-09D 7 Upgradient 07/10/2017 Cation/Anion mg/L 240 N
Sulfate JTEC-MW-PZ-09D 8 Upgradient 08/10/2017 Cation/Anion mg/L 230 J N
Sulfate JTEC-MW-PZ-10D 1 Downgradient 10/21/2016 Cation/Anion mg/L 300 N
Sulfate JTEC-MW-PZ-10D 2 Downgradient 11/15/2016 Cation/Anion mg/L 280 J N
Sulfate JTEC-MW-PZ-10D 3 Downgradient 01/11/2017 Cation/Anion mg/L 260 N
Sulfate JTEC-MW-PZ-10D 4 Downgradient 02/21/2017 Cation/Anion mg/L 250 N
Sulfate JTEC-MW-PZ-10D 5 Downgradient 04/07/2017 Cation/Anion mg/L 250 N
Sulfate JTEC-MW-PZ-10D 6 Downgradient 05/10/2017 Cation/Anion mg/L 260 N
Sulfate JTEC-MW-PZ-10D 7 Downgradient 07/13/2017 Cation/Anion mg/L 260 N
Sulfate JTEC-MW-PZ-10D 8 Downgradient 08/09/2017 Cation/Anion mg/L 270 J N
Sulfate JTEC-MW-PZ-11D 1 Downgradient 10/21/2016 Cation/Anion mg/L 31 N
Sulfate JTEC-MW-PZ-11D 2 Downgradient 11/15/2016 Cation/Anion mg/L 15 J N
Sulfate JTEC-MW-PZ-11D 3 Downgradient 01/10/2017 Cation/Anion mg/L 38 N
Sulfate JTEC-MW-PZ-11D 4 Downgradient 02/21/2017 Cation/Anion mg/L 27 N
Sulfate JTEC-MW-PZ-11D 5 Downgradient 04/05/2017 Cation/Anion mg/L 110 FD
Sulfate JTEC-MW-PZ-11D 6 Downgradient 05/10/2017 Cation/Anion mg/L 15 N
Sulfate JTEC-MW-PZ-11D 7 Downgradient 07/13/2017 Cation/Anion mg/L 14 N
Sulfate JTEC-MW-PZ-11D 8 Downgradient 08/09/2017 Cation/Anion mg/L 18 J N
Sulfate JTEC-MW-PZ-12D 1 Downgradient 10/20/2016 Cation/Anion mg/L 24 N
Sulfate JTEC-MW-PZ-12D 2 Downgradient 11/15/2016 Cation/Anion mg/L 20 J N
Sulfate JTEC-MW-PZ-12D 3 Downgradient 01/11/2017 Cation/Anion mg/L 43 N
Sulfate JTEC-MW-PZ-12D 4 Downgradient 02/20/2017 Cation/Anion mg/L 32 N
Sulfate JTEC-MW-PZ-12D 5 Downgradient 04/05/2017 Cation/Anion mg/L 49 N
Sulfate JTEC-MW-PZ-12D 6 Downgradient 05/10/2017 Cation/Anion mg/L 32 N
Sulfate JTEC-MW-PZ-12D 7 Downgradient 07/12/2017 Cation/Anion mg/L 23 N
Sulfate JTEC-MW-PZ-12D 8 Downgradient 08/08/2017 Cation/Anion mg/L 29 J N
Sulfate JTEC-MW-PZ-13D 1 Downgradient 10/20/2016 Cation/Anion mg/L 36 N
Sulfate JTEC-MW-PZ-13D 2 Downgradient 11/14/2016 Cation/Anion mg/L 21 N
Sulfate JTEC-MW-PZ-13D 3 Downgradient 01/10/2017 Cation/Anion mg/L 26 N
Sulfate JTEC-MW-PZ-13D 4 Downgradient 02/14/2017 Cation/Anion mg/L 21 N
Sulfate JTEC-MW-PZ-13D 5 Downgradient 04/03/2017 Cation/Anion mg/L 27 N
Sulfate JTEC-MW-PZ-13D 6 Downgradient 05/10/2017 Cation/Anion mg/L 38 N

Consituent Name Well IDSample Round
Upgradient/Downgradient Sample Date Analyte Group Units Result
Val. Qualifiers
Normal/Duplicate
Table 2 Analytical Results for Appendix III Constituents in Groundwater at the JTEC Facility.
Sulfate JTEC-MW-PZ-13D 7 Downgradient 07/10/2017 Cation/Anion mg/L 16 N
Sulfate JTEC-MW-PZ-13D 8 Downgradient 08/07/2017 Cation/Anion mg/L 18 J N
Sulfate JTEC-MW-SA-2A 1 Downgradient 10/31/2016 Cation/Anion mg/L 110 J N
Sulfate JTEC-MW-SA-2A 2 Downgradient 11/15/2016 Cation/Anion mg/L 110 J N
Sulfate JTEC-MW-SA-2A 3 Downgradient 01/11/2017 Cation/Anion mg/L 110 N
Sulfate JTEC-MW-SA-2A 4 Downgradient 02/17/2017 Cation/Anion mg/L 94 N
Sulfate JTEC-MW-SA-2A 5 Downgradient 04/05/2017 Cation/Anion mg/L 98 N
Sulfate JTEC-MW-SA-2A 6 Downgradient 05/09/2017 Cation/Anion mg/L 100 N
Sulfate JTEC-MW-SA-2A 7 Downgradient 07/11/2017 Cation/Anion mg/L 110 N
Sulfate JTEC-MW-SA-2A 8 Downgradient 08/08/2017 Cation/Anion mg/L 99 J N
Sulfate JTEC-MW-SA-3 1 Downgradient 10/21/2016 Cation/Anion mg/L 43 N
Sulfate JTEC-MW-SA-3 2 Downgradient 11/15/2016 Cation/Anion mg/L 41 J N
Sulfate JTEC-MW-SA-3 3 Downgradient 01/11/2017 Cation/Anion mg/L 42 N
Sulfate JTEC-MW-SA-3 4 Downgradient 02/21/2017 Cation/Anion mg/L 41 N
Sulfate JTEC-MW-SA-3 5 Downgradient 04/10/2017 Cation/Anion mg/L 48 N
Sulfate JTEC-MW-SA-3 6 Downgradient 05/11/2017 Cation/Anion mg/L 51 N
Sulfate JTEC-MW-SA-3 7 Downgradient 07/13/2017 Cation/Anion mg/L 52 N
Sulfate JTEC-MW-SA-3 8 Downgradient 08/10/2017 Cation/Anion mg/L 55 J N
Sulfate JTEC-MW-SA-4 1 Downgradient 10/24/2016 Cation/Anion mg/L 590 N
Sulfate JTEC-MW-SA-4 2 Downgradient 11/15/2016 Cation/Anion mg/L 560 J N
Sulfate JTEC-MW-SA-4 3 Downgradient 01/10/2017 Cation/Anion mg/L 590 N
Sulfate JTEC-MW-SA-4 4 Downgradient 02/22/2017 Cation/Anion mg/L 520 N
Sulfate JTEC-MW-SA-4 5 Downgradient 04/11/2017 Cation/Anion mg/L 430 N
Sulfate JTEC-MW-SA-4 6 Downgradient 05/11/2017 Cation/Anion mg/L 310 N
Sulfate JTEC-MW-SA-4 7 Downgradient 07/13/2017 Cation/Anion mg/L 460 N
Sulfate JTEC-MW-SA-4 8 Downgradient 08/11/2017 Cation/Anion mg/L 490 J N
Total Dis. Solids (TDJTEC-MW-PZ-01D 1 Upgradient 10/20/2016 Phys. Prop. mg/L 220 N
Total Dis. Solids (TDJTEC-MW-PZ-01D 2 Upgradient 11/14/2016 Phys. Prop. mg/L 300 N
Total Dis. Solids (TDJTEC-MW-PZ-01D 3 Upgradient 01/09/2017 Phys. Prop. mg/L 240 N
Total Dis. Solids (TDJTEC-MW-PZ-01D 4 Upgradient 02/13/2017 Phys. Prop. mg/L 180 N
Total Dis. Solids (TDJTEC-MW-PZ-01D 5 Upgradient 04/03/2017 Phys. Prop. mg/L 180 J N
Total Dis. Solids (TDJTEC-MW-PZ-01D 6 Upgradient 05/08/2017 Phys. Prop. mg/L 210 N
Total Dis. Solids (TDJTEC-MW-PZ-01D 7 Upgradient 07/10/2017 Phys. Prop. mg/L 180 N
Total Dis. Solids (TDJTEC-MW-PZ-01D 8 Upgradient 08/07/2017 Phys. Prop. mg/L 140 J N
Total Dis. Solids (TDJTEC-MW-PZ-03D 1 Downgradient 10/25/2016 Phys. Prop. mg/L 210 N
Total Dis. Solids (TDJTEC-MW-PZ-03D 2 Downgradient 11/15/2016 Phys. Prop. mg/L 180 J N
Total Dis. Solids (TDJTEC-MW-PZ-03D 3 Downgradient 01/11/2017 Phys. Prop. mg/L 240 N
Total Dis. Solids (TDJTEC-MW-PZ-03D 4 Downgradient 02/20/2017 Phys. Prop. mg/L 230 N
Total Dis. Solids (TDJTEC-MW-PZ-03D 5 Downgradient 04/06/2017 Phys. Prop. mg/L 200 N
Total Dis. Solids (TDJTEC-MW-PZ-03D 6 Downgradient 05/10/2017 Phys. Prop. mg/L 180 N
Total Dis. Solids (TDJTEC-MW-PZ-03D 7 Downgradient 07/12/2017 Phys. Prop. mg/L 200 N
Total Dis. Solids (TDJTEC-MW-PZ-03D 8 Downgradient 08/09/2017 Phys. Prop. mg/L 160 J N
Total Dis. Solids (TDJTEC-MW-PZ-08D 1 Downgradient 10/20/2016 Phys. Prop. mg/L 450 N
Total Dis. Solids (TDJTEC-MW-PZ-08D 2 Downgradient 11/14/2016 Phys. Prop. mg/L 450 N
Total Dis. Solids (TDJTEC-MW-PZ-08D 3 Downgradient 01/10/2017 Phys. Prop. mg/L 360 N
Total Dis. Solids (TDJTEC-MW-PZ-08D 4 Downgradient 02/16/2017 Phys. Prop. mg/L 400 N
Consituent Name Well IDSample Round
Upgradient/Downgradient Sample Date Analyte Group Units Result
Val. Qualifiers
Normal/Duplicate
Table 2 Analytical Results for Appendix III Constituents in Groundwater at the JTEC Facility.
Total Dis. Solids (TDJTEC-MW-PZ-08D 5 Downgradient 04/04/2017 Phys. Prop. mg/L 330 N
Total Dis. Solids (TDJTEC-MW-PZ-08D 6 Downgradient 05/09/2017 Phys. Prop. mg/L 380 N
Total Dis. Solids (TDJTEC-MW-PZ-08D 7 Downgradient 07/11/2017 Phys. Prop. mg/L 220 N
Total Dis. Solids (TDJTEC-MW-PZ-08D 8 Downgradient 08/11/2017 Phys. Prop. mg/L 340 J N
Total Dis. Solids (TDJTEC-MW-PZ-09D 1 Upgradient 10/20/2016 Phys. Prop. mg/L 730 N
Total Dis. Solids (TDJTEC-MW-PZ-09D 2 Upgradient 11/14/2016 Phys. Prop. mg/L 700 N
Total Dis. Solids (TDJTEC-MW-PZ-09D 3 Upgradient 01/09/2017 Phys. Prop. mg/L 620 N
Total Dis. Solids (TDJTEC-MW-PZ-09D 4 Upgradient 02/15/2017 Phys. Prop. mg/L 620 N
Total Dis. Solids (TDJTEC-MW-PZ-09D 5 Upgradient 04/04/2017 Phys. Prop. mg/L 610 N
Total Dis. Solids (TDJTEC-MW-PZ-09D 6 Upgradient 05/09/2017 Phys. Prop. mg/L 680 N
Total Dis. Solids (TDJTEC-MW-PZ-09D 7 Upgradient 07/10/2017 Phys. Prop. mg/L 570 N
Total Dis. Solids (TDJTEC-MW-PZ-09D 8 Upgradient 08/10/2017 Phys. Prop. mg/L 560 J N
Total Dis. Solids (TDJTEC-MW-PZ-10D 1 Downgradient 10/21/2016 Phys. Prop. mg/L 900 N
Total Dis. Solids (TDJTEC-MW-PZ-10D 2 Downgradient 11/15/2016 Phys. Prop. mg/L 1300 J N
Total Dis. Solids (TDJTEC-MW-PZ-10D 3 Downgradient 01/11/2017 Phys. Prop. mg/L 1000 N
Total Dis. Solids (TDJTEC-MW-PZ-10D 4 Downgradient 02/21/2017 Phys. Prop. mg/L 1000 N
Total Dis. Solids (TDJTEC-MW-PZ-10D 5 Downgradient 04/07/2017 Phys. Prop. mg/L 1100 N
Total Dis. Solids (TDJTEC-MW-PZ-10D 6 Downgradient 05/10/2017 Phys. Prop. mg/L 960 N
Total Dis. Solids (TDJTEC-MW-PZ-10D 7 Downgradient 07/13/2017 Phys. Prop. mg/L 960 N
Total Dis. Solids (TDJTEC-MW-PZ-10D 8 Downgradient 08/09/2017 Phys. Prop. mg/L 1000 J N
Total Dis. Solids (TDJTEC-MW-PZ-11D 1 Downgradient 10/21/2016 Phys. Prop. mg/L 310 N
Total Dis. Solids (TDJTEC-MW-PZ-11D 2 Downgradient 11/15/2016 Phys. Prop. mg/L 160 J N
Total Dis. Solids (TDJTEC-MW-PZ-11D 3 Downgradient 01/10/2017 Phys. Prop. mg/L 320 N
Total Dis. Solids (TDJTEC-MW-PZ-11D 4 Downgradient 02/21/2017 Phys. Prop. mg/L 280 N
Total Dis. Solids (TDJTEC-MW-PZ-11D 5 Downgradient 04/05/2017 Phys. Prop. mg/L 740 FD
Total Dis. Solids (TDJTEC-MW-PZ-11D 6 Downgradient 05/10/2017 Phys. Prop. mg/L 200 FD
Total Dis. Solids (TDJTEC-MW-PZ-11D 7 Downgradient 07/13/2017 Phys. Prop. mg/L 180 FD
Total Dis. Solids (TDJTEC-MW-PZ-11D 8 Downgradient 08/09/2017 Phys. Prop. mg/L 180 J N
Total Dis. Solids (TDJTEC-MW-PZ-12D 1 Downgradient 10/20/2016 Phys. Prop. mg/L 390 N
Total Dis. Solids (TDJTEC-MW-PZ-12D 2 Downgradient 11/15/2016 Phys. Prop. mg/L 220 J N
Total Dis. Solids (TDJTEC-MW-PZ-12D 3 Downgradient 01/11/2017 Phys. Prop. mg/L 280 N
Total Dis. Solids (TDJTEC-MW-PZ-12D 4 Downgradient 02/20/2017 Phys. Prop. mg/L 270 N
Total Dis. Solids (TDJTEC-MW-PZ-12D 5 Downgradient 04/05/2017 Phys. Prop. mg/L 240 N
Total Dis. Solids (TDJTEC-MW-PZ-12D 6 Downgradient 05/10/2017 Phys. Prop. mg/L 250 N
Total Dis. Solids (TDJTEC-MW-PZ-12D 7 Downgradient 07/12/2017 Phys. Prop. mg/L 220 N
Total Dis. Solids (TDJTEC-MW-PZ-12D 8 Downgradient 08/08/2017 Phys. Prop. mg/L 270 J N
Total Dis. Solids (TDJTEC-MW-PZ-13D 1 Downgradient 10/20/2016 Phys. Prop. mg/L 320 N
Total Dis. Solids (TDJTEC-MW-PZ-13D 2 Downgradient 11/14/2016 Phys. Prop. mg/L 280 N
Total Dis. Solids (TDJTEC-MW-PZ-13D 3 Downgradient 01/10/2017 Phys. Prop. mg/L 310 N
Total Dis. Solids (TDJTEC-MW-PZ-13D 4 Downgradient 02/14/2017 Phys. Prop. mg/L 280 N
Total Dis. Solids (TDJTEC-MW-PZ-13D 5 Downgradient 04/03/2017 Phys. Prop. mg/L 260 N
Total Dis. Solids (TDJTEC-MW-PZ-13D 6 Downgradient 05/10/2017 Phys. Prop. mg/L 340 N
Total Dis. Solids (TDJTEC-MW-PZ-13D 7 Downgradient 07/10/2017 Phys. Prop. mg/L 240 N
Total Dis. Solids (TDJTEC-MW-PZ-13D 8 Downgradient 08/07/2017 Phys. Prop. mg/L 160 J N
Total Dis. Solids (TDJTEC-MW-SA-2A 1 Downgradient 10/31/2016 Phys. Prop. mg/L 430 J N
Total Dis. Solids (TDJTEC-MW-SA-2A 2 Downgradient 11/15/2016 Phys. Prop. mg/L 470 J N

Consituent Name Well IDSample Round
Upgradient/Downgradient Sample Date Analyte Group Units Result
Val. Qualifiers
Normal/Duplicate
Table 2 Analytical Results for Appendix III Constituents in Groundwater at the JTEC Facility.
Total Dis. Solids (TDJTEC-MW-SA-2A 3 Downgradient 01/11/2017 Phys. Prop. mg/L 450 N
Total Dis. Solids (TDJTEC-MW-SA-2A 4 Downgradient 02/17/2017 Phys. Prop. mg/L 450 N
Total Dis. Solids (TDJTEC-MW-SA-2A 5 Downgradient 04/05/2017 Phys. Prop. mg/L 420 N
Total Dis. Solids (TDJTEC-MW-SA-2A 6 Downgradient 05/09/2017 Phys. Prop. mg/L 450 N
Total Dis. Solids (TDJTEC-MW-SA-2A 7 Downgradient 07/11/2017 Phys. Prop. mg/L 420 J N
Total Dis. Solids (TDJTEC-MW-SA-2A 8 Downgradient 08/08/2017 Phys. Prop. mg/L 400 J N
Total Dis. Solids (TDJTEC-MW-SA-3 1 Downgradient 10/21/2016 Phys. Prop. mg/L 250 FD
Total Dis. Solids (TDJTEC-MW-SA-3 2 Downgradient 11/15/2016 Phys. Prop. mg/L 330 J FD
Total Dis. Solids (TDJTEC-MW-SA-3 3 Downgradient 01/11/2017 Phys. Prop. mg/L 270 FD
Total Dis. Solids (TDJTEC-MW-SA-3 4 Downgradient 02/21/2017 Phys. Prop. mg/L 280 N
Total Dis. Solids (TDJTEC-MW-SA-3 5 Downgradient 04/10/2017 Phys. Prop. mg/L 280 N
Total Dis. Solids (TDJTEC-MW-SA-3 6 Downgradient 05/11/2017 Phys. Prop. mg/L 260 N
Total Dis. Solids (TDJTEC-MW-SA-3 7 Downgradient 07/13/2017 Phys. Prop. mg/L 230 N
Total Dis. Solids (TDJTEC-MW-SA-3 8 Downgradient 08/10/2017 Phys. Prop. mg/L 260 J N
Total Dis. Solids (TDJTEC-MW-SA-4 1 Downgradient 10/24/2016 Phys. Prop. mg/L 1700 N
Total Dis. Solids (TDJTEC-MW-SA-4 2 Downgradient 11/15/2016 Phys. Prop. mg/L 230 J N
Total Dis. Solids (TDJTEC-MW-SA-4 3 Downgradient 01/10/2017 Phys. Prop. mg/L 1600 N
Total Dis. Solids (TDJTEC-MW-SA-4 4 Downgradient 02/22/2017 Phys. Prop. mg/L 1600 N
Total Dis. Solids (TDJTEC-MW-SA-4 5 Downgradient 04/11/2017 Phys. Prop. mg/L 1200 N
Total Dis. Solids (TDJTEC-MW-SA-4 6 Downgradient 05/11/2017 Phys. Prop. mg/L 650 J N
Total Dis. Solids (TDJTEC-MW-SA-4 7 Downgradient 07/13/2017 Phys. Prop. mg/L 800 J N
Total Dis. Solids (TDJTEC-MW-SA-4 8 Downgradient 08/11/2017 Phys. Prop. mg/L 940 J N
Table 3 Analytical Results for Appendix IV Constituents in Groundwater at JTEC

Consituent Name Well IDSample Round
Upgradient/Downgradient Sample Date
Analyte Group Units Result
Val. Qualifiers
Normal/Duplicate
Antimony (total) JTEC-MW-PZ-01D 1 Upgradient 10/20/2016 Metal mg/L 0.0032 N
Antimony (total) JTEC-MW-PZ-01D 2 Upgradient 11/14/2016 Metal mg/L 0.00056 J N
Antimony (total) JTEC-MW-PZ-01D 3 Upgradient 01/09/2017 Metal mg/L 0.0033 N
Antimony (total) JTEC-MW-PZ-01D 4 Upgradient 02/13/2017 Metal mg/L 0.0008 J N
Antimony (total) JTEC-MW-PZ-01D 5 Upgradient 04/03/2017 Metal mg/L 0.0055 N
Antimony (total) JTEC-MW-PZ-01D 6 Upgradient 05/08/2017 Metal mg/L 0.0024 J N
Antimony (total) JTEC-MW-PZ-01D 7 Upgradient 07/10/2017 Metal mg/L 0.0013 J N
Antimony (total) JTEC-MW-PZ-01D 8 Upgradient 08/07/2017 Metal mg/L 0.0033 N
Antimony (total) JTEC-MW-PZ-03D 1 Downgradient 10/25/2016 Metal mg/L 0.0037 N
Antimony (total) JTEC-MW-PZ-03D 2 Downgradient 11/15/2016 Metal mg/L 0.0031 N
Antimony (total) JTEC-MW-PZ-03D 3 Downgradient 01/11/2017 Metal mg/L 0.0059 N
Antimony (total) JTEC-MW-PZ-03D 4 Downgradient 02/20/2017 Metal mg/L 0.0025 J N
Antimony (total) JTEC-MW-PZ-03D 5 Downgradient 04/06/2017 Metal mg/L 0.0019 J N
Antimony (total) JTEC-MW-PZ-03D 6 Downgradient 05/10/2017 Metal mg/L 0.0038 N
Antimony (total) JTEC-MW-PZ-03D 7 Downgradient 07/12/2017 Metal mg/L 0.0016 J N
Antimony (total) JTEC-MW-PZ-03D 8 Downgradient 08/09/2017 Metal mg/L 0.0098 N
Antimony (total) JTEC-MW-PZ-08D 1 Downgradient 10/20/2016 Metal mg/L 0.0033 N
Antimony (total) JTEC-MW-PZ-08D 2 Downgradient 11/14/2016 Metal mg/L 0.0097 N
Antimony (total) JTEC-MW-PZ-08D 3 Downgradient 01/10/2017 Metal mg/L 0.011 N
Antimony (total) JTEC-MW-PZ-08D 4 Downgradient 02/16/2017 Metal mg/L 0.00073 J N
Antimony (total) JTEC-MW-PZ-08D 5 Downgradient 04/04/2017 Metal mg/L 0.00097 J N
Antimony (total) JTEC-MW-PZ-08D 6 Downgradient 05/09/2017 Metal mg/L 0.021 N
Antimony (total) JTEC-MW-PZ-08D 7 Downgradient 07/11/2017 Metal mg/L 0.0012 J N
Antimony (total) JTEC-MW-PZ-08D 8 Downgradient 08/11/2017 Metal mg/L 0.0033 N
Antimony (total) JTEC-MW-PZ-09D 1 Upgradient 10/20/2016 Metal mg/L 0.002 J N
Antimony (total) JTEC-MW-PZ-09D 2 Upgradient 11/14/2016 Metal mg/L 0.000071 J N
Antimony (total) JTEC-MW-PZ-09D 3 Upgradient 01/09/2017 Metal mg/L 0.000036 U N
Antimony (total) JTEC-MW-PZ-09D 4 Upgradient 02/15/2017 Metal mg/L 0.00045 J N
Antimony (total) JTEC-MW-PZ-09D 5 Upgradient 04/04/2017 Metal mg/L 0.00084 J N
Antimony (total) JTEC-MW-PZ-09D 6 Upgradient 05/09/2017 Metal mg/L 0.00027 J N
Antimony (total) JTEC-MW-PZ-09D 7 Upgradient 07/10/2017 Metal mg/L 0.00036 J N
Antimony (total) JTEC-MW-PZ-09D 8 Upgradient 08/10/2017 Metal mg/L 0.00096 J N
Antimony (total) JTEC-MW-PZ-10D 1 Downgradient 10/21/2016 Metal mg/L 0.00035 J N
Antimony (total) JTEC-MW-PZ-10D 2 Downgradient 11/15/2016 Metal mg/L 0.000036 U N
Antimony (total) JTEC-MW-PZ-10D 3 Downgradient 01/11/2017 Metal mg/L 0.000036 U N
Antimony (total) JTEC-MW-PZ-10D 4 Downgradient 02/21/2017 Metal mg/L 0.000036 U N
Antimony (total) JTEC-MW-PZ-10D 5 Downgradient 04/07/2017 Metal mg/L 0.000036 U N
Antimony (total) JTEC-MW-PZ-10D 6 Downgradient 05/10/2017 Metal mg/L 0.0014 J N
Antimony (total) JTEC-MW-PZ-10D 7 Downgradient 07/13/2017 Metal mg/L 0.000036 U N
Antimony (total) JTEC-MW-PZ-10D 8 Downgradient 08/09/2017 Metal mg/L 0.00034 J N
Antimony (total) JTEC-MW-PZ-11D 1 Downgradient 10/21/2016 Metal mg/L 0.00023 J N
Antimony (total) JTEC-MW-PZ-11D 2 Downgradient 11/15/2016 Metal mg/L 0.000036 U N
Antimony (total) JTEC-MW-PZ-11D 3 Downgradient 01/10/2017 Metal mg/L 0.000036 U N
Antimony (total) JTEC-MW-PZ-11D 4 Downgradient 02/21/2017 Metal mg/L 0.000036 U N
Antimony (total) JTEC-MW-PZ-11D 5 Downgradient 04/05/2017 Metal mg/L 0.000036 U N
Antimony (total) JTEC-MW-PZ-11D 6 Downgradient 05/10/2017 Metal mg/L 0.00023 J N
Antimony (total) JTEC-MW-PZ-11D 7 Downgradient 07/13/2017 Metal mg/L 0.000036 U N
Table 3 Analytical Results for Appendix IV Constituents in Groundwater at the JTEC Facility.
Consituent Name Well IDSample Round
Upgradient/Downgradient Sample Date
Analyte Group Units Result
Val. Qualifiers
Normal/Duplicate
Table 3 Analytical Results for Appendix IV Constituents in Groundwater at the JTEC Facility.
Antimony (total) JTEC-MW-PZ-11D 8 Downgradient 08/09/2017 Metal mg/L 0.000036 U N
Antimony (total) JTEC-MW-PZ-12D 1 Downgradient 10/20/2016 Metal mg/L 0.0012 J N
Antimony (total) JTEC-MW-PZ-12D 2 Downgradient 11/15/2016 Metal mg/L 0.000036 U N
Antimony (total) JTEC-MW-PZ-12D 3 Downgradient 01/11/2017 Metal mg/L 0.000036 U N
Antimony (total) JTEC-MW-PZ-12D 4 Downgradient 02/20/2017 Metal mg/L 0.0006 J N
Antimony (total) JTEC-MW-PZ-12D 5 Downgradient 04/05/2017 Metal mg/L 0.00088 J N
Antimony (total) JTEC-MW-PZ-12D 6 Downgradient 05/10/2017 Metal mg/L 0.00075 J N
Antimony (total) JTEC-MW-PZ-12D 7 Downgradient 07/12/2017 Metal mg/L 0.000089 J N
Antimony (total) JTEC-MW-PZ-12D 8 Downgradient 08/08/2017 Metal mg/L 0.00039 J N
Antimony (total) JTEC-MW-PZ-13D 1 Downgradient 10/20/2016 Metal mg/L 0.00081 J N
Antimony (total) JTEC-MW-PZ-13D 2 Downgradient 11/14/2016 Metal mg/L 0.000036 U N
Antimony (total) JTEC-MW-PZ-13D 3 Downgradient 01/10/2017 Metal mg/L 0.000036 U N
Antimony (total) JTEC-MW-PZ-13D 4 Downgradient 02/14/2017 Metal mg/L 0.000078 J N
Antimony (total) JTEC-MW-PZ-13D 5 Downgradient 04/03/2017 Metal mg/L 0.00093 J N
Antimony (total) JTEC-MW-PZ-13D 6 Downgradient 05/10/2017 Metal mg/L 0.00086 J N
Antimony (total) JTEC-MW-PZ-13D 7 Downgradient 07/10/2017 Metal mg/L 0.000036 U N
Antimony (total) JTEC-MW-PZ-13D 8 Downgradient 08/07/2017 Metal mg/L 0.00019 J N
Antimony (total) JTEC-MW-SA-2A 1 Downgradient 10/31/2016 Metal mg/L 0.000036 U N
Antimony (total) JTEC-MW-SA-2A 2 Downgradient 11/15/2016 Metal mg/L 0.000036 U N
Antimony (total) JTEC-MW-SA-2A 3 Downgradient 01/11/2017 Metal mg/L 0.0038 N
Antimony (total) JTEC-MW-SA-2A 4 Downgradient 02/17/2017 Metal mg/L 0.0099 N
Antimony (total) JTEC-MW-SA-2A 5 Downgradient 04/05/2017 Metal mg/L 0.0081 N
Antimony (total) JTEC-MW-SA-2A 6 Downgradient 05/09/2017 Metal mg/L 0.015 N
Antimony (total) JTEC-MW-SA-2A 7 Downgradient 07/11/2017 Metal mg/L 0.009 N
Antimony (total) JTEC-MW-SA-2A 8 Downgradient 08/08/2017 Metal mg/L 0.0095 N
Antimony (total) JTEC-MW-SA-3 1 Downgradient 10/21/2016 Metal mg/L 0.00038 J N
Antimony (total) JTEC-MW-SA-3 2 Downgradient 11/15/2016 Metal mg/L 0.000036 U N
Antimony (total) JTEC-MW-SA-3 3 Downgradient 01/11/2017 Metal mg/L 0.0024 J N
Antimony (total) JTEC-MW-SA-3 4 Downgradient 02/21/2017 Metal mg/L 0.0021 J N
Antimony (total) JTEC-MW-SA-3 5 Downgradient 04/10/2017 Metal mg/L 0.0016 J N
Antimony (total) JTEC-MW-SA-3 6 Downgradient 05/11/2017 Metal mg/L 0.0082 N
Antimony (total) JTEC-MW-SA-3 7 Downgradient 07/13/2017 Metal mg/L 0.0042 N
Antimony (total) JTEC-MW-SA-3 8 Downgradient 08/10/2017 Metal mg/L 0.0034 N
Antimony (total) JTEC-MW-SA-4 1 Downgradient 10/24/2016 Metal mg/L 0.000098 J N
Antimony (total) JTEC-MW-SA-4 2 Downgradient 11/15/2016 Metal mg/L 0.000036 U N
Antimony (total) JTEC-MW-SA-4 3 Downgradient 01/10/2017 Metal mg/L 0.000036 U N
Antimony (total) JTEC-MW-SA-4 4 Downgradient 02/22/2017 Metal mg/L 0.000036 U N
Antimony (total) JTEC-MW-SA-4 5 Downgradient 04/11/2017 Metal mg/L 0.000036 U N
Antimony (total) JTEC-MW-SA-4 6 Downgradient 05/11/2017 Metal mg/L 0.000036 U N
Antimony (total) JTEC-MW-SA-4 7 Downgradient 07/13/2017 Metal mg/L 0.000087 J N
Antimony (total) JTEC-MW-SA-4 8 Downgradient 08/11/2017 Metal mg/L 0.00098 J N
Arsenic (total) JTEC-MW-PZ-01D 1 Upgradient 10/20/2016 Metal mg/L 0.0009 J N
Arsenic (total) JTEC-MW-PZ-01D 2 Upgradient 11/14/2016 Metal mg/L 0.00047 J N
Arsenic (total) JTEC-MW-PZ-01D 3 Upgradient 01/09/2017 Metal mg/L 0.00054 J N
Arsenic (total) JTEC-MW-PZ-01D 4 Upgradient 02/13/2017 Metal mg/L 0.001 N
Arsenic (total) JTEC-MW-PZ-01D 5 Upgradient 04/03/2017 Metal mg/L 0.0027 N
Arsenic (total) JTEC-MW-PZ-01D 6 Upgradient 05/08/2017 Metal mg/L 0.0015 N
Consituent Name Well IDSample Round
Upgradient/Downgradient Sample Date
Analyte Group Units Result
Val. Qualifiers
Normal/Duplicate
Table 3 Analytical Results for Appendix IV Constituents in Groundwater at the JTEC Facility.
Arsenic (total) JTEC-MW-PZ-01D 7 Upgradient 07/10/2017 Metal mg/L 0.0034 N
Arsenic (total) JTEC-MW-PZ-01D 8 Upgradient 08/07/2017 Metal mg/L 0.0016 N
Arsenic (total) JTEC-MW-PZ-03D 1 Downgradient 10/25/2016 Metal mg/L 0.00046 J N
Arsenic (total) JTEC-MW-PZ-03D 2 Downgradient 11/15/2016 Metal mg/L 0.0006 J N
Arsenic (total) JTEC-MW-PZ-03D 3 Downgradient 01/11/2017 Metal mg/L 0.00078 J N
Arsenic (total) JTEC-MW-PZ-03D 4 Downgradient 02/20/2017 Metal mg/L 0.0008 J N
Arsenic (total) JTEC-MW-PZ-03D 5 Downgradient 04/06/2017 Metal mg/L 0.00079 J N
Arsenic (total) JTEC-MW-PZ-03D 6 Downgradient 05/10/2017 Metal mg/L 0.0011 B N
Arsenic (total) JTEC-MW-PZ-03D 7 Downgradient 07/12/2017 Metal mg/L 0.00082 J N
Arsenic (total) JTEC-MW-PZ-03D 8 Downgradient 08/09/2017 Metal mg/L 0.00078 J N
Arsenic (total) JTEC-MW-PZ-08D 1 Downgradient 10/20/2016 Metal mg/L 0.00027 J N
Arsenic (total) JTEC-MW-PZ-08D 2 Downgradient 11/14/2016 Metal mg/L 0.00042 J N
Arsenic (total) JTEC-MW-PZ-08D 3 Downgradient 01/10/2017 Metal mg/L 0.00026 J N
Arsenic (total) JTEC-MW-PZ-08D 4 Downgradient 02/16/2017 Metal mg/L 0.0003 J N
Arsenic (total) JTEC-MW-PZ-08D 5 Downgradient 04/04/2017 Metal mg/L 0.00039 J N
Arsenic (total) JTEC-MW-PZ-08D 6 Downgradient 05/09/2017 Metal mg/L 0.00043 J N
Arsenic (total) JTEC-MW-PZ-08D 7 Downgradient 07/11/2017 Metal mg/L 0.00023 J N
Arsenic (total) JTEC-MW-PZ-08D 8 Downgradient 08/11/2017 Metal mg/L 0.00032 J N
Arsenic (total) JTEC-MW-PZ-09D 1 Upgradient 10/20/2016 Metal mg/L 0.00013 U N
Arsenic (total) JTEC-MW-PZ-09D 2 Upgradient 11/14/2016 Metal mg/L 0.00013 U N
Arsenic (total) JTEC-MW-PZ-09D 3 Upgradient 01/09/2017 Metal mg/L 0.00016 J N
Arsenic (total) JTEC-MW-PZ-09D 4 Upgradient 02/15/2017 Metal mg/L 0.00024 J N
Arsenic (total) JTEC-MW-PZ-09D 5 Upgradient 04/04/2017 Metal mg/L 0.00065 J N
Arsenic (total) JTEC-MW-PZ-09D 6 Upgradient 05/09/2017 Metal mg/L 0.00054 J N
Arsenic (total) JTEC-MW-PZ-09D 7 Upgradient 07/10/2017 Metal mg/L 0.0006 J N
Arsenic (total) JTEC-MW-PZ-09D 8 Upgradient 08/10/2017 Metal mg/L 0.00039 J N
Arsenic (total) JTEC-MW-PZ-10D 1 Downgradient 10/21/2016 Metal mg/L 0.00013 U N
Arsenic (total) JTEC-MW-PZ-10D 2 Downgradient 11/15/2016 Metal mg/L 0.00013 U N
Arsenic (total) JTEC-MW-PZ-10D 3 Downgradient 01/11/2017 Metal mg/L 0.00013 U N
Arsenic (total) JTEC-MW-PZ-10D 4 Downgradient 02/21/2017 Metal mg/L 0.00014 J N
Arsenic (total) JTEC-MW-PZ-10D 5 Downgradient 04/07/2017 Metal mg/L 0.00013 U N
Arsenic (total) JTEC-MW-PZ-10D 6 Downgradient 05/10/2017 Metal mg/L 0.00026 B N
Arsenic (total) JTEC-MW-PZ-10D 7 Downgradient 07/13/2017 Metal mg/L 0.00013 U N
Arsenic (total) JTEC-MW-PZ-10D 8 Downgradient 08/09/2017 Metal mg/L 0.00013 U N
Arsenic (total) JTEC-MW-PZ-11D 1 Downgradient 10/21/2016 Metal mg/L 0.00013 U N
Arsenic (total) JTEC-MW-PZ-11D 2 Downgradient 11/15/2016 Metal mg/L 0.00013 U N
Arsenic (total) JTEC-MW-PZ-11D 3 Downgradient 01/10/2017 Metal mg/L 0.00013 U N
Arsenic (total) JTEC-MW-PZ-11D 4 Downgradient 02/21/2017 Metal mg/L 0.00013 U N
Arsenic (total) JTEC-MW-PZ-11D 5 Downgradient 04/05/2017 Metal mg/L 0.00016 J N
Arsenic (total) JTEC-MW-PZ-11D 6 Downgradient 05/10/2017 Metal mg/L 0.00017 B N
Arsenic (total) JTEC-MW-PZ-11D 7 Downgradient 07/13/2017 Metal mg/L 0.00013 U N
Arsenic (total) JTEC-MW-PZ-11D 8 Downgradient 08/09/2017 Metal mg/L 0.00013 U N
Arsenic (total) JTEC-MW-PZ-12D 1 Downgradient 10/20/2016 Metal mg/L 0.00013 U N
Arsenic (total) JTEC-MW-PZ-12D 2 Downgradient 11/15/2016 Metal mg/L 0.00026 J N
Arsenic (total) JTEC-MW-PZ-12D 3 Downgradient 01/11/2017 Metal mg/L 0.00013 U N
Arsenic (total) JTEC-MW-PZ-12D 4 Downgradient 02/20/2017 Metal mg/L 0.00022 J N
Arsenic (total) JTEC-MW-PZ-12D 5 Downgradient 04/05/2017 Metal mg/L 0.00025 J N
Consituent Name Well IDSample Round
Upgradient/Downgradient Sample Date
Analyte Group Units Result
Val. Qualifiers
Normal/Duplicate
Table 3 Analytical Results for Appendix IV Constituents in Groundwater at the JTEC Facility.
Arsenic (total) JTEC-MW-PZ-12D 6 Downgradient 05/10/2017 Metal mg/L 0.0002 B N
Arsenic (total) JTEC-MW-PZ-12D 7 Downgradient 07/12/2017 Metal mg/L 0.00017 J N
Arsenic (total) JTEC-MW-PZ-12D 8 Downgradient 08/08/2017 Metal mg/L 0.00013 U N
Arsenic (total) JTEC-MW-PZ-13D 1 Downgradient 10/20/2016 Metal mg/L 0.0004 J N
Arsenic (total) JTEC-MW-PZ-13D 2 Downgradient 11/14/2016 Metal mg/L 0.00016 J N
Arsenic (total) JTEC-MW-PZ-13D 3 Downgradient 01/10/2017 Metal mg/L 0.00013 U N
Arsenic (total) JTEC-MW-PZ-13D 4 Downgradient 02/14/2017 Metal mg/L 0.00021 J N
Arsenic (total) JTEC-MW-PZ-13D 5 Downgradient 04/03/2017 Metal mg/L 0.00027 J N
Arsenic (total) JTEC-MW-PZ-13D 6 Downgradient 05/10/2017 Metal mg/L 0.00018 J N
Arsenic (total) JTEC-MW-PZ-13D 7 Downgradient 07/10/2017 Metal mg/L 0.00013 U N
Arsenic (total) JTEC-MW-PZ-13D 8 Downgradient 08/07/2017 Metal mg/L 0.00013 U N
Arsenic (total) JTEC-MW-SA-2A 1 Downgradient 10/31/2016 Metal mg/L 0.0011 N
Arsenic (total) JTEC-MW-SA-2A 2 Downgradient 11/15/2016 Metal mg/L 0.00061 J N
Arsenic (total) JTEC-MW-SA-2A 3 Downgradient 01/11/2017 Metal mg/L 0.0024 N
Arsenic (total) JTEC-MW-SA-2A 4 Downgradient 02/17/2017 Metal mg/L 0.0013 N
Arsenic (total) JTEC-MW-SA-2A 5 Downgradient 04/05/2017 Metal mg/L 0.00054 J N
Arsenic (total) JTEC-MW-SA-2A 6 Downgradient 05/09/2017 Metal mg/L 0.00093 B N
Arsenic (total) JTEC-MW-SA-2A 7 Downgradient 07/11/2017 Metal mg/L 0.0021 N
Arsenic (total) JTEC-MW-SA-2A 8 Downgradient 08/08/2017 Metal mg/L 0.00052 J N
Arsenic (total) JTEC-MW-SA-3 1 Downgradient 10/21/2016 Metal mg/L 0.00059 J N
Arsenic (total) JTEC-MW-SA-3 2 Downgradient 11/15/2016 Metal mg/L 0.00065 J FD
Arsenic (total) JTEC-MW-SA-3 3 Downgradient 01/11/2017 Metal mg/L 0.0013 N
Arsenic (total) JTEC-MW-SA-3 4 Downgradient 02/21/2017 Metal mg/L 0.0015 N
Arsenic (total) JTEC-MW-SA-3 5 Downgradient 04/10/2017 Metal mg/L 0.0016 N
Arsenic (total) JTEC-MW-SA-3 6 Downgradient 05/11/2017 Metal mg/L 0.0013 N
Arsenic (total) JTEC-MW-SA-3 7 Downgradient 07/13/2017 Metal mg/L 0.0014 N
Arsenic (total) JTEC-MW-SA-3 8 Downgradient 08/10/2017 Metal mg/L 0.0013 N
Arsenic (total) JTEC-MW-SA-4 1 Downgradient 10/24/2016 Metal mg/L 0.00017 J N
Arsenic (total) JTEC-MW-SA-4 2 Downgradient 11/15/2016 Metal mg/L 0.00019 J N
Arsenic (total) JTEC-MW-SA-4 3 Downgradient 01/10/2017 Metal mg/L 0.00027 J N
Arsenic (total) JTEC-MW-SA-4 4 Downgradient 02/22/2017 Metal mg/L 0.00047 J N
Arsenic (total) JTEC-MW-SA-4 5 Downgradient 04/11/2017 Metal mg/L 0.00035 J N
Arsenic (total) JTEC-MW-SA-4 6 Downgradient 05/11/2017 Metal mg/L 0.00098 B N
Arsenic (total) JTEC-MW-SA-4 7 Downgradient 07/13/2017 Metal mg/L 0.00029 J N
Arsenic (total) JTEC-MW-SA-4 8 Downgradient 08/11/2017 Metal mg/L 0.00063 J N
Barium (total) JTEC-MW-PZ-01D 1 Upgradient 10/20/2016 Metal mg/L 0.075 N
Barium (total) JTEC-MW-PZ-01D 2 Upgradient 11/14/2016 Metal mg/L 0.088 N
Barium (total) JTEC-MW-PZ-01D 3 Upgradient 01/09/2017 Metal mg/L 0.086 N
Barium (total) JTEC-MW-PZ-01D 4 Upgradient 02/13/2017 Metal mg/L 0.059 N
Barium (total) JTEC-MW-PZ-01D 5 Upgradient 04/03/2017 Metal mg/L 0.073 N
Barium (total) JTEC-MW-PZ-01D 6 Upgradient 05/08/2017 Metal mg/L 0.06 N
Barium (total) JTEC-MW-PZ-01D 7 Upgradient 07/10/2017 Metal mg/L 0.11 N
Barium (total) JTEC-MW-PZ-01D 8 Upgradient 08/07/2017 Metal mg/L 0.065 N
Barium (total) JTEC-MW-PZ-03D 1 Downgradient 10/25/2016 Metal mg/L 0.097 N
Barium (total) JTEC-MW-PZ-03D 2 Downgradient 11/15/2016 Metal mg/L 0.084 N
Barium (total) JTEC-MW-PZ-03D 3 Downgradient 01/11/2017 Metal mg/L 0.097 N
Barium (total) JTEC-MW-PZ-03D 4 Downgradient 02/20/2017 Metal mg/L 0.1 N

Consituent Name Well IDSample Round
Upgradient/Downgradient Sample Date
Analyte Group Units Result
Val. Qualifiers
Normal/Duplicate
Table 3 Analytical Results for Appendix IV Constituents in Groundwater at the JTEC Facility.
Barium (total) JTEC-MW-PZ-03D 5 Downgradient 04/06/2017 Metal mg/L 0.093 N
Barium (total) JTEC-MW-PZ-03D 6 Downgradient 05/10/2017 Metal mg/L 0.099 N
Barium (total) JTEC-MW-PZ-03D 7 Downgradient 07/12/2017 Metal mg/L 0.099 N
Barium (total) JTEC-MW-PZ-03D 8 Downgradient 08/09/2017 Metal mg/L 0.1 N
Barium (total) JTEC-MW-PZ-08D 1 Downgradient 10/20/2016 Metal mg/L 0.11 N
Barium (total) JTEC-MW-PZ-08D 2 Downgradient 11/14/2016 Metal mg/L 0.092 N
Barium (total) JTEC-MW-PZ-08D 3 Downgradient 01/10/2017 Metal mg/L 0.075 N
Barium (total) JTEC-MW-PZ-08D 4 Downgradient 02/16/2017 Metal mg/L 0.083 N
Barium (total) JTEC-MW-PZ-08D 5 Downgradient 04/04/2017 Metal mg/L 0.077 N
Barium (total) JTEC-MW-PZ-08D 6 Downgradient 05/09/2017 Metal mg/L 0.072 N
Barium (total) JTEC-MW-PZ-08D 7 Downgradient 07/11/2017 Metal mg/L 0.057 N
Barium (total) JTEC-MW-PZ-08D 8 Downgradient 08/11/2017 Metal mg/L 0.075 N
Barium (total) JTEC-MW-PZ-09D 1 Upgradient 10/20/2016 Metal mg/L 0.075 N
Barium (total) JTEC-MW-PZ-09D 2 Upgradient 11/14/2016 Metal mg/L 0.068 N
Barium (total) JTEC-MW-PZ-09D 3 Upgradient 01/09/2017 Metal mg/L 0.059 N
Barium (total) JTEC-MW-PZ-09D 4 Upgradient 02/15/2017 Metal mg/L 0.055 N
Barium (total) JTEC-MW-PZ-09D 5 Upgradient 04/04/2017 Metal mg/L 0.045 N
Barium (total) JTEC-MW-PZ-09D 6 Upgradient 05/09/2017 Metal mg/L 0.053 N
Barium (total) JTEC-MW-PZ-09D 7 Upgradient 07/10/2017 Metal mg/L 0.047 N
Barium (total) JTEC-MW-PZ-09D 8 Upgradient 08/10/2017 Metal mg/L 0.051 N
Barium (total) JTEC-MW-PZ-10D 1 Downgradient 10/21/2016 Metal mg/L 0.075 N
Barium (total) JTEC-MW-PZ-10D 2 Downgradient 11/15/2016 Metal mg/L 0.072 N
Barium (total) JTEC-MW-PZ-10D 3 Downgradient 01/11/2017 Metal mg/L 0.066 N
Barium (total) JTEC-MW-PZ-10D 4 Downgradient 02/21/2017 Metal mg/L 0.063 N
Barium (total) JTEC-MW-PZ-10D 5 Downgradient 04/07/2017 Metal mg/L 0.065 N
Barium (total) JTEC-MW-PZ-10D 6 Downgradient 05/10/2017 Metal mg/L 0.067 N
Barium (total) JTEC-MW-PZ-10D 7 Downgradient 07/13/2017 Metal mg/L 0.063 N
Barium (total) JTEC-MW-PZ-10D 8 Downgradient 08/09/2017 Metal mg/L 0.065 N
Barium (total) JTEC-MW-PZ-11D 1 Downgradient 10/21/2016 Metal mg/L 0.051 N
Barium (total) JTEC-MW-PZ-11D 2 Downgradient 11/15/2016 Metal mg/L 0.03 N
Barium (total) JTEC-MW-PZ-11D 3 Downgradient 01/10/2017 Metal mg/L 0.044 N
Barium (total) JTEC-MW-PZ-11D 4 Downgradient 02/21/2017 Metal mg/L 0.036 N
Barium (total) JTEC-MW-PZ-11D 5 Downgradient 04/05/2017 Metal mg/L 0.14 N
Barium (total) JTEC-MW-PZ-11D 6 Downgradient 05/10/2017 Metal mg/L 0.03 N
Barium (total) JTEC-MW-PZ-11D 7 Downgradient 07/13/2017 Metal mg/L 0.027 N
Barium (total) JTEC-MW-PZ-11D 8 Downgradient 08/09/2017 Metal mg/L 0.031 FD
Barium (total) JTEC-MW-PZ-12D 1 Downgradient 10/20/2016 Metal mg/L 0.09 N
Barium (total) JTEC-MW-PZ-12D 2 Downgradient 11/15/2016 Metal mg/L 0.046 N
Barium (total) JTEC-MW-PZ-12D 3 Downgradient 01/11/2017 Metal mg/L 0.054 N
Barium (total) JTEC-MW-PZ-12D 4 Downgradient 02/20/2017 Metal mg/L 0.045 N
Barium (total) JTEC-MW-PZ-12D 5 Downgradient 04/05/2017 Metal mg/L 0.054 N
Barium (total) JTEC-MW-PZ-12D 6 Downgradient 05/10/2017 Metal mg/L 0.052 N
Barium (total) JTEC-MW-PZ-12D 7 Downgradient 07/12/2017 Metal mg/L 0.031 N
Barium (total) JTEC-MW-PZ-12D 8 Downgradient 08/08/2017 Metal mg/L 0.067 N
Barium (total) JTEC-MW-PZ-13D 1 Downgradient 10/20/2016 Metal mg/L 0.11 N
Barium (total) JTEC-MW-PZ-13D 2 Downgradient 11/14/2016 Metal mg/L 0.087 N
Barium (total) JTEC-MW-PZ-13D 3 Downgradient 01/10/2017 Metal mg/L 0.11 N

Consituent Name Well IDSample Round
Upgradient/Downgradient Sample Date
Analyte Group Units Result
Val. Qualifiers
Normal/Duplicate
Table 3 Analytical Results for Appendix IV Constituents in Groundwater at the JTEC Facility.
Barium (total) JTEC-MW-PZ-13D 4 Downgradient 02/14/2017 Metal mg/L 0.08 N
Barium (total) JTEC-MW-PZ-13D 5 Downgradient 04/03/2017 Metal mg/L 0.086 N
Barium (total) JTEC-MW-PZ-13D 6 Downgradient 05/10/2017 Metal mg/L 0.086 N
Barium (total) JTEC-MW-PZ-13D 7 Downgradient 07/10/2017 Metal mg/L 0.067 N
Barium (total) JTEC-MW-PZ-13D 8 Downgradient 08/07/2017 Metal mg/L 0.057 N
Barium (total) JTEC-MW-SA-2A 1 Downgradient 10/31/2016 Metal mg/L 0.075 N
Barium (total) JTEC-MW-SA-2A 2 Downgradient 11/15/2016 Metal mg/L 0.076 N
Barium (total) JTEC-MW-SA-2A 3 Downgradient 01/11/2017 Metal mg/L 0.1 N
Barium (total) JTEC-MW-SA-2A 4 Downgradient 02/17/2017 Metal mg/L 0.074 N
Barium (total) JTEC-MW-SA-2A 5 Downgradient 04/05/2017 Metal mg/L 0.063 N
Barium (total) JTEC-MW-SA-2A 6 Downgradient 05/09/2017 Metal mg/L 0.068 N
Barium (total) JTEC-MW-SA-2A 7 Downgradient 07/11/2017 Metal mg/L 0.077 N
Barium (total) JTEC-MW-SA-2A 8 Downgradient 08/08/2017 Metal mg/L 0.07 N
Barium (total) JTEC-MW-SA-3 1 Downgradient 10/21/2016 Metal mg/L 0.033 N
Barium (total) JTEC-MW-SA-3 2 Downgradient 11/15/2016 Metal mg/L 0.042 FD
Barium (total) JTEC-MW-SA-3 3 Downgradient 01/11/2017 Metal mg/L 0.045 N
Barium (total) JTEC-MW-SA-3 4 Downgradient 02/21/2017 Metal mg/L 0.049 N
Barium (total) JTEC-MW-SA-3 5 Downgradient 04/10/2017 Metal mg/L 0.057 N
Barium (total) JTEC-MW-SA-3 6 Downgradient 05/11/2017 Metal mg/L 0.06 N
Barium (total) JTEC-MW-SA-3 7 Downgradient 07/13/2017 Metal mg/L 0.057 N
Barium (total) JTEC-MW-SA-3 8 Downgradient 08/10/2017 Metal mg/L 0.06 N
Barium (total) JTEC-MW-SA-4 1 Downgradient 10/24/2016 Metal mg/L 0.058 N
Barium (total) JTEC-MW-SA-4 2 Downgradient 11/15/2016 Metal mg/L 0.054 N
Barium (total) JTEC-MW-SA-4 3 Downgradient 01/10/2017 Metal mg/L 0.06 N
Barium (total) JTEC-MW-SA-4 4 Downgradient 02/22/2017 Metal mg/L 0.057 N
Barium (total) JTEC-MW-SA-4 5 Downgradient 04/11/2017 Metal mg/L 0.043 N
Barium (total) JTEC-MW-SA-4 6 Downgradient 05/11/2017 Metal mg/L 0.046 N
Barium (total) JTEC-MW-SA-4 7 Downgradient 07/13/2017 Metal mg/L 0.044 N
Barium (total) JTEC-MW-SA-4 8 Downgradient 08/11/2017 Metal mg/L 0.053 N
Beryllium (total) JTEC-MW-PZ-01D 1 Upgradient 10/20/2016 Metal mg/L 0.000032 J N
Beryllium (total) JTEC-MW-PZ-01D 2 Upgradient 11/14/2016 Metal mg/L 0.000017 U N
Beryllium (total) JTEC-MW-PZ-01D 3 Upgradient 01/09/2017 Metal mg/L 0.000017 U N
Beryllium (total) JTEC-MW-PZ-01D 4 Upgradient 02/13/2017 Metal mg/L 0.000019 J N
Beryllium (total) JTEC-MW-PZ-01D 5 Upgradient 04/03/2017 Metal mg/L 0.0037 N
Beryllium (total) JTEC-MW-PZ-01D 6 Upgradient 05/08/2017 Metal mg/L 0.000017 U N
Beryllium (total) JTEC-MW-PZ-01D 7 Upgradient 07/10/2017 Metal mg/L 0.000051 J N
Beryllium (total) JTEC-MW-PZ-01D 8 Upgradient 08/07/2017 Metal mg/L 0.000017 U N
Beryllium (total) JTEC-MW-PZ-03D 1 Downgradient 10/25/2016 Metal mg/L 0.000076 J N
Beryllium (total) JTEC-MW-PZ-03D 2 Downgradient 11/15/2016 Metal mg/L 0.000018 J N
Beryllium (total) JTEC-MW-PZ-03D 3 Downgradient 01/11/2017 Metal mg/L 0.000017 U N
Beryllium (total) JTEC-MW-PZ-03D 4 Downgradient 02/20/2017 Metal mg/L 0.000029 J N
Beryllium (total) JTEC-MW-PZ-03D 5 Downgradient 04/06/2017 Metal mg/L 0.000017 U N
Beryllium (total) JTEC-MW-PZ-03D 6 Downgradient 05/10/2017 Metal mg/L 0.0003 J N
Beryllium (total) JTEC-MW-PZ-03D 7 Downgradient 07/12/2017 Metal mg/L 0.000026 J N
Beryllium (total) JTEC-MW-PZ-03D 8 Downgradient 08/09/2017 Metal mg/L 0.000017 U N
Beryllium (total) JTEC-MW-PZ-08D 1 Downgradient 10/20/2016 Metal mg/L 0.000066 J N
Beryllium (total) JTEC-MW-PZ-08D 2 Downgradient 11/14/2016 Metal mg/L 0.000017 U N
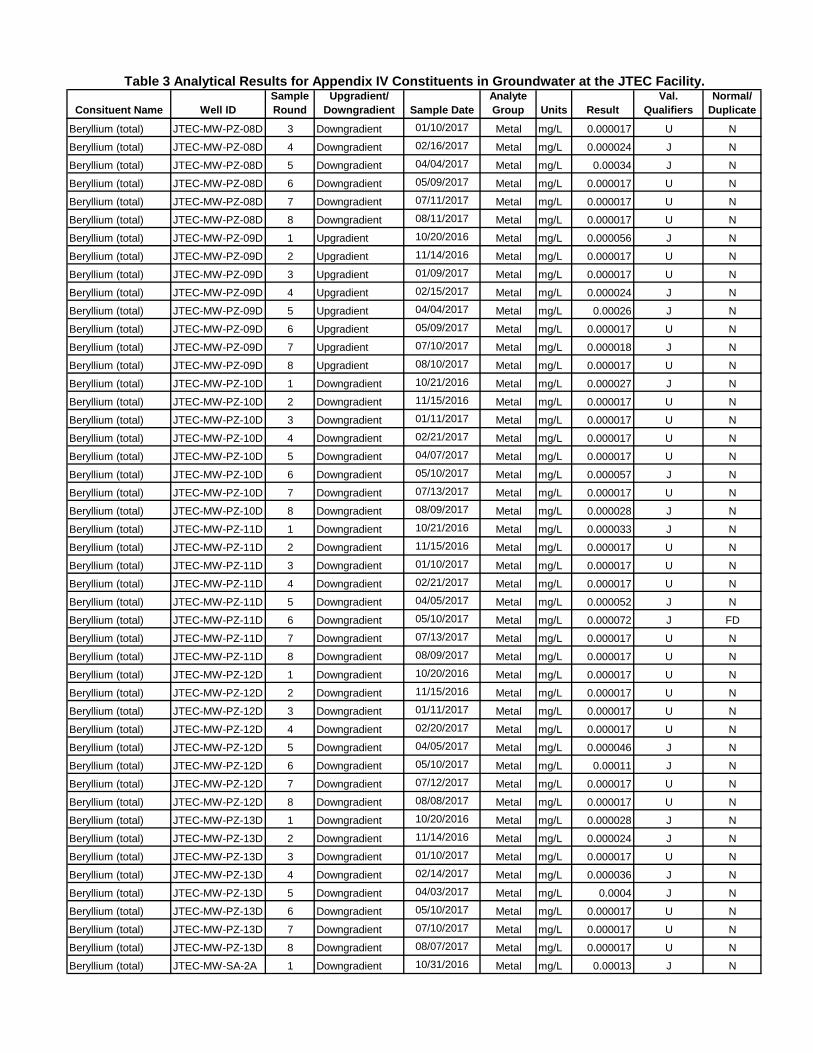
Consituent Name Well IDSample Round
Upgradient/Downgradient Sample Date
Analyte Group Units Result
Val. Qualifiers
Normal/Duplicate
Table 3 Analytical Results for Appendix IV Constituents in Groundwater at the JTEC Facility.
Beryllium (total) JTEC-MW-PZ-08D 3 Downgradient 01/10/2017 Metal mg/L 0.000017 U N
Beryllium (total) JTEC-MW-PZ-08D 4 Downgradient 02/16/2017 Metal mg/L 0.000024 J N
Beryllium (total) JTEC-MW-PZ-08D 5 Downgradient 04/04/2017 Metal mg/L 0.00034 J N
Beryllium (total) JTEC-MW-PZ-08D 6 Downgradient 05/09/2017 Metal mg/L 0.000017 U N
Beryllium (total) JTEC-MW-PZ-08D 7 Downgradient 07/11/2017 Metal mg/L 0.000017 U N
Beryllium (total) JTEC-MW-PZ-08D 8 Downgradient 08/11/2017 Metal mg/L 0.000017 U N
Beryllium (total) JTEC-MW-PZ-09D 1 Upgradient 10/20/2016 Metal mg/L 0.000056 J N
Beryllium (total) JTEC-MW-PZ-09D 2 Upgradient 11/14/2016 Metal mg/L 0.000017 U N
Beryllium (total) JTEC-MW-PZ-09D 3 Upgradient 01/09/2017 Metal mg/L 0.000017 U N
Beryllium (total) JTEC-MW-PZ-09D 4 Upgradient 02/15/2017 Metal mg/L 0.000024 J N
Beryllium (total) JTEC-MW-PZ-09D 5 Upgradient 04/04/2017 Metal mg/L 0.00026 J N
Beryllium (total) JTEC-MW-PZ-09D 6 Upgradient 05/09/2017 Metal mg/L 0.000017 U N
Beryllium (total) JTEC-MW-PZ-09D 7 Upgradient 07/10/2017 Metal mg/L 0.000018 J N
Beryllium (total) JTEC-MW-PZ-09D 8 Upgradient 08/10/2017 Metal mg/L 0.000017 U N
Beryllium (total) JTEC-MW-PZ-10D 1 Downgradient 10/21/2016 Metal mg/L 0.000027 J N
Beryllium (total) JTEC-MW-PZ-10D 2 Downgradient 11/15/2016 Metal mg/L 0.000017 U N
Beryllium (total) JTEC-MW-PZ-10D 3 Downgradient 01/11/2017 Metal mg/L 0.000017 U N
Beryllium (total) JTEC-MW-PZ-10D 4 Downgradient 02/21/2017 Metal mg/L 0.000017 U N
Beryllium (total) JTEC-MW-PZ-10D 5 Downgradient 04/07/2017 Metal mg/L 0.000017 U N
Beryllium (total) JTEC-MW-PZ-10D 6 Downgradient 05/10/2017 Metal mg/L 0.000057 J N
Beryllium (total) JTEC-MW-PZ-10D 7 Downgradient 07/13/2017 Metal mg/L 0.000017 U N
Beryllium (total) JTEC-MW-PZ-10D 8 Downgradient 08/09/2017 Metal mg/L 0.000028 J N
Beryllium (total) JTEC-MW-PZ-11D 1 Downgradient 10/21/2016 Metal mg/L 0.000033 J N
Beryllium (total) JTEC-MW-PZ-11D 2 Downgradient 11/15/2016 Metal mg/L 0.000017 U N
Beryllium (total) JTEC-MW-PZ-11D 3 Downgradient 01/10/2017 Metal mg/L 0.000017 U N
Beryllium (total) JTEC-MW-PZ-11D 4 Downgradient 02/21/2017 Metal mg/L 0.000017 U N
Beryllium (total) JTEC-MW-PZ-11D 5 Downgradient 04/05/2017 Metal mg/L 0.000052 J N
Beryllium (total) JTEC-MW-PZ-11D 6 Downgradient 05/10/2017 Metal mg/L 0.000072 J FD
Beryllium (total) JTEC-MW-PZ-11D 7 Downgradient 07/13/2017 Metal mg/L 0.000017 U N
Beryllium (total) JTEC-MW-PZ-11D 8 Downgradient 08/09/2017 Metal mg/L 0.000017 U N
Beryllium (total) JTEC-MW-PZ-12D 1 Downgradient 10/20/2016 Metal mg/L 0.000017 U N
Beryllium (total) JTEC-MW-PZ-12D 2 Downgradient 11/15/2016 Metal mg/L 0.000017 U N
Beryllium (total) JTEC-MW-PZ-12D 3 Downgradient 01/11/2017 Metal mg/L 0.000017 U N
Beryllium (total) JTEC-MW-PZ-12D 4 Downgradient 02/20/2017 Metal mg/L 0.000017 U N
Beryllium (total) JTEC-MW-PZ-12D 5 Downgradient 04/05/2017 Metal mg/L 0.000046 J N
Beryllium (total) JTEC-MW-PZ-12D 6 Downgradient 05/10/2017 Metal mg/L 0.00011 J N
Beryllium (total) JTEC-MW-PZ-12D 7 Downgradient 07/12/2017 Metal mg/L 0.000017 U N
Beryllium (total) JTEC-MW-PZ-12D 8 Downgradient 08/08/2017 Metal mg/L 0.000017 U N
Beryllium (total) JTEC-MW-PZ-13D 1 Downgradient 10/20/2016 Metal mg/L 0.000028 J N
Beryllium (total) JTEC-MW-PZ-13D 2 Downgradient 11/14/2016 Metal mg/L 0.000024 J N
Beryllium (total) JTEC-MW-PZ-13D 3 Downgradient 01/10/2017 Metal mg/L 0.000017 U N
Beryllium (total) JTEC-MW-PZ-13D 4 Downgradient 02/14/2017 Metal mg/L 0.000036 J N
Beryllium (total) JTEC-MW-PZ-13D 5 Downgradient 04/03/2017 Metal mg/L 0.0004 J N
Beryllium (total) JTEC-MW-PZ-13D 6 Downgradient 05/10/2017 Metal mg/L 0.000017 U N
Beryllium (total) JTEC-MW-PZ-13D 7 Downgradient 07/10/2017 Metal mg/L 0.000017 U N
Beryllium (total) JTEC-MW-PZ-13D 8 Downgradient 08/07/2017 Metal mg/L 0.000017 U N
Beryllium (total) JTEC-MW-SA-2A 1 Downgradient 10/31/2016 Metal mg/L 0.00013 J N

Consituent Name Well IDSample Round
Upgradient/Downgradient Sample Date
Analyte Group Units Result
Val. Qualifiers
Normal/Duplicate
Table 3 Analytical Results for Appendix IV Constituents in Groundwater at the JTEC Facility.
Beryllium (total) JTEC-MW-SA-2A 2 Downgradient 11/15/2016 Metal mg/L 0.000017 U N
Beryllium (total) JTEC-MW-SA-2A 3 Downgradient 01/11/2017 Metal mg/L 0.00037 J N
Beryllium (total) JTEC-MW-SA-2A 4 Downgradient 02/17/2017 Metal mg/L 0.00019 J N
Beryllium (total) JTEC-MW-SA-2A 5 Downgradient 04/05/2017 Metal mg/L 0.000045 J N
Beryllium (total) JTEC-MW-SA-2A 6 Downgradient 05/09/2017 Metal mg/L 0.00014 J N
Beryllium (total) JTEC-MW-SA-2A 7 Downgradient 07/11/2017 Metal mg/L 0.0004 J N
Beryllium (total) JTEC-MW-SA-2A 8 Downgradient 08/08/2017 Metal mg/L 0.000017 U N
Beryllium (total) JTEC-MW-SA-3 1 Downgradient 10/21/2016 Metal mg/L 0.000031 J FD
Beryllium (total) JTEC-MW-SA-3 2 Downgradient 11/15/2016 Metal mg/L 0.000017 U N
Beryllium (total) JTEC-MW-SA-3 3 Downgradient 01/11/2017 Metal mg/L 0.000051 J FD
Beryllium (total) JTEC-MW-SA-3 4 Downgradient 02/21/2017 Metal mg/L 0.000017 U N
Beryllium (total) JTEC-MW-SA-3 5 Downgradient 04/10/2017 Metal mg/L 0.000017 U N
Beryllium (total) JTEC-MW-SA-3 6 Downgradient 05/11/2017 Metal mg/L 0.000017 U N
Beryllium (total) JTEC-MW-SA-3 7 Downgradient 07/13/2017 Metal mg/L 0.000017 U N
Beryllium (total) JTEC-MW-SA-3 8 Downgradient 08/10/2017 Metal mg/L 0.000017 U N
Beryllium (total) JTEC-MW-SA-4 1 Downgradient 10/24/2016 Metal mg/L 0.000027 J N
Beryllium (total) JTEC-MW-SA-4 2 Downgradient 11/15/2016 Metal mg/L 0.000017 U N
Beryllium (total) JTEC-MW-SA-4 3 Downgradient 01/10/2017 Metal mg/L 0.000017 U N
Beryllium (total) JTEC-MW-SA-4 4 Downgradient 02/22/2017 Metal mg/L 0.000084 J N
Beryllium (total) JTEC-MW-SA-4 5 Downgradient 04/11/2017 Metal mg/L 0.000031 J N
Beryllium (total) JTEC-MW-SA-4 6 Downgradient 05/11/2017 Metal mg/L 0.00034 J N
Beryllium (total) JTEC-MW-SA-4 7 Downgradient 07/13/2017 Metal mg/L 0.000068 J N
Beryllium (total) JTEC-MW-SA-4 8 Downgradient 08/11/2017 Metal mg/L 0.00011 J N
Cadmium (total) JTEC-MW-PZ-01D 1 Upgradient 10/20/2016 Metal mg/L 0.000042 U N
Cadmium (total) JTEC-MW-PZ-01D 2 Upgradient 11/14/2016 Metal mg/L 0.000073 J N
Cadmium (total) JTEC-MW-PZ-01D 3 Upgradient 01/09/2017 Metal mg/L 0.000042 U N
Cadmium (total) JTEC-MW-PZ-01D 4 Upgradient 02/13/2017 Metal mg/L 0.000042 U N
Cadmium (total) JTEC-MW-PZ-01D 5 Upgradient 04/03/2017 Metal mg/L 0.0032 N
Cadmium (total) JTEC-MW-PZ-01D 6 Upgradient 05/08/2017 Metal mg/L 0.000042 U N
Cadmium (total) JTEC-MW-PZ-01D 7 Upgradient 07/10/2017 Metal mg/L 0.000084 U N
Cadmium (total) JTEC-MW-PZ-01D 8 Upgradient 08/07/2017 Metal mg/L 0.000042 U N
Cadmium (total) JTEC-MW-PZ-03D 1 Downgradient 10/25/2016 Metal mg/L 0.000042 U N
Cadmium (total) JTEC-MW-PZ-03D 2 Downgradient 11/15/2016 Metal mg/L 0.000042 U N
Cadmium (total) JTEC-MW-PZ-03D 3 Downgradient 01/11/2017 Metal mg/L 0.000042 U N
Cadmium (total) JTEC-MW-PZ-03D 4 Downgradient 02/20/2017 Metal mg/L 0.000042 U N
Cadmium (total) JTEC-MW-PZ-03D 5 Downgradient 04/06/2017 Metal mg/L 0.000042 U N
Cadmium (total) JTEC-MW-PZ-03D 6 Downgradient 05/10/2017 Metal mg/L 0.0001 B N
Cadmium (total) JTEC-MW-PZ-03D 7 Downgradient 07/12/2017 Metal mg/L 0.000069 J N
Cadmium (total) JTEC-MW-PZ-03D 8 Downgradient 08/09/2017 Metal mg/L 0.000042 U N
Cadmium (total) JTEC-MW-PZ-08D 1 Downgradient 10/20/2016 Metal mg/L 0.000042 U N
Cadmium (total) JTEC-MW-PZ-08D 2 Downgradient 11/14/2016 Metal mg/L 0.000057 J N
Cadmium (total) JTEC-MW-PZ-08D 3 Downgradient 01/10/2017 Metal mg/L 0.000042 U N
Cadmium (total) JTEC-MW-PZ-08D 4 Downgradient 02/16/2017 Metal mg/L 0.000042 U N
Cadmium (total) JTEC-MW-PZ-08D 5 Downgradient 04/04/2017 Metal mg/L 0.0002 B N
Cadmium (total) JTEC-MW-PZ-08D 6 Downgradient 05/09/2017 Metal mg/L 0.000042 U N
Cadmium (total) JTEC-MW-PZ-08D 7 Downgradient 07/11/2017 Metal mg/L 0.000042 U N
Cadmium (total) JTEC-MW-PZ-08D 8 Downgradient 08/11/2017 Metal mg/L 0.000042 U N

Consituent Name Well IDSample Round
Upgradient/Downgradient Sample Date
Analyte Group Units Result
Val. Qualifiers
Normal/Duplicate
Table 3 Analytical Results for Appendix IV Constituents in Groundwater at the JTEC Facility.
Cadmium (total) JTEC-MW-PZ-09D 1 Upgradient 10/20/2016 Metal mg/L 0.000042 U N
Cadmium (total) JTEC-MW-PZ-09D 2 Upgradient 11/14/2016 Metal mg/L 0.000068 J N
Cadmium (total) JTEC-MW-PZ-09D 3 Upgradient 01/09/2017 Metal mg/L 0.000071 B N
Cadmium (total) JTEC-MW-PZ-09D 4 Upgradient 02/15/2017 Metal mg/L 0.000042 U N
Cadmium (total) JTEC-MW-PZ-09D 5 Upgradient 04/04/2017 Metal mg/L 0.00015 B N
Cadmium (total) JTEC-MW-PZ-09D 6 Upgradient 05/09/2017 Metal mg/L 0.000042 U N
Cadmium (total) JTEC-MW-PZ-09D 7 Upgradient 07/10/2017 Metal mg/L 0.000042 U N
Cadmium (total) JTEC-MW-PZ-09D 8 Upgradient 08/10/2017 Metal mg/L 0.000067 J N
Cadmium (total) JTEC-MW-PZ-10D 1 Downgradient 10/21/2016 Metal mg/L 0.000042 U N
Cadmium (total) JTEC-MW-PZ-10D 2 Downgradient 11/15/2016 Metal mg/L 0.000042 U N
Cadmium (total) JTEC-MW-PZ-10D 3 Downgradient 01/11/2017 Metal mg/L 0.000042 U N
Cadmium (total) JTEC-MW-PZ-10D 4 Downgradient 02/21/2017 Metal mg/L 0.000042 U N
Cadmium (total) JTEC-MW-PZ-10D 5 Downgradient 04/07/2017 Metal mg/L 0.000042 U N
Cadmium (total) JTEC-MW-PZ-10D 6 Downgradient 05/10/2017 Metal mg/L 0.000044 B N
Cadmium (total) JTEC-MW-PZ-10D 7 Downgradient 07/13/2017 Metal mg/L 0.000042 U N
Cadmium (total) JTEC-MW-PZ-10D 8 Downgradient 08/09/2017 Metal mg/L 0.000042 U N
Cadmium (total) JTEC-MW-PZ-11D 1 Downgradient 10/21/2016 Metal mg/L 0.000042 U N
Cadmium (total) JTEC-MW-PZ-11D 2 Downgradient 11/15/2016 Metal mg/L 0.000042 U N
Cadmium (total) JTEC-MW-PZ-11D 3 Downgradient 01/10/2017 Metal mg/L 0.000042 U N
Cadmium (total) JTEC-MW-PZ-11D 4 Downgradient 02/21/2017 Metal mg/L 0.000042 U N
Cadmium (total) JTEC-MW-PZ-11D 5 Downgradient 04/05/2017 Metal mg/L 0.000074 B N
Cadmium (total) JTEC-MW-PZ-11D 6 Downgradient 05/10/2017 Metal mg/L 0.00011 B N
Cadmium (total) JTEC-MW-PZ-11D 7 Downgradient 07/13/2017 Metal mg/L 0.000042 U N
Cadmium (total) JTEC-MW-PZ-11D 8 Downgradient 08/09/2017 Metal mg/L 0.000072 J FD
Cadmium (total) JTEC-MW-PZ-12D 1 Downgradient 10/20/2016 Metal mg/L 0.000052 J N
Cadmium (total) JTEC-MW-PZ-12D 2 Downgradient 11/15/2016 Metal mg/L 0.000042 U N
Cadmium (total) JTEC-MW-PZ-12D 3 Downgradient 01/11/2017 Metal mg/L 0.000042 U N
Cadmium (total) JTEC-MW-PZ-12D 4 Downgradient 02/20/2017 Metal mg/L 0.000042 U N
Cadmium (total) JTEC-MW-PZ-12D 5 Downgradient 04/05/2017 Metal mg/L 0.000042 U N
Cadmium (total) JTEC-MW-PZ-12D 6 Downgradient 05/10/2017 Metal mg/L 0.00012 B N
Cadmium (total) JTEC-MW-PZ-12D 7 Downgradient 07/12/2017 Metal mg/L 0.000042 U N
Cadmium (total) JTEC-MW-PZ-12D 8 Downgradient 08/08/2017 Metal mg/L 0.000058 J N
Cadmium (total) JTEC-MW-PZ-13D 1 Downgradient 10/20/2016 Metal mg/L 0.000042 U N
Cadmium (total) JTEC-MW-PZ-13D 2 Downgradient 11/14/2016 Metal mg/L 0.000042 U N
Cadmium (total) JTEC-MW-PZ-13D 3 Downgradient 01/10/2017 Metal mg/L 0.000042 U N
Cadmium (total) JTEC-MW-PZ-13D 4 Downgradient 02/14/2017 Metal mg/L 0.000042 U N
Cadmium (total) JTEC-MW-PZ-13D 5 Downgradient 04/03/2017 Metal mg/L 0.00017 B N
Cadmium (total) JTEC-MW-PZ-13D 6 Downgradient 05/10/2017 Metal mg/L 0.000042 U N
Cadmium (total) JTEC-MW-PZ-13D 7 Downgradient 07/10/2017 Metal mg/L 0.000042 U N
Cadmium (total) JTEC-MW-PZ-13D 8 Downgradient 08/07/2017 Metal mg/L 0.000057 J N
Cadmium (total) JTEC-MW-SA-2A 1 Downgradient 10/31/2016 Metal mg/L 0.000042 U N
Cadmium (total) JTEC-MW-SA-2A 2 Downgradient 11/15/2016 Metal mg/L 0.00035 J N
Cadmium (total) JTEC-MW-SA-2A 3 Downgradient 01/11/2017 Metal mg/L 0.000097 J N
Cadmium (total) JTEC-MW-SA-2A 4 Downgradient 02/17/2017 Metal mg/L 0.00013 J N
Cadmium (total) JTEC-MW-SA-2A 5 Downgradient 04/05/2017 Metal mg/L 0.000048 B N
Cadmium (total) JTEC-MW-SA-2A 6 Downgradient 05/09/2017 Metal mg/L 0.00021 B N
Cadmium (total) JTEC-MW-SA-2A 7 Downgradient 07/11/2017 Metal mg/L 0.000044 J N

Consituent Name Well IDSample Round
Upgradient/Downgradient Sample Date
Analyte Group Units Result
Val. Qualifiers
Normal/Duplicate
Table 3 Analytical Results for Appendix IV Constituents in Groundwater at the JTEC Facility.
Cadmium (total) JTEC-MW-SA-2A 8 Downgradient 08/08/2017 Metal mg/L 0.00013 J N
Cadmium (total) JTEC-MW-SA-3 1 Downgradient 10/21/2016 Metal mg/L 0.000042 U N
Cadmium (total) JTEC-MW-SA-3 2 Downgradient 11/15/2016 Metal mg/L 0.000042 U N
Cadmium (total) JTEC-MW-SA-3 3 Downgradient 01/11/2017 Metal mg/L 0.000042 U N
Cadmium (total) JTEC-MW-SA-3 4 Downgradient 02/21/2017 Metal mg/L 0.000042 U N
Cadmium (total) JTEC-MW-SA-3 5 Downgradient 04/10/2017 Metal mg/L 0.000042 U N
Cadmium (total) JTEC-MW-SA-3 6 Downgradient 05/11/2017 Metal mg/L 0.0001 B N
Cadmium (total) JTEC-MW-SA-3 7 Downgradient 07/13/2017 Metal mg/L 0.000042 U N
Cadmium (total) JTEC-MW-SA-3 8 Downgradient 08/10/2017 Metal mg/L 0.00014 J N
Cadmium (total) JTEC-MW-SA-4 1 Downgradient 10/24/2016 Metal mg/L 0.000049 J N
Cadmium (total) JTEC-MW-SA-4 2 Downgradient 11/15/2016 Metal mg/L 0.000087 J N
Cadmium (total) JTEC-MW-SA-4 3 Downgradient 01/10/2017 Metal mg/L 0.000098 J N
Cadmium (total) JTEC-MW-SA-4 4 Downgradient 02/22/2017 Metal mg/L 0.000073 J N
Cadmium (total) JTEC-MW-SA-4 5 Downgradient 04/11/2017 Metal mg/L 0.000048 B N
Cadmium (total) JTEC-MW-SA-4 6 Downgradient 05/11/2017 Metal mg/L 0.000042 U N
Cadmium (total) JTEC-MW-SA-4 7 Downgradient 07/13/2017 Metal mg/L 0.000042 U N
Cadmium (total) JTEC-MW-SA-4 8 Downgradient 08/11/2017 Metal mg/L 0.00027 J N
Chromium (total) JTEC-MW-PZ-01D 1 Upgradient 10/20/2016 Metal mg/L 0.00027 U N
Chromium (total) JTEC-MW-PZ-01D 2 Upgradient 11/14/2016 Metal mg/L 0.00042 J N
Chromium (total) JTEC-MW-PZ-01D 3 Upgradient 01/09/2017 Metal mg/L 0.00027 U N
Chromium (total) JTEC-MW-PZ-01D 4 Upgradient 02/13/2017 Metal mg/L 0.00057 J N
Chromium (total) JTEC-MW-PZ-01D 5 Upgradient 04/03/2017 Metal mg/L 0.004 N
Chromium (total) JTEC-MW-PZ-01D 6 Upgradient 05/08/2017 Metal mg/L 0.00027 U N
Chromium (total) JTEC-MW-PZ-01D 7 Upgradient 07/10/2017 Metal mg/L 0.0011 J N
Chromium (total) JTEC-MW-PZ-01D 8 Upgradient 08/07/2017 Metal mg/L 0.00027 U N
Chromium (total) JTEC-MW-PZ-03D 1 Downgradient 10/25/2016 Metal mg/L 0.00027 U N
Chromium (total) JTEC-MW-PZ-03D 2 Downgradient 11/15/2016 Metal mg/L 0.00027 U N
Chromium (total) JTEC-MW-PZ-03D 3 Downgradient 01/11/2017 Metal mg/L 0.00058 J N
Chromium (total) JTEC-MW-PZ-03D 4 Downgradient 02/20/2017 Metal mg/L 0.00098 B N
Chromium (total) JTEC-MW-PZ-03D 5 Downgradient 04/06/2017 Metal mg/L 0.0011 J N
Chromium (total) JTEC-MW-PZ-03D 6 Downgradient 05/10/2017 Metal mg/L 0.00089 B N
Chromium (total) JTEC-MW-PZ-03D 7 Downgradient 07/12/2017 Metal mg/L 0.00043 J N
Chromium (total) JTEC-MW-PZ-03D 8 Downgradient 08/09/2017 Metal mg/L 0.00027 U N
Chromium (total) JTEC-MW-PZ-08D 1 Downgradient 10/20/2016 Metal mg/L 0.00027 U N
Chromium (total) JTEC-MW-PZ-08D 2 Downgradient 11/14/2016 Metal mg/L 0.0011 J N
Chromium (total) JTEC-MW-PZ-08D 3 Downgradient 01/10/2017 Metal mg/L 0.00027 U N
Chromium (total) JTEC-MW-PZ-08D 4 Downgradient 02/16/2017 Metal mg/L 0.00073 B N
Chromium (total) JTEC-MW-PZ-08D 5 Downgradient 04/04/2017 Metal mg/L 0.001 J N
Chromium (total) JTEC-MW-PZ-08D 6 Downgradient 05/09/2017 Metal mg/L 0.00027 U N
Chromium (total) JTEC-MW-PZ-08D 7 Downgradient 07/11/2017 Metal mg/L 0.00054 J N
Chromium (total) JTEC-MW-PZ-08D 8 Downgradient 08/11/2017 Metal mg/L 0.00027 U N
Chromium (total) JTEC-MW-PZ-09D 1 Upgradient 10/20/2016 Metal mg/L 0.00027 U N
Chromium (total) JTEC-MW-PZ-09D 2 Upgradient 11/14/2016 Metal mg/L 0.00027 U N
Chromium (total) JTEC-MW-PZ-09D 3 Upgradient 01/09/2017 Metal mg/L 0.00027 U N
Chromium (total) JTEC-MW-PZ-09D 4 Upgradient 02/15/2017 Metal mg/L 0.00085 J N
Chromium (total) JTEC-MW-PZ-09D 5 Upgradient 04/04/2017 Metal mg/L 0.0011 J N
Chromium (total) JTEC-MW-PZ-09D 6 Upgradient 05/09/2017 Metal mg/L 0.00027 U N
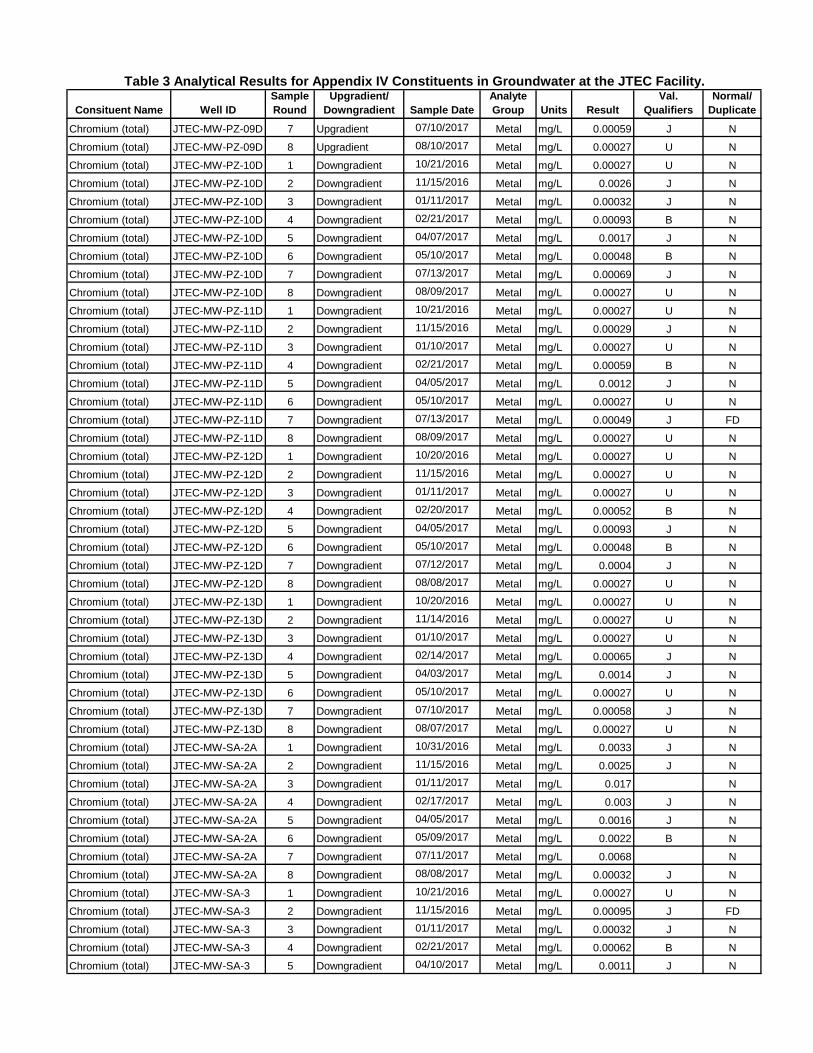
Consituent Name Well IDSample Round
Upgradient/Downgradient Sample Date
Analyte Group Units Result
Val. Qualifiers
Normal/Duplicate
Table 3 Analytical Results for Appendix IV Constituents in Groundwater at the JTEC Facility.
Chromium (total) JTEC-MW-PZ-09D 7 Upgradient 07/10/2017 Metal mg/L 0.00059 J N
Chromium (total) JTEC-MW-PZ-09D 8 Upgradient 08/10/2017 Metal mg/L 0.00027 U N
Chromium (total) JTEC-MW-PZ-10D 1 Downgradient 10/21/2016 Metal mg/L 0.00027 U N
Chromium (total) JTEC-MW-PZ-10D 2 Downgradient 11/15/2016 Metal mg/L 0.0026 J N
Chromium (total) JTEC-MW-PZ-10D 3 Downgradient 01/11/2017 Metal mg/L 0.00032 J N
Chromium (total) JTEC-MW-PZ-10D 4 Downgradient 02/21/2017 Metal mg/L 0.00093 B N
Chromium (total) JTEC-MW-PZ-10D 5 Downgradient 04/07/2017 Metal mg/L 0.0017 J N
Chromium (total) JTEC-MW-PZ-10D 6 Downgradient 05/10/2017 Metal mg/L 0.00048 B N
Chromium (total) JTEC-MW-PZ-10D 7 Downgradient 07/13/2017 Metal mg/L 0.00069 J N
Chromium (total) JTEC-MW-PZ-10D 8 Downgradient 08/09/2017 Metal mg/L 0.00027 U N
Chromium (total) JTEC-MW-PZ-11D 1 Downgradient 10/21/2016 Metal mg/L 0.00027 U N
Chromium (total) JTEC-MW-PZ-11D 2 Downgradient 11/15/2016 Metal mg/L 0.00029 J N
Chromium (total) JTEC-MW-PZ-11D 3 Downgradient 01/10/2017 Metal mg/L 0.00027 U N
Chromium (total) JTEC-MW-PZ-11D 4 Downgradient 02/21/2017 Metal mg/L 0.00059 B N
Chromium (total) JTEC-MW-PZ-11D 5 Downgradient 04/05/2017 Metal mg/L 0.0012 J N
Chromium (total) JTEC-MW-PZ-11D 6 Downgradient 05/10/2017 Metal mg/L 0.00027 U N
Chromium (total) JTEC-MW-PZ-11D 7 Downgradient 07/13/2017 Metal mg/L 0.00049 J FD
Chromium (total) JTEC-MW-PZ-11D 8 Downgradient 08/09/2017 Metal mg/L 0.00027 U N
Chromium (total) JTEC-MW-PZ-12D 1 Downgradient 10/20/2016 Metal mg/L 0.00027 U N
Chromium (total) JTEC-MW-PZ-12D 2 Downgradient 11/15/2016 Metal mg/L 0.00027 U N
Chromium (total) JTEC-MW-PZ-12D 3 Downgradient 01/11/2017 Metal mg/L 0.00027 U N
Chromium (total) JTEC-MW-PZ-12D 4 Downgradient 02/20/2017 Metal mg/L 0.00052 B N
Chromium (total) JTEC-MW-PZ-12D 5 Downgradient 04/05/2017 Metal mg/L 0.00093 J N
Chromium (total) JTEC-MW-PZ-12D 6 Downgradient 05/10/2017 Metal mg/L 0.00048 B N
Chromium (total) JTEC-MW-PZ-12D 7 Downgradient 07/12/2017 Metal mg/L 0.0004 J N
Chromium (total) JTEC-MW-PZ-12D 8 Downgradient 08/08/2017 Metal mg/L 0.00027 U N
Chromium (total) JTEC-MW-PZ-13D 1 Downgradient 10/20/2016 Metal mg/L 0.00027 U N
Chromium (total) JTEC-MW-PZ-13D 2 Downgradient 11/14/2016 Metal mg/L 0.00027 U N
Chromium (total) JTEC-MW-PZ-13D 3 Downgradient 01/10/2017 Metal mg/L 0.00027 U N
Chromium (total) JTEC-MW-PZ-13D 4 Downgradient 02/14/2017 Metal mg/L 0.00065 J N
Chromium (total) JTEC-MW-PZ-13D 5 Downgradient 04/03/2017 Metal mg/L 0.0014 J N
Chromium (total) JTEC-MW-PZ-13D 6 Downgradient 05/10/2017 Metal mg/L 0.00027 U N
Chromium (total) JTEC-MW-PZ-13D 7 Downgradient 07/10/2017 Metal mg/L 0.00058 J N
Chromium (total) JTEC-MW-PZ-13D 8 Downgradient 08/07/2017 Metal mg/L 0.00027 U N
Chromium (total) JTEC-MW-SA-2A 1 Downgradient 10/31/2016 Metal mg/L 0.0033 J N
Chromium (total) JTEC-MW-SA-2A 2 Downgradient 11/15/2016 Metal mg/L 0.0025 J N
Chromium (total) JTEC-MW-SA-2A 3 Downgradient 01/11/2017 Metal mg/L 0.017 N
Chromium (total) JTEC-MW-SA-2A 4 Downgradient 02/17/2017 Metal mg/L 0.003 J N
Chromium (total) JTEC-MW-SA-2A 5 Downgradient 04/05/2017 Metal mg/L 0.0016 J N
Chromium (total) JTEC-MW-SA-2A 6 Downgradient 05/09/2017 Metal mg/L 0.0022 B N
Chromium (total) JTEC-MW-SA-2A 7 Downgradient 07/11/2017 Metal mg/L 0.0068 N
Chromium (total) JTEC-MW-SA-2A 8 Downgradient 08/08/2017 Metal mg/L 0.00032 J N
Chromium (total) JTEC-MW-SA-3 1 Downgradient 10/21/2016 Metal mg/L 0.00027 U N
Chromium (total) JTEC-MW-SA-3 2 Downgradient 11/15/2016 Metal mg/L 0.00095 J FD
Chromium (total) JTEC-MW-SA-3 3 Downgradient 01/11/2017 Metal mg/L 0.00032 J N
Chromium (total) JTEC-MW-SA-3 4 Downgradient 02/21/2017 Metal mg/L 0.00062 B N
Chromium (total) JTEC-MW-SA-3 5 Downgradient 04/10/2017 Metal mg/L 0.0011 J N
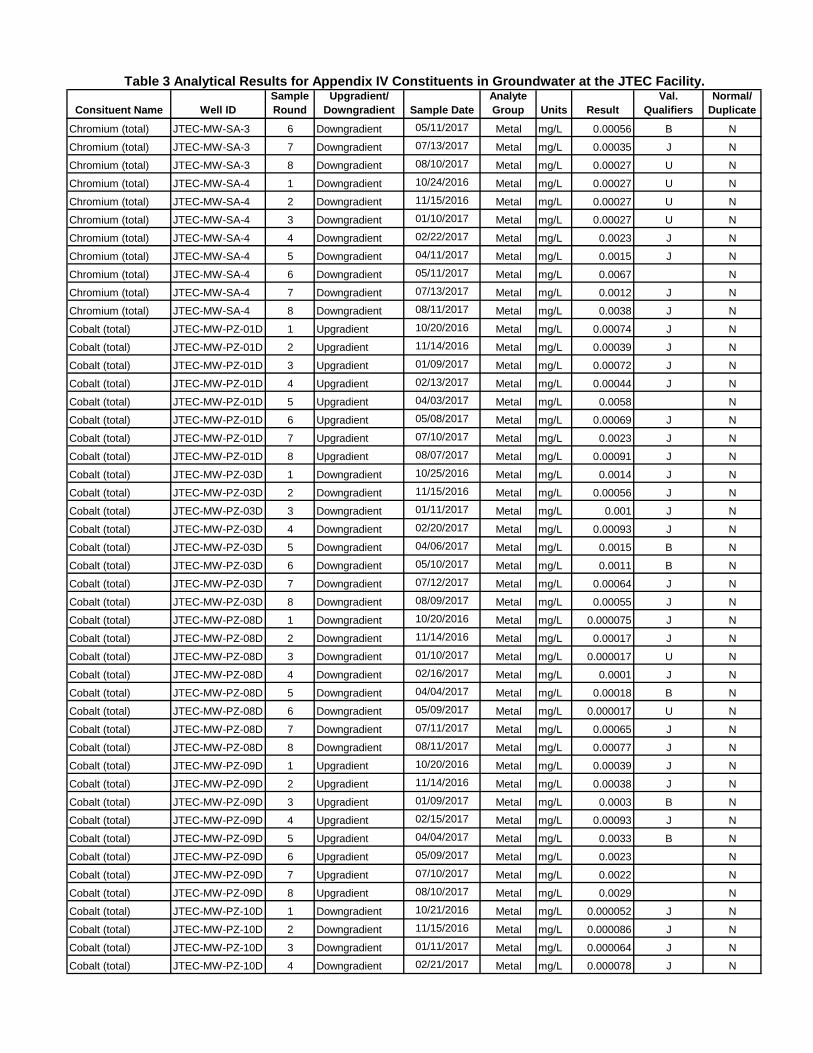
Consituent Name Well IDSample Round
Upgradient/Downgradient Sample Date
Analyte Group Units Result
Val. Qualifiers
Normal/Duplicate
Table 3 Analytical Results for Appendix IV Constituents in Groundwater at the JTEC Facility.
Chromium (total) JTEC-MW-SA-3 6 Downgradient 05/11/2017 Metal mg/L 0.00056 B N
Chromium (total) JTEC-MW-SA-3 7 Downgradient 07/13/2017 Metal mg/L 0.00035 J N
Chromium (total) JTEC-MW-SA-3 8 Downgradient 08/10/2017 Metal mg/L 0.00027 U N
Chromium (total) JTEC-MW-SA-4 1 Downgradient 10/24/2016 Metal mg/L 0.00027 U N
Chromium (total) JTEC-MW-SA-4 2 Downgradient 11/15/2016 Metal mg/L 0.00027 U N
Chromium (total) JTEC-MW-SA-4 3 Downgradient 01/10/2017 Metal mg/L 0.00027 U N
Chromium (total) JTEC-MW-SA-4 4 Downgradient 02/22/2017 Metal mg/L 0.0023 J N
Chromium (total) JTEC-MW-SA-4 5 Downgradient 04/11/2017 Metal mg/L 0.0015 J N
Chromium (total) JTEC-MW-SA-4 6 Downgradient 05/11/2017 Metal mg/L 0.0067 N
Chromium (total) JTEC-MW-SA-4 7 Downgradient 07/13/2017 Metal mg/L 0.0012 J N
Chromium (total) JTEC-MW-SA-4 8 Downgradient 08/11/2017 Metal mg/L 0.0038 J N
Cobalt (total) JTEC-MW-PZ-01D 1 Upgradient 10/20/2016 Metal mg/L 0.00074 J N
Cobalt (total) JTEC-MW-PZ-01D 2 Upgradient 11/14/2016 Metal mg/L 0.00039 J N
Cobalt (total) JTEC-MW-PZ-01D 3 Upgradient 01/09/2017 Metal mg/L 0.00072 J N
Cobalt (total) JTEC-MW-PZ-01D 4 Upgradient 02/13/2017 Metal mg/L 0.00044 J N
Cobalt (total) JTEC-MW-PZ-01D 5 Upgradient 04/03/2017 Metal mg/L 0.0058 N
Cobalt (total) JTEC-MW-PZ-01D 6 Upgradient 05/08/2017 Metal mg/L 0.00069 J N
Cobalt (total) JTEC-MW-PZ-01D 7 Upgradient 07/10/2017 Metal mg/L 0.0023 J N
Cobalt (total) JTEC-MW-PZ-01D 8 Upgradient 08/07/2017 Metal mg/L 0.00091 J N
Cobalt (total) JTEC-MW-PZ-03D 1 Downgradient 10/25/2016 Metal mg/L 0.0014 J N
Cobalt (total) JTEC-MW-PZ-03D 2 Downgradient 11/15/2016 Metal mg/L 0.00056 J N
Cobalt (total) JTEC-MW-PZ-03D 3 Downgradient 01/11/2017 Metal mg/L 0.001 J N
Cobalt (total) JTEC-MW-PZ-03D 4 Downgradient 02/20/2017 Metal mg/L 0.00093 J N
Cobalt (total) JTEC-MW-PZ-03D 5 Downgradient 04/06/2017 Metal mg/L 0.0015 B N
Cobalt (total) JTEC-MW-PZ-03D 6 Downgradient 05/10/2017 Metal mg/L 0.0011 B N
Cobalt (total) JTEC-MW-PZ-03D 7 Downgradient 07/12/2017 Metal mg/L 0.00064 J N
Cobalt (total) JTEC-MW-PZ-03D 8 Downgradient 08/09/2017 Metal mg/L 0.00055 J N
Cobalt (total) JTEC-MW-PZ-08D 1 Downgradient 10/20/2016 Metal mg/L 0.000075 J N
Cobalt (total) JTEC-MW-PZ-08D 2 Downgradient 11/14/2016 Metal mg/L 0.00017 J N
Cobalt (total) JTEC-MW-PZ-08D 3 Downgradient 01/10/2017 Metal mg/L 0.000017 U N
Cobalt (total) JTEC-MW-PZ-08D 4 Downgradient 02/16/2017 Metal mg/L 0.0001 J N
Cobalt (total) JTEC-MW-PZ-08D 5 Downgradient 04/04/2017 Metal mg/L 0.00018 B N
Cobalt (total) JTEC-MW-PZ-08D 6 Downgradient 05/09/2017 Metal mg/L 0.000017 U N
Cobalt (total) JTEC-MW-PZ-08D 7 Downgradient 07/11/2017 Metal mg/L 0.00065 J N
Cobalt (total) JTEC-MW-PZ-08D 8 Downgradient 08/11/2017 Metal mg/L 0.00077 J N
Cobalt (total) JTEC-MW-PZ-09D 1 Upgradient 10/20/2016 Metal mg/L 0.00039 J N
Cobalt (total) JTEC-MW-PZ-09D 2 Upgradient 11/14/2016 Metal mg/L 0.00038 J N
Cobalt (total) JTEC-MW-PZ-09D 3 Upgradient 01/09/2017 Metal mg/L 0.0003 B N
Cobalt (total) JTEC-MW-PZ-09D 4 Upgradient 02/15/2017 Metal mg/L 0.00093 J N
Cobalt (total) JTEC-MW-PZ-09D 5 Upgradient 04/04/2017 Metal mg/L 0.0033 B N
Cobalt (total) JTEC-MW-PZ-09D 6 Upgradient 05/09/2017 Metal mg/L 0.0023 N
Cobalt (total) JTEC-MW-PZ-09D 7 Upgradient 07/10/2017 Metal mg/L 0.0022 N
Cobalt (total) JTEC-MW-PZ-09D 8 Upgradient 08/10/2017 Metal mg/L 0.0029 N
Cobalt (total) JTEC-MW-PZ-10D 1 Downgradient 10/21/2016 Metal mg/L 0.000052 J N
Cobalt (total) JTEC-MW-PZ-10D 2 Downgradient 11/15/2016 Metal mg/L 0.000086 J N
Cobalt (total) JTEC-MW-PZ-10D 3 Downgradient 01/11/2017 Metal mg/L 0.000064 J N
Cobalt (total) JTEC-MW-PZ-10D 4 Downgradient 02/21/2017 Metal mg/L 0.000078 J N

Consituent Name Well IDSample Round
Upgradient/Downgradient Sample Date
Analyte Group Units Result
Val. Qualifiers
Normal/Duplicate
Table 3 Analytical Results for Appendix IV Constituents in Groundwater at the JTEC Facility.
Cobalt (total) JTEC-MW-PZ-10D 5 Downgradient 04/07/2017 Metal mg/L 0.000029 B N
Cobalt (total) JTEC-MW-PZ-10D 6 Downgradient 05/10/2017 Metal mg/L 0.00028 B N
Cobalt (total) JTEC-MW-PZ-10D 7 Downgradient 07/13/2017 Metal mg/L 0.000054 J N
Cobalt (total) JTEC-MW-PZ-10D 8 Downgradient 08/09/2017 Metal mg/L 0.000017 U N
Cobalt (total) JTEC-MW-PZ-11D 1 Downgradient 10/21/2016 Metal mg/L 0.000017 U N
Cobalt (total) JTEC-MW-PZ-11D 2 Downgradient 11/15/2016 Metal mg/L 0.000017 U N
Cobalt (total) JTEC-MW-PZ-11D 3 Downgradient 01/10/2017 Metal mg/L 0.000017 U N
Cobalt (total) JTEC-MW-PZ-11D 4 Downgradient 02/21/2017 Metal mg/L 0.000017 U N
Cobalt (total) JTEC-MW-PZ-11D 5 Downgradient 04/05/2017 Metal mg/L 0.000092 B FD
Cobalt (total) JTEC-MW-PZ-11D 6 Downgradient 05/10/2017 Metal mg/L 0.00016 J,B FD
Cobalt (total) JTEC-MW-PZ-11D 7 Downgradient 07/13/2017 Metal mg/L 0.000017 U N
Cobalt (total) JTEC-MW-PZ-11D 8 Downgradient 08/09/2017 Metal mg/L 0.000085 J,B FD
Cobalt (total) JTEC-MW-PZ-12D 1 Downgradient 10/20/2016 Metal mg/L 0.0032 N
Cobalt (total) JTEC-MW-PZ-12D 2 Downgradient 11/15/2016 Metal mg/L 0.0011 J N
Cobalt (total) JTEC-MW-PZ-12D 3 Downgradient 01/11/2017 Metal mg/L 0.0008 J N
Cobalt (total) JTEC-MW-PZ-12D 4 Downgradient 02/20/2017 Metal mg/L 0.00013 J N
Cobalt (total) JTEC-MW-PZ-12D 5 Downgradient 04/05/2017 Metal mg/L 0.000056 B N
Cobalt (total) JTEC-MW-PZ-12D 6 Downgradient 05/10/2017 Metal mg/L 0.00018 B N
Cobalt (total) JTEC-MW-PZ-12D 7 Downgradient 07/12/2017 Metal mg/L 0.000078 J N
Cobalt (total) JTEC-MW-PZ-12D 8 Downgradient 08/08/2017 Metal mg/L 0.00014 J N
Cobalt (total) JTEC-MW-PZ-13D 1 Downgradient 10/20/2016 Metal mg/L 0.005 N
Cobalt (total) JTEC-MW-PZ-13D 2 Downgradient 11/14/2016 Metal mg/L 0.00058 J N
Cobalt (total) JTEC-MW-PZ-13D 3 Downgradient 01/10/2017 Metal mg/L 0.00015 B N
Cobalt (total) JTEC-MW-PZ-13D 4 Downgradient 02/14/2017 Metal mg/L 0.00013 J N
Cobalt (total) JTEC-MW-PZ-13D 5 Downgradient 04/03/2017 Metal mg/L 0.00037 B N
Cobalt (total) JTEC-MW-PZ-13D 6 Downgradient 05/10/2017 Metal mg/L 0.00012 J N
Cobalt (total) JTEC-MW-PZ-13D 7 Downgradient 07/10/2017 Metal mg/L 0.00023 J N
Cobalt (total) JTEC-MW-PZ-13D 8 Downgradient 08/07/2017 Metal mg/L 0.00014 J N
Cobalt (total) JTEC-MW-SA-2A 1 Downgradient 10/31/2016 Metal mg/L 0.00096 J N
Cobalt (total) JTEC-MW-SA-2A 2 Downgradient 11/15/2016 Metal mg/L 0.00068 J N
Cobalt (total) JTEC-MW-SA-2A 3 Downgradient 01/11/2017 Metal mg/L 0.0024 N
Cobalt (total) JTEC-MW-SA-2A 4 Downgradient 02/17/2017 Metal mg/L 0.00061 J N
Cobalt (total) JTEC-MW-SA-2A 5 Downgradient 04/05/2017 Metal mg/L 0.00011 B N
Cobalt (total) JTEC-MW-SA-2A 6 Downgradient 05/09/2017 Metal mg/L 0.00049 B N
Cobalt (total) JTEC-MW-SA-2A 7 Downgradient 07/11/2017 Metal mg/L 0.0019 J N
Cobalt (total) JTEC-MW-SA-2A 8 Downgradient 08/08/2017 Metal mg/L 0.00017 J N
Cobalt (total) JTEC-MW-SA-3 1 Downgradient 10/21/2016 Metal mg/L 0.000017 U N
Cobalt (total) JTEC-MW-SA-3 2 Downgradient 11/15/2016 Metal mg/L 0.000074 J N
Cobalt (total) JTEC-MW-SA-3 3 Downgradient 01/11/2017 Metal mg/L 0.00022 J N
Cobalt (total) JTEC-MW-SA-3 4 Downgradient 02/21/2017 Metal mg/L 0.00034 J N
Cobalt (total) JTEC-MW-SA-3 5 Downgradient 04/10/2017 Metal mg/L 0.000086 B N
Cobalt (total) JTEC-MW-SA-3 6 Downgradient 05/11/2017 Metal mg/L 0.00027 B N
Cobalt (total) JTEC-MW-SA-3 7 Downgradient 07/13/2017 Metal mg/L 0.000025 J N
Cobalt (total) JTEC-MW-SA-3 8 Downgradient 08/10/2017 Metal mg/L 0.000061 B N
Cobalt (total) JTEC-MW-SA-4 1 Downgradient 10/24/2016 Metal mg/L 0.00047 J N
Cobalt (total) JTEC-MW-SA-4 2 Downgradient 11/15/2016 Metal mg/L 0.00039 J N
Cobalt (total) JTEC-MW-SA-4 3 Downgradient 01/10/2017 Metal mg/L 0.00042 J N
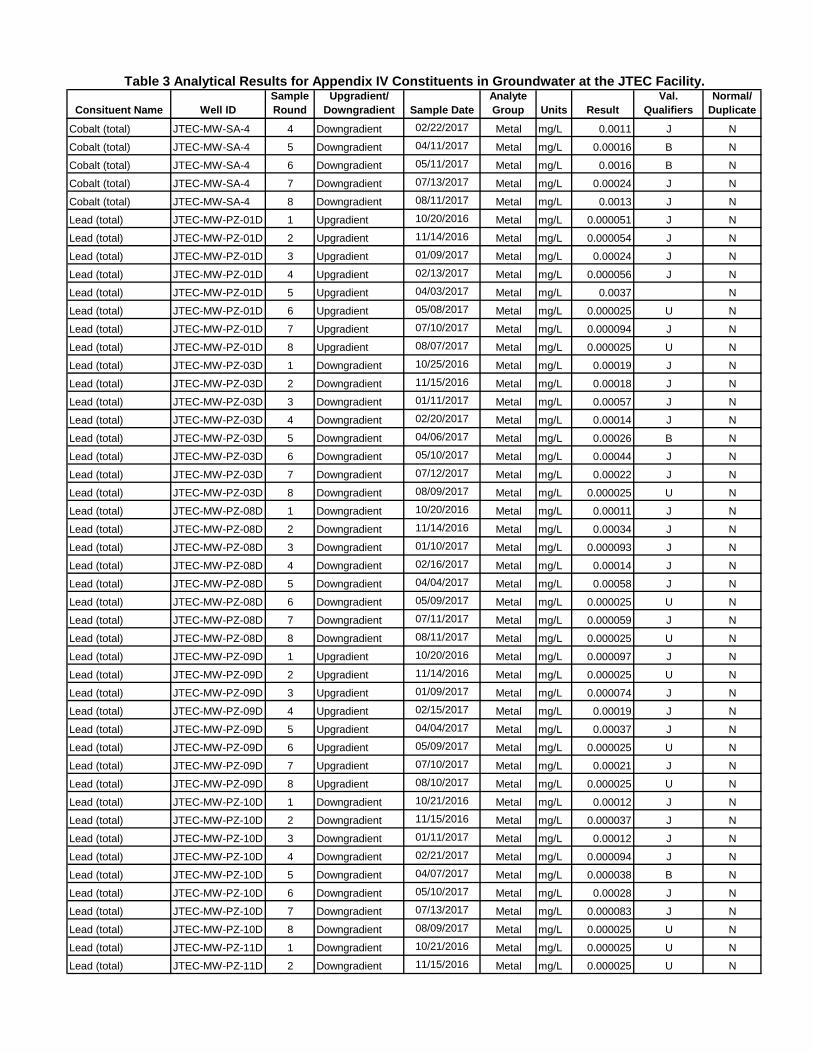
Consituent Name Well IDSample Round
Upgradient/Downgradient Sample Date
Analyte Group Units Result
Val. Qualifiers
Normal/Duplicate
Table 3 Analytical Results for Appendix IV Constituents in Groundwater at the JTEC Facility.
Cobalt (total) JTEC-MW-SA-4 4 Downgradient 02/22/2017 Metal mg/L 0.0011 J N
Cobalt (total) JTEC-MW-SA-4 5 Downgradient 04/11/2017 Metal mg/L 0.00016 B N
Cobalt (total) JTEC-MW-SA-4 6 Downgradient 05/11/2017 Metal mg/L 0.0016 B N
Cobalt (total) JTEC-MW-SA-4 7 Downgradient 07/13/2017 Metal mg/L 0.00024 J N
Cobalt (total) JTEC-MW-SA-4 8 Downgradient 08/11/2017 Metal mg/L 0.0013 J N
Lead (total) JTEC-MW-PZ-01D 1 Upgradient 10/20/2016 Metal mg/L 0.000051 J N
Lead (total) JTEC-MW-PZ-01D 2 Upgradient 11/14/2016 Metal mg/L 0.000054 J N
Lead (total) JTEC-MW-PZ-01D 3 Upgradient 01/09/2017 Metal mg/L 0.00024 J N
Lead (total) JTEC-MW-PZ-01D 4 Upgradient 02/13/2017 Metal mg/L 0.000056 J N
Lead (total) JTEC-MW-PZ-01D 5 Upgradient 04/03/2017 Metal mg/L 0.0037 N
Lead (total) JTEC-MW-PZ-01D 6 Upgradient 05/08/2017 Metal mg/L 0.000025 U N
Lead (total) JTEC-MW-PZ-01D 7 Upgradient 07/10/2017 Metal mg/L 0.000094 J N
Lead (total) JTEC-MW-PZ-01D 8 Upgradient 08/07/2017 Metal mg/L 0.000025 U N
Lead (total) JTEC-MW-PZ-03D 1 Downgradient 10/25/2016 Metal mg/L 0.00019 J N
Lead (total) JTEC-MW-PZ-03D 2 Downgradient 11/15/2016 Metal mg/L 0.00018 J N
Lead (total) JTEC-MW-PZ-03D 3 Downgradient 01/11/2017 Metal mg/L 0.00057 J N
Lead (total) JTEC-MW-PZ-03D 4 Downgradient 02/20/2017 Metal mg/L 0.00014 J N
Lead (total) JTEC-MW-PZ-03D 5 Downgradient 04/06/2017 Metal mg/L 0.00026 B N
Lead (total) JTEC-MW-PZ-03D 6 Downgradient 05/10/2017 Metal mg/L 0.00044 J N
Lead (total) JTEC-MW-PZ-03D 7 Downgradient 07/12/2017 Metal mg/L 0.00022 J N
Lead (total) JTEC-MW-PZ-03D 8 Downgradient 08/09/2017 Metal mg/L 0.000025 U N
Lead (total) JTEC-MW-PZ-08D 1 Downgradient 10/20/2016 Metal mg/L 0.00011 J N
Lead (total) JTEC-MW-PZ-08D 2 Downgradient 11/14/2016 Metal mg/L 0.00034 J N
Lead (total) JTEC-MW-PZ-08D 3 Downgradient 01/10/2017 Metal mg/L 0.000093 J N
Lead (total) JTEC-MW-PZ-08D 4 Downgradient 02/16/2017 Metal mg/L 0.00014 J N
Lead (total) JTEC-MW-PZ-08D 5 Downgradient 04/04/2017 Metal mg/L 0.00058 J N
Lead (total) JTEC-MW-PZ-08D 6 Downgradient 05/09/2017 Metal mg/L 0.000025 U N
Lead (total) JTEC-MW-PZ-08D 7 Downgradient 07/11/2017 Metal mg/L 0.000059 J N
Lead (total) JTEC-MW-PZ-08D 8 Downgradient 08/11/2017 Metal mg/L 0.000025 U N
Lead (total) JTEC-MW-PZ-09D 1 Upgradient 10/20/2016 Metal mg/L 0.000097 J N
Lead (total) JTEC-MW-PZ-09D 2 Upgradient 11/14/2016 Metal mg/L 0.000025 U N
Lead (total) JTEC-MW-PZ-09D 3 Upgradient 01/09/2017 Metal mg/L 0.000074 J N
Lead (total) JTEC-MW-PZ-09D 4 Upgradient 02/15/2017 Metal mg/L 0.00019 J N
Lead (total) JTEC-MW-PZ-09D 5 Upgradient 04/04/2017 Metal mg/L 0.00037 J N
Lead (total) JTEC-MW-PZ-09D 6 Upgradient 05/09/2017 Metal mg/L 0.000025 U N
Lead (total) JTEC-MW-PZ-09D 7 Upgradient 07/10/2017 Metal mg/L 0.00021 J N
Lead (total) JTEC-MW-PZ-09D 8 Upgradient 08/10/2017 Metal mg/L 0.000025 U N
Lead (total) JTEC-MW-PZ-10D 1 Downgradient 10/21/2016 Metal mg/L 0.00012 J N
Lead (total) JTEC-MW-PZ-10D 2 Downgradient 11/15/2016 Metal mg/L 0.000037 J N
Lead (total) JTEC-MW-PZ-10D 3 Downgradient 01/11/2017 Metal mg/L 0.00012 J N
Lead (total) JTEC-MW-PZ-10D 4 Downgradient 02/21/2017 Metal mg/L 0.000094 J N
Lead (total) JTEC-MW-PZ-10D 5 Downgradient 04/07/2017 Metal mg/L 0.000038 B N
Lead (total) JTEC-MW-PZ-10D 6 Downgradient 05/10/2017 Metal mg/L 0.00028 J N
Lead (total) JTEC-MW-PZ-10D 7 Downgradient 07/13/2017 Metal mg/L 0.000083 J N
Lead (total) JTEC-MW-PZ-10D 8 Downgradient 08/09/2017 Metal mg/L 0.000025 U N
Lead (total) JTEC-MW-PZ-11D 1 Downgradient 10/21/2016 Metal mg/L 0.000025 U N
Lead (total) JTEC-MW-PZ-11D 2 Downgradient 11/15/2016 Metal mg/L 0.000025 U N

Consituent Name Well IDSample Round
Upgradient/Downgradient Sample Date
Analyte Group Units Result
Val. Qualifiers
Normal/Duplicate
Table 3 Analytical Results for Appendix IV Constituents in Groundwater at the JTEC Facility.
Lead (total) JTEC-MW-PZ-11D 3 Downgradient 01/10/2017 Metal mg/L 0.00003 J N
Lead (total) JTEC-MW-PZ-11D 4 Downgradient 02/21/2017 Metal mg/L 0.000025 U N
Lead (total) JTEC-MW-PZ-11D 5 Downgradient 04/05/2017 Metal mg/L 0.00016 B N
Lead (total) JTEC-MW-PZ-11D 6 Downgradient 05/10/2017 Metal mg/L 0.00011 J FD
Lead (total) JTEC-MW-PZ-11D 7 Downgradient 07/13/2017 Metal mg/L 0.000025 U N
Lead (total) JTEC-MW-PZ-11D 8 Downgradient 08/09/2017 Metal mg/L 0.000025 U N
Lead (total) JTEC-MW-PZ-12D 1 Downgradient 10/20/2016 Metal mg/L 0.000091 J N
Lead (total) JTEC-MW-PZ-12D 2 Downgradient 11/15/2016 Metal mg/L 0.000025 U N
Lead (total) JTEC-MW-PZ-12D 3 Downgradient 01/11/2017 Metal mg/L 0.00013 J N
Lead (total) JTEC-MW-PZ-12D 4 Downgradient 02/20/2017 Metal mg/L 0.000059 J N
Lead (total) JTEC-MW-PZ-12D 5 Downgradient 04/05/2017 Metal mg/L 0.00023 B N
Lead (total) JTEC-MW-PZ-12D 6 Downgradient 05/10/2017 Metal mg/L 0.00026 J N
Lead (total) JTEC-MW-PZ-12D 7 Downgradient 07/12/2017 Metal mg/L 0.000096 J N
Lead (total) JTEC-MW-PZ-12D 8 Downgradient 08/08/2017 Metal mg/L 0.000025 U N
Lead (total) JTEC-MW-PZ-13D 1 Downgradient 10/20/2016 Metal mg/L 0.00013 J N
Lead (total) JTEC-MW-PZ-13D 2 Downgradient 11/14/2016 Metal mg/L 0.000058 J N
Lead (total) JTEC-MW-PZ-13D 3 Downgradient 01/10/2017 Metal mg/L 0.00017 J N
Lead (total) JTEC-MW-PZ-13D 4 Downgradient 02/14/2017 Metal mg/L 0.000069 J N
Lead (total) JTEC-MW-PZ-13D 5 Downgradient 04/03/2017 Metal mg/L 0.0005 J N
Lead (total) JTEC-MW-PZ-13D 6 Downgradient 05/10/2017 Metal mg/L 0.000025 U N
Lead (total) JTEC-MW-PZ-13D 7 Downgradient 07/10/2017 Metal mg/L 0.000025 U N
Lead (total) JTEC-MW-PZ-13D 8 Downgradient 08/07/2017 Metal mg/L 0.000025 U N
Lead (total) JTEC-MW-SA-2A 1 Downgradient 10/31/2016 Metal mg/L 0.0021 N
Lead (total) JTEC-MW-SA-2A 2 Downgradient 11/15/2016 Metal mg/L 0.0081 N
Lead (total) JTEC-MW-SA-2A 3 Downgradient 01/11/2017 Metal mg/L 0.0044 N
Lead (total) JTEC-MW-SA-2A 4 Downgradient 02/17/2017 Metal mg/L 0.0014 N
Lead (total) JTEC-MW-SA-2A 5 Downgradient 04/05/2017 Metal mg/L 0.00016 B N
Lead (total) JTEC-MW-SA-2A 6 Downgradient 05/09/2017 Metal mg/L 0.00084 J N
Lead (total) JTEC-MW-SA-2A 7 Downgradient 07/11/2017 Metal mg/L 0.0037 N
Lead (total) JTEC-MW-SA-2A 8 Downgradient 08/08/2017 Metal mg/L 0.000025 U N
Lead (total) JTEC-MW-SA-3 1 Downgradient 10/21/2016 Metal mg/L 0.000048 J FD
Lead (total) JTEC-MW-SA-3 2 Downgradient 11/15/2016 Metal mg/L 0.000034 J FD
Lead (total) JTEC-MW-SA-3 3 Downgradient 01/11/2017 Metal mg/L 0.00043 J N
Lead (total) JTEC-MW-SA-3 4 Downgradient 02/21/2017 Metal mg/L 0.000025 U N
Lead (total) JTEC-MW-SA-3 5 Downgradient 04/10/2017 Metal mg/L 0.000043 B N
Lead (total) JTEC-MW-SA-3 6 Downgradient 05/11/2017 Metal mg/L 0.000025 U N
Lead (total) JTEC-MW-SA-3 7 Downgradient 07/13/2017 Metal mg/L 0.000025 U N
Lead (total) JTEC-MW-SA-3 8 Downgradient 08/10/2017 Metal mg/L 0.000025 U N
Lead (total) JTEC-MW-SA-4 1 Downgradient 10/24/2016 Metal mg/L 0.00014 J N
Lead (total) JTEC-MW-SA-4 2 Downgradient 11/15/2016 Metal mg/L 0.00022 J N
Lead (total) JTEC-MW-SA-4 3 Downgradient 01/10/2017 Metal mg/L 0.00031 J N
Lead (total) JTEC-MW-SA-4 4 Downgradient 02/22/2017 Metal mg/L 0.00051 J N
Lead (total) JTEC-MW-SA-4 5 Downgradient 04/11/2017 Metal mg/L 0.00042 J N
Lead (total) JTEC-MW-SA-4 6 Downgradient 05/11/2017 Metal mg/L 0.0038 N
Lead (total) JTEC-MW-SA-4 7 Downgradient 07/13/2017 Metal mg/L 0.00071 J N
Lead (total) JTEC-MW-SA-4 8 Downgradient 08/11/2017 Metal mg/L 0.00094 J N
Lithium (total) JTEC-MW-PZ-01D 1 Upgradient 10/20/2016 Metal mg/L 0.007 J N

Consituent Name Well IDSample Round
Upgradient/Downgradient Sample Date
Analyte Group Units Result
Val. Qualifiers
Normal/Duplicate
Table 3 Analytical Results for Appendix IV Constituents in Groundwater at the JTEC Facility.
Lithium (total) JTEC-MW-PZ-01D 2 Upgradient 11/14/2016 Metal mg/L 0.0082 J N
Lithium (total) JTEC-MW-PZ-01D 3 Upgradient 01/09/2017 Metal mg/L 0.0092 J N
Lithium (total) JTEC-MW-PZ-01D 4 Upgradient 02/13/2017 Metal mg/L 0.0057 J N
Lithium (total) JTEC-MW-PZ-01D 5 Upgradient 04/03/2017 Metal mg/L 0.0059 J N
Lithium (total) JTEC-MW-PZ-01D 6 Upgradient 05/08/2017 Metal mg/L 0.0058 J N
Lithium (total) JTEC-MW-PZ-01D 7 Upgradient 07/10/2017 Metal mg/L 0.0052 J N
Lithium (total) JTEC-MW-PZ-01D 8 Upgradient 08/07/2017 Metal mg/L 0.0046 J N
Lithium (total) JTEC-MW-PZ-03D 1 Downgradient 10/25/2016 Metal mg/L 0.0027 J N
Lithium (total) JTEC-MW-PZ-03D 2 Downgradient 11/15/2016 Metal mg/L 0.0031 J N
Lithium (total) JTEC-MW-PZ-03D 3 Downgradient 01/11/2017 Metal mg/L 0.004 J N
Lithium (total) JTEC-MW-PZ-03D 4 Downgradient 02/20/2017 Metal mg/L 0.0041 J N
Lithium (total) JTEC-MW-PZ-03D 5 Downgradient 04/06/2017 Metal mg/L 0.0023 J N
Lithium (total) JTEC-MW-PZ-03D 6 Downgradient 05/10/2017 Metal mg/L 0.0041 J N
Lithium (total) JTEC-MW-PZ-03D 7 Downgradient 07/12/2017 Metal mg/L 0.0054 J N
Lithium (total) JTEC-MW-PZ-03D 8 Downgradient 08/09/2017 Metal mg/L 0.0028 J N
Lithium (total) JTEC-MW-PZ-08D 1 Downgradient 10/20/2016 Metal mg/L 0.011 N
Lithium (total) JTEC-MW-PZ-08D 2 Downgradient 11/14/2016 Metal mg/L 0.013 N
Lithium (total) JTEC-MW-PZ-08D 3 Downgradient 01/10/2017 Metal mg/L 0.011 N
Lithium (total) JTEC-MW-PZ-08D 4 Downgradient 02/16/2017 Metal mg/L 0.012 N
Lithium (total) JTEC-MW-PZ-08D 5 Downgradient 04/04/2017 Metal mg/L 0.01 N
Lithium (total) JTEC-MW-PZ-08D 6 Downgradient 05/09/2017 Metal mg/L 0.0096 J N
Lithium (total) JTEC-MW-PZ-08D 7 Downgradient 07/11/2017 Metal mg/L 0.0056 J N
Lithium (total) JTEC-MW-PZ-08D 8 Downgradient 08/11/2017 Metal mg/L 0.0059 J N
Lithium (total) JTEC-MW-PZ-09D 1 Upgradient 10/20/2016 Metal mg/L 0.016 N
Lithium (total) JTEC-MW-PZ-09D 2 Upgradient 11/14/2016 Metal mg/L 0.019 N
Lithium (total) JTEC-MW-PZ-09D 3 Upgradient 01/09/2017 Metal mg/L 0.02 N
Lithium (total) JTEC-MW-PZ-09D 4 Upgradient 02/15/2017 Metal mg/L 0.019 N
Lithium (total) JTEC-MW-PZ-09D 5 Upgradient 04/04/2017 Metal mg/L 0.019 N
Lithium (total) JTEC-MW-PZ-09D 6 Upgradient 05/09/2017 Metal mg/L 0.017 N
Lithium (total) JTEC-MW-PZ-09D 7 Upgradient 07/10/2017 Metal mg/L 0.021 N
Lithium (total) JTEC-MW-PZ-09D 8 Upgradient 08/10/2017 Metal mg/L 0.014 N
Lithium (total) JTEC-MW-PZ-10D 1 Downgradient 10/21/2016 Metal mg/L 0.0027 J N
Lithium (total) JTEC-MW-PZ-10D 2 Downgradient 11/15/2016 Metal mg/L 0.0035 J N
Lithium (total) JTEC-MW-PZ-10D 3 Downgradient 01/11/2017 Metal mg/L 0.0034 J N
Lithium (total) JTEC-MW-PZ-10D 4 Downgradient 02/21/2017 Metal mg/L 0.0035 J N
Lithium (total) JTEC-MW-PZ-10D 5 Downgradient 04/07/2017 Metal mg/L 0.0033 J N
Lithium (total) JTEC-MW-PZ-10D 6 Downgradient 05/10/2017 Metal mg/L 0.004 J N
Lithium (total) JTEC-MW-PZ-10D 7 Downgradient 07/13/2017 Metal mg/L 0.0034 J N
Lithium (total) JTEC-MW-PZ-10D 8 Downgradient 08/09/2017 Metal mg/L 0.00081 J N
Lithium (total) JTEC-MW-PZ-11D 1 Downgradient 10/21/2016 Metal mg/L 0.02 N
Lithium (total) JTEC-MW-PZ-11D 2 Downgradient 11/15/2016 Metal mg/L 0.025 N
Lithium (total) JTEC-MW-PZ-11D 3 Downgradient 01/10/2017 Metal mg/L 0.027 N
Lithium (total) JTEC-MW-PZ-11D 4 Downgradient 02/21/2017 Metal mg/L 0.024 N
Lithium (total) JTEC-MW-PZ-11D 5 Downgradient 04/05/2017 Metal mg/L 0.016 N
Lithium (total) JTEC-MW-PZ-11D 6 Downgradient 05/10/2017 Metal mg/L 0.022 N
Lithium (total) JTEC-MW-PZ-11D 7 Downgradient 07/13/2017 Metal mg/L 0.024 N
Lithium (total) JTEC-MW-PZ-11D 8 Downgradient 08/09/2017 Metal mg/L 0.021 N

Consituent Name Well IDSample Round
Upgradient/Downgradient Sample Date
Analyte Group Units Result
Val. Qualifiers
Normal/Duplicate
Table 3 Analytical Results for Appendix IV Constituents in Groundwater at the JTEC Facility.
Lithium (total) JTEC-MW-PZ-12D 1 Downgradient 10/20/2016 Metal mg/L 0.0024 J N
Lithium (total) JTEC-MW-PZ-12D 2 Downgradient 11/15/2016 Metal mg/L 0.0014 J N
Lithium (total) JTEC-MW-PZ-12D 3 Downgradient 01/11/2017 Metal mg/L 0.0023 J N
Lithium (total) JTEC-MW-PZ-12D 4 Downgradient 02/20/2017 Metal mg/L 0.002 J N
Lithium (total) JTEC-MW-PZ-12D 5 Downgradient 04/05/2017 Metal mg/L 0.0027 J N
Lithium (total) JTEC-MW-PZ-12D 6 Downgradient 05/10/2017 Metal mg/L 0.0022 J N
Lithium (total) JTEC-MW-PZ-12D 7 Downgradient 07/12/2017 Metal mg/L 0.0014 J N
Lithium (total) JTEC-MW-PZ-12D 8 Downgradient 08/08/2017 Metal mg/L 0.00096 J N
Lithium (total) JTEC-MW-PZ-13D 1 Downgradient 10/20/2016 Metal mg/L 0.006 J N
Lithium (total) JTEC-MW-PZ-13D 2 Downgradient 11/14/2016 Metal mg/L 0.0099 J N
Lithium (total) JTEC-MW-PZ-13D 3 Downgradient 01/10/2017 Metal mg/L 0.011 N
Lithium (total) JTEC-MW-PZ-13D 4 Downgradient 02/14/2017 Metal mg/L 0.0078 J N
Lithium (total) JTEC-MW-PZ-13D 5 Downgradient 04/03/2017 Metal mg/L 0.0073 J N
Lithium (total) JTEC-MW-PZ-13D 6 Downgradient 05/10/2017 Metal mg/L 0.072 N
Lithium (total) JTEC-MW-PZ-13D 7 Downgradient 07/10/2017 Metal mg/L 0.0047 J N
Lithium (total) JTEC-MW-PZ-13D 8 Downgradient 08/07/2017 Metal mg/L 0.0049 J N
Lithium (total) JTEC-MW-SA-2A 1 Downgradient 10/31/2016 Metal mg/L 0.0036 J N
Lithium (total) JTEC-MW-SA-2A 2 Downgradient 11/15/2016 Metal mg/L 0.0019 J N
Lithium (total) JTEC-MW-SA-2A 3 Downgradient 01/11/2017 Metal mg/L 0.0053 J N
Lithium (total) JTEC-MW-SA-2A 4 Downgradient 02/17/2017 Metal mg/L 0.003 J N
Lithium (total) JTEC-MW-SA-2A 5 Downgradient 04/05/2017 Metal mg/L 0.0018 J N
Lithium (total) JTEC-MW-SA-2A 6 Downgradient 05/09/2017 Metal mg/L 0.0037 J N
Lithium (total) JTEC-MW-SA-2A 7 Downgradient 07/11/2017 Metal mg/L 0.0066 J N
Lithium (total) JTEC-MW-SA-2A 8 Downgradient 08/08/2017 Metal mg/L 0.00027 J N
Lithium (total) JTEC-MW-SA-3 1 Downgradient 10/21/2016 Metal mg/L 0.003 J N
Lithium (total) JTEC-MW-SA-3 2 Downgradient 11/15/2016 Metal mg/L 0.0058 J FD
Lithium (total) JTEC-MW-SA-3 3 Downgradient 01/11/2017 Metal mg/L 0.005 J N
Lithium (total) JTEC-MW-SA-3 4 Downgradient 02/21/2017 Metal mg/L 0.0052 J N
Lithium (total) JTEC-MW-SA-3 5 Downgradient 04/10/2017 Metal mg/L 0.0049 J N
Lithium (total) JTEC-MW-SA-3 6 Downgradient 05/11/2017 Metal mg/L 0.0052 J N
Lithium (total) JTEC-MW-SA-3 7 Downgradient 07/13/2017 Metal mg/L 0.0052 J N
Lithium (total) JTEC-MW-SA-3 8 Downgradient 08/10/2017 Metal mg/L 0.0023 J N
Lithium (total) JTEC-MW-SA-4 1 Downgradient 10/24/2016 Metal mg/L 0.0022 J N
Lithium (total) JTEC-MW-SA-4 2 Downgradient 11/15/2016 Metal mg/L 0.0029 J N
Lithium (total) JTEC-MW-SA-4 3 Downgradient 01/10/2017 Metal mg/L 0.0043 J N
Lithium (total) JTEC-MW-SA-4 4 Downgradient 02/22/2017 Metal mg/L 0.0018 J N
Lithium (total) JTEC-MW-SA-4 5 Downgradient 04/11/2017 Metal mg/L 0.0011 J N
Lithium (total) JTEC-MW-SA-4 6 Downgradient 05/11/2017 Metal mg/L 0.003 J N
Lithium (total) JTEC-MW-SA-4 7 Downgradient 07/13/2017 Metal mg/L 0.00065 J N
Lithium (total) JTEC-MW-SA-4 8 Downgradient 08/11/2017 Metal mg/L 0.0001 UJ N
Mercury (total) JTEC-MW-PZ-01D 1 Upgradient 10/20/2016 Metal mg/L 0.000026 J N
Mercury (total) JTEC-MW-PZ-01D 2 Upgradient 11/14/2016 Metal mg/L 0.0000022 U N
Mercury (total) JTEC-MW-PZ-01D 3 Upgradient 01/09/2017 Metal mg/L 0.000047 J N
Mercury (total) JTEC-MW-PZ-01D 4 Upgradient 02/13/2017 Metal mg/L 0.0000022 U N
Mercury (total) JTEC-MW-PZ-01D 5 Upgradient 04/03/2017 Metal mg/L 0.00001 J N
Mercury (total) JTEC-MW-PZ-01D 6 Upgradient 05/08/2017 Metal mg/L 0.0000022 U N
Mercury (total) JTEC-MW-PZ-01D 7 Upgradient 07/10/2017 Metal mg/L 0.000012 J N

Consituent Name Well IDSample Round
Upgradient/Downgradient Sample Date
Analyte Group Units Result
Val. Qualifiers
Normal/Duplicate
Table 3 Analytical Results for Appendix IV Constituents in Groundwater at the JTEC Facility.
Mercury (total) JTEC-MW-PZ-01D 8 Upgradient 08/07/2017 Metal mg/L 0.0000083 U N
Mercury (total) JTEC-MW-PZ-03D 1 Downgradient 10/25/2016 Metal mg/L 0.0000022 U N
Mercury (total) JTEC-MW-PZ-03D 2 Downgradient 11/15/2016 Metal mg/L 0.0000022 U N
Mercury (total) JTEC-MW-PZ-03D 3 Downgradient 01/11/2017 Metal mg/L 0.000007 J N
Mercury (total) JTEC-MW-PZ-03D 4 Downgradient 02/20/2017 Metal mg/L 0.0000022 U N
Mercury (total) JTEC-MW-PZ-03D 5 Downgradient 04/06/2017 Metal mg/L 0.000027 J N
Mercury (total) JTEC-MW-PZ-03D 6 Downgradient 05/10/2017 Metal mg/L 0.000009 J N
Mercury (total) JTEC-MW-PZ-03D 7 Downgradient 07/12/2017 Metal mg/L 0.000023 J N
Mercury (total) JTEC-MW-PZ-03D 8 Downgradient 08/09/2017 Metal mg/L 0.0000083 U N
Mercury (total) JTEC-MW-PZ-08D 1 Downgradient 10/20/2016 Metal mg/L 0.000034 J N
Mercury (total) JTEC-MW-PZ-08D 2 Downgradient 11/14/2016 Metal mg/L 0.0000022 U N
Mercury (total) JTEC-MW-PZ-08D 3 Downgradient 01/10/2017 Metal mg/L 0.000007 J N
Mercury (total) JTEC-MW-PZ-08D 4 Downgradient 02/16/2017 Metal mg/L 0.0000022 U N
Mercury (total) JTEC-MW-PZ-08D 5 Downgradient 04/04/2017 Metal mg/L 0.000029 J N
Mercury (total) JTEC-MW-PZ-08D 6 Downgradient 05/09/2017 Metal mg/L 0.000011 J N
Mercury (total) JTEC-MW-PZ-08D 7 Downgradient 07/11/2017 Metal mg/L 0.000019 J N
Mercury (total) JTEC-MW-PZ-08D 8 Downgradient 08/11/2017 Metal mg/L 0.0000083 U N
Mercury (total) JTEC-MW-PZ-09D 1 Upgradient 10/20/2016 Metal mg/L 0.000025 J N
Mercury (total) JTEC-MW-PZ-09D 2 Upgradient 11/14/2016 Metal mg/L 0.0000022 U N
Mercury (total) JTEC-MW-PZ-09D 3 Upgradient 01/09/2017 Metal mg/L 0.00009 J N
Mercury (total) JTEC-MW-PZ-09D 4 Upgradient 02/15/2017 Metal mg/L 0.0000022 U N
Mercury (total) JTEC-MW-PZ-09D 5 Upgradient 04/04/2017 Metal mg/L 0.000023 J N
Mercury (total) JTEC-MW-PZ-09D 6 Upgradient 05/09/2017 Metal mg/L 0.000009 J N
Mercury (total) JTEC-MW-PZ-09D 7 Upgradient 07/10/2017 Metal mg/L 0.000019 J N
Mercury (total) JTEC-MW-PZ-09D 8 Upgradient 08/10/2017 Metal mg/L 0.0000083 U N
Mercury (total) JTEC-MW-PZ-10D 1 Downgradient 10/21/2016 Metal mg/L 0.00001 J N
Mercury (total) JTEC-MW-PZ-10D 2 Downgradient 11/15/2016 Metal mg/L 0.0000022 U N
Mercury (total) JTEC-MW-PZ-10D 3 Downgradient 01/11/2017 Metal mg/L 0.000005 J N
Mercury (total) JTEC-MW-PZ-10D 4 Downgradient 02/21/2017 Metal mg/L 0.0000022 U N
Mercury (total) JTEC-MW-PZ-10D 5 Downgradient 04/07/2017 Metal mg/L 0.000022 J N
Mercury (total) JTEC-MW-PZ-10D 6 Downgradient 05/10/2017 Metal mg/L 0.000003 J N
Mercury (total) JTEC-MW-PZ-10D 7 Downgradient 07/13/2017 Metal mg/L 0.000015 J N
Mercury (total) JTEC-MW-PZ-10D 8 Downgradient 08/09/2017 Metal mg/L 0.0000083 U N
Mercury (total) JTEC-MW-PZ-11D 1 Downgradient 10/21/2016 Metal mg/L 0.000005 J N
Mercury (total) JTEC-MW-PZ-11D 2 Downgradient 11/15/2016 Metal mg/L 0.0000022 U N
Mercury (total) JTEC-MW-PZ-11D 3 Downgradient 01/10/2017 Metal mg/L 0.000006 J N
Mercury (total) JTEC-MW-PZ-11D 4 Downgradient 02/21/2017 Metal mg/L 0.0000022 U N
Mercury (total) JTEC-MW-PZ-11D 5 Downgradient 04/05/2017 Metal mg/L 0.000025 J FD
Mercury (total) JTEC-MW-PZ-11D 6 Downgradient 05/10/2017 Metal mg/L 0.000004 J FD
Mercury (total) JTEC-MW-PZ-11D 7 Downgradient 07/13/2017 Metal mg/L 0.000015 J N
Mercury (total) JTEC-MW-PZ-11D 8 Downgradient 08/09/2017 Metal mg/L 0.0000083 U N
Mercury (total) JTEC-MW-PZ-12D 1 Downgradient 10/20/2016 Metal mg/L 0.000015 J N
Mercury (total) JTEC-MW-PZ-12D 2 Downgradient 11/15/2016 Metal mg/L 0.0000022 U N
Mercury (total) JTEC-MW-PZ-12D 3 Downgradient 01/11/2017 Metal mg/L 0.000004 J N
Mercury (total) JTEC-MW-PZ-12D 4 Downgradient 02/20/2017 Metal mg/L 0.0000022 U N
Mercury (total) JTEC-MW-PZ-12D 5 Downgradient 04/05/2017 Metal mg/L 0.000027 J N
Mercury (total) JTEC-MW-PZ-12D 6 Downgradient 05/10/2017 Metal mg/L 0.0000022 U N
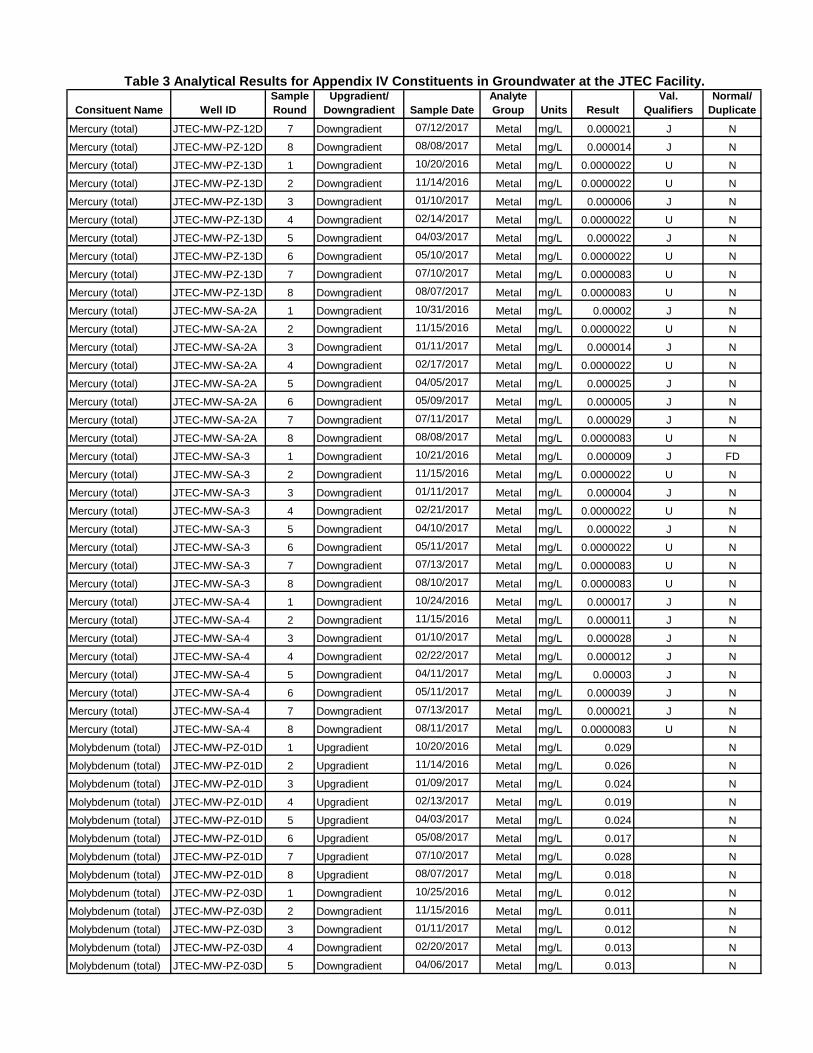
Consituent Name Well IDSample Round
Upgradient/Downgradient Sample Date
Analyte Group Units Result
Val. Qualifiers
Normal/Duplicate
Table 3 Analytical Results for Appendix IV Constituents in Groundwater at the JTEC Facility.
Mercury (total) JTEC-MW-PZ-12D 7 Downgradient 07/12/2017 Metal mg/L 0.000021 J N
Mercury (total) JTEC-MW-PZ-12D 8 Downgradient 08/08/2017 Metal mg/L 0.000014 J N
Mercury (total) JTEC-MW-PZ-13D 1 Downgradient 10/20/2016 Metal mg/L 0.0000022 U N
Mercury (total) JTEC-MW-PZ-13D 2 Downgradient 11/14/2016 Metal mg/L 0.0000022 U N
Mercury (total) JTEC-MW-PZ-13D 3 Downgradient 01/10/2017 Metal mg/L 0.000006 J N
Mercury (total) JTEC-MW-PZ-13D 4 Downgradient 02/14/2017 Metal mg/L 0.0000022 U N
Mercury (total) JTEC-MW-PZ-13D 5 Downgradient 04/03/2017 Metal mg/L 0.000022 J N
Mercury (total) JTEC-MW-PZ-13D 6 Downgradient 05/10/2017 Metal mg/L 0.0000022 U N
Mercury (total) JTEC-MW-PZ-13D 7 Downgradient 07/10/2017 Metal mg/L 0.0000083 U N
Mercury (total) JTEC-MW-PZ-13D 8 Downgradient 08/07/2017 Metal mg/L 0.0000083 U N
Mercury (total) JTEC-MW-SA-2A 1 Downgradient 10/31/2016 Metal mg/L 0.00002 J N
Mercury (total) JTEC-MW-SA-2A 2 Downgradient 11/15/2016 Metal mg/L 0.0000022 U N
Mercury (total) JTEC-MW-SA-2A 3 Downgradient 01/11/2017 Metal mg/L 0.000014 J N
Mercury (total) JTEC-MW-SA-2A 4 Downgradient 02/17/2017 Metal mg/L 0.0000022 U N
Mercury (total) JTEC-MW-SA-2A 5 Downgradient 04/05/2017 Metal mg/L 0.000025 J N
Mercury (total) JTEC-MW-SA-2A 6 Downgradient 05/09/2017 Metal mg/L 0.000005 J N
Mercury (total) JTEC-MW-SA-2A 7 Downgradient 07/11/2017 Metal mg/L 0.000029 J N
Mercury (total) JTEC-MW-SA-2A 8 Downgradient 08/08/2017 Metal mg/L 0.0000083 U N
Mercury (total) JTEC-MW-SA-3 1 Downgradient 10/21/2016 Metal mg/L 0.000009 J FD
Mercury (total) JTEC-MW-SA-3 2 Downgradient 11/15/2016 Metal mg/L 0.0000022 U N
Mercury (total) JTEC-MW-SA-3 3 Downgradient 01/11/2017 Metal mg/L 0.000004 J N
Mercury (total) JTEC-MW-SA-3 4 Downgradient 02/21/2017 Metal mg/L 0.0000022 U N
Mercury (total) JTEC-MW-SA-3 5 Downgradient 04/10/2017 Metal mg/L 0.000022 J N
Mercury (total) JTEC-MW-SA-3 6 Downgradient 05/11/2017 Metal mg/L 0.0000022 U N
Mercury (total) JTEC-MW-SA-3 7 Downgradient 07/13/2017 Metal mg/L 0.0000083 U N
Mercury (total) JTEC-MW-SA-3 8 Downgradient 08/10/2017 Metal mg/L 0.0000083 U N
Mercury (total) JTEC-MW-SA-4 1 Downgradient 10/24/2016 Metal mg/L 0.000017 J N
Mercury (total) JTEC-MW-SA-4 2 Downgradient 11/15/2016 Metal mg/L 0.000011 J N
Mercury (total) JTEC-MW-SA-4 3 Downgradient 01/10/2017 Metal mg/L 0.000028 J N
Mercury (total) JTEC-MW-SA-4 4 Downgradient 02/22/2017 Metal mg/L 0.000012 J N
Mercury (total) JTEC-MW-SA-4 5 Downgradient 04/11/2017 Metal mg/L 0.00003 J N
Mercury (total) JTEC-MW-SA-4 6 Downgradient 05/11/2017 Metal mg/L 0.000039 J N
Mercury (total) JTEC-MW-SA-4 7 Downgradient 07/13/2017 Metal mg/L 0.000021 J N
Mercury (total) JTEC-MW-SA-4 8 Downgradient 08/11/2017 Metal mg/L 0.0000083 U N
Molybdenum (total) JTEC-MW-PZ-01D 1 Upgradient 10/20/2016 Metal mg/L 0.029 N
Molybdenum (total) JTEC-MW-PZ-01D 2 Upgradient 11/14/2016 Metal mg/L 0.026 N
Molybdenum (total) JTEC-MW-PZ-01D 3 Upgradient 01/09/2017 Metal mg/L 0.024 N
Molybdenum (total) JTEC-MW-PZ-01D 4 Upgradient 02/13/2017 Metal mg/L 0.019 N
Molybdenum (total) JTEC-MW-PZ-01D 5 Upgradient 04/03/2017 Metal mg/L 0.024 N
Molybdenum (total) JTEC-MW-PZ-01D 6 Upgradient 05/08/2017 Metal mg/L 0.017 N
Molybdenum (total) JTEC-MW-PZ-01D 7 Upgradient 07/10/2017 Metal mg/L 0.028 N
Molybdenum (total) JTEC-MW-PZ-01D 8 Upgradient 08/07/2017 Metal mg/L 0.018 N
Molybdenum (total) JTEC-MW-PZ-03D 1 Downgradient 10/25/2016 Metal mg/L 0.012 N
Molybdenum (total) JTEC-MW-PZ-03D 2 Downgradient 11/15/2016 Metal mg/L 0.011 N
Molybdenum (total) JTEC-MW-PZ-03D 3 Downgradient 01/11/2017 Metal mg/L 0.012 N
Molybdenum (total) JTEC-MW-PZ-03D 4 Downgradient 02/20/2017 Metal mg/L 0.013 N
Molybdenum (total) JTEC-MW-PZ-03D 5 Downgradient 04/06/2017 Metal mg/L 0.013 N

Consituent Name Well IDSample Round
Upgradient/Downgradient Sample Date
Analyte Group Units Result
Val. Qualifiers
Normal/Duplicate
Table 3 Analytical Results for Appendix IV Constituents in Groundwater at the JTEC Facility.
Molybdenum (total) JTEC-MW-PZ-03D 6 Downgradient 05/10/2017 Metal mg/L 0.013 N
Molybdenum (total) JTEC-MW-PZ-03D 7 Downgradient 07/12/2017 Metal mg/L 0.013 N
Molybdenum (total) JTEC-MW-PZ-03D 8 Downgradient 08/09/2017 Metal mg/L 0.014 N
Molybdenum (total) JTEC-MW-PZ-08D 1 Downgradient 10/20/2016 Metal mg/L 0.011 N
Molybdenum (total) JTEC-MW-PZ-08D 2 Downgradient 11/14/2016 Metal mg/L 0.011 N
Molybdenum (total) JTEC-MW-PZ-08D 3 Downgradient 01/10/2017 Metal mg/L 0.009 N
Molybdenum (total) JTEC-MW-PZ-08D 4 Downgradient 02/16/2017 Metal mg/L 0.01 N
Molybdenum (total) JTEC-MW-PZ-08D 5 Downgradient 04/04/2017 Metal mg/L 0.0097 N
Molybdenum (total) JTEC-MW-PZ-08D 6 Downgradient 05/09/2017 Metal mg/L 0.0085 N
Molybdenum (total) JTEC-MW-PZ-08D 7 Downgradient 07/11/2017 Metal mg/L 0.0062 N
Molybdenum (total) JTEC-MW-PZ-08D 8 Downgradient 08/11/2017 Metal mg/L 0.0087 N
Molybdenum (total) JTEC-MW-PZ-09D 1 Upgradient 10/20/2016 Metal mg/L 0.02 N
Molybdenum (total) JTEC-MW-PZ-09D 2 Upgradient 11/14/2016 Metal mg/L 0.019 N
Molybdenum (total) JTEC-MW-PZ-09D 3 Upgradient 01/09/2017 Metal mg/L 0.019 N
Molybdenum (total) JTEC-MW-PZ-09D 4 Upgradient 02/15/2017 Metal mg/L 0.019 N
Molybdenum (total) JTEC-MW-PZ-09D 5 Upgradient 04/04/2017 Metal mg/L 0.021 N
Molybdenum (total) JTEC-MW-PZ-09D 6 Upgradient 05/09/2017 Metal mg/L 0.02 N
Molybdenum (total) JTEC-MW-PZ-09D 7 Upgradient 07/10/2017 Metal mg/L 0.025 N
Molybdenum (total) JTEC-MW-PZ-09D 8 Upgradient 08/10/2017 Metal mg/L 0.024 N
Molybdenum (total) JTEC-MW-PZ-10D 1 Downgradient 10/21/2016 Metal mg/L 0.00051 J N
Molybdenum (total) JTEC-MW-PZ-10D 2 Downgradient 11/15/2016 Metal mg/L 0.00063 J N
Molybdenum (total) JTEC-MW-PZ-10D 3 Downgradient 01/11/2017 Metal mg/L 0.00033 J N
Molybdenum (total) JTEC-MW-PZ-10D 4 Downgradient 02/21/2017 Metal mg/L 0.00026 J N
Molybdenum (total) JTEC-MW-PZ-10D 5 Downgradient 04/07/2017 Metal mg/L 0.0003 J N
Molybdenum (total) JTEC-MW-PZ-10D 6 Downgradient 05/10/2017 Metal mg/L 0.00071 J N
Molybdenum (total) JTEC-MW-PZ-10D 7 Downgradient 07/13/2017 Metal mg/L 0.00021 J N
Molybdenum (total) JTEC-MW-PZ-10D 8 Downgradient 08/09/2017 Metal mg/L 0.0014 N
Molybdenum (total) JTEC-MW-PZ-11D 1 Downgradient 10/21/2016 Metal mg/L 0.0021 N
Molybdenum (total) JTEC-MW-PZ-11D 2 Downgradient 11/15/2016 Metal mg/L 0.0016 N
Molybdenum (total) JTEC-MW-PZ-11D 3 Downgradient 01/10/2017 Metal mg/L 0.0024 N
Molybdenum (total) JTEC-MW-PZ-11D 4 Downgradient 02/21/2017 Metal mg/L 0.0014 N
Molybdenum (total) JTEC-MW-PZ-11D 5 Downgradient 04/05/2017 Metal mg/L 0.0044 N
Molybdenum (total) JTEC-MW-PZ-11D 6 Downgradient 05/10/2017 Metal mg/L 0.0017 N
Molybdenum (total) JTEC-MW-PZ-11D 7 Downgradient 07/13/2017 Metal mg/L 0.0013 N
Molybdenum (total) JTEC-MW-PZ-11D 8 Downgradient 08/09/2017 Metal mg/L 0.0015 N
Molybdenum (total) JTEC-MW-PZ-12D 1 Downgradient 10/20/2016 Metal mg/L 0.0046 N
Molybdenum (total) JTEC-MW-PZ-12D 2 Downgradient 11/15/2016 Metal mg/L 0.0084 N
Molybdenum (total) JTEC-MW-PZ-12D 3 Downgradient 01/11/2017 Metal mg/L 0.0081 N
Molybdenum (total) JTEC-MW-PZ-12D 4 Downgradient 02/20/2017 Metal mg/L 0.0084 N
Molybdenum (total) JTEC-MW-PZ-12D 5 Downgradient 04/05/2017 Metal mg/L 0.0086 N
Molybdenum (total) JTEC-MW-PZ-12D 6 Downgradient 05/10/2017 Metal mg/L 0.0081 N
Molybdenum (total) JTEC-MW-PZ-12D 7 Downgradient 07/12/2017 Metal mg/L 0.0072 N
Molybdenum (total) JTEC-MW-PZ-12D 8 Downgradient 08/08/2017 Metal mg/L 0.0056 N
Molybdenum (total) JTEC-MW-PZ-13D 1 Downgradient 10/20/2016 Metal mg/L 0.0045 N
Molybdenum (total) JTEC-MW-PZ-13D 2 Downgradient 11/14/2016 Metal mg/L 0.0057 N
Molybdenum (total) JTEC-MW-PZ-13D 3 Downgradient 01/10/2017 Metal mg/L 0.0055 N
Molybdenum (total) JTEC-MW-PZ-13D 4 Downgradient 02/14/2017 Metal mg/L 0.005 N
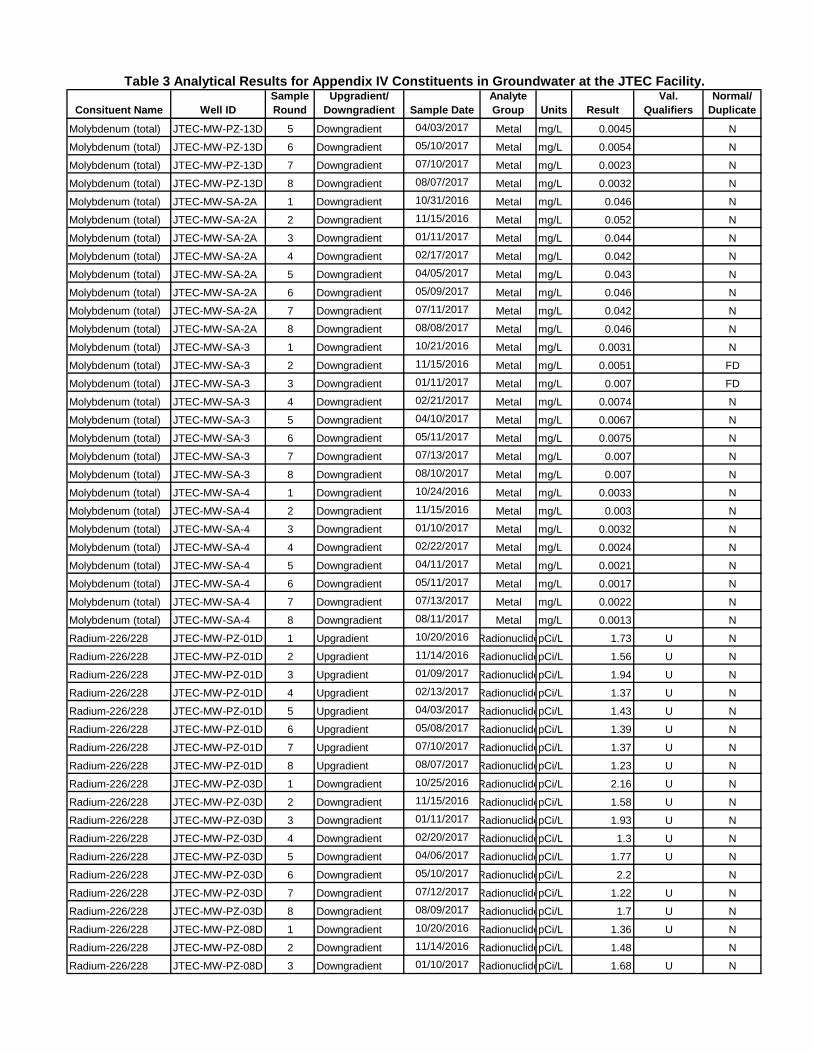
Consituent Name Well IDSample Round
Upgradient/Downgradient Sample Date
Analyte Group Units Result
Val. Qualifiers
Normal/Duplicate
Table 3 Analytical Results for Appendix IV Constituents in Groundwater at the JTEC Facility.
Molybdenum (total) JTEC-MW-PZ-13D 5 Downgradient 04/03/2017 Metal mg/L 0.0045 N
Molybdenum (total) JTEC-MW-PZ-13D 6 Downgradient 05/10/2017 Metal mg/L 0.0054 N
Molybdenum (total) JTEC-MW-PZ-13D 7 Downgradient 07/10/2017 Metal mg/L 0.0023 N
Molybdenum (total) JTEC-MW-PZ-13D 8 Downgradient 08/07/2017 Metal mg/L 0.0032 N
Molybdenum (total) JTEC-MW-SA-2A 1 Downgradient 10/31/2016 Metal mg/L 0.046 N
Molybdenum (total) JTEC-MW-SA-2A 2 Downgradient 11/15/2016 Metal mg/L 0.052 N
Molybdenum (total) JTEC-MW-SA-2A 3 Downgradient 01/11/2017 Metal mg/L 0.044 N
Molybdenum (total) JTEC-MW-SA-2A 4 Downgradient 02/17/2017 Metal mg/L 0.042 N
Molybdenum (total) JTEC-MW-SA-2A 5 Downgradient 04/05/2017 Metal mg/L 0.043 N
Molybdenum (total) JTEC-MW-SA-2A 6 Downgradient 05/09/2017 Metal mg/L 0.046 N
Molybdenum (total) JTEC-MW-SA-2A 7 Downgradient 07/11/2017 Metal mg/L 0.042 N
Molybdenum (total) JTEC-MW-SA-2A 8 Downgradient 08/08/2017 Metal mg/L 0.046 N
Molybdenum (total) JTEC-MW-SA-3 1 Downgradient 10/21/2016 Metal mg/L 0.0031 N
Molybdenum (total) JTEC-MW-SA-3 2 Downgradient 11/15/2016 Metal mg/L 0.0051 FD
Molybdenum (total) JTEC-MW-SA-3 3 Downgradient 01/11/2017 Metal mg/L 0.007 FD
Molybdenum (total) JTEC-MW-SA-3 4 Downgradient 02/21/2017 Metal mg/L 0.0074 N
Molybdenum (total) JTEC-MW-SA-3 5 Downgradient 04/10/2017 Metal mg/L 0.0067 N
Molybdenum (total) JTEC-MW-SA-3 6 Downgradient 05/11/2017 Metal mg/L 0.0075 N
Molybdenum (total) JTEC-MW-SA-3 7 Downgradient 07/13/2017 Metal mg/L 0.007 N
Molybdenum (total) JTEC-MW-SA-3 8 Downgradient 08/10/2017 Metal mg/L 0.007 N
Molybdenum (total) JTEC-MW-SA-4 1 Downgradient 10/24/2016 Metal mg/L 0.0033 N
Molybdenum (total) JTEC-MW-SA-4 2 Downgradient 11/15/2016 Metal mg/L 0.003 N
Molybdenum (total) JTEC-MW-SA-4 3 Downgradient 01/10/2017 Metal mg/L 0.0032 N
Molybdenum (total) JTEC-MW-SA-4 4 Downgradient 02/22/2017 Metal mg/L 0.0024 N
Molybdenum (total) JTEC-MW-SA-4 5 Downgradient 04/11/2017 Metal mg/L 0.0021 N
Molybdenum (total) JTEC-MW-SA-4 6 Downgradient 05/11/2017 Metal mg/L 0.0017 N
Molybdenum (total) JTEC-MW-SA-4 7 Downgradient 07/13/2017 Metal mg/L 0.0022 N
Molybdenum (total) JTEC-MW-SA-4 8 Downgradient 08/11/2017 Metal mg/L 0.0013 N
Radium-226/228 JTEC-MW-PZ-01D 1 Upgradient 10/20/2016 RadionuclidepCi/L 1.73 U N
Radium-226/228 JTEC-MW-PZ-01D 2 Upgradient 11/14/2016 RadionuclidepCi/L 1.56 U N
Radium-226/228 JTEC-MW-PZ-01D 3 Upgradient 01/09/2017 RadionuclidepCi/L 1.94 U N
Radium-226/228 JTEC-MW-PZ-01D 4 Upgradient 02/13/2017 RadionuclidepCi/L 1.37 U N
Radium-226/228 JTEC-MW-PZ-01D 5 Upgradient 04/03/2017 RadionuclidepCi/L 1.43 U N
Radium-226/228 JTEC-MW-PZ-01D 6 Upgradient 05/08/2017 RadionuclidepCi/L 1.39 U N
Radium-226/228 JTEC-MW-PZ-01D 7 Upgradient 07/10/2017 RadionuclidepCi/L 1.37 U N
Radium-226/228 JTEC-MW-PZ-01D 8 Upgradient 08/07/2017 RadionuclidepCi/L 1.23 U N
Radium-226/228 JTEC-MW-PZ-03D 1 Downgradient 10/25/2016 RadionuclidepCi/L 2.16 U N
Radium-226/228 JTEC-MW-PZ-03D 2 Downgradient 11/15/2016 RadionuclidepCi/L 1.58 U N
Radium-226/228 JTEC-MW-PZ-03D 3 Downgradient 01/11/2017 RadionuclidepCi/L 1.93 U N
Radium-226/228 JTEC-MW-PZ-03D 4 Downgradient 02/20/2017 RadionuclidepCi/L 1.3 U N
Radium-226/228 JTEC-MW-PZ-03D 5 Downgradient 04/06/2017 RadionuclidepCi/L 1.77 U N
Radium-226/228 JTEC-MW-PZ-03D 6 Downgradient 05/10/2017 RadionuclidepCi/L 2.2 N
Radium-226/228 JTEC-MW-PZ-03D 7 Downgradient 07/12/2017 RadionuclidepCi/L 1.22 U N
Radium-226/228 JTEC-MW-PZ-03D 8 Downgradient 08/09/2017 RadionuclidepCi/L 1.7 U N
Radium-226/228 JTEC-MW-PZ-08D 1 Downgradient 10/20/2016 RadionuclidepCi/L 1.36 U N
Radium-226/228 JTEC-MW-PZ-08D 2 Downgradient 11/14/2016 RadionuclidepCi/L 1.48 N
Radium-226/228 JTEC-MW-PZ-08D 3 Downgradient 01/10/2017 RadionuclidepCi/L 1.68 U N

Consituent Name Well IDSample Round
Upgradient/Downgradient Sample Date
Analyte Group Units Result
Val. Qualifiers
Normal/Duplicate
Table 3 Analytical Results for Appendix IV Constituents in Groundwater at the JTEC Facility.
Radium-226/228 JTEC-MW-PZ-08D 4 Downgradient 02/16/2017 RadionuclidepCi/L 1.52 U N
Radium-226/228 JTEC-MW-PZ-08D 5 Downgradient 04/04/2017 RadionuclidepCi/L 1.3 U N
Radium-226/228 JTEC-MW-PZ-08D 6 Downgradient 05/09/2017 RadionuclidepCi/L 1.19 U N
Radium-226/228 JTEC-MW-PZ-08D 7 Downgradient 07/11/2017 RadionuclidepCi/L 1.31 U N
Radium-226/228 JTEC-MW-PZ-08D 8 Downgradient 08/11/2017 RadionuclidepCi/L 1.88 U N
Radium-226/228 JTEC-MW-PZ-09D 1 Upgradient 10/20/2016 RadionuclidepCi/L 1.39 U N
Radium-226/228 JTEC-MW-PZ-09D 2 Upgradient 11/14/2016 RadionuclidepCi/L 1.68 N
Radium-226/228 JTEC-MW-PZ-09D 3 Upgradient 01/09/2017 RadionuclidepCi/L 1.82 U N
Radium-226/228 JTEC-MW-PZ-09D 4 Upgradient 02/15/2017 RadionuclidepCi/L 1.92 U N
Radium-226/228 JTEC-MW-PZ-09D 5 Upgradient 04/04/2017 RadionuclidepCi/L 1.39 U N
Radium-226/228 JTEC-MW-PZ-09D 6 Upgradient 05/09/2017 RadionuclidepCi/L 1.6 U N
Radium-226/228 JTEC-MW-PZ-09D 7 Upgradient 07/10/2017 RadionuclidepCi/L 1.27 U N
Radium-226/228 JTEC-MW-PZ-09D 8 Upgradient 08/10/2017 RadionuclidepCi/L 1.48 U N
Radium-226/228 JTEC-MW-PZ-10D 1 Downgradient 10/21/2016 RadionuclidepCi/L 1.42 U N
Radium-226/228 JTEC-MW-PZ-10D 2 Downgradient 11/15/2016 RadionuclidepCi/L 1.4 U N
Radium-226/228 JTEC-MW-PZ-10D 3 Downgradient 01/11/2017 RadionuclidepCi/L 1.72 U N
Radium-226/228 JTEC-MW-PZ-10D 4 Downgradient 02/21/2017 RadionuclidepCi/L 1.66 U N
Radium-226/228 JTEC-MW-PZ-10D 5 Downgradient 04/07/2017 RadionuclidepCi/L 1.55 U N
Radium-226/228 JTEC-MW-PZ-10D 6 Downgradient 05/10/2017 RadionuclidepCi/L 1.6 U N
Radium-226/228 JTEC-MW-PZ-10D 7 Downgradient 07/13/2017 RadionuclidepCi/L 1.62 U N
Radium-226/228 JTEC-MW-PZ-10D 8 Downgradient 08/09/2017 RadionuclidepCi/L 1.4 J N
Radium-226/228 JTEC-MW-PZ-11D 1 Downgradient 10/21/2016 RadionuclidepCi/L 1.22 U N
Radium-226/228 JTEC-MW-PZ-11D 2 Downgradient 11/15/2016 RadionuclidepCi/L 1.28 U N
Radium-226/228 JTEC-MW-PZ-11D 3 Downgradient 01/10/2017 RadionuclidepCi/L 1.54 U N
Radium-226/228 JTEC-MW-PZ-11D 4 Downgradient 02/21/2017 RadionuclidepCi/L 1.33 U FD
Radium-226/228 JTEC-MW-PZ-11D 5 Downgradient 04/05/2017 RadionuclidepCi/L 0.911 J N
Radium-226/228 JTEC-MW-PZ-11D 6 Downgradient 05/10/2017 RadionuclidepCi/L 1.24 U FD
Radium-226/228 JTEC-MW-PZ-11D 7 Downgradient 07/13/2017 RadionuclidepCi/L 1.49 U FD
Radium-226/228 JTEC-MW-PZ-11D 8 Downgradient 08/09/2017 RadionuclidepCi/L 1.6 U FD
Radium-226/228 JTEC-MW-PZ-12D 1 Downgradient 10/20/2016 RadionuclidepCi/L 1.58 U N
Radium-226/228 JTEC-MW-PZ-12D 2 Downgradient 11/15/2016 RadionuclidepCi/L 1.33 U N
Radium-226/228 JTEC-MW-PZ-12D 3 Downgradient 01/11/2017 RadionuclidepCi/L 1.39 U N
Radium-226/228 JTEC-MW-PZ-12D 4 Downgradient 02/20/2017 RadionuclidepCi/L 1.72 U N
Radium-226/228 JTEC-MW-PZ-12D 5 Downgradient 04/05/2017 RadionuclidepCi/L 1.41 U N
Radium-226/228 JTEC-MW-PZ-12D 6 Downgradient 05/10/2017 RadionuclidepCi/L 1.36 U N
Radium-226/228 JTEC-MW-PZ-12D 7 Downgradient 07/12/2017 RadionuclidepCi/L 1.53 U N
Radium-226/228 JTEC-MW-PZ-12D 8 Downgradient 08/08/2017 RadionuclidepCi/L 0.796 U N
Radium-226/228 JTEC-MW-PZ-13D 1 Downgradient 10/20/2016 RadionuclidepCi/L 1.27 U N
Radium-226/228 JTEC-MW-PZ-13D 2 Downgradient 11/14/2016 RadionuclidepCi/L 2.17 N
Radium-226/228 JTEC-MW-PZ-13D 3 Downgradient 01/10/2017 RadionuclidepCi/L 1.65 U N
Radium-226/228 JTEC-MW-PZ-13D 4 Downgradient 02/14/2017 RadionuclidepCi/L 1.72 U N
Radium-226/228 JTEC-MW-PZ-13D 5 Downgradient 04/03/2017 RadionuclidepCi/L 1.7 U N
Radium-226/228 JTEC-MW-PZ-13D 6 Downgradient 05/10/2017 RadionuclidepCi/L 1.31 U N
Radium-226/228 JTEC-MW-PZ-13D 7 Downgradient 07/10/2017 RadionuclidepCi/L 1.63 U N
Radium-226/228 JTEC-MW-PZ-13D 8 Downgradient 08/07/2017 RadionuclidepCi/L 1.68 U N
Radium-226/228 JTEC-MW-SA-2A 1 Downgradient 10/31/2016 RadionuclidepCi/L 1.55 U N
Radium-226/228 JTEC-MW-SA-2A 2 Downgradient 11/15/2016 RadionuclidepCi/L 1.18 U N
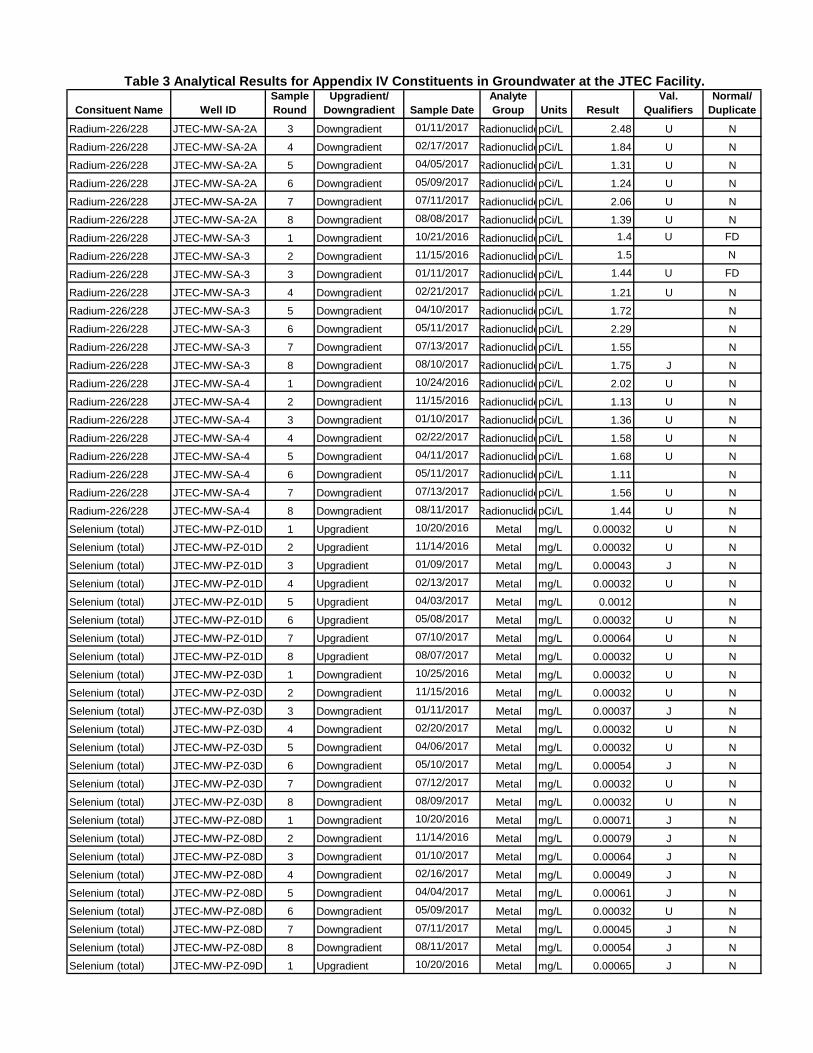
Consituent Name Well IDSample Round
Upgradient/Downgradient Sample Date
Analyte Group Units Result
Val. Qualifiers
Normal/Duplicate
Table 3 Analytical Results for Appendix IV Constituents in Groundwater at the JTEC Facility.
Radium-226/228 JTEC-MW-SA-2A 3 Downgradient 01/11/2017 RadionuclidepCi/L 2.48 U N
Radium-226/228 JTEC-MW-SA-2A 4 Downgradient 02/17/2017 RadionuclidepCi/L 1.84 U N
Radium-226/228 JTEC-MW-SA-2A 5 Downgradient 04/05/2017 RadionuclidepCi/L 1.31 U N
Radium-226/228 JTEC-MW-SA-2A 6 Downgradient 05/09/2017 RadionuclidepCi/L 1.24 U N
Radium-226/228 JTEC-MW-SA-2A 7 Downgradient 07/11/2017 RadionuclidepCi/L 2.06 U N
Radium-226/228 JTEC-MW-SA-2A 8 Downgradient 08/08/2017 RadionuclidepCi/L 1.39 U N
Radium-226/228 JTEC-MW-SA-3 1 Downgradient 10/21/2016 RadionuclidepCi/L 1.4 U FD
Radium-226/228 JTEC-MW-SA-3 2 Downgradient 11/15/2016 RadionuclidepCi/L 1.5 N
Radium-226/228 JTEC-MW-SA-3 3 Downgradient 01/11/2017 RadionuclidepCi/L 1.44 U FD
Radium-226/228 JTEC-MW-SA-3 4 Downgradient 02/21/2017 RadionuclidepCi/L 1.21 U N
Radium-226/228 JTEC-MW-SA-3 5 Downgradient 04/10/2017 RadionuclidepCi/L 1.72 N
Radium-226/228 JTEC-MW-SA-3 6 Downgradient 05/11/2017 RadionuclidepCi/L 2.29 N
Radium-226/228 JTEC-MW-SA-3 7 Downgradient 07/13/2017 RadionuclidepCi/L 1.55 N
Radium-226/228 JTEC-MW-SA-3 8 Downgradient 08/10/2017 RadionuclidepCi/L 1.75 J N
Radium-226/228 JTEC-MW-SA-4 1 Downgradient 10/24/2016 RadionuclidepCi/L 2.02 U N
Radium-226/228 JTEC-MW-SA-4 2 Downgradient 11/15/2016 RadionuclidepCi/L 1.13 U N
Radium-226/228 JTEC-MW-SA-4 3 Downgradient 01/10/2017 RadionuclidepCi/L 1.36 U N
Radium-226/228 JTEC-MW-SA-4 4 Downgradient 02/22/2017 RadionuclidepCi/L 1.58 U N
Radium-226/228 JTEC-MW-SA-4 5 Downgradient 04/11/2017 RadionuclidepCi/L 1.68 U N
Radium-226/228 JTEC-MW-SA-4 6 Downgradient 05/11/2017 RadionuclidepCi/L 1.11 N
Radium-226/228 JTEC-MW-SA-4 7 Downgradient 07/13/2017 RadionuclidepCi/L 1.56 U N
Radium-226/228 JTEC-MW-SA-4 8 Downgradient 08/11/2017 RadionuclidepCi/L 1.44 U N
Selenium (total) JTEC-MW-PZ-01D 1 Upgradient 10/20/2016 Metal mg/L 0.00032 U N
Selenium (total) JTEC-MW-PZ-01D 2 Upgradient 11/14/2016 Metal mg/L 0.00032 U N
Selenium (total) JTEC-MW-PZ-01D 3 Upgradient 01/09/2017 Metal mg/L 0.00043 J N
Selenium (total) JTEC-MW-PZ-01D 4 Upgradient 02/13/2017 Metal mg/L 0.00032 U N
Selenium (total) JTEC-MW-PZ-01D 5 Upgradient 04/03/2017 Metal mg/L 0.0012 N
Selenium (total) JTEC-MW-PZ-01D 6 Upgradient 05/08/2017 Metal mg/L 0.00032 U N
Selenium (total) JTEC-MW-PZ-01D 7 Upgradient 07/10/2017 Metal mg/L 0.00064 U N
Selenium (total) JTEC-MW-PZ-01D 8 Upgradient 08/07/2017 Metal mg/L 0.00032 U N
Selenium (total) JTEC-MW-PZ-03D 1 Downgradient 10/25/2016 Metal mg/L 0.00032 U N
Selenium (total) JTEC-MW-PZ-03D 2 Downgradient 11/15/2016 Metal mg/L 0.00032 U N
Selenium (total) JTEC-MW-PZ-03D 3 Downgradient 01/11/2017 Metal mg/L 0.00037 J N
Selenium (total) JTEC-MW-PZ-03D 4 Downgradient 02/20/2017 Metal mg/L 0.00032 U N
Selenium (total) JTEC-MW-PZ-03D 5 Downgradient 04/06/2017 Metal mg/L 0.00032 U N
Selenium (total) JTEC-MW-PZ-03D 6 Downgradient 05/10/2017 Metal mg/L 0.00054 J N
Selenium (total) JTEC-MW-PZ-03D 7 Downgradient 07/12/2017 Metal mg/L 0.00032 U N
Selenium (total) JTEC-MW-PZ-03D 8 Downgradient 08/09/2017 Metal mg/L 0.00032 U N
Selenium (total) JTEC-MW-PZ-08D 1 Downgradient 10/20/2016 Metal mg/L 0.00071 J N
Selenium (total) JTEC-MW-PZ-08D 2 Downgradient 11/14/2016 Metal mg/L 0.00079 J N
Selenium (total) JTEC-MW-PZ-08D 3 Downgradient 01/10/2017 Metal mg/L 0.00064 J N
Selenium (total) JTEC-MW-PZ-08D 4 Downgradient 02/16/2017 Metal mg/L 0.00049 J N
Selenium (total) JTEC-MW-PZ-08D 5 Downgradient 04/04/2017 Metal mg/L 0.00061 J N
Selenium (total) JTEC-MW-PZ-08D 6 Downgradient 05/09/2017 Metal mg/L 0.00032 U N
Selenium (total) JTEC-MW-PZ-08D 7 Downgradient 07/11/2017 Metal mg/L 0.00045 J N
Selenium (total) JTEC-MW-PZ-08D 8 Downgradient 08/11/2017 Metal mg/L 0.00054 J N
Selenium (total) JTEC-MW-PZ-09D 1 Upgradient 10/20/2016 Metal mg/L 0.00065 J N

Consituent Name Well IDSample Round
Upgradient/Downgradient Sample Date
Analyte Group Units Result
Val. Qualifiers
Normal/Duplicate
Table 3 Analytical Results for Appendix IV Constituents in Groundwater at the JTEC Facility.
Selenium (total) JTEC-MW-PZ-09D 2 Upgradient 11/14/2016 Metal mg/L 0.00072 J N
Selenium (total) JTEC-MW-PZ-09D 3 Upgradient 01/09/2017 Metal mg/L 0.001 N
Selenium (total) JTEC-MW-PZ-09D 4 Upgradient 02/15/2017 Metal mg/L 0.00033 J N
Selenium (total) JTEC-MW-PZ-09D 5 Upgradient 04/04/2017 Metal mg/L 0.00044 J N
Selenium (total) JTEC-MW-PZ-09D 6 Upgradient 05/09/2017 Metal mg/L 0.00032 U N
Selenium (total) JTEC-MW-PZ-09D 7 Upgradient 07/10/2017 Metal mg/L 0.00032 U N
Selenium (total) JTEC-MW-PZ-09D 8 Upgradient 08/10/2017 Metal mg/L 0.00032 U N
Selenium (total) JTEC-MW-PZ-10D 1 Downgradient 10/21/2016 Metal mg/L 0.0018 N
Selenium (total) JTEC-MW-PZ-10D 2 Downgradient 11/15/2016 Metal mg/L 0.0023 N
Selenium (total) JTEC-MW-PZ-10D 3 Downgradient 01/11/2017 Metal mg/L 0.0022 N
Selenium (total) JTEC-MW-PZ-10D 4 Downgradient 02/21/2017 Metal mg/L 0.0017 N
Selenium (total) JTEC-MW-PZ-10D 5 Downgradient 04/07/2017 Metal mg/L 0.002 N
Selenium (total) JTEC-MW-PZ-10D 6 Downgradient 05/10/2017 Metal mg/L 0.0032 N
Selenium (total) JTEC-MW-PZ-10D 7 Downgradient 07/13/2017 Metal mg/L 0.0018 N
Selenium (total) JTEC-MW-PZ-10D 8 Downgradient 08/09/2017 Metal mg/L 0.0018 N
Selenium (total) JTEC-MW-PZ-11D 1 Downgradient 10/21/2016 Metal mg/L 0.00054 J N
Selenium (total) JTEC-MW-PZ-11D 2 Downgradient 11/15/2016 Metal mg/L 0.00032 U N
Selenium (total) JTEC-MW-PZ-11D 3 Downgradient 01/10/2017 Metal mg/L 0.00055 J N
Selenium (total) JTEC-MW-PZ-11D 4 Downgradient 02/21/2017 Metal mg/L 0.00032 U N
Selenium (total) JTEC-MW-PZ-11D 5 Downgradient 04/05/2017 Metal mg/L 0.0016 N
Selenium (total) JTEC-MW-PZ-11D 6 Downgradient 05/10/2017 Metal mg/L 0.00097 J N
Selenium (total) JTEC-MW-PZ-11D 7 Downgradient 07/13/2017 Metal mg/L 0.00032 U N
Selenium (total) JTEC-MW-PZ-11D 8 Downgradient 08/09/2017 Metal mg/L 0.00046 J N
Selenium (total) JTEC-MW-PZ-12D 1 Downgradient 10/20/2016 Metal mg/L 0.00066 J N
Selenium (total) JTEC-MW-PZ-12D 2 Downgradient 11/15/2016 Metal mg/L 0.00032 U N
Selenium (total) JTEC-MW-PZ-12D 3 Downgradient 01/11/2017 Metal mg/L 0.00032 U N
Selenium (total) JTEC-MW-PZ-12D 4 Downgradient 02/20/2017 Metal mg/L 0.00032 U N
Selenium (total) JTEC-MW-PZ-12D 5 Downgradient 04/05/2017 Metal mg/L 0.00032 U N
Selenium (total) JTEC-MW-PZ-12D 6 Downgradient 05/10/2017 Metal mg/L 0.00048 J N
Selenium (total) JTEC-MW-PZ-12D 7 Downgradient 07/12/2017 Metal mg/L 0.00032 U N
Selenium (total) JTEC-MW-PZ-12D 8 Downgradient 08/08/2017 Metal mg/L 0.0005 J N
Selenium (total) JTEC-MW-PZ-13D 1 Downgradient 10/20/2016 Metal mg/L 0.00073 J N
Selenium (total) JTEC-MW-PZ-13D 2 Downgradient 11/14/2016 Metal mg/L 0.00048 J N
Selenium (total) JTEC-MW-PZ-13D 3 Downgradient 01/10/2017 Metal mg/L 0.00081 J N
Selenium (total) JTEC-MW-PZ-13D 4 Downgradient 02/14/2017 Metal mg/L 0.00032 U N
Selenium (total) JTEC-MW-PZ-13D 5 Downgradient 04/03/2017 Metal mg/L 0.00092 J N
Selenium (total) JTEC-MW-PZ-13D 6 Downgradient 05/10/2017 Metal mg/L 0.00046 J N
Selenium (total) JTEC-MW-PZ-13D 7 Downgradient 07/10/2017 Metal mg/L 0.00035 J N
Selenium (total) JTEC-MW-PZ-13D 8 Downgradient 08/07/2017 Metal mg/L 0.00034 J N
Selenium (total) JTEC-MW-SA-2A 1 Downgradient 10/31/2016 Metal mg/L 0.0016 N
Selenium (total) JTEC-MW-SA-2A 2 Downgradient 11/15/2016 Metal mg/L 0.0012 N
Selenium (total) JTEC-MW-SA-2A 3 Downgradient 01/11/2017 Metal mg/L 0.0015 N
Selenium (total) JTEC-MW-SA-2A 4 Downgradient 02/17/2017 Metal mg/L 0.0012 N
Selenium (total) JTEC-MW-SA-2A 5 Downgradient 04/05/2017 Metal mg/L 0.0005 J N
Selenium (total) JTEC-MW-SA-2A 6 Downgradient 05/09/2017 Metal mg/L 0.0011 N
Selenium (total) JTEC-MW-SA-2A 7 Downgradient 07/11/2017 Metal mg/L 0.00094 J N
Selenium (total) JTEC-MW-SA-2A 8 Downgradient 08/08/2017 Metal mg/L 0.001 N
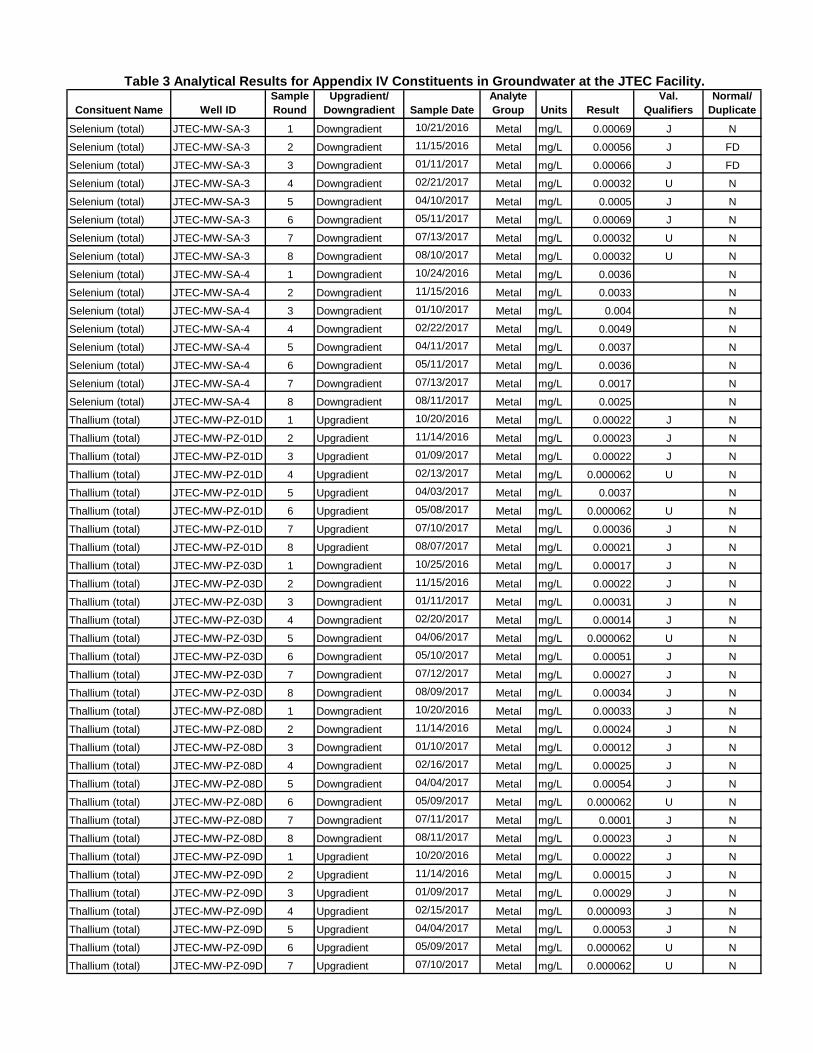
Consituent Name Well IDSample Round
Upgradient/Downgradient Sample Date
Analyte Group Units Result
Val. Qualifiers
Normal/Duplicate
Table 3 Analytical Results for Appendix IV Constituents in Groundwater at the JTEC Facility.
Selenium (total) JTEC-MW-SA-3 1 Downgradient 10/21/2016 Metal mg/L 0.00069 J N
Selenium (total) JTEC-MW-SA-3 2 Downgradient 11/15/2016 Metal mg/L 0.00056 J FD
Selenium (total) JTEC-MW-SA-3 3 Downgradient 01/11/2017 Metal mg/L 0.00066 J FD
Selenium (total) JTEC-MW-SA-3 4 Downgradient 02/21/2017 Metal mg/L 0.00032 U N
Selenium (total) JTEC-MW-SA-3 5 Downgradient 04/10/2017 Metal mg/L 0.0005 J N
Selenium (total) JTEC-MW-SA-3 6 Downgradient 05/11/2017 Metal mg/L 0.00069 J N
Selenium (total) JTEC-MW-SA-3 7 Downgradient 07/13/2017 Metal mg/L 0.00032 U N
Selenium (total) JTEC-MW-SA-3 8 Downgradient 08/10/2017 Metal mg/L 0.00032 U N
Selenium (total) JTEC-MW-SA-4 1 Downgradient 10/24/2016 Metal mg/L 0.0036 N
Selenium (total) JTEC-MW-SA-4 2 Downgradient 11/15/2016 Metal mg/L 0.0033 N
Selenium (total) JTEC-MW-SA-4 3 Downgradient 01/10/2017 Metal mg/L 0.004 N
Selenium (total) JTEC-MW-SA-4 4 Downgradient 02/22/2017 Metal mg/L 0.0049 N
Selenium (total) JTEC-MW-SA-4 5 Downgradient 04/11/2017 Metal mg/L 0.0037 N
Selenium (total) JTEC-MW-SA-4 6 Downgradient 05/11/2017 Metal mg/L 0.0036 N
Selenium (total) JTEC-MW-SA-4 7 Downgradient 07/13/2017 Metal mg/L 0.0017 N
Selenium (total) JTEC-MW-SA-4 8 Downgradient 08/11/2017 Metal mg/L 0.0025 N
Thallium (total) JTEC-MW-PZ-01D 1 Upgradient 10/20/2016 Metal mg/L 0.00022 J N
Thallium (total) JTEC-MW-PZ-01D 2 Upgradient 11/14/2016 Metal mg/L 0.00023 J N
Thallium (total) JTEC-MW-PZ-01D 3 Upgradient 01/09/2017 Metal mg/L 0.00022 J N
Thallium (total) JTEC-MW-PZ-01D 4 Upgradient 02/13/2017 Metal mg/L 0.000062 U N
Thallium (total) JTEC-MW-PZ-01D 5 Upgradient 04/03/2017 Metal mg/L 0.0037 N
Thallium (total) JTEC-MW-PZ-01D 6 Upgradient 05/08/2017 Metal mg/L 0.000062 U N
Thallium (total) JTEC-MW-PZ-01D 7 Upgradient 07/10/2017 Metal mg/L 0.00036 J N
Thallium (total) JTEC-MW-PZ-01D 8 Upgradient 08/07/2017 Metal mg/L 0.00021 J N
Thallium (total) JTEC-MW-PZ-03D 1 Downgradient 10/25/2016 Metal mg/L 0.00017 J N
Thallium (total) JTEC-MW-PZ-03D 2 Downgradient 11/15/2016 Metal mg/L 0.00022 J N
Thallium (total) JTEC-MW-PZ-03D 3 Downgradient 01/11/2017 Metal mg/L 0.00031 J N
Thallium (total) JTEC-MW-PZ-03D 4 Downgradient 02/20/2017 Metal mg/L 0.00014 J N
Thallium (total) JTEC-MW-PZ-03D 5 Downgradient 04/06/2017 Metal mg/L 0.000062 U N
Thallium (total) JTEC-MW-PZ-03D 6 Downgradient 05/10/2017 Metal mg/L 0.00051 J N
Thallium (total) JTEC-MW-PZ-03D 7 Downgradient 07/12/2017 Metal mg/L 0.00027 J N
Thallium (total) JTEC-MW-PZ-03D 8 Downgradient 08/09/2017 Metal mg/L 0.00034 J N
Thallium (total) JTEC-MW-PZ-08D 1 Downgradient 10/20/2016 Metal mg/L 0.00033 J N
Thallium (total) JTEC-MW-PZ-08D 2 Downgradient 11/14/2016 Metal mg/L 0.00024 J N
Thallium (total) JTEC-MW-PZ-08D 3 Downgradient 01/10/2017 Metal mg/L 0.00012 J N
Thallium (total) JTEC-MW-PZ-08D 4 Downgradient 02/16/2017 Metal mg/L 0.00025 J N
Thallium (total) JTEC-MW-PZ-08D 5 Downgradient 04/04/2017 Metal mg/L 0.00054 J N
Thallium (total) JTEC-MW-PZ-08D 6 Downgradient 05/09/2017 Metal mg/L 0.000062 U N
Thallium (total) JTEC-MW-PZ-08D 7 Downgradient 07/11/2017 Metal mg/L 0.0001 J N
Thallium (total) JTEC-MW-PZ-08D 8 Downgradient 08/11/2017 Metal mg/L 0.00023 J N
Thallium (total) JTEC-MW-PZ-09D 1 Upgradient 10/20/2016 Metal mg/L 0.00022 J N
Thallium (total) JTEC-MW-PZ-09D 2 Upgradient 11/14/2016 Metal mg/L 0.00015 J N
Thallium (total) JTEC-MW-PZ-09D 3 Upgradient 01/09/2017 Metal mg/L 0.00029 J N
Thallium (total) JTEC-MW-PZ-09D 4 Upgradient 02/15/2017 Metal mg/L 0.000093 J N
Thallium (total) JTEC-MW-PZ-09D 5 Upgradient 04/04/2017 Metal mg/L 0.00053 J N
Thallium (total) JTEC-MW-PZ-09D 6 Upgradient 05/09/2017 Metal mg/L 0.000062 U N
Thallium (total) JTEC-MW-PZ-09D 7 Upgradient 07/10/2017 Metal mg/L 0.000062 U N

Consituent Name Well IDSample Round
Upgradient/Downgradient Sample Date
Analyte Group Units Result
Val. Qualifiers
Normal/Duplicate
Table 3 Analytical Results for Appendix IV Constituents in Groundwater at the JTEC Facility.
Thallium (total) JTEC-MW-PZ-09D 8 Upgradient 08/10/2017 Metal mg/L 0.000073 J N
Thallium (total) JTEC-MW-PZ-10D 1 Downgradient 10/21/2016 Metal mg/L 0.000062 U N
Thallium (total) JTEC-MW-PZ-10D 2 Downgradient 11/15/2016 Metal mg/L 0.00009 J N
Thallium (total) JTEC-MW-PZ-10D 3 Downgradient 01/11/2017 Metal mg/L 0.00012 J N
Thallium (total) JTEC-MW-PZ-10D 4 Downgradient 02/21/2017 Metal mg/L 0.000062 U N
Thallium (total) JTEC-MW-PZ-10D 5 Downgradient 04/07/2017 Metal mg/L 0.000062 U N
Thallium (total) JTEC-MW-PZ-10D 6 Downgradient 05/10/2017 Metal mg/L 0.00052 J N
Thallium (total) JTEC-MW-PZ-10D 7 Downgradient 07/13/2017 Metal mg/L 0.000062 U N
Thallium (total) JTEC-MW-PZ-10D 8 Downgradient 08/09/2017 Metal mg/L 0.000062 U N
Thallium (total) JTEC-MW-PZ-11D 1 Downgradient 10/21/2016 Metal mg/L 0.000091 J N
Thallium (total) JTEC-MW-PZ-11D 2 Downgradient 11/15/2016 Metal mg/L 0.000063 J N
Thallium (total) JTEC-MW-PZ-11D 3 Downgradient 01/10/2017 Metal mg/L 0.000065 J N
Thallium (total) JTEC-MW-PZ-11D 4 Downgradient 02/21/2017 Metal mg/L 0.000062 U N
Thallium (total) JTEC-MW-PZ-11D 5 Downgradient 04/05/2017 Metal mg/L 0.0002 J N
Thallium (total) JTEC-MW-PZ-11D 6 Downgradient 05/10/2017 Metal mg/L 0.00022 J N
Thallium (total) JTEC-MW-PZ-11D 7 Downgradient 07/13/2017 Metal mg/L 0.000062 U N
Thallium (total) JTEC-MW-PZ-11D 8 Downgradient 08/09/2017 Metal mg/L 0.000093 J N
Thallium (total) JTEC-MW-PZ-12D 1 Downgradient 10/20/2016 Metal mg/L 0.00011 J N
Thallium (total) JTEC-MW-PZ-12D 2 Downgradient 11/15/2016 Metal mg/L 0.000062 U N
Thallium (total) JTEC-MW-PZ-12D 3 Downgradient 01/11/2017 Metal mg/L 0.000078 J N
Thallium (total) JTEC-MW-PZ-12D 4 Downgradient 02/20/2017 Metal mg/L 0.000064 J N
Thallium (total) JTEC-MW-PZ-12D 5 Downgradient 04/05/2017 Metal mg/L 0.000062 U N
Thallium (total) JTEC-MW-PZ-12D 6 Downgradient 05/10/2017 Metal mg/L 0.00017 J N
Thallium (total) JTEC-MW-PZ-12D 7 Downgradient 07/12/2017 Metal mg/L 0.000062 U N
Thallium (total) JTEC-MW-PZ-12D 8 Downgradient 08/08/2017 Metal mg/L 0.000062 U N
Thallium (total) JTEC-MW-PZ-13D 1 Downgradient 10/20/2016 Metal mg/L 0.000062 U N
Thallium (total) JTEC-MW-PZ-13D 2 Downgradient 11/14/2016 Metal mg/L 0.000062 U N
Thallium (total) JTEC-MW-PZ-13D 3 Downgradient 01/10/2017 Metal mg/L 0.000063 J N
Thallium (total) JTEC-MW-PZ-13D 4 Downgradient 02/14/2017 Metal mg/L 0.000078 J N
Thallium (total) JTEC-MW-PZ-13D 5 Downgradient 04/03/2017 Metal mg/L 0.00062 J N
Thallium (total) JTEC-MW-PZ-13D 6 Downgradient 05/10/2017 Metal mg/L 0.000062 U N
Thallium (total) JTEC-MW-PZ-13D 7 Downgradient 07/10/2017 Metal mg/L 0.000062 U N
Thallium (total) JTEC-MW-PZ-13D 8 Downgradient 08/07/2017 Metal mg/L 0.000062 U N
Thallium (total) JTEC-MW-SA-2A 1 Downgradient 10/31/2016 Metal mg/L 0.000062 U N
Thallium (total) JTEC-MW-SA-2A 2 Downgradient 11/15/2016 Metal mg/L 0.000062 U N
Thallium (total) JTEC-MW-SA-2A 3 Downgradient 01/11/2017 Metal mg/L 0.00016 J N
Thallium (total) JTEC-MW-SA-2A 4 Downgradient 02/17/2017 Metal mg/L 0.00031 J N
Thallium (total) JTEC-MW-SA-2A 5 Downgradient 04/05/2017 Metal mg/L 0.000062 U N
Thallium (total) JTEC-MW-SA-2A 6 Downgradient 05/09/2017 Metal mg/L 0.00011 J N
Thallium (total) JTEC-MW-SA-2A 7 Downgradient 07/11/2017 Metal mg/L 0.000062 U N
Thallium (total) JTEC-MW-SA-2A 8 Downgradient 08/08/2017 Metal mg/L 0.000062 U N
Thallium (total) JTEC-MW-SA-3 1 Downgradient 10/21/2016 Metal mg/L 0.000062 U N
Thallium (total) JTEC-MW-SA-3 2 Downgradient 11/15/2016 Metal mg/L 0.000062 U N
Thallium (total) JTEC-MW-SA-3 3 Downgradient 01/11/2017 Metal mg/L 0.000062 U N
Thallium (total) JTEC-MW-SA-3 4 Downgradient 02/21/2017 Metal mg/L 0.000062 U N
Thallium (total) JTEC-MW-SA-3 5 Downgradient 04/10/2017 Metal mg/L 0.000062 U N
Thallium (total) JTEC-MW-SA-3 6 Downgradient 05/11/2017 Metal mg/L 0.000062 U N

Consituent Name Well IDSample Round
Upgradient/Downgradient Sample Date
Analyte Group Units Result
Val. Qualifiers
Normal/Duplicate
Table 3 Analytical Results for Appendix IV Constituents in Groundwater at the JTEC Facility.
Thallium (total) JTEC-MW-SA-3 7 Downgradient 07/13/2017 Metal mg/L 0.000062 U N
Thallium (total) JTEC-MW-SA-3 8 Downgradient 08/10/2017 Metal mg/L 0.000062 U N
Thallium (total) JTEC-MW-SA-4 1 Downgradient 10/24/2016 Metal mg/L 0.000062 U N
Thallium (total) JTEC-MW-SA-4 2 Downgradient 11/15/2016 Metal mg/L 0.000062 U N
Thallium (total) JTEC-MW-SA-4 3 Downgradient 01/10/2017 Metal mg/L 0.00018 J N
Thallium (total) JTEC-MW-SA-4 4 Downgradient 02/22/2017 Metal mg/L 0.000062 U N
Thallium (total) JTEC-MW-SA-4 5 Downgradient 04/11/2017 Metal mg/L 0.000062 U N
Thallium (total) JTEC-MW-SA-4 6 Downgradient 05/11/2017 Metal mg/L 0.000062 U N
Thallium (total) JTEC-MW-SA-4 7 Downgradient 07/13/2017 Metal mg/L 0.000062 U N
Thallium (total) JTEC-MW-SA-4 8 Downgradient 08/11/2017 Metal mg/L 0.000062 U N

Figures
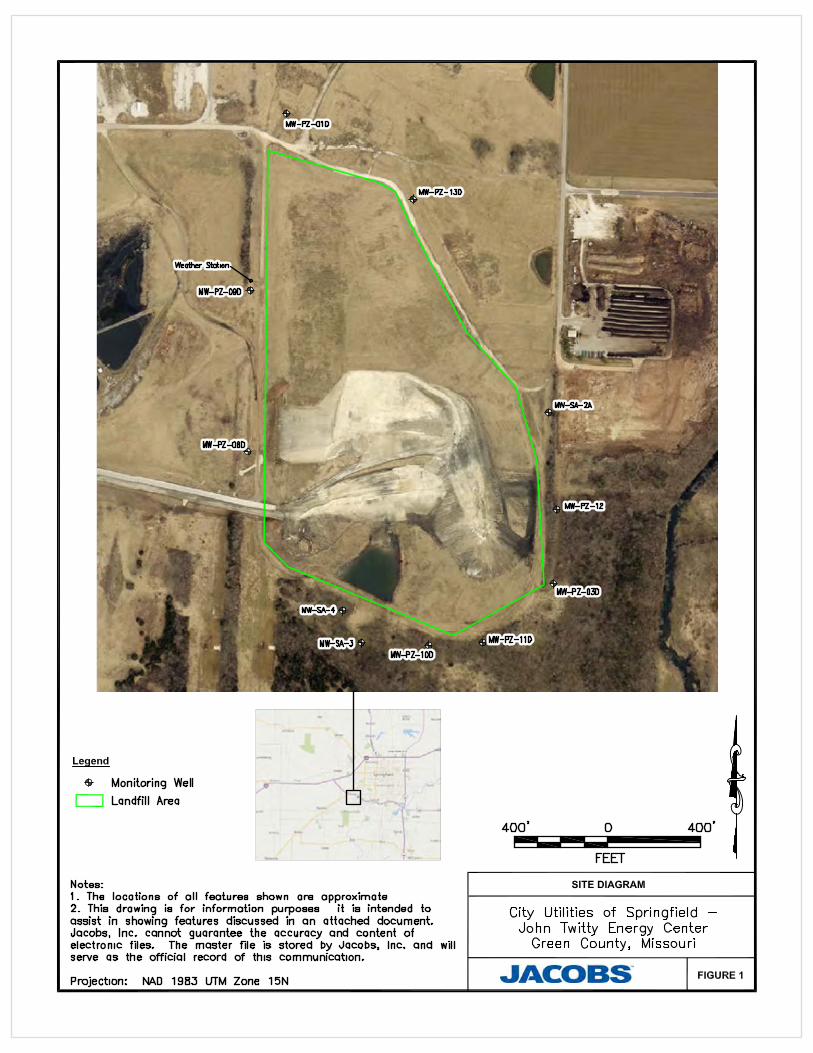

FIGURE 2
POTENTIOMETRIC ELEVATION 11/21/2016
Legend

FIGURE 3
POTENTIOMETRIC ELEVATION 12/07/2016
Legend
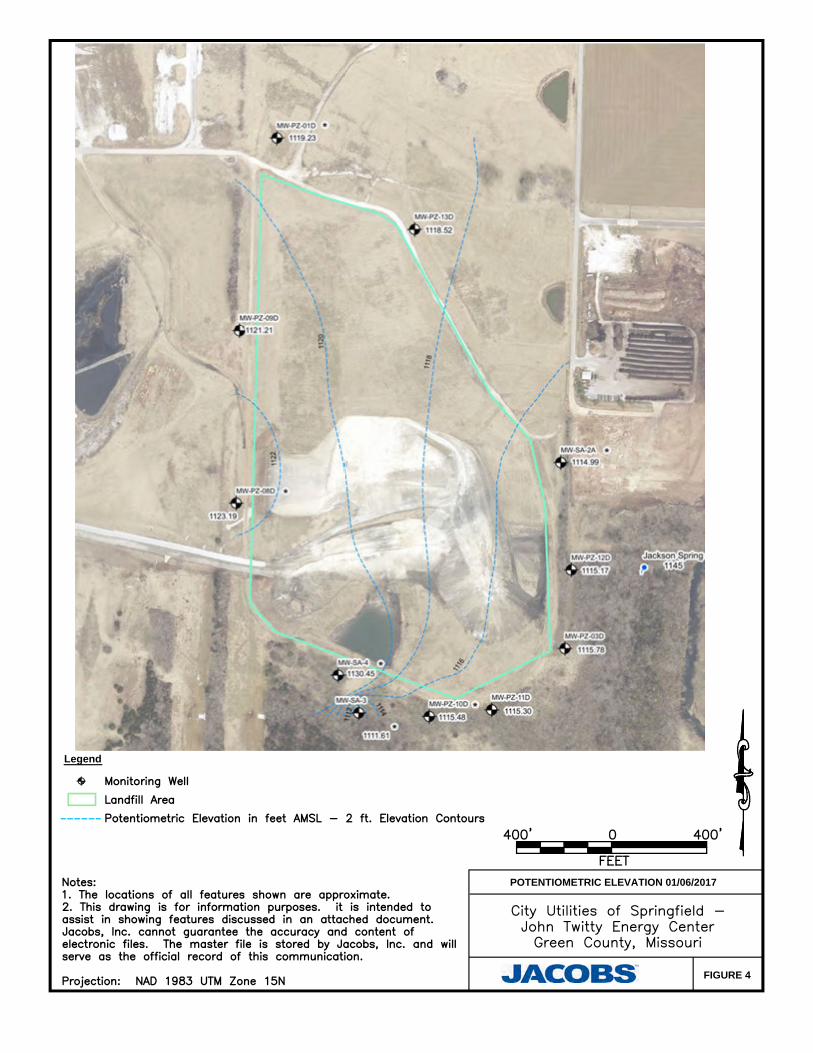
FIGURE 4
POTENTIOMETRIC ELEVATION 01/06/2017
Legend
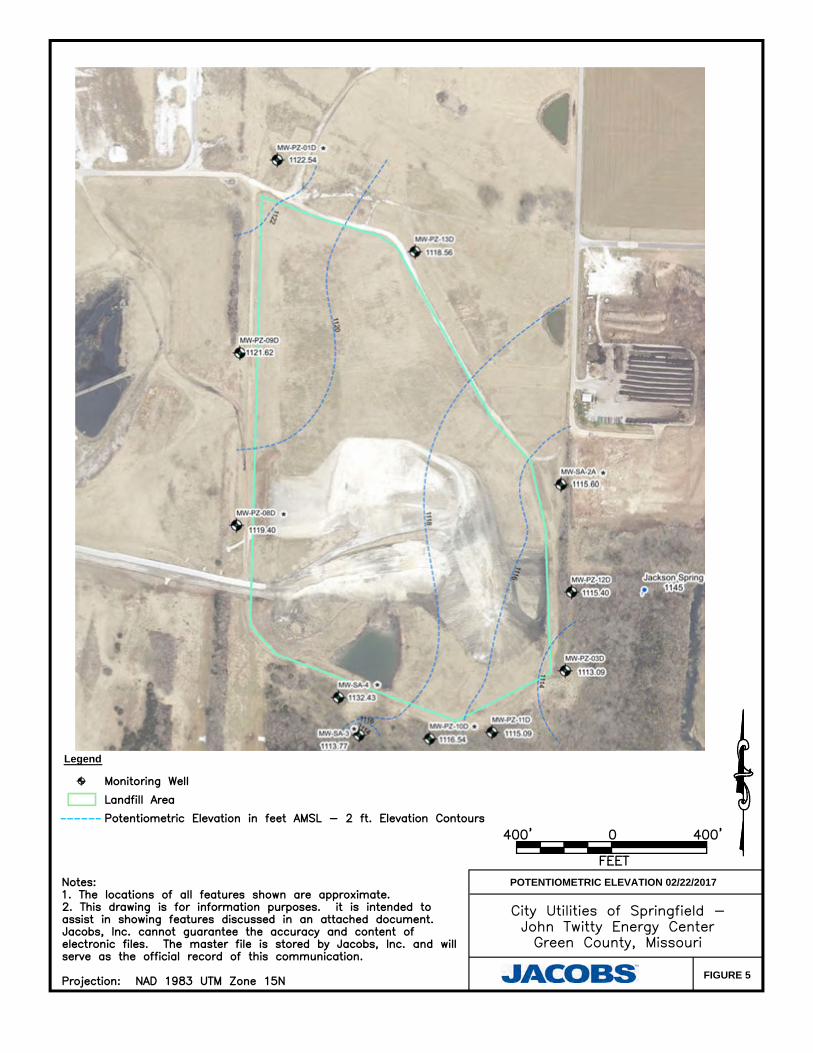
FIGURE 5
POTENTIOMETRIC ELEVATION 02/22/2017
Legend

FIGURE 6
POTENTIOMETRIC ELEVATION 04/04/2017
Legend

FIGURE 7
POTENTIOMETRIC ELEVATION 05/11/2017
Legend
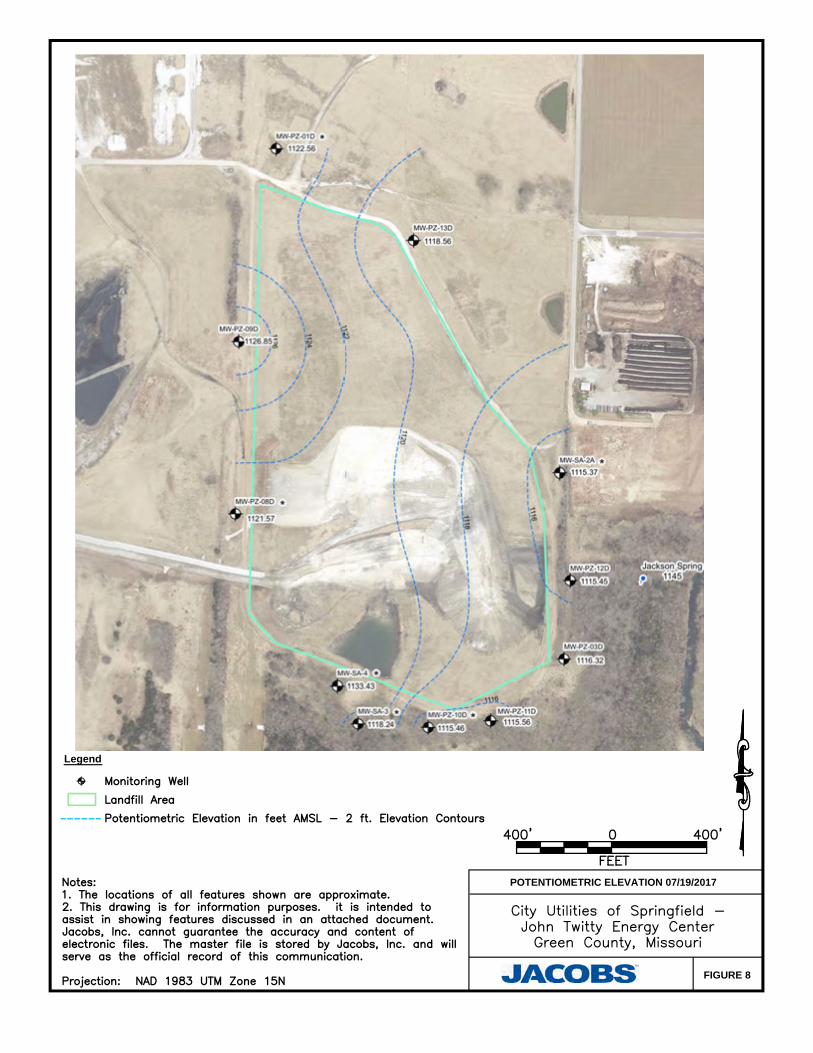
FIGURE 8
POTENTIOMETRIC ELEVATION 07/19/2017
Legend
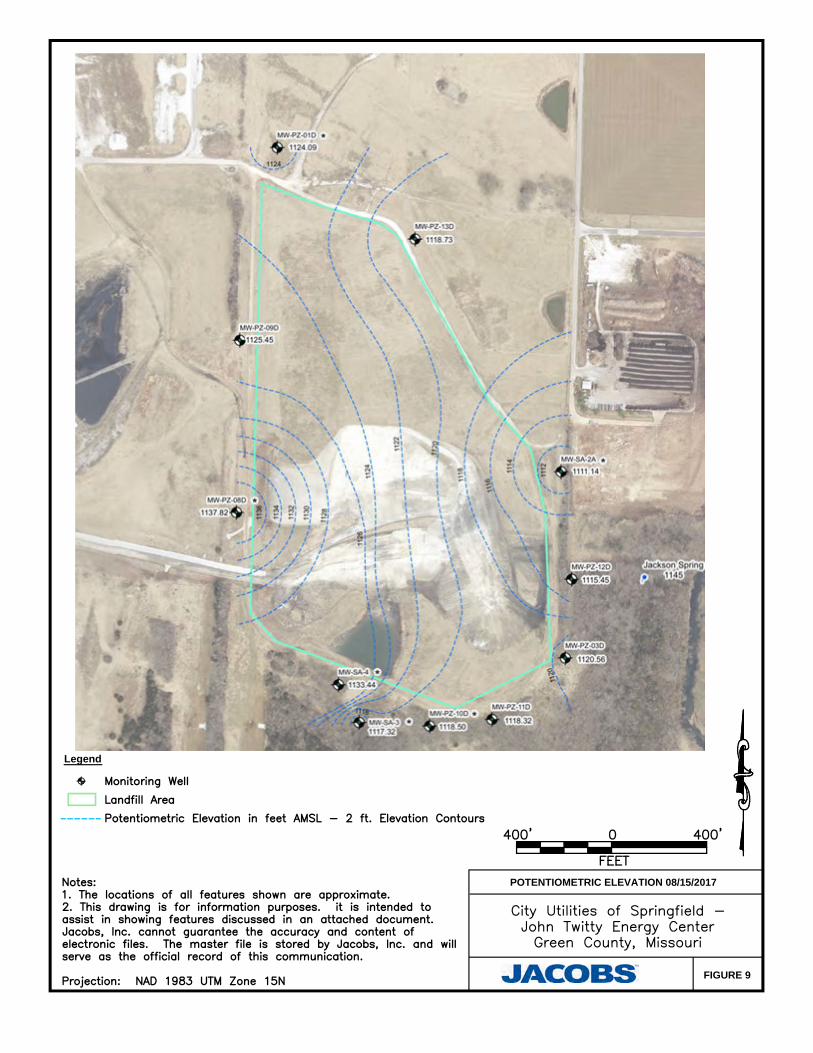
FIGURE 9
POTENTIOMETRIC ELEVATION 08/15/2017
Legend

Appendices

Appendix A Analytical Data Validation Reports

QC Certificate John Twitty Energy Center Annual Groundwater Monitoring and Corrective Action
Report
SIGN-OFF CERTIFICATE FOR FINAL DELIVERY OF DATA VALIDATION
This certificate confirms that Jacobs has completed the review of the JTEC Data Validation Reports in the Annual Groundwater and Corrective Action Report and these reports meet the standards in the Groundwater Sampling and Analysis Plan (GeoEngineers 2016).
Signature-:~~ 1d • Printed Name - : Christopher Hickman
Date approved: 01 I 23 I 2018

D a t a V a l i d a t i o n M e m o r a n d u m
1
John Twitty Energy Center Round 1 Groundwater
Eleven groundwater samples were collected between October 20th and October 31st at John Twitty Energy Center. Additionally, a field duplicate was collected at location JTEC-MW-SA-3 and a filtered aliquot for metals was collected at JTEC-MW-SA-2A. The filtered aliquot at JTEC-MW-SA-2A was collected due to elevated turbidity issues at the well and extended well development required at the location.
The groundwater samples were collected by GeoEngineers and hand delivered to PDC Laboratories Springfield, Missouri locaton. The PDC Springfield Laboratory performed the pH and total dissolved solids (TDS) analyses on the samples, and shipped sample aliquots to PDC’s Peoria Laboratory for metals and wet chemistry analyses and PACE Analytical in Greensburg, PA for Total Radium 226/228. While samples were collected and immediately stored in coolers on ice, the samples were hand delivered on the same day to PDC Springfield and there was insufficient time for cooling the samples to <6 degrees Celsius. Therefore, the intial receipt temperatures at PDC Springfield were not used as the basis for qualification. However, the temperatures for receipt at the Peoria Laboratory were evaluated and data were qualified if outside the acceptable range.
The table below provides a crosswalk of sample IDs from field to the laboratories.
Field Sample ID. PDC ID. PACE ID.
JTEC-MW-PZ-01D-20161020 6103390-01 30200335001 JTEC-MW-PZ-08D-20161020 6103390-02 30200335002 JTEC-MW-PZ-09D-20161020 6103390-03 30200335003 JTEC-MW-PZ-12D-20161020 6103390-04 30200335004 JTEC-MW-PZ-13D-20161020 6103390-05 30200335005 JTEC-MW-PZ-10D-20161021 6103530-01 30200333001 JTEC-MW-PZ-11D-20161021 6103530-02 30200333002 JTEC-MW-SA-3-20161021 6103530-03 30200333003 JTEC-MW-SA-3-20161021-FD 6103530-04 30200333004 JTEC-MW-SA-4-20161024 6103644-01 30200498001 JTEC-MW-PZ-03D-20161025 6103862-01 30200729001 JTEC-MW-SA-2A-20161031 6104470-01 30201214001 JTEC-MW-SA-2A-20161031 6104470-02 NA
(Filtered aliquot for metals)

JOHN TWITTY ENERGY CENTER ROUND 1 GROUNDWATER
2
The samples were analyzed at PDC Springfield, MO. for the following analyses:
- pH by SM 4500-H B
- Total Dissolved Solids by SM 2540C
The samples were analyzed at PDC Peoria, IL. for the following analyses:
- Anions by EPA 300.0
- COD by SM 5220D
- Conductivity by SM 2510B
- Total Organic Halide by SW-846 9020
- Total Organic Carbon by SM5310C
- Total Metals by SW-846 6010/6020
- Hardness (calculation)
- Total Mercury by SW-846 7470
The samples were analyzed at PACE Greensburg, PA. for the following analyses:
- Total Radium (226/228)
This quality assurance memorandum is based upon the validation of analytical data generated for Round 2 groundwater samples collected at John Twitty Energy Center. The analyses were reviewed for adherence to the specified analytical protocols in accordance with the analytical methods, laboratory standard operating procedures, Quality Assurance Project Plan (QAPP) for Coal Combustion Residual Landfill Monitoring at John Twitty Energy Center, January 2016, and the guidance of the USEPA Contract Laboratory Program National Functional Guidelines for Inorganic Data Review, August 2014. The findings of this quality assurance report are based upon the comprehensive review of the data deliverables from PDC and PACE reported according to the project QAPP and the EPA modified Level III format (including raw data). The review included chain of custody documentation, sample receipt conditions, holding times, field QA samples, laboratory QC samples, calibrations, and target compound identification and quantitation of results.
The following definitions provide explanations of the data qualifiers that may be assigned to results based on this evaluation. The data qualifier definitions are consistent with the USEPA National Functional Guidelines for Inorganic Data Review.
U- The analyte was analyzed for but not detected (ND).
J- The identification of the analyte is acceptable, but the quality assurance criteria indicate that the quantitative values may be outside the normal expected range of precision (i.e.

JOHN TWITTY ENERGY CENTER ROUND 1 GROUNDWATER
3
the quantitative value is considered estimated).
UJ- This flag is a combination of the U and J qualifiers. This indicates that the analyte is not present and the reported value is considered to be an estimated result.
R- Data are considered to be rejected and shall not be used. This flag denotes the failure of
quality control criteria such that it cannot be determined if the analyte is present or absent from the sample.
B- The B flag is to be used for both organic and inorganic analyses when the analyte is
found in the associated blank as well as the in the sample. The result is considered ND, and the reported value is considered to be an estimated quantitation limit.
INORGANIC DATA QUALIFIERS
All results for the pH analyses were qualified as estimated due to exceedance of the method specific holding time. The pH method specific holding time requires the samples to be analyzed immediately, which is not possible to achieve when sending samples to an offsite laboratory. Analyzing the pH outside the method specific holding time could indicate a bias in the sample result. Field measurements for pH were also recorded at the time of sample collection.
Sample ID Analyte Holding Time Qualifier
JTEC-MW-PZ-01D-20161020 pH > immediately J
JTEC-MW-PZ-08D-20161020 pH > immediately J
JTEC-MW-PZ-09D-20161020 pH > immediately J
JTEC-MW-PZ-12D-20161020 pH > immediately J
JTEC-MW-PZ-13D-20161020 pH > immediately J
JTEC-MW-PZ-10D-20161021 pH > immediately J
JTEC-MW-PZ-11D-20161021 pH > immediately J
JTEC-MW-SA-3-20161021 pH > immediately J
JTEC-MW-SA-3-20161021-FD pH > immediately J
JTEC-MW-SA-4-20161024 pH > immediately J
JTEC-MW-PZ-03D-20161025 pH > immediately J
JTEC-MW-SA-2A-20161031 pH > immediately J

JOHN TWITTY ENERGY CENTER ROUND 1 GROUNDWATER
4
One groundwater samples collected at JTEC was received at PDC Peoria above the acceptable temperature of 4 degrees celsius +/- 2 degrees. The anions (chloride, Fluoride, and sulfate) and TDS methods require temperature preservation. Temperatures above the range may be indicative of a low bias in the sample results. Samples received minimally above the acceptable range are qualified as estimated, while receipt conditions above twice the acceptable range would require rejection of the associated sample results. The associated TDS and anion results were reported as positive detects and qualified as estimated “J”in the sample listed below.
Sample ID Analyte Receipt Temperature Qualifier
JTEC-MW-SA-2A-20161031 Cloride, Fluoride, Sulfate, TDS
7 degrees celsius J
Chemical Oxygen Demand (COD) method SM-5220D requires that sample analyses are bracketed by acceptable calibration verification samples. One groundwater sample collected at JTEC was analyzed in a batch without a closing calibration verification standard. Without an instrument calibration verification sample at the end of the analytical sequence it is not possible to determine if the instrument was still in control and operating within the acceptable range. The COD result in the JTEC sample listed below could be biased high or low, and the non-detect result is qualified as estimated.
Sample ID Analyte Calibration Verification Qualifier
JTEC-MW-SA-2A-20161031 COD Not performed UJ
In the SW-846 6020 analysis for silver performed on sample JTEC-MW-PZ-01D-20161020, the MS/MSD spike recovery was reported below the lower control limit. Low spike recoveries are indicative of a potential low bias for silver in the sample. The silver result in the sample is reported as a detect greater than the method detection level but less than the quantitation limit and is already qualified as estimated “J”.
In the SW-846 6020 analyses for antimony, selenium, and the SW-846 7470 analysis for mercury performed on samples JTEC-MW-SA-3-20161021 and JTEC-MW-SA-3-20161021-FD, the reported field duplicate RPD was greater than 50%. However, the positive results for arsenic, selenium, and mercury were already qualified as estimated “J” due to being reported above the method detection limit but below the quantitation limit.
In order to achieve the lowest possible detection levels and facilitate the statistical analysis of the groundwater data, PDC was required to report positive results between the method detection level and quantitation limits as estimated detects with a “J” qualifier.
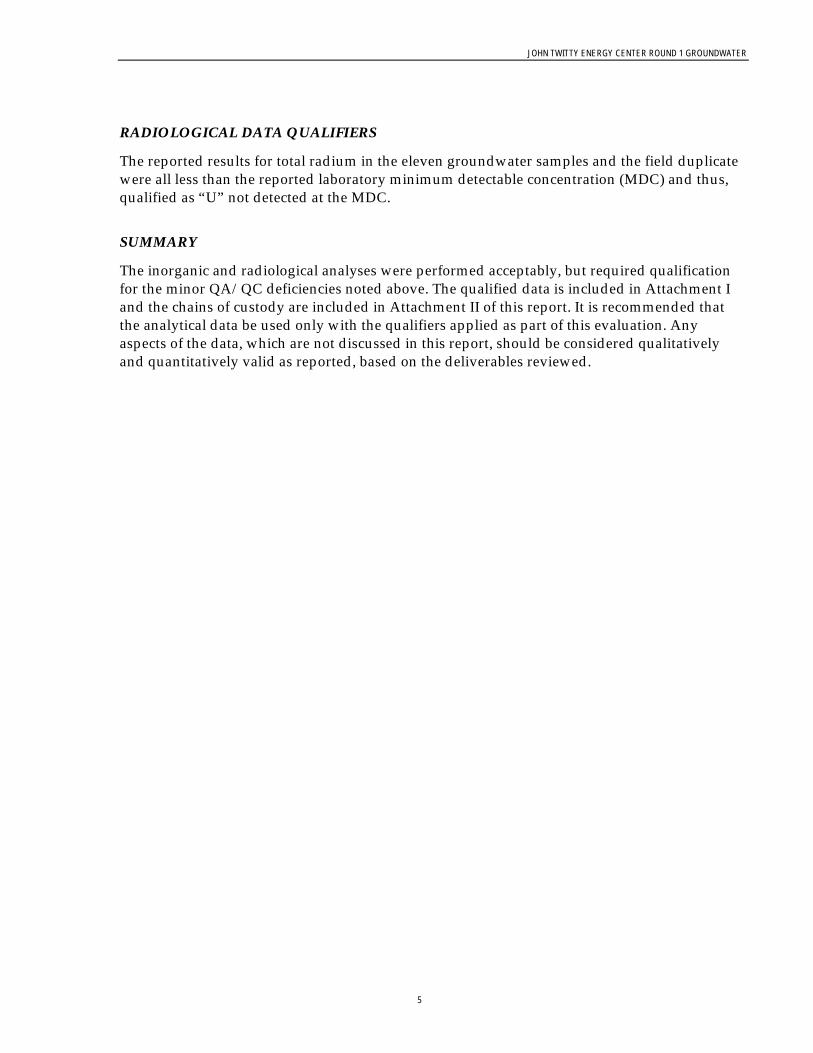
JOHN TWITTY ENERGY CENTER ROUND 1 GROUNDWATER
5
RADIOLOGICAL DATA QUALIFIERS
The reported results for total radium in the eleven groundwater samples and the field duplicate were all less than the reported laboratory minimum detectable concentration (MDC) and thus, qualified as “U” not detected at the MDC.
SUMMARY
The inorganic and radiological analyses were performed acceptably, but required qualification for the minor QA/QC deficiencies noted above. The qualified data is included in Attachment I and the chains of custody are included in Attachment II of this report. It is recommended that the analytical data be used only with the qualifiers applied as part of this evaluation. Any aspects of the data, which are not discussed in this report, should be considered qualitatively and quantitatively valid as reported, based on the deliverables reviewed.

JOHN TWITTY ENERGY CENTER ROUND 1 GROUNDWATER
6
Attachment I
JTEC Round 1 Groundwater Data

Location JTEC-MW-PZ-01D JTEC-MW-PZ-09D
Sample Date 10/20/2016 10/20/2016
Sample Type Normal Normal
Group Analyte Units Result / Qual Result / Qual
Metal Aluminum (total) mg/L 0.035 0.042
Metal Antimony (total) mg/L 0.0032 0.002 J
Metal Arsenic (total) mg/L 0.0009 J 0.00013 U
Metal Barium (total) mg/L 0.075 0.075
Metal Beryllium (total) mg/L 0.000032 J 0.000056 J
Metal Boron (total) mg/L 0.02 0.071
Metal Cadmium (total) mg/L 0.000042 U 0.000042 U
Metal Calcium (total) mg/L 46 100
Metal Chromium (total) mg/L 0.00027 U 0.00027 U
Metal Cobalt (total) mg/L 0.00074 J 0.00039 J
Metal Copper (total) mg/L 0.00083 J 0.0021 J
Metal Iron (total) mg/L 0.0081 J 0.032
Metal Lead (total) mg/L 0.000051 J 0.000097 J
Metal Lithium (total) mg/L 0.007 J 0.016
Metal Magnesium (total) mg/L 17 24
Metal Manganese (total) mg/L 0.099 0.02
Metal Mercury (total) mg/L 0.000026 J 0.000025 J
Metal Molybdenum (total) mg/L 0.029 0.02
Metal Nickel (total) mg/L 0.017 0.0033 J
Metal Selenium (total) mg/L 0.00032 U 0.00065 J
Metal Silver (total) mg/L 0.000076 J 0.000097 J
Metal Sodium (total) mg/L 12 87
Metal Thallium (total) mg/L 0.00022 J 0.00022 J
Metal Zinc (total) mg/L 0.0013 J 0.0062
Cation/Anion Chloride mg/L 5.2 57
Cation/Anion Fluoride mg/L 0.319 0.307
Cation/Anion Sulfate mg/L 28 270
Physical Properties Chemical Oxygen Demand (COD) mg/L 3.2 U 3.2 U
Physical Properties Conductivity umhos/cm 400 1100
Physical Properties Hardness (as CACO3) mg/L 180 360
Physical Properties pH pH Units 7.6 J 7.2 J
Physical Properties Total Dissolved Solids (TDS) mg/L 220 730
Physical Properties Total Organic Carbon (TOC) mg/L 0.52 0.84
Physical Properties Total Organic Halides (TOX) mg/L 0.008 0.014
Radionuclide Radium-226/228 pCi/L 1.73 U 1.39 U
JTEC Up Gradient Groundwater Collected in Round 1

Location JTEC-MW-PZ-03D JTEC-MW-PZ-08D JTEC-MW-PZ-10D JTEC-MW-PZ-11D JTEC-MW-PZ-12D JTEC-MW-PZ-13D JTEC-MW-SA-2A JTEC-MW-SA-3 JTEC-MW-SA-3 JTEC-MW-SA-4
Sample Date 10/25/2016 10/20/2016 10/21/2016 10/21/2016 10/20/2016 10/20/2016 10/31/2016 10/21/2016 10/21/2016 10/24/2016
Sample Type Normal Normal Normal Normal Normal Normal Normal Field Duplicate Normal Normal
Group Analyte Units Result / Qual Result / Qual Result / Qual Result / Qual Result / Qual Result / Qual Result / Qual Result / Qual Result / Qual Result / Qual
Metal Aluminum (total) mg/L 0.096 0.047 0.057 0.017 0.083 0.066 2.4 0.04 0.056 0.068
Metal Antimony (total) mg/L 0.0037 0.0033 0.00035 J 0.00023 J 0.0012 J 0.00081 J 0.000036 U 0.00024 J 0.00038 J 0.000098 J
Metal Arsenic (total) mg/L 0.00046 J 0.00027 J 0.00013 U 0.00013 U 0.00013 U 0.0004 J 0.0011 0.00049 J 0.00059 J 0.00017 J
Metal Barium (total) mg/L 0.097 0.11 0.075 0.051 0.09 0.11 0.075 0.031 0.033 0.058
Metal Beryllium (total) mg/L 0.000076 J 0.000066 J 0.000027 J 0.000033 J 0.000017 U 0.000028 J 0.00013 J 0.000031 J 0.000021 J 0.000027 J
Metal Boron (total) mg/L 0.031 0.029 0.66 0.066 0.016 0.0086 J 0.032 0.044 0.049 1.1
Metal Cadmium (total) mg/L 0.000042 U 0.000042 U 0.000042 U 0.000042 U 0.000052 J 0.000042 U 0.000042 U 0.000042 U 0.000042 U 0.000049 J
Metal Calcium (total) mg/L 48 63 220 64 82 66 60 44 46 320
Metal Chromium (total) mg/L 0.00027 U 0.00027 U 0.00027 U 0.00027 U 0.00027 U 0.00027 U 0.0033 J 0.00027 U 0.00027 U 0.00027 U
Metal Cobalt (total) mg/L 0.0014 J 0.000075 J 0.000052 J 0.000017 U 0.0032 0.005 0.00096 J 0.000017 U 0.000017 U 0.00047 J
Metal Copper (total) mg/L 0.0012 J 0.0016 J 0.0016 J 0.0012 J 0.0012 J 0.0013 J 0.0043 0.00098 J 0.00088 J 0.0011 J
Metal Iron (total) mg/L 0.13 0.027 0.073 0.0068 J 0.035 0.54 1.9 0.017 0.026 0.036
Metal Lead (total) mg/L 0.00019 J 0.00011 J 0.00012 J 0.000025 U 0.000091 J 0.00013 J 0.0021 0.000048 J 0.000037 J 0.00014 J
Metal Lithium (total) mg/L 0.0027 J 0.011 0.0027 J 0.02 0.0024 J 0.006 J 0.0036 J 0.0029 J 0.003 J 0.0022 J
Metal Magnesium (total) mg/L 17 28 45 24 23 26 6.9 25 25 15
Metal Manganese (total) mg/L 0.11 0.002 0.004 0.00076 J 0.82 2 0.038 0.00048 J 0.00054 J 0.015
Metal Mercury (total) mg/L 0.0000022 U 0.000034 J 0.00001 J 0.000005 J 0.000015 J 0.0000022 U 0.00002 J 0.000009 J 0.000004 J 0.000017 J
Metal Molybdenum (total) mg/L 0.012 0.011 0.00051 J 0.0021 0.0046 0.0045 0.046 0.0027 0.0031 0.0033
Metal Nickel (total) mg/L 0.0041 J 0.002 J 0.0019 J 0.0016 J 0.0056 0.0058 0.0078 0.0036 J 0.0046 J 0.0077
Metal Selenium (total) mg/L 0.00032 U 0.00071 J 0.0018 0.00054 J 0.00066 J 0.00073 J 0.0016 0.00041 J 0.00069 J 0.0036
Metal Silver (total) mg/L 0.00028 J 0.00014 J 0.000028 U 0.000028 U 0.000058 J 0.000033 J 0.0023 J 0.000028 U 0.000028 U 0.000028 U
Metal Sodium (total) mg/L 5.6 55 30 10 12 8.4 97 8.4 9.1 75
Metal Thallium (total) mg/L 0.00017 J 0.00033 J 0.000062 U 0.000091 J 0.00011 J 0.000062 U 0.000062 U 0.000062 U 0.000062 U 0.000062 U
Metal Zinc (total) mg/L 0.0031 J 0.0032 J 0.0077 0.0036 J 0.0037 J 0.0032 J 0.016 0.0015 J 0.0014 J 0.0085
Cation/Anion Chloride mg/L 3.2 25 280 31 33 22 54 J 9.3 9.7 290
Cation/Anion Fluoride mg/L 0.286 0.31 0.11 J 0.327 0.204 J 0.234 J 0.202 J 0.283 0.305 0.166 J
Cation/Anion Sulfate mg/L 17 120 300 31 24 36 110 J 43 43 590
Physical Properties Chemical Oxygen Demand (COD) mg/L 3.2 U 3.2 U 3.2 U 3.2 U 4.9 J 24 3.2 UJ 3.2 U 3.2 U 3.2 U
Physical Properties Conductivity umhos/cm 390 720 1600 520 680 560 790 430 430 2100
Physical Properties Hardness (as CACO3) mg/L 190 270 720 260 300 270 180 210 220 870
Physical Properties pH pH Units 7.3 J 7.4 J 6.9 J 7.3 J 7.1 J 7.3 J 7.6 J 7.6 J 7.6 J 6.9 J
Physical Properties Total Dissolved Solids (TDS) mg/L 210 450 900 310 390 320 430 J 250 230 1700
Physical Properties Total Organic Carbon (TOC) mg/L 0.62 0.49 J 0.46 J 0.35 J 0.96 5.2 0.74 0.36 J 0.45 J 0.87
Physical Properties Total Organic Halides (TOX) mg/L 0.0048 J 0.0041 U 0.016 0.0041 U 0.0049 J 0.0041 U 0.0093 0.0044 J 0.01 0.033
Radionuclide Radium-226/228 pCi/L 2.16 U 1.36 U 1.42 U 1.22 U 1.58 U 1.27 U 1.55 U 1.4 U 1.54 U 2.02 U
JTEC Down Gradient Groundwater Collected in Round 1

JOHN TWITTY ENERGY CENTER ROUND 1 GROUNDWATER
7
Attachment II
Chains of Custody

= ()oH3=oaEP8
o=tIII
i3=o(,otoo
NE
o)o09\rf, t+(D
G}
s+
*4<(J IL
(L
t-orf,
azz;a;;ErJ)=O
)tP
&

E
(
6aE
xx
xx
xx
xx
Xx
xx
xolx
xx
xx
Xx
xx
xx
Xcol-
xx
xX
Xx
xX
xx
xx
fl!^!tcnpuoCx
xx
xx
xx
xx
xx
xos 1l 'lc
xx
xx
xx
xx
xX
x)<
\tssrEN
EE
E
Hd 'S
Or'O
O9
'xX
xx
xx
Xx
XX
xX
ssaupJeH'slE
lawx
xx
xX
xX
xx
xx
X
ir
cEE
F F
its H
E 3E
r!dge l:E
lcq
@to
CO
I
=E
= o3
E= o
= (,3
Eo=
= o=
xX
Xx
xxrc\(.F.,i_
xx
xx\.^$5
x\^*
3
x
;l'Bg;
J6 Y
E
ii r ;
?3 I
:; 5
..,4
g >
:; ! E
iEE
iiF
q
E
19. 2 E
.Ed.P
E
-9\,-/ i
iFE
!Y
; (v)
ZF
9t{\{J]
d-
\!c.
!i22
HE
('40trilr7@zU
J
oc0oo?
c\
ilrotEIttr
NN
Fl
.t6at,
IL
(la\r\
^ I'i
tr\;\ad;+
-
9X90.\
kgI5
If
tI59a6o9
o5II
goo-gqo0)' o(E,
@
\fFot@qEtt{(l,@€c9**rE+
v:t! +uj x6f-
Fo@ro
r-OY
n=z;fi(/rtrigt4) =9F:6
u,uJe.I

"llIt
E
I
ogoIooo;o
SE
qB+s
(o G)
6€Nr...
-Etq{*+6fIo-
6E4EaGFxY
l''-
1')(I'
HE
z;6fr;EtD
=oqd!
tLa (/)
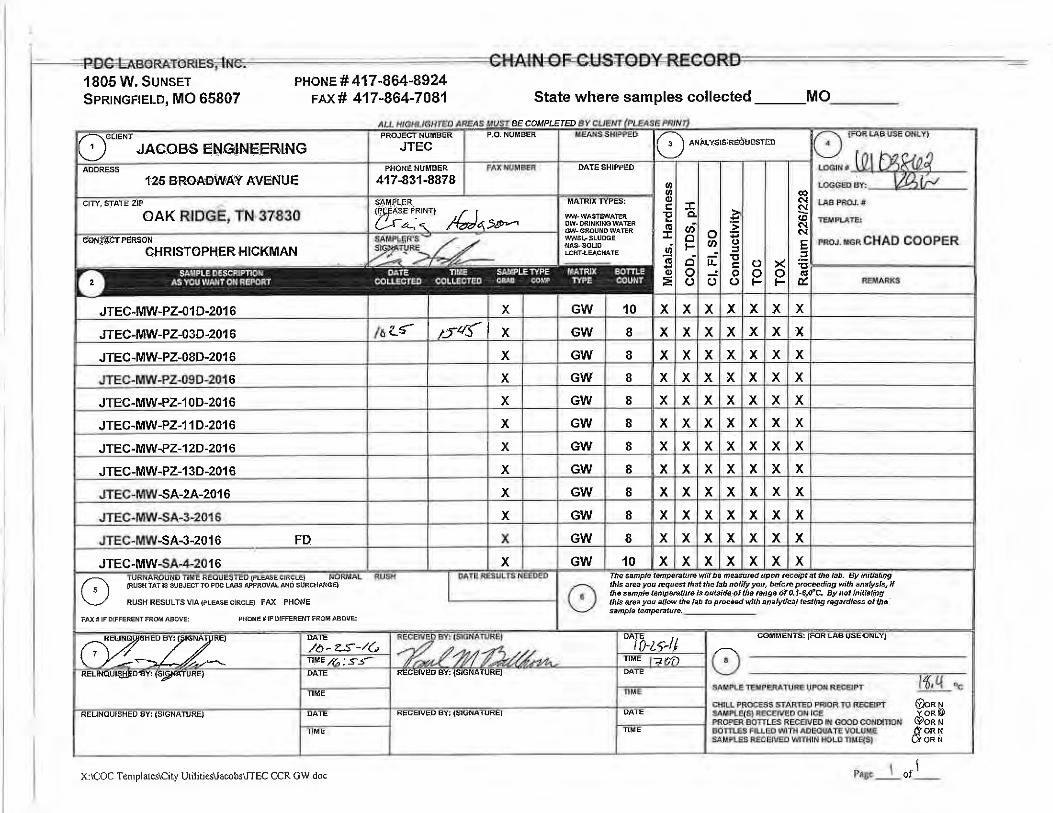
ge!tFei
E {si:.:qdiiE! E
,i &S
EoB
IEt3
iIEF
-r ss:
iiiIs:t:o !:e
E$$E
FE
Fp
),
(
!o^ooo\>
)>ueA
I,€I>;
8ZZ
I9ZZ
urn!pPU
Xx
xX
Xx
xX
Xx
xX
xorx
XX
Xx
xX
xx
xx
xcor
xx
Xx
xx
xx
xx
xx
A1!^!lcnpuoS
xX
xx
Xx
Xx
xx
xx
os 'H 'lc
xx
xx
xx
xx
)<x
xx
d.^,)
"4
/4.
fi
Hd 'sqr 'ooc
xx
xx
xx
xx
xx
xx
sssupJeH 'sleloultr
xX
xx
xX
XX
xx
xx
=
-Efi
! Eiir t
- E
=<
-o6z q:]"iji!s l:E
;CI
@
= o=
B=
==
==
== a4
= o=
d\A!/\\6-
--\NE!+
-\d s\J
Xxvt.'{l
;
xx
xx
xx
xx
x
,2q;^zbazdvIE
3 T
!"' o
=
?3 {
!! i "
anSe
?; ii
*i.F
rz E
ledHt
,..-.r t(- ) r\_-,/
f
irrz iil
o
gaoE
T
H"9
il-
sVN
cl3\
h{EtrE
E
(,4tU,l
rE,
zz,BI
rnog
2t!= oE.
|{)6l
ft
Ytr,
5
zE:4=IrlEF2,
6aHF
(0o$lil= EouJ
(o6l9N= Eotu-'
oqNtE(JurF
o(.1oN3EulF
c{oN= Eul-t
NoNN= EIIJF
o(.,
rt= EuJF
C-l
NU'
u-NIo
(o==ulF
c/\{;\\)l\iA5\vt\\f
\!
ap5a&
e5
I8(-)
t-35E6BEE
aE
o=ooo(!oEo;Nat)
NE
q8ssq?F. i..
FE
<q
+t+
Lu )<6tNocoro(0
HE
z;f-iofr:99F-U
!

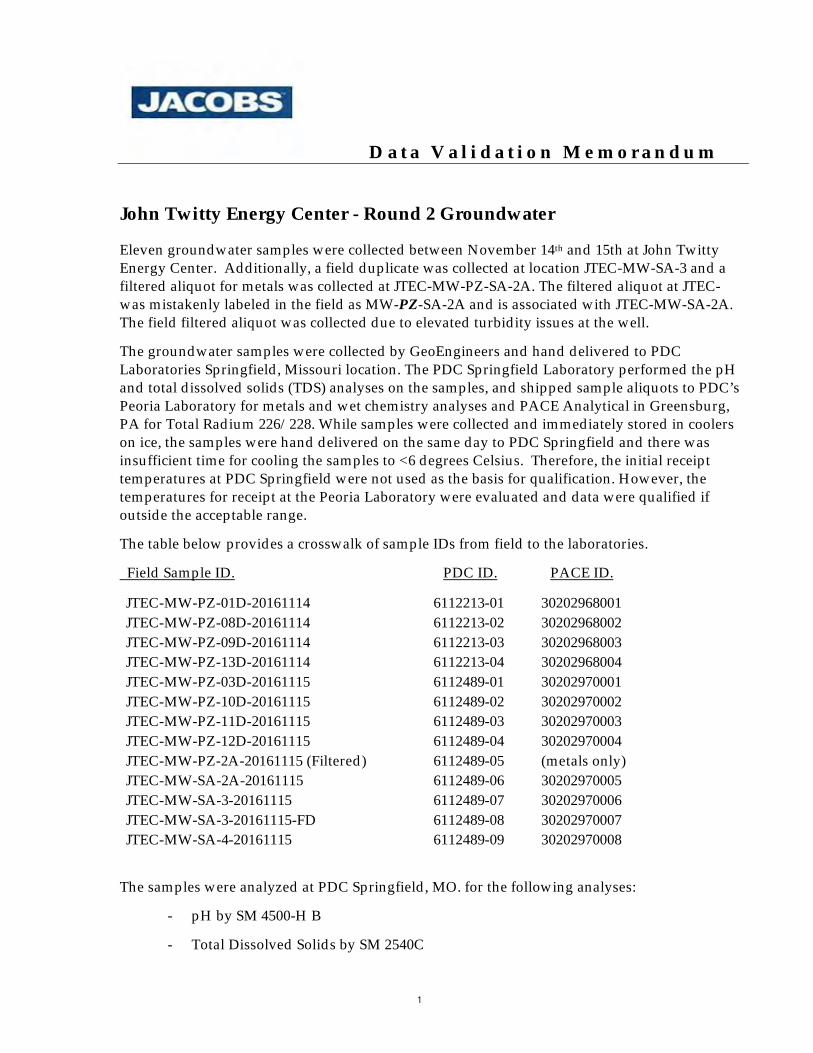
D a t a V a l i d a t i o n M e m o r a n d u m
1
John Twitty Energy Center - Round 2 Groundwater
Eleven groundwater samples were collected between November 14th and 15th at John Twitty Energy Center. Additionally, a field duplicate was collected at location JTEC-MW-SA-3 and a filtered aliquot for metals was collected at JTEC-MW-PZ-SA-2A. The filtered aliquot at JTEC- was mistakenly labeled in the field as MW-PZ-SA-2A and is associated with JTEC-MW-SA-2A. The field filtered aliquot was collected due to elevated turbidity issues at the well.
The groundwater samples were collected by GeoEngineers and hand delivered to PDC Laboratories Springfield, Missouri location. The PDC Springfield Laboratory performed the pH and total dissolved solids (TDS) analyses on the samples, and shipped sample aliquots to PDC’s Peoria Laboratory for metals and wet chemistry analyses and PACE Analytical in Greensburg, PA for Total Radium 226/228. While samples were collected and immediately stored in coolers on ice, the samples were hand delivered on the same day to PDC Springfield and there was insufficient time for cooling the samples to <6 degrees Celsius. Therefore, the initial receipt temperatures at PDC Springfield were not used as the basis for qualification. However, the temperatures for receipt at the Peoria Laboratory were evaluated and data were qualified if outside the acceptable range.
The table below provides a crosswalk of sample IDs from field to the laboratories.
Field Sample ID. PDC ID. PACE ID.
JTEC-MW-PZ-01D-20161114 6112213-01 30202968001 JTEC-MW-PZ-08D-20161114 6112213-02 30202968002 JTEC-MW-PZ-09D-20161114 6112213-03 30202968003 JTEC-MW-PZ-13D-20161114 6112213-04 30202968004 JTEC-MW-PZ-03D-20161115 6112489-01 30202970001 JTEC-MW-PZ-10D-20161115 6112489-02 30202970002 JTEC-MW-PZ-11D-20161115 6112489-03 30202970003 JTEC-MW-PZ-12D-20161115 6112489-04 30202970004 JTEC-MW-PZ-2A-20161115 (Filtered) 6112489-05 (metals only) JTEC-MW-SA-2A-20161115 6112489-06 30202970005 JTEC-MW-SA-3-20161115 6112489-07 30202970006 JTEC-MW-SA-3-20161115-FD 6112489-08 30202970007 JTEC-MW-SA-4-20161115 6112489-09 30202970008
The samples were analyzed at PDC Springfield, MO. for the following analyses:
- pH by SM 4500-H B
- Total Dissolved Solids by SM 2540C

JOHN TWITTY ENERGY CENTER - ROUND 2 GROUNDWATER
2
The samples were analyzed at PDC Peoria, IL. for the following analyses:
- Anions by EPA 300.0
- COD by SM 5220D
- Conductivity by SM 2510B
- Total Organic Halide by SW-846 9020
- Total Organic Carbon by SM5310C
- Total Metals by SW-846 6010/6020
- Hardness (calculation)
- Total Mercury by SW-846 7470
The samples were analyzed at PACE Greensburg, PA. for the following:
- Total Radium (226/228)
This quality assurance memorandum is based upon the validation of analytical data generated for Round 2 groundwater samples collected at John Twitty Energy Center. The analyses were reviewed for adherence to the specified analytical protocols in accordance with the analytical methods, laboratory standard operating procedures, Quality Assurance Project Plan (QAPP) for Coal Combustion Residual Landfill Monitoring at John Twitty Energy Center, January 2016, and the guidance of the USEPA Contract Laboratory Program National Functional Guidelines for Inorganic Data Review, August 2014. The findings of this quality assurance report are based upon the comprehensive review of the data deliverables from PDC and PACE reported according to the project QAPP and the EPA modified Level III format (including raw data). The review included chain of custody documentation, sample receipt conditions, holding times, field QA samples, laboratory QC samples, calibrations, and target compound identification and quantitation of results.
The following definitions provide explanations of the data qualifiers that may be assigned to results based on this evaluation. The data qualifier definitions are consistent with the USEPA National Functional Guidelines for Inorganic Data Review.
U- The compound was analyzed for but not detected (ND).
J- The identification of the analyte is acceptable, but the quality assurance criteria indicate that the quantitative values may be outside the normal expected range of precision (i.e. the quantitative value is considered estimated).
UJ- This flag is a combination of the U and J qualifiers. This indicates that the analyte is not
present and the reported value is considered to be an estimated result.

JOHN TWITTY ENERGY CENTER - ROUND 2 GROUNDWATER
3
R- Data are considered to be rejected and shall not be used. This flag denotes the failure of quality control criteria such that it cannot be determined if the analyte is present or absent from the sample.
B- The B flag is to be used for both organic and inorganic analyses when the analyte is
found in the associated blank as well as the in the sample. The result is considered ND, and the reported value is considered to be an estimated quantitation limit.
INORGANIC DATA QUALIFIERS
All results for the pH analyses were qualified as estimated due to exceedance of the method specific holding time. The pH method specific holding time requires the samples to be analyzed immediately, which is not possible to achieve when sending samples to an offsite laboratory. Analyzing the pH outside the method specific holding time could indicate a bias in the sample result. Field measurements for pH were also recorded in the field notes at the time of sample collection.
Sample ID Analyte Holding Time Qualifier
JTEC-MW-PZ-01D-20161114 pH > immediately J
JTEC-MW-PZ-08D-20161114 pH > immediately J
JTEC-MW-PZ-09D-20161114 pH > immediately J
JTEC-MW-PZ-13D-20161114 pH > immediately J
JTEC-MW-PZ-03D-20161115 pH > immediately J
JTEC-MW-PZ-10D-20161115 pH > immediately J
JTEC-MW-PZ-11D-20161115 pH > immediately J
JTEC-MW-PZ-12D-20161115 pH > immediately J
JTEC-MW-SA-2A-20161115 pH > immediately J
JTEC-MW-SA-3-20161115 pH > immediately J
JTEC-MW-SA-3-20161115-FD pH > immediately J
JTEC-MW-SA-4-20161115 pH > immediately J
Seven groundwater samples and the field duplicate collected at JTEC were received at PDC Peoria above the acceptable temperature of 4 degrees celsius +/- 2 degrees. The anions (chloride, fluoride, and sulfate) and TDS methods require temperature preservation. Temperatures above the range may be indicative of a low bias in the sample results. Samples received minimally above the acceptable range are qualified as estimated, while receipt conditions above twice the acceptable range would require rejection of the associated sample results. The associated TDS

JOHN TWITTY ENERGY CENTER - ROUND 2 GROUNDWATER
4
and anion results were reported as positive detects and qualified as estimated “J”in the samples listed below.
Sample ID Analyte Receipt Temperature Qualifier
JTEC-MW-PZ-03D-20161115
Cloride, Fluoride, Sulfate, TDS 7 degrees celsius J
JTEC-MW-PZ-10-20161115
JTEC-MW-PZ-11-20161115
JTEC-MW-PZ-12-20161115
JTEC-MW-SA-2A-20161115
JTEC-MW-SA-3A-20161115
JTEC-MW-SA-3A-20161115-FD
JTEC-MW-SA-4A-20161115
In the SW-846 6020 analyses for magnesium and silver performed on sample JTEC-MW-PZ-01D-20161114, MS/MSD spike recoveries were reported below lower control limits. Low spike recoveries are indicative of a potential low bias for magnesium and silver in the sample. The positive magnesium result was qualified estimated “J”. The non-detect silver result was qualified as an estimated non-detect “UJ”.
Sample ID Analyte MS/MSD % recovery Qualifier
JTEC-MW-PZ-01D-20161114 Magnesium 71 J
JTEC-MW-PZ-01D-20161114 Silver 58/58 UJ
In the SW-846 6020 analysis for silver performed on sample JTEC-MW-SA-4-20161115, the MS/MSD spike recoveries were reported below the lower control limit. Low spike recoveries are indicative of a potential low bias for silver in the sample. The non-detect silver result was qualified as an estimated non-detect “UJ”.
Sample ID Analyte MS/MSD % recovery Qualifier
JTEC-MW-SA-4-20161115 Silver 5/5 UJ
In the SW-846 6020 analyses for manganese and nickel performed on samples JTEC-MW-SA-3-20161115 and JTEC-MW-SA-3-20161115-FD, the reported field duplicate RPD was greater than

JOHN TWITTY ENERGY CENTER - ROUND 2 GROUNDWATER
5
50%. However, the positive result for nickel was already qualified as estimated “J” due to being reported above the method detection limit but below the quantitation limit. The positive results for manganese in the sample and field duplicate were qualified as estimated “J”.
Sample ID Analyte RPD % Qualifier
JTEC-MW-SA-3-20161115 Manganese 51 J
In order to achieve the lowest possible detection levels and facilitate the statistical analysis of the groundwater data, PDC was required to report positive results between the method detection level and quantitation limits as estimated detects with a “J” qualifier. RADIOLOGICAL DATA QUALIFIERS
The reported results for total radium in seven groundwater samples and the field duplicate were less than the reported laboratory minimum detectable concentration (MDC) and thus, qualified as “U” not detected at the MDC.
SUMMARY
The inorganic and radiological analyses were performed acceptably, but required qualification for the minor QA/QC deficiencies noted above. The qualified data is included in Attachment I and the chains of custody are included in Attachment II of this report. It is recommended that the analytical data be used only with the qualifiers applied as part of this evaluation. Any aspects of the data, which are not discussed in this report, should be considered qualitatively and quantitatively valid as reported, based on the deliverables reviewed.

JOHN TWITTY ENERGY CENTER - ROUND 2 GROUNDWATER
6
Attachment I
JTEC Round 2 Groundwater Data

Location JTEC-MW-PZ-01D JTEC-MW-PZ-09D
Sample Date 11/14/2016 11/14/2016
Sample Type Normal Normal
Group Analyte Units Result / Qual Result / Qual
Metal Aluminum (total) mg/L 0.14 0.2
Metal Antimony (total) mg/L 0.00056 J 0.000071 J
Metal Arsenic (total) mg/L 0.00047 J 0.00013 U
Metal Barium (total) mg/L 0.088 0.068
Metal Beryllium (total) mg/L 0.000017 U 0.000017 U
Metal Boron (total) mg/L 0.02 0.081
Metal Cadmium (total) mg/L 0.000073 J 0.000068 J
Metal Calcium (total) mg/L 52 120
Metal Chromium (total) mg/L 0.00042 J 0.00027 U
Metal Cobalt (total) mg/L 0.00039 J 0.00038 J
Metal Copper (total) mg/L 0.0014 J 0.0013 J
Metal Iron (total) mg/L 0.099 0.085
Metal Lead (total) mg/L 0.000054 J 0.000025 U
Metal Lithium (total) mg/L 0.0082 J 0.019
Metal Magnesium (total) mg/L 15 J 23
Metal Manganese (total) mg/L 0.071 0.051
Metal Mercury (total) mg/L 0.0000022 U 0.0000022 U
Metal Molybdenum (total) mg/L 0.026 0.019
Metal Nickel (total) mg/L 0.004 J 0.0025 J
Metal Selenium (total) mg/L 0.00032 U 0.00072 J
Metal Silver (total) mg/L 0.000028 UJ 0.000028 U
Metal Sodium (total) mg/L 8 95
Metal Thallium (total) mg/L 0.00023 J 0.00015 J
Metal Zinc (total) mg/L 0.0026 J 0.004 J
Cation/Anion Chloride mg/L 4.4 52
Cation/Anion Fluoride mg/L 0.344 0.352
Cation/Anion Sulfate mg/L 27 310
Physical Properties Chemical Oxygen Demand (COD) mg/L 3.2 U 3.2 U
Physical Properties Conductivity umhos/cm 400 1000
Physical Properties Hardness (as CACO3) mg/L 190 400
Physical Properties pH pH Units 7 7.1
Physical Properties Total Dissolved Solids (TDS) mg/L 300 700
Physical Properties Total Organic Carbon (TOC) mg/L 0.41 J 0.83
Physical Properties Total Organic Halides (TOX) mg/L 0.0041 U 0.017
Radionuclide Radium-226/228 pCi/L 1.56 U 1.68
JTEC Up Gradient Groundwater Collected in Round 2

Location JTEC-MW-PZ-03D JTEC-MW-PZ-08D JTEC-MW-PZ-10D JTEC-MW-PZ-11D JTEC-MW-PZ-12D JTEC-MW-PZ-13D JTEC-MW-SA-2A JTEC-MW-SA-3 JTEC-MW-SA-3 JTEC-MW-SA-4
Sample Date 11/15/2016 11/14/2016 11/15/2016 11/15/2016 11/15/2016 11/14/2016 11/15/2016 11/15/2016 11/15/2016 11/15/2016
Sample Type Normal Normal Normal Normal Normal Normal Normal Field Duplicate Normal Normal
Group Analyte Units Result / Qual Result / Qual Result / Qual Result / Qual Result / Qual Result / Qual Result / Qual Result / Qual Result / Qual Result / Qual
Metal Aluminum (total) mg/L 0.12 0.35 0.039 0.033 0.081 0.11 0.83 0.17 0.15 0.22
Metal Antimony (total) mg/L 0.0031 0.0097 0.000036 U 0.000036 U 0.000036 U 0.000036 U 0.000036 U 0.000036 U 0.000036 U 0.000036 U
Metal Arsenic (total) mg/L 0.0006 J 0.00042 J 0.00013 U 0.00013 U 0.00026 J 0.00016 J 0.00061 J 0.00065 J 0.00061 J 0.00019 J
Metal Barium (total) mg/L 0.084 0.092 0.072 0.03 0.046 0.087 0.076 0.042 0.036 0.054
Metal Beryllium (total) mg/L 0.000018 J 0.000017 U 0.000017 U 0.000017 U 0.000017 U 0.000024 J 0.000017 U 0.000017 U 0.000017 U 0.000017 U
Metal Boron (total) mg/L 0.03 0.039 0.67 0.06 0.016 0.013 0.034 0.045 0.042 1.1
Metal Cadmium (total) mg/L 0.000042 U 0.000057 J 0.000042 U 0.000042 U 0.000042 U 0.000042 U 0.00035 J 0.000042 U 0.000042 U 0.000087 J
Metal Calcium (total) mg/L 51 78 230 44 60 54 54 46 45 330
Metal Chromium (total) mg/L 0.00027 U 0.0011 J 0.0026 J 0.00029 J 0.00027 U 0.00027 U 0.0025 J 0.00095 J 0.00027 U 0.00027 U
Metal Cobalt (total) mg/L 0.00056 J 0.00017 J 0.000086 J 0.000017 U 0.0011 J 0.00058 J 0.00068 J 0.000073 J 0.000074 J 0.00039 J
Metal Copper (total) mg/L 0.0018 J 0.0021 J 0.0011 J 0.00085 J 0.00095 J 0.0011 J 0.0087 0.0011 J 0.0013 J 0.00093 J
Metal Iron (total) mg/L 0.12 0.33 0.04 0.017 0.059 0.099 0.71 0.065 0.066 0.12
Metal Lead (total) mg/L 0.00018 J 0.00034 J 0.000037 J 0.000025 U 0.000025 U 0.000058 J 0.0081 0.000034 J 0.000025 U 0.00022 J
Metal Lithium (total) mg/L 0.0031 J 0.013 0.0035 J 0.025 0.0014 J 0.0099 J 0.0019 J 0.0058 J 0.0048 J 0.0029 J
Metal Magnesium (total) mg/L 17 25 40 21 18 20 7.5 21 22 14
Metal Manganese (total) mg/L 0.056 0.023 0.0019 0.00051 J 0.38 0.15 0.017 0.0026 J 0.0044 J 0.015
Metal Mercury (total) mg/L 0.0000022 U 0.0000022 U 0.0000022 U 0.0000022 U 0.0000022 U 0.0000022 U 0.0000022 U 0.0000022 U 0.0000022 U 0.000011 J
Metal Molybdenum (total) mg/L 0.011 0.011 0.00063 J 0.0016 0.0084 0.0057 0.052 0.0051 0.0044 0.003
Metal Nickel (total) mg/L 0.0016 J 0.00088 J 0.0016 J 0.0013 J 0.0013 J 0.00014 J 0.0045 J 0.00026 J 0.00013 J 0.002 J
Metal Selenium (total) mg/L 0.00032 U 0.00079 J 0.0023 0.00032 U 0.00032 U 0.00048 J 0.0012 0.00056 J 0.00043 J 0.0033
Metal Silver (total) mg/L 0.00015 J 0.000028 U 0.000028 U 0.000028 U 0.000054 J 0.000028 U 0.00067 J 0.000028 U 0.000028 U 0.000028 UJ
Metal Sodium (total) mg/L 5 55 27 4.7 3.3 3.9 94 16 13 70
Metal Thallium (total) mg/L 0.00022 J 0.00024 J 0.00009 J 0.000063 J 0.000062 U 0.000062 U 0.000062 U 0.000062 U 0.000062 U 0.000062 U
Metal Zinc (total) mg/L 0.0042 J 0.0038 J 0.0029 J 0.0023 J 0.0022 J 0.002 J 0.18 0.0042 J 0.0057 J 0.013
Cation/Anion Chloride mg/L 3.7 J 27 270 J 3.2 J 8.5 J 5.4 52 J 18 J 16 J 280 J
Cation/Anion Fluoride mg/L 0.317 J 0.327 0.13 J 0.388 J 0.28 J 0.31 0.239 J 0.373 J 0.356 J 0.178 J
Cation/Anion Sulfate mg/L 16 J 130 280 J 15 J 20 J 21 110 J 41 J 41 J 560 J
Physical Properties Chemical Oxygen Demand (COD) mg/L 3.2 U 3.2 U 3.2 U 3.2 U 3.2 U 3.2 U 3.2 U 3.2 U 3.2 U 3.2 U
Physical Properties Conductivity umhos/cm 410 750 1600 380 430 420 790 480 470 2100
Physical Properties Hardness (as CACO3) mg/L 200 300 750 200 220 220 160 200 200 870
Physical Properties pH pH Units 7.1 7.2 7 7.6 7.4 7.2 7.6 7.6 7.6 6.8
Physical Properties Total Dissolved Solids (TDS) mg/L 180 J 450 1300 J 160 J 220 J 280 470 J 330 J 270 J 230 J
Physical Properties Total Organic Carbon (TOC) mg/L 0.66 0.56 0.41 J 0.18 J 1 0.7 0.68 0.59 0.81 1
Physical Properties Total Organic Halides (TOX) mg/L 0.0095 0.0041 U 0.03 0.0041 U 0.0057 0.0041 U 0.005 0.0056 0.0041 U 0.04
Radionuclide Radium-226/228 pCi/L 1.58 U 1.48 1.4 U 1.28 U 1.33 U 2.17 1.18 U 1.48 U 1.5 1.13 U
JTEC Down Gradient Groundwater Collected in Round 2

JOHN TWITTY ENERGY CENTER - ROUND 2 GROUNDWATER
7
Attachment II
Chains of Custody


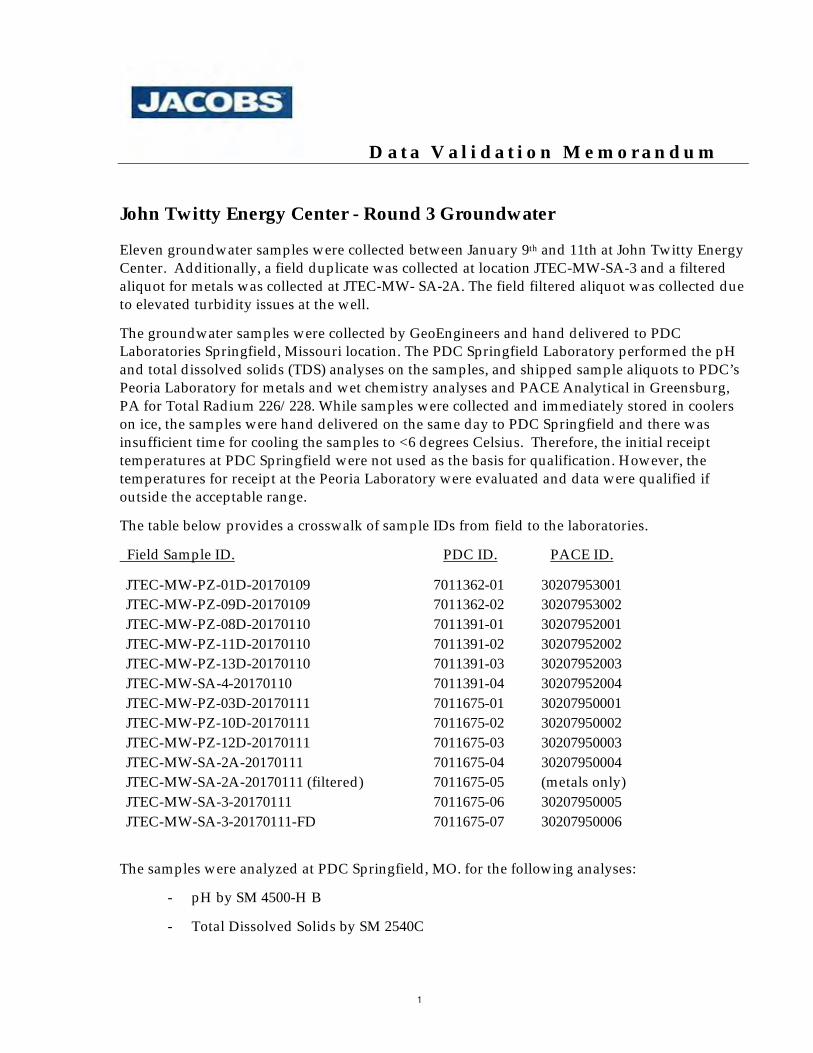
D a t a V a l i d a t i o n M e m o r a n d u m
1
John Twitty Energy Center - Round 3 Groundwater
Eleven groundwater samples were collected between January 9th and 11th at John Twitty Energy Center. Additionally, a field duplicate was collected at location JTEC-MW-SA-3 and a filtered aliquot for metals was collected at JTEC-MW- SA-2A. The field filtered aliquot was collected due to elevated turbidity issues at the well.
The groundwater samples were collected by GeoEngineers and hand delivered to PDC Laboratories Springfield, Missouri location. The PDC Springfield Laboratory performed the pH and total dissolved solids (TDS) analyses on the samples, and shipped sample aliquots to PDC’s Peoria Laboratory for metals and wet chemistry analyses and PACE Analytical in Greensburg, PA for Total Radium 226/228. While samples were collected and immediately stored in coolers on ice, the samples were hand delivered on the same day to PDC Springfield and there was insufficient time for cooling the samples to <6 degrees Celsius. Therefore, the initial receipt temperatures at PDC Springfield were not used as the basis for qualification. However, the temperatures for receipt at the Peoria Laboratory were evaluated and data were qualified if outside the acceptable range.
The table below provides a crosswalk of sample IDs from field to the laboratories.
Field Sample ID. PDC ID. PACE ID.
JTEC-MW-PZ-01D-20170109 7011362-01 30207953001 JTEC-MW-PZ-09D-20170109 7011362-02 30207953002 JTEC-MW-PZ-08D-20170110 7011391-01 30207952001 JTEC-MW-PZ-11D-20170110 7011391-02 30207952002 JTEC-MW-PZ-13D-20170110 7011391-03 30207952003 JTEC-MW-SA-4-20170110 7011391-04 30207952004 JTEC-MW-PZ-03D-20170111 7011675-01 30207950001 JTEC-MW-PZ-10D-20170111 7011675-02 30207950002 JTEC-MW-PZ-12D-20170111 7011675-03 30207950003 JTEC-MW-SA-2A-20170111 7011675-04 30207950004 JTEC-MW-SA-2A-20170111 (filtered) 7011675-05 (metals only) JTEC-MW-SA-3-20170111 7011675-06 30207950005 JTEC-MW-SA-3-20170111-FD 7011675-07 30207950006
The samples were analyzed at PDC Springfield, MO. for the following analyses:
- pH by SM 4500-H B
- Total Dissolved Solids by SM 2540C

JOHN TWITTY ENERGY CENTER - ROUND 3 GROUNDWATER
2
The samples were analyzed at PDC Peoria, IL. for the following analyses:
- Anions by EPA 300.0
- COD by SM 5220D
- Conductivity by SM 2510B
- Total Organic Halide by SW-846 9020
- Total Organic Carbon by SM5310C
- Total Metals by SW-846 6010/6020
- Hardness (calculation)
- Total Mercury by SW-846 7470
The samples were analyzed at PACE Greensburg, PA. for the following:
- Total Radium (226/228)
This quality assurance memorandum is based upon the validation of analytical data generated for Round 3 groundwater samples collected at John Twitty Energy Center. The analyses were reviewed for adherence to the specified analytical protocols in accordance with the analytical methods, laboratory standard operating procedures, Quality Assurance Project Plan (QAPP) for Coal Combustion Residual Landfill Monitoring at John Twitty Energy Center, January 2016, and the guidance of the USEPA Contract Laboratory Program National Functional Guidelines for Inorganic Data Review, August 2014. The findings of this quality assurance report are based upon the comprehensive review of the data deliverables from PDC and PACE reported according to the project QAPP and the EPA modified Level III format (including raw data). The review included chain of custody documentation, sample receipt conditions, holding times, field QA samples, laboratory QC samples, calibrations, and target compound identification and quantitation of results.
The following definitions provide explanations of the data qualifiers that may be assigned to results based on this evaluation. The data qualifier definitions are consistent with the USEPA National Functional Guidelines for Inorganic Data Review.
U- The compound was analyzed for but not detected (ND).
J- The identification of the analyte is acceptable, but the quality assurance criteria indicate that the quantitative values may be outside the normal expected range of precision (i.e. the quantitative value is considered estimated).
UJ- This flag is a combination of the U and J qualifiers. This indicates that the analyte is not
present and the reported value is considered to be an estimated result.
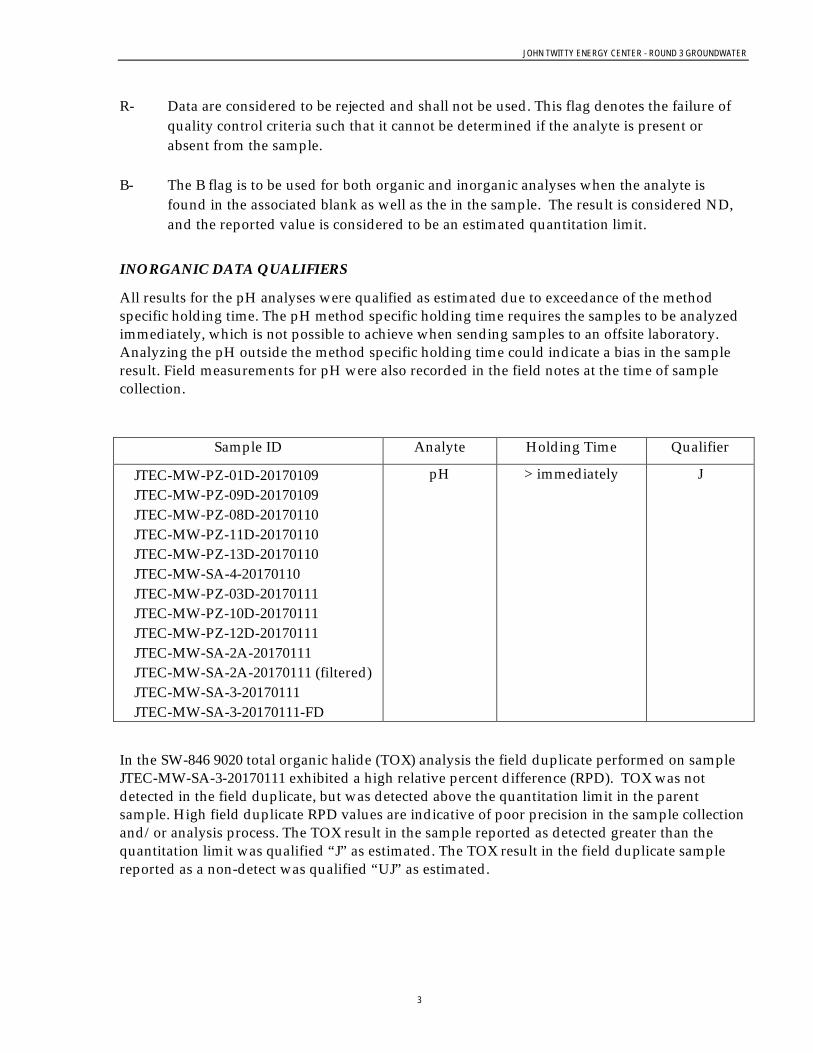
JOHN TWITTY ENERGY CENTER - ROUND 3 GROUNDWATER
3
R- Data are considered to be rejected and shall not be used. This flag denotes the failure of quality control criteria such that it cannot be determined if the analyte is present or absent from the sample.
B- The B flag is to be used for both organic and inorganic analyses when the analyte is
found in the associated blank as well as the in the sample. The result is considered ND, and the reported value is considered to be an estimated quantitation limit.
INORGANIC DATA QUALIFIERS
All results for the pH analyses were qualified as estimated due to exceedance of the method specific holding time. The pH method specific holding time requires the samples to be analyzed immediately, which is not possible to achieve when sending samples to an offsite laboratory. Analyzing the pH outside the method specific holding time could indicate a bias in the sample result. Field measurements for pH were also recorded in the field notes at the time of sample collection.
Sample ID Analyte Holding Time Qualifier
JTEC-MW-PZ-01D-20170109 JTEC-MW-PZ-09D-20170109 JTEC-MW-PZ-08D-20170110 JTEC-MW-PZ-11D-20170110 JTEC-MW-PZ-13D-20170110 JTEC-MW-SA-4-20170110 JTEC-MW-PZ-03D-20170111 JTEC-MW-PZ-10D-20170111 JTEC-MW-PZ-12D-20170111 JTEC-MW-SA-2A-20170111 JTEC-MW-SA-2A-20170111 (filtered) JTEC-MW-SA-3-20170111 JTEC-MW-SA-3-20170111-FD
pH > immediately J
In the SW-846 9020 total organic halide (TOX) analysis the field duplicate performed on sample JTEC-MW-SA-3-20170111 exhibited a high relative percent difference (RPD). TOX was not detected in the field duplicate, but was detected above the quantitation limit in the parent sample. High field duplicate RPD values are indicative of poor precision in the sample collection and/or analysis process. The TOX result in the sample reported as detected greater than the quantitation limit was qualified “J” as estimated. The TOX result in the field duplicate sample reported as a non-detect was qualified “UJ” as estimated.

JOHN TWITTY ENERGY CENTER - ROUND 3 GROUNDWATER
4
Sample ID Analyte Field Duplicate RPD Qualifier
JTEC-MW-SA-3-20170111
TOX 91% RPD J/UJ
JTEC-MW-SA-3-20170111-FD
TOX 91% RPD UJ
In the EPA 300 analyses for chloride and fluoride performed on sample JTEC-MW-PZ-01D-20170109, MS/MSD spike recoveries were reported above the upper control limits. Elevated spike recoveries are indicative of a potential high bias for chloride and fluoride in the sample. The positive chloride and fluoride results were qualified estimated “J”.
Sample ID Analyte MS/MSD % recovery Qualifier
JTEC-MW-PZ-01D-20170109 Chloride 137/137 J
JTEC-MW-PZ-01D-20170109 Fluoride 126/127 J
In the SW-846 6020 metals analyses, several compounds were present in the blanks at less than 5 times the blank value. Detects of metals analytes in the method blanks indicates a potential contamination issue with the analytical process for the associated samples. The positive results for the metals analytes in the samples listed below were qualified as “B” to indicate the potential high bias in the samples due to the blank contamination.
Sample ID Analytes (less than 5x blank value) Qualifier
JTEC-MW-PZ-01D-20170109 Nickel B
JTEC-MW-PZ-08D-20170110 Iron B
JTEC-MW-PZ-09D-20170109 Nickel, Cadmium, Cobalt B
JTEC-MW-PZ-13D-20170110 Cobalt B
JTEC-MW-SA-4-20170110 Nickel B
JTEC-MW-PZ-03D-20170111 Nickel B
JTEC-MW-PZ-10D-20170111 Nickel, Copper B
JTEC-MW-PZ-12D-20170111 Nickel, Copper B
JTEC-MW-SA-2A-20170111 Nickel B
JTEC-MW-SA-2A-20170111 filtered Nickel B
JTEC-MW-SA-3A-20170111 Nickel B
JTEC-MW-SA-3A-20170111-FD Nickel B

JOHN TWITTY ENERGY CENTER - ROUND 3 GROUNDWATER
5
In the SW-846 6010 analyses for lithium performed on samples JTEC-MW-PZ-01D-20170109 and JTEC-MW-SA-4-20170110, the MS/MSD spike recoveries were reported above the upper control limit. High spike recoveries are indicative of a potential high bias for lithium in the samples. The detects for lithium in the parent samples were qualified as an estimated “J”.
Sample ID Analyte MS/MSD % recovery Qualifier
JTEC-MW-PZ-01D-20170109 Lithium 136/131 J
JTEC-MW-SA-4-20170110 Lithium 155/152 J
In the SW-846 6020 analysis for aluminum performed on sample JTEC-MW-PZ-01D-20170109, the MS/MSD spike recoveries were reported above the upper control limit. High spike recoveries are indicative of a potential high bias for aluminum in the sample. The detect for aluminum in the parent sample was qualified as estimated “J”.
Sample ID Analyte MS/MSD % recovery Qualifier
JTEC-MW-PZ-01D-20170109 Aluminum 134/134 J
In the SW-846 6010 analysis for iron performed on sample JTEC-MW-SA-3-20170111, the reported field duplicate RPD was greater than 50%. High field duplicate RPD is indicative of poor precision in the sampling and/or analytical process. The positive result for iron in the associated parent was qualified as estimated “J”
Sample ID Analyte RPD % Qualifier
JTEC-MW-SA-3-20170111 Iron 119 J
In the SW-846 6020 analyses for aluminum, copper, lead, and antimony performed on sample JTEC-MW-SA-3-20170111, the reported field duplicate RPDs were greater than 50%. High field duplicate RPD is indicative of poor precision in the sampling and/or analytical process. The positive results for aluminum, copper, lead, and antimony in the associated parent were qualified as estimated “J”
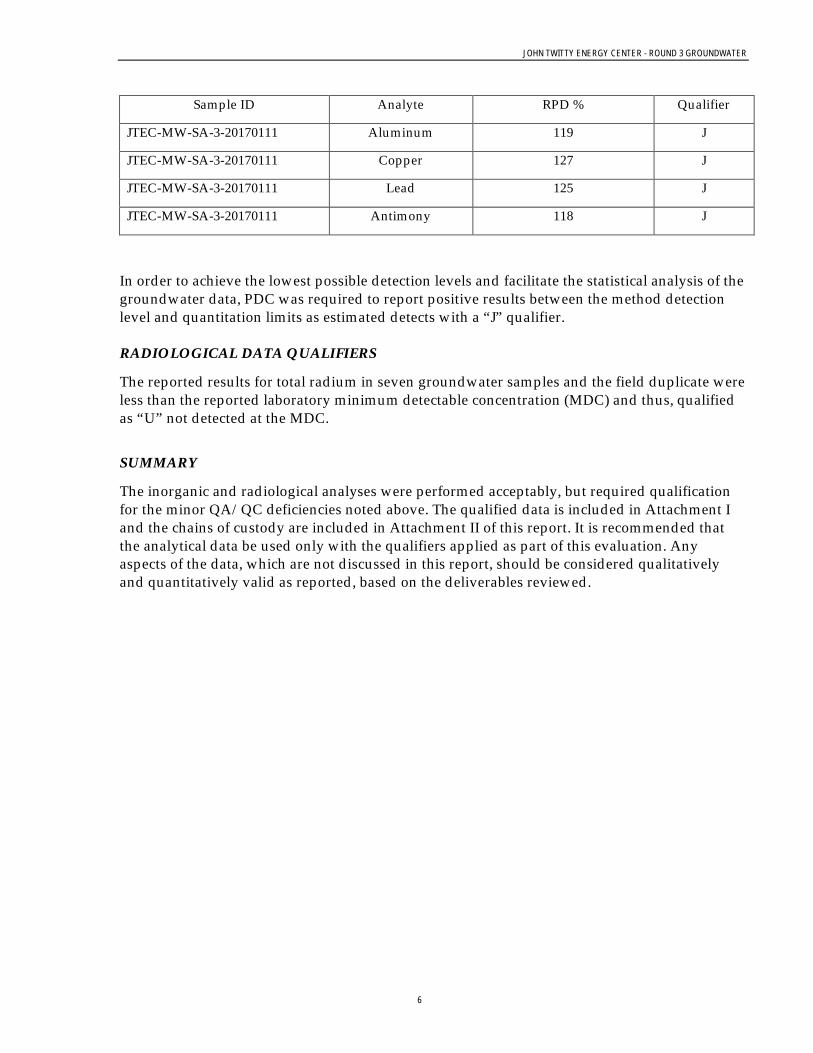
JOHN TWITTY ENERGY CENTER - ROUND 3 GROUNDWATER
6
Sample ID Analyte RPD % Qualifier
JTEC-MW-SA-3-20170111 Aluminum 119 J
JTEC-MW-SA-3-20170111 Copper 127 J
JTEC-MW-SA-3-20170111 Lead 125 J
JTEC-MW-SA-3-20170111 Antimony 118 J
In order to achieve the lowest possible detection levels and facilitate the statistical analysis of the groundwater data, PDC was required to report positive results between the method detection level and quantitation limits as estimated detects with a “J” qualifier. RADIOLOGICAL DATA QUALIFIERS
The reported results for total radium in seven groundwater samples and the field duplicate were less than the reported laboratory minimum detectable concentration (MDC) and thus, qualified as “U” not detected at the MDC.
SUMMARY
The inorganic and radiological analyses were performed acceptably, but required qualification for the minor QA/QC deficiencies noted above. The qualified data is included in Attachment I and the chains of custody are included in Attachment II of this report. It is recommended that the analytical data be used only with the qualifiers applied as part of this evaluation. Any aspects of the data, which are not discussed in this report, should be considered qualitatively and quantitatively valid as reported, based on the deliverables reviewed.

JOHN TWITTY ENERGY CENTER - ROUND 3 GROUNDWATER
7
Attachment I
JTEC Round 3 Groundwater Data

Location JTEC-MW-PZ-01D JTEC-MW-PZ-09D
Sample Date 01/09/2017 01/09/2017
Sample Type Normal Normal
Group Analyte Units Result / Qual Result / Qual
Metal Aluminum (total) mg/L 0.2 J 0.034
Metal Antimony (total) mg/L 0.0033 0.000036 U
Metal Arsenic (total) mg/L 0.00054 J 0.00016 J
Metal Barium (total) mg/L 0.086 0.059
Metal Beryllium (total) mg/L 0.000017 U 0.000017 U
Metal Boron (total) mg/L 0.019 0.068
Metal Cadmium (total) mg/L 0.000042 U 0.000071 B
Metal Calcium (total) mg/L 53 100
Metal Chromium (total) mg/L 0.00027 U 0.00027 U
Metal Cobalt (total) mg/L 0.00072 J 0.0003 B
Metal Copper (total) mg/L 0.00048 J 0.0006 J
Metal Iron (total) mg/L 0.13 0.048
Metal Lead (total) mg/L 0.00024 J 0.000074 J
Metal Lithium (total) mg/L 0.0092 J 0.02
Metal Magnesium (total) mg/L 17 19
Metal Manganese (total) mg/L 0.03 0.013
Metal Mercury (total) mg/L 0.000047 J 0.00009 J
Metal Molybdenum (total) mg/L 0.024 0.019
Metal Nickel (total) mg/L 0.0035 B 0.014 B
Metal Selenium (total) mg/L 0.00043 J 0.001
Metal Silver (total) mg/L 0.000028 U 0.000028 U
Metal Sodium (total) mg/L 11 100
Metal Thallium (total) mg/L 0.00022 J 0.00029 J
Metal Zinc (total) mg/L 0.0022 J 0.0022 J
Cation/Anion Chloride mg/L 6.1 J 53
Cation/Anion Fluoride mg/L 0.311 J 0.328
Cation/Anion Sulfate mg/L 34 250
Physical Properties Chemical Oxygen Demand (COD) mg/L 3.2 U 3.2 U
Physical Properties Conductivity umhos/cm 440 1100
Physical Properties Hardness (as CACO3) mg/L 200 340
Physical Properties pH pH Units 7.59 J 7.43 J
Physical Properties Total Dissolved Solids (TDS) mg/L 240 620
Physical Properties Total Organic Carbon (TOC) mg/L 0.8 0.65
Physical Properties Total Organic Halides (TOX) mg/L 0.0068 0.018
Radionuclide Radium-226/228 pCi/L 1.94 U 1.82 U
JTEC Up Gradient Groundwater Collected in Round 3
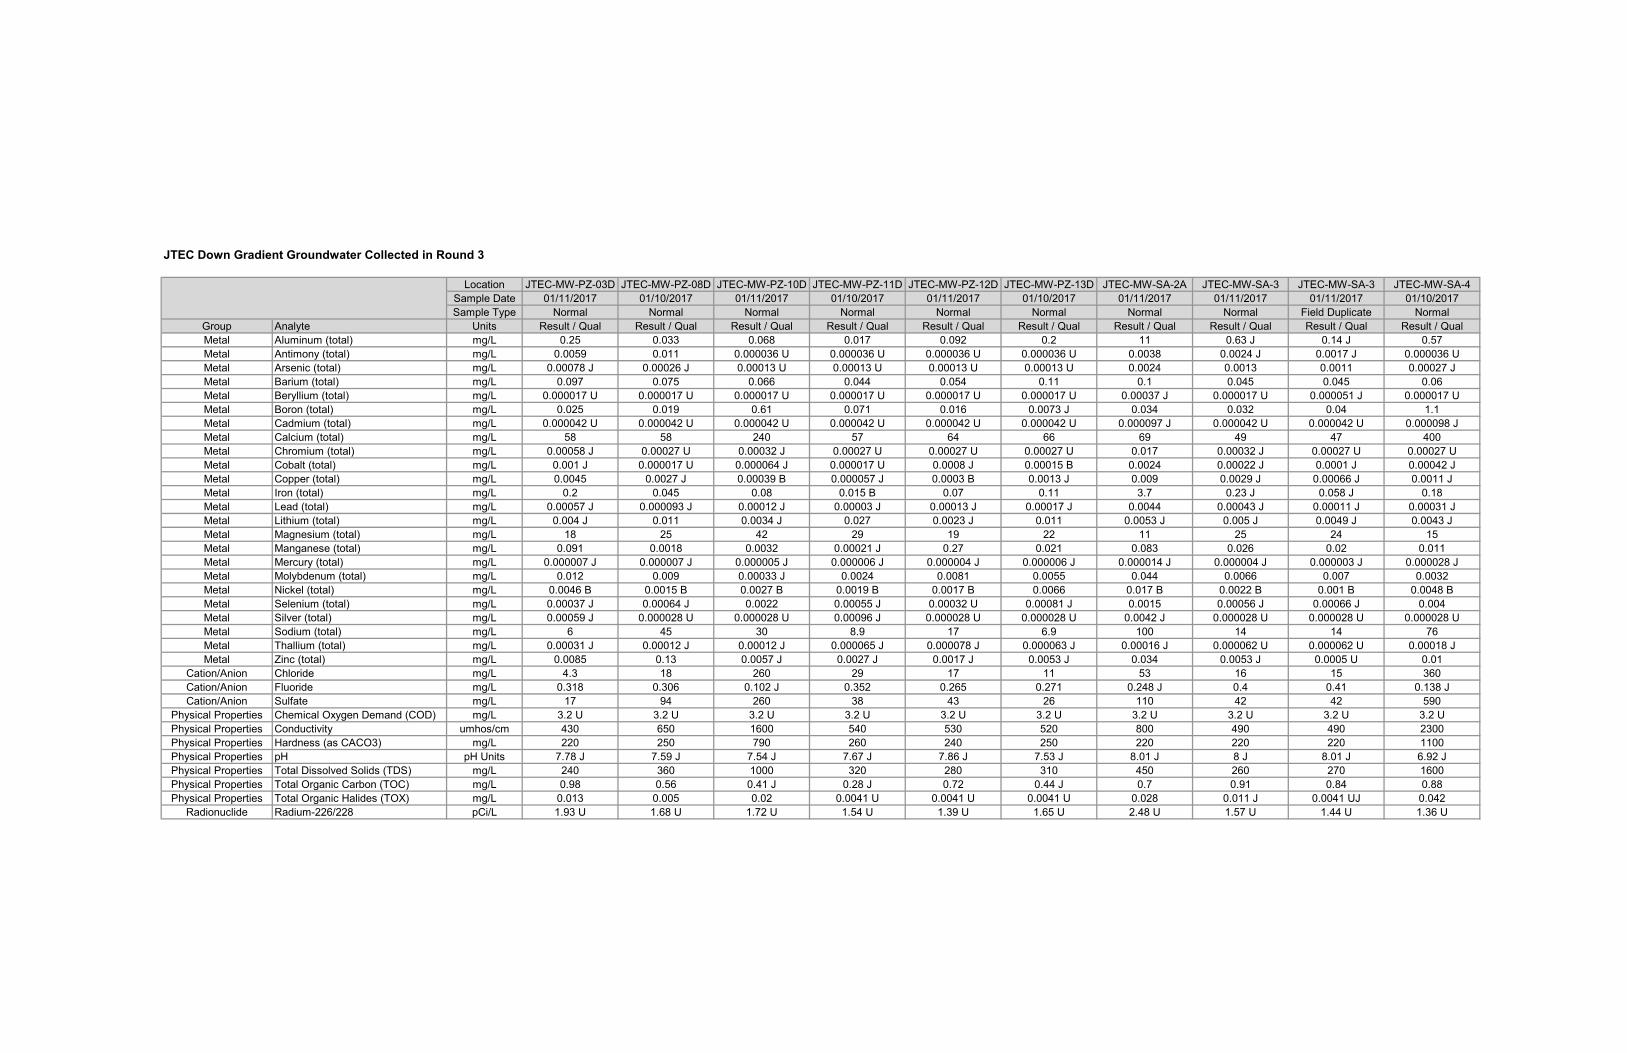
Location JTEC-MW-PZ-03D JTEC-MW-PZ-08D JTEC-MW-PZ-10D JTEC-MW-PZ-11D JTEC-MW-PZ-12D JTEC-MW-PZ-13D JTEC-MW-SA-2A JTEC-MW-SA-3 JTEC-MW-SA-3 JTEC-MW-SA-4
Sample Date 01/11/2017 01/10/2017 01/11/2017 01/10/2017 01/11/2017 01/10/2017 01/11/2017 01/11/2017 01/11/2017 01/10/2017
Sample Type Normal Normal Normal Normal Normal Normal Normal Normal Field Duplicate Normal
Group Analyte Units Result / Qual Result / Qual Result / Qual Result / Qual Result / Qual Result / Qual Result / Qual Result / Qual Result / Qual Result / Qual
Metal Aluminum (total) mg/L 0.25 0.033 0.068 0.017 0.092 0.2 11 0.63 J 0.14 J 0.57
Metal Antimony (total) mg/L 0.0059 0.011 0.000036 U 0.000036 U 0.000036 U 0.000036 U 0.0038 0.0024 J 0.0017 J 0.000036 U
Metal Arsenic (total) mg/L 0.00078 J 0.00026 J 0.00013 U 0.00013 U 0.00013 U 0.00013 U 0.0024 0.0013 0.0011 0.00027 J
Metal Barium (total) mg/L 0.097 0.075 0.066 0.044 0.054 0.11 0.1 0.045 0.045 0.06
Metal Beryllium (total) mg/L 0.000017 U 0.000017 U 0.000017 U 0.000017 U 0.000017 U 0.000017 U 0.00037 J 0.000017 U 0.000051 J 0.000017 U
Metal Boron (total) mg/L 0.025 0.019 0.61 0.071 0.016 0.0073 J 0.034 0.032 0.04 1.1
Metal Cadmium (total) mg/L 0.000042 U 0.000042 U 0.000042 U 0.000042 U 0.000042 U 0.000042 U 0.000097 J 0.000042 U 0.000042 U 0.000098 J
Metal Calcium (total) mg/L 58 58 240 57 64 66 69 49 47 400
Metal Chromium (total) mg/L 0.00058 J 0.00027 U 0.00032 J 0.00027 U 0.00027 U 0.00027 U 0.017 0.00032 J 0.00027 U 0.00027 U
Metal Cobalt (total) mg/L 0.001 J 0.000017 U 0.000064 J 0.000017 U 0.0008 J 0.00015 B 0.0024 0.00022 J 0.0001 J 0.00042 J
Metal Copper (total) mg/L 0.0045 0.0027 J 0.00039 B 0.000057 J 0.0003 B 0.0013 J 0.009 0.0029 J 0.00066 J 0.0011 J
Metal Iron (total) mg/L 0.2 0.045 0.08 0.015 B 0.07 0.11 3.7 0.23 J 0.058 J 0.18
Metal Lead (total) mg/L 0.00057 J 0.000093 J 0.00012 J 0.00003 J 0.00013 J 0.00017 J 0.0044 0.00043 J 0.00011 J 0.00031 J
Metal Lithium (total) mg/L 0.004 J 0.011 0.0034 J 0.027 0.0023 J 0.011 0.0053 J 0.005 J 0.0049 J 0.0043 J
Metal Magnesium (total) mg/L 18 25 42 29 19 22 11 25 24 15
Metal Manganese (total) mg/L 0.091 0.0018 0.0032 0.00021 J 0.27 0.021 0.083 0.026 0.02 0.011
Metal Mercury (total) mg/L 0.000007 J 0.000007 J 0.000005 J 0.000006 J 0.000004 J 0.000006 J 0.000014 J 0.000004 J 0.000003 J 0.000028 J
Metal Molybdenum (total) mg/L 0.012 0.009 0.00033 J 0.0024 0.0081 0.0055 0.044 0.0066 0.007 0.0032
Metal Nickel (total) mg/L 0.0046 B 0.0015 B 0.0027 B 0.0019 B 0.0017 B 0.0066 0.017 B 0.0022 B 0.001 B 0.0048 B
Metal Selenium (total) mg/L 0.00037 J 0.00064 J 0.0022 0.00055 J 0.00032 U 0.00081 J 0.0015 0.00056 J 0.00066 J 0.004
Metal Silver (total) mg/L 0.00059 J 0.000028 U 0.000028 U 0.00096 J 0.000028 U 0.000028 U 0.0042 J 0.000028 U 0.000028 U 0.000028 U
Metal Sodium (total) mg/L 6 45 30 8.9 17 6.9 100 14 14 76
Metal Thallium (total) mg/L 0.00031 J 0.00012 J 0.00012 J 0.000065 J 0.000078 J 0.000063 J 0.00016 J 0.000062 U 0.000062 U 0.00018 J
Metal Zinc (total) mg/L 0.0085 0.13 0.0057 J 0.0027 J 0.0017 J 0.0053 J 0.034 0.0053 J 0.0005 U 0.01
Cation/Anion Chloride mg/L 4.3 18 260 29 17 11 53 16 15 360
Cation/Anion Fluoride mg/L 0.318 0.306 0.102 J 0.352 0.265 0.271 0.248 J 0.4 0.41 0.138 J
Cation/Anion Sulfate mg/L 17 94 260 38 43 26 110 42 42 590
Physical Properties Chemical Oxygen Demand (COD) mg/L 3.2 U 3.2 U 3.2 U 3.2 U 3.2 U 3.2 U 3.2 U 3.2 U 3.2 U 3.2 U
Physical Properties Conductivity umhos/cm 430 650 1600 540 530 520 800 490 490 2300
Physical Properties Hardness (as CACO3) mg/L 220 250 790 260 240 250 220 220 220 1100
Physical Properties pH pH Units 7.78 J 7.59 J 7.54 J 7.67 J 7.86 J 7.53 J 8.01 J 8 J 8.01 J 6.92 J
Physical Properties Total Dissolved Solids (TDS) mg/L 240 360 1000 320 280 310 450 260 270 1600
Physical Properties Total Organic Carbon (TOC) mg/L 0.98 0.56 0.41 J 0.28 J 0.72 0.44 J 0.7 0.91 0.84 0.88
Physical Properties Total Organic Halides (TOX) mg/L 0.013 0.005 0.02 0.0041 U 0.0041 U 0.0041 U 0.028 0.011 J 0.0041 UJ 0.042
Radionuclide Radium-226/228 pCi/L 1.93 U 1.68 U 1.72 U 1.54 U 1.39 U 1.65 U 2.48 U 1.57 U 1.44 U 1.36 U
JTEC Down Gradient Groundwater Collected in Round 3

JOHN TWITTY ENERGY CENTER - ROUND 3 GROUNDWATER
8
Attachment II
Chains of Custody
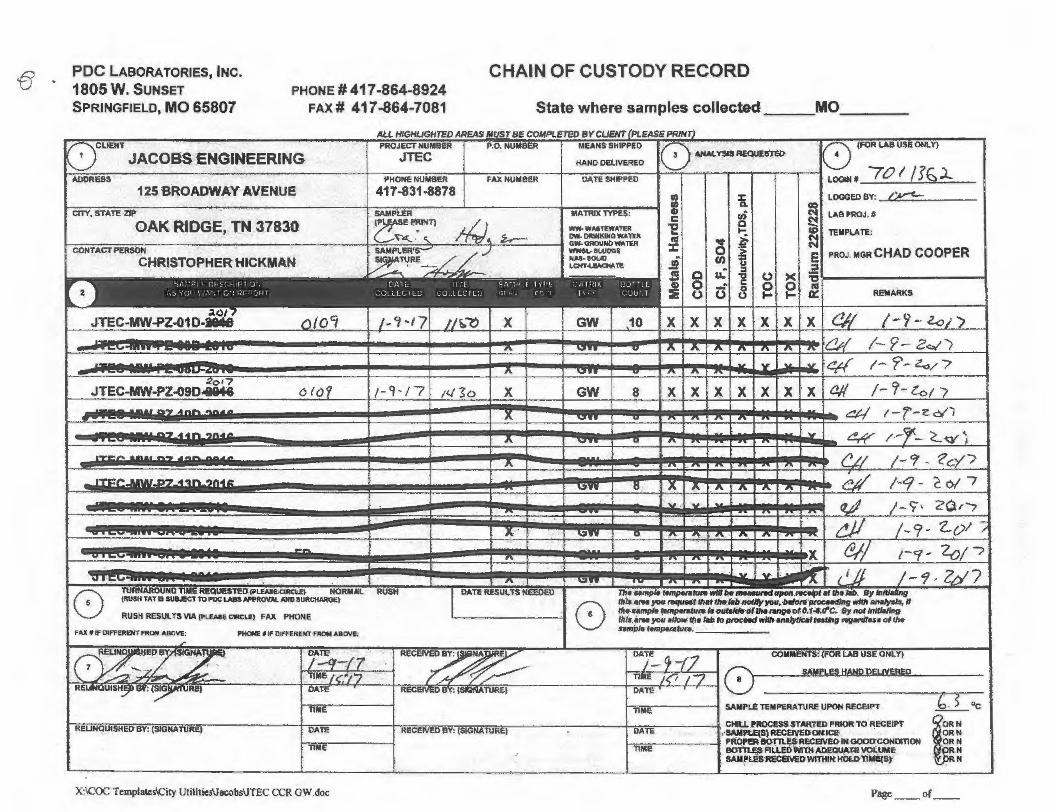
POC lABORA TORIES, INC.
1805W. SUNSET SPRINGFIELD, MO 65807
PHONE# 417-864-8924 FAX# 417-864-7081
12$.'B:ROADWAY AVENUE
crTY, STATE·ZJP
OAK RIDGE, TN 37830' CONTACT PERSON
CHRISTOPHER HICKMAN
017 JTEC-MW•PZ-09011846 0 {() / - Cf • I 7 1<1 !, o
TlJRffAROUNQ" ltl!QUESlEO (l>ILUIL'CIMU) NORMAL (ftUSll TAT IS SUUl!CTTOPDc; I.Alla N'f'f«71M. ~l~E}
RUSH
RUSI! RESUt. T$ VIA (PU!All ClltCU!) FAX PHOME
CHAIN OF CUSTODY RECORD
State where samples collected ___ MO ___ _
a v)
~ .., ~ 0 ~ U)
&L :I 0 'O
0 c 0 0
0 0
l.OGGEDBY: ~ ~ LASPROJ.# ~ co TEMPI.A Tt:: ~ E PROJ. MGR CHAD COOPER = . o >< :s-
0 0 I'd REMARKS .... . .... «. 1-9-l.c
I- 9- Ze:,1/ 1- f-Z.0/7
/- ?- ~o/ /
COMMEM:S-S:' (FOR t.AB USE ONLY)
S.Q!PLES HAND QEUVERED
1-=llM=e=------.1 SAMPU! TEllPEAATURE UPOH RECEIPT
f-;;jm;;;n.;;-;;u;;nc;;;;:-;.;:;;;;tti'ln;;;-------f-r=i;.-----f-.=-i...,..,.....:::-::::-:::-;-:-==---------+-=-:.:;:-----lC~lLPROCESS-STAfUEl>PRIORTORea:tPT REUNQUISHEOBY: (SIGNAT\JRE) DATE RECE BY: !51GNAl1JREI DATE SAMPt.E(S~RECEJWE.tJOftlCI!'
TIME
~,.,.,-----___.. PROPt!RISOHl.U.RECENEI>bt~DmON TIME "TIME 90Tn.e$ FILLEDWrQl-~QU~lE \/Ol.UME
SAMPlES RECeNEOWJnfllt HOU>JIMl!(S)
X:\COC Templatcs\City Utllitics\lacobs\ITEC cx:;R OW.doc Pilgc __ of __

CHAIN OF CUSTODY RECORD PDC LABORATORIES, INC. 1805 W. SUNSET SPRINGFIELD, MO 65807
PHONE# 417-864-8924 FAX# 417-864-7081 State where samples collected ___ MO ___ _
ALL H/GHLIGHTEO AREAS MUST BE COMPl.ETED BY CUENT (PLEASE PR/NT) ocuarr PROJECT NUMBER 1'.0. NUMBER MEANS SHIPPl!D 0 ~M,YS!S l(~QOESTEl) . 8 (FOR LAB USE ONLY)
. JAC.QB.~ ENGtNE.ERING JTEC HAND DELIVERED
ADORE!lS '. PHONE NUMBER FAX NUMBER DATI! SHIPPED LOGIN# -:Z.~l lf.i l '125.BROADWAY AVENUE 417-831-8878 en :z: LOGGED BY:~
= a. co
ctJY, STATE ZIP' SAllPLl!R MA TRIX 'IYPl!S: uj N LA9PROJ,I c N OAK RIDGE, TN 37830 (~~~) 4.Jo.7_,._ W'N· WMTEWATEA 'E 0 -.... co TEMPLATE: fNl·-WATUI Cll ~ ~
N OW- GllOUND WA TIR :C N
! 0 ~ E PROJ. lllGR CHAD COOPER en u ::i u.· :I
0 "D 0 ~ ;:; 0 - c 0 ca (j 0
~ (,) 0 .... I- ct: REMARKS
' ' .. - (],(/ /-/d-/7 - - - · - - · - - - ·-· - .... ' - .... .. .
v - -- - -- - .. tt'I/ ;-:ro-11 ~~-........ - - •v --- - " .... , . :to ...,
(Z.: 1:5" JTEC-MW-PZ..OBD.M 0110 /-10 · ll x GW 8 x x x x x x x ...--.. .. -·· 0 ,..
" " 7' A A ,.. ~ 1-./0-1 7 .. -- ,,.Ii I f0 ·/7 "'. - .. ..,_ - -
.1.0/'"7 JTEC-MW-PZ-110--- () ll /') l-lo·l7 pi OS- x GW 8 x x x x x x x
- ,.. ... ~ -- ;&f /-to-I'/ ~.,,.,
JTEC-MW-PZ·13D-2it!f& 01/t) 1-10-n /) ~ '3 8 x GW 8 x x x x x x x - -- -- L!I/ 1-10-17 ,. -· u ' ;n ... ..
-.......... -··· .. v -· all 1-10-( 7 v ~ ..... - - .. ... A A A
... ~ -- t!// 1-10-/) - .... _ .. -· --- . -- --- ·~ - -,.. ,. ~
JTEC-MW-SA-4-• .to t'7 OlLO 1-10-f? It>: lo x GW tO x x x x x x x
8 l\JRNAROUND TIME R£QUE~D (PU!AH CIRCLE> NORMAL RUSH
I DATE RESULTS NEEDED 111• ample~-"'"' l1e _ _,upon~ al the lab. By lnllM/lnfl
(RU!JHlATIS8tJBJ£CT TOPOC I.Alla N'f'ftCN/IJ.. NfO 8URaWt01!)
8 this etM you requesl Itta( Ille lalMOIJfy you, twfole P.tfJC'l'ldlnSI with etN,tysl9.H
RUSH RESULT$VIA (PUAll!ClftCU!) FAX PHONE tM ump/9 ,.,,,,_.rure I• out.Ide of the r.n~ oi o. ;,..O"C. By not lnllJellng lhl• -you •flow lh•lab to~ wlfh M•/yt1caJtwt1n11,.,,.,.n.eaot tM
PAX I IP Oll'nlll!NT FROM~ PllONl! t IF 0.-Pel'IENTFROM·M0\11!: Hiii~ totnpenllU,...
' .~;n::ATIJ~~. '~~ - . RECEfVED8Y: (SIGNATURE! PATIO 7
COMMENT& {FOR µa USE! ONLY)
' }iJ~-'( 7. ' n ~- 6 1-10-1
8 ' 7 ' .......-Z·d - ' . - llMf -l'sts"' ~ /J- v 71 i-> TIMI! l~~'.:I SAMPLES HAND DEL!yERED
. ~ .. ··. ''="' Rt:nmi.UIS~ BY! "'ilftATUREJ OAJE REVEIVED SY: (SIGNATURE} DATE
I;;,,.::> 0 c TIME TIME
SAMPLE 'TEMPERA TIJRE UPO,. RECEIPT
CHILL PROCESS STARTED PRIOR TO RECEIP'T ~ORN RELINQUISHED BY: (51GKATURE) OA!E RECEIVED 8'1': (SIGNAT\IREI DATE SAlllPl.E(S) RECSVEDON'lCE
i~ PROP1'R1IOTTL£S-RECENED IROOOO'CONOl110N TIME TIME BOTT\.ES' FlUf.DWllH AOEQU.-.n. VOLUME
SAMPU!s.RecEIVEDwmllN HOt.Dllllll!IS}
X:\COC Tcmplates\City Utilitics\Jacobs\ITEC CCR GW .doc Pagc __ of __

CHAIN OF CUSTODY RECORD POC LABORATORIES, INC. 1805 W. SUNSET SPRINGFIELD, MO 65807
PHONE# 417-864-8924 FAX# 417-864 .. 7081 State where samples collected __ --'MO ___ _
·CONTACT PERSON' ~ . -
. CHRISJ-0,~HE'R HJCKMAN
JTEC-MW-PZ'-100-20·17 0111
JTEC-MW-SA-3-2017
JTEC-MW..:SA-3-20't1 .FD
TURRARO TlllE REQUESTEl>-IJ'IDIECIRCt'Et NORMAL (RUllK ri•1 • IUBJECJ TD P0C LA11S Mf'P.t:NM.. NfO SUIUlHAROE)
RUSH RESULT$ VIA tPl:.EAllE ClltCLEt FAX PHONE
f AX I IF DIFR:AENT-AllOVE: PKONE #IF Cl'fl!RENT FllOM ABo\IEJ
.. RE) ' DATE
/-I· I?
ALL HIGHLJGHTEO AREAS lllUST SE CONIPU!TEO BY CUENT PROJECT NUMBl!R P.O. NUMBER MEANS SHIPPED
JTEC
l-1/-/ 7 zio x
hl-17 ,~-:·10 x
J ·tf.-17 /~ : $f x 1-1(-17 01GIV x /....//-/ ...-
100::. x
SH DATERESUL .
TEMPLATE:
PROJ. MGR CHAD COOPER
REMAIU<S
-1r-1
-fi -r I { -it-17
GW 8
1-1!-;7
GW 8
GW 8
GW
GW
8
8 X X. X X X .X )(
· samptf lamperature wUJ W lrt9HUM llpOll _,-lib. By In allng tf1t. •raYfll' request lh•I lhft lab nollf)l ~. bdol9 pn>ceedlng with analysls, If th• ample lvmpentWre ls 011tsldlt at the ,.nga of 0.1 ... cl'C: By~ lnH1lltlng 11!/s arH.)IO<l al/ow Ille 141> to ptoeHd wilh •n•lyllcal tmlln11 ~anllna or lhe ssmplfl lempt,..twe. ____ _
MNIE"'TS: (FOR LAB USE DNL Y)
SAMPLES HANP DELl\/EREI>
TIME f--=m.t=. E,....-----1 SAMPLE TIOMPERA"l'URE tJPON RECEIPT
heor.rnrr.=<=:r.o.==-;=------+.=.-----+,=,,,.,......,===~--------f-...,....,.------1 CHILii. PROCESS &TAR'TEOP.RIOR TO RECEIPT DA DA SA'MPLl!ISt RECEIVEDrON let;
t-==------1 PROPER BOTTLES.RECEIVE!) IN GOOD CONOlllON TIME ME 60111.ES. FIUED WITNADEQUA TE VOLUME
SAMPLES RECEIV,ED Wl:nttN· HOLD TlME(S)
X:\COC Templates\City U!ilities\Jacobs\ffEC CCR OW .doc Page _ _ of __
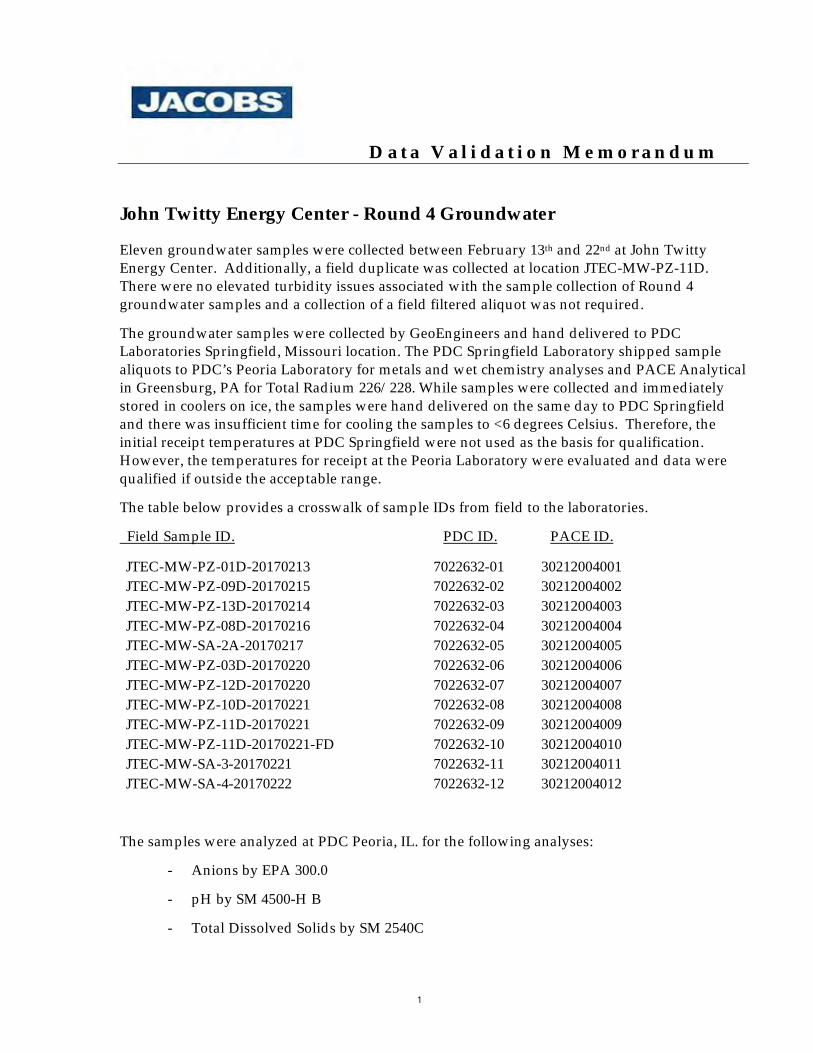
D a t a V a l i d a t i o n M e m o r a n d u m
1
John Twitty Energy Center - Round 4 Groundwater
Eleven groundwater samples were collected between February 13th and 22nd at John Twitty Energy Center. Additionally, a field duplicate was collected at location JTEC-MW-PZ-11D. There were no elevated turbidity issues associated with the sample collection of Round 4 groundwater samples and a collection of a field filtered aliquot was not required.
The groundwater samples were collected by GeoEngineers and hand delivered to PDC Laboratories Springfield, Missouri location. The PDC Springfield Laboratory shipped sample aliquots to PDC’s Peoria Laboratory for metals and wet chemistry analyses and PACE Analytical in Greensburg, PA for Total Radium 226/228. While samples were collected and immediately stored in coolers on ice, the samples were hand delivered on the same day to PDC Springfield and there was insufficient time for cooling the samples to <6 degrees Celsius. Therefore, the initial receipt temperatures at PDC Springfield were not used as the basis for qualification. However, the temperatures for receipt at the Peoria Laboratory were evaluated and data were qualified if outside the acceptable range.
The table below provides a crosswalk of sample IDs from field to the laboratories.
Field Sample ID. PDC ID. PACE ID.
JTEC-MW-PZ-01D-20170213 7022632-01 30212004001 JTEC-MW-PZ-09D-20170215 7022632-02 30212004002 JTEC-MW-PZ-13D-20170214 7022632-03 30212004003 JTEC-MW-PZ-08D-20170216 7022632-04 30212004004 JTEC-MW-SA-2A-20170217 7022632-05 30212004005 JTEC-MW-PZ-03D-20170220 7022632-06 30212004006 JTEC-MW-PZ-12D-20170220 7022632-07 30212004007 JTEC-MW-PZ-10D-20170221 7022632-08 30212004008 JTEC-MW-PZ-11D-20170221 7022632-09 30212004009 JTEC-MW-PZ-11D-20170221-FD 7022632-10 30212004010 JTEC-MW-SA-3-20170221 7022632-11 30212004011 JTEC-MW-SA-4-20170222 7022632-12 30212004012
The samples were analyzed at PDC Peoria, IL. for the following analyses:
- Anions by EPA 300.0
- pH by SM 4500-H B
- Total Dissolved Solids by SM 2540C
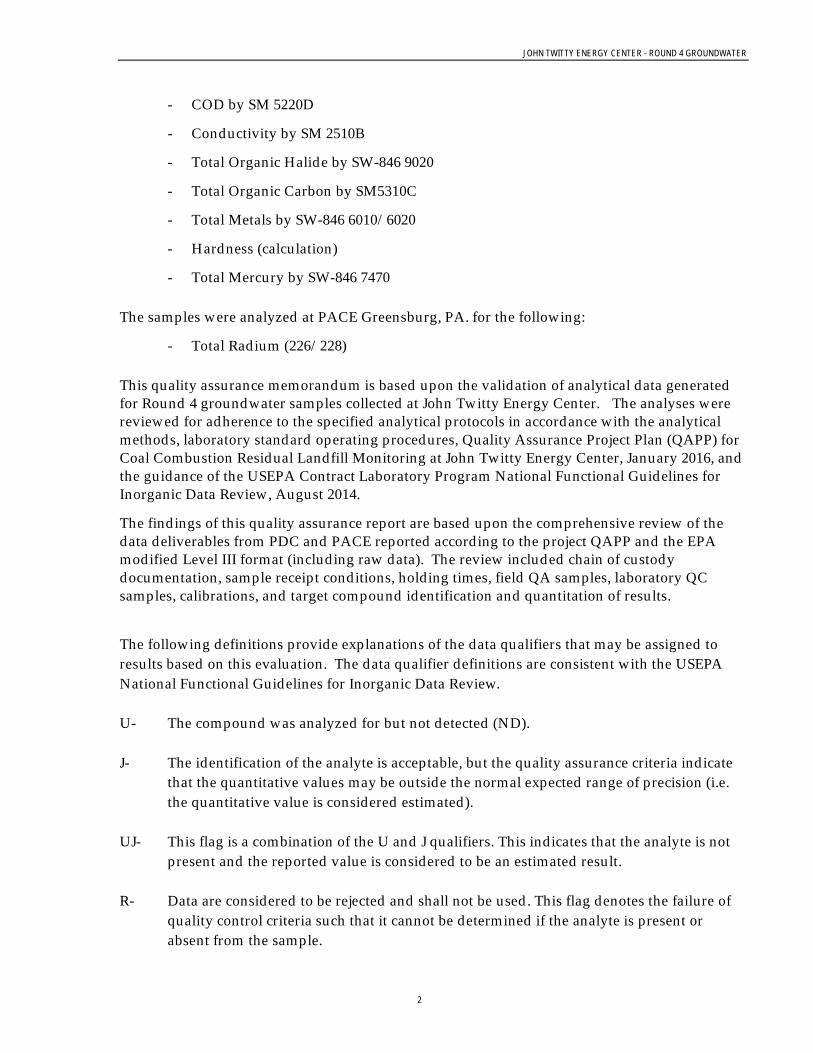
JOHN TWITTY ENERGY CENTER - ROUND 4 GROUNDWATER
2
- COD by SM 5220D
- Conductivity by SM 2510B
- Total Organic Halide by SW-846 9020
- Total Organic Carbon by SM5310C
- Total Metals by SW-846 6010/6020
- Hardness (calculation)
- Total Mercury by SW-846 7470
The samples were analyzed at PACE Greensburg, PA. for the following:
- Total Radium (226/228)
This quality assurance memorandum is based upon the validation of analytical data generated for Round 4 groundwater samples collected at John Twitty Energy Center. The analyses were reviewed for adherence to the specified analytical protocols in accordance with the analytical methods, laboratory standard operating procedures, Quality Assurance Project Plan (QAPP) for Coal Combustion Residual Landfill Monitoring at John Twitty Energy Center, January 2016, and the guidance of the USEPA Contract Laboratory Program National Functional Guidelines for Inorganic Data Review, August 2014. The findings of this quality assurance report are based upon the comprehensive review of the data deliverables from PDC and PACE reported according to the project QAPP and the EPA modified Level III format (including raw data). The review included chain of custody documentation, sample receipt conditions, holding times, field QA samples, laboratory QC samples, calibrations, and target compound identification and quantitation of results.
The following definitions provide explanations of the data qualifiers that may be assigned to results based on this evaluation. The data qualifier definitions are consistent with the USEPA National Functional Guidelines for Inorganic Data Review.
U- The compound was analyzed for but not detected (ND).
J- The identification of the analyte is acceptable, but the quality assurance criteria indicate that the quantitative values may be outside the normal expected range of precision (i.e. the quantitative value is considered estimated).
UJ- This flag is a combination of the U and J qualifiers. This indicates that the analyte is not
present and the reported value is considered to be an estimated result.
R- Data are considered to be rejected and shall not be used. This flag denotes the failure of quality control criteria such that it cannot be determined if the analyte is present or absent from the sample.

JOHN TWITTY ENERGY CENTER - ROUND 4 GROUNDWATER
3
B- The B flag is to be used for both organic and inorganic analyses when the analyte is
found in the associated blank as well as the in the sample. The result is considered ND, and the reported value is considered to be an estimated quantitation limit.
INORGANIC DATA QUALIFIERS
All results for the pH analyses were qualified as estimated due to exceedance of the method specific holding time. The pH method specific holding time requires the samples to be analyzed immediately, which is not possible to achieve when sending samples to an offsite laboratory. Analyzing the pH outside the method specific holding time could indicate a bias in the sample result. Field measurements for pH were also recorded in the field notes at the time of sample collection.
Sample ID Analyte Holding Time Qualifier
JTEC-MW-PZ-01D-20170213 JTEC-MW-PZ-09D-20170215 JTEC-MW-PZ-13D-20170214 JTEC-MW-PZ-08D-20170216 JTEC-MW-SA-2-20170217 JTEC-MW-PZ-03D-20170220 JTEC-MW-PZ-12D-20170220 JTEC-MW-PZ-10D-20170221 JTEC-MW-PZ-11D-20170221 JTEC-MW-PZ-11D-20170221-FD JTEC-MW-SA-3-20170221 JTEC-MW-SA-4-20170222
pH > immediately J
In the SW-846 9020 total organic halide (TOX) analysis the field duplicate performed on sample JTEC-MW-PZ-11D-20170221 exhibited a high relative percent difference (RPD). TOX was not detected in the field duplicate, but was detected above the quantitation limit in the parent sample. High field duplicate RPD values are indicative of poor precision in the sample collection and/or analysis process. The TOX result in the sample reported as detected greater than the quantitation limit was qualified “J” as estimated. The TOX result in the field duplicate sample reported as a non-detect was qualified “UJ” as estimated.
Sample ID Analyte Field Duplicate RPD Qualifier
JTEC-MW-PZ-11D-20170221
TOX 48% RPD J
JTEC-MW-PZ-11D-20170221-FD TOX 48% RPD UJ

JOHN TWITTY ENERGY CENTER - ROUND 4 GROUNDWATER
4
In the SW-846 6020 metals analyses, several compounds were present in the blanks at less than 5 times the blank value. Detects of metals analytes in the method blanks indicates a potential contamination issue with the analytical process for the associated samples. The positive results for the metals analytes in the samples listed below were qualified as “B” to indicate the potential high bias in the samples due to the blank contamination.
Sample ID Analytes (less than 5x blank value) Qualifier
JTEC-MW-PZ-01D-20170213 Copper B
JTEC-MW-PZ-13D-20170214 Aluminum B
JTEC-MW-PZ-08D-20170216 Boron, Chromium B
JTEC-MW-PZ-03D-20170220 Boron, Chromium, Copper B
JTEC-MW-PZ-12D-20170220 Boron, Chromium, Copper B
JTEC-MW-PZ-10D-20170221 Chromium B
JTEC-MW-PZ-11D-20170221 Iron, Chromium, Copper, Magnesium B
JTEC-MW-PZ-11D-20170221-FD Iron, Chromium, Copper, Magnesium B
JTEC-MW-SA-3A-20170221 Chromium, Copper B
JTEC-MW-SA-4A-20170222 Cooper B
In the SW-846 6010 analysis for iron performed on sample JTEC-MW-PZ-11D-20170221, the reported field duplicate RPD was greater than 30%. High field duplicate RPD is indicative of poor precision in the sampling and/or analytical process. The positive results for iron in the associated parent and field duplicate samples were qualified as estimated “J”.
Sample ID Analyte RPD % Qualifier
JTEC-MW-PZ-11D-20170221 JTEC-MW-PZ-11D-20170221-FD
Iron 35 J
In order to achieve the lowest possible detection levels and facilitate the statistical analysis of the groundwater data, PDC was required to report positive results between the method detection level and quantitation limits as estimated detects with a “J” qualifier. RADIOLOGICAL DATA QUALIFIERS
The reported results for total radium in seven groundwater samples and the field duplicate were less than the reported laboratory minimum detectable concentration (MDC) and thus, qualified as “U” not detected at the MDC.
JOHN TWITTY ENERGY CENTER - ROUND 4 GROUNDWATER
5
SUMMARY
The inorganic and radiological analyses were performed acceptably, but required qualification for the minor QA/QC deficiencies noted above. The qualified data is included in Attachment I and the chains of custody are included in Attachment II of this report. It is recommended that the analytical data be used only with the qualifiers applied as part of this evaluation. Any aspects of the data, which are not discussed in this report, should be considered qualitatively and quantitatively valid as reported, based on the deliverables reviewed.

JOHN TWITTY ENERGY CENTER - ROUND 4 GROUNDWATER
6
Attachment I
JTEC Round 4 Groundwater Data
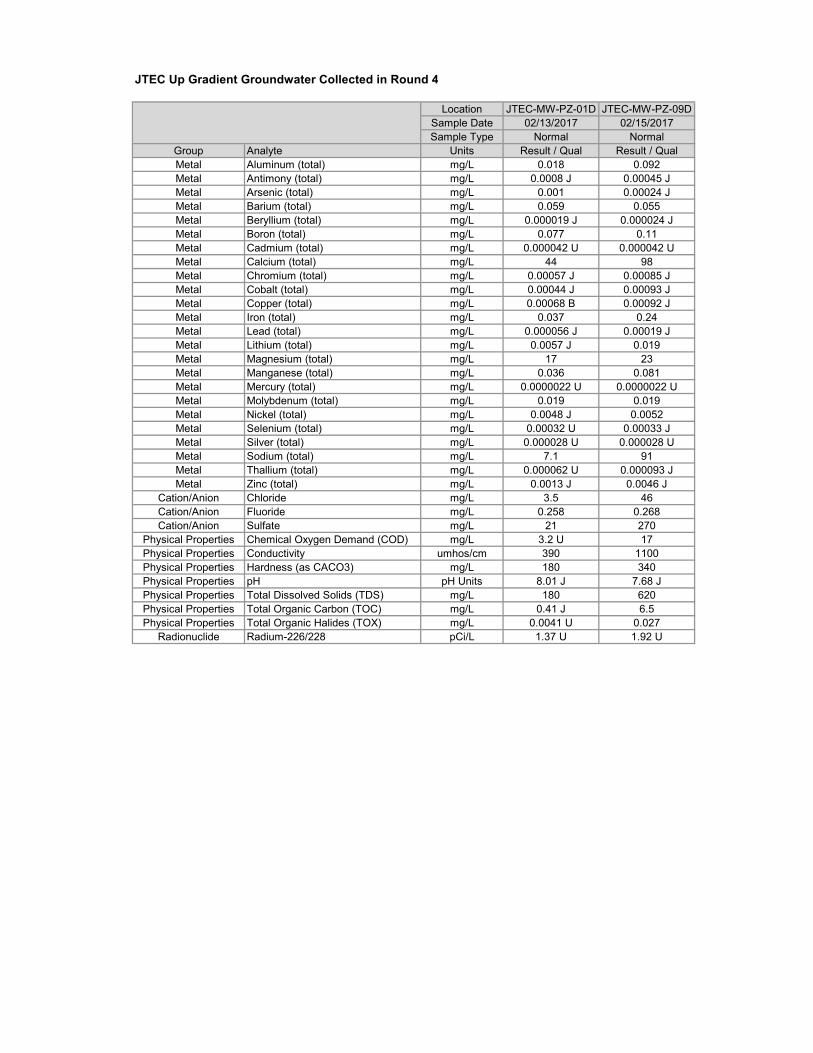
Location JTEC-MW-PZ-01D JTEC-MW-PZ-09D
Sample Date 02/13/2017 02/15/2017
Sample Type Normal Normal
Group Analyte Units Result / Qual Result / Qual
Metal Aluminum (total) mg/L 0.018 0.092
Metal Antimony (total) mg/L 0.0008 J 0.00045 J
Metal Arsenic (total) mg/L 0.001 0.00024 J
Metal Barium (total) mg/L 0.059 0.055
Metal Beryllium (total) mg/L 0.000019 J 0.000024 J
Metal Boron (total) mg/L 0.077 0.11
Metal Cadmium (total) mg/L 0.000042 U 0.000042 U
Metal Calcium (total) mg/L 44 98
Metal Chromium (total) mg/L 0.00057 J 0.00085 J
Metal Cobalt (total) mg/L 0.00044 J 0.00093 J
Metal Copper (total) mg/L 0.00068 B 0.00092 J
Metal Iron (total) mg/L 0.037 0.24
Metal Lead (total) mg/L 0.000056 J 0.00019 J
Metal Lithium (total) mg/L 0.0057 J 0.019
Metal Magnesium (total) mg/L 17 23
Metal Manganese (total) mg/L 0.036 0.081
Metal Mercury (total) mg/L 0.0000022 U 0.0000022 U
Metal Molybdenum (total) mg/L 0.019 0.019
Metal Nickel (total) mg/L 0.0048 J 0.0052
Metal Selenium (total) mg/L 0.00032 U 0.00033 J
Metal Silver (total) mg/L 0.000028 U 0.000028 U
Metal Sodium (total) mg/L 7.1 91
Metal Thallium (total) mg/L 0.000062 U 0.000093 J
Metal Zinc (total) mg/L 0.0013 J 0.0046 J
Cation/Anion Chloride mg/L 3.5 46
Cation/Anion Fluoride mg/L 0.258 0.268
Cation/Anion Sulfate mg/L 21 270
Physical Properties Chemical Oxygen Demand (COD) mg/L 3.2 U 17
Physical Properties Conductivity umhos/cm 390 1100
Physical Properties Hardness (as CACO3) mg/L 180 340
Physical Properties pH pH Units 8.01 J 7.68 J
Physical Properties Total Dissolved Solids (TDS) mg/L 180 620
Physical Properties Total Organic Carbon (TOC) mg/L 0.41 J 6.5
Physical Properties Total Organic Halides (TOX) mg/L 0.0041 U 0.027
Radionuclide Radium-226/228 pCi/L 1.37 U 1.92 U
JTEC Up Gradient Groundwater Collected in Round 4

Location JTEC-MW-PZ-03D JTEC-MW-PZ-08D JTEC-MW-PZ-10D JTEC-MW-PZ-11D JTEC-MW-PZ-11D JTEC-MW-PZ-12D JTEC-MW-PZ-13D JTEC-MW-SA-2A JTEC-MW-SA-3 JTEC-MW-SA-4
Sample Date 02/20/2017 02/16/2017 02/21/2017 02/21/2017 02/21/2017 02/20/2017 02/14/2017 02/17/2017 02/21/2017 02/22/2017
Sample Type Normal Normal Normal Field Duplicate Normal Normal Normal Normal Normal Normal
Group Analyte Units Result / Qual Result / Qual Result / Qual Result / Qual Result / Qual Result / Qual Result / Qual Result / Qual Result / Qual Result / Qual
Metal Aluminum (total) mg/L 0.11 0.053 0.051 0.024 0.013 0.045 0.013 B 1.2 0.023 0.44
Metal Antimony (total) mg/L 0.0025 J 0.00073 J 0.000036 U 0.000036 U 0.000036 U 0.0006 J 0.000078 J 0.0099 0.0021 J 0.000036 U
Metal Arsenic (total) mg/L 0.0008 J 0.0003 J 0.00014 J 0.00013 U 0.00013 U 0.00022 J 0.00021 J 0.0013 0.0015 0.00047 J
Metal Barium (total) mg/L 0.1 0.083 0.063 0.031 0.036 0.045 0.08 0.074 0.049 0.057
Metal Beryllium (total) mg/L 0.000029 J 0.000024 J 0.000017 U 0.000017 U 0.000017 U 0.000017 U 0.000036 J 0.00019 J 0.000017 U 0.000084 J
Metal Boron (total) mg/L 0.021 B 0.03 B 0.58 0.059 0.069 0.019 B 0.017 0.034 0.042 1.1
Metal Cadmium (total) mg/L 0.000042 U 0.000042 U 0.000042 U 0.000042 U 0.000042 U 0.000042 U 0.000042 U 0.00013 J 0.000042 U 0.000073 J
Metal Calcium (total) mg/L 53 60 230 45 50 56 56 54 48 370
Metal Chromium (total) mg/L 0.00098 B 0.00073 B 0.00093 B 0.00059 B 0.00059 B 0.00052 B 0.00065 J 0.003 J 0.00062 B 0.0023 J
Metal Cobalt (total) mg/L 0.00093 J 0.0001 J 0.000078 J 0.000017 U 0.000017 U 0.00013 J 0.00013 J 0.00061 J 0.00034 J 0.0011 J
Metal Copper (total) mg/L 0.0016 B 0.0048 0.0054 0.00051 B 0.00074 B 0.00089 B 0.00099 J 0.0037 0.00099 B 0.0018 B
Metal Iron (total) mg/L 0.16 0.081 0.089 0.013 J, B 0.0091 J, B 0.063 0.017 1.3 0.051 0.28
Metal Lead (total) mg/L 0.00014 J 0.00014 J 0.000094 J 0.000025 U 0.000025 U 0.000059 J 0.000069 J 0.0014 0.000025 U 0.00051 J
Metal Lithium (total) mg/L 0.0041 J 0.012 0.0035 J 0.023 0.024 0.002 J 0.0078 J 0.003 J 0.0052 J 0.0018 J
Metal Magnesium (total) mg/L 18 25 42 23 26 19 21 10 24 15
Metal Manganese (total) mg/L 0.096 0.0064 0.0033 0.00061 B 0.00047 B 0.076 0.03 0.021 0.03 0.022
Metal Mercury (total) mg/L 0.0000022 U 0.0000022 U 0.0000022 U 0.0000022 U 0.0000022 U 0.0000022 U 0.0000022 U 0.0000022 U 0.0000022 U 0.000012 J
Metal Molybdenum (total) mg/L 0.013 0.01 0.00026 J 0.0013 0.0014 0.0084 0.005 0.042 0.0074 0.0024
Metal Nickel (total) mg/L 0.0029 J 0.00098 J 0.0014 J 0.00048 J 0.00043 J 0.0015 J 0.0012 J 0.0054 0.0012 J 0.032
Metal Selenium (total) mg/L 0.00032 U 0.00049 J 0.0017 0.00032 U 0.00032 U 0.00032 U 0.00032 U 0.0012 0.00032 U 0.0049
Metal Silver (total) mg/L 0.000082 J 0.000028 U 0.000028 U 0.000028 U 0.000028 U 0.000028 U 0.00003 J 0.00087 J 0.000028 U 0.000028 U
Metal Sodium (total) mg/L 6.2 50 28 5.5 7.1 9.6 5 100 14 66
Metal Thallium (total) mg/L 0.00014 J 0.00025 J 0.000062 U 0.000062 U 0.000062 U 0.000064 J 0.000078 J 0.00031 J 0.000062 U 0.000062 U
Metal Zinc (total) mg/L 0.003 J 0.0028 J 0.0055 J 0.00084 J 0.00084 J 0.0015 J 0.00088 J 0.013 0.0014 J 0.013
Cation/Anion Chloride mg/L 3.9 17 240 9.9 23 10 6.9 45 15 310
Cation/Anion Fluoride mg/L 0.298 0.285 0.042 U 0.319 0.297 0.245 J 0.213 J 0.205 J 0.379 0.0838 J
Cation/Anion Sulfate mg/L 14 98 250 19 27 32 21 94 41 520
Physical Properties Chemical Oxygen Demand (COD) mg/L 3.2 U 3.2 U 3.2 U 3.2 U 3.2 U 3.2 U 3.2 U 3.2 U 3.2 U 3.2 U
Physical Properties Conductivity umhos/cm 430 680 1600 420 490 460 450 810 500 2200
Physical Properties Hardness (as CACO3) mg/L 210 260 750 210 230 220 220 180 220 990
Physical Properties pH pH Units 7.95 J 8.11 J 7.47 J 7.95 J 7.99 J 7.96 J 8.21 J 8.06 J 7.97 J 7.11 J
Physical Properties Total Dissolved Solids (TDS) mg/L 230 400 1000 240 280 270 280 450 280 1600
Physical Properties Total Organic Carbon (TOC) mg/L 0.8 0.51 0.56 0.29 J 0.25 J 0.6 0.39 J 1.6 0.62 1
Physical Properties Total Organic Halides (TOX) mg/L 0.0041 U 0.0065 0.025 0.0041 UJ 0.0067 J 0.0041 U 0.0041 U 0.017 0.011 0.049
Radionuclide Radium-226/228 pCi/L 1.3 U 1.52 U 1.66 U 1.33 U 1.81 U 1.72 U 1.72 U 1.84 U 1.21 U 1.58 U
JTEC Down Gradient Groundwater Collected in Round 4

JOHN TWITTY ENERGY CENTER - ROUND 4 GROUNDWATER
7
Attachment II
Chains of Custody
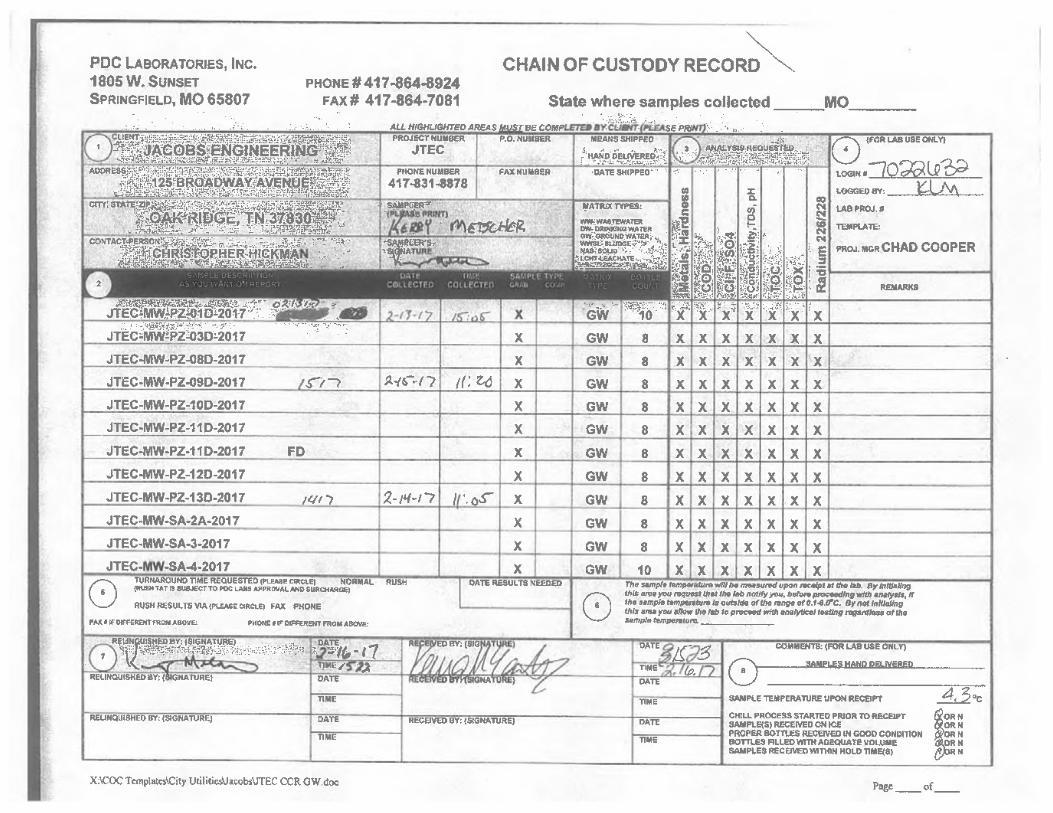

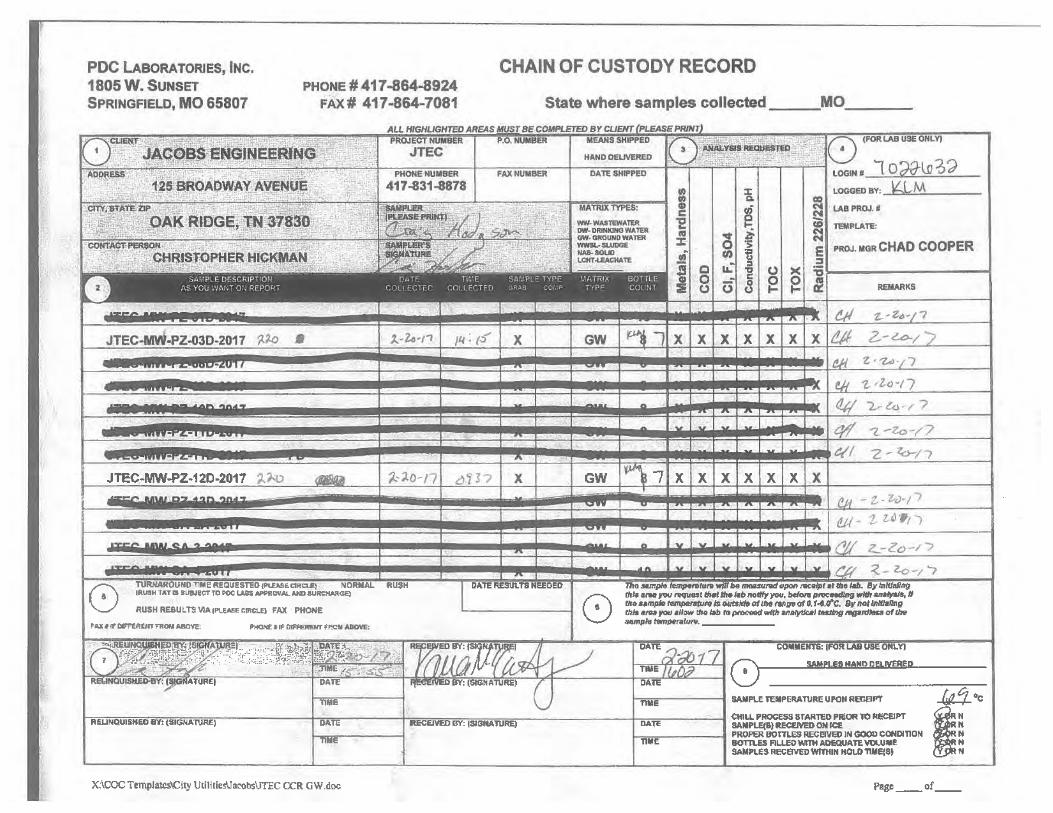

D a t a V a l i d a t i o n M e m o r a n d u m
1
John Twitty Energy Center - Round 5 Groundwater
Eleven groundwater samples were collected between April 3rd and 11th at John Twitty Energy Center. Additionally, a field duplicate was collected at location JTEC-MW-PZ-11D. There were no elevated turbidity issues associated with the sample collection of Round 5 groundwater samples and a collection of field filtered aliquots were not required.
The groundwater samples were collected by GeoEngineers and hand delivered to PDC Laboratories Springfield, Missouri location. The PDC Springfield Laboratory shipped sample aliquots to PDC’s Peoria Laboratory for metals and wet chemistry analyses and PACE Analytical in Greensburg, PA for Total Radium 226/228. While samples were collected and immediately stored in coolers on ice, the samples were hand delivered on the same day to PDC Springfield and there was insufficient time for cooling the samples to <6 degrees Celsius. Therefore, the initial receipt temperatures at PDC Springfield were not used as the basis for qualification. However, the temperatures for receipt at the Peoria Laboratory were evaluated and data were qualified if outside the acceptable range.
The table below provides a crosswalk of sample IDs from field to the laboratories.
Field Sample ID. PDC ID. PACE ID.
JTEC-MW-PZ-01D-20170403 7040893-01 30216170001 JTEC-MW-PZ-09D-20170404 7040893-02 30216170002 JTEC-MW-PZ-13D-20170403 7040893-03 30216170003 JTEC-MW-PZ-08D-20170404 7040893-04 30216170004 JTEC-MW-PZ-11D-20170405 7040893-05 30216170005 JTEC-MW-PZ-11D-20170405-FD 7040893-06 30216170006 JTEC-MW-PZ-12D-20170405 7040893-07 30216170007 JTEC-MW-SA-2-20170405 7040893-08 30216170008 JTEC-MW-PZ-03D-20170406 7040893-09 30216170009 JTEC-MW-PZ-10D-20170407 7040893-10 30216170010 JTEC-MW-SA-3-20170410 7040893-11 30216170011 JTEC-MW-SA-4-20170411 7040893-12 30216170012
The samples were analyzed at PDC Peoria, IL. for the following analyses:
- Anions by EPA 300.0
- pH by SM 4500-H B
- Total Dissolved Solids by SM 2540C

JOHN TWITTY ENERGY CENTER - ROUND 5 GROUNDWATER
2
- COD by SM 5220D
- Conductivity by SM 2510B
- Total Organic Halide by SW-846 9020
- Total Organic Carbon by SM5310C
- Total Metals by SW-846 6010/6020
- Hardness (calculation)
- Total Mercury by SW-846 7470
The samples were analyzed at PACE Greensburg, PA. for the following:
- Total Radium (226/228)
This quality assurance memorandum is based upon the validation of analytical data generated for Round five groundwater samples collected at John Twitty Energy Center. The analyses were reviewed for adherence to the specified analytical protocols in accordance with the analytical methods, laboratory standard operating procedures, Quality Assurance Project Plan (QAPP) for Coal Combustion Residual Landfill Monitoring at John Twitty Energy Center, January 2016, and the guidance of the USEPA Contract Laboratory Program National Functional Guidelines for Inorganic Data Review, August 2014. The findings of this quality assurance report are based upon the comprehensive review of the data deliverables from PDC and PACE reported according to the project QAPP and the EPA modified Level III format (including raw data). The review included chain of custody documentation, sample receipt conditions, holding times, field QA samples, laboratory QC samples, calibrations, and target compound identification and quantitation of results.
The following definitions provide explanations of the data qualifiers that may be assigned to results based on this evaluation. The data qualifier definitions are consistent with the USEPA National Functional Guidelines for Inorganic Data Review.
U- The compound was analyzed for but not detected (ND).
J- The identification of the analyte is acceptable, but the quality assurance criteria indicate that the quantitative values may be outside the normal expected range of precision (i.e. the quantitative value is considered estimated).
UJ- This flag is a combination of the U and J qualifiers. This indicates that the analyte is not
present and the reported value is considered to be an estimated result.
R- Data are considered to be rejected and shall not be used. This flag denotes the failure of quality control criteria such that it cannot be determined if the analyte is present or absent from the sample.
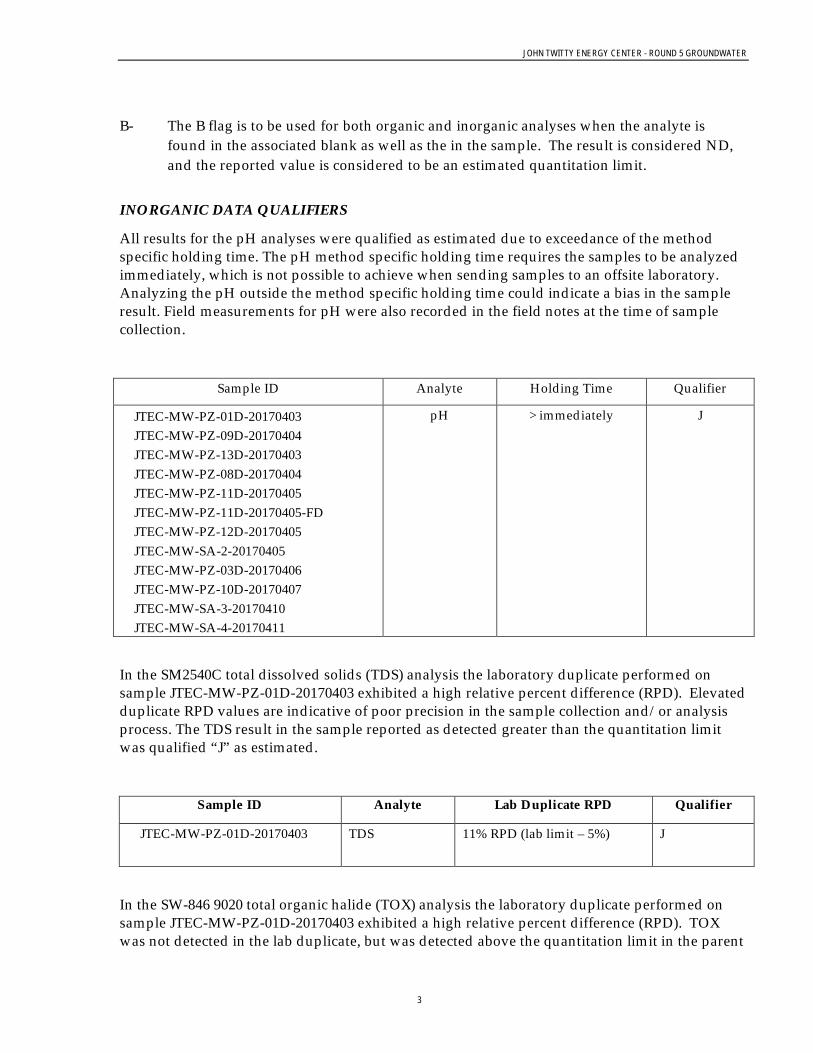
JOHN TWITTY ENERGY CENTER - ROUND 5 GROUNDWATER
3
B- The B flag is to be used for both organic and inorganic analyses when the analyte is
found in the associated blank as well as the in the sample. The result is considered ND, and the reported value is considered to be an estimated quantitation limit.
INORGANIC DATA QUALIFIERS
All results for the pH analyses were qualified as estimated due to exceedance of the method specific holding time. The pH method specific holding time requires the samples to be analyzed immediately, which is not possible to achieve when sending samples to an offsite laboratory. Analyzing the pH outside the method specific holding time could indicate a bias in the sample result. Field measurements for pH were also recorded in the field notes at the time of sample collection.
Sample ID Analyte Holding Time Qualifier
JTEC-MW-PZ-01D-20170403 JTEC-MW-PZ-09D-20170404 JTEC-MW-PZ-13D-20170403 JTEC-MW-PZ-08D-20170404 JTEC-MW-PZ-11D-20170405 JTEC-MW-PZ-11D-20170405-FD JTEC-MW-PZ-12D-20170405 JTEC-MW-SA-2-20170405 JTEC-MW-PZ-03D-20170406 JTEC-MW-PZ-10D-20170407 JTEC-MW-SA-3-20170410 JTEC-MW-SA-4-20170411
pH > immediately J
In the SM2540C total dissolved solids (TDS) analysis the laboratory duplicate performed on sample JTEC-MW-PZ-01D-20170403 exhibited a high relative percent difference (RPD). Elevated duplicate RPD values are indicative of poor precision in the sample collection and/or analysis process. The TDS result in the sample reported as detected greater than the quantitation limit was qualified “J” as estimated.
Sample ID Analyte Lab Duplicate RPD Qualifier
JTEC-MW-PZ-01D-20170403
TDS 11% RPD (lab limit – 5%) J
In the SW-846 9020 total organic halide (TOX) analysis the laboratory duplicate performed on sample JTEC-MW-PZ-01D-20170403 exhibited a high relative percent difference (RPD). TOX was not detected in the lab duplicate, but was detected above the quantitation limit in the parent
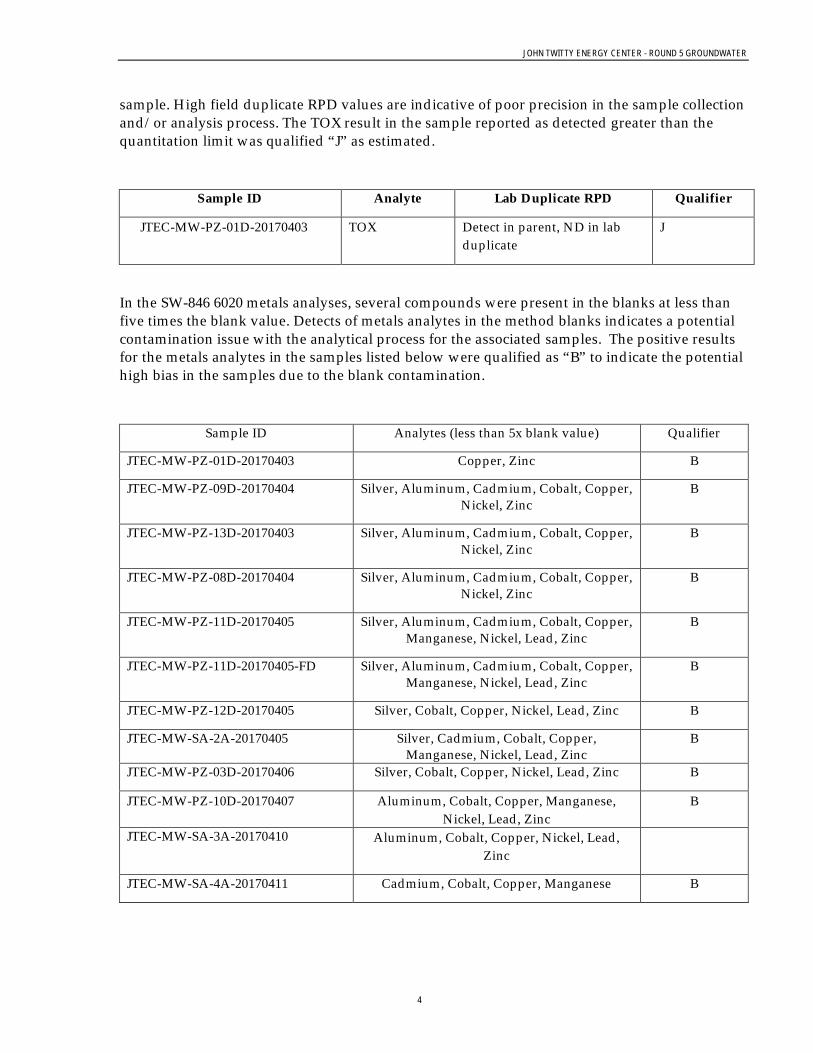
JOHN TWITTY ENERGY CENTER - ROUND 5 GROUNDWATER
4
sample. High field duplicate RPD values are indicative of poor precision in the sample collection and/or analysis process. The TOX result in the sample reported as detected greater than the quantitation limit was qualified “J” as estimated.
Sample ID Analyte Lab Duplicate RPD Qualifier
JTEC-MW-PZ-01D-20170403
TOX Detect in parent, ND in lab duplicate
J
In the SW-846 6020 metals analyses, several compounds were present in the blanks at less than five times the blank value. Detects of metals analytes in the method blanks indicates a potential contamination issue with the analytical process for the associated samples. The positive results for the metals analytes in the samples listed below were qualified as “B” to indicate the potential high bias in the samples due to the blank contamination.
Sample ID Analytes (less than 5x blank value) Qualifier
JTEC-MW-PZ-01D-20170403 Copper, Zinc B
JTEC-MW-PZ-09D-20170404 Silver, Aluminum, Cadmium, Cobalt, Copper, Nickel, Zinc
B
JTEC-MW-PZ-13D-20170403 Silver, Aluminum, Cadmium, Cobalt, Copper, Nickel, Zinc
B
JTEC-MW-PZ-08D-20170404 Silver, Aluminum, Cadmium, Cobalt, Copper, Nickel, Zinc
B
JTEC-MW-PZ-11D-20170405 Silver, Aluminum, Cadmium, Cobalt, Copper, Manganese, Nickel, Lead, Zinc
B
JTEC-MW-PZ-11D-20170405-FD Silver, Aluminum, Cadmium, Cobalt, Copper, Manganese, Nickel, Lead, Zinc
B
JTEC-MW-PZ-12D-20170405 Silver, Cobalt, Copper, Nickel, Lead, Zinc B
JTEC-MW-SA-2A-20170405 Silver, Cadmium, Cobalt, Copper, Manganese, Nickel, Lead, Zinc
B
JTEC-MW-PZ-03D-20170406 Silver, Cobalt, Copper, Nickel, Lead, Zinc B
JTEC-MW-PZ-10D-20170407 Aluminum, Cobalt, Copper, Manganese, Nickel, Lead, Zinc
B
JTEC-MW-SA-3A-20170410 Aluminum, Cobalt, Copper, Nickel, Lead, Zinc
JTEC-MW-SA-4A-20170411 Cadmium, Cobalt, Copper, Manganese B
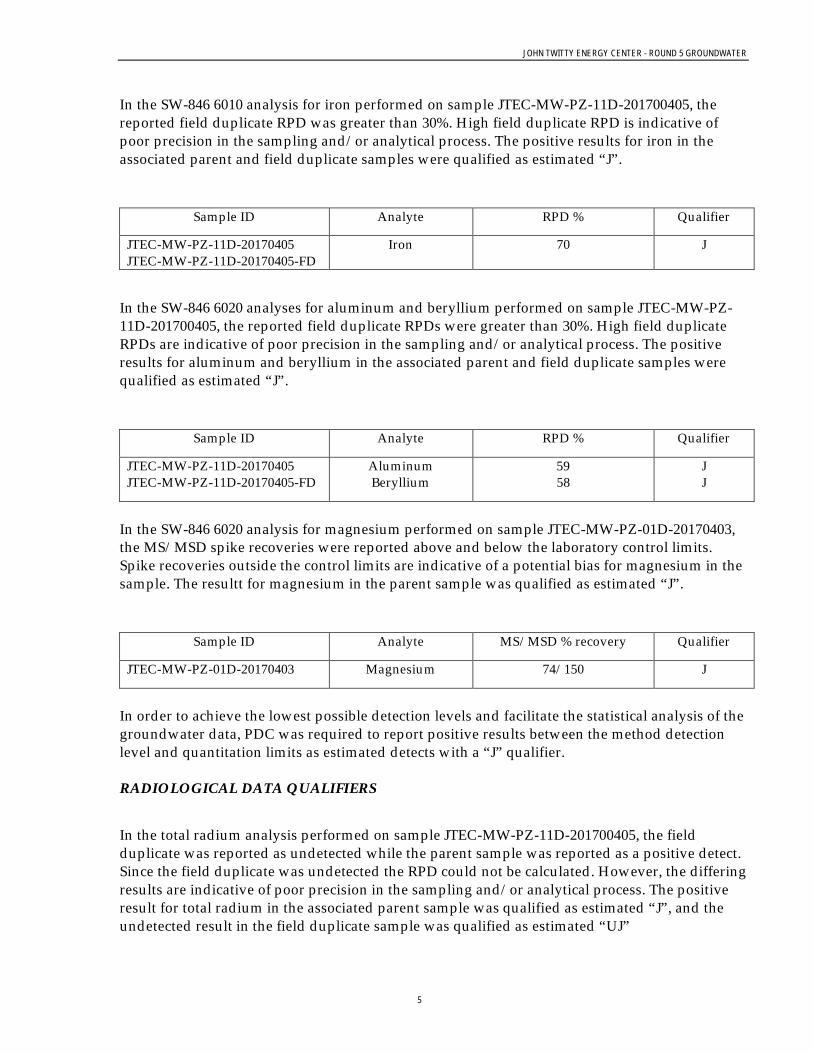
JOHN TWITTY ENERGY CENTER - ROUND 5 GROUNDWATER
5
In the SW-846 6010 analysis for iron performed on sample JTEC-MW-PZ-11D-201700405, the reported field duplicate RPD was greater than 30%. High field duplicate RPD is indicative of poor precision in the sampling and/or analytical process. The positive results for iron in the associated parent and field duplicate samples were qualified as estimated “J”.
Sample ID Analyte RPD % Qualifier
JTEC-MW-PZ-11D-20170405 JTEC-MW-PZ-11D-20170405-FD
Iron 70 J
In the SW-846 6020 analyses for aluminum and beryllium performed on sample JTEC-MW-PZ-11D-201700405, the reported field duplicate RPDs were greater than 30%. High field duplicate RPDs are indicative of poor precision in the sampling and/or analytical process. The positive results for aluminum and beryllium in the associated parent and field duplicate samples were qualified as estimated “J”.
Sample ID Analyte RPD % Qualifier
JTEC-MW-PZ-11D-20170405 JTEC-MW-PZ-11D-20170405-FD
Aluminum Beryllium
59 58
J J
In the SW-846 6020 analysis for magnesium performed on sample JTEC-MW-PZ-01D-20170403, the MS/MSD spike recoveries were reported above and below the laboratory control limits. Spike recoveries outside the control limits are indicative of a potential bias for magnesium in the sample. The resultt for magnesium in the parent sample was qualified as estimated “J”.
Sample ID Analyte MS/MSD % recovery Qualifier
JTEC-MW-PZ-01D-20170403 Magnesium 74/150 J
In order to achieve the lowest possible detection levels and facilitate the statistical analysis of the groundwater data, PDC was required to report positive results between the method detection level and quantitation limits as estimated detects with a “J” qualifier. RADIOLOGICAL DATA QUALIFIERS
In the total radium analysis performed on sample JTEC-MW-PZ-11D-201700405, the field duplicate was reported as undetected while the parent sample was reported as a positive detect. Since the field duplicate was undetected the RPD could not be calculated. However, the differing results are indicative of poor precision in the sampling and/or analytical process. The positive result for total radium in the associated parent sample was qualified as estimated “J”, and the undetected result in the field duplicate sample was qualified as estimated “UJ”

JOHN TWITTY ENERGY CENTER - ROUND 5 GROUNDWATER
6
The reported results for total radium in nine of the eleven groundwater samples and the field duplicate were less than the reported laboratory minimum detectable concentration (MDC) and thus, qualified as “U” not detected at the MDC.
SUMMARY
The inorganic and radiological analyses were performed acceptably, but required qualification for the minor QA/QC deficiencies noted above. The qualified data is included in Attachment I and the chains of custody are included in Attachment II of this report. It is recommended that the analytical data be used only with the qualifiers applied as part of this evaluation. Any aspects of the data, which are not discussed in this report, should be considered qualitatively and quantitatively valid as reported, based on the deliverables reviewed.

JOHN TWITTY ENERGY CENTER - ROUND 5 GROUNDWATER
7
Attachment I
JTEC Round 5 Groundwater Data

Location JTEC-MW-PZ-01D JTEC-MW-PZ-09D
Sample Date 04/03/2017 04/04/2017
Sample Type Normal Normal
Group Analyte Units Result / Qual Result / Qual
Metal Aluminum (total) mg/L 0.061 0.039 B
Metal Antimony (total) mg/L 0.0055 0.00084 J
Metal Arsenic (total) mg/L 0.0027 0.00065 J
Metal Barium (total) mg/L 0.073 0.045
Metal Beryllium (total) mg/L 0.0037 0.00026 J
Metal Boron (total) mg/L 0.02 0.072
Metal Cadmium (total) mg/L 0.0032 0.00015 B
Metal Calcium (total) mg/L 43 100
Metal Chromium (total) mg/L 0.004 0.0011 J
Metal Cobalt (total) mg/L 0.0058 0.0033 B
Metal Copper (total) mg/L 0.0041 B 0.002 B
Metal Iron (total) mg/L 0.19 1.1
Metal Lead (total) mg/L 0.0037 0.00037 J
Metal Lithium (total) mg/L 0.0059 J 0.019
Metal Magnesium (total) mg/L 18 J 23
Metal Manganese (total) mg/L 0.29 0.23
Metal Mercury (total) mg/L 0.00001 J 0.000023 J
Metal Molybdenum (total) mg/L 0.024 0.021
Metal Nickel (total) mg/L 0.016 0.0033 B
Metal Selenium (total) mg/L 0.0012 0.00044 J
Metal Silver (total) mg/L 0.0035 J 0.00027 B
Metal Sodium (total) mg/L 8.3 95
Metal Thallium (total) mg/L 0.0037 0.00053 J
Metal Zinc (total) mg/L 0.0053 B 0.0033 B
Cation/Anion Chloride mg/L 3.6 46
Cation/Anion Fluoride mg/L 0.262 0.253
Cation/Anion Sulfate mg/L 22 250
Physical Properties Chemical Oxygen Demand (COD) mg/L 3.2 U 110
Physical Properties Conductivity umhos/cm 380 1100
Physical Properties Hardness (as CACO3) mg/L 180 350
Physical Properties pH pH Units 7.91 J 7.48 J
Physical Properties Total Dissolved Solids (TDS) mg/L 180 J 610
Physical Properties Total Organic Carbon (TOC) mg/L 0.55 25
Physical Properties Total Organic Halides (TOX) mg/L 0.0077 J 0.042
Radionuclide Radium-226/228 pCi/L 1.43 U 1.39 U
JTEC Up Gradient Groundwater Collected in Round 5
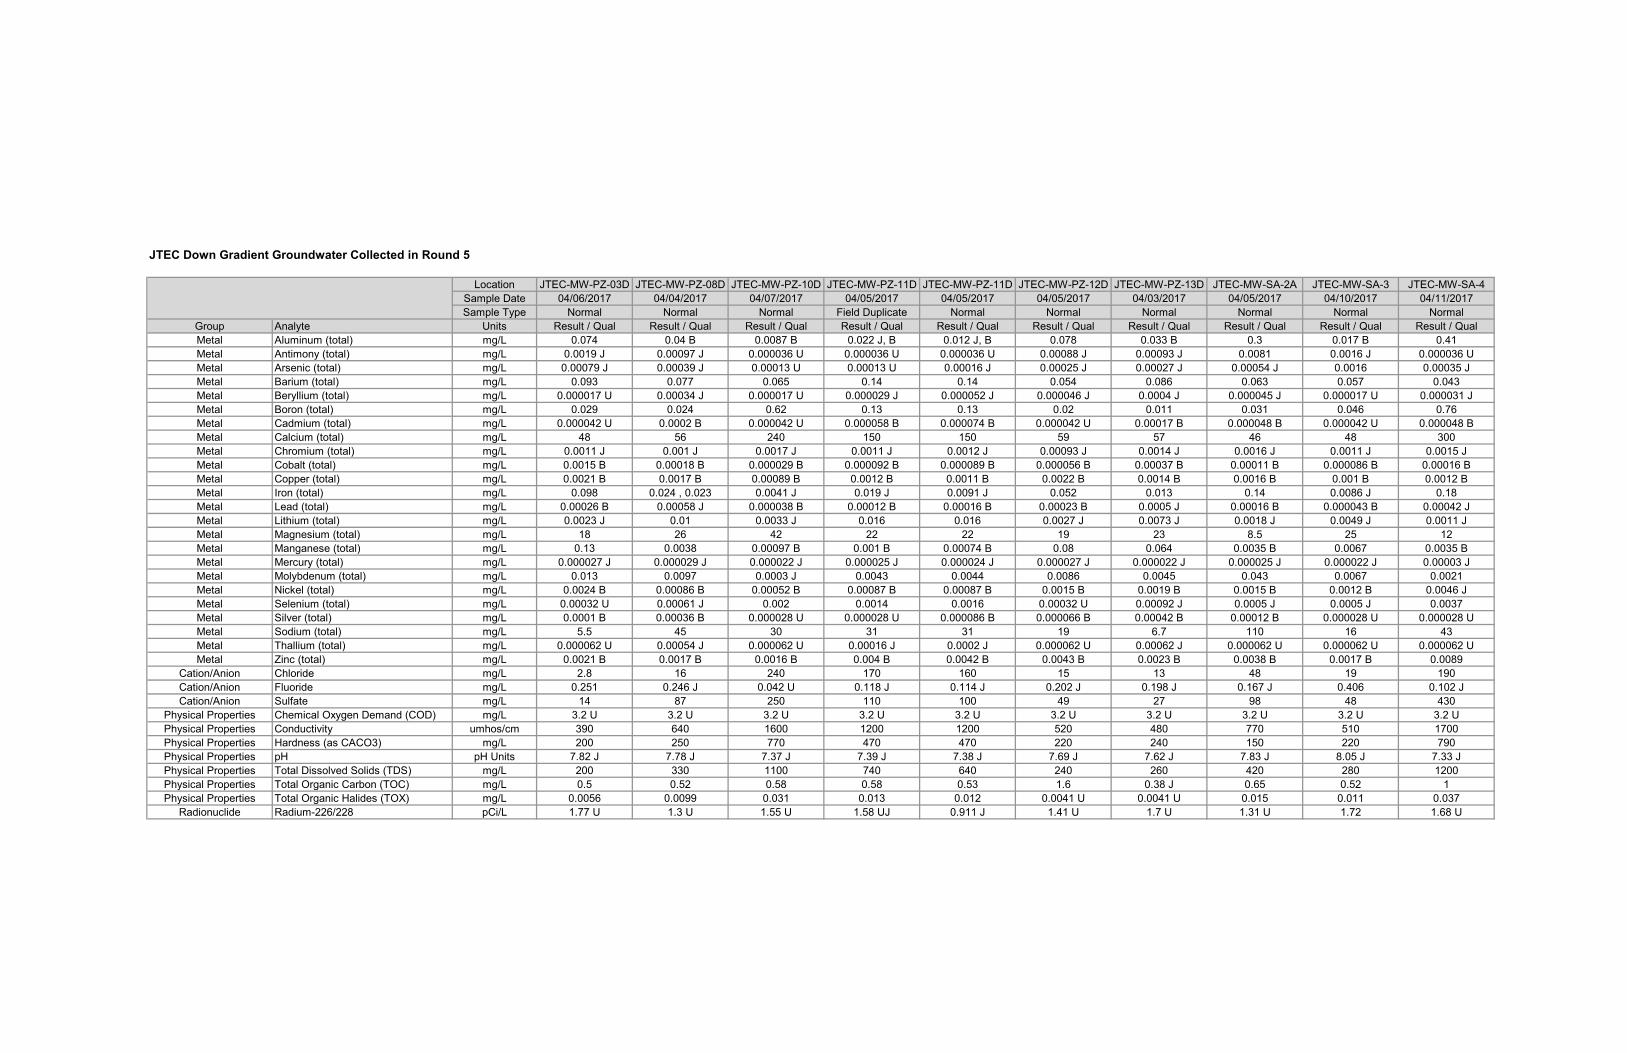
Location JTEC-MW-PZ-03D JTEC-MW-PZ-08D JTEC-MW-PZ-10D JTEC-MW-PZ-11D JTEC-MW-PZ-11D JTEC-MW-PZ-12D JTEC-MW-PZ-13D JTEC-MW-SA-2A JTEC-MW-SA-3 JTEC-MW-SA-4
Sample Date 04/06/2017 04/04/2017 04/07/2017 04/05/2017 04/05/2017 04/05/2017 04/03/2017 04/05/2017 04/10/2017 04/11/2017
Sample Type Normal Normal Normal Field Duplicate Normal Normal Normal Normal Normal Normal
Group Analyte Units Result / Qual Result / Qual Result / Qual Result / Qual Result / Qual Result / Qual Result / Qual Result / Qual Result / Qual Result / Qual
Metal Aluminum (total) mg/L 0.074 0.04 B 0.0087 B 0.022 J, B 0.012 J, B 0.078 0.033 B 0.3 0.017 B 0.41
Metal Antimony (total) mg/L 0.0019 J 0.00097 J 0.000036 U 0.000036 U 0.000036 U 0.00088 J 0.00093 J 0.0081 0.0016 J 0.000036 U
Metal Arsenic (total) mg/L 0.00079 J 0.00039 J 0.00013 U 0.00013 U 0.00016 J 0.00025 J 0.00027 J 0.00054 J 0.0016 0.00035 J
Metal Barium (total) mg/L 0.093 0.077 0.065 0.14 0.14 0.054 0.086 0.063 0.057 0.043
Metal Beryllium (total) mg/L 0.000017 U 0.00034 J 0.000017 U 0.000029 J 0.000052 J 0.000046 J 0.0004 J 0.000045 J 0.000017 U 0.000031 J
Metal Boron (total) mg/L 0.029 0.024 0.62 0.13 0.13 0.02 0.011 0.031 0.046 0.76
Metal Cadmium (total) mg/L 0.000042 U 0.0002 B 0.000042 U 0.000058 B 0.000074 B 0.000042 U 0.00017 B 0.000048 B 0.000042 U 0.000048 B
Metal Calcium (total) mg/L 48 56 240 150 150 59 57 46 48 300
Metal Chromium (total) mg/L 0.0011 J 0.001 J 0.0017 J 0.0011 J 0.0012 J 0.00093 J 0.0014 J 0.0016 J 0.0011 J 0.0015 J
Metal Cobalt (total) mg/L 0.0015 B 0.00018 B 0.000029 B 0.000092 B 0.000089 B 0.000056 B 0.00037 B 0.00011 B 0.000086 B 0.00016 B
Metal Copper (total) mg/L 0.0021 B 0.0017 B 0.00089 B 0.0012 B 0.0011 B 0.0022 B 0.0014 B 0.0016 B 0.001 B 0.0012 B
Metal Iron (total) mg/L 0.098 0.024 , 0.023 0.0041 J 0.019 J 0.0091 J 0.052 0.013 0.14 0.0086 J 0.18
Metal Lead (total) mg/L 0.00026 B 0.00058 J 0.000038 B 0.00012 B 0.00016 B 0.00023 B 0.0005 J 0.00016 B 0.000043 B 0.00042 J
Metal Lithium (total) mg/L 0.0023 J 0.01 0.0033 J 0.016 0.016 0.0027 J 0.0073 J 0.0018 J 0.0049 J 0.0011 J
Metal Magnesium (total) mg/L 18 26 42 22 22 19 23 8.5 25 12
Metal Manganese (total) mg/L 0.13 0.0038 0.00097 B 0.001 B 0.00074 B 0.08 0.064 0.0035 B 0.0067 0.0035 B
Metal Mercury (total) mg/L 0.000027 J 0.000029 J 0.000022 J 0.000025 J 0.000024 J 0.000027 J 0.000022 J 0.000025 J 0.000022 J 0.00003 J
Metal Molybdenum (total) mg/L 0.013 0.0097 0.0003 J 0.0043 0.0044 0.0086 0.0045 0.043 0.0067 0.0021
Metal Nickel (total) mg/L 0.0024 B 0.00086 B 0.00052 B 0.00087 B 0.00087 B 0.0015 B 0.0019 B 0.0015 B 0.0012 B 0.0046 J
Metal Selenium (total) mg/L 0.00032 U 0.00061 J 0.002 0.0014 0.0016 0.00032 U 0.00092 J 0.0005 J 0.0005 J 0.0037
Metal Silver (total) mg/L 0.0001 B 0.00036 B 0.000028 U 0.000028 U 0.000086 B 0.000066 B 0.00042 B 0.00012 B 0.000028 U 0.000028 U
Metal Sodium (total) mg/L 5.5 45 30 31 31 19 6.7 110 16 43
Metal Thallium (total) mg/L 0.000062 U 0.00054 J 0.000062 U 0.00016 J 0.0002 J 0.000062 U 0.00062 J 0.000062 U 0.000062 U 0.000062 U
Metal Zinc (total) mg/L 0.0021 B 0.0017 B 0.0016 B 0.004 B 0.0042 B 0.0043 B 0.0023 B 0.0038 B 0.0017 B 0.0089
Cation/Anion Chloride mg/L 2.8 16 240 170 160 15 13 48 19 190
Cation/Anion Fluoride mg/L 0.251 0.246 J 0.042 U 0.118 J 0.114 J 0.202 J 0.198 J 0.167 J 0.406 0.102 J
Cation/Anion Sulfate mg/L 14 87 250 110 100 49 27 98 48 430
Physical Properties Chemical Oxygen Demand (COD) mg/L 3.2 U 3.2 U 3.2 U 3.2 U 3.2 U 3.2 U 3.2 U 3.2 U 3.2 U 3.2 U
Physical Properties Conductivity umhos/cm 390 640 1600 1200 1200 520 480 770 510 1700
Physical Properties Hardness (as CACO3) mg/L 200 250 770 470 470 220 240 150 220 790
Physical Properties pH pH Units 7.82 J 7.78 J 7.37 J 7.39 J 7.38 J 7.69 J 7.62 J 7.83 J 8.05 J 7.33 J
Physical Properties Total Dissolved Solids (TDS) mg/L 200 330 1100 740 640 240 260 420 280 1200
Physical Properties Total Organic Carbon (TOC) mg/L 0.5 0.52 0.58 0.58 0.53 1.6 0.38 J 0.65 0.52 1
Physical Properties Total Organic Halides (TOX) mg/L 0.0056 0.0099 0.031 0.013 0.012 0.0041 U 0.0041 U 0.015 0.011 0.037
Radionuclide Radium-226/228 pCi/L 1.77 U 1.3 U 1.55 U 1.58 UJ 0.911 J 1.41 U 1.7 U 1.31 U 1.72 1.68 U
JTEC Down Gradient Groundwater Collected in Round 5

JOHN TWITTY ENERGY CENTER - ROUND 5 GROUNDWATER
8
Attachment II
Chains of Custody


D a t a V a l i d a t i o n M e m o r a n d u m
1
John Twitty Energy Center - Round 6 Groundwater
Eleven groundwater samples were collected between May 8th and 11th at John Twitty Energy Center. Additionally, a field duplicate was collected at location JTEC-MW-PZ-11D. There were separate field filtered metals aliquots collected at JTEC-MW-SA-2A and JTEC-MW-SA-4 due to elevated turbidity issues associated with the samples.
The groundwater samples were collected by GeoEngineers and hand delivered to PDC Laboratories Springfield, Missouri location. The PDC Springfield Laboratory shipped sample aliquots to PDC’s Peoria Laboratory for metals and wet chemistry analyses and PACE Analytical in Greensburg, PA for Total Radium 226/228. While samples were collected and immediately stored in coolers on ice, the samples were hand delivered on the same day to PDC Springfield and there was insufficient time for cooling the samples to <6 degrees Celsius. Therefore, the initial receipt temperatures at PDC Springfield were not used as the basis for qualification. However, the temperatures for receipt at the Peoria Laboratory were evaluated and data were qualified if outside the acceptable range.
The table below provides a crosswalk of sample IDs from field to the laboratories.
Field Sample ID. PDC ID. PACE ID.
JTEC-MW-PZ-01D-20170508 7051623-01 30219031001 JTEC-MW-PZ-08D-20170509 7051623-02 30219031002 JTEC-MW-PZ-09D-20170509 7051623-03 30219031003 JTEC-MW-PZ-13D-20170509 7051623-04 30219031004 JTEC-MW-PZ-03D-20170510 7051623-05 30219031005 JTEC-MW-PZ-10D-20170510 7051623-06 30219031006 JTEC-MW-PZ-11D-20170510 7051623-07 30219031007 JTEC-MW-PZ-11D-20170510-FD 7051623-08 30219031008 JTEC-MW-PZ-12D-20170510 7051623-09 30219031009 JTEC-MW-SA-2A-20170510 7051623-10 30219031000 JTEC-MW-SA-3-20170511 7051623-11 30219031011 JTEC-MW-SA-4-20170511 7051623-12 30219031012
JTEC-MW-SA-2A-20170510-filtered 7051623-13 metals only JTEC-MW-SA-4-20170511-filtered 7051623-14 metals only
The samples were analyzed at PDC Peoria, IL. for the following analyses:
- Anions by EPA 300.0

JOHN TWITTY ENERGY CENTER - ROUND 6 GROUNDWATER
2
- pH by SM 4500-H B
- Total Dissolved Solids by SM 2540C
- COD by SM 5220D
- Conductivity by SM 2510B
- Total Organic Halide by SW-846 9020
- Total Organic Carbon by SM5310C
- Total Metals by SW-846 6010/6020
- Hardness (calculation)
- Total Mercury by SW-846 7470
The samples were analyzed at PACE Greensburg, PA. for the following:
- Total Radium (226/228)
This quality assurance memorandum is based upon the validation of analytical data generated for Round six groundwater samples collected at John Twitty Energy Center. The analyses were reviewed for adherence to the specified analytical protocols in accordance with the analytical methods, laboratory standard operating procedures, Quality Assurance Project Plan (QAPP) for Coal Combustion Residual Landfill Monitoring at John Twitty Energy Center, January 2016, and the guidance of the USEPA Contract Laboratory Program National Functional Guidelines for Inorganic Data Review, August 2014. The findings of this quality assurance report are based upon the comprehensive review of the data deliverables from PDC and PACE reported according to the project QAPP and the EPA modified Level III format (including raw data). The review included chain of custody documentation, sample receipt conditions, holding times, field QA samples, laboratory QC samples, calibrations, and target compound identification and quantitation of results.
The following definitions provide explanations of the data qualifiers that may be assigned to results based on this evaluation. The data qualifier definitions are consistent with the USEPA National Functional Guidelines for Inorganic Data Review.
U- The compound was analyzed for but not detected (ND).
J- The identification of the analyte is acceptable, but the quality assurance criteria indicate that the quantitative values may be outside the normal expected range of precision (i.e. the quantitative value is considered estimated).
UJ- This flag is a combination of the U and J qualifiers. This indicates that the analyte is not
present and the reported value is considered to be an estimated result.
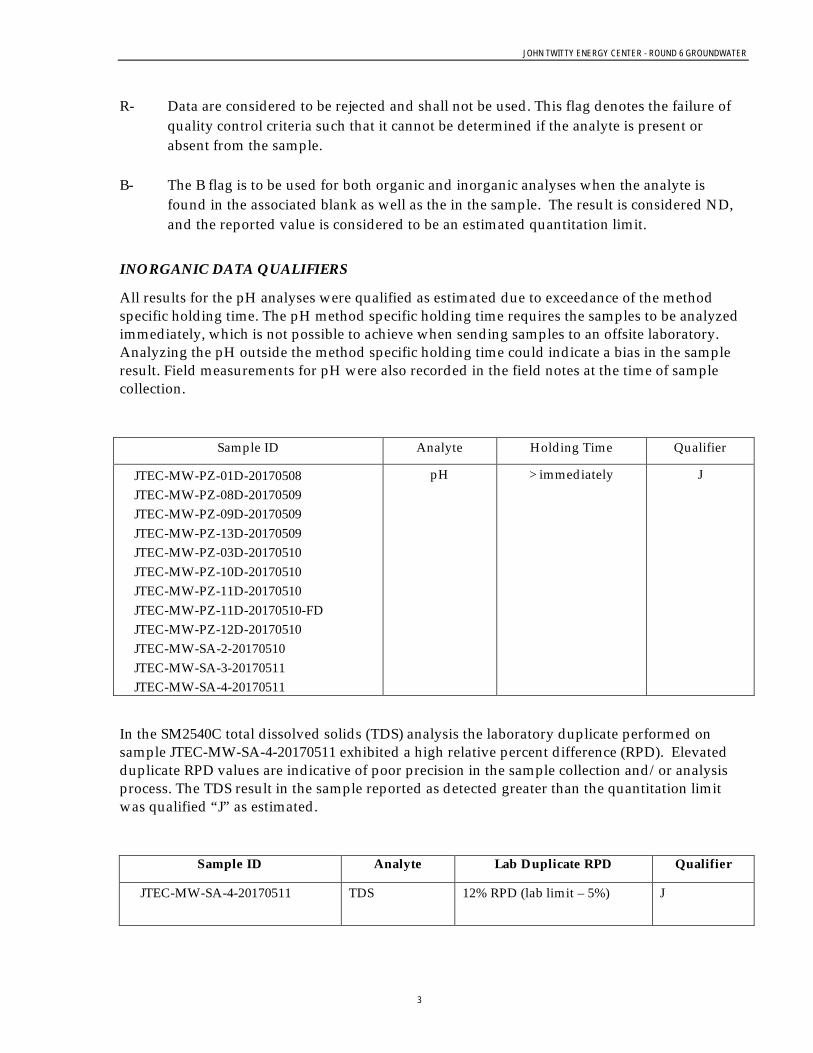
JOHN TWITTY ENERGY CENTER - ROUND 6 GROUNDWATER
3
R- Data are considered to be rejected and shall not be used. This flag denotes the failure of quality control criteria such that it cannot be determined if the analyte is present or absent from the sample.
B- The B flag is to be used for both organic and inorganic analyses when the analyte is
found in the associated blank as well as the in the sample. The result is considered ND, and the reported value is considered to be an estimated quantitation limit.
INORGANIC DATA QUALIFIERS
All results for the pH analyses were qualified as estimated due to exceedance of the method specific holding time. The pH method specific holding time requires the samples to be analyzed immediately, which is not possible to achieve when sending samples to an offsite laboratory. Analyzing the pH outside the method specific holding time could indicate a bias in the sample result. Field measurements for pH were also recorded in the field notes at the time of sample collection.
Sample ID Analyte Holding Time Qualifier
JTEC-MW-PZ-01D-20170508 JTEC-MW-PZ-08D-20170509 JTEC-MW-PZ-09D-20170509 JTEC-MW-PZ-13D-20170509 JTEC-MW-PZ-03D-20170510 JTEC-MW-PZ-10D-20170510 JTEC-MW-PZ-11D-20170510 JTEC-MW-PZ-11D-20170510-FD JTEC-MW-PZ-12D-20170510 JTEC-MW-SA-2-20170510 JTEC-MW-SA-3-20170511 JTEC-MW-SA-4-20170511
pH > immediately J
In the SM2540C total dissolved solids (TDS) analysis the laboratory duplicate performed on sample JTEC-MW-SA-4-20170511 exhibited a high relative percent difference (RPD). Elevated duplicate RPD values are indicative of poor precision in the sample collection and/or analysis process. The TDS result in the sample reported as detected greater than the quantitation limit was qualified “J” as estimated.
Sample ID Analyte Lab Duplicate RPD Qualifier
JTEC-MW-SA-4-20170511
TDS 12% RPD (lab limit – 5%) J
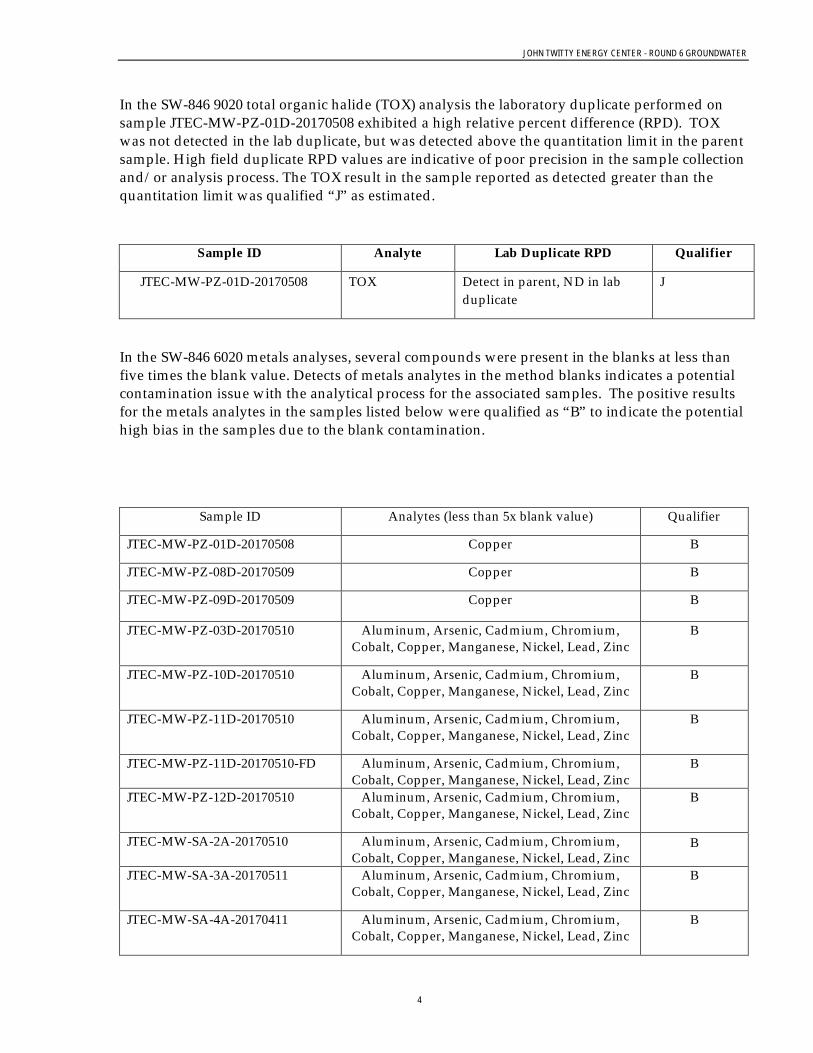
JOHN TWITTY ENERGY CENTER - ROUND 6 GROUNDWATER
4
In the SW-846 9020 total organic halide (TOX) analysis the laboratory duplicate performed on sample JTEC-MW-PZ-01D-20170508 exhibited a high relative percent difference (RPD). TOX was not detected in the lab duplicate, but was detected above the quantitation limit in the parent sample. High field duplicate RPD values are indicative of poor precision in the sample collection and/or analysis process. The TOX result in the sample reported as detected greater than the quantitation limit was qualified “J” as estimated.
Sample ID Analyte Lab Duplicate RPD Qualifier
JTEC-MW-PZ-01D-20170508
TOX Detect in parent, ND in lab duplicate
J
In the SW-846 6020 metals analyses, several compounds were present in the blanks at less than five times the blank value. Detects of metals analytes in the method blanks indicates a potential contamination issue with the analytical process for the associated samples. The positive results for the metals analytes in the samples listed below were qualified as “B” to indicate the potential high bias in the samples due to the blank contamination.
Sample ID Analytes (less than 5x blank value) Qualifier
JTEC-MW-PZ-01D-20170508 Copper B
JTEC-MW-PZ-08D-20170509 Copper B
JTEC-MW-PZ-09D-20170509 Copper B
JTEC-MW-PZ-03D-20170510 Aluminum, Arsenic, Cadmium, Chromium, Cobalt, Copper, Manganese, Nickel, Lead, Zinc
B
JTEC-MW-PZ-10D-20170510 Aluminum, Arsenic, Cadmium, Chromium, Cobalt, Copper, Manganese, Nickel, Lead, Zinc
B
JTEC-MW-PZ-11D-20170510 Aluminum, Arsenic, Cadmium, Chromium, Cobalt, Copper, Manganese, Nickel, Lead, Zinc
B
JTEC-MW-PZ-11D-20170510-FD Aluminum, Arsenic, Cadmium, Chromium, Cobalt, Copper, Manganese, Nickel, Lead, Zinc
B
JTEC-MW-PZ-12D-20170510 Aluminum, Arsenic, Cadmium, Chromium, Cobalt, Copper, Manganese, Nickel, Lead, Zinc
B
JTEC-MW-SA-2A-20170510 Aluminum, Arsenic, Cadmium, Chromium, Cobalt, Copper, Manganese, Nickel, Lead, Zinc
B
JTEC-MW-SA-3A-20170511 Aluminum, Arsenic, Cadmium, Chromium, Cobalt, Copper, Manganese, Nickel, Lead, Zinc
B
JTEC-MW-SA-4A-20170411 Aluminum, Arsenic, Cadmium, Chromium, Cobalt, Copper, Manganese, Nickel, Lead, Zinc
B
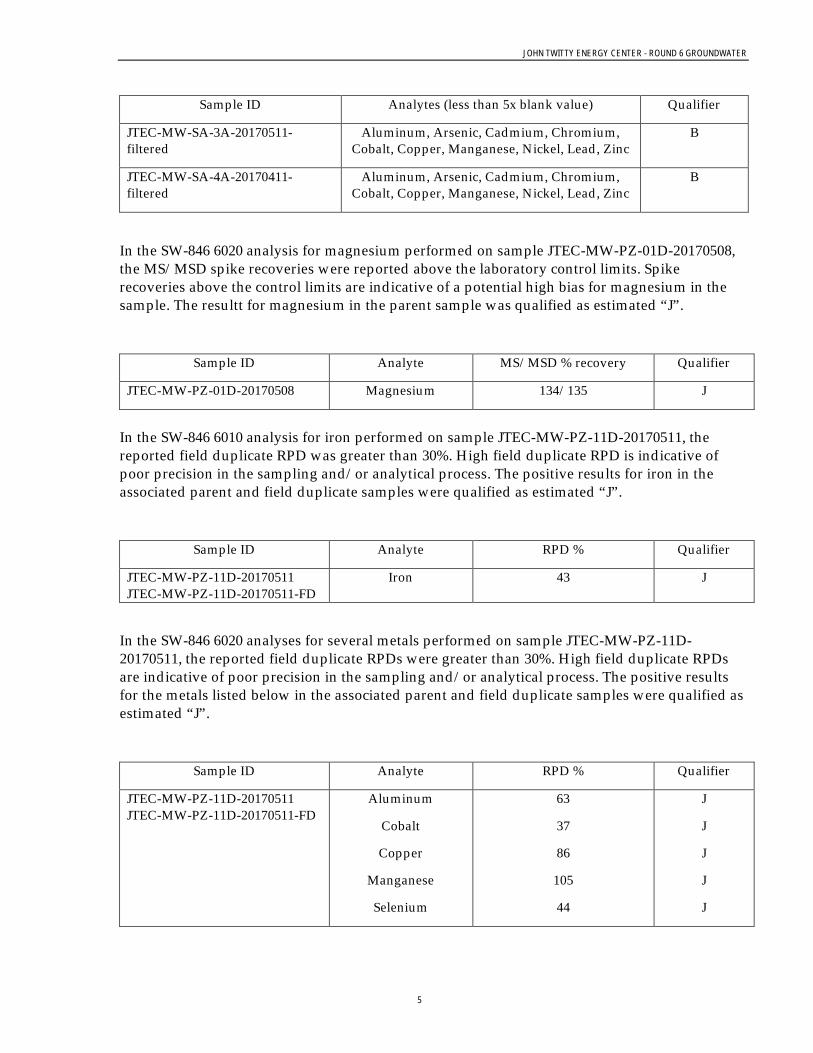
JOHN TWITTY ENERGY CENTER - ROUND 6 GROUNDWATER
5
Sample ID Analytes (less than 5x blank value) Qualifier
JTEC-MW-SA-3A-20170511-filtered
Aluminum, Arsenic, Cadmium, Chromium, Cobalt, Copper, Manganese, Nickel, Lead, Zinc
B
JTEC-MW-SA-4A-20170411-filtered
Aluminum, Arsenic, Cadmium, Chromium, Cobalt, Copper, Manganese, Nickel, Lead, Zinc
B
In the SW-846 6020 analysis for magnesium performed on sample JTEC-MW-PZ-01D-20170508, the MS/MSD spike recoveries were reported above the laboratory control limits. Spike recoveries above the control limits are indicative of a potential high bias for magnesium in the sample. The resultt for magnesium in the parent sample was qualified as estimated “J”.
Sample ID Analyte MS/MSD % recovery Qualifier
JTEC-MW-PZ-01D-20170508 Magnesium 134/135 J
In the SW-846 6010 analysis for iron performed on sample JTEC-MW-PZ-11D-20170511, the reported field duplicate RPD was greater than 30%. High field duplicate RPD is indicative of poor precision in the sampling and/or analytical process. The positive results for iron in the associated parent and field duplicate samples were qualified as estimated “J”.
Sample ID Analyte RPD % Qualifier
JTEC-MW-PZ-11D-20170511 JTEC-MW-PZ-11D-20170511-FD
Iron 43 J
In the SW-846 6020 analyses for several metals performed on sample JTEC-MW-PZ-11D-20170511, the reported field duplicate RPDs were greater than 30%. High field duplicate RPDs are indicative of poor precision in the sampling and/or analytical process. The positive results for the metals listed below in the associated parent and field duplicate samples were qualified as estimated “J”.
Sample ID Analyte RPD % Qualifier
JTEC-MW-PZ-11D-20170511 JTEC-MW-PZ-11D-20170511-FD
Aluminum
Cobalt
Copper
Manganese
Selenium
63
37
86
105
44
J
J
J
J
J

JOHN TWITTY ENERGY CENTER - ROUND 6 GROUNDWATER
6
In order to achieve the lowest possible detection levels and facilitate the statistical analysis of the groundwater data, PDC was required to report positive results between the method detection level and quantitation limits as estimated detects with a “J” qualifier. RADIOLOGICAL DATA QUALIFIERS
The reported results for total radium in nine of the eleven groundwater samples and the field duplicate were less than the reported laboratory minimum detectable concentration (MDC) and thus, qualified as “U” not detected at the MDC.
SUMMARY
The inorganic and radiological analyses were performed acceptably, but required qualification for the minor QA/QC deficiencies noted above. The qualified data is included in Attachment I and the chains of custody are included in Attachment II of this report. It is recommended that the analytical data be used only with the qualifiers applied as part of this evaluation. Any aspects of the data, which are not discussed in this report, should be considered qualitatively and quantitatively valid as reported, based on the deliverables reviewed.
JOHN TWITTY ENERGY CENTER - ROUND 6 GROUNDWATER
7
Attachment I
JTEC Round 6 Groundwater Data
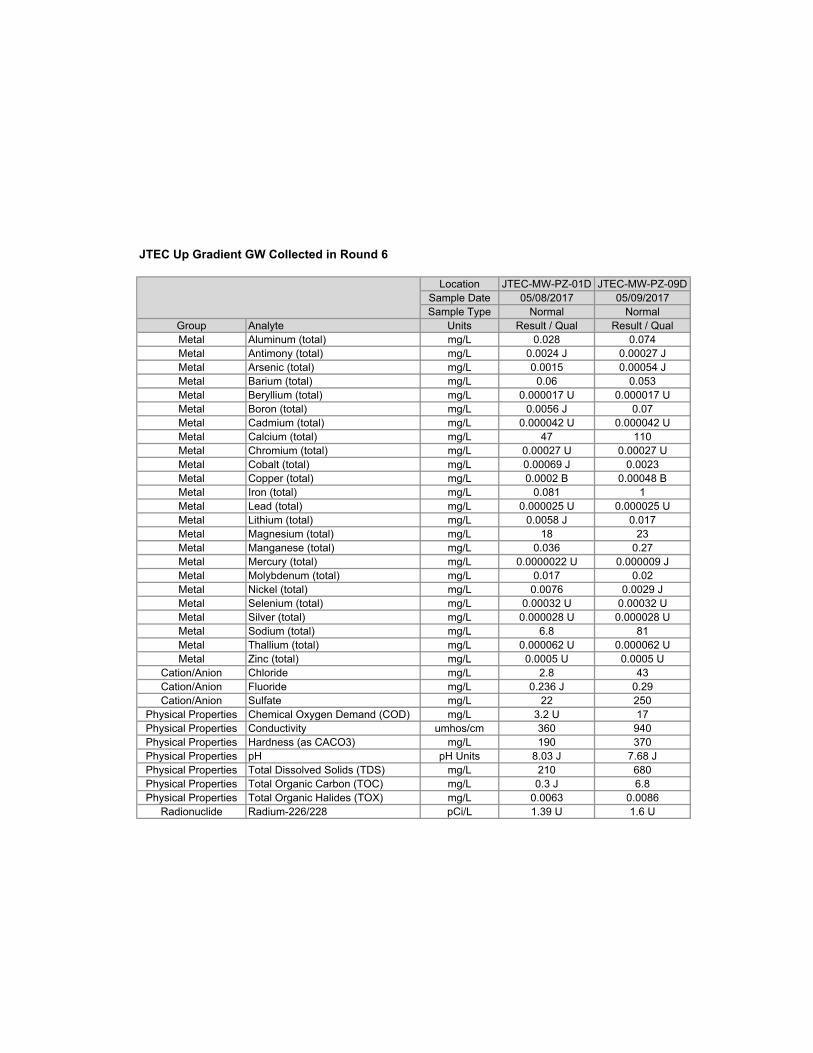
Location JTEC-MW-PZ-01D JTEC-MW-PZ-09D
Sample Date 05/08/2017 05/09/2017
Sample Type Normal Normal
Group Analyte Units Result / Qual Result / Qual
Metal Aluminum (total) mg/L 0.028 0.074
Metal Antimony (total) mg/L 0.0024 J 0.00027 J
Metal Arsenic (total) mg/L 0.0015 0.00054 J
Metal Barium (total) mg/L 0.06 0.053
Metal Beryllium (total) mg/L 0.000017 U 0.000017 U
Metal Boron (total) mg/L 0.0056 J 0.07
Metal Cadmium (total) mg/L 0.000042 U 0.000042 U
Metal Calcium (total) mg/L 47 110
Metal Chromium (total) mg/L 0.00027 U 0.00027 U
Metal Cobalt (total) mg/L 0.00069 J 0.0023
Metal Copper (total) mg/L 0.0002 B 0.00048 B
Metal Iron (total) mg/L 0.081 1
Metal Lead (total) mg/L 0.000025 U 0.000025 U
Metal Lithium (total) mg/L 0.0058 J 0.017
Metal Magnesium (total) mg/L 18 23
Metal Manganese (total) mg/L 0.036 0.27
Metal Mercury (total) mg/L 0.0000022 U 0.000009 J
Metal Molybdenum (total) mg/L 0.017 0.02
Metal Nickel (total) mg/L 0.0076 0.0029 J
Metal Selenium (total) mg/L 0.00032 U 0.00032 U
Metal Silver (total) mg/L 0.000028 U 0.000028 U
Metal Sodium (total) mg/L 6.8 81
Metal Thallium (total) mg/L 0.000062 U 0.000062 U
Metal Zinc (total) mg/L 0.0005 U 0.0005 U
Cation/Anion Chloride mg/L 2.8 43
Cation/Anion Fluoride mg/L 0.236 J 0.29
Cation/Anion Sulfate mg/L 22 250
Physical Properties Chemical Oxygen Demand (COD) mg/L 3.2 U 17
Physical Properties Conductivity umhos/cm 360 940
Physical Properties Hardness (as CACO3) mg/L 190 370
Physical Properties pH pH Units 8.03 J 7.68 J
Physical Properties Total Dissolved Solids (TDS) mg/L 210 680
Physical Properties Total Organic Carbon (TOC) mg/L 0.3 J 6.8
Physical Properties Total Organic Halides (TOX) mg/L 0.0063 0.0086
Radionuclide Radium-226/228 pCi/L 1.39 U 1.6 U
JTEC Up Gradient GW Collected in Round 6
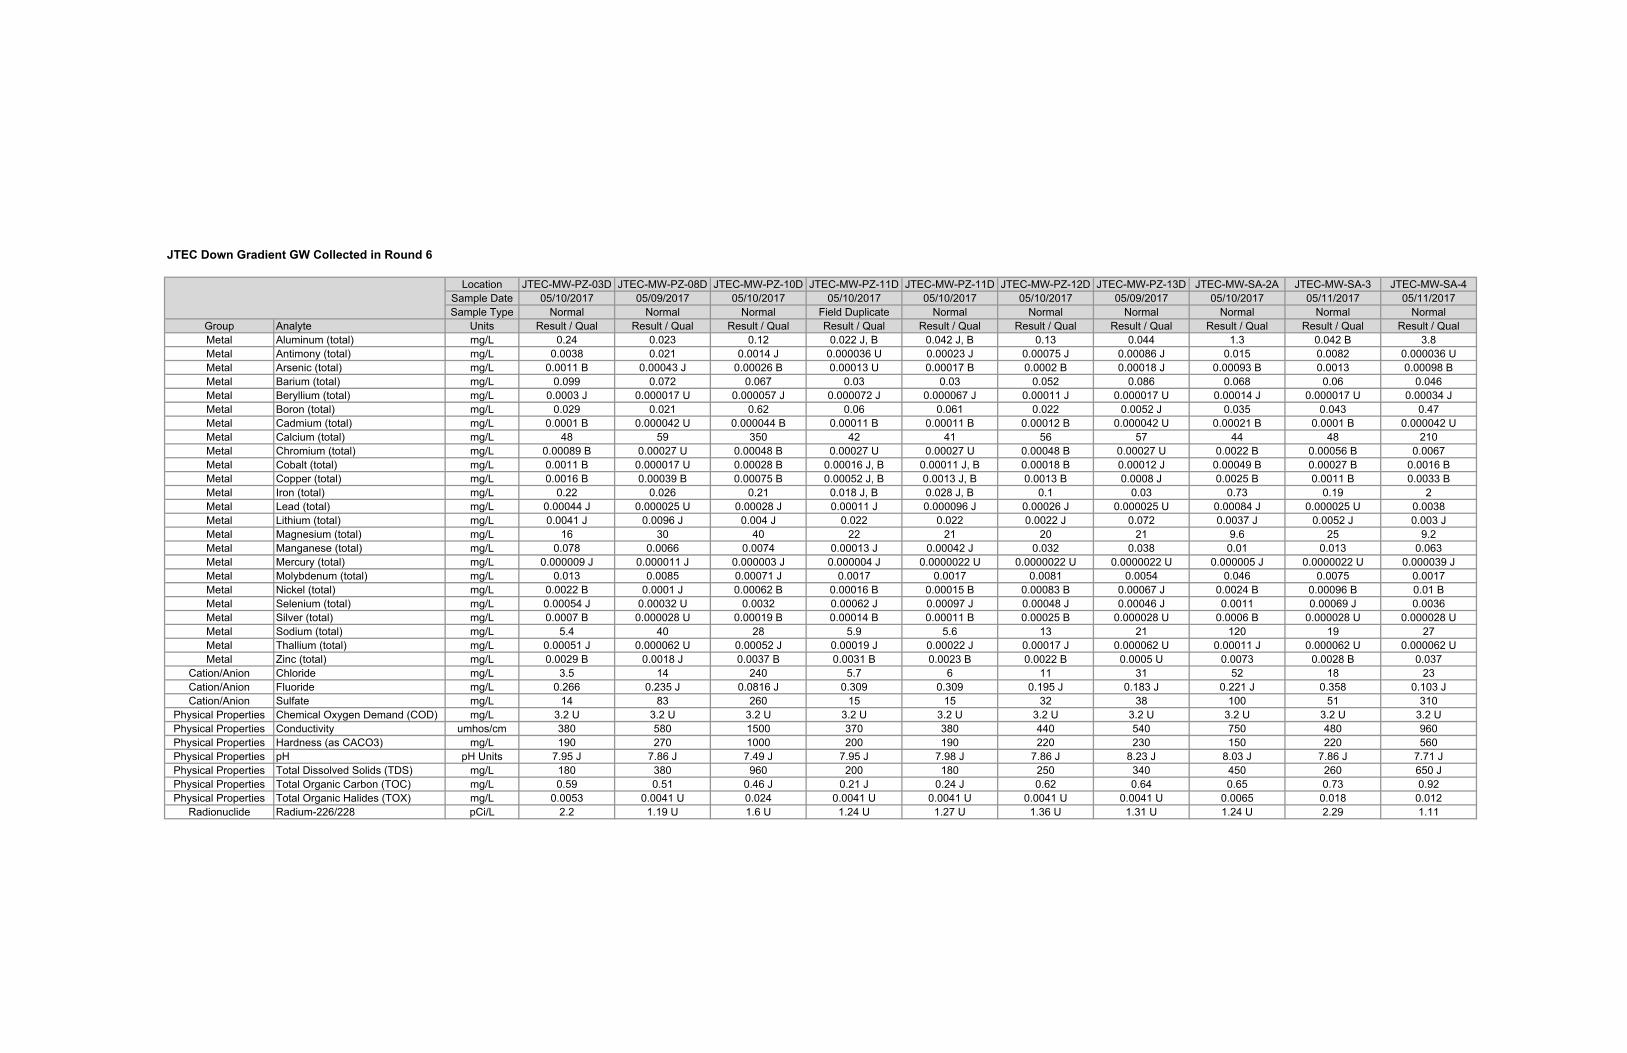
Location JTEC-MW-PZ-03D JTEC-MW-PZ-08D JTEC-MW-PZ-10D JTEC-MW-PZ-11D JTEC-MW-PZ-11D JTEC-MW-PZ-12D JTEC-MW-PZ-13D JTEC-MW-SA-2A JTEC-MW-SA-3 JTEC-MW-SA-4
Sample Date 05/10/2017 05/09/2017 05/10/2017 05/10/2017 05/10/2017 05/10/2017 05/09/2017 05/10/2017 05/11/2017 05/11/2017
Sample Type Normal Normal Normal Field Duplicate Normal Normal Normal Normal Normal Normal
Group Analyte Units Result / Qual Result / Qual Result / Qual Result / Qual Result / Qual Result / Qual Result / Qual Result / Qual Result / Qual Result / Qual
Metal Aluminum (total) mg/L 0.24 0.023 0.12 0.022 J, B 0.042 J, B 0.13 0.044 1.3 0.042 B 3.8
Metal Antimony (total) mg/L 0.0038 0.021 0.0014 J 0.000036 U 0.00023 J 0.00075 J 0.00086 J 0.015 0.0082 0.000036 U
Metal Arsenic (total) mg/L 0.0011 B 0.00043 J 0.00026 B 0.00013 U 0.00017 B 0.0002 B 0.00018 J 0.00093 B 0.0013 0.00098 B
Metal Barium (total) mg/L 0.099 0.072 0.067 0.03 0.03 0.052 0.086 0.068 0.06 0.046
Metal Beryllium (total) mg/L 0.0003 J 0.000017 U 0.000057 J 0.000072 J 0.000067 J 0.00011 J 0.000017 U 0.00014 J 0.000017 U 0.00034 J
Metal Boron (total) mg/L 0.029 0.021 0.62 0.06 0.061 0.022 0.0052 J 0.035 0.043 0.47
Metal Cadmium (total) mg/L 0.0001 B 0.000042 U 0.000044 B 0.00011 B 0.00011 B 0.00012 B 0.000042 U 0.00021 B 0.0001 B 0.000042 U
Metal Calcium (total) mg/L 48 59 350 42 41 56 57 44 48 210
Metal Chromium (total) mg/L 0.00089 B 0.00027 U 0.00048 B 0.00027 U 0.00027 U 0.00048 B 0.00027 U 0.0022 B 0.00056 B 0.0067
Metal Cobalt (total) mg/L 0.0011 B 0.000017 U 0.00028 B 0.00016 J, B 0.00011 J, B 0.00018 B 0.00012 J 0.00049 B 0.00027 B 0.0016 B
Metal Copper (total) mg/L 0.0016 B 0.00039 B 0.00075 B 0.00052 J, B 0.0013 J, B 0.0013 B 0.0008 J 0.0025 B 0.0011 B 0.0033 B
Metal Iron (total) mg/L 0.22 0.026 0.21 0.018 J, B 0.028 J, B 0.1 0.03 0.73 0.19 2
Metal Lead (total) mg/L 0.00044 J 0.000025 U 0.00028 J 0.00011 J 0.000096 J 0.00026 J 0.000025 U 0.00084 J 0.000025 U 0.0038
Metal Lithium (total) mg/L 0.0041 J 0.0096 J 0.004 J 0.022 0.022 0.0022 J 0.072 0.0037 J 0.0052 J 0.003 J
Metal Magnesium (total) mg/L 16 30 40 22 21 20 21 9.6 25 9.2
Metal Manganese (total) mg/L 0.078 0.0066 0.0074 0.00013 J 0.00042 J 0.032 0.038 0.01 0.013 0.063
Metal Mercury (total) mg/L 0.000009 J 0.000011 J 0.000003 J 0.000004 J 0.0000022 U 0.0000022 U 0.0000022 U 0.000005 J 0.0000022 U 0.000039 J
Metal Molybdenum (total) mg/L 0.013 0.0085 0.00071 J 0.0017 0.0017 0.0081 0.0054 0.046 0.0075 0.0017
Metal Nickel (total) mg/L 0.0022 B 0.0001 J 0.00062 B 0.00016 B 0.00015 B 0.00083 B 0.00067 J 0.0024 B 0.00096 B 0.01 B
Metal Selenium (total) mg/L 0.00054 J 0.00032 U 0.0032 0.00062 J 0.00097 J 0.00048 J 0.00046 J 0.0011 0.00069 J 0.0036
Metal Silver (total) mg/L 0.0007 B 0.000028 U 0.00019 B 0.00014 B 0.00011 B 0.00025 B 0.000028 U 0.0006 B 0.000028 U 0.000028 U
Metal Sodium (total) mg/L 5.4 40 28 5.9 5.6 13 21 120 19 27
Metal Thallium (total) mg/L 0.00051 J 0.000062 U 0.00052 J 0.00019 J 0.00022 J 0.00017 J 0.000062 U 0.00011 J 0.000062 U 0.000062 U
Metal Zinc (total) mg/L 0.0029 B 0.0018 J 0.0037 B 0.0031 B 0.0023 B 0.0022 B 0.0005 U 0.0073 0.0028 B 0.037
Cation/Anion Chloride mg/L 3.5 14 240 5.7 6 11 31 52 18 23
Cation/Anion Fluoride mg/L 0.266 0.235 J 0.0816 J 0.309 0.309 0.195 J 0.183 J 0.221 J 0.358 0.103 J
Cation/Anion Sulfate mg/L 14 83 260 15 15 32 38 100 51 310
Physical Properties Chemical Oxygen Demand (COD) mg/L 3.2 U 3.2 U 3.2 U 3.2 U 3.2 U 3.2 U 3.2 U 3.2 U 3.2 U 3.2 U
Physical Properties Conductivity umhos/cm 380 580 1500 370 380 440 540 750 480 960
Physical Properties Hardness (as CACO3) mg/L 190 270 1000 200 190 220 230 150 220 560
Physical Properties pH pH Units 7.95 J 7.86 J 7.49 J 7.95 J 7.98 J 7.86 J 8.23 J 8.03 J 7.86 J 7.71 J
Physical Properties Total Dissolved Solids (TDS) mg/L 180 380 960 200 180 250 340 450 260 650 J
Physical Properties Total Organic Carbon (TOC) mg/L 0.59 0.51 0.46 J 0.21 J 0.24 J 0.62 0.64 0.65 0.73 0.92
Physical Properties Total Organic Halides (TOX) mg/L 0.0053 0.0041 U 0.024 0.0041 U 0.0041 U 0.0041 U 0.0041 U 0.0065 0.018 0.012
Radionuclide Radium-226/228 pCi/L 2.2 1.19 U 1.6 U 1.24 U 1.27 U 1.36 U 1.31 U 1.24 U 2.29 1.11
JTEC Down Gradient GW Collected in Round 6

JOHN TWITTY ENERGY CENTER - ROUND 6 GROUNDWATER
8
Attachment II
Chains of Custody
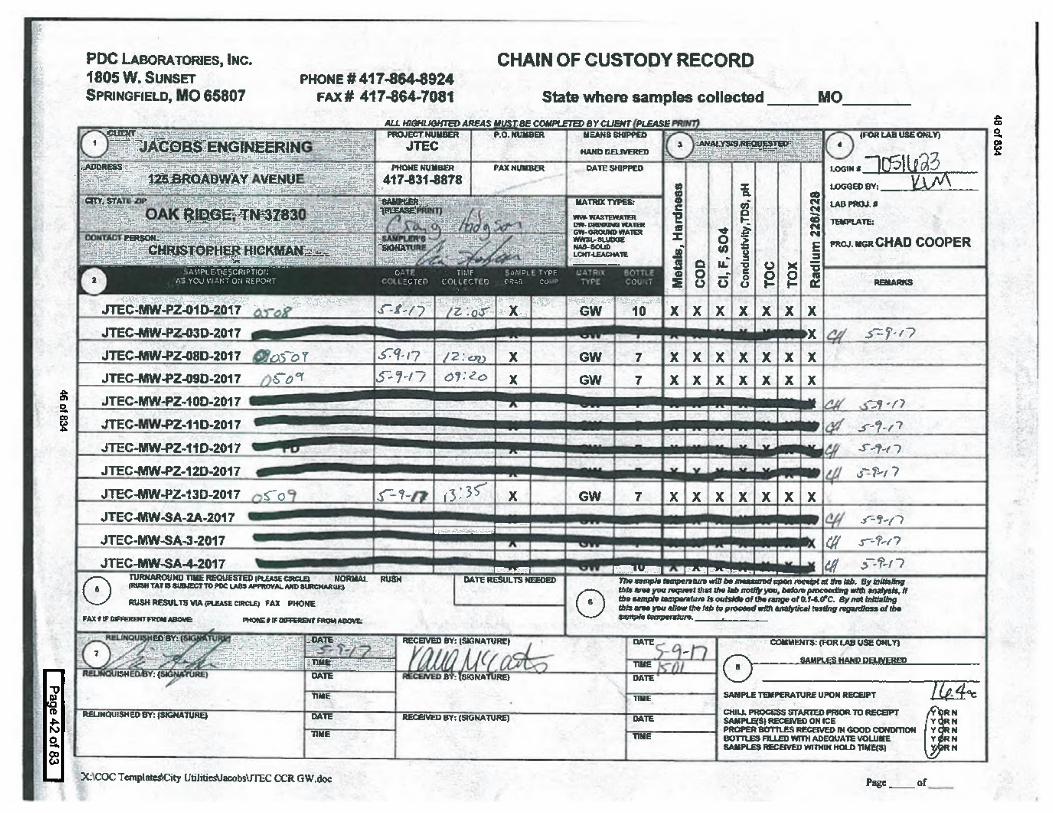
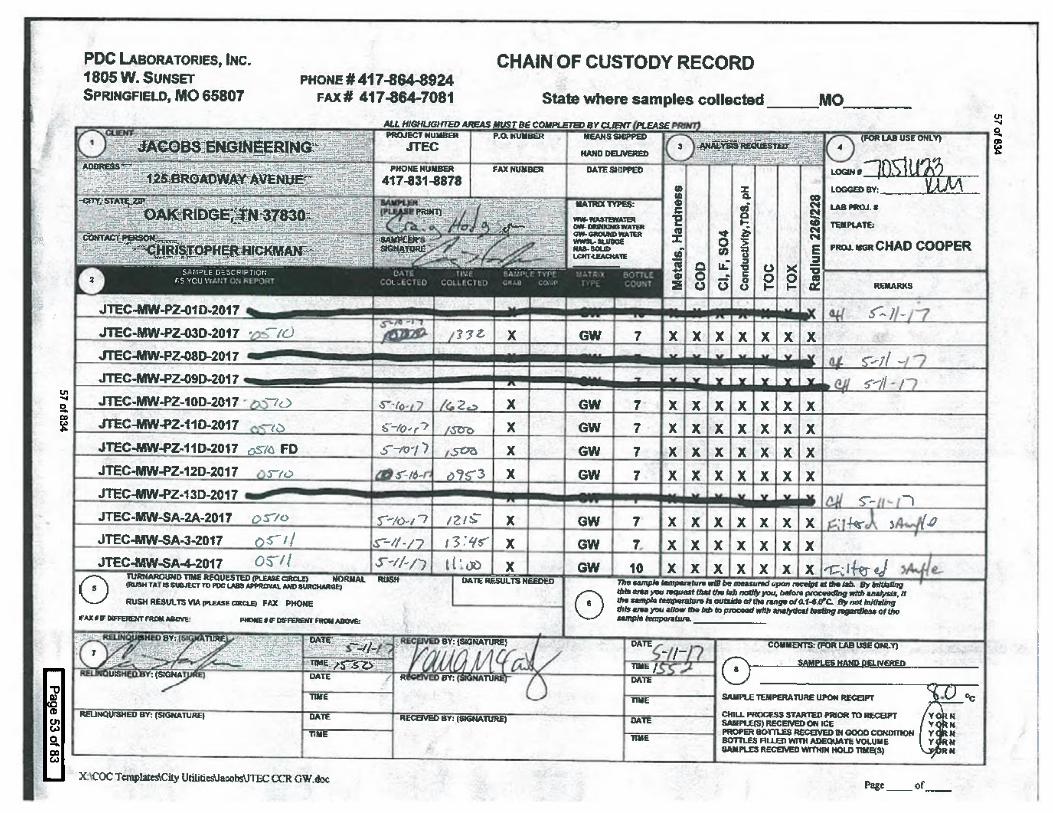
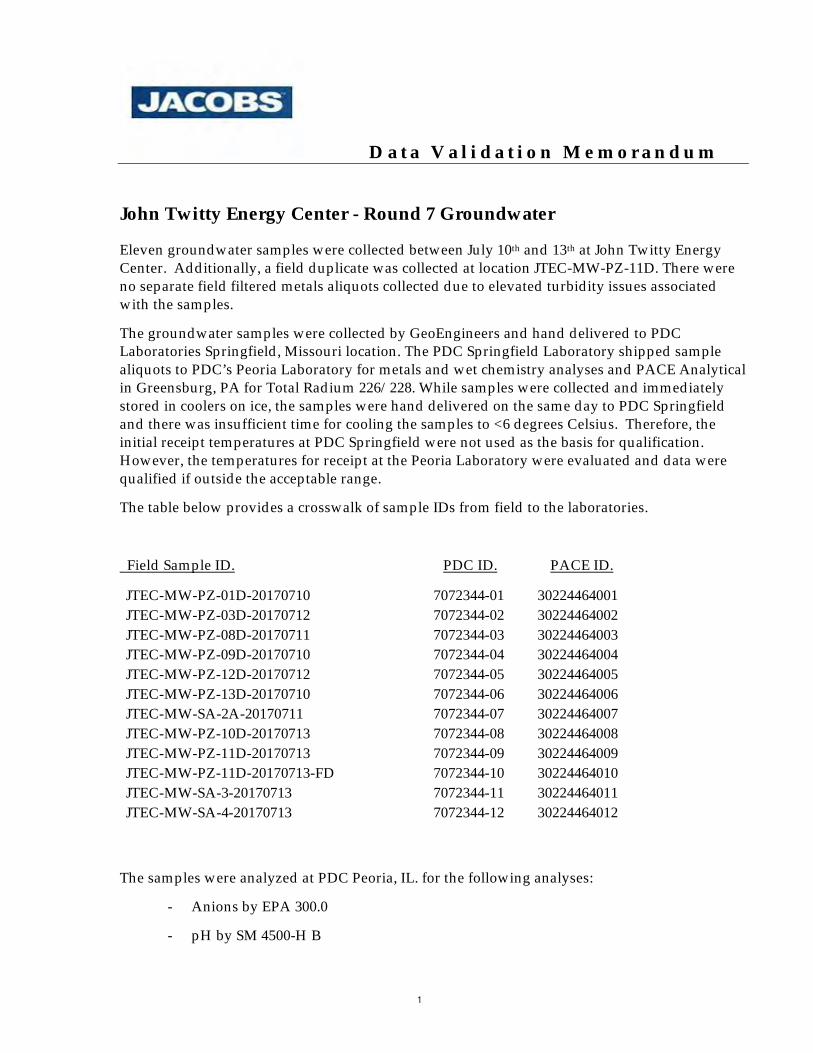
D a t a V a l i d a t i o n M e m o r a n d u m
1
John Twitty Energy Center - Round 7 Groundwater
Eleven groundwater samples were collected between July 10th and 13th at John Twitty Energy Center. Additionally, a field duplicate was collected at location JTEC-MW-PZ-11D. There were no separate field filtered metals aliquots collected due to elevated turbidity issues associated with the samples.
The groundwater samples were collected by GeoEngineers and hand delivered to PDC Laboratories Springfield, Missouri location. The PDC Springfield Laboratory shipped sample aliquots to PDC’s Peoria Laboratory for metals and wet chemistry analyses and PACE Analytical in Greensburg, PA for Total Radium 226/228. While samples were collected and immediately stored in coolers on ice, the samples were hand delivered on the same day to PDC Springfield and there was insufficient time for cooling the samples to <6 degrees Celsius. Therefore, the initial receipt temperatures at PDC Springfield were not used as the basis for qualification. However, the temperatures for receipt at the Peoria Laboratory were evaluated and data were qualified if outside the acceptable range.
The table below provides a crosswalk of sample IDs from field to the laboratories.
Field Sample ID. PDC ID. PACE ID.
JTEC-MW-PZ-01D-20170710 7072344-01 30224464001 JTEC-MW-PZ-03D-20170712 7072344-02 30224464002 JTEC-MW-PZ-08D-20170711 7072344-03 30224464003 JTEC-MW-PZ-09D-20170710 7072344-04 30224464004 JTEC-MW-PZ-12D-20170712 7072344-05 30224464005 JTEC-MW-PZ-13D-20170710 7072344-06 30224464006 JTEC-MW-SA-2A-20170711 7072344-07 30224464007 JTEC-MW-PZ-10D-20170713 7072344-08 30224464008 JTEC-MW-PZ-11D-20170713 7072344-09 30224464009 JTEC-MW-PZ-11D-20170713-FD 7072344-10 30224464010 JTEC-MW-SA-3-20170713 7072344-11 30224464011 JTEC-MW-SA-4-20170713 7072344-12 30224464012
The samples were analyzed at PDC Peoria, IL. for the following analyses:
- Anions by EPA 300.0
- pH by SM 4500-H B
JOHN TWITTY ENERGY CENTER - ROUND 7 GROUNDWATER
2
- Total Dissolved Solids by SM 2540C
- COD by SM 5220D
- Conductivity by SM 2510B
- Total Organic Halide by SW-846 9020
- Total Organic Carbon by SM5310C
- Total Metals by SW-846 6010/6020
- Hardness (calculation)
- Total Mercury by SW-846 7470
The samples were analyzed at PACE Greensburg, PA. for the following:
- Total Radium (226/228)
This quality assurance memorandum is based upon the validation of analytical data generated for Round seven groundwater samples collected at John Twitty Energy Center. The analyses were reviewed for adherence to the specified analytical protocols in accordance with the analytical methods, laboratory standard operating procedures, Quality Assurance Project Plan (QAPP) for Coal Combustion Residual Landfill Monitoring at John Twitty Energy Center, January 2016, and the guidance of the USEPA Contract Laboratory Program National Functional Guidelines for Inorganic Data Review, August 2014. The findings of this quality assurance report are based upon the comprehensive review of the data deliverables from PDC and PACE reported according to the project QAPP and the EPA modified Level III format (including raw data). The review included chain of custody documentation, sample receipt conditions, holding times, field QA samples, laboratory QC samples, calibrations, and target compound identification and quantitation of results.
The following definitions provide explanations of the data qualifiers that may be assigned to results based on this evaluation. The data qualifier definitions are consistent with the USEPA National Functional Guidelines for Inorganic Data Review.
U- The compound was analyzed for but not detected (ND).
J- The identification of the analyte is acceptable, but the quality assurance criteria indicate that the quantitative values may be outside the normal expected range of precision (i.e. the quantitative value is considered estimated).
UJ- This flag is a combination of the U and J qualifiers. This indicates that the analyte is not
present and the reported value is considered to be an estimated result.
R- Data are considered to be rejected and shall not be used. This flag denotes the failure of

JOHN TWITTY ENERGY CENTER - ROUND 7 GROUNDWATER
3
quality control criteria such that it cannot be determined if the analyte is present or absent from the sample.
B- The B flag is to be used for both organic and inorganic analyses when the analyte is
found in the associated blank as well as the in the sample. The result is considered ND, and the reported value is considered to be an estimated quantitation limit.
INORGANIC DATA QUALIFIERS
All results for the pH analyses were qualified as estimated due to exceedance of the method specific holding time. The pH method specific holding time requires the samples to be analyzed immediately, which is not possible to achieve when sending samples to an offsite laboratory. Analyzing the pH outside the method specific holding time could indicate a bias in the sample result. Field measurements for pH were also recorded in the field notes at the time of sample collection.
Sample ID Analyte Holding Time Qualifier
JTEC-MW-PZ-01D-20170710 JTEC-MW-PZ-03D-20170712 JTEC-MW-PZ-08D-20170711 JTEC-MW-PZ-09D-20170710 JTEC-MW-PZ-12D-20170712 JTEC-MW-PZ-13D-20170710 JTEC-MW-SA-2-20170711 JTEC-MW-PZ-10D-20170713 JTEC-MW-PZ-11D-20170713 JTEC-MW-PZ-11D-20170713-FD JTEC-MW-SA-3-20170713 JTEC-MW-SA-4-20170713
pH > immediately J
In the SM2540C total dissolved solids (TDS) analysis the laboratory duplicates performed on samples JTEC-MW-SA-2A-20170711 and JTEC-MW-SA-4-20170713 exhibited high relative percent difference (RPD). Elevated duplicate RPD values are indicative of poor precision in the sample collection and/or analysis process. The TDS results in the samples reported as detects greater than the quantitation limit were qualified “J” as estimated.
Sample ID Analyte Lab Duplicate RPD Qualifier
JTEC-MW-SA-2A-20170711 JTEC-MW-SA-4-20170713
TDS 8% RPD (lab limit – 5%)
6% RPD (lab limit – 5%)
J
J

JOHN TWITTY ENERGY CENTER - ROUND 7 GROUNDWATER
4
In the SM 5220 D chemical oxygen demand (COD) analysis the matrix spike duplicate performed on sample JTEC-MW-SA-4-20170713 exhibited a low recovery. Low matrix spike recovery is indicative of a low bias in the sample result. The COD result in the sample reported as a non-detect was qualified “UJ” as estimated.
Sample ID Analyte MS/MSD % Recovery Qualifier
JTEC-MW-SA-4-20170713
COD 73% (80-120 lab limits) UJ
In the SW-846 9020 total organic halide (TOX) analysis the laboratory duplicate performed on sample JTEC-MW-PZ-01D-20170710 exhibited a high relative percent difference (RPD). TOX was not detected in the lab duplicate, but was detected above the quantitation limit in the parent sample. High laboratory duplicate RPD values are indicative of poor precision in the sample collection and/or analysis process. The TOX result in the sample reported as detected greater than the quantitation limit was qualified “J” as estimated.
Sample ID Analyte Lab Duplicate RPD Qualifier
JTEC-MW-PZ-01D-20170710
TOX Detect in parent, ND in lab duplicate
J
In the SM 5310 C total organic carbon (TOC) analysis the filed duplicate performed on sample JTEC-MW-PZ-11D-20170713 exhibited a high relative percent difference (RPD). High field duplicate RPD values are indicative of poor precision in the sample collection and/or analysis process. The TOC result in the sample reported as detected greater than the quantitation limit was qualified “J” as estimated.
Sample ID Analyte Field Duplicate RPD Qualifier
JTEC-MW-PZ-11D-20170713 JTEC-MW-PZ-11D-20170713
TOC 33% (less than 30% RPD) J
In the SW-846 6020 metals analyses, several compounds were present in the blanks at less than five times the blank value. Detects of metals analytes in the method blanks indicates a potential contamination issue with the analytical process for the associated samples. The positive results for the metals analytes in the samples listed below were qualified as “B” to indicate the potential high bias in the samples due to the blank contamination.

JOHN TWITTY ENERGY CENTER - ROUND 7 GROUNDWATER
5
Sample ID Analytes (less than 5x blank value) Qualifier
JTEC-MW-PZ-01D-20170710 Copper B
JTEC-MW-PZ-03D-20170712 Copper B
JTEC-MW-PZ-08D-20170711 Copper B
JTEC-MW-PZ-09D-20170710 Copper B
JTEC-MW-PZ-12D-20170712 Copper B
JTEC-MW-PZ-13D-20170710 Copper B
JTEC-MW-PZ-10D-20170713 Copper B
JTEC-MW-PZ-11D-20170713 Copper B
JTEC-MW-PZ-11D-20170713-FD Copper B
JTEC-MW-SA-3A-20170713 Copper B
JTEC-MW-SA-4A-20170713 Copper B
In the SW-846 6020 analysis for magnesium and sodium performed on sample JTEC-MW-PZ-01D-20170710, the MS/MSD spike recoveries were reported below the laboratory control limits. Spike recoveries below the control limits are indicative of a potential low bias for magnesium and sodium in the sample. The resultt for magnesium and sodium in the parent sample were qualified as estimated “J”.
Sample ID Analyte MS/MSD % recovery Qualifier
JTEC-MW-PZ-01D-20170710 Magnesium 0%/10% J
JTEC-MW-PZ-01D-20170710 Sodium 10%/11% J
In the SW-846 6020 analyses for copper performed on sample JTEC-MW-PZ-11D-20170713, the reported field duplicate RPD was greater than 30%. High field duplicate RPDs are indicative of poor precision in the sampling and/or analytical process. The positive results for the metals listed below in the associated parent and field duplicate samples were qualified as estimated “J”.
Sample ID Analyte RPD % Qualifier
JTEC-MW-PZ-11D-20170511 JTEC-MW-PZ-11D-20170511-FD
Copper 101
J

JOHN TWITTY ENERGY CENTER - ROUND 7 GROUNDWATER
6
In order to achieve the lowest possible detection levels and facilitate the statistical analysis of the groundwater data, PDC was required to report positive results between the method detection level and quantitation limits as estimated detects with a “J” qualifier. RADIOLOGICAL DATA QUALIFIERS
The reported results for total radium in ten of the eleven groundwater samples and the field duplicate were less than the reported laboratory minimum detectable concentration (MDC) and thus, qualified as “U” not detected at the MDC.
SUMMARY
The inorganic and radiological analyses were performed acceptably, but required qualification for the minor QA/QC deficiencies noted above. The qualified data is included in Attachment I and the chains of custody are included in Attachment II of this report. It is recommended that the analytical data be used only with the qualifiers applied as part of this evaluation. Any aspects of the data, which are not discussed in this report, should be considered qualitatively and quantitatively valid as reported, based on the deliverables reviewed.
JOHN TWITTY ENERGY CENTER - ROUND 7 GROUNDWATER
7
Attachment I
JTEC Round 7 Groundwater Data

Location JTEC-MW-PZ-01D JTEC-MW-PZ-09D
Sample Date 07/10/2017 07/10/2017
Sample Type Normal Normal
Group Analyte Units Result / Qual Result / Qual
Metal Aluminum (total) mg/L 0.047 0.12
Metal Antimony (total) mg/L 0.0013 J 0.00036 J
Metal Arsenic (total) mg/L 0.0034 0.0006 J
Metal Barium (total) mg/L 0.11 0.047
Metal Beryllium (total) mg/L 0.000051 J 0.000018 J
Metal Boron (total) mg/L 0.013 J 0.065
Metal Cadmium (total) mg/L 0.000084 U 0.000042 U
Metal Calcium (total) mg/L 85 110
Metal Chromium (total) mg/L 0.0011 J 0.00059 J
Metal Cobalt (total) mg/L 0.0023 J 0.0022
Metal Copper (total) mg/L 0.0028 B 0.0019 B
Metal Iron (total) mg/L 0.18 0.58
Metal Lead (total) mg/L 0.000094 J 0.00021 J
Metal Lithium (total) mg/L 0.0052 J 0.021
Metal Magnesium (total) mg/L 37 J 21
Metal Manganese (total) mg/L 0.099 0.46
Metal Mercury (total) mg/L 0.000012 J 0.000019 J
Metal Molybdenum (total) mg/L 0.028 0.025
Metal Nickel (total) mg/L 0.017 0.0021 J
Metal Selenium (total) mg/L 0.00064 U 0.00032 U
Metal Silver (total) mg/L 0.000056 U 0.000028 U
Metal Sodium (total) mg/L 10 J 100
Metal Thallium (total) mg/L 0.00036 J 0.000062 U
Metal Zinc (total) mg/L 0.0042 J 0.0036 J
Cation/Anion Chloride mg/L 2.5 45
Cation/Anion Fluoride mg/L 0.233 J 0.327
Cation/Anion Sulfate mg/L 21 240
Physical Properties Chemical Oxygen Demand (COD) mg/L 3.2 U 5.3 J
Physical Properties Conductivity umhos/cm 370 1000
Physical Properties Hardness (as CACO3) mg/L 370 360
Physical Properties pH pH Units 7.89 J 7.66 J
Physical Properties Total Dissolved Solids (TDS) mg/L 180 570
Physical Properties Total Organic Carbon (TOC) mg/L 0.31 J 2.8
Physical Properties Total Organic Halides (TOX) mg/L 0.0041 U 0.0097
Radionuclide Radium-226/228 pCi/L 1.37 U 1.27 U
JTEC Up Gradient GW Collected in Round 7
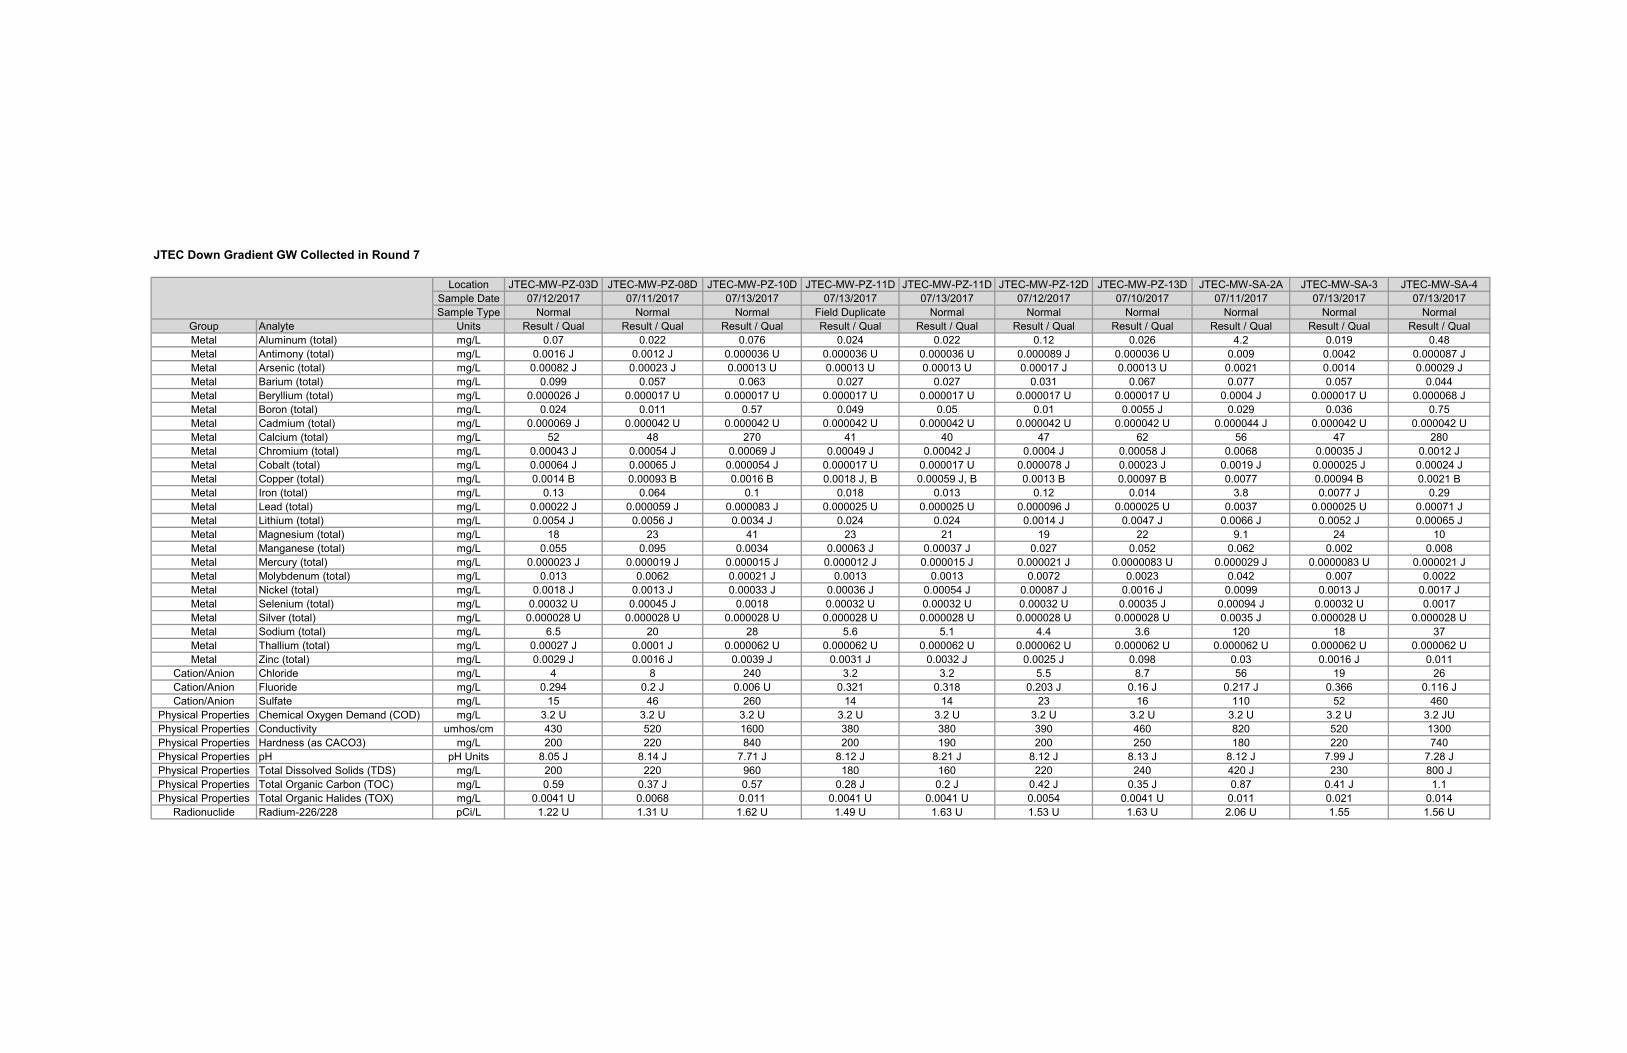
Location JTEC-MW-PZ-03D JTEC-MW-PZ-08D JTEC-MW-PZ-10D JTEC-MW-PZ-11D JTEC-MW-PZ-11D JTEC-MW-PZ-12D JTEC-MW-PZ-13D JTEC-MW-SA-2A JTEC-MW-SA-3 JTEC-MW-SA-4
Sample Date 07/12/2017 07/11/2017 07/13/2017 07/13/2017 07/13/2017 07/12/2017 07/10/2017 07/11/2017 07/13/2017 07/13/2017
Sample Type Normal Normal Normal Field Duplicate Normal Normal Normal Normal Normal Normal
Group Analyte Units Result / Qual Result / Qual Result / Qual Result / Qual Result / Qual Result / Qual Result / Qual Result / Qual Result / Qual Result / Qual
Metal Aluminum (total) mg/L 0.07 0.022 0.076 0.024 0.022 0.12 0.026 4.2 0.019 0.48
Metal Antimony (total) mg/L 0.0016 J 0.0012 J 0.000036 U 0.000036 U 0.000036 U 0.000089 J 0.000036 U 0.009 0.0042 0.000087 J
Metal Arsenic (total) mg/L 0.00082 J 0.00023 J 0.00013 U 0.00013 U 0.00013 U 0.00017 J 0.00013 U 0.0021 0.0014 0.00029 J
Metal Barium (total) mg/L 0.099 0.057 0.063 0.027 0.027 0.031 0.067 0.077 0.057 0.044
Metal Beryllium (total) mg/L 0.000026 J 0.000017 U 0.000017 U 0.000017 U 0.000017 U 0.000017 U 0.000017 U 0.0004 J 0.000017 U 0.000068 J
Metal Boron (total) mg/L 0.024 0.011 0.57 0.049 0.05 0.01 0.0055 J 0.029 0.036 0.75
Metal Cadmium (total) mg/L 0.000069 J 0.000042 U 0.000042 U 0.000042 U 0.000042 U 0.000042 U 0.000042 U 0.000044 J 0.000042 U 0.000042 U
Metal Calcium (total) mg/L 52 48 270 41 40 47 62 56 47 280
Metal Chromium (total) mg/L 0.00043 J 0.00054 J 0.00069 J 0.00049 J 0.00042 J 0.0004 J 0.00058 J 0.0068 0.00035 J 0.0012 J
Metal Cobalt (total) mg/L 0.00064 J 0.00065 J 0.000054 J 0.000017 U 0.000017 U 0.000078 J 0.00023 J 0.0019 J 0.000025 J 0.00024 J
Metal Copper (total) mg/L 0.0014 B 0.00093 B 0.0016 B 0.0018 J, B 0.00059 J, B 0.0013 B 0.00097 B 0.0077 0.00094 B 0.0021 B
Metal Iron (total) mg/L 0.13 0.064 0.1 0.018 0.013 0.12 0.014 3.8 0.0077 J 0.29
Metal Lead (total) mg/L 0.00022 J 0.000059 J 0.000083 J 0.000025 U 0.000025 U 0.000096 J 0.000025 U 0.0037 0.000025 U 0.00071 J
Metal Lithium (total) mg/L 0.0054 J 0.0056 J 0.0034 J 0.024 0.024 0.0014 J 0.0047 J 0.0066 J 0.0052 J 0.00065 J
Metal Magnesium (total) mg/L 18 23 41 23 21 19 22 9.1 24 10
Metal Manganese (total) mg/L 0.055 0.095 0.0034 0.00063 J 0.00037 J 0.027 0.052 0.062 0.002 0.008
Metal Mercury (total) mg/L 0.000023 J 0.000019 J 0.000015 J 0.000012 J 0.000015 J 0.000021 J 0.0000083 U 0.000029 J 0.0000083 U 0.000021 J
Metal Molybdenum (total) mg/L 0.013 0.0062 0.00021 J 0.0013 0.0013 0.0072 0.0023 0.042 0.007 0.0022
Metal Nickel (total) mg/L 0.0018 J 0.0013 J 0.00033 J 0.00036 J 0.00054 J 0.00087 J 0.0016 J 0.0099 0.0013 J 0.0017 J
Metal Selenium (total) mg/L 0.00032 U 0.00045 J 0.0018 0.00032 U 0.00032 U 0.00032 U 0.00035 J 0.00094 J 0.00032 U 0.0017
Metal Silver (total) mg/L 0.000028 U 0.000028 U 0.000028 U 0.000028 U 0.000028 U 0.000028 U 0.000028 U 0.0035 J 0.000028 U 0.000028 U
Metal Sodium (total) mg/L 6.5 20 28 5.6 5.1 4.4 3.6 120 18 37
Metal Thallium (total) mg/L 0.00027 J 0.0001 J 0.000062 U 0.000062 U 0.000062 U 0.000062 U 0.000062 U 0.000062 U 0.000062 U 0.000062 U
Metal Zinc (total) mg/L 0.0029 J 0.0016 J 0.0039 J 0.0031 J 0.0032 J 0.0025 J 0.098 0.03 0.0016 J 0.011
Cation/Anion Chloride mg/L 4 8 240 3.2 3.2 5.5 8.7 56 19 26
Cation/Anion Fluoride mg/L 0.294 0.2 J 0.006 U 0.321 0.318 0.203 J 0.16 J 0.217 J 0.366 0.116 J
Cation/Anion Sulfate mg/L 15 46 260 14 14 23 16 110 52 460
Physical Properties Chemical Oxygen Demand (COD) mg/L 3.2 U 3.2 U 3.2 U 3.2 U 3.2 U 3.2 U 3.2 U 3.2 U 3.2 U 3.2 JU
Physical Properties Conductivity umhos/cm 430 520 1600 380 380 390 460 820 520 1300
Physical Properties Hardness (as CACO3) mg/L 200 220 840 200 190 200 250 180 220 740
Physical Properties pH pH Units 8.05 J 8.14 J 7.71 J 8.12 J 8.21 J 8.12 J 8.13 J 8.12 J 7.99 J 7.28 J
Physical Properties Total Dissolved Solids (TDS) mg/L 200 220 960 180 160 220 240 420 J 230 800 J
Physical Properties Total Organic Carbon (TOC) mg/L 0.59 0.37 J 0.57 0.28 J 0.2 J 0.42 J 0.35 J 0.87 0.41 J 1.1
Physical Properties Total Organic Halides (TOX) mg/L 0.0041 U 0.0068 0.011 0.0041 U 0.0041 U 0.0054 0.0041 U 0.011 0.021 0.014
Radionuclide Radium-226/228 pCi/L 1.22 U 1.31 U 1.62 U 1.49 U 1.63 U 1.53 U 1.63 U 2.06 U 1.55 1.56 U
JTEC Down Gradient GW Collected in Round 7

JOHN TWITTY ENERGY CENTER - ROUND 7 GROUNDWATER
8
Attachment II
Chains of Custody


D a t a V a l i d a t i o n M e m o r a n d u m
1
John Twitty Energy Center - Round 8 Groundwater
Eleven groundwater samples were collected between August 7th and 11th at John Twitty Energy Center. Additionally, a field duplicate was collected at location JTEC-MW-PZ-11D. There were no separate field filtered metals aliquots collected due to elevated turbidity issues associated with the samples.
The groundwater samples were collected by GeoEngineers and hand delivered to PDC Laboratories Springfield, Missouri location. The PDC Springfield Laboratory shipped sample aliquots to PDC’s Peoria Laboratory for metals and wet chemistry analyses and PACE Analytical in Greensburg, PA for Total Radium 226/228. While samples were collected and immediately stored in coolers on ice, the samples were hand delivered on the same day to PDC Springfield and there was insufficient time for cooling the samples to <6 degrees Celsius. Therefore, the initial receipt temperatures at PDC Springfield were not used as the basis for qualification. However, the temperatures for receipt at the Peoria Laboratory were evaluated and data were qualified if outside the acceptable range.
The table below provides a crosswalk of sample IDs from field to the laboratories.
Field Sample ID. PDC ID. PACE ID.
JTEC‐MW‐PZ‐01D‐20170807 7082402‐01 30227241001 JTEC‐MW‐PZ‐03D‐20170809 7082402‐02 30227241002 JTEC‐MW‐PZ‐11D‐20170809 7082402‐03 30227241003 JTEC‐MW‐PZ‐11D‐20170809‐FD 7082402‐04 30227241004 JTEC‐MW‐PZ‐12D‐20170808 7082402‐05 30227241005 JTEC‐MW‐PZ‐13D‐20170807 7082402‐06 30227241006 JTEC‐MW‐SA‐2A‐20170808 7082402‐07 30227241007 JTEC‐MW‐PZ‐08D‐20170811 7082402‐08 30227241008 JTEC‐MW‐PZ‐09D‐20170810 7082402‐09 30227241009 JTEC‐MW‐PZ‐10D‐20170809 7082402‐10 30227241010 JTEC‐MW‐SA‐3‐20170810 7082402‐11 30227241011 JTEC‐MW‐SA‐4‐20170811 7082402‐12 30227241012
The samples were analyzed at PDC Peoria, IL. for the following analyses:
- Anions by EPA 300.0
- pH by SM 4500-H B

JOHN TWITTY ENERGY CENTER - ROUND 8 GROUNDWATER
2
- Total Dissolved Solids by SM 2540C
- COD by SM 5220D
- Conductivity by SM 2510B
- Total Organic Halide by SW-846 9020
- Total Organic Carbon by SM5310C
- Total Metals by SW-846 6010/6020
- Hardness (calculation)
- Total Mercury by SW-846 7470
The samples were analyzed at PACE Greensburg, PA. for the following:
- Total Radium (226/228)
This quality assurance memorandum is based upon the validation of analytical data generated for round eight groundwater samples collected at John Twitty Energy Center. The analyses were reviewed for adherence to the specified analytical protocols in accordance with the analytical methods, laboratory standard operating procedures, Quality Assurance Project Plan (QAPP) for Coal Combustion Residual Landfill Monitoring at John Twitty Energy Center, January 2016, and the guidance of the USEPA Contract Laboratory Program National Functional Guidelines for Inorganic Data Review, August 2014. The findings of this quality assurance report are based upon the comprehensive review of the data deliverables from PDC and PACE reported according to the project QAPP and the EPA modified Level III format (including raw data). The review included chain of custody documentation, sample receipt conditions, holding times, field QA samples, laboratory QC samples, calibrations, and target compound identification and quantitation of results.
The following definitions provide explanations of the data qualifiers that may be assigned to results based on this evaluation. The data qualifier definitions are consistent with the USEPA National Functional Guidelines for Inorganic Data Review.
U‐ The compound was analyzed for but not detected (ND).
J‐ The identification of the analyte is acceptable, but the quality assurance criteria indicate that the quantitative values may be outside the normal expected range of precision (i.e. the quantitative value is considered estimated).
UJ‐ This flag is a combination of the U and J qualifiers. This indicates that the analyte is not present and the reported value is considered to be an estimated result.
R‐ Data are considered to be rejected and shall not be used. This flag denotes the failure of
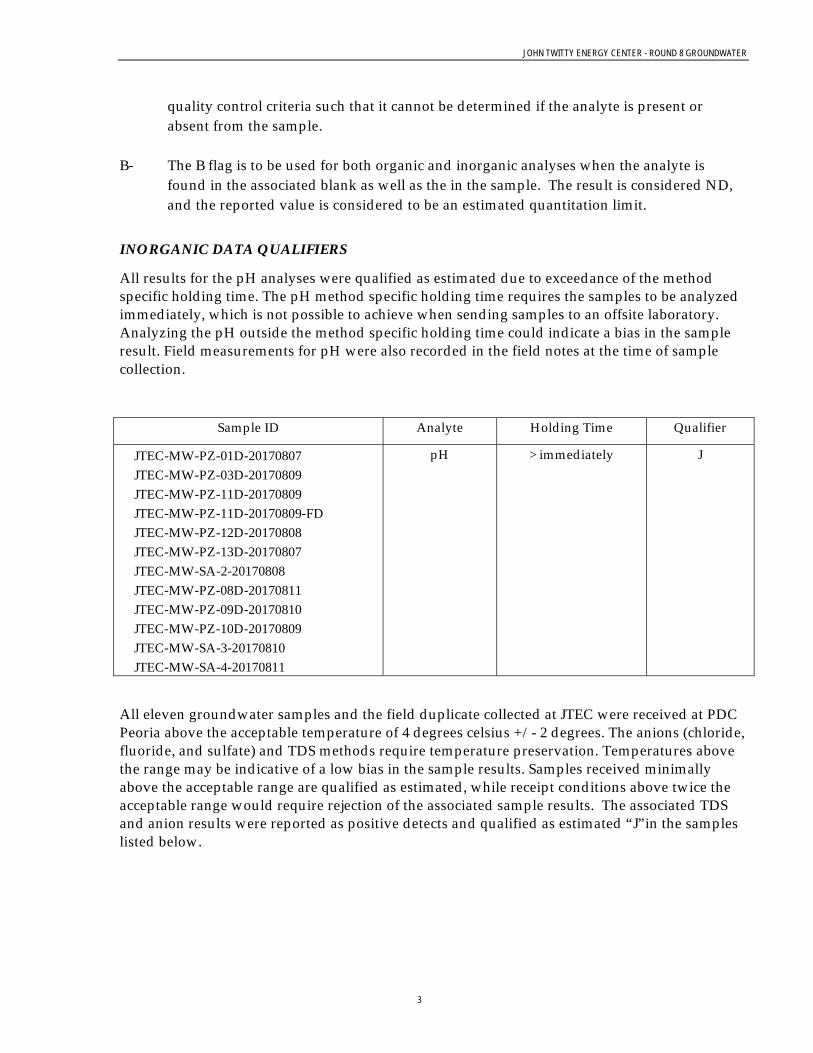
JOHN TWITTY ENERGY CENTER - ROUND 8 GROUNDWATER
3
quality control criteria such that it cannot be determined if the analyte is present or absent from the sample.
B‐ The B flag is to be used for both organic and inorganic analyses when the analyte is found in the associated blank as well as the in the sample. The result is considered ND, and the reported value is considered to be an estimated quantitation limit.
INORGANIC DATA QUALIFIERS
All results for the pH analyses were qualified as estimated due to exceedance of the method specific holding time. The pH method specific holding time requires the samples to be analyzed immediately, which is not possible to achieve when sending samples to an offsite laboratory. Analyzing the pH outside the method specific holding time could indicate a bias in the sample result. Field measurements for pH were also recorded in the field notes at the time of sample collection.
Sample ID Analyte Holding Time Qualifier
JTEC‐MW‐PZ‐01D‐20170807 JTEC‐MW‐PZ‐03D‐20170809 JTEC‐MW‐PZ‐11D‐20170809 JTEC‐MW‐PZ‐11D‐20170809‐FD JTEC‐MW‐PZ‐12D‐20170808 JTEC‐MW‐PZ‐13D‐20170807 JTEC‐MW‐SA‐2‐20170808 JTEC‐MW‐PZ‐08D‐20170811 JTEC‐MW‐PZ‐09D‐20170810 JTEC‐MW‐PZ‐10D‐20170809 JTEC‐MW‐SA‐3‐20170810 JTEC‐MW‐SA‐4‐20170811
pH > immediately J
All eleven groundwater samples and the field duplicate collected at JTEC were received at PDC Peoria above the acceptable temperature of 4 degrees celsius +/- 2 degrees. The anions (chloride, fluoride, and sulfate) and TDS methods require temperature preservation. Temperatures above the range may be indicative of a low bias in the sample results. Samples received minimally above the acceptable range are qualified as estimated, while receipt conditions above twice the acceptable range would require rejection of the associated sample results. The associated TDS and anion results were reported as positive detects and qualified as estimated “J”in the samples listed below.
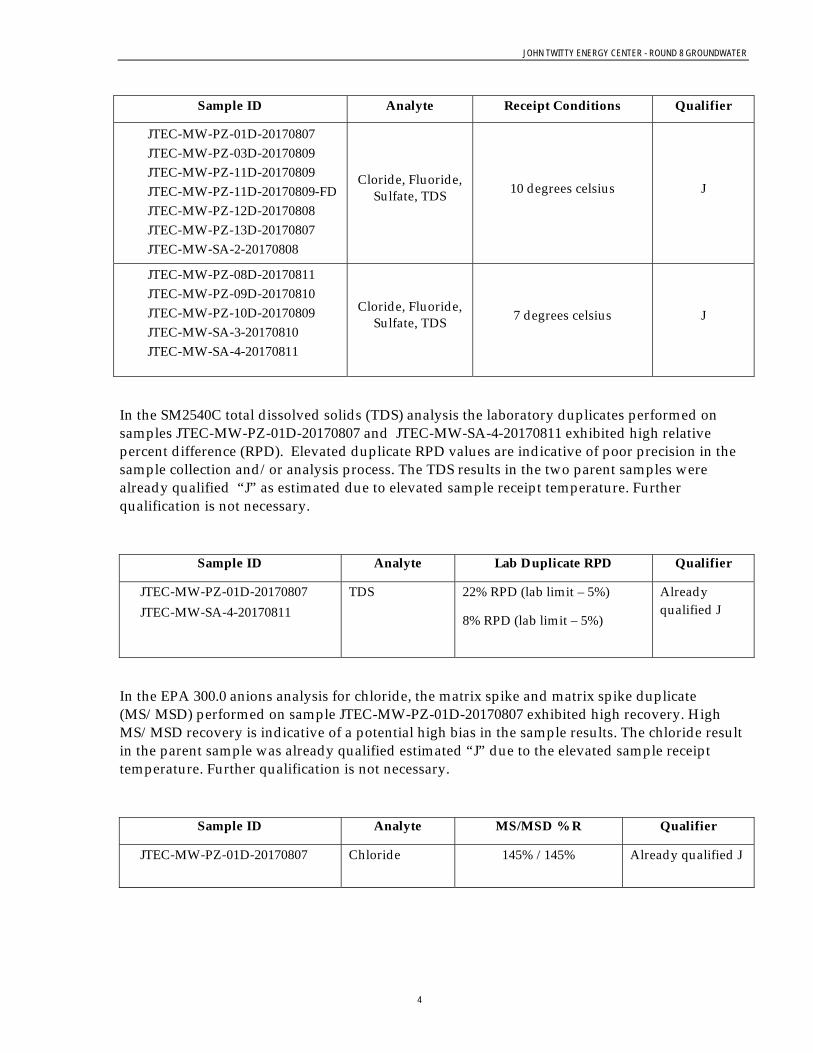
JOHN TWITTY ENERGY CENTER - ROUND 8 GROUNDWATER
4
Sample ID Analyte Receipt Conditions Qualifier
JTEC‐MW‐PZ‐01D‐20170807 JTEC‐MW‐PZ‐03D‐20170809 JTEC‐MW‐PZ‐11D‐20170809 JTEC‐MW‐PZ‐11D‐20170809‐FD JTEC‐MW‐PZ‐12D‐20170808 JTEC‐MW‐PZ‐13D‐20170807 JTEC‐MW‐SA‐2‐20170808
Cloride, Fluoride, Sulfate, TDS 10 degrees celsius J
JTEC‐MW‐PZ‐08D‐20170811 JTEC‐MW‐PZ‐09D‐20170810 JTEC‐MW‐PZ‐10D‐20170809 JTEC‐MW‐SA‐3‐20170810 JTEC‐MW‐SA‐4‐20170811
Cloride, Fluoride, Sulfate, TDS 7 degrees celsius J
In the SM2540C total dissolved solids (TDS) analysis the laboratory duplicates performed on samples JTEC-MW-PZ-01D-20170807 and JTEC-MW-SA-4-20170811 exhibited high relative percent difference (RPD). Elevated duplicate RPD values are indicative of poor precision in the sample collection and/or analysis process. The TDS results in the two parent samples were already qualified “J” as estimated due to elevated sample receipt temperature. Further qualification is not necessary.
Sample ID Analyte Lab Duplicate RPD Qualifier
JTEC‐MW‐PZ‐01D‐20170807 JTEC‐MW‐SA‐4‐20170811
TDS 22% RPD (lab limit – 5%)
8% RPD (lab limit – 5%)
Already qualified J
In the EPA 300.0 anions analysis for chloride, the matrix spike and matrix spike duplicate (MS/MSD) performed on sample JTEC-MW-PZ-01D-20170807 exhibited high recovery. High MS/MSD recovery is indicative of a potential high bias in the sample results. The chloride result in the parent sample was already qualified estimated “J” due to the elevated sample receipt temperature. Further qualification is not necessary.
Sample ID Analyte MS/MSD % R Qualifier
JTEC‐MW‐PZ‐01D‐20170807
Chloride 145% / 145% Already qualified J

JOHN TWITTY ENERGY CENTER - ROUND 8 GROUNDWATER
5
In the SW-846 6020 metals analyses, several compounds were present in the blanks at less than five times the blank value. Detects of metals analytes in the method blanks indicates a potential contamination issue with the analytical process for the associated samples. The positive results for the metals analytes in the samples listed below were qualified as “B” to indicate the potential high bias in the samples due to the blank contamination.
Sample ID Analytes (less than 5x blank value) Qualifier
JTEC-MW-PZ-01D-20170807 Copper B
JTEC-MW-PZ-03D-20170809 Copper B
JTEC-MW-PZ-11D-20170809 Aluminum, Cobalt, Copper, Iron, Manganese B
JTEC-MW-PZ-11D-20170809-FD Aluminum, Cobalt, Copper B
JTEC-MW-PZ-12D-20170808 Aluminum., Copper, Iron B
JTEC-MW-PZ-13D-20170807 Aluminum, Copper, Nickel B
JTEC-MW-SA-2A-20170808 Copper B
JTEC-MW-PZ-08D-20170811 Copper, Nickel B
JTEC-MW-PZ-09D-20170810 Copper, Nickel B
JTEC-MW-PZ-10D-20170809-FD Copper, Nickel B
JTEC-MW-SA-3A-20170810 Cobalt, Copper B
JTEC-MW-SA-4A-20170811 Copper B
In the SW-846 6010 analysis for lithium performed on sample JTEC-MW-SA-4-20170811, the MS/MSD spike recoveries were reported above the laboratory control limits. Spike recoveries above the control limits are indicative of a potential high bias for lithium in the parent sample. The result for lithium in the parent sample was qualified as estimated “J”.
Sample ID Analyte MS/MSD % recovery Qualifier
JTEC-MW-SA-4-20170811 Lithium 127%/127% J
In the SW-846 6020 analyses for aluminum, cobalt, and manganese performed on sample JTEC-MW-PZ-11D-20170809, the reported field duplicate RPD was greater than 30%. High field duplicate RPDs are indicative of poor precision in the sampling and/or analytical process. The positive results for the metals listed below in the associated parent and field duplicate samples were qualified as estimated “J”.
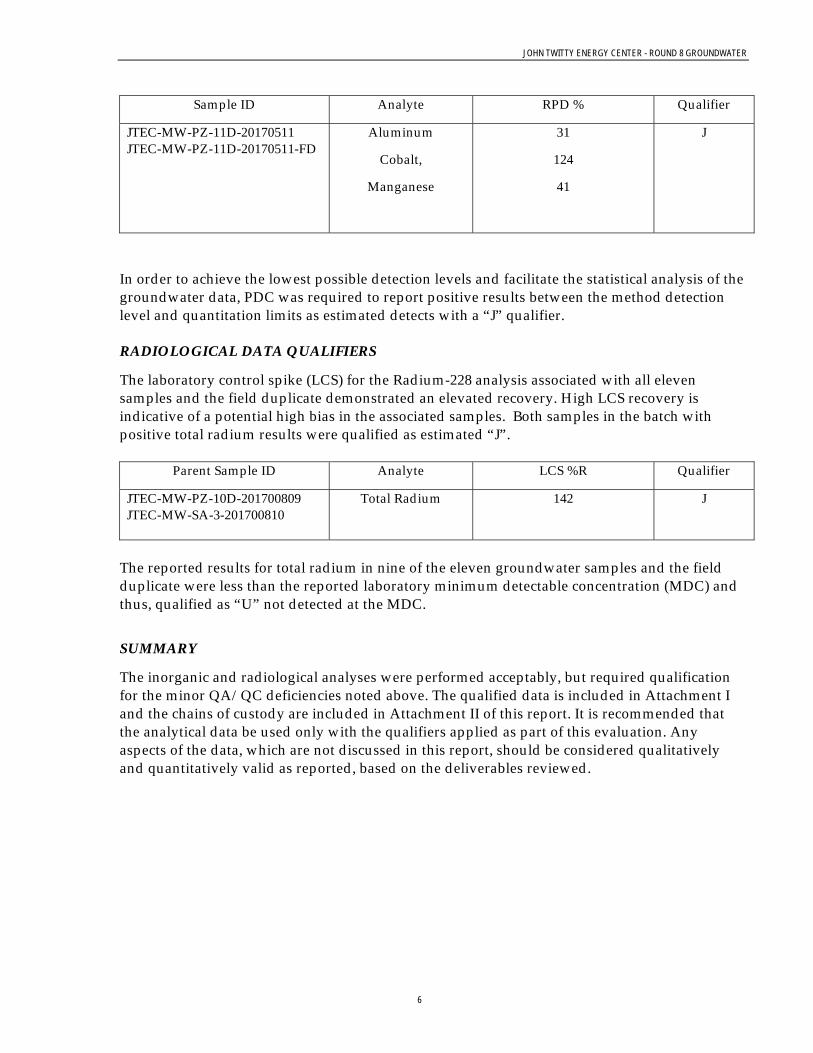
JOHN TWITTY ENERGY CENTER - ROUND 8 GROUNDWATER
6
Sample ID Analyte RPD % Qualifier
JTEC-MW-PZ-11D-20170511 JTEC-MW-PZ-11D-20170511-FD
Aluminum
Cobalt,
Manganese
31
124
41
J
In order to achieve the lowest possible detection levels and facilitate the statistical analysis of the groundwater data, PDC was required to report positive results between the method detection level and quantitation limits as estimated detects with a “J” qualifier. RADIOLOGICAL DATA QUALIFIERS
The laboratory control spike (LCS) for the Radium-228 analysis associated with all eleven samples and the field duplicate demonstrated an elevated recovery. High LCS recovery is indicative of a potential high bias in the associated samples. Both samples in the batch with positive total radium results were qualified as estimated “J”.
Parent Sample ID Analyte LCS %R Qualifier
JTEC-MW-PZ-10D-201700809 JTEC-MW-SA-3-201700810
Total Radium 142 J
The reported results for total radium in nine of the eleven groundwater samples and the field duplicate were less than the reported laboratory minimum detectable concentration (MDC) and thus, qualified as “U” not detected at the MDC.
SUMMARY
The inorganic and radiological analyses were performed acceptably, but required qualification for the minor QA/QC deficiencies noted above. The qualified data is included in Attachment I and the chains of custody are included in Attachment II of this report. It is recommended that the analytical data be used only with the qualifiers applied as part of this evaluation. Any aspects of the data, which are not discussed in this report, should be considered qualitatively and quantitatively valid as reported, based on the deliverables reviewed.

JOHN TWITTY ENERGY CENTER - ROUND 8 GROUNDWATER
7
Attachment I
JTEC Round 8 Groundwater Data
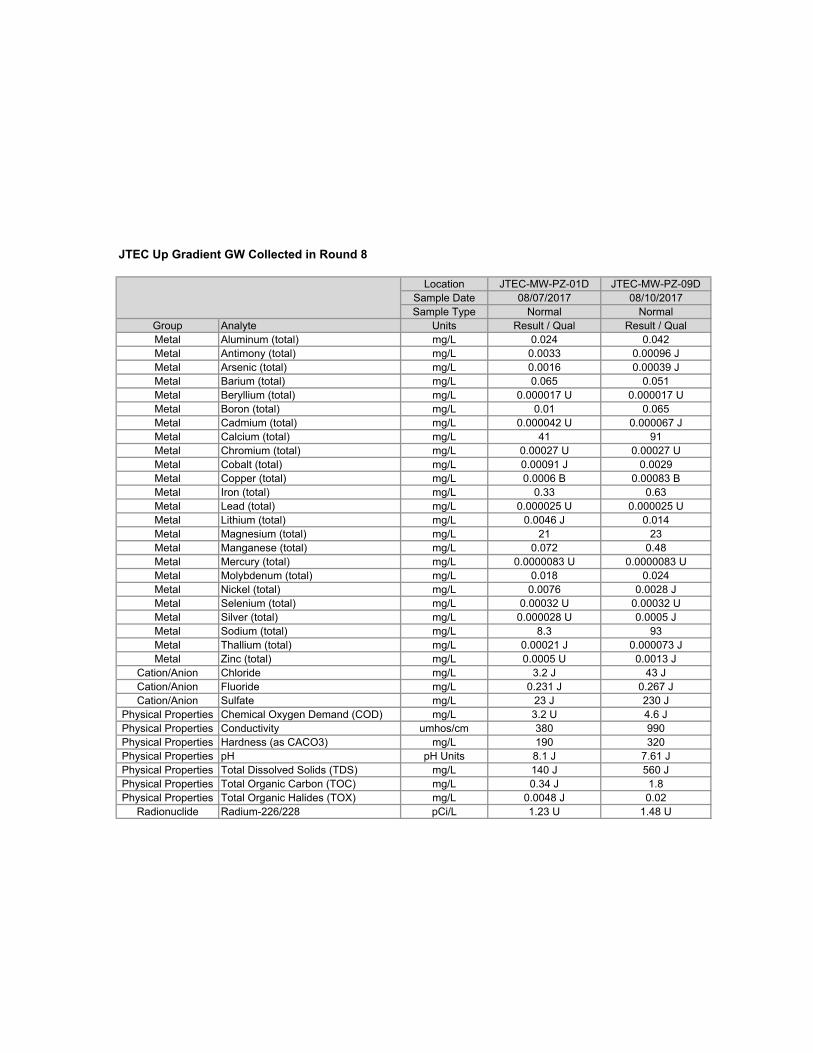
Location JTEC-MW-PZ-01D JTEC-MW-PZ-09D
Sample Date 08/07/2017 08/10/2017
Sample Type Normal Normal
Group Analyte Units Result / Qual Result / Qual
Metal Aluminum (total) mg/L 0.024 0.042
Metal Antimony (total) mg/L 0.0033 0.00096 J
Metal Arsenic (total) mg/L 0.0016 0.00039 J
Metal Barium (total) mg/L 0.065 0.051
Metal Beryllium (total) mg/L 0.000017 U 0.000017 U
Metal Boron (total) mg/L 0.01 0.065
Metal Cadmium (total) mg/L 0.000042 U 0.000067 J
Metal Calcium (total) mg/L 41 91
Metal Chromium (total) mg/L 0.00027 U 0.00027 U
Metal Cobalt (total) mg/L 0.00091 J 0.0029
Metal Copper (total) mg/L 0.0006 B 0.00083 B
Metal Iron (total) mg/L 0.33 0.63
Metal Lead (total) mg/L 0.000025 U 0.000025 U
Metal Lithium (total) mg/L 0.0046 J 0.014
Metal Magnesium (total) mg/L 21 23
Metal Manganese (total) mg/L 0.072 0.48
Metal Mercury (total) mg/L 0.0000083 U 0.0000083 U
Metal Molybdenum (total) mg/L 0.018 0.024
Metal Nickel (total) mg/L 0.0076 0.0028 J
Metal Selenium (total) mg/L 0.00032 U 0.00032 U
Metal Silver (total) mg/L 0.000028 U 0.0005 J
Metal Sodium (total) mg/L 8.3 93
Metal Thallium (total) mg/L 0.00021 J 0.000073 J
Metal Zinc (total) mg/L 0.0005 U 0.0013 J
Cation/Anion Chloride mg/L 3.2 J 43 J
Cation/Anion Fluoride mg/L 0.231 J 0.267 J
Cation/Anion Sulfate mg/L 23 J 230 J
Physical Properties Chemical Oxygen Demand (COD) mg/L 3.2 U 4.6 J
Physical Properties Conductivity umhos/cm 380 990
Physical Properties Hardness (as CACO3) mg/L 190 320
Physical Properties pH pH Units 8.1 J 7.61 J
Physical Properties Total Dissolved Solids (TDS) mg/L 140 J 560 J
Physical Properties Total Organic Carbon (TOC) mg/L 0.34 J 1.8
Physical Properties Total Organic Halides (TOX) mg/L 0.0048 J 0.02
Radionuclide Radium-226/228 pCi/L 1.23 U 1.48 U
JTEC Up Gradient GW Collected in Round 8

Location JTEC-MW-PZ-03D JTEC-MW-PZ-08D JTEC-MW-PZ-10D JTEC-MW-PZ-11D JTEC-MW-PZ-11D JTEC-MW-PZ-12D JTEC-MW-PZ-13D JTEC-MW-SA-2A JTEC-MW-SA-3 JTEC-MW-SA-4
Sample Date 08/09/2017 08/11/2017 08/09/2017 08/09/2017 08/09/2017 08/08/2017 08/07/2017 08/08/2017 08/10/2017 08/11/2017
Sample Type Normal Normal Normal Normal Field Duplicate Normal Normal Normal Normal Normal
Group Analyte Units Result / Qual Result / Qual Result / Qual Result / Qual Result / Qual Result / Qual Result / Qual Result / Qual Result / Qual Result / Qual
Metal Aluminum (total) mg/L 0.045 0.21 0.032 0.015 J, B 0.011 J, B 0.016 B 0.013 B 0.14 0.043 4
Metal Antimony (total) mg/L 0.0098 0.0033 0.00034 J 0.000036 U 0.000036 U 0.00039 J 0.00019 J 0.0095 0.0034 0.00098 J
Metal Arsenic (total) mg/L 0.00078 J 0.00032 J 0.00013 U 0.00013 U 0.00013 U 0.00013 U 0.00013 U 0.00052 J 0.0013 0.00063 J
Metal Barium (total) mg/L 0.1 0.075 0.065 0.028 0.031 0.067 0.057 0.07 0.06 0.053
Metal Beryllium (total) mg/L 0.000017 U 0.000017 U 0.000028 J 0.000017 U 0.000017 U 0.000017 U 0.000017 U 0.000017 U 0.000017 U 0.00011 J
Metal Boron (total) mg/L 0.025 0.024 0.59 0.045 0.047 0.013 0.0064 J 0.038 0.045 1.5
Metal Cadmium (total) mg/L 0.000042 U 0.000042 U 0.000042 U 0.000042 U 0.000072 J 0.000058 J 0.000057 J 0.00013 J 0.00014 J 0.00027 J
Metal Calcium (total) mg/L 51 52 270 40 43 77 43 49 47 330
Metal Chromium (total) mg/L 0.00027 U 0.00027 U 0.00027 U 0.00027 U 0.00027 U 0.00027 U 0.00027 U 0.00032 J 0.00027 U 0.0038 J
Metal Cobalt (total) mg/L 0.00055 J 0.00077 J 0.000017 U 0.00002 J, B 0.000085 J, B 0.00014 J 0.00014 J 0.00017 J 0.000061 B 0.0013 J
Metal Copper (total) mg/L 0.001 B 0.00078 B 0.00055 B 0.00062 B 0.0008 B 0.0011 B 0.00084 B 0.0014 B 0.0008 B 0.0025 B
Metal Iron (total) mg/L 0.072 0.25 0.035 0.0031 B 0.0024 U 0.0046 B 0.0024 U 0.071 0.03 0.28
Metal Lead (total) mg/L 0.000025 U 0.000025 U 0.000025 U 0.000025 U 0.000025 U 0.000025 U 0.000025 U 0.000025 U 0.000025 U 0.00094 J
Metal Lithium (total) mg/L 0.0028 J 0.0059 J 0.00081 J 0.021 0.021 0.00096 J 0.0049 J 0.00027 J 0.0023 J 0.0001 UJ
Metal Magnesium (total) mg/L 18 26 41 22 J 22 J 28 24 10 26 13
Metal Manganese (total) mg/L 0.058 0.12 0.0014 0.00037 B 0.00056 B 0.018 0.027 0.0022 0.0023 0.013
Metal Mercury (total) mg/L 0.0000083 U 0.0000083 U 0.0000083 U 0.0000083 U 0.0000083 U 0.000014 J 0.0000083 U 0.0000083 U 0.0000083 U 0.0000083 U
Metal Molybdenum (total) mg/L 0.014 0.0087 0.0014 0.0013 0.0015 0.0056 0.0032 0.046 0.007 0.0013
Metal Nickel (total) mg/L 0.0019 J 0.0011 B 0.00032 B 0.00046 J 0.00058 J 0.0019 J 0.0011 B 0.0018 J 0.00095 B 0.0033 J
Metal Selenium (total) mg/L 0.00032 U 0.00054 J 0.0018 0.00046 J 0.00037 J 0.0005 J 0.00034 J 0.001 0.00032 U 0.0025
Metal Silver (total) mg/L 0.000028 U 0.000028 U 0.000028 U 0.000028 U 0.000028 U 0.000028 U 0.000028 U 0.000028 U 0.000028 U 0.000028 U
Metal Sodium (total) mg/L 6.5 37 28 6.1 6.1 13 3.2 120 18 43
Metal Thallium (total) mg/L 0.00034 J 0.00023 J 0.000062 U 0.000093 J 0.000062 U 0.000062 U 0.000062 U 0.000062 U 0.000062 U 0.000062 U
Metal Zinc (total) mg/L 0.01 0.0005 U 0.0023 J 0.0005 U 0.00093 J 0.0012 J 0.0005 U 0.00064 J 0.0013 J 0.011
Cation/Anion Chloride mg/L 3.7 J 14 J 250 J 7.5 J 7.3 J 33 J 4.6 J 52 J 17 J 55 J
Cation/Anion Fluoride mg/L 0.245 J 0.214 J 0.042 U 0.296 J 0.295 J 0.115 J 0.185 J 0.183 J 0.317 J 0.072 J
Cation/Anion Sulfate mg/L 14 J 86 J 270 J 18 J 17 J 29 J 18 J 99 J 55 J 490 J
Physical Properties Chemical Oxygen Demand (COD) mg/L 3.2 U 3.2 U 3.2 U 3.2 U 3.2 U 3.2 U 3.2 U 3.2 U 3.2 U 3.2 U
Physical Properties Conductivity umhos/cm 420 640 1600 410 400 650 400 790 520 1400
Physical Properties Hardness (as CACO3) mg/L 200 240 830 190 200 310 200 160 230 880
Physical Properties pH pH Units 7.94 J 7.97 J 7.74 J 7.94 J 8.02 J 7.67 J 7.95 J 8.11 J 7.92 J 7.75 J
Physical Properties Total Dissolved Solids (TDS) mg/L 160 J 340 J 1000 J 180 J 140 J 270 J 160 J 400 J 260 J 940 J
Physical Properties Total Organic Carbon (TOC) mg/L 0.72 0.42 J 0.53 0.29 J 0.28 J 0.65 0.28 J 0.53 0.92 1.3
Physical Properties Total Organic Halides (TOX) mg/L 0.0063 0.0045 J 0.03 0.0041 U 0.0041 U 0.005 0.0041 U 0.017 0.018 0.02
Radionuclide Radium-226/228 pCi/L 1.7 U 1.88 U 1.4 J 1.7 U 1.6 U 0.796 U 1.68 U 1.39 U 1.75 J 1.44 U
JTEC Down Gradient GW Collected in Round 8

JOHN TWITTY ENERGY CENTER - ROUND 8 GROUNDWATER
8
Attachment II
Chains of Custody


Appendix B Statistical Analysis Report

STATISTICAL ANALYSIS REPORT
JOHN TWITTY ENERGY CENTER (JTEC)
Prepared for:
City Utilities of Springfield 301 E. Central Street Springfield, Missouri
Prepared by:
125 Broadway Avenue
Oak Ridge, Tennessee, 37830
January 2018

1
Table of Contents
Statistical Analysis Approach ........................................................................................................................................................ 2
CCR Appendix III Constituent List ............................................................................................................................................. 7
Boron .............................................................................................................................................................................................. 8
Calcium .......................................................................................................................................................................................... 13
Chloride ......................................................................................................................................................................................... 18
Fluoride ......................................................................................................................................................................................... 24
pH ................................................................................................................................................................................................... 27
Sulfate ............................................................................................................................................................................................ 30
Total Dissolved Solids (TDS) ........................................................................................................................................................ 34
Statistical Analysis Summary for the CCR Appendix III Constituent List ............................................................................ 39
CCR Appendix IV Constituent List ........................................................................................................................................... 40
Antimony ...................................................................................................................................................................................... 41
Arsenic .......................................................................................................................................................................................... 46
Barium .......................................................................................................................................................................................... 50
Beryllium ...................................................................................................................................................................................... 55
Cadmium ....................................................................................................................................................................................... 60
Chromium ..................................................................................................................................................................................... 65
Cobalt............................................................................................................................................................................................. 70
Fluoride ......................................................................................................................................................................................... 75
Lead ............................................................................................................................................................................................... 78
Lithium .......................................................................................................................................................................................... 85
Mercury ......................................................................................................................................................................................... 90
Molybdenum ................................................................................................................................................................................. 95
Radium 226/228 Combined .......................................................................................................................................................... 99
Selenium ...................................................................................................................................................................................... 102
Thallium ...................................................................................................................................................................................... 106
Statistical Analysis Summary for the CCR Appendix IV Constituent List ........................................................................... 110
Statistical Analysis Summary for All CCR Constituents Separated by Well ........................................................................ 111
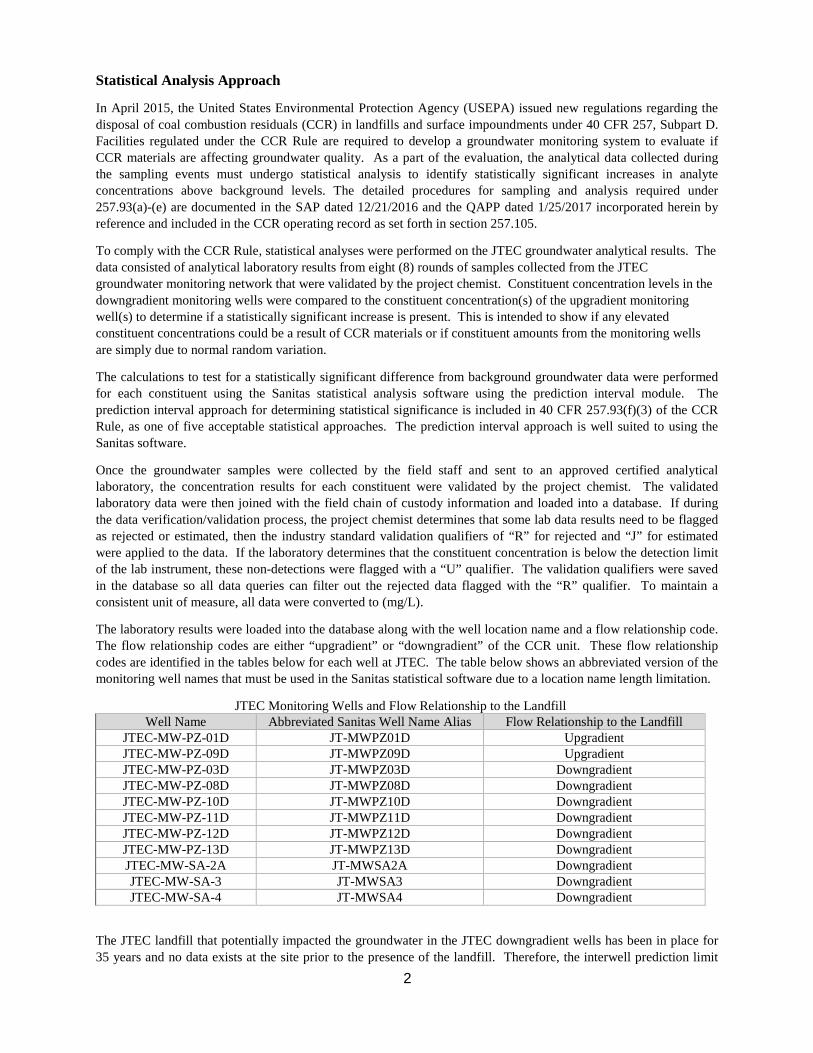
2
Statistical Analysis Approach
In April 2015, the United States Environmental Protection Agency (USEPA) issued new regulations regarding the disposal of coal combustion residuals (CCR) in landfills and surface impoundments under 40 CFR 257, Subpart D. Facilities regulated under the CCR Rule are required to develop a groundwater monitoring system to evaluate if CCR materials are affecting groundwater quality. As a part of the evaluation, the analytical data collected during the sampling events must undergo statistical analysis to identify statistically significant increases in analyte concentrations above background levels. The detailed procedures for sampling and analysis required under 257.93(a)-(e) are documented in the SAP dated 12/21/2016 and the QAPP dated 1/25/2017 incorporated herein by reference and included in the CCR operating record as set forth in section 257.105.
To comply with the CCR Rule, statistical analyses were performed on the JTEC groundwater analytical results. The data consisted of analytical laboratory results from eight (8) rounds of samples collected from the JTEC groundwater monitoring network that were validated by the project chemist. Constituent concentration levels in the downgradient monitoring wells were compared to the constituent concentration(s) of the upgradient monitoring well(s) to determine if a statistically significant increase is present. This is intended to show if any elevated constituent concentrations could be a result of CCR materials or if constituent amounts from the monitoring wells are simply due to normal random variation.
The calculations to test for a statistically significant difference from background groundwater data were performed for each constituent using the Sanitas statistical analysis software using the prediction interval module. The prediction interval approach for determining statistical significance is included in 40 CFR 257.93(f)(3) of the CCR Rule, as one of five acceptable statistical approaches. The prediction interval approach is well suited to using the Sanitas software.
Once the groundwater samples were collected by the field staff and sent to an approved certified analytical laboratory, the concentration results for each constituent were validated by the project chemist. The validated laboratory data were then joined with the field chain of custody information and loaded into a database. If during the data verification/validation process, the project chemist determines that some lab data results need to be flagged as rejected or estimated, then the industry standard validation qualifiers of “R” for rejected and “J” for estimated were applied to the data. If the laboratory determines that the constituent concentration is below the detection limit of the lab instrument, these non-detections were flagged with a “U” qualifier. The validation qualifiers were saved in the database so all data queries can filter out the rejected data flagged with the “R” qualifier. To maintain a consistent unit of measure, all data were converted to (mg/L).
The laboratory results were loaded into the database along with the well location name and a flow relationship code. The flow relationship codes are either “upgradient” or “downgradient” of the CCR unit. These flow relationship codes are identified in the tables below for each well at JTEC. The table below shows an abbreviated version of the monitoring well names that must be used in the Sanitas statistical software due to a location name length limitation.
JTEC Monitoring Wells and Flow Relationship to the Landfill Well Name Abbreviated Sanitas Well Name Alias Flow Relationship to the Landfill
JTEC-MW-PZ-01D JT-MWPZ01D Upgradient JTEC-MW-PZ-09D JT-MWPZ09D Upgradient JTEC-MW-PZ-03D JT-MWPZ03D Downgradient JTEC-MW-PZ-08D JT-MWPZ08D Downgradient JTEC-MW-PZ-10D JT-MWPZ10D Downgradient JTEC-MW-PZ-11D JT-MWPZ11D Downgradient JTEC-MW-PZ-12D JT-MWPZ12D Downgradient JTEC-MW-PZ-13D JT-MWPZ13D Downgradient JTEC-MW-SA-2A JT-MWSA2A Downgradient JTEC-MW-SA-3 JT-MWSA3 Downgradient JTEC-MW-SA-4 JT-MWSA4 Downgradient
The JTEC landfill that potentially impacted the groundwater in the JTEC downgradient wells has been in place for 35 years and no data exists at the site prior to the presence of the landfill. Therefore, the interwell prediction limit

3
module in the Sanitas software was used since the intrawell method requires either a background for each constituent or dates at each downgradient well that can be flagged as samples that are known to not be impacted by the landfill. The interwell prediction limit method uses all the upgradient well data to determine a statistical prediction limit and all of the downgradient data is compared individually against this limit.
As part of the statistical analysis of the data, a USEPA power curve was used to ensure that the number of upgradient well samples was adequate to meet the USEPA recommendations for statistical power to have confidence false positives and false negatives are minimized in the statistical analysis results. A false positive is a false alarm where a constituent is shown to exceed the statistical prediction limit where it was really within the limit. A false negative would be if a constituent was shown to be within the statistical prediction limit where it is really an exceedance. The USEPA power curve analysis showed that using both wells MWPZ01D and MWPZ09D for the upgradient data met the USEPA recommendations for statistical power and is shown in the figure below. The solid dark line is the USEPA recommendation for statistical power and the dashed blue line is the power curve using both MWPZ01D and MWPZ09D as the upgradient data. The vertical axis shows the statistical power to not report false positives and false negatives where being close to 100% is best. The horizontal axis shows the number of standard deviations of the difference between the upgradient statistical prediction limit and each individual downgradient well result. In this case, larger differences between the upgradient prediction limit and downgradient well results increases the confidence that there will not be any false positives or false negatives reported. To meet the USEPA recommendations for statistical power, the dashed blue line must fall above the solid line.
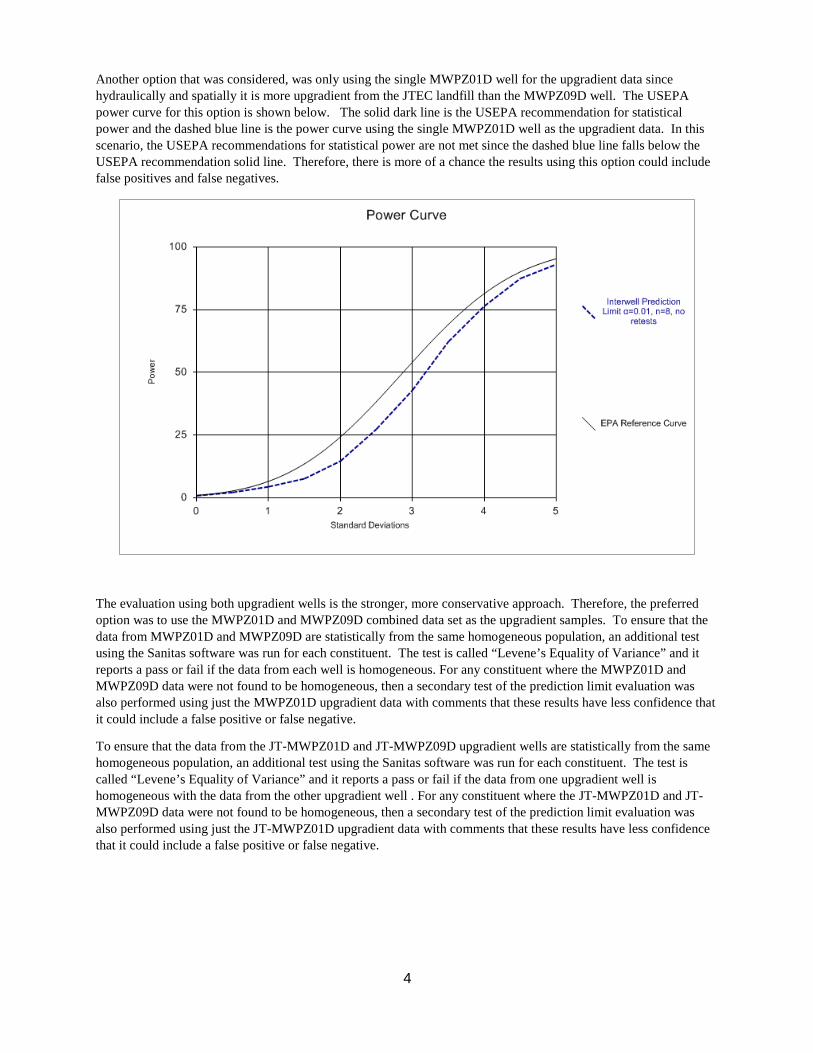
4
Another option that was considered, was only using the single MWPZ01D well for the upgradient data since hydraulically and spatially it is more upgradient from the JTEC landfill than the MWPZ09D well. The USEPA power curve for this option is shown below. The solid dark line is the USEPA recommendation for statistical power and the dashed blue line is the power curve using the single MWPZ01D well as the upgradient data. In this scenario, the USEPA recommendations for statistical power are not met since the dashed blue line falls below the USEPA recommendation solid line. Therefore, there is more of a chance the results using this option could include false positives and false negatives.
The evaluation using both upgradient wells is the stronger, more conservative approach. Therefore, the preferred option was to use the MWPZ01D and MWPZ09D combined data set as the upgradient samples. To ensure that the data from MWPZ01D and MWPZ09D are statistically from the same homogeneous population, an additional test using the Sanitas software was run for each constituent. The test is called “Levene’s Equality of Variance” and it reports a pass or fail if the data from each well is homogeneous. For any constituent where the MWPZ01D and MWPZ09D data were not found to be homogeneous, then a secondary test of the prediction limit evaluation was also performed using just the MWPZ01D upgradient data with comments that these results have less confidence that it could include a false positive or false negative.
To ensure that the data from the JT-MWPZ01D and JT-MWPZ09D upgradient wells are statistically from the same homogeneous population, an additional test using the Sanitas software was run for each constituent. The test is called “Levene’s Equality of Variance” and it reports a pass or fail if the data from one upgradient well is homogeneous with the data from the other upgradient well . For any constituent where the JT-MWPZ01D and JT-MWPZ09D data were not found to be homogeneous, then a secondary test of the prediction limit evaluation was also performed using just the JT-MWPZ01D upgradient data with comments that these results have less confidence that it could include a false positive or false negative.
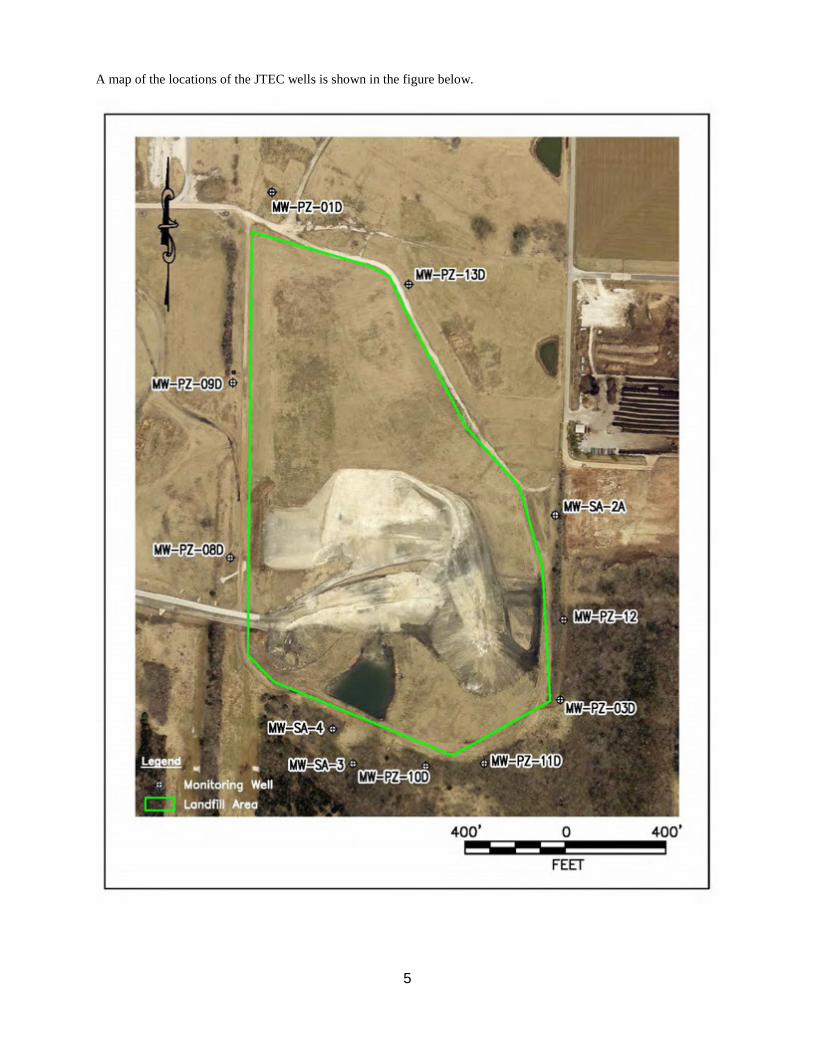
5
A map of the locations of the JTEC wells is shown in the figure below.
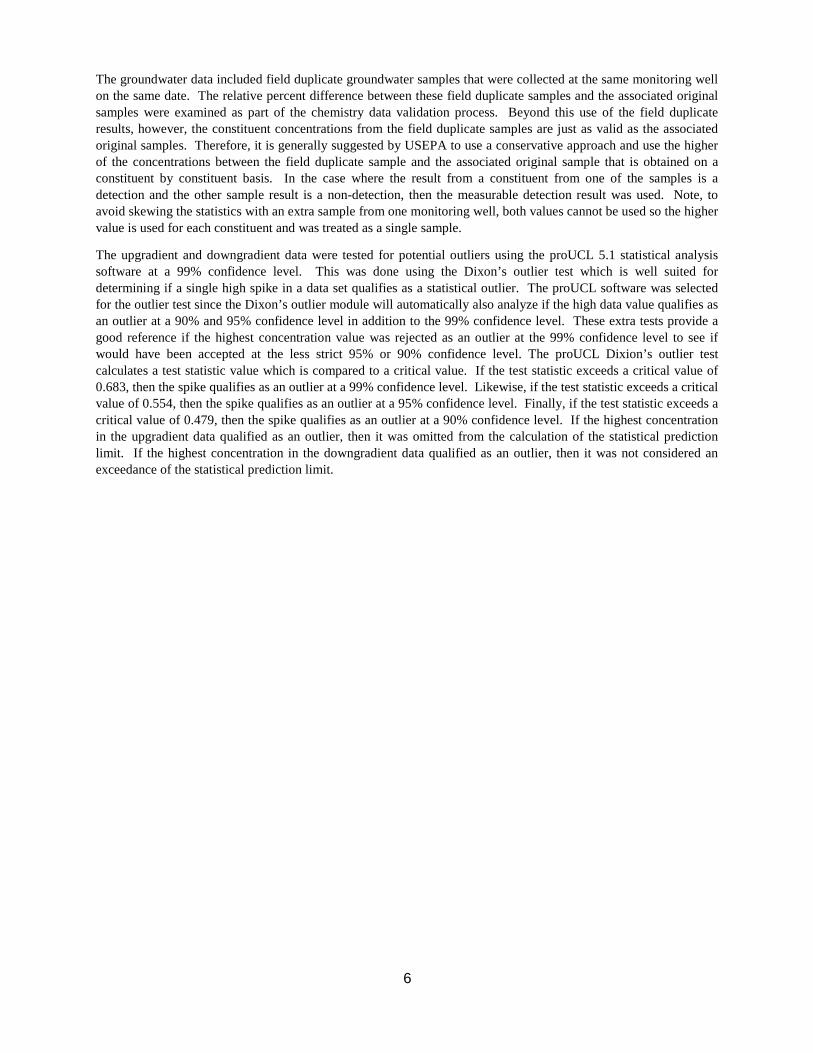
6
The groundwater data included field duplicate groundwater samples that were collected at the same monitoring well on the same date. The relative percent difference between these field duplicate samples and the associated original samples were examined as part of the chemistry data validation process. Beyond this use of the field duplicate results, however, the constituent concentrations from the field duplicate samples are just as valid as the associated original samples. Therefore, it is generally suggested by USEPA to use a conservative approach and use the higher of the concentrations between the field duplicate sample and the associated original sample that is obtained on a constituent by constituent basis. In the case where the result from a constituent from one of the samples is a detection and the other sample result is a non-detection, then the measurable detection result was used. Note, to avoid skewing the statistics with an extra sample from one monitoring well, both values cannot be used so the higher value is used for each constituent and was treated as a single sample.
The upgradient and downgradient data were tested for potential outliers using the proUCL 5.1 statistical analysis software at a 99% confidence level. This was done using the Dixon’s outlier test which is well suited for determining if a single high spike in a data set qualifies as a statistical outlier. The proUCL software was selected for the outlier test since the Dixon’s outlier module will automatically also analyze if the high data value qualifies as an outlier at a 90% and 95% confidence level in addition to the 99% confidence level. These extra tests provide a good reference if the highest concentration value was rejected as an outlier at the 99% confidence level to see if would have been accepted at the less strict 95% or 90% confidence level. The proUCL Dixion’s outlier test calculates a test statistic value which is compared to a critical value. If the test statistic exceeds a critical value of 0.683, then the spike qualifies as an outlier at a 99% confidence level. Likewise, if the test statistic exceeds a critical value of 0.554, then the spike qualifies as an outlier at a 95% confidence level. Finally, if the test statistic exceeds a critical value of 0.479, then the spike qualifies as an outlier at a 90% confidence level. If the highest concentration in the upgradient data qualified as an outlier, then it was omitted from the calculation of the statistical prediction limit. If the highest concentration in the downgradient data qualified as an outlier, then it was not considered an exceedance of the statistical prediction limit.

7
CCR Appendix III Constituent List
The statistical analysis of each CCR Appendix III constituent follows. This includes:
Boron
Calcium
Chloride
Fluoride
pH
Sulfate
Total Dissolved Solids (TDS)

8
Boron
The eight (8) rounds of validated boron data from the JT-MWPZ01D and JT-MWPZ09D upgradient wells are shown below.
The upgradient well JT-MWPZ01D was observed to have potential statistical outlier. The data for the well was loaded separately into the proUCL outlier analysis module and the highest concentration was found to qualify as a statistical outlier at a 99% confidence level as shown below.
proUCL 5.1 Dixon's Outlier Test for Boron at JT-MWPZ01D
Number of Observations = 8 10% critical value: 0.479, 5% critical value: 0.554, 1% critical value: 0.683
Observation Value 0.077 is a Potential Outlier (Upper Tail)?
Test Statistic: 0.851
For 10% significance level, 0.077 is an outlier. For 5% significance level, 0.077 is an outlier. For 1% significance level, 0.077 is an outlier.

9
The upgradient well JT-MWPZ09D was observed to have potential statistical outlier. The data for the well was loaded separately into the proUCL outlier analysis module and the highest concentration was not found to qualify as a statistical outlier at a 99% confidence level as shown below. The spike would have qualified however as an outlier at a less strict 95% confidence level
proUCL 5.1 Dixon's Outlier Test for Boron at JT-MWPZ09D
Number of Observations = 8 10% critical value: 0.479, 5% critical value: 0.554, 1% critical value: 0.683
Observation Value 0.11 is a Potential Outlier (Upper Tail)?
Test Statistic: 0.644
For 10% significance level, 0.11 is an outlier. For 5% significance level, 0.11 is an outlier.
For 1% significance level, 0.11 is not an outlier.
After removing the outlier at the JT-MWPZ01D well, the remaining validated boron data from the JT-MWPZ01D and JT-MWPZ09D upgradient wells are shown below.
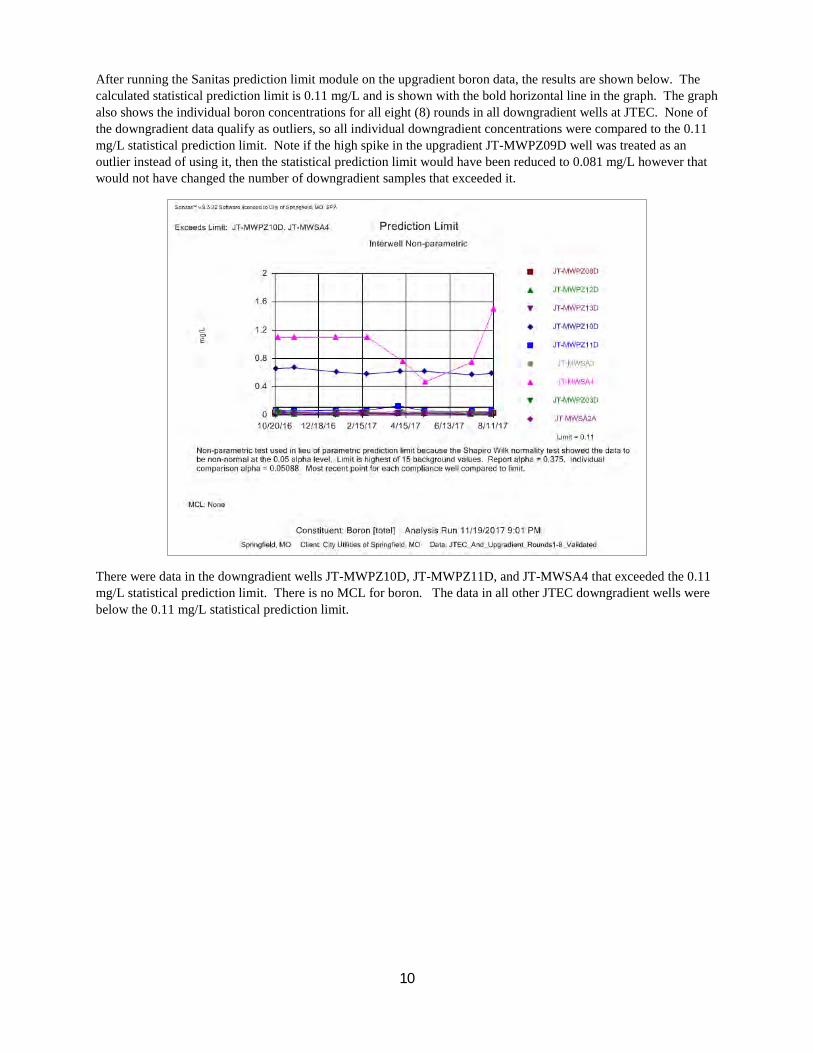
10
After running the Sanitas prediction limit module on the upgradient boron data, the results are shown below. The calculated statistical prediction limit is 0.11 mg/L and is shown with the bold horizontal line in the graph. The graph also shows the individual boron concentrations for all eight (8) rounds in all downgradient wells at JTEC. None of the downgradient data qualify as outliers, so all individual downgradient concentrations were compared to the 0.11 mg/L statistical prediction limit. Note if the high spike in the upgradient JT-MWPZ09D well was treated as an outlier instead of using it, then the statistical prediction limit would have been reduced to 0.081 mg/L however that would not have changed the number of downgradient samples that exceeded it.
There were data in the downgradient wells JT-MWPZ10D, JT-MWPZ11D, and JT-MWSA4 that exceeded the 0.11 mg/L statistical prediction limit. There is no MCL for boron. The data in all other JTEC downgradient wells were below the 0.11 mg/L statistical prediction limit.

11
The figure below, shows a combined summary of the boron data from both the upgradient wells and downgradient wells along with the statistical prediction limit reference line. The figure also includes precipitation amounts with a daily accumulation of at least 1 inch that is thought to contribute to the variability of the boron result values.
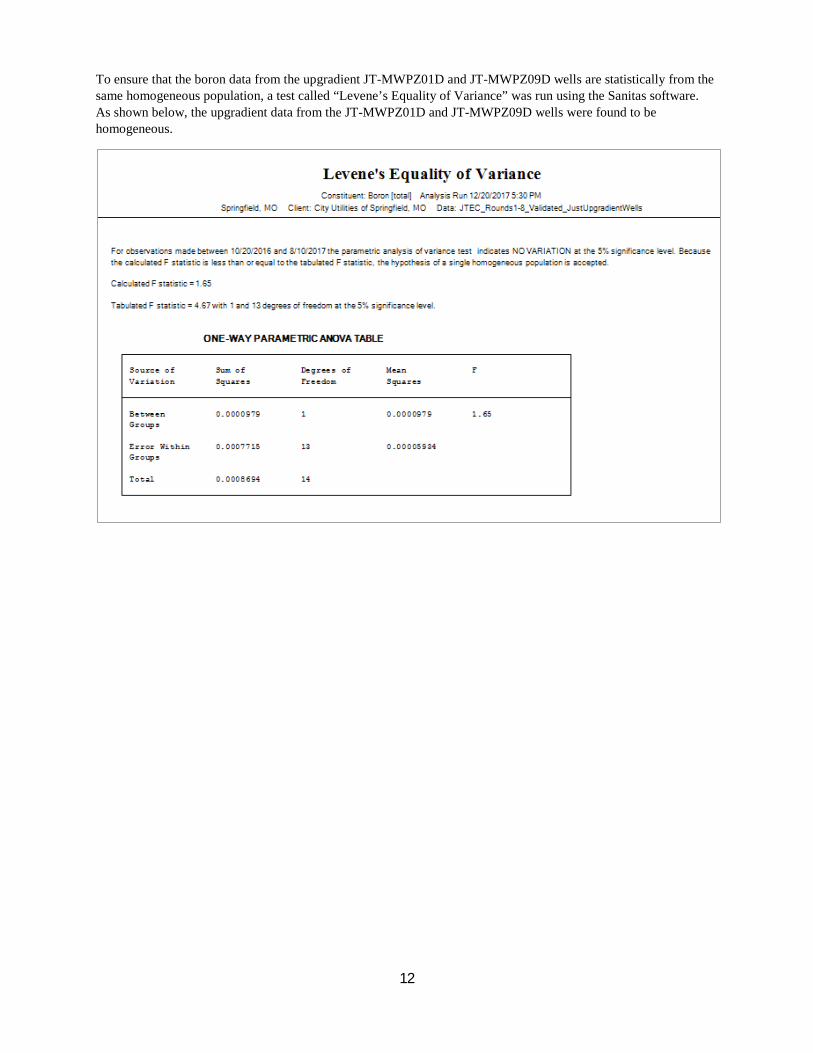
12
To ensure that the boron data from the upgradient JT-MWPZ01D and JT-MWPZ09D wells are statistically from the same homogeneous population, a test called “Levene’s Equality of Variance” was run using the Sanitas software. As shown below, the upgradient data from the JT-MWPZ01D and JT-MWPZ09D wells were found to be homogeneous.
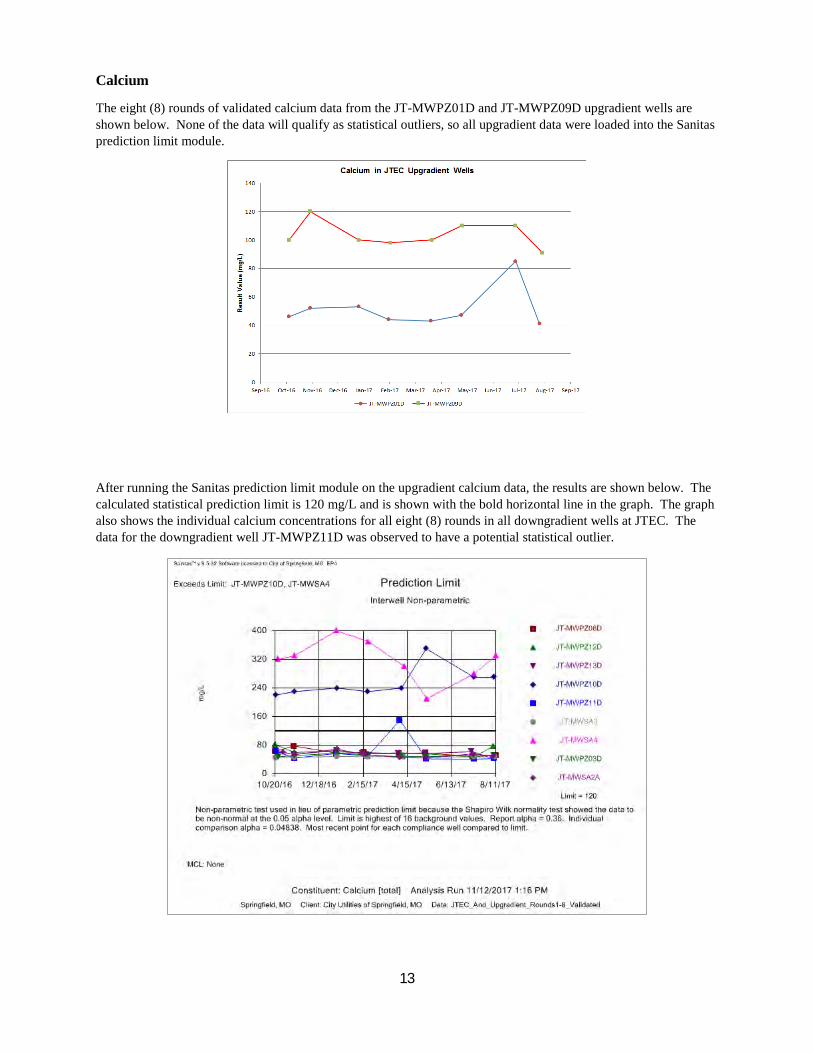
13
Calcium
The eight (8) rounds of validated calcium data from the JT-MWPZ01D and JT-MWPZ09D upgradient wells are shown below. None of the data will qualify as statistical outliers, so all upgradient data were loaded into the Sanitas prediction limit module.
After running the Sanitas prediction limit module on the upgradient calcium data, the results are shown below. The calculated statistical prediction limit is 120 mg/L and is shown with the bold horizontal line in the graph. The graph also shows the individual calcium concentrations for all eight (8) rounds in all downgradient wells at JTEC. The data for the downgradient well JT-MWPZ11D was observed to have a potential statistical outlier.

14
Th e downgradient well JT-MWPZ11D was observed to have potential statistical outlier. The data for the well was loaded separately into the proUCL outlier analysis module and the highest concentration was found to qualify as a statistical outlier at a 99% confidence level as shown below.
proUCL 5.1 Dixon's Outlier Test for Calcium at JT-MWPZ11D
Number of Observations = 8 10% critical value: 0.479, 5% critical value: 0.554, 1% critical value: 0.683
Observation Value 150 is a Potential Outlier (Upper Tail)?
Test Statistic: 0.796
For 10% significance level, 150 is an outlier. For 5% significance level, 150 is an outlier. For 1% significance level, 150 is an outlier.
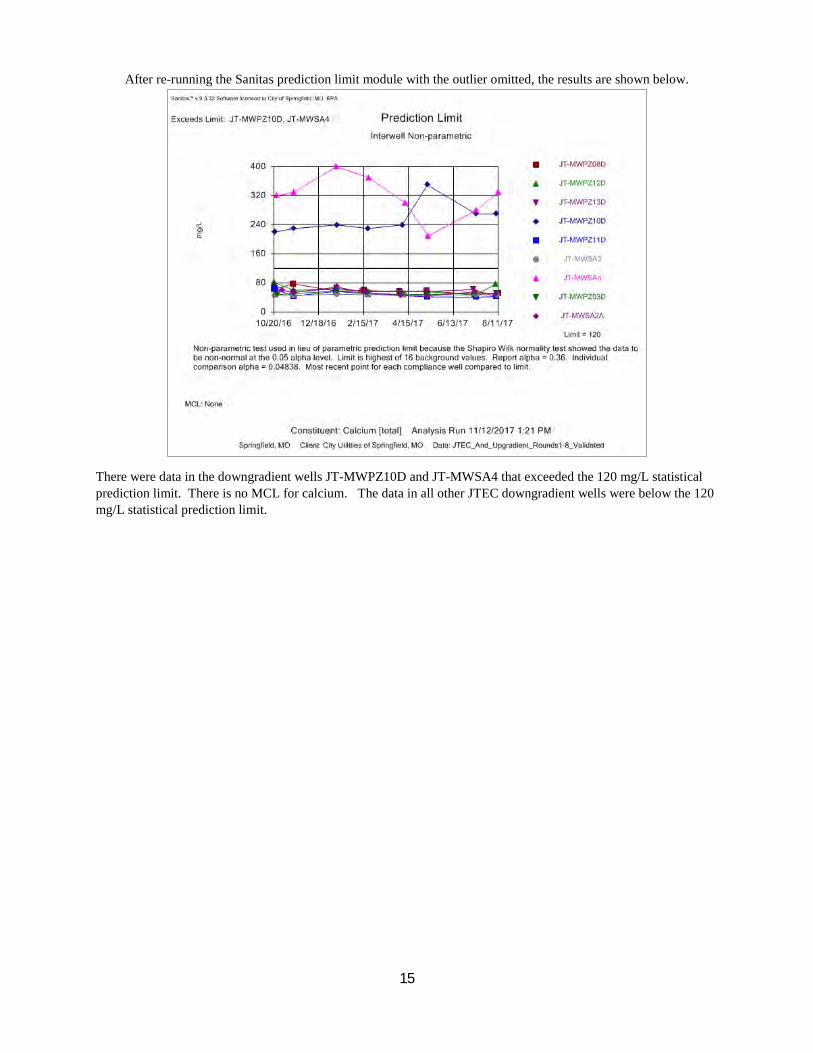
15
After re-running the Sanitas prediction limit module with the outlier omitted, the results are shown below.
There were data in the downgradient wells JT-MWPZ10D and JT-MWSA4 that exceeded the 120 mg/L statistical prediction limit. There is no MCL for calcium. The data in all other JTEC downgradient wells were below the 120 mg/L statistical prediction limit.
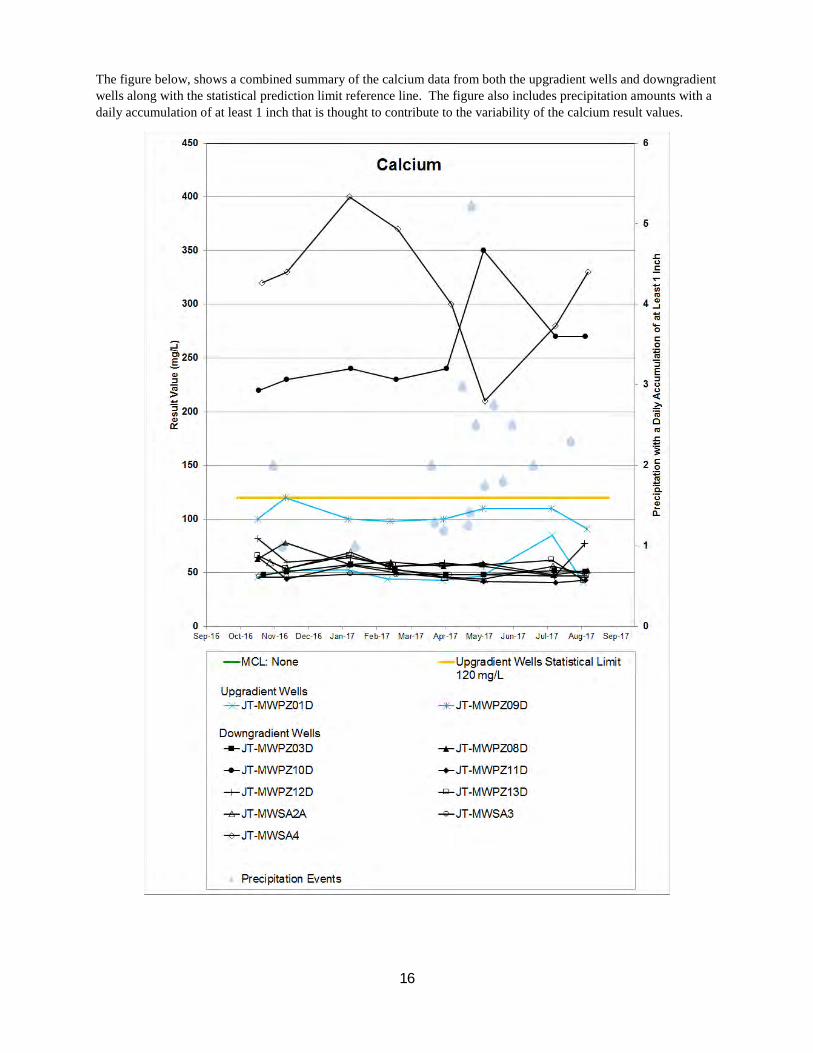
16
The figure below, shows a combined summary of the calcium data from both the upgradient wells and downgradient wells along with the statistical prediction limit reference line. The figure also includes precipitation amounts with a daily accumulation of at least 1 inch that is thought to contribute to the variability of the calcium result values.

17
To ensure that the calcium data from the upgradient JT-MWPZ01D and JT-MWPZ09D wells are statistically from the same homogeneous population, a test called “Levene’s Equality of Variance” was run using the Sanitas software. As shown below, the upgradient data from the JT-MWPZ01D and JT-MWPZ09D wells were found to be homogeneous.
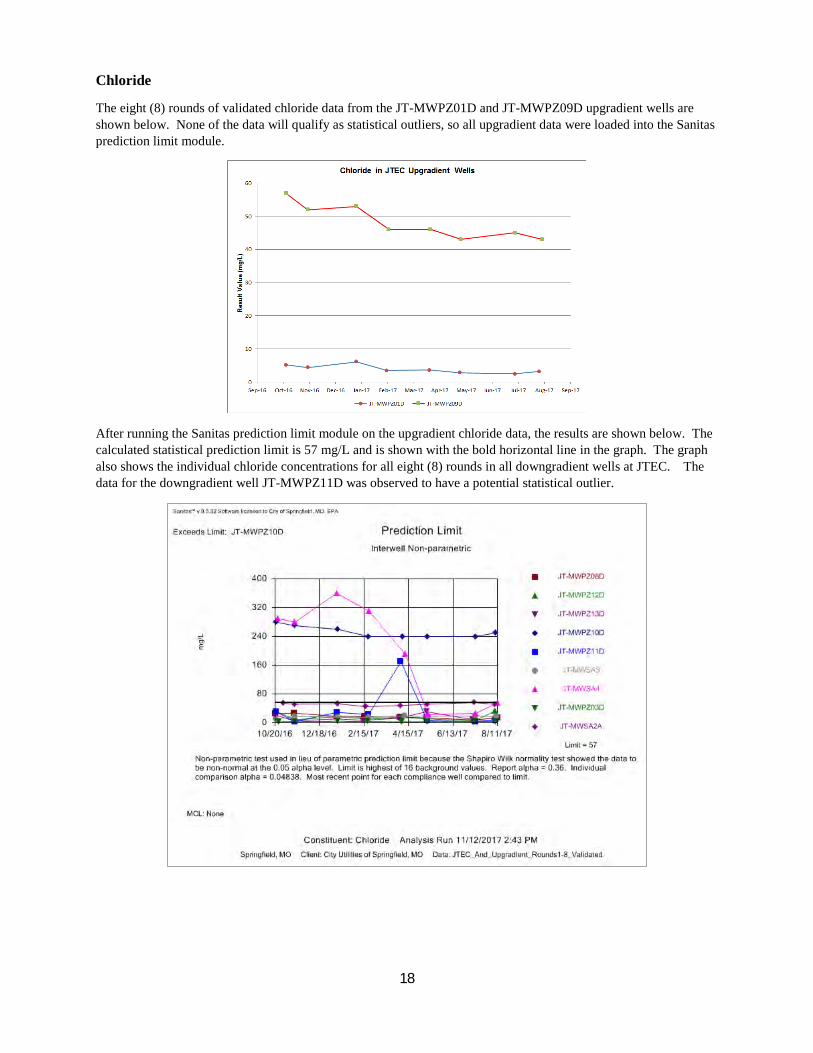
18
Chloride
The eight (8) rounds of validated chloride data from the JT-MWPZ01D and JT-MWPZ09D upgradient wells are shown below. None of the data will qualify as statistical outliers, so all upgradient data were loaded into the Sanitas prediction limit module.
After running the Sanitas prediction limit module on the upgradient chloride data, the results are shown below. The calculated statistical prediction limit is 57 mg/L and is shown with the bold horizontal line in the graph. The graph also shows the individual chloride concentrations for all eight (8) rounds in all downgradient wells at JTEC. The data for the downgradient well JT-MWPZ11D was observed to have a potential statistical outlier.
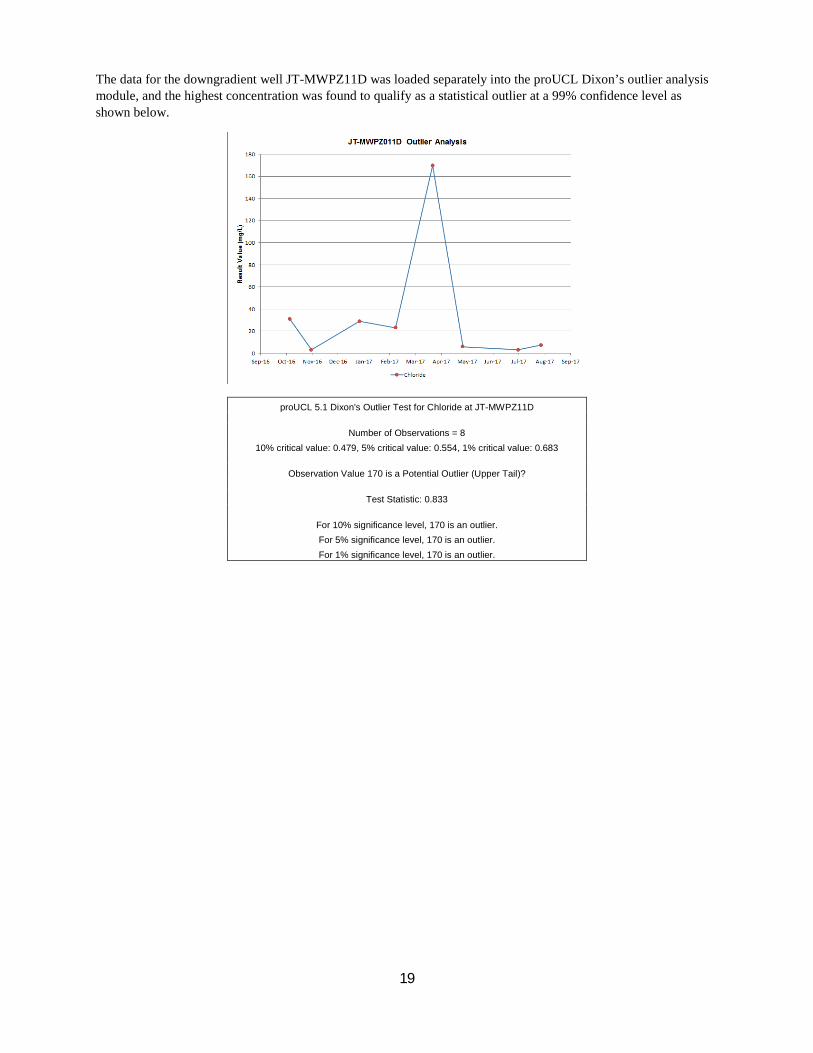
19
The data for the downgradient well JT-MWPZ11D was loaded separately into the proUCL Dixon’s outlier analysis module, and the highest concentration was found to qualify as a statistical outlier at a 99% confidence level as shown below.
proUCL 5.1 Dixon's Outlier Test for Chloride at JT-MWPZ11D
Number of Observations = 8 10% critical value: 0.479, 5% critical value: 0.554, 1% critical value: 0.683
Observation Value 170 is a Potential Outlier (Upper Tail)?
Test Statistic: 0.833
For 10% significance level, 170 is an outlier. For 5% significance level, 170 is an outlier. For 1% significance level, 170 is an outlier.

20
After re-running the Sanitas prediction limit module with the outlier omitted, the results are shown below.
There were data in the downgradient wells JT-MWPZ10D and JT-MWSA4 that exceeded the 57 mg/L statistical prediction limit. There is no MCL for chloride. The data in all other JTEC downgradient wells were below the 57 mg/L statistical prediction limit.

21
The figure below, shows a combined summary of the chloride data from both the upgradient wells and downgradient wells along with the statistical prediction limit reference line. The figure also includes precipitation amounts with a daily accumulation of at least 1 inch that is thought to contribute to the variability of the chloride result values.
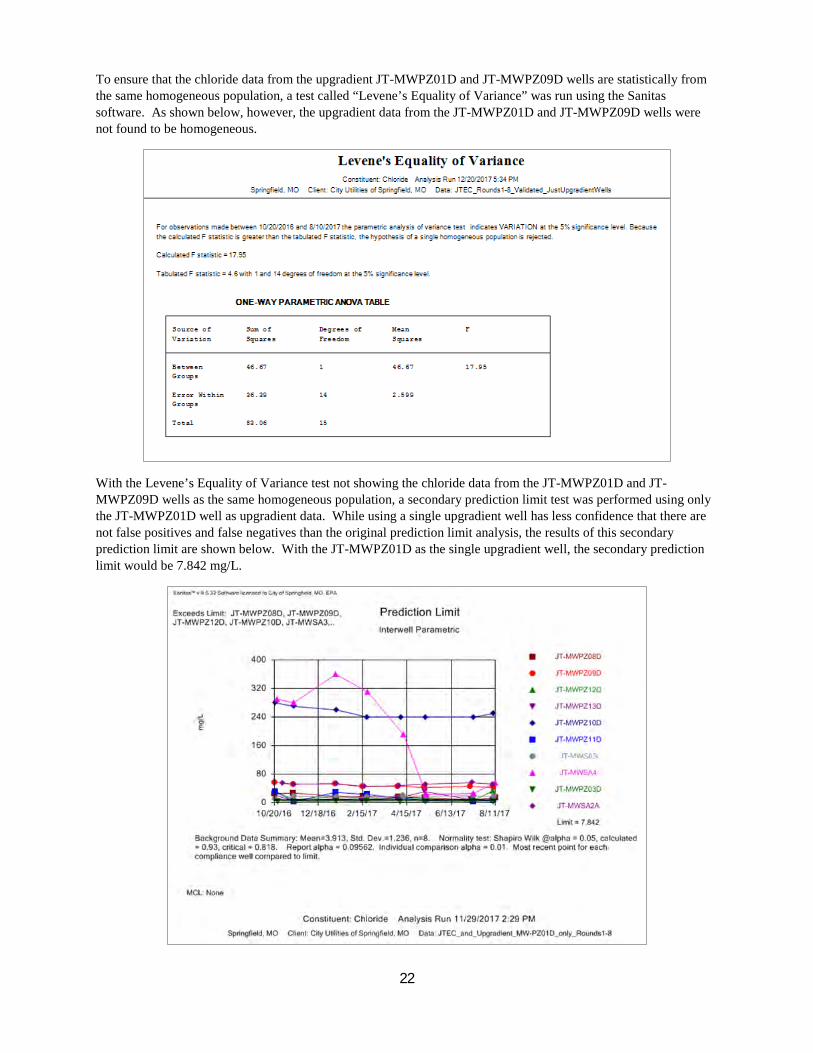
22
To ensure that the chloride data from the upgradient JT-MWPZ01D and JT-MWPZ09D wells are statistically from the same homogeneous population, a test called “Levene’s Equality of Variance” was run using the Sanitas software. As shown below, however, the upgradient data from the JT-MWPZ01D and JT-MWPZ09D wells were not found to be homogeneous.
With the Levene’s Equality of Variance test not showing the chloride data from the JT-MWPZ01D and JT-MWPZ09D wells as the same homogeneous population, a secondary prediction limit test was performed using only the JT-MWPZ01D well as upgradient data. While using a single upgradient well has less confidence that there are not false positives and false negatives than the original prediction limit analysis, the results of this secondary prediction limit are shown below. With the JT-MWPZ01D as the single upgradient well, the secondary prediction limit would be 7.842 mg/L.

23
There were data in the downgradient wells JT-MWPZ08D, JT-MWPZ10D, JT-MWPZ11D, JT-MWPZ12D, JT-MWPZ13D, JT-MWSA2A, JT-MWSA3, and JT-MWSA4 that exceeded the chloride 7.842 mg/L secondary statistical prediction limit when using the single JT-MWPZ01D well as the upgradient data.
The figure below, shows a combined summary of the chloride data from the single JT-MWPZ01D upgradient well and downgradient wells along with the statistical prediction limit reference line. The figure also includes precipitation amounts with a daily accumulation of at least 1 inch that is thought to contribute to the variability of the chloride result values.

24
Fluoride
The eight (8) rounds of validated fluoride data from the JT-MWPZ01D and JT-MWPZ09D upgradient wells are shown below. None of the data will qualify as statistical outliers, so all upgradient data were loaded into the Sanitas prediction limit module.
After running the Sanitas prediction limit module on the upgradient fluoride data, the results are shown below. The calculated statistical prediction limit is 0.3957 mg/L and is shown with the bold horizontal line in the graph. The graph also shows the individual fluoride concentrations for all eight (8) rounds in all downgradient wells at JTEC. None of the downgradient data qualify as outliers, so all individual downgradient concentrations were compared to the 0.3957 mg/L statistical prediction limit.
There were data in the downgradient well JT-MWSA3 that exceeded the 0.3957 mg/L statistical prediction limit. These statistical exceedances however were below the 4 mg/L fluoride MCL. The data in all other JTEC downgradient wells were below the 0.3957 mg/L statistical prediction limit.

25
The figure below, shows a combined summary of the fluoride data from both the upgradient wells and downgradient wells along with the statistical prediction limit reference line. The figure also includes precipitation amounts with a daily accumulation of at least 1 inch that is thought to contribute to the variability of the fluoride result values.
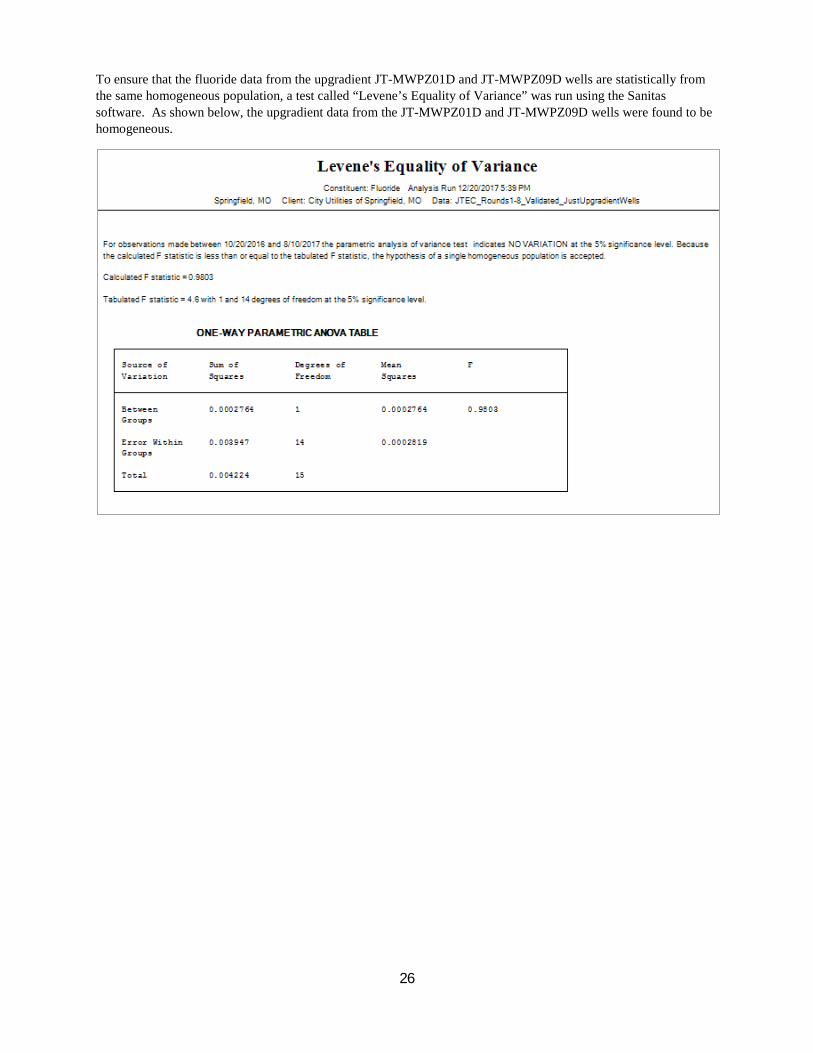
26
To ensure that the fluoride data from the upgradient JT-MWPZ01D and JT-MWPZ09D wells are statistically from the same homogeneous population, a test called “Levene’s Equality of Variance” was run using the Sanitas software. As shown below, the upgradient data from the JT-MWPZ01D and JT-MWPZ09D wells were found to be homogeneous.
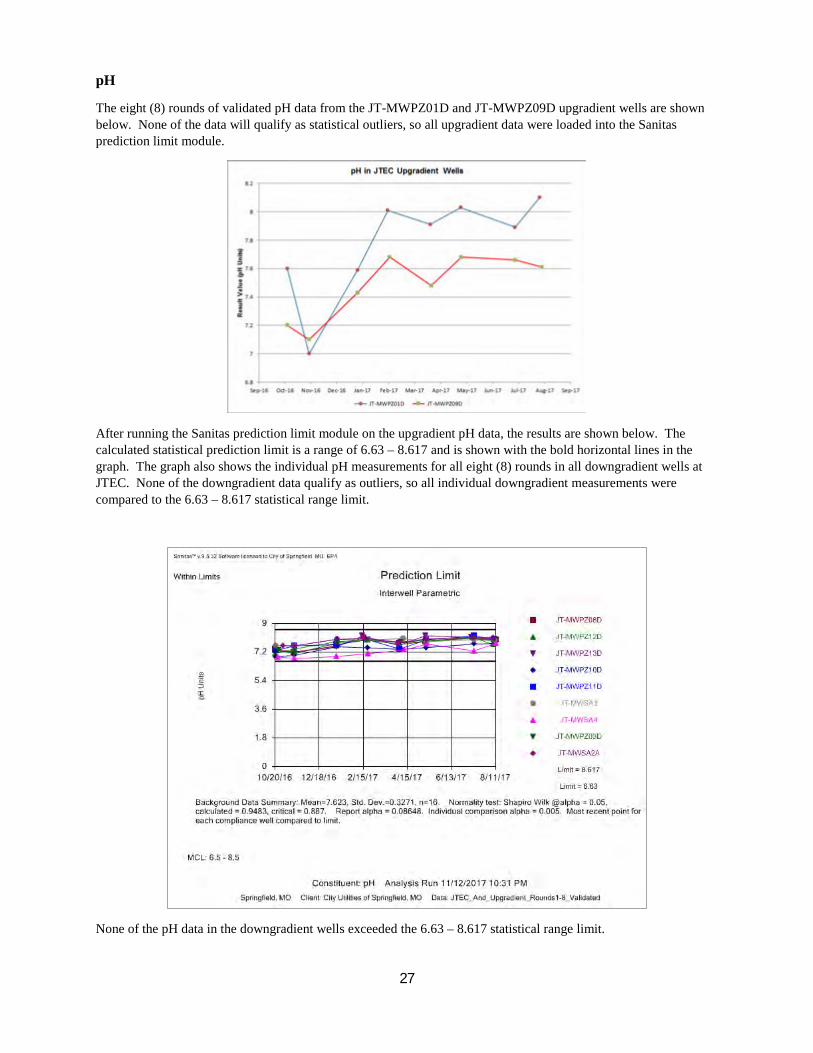
27
pH
The eight (8) rounds of validated pH data from the JT-MWPZ01D and JT-MWPZ09D upgradient wells are shown below. None of the data will qualify as statistical outliers, so all upgradient data were loaded into the Sanitas prediction limit module.
After running the Sanitas prediction limit module on the upgradient pH data, the results are shown below. The calculated statistical prediction limit is a range of 6.63 – 8.617 and is shown with the bold horizontal lines in the graph. The graph also shows the individual pH measurements for all eight (8) rounds in all downgradient wells at JTEC. None of the downgradient data qualify as outliers, so all individual downgradient measurements were compared to the 6.63 – 8.617 statistical range limit.
None of the pH data in the downgradient wells exceeded the 6.63 – 8.617 statistical range limit.
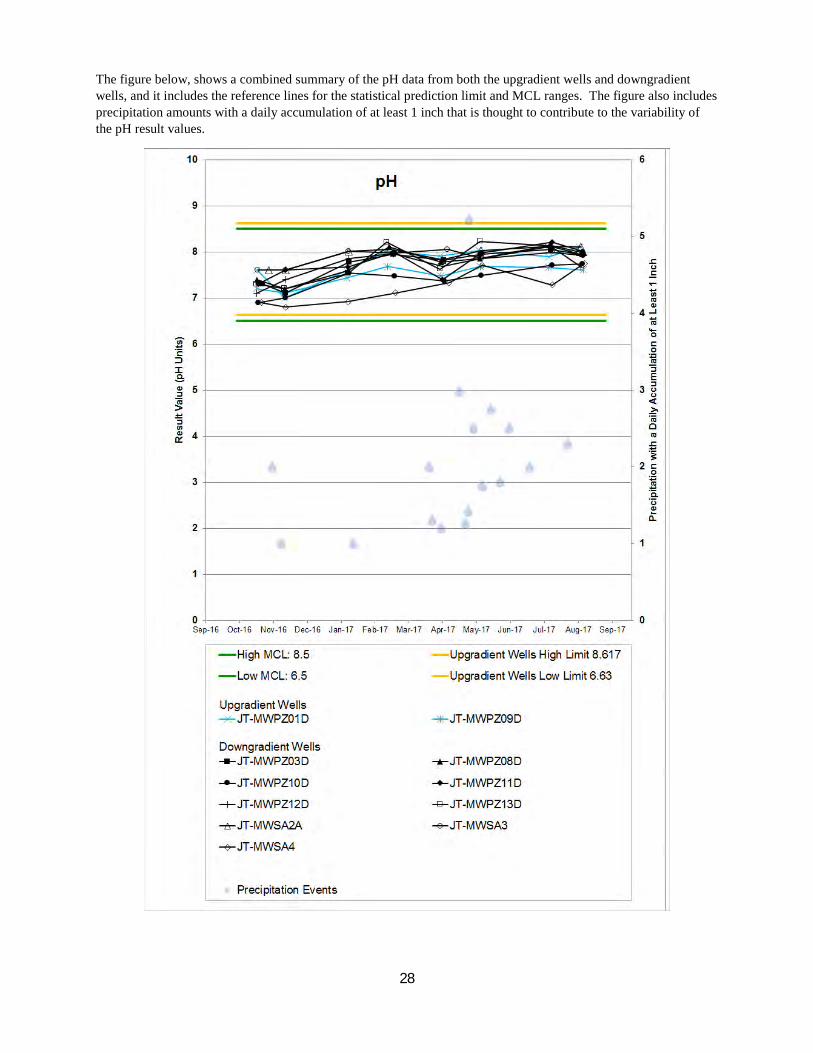
28
The figure below, shows a combined summary of the pH data from both the upgradient wells and downgradient wells, and it includes the reference lines for the statistical prediction limit and MCL ranges. The figure also includes precipitation amounts with a daily accumulation of at least 1 inch that is thought to contribute to the variability of the pH result values.
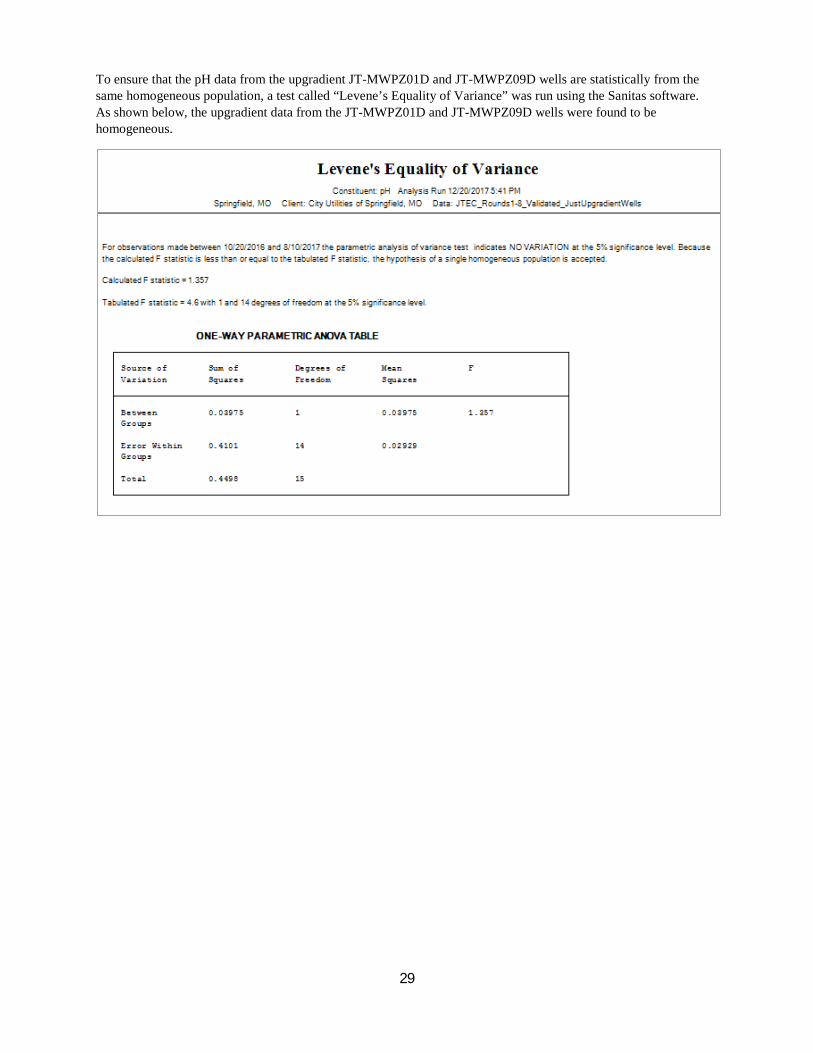
29
To ensure that the pH data from the upgradient JT-MWPZ01D and JT-MWPZ09D wells are statistically from the same homogeneous population, a test called “Levene’s Equality of Variance” was run using the Sanitas software. As shown below, the upgradient data from the JT-MWPZ01D and JT-MWPZ09D wells were found to be homogeneous.

30
Sulfate
The eight (8) rounds of validated sulfate data from the JT-MWPZ01D and JT-MWPZ09D upgradient wells are shown below. None of the data will qualify as statistical outliers, so all upgradient data were loaded into the Sanitas prediction limit module.
After running the Sanitas prediction limit module on the upgradient sulfate data, the results are shown below. The calculated statistical prediction limit is 310 mg/L and is shown with the bold horizontal line in the graph. The graph also shows the individual sulfate concentrations for all eight (8) rounds in all downgradient wells at JTEC. None of the downgradient data qualify as outliers, so all individual downgradient concentrations were compared to the 310 mg/L statistical prediction limit.
There were data in the downgradient well JT-MWSA4 that exceeded the 310 mg/L statistical prediction limit. There is no MCL for sulfate. The data in all other JTEC downgradient wells were below the 310 mg/L statistical prediction limit.

31
The figure below, shows a combined summary of the sulfate data from both the upgradient wells and downgradient wells along with the statistical prediction limit reference line. The figure also includes precipitation amounts with a daily accumulation of at least 1 inch that is thought to contribute to the variability of the sulfate result values.

32
To ensure that the sulfate data from the upgradient JT-MWPZ01D and JT-MWPZ09D wells are statistically from the same homogeneous population, a test called “Levene’s Equality of Variance” was run using the Sanitas software. As shown below, however, the upgradient data from the JT-MWPZ01D and JT-MWPZ09D wells were not found to be homogeneous.
With the Levene’s Equality of Variance test not showing the sulfate data from the JT-MWPZ01D and JT-MWPZ09D wells as the same homogeneous population, a secondary prediction limit test was performed using only the JT-MWPZ01D well as upgradient data. While using a single upgradient well has less confidence that there are not false positives and false negatives than the original prediction limit analysis, the results of this secondary prediction limit are shown below. With the JT-MWPZ01D as the single upgradient well, the secondary prediction limit would be 39.35 mg/L.
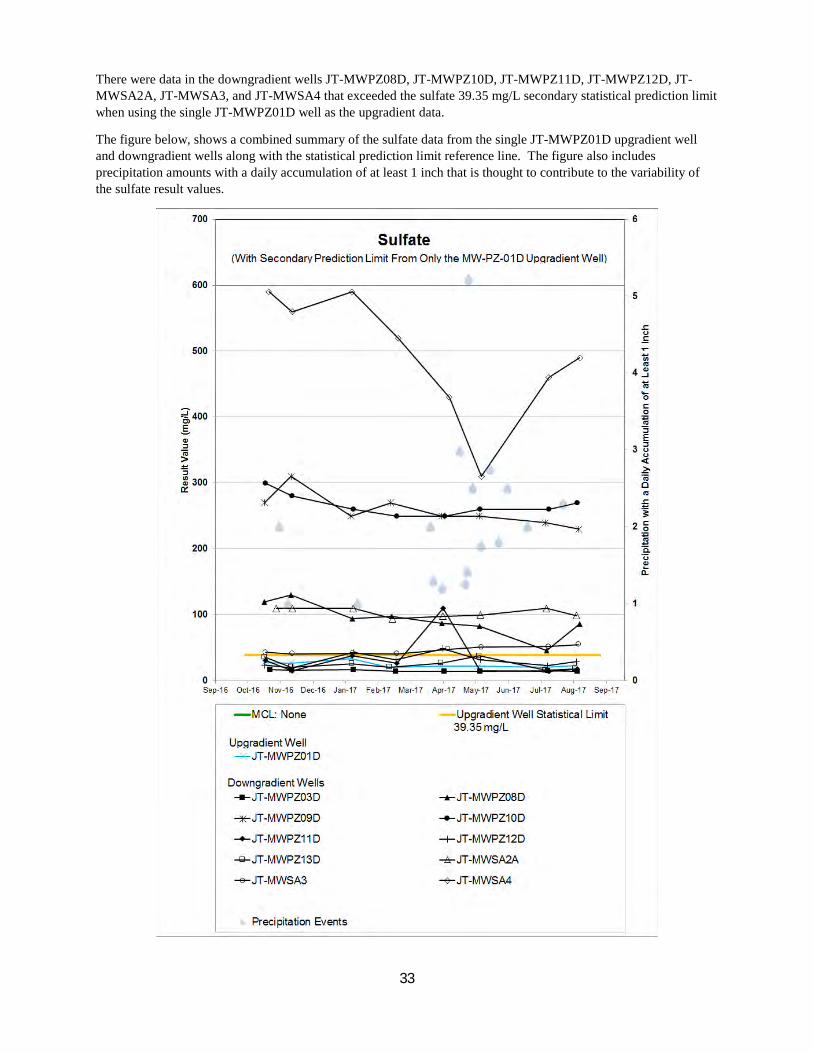
33
There were data in the downgradient wells JT-MWPZ08D, JT-MWPZ10D, JT-MWPZ11D, JT-MWPZ12D, JT-MWSA2A, JT-MWSA3, and JT-MWSA4 that exceeded the sulfate 39.35 mg/L secondary statistical prediction limit when using the single JT-MWPZ01D well as the upgradient data.
The figure below, shows a combined summary of the sulfate data from the single JT-MWPZ01D upgradient well and downgradient wells along with the statistical prediction limit reference line. The figure also includes precipitation amounts with a daily accumulation of at least 1 inch that is thought to contribute to the variability of the sulfate result values.

34
Total Dissolved Solids (TDS)
The eight (8) rounds of validated Total Dissolved Solids (TDS) data from the JT-MWPZ01D and JT-MWPZ09D upgradient wells are shown below. None of the data will qualify as statistical outliers, so all upgradient data were loaded into the Sanitas prediction limit module.
After running the Sanitas prediction limit module on the upgradient total dissolved solids (TDS) data, the results are shown below. The calculated statistical prediction limit is 730 mg/L and is shown with the bold horizontal line in the graph. The graph also shows the individual Total Dissolved Solids (TDS) concentrations for all eight (8) rounds in all downgradient wells at JTEC. None of the downgradient data qualify as outliers, so all individual downgradient concentrations were compared to the 730 mg/L statistical prediction limit.
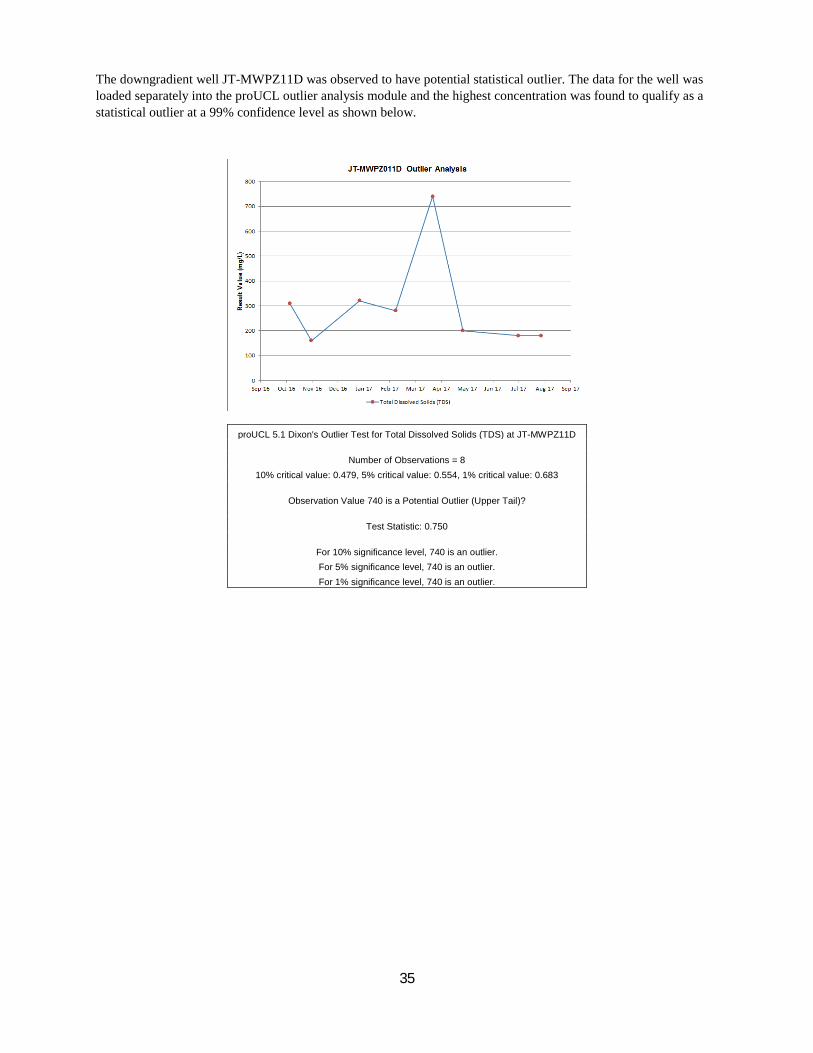
35
The downgradient well JT-MWPZ11D was observed to have potential statistical outlier. The data for the well was loaded separately into the proUCL outlier analysis module and the highest concentration was found to qualify as a statistical outlier at a 99% confidence level as shown below.
proUCL 5.1 Dixon's Outlier Test for Total Dissolved Solids (TDS) at JT-MWPZ11D
Number of Observations = 8 10% critical value: 0.479, 5% critical value: 0.554, 1% critical value: 0.683
Observation Value 740 is a Potential Outlier (Upper Tail)?
Test Statistic: 0.750
For 10% significance level, 740 is an outlier. For 5% significance level, 740 is an outlier. For 1% significance level, 740 is an outlier.

36
There were data in the downgradient wells JT-MWPZ10D and JT-MWSA4 that exceeded the 730 mg/L statistical prediction limit. There is no MCL for total dissolved solids (TDS). The data in all other JTEC downgradient wells were below the 730 mg/L statistical prediction limit.

37
The figure below, shows a combined summary of the total dissolved solids (TDS) data from both the upgradient wells and downgradient wells along with the statistical prediction limit reference line. The figure also includes precipitation amounts with a daily accumulation of at least 1 inch that is thought to contribute to the variability of the total dissolved solids (TDS) result values.
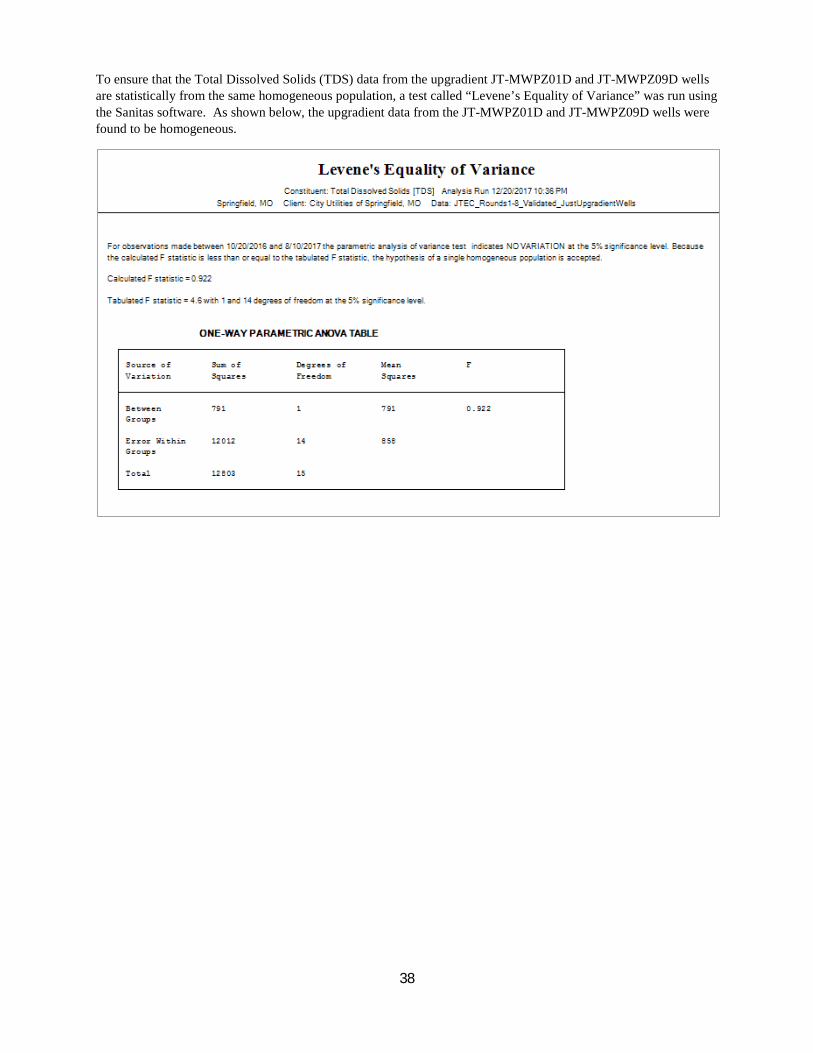
38
To ensure that the Total Dissolved Solids (TDS) data from the upgradient JT-MWPZ01D and JT-MWPZ09D wells are statistically from the same homogeneous population, a test called “Levene’s Equality of Variance” was run using the Sanitas software. As shown below, the upgradient data from the JT-MWPZ01D and JT-MWPZ09D wells were found to be homogeneous.

39
Statistical Analysis Summary for the CCR Appendix III Constituent List
JTEC Statistical Summary Results of CCR Appendix III Constituents for Rounds 1-8
Constituent
Statistical Prediction Limit from Upgradient
Wells
Maximum Downgradient
Well Concentration
Downgradient Well Names with One or More Results > Statistical Prediction
Limit MCL
Downgradient Well Names with
One or More Results > MCL
Boron 0.11 mg/L * 1.5 mg/L JT-MWPZ10D, JT-MWPZ11D, JT-
MWSA4 no MCL NA
Calcium 120 mg/L 400 mg/L JT-MWPZ10D, JT-MWSA4 no MCL NA
Chloride 57 mg/L
360 mg/L JT-MWPZ10D, JT-MWSA4
no MCL NA
7.842 mg/L **
JT-MWPZ08D, JT-MWPZ10D, JT-MWPZ11D, JT-MWPZ12D, JT-
MWPZ13D, JT-MWSA2A, JT-MWSA3, JT-MWSA4 **
Fluoride 0.3957 mg/L 0.41 mg/L JT-MWSA3 4 mg/L All below MCL
pH 6.63 - 8.617 6.8 - 8.23 None 6.5 - 8.5 All within range
of MCL
Sulfate 310 mg/L
590 mg/L JT-MWSA4
no MCL NA
39.35 mg/L **
JT-MWPZ08D, JT-MWPZ10D, JT-MWPZ11D, JT-MWPZ12D, JT-
MWSA2A, JT-MWSA3, JT-MWSA4 ** Total Dissolved Solids (TDS) 730 mg/L 1700 mg/L JT-MWPZ10D, JT-MWSA4 no MCL NA
* After statistical outliers were removed with a 99% confidence interval
** Using the Secondary Prediction Limit Analysis with the Single JT-MWPZ01D Upgradient Well
6 constituents on the CCR Appendix III list had one or more concentrations in downgradient wells with a statistical difference with the upgradient well data. The constituents with exceedances were boron, calcium, chloride, fluoride, sulfate, and TDS. None of the constituents on the CCR Appendix III list also exceeded the MCL.

40
CCR Appendix IV constituent list
The statistical analysis of each CCR Appendix IV constituent follows. This includes:
Antimony
Arsenic
Barium
Beryllium
Cadmium
Chromium
Cobalt
Fluoride
Lead
Lithium
Mercury
Molybdenum
Radium 228/228 Combined
Selenium
Thallium

41
Antimony
The eight (8) rounds of validated antimony data from the JT-MWPZ01D and JT-MWPZ09D upgradient wells are shown below. None of the data will qualify as statistical outliers, so all upgradient data were loaded into the Sanitas prediction limit module.
After running the Sanitas prediction limit module on the upgradient antimony data, the results are shown below. The calculated statistical prediction limit is 0.007795 mg/L and is shown with the bold horizontal line in the graph. The graph also shows the individual antimony concentrations for all eight (8) rounds in all downgradient wells at JTEC. None of the downgradient data qualify as outliers, so all individual downgradient concentrations were compared to the 0.007795 mg/L statistical prediction limit.

42
The downgradient well JT-MWPZ08D was observed to have potential statistical outlier. The data for the well was loaded separately into the proUCL outlier analysis module and the highest concentration was not found to qualify as a statistical outlier at the 99% and 95% confidence levels as shown below.
proUCL 5.1 Dixon's Outlier Test for Antimony at JT-MWPZ08D
Number of Observations = 8 10% critical value: 0.479, 5% critical value: 0.554, 1% critical value: 0.683
Observation Value 0.021 is a Potential Outlier (Upper Tail)?
Test Statistic: 0.499
For 10% significance level, 0.021 is an outlier.
For 5% significance level, 0.021 is not an outlier. For 1% significance level, 0.021 is not an outlier.
There were data in the downgradient wells JT-MWPZ03D, JT-MWPZ08D, JT-MWSA2A, and JT-MWSA3 that exceeded the 0.007795 mg/L statistical prediction limit. These exceedances also are above the 0.006 mg/L antimony MCL. The data in all other JTEC downgradient wells were below the 0.007795 mg/L statistical prediction limit.
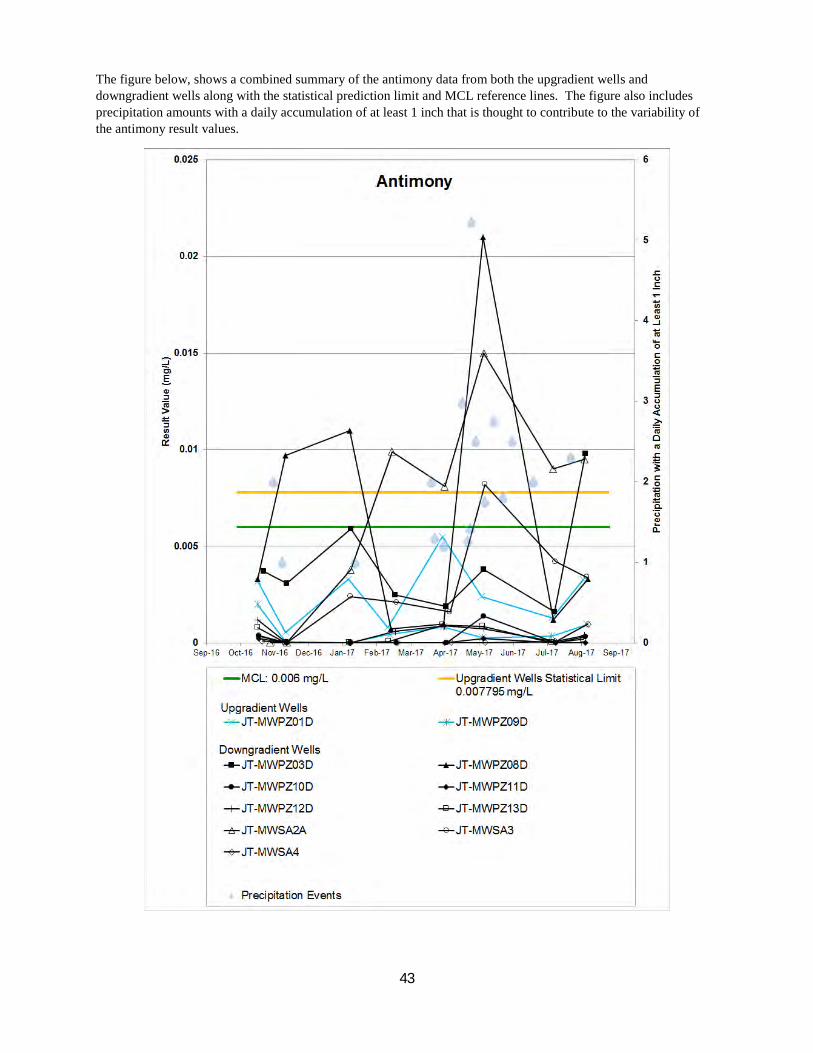
43
The figure below, shows a combined summary of the antimony data from both the upgradient wells and downgradient wells along with the statistical prediction limit and MCL reference lines. The figure also includes precipitation amounts with a daily accumulation of at least 1 inch that is thought to contribute to the variability of the antimony result values.

44
To ensure that the antimony data from the upgradient JT-MWPZ01D and JT-MWPZ09D wells are statistically from the same homogeneous population, a test called “Levene’s Equality of Variance” was run using the Sanitas software. As shown below, however, the upgradient data from the JT-MWPZ01D and JT-MWPZ09D wells were not found to be homogeneous.
With the Levene’s Equality of Variance test not showing the antimony data from the JT-MWPZ01D and JT-MWPZ09D wells as the same homogeneous population, a secondary prediction limit test was performed using only the JT-MWPZ01D well as upgradient data. While using a single upgradient well has less confidence that there are not false positives and false negatives than the original prediction limit analysis, the results of this secondary prediction limit are shown below. With the JT-MWPZ01D as the single upgradient well, the secondary prediction limit would be 0.007764 mg/L.

45
There were data in the downgradient wells JT-MWPZ03D, JT-MWPZ08D, JT-MWSA2A, and JT-MWSA3 that exceeded the antimony 0.007764 mg/L secondary statistical prediction limit when using the single JT-MWPZ01D well as the upgradient data. This was the same result when using both the JT-MWPZ01D and JT-MWPZ09D wells as the upgradient data.
The figure below, shows a combined summary of the antimony data from the single JT-MWPZ01D upgradient well and downgradient wells along with the statistical prediction limit reference line. The figure also includes precipitation amounts with a daily accumulation of at least 1 inch that is thought to contribute to the variability of the antimony result values.
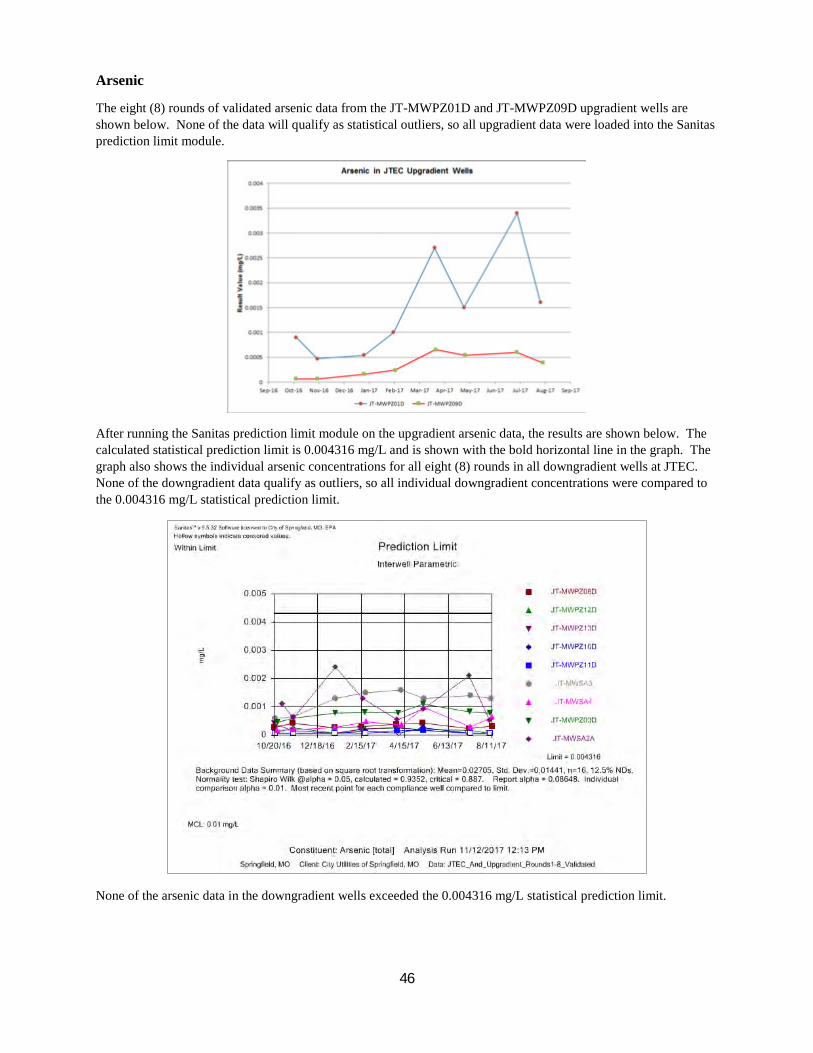
46
Arsenic
The eight (8) rounds of validated arsenic data from the JT-MWPZ01D and JT-MWPZ09D upgradient wells are shown below. None of the data will qualify as statistical outliers, so all upgradient data were loaded into the Sanitas prediction limit module.
After running the Sanitas prediction limit module on the upgradient arsenic data, the results are shown below. The calculated statistical prediction limit is 0.004316 mg/L and is shown with the bold horizontal line in the graph. The graph also shows the individual arsenic concentrations for all eight (8) rounds in all downgradient wells at JTEC. None of the downgradient data qualify as outliers, so all individual downgradient concentrations were compared to the 0.004316 mg/L statistical prediction limit.
None of the arsenic data in the downgradient wells exceeded the 0.004316 mg/L statistical prediction limit.
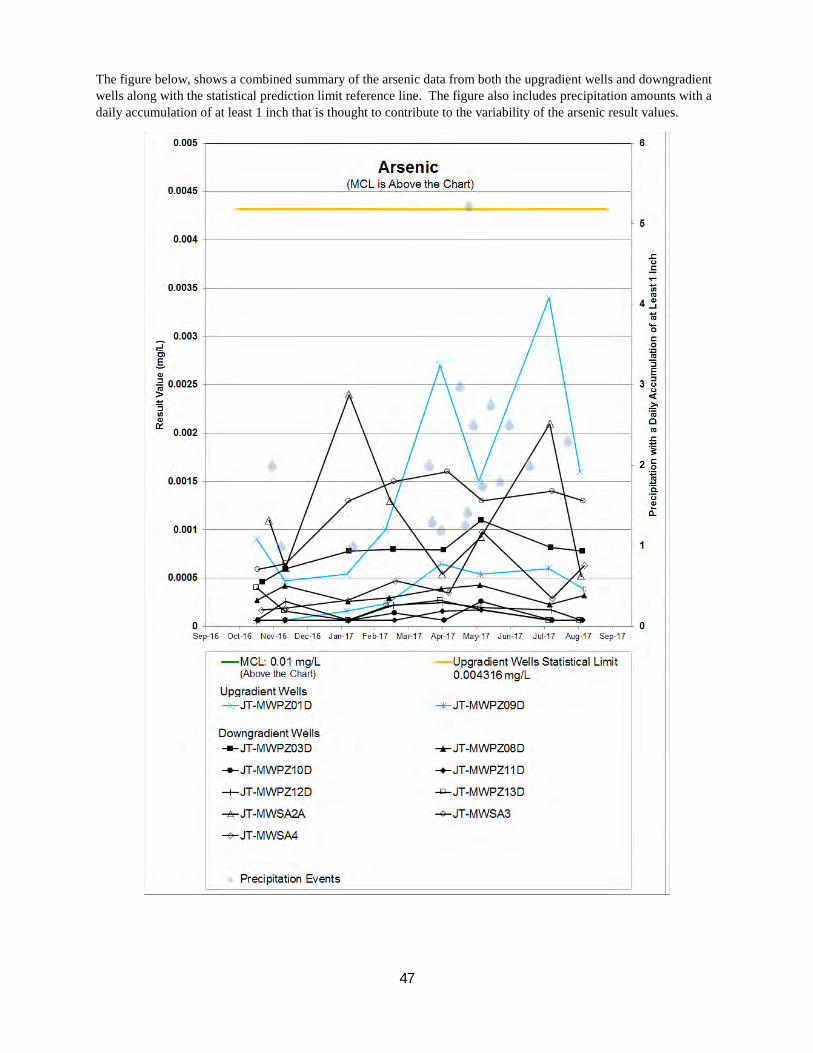
47
The figure below, shows a combined summary of the arsenic data from both the upgradient wells and downgradient wells along with the statistical prediction limit reference line. The figure also includes precipitation amounts with a daily accumulation of at least 1 inch that is thought to contribute to the variability of the arsenic result values.
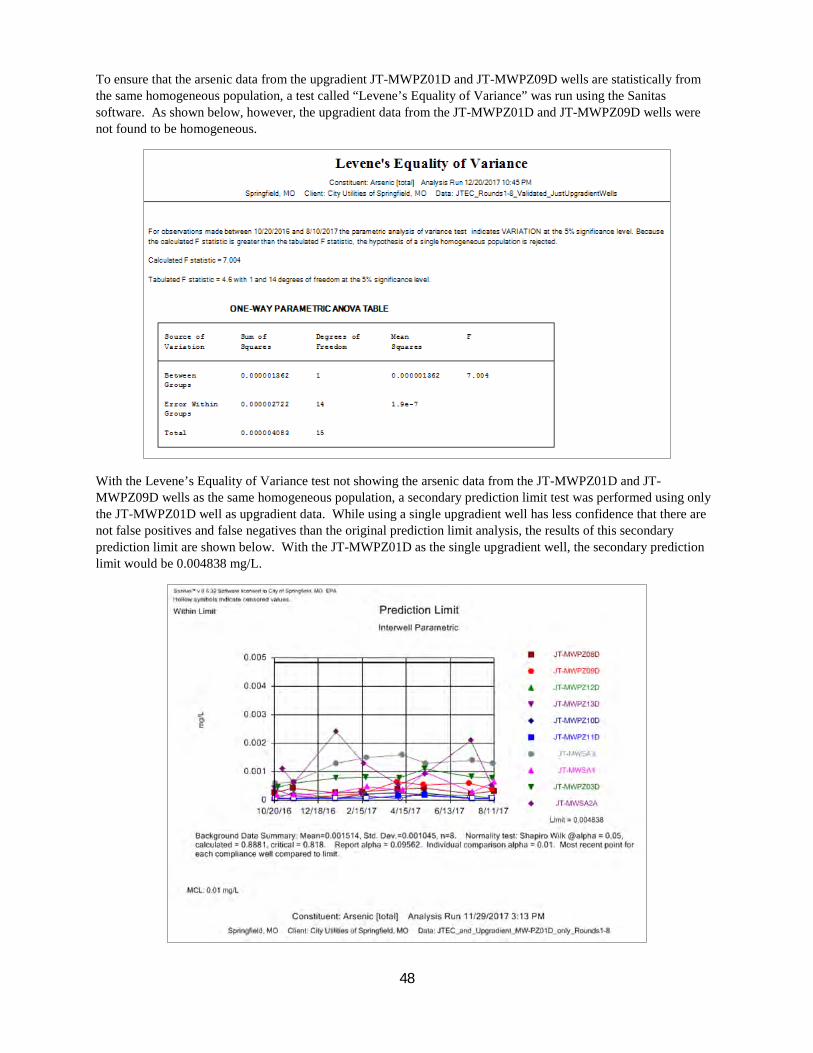
48
To ensure that the arsenic data from the upgradient JT-MWPZ01D and JT-MWPZ09D wells are statistically from the same homogeneous population, a test called “Levene’s Equality of Variance” was run using the Sanitas software. As shown below, however, the upgradient data from the JT-MWPZ01D and JT-MWPZ09D wells were not found to be homogeneous.
With the Levene’s Equality of Variance test not showing the arsenic data from the JT-MWPZ01D and JT-MWPZ09D wells as the same homogeneous population, a secondary prediction limit test was performed using only the JT-MWPZ01D well as upgradient data. While using a single upgradient well has less confidence that there are not false positives and false negatives than the original prediction limit analysis, the results of this secondary prediction limit are shown below. With the JT-MWPZ01D as the single upgradient well, the secondary prediction limit would be 0.004838 mg/L.
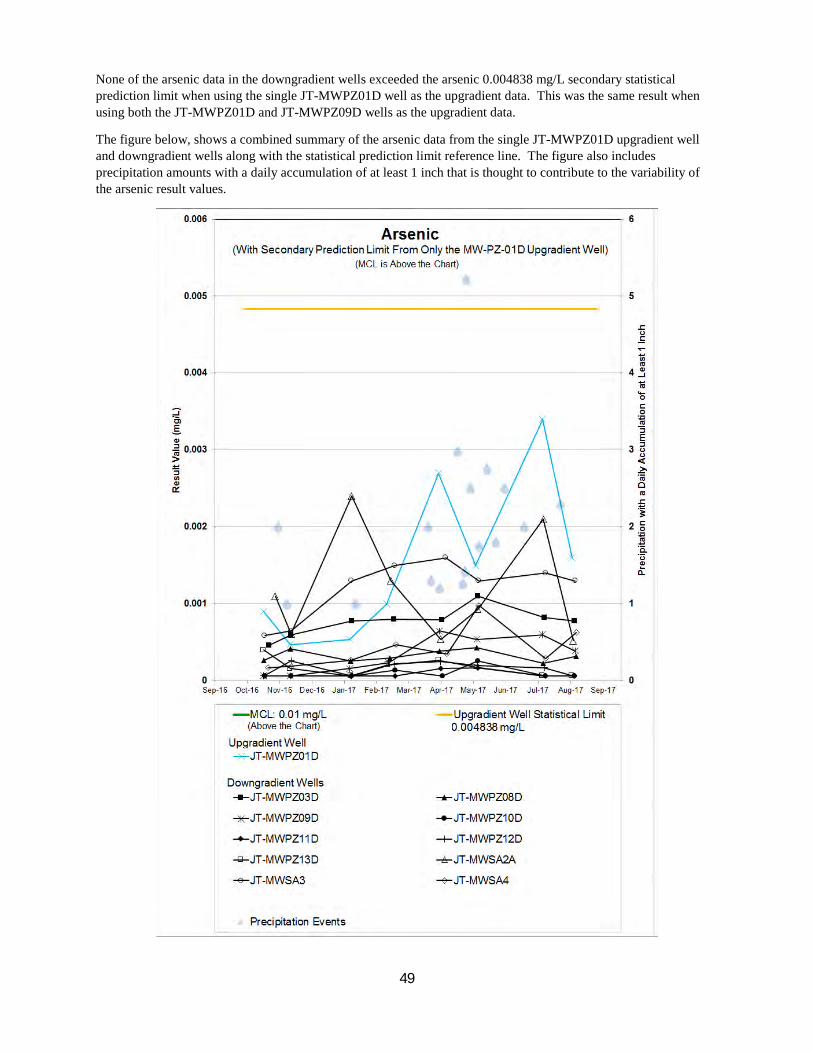
49
None of the arsenic data in the downgradient wells exceeded the arsenic 0.004838 mg/L secondary statistical prediction limit when using the single JT-MWPZ01D well as the upgradient data. This was the same result when using both the JT-MWPZ01D and JT-MWPZ09D wells as the upgradient data.
The figure below, shows a combined summary of the arsenic data from the single JT-MWPZ01D upgradient well and downgradient wells along with the statistical prediction limit reference line. The figure also includes precipitation amounts with a daily accumulation of at least 1 inch that is thought to contribute to the variability of the arsenic result values.

50
Barium
The eight (8) rounds of validated barium data from the JT-MWPZ01D and JT-MWPZ09D upgradient wells are shown below. None of the data will qualify as statistical outliers, so all upgradient data were loaded into the Sanitas prediction limit module.
After running the Sanitas prediction limit module on the upgradient barium data, the results are shown below. The calculated statistical prediction limit is 0.1132 mg/L and is shown with the bold horizontal line in the graph. The graph also shows the individual barium concentrations for all eight (8) rounds in all downgradient wells at JTEC.

51
The downgradient well JT-MWPZ11D was observed to have potential statistical outlier. The data for the well was loaded separately into the proUCL outlier analysis module and the highest concentration was found to qualify as a statistical outlier at a 99% confidence level as shown below.
proUCL 5.1 Dixon's Outlier Test for Barium at JT-MWPZ11D
Number of Observations = 8 10% critical value: 0.479, 5% critical value: 0.554, 1% critical value: 0.683
Observation Value 0.14 is a Potential Outlier (Upper Tail)?
Test Statistic: 0.809
For 10% significance level, 0.14 is an outlier. For 5% significance level, 0.14 is an outlier. For 1% significance level, 0.14 is an outlier.
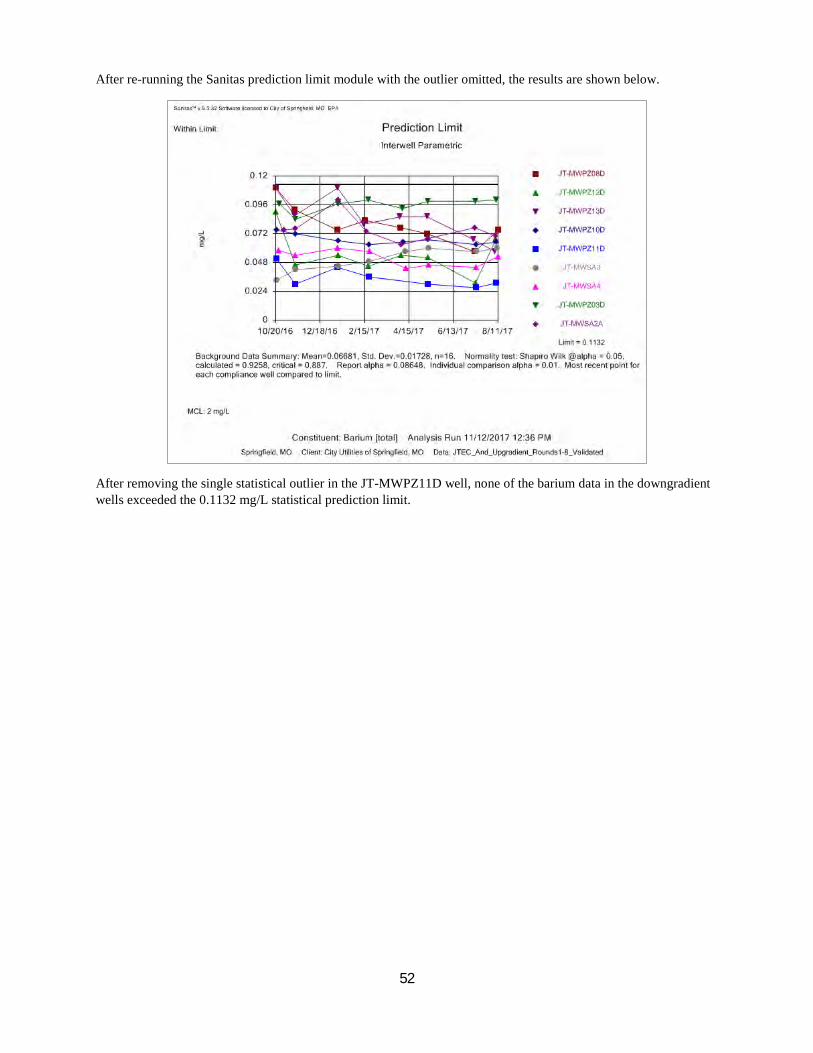
52
After re-running the Sanitas prediction limit module with the outlier omitted, the results are shown below.
After removing the single statistical outlier in the JT-MWPZ11D well, none of the barium data in the downgradient wells exceeded the 0.1132 mg/L statistical prediction limit.

53
The figure below, shows a combined summary of the barium data from both the upgradient wells and downgradient wells along with the statistical prediction limit reference line. The figure also includes precipitation amounts with a daily accumulation of at least 1 inch that is thought to contribute to the variability of the barium result values.
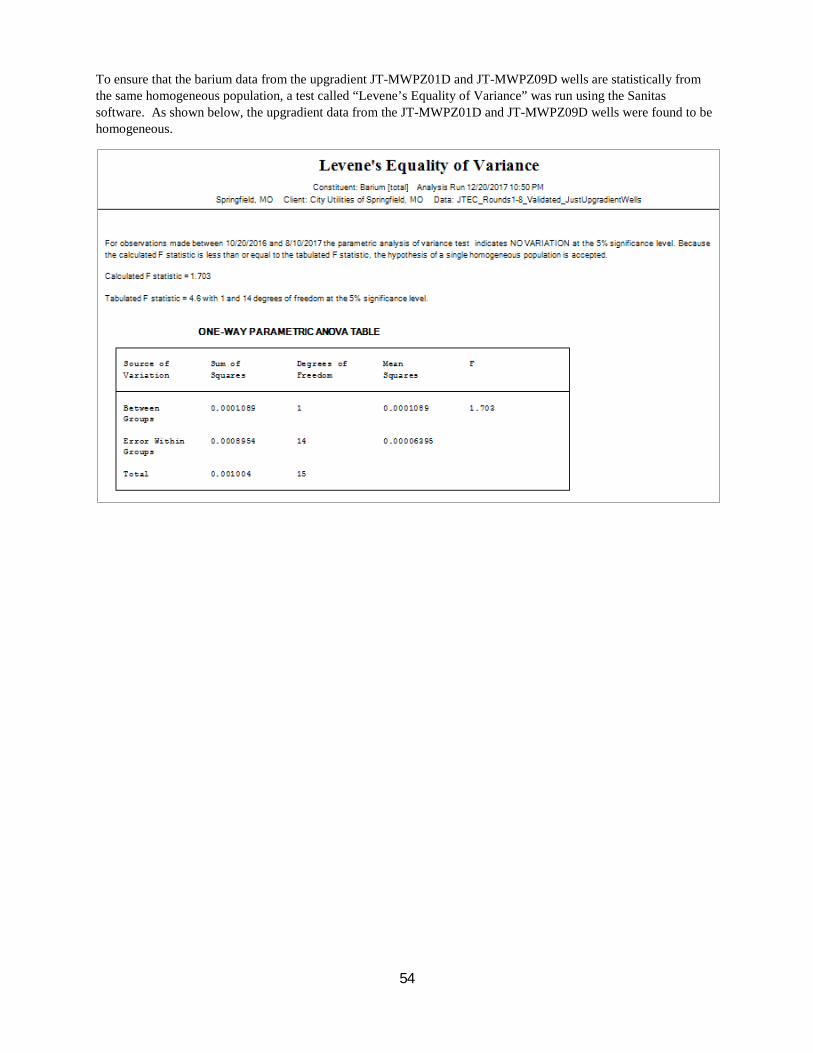
54
To ensure that the barium data from the upgradient JT-MWPZ01D and JT-MWPZ09D wells are statistically from the same homogeneous population, a test called “Levene’s Equality of Variance” was run using the Sanitas software. As shown below, the upgradient data from the JT-MWPZ01D and JT-MWPZ09D wells were found to be homogeneous.

55
Beryllium
The eight (8) rounds of validated beryllium data from the JT-MWPZ01D and JT-MWPZ09D upgradient wells are shown below. The data for both wells JTEC-MW-PZ-01D and JTEC-MW-PZ09D was observed to have potential statistical outliers.
The upgradient well JT-MWPZ01D was observed to have potential statistical outlier. The data for the well was loaded separately into the proUCL outlier analysis module and the highest concentration was found to qualify as a statistical outlier at a 99% confidence level as shown below.
proUCL 5.1 Dixon's Outlier Test for Beryllium at JT-MWPZ01D
Number of Observations = 8 10% critical value: 0.479, 5% critical value: 0.554, 1% critical value: 0.683
Observation Value 0.0037 is a Potential Outlier (Upper Tail)?
Test Statistic: 0.988
For 10% significance level, 0.0037 is an outlier. For 5% significance level, 0.0037 is an outlier. For 1% significance level, 0.0037 is an outlier.

56
The upgradient well JT-MWPZ09D was observed to have potential statistical outlier. The data for the well was loaded separately into the proUCL outlier analysis module and the highest concentration was found to qualify as a statistical outlier at a 99% confidence level as shown below.
proUCL 5.1 Dixon's Outlier Test for Beryllium at JT-MWPZ09D
Number of Observations = 8 10% critical value: 0.479, 5% critical value: 0.554, 1% critical value: 0.683
Observation Value 0.00026 is a Potential Outlier (Upper Tail)?
Test Statistic: 0.811
For 10% significance level, 0.00026 is an outlier. For 5% significance level, 0.00026 is an outlier. For 1% significance level, 0.00026 is an outlier.
After removing the outliers at the JT-MWPZ01D and JT-MWPZ09D wells, the remaining validated beryllium data from the JT-MWPZ01D and JT-MWPZ09D upgradient wells are shown below.
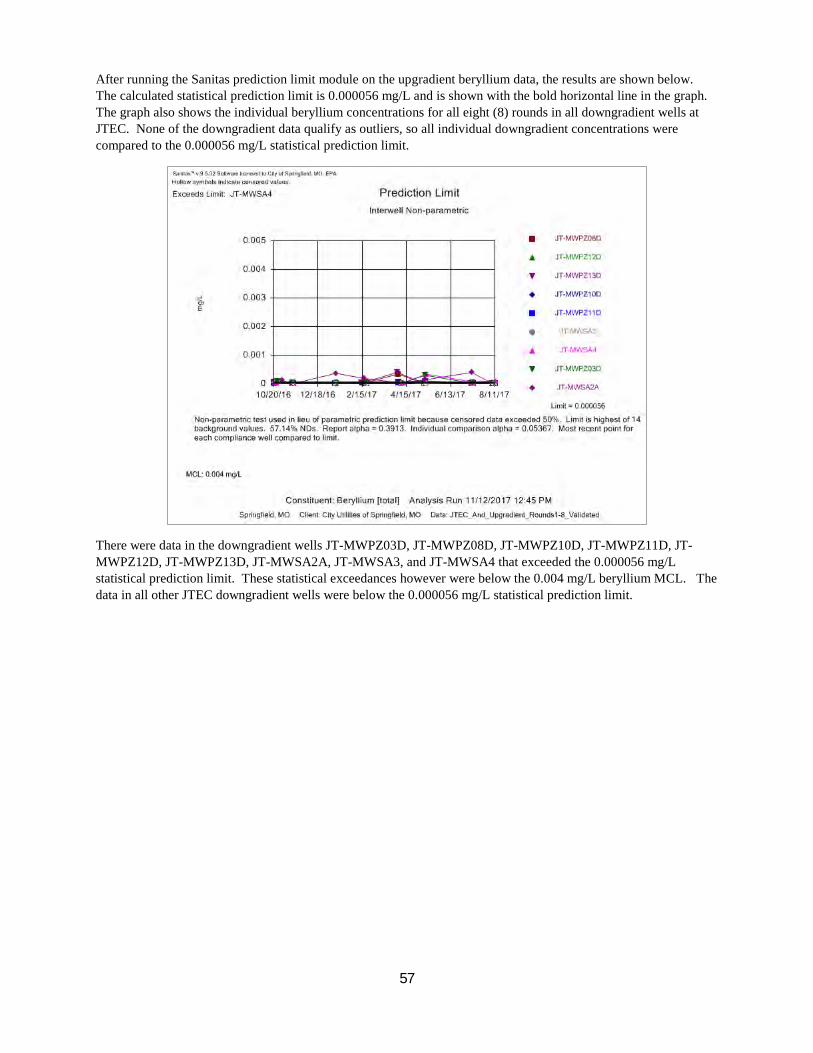
57
After running the Sanitas prediction limit module on the upgradient beryllium data, the results are shown below. The calculated statistical prediction limit is 0.000056 mg/L and is shown with the bold horizontal line in the graph. The graph also shows the individual beryllium concentrations for all eight (8) rounds in all downgradient wells at JTEC. None of the downgradient data qualify as outliers, so all individual downgradient concentrations were compared to the 0.000056 mg/L statistical prediction limit.
There were data in the downgradient wells JT-MWPZ03D, JT-MWPZ08D, JT-MWPZ10D, JT-MWPZ11D, JT-MWPZ12D, JT-MWPZ13D, JT-MWSA2A, JT-MWSA3, and JT-MWSA4 that exceeded the 0.000056 mg/L statistical prediction limit. These statistical exceedances however were below the 0.004 mg/L beryllium MCL. The data in all other JTEC downgradient wells were below the 0.000056 mg/L statistical prediction limit.

58
The figure below, shows a combined summary of the beryllium data from both the upgradient wells and downgradient wells along with the statistical prediction limit reference line. The figure also includes precipitation amounts with a daily accumulation of at least 1 inch that is thought to contribute to the variability of the beryllium result values.

59
To ensure that the beryllium data from the upgradient JT-MWPZ01D and JT-MWPZ09D wells are statistically from the same homogeneous population, a test called “Levene’s Equality of Variance” was run using the Sanitas software. As shown below, the upgradient data from the JT-MWPZ01D and JT-MWPZ09D wells were found to be homogeneous.
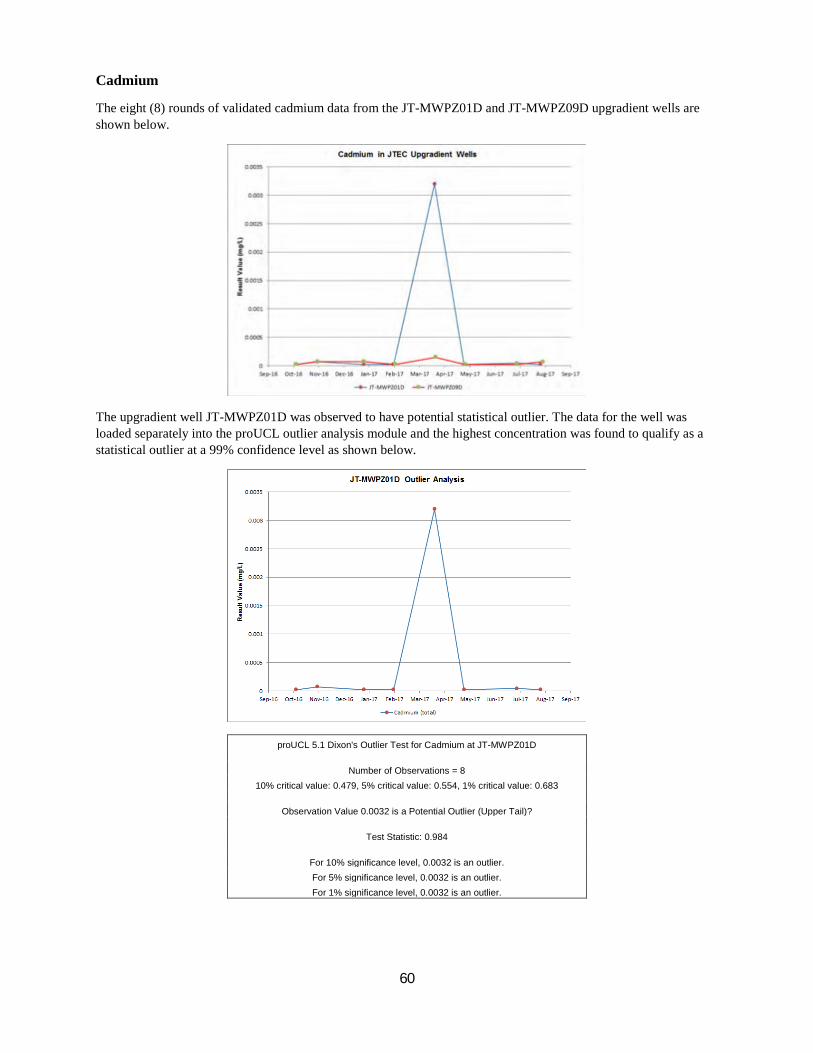
60
Cadmium
The eight (8) rounds of validated cadmium data from the JT-MWPZ01D and JT-MWPZ09D upgradient wells are shown below.
The upgradient well JT-MWPZ01D was observed to have potential statistical outlier. The data for the well was loaded separately into the proUCL outlier analysis module and the highest concentration was found to qualify as a statistical outlier at a 99% confidence level as shown below.
proUCL 5.1 Dixon's Outlier Test for Cadmium at JT-MWPZ01D
Number of Observations = 8 10% critical value: 0.479, 5% critical value: 0.554, 1% critical value: 0.683
Observation Value 0.0032 is a Potential Outlier (Upper Tail)?
Test Statistic: 0.984
For 10% significance level, 0.0032 is an outlier. For 5% significance level, 0.0032 is an outlier. For 1% significance level, 0.0032 is an outlier.
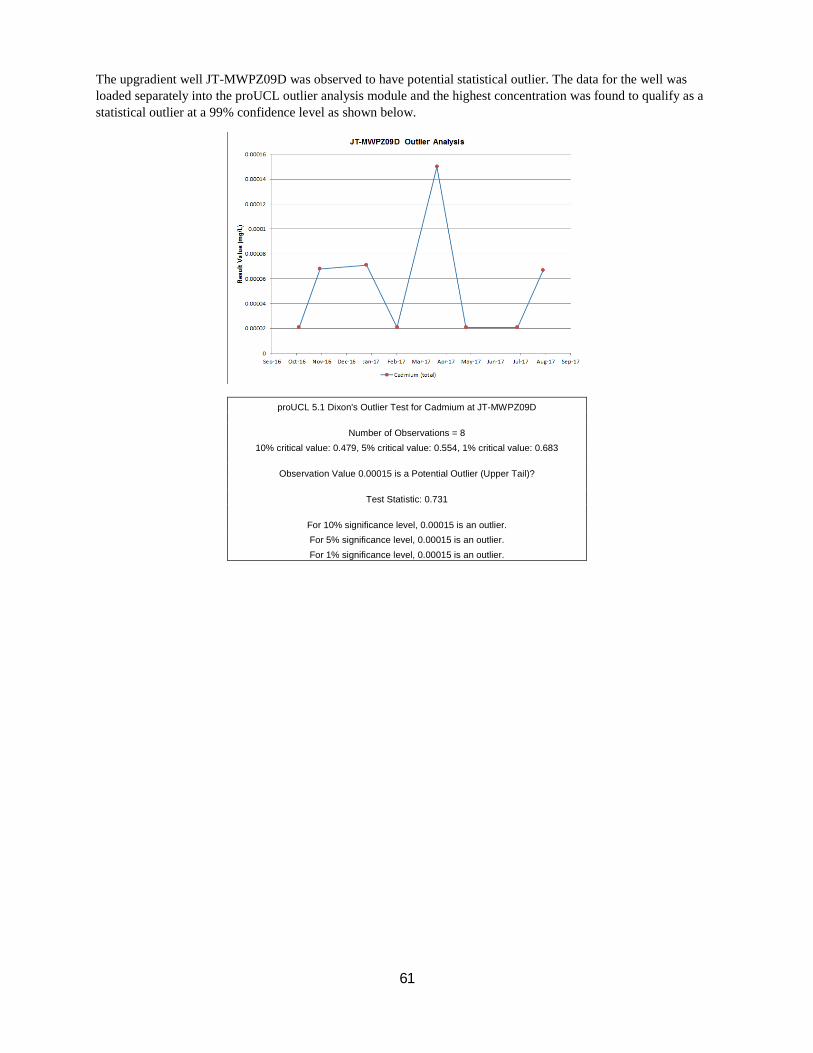
61
The upgradient well JT-MWPZ09D was observed to have potential statistical outlier. The data for the well was loaded separately into the proUCL outlier analysis module and the highest concentration was found to qualify as a statistical outlier at a 99% confidence level as shown below.
proUCL 5.1 Dixon's Outlier Test for Cadmium at JT-MWPZ09D
Number of Observations = 8 10% critical value: 0.479, 5% critical value: 0.554, 1% critical value: 0.683
Observation Value 0.00015 is a Potential Outlier (Upper Tail)?
Test Statistic: 0.731
For 10% significance level, 0.00015 is an outlier. For 5% significance level, 0.00015 is an outlier. For 1% significance level, 0.00015 is an outlier.
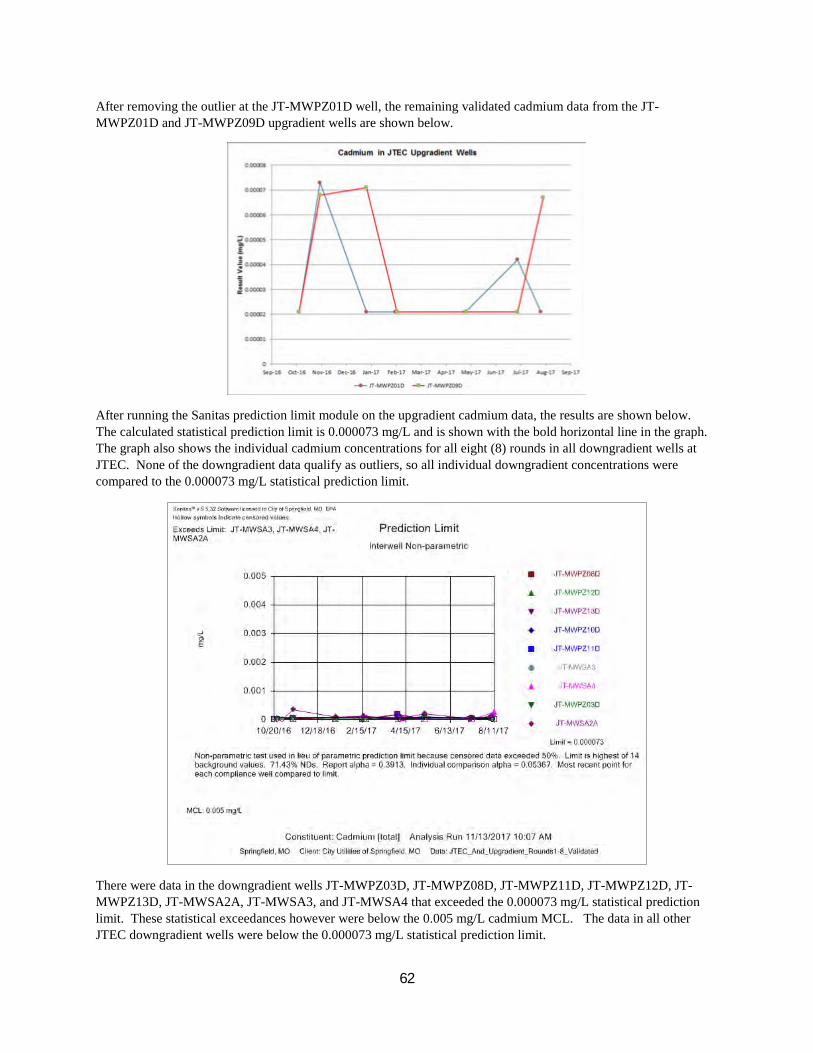
62
After removing the outlier at the JT-MWPZ01D well, the remaining validated cadmium data from the JT-MWPZ01D and JT-MWPZ09D upgradient wells are shown below.
After running the Sanitas prediction limit module on the upgradient cadmium data, the results are shown below. The calculated statistical prediction limit is 0.000073 mg/L and is shown with the bold horizontal line in the graph. The graph also shows the individual cadmium concentrations for all eight (8) rounds in all downgradient wells at JTEC. None of the downgradient data qualify as outliers, so all individual downgradient concentrations were compared to the 0.000073 mg/L statistical prediction limit.
There were data in the downgradient wells JT-MWPZ03D, JT-MWPZ08D, JT-MWPZ11D, JT-MWPZ12D, JT-MWPZ13D, JT-MWSA2A, JT-MWSA3, and JT-MWSA4 that exceeded the 0.000073 mg/L statistical prediction limit. These statistical exceedances however were below the 0.005 mg/L cadmium MCL. The data in all other JTEC downgradient wells were below the 0.000073 mg/L statistical prediction limit.

63
The figure below, shows a combined summary of the cadmium data from both the upgradient wells and downgradient wells along with the statistical prediction limit reference line. The figure also includes precipitation amounts with a daily accumulation of at least 1 inch that is thought to contribute to the variability of the cadmium result values.

64
To ensure that the cadmium data from the upgradient JT-MWPZ01D and JT-MWPZ09D wells are statistically from the same homogeneous population, a test called “Levene’s Equality of Variance” was run using the Sanitas software. As shown below, the upgradient data from the JT-MWPZ01D and JT-MWPZ09D wells were found to be homogeneous.
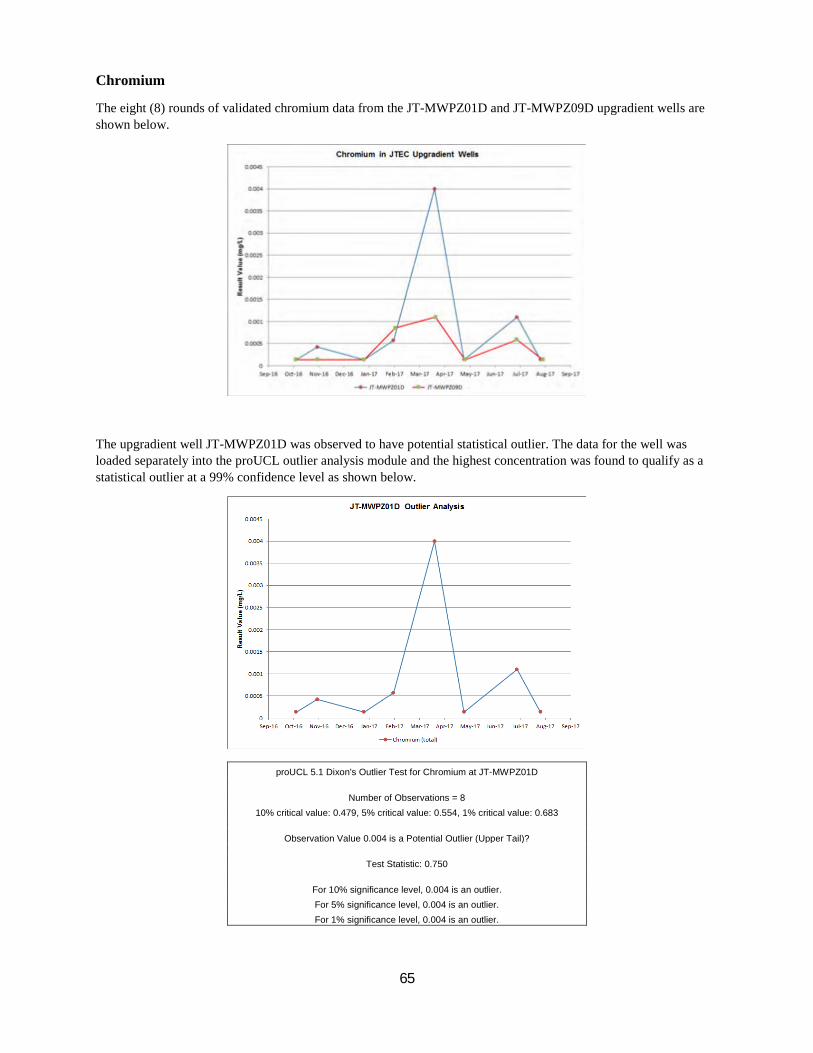
65
Chromium
The eight (8) rounds of validated chromium data from the JT-MWPZ01D and JT-MWPZ09D upgradient wells are shown below.
The upgradient well JT-MWPZ01D was observed to have potential statistical outlier. The data for the well was loaded separately into the proUCL outlier analysis module and the highest concentration was found to qualify as a statistical outlier at a 99% confidence level as shown below.
proUCL 5.1 Dixon's Outlier Test for Chromium at JT-MWPZ01D
Number of Observations = 8 10% critical value: 0.479, 5% critical value: 0.554, 1% critical value: 0.683
Observation Value 0.004 is a Potential Outlier (Upper Tail)?
Test Statistic: 0.750
For 10% significance level, 0.004 is an outlier. For 5% significance level, 0.004 is an outlier. For 1% significance level, 0.004 is an outlier.

66
After removing the outlier at the JT-MWPZ01D well, the remaining validated chromium data from the JT-MWPZ01D and JT-MWPZ09D upgradient wells are shown below.
After running the Sanitas prediction limit module on the upgradient chromium data, the results are shown below. The calculated statistical prediction limit is 0.004 mg/L and is shown with the bold horizontal line in the graph. The graph also shows the individual chromium concentrations for all eight (8) rounds in all downgradient wells at JTEC.

67
The downgradient well JT-MWSA2A was observed to have potential statistical outlier. The data for the well was loaded separately into the proUCL outlier analysis module and the highest concentration was not found to qualify as a statistical outlier at a 99% confidence level as shown below. The spike would have qualified however as an outlier at a less strict 95% confidence level
proUCL 5.1 Dixon's Outlier Test for Chromium at JT-MWSA2A
Number of Observations = 8 10% critical value: 0.479, 5% critical value: 0.554, 1% critical value: 0.683
Observation Value 0.017 is a Potential Outlier (Upper Tail)?
Test Statistic: 0.662
For 10% significance level, 0.017 is an outlier. For 5% significance level, 0.017 is an outlier.
For 1% significance level, 0.017 is not an outlier.
There were data in the downgradient wells JT-MWSA2A and JT-MWSA4 that exceeded the 0.004 mg/L statistical prediction limit. These statistical exceedances however were below the 0.1 mg/L chromium MCL. The data in all other JTEC downgradient wells were below the 0.004 mg/L statistical prediction limit. Note if the high spike in the downgradient JT-MWPZ09D well was treated as an outlier instead of using it, then the maximum would have been reduced to 0.0068 mg/L instead of 0.017 mg/L however that would not have changed the number of downgradient wells that exceeded the statistical prediction limit.
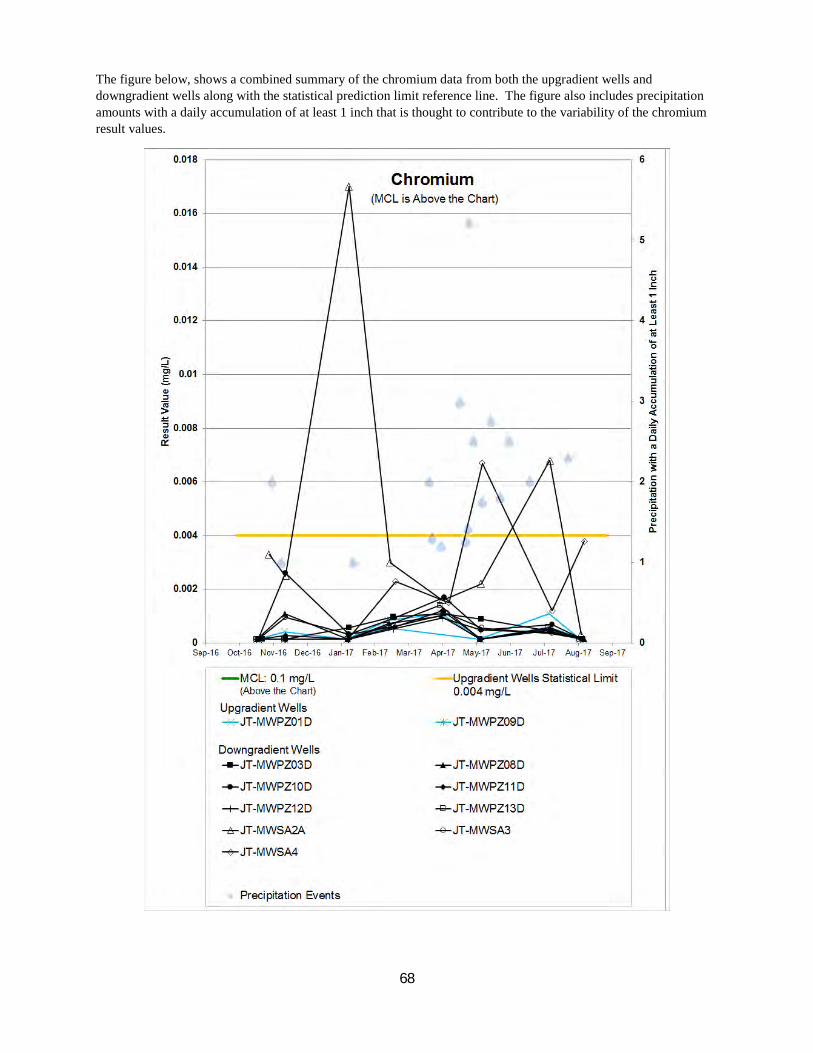
68
The figure below, shows a combined summary of the chromium data from both the upgradient wells and downgradient wells along with the statistical prediction limit reference line. The figure also includes precipitation amounts with a daily accumulation of at least 1 inch that is thought to contribute to the variability of the chromium result values.

69
To ensure that the chromium data from the upgradient JT-MWPZ01D and JT-MWPZ09D wells are statistically from the same homogeneous population, a test called “Levene’s Equality of Variance” was run using the Sanitas software. As shown below, the upgradient data from the JT-MWPZ01D and JT-MWPZ09D wells were found to be homogeneous.
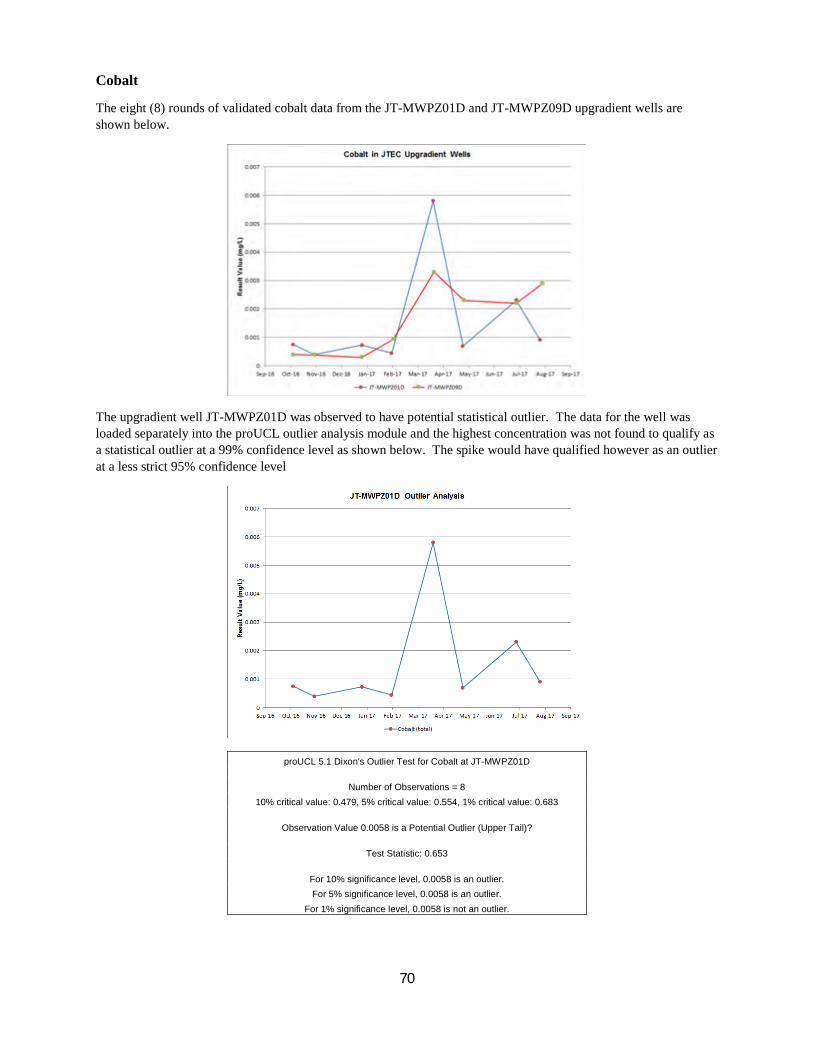
70
Cobalt
The eight (8) rounds of validated cobalt data from the JT-MWPZ01D and JT-MWPZ09D upgradient wells are shown below.
The upgradient well JT-MWPZ01D was observed to have potential statistical outlier. The data for the well was loaded separately into the proUCL outlier analysis module and the highest concentration was not found to qualify as a statistical outlier at a 99% confidence level as shown below. The spike would have qualified however as an outlier at a less strict 95% confidence level
proUCL 5.1 Dixon's Outlier Test for Cobalt at JT-MWPZ01D
Number of Observations = 8 10% critical value: 0.479, 5% critical value: 0.554, 1% critical value: 0.683
Observation Value 0.0058 is a Potential Outlier (Upper Tail)?
Test Statistic: 0.653
For 10% significance level, 0.0058 is an outlier. For 5% significance level, 0.0058 is an outlier.
For 1% significance level, 0.0058 is not an outlier.

71
After running the Sanitas prediction limit module on the upgradient cobalt data, the results are shown below. The calculated statistical prediction limit is 0.007589 mg/L and is shown with the bold horizontal line in the graph. The graph also shows the individual cobalt concentrations for all eight (8) rounds in all downgradient wells at JTEC.
The downgradient well JT-MWPZ13D was observed to have potential statistical outlier. The data for the well was loaded separately into the proUCL outlier analysis module and the highest concentration was found to qualify as a statistical outlier at a 99% confidence level as shown below.

72
proUCL 5.1 Dixon's Outlier Test for Cobalt at JT-MWPZ13D
Number of Observations = 8 10% critical value: 0.479, 5% critical value: 0.554, 1% critical value: 0.683
Observation Value 0.005 is a Potential Outlier (Upper Tail)?
Test Statistic: 0.908
For 10% significance level, 0.005 is an outlier. For 5% significance level, 0.005 is an outlier. For 1% significance level, 0.005 is an outlier.
After re-running the Sanitas prediction limit module with the outlier omitted, the results are shown below.
None of the cobalt data in the downgradient wells exceeded the 0.007589 mg/L statistical prediction limit. Note if the high spike in the upgradient JT-MWPZ01D well was treated as an outlier instead of using it, then the statistical prediction limit would have been changed to 0.008669 mg/L however that would not have changed anything and all of the downgradient samples would have been below the limit.

73
The figure below, shows a combined summary of the cobalt data from both the upgradient wells and downgradient wells along with the statistical prediction limit reference line. The figure also includes precipitation amounts with a daily accumulation of at least 1 inch that is thought to contribute to the variability of the cobalt result values.
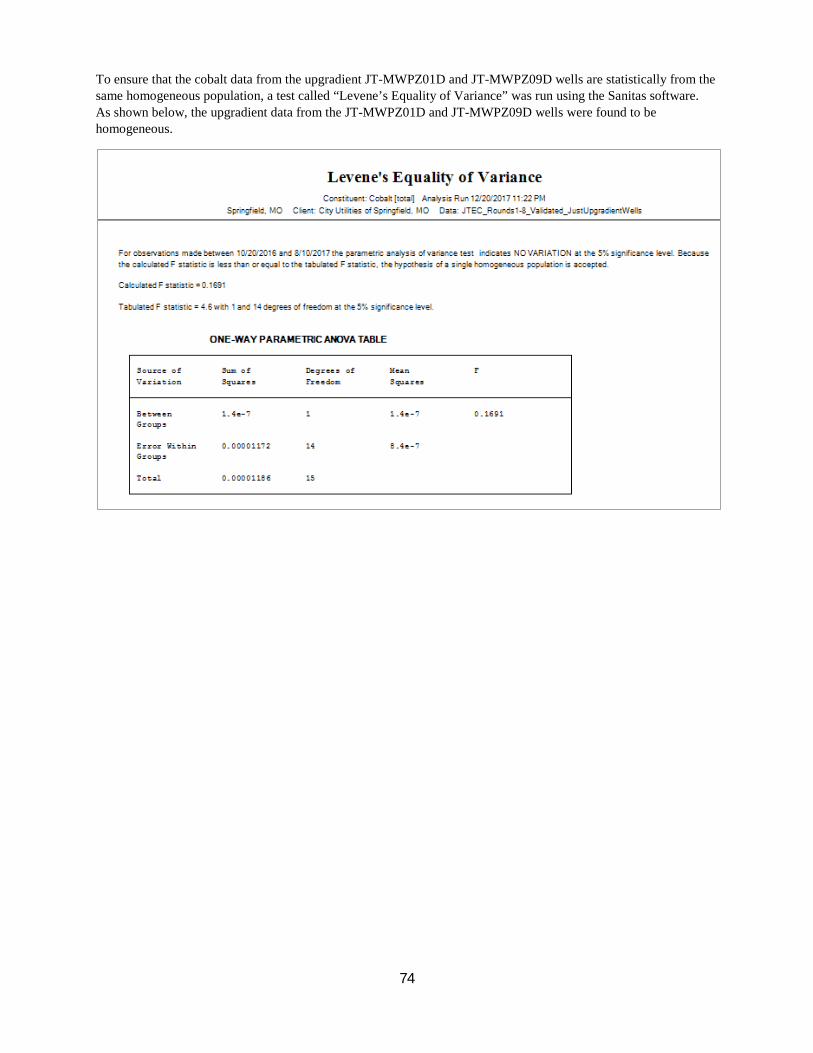
74
To ensure that the cobalt data from the upgradient JT-MWPZ01D and JT-MWPZ09D wells are statistically from the same homogeneous population, a test called “Levene’s Equality of Variance” was run using the Sanitas software. As shown below, the upgradient data from the JT-MWPZ01D and JT-MWPZ09D wells were found to be homogeneous.

75
Fluoride
The eight (8) rounds of validated fluoride data from the JT-MWPZ01D and JT-MWPZ09D upgradient wells are shown below. None of the data will qualify as statistical outliers, so all upgradient data were loaded into the Sanitas prediction limit module.
After running the Sanitas prediction limit module on the upgradient fluoride data, the results are shown below. The calculated statistical prediction limit is 0.3957 mg/L and is shown with the bold horizontal line in the graph. The graph also shows the individual fluoride concentrations for all eight (8) rounds in all downgradient wells at JTEC. None of the downgradient data qualify as outliers, so all individual downgradient concentrations were compared to the 0.3957 mg/L statistical prediction limit.
There were data in the downgradient well JT-MWSA3 that exceeded the 0.3957 mg/L statistical prediction limit. These statistical exceedances however were below the 4 mg/L fluoride MCL. The data in all other JTEC downgradient wells were below the 0.3957 mg/L statistical prediction limit.

76
The figure below, shows a combined summary of the fluoride data from both the upgradient wells and downgradient wells along with the statistical prediction limit reference line. The figure also includes precipitation amounts with a daily accumulation of at least 1 inch that is thought to contribute to the variability of the fluoride result values.
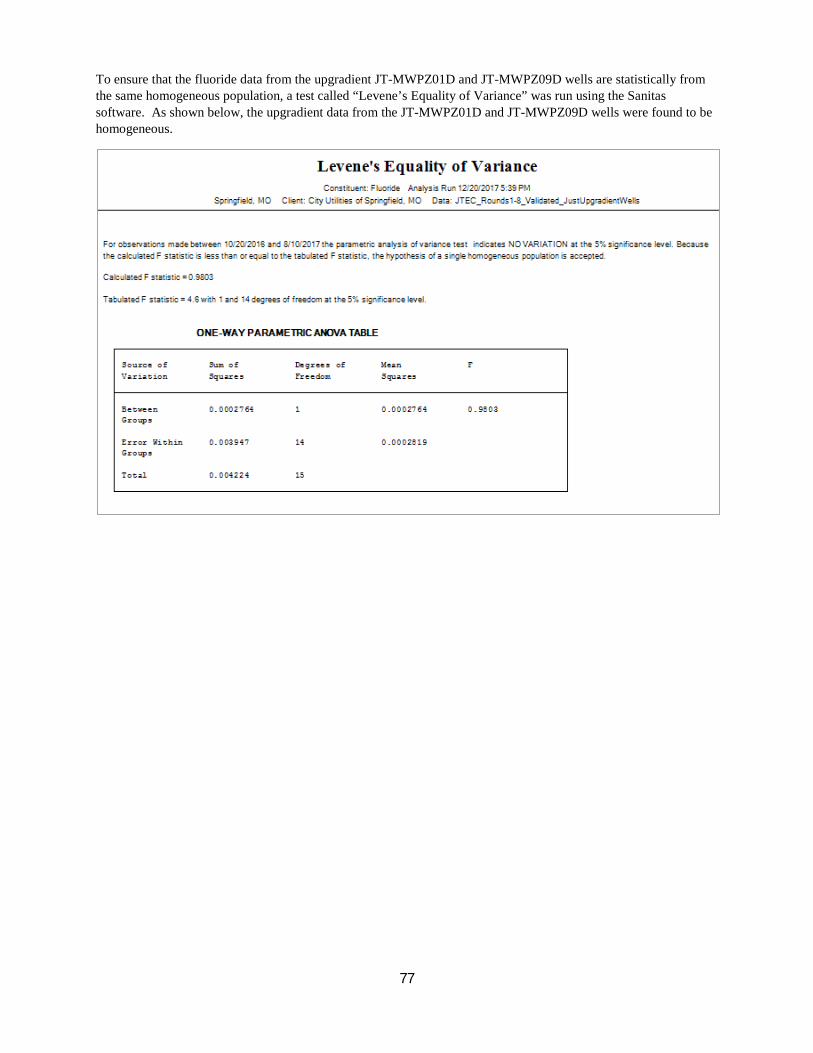
77
To ensure that the fluoride data from the upgradient JT-MWPZ01D and JT-MWPZ09D wells are statistically from the same homogeneous population, a test called “Levene’s Equality of Variance” was run using the Sanitas software. As shown below, the upgradient data from the JT-MWPZ01D and JT-MWPZ09D wells were found to be homogeneous.

78
Lead
The eight (8) rounds of validated lead data from the JT-MWPZ01D and JT-MWPZ09D upgradient wells are shown below.
The upgradient well JT-MWPZ01D was observed to have potential statistical outlier. The data for the well was loaded separately into the proUCL outlier analysis module and the highest concentration was found to qualify as a statistical outlier at a 99% confidence level as shown below.
proUCL 5.1 Dixon's Outlier Test for Lead at JT-MWPZ01D
Number of Observations = 8 10% critical value: 0.479, 5% critical value: 0.554, 1% critical value: 0.683
Observation Value 0.0037 is a Potential Outlier (Upper Tail)?
Test Statistic: 0.938
For 10% significance level, 0.0037 is an outlier. For 5% significance level, 0.0037 is an outlier. For 1% significance level, 0.0037 is an outlier.
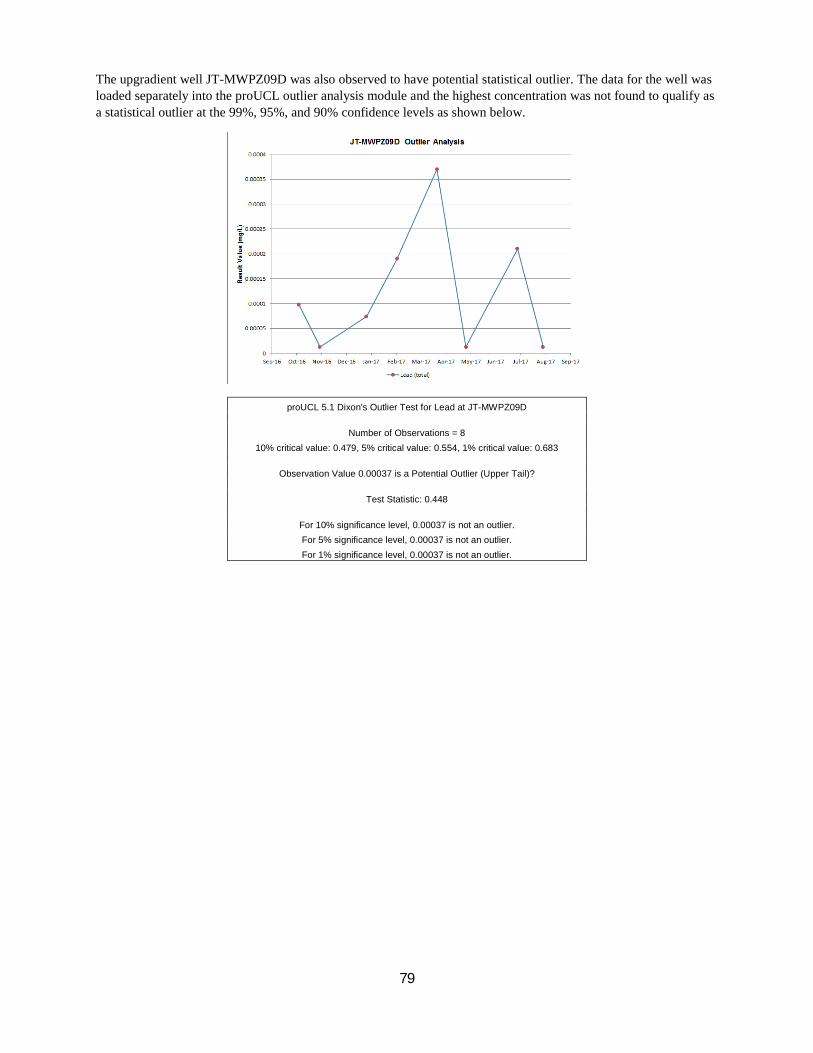
79
The upgradient well JT-MWPZ09D was also observed to have potential statistical outlier. The data for the well was loaded separately into the proUCL outlier analysis module and the highest concentration was not found to qualify as a statistical outlier at the 99%, 95%, and 90% confidence levels as shown below.
proUCL 5.1 Dixon's Outlier Test for Lead at JT-MWPZ09D
Number of Observations = 8 10% critical value: 0.479, 5% critical value: 0.554, 1% critical value: 0.683
Observation Value 0.00037 is a Potential Outlier (Upper Tail)?
Test Statistic: 0.448
For 10% significance level, 0.00037 is not an outlier. For 5% significance level, 0.00037 is not an outlier. For 1% significance level, 0.00037 is not an outlier.
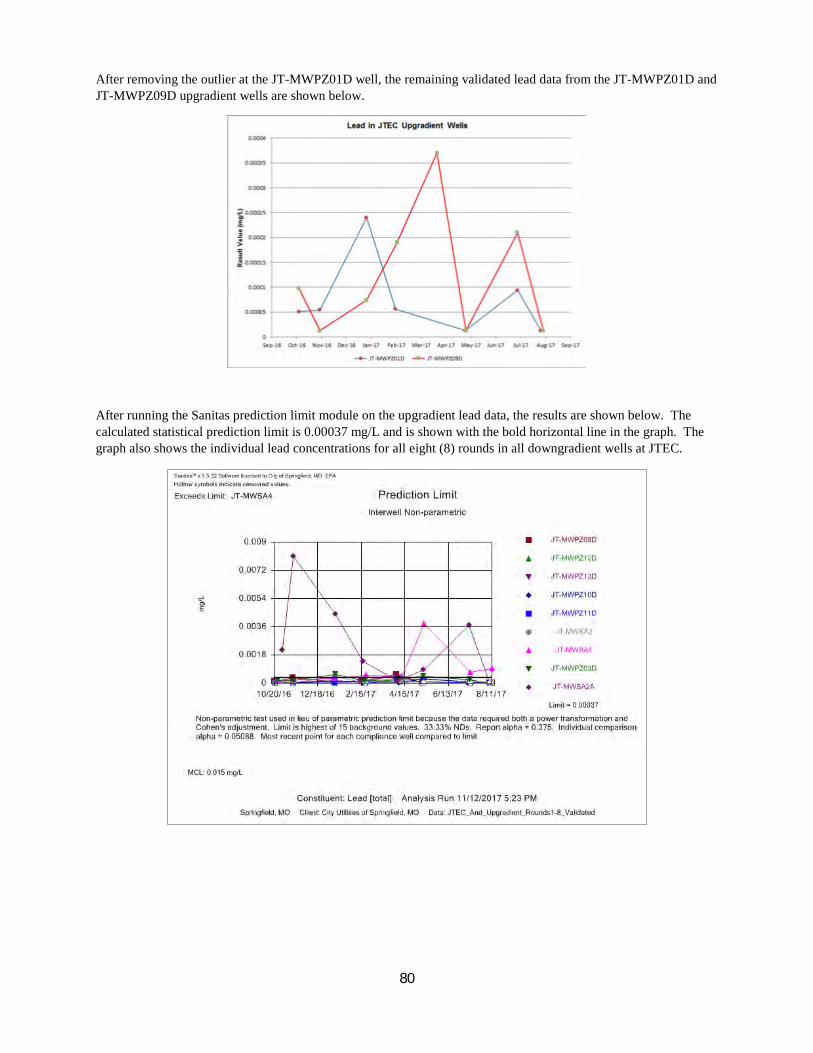
80
After removing the outlier at the JT-MWPZ01D well, the remaining validated lead data from the JT-MWPZ01D and JT-MWPZ09D upgradient wells are shown below.
After running the Sanitas prediction limit module on the upgradient lead data, the results are shown below. The calculated statistical prediction limit is 0.00037 mg/L and is shown with the bold horizontal line in the graph. The graph also shows the individual lead concentrations for all eight (8) rounds in all downgradient wells at JTEC.

81
The downgradient well JT-MWSA4 was observed to have potential statistical outlier. The data for the well was loaded separately into the proUCL outlier analysis module and the highest concentration was found to qualify as a statistical outlier at a 99% confidence level as shown below.
proUCL 5.1 Dixon's Outlier Test for Lead at JT-MWSA4
Number of Observations = 8 10% critical value: 0.479, 5% critical value: 0.554, 1% critical value: 0.683
Observation Value 0.0038 is a Potential Outlier (Upper Tail)?
Test Statistic: 0.799
For 10% significance level, 0.0038 is an outlier. For 5% significance level, 0.0038 is an outlier. For 1% significance level, 0.0038 is an outlier.

82
After re-running the Sanitas prediction limit module with the outlier omitted, the results are shown below.
There were data in the downgradient wells JT-MWPZ03D, JT-MWPZ08D, JT-MWPZ13D, JT-MWSA2A, JT-MWSA3, and JT-MWSA4 that exceeded the 0.00037 mg/L statistical prediction limit. These statistical exceedances however were below the 0.015 mg/L lead MCL. The data in all other JTEC downgradient wells were below the 0.00037 mg/L statistical prediction limit.

83
The figure below, shows a combined summary of the lead data from both the upgradient wells and downgradient wells along with the statistical prediction limit reference line. The figure also includes precipitation amounts with a daily accumulation of at least 1 inch that is thought to contribute to the variability of the lead result values.

84
To ensure that the lead data from the upgradient JT-MWPZ01D and JT-MWPZ09D wells are statistically from the same homogeneous population, a test called “Levene’s Equality of Variance” was run using the Sanitas software. As shown below, the upgradient data from the JT-MWPZ01D and JT-MWPZ09D wells were found to be homogeneous.

85
Lithium
The eight (8) rounds of validated lithium data from the JT-MWPZ01D and JT-MWPZ09D upgradient wells are shown below. None of the data will qualify as statistical outliers, so all upgradient data were loaded into the Sanitas prediction limit module.
After running the Sanitas prediction limit module on the upgradient lithium data, the results are shown below. The calculated statistical prediction limit is 0.021 mg/L and is shown with the bold horizontal line in the graph. The graph also shows the individual lithium concentrations for all eight (8) rounds in all downgradient wells at JTEC.

86
The downgradient well JT-MWPZ13D was observed to have potential statistical outlier. The data for the well was loaded separately into the proUCL outlier analysis module and the highest concentration was found to qualify as a statistical outlier at a 99% confidence level as shown below.
proUCL 5.1 Dixon's Outlier Test for Lithium at JT-MWPZ13D
Number of Observations = 8 10% critical value: 0.479, 5% critical value: 0.554, 1% critical value: 0.683
Observation Value 0.072 is a Potential Outlier (Upper Tail)?
Test Statistic: 0.909
For 10% significance level, 0.072 is an outlier. For 5% significance level, 0.072 is an outlier. For 1% significance level, 0.072 is an outlier.

87
After re-running the Sanitas prediction limit module with the outlier omitted, the results are shown below.
There were data in the downgradient well JT-MWPZ11D that exceeded the 0.021 mg/L statistical prediction limit. There is no MCL for lithium. The data in all other JTEC downgradient wells were below the 0.021mg/L statistical prediction limit.
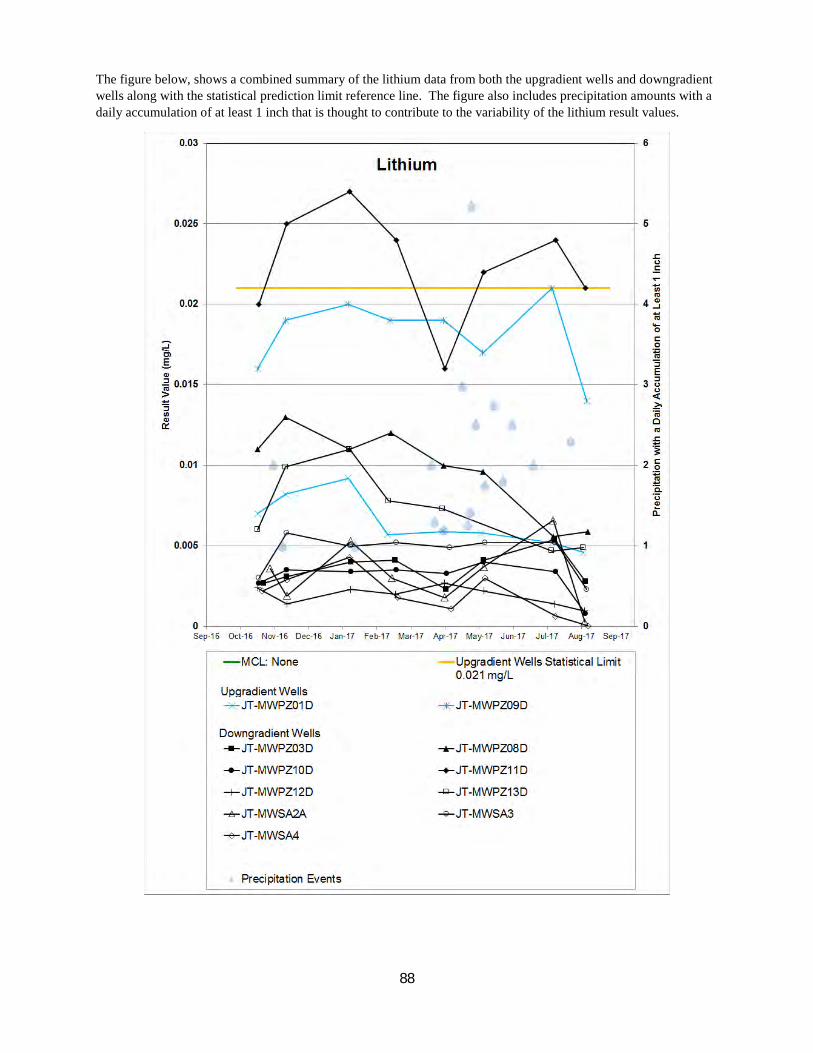
88
The figure below, shows a combined summary of the lithium data from both the upgradient wells and downgradient wells along with the statistical prediction limit reference line. The figure also includes precipitation amounts with a daily accumulation of at least 1 inch that is thought to contribute to the variability of the lithium result values.
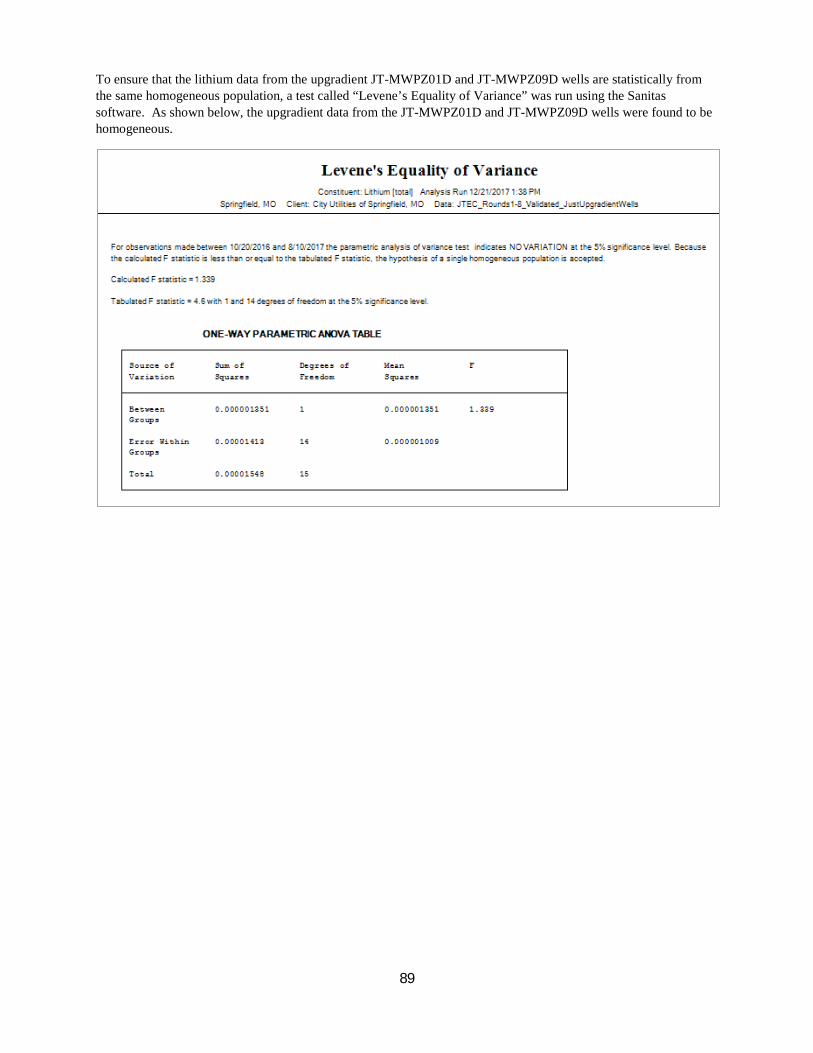
89
To ensure that the lithium data from the upgradient JT-MWPZ01D and JT-MWPZ09D wells are statistically from the same homogeneous population, a test called “Levene’s Equality of Variance” was run using the Sanitas software. As shown below, the upgradient data from the JT-MWPZ01D and JT-MWPZ09D wells were found to be homogeneous.
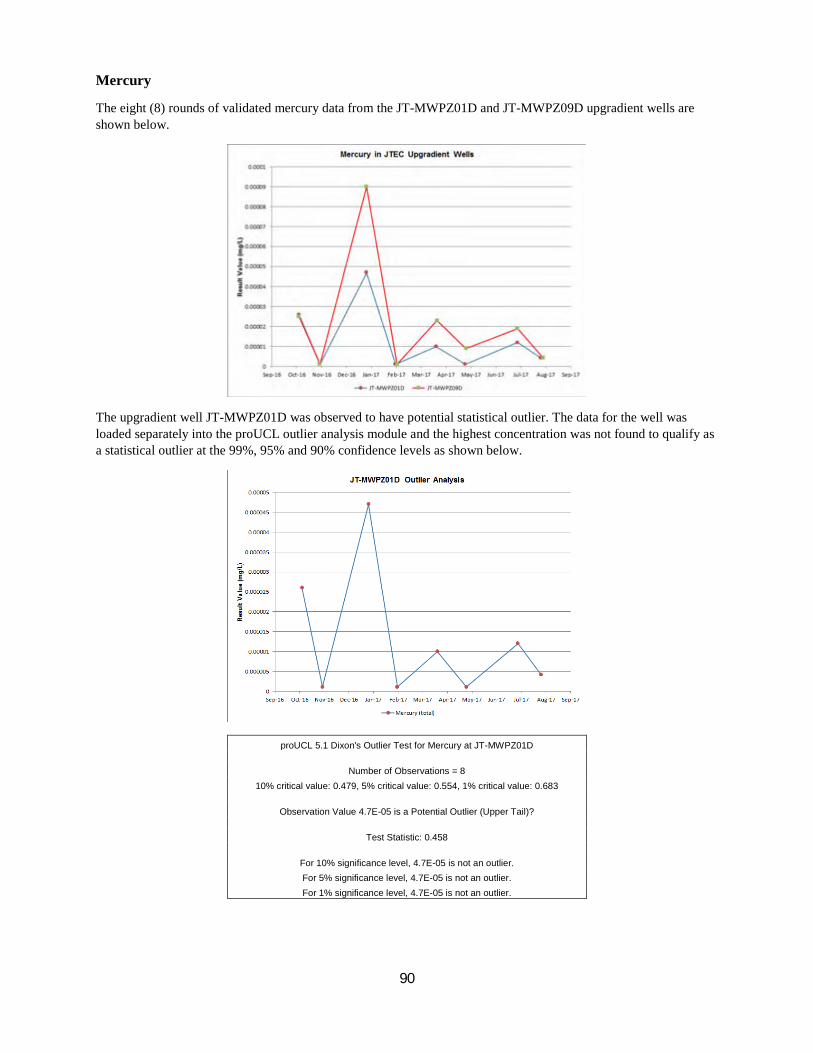
90
Mercury
The eight (8) rounds of validated mercury data from the JT-MWPZ01D and JT-MWPZ09D upgradient wells are shown below.
The upgradient well JT-MWPZ01D was observed to have potential statistical outlier. The data for the well was loaded separately into the proUCL outlier analysis module and the highest concentration was not found to qualify as a statistical outlier at the 99%, 95% and 90% confidence levels as shown below.
proUCL 5.1 Dixon's Outlier Test for Mercury at JT-MWPZ01D
Number of Observations = 8 10% critical value: 0.479, 5% critical value: 0.554, 1% critical value: 0.683
Observation Value 4.7E-05 is a Potential Outlier (Upper Tail)?
Test Statistic: 0.458
For 10% significance level, 4.7E-05 is not an outlier. For 5% significance level, 4.7E-05 is not an outlier. For 1% significance level, 4.7E-05 is not an outlier.

91
The upgradient well JT-MWPZ09D was also observed to have potential statistical outlier. The data for the well was loaded separately into the proUCL outlier analysis module and the highest concentration was found to qualify as a statistical outlier at a 99% confidence level as shown below.
proUCL 5.1 Dixon's Outlier Test for Mercury at JT-MWPZ09D
Number of Observations = 8 10% critical value: 0.479, 5% critical value: 0.554, 1% critical value: 0.683
Observation Value 9E-05 is a Potential Outlier (Upper Tail)?
Test Statistic: 0.731
For 10% significance level, 9E-05 is an outlier. For 5% significance level, 9E-05 is an outlier. For 1% significance level, 9E-05 is an outlier.
After removing the outlier at the JT-MWPZ09D well, the remaining validated mercury data from the JT-MWPZ01D and JT-MWPZ09D upgradient wells are shown below.

92
After running the Sanitas prediction limit module on the upgradient mercury data, the results are shown below. The calculated statistical prediction limit is 0.000047 mg/L and is shown with the bold horizontal line in the graph. The graph also shows the individual mercury concentrations for all eight (8) rounds in all downgradient wells at JTEC. None of the downgradient data qualify as outliers, so all individual downgradient concentrations were compared to the 0.000047 mg/L statistical prediction limit.
None of the mercury data in the downgradient wells exceeded the 0.000047 mg/L statistical prediction limit.

93
The figure below, shows a combined summary of the mercury data from both the upgradient wells and downgradient wells along with the statistical prediction limit reference line. The figure also includes precipitation amounts with a daily accumulation of at least 1 inch that is thought to contribute to the variability of the mercury result values.
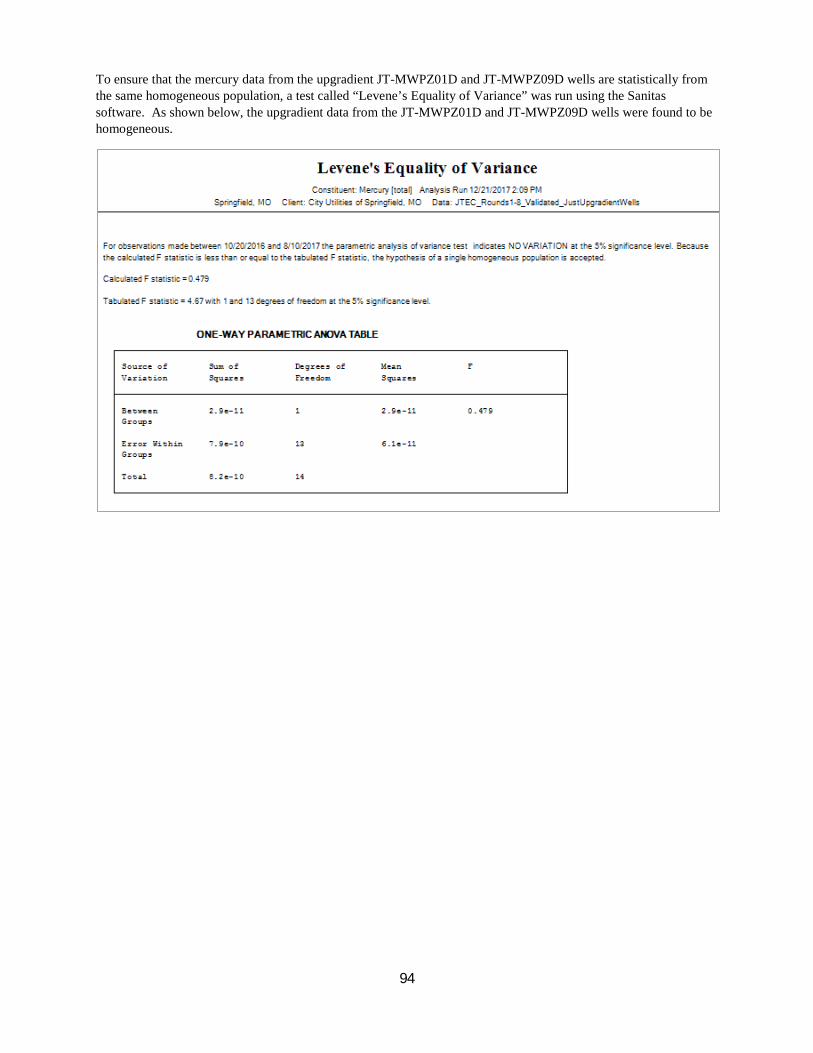
94
To ensure that the mercury data from the upgradient JT-MWPZ01D and JT-MWPZ09D wells are statistically from the same homogeneous population, a test called “Levene’s Equality of Variance” was run using the Sanitas software. As shown below, the upgradient data from the JT-MWPZ01D and JT-MWPZ09D wells were found to be homogeneous.

95
Molybdenum
The eight (8) rounds of validated molybdenum data from the JT-MWPZ01D and JT-MWPZ09D upgradient wells are shown below. None of the data will qualify as statistical outliers, so all upgradient data were loaded into the Sanitas prediction limit module.
After running the Sanitas prediction limit module on the upgradient molybdenum data, the results are shown below. The calculated statistical prediction limit is 0.03199 mg/L and is shown with the bold horizontal line in the graph. The graph also shows the individual molybdenum concentrations for all eight (8) rounds in all downgradient wells at JTEC. None of the downgradient data qualify as outliers, so all individual downgradient concentrations were compared to the 0.03199 mg/L statistical prediction limit.
There were data in the downgradient well JT-MWSA2A that exceeded the 0.03199 mg/L statistical prediction limit. There is no MCL for molybdenum. The data in all other JTEC downgradient wells were below the 0.03199 mg/L statistical prediction limit.
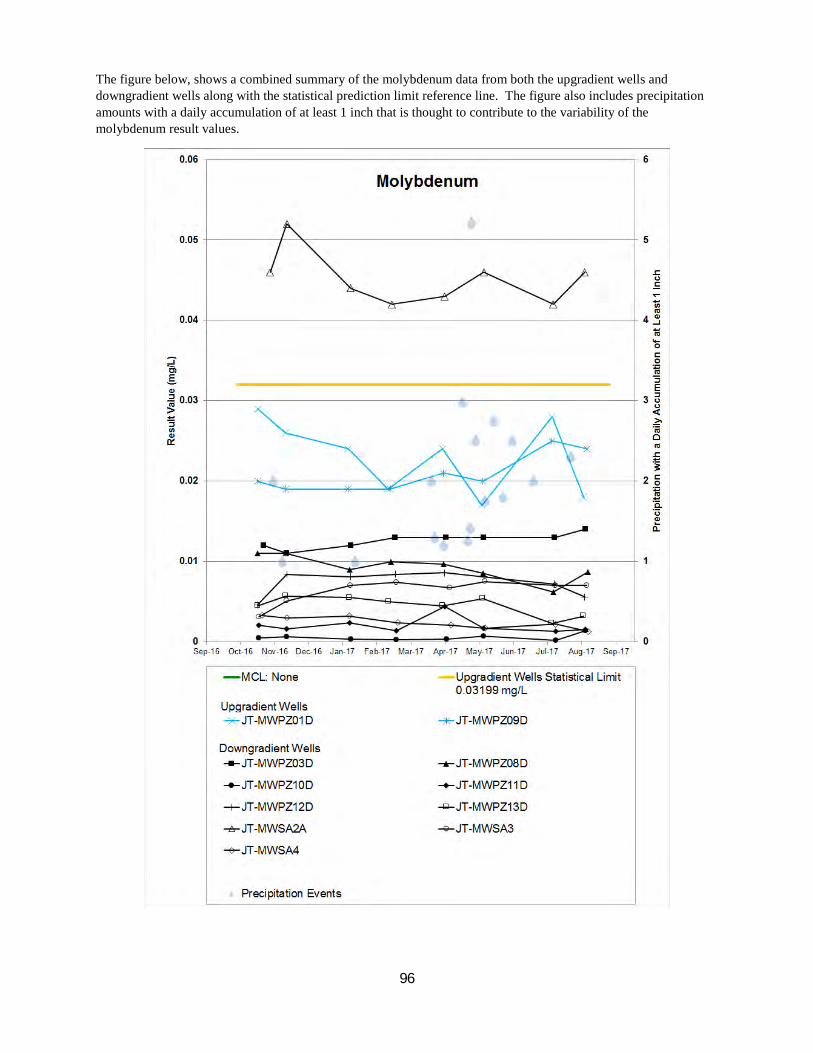
96
The figure below, shows a combined summary of the molybdenum data from both the upgradient wells and downgradient wells along with the statistical prediction limit reference line. The figure also includes precipitation amounts with a daily accumulation of at least 1 inch that is thought to contribute to the variability of the molybdenum result values.

97
To ensure that the molybdenum data from the upgradient JT-MWPZ01D and JT-MWPZ09D wells are statistically from the same homogeneous population, a test called “Levene’s Equality of Variance” was run using the Sanitas software. As shown below, however, the upgradient data from the JT-MWPZ01D and JT-MWPZ09D wells were not found to be homogeneous.
With the Levene’s Equality of Variance test not showing the molybdenum data from the JT-MWPZ01D and JT-MWPZ09D wells as the same homogeneous population, a secondary prediction limit test was performed using only the JT-MWPZ01D well as upgradient data. While using a single upgradient well has less confidence that there are not false positives and false negatives than the original prediction limit analysis, the results of this secondary prediction limit are shown below. With the JT-MWPZ01D as the single upgradient well, the secondary prediction limit would be 0.03779 mg/L.

98
There were data in the downgradient well JT-MWSA2A that exceeded the molybdenum 0.03779 mg/L secondary statistical prediction limit when using the single JT-MWPZ01D well as the upgradient data. This was the same result when using both the JT-MWPZ01D and JT-MWPZ09D wells as the upgradient data.
The figure below, shows a combined summary of the molybdenum data from the single JT-MWPZ01D upgradient well and downgradient wells along with the statistical prediction limit reference line. The figure also includes precipitation amounts with a daily accumulation of at least 1 inch that is thought to contribute to the variability of the molybdenum result values.

99
Radium 226/228 Combined
The eight (8) rounds of validated radium 226/228 data from the JT-MWPZ01D and JT-MWPZ09D upgradient wells are shown below. None of the data will qualify as statistical outliers, so all upgradient data were loaded into the Sanitas prediction limit module.
After running the Sanitas prediction limit module on the upgradient radium 226/228 data, the results are shown below. The calculated statistical prediction limit is 1.68 pCi/L and is shown with the bold horizontal line in the graph. The graph also shows the individual radium 226/228 concentrations for all eight (8) rounds in all downgradient wells at JTEC. None of the downgradient data qualify as outliers, so all individual downgradient concentrations were compared to the 1.68 pCi/L statistical prediction limit.
There were data in the downgradient wells JT-MWPZ03D, JT-MWPZ13D, and JT-MWSA3 that exceeded the 1.68 pCi/L statistical prediction limit. These statistical exceedances however were below the 5 pCi/L radium 226/228 MCL. The data in all other JTEC downgradient wells were below the 1.68 pCi/L statistical prediction limit.

100
The figure below, shows a combined summary of the radium 226/228 data from both the upgradient wells and downgradient wells along with the statistical prediction limit reference line. The figure also includes precipitation amounts with a daily accumulation of at least 1 inch that is thought to contribute to the variability of the radium 226/228 result values.

101
To ensure that the radium-226/228 combined data from the upgradient JT-MWPZ01D and JT-MWPZ09D wells are statistically from the same homogeneous population, a test called “Levene’s Equality of Variance” was run using the Sanitas software. As shown below, the upgradient data from the JT-MWPZ01D and JT-MWPZ09D wells were found to be homogeneous.
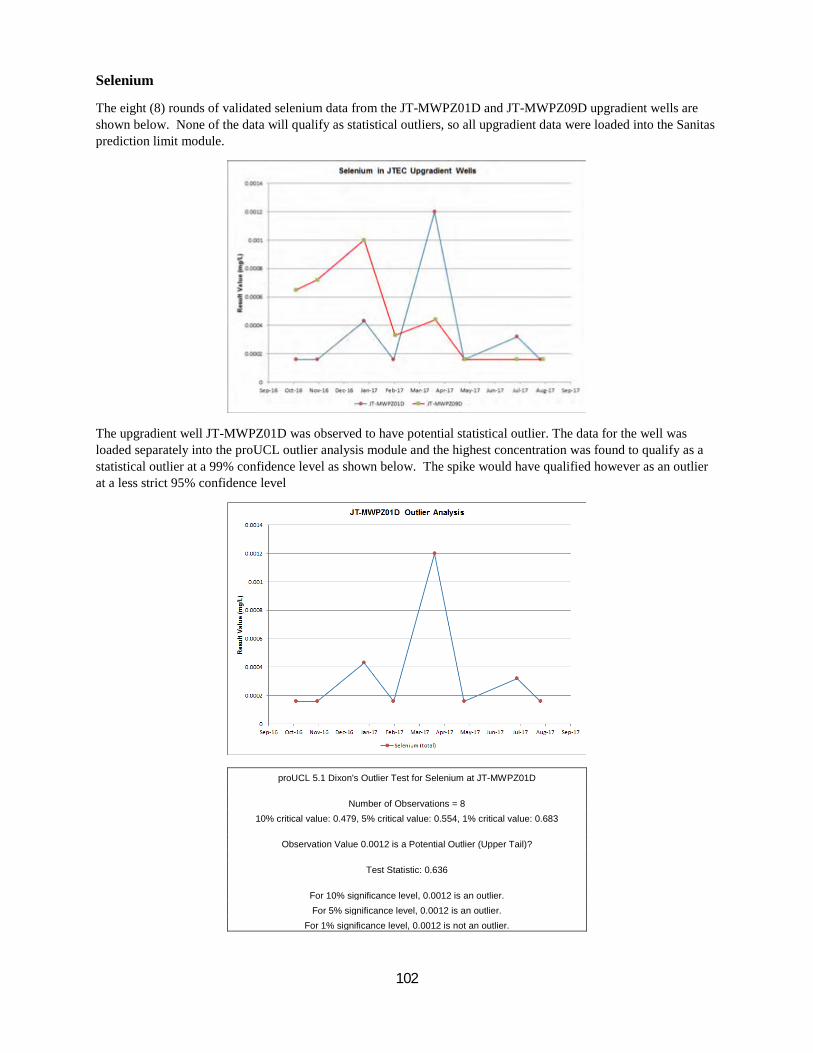
102
Selenium
The eight (8) rounds of validated selenium data from the JT-MWPZ01D and JT-MWPZ09D upgradient wells are shown below. None of the data will qualify as statistical outliers, so all upgradient data were loaded into the Sanitas prediction limit module.
The upgradient well JT-MWPZ01D was observed to have potential statistical outlier. The data for the well was loaded separately into the proUCL outlier analysis module and the highest concentration was found to qualify as a statistical outlier at a 99% confidence level as shown below. The spike would have qualified however as an outlier at a less strict 95% confidence level
proUCL 5.1 Dixon's Outlier Test for Selenium at JT-MWPZ01D
Number of Observations = 8 10% critical value: 0.479, 5% critical value: 0.554, 1% critical value: 0.683
Observation Value 0.0012 is a Potential Outlier (Upper Tail)?
Test Statistic: 0.636
For 10% significance level, 0.0012 is an outlier. For 5% significance level, 0.0012 is an outlier.
For 1% significance level, 0.0012 is not an outlier.

103
After running the Sanitas prediction limit module on the upgradient selenium data, the results are shown below. The calculated statistical prediction limit is 0.0012 mg/L and is shown with the bold horizontal line in the graph. The graph also shows the individual selenium concentrations for all eight (8) rounds in all downgradient wells at JTEC. None of the downgradient data qualify as outliers, so all individual downgradient concentrations were compared to the 0.0012 mg/L statistical prediction limit.
There were data in the downgradient wells JT-MWPZ10D, JT-MWPZ11D, JT-MWSA2A , and JT-MWSA4 that exceeded the 0.0012 mg/L statistical prediction limit. These statistical exceedances however were below the 0.05 mg/L selenium MCL. The data in all other JTEC downgradient wells were below the 0.0012 mg/L statistical prediction limit. Note if the high spike in the upgradient JT-MWPZ01D well was treated as an outlier instead of using it, then the statistical prediction limit would have been reduced to 0.001 mg/L which would cause the JT-MWSA3 well to be added to the list of downgradient wells with statistical exceedances of the prediction limit.

104
The figure below, shows a combined summary of the selenium data from both the upgradient wells and downgradient wells along with the statistical prediction limit reference line. The figure also includes precipitation amounts with a daily accumulation of at least 1 inch that is thought to contribute to the variability of the selenium result values.

105
To ensure that the selenium data from the upgradient JT-MWPZ01D and JT-MWPZ09D wells are statistically from the same homogeneous population, a test called “Levene’s Equality of Variance” was run using the Sanitas software. As shown below, the upgradient data from the JT-MWPZ01D and JT-MWPZ09D wells were found to be homogeneous.
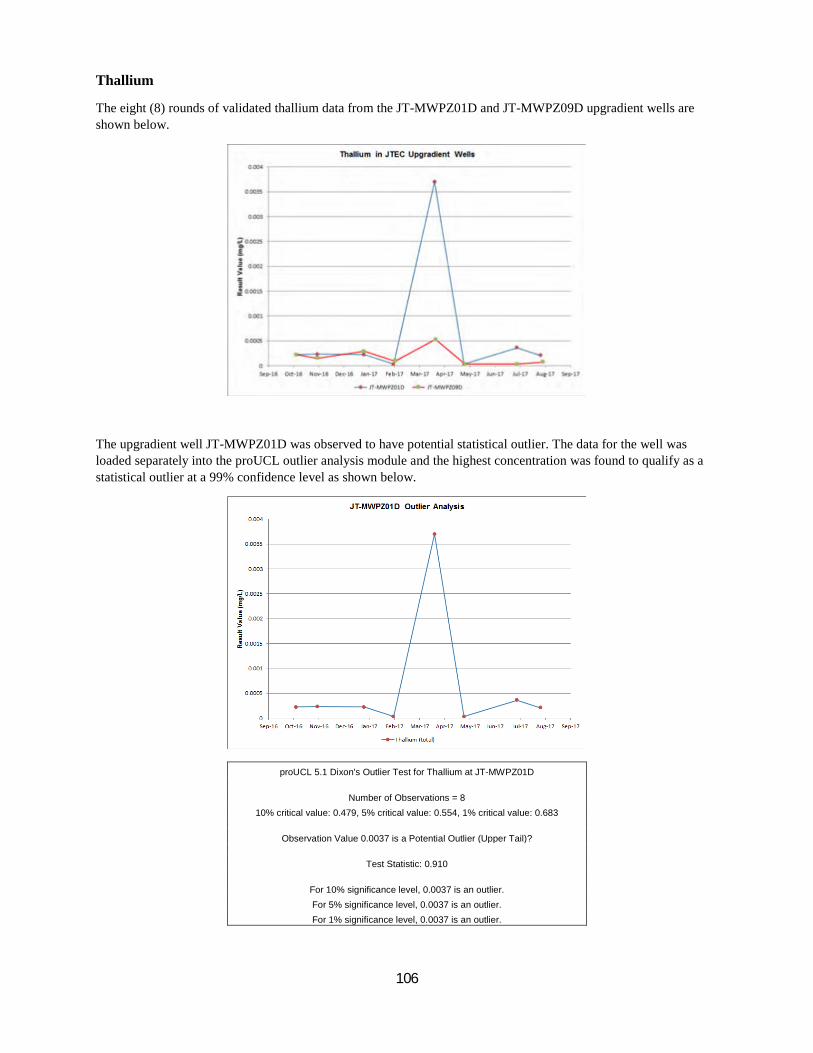
106
Thallium
The eight (8) rounds of validated thallium data from the JT-MWPZ01D and JT-MWPZ09D upgradient wells are shown below.
The upgradient well JT-MWPZ01D was observed to have potential statistical outlier. The data for the well was loaded separately into the proUCL outlier analysis module and the highest concentration was found to qualify as a statistical outlier at a 99% confidence level as shown below.
proUCL 5.1 Dixon's Outlier Test for Thallium at JT-MWPZ01D
Number of Observations = 8 10% critical value: 0.479, 5% critical value: 0.554, 1% critical value: 0.683
Observation Value 0.0037 is a Potential Outlier (Upper Tail)?
Test Statistic: 0.910
For 10% significance level, 0.0037 is an outlier. For 5% significance level, 0.0037 is an outlier. For 1% significance level, 0.0037 is an outlier.
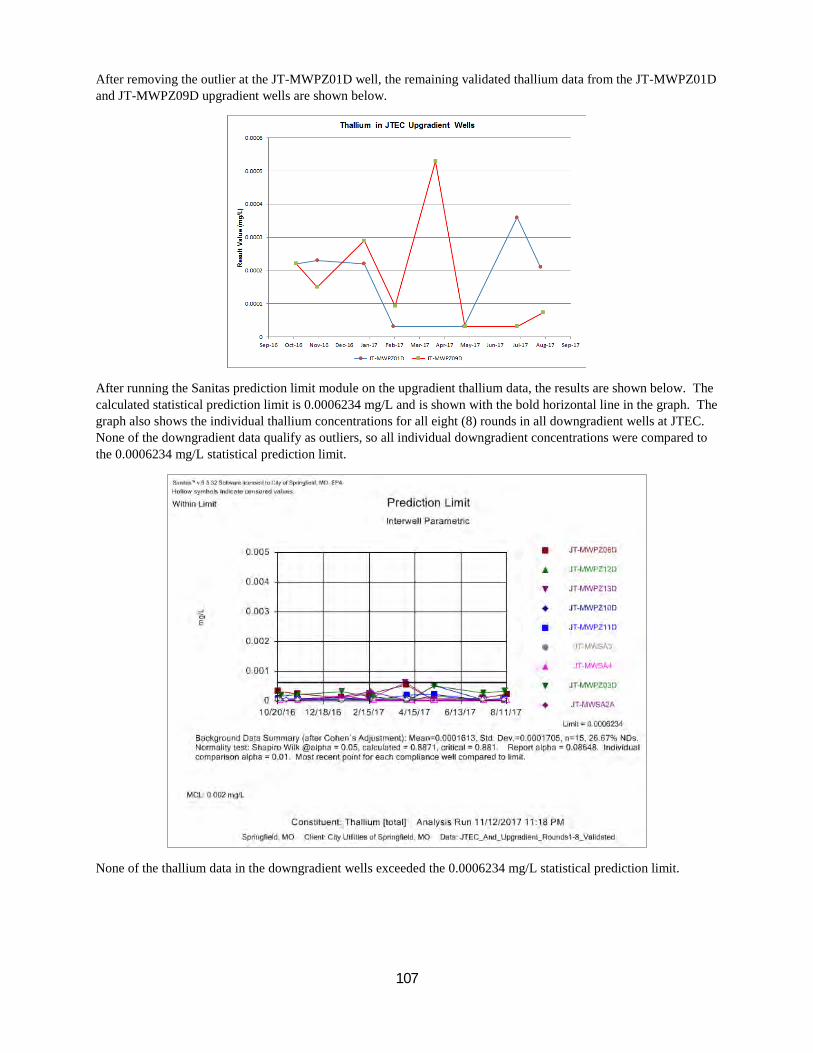
107
After removing the outlier at the JT-MWPZ01D well, the remaining validated thallium data from the JT-MWPZ01D and JT-MWPZ09D upgradient wells are shown below.
After running the Sanitas prediction limit module on the upgradient thallium data, the results are shown below. The calculated statistical prediction limit is 0.0006234 mg/L and is shown with the bold horizontal line in the graph. The graph also shows the individual thallium concentrations for all eight (8) rounds in all downgradient wells at JTEC. None of the downgradient data qualify as outliers, so all individual downgradient concentrations were compared to the 0.0006234 mg/L statistical prediction limit.
None of the thallium data in the downgradient wells exceeded the 0.0006234 mg/L statistical prediction limit.
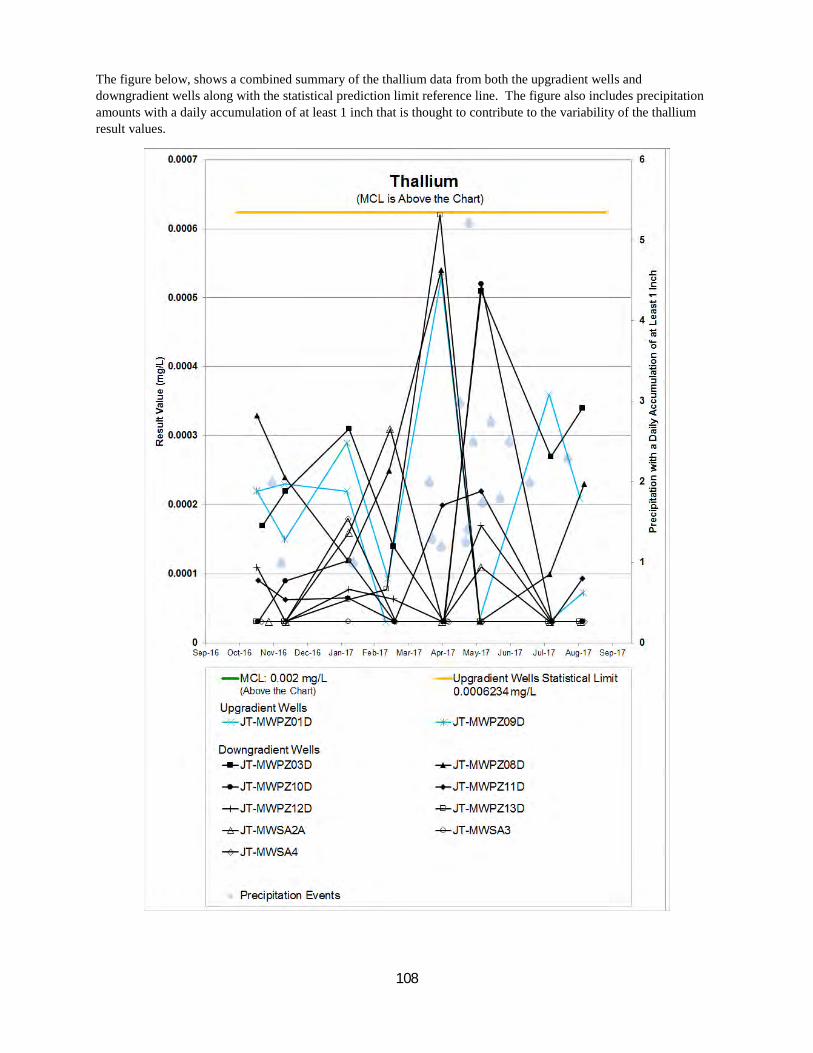
108
The figure below, shows a combined summary of the thallium data from both the upgradient wells and downgradient wells along with the statistical prediction limit reference line. The figure also includes precipitation amounts with a daily accumulation of at least 1 inch that is thought to contribute to the variability of the thallium result values.
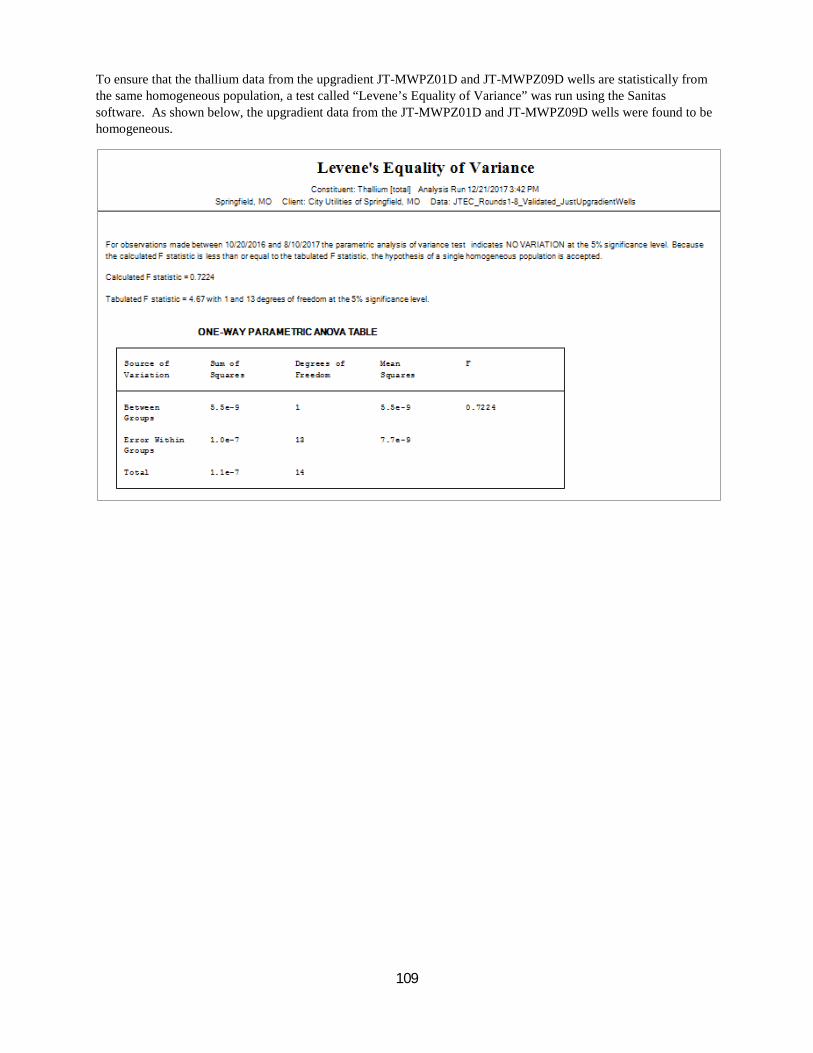
109
To ensure that the thallium data from the upgradient JT-MWPZ01D and JT-MWPZ09D wells are statistically from the same homogeneous population, a test called “Levene’s Equality of Variance” was run using the Sanitas software. As shown below, the upgradient data from the JT-MWPZ01D and JT-MWPZ09D wells were found to be homogeneous.

110
Statistical Analysis Summary for the CCR Appendix IV Constituent List
JTEC Statistical Summary Results of CCR Appendix IV Constituents for Rounds 1-8
Constituent
Statistical Prediction Limit from Upgradient
Wells
Maximum Downgradient
Well Concentration
Downgradient Well Names with One or More Results > Statistical Prediction Limit MCL
Downgradient Well Names with One or
More Results > MCL
Antimony 0.007795 mg/L 0.021 mg/L
JT-MWPZ03D, JT-MWPZ08D, JT-MWSA2A, JT-MWSA3 0.006
mg/L
JT-MWPZ03D, JT-MWPZ08D, JT-
MWSA2A, JT-MWSA3
0.007764 mg/L ** JT-MWPZ03D, JT-MWPZ08D, JT-MWSA2A, JT-
MWSA3 **
Arsenic 0.004316 mg/L 0.0024 mg/L None 0.01 mg/L All Below Stats Limit and MCL
0.004838 mg/L ** None **
Barium 0.1132 mg/L * 0.11 mg/L* None 2 mg/L All Below MCL
Beryllium 0.00056 mg/L* 0.0004 mg/L
JT-MSPZ03D, JT-MSPZ08D, JT-MWPZ10D, JT-MWPZ11D, JT-MWPZ12D, JT-MWPZ13D, JT-
MWSA2A, JT-MWSA3, JT-MWSA4 0.004 mg/L All Below MCL
Cadmium 0.000073 mg/L* 0.00035 mg/L
JT-MWPZ03D, JT-MWPZ08D, JT-MWPZ11D, JT-MWPZ12D, JT-MWPZ13D, JT-MWSA2A, JT-
MWSA3, JT-MWSA4 0.005 mg/L All Below MCL
Chromium 0.004 mg/L* 0.017 mg/L JT-MWSA2A, JT-MWSA4 0.1 mg/L All Below MCL
Cobalt 0.007589 mg/L 0.005 mg/L* None no MCL NA
Fluoride 0.3957 mg/L 0.41 mg/L JT-MWSA3 4 mg/L All below MCL
Lead 0.00037 mg/L* 0.0081 mg/L JT-MWPZ03D, JT-MWPZ08D, JT-MWPZ13D,
JT-MWSA2A, JT-MWSA3, JT-MWSA4 0.015 mg/L All Below MCL
Lithium 0.021 mg/L 0.027 mg/L* JT-MWPZ11D no MCL NA
Mercury 0.000047 mg/L 0.000039
mg/L None 0.002 mg/L
All Below Stats Limit and MCL
Molybdenum 0.03199 mg/L 0.052 mg/L JT-MWSA2A no MCL NA 0.03779 mg/L ** JT-MWSA2A **
Radium 226/228 Combined 1.68 pCi/L 2.29 pCi/L JT-MWPZ03D, JT-MWPZ13D, JT-MWSA3 5 pCi/L All Below MCL
Selenium 0.0012 mg/L 0.0049 mg/L JT-MWPZ10D, JT-MWPZ11D, JT-MWSA2A ,
JT-MWSA4 0.05 mg/L All Below MCL
Thallium 0.0006234 mg/L* 0.00062 mg/L None 0.002 mg/L
All Below Stats Limit and MCL
* After statistical outliers were removed with a 99% confidence interval
** Using the Secondary Prediction Limit Analysis with the Single JT-MWPZ01D Upgradient Well
10 constituents on the CCR Appendix IV list had one or more concentrations in downgradient wells with a statistical difference with the upgradient well data. The constituents were antimony, beryllium, cadmium, chromium, lead, lithium, molybdenum, radium 226/228, and selenium. The only constituent on the CCR Appendix IV list that also exceeded the MCL was antimony.

111
Statistical Analysis Summary for All CCR Constituents Separated by Well
A summary of all the appendix III and appendix IV constituents is shown in the table below that is separated by downgradient well. The table includes a list of constituents that have exceedances of the statistical prediction limit that was calculated using both the JT-MWPZ01D and JT-MWPZ09D upgradient wells. Three of the downgradient wells JT-MWPZ10D, JT-MWSA3, and JT-MWSA4 have exceedances for the CCR Appendix III constituent list. All the downgradient wells have exceedances of at least one of the CCR Appendix IV constituents. The JT-MWSA4 well has the most constituents with exceedances followed by the JT-MWSA2A and JT-MWSA3 wells. There were 6 of the CCR Appendix III constituents with exceedances and 10 of the CCR Appendix IV constituents with exceedances. Note Fluoride is on both CCR Appendix constituent lists, so a total of 15 of the 21 CCR constituents had exceedances of the prediction limit.
JTEC Statistical Summary Results of Rounds 1 - 8 for CCR Constituents (With Prediction Limit from Both JT-MWPZ01D and JT-MWPZ09D Upgradient Wells)
Downgradient Well Name Constituents that Exceed the Statistical Prediction Limit from the Upgradient Wells
Number of Constituents that
Exceed the Statistical Prediction
Limit
JT-MWPZ03D Appendix III Constituents: None
5 Appendix IV Constituents: Antimony, Beryllium, Cadmium, Lead, Radium 226/228 Combined
JT-MWPZ08D Appendix III Constituents: None 4 Appendix IV Constituents: Antimony, Beryllium, Cadmium, Lead
JT-MWPZ10D Appendix III Constituents: Boron, Calcium, Chloride, Total Dissolved Solids (TDS) 5 Appendix IV Constituents: Selenium
JT-MWPZ11D Appendix III Constituents: Boron 5 Appendix IV Constituents: Beryllium, Cadmium, Lithium, Selenium
JT-MWPZ12D Appendix III Constituents: None 2 Appendix IV Constituents: Beryllium, Cadmium
JT-MWPZ13D Appendix III Constituents: None 4 Appendix IV Constituents: Beryllium, Cadmium, Lead, Radium 226/228 Combined
JT-MWSA2A Appendix III Constituents: None
7 Appendix IV Constituents: Antimony, Beryllium, Cadmium, Chromium, Lead, Molybdenum, Selenium
JT-MWSA3 Appendix III Constituents: Fluoride
7 Appendix IV Constituents: Antimony, Beryllium, Cadmium, Fluoride, Lead, Radium 226/228 Combined
JT-MWSA4 Appendix III Constituents: Boron, Calcium, Chromium, Sulfate, Total Dissolved Solids (TDS) 10
Appendix IV Constituents: Beryllium, Cadmium, Chromium, Lead, Selenium

112
A summary of all the appendix III and appendix IV constituents that include the secondary prediction limit analysis is shown in the table below that is separated by downgradient well. The secondary prediction limit analysis was calculated for chloride, sulfate, antimony, arsenic, and molybdenum using just the single JT-MWPZ09D upgradient well. This was included for these constituents since the JT-MWPZ01D and JT-MWPZ09D upgradient wells were not shown to be of the same homogeneous population for these 5 constituents. Note however, using just the single JT-MWPZ01D well also has less confidence that there are not false positives and false negatives, so the secondary prediction limit analysis is not necessarily the preferred option for chloride, sulfate, antimony, arsenic, and molybdenum. Compared to the original prediction limit calculation with both the JT-MWPZ01D and JT-MWPZ09D upgradient wells, antimony, arsenic, and molybdenum all had the same list of downgradient wells with exceedances so nothing changed using the secondary prediction limit. For chloride and sulfate, the number of downgradient wells with exceedances did increase. Most importantly however, the overall list of constituents with statistical exceedances did not change when including the secondary prediction limit.
6 of the downgradient wells JT-MWPZ08D, JT-MWPZ10D, JT-MWPZ11D, JT-MWPZ12D, JT-MWPZ13D, JT-MWSA3, and JT-MWSA4 have exceedances for the CCR Appendix III constituent list. All the downgradient wells have exceedances of at least one of the CCR Appendix IV constituents. The JT-MWSA4 well has the most constituents with exceedances followed by the JT-MWSA2A and JT-MWSA3 wells. There were 6 of the CCR Appendix III constituents with exceedances and 10 of the CCR Appendix IV constituents with exceedances. Note Fluoride is on both CCR Appendix constituent lists, so a total of 15 of the 21 CCR constituents had exceedances of the prediction limit.
JTEC Statistical Summary Results of Rounds 1 - 8 for CCR Constituents (With Secondary Prediction Limit for Chloride, Sulfate, Antimony, Arsenic, & Molybdenum)
Downgradient Well Name Constituents that Exceed the Statistical Prediction Limit from the Upgradient Wells
Number of Constituents that
Exceed the Statistical Prediction
Limit
JT-MWPZ03D Appendix III Constituents: None
5 Appendix IV Constituents: Antimony, Beryllium, Cadmium, Lead, Radium 226/228 Combined
JT-MWPZ08D Appendix III Constituents: Chloride, Sulfate 6 Appendix IV Constituents: Antimony, Beryllium, Cadmium, Lead
JT-MWPZ10D Appendix III Constituents: Boron, Calcium, Chloride, Sulfate, Total Dissolved Solids (TDS) 6
Appendix IV Constituents: Selenium
JT-MWPZ11D Appendix III Constituents: Boron, Chloride, Sulfate 7 Appendix IV Constituents: Beryllium, Cadmium, Lithium, Selenium
JT-MWPZ12D Appendix III Constituents: Chloride, Sulfate 4 Appendix IV Constituents: Beryllium, Cadmium
JT-MWPZ13D Appendix III Constituents: Chloride 5 Appendix IV Constituents: Beryllium, Cadmium, Lead, Radium 226/228 Combined
JT-MWSA2A Appendix III Constituents: Chloride, Sulfate
9 Appendix IV Constituents: Antimony, Beryllium, Cadmium, Chromium, Lead, Molybdenum, Selenium
JT-MWSA3 Appendix III Constituents: Chloride, Fluoride, Sulfate
9 Appendix IV Constituents: Antimony, Beryllium, Cadmium, Fluoride, Lead, Radium 226/228 Combined
JT-MWSA4 Appendix III Constituents: Boron, Calcium, Chloride, Chromium, Sulfate, Total Dissolved Solids (TDS) 11 Appendix IV Constituents: Beryllium, Cadmium, Chromium, Lead, Selenium