annual open report 2015 (all facilities) japan nosocomial ... · janis members† janis...
TRANSCRIPT

≧ 900 beds500 - 899 bed200 - 499 bed
56381
2,207
Number of beds
48289840
( 85.7% )( 75.9% )( 38.1% )
¶Data of medical facilities is referred to Vital Statistics 2014.
Number of facilities nationwide in 2014¶
Number of Facilities Included in Annual Open Report 2015(percentage of facilities nationwide)
< 200 beds 5,849 258 ( 4.4% )Unknown - 0 ( - )Total 8,493 1,435 ( 16.9% )
0% 10% 20% 30% 40% 50% 60% 70% 80% 90% 100%
< 200 beds
200 - 499 beds
500 - 899 beds
≧ 900 beds
JANISMembers†
JANIS Non-Members‡
*Data-submitting Facilities indicate facilities included in Annual Open Report 2015.†Number of JANIS Members = Number of facilities included in Annual Open Report 2015.‡Number of JANIS Non-members = (Number of facilities nationwide in 2014¶)-(Number of facilities included in Annual Open Report 2015)
N=56
N=381
N=2,207
N=5,849
85.7% (48 facilities)
14.3% (8 facilities)
75.9% (289 facilities)
24.1% (92 facilities)
38.1% (840 facilities) 61.9% (1,367 facilities)
4.4% (258 facilities)
95.6% (5,591 facilities)
Annual Open Report 2015 (All Facilities)
1.Number of Data-submitting Facilities* (1,435 facilities)
1
April 04, 2017
Clinical Laboratory DivisionJapan Nosocomial Infections Surveillance (JANIS)
This Open Report does not cover every data from facilities nationwide.Date of Total Tabulation : June 14, 2016
Date of Publication (English Version) :
【CLSI2012 Version】

Inpatient specimens are counted.All isolated bacteria except Isolated Bacterial Code 9999 (comments only) are counted.Each specimen includes corresponding specimen source codes as below. Respiratory : 101 (Sputum), 102 (Endotracheal aspirate), 103 (Bronchoalveolar lavage), 104 (Throat),
105 (Nasal), 106 (Oral), 107 (Lung biopsy), Other (Respiratory) and 404 (Pleural effusion) Urinary : 201 (Urine), 202 (Urine collected by catheter), 203 (Urine obtained from indwelling catheter)
and 206 (Catheterized urine) Feces : 301 (Feces) Blood : 401 (Venous blood) and 402 (Arterial blood) Cerebrospinal fluid : 403 (Cerebrospinal fluid) Others : Specimen codes not indicated aboveSpecimen Source Code : http://www.nih-janis.jp/section/kensa.html
Respiratory 1,435 2,092,027 1,309,327 (2,726,684)
Specimen Sources Number of SpecimensNumber of culture-positive
specimens(Number of isolates)
Urine 1,431 902,325 478,444 (726,156)
Feces 1,427 548,310 265,460 (520,818)
Blood 1,429 2,311,915 298,971 (336,575)
Cerebrospinal fluid 1,216 83,604 3,939 (4,352)
Others 1,434 1,347,946 624,502 (1,097,784)
Total 1,435 7,286,127 2,980,643 (5,412,369)
Number of facilitiesincluded in Annual Open
Report 2015
Annual Open Report 2015 (All Facilities)
2.Number of Data-submitting Facilities,
Specimens and Isolates Counted by Specimen Source
2
April 04, 2017
Clinical Laboratory DivisionJapan Nosocomial Infections Surveillance (JANIS)
This Open Report does not cover every data from facilities nationwide.Date of Total Tabulation : June 14, 2016
Date of Publication (English Version) :
【CLSI2012 Version】

Inpatient specimens are counted.Others include Isolated Bacterial Code 9998 (other species) and bacteria ranked 16th and lower.All isolated bacteria except Bacterial Code 9999 (comments only) are counted.Specimen reported as Specimen Source Code 401 (venous blood) and Code 402 (arterial blood) are counted.Percentage of Corresponding Blood Isolates = (Number of Corresponding Blood Isolates ) / (Total Number of Blood Isolates ) x 100Isolated Bacterial Code : http://www.nih-janis.jp/section/kensa.htmlSpecimen Source Code : http://www.nih-janis.jp/section/kensa.html
Blood Isolates (N=336,575)
*Coagulase-negative staphylococci correspond to Isolated Bacterial Codes 1311, 1313-1325 (except Code 1312,Staphylococcus
epidermidis)
Annual Open Report 2015 (All Facilities)
3.Isolated Bacteria from Blood Specimens
3
April 04, 2017
Escherichia coli
Staphylococcus aureus
Staphylococcus epidermidis
Coagulase-negative staphylococci (CNS)*
Klebsiella pneumoniae
Enterococcus faecalis
Pseudomonas aeruginosa
Enterococcus faecium
Enterobacter cloacae
Candida albicans
Klebsiella oxytoca
Bacillus cereus
Corynebacterium sp.
Bacillus sp.
Staphylococcus sp. 4,046 (1.2%)
4,566 (1.4%)
4,670 (1.4%)
5,089 (1.5%)
5,204 (1.5%)
5,955 (1.8%)
7,004 (2.1%)
7,787 (2.3%)
10,324 (3.1%)
11,109 (3.3%)
21,319 (6.3%)
31,383 (9.3%)
37,926 (11.3%)
44,489 (13.2%)
53,074 (15.8%)
0 10,000 20,000 30,000 40,000 50,000 60,000
Others 82,630 (24.6%)
Clinical Laboratory DivisionJapan Nosocomial Infections Surveillance (JANIS)
This Open Report does not cover every data from facilities nationwide.June 14, 2016Date of Total Tabulation :
Date of Publication (English Version) :
【CLSI2012 Version】

Inpatient specimens are counted.Others include Isolated Bacterial Code 9998 (other species) and bacteria ranked 16th and lower.All isolated bacteria except Bacterial Code 9999 (comments only) are counted.Specimen reported as Specimen Source Code 403 (Cerebrospinal Fluid Samples) are counted.Percentage of Corresponding Cerebrospinal Fluid Isolates = (Number of Corresponding Cerebrospinal Fluid Isolates ) / (Total Number of Cerebrospinal Fluid Isolates ) x 100Isolated Bacterial Code : http://www.nih-janis.jp/section/kensa.htmlSpecimen Source Code : http://www.nih-janis.jp/section/kensa.html
Cerebrospinal Fluid Isolates (N=4,352)
*Coagulase-negative staphylococci correspond to Isolated Bacterial Codes 1311, 1313-1325 (except Code 1312,Staphylococcus
epidermidis)
Annual Open Report 2015 (All Facilities)
3.Isolated Bacteria from Cerebrospinal Fluid Specimens
4
April 04, 2017
Staphylococcus epidermidis
Staphylococcus aureus
Coagulase-negative staphylococci (CNS)*
Corynebacterium sp.
Cryptococcus neoformans
Streptococcus pneumoniae
Propionibacterium acnes
Pseudomonas aeruginosa
Enterococcus faecalis
Escherichia coli
Staphylococcus sp.
Klebsiella pneumoniae
Streptococcus agalactiae
Enterobacter cloacae
Listeria monocytogenes 56 (1.3%)
69 (1.6%)
85 (2.0%)
94 (2.2%)
106 (2.4%)
108 (2.5%)
119 (2.7%)
124 (2.8%)
125 (2.9%)
153 (3.5%)
157 (3.6%)
217 (5.0%)
575 (13.2%)
593 (13.6%)
837 (19.2%)
0 200 400 600 800 1,000
Others 934 (21.5%)
Clinical Laboratory DivisionJapan Nosocomial Infections Surveillance (JANIS)
This Open Report does not cover every data from facilities nationwide.June 14, 2016Date of Total Tabulation :
Date of Publication (English Version) :
【CLSI2012 Version】

S. epidermidis
S. pneumoniae
E. faecalis
E. faecium
E. coli
K. pneumoniae
Enterobacter spp.
S. marcescens
P. aeruginosa
210,382 cases
(16.06%)
64,588 cases
(4.93%)
32,501 cases
(2.48%)
75,862 cases
(5.79%)
23,523 cases
(1.80%)
151,601 cases
(11.57%)
77,702 cases
(5.93%)
53,484 cases
(4.08%)
18,762 cases
(1.43%)
99,299 cases
(7.58%)
Distribution of Isolation Rates (%)¶
among Data-submitting Facilities†
Number of Specimen-submitting Patients
1,309,993 cases
221,239 cases
(15.22%)
65,531 cases
(4.51%)
30,484 cases
(2.10%)
82,510 cases
(5.67%)
26,941 cases
(1.85%)
171,361 cases
(11.79%)
85,532 cases
(5.88%)
57,843 cases
(3.98%)
19,452 cases
(1.34%)
101,821 cases
(7.00%)
1,453,969 cases
231,909 cases
(14.64%)
69,423 cases
(4.38%)
32,083 cases
(2.03%)
87,239 cases
(5.51%)
29,540 cases
(1.86%)
189,127 cases
(11.94%)
93,395 cases
(5.90%)
62,966 cases
(3.98%)
20,358 cases
(1.29%)
105,968 cases
(6.69%)
1,584,041 cases
246,030 cases
(14.08%)
74,651 cases
(4.27%)
32,256 cases
(1.85%)
93,822 cases
(5.37%)
32,300 cases
(1.85%)
214,281 cases
(12.26%)
103,737 cases
(5.94%)
67,752 cases
(3.88%)
22,681 cases
(1.30%)
113,011 cases
(6.47%)
1,747,538 cases
349,743 cases
(13.71%)
99,594 cases
(3.90%)
43,390 cases
(1.70%)
130,647 cases
(5.12%)
46,969 cases
(1.84%)
322,142 cases
(12.63%)
150,147 cases
(5.88%)
96,837 cases
(3.80%)
31,891 cases
(1.25%)
163,631 cases
(6.41%)
2,551,541 cases
Acinetobacter spp. 20,551 cases
(1.57%)
20,997 cases
(1.44%)
23,447 cases
(1.48%)
23,161 cases
(1.33%)
30,277 cases
(1.19%)
Annual Open Report 2015 (All Facilities)
4.Number of Patients* and Isolation Rate of Major Bacteria
5
April 04, 2017
Inpatient specimens are counted.*The number of duplicates within 30 days is not recounted for Patients with Major Bacteria and Specimen-submitting Patients (See Appendix).‡Total Isolation Rate = (Total Number of Patients with Major Bacteria for Data-submitting Facilities ) / (Total Number of Specimen-submitting Patients for Data-submitting Facilities) x 100¶Isolation Rate = (Number of Patients with Major Bacteria for Each Facility) / (Number of Specimen-submitting Patients for Each Facility) x 100†Data-submitting Facilities indicate facilities included in Annual Open Report 2015
S. aureus
Clinical Laboratory Division
Number of Patients(Total Isolation Rate‡)
2011 2012 2013 2014 2015
Japan Nosocomial Infections Surveillance (JANIS)
This Open Report does not cover every data from facilities nationwide.June 14, 2016Date of Total Tabulation :
Date of Publication (English Version) :
【CLSI2012 Version】
Vancomycin-resistant Staphylococcus
aureus(VRSA)
Vancomycin-resistant
Enterococci(VRE)
Penicillin-resistant Streptococcus
pneumoniae(PRSP)
Multidrug-resistant Pseudomonas
aeruginosa(MDRP)
Multidrug-resistant Acinetobacter
spp.(MDRA)
Carbapenem-resistant
Enterobacteriaceae(CRE)
Carbapenem-resistant Pseudomonas
aeruginosa
3rd Generation Cephalosporin-
resistant Klebsiella pneumoniae
3rd Generation Cephalosporin-
resistant Escherichia coli
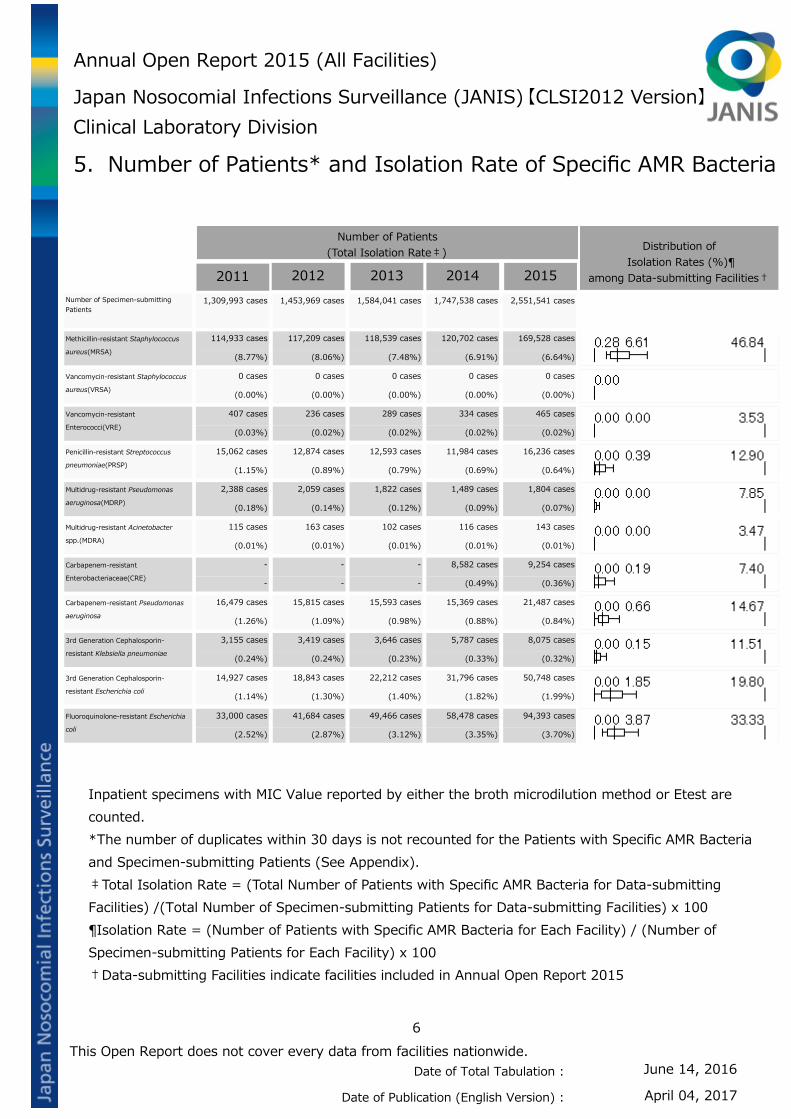
114,933 cases
(8.77%)
0 cases
(0.00%)
407 cases
(0.03%)
15,062 cases
(1.15%)
2,388 cases
(0.18%)
115 cases
(0.01%)
-
-
16,479 cases
(1.26%)
3,155 cases
(0.24%)
14,927 cases
(1.14%)
Distribution of Isolation Rates (%)¶
among Data-submitting Facilities†
Number of Specimen-submitting Patients
1,309,993 cases
117,209 cases
(8.06%)
0 cases
(0.00%)
236 cases
(0.02%)
12,874 cases
(0.89%)
2,059 cases
(0.14%)
163 cases
(0.01%)
-
-
15,815 cases
(1.09%)
3,419 cases
(0.24%)
18,843 cases
(1.30%)
1,453,969 cases
118,539 cases
(7.48%)
0 cases
(0.00%)
289 cases
(0.02%)
12,593 cases
(0.79%)
1,822 cases
(0.12%)
102 cases
(0.01%)
-
-
15,593 cases
(0.98%)
3,646 cases
(0.23%)
22,212 cases
(1.40%)
1,584,041 cases
120,702 cases
(6.91%)
0 cases
(0.00%)
334 cases
(0.02%)
11,984 cases
(0.69%)
1,489 cases
(0.09%)
116 cases
(0.01%)
8,582 cases
(0.49%)
15,369 cases
(0.88%)
5,787 cases
(0.33%)
31,796 cases
(1.82%)
1,747,538 cases
169,528 cases
(6.64%)
0 cases
(0.00%)
465 cases
(0.02%)
16,236 cases
(0.64%)
1,804 cases
(0.07%)
143 cases
(0.01%)
9,254 cases
(0.36%)
21,487 cases
(0.84%)
8,075 cases
(0.32%)
50,748 cases
(1.99%)
2,551,541 cases
Fluoroquinolone-resistant Escherichia
coli
33,000 cases
(2.52%)
41,684 cases
(2.87%)
49,466 cases
(3.12%)
58,478 cases
(3.35%)
94,393 cases
(3.70%)
Annual Open Report 2015 (All Facilities)
5.Number of Patients* and Isolation Rate of Specific AMR Bacteria
6
April 04, 2017
Inpatient specimens with MIC Value reported by either the broth microdilution method or Etest are counted.*The number of duplicates within 30 days is not recounted for the Patients with Specific AMR Bacteria and Specimen-submitting Patients (See Appendix).‡Total Isolation Rate = (Total Number of Patients with Specific AMR Bacteria for Data-submitting Facilities) /(Total Number of Specimen-submitting Patients for Data-submitting Facilities) x 100¶Isolation Rate = (Number of Patients with Specific AMR Bacteria for Each Facility) / (Number of Specimen-submitting Patients for Each Facility) x 100†Data-submitting Facilities indicate facilities included in Annual Open Report 2015
Methicillin-resistant Staphylococcus
aureus(MRSA)
Clinical Laboratory Division
Number of Patients(Total Isolation Rate‡)
2011 2012 2013 2014 2015
Japan Nosocomial Infections Surveillance (JANIS)
This Open Report does not cover every data from facilities nationwide.June 14, 2016Date of Total Tabulation :
Date of Publication (English Version) :
【CLSI2012 Version】

1,374 (95.7%)
1,294 (90.2%)
1,019 (71.0%)
1,281 (89.3%)
1,011 (70.5%)
37 (2.6%)
541 (37.7%)
1,099 (76.6%)
103 (7.2%)
1,435 (100.0%)
61 (4.3%)
141 (9.8%)
416 (29.0%)
154 (10.7%)
424 (29.5%)
1,398 (97.4%)
894 (62.3%)
336 (23.4%)
1,332 (92.8%)
1,435 (100.0%)
0% 20% 40% 60% 80% 100%
Facilities reporting at least one corresponding Specific AMR BacteriaFacilities reporting no corresponding Specific AMR Bacteria
7
6.Percentage of Facilities Reporting Specific AMR Bacteria
Percentage of Facilities Reporting Specific AMR Bacteria in 2015 (N=1,435)
Annual Open Report 2015 (All Facilities)
April 04, 2017
Inpatient specimens with MIC values reported by either the broth microdilution method or Etest are counted.Percentage of Facilities Reporting Specific AMR Bacteria = (Number of Facilities Reporting at Least one Corresponding Specific AMR Bacteria) / (Number of Data-submitting Facilities)
Methicillin-resistant Staphylococcus aureus(MRSA)
Vancomycin-resistant Staphylococcus aureus(VRSA)
Vancomycin-resistant Enterococci(VRE)
Penicillin-resistant Streptococcus pneumoniae(PRSP)
Multidrug-resistant Pseudomonas aeruginosa(MDRP)
Multidrug-resistant Acinetobacter spp.(MDRA)
Carbapenem-resistant Enterobacteriaceae(CRE)
Carbapenem-resistant Pseudomonas aeruginosa
3rd Generation Cephalosporin-resistant Klebsiella pneumoniae
3rd Generation Cephalosporin-resistant Escherichia coli
2011
100.0%0.0%
11.1%85.0%59.6%5.2%
-94.8%69.9%91.8%
Number of facilities included in Annual Open Report 594
2012
100.0%0.0%
10.8%83.8%53.2%4.4%
-94.8%69.2%90.0%
660
2013
100.0%0.0%8.6%
81.2%50.2%3.8%
-93.4%69.3%89.9%
745
2014
100.0%0.0%8.8%
80.7%44.3%3.4%
81.0%92.6%71.7%92.1%
883
2015
100.0%0.0%7.2%
76.6%37.7%2.6%
70.5%89.3%71.0%90.2%
1,435
Fluoroquinolone-resistant Escherichia coli 94.6% 93.9% 94.9% 95.4% 95.7%
Percentage of Facilities Reporting Specific AMR Bacteria for the Past Five Years
Methicillin-resistant Staphylococcus aureus(MRSA)
Vancomycin-resistant Staphylococcus aureus(VRSA)
Vancomycin-resistant Enterococci(VRE)
Penicillin-resistant Streptococcus pneumoniae(PRSP)
Multidrug-resistant Pseudomonas aeruginosa(MDRP)
Multidrug-resistant Acinetobacter spp.(MDRA)
Carbapenem-resistant Enterobacteriaceae(CRE)
Carbapenem-resistant Pseudomonas aeruginosa
3rd Generation Cephalosporin-resistant Klebsiella pneumoniae
3rd Generation Cephalosporin-resistant Escherichia coli
Fluoroquinolone-resistant Escherichia coli
Clinical Laboratory DivisionJapan Nosocomial Infections Surveillance (JANIS)
This Open Report does not cover every data from facilities nationwide.Date of Total Tabulation : June 14, 2016
Date of Publication (English Version) :
【CLSI2012 Version】
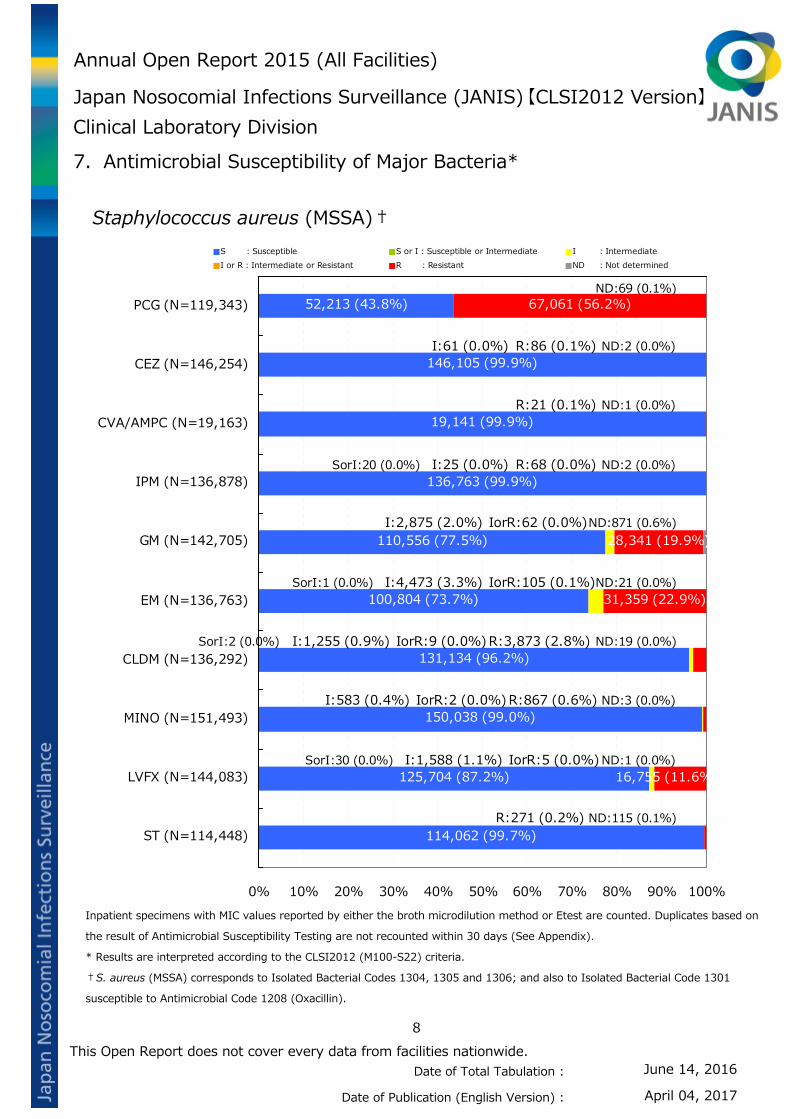
7.Antimicrobial Susceptibility of Major Bacteria*
Staphylococcus aureus (MSSA)†
114,062 (99.7%)
125,704 (87.2%)
150,038 (99.0%)
131,134 (96.2%)
100,804 (73.7%)
110,556 (77.5%)
136,763 (99.9%)
19,141 (99.9%)
146,105 (99.9%)
52,213 (43.8%)
SorI:30 (0.0%)
SorI:2 (0.0%)
SorI:1 (0.0%)
SorI:20 (0.0%)
I:1,588 (1.1%)
I:583 (0.4%)
I:1,255 (0.9%)
I:4,473 (3.3%)
I:2,875 (2.0%)
I:25 (0.0%)
I:61 (0.0%)
IorR:5 (0.0%)
IorR:2 (0.0%)
IorR:9 (0.0%)
IorR:105 (0.1%)
IorR:62 (0.0%)
R:271 (0.2%)
16,755 (11.6%)
R:867 (0.6%)
R:3,873 (2.8%)
31,359 (22.9%)
28,341 (19.9%)
R:68 (0.0%)
R:21 (0.1%)
R:86 (0.1%)
67,061 (56.2%)
ND:115 (0.1%)
ND:1 (0.0%)
ND:3 (0.0%)
ND:19 (0.0%)
ND:21 (0.0%)
ND:871 (0.6%)
ND:2 (0.0%)
ND:1 (0.0%)
ND:2 (0.0%)
ND:69 (0.1%)
0% 10% 20% 30% 40% 50% 60% 70% 80% 90% 100%
PCG (N=119,343)
CEZ (N=146,254)
CVA/AMPC (N=19,163)
IPM (N=136,878)
GM (N=142,705)
EM (N=136,763)
CLDM (N=136,292)
MINO (N=151,493)
LVFX (N=144,083)
ST (N=114,448)
S : Susceptible S or I : Susceptible or Intermediate I : IntermediateI or R : Intermediate or Resistant R : Resistant ND : Not determined
Annual Open Report 2015 (All Facilities)
April 04, 2017
Inpatient specimens with MIC values reported by either the broth microdilution method or Etest are counted. Duplicates based on
the result of Antimicrobial Susceptibility Testing are not recounted within 30 days (See Appendix).
* Results are interpreted according to the CLSI2012 (M100-S22) criteria.
†S. aureus (MSSA) corresponds to Isolated Bacterial Codes 1304, 1305 and 1306; and also to Isolated Bacterial Code 1301
susceptible to Antimicrobial Code 1208 (Oxacillin).
8
Clinical Laboratory DivisionJapan Nosocomial Infections Surveillance (JANIS)
This Open Report does not cover every data from facilities nationwide.Date of Total Tabulation : June 14, 2016
Date of Publication (English Version) :
【CLSI2012 Version】

7.Antimicrobial Susceptibility of Major Bacteria*
Staphylococcus aureus (MRSA)†
Annual Open Report 2015 (All Facilities)
April 04, 2017
127,198 (99.9%)
126,701 (99.3%)
S:23,672 (14.4%)
158,209 (100.0%)
172,024 (100.0%)
98,892 (56.8%)
64,566 (42.1%)
S:17,856 (11.9%)
74,678 (47.3%)
SorI:6 (0.0%)
SorI:2 (0.0%)
SorI:2 (0.0%)
I:626 (0.4%)
I:13 (0.0%)
I:54 (0.0%)
19,787 (11.4%)
I:2,552 (1.7%)
I:5,509 (3.7%)
I:3,560 (2.3%)
IorR:90 (0.1%)
IorR:78 (0.0%)
IorR:346 (0.2%)
IorR:516 (0.3%)
IorR:217 (0.1%)
R:68 (0.1%)
R:626 (0.5%)
140,335 (85.2%)
R:5 (0.0%)
55,220 (31.7%)
85,839 (56.0%)
125,960 (84.1%)
78,509 (49.7%)
ND:12 (0.0%)
ND:274 (0.2%)
ND:5 (0.0%)
ND:6 (0.0%)
ND:5 (0.0%)
ND:6 (0.0%)
ND:24 (0.0%)
ND:8 (0.0%)
ND:981 (0.6%)
0% 10% 20% 30% 40% 50% 60% 70% 80% 90% 100%
GM (N=157,945)
EM (N=149,851)
CLDM (N=153,329)
MINO (N=173,983)
VCM (N=172,083)
TEIC (N=158,233)
LVFX (N=164,734)
ST (N=127,601)
LZD (N=127,278)
S : Susceptible S or I : Susceptible or Intermediate I : IntermediateI or R : Intermediate or Resistant R : Resistant ND : Not determined
16,504 (99.1%)NS:144 (0.9%)
0% 10% 20% 30% 40% 50% 60% 70% 80% 90% 100%
DAP (N=16,648)
S : Susceptible NS : Non-susceptible ND : Not determined
Inpatient specimens with MIC values reported by either the broth microdilution method or Etest are counted. Duplicates based on
the result of Antimicrobial Susceptibility Testing are not recounted within 30 days (See Appendix).
* Results are interpreted according to the CLSI2012 (M100-S22) criteria.
†S. aureus (MRSA) corresponds to Isolated Bacterial Codes 1303, and also to Isolated Bacterial Code 1301 Resistant to
Antimicrobial Code 1208 (Oxacillin).
9
Clinical Laboratory DivisionJapan Nosocomial Infections Surveillance (JANIS)
This Open Report does not cover every data from facilities nationwide.Date of Total Tabulation : June 14, 2016
Date of Publication (English Version) :
【CLSI2012 Version】

7.Antimicrobial Susceptibility of Major Bacteria*
Staphylococcus epidermidis†
85,446 (96.2%)
95,317 (100.0%)
17,150 (22.3%)
S:8,359 (11.5%)
SorI:1 (0.0%) I:2,974 (3.3%)
I:5 (0.0%)
IorR:35 (0.0%)R:358 (0.4%)
R:7 (0.0%)
59,774 (77.6%)
64,375 (88.5%)
ND:1 (0.0%)
ND:83 (0.1%)
ND:2 (0.0%)
0% 10% 20% 30% 40% 50% 60% 70% 80% 90% 100%
PCG (N=72,736)
MPIPC (N=77,007)
VCM (N=95,330)
TEIC (N=88,814)
S : Susceptible S or I : Susceptible or Intermediate I : IntermediateI or R : Intermediate or Resistant R : Resistant ND : Not determined
Annual Open Report 2015 (All Facilities)
April 04, 2017
Inpatient specimens with MIC values reported by either the broth microdilution method or Etest are counted. Duplicates based on
the result of Antimicrobial Susceptibility Testing are not recounted within 30 days (See Appendix).
* Results are interpreted according to the CLSI2012 (M100-S22) criteria.
†S. epidermidis corresponds to Isolated Bacterial Code 1312.
10
Clinical Laboratory DivisionJapan Nosocomial Infections Surveillance (JANIS)
This Open Report does not cover every data from facilities nationwide.Date of Total Tabulation : June 14, 2016
Date of Publication (English Version) :
【CLSI2012 Version】

7.Antimicrobial Susceptibility of Major Bacteria*
Coagulase-negative staphylococci (CNS)†
72,351 (97.8%)
81,505 (100.0%)
19,462 (30.5%)
11,663 (19.6%)
I:1,229 (1.7%)
I:10 (0.0%)
IorR:21 (0.0%)R:365 (0.5%)
R:18 (0.0%)
44,227 (69.4%)
47,847 (80.4%)
ND:4 (0.0%)
ND:7 (0.0%)
ND:47 (0.1%)
ND:7 (0.0%)
0% 10% 20% 30% 40% 50% 60% 70% 80% 90% 100%
PCG (N=59,517)
MPIPC (N=63,736)
VCM (N=81,540)
TEIC (N=73,970)
S : Susceptible S or I : Susceptible or Intermediate I : IntermediateI or R : Intermediate or Resistant R : Resistant ND : Not determined
Annual Open Report 2015 (All Facilities)
April 04, 2017
Inpatient specimens with MIC values reported by either the broth microdilution method or Etest are counted. Duplicates based on
the result of Antimicrobial Susceptibility Testing are not recounted within 30 days (See Appendix).
* Results are interpreted according to the CLSI2012 (M100-S22) criteria.
† Coagulase-negative staphylococci (CNS) corresponds to Isolated Bacterial Codes 1311 and 1313-1325 (except Code
1312,Staphylococcus epidermidis).
11
Clinical Laboratory DivisionJapan Nosocomial Infections Surveillance (JANIS)
This Open Report does not cover every data from facilities nationwide.Date of Total Tabulation : June 14, 2016
Date of Publication (English Version) :
【CLSI2012 Version】

7.Antimicrobial Susceptibility of Major Bacteria*
Enterococcus faecalis†
94,240 (86.3%)
105,394 (100.0%)
115,081 (100.0%)
34,600 (29.9%)
15,000 (15.7%)
107,235 (99.5%)
90,361 (98.1%)
SorI:1 (0.0%)
I:1,177 (1.1%)
I:2 (0.0%)
I:9 (0.0%)
23,414 (20.2%)
27,977 (29.3%)
IorR:75 (0.1%)
IorR:137 (0.1%)
IorR:133 (0.1%)
13,667 (12.5%)
R:7 (0.0%)
R:5 (0.0%)
57,490 (49.7%)
52,297 (54.8%)
R:270 (0.3%)
R:1,251 (1.4%)
ND:1 (0.0%)
ND:5 (0.0%)
ND:6 (0.0%)
ND:2 (0.0%)
ND:228 (0.2%)
ND:520 (0.6%)
0% 10% 20% 30% 40% 50% 60% 70% 80% 90% 100%
PCG (N=92,132)
ABPC (N=107,733)
EM (N=95,409)
MINO (N=115,648)
VCM (N=115,100)
TEIC (N=105,403)
LVFX (N=109,160)
S : Susceptible S or I : Susceptible or Intermediate I : IntermediateI or R : Intermediate or Resistant R : Resistant ND : Not determined
Annual Open Report 2015 (All Facilities)
April 04, 2017
Inpatient specimens with MIC values reported by either the broth microdilution method or Etest are counted. Duplicates based on
the result of Antimicrobial Susceptibility Testing are not recounted within 30 days (See Appendix).
* Results are interpreted according to the CLSI2012 (M100-S22) criteria.
†E. faecalis corresponds to Isolated Bacterial Codes 1201 and 1202.
12
Clinical Laboratory DivisionJapan Nosocomial Infections Surveillance (JANIS)
This Open Report does not cover every data from facilities nationwide.Date of Total Tabulation : June 14, 2016
Date of Publication (English Version) :
【CLSI2012 Version】

7.Antimicrobial Susceptibility of Major Bacteria*
Enterococcus faecium†
33,053 (99.0%)
S:4,586 (10.9%)
41,735 (99.6%)
44,916 (98.7%)
16,574 (35.8%)
S:2,413 (6.4%)
S:5,114 (12.3%)
S:3,947 (11.4%)
SorI:1 (0.0%)
I:298 (0.9%)
I:1,208 (2.9%)
I:24 (0.1%)
I:256 (0.6%)
13,474 (29.1%)
I:3,315 (8.8%)
IorR:1 (0.0%)
IorR:185 (0.4%)
IorR:56 (0.1%)
IorR:78 (0.2%)
R:29 (0.1%)
36,088 (85.8%)
R:145 (0.3%)
R:340 (0.7%)
16,247 (35.1%)
31,729 (84.5%)
36,310 (87.6%)
30,440 (87.6%)
ND:1 (0.0%)
ND:1 (0.0%)
ND:2 (0.0%)
ND:1 (0.0%)
ND:35 (0.1%)
ND:365 (1.1%)
0% 10% 20% 30% 40% 50% 60% 70% 80% 90% 100%
PCG (N=34,752)
ABPC (N=41,459)
EM (N=37,536)
MINO (N=46,351)
VCM (N=45,514)
TEIC (N=41,905)
LVFX (N=42,068)
LZD (N=33,382)
S : Susceptible S or I : Susceptible or Intermediate I : IntermediateI or R : Intermediate or Resistant R : Resistant ND : Not determined
Annual Open Report 2015 (All Facilities)
April 04, 2017
Inpatient specimens with MIC values reported by either the broth microdilution method or Etest are counted. Duplicates based on
the result of Antimicrobial Susceptibility Testing are not recounted within 30 days (See Appendix).
* Results are interpreted according to the CLSI2012 (M100-S22) criteria.
†E. faecium corresponds to Isolated Bacterial Codes 1205 and 1206.
13
Clinical Laboratory DivisionJapan Nosocomial Infections Surveillance (JANIS)
This Open Report does not cover every data from facilities nationwide.Date of Total Tabulation : June 14, 2016
Date of Publication (English Version) :
【CLSI2012 Version】
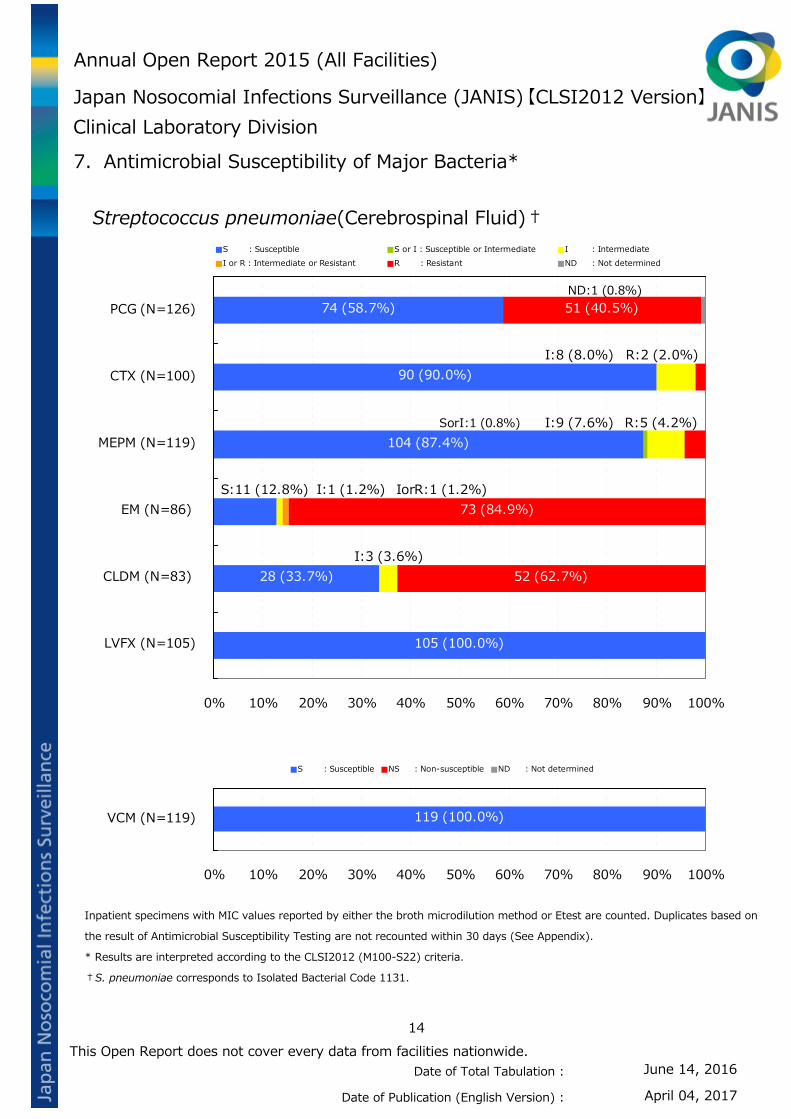
7.Antimicrobial Susceptibility of Major Bacteria*
Streptococcus pneumoniae(Cerebrospinal Fluid)†
Annual Open Report 2015 (All Facilities)
April 04, 2017
105 (100.0%)
28 (33.7%)
S:11 (12.8%)
104 (87.4%)
90 (90.0%)
74 (58.7%)
SorI:1 (0.8%)
I:3 (3.6%)
I:1 (1.2%)
I:9 (7.6%)
I:8 (8.0%)
IorR:1 (1.2%)
52 (62.7%)
73 (84.9%)
R:5 (4.2%)
R:2 (2.0%)
51 (40.5%)ND:1 (0.8%)
0% 10% 20% 30% 40% 50% 60% 70% 80% 90% 100%
PCG (N=126)
CTX (N=100)
MEPM (N=119)
EM (N=86)
CLDM (N=83)
LVFX (N=105)
S : Susceptible S or I : Susceptible or Intermediate I : IntermediateI or R : Intermediate or Resistant R : Resistant ND : Not determined
119 (100.0%)
0% 10% 20% 30% 40% 50% 60% 70% 80% 90% 100%
VCM (N=119)
S : Susceptible NS : Non-susceptible ND : Not determined
Inpatient specimens with MIC values reported by either the broth microdilution method or Etest are counted. Duplicates based on
the result of Antimicrobial Susceptibility Testing are not recounted within 30 days (See Appendix).
* Results are interpreted according to the CLSI2012 (M100-S22) criteria.
†S. pneumoniae corresponds to Isolated Bacterial Code 1131.
14
Clinical Laboratory DivisionJapan Nosocomial Infections Surveillance (JANIS)
This Open Report does not cover every data from facilities nationwide.Date of Total Tabulation : June 14, 2016
Date of Publication (English Version) :
【CLSI2012 Version】

7.Antimicrobial Susceptibility of Major Bacteria*
Streptococcus pneumoniae(Other than Cerebrospinal Fluid)†
Annual Open Report 2015 (All Facilities)
April 04, 2017
34,038 (96.0%)
11,497 (41.7%)
S:3,513 (11.5%)
28,479 (82.6%)
29,755 (96.8%)
35,491 (97.3%)
SorI:14 (0.1%)
SorI:3 (0.0%)
SorI:20 (0.1%)
I:191 (0.5%)
I:571 (2.1%)
I:891 (2.9%)
4,207 (12.2%)
I:489 (1.6%)
I:753 (2.1%)
IorR:1 (0.0%)
IorR:12 (0.0%)
IorR:17 (0.1%)
IorR:7 (0.0%)
R:1,224 (3.5%)
15,453 (56.1%)
26,077 (85.5%)
R:1,725 (5.0%)
R:490 (1.6%)
R:224 (0.6%)
ND:3 (0.0%)
ND:8 (0.0%)
ND:30 (0.1%)
0% 10% 20% 30% 40% 50% 60% 70% 80% 90% 100%
PCG (N=36,475)
CTX (N=30,734)
MEPM (N=34,461)
EM (N=30,501)
CLDM (N=27,555)
LVFX (N=35,457)
S : Susceptible S or I : Susceptible or Intermediate I : IntermediateI or R : Intermediate or Resistant R : Resistant ND : Not determined
33,529 (100.0%)ND:1 (0.0%)
0% 10% 20% 30% 40% 50% 60% 70% 80% 90% 100%
VCM (N=33,530)
S : Susceptible NS : Non-susceptible ND : Not determined
Inpatient specimens with MIC values reported by either the broth microdilution method or Etest are counted. Duplicates based on
the result of Antimicrobial Susceptibility Testing are not recounted within 30 days (See Appendix).
* Results are interpreted according to the CLSI2012 (M100-S22) criteria.
†S. pneumoniae corresponds to Isolated Bacterial Code 1131.
15
Clinical Laboratory DivisionJapan Nosocomial Infections Surveillance (JANIS)
This Open Report does not cover every data from facilities nationwide.Date of Total Tabulation : June 14, 2016
Date of Publication (English Version) :
【CLSI2012 Version】

7.Antimicrobial Susceptibility of Major Bacteria*
Streptococcus pyogenes†
Annual Open Report 2015 (All Facilities)
April 04, 2017
3,396 (84.9%)
2,442 (64.8%)
SorI:18 (0.4%)
SorI:6 (0.2%)
I:30 (0.7%)
I:28 (0.7%)
IorR:2 (0.0%)
IorR:2 (0.1%)
555 (13.9%)
1,290 (34.2%)
0% 10% 20% 30% 40% 50% 60% 70% 80% 90% 100%
EM (N=3,768)
CLDM (N=4,001)
S : Susceptible S or I : Susceptible or Intermediate I : IntermediateI or R : Intermediate or Resistant R : Resistant ND : Not determined
3,761 (99.7%)
4,504 (99.7%)
4,492 (99.8%)
NS:11 (0.3%)
ND:15 (0.3%)
ND:8 (0.2%)
0% 10% 20% 30% 40% 50% 60% 70% 80% 90% 100%
PCG (N=4,500)
ABPC (N=4,519)
CTX (N=3,772)
S : Susceptible NS : Non-susceptible ND : Not determined
Inpatient specimens with MIC values reported by either the broth microdilution method or Etest are counted. Duplicates based on
the result of Antimicrobial Susceptibility Testing are not recounted within 30 days (See Appendix).
* Results are interpreted according to the CLSI2012 (M100-S22) criteria.
†S. pyogenes corresponds to Isolated Bacterial Code 1111.
16
Clinical Laboratory DivisionJapan Nosocomial Infections Surveillance (JANIS)
This Open Report does not cover every data from facilities nationwide.Date of Total Tabulation : June 14, 2016
Date of Publication (English Version) :
【CLSI2012 Version】

7.Antimicrobial Susceptibility of Major Bacteria*
Streptococcus agalactiae†
Annual Open Report 2015 (All Facilities)
April 04, 2017
22,353 (73.2%)
18,815 (65.2%)
SorI:1,060 (3.5%)
SorI:209 (0.7%)
I:566 (1.9%)
I:940 (3.3%)
IorR:3 (0.0%)
IorR:6 (0.0%)
6,568 (21.5%)
8,882 (30.8%)
ND:2 (0.0%)
ND:3 (0.0%)
0% 10% 20% 30% 40% 50% 60% 70% 80% 90% 100%
EM (N=28,855)
CLDM (N=30,552)
S : Susceptible S or I : Susceptible or Intermediate I : IntermediateI or R : Intermediate or Resistant R : Resistant ND : Not determined
20,348 (97.5%)
31,075 (97.2%)
29,641 (93.1%)
NS:527 (2.5%)
NS:819 (2.6%)
NS:2,171 (6.8%)
ND:2 (0.0%)
ND:81 (0.3%)
ND:29 (0.1%)
0% 10% 20% 30% 40% 50% 60% 70% 80% 90% 100%
PCG (N=31,841)
ABPC (N=31,975)
CTX (N=20,877)
S : Susceptible NS : Non-susceptible ND : Not determined
Inpatient specimens with MIC values reported by either the broth microdilution method or Etest are counted. Duplicates based on
the result of Antimicrobial Susceptibility Testing are not recounted within 30 days (See Appendix).
* Results are interpreted according to the CLSI2012 (M100-S22) criteria.
†S. agalactiae corresponds to Isolated Bacterial Code 1114.
17
Clinical Laboratory DivisionJapan Nosocomial Infections Surveillance (JANIS)
This Open Report does not cover every data from facilities nationwide.Date of Total Tabulation : June 14, 2016
Date of Publication (English Version) :
【CLSI2012 Version】

7.Antimicrobial Susceptibility of Major Bacteria*
Escherichia coli†
255,294 (97.9%)
165,495 (60.2%)
280,585 (99.6%)
265,396 (98.3%)
246,315 (98.1%)
165,983 (76.7%)
197,035 (83.2%)
231,076 (83.8%)
146,635 (70.0%)
S:33,786 (12.6%)
173,749 (96.7%)
142,004 (52.5%)
124,096 (48.3%)
SorI:462 (0.2%)
SorI:2 (0.0%)
SorI:319 (0.1%)
SorI:361 (0.1%)
SorI:4,977 (2.3%)
SorI:3,612 (1.3%)
SorI:418 (0.2%)
121,367 (45.1%)
SorI:1 (0.0%)
SorI:40 (0.0%)
I:2,503 (1.0%)
I:4,242 (1.5%)
I:661 (0.2%)
I:161 (0.1%)
I:359 (0.1%)
I:7,305 (3.4%)
I:3,815 (1.6%)
I:10,994 (4.0%)
I:1,221 (0.6%)
I:7,739 (2.9%)
I:2,787 (1.6%)
I:8,535 (3.2%)
I:2,428 (0.9%)
IorR:104 (0.0%)
IorR:453 (0.2%)
IorR:33 (0.0%)
IorR:262 (0.1%)
IorR:22 (0.0%)
IorR:333 (0.2%)
IorR:3 (0.0%)
IorR:20 (0.0%)
IorR:761 (0.3%)
IorR:527 (0.2%)
R:2,471 (0.9%)
104,461 (38.0%)
R:387 (0.1%)
R:528 (0.2%)
R:244 (0.1%)
38,136 (17.6%)
35,528 (15.0%)
29,885 (10.8%)
51,389 (24.5%)
96,247 (35.8%)
R:3,141 (1.7%)
119,149 (44.1%)
129,819 (50.5%)
ND:10 (0.0%)
ND:34 (0.0%)
ND:8 (0.0%)
ND:3,489 (1.3%)
ND:3,771 (1.5%)
ND:60 (0.0%)
ND:65 (0.0%)
ND:82 (0.0%)
ND:9,408 (4.5%)
9,756 (3.6%)
ND:25 (0.0%)
ND:2 (0.0%)
ND:155 (0.1%)
0% 10% 20% 30% 40% 50% 60% 70% 80% 90% 100%
ABPC (N=257,065)
PIPC (N=270,452)
TAZ/PIPC (N=179,722)
CEZ (N=268,898)
CTX (N=209,404)
CAZ (N=275,671)
CFPM (N=236,705)
AZT (N=216,494)
IPM (N=251,050)
MEPM (N=269,893)
AMK (N=281,641)
LVFX (N=274,687)
CMZ (N=260,844)
S : Susceptible S or I : Susceptible or Intermediate I : IntermediateI or R : Intermediate or Resistant R : Resistant ND : Not determined
Annual Open Report 2015 (All Facilities)
April 04, 2017
Inpatient specimens with MIC values reported by either the broth microdilution method or Etest are counted. Duplicates based on
the result of Antimicrobial Susceptibility Testing are not recounted within 30 days (See Appendix).
* Results are interpreted according to the CLSI2012 (M100-S22) criteria.
†E. coli corresponds to Isolated Bacterial Codes 2001-2007.
18
Clinical Laboratory DivisionJapan Nosocomial Infections Surveillance (JANIS)
This Open Report does not cover every data from facilities nationwide.Date of Total Tabulation : June 14, 2016
Date of Publication (English Version) :
【CLSI2012 Version】

7.Antimicrobial Susceptibility of Major Bacteria*
Klebsiella pneumoniae†
128,579 (97.3%)
132,943 (96.0%)
141,373 (99.8%)
132,990 (97.8%)
123,989 (97.6%)
100,467 (91.1%)
113,897 (95.3%)
129,375 (93.6%)
92,490 (86.1%)
23,616 (17.4%)
88,480 (96.7%)
85,723 (62.9%)
S:5,715 (4.3%)
SorI:224 (0.2%)
SorI:132 (0.1%)
SorI:158 (0.1%)
SorI:3,033 (2.8%)
SorI:2,045 (1.5%)
SorI:135 (0.1%)
85,409 (63.0%)
SorI:28 (0.0%)
I:739 (0.6%)
I:1,843 (1.3%)
I:126 (0.1%)
I:219 (0.2%)
I:617 (0.5%)
I:910 (0.8%)
I:833 (0.7%)
I:1,155 (0.8%)
I:387 (0.4%)
I:3,926 (2.9%)
I:1,161 (1.3%)
21,726 (15.9%)
24,024 (18.2%)
IorR:100 (0.1%)
IorR:17 (0.0%)
IorR:1 (0.0%)
IorR:1 (0.0%)
IorR:1 (0.0%)
IorR:3 (0.0%)
IorR:34 (0.0%)
IorR:1 (0.0%)
IorR:44 (0.0%)
IorR:8 (0.0%)
IorR:185 (0.1%)
IorR:487 (0.4%)
R:2,514 (1.9%)
R:3,598 (2.6%)
R:207 (0.1%)
R:772 (0.6%)
R:345 (0.3%)
R:5,841 (5.3%)
R:4,795 (4.0%)
R:5,560 (4.0%)
R:8,594 (8.0%)
16,408 (12.1%)
R:1,848 (2.0%)
28,710 (21.1%)
101,281 (76.9%)
ND:7 (0.0%)
ND:27 (0.0%)
ND:3 (0.0%)
ND:1,816 (1.3%)
ND:1,887 (1.5%)
ND:5 (0.0%)
ND:4 (0.0%)
ND:55 (0.0%)
5,759 (5.4%)
6,127 (4.5%)
ND:6 (0.0%)
ND:3 (0.0%)
ND:165 (0.1%)
0% 10% 20% 30% 40% 50% 60% 70% 80% 90% 100%
ABPC (N=131,700)
PIPC (N=136,347)
TAZ/PIPC (N=91,503)
CEZ (N=135,486)
CTX (N=107,409)
CAZ (N=138,191)
CFPM (N=119,563)
AZT (N=110,259)
IPM (N=126,997)
MEPM (N=135,930)
AMK (N=141,710)
LVFX (N=138,428)
CMZ (N=132,163)
S : Susceptible S or I : Susceptible or Intermediate I : IntermediateI or R : Intermediate or Resistant R : Resistant ND : Not determined
Annual Open Report 2015 (All Facilities)
April 04, 2017
Inpatient specimens with MIC values reported by either the broth microdilution method or Etest are counted. Duplicates based on
the result of Antimicrobial Susceptibility Testing are not recounted within 30 days (See Appendix).
* Results are interpreted according to the CLSI2012 (M100-S22) criteria.
†K. pneumoniae corresponds to Isolated Bacterial Code 2351.
19
Clinical Laboratory DivisionJapan Nosocomial Infections Surveillance (JANIS)
This Open Report does not cover every data from facilities nationwide.Date of Total Tabulation : June 14, 2016
Date of Publication (English Version) :
【CLSI2012 Version】

7.Antimicrobial Susceptibility of Major Bacteria*
Enterobacter cloacae†
S:3,101 (5.5%)
55,653 (93.7%)
60,889 (99.7%)
57,133 (96.8%)
50,471 (91.9%)
34,090 (70.2%)
49,048 (93.9%)
42,202 (70.9%)
28,604 (61.2%)
S:208 (0.4%)
33,051 (82.0%)
42,415 (73.1%)
S:4,499 (8.0%)
SorI:23 (0.0%)
SorI:66 (0.1%)
SorI:88 (0.2%)
SorI:1,004 (2.1%)
SorI:611 (1.0%)
SorI:15 (0.0%)
SorI:596 (1.0%)
SorI:8 (0.0%)
I:3,368 (5.9%)
I:1,557 (2.6%)
I:79 (0.1%)
I:234 (0.4%)
I:2,880 (5.2%)
I:1,819 (3.7%)
I:957 (1.8%)
I:1,819 (3.1%)
I:1,426 (3.1%)
I:154 (0.3%)
I:3,624 (9.0%)
I:4,020 (6.9%)
6,311 (11.3%)
IorR:1,674 (3.0%)
IorR:5 (0.0%)
IorR:1 (0.0%)
IorR:2 (0.0%)
IorR:4 (0.0%)
IorR:35 (0.1%)
IorR:56 (0.1%)
IorR:2 (0.0%)
IorR:30 (0.1%)
IorR:112 (0.2%)
IorR:117 (0.2%)
48,364 (85.4%)
R:2,172 (3.7%)
R:116 (0.2%)
R:836 (1.4%)
R:732 (1.3%)
11,648 (24.0%)
R:2,174 (4.2%)
14,887 (25.0%)
14,755 (31.6%)
57,618 (98.3%)
R:3,602 (8.9%)
11,490 (19.8%)
44,904 (80.2%)
ND:117 (0.2%)
ND:6 (0.0%)
ND:1 (0.0%)
ND:738 (1.3%)
ND:751 (1.4%)
ND:9 (0.0%)
ND:4 (0.0%)
ND:14 (0.0%)
1,871 (4.0%)
ND:59 (0.1%)
ND:8 (0.0%)
ND:2 (0.0%)
ND:121 (0.2%)
0% 10% 20% 30% 40% 50% 60% 70% 80% 90% 100%
ABPC (N=55,960)
PIPC (N=58,039)
TAZ/PIPC (N=40,315)
CEZ (N=58,637)
CTX (N=46,727)
CAZ (N=59,533)
CFPM (N=52,218)
AZT (N=48,570)
IPM (N=54,926)
MEPM (N=59,009)
AMK (N=61,086)
LVFX (N=59,393)
CMZ (N=56,647)
S : Susceptible S or I : Susceptible or Intermediate I : IntermediateI or R : Intermediate or Resistant R : Resistant ND : Not determined
Annual Open Report 2015 (All Facilities)
April 04, 2017
Inpatient specimens with MIC values reported by either the broth microdilution method or Etest are counted. Duplicates based on
the result of Antimicrobial Susceptibility Testing are not recounted within 30 days (See Appendix).
* Results are interpreted according to the CLSI2012 (M100-S22) criteria.
†E. cloacae corresponds to Isolated Bacterial Code 2151.
20
Clinical Laboratory DivisionJapan Nosocomial Infections Surveillance (JANIS)
This Open Report does not cover every data from facilities nationwide.Date of Total Tabulation : June 14, 2016
Date of Publication (English Version) :
【CLSI2012 Version】

7.Antimicrobial Susceptibility of Major Bacteria*
Enterobacter aerogenes†
S:1,427 (5.3%)
27,560 (98.4%)
28,576 (99.8%)
26,958 (97.8%)
21,616 (84.1%)
16,937 (72.9%)
23,905 (98.4%)
19,571 (70.2%)
13,785 (62.7%)
S:199 (0.7%)
15,378 (82.1%)
19,104 (70.3%)
S:2,210 (8.3%)
SorI:12 (0.0%)
SorI:49 (0.2%)
SorI:45 (0.2%)
SorI:584 (2.5%)
SorI:303 (1.1%)
SorI:10 (0.0%)
SorI:1,301 (4.7%)
SorI:3 (0.0%)
I:1,223 (4.6%)
I:192 (0.7%)
I:26 (0.1%)
I:76 (0.3%)
3,254 (12.7%)
I:1,622 (7.0%)
I:117 (0.5%)
I:964 (3.5%)
I:453 (2.1%)
I:172 (0.6%)
2,445 (13.1%)
4,189 (15.4%)
3,295 (12.4%)
IorR:829 (3.1%)
IorR:2 (0.0%)
IorR:13 (0.1%)
IorR:18 (0.1%)
IorR:21 (0.1%)
IorR:2 (0.0%)
IorR:12 (0.1%)
IorR:38 (0.1%)
IorR:73 (0.3%)
23,202 (86.8%)
R:255 (0.9%)
R:24 (0.1%)
R:211 (0.8%)
R:486 (1.9%)
4,066 (17.5%)
R:279 (1.1%)
7,028 (25.2%)
6,760 (30.7%)
25,803 (93.7%)
R:893 (4.8%)
3,857 (14.2%)
21,054 (78.9%)
ND:46 (0.2%)
ND:3 (0.0%)
ND:1 (0.0%)
ND:266 (1.0%)
ND:289 (1.1%)
ND:3 (0.0%)
ND:1 (0.0%)
ND:2 (0.0%)
956 (4.3%)
ND:49 (0.2%)
ND:3 (0.0%)
ND:1 (0.0%)
ND:45 (0.2%)
0% 10% 20% 30% 40% 50% 60% 70% 80% 90% 100%
ABPC (N=26,680)
PIPC (N=27,189)
TAZ/PIPC (N=18,731)
CEZ (N=27,526)
CTX (N=21,985)
CAZ (N=27,886)
CFPM (N=24,302)
AZT (N=23,225)
IPM (N=25,690)
MEPM (N=27,560)
AMK (N=28,627)
LVFX (N=28,012)
CMZ (N=26,739)
S : Susceptible S or I : Susceptible or Intermediate I : IntermediateI or R : Intermediate or Resistant R : Resistant ND : Not determined
Annual Open Report 2015 (All Facilities)
April 04, 2017
Inpatient specimens with MIC values reported by either the broth microdilution method or Etest are counted. Duplicates based on
the result of Antimicrobial Susceptibility Testing are not recounted within 30 days (See Appendix).
* Results are interpreted according to the CLSI2012 (M100-S22) criteria.
†E. aerogenes corresponds to Isolated Bacterial Code 2152.
21
Clinical Laboratory DivisionJapan Nosocomial Infections Surveillance (JANIS)
This Open Report does not cover every data from facilities nationwide.Date of Total Tabulation : June 14, 2016
Date of Publication (English Version) :
【CLSI2012 Version】

7.Antimicrobial Susceptibility of Major Bacteria*
Citrobacter freundii†
8,031 (41.5%)
19,158 (95.5%)
20,728 (99.8%)
19,795 (98.1%)
17,411 (94.2%)
11,926 (71.5%)
17,646 (98.1%)
14,600 (72.2%)
10,620 (66.6%)
S:100 (0.5%)
12,649 (89.6%)
13,922 (71.1%)
5,272 (27.4%)
SorI:28 (0.1%)
SorI:19 (0.1%)
SorI:46 (0.2%)
SorI:381 (2.3%)
SorI:266 (1.3%)
SorI:7 (0.0%)
SorI:457 (2.3%)
SorI:2 (0.0%)
5,261 (27.2%)
I:371 (1.9%)
I:19 (0.1%)
I:26 (0.1%)
I:651 (3.5%)
I:630 (3.8%)
I:111 (0.6%)
I:413 (2.0%)
I:282 (1.8%)
I:134 (0.7%)
I:1,064 (7.5%)
I:1,463 (7.5%)
2,853 (14.8%)
IorR:358 (1.8%)
IorR:9 (0.0%)
IorR:2 (0.0%)
IorR:34 (0.2%)
IorR:10 (0.1%)
IorR:33 (0.2%)
IorR:58 (0.4%)
IorR:18 (0.1%)
IorR:59 (0.3%)
IorR:88 (0.5%)
5,643 (29.1%)
R:514 (2.6%)
R:18 (0.1%)
R:61 (0.3%)
R:78 (0.4%)
3,687 (22.1%)
R:213 (1.2%)
4,908 (24.3%)
4,254 (26.7%)
19,312 (96.3%)
R:381 (2.7%)
4,146 (21.2%)
11,002 (57.1%)
ND:50 (0.3%)
ND:1 (0.0%)
ND:2 (0.0%)
ND:283 (1.4%)
ND:297 (1.6%)
ND:11 (0.1%)
ND:1 (0.0%)
ND:2 (0.0%)
ND:729 (4.6%)
ND:47 (0.2%)
ND:1 (0.0%)
ND:1 (0.0%)
ND:58 (0.3%)
0% 10% 20% 30% 40% 50% 60% 70% 80% 90% 100%
ABPC (N=19,275)
PIPC (N=19,591)
TAZ/PIPC (N=14,113)
CEZ (N=20,050)
CTX (N=15,950)
CAZ (N=20,222)
CFPM (N=17,981)
AZT (N=16,669)
IPM (N=18,485)
MEPM (N=20,184)
AMK (N=20,767)
LVFX (N=20,053)
CMZ (N=19,371)
S : Susceptible S or I : Susceptible or Intermediate I : IntermediateI or R : Intermediate or Resistant R : Resistant ND : Not determined
Annual Open Report 2015 (All Facilities)
April 04, 2017
Inpatient specimens with MIC values reported by either the broth microdilution method or Etest are counted. Duplicates based on
the result of Antimicrobial Susceptibility Testing are not recounted within 30 days (See Appendix).
* Results are interpreted according to the CLSI2012 (M100-S22) criteria.
†C. freundii corresponds to Isolated Bacterial Code 2051.
22
Clinical Laboratory DivisionJapan Nosocomial Infections Surveillance (JANIS)
This Open Report does not cover every data from facilities nationwide.Date of Total Tabulation : June 14, 2016
Date of Publication (English Version) :
【CLSI2012 Version】

7.Antimicrobial Susceptibility of Major Bacteria*
Citrobacter koseri†
8,946 (89.7%)
9,127 (87.1%)
10,564 (99.5%)
10,012 (98.6%)
9,286 (97.6%)
6,716 (83.0%)
8,788 (85.3%)
6,156 (80.7%)
1,651 (16.4%)
6,031 (93.2%)
3,075 (29.2%)
S:64 (0.7%)
SorI:10 (0.1%)
SorI:7 (0.1%)
SorI:10 (0.1%)
SorI:170 (2.1%)
SorI:114 (1.1%)
5,740 (57.1%)
I:369 (3.7%)
I:160 (1.5%)
I:44 (0.4%)
I:12 (0.1%)
I:94 (1.0%)
I:75 (0.9%)
I:105 (1.0%)
I:49 (0.6%)
I:264 (2.6%)
I:143 (2.2%)
3,826 (36.4%)
I:395 (4.1%)
IorR:12 (0.1%)
IorR:11 (0.1%)
IorR:9 (0.1%)
IorR:1 (0.0%)
IorR:1 (0.0%)
IorR:23 (0.2%)
IorR:24 (0.2%)
R:631 (6.3%)
1,181 (11.3%)
R:12 (0.1%)
R:39 (0.4%)
R:36 (0.4%)
1,133 (14.0%)
1,283 (12.5%)
1,124 (14.7%)
2,010 (20.0%)
R:296 (4.6%)
3,598 (34.2%)
9,114 (94.8%)
ND:2 (0.0%)
ND:1 (0.0%)
ND:1 (0.0%)
ND:81 (0.8%)
ND:93 (1.0%)
ND:1 (0.0%)
ND:12 (0.1%)
290 (3.8%)
385 (3.8%)
ND:3 (0.0%)
ND:12 (0.1%)
0% 10% 20% 30% 40% 50% 60% 70% 80% 90% 100%
ABPC (N=9,609)
PIPC (N=10,522)
TAZ/PIPC (N=6,474)
CEZ (N=10,051)
CTX (N=7,628)
CAZ (N=10,302)
AZT (N=8,095)
IPM (N=9,519)
MEPM (N=10,151)
AMK (N=10,621)
LVFX (N=10,480)
CMZ (N=9,970)
S : Susceptible S or I : Susceptible or Intermediate I : IntermediateI or R : Intermediate or Resistant R : Resistant ND : Not determined
Annual Open Report 2015 (All Facilities)
April 04, 2017
Inpatient specimens with MIC values reported by either the broth microdilution method or Etest are counted. Duplicates based on
the result of Antimicrobial Susceptibility Testing are not recounted within 30 days (See Appendix).
* Results are interpreted according to the CLSI2012 (M100-S22) criteria.
†C. koseri corresponds to Isolated Bacterial Code 2052.
23
Clinical Laboratory DivisionJapan Nosocomial Infections Surveillance (JANIS)
This Open Report does not cover every data from facilities nationwide.Date of Total Tabulation : June 14, 2016
Date of Publication (English Version) :
【CLSI2012 Version】

7.Antimicrobial Susceptibility of Major Bacteria*
Proteus mirabilis†
23,028 (98.5%)
18,868 (76.3%)
24,804 (99.4%)
22,929 (98.3%)
5,157 (44.1%)
15,952 (87.1%)
22,938 (96.4%)
12,343 (71.6%)
S:1,679 (6.9%)
15,526 (99.5%)
16,336 (67.0%)
14,246 (64.1%)
SorI:25 (0.1%)
SorI:17 (0.1%)
SorI:824 (7.0%)
SorI:447 (2.4%)
SorI:345 (1.4%)
SorI:13 (0.1%)
10,549 (43.7%)
SorI:5 (0.0%)
I:98 (0.4%)
I:2,196 (8.9%)
I:99 (0.4%)
I:27 (0.1%)
2,861 (24.5%)
I:219 (1.2%)
I:180 (0.8%)
I:170 (1.0%)
I:1,780 (7.4%)
I:45 (0.3%)
I:983 (4.0%)
I:178 (0.8%)
IorR:6 (0.0%)
IorR:37 (0.1%)
IorR:1 (0.0%)
IorR:3 (0.0%)
IorR:9 (0.0%)
IorR:50 (0.3%)
IorR:2 (0.0%)
IorR:56 (0.2%)
IorR:51 (0.2%)
R:215 (0.9%)
3,633 (14.7%)
R:56 (0.2%)
R:36 (0.2%)
2,486 (21.3%)
1,698 (9.3%)
R:337 (1.4%)
3,830 (22.2%)
9,184 (38.0%)
R:26 (0.2%)
7,007 (28.7%)
7,731 (34.8%)
ND:5 (0.0%)
ND:3 (0.0%)
ND:319 (1.4%)
ND:359 (3.1%)
ND:1 (0.0%)
ND:830 (4.8%)
968 (4.0%)
ND:1 (0.0%)
0% 10% 20% 30% 40% 50% 60% 70% 80% 90% 100%
ABPC (N=22,212)
PIPC (N=24,382)
TAZ/PIPC (N=15,597)
CEZ (N=24,162)
CTX (N=17,236)
CAZ (N=23,801)
AZT (N=18,325)
IPM (N=11,690)
MEPM (N=23,328)
AMK (N=24,963)
LVFX (N=24,739)
CMZ (N=23,372)
S : Susceptible S or I : Susceptible or Intermediate I : IntermediateI or R : Intermediate or Resistant R : Resistant ND : Not determined
Annual Open Report 2015 (All Facilities)
April 04, 2017
Inpatient specimens with MIC values reported by either the broth microdilution method or Etest are counted. Duplicates based on
the result of Antimicrobial Susceptibility Testing are not recounted within 30 days (See Appendix).
* Results are interpreted according to the CLSI2012 (M100-S22) criteria.
†P. mirabilis corresponds to Isolated Bacterial Code 2201.
24
Clinical Laboratory DivisionJapan Nosocomial Infections Surveillance (JANIS)
This Open Report does not cover every data from facilities nationwide.Date of Total Tabulation : June 14, 2016
Date of Publication (English Version) :
【CLSI2012 Version】

7.Antimicrobial Susceptibility of Major Bacteria*
Proteus vulgaris†
5,825 (98.8%)
6,110 (98.6%)
6,346 (99.8%)
5,953 (98.3%)
1,260 (52.9%)
4,169 (82.4%)
5,898 (95.7%)
3,249 (66.8%)
S:11 (0.2%)
4,276 (99.5%)
4,058 (67.2%)
S:229 (3.9%)
SorI:14 (0.2%)
SorI:8 (0.1%)
SorI:9 (0.4%)
SorI:140 (2.8%)
SorI:103 (1.7%)
SorI:6 (0.1%)
SorI:79 (1.3%)
I:20 (0.3%)
I:40 (0.6%)
I:6 (0.1%)
I:6 (0.1%)
567 (23.8%)
I:113 (2.2%)
I:96 (1.6%)
I:195 (4.0%)
I:16 (0.3%)
I:15 (0.3%)
1,030 (17.0%)
I:78 (1.3%)
IorR:3 (0.1%)
IorR:2 (0.0%)
IorR:7 (0.1%)
IorR:20 (0.3%)
R:32 (0.5%)
R:47 (0.8%)
R:5 (0.1%)
R:5 (0.1%)
457 (19.2%)
636 (12.6%)
R:68 (1.1%)
1,114 (22.9%)
6,013 (98.2%)
R:5 (0.1%)
948 (15.7%)
5,485 (94.2%)
ND:86 (1.4%)
91 (3.8%)
ND:297 (6.1%)
ND:5 (0.1%)
ND:8 (0.1%)
0% 10% 20% 30% 40% 50% 60% 70% 80% 90% 100%
ABPC (N=5,820)
PIPC (N=6,043)
TAZ/PIPC (N=4,296)
CEZ (N=6,124)
CTX (N=4,863)
CAZ (N=6,165)
AZT (N=5,058)
IPM (N=2,384)
MEPM (N=6,058)
AMK (N=6,357)
LVFX (N=6,197)
CMZ (N=5,894)
S : Susceptible S or I : Susceptible or Intermediate I : IntermediateI or R : Intermediate or Resistant R : Resistant ND : Not determined
Annual Open Report 2015 (All Facilities)
April 04, 2017
Inpatient specimens with MIC values reported by either the broth microdilution method or Etest are counted. Duplicates based on
the result of Antimicrobial Susceptibility Testing are not recounted within 30 days (See Appendix).
* Results are interpreted according to the CLSI2012 (M100-S22) criteria.
†P. vulgaris corresponds to Isolated Bacterial Code 2202.
25
Clinical Laboratory DivisionJapan Nosocomial Infections Surveillance (JANIS)
This Open Report does not cover every data from facilities nationwide.Date of Total Tabulation : June 14, 2016
Date of Publication (English Version) :
【CLSI2012 Version】

7.Antimicrobial Susceptibility of Major Bacteria*
Serratia marcescens†
24,943 (79.0%)
30,469 (91.2%)
33,739 (99.0%)
31,644 (98.4%)
27,456 (90.8%)
22,528 (84.9%)
28,070 (98.1%)
28,635 (87.1%)
6,861 (62.1%)
S:12 (0.0%)
18,431 (85.5%)
25,110 (76.3%)
S:1,406 (4.5%)
SorI:33 (0.1%)
SorI:30 (0.1%)
SorI:29 (0.1%)
SorI:751 (2.8%)
SorI:371 (1.1%)
SorI:11 (0.1%)
SorI:17 (0.1%)
SorI:10 (0.0%)
3,558 (11.3%)
I:1,646 (4.9%)
I:239 (0.7%)
I:55 (0.2%)
I:1,943 (6.4%)
I:955 (3.6%)
I:203 (0.7%)
I:776 (2.4%)
I:589 (5.3%)
I:2 (0.0%)
2,161 (10.0%)
4,839 (14.7%)
3,395 (11.0%)
IorR:157 (0.5%)
IorR:4 (0.0%)
IorR:3 (0.0%)
IorR:3 (0.0%)
IorR:5 (0.0%)
IorR:2 (0.0%)
IorR:6 (0.0%)
IorR:9 (0.1%)
IorR:8 (0.0%)
IorR:20 (0.1%)
IorR:79 (0.3%)
2,871 (9.1%)
R:1,279 (3.8%)
R:90 (0.3%)
R:115 (0.4%)
R:475 (1.6%)
R:2,308 (8.7%)
R:332 (1.2%)
3,087 (9.4%)
2,464 (22.3%)
32,504 (99.9%)
R:942 (4.4%)
R:2,930 (8.9%)
26,067 (84.1%)
ND:13 (0.0%)
ND:11 (0.0%)
ND:3 (0.0%)
ND:326 (1.0%)
ND:333 (1.1%)
ND:2 (0.0%)
ND:5 (0.0%)
ND:3 (0.0%)
ND:1,122 (10.1%)
ND:3 (0.0%)
ND:3 (0.0%)
ND:2 (0.0%)
ND:45 (0.1%)
0% 10% 20% 30% 40% 50% 60% 70% 80% 90% 100%
ABPC (N=31,002)
PIPC (N=32,901)
TAZ/PIPC (N=21,545)
CEZ (N=32,538)
CTX (N=11,056)
CAZ (N=32,878)
CFPM (N=28,612)
AZT (N=26,549)
IPM (N=30,239)
MEPM (N=32,170)
AMK (N=34,074)
LVFX (N=33,409)
CMZ (N=31,575)
S : Susceptible S or I : Susceptible or Intermediate I : IntermediateI or R : Intermediate or Resistant R : Resistant ND : Not determined
Annual Open Report 2015 (All Facilities)
April 04, 2017
Inpatient specimens with MIC values reported by either the broth microdilution method or Etest are counted. Duplicates based on
the result of Antimicrobial Susceptibility Testing are not recounted within 30 days (See Appendix).
* Results are interpreted according to the CLSI2012 (M100-S22) criteria.
†S. marcescens corresponds to Isolated Bacterial Code 2101.
26
Clinical Laboratory DivisionJapan Nosocomial Infections Surveillance (JANIS)
This Open Report does not cover every data from facilities nationwide.Date of Total Tabulation : June 14, 2016
Date of Publication (English Version) :
【CLSI2012 Version】

7.Antimicrobial Susceptibility of Major Bacteria*
Pseudomonas aeruginosa†
141,935 (81.4%)
178,210 (96.2%)
140,707 (84.9%)
144,874 (80.1%)
127,779 (75.8%)
140,365 (84.5%)
104,503 (71.2%)
154,816 (85.8%)
108,857 (82.0%)
143,616 (78.9%)
SorI:1 (0.0%)
SorI:13 (0.0%)
SorI:1,913 (1.1%)
SorI:1,750 (1.0%)
SorI:2 (0.0%)
SorI:5 (0.0%)
I:11,300 (6.5%)
I:4,268 (2.3%)
17,631 (10.6%)
I:10,091 (5.6%)
I:6,705 (4.0%)
I:14,748 (8.9%)
20,623 (14.0%)
I:9,649 (5.3%)
12,142 (9.1%)
19,034 (10.5%)
IorR:79 (0.0%)
IorR:50 (0.0%)
IorR:8 (0.0%)
IorR:360 (0.2%)
IorR:416 (0.2%)
IorR:43 (0.0%)
IorR:966 (0.7%)
IorR:516 (0.3%)
IorR:137 (0.1%)
IorR:154 (0.1%)
20,984 (12.0%)
R:2,794 (1.5%)
R:7,415 (4.5%)
23,611 (13.1%)
31,747 (18.8%)
R:10,939 (6.6%)
20,597 (14.0%)
R:15,494 (8.6%)
R:11,626 (8.8%)
19,171 (10.5%)
ND:2 (0.0%)
ND:5 (0.0%)
ND:3 (0.0%)
ND:1 (0.0%)
ND:74 (0.0%)
ND:1 (0.0%)
ND:152 (0.1%)
ND:2 (0.0%)
ND:2 (0.0%)
ND:2 (0.0%)
0% 10% 20% 30% 40% 50% 60% 70% 80% 90% 100%
PIPC (N=181,977)
TAZ/PIPC (N=132,769)
CAZ (N=180,479)
AZT (N=146,841)
CFPM (N=166,096)
IPM (N=168,471)
MEPM (N=180,850)
GM (N=165,777)
AMK (N=185,327)
LVFX (N=174,301)
S : Susceptible S or I : Susceptible or Intermediate I : IntermediateI or R : Intermediate or Resistant R : Resistant ND : Not determined
Annual Open Report 2015 (All Facilities)
April 04, 2017
Inpatient specimens with MIC values reported by either the broth microdilution method or Etest are counted. Duplicates based on
the result of Antimicrobial Susceptibility Testing are not recounted within 30 days (See Appendix).
* Results are interpreted according to the CLSI2012 (M100-S22) criteria.
†P. aeruginosa corresponds to Isolated Bacterial Code 4001.
27
Clinical Laboratory DivisionJapan Nosocomial Infections Surveillance (JANIS)
This Open Report does not cover every data from facilities nationwide.Date of Total Tabulation : June 14, 2016
Date of Publication (English Version) :
【CLSI2012 Version】

7.Antimicrobial Susceptibility of Major Bacteria*
Acinetobacter spp.†
19,489 (89.5%)
24,236 (87.0%)
27,445 (96.1%)
22,750 (88.6%)
27,446 (97.2%)
13,416 (96.2%)
22,025 (86.7%)
24,012 (85.3%)
10,567 (93.1%)
7,818 (86.3%)
20,822 (74.7%)
SorI:3 (0.0%)
SorI:1 (0.0%)
SorI:2 (0.0%)
SorI:6 (0.0%)
SorI:1 (0.0%)
SorI:1 (0.0%)
SorI:6 (0.1%)
I:1,462 (5.2%)
I:238 (0.8%)
I:740 (2.9%)
I:122 (0.4%)
I:48 (0.3%)
I:1,547 (6.1%)
I:1,407 (5.0%)
I:236 (2.1%)
I:465 (5.1%)
3,806 (13.6%)
IorR:5 (0.0%)
IorR:5 (0.0%)
IorR:7 (0.0%)
IorR:19 (0.1%)
IorR:15 (0.1%)
IorR:9 (0.0%)
IorR:499 (1.8%)
IorR:7 (0.1%)
IorR:16 (0.2%)
IorR:43 (0.2%)
R:1,817 (8.3%)
R:2,150 (7.7%)
R:878 (3.1%)
R:2,191 (8.5%)
R:521 (1.8%)
R:448 (3.2%)
R:1,829 (7.2%)
R:2,247 (8.0%)
R:545 (4.8%)
R:733 (8.1%)
3,216 (11.5%)
475 (2.2%)
ND:2 (0.0%)
ND:2 (0.0%)
ND:117 (0.4%)
ND:9 (0.1%)
ND:2 (0.0%)
ND:20 (0.2%)
0% 10% 20% 30% 40% 50% 60% 70% 80% 90% 100%
PIPC (N=27,887)
TAZ/PIPC (N=9,058)
SBT/ABPC (N=11,356)
CAZ (N=28,166)
CFPM (N=25,412)
IPM (N=13,942)
MEPM (N=28,227)
GM (N=25,689)
AMK (N=28,568)
LVFX (N=27,858)
ST (N=21,781)
S : Susceptible S or I : Susceptible or Intermediate I : IntermediateI or R : Intermediate or Resistant R : Resistant ND : Not determined
Annual Open Report 2015 (All Facilities)
April 04, 2017
Inpatient specimens with MIC values reported by either the broth microdilution method or Etest are counted. Duplicates based on
the result of Antimicrobial Susceptibility Testing are not recounted within 30 days (See Appendix).
* Results are interpreted according to the CLSI2012 (M100-S22) criteria.
†Acinetobacter spp. correspond to Isolated Bacterial Codes 4400-4403.
28
Clinical Laboratory DivisionJapan Nosocomial Infections Surveillance (JANIS)
This Open Report does not cover every data from facilities nationwide.Date of Total Tabulation : June 14, 2016
Date of Publication (English Version) :
【CLSI2012 Version】

7.Antimicrobial Susceptibility of Major Bacteria*
Haemophilus influenzae†
Annual Open Report 2015 (All Facilities)
April 04, 2017
17,237 (98.4%)
28,752 (80.0%)
17,709 (77.9%)
22,741 (66.0%)
16,036 (39.7%)SorI:23 (0.1%)
I:66 (0.4%)
5,829 (16.2%)
7,819 (19.4%)
IorR:75 (0.2%)
IorR:2 (0.0%)
R:208 (1.2%)
R:1,173 (3.3%)
5,028 (22.1%)
11,734 (34.0%)
16,473 (40.8%)
ND:125 (0.3%)
ND:6 (0.0%)
ND:3 (0.0%)
0% 10% 20% 30% 40% 50% 60% 70% 80% 90% 100%
ABPC (N=40,353)
SBT/ABPC (N=34,478)
CVA/AMPC (N=22,743)
CAM (N=35,954)
TC (N=17,511)
S : Susceptible S or I : Susceptible or Intermediate I : IntermediateI or R : Intermediate or Resistant R : Resistant ND : Not determined
39,231 (98.5%)
37,848 (95.8%)
29,898 (98.7%)
NS:598 (1.5%)
NS:1,653 (4.2%)
NS:372 (1.2%)
ND:5 (0.0%)
ND:14 (0.0%)
ND:19 (0.1%)
0% 10% 20% 30% 40% 50% 60% 70% 80% 90% 100%
CTX (N=30,289)
MEPM (N=39,515)
LVFX (N=39,834)
S : Susceptible NS : Non-susceptible ND : Not determined
Inpatient specimens with MIC values reported by either the broth microdilution method or Etest are counted. Duplicates based on
the result of Antimicrobial Susceptibility Testing are not recounted within 30 days (See Appendix).
* Results are interpreted according to the CLSI2012 (M100-S22) criteria.
†H. influenzae corresponds to Isolated Bacterial Codes 3201, 3202, 3203, 3205, 3208, 3211, 3214, 3217, 3220 and 3223.
29
Clinical Laboratory DivisionJapan Nosocomial Infections Surveillance (JANIS)
This Open Report does not cover every data from facilities nationwide.Date of Total Tabulation : June 14, 2016
Date of Publication (English Version) :
【CLSI2012 Version】

【Appendix 1 Interpretive Criteria for Specific AMR Bacteria based on the Broth Microdilution Method】 Isolated
Bacterium Comments*
MIC Values by Broth Microdilution Method
Isolated Bacterial Code Ver.4.0
Methicillin-Resistant Staphylococcus aureus
(MRSA)
S. aureus resistant to oxacillin by the broth microdilution method or methicillin-resistant S. aureus detected on selective media
oxacillin ≥ 4 μg/mL
1301, 1303
Vancomycin- Resistant
Staphylococcus aureus (VRSA)
S. aureus resistant to vancomycin vancomycin ≥ 16 μg/mL 1301,1303–1306
Vancomycin- Resistant Enterococci
(VRE)
Enterococcus spp. resistant† to vancomycin by the broth microdilution method or vancomycin-resistant enterococci detected on selective media Note: Excluding species that were not identified within Enterococcus sp.
vancomycin ≥ 16 μg/mL† 1201,1202,1205, 1206,1209,1210, 1213–1217
Penicillin-Resistant Streptococcus pneumoniae
(PRSP)
S. pneumoniae resistant† to penicillin G
penicillin G ≥ 0.125 μg/mL† 1131
Multidrug-Resistant Pseudomonas
aeruginosa (MDRP)
P. aeruginosa satisfying all of the following criteria: 1. Resistant† to carbapenems (imipenem and/or meropenem) 2. Resistant† to aminoglycosides (amikacin) 3. Resistant to fluoroquinolones (any of norfloxacin, ofloxacin, levofloxacin, lomefloxacin, ciprofloxacin and gatifloxacin).
1. imipenem ≥ 16 μg/mL†, meropenem ≥ 16 μg/mL† 2. amikacin ≥ 32 μg/mL† 3. norfloxacin ≥ 16 μg/mL, ofloxacin ≥ 8 μg/mL, levofloxacin ≥ 8 μg/mL, lomefloxacin≥ 8 μg/mL, ciprofloxacin ≥ 4 μg/mL,
gatifloxacin ≥ 8 μg/mL
4001
Multidrug-Resistant Acinetobacter spp.
(MDRA)
Acinetobacter spp. satisfying all of the following criteria: 1. Resistant to carbapenems (imipenem and/or meropenem) 2. Resistant† to aminoglycosides (amikacin) 3. Resistant to fluoroquinolones (any of levofloxacin, ciprofloxacin and gatifloxacin)
1. imipenem ≥ 16 μg/mL†, meropenem ≥ 16 μg/mL† 2. amikacin ≥ 32 μg/mL† 3. levofloxacin ≥ 8 μg/mL, ciprofloxacin ≥ 4 μg/mL,
gatifloxacin ≥ 8 μg/mL
4400–4403
Carbapenem- Resistant
Enterobacteriaceae (CRE)
Enterobacteriaceae satisfying one of the following criteria. 1. Resistant† to meropenem 2. Resistant† to imipenem and also resistant to cefmetazole
imipenem ≥ 2 μg/mL†, meropenem ≥ 2 μg/mL† and also cefmetazole ≥ 64 μg/mL
2000-2394, 3150-3151
Isolated Bacterium
Comments* MIC Values by Broth
Microdilution Method Isolated Bacterial
Code Ver.4.0 Carbapenem-
Resistant Pseudomonas
aeruginosa
P. aeruginosa resistant to imipenem and/or meropenem
imipenem ≥ 16 μg/mL†, meropenem ≥ 16 μg/mL†
4001
3rd Generation Cephalosporin-
Resistant Klebsiella pneumoniae
K. pneumoniae resistant to cefotaxime and/or ceftazidime
cefotaxime ≥ 4 μg/mL, ceftazidime ≥ 16 μg/mL
2351
3rd Generation Cephalosporin-
Resistant Escherichia coli
E. coli resistant to cefotaxime and/or ceftazidime
cefotaxime ≥ 4 μg/mL, ceftazidime ≥ 16 μg/mL
2001–2007
Fluoroquinolone- Resistant
Escherichia coli
E. coli resistant to fluoroquinolones (any of norfloxacin, ofloxacin, levofloxacin, lomefloxacin, ciprofloxacin and gatifloxacin)
norfloxacin ≥ 16 μg/mL, ofloxacin ≥ 8 μg/mL, levofloxacin ≥ 8 μg/mL, lomefloxacin ≥ 8 μg/mL, ciprofloxacin ≥ 4 μg/mL, gatifloxacin ≥ 8μg/mL
2001–2007
* In principle, RIS interpretation is based on the CLSI2012 (M100-S22) guidelines † Criteria are based on the Infectious Diseases Control Law

【Appendix 2 Method to Eliminate Duplicates of Annual Report】 1. Rule of Counting Days
“Day 1” is defined as the day after the "Specimen Reception Date". For example, if a specimen is received on March 1, “Day 1” will be March 2 and “Day 30” will be March 31.
Example)
2. Number of "Specimen-submitting Patients"
The number of “Specimen-submitting Patients” is equal to the number of inpatients whose specimens were submitted, regardless of the specimen sources. If more than one specimen is submitted by one patient within 30 days, the number of “Specimen-submitting Patients” is defined as one. This is how we eliminate duplicates.
3. Number of Patients with Major/Specific AMR Bacteria The same method used to eliminate duplicate “Specimen-submitting Patients” records is applied to “Patients with Major/Specific AMR Bacteria”. If more than one identical bacterium is isolated from the same patient within 30 days, the number of “Patients with Major/Specific AMR Bacteria” is not recounted. To obtain the number of “Patients with Specific AMR Bacteria”, first the data regarding pathogens which meet “Specific AMR Bacteria” criteria are extracted. Then the method mentioned above is applied to eliminate duplicates. Example
4. Definition of Isolates Based on the Results of Antimicrobial Susceptibility Testing
(AST) If the AST results differ* between the same bacteria isolated within 30 days, each of them is counted separately. *Difference of AST is determined by satisfying any of the following four criteria: ① More than four-fold difference in the MIC value; however,
MIC > 2 is equivalent to MIC ≥ 4 and is interpreted as MIC = 4, and MIC < 16 is equivalent to MIC ≦ 16 and is interpreted as MIC = 16
② Findings of “R and S” on RIS interpretation ③ Findings of “- and ++”, “+ and +++”, or “- and +++” on +/- interpretation ④ Fewer than five duplicate antimicrobial agents among testings
Mar 1"Specimen
Reception Date"
Mar 2"Day 1"
Mar 31"Day 30"
March Apri l
within 30 days
Example)
March Apri l May
Mar 2 Mar 30 Apr 10 May 15
The number of "Specimen-submittingPatients" is not recounted i f the second specimen is submitted within
d
The number of "Specimen-submitting Patients" is recounted if the second specimen is submitted on after 31
SpecimenReceiption Date
Specimen-submitting Patients
Specimen
March Apri l May
Mar 2 Mar 30 Apr 10 May 15
39 days 35 days28 days
The number of "Patients with Major/Specific AMR Bacteria" is not recounted i f an i solated pathogen is the same species as one identified within the past 30 days
The number of "Patiens with Major/Specific AMR Bacteria" is recounted i f the same pathogen i s i solated again on or after 31 days
SpecimenReception Date
Pts with Major/Specific AMRbacteria
Specimen
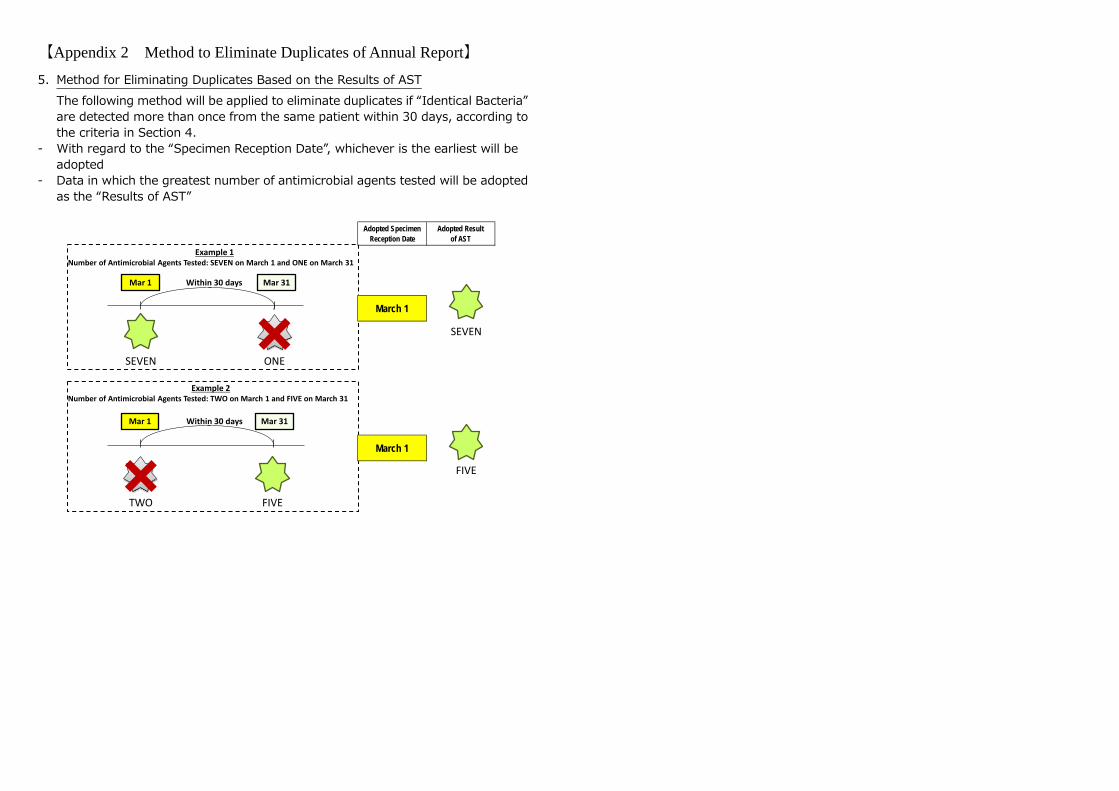
【Appendix 2 Method to Eliminate Duplicates of Annual Report】
5. Method for Eliminating Duplicates Based on the Results of AST The following method will be applied to eliminate duplicates if “Identical Bacteria”
are detected more than once from the same patient within 30 days, according to the criteria in Section 4.
- With regard to the “Specimen Reception Date”, whichever is the earliest will be adopted
- Data in which the greatest number of antimicrobial agents tested will be adopted as the “Results of AST”
Mar 31Within 30 days
Example 1Number of Antimicrobial Agents Tested: SEVEN on March 1 and ONE on March 31
Mar 1
SEVEN ONE
TWO FIVE
Example 2Number of Antimicrobial Agents Tested: TWO on March 1 and FIVE on March 31
Mar 1 Mar 31Within 30 days
Adopted SpecimenReception Date
Adopted Resultof AST
March 1
March 1
SEVEN
FIVE

【Appendix 3 Box Plot Chart】
1. Box Plot Chart The chart represents the data distribution of the facilities.
※ Percentile represents the position of a single data value within a group of
samples in ascending order. For example, if a group contains 100 samples, then the 10th percentile refers to the position of the 10th smallest value in the group. nn
2. Box Plot Chart of Feedback Reports
Example
Example