annual report 2 0 0 5 - sun pharmaranbaxy laboratories limited annual report 2005 chairman's...
TRANSCRIPT

A N N U A L R E P O RT 2 0 0 5

North America
Europe, CIS,Africa &Latin America
Asia
North America
Europe, CIS,Africa &Latin America
Asia

From total quality to total integration. From an Indian multinational to a global corporate.
And from generic products, to a series of differentiated products...
At Ranbaxy, the ability to foresee and consequently capitalize on change, has enabled us to
constantly expand the sphere of leadership. The year gone by has been a time of strategic
consolidation and preparation for manifold growth and transformation, through scientific
breakthroughs and strategic acquisitions & alliances. As the global pharmaceutical industry
gears up to accelerate once again, Ranbaxy, with its thrust on end-to-end integration, is better
prepared than ever before, to convert emerging opportunities into transformational
successes.
Today, Ranbaxy is India’s largest pharmaceutical company; a Top 10 global generic player
with a growing presence in 23 of the Top 25 pharma markets and is among the largest ANDA
filers with the US FDA. But tomorrow is more promising, with a wide range of products in the
pipeline, new acquisitions in strategic markets on the anvil and a clear target to achieve global
sales of US $ 2 Bn by 2007. To attain a size of US $ 5 Bn by 2012 is within the realms of
possibility, driven by passion and led by a vision that extends beyond tomorrow...
Expanding the leadership horizon

Chairman’s Message ........................4
CEO & MD’s Message.......................6
Global Markets Review
.............................10
...12
..........................................15
Research & Development.................18
Financial Review ............................22
Corporate Governance....................23
Corporate Social Responsibility & ....30Environment, Health & Safety
Global Manufacturing & Quality ......33
Human Resources ..........................35
Board of Directors .........................36
Report of the Directors ...................37
Ten Years at a Glance ......................49
Auditors’ Report.............................50
Financial Statements of Ranbaxy
..................................54
..............79
................102
North America
Europe, CIS, Africa & Latin America
Asia
Standalone
Consolidated Indian GAAP
Consolidated US GAAP
Contents

New dimensions of generic leadership
Dear Shareholders,
During 2005, the global generics
pharmaceutical industry underwent
dynamic changes in the business
environment. On the one hand, the
developed markets led by the US were
subjected to severe price erosion, while on
the other hand, emerging markets
witnessed further increase in generic
p e n e t r a t i o n , p rov i d i n g n e w e r
opportunities to companies such as
Ranbaxy. The industry experienced
consolidation amongst key generic
players, a trend which is expected to gain
momentum in the future.
The Company’s global performance
during the year, was impacted primarily
by the adverse pricing pressures in our key
market, the US. However, despite this, we
gained in market share for our products in
the US, reflecting our commitment to
fortify our existing presence in this
market.
It is important to note that the Company’s
Performance
4
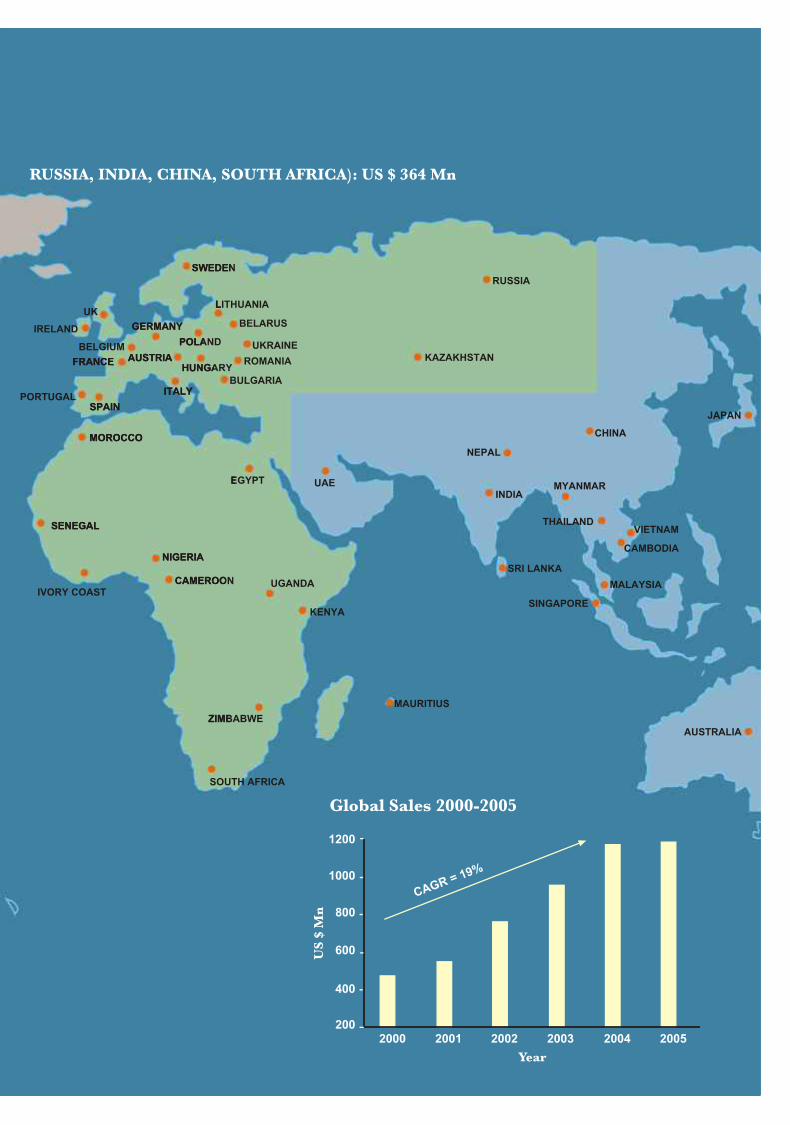
“In order to pursue its global vision and to achieve size and scale of operations, it is imperative for the Company to expand its global footprint.”
performance in other global markets,
such as BRICS (Brazil, Russia, India,
China, South Africa) and Asia, has been
buoyant. This has helped the Company
maintain its global sales at the same level
as last year, at US $ 1178 Mn. I would like
to mention here, that globally, the outlook
for 2006 is promising for generics in
general, as a greater number of branded
products lose patent protection and face
genericization.
D u r i n g 2 0 0 5 , t h e C o m p a n y
demonstrated its commitment to bring
value to its shareholders by implementing
several projects company-wide, which are
expected to yield results in the coming
years. In this regard, the Company’s foray
into new markets, such as Canada & Italy,
and the increase of its stake in its Japanese
Joint Venture from 10% to 50%, will help
improve the Company’s performance in
the long term. Several beneficial projects,
related to capacity augmentation,
modernization and automation, at its
manufacturing locations in India and
overseas, have also been implemented.
Research & Development
Scaling up Operations
A major recognition of Ranbaxy’s
contribution to the world of science was
the inauguration of its new Research &
Development Center by the Hon’ble
President of India, Dr. A. P. J. Abdul
Kalam. During his address, the President
appreciated the progress made by
Ranbaxy and recognized the value
brought by its research community to the
world of science. He expressed his desire
to see Ranbaxy as the first Indian
Company to launch its own molecule in
the global pharma space. He also
expressed his confidence in Ranbaxy’s
ability as a pharma leader to bring glory
to the nation, by placing India as a
‘shining star’ on the global firmament.
Our commitment to fight the diseases of
the developing world, is reflected through
the progress our scientists have made on
our anti-malarial molecule, RBx 11160,
which is being developed jointly with
Medicines for Malaria Venture (MMV),
Geneva. During the year, this molecule
successfully completed Proof of Concept
Phase II (a) studies and the activities for
Phase II (b) studies are underway, with
trials in India, Thailand and Africa
scheduled to commence by mid-2006.
The Company accelerated its internal
initiatives on cost optimization,
productivity enhancement, and also built
a robust and secure work environment,
that will lead to the sound management of
the Company’s information assets. Going
forward, achieving improved productivity
and cost efficiency in all departments will
be the priorities of the Management. The
Company has also realigned and
strengthened its business units, and is
Chairman's Message
Tejendra Khanna, Chairman
5
Annual Report 2005 Chairman's MessageRanbaxy Laboratories Limited
actively pursuing various options to
augment its global operations. The
Company has also decided to pursue a
more active policy of forging both
business and research alliances, so that
risks and rewards can be shared. In-
licensing, co-marketing, as well as
research collaborations in New Drug
Discovery Research (NDDR), are some
of the areas which are being pursued
actively.
During the year the Company divested its
Allied Businesses, namely Animal
Healthcare, Diagnostics and Fine
Chemicals.
Overall, the Company stays committed to
move up the pharma value chain, in order
to pursue its vision of being amongst the
Top 5 global generic players, with a
turnover of US $ 5 Bn by 2012.
In order to pursue its global vision and to
achieve size and scale of operations, it is
imperative for the Company to expand its
global footprint. To facilitate this action, a
decision has been taken to evaluate
opportunities for further acquisition of
pharmaceutical assets, which, in addition
to building size and scale, can expand the
Company’s therapeutic width by entering
into new segments which are not already a
part of the Company’s portfolio. This will
also strengthen the existing therapeutic
areas. In order to seek statutory approvals
to be able to mobilize funds required for
f inancing such acquis i t ions, an
Extraordinary General Meeting of
shareholders (EGM) was held on October
21, 2005, in Mohali. During this meeting,
a series of concomitant resolutions were
passed by the shareholders present, to
allow the Company to raise up to
US $ 1.5 Bn through a suitable mix of
equity and debt, as may be decided by the
Board from time-to-time.
With the Company acquiring high global
visibility, the Directors have mandated the
Operating Management to see that
business and work processes in all
departments of activity, match the
standards of global best practices in the
relevant areas. The Vice President,
Strategy Planning & Development, Vice
President, Global Internal Audit, and the
President & CFO, have been asked to pool
their efforts and work convergently
Global Best Practices
t o w a r d s t h i s
o b j e c t i v e . T h e
I n d e p e n d e n t
Directors of the
Company have been
working diligently
through Corporate
G o v e r n a n c e
Committees, viz.,
C o m p e n s a t i o n
Committee, Audit
Committee, Science
Committee, Share
T r a n s f e r a n d
S h a r e h o l d e r s ’
G r i e v a n c e s
C o m m i t t e e , t o
scrutinize policies
a n d p r o p o s a l s
m o o t e d by t h e
O p e r a t i n g
Management, as
well as provide independent inputs to
strengthen the Company’s ‘road-
worthiness’ on a long-term basis.
At the meeting of the Board of Directors
held in mid-January 2006, as part of a
carefully thought-out succession planning
strategy, it was decided to promote the
CEO & Managing Director, Dr. Brian
Tempest, to the position of Chief Mentor
& Executive Vice Chairman. His place as
Head of the Executive Team in the
capacity of CEO & Managing Director
was assigned to Mr. Malvinder Mohan
Singh, President, Pharmaceuticals. The
Company hopes to derive great benefit
from the rich global pharmaceutical
experience of Dr. Brian Tempest, as it
proceeds on its journey towards
becoming a US $ 2 Bn Company by 2007,
and a US $ 5 Bn Company by 2012.
Ranbaxy’s Human Resources are its most
important assets. It is the people, who by
their robust professionalism, ethical
commitment and devotion to duty, have
been adding value to the Company in the
years gone by, and continue to do so with
zeal and tenacity. The Human Resources
Division is making sincere efforts to create
an environment in which our people can
feel motivated and perform to their best
potential. We continue to pursue
individual training and career planning
Succession Planning
People Focus
efforts. The elaborate Code of Conduct
of the Company prepared in 2004, and
progress ively rol led out to the
Management cadre as a whole during
2005, has set out clear standards of DOs
and DON’Ts, directed at both, observing
complete ethical integrity and propriety,
and undertaking effective discharge of
assigned duties.
With the various initiatives underway and
the new product launches planned for
2006, the Company should be able to
record an improved performance in
2006, capitalizing on the overall, newly-
emerging generic opportunity.
I sincerely thank all of you for continuing
to repose confidence in the Company’s
Directors, as well as in the Operating
Management. Collectively, we will
certainly do our best to discharge your
trust and make Ranbaxy a greater force to
reckon with, in the global pharmaceutical
space.
Tejendra Khanna
Chairman
April 24, 2006
Promising Future
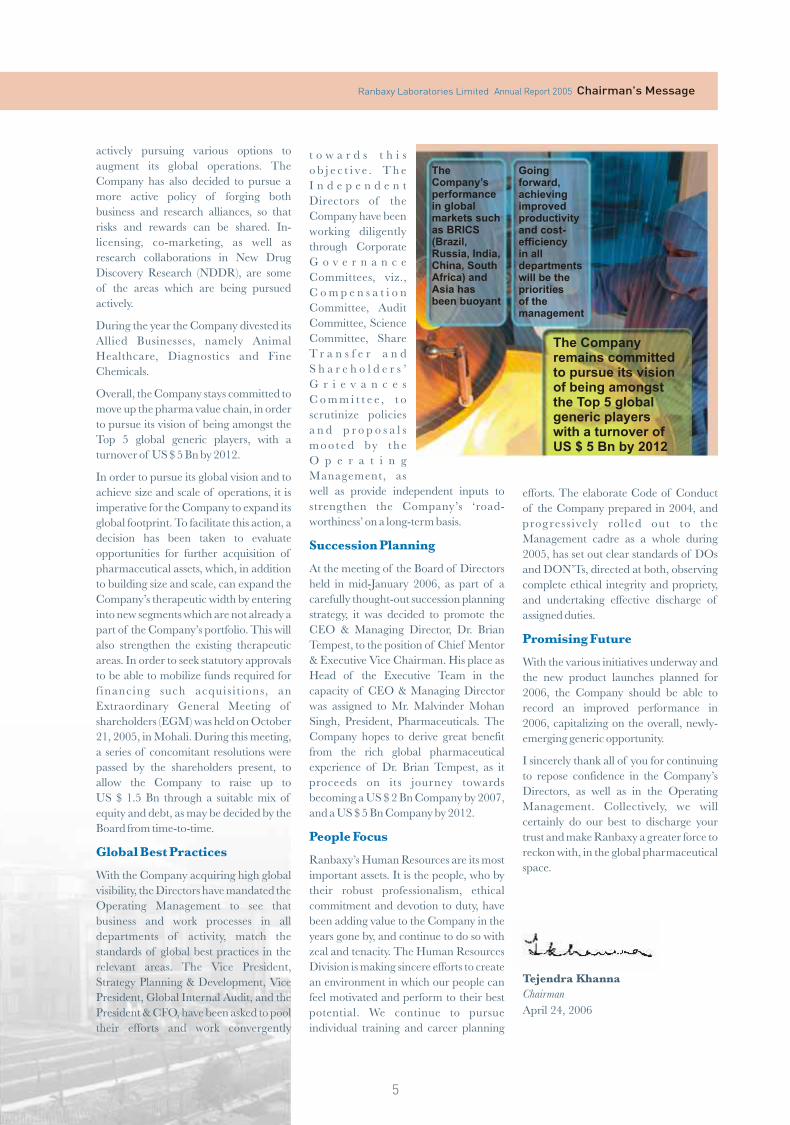
TheCompany’sperformancein globalmarkets suchas BRICS (Brazil, Russia, India,China, SouthAfrica) andAsia has been buoyant
Goingforward,achievingimprovedproductivityand cost-efficiencyin alldepartmentswill be theprioritiesof themanagement
The Companyremains committedto pursue its visionof being amongstthe Top 5 globalgeneric playerswith a turnover ofUS $ 5 Bn by 2012
Dear Shareholders,
As we progress into 2006, we see a world
of new opportunities. Based on our strong
f u n d a m e n t a l s o f i n n o v a t i o n ,
entrepreneurship and aggressive
marketing skills, we are determined to
capitalize upon them and remain
committed to enhancing shareholder
value, as we actively pursue our strategy
of growth through organic and inorganic
means.
Our recent acquisition of Terapia, the
largest independent generic company in
Romania, is a step towards realizing our
aspiration of being amongst the Top 5
generics companies of the world, by
2012.
Today, we are already amongst the Top 10
global generics companies and have
delivered a compounded annual growth
rate of 19%, in revenue terms, in the last 5
years. As we move into our next phase of
growth, I feel great optimism. I also take
on the role of the CEO & MD at
6
“Ranbaxy follows a balanced business strategy and continuously evaluates risk-reward options to choose a course of action that is in the best interests of the Company and its shareholders.”
Ranbaxy, with all humility.
I would like to thank the Board for giving
me this opportunity to serve the
Company and re-dedicate myself to the
task of building a trusted and reliable
organization that stands ready to invest in
the growth of its people and its business.
Armed with your support and driven by
the passion of the organization and the
commitment of its people, I remain
confident that we will be at the forefront in
cap i ta l i z ing upon the gener ic s
opportunity as it unfolds.
I am sanguine and remain committed to
our revenue target of US $ 2 Bn for 2007,
and our aspiration to achieve US $ 5 Bn in
revenues by 2012.
The global generics industry is poised to
grow rapidly in the coming years, as most
governments look at balancing their
Global Generics Industry
healthcare costs through the use of
generics. While the growth of the generics
industry will be spurred by the ageing
demographic profile of the world, we see
significant opportunity in the immediate
future, due to the large number of patent
expiries, worldwide.
The genericization of the developed
markets continues to exhibit an upward
trend. Simultaneously, the emerging
markets have also been gaining in
momentum. This presents to us new
prospects in the so far underdeveloped
markets.
The field undoubtedly is very competitive
and speed to market is critical. At the
same time, our customers are becoming
more discerning, and therefore, a robust
future product l ine compris ing
differentiated products, is necessary to
attain greater market share. The legal and
regulatory environment is also becoming
more complex. All these factors are
contributing to the building up of cost
pressures.
However, our Company is well placed to
capitalize on the changing scenario due to
its inherent strengths. These include a
truly global footprint and the India
advantage. We are confident of
leveraging the lead we have in terms of
cost of innovation and manufacturing,
our strong chemistry skills and the
marketing prowess that we possess, to
del iver superior returns to our
shareholders.
The Year 2005 has been challenging for
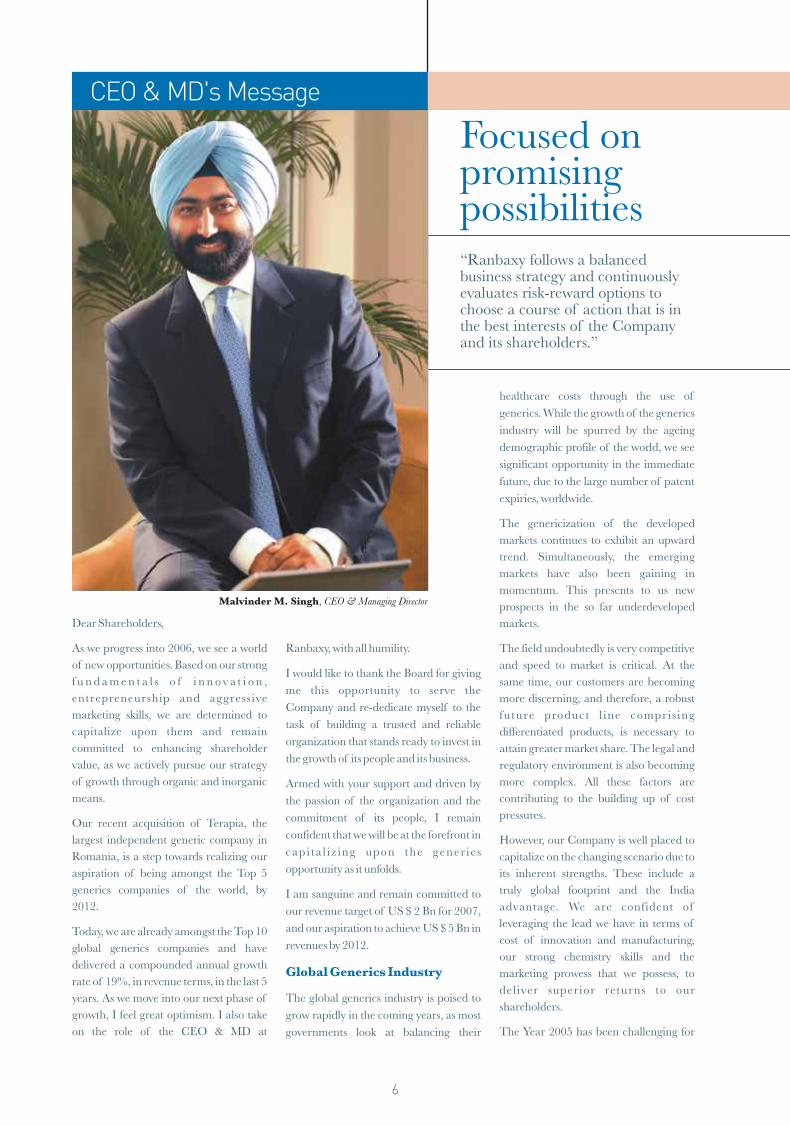
Focused on promising possibilities
Malvinder M. Singh, CEO & Managing Director
CEO & MD's Message

the entire industry due to fewer patent
expiries. These resulted in a lesser
number of new product introductions for
the year. We also saw an increase in the
number of big pharma companies
looking to bring in their own authorized
generics, in an attempt to slow down the
commoditization of their brands.
During the year, the Company registered
global sales of US $ 1178 Mn, of which
the US contributed 28% (US $ 328 Mn),
Europe 17% (US $ 204 Mn) and the
BRICS (Brazil, Russia, India, China,
South Africa) countries 31% (US $ 364
Mn).
In the US, the world’s largest pharma
market and also our largest market, we
strengthened our presence with more
products and an increased market share.
We were able to capture a generics market
share of 2.3% (YTD Dec’05), up from
2.0% last year (YTD Dec’04). Currently,
we have over 110 Abbreviated New Drug
Applications (ANDAs) in the US, with 59
pending approvals from the United States
Food & Drug Administration (US FDA).
We believe, we have the second largest
product pipeline pending with the
US FDA.
During the year, Ranbaxy also
commenced its operations in Canada,
the 8th largest pharma market of the
world, with the introduction of 8
products.
In Europe, we consolidated our business
further during the year. In France, we
extended our product portfolio with the
launch of 12 new products. This led to
100% coverage of the Top 20 molecules.
Our operations in Germany and the
Rest of Europe (ROE) continued to
perform well, registering a growth of
over 20% with sales of US $ 31 Mn and
US $ 54 Mn, respectively.
Our business in the emerging markets
also continued to register a strong
performance, led by the BRICS
countries, exhibiting a growth of 12% at
US $ 364 Mn during the year.
Global Operations
We continued to forge ahead in India,
growing faster than the market, while
clocking sales of US $ 238 Mn (including
the consumer healthcare business) and
registering a growth of over 9%. This was
an outcome of our focus on the chronic
disease segment (contributing 19% to the
business) and the Novel Drug Delivery
System based differentiated products
(contributing 9% to the business), which
also led to 20 of our brands featuring in
the Top 300 list.
As a result of our business model
realignment in 2004, our China
operations performed well. The year saw
the launch of the first generic injectable
product Imipenem + Cilastatin. The
first once-a-day (OD) formulation of
Ciprofloxacin in the country, was also
introduced in 2006.
Business in Russia and South Africa
continued to outperform the respective
markets, registering a growth of over
25%, further consol idating and
strengthening our presence in these
countries.
Our operations in the Rest of the
Wo r l d , i n c l u d i n g t h e A c t i v e
Pharmaceutical Ingredients (APIs)
business, continued to perform well, with
a combined sales of US $ 282 Mn, up by
21% compared to the year before.
During the year, our Company
successfully launched its first product in
the world’s 2nd largest pharma market,
spearheading our entry into the Japanese
generic market. Generics currently
constitute only 5% of the overall Japanese
p h a r m a m a r k e t , r e p r e s e n t i n g
considerable headroom for growth.
Ranbaxy is the first company from India
to meet the most stringent quality
standards of the Japanese regulatory
agencies. This clearly reflects the global
quality standards practised at Ranbaxy.
We further consolidated our presence in
Japan, by increasing our stake in the Joint
Venture (JV), Nihon Pharmaceutical
Industry Co. Ltd (NPI) to 50%. The first
product of the JV, Vogseal (Voglibose), an
anti-diabetic, is already a market leader
and is likely to garner better market share
in the coming months. We continue to
make filings in Japan to build a healthy
product flow for the future.
During 2005, large investments were
directed towards enhancing our
manufacturing strengths. In addition to
Japan
Enhancing Manufacturing
Capabilities
Annual Report 2005Ranbaxy Laboratories Limited CEO & MD's Message
7
TheCompany is positionedamongst theTop 10genericscompaniesglobally
Global salesduring 2005 stood at US $ 1178 Mn
Ranbaxy isone of the largest pharmapatent filers in the developingworld and the second largestin the US in terms of pendingproductpipeline
Terapia, thelargestindependentgenericscompany in Romania, was a majoracquisition by Ranbaxy
The focus in the future will be on accelerating the genericsbusiness and enhancingR&Dproductivity
2005 was a year ofventuring into new markets, investingfor expansion,consolidating andrealigning for the future

expansion and modernization of the
existing facilities, we invested significantly
in building substantial capacities for new
molecules, targeted to drive growth in key
geographies in the coming years. Today,
our US manufacturing capability is the
2nd largest in terms of oral solid dosage
forms manufacturing, after India.
In India, we also built a dedicated, world-
class, sterile injectables facility to create
in-house capabilities and infrastructure
for new therapeutic areas.
As we look ahead over the next couple of
years, we are confident that our
investments will come to fruition, leading
to a strong product flow into our markets.
Pursuing the mission of being a research-
led organization, Ranbaxy has focused on
building its Intellectual Property and has
been at the forefront in using innovation
to create value. Ranbaxy filed 185 patent
applications in India during 2005,
becoming one of the largest pharma
Leveraging Intellectual
Property and 180-day
Exclusivities
8
patent filers in the developing world.
Our Company is confident of the
strength of its scientific and legal
rationale and corresponding intellectual
property strategies, and has challenged
patents where we are confident of the
merits of the case. We have 19 potential
First to File (FTF) Para IV ANDAs, of
which only 7 are under litigation.
During the year, Ranbaxy faced first
instance decisions on Atorvastatin, one
of its key FTF products in the key
countries of the US and the UK. While
we were successful in invalidating one of
the two patents under challenge, in the
UK, the US District Court decided
against us on both patents. We however,
stand by what we believe are meritorious
defenses and have appealed to the higher
courts in both these countries. Decisions
by the appeals courts in the UK and the
US are expected around the end of the
year.
Ranbaxy follows a balanced business
strategy and continuously evaluates risk-
reward options to choose a course of
action that is in the best interests of the
Company and its shareholders.
Our settlement with Cephalon Inc (USA)
in the Para IV litigation surrounding the
generic version of Provigil (Registered
Trademark of Cephalon Inc.), reflects
our balanced litigation perspective.
Research has been the driving force for
Ranbaxy. We have well-defined programs
in the areas of generics research as well as
new drug discovery, which continued to
progress well during the year.
Our overall research endeavours are ably
supported by a world-class infrastructure;
during 2005, further investments were
made to enhance our R&D capabilities.
Our new, state-of-the-art Drug Discovery
Center, was inaugurated by the Hon’ble
President of India, Dr. A. P. J. Abdul
Kalam, in 2005. With the addition of this
Center, our Company now has over 1100
people dedicated to path-breaking
research.
We also invested in creating new in-house
capacities for Bio-equivalence and Bio-
analytical studies. This move, we believe,
will considerably reduce the overall cost
of innovation and will help us further
accentuate our India advantage, in this
area.
Our Company’s Drug Discovery
program is progressing well, with 10
active drug candidates at various stages of
development in its New Chemical Entity
(NCE) pipeline.
Our malaria molecule, RBx 11160, being
developed jointly with Medicines for
Malaria Venture (MMV), Geneva, has
successfully completed Phase II (a)
studies, and the activities for Phase II (b)
studies are currently underway, with trials
in India, Thailand and Africa, scheduled
to commence by mid-2006.
Our collaborative research program with
Glaxo Smithkline (GSK) is also
progressing well, with two drug
candidates having progressed towards
meeting the development criteria.
On the generics front, during the year we
successfully maintained a steady flow of
Strong Research Focus
Pushing new frontiers... (L-R) Dr. Brian W. Tempest, Chief Mentor & Executive Vice Chairman and Malvinder M. Singh, CEO & Managing Director
CEO & MD's Message
9
US ANDA filings and completed 26
filings. 16 ANDA approvals were
obtained during the same period. In
addition, our Company also filed 10
ANDAs under the US President’s
Emergency Plan For AIDS Relief
(PEPFAR), taking the number of
cumulative filings during the year to 36.
In the European Union (EU) we made 52
national filings for 46 products. The
global regulatory filings stood at 852
during the year.
In pursuit of our commitment to provide
medicines to address the emerging
h u m a n i t a r i a n n e e d s , R a n b a x y
accelerated the development process for
the manufacture of Oseltamivir for the
treatment of Avian flu, during the year.
Our focus on inorganic growth
underscores our belief that success in
today's generic space requires size and
scale. We continue to evaluate
opportunities to add to our product
basket, enhance our therapeutic presence
and expand our distribution reach. Our
recent acquisition of Terapia, is our
largest acquisition so far, reflecting our
commitment to not only achieve the
defined growth attributes, but also add
immediately to shareholder value by
being Earnings Per Share (EPS) accretive.
This acquisition was funded by the
proceeds from Ranbaxy’s recent Foreign
Currency Convertible Bonds (FCCB)
issue of US $ 440 Mn, the largest capital
raising exercise in the Indian healthcare
industry, till date.
We continue to evaluate options for
acquiring new technology platforms to
develop differentiated high margin
products. We are also exploring
opportunities in the areas of Licensing
and Alliances to draw maximum value
from such arrangements.
As I see the Ranbaxy of tomorrow, I see
our Company transforming rapidly,
New Opportunities
Acquisitions & Alliances
Future Outlook
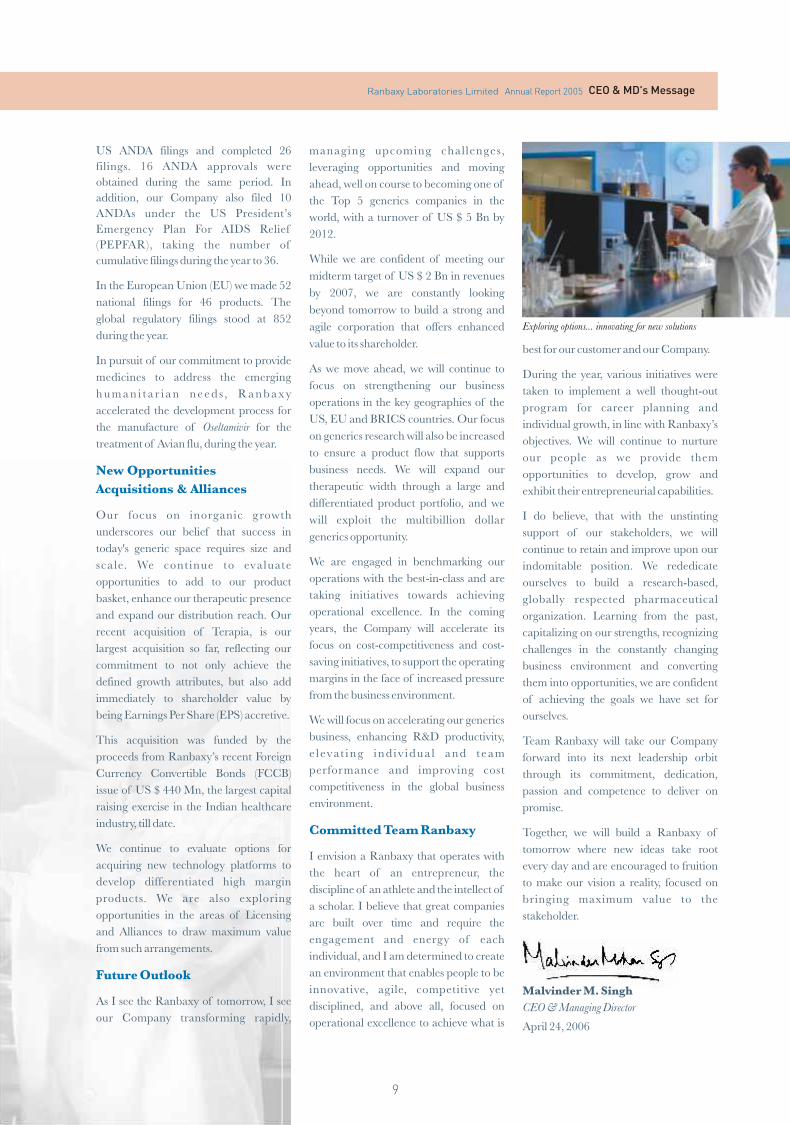
Exploring options... innovating for new solutions
Annual Report 2005Ranbaxy Laboratories Limited CEO & MD's Message
managing upcoming challenges,
leveraging opportunities and moving
ahead, well on course to becoming one of
the Top 5 generics companies in the
world, with a turnover of US $ 5 Bn by
2012.
While we are confident of meeting our
midterm target of US $ 2 Bn in revenues
by 2007, we are constantly looking
beyond tomorrow to build a strong and
agile corporation that offers enhanced
value to its shareholder.
As we move ahead, we will continue to
focus on strengthening our business
operations in the key geographies of the
US, EU and BRICS countries. Our focus
on generics research will also be increased
to ensure a product flow that supports
business needs. We will expand our
therapeutic width through a large and
differentiated product portfolio, and we
will exploit the multibillion dollar
generics opportunity.
We are engaged in benchmarking our
operations with the best-in-class and are
taking initiatives towards achieving
operational excellence. In the coming
years, the Company will accelerate its
focus on cost-competitiveness and cost-
saving initiatives, to support the operating
margins in the face of increased pressure
from the business environment.
We will focus on accelerating our generics
business, enhancing R&D productivity,
e l evat ing ind iv idua l and t eam
performance and improving cost
competitiveness in the global business
environment.
I envision a Ranbaxy that operates with
the heart of an entrepreneur, the
discipline of an athlete and the intellect of
a scholar. I believe that great companies
are built over time and require the
engagement and energy of each
individual, and I am determined to create
an environment that enables people to be
innovative, agile, competitive yet
disciplined, and above all, focused on
operational excellence to achieve what is
Committed Team Ranbaxy
best for our customer and our Company.
During the year, various initiatives were
taken to implement a well thought-out
program for career planning and
individual growth, in line with Ranbaxy’s
objectives. We will continue to nurture
our people as we provide them
opportunities to develop, grow and
exhibit their entrepreneurial capabilities.
I do believe, that with the unstinting
support of our stakeholders, we will
continue to retain and improve upon our
indomitable position. We rededicate
ourselves to build a research-based,
globally respected pharmaceutical
organization. Learning from the past,
capitalizing on our strengths, recognizing
challenges in the constantly changing
business environment and converting
them into opportunities, we are confident
of achieving the goals we have set for
ourselves.
Team Ranbaxy will take our Company
forward into its next leadership orbit
through its commitment, dedication,
passion and competence to deliver on
promise.
Together, we will build a Ranbaxy of
tomorrow where new ideas take root
every day and are encouraged to fruition
to make our vision a reality, focused on
bringing maximum value to the
stakeholder.
Malvinder M. Singh
CEO & Managing Director
April 24, 2006

Ranbaxy’s entry into the North American
Region was marked by its first acquisition
in the US in 1995. The Company
ventured into the world’s largest Pharma
market, ahead of the other Indian
pharma companies. Ranbaxy is today
well positioned to capitalize on the
growing opportunities offered by this
market, currently valued at US $ 266 Bn.
The US being our largest market, we
accelerated our efforts to strengthen our
presence in this market during 2005.
These were directed towards sustained
growth in product offerings and increased
market share. Further, substantial
investments in the manufacturing
infrastructure in the US have led to an
increase in capacities over the previous
year. The US has now become our 2nd
largest manufacturing hub for oral solid
dosage forms, after India.
Our sustained marketing effort has led to
our products being available in every
pharmacy and wholesale distribution
outlet throughout the US. We have
further expanded our distribution in the
US and have added new customers and
products to our portfolio. Our cumulative
product listings in the US were 862 by the
end of the year.
During the year, the generics market in
the US grew by 20.6%, while in Canada it
grew by 15%, on the back of increased
USA
“The US being our largest market, we endeavoured to enhance both our market share and our market reach, building strong foundations for the future.”
prescriptions written for generic drugs.
Generic sales, although still volatile, have
grown progressively over the past few
years. The branded and generics market
together, grew by 5.2% in the US and by
7% in Canada.
Generic drugs now feature in over 50%
prescriptions, as a result of steadily
increasing acceptance by health planners,
prescribers and patients. In the US, the
newly enacted ‘Medicare Part D’ now
provides prescription coverage to
potentially 30 million senior citizens.
This is expected to fuel market growth.
The US operations clocked in sales of
US $ 328 Mn during 2005.
Ranbaxy’s business in the Region is
focused on three market segments – the
generic pharmaceuticals, private label
over-the-counter (OTC) formulations
and Ranbaxy labeled products. During
2005, our market share surged ahead in
each of these market segments.
The generic pharmaceuticals market
share in our represented market segments
grew from 12.2% in 2004, to 13.9% in
2005, with sales of US $ 251 Mn.
Our private label OTC business
generated the highest sales to date,
growing to US $ 43 Mn. This growth
came on the back of the additional
business from two top grocery retailers in
the US, and signif icant market
penetration by Loratadine Liquid.
North America
Foraying…investing…consolidating
Atul Malhotra, President - North America
10
The market share in our branded
business, which focuses on the
dermatology segment, witnessed growth
from 15.9% in 2004 to 21.7% in 2005,
resulting in sales of US $ 34 Mn.
Since the acqui s i t ion o f Ohm
Laboratories in 1995, our manufacturing
division has added 200,000 sq.ft. of space
in the last three years, comprising a new
state-of-the-art solid dosage forms facility,
a process development cell, a warehouse
and a quality control laboratory. A liquid
dosage forms facility was also acquired
d u r i n g t h e y e a r. T h e e n t i r e
manufactur ing fac i l i ty at Ohm
Laboratories now covers 240,000 sq.ft.
area. Our warehouse and distribution
facility in Jacksonville, Florida, has also
been further expanded from 72,000 sq.ft.
to 244,000 sq.ft.
A strong product pipeline reinforces the
very foundations of a pharma company.
By the end of 2005, Ranbaxy had a total
portfolio of 111 products, with 59 drugs
pending approval from the United States
Food and Drug Adminis tration
(US FDA). In 2005, our Company filed 26
Abbreviated New Drug Applications
(ANDAs) with the US FDA and received
approvals for 16 ANDAs.
Ranbaxy is also making strategic
investments in specific resources, in
support of our Company's plans for
Strong Product Pipeline
Global Markets Review

11
simultaneous organic and inorganic
growth. The expansion of our product
portfolio has fueled organic growth, with
inorganic growth coming from business
development alliances that constituted
four different types of agreements,
including product development/
manufacturing and in- & out-licensing
opportunities.
At the end of 2005, we had a total of 19
potential First-to-File Para IV candidates,
with a market size worth US $ 28 Bn at
innovator prices. In December 2005, the
US District Court ruled against Ranbaxy
in the case for non-infringement and
invalidation of Atorvastatin patents.
This matter is now under the appeal
process.
Being a responsible corporate citizen, our
Company accelerated its efforts to
support the HIV / AIDS global
pandemic in 2005, and continued to
support the US President’s Emergency
Plan For AIDS Relief (PEPFAR)
initiative. Also during the year, the World
Health Organization (WHO) included
eight of our Anti-Retrovirals (ARVs) in its
pre-qualification list. Ranbaxy received
US FDA tentative approval for 3 ARVs
under PEPFAR.
Our consistent performance, won us
many accolades during 2005. We
received the ‘Outstanding Supplier
Award’ from Wal-Mart, the largest chain
store in the US, for consistency of
products and programs provided to Wal-
Mart, and for efficiently fulfilling the
requests of Wal-Mart customers. The
New Jersey Business & Industry
Association awarded Ranbaxy the ‘Award
for Excellence’ in the Enterprise category,
recognizing Ranbaxy for creating new
jobs and making a significant economic
contribution to the State of New Jersey.
The coveted ‘Supplier Quality Award’
from Cardinal Health was also presented
to Ranbaxy in 2005.
Responsible Corporate Citizen
Awards & Recognition
CANADA
During the year, our Company initiated
its operations in Canada under the
flagship of Ranbaxy Pharmaceuticals
Canada Inc., with the launch of 8
products. These products, from the
Cardiovascular, Diabetes, Anti-infectives
and Central Nervous System therapy
segments, have been received well.
Additionally, 8 product filings were made
to the Therapeutic Products Directorate
(TPD).
We are constantly learning and adapting
to a very dynamic market environment.
We are facing challenges related to
operating in diverse geographical and
cultural milieus, as well as increased
competition and price pressures.
However, we are well poised to leverage
our capabilities as a fully integrated
pharmaceutical company, to strengthen
our position in the market and capitalize
on the generics opportunity, in the world’s
largest pharma market, the US.
Global Markets ReviewAnnual Report 2005Ranbaxy Laboratories Limited
USA clocked in sales ofUS $ 328 Mn
The privatelabel OTCbusinessperformedwell andregisteredsales ofUS $ 43 Mn
Ranbaxyholds acumulativebasket of170 ANDAsin the US
Ranbaxy'sgenericpharmaceuticalsmarketshare in itsrepresentedmarketsegments,grew from12.2% in2004, to13.9% in2005
The marketshare of ourbrandedbusinessfocusing on thedermatologysegment,grew from15.9% in2004, to21.7% in2005
Our sustainedmarketingefforts haveenabled us tohave at leastone product inalmost everypharmacy inthe US
Ranbaxy received anumber of covetedawards from various US Business Organizationsand Associations
USA
CANADA
During 2005, Ranbaxycommenced itsoperations throughRanbaxyPharmaceuticalsCanada Inc., with abasket of 8 products

Europe, CIS, Africa & Latin America
Ranbaxy has a strong presence in the
Europe, CIS, Africa & Latin America
Region. During the year, the Region
clocked in sales of US $ 377 Mn. While
sales in Europe grew by over 5% during
the year, the buoyancy of performance in
the CIS and Africa markets led to Europe,
CIS & Africa operations, collectively
registering a growth of 14%.
D u r i n g 2 0 0 5 , w e f o c u s e d o n
strengthening and consolidating our
position in the Region and scaled up
operations in many countries. The
number of regulatory filings were also
stepped up to meet the growing needs of
the future.
Beginning 2006, the Company expanded
its footprint in the Region by acquiring
Terapia, the largest independent generic
company in Romania, and Ethimed, an
established generics company in Belgium.
A large unbranded generic product
portfolio of Allen S.p.A. was also
acquired by the Company in Italy. These
strategic moves are expected to bolster the
Company’s performance in these
markets.
In Europe, the healthcare costs are largely
borne by the governments that are aiming
at bringing down the state expense.
Hence, a pro-generic sentiment is gaining
momentum in this market. Ranbaxy is
well positioned to exploit the generic
opportunity through its presence in some
Europe - Key Markets
“Day-1 launches in many markets helped us consolidate our position in the region. We stepped up our regulatory filings and invested strategically to draw a clear roadmap for the future.”
of the key markets of Europe, such as
UK, Germany, France, Italy and Spain.
Our products are today available in 21 of
the Top 25 European Union (EU)
countries. During the year, we expanded
our presence by starting wholly-owned
subsidiaries in Hungary, Portugal, Italy
and a representative office in Bulgaria.
During 2005, our operations in the UK
clocked in sales of US $ 44 Mn, even
though the market was characterized by
severe price erosion and intense
competition. The branded business
witnessed sales exceeding US $ 5.5 Mn,
reflecting a growth of 33% over the
previous year.
We reinforced our branded product
portfolio in the respiratory segment by
introducing Easyhaler (Inhaler),
complementing the respiratory class.
Ranbaxy UK now has the Easyhaler for
Asthma, Visclair (Mecysteine) for
Chronic Obstructive Pulmonary Disease
(COPD) and Distaclor-MR (Cefaclor
MR) for Respiratory Tract Infection
(RTI).
In the generics segment, the Company
successfully introduced Sertraline and
Lansaprozole on ‘Day-1.’ Both
products represent a market size of over
US $ 430 Mn at innovator prices.
Terbinafine and Lamotrigine were
some of the new products launched in this
market.
UK
Germany
France
Spain
We achieved sales of US $ 31.0 Mn in
Germany, backed by two successful ‘Day-
1’ launches of Cefpodoxime Tablets
and Sertraline, with a combined market
size of over US $ 50 Mn at innovator
prices. Our business grew at 20% over the
previous year, outperforming the market
which grew at 8%. (Source : IMS).
During 2005, our IMS Ranking in the
German market was up by 6, and
currently stands at No. 30 in the generics
segment.
We registered sales of US $ 74 Mn in
2005, similar to the previous year. 12 new
molecules, including two ‘Day-1’
launches in France, enabled us to
gain 100% coverage of the Top 20
molecules.
Simvastatin and Sertraline, two
products being manufactured in India,
were successfully launched in France.
Sertraline, a ‘Day-1’ launch, captured
17% of the generics market. Effective
2006, a number of regulatory changes
have been introduced in France. The
trade margin structures have been
revised, including price cuts in the range
of 15% to 18%, thus impacting both
generics and innovator products.
Year 2005 was quite encouraging for us in
12
Peter Burema, President - Europe, CIS, Africa & Latin America
Global Markets Review

Spain as our business demonstrated
distinct buoyancy, registering sales of
US $ 4.2 Mn. We also strengthened our
product portfolio further, through the
acquisition of 18 generic products from a
leading pharma company.
We initiated our operations in this market
during the year and set forth to prepare
ourselves to capitalize on the upcoming
generics opportunity, by focusing on
product registrations. Ranbaxy Italia was
granted its first product license for
Sertraline Tablets during 2005.
The Company is fully geared to bring
Ranbaxy’s products to the relatively
unexploited, but rapidly expanding,
gener ic s sec tor o f the I ta l ian
pharmaceuticals market.
Other markets in Europe registered sales
of US $ 49 Mn, reflecting a growth of
19% during the year. The performance in
these markets was led by the Company’s
operations in Northern Europe,
comprising the Nordic markets, Belgium
and Netherlands. The successful ‘Day-1’
launch of Sertraline added to the
performance.
During the year, CIS markets registered
sales of US $ 65 Mn, reflecting a growth
of 42%.
The operations in Russia recorded sales
of US $ 33 Mn, reflecting a growth of
2 8 % ove r t h e p r e v i o u s ye a r,
outperforming the market which grew at
23%, MAT basis. Ranbaxy is currently
ranked 13th amongst foreign generics
companies and 20th amongst generics
companies in Russia.
We developed a strong presence in the
fluoroquinolones market, with three of our
products featuring amongst the Top 10 in
the Russian market. The Company also
launched a number of new products, such
as Cifran CT (Ciprofloxacin + Tinidazole),
Eleflox (Lev o fl oxac in ) , Coldact
Broncho (Anti-cold) and Coldact
lozenges.
Italy
CIS Markets
Russia
Ukraine Belt, including
Romania
The Ukraine Belt achieved sales of
US $ 32 Mn for 2005, achieving 60%
growth over 2004. The Company
attained the 24th ranking amongst more
than 500 manufacturers in Ukraine. The
Company’s leading brands, such as
Cifran (Ciprofloxac in) , Zanocin
(Ofloxacin), Loxof (Levofloxacin), Coldact
(Anti-cold), Simvor (Simvastatin) and
Ketanov (Ketorolac Tromethamine)
continued to perform well.
In Romania, we achieved sales of
US $ 12 Mn, recording a growth of 86%.
We were rated as one of the fastest-
growing pharmaceutical companies of
the country. This growth was driven by
the strong presence and product
promotion in the Cardiovascular (CVS),
Anti-Infectives and Central Nervous
System (CNS) segments. Our key
products performed well, with Zanocin
(Ofloxacin), being ranked No. 1, Serlift
(Sertraline), Ranolip (Lisinopril) and
Cefaclor No. 2 , and Simvor
(Simvastatin) and Enalapril ranked at
No. 3, in their respective segments.
During the year, Africa recorded sales of
US $ 68 Mn, registering a growth of 16%.
Ranbaxy in South Africa clocked in sales
of US $ 24 Mn during the year. The
Company is ranked at No. 7 amongst the
generics companies and is placed at No.
29 amongst pharma corporations in
South Africa.
Ranbaxy’s portfolio is divided into three
segments – Acute, Chronic and OTC.
Acute products contribute to the majority
of the Company’s turnover and include
Anti-infectives and Anti-fungals, with the
flagship brands being Cepodem
(Ce fpodox ime Prox e t i l ) , Ceroxim
(Cefuroxime Axetil) and Klarithran
(Clarithromycin). In these segments, the
Company’s market share increased from
16.4% in 2004, to 18.6% in 2005 (IMS
TPM November 2005).
In the CNS and CVS areas, our main
brands include Simvotin (Simvastatin),
AFRICA
South Africa
13
Global Markets ReviewAnnual Report 2005Ranbaxy Laboratories Limited
The region clocked in US $ 377 Mnsales
In UK, wereinforcedour productportfolio in the respiratorysegment
In Germany, the business grew at 20% over the previous year, outperformingthe market
In France, 12 new molecules were launched,including 2 ‘Day-1’ launches, improving our coverageof the Top 20molecules
Ranbaxy inRomania became one of the fastest-growing companies
Ranbaxy inSouth Africa was ranked as the 7th largest generics company
EUROPE, CIS, AFRICA & LATIN AMERICA
Serl i fe ( S e r t r a l i n e ) , and Ran-
Citalopram (Citalopram). In this
segment, our market share grew from
1.6% in 2004, to 3.9% in 2005.
The OTC portfolio of the Company
includes flagship brands, such as Histak
(Ranitidine) and Laura (Loratidine).
During 2005, Ranbaxy in Nigeria
recorded sales of US $ 20 Mn. The star
performer was Gestid (Antac id
combination) which was awarded the Best
West Africa’s ‘Antacid’ brand. Leading
brands, such as Fortwin (Pentazocine),
Ranferon (Iron combination), Enhancin
(Co-Amoxiclav) , Revital (Ginseng
combination) and Cifran (Ciprofloxacin), all
registered encouraging growth. Several
new launches added to the portfolio in
Nigeria. Triviro LNS 30 (Lamivudine +
Nevirapine + Stavudine) and Coviro LS 30
(Lamivudine + Stavudine) were registered
with the regulatory agency during the
year.
The Latin American operations reported
sales of US $ 40 Mn.
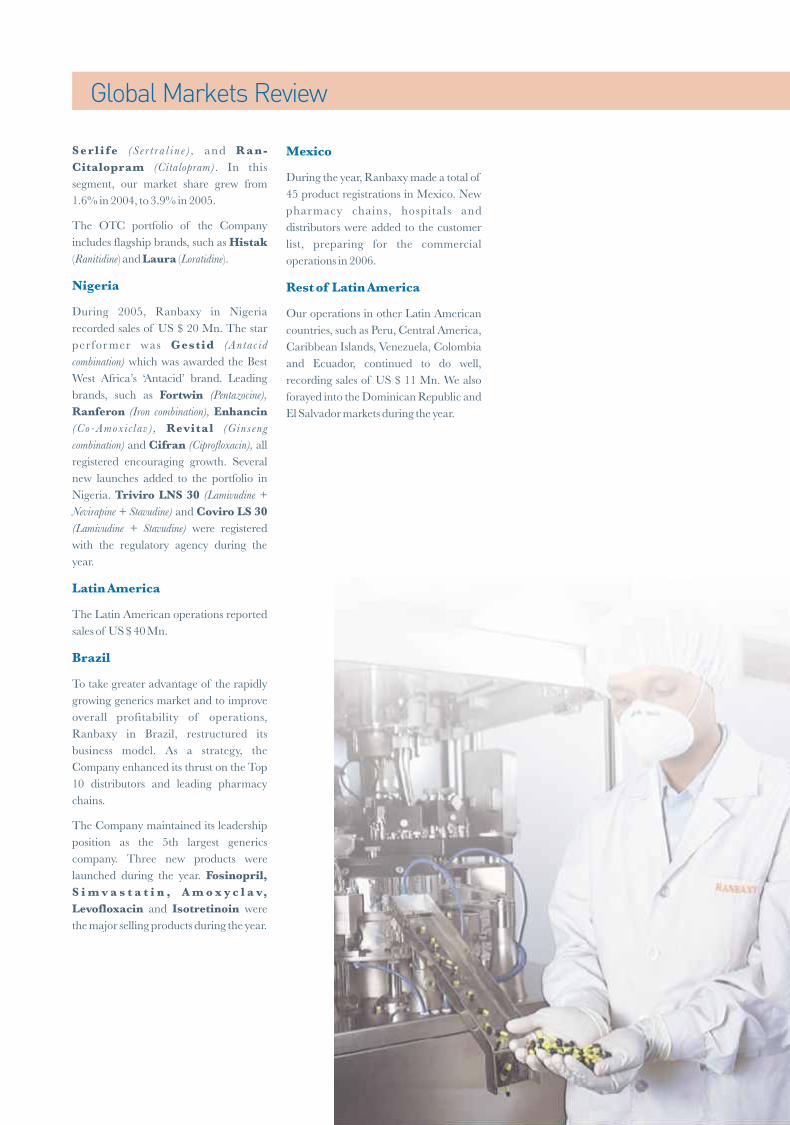
To take greater advantage of the rapidly
growing generics market and to improve
overall profitability of operations,
Ranbaxy in Brazil, restructured its
business model. As a strategy, the
Company enhanced its thrust on the Top
10 distributors and leading pharmacy
chains.
The Company maintained its leadership
position as the 5th largest generics
company. Three new products were
launched during the year. Fosinopril,
S i m v a s t a t i n , A m o x y c l a v,
Levofloxacin and Isotretinoin were
the major selling products during the year.
Nigeria
Latin America
Brazil
Mexico
Rest of Latin America
During the year, Ranbaxy made a total of
45 product registrations in Mexico. New
pharmacy chains, hospitals and
distributors were added to the customer
list, preparing for the commercial
operations in 2006.
Our operations in other Latin American
countries, such as Peru, Central America,
Caribbean Islands, Venezuela, Colombia
and Ecuador, continued to do well,
recording sales of US $ 11 Mn. We also
forayed into the Dominican Republic and
El Salvador markets during the year.
Global Markets Review
Ranbaxy took the first step of expanding
its presence in the Asia Region in 1993,
with a Joint Venture (JV) in China. Four
out of seven countries housing our world-
class manufacturing facilities fall in this
Region. We have constantly endeavoured
to be at the forefront in delivering value to
our customers, and have relentlessly
widened and deepened our presence with
consistent investments in India, China,
Malaysia, Japan, Thailand & the Middle
East.
Over the years, the Region has aligned
i tsel f to the changing business
environment, and has la id the
foundations for a profitable and
sustainable future in becoming a truly
successful global pharmaceutical
company.
With downward environmental pressures
on the bottom line during 2005, a change
in the business model, resumption of the
Anti-retroviral (ARVs) business and
persistent brand-building efforts, became
the fulcrum of a sustainable model for the
Region. As a result, the business
registered sales of US $ 308 Mn and
recorded a growth of 12%.
Even as the Indian markets faced
unprecedented challenges during 2005,
Ranbaxy’s domestic market share
increased to 4.9%. The ethical
pharmaceutical business registered sales
of US $ 222 Mn, reflecting a growth of
India
15
10%, ahead of the market which grew at
8.6% (YTD Dec ’05 ORG).
Ranbaxy’s performance during the year
helped it improve its ranking, which stood
at No. 2 for a period of five months during
the year (June - Oct’05). India operations’
brand building capabilities were
demonstrated with eight brands, such as
Sporidex (Ce pha l e x i n ) , Cifran
(Ciprofloxacin), Mox (Amoxicillin), Revital
(Ginseng combination), Zanocin (Ofloxacin),
Volini (Diclofenac), Storvas (Atorvastatin)
and Oframax (Ceftriaxone), featuring
amongst the Top 100 brands of the
industry. 20 of our brands featured in the
Top 300, as against 14 in the previous
year.
The advent of the patent regime in India
has unleashed for Ranbaxy a potential
business area through Novel Drug
Delivery System (NDDS) and product in-
licensing agreements. At Ranbaxy, we
believe that both these areas have the
capacity to enhance stakeholder value.
We focused on the chronic disease
segment and NDDS-based differentiated
products during the year. As a result,
contributions to the overall business from
these areas stand at 19% and 9%,
respectively. Preparing for the future, we
consolidated our leadership position in
NDDS, with our market share increasing
to 9.6%, as against 9.2% in 2004. During
the year, we also signed a number of
strategic in-licensing deals that augment
our ability to launch differentiated
Asia
products in the Indian market.
The Indian operations scaled up from one
business to another, launching many
‘Firsts.’ Premium molecules in Acute and
Chronic therapies, such as Faronem
(Faropenem), Riomet Liquid (Metformin),
Volix Tablets (Voglibose) and Simvotin
EZ (Simvastatin + Ezetimibe), were
launched. Ranbaxy also made an entry in
the Respiratory / Asthma market with the
launch of Dry Powder Inhalers (DPI) &
Metered Dose Inhalers (MDI), thus
becoming the first Indian company to
launch its entire MDI range, based on
Hydro Fluoro Alkane (HFA) propellants.
We also introduced Rheohaler (Inhaler),
an innovative DPI device, which is
convenient to use and demonstrates
better drug deposition rates vital for
Respiratory medication. In the Anti-HIV
segment, the Company launched the
combipack, Virolis E (Lamivudine +
Stavudine + Efavirenz) and Virocomb E
(Lamivudine + Zidovudine + Efavirenz),
offering the prospect of better
compliance to patients. These products
were introduced for the first time in the
country. In the dermatology segment,
Suncross lotion was a notable launch
and features amongst the Top 30
introductions of the year.
The launch of many other products in
Neuro-psychiatry, Gastroenterology and
Urology segments, further strengthened
our presence.
Focusing on customer relationships, we
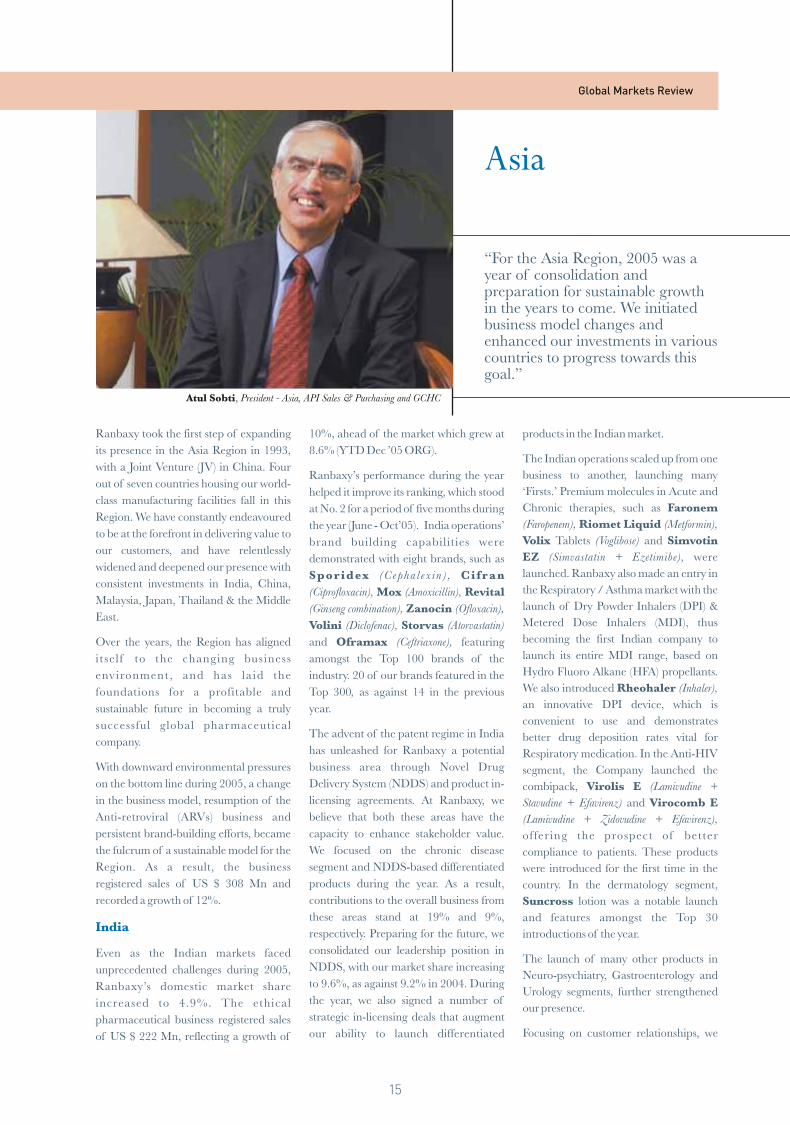
“For the Asia Region, 2005 was a year of consolidation and preparation for sustainable growth in the years to come. We initiated business model changes and enhanced our investments in various countries to progress towards this goal.”
Atul Sobti, President - Asia, API Sales & Purchasing and GCHC
Global Markets Review
16
launched ‘Insucare’ – a value added
service for diabetic patients that comes
with ‘Controlled Insulin Logistics’ – an
innovative delivery mechanism ensuring
that the vital Cold Chain is maintained.
Continuing our tradition of bringing
value to the stakeholders, we enhanced
our Knowledge Management and
Medico-marketing initiatives, organizing
more than 1600 interface programs with
the medical fraternity.
Given the demands of the business
environment, India operations focused on
improv ing in ter na l opera t iona l
efficiencies through better management
of financial resources and working capital
investments to get a better return on sales.
Some of the taxation-related changes,
such as Value Added Tax and other policy
implementation measures, resulted in
restrictions on Cox II (Cyclo-Oxygenase)
products, impacting the performance
during the year. However, technology
advancements and solutions were
in t roduced to fur ther improve
operational efficiencies. These initiatives
are expected to enable the Company to
scale up its operations with speed, while
capturing the future growth opportunities
being presented by the market.
China performed well in 2005, returning
positive earnings during the year with
sales growing by 25% to US $ 14.6 Mn.
The growth was driven by major brands,
such as Simcor (Simvastatin), Tomiron
(Cef t e ram Pivoxi l ) and Ceroxim
(Cefuroxime Axetil), with significant volume
gains by the flagship brand, Cifran
(Ciprofloxacin). The year also saw the
launch of the first generic injectable
product Imipenem + Cilastatin.
While price cuts did apply pressures on
the bottom line for the fourth consecutive
year, a business model change with a focus
on hospital sales, enabled us to deepen
our reach in China. Our products are now
being sold from 2000 hospitals in 375
cities out of 25 provinces.
During the year, investments were made
in improving the manufacturing
China
capabilities; as a result three China GMP
approvals were obtained.
Japan, the 2nd largest Pharma market of
the world (US $ 60 Bn), witnessed a
distinct buoyancy in its relatively small
generic market (~US $ 3.3 Bn), as a result
of the regulations and reforms introduced
by the Government towards bringing
down health costs.
Capturing the opportunity offered by
these regulations, Ranbaxy, through its
JV, Nihon Pharmaceutical Industry
Company Ltd (NPI), launched Vogseal
(Voglibose), an anti-diabetic product, in
Japan . Desp i te in tense marke t
competition, Vogseal became the
market leader in its segment (source : IMS
health Jul-Dec 2005). In an effort to
consolidate our relationship with our JV
partner, we increased our equity stake in
NPI from 10% to 50%. This reflects our
commitment to step up our efforts in this
market to exploit the emerging generics
opportunity.
Japan
Key Markets in the Middle East &
the Asia Pacific
Malaysia
The Middle East markets contributed
US $ 15.8 Mn, reflecting a growth of 25%
during 2005. The Company is recognized
as the largest generic pharma in UAE
with two of its brands, Enhancin (Co-
Amoxiclav) and Cifran (Ciprofloxacin),
featuring amongst the Top 50. In Oman,
the Company consolidated its leadership
position with the launch of Riconia
(Fortified micronutrients combination) and
Roletra (Loratadine) Tablets.
Ranbaxy in Malaysia, continued to
perform well. During 2005, the Company
recorded sales of US $ 14 Mn, reflecting a
growth of 12%. The growth was
primarily fueled by the increase in trade
sales to General Practitioners and
hospital sales. The fastest growing
products in the portfolio are Romesec
(Omeprazole) Capsules and Crixan
(Clarithromycin) Tablets, while Lestric
Global Markets Review
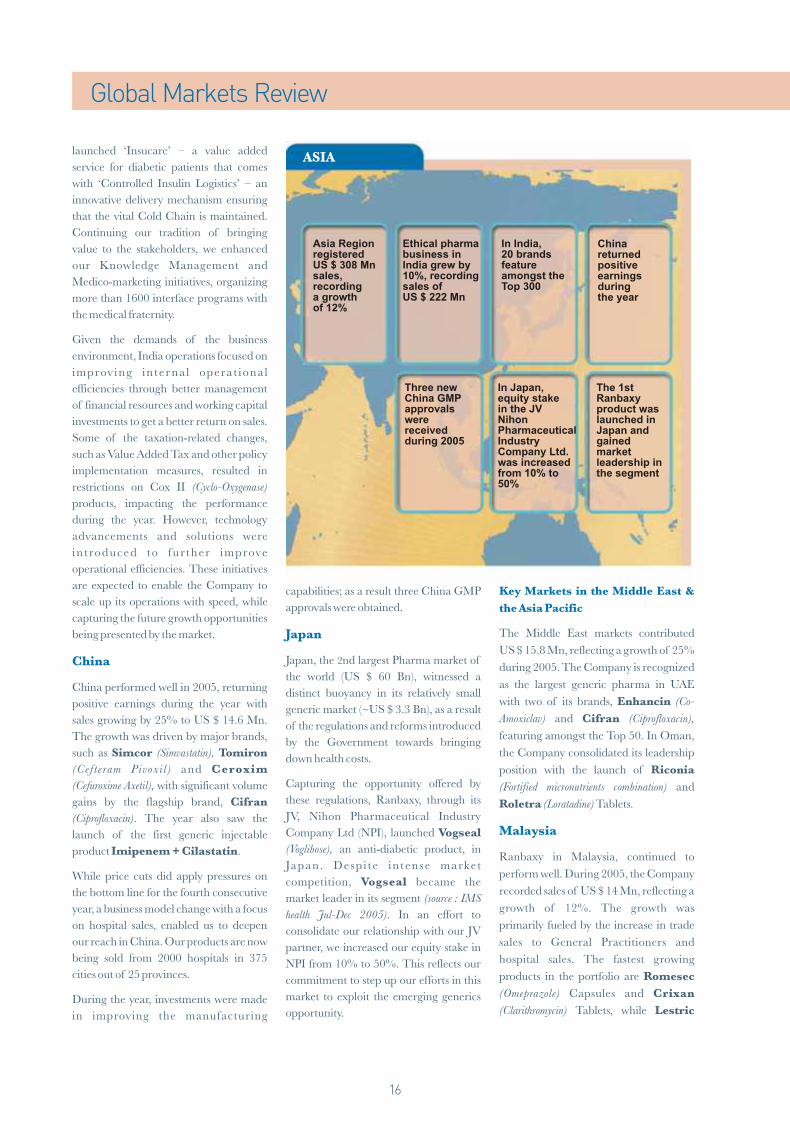
Ethical pharmabusiness in India grew by10%, recordingsales of US $ 222 Mn
Asia RegionregisteredUS $ 308 Mnsales,recording a growth of 12%
In India,20 brandsfeature amongst theTop 300
Chinareturnedpositiveearningsduringthe year
Three newChina GMPapprovalswere receivedduring 2005
In Japan,equity stakein the JV NihonPharmaceuticalIndustryCompany Ltd.was increasedfrom 10% to50%
The 1stRanbaxy product waslaunched in Japan andgainedmarketleadership inthe segment
ASIA

(Lovastatin) remained the largest brand for
the Company.
The key achievement of the year was the
successful launch of products such as
Vercef Distabs (Cefaclor), Loxof
(Levofloxacin), Caslot (Carvedilol) and
Zanocin OD (Ofloxacin).
Thailand
In line with the rest of the Region,
Thailand operations registered 20%
growth, at sales of US $ 8 Mn, moving up
in the IMS Hospital Rank to No. 31 from
No. 35.
In the Anti-infective segment, the 56%
growth of Ranclav (Co-Amoxiclav) was
led by the new Ranclav BID
Suspension, Ranclav Inj and Ranclav
1g Tablets.
Cascor XL (Diltiazem XL), an NDDS-
based Cardiovascular product, made an
entry into the most prestigious Medical
School Hospitals with sales doubling
during the year. Crixan (Clarithromycin), a
relatively new product, also grew by 37%
during the year.
Ranbaxy Global Consumer Healthcare
The Company’s global consumer healthcare (GCHC) business
which began in India in 2002, now focuses on a product basket
of ten brands. While five of these have been switched from
prescription to OTC, the other five belong to the herbal range
marketed under New Age Herbals brand.
During 2005, the business focused on expanding the choice for
customers, as regards remedies for diverse common ailments,
such as cough, cold, indigestion, etc.
The lead brand, Revital (Ginseng combination), recorded a
CAGR at 21.7% (2005 over 2002), as per the ORG-IMS, SSA
report. The consumer healthcare business registered sales of
US $ 16 Mn during the year.
Moving forward, the Company is focusing on expanding the
consumer healthcare business globally. In countries like Russia,
Romania, Malaysia, Vietnam, Myanmar and Ukraine, the
OTC business has already started and is progressing well.
Global Active Pharmaceutical Ingredients
(APIs) Business
The year 2005 was a strong year for the API business, with a
growth of 25%, registering sales of US $ 128 Mn. Despite
unprecedented price erosions across the industry, the business
was able to achieve a growth in margins. We expanded our
presence in the regulated markets, particularly USA and
European, where business grew by 52%. With the initiation of
business with several new customers, our share in the Eastern
Europe market has also increased. Significant strides in the
custom synthesis area were made in Japan; this is expected to
open new doors of opportunity with the innovator companies.
Going forward, the business is expected to focus on technology-
based products.
Other Global Businesses
Global Markets ReviewAnnual Report 2005Ranbaxy Laboratories Limited

Innovating for a healthier world
At Ranbaxy, Research & Development
(R&D) is a manifestation of our belief in
quality and innovation. The Company is
focused on world-class R&D and has built
significant expertise in Drug Discovery
research, Novel Drug Delivery Systems
research, Pharmaceutical research and
Chemical & Fermentation research.
We have always demonstrated our
commitment to support humanitarian
efforts by bringing quality products to the
market. Our focus on the Malaria
Molecule, RBx 11160, under the Drug
Discovery program, bears testimony to
this commitment.
With the collective efforts of its
multidisciplinary dedicated team of over
300 scientists, the Company is currently
pursuing 10 research programs. During
the year, the Company accelerated its
drug discovery programs in the
therapeutic areas of Infectious Diseases
(Anti-bacterials and Anti-fungals),
Urology (Benign Prostatic Hyperplasia
and Urinary Incontinence), Metabolic
D i s e a s e s ( Ty p e 2 D i a b e t e s ,
Hyperlipidemia) and Inflammatory /
Respiratory Diseases (Asthma, Chronic
Obstructive Pulmonary Disease [COPD]
and Rheumatoid Arthritis).
The RBx 11160 molecule, a potential
Anti-malarial candidate, is being
developed jointly with Geneva-based
New Drug Discovery Research
(NDDR)
18
“With the collective efforts of its multidisciplinary dedicated team of over 300 scientists, the Company is currently pursuing 10 research programs.”
Medicines for Malaria Venture (MMV).
The molecule, a synthetic peroxide, can
be produced economically and quickly,
and holds great promise for millions of
patients afflicted with malaria in the
developing countries. Phase II (a) (Proof
of Concept) studies on this molecule have
been completed. We are now initiating
the Phase II (b) (Dose Range Finding)
studies in Africa, India and Thailand.
RBx 11160 is a short-acting drug, which
needs to be combined with another long-
acting drug, to comply with the current
World Health Organization (WHO)
guidelines for development of new anti-
malarial compounds. During the year,
our scientists considered several potential
partner drugs, and finally identified
Piperaquine Phosphate (PQP) as a
synergistic partner for RBx 11160. The
Company has successfully completed
preclinical toxicology and safety
pharmacology studies with PQP, and
subsequently filed an Investigational New
Drug (IND) application with Swiss medic,
in December 2005. The Phase I studies
on this molecule have been initiated in
early 2006, in Switzerland.
Ranbaxy, along with MMV, participated
at the 54th annual meeting of the
American Society of Tropical Medicine
& Hygiene in Washington, in 2005.
The preclinical and Phase I study data
and the development strategy of
RBx 11160 presented at the forum, was
well received.
For Urinary Incontinence, Phase I single
and multiple rising dose studies with
RBx 9841, were successfully completed.
The molecule is a potent and selective
inhibitor of M3 (muscurinic) receptor.
It is also being investigated for other
indications such as COPD and Asthma.
The Company is exploring suitable
collaborative avenues to advance this
molecule to Phase II studies and beyond.
During the year, the Company also
submitted an IND application with the
Drugs Controller General of India, for
RBx 10558, a potent candidate for
Dyslipidemia. The advantage with this
candidate is that there is potentially no
myopathy (muscular toxicity) associated
with this molecule.
In the area of Infectious Disease, the
Company is working on a novel antibiotic
Research... a driving force for the Company
(L-R) Dr. Vijay Batra, Head - Generics, NDDS & Drug Development andDr. Pradip K. Bhatnagar, Vice President - New Drug Discovery Research
Research & Development

19
t o t rea t Commun i t y Acqu i r ed
Respiratory Tract Infections (CARTI).
The molecule has shown promising
results in late discovery stages.
A d d i t i o n a l l y, f o r Re s p i r a t o r y
Inflammatory diseases, a potent and
selective PDE-IV inhibitor is being
profiled as a potential clinical candidate
for COPD and Asthma.
Significant progress has been made on the
two research programs, that are being
pursued with GlaxoSmithKline (GSK).
An alliance with Anna University in India
is going well. A large number of
medicinal plants are being evaluated as
p o t e n t i a l s o u r c e s f o r n o v e l
pharmaceutical agents. The Company
also has an ongoing collaborative
research project with the National
Institute of Pharmaceutical Education &
Research (NIPER) in the area of
Respiratory disease, and another one with
National Chemical Laboratories (NCL)
in the area of Infectious Disease.
During the year, the Drug Discovery
research team filed 60 patent applications
in India.
To provide the requisite growth
momentum to the research activity, a
state-of-the-art R&D center, dedicated to
New Drug Discovery Research, was
New R&D Center
commissioned during the year. It was
inaugurated by the Hon’ble President of
India, Dr. A. P. J. Abdul Kalam. Ranbaxy
now houses one of the largest R&D
centers in the country.
Ranbaxy made significant progress in its
NDDS programs during the year.
The Company launched 4 products in
India in the area of Oral Controlled
Release Systems, of which 3 were
developed in-house and 1 was out-
sourced. These were : Contiflo OD
(Tamsulosin 0.4 mg + Finasteride 5 mg)
Capsules; Desval ER (Divalproex Sodium
750 mg) Tablets; Pioglar MF (Pioglitazone
3 0 m g + M e t f o r m i n S R
500 mg) Tablets; Selzic OD (Oxcarbazepine
150 / 300 / 600 mg) Tablets.
During the year, the Company filed 3
NDDS-based Abbreviated New Drug
Applications (ANDAs) with the US FDA
and 4 with European regulatory agencies.
Currently, a number of oral controlled
release products are in the advanced
stages of development. The Company is
also exploring a range of transdermal and
transmucosal delivery systems for future
development.
15 patents were filed in the NDDS area in
India.
Novel Drug Delivery System
(NDDS)
Pharmaceutical Research
During the year, apart from 4 NDDS
products, the Company introduced 49
new products and line extensions in India,
through Pharma Research capabilities.
While 34 of these were developed in-
house, 15 products were out-sourced.
This also included a number of niche
products comprising Metered Dose and
Dry Powder Inhalers for this market. As
opposed to conventional CFC (Chloro
Fluoro Carbon propellant) based
inhalers, these are considered to be
environment-friendly.
During the year 36 ANDAs were filed
with the US FDA, including 10 under the
US President’s Emergency Plan For
AIDS Relief (PEPFAR) program.
The Company received approvals for 19
ANDAs, including 3 under PEPFAR.
To d a y, o u r c u mu l a t i ve A N DA
applications total at 183, with 114
approvals obtained and 69 pending
approval with the US FDA.
International Regulatory Filings and Approvals – Dosage Forms
Table R1
Key Countries Jan - Dec 2005
Approvals^ Filings*
USA 19** 36**
European Union
- National 24^^ 52***
- Mutual Recognition 47^^^ 51**** Procedure
BRICS
- Brazil 07 16
- Russia 12 41 (incl. Ukraine Belt)
- India 25 28
- China 03 05
- South Africa 09 20
Rest of the world 234 472
Total 380 721
^ includes 19 approvals for 4 out-sourced products
^^ 24 national approvals for 24 products in 7 Reference Member States (incl. 1 OTC product)
^^^ 47 MRP licenses for 6 products in 23 Concerned Member States (incl. 17 MRP licenses for 2 outsourced products)
* does not include out-sourced products and tender documents; includes fresh / new filings only; includes OTC and ARV products
** includes 10 ANDAs filed under PEPFAR and 3 ANDAs approved under PEPFAR
*** Filings for 46 products in 7 Reference Member States (incl. 1 OTC product and 1 DCP fling for 1 product)
**** Filings for 6 products in 24 Concerned Member States under MRP
Research & DevelopmentAnnual Report 2005Ranbaxy Laboratories Limited
185 patentapplicationswere filedduring theyear
Phase II (a) (Proof of Concept)studies for RBx11160, beingdeveloped jointlywith Geneva-basedMedicinesfor MalariaVenture (MMV)was completed
Working towardsthe future vision,the Companystepped up its filings in theinternationalmarkets
49 new productsand lineextensions wereintroduced in India
R&D

20
The Company also made 52 National
Filings for 46 products in 7 European
Union (EU) Reference Member States
and 51 Mutual Recognition Procedure
applications for 6 products in 24 EU
Concerned Member States (see Table R1 on
page 19).
In emerging markets, comprising the
BRICS (Brazil, Russia, India, China,
South Africa) countries, a total of 110
filings were made.
During the year, the pharmaceutical
research team filed 35 patents in India.
Research & Development
Key Countries Approvals Filings
USA 06 13
Europe 108** 80
Brazil 01 02
Russia 04 09(incl. Ukraine Belt)
China 03 01
South Africa 01 06
Rest of the World 08 20
Total 131 131
* does not include re-registration and outsourced products
** includes approvals for 4 APIs under MRP
DMF: Drug Master File
MRP: Mutual Recognition Procedure
International DMF Filings* and Approvals (Jan - Dec 2005)
Table R2
Chemical and Fermentation
Research (Active Pharmaceutical
Ingredients)
The Company continued with its focus on
the development of Chemical and
Biological (fermentation-based) processes
for high-value Active Pharmaceutical
Ingredients (APIs). The emphasis is on
developing novel, patentable, safe and
environment-friendly processes for the
production of high quality APIs.
During the year, scale-up / pilot plant
studies were completed for 13 APIs. The
Company a l so commerc i a l i z ed
technologies for 6 other APIs, and filed
131 Drug Master Files, comprising 37
APIs in various countries (see Table R2).
During the year, the Chemical and
Fermentation Research teams filed 68
patents in India.
Herbal Drugs Research
The Company continued with its focus on
developing safe and effective herbal drugs
that comply to international quality
standards. Substantial emphasis is placed
on product differentiation through
scientific processes, with respect to the
standardization of botanical actives,
minimum ingredients, batch-to-batch
consistency and optimum dose. This is
reflected in the fact that the Company
contributed significantly in developing
the quality standards of 10 medicinal
plants, which have been included in the
2005 addendum of the Indian
Pharmacopoeia.
During the year, the Company launched 2
products in the international market
Leav (a natural sweetener) in Malaysia
and Revital Appetit (appetite enhancer
for kids) in Romania. The Company also
filed 2 other products in Russia, Ukraine
and Malaysia. The Company has several
niche products under the over-the-
counter (OTC) category, which are
currently under different phases of
development.
Work is also under progress for isolation
and characterization of biologically
active compounds (either as New
Chemical Entities (NCEs) or potential
lead compounds), to substantiate the
Company’s Drug Discovery program.
Area India PCT US Total
APIs 68 - - 68
- Synthetic 65 - - 65
- Fermentation 03 - - 03
Dosage Forms 35 - - 35
Herbal 04 - - 04
NDDS 15 - - 15
NDDR 60 - - 60
Packaging 02 - - 02
Analytical 01 - - 01Development
Total 185 - - 185
* These are first time (fresh) filings; not international or national filings of earlier applications filed in India
Patent Applications* Filed(Jan-Dec 2005)
Area India US Total
APIs 05 02 07
- Synthetic 05 01 06
-Fermentation - 01 01
Dosage Forms 02 01 03
NDDS - 01 01
NDDR - 01 01
Total 07 05 12
**These are unique patents – meaning any equivalent patents granted in other countries have not been counted
Accepted / Granted Patents** (Jan-Dec 2005)
INTELLECTUAL PROPERTY GENERATED

21
Research & DevelopmentAnnual Report 2005Ranbaxy Laboratories Limited
The New Drug Discovery Research Center, inaugurated by the President of India, in 2005
Led by a vision... towards a healthier tomorrow...

22
“We continued with our strategy to grow and invest in key markets, augment our manufacturing capacities and research & development capabilities, involving substantial financial investments in 2005.”
These projects focused on identification
of key risks, their mitigation plans and
e s t a b l i s h i n g a c o m p r e h e n s i v e
information security management system
for the Company.
In order to focus on the core
pharmaceutical business, the portfolio of
Allied Businesses consisting of Animal
Healthcare, Fine Chemicals and
Diagnostics, was divested towards the end
of 2005.
In the wake of the consolidation
initiatives happening across the generics
industry landscape, your Company also
actively pursued merger and acquisition
opportunities as a growth strategy, and
evaluated a number of potential targets
during 2005. In Japan, we acquired an
additional 40% stake in Nihon
Pharmaceutical Industry Co. Ltd., which
has now become a 50:50 Joint Venture. In
March 2006 we concluded an agreement
to acquire 96.7% stake in Terapia, the
largest independent generics company in
Financial Review
Investing for the future
Ram S. Ramasundar, President & CFO
Dear Shareholders,
Global sales for the year were US $ 1178
Mn, at the same level as the prior year.
Many of our key markets, notably China,
CIS, Germany, India and South Africa,
recorded good growth rates over the
previous year, whereas in the US our sales
were lower by 25% at US $ 328 Mn. This
decline in sales in the US was caused
primarily by steep erosion in prices due to
increasing competitive pressures, which
were felt across the entire generics
industry. The lower sales in the US, along
with the increase in research &
development and litigation-related
expenditure, significantly impacted the
p ro f i t a b i l i t y o f t h e C o m p a ny.
Consequently, the overall consolidated
Profit after Tax and Minority Interest was
lower at Rs. 2,617 Mn.
A number of key initiatives were initiated
and progressed during the year. We
embarked upon a Company-wide
program on cost optimization across the
entire value chain, which is expected to
improve our cost competitiveness in the
foreseeable future. At the same time, we
continued with our strategy to grow and
invest in key markets, augment our
manufacturing capacities and research &
development capabilities, involving
substantial financial investments in 2005.
These measures are expected to
strengthen our competitive position and
market standing, as well as meet our
medium term business requirements.
Two important projects to enhance the
control environment and establish an
effective business risk management
mechanism were initiated during the year.
Romania for a net consideration of
US $ 324 Mn. We also acquired Ethimed,
a generic company in Belgium, and the
generics portfolio of GlaxoSmithKline in
Italy. In order to fund the acquisitions and
other capital expenditure requirements,
an amount of US $ 440 Mn was raised in
March 2006, through issuance of Zero
Coupon Foreign Currency Convertible
Bonds.
In summary, we believe that the cost
reduction initiatives and planned new
product launches, combined with the
increased focus on inorganic growth
opportunities, will help to strengthen the
financial performance of your Company
in 2006, and beyond.
Ram S. RamasundarPresident & CFO
April 24, 2006
Particulars Unit of Measure 2005 2004 2003 2002
PBIDA to Sales % 7.2 20.4 24.8 23.7PAT to Sales % 5.0 13.1 16.8 17.4ROCE % 6.1 28.4 39.5 39.8RONW % 10.4 28.9 36.9 38.2Earning per share (Fully diluted) Rs. 6.85 18.74 19.58 14.99Book Value per share Rs. 65.69 69.72 60.65 50.31 @Debt Equity Ratio Times 0.82 0.33 0.26 0.21Inventories No. of Sale Days 98 82 75 80Receivables No. of Sale Days 80 65 62 72Dividend Rs. Millions 3166.7 3162.6 3156.3 2434Tax on Dividend Rs. Millions 447.8 440.4 404.4 237.6
PBIDA - Profit before Interest, Depreciation and AmortizationPAT - Profit after TaxROCE - Return on Capital EmployedRONW - Return on Net Worth
@ Post issue of Bonus Shares in the ratio of 3 for 5 in October 2002Earning per share & book value per share has been adjusted to consider the impact of stock split
Key Parameters Consolidated

23
1. T H E C O M P A N Y ' S
PHILOSOPHY ON CODE OF
CORPORATE GOVERNANCE
In order to ensure sustainable returns
to all stakeholders of the business, it is
imperative, especially for large
organizations, to adopt and follow
certain policies, procedures and
processes, which together constitute a
“Code of Corporate Governance.” It
is important that such a Code is
i n s t i t u t i o n a l i ze d , t o e n s u re
transparency, consistency and
uniformity of decision making
processes and actions. Ranbaxy has
always believed in such a “Sound”
Code of Corporate Governance, as a
tool for highest standards of
management and business integrity
and as a result started implementing a
series of voluntary initiatives as early
as 1999.
Some of these measures included :
· Composition of the Board of
D i r e c t o r s ( e g . M a j o r i t y
Independent Directors).
· Constitution of various Board
Committees for oversight and
guidance concerning key decisions
and soundness of decision making
processes connected with the
functioning of the Company.
· T i m e l y d i s s e m i n a t i o n o f
information to shareholders.
· Code of Conduct.
Corporate Governance
Showing the way
“Ranbaxy has always believed in a ‘sound’ Code of Corporate Governance, as a tool for highest standards of management and business integrity...”
2. BOARD OF DIRECTORS
Composition as on December 31, 2005
The Board comprises fourteen Directors, including the Non-Executive
Independent Chairman and three Executive Directors.
Corporate Governance
* Appointed on July 28, 2005.
** Up to December 31, 2003, was a Whole-time Director of the Company.
*** Related to promoters.
**** Appointed on January 18, 2005.
@ Excludes private, foreign and companies registered under section 25 of the Companies
Act, 1956.
Name of the Director Category No. of No. of
Directorships Board Committee
held in other Memberships
Companies @ held in other
Companies
Mr. Tejendra Khanna, Non-Executive- 3 3
Chairman Independent
Mr. J. W. Balani -do- – –
Mr. Vivek Bharat Ram - do - 3 1
Mr. Gurcharan Das -do- 5 –
Dr. P. S. Joshi - do - 1
Mr. Nimesh N. Kampani - do - 7 6
Mr. Vivek Mehra - do - – –
Mr. Surendra Daulet-Singh -do- 1 1
Mr. Ravi Mehrotra * -do- – –
Mr. V. K. Kaul ** Non-Executive & 14 7
Non-Independent
Mr. Harpal Singh*** - do - 8 1
Dr. Brian W. Tempest Executive – –
Mr. Malvinder Mohan Singh Executive 10 7
(Promoter)
Mr. Ramesh L. Adige **** Executive 1 –

Name of the Member No. of
Meetings
attended
Mr. Tejendra Khanna, 4ChairmanMr. Vivek Bharat Ram * 3Mr. Vivek Mehra 4Mr. Harpal Singh 4Mr. Surendra Daulet-Singh * 2Mr. Nimesh N. Kampani ** -Mr. V. K. Kaul ** -Mr. Ravi Mehrotra ** 1Permanent InviteesDr. Brian W. Tempest 4Mr. Malvinder Mohan Singh 4
* Resigned as a member of the Committee w.e.f. July 28, 2005.
** Co-opted as a member of the Committee w.e.f. July 28, 2005.
Members of the Audit Committee
have requis i te f inancia l and
management expertise and have held
or hold senior positions in other
reputed organizations.
The Statutory Auditors, Internal
Auditor and the Chief Financial
Officer are invited to attend and
participate at meetings of the
Committee.
The Company Secretary acts as the
Secretary to the Committee.
(ii)Management Committee
Ter ms of Reference of the
Management Committee include:
· Review and approval of business
strategies and policies, merger
and acquisition proposals,
medium term plans and annual
budgets.
· Review operating performance for
the global organization.
· Approval of processes and
practices relating to human
resources, succession planning for
senior management personnel.
· Review policies, processes and
systems on Environment, Safety
and Ecology.
Corporate Governance
Subsequent Changes in the
Board
1. Mr. J. W. Balani resigned on January
18, 2006, and in the casual vacancy so
caused, Mr. Shivinder Mohan Singh
was appointed as a Director of
the Company, effective January 18,
2006.
2. Dr. Brian W. Tempest was appointed
as Chief Mentor and Executive Vice
Chairman, effective January 18,
2006.
3. Mr. Malvinder Mohan Singh was
appointed as Chief Executive Officer
and Managing Director, effective
January 18, 2006.
Dates of Board meetings are fixed in
advance and agenda papers are
circulated to Directors seven days
before the meeting.
Meetings and Attendance
During the year 2005, six Board
Meetings were held : January 18,
April 28, June 30, July 28, September
9 and October 21.
3. BOARD MEETINGS
4. COMMITTEES OF THE BOARD
(i) Audit Committee
The Audit Committee has been
constituted as per Section 292 A of the
Companies Act, 1956, and the
guidelines set out in the Listing
A g r e e m e n t s w i t h t h e S t o c k
Exchanges. The terms of reference
include:
· Overseeing financial reporting
processes.
· Reviewing periodic financial
results, financial statements and
adequacy of internal control
systems.
· Approving internal audit plans
and reviewing efficacy of the
function.
· Discussion and review of periodic
audit reports, and
· Discussions with external auditors
about the scope of audit including
the observations of the auditors.
Minutes of meetings of the Audit
Committee are circulated to members
of the Committee and the Board is
kept apprised.
24
Composition and Attendance
During the year 2005, four meetings
of the Audit Committee were held:
January 18, April 28, July 28, and
October 21.
Attendance of Directors at Board Meetings
and at the Annual General Meeting (AGM)
Name of the Director No. of Board Whether Attended
Meetings attended the AGM held on
June 30, 2005
Mr. Tejendra Khanna, Chairman 6 Yes
Mr. J. W. Balani – –
Mr. Vivek Bharat Ram 6 Yes
Mr. Gurcharan Das 3 –
Dr. P. S. Joshi 6 Yes
Mr. Nimesh N. Kampani 3 Yes
Mr. V. K. Kaul 5 Yes
Mr. Vivek Mehra 6 Yes
Mr. Harpal Singh 6 Yes
Mr. Ravi Mehrotra 1 Yes
Mr. Surendra Daulet-Singh 3 –
Dr. Brian W. Tempest 6 Yes
Mr. Malvinder Mohan Singh 6 Yes
Mr. Ramesh L. Adige 5 Yes

(iii)Compensation Committee
Ter ms of Reference of the
Compensation Committee include :
· A d m i n i s t r a t i o n a n d
superintendence of Employee
S t o c k O p t i o n S c h e m e
(ESOS).
· Formulation of the detailed terms
and conditions of the ESOS.
· Grant of stock options.
· Recommendation for fixation
and per iodic rev i s ion o f
compensation of the Managing
Director and Executive Directors
to the Board for approval and
· R e v i e w a n d a p p r o v e
compensation policy (including
performance bonus, incentives,
perquisites and benefits) for
senior management personnel
(VPs and above).
Composition and Attendance
During the year 2005, two meetings
of the Compensation Committee
were held : January 17 and April 27.
25
Annual Report 2005Ranbaxy Laboratories Limited Corporate Governance
Minutes of meetings of the
Management Committee are
circulated to members of the
Committee and the Board is kept
apprised.
Composition and Attendance
During the year 2005, six meetings
of the Management Committee were
held: January 17, April 27, July 27,
September 15, October 20 and
December 21.
Name of the Member No. of Meetings
attended
Mr. Tejendra Khanna, 6ChairmanMr. Vivek Bharat Ram 5Mr. Nimesh N.Kampani 2@Mr. Harpal Singh 6Mr. Surendra Daulet-Singh 4Mr. Gurcharan Das * 1Permanent InviteesDr. Brian W. Tempest 4Mr. Malvinder Mohan Singh 5
* Co-opted as a member of the Committee w.e.f. July 28, 2005.
@ In addition, at the meeting held on October 20, participated through video conferencing.
Name of the Salary Commission Perquisites Retiral Stock Post Service Contract Director & Benefits* Options** Split Tenure Notice
Allowances (granted on No. of Period 17.1.2005) options
Rs. Lacs
Dr. Brian W. 226.20 52.34 72.30 21.29 40,000 80,000 up to 12 Tempest 31.12.07 months
Mr. Malvinder 210.01 31.40 4.76 16.20 – – up to 12 Mohan Singh 31.12.08 months
Mr. Ramesh 52.71 15.00 0.57 2.46 3,000 6000 up to 12 L. Adige 17.01.10 months
subject to super
annuation policy of the Company.
Name of the Member No. of
Meetings attended
Mr. Tejendra Khanna, 2ChairmanMr. Vivek Bharat Ram 2Mr. Nimesh N.Kampani 1Mr. Harpal Singh 2Mr. Surendra Daulet-Singh 2Mr. V. K. Kaul * -Permanent InviteesDr. Brian W. Tempest 2Mr. Malvinder Mohan Singh 2
* Co-opted as a member of the Committee w.e.f. July 28, 2005.
Remuneration Policy
The Remuneration Policy of the
Company for managerial personnel is
primarily based on the following
criteria :
· Performance of the Company, its
divisions and units.
· Track record, potential and
performance of individual
managers, and
· E x t e r n a l c o m p e t i t i v e
environment.
Remuneration of Directors
Remuneration of Executive Directors is decided by the Board, based on recommendations of the Compensation Committee as per
the remuneration policy of the Company, within the ceilings fixed by the shareholders. Remuneration of the Executive Directors for
the year ended December 31, 2005, was as follows.
Executive Directors
* Exclusive of provision for future liabilities in respect of retirement benefits (which are based on actuarial valuation done on overall Company basis).
** Each vested option is exercisable into one fully paid-up Equity Share against payment of Rs. 1077 per share of Rs. 10 each. (Post Split Rs. 538.50
per share of Rs. 5 each) Market price of the share on January 14, 2005 was Rs. 1068.65 per share; hence stock options were not at a discount. The
options granted are exercisable till expiry of ten years from the date of grant. Vesting period will commence on the expiry of one year from the date
of grant of options and the entitlement will be in the graduated scale over a period of five years as provided in the Employees' Stock Option
Scheme of the Company.
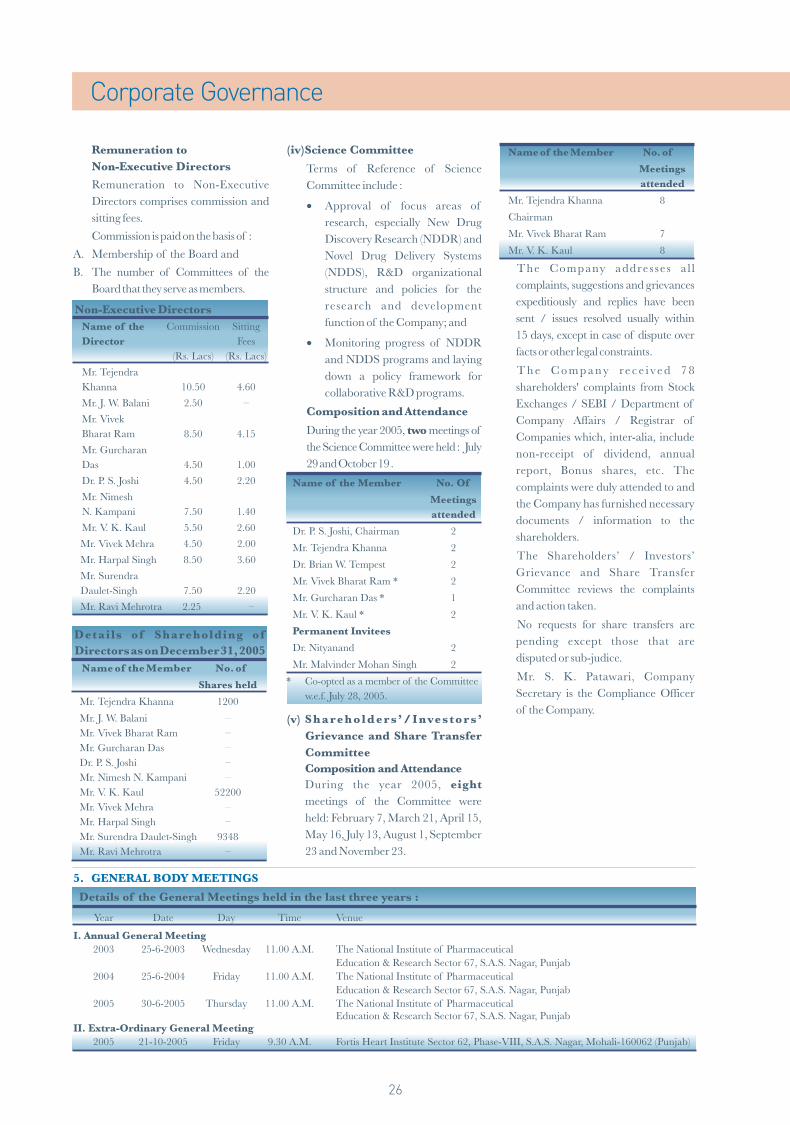
Corporate Governance
Remuneration to
Non-Executive Directors
Remuneration to Non-Executive
Directors comprises commission and
sitting fees.
Commission is paid on the basis of :
A. Membership of the Board and
B. The number of Committees of the
Board that they serve as members.
Non-Executive Directors
Name of the Commission Sitting
Director Fees
(Rs. Lacs) (Rs. Lacs)
Mr. Tejendra
Khanna 10.50 4.60
Mr. J. W. Balani 2.50 –
Mr. Vivek
Bharat Ram 8.50 4.15
Mr. Gurcharan
Das 4.50 1.00
Dr. P. S. Joshi 4.50 2.20
Mr. Nimesh
N. Kampani 7.50 1.40
Mr. V. K. Kaul 5.50 2.60
Mr. Vivek Mehra 4.50 2.00
Mr. Harpal Singh 8.50 3.60
Mr. Surendra
Daulet-Singh 7.50 2.20
Mr. Ravi Mehrotra 2.25 –
Name of the Member No. of
Meetings
attended
Mr. Tejendra Khanna 8
Chairman
Mr. Vivek Bharat Ram 7
Mr. V. K. Kaul 8
The Company addres ses a l l
complaints, suggestions and grievances
expeditiously and replies have been
sent / issues resolved usually within
15 days, except in case of dispute over
facts or other legal constraints.
T h e C o m p a n y re c e i ve d 7 8
shareholders' complaints from Stock
Exchanges / SEBI / Department of
Company Affairs / Registrar of
Companies which, inter-alia, include
non-receipt of dividend, annual
report, Bonus shares, etc. The
complaints were duly attended to and
the Company has furnished necessary
documents / information to the
shareholders.
The Shareholders’ / Investors’
Grievance and Share Transfer
Committee reviews the complaints
and action taken.
No requests for share transfers are
pending except those that are
disputed or sub-judice.
Mr. S. K. Patawari, Company
Secretary is the Compliance Officer
of the Company.
5. GENERAL BODY MEETINGS
Details of the General Meetings held in the last three years :
Year Date Day Time Venue
I. Annual General Meeting
2003 25-6-2003 Wednesday 11.00 A.M. The National Institute of Pharmaceutical
Education & Research Sector 67, S.A.S. Nagar, Punjab
2004 25-6-2004 Friday 11.00 A.M. The National Institute of Pharmaceutical
Education & Research Sector 67, S.A.S. Nagar, Punjab
2005 30-6-2005 Thursday 11.00 A.M. The National Institute of PharmaceuticalEducation & Research Sector 67, S.A.S. Nagar, Punjab
II. Extra-Ordinary General Meeting
2005 21-10-2005 Friday 9.30 A.M. Fortis Heart Institute Sector 62, Phase-VIII, S.A.S. Nagar, Mohali-160062 (Punjab)
26
Details of Shareholding of
Directors as on December 31, 2005
Name of the Member No. of
Shares held
Mr. Tejendra Khanna 1200
Mr. J. W. Balani –
Mr. Vivek Bharat Ram –
Mr. Gurcharan Das –
Dr. P. S. Joshi –
Mr. Nimesh N. Kampani –
Mr. V. K. Kaul 52200
Mr. Vivek Mehra –
Mr. Harpal Singh –
Mr. Surendra Daulet-Singh 9348
Mr. Ravi Mehrotra –
(iv)Science Committee
Terms of Reference of Science
Committee include :
· Approval of focus areas of
research, especially New Drug
Discovery Research (NDDR) and
Novel Drug Delivery Systems
(NDDS), R&D organizational
structure and policies for the
research and development
function of the Company; and
· Monitoring progress of NDDR
and NDDS programs and laying
down a policy framework for
collaborative R&D programs.
Composition and Attendance
During the year 2005, two meetings of
the Science Committee were held : July
29 and October 19 .
Name of the Member No. Of
Meetings
attended
Dr. P. S. Joshi, Chairman 2
Mr. Tejendra Khanna 2
Dr. Brian W. Tempest 2
Mr. Vivek Bharat Ram * 2
Mr. Gurcharan Das * 1
Mr. V. K. Kaul * 2
Permanent Invitees
Dr. Nityanand 2
Mr. Malvinder Mohan Singh 2
* Co-opted as a member of the Committee
w.e.f. July 28, 2005.
(v) Shareh o l d ers’/Investors’
Grievance and Share Transfer
Committee
Composition and Attendance
During the year 2005, eight
meetings of the Committee were
held: February 7, March 21, April 15,
May 16, July 13, August 1, September
23 and November 23.
Annual Report 2005Ranbaxy Laboratories Limited Corporate Governance
6. CODE OF CONDUCT
7. DISCLOSURES
8. MEANS OF COMMUNICATION
The Code of Conduct for the
Directors and the Employees of the
Company has been laid down by the
Board and the same is posted on the
website of the Company.
A. Related Party Transactions
The Company has not entered into
any transaction of material nature
with the promoters, the Directors or
the management, their subsidiaries or
relatives etc., that may have any
potential conflict with the interests of
the Company.
B. Compliances by the Company
During the last three years, no
penalties or strictures have been
imposed on the Company by the
Stock Exchanges or SEBI or any
other statutory authorities on matters
related to capital markets.
(a) The Company regularly intimates
unaudited, as well as audited,
financial results to the Stock
Exchanges immediately after these
are taken on record by the Board.
These financial results are normally
published in the Business Standard /
Financial Express, the Tribune
(Punjabi Edition) and are displayed
on the website of the Company
w w w . r a n b a x y . c o m a n d
simultaneously posted on the
Electronic Data Information Filing
and Retrieval website, namely
www.sebiedifar.nic.in. The website is
also accessible through a hyperlink
'EDIFAR' from SEBI's official
website, www.sebi.gov.in.
The official news releases and the
presentations made to the investors /
analysts are also displayed on the
Company's website.
(b) The Management Discussion and
Analysis Report forms part of the
Report of the Directors.
Annual General Meeting
Date : June 28, 2006
Time : 11.00 A.M.
Venue : The National Institute of
Pharmaceutical
Education and Research
(NIPER) Sector-67, S.A.S.
Nagar, Mohali - 160 062
(Punjab).
No Special resolution is proposed to be
passed by Postal ballot at the aforesaid
Annual General Meeting.
9. SHAREHOLDER
INFORMATION
Postal Ballot
Postal Ballot was conducted for seeking approval of the shareholders, under Section
293(1)(a) of the Companies Act, 1956 for sale / divestment of the Allied Businesses
portfolio of the Company consisting of (i) Ranbaxy Fine Chemicals Ltd. (a wholly-
owned subsidiary); (ii) Animal Health Care Business; and (iii) Diagnostics Business.
Mr. Sooraj Kapoor, a Practicing Company Secretary (Retired Registrar of
Companies, NCT of Delhi & Haryana), was appointed as Scrutinizer for
conducting the postal ballot process. The details of the voting pattern are as under :
Particulars No. of Valid No. of % of total valid
Ballots Received votes
cast votes cast
In favour of the 5326 160,559,936 99.94
Resolution
Against the Resolution 115 88,395 0.06
Total 5441 160,648,331 100.00
Number of Invalid Ballots (unsigned / unticked / ticked both the columns) were 234.
The Resolution was approved by the overwhelming majority of the shareholders.
Financial Calendar
Adoption of 3rd / 4th
Quarterly week of
Results for
the quarter
ending
June 30, 2006 July 2006
September 30, 2006 October 2006
December 31, 2006 January 2007
March 31, 2007 April 2007
Book Closure Dates
June 17, 2006 to June 28, 2006
(both days inclusive)
Dividend Payment Date
on or before July 10, 2006.
The Equity Shares of the Company as on
December 31, 2005, were listed on the
Stock Exchanges at Mumbai and
National Stock Exchange. Global
Depository Shares are listed on the Stock
Exchange at Luxembourg. The Company
confirms that it has paid annual listing fees
due to the Stock Exchanges for the year
2005-2006.
1. The National - Ranbaxy
Stock Exchange
of India Ltd.
2. Bombay Stock - 359 (Physical)
Exchange Ltd. 500359 (Demat)
M/s Alankit Assignments Ltd. (Alankit),
2E/8 , 1 s t F l oo r, Jhandewa lan
Extension, New Delhi-110 055 are the
Registrar and Share Transfer Agent for
physical shares of the Company. Alankit
is also the depository interface of the
Company with both National Securities
Depository Ltd. (NSDL) and Central
Depository Services (India) Ltd.
(CDSL).
However, keep ing in v i ew the
convenience of shareholders, documents
relating to shares will continue to be
LISTING ON STOCK
EXCHANGES
STOCK CODE
REGISTRAR AND TRANSFER
AGENTS
27

Corporate Governance
received by the Company at the Corporate Office of the Company at Plot No. 90, Sector 32, Gurgaon 122 001 (Haryana), Tel No.
91-124-4135000, Registered Office at A-11, Industrial Area, Sahibzada Ajit Singh Nagar (Mohali) - 160 055, (Punjab) and Head
Office at 12th Floor, Devika Tower, 6, Nehru Place, New Delhi 110 019, Tel No. 91-11-26452666; email: [email protected].
Distribution of Shareholding as on December 31, 2005
From To No. of Shareholders No. of SharesNumber % Total Number % Total
1 - 50 79388 45.57 2178695 0.5951 - 100 30443 17.48 2655618 0.71
101 - 200 19728 11.33 3207373 0.86201 - 300 7393 4.24 1929193 0.52301 - 400 7128 4.09 2500119 0.67401 - 500 3999 2.30 1877547 0.50501 - 600 3050 1.75 1709041 0.46601 - 700 2553 1.47 1663881 0.45701 - 800 1770 1.02 1354564 0.36801 - 900 1224 0.70 1050952 0.28901 - 1000 2138 1.23 2083132 0.56
1001 - 2000 7603 4.36 11043406 2.972001 - 3000 2976 1.71 7340674 1.973001 - 4000 1549 0.89 5329634 1.434001 - 5000 798 0.46 3613725 0.975001 & above 2442 1.40 322904636 86.70
Total 174182 100.00 372442190 100.00
Stock Price Performance - Ranbaxy Vs BSE Sensex Year 2005
300
400
500
600
700
Jan Feb Mar Apr May Jun Jul Aug Sep Oct Nov Dec
Ran
baxy
Sh
are
Pri
ce
(Rs.)
5000
6000
7000
8000
9000
10000
BS
ES
en
se
x(P
ts.)
Ranbaxy Share Price BSE Sensex
SHARE TRANSFER SYSTEM
DEMATERIALISATION OF SHARES
With a view to expedite the process of share transfers, the Board of Directors of the Company has delegated the power of share
transfer to some of the Directors, with appropriate individual limits. The delegated Director(s) attend(s) to the share transfer
formalities at least once in a fortnight. The shares for transfers received in physical form are transferred expeditiously, provided the
documents are complete and the shares under transfer are not under any dispute. The share certificates duly endorsed are returned
immediately to shareholders. Confirmation in respect of the requests for dematerialisation of shares is sent to the respective
depositories i.e. NSDL and CDSL expeditiously.
The shares of the Company are in compulsory demat segment and are available for trading in the depository systems of both NSDL
and CDSL. As on December 31, 2005, 356,404,900 Equity Shares of the Company, forming 95.69% of the Share Capital of the
Company, stand dematerialised.
International Securities Identification Number - INE015A01028 (with NSDL and CDSL)
Note : Based on daily closing data of Ranbaxy (Rs. Per share) and the BSE Sensex (Pts.)
28
Category No. of Percentage ofShares held Shareholding (%)
Promoters 133286388 35.79Mutual Funds & UTI 4355816 1.17Banks, Financial 50160678 13.47Institutions, Insurance Companies FIIs 72216182 19.39Private Corporate Bodies 5780485 1.55Indian Public 70345720 18.89Foreign Nationals 11052 0.00NRIs / OCBs 7079350 1.90GDRs 29206519 7.84
Grand Total 372442190 100.00
Shareholding Pattern as on December 31, 2005
Market Price Data (Rs.)
Month Bombay Stock National Stock
Exchange Exchange
(BSE) (NSE)
High Low High LowJanuary 2005 632.50 484.25 634.00 484.00February 2005 544.95 498.00 544.50 495.25March 2005 549.95 496.00 551.00 496.25April 2005 513.75 437.50 515.00 435.13May 2005 573.90 446.10 559.50 445.25June 2005 566.50 517.00 567.50 505.55July 2005 548.25 456.60 548.45 450.50August 2005 550.00 472.00 550.00 445.00September 2005 558.80 479.00 557.95 478.20October 2005 530.90 340.05 535.00 339.05November 2005 408.30 345.50 408.55 345.30December 2005 405.00 353.15 453.65 340.00
Post-split adjusted price

Annual Report 2005Ranbaxy Laboratories Limited Corporate Governance
Liquidity of Shares
The Equity Shares of the Company have
been included in the Sensex of the leading
Stock Exchanges.
Outstanding Stock Options
Number of Stock - 6,704,838 *
Options outstanding
as on December 31, 2005.
Out of which 9518 Stock Options
exercised are pending allotment.
* Options granted up to October 3,
2002, are entitled for additional shares
(518,858 shares) on a proportionate basis,
in view of issue of bonus shares by the
Company in the ratio of 3 for 5 in
October 2002.
As on December 31, 2005, there are no
outstanding warrants or any convertible
instruments.
Plant Locations of the Company
1. A-8, A-9, A-10 & A-11,
Industrial Area, Phase - III,
Sahibzada Ajit Singh Nagar
(Mohali) - 160 055 (Punjab)
2. Village Toansa, P.O. Railmajra
Distt. Nawansahar (Punjab),
Pin - 144 533
3. Industrial Area 3
A. B. Road, Dewas - 450 001
Madhya Pradesh
4. Village & PO Ganguwala
Teh. Paonta Sahib - 173 025,
Distt. Sirmour (H.P.)
5. E-47/9, Okhla Industrial Area
Phase-II, Okhla, New Delhi-110 020
6. E-2 & E-3, MIDC, Jejuri,
Distt. Pune - 412 303
7. Plot No. B-2 Madkaim Industrial
Estate, Ponda, Goa
Address for Correspondence
Shareholders are requested to contact
Mr. S. K. Patawari Company Secretary
Ranbaxy Laboratories Ltd. Plot No.
90, Sector 32 Gurgaon - 122 001
Haryana Tel. : 91-124-4135000.
F a x : 9 1 - 1 2 4 - 4 1 0 6 4 9 0
Email: [email protected]
NON-MANDATORY REQUIREMENTS
1. Chairman’s Office
The Company maintains the Office of
the Chairman at its Corporate Office at
Plot No. 90, Sector 32, Gurgaon - 122 001
(Haryana) and also reimburses the
expenses incurred in performance of his
duties.
2. Remuneration Committee
The Company has cons t i tu ted
Compensation Committee. Terms of
Reference of the Committee have been
described at 4(iii) hereinabove.
3. Shareholders Rights
The quarterly financial results are
published in the newspapers as
mentioned under the heading “Means of
Communication” at Sl. No. 8 herein
above and also displayed on the website of
the Company. The results are not
separately circulated to the shareholders.
Auditors’ certificate on compliance with the conditions of corporate
governance under clause 49 of the listing agreements
To the members of
Ranbaxy Laboratories Limited
We have examined the compliance of conditions of corporate governance by Ranbaxy Laboratories Limited
(“the Company”) for the year ended on December 31, 2005, as stipulated in clause 49 of the listing agreement of the Company with
the stock exchange.
The compliance of conditions of corporate governance is the responsibility of the management. Our examination was limited to
procedures and implementation thereof, adopted by the Company, for ensuring the compliance of the conditions of corporate
governance. It is neither an audit nor an expression of opinion on the financial statements of the Company.
In our opinion and to the best of our information and according to the explanations given to us, we certify that the Company has
complied with the conditions of corporate governance as stipulated in the abovementioned listing agreement.
We state that no investor grievances are pending for a period exceeding one month, except where disputed or sub-judice, as per the
records maintained by the Shareholders' / Investors' Grievance Committee.
We further state that such compliance is neither an assurance as to the future viability of the Company, nor the efficiency or
effectiveness with which the management has conducted the affairs of the Company.
For Walker, Chandiok & Co
Chartered Accountants
Vinod Chandiok
Gurgaon Partner
April 19, 2006 Membership No. 10093
29
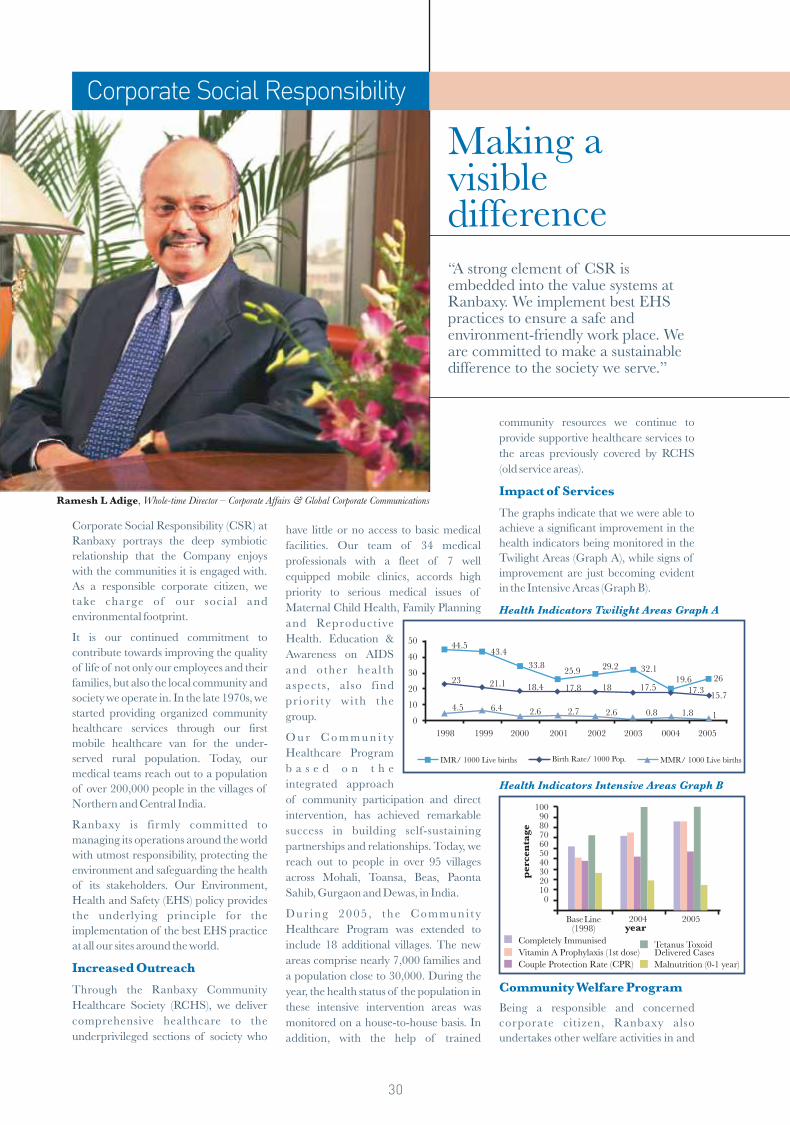
“A strong element of CSR is embedded into the value systems at Ranbaxy. We implement best EHS practices to ensure a safe and environment-friendly work place. We are committed to make a sustainable difference to the society we serve.”
Corporate Social Responsibility (CSR) at
Ranbaxy portrays the deep symbiotic
relationship that the Company enjoys
with the communities it is engaged with.
As a responsible corporate citizen, we
take charge of our social and
environmental footprint.
It is our continued commitment to
contribute towards improving the quality
of life of not only our employees and their
families, but also the local community and
society we operate in. In the late 1970s, we
started providing organized community
healthcare services through our first
mobile healthcare van for the under-
served rural population. Today, our
medical teams reach out to a population
of over 200,000 people in the villages of
Northern and Central India.
Ranbaxy is firmly committed to
managing its operations around the world
with utmost responsibility, protecting the
environment and safeguarding the health
of its stakeholders. Our Environment,
Health and Safety (EHS) policy provides
the underlying principle for the
implementation of the best EHS practice
at all our sites around the world.
Through the Ranbaxy Community
Healthcare Society (RCHS), we deliver
comprehensive healthcare to the
underprivileged sections of society who
Increased Outreach
community resources we continue to
provide supportive healthcare services to
the areas previously covered by RCHS
(old service areas).
The graphs indicate that we were able to
achieve a significant improvement in the
health indicators being monitored in the
Twilight Areas (Graph A), while signs of
improvement are just becoming evident
in the Intensive Areas (Graph B).
Impact of Services
Community Welfare Program
Being a responsible and concerned
corporate citizen, Ranbaxy also
undertakes other welfare activities in and
have little or no access to basic medical
facilities. Our team of 34 medical
professionals with a fleet of 7 well
equipped mobile clinics, accords high
priority to serious medical issues of
Maternal Child Health, Family Planning
and Reproduct ive
Health. Education &
Awareness on AIDS
and other hea l th
aspects, also f ind
pr ior i ty wi th the
group.
O u r C o m m u n i t y
Healthcare Program
b a s e d o n t h e
integrated approach
of community participation and direct
intervention, has achieved remarkable
success in building self-sustaining
partnerships and relationships. Today, we
reach out to people in over 95 villages
across Mohali, Toansa, Beas, Paonta
Sahib, Gurgaon and Dewas, in India.
D u r i n g 2 0 0 5 , t h e C o m mu n i t y
Healthcare Program was extended to
include 18 additional villages. The new
areas comprise nearly 7,000 families and
a population close to 30,000. During the
year, the health status of the population in
these intensive intervention areas was
monitored on a house-to-house basis. In
addition, with the help of trained
gMakin a v i leis b difference
Ramesh L Adige, Whole-time Director – Corporate Affairs & Global Corporate Communications
Corporate Social Responsibility
30
Health Indicators Twilight Areas Graph A
Completely Immunised
Vitamin A Prophylaxis (1st dose)Tetanus Toxoid Delivered Cases
Malnutrition (0-1 year)
Health Indicators Intensive Areas Graph B
(1998)
Couple Protection Rate (CPR)

Corporate Social Responsibility
Doctor attending to patients in one of the villages
around its plants in Mohali, Toansa,
Paonta Sahib, Dewas and Gurgaon in
India. We work to improve the quality of
life of the population in these areas by
providing safe drinking water, developing
parks & community centers, improving
sanitation, planting trees, holding health
camps and donating medicines apart
from other beneficial activities.
To enhance the productivity of the
government schools, support for
infrastructure maintenance, First Aid kits,
study materials, etc., are provided on a
regular basis. In line with our philosophy
of encouraging meritocracy, we offer
scholarships in many primary schools to
meritorious children.
During the year, a drinking water project
at Kedarpur Village, Paonta Sahib, was
successfully completed. Additionally, the
construction of a kitchen for mid-day
meals at a primary school in the area, is
currently underway.
The Company has also donated
medicines for a cancer detection camp
and has refurbished and reactivated the
Incinerator at the local Civil Hospital, so
that hospital waste can be safely disposed.
Ranbaxy has also started an ambulance
service for the villagers, in collaboration
with the Red Cross Society.
As a mark of its contribution to the
elderly, Ranbaxy is developing a 1500
square meter park for senior citizens, at
Paonta Sahib.
Whenever the world is faced with a
natural calamity, Ranbaxy has risen to the
occasion as a conscientious company. We
provided both life-saving medicines, as
well as monetary support to the recent
earthquake victims in Kashmir in India,
and also for the victims of the Katrina
Hurricane in the US. Ranbaxy has
gained appreciation for having created
new jobs and for having contributed
significantly towards the economic
Humanitarian Support
size and complexity, we will be driven by
our values and we pledge ourselves to
conducting our affairs most responsibly,
in fulfilling the needs of our stakeholders.
In line with our value statement,
‘Managing our operations with a high
concern for safety and environment’ and
to ‘Be a responsible corporate citizen,’
Environment, Health & Safety (EHS)
excellence has been extensively promoted
as a corporate culture within Ranbaxy.
We have developed a structured approach
to assess EHS hazards associated with the
research, development and manufacture
of our products. It is our endeavour
therefore, to ensure that the workplace is
safe and the environment is protected at
all times.
Doing the ‘right things right’ ensures that
the environment, including the natural
resources are well protected and the
industry adopts a model of sustainable
development. On the road to EHS
excellence, Ranbaxy has adopted a top-
down approach and has embraced the
principles and codes of best EHS
practices in its redefined world-class EHS
Management System, successfully rolled
out during the year.
Ranbaxy aims to lead, not only in terms
of innovation and quality, but also in the
areas of safety and environment
Environment, Health & Safety
EHS Management System
development of the State of New Jersey,
USA. It was conferred with the New
Jersey Business & Industry Association
Award for Excellence in the Enterprise
category, in 2005.
As a leading pharmaceutical organization
from the developing world, Ranbaxy has
taken a conscious decision to pool its
resources to fight the neglected diseases of
the developing nations. Our path-
breaking research in collaboration with
Medicines for Malaria Venture (MMV),
Geneva, on an anti-malarial molecule,
RBx 11160, which can be produced
economically, is progressing well. This
exemplifies our commitment to provide
quality medicines at affordable prices to
susceptible populations around the world
that need them the most.
The AIDS epidemic today is unparalleled
in the challenges it poses to the world and
it is clearly an issue that no one can
address alone. Ranbaxy is contributing its
might to the cause. As a conscientious
research-based pharmaceutical company,
it has successfully introduced high quality
Bio-equivalent, single-dose and fixed-
dose generic Anti-retrovirals (ARVs) for
HIV / AIDS patients at affordable prices.
Ranbaxy today offers the most
comprehensive portfolio of ARV
medicines for the afflicted.
Committed to recognizing and furthering
excellence, the Company instituted the
Ranbaxy Science Foundation to
encourage and reward scientists for
excellence in the field of Medical and
Pharmaceutical research. Four Ranbaxy
Research Awards, that carry a citation, a
trophy and a cash prize of Rs. 100,000
each, are given every year to deserving
scientists, in recognition of their
contributions. To date, 90 scientists have
received this award from Ranbaxy.
Ranbaxy is committed to enabling and
empowering people to live a healthier and
a more fulfilling life. At Ranbaxy,
Corporate Social Responsibility is not an
obligation but a genuine expression of
concern and goodwill towards society. It is
very much an integral part of how we
conduct our business. Even as we grow in
Research on Neglected
Diseases
Promoting Excellence in
Science
Annual Report 2005Ranbaxy Laboratories Limited
31
In pursuing the clarion call of “Health for All,” RCHS extended the healthcare benefit to an additional 18 villages during 2005
Ranbaxy provided both, life-saving medicines, as well as monetary support, for victims of the Earthquake in Kashmir and the Katrina Hurricane
Ranbaxy successfully markets the most comprehensive portfolio of Bio-equivalent single dose and fixed dose combinations of ARV formulations, for HIV / AIDS
CSR

protection. As a result, the very
foundations of our EHS Management
System are based on a continuous
improvement approach.
The effective implementation of our
Corporate EHS Policy is further secured
by well-defined Corporate EHS
Standards, supported by Corporate EHS
Guidelines and the Local EHS
Procedures. These provide a strong
opera t iona l f ramework for the
implementation of healthy EHS
practices, uniformly across Ranbaxy.
Ranbaxy’s sustainability initiatives are
focused on resource conservation, and are
aimed at preserving and protecting the
natural resources for future generations.
Ranbaxy’s water conservation efforts are
directed at prevention of water wastage.
This is in full evidence at our
establishments where wasteful water use
is eliminated at the design stage itself,
ensuring the productive & efficient
Environment
utilization of water in the manufacturing
plants. As part of the process, by-products
are recovered from the aqueous effluent
streams through recycling. This reduces
the load on the effluent treatment plant
significantly. A scientific approach to
effluent handling also brings down the
quantum of water consumption.
At our locations, besides conventional
biological treatments of waste-water,
water is also subjected to tertiary
treatment comprising Ultra-Filtration,
Nano-Filtration, Reverse Osmosis and
thermal effect evaporators. Monitoring
devices placed in the system ensure
compliance and confirm that the safety
norms are never exceeded.
Continuing with our success of
converting the Toansa API facility into a
Zero-Liquid-Discharge site, similar
infrastructure was set up at Mohali,
Paonta Sahib and Dewas during the year.
This reflects our commitment to convert
our Active Pharmaceutical Ingredients
(APIs) manufacturing sites into Zero-
Liquid-Discharge facilities.
‘Rainwater Harvesting’ was also
undertaken at most of our factories and at
the Corporate Office, to recharge the
groundwater strata effectively. Our
Toansa plant received the ‘National
Award for Excellence in Water
Management 2005’ for ‘Excellent Water
Efficient Unit’ as well as ‘Most Useful
Presentation.’ The award was given
during 2005, and was conferred by the
Confederation of Indian Industries (CII).
Ranbaxy is committed to improving the
Occupational Health and SafetyProtection of the environment is a priority at Ranbaxy –Fish pond at Toansa facility, using ETP-treated water
“The safety of our employees and the community is of paramount importance for us.”
Taking care of the environmental footprint...
32
Environment, Health & Safety
safety at the work place. During the year, a number of initiatives were taken towards strengthening the existing safety infrastructure at the API manufacturing sites at Mohali, Toansa and Dewas. Comprehensive Specialist Safety Audits covering general safety, process and fire safety, powder processing equipment and electrical safety, were conducted at Mohali and Toansa.
EHS training programs were also organized on a regular basis for employees, as well as for business partners to increase the level of EHS awareness amongst its constituents.
In addition, Health Assessment programs were regularly organized and managed by qua l i f i ed Occupa t iona l Hea l th professionals. Hygiene at work was continually monitored to ensure that the workplace supports and ensures the good health of the employees.
As is evident, Ranbaxy views its CSR and EHS obligations with great sincerity and seriousness. The contributions made by the Company to society must be seen in a larger context and are clearly manifest in the multiple actions that are aimed at the larger good, and are not limited by the motive of profit alone. This represents the synergistic and lasting bond between the organization and its stakeholders.
Environment, Health and Safety are a prime concern and a focus area at Ranbaxy
The Toansa plant received the National Award for Excellence in Water Management 2005 for ‘Excellent Water Efficient Unit’ as well as ‘Most Useful Presentation’
EHS
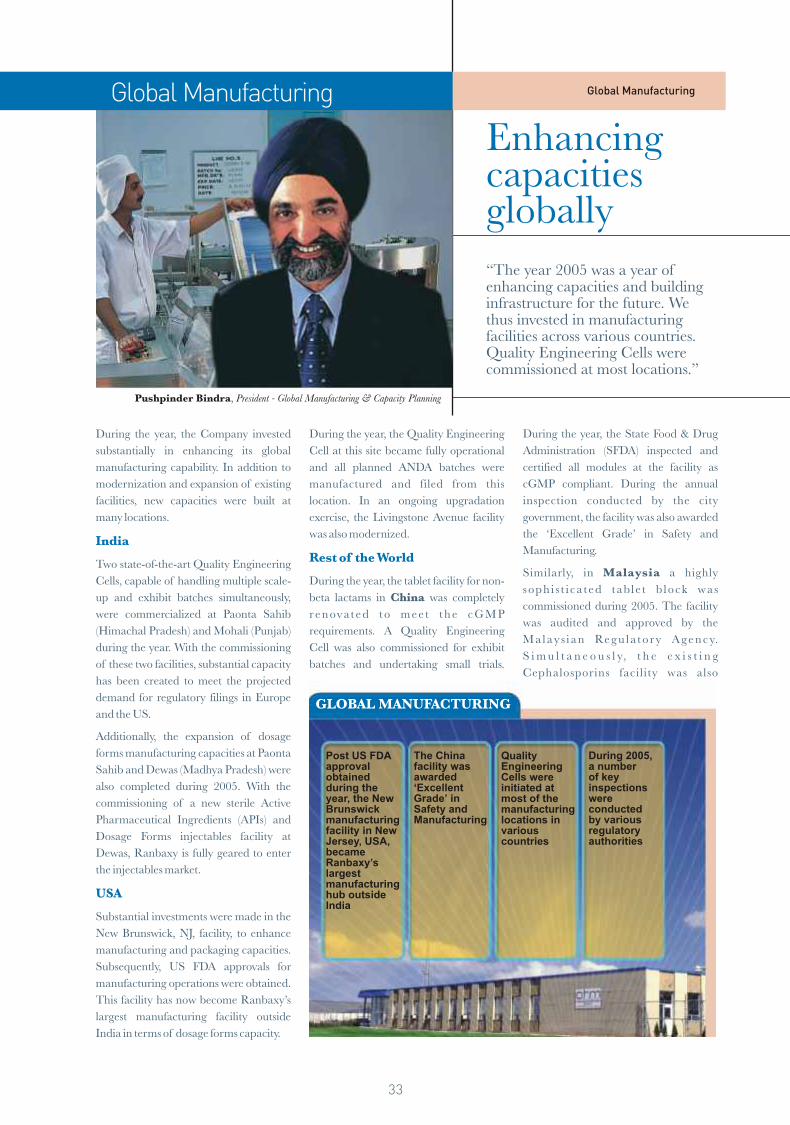
“The year 2005 was a year of enhancing capacities and building infrastructure for the future. We thus invested in manufacturing facilities across various countries. Quality Engineering Cells were commissioned at most locations.”
Enhancing capacities globally
During the year, the Company invested
substantially in enhancing its global
manufacturing capability. In addition to
modernization and expansion of existing
facilities, new capacities were built at
many locations.
Two state-of-the-art Quality Engineering
Cells, capable of handling multiple scale-
up and exhibit batches simultaneously,
were commercialized at Paonta Sahib
(Himachal Pradesh) and Mohali (Punjab)
during the year. With the commissioning
of these two facilities, substantial capacity
has been created to meet the projected
demand for regulatory filings in Europe
and the US.
Additionally, the expansion of dosage
forms manufacturing capacities at Paonta
Sahib and Dewas (Madhya Pradesh) were
also completed during 2005. With the
commissioning of a new sterile Active
Pharmaceutical Ingredients (APIs) and
Dosage Forms injectables facility at
Dewas, Ranbaxy is fully geared to enter
the injectables market.
Substantial investments were made in the
New Brunswick, NJ, facility, to enhance
manufacturing and packaging capacities.
Subsequently, US FDA approvals for
manufacturing operations were obtained.
This facility has now become Ranbaxy’s
largest manufacturing facility outside
India in terms of dosage forms capacity.
India
USA
During the year, the State Food & Drug
Administration (SFDA) inspected and
certified all modules at the facility as
cGMP compliant. During the annual
inspection conducted by the city
government, the facility was also awarded
the ‘Excellent Grade’ in Safety and
Manufacturing.
Similarly, in Malaysia a highly
soph i s t i ca ted table t b lock was
commissioned during 2005. The facility
was audited and approved by the
Ma lay s i an Regu la to ry Agency.
S i m u l t a n e o u s l y, t h e e x i s t i n g
Cephalosporins facility was also
During the year, the Quality Engineering
Cell at this site became fully operational
and all planned ANDA batches were
manufactured and filed from this
location. In an ongoing upgradation
exercise, the Livingstone Avenue facility
was also modernized.
During the year, the tablet facility for non-
beta lactams in China was completely
r e n ov at e d t o m e e t t h e c G M P
requirements. A Quality Engineering
Cell was also commissioned for exhibit
batches and undertaking small trials.
Rest of the World
Pushpinder Bindra, President - Global Manufacturing & Capacity Planning
33
Global ManufacturingGlobal Manufacturing
Post US FDA approval obtained during the year, the NewBrunswickmanufacturing facility in NewJersey, USA,became Ranbaxy’s largest manufacturinghub outside India
The China facility was awarded ‘Excellent Grade’ in Safety and Manufacturing
Quality Engineering Cells were initiated at most of the manufacturing locations in various countries
During 2005, a number of key inspections were conducted by various regulatory authorities
GLOBAL MANUFACTURING

34
u p g r a d e d a n d m o d e r n i z e d t o
continuously remain cGMP compliant.
Work also began on a Quality
Engineering Cell, for scale-up and exhibit
batches for regulatory filings. The Cell is
expected to be operational soon.
In Ireland, Ranbaxy, with the
commissioning of its high-speed, state-of-
the-art, integrated packaging lines, was
able to pack bulk tablets received from
India, ‘just in time’ for various European
countries. This resulted in efficient
capacity utilization and cost reduction.
This facility continues to be the main QA
Batch Release site for products
manufactured outside the EU and sold in
the EU. During the year, a record number
the US FDA (United States Food and
Drug Administration), the MHRA UK
(Medicines and Healthcare products
Regulatory Agency), the ANVISA, Brazil
(Agência Nacional de Vigilância
Sanitária – Brazilian National Health
Vigilance Agency), the WHO Geneva
(World Health Organization), the PDA
and the SFDA China (Provincial Drug
Authorities and The State Food and Drug
Administration), for pre-approval of
products or to verify cGMP compliance at
various manufacturing plants.
To comply with new European Union
(EU) regulations that came into force in
November 2005, Ranbaxy’s Active
Pharmaceutical Ingredients (APIs)
facilities at Toansa and Mohali were
inspected by Cologne Regional
Administration, Germany, and were
approved for the supply of APIs to the
European market.
Quality in the organization’s eco-system,
can be ensured only when every
stakeholder adheres to certain standards
and buys into a philosophy of total
quality. Therefore, Ranbaxy insists that its
business associates strictly follow the
cGMP norms. Since outsourcing forms a
strategic part of our business support
functions, we relentlessly provide Quality
consultation to our business associates.
These positive interventions are provided
through training, audits and plant visits.
of over 130 batches per month were
tested and released to meet the growing
needs of the expanding European
market.
In Nigeria, a high-speed bottling plant
was commissioned, which doubled the
capacity. The plant was further upgraded
to be compliant to meet local regulatory
needs.
We also commenced the in-house testing
facility for all micro biological tests and
certain chemicals tests, subsequent to the
refurbishing of the Micro lab and
installation of HPLC, stability chambers
and auto clave equipment.
Pursuing its global vision, Ranbaxy has
benchmarked its supply chain processes
with the global best. To this end, the
Project Spectrum+ team had been
working on the ‘Advanced Planner &
Optimizer,’ the global planning software,
since last year. This software covers a
range of activities, from marketing,
sourcing, manufacturing, quality control
to logistics. During the year, this program
was introduced in the major markets of
the US, India and UK, through various
modules, such as the Demand Planning
(DP), the Distribution Requirement
Planning (DRP), etc. The Deployment &
Transport Load builder module was also
implemented in the US market and is
expected to be rolled out in other markets
soon.
We believe that quality is the mainstay of
global competitiveness, and accordingly,
have built an environment which supports
the achievement of best quality
standards, ensuring all-time compliance
to cGMP and cGLP.
Our continuous efforts in this direction
have resulted in various international
accreditation and approvals of our
manufacturing facilities, Research and
Development (R&D) facilities and
Clinical Research activities at R&D.
During 2005, a large number of key
inspections were successfully conducted
by various regulatory authorities such as
Global Supply Chain
Global Quality
Best-in-class infrastructure for world-class products
The new sterile injectables facility in Dewas (M.P.), India
Global Manufacturing
GLOBAL SUPPLY CHAIN
The‘Advanced Planner & Optimizer’ software was implemented in major markets such as the US, India and the UK, during 2005
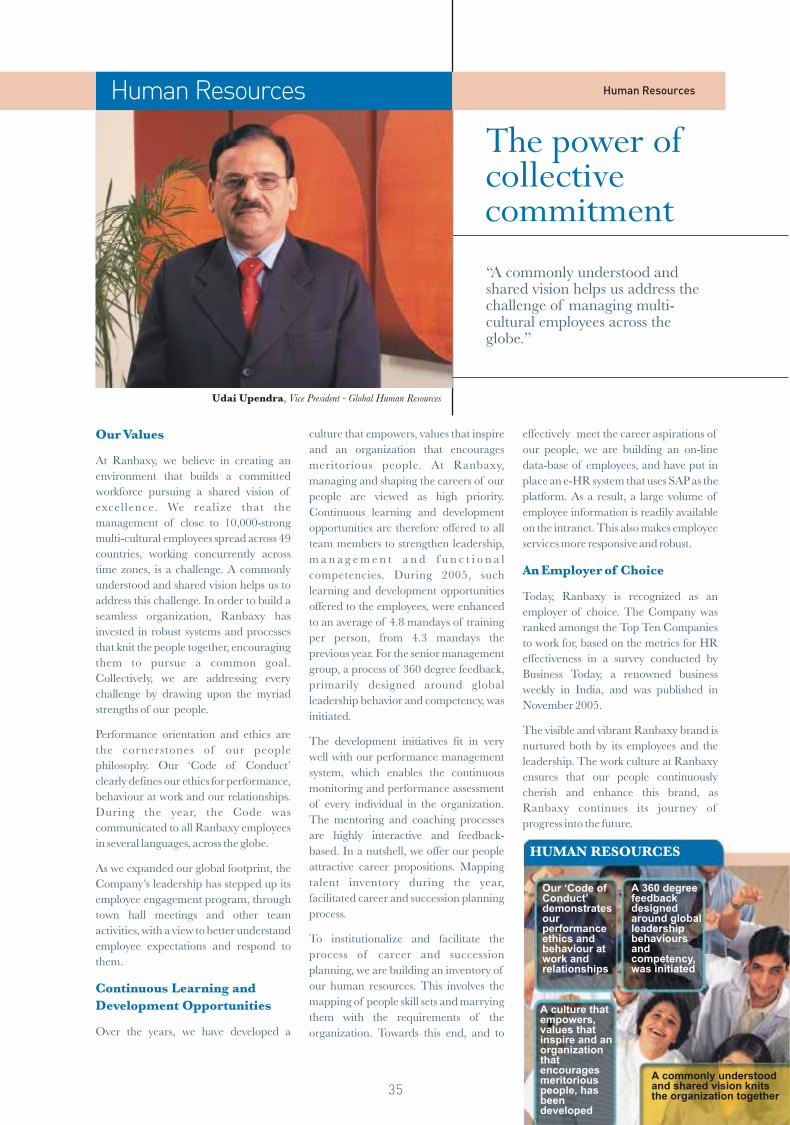
35
Our Values
Continuous Learning and
Development Opportunities
At Ranbaxy, we believe in creating an
environment that builds a committed
workforce pursuing a shared vision of
excel lence. We realize that the
management of close to 10,000-strong
multi-cultural employees spread across 49
countries, working concurrently across
time zones, is a challenge. A commonly
understood and shared vision helps us to
address this challenge. In order to build a
seamless organization, Ranbaxy has
invested in robust systems and processes
that knit the people together, encouraging
them to pursue a common goal.
Collectively, we are addressing every
challenge by drawing upon the myriad
strengths of our people.
Performance orientation and ethics are
the cornerstones of our people
philosophy. Our ‘Code of Conduct’
clearly defines our ethics for performance,
behaviour at work and our relationships.
During the year, the Code was
communicated to all Ranbaxy employees
in several languages, across the globe.
As we expanded our global footprint, the
Company’s leadership has stepped up its
employee engagement program, through
town hall meetings and other team
activities, with a view to better understand
employee expectations and respond to
them.
Over the years, we have developed a
effectively meet the career aspirations of
our people, we are building an on-line
data-base of employees, and have put in
place an e-HR system that uses SAP as the
platform. As a result, a large volume of
employee information is readily available
on the intranet. This also makes employee
services more responsive and robust.
Today, Ranbaxy is recognized as an
employer of choice. The Company was
ranked amongst the Top Ten Companies
to work for, based on the metrics for HR
effectiveness in a survey conducted by
Business Today, a renowned business
weekly in India, and was published in
November 2005.
The visible and vibrant Ranbaxy brand is
nurtured both by its employees and the
leadership. The work culture at Ranbaxy
ensures that our people continuously
cherish and enhance this brand, as
Ranbaxy continues its journey of
progress into the future.
An Employer of Choice
culture that empowers, values that inspire
and an organization that encourages
meritorious people. At Ranbaxy,
managing and shaping the careers of our
people are viewed as high priority.
Continuous learning and development
opportunities are therefore offered to all
team members to strengthen leadership,
m a n a g e m e n t a n d f u n c t i o n a l
competencies. During 2005, such
learning and development opportunities
offered to the employees, were enhanced
to an average of 4.8 mandays of training
per person, from 4.3 mandays the
previous year. For the senior management
group, a process of 360 degree feedback,
primarily designed around global
leadership behavior and competency, was
initiated.
The development initiatives fit in very
well with our performance management
system, which enables the continuous
monitoring and performance assessment
of every individual in the organization.
The mentoring and coaching processes
are highly interactive and feedback-
based. In a nutshell, we offer our people
attractive career propositions. Mapping
talent inventory during the year,
facilitated career and succession planning
process.
To institutionalize and facilitate the
process of career and succession
planning, we are building an inventory of
our human resources. This involves the
mapping of people skill sets and marrying
them with the requirements of the
organization. Towards this end, and to
“A commonly understood and shared vision helps us address the challenge of managing multi-cultural employees across the globe.”
he we of T po rcol e t l c iveommitm nc e t
Udai Upendra, Vice President - Global Human Resources
Human Resources Human Resources
HUMAN RESOURCES
A culture that empowers, values that inspire and an organization that encourages meritorious people, has been developed
A 360 degree feedback designed around global leadership behaviours and competency, was initiated
Our ‘Code of Conduct’ demonstrates our performance ethics andbehaviour at work and relationships
A commonly understood and shared vision knits the organization together


37
Your Directors have pleasure in presenting this 45th Annual Report and Audited Accounts for the year ended31st December, 2005.
WORKING RESULTS
Rs. MillionsYear ended Year ended
December 31, December 31,2005 2004
Net Sales 34081.27 34976.16
Profit before Interest, Depreciation, Amortization and Impairment 3178.78 7211.66
Interest 264.11 109.80
Depreciation, Amortization and Impairment 1013.33 818.47
Profit before Tax 1901.34 6283.39
Provision for Tax 223.35 (998.67)
Profit from sale of undertaking 112.29 –
Profit After Tax 2236.98 5284.72
Tax – earlier years (current) (116.56) (9.51)
Balance as per last balance sheet 2270.05 3570.15
Transfer from:Foreign projects reserve 30.65 32.27
Balance available for appropriation 4421.12 8877.63
Appropriations:
Dividend 3166.66 3162.60
Tax on dividend 444.12 440.38
Transfer to:
– Foreign projects reserve – 4.60
– General reserve 250.00 3000.00
Surplus carried forward 560.34 2270.05
4421.12 8877.63
CONSOLIDATED WORKING RESULTS (UNDER INDIAN GAAP)
Net Sales 51019.47 52451.04
Profit before Interest, Depreciation, Amortization and Impairment 3727.38 10813.83
Interest 671.16 334.88
Depreciation, Amortization and Impairment 1444.52 1214.83
Profit before Exceptional Items, Tax and Minority Interests 1611.70 9264.12
Exceptional Items: Interest in Joint venture written off (121.80) –
Litigation settlements – (371.90)
Profit before Tax and Minority Interests 1489.90 8892.22
Provision for Tax 697.57 (1881.08)
Profit from sale of undertaking and a subsidiary 454.95 –
Profit after Tax 2642.42 7011.14
Minority Interests 25.35 25.53
Profit after Tax and Minority Interests 2617.07 6985.61
CONSOLIDATED FINANCIAL STATEMENTS
Consolidated Financial Statements for the year ended December 31, 2005, under Indian GAAP and US GAAP form part of theAnnual Report.
Report of the Directors Report of the Directors

38
OPERATIONS
During the year under review, the Company had a mixed performance across various markets. The lower profits were due todifficult market conditions in USA (sharp price erosion has adversely impacted margins) and higher expenditure on R&D andIntellectual Property. At the same time, the Company recorded strong results across the markets of India, CIS, Asia Pacific andAfrica. Overall, the overseas markets accounted for 76% of the consolidated sales of the Company. Dosage forms sales at 86%of the global sales is an evidence of the continued focus of the Company on value added products.
The Company continued with its strategy to grow and invest in key markets and expand the ground presence to 46 markets withentry into Japan, Spain and Italy and also commenced commercial operations in Canada. During the year, the manufacturingcapacities both in India and overseas were augmented, modernized and automated which will support the growth initiative of theCompany in future.
As a part of its strategy to focus on core pharmaceutical business, your Company divested the Allied Businesses portfolioconsisting of (i) Fine Chemicals (Ranbaxy Fine Chemicals Ltd. (RFCL), a wholly-owned subsidiary of the Company (ii) AnimalHealth Care and (iii) Diagnostics. This would help your Company to sharply align its resources to develop and grow thecore pharmaceutical business. Accordingly, RFCL ceased to be a wholly-owned subsidiary of the Company, effectiveNovember 30, 2005.
DIVIDEND
An interim dividend of Rs. 2.50 per share was paid in November 2005. Your Directors now recommend a final dividend ofRs. 6 per share for the year ended December 31, 2005, taking the total dividend for the year to Rs. 8.50 per share of par value ofRs. 5 each (2004 – total dividend Rs. 17 per share of par value of Rs. 10 each).
CHANGES IN CAPITAL STRUCTURE
(i) Sub-Division of Equity Shares
Pursuant to the approval granted by the shareholders at the Annual General Meeting held on June 30, 2005,the Equity Shares of the face value of Rs. 10 each, have been sub-divided into 2 Equity Shares of Rs. 5 each, effectiveAugust 1, 2005.
(ii) Authorised Share Capital
Pursuant to the approval granted by the shareholders at the Extra-ordinary General Meeting held onOctober 21, 2005, the Authorised Share Capital of the Company has been increased from Rs. 2000 Mn to Rs. 3000 Mn.
(iii) Issue of shares on exercise of Employees’ Stock Options
The Company allotted Equity Shares (on pari-passu basis) pursuant to exercise of Stock Options by the eligible employees,as summarised below:
Date of Allotment No. of Shares
August 9, 2005 202,837
October 10, 2005 48,313
January 13, 2006 32,003
April 10, 2006 117,423
ISSUE OF FOREIGN CURRENCY CONVERTIBLE BONDS
Your Company has raised US $ 440,000,000 (including over allotment option exercise) on March 17, 2006, through Zero CouponConvertible Bonds (“the Bonds”), vide Offering Circular dated March 13, 2006. The Bonds are convertible at any time on andafter April 27, 2006 up to March 8, 2011 by the holders into fully paid Equity Shares of Rs. 5 each of the Company, which may,subject to certain conditions, be represented by Global Depositary Shares (GDS) with each GDS representing one share, at aconversion price of Rs. 716.32 per share. The conversion price is subject to adjustment in certain circumstances. In case the Bondsare not converted into shares, the Company will redeem each Bond at 126.765% of its principal amount on maturity date i.e.March 18, 2011. The Bonds have been listed with the Singapore Exchange Securities Trading Limited.
The proceeds of this issue will primarily be used to finance overseas acquisitions as well as capital expenditure.
SUBSIDIARIES AND JOINT VENTURES
(A) Increase of Equity Stake in existing operations
(i) Japan
Japan is the second largest pharmaceutical market in the world. With a view to consolidate its position, theCompany has acquired an additional 40% Equity stake in Nihon Pharmaceutical Industry Co. Ltd. (NPI). NPI hasnow become a 50:50 joint venture of Ranbaxy with Nippon Chemiphar Co. Ltd., Japan. Ranbaxy is the first Indianpharmaceutical company to enter the Japanese pharmaceutical market, with the launch of its first product, voglibose.
(ii) Malaysia
Ranbaxy Malaysia Sdn. Bhd (RMSB), a joint venture company, has been consistently performing well and hasregistered steady growth in sales and profits. The Company has increased its equity stake in RMSB by 11.8%,making the total holding to 68.05%.
Report of the Directors

39
(iii) Brazil
Brazil is one of the largest markets in Latin America. In order to consolidate the position, the Company hasincreased its equity stake in Ranbaxy Pharmaceutica Ltda. (RPL) by 10% and after this investment, the shareholdingof Ranbaxy has increased to 80% of the Share Capital of RPL.
(B) NEW OPERATIONS
(i) Hungary
In line with the Company’s strategy to strengthen its operations in key European markets. Ranbaxy Hungary Kftwas set up as a wholly-owned subsidiary of Ranbaxy Netherlands B.V.
(ii) Mexico
Mexico is one of the largest pharmaceutical markets in Latin America. In order to avail of the growth potential ofthis growing market, Ranbaxy Mexico S.A. was set up as a wholly-owned subsidiary of Ranbaxy Netherlands B.V.
(iii) Italy
Italy is amongst the top ten pharmaceutical markets in the world and the market projections indicate that thegeneric market in Italy is poised to grow rapidly in the next five years and offers a good opportunity for the Company.During the year, Ranbaxy Italia S.P.A. was set up as a wholly-owned subsidiary of Ranbaxy Netherlands B.V.
MERGER & ACQUISITIONS
Globally, the pharmaceutical industry is witnessing a consolidation process and quite a few Indian companies are also participatingactively in this consolidation. Your Company, being the largest pharmaceutical company in India with an ambition to become apowerful global generic business player, would also like to complement its organic growth with strategic merger & acquisitionopportunities. Accordingly, your Company has been and is evaluating a number of opportunities and thus far has been successfulin concluding the following acquisition transactions :
(i) Terapia S.A. - Romania
Terapia S.A. is a Romanian generics company with its Head Office in Bucharest and largely deals in branded generics andOTC formulations. It has a primary manufacturing facility at Cluj and a small secondary manufacturing facility inBucharest. Ranbaxy (Netherlands) B.V., a wholly-owned subsidiary of the Company concluded this transaction and signedthe Share Purchase Agreement with the sellers, for acquisition of 96.7% of the equity stake of Terapia S.A. for a netconsideration of US $ 324 Mn. This transaction is expected to close some time in June 2006, after receiving requisiteapprovals from the Romanian Competition Council.
Overall, this is an excellent strategic acquisition for the Company, enabling it to consolidate its presence in a highly profitablebranded generics market with strong growth possibilities. In addition, Terapia’s manufacturing plant alongwith its bio-equivalence facilities would provide a strong competitive advantage to the Company for its European operations.
(ii) Ethimed – (Belgium) and Allen (Italy)
These are relatively small acquisitions, primarily to acquire marketing authorizations and thus get a head start.
Ethimed NV is an established generics company in Belgium, with a significant customer network especially among pharmacies.
Allen SPA is a division of unbranded generic business of Glaxo Smithkline in Italy. The product portfolio of Allen complementsRanbaxy’s own pipeline of products for the Italian market and will enable the Company to utilize opportunities arising fromfuture patent expiries.
Both these transactions are expected to provide significant momentum for sales growth in these markets.
MANAGEMENT DISCUSSION AND ANALYSIS REPORT
Management Discussion and Analysis Report, as required under the Listing Agreements with the Stock Exchanges, is enclosedat Annexure ‘A’.
EMPLOYEES’ STOCK OPTION SCHEME
Information regarding the Employees’ Stock Option Scheme, is enclosed at Annexure ‘B’.
LISTING AT STOCK EXCHANGE
The Equity Shares of the Company continue to be listed on Bombay Stock Exchange Ltd. and The National Stock Exchange.Global Depository Shares are listed on the Stock Exchange at Luxembourg. The annual listing fees for the year 2005-2006 havebeen paid to these Exchanges.
DISCLOSURE OF PARTICULARS
As required by the Companies (Disclosure of Particulars in the Report of Board of Directors) Rules 1988, the relevant informationand data is given at Annexure ‘C’.
FIXED DEPOSITS
The Company has not invited / received any fixed deposits during the year.
Ranbaxy Laboratories Limited Annual Report 2005 Report of the Directors
40
DIRECTORS’ RESPONSIBILITY STATEMENT
In terms of provisions of Section 217(2AA) of the Companies Act, 1956, (Act) your Directors confirm that :
(i) In the preparation of the annual accounts, the applicable accounting standards have been followed, along with properexplanation relating to material departures, wherever applicable.
(ii) The Directors have selected such accounting policies and applied them consistently and made judgements and estimatesthat are reasonable and prudent so as to give a true and fair view of the state of affairs of the Company, as at the end of theaccounting year and of the profit of the Company for that period.
(iii) The Directors have taken proper and sufficient care for the maintenance of adequate accounting records in accordance withthe provisions of this Act for safeguarding the assets of the Company, and for preventing and detecting fraud and otherirregularities.
(iv) The Directors have prepared the annual accounts on a going concern basis.
DIRECTORS
Mr. Ravi Mehrotra was appointed as an Additional Director of the Company effective July 28, 2005, and holds office upto theensuing Annual General Meeting. Mr. Mehrotra is Regional Head of AIG Asia Asset Management Companies. Earlier he hadbeen President of Franklin Templeton Asset Management (India) Pvt. Ltd. The Company has received a notice from a memberproposing his candidature for being appointed as a Director of the Company.
Dr. Brian W. Tempest, Chief Executive Officer and Managing Director of the Company has been appointed by the Board to theposition of Chief Mentor and Executive Vice Chairman, effective January 18, 2006, until December 31, 2007. Requisite approvalof shareholders for his appointment and payment of remuneration is being sought at the ensuing Annual General Meeting.
Mr. Malvinder Mohan Singh, President Pharmaceuticals and Whole-time Director was appointed by the Board as Chief ExecutiveOfficer and Managing Director, effective January 18, 2006, for a period of five years. Requisite approval of shareholders for hisappointment and payment of remuneration is being sought at the ensuing Annual General Meeting.
Mr. J. W. Balani resigned from the Directorship of the Company due to his inability to attend the Board meetings. The Boardaccepted his resignation on January 18, 2006 and appointed Mr. Shivinder Mohan Singh as a Director of the Company, effectiveJanuary 18, 2006 in the casual vacancy so caused. Mr. Shivinder Mohan Singh is the Managing Director of Fortis Healthcare Ltd.and Escorts Heart Institute and Research Center Ltd. The Board placed on record its appreciation for the valuable contributionsmade by Mr. Balani.
In accordance with the Articles of Association of the Company, Mr. Nimesh N. Kampani, Mr. Harpal Singh,Mr. V. K. Kaul and Mr. Gurcharan Das retire by rotation as Directors at the ensuing Annual General Meeting and are eligible forre-appointment.
COST AUDIT
The reports of M/s R. J. Goel & Co., Cost Accountants, in respect of audit of the cost accounts of the pharmaceutical substancesand dosage forms units of the Company for the year ended December 31, 2005, will be submitted to the Central Government indue course.
AUDITORS
M/s Walker, Chandiok & Co., Chartered Accountants, retire as Auditors of the Company at the conclusion of the ensuingAnnual General Meeting and have confirmed their eligibility and willingness to accept the office of the Auditors, if re-appointed.
PARTICULARS OF EMPLOYEES
As required under Section 217(2A) of the Companies Act, 1956, and Rules framed thereunder, the names and other particulars ofemployees receiving remuneration above the prescribed threshold are set out in the annexure appended to this Report.
ACKNOWLEDGMENTS
Your Directors commend the continuing commitment and dedication of employees at all levels. The Directors would also like tothank all other stakeholders, including bankers and other business associates, who have provided sustained support andencouragement. The members of the medical profession in India and abroad have shown their sustained confidence in the qualityand efficacy of your Company’s ethical therapeutic products. This has, understandably, been critical for the Company’s success.The Directors look forward to their continued support in the years to come.
On behalf of the Board of Directors
Gurgaon (TEJENDRA KHANNA)April 19, 2006 CHAIRMAN
Report of the Directors
41
ANNEXURE A
MANAGEMENT DISCUSSION AND ANALYSIS REPORT
INDUSTRY STRUCTURE & DEVELOPMENTS
The Global Pharmaceutical market audited sales grew by 7% (at constant exchange rates) to reach US $ 565.9 Bn. NorthAmerica, Europe and Japan accounted for 88% of the audited worldwide pharmaceutical sales in 2005.
The North American pharmaceutical sales grew by 5.2% to reach US $ 265.7 Bn, constituting 47% of the global sales in 2005.
Sales in Europe grew by 7.1% to reach US $ 169.5 Bn, constituting 30% of the total market.
Japan, the world's second largest market, which has historically posted slower growth rates, performed strongly in 2005, growingby 6.8% to reach US $ 60.3 Bn, its highest year-over-year growth since 1991.
Sales in Latin America grew by 18.5% to reach US $ 24 Bn and pharmaceutical sales in Asia, Africa & Australia grew by 11%to reach US $ 46.4 Bn. China showed the strongest growth in 2005, growing by 20% to reach US $ 11.7 Bn.
Emerging markets including China, Korea, Mexico, Russia and Turkey, all experienced double digit growth, outpacing globalperformance and signaling important shifts in the market place.
There were 94 products with sales of over US $ 1 Bn, 12 more than in 2004. The top two were Pfizer's Atorvastatin(Lipitor US $ 12.9 Bn) followed by Clopidogrel (Plavix US $ 5.9 Bn).
Cholesterol and Triglyceride reducers continued to hold the number one position in therapeutic classes worldwide, with sales ofUS $ 32.4 Bn, up 6.8%.
Cytostatics became the second largest therapy class growing at 18.6% to reach US $ 28.5 Bn, ahead of Antiulcerants thatrecorded sales of US $ 26.7 Bn.
(Source: IMS Health)
Generics
Generic drugs are the pharmaceutical and therapeutic equivalents of brand-name drugs. Generic medicines are widely used inmany countries in cost-effective treatment programs and are increasingly prescribed by general practitioners as effective alternativesto higher-priced originator brand-name drugs.
In 2005, the growth of the generics industry outpaced the growth of the total pharmaceutical industry, however the genericindustry witnessed a challenging environment with fewer patent expiries and excess capacities leading to slowing sales growthand increasing pricing pressures in the key markets of USA and in some European markets like the United Kingdom.
The branded industry aggressively defended its patents and sought to extend them wherever possible. The pricing pressure wasmost severe in the largest pharma market of USA, resulting in downward pressure on margins of most generic companies witha significant presence in USA, like Ranbaxy.
The year also saw consolidation taking place in the generics industry, with significant increase in M&A activity.
The Sales of generics in the top eight markets (USA, Canada, France, Germany, Italy, Spain, UK and Japan) exceededUS $ 55 Bn (Source : IMS Health).
The three largest markets for Ranbaxy are USA, European Union and India. The prevailing market environment in thesemarkets is discussed below.
Generic Pharmaceutical Market in the United States: Generics are playing an increasingly prominent role in theUS healthcare market. According to IMS Health, generics (including branded generics) accounted for over 55% of all prescriptionsdispensed and 17.4% of all prescription dollars spent in 2004. Unbranded generics in particular have made steady gains inprescription market share over the past four to five years, up from 38.3% in 1998 to 45.8% in 2004.
According to the baseline forecast of IMS Health, the US generics market is expected to deliver a CAGR of 7.4% in value termsover the period from 2005 to 2009 excluding sales of branded generics.
The displacement of higher-priced brand-name drugs by less expensive generic products translates into significant savings forhealthcare consumers. The Medicare Modernization Act, increased emphasis on overall healthcare cost containment and agingnational demographics should also lead to increased generic usage.
Both private insurers, which according to IMS Health estimates account for 49% of retail drug spending and public payers, areplacing more emphasis on cost containment. With prescription drug costs accounting for between 15% and 20% of employer-based health plans, employers are taking more control over benefits. In the public sector, generics are being given greaterprominence as state and federal budgets come under greater pressure.
In 2005, the US generics market experienced intensified competition and increased price pressure.
Generic Pharmaceutical Markets in Europe: In Europe, most of the healthcare costs are largely borne by the state. Withyear on year increases in state spending on healthcare, governments have been seeking ways to reduce healthcare costs. Towardsthis end, the 25 EU member states are in the process of streamlining the registration of medicines through mutual recognition
Ranbaxy Laboratories Limited Annual Report 2005 Report of the Directors

42
procedures, which provide a mechanism for obtaining approval in other member states after approval has been granted in onemember state.
In many European countries, doctors and pharmacies are also being incentivized, to prescribe generic products. The uptake ofgenerics in the European Union varies greatly from country to country, although the general trend is towards greater generic use.This has been done through reimbursement reforms and pharmacy substitution measures.
The Indian Pharmaceutical Market is in the front rank of India's science-based industries, with wide ranging capabilities inthe complex field of drug manufacture and technology. The Indian pharmaceutical industry is a highly competitive and fragmentedmarket with several players, including small scale companies. The Domestic formulation market for the year 2005 is valuedaround Rs. 230 Bn, having grown by 8.6%. The Market continues to be highly competitive and fragmented with the Top-5companies having 23.54% share. (Source: ORG-IMS SSA Audit MAT December 2005).
More than 85% of the formulations produced in the country are sold in the domestic market. India is largely self-sufficient in caseof formulations; some life saving, new generation technology barrier formulations continue to be imported.
Key developments in the Indian Pharmaceutical Sector include:
• India became signatory to the WTO order, thus ushering the Product Patent regime.
• New products launched accounted for around 12% of the overall market growth.
• Chronic therapy segment accounts for 26.5% of the domestic formulation business growing at 9.9%, which is faster than thatof Acute therapy segments. Chronic therapy segment mainly includes Anti-diabetics, Cardiac and Neuro-Psychiatryformulations.
OUTLOOK ON OPPORTUNITIES
We believe that Ranbaxy is well positioned in the Global generics space with its geographical spread, broad product portfolio andbackward integration. Ranbaxy has the distinction of having ground presence in the top 10 pharmaceutical markets of the world.We are also present in 23 of top 25 pharmaceutical markets of the world.
In the USA, our potential for revenue growth from generic products is closely related to our pipeline of pending ANDAs, as wellas tentative approvals already granted. As of December 31, 2005, we had 170 ANDAs, filed with the FDA, of which 111 have beenapproved. Of the 59 ANDAs pending approval, based on our own analysis of publicly available FDA data, we believe we are thefirst to file on 19 of these applications, which relate to brand-name drugs having aggregate sales in the United States of morethan US $ 28 Bn in 2004, according to IMS Health.
Primary near term growth drivers in USA, include multiple branded drug patent expirations, increased use of generics by seniorsunder Medicare Part D, mounting efforts on part of insurers and employers to encourage use of generics to control healthcarecosts.
The Pricing pressure witnessed in 2005, is expected to stabilize, though new generic introductions are expected to continueadopting an aggressive pricing model.
Europe: We believe that the European generics markets will continue to provide us with opportunities for robust growth. In recenttimes we have increased the number of regulatory filings in the EU, as we seek to establish ourselves as a leader in the Europeanmarket for generic products by leveraging our strengths, including our diverse portfolio of generic drugs, our manufacturing costadvantage and our marketing experience in other markets, such as the United States and India.
Outlook on the Indian Pharma market is positive. With the introduction of the product patent regime beginning January 1,2005, the Indian market will be an attractive option for introduction of research-based products. Ranbaxy, the leadingpharmaceutical company in India, is well set to further its growth in the Indian market.
The outlook for the Global generics industry, both in the near and long term, we believe is positive. The key growth drivers for thegenerics industry can be summarized as follows:
• Multiple branded drug patent expirations in the short term, as many as six blockbusters (drugs with sales of over US $ 1 Bneach) expected to lose their patent protection in 2006.
According to IMS Health, 2006 and 2007 could potentially see US $ 28 Bn and US $ 20 Bn, respectively, of branded salesbecoming susceptible to the entry of generic equivalents. Coupled with the cost containment policies adopted by healthregulators, these patent expirations are expected to result in an increase in the prescription growth rate for the genericindustry in 2006 and 2007.
• Increasing consumer confidence in generics because of the involvement of large pharmaceutical companies and campaignsto heighten consumer awareness of the availability of cheaper drugs.
• A pro-generic sentiment from healthcare authorities driven by the pressure to contain rising healthcare cost.
• An aging population fueling demand for low cost therapies across the world.
• Global healthcare crisis such as AIDS in the developing world, like sub-Saharan countries, necessitating affordable medicationfor the masses.
Industry consolidation is expected to bring in economies of scale and provide access to newer geographies to regional players. Thebiggest growth driver continues to be the pipeline of blockbuster patent expiries. Consequently, generic companies are recognizingthe importance of pipelines and are making significant incremental investments in research and drug development.
Report of the Directors
43
OUTLOOK ON THREATS, RISKS AND CONCERNS
The global generics business has inherent risks of patent litigation, regulatory issues and product liability, particularly in thedeveloped markets wherein Ranbaxy has a significant presence.
Globally, overinvestment and excess capacities weigh on the generic industry resulting in increasing competition and pricingpressures.
Significant industry consolidation is taking place. The larger Generic players are becoming more dominant and this could impactthe market standing and financial performance of the other generic companies.
SEGMENT-WISE PERFORMANCE
Ranbaxy recorded global sales of US $ 1,178 Mn, same level as last year. Dosage form sales constituted 86% of global sales. Thesales in overseas market constituted 76% of the total sales of the Company, as compared to 78% last year.
INTERNAL CONTROL SYSTEMS AND ADEQUACY
The internal control systems in the Company and its subsidiaries in India and overseas are robust. Over 90% of our Revenuesare on ERP based system SAP.
In 2005, several initiatives were undertaken to further strengthen the internal controls. A company-wide risk analysis was carriedout with the help of external consultants, covering all types of risks the Company may be exposed to. A comprehensive riskmitigation program, with well documented policies, procedures and systems, is under implementation.
The Internal Audit function at Ranbaxy, headed by a Vice President, reports directly to the CEO and the Audit Committee. Thisdepartment carries out regular audits covering the global operations of the Company and the reports are sent to the CEO and theAudit committee.
The Finance function is also adequately staffed with professionally qualified and experienced personnel.
FINANCIAL PERFORMANCE
For the year, the Company recorded consolidated global sales of Rs. 51,880 Mn (US $ 1,178 Mn), 2% lower than prior year. Profitbefore interest, depreciation and amortization and exceptional items was Rs. 3,727 Mn (US $ 85 Mn), lower that prior year by66%. Profit before tax at Rs. 1,944 (US $ 44 Mn) was lower by 78%, mainly due to pricing pressures in the USA and higher R&Dspend, while profit after tax was Rs. 2,642 Mn (US $ 60 Mn), 62% lower than last year.
HUMAN RESOURCES
Human resources are a valuable asset at Ranbaxy and the Company endeavours to provide an environment that each employeeis motivated to contribute his best to achieve the Company's objectives. Training and development of its personnel is a priorityand is ensured through succession planning, job rotation, on the job training, training programs and workshops. The total numberof training man-days during 2005 were 44,414, (2004 : 40,412) imparted in-house and at some of the best institutes in India andoverseas.
The total number of employees of the Company and its subsidiaries as on December 31, 2005 stood at 9,648.
CAUTIONARY STATEMENT:
Statements in the "Management Discussion and Analysis" describing the Company's objectives, estimates, expectations orprojections may be "forward looking statements" within the meaning of applicable laws and regulations. Actual results coulddiffer materially from those expressed or implied. Important factors that could make a difference to the Company's operations,include Government regulations, patent laws, tax regimes, economic developments within India and countries in which theCompany conducts business, litigation and other allied factors.
Ranbaxy Laboratories Limited Annual Report 2005 Report of the Directors
44
ANNEXURE B
Information regarding the Employees Stock Option Scheme(As on December 31, 2005)
(a) S. No. Details Nos.
Pre-split
1. Options granted in the year 2005 1,506,6752. Options granted up to December 31, 2005, including (1) above 4,742,3453. No. of Options vested 3,405,5944. No. of Options exercised 468,6395. No. of Shares arising as a result of exercise of Options (Note 2) 662,5516. No. of Options lapsed and forfeited 557,0577. Pre-split Options outstanding 3,716,649
Post-split1. Post-split Options outstanding (Note 1) 7,433,2982. No. of Options vested 1,520,6743. No. of Options exercised 188,6664. No. of Shares arising as a result of exercise of Options (Note 2) 251,1505. No. of Options lapsed and forfeited 539,794
(i) Variance in terms of options N. A.(ii) Money realized by exercise of Options Rs. 366,208,940(iii) Total No. of Options in force 6,704,838
Notes :
1. The Grant / Exercise price and number of Stock Options Outstanding as on June 30, 2005, have been proportionatelyadjusted in view of sub-division of Equity Shares of the Company from face value of Rs. 10 each into 2 Equity Sharesof Rs. 5 each.
2. Options granted up to October 3, 2002, are entitled for additional Shares, keeping in view of Bonus Shares in the ratioof 3 for 5.
(b) Pricing formula: Average of the daily closing prices of the Equity Shares of the Company at the National Stock Exchangefor a period of twenty six weeks preceding the date(s) of grant of Options. On this basis, exercise price of the Optionsgranted, on January 17, 2005, was Rs. 1077 per Equity Share of Rs. 10 each (Post-split adjusted price is Rs. 538.50 perShare).
(c) (i) Options granted in the year 2005, to senior managerial personnel*:
Name Designation (Present) No. of Optionsgranted (Pre-split) @
Mr. Ramesh L Adige Whole-time Director -Corporate Affairs andGlobal Corporate Communications 3,000
Mr. S. C. Agarwal Vice President - Direct Taxation 6,500Mr. Lalit Ahluwalia Vice President - Business Finance 4,000Mr. Ranjit G. Barshikar Vice President - Global Quality 5,625Dr. Vijay Kumar Batra Head-Generics, NDDS & Drug Development 7,500Mr. Pushpinder Bindra President-Global Manufacturing & Capacity Planning 7,500Mr. Peter Burema President - Europe, CIS, Africa and Latin America 7,500Mr. Dipak Chattaraj Chairman Ranbaxy Inc USA & President
Corporate Development 5,625Mr. S. K. Chawla Vice President - Global Internal Audit 3,000Mr. Sanjeev I. Dani Regional Director - India 7,500Mr. Jay Deshmukh Vice President - Intellectual Property 7,500Mr. Rahul Goswami Vice President - Strategic Material Sourcing & CIO 3,000Dr. Naresh Kumar Vice President - Chemical Manufacturing 3,000Mr. Atul Malhotra President - North America 7,500Mr. Vishal Malhotra Vice President - Fermentation & Engineering & Facilities 3,000Mr. James Meehan Vice President - Generics Sales and Marketing (Region IV) 2,250Mr. Ramesh Parekh Vice President - Pharma Manufacturing 5,625
Report of the Directors

45
Dr. Arun Purohit Vice President - International Marketing Development 3,000Mr. Ram S. Ramasundar President & CFO 4,000Mr. Ashok Kumar Rampal Vice President - Pharma Research & NDDS 4,000Mr. Omesh Sethi Vice President & CFO (Region IV) 2,250Dr. Gowri Shankar Vice President - Clinical Research & Medical Affairs 5,625Dr. Brian W. Tempest Chief Mentor and Executive Vice Chairman 40,000Mr. Udai Upendra Vice President - Global Human Resources 3,000
* Excludes the Senior Managerial personnel who ceased to be in employment with the Company.
@ Post-split, number of Stock Options proportionately increased.
(ii) Employees who have been granted 5% or more,of the Options granted during the year : Nil
(iii) Employees who have been granted Options duringany one year, equal to or exceeding 1% of the issuedcapital of the Company at the time of grant : Nil
(d) Diluted Earnings Per Share (EPS) : Rs. 5.68
(e) (i) Method of calculation of employee : The Company has calculated the employeecompensation cost : compensation cost using the intrinsic value
of the Stock Options
(ii) Difference between the employee compensation : Rs. 180.75 Mn (Increase)cost so computed at (i) above and the employeecompensation cost that shall have been recognizedif it had used the fair value of the Options
(iii) The impact of this difference on profits and on : Profit After Tax : Rs. 2,236.98 MnEPS of the Company : Less : additional
employee compensationcost based on fair value : Rs. 180.75 Mn
Adjusted PAT : Rs. 2,056.23 Mn
Adjusted EPS : Rs. 5.51
(f) Weighted-average exercise price andfair value of Stock Options granted :(Post split adjusted price)
Stock Options Weighted average Weighted average Closing market pricegranted on exercise price (in Rs.) Fair value (in Rs.) at NSE on the date of
grant (in Rs.)
12.01.2001 336.50 145.00 324.1503.12.2001 297.50 188.50 369.4801.04.2002 372.50 226.00 449.4807.02.2003 283.50 132.50 317.4522.01.2004 496.00 212.50 503.1017.01.2005 538.50 215.68 534.33
(g) Description of the method and The Black Scholes Option pricing model wassignificant assumptions used during developed for estimating fair value of tradedthe year to estimate the fair value of options that have no vesting restrictions andthe Options, including the following are fully transferable. Since Option pricingweighted average information : models require use of substantive
assumptions, changes therein can materiallyaffect fair value of Options. The Optionpricing models do not necessarily provide areliable measure of fair value of Options.
The main assumptions used in the Black – Scholes option-pricing model during the year were as follows :Risk free interest rate : 7%Expected life of Options from the date(s) of grant : 10 yearsExpected volatility : 32.23%Dividend yield : 2.20%
Name Designation (Present) No. of Optionsgranted (Pre-split) @
Ranbaxy Laboratories Limited Annual Report 2005 Report of the Directors

46
ANNEXURE C
Information pursuant to Companies (Disclosure of Particulars in Report of Board of Directors) Rules, 1988 formingpart of the Report of the Directors.
1. A) CONSERVATION OF ENERGY AND ITS IMPACT
Measures for Conservation of Energy Impact resulting intosaving of Rs. Millions
– Reduction of Furnace Oil Consumption to the extent of 100KL per annum byoptimizing/reducing working pressure. 3.53
– Isolating Primary Refrigeration Circuit for New Utilities by taking SecondaryRefrigeration in the entire circuit. 2.42
– Energy efficient Screw Trane Chiller Installed in place of Vapour absorption &KGK screw chillers. 2.29
– High TDS RO system to reduce load on thermal evaporator. 2.01– Optimization of Old Cooling Tower flow rate with 1 Transfer pump instead of 2 pumps. 1.28– Utilization of New Cooling tower with Delta T of 8 Deg C by switching to
Old Cooling tower in New Utility and supplying both utility and Process. 1.15– Centralized chiller water system operationalized in place of localized chillers
in PDL service areas. 1.10– Rationalization of cooling tower operations by dedicating these to specific areas. 1.00– RO water system to reduce TDS to 50 PPM for DI water plant feed water to reduce
regeneration frequency to the extent of 12KL per day and Boiler Blowdown 10KL per day. 0.88– Improvement in Chilled water operations by:
a) Optimization of Distribution Network.b) Installation of Energy efficient pumps along with VFD.c) Installation of Modulating valves in AC Air Handling Unit 0.83
– Providing Orifice plates (15 - 20MM) in place of 25 MM direct purgingsystem of 45 Nos. Hot water tanks to reduce steam consumption. 0.75
– Improvement in lighting by:a) Copper Ballast & Normal Tubes were replaced by Electronic Ballast & high tubes.b) Mercury lamps were replaced by Metal Helide lamps. 0.73
– Upgradation of Cooling Water System by:a) Installation of New JET type, fan less, filled cooling tower in place of
convention forced draft PVC fill type Cooling tower.b) Heat Load of DG sets, Chillers & Air Compressors were redistributed and
arranged to feed from different cooling towers.c) Installation of VFD for pumps. 0.67
– Chilling water load of administration block (60TR) and New SSP Block (160TR)shifted to Central Utility energy efficient Chiller by providing additional headers. 0.61
– Raw water Pumps standardized with 20 HP pumps as against earlier 30 HP pumps 0.55– Utilisation of 720 CFM of 200HP by stopping 30HPx 8 Compressor, 60HPx1
Compressor and 75HPx1 Compressor by optimizing the Air compressors operations. 0.54– The Brine compressors of 150HP was replaced with 125 HP Compressor. 0.48– Pressure Transmitters installed in place of conventional pressure switches for loading/
unloading of air compressors for better control and reduced pressure fluctuation. 0.45– Replacement of 15 HP Pumps with 10 HP ejectors in various plants. 0.36– VFD control on DI water pumping for Fermentation plant. 0.27– Commissioning of Variable Frequency Drives (VFD) for FD fan (22KW) of 12 TPH Boiler 0.26– Stoppage of CHW Booster Pump of MP1 by diverting CHW from New Utilities
instead of Old Utilities. 0.26– Auto mode for Cooling Tower Fans 4 Nos. 0.11– Replacement of 82 Nos. NFLP Motors with FLP with High Efficiency Motors. 0.15
2. RESEARCH & DEVELOPMENT
a) Specific areas in which R&D is carried out– Develop technology for Active Pharmaceutical Ingredients (APIs), key drug intermediates and, conventional & value added
innovative dosage forms - complying to international quality and regulatory norms.– Develop “Platform Technologies” and “Products” in the area of Novel Drug Delivery Systems.– Design, synthesis and discovery of new drug molecules in select areas: Infectious Diseases (anti-bacterials and anti-
fungals), Urology [benign prostatic hyperplasia (BPH) and urinary incontinence], Metabolic Diseases (type 2 diabetes,hyperlipidemia) and Inflammatory/Respiratory Diseases (asthma, chronic pulmonary obstructive disease and rheumatoidarthritis).
– Develop NCEs from animal testing for safety to establishing Proof Of Concept (POC) in humans by conducting Phase Iand II trials, and then Phase III clinical efficacy trials if POC is positive.
Report of the Directors

47
– Develop Phyto-pharmaceuticals (OTC as well as ethical) with strong scientific footing, involving standardization of botanicalActives, followed by their toxicity and clinical studies
– GLP/cGCP complying Bioavailability / Bioequivalence, Toxicology and Clinical Studies (Phase - I, II & III)– Innovation in packaging for improved patient convenience & compliance– Up-gradation of existing technologies / products on ongoing basis
b) Benefits derived as result of R&D activities– Technology to manufacture APIs and Dosage Forms– Oral Controlled Release Dosage Forms leading to better patient convenience and compliance– Generation of high quality data complying the international regulatory requirements, for registration of APIs and generic
dosage forms in India and Abroad leading to speedy approvals– Improved productivity / process efficiencies– Internationally competitive prices and product quality– Safe and environment friendly processes– Generation of Intellectual wealth for the Company in key potential markets– Grant of process patents for both Active Pharmaceutical Ingredients (APIs) as well as Dosage Forms (both conventional &
novel drug delivery systems)– Product patents in the areas of drug discovery research– Self reliance and import substitution for conservation of Foreign Exchange– Foreign exchange earnings / savings– Speed to marketplace– Enhanced business through Licensing arrangements (Platform Technologies, NCEs, etc.) / strategic alliances / custom
synthesis– Enhanced Global presence / visibility
c) Future plan of action– Continue augmenting R&D capabilities and productivity through technological innovations, use of modern scientific and
technological techniques, training and development, benchmarking and global networking– Greater thrust in the areas of Novel Drug Delivery Systems and New Drug Discovery Research– Enhance emphasis on Custom Synthesis to draw a greater leverage on the built-in Chemical & Clinical Research infrastructure
and capabilities– Continue developing innovative, commercially viable process know-hows for both Active Pharmaceutical Ingredients
(APIs) and Dosage Forms– Expansion of pre-clinical and Clinical Research infrastructure complying international GLP/cGCP norms– Continue improvements in packaging for pharmaceuticals to ensure shelf-life/stability, quality and, better patient convenience
and compliance– Enhance national and international research networking and strategic alliances
d) Expenditure on R&D Rs. MillionsYear ended Year ended
December 31, 2005 December 31, 2004Capital 1,529.72 682.68Revenue 4,863.60 3,313.85
3. TECHNOLOGY, ABSORPTION, ADAPTATION AND INNOVATIONa) Efforts in brief, made towards technology absorption and innovation
– As per 2(a) aboveb) Benefit derived as a result of the above efforts, e.g. product improvement, cost reduction, product development.
– As per 2(b) above
Future course of actiona) – To continue developing innovative and commercially viable process know-how for APIs and Dosage Forms
(Conventional and Novel Drug Delivery System).c) Information in case of imported technology (imports during last five years)
– Not applicable.
4. FOREIGN EXCHANGE EARNINGS AND OUTGOa) Exports sales (excluding sales to Nepal) were Rs. 23,332.17 Mn for the financial year ended December 31, 2005
– 720 product dossiers were filed with various international regulatory authorities and regulatory approvals were received for381 product dossiers
– Drug Master Files (DMFs) for APIs were filed with the regulatory authorities in several markets– Continued to receive income by way of royalty, technical and management service fee and dividend from overseas
subsidiaries/affiliatesRs Millions
Year ended Year endedDecember 31, 2005 December 31, 2004
Earnings 23,577.40 25,330.95Outgo 13,243.75 12,459.59
Ranbaxy Laboratories Limited Annual Report 2005 Report of the Directors

48
Form for disclosure of particulars with respect to conservation of energy
Current PreviousYear Year
A. Electricity and Fuel Consumption
1. Electricity
(a) Purchased Units (KWH) 94244048 91114500Total Amount (Rs. Mn) 368.04 364.99Rate/Unit (Rs.) Rs. 3.91 Rs. 4.01
(b) Own Generation
i) Through Diesel Generator Unit (KWH) 14487613 15852848Unit per Ltr. of Diesel Oil 3.63 3.72Cost/Unit Rs. 6.93 Rs. 5.65
ii) Through Steam Turbine/Generator Not Applicable Not Applicable
2. Coal (Specify quality and where used) Not Applicable Not Applicable
3. Furnace Oil Qty. (K. Ltrs.) 14035 12949Total Amount (Rs. Mn) 211.69 161.62Average Rate (Rs. per Ltr.) Rs. 15.08 Rs. 12.48
4. Others/internal generation Not Applicable Not Applicable
B. Consumption per unit of production
Units Standards Current Previous(if any) Year Year
ElectricityActive Pharmaceutical Ingredients (kwh per kg) No specific standards - 60.50 54.11Dosage Forms (kwh per consumption 82.60 81.06
1000 packs) per unit dependson product mix
Furnace OilActive Pharmaceutical Ingredients (Ltrs. per kg) 9.04 7.68Dosage Forms (K. Ltrs. per 0.01 0.01
1000 packs)Coal Not Applicable Not ApplicableOthers Not Applicable Not Applicable
Form - A

49
Rs. Millions
1996-97 1997-98 1998 ** 1999 2000 2001 2002 2003 2004 2005
Results for the year
Sales 11,482.1 13,335.2 10,640.5 15,598.3 17,366.6 20,545.4 28,197.9 35,334.9 36,143.4 35,366.5
Index 1.0 1.2 1.2 1.4 1.5 1.8 2.5 3.1 3.1 3.1
Exports 5,223.6 5,956.9 4,414.1 7,323.7 8,019.6 10,290.8 18,502.9 24,674.6 24,562.4 23,371.1
Index 1.0 1.1 1.1 1.4 1.5 2.0 3.5 4.7 4.7 4.5
Gross Profit 2,188.0 2,387.6 1,552.1 2,562.5 3,177.1 3,924.1 7,304.8 10,061.4 7,211.7 3,178.8
Index 1.0 1.1 0.9 1.2 1.5 1.8 3.3 4.6 3.3 1.5
Profit before tax 1,869.4 2,011.5 1,240.4 2,103.8 1,945.4 2,777.7 7,133.8 9,563.7 6,283.4 2,013.6
Index 1.0 1.1 0.9 1.1 1.0 1.5 3.8 5.1 3.4 1.1
Profit after tax 1,604.4 1,866.5 1,170.0 1,968.8 1,824.4 2,519.6 6,235.8 7,947.8 5,284.7 2,237.0
Index 1.0 1.2 1.0 1.2 1.1 1.6 3.9 5.0 3.3 1.4
Equity Dividend 379.1 530.7 560.1 869.2 869.2 1,158.9 2,434.0 $ 3,156.3 3,162.6 3,166.7
Index 1.0 1.4 2.0 2.3 2.3 3.1 6.4 8.3 8.3 8.4
Equity Dividend (%) 80 +++ 100 50 75 75 100 150 170 170 170
Earning per share (Rs.) 32.47 34.74 13.46 *** 16.99 15.74 21.86 28.86 42.61 28.26 5.68 ^
Year-end Position
Gross Block+ 5,848.0 7,347.2 8,045.6 8,675.9 9,241.5 9,278.2 10,448.8 12,470.6 16,669.4 22,321.6
Index 1.0 1.3 1.4 1.5 1.6 1.6 1.8 2.1 2.9 3.8
Net Block 4,605.9 5,742.4 6,135.5 6,319.0 6,443.7 6,130.5 6,753.9 8,017.9 11,417.2 16,328.1
Index 1.0 1.2 1.3 1.4 1.4 1.3 1.5 1.7 2.5 3.5
Net Current Assets 9,334.8 9,032.8 8,320.5 8,157.5 8,257.7 7,454.5 9,564.4 13,302.9 9,466.8 11,231.0
Index 1.0 1.0 0.9 0.9 0.9 0.8 1.0 1.4 1.0 1.2
Net Worth 11,550.0 @@ 12,864.3 14,008.3 14,979.3 15,826.9 17,355.1 19,623.9 24,333.4 26,288.0 24,886.0
Index 1.0 1.1 1.2 1.3 1.4 1.5 1.7 2.1 2.3 2.2
Share Capital 494.1 537.2 1,158.9 *** 1,158.9 1,158.9 1,158.9 1,854.5 1,855.4 1,858.9 1,862.2
Reserves & Surplus 11,055.9 12,327.1 12,849.4 13,820.4 14,667.6 16,196.2 17,769.4 22,477.9 24,429.1 23,023.8
Book value per share (Rs.) 233.74 239.44 120.9 *** 129.25 136.56 149.75 105.71 $$ 131.14 141.42 66.82 ^
No. of Employees 6,131 5,655 5,469 5,347 5,784 6,424 6,297 6,797 7,195 7,174
Index : No. of times+ Includes Capital work-in-progress@ @ Includes Warrant option Money and Application Money pending allotment+++ Does not include Interim Dividend of Croslands Research Laboratories Ltd. for the year 1996-97** 9 months Apr-Dec. Indexation based on annualized figures for 9 months ended 31.12.98*** After 1:1 Bonus Issue and conversion of outstanding warrants.$ Includes Interim Dividend Rs. 5 per share, prior to issue of bonus shares and Final Dividend of Rs. 10 per share$$ Post issue of Bonus shares in the ratio of 3 for 5 in October, 2002.^ After Share split
Sales are stated net of excise duty recovered from 2002 onwardsEarnings per share are stated on fully diluted basis from 2002 onwards
Ten Years at A GlanceTen Years at a Glance

50
To the Members of Ranbaxy Laboratories Limited
1. We have audited the attached Balance Sheet ofRanbaxy Laboratories Limited ("the Company") as atDecember 31, 2005, and also the Profit and Loss Accountand Cash Flow Statement for the year ended on that dateannexed thereto. These financial statements are theresponsibility of the Company's management. Ourresponsibility is to express an opinion on these financialstatements based on our audit.
2. We conducted our audit in accordance with the auditingstandards generally accepted in India. Those Standardsrequire that we plan and perform the audit to obtainreasonable assurance about whether the financialstatements are free of material misstatement. An auditincludes examining, on a test basis, evidence supportingthe amounts and disclosures in the financial statements.An audit also includes assessing the accounting principlesused and significant estimates made by management, aswell as evaluating the overall financial statementpresentation. We believe that our audit provides areasonable basis for our opinion.
3. As required by the Companies (Auditor's Report) Order,2003 as amended by the Companies (Auditor's Report)(Amendment) Order, 2004 (the 'Order') issued by theCentral Government of India in terms of sub-section (4A)of Section 227 of the Companies Act, 1956 (the 'Act'), wegive in the Annexure 'A' statement on the matters specifiedin paragraphs 4 and 5 of the said Order.
4. Further to our comments in Annexure "A" referred to above,we report that:
a) We have obtained all the information andexplanations, which to the best of our knowledgeand belief were necessary for the purposes of ouraudit;
b) In our opinion, proper books of account as requiredby law have been kept by the Company so far asappears from our examination of those books;
c) The Balance Sheet, Profit and Loss Account andCash Flow Statement dealt with by this report arein agreement with the books of account;
d. In our opinion and to the best of our information andaccording to the explanations given to us, thefinancial statements, read together with the notesthereon, comply with the accounting standardsreferred to in sub-section (3C) of Section 211 of theAct, give the information required by the Act in themanner so required and give a true and fair view inconformity with the accounting principles generallyaccepted in India, in the case of:
i) the Balance Sheet, of the state of affairs of theCompany as at December 31, 2005;
ii) the Profit and Loss Account, of the profit forthe year ended on that date; and
iii) the Cash Flow Statement, of the cash flows forthe year ended on that date.
e. On the basis of written representations received fromthe directors, as on December 31, 2005, and takenon record by the Board of Directors, we report thatnone of the Directors is disqualified as on December31, 2005 from being appointed as a Director in termsof clause (g) of sub-section (1) of Section 274 of theAct.
For Walker, Chandiok & CoChartered Accountants
Vinod ChandiokPartnerMembership No. 10093
Place : GurgaonDated : April 19, 2006
Auditors’ Report
51
Annexure ‘A’ to the auditors' report of even dateto the members of Ranbaxy Laboratories Limitedon the financial statements for the year endedDecember 31, 2005
Based upon the audit procedures performed for the purpose ofreporting the true and fair view of the financial statements andin terms of the information and explanations given to us andthe books and records examined by us in the normal course ofaudit, we report that:
(i) (a) The Company is maintaining proper recordsshowing full particulars including quantitativedetails and situation of fixed assets.
(b) The Company's programme of physicalverification of all its fixed assets over a period ofthree years, is in our opinion, reasonable havingregard to the size of the Company and the natureof its fixed assets. As informed, no materialdiscrepancies were noticed on such verification.
(c) In our opinion, a substantial part of fixed assetshave not been disposed off during the year.
(ii) (a) Inventory has been physically verified by themanagement during the year. In our opinion, thefrequency of verification is reasonable.
(b) The procedures of physical verification ofinventory followed by the management arereasonable and adequate in relation to the size ofthe Company and the nature of its business.
(c) The Company is maintaining proper records ofinventory and no material discrepancies werenoticed on physical verification.
(iii) (a) The Company has not granted any loans, securedor unsecured, to companies, firms or other partiescovered in the register maintained under section301 of the Act. Accordingly, the provisions ofclauses 4(iii)(b), 4(iii)(c) and 4(iii)(d) of the Orderare not applicable to the Company.
(b) The Company has not taken any loans, securedor unsecured, from companies, firms or otherparties covered in the register maintained undersection 301 of the Act. Accordingly, the provisionsof clauses 4(iii)(f) and 4(iii)(g) of the Order are notapplicable to the Company.
(iv) In our opinion, there are adequate internal controlsystems commensurate with the size of the Companyand the nature of its business, for the purchase ofinventory, fixed assets and for the sale of goods andservices. During the course of our audit, no majorweakness has been noticed in the internal controls inrespect of these areas.
(v) (a) The particulars of contracts or arrangementsreferred to in section 301 of the Act, have beenentered in the register maintained under thatsection.
(b) The transactions made in pursuance of contractsor arrangements referred to in section 301 of theAct are, in our opinion, at prices which arereasonable having regard to the prevailing marketprices at the relevant time.
(vi) The directives issued by the Reserve Bank of India andthe provisions of sections 58A, 58AA and other relevantprovisions of the Act and the rules framed there under, tothe extent applicable, have been complied with by theCompany. We are informed by the management that noorder has been passed by the Company Law Board orNational Company Law Tribunal or Reserve Bank ofIndia or any Court or any other Tribunal, relevant tosections 58A, 58AA or the other relevant provisions ofthe Act.
(vii) In our opinion, the Company has an internal auditsystem commensurate with its size and nature of itsbusiness.
(viii) We have broadly reviewed the books of accountmaintained by the Company pursuant to the rules madeby the Central Government for the maintenance of costrecords under clause (d) of sub-section (1) of section 209of the Companies Act, 1956, and are of the opinion thatprima facie, the prescribed accounts and records havebeen made and maintained.
(ix) (a) The Company is regular in depositing theundisputed statutory dues including providentfund, investor education fund, employees' stateinsurance, income-tax, sales-tax, wealth-tax,service-tax, custom duty, excise duty, cess andother material statutory dues as applicable withthe appropriate authorities. No undisputedamounts payable in respect of income-tax,wealth-tax, service-tax, sales-tax, customs dutyand excise duty were outstanding, at the year endfor a period of more than six months from thedate they became payable.
(b) There are no amounts in respect of sales-tax,income-tax, customs duty, wealth-tax, service-tax, excise duty and cess that have not beendeposited with the appropriate authorities onaccount of any dispute, other than thosementioned in 'Annexure 1' to this report.
(x) The Company has no accumulated losses at the endof the financial year and it has not incurred cashlosses in the current and immediately preceding financialyear.
(xi) The Company has not defaulted in repayment of duesto a financial institution, bank or to debenture holdersduring the year.
ANNEXURE ‘A’ TO THE AUDITORS’ REPORT
Ranbaxy Laboratories Limited Annual Report 2005 Auditors’ Report

52
(xii) The Company has not granted any loans and advanceson the basis of security by way of pledge of shares,debentures and other securities. Accordingly, theprovisions of clause 4(xii) of the Order are not applicableto the Company.
(xiii) The Company is not a chit fund or a nidhi / mutualbenefit fund / society. Accordingly, the provisions ofclause 4(xiii) of the Order are not applicable to theCompany.
(xiv) The company is not dealing in or trading in shares,securities, debentures and other investments. Accordingly,the provisions of clause 4(xiv) of the Order are notapplicable to the Company.
(xv) The Company has not given any guarantee for loanstaken by others from bank or financial institutions.Accordingly, the provisions of clause 4(xv) of the Orderare not applicable to the Company.
(xvi) The Company has applied the term loans for the purposefor which the loans were obtained.
(xvii) Based on an overall examination of the balance sheetand cash flow statement of the Company, we report thatno funds raised on short-term basis have been used forlong-term investment (excludes permanent workingcapital).
(xviii) The Company has not made any preferential allotmentof shares to parties or companies covered in the registermaintained under section 301 of the Act. Accordingly,the provisions of clause 4(xviii) of the Order are notapplicable to the Company.
(xix) The Company did not have any outstanding debenturesduring the year. Accordingly, the provisions ofclause 4(xix) of the Order are not applicable to theCompany.
(xx) The Company has not raised any money by public issuesduring the year. Accordingly, the provisions ofclause 4(xx) of the Order are not applicable to theCompany.
(xxi) We report that no fraud on or by the Company hasbeen noticed or reported during the period covered by ouraudit.
For Walker, Chandiok & Co
Chartered Accountants
Vinod Chandiok
Partner
Membership No. 10093
Place : Gurgaon
Dated : April 19, 2006
Auditors’ Report

53
Annexure 1 as referred to in para ix (b) of Annexure ‘A’ to the Auditors’ Report
Name of the statute Nature of the dues Amount in Period to Forum whereRs. Millions which the dispute is pending
amount relates
Punjab General Sales-tax Purchase tax, 2.19 1989-90 & Sales tax TribunalAct, 1948 interest and penalty 1990-91
Punjab General Sales-tax Purchase tax 0.06 2005 Sales tax TribunalAct, 1948
Rajasthan Sales-tax Act, 1956 Local Sales-tax, 0.05 1999-2000 Commissioner Sales taxinterest and penalty
U P Sales-tax Act, 1948 Local Sales-tax, 0.12 2002-03 Commissioner Sales taxinterest and penalty
West Bengal Local Sales-tax Act Local Sales-tax, 0.05 1998-99 Deputy Commissioner,interest and penalty Corporate Division.
West Bengal Central Sales-tax Act Central Sales-tax, 0.03 1998-99 Deputy Commissioner,interest and penalty Corporate Division.
Orissa Sales-tax Act, 1947 Local Sales-tax, 0.54 2002-03 Sales tax Tribunalinterest and penalty
Bihar Finance Act, 1981 Local and Central Sales-tax 17.53 1999-2003 Commissioner ofCommercial taxes (Appeals)
Bihar Finance Act, 1981 Local and Central Sales-tax 1.82 1999-2003 Commissioner ofCommercial taxes (Appeals)
Ranbaxy Laboratories Limited Annual Report 2005 Auditors’ Report & Annexure 1

54
BALANCE SHEETAS AT DECEMBER 31, 2005
Rs. Millions
Schedule 2005 2004
SOURCES OF FUNDS
SHAREHOLDERS' FUNDS
Share capital 1 1,862.21 1,858.91
Reserves and surplus 2 21,907.98 23,207.92
23,770.19 25,066.83
SHARE APPLICATION MONEY PENDING ALLOTMENT 2.78 28.29
LOAN FUNDS
Secured loans 3 3,534.92 1,333.74
Unsecured loans 4 6,763.12 24.90
10,298.04 1,358.64
Deferred tax liability (Net) 5 1,115.81 1,451.07
35,186.82 27,904.83
APPLICATION OF FUNDSFIXED ASSETS 6Gross block 17,993.15 14,027.86Less : Depreciation 5,993.47 5,252.06Net block 11,999.68 8,775.80Capital works-in-progress 4,328.43 2,641.58
INVESTMENTS 7 7,627.75 6,790.72
CURRENT ASSETS, LOANS AND ADVANCESInventories 8 8,909.33 8,963.38Sundry debtors 9 8,066.18 7,846.89Cash and bank balances 10 1,165.93 372.60Other current assets 11 1,179.16 805.08Loans and advances 12 3,333.08 5,094.25
22,653.68 23,082.20Less:CURRENT LIABILITIES AND PROVISIONSCurrent liabilities 13 7,282.80 8,307.37Provisions 14 4,139.92 5,078.10
11,422.72 13,385.47
NET CURRENT ASSETS 11,230.96 9,696.73
35,186.82 27,904.83SIGNIFICANT ACCOUNTING POLICIES 25NOTES TO THE FINANCIAL STATEMENTS 26The schedules referred to above form an integral part of the financial statements.This is the balance sheet referred to in our report of even date.
On behalf of the Board of Directors
For WALKER, CHANDIOK & CO TEJENDRA KHANNA DR. BRIAN W. TEMPEST MALVINDER MOHAN SINGHChartered Accountants Chairman Chief Mentor & CEO & Managing Director
Executive Vice Chairman
VINOD CHANDIOK RAMESH L ADIGE HARPAL SINGH VIVEK BHARAT RAMPartner Whole-time Director Director DirectorMembership No. 10093
RAM S. RAMASUNDAR SUSHIL K. PATAWARIPlace : Gurgaon President & CFO SecretaryDated : April 19, 2006
Financial Statements of Ranbaxy

55
PROFIT AND LOSS ACCOUNTFOR THE YEAR ENDED DECEMBER 31, 2005 Rs. Millions
Schedule 2005 2004INCOMEOperating income 15 35,697.69 37,301.71Other income 16 904.80 558.66
36,602.49 37,860.37EXPENDITUREMaterials 17 15,048.92 14,515.93Manufacturing 18 1,752.91 1,767.46Personnel 19 3,016.52 3,278.54Selling, general and administration 20 8,741.76 7,772.93Research and development 21 4,863.60 3,313.85
33,423.71 30,648.71PROFIT FROM OPERATIONS BEFORE INTEREST,DEPRECIATION, AMORTISATION AND IMPAIRMENT 3,178.78 7,211.66Interest 264.11 109.80Depreciation, amortisation and impairment 22 1,013.33 818.47Profit from operations before tax 1,901.34 6,283.39Profit from continuing operations 1,731.68 6,047.80Provision for tax 23 296.40 (912.46)Profit from continuing operations after tax 2,028.08 5,135.34Discontinued operationsProfit from operations 169.66 235.59Profit from sale of Undertaking 112.29 –Provision for tax 23 (73.05) (86.21)Net profit from discontinued operations 208.90 149.38PROFIT AFTER TAX 2,236.98 5,284.72Tax - earlier years
Current (116.56) (9.51)2,120.42 5,275.21
Balance as per last balance sheet 2,270.05 3,570.15Transfer from :
Foreign projects reserve 30.65 32.27Balance available for appropriation 4,421.12 8,877.63APPROPRIATIONS
DividendInterim 931.11 929.45Final (Proposed) 2,235.55 2,233.15
Tax on dividend 444.12 440.38Transfer to :
Foreign projects reserve – 4.60General reserve 250.00 3,000.00
Surplus carried forward 560.34 2,270.054,421.12 8,877.63
EARNINGS PER SHARE (RS.) 24Including discontinued operations
Basic 5.70 14.20Diluted 5.68 14.13
Excluding discontinued operationsBasic 5.14 13.80Diluted 5.12 13.73
SIGNIFICANT ACCOUNTING POLICIES 25NOTES TO THE FINANCIAL STATEMENTS 26The schedules referred to above form an integral part of the financial statementsThis is the profit and loss account referred to in our report of even date.
On behalf of the Board of Directors
For WALKER, CHANDIOK & CO TEJENDRA KHANNA DR. BRIAN W. TEMPEST MALVINDER MOHAN SINGHChartered Accountants Chairman Chief Mentor & CEO & Managing Director
Executive Vice Chairman
VINOD CHANDIOK RAMESH L ADIGE HARPAL SINGH VIVEK BHARAT RAMPartner Whole-time Director Director DirectorMembership No. 10093
RAM S. RAMASUNDAR SUSHIL K. PATAWARIPlace : Gurgaon President & CFO SecretaryDated : April 19, 2006
Ranbaxy Laboratories Limited Annual Report 2005 Balance Sheet & Profit and Loss Account

56
CASH FLOW STATEMENTFOR THE YEAR ENDED DECEMBER 31, 2005 Rs. Millions
2005 2004A. CASH FLOW FROM OPERATING ACTIVITIES
Profit from operations 1,901.34 6,283.39Adjustments for :
Depreciation, amortisation and impairment 1,013.33 818.47Assets written off 29.54 39.61Deferred employees compensation 32.68 38.42Unrealised foreign exchange (gain) (42.64) (81.84)Dividend income (30.91) (5.35)Profit on sale of long term investments (424.50) –Loss on sale of fixed assets (Net) 29.29 13.27Interest expense 264.11 109.80Interest income (139.76) (217.47)Amounts written off – 16.71Provision/ (Reversal) for doubtful debts and advances (61.81) 68.65
669.33 800.27Operating profit before working capital changes 2,570.67 7,083.66
Adjustments for :Inventories (278.31) (1,916.07)Sundry debtors / receivables (289.59) (3,110.73)Loans and advances 158.95 (477.47)Trade/Other payables (743.88) 2,521.75Other current assets (566.61) 986.67
(1,719.44) (1,995.85)Cash generated from operating activity 851.23 5,087.81
Direct taxes (paid, net of refunds) / refund 221.94 (973.11)Net cash from operating activities 1,073.17 4,114.70
B. CASH FLOW FROM INVESTING ACTIVITIESPurchase of fixed assets / capital works-in-progress (6,258.89) (4,253.87)Consideration received for discontinued business 780.10 –Sale proceeds of fixed assets 91.35 19.53Purchase of investments (892.53) (3,415.71)Sale proceeds of investments 480.00 –Short term deposit / secured loans 5.68 0.62Interest received 135.73 239.37Dividend received 30.91 5.35
Net cash used in investing activities (5,627.65) (7,404.71)
C. CASH FLOW FROM FINANCING ACTIVITIESProceeds from issue of capital (including premium) 135.53 166.72Increase in bank borrowings 9,101.29 1,028.80Decrease in other borrowings (5.14) (12.72)Interest paid (262.12) (110.46)Dividend paid (3,164.26) (3,157.83)Tax on dividend (443.80) (412.69)
Net cash from / (used) in financing activities 5,361.50 (2,498.18)
INCREASE / (DECREASE) IN CASH AND CASH EQUIVALENTS 807.02 (5,788.19)
Cash and cash equivalents at the beginning 302.54 6,090.73
Cash and cash equivalents at the close 1,109.56 302.54Notes :
Cash and cash equivalents include :Cash and cheques in hand and remittances in transit 204.93 187.83With banks in :
Current accounts [Net of dividend accounts Rs. 55.27 million 44.63 114.71 (Previous year Rs. 68.81 million)]Deposit accounts [Net of pledged Rs. 1.05 million (Previous year Rs 0.94 million)] 860.00 –
1,109.56 302.54This is the cash flow statement referred to in our report of even date
On behalf of the Board of Directors
For WALKER, CHANDIOK & CO TEJENDRA KHANNA DR. BRIAN W. TEMPEST MALVINDER MOHAN SINGHChartered Accountants Chairman Chief Mentor & CEO & Managing Director
Executive Vice Chairman
VINOD CHANDIOK RAMESH L ADIGE HARPAL SINGH VIVEK BHARAT RAMPartner Whole-time Director Director DirectorMembership No. 10093
RAM S. RAMASUNDAR SUSHIL K. PATAWARIPlace : Gurgaon President & CFO SecretaryDated : April 19, 2006
Financial Statements of Ranbaxy
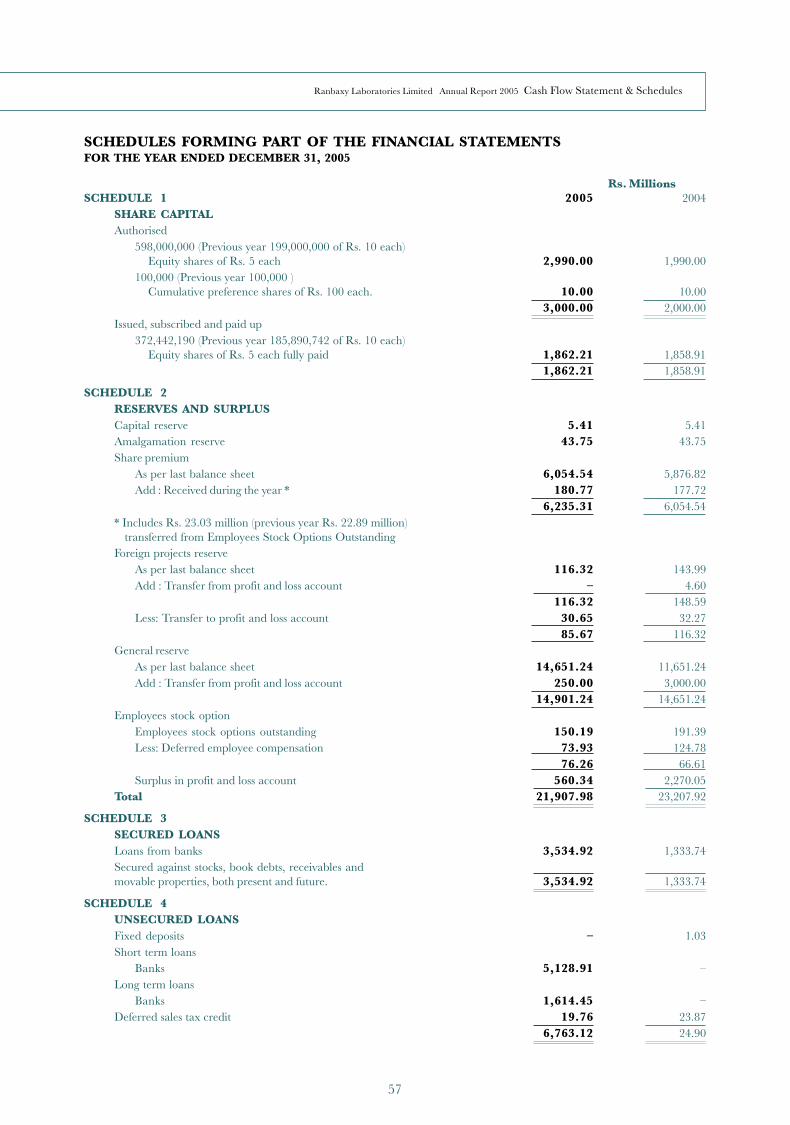
57
SCHEDULES FORMING PART OF THE FINANCIAL STATEMENTSFOR THE YEAR ENDED DECEMBER 31, 2005
Rs. MillionsSCHEDULE 1 2005 2004
SHARE CAPITALAuthorised
598,000,000 (Previous year 199,000,000 of Rs. 10 each)Equity shares of Rs. 5 each 2,990.00 1,990.00
100,000 (Previous year 100,000 )Cumulative preference shares of Rs. 100 each. 10.00 10.00
3,000.00 2,000.00Issued, subscribed and paid up
372,442,190 (Previous year 185,890,742 of Rs. 10 each)Equity shares of Rs. 5 each fully paid 1,862.21 1,858.91
1,862.21 1,858.91
SCHEDULE 2RESERVES AND SURPLUSCapital reserve 5.41 5.41Amalgamation reserve 43.75 43.75Share premium
As per last balance sheet 6,054.54 5,876.82Add : Received during the year * 180.77 177.72
6,235.31 6,054.54* Includes Rs. 23.03 million (previous year Rs. 22.89 million) transferred from Employees Stock Options OutstandingForeign projects reserve
As per last balance sheet 116.32 143.99Add : Transfer from profit and loss account – 4.60
116.32 148.59Less: Transfer to profit and loss account 30.65 32.27
85.67 116.32General reserve
As per last balance sheet 14,651.24 11,651.24Add : Transfer from profit and loss account 250.00 3,000.00
14,901.24 14,651.24Employees stock option
Employees stock options outstanding 150.19 191.39Less: Deferred employee compensation 73.93 124.78
76.26 66.61Surplus in profit and loss account 560.34 2,270.05
Total 21,907.98 23,207.92
SCHEDULE 3SECURED LOANSLoans from banks 3,534.92 1,333.74Secured against stocks, book debts, receivables andmovable properties, both present and future. 3,534.92 1,333.74
SCHEDULE 4UNSECURED LOANSFixed deposits – 1.03Short term loans
Banks 5,128.91 –Long term loans
Banks 1,614.45 –Deferred sales tax credit 19.76 23.87
6,763.12 24.90
Ranbaxy Laboratories Limited Annual Report 2005 Cash Flow Statement & Schedules

58
SCHEDULES FORMING PART OF THE FINANCIAL STATEMENTSFOR THE YEAR ENDED DECEMBER 31, 2005 Rs. MillionsSCHEDULE 5 2005 2004
DEFERRED TAX LIABILITY (NET)Deferred tax liability arising on account of :
Depreciation, amortisation and impairment 2,552.88 1,807.902,552.88 1,807.90
Less:Deferred tax asset arising on account of :Provision for doubtful debts and advances 184.57 304.40Retirement benefits 46.99 47.95Tax losses carried forward 1,201.72 –Others 3.79 4.48
1,437.07 356.831,115.81 1,451.07
SCHEDULE 6FIXED ASSETS Rs. Millions
AccumulatedGross block Depreciation, Net Block
amortisation& impairment
Description 2004 Additions Deletions 2005 2005 2005 2004TangiblesLand 401.93 1.43 – 403.36 – 403.36 401.93Buildings 1,674.17 1,013.78 18.77 2,669.18 439.27 2,229.91 1,301.08Plant and machinery 9,929.96 2,831.89 306.13 12,455.72 4,440.48 8,015.24 6,020.09Furniture and fixtures 478.25 321.50 99.31 700.44 169.54 530.90 304.04Vehicles 255.60 90.43 81.63 264.40 50.87 213.53 201.81IntangiblesProduct development – 268.81 – 268.81 – 268.81 –Patent, trade marks, designs and licences 716.90 15.25 100.91 631.24 523.82 107.42 276.10Software 361.05 28.95 – 390.00 229.49 160.51 180.75Non-compete 210.00 – – 210.00 140.00 70.00 90.00Total 14,027.86 4,572.04 606.75 17,993.15 5,993.47 11,999.68 8,775.80Previous Year 11,627.88 2,455.03 55.05 14,027.86 5,252.06 8,775.80 7,175.15
SCHEDULE 7 Rs. MillionsINVESTMENTS 2005 2004CURRENTTrust securitiesOther than trade - unquoted41,089 US64 Bonds of Rs. 100 each (6.75% Tax Free) of the Unit Trust of India 4.11 4.11
4.11 4.11LONG TERMInvestments in government securitiesOther than trade - unquotedIndira Vikas Patra – 0.01Investments in shares of companies (fully paid)
Nature of Face NumbersOther than Trade : investment value 2005 2004QuotedFortis Financial Services Ltd. Equity shares Rs. 10 100 100 * *The Great Eastern Shipping Company Ltd. Equity shares Rs. 10 500 500 0.03 0.03
0.03 0.03UnquotedFortis Healthcare Limited Equity shares Rs. 10 14,097,660 14,097,660 140.98 140.98Biotech Consortium India Ltd. Equity shares Rs. 10 50,000 50,000 0.50 0.50Nimbua Greenfield (Punjab) Limited Equity shares Rs. 10 50,000 – 0.50 –
141.98 141.48Subsidiary companies (Trade)DomesticVidyut Investments Ltd. Equity shares Rs. 10 25,008,400 25,008,400 250.08 250.08Ranbaxy Drugs Ltd. Equity shares Rs. 10 3,100,020 3,100,020 31.00 31.00
10% NCRP Rs. 10 250 250 * *Ranbaxy Fine Chemicals Ltd. ** Equity shares Rs. 10 – 5,550,000 – 55.50Ranbaxy Drugs and Chemicals Company Equity shares Rs. 10 3,100,000 1,550,000 17.25 15.50(A public company with unlimited liability)Solus Pharmaceuticals Ltd. Equity shares Rs. 10 3,000,700 3,000,700 30.01 30.01Rexcel Pharmaceuticals Ltd. Equity shares Rs. 10 1,000,000 1,000,000 10.00 10.00Gufic Pharma Ltd. Equity shares Rs. 100 4,900 4,900 535.22 535.22OverseasRanbaxy (Netherlands) B.V., The Netherlands Shares EUR 100 459,863 459,863 2,949.46 @ 2,070.57Ranbaxy (Hongkong) Ltd., Hongkong Equity shares HK $ 1 2,400,000 2,400,000 9.84 9.84Ranbaxy Pharmacie Generiques SAS, France Equity shares 9 800,000 800,000 3,400.02 3,400.02 (Formerly RPG (Aventis) S.A.Ranbaxy (Guangzhou China) Ltd., China Capital contribution US $ 5,900,000 193.95 193.95Ranbaxy (Malaysia) Sdn. Bhd., Malaysia Ordinary shares RM 1 3,189,248 2,242,383 36.56 25.16Ranbaxy (Nigeria) Ltd., Nigeria Ordinary shares Naira 1 13,070,648 13,070,648 7.40 7.40Ranbaxy Unichem Co. Ltd., Thailand Ordinary shares Bahts 100 206,670 206,670 21.20 21.20
7,491.99 6,655.457,638.11 6,801.08
Less: Provision for diminution in value of long term investments (10.36) (10.36)7,627.75 6,790.72
NOTES1. * Rounded off to Nil.2. NCRP denotes Non convertible redeemable preference shares.3. ** Sold during the year4. @ include Rs. 878.89 million paid as share application money pending allotment
Financial Statements of Ranbaxy

59
SCHEDULES FORMING PART OF THE FINANCIAL STATEMENTSFOR THE YEAR ENDED DECEMBER 31, 2005
Rs. MillionsSCHEDULE 8 2005 2004
INVENTORIES(As certified by the management)
Stores and spares 82.38 73.29Raw materials 3,664.20 3,935.64Packaging materials 400.06 501.34Finished goods
Own manufactured 2,704.77 2,228.83Others 325.75 565.81
Work-in-process 1,732.17 1,658.478,909.33 8,963.38
SCHEDULE 9SUNDRY DEBTORS(Considered good except where provided for)Debts outstanding for a period exceeding six monthsSecured 23.26 0.25Unsecured 688.80 790.99
712.06 791.24Other debtsSecured 224.09 236.98Unsecured 7,243.56 7,162.63
7,467.65 7,399.618,179.71 8,190.85
Less : Doubtful and provided for 113.53 343.968,066.18 7,846.89
SCHEDULE 10CASH AND BANK BALANCESCash and cheques in hand 18.25 9.28Remittances in transit 186.68 178.55With scheduled banks in:
Current accounts 6.88 57.78Deposit accounts 861.05 0.94Margin money accounts 0.05 0.31Unclaimed dividend accounts 55.27 68.81
With non-scheduled banks in:Current accounts 37.75 56.93
1,165.93 372.60
SCHEDULE 11OTHER CURRENT ASSETS(Unsecured, considered good except where provided for)
Export incentives accrued 696.79 587.43Exchange gain accrued on forward contracts 321.06 115.61Insurance claims 144.84 87.93Interest accrued 8.58 4.55Others 37.81 28.54
1,209.08 824.06Less : Doubtful and provided for 29.92 18.98
1,179.16 805.08
SCHEDULE 12LOANS AND ADVANCES(Considered good except where provided for)
Secured 73.69 79.37UnsecuredAdvances recoverable in cash or in kind
or for value to be received 2,233.65 2,396.88Due from subsidiary companies 404.57 391.61Prepaid income-tax 1,026.07 2,636.88
3,737.98 5,504.74Less : Doubtful and provided for 404.90 410.49
3,333.08 5,094.25
Ranbaxy Laboratories Limited Annual Report 2005 Schedules
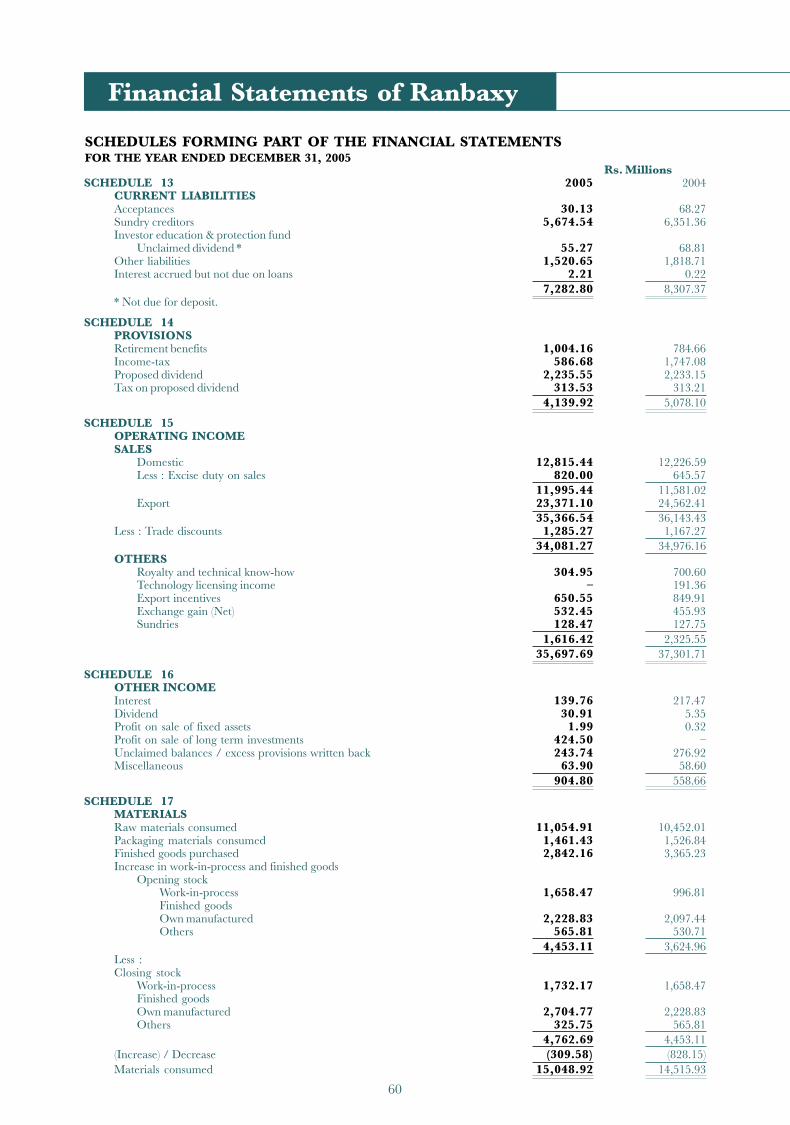
60
SCHEDULES FORMING PART OF THE FINANCIAL STATEMENTSFOR THE YEAR ENDED DECEMBER 31, 2005
Rs. MillionsSCHEDULE 13 2005 2004
CURRENT LIABILITIESAcceptances 30.13 68.27Sundry creditors 5,674.54 6,351.36Investor education & protection fund
Unclaimed dividend * 55.27 68.81Other liabilities 1,520.65 1,818.71Interest accrued but not due on loans 2.21 0.22
7,282.80 8,307.37* Not due for deposit.
SCHEDULE 14PROVISIONSRetirement benefits 1,004.16 784.66Income-tax 586.68 1,747.08Proposed dividend 2,235.55 2,233.15Tax on proposed dividend 313.53 313.21
4,139.92 5,078.10
SCHEDULE 15OPERATING INCOMESALES
Domestic 12,815.44 12,226.59Less : Excise duty on sales 820.00 645.57
11,995.44 11,581.02Export 23,371.10 24,562.41
35,366.54 36,143.43Less : Trade discounts 1,285.27 1,167.27
34,081.27 34,976.16OTHERS
Royalty and technical know-how 304.95 700.60Technology licensing income – 191.36Export incentives 650.55 849.91Exchange gain (Net) 532.45 455.93Sundries 128.47 127.75
1,616.42 2,325.5535,697.69 37,301.71
SCHEDULE 16OTHER INCOMEInterest 139.76 217.47Dividend 30.91 5.35Profit on sale of fixed assets 1.99 0.32Profit on sale of long term investments 424.50 –Unclaimed balances / excess provisions written back 243.74 276.92Miscellaneous 63.90 58.60
904.80 558.66
SCHEDULE 17MATERIALSRaw materials consumed 11,054.91 10,452.01Packaging materials consumed 1,461.43 1,526.84Finished goods purchased 2,842.16 3,365.23Increase in work-in-process and finished goods
Opening stockWork-in-process 1,658.47 996.81Finished goodsOwn manufactured 2,228.83 2,097.44Others 565.81 530.71
4,453.11 3,624.96Less :Closing stock
Work-in-process 1,732.17 1,658.47Finished goodsOwn manufactured 2,704.77 2,228.83Others 325.75 565.81
4,762.69 4,453.11(Increase) / Decrease (309.58) (828.15)Materials consumed 15,048.92 14,515.93
Financial Statements of Ranbaxy

61
Rs. Millions2005 2004
SCHEDULE 18MANUFACTURINGStores and spares consumed 317.00 322.71Power and fuel 695.51 626.70Repairs and maintenance
Factory buildings 23.92 31.00Plant and machinery 51.86 46.18
Analytical charges 23.43 20.23Processing charges 595.63 620.43Excise duty 45.56 100.21
1,752.91 1,767.46
SCHEDULE 19PERSONNELSalaries, wages and bonus 2,639.80 2,896.82Contribution to provident and other funds 180.79 193.66Workmen and staff welfare 163.25 149.64Amortisation of deferred employees compensation 32.68 38.42
3,016.52 3,278.54
SCHEDULE 20SELLING, GENERAL AND ADMINISTRATIONRentals 168.56 193.56Rates and taxes 152.74 88.60Regulatory filing fee 167.67 193.10Printing and stationery 68.23 65.67Electricity and water 55.47 40.36Insurance 249.94 319.37Communication 150.60 145.67Legal and professional charges 1,620.77 1,172.62Travel and conveyance 529.76 538.22Running and maintenance of vehicles 51.21 51.80Repairs and maintenance 138.88 143.89Discounts 26.90 64.47Claims paid 762.40 77.94Freight, clearing and forwarding 1,291.53 1,426.35Marketing and promotion services 178.64 90.00Advertising and sales promotion 2,008.12 2,017.23Conferences and meetings 98.79 83.43Commission 572.29 543.92Recruitment and training 79.84 98.90Assets written off 29.54 39.61Loss on sale of fixed assets 21.16 11.69Amounts written off [Net of reversal of provision for doubtful 62.46 16.71
debts and advances Rs. 100.81 million (Previous year Nil)]Provision for doubtful debts and advances – 68.65Others 256.26 281.17
8,741.76 7,772.93
SCHEDULES FORMING PART OF THE FINANCIAL STATEMENTSFOR THE YEAR ENDED DECEMBER 31, 2005
Ranbaxy Laboratories Limited Annual Report 2005 Schedules

62
SCHEDULES FORMING PART OF THE FINANCIAL STATEMENTSFOR THE YEAR ENDED DECEMBER 31, 2005
Rs. Millions2005 2004
SCHEDULE 21
RESEARCH AND DEVELOPMENT EXPENDITURESalaries, wages and bonus 941.91 682.88Contribution to provident and other funds 43.57 42.96Workmen and staff welfare 44.51 39.40Raw materials and consumables 1,596.42 894.34Power and fuel 112.72 75.41Clinical trials 1,652.37 1,089.64Rentals 62.90 60.27Printing and stationery 20.77 23.42Insurance 22.45 16.74Communication 52.29 37.04Legal and professional charges 12.89 28.77Travel and conveyance 68.81 91.56Running and maintenance of vehicles 10.52 10.46Repairs and maintenance
Machinery 15.55 14.96Buildings 5.97 6.24Others 33.17 22.00
Recruitment and training 14.15 41.38Others 152.63 136.38
4,863.60 3,313.85
SCHEDULE 22
DEPRECIATION, AMORTISATION AND IMPAIRMENTDepreciationBuildings 59.07 45.55Plant and machinery 639.86 512.39Furniture and fixtures 37.48 26.11Vehicles 23.80 21.54
760.21 605.59AmortisationPatents, trade marks, designs and licences 126.25 143.38Software 49.19 49.50Non compete 20.00 20.00
195.44 212.88ImpairmentProduct licences 57.68 –
1,013.33 818.47
SCHEDULE 23
PROVISION FOR TAXCurrent income-tax 26.91 683.09Deferred tax (335.26) 315.58Fringe benefit tax 85.00 –
(223.35) 998.67
Financial Statements of Ranbaxy

63
SCHEDULES FORMING PART OF THE FINANCIAL STATEMENTSFOR THE YEAR ENDED DECEMBER 31, 2005
Rs. MillionsSCHEDULE 24 2005 2004
EARNINGS PER SHARENet profit attributable to equity shareholders
including discontinued operationsProfit after tax 2,236.98 5,284.72Less:Tax-earlier years (116.56) (9.51)Net profit available 2,120.42 5,275.21
Net profit attributable to equity shareholdersexcluding discontinued operations
Net profit available 2,120.42 5,275.21Net profit from Discontinued operations (208.90) (149.38)
1,911.52 5,125.83No. of weighted average equity sharesBasic 372,216,805 371,503,666Effect of dilutive equity shares equivalent
– stock options outstanding 1,089,479 1,849,060Diluted 373,306,284 373,352,726
Nominal value of equity share (Rs.) 5.00 5.00EARNINGS PER SHARE (Rs.)Including discontinued operations
Basic 5.70 14.20Diluted 5.68 14.13
Excluding discontinued operationsBasic 5.14 13.80Diluted 5.12 13.73
Earnings per share for all period reported has been adjusted to reflect the share split from the face value of Rs. 10 each toRs. 5 each
Ranbaxy Laboratories Limited Annual Report 2005 Schedules

64
SCHEDULES FORMING PART OF THE FINANCIAL STATEMENTSFOR THE YEAR ENDED DECEMBER 31, 2005
SCHEDULE 25
SIGNIFICANT ACCOUNTING POLICIES
[a] Basis of preparation
The financial statements have been prepared to comply with the mandatory Accounting Standards issued by the Instituteof Chartered Accountants of India ('ICAI') and the relevant provisions of the Companies Act, 1956 (the 'Act'). The financialstatements have been prepared under the historical cost convention on accrual basis. The accounting policies have beenconsistently applied by the Company unless otherwise stated.
[b] Fixed assets
Fixed assets are stated at cost less accumulated depreciation and impairment losses. Cost comprises the purchase price andany attributable cost of bringing the asset to its working condition for its intended use.
Borrowing costs directly attributable to acquisition or construction of fixed assets which necessarily take a substantialperiod of time to get ready for their intended use are capitalised.
[c] IntangiblesPatents, Trademarks, Designs and Licences
Costs relating to patents, trademarks, designs and licences which are acquired, are capitalised and amortised on a straight-line basis over a period of 5 years.
Computer software
Software which is not an integral part of the related hardware, is classified as an intangible asset and is being amortised overa period of 6 years, being the estimated useful life.
Non-compete
Non-compete compensation is capitalised and amortised on a straight-line basis over the life of the non-compete agreement.
Product Development
Cost incurred for acquiring rights for product under development are recognised as intangible assets and amortised on astraight-line basis over a period of 5 years from the date of regulatory approval. Subsequent expenditures on developmentof such products are also added to the cost of intangibles.
[d] Depreciation
Depreciation on fixed assets is provided on straight-line method at the rates and in the manner prescribed in Schedule XIVof the Act.
Premium paid on perpetual leasehold land is charged to revenue on termination / renewal of lease agreements.
[e] Leases
Operating lease payments are recognised as an expense in the Profit and Loss account on a straight-line basis over the leaseterm.
[f] Investments
Investments that are readily realisable and intended to be held for not more than a year are classified as current investments.All other investments are classified as long-term investments. Current investments are carried at lower of cost and fairvalue determined on an individual investment basis. Long-term investments are carried at cost. However, provision fordiminution in value is made to recognise a decline other than temporary in the value of the investments.
Profit / loss on sale of investments is computed with reference to their average cost.
[g] Inventories
Inventories are valued as follows:
Raw materials, stores and spares and packaging materials
Lower of cost and net realisable value. However, materials and other items held for use in the production of finished goodsare not written down below cost if the products in which they will be incorporated are expected to be sold at or above cost.Cost is determined on a weighted average basis.
Finished goods
Lower of cost and net realisable value. Cost includes direct materials and labour and a proportion of manufacturingoverheads based on normal operating capacity. Cost of finished goods includes excise duty.
Work-in-process
At cost upto estimated stage of process. Cost includes direct materials and labour and a proportion of manufacturingoverheads based on normal operating capacity.
Net realisable value is the estimated selling price in the ordinary course of business, less estimated costs of completion andthe estimated costs necessary to make the sale.
Financial Statements of Ranbaxy

65
Where duty paid / indigenous materials are consumed, in manufacture of products exported prior to duty-free import ofmaterials under the Advance License Scheme, the estimated excess cost of such materials over that of duty free materialsis carried forward in the carrying cost of raw materials and charged to revenue on consumption of such duty-free materials.
[h] Revenue recognition
Revenue is recognised to the extent that it can be reliably measured and is probable that the economic benefits will flow tothe Company.
Sale of Goods:
Revenue from sale of goods is recognised when the significant risks and rewards of ownership of the goods are transferredto the customer and is stated net of trade discounts, excise duty, sales returns and sales tax.
Royalties, Technical know-how and Licensing income:
Revenue is recognised on accrual basis in accordance with the terms of the relevant agreement.
Interest:
Revenue is recognised on a time proportion basis taking into account the amount outstanding and the rate applicable.
Dividends:
Revenue is recognised when the right to receive is established.
[i] Research and development costs
Revenue expenditure incurred on research and development is charged to profit and loss account in the year it is incurred.
Capital expenditure is included in the respective heads under fixed assets.
[j] Expenditure on regulatory approvals
Expenditure incurred for obtaining regulatory approvals and registration of products for overseas markets and productacquisitions is charged to revenue.
[k] Employee stock option plan
The accounting value of stock options representing the excess of the market price over the exercise price of the sharesgranted under "Employees Stock Option Scheme" of the Company, is amortised as "Deferred employees compensation" ona straight-line basis over the vesting period in accordance with the SEBI (Employee Stock Option Scheme and EmployeeStock Purchase Scheme) Guidelines, 1999.
[l] Foreign currency translation
Investments in foreign entities are recorded at the exchange rates prevailing on the date of making the investments.
Transactions in foreign currencies are recorded at the rates prevailing on the date of the transaction. Monetary itemsdenominated in foreign currency are restated at the rate prevailing on balance sheet date.
Exchange differences arising on the settlement of monetary items or on reporting company's monetary items at ratesdifferent from those at which they were initially recorded during the year, or reported in the previous financial statements, arerecognised as income or expenses in the year in which they arise, except for exchange differences arising on loans denominatedin foreign currencies utilised for acquisition of fixed assets form outside India, where the exchange gains/losses are adjustedto the cost of such assets.
The exchange differences arising on forward contracts other than those entered into, to hedge the foreign currency risk of firmcommitments or highly probable forecast transactions are recognized in the period in which they arise based on the differencebetween i) foreign currency amount of the contract translated at the exchange rate on the reporting date and ii) the sameforeign currency amount translated at the later of the date of inception of the forward exchange contract or the last reportingdate. The premium or discount on all such contracts arising at the inception of each contract is amortised as expense orincome over the life of the contract.
The premium or discount arising at the inception of the forward contracts entered into, to hedge the foreign currency risk offirm commitments or highly probable forecast transactions is amortised as expense or income over the life of the contract.
Any profit or loss arising on cancellation or renewal of forward exchange contracts is recognized as income or expense forthe year.
Representative offices
In translating the financial statements of representative offices for incorporation in financial statements, the monetaryassets and liabilities are translated at the closing rate; non monetary assets and liabilities are translated at exchange ratesprevailing at the dates of the transactions and income and expense items are converted at the respective monthly averagerate.
SCHEDULES FORMING PART OF THE FINANCIAL STATEMENTSFOR THE YEAR ENDED DECEMBER 31, 2005
SCHEDULE 25
SIGNIFICANT ACCOUNTING POLICIES (Contd.)
Ranbaxy Laboratories Limited Annual Report 2005 Schedules

66
[m] Retirement benefits
Provisions for liabilities in respect of gratuity, pension and leave encashment benefits are made based on actuarial valuationmade by an independent actuary as at the balance sheet date.
Contributions in respect of provident fund, superannuation and gratuity are made to Trust set up by the Company for thepurpose and charged to profit and loss account.
[n] Taxes on income
Tax expenses comprises current tax, deferred tax and fringe benefit tax.
The provision for current income-tax is the aggregate of the balance provision for tax for three months ended March 31,2005 and the estimated provision based on the taxable profit of remaining nine months up to December 31, 2005, the actualtax liability, for which, will be determined on the basis of the results for the period April 1, 2005 to March 31, 2006.
Deferred income tax reflects the impact of current year timing differences between taxable income/ losses and accountingincome for the year and reversal of timing differences of earlier years. Deferred tax is measured based on the tax rates andthe tax laws enacted or substantively enacted at the balance sheet date. Deferred tax assets are recognised only to the extentthat there is reasonable certainty that sufficient future taxable income will be available against which such deferred taxassets can be realised. In respect of carry forward losses, deferred tax assets are recognised only to the extent there is virtualcertainty that sufficient future taxable income will be available against which such losses can be set off.
Consequent to the introduction of Fringe Benefit Tax (FBT) effective April 1, 2005, the Company has made provision forFBT in accordance with applicable Income-tax laws.
[o] Export benefits / incentives
Export entitlements under the Duty Entitlement Pass Book ("DEPB") Scheme are recognised in the profit and loss accountwhen the right to receive credit as per the terms of the scheme is established in respect of the exports made.
Obligation / entitlements on account of Advance Licence Scheme for import of raw materials are accounted for on purchaseof raw materials and / or export sales.
[p] Contingent liabilities
Depending on the facts of each case and after due evaluation of relevant legal aspects, the Company makes a provisionwhen there is a present obligation as a result of a past event where the outflow of economic resources is probable and areliable estimate of the amount of obligation can be made. The disclosure is made for all possible or present obligationsthat may but probably will not require outflow of resources as contingent liability in the financial statement.
[q] Use of estimates
In preparing Company's financial statements in conformity with accounting principles generally accepted in India, managementis required to make estimates and assumptions that affect the reported amounts of assets and liabilities and the disclosureof contingent liabilities at the date of the financial statements and the reported amounts of revenues and expenses duringthe reporting period; actual results could differ from those estimates.
[r] Earnings per share
Basic earnings per share are calculated by dividing the net profit or loss for the period attributable to equity shareholders bythe weighted average number of equity shares outstanding during the period. The weighted average number of equity sharesoutstanding during the period are adjusted for events of bonus issue and share split.
For the purpose of calculating diluted earnings per share, the net profit or loss for the period attributable to equity shareholdersand the weighted average number of shares outstanding during the period are adjusted for the effects of all dilutive potentialequity shares.
[s] Impairment of assets
The Company on an annual basis makes an assessment of any indicator that may lead to impairment of assets. If any suchindication exists, the Company estimates the recoverable amount of the assets. If such recoverable amount is less than thecarrying amount, then the carrying amount is reduced to its recoverable amount by treating the difference between them asimpairment loss and is charged to the profit and loss account.
SCHEDULES FORMING PART OF THE FINANCIAL STATEMENTSFOR THE YEAR ENDED DECEMBER 31, 2005
SCHEDULE 25
SIGNIFICANT ACCOUNTING POLICIES (Contd.)
Financial Statements of Ranbaxy

67
SCHEDULES FORMING PART OF THE FINANCIAL STATEMENTSFOR THE YEAR ENDED DECEMBER 31, 2005
SCHEDULE 26
NOTES TO THE FINANCIAL STATEMENTS
1. Share capitala] Share capital includes :
[i] 293,698,988 (Previous year 146,849,494 Equity shares of Rs. 10 each) Equity shares of Rs. 5 each allotted asfully paid bonus shares by capitalisation out of share premium and reserves.
[ii] 6,562,308 (Previous year 3,281,154 Equity shares of Rs. 10 each) Equity shares of Rs. 5 each allotted as fullypaid up pursuant to contract without payment being received in cash.
b] Outstanding stock options for equity shares of the Company under the "Employees Stock OptionScheme” :
Date of grant Exercise price 2005 2004Rs. Rs. Numbers ** Numbers **
January 12, 2001* 336.50 (210.31) 126,996 (203,194) 202,312 (323,700)December 3, 2001* 297.50 (185.94) 282,626 (452,202) 406,856 (650,970)April 1, 2002* 372.50 (232.81) 455,142 (728,227) 623,600 (997,760)February 7, 2003 283.50 – 1,167,974 – 1,443,802 –August 18, 2003 350.50 – – – 800 –January 12, 2004 496.00 – 2,003,450 – 2,362,250 –January 17, 2005 538.50 – 2,668,650 – – –
6,704,838 (1,383,623) 5,039,620 (1,972,430)
* The figures in parenthesis represents adjusted exercise price in accordance with the Employees Stock Option Schemeof the company on account of issue of bonus shares in the ratio of 3:5 on October 11, 2002.
** Consequent to the sub-division of Equity Shares of the Company from face value of Rs. 10 each to Rs. 5 each effectiveAugust 1, 2005, the numbers of the outstanding stock options have been proportionately increased.
2. Stock Split
Pursuant to the approval granted by the shareholders at the Annual General Meeting held on June 30, 2005, the equity shareof face value of Rs. 10 each has been sub-divided in two equity shares of Rs. 5 each effective August 1, 2005.
3. Fixed assetsa] Land includes :
(i) cost of leasehold land Rs. 196.24 million (Previous year Rs. 196.24 million).(ii) freehold land, valued at Rs. 12.24 million (Previous year Rs. 12.24 million) purchased alongwith building etc.(iii) cost of land Rs. 27.65 million (Previous year Rs. 27.06 million) pending registration in the name of the
Company.b] Buildings include Rs. 500 (Previous year Rs. 500) representing unquoted fully paid shares of Rs. 50 each in a
co-operative housing society.c] Capital works-in progress includes:
(i) advances Rs. 114.16 million (Pervious year Rs. 338.47 million).(ii) pre-operative expenses Rs. 156.79 million (Previous year Rs. 70.75 million) as detailed below :
Rs. MillionsDescription 2005 2004Opening balance 70.75 16.89Add : Addition during the year
Salaries, wages and bonus 55.37 33.89Contributions to provident and other funds 5.75 2.32Workmen and staff welfare 3.36 1.44Raw materials 23.76 1.19Power and fuel 50.82 7.23Rentals 0.51 0.67Insurance – 0.84Others 43.99 30.12
254.31 94.59Less : Capitalised during the year 97.52 23.84
Balance 156.79 70.75
Ranbaxy Laboratories Limited Annual Report 2005 Schedules

68
4. Cash and bank balances :
(i) Deposit receipts of Rs. 1.05 million (Previous year Rs 0.94 million) pledged with Government Authorities.
(ii) Balances with non scheduled banks in current accounts :
Maximum balanceRs. Millions Rs. Millions
2005 2004 2005 2004
AB Vilnius Bankas, Kaunas, Lithuania 6.40 4.30 16.49 11.14
ABN AMRO BANK, Bucharest, Romania 0.18 1.72 1.72 4.34
ABN AMRO Bank, Moscow, Russia 5.45 2.84 28.65 32.67
Banque Internationale Pour LeCommerce Et L'industrie duCameroun, Doula, Cameroon 4.75 9.66 12.17 11.73
Barclays Bank of Kenya Ltd, Nairobi Kenya 1.40 (0.72) @ 3.77 10.14
Standbic Bank Zimbabwe LimitedCauseway Zimbabwe, Harare 0.05 0.22 3.54 0.50
Bank Handlowy W Warszawie SA, Warsaw, Poland 0.42 15.12 15.12 20.56
HSBC Bital, MaxicoDel Miguel Hidalgo, Maxico 1.44 0.38 4.97 3.42
Calyon Corporate, Vietnam 9.20 5.85 16.75 16.31
Calyon Corporate, Kiev, Ukraine 2.94 5.28 15.54 15.80
Citi Bank, Almaty, Kazakhstan 0.17 0.24 9.69 3.23
Myanma Investment and Commercial BankYangon, Myanmar 2.93 1.64 5.16 4.64
Societe Generale De Banques Au CamerounDoula, Ivony Coast 0.15 9.10 9.86 11.44
The Hongkong & Shanghai BankingCorporation, Hongkong, Singapore 1.25 1.30 9.45 5.11
Standbic Bank, Kenya (1.19) @ – 1.30 –
Citi Bank, Bulgaria 1.94 – 2.15 –
Credit Du Maroc, Morocco 0.27 – 5.73 –
Total 37.75 56.93
@ Book overdraft with a bank
5. Amounts due from :An officer of the Company 0.63 0.73 0.73 0.82
6. InvestmentsQuoted
Aggregate book value (Net of provision) 0.03 0.03Market value 0.12 0.09
UnquotedAggregate book value (Net of provision) 7,627.72 6,790.69
7. Interest accrued on investments 0.02 0.02
8. Sundry debtors include debts due from 3,766.32 4,199.98subsidiary companies
SCHEDULES FORMING PART OF THE FINANCIAL STATEMENTSFOR THE YEAR ENDED DECEMBER 31, 2005
SCHEDULE 26
NOTES TO THE FINANCIAL STATEMENTS (Contd.)
Financial Statements of Ranbaxy

69
9. Loans and advances include :Secured loans to employees 73.69 79.37Advances recoverable in cash or in kind or for value to be received include dues from :
Employees 73.75 74.59Suppliers 57.36 129.27Security deposits with government department 54.77 49.69
10. Unsecured loans due for repayment within one year 5,134.51 6.49
11. Sundry creditors include due to :a] Subsidiary companies 94.47 118.88b] Small scale industrial undertakings 235.93 198.90
Total outstanding dues of small scale industrial undertakings have been determined to the extent such parties have beenidentified on the basis of information available with the Company. The parties to whom the Company owes amountsgreater than Rs. 100,000 outstanding for more than 30 days as at the balance sheet date are:Ammonia Supply Co. Ankur Drugs & Pharma Ltd. Best Laboratories Pvt. Ltd. ESPI Industries & ChemicalsGlide Chem Pvt. Ltd. J. M. Chemicals Pvt. Ltd. Maral Labs. Motiff Laboratories Pvt. Ltd.Medibios Laboratories Pvt. Ltd. Medreich Sterilab Limited Nazi & Company Promed Laboratories Pvt. Ltd.NBZ Pharma Ltd. Parnax Lab. Pvt. Ltd. Plenthico Pharmaceuticals Ltd. Time Cap Pharma Labs Pvt. Ltd.Rexcin Pharmaceuticals Pvt. Ltd. Sidmak Laboratories (India) Ltd. Softesule Pvt. Ltd. Themis Laboratories Pvt. Ltd.Umedica Laboratories Ltd. Vectra Pharmaceuticals Pvt. Ltd.
Rs. Millions2005 2004
12. Interest income :Interest on
Current investments - other than trade 0.28 0.28Income-tax refunds 36.84 0.58Loans and deposits:
Short term deposits 79.67 175.76Subsidiary companies 8.75 34.36Employees loans 4.77 3.97Others 9.45 2.52
139.76 217.47
13. Dividend from investments :Long term
Other than trade 0.01 0.02Subsidiary companies 30.89 5.33
30.90 5.35
14. Tax deducted at source on :Interest received 20.86 43.68Dividend received 0.09 0.16
15. Interest paid on fixed period loans 229.32 14.97
16. Donation to political parties :a] Bhartiya Janta Party – 2.50b] All India Congress Committee – 2.50c] Telgu Desham Party – 0.50d] Shiromani Akali Dal – 0.50
17. Exchange gain on outstanding forward exchangerate contracts to be recognised in the subsequent year 104.92 69.43
SCHEDULES FORMING PART OF THE FINANCIAL STATEMENTSFOR THE YEAR ENDED DECEMBER 31, 2005
SCHEDULE 26
NOTES TO THE FINANCIAL STATEMENTS (Contd.)
Rs. Millions2005 2004
Ranbaxy Laboratories Limited Annual Report 2005 Schedules
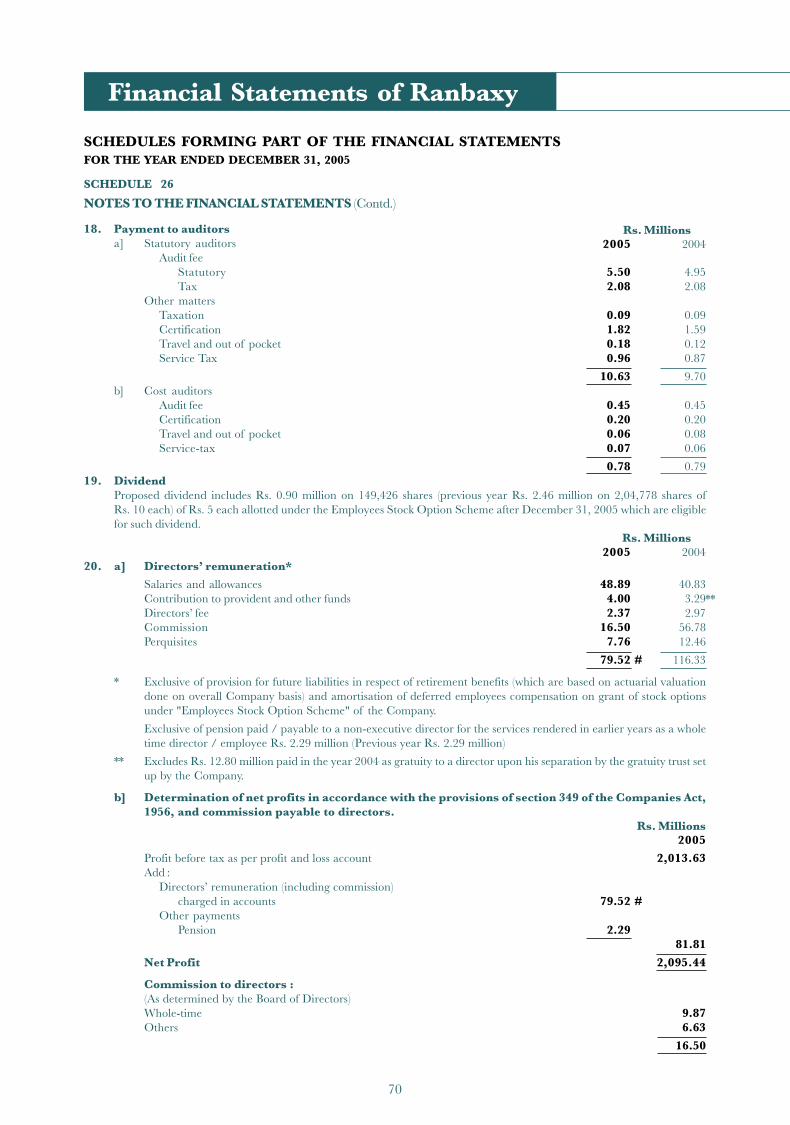
70
SCHEDULES FORMING PART OF THE FINANCIAL STATEMENTSFOR THE YEAR ENDED DECEMBER 31, 2005
SCHEDULE 26
NOTES TO THE FINANCIAL STATEMENTS (Contd.)
18. Payment to auditorsa] Statutory auditors
Audit feeStatutory 5.50 4.95Tax 2.08 2.08
Other mattersTaxation 0.09 0.09Certification 1.82 1.59Travel and out of pocket 0.18 0.12Service Tax 0.96 0.87
10.63 9.70b] Cost auditors
Audit fee 0.45 0.45Certification 0.20 0.20Travel and out of pocket 0.06 0.08Service-tax 0.07 0.06
0.78 0.7919. Dividend
Proposed dividend includes Rs. 0.90 million on 149,426 shares (previous year Rs. 2.46 million on 2,04,778 shares ofRs. 10 each) of Rs. 5 each allotted under the Employees Stock Option Scheme after December 31, 2005 which are eligiblefor such dividend.
Rs. Millions2005 2004
20. a] Directors’ remuneration*
Salaries and allowances 48.89 40.83Contribution to provident and other funds 4.00 3.29Directors’ fee 2.37 2.97Commission 16.50 56.78Perquisites 7.76 12.46
79.52 # 116.33
* Exclusive of provision for future liabilities in respect of retirement benefits (which are based on actuarial valuationdone on overall Company basis) and amortisation of deferred employees compensation on grant of stock optionsunder "Employees Stock Option Scheme" of the Company.
Exclusive of pension paid / payable to a non-executive director for the services rendered in earlier years as a wholetime director / employee Rs. 2.29 million (Previous year Rs. 2.29 million)
** Excludes Rs. 12.80 million paid in the year 2004 as gratuity to a director upon his separation by the gratuity trust setup by the Company.
b] Determination of net profits in accordance with the provisions of section 349 of the Companies Act,1956, and commission payable to directors.
Rs. Millions2005
Profit before tax as per profit and loss account 2,013.63Add :
Directors’ remuneration (including commission)charged in accounts 79.52 #
Other paymentsPension 2.29
81.81
Net Profit 2,095.44
Commission to directors :(As determined by the Board of Directors)Whole-time 9.87Others 6.63
16.50
Rs. Millions2005 2004
Financial Statements of Ranbaxy
**
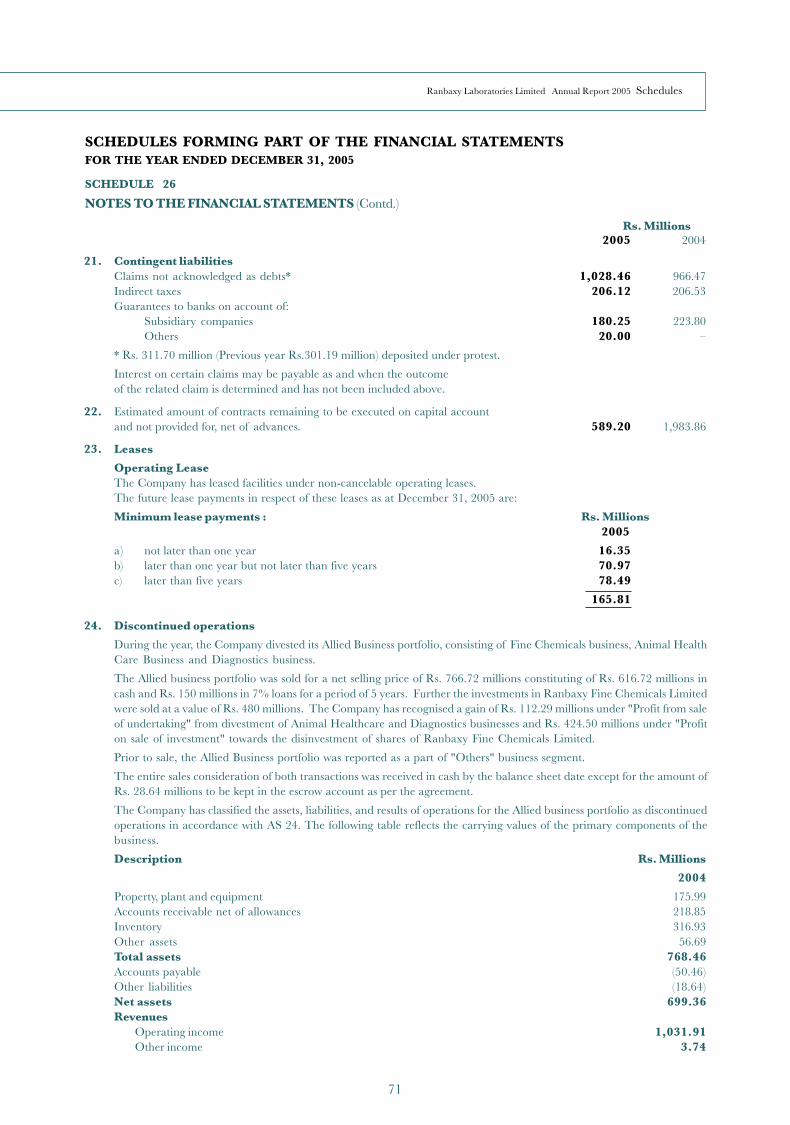
71
21. Contingent liabilitiesClaims not acknowledged as debts* 1,028.46 966.47Indirect taxes 206.12 206.53Guarantees to banks on account of:
Subsidiary companies 180.25 223.80Others 20.00 –
* Rs. 311.70 million (Previous year Rs.301.19 million) deposited under protest.
Interest on certain claims may be payable as and when the outcomeof the related claim is determined and has not been included above.
22. Estimated amount of contracts remaining to be executed on capital accountand not provided for, net of advances. 589.20 1,983.86
23. Leases
Operating LeaseThe Company has leased facilities under non-cancelable operating leases.The future lease payments in respect of these leases as at December 31, 2005 are:
Minimum lease payments : Rs. Millions2005
a) not later than one year 16.35b) later than one year but not later than five years 70.97c) later than five years 78.49
165.81
24. Discontinued operations
During the year, the Company divested its Allied Business portfolio, consisting of Fine Chemicals business, Animal HealthCare Business and Diagnostics business.
The Allied business portfolio was sold for a net selling price of Rs. 766.72 millions constituting of Rs. 616.72 millions incash and Rs. 150 millions in 7% loans for a period of 5 years. Further the investments in Ranbaxy Fine Chemicals Limitedwere sold at a value of Rs. 480 millions. The Company has recognised a gain of Rs. 112.29 millions under "Profit from saleof undertaking" from divestment of Animal Healthcare and Diagnostics businesses and Rs. 424.50 millions under "Profiton sale of investment" towards the disinvestment of shares of Ranbaxy Fine Chemicals Limited.
Prior to sale, the Allied Business portfolio was reported as a part of "Others" business segment.
The entire sales consideration of both transactions was received in cash by the balance sheet date except for the amount ofRs. 28.64 millions to be kept in the escrow account as per the agreement.
The Company has classified the assets, liabilities, and results of operations for the Allied business portfolio as discontinuedoperations in accordance with AS 24. The following table reflects the carrying values of the primary components of thebusiness.
Description Rs. Millions
2004
Property, plant and equipment 175.99Accounts receivable net of allowances 218.85Inventory 316.93Other assets 56.69Total assets 768.46Accounts payable (50.46)Other liabilities (18.64)Net assets 699.36Revenues
Operating income 1,031.91Other income 3.74
SCHEDULES FORMING PART OF THE FINANCIAL STATEMENTSFOR THE YEAR ENDED DECEMBER 31, 2005
SCHEDULE 26
NOTES TO THE FINANCIAL STATEMENTS (Contd.)
Rs. Millions2005 2004
Ranbaxy Laboratories Limited Annual Report 2005 Schedules

72
25. Event occurring after the balance sheet date
Foreign currency convertible bond offering :
On March 17, 2006, the Company issued US $ 440,000,000 zero coupon convertible bonds (the “Bonds”) listed on theSingapore Stock Exchange. Unless previously redeemed, converted or purchased and cancelled the Bonds are convertible atany time on or after April 27, 2006, up till March 8, 2011, into fully paid equity shares of par value of Rs. 5 each which maybe represented by Global Depositary Shares (the “GDS”), with each GDS representing one share at a conversion price ofRs. 716.32 per share with a fixed rate of exchange of Rs. 44.15 per US $ 1. The conversion price is subject to adjustmentsin certain circumstances. At any time on or after March 18, 2009, on and prior to February 6, 2011, the Company may,subject to certain conditions, redeem the bonds in whole but not in part at their early redemption amount as defined in theterms and conditions of the Bonds. Unless previously redeemed, converted or purchased and cancelled, the Bonds will beredeemed in US dollars on March 18, 2011, at 126.765 percent of their principal amount.
26. Related party disclosures
a] Relationship :
i) Subsidiary companies
DomesticRanbaxy Drugs and Chemicals Company Ranbaxy Fine Chemicals Limited # Rexcel Pharmaceuticals Limited(A public company with unlimited liability) Ranbaxy Drugs Limited Ran Air Services LimitedSolus Pharmaceuticals Limited Gufic Pharma Limited (Formerly Vidyut Travel Services Limited)Vidyut Investments Limited
# Ceased to be a subsidiary on November 30, 2005
OverseasRanbaxy (Netherlands) B.V., Netherlands Ranbaxy NANV, The Netherlands Antilles Ranbaxy Pharmaceuticals BV, Rotterdam AlbrandswarrdRanbaxy (Hong Kong) Limited, Hong Kong Ranbaxy (Poland) Sp Zoo, Poland Ranbaxy Ireland Limited, IrelandRanbaxy Inc., USA Ranbaxy Nigeria Limited, Nigeria Ranbaxy (S.A.) Proprietary Limited, South AfricaRanbaxy Egypt (L.L.C.), Egypt Ranbaxy Europe Limited, U.K. Ranbaxy Holdings (UK) Ltd., U.KRanbaxy (Guangzhou China) Limited, China Ranbaxy (UK) Limited, U.K Ranbaxy Do Brazil Ltda, BrazilRanbaxy Farmaceutica Ltda, Brazil Basics GmbH , Germany. Laboratorios Ranbaxy, S.L., Spain(Formerly Ranbaxy S.P. Medicamentos Ltds) Ranbaxy Signature, LLC. USA ZAO Ranbaxy, RussiaRanbaxy Vietnam Company Ltd., Vietnam Ranbaxy Panama SA, Panama Unichem Distributors Ltd., Thailand (Partnership)Ranbaxy Pharmacie Generiques SAS, France Office Pharmaceutique Industriel et Hospitalier SARL Ranbaxy Pharmaceuticals Canada Inc., CanadaRanbaxy PRP(Peru) SAC Ranbaxy Australia Pty Ltd., Australia Unichem Pharmaceuticals Ltd., ThailandRanbaxy (Malaysia) Sdn. Bhd., Malaysia Ranbaxy France SAS, France* Bounty Holdings Company Limited, ThailandRanbaxy Unichem Company Ltd., Thailand Ranbaxy Pharmaceuticals, Inc. USA Ranbaxy Laboratories Inc., USARanbaxy USA, Inc. Ohm Laboratories, Inc, USA Ranbaxy Mexico S.A.de C.V.Ranbaxy Italia S.p.A Ranbaxy Hungary LLC Ranbaxy Portugal - Com E Desenvolv De ProdSonke Pharmaceuticals (Proprietary) Ltd. Farmaceuticos Unipessoal Lda, Portual
* Ceased to be subsidiary during the year
ii) Joint venture and associatesOverseasThembalami Pharmaceuticals (Pty) Ltd. Nihon Pharmaceuticals Industry Co. Ltd.
iii) Key management Relatives* Entities over which significantpersonnel influence is exercised
Mr. Malvinder Mohan Singh Mrs. Nimmi Singh, mother Fortis Healthcare Ltd.SRL Ranbaxy Ltd.International Hospitals Ltd.Religare Securities Ltd.(Formerly Fortis Securities Ltd.)
Dr. Brian W. Tempest –Mr. Ramesh L Adige –Mr. Ram S. Ramasundar –
* Relatives of key management personnel with whom the Company had transactions during the year.
SCHEDULES FORMING PART OF THE FINANCIAL STATEMENTSFOR THE YEAR ENDED DECEMBER 31, 2004
SCHEDULE 26
NOTES TO THE FINANCIAL STATEMENTS (Contd.)
Financial Statements of Ranbaxy
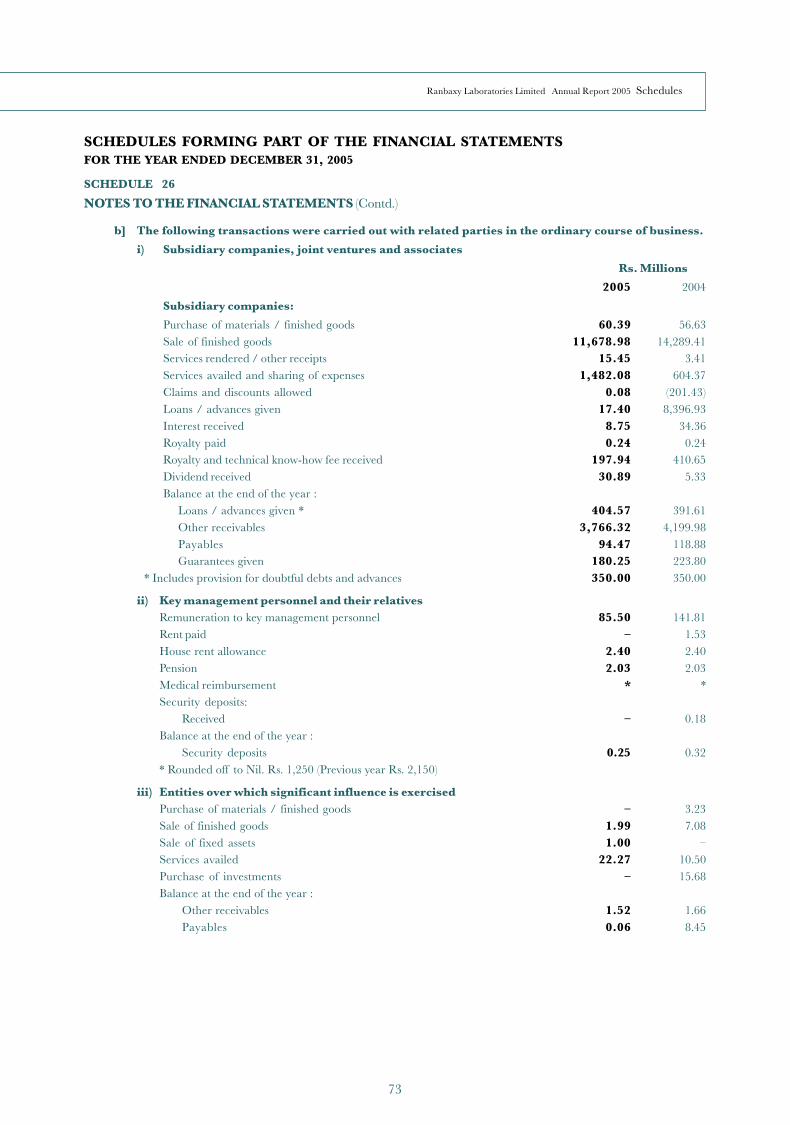
73
SCHEDULES FORMING PART OF THE FINANCIAL STATEMENTSFOR THE YEAR ENDED DECEMBER 31, 2005
SCHEDULE 26
NOTES TO THE FINANCIAL STATEMENTS (Contd.)
b] The following transactions were carried out with related parties in the ordinary course of business.
i) Subsidiary companies, joint ventures and associates
Rs. Millions
2005 2004
Subsidiary companies:
Purchase of materials / finished goods 60.39 56.63Sale of finished goods 11,678.98 14,289.41Services rendered / other receipts 15.45 3.41Services availed and sharing of expenses 1,482.08 604.37Claims and discounts allowed 0.08 (201.43)Loans / advances given 17.40 8,396.93Interest received 8.75 34.36Royalty paid 0.24 0.24Royalty and technical know-how fee received 197.94 410.65Dividend received 30.89 5.33Balance at the end of the year :
Loans / advances given * 404.57 391.61Other receivables 3,766.32 4,199.98Payables 94.47 118.88Guarantees given 180.25 223.80
* Includes provision for doubtful debts and advances 350.00 350.00
ii) Key management personnel and their relativesRemuneration to key management personnel 85.50 141.81Rent paid – 1.53House rent allowance 2.40 2.40Pension 2.03 2.03Medical reimbursement * *Security deposits:
Received – 0.18Balance at the end of the year :
Security deposits 0.25 0.32* Rounded off to Nil. Rs. 1,250 (Previous year Rs. 2,150)
iii) Entities over which significant influence is exercisedPurchase of materials / finished goods – 3.23Sale of finished goods 1.99 7.08Sale of fixed assets 1.00 –Services availed 22.27 10.50Purchase of investments – 15.68Balance at the end of the year :
Other receivables 1.52 1.66Payables 0.06 8.45
Ranbaxy Laboratories Limited Annual Report 2005 Schedules

74
SCHEDULES FORMING PART OF THE FINANCIAL STATEMENTSFOR THE YEAR ENDED DECEMBER 31, 2005
SCHEDULE 26
NOTES TO THE FINANCIAL STATEMENTS (Contd.)
27. Additional information pursuant to paragraphs 3 & 4 of part II of schedule VI to the Companies Act, 1956(As certified by the management and accepted by the auditors)
a] Particulars of installed capacities and actual production
2005 2004
Unit of Installed Actual Installed Actualmeasure capacity production capacity production
Dosage FormsTablets Nos./Millions 6,518.00 4,006.80 4,098.00 3,530.95Capsules Nos./Millions 2,380.00 1,314.20 1,630.00 1,638.83Dry syrups/Powders Bottles /Millions 27.20 35.20 27.20 37.03Ampoules Nos./Millions 74.40 81.42 74.40 101.03Vials Nos./Millions 29.40 33.97 29.40 41.16Liquids Kilolitres – 1,277.84 – 1,139.28Drops Kilolitres – 29.37 – 37.64Active pharmaceuticals ingredients
and drugs intermediates Tonnes 1,844.07 1,670.53 2,058.02 1,821.61Medical aids Nos./Millions – – – 0.12
Ointments Tonnes * 296.21 * 301.37
* In different denominations than actual production
Notes :1. Installed capacity being effective operational capacity has been calculated on a double shift basis for dosage forms
facilities and on a three shift basis for active pharmaceuticals ingredients and drug intermediates.2. Actual production includes production at loan licencees locations.
b] Stocks and sales of finished goodsSales Opening stock Closing stock
Unit of Quantity@ Rs. Quantity Rs. Quantity Rs.measure Millions Millions Millions
Dosage FormsTablets Nos./Millions 5,291.74 16,931.28 517.99 720.31 549.44 784.89
5,043.00 17,059.40 577.62 768.33 517.99 720.31Capsules Nos./Millions 1,761.34 2,410.42 153.12 204.74 154.85 183.74
2,136.40 5,719.73 221.21 255.31 153.12 204.74Dry syrups/Powders Bottles/Millions 42.16 2,649.21 5.00 100.74 5.36 76.09
46.22 3,162.08 6.78 159.34 5.00 100.74Ampoules Nos./Millions 90.80 3,581.06 13.87 47.03 8.58 43.15
108.92 898.94 16.24 48.38 13.87 47.03Vials Nos./Millions 101.79 1,801.27 12.64 136.74 9.22 158.73
114.81 1,880.84 9.64 147.09 12.64 136.74Liquids Kilolitres 5,433.24 1,099.62 722.16 79.61 384.98 69.74
6,137.87 1,099.52 807.97 101.20 722.16 79.61Drops Kilolitres 33.06 63.08 3.86 4.04 4.04 3.80
37.26 44.99 1.89 1.53 3.86 4.04Active pharmaceuticals
ingredients anddrugs intermediates Tonnes 2,050.73 10,276.44 163.23 1,183.83 140.10 1,616.21
2,017.36 9,275.33 138.32 922.18 163.23 1,183.83Medical aids Nos./Millions 0.15 403.02 0.07 247.87 – –
0.19 467.13 0.05 182.03 0.07 247.87Ointments Tonnes 824.06 1,028.28 96.98 49.42 99.95 52.41
790.35 926.09 80.41 36.25 96.98 49.42Others (Chemicals etc.) 244.61 20.30 41.77
349.21 6.51 20.30Inter unit transfers (4,301.75)
(4,094.26)Less : Excise Duty (820.00)
(645.57)
TOTAL 35,366.54 2,794.63 3,030.53
36,143.43 2,628.15 2,794.63
@ Inclusive of physician samples.
Figures in italics are for 2004.
Financial Statements of Ranbaxy
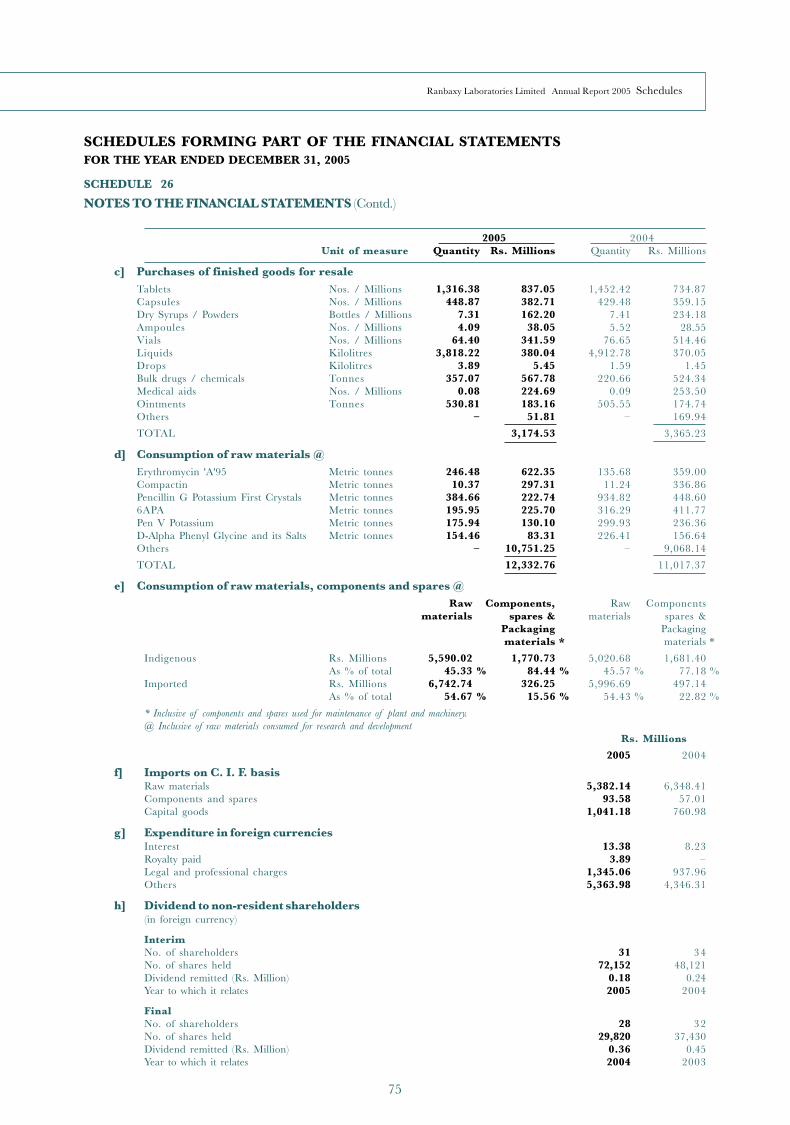
75
2005 2004Unit of measure Quantity Rs. Millions Quantity Rs. Millions
c] Purchases of finished goods for resaleTablets Nos. / Millions 1,316.38 837.05 1,452.42 734.87Capsules Nos. / Millions 448.87 382.71 429.48 359.15Dry Syrups / Powders Bottles / Millions 7.31 162.20 7.41 234.18Ampoules Nos. / Millions 4.09 38.05 5.52 28.55Vials Nos. / Millions 64.40 341.59 76.65 514.46Liquids Kilolitres 3,818.22 380.04 4,912.78 370.05Drops Kilolitres 3.89 5.45 1.59 1.45Bulk drugs / chemicals Tonnes 357.07 567.78 220.66 524.34Medical aids Nos. / Millions 0.08 224.69 0.09 253.50Ointments Tonnes 530.81 183.16 505.55 174.74Others – 51.81 – 169.94
TOTAL 3,174.53 3,365.23
d] Consumption of raw materials @Erythromycin 'A'95 Metric tonnes 246.48 622.35 135.68 359.00Compactin Metric tonnes 10.37 297.31 11.24 336.86Pencillin G Potassium First Crystals Metric tonnes 384.66 222.74 934.82 448.606APA Metric tonnes 195.95 225.70 316.29 411.77Pen V Potassium Metric tonnes 175.94 130.10 299.93 236.36D-Alpha Phenyl Glycine and its Salts Metric tonnes 154.46 83.31 226.41 156.64Others – 10,751.25 – 9,068.14
TOTAL 12,332.76 11,017.37
e] Consumption of raw materials, components and spares @Raw Components, Raw Components
materials spares & materials spares &Packaging Packagingmaterials * materials *
Indigenous Rs. Millions 5,590.02 1,770.73 5,020.68 1,681.40As % of total 45.33 % 84.44 % 45.57 % 77.18 %
Imported Rs. Millions 6,742.74 326.25 5,996.69 497.14As % of total 54.67 % 15.56 % 54.43 % 22.82 %
* Inclusive of components and spares used for maintenance of plant and machinery.@ Inclusive of raw materials consumed for research and development
Rs. Millions
2005 2004
f] Imports on C. I. F. basisRaw materials 5,382.14 6,348.41Components and spares 93.58 57.01Capital goods 1,041.18 760.98
g] Expenditure in foreign currenciesInterest 13.38 8.23Royalty paid 3.89 –Legal and professional charges 1,345.06 937.96Others 5,363.98 4,346.31
h] Dividend to non-resident shareholders(in foreign currency)
InterimNo. of shareholders 31 34No. of shares held 72,152 48,121Dividend remitted (Rs. Million) 0.18 0.24Year to which it relates 2005 2004
FinalNo. of shareholders 28 32No. of shares held 29,820 37,430Dividend remitted (Rs. Million) 0.36 0.45Year to which it relates 2004 2003
SCHEDULES FORMING PART OF THE FINANCIAL STATEMENTSFOR THE YEAR ENDED DECEMBER 31, 2005
SCHEDULE 26
NOTES TO THE FINANCIAL STATEMENTS (Contd.)
Ranbaxy Laboratories Limited Annual Report 2005 Schedules

76
On behalf of the Board of Directors
For WALKER, CHANDIOK & CO TEJENDRA KHANNA DR. BRIAN W. TEMPEST MALVINDER MOHAN SINGHChartered Accountants Chairman Chief Mentor & CEO & Managing Director
Executive Vice Chairman
VINOD CHANDIOK RAMESH L ADIGE HARPAL SINGH VIVEK BHARAT RAMPartner Whole-time Director Director DirectorMembership No. 10093
RAM S. RAMASUNDAR SUSHIL K. PATAWARIPlace : Gurgaon President & CFO SecretaryDated : April 19, 2006
SCHEDULES FORMING PART OF THE FINANCIAL STATEMENTSFOR THE YEAR ENDED DECEMBER 31, 2005
SCHEDULE 26
NOTES TO THE FINANCIAL STATEMENTS (Contd.)Rs. Millions
2005 2004i] Earnings in foreign exchange
F.O.B. value of exports (excluding Nepal) 22,243.38 23,350.21Royalty/Technical consultancy fees 304.95 698.05Dividends 4.49 5.33Others (freight, insurance & others) 1,024.58 1,277.36
28. Information pursuant to clause 32 of the listing agreementswith stock exchanges
Maximum balanceRs. Millions Rs. Millions
2005 2004 2005 2004
Loans and advances in the nature of loans to :
Wholly-owned subsidiary companies with no specified payment schedule *Vidyut Investments Ltd. 350.08 350.08 350.08 8,153.52Ran Air Services Ltd 51.45 38.50 55.15 44.50(Formerly Vidyut Travel Services Limited)Ranbaxy Drugs Ltd. 3.04 3.04 3.04 3.04
* Interest free.
29. Previous year figuresPrevious year figures have been regrouped/recast wherever considered necessary to make them comparable with those of thecurrent year.
Signatories to schedules 1 to 26
Financial Statements of Ranbaxy
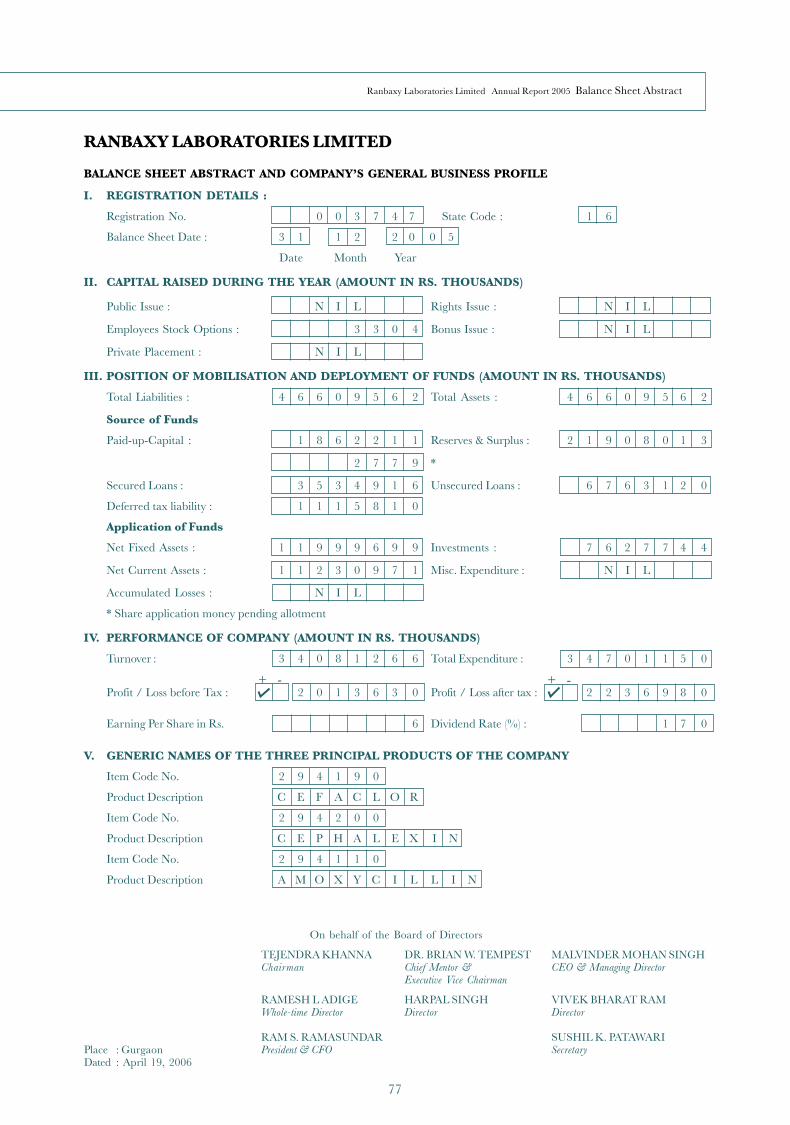
77
RANBAXY LABORATORIES LIMITED
BALANCE SHEET ABSTRACT AND COMPANY’S GENERAL BUSINESS PROFILE
I. REGISTRATION DETAILS :
Registration No. 0 0 3 7 4 7 State Code : 1 6
Balance Sheet Date : 3 1 1 2 2 0 0 5
Date Month Year
II. CAPITAL RAISED DURING THE YEAR (AMOUNT IN RS. THOUSANDS)
Public Issue : N I L Rights Issue : N I L
Employees Stock Options : 3 3 0 4 Bonus Issue : N I L
Private Placement : N I L
III. POSITION OF MOBILISATION AND DEPLOYMENT OF FUNDS (AMOUNT IN RS. THOUSANDS)
Total Liabilities : 4 6 6 0 9 5 6 2 Total Assets : 4 6 6 0 9 5 6 2
Source of Funds
Paid-up-Capital : 1 8 6 2 2 1 1 Reserves & Surplus : 2 1 9 0 8 0 1 3
2 7 7 9 *
Secured Loans : 3 5 3 4 9 1 6 Unsecured Loans : 6 7 6 3 1 2 0
Deferred tax liability : 1 1 1 5 8 1 0
Application of Funds
Net Fixed Assets : 1 1 9 9 9 6 9 9 Investments : 7 6 2 7 7 4 4
Net Current Assets : 1 1 2 3 0 9 7 1 Misc. Expenditure : N I L
Accumulated Losses : N I L
* Share application money pending allotment
IV. PERFORMANCE OF COMPANY (AMOUNT IN RS. THOUSANDS)
Turnover : 3 4 0 8 1 2 6 6 Total Expenditure : 3 4 7 0 1 1 5 0
Profit / Loss before Tax : 2 0 1 3 6 3 0 Profit / Loss after tax : 2 2 3 6 9 8 0
Earning Per Share in Rs. 6 Dividend Rate (%) : 1 7 0
V. GENERIC NAMES OF THE THREE PRINCIPAL PRODUCTS OF THE COMPANY
Item Code No. 2 9 4 1 9 0
Product Description C E F A C L O R
Item Code No. 2 9 4 2 0 0
Product Description C E P H A L E X I N
Item Code No. 2 9 4 1 1 0
Product Description A M O X Y C I L L I N
+ -+ -
On behalf of the Board of Directors
TEJENDRA KHANNA DR. BRIAN W. TEMPEST MALVINDER MOHAN SINGHChairman Chief Mentor & CEO & Managing Director
Executive Vice Chairman
RAMESH L ADIGE HARPAL SINGH VIVEK BHARAT RAMWhole-time Director Director Director
RAM S. RAMASUNDAR SUSHIL K. PATAWARIPlace : Gurgaon President & CFO SecretaryDated : April 19, 2006
Ranbaxy Laboratories Limited Annual Report 2005 Balance Sheet Abstract

78
Statement Regarding Subsidiary Companies Pursuant to Section 212(3) and 212(5) of the Companies Act, 1956
Net aggregate amount of subsidiary Net aggregate amount Holdingcompany’s profits after deducting its of subsidiary company Company’slosses or vice-versa, so far as it profit after deducting its interest as at
Name of Subsidiary Financial Holding Company’s interest concerns members of Holding losses or vice-versa, December 31, 2005company year to as at close of financial year of Company which are not dealt within dealt within the incorporating
which subsidiary company the Company’s account company’s accounts changesaccounts since closerelates i) Shareholding ii) Extent of For the For the For the For the of financial
Holding current previous current previous year offinancial financial financial financial subsidiaryyear year year year company
%age Rs. Millions Rs. Millions Rs. Millions Rs. Millions
Domestic :
Solus Pharmaceuticals Ltd. 2005 3,000,700 Equity shares 100 2.20 (Profit) 6.33 (Loss) Nil Nil No changeof Rs. 10 each
Rexcel Pharmaceuticals Ltd. 2005 1,000,000 Equity shares 100 3.41 (Profit) 34.76 (Profit) Nil Nil No changeof Rs. 10 each
Vidyut Investments Ltd. 2005 25,008,400 Equity shares 100 40.65 (Profit) 34.82 (Profit) Nil 78.45 No changeof Rs. 10 each
Ran Air services Limited 2005 1,000,000 Equity shares 100 @ 4.34 (Loss) 1.39 (Loss) Nil Nil No change(Formerly Vidyut Travel of Rs. 10 eachServices Ltd.)
Ranbaxy Drugs and 2005 6,200,000 Equity shares 100 @ 1.32 (Profit) 0.02 (Loss) Nil Nil No changeChemical Company of Rs. 10 each(A public company withunlimited liability)
Ranbaxy Drugs Ltd. 2005 i) 3,100,020 Equity shares 100 0.01 (Loss) 0.37 (Loss) Nil Nil No changeof Rs. 10 each
ii) 250 10% Non-CumulativeRedeemable Preferenceshare of Rs. 10 each
Gufic Pharma Ltd. 2005 4900 Equity shares of 98 0.31 (Profit) 0.29 (Profit) Nil Nil No changeRs. 100 each
Overseas :
Ranbaxy (Guangzhou China) 2005 Investment Certificate of 83 14.32 (Loss) # 175.54 (Loss) # Nil Nil No changeLtd., China US $ 6,225,000
Ranbaxy (Netherlands) B.V., 2005 459,863 shares of 100 1,300.54 (Loss) # 2,997.97 (Profit) # Nil Nil No changeThe Netherlands Euro 100 each
Ranbaxy Nigeria Ltd., 2005 33,956,284 Ordinary 84.89 @ 46.75 (Profit) # 47.99 (Profit) # Nil 11.54 No changeNigeria shares of Naira 1 each
Ranbaxy (Hong Kong) Ltd., 2005 2,400,000 Equity shares of 100 1.59 (Loss) # 35.54 (Profit) # Nil Nil No changeHong Kong HK $ 1 each
Unichem Pharmaceuticals Ltd., 2005 40,000 Ordinary shares of 98.5 @ 0.06 (Loss) # 4.38 (Loss) # Nil Nil No changeThailand Baht 100 each
Ranbaxy (Malaysia) Sdn. Bhd. 2005 5,446,865 Ordinary 68.05 @ 73.21 (Profit) # 72.16 (Profit) # 3.60 10.5 No changeMalaysia shares of RM 1 each*
Bounty Holdings Company 2005 10, 000 shares, paid up at 99.3 @ 0.05 (Loss) # 5.93 (Loss) # Nil Nil No changeLimited, Thailand Baht 550 per share
Ranbaxy Unichem Company 2005 885,570 Ordinary 88.56 @ 32.88 (Profit) # 4.75 (Profit) # 0.79 Nil No changeLimited, Thailand shares of Baht 100 each
Ranbaxy Pharmacie 2005 800,000 Equity shares of 100 @ 69.84 (Loss) # 74.18 (Loss) # Nil Nil No changeGeneriques SAS Euro 9 eachFrance
@ Inclusive of shares held through wholly owned subsidiaries.# Exchange rates conversion as on the year end.* Previous year 4,499,983 Ordinary shares of RM 1 eachPrevious year figures have been regrouped / recast wherever considered necessary.
On behalf of the Board of Directors
TEJENDRA KHANNA DR. BRIAN W. TEMPEST MALVINDER MOHAN SINGHChairman Chief Mentor & CEO & Managing Director
Executive Vice Chairman
RAMESH L ADIGE HARPAL SINGH VIVEK BHARAT RAMWhole-time Director Director Director
RAM S. RAMASUNDAR SUSHIL K. PATAWARIPlace : Gurgaon President & CFO SecretaryDated : April 19, 2006
Financial Statements of Ranbaxy

79
Auditors' report to the Board of Directors of RanbaxyLaboratories Limited.
We have audited the attached consolidated balance sheet ofRanbaxy Laboratories Limited ("the Company") its subsidiariesand joint ventures (as per list appearing in Note 20 onSchedule 26) collectively referred to as "the Ranbaxy Group" asat December 31, 2005 and also the consolidated profit and lossaccount and the consolidated cash flow statement for the yearended on the date annexed thereto. These financial statementsare the responsibility of the Ranbaxy Group's managementand have been prepared by the management on the basis ofseparate financial statements and other financial informationregarding components. Our responsibility is to express anopinion on these financial statements based on our audit.
We conducted our audit in accordance with auditing standardsgenerally accepted in India. Those standards require that weplan and perform the audit to obtain reasonable assurancewhether the financial statements are free of materialmisstatement. An audit includes examining, on a test basis,evidence supporting the amounts and disclosures in the financialstatements. An audit also includes assessing the accountingprinciples used and significant estimates made by management,as well as evaluating the overall financial statement presentation.We believe that our audit provides a reasonable basis for ouropinion.
We did not audit the financial statements of some consolidatedentities, whose financial statements reflect total assets ofRs. 17,938.38 million as at December 31, 2005, total revenueof Rs. 16,507.24 million and cash flows amounting toRs. 141.91 million for the year then ended. These financialstatements and other financial information have been auditedby other auditors whose reports have been furnished to us, andour opinion in respect thereof, is based solely on the report ofother auditors.
We report that the consolidated financial statements have beenprepared by Ranbaxy Group's management in accordance withthe requirements of Accounting Standard 21, ConsolidatedFinancial Statements and Accounting Standard 27, FinancialReporting of Interests in Joint Venture, issued by the Instituteof Chartered Accountants of India.
Based on our audit and consideration of reports of other auditorson separate financial statements and on the other financialinformation of the components, and to the best of ourinformation and according to the explanations given to us,we are of the opinion that the attached consolidatedfinancial statements give a true and fair view in conformity withthe accounting principles generally accepted in India;in case of:
(a) the consolidated balance sheet, of the state of affairs ofthe Ranbaxy Group as at December 31, 2005;
(b) the consolidated profit and loss account, of the profit forthe year ended on that date; and
(c) the consolidated cash flow statement, of the cash flowsfor the year ended on that date.
For Walker, Chandiok & CoChartered Accountants
Vinod ChandiokPartnerMembership No. 10093
Place : GurgaonDated : April 19, 2006
Consolidated Financial Statements – Indian GAAP
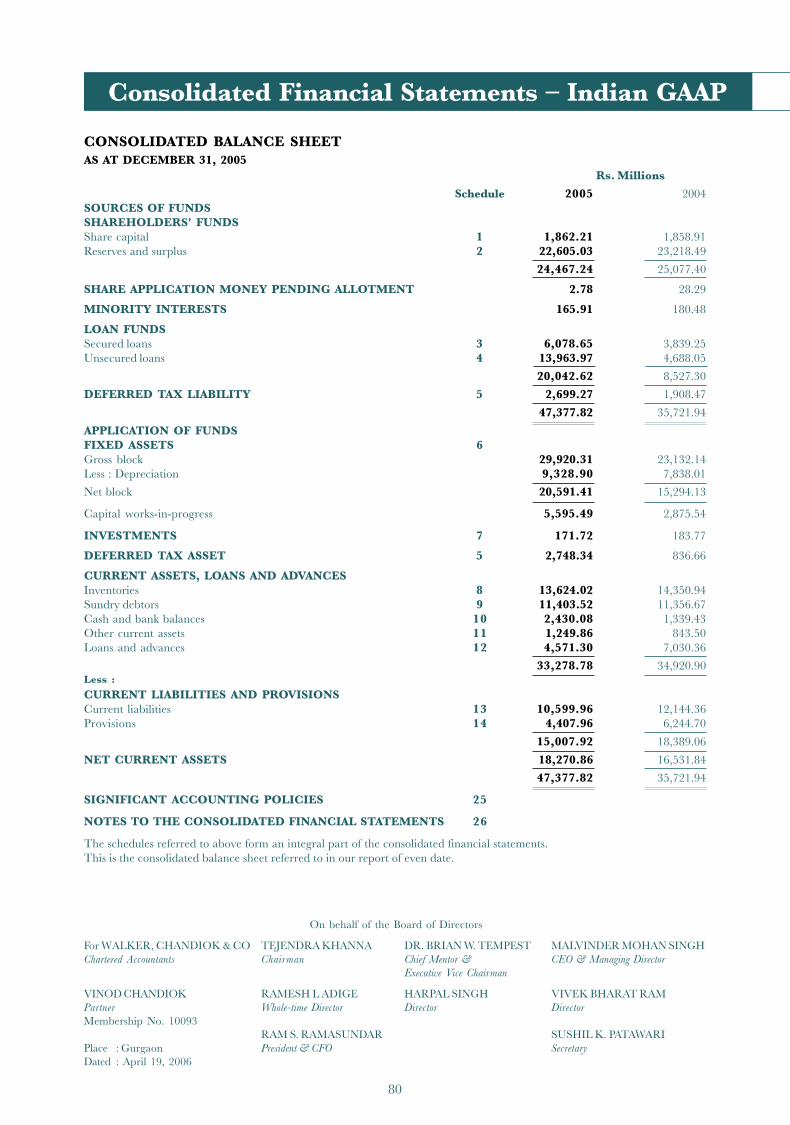
80
CONSOLIDATED BALANCE SHEETAS AT DECEMBER 31, 2005
Rs. Millions
Schedule 2005 2004SOURCES OF FUNDSSHAREHOLDERS' FUNDSShare capital 1 1,862.21 1,858.91Reserves and surplus 2 22,605.03 23,218.49
24,467.24 25,077.40
SHARE APPLICATION MONEY PENDING ALLOTMENT 2.78 28.29
MINORITY INTERESTS 165.91 180.48
LOAN FUNDSSecured loans 3 6,078.65 3,839.25Unsecured loans 4 13,963.97 4,688.05
20,042.62 8,527.30
DEFERRED TAX LIABILITY 5 2,699.27 1,908.47
47,377.82 35,721.94
APPLICATION OF FUNDSFIXED ASSETS 6Gross block 29,920.31 23,132.14Less : Depreciation 9,328.90 7,838.01
Net block 20,591.41 15,294.13
Capital works-in-progress 5,595.49 2,875.54
INVESTMENTS 7 171.72 183.77
DEFERRED TAX ASSET 5 2,748.34 836.66
CURRENT ASSETS, LOANS AND ADVANCESInventories 8 13,624.02 14,350.94Sundry debtors 9 11,403.52 11,356.67Cash and bank balances 10 2,430.08 1,339.43Other current assets 11 1,249.86 843.50Loans and advances 12 4,571.30 7,030.36
33,278.78 34,920.90Less :CURRENT LIABILITIES AND PROVISIONSCurrent liabilities 13 10,599.96 12,144.36Provisions 14 4,407.96 6,244.70
15,007.92 18,389.06
NET CURRENT ASSETS 18,270.86 16,531.84
47,377.82 35,721.94
SIGNIFICANT ACCOUNTING POLICIES 25
NOTES TO THE CONSOLIDATED FINANCIAL STATEMENTS 26
The schedules referred to above form an integral part of the consolidated financial statements.This is the consolidated balance sheet referred to in our report of even date.
On behalf of the Board of Directors
For WALKER, CHANDIOK & CO TEJENDRA KHANNA DR. BRIAN W. TEMPEST MALVINDER MOHAN SINGHChartered Accountants Chairman Chief Mentor & CEO & Managing Director
Executive Vice Chairman
VINOD CHANDIOK RAMESH L ADIGE HARPAL SINGH VIVEK BHARAT RAMPartner Whole-time Director Director DirectorMembership No. 10093
RAM S. RAMASUNDAR SUSHIL K. PATAWARIPlace : Gurgaon President & CFO SecretaryDated : April 19, 2006
Consolidated Financial Statements – Indian GAAP

81
Rs. MillionsSchedule 2005 2004
INCOMEOperating income 15 52,815.87 54,512.00Other income 16 616.28 808.84
53,432.15 55,320.84EXPENDITUREMaterials 17 22,212.71 19,089.67Manufacturing 18 2,549.40 3,163.85Personnel 19 6,785.66 6,382.30Selling, general and administration 20 13,231.94 12,495.58Research and development 21 4,925.06 3,375.61
49,704.77 44,507.01PROFIT BEFORE INTEREST, DEPRECIATION,AMORTISATION AND IMPAIRMENT 3,727.38 10,813.83Interest 671.16 334.88Depreciation, amortisation and impairment 22 1,444.52 1,214.83PROFIT BEFORE EXCEPTIONAL ITEMS,TAX AND MINORITY INTERESTS 1,611.70 9,264.12Exceptional items
Interest in Joint venture written off (121.80) –Litigation settlement – (371.90)
PROFIT BEFORE TAX AND MINORITY INTERESTS 1,489.90 8,892.22PROFIT BEFORE TAX AND MINORITY INTERESTSFROM CONTINUING OPERATIONS 1,249.43 8,625.68Provision for tax on continuing operations 23 884.70 (1,773.35)PROFIT AFTER TAX FROM CONTINUING OPERATIONS 2,134.13 6,852.33Discontinued operations
Profit before tax from operations 240.47 266.54Profit from sale of undertaking and a subsidiary 454.95 –Provision for tax 23 (187.13) (107.73)
PROFIT AFTER TAX FROM DISCONTINUED OPERATIONS 508.29 158.81PROFIT AFTER TAX 2,642.42 7,011.14Minority interests (25.35) (25.53)PROFIT AFTER TAX AND MINORITY INTERESTS 2,617.07 6,985.61Tax - earlier years :
Current (61.78) 11.24 2,555.29 6,996.85
Transfer from :Foreign projects reserve 30.65 32.27Profit & loss appropriation 1,278.55 –
Balance available for appropriation 3,864.49 7,029.12APPROPRIATIONS
DividendInterim 931.11 929.45Final (Proposed) 2,235.55 2,233.15
Tax on dividend 447.83 440.38Transfer to :
Foreign projects reserve – 4.60General reserve 250.00 3,421.54
3,864.49 7,029.12EARNINGS PER SHARE (Rs.) 24
After exceptional items and including discontinued operationsBasic 6.87 18.83Diluted 6.85 18.74
Before exceptional items and excluding discontinued operationsBasic 5.70 19.11Diluted 5.69 19.01
SIGNIFICANT ACCOUNTING POLICIES 25NOTES TO THE CONSOLIDATED FINANCIAL STATEMENTS 26The schedules referred to above form an integral part of the consolidated financial statements.This is the consolidated profit and loss account referred to in our report of even date.
On behalf of the Board of Directors
For WALKER, CHANDIOK & CO TEJENDRA KHANNA DR. BRIAN W. TEMPEST MALVINDER MOHAN SINGHChartered Accountants Chairman Chief Mentor & CEO & Managing Director
Executive Vice Chairman
VINOD CHANDIOK RAMESH L ADIGE HARPAL SINGH VIVEK BHARAT RAMPartner Whole-time Director Director DirectorMembership No. 10093
RAM S. RAMASUNDAR SUSHIL K. PATAWARIPlace : Gurgaon President & CFO SecretaryDated : April 19, 2006
CONSOLIDATED PROFIT AND LOSS ACCOUNTFOR THE YEAR ENDED DECEMBER 31, 2005
Ranbaxy Laboratories Limited Annual Report 2005 Consolidated Balance Sheet & Profit and Loss Account
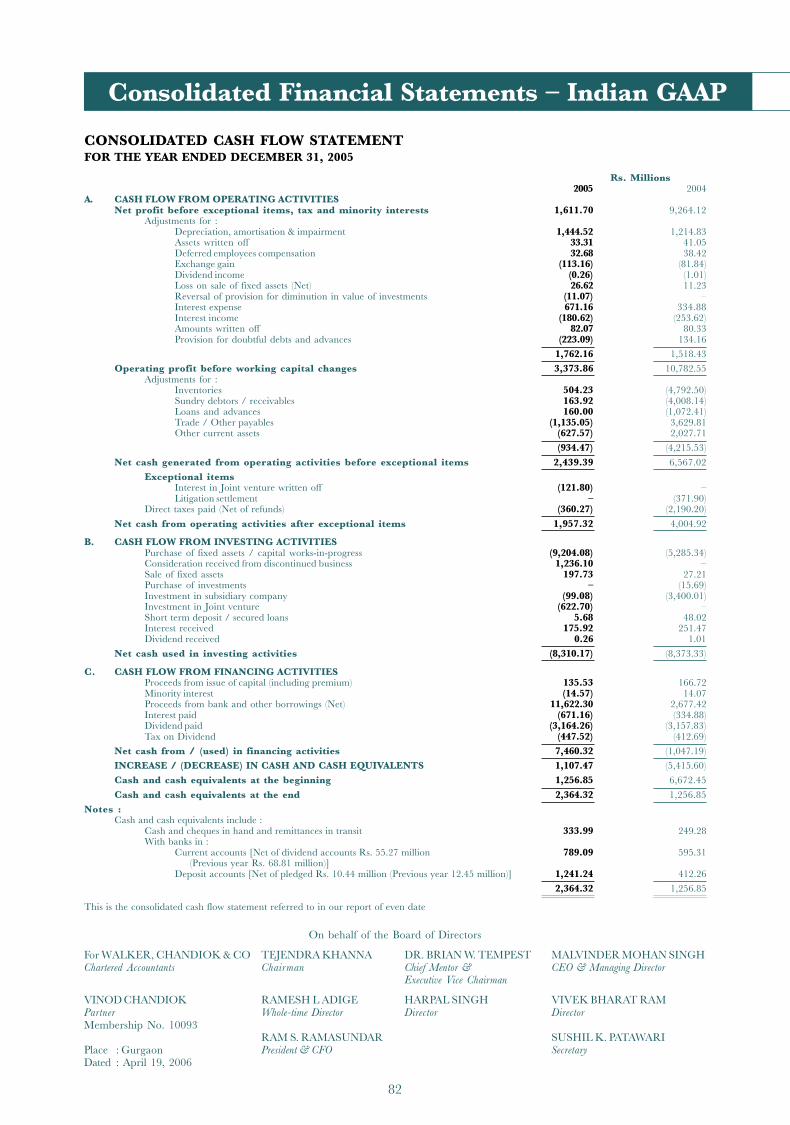
82
CONSOLIDATED CASH FLOW STATEMENTFOR THE YEAR ENDED DECEMBER 31, 2005
Rs. Millions2005 2004
A. CASH FLOW FROM OPERATING ACTIVITIESNet profit before exceptional items, tax and minority interests 1,611.70 9,264.12
Adjustments for :Depreciation, amortisation & impairment 1,444.52 1,214.83Assets written off 33.31 41.05Deferred employees compensation 32.68 38.42Exchange gain (113.16) (81.84)Dividend income (0.26) (1.01)Loss on sale of fixed assets (Net) 26.62 11.23Reversal of provision for diminution in value of investments (11.07) –Interest expense 671.16 334.88Interest income (180.62) (253.62)Amounts written off 82.07 80.33Provision for doubtful debts and advances (223.09) 134.16
1,762.16 1,518.43
Operating profit before working capital changes 3,373.86 10,782.55Adjustments for :
Inventories 504.23 (4,792.50)Sundry debtors / receivables 163.92 (4,008.14)Loans and advances 160.00 (1,072.41)Trade / Other payables (1,135.05) 3,629.81Other current assets (627.57) 2,027.71
(934.47) (4,215.53)
Net cash generated from operating activities before exceptional items 2,439.39 6,567.02
Exceptional itemsInterest in Joint venture written off (121.80) –Litigation settlement – (371.90)
Direct taxes paid (Net of refunds) (360.27) (2,190.20)
Net cash from operating activities after exceptional items 1,957.32 4,004.92
B. CASH FLOW FROM INVESTING ACTIVITIESPurchase of fixed assets / capital works-in-progress (9,204.08) (5,285.34)Consideration received from discontinued business 1,236.10 –Sale of fixed assets 197.73 27.21Purchase of investments – (15.69)Investment in subsidiary company (99.08) (3,400.01)Investment in Joint venture (622.70) –Short term deposit / secured loans 5.68 48.02Interest received 175.92 251.47Dividend received 0.26 1.01
Net cash used in investing activities (8,310.17) (8,373.33)
C. CASH FLOW FROM FINANCING ACTIVITIESProceeds from issue of capital (including premium) 135.53 166.72Minority interest (14.57) 14.07Proceeds from bank and other borrowings (Net) 11,622.30 2,677.42Interest paid (671.16) (334.88)Dividend paid (3,164.26) (3,157.83)Tax on Dividend (447.52) (412.69)
Net cash from / (used) in financing activities 7,460.32 (1,047.19)
INCREASE / (DECREASE) IN CASH AND CASH EQUIVALENTS 1,107.47 (5,415.60)
Cash and cash equivalents at the beginning 1,256.85 6,672.45
Cash and cash equivalents at the end 2,364.32 1,256.85
Notes :Cash and cash equivalents include :
Cash and cheques in hand and remittances in transit 333.99 249.28With banks in :
Current accounts [Net of dividend accounts Rs. 55.27 million 789.09 595.31(Previous year Rs. 68.81 million)]
Deposit accounts [Net of pledged Rs. 10.44 million (Previous year 12.45 million)] 1,241.24 412.26
2,364.32 1,256.85
This is the consolidated cash flow statement referred to in our report of even date
On behalf of the Board of Directors
For WALKER, CHANDIOK & CO TEJENDRA KHANNA DR. BRIAN W. TEMPEST MALVINDER MOHAN SINGHChartered Accountants Chairman Chief Mentor & CEO & Managing Director
Executive Vice Chairman
VINOD CHANDIOK RAMESH L ADIGE HARPAL SINGH VIVEK BHARAT RAMPartner Whole-time Director Director DirectorMembership No. 10093
RAM S. RAMASUNDAR SUSHIL K. PATAWARIPlace : Gurgaon President & CFO SecretaryDated : April 19, 2006
Consolidated Financial Statements – Indian GAAP
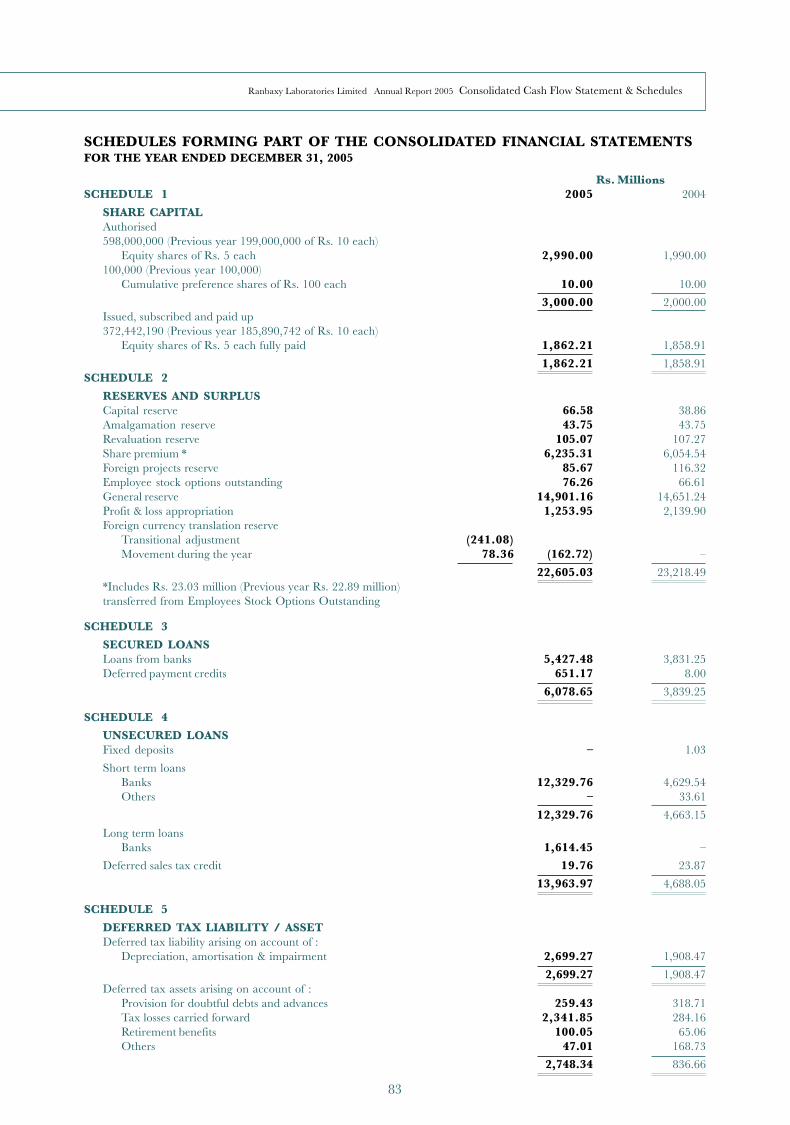
83
SCHEDULES FORMING PART OF THE CONSOLIDATED FINANCIAL STATEMENTSFOR THE YEAR ENDED DECEMBER 31, 2005
Rs. MillionsSCHEDULE 1 2005 2004
SHARE CAPITALAuthorised598,000,000 (Previous year 199,000,000 of Rs. 10 each)
Equity shares of Rs. 5 each 2,990.00 1,990.00100,000 (Previous year 100,000)
Cumulative preference shares of Rs. 100 each 10.00 10.00
3,000.00 2,000.00Issued, subscribed and paid up372,442,190 (Previous year 185,890,742 of Rs. 10 each)
Equity shares of Rs. 5 each fully paid 1,862.21 1,858.91
1,862.21 1,858.91SCHEDULE 2
RESERVES AND SURPLUSCapital reserve 66.58 38.86Amalgamation reserve 43.75 43.75Revaluation reserve 105.07 107.27Share premium * 6,235.31 6,054.54Foreign projects reserve 85.67 116.32Employee stock options outstanding 76.26 66.61General reserve 14,901.16 14,651.24Profit & loss appropriation 1,253.95 2,139.90Foreign currency translation reserve
Transitional adjustment (241.08)Movement during the year 78.36 (162.72) –
22,605.03 23,218.49*Includes Rs. 23.03 million (Previous year Rs. 22.89 million)transferred from Employees Stock Options Outstanding
SCHEDULE 3
SECURED LOANSLoans from banks 5,427.48 3,831.25Deferred payment credits 651.17 8.00
6,078.65 3,839.25
SCHEDULE 4
UNSECURED LOANSFixed deposits – 1.03
Short term loansBanks 12,329.76 4,629.54Others – 33.61
12,329.76 4,663.15
Long term loansBanks 1,614.45 –
Deferred sales tax credit 19.76 23.87
13,963.97 4,688.05
SCHEDULE 5
DEFERRED TAX LIABILITY / ASSETDeferred tax liability arising on account of :
Depreciation, amortisation & impairment 2,699.27 1,908.47
2,699.27 1,908.47Deferred tax assets arising on account of :
Provision for doubtful debts and advances 259.43 318.71Tax losses carried forward 2,341.85 284.16Retirement benefits 100.05 65.06Others 47.01 168.73
2,748.34 836.66
Ranbaxy Laboratories Limited Annual Report 2005 Consolidated Cash Flow Statement & Schedules

84
SCHEDULES FORMING PART OF THE CONSOLIDATED FINANCIAL STATEMENTSFOR THE YEAR ENDED DECEMBER 31, 2005
Rs. MillionsSCHEDULE 7 2005 2004
INVESTMENTSCURRENTTrust securitiesOther than trade - unquoted41,089 US64 Bonds of Rs. 100 each (6.75% Tax Free) 4.11 4.11
4.11 4.11
LONG TERMInvestments in government securitiesOther than trade - unquotedIndira Vikas patra – 0.01Investments in shares of companies (fully paid)
Country Nature of Face Numbersinvestment value 2005 2004
Trade :UnquotedNihon Pharmaceuticals Industry Co. Ltd.,* Japan Equity shares Yen 500 – 32,000 – 27.06Sidmak Laboratories (India) Limited India Equity shares Rs. 10 16,733 16,733 10.54 10.54QuotedAutobacs Seven Co.,Ltd # Japan Equity shares 1.52 –
12.06 37.60Other than trade :QuotedFortis Financial Services Ltd. India Equity shares Rs. 10 353,250 353,250 14.49 14.49The Great Eastern Shipping Company Ltd. India Equity shares Rs. 10 500 500 0.03 0.03Sawai Pharmaceutical Co.,Ltd # Japan Equity shares 0.48 –UnquotedFortis Healthcare Limited India Equity shares Rs. 10 14,097,660 14,097,660 140.98 140.98Biotech Consortium India Ltd. India Equity shares Rs. 10 50,000 50,000 0.50 0.50Nimbua Greenfield (Punjab) Limited India Equity shares Rs. 10 50,000 – 0.50 –Tomita Pharmaceutical Co.,Ltd # Japan Equity shares 1.44 –
158.42 156.00
174.59 197.72
Less : Provision for diminution in value of long term investments 2.87 13.95
171.72 183.77* Became a joint venture during the year and proportionately consolidated (refer note 16(b) of schedule 26)# Held by Japanese joint venture "Nihon Pharmaceuticals Industry Co. Ltd."
SCHEDULE 6FIXED ASSETS Rs. Millions
Gross block Accumulated Net BlockDepreciation,
amortisation &impairment
Description 2004 Additions Deletions Foreign 2005 2005 2005 2004exchange
adjustmentIntangiblesGoodwill 4,494.23 556.19 – 168.24 5,218.66 576.28 4,642.38 3,987.21Trade marks, product licenses 1,877.45 286.23 102.58 81.71 2,142.81 1,411.63 731.18 735.19Software 361.05 28.96 – – 390.01 229.49 160.52 180.75Product development – 268.81 – – 268.81 – 268.81 –Non-compete 210.00 – – – 210.00 140.00 70.00 90.00TangiblesLand 428.75 43.37 – 3.49 475.61 – 475.61 428.75Buildings 2,613.10 1,359.84 33.31 87.96 4,027.59 669.60 3,357.99 2,105.09Plant and machinery 12,054.14 3,387.05 434.64 98.44 15,104.99 5,811.55 9,293.44 7,066.98Furniture and fixtures 765.16 403.70 124.10 6.92 1,051.68 346.77 704.91 465.67Vehicles 310.97 126.64 94.04 2.43 346.00 90.95 255.05 225.22Assets taken on lease
Plant and machinery 1.19 – – – 1.19 0.21 0.98 1.10Buildings – 611.65 – 14.09 625.74 36.53 589.21 –Equipments 4.69 37.79 – 0.59 43.07 9.51 33.56 1.67Vehicles 11.41 5.44 3.12 0.42 14.15 6.38 7.77 6.50
Total 23,132.14 7,115.67 791.79 464.29 29,920.31 9,328.90 20,591.41 15,294.13
Previous year 16,532.97 6,682.41 83.24 – 23,132.14 7,838.01 15,294.13
Consolidated Financial Statements – Indian GAAP

85
SCHEDULES FORMING PART OF THE CONSOLIDATED FINANCIAL STATEMENTSFOR THE YEAR ENDED DECEMBER 31, 2005
Rs. MillionsSCHEDULE 8 2005 2004
INVENTORIESStores and spares 88.07 79.71Raw materials 4,433.22 4,877.05Packaging materials 605.46 669.71Finished goods 6,509.92 6,804.88Work-in-process 1,987.35 1,919.59
13,624.02 14,350.94
SCHEDULE 9SUNDRY DEBTORS(Considered good except where provided for)Secured 247.51 237.26Unsecured 11,365.64 11,563.43
11,613.15 11,800.69Less : Doubtful and provided for 209.63 444.02
11,403.52 11,356.67
SCHEDULE 10CASH AND BANK BALANCESCash and cheques in hand 27.16 36.53Remittances in transit 286.02 212.75Balances with banks:
Current accounts 865.18 664.12Deposit accounts 1,251.67 424.71Margin money accounts 0.05 1.32
2,430.08 1,339.43
SCHEDULE 11OTHER CURRENT ASSETS(Unsecured, considered good except where provided for)Export incentives accrued 696.79 587.43Exchange gain accrued on forward contracts 321.06 105.64Insurance claims 144.84 117.97Interest accrued 9.38 4.68Others 111.71 46.76
1,283.78 862.48Less : Doubtful and provided for 33.92 18.98
1,249.86 843.50
SCHEDULE 12LOANS AND ADVANCES(Considered good except where provided for)Secured 73.69 79.37Unsecured
Advances recoverable in cash or in kind or for value to be received 3,403.71 3,682.83Prepaid income-tax 1,507.52 3,685.42
4,984.92 7,447.62Less : Doubtful and provided for 413.62 417.26
4,571.30 7,030.36
SCHEDULE 13CURRENT LIABILITIESAcceptances 89.93 68.27Sundry creditors 7,624.32 9,908.71Other liabilities 2,885.71 2,167.38
10,599.96 12,144.36
SCHEDULE 14PROVISIONSRetirement benefits 1,093.42 857.51Income-tax 765.46 2,840.83Proposed dividend 2,235.55 2,233.15Tax on proposed dividend 313.53 313.21
4,407.96 6,244.70
Ranbaxy Laboratories Limited Annual Report 2005 Consolidated Schedules

86
SCHEDULES FORMING PART OF THE CONSOLIDATED FINANCIAL STATEMENTSFOR THE YEAR ENDED DECEMBER 31, 2005
Rs. MillionsSCHEDULE 15 2005 2004
OPERATING INCOMESales and ServicesSales 51,880.43 53,129.69Less : Excise duty on sales 860.96 678.65
51,019.47 52,451.04Services 16.62 24.02
51,036.09 52,475.06OthersExport incentives 650.64 850.38Technology licensing income – 191.36Exchange gain (Net) 547.35 482.16Sundries 581.79 513.04
1,779.78 2,036.94 52,815.87 54,512.00
SCHEDULE 16OTHER INCOMEInterest 180.62 253.62Dividend 0.26 1.01Profit on sale of assets 7.89 2.55Reversal of provision for diminution in the value of investment 11.07 –Bad debts / advances recovered 33.07 17.53Unclaimed balances and excess provisions 255.51 277.02Miscellaneous 127.86 257.11
616.28 808.84
SCHEDULE 17MATERIALSRaw materials consumed 12,494.57 12,701.57Packaging materials consumed 2,123.21 1,980.54Finished goods purchased 7,367.73 7,658.58Increase in work-in-process and finished goods
Opening stockWork-in-process 1,919.59 1,229.41Finished goods 6,804.88 4,244.04
8,724.47 5,473.45Less :Closing stock
Work-in-process 1,987.35 1,919.59Finished goods 6,509.92 6,804.88
8,497.27 8,724.47Decrease / (Increase) 227.20 (3,251.02)Materials consumed 22,212.71 19,089.67
SCHEDULE 18MANUFACTURINGPower and fuel 722.88 646.76Excise duty 45.57 100.26Stores and spares consumed 410.62 423.68Analytical charges 49.07 44.18Processing charges 802.23 894.39Royalty paid 378.66 896.51Repairs and maintenance
Factory buildings 27.80 35.73Plant and machinery 112.57 122.34
2,549.40 3,163.85
SCHEDULE 19PERSONNELSalaries, wages and bonus 5,838.42 5,558.65Contribution to provident and other funds 443.22 382.34Workmen and staff welfare 471.34 402.89Amortisation of deferred employees compensation 32.68 38.42
6,785.66 6,382.30
Consolidated Financial Statements – Indian GAAP

87
SCHEDULES FORMING PART OF THE CONSOLIDATED FINANCIAL STATEMENTSFOR THE YEAR ENDED DECEMBER 31, 2005
Rs. MillionsSCHEDULE 20 2005 2004
SELLING, GENERAL AND ADMINISTRATIONRentals 429.85 416.94Rates and taxes 273.87 197.11Regulatory filing fee 477.63 437.10Printing and stationery 115.71 109.15Insurance 476.46 488.70Communication 299.44 271.00Legal and professional charges 1,912.36 1,683.60Travel and conveyance 815.76 852.68Discounts 232.39 167.43Freight, clearing and forwarding 1,841.32 1,936.04Advertising and sales promotion 3,533.34 3,563.79Repairs and maintenance 233.92 219.72Recruitment and training 125.91 156.70Conferences and meetings 176.81 163.83Commission 953.56 852.67Amounts written off 82.07 80.01Assets written off 33.31 41.05Provision for doubtful debts and advances 13.36 76.05Loss on sale of fixed assets 24.39 11.88Others 1,180.48 770.13
13,231.94 12,495.58
SCHEDULE 21RESEARCH AND DEVELOPMENT EXPENDITURESalaries, wages and bonus 941.91 682.88Contribution to provident and other funds 43.57 42.96Workmen and staff welfare 44.51 39.40Materials and consumables 1,596.42 894.34Power and fuel 112.72 75.41Clinical trials 1,652.37 1,089.64Rentals 62.90 60.27Printing and stationery 20.77 23.42Insurance 22.45 16.74Communication 52.29 37.04Legal and professional charges 74.36 90.53Travel and conveyance 68.81 91.56Others 231.98 231.42
4,925.06 3,375.61
SCHEDULE 22DEPRECIATION, AMORTISATION AND IMPAIRMENTDepreciationBuildings 87.96 67.65Plant and machinery 842.19 693.06Furniture and fixtures 82.14 59.17Vehicles 36.87 28.43Assets taken on lease
Plant and machinery 0.12 0.18Buildings 35.70 –Equipments 6.55 1.63Vehicles 3.89 3.05
1,095.42 853.17
Less : Transfer from revaluation reserves (2.20) (2.27)
1,093.22 850.90AmortisationTrade marks, product licenses & software 273.62 343.93Non-compete 20.00 20.00
293.62 363.93ImpairmentProduct licence 57.68 –
1,444.52 1,214.83
Ranbaxy Laboratories Limited Annual Report 2005 Consolidated Schedules

88
SCHEDULES FORMING PART OF THE CONSOLIDATED FINANCIAL STATEMENTSFOR THE YEAR ENDED DECEMBER 31, 2005
Rs. MillionsSCHEDULE 23 2005 2004
PROVISION FOR TAXCurrent Income-tax 401.03 1,753.28Deferred tax (1,098.60) 127.80
(697.57) 1,881.08SCHEDULE 24
EARNINGS PER SHARENet profit attributable to equity shareholders
including discontinued operationsProfit after tax and minority interests 2,617.07 6,985.61Add :Tax-earlier years (61.78) 11.24
Net profit available 2,555.29 6,996.85
Net profit attributable to equity shareholdersbefore exceptional items & discontinued operationsNet profit available 2,555.29 6,996.85Net profit from discontinued operations (695.42) (266.54)Interest in Joint venture written off 121.80 –Litigation settlement – 371.90
Tax effect of above items 140.85 (3.84)
2,122.52 7,098.37No. of weighted average equity shares
Basic 372,216,805 371,503,666Effect of dilutive equity shares equivalent
– stock options outstanding 1,089,479 1,849,060
Diluted 373,306,284 373,352,726
Nominal value of equity share (Rs.) 5.00 5.00EARNINGS PER SHARE (Rs.)
After exceptional items and including discontinued operationsBasic 6.87 18.83Diluted 6.85 18.74
Before exceptional items and excluding discontinued operationsBasic 5.70 19.11Diluted 5.69 19.01
Earnings per share for all period reported has been adjusted to reflect the share split from the face value of Rs. 10 each toRs. 5 each.
Consolidated Financial Statements – Indian GAAP

89
SCHEDULES FORMING PART OF THE CONSOLIDATED FINANCIAL STATEMENTSFOR THE YEAR ENDED DECEMBER 31, 2005
SCHEDULE 25
SIGNIFICANT ACCOUNTING POLICIES
1. Nature of operationsRanbaxy Laboratories Limited ("Parent Company"), a public limited company, together with its subsidiaries and jointventures (hereinafter collectively referred to as the "Group") operates as an integrated international pharmaceutical organizationwith businesses encompassing the entire value chain in the marketing, production and distribution of dosage forms andactive pharmaceutical ingredients. The Group is also engaged in the business of consumer healthcare products.The Group presently has manufacturing facilities in seven countries, namely India, United States of America, Ireland,China, Malaysia, Nigeria and Vietnam. Their major markets include United States of America, India, Europe, CIS andSouth Africa. The United States of America remained the largest market and major products are Amoxy Clav, Isotretroin,Clindamycin, Minocycline and Cefuroxime Axetil. The research and development activities of the Group are principallycarried out at its facilities in Gurgaon, India.The Parent Company's shares are listed for trading on the two leading stock exchanges in India and its Global DepositoryReceipts (covering equity shares of parent company) are listed on the Luxembourg Stock Exchange.
2. Basis of presentationThe financial statements have been prepared to comply with the mandatory Accounting Standards issued by the Institute ofChartered Accountants of India ('ICAI') and the relevant provisions of the Companies Act, 1956 (the 'Act'). The financialstatements have been prepared under the historical cost convention on accrual basis. The accounting policies have beenconsistently applied by the Company unless otherwise stated.
3. Use of estimatesIn preparing Group's financial statements in conformity with the accounting principles generally accepted in India, managementis required to make estimates and assumptions that affect the reported amounts of assets and liabilities and the disclosureof contingent liabilities at the date of the consolidated financial statements and reported amounts of revenues and expensesduring the reporting period; actual results could differ from those estimates.
4. Principles of consolidationThe consolidated financial statements include the financial statements of the Parent Company, its subsidiaries and jointventures (collectively referred to as "Group").The consolidated financial statements have been combined on a line-by-line basis by adding the book values of like items ofassets, liabilities, income and expenses after eliminating intra-group balances / transactions and unrealized profits in full.The amounts shown in respect of reserves comprise the amount of the relevant reserves as per the balance sheet of theParent Company and its share in the post-acquisition increase in the relevant reserves of the consolidated entities.Proportionate share of interest in joint ventures has been accounted for by the proportionate consolidation method inaccordance with Accounting Standard - 27 - Financial Reporting of Interests in Joint Ventures, issued by the ICAI.The excess / deficit of cost to the Parent Company of its investment over its portion of net worth in the consolidated entitiesat the respective dates on which the investment in such entities was made is recognized in the financial statements asgoodwill / capital reserve. The Parent Company's portion of net worth in such entities is determined on the basis of bookvalues of assets and liabilities as per the financial statements of the entities as on the date of investment and if not available,the financial statements for the immediately preceding period adjusted for the effects of significant changes.Entities acquired during the year have been consolidated from the respective dates of their acquisition.The consolidated financial statements are presented, to the extent possible, in the same format as that adopted by the ParentCompany for its separate financial statements.
5. New accounting standardsThe Group has adopted the revised Accounting Standard - 11 - The Effects of Changes in Foreign Exchange rates (AS 11),issued by the ICAI, effective for the accounting periods commencing on or after April 1, 2004. The revised standard prescribesprinciples of classification and corresponding methodology for translation of financial statements of foreign operations.In accordance with revised AS 11, the foreign subsidiaries Ranbaxy Holding U.K Limited, Ranbaxy Hong Kong Limited andRanbaxy Netherlands B.V. have been identified as integral operations. The financial statements of the foreign integralsubsidiaries are translated into Indian Rupees as follows:• All monetary assets and liabilities are translated into Indian Rupees at the appropriate year-end exchange rates.• Non-monetary assets, being investments and fixed assets, are translated using exchange rate at the date of their
acquisition.• Income and expenses are translated using the monthly average exchange rates in effect during the year being reported.• The resulting net exchange differences from translation of items in the financials statements are reported as income and
expenses for the year.The foreign subsidiaries other than mentioned above are identified as non-integral subsidiaries and are translated into IndianRupees as follows:• All assets and liabilities are translated into Indian Rupees at the appropriate year-end exchange rates.• Income and expenses are translated using the monthly average exchange rates in effect during the year being reported.• The resulting exchange rate differences are reported as a component of reserve and surplus under the head Translation Reserve.
Ranbaxy Laboratories Limited Annual Report 2005 Consolidated Schedules

90
SCHEDULES FORMING PART OF THE CONSOLIDATED FINANCIAL STATEMENTSFOR THE YEAR ENDED DECEMBER 31, 2005
SCHEDULE 25
SIGNIFICANT ACCOUNTING POLICIES (Contd.)
The Group has adopted the Accounting Standard - 24 - Discontinuing operations (AS 24), issued by the ICAI, effective for theaccounting periods commencing on or after April 1, 2004. The standard establishes principles for reporting information aboutdiscontinuing operations. The objective of the standard is to enhance the ability of the users of financial statements to makeprojections of an enterprise's cash flow, earning-generating capacity, and financial position by segregating information aboutdiscontinuing operations from information about continuing operations. Pursuant to the adoption of AS 24, the Group hasclassified its Allied Business portfolio, consisting of Fine Chemicals business, Animal Health Care business and Diagnosticsbusiness as discontinued operations.The Group has adopted the Accounting Standard - 29 - Provisions, Contingent Liabilities and Contingent Assets (AS 29),issued by the ICAI, effective for the accounting periods commencing on or after April 1, 2004. The Standard requires that theappropriate recognition criteria and measurement bases are applied to provisions and contingent liabilities and that sufficientinformation is disclosed in the notes to the financial statements to enable users to understand their nature, timing and amount.
6. Fixed assetsFixed assets are stated at cost less accumulated depreciation and impairment losses. Cost comprises the purchase price andany attributable cost of bringing the asset to its working condition for its intended use.Borrowing costs directly attributable to acquisition or construction of fixed assets which necessarily take a substantial periodof time to get ready for their intended use are capitalised.
7. DepreciationDepreciation on fixed assets is provided on straight line method over useful life estimated by the management or on the basisof depreciation rates prescribed under respective domestic laws.Premium paid on perpetual leasehold land is charged to revenue on termination / renewal of lease agreements.
8. IntangiblesTrademarks and product licensesCosts relating to trademarks and product licences, which are acquired, are capitalised and amortised on a straight-line basisover a period of 5 years.Computer softwareSoftware which is not an integral part of the related hardware, is classified as an intangible asset and is being amortised overa period of 6 years, being the estimated useful life.Non-competeNon-compete compensation is capitalised and amortised on a straight line basis over the life of the non-compete agreement.GoodwillGoodwill reflects the excess of the purchase price over the book value of net assets acquired. Goodwill arising on acquisitionof subsidiaries / business is being tested for impairment on an annual basis.Product DevelopmentCost incurred for acquiring rights for product under development are recognised as intangible assets and amortised on astraight-line basis over a period of 5 years from the date of regulatory approval. Subsequent expenditures on developmentof such products are added to the cost of intangibles.
9. InvestmentsInvestments that are readily realisable and intended to be held for not more than a year are classified as current investments.All other investments are classified as long-term investments. Current investments are carried at lower of cost and fair valuedetermined on an individual investment basis. Long-term investments are carried at cost. However, provision for diminutionin value is made to recognise a decline other than temporary in the value of the investments.Profit / loss on sale of investments is computed with reference to their average cost.
10. InventoriesInventories are valued as follows:Raw materials, stores and spares and packaging materialsLower of cost and net realizable value. However, materials and other items held for use in the production of finished goodsare not written down below cost, if the products in which they will be incorporated are expected to be sold at or above cost.Cost is determined on a weighted average basis.Finished goodsLower of cost and net realizable value. Cost includes direct materials and labour and a proportion of manufacturingoverheads based on normal operating capacity. Cost of finished goods includes excise duty.Work-in-processAt cost upto estimated stage of process. Cost includes direct materials and labour and a proportion of manufacturingoverheads based on normal operating capacity.
Consolidated Financial Statements – Indian GAAP

91
Net realizable value is the estimated selling price in the ordinary course of business, less estimated costs of completion andthe estimated costs necessary to make the sale.
Where duty paid / indigenous materials are consumed, in manufacture of products for export, prior to duty-free import ofmaterials under the Advance License Scheme, the estimated excess cost of such materials over that of duty free materialsis carried forward in the cost of raw materials and charged to revenue on consumption of such duty-free materials.
11. Expenditure on regulatory approvalsExpenditure incurred for obtaining regulatory approvals and registration of products for overseas markets and productacquisitions is charged to revenue.
12. Employees stock option planThe accounting value of stock options representing the excess of the market price over the exercise price of the sharesgranted under "Employees Stock Option Scheme" of the Company, is amortised as "Deferred employees compensation" onstraight-line basis over the vesting period in accordance with the SEBI (Employee Stock Option Scheme and Employee StockPurchase Scheme) Guidelines, 1999.
13. Revenue recognitionRevenue is recognised to the extent that it can be reliably measured and is probable that the economic benefits will flow to theCompany.
Sale of GoodsRevenue from sale of goods is recognised when the significant risks and rewards of ownership of the goods are transferred tothe customer and is stated net of trade discounts, excise duty, sales returns and sales tax.
Royalties, Technical know-how and Licensing incomeRevenue is recognized on accrual basis in accordance with the terms of the relevant agreement.
InterestRevenue is recognised on a time proportion basis taking into account the amount outstanding and the rate applicable.
DividendsRevenue is recognised when the right to receive is established.
ChargebacksIn the United States, amongst our large customers are the major wholesalers who resell our products to third partycustomers like managed care organisations, drug store chains and pharmacies. A significant part of our gross revenues fromsuch wholesalers are subject to various forms of rebates and allowances (known as "Chargebacks"), which are recorded asreductions from gross revenues. The computation of the estimate for expected chargebacks is complex and involvessignificant judgment based on historical experience and estimated wholesaler inventory levels, as well as expected sell-through levels by the wholesalers to indirect customers. The primary factors we consider in developing and evaluating ourprovision for chargebacks include the average historical chargeback credits and an estimate of the inventory held by ourwholesalers, based on internal analysis of wholesaler’s historical purchases and contract sales.
14. Export benefits/incentiveExport entitlements under the Duty Entitlement Pass Book ("DEPB") Scheme are recognised in the profit and loss accountwhen the right to receive credit as per the terms of the scheme is established in respect of the exports made.
Obligations / entitlements on account of Advance Licence Scheme for import of raw materials are accounted for onpurchase of raw materials and / or export sales.
15. Research and developmentRevenue expenditure incurred on research and development is charged to profit and loss account in the year it is incurred.
Capital expenditure is included in the respective heads under fixed assets.
16. Foreign exchange translationsIndian Rupee is the reporting currency for the Group. However, the local currencies of overseas subsidiaries and joint venturesare different from the reporting currency of the Group. The translation of local currencies into Indian Rupee is performed forassets and liabilities (excluding share capital, opening reserves and surplus), using the exchange rate as at the balance sheetdate, for revenues, costs and expenses using weighted average exchange rate during the reporting period. Share capital andopening reserves and surplus are carried at historical cost. Resultant currency translation exchange gain/ loss is carried asforeign currency translation reserve under reserves and surplus. Investments in foreign entities are recorded at the exchangerates prevailing on the date of making the investments.
Income and expenditure items of integral foreign operations are translated at the monthly average exchange rate of theirrespective foreign currencies. Monetary items at the balance sheet date are translated using the year-end rates. Non-monetary assets are recorded at the rates prevailing on the date of the transaction.
SCHEDULES FORMING PART OF THE CONSOLIDATED FINANCIAL STATEMENTSFOR THE YEAR ENDED DECEMBER 31, 2005
SCHEDULE 25
SIGNIFICANT ACCOUNTING POLICIES (Contd.)
Ranbaxy Laboratories Limited Annual Report 2005 Consolidated Schedules

92
SCHEDULES FORMING PART OF THE CONSOLIDATED FINANCIAL STATEMENTSFOR THE YEAR ENDED DECEMBER 31, 2005
SCHEDULE 25
SIGNIFICANT ACCOUNTING POLICIES (Contd.)
Consolidated Financial Statements – Indian GAAP
Transactions in foreign currencies are recorded by the reporting entities in their local currency at the rates prevailing on thedate of the transaction. Monetary items denominated in foreign currency are restated at the rate prevailing on the balancesheet date.Exchange differences arising on the settlement of monetary items or on reporting company's monetary items at ratesdifferent from those at which they were initially recorded during the year, or reported in the previous financial statements, arerecognised as income or expenses in the year in which they arise, except for exchange differences arising on loans denominatedin foreign currencies utilized for acquisition of fixed assets from outside India, where the exchange gains / losses are adjustedto the cost of such assets.The exchange differences arising on forward contracts other than those entered into to hedge the foreign currency risk of firmcommitments or highly probable forecast transactions are recognized in the period in which they arise based on the differencebetween i) foreign currency amount of the contract translated at the exchange rate on the reporting date and ii) the sameforeign currency amount translated at the later of the date of inception of the forward exchange contract or the last reportingdate. The premium or discount on all such contracts arising at the inception of each contract is amortised as expense orincome over the life of the contract.The premium or discount arising at the inception of the forward contracts entered into to hedge the foreign currency risk offirm commitments or highly probable forecast transactions is amortised as expense or income over the life of the contract.Any profit or loss arising on cancellation or renewal of forward exchange contracts is recognized as income or expense for theyear.
17. Retirement benefitsProvisions for liabilities in respect of gratuity, pension and leave encashment benefits are made based on actuarial valuationmade by an independent actuary as at the balance sheet date.Contributions in respect of provident fund, superannuation and gratuity are made to Trust set up by the Company for thepurpose and charged to profit and loss account.
18. Earnings per shareBasic earnings per share are calculated by dividing the net profit or loss for the period attributable to equity shareholders bythe weighted average number of equity shares outstanding during the period. The weighted average numbers of equityshares outstanding during the period are adjusted for events of bonus issue and share split.For the purpose of calculating diluted earnings per share, the net profit or loss for the period attributable to equity shareholdersand the weighted average number of shares outstanding during the period are adjusted for the effects of all dilutive potentialequity shares.
19. Taxes on incomeProvision for tax for the year comprises estimated current income-tax determined to be payable in respect of taxable incomeand deferred tax being the tax effect of timing differences representing the difference between taxable and accounting incomethat originate in one period and are capable of reversal in one or more subsequent periods and is calculated in accordance withthe relevant domestic tax laws. Deferred tax is measured based on the tax rates and the tax laws enacted or substantivelyenacted at the balance sheet date. Deferred tax assets are recognized only to the extent that there is reasonable certainty thatsufficient future taxable income will be available against which such deferred tax assets can be realized.
20. Contingent liabilitiesDepending on the facts of each case and after due evaluation of relevant legal aspects, the Company creates a provisionwhen there is a present obligation as a result of a past event where the out flow of economic resources is probable and areliable estimate of the amount of obligation can be made. The disclosure is made for all possible or present obligations thatmay but probably will not require out flow of resources as contingent liabilities in the financial statements.
21. Impairment of assetsThe Company on an annual basis makes an assessment of any indicator that may lead to impairment of assets. If any suchindication exists, the Company estimates the recoverable amount of the assets. If such recoverable amount is less than thecarrying amount, then the carrying amount is reduced to its recoverable amount by treating the difference between them asimpairment loss and is charged to profit and loss account.
22. Lease accountingi) Assets acquired on lease where the Company has substantially all the risks and rewards of ownership are classified as
finance leases. Such assets are capitalised at the inception of the lease at the lower of fair value or the present value ofminimum lease payments and a liability is created for an equivalent amount. Each lease rental paid is allocated betweenthe liability and the interest cost, so as to obtain a constant periodic rate of interest on the outstanding liability for eachperiod.
ii) Operating lease payments are recognised as an expense in the profit and loss account on a straight line basis over thelease term.
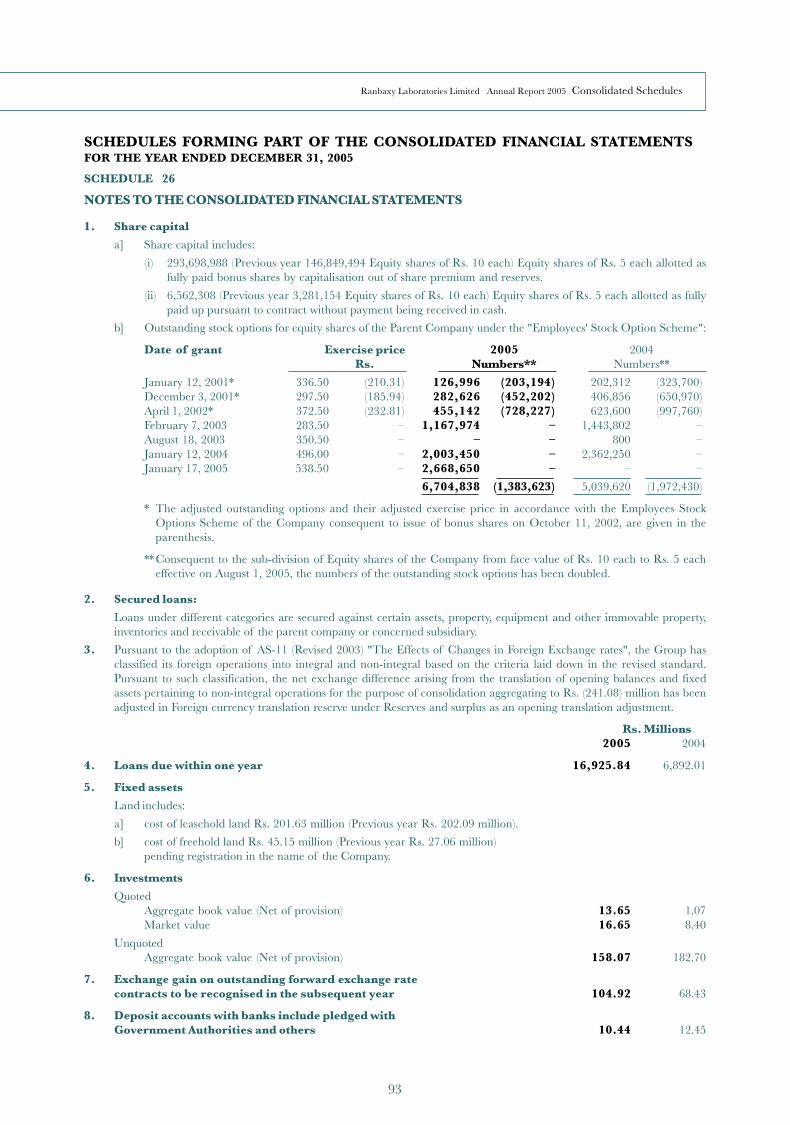
93
Ranbaxy Laboratories Limited Annual Report 2005 Consolidated Schedules
1. Share capital
a] Share capital includes:
(i) 293,698,988 (Previous year 146,849,494 Equity shares of Rs. 10 each) Equity shares of Rs. 5 each allotted asfully paid bonus shares by capitalisation out of share premium and reserves.
(ii) 6,562,308 (Previous year 3,281,154 Equity shares of Rs. 10 each) Equity shares of Rs. 5 each allotted as fullypaid up pursuant to contract without payment being received in cash.
b] Outstanding stock options for equity shares of the Parent Company under the "Employees' Stock Option Scheme":
Date of grant Exercise price 2005 2004Rs. Numbers** Numbers**
January 12, 2001* 336.50 (210.31) 126,996 (203,194) 202,312 (323,700)December 3, 2001* 297.50 (185.94) 282,626 (452,202) 406,856 (650,970)April 1, 2002* 372.50 (232.81) 455,142 (728,227) 623,600 (997,760)February 7, 2003 283.50 – 1,167,974 – 1,443,802 –August 18, 2003 350.50 – – – 800 –January 12, 2004 496.00 – 2,003,450 – 2,362,250 –January 17, 2005 538.50 – 2,668,650 – – –
6,704,838 (1,383,623) 5,039,620 (1,972,430)
* The adjusted outstanding options and their adjusted exercise price in accordance with the Employees StockOptions Scheme of the Company consequent to issue of bonus shares on October 11, 2002, are given in theparenthesis.
**Consequent to the sub-division of Equity shares of the Company from face value of Rs. 10 each to Rs. 5 eacheffective on August 1, 2005, the numbers of the outstanding stock options has been doubled.
2. Secured loans:
Loans under different categories are secured against certain assets, property, equipment and other immovable property,inventories and receivable of the parent company or concerned subsidiary.
3. Pursuant to the adoption of AS-11 (Revised 2003) "The Effects of Changes in Foreign Exchange rates", the Group hasclassified its foreign operations into integral and non-integral based on the criteria laid down in the revised standard.Pursuant to such classification, the net exchange difference arising from the translation of opening balances and fixedassets pertaining to non-integral operations for the purpose of consolidation aggregating to Rs. (241.08) million has beenadjusted in Foreign currency translation reserve under Reserves and surplus as an opening translation adjustment.
Rs. Millions2005 2004
4. Loans due within one year 16,925.84 6,892.01
5. Fixed assets
Land includes:
a] cost of leasehold land Rs. 201.63 million (Previous year Rs. 202.09 million).
b] cost of freehold land Rs. 45.15 million (Previous year Rs. 27.06 million)pending registration in the name of the Company.
6. Investments
QuotedAggregate book value (Net of provision) 13.65 1.07Market value 16.65 8.40
UnquotedAggregate book value (Net of provision) 158.07 182.70
7. Exchange gain on outstanding forward exchange ratecontracts to be recognised in the subsequent year 104.92 68.43
8. Deposit accounts with banks include pledged withGovernment Authorities and others 10.44 12.45
SCHEDULES FORMING PART OF THE CONSOLIDATED FINANCIAL STATEMENTSFOR THE YEAR ENDED DECEMBER 31, 2005
SCHEDULE 26
NOTES TO THE CONSOLIDATED FINANCIAL STATEMENTS

94
Consolidated Financial Statements – Indian GAAP
SCHEDULES FORMING PART OF THE CONSOLIDATED FINANCIAL STATEMENTSFOR THE YEAR ENDED DECEMBER 31, 2005
SCHEDULE 26
NOTES TO THE CONSOLIDATED FINANCIAL STATEMENTS (Contd.)
Rs. Millions2005 2004
9. Remuneration to directors of Parent Company*
Salaries and allowances 48.89 40.83Contribution to provident and other funds # 4.00 3.29Directors' fee 2.37 2.97Commission 28.87 56.78Perquisites 7.76 12.46
91.89 116.33
* Exclusive of provision for future liabilities in respect of retirement benefits (which are based on actuarial valuation doneon overall Company basis) and amortisation of deferred employees compensation on grant of stock options under"Employees' Stock Option Scheme" of the Company.
Exclusive of pension paid / payable to a non-executive director for the services rendered in earlier years as a whole-timedirector / employee Rs. 2.29 million (Previous year Rs. 2.29 million).
# Excludes Rs. 12.80 million paid in year 2004 as gratuity to a director upon his separation by the gratuity trust set up bythe Company.
Rs. Millions2005 2004
10. Contingent liabilities
Claims not acknowledged as debts* 1,028.46 971.65Indirect taxes* 206.12 206.53Guarantees to banks/others on account of joint ventures 24.90 5.31Bills purchased / discounted under letters of credit – 3.23
*Rs. 311.70 million (Previous year 301.19 million) deposited under protest.
Interest on certain claims may be payable as and when the outcome of therelated claim is determined and has not been included above.
11. Estimated amount of contracts remaining to be executed oncapital account and not provided for, net of advances 589.20 2,068.53
12. Leases
Finance lease :
a] The Group has acquired assets under finance lease comprising mainly of land,buildings and vehicles. The minimum lease rentals and the present value ofminimum lease payments as at December 31, 2005 and 2004, are under mentioned:a) Minimum lease payments outstanding 790.60 10.72b) Present value of minimum lease payments 651.17 8.00c) Amounts due
Minimum lease Present value of minimumpayments lease payments
Rs. Millions Rs. Millions2005 2004 2005 2004
(i) not later than one year 116.64 5.42 85.91 3.61(ii) later than one year but 306.60 5.30 260.08 4.39
not later than five years(iii) later than five years 367.36 – 305.18 –
Operating lease
b) The Group has leased various commercial premises and other facilities under non-cancelable operating lease.The future lease payments in respect of these are as follows:
Minimum lease payments: Rs. Millions
a. not later than one year 137.69b. later than one year but not later than five years 210.05c. later than five years 123.06
Total 470.80
The lease expense recognised during the year amounted to Rs. 313.83 million
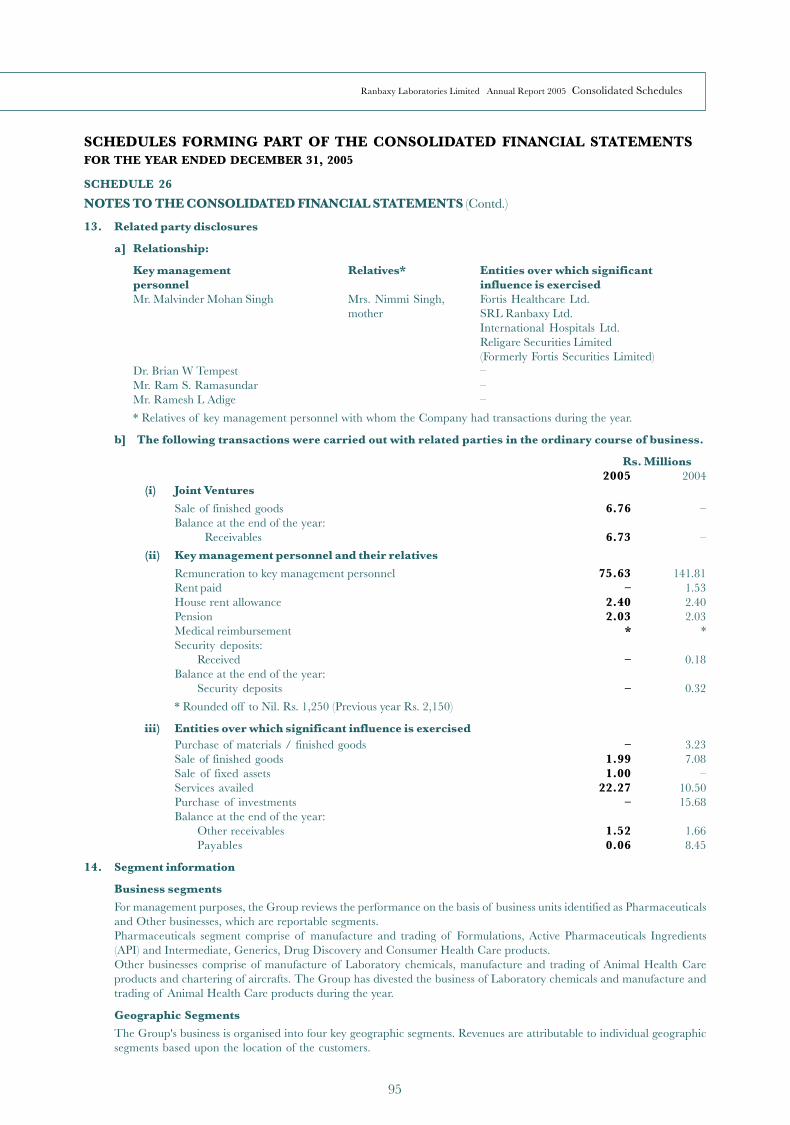
95
Ranbaxy Laboratories Limited Annual Report 2005 Consolidated Schedules
SCHEDULES FORMING PART OF THE CONSOLIDATED FINANCIAL STATEMENTSFOR THE YEAR ENDED DECEMBER 31, 2005
SCHEDULE 26
NOTES TO THE CONSOLIDATED FINANCIAL STATEMENTS (Contd.)
13. Related party disclosures
a] Relationship:
Key management Relatives* Entities over which significantpersonnel influence is exercisedMr. Malvinder Mohan Singh Mrs. Nimmi Singh, Fortis Healthcare Ltd.
mother SRL Ranbaxy Ltd.International Hospitals Ltd.Religare Securities Limited(Formerly Fortis Securities Limited)
Dr. Brian W Tempest –Mr. Ram S. Ramasundar –Mr. Ramesh L Adige –
* Relatives of key management personnel with whom the Company had transactions during the year.
b] The following transactions were carried out with related parties in the ordinary course of business.
Rs. Millions2005 2004
(i) Joint Ventures
Sale of finished goods 6.76 –Balance at the end of the year:
Receivables 6.73 –
(ii) Key management personnel and their relatives
Remuneration to key management personnel 75.63 141.81Rent paid – 1.53House rent allowance 2.40 2.40Pension 2.03 2.03Medical reimbursement * *Security deposits:
Received – 0.18Balance at the end of the year:
Security deposits – 0.32
* Rounded off to Nil. Rs. 1,250 (Previous year Rs. 2,150)
iii) Entities over which significant influence is exercisedPurchase of materials / finished goods – 3.23Sale of finished goods 1.99 7.08Sale of fixed assets 1.00 –Services availed 22.27 10.50Purchase of investments – 15.68Balance at the end of the year:
Other receivables 1.52 1.66Payables 0.06 8.45
14. Segment information
Business segments
For management purposes, the Group reviews the performance on the basis of business units identified as Pharmaceuticalsand Other businesses, which are reportable segments.Pharmaceuticals segment comprise of manufacture and trading of Formulations, Active Pharmaceuticals Ingredients(API) and Intermediate, Generics, Drug Discovery and Consumer Health Care products.Other businesses comprise of manufacture of Laboratory chemicals, manufacture and trading of Animal Health Careproducts and chartering of aircrafts. The Group has divested the business of Laboratory chemicals and manufacture andtrading of Animal Health Care products during the year.
Geographic Segments
The Group's business is organised into four key geographic segments. Revenues are attributable to individual geographicsegments based upon the location of the customers.

96
Consolidated Financial Statements – Indian GAAP
SCHEDULES FORMING PART OF THE CONSOLIDATED FINANCIAL STATEMENTSFOR THE YEAR ENDED DECEMBER 31, 2005
SCHEDULE 26
NOTES TO THE CONSOLIDATED FINANCIAL STATEMENTS (Contd.)
Other Information
All segment revenues, expenses, assets and liabilities are directly attributable to the segments and disclosed accordingly.Segment revenues, expenses and results include transfers between business segments. Inter-segment transfers are accounted forat selling price to the transferring segment. Such transfers are eliminated on consolidation.The accounting policies consistently used in the preparation of the financial statements are also applied to revenues andexpenditure of individual segments.
Segment information disclosures as required under accounting standard on "Segment Reporting" issued by Institute of CharteredAccountants of India.
a] Primary segment informationRs. Millions
Pharmaceuticals Others Segment Total Elimination Total
2005 2004 2005 2004 2005 2004 2005 2004 2005 2004REVENUEExternal revenue 51,343.06 53,072.25 1,472.81 1,439.75 52,815.87 54,512.00 – – 52,815.87 54,512.00Inter segment revenue 23.48 50.02 33.89 37.21 – – (57.37) (87.23) – –
Total revenue 51,366.54 53,122.27 1,506.70 1,476.96 52,873.24 54,599.23 (57.37) (87.23) 52,815.87 54,512.00
RESULTS
Total segment results 1,501.01 8,642.97 211.96 220.71 1,712.97 8,863.68 – – 1,712.97 8,863.68Interest expense (671.16) (334.88)Interest income 180.62 253.62Exceptional items (121.80) (371.90)Income from sale of undertaking 454.95 –Unallocated corporate income net of expenses 389.27 481.70Income taxes 697.57 (1,881.08)Profit after tax 2,642.42 7,011.14
OTHER INFORMATION
Segment assets 57,142.78 47,711.46 102.30 1,007.73 57,245.08 48,719.19 – – 57,245.08 48,719.19
Unallocated assets 5,140.65 5,391.81
Total assets 62,385.73 54,111.00
Segment liabilities 11,588.69 12,739.53 17.19 177.12 11,605.88 12,916.65 – – 11,605.88 12,916.65
Unallocated liabilities 26,309.84 16,088.66
Total liabilities 37,915.72 29,005.31
Capital Expenditure 9,694.10 8,335.94 141.51 217.03 9,835.61 8,552.97 – – 9,835.61 8,552.97
Depreciation, Amortisation& Impairment 1,424.59 1,196.27 19.93 18.56 1,444.52 1,214.83 – – 1,444.52 1,214.83
Non cash expenses other thanDepreciation, Amortisation& Impairment 185.54 277.47 1.83 6.06 187.37 283.53 – – 187.37 283.53
Unallocated non-cash expenses 0.67 22.31
188.04 305.84
b] Secondary segment information - Geographical
Rs. Millions
India Europe North America Asia Pacific
2005 2004 2005 2004 2005 2004 2005 2004
Segment revenue 12,650.86 12,272.75 11,583.19 10,575.59 15,096.61 19,938.33 5,184.06 4,646.31Segment assets 30,872.61 29,229.18 8,681.38 8,603.43 13,881.58 10,755.99 – –Capital expenditure 6,348.00 4,257.72 831.17 3,732.36 2,229.24 420.49 – –
15. Share Split
Pursuant to the approval granted by the shareholders at the Annual General Meeting held on June 30, 2005, the equity shareof face value of Rs. 10 each has been sub-divided in two equity shares of Rs. 5 each effective August 1, 2005. Accordingly,the numbers of equity shares have been increased proportionately.
16. a] Acquisition of additional ownership interest in Ranbaxy Farmaceutica Ltda., Brazil
As of December 31, 2004, Ranbaxy Netherlands B.V. ("RNBV") held 70 percent of the outstanding equity shares ofRanbaxy Farmaceutica Ltda. ("RFL"). During the year ended December 31, 2005, RNBV acquired an additional10 percent of the equity shares, resulting in a total holding of 80 percent at an aggregate consideration of

97
Ranbaxy Laboratories Limited Annual Report 2005 Consolidated Schedules
SCHEDULES FORMING PART OF THE CONSOLIDATED FINANCIAL STATEMENTSFOR THE YEAR ENDED DECEMBER 31, 2005
SCHEDULE 26
NOTES TO THE CONSOLIDATED FINANCIAL STATEMENTS (Contd.)
Rs. 87.36 million. This acquisition has been accounted for under the purchase method and excess of purchase priceover the aggregate of the proportionate book value of the net assets acquired amounting to Rs. 83.10 million hasbeen recorded as goodwill.
b] Additional equity stake in Nihon Pharmaceutical Industry Co., Ltd.
During the year ended December 31, 2005 RNBV has acquired 128,000 shares of common voting stock of NihonPharmaceutical Industry Co., Ltd. (NPI), a joint venture between Ranbaxy and Nippon Chemiphar Co. Ltd. (NC).This acquisition has resulted in a total holding of 50 percent by RNBV of the voting stock of NPI, from the earlier10 percent. RNBV has paid an aggregate consideration of Rs. 714.80 million. This acquisition has been accountedfor under the purchase method and excess of purchase price over the aggregate of the proportionate book value of thenet assets acquired amounting to Rs. 473.08 million has been recorded as goodwill.
17. Events occurring after the balance sheet date
a. Acquisitions
On March 29, 2006, Ranbaxy Netherlands B.V., signed a definitive agreement for the acquisition of Terapia S.A., aRomanian company engaged in the business of manufacturing generic pharmaceuticals, for a consideration ofapproximately Rs. 14,486 million. This transaction will be accounted for under the purchase method. During theyear ended December 31, 2005, the acquired company earned revenues of approximately Rs. 3,524.23 million.The major product lines of the acquired company include Cardiovascular, Respiratory, Musculoskeletal andAnti-infectives.
On February 14, 2006, RNBV acquired Ethimed NV, a generic pharmaceuticals company in Belgium. Further, onApril 1, 2006, the Company acquired substantial assets of the unbranded generic business of Allen S.p.A, a divisionof GlaxoSmithKline, in Italy, through its Italian subsidiary, Ranbaxy Italia S.p.A.
b. Foreign currency convertible bond offering
On March 17, 2006, the Company issued US $ 440,000,000 zero coupon convertible bonds (the "Bonds") listed in theSingapore Stock Exchange. Unless previously redeemed, converted or purchased and cancelled, the Bonds areconvertible at any time on or after April 27, 2006 up till March 8, 2011 into fully paid equity shares of par value ofRs. 5 each which may be represented by Global Depositary Shares (the "GDS"), with each GDS representing oneshare at a conversion price of Rs. 716.32 per share with a fixed rate of exchange of Rs. 44.15 per US $ 1.00.The conversion price is subject to adjustments in certain circumstances. At any time on or after March 18, 2009, onand prior to February 6, 2011, the Company may, subject to certain conditions, redeem the bonds in whole but not inpart at their early redemption amount as defined in the terms and conditions of the Bonds. Unless previouslyredeemed, converted or purchased and cancelled, the Bonds will be redeemed in US dollars on March 18, 2011 at126.765 percent of their principal amount.
c. Serious Fraud Office case
Though Ranbaxy UK Limited ("RUKL") has not received official notice of criminal proceeding being brought againstit by Serious Fraud Office, UK for alleged anti-competitive conduct in connection with the supply of penicillin-basedantibiotics between 1996 and 2000, the Company is aware of the same through media reports. RUKL, if found guiltywill be subject to a fine. However, management does not consider it necessary to make any provision against suchproceedings.
Earlier in March 2005, RUKL had reached a final settlement of claims brought against it by Department of Health,Prescription Pricing Authority, UK and others in connection with supply of generic drugs to National HealthServices, UK (NHS), whereby it had agreed to compensate NHS for Rs. 371.90 million, without admission ofliability.
18. Discontinued operations
During the year, the Company divested its Allied Business portfolio, consisting of Fine Chemicals business, Animal HealthCare Business and Diagnostics business.
The Allied business portfolio was sold for a net selling price of Rs. 1,246.72 million constituting of Rs. 1,096.72 million incash and Rs. 150 million as 7 percent loan for a period of 5 years. The Company has recognised a gain of Rs. 454.95 millionunder "Profit from sale of undertaking" from divestment of Allied Business Portfolio.
The entire sales consideration was received in cash by the balance sheet date except for the amount of Rs. 28.64 million tobe kept in the escrow account as per the agreement.
Prior to sale, the Allied Business portfolio was reported as a part of "Others" business segment.
The Company has classified the assets, liabilities and results of operations for the Allied business portfolio as discontinued

98
Consolidated Financial Statements – Indian GAAP
SCHEDULES FORMING PART OF THE CONSOLIDATED FINANCIAL STATEMENTSFOR THE YEAR ENDED DECEMBER 31, 2005
SCHEDULE 26
NOTES TO THE CONSOLIDATED FINANCIAL STATEMENTS (Contd.)
operations in accordance with AS 24. The following table reflects the carrying values of the primary components of thebusiness.
Rs. Millions2004
Description
Property, plant and equipment 189.90Accounts receivable net of allowances 275.62Inventory 393.76Other assets 129.39Total assets 988.67Accounts payable 108.28Other liabilities 83.78Net assets 796.61In 2005, the Company decided to close its joint venture "Thembalami Pharmaceuticals (Pty.) Ltd." in South Africa. Theprocess for liquidation of the joint venture has been initiated and is likely to be completed in 2006. The joint venture isdormant with no net worth.
19. Interest in Joint venture written off for Rs. 121.80 million represents share of loss in joint venture "Ranbaxy Signature,LLC" which is not recoverable consequent to discontinuation of promotion of products of joint venture.
20. Consolidated financial statements comprise the financial statements of the Parent Company, its subsidiaries and jointventures listed below:
Subsidiary Country of Effective groupincorporation shareholding (%)
Ranbaxy Drugs and Chemicals Company India 100.00(A public company with unlimited liability)Ranbaxy Drugs Limited India 100.00Ranbaxy Fine Chemicals Limited # India 100.00Rexcel Pharmaceuticals Limited India 100.00Solus Pharmaceuticals Limited India 100.00Vidyut Investments Limited India 100.00Ran Air Services Limited India 100.00(Formerly Vidyut Travel Services Limited)Ranbaxy (Netherlands) B.V. ("RNBV") Netherlands 100.00Ranbaxy N.A.N.V Netherlands 100.00Ranbaxy (S.A.) (Proprietary) Limited South Africa 100.00Ranbaxy Inc. United States of America 100.00(Formerly Ranbaxy Pharmaceuticals, Inc)Ranbaxy Pharmaceuticals, Inc United States of America 100.00Ranbaxy USA, Inc United States of America 100.00Ohm Laboratories, Inc United States of America 100.00Ranbaxy Laboratories Inc United States of America 100.00Ranbaxy Holdings (UK) Limited United Kingdom 100.00Ranbaxy (UK) Limited United Kingdom 100.00Ranbaxy Ireland Limited Ireland 100.00Ranbaxy (Hong Kong) Limited Hong Kong 100.00Ranbaxy Egypt (L.L.C.) Egypt 100.00Ranbaxy Poland S.P. Zoo. Poland 100.00Ranbaxy Pharmaceuticals B.V. Netherlands 100.00Ranbaxy Europe Limited United Kingdom 100.00Basics GmbH Germany 100.00Ranbaxy Do Brasil Ltda. Brazil 100.00Ranbaxy Panama, S.A. Panama 100.00Ranbaxy Vietnam Company Limited Vietnam 100.00Ranbaxy Pharmacie Generiques SAS France 100.00(Formerly RPG (Aventis) S.A.)

99
Ranbaxy Laboratories Limited Annual Report 2005 Consolidated Schedules
SCHEDULES FORMING PART OF THE CONSOLIDATED FINANCIAL STATEMENTSFOR THE YEAR ENDED DECEMBER 31, 2005
SCHEDULE 26
NOTES TO THE CONSOLIDATED FINANCIAL STATEMENTS (Contd.)
On behalf of the Board of Directors
For WALKER, CHANDIOK & CO TEJENDRA KHANNA DR. BRIAN W. TEMPEST MALVINDER MOHAN SINGHChartered Accountants Chairman Chief Mentor & CEO & Managing Director
Executive Vice Chairman
VINOD CHANDIOK RAMESH L ADIGE HARPAL SINGH VIVEK BHARAT RAMPartner Whole-time Director Director DirectorMembership No. 10093
RAM S. RAMASUNDAR SUSHIL K. PATAWARIPlace : Gurgaon President & CFO SecretaryDated : April 19, 2006
Office Pharmaceutique Industriel et Hospitalier SARL France 100.00("OPIH SARL")Ranbaxy France SAS # France 100.00Ranbaxy PRP (Peru) S.A.C. Peru 100.00Laboratorios Ranbaxy, S.L. Spain 100.00ZAO Ranbaxy Russia 100.00Ranbaxy Portugal - Com E Desenvolv De Prod Portugal 100.00 Farmaceuticos Unipessoal LdaRanbaxy Australia Pty. Ltd Australia 100.00Ranbaxy Italia S.p.A Italy 100.00Ranbaxy Hungary Kft Hungary 100.00Ranbaxy Mexico S.A. de C.V. Mexico 100.00Ranbaxy Pharmaceuticals Canada Inc Canada 100.00Unichem Distributors Ltd. Thailand 99.96Bounty Holdings Company Limited Thailand 99.30Unichem Pharmaceuticals Limited Thailand 98.50Gufic Pharma Limited India 98.00Ranbaxy Unichem Company Limited Thailand 88.56(Formerly Ranbaxy (Thailand) Co. Ltd.)Ranbaxy Nigeria Limited Nigeria 84.89Ranbaxy (Guangzhou China) Limited China 83.00Ranbaxy Farmaceutica Ltda. Brazil 80.00(Formerly Ranbaxy S.P. Medicamentos Ltda)Ranbaxy Signature, LLC United States of America 67.50Ranbaxy Malaysia Sdn. Bhd. Malaysia 68.05Sonke Pharmaceuticals (Proprietary) Limited South Africa 100.00
Joint VentureNihon Pharmaceutical Industry Co., Ltd Japan 50.00Thembalami Pharmaceuticals (Pty.) Ltd. South Africa 50.00
# disposed off during the year
21. Previous year figuresPrevious year figures have been regrouped / recast wherever considered necessary to make these comparable with those of thecurrent year.
Signatories to schedules 1 to 26
Subsidiary Country of Effective groupincorporation shareholding (%)

100
FINANCIAL DETAILS OF THE SUBSIDIARY COMPANIES
Rs. MillionsClosing Capital Reserves Total Total Investments Turnover Profit Provision Profit Proposed
exchange assets liabilities (except in before for after dividendrate case of taxation taxation taxation
against investmentIndian subsidiaries)*Rupee
as onDecember31, 2005
Solus Pharmaceuticals Ltd. – 30.01 (4.13) 32.80 6.93 – 34.65 2.03 0.77 1.26 –
Rexcel Pharmaceuticals Ltd. – 10.00 38.17 78.60 30.42 – 107.70 6.64 3.23 3.41 –
Vidyut Investments Ltd. – 250.08 75.47 679.87 354.31 – – 43.39 2.74 40.65 –
Ran Air Services Ltd. – 10.00 (5.73) 63.37 59.10 – 16.62 (2.52) (1.82) (4.34) –(Formerly Vidut TravelServices Limited)
Ranbaxy Drugs andChemicals Company(A public company withunlimited liability) – 62.00 1.30 64.12 0.82 34.30 – 1.93 0.61 1.32 –
Ranbaxy Drugs Ltd. – 31.00 (0.38) 33.68 3.06 31.00 – (0.01) – (0.01) –
Gufic Pharma Ltd. – 0.50 0.65 1.93 0.78 – – 0.35 0.03 0.32 –
Ranbaxy(Guangzhou China) Ltd.,China 5.5863 364.51 (229.87) 449.36 314.72 – 579.50 (17.26) – (17.26) –
Ranbaxy (Netherlands)B.V. (Consolidated),Netherlands 45.0700 2,478.98 2,351.59 21,734.37 16,903.80 384.20 25,032.25 (1,528.42) 364.02 (1,164.39) –
Ranbaxy Nigeria Ltd.,Nigeria 0.3505 14.02 120.83 424.39 289.54 – 874.91 81.03 25.95 55.08 7.01
Ranbaxy(Hong Kong) Ltd.,(Consolidated),Hongkong 45.0700 13.95 (48.31) 0.92 35.28 – 0.11 (1.59) – (1.59) –
Bounty HoldingsCompany Ltd.,Thailand 1.0958 6.03 (5.98) 0.09 0.04 – – (0.06) – (0.06) –
Ranbaxy UnichemCompany Ltd.,Thailand 1.0958 109.58 39.28 195.03 46.17 0.40 344.08 54.43 16.14 38.29 4.38
UnichemPharmaceuticals Ltd.,Thailand 1.0958 4.38 (4.51) 0.15 0.27 – – (0.06) – (0.06) –
Ranbaxy MalaysiaSdn. Bhd., Malaysia 11.9233 95.39 239.44 567.67 232.84 – 627.33 128.08 20.51 107.57 13.43
Ranbaxy PharmacieGeneriques SAS(Consolidated),France 53.4321 398.31 161.30 1,618.13 1,653.66 – 3,371.81 (140.78) (69.02) (71.76) –
FOR THE YEAR ENDED DECEMBER 31, 2005
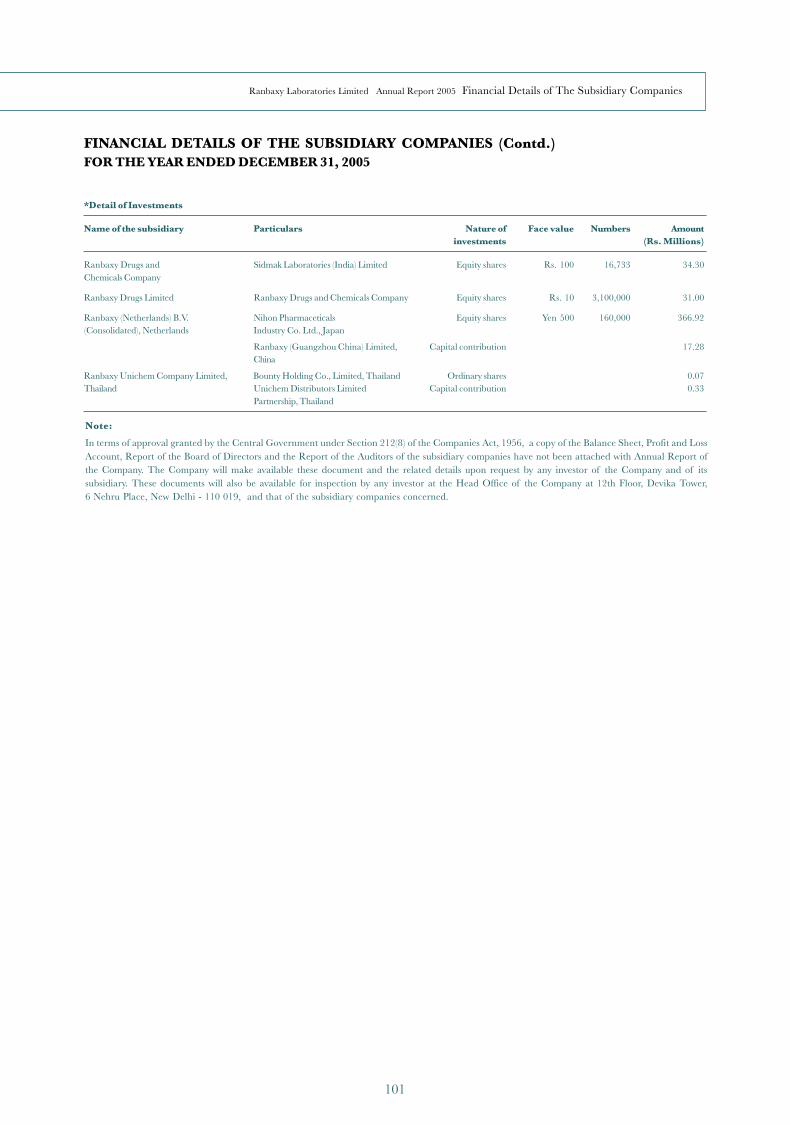
101
FINANCIAL DETAILS OF THE SUBSIDIARY COMPANIES (Contd.)FOR THE YEAR ENDED DECEMBER 31, 2005
*Detail of Investments
Name of the subsidiary Particulars Nature of Face value Numbers Amountinvestments (Rs. Millions)
Ranbaxy Drugs and Sidmak Laboratories (India) Limited Equity shares Rs. 100 16,733 34.30Chemicals Company
Ranbaxy Drugs Limited Ranbaxy Drugs and Chemicals Company Equity shares Rs. 10 3,100,000 31.00
Ranbaxy (Netherlands) B.V. Nihon Pharmaceticals Equity shares Yen 500 160,000 366.92(Consolidated), Netherlands Industry Co. Ltd., Japan
Ranbaxy (Guangzhou China) Limited, Capital contribution 17.28China
Ranbaxy Unichem Company Limited, Bounty Holding Co., Limited, Thailand Ordinary shares 0.07Thailand Unichem Distributors Limited Capital contribution 0.33
Partnership, Thailand
Note:
In terms of approval granted by the Central Government under Section 212(8) of the Companies Act, 1956, a copy of the Balance Sheet, Profit and LossAccount, Report of the Board of Directors and the Report of the Auditors of the subsidiary companies have not been attached with Annual Report ofthe Company. The Company will make available these document and the related details upon request by any investor of the Company and of itssubsidiary. These documents will also be available for inspection by any investor at the Head Office of the Company at 12th Floor, Devika Tower,6 Nehru Place, New Delhi - 110 019, and that of the subsidiary companies concerned.
Ranbaxy Laboratories Limited Annual Report 2005 Financial Details of The Subsidiary Companies
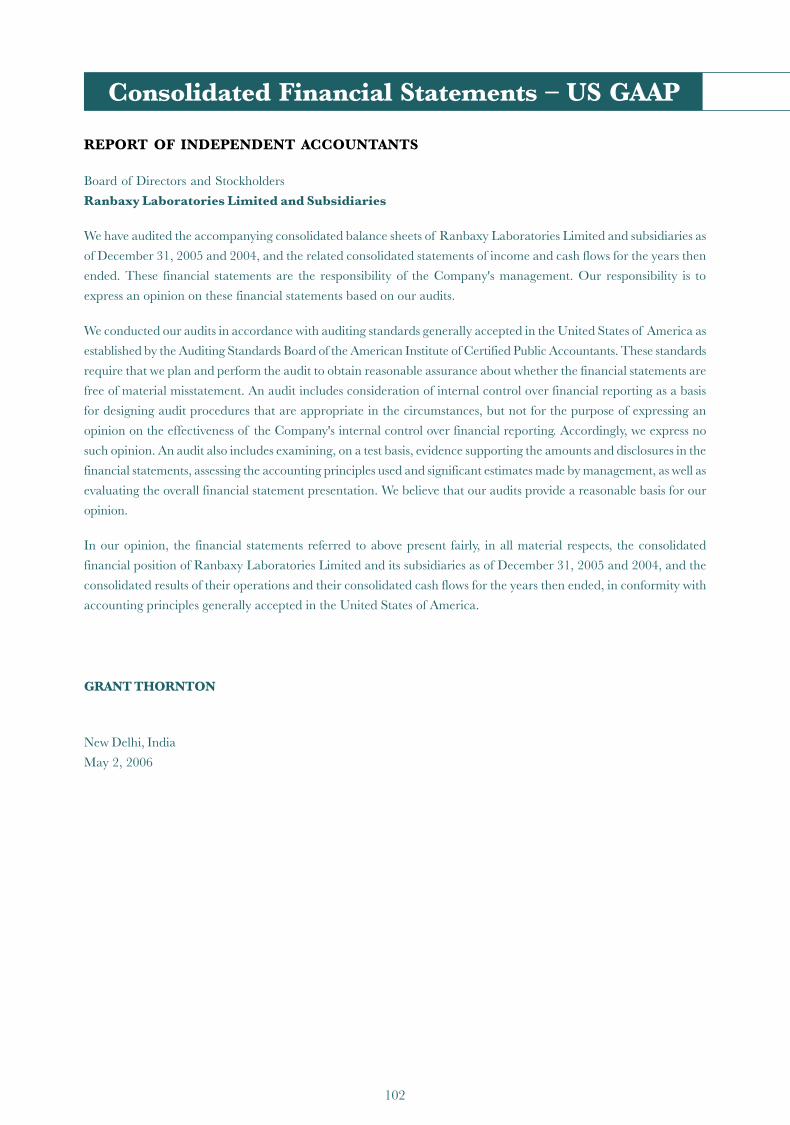
102
REPORT OF INDEPENDENT ACCOUNTANTS
Board of Directors and Stockholders
Ranbaxy Laboratories Limited and Subsidiaries
We have audited the accompanying consolidated balance sheets of Ranbaxy Laboratories Limited and subsidiaries as
of December 31, 2005 and 2004, and the related consolidated statements of income and cash flows for the years then
ended. These financial statements are the responsibility of the Company's management. Our responsibility is to
express an opinion on these financial statements based on our audits.
We conducted our audits in accordance with auditing standards generally accepted in the United States of America as
established by the Auditing Standards Board of the American Institute of Certified Public Accountants. These standards
require that we plan and perform the audit to obtain reasonable assurance about whether the financial statements are
free of material misstatement. An audit includes consideration of internal control over financial reporting as a basis
for designing audit procedures that are appropriate in the circumstances, but not for the purpose of expressing an
opinion on the effectiveness of the Company's internal control over financial reporting. Accordingly, we express no
such opinion. An audit also includes examining, on a test basis, evidence supporting the amounts and disclosures in the
financial statements, assessing the accounting principles used and significant estimates made by management, as well as
evaluating the overall financial statement presentation. We believe that our audits provide a reasonable basis for our
opinion.
In our opinion, the financial statements referred to above present fairly, in all material respects, the consolidated
financial position of Ranbaxy Laboratories Limited and its subsidiaries as of December 31, 2005 and 2004, and the
consolidated results of their operations and their consolidated cash flows for the years then ended, in conformity with
accounting principles generally accepted in the United States of America.
GRANT THORNTON
New Delhi, India
May 2, 2006
Consolidated Financial Statements – US GAAP

103
RANBAXY LABORATORIES LIMITED AND SUBSIDIARIES
CONSOLIDATED BALANCE SHEET(All amounts in Rupees Million, unless otherwise stated)
As at December 31,
2005 2004
ASSETS
Current assets
Cash and cash equivalents 2,286.33 1,246.05
Restricted cash 64.79 80.44
Accounts receivable, net of allowances 11,237.96 11,387.89
Inventories 13,539.97 14,440.52
Deferred income taxes 1,806.51 1,474.19
Income taxes recoverable 1,558.02 3,689.79
Other current assets, net of allowances 3,416.30 4,456.87
Total current assets 33,909.88 36,775.75
Property, plant and equipment, net 17,325.11 10,560.95
Deferred income taxes, net of allowances 1,803.44 268.81
Investment securities 423.21 181.22
Goodwill, net 4,379.95 3,831.37
Intangible assets, net 1,334.19 1,494.70
Other assets 670.96 329.91
Total assets 59,846.74 53,442.71
LIABILITIES AND STOCKHOLDERS’ EQUITY
Current liabilities
Borrowings from banks and financial institutions 13,748.02 4,479.65
Current portion of long term debt 3,142.86 2,415.97
Accounts payable 7,357.27 8,301.76
Income taxes payable 765.14 2,460.16
Accrued expenses 2,085.65 2,354.63
Other current liabilities 1,346.42 1,757.93
Total current liabilities 28,445.36 21,770.10
Long-term debt, excluding current portion 3,116.74 1,631.99
Deferred revenues 138.96 23.00
Deferred income taxes 1,600.33 1,041.86
Other liabilities 958.71 724.58
Total liabilities 34,260.10 25,191.53
Minority interest 164.72 182.87
Commitments and contingencies (See Note K, L, S and V)
Stockholders' equity
Common stock, Rs. 5.00 par value,598,000,000 equity shares authorized,372,442,190 and 371,781,484 equity sharesissued and outstanding at December 31, 2005 and 2004, respectively 1,862.21 1,858.91
Additional paid in capital 6,388.29 6,274.22
Deferred stock-based compensation (73.93) (124.78)
Retained earnings 17,036.85 19,869.63
Accumulated other comprehensive income 208.50 190.33
Total stockholders' equity 25,421.92 28,068.31
Total liabilities and stockholders' equity 59,846.74 53,442.71
The accompanying notes are an integral part of these consolidated financial statements.
Ranbaxy Laboratories Limited Annual Report 2005 Report of Independent Accountants & Consolidated Balance Sheet – US GAAP

104
RANBAXY LABORATORIES LIMITED AND SUBSIDIARIES
CONSOLIDATED STATEMENTS OF INCOME(All amounts in Rupees Million, unless otherwise stated)
Year Ended December 31,
2005 2004
Revenues
Product sales 50,468.67 51,875.16Service revenue 273.75 697.25Other operating revenue 856.11 966.28
51,598.53 53,538.69Cost of sales (excluding depreciation and amortization) 27,143.85 24,337.06Gross profit 24,454.68 29,201.63Operating expenses
Selling, general and administrative expenses 17,274.06 15,767.63Research and development expenses 5,055.33 3,504.51Depreciation and amortization 1,718.00 1,486.78Litigation settlement – 371.90Foreign exchange loss / (gain) 978.98 (657.16)
Total operating expenses 25,026.37 20,473.66Operating (loss) / income (571.69) 8,727.97Equity in gain / (loss) of affiliate 4.71 (4.15)Interest expense (669.60) (332.94)Interest income 173.99 252.89Other income 300.49 348.17(Loss)/income from continuing operations before
income taxes, discontinued operations and minorityinterest (762.10) 8,991.94
Income taxes on continuing operations (1,020.91) 1,616.53Income from continuing operations before discontinued
operations and minority interest 258.81 7,375.41Minority interest (26.38) (33.54)Income from continuing operations 232.43 7,341.87Income from discontinued operations, net of tax effect of
Rs. 79.41 million and Rs. 89.64 million, respectively 161.88 154.42Gain from disposal of discontinued operations, net of tax
effect of Rs. 107.00 million 384.72 –Net income 779.03 7,496.29Earnings per equity shareBasic
Continuing operations Rs. 0.62 Rs. 19.76Discontinued operations Rs. 1.47 Rs. 0.42Net income Rs. 2.09 Rs. 20.18
DilutedContinuing operations Rs. 0.62 Rs. 19.66Discontinued operations Rs. 1.47 Rs. 0.41Net income Rs. 2.09 Rs. 20.07
Weighted average number of equity shares used incomputing earnings per equity shareBasic 372,216,805 371,503,666Effect of dilutive securities - employee stock options 1,089,479 1,849,060Diluted 373,306,284 373,352,726
The accompanying notes are an integral part of these consolidated financial statements.
Consolidated Financial Statements – US GAAP
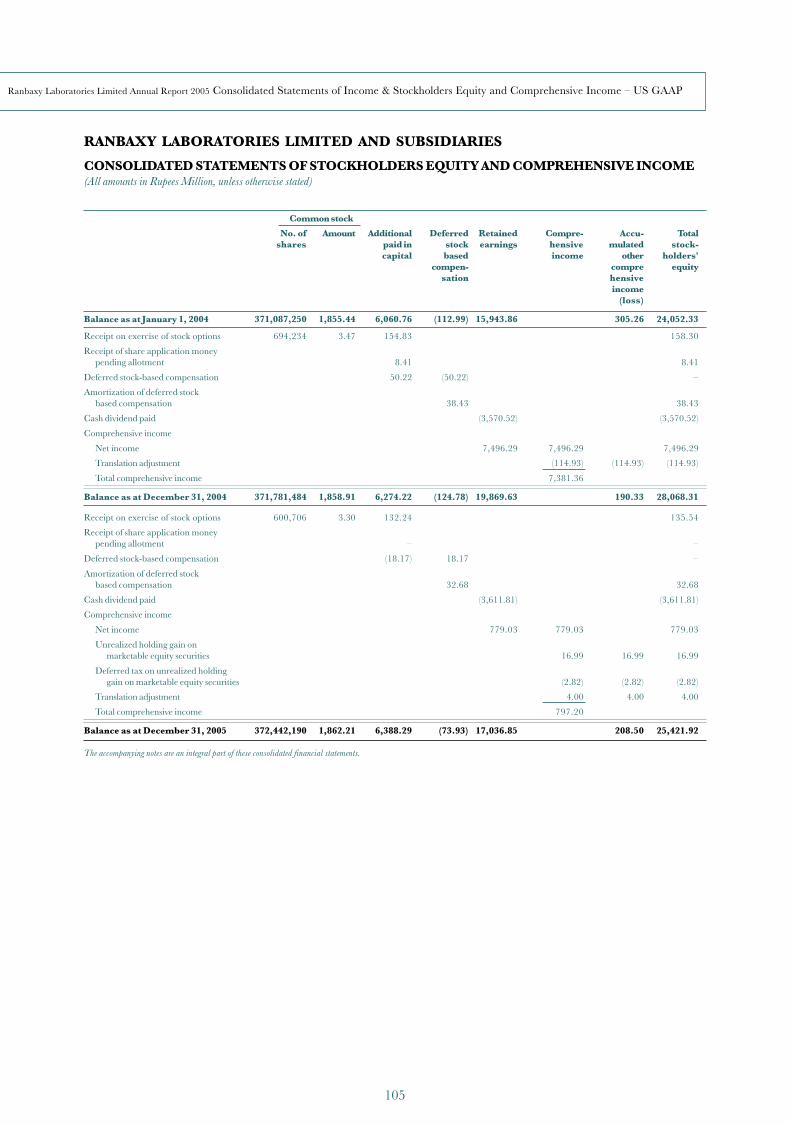
105
Ranbaxy Laboratories Limited Annual Report 2005 Consolidated Statements of Income & Stockholders Equity and Comprehensive Income – US GAAP
RANBAXY LABORATORIES LIMITED AND SUBSIDIARIES
CONSOLIDATED STATEMENTS OF STOCKHOLDERS EQUITY AND COMPREHENSIVE INCOME(All amounts in Rupees Million, unless otherwise stated)
Common stock
No. of Amount Additional Deferred Retained Compre- Accu- Totalshares paid in stock earnings hensive mulated stock-
capital based income other holders'compen- compre equity
sation hensiveincome
(loss)
Balance as at January 1, 2004 371,087,250 1,855.44 6,060.76 (112.99) 15,943.86 305.26 24,052.33
Receipt on exercise of stock options 694,234 3.47 154.83 158.30
Receipt of share application moneypending allotment 8.41 8.41
Deferred stock-based compensation 50.22 (50.22) –
Amortization of deferred stockbased compensation 38.43 38.43
Cash dividend paid (3,570.52) (3,570.52)
Comprehensive income
Net income 7,496.29 7,496.29 7,496.29
Translation adjustment (114.93) (114.93) (114.93)
Total comprehensive income 7,381.36
Balance as at December 31, 2004 371,781,484 1,858.91 6,274.22 (124.78) 19,869.63 190.33 28,068.31
Receipt on exercise of stock options 600,706 3.30 132.24 135.54
Receipt of share application moneypending allotment – –
Deferred stock-based compensation (18.17) 18.17 –
Amortization of deferred stockbased compensation 32.68 32.68
Cash dividend paid (3,611.81) (3,611.81)
Comprehensive income
Net income 779.03 779.03 779.03
Unrealized holding gain onmarketable equity securities 16.99 16.99 16.99
Deferred tax on unrealized holdinggain on marketable equity securities (2.82) (2.82) (2.82)
Translation adjustment 4.00 4.00 4.00
Total comprehensive income 797.20
Balance as at December 31, 2005 372,442,190 1,862.21 6,388.29 (73.93) 17,036.85 208.50 25,421.92
The accompanying notes are an integral part of these consolidated financial statements.
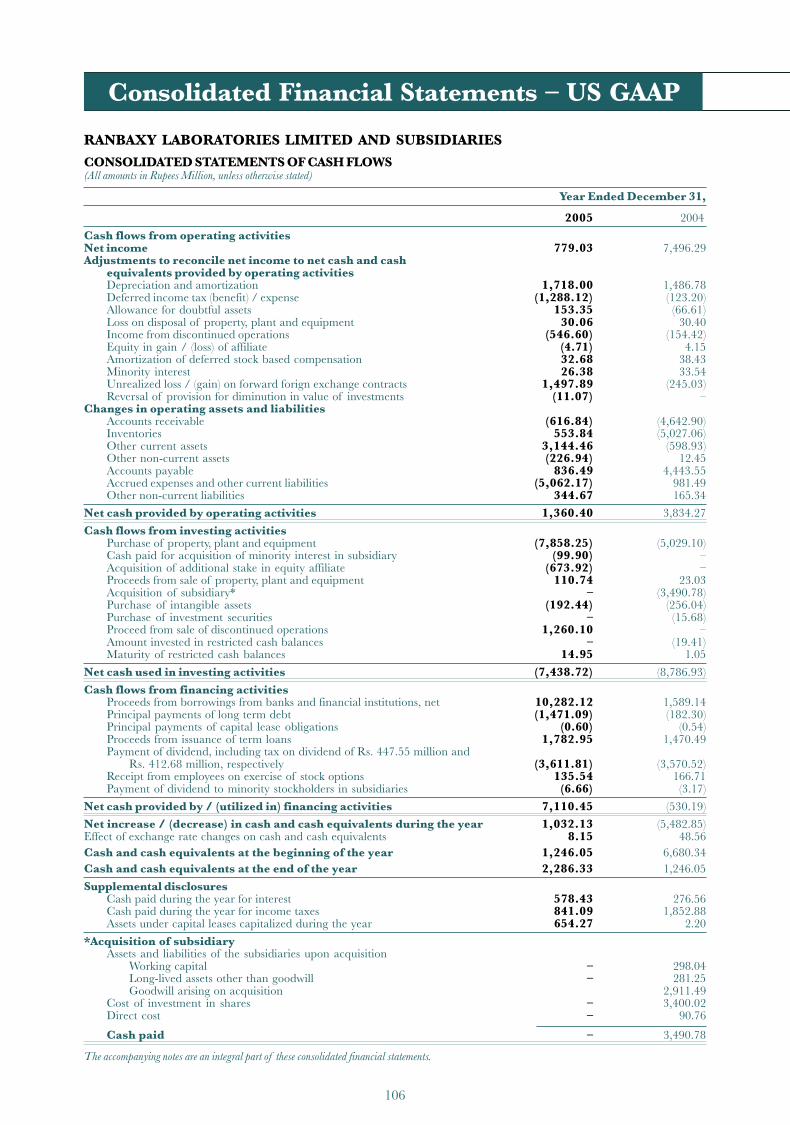
106
RANBAXY LABORATORIES LIMITED AND SUBSIDIARIESCONSOLIDATED STATEMENTS OF CASH FLOWS(All amounts in Rupees Million, unless otherwise stated)
Year Ended December 31,
2005 2004
Cash flows from operating activitiesNet income 779.03 7,496.29Adjustments to reconcile net income to net cash and cash
equivalents provided by operating activitiesDepreciation and amortization 1,718.00 1,486.78Deferred income tax (benefit) / expense (1,288.12) (123.20)Allowance for doubtful assets 153.35 (66.61)Loss on disposal of property, plant and equipment 30.06 30.40Income from discontinued operations (546.60) (154.42)Equity in gain / (loss) of affiliate (4.71) 4.15Amortization of deferred stock based compensation 32.68 38.43Minority interest 26.38 33.54Unrealized loss / (gain) on forward forign exchange contracts 1,497.89 (245.03)Reversal of provision for diminution in value of investments (11.07) –
Changes in operating assets and liabilitiesAccounts receivable (616.84) (4,642.90)Inventories 553.84 (5,027.06)Other current assets 3,144.46 (598.93)Other non-current assets (226.94) 12.45Accounts payable 836.49 4,443.55Accrued expenses and other current liabilities (5,062.17) 981.49Other non-current liabilities 344.67 165.34
Net cash provided by operating activities 1,360.40 3,834.27
Cash flows from investing activitiesPurchase of property, plant and equipment (7,858.25) (5,029.10)Cash paid for acquisition of minority interest in subsidiary (99.90) –Acquisition of additional stake in equity affiliate (673.92) –Proceeds from sale of property, plant and equipment 110.74 23.03Acquisition of subsidiary* – (3,490.78)Purchase of intangible assets (192.44) (256.04)Purchase of investment securities – (15.68)Proceed from sale of discontinued operations 1,260.10 –Amount invested in restricted cash balances – (19.41)Maturity of restricted cash balances 14.95 1.05
Net cash used in investing activities (7,438.72) (8,786.93)
Cash flows from financing activitiesProceeds from borrowings from banks and financial institutions, net 10,282.12 1,589.14Principal payments of long term debt (1,471.09) (182.30)Principal payments of capital lease obligations (0.60) (0.54)Proceeds from issuance of term loans 1,782.95 1,470.49Payment of dividend, including tax on dividend of Rs. 447.55 million and
Rs. 412.68 million, respectively (3,611.81) (3,570.52)Receipt from employees on exercise of stock options 135.54 166.71Payment of dividend to minority stockholders in subsidiaries (6.66) (3.17)
Net cash provided by / (utilized in) financing activities 7,110.45 (530.19)
Net increase / (decrease) in cash and cash equivalents during the year 1,032.13 (5,482.85)Effect of exchange rate changes on cash and cash equivalents 8.15 48.56Cash and cash equivalents at the beginning of the year 1,246.05 6,680.34Cash and cash equivalents at the end of the year 2,286.33 1,246.05
Supplemental disclosuresCash paid during the year for interest 578.43 276.56Cash paid during the year for income taxes 841.09 1,852.88Assets under capital leases capitalized during the year 654.27 2.20
*Acquisition of subsidiaryAssets and liabilities of the subsidiaries upon acquisition
Working capital – 298.04Long-lived assets other than goodwill – 281.25Goodwill arising on acquisition 2,911.49
Cost of investment in shares – 3,400.02Direct cost – 90.76
Cash paid – 3,490.78
The accompanying notes are an integral part of these consolidated financial statements.
Consolidated Financial Statements – US GAAP

107
RANBAXY LABORATORIES LIMITED AND SUBSIDIARIES
NOTES TO CONSOLIDATED FINANCIAL STATEMENTSDecember 31, 2005 and 2004(All amounts in Rupees Million, unless otherwise stated)
NOTE A - SUMMARY OF SIGNIFICANT ACCOUNTING POLICIES
A summary of the significant accounting policies applied in the preparation of the accompanying consolidated financial statementsfollows:
1. Organization and Nature of operations
Ranbaxy Laboratories Limited ("RLL" or the "Company"), a public limited company, was incorporated in India on June 16,1961 and with its subsidiaries (hereinafter collectively referred to as the "Group") operates as an integrated internationalpharmaceutical organization with businesses encompassing the entire value chain in the marketing, production and distributionof dosage forms and active pharmaceutical ingredients.
The Group presently has manufacturing facilities in seven countries, namely India, the United States of America, Ireland,China, Malaysia, Nigeria and Vietnam. The Group's major markets include the United States of America, India, Europe,Russia / CIS, and South Africa. The United States of America is the largest market and major products are Amoxicillin,Isotretenoin, Minocycline, Fosinopril, Cephalexin and Clindamycin. The research and development activities of the Groupare principally carried out at its facilities in Gurgaon, near New Delhi, India.
The Company's shares are listed for trading on the Mumbai and National Stock Exchanges in India, and its GlobalDepository Receipts (covering equity shares of RLL) are listed on the Luxembourg Stock Exchange.
2. Principles of consolidation
The consolidated financial statements include the financial statements of RLL and all its subsidiaries, which are more than50 percent owned and controlled.
The Group accounts for investments by the equity method of accounting where it is able to exercise significant influence overthe operating and financing policies of the investee. The Group's equity in the income or loss of equity method affiliates isincluded in the consolidated statements of income.
All inter-company transactions and balances, between the entities included in the consolidated financial statements, havebeen eliminated.
Details of the entities, which presently form part of the Group and are consolidated under RLL are as follows:
Name of entity Country of Shareholdingincorporation
Ranbaxy Drugs and Chemicals Company India 100.00%Ranbaxy Drugs Limited India 100.00%Ranbaxy Fine Chemicals Limited (See note X) India 100.00%Rexcel Pharmaceuticals Limited India 100.00%Solus Pharmaceuticals Limited India 100.00%Vidyut Investments Limited India 100.00%Ran Air Services Limited
(Formerly Vidyut Travel Services Limited) India 100.00%Ranbaxy (Netherlands) B.V. ("RNBV") The Netherlands 100.00%Ranbaxy N.A.N.V. Antilles, Netherlands 100.00%Ranbaxy (S.A.) (Proprietary) Ltd. South Africa 100.00%Sonke Pharmaceuticals (Pty) Ltd* South Africa 100.00%Ranbaxy Inc. ("RPI")
(Formerly Ranbaxy Pharmaceuticals, Inc.) United States of America 100.00%Ranbaxy Pharmaceuticals, Inc. United States of America 100.00%Ranbaxy USA, Inc. United States of America 100.00%Ohm Laboratories, Inc. United States of America 100.00%Ranbaxy Laboratories, Inc. United States of America 100.00%Ranbaxy Holdings (U.K.) Ltd. United Kingdom 100.00%Ranbaxy (U.K.) Ltd. United Kingdom 100.00%Ranbaxy Pharmacie Generiques SAS
(Formerly RPG (Aventis) S.A.) France 100.00%Office Pharmaceutique Industriel Et
Hospitalier SARL ("OPIH SARL ") France 100.00%Ranbaxy Ireland Ltd. Ireland 100.00%Ranbaxy (Hong Kong) Limited Hong Kong 100.00%
Ranbaxy Laboratories Limited Annual Report 2005 Consolidated Statements of Cash Flows & Notes to Consolidated Financial Statements – US GAAP

RANBAXY LABORATORIES LIMITED AND SUBSIDIARIES
NOTES TO CONSOLIDATED FINANCIAL STATEMENTSDecember 31, 2005 and 2004(All amounts in Rupees Million, unless otherwise stated)
Consolidated Financial Statements – US GAAP
108
Ranbaxy Egypt (L.L.C.) Egypt 100.00%Rexcel Egypt (L.L.C.) Egypt 100.00%Ranbaxy Poland S.P. Z.o.o. Poland 100.00%Ranbaxy Pharmaceuticals BV The Netherlands 100.00%Ranbaxy Europe Ltd. United Kingdom 100.00%Basics GmbH Germany 100.00%Ranbaxy Do Brazil Ltda Brazil 100.00%Ranbaxy Panama, S.A. Panama 100.00%Ranbaxy Vietnam Company Ltd. Vietnam 100.00%Ranbaxy France SAS** France 100.00%Ranbaxy-PRP (Peru) S.A.C. Peru 100.00%Laboratorios Ranbaxy, S.L. Spain 100.00%ZAO Ranbaxy Russia 100.00%Ranbaxy Australia Pty. Ltd. Australia 100.00%Ranbaxy Portugal - Com E Desenvolv
De Prod Farmaceuticos Unipessoal Lda Portugal 100.00%Ranbaxy Pharmaceuticals Canada Inc. Canada 100.00%Unichem Distributors Ltd. Thailand 99.96%Ranbaxy Italia S.p.A* Italy 100.00%Ranbaxy Hungary (L.L.C.)* Hungary 100.00%Ranbaxy Mexcico S.A. de C.V.* Mexico 100.00%Bounty Holdings Co. Ltd. Thailand 99.30%Unichem Pharmaceuticals Ltd. Thailand 98.50%Gufic Pharma Limited India 98.00%Ranbaxy Unichem Company Ltd.
(Formerly Ranbaxy (Thailand) Co. Ltd.) Thailand 88.56%Ranbaxy Nigeria Ltd. Nigeria 84.89%Ranbaxy (Guangzhou China) Limited Republic of China 83.00%Ranbaxy Farmaceutica Ltda.
(Formerly Ranbaxy S.P. Medicamentos Ltda.) Brazil 80.00%Ranbaxy Signature L.L.C United States of America 67.50%Ranbaxy Malaysia Sdn. Bhd. Malaysia 68.05%
*new entities in 2005** Liquidated during the year
During 2005, RNBV raised its equity stake in Nihon Pharmaceutical Industry Co., Ltd. ("NPI") from 10 percent to50 percent. Consequent to this transaction, the Company accounts for this investment under the equity method of accounting.The Company's equity in the income of equity affiliate, NPI, is included in the consolidated statements of income. Inter-company profits and losses have been eliminated.
3. Basis of presentationThe accompanying consolidated financial statements have been prepared on the accrual basis of accounting in conformitywith accounting principles generally accepted in the United States of America ("US GAAP"), to reflect the financial position,results of operations and cash flows of the Group.
4. Use of estimatesIn preparing the Group's financial statements in conformity with accounting principles generally accepted in the UnitedStates of America, the Group's management is required to make estimates and assumptions that affect the reportedamounts of assets and liabilities and the disclosure of contingent assets and liabilities at the date of the financial statementsand the reported amounts of revenues and expenses during the reporting periods; actual results could differ from thoseestimates. Management's estimates for charge-backs, rebates, discounts and returns, future obligations under employeebenefit plans, the useful life of tangible and intangible assets and the realization of deferred tax assets represent particularlysensitive estimates.
Name of entity Country of Shareholdingincorporation
NOTE A (continued)

RANBAXY LABORATORIES LIMITED AND SUBSIDIARIES
NOTES TO CONSOLIDATED FINANCIAL STATEMENTSDecember 31, 2005 and 2004(All amounts in Rupees Million, unless otherwise stated)
Ranbaxy Laboratories Limited Annual Report 2005 Notes to Consolidated Financial Statements – US GAAP
109
5. Exchange rate translation
The functional currency of the Company, including its consolidated domestic and foreign subsidiaries, has been determinedin accordance with the primary economic environment in which the respective entities operate. The functional currency forRNBV, Ranbaxy Hongkong Ltd. and Ranbaxy Holding (U.K.) Ltd. is the US Dollar and not their local currency.
In respect of entities for which the functional currency is other than the Indian Rupee, the reporting currency of RLL, theassets and liabilities are translated into Indian Rupees at the appropriate year-end exchange rates. Income and expenses aretranslated using the monthly average exchange rates in effect during the year being reported. The resulting translationadjustments are reported as a component of accumulated other comprehensive income.
Transactions in foreign currency are translated into the functional currency of the respective Group Company at the averagerates of exchange prevailing in the month of the transaction. Monetary assets and liabilities in foreign currency aretranslated into the functional currency of the respective Group Company at the rate of exchange prevailing at the balancesheet date. All foreign exchange gains and losses are recorded under "Foreign exchange loss / (gain)" in the accompanyingconsolidated financial statements. The foreign currency exchange loss / (gain) included in the consolidated statements ofincome for the years ended December 31, 2005 and 2004 is Rs. 978.98 million and Rs. (657.16) million, respectively.
6. Cash and cash equivalents
Cash and cash equivalents include all highly liquid investments with an original maturity of three months or less. Restrictedcash represents deposits that have been pledged with banks and will mature within one year.
7. Inventories
Inventories consist of raw materials, work-in-process, finished goods, and packaging materials, and are stated at the lowerof cost or market value. Cost is determined using the weighted average and first-in-first-out methods for raw materials,packaging materials and stores and spares and includes the purchase price and attributable direct costs, less trade discounts.The cost of work-in-process and finished goods comprises of direct labor, material costs and production overheads.
Allowance for potentially obsolete or slow moving inventory is made on the basis of management's analysis of inventorylevels, expiration dates and prevailing market conditions as part of cost of sales.
8. Property, plant and equipment
Property, plant and equipment, including assets acquired under capital lease agreements, are stated at historical cost lessaccumulated depreciation. Depreciation is calculated on the straight-line method over the estimated useful life of therespective assets. Assets under capital leases and leasehold improvements are amortized over the lower of their estimateduseful lives or the term of the lease.
Advances paid for the acquisition of property, plant and equipment outstanding at the balance sheet date and the cost ofproperty, plant and equipment not put to use before such date are disclosed as 'Capital work-in-progress'. The interest costincurred for funding an asset during its construction period is capitalized based on the actual investment in the asset and theaverage cost of funds; and was immaterial during the years ended December 31, 2005 and 2004. The capitalized interest isincluded in the cost of the relevant asset and is depreciated over the estimated useful life of the asset.
The Group has determined the estimated useful lives of assets for depreciation purposes as follows:
Leasehold land Over a term not exceeding 99 yearsBuildings 30-50 yearsPlant and machinery 5-15 yearsFurniture and fixtures 5-10 yearsOffice equipment 3-10 yearsVehicles 5 years
Expenditure for maintenance and repairs are expensed as incurred and amounted to Rs.374.29 million andRs. 377.79 million for the years ended December 31, 2005 and 2004, respectively. When assets are retired or otherwisedisposed of, the cost of the asset and related accumulated depreciation are eliminated from the financial records. Any gainor loss on disposition is credited or charged to income.
9. Goodwill (see Note C)
Goodwill reflects the excess of the purchase price over the fair value of net assets acquired in a business acquisition.Pursuant to Statement of Financial Accounting Standards No. 142 "Goodwill and Other Intangible Assets," the Groupdoes not amortize goodwill, and instead goodwill is tested for impairment at least annually. The Company reviews goodwillfor impairment annually or more frequently if impairment indicators arise.
NOTE A (continued)

RANBAXY LABORATORIES LIMITED AND SUBSIDIARIES
NOTES TO CONSOLIDATED FINANCIAL STATEMENTSDecember 31, 2005 and 2004(All amounts in Rupees Million, unless otherwise stated)
Consolidated Financial Statements – US GAAP
110
10. Intangible assets (see Note D)
Intangible assets consist primarily of acquired license agreements, brands, purchased trademarks, technical know-how,product dossiers and other intangibles identified on acquisition and are amortized over the expected benefit period or thelegal life, whichever is lower.
11. Revenue Recognition
Product sales
Revenue from sales of active pharmaceutical ingredients and formulation products is recognized when title and risk of lossof products are transferred to the customer, on shipment of products for Free-on-Board ("FOB") shipping point sales andupon delivery to the customers for FOB destination point sales, and when provisions for estimates, including discounts,relative price adjustments, refunds, chargebacks and other promotional programs are reasonably determinable, and whenthe following criteria are met:
• Persuasive evidence of an arrangement exists;
• The price to the buyer is fixed and determinable; and
• Collectibility of the sales price is reasonably assured.
Provisions for sales discounts, medicaid and other rebates, damaged product returns and exchanges for expired products areestablished as a reduction of product sales revenues. These revenue reductions are established by us as our best estimatesat the time of sale based on historical experience, adjusted to reflect known changes in the factors that impact such reserves.These revenue reductions are reflected either as a direct reduction to accounts receivable or through an allowance.
In the United States, amongst our large customers are the major wholesalers who resell our products to third partycustomers like managed care organizations, drug store chains and pharmacies. A significant part of our gross revenues fromsuch wholesalers are subject to various forms of rebates and allowances (known as "Chargebacks"), which are recorded asreductions from gross revenues. The computation of the estimate for expected chargebacks is complex and involvessignificant judgment based on historical experience and estimated wholesaler inventory levels, as well as expected sell-through levels by the wholesalers to indirect customers. The primary factors we consider in developing and evaluating ourprovision for chargebacks include the average historical chargeback credits and an estimate of the inventory held be ourwholesalers, based on internal analysis of wholesaler’s historical purchases and contract sales.
Actual experience associated with any of these items may be different than the Company’s estimates and the Companyregularly reviews the factors that influence its estimates and, if necessary, makes adjustments when it believes that actualproduct returns, credits, rebates chargeback and other allowances may differ from established provisions.
At December 31, 2005 and 2004, the Group had reserves for chargebacks, returns and rebates of approximatelyRs. 2,633.65 million and Rs. 4,078.05 million.
Service income
License fees
The Group receives payments under various development, manufacturing, supply and distribution agreements. Under theterms of these agreements, certain amounts may be received by the Group prior to the commercial launch of a product andfulfillment of the Group's obligations under such agreements. These amounts are recorded as deferred revenue and areamortized to revenue from the date of commercial launch through the term of the related agreement.
Non-refundable upfront payments received are deferred and recognized in the consolidated statements of income on astraight-line basis over the estimated development period. Other milestone payments received are recognized in accordancewith the terms prescribed in the license agreement and where the Group has no future obligations or continuing involvementpursuant to such milestone payment.
Royalty
Royalty income is based on sales made by third parties and is recognized on an accrual basis, in accordance with the termsof the respective agreements.
Other revenues
Other revenues include claim settlements and export incentives. Revenues under claim settlement agreements are recognizedin accordance with the terms of the respective settlement agreements in the period in which the claim is received. Exportincentives are recognized on an accrual basis, in accordance with the applicable terms.
NOTE A (continued)

RANBAXY LABORATORIES LIMITED AND SUBSIDIARIES
NOTES TO CONSOLIDATED FINANCIAL STATEMENTSDecember 31, 2005 and 2004(All amounts in Rupees Million, unless otherwise stated)
Ranbaxy Laboratories Limited Annual Report 2005 Notes to Consolidated Financial Statements – US GAAP
111
12. Investment securities
Investment securities consist of available-for-sale equity securities and non- marketable equity securities.
Available-for-sale securities are recorded at fair value based on quoted market prices with unrealized gains and losses, netof income taxes are reported as accumulated other comprehensive income or separate component of stockholders' equityuntil realized. Decline in the fair value of any available-for-sale security below cost that is determined to be other thantemporary is charged to the statements of income. Realized gains and losses from the sale of available-for-sale securitiesare determined on the average cost method and are included in earnings.
Non-marketable equity securities are accounted for by the cost method and are stated at cost, less provision for any declineother than temporary decline in value.
Interest and dividend income is recognized when earned.
13. Shipping and handling costs
Shipping and handling expenses of Rs. 1,191.57 million and Rs. 1,101.26 million for the years ended December 31, 2005 and2004, respectively, incurred to transport products to customers, have been classified under selling, general and administrativeexpenses. Expenses relating to inward receipt of materials are classified under cost of sales.
14. Advertising costs
Costs associated with advertising are expensed as incurred; and amounted to Rs. 1,633.54 million and Rs. 2,480.98 millionfor the years ended December 31, 2005 and 2004, respectively.
15. Income taxes
The provision for current income tax expense is estimated by the respective entities in accordance with the relevant domestictax laws. The Group accounts for deferred income taxes under the liability method, in accordance with Statement ofFinancial Accounting Standards No. 109 "Accounting for Income Taxes". Deferred income tax assets and liabilities arerecognized for the future tax consequences attributable to differences between carrying amounts of existing assets andliabilities in the financial statements and their respective tax basis. Deferred income tax assets and liabilities are measuredusing enacted tax rates for the respective tax jurisdictions as on the date of the financial statements. The effect on deferredincome tax assets and liabilities of a change in tax rates is recognized in the statement of income in the period of change.Based on management's judgment, the measurement of deferred income tax assets is reduced, if necessary, by a valuationallowance for any tax benefits for which it is more likely than not that some portion or all of such benefits will not be realized.
16. Research and development costs
Research and development costs are expensed as incurred, and amounted to Rs. 5,055.33 million and Rs. 3,504.51 millionfor the years ended December 31, 2005 and 2004, respectively. Costs incurred for equipment and facilities acquired orconstructed for research and development activities and having alternative future uses, are capitalized as property, plant andequipment when acquired or constructed.
17. Valuation of long-lived assets
The Group follows the guidance of Statement of Financial Accounting Standards No. 144, "Accounting for the Impairmentor Disposal of Long-lived Assets". The Group companies review long-lived assets and certain identifiable intangibles heldand used for possible impairment whenever events or changes in circumstances indicate that the carrying amount of anasset may not be recoverable. If such assets are considered to be impaired, the impairment is measured by the amount bywhich the carrying value of the assets exceeds the fair value of the assets. Assets to be disposed are reported at the lower ofthe carrying value, or the fair value less the cost to sell.
18. Operating leases - lessee accounting (see Note V)
Lease rental expenses on operating leases are charged to expense over the lease term as they become payable. Certainoperating lease agreements provide for scheduled rent increases over the lease term. Rental expense for these leases isrecognized on a straight-line basis over the lease term.
19. Other comprehensive income
Statement of Financial Accounting Standards No. 130, "Reporting Comprehensive Income", establishes rules for thereporting of comprehensive income and its components. Comprehensive income is defined as all changes in equity fromnon-owner sources. For the Group, comprehensive income consists of net earnings, changes in the cumulative foreigncurrency translation adjustments and unrealized holding gains and losses on available-for-sale securities. The Companyreports comprehensive income in the consolidated statements of stockholders' equity.
NOTE A (continued)

RANBAXY LABORATORIES LIMITED AND SUBSIDIARIES
NOTES TO CONSOLIDATED FINANCIAL STATEMENTSDecember 31, 2005 and 2004(All amounts in Rupees Million, unless otherwise stated)
Consolidated Financial Statements – US GAAP
112
20. Earnings per share (see note O)
In accordance with Statement of Financial Accounting Standards No. 128, "Earnings per share", basic earnings per shareare computed using the weighted average number of common shares outstanding during the period. Diluted earnings pershare are computed using the weighted average number of common and dilutive common equivalent shares outstandingduring the period.
21. Stock-based compensation
The Company uses the intrinsic value based method as prescribed by Accounting Principles Board Opinion No. 25,"Accounting for Stock Issued to Employees" and related interpretations, to account for its employee stock based compensationplan. The Company has therefore adopted pro forma disclosure provisions of Statement of Financial Accounting StandardsNo. 123, "Accounting for Stock-based Compensation" ("SFAS No. 123"), as amended by Statement of Financial AccountingStandards No. 148, "Accounting for Stock-based Compensation Transition and Disclosure, an amendment ofSFAS No. 123" ("SFAS No. 148"). Accordingly, compensation expense is recognized over the vesting period of the optionsbased on the difference, if any, between the market value of the stock of the Company on the date of grant of the stockoption and the amount to be paid by the employee for exercising the option. As permitted by SFAS No. 123, the Companyhas elected to continue to employ the intrinsic value based method of accounting and has followed the disclosure requirementsof SFAS No. 148.
22. Derivative financial instruments
The Company enters into forward foreign exchange contracts where the counterparty is generally a bank. The Companypurchases forward foreign exchange contracts to mitigate the risk of changes in foreign exchange rates on accountsreceivable and loans payable. These contracts do not qualify for hedge accounting under Statement of Financial AccountingStandards No. 133, "Accounting for Derivative Instruments and Hedging Activities" ("SFAS No. 133"), as amended. Anyderivative that is either not designated as a hedge, or is so designated but is ineffective per SFAS No. 133, is marked tomarket and recognized in income immediately.
At December 31, 2005, the Company recognized a mark-to-market loss under "foreign exchange loss / (gain)" in the incomestatement on non-designated hedges of Rs. 1,497.89 million and recorded a liability of Rs. 844.54 million, included in "othercurrent liabilities" on the balance sheet. At December 31, 2004, the Company recognized a mark-to-market gain under"foreign exchange loss / (gain)" in the income statement on non-designated hedges of Rs. 245.03 million and recorded anasset of Rs. 780.55 million, included in "other current assets" on the balance sheet.
24. Dividend
Dividends paid on common stock is recorded as a reduction of equity when approved by the stockholders.
25. Reclassification
Certain prior period amounts have been reclassified to conform to the current period presentation.
26. Recent Accounting Pronouncements
In May 2005, the Financial Accounting Standards Board ("FASB") issued Statement of Financial Accounting Standards("SFAS") No. 154, Accounting Changes and Error Corrections. This new standard replaces APB Opinion No. 20, AccountingChanges, and SFAS No. 3, Reporting Accounting Changes in Interim Financial Statements. This statement requires thata voluntary change in accounting principle be applied retrospectively with all prior period financial statements presented onthe new accounting principle, unless it is impracticable to do so. It also provides that (1) a change in method of depreciatingor amortizing a long-lived non-financial asset be accounted for as a change in estimate (prospectively) that was effected bya change in accounting principle, and (2) correction of errors in previously issued financial statements should be termed a"restatement". The new standard is effective for accounting changes and correction of errors made in fiscal years beginningafter December 15, 2005. The impact of the adoption of this Statement is not expected to be material.
In December 2004, the Financial Accounting Standards Board (the "FASB") issued Statement of Financial AccountingStandard ("SFAS") No. 123(R), "Share-Based Payment," which revises SFAS No. 123, "Accounting for Stock-BasedCompensation" ("SFAS No. 123"), and supersedes Accounting Principles Board Opinion No. 25, "Accounting for StockIssued to Employees" ("APB No. 25") and amends SFAS No. 95 "Statement of Cash Flows." For interim or annualreporting periods beginning on or after June 15, 2005 (the "effective date"), SFAS No. 123(R) requires companies to recognizecompensation expense in their income statement for the grant-date fair value of stock options issued to employees over therequisite service period, usually the vesting period. Pro forma disclosure is no longer an alternative. SFAS No. 123(R) alsorequires the benefits of tax deductions in excess of recognized compensation cost to be reported as a financing cash flow,
NOTE A (continued)
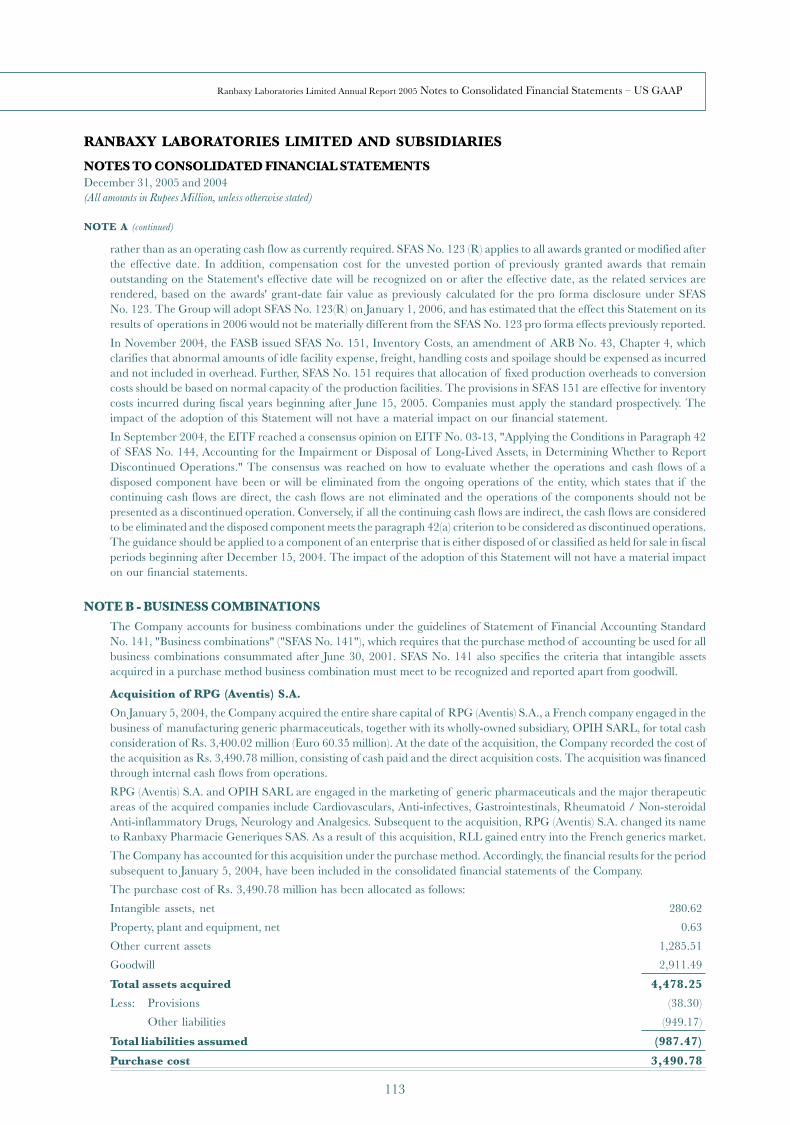
RANBAXY LABORATORIES LIMITED AND SUBSIDIARIES
NOTES TO CONSOLIDATED FINANCIAL STATEMENTSDecember 31, 2005 and 2004(All amounts in Rupees Million, unless otherwise stated)
Ranbaxy Laboratories Limited Annual Report 2005 Notes to Consolidated Financial Statements – US GAAP
113
rather than as an operating cash flow as currently required. SFAS No. 123 (R) applies to all awards granted or modified afterthe effective date. In addition, compensation cost for the unvested portion of previously granted awards that remainoutstanding on the Statement's effective date will be recognized on or after the effective date, as the related services arerendered, based on the awards' grant-date fair value as previously calculated for the pro forma disclosure under SFASNo. 123. The Group will adopt SFAS No. 123(R) on January 1, 2006, and has estimated that the effect this Statement on itsresults of operations in 2006 would not be materially different from the SFAS No. 123 pro forma effects previously reported.
In November 2004, the FASB issued SFAS No. 151, Inventory Costs, an amendment of ARB No. 43, Chapter 4, whichclarifies that abnormal amounts of idle facility expense, freight, handling costs and spoilage should be expensed as incurredand not included in overhead. Further, SFAS No. 151 requires that allocation of fixed production overheads to conversioncosts should be based on normal capacity of the production facilities. The provisions in SFAS 151 are effective for inventorycosts incurred during fiscal years beginning after June 15, 2005. Companies must apply the standard prospectively. Theimpact of the adoption of this Statement will not have a material impact on our financial statement.
In September 2004, the EITF reached a consensus opinion on EITF No. 03-13, "Applying the Conditions in Paragraph 42of SFAS No. 144, Accounting for the Impairment or Disposal of Long-Lived Assets, in Determining Whether to ReportDiscontinued Operations." The consensus was reached on how to evaluate whether the operations and cash flows of adisposed component have been or will be eliminated from the ongoing operations of the entity, which states that if thecontinuing cash flows are direct, the cash flows are not eliminated and the operations of the components should not bepresented as a discontinued operation. Conversely, if all the continuing cash flows are indirect, the cash flows are consideredto be eliminated and the disposed component meets the paragraph 42(a) criterion to be considered as discontinued operations.The guidance should be applied to a component of an enterprise that is either disposed of or classified as held for sale in fiscalperiods beginning after December 15, 2004. The impact of the adoption of this Statement will not have a material impacton our financial statements.
NOTE B - BUSINESS COMBINATIONSThe Company accounts for business combinations under the guidelines of Statement of Financial Accounting StandardNo. 141, "Business combinations" ("SFAS No. 141"), which requires that the purchase method of accounting be used for allbusiness combinations consummated after June 30, 2001. SFAS No. 141 also specifies the criteria that intangible assetsacquired in a purchase method business combination must meet to be recognized and reported apart from goodwill.
Acquisition of RPG (Aventis) S.A.
On January 5, 2004, the Company acquired the entire share capital of RPG (Aventis) S.A., a French company engaged in thebusiness of manufacturing generic pharmaceuticals, together with its wholly-owned subsidiary, OPIH SARL, for total cashconsideration of Rs. 3,400.02 million (Euro 60.35 million). At the date of the acquisition, the Company recorded the cost ofthe acquisition as Rs. 3,490.78 million, consisting of cash paid and the direct acquisition costs. The acquisition was financedthrough internal cash flows from operations.
RPG (Aventis) S.A. and OPIH SARL are engaged in the marketing of generic pharmaceuticals and the major therapeuticareas of the acquired companies include Cardiovasculars, Anti-infectives, Gastrointestinals, Rheumatoid / Non-steroidalAnti-inflammatory Drugs, Neurology and Analgesics. Subsequent to the acquisition, RPG (Aventis) S.A. changed its nameto Ranbaxy Pharmacie Generiques SAS. As a result of this acquisition, RLL gained entry into the French generics market.
The Company has accounted for this acquisition under the purchase method. Accordingly, the financial results for the periodsubsequent to January 5, 2004, have been included in the consolidated financial statements of the Company.
The purchase cost of Rs. 3,490.78 million has been allocated as follows:
Intangible assets, net 280.62
Property, plant and equipment, net 0.63
Other current assets 1,285.51
Goodwill 2,911.49
Total assets acquired 4,478.25
Less: Provisions (38.30)
Other liabilities (949.17)
Total liabilities assumed (987.47)
Purchase cost 3,490.78
NOTE A (continued)
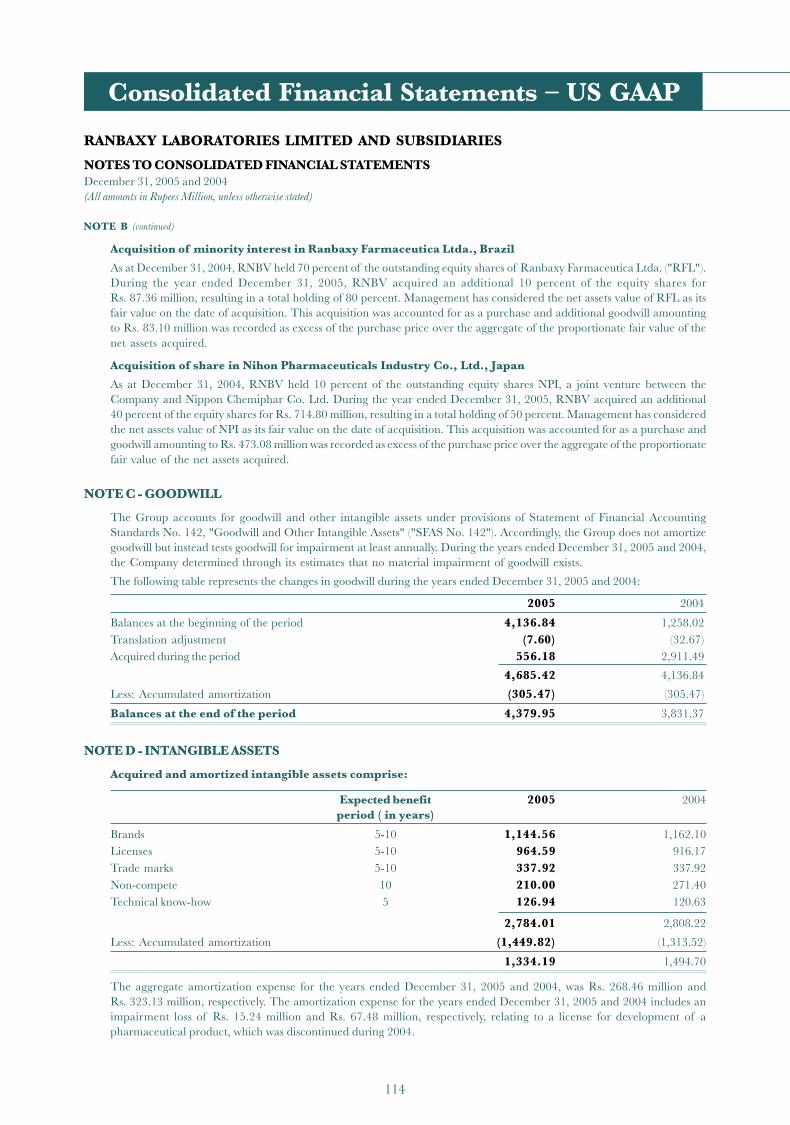
RANBAXY LABORATORIES LIMITED AND SUBSIDIARIES
NOTES TO CONSOLIDATED FINANCIAL STATEMENTSDecember 31, 2005 and 2004(All amounts in Rupees Million, unless otherwise stated)
Consolidated Financial Statements – US GAAP
114
Acquisition of minority interest in Ranbaxy Farmaceutica Ltda., Brazil
As at December 31, 2004, RNBV held 70 percent of the outstanding equity shares of Ranbaxy Farmaceutica Ltda. ("RFL").During the year ended December 31, 2005, RNBV acquired an additional 10 percent of the equity shares forRs. 87.36 million, resulting in a total holding of 80 percent. Management has considered the net assets value of RFL as itsfair value on the date of acquisition. This acquisition was accounted for as a purchase and additional goodwill amountingto Rs. 83.10 million was recorded as excess of the purchase price over the aggregate of the proportionate fair value of thenet assets acquired.
Acquisition of share in Nihon Pharmaceuticals Industry Co., Ltd., Japan
As at December 31, 2004, RNBV held 10 percent of the outstanding equity shares NPI, a joint venture between theCompany and Nippon Chemiphar Co. Ltd. During the year ended December 31, 2005, RNBV acquired an additional40 percent of the equity shares for Rs. 714.80 million, resulting in a total holding of 50 percent. Management has consideredthe net assets value of NPI as its fair value on the date of acquisition. This acquisition was accounted for as a purchase andgoodwill amounting to Rs. 473.08 million was recorded as excess of the purchase price over the aggregate of the proportionatefair value of the net assets acquired.
NOTE C - GOODWILL
The Group accounts for goodwill and other intangible assets under provisions of Statement of Financial AccountingStandards No. 142, "Goodwill and Other Intangible Assets" ("SFAS No. 142"). Accordingly, the Group does not amortizegoodwill but instead tests goodwill for impairment at least annually. During the years ended December 31, 2005 and 2004,the Company determined through its estimates that no material impairment of goodwill exists.
The following table represents the changes in goodwill during the years ended December 31, 2005 and 2004:
2005 2004
Balances at the beginning of the period 4,136.84 1,258.02Translation adjustment (7.60) (32.67)Acquired during the period 556.18 2,911.49
4,685.42 4,136.84
Less: Accumulated amortization (305.47) (305.47)
Balances at the end of the period 4,379.95 3,831.37
NOTE D - INTANGIBLE ASSETS
Acquired and amortized intangible assets comprise:
Expected benefit 2005 2004period ( in years)
Brands 5-10 1,144.56 1,162.10Licenses 5-10 964.59 916.17Trade marks 5-10 337.92 337.92Non-compete 10 210.00 271.40Technical know-how 5 126.94 120.63
2,784.01 2,808.22
Less: Accumulated amortization (1,449.82) (1,313.52)
1,334.19 1,494.70
The aggregate amortization expense for the years ended December 31, 2005 and 2004, was Rs. 268.46 million andRs. 323.13 million, respectively. The amortization expense for the years ended December 31, 2005 and 2004 includes animpairment loss of Rs. 15.24 million and Rs. 67.48 million, respectively, relating to a license for development of apharmaceutical product, which was discontinued during 2004.
NOTE B (continued)
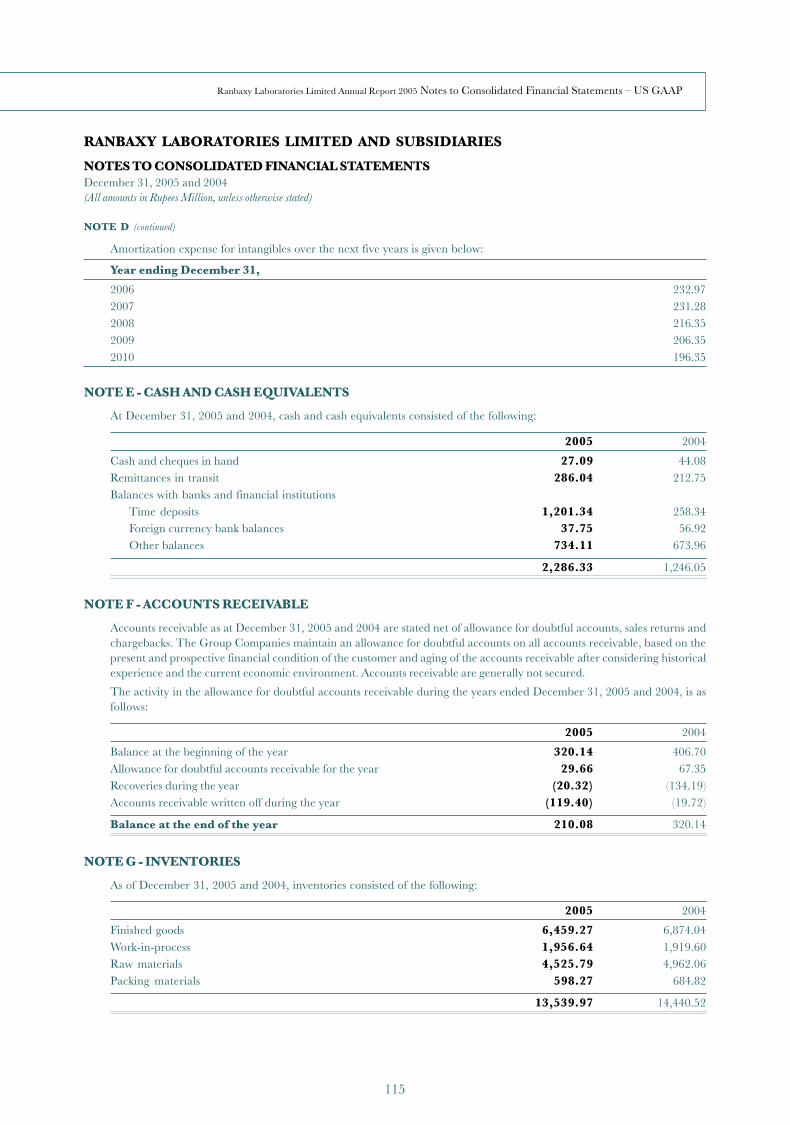
RANBAXY LABORATORIES LIMITED AND SUBSIDIARIES
NOTES TO CONSOLIDATED FINANCIAL STATEMENTSDecember 31, 2005 and 2004(All amounts in Rupees Million, unless otherwise stated)
Ranbaxy Laboratories Limited Annual Report 2005 Notes to Consolidated Financial Statements – US GAAP
115
Amortization expense for intangibles over the next five years is given below:
Year ending December 31,
2006 232.972007 231.282008 216.352009 206.352010 196.35
NOTE E - CASH AND CASH EQUIVALENTS
At December 31, 2005 and 2004, cash and cash equivalents consisted of the following:
2005 2004
Cash and cheques in hand 27.09 44.08Remittances in transit 286.04 212.75Balances with banks and financial institutions
Time deposits 1,201.34 258.34Foreign currency bank balances 37.75 56.92Other balances 734.11 673.96
2,286.33 1,246.05
NOTE F - ACCOUNTS RECEIVABLE
Accounts receivable as at December 31, 2005 and 2004 are stated net of allowance for doubtful accounts, sales returns andchargebacks. The Group Companies maintain an allowance for doubtful accounts on all accounts receivable, based on thepresent and prospective financial condition of the customer and aging of the accounts receivable after considering historicalexperience and the current economic environment. Accounts receivable are generally not secured.
The activity in the allowance for doubtful accounts receivable during the years ended December 31, 2005 and 2004, is asfollows:
2005 2004
Balance at the beginning of the year 320.14 406.70Allowance for doubtful accounts receivable for the year 29.66 67.35Recoveries during the year (20.32) (134.19)Accounts receivable written off during the year (119.40) (19.72)
Balance at the end of the year 210.08 320.14
NOTE G - INVENTORIES
As of December 31, 2005 and 2004, inventories consisted of the following:
2005 2004
Finished goods 6,459.27 6,874.04Work-in-process 1,956.64 1,919.60Raw materials 4,525.79 4,962.06Packing materials 598.27 684.82
13,539.97 14,440.52
NOTE D (continued)

RANBAXY LABORATORIES LIMITED AND SUBSIDIARIES
NOTES TO CONSOLIDATED FINANCIAL STATEMENTSDecember 31, 2005 and 2004(All amounts in Rupees Million, unless otherwise stated)
Consolidated Financial Statements – US GAAP
116
NOTE H - PROPERTY, PLANT AND EQUIPMENT
Property, plant and equipment comprise of the following:
2005 2004
Freehold land 250.53 231.13Leasehold land 207.33 191.32Buildings 4,279.64 2,465.55Plant and machinery 12,666.46 9,981.71Furniture and fixtures 593.32 419.25Office equipment 2,500.74 2,078.75Vehicles 359.47 321.35Capital work-in-progress 5,598.24 2,886.48
26,455.73 18,575.54
Less: Accumulated depreciation (9,130.62) (8,014.59)
17,325.11 10,560.95
Capital lease assets comprise of the following:
2005 2004
Buildings 625.74 –Plant and machinery 1.20 1.15Office equipment 43.06 4.35Vehicles 14.14 11.08
684.14 16.58
Less: Accumulated depreciation (53.19) (7.83)
630.95 8.75
During the term of the lease, but not later than eighteen months prior to the expiration of the lease term, the Group has anoption to purchase the buildings recorded under capital lease assets above.
Depreciation expense for assets acquired under capital lease for the years ended December 31, 2005 and 2004, wasRs. 45.36 million and Rs. 3.46 million, respectively.
NOTE I - INVESTMENT SECURITIES
Investment securities comprise the following:
As of December 31, 2005 As of December 31, 2004
Gross GrossCarrying unrealized Carrying unrealized
value losses Fair value value losses Fair value
Equity securities 14.52 (2.37) 12.15 14.52 (13.45) 1.07Non-marketable equity securities 152.51 (0.50) 152.01 152.02 (0.50) 151.52Equity affiliate 254.93 – 254.93 24.51 – 24.51Readily marketable debt securities 4.12 – 4.12 4.12 – 4.12
426.08 (2.87) 423.21 195.17 (13.95) 181.22
During 2005, the Company raised its equity stake in NPI from 10 percent to 50 percent. Subsequent to the acquisition, theCompany has accounted for this investment by the equity method.

RANBAXY LABORATORIES LIMITED AND SUBSIDIARIES
NOTES TO CONSOLIDATED FINANCIAL STATEMENTSDecember 31, 2005 and 2004(All amounts in Rupees Million, unless otherwise stated)
Ranbaxy Laboratories Limited Annual Report 2005 Notes to Consolidated Financial Statements – US GAAP
117
NOTE J - OTHER ASSETS
Other assets comprise of the following:
2005 2004
Prepaid expenses 352.90 448.61Loans and advances 231.94 274.36Trade advances 324.97 493.67Balances with statutory authorities 1,974.06 2,021.98Deposits 964.43 920.39Others 238.96 627.77
4,087.26 4,786.78Less: Current assets (3,416.30) (4,456.87)
670.96 329.91
NOTE K - BORROWINGS FROM BANKS AND FINANCIAL INSTITUTIONS
The Company and certain Group Companies have availed working capital and short term loans from banks and financialinstitutions, expiring at various dates during 2006 providing an aggregate borrowing capability of Rs. 5,904.84 million,primarily to finance their working capital requirements. The interest rates for these facilities are primarily based on theLondon Inter-bank Offer Rate ("LIBOR") or the Euro Inter-bank Offer Rate ("EURIBOR"), with local currency borrowingsbeing based on country-specific benchmark rates. Accordingly, interest rates ranged from 4.0 percent to 17.0 percent, withthe majority averaging approximately 4.5 percent. Details of the borrowings from banks are as follows:
2005 2004
Overdraft facilities 1,624.12 1,183.44Short term loans 12,123.90 3,296.21
13,748.02 4,479.65
A majority of these facilities are secured by some of the underlying assets of the borrowing entity and contain financialcovenants and restrictions on indebtedness. These borrowings are further supported by the following:
2005 2004
Corporate guarantee issued by RLL 166.47 127.61Corporate guarantee issued by RNBV and Letter of comfort from RLL 541.36 630.49Letter of comfort / Letter of awareness from RLL 3,047.88 2,144.25Charge over assets 4,862.89 1,577.30
Sub-total 8,618.60 4,479.65
Unsecured loans 5,129.42 –
Total 13,748.02 4,479.65
The aggregate of Corporate guarantees issued by RLL and RNBV in respect of the overdraft facilities and short term loansfrom banks is a maximum of Rs. 1,150.65 million. The terms of the guarantees are in accordance with the tenor of theloans. The guarantees can be invoked only in the event of default in repayment by the borrowing entity.
NOTE L - LONG-TERM DEBTLong-term debt comprise the following:
2005 2004
Secured term loans from banks 30.63 1,779.98Unsecured term loans from banks 5,558.08 2,202.49Other unsecured loans 19.75 57.49Capital lease obligations 651.14 8.00
6,259.60 4,047.96Less: Current portion of long term debt (3,142.86) (2,415.97)
3,116.74 1,631.99
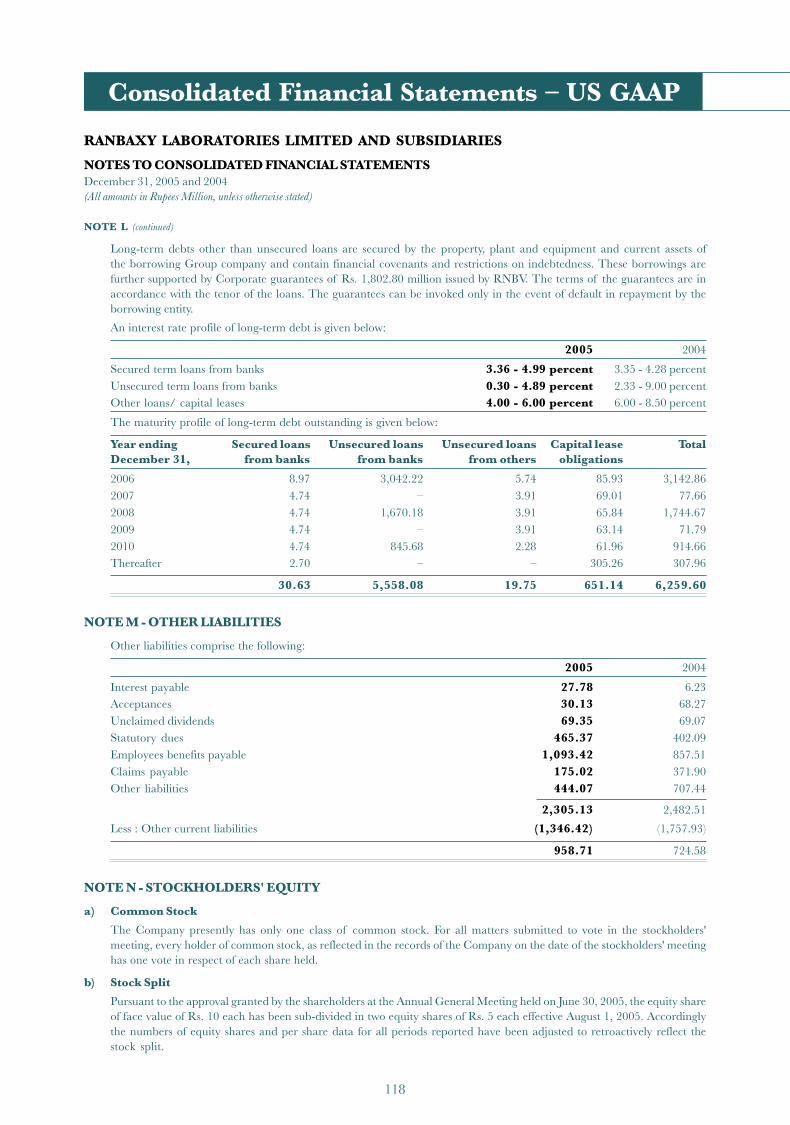
RANBAXY LABORATORIES LIMITED AND SUBSIDIARIES
NOTES TO CONSOLIDATED FINANCIAL STATEMENTSDecember 31, 2005 and 2004(All amounts in Rupees Million, unless otherwise stated)
Consolidated Financial Statements – US GAAP
118
Long-term debts other than unsecured loans are secured by the property, plant and equipment and current assets ofthe borrowing Group company and contain financial covenants and restrictions on indebtedness. These borrowings arefurther supported by Corporate guarantees of Rs. 1,802.80 million issued by RNBV. The terms of the guarantees are inaccordance with the tenor of the loans. The guarantees can be invoked only in the event of default in repayment by theborrowing entity.
An interest rate profile of long-term debt is given below:
2005 2004
Secured term loans from banks 3.36 - 4.99 percent 3.35 - 4.28 percentUnsecured term loans from banks 0.30 - 4.89 percent 2.33 - 9.00 percentOther loans/ capital leases 4.00 - 6.00 percent 6.00 - 8.50 percent
The maturity profile of long-term debt outstanding is given below:
Year ending Secured loans Unsecured loans Unsecured loans Capital lease TotalDecember 31, from banks from banks from others obligations
2006 8.97 3,042.22 5.74 85.93 3,142.862007 4.74 – 3.91 69.01 77.662008 4.74 1,670.18 3.91 65.84 1,744.672009 4.74 – 3.91 63.14 71.792010 4.74 845.68 2.28 61.96 914.66Thereafter 2.70 – – 305.26 307.96
30.63 5,558.08 19.75 651.14 6,259.60
NOTE M - OTHER LIABILITIES
Other liabilities comprise the following:
2005 2004
Interest payable 27.78 6.23Acceptances 30.13 68.27Unclaimed dividends 69.35 69.07Statutory dues 465.37 402.09Employees benefits payable 1,093.42 857.51Claims payable 175.02 371.90Other liabilities 444.07 707.44
2,305.13 2,482.51
Less : Other current liabilities (1,346.42) (1,757.93)
958.71 724.58
NOTE N - STOCKHOLDERS' EQUITY
a) Common Stock
The Company presently has only one class of common stock. For all matters submitted to vote in the stockholders'meeting, every holder of common stock, as reflected in the records of the Company on the date of the stockholders' meetinghas one vote in respect of each share held.
b) Stock Split
Pursuant to the approval granted by the shareholders at the Annual General Meeting held on June 30, 2005, the equity shareof face value of Rs. 10 each has been sub-divided in two equity shares of Rs. 5 each effective August 1, 2005. Accordinglythe numbers of equity shares and per share data for all periods reported have been adjusted to retroactively reflect thestock split.
NOTE L (continued)

RANBAXY LABORATORIES LIMITED AND SUBSIDIARIES
NOTES TO CONSOLIDATED FINANCIAL STATEMENTSDecember 31, 2005 and 2004(All amounts in Rupees Million, unless otherwise stated)
Ranbaxy Laboratories Limited Annual Report 2005 Notes to Consolidated Financial Statements – US GAAP
119
c) Dividends
Indian statutes mandate that the dividends shall be declared out of the distributable profits only after the transfer of up to10 percent of net income computed in accordance with regulations to a general reserve. Should the Company declare andpay dividends, such dividends are required to be paid in Indian rupees to each holder of equity shares in proportion to thenumber of shares held to the total equity shares outstanding as on that date. During the years ended December 31, 2005 and2004, the Company distributed dividends of Rs. 3,164.26 million and Rs. 3,157.84 million, at the rate of 170 percent ofcommon stock in each year.
During the year Ranbaxy Malaysia Sdn. Bhd. and Ranbaxy Unichem Company Limited distributed dividends to stockholders,other than RNBV and RLL, of Rs. 5.87 million (2004 - Rs. 5.87 million) at the rate of 14.08 percent (2004 - 14 percent) ofcommon stock and Rs. 0.51 million (2004 - Rs. Nil million) at the rate of 4 percent (2004 - Nil percent) of common stock,respectively. During the year ended December 31, 2004, Ranbaxy Nigeria Limited distributed dividends to stockholders,other than RNBV and RLL of Rs. 0.37 million, at the rate of 18 percent of common stock.
NOTE O - EARNINGS PER COMMON SHAREA reconciliation of net income and number of shares of the basic and diluted earnings per share computation fromcontinuing operations is as follows:
2005 2004
Net Income
Income from continuing operations after minority interest 232.43 7,341.87Income from discontinued operations, net of tax effect of
Rs. 79.41 million and Rs. 89.64, respectively 161.88 154.42Gain from disposal of discontinued operations, net of tax
effect of Rs. 107.00 million 384.72 –
Net income 779.03 7,496.29
Number of shares
Basic weighted average number of shares outstanding 372,216,805 371,503,666Effect of dilutive securities* - employee stock options 1,089,479 1,849,060
Diluted weighted average number of shares outstanding 373,306,284 373,352,726
* excludes anti-dilutive securities 4,895,520 –
NOTE P - EMPLOYEE STOCK INCENTIVE SCHEMESThe Company's Employee Stock Option Schemes ("ESOSs") provide for the grant of stock options to eligible managementemployees and Directors of the Company and eligible management employees and Directors of the subsidiaries.The ESOSs are administered by the board's Compensation Committee. Options are granted on the basis of performanceand the managerial grade of the employee. Presently, we have three ESOSs ("ESOS I", "ESOS II" and "ESOS 2005").Options can be distributed at the discretion of the committee to select employees depending upon (i) Criticality of theposition held, (ii) Potential of the Manager and (iii) Significant contribution during the year.
The ESOSs limit grants to an employee to 25,000 options for ESOS I and 40,000 each options for ESOS II and ESOS 2005in any given year. ESOS I and II provide that the exercise price of options is to be determined at the average of the dailyclosing price of the Company's equity shares on the National Stock Exchange ("NSE") during a period of 26 weekspreceding the date of the grant. ESOS 2005 provides that the exercise price of options will be the latest available closingprice on the Stock exchange on which the shares of the Company are listed, prior to the date of the meeting of theCommittee of Directors in which the options are granted. If the shares are listed on more than one stock exchange, then thestock exchange where there is highest trading volume on the said date shall be considered. The options vest over a period offive years from the date of grant with 20 percent of the options vesting at the end of each year. Options lapse if they are notexercised prior to the expiry date, which is ten years from the date of the grant.
As the number of shares that an individual employee is entitled to receive and the price of the option is known on the grantdate, the grants made pursuant to the ESOSs are considered fixed grants. The Company applies the intrinsic value-basedmethod of accounting for calculation of employee compensation cost for the stock options granted.
NOTE N (continued)
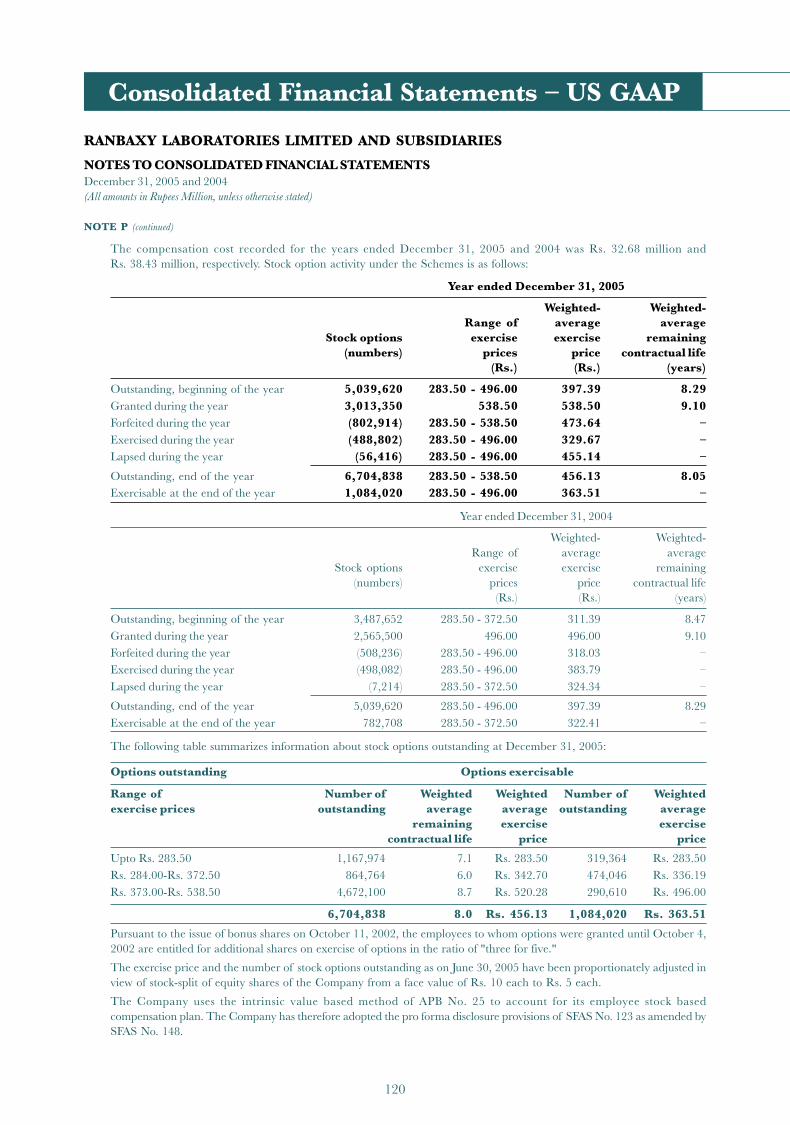
RANBAXY LABORATORIES LIMITED AND SUBSIDIARIES
NOTES TO CONSOLIDATED FINANCIAL STATEMENTSDecember 31, 2005 and 2004(All amounts in Rupees Million, unless otherwise stated)
Consolidated Financial Statements – US GAAP
120
The compensation cost recorded for the years ended December 31, 2005 and 2004 was Rs. 32.68 million andRs. 38.43 million, respectively. Stock option activity under the Schemes is as follows:
Year ended December 31, 2005
Weighted- Weighted-Range of average average
Stock options exercise exercise remaining(numbers) prices price contractual life
(Rs.) (Rs.) (years)
Outstanding, beginning of the year 5,039,620 283.50 - 496.00 397.39 8.29Granted during the year 3,013,350 538.50 538.50 9.10Forfeited during the year (802,914) 283.50 - 538.50 473.64 –Exercised during the year (488,802) 283.50 - 496.00 329.67 –Lapsed during the year (56,416) 283.50 - 496.00 455.14 –
Outstanding, end of the year 6,704,838 283.50 - 538.50 456.13 8.05Exercisable at the end of the year 1,084,020 283.50 - 496.00 363.51 –
Year ended December 31, 2004
Weighted- Weighted-Range of average average
Stock options exercise exercise remaining(numbers) prices price contractual life
(Rs.) (Rs.) (years)
Outstanding, beginning of the year 3,487,652 283.50 - 372.50 311.39 8.47Granted during the year 2,565,500 496.00 496.00 9.10Forfeited during the year (508,236) 283.50 - 496.00 318.03 –Exercised during the year (498,082) 283.50 - 496.00 383.79 –Lapsed during the year (7,214) 283.50 - 372.50 324.34 –
Outstanding, end of the year 5,039,620 283.50 - 496.00 397.39 8.29Exercisable at the end of the year 782,708 283.50 - 372.50 322.41 –
The following table summarizes information about stock options outstanding at December 31, 2005:
Options outstanding Options exercisable
Range of Number of Weighted Weighted Number of Weightedexercise prices outstanding average average outstanding average
remaining exercise exercisecontractual life price price
Upto Rs. 283.50 1,167,974 7.1 Rs. 283.50 319,364 Rs. 283.50Rs. 284.00-Rs. 372.50 864,764 6.0 Rs. 342.70 474,046 Rs. 336.19Rs. 373.00-Rs. 538.50 4,672,100 8.7 Rs. 520.28 290,610 Rs. 496.00
6,704,838 8.0 Rs. 456.13 1,084,020 Rs. 363.51
Pursuant to the issue of bonus shares on October 11, 2002, the employees to whom options were granted until October 4,2002 are entitled for additional shares on exercise of options in the ratio of "three for five."
The exercise price and the number of stock options outstanding as on June 30, 2005 have been proportionately adjusted inview of stock-split of equity shares of the Company from a face value of Rs. 10 each to Rs. 5 each.
The Company uses the intrinsic value based method of APB No. 25 to account for its employee stock basedcompensation plan. The Company has therefore adopted the pro forma disclosure provisions of SFAS No. 123 as amended bySFAS No. 148.
NOTE P (continued)
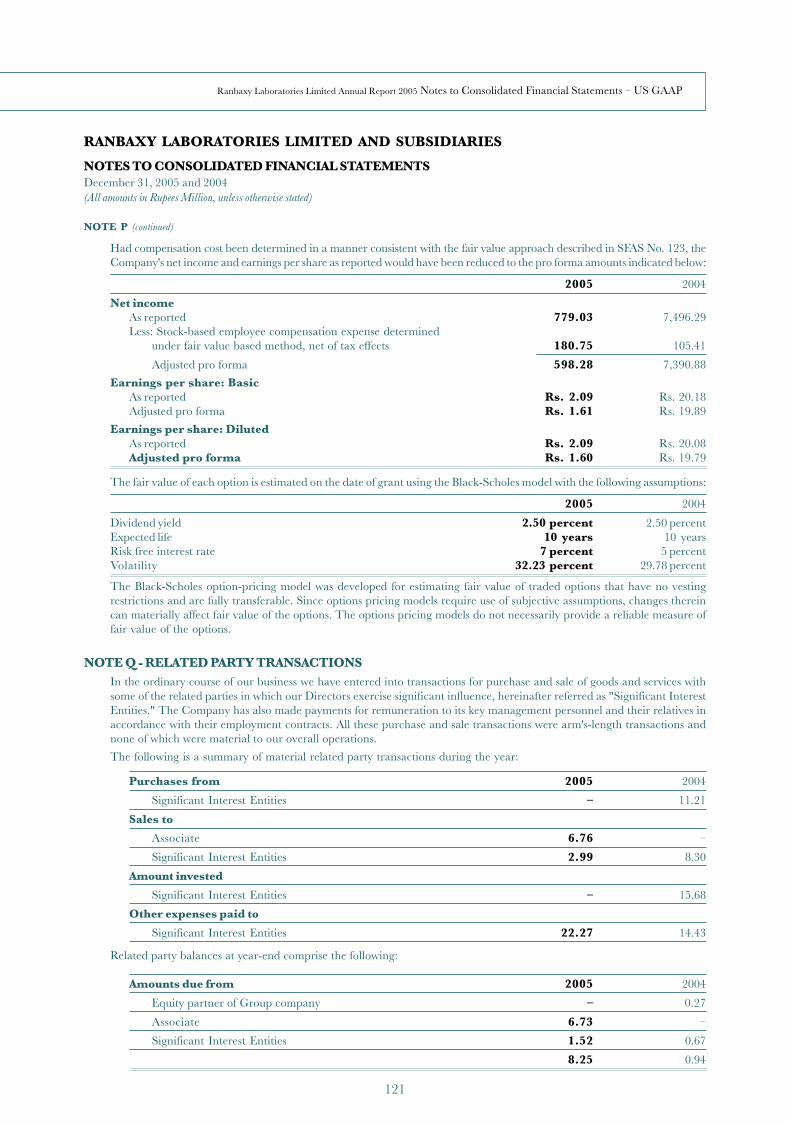
RANBAXY LABORATORIES LIMITED AND SUBSIDIARIES
NOTES TO CONSOLIDATED FINANCIAL STATEMENTSDecember 31, 2005 and 2004(All amounts in Rupees Million, unless otherwise stated)
Ranbaxy Laboratories Limited Annual Report 2005 Notes to Consolidated Financial Statements – US GAAP
121
Had compensation cost been determined in a manner consistent with the fair value approach described in SFAS No. 123, theCompany's net income and earnings per share as reported would have been reduced to the pro forma amounts indicated below:
2005 2004
Net incomeAs reported 779.03 7,496.29Less: Stock-based employee compensation expense determined
under fair value based method, net of tax effects 180.75 105.41
Adjusted pro forma 598.28 7,390.88
Earnings per share: BasicAs reported Rs. 2.09 Rs. 20.18Adjusted pro forma Rs. 1.61 Rs. 19.89
Earnings per share: DilutedAs reported Rs. 2.09 Rs. 20.08Adjusted pro forma Rs. 1.60 Rs. 19.79
The fair value of each option is estimated on the date of grant using the Black-Scholes model with the following assumptions:
2005 2004
Dividend yield 2.50 percent 2.50 percentExpected life 10 years 10 yearsRisk free interest rate 7 percent 5 percentVolatility 32.23 percent 29.78 percent
The Black-Scholes option-pricing model was developed for estimating fair value of traded options that have no vestingrestrictions and are fully transferable. Since options pricing models require use of subjective assumptions, changes thereincan materially affect fair value of the options. The options pricing models do not necessarily provide a reliable measure offair value of the options.
NOTE Q - RELATED PARTY TRANSACTIONSIn the ordinary course of our business we have entered into transactions for purchase and sale of goods and services withsome of the related parties in which our Directors exercise significant influence, hereinafter referred as "Significant InterestEntities." The Company has also made payments for remuneration to its key management personnel and their relatives inaccordance with their employment contracts. All these purchase and sale transactions were arm's-length transactions andnone of which were material to our overall operations.
The following is a summary of material related party transactions during the year:
Purchases from 2005 2004
Significant Interest Entities – 11.21
Sales to
Associate 6.76 –
Significant Interest Entities 2.99 8.30
Amount invested
Significant Interest Entities – 15.68
Other expenses paid to
Significant Interest Entities 22.27 14.43
Related party balances at year-end comprise the following:
Amounts due from 2005 2004
Equity partner of Group company – 0.27
Associate 6.73 –
Significant Interest Entities 1.52 0.67
8.25 0.94
NOTE P (continued)

RANBAXY LABORATORIES LIMITED AND SUBSIDIARIES
NOTES TO CONSOLIDATED FINANCIAL STATEMENTSDecember 31, 2005 and 2004(All amounts in Rupees Million, unless otherwise stated)
Consolidated Financial Statements – US GAAP
122
Amounts due to 2005 2004
Equity partner of Group Company – 10.03
Significant Interest Entities 0.06 8.46
0.06 18.49
NOTE R - INCOME TAXES
The provision for income taxes comprises the following:
2005 2004
Income before income taxesDomestic 782.09 6,978.15Foreign (1,544.19) 2,013.79
(762.10) 8,991.94Income from discontinued operations 241.29 244.06Gain from disposal of discontinued operations 491.72 –
(29.09) 9,236.00
Current income tax expenseDomestic taxes 273.92 808.85Foreign taxes 179.70 1,020.52
Deferred income tax expense / (benefit)Domestic taxes (601.58) 95.11Foreign taxes (686.54) (218.31)
Total (834.50) 1,706.17Less: tax on Discontinued operationsCurrent tax expense (193.73) (93.03)Deferred tax benefit 7.32 3.39
(1,020.91) 1,616.53
The reported income tax expense differed from amounts computed by applying the enacted tax rates to income / (loss)before income taxes as a result of the following:
2005 2004
Income/(loss) before income taxes and minority interest (762.10) 8,991.94Enacted tax rate in India 33.66% 36.59%Computed expected tax benefit (benefit)/expense (256.52) 3,290.15
Effect of:Valuation allowance 106.54 39.01Expenses not deductible for tax purposes (47.77) 80.95Differences between Indian and foreign tax rates (103.89) (63.88)Income exempt from income taxes (10.79) (534.02)Incremental deduction allowed for research and development expenses (1,081.82) (819.77)Tax rate change 179.27 (25.70)Minimum alternate tax – (385.30)Others 194.07 35.09Income tax (benefit)/expense (1,020.91) 1,616.53
The tax effect of significant temporary differences that resulted in deferred income tax assets and liabilities and a descriptionof the items that create those differences are given below. The classification of the deferred tax assets and liabilities isdetermined based on the transaction from which the timing difference arises. Non-current deferred tax assets and liabilitiesare shown separately due to the tax jurisdiction in which the timing difference arises.
NOTE Q (continued)
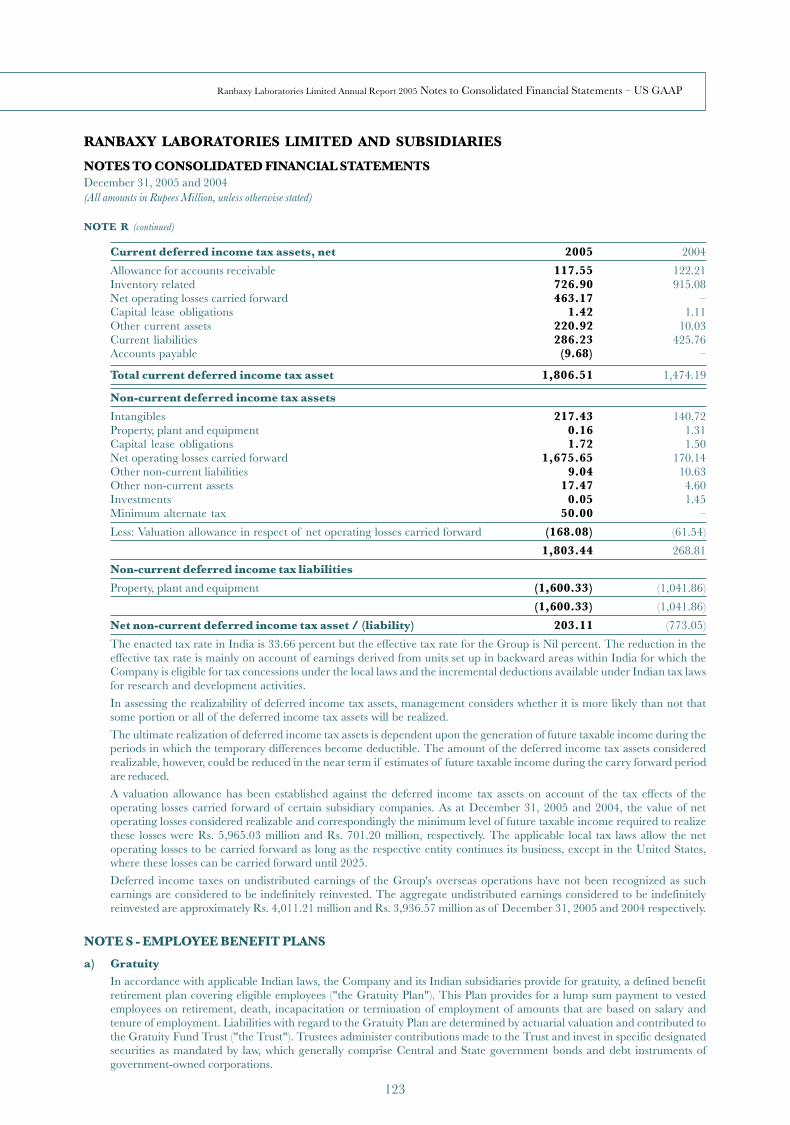
RANBAXY LABORATORIES LIMITED AND SUBSIDIARIES
NOTES TO CONSOLIDATED FINANCIAL STATEMENTSDecember 31, 2005 and 2004(All amounts in Rupees Million, unless otherwise stated)
Ranbaxy Laboratories Limited Annual Report 2005 Notes to Consolidated Financial Statements – US GAAP
123
Current deferred income tax assets, net 2005 2004
Allowance for accounts receivable 117.55 122.21Inventory related 726.90 915.08Net operating losses carried forward 463.17 –Capital lease obligations 1.42 1.11Other current assets 220.92 10.03Current liabilities 286.23 425.76Accounts payable (9.68) –
Total current deferred income tax asset 1,806.51 1,474.19
Non-current deferred income tax assets
Intangibles 217.43 140.72Property, plant and equipment 0.16 1.31Capital lease obligations 1.72 1.50Net operating losses carried forward 1,675.65 170.14Other non-current liabilities 9.04 10.63Other non-current assets 17.47 4.60Investments 0.05 1.45Minimum alternate tax 50.00 –
Less: Valuation allowance in respect of net operating losses carried forward (168.08) (61.54)
1,803.44 268.81
Non-current deferred income tax liabilities
Property, plant and equipment (1,600.33) (1,041.86)
(1,600.33) (1,041.86)
Net non-current deferred income tax asset / (liability) 203.11 (773.05)
The enacted tax rate in India is 33.66 percent but the effective tax rate for the Group is Nil percent. The reduction in theeffective tax rate is mainly on account of earnings derived from units set up in backward areas within India for which theCompany is eligible for tax concessions under the local laws and the incremental deductions available under Indian tax lawsfor research and development activities.
In assessing the realizability of deferred income tax assets, management considers whether it is more likely than not thatsome portion or all of the deferred income tax assets will be realized.
The ultimate realization of deferred income tax assets is dependent upon the generation of future taxable income during theperiods in which the temporary differences become deductible. The amount of the deferred income tax assets consideredrealizable, however, could be reduced in the near term if estimates of future taxable income during the carry forward periodare reduced.
A valuation allowance has been established against the deferred income tax assets on account of the tax effects of theoperating losses carried forward of certain subsidiary companies. As at December 31, 2005 and 2004, the value of netoperating losses considered realizable and correspondingly the minimum level of future taxable income required to realizethese losses were Rs. 5,965.03 million and Rs. 701.20 million, respectively. The applicable local tax laws allow the netoperating losses to be carried forward as long as the respective entity continues its business, except in the United States,where these losses can be carried forward until 2025.
Deferred income taxes on undistributed earnings of the Group's overseas operations have not been recognized as suchearnings are considered to be indefinitely reinvested. The aggregate undistributed earnings considered to be indefinitelyreinvested are approximately Rs. 4,011.21 million and Rs. 3,936.57 million as of December 31, 2005 and 2004 respectively.
NOTE S - EMPLOYEE BENEFIT PLANS
a) GratuityIn accordance with applicable Indian laws, the Company and its Indian subsidiaries provide for gratuity, a defined benefitretirement plan covering eligible employees ("the Gratuity Plan"). This Plan provides for a lump sum payment to vestedemployees on retirement, death, incapacitation or termination of employment of amounts that are based on salary andtenure of employment. Liabilities with regard to the Gratuity Plan are determined by actuarial valuation and contributed tothe Gratuity Fund Trust ("the Trust"). Trustees administer contributions made to the Trust and invest in specific designatedsecurities as mandated by law, which generally comprise Central and State government bonds and debt instruments ofgovernment-owned corporations.
NOTE R (continued)

RANBAXY LABORATORIES LIMITED AND SUBSIDIARIES
NOTES TO CONSOLIDATED FINANCIAL STATEMENTSDecember 31, 2005 and 2004(All amounts in Rupees Million, unless otherwise stated)
Consolidated Financial Statements – US GAAP
124
The following table sets out the funded status of the Gratuity Plan and the amounts recognized in the Group's consolidatedfinancial statements:
2005 2004
Change in the benefit obligations
Projected Benefit Obligations ("PBO") at the beginning of the year 236.30 187.78Service cost 24.54 22.24Interest cost 17.72 13.15Actuarial loss 12.46 40.09Benefits paid (27.71) (26.96)
PBO at the end of the year 263.31 236.30
Change in plan assetsFair value of plan assets at the beginning of the year 239.95 201.89
Actual return on plan assets 16.15 17.58Employer contributions 38.76 47.44Benefits paid (27.71) (26.96)
Fair value of plan assets at the end of the year 267.15 239.95
Net gratuity cost for the years ended December 31, 2005 and 2004, included the following components:
2005 2004
Service cost 24.54 22.24Interest cost 17.72 13.15Actuarial loss 12.46 40.09
Net gratuity cost 54.72 75.48
The actuarial assumptions used in accounting for the Gratuity Plan were as follows:
2005 2004
Discount rate 7.5% 7.0%Rate of increase in compensation levels 5.0% 4.0%Rate of return on plan assets 8.0% 8.5%
The expected long-term return on plan assets is based on the expectation of the average long-term rate of return expectedto prevail over the next 15 - 20 years on the types of investments prescribed as per the statutory pattern of investment.
The Company's Gratuity Plan weighted-average asset allocations at December 31, 2005 and 2004 is fully in the debtinstruments category.
The Company expects to contribute Rs. 67.00 million to its Gratuity Plan during the year ended December 31, 2006. Thefollowing benefit payments, based on future services of employees, as appropriate, are expected to be paid:
Year ending December 31,
2006 27.642007 30.642008 34.002009 37.752010 41.942011 to 2015 290.21
In respect of certain other employees of the Company, the gratuity benefit is provided through annual contributions to afund managed by The Life Insurance Corporation of India ("LIC"). Under this plan, the settlement obligation remains withthe Company, although LIC administers the fund and determines the annual contribution premium required to be paid bythe Company. In respect of the Indian subsidiaries, gratuity benefit is provided on the basis of actuarial valuation,performed by an independent actuary at the balance sheet date. Expenses incurred in respect of these employees approximatedRs. 1.79 million and Rs. 3.94 million for the years ended December 31, 2005 and 2004 respectively.
b) Superannuation benefitApart from being covered under the Gratuity Plan described earlier, certain employees of the Company and its Indiansubsidiaries participate in a superannuation benefit; a defined contribution plan administered by the LIC. The Company and
NOTE S (continued)

RANBAXY LABORATORIES LIMITED AND SUBSIDIARIES
NOTES TO CONSOLIDATED FINANCIAL STATEMENTSDecember 31, 2005 and 2004(All amounts in Rupees Million, unless otherwise stated)
Ranbaxy Laboratories Limited Annual Report 2005 Notes to Consolidated Financial Statements – US GAAP
125
its Indian subsidiaries make annual contributions, based on a specified percentage of salary of each covered employee. TheCompany and its Indian subsidiaries do not have any further obligation to the superannuation plan, beyond making suchcontributions. Upon retirement or separation (only if after completion of service of 5 years) an employee becomes entitledfor pension, as determined by the LIC, which is paid directly to the concerned employee. The Company and its Indiansubsidiaries contributed approximately Rs. 40.50 million and Rs. 51.96 million to the superannuation plan, during the yearsended December 31, 2005 and 2004 respectively.
c) Pension plans
RLL and one of its Indian subsidiaries also have a retirement pension plan ("Pension Plan"), which is linked to superannuationbenefits described above. This Pension Plan is applicable for certain management employees who retire after completion ofservice of 10 years or are separated after completion of service of 20 years, based on last drawn salary and tenure ofemployment. Such pension amount is reduced by the amount payable by LIC under the superannuation plan and is payableas additional pension. The liability for such additional pension is determined and provided on the basis of actuarialvaluation.
The following table sets out the status of the Pension Plan and the amounts recognized in the Group's consolidated financialstatements:
2005 2004
Change in the benefit obligationsProjected Benefit Obligations ("PBO") at the beginning of the year 635.58 420.02Service cost 53.23 38.68Interest cost 47.62 29.40Actuarial loss 137.80 161.30Benefits paid (18.79) (13.82)
PBO at the end of the year 855.44 635.58
Net pension cost for the years ended December 31, 2005 and 2004 included the following components:
2005 2004
Service cost 53.23 38.68Interest cost 47.62 29.40Actuarial loss 137.80 161.30
Net pension cost 238.65 229.38
The actuarial assumptions used in accounting for the Pension Plan were as follows:
2005 2004
Discount rate 7.5% 7.0%
Rate of increase in compensation levels 5.0% 4.0%
The following benefit payments, which reflect expected future service, as appropriate, are expected to be paid:
Year ending December 31,
2006 20.472007 23.552008 27.082009 31.642010 36.512011 to 2015 279.50
RLL and its Indian subsidiaries contributed approximately Rs. 238.31 million and Rs. 233.75 million to the Pension Planduring the years ended December 31, 2005 and 2004, respectively.
d) Deferred compensation plan
RPI maintains a nonqualified, deferred compensation plan for certain executive employees. Each participating employeemay elect to defer up to 100 percent of their compensation. The employees' contributions to the plan are invested in certainfunds based on each employee's investment election and the fair market value of those funds are recorded as a long-termasset with a corresponding liability representing future benefits payable to the employees.
NOTE S (continued)
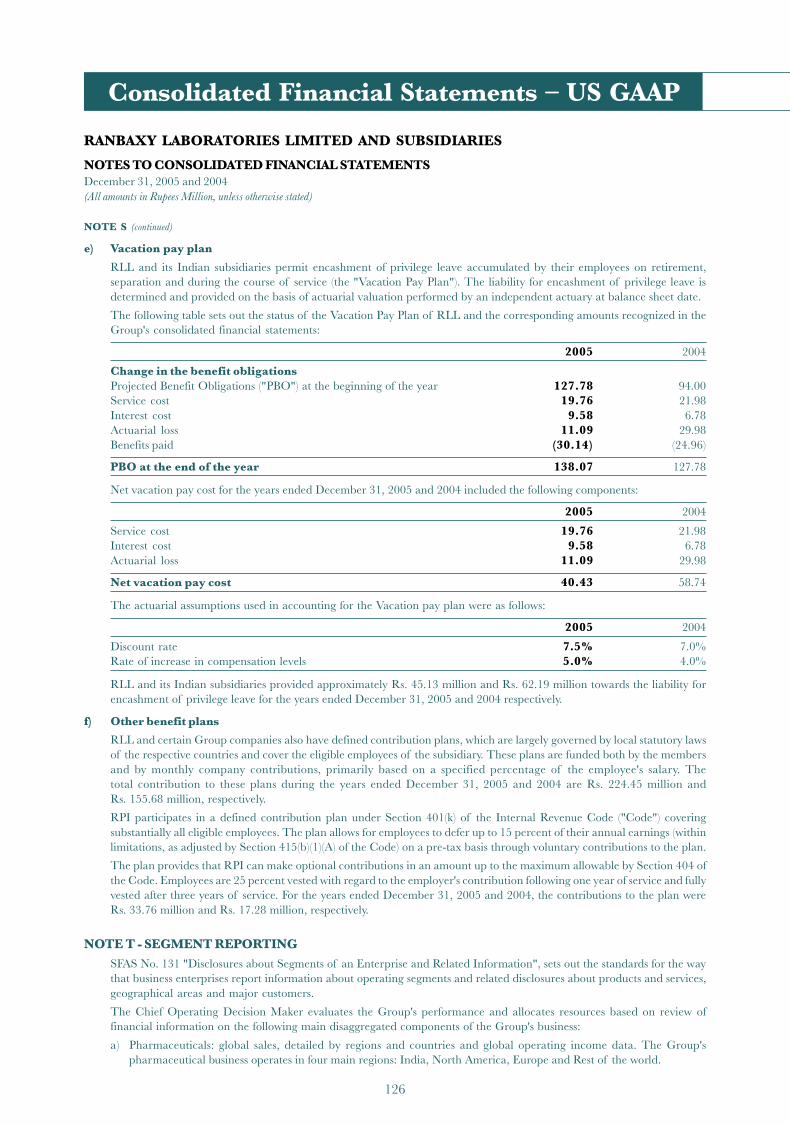
RANBAXY LABORATORIES LIMITED AND SUBSIDIARIES
NOTES TO CONSOLIDATED FINANCIAL STATEMENTSDecember 31, 2005 and 2004(All amounts in Rupees Million, unless otherwise stated)
Consolidated Financial Statements – US GAAP
126
e) Vacation pay plan
RLL and its Indian subsidiaries permit encashment of privilege leave accumulated by their employees on retirement,separation and during the course of service (the "Vacation Pay Plan"). The liability for encashment of privilege leave isdetermined and provided on the basis of actuarial valuation performed by an independent actuary at balance sheet date.
The following table sets out the status of the Vacation Pay Plan of RLL and the corresponding amounts recognized in theGroup's consolidated financial statements:
2005 2004
Change in the benefit obligationsProjected Benefit Obligations ("PBO") at the beginning of the year 127.78 94.00Service cost 19.76 21.98Interest cost 9.58 6.78Actuarial loss 11.09 29.98Benefits paid (30.14) (24.96)
PBO at the end of the year 138.07 127.78
Net vacation pay cost for the years ended December 31, 2005 and 2004 included the following components:
2005 2004
Service cost 19.76 21.98Interest cost 9.58 6.78Actuarial loss 11.09 29.98
Net vacation pay cost 40.43 58.74
The actuarial assumptions used in accounting for the Vacation pay plan were as follows:
2005 2004
Discount rate 7.5% 7.0%Rate of increase in compensation levels 5.0% 4.0%
RLL and its Indian subsidiaries provided approximately Rs. 45.13 million and Rs. 62.19 million towards the liability forencashment of privilege leave for the years ended December 31, 2005 and 2004 respectively.
f) Other benefit plans
RLL and certain Group companies also have defined contribution plans, which are largely governed by local statutory lawsof the respective countries and cover the eligible employees of the subsidiary. These plans are funded both by the membersand by monthly company contributions, primarily based on a specified percentage of the employee's salary. Thetotal contribution to these plans during the years ended December 31, 2005 and 2004 are Rs. 224.45 million andRs. 155.68 million, respectively.
RPI participates in a defined contribution plan under Section 401(k) of the Internal Revenue Code ("Code") coveringsubstantially all eligible employees. The plan allows for employees to defer up to 15 percent of their annual earnings (withinlimitations, as adjusted by Section 415(b)(1)(A) of the Code) on a pre-tax basis through voluntary contributions to the plan.
The plan provides that RPI can make optional contributions in an amount up to the maximum allowable by Section 404 ofthe Code. Employees are 25 percent vested with regard to the employer's contribution following one year of service and fullyvested after three years of service. For the years ended December 31, 2005 and 2004, the contributions to the plan wereRs. 33.76 million and Rs. 17.28 million, respectively.
NOTE T - SEGMENT REPORTINGSFAS No. 131 "Disclosures about Segments of an Enterprise and Related Information", sets out the standards for the waythat business enterprises report information about operating segments and related disclosures about products and services,geographical areas and major customers.
The Chief Operating Decision Maker evaluates the Group's performance and allocates resources based on review offinancial information on the following main disaggregated components of the Group's business:
a) Pharmaceuticals: global sales, detailed by regions and countries and global operating income data. The Group'spharmaceutical business operates in four main regions: India, North America, Europe and Rest of the world.
NOTE S (continued)

RANBAXY LABORATORIES LIMITED AND SUBSIDIARIES
NOTES TO CONSOLIDATED FINANCIAL STATEMENTSDecember 31, 2005 and 2004(All amounts in Rupees Million, unless otherwise stated)
Ranbaxy Laboratories Limited Annual Report 2005 Notes to Consolidated Financial Statements – US GAAP
127
b) Research and development: expenses incurred on research and development, and
c) Administration: corporate expenses.
The Group's reportable segments are strategic businesses aggregated by the nature of their products, customers, productiontechnologies and marketing methods. Accordingly, the Group provides information regarding its Pharmaceuticals segment(dosage forms, active pharmaceutical ingredient and drug intermediates), trading in pharmaceutical products, drug discoveryresearch and novel drug delivery systems research, which is collectively referred to as the "Pharmaceuticals" business.
The Company is also engaged in operations relating to charter of aircraft, manufacture of laboratory chemicals andmanufacture of pharmaceutical products for animal health care and diagnostics, collectively referred to as "Others"businesses. The Group has divested the business of laboratory chemicals, manufacture and trading of animal health careproducts and diagnostics during the year.
Revenue and expenditure in relation to segments is categorized based on items that are individually identifiable to thatsegment. Geographic segments are based on location of the customers of the Company.
Information by business segments for the year ended December 31, 2005:
Particulars Pharmaceuticals Others Total
Revenues 51,582.45 17.10 51,599.55Less: Inter-segment revenue – (1.02) (1.02)
Net revenues 51,582.45 16.08 51,598.53
Operating expensesCost of sales 27,143.85 – 27,143.85Selling, general and administrative 17,239.32 16.01 17,255.33Depreciation and amortization 1,711.34 6.66 1,718.00Research and development 5,055.33 – 5,055.33
51,149.84 22.67 51,172.51Less: Inter-segment expenses (1.02) (1.02)
Net operating expenses 51,148.82 22.67 51,171.49
Net income before unallocated items 433.63 (6.59) 427.04Reconciliation to net incomeUnallocated corporate expenses – – (19.75)Financial expenses, net – – (495.61)Foreign exchange loss – – (978.98)Other income, net – – 300.49Income tax benefit – – 1,020.91Equity in gain of affiliate – – 4.71Income from discontinued operations,
net of tax effect of Rs. 79.41 million – – 161.88Gain from disposal of discontinued operations,
net of tax effect of Rs. 107.00 million – – 384.72Minority interest – – (26.38)
Net income as per consolidated statement of Income 779.03
Information relating to assets Pharmaceuticals Others Total
Total assets 54,675.95 53.11 54,729.06
Less: Inter-segment assetsAccounts receivable, net of allowances – – –Other current assets, net of allowances – – –
– – –
Net assets employed 54,675.95 53.11 54,729.06
Unallocated corporate assets 5,117.68
Total assets 59,846.74
NOTE T (continued)
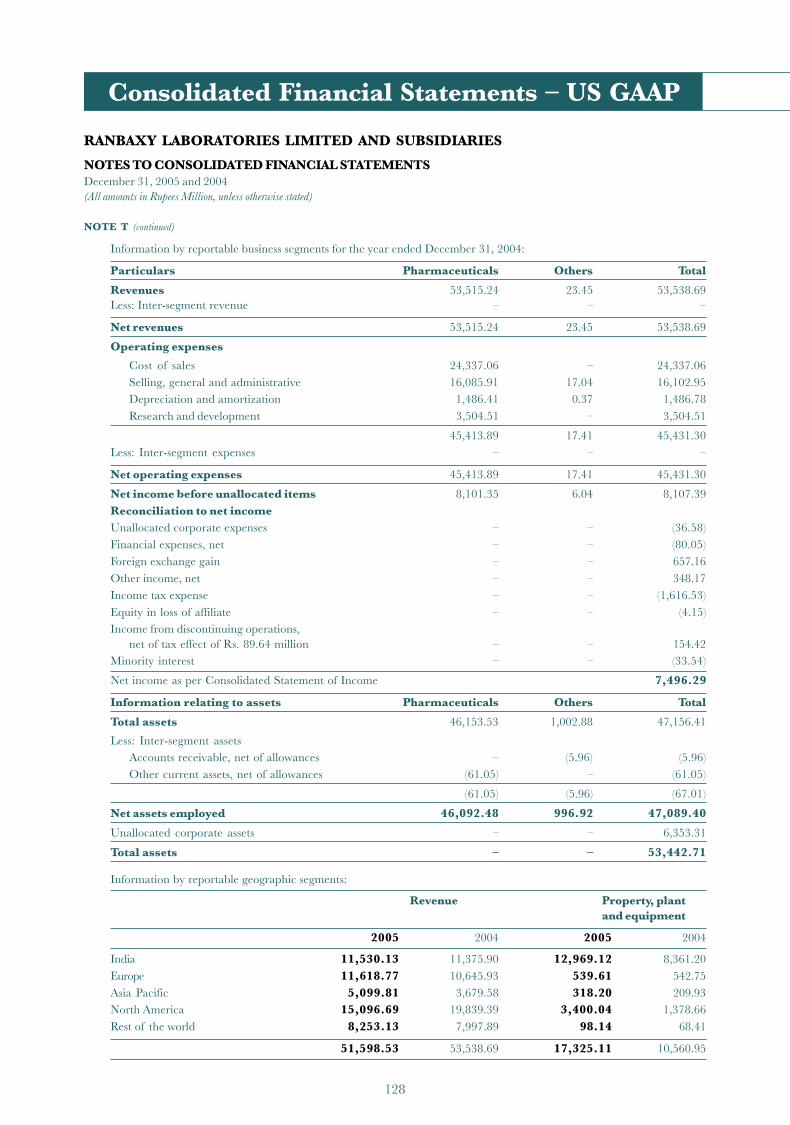
RANBAXY LABORATORIES LIMITED AND SUBSIDIARIES
NOTES TO CONSOLIDATED FINANCIAL STATEMENTSDecember 31, 2005 and 2004(All amounts in Rupees Million, unless otherwise stated)
Consolidated Financial Statements – US GAAP
128
Information by reportable business segments for the year ended December 31, 2004:
Particulars Pharmaceuticals Others Total
Revenues 53,515.24 23.45 53,538.69Less: Inter-segment revenue – – –
Net revenues 53,515.24 23.45 53,538.69
Operating expenses
Cost of sales 24,337.06 – 24,337.06Selling, general and administrative 16,085.91 17.04 16,102.95Depreciation and amortization 1,486.41 0.37 1,486.78Research and development 3,504.51 – 3,504.51
45,413.89 17.41 45,431.30Less: Inter-segment expenses – – –
Net operating expenses 45,413.89 17.41 45,431.30
Net income before unallocated items 8,101.35 6.04 8,107.39Reconciliation to net incomeUnallocated corporate expenses – – (36.58)Financial expenses, net – – (80.05)Foreign exchange gain – – 657.16Other income, net – – 348.17Income tax expense – – (1,616.53)Equity in loss of affiliate – – (4.15)Income from discontinuing operations,
net of tax effect of Rs. 89.64 million – – 154.42Minority interest – – (33.54)
Net income as per Consolidated Statement of Income 7,496.29
Information relating to assets Pharmaceuticals Others Total
Total assets 46,153.53 1,002.88 47,156.41
Less: Inter-segment assetsAccounts receivable, net of allowances – (5.96) (5.96)Other current assets, net of allowances (61.05) – (61.05)
(61.05) (5.96) (67.01)
Net assets employed 46,092.48 996.92 47,089.40
Unallocated corporate assets – – 6,353.31
Total assets – – 53,442.71
Information by reportable geographic segments:
Revenue Property, plantand equipment
2005 2004 2005 2004
India 11,530.13 11,375.90 12,969.12 8,361.20Europe 11,618.77 10,645.93 539.61 542.75Asia Pacific 5,099.81 3,679.58 318.20 209.93North America 15,096.69 19,839.39 3,400.04 1,378.66Rest of the world 8,253.13 7,997.89 98.14 68.41
51,598.53 53,538.69 17,325.11 10,560.95
NOTE T (continued)
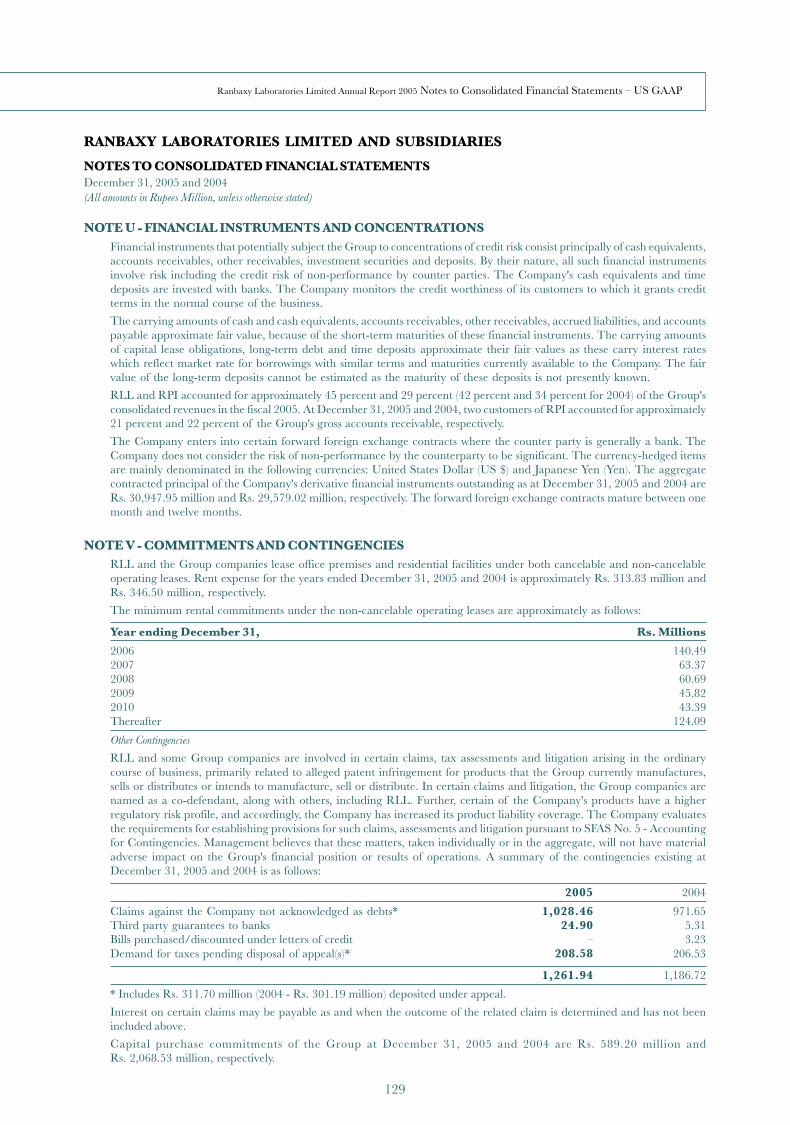
RANBAXY LABORATORIES LIMITED AND SUBSIDIARIES
NOTES TO CONSOLIDATED FINANCIAL STATEMENTSDecember 31, 2005 and 2004(All amounts in Rupees Million, unless otherwise stated)
Ranbaxy Laboratories Limited Annual Report 2005 Notes to Consolidated Financial Statements – US GAAP
129
NOTE U - FINANCIAL INSTRUMENTS AND CONCENTRATIONSFinancial instruments that potentially subject the Group to concentrations of credit risk consist principally of cash equivalents,accounts receivables, other receivables, investment securities and deposits. By their nature, all such financial instrumentsinvolve risk including the credit risk of non-performance by counter parties. The Company's cash equivalents and timedeposits are invested with banks. The Company monitors the credit worthiness of its customers to which it grants creditterms in the normal course of the business.
The carrying amounts of cash and cash equivalents, accounts receivables, other receivables, accrued liabilities, and accountspayable approximate fair value, because of the short-term maturities of these financial instruments. The carrying amountsof capital lease obligations, long-term debt and time deposits approximate their fair values as these carry interest rateswhich reflect market rate for borrowings with similar terms and maturities currently available to the Company. The fairvalue of the long-term deposits cannot be estimated as the maturity of these deposits is not presently known.
RLL and RPI accounted for approximately 45 percent and 29 percent (42 percent and 34 percent for 2004) of the Group'sconsolidated revenues in the fiscal 2005. At December 31, 2005 and 2004, two customers of RPI accounted for approximately21 percent and 22 percent of the Group's gross accounts receivable, respectively.
The Company enters into certain forward foreign exchange contracts where the counter party is generally a bank. TheCompany does not consider the risk of non-performance by the counterparty to be significant. The currency-hedged itemsare mainly denominated in the following currencies: United States Dollar (US $) and Japanese Yen (Yen). The aggregatecontracted principal of the Company's derivative financial instruments outstanding as at December 31, 2005 and 2004 areRs. 30,947.95 million and Rs. 29,579.02 million, respectively. The forward foreign exchange contracts mature between onemonth and twelve months.
NOTE V - COMMITMENTS AND CONTINGENCIESRLL and the Group companies lease office premises and residential facilities under both cancelable and non-cancelableoperating leases. Rent expense for the years ended December 31, 2005 and 2004 is approximately Rs. 313.83 million andRs. 346.50 million, respectively.
The minimum rental commitments under the non-cancelable operating leases are approximately as follows:
Year ending December 31, Rs. Millions
2006 140.492007 63.372008 60.692009 45.822010 43.39Thereafter 124.09
Other Contingencies
RLL and some Group companies are involved in certain claims, tax assessments and litigation arising in the ordinarycourse of business, primarily related to alleged patent infringement for products that the Group currently manufactures,sells or distributes or intends to manufacture, sell or distribute. In certain claims and litigation, the Group companies arenamed as a co-defendant, along with others, including RLL. Further, certain of the Company's products have a higherregulatory risk profile, and accordingly, the Company has increased its product liability coverage. The Company evaluatesthe requirements for establishing provisions for such claims, assessments and litigation pursuant to SFAS No. 5 - Accountingfor Contingencies. Management believes that these matters, taken individually or in the aggregate, will not have materialadverse impact on the Group's financial position or results of operations. A summary of the contingencies existing atDecember 31, 2005 and 2004 is as follows:
2005 2004
Claims against the Company not acknowledged as debts* 1,028.46 971.65Third party guarantees to banks 24.90 5.31Bills purchased/discounted under letters of credit – 3.23Demand for taxes pending disposal of appeal(s)* 208.58 206.53
1,261.94 1,186.72
* Includes Rs. 311.70 million (2004 - Rs. 301.19 million) deposited under appeal.
Interest on certain claims may be payable as and when the outcome of the related claim is determined and has not beenincluded above.
Capital purchase commitments of the Group at December 31, 2005 and 2004 are Rs. 589.20 million andRs. 2,068.53 million, respectively.

RANBAXY LABORATORIES LIMITED AND SUBSIDIARIES
NOTES TO CONSOLIDATED FINANCIAL STATEMENTSDecember 31, 2005 and 2004(All amounts in Rupees Million, unless otherwise stated)
Consolidated Financial Statements – US GAAP
130
Royalty Agreements
RPI has a royalty agreement with a third party for the payment of royalties relating to the sale of certain products in theUnited States of America. The third party supplies active pharmaceutical ingredient to the Company. The Company, inturn, supplies the finished product to RPI. The total royalty expense incurred during 2005 and 2004 under this royaltyagreement is approximately Rs. 331.40 million and Rs. 694.08 million, respectively, and is included in cost of sales.Approximately Rs. 900.54 million and Rs. 567.88 million remained payable under the agreement as of December 31, 2005and 2004 respectively, and is included in "accounts payable" on the balance sheet.
NOTE W - LITIGATION SETTLEMENTOn March 30, 2005, Ranbaxy (U.K.) Limited reached a final settlement of the claims brought against it by claimants,comprising of Department of Health, Prescription Pricing Authority and others, in connection with the supply of genericdrugs to the National Health Services ("NHS") between 1996 and 2000. Under the terms of the settlement Ranbaxy (U.K.)Limited has agreed to compensate the NHS for Rs. 371.90 million (GBP 4.5 million), without admission of liability. Thelitigation was initiated by the claimant in 2003; the settlement agreement provides additional evidence of a liability as ofDecember 31, 2004. Accordingly, the amount has been charged to the profits for the year ended December 31, 2004, aslitigation settlement and recorded as a liability, included in "other current liabilities" on the balance sheet.
NOTE X - DISCONTINUED OPERATIONSOn September 2, 2005, the Company announced that it had reached an understanding with ICICI Venture Funds PrivateLimited (ICICI Venture) on the divestment of its Allied Business portfolio, consisting of the Fine Chemicals business,Animal Health Care business and Diagnostics business (excluding the Dade Behring diagnostic assets). The sale wassubject to certain conditions to prepare the assets for sale, requisite regulatory consents and stockholders approval. TheCompany determined that it had substantially fulfilled the required conditions, received requisite consents and approvals byOctober 21, 2005. The sale was effective on November 30, 2005.
On December 22, 2005, Dade Behring India Private Limited acquired certain diagnostic assets from RLL separately.
The Company has classified the assets, liabilities, and results of operations for the Allied Business portfolio as discontinuedoperations in accordance with SFAS 144. The following table reflects the US GAAP carrying values of the primarycomponents of the business to be disposed at December 31, 2004.
Description 2004
Property, plant and equipment 160.99Accounts receivable, net of allowances 275.62Inventory 393.76Other assets 150.09
Total assets 980.46
Accounts payable (59.88)Other liabilities (204.87)
Net assets of discontinued operations 715.71
The following amounts relates to the Allied business operations that the Company agreed to sell:
Description 2005 2004
Net revenue 1,494.24 1,495.12
Cost of revenues 909.93 899.42
Selling, general & administration 366.62 339.54
Depreciation & amortization 15.14 21.26
Operating profit 202.55 234.90
Interest expense (0.52) (2.43)
Other income 39.26 11.59
Profit before income tax 241.29 244.06
Income tax 79.41 89.64
Profit after tax 161.88 154.42
NOTE V (continued)
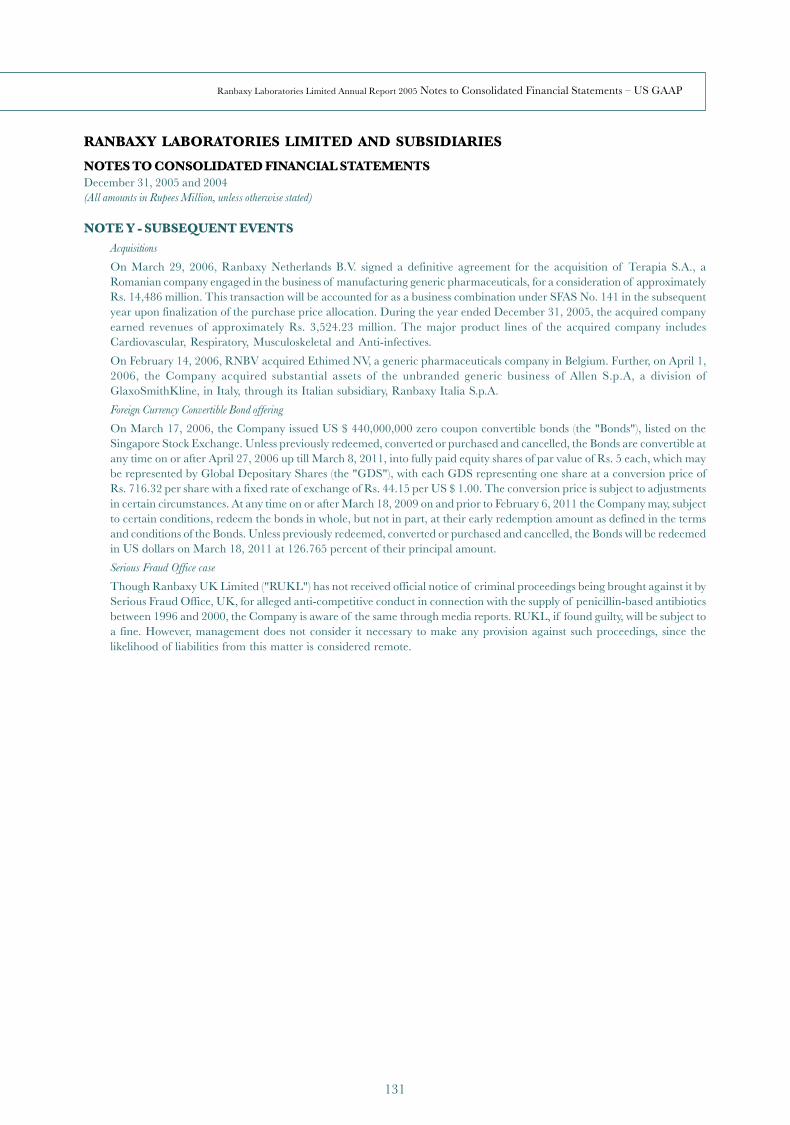
RANBAXY LABORATORIES LIMITED AND SUBSIDIARIES
NOTES TO CONSOLIDATED FINANCIAL STATEMENTSDecember 31, 2005 and 2004(All amounts in Rupees Million, unless otherwise stated)
Ranbaxy Laboratories Limited Annual Report 2005 Notes to Consolidated Financial Statements – US GAAP
131
NOTE Y - SUBSEQUENT EVENTSAcquisitions
On March 29, 2006, Ranbaxy Netherlands B.V. signed a definitive agreement for the acquisition of Terapia S.A., aRomanian company engaged in the business of manufacturing generic pharmaceuticals, for a consideration of approximatelyRs. 14,486 million. This transaction will be accounted for as a business combination under SFAS No. 141 in the subsequentyear upon finalization of the purchase price allocation. During the year ended December 31, 2005, the acquired companyearned revenues of approximately Rs. 3,524.23 million. The major product lines of the acquired company includesCardiovascular, Respiratory, Musculoskeletal and Anti-infectives.
On February 14, 2006, RNBV acquired Ethimed NV, a generic pharmaceuticals company in Belgium. Further, on April 1,2006, the Company acquired substantial assets of the unbranded generic business of Allen S.p.A, a division ofGlaxoSmithKline, in Italy, through its Italian subsidiary, Ranbaxy Italia S.p.A.
Foreign Currency Convertible Bond offering
On March 17, 2006, the Company issued US $ 440,000,000 zero coupon convertible bonds (the "Bonds"), listed on theSingapore Stock Exchange. Unless previously redeemed, converted or purchased and cancelled, the Bonds are convertible atany time on or after April 27, 2006 up till March 8, 2011, into fully paid equity shares of par value of Rs. 5 each, which maybe represented by Global Depositary Shares (the "GDS"), with each GDS representing one share at a conversion price ofRs. 716.32 per share with a fixed rate of exchange of Rs. 44.15 per US $ 1.00. The conversion price is subject to adjustmentsin certain circumstances. At any time on or after March 18, 2009 on and prior to February 6, 2011 the Company may, subjectto certain conditions, redeem the bonds in whole, but not in part, at their early redemption amount as defined in the termsand conditions of the Bonds. Unless previously redeemed, converted or purchased and cancelled, the Bonds will be redeemedin US dollars on March 18, 2011 at 126.765 percent of their principal amount.
Serious Fraud Office case
Though Ranbaxy UK Limited ("RUKL") has not received official notice of criminal proceedings being brought against it bySerious Fraud Office, UK, for alleged anti-competitive conduct in connection with the supply of penicillin-based antibioticsbetween 1996 and 2000, the Company is aware of the same through media reports. RUKL, if found guilty, will be subject toa fine. However, management does not consider it necessary to make any provision against such proceedings, since thelikelihood of liabilities from this matter is considered remote.

132
RECONCILIATION BETWEEN THE FINANCIAL STATEMENTS UNDER INDIAN GAAP AND U.S. GAAP
Material differences between the financial statements under the Indian GAAP and U.S. GAAP are primarily attributable to therequirements of U.S. GAAP for accounting of depreciation of property, plant and equipment, accounting for cost incurred foracquiring rights for product under development and forward foreign exchange contracts which are summarized below:
Description Indian GAAP U.S. GAAP
Depreciation of property, At rates prescribed under respective Based on estimated useful lifeplant and equipment domestic laws and regulations of assets
Forward foreign exchange Premiums earned/paid accounted in Contracts that are notcontracts income statement over the term of effective hedges are recorded
contracts at year end at their fair valueand resultant gain/lossrecognized in the resultsof operations
Cost incurred for acquiring Capitalized as intangible assets under Charged to income statement inrights for product the head "Product Development" and the year in which it is incurredunder development subsequent expenditures on development
of such products are also added to thecost of intangibles
A reconciliation of net income as per Indian GAAP and U.S. GAAP is set out below:
Rs. Millions
2005 2004
Net income as per U.S. GAAP 779 7,067
Additional depreciation on property, plant and equipment 260 197
Cost incurred for acquiring product under development including subsequent expenditures 342 –
Forward foreign exchange contracts at fair value at year end 1,497 (94)
Deferred taxes (189) (107)
Others (72) (77)
Net income as per Indian GAAP 2,617 6,986
RANBAXY LABORATORIES LIMITED
Ranbaxy Laboratories Limited Annual Report 2005

Concept and Design by
United Advertising
Photography by Aditya Arya
Edited and Published by
Corporate CommunicationsRanbaxy Laboratories LimitedTel : +91-124-4135000e-mail : [email protected] Printed at Thomson Press (I) Ltd.