annual report 2003 power point presentation. mechanics of merging data
TRANSCRIPT

Annual Report 2003
Power Point Presentation

Mechanics of merging data

Number of entries in the database

The growth of the database (n=2,742)

Number of entries by centre

Period of data collection by centre

VTE diagnosis rate by centre (n= 2,361)

Number of entries by centre (n=2,742)

Age and disease

Age distribution for all cases (n= 2,734)

Age distribution for patients with VTE (n=558)

Age distribution by final diagnosis for patients with VTE (n=558)

Age and gender for non-VTE patients

Age and gender distribution for non-VTE patients (n=1,795)

Age and gender patients with VTE

Age and gender for patients with VTE (n=558)

Number of risk factors and diagnosis

Number of risk factors for patients with VTE (n=430)

VTE and non-VTE final diagnosis by the number of risk factors (n=1,868)

Number of risk factors and history of VTE in patients with current VTE

History of VTE amongst patients with current VTE (n=430)

Number of risk factors and age in patients with VTE

Number of risk factors by age in patients with VTE (n=427)

Number of risk factors by age in patients with VTE (n = 427)

Number of risk factors and gender in patients with VTE

Number of risk factors by gender in patients with VTE (n=430)

Recent major surgery in patients with VTE

Recent major surgery in patients with VTE (n=522)

Recent major surgery by specialty in patients with VTE

Specialty for VTE patients who have undergone recent major surgery (n=45)

Recent medical inpatient – stay in patients with VTE

Recent medical inpatient- stay in patients with VTE (n=535)

Final diagnosis of VTE in surgical and medical inpatients

Final diagnosis of VTE in surgical and medical inpatients

Cancer in patients with VTE according to centre

Cancer in patients with VTE (n=545)

Cancer in patients with VTE by age and gender

Cancer in patients with VTE by age and gender (n=542)

Cancer in female patients with VTE by age (n=268)

Cancer in male patients with VTE by age (n=274)

Long-distance travel in patients with VTE

History of long-distance travel by the number of risk factors in patients with
VTE (n=430)

D-dimer result and final diagnosis

Final diagnosis by D-dimer result (n=1,795)

DVT pre-test probability and final diagnosis

Final diagnosis by DVT pre-test probability (n=1,314)

DVT pre-test probability and D-dimer result

D-dimer result by DVT pre-test probability (n=993)

D-dimer result, DVT pre-test probability and final diagnosis

Final diagnosis by D-dimer result and DVT pre-test probability (n=912)

PE pre-test probability and final diagnosis of PE

Final diagnosis by PE pre-test probability (n=1,351)
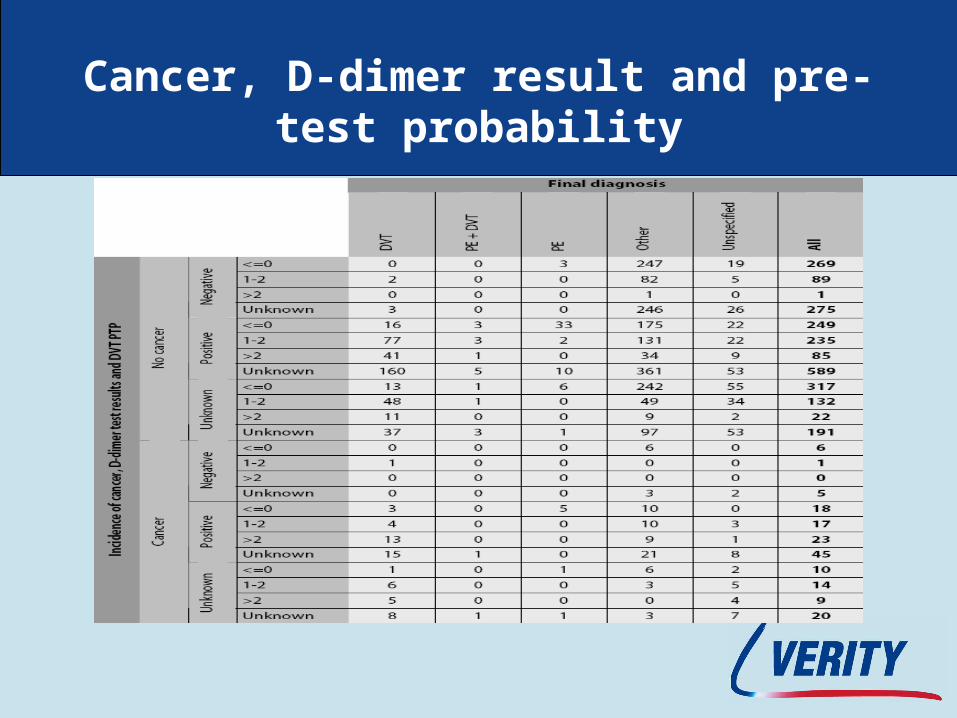
Cancer, D-dimer result and pre-test probability

D-dimer result in the context of cancer

Final diagnosis by D-dimer result and DVT pre-test probability for patients
who had cancer (n=83)

Suitability for home treatment

Suitability for home treatment by final diagnosis (n=551)

Use of LMWH

Use of LMWH therapy by final diagnosis

Duration of LMWH therapy in patients with VTE

Duration of LMWH therapy in patients with VTE (n=406)

Duration of LMWH therapy in patients with VTE (n=406)

Time to therapeutic INR

Time to therapeutic INR patients with VTE (n=349)

Time to therapeutic INR in patients with VTE (n=349)

Duration of LMWH therapy and time to therapeutic INR in patients with VTE
(n=341)

What do Bayes tables do?

ROC curve for a general Bayesian risk model designed to predict DVT
diagnoses (n=2,361)

Calibration plot for the general model (n=2,361)

Risk-adjusted funnel plot on DVT diagnosis rate using the general Bayesian model as
the predictor of risk (n=2,361)

Funnel plot on DVT diagnosis rate (n=2,361)

Calibration plot for specific model 1 – low DVT diagnosis rate hospital model
(n=981)

Calibration plot for specific model 2 – average diagnosis rate hospital model
(n=1,302)

Funnel plot on DVT diagnosis rate (n=2,283)

Risk adjusted funnel plot on DVT diagnosis rate using the specific Bayesian models as
the predictors of risk (n = 2,283)

Calculation by computer