annual report 2008 - financial report · annual report 2008 financial report volume ii ... pim van...
TRANSCRIPT

Volu
me
II
Annual Report 2008
Financial ReportVolume II
E u r o p e a n I n v e s t m e n t B a n k G r o u p • E u r o p e a n I n v e s t m e n t B a n k G r o u p • E u r o p e a n I n v e s t m e n t B a n k G r o u p • E u r o p e a n I n v e s t m e n t B a n k G r o u p
© EIB – 06/2009 – EN QH-AB-09-001-EN- C ISSN 1725-3446
E u r o p e a n I n v e s t m e n t B a n k G r o u p • E u r o p e a n I n v e s t m e n t B a n k G r o u p • E u r o p e a n I n v e s t m e n t B a n k G r o u p • E u r o p e a n I n v e s t m e n t B a n k G r o u p
Annual Report 2008 • Volume II
Ann
ual R
epor
t 200
8


The EIB Group’s 2008 Annual Report consists of three sepa-rate volumes:
- the Activity and Corporate Responsibility Report, present-ing the EIB Group’s activity over the past year and future prospects;
- the Financial Report, presenting the financial statements of the EIB Group, the EIB, the Cotonou Investment Facility, the FEMIP Trust Fund, the EU-Africa Infrastructure Trust Fund and the EIF, along with the related explanatory annexes;
- the Statistical Report, presenting in list form the projects financed and borrowings undertaken by the EIB in 2008, together with a list of the EIF’s projects. It also includes summary tables for the year and over the last five years.
The Annual Report is also available on the Bank’s website www.eib.org/report.
Annual Report 2008
Financial ReportVolume II
E u r o p e a n I n v e s t m e n t B a n k G r o u p • E u r o p e a n I n v e s t m e n t B a n k G r o u p • E u r o p e a n I n v e s t m e n t B a n k G r o u p • E u r o p e a n I n v e s t m e n t B a n k G r o u p
Financial Report 20082EIB Group
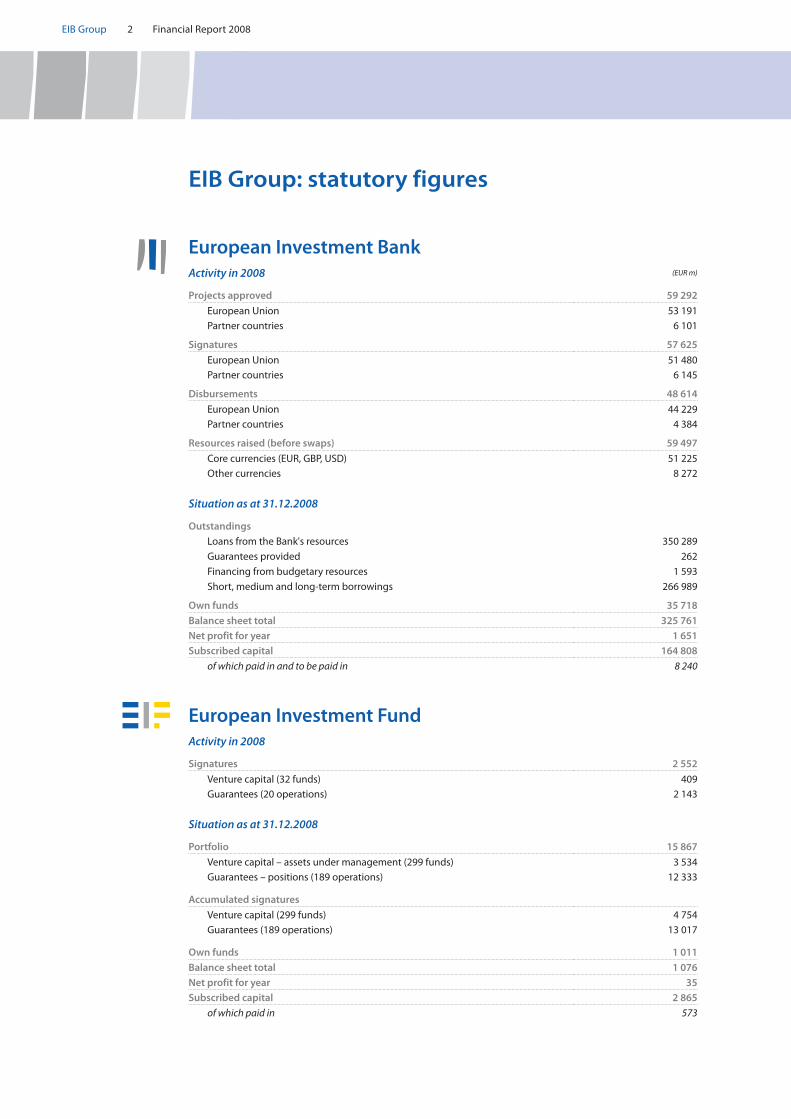
EIB Group: statutory figures
European Investment BankActivity in 2008 (EUR m)
Projects approved 59 292
European Union 53 191Partner countries 6 101
Signatures 57 625
European Union 51 480Partner countries 6 145
Disbursements 48 614
European Union 44 229Partner countries 4 384
Resources raised (before swaps) 59 497
Core currencies (EUR, GBP, USD) 51 225Other currencies 8 272
Situation as at 31.12.2008
OutstandingsLoans from the Bank's resources 350 289
Guarantees provided 262
Financing from budgetary resources 1 593
Short, medium and long-term borrowings 266 989
Own funds 35 718
Balance sheet total 325 761Net profit for year 1 651Subscribed capital 164 808
of which paid in and to be paid in 8 240
European Investment FundActivity in 2008
Signatures 2 552
Venture capital (32 funds) 409Guarantees (20 operations) 2 143
Situation as at 31.12.2008
Portfolio 15 867
Venture capital – assets under management (299 funds) 3 534Guarantees – positions (189 operations) 12 333
Accumulated signatures
Venture capital (299 funds) 4 754Guarantees (189 operations) 13 017
Own funds 1 011
Balance sheet total 1 076Net profit for year 35Subscribed capital 2 865
of which paid in 573
Financial Report 2008 3 EIB Group
Contents
Message from the President 4EIB Statutory Bodies 6EIF Statutory Bodies 9EIB Financing Activity 10EIB Borrowing Activity 12EIB Treasury Activity 17EIF Activity 19Audit and Control 22
EIB Group 25➾ Consolidated Results for the Year 27➾ Financial Statements 28➾ Independent Auditor’s Report 100➾ Statement by the Audit Committee 101
EIB 103➾ Results for the Year 105➾ Financial Statements 106➾ Independent Auditor’s Report 153➾ Statement by the Audit Committee 154
Investment Facility 155➾ Financial Statements 156➾ Independent Auditor’s Report 173➾ Statement by the Audit Committee 174
FEMIP Trust Fund 175➾ Financial Statements 176➾ Independent Auditor’s Report 183➾ Statement by the Audit Committee 184
EU-Africa Infrastructure Trust Fund 185➾ Financial Statements 186➾ Independent Auditor’s Report 191➾ Statement by the Audit Committee 192
EIF 193➾ Independent Auditor’s Report 194➾ Statement by the Audit Board 195➾ Financial Statements 196
EIB Group Addresses 244

Financial Report 20084EIB Group
The financial crisis has had a dramatic impact not only on the financial sector but also on the economy as a whole, affecting many men and women in every one of our countries.
It was therefore only natural for our shareholders, the 27 Member States of the European Union, to ask us to do more to help businesses and encourage economic recov-ery, and to do it faster. In the last quarter of 2008 the EIB substantially increased the volume of its lending, with sig-natures ultimately totalling EUR 57 billion, an increase of 21% compared with 2007. Over the same period it dis-bursed EUR 10 billion more than expected, with disburse-ments totalling EUR 49 billion at the end of the year. In particular, loans to SMEs increased, at the behest of the Ecofin Council, by 42% compared with 2007.
The EIB was hardly affected by the financial crisis, thanks to its prudent management, and its annual profit rose slightly. The Bank’s own funds increased by 6.9% to EUR 36 billion, giving a capital adequacy ratio of 35.5% ac-cording to the Basel II rules. This exceptionally high level illustrates the EIB’s financial strength, which is essential in these difficult and unpredictable times when the EIB is being called upon by its shareholders to lend even more.
In fact, its shareholders understood the importance of further strengthening the EIB, bringing forward a capital increase initially scheduled for 2010. Since 1 April 2009, the EIB’s capital has amounted to EUR 232 billion, which gives it the necessary scope to in-crease the volume of its lending to the extent required by the scale of the crisis.
Of course this does not mean that we can finance any-thing and everything. The EIB, as the European Union’s long-term financing instrument, can only finance viable projects that contribute to the objectives of the Union and meet our technical, economic and environmental quality criteria.
With regard to governance, the EIB abides by the rules of the European Union and the guidelines laid down by the G-20. Measures to combat fraud, corruption, money laundering and the financing of terrorism are an integral
part of the project appraisal and monitoring process. In the case of certain riskier countries, the Bank is guided by the advice of Transparency International. The Compli-ance Office pays particular attention to these aspects; its opinion is carefully taken into account and some-times leads to a refusal to finance a project. As urged by the G-20, the EIB has decided to review its policy on off-shore centres, in cooperation with other international fi-nancial institutions.
The remuneration of the members of the Management Committee is strictly aligned with that of the members of the European Commission and does not include any bonus or other benefits. The members of the Bank’s staff have a system of bonuses linked to their individual and collective performance. The overall budget for bonuses is determined by the extent to which a number of tar-gets laid down every year by the Board of Directors (key performance indicators) are met. For senior managers, the bonus corresponds to 2.38 to 3.90 months of basic salary, or less than one third of annual salary.
There are two possible responses to the crisis: “every man for himself” or stronger, pragmatic coopera-tion for the benefit of everyone. The EIB’s shareholders have opted for the latter and we intend to make our contribution to that goal.
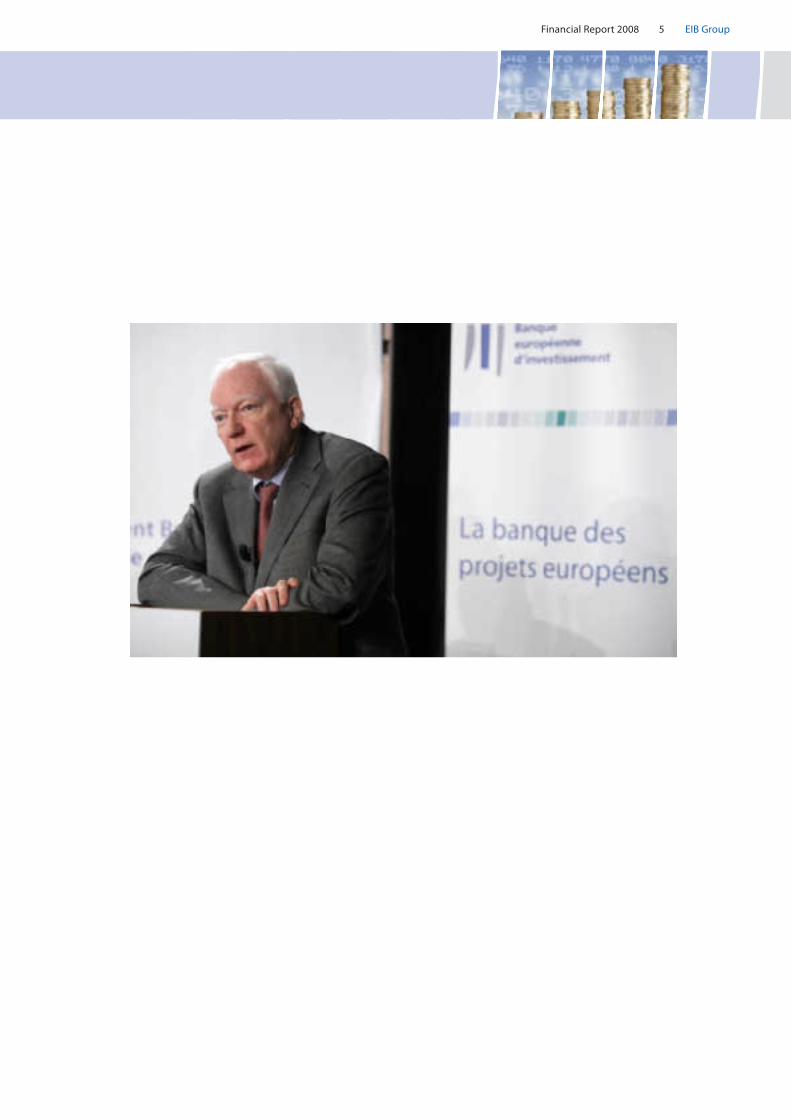
Philippe Maystadt President of the European Investment
Bank Group
Message from the President
Financial Report 2008 5 EIB Group
Financial Report 20086EIB Group
EIB Statutory Bodies Situation at 12 March 2009
The composition of the Bank’s statutory bodies, the curricula vitae of their members and additional information on the remuneration arrangements are regularly updated and posted on the EIB’s website: www.eib.org.
Board of Governors
Chairman Charilaos STAVRAKIS (Cyprus)Belgium Didier REYNDERS Ministre des FinancesBulgaria Plamen ORESHARSKI Minister for FinanceCzech Republic Miroslav KALOUSEK Ministr financíDenmark Lene ESPERSEN Økonomi- og erhvervsministerGermany Peer STEINBRÜCK Bundesminister der FinanzenEstonia Ivari PADAR RahandusministerGreece John PAPATHANASSIOU Minister of Economy and FinanceSpain Pedro SOLBES MIRA Vicepresidente Segundo del Gobierno y Ministro de
Economía y HaciendaFrance Christine LAGARDE Ministre de l'Économie, de l’industrie et de l'emploiIreland Brian LENIHAN Minister for FinanceItaly Giulio TREMONTI Ministro dell’Economia e delle FinanzeCyprus Charilaos STAVRAKIS Minister of FinanceLatvia Einars REPŠE Finanšu ministrsLithuania Algirdas Gediminas ŠEMETA Finansų ministrasLuxembourg Jean-Claude JUNCKER Premier Ministre, Ministre d’État, Ministre des FinancesHungary János VERES PénzügyminiszterMalta Tonio FENECH Ministru tal-Finanzi, l-Ekonomija u l-InvestimentNetherlands Wouter BOS Minister van FinanciënAustria Josef PRÖLL Bundesminister für FinanzenPoland Jacek ROSTOWSKI Ministra FinansówPortugal Fernando TEIXEIRA DOS SANTOS Ministro de Estado e das FinançasRomania Gheorghe POGEA Ministrul Finanţelor PubliceSlovenia Franc KRIŽANIČ Minister za financeSlovakia Ján POČIATEK Minister financiíFinland Mari KIVINIEMI Hallinto- ja kuntaministeriSweden Anders BORG FinansministerUnited Kingdom Alistair DARLING Chancellor of the Exchequer
Audit Committee
Chairman Constantinos KARMIOS Chief Accountant, Treasury of the Republic of Cyprus, NicosiaMembers Ortwin KLAPPER Former Chief Executive Officer of Bank Austria Creditanstalt
Leasing GroupGerard SMYTH Secretary and Director of Audit at the Office of the
Comptroller and Auditor General, DublinObservers Éric MATHAY Member of the Board of Institut des Réviseurs d'Entreprises (IRE)
José RODRIGUES DE JESUS Chartered Auditor, OportoDanièle NOUY Secretary General of the French Banking Commission, Paris
Management Committee
President Philippe MAYSTADTVice-Presidents Philippe de FONTAINE VIVE CURTAZ Eva SREJBER
Simon BROOKS Marta GAJĘCKACarlos da SILVA COSTA Dario SCANNAPIECOMatthias KOLLATZ-AHNEN Plutarchos SAKELLARIS
Financial Report 2008 7 EIB Group
Board of Directors
The Board of Directors consists of 28 Directors, with one Director nominated by each Member State and one by the Euro- pean Commission. There are 18 Alternates, meaning that some of these positions will be shared by groupings of States.
Furthermore, in order to broaden the Board of Directors’ professional expertise in certain fields, the Board is able to co-opt a maximum of six experts (three Directors and three Alternates), who participate in the Board meetings in an advi-sory capacity, without voting rights.
Directors
Olivier HENIN Directeur adjoint, responsable de la Cellule Marchés financiers internationaux, Ministère des Finances, Brussels
Dimiter IVANOVSKI Deputy Minister, Ministry of Finance, SofiaZdenĕk HRUBÝ Member of the Board of Directors of the EIB, PragueSigmund LUBANSKI Kontorchef, Økonomi- og Erhvervsministeriet, CopenhagenRalph MÜLLER Leiter des Referats Haushalt der EU, Bundesministerium der Finanzen, BerlinIvar SIKK Deputy Secretary General, State Budget and Governance, Ministry of Finance,
TallinnPanagiotis DROSSOS Secretary General of Investments and Development, Ministry of Economy and
Finance, AthensMaria Jesús FERNÁNDEZ GARCÍA Directora General, Dirección General de Financiación Internacional, Ministerio de
Economía y Hacienda, MadridClaire WAYSAND Chef du service des politiques macroéconomiques et des affaires européennes,
direction générale du Trésor et de la politique économique, ministère de l'Économie, de l'industrie et de l’emploi, Paris
Michael SOMERS Chief Executive, National Treasury Management Agency, DublinCarlo MONTICELLI Direttore per i Rapporti finanziari internazionali, Dipartimento del Tesoro, Ministero
dell’Economia e delle Finanze, RomeKyriacos KAKOURIS Senior Economic Officer, Ministry of Finance, NicosiaIrena KRUMANE Chairwoman of the Finance and Capital Market Commission, The Ministry of
Finance of the Republic of Latvia, RigaJurgita UZIELIENE Deputy Director, European Union and International Relations Department, Ministry
of Finance,VilniusGaston REINESCH Administrateur général, Ministère des Finances, LuxembourgJános ERŐS Chief Executive Officer, Magyar Fejlesztési Bank Zrt., BudapestVince GRECH Consultant to the government of Malta, Ministry of Finance, the Economy and
Investment, ValettaPim VAN BALLEKOM Financial Counsellor, Permanent Representation of the Netherlands to the EU,
BrusselsWolfgang NITSCHE Bundesministerium für Finanzen, ViennaJacek DOMINIK Undersecretary of State, Ministry of Finance, WarsawNuno de SOUSA PEREIRA Gabinete de Planeamento, Estratégia, Avaliação e Relações Internacionais ,
Ministério das Finanças e da Administração Pública, LisbonBogdan Alexandru DRAGOI Secretary of State, Ministry of Public Finance, BucharestAndrej ŠIRCELJ Member of the Board of Directors, Grosuplje (Slovenia)Katarina KASZASOVÁ Director General of the State Reporting Section, Ministry of Finance, BratislavaTytti NORAS Lainsäädäntöneuvos, valtiovarainministeriö, HelsinkiKurt Arne HALL Finansråd, Internationella avdelningen, Finansdepartementet, StockholmPeter CURWEN Director Europe, H.M. Treasury, Finance Directorate, LondonMarco BUTI Director-General, Directorate-General for Economic and Financial Affairs, European
Commission, Brussels
Experts
Pierre RICHARD Expert on the Board of Directors of the EIB, ParisRainer MASERA Capo della Delegazione Italiana, CIG – Struttura di Missione Torino - Lione , RomeTimothy STONE Chairman, Global Infrastructure and Projects Group, KPMG, London

Financial Report 20088EIB Group
Alternates
Michael KRUSE Ministerialdirektor, Bundesministerium für Wirtschaft und Technologie, Berlin(…) (Germany)Jean-Michel SEVERINO Directeur général, Groupe Agence Française de Développement, ParisMichel HOUDEBINE Sous-directeur des affaires européennes, Direction du Trésor et de la politique
économique, ministère de l'Économie, de l’industrie et de l'emploi, ParisPietro MASCI Direttore dell'Ufficio per le relazioni istituzionali con la Banca europea per gli
investimenti, Paesi del Mediterraneo e dei Balcani, Dipartimento del Tesoro, Ministero dell’Economia e delle Finanze, Rome
(…) (Italy)Jean-Christophe GRAY Head of EU Coordination and Strategy, HM Treasury, LondonTamsyn BARTON Head of EU Department, Department for International Development, LondonCarmen LAÍN Subdirectora General, Subdirección General de Instituciones Financieras Europeas,
Ministerio de Economía y Hacienda, MadridRudolf de KORTE Plaatsvervangend lid van de Raad van Bewind van de EIB, WassenaarAlf THERKILDSEN Økonomi- og Erhvervsministeriet, CopenhagenŞtefan NANU General Director, General Department of Treasury and Public Debt, Ministry of
Economy and Finance, BucharestPauli KARINIEMI Vanhempi finanssisihteeri, Rahoitusmarkkinaosasto, valtiovarainministeriö, HelsinkiAndžs ŪBELIS Deputy State Secretary on European Affairs, Ministry of Finance, RigaZsuzsanna VARGA Director General, Department of International Relations, Ministry of Finance,
BudapestAndrej KAVČIČ Head of International Finance Department, Ministry of Finance, Ljubljana(…) …Dirk AHNER Director-General, Regional Policy Directorate-General, European Commission,
Brussels
Alternate experts
Antoni SALA Advisor, Bank Gospodarstwa Krajowego, WarsawEneko LANDABURU Director-General, Directorate-General for External Relations, European Commission,
Brussels(…) …
Financial Report 2008 9 EIB Group
EIF Statutory Bodies Situation at 11 March 2009
The composition of the Fund’s statutory bodies, the curricula vitae of their members and additional information on the remuneration arrangements are regularly updated and posted on the EIF’s website: www.eif.org.
The EIF is managed and administered by the following three authorities:the General Meeting of all shareholders (EIB, European Commission, 31 financial institutions); •the Board of Directors; •the Chief Executive, Mr Richard Pelly. •
Board of Directors
Chairman
Philippe MAYSTADT President, European Investment Bank, Luxembourg
Members
Philippe de FONTAINE VIVE CURTAZ Vice-President, European Investment Bank, LuxembourgWerner OERTER Leiter des Bereichs KfW Mittelstandsbank, KfW BankengruppeDavid McGLUE Former Director, Directorate for Financial Operations, Programme Management
and Liaison with the EIB Group, Directorate-General for Economic and Financial Affairs, European Commission, Luxembourg
Ralph MÜLLER Leiter des Referats Haushalt der EU, Bundesministerium der Finanzen, BerlinHeinz ZOUREK Director-General, Directorate-General for Enterprise and Industry, European
Commission, Brussels
Alternates
Thomas HACKETT Director General, Directorate for Operations in the European Union and Candidate Countries, European Investment Bank, Luxembourg
Rémy JACOB Director General, Strategy and Corporate Centre, European Investment Bank, Luxembourg
Gaston REINESCH Director General, Ministry of Finance, Luxembourg Tytti NORAS Legal Counsellor, Ministry of Finance, FinlandPeter BASCH Acting Director, Directorate for Financial Operations, Programme Management
and Liaison with the EIB Group, Directorate-General for Economic and Financial Affairs, European Commission, Luxembourg
Dirk AHNER Director-General, Directorate-General for Regional Policy, European CommissionMarc AUBERGER Director General CDC Capital Investissement
Audit Board
Chairman
Tony MURPHY Head of Internal Audit Unit, European Commission, DG ECFIN
Members
Ortwin KLAPPER Former Chief Executive Officer of Bank Austria Creditanstalt Leasing GroupGabriela PANTRING Managing Director, Head of Corporate Steering NRW. BANK, Düsseldorf, Germany

Financial Report 200810EIB Group
Faced with the financial crisis, the European Investment Bank demonstrated that it was capable of reacting rap-idly to the financing requirements by increasing its vol-ume of operations for 2008 by nearly 20%. Thus it made available a total of 57.6bn euros1 in support of the ob-jectives of the European Union. The finance provided in the EU amounted to 51.5bn, of which 8.2bn (16%) in the 12 new member countries. Financing in the partner countries came to 6.1bn.
The EIB’s strategic orientations are reflected in a number of objectives defined in the Bank’s Corporate Operation-al Plan. For the period 2008-2010, six strategic priorities have been defined for financing operations in the Mem-ber States of the European Union: economic and social cohesion and convergence within the enlarged Union; implementation of the knowledge economy, which suc-ceeds the objective of fostering innovation; developing trans-European networks and their access routes; pro-tecting and improving the environment and promoting sustainable communities; supporting small and medi-um-sized enterprises (SMEs); and promoting secure, competitive and sustainable energy supplies.
Under the cohesion policy for the period 2007-2013, •the convergence objective covers the 100 poorest regions of the European Union and is intended to stimulate growth in order to achieve convergence with the rest of the Union. Convergence remains the top operational priority of the Bank, which set itself the medium-term target of granting 40% of the total volume of its loans within the EU to these regions. In 2008, individual financing operations under the con-vergence objective totalled 17.8bn, of which 6.9bn in the 12 new Member States. Spain is the main re-cipient of this finance.
Since 2000, the date on which the initiative fostering •innovation was launched, the EIB Group has been contributing to the development of a knowledge-based economy. Loans worth 68bn have already been signed in this field. In 2008, the Bank advanced a total of 12.4bn in three areas: research and devel-
opment (7.1bn); education and training (2.6bn); and information and communications technology-relat-ed innovation and infrastructure (2bn). The Euro- pean Investment Fund also supports this initiative by taking stakes in venture capital funds2.
Efficient communications and energy transfer net- •works are a key factor in economic integration. Since 1993, the Bank has been supporting the develop-ment of trans-European networks (TENs) and has become the leading provider of long-term funds for this type of infrastructure within the European Un-ion. In 2008, it lent 9.9bn for transport TENs involv-ing major transport arteries. The finance provided for energy TENs within the European Union totalled 2.7bn and for energy supply projects 50m.
In 2008 individual loans for capital projects relating •to the environment amounted to 15.7bn within the EU and 2.3bn outside the European Union, together accounting for 31% of total financing. These loans centred on sustainable communities (9.3bn) for ur-ban renewal and sustainable transport projects as well as environmental protection (8.7bn) for com-bating climate change, protecting natural resources and improving the environment and health.
Support for investment by SMEs • is intended to give them easier access to credit, or even equity capi-tal. This support takes the form of medium or long-term credit lines to commercial banks, which in turn allocate individual loans on more favourable terms to their SME customers. In September 2008, to cush-ion the effects of the financial crisis on SMEs, the Euro-pean Council asked the EIB to mobilise 30bn by 2011. Accordingly, by the end of the year, the EIB stepped up its lending activity for SMEs in order to facilitate their access to finance and provided a total of 8.1bn within the European Union. This represents an increase of 42% compared with 2007. As for its subsidiary the EIF, it provided guarantees totalling 2.1bn to SMEs and invested 409m via venture capital funds.
EIB Financing Activity
(1) Unless otherwise indicated, all amounts are expressed in EUR.(2) See section on EIF Activity.

Financial Report 2008 11 EIB Group
The • energy objective involves the following: renew-able energies; energy efficiency; research, develop-ment and innovation; and security of internal and external supplies. In 2008, the Bank provided finance totalling 8.6bn to support projects meeting this ob-jective within the European Union. Outside the EU, the energy sector accounted for 1.6bn. Renewable energy projects, including manufacturing, totalled 2.2bn.
The Bank operates in the partner countries of the EU in accordance with the lending mandates renewed by the Council in December 2006. In 2008, EIB backing for the Community’s development aid and cooperation policy in the partner countries amounted to 6.1bn.
In • South-Eastern Europe3, the Bank provided loans totalling 3.5bn to support economic development and promote accession to the European Union. Tur-key received 78% of this finance (2.7bn).
In the • Eastern neighbour countries, the Bank provided 170m worth of finance in Moldova and Ukraine.
In the • Mediterranean countries, the Southern neigh-bour countries, loans signed under the Facility for Euro-Mediterranean Investment and Partnership (FEMIP) totalled 1.3bn, with increased support being given to the private sector.
In • Latin America, finance totalling 319m went mainly on projects to develop telecommunications net-works, while in Asia a 150m framework loan was signed to finance renewable energy projects.
The EIB continued its lending operations in the • Afri-can, Caribbean and Pacific (ACP) countries and Over-seas Countries and Territories (OCTs) (561m) and South Africa (203m).
The Bank’s new strategy is being implemented by focus-ing on riskier operations, in order to increase the value added of the finance provided. The reserves specifically
(3) Albania, Bosnia and Herzegovina, Croatia, Former Yugoslav Republic of Macedonia, Montenegro, Serbia and Turkey.
0 30 60
2004
2005
2006
2007
2008
European Union Partner Countries
Financing 2004-2008: EUR 242bn
dedicated to these operations are taken either from the Bank’s own funds or from European Commission re-sources (Structured or Risk Sharing Finance Facilities). At end-2008, outstanding loans had more than doubled compared with 2007 (2.7bn) and amounted to 6.2bn.
The Bank’s Corporate Operational Plan (COP) approved for the period 2009-2011 provides for stepping up lend-ing activity and other specific measures to mitigate the effects of the current economic and financial crisis. Lending will be increased by 15bn in 2009 and 2010 and concentrate on three areas: SMEs, for which new prod-ucts will be proposed, such as risk-sharing loans; projects to help combat climate change; and conver-gence.
To meet these revised lending targets a proposal to bring forward the increase in capital initially planned for 2010 was submitted to the Board of Governors. As from April 2009, the EIB’s subscribed capital was raised to 232bn, an increase of 67bn.

Financial Report 200812EIB Group
EIB Borrowing ActivityA leading sovereign-class international debt issuer
Resilience in uncertain times
In 2008 the Bank’s funding activities remained resilient amidst heightened market volatility and uncertainty, and a severely disrupted funding environment for most of the fourth quarter. Under the 2008 funding pro-gramme, the Bank raised an amount of EUR 59.5bn via 247 transactions, a significant increase compared with 2007 (EUR 54.7bn). In July 2008, in parallel with growth in its lending programme and loan disbursements, the Bank increased its funding ceiling from EUR 55bn to EUR 60bn. The Bank raised funds in 18 currencies and is-sued in four further currencies in synthetic format (booked under other payment currencies) for EUR 639m.
Benefiting from top-quality credit standing and strategic approach
The results in 2008 were underpinned by the Bank’s top-quality credit standing, continuing support from EU sovereign shareholders, as well as its borrowing strategy. The flexibility, diversification and attention to liquidity inherent in the borrowing strategy were to a large ex-tent able to overcome volatile market conditions during the first nine months, and to secure attractive funding relatively early in the year. This approach enabled the Bank to accommodate severely disrupted markets in the final quarter, when, from mid-October onwards, benchmark markets were largely closed. In the fourth quarter competition intensified, with new government-guaranteed issuance on a large scale and prospects for greatly increased sovereign issuance. This conditioned the radical re-pricing that took place. The Bank nonethe-less raised EUR 4.8bn between mid-October and year-end, of which the largest share was raised in EUR.
EUR: responsiveness to investor demand
In EUR a total of 29 transactions were finalised in 2008, rais-ing EUR 16.8bn, or 28% of the total programme for the year.
Euro Area Reference Note (EARN) benchmark issues accounted for the bulk (EUR 13bn, or 78%) of EUR issuance. New EARNs were launched in the 3-year and 7-year maturi-ties, each in EUR 3bn size. In addition, there were five re-openings of existing EARNs in sizes of EUR 1-2bn. Re-openings proved a valuable means of adding liquidity to existing benchmarks, and aimed to avoid burdening dis-tribution channels and secondary performance in a lacklus-tre environment. The 7-year issue in April was the lon gest-dated EARN issue in 2008. From May onwards, the Bank issued EARN benchmarks only in the 2-year and 3-year sectors. The varied issue sizes and shifting maturity focus across the year are among the factors illustrating the great care taken in responding to investor demand, while paying attention to maintenance of a liquid presence and second-ary market performance across important maturities.
Targeted plain-vanilla issuance in EUR amounted to around EUR 3bn via nine transactions. The Bank also concluded 13 structured transactions in 2008, amount-ing to EUR 548m, or 3% of total EUR issuance. Retail in-vestors accounted for a significant share of the demand for targeted bonds, notably in the EUR 180m “Popular Bond”, the first issue entirely underwritten and distrib-uted by Italian ”banche popolari” (cooperative banks).
Fulfilment of the SRI (socially responsible investing) commitment: In 2007, the Bank issued a product spe-cifically geared to the SRI market, the “Climate Aware-ness Bond”. The bond offered a unique combination of environmental characteristics. Among these, the pro-ceeds were earmarked for the Bank’s future projects supporting climate protection, in the fields of renew-able energy and energy efficiency. During 2007/8, the funds raised by this issue were completely disbursed to projects meeting these sectoral criteria. In total 14 projects located in six European countries received funds raised via this bond.
GBP: largest non-gilt issuer
A total of 50 transactions were launched in 2008, raising GBP 6.9bn (EUR 8.9bn), or 15% of the total programme for the year.

Financial Report 2008 13 EIB Group
The Bank was able to maintain its position as the largest non-gilt benchmark issuer in 2008. It started the year with intensive issuance in the sterling market, respond-ing to strong investor demand for high-grade sterling bonds. GBP 4bn, or 57% of 2008 GBP issuance, was launched in the first quarter, aided by favourable swap market conditions in maturities between 2010 and 2044. The Bank’s sterling issuance slowed down in the second quarter to GBP 1.4bn, as higher-yielding alternatives di-verted investors’ focus away from supranational and agency bonds.
The sterling primary bond market became more of a do-mestic market in the second half of the year, focusing on corporates and, later, on UK government-guaranteed bank issues. Nonetheless, until early October, the Bank continued its GBP issuance in good size, making it ex-ceptional among non-gilt sterling issuers. It was able to launch a new 2012 benchmark issue and two large tar-geted transactions for a total of GBP 875m.
USD: record volume of USD Global issuance
A total of 55 transactions were executed in 2008, raising a record USD volume for the Bank of USD 35.5bn (EUR 25.5bn), or 43% of the total funding programme. It represented a volume increase of 85% compared to 2007.
The first nine months of 2008 were characterised by an exceptional level of demand for the best-quality AAA bonds, particularly in the short to medium-term maturi-ties. The worldwide central bank community was the driving force of this phenomenon. There were highly at-tractive funding levels in USD, further enhanced by the basis swap market, which gave a historical advantage for a EUR-based borrower such as the EIB raising funds in USD, particularly at the short end.
The Bank upsized its 3-year benchmark issues to USD 4bn, executing all five benchmarks in this maturity segment in such size. One of the 3-year USD Global benchmarks won the “Sovereign/Supranational/Agency/
Regional bond of the year” award from IFR. The Bank also carried out three 5-year benchmark deals, a record number in a given year for the EIB in this more chal-lenging maturity. The EIB’s price leadership compared to peers improved, assisted by timely execution and continuing attention to liquidity and secondary market performance.
Structured issuance and other tailor-made transactions also reached solid volumes in 2008, at USD 3.8bn. De-mand was particularly good for various callable struc-tures as well as plain vanilla private placements.
EUR GBP USD Others
0 10 20 30 40 50 60
2008
2004
2005
2006
2007
Borrowing activity 2004-2008: EUR 262bn
Financial Report 200814EIB Group
Strong diversification: issuance in 19 other currencies
Outside the three core currencies, 113 transactions were finalised in 19 currencies in 2008, including four in synthetic format, raising EUR 8.3bn, or 14% of the total programme for the year. The three largest contributors in these other currencies were Australian dollars (EUR 2.3bn), Japanese yen (EUR 1.4bn) and Swiss francs (EUR 1.2bn). Among non-core currencies, significant growth areas compared to 2007 were Australian dollars (AUD), Swiss francs (CHF) and Norwegian kroner (NOK). Aggregate issuance in the four currencies in which the Bank issued in synthetic format (booked under other payment currencies) was EUR 639m. These currencies were the Brazilian real (BRL), Indonesian rupiah (IDR), Philippine peso (PHP) and Zambian kwacha (ZMK).
European and neighbouring country currencies
The largest volume of issuance in this sector was in Swiss francs (CHF). The Bank was able to capitalise on its long-standing presence in the Swiss domestic market and benefited from its safe-haven status in a market where top-quality names were especially in demand. The Bank issued a total of CHF 1.9bn (EUR 1.2bn) via 12 transac-tions. Issuance was mainly achieved through taps of ex-isting bonds (maturities 2015 and 2019), but the Bank was also able to bring new transactions at 1-year, 2-year, 3-year and 10-year tenors.
The volume of issuance in the Nordic region totalled EUR 1bn. In Swedish krona (SEK), the Bank raised a total of SEK 4.1bn (EUR 435m). The Bank expanded its SEK yield curve with a new 3-year fixed-rate issue, matching the tenor of a government bond. In NOK, the Bank launched two new bonds, also matching the tenor of government bonds (May 2013 and May 2017).
Progress in developing capital markets
There was progress in contributing to the development of capital markets in new/future EU Member States, EU neighbouring countries and EU partner countries in Af-rica. Such activities also provide a platform for potential future lending by the Bank in local currency, where ben-efits include the removal of exchange rate risk for loan customers.
In new and future Member States and EU neighbour-ing country currencies, the Bank extended the yield curve in Russian rouble and Turkish lira, offering inves-tors the longest available maturities in the fixed rate Euro-bond market. Volumes in such countries amounted to EUR 1.1bn equivalent, raised via 33 transactions. Turkish lira (TRY) represented the bulk of the volume. Other is-suance currencies were Bulgarian leva (BGN), Hungarian forint (HUF), Russian rouble (RUB), Czech koruny (CZK) and Slovakian koruny (SKK).
In Turkish lira the Bank maintained its position as the leading issuer in the Eurobond market. The Bank con-ducted 14 transactions for a total of TRY 1.5bn (EUR 836m). It increased its February 2010 issue to the benchmark size of TRY 1bn, providing a further liquid reference for the market. The November 2018 bond is-sue offered the longest maturity in the TRY fixed-rate Eurobond market at the time of issuance.
In Bulgarian leva the Bank confirmed its leading posi-tion in the Eurobond market with a total of BGN 250m (EUR 128m). The Bank issued three new transactions in maturities ranging from 2011 to 2013.
The Bank launched two new bonds in Russian rouble (RUB): a RUB 750m (EUR 20m) 3-year and a RUB 355m (EUR 10m) 10-year bond. The latter was the longest RUB fixed-rate Eurobond in the market.
In African currencies the Bank issued for the first time in Zambian kwacha (ZMK), which further expanded the Bank’s repertoire of African funding currencies to seven.

Financial Report 2008 15 EIB Group
“The way to buy Europe” Snapshot of the EIB as an issuer
Joint EU sovereign ownership underpins top-class credit quality and means EIB bonds can be seen as “the way to buy Europe”.
The EIB is one of the largest and most frequent borrowers in the international capital markets. In 2008 it is-sued a total of EUR 59.5bn.
Ownership by all EU sovereigns means EIB bonds offer a unique and diversified sovereign-class investment.
The Bank has been consistently rated Aaa/AAA/AAA by Moody’s/Standard & Poors/Fitch.
The Bank’s strategic approach to markets involves a strong focus on liquidity and transparency. It offers comprehensive benchmark programmes in the Bank’s three core currencies (EUR, GBP and USD). Where possible and appropriate, it also builds a benchmark presence in other currencies. It also conducts tailor-made issuance across a wide range of currencies and products.
The Bank has historically contributed to the development of capital markets in currencies of new and future EU Member States, and selected EU partner countries. Here issuance in local currencies can support the develop-ment of lending activities.
The ZMK issue was the first by a foreign issuer and the first in the international market (it was in synthetic for-mat, with payment and settlement in USD).
Overall the Bank launched a total of 13 transactions in two African currencies for a total of EUR 364m equiva-lent, the vast majority in South African rand (ZAR). The Bank remained a leading issuer in the ZAR Eurobond market, where it issued EUR 336m equivalent.
Japan and Asian/Pacific Currencies: leadership and scale
Among the non-core currencies in 2008, the largest source of funding – and hence the Bank’s fourth-largest currency – was the Australian dollar, accounting for AUD 3.9bn (EUR 2.3bn). For the second year in a row, the Bank has been the largest Kangaroo issuer (foreign
issuer in AUD). The public JPY issuance, supported by international demand from Europe and the US, was brisk, particularly in the first half of the year. In 2008, the Bank raised a total of JPY 223bn (EUR 1.4bn) and it was again the largest international issuer of JPY Global bonds. In both AUD and JPY, the Bank was able to raise funds in longer duration, with tenors of up to 10 years in AUD and up to 20 years in JPY. The Bank also made its first issue in Philippine peso (PHP), in synthetic format, as well as an Indonesian rupiah (IDR) synthetic issue.
Americas (ex-US): the first BRL Global benchmark bond
In early 2008, the Bank issued the market’s first ever Bra-zilian real (BRL) Global benchmark bond. The Bank also tapped the Mexican peso (MXN) market with one trans-action, the first since 2005.
Financial Report 200816EIB Group
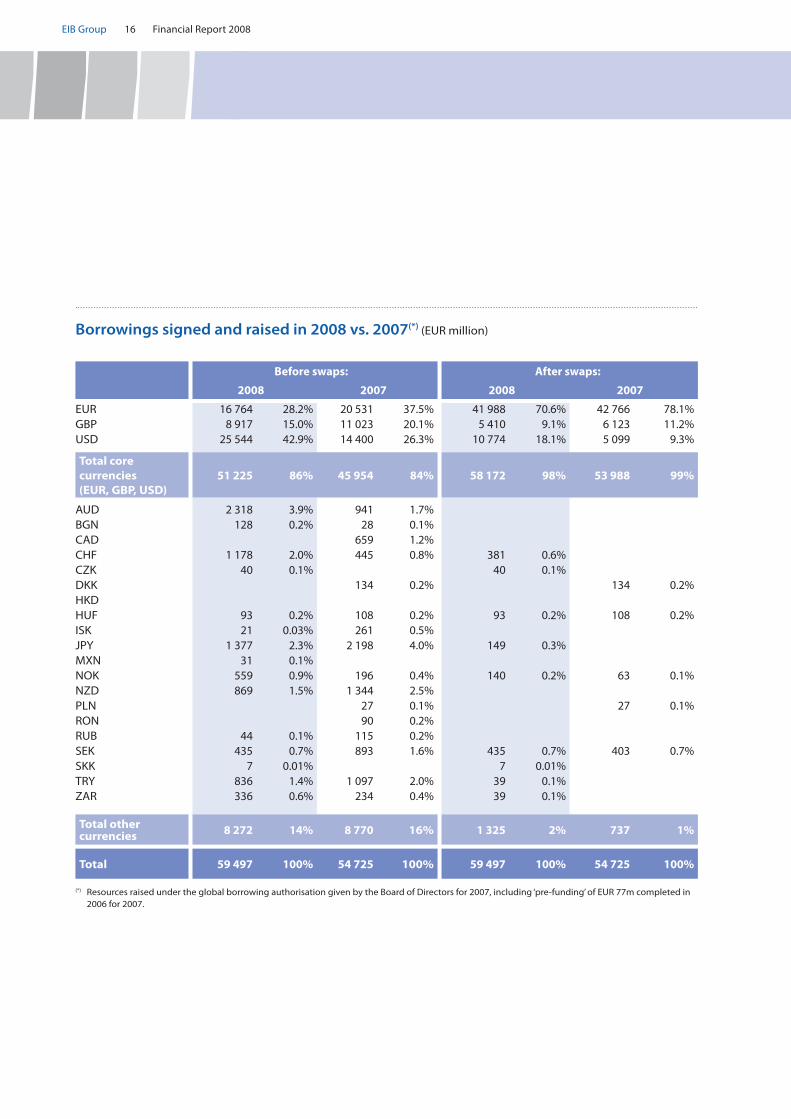
Before swaps: After swaps:
2008 2007 2008 2007
EUR 16 764 28.2% 20 531 37.5% 41 988 70.6% 42 766 78.1%GBP 8 917 15.0% 11 023 20.1% 5 410 9.1% 6 123 11.2%USD 25 544 42.9% 14 400 26.3% 10 774 18.1% 5 099 9.3%
Total core currencies (EUR, GBP, USD)
51 225 86% 45 954 84% 58 172 98% 53 988 99%
AUD 2 318 3.9% 941 1.7% BGN 128 0.2% 28 0.1% CAD 659 1.2% CHF 1 178 2.0% 445 0.8% 381 0.6% CZK 40 0.1% 40 0.1% DKK 134 0.2% 134 0.2%HKD HUF 93 0.2% 108 0.2% 93 0.2% 108 0.2%ISK 21 0.03% 261 0.5% JPY 1 377 2.3% 2 198 4.0% 149 0.3% MXN 31 0.1% NOK 559 0.9% 196 0.4% 140 0.2% 63 0.1%NZD 869 1.5% 1 344 2.5% PLN 27 0.1% 27 0.1%RON 90 0.2% RUB 44 0.1% 115 0.2% SEK 435 0.7% 893 1.6% 435 0.7% 403 0.7%SKK 7 0.01% 7 0.01% TRY 836 1.4% 1 097 2.0% 39 0.1% ZAR 336 0.6% 234 0.4% 39 0.1%
Total other currencies 8 272 14% 8 770 16% 1 325 2% 737 1%
Total 59 497 100% 54 725 100% 59 497 100% 54 725 100%
(*) Resources raised under the global borrowing authorisation given by the Board of Directors for 2007, including ‘pre-funding’ of EUR 77m completed in 2006 for 2007.
Borrowings signed and raised in 2008 vs. 2007(*) (EUR million)

Financial Report 2008 17 EIB Group
EIB Treasury Activity
Liquidity and portfolio management
As at 31 December 2008, the Bank’s overall net liquidity amounted to EUR 21.0bn (EUR 14.5bn at year-end 2007), representing a liquidity ratio of 32.4%, above the mini-mum liquidity requirement of 25% of the forecast net cash requirement for the following calendar year. The 2008 monthly average net global liquidity amounted to EUR 23.5bn, i.e. 26% more than the 2007 level of EUR 18.6bn. On a yearly basis the average liquidity ratio was 36.3%, but it decreased in the last quarter of the year, when the disruption of the global bond markets brought long-term issuance to a near halt. Among pru-dential measures applied to the treasury, no ABS has been purchased since the beginning of the crisis, invest-ments in ABCP have been kept at low levels and the lim-its on SIVs were cancelled.
The component portfolios of the operational treasury can be described as follows:
A short-term money market portfolio (A1), designed •for daily liquidity management in 13 different cur-rencies, whose benchmarks are based on the index of the daily 1-month EURIBID/LIBID for assets and the index of the daily 1-month EURIBOR/LIBOR for li-abilities.
An operational money market portfolio (A2), de- •signed to diversify the credit risk profile and en-hance the money market performance in the core currencies, i.e. EUR, GBP and USD, with a benchmark indexed to the daily 3-month EURIBID/LIBID.
A credit spread portfolio (B1), designed to enhance •overall treasury performance, with a benchmark in-dexed to the daily 3-month EURIBOR/LIBOR.
An alternative investment portfolio (B2), invested in •capital-guaranteed structured products with cou-
pons indexed to the performance of selected funds of hedge funds.
A global fixed-income portfolio (B3), with a bench- •mark based on the iBoxx Eurozone 1 to 3-year Gov-ernment Bond Index.
An investment bond portfolio, which is being •phased out.
Short-term gross liquidity held in the money market portfolios increased slightly at year-end from EUR 19.7bn in 2007 to EUR 24.2bn with short-term commitments of EUR 20.2bn (EUR 9.1bn in 2007), of which EUR 14.3bn of commercial paper outstanding (EUR 8.3bn in 2007). The operational bond portfolios and investment portfolio amounted to EUR 3.4bn (EUR 4.0bn in 2007). The break-down of treasury net liquidity of EUR 7.4bn at year-end (EUR 14.5bn in 2007) moved as follows in comparison with 2007: 54.1% (72.5%) for the operational money market portfolio, 20.7% (12.9%) for the operational bond portfolios and 25.1% (14.6%) for the investment bond portfolio.
Market development and treasury financial result
The market conditions in 2008 remained extremely diffi-cult, as the financial crisis spread to affect all banks and started to impact the real economy. The quarterly evo-lution was volatile, with the first quarter witnessing much wider credit spreads, which were largely reversed in the second quarter. The end of the summer lull fin-ished in an unprecedented level of concern, even dis-trust, about US investment banks, and the failure of Lehman Brothers, which destroyed the budding return of confidence in the markets. The resulting further wid-ening of credit spreads, hoarding of liquidity, and stock

Financial Report 200818EIB Group
market falls left no investor unaffected. Waves of down-grades of banks by rating agencies were followed by government rescue operations. The general need to deleverage experienced by banks and asset managers resulted in forced liquidations of assets, and the flight to the most liquid instruments impacted downwards the market value of most asset classes, including segments of government bonds.
Central banks across the globe cut interest rates aggres-sively to help the flow of funding to the real economy and to support their banks.
The treasury financial results are satisfactory considering these negative circumstances. The financial income from treasury operational portfolios was EUR 928m vs. EUR 721m in 2007 (+ 29%). Two portfolios had a negative accounting result (B1 had a loss of EUR 24.7m and B2 EUR 4.3m), but these were more than offset by the in-come from the other portfolios.
Financial Report 2008 19 EIB Group
EIF Activity
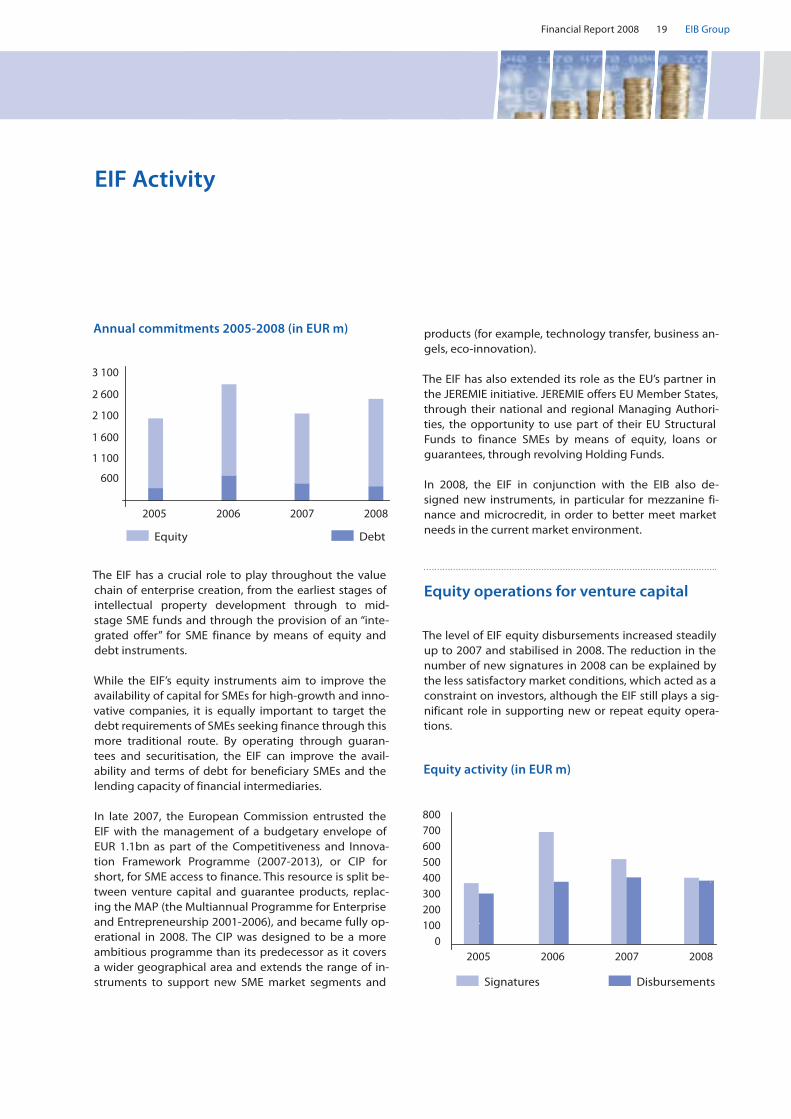
The EIF has a crucial role to play throughout the value chain of enterprise creation, from the earliest stages of intellectual property development through to mid-stage SME funds and through the provision of an “inte-grated offer” for SME finance by means of equity and debt instruments.
While the EIF’s equity instruments aim to improve the availability of capital for SMEs for high-growth and inno-vative companies, it is equally important to target the debt requirements of SMEs seeking finance through this more traditional route. By operating through guaran-tees and securitisation, the EIF can improve the avail-ability and terms of debt for beneficiary SMEs and the lending capacity of financial intermediaries.
In late 2007, the European Commission entrusted the EIF with the management of a budgetary envelope of EUR 1.1bn as part of the Competitiveness and Innova-tion Framework Programme (2007-2013), or CIP for short, for SME access to finance. This resource is split be-tween venture capital and guarantee products, replac-ing the MAP (the Multiannual Programme for Enterprise and Entrepreneurship 2001-2006), and became fully op-erational in 2008. The CIP was designed to be a more ambitious programme than its predecessor as it covers a wider geographical area and extends the range of in-struments to support new SME market segments and
DebtEquity
2005 2006 2007 2008
600
1 100
1 600
2 100
2 600
3 100
Annual commitments 2005-2008 (in EUR m) products (for example, technology transfer, business an-gels, eco-innovation).
The EIF has also extended its role as the EU’s partner in the JEREMIE initiative. JEREMIE offers EU Member States, through their national and regional Managing Authori-ties, the opportunity to use part of their EU Structural Funds to finance SMEs by means of equity, loans or guarantees, through revolving Holding Funds.
In 2008, the EIF in conjunction with the EIB also de-signed new instruments, in particular for mezzanine fi-nance and microcredit, in order to better meet market needs in the current market environment.
Equity operations for venture capital
The level of EIF equity disbursements increased steadily up to 2007 and stabilised in 2008. The reduction in the number of new signatures in 2008 can be explained by the less satisfactory market conditions, which acted as a constraint on investors, although the EIF still plays a sig-nificant role in supporting new or repeat equity opera-tions.
DisbursementsSignatures
2005 2006 2007 2008
1000
200300400500600700800
Equity activity (in EUR m)
Financial Report 200820EIB Group
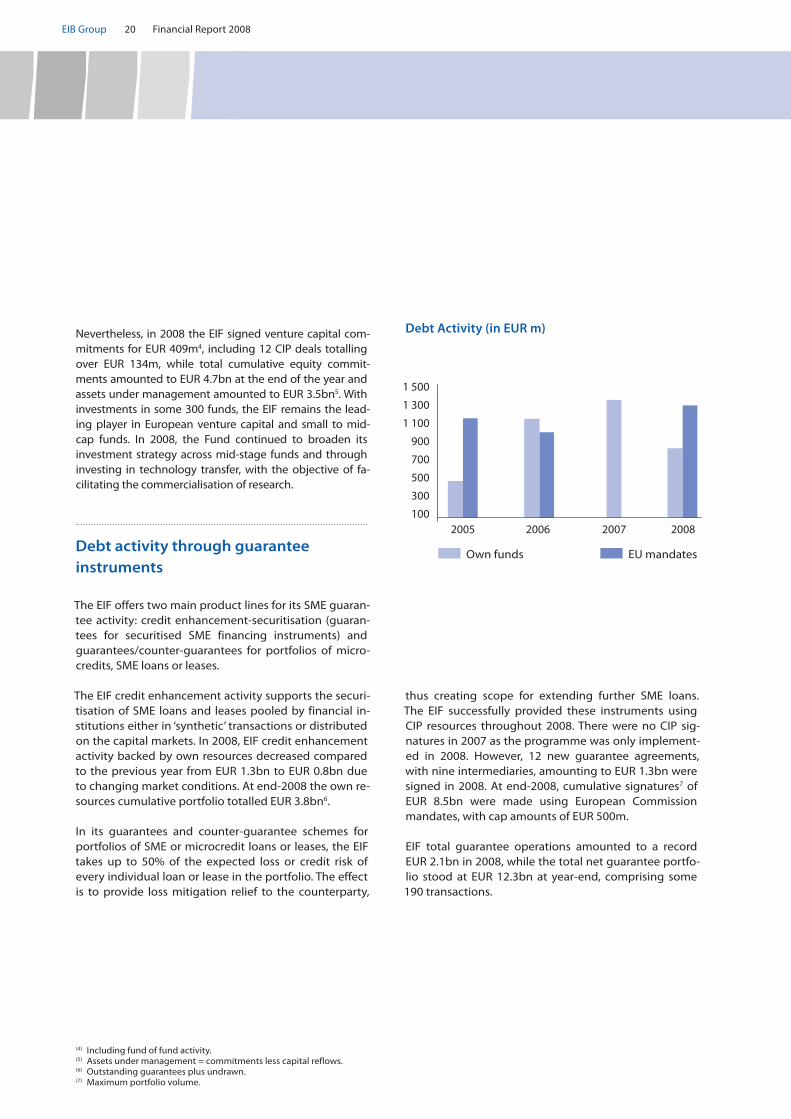
Nevertheless, in 2008 the EIF signed venture capital com-mitments for EUR 409m4, including 12 CIP deals totalling over EUR 134m, while total cumulative equity commit-ments amounted to EUR 4.7bn at the end of the year and assets under management amounted to EUR 3.5bn5. With investments in some 300 funds, the EIF remains the lead-ing player in European venture capital and small to mid-cap funds. In 2008, the Fund continued to broaden its investment strategy across mid-stage funds and through investing in technology transfer, with the objective of fa-cilitating the commercialisation of research.
Debt activity through guarantee instruments
The EIF offers two main product lines for its SME guaran-tee activity: credit enhancement-securitisation (guaran-tees for securitised SME financing instruments) and guarantees/counter-guarantees for portfolios of micro-credits, SME loans or leases.
The EIF credit enhancement activity supports the securi-tisation of SME loans and leases pooled by financial in-stitutions either in ‘synthetic’ transactions or distributed on the capital markets. In 2008, EIF credit enhancement activity backed by own resources decreased compared to the previous year from EUR 1.3bn to EUR 0.8bn due to changing market conditions. At end-2008 the own re-sources cumulative portfolio totalled EUR 3.8bn6.
In its guarantees and counter-guarantee schemes for portfolios of SME or microcredit loans or leases, the EIF takes up to 50% of the expected loss or credit risk of every individual loan or lease in the portfolio. The effect is to provide loss mitigation relief to the counterparty,
thus creating scope for extending further SME loans. The EIF successfully provided these instruments using CIP resources throughout 2008. There were no CIP sig-natures in 2007 as the programme was only implement-ed in 2008. However, 12 new guarantee agreements, with nine intermediaries, amounting to EUR 1.3bn were signed in 2008. At end-2008, cumulative signatures7 of EUR 8.5bn were made using European Commission mandates, with cap amounts of EUR 500m.
EIF total guarantee operations amounted to a record EUR 2.1bn in 2008, while the total net guarantee portfo-lio stood at EUR 12.3bn at year-end, comprising some 190 transactions.
(4) Including fund of fund activity.(5) Assets under management = commitments less capital reflows.(6) Outstanding guarantees plus undrawn. (7) Maximum portfolio volume.
2005 2006 2007 2008
300
100
500
700
900
1 100
1 500
1 300
Debt Activity (in EUR m)
Own funds EU mandates

Financial Report 2008 21 EIB Group
The Joint European Resources for Micro to Medium Enterprises (JEREMIE) initiative
By end-2008, the EIF had carried out 53 national and re-gional evaluation studies (gap analysis), thus finalising the evaluation phase of the initiative.
To date the EIF has signed seven Holding Fund Manage-ment agreements with Member States and regions, four of which in new Member States, demonstrating continu-ing commitment to supporting economic development in these regions. The total funds committed to these agreements by the end of 2008 amounted to EUR 704m.
Joint Action to Support Microfinance institutions in Europe (JASMINE)
JASMINE is a EUR 50m three-year pilot initiative promot-ed by the EC, in cooperation with the EIB/EIF, partner fi-nancial institutions and the European Parliament, to help entrepreneurs excluded from the banking sector create or develop their projects. JASMINE will provide both operational technical assistance and funding (eq-uity and debt) to institutions providing microcredit.
In 2008, the EIF’s dedicated JASMINE team conducted evaluation studies covering 12 EU countries to assess the demand and supply for “non-banking” microcredit. The estimated demand from these studies amounted to 11 million potential microcredit borrowers in the EU, a market which is recognised as being particularly impor-tant in the current environment.

Financial Report 200822EIB Group
Audit and Control
Audit Committee – The Audit Committee is an inde-pendent statutory body, appointed by, and reporting directly to, the Board of Governors. In compliance with the formalities and procedures defined in the Statute and Rules of Procedure, the Audit Committee’s role is to verify that the Bank’s operations have been conducted and its books kept in a proper manner and to obtain as-surance on the effectiveness of the internal control sys-tems, risk management and internal administration. The Audit Committee has overall responsibility for the audit of the Bank’s accounts. The Committee provides state-ments each year on whether the financial statements, as well as any other financial information contained in the annual accounts drawn up by the Board of Directors, give a true and fair view of the financial position of the Bank, the EIB Group, the Investment Facility and the FEMIP Trust Fund. Starting with the 2008 financial state-ments such a statement will also be issued by the Com-mittee for the EU-Africa Infrastructure Trust Fund. The Governors take note of the statements by the Commit-tee and of the conclusions in the annual reports of the Audit Committee when reviewing the Annual Report of the Board of Directors.
In fulfilling its role, the Committee meets with repre-sentatives of the other statutory bodies, reviews the fi-nancial statements and accounting policies, takes note of the work performed by the internal auditors, oversees and supervises the external auditors, safeguards the in-dependence and integrity of the external audit function, and coordinates audit work in general. Regular meet-ings with the Bank services and reviews of internal and external reports enable the Committee to understand and monitor how Management is providing for ade-quate and effective internal control systems, risk man-agement and internal administration.
External Auditors – The external auditors report direct-ly to the Audit Committee, which is empowered to del-egate the day-to-day work concerning the audit of the financial statements to them. The Audit Committee des-ignated the firm Ernst & Young in 2004, after consulta-tion with the Management Committee. The contract expires on the date on which the Board of Governors approves the 2008 financial statements. Following a public tendering procedure the assignment will be ro-
tated, in line with best practice, to another audit firm from 2009 onwards. The external auditors are not al-lowed to carry out any work of an advisory nature or act in any other capacity that could compromise their inde-pendence when performing their audit tasks. A sum-mary of services provided by the external auditors and the associated fees is published each year by the Bank on its website, in accordance with best practice.
Inspectorate General – The Inspectorate General for the EIB Group comprises three independent control func-tions.
Internal audit. Catering for audit needs at all levels of management of the EIB Group and acting with the guar-antees of independence and of professional standards conferred upon it by its Charter, Internal Audit examines and evaluates the relevance and effectiveness of the in-ternal control systems and the procedures involved in managing risk within the Group. An internal control framework covering all key operational activities of the Group and any newly identified processes continues to be maintained. Action Plans agreed with the Bank’s de-partments are a catalyst for improving procedures and strengthening controls. Hence, Internal Audit reviews and tests controls in critical banking, information tech-nology and administrative areas on a rotational basis using a risk-based approach.
Operations Evaluation. Operations Evaluation (EV) inde-pendently carries out evaluations (mainly ex post) of the EIB Group’s operations. The objective is to assess opera-tions with a view to identifying aspects that could im-prove operational performance, accountability and transparency. EV focuses on how the institution (EIB – EIF) conducts its operations, given the framework of relevant EU policies (the Treaty, Directives, Council Decisions, mandates, etc.) and the decisions of the EIB’s Governors. Evaluation reports are published in a dedicated section of the EIB’s website (www.eib.org/evaluation).
Fraud investigations. Under internal procedures to com-bat fraud, the Inspector General has the authority to in-dependently conduct inquiries into allegations of possible fraud or corruption involving EIB funds. The Bank may also call upon external assistance or experts
Financial Report 2008 23 EIB Group
in accordance with the requirements of the inquiry, and works closely with the services of the European Anti-Fraud Office (OLAF). In addition, the Inspector General provides, when required, an independent recourse mechanism for investigating complaints that the Euro-pean Ombudsman considers to be outside his remit.
Compliance Office – The Office of the Group Chief Compliance Officer (OCCO) identifies the compliance risk of any of the members of the EIB Group, assesses or advises on compliance-related questions by expressing opinions or making recommendations either upon re-quest or on its own initiative, monitors the risk and re-ports it. More specifically, OCCO is responsible for the observance of guidelines, policies and procedures adopted from time to time by the members of the EIB Group on money laundering, fraud and terrorism and actively promotes the compliance of the members of the EIB Group with current best standards of good pro-fessional practice, with the codes of conduct and with compilations of best practices.
Management Control – Within the Strategy and Corpo-rate Centre Directorate, the Strategy and Management Control Department brings together the functions re-sponsible for management control – namely strategy, budget and associated analyses, partnership coordina-tion and process improvement – and integrates them with functions responsible for macroeconomic research and corporate responsibility policies and corporate gov-ernance issues. A Financial Control division exists which also manages the Bank’s relationship with the European Court of Auditors. This structure ensures that the overall strategic and financial planning and reporting processes are coordinated and support the achievement of the Bank-wide objectives and ultimately that the results achieved are monitored. Key tools include the Corpo-rate Operational Plan, the budget and associated con-trol systems, and financial accounting and control systems. A suite of integrated reports facilitates evalua-tion of the financial situation in relation to strategy, in-stitutional and operational objectives and business plans. Management Control provides an opinion on in-ternal proposals to the Management Committee that have a strategic, budgetary/financial, corporate respon-sibility or organisational impact.

EIB Group – Financial Statements 25 EIB Group
Financial StatementsEIB Group


EIB Group – Financial Statements 27 EIB Group
The EIB Group balance sheet total increased by EUR 41bil-lion (+13%) compared to 2007. The result of the Group for the reporting date stands at EUR 6 356 million compared to an ordinary consolidated result of EUR 843 million for 2007, representing an increase of EUR 5 513 million.
The main contributing factor influencing the consolidat-ed financial statements is the result on financial opera-tions, which mainly comprises the net results on derivatives, loans and borrowings, with application of the fair value option under IAS 39; it increased by EUR 5 321 million (see Consolidated Financial Statements – Note N). The major impact is the increase related to borrowings designated at fair value and their related swaps for EUR 5 550 million. A widening of EIB credit spreads in the sec-ondary market was observed, mostly due to the increased supply of government and government guaranteed debt issuance. A widening of credit spreads infers a higher yield to maturity for the outstanding borrowings, which in turn implies lower market prices. A lower price on liabil-ity implies a profit.
Overall, bond prices are observed directly in the market and are very sensitive to market situation, while swap val-ues are derived from internal valuation models. The net result of the variation of the value of the liabilities and the hedging items results in an accounting profit. As it is the intention of the Group to hold all financial instruments in-volved until maturity, it is expected that this accounting profit will be completely neutralised when the cashflows of the bonds and the hedging swaps are unwound. The opposite phenomenon was observed last year.
Other positive or negative factors are the following:
Positive impacts:
The net result of interest and similar income and •charges stands at EUR 2 141 million in 2008, i.e. an increase of EUR 277 million (items 1 and 2 of the In-come Statement).
The credit loss expense, together with the movements •
in the specific provision for credit risk, resulted in a gain of EUR 3 million, compared with a loss of EUR 17 million in 2007, being a positive variation of EUR 20 million.
All other profit and loss items gave rise to an overall •net increase of EUR 13 million.
Negative impacts:
The impairment losses on shares and other variable- •yield securities resulted in a negative variation of EUR 79 million.
General administrative expenses and depreciation •increased by EUR 39 million.
Consolidated Results for the Year

Financial Report 200828EIB Group
Consolidated balance sheet as at 31 December 2008 (in EUR ’000)
Assets 31.12.2008 31.12.2007
1. Cash in hand, balances with central banks and post office banks 76
27 318
2. Treasury bills eligible for refinancing with central banks (Note B)
2 016 818
2 273 135
3. Loans and advances to credit institutions
a) repayable on demand 275 915 286 263
b) other loans and advances (Note C) 21 745 356 15 816 580
c) loans (Note D.1) 116 216 197 112 323 909
138 237 468 128 426 752
4. Loans and advances to customers
a) loans (Note D.1) 175 668 894 156 435 308
b) specific provisions (Note D.2) - 17 500 - 37 050
175 651 394 156 398 258
5. Debt securities including fixed-income securities (Note B)
a) issued by public bodies 583 455 580 386
b) issued by other borrowers 10 646 207 10 435 661
11 229 662 11 016 047
6. Shares and other variable-yield securities (Note E) 1 983 238 2 078 830
7. Intangible assets (Note F) 4 316 3 972
8. Property, furniture and equipment (Note F) 316 184 285 720
9. Other assets
a) sundry debtors (Note H) 159 955 145 445
b) positive replacement values (Note R) 21 861 679 9 060 783
22 021 634 9 206 228
10. Assets held for sale (Note F) 3 373 0
11. Subscribed capital and receivable reserves, called but not paid (Note X.2)
458 925
1 061 503
12. Prepayments and accrued income 37 471 30 658
Total Assets 351 960 559 310 808 421
The accompanying notes form an integral part of these consolidated financial statements

EIB Group – Financial Statements 29 EIB Group
Liabilities 31.12.2008 31.12.2007
1. Amounts owed to credit institutions (Note I)
a) with agreed maturity dates or periods of notice 5 959 353 341 757
5 959 353 341 757
2. Debts evidenced by certificates (Note J)
a) debt securities in issue 283 832 176 259 280 003
b) others 668 769 892 400
284 500 945 260 172 403
3. Other liabilities
a) sundry creditors (Note H) 1 805 887 1 429 085
b) sundry liabilities (Note H) 43 123 37 457
c) negative replacement values (Note R) 17 473 719 12 945 900
19 322 729 14 412 442
4. Accruals and deferred income (Note G) 267 231 270 724
5. Provisions
a) pension plans and health insurance scheme (Note K) 1 122 800 1 038 545
1 122 800 1 038 545
Total Liabilities 311 173 058 276 235 871
Total Liabilities & Equity 351 960 559 310 808 421
6. Capital (Note X)
- Subscribed 164 808 169 164 808 169
- Uncalled - 156 567 760 - 156 567 760
8 240 409 8 240 409
7. Consolidated reserves
a) reserve fund 16 480 817 16 480 817
b) additional reserves 5 196 255 6 067 178
21 677 072 22 547 995
8. Funds allocated to structured finance facility 2 750 000 1 250 000
9. Funds allocated to venture capital operations 1 764 305 1 690 940
10. Profit for the financial year 6 355 715 843 206
Total Equity 40 787 501 34 572 550

Financial Report 200830EIB Group
Consolidated income statement for the year ended 31 December 2008 (in EUR ’000)
The accompanying notes form an integral part of these consolidated financial statements.
31.12.2008 31.12.2007
1 Interest and similar income (Note M) 14 812 995 14 051 950
2 Interest expense and similar charges (Note M) - 12 672 229 - 12 188 607
3 Income from shares and other variable-yield securities 56 084 68 247
4 Fee and commission income (Note P) 96 072 85 924
5 Fee and commission expense (Note P) - 125 - 1 842
6 Result on financial operations (Note N) 4 644 604 - 676 792
7 Other operating income (Note O) 38 533 26 526
8 General administrative expenses (Note Κ, Q) - 397 138 - 365 980
a) staff costs (Note K) - 289 475 - 280 100
b) other administrative costs - 107 663 - 85 880
9 Depreciation and amortisation (Note F) - 28 319 - 20 027
a) intangible assets - 1 854 - 2 984
b) tangible assets - 26 465 - 17 043
10 Credit loss expense 2 659 - 17 465
11 Impairment losses on shares and other variable-yield securi-ties (Note E)
- 197 421
- 118 728
12 Profit for the financial year 6 355 715 843 206

EIB Group – Financial Statements 31 EIB Group
(*)
An
am
ou
nt
of E
UR
’000
73
365
resu
ltin
g fr
om
th
e va
lue
adju
stm
ents
on
ven
ture
cap
ital
op
erat
ion
s h
as b
een
tra
nsf
erre
d fr
om
th
e A
dd
itio
nal
rese
rves
to t
he
Fun
ds
allo
cate
d to
ven
ture
cap
ital
op
erat
ion
s.(*
*)
Bef
ore
ap
pro
pri
atio
n o
f cu
rren
t ye
ar p
rofit
.(*
**) A
s at
1 J
anu
ary
2007
, th
e su
bsc
rib
ed c
apit
al in
crea
sed
fro
m E
UR
’000
163
653
737
to E
UR
’000
164
808
169
, by
virt
ue
of t
he
con
trib
uti
on
s o
f tw
o n
ew M
emb
er S
tate
s: B
ulg
aria
an
d R
om
ania
. As
a co
nse
qu
ence
of t
his
cap
ital
incr
ease
, th
e tw
o n
ew M
emb
er S
tate
s h
ad t
o c
on
trib
ute
to
th
eir
shar
e o
f Pai
d-i
n c
apit
al (E
UR
’000
57
722)
, an
d a
lso
th
eir
shar
e o
f th
e R
eser
ves
and
Gen
eral
Pro
visi
on
s (E
UR
’000
172
932
) fo
r th
e am
ou
nts
ou
tsta
nd
ing
as
of 3
1 D
ecem
ber
20
06.
The
acco
mp
anyi
ng
no
tes
form
an
inte
gra
l par
t o
f th
ese
con
solid
ated
fin
anci
al s
tate
men
ts.
Stat
emen
t o
f mo
vem
ents
in c
on
solid
ated
ow
n fu
nd
s fo
r th
e ye
ar e
nd
ed 3
1 D
ecem
ber
200
8 (in
EU
R ’0
00)
Sub
scri
bed
cap
ital
Cal
lab
le c
apit
alFu
nd
for
gen
eral
ban
kin
g r
isks
(**)
Fun
ds
allo
cate
d to
Stru
ctur
ed F
inan
ce
Faci
lity
Fun
ds
allo
cate
d to
ven
ture
cap
ital
op
erat
ion
s
Res
erve
fun
dA
dd
itio
nal
res
erve
sPr
ofi
t of t
he
year
bef
ore
app
rop
riat
ion
Tota
l con
solid
ated
own
fun
ds
O
ther
AFS
res
erve
At 3
1 D
ecem
ber
200
616
3 65
3 73
7- 1
55 4
71 0
5097
5 00
01
250
000
1 66
3 82
416
365
374
2 15
3 81
635
7 52
62
259
612
33 2
07 8
39
Con
trib
utio
n o
f Bul
gar
ia a
nd
Ro
man
ia a
s of
Jan
uary
200
7 (*
**)
1
154
432
- 1
096
710
0 0
0
115
443
57
489
0 0
23
0 65
4
Ap
pro
pri
atio
n o
f pri
or y
ear’s
pro
fit0
0- 9
75 0
000
00
3 23
4 61
20
- 2 2
59 6
120
Tran
sfer
to a
dd
itio
nal
rese
rves
00
00
27 1
160
- 27
116
00
0
Ch
ang
es in
fair
val
ue d
urin
g th
e ye
ar 0
0 0
0 0
0 0
29
0 85
1 0
29
0 85
1
Net
pro
fit o
f th
e ye
ar0
00
00
00
084
3 20
684
3 20
6
At 3
1 D
ecem
ber
200
716
4 80
8 16
9- 1
56 5
67 7
600
1 25
0 00
01
690
940
16 4
80 8
175
418
801
648
377
843
206
34 5
72 5
50
Ap
pro
pri
atio
n o
f pri
or y
ear’s
pro
fit0
00
1 50
0 00
00
0- 6
56 7
940
- 843
206
0
Tran
sfer
to a
dd
itio
nal
rese
rves
(*)
00
00
73 3
650
- 73
365
00
0
Ch
ang
es in
fair
val
ue d
urin
g th
e ye
ar 0
0 0
0 0
0 0
- 1
40 7
64 0
- 1
40 7
64
Net
pro
fit o
f th
e ye
ar0
00
00
00
06
355
715
6 35
5 71
5
At 3
1 D
ecem
ber
200
816
4 80
8 16
9- 1
56 5
67 7
600
2 75
0 00
01
764
305
16 4
80 8
174
688
642
507
613
6 35
5 71
540
787
501

Financial Report 200832EIB Group
Consolidated Cash Flow Statement as at 31 December 2008 In EUR ’000
31.12.2008 31.12.2007
A. Cash flows from operating activities:Profit for the financial year 6 355 715 843 206Adjustments: Unwinding of the discount relating to capital and reserve called, but not paid in - 28 245 - 45 663Depreciation and amortisation on tangible and intangible assets 28 319 20 027Impairment losses on venture capital operations 197 421 118 728Decrease in accruals and deferred income - 3 493 - 73 561Decrease in prepayments and accrued income 1 796 57 845Investment portfolio amortisation - 5 824 - 17 454Changes in replacement values on derivatives others than those associated with borrowings and loans
- 3 464 428
- 1 526 786
Profit on operating activities 3 081 261 - 623 658
Net loans disbursements - 47 423 453 - 39 910 416Repayments 19 765 944 19 984 413Effects of exchange rate changes on loans 8 442 502 8 104 408Increase in prepayments and accrued income on loans - 2 960 - 219 593Adjustment of loans (fair value option) - 3 907 908 899 229Changes in replacement values on derivatives associated with loans 3 763 672 - 777 549Decrease in operational portfolio 628 001 1 090 330Increase in venture capital operations - 84 026 - 153 690Impairment losses on loans and advances - 19 550 - 45 367Increase in shares and other variable-yield securities - 53 536 - 49 207Increase /Decrease in other assets - 14 510 103 238Increase in other liabilities 448 103 213 740
Net cash from operating activities - 15 376 460 -11 384 122
B. Cash flows from investing activities:Securities matured during the year 311 577 328 790Increase in asset backed securities - 1 070 036 - 1 995 637Purchase of property, furniture and equipment - 56 929 - 82 879Purchase of intangible assets - 2 198 - 1 825Increase in assets held for sale - 3 373 0
Net cash from investing activities - 820 959 - 1 751 551
C. Cash flows from financing activities:Issue of borrowings 58 002 563 54 678 538Redemption of borrowings - 39 727 853 - 35 348 649Effects of exchange rate changes on borrowings and swaps - 8 559 711 - 8 408 498Adjustments of borrowings (fair value option) 11 445 727 - 553 677Changes in replacement values on derivatives associated with borrowings - 11 372 696 1 368 022Increase /Decrease in accrual and deferred income on borrowings and swaps - 19 200 157 800Paid in by Member States 630 823 630 824Increase in commercial paper 5 987 392 514 480Increase in amounts owed to credit institutions 5 617 596 122 790
Net cash from financing activities 22 004 641 13 161 630

EIB Group – Financial Statements 33 EIB Group
The accompanying notes form an integral part of these consolidated financial statements.
Summary statement of cash flows:
Cash and cash equivalents at beginning of financial year 18 322 348 18 296 391
Net cash from:(1) operating activities - 15 376 460 - 11 384 122(2) investing activities - 820 959 - 1 751 551(3) financing activities 22 004 641 13 161 630
Cash and cash equivalents at end of financial year 24 129 570 18 322 348
Cash analysis: Cash in hand, balances with central banks and post office banks 76 27 318Bills maturing within three months of issue 2 108 223 2 192 187Loans and advances to credit institutions:Accounts repayable on demand 275 915 286 263Term deposit accounts 21 745 356 15 816 580
24 129 570 18 322 348

Financial Report 200834EIB Group
Note A – Significant accounting policies
A.1. Basis of preparation
Statement of compliance
The European Investment Bank (the “Group”) consoli-dated financial statements (the “Financial Statements”) have been prepared in accordance with international fi-nancial reporting standards (IFRS), as endorsed by the European Union.
The accounting policies applied are in conformity, in all material respects, with the general principles of the Direc-tive 86/635/EEC of the Council of the European Commu-nities of 8 December 1986 on the annual accounts and consolidated accounts of banks and other financial insti-tutions, as amended by Directive 2001/65/EC of 27 Sep-tember 2001 and by Directive 2003/51/EC of 18 June 2003 on the annual and consolidated accounts of certain types of companies, banks and other financial institutions and insurance undertakings (the “Directives”). However, the Financial Statements do not include any management report. The Group prepares an Activity Report which is presented separately from the Financial Statements and its consistency with the Financial Statements is not au-dited.
Basis of consolidation
The Financial Statements comprise those of the Euro-pean Investment Bank (the “Bank” or the “EIB”) and those of its subsidiary, the European Investment Fund (the “Fund” or the “EIF”), having its registered office at 100, boulevard Konrad Adenauer, Luxembourg. The financial statements of the Fund are prepared for the same re-porting year as the Bank, using consistent accounting policies.
After aggregation of the balance sheets and income statements, all intra-group balances, transactions, income and expenses resulting from intra-group transactions are eliminated.
The Bank holds 63.60% (2007: 65.78%) of the subscribed capital of the EIF and therefore has applied the principles pronounced by IAS 27 in preparing consolidated financial statements. Hence, the Group combines the financial statements of the EIB and the EIF line by line by adding together like items of assets, liabilities, equity, income and expenses.
Minority interests represent the portion of profit or loss and net assets not owned, directly or indirectly, by the
Bank and are presented under item 6. Result on financial operations in the consolidated income statement and under item 3. Other liabilities - b) sundry creditors (Note A.4.21) in the consolidated balance sheet.
Assets held in an agency or fiduciary capacity are not as-sets of the Group and are reported in Note W.
A.2. Significant accounting judgements and estimates
In preparing the Financial Statements, the Management Committee is required to make estimates and assump-tions that affect reported income, expenses, assets, liabil-ities and disclosure of contingent assets and liabilities. Use of available information and application of judge-ment are inherent in the formation of estimates. Actual results in the future could differ from such estimates and the differences may be material to the Financial State-ments.
The most significant use of judgements and estimates are as follows:
Fair value of financial instruments
Where the fair values of financial assets and financial lia-bilities recorded on the balance sheet cannot be derived from active markets, they are determined using a variety of valuation techniques that include the use of mathe-matical models. The input to these models is taken from observable markets where possible, but where this is not feasible, a degree of judgement is required in establishing fair values. The judgements include considerations of li-quidity and model inputs such as correlation and volatil-ity for longer dated derivatives.
Impairment losses on loans and advances
The Group reviews its problem loans and advances at each reporting date to assess whether an allowance for impairment should be recorded in the consolidated in-come statement. In particular, judgement by manage-ment is required in the estimation of the amount and timing of future cash flows when determining the level of allowance required. Such estimates are based on as-sumptions about a number of factors and actual results may differ, resulting in future changes to the allowance. In addition to specific allowance against individually sig-nificant loans and advances, the Group also makes a col-lective impairment test on exposures which, although not specifically identified as requiring a specific allowance, have a greater risk of default than when originally grant-ed.
European Investment Bank Group
Notes to the consolidated financial statements as at 31 December 2008

EIB Group – Financial Statements 35 EIB Group
Valuation of unquoted equity investments
Valuation of unquoted equity investments is normally based on one of the following:
recent arms length market transactions; •
current fair value of another instrument that is sub- •stantially the same;
the expected cash flows discounted at current rates •applicable for items with similar terms and risk char-acteristics; or
other valuation models. •
The determination of the cash flows and discount factors for unquoted equity investments requires significant es-timation. The Group calibrates the valuation techniques periodically and tests them for validity using either prices from observable current market transactions in the same instrument or from other available observable market data.
As at 31 December 2008, there were no differences be-tween the transaction price at initial recognition and the fair value that would be determined at that date using the valuation technique mentioned above.
Impairment of equity investments
The Group treats available-for-sale equity investments as impaired when there has been a significant or prolonged decline in the fair value below its cost or where other ob-jective evidence of impairment exists. The determination of what is “significant” or “prolonged” requires judgement. The Group treats “significant” generally as 30% or more and “prolonged” greater than 12 months. In addition, the Group evaluates other factors, including normal volatility in share price for quoted equities and the future cash flows and the discount factors for unquoted equities.
Pension and other post employment benefits
The cost of defined benefit pension plans and other post employment medical benefits is determined using actu-arial valuations. The actuarial valuation involves making assumptions about discount rates, expected rates of re-turn on assets, future salary increases, mortality rates and future pension increases. Due to the long term nature of these plans, such estimates are subject to significant un-certainty.
A.3. Changes in accounting policies
The accounting policies adopted are consistent with those of the previous financial year except as fol-lows:
The Group has adopted the following new and amended IFRS and IFRIC interpretations during the year. Adoption of these revised standards and interpretations did not
have any effect on the financial performance or position of the Group. They did however give rise to additional disclosures, including in some cases, revisions to account-ing policies.
IFRIC 14 IAS 19 - The Limit on a Defined Benefit Asset, Minimum Funding Requirements and their Interaction.
IFRIC Interpretation 14 provides guidance on how to as-sess the limit on the amount of surplus in a defined ben-efit scheme that can be recognised as an asset under IAS 19 Employee Benefits. The Group amended its accounting policy accordingly.
Standards issued but not yet effective:
The following IFRS and IFRIC interpretations were issued with an effective date for financial periods beginning on or after January 1, 2009. The Group has chosen not to early adopt these standards and interpretations before their effective dates.
IFRS 8 — Operating Segments:
This standard is to be applied for annual periods beginning on or after 1 January 2009. This standard requires disclo-sure of information about the Group’s operating segments and replaced the requirement to determine primary and secondary reporting segments of the Group. The Group plans to adopt this standard at its effective date.
IAS 23 — Amendment – Borrowing costs:
This standard is to be applied for annual periods begin-ning on or after 1 January 2009. This amendment elimi-nates the option of expensing all borrowing costs and requires borrowing costs to be capitalized if they are di-rectly attributable to the acquisition, construction or pro-duction of a qualifying asset. Accordingly, borrowing costs will be capitalized on qualifying assets with a com-mencement date after January 1, 2009. The Group plans to adopt this revised standard at its effective date or at the date of endorsement by the European Union, if later, and does not anticipate any significant impacts on its fi-nancial statements.
IAS 27R —Consolidated Financial Statements:
This standard is applicable for annual periods beginning on or after 1 July 2009 and must be adopted simultane-ously with the adoption of IFRS 3R. The revised IAS 27 will require entities to account for changes in the ownership of a subsidiary, which does not result in the loss of con-trol, as an equity transaction and therefore will not give rise to a gain or loss in income. In addition losses incurred by a subsidiary will be required to be allocated between the controlling and non-controlling interests, even if the losses exceed the non-controlling equity investment in the subsidiary. Finally on loss of control of a subsidiary, entities will be required to re-measure to fair value any retained interest, which will impact the gain or loss rec-

Financial Report 200836EIB Group
ognised on the disposal linked to the loss of control. The Group plans to adopt this revised standard at its effective date or at the date of endorsement by the European Un-ion, if later and does not anticipate any significant im-pacts on its financial statements.
A.4. Summary of significant accounting policies
A.4.1. Foreign currency translation
The Financial Statements are presented in euro (EUR), as the functional currency and the unit of measure for the capital accounts and for presenting its Financial State-ments.
The Group conducts its operations in euro, in the other currencies of the Member States and in non-EU curren-cies.
Its resources are derived from its capital, borrowings and accumulated earnings in various currencies and are held, invested or lent in the same currencies.
Foreign currency transactions are translated, in accord-ance with IAS 21, at the exchange rate prevailing on the date of the transaction.
Monetary assets and liabilities denominated in currencies other than in euro are translated into euro at the ex-change rate prevailing at the balance sheet date. The gain or loss arising from such translation is recorded in the consolidated income statement.
Non-monetary items that are measured in terms of his-torical cost in a foreign currency are translated using the exchange rates at the dates of the initial transactions. Non-monetary items measured at fair value in a foreign currency are translated using the exchange rates at the date when the fair value was determined.
Exchange differences on non-monetary financial assets are a component of the change in their fair value. De-pending on the classification of a non-monetary financial asset, exchange differences are either recognized in the income statement or within the equity reserves.
Exchange differences arising on the settlement of transac-tions at rates different from those at the date of the trans-action, and unrealised foreign exchange differences on unsettled foreign currency monetary assets and liabilities, are recognized in the consolidated income statement.
The elements of the consolidated income statement are translated into euro on the basis of the exchange rates prevailing at the end of each month.
A.4.2. Derivatives
All derivative instruments of the Group are measured at fair value through profit and loss account on the con-
solidated balance sheet and are reported as positive or negative replacement values. Fair values are obtained from quoted market pricing, discounted cash flow models and option pricing models, which consider current mar-ket and contractual prices for the underlying instrument, as well as time value of money, yield curve and volatility of the underlying.
The Group uses derivative instruments mainly for hedg-ing market exposure on borrowings and lending transac-tions, and also as part of its asset and liability management activities to manage exposures to interest rate and for-eign currency risk, including exposures arising from fore-cast transactions. The Group applies the amended Fair Value Option of IAS 39 when balance sheet items, togeth-er with one or more derivative transactions meet the eli-gibility criteria of the amended Fair Value Option, more in particular when a significant reduction of the account-ing mismatch is thus obtained.
The Group currently does not use any of the hedge ac-counting possibilities available under IAS39.
The majority of the Group’s swaps are concluded with a view to hedging specific bond issues. The Group en-ters into currency swaps, in which, at inception, the proceeds of a borrowing are converted into a different currency, mainly as part of its resource-raising opera-tions and, thereafter, the Group will obtain the amounts needed to service the borrowing in the original cur-rency.
Macro-hedging swaps used as part of asset/liability man-agement are marked to market (fair value) using internal valuation models. In general, derivative instruments transacted as economic hedges are treated in the same way as derivative instruments used for trading purposes, i.e. realized and unrealized gains and losses are recog-nized in Result on financial operations. Accrued interest on derivatives is part of the fair value recorded in the con-solidated income statement and in the consolidated bal-ance sheet.
A derivative may be embedded in a “host contract”. Such combinations are known as hybrid instruments and arise predominantly from the issuance of certain structured debt instruments. If the host contract is not carried at fair value with changes in fair value reported in the consoli-dated income statement, the embedded derivative is separated from the host contract and accounted for as a stand-alone derivative instrument at fair value if, and only if, the economic characteristics and risks of the embed-ded derivative are not closely related to the economic characteristics and risks of the host contract and the em-bedded derivative actually meets the definition of a de-rivative.
A.4.3. Financial assets
Financial assets are accounted for using the settlement date basis.

EIB Group – Financial Statements 37 EIB Group
A.4.4. Cash and Cash Equivalents
The Group defines cash equivalents as short-term, highly liquid securities and interest-earning deposits with origi-nal maturities of 90 days or less.
A.4.5. Fee income
The Group earns fee income from a diverse range of serv-ices it provides to its customers. Fee income can be di-vided into two broad categories:
income earned from services that are provided over •a certain period of time, for which customers are gen-erally billed on an annual or semi-annual basis, and
income earned from providing transaction-type serv- •ices.
Fees earned from services that are provided over a certain period of time are recognised on an accrual basis over the service period. Fees earned from providing transaction-type services are recognized when the service has been completed. Fees or components of fees that are perform-ance linked are recognized when the performance criteria are fulfilled. Issuance fees and redemption premiums or discounts are amortised over the period to maturity of the related borrowings, unless those borrowings are measured at fair value, in which case the recognition in the consolidated income statement is immediate.
A.4.6. Securities lending
In April 2003, the Group signed an agreement for securi-ties lending with Northern Trust Global Investment acting as an agent to lend securities from the Investment Port-folio, B1 ‘Credit Spread’ portfolio and B3 ‘Global Fixed in-come’ portfolio.
Securities received as collateral under securities lending transactions are not recognized in the consolidated bal-ance sheet unless control of the contractual rights that comprise these securities received is gained. Securities lent under securities lending transactions are not derec-ognised from the consolidated balance sheet unless con-trol of the contractual rights that comprise these securities transferred is relinquished. The Group monitors the mar-ket value of the securities lent on a daily basis and re-quests additional collateral in accordance with the underlying agreement.
Fees and interest received or paid are recorded as interest income or interest expense, on an accrual basis.
A.4.7. Treasury bills and other bills eligible for refinancing with central banks and debt securities including fixed-income securities and other variable-yield securities
With a view to clarifying management of its liquid assets and consolidating its solvency, the Group has established the following portfolio categories:
A.4.7.1. Held for trading portfolio
The held for trading portfolio (see Operational portfolio B3 in Note B) comprises listed debt securities issued and guaranteed by financial establishments, which are owned by the Group (“long” positions). Securities held in this portfolio are marked to market in the consolidated bal-ance sheet, any gain or loss arising from a change in fair value being included in the consolidated income state-ment in the period in which it arises.
Gains and losses realized on disposal or redemption and unrealized gains and losses from changes in the fair value of trading portfolio assets are reported as Net trading income in the account “Result on financial operations”. Interest income on trading portfolio assets is included in interest income.
The determination of fair values of trading portfolio as-sets is based on quoted market prices in active markets or dealer price quotations, pricing models (using assump-tions based on market and economic conditions), or man-agement’s estimates, as applicable.
A.4.7.2. Held-to-maturity portfolio
The held-to-maturity portfolio comprises the Group’s In-vestment portfolio and the operational portfolio A1 of EIB (see Note B).
The Investment portfolio consists of securities purchased with the intention of holding them to maturity. These se-curities are issued or guaranteed by:
Governments of the European Union, G10 countries and their agencies;
Supranational public institutions, including multination-al development banks.
These securities are initially recorded at the purchase price, or more exceptionally the transfer price. The differ-ence between entry price and redemption value is amor-tised prorata temporis over the remaining life of the securities.
The Group has decided to phase out the investment port-folio of the Bank, by ceasing to invest the redemption proceeds of matured securities in the portfolio.
The Operational portfolios A1 of the Group are held for the purpose of maintaining an adequate level of liquidity in the Group and comprise money market products with a maximum maturity of twelve months, in particular, treasury bills and negotiable debt securities issued by credit institutions. The securities are held until their final maturity and presented in the Financial Statements at their amortized cost.
The Asset Backed Securities portfolio mainly consists of obligations in the form of bonds, notes or certificates is-

Financial Report 200838EIB Group
sued by a Special Purpose Vehicle (SPV) or a trust vehicle. These securities are classified as held-to-maturity and recorded at purchase price. Value impairments are ac-counted for, if these are other than temporary.
A.4.7.3. Available-for-sale portfolio
The available-for-sale portfolio comprises the securities of the operational money market portfolio A2 and of the operational bond portfolios B1 and B2 (see Note B), the operational portfolio of the Fund, shares, other variable-yield securities and participating interests (see Note B). Securities are classified as available-for-sale where they do not appropriately belong to one of the other catego-ries of financial instruments recognised under IAS 39, i.e. “held for trading” or “held-to-maturity”. The Manage-ment Committee determines the appropriate classifica-tion of its investments at the time of the constitution of a portfolio, financial instruments within one portfolio have always the same classification. Available-for-sale financial investments may be sold in response to or in anticipation of needs for liquidity or changes in interest rates, credit quality, foreign exchange rates or equity prices.
Available-for-sale financial investments are carried at fair value. They are initially recognised at fair value plus trans-action costs. Unrealised gains or losses are reported in consolidated reserves until such investment is sold, col-lected or otherwise disposed of, or until such investment is determined to be impaired. If an available-for-sale in-vestment is determined to be impaired, the cumulative unrealised gain or loss previously recognised in own funds is included in consolidated income statement for the period. A financial investment is considered impaired if its carrying value exceeds the recoverable amount. Quoted financial investments are considered impaired if the decline in market price below cost is of such a mag-nitude that recovery of the cost value cannot be reason-ably expected within the foreseeable future. For non-quoted equity investments, the recoverable amount is determined by applying recognized valuation tech-niques.
Financial assets are derecognised when the right to re-ceive cash flows from the financial assets have expired or where the Group has transferred substantially all risks and rewards of ownership. On disposal of an available-for-sale investment, the accumulated unrealised gain or loss in-cluded in own funds is transferred to consolidated in-come statement for the period. Gains and losses on disposal are determined using the average cost method. Interest and dividend income on available-for-sale finan-cial investments are included in “interest and similar in-come” and “income from securities with variable yield”. Interest on available-for-sale debt securities and other fixed income securities calculated using the effective in-terest method is recognised in the income statement. Dividends on equity investments are recognised in the income statement when the Group’s right to receive pay-ment is established.
The determination of fair values of available-for-sale fi-nancial investments is generally based on quoted market rates in active markets, dealer price quotations, discount-ed expected cash flows using market rates commensurate with the credit quality and maturity of the investment or based upon review of the investee’s financial results, con-dition and prospects including comparisons to similar companies for which quoted market prices are availa-ble.
Venture capital operations and participating interests held represent medium and long-term investments and are measured at fair value, by using fair value measure-ment techniques including entity inputs, in absence of liquid market prices, commonly used by market partici-pants. However, some are accounted for at cost when the fair value cannot be reliably measured. The nature of those investments is such that an accurate fair value can be determined only upon realization of those invest-ments. The estimation by the Group of a fair value for venture capital investments for which the method and timing of realization have not yet been determined is therefore considered to be inappropriate in those in-stances. All venture capital operations are subject to re-view for impairment.
The Group assesses at each balance sheet date whether there is any objective evidence that a financial asset or a group of financial assets is impaired. A financial asset or a group of financial assets is deemed to be impaired if, and only if, there is objective evidence of impairment as a result of one or more events that has occurred after the initial recognition of the asset (an incurred “loss event”) and that loss event (or events) has an impact on the esti-mated future cash flows of the financial asset or the group of financial assets that can be reliably estimated.
In the case of equity investments classified as available-for-sale, this would include a significant or prolonged decline in the fair value of the investments below its cost. Where there is evidence of impairment, the cumulative loss measured as the difference between the acquisition cost and the current fair value, less any impairment loss on that financial asset previously recognised in the con-solidated income statement is removed from equity and recognised in the income statement. Impairment losses on equity investments are not reversed through the con-solidated income statement; increases in their fair value after impairment are recognised directly in equity. In con-trast, if in a subsequent period, the fair value of a debt instrument classified as available-for-sale increases and the increase can be objectively related to an event occur-ring after the impairment loss was recognised, the impair-ment loss is reversed through the income statement.
A.4.8. Loans and advances to credit institutions and customers
Loans and receivable include loans where money is pro-vided directly to the borrower. A participation in a loan from another lender is considered to be originated by the

EIB Group – Financial Statements 39 EIB Group
Group, provided it is funded on the date the loan is orig-inated by the lender.
Loans and receivable are recognized in the assets of the Group when cash is advanced to borrowers. They are ini-tially recorded at cost (their net disbursed amounts), which is the fair value of the cash given to originate the loan, including any transaction costs, and are subse-quently measured at amortized cost using the effective interest rate method.
Where loans meet the eligibility criteria of the amended Fair Value Option and have been designated as at Fair Value through Profit and Loss, they are measured at their fair value. The fair value measurement technique used is based on a discounted cash flow technique.
A.4.8.1. Interest on loans
Interest on loans originated by the Group is recorded in the consolidated income statement (interest and similar income) and on the consolidated balance sheet (loans and advances) on an accruals basis.
A.4.8.2. Reverse repurchase and repurchase operations (reverse repos and repos)
A reverse repurchase (repurchase) operation is one under which the Group lends (borrows) liquid funds to (from) a credit institution which provides (receives) collateral in the form of securities. The two parties enter into an ir-revocable commitment to complete the operation on a date and at a price fixed at the outset.
The operation is based on the principle of delivery against payment: the borrower (lender) of the liquid funds trans-fers the securities to the Group’s (counterparty’s) custo-dian in exchange for settlement at the agreed price, which generates a return (cost) for the Group linked to the money market.
This type of operation is considered for the purposes of the Group to be a loan (borrowing) at a guaranteed rate of interest. Generally treated as collateralized financing trans-actions, they are carried at the amounts of cash advanced or received, plus accrued interest and are entered on the assets side of the consolidated balance sheet under item 3. Loans and advances to credit institutions - b) other loans and advances (on the liabilities side of the consolidated balance sheet under item 1. Amounts owed to credit institu-tions - a) with agreed maturity dates or periods of notice).
Securities received under reverse repurchase agreements and securities delivered under repurchase agreements are not recognized in the consolidated balance sheet or derecognized from the consolidated balance sheet, un-less control of the contractual rights that comprise these securities is relinquished. The Group monitors the market value of the securities received or delivered on a daily basis, and provides or requests additional collateral in ac-cordance with the underlying agreements.
Interest earned on reverse repurchase agreements and interest incurred on repurchase agreements is recognized as interest income or interest expense, over the life of each agreement.
A.4.8.3. Fees on loans
Front-end fees and commitment fees are deferred in ac-cordance with IAS 18, together with the related direct costs of originating and maintaining the commitment, and are recognised as an adjustment to the effective yield, being recorded in the consolidated income state-ment over the period from disbursement to repayment of the related loan. If the commitment expires without the loan being drawn down, the fee is recognised as in-come on expiry.
A.4.8.4. Interest subsidies
Interest subsidies received in advance (see Note G) are deferred in accordance with IAS 18, and are recognised as an adjustment to the effective yield, being recorded in the consolidated income statement over the period from disbursement to repayment of the subsidized loan.
A.4.9. Credit loss expense
An allowance for credit losses is established if there is ob-jective evidence that the Group will be unable to collect all amounts due on a claim according to the original con-tractual terms or the equivalent value. A “claim” means a loan, a commitment such as a letter of credit, a guarantee, a commitment to extend credit, or other credit product.
An allowance for credit losses is reported as a reduction of the carrying value of a claim on the consolidated balance sheet, whereas for an off-balance sheet item such as a com-mitment a provision for credit loss is reported in Other li-abilities. Additions to the allowances and provisions for credit losses are made through credit loss expense.
A.4.9.1. Impairment allowances related to individual loans and advances
Impairment losses have been made for individual loans and advances outstanding at the end of the financial year and presenting objective evidence of risks of non-recov-ery of all or part of their amounts according to the origi-nal contractual terms or the equivalent value. Changes to these provisions are entered on the consolidated income statement as “Credit loss expense”. Allowances and provi-sions for credit losses are evaluated on the following counterparty specific based principle.
A claim is considered impaired when the Management Committee determines that it is probable that the Group will not be able to collect all amounts due according to the original contractual terms or the equivalent value. Individual credit exposures are evaluated based upon the borrower’s character, overall financial condition, resourc-es and payment record, the prospects for support from

Financial Report 200840EIB Group
any financially responsible guarantors and, where appli-cable, the realizable value of any collateral. The estimated recoverable amount is the present value of expected fu-ture cash flows, which may result from restructuring or liquidation. Impairment is measured and allowances for credit losses are established for the difference between the carrying amount and its estimated recoverable amount of any claim considered as impaired. The amount of the loss is the difference between the asset’s carrying amount and the present value of expected future cash flows discounted at the financial instrument’s original ef-fective interest rate.
All impaired claims are reviewed and analysed at least semi-annually. Any subsequent changes to the amounts and timing of the expected future cash flows compared to the prior estimates will result in a change in the provi-sion for credit losses and be charged or credited to cred-it loss expense. An allowance for impairment is reversed only when the credit quality has improved such that there is reasonable assurance of timely collection of principal and interest in accordance with the original contractual terms of the claim agreement. A write-off is made when all or part of a claim is deemed uncollectible or forgiven. Write-offs are charged against previously established pro-visions for credit losses or directly to credit loss expense and reduce the principal amount of a claim. Recoveries in part or in full of amounts previously written off are cred-ited to credit loss expense.
Upon impairment the accrual of interest income based on the original terms of the claim is discontinued, and is replaced by an accrual based upon the impaired value; in addition, the increase of the present value of impaired claims due to the passage of time is reported as interest income.
A.4.9.2. Collective impairment
In addition to specific allowances against individually significant loans and advances, the Group also makes a collective impairment test on exposures which, although not specifically identified as requiring a specific allow-ance, have a greater risk of default than when originally granted. This collective impairment test is based on any deterioration in the internal rating of the groups of loans or investments since they were granted or acquired. These internal ratings take into consideration factors such as any deterioration in counterparties risk, values of collater-als or securities received, and sectorial outlook, as well as identified structural weaknesses or deterioration in cash flows (refer to section T.2.3.3.1.).
A.4.9.3. Guarantees
In the normal course of business, the Group issues various forms of guarantees to support some institutions.
Under the existing rules, these guarantees do not meet the definition of an insurance contract (IFRS 4 Insurance Contracts) and are accounted for under IAS 39 Financial
Instruments: Recognition and Measurement, either as “Derivatives” or “Financial Guarantees”, depending on their features and characteristics as defined by IAS 39.
The accounting policy for Derivatives is disclosed under Note A.4.2.
Financial Guarantees are initially recognised at fair value in the consolidated balance sheet under item 3b. Other liabil-ities – sundry liabilities, being the premium received.
Subsequent to initial recognition, the Group’s liabilities under each financial guarantee are measured at the high-er of 1) the amount initially recognized less, when appro-priate, cumulative amortization recognized in accordance with IAS 18 and 2) the best estimate of expenditure re-quired to settle any present financial obligation arising as a result of the guarantee in accordance with IAS 37.
Any increase in the liability relating to financial guarantee is taken to the consolidated income statement in “Credit loss expense”. The premium received is recognised in the consolidated income statement in “Fee and commission income” on the basis of an amortization schedule in accord-ance with IAS 18 over the life of the financial guarantee.
A.4.10. Property, furniture and equipment
Property, furniture and equipment include land, Group-occupied properties and other machines and equipment.
Property, furniture and equipment are carried at cost less accumulated depreciation and accumulated impairment losses.
Property, furniture and equipment are reviewed periodi-cally for impairment.
Land and buildings are stated at acquisition cost less ac-cumulated depreciation. The value of the Group’s head-quarters building in Luxembourg-Kirchberg and its buildings in Luxembourg-Hamm, Luxembourg-Weimer-shof and Lisbon is depreciated on the straight-line basis as set out below.
Office furniture and equipment were, until end-1997, de-preciated in full in the year of acquisition. With effect from 1998, permanent equipment, fixtures and fittings, furni-ture, office equipment and vehicles have been recorded in the consolidated balance sheet at their acquisition cost, less accumulated depreciation.
Depreciation is calculated on the straight-line basis over the estimated life of each item purchased, as set out be-low:
Buildings in Kirchberg, Hamm and Weimershof - •30 years
Building in Lisbon – 25 years •
Permanent equipment, fixtures and fittings - 10 years •
EIB Group – Financial Statements 41 EIB Group
Furniture - 5 years •
Office equipment and vehicles - 3 years •
A.4.11. Intangible assets
Intangible assets comprise computer software. Software development costs are capitalized if they meet certain criteria relating to identifiability, to the probability that future economic benefits will flow to the enterprise, and to the reliability of cost measurement.
Intangible assets are recognized as assets and are amor-tized using the straight-line basis over their estimated useful economic life. At each consolidated balance sheet date, intangible assets are reviewed for indications of im-pairment or changes in estimated future benefits. If such indications exist, an analysis is performed to assess whether the carrying amount is fully recoverable. A write-down is made if the carrying amount exceeds the recov-erable amount.
Internally developed software meeting these criteria is carried at cost less accumulated depreciation calculated on the straight-line basis over three years from comple-tion.
Software purchased is depreciated on the straight-line basis over its estimated life (2 to 5 years).
A.4.12. Pension plans and health insurance scheme
The Group operates defined benefit pension plans to pro-vide retirement benefits to substantially all of its staff. The Group also provides certain additional post-employment healthcare benefits to former employees in EIB. These ben-efits are unfunded, as defined by IAS 19. The cost of provid-ing benefits under the plans is determined separately for each plan using the projected unit credit actuarial valua-tion method. Actuarial gains and losses are recognised as income or expense over the expected average remaining working lives of the employees participating in the plans. The charge to the consolidated income statement in re-spect of the defined benefit pension plan is based on the current service cost and other actuarial adjustments as determined by qualified external actuaries.
A.4.12.1. Pension plan for staff
The Bank’s main pension plan is a defined benefit pension plan funded by contributions from staff and from the Bank which covers all employees.
Commitments for retirements benefits are valued at least every year using the projected unit credit method, in or-der to ensure that the liability entered in the accounts is adequate. The results of the latest valuation are as at 30 September 2008, with an extrapolation to 31 Decem-ber 2008. The main actuarial assumptions used by the actuary are set out in Note K. Actuarial surpluses and deficits are spread forward over the average expected remaining service lives of the plan active participants.
The main pension plan of the EIF is a defined benefit plan funded by contributions from staff and from the EIF which covers all employees. All contributions of the EIF and its members of staff are transferred to the EIB for management. The transferred funds allocated to the pension plan are invested for by the Group, following the rules and principles applied by EIB for its own staff pension plan.
A.4.12.2. Health insurance plan
The Bank has set up its own health insurance plan for the benefit of staff and Management Committee at retire-ment age, financed by contributions from the Bank and its employees. A specific provision is set aside on the lia-bility side of the consolidated balance sheet. The Fund has subscribed to a health insurance scheme with an in-surance company for the benefit of staff at retirement age, financed by contribution from the Fund and its em-ployees.
The entitlement to these benefits is based on the employ-ees remaining in service up to retirement age and the completion of a minimum service period. The expected costs of these benefits are accrued over the period of em-ployment, using a methodology similar to that for defined benefit pension plans. The health insurance liabilities are determined based on actuarial calculations as per the same dates as the pension plans.
A.4.12.3. Pension plan for members of the Management Committee
The related provision shown on the liability side of the Group’s balance sheet is determined, as for all plans, in conformity with IAS 19. Benefits are based on years of service and a percentage of final gross base salary as de-fined under the plan.
A.4.13. Debts evidenced by certificates
Debts evidenced by certificates are initially measured at cost, which is the fair value of the consideration received. Transaction costs and net premiums (discounts) are in-cluded in the initial measurement. Subsequent measure-ment is at amortised cost, and any difference between net proceeds and the redemption value is recognised in the consolidated income statement over the period of the borrowings using the effective yield method. Where borrowings meet the eligibility criteria of the amended Fair Value Option and have been designated as at Fair Value through Profit and Loss, they are measured at their fair value. The fair value measurement technique used, in the case of absence of liquid market prices, is a discount-ed cash flow technique, using current yield curves.
Combined debt instruments that are related to foreign exchange or indices are considered structured instru-ments. For all the debt instruments including embedded derivatives, the Group has concluded a reversed swap agreement to fully hedge the exposure.
Financial Report 200842EIB Group
It is the Group policy to hedge the fixed interest rate risk on debt issues and to apply the amended Fair Value Op-tion when this results in a significant reduction of an ac-counting mismatch. The effect is such that the carrying value of the thus elected debt instruments is adjusted for changes in fair value rather than carried and accrued at cost (see Note R – Derivative financial instruments).
Interest expense on debt instruments is included in the account “interest expense and similar charges” in the con-solidated income statement and in the liabilities caption including the underlying debt instruments in the con-solidated balance sheet.
A.4.14. Fund for general banking risks
Until 31 December 2005, the Group identified, as a sepa-rate balance sheet item, the amounts it decided to put aside to cover risks associated with loans and other finan-cial operations, having regard to the particular risks at-tached to such operations.
Starting from 2006, the Group no longer identifies such separate balance sheet item. The decision to release it completely does not affect the ability of the Group to cover its risks. The Group continues to compute the amount corresponding to the general banking risks, for internal and disclosure purposes (see Note L), according to the existing methodology based on an internal mech-anism used to evaluate the credit risk associated with each position and transaction of the Group at year end.
The amount corresponding to the general banking risks with respect to operations of the Structured Finance Facil-ity is disclosed in “Fund allocated to Structured Finance Facility” on the consolidated balance sheet.
A.4.15. Funds allocated to venture capital operations and to the Structured Finance Facility
A.4.15.1. Funds allocated to venture capital operations
This item comprises the amount of appropriations from the annual result of the Group, determined each year by the Board of Governors to facilitate instruments providing venture capital in the context of implementing the Euro-pean Council Resolution on Growth and Employment.
A.4.15.2. Funds allocated to the Structured Finance Facility
This item comprises the amount of appropriations from the annual result of the Group, determined each year by the Board of Governors to facilitate implementation of operations with a greater degree of risk for this new type of instrument. Value adjustments on venture capital and structured finance operations are accounted for in the profit and loss account. Upon appropriation of the Group’s result, such value adjustments are taken into considera-tion for determining the amounts to be recorded in the
‘Funds allocated to venture capital operations’ and ‘Funds allocated to the Structured Finance Facility’ accounts.
A.4.16. Taxation
The Protocol on the Privileges and Immunities of the Eu-ropean Communities, appended to the Treaty of 8 April 1965 establishing a Single Council and a Single Commis-sion of the European Communities, stipulates that the assets, revenues and other property of the Group are ex-empt from all direct taxes.
A.4.17. Prepayments and accrued income – Accruals and deferred income
These accounts comprise:
Prepayments and accrued income: expenditure in- •curred during the financial year but relating to a sub-sequent financial year, together with any income not disclosed in the reporting value of the underlying fi-nancial instrument which, though relating to the fi-nancial year in question, is not due until after its expiry.
Accruals and deferred income: income received be- •fore the balance sheet date but relating to a subse-quent financial year, together with any charges not disclosed in the reporting value of the underlying fi-nancial instrument which, though relating to the fi-nancial year in question, will be paid only in the course of a subsequent financial year (principally in-terest on borrowings).
A.4.18. Interest income and expenses
Interest income and interest expense are recognised in the income statement for all interest bearing instruments on an accrual basis using the effective interest method based on the actual purchase price including direct trans-action costs. This is a method of calculating the amortised cost of a financial asset and allocating the interest income over the relevant period. The effective interest rate is the rate that exactly discounts estimated future cash receipts through the expected life of the financial instrument to the net carrying amount of the financial asset. Interest is recognised on impaired loans through unwinding the discount used in the present value calculations applied to expected future cash flows.
In addition to interest and commission on loans, deposits and other revenue from the securities portfolio, this head-ing includes the indemnities received by the Group in respect of early loan reimbursements prepayments made by its borrowers.
In accordance with the provisions of the International Ac-counting Standard IAS 39 – Financial Instruments: Recog-nition and Measurement - the Group takes immediately into the consolidated income statement the indemnities received for early reimbursement of loans at the time of derecognition of those related loans instead of depreciat-ing the indemnities over the remaining life of loans.

EIB Group – Financial Statements 43 EIB Group
A.4.19. Fiduciary operations
Pursuant to Article 28 of its Statutes, the EIF acquires, manages and disposes of investments in venture capital enterprises, in its own name but on behalf and at the risk of the European Community, according to Fiduciary and Management Agreements concluded with the European Community (“ETF Start-up Facility”) and “High Growth and Innovative SME Facility (GIF), under two programs known as GIF1 and GIF2).
The EIF is also empowered to issue guarantees in its own name but on behalf and at the risk of the European Com-munity according to the Fiduciary and Management Agreement concluded with the European Community (“SME Guarantee Facility”).
A.4.20. Assets held for third parties
Assets held for third parties, as set out below, represent trust accounts opened and maintained in the name of the Group entities but for the benefit of the Commission. Sums held in these accounts remain the property of the Commission so long as they are not disbursed for the purposes set out in relation to each project.
Under the Growth and Environment Pilot Project, the •EIF provides a free guarantee to the financial interme-diaries for loans extended to SME’s with the purpose of financing environmentally friendly investments. The ultimate risk from the guarantee rests with the EIF and the guarantee fee is paid out of European Union budget funds.
Under the SME Guarantee Facility and the MAP Guar- •antee programme (followed by the CIP programme), the EIF is empowered to issue guarantees in its own name but on behalf of and at the risk of the Commis-sion.
Under the ETF Start-Up Facility and the MAP Equity •programme (followed by the CIP programme), the EIF is empowered to acquire, manage and dispose of ETF start-up investments, in its own name but on behalf of and at the risk of the Commission.
The support currently provided by the Seed Capital Ac-tion is aimed at the long-term recruitment of additional investment managers by the venture capital funds to in-crease the number of qualified personnel and to reinforce the capacity of the venture capital and incubator indus-tries to cater for investments in seed capital.
The Investment Facility, which is managed by the EIB, has been established within the framework of the Cotonou Agreement on cooperation and development of the Af-rican, Caribbean and Pacific Group of States and the Eu-ropean Union and its Member States on 23 June 2000. The EIB prepares separate financial statements for the Investment Facility.
The Commission entrusted financial management of the Guarantee Fund to the EIB under an agreement signed
between the two parties in November 1994. The EIB pre-pares separate financial statements for the Guarantee Fund.
The Femip Trust Fund, which is also managed by the EIB, was set up to enhance the existing activities of the EIB in the Mediterranean Partner Countries, with the support of a number of donor countries and with a view to directing resources to operations in certain priority sectors through the provision of technical assistance and risk capital. The EIB prepares separate financial statements for The Femip Trust Fund.
The Risk-Sharing Finance Facility (the “RSFF”) has been es-tablished within the framework of the Co-operation Agree-ment, entered into force on this 5th of June 2007, between the European Commission on behalf of the European Com-munity and the European Investment Bank. The EIB is set-ting up the RSFF, an instrument aimed at fostering investment for Europe in research, technological develop-ment and demonstration, as well as innovation, in particu-lar in the private sector. The EIB prepares separate financial statements for the Risk-Sharing Finance Facility.
The Heavily Indebted Poor Countries (HIPC) Initiative (the “Initiative”) is an international debt relief mechanism that provides special assistance to the world’s poorest coun-tries. It was launched in 1996 following a proposal from the World Bank and the International Monetary Fund (IMF). The principal objective of the initiative is to reduce the debt burden of poor countries to sustainable. The EIB prepares separate financial statements for the Heavily Indebted Poor Countries Initiative.
The EU-Africa Infrastructure Trust Fund (the “Trust Fund”) has been created within the framework of the Trust Fund Agreement between The European Commission on be-half of the European Community as Founding Donor and the European Investment Bank as Manager, also open to Member States of the European Union which subse-quently accede to this agreement as Donors. On 9 Febru-ary 2006, the European Commission and the European Investment Bank signed a Memorandum of Understand-ing (the “MoU”) to promote jointly the EU-Africa Infra-structure Partnership and, in particular, to establish a supporting EU-Africa Infrastructure Trust Fund. The EIB prepares separate financial statements for the EU-Africa Infrastructure Trust Fund.
The Commission entrusted financial management of the FP7 Guarantee Fund to the EIB under an agreement signed between the two parties in December 2007.
JASPERS (Joint Assistance to Support Projects in Euro-pean RegionS) is a major joint policy initiative of the EIB, European Commission (Regional Policy Directorate-Gen-eral - DG Regio) and the European Bank for Reconstruc-tion and Development (EBRD).
JESSICA (Joint European Support for Sustainable Invest-ment in City Areas) is an initiative developed by the Eu-

Financial Report 200844EIB Group
ropean Commission and the European Investment Bank (EIB), in collaboration with the Council of Europe Devel-opment Bank (CEB).
The Joint European Resources for Micro to Medium En-terprises initiative, known by the acronym JEREMIE, is the initiative of the European Commission’s Directorate Gen-eral for Regional Policy (DG Regio) and the EIB Group (European Investment Fund and European Investment Bank).
GEEREF (Global Energy Efficiency and Renewable Energy Fund) is a fund of funds set-up at the initiative of the European Commission. Its objective is to make invest-ments in private equity funds that focus on the fields of renewable energy and energy efficiency in emerging markets (ACP, ALA and European Neighbour coun-tries).
The Loan Guarantee Instrument for Ten-T Projects (“LGTT”) has been established within the framework of the Co-operation Agreement, entered into force on this 11Janu-ary 2008, between The European Commission on behalf of the European Communities and the European Invest-ment Bank. The Commission and the EIB are setting up the LGTT which aims at facilitating a greater private sec-tor involvement in the financing of trans-European trans-port networks infrastructure. The EIB prepares separate financial statements for the LGTT.
In the SMEG 2007 under the Competitiveness and Innova-tion Framework Programme (CIP/SMEG 2007), the EIF is empowered to issue guarantees in its own name but on behalf and at the risk of the Commission.
In the GIF 2007 under the Competitiveness and Innova-tion Framework Programme and the Technology Trans-fer Pilot Project (CIP/GIF 2007), the EIF is empowered to acquire, manage and dispose of investments, in its own name but on behalf and at the risk of the Commission.
The EIF is managing a European Commission facility, the Preparatory Action Facility (Preparatory Action) on behalf of the EIB Group. The facility is particularly targeting mi-cro lending and will be used for grants to finance techni-cal assistance to SMEs, which must be coupled with an EIF guarantee or an EIB global loan.
The Special Section was set up by the Board of Governors on 27 May 1963, under a Decision taken on 4 August 1977. Its purpose was redefined as being that of recording fi-nancing operations carried out by the European Invest-ment Bank for the account of and under mandate from third parties.
A.4.21. Commitment to purchase EIF shares
Under the terms of a replacement share purchase un-dertaking in respect of the 1 043 shares held by EIF’s minority shareholders (2007: 948 shares), the EIB is of-fering to buy these on an annual basis. The exercise price is determined on the basis of the audited annual ac-counts of EIF and corresponds to the part of each share in the called capital of EIF, increased by the share pre-mium account, the statutory reserves, the fair value re-serve, the retained earnings and profit of the year, net of the dividend decided by the EIF’s General Meeting. The commitment to purchase is shown in the consoli-dated balance sheet as a debt item under sundry credi-tors (see also Note H).
A.4.22. Reclassification of prior year figures
Where necessary, certain prior-year figures have been reclassified to conform with changes to the current year’s presentation for comparative purpose.
A.4.23. Accounting for operating leases
Leases of assets under which all the risks and benefits of ownership are effectively retained by the lessor are clas-sified as operating leases. Payments made under operat-ing leases are charged to the consolidated income statement on a straight-line basis over the period of the lease. When an operating lease is terminated before the lease period has expired, any payment required to be made to the lessor by way of penalty is recognised as an expense in the period in which the termination takes place.
A.4.24. Compound financial instruments with multiple embedded derivatives
As at 31 December 2008, the Group does not have any compound financial instrument with multiple embedded derivatives.
A.4.25. Dividend income
Dividends are recognised in the income statement when the entity’s right to receive payment is established.
A.4.26. Assets held for sale
Assets classified as held for sale includes assets reclassi-fied from Property plant and equipment for which the sale is highly probable and the asset is available for im-mediate sale in its current condition. They are classified as held for sale as their carrying amounts will be recov-ered through a sale transaction rather than through con-tinuing use and are measured at the lower of carrying amount and fair value less costs to sell.

EIB Group – Financial Statements 45 EIB Group
At 31.12.2008 Classification Book value Market value
Group Investment portfolio Held-to-maturity 2 262 443 2 327 598
Operational money market portfolios:
- money market securities with a max. 3 month maturity A1 Held-to-maturity 2 108 223 2 108 223
- money market securities with a max. 18 month maturity A2 Available for sale 1 364 554 (1) 1 364 554
Operational bond portfolios:
- B1 - Credit Spread Available for sale 890 162 (2) 890 162
- B2 - Alternative Investment Available for sale 145 685 (3) 145 685
- B3 - Global Fixed Income Trading 526 291 526 291
Operational portfolio – EIF Available for sale 149 128 (4) 149 128
Asset backed securities (Note D) Held-to-maturity 5 799 994 (5) 5 300 242 (5)
13 246 480 12 811 883
(1) including unrealised gain of EUR ’000 926. (2) including unrealised loss of EUR ’000 - 87 477(3) including unrealised loss of EUR ’000 - 4 315. (4) including unrealised loss of EUR ’000 - 5 844(5) The Asset Backed Securities set out above are undertaken as loan substitutes and as such are considered as part of the aggregate loans (see Note D).
Some of these transactions have been structured by adding a credit or project related remedies, thus offering additional recourse. The difference between book value and market value is quasi exclusively explained by the credit spread increase and does not really represent value impairment. Therefore, no specific provision has been accounted for.
31.12.2008 31.12.2007
Treasury bills eligible for refinancing with central banks (listed) 2 016 818 2 273 135
Debt securities including fixed-income securities (of which EUR ’000 3 893 591 unlisted in 2008 and EUR ‘000 2 860 459 in 2007)
11 229 662
11 016 047
13 246 480 13 289 182
At 31.12.2007 Classification Book value Market value
Group Investment portfolio Held-to-maturity 2 576 805 2 591 180
Operational money market portfolios:
- money market securities with a max. 3 month maturity A1 Held-to-maturity 2 192 187 2 192 187
- money market securities with a max. 18 month maturity A2 Available for sale 1 753 857 (1) 1 753 857
Operational bond portfolios:
- B1 - Credit Spread Available for sale 1 241 142 (2) 1 241 142
- B2 - Alternative Investment Available for sale 161 724 (3) 161 724
- B3 - Global Fixed Income Trading 504 572 504 572
Operational portfolio – EIF Available for sale 128 937 (4) 128 937
Asset backed securities (Note D) Held-to-maturity 4 729 958 (5) 4 702 566 (5)
13 289 182 13 276 165
(1) including unrealised loss of EUR ’000 -1 237. (2) including unrealised loss of EUR ’000 -15 389(3) including unrealised gain of EUR ’000 11 724. (4) including unrealised loss of EUR ’000 - 598(5) The Asset Backed Securities set out above are undertaken as loan substitutes and as such are considered as part of the aggregate loans (see Note D).
Some of these transactions have been structured by adding a credit or project related remedies, thus offering additional recourse. The difference between book value and market value is quasi exclusively explained by the credit spread increase and does not really represent value impairment. Therefore, no specific provision has been accounted for.
The Group enters into collateralized securities lending transactions that may result in credit exposure in the event that the counterparty to the transaction is unable to fulfill its contractual obligations. The Group controls credit risk associated with these activities by monitoring counterparty credit exposure and collateral values on a daily basis and requiring ad-ditional collateral to be deposited with or returned to the Group when deemed necessary.
The security lending activity amounts to EUR ’000 367 704 at the end of December 2008 (2007: EUR ’000 936 629).
Note B – Debt securities portfolio (in EUR ’000)
In addition to the asset backed securities, which represent acquisitions of interest pools of loans or receivables in connec-tion with securitization transactions, the debt securities portfolio is made up of trading financial assets (Portfolio B3), available-for-sale financial assets (portfolios A2, B1, B2 and operational portfolio-EIF) and financial assets held-to-matu-rity (Portfolio A1 and Investment portfolio). The detail of each portfolio is as follows as at 31 December 2008 and 2007:

Financial Report 200846EIB Group
Note C – Loans and advances to credit institutions (other loans and advances) (in EUR ’000)
The Group enters into collateralized reverse repurchase and repurchase agreements transactions that may result in cred-it exposure in the event that the counterparty to the transaction is unable to fulfill its contractual obligations. The Group controls credit risk associated with these activities by monitoring counterparty credit exposure and collateral values on a daily basis and requiring additional collateral to be deposited with or returned to the Group when deemed necessary.
Note D – Summary statement of loans (in EUR ’000)
D.1. Aggregate loans granted
Aggregate loans granted comprise both the disbursed and undisbursed portions of loans. The analysis is as follows:
D.2. Credit losses due to impairment on loans and advances to customers
A specific provision is created against all F-graded loans, as well as against E-graded ones when an impairment loss is assessed. The amount of such provisioning reflects the difference between the loan’s nominal value and the present value of all the expected future cash flows generated by the impaired asset.
Movements in the specific provision are tabulated below:
31.12.2008 31.12.2007
Specific provision at beginning of the year 37 050 82 417
Allowance (+) / Release (-) during the year - 18 219 (**) - 44 244 (*)
Foreign exchange adjustment - 1 331 (*) - 1 123
Specific provision at end of the year 17 500 37 050
(*) the amount of EUR ’000 44 244 comprises an amount of EUR ’000 64 917 which was released following the sale, during 2007, of loan assets for which an impairment loss was established. The sale of those loan assets resulted in a realised loss of EUR ‘000 61 490.
(**) the amount of EUR ‘000 18 219 was released following the sale during 2008, of loan assets for which a specific provision has previously been established. The sale of those loan assets resulted in a realized loss of EUR ‘000 - 15 467.
To intermediary credit institutions
Directly to final beneficiaries
Total 2008 Total 2007
Disbursed portion 116 216 197 175 668 894 291 885 091 268 759 217
Undisbursed loans 12 457 853 46 411 674 58 869 527 53 606 621
Aggregate loans granted 128 674 050 222 080 568 350 754 618 322 365 838
31.12.2008 31.12.2007
Aggregate loans granted 350 754 618 322 365 838
Asset backed securities portfolio (Note B) 5 799 994 4 729 958
Aggregate loans including asset backed securities portfolio (Note D.3) 356 554 612 327 095 796
31.12.2008 31.12.2007
Term deposits 14 490 118 11 205 010
Tripartite reverse repos (*) 7 255 238 4 611 570
21 745 356 15 816 580
(*) These operations are carried out with a third-party custodian who undertakes, on the basis of a framework contract, to guarantee compliance with the contractual terms and conditions, notably with respect to:
- delivery against payment, - verification of collateral, - the collateral margin required by the lender which must always be available and adequate, with the market value of the securities being verified daily
by the said custodian, - organisation of substitute collateral provided that this meets all the contractual requirements.
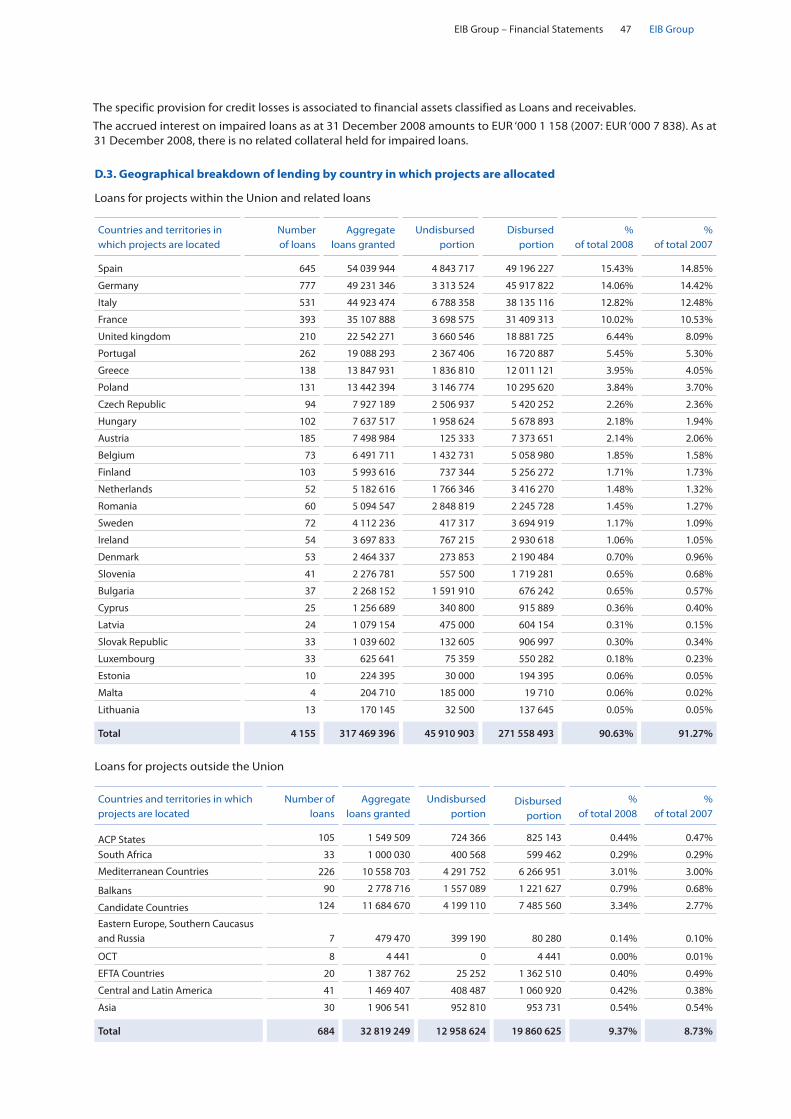
EIB Group – Financial Statements 47 EIB Group
Countries and territories in which projects are located
Number of loans
Aggregate loans granted
Undisbursed portion
Disbursed portion
% of total 2008
% of total 2007
Spain 645 54 039 944 4 843 717 49 196 227 15.43% 14.85%
Germany 777 49 231 346 3 313 524 45 917 822 14.06% 14.42%
Italy 531 44 923 474 6 788 358 38 135 116 12.82% 12.48%
France 393 35 107 888 3 698 575 31 409 313 10.02% 10.53%
United kingdom 210 22 542 271 3 660 546 18 881 725 6.44% 8.09%
Portugal 262 19 088 293 2 367 406 16 720 887 5.45% 5.30%
Greece 138 13 847 931 1 836 810 12 011 121 3.95% 4.05%
Poland 131 13 442 394 3 146 774 10 295 620 3.84% 3.70%
Czech Republic 94 7 927 189 2 506 937 5 420 252 2.26% 2.36%
Hungary 102 7 637 517 1 958 624 5 678 893 2.18% 1.94%
Austria 185 7 498 984 125 333 7 373 651 2.14% 2.06%
Belgium 73 6 491 711 1 432 731 5 058 980 1.85% 1.58%
Finland 103 5 993 616 737 344 5 256 272 1.71% 1.73%
Netherlands 52 5 182 616 1 766 346 3 416 270 1.48% 1.32%
Romania 60 5 094 547 2 848 819 2 245 728 1.45% 1.27%
Sweden 72 4 112 236 417 317 3 694 919 1.17% 1.09%
Ireland 54 3 697 833 767 215 2 930 618 1.06% 1.05%
Denmark 53 2 464 337 273 853 2 190 484 0.70% 0.96%
Slovenia 41 2 276 781 557 500 1 719 281 0.65% 0.68%
Bulgaria 37 2 268 152 1 591 910 676 242 0.65% 0.57%
Cyprus 25 1 256 689 340 800 915 889 0.36% 0.40%
Latvia 24 1 079 154 475 000 604 154 0.31% 0.15%
Slovak Republic 33 1 039 602 132 605 906 997 0.30% 0.34%
Luxembourg 33 625 641 75 359 550 282 0.18% 0.23%
Estonia 10 224 395 30 000 194 395 0.06% 0.05%
Malta 4 204 710 185 000 19 710 0.06% 0.02%
Lithuania 13 170 145 32 500 137 645 0.05% 0.05%
Total 4 155 317 469 396 45 910 903 271 558 493 90.63% 91.27%
The specific provision for credit losses is associated to financial assets classified as Loans and receivables.
The accrued interest on impaired loans as at 31 December 2008 amounts to EUR ‘000 1 158 (2007: EUR ‘000 7 838). As at 31 December 2008, there is no related collateral held for impaired loans.
D.3. Geographical breakdown of lending by country in which projects are allocated
Loans for projects within the Union and related loans
Loans for projects outside the Union
Countries and territories in which projects are located
Number of loans
Aggregate loans granted
Undisbursed portion
Disbursed portion
% of total 2008
% of total 2007
ACP States 105 1 549 509 724 366 825 143 0.44% 0.47%
South Africa 33 1 000 030 400 568 599 462 0.29% 0.29%
Mediterranean Countries 226 10 558 703 4 291 752 6 266 951 3.01% 3.00%
Balkans 90 2 778 716 1 557 089 1 221 627 0.79% 0.68%
Candidate Countries 124 11 684 670 4 199 110 7 485 560 3.34% 2.77%
Eastern Europe, Southern Caucasus and Russia
7
479 470
399 190
80 280
0.14%
0.10%
OCT 8 4 441 0 4 441 0.00% 0.01%
EFTA Countries 20 1 387 762 25 252 1 362 510 0.40% 0.49%
Central and Latin America 41 1 469 407 408 487 1 060 920 0.42% 0.38%
Asia 30 1 906 541 952 810 953 731 0.54% 0.54%
Total 684 32 819 249 12 958 624 19 860 625 9.37% 8.73%
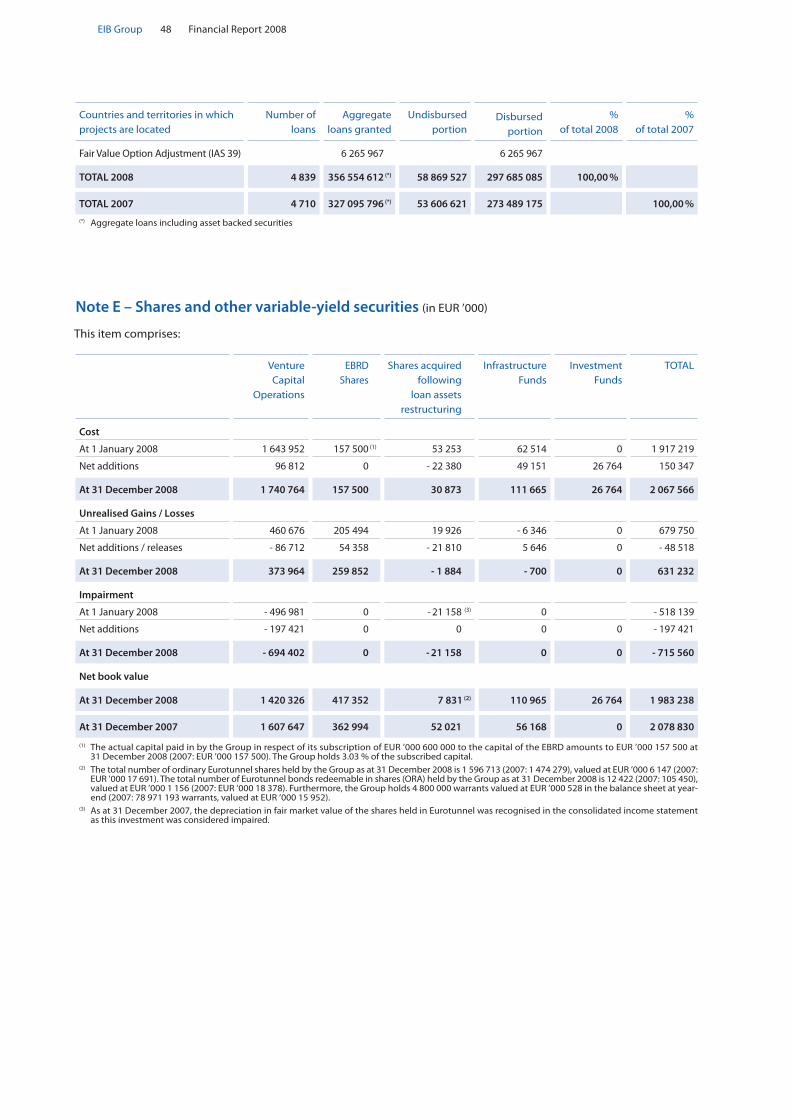
Financial Report 200848EIB Group
Note E – Shares and other variable-yield securities (in EUR ’000)
This item comprises:
Countries and territories in which projects are located
Number of loans
Aggregate loans granted
Undisbursed portion
Disbursed portion
% of total 2008
% of total 2007
Fair Value Option Adjustment (IAS 39) 6 265 967 6 265 967
TOTAL 2008 4 839 356 554 612 (*) 58 869 527 297 685 085 100,00 %
TOTAL 2007 4 710 327 095 796 (*) 53 606 621 273 489 175 100,00 %
(*) Aggregate loans including asset backed securities
Venture Capital
Operations
EBRD Shares
Shares acquired following
loan assets restructuring
Infrastructure Funds
Investment Funds
TOTAL
Cost
At 1 January 2008 1 643 952 157 500 (1) 53 253 62 514 0 1 917 219
Net additions 96 812 0 - 22 380 49 151 26 764 150 347
At 31 December 2008 1 740 764 157 500 30 873 111 665 26 764 2 067 566
Unrealised Gains / Losses
At 1 January 2008 460 676 205 494 19 926 - 6 346 0 679 750
Net additions / releases - 86 712 54 358 - 21 810 5 646 0 - 48 518
At 31 December 2008 373 964 259 852 - 1 884 - 700 0 631 232
Impairment
At 1 January 2008 - 496 981 0 - 21 158 (3) 0 - 518 139
Net additions - 197 421 0 0 0 0 - 197 421
At 31 December 2008 - 694 402 0 - 21 158 0 0 - 715 560
Net book value
At 31 December 2008 1 420 326 417 352 7 831 (2) 110 965 26 764 1 983 238
At 31 December 2007 1 607 647 362 994 52 021 56 168 0 2 078 830
(1) The actual capital paid in by the Group in respect of its subscription of EUR ’000 600 000 to the capital of the EBRD amounts to EUR ’000 157 500 at 31 December 2008 (2007: EUR ’000 157 500). The Group holds 3.03 % of the subscribed capital.
(2) The total number of ordinary Eurotunnel shares held by the Group as at 31 December 2008 is 1 596 713 (2007: 1 474 279), valued at EUR ’000 6 147 (2007: EUR ’000 17 691). The total number of Eurotunnel bonds redeemable in shares (ORA) held by the Group as at 31 December 2008 is 12 422 (2007: 105 450), valued at EUR ’000 1 156 (2007: EUR ’000 18 378). Furthermore, the Group holds 4 800 000 warrants valued at EUR ’000 528 in the balance sheet at year-end (2007: 78 971 193 warrants, valued at EUR ’000 15 952).
(3) As at 31 December 2007, the depreciation in fair market value of the shares held in Eurotunnel was recognised in the consolidated income statement as this investment was considered impaired.

EIB Group – Financial Statements 49 EIB Group
Note F – Property, furniture, equipment and intangible assets (in EUR ’000)
All of the land and buildings are used by the Group for its own activities. The Luxembourg buildings category includes cost relating to the construction of the new building for an amount of EUR ’000 211 769 (2007: EUR ’000 171 710) com-pleted in 2008. The Lisbon building was sold in 2008.
For subsequent measurement purposes the Group uses the “cost model” under IAS 16.
In 2008, the carrying value of land and Luxembourg buildings for the EIF was transferred from Property, furniture, equip-ment to Assets held for sale (see note A.4.26).
Note G – Accruals and deferred income (in EUR ’000)
Land
Luxembourg buildings
Lisbon building
Furniture and equipment
Total property, furniture and
equipment
Total intangible
assets
Historical cost
At 1 January 2008 10 415 318 550 349 67 267 396 581 5 539
Additions 0 40 060 0 20 242 60 302 2 198
Disposals - 330 - 4 833 - 349 - 8 671 -14 183 - 1 073
At 31 December 2008 10 085 353 777 0 78 838 442 700 6 664
Accumulated depreciation
At 1 January 2008 0 - 82 075 - 308 - 28 478 - 110 861 - 1 567
Depreciation 0 - 11 926 - 12 - 14 527 - 26 465 - 1 854
Disposals 0 1 789 320 8 701 10 810 1 073
At 31 December 2008 0 - 92 212 0 - 34 304 - 126 516 - 2 348
Net book value
At 31 December 2008 10 085 261 565 0 44 534 316 184 4 316
At 31 December 2007 10 415 236 475 41 38 789 285 720 3 972
Accruals and deferred income 31.12.2008 31.12.2007
- Interest subsidies received in advance (1) 171 155 186 622
- Administrative cost payable on HIPC initiative 46 872 48 683
- Personnel costs payable 8 674 7 607
- Western Balkans infrastructure 5 000 0
- Other 35 530 27 812
267 231 270 724
(1) Part of the amounts received from the European Commission through EMS (European Monetary System) arrangements has been made available as a long-term advance which is entered on the liabilities side under item Accruals and deferred income, and comprises:
• amountsinrespectofinterestsubsidiesforloansgrantedforprojectsoutsidetheUnion,underConventionssignedwiththeACPStatesandProtocolsconcluded with the Mediterranean Countries;
• interestsubsidies,concerningcertainlendingoperationsputinplacewithintheUnionfromtheGroup’sownresources,madeavailableinconjunctionwith the EMS under Council Regulation (EEC) No 1736/79 of 3 August 1979 and in conjunction with the financial mechanism established by the EFTA Countries under the EFTA Agreement signed on 2 May 1992;
• amountsreceivedinrespectofinterestsubsidiesforloansgrantedfromECresourcesunderCouncilDecisions78/870/EECof16October1978(NewCommunity Instrument), 82/169/EEC of 15 March 1982 and 83/200/EEC of 19 April 1983 and under Council Regulation (EEC) No 1736/79 of 3 August 1979 as amended by Council Regulation (EEC) No 2790/82 of 18 October 1982.
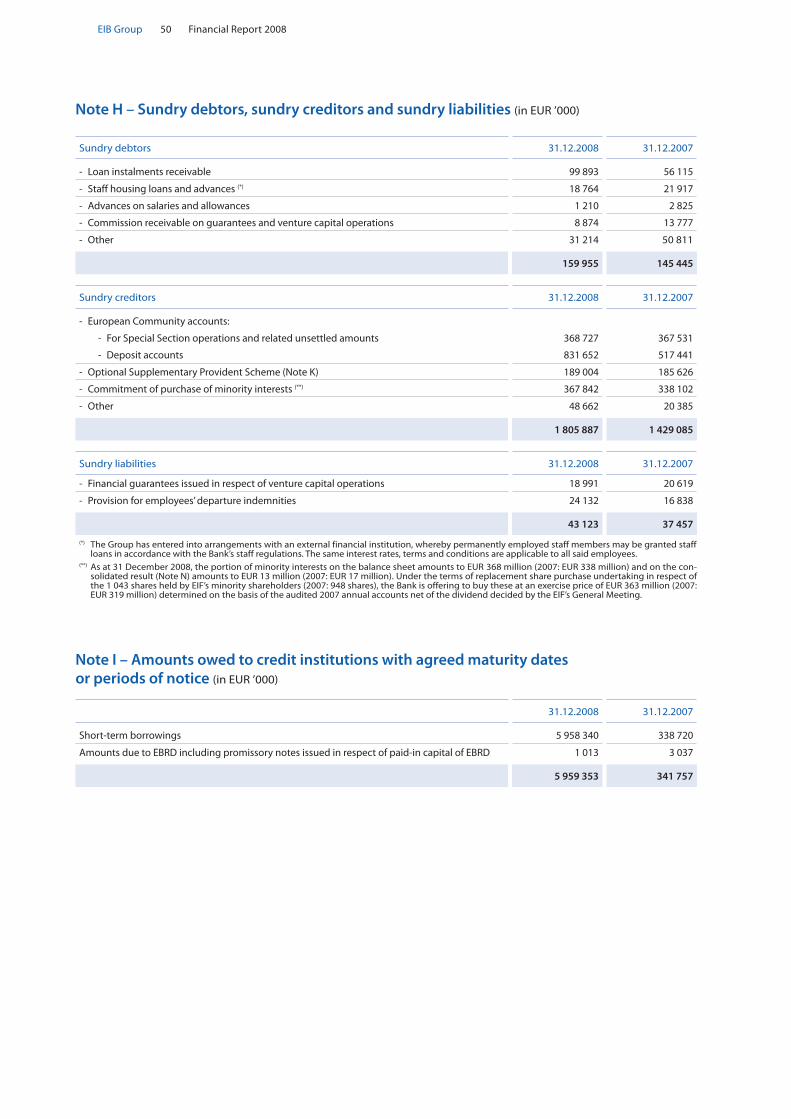
Financial Report 200850EIB Group
Note H – Sundry debtors, sundry creditors and sundry liabilities (in EUR ’000)
Note I – Amounts owed to credit institutions with agreed maturity dates or periods of notice (in EUR ’000)
Sundry debtors 31.12.2008 31.12.2007
- Loan instalments receivable 99 893 56 115
- Staff housing loans and advances (*) 18 764 21 917
- Advances on salaries and allowances 1 210 2 825
- Commission receivable on guarantees and venture capital operations 8 874 13 777
- Other 31 214 50 811
159 955 145 445
Sundry creditors 31.12.2008 31.12.2007
- European Community accounts:
- For Special Section operations and related unsettled amounts 368 727 367 531
- Deposit accounts 831 652 517 441
- Optional Supplementary Provident Scheme (Note K) 189 004 185 626
- Commitment of purchase of minority interests (**) 367 842 338 102
- Other 48 662 20 385
1 805 887 1 429 085
Sundry liabilities 31.12.2008 31.12.2007
- Financial guarantees issued in respect of venture capital operations 18 991 20 619
- Provision for employees’ departure indemnities 24 132 16 838
43 123 37 457
(*) The Group has entered into arrangements with an external financial institution, whereby permanently employed staff members may be granted staff loans in accordance with the Bank’s staff regulations. The same interest rates, terms and conditions are applicable to all said employees.
(**) As at 31 December 2008, the portion of minority interests on the balance sheet amounts to EUR 368 million (2007: EUR 338 million) and on the con-solidated result (Note N) amounts to EUR 13 million (2007: EUR 17 million). Under the terms of replacement share purchase undertaking in respect of the 1 043 shares held by EIF’s minority shareholders (2007: 948 shares), the Bank is offering to buy these at an exercise price of EUR 363 million (2007: EUR 319 million) determined on the basis of the audited 2007 annual accounts net of the dividend decided by the EIF’s General Meeting.
31.12.2008 31.12.2007
Short-term borrowings 5 958 340 338 720
Amounts due to EBRD including promissory notes issued in respect of paid-in capital of EBRD 1 013 3 037
5 959 353 341 757

EIB Group – Financial Statements 51 EIB Group
Note J – Debts evidenced by certificates as at 31 December (in EUR ’000)
In its financing activity, one of the Group’s objectives is to align its funding strategy with the funds required for the loans granted, notably in terms of currencies. The below table discloses the details per currency of debts outstanding at 31 December 2008, together with the cumulated notional amount of currency swaps associated with the debts issued, whose goal is to transform the initial currency of the debt into a new currency in line with the currency of the loan. The last column of the table indicates the total amount of debts per currency, taking into account the economic effect brought by the currency swaps in order to disclose a net exposure per currency of the debts outstanding at 31 December 2008.
BORROWINGS CURRENCY SWAPS NET AMOUNT
RECEIVABLE
PAYABLE IN
OUT-STANDING AT
31.12.2007
AVERAGE RATE
OUT-STANDING AT
31.12.2008
AVERAGE RATE
DUE DATES
31.12.2007
31.12.2008
OUT-STANDING AT
31.12.2007
OUT-STANDING
AT 31.12.2008
EUR 106 548 588 4.04 107 758 784 4.02 2009/2057 -1 667 912 - 1 692 262 104 880 676 106 066 522
GBP 59 387 205 5.21 47 705 235 5.11 2009/2054 -18 302 492 - 15 100 101 41 084 713 32 605 134
DKK 536 315 2.86 536 869 2.86 2010/2026 0 0 536 315 536 869
SEK 1 851 401 4.24 1 985 281 4.18 2009/2028 -636 175 - 552 571 1 215 226 1 432 710
CZK 952 562 5.09 928 119 5.03 2009/2030 -159 606 0 792 956 928 119
HUF 1 062 153 7.17 731 159 7.20 2009/2015 -648 327 - 328 084 413 826 403 075
PLN 662 295 6.05 465 206 6.29 2009/2026 -107 854 - 93 313 554 441 371 893
BGN 181 511 5.35 309 336 6.60 2009/2013 -181 511 - 309 336 0 0
MTL 23 294 3.80 0 0.00 -23 294 0 0 0
SKK 121 261 4.79 144 175 4.75 2023/2028 0 0 121 261 144 175
RON 83 155 7.00 74 580 7.00 2014/2014 -83 155 - 74 580 0 0
USD 58 410 692 4.52 77 423 397 3.72 2009/2058 -25 074 313 - 41 397 725 33 336 379 36 025 672
CHF 2 955 218 2.75 4 468 687 2.47 2009/2036 -1 525 956 - 2 545 455 1 429 262 1 923 232
JPY 6 982 434 1.51 10 331 351 0.97 2009/2047 -6 814 744 - 10 022 170 167 690 309 181
NOK 760 241 4.67 1 315 897 4.08 2009/2025 -508 922 - 733 333 251 319 582 564
CAD 976 045 4.92 770 751 4.70 2037/2045 -906 836 - 775 163 69 209 - 4 412
AUD 4 026 888 5.61 4 971 016 5.83 2009/2021 -4 026 888 - 4 927 858 0 43 158
HKD 334 498 5.09 77 883 6.97 2009/2019 -203 836 - 77 884 130 662 - 1
NZD 3 369 954 6.62 2 806 416 6.88 2009/2017 -3 369 954 - 2 788 227 0 18 189
ZAR 1 167 340 8.53 1 160 062 8.91 2009/2018 -726 625 - 791 164 440 715 368 898
MXN 61 772 8.63 79 425 8.57 2009/2015 -61 772 - 79 425 0 0
TWD 255 830 0.33 176 856 1.66 2010/2013 -255 830 - 176 856 0 0
TRY 2 659 580 14.14 2 518 980 14.04 2009/2022 -2 659 580 - 2 484 077 0 34 903
ISK 739 935 8.38 113 793 9.47 2009/2011 -739 935 - 113 793 0 0
RUB 111 154 6.50 135 770 7.39 2011/2018 -111 154 - 135 770 0 0
TOTAL 254 221 321 266 989 028 - 68 796 671 - 85 199 147 185 424 650 181 789 881
Fair Value Option Adjustment
(IAS 39) 5 951 082 17 511 917
TOTAL 260 172 403 284 500 945

Financial Report 200852EIB Group
Note K – Pension plans and health insurance scheme (in EUR ’000)
The Group operates 3 defined benefit pension plans. The Group also provides certain post-employment healthcare ben-efits to former employees of EIB. These benefits are unfunded as defined by IAS19. The cost of providing benefits under the plans is determined separately for each plan using the projected unit credit actuarial valuation method. Actuarial valuation took place at 30 September 2008 and was rolled forward to 31 December 2008.
An additional plan is not included in the figures below: it is the Optional Supplementary Provident Scheme (a defined contribution pension scheme). The corresponding amount of EUR 189 million (2007: EUR 186 million) is entered under
“Sundry creditors” (Note H).
Net benefit expense (recognized in consolidated income statement) as at 31 December 2008:
EIB PensionManagement
Committee Pension
EIF Pension Health Insurance Total 2008
Net current service cost(1) 24 271 1 197 1 249 5 058 31 775
Interest cost on benefit obligation(2) 57 061 1 625 697 4 750 64 133
Special termination benefits(1) 3 830 0 0 0 3 830
Recognition of actuarial (gains)/losses(1)
10 046 151 38 225 10 460
Net benefit expense 95 208 2 973 1 984 10 033 110 198
EIB PensionManagement
Committee Pension
EIF Pension Health Insurance Total 2007
Net current service cost(1) 27 708 1 792 1 258 4 388 35 146
Interest cost on benefit obligation(2) 48 633 1 353 477 4 174 54 637
Amortization of unrecognized past service cost(1)
0 0 75 0 75
Special termination benefits(1) 4 267 0 0 0 4 267
Recognition of actuarial (gains)/losses(1)
15 003
253
0
954
16 210
Net benefit expense 95 611 3 398 1 810 9 516 110 335
(1) Recognised in General administrative expenses(2) Recognised in Interest expense and similar charges
EIB PensionManagement
Committee Pension (1)
EIF Pension Health Insurance Total 2008
Benefit obligation 1 059 102 34 407 15 340 88 048 1 196 897
Unrecognised net actuarial losses - 76 793 - 116 60 2 752 - 74 097
Net liability 982 309 34 291 15 400 90 800 1 122 800
Net benefit expense (recognized in consolidated income statement) as at 31 December 2007:
Benefit liabilities as at 31 December 2008:
Unrecognised net actuarial losses will be recognised, from 2009 onwards, according to the average remaining service life of the participants of each plan, in accordance with IAS 19.

EIB Group – Financial Statements 53 EIB Group
EIB PensionManagement
Committee Pension(1)
EIF Pension Health Insurance Total 2007
Benefit obligation 1 046 162 34 950 12 628 87 088 1 180 828
Unrecognised net actuarial losses -136 626 -1 718 -646 -3 293 -142 283
Net liability 909 536 33 232 11 982 83 795 1 038 545
EIB Staff Pension Plan
Management Committee
Pension Plan(1)
EIF Staff Pension Plan
Health Insurance Plan
Total
At 1 January 2008 909 536 33 232 11 982 83 795 1 038 545
Net benefit expense 95 208 2 973 1 984 10 033 110 198
Benefit payments net of employee contributions
- 22 435
- 1 914
1 434
- 3 028
- 25 943
At 31 December 2008 982 309 34 291 15 400 90 800 1 122 800
At 31 December 2007 909 536 33 232 11 982 83 795 1 038 545
(1) This amount includes indemnities 2008: EUR ‘000 4 589 (2007: EUR ’000 4 711) that are not subject to IAS 19 actuarial valuations.
EIB Pension
Management Committee
Pension
EIF Pension
Health Insurance
Total
2008 29 895 - 434 653 - 1 084 29 030
2007 19 790 1 481 1 230 -6 151 16 350
2008 2007
in % in %
Discount rate for pension plans 6.00 5.52
Discount rate for health insurance plans 6.00 5.52
Future salary increase (including inflation) 4.50 4.00
Future pension increases 2.00 2.00
Healthcare cost increase rate 4.00 4.00
Actuarial tables LPP 2005 LPP 2005
1 % increase 1 % decrease
Benefit expenses 2 941 - 2 218
Defined benefit obligation 21 132 - 16 592
Benefit liabilities as at 31 December 2007:
Movements in the benefit (asset)/liability during the year ended 31 December 2008 are as follows (in EUR ’000):
The principal assumptions used in determining pension and post-employment benefit obligations for the Group’s plans are shown below:
The table below shows the sensitivity of both benefit expenses for 2008 and defined benefit obligation as at 31 Decem-ber 2008 of the Health Insurance Plan to a 1% increase and decrease in the healthcare cost increase rate:
The table below shows the actuarial experience (gain)/loss for the different Plans for 2007 to 2008:

Financial Report 200854EIB Group
EIB PensionManagement
Committee Pension
EIF Pension Health Insurance Total 2008
Obligation at the beginning of the year
1 046 162
34 950
12 628
87 088
1 180 828
Net current service cost 24 271 1 197 1 249 5 058 31 775
Employee contributions 11 091 0 812 0 11 903
Interest cost 57 061 1 625 697 4 750 64 133
Benefit payments - 33 526 - 1 914 622 - 3 028 - 37 846
Experience (gain)/loss 29 895 - 434 653 - 1 084 29 030
Assumption (gain)/loss - 79 682 - 1 017 - 1 321 - 4 736 - 86 756
Special termination benefits 3 830 0 0 0 3 830
Benefit obligation as at 31 December 2008
1 059 102
34 407
15 340
88 048
1 196 897
Evaluation of the amount representative of general banking risks: 31.12.2008 31.12.2007
1 280 000 (*) 1 000 000 (**)
(*) Of which EUR ‘000 198 000 for Structured Finance Facility operations(**) Of which EUR ‘000 113 000 for Structured Finance Facility operations
The table below shows the evolution of the Defined Benefit Obligation during the year under review:
Note L – Fund for general banking risks (in EUR ’000)
In line with Note A.4.14, the Group no longer identifies the fund for general banking risks as a separate balance sheet item but continues to compute the amount corresponding to this fund, according to last year methodology for disclosure purpose.
Loan Grading Provisioning rate for 2008 Provisioning rate for 2007
A 0.00% 0.00%
A+ 0.10% 0.10%
A- 0.20% 0.20%
B+ 0.30% 0.30%
B- 0.50% 0.50%
C 1.00% 1.00%
D+ 2.00% 2.00%
D- 3.00% 3.00%
E+ 10.00% 10.00%
E- 25.00% 25.00%
As at 31 December 2008, the general provisioning rates by Loan Grading categories are as follows:
The evolution of the computed Fund for general banking risks from 31 December 2007 to 31 December 2008 reflects a slight decrease in the Bank’s loan portfolio quality, mainly due to new signatures to lower rating categories.

EIB Group – Financial Statements 55 EIB Group
31.12.2008 31.12.2007
Interest and similar income
Loans and advances to credits institutions and customers 14 006 401 13 252 385
Treasury bills eligible for refinancing with central banks and debt securities including fixed-income securities
734 631
709 903
Interest subsidy from the E.U. 42 264 46 893
Cash in hand, balances with central banks and post office banks 202 344
Other 29 497 42 425
TOTAL 14 812 995 14 051 950
Interest expense and similar charges
Debts evidenced by certificates - 12 045 965 - 12 059 580
Derivatives (1) - 460 727 - 7 626
Interest on third party mandates - 45 143 - 42 610
Amounts owed to credit institutions - 53 185 - 14 098
Other - 67 209 - 64 693
TOTAL - 12 672 229 - 12 188 607
Net interest income 2 140 766 1 863 343
(1) Τhe interest income and expenses on derivatives are netted and amount to EUR ‘000 – 460 727 as at 31 December 2008 (EUR ‘000 -7 626 as at 31 Decem-ber 2007).
31.12.2008 31.12.2007
Interest and similar income
Trading 22 111 19 289
Designated at fair value through profit and loss 844 896 645 422
Held to maturity 573 361 527 869
Loans and receivables(1) 13 204 183 12 665 166
Available for sale 139 159 148 541
Non financial assets 29 285 45 663
TOTAL 14 812 995 14 051 950
Interest expense and similar charges
Trading - 550 368 - 9 592
Designated at fair value through profit and loss - 10 994 516 - 10 412 549
Financial liabilities measured at amortised cost - 1 005 098 - 1 657 092
Non financial liabilities - 122 247 - 109 374
TOTAL - 12 672 229 - 12 188 607
Net interest income 2 140 766 1 863 343
(1) Including in this class of financial asset accrued interests on impaired loans as at 31 December 2008 which amount to EUR ‘000 2 600 (2007: EUR ‘000 7 832).
Note M – “Interest and similar income” and “Interest expense and similar charges” (in EUR ’000)
M.1. Net interest income
The table below sets out the net interest income relating to each class of financial assets and liabilities.

Financial Report 200856EIB Group
31.12.2008 31.12.2007
Germany 2 008 176 2 356 560
Spain 2 143 128 1 833 671
Italy 1 697 814 1 456 260
France 1 385 791 1 437 073
United Kingdom 1 058 937 1 211 146
Portugal 774 637 698 928
Greece 559 600 533 178
Austria 294 940 292 310
Poland 445 242 287 992
Finland 232 420 227 245
Hungary 294 328 197 499
Belgium 198 322 187 366
Czech Republic 229 290 180 895
Denmark 123 138 152 085
Netherlands 141 405 151 539
Ireland 128 691 137 067
Sweden 165 245 123 075
Romania 90 755 81 155
Slovenia 75 551 57 535
Slovak Republic 42 227 35 134
Luxembourg 27 125 34 002
Cyprus 38 896 29 550
Bulgaria 24 765 17 465
Latvia 23 012 16 017
Estonia 8 145 6 753
Lithuania 5 766 5 204
Malta 581 348
Total 12 217 927 11 747 052
Outside the European Union 889 208 795 520
13 107 135 12 542 572
Income not detailed per country (1) 1 705 860 1 509 378
14 812 995 14 051 950
(1) Income not detailed per country: 1. Revenue from investment portfolio securities and ABS portfolio 369 969 289 436 2. Revenue from operational bond portfolios 81 588 80 419 3. Revenue from operational money market portfolios 283 074 340 001 4. Revenue from money-market operations 981 830 808 378 5. Unwinding of interest income from the present value adjustment of paid-in capital and reserve receivable 28 245 45 663 6. Adjustment on early repayments of loans - 38 846 - 54 519
1 705 860 1 509 378
M.2. Geographical analysis of “Interest and similar income”

EIB Group – Financial Statements 57 EIB Group
31.12.2008 31.12.2007
Net result on derivatives under the fair value option (1) - 812 688 345 960
Net result on loans and associated swaps under the fair value option (2) - 106 559 - 147 208
Net result on borrowings and associated swaps under the fair value option (3) 5 549 832 - 896 103
4 630 585 - 697 351
Value adjustment on operational treasury portfolio 7 683 7 042
Gain and loss on operational treasury portfolio - 3 189 - 8 510
Foreign exchange gain and loss 9 483 37 337
Gain and loss on buy back of debts evidenced by certificates 3 430 1 082
Gain and loss on wind of ALM swaps 21 125 924
Realised loss on sale of shares - 11 449 0
Minority interest (Notes A.4.21 and H) - 13 064 - 17 316
4 644 604 - 676 792
(1) The Net result on derivatives under the Fair Value Option includes for the majority the fair value of Macro-hedging swaps, which has decreased during 2008 due to the general decrease of interest rates. This effect stems from the actual composition of the swap portfolio. The current portfolio of Macro-hedging swaps includes a portion of fixed rate payer swaps bigger than the portion of fixed rate receiver swaps. The effect of a fall in interest rates on the fair value of a portfolio where fixed rate payer swaps are prevalent is a decrease in its fair value. The Net result on derivatives under the Fair Value Option on the total derivatives generates a decrease of EUR ‘ 000 - 812 688 (2007: EUR’ 000 345 960) and included within that figure is the total negative impact on Macro-hedging swaps which amounts to EUR ‘000 - 781 378 as at 31 December 2008 (2007: EUR ‘ 000 294 874).
(2) The Fair Value Option is applied on loans hedged by a derivative and on the derivative itself. As at 31 December 2008, the total outstanding of loans designated at Fair Value stands at EUR 59.3 billion (2007: EUR 43,5 billion), as only loans at a fixed rate are being hedged. The use of Fair Value Option on loans generates a decrease of EUR’ 000 - 106 559 on the profit and loss account as at 31 December 2008 (2007 : EUR’ 000 - 147 208). The negative result is due to the increase of 10 basis points of the funding curve decided in early November. In particular, the increase of the funding curve has caused the fair value of the loans to decrease relative to the fair value of the hedging swaps, the latter being influenced only by the level of the swap curve and not by that of the funding curve.
(3) The Fair Value Option is applied on borrowings hedged by derivatives and the derivatives themself. The majority of the borrowings are systematically hedged, and the volume of borrowings designated at Fair Value amounts to EUR 254.5 billion (2007: EUR 231.4 billion) as at 31 December 2008. The net impact on the profit and loss account as at 31 December 2008 on borrowings and associated swaps is an increase of the profit for the year by EUR’ 000 5 549 832 (2007: EUR’ 000 – 896 103). This increase mainly stems from the widening of EIB credit spreads in the secondary market (EUR’ 000 6 007 717), mostly due to the increased supply of government and government guaranteed debt issuance. Overall, bond prices are observed directly in the market and are very sensitive to market situation, while swap values are derived from internal valuation models. In this context, the fair value of borrowings decreases by EUR’ 000 - 10 994 901 and the fair value of derivatives hedging bor-rowings increases by EUR’ 000 16 544 733 and the net result of the variation of the fair value of the liabilities and the hedging items results in an accounting profit of EUR’ 000 5 549 832. The opposite phenomenon was observed last year ( EUR’ 000 - 896 103). As it is the intention to hold all financial instruments involved until ma-turity, it is expected that this accounting profit will be completely neutralised once the cashflows on both the bonds and the hedging swaps will have occurred. The outstanding amount of borrowing operations involved (EUR 254.5 billion) is such that even small changes in the involved market conditions have a significant impact on the result.
31.12.2008 31.12.2007
Income from advisory activities 32 380 20 369
Reversal of previous years’ unutilized accruals 3 999 3 597
Other 2 154 2 560
38 533 26 526
31.12.2008 31.12.2007
Financial assets available-for-sale - 17 015 0
Financial assets designated at fair value through profit and loss 3 878 973 - 949 088
Financial liabilities designated at fair value through profit and loss - 10 994 901 493 328
Financial instruments held for trading 11 777 697 - 208 496
Other - 150 - 12 536
4 644 604 - 676 792
Note N – Result on financial operations (in EUR ’000)
N.1. Per nature of result
Note O – Other operating income (in EUR ’000)
N.2. Per category of assets and liabilities

Financial Report 200858EIB Group
31.12.2008 31.12.2007
Commission on Investment Facility – Cotonou 35 741 32 756
Commission on Jaspers 14 933 10 529
Commission on Jessica 3 962 1 903
Commission on Yaoundé/Lomé conventions 10 371 10 227
Commission on other European Community institutions and EU countries 28 274 22 096
Commission on financial guarantees 2 791 8 413
96 072 85 924
31.12.2008 31.12.2007
Commission expense - 125 - 1 842
Note P – “Fee and commission income” and “Fee and commission expense” (in EUR ’000)
P.1. Fee and commission income
P.2. Fee and commission expense
31.12.2008 31.12.2007
Salaries and allowances (*) - 187 327 - 171 690
Welfare contributions and other social costs - 102 148 - 108 410
Staff costs - 289 475 - 280 100
Other general and administrative expenses - 107 663 - 85 880
- 397 138 - 365 980
(*) Of which the amount for members of the Management Committee is EUR ’000 2 821 at 31 December 2008 and EUR ’000 2 655 at 31 December 2007.
Note Q – General administrative expenses (in EUR ’000)
The number of persons employed by the Group was 1 744 at 31 December 2008 (1 569 at 31 December 2007).
Note R – Derivative financial instruments
R.1. Usage of derivative financial instruments
In the funding activity of the Group
The Group uses derivatives mainly as part of its funding strategy in order to bring the characteristics, in terms of currencies and interest rates, of the funds raised into line with those of loans granted and also to reduce funding costs. It uses also long-term swaps to hedge certain treas-ury transactions and for ALM purposes.
Long-term derivative transactions are not used for trad-ing, but only in connexion with fund-raising and for the reduction of market risk exposure.
All interest rate and currency swaps linked to the borrow-ing portfolio have maturities matching the corresponding borrowings and are therefore of a long-term nature.
The derivatives most commonly used are:
Currency swaps
Currency swaps are contracts under which it is agreed to convert funds raised through borrowings into another currency and, simultaneously, a forward exchange con-tract is concluded to re-exchange the two currencies in the future in order to be able to repay the funds raised on the due dates
Interest rate swaps
Interest rate swaps are contracts under which, generally, it is agreed to exchange floating-rate interest for fixed-rate interest or vice versa.
Asset swaps
Asset swaps are arranged for investments in bonds that do not have the desired cash-flow features. Specifically,

EIB Group – Financial Statements 59 EIB Group
Quoted market price
Valuation techniques – market observable
inputs
Valuation techniques – non observable
market inputs
Total
Notional amount
Net fair value
Notional amount
Net fair value
Notional amount
Net fair value
Notional amount
Net fair value
Derivatives related to borrowings 0 0 219 491 12 808 19 302 166 238 793 12 974
Derivatives related to loans 0 0 50 680 - 3 651 3 145 - 629 53 825 - 4 280
Derivatives related to assets portfolio 0 0 57 - 1 0 0 57 - 1
Derivatives related to Asset Liability Management
0
0
74 002
- 3 326
0
0
74 002
- 3 326
Derivatives related to asset backed securities
0
0
131
13
0
0
131
13
Forward foreign exchange contracts 0 0 16 296 - 989 0 0 16 296 - 989
Futures contracts 394 - 1 0 0 0 0 394 - 1
Forward rate agreements 0 0 5 472 1 0 0 5 472 1
Guarantees associated to derivatives 0 0 0 0 1 217 - 3 1 217 - 3
Total 394 - 1 366 129 4 855 23 664 - 466 390 187 4 388
Derivatives by valuation method as at 31 December 2008 (in EUR million)
swaps are used to convert investments into floating-rate instruments with 3-month coupon payment and reset frequency. Thus, the Group eliminates interest-rate and/or exchange risk, while retaining, as intended, the credit risk.
Interest rate and currency swaps allow the Group to mod-ify the interest rates and currencies of its borrowing port-folio in order to accommodate requests from its clients and also to reduce funding costs by exchanging its ad-vantageous access conditions to certain capital markets with its swap counterparties. The use of derivatives by the Bank is limited to the hedging of individual transactions in the area of borrowing and treasury activities and, to a minor degree, to asset and liability management.
In the liquidity management of the Group
The Group enters into short-term currency swap contracts in order to adjust currency positions in its operational treasury in relation to its benchmark currency, the euro, and to cater for demand for currencies in conjunction with loan disbursements.
The notional amount of short-term currency swaps and short term forwards stood at EUR 16 296 million at 31 De-cember 2008, against EUR 4 841 million at 31 December 2007.
The notional amount of Overnight indexed swaps stood at EUR nil million as at 31 December 2008 (EUR 6 000 mil-lion as at 31 December 2007).
Long-term futures are also used by the Group to adjust the medium-term (2 years) interest rate exposure of its treasury bond portfolios. The notional amount of long-term futures stood at EUR 394 million at 31 December 2008 (2007: EUR 419 million).
In the Asset Liability Management of the Group
The Group’s policy aims to maintain a high and stable level of income as well as to safeguard the economic value of the Group.
Accordingly, the Group:
has adopted an own funds investment profile ensur- •ing a stable and high flow of income;
manages residual interest rate risks in relation to this •investment profile.
With a view to managing residual interest rate risks, the Group operates natural hedges in respect of loans and borrowings or concludes global hedging operations (in-terest rate swaps).
Macro hedging swaps used as part of asset/liability man-agement are market to market (fair value) in accordance with IAS 39.
R.2. Fair value of derivative financial instruments
The table below shows the net fair value of derivative fi-nancial instruments, recorded as assets or liabilities (be-tween those whose fair value is based on quoted market prices, those whose valuation technique where all the model inputs are observable in the market and those where the valuation techniques involves the use of non-market observable inputs) together with their nominal amounts. The nominal amounts indicate the volume of transactions outstanding at the year end and are indica-tive of neither the market risk nor the credit risk.

Financial Report 200860EIB Group
Derivatives by valuation method as at 31 December 2007 (in EUR million)
Quoted prices for EIB’s derivative transactions are not available in the market. For such instruments the fair values are estimated using valuation techniques or models, based whenever is possible on observable market data prevailing at the balance sheet date.
The fair value of swap transactions is computed using the income approach, applying valuation techniques to convert future amounts to a single present amount (discounted). The estimate of fair value is based on the value indicated by marketplace expectations about those future amounts. Valuation techniques can range from simple discounted known cash flows to complex option models. The valuation models applied are consistent with accepted economic methodologies for pricing financial instruments, and incorporate the factors that market participants consider when setting a price.
For a portion of derivative transactions, internal estimates and assumptions might be used in the valuation techniques when the market inputs are not directly available.
Quoted market price
Valuation techniques – market observable
inputs
Valuation techniques – non observable
market inputs
Total
Notional amount
Net fair value
Notional amount
Net fair value
Notional amount
Net fair value
Notional amount
Net fair value
Derivatives related to borrowings 0 0 204 219 2 573 18 931 - 1 353 223 150 1 220
Derivatives related to loans 0 0 39 627 - 176 2 718 - 228 42 345 - 404
Derivatives related to assets portfolio 0 0 64 - 1 0 0 64 - 1
Derivatives related to Asset Liability Management
0
0
54 675
- 4 686
0
0
54 675
- 4 686
Derivatives related to asset backed securities
0
0
132
1
0
0
132
1
Forward foreign exchange contracts 0 0 4 841 - 18 0 0 4 841 - 18
Futures contracts 419 3 0 0 0 0 419 3
Overnight indexed Swaps 0 0 6 000 2 0 0 6 000 2
Guarantees associated to derivatives 0 0 0 0 1 268 - 2 1 268 - 2
Total 419 3 309 558 - 2 305 22 917 - 1 583 332 894 - 3 885
Note S – Fair value of financial assets and liabilities (in EUR million)
The tables below set out a comparison by category of the carrying amounts and fair values of the Group’s financial assets and financial liabilities that are carried in the financial statements. The tables do not include the fair values of non-finan-cial assets and non-financial liabilities.
Carrying value 2008
Fair value 2008
Unrecognized gain/loss
2008
Carrying value 2007
Fair value 2007
Unrecognized gain/loss
2007
Financial assets
Loans and receivables 254 633 255 748 1 115 241 329 224 381 - 16 948
Financial assets held for trading 22 388 22 388 0 9 566 9 566 0
Financial assets designated at fair value through P/L
59 257 59 257 0 43 523 43 523 0
Financial assets – Available-for-sale 4 533 4 533 0 5 364 5 364 0
Financial assets – Held-to-maturity 10 171 9 736 - 435 9 499 9 486 - 13
Financial liabilities
Financial liabilities held for trading 17 474 17 474 0 12 946 12 946 0
Financial liabilities designated at fair value through P/L
254 526
254 526
0
231 449
231 449
0
Financial liabilities measured at amortised cost
35 934
37 371
- 1 437
29 065
29 836
- 771
Total unrecognized change in unrealised fair value
- 757
- 17 732

EIB Group – Financial Statements 61 EIB Group
The following describes the methodologies and assumptions used to determine the fair value of the financial assets and the financial liabilities.
Assets for which fair value approximates carrying value
For financial assets and financial liabilities that are liquid or having a short term maturity (less than three months), it is assumed that the carrying amounts approximate to their fair value.
Assets and liabilities recorded at fair value
Published price quotations in an active market are the first source for determining the fair value of a financial instrument. For instruments without an available market price the fair values are estimated using valuation techniques or models, based whenever is possible on observable market data prevailing at the balance sheet date.
The fair value of such instruments is determined by using valuation techniques to convert future amounts to a single present amount (discounted). The estimate of fair value is based on the value indicated by marketplace expectations about those future amounts. Valuation techniques can range from simple discounted known cash flows to complex option models. The valuation models applied are consistent with accepted economic methodologies for pricing financial instru-ments, and incorporate the factors that market participants consider when setting a price. Internal estimates and assump-tions might be used in the valuation techniques when the market inputs are not directly available.
The following tables show an analysis of financial assets and financial liabilities recorded at fair value, between those whose fair value is based on quoted market prices, those whose valuation technique where all the model inputs are ob-servable in the market and those where the valuation techniques involves the use of non-market observable inputs.
Quoted market price
2008
Valuation techniques
– market observable input 2008
Valuation techniques
– non market observable input 2008
Total 2008
Positive fair value
Negative fair value
Total
Financial assets
Financial assets held for trading 526 20 854 1 008 22 388 0 22 388
Financial assets designated at fair value through P/L
0
56 158
3 099
59 258
- 1
59 257
Financial investments – Available-for-sale
1 993
419
2 121
4 533
0
4 533
Total 2 519 77 431 6 228 86 179 - 1 86 178
Financial liabilities
Financial liabilities held for trading 1 16 000 1 473 0 17 474 17 474
Financial liabilities designated at fair value through P/L
206 206
33 916
14 404
- 1 229
255 755
254 526
Total 206 207 49 916 15 877 - 1 229 273 229 272 000
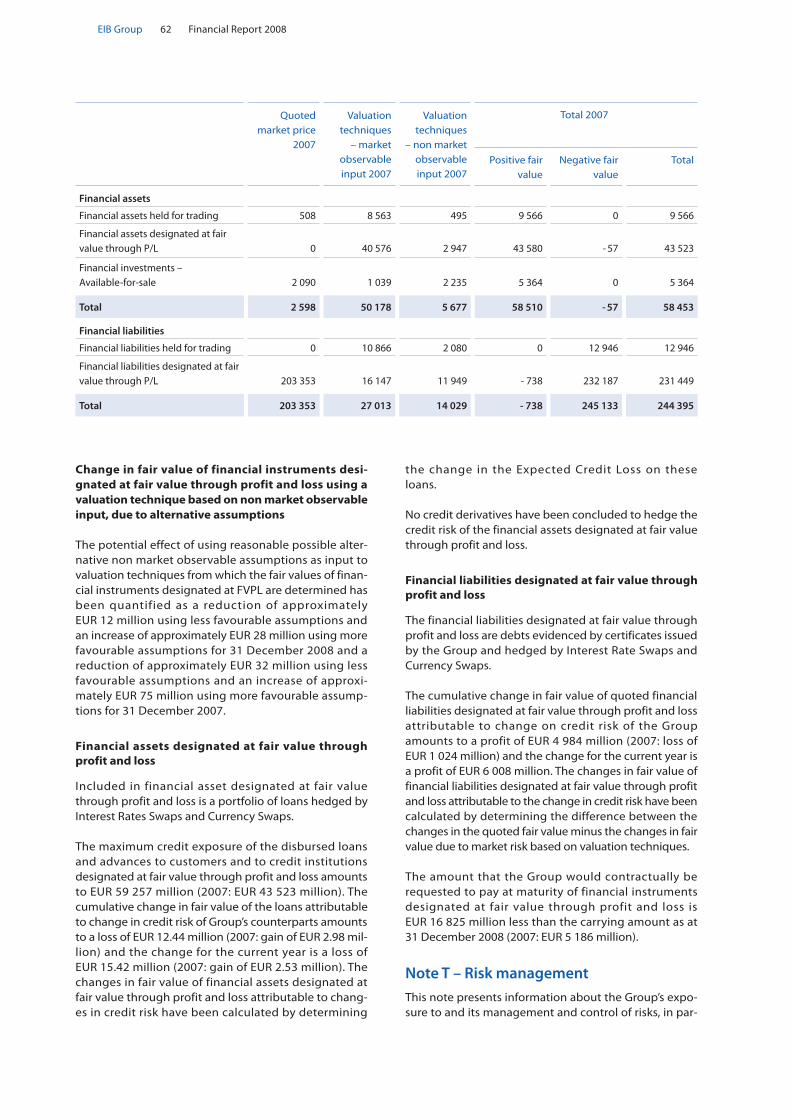
Financial Report 200862EIB Group
Quoted market price
2007
Valuation techniques
– market observable input 2007
Valuation techniques
– non market observable input 2007
Total 2007
Positive fair value
Negative fair value
Total
Financial assets
Financial assets held for trading 508 8 563 495 9 566 0 9 566
Financial assets designated at fair value through P/L
0
40 576
2 947
43 580
- 57
43 523
Financial investments – Available-for-sale
2 090
1 039
2 235
5 364
0
5 364
Total 2 598 50 178 5 677 58 510 - 57 58 453
Financial liabilities
Financial liabilities held for trading 0 10 866 2 080 0 12 946 12 946
Financial liabilities designated at fair value through P/L
203 353
16 147
11 949
- 738
232 187
231 449
Total 203 353 27 013 14 029 - 738 245 133 244 395
Change in fair value of financial instruments desi-gnated at fair value through profit and loss using a valuation technique based on non market observable input, due to alternative assumptions
The potential effect of using reasonable possible alter-native non market observable assumptions as input to valuation techniques from which the fair values of finan-cial instruments designated at FVPL are determined has been quantified as a reduction of approximately EUR 12 million using less favourable assumptions and an increase of approximately EUR 28 million using more favourable assumptions for 31 December 2008 and a reduction of approximately EUR 32 million using less favourable assumptions and an increase of approxi-mately EUR 75 million using more favourable assump-tions for 31 December 2007.
Financial assets designated at fair value through profit and loss
Included in financial asset designated at fair value through profit and loss is a portfolio of loans hedged by Interest Rates Swaps and Currency Swaps.
The maximum credit exposure of the disbursed loans and advances to customers and to credit institutions designated at fair value through profit and loss amounts to EUR 59 257 million (2007: EUR 43 523 million). The cumulative change in fair value of the loans attributable to change in credit risk of Group’s counterparts amounts to a loss of EUR 12.44 million (2007: gain of EUR 2.98 mil-lion) and the change for the current year is a loss of EUR 15.42 million (2007: gain of EUR 2.53 million). The changes in fair value of financial assets designated at fair value through profit and loss attributable to chang-es in credit risk have been calculated by determining
the change in the Expected Credit Loss on these loans.
No credit derivatives have been concluded to hedge the credit risk of the financial assets designated at fair value through profit and loss.
Financial liabilities designated at fair value through profit and loss
The financial liabilities designated at fair value through profit and loss are debts evidenced by certificates issued by the Group and hedged by Interest Rate Swaps and Currency Swaps.
The cumulative change in fair value of quoted financial liabilities designated at fair value through profit and loss attributable to change on credit risk of the Group amounts to a profit of EUR 4 984 million (2007: loss of EUR 1 024 million) and the change for the current year is a profit of EUR 6 008 million. The changes in fair value of financial liabilities designated at fair value through profit and loss attributable to the change in credit risk have been calculated by determining the difference between the changes in the quoted fair value minus the changes in fair value due to market risk based on valuation techniques.
The amount that the Group would contractually be requested to pay at maturity of financial instruments designated at fair value through profit and loss is EUR 16 825 million less than the carrying amount as at 31 December 2008 (2007: EUR 5 186 million).
Note T – Risk management
This note presents information about the Group’s expo-sure to and its management and control of risks, in par-
EIB Group – Financial Statements 63 EIB Group
ticular the primary risks associated with its use of financial instruments. These are:
Credit risk - the risk of loss resulting from client or •counterparty default and arising on credit exposure in all forms, including settlement risk;
Market risk - exposure to observable market variables •such as interest rates, exchange rates and equity mar-ket prices;
Liquidity and funding risk - the risk that the Group is •unable to fund assets or meet obligations at a reason-able price or, in extreme situations, at any price.
Operational risk - the potential loss resulting from in- •adequate or failed internal processes, people and systems or from external events.
Within the Group, the management and control of risks is handled separately by each entity. As a consequence, risk management information presented in this note will distinguish between the Bank and the Fund.
T.1. Risk Management Organisation
T.1.1. Risk Management Organisation of the Bank
The Bank aligns its risk management systems to changing economic conditions and evolving regulatory standards. It adapts them on an ongoing basis as best market prac-tice develops. Systems are in place to control and report on the main risks inherent in its operations, i.e. credit, market and operational risks.
The Bank applies best market practice in order to analyse and manage risks so as to obtain the strongest protection for its assets, its financial result, and consequently its capital. While the Bank is not subject to regulation, it aims to comply in substance with the relevant EU banking di-rectives and the recommendations of the banking super-visors of the EU Member States, EU legislation and the competent supranational bodies, such as the Basel Com-mittee on Banking Supervision (BCBS).
The following sections disclose the credit, market and li-quidity risks to which the Bank is exposed on its activities performed on own resources.
The Risk Management Directorate (RM) has, since Novem-ber 2003, initially been structured around two depart-ments – namely the Credit Risk (CRD) and the ALM, Derivatives, Financial and Operational Risk (FRD) Depart-ments – and a Coordination Division. In 2006, the Bank formalised credit risk policies for own resource operations outside the European Union, expanding CRD’s remit.
RM independently identifies, assesses, monitors and re-ports the credit, market and operational risks to which the Bank is exposed in a comprehensive and consistent way and under a consistent approach. Within a common-ly defined framework, whereby the segregation of duties
is preserved, RM is independent of the Front Offices. The Director General of RM reports, for credit, market and op-erational risks, to the designated Vice-President. The des-ignated Vice-President meets regularly with the Audit Committee to discuss topics relating to credit, market and operational risks. He is also responsible for overseeing risk reporting to the Management Committee and the Board of Directors.
To support the implementation of the Bank’s risk policies, two risk-oriented committees have been created.
The Credit Risk Assessment Group (CRAG) is a high-level forum for discussing relevant credit risk issues arising in the course of the Bank’s activities and for advising the Management Committee on these. Its members are the Directors General of the Operations, Projects, Risk Man-agement, Finance and Legal Affairs Directorates. The CRAG is intended to complement, and does not replace, the existing case-by-case review of lending operations, which remains central to the loan approval process.
An ALM Committee (ALCO), made up of the Directors General of the Operations, Finance and Risk Management Directorates, provides a high-level forum for debating the Bank’s ALM policy and for making proposals in this field to the Management Committee. It promotes and facili-tates the dialogue among the Directorates represented in it, while providing a wider perspective on, and enhanc-ing their understanding of, the main financial risks.
During 2008, the Bank continued to develop its capacity to manage loans post signature, thereby also preparing for post-signature management of riskier transactions resulting from its “take-more-risk” strategy. The Transac-tion Management & Restructuring department (TMR), initially part of Risk Management Directorates when cre-ated in 2007, has been transformed into an autonomous department, reporting to a separate Vice-President. In doing so, the Bank has segregated the EU-post signature operational activity from that of providing second opin-ions. The Bank also decided to allocate additional resourc-es to TMR thereby enabling it, in 2009, to widen its monitoring coverage and enhancing its capacity to man-age distressed cases.
T.1.1.1. Risk measurement and reporting system
The Bank’s risks are measured using a method which re-flects both expected losses likely to arise in normal cir-cumstances and unexpected losses, which are an estimate of the ultimate actual loss based on a portfolio model. The models make use of probabilities derived from sta-tistics based on historical experiences observed in finan-cial markets. The Bank also runs worst case scenarios that would arise in the event that extreme events which are unlikely to occur do, in fact, occur.
Information on the risk measures described above are presented and explained to the Management Committee on a quarterly basis and to the Board of Directors twice a

Financial Report 200864EIB Group
year. The reports include aggregate credit exposures, credit concentration analyses, VaR, liquidity ratios and risk profile changes.
T.1.1.2. The Bank’s financial risk tolerance
As a public institution, the Bank does not aim to make profits from speculative exposures to financial risks, sets its financial risk tolerance to a minimum level as defined by approved limits, and applies a conservative financial framework.
As a consequence, the Bank does not view its treasury or funding activities as profit- maximising centres, even though performance objectives are attached to those activities. Investment activities are conducted within the primary objective of protection of the capital invested. With respect to exposures arising from the Bank’s lending and borrowing operations, the main principle of the Bank’s financial risk policy is therefore that all material financial risks are hedged.
Following best market practice, all new types of transac-tion introducing operational or financial risks must be authorised by the Management Committee, after the ap-proval of the New Products Committee, and are managed within approved limits.
T.1.1.3. Sustainability of revenue and self-financing capacity
The Bank’s ALM policy forms an integral part of the Group’s overall financial risk management. It reflects the expectations of the three main stakeholders of the Bank (i.e. the Bank’s shareholders, the Bank’s borrowers and the financial markets) in terms of stability of earnings, pres-ervation of the economic value of own funds, and the self-financing of the Bank’s growth in the long term.
To achieve these aims, the ALM policy employs medium to long-term indexation for the investment of own funds to promote stability of revenues and enhance overall re-turns. This indexation policy implies an exposure to me-dium to long-term yields and is not influenced by any short-term views on trends in interest rates.
This is accomplished by targeting a duration for the Bank’s own funds of between 4.5-5.5 years.
T.1.2. Risk Management Organisation of the Fund
Venture Capital and Garantees operations for both enti-ties of the Group are managed by the Fund. The mandate of the Fund is to support small and mid-size enterprise (SME) finance for start-up, growth and development within European Union objectives for SME.
The Fund aligns its risk management systems to changing economic conditions and evolving regulatory standards. It therefore adapts them on an ongoing basis as best mar-ket practices develop. Credit, market and operational
systems are in place to control and report on the main risks inherent to its operations.
Risk Management and Monitoring (RMM) independently reports directly to the Chief Executive. This segregation of duties and the “four-eyes” principle ensures an unbi-ased review of the Fund’s business activities. Moreover, within the EIB Group context, RMM operates in close con-tact with the European Investment Bank’s Risk Manage-ment Directorate, particularly with regard to Group risk exposure relating to guarantee operations, the venture capital operations under the Bank’s Risk Capital Mandate (RCM) and general EIF policy matters.
RMM is divided into two main areas: venture capital and for portfolio guarantees & securitisation activities. Each of these encompass a Risk Management team and an Ad-ministration and Monitoring team, adding to a total of four teams within RMM.
The Fund’s treasury management has been outsourced to the Bank under a treasury management agreement signed by both parties and it is carried out according to EIF treasury guidelines
T.1.2.1. Risk assessment venture capital
Under its venture capital (“VC”) operations, the Fund has a fund of funds approach, taking minority equity partici-pations in funds managed by independent teams in order to catalyse further commitments from a wide range of investors. The Fund’s VC operations include investments in early-stage and seed capital, but also in well-estab-lished funds targeting mid- and later-stage investments, which, generally speaking, have a lower risk profile.
Over the last years, the Fund has developed a tool-set to design, manage and monitor portfolios of VC funds tai-lored to the dynamics of this market place, going beyond the typical and often-simplistic recipe of investing only in top quartile funds. This tool-set is based on an internal model, the Grading-based Economic Model (“GEM”), which allows the Fund to better assess and verify each funds’ but also each portfolios of funds’ valuations, risks and expected future cash flows and performances. Before committing to a VC fund, the Fund assigns a grading which is based on the outcome of an extensive due dili-gence performed by the Fund’s transaction team and reviewed by its risk management team. During the funds lifetimes, gradings are periodically reviewed with a fre-quency and intensity depending on the level of risk.
These efforts, supported by the development of a propri-etary IT system and an integrated software (front to back), improve the investment decision-making process and the management of the portfolio’s financial risks and of li-quidity.
In the context of the actual financial crisis, the Fund has intensified its monitoring done on the fair values report-ed by each VC funds managers, but also on other specific
EIB Group – Financial Statements 65 EIB Group
risks linked to the current crisis. The Fund has also run more stringent stress test scenarios on its VC funds port-folios to assess the impact of a worsening and/or con-tinuation of the current crisis.
T.1.2.2. Risk assessment guarantees
The Fund extends portfolio guarantees to financial inter-mediaries involved in SME financing, and by taking on the risk faced by those institutions, it facilitates access to funding, and, in turn, it helps to finance SMEs.
For its guarantee & securitisation business, over the last years, the Fund has developed a tool-set to analyse port-folio guarantee and structured financial transactions in line with best market practices. Before the Fund enters legally into a guarantee transaction, an internal rating is assigned to each new own risk guarantee transaction in accordance with the Fund’s Credit Risk Policy and Model Review Guidelines. The rating is based on internal models, which analyse and summarise the transaction’s credit quality (expected loss concept), considering not only quantitative parameters but also qualitative aspects. Guarantee transactions are monitored regularly, at least quarterly.
The guarantees portfolio is valued according to marked-to model. The main impact on the valuation stems from the assigned rating and the possible subsequent rating changes.
In the context of the actual financial crisis, the Fund has increased its monitoring efforts to follow a potential negative rating migration and due to conservative meas-ures potential upgrades decisions are avoided. The im-provement of the monitoring is not only based on the financial crisis but is a continuous process.
Furthermore, the Fund has strengthened the stress test-ing methodology, i.e. its scenario analysis with regard to portfolio downgrades and related impacts on capital al-location, expected losses, as well as on P&L.
T.2. Credit risk
T.2.1. Credit risk policies
Credit risk concerns mainly the Group’s lending activity and, to a lesser extent, treasury instruments such as fixed-
income securities held in the investment and operational portfolios, certificates of deposit and interbank term de-posits as well as the derivatives transactions of the Group and the Fund’s guarantee transactions funded by own resources. No credit risk is attached to the Group’s venture capital operations, which are performed entirely through equity participations and are, hence, only exposed to market risk.
The EIB’s policies on credit risk are approved by the Bank’s governing bodies. They set out minimum credit quality levels for both borrowers and guarantors in lending op-erations and identify the types of security that are deemed acceptable. They also detail the minimum re-quirements which loan contracts must meet in terms of key legal clauses and other contractual stipulations to ensure that the Bank’s position ranks at least as high as that of other senior lenders, with prompt access to secu-rity when required. In addition, via a counterpart and sec-tor limit system, the credit policies ensure an acceptable degree of diversification in the Bank’s loan portfolio. The Bank’s limit system draws its inspiration from the tradi-tional prudential regulations on concentration and large exposure management contained in the EU banking di-rectives, though the Bank generally adopts a more restric-tive approach to risk-taking than commercial banks. They also set out the minimum credit quality of counterparties of derivatives and treasury transactions as well as the contractual framework for each type of transaction.
As regards lending, treasury and derivatives operations, credit risk is managed by the independent Risk Manage-ment Directorate (RM) under the direct responsibility of the Management Committee. The Bank has thus estab-lished an operationally independent structure for deter-mining and monitoring credit risk.
The Fund manages exposures and risk taking in the frame of conservative policies deriving from statutory provi-sions and Credit Risk Policy Guidelines approved by the Fund’s Board of Directors or guidelines as set out under mandates.
Credit policies undergo periodic adaptations to incorpo-rate evolving operational circumstances and respond to new mandates that the Bank may receive from its share-holders.
Management of credit risk is based, firstly, on the degree of credit risk vis-à-vis counterparties and, secondly, on an analysis of the solvency of counterparties.

Financial Report 200866EIB Group
T.2.2. Maximum exposure to credit risk without taking into account any collateral and other credit enhancements
The table below shows the maximum exposure to credit risk for the components of the balance sheet, including deriva-tives. The maximum exposure is shown gross, before the effect of mitigation through the use of collateral agreements.
T.2.3. Credit risk on loans
T.2.3.1. Credit risk measurement for loans and advances to customers and credit institutions
In line with best practice in the banking sector, an inter-nal loan grading system (based on the expected loss methodology) is implemented for lending operations. This has become an important part of the loan apprais-al process and of credit risk monitoring, as well as pro-viding a reference point for pricing credit risk when appropriate.
The loan grading (LG) system comprises the methodolo-gies, processes, databases and IT systems supporting the assessment of credit risk in lending operations and the quantification of expected loss estimates. It summarises a large amount of information with the purpose of offer-ing a relative ranking of loans’ credit risks. At the EIB, LGs reflect the present value of the estimated level of the “ex-pected loss”, this being the product of the probability of default of the main obligors, the exposure at risk and the loss severity in the case of default. LGs are used for the following purposes:
as an aid to a finer and more quantitative assessment •of lending risks;
as help in distributing monitoring efforts; •
as a description of the loan’s portfolio quality at any •given date;
as a benchmark for calculating the annual additions •to the Fund for general banking risks;
as one input in risk-pricing decisions based on the •expected loss.
The following factors enter into the determination of an LG:
i) The borrower’s creditworthiness: RM/CRD independ-ently reviews borrowers and assesses their creditwor-thiness based on internal methodologies and external data.
ii) The default correlation: it quantifies the chances of simultaneous financial difficulties arising for both the borrower and the guarantor. The higher the correla-tion between the borrower and the guarantor’s de-fault probabilities, the lower the value of the guarantee and therefore the lower the LG.
Maximum exposure 2008 (in EUR million)
Maximum exposure 2007 (in EUR million)
Financial assets
Loans and receivables 254 633 241 329
Financial assets held for trading 22 388 9 566
Financial assets designated at fair value through P/L 59 257 43 523
Financial assets – Available-for-sale 4 533 5 364
Financial assets – Held-to-maturity 10 171 9 499
Non financial assets 520 466
Total 351 502 309 747
Off-balance-sheet
Contingent liabilities 4 083 3 773
Commitments
- Undisbursed loans 58 870 53 607
- Undisbursed Venture Capital operations 1 227 1 421
- Other 777 771
Total 64 957 59 572
Total credit risk exposure 416 459 369 319
Where financial instruments are recorded at fair value, the amounts shown above represent maximum risk exposure that could arise in the future as a result of change in values.
For more detail on the maximum credit exposure to credit risk for each class of financial instrument, references shall be made to the specific notes.

EIB Group – Financial Statements 67 EIB Group
iii) The value of guarantee instruments and of securities: this value is assessed on the basis of the combination of the issuer’s creditworthiness and the type of instru-ment used.
iv) The contractual framework: a sound contractual framework will add to the loan’s quality and enhance its internal grading.
v) The loan’s duration: all else being equal, the longer the loan, the higher the risk of incurring difficulties in the servicing of the loan.
A loan’s expected loss is computed by combining the five elements discussed above. Depending on the level of this loss, a loan is assigned to one of the following LG classes listed below.
A Prime quality loans: there are three sub-categories. A° comprises EU sovereign risks, that is loans granted to – or fully, explicitly and unconditionally guaranteed by – Member States where no repayment difficulties are expected. A+ denotes loans granted to (or guar-anteed by) entities other than Member States, with no expectation of deterioration over their duration.
B High quality loans: these represent an assets class with which the EIB feels comfortable, although a mi-nor deterioration is not ruled out in the future. B+ and B- are used to denote the relative likelihood of the possibility of such deterioration occurring.
C Good quality loans: an example could be unsecured loans to solid banks and corporates with a 7-year bullet, or equivalent amortising, maturity at disbursement.
D This rating class represents the borderline between “acceptable quality” loans and those that have expe-rienced some difficulties. This watershed in loan grading is more precisely determined by the sub-classifications D+ and D-. Loans rated D- require heightened monitoring.
E This LG category includes loans that in the course of their lives have experienced severe problems and their sliding into a situation of loss cannot be exclud-ed. For this reason, they require careful, close and high monitoring. The sub-classes E+ and E- differentiate the intensity of this special monitoring process, with those operations graded E- being in a position where there is a strong possibility that debt service can not be maintained on a timely basis and therefore some form of debt restructuring is required, possibly lead-ing to an impairment loss.
F F (fail) denotes loans representing unacceptable risks. F-graded loans can only arise out of outstanding transactions that have experienced, after signature, unforeseen, exceptional and dramatic adverse cir-cumstances. All operations where there is a loss of principal to the Group are graded F and a specific pro-vision is applied.
Generally, loans internally graded D- or below are placed on the Watch List. However, under the Structured Finance Facility (SFF) and the Special Femip Envelope (SFE), a lim-ited amount of credit exposures with an original LG of D- or less can be accepted. As of 31 December 2008, a dedicated reserve of EUR 2 750 million (2007: EUR 1 250 million) is set aside to meet the higher credit risks implied by such operations.
In addition to the deal-by-deal analysis of each loan, the Group, using an external credit software package, also develops a portfolio view of credit exposures, integrating the concentration and correlation effects created by the dependence of various exposures on common risk fac-tors. By adding a portfolio dimension of credit risks, it is possible to complement the LG’s deal-by-deal approach and thus provide a finer and more comprehensive risk assessment of the credit risks in the Group’s loan book. The EIB has also developed an internal rating methodol-ogy (IRM) to determine the internal ratings of all its coun-terpart exposures. The methodology is based on a system of scoring sheets.
T.2.3.2. Loans secured by Guarantees of the Community budget or the Member States
Loans outside the Community (apart from Risk Sharing loans and article 18 Facilities, and those falling under the Pre Accession Facility, the Mediterranean Partnership Fa-cility, the Energy Sustainability Facility and the EFTA Facil-ity) are, in the last resort, secured by guarantees of the Community budget or the Member States (the Guaran-tees). In South Africa, Latin America and Asia, Southern Mediterranean, Eastern Europe, Southern Caucasus and Russia the guarantee is provided by the Community, and in African, Caribbean and Pacific (ACP) countries as well as OCTs, the loans are benefiting from the Member States guarantee. Operations focus primarily on the infrastruc-ture, energy and the environment sectors, as well as sup-porting SMEs through credit lines to intermediaries (Global Loans).
In accordance with the terms of the Guarantees, the Community and the Member States secure up to 65%, 75% and 100% of pool of signed1 operations, which - in view of the traditionally low disbursed vs. signed opera-tions ratio outside the EU - result in an effective full cov-erage of the Group’s disbursed exposure. For this reasons, the Group deems the credit risk associated to each individual loan as fully risk covered and therefore the Guaranteed portfolio is not included in the section T.2.3 analysing the credit risk exposure of the Group’s lending activities.
Falling into this category, the total amount of loans signed as at 31 December 2008 amounts to EUR 25 694 million
(1) Under the new Guarantee Agreement with the Commission signed on 1 and 29 August 2007, all Community guaranteed operations signed on and after 17 April 2007 shall be covered up to 65% of “the aggregate amount of credits disbursed”. As of 31 December 2008, the disbursed exposure under the new Guarantee Agreement amounted to Eur 301 million (2007: EUR 93.38 million). The residual risk borne by the Group in connection with operations is managed in accordance with the Group´s fundamental credit rules and procedures.
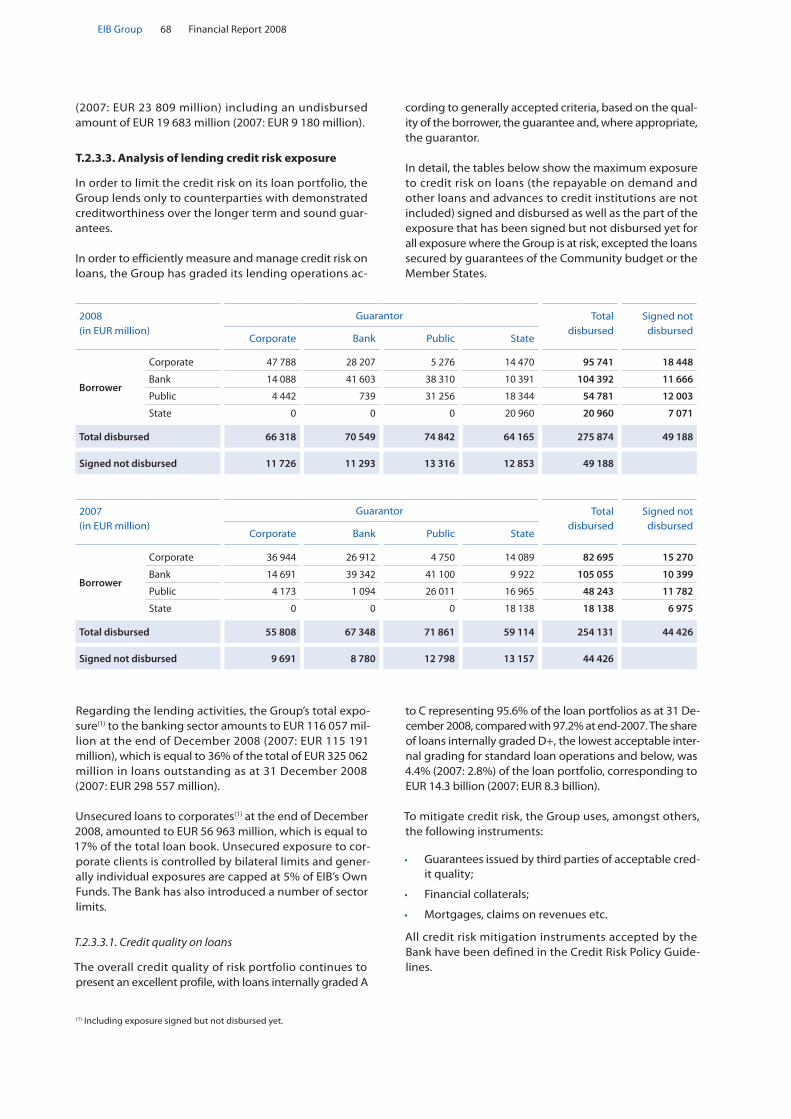
Financial Report 200868EIB Group
(2007: EUR 23 809 million) including an undisbursed amount of EUR 19 683 million (2007: EUR 9 180 million).
T.2.3.3. Analysis of lending credit risk exposure
In order to limit the credit risk on its loan portfolio, the Group lends only to counterparties with demonstrated creditworthiness over the longer term and sound guar-antees.
In order to efficiently measure and manage credit risk on loans, the Group has graded its lending operations ac-
cording to generally accepted criteria, based on the qual-ity of the borrower, the guarantee and, where appropriate, the guarantor.
In detail, the tables below show the maximum exposure to credit risk on loans (the repayable on demand and other loans and advances to credit institutions are not included) signed and disbursed as well as the part of the exposure that has been signed but not disbursed yet for all exposure where the Group is at risk, excepted the loans secured by guarantees of the Community budget or the Member States.
2008 (in EUR million)
Guarantor Total disbursed
Signed not disbursed
Corporate Bank Public State
Borrower
Corporate 47 788 28 207 5 276 14 470 95 741 18 448
Bank 14 088 41 603 38 310 10 391 104 392 11 666
Public 4 442 739 31 256 18 344 54 781 12 003
State 0 0 0 20 960 20 960 7 071
Total disbursed 66 318 70 549 74 842 64 165 275 874 49 188
Signed not disbursed 11 726 11 293 13 316 12 853 49 188
2007 (in EUR million)
Guarantor Total disbursed
Signed not disbursed
Corporate Bank Public State
Borrower
Corporate 36 944 26 912 4 750 14 089 82 695 15 270
Bank 14 691 39 342 41 100 9 922 105 055 10 399
Public 4 173 1 094 26 011 16 965 48 243 11 782
State 0 0 0 18 138 18 138 6 975
Total disbursed 55 808 67 348 71 861 59 114 254 131 44 426
Signed not disbursed 9 691 8 780 12 798 13 157 44 426
Regarding the lending activities, the Group’s total expo-sure(1) to the banking sector amounts to EUR 116 057 mil-lion at the end of December 2008 (2007: EUR 115 191 million), which is equal to 36% of the total of EUR 325 062 million in loans outstanding as at 31 December 2008 (2007: EUR 298 557 million).
Unsecured loans to corporates(1) at the end of December 2008, amounted to EUR 56 963 million, which is equal to 17% of the total loan book. Unsecured exposure to cor-porate clients is controlled by bilateral limits and gener-ally individual exposures are capped at 5% of EIB’s Own Funds. The Bank has also introduced a number of sector limits.
T.2.3.3.1. Credit quality on loans
The overall credit quality of risk portfolio continues to present an excellent profile, with loans internally graded A
to C representing 95.6% of the loan portfolios as at 31 De-cember 2008, compared with 97.2% at end-2007. The share of loans internally graded D+, the lowest acceptable inter-nal grading for standard loan operations and below, was 4.4% (2007: 2.8%) of the loan portfolio, corresponding to EUR 14.3 billion (2007: EUR 8.3 billion).
To mitigate credit risk, the Group uses, amongst others, the following instruments:
Guarantees issued by third parties of acceptable cred- •it quality;
Financial collaterals; •
Mortgages, claims on revenues etc. •
All credit risk mitigation instruments accepted by the Bank have been defined in the Credit Risk Policy Guide-lines.
(1) Including exposure signed but not disbursed yet.
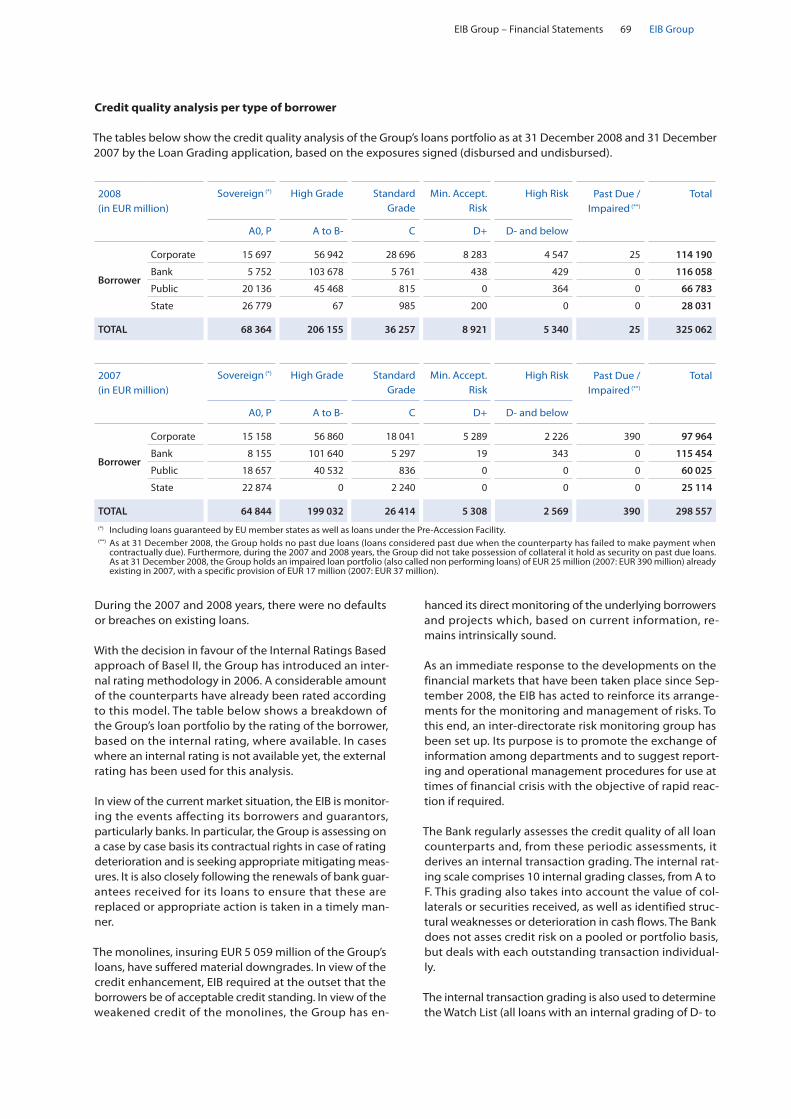
EIB Group – Financial Statements 69 EIB Group
Credit quality analysis per type of borrower
The tables below show the credit quality analysis of the Group’s loans portfolio as at 31 December 2008 and 31 December 2007 by the Loan Grading application, based on the exposures signed (disbursed and undisbursed).
During the 2007 and 2008 years, there were no defaults or breaches on existing loans.
With the decision in favour of the Internal Ratings Based approach of Basel II, the Group has introduced an inter-nal rating methodology in 2006. A considerable amount of the counterparts have already been rated according to this model. The table below shows a breakdown of the Group’s loan portfolio by the rating of the borrower, based on the internal rating, where available. In cases where an internal rating is not available yet, the external rating has been used for this analysis.
In view of the current market situation, the EIB is monitor-ing the events affecting its borrowers and guarantors, particularly banks. In particular, the Group is assessing on a case by case basis its contractual rights in case of rating deterioration and is seeking appropriate mitigating meas-ures. It is also closely following the renewals of bank guar-antees received for its loans to ensure that these are replaced or appropriate action is taken in a timely man-ner.
The monolines, insuring EUR 5 059 million of the Group’s loans, have suffered material downgrades. In view of the credit enhancement, EIB required at the outset that the borrowers be of acceptable credit standing. In view of the weakened credit of the monolines, the Group has en-
2008 (in EUR million)
Sovereign (*) High Grade Standard Grade
Min. Accept. Risk
High Risk Past Due / Impaired (**)
Total
A0, P A to B- C D+ D- and below
Borrower
Corporate 15 697 56 942 28 696 8 283 4 547 25 114 190
Bank 5 752 103 678 5 761 438 429 0 116 058
Public 20 136 45 468 815 0 364 0 66 783
State 26 779 67 985 200 0 0 28 031
TOTAL 68 364 206 155 36 257 8 921 5 340 25 325 062
2007 (in EUR million)
Sovereign (*) High Grade Standard Grade
Min. Accept. Risk
High Risk Past Due / Impaired (**)
Total
A0, P A to B- C D+ D- and below
Borrower
Corporate 15 158 56 860 18 041 5 289 2 226 390 97 964
Bank 8 155 101 640 5 297 19 343 0 115 454
Public 18 657 40 532 836 0 0 0 60 025
State 22 874 0 2 240 0 0 0 25 114
TOTAL 64 844 199 032 26 414 5 308 2 569 390 298 557
(*) Including loans guaranteed by EU member states as well as loans under the Pre-Accession Facility.(**) As at 31 December 2008, the Group holds no past due loans (loans considered past due when the counterparty has failed to make payment when
contractually due). Furthermore, during the 2007 and 2008 years, the Group did not take possession of collateral it hold as security on past due loans. As at 31 December 2008, the Group holds an impaired loan portfolio (also called non performing loans) of EUR 25 million (2007: EUR 390 million) already existing in 2007, with a specific provision of EUR 17 million (2007: EUR 37 million).
hanced its direct monitoring of the underlying borrowers and projects which, based on current information, re-mains intrinsically sound.
As an immediate response to the developments on the financial markets that have been taken place since Sep-tember 2008, the EIB has acted to reinforce its arrange-ments for the monitoring and management of risks. To this end, an inter-directorate risk monitoring group has been set up. Its purpose is to promote the exchange of information among departments and to suggest report-ing and operational management procedures for use at times of financial crisis with the objective of rapid reac-tion if required.
The Bank regularly assesses the credit quality of all loan counterparts and, from these periodic assessments, it derives an internal transaction grading. The internal rat-ing scale comprises 10 internal grading classes, from A to F. This grading also takes into account the value of col-laterals or securities received, as well as identified struc-tural weaknesses or deterioration in cash flows. The Bank does not asses credit risk on a pooled or portfolio basis, but deals with each outstanding transaction individual-ly.
The internal transaction grading is also used to determine the Watch List (all loans with an internal grading of D- to

Financial Report 200870EIB Group
Rating Grade
Moody’s equiv. grade
1-y history Def. rate (*)
2008 (in EUR million)
2007 (in EUR million)
Exposures Signed
Weighted Exposures (**)
Exposures Signed
Weighted Exposures (**)
No rating available
n/a
n/a
0 %
0
0
0
0
Internal Rating 1
1
Aaa
0 %
26 983
4 798
27 812
2 405
Internal Rating 2
2+ Aa1 0 % 29 307 2 612 30 677 3 100
2 Aa2 0 % 15 710 7 337 33 930 14 415
2- Aa3 0 % 48 014 21 530 30 273 12 070
Internal Rating 3
3+ A1 0 % 45 355 15 773 36 459 14 476
3 A2 0 % 32 561 16 511 32 497 11 650
3- A3 0 % 32 155 18 666 28 876 16 218
Internal Rating 4
4+ Baa1 0 % 31 003 19 197 30 513 16 136
4 Baa2 0 % 15 834 5 803 5 681 2 561
4- Baa3 0 % 32 351 14 086 31 711 15 856
Internal Rating 5
5+ Ba1 0 % 3 424 3 494 1 405 823
5 Ba2 0 % 3 470 2 113 1 568 1 114
5- Ba3 0 % 3 233 1 477 1 411 736
Internal Rating 6
6+ B1 0 % 3 830 2 126 4 940 1 921
6 B2 0 % 166 111 93 74
6- B3 0 % 806 589 623 312
Internal Rating 7
7
C
0 %
860
696
88
14
TOTAL 325 062 136 919 298 557 113 881
(*) based on actual losses obtained in 2008.(**) Risk-weights are percentages (from 0% to 100%) applied to the outstanding nominal amounts of loans or other credit exposures (e.g. deposits, derivatives
and securities). They depend on the perceived credit risk represented both by the types of claims and by the nature of the main obligator or guarantor. The main risk-weights are 0% (Member States, German and Austria Länder), 20% (public institutions), 50% (banks) and 100% (corporates), or broadly those applied within the 1988 BIS Capital Accord and EU Capital Adequacy Directive.
F, other than SFF/LGTT/RSFF transactions unless down-graded post signature), which increased to EUR 1 126 million (EUR 91 million end 2007), also reflecting the gen-eral economic situation.
The portion of loans internally rated graded A0 to C rep-resents 95.6% of the total risk portfolio (97.2% end 2007). However, this change was largely driven by the rising vol-ume of new signatures under SFF/LGTT/RSFF (increasing by almost 240% in 2008) for which each loan has a pro-portion of the funds allocated to the SFF reserve.
Taking into account the above, and the Bank’s contrac-tual protections, which if breached enable the Bank to negotiate remedies, as at 31 December 2008, there was no need for a collective impairment allowance.
Credit risk exposure for each internal risk rating
The table shows both the exposures signed (disbursed and undisbursed), as well as the risk-weighted exposures, based on an internal methodology that the Group uses for limit management.

EIB Group – Financial Statements 71 EIB Group
A critical element of risk management is to ensure adequate diversification of credit exposures. The Group tracks its glo-bal exposure by industry (shown in the following table), paying particular attention to industries that might be cyclical, volatile or undergoing substantial changes.
An industry sector analysis of the Group’s loan portfolio (based on the industry sector of the borrower) is as follows:
2008 (in EUR million) 2007 (in EUR million)
Exposures Signed Weighted Exposures (1) Exposures Signed Weighted Exposures (1)
Energy 27 687 21 574 24 240 17 771
Transport 37 780 13 230 32 806 10 158
Telecommunications 776 415 662 355
Water and sewerage 10 587 5 981 10 011 5 795
Miscellaneous Infrastructure 2 876 920 2 465 902
Agriculture, forestry and fisheries 38 19 45 23
Industry 15 631 14 522 13 759 11 119
Services (2) 225 401 78 797 210 513 66 327
Health and education 4 286 1 461 4 056 1 431
TOTAL 325 062 136 919 298 557 113 881
(1) Risk-weights are percentages (from 0% to 100%) applied to the outstanding nominal amounts of loans or other credit exposures (e.g. deposits, derivatives and securities). They depend on the perceived credit risk represented both by the types of claims and by the nature of the main obligator or guarantor. The main risk-weights are 0% (Member States, German and Austria Länder), 20% (public institutions), 50% (banks) and 100% (corporates), or broadly those applied within the 1988 BIS Capital Accord and EU Capital Adequacy Directive.
(2) The category “Services” includes the credit exposure of the banking sector. At the end of 2008, the total amount of loans directly exposed to counterparts of the banking sector amounted to EUR 116 057 million (EUR 115 191 million at the end of 2007), or EUR 47 695 million in risk-weighted terms (EUR 41 222 million at the end of 2007). Exposure to bank counterparts is subject to limits approved by the Management Committee. In specific cases, available limits have been temporarily suspended, restricted or withdrawn. The Bank systematically follows up on a daily basis publicly available news and, in particular, external rating movements. On top of the traditional loan exposures to the banking sector there is an amount of EUR 33 869 million in the form of guarantees received from financial institutions at the end of December 2008, of which EUR 5 059 million represents exposure to monoline insurers.
T.2.3.3.2. Risk concentrations of maximum exposure to credit risk on loans
The Group’s loans portfolio can be analysed by the following geographical regions (based on the country of the bor-rower):
2008 (in EUR million) 2007 (in EUR million)
Exposures Signed Weighted Exposures (1) Exposures Signed Weighted Exposures (1)
EU (*) 315 926 132 367 291 519 110 866
Thereof :
- Germany 48 378 15 168 46 523 12 268
- Spain 54 111 15 017 47 188 12 408
- Italy 43 620 22 201 40 061 19 392
- France 35 011 17 615 33 632 14 956
- United Kingdom 22 363 16 336 25 550 17 946
ENLARGEMENT COUNTRIES (**) 4 366 1 649 4 207 1 753
PARTNER COUNTRIES (***) 4 770 2 903 2 831 1 262
TOTAL 325 062 136 919 298 557 113 881
(1) Risk-weights are percentages (from 0% to 100%) applied to the outstanding nominal amounts of loans or other credit exposures (e.g. deposits, derivatives and securities). They depend on the perceived credit risk represented both by the types of claims and by the nature of the main obligator or guarantor. The main risk-weights are 0% (Member States, German and Austria Länder), 20% (public institutions), 50% (banks) and 100% (corporates), or broadly those applied within the 1988 BIS Capital Accord and EU Capital Adequacy Directive.
(*) Including loans outside the EU approved by the Board of Governors according to Article 18 of the Bank’s Statute as well as loans in EFTA countries.(**) Enlargement Countries as per end 2007 include Albania, Bosnia and Herzegovina, Croatia, FYROM, Serbia and Montenegro, and Turkey.(***) Loans in Partner Countries include loans under the Mediterranean Partnership Facility, the Pre-Accession Facility, and Risk Sharing loans.

Financial Report 200872EIB Group
The principle of risk diversification is at the core of sound banking practices. The Group places limits on the maximum amount that can be lent to a single borrower, group of debtors or sectors. In addition, it follows the evolution of credit risk concentration using the concept of Credit Value at Risk (CVaR). This is done using a tool for assessing portfolio risk due to changes in debt value caused by changes in obligor credit quality. Importantly, this methodology assesses risk within the full context of a portfolio and addresses the correlation of credit quality moves across obligors. This allows the Group to directly calculate the diversification benefits or potential over-concentrations across the portfolio.
The table below shows the concentration indexes the Group follows as at 31 December 2007 and 31 December 2008:
End-of-Period 2008 2007
Largest Nominal and Risk-Weighted Group Exposures (*)
Nominal Exposures (% of EIB Loan Portfolio)
- Top 3 7.2% 8.2%
- Top 5 10.4% 11.7%
- Top 10 17.3% 18.8%
N° of Exposures (% of EIB Own Funds)
- over 10 % 12 13
- over 15 % 4 6
- over 20 % 2 2
N° of SSSR Exposures over 5 % of EIB Own Funds (**) 4 2
Sum of all Large Risk-Weighted Exposures (% of EIB Own Funds) (***) 87% 85%(*) Including also the net market exposure of treasury operations.(**) The terms “single signature” and “single risk” (or for brevity, “unsecured” or “SSSR”) loans are used to indicate those lending operations where the EIB, ir-
respective of the number of signatures provided, has no genuine recourse to an independent third party, or to other forms of autonomous security.(***) The EIB defines a Large Individual Exposure as a consolidated group exposure that, when computed in risk-weighted terms, is at or above 5% of the EIB’s
own funds. This definition applies to single individual borrowers or guarantors, excluding loans to Member States and loans fully covered by an explicit guarantee from, or secured by bonds issued by, Member States.
T.2.3.4. Collaterals on loans
Among other credit mitigant instruments, the Group also uses pledges of financial securities. These pledges are formalized through a Pledge Agreement, enforceable in the relevant jurisdiction. The Group does not have right to sell or repledge them. The portfolio of collaterals re-ceived in pledge contracts amounts to EUR 12 998 million at the end of 2008 (2007: EUR 11 123 million).
The fair value of the portfolio of collateral received by the Group under pledge contracts that the Group is allowed to sell or repledge amounts to EUR 3 224 million (2007: EUR 3 446 million). None of these collaterals has been sold or re-pledged to third parties.
T.2.3.5. Loan Substitutes
Regarding the Bank’s exposure to Loan Substitutes (LS), this portfolio comprises Covered Bonds and Asset Backed Securities (ABS). Covered Bonds offer full recourse to the issuer, while ABS are issued by Special Purpose Vehicles backing the underlying issues. Some of these transactions have been structured by adding a credit or project re-lated remedies, thus offering additional recourse.
As of 31 December 2008, the Loan Substitutes amounts to EUR 16 622 million (2007: EUR 14 323 million). This amount is composed of loan substitutes included in debt securities portfolio (Note B) for an amount of EUR 5 800 million (2007: EUR 4 730 million) and loan substitutes in-cluded in loans and advances to credit institutions and to customers (Note C) for an amount of EUR 10 822 million (2007: EUR 9 593 million).

EIB Group – Financial Statements 73 EIB Group
The following table summarises the breakdown of the Loan Substitutes portfolio by asset class (Mortgages exposure in ABS is primarily residential):
Loan Substitutes Asset Class TOTAL 31.12.2008 (in EUR million)
TOTAL 31.12.2007 (in EUR million)
Asset Backed Securities Diversified Payment Rights 483 0
Asset Backed Securities MBS 1 923 1 953
Asset Backed Securities SME 3 873 3 581
Covered Bonds MBS 8 731 7 665
Covered Bonds Public Sector 1 597 1 108
Structured Public Sector Bonds Public Sector 15 16
TOTAL 16 622 14 323
While for Covered Bonds, the majority of covered assets are based on residential mortgages, most of the ABS structures are based on SME.
Aside from two Diversified Payments Rights (DPR) trans-action with Turkish promoters (amounting to EUR 483 million (2007: nil)), all the promoters of the Bank’s Loan Subsitutes portfolio are domiciled in the European Union, with the majority being located in Spain (65%), in Italy (13%) and in France (5%).
All outstanding Loan Substitutes have an AAA rating pro-vided by at least one of the three major rating agencies, except ten transactions (6% of the Group´s Loan Substi-tutes portfolio in terms of nominal amount) with a AA rating for EUR 458 million and a BBB rating for EUR 483 million (this category represents transactions to promot-ers located in Turkey).
The EIB LS transactions have to date performed well, es-pecially when considering the current market environ-ment. This is mainly due to the highly regulated environment and requirements to achieve for Covered Bonds the highest ratings set by the rating agencies and embedded credit enhancements for ABS, along with the selection of sound structures and asset classes.
Specifically, regarding the ABS portfolio, ratings for the holdings are stable, with only one potential exception for a transaction rated by two rating agencies: one of them, due to a deterioration in the underlying assets and a change in its own methodology, has put the transaction under negative rating watch (while the other rating agen-cy confirmed its AAA rating).
As for Covered Bonds, two downgrades have taken place so far, one being a Spanish Cedula ( with a total outstand-ing of EUR 100 million (2007: nil)), downgraded from Aaa to Aa1 and the other one being a Public Sector Bond (amounting to EUR 175 million (2007: 181 million)), down-graded by Moody’s to Aa1 from AAA and maintaining them on negative review. For the time being, S&P is keep-ing its AAA rating for this issue but it is also on review for possible downgrade.
Embedded credit mitigants and requirements imposed by the regulation and rating agencies are the initial rem-edies which are triggered in case of credit event on the issuer. As mentioned above, in some ABS transactions credit or project remedies are available and represent a second way out. Overall, the credit quality of the Bank’s LS portfolio remains highly satisfactory.
T.2.4. Credit risk on treasury transactions
T.2.4.1. Credit risk measurement on treasury transac-tions
Treasury investments are divided into three categories: (i) monetary treasury assets, with the primary objective of maintaining liquidity, (ii) operational bond portfolios, as a second liquidity line, and (iii) an investment portfolio composed of EU sovereign bonds. In September 2006, the Management Committee decided to gradually phase out the investment portfolio (see A.4.7.2.).
Credit risk policy for treasury transactions is monitored through the attribution of credit limits to the counter-parts for monetary and bond transactions and short-term derivatives. The weighted exposure for each counterpart must not exceed the authorised limits.

Financial Report 200874EIB Group
Credit Risk Exposures as at 31 December 2008 (in EUR million) (based on book values)
Short term external
rating
Long term external rating
Total
A-1+/P-1 < A or NR A AA Aaa
A1 Portfolio max Maturity 3 months 237 586 16 620 6 105 305 23 853
Deposits 0 442 9 847 3 996 205 14 490
Triparty Reverse Repos 0 144 5 442 1 669 0 7 255
Discount papers, Bonds 237 0 1 331 440 100 2 108
A2 Portfolio max Maturity 18 months 0 1 433 798 133 1 365
Total Monetary Treasury Assets 237 587 17 053 6 903 438 25 218
Repartition 1% 2% 68% 27% 2% 100 %
B1 Portfolio 0 0 40 215 635 890
B2 Portfolio 0 0 24 98 24 146
B3 Portfolio 0 0 77 153 296 526
BH Portfolio (futures) 0 0 0 -1 0 -1
EIF - AFS 0 0 19 52 78 149
Total Operational Bond Portfolios 0 0 160 517 1 033 1 710
Repartition 0 % 0 % 9 % 30 % 61 % 100 %
Investment Portfolio 0 54 291 627 1 290 2 262
Repartition 0 % 2 % 13 % 28 % 57 % 100 %
Assets backed securities 0 488 0 260 5 052 5 800
Repartition 0 % 8 % 0 % 5 % 87 % 100 %
Total Treasury Funds 237 1 129 17 504 8 307 7 813 34 990
Repartition 1 % 3 % 50 % 24 % 22 % 100 %
The tables below provide an illustration of the credit exposure of the Group various treasury portfolios as at 31 December 2008 and 31 December 2007:

EIB Group – Financial Statements 75 EIB Group
Credit Risk Exposures as at 31 December 2007 (in EUR million) (based on book values)
Short term external
rating
Long term external rating
Total
A-1+/P-1 < A or NR A AA Aaa
A1 Portfolio max Maturity 3 months 576 60 7 375 9 862 136 18 009
Deposits 0 60 4 454 6 691 0 11 205
Triparty Reverse Repos 0 0 2 504 2 108 0 4 612
Discount papers, Bonds 576 0 417 1 063 136 2 192
A2 Portfolio max Maturity 18 months 40 0 60 948 706 1 754
Total Monetary Treasury Assets 616 60 7 435 10 810 842 19 763
Repartition 3% 0% 38% 55% 4% 100%
B1 Portfolio 0 0 11 296 934 1 241
B2 Portfolio 0 0 0 109 53 162
B3 Portfolio 0 0 75 151 279 505
BH Portoflio (futures) 0 0 0 3 0 3
EIF - AFS 0 0 0 16 113 129
Total Operational Bond Portfolios 0 0 86 575 1 379 2 040
Repartition 0% 0% 4% 28% 68% 100%
Investment Portfolio 0 54 308 697 1 518 2 577
Repartition 0% 2% 12% 27% 59% 100%
Assets backed securities 0 0 56 186 4 488 4 730
Repartition 0% 0% 1% 4% 95% 100%
Total Treasury Funds 616 114 7 885 12 268 8 227 29 110
Repartition 2% 0% 27% 42% 29% 100%
The credit risk associated with treasury (the securities portfolio, commercial paper, term accounts, etc.) is rigor-ously managed through selecting first-class counterpar-ties and issuers.
Limits governing the structure of the securities portfolio and outstanding treasury instruments have been laid down by Management, in particular on the basis of the ratings awarded to counterparties by the rating agencies (these limits are reviewed regularly by the Risk Manage-ment Directorate).
As part of its treasury management activities, the Group holds investments in capital guaranteed notes, the cou-pons of which embed options on the performance of funds of hedge funds. As at 31 December 2008, the total nominal amount of such notes, that are part of the op-erational bond portfolio stood at EUR 150 million (2007: EUR 150 million) with a market value of EUR 146 million (2007: EUR 162 million).
Regarding the Treasury activities, the Bank had, as at the end of December 2008, a Treasury outstanding of
EUR 29.2 billion (End of December 2007 EUR 24.3 billion), distributed over different portfolios and invested in diver-sified products (deposits, securities and derivative/struc-tured products). Structured credit products amount to EUR 0.9 billion (End of December 2007 EUR 2.2 billion). Those held in the Bank’s short-term portfolio (EUR 0.2 bil-lion in the A1 portfolio) are booked at historic cost, whereas the others are recorded in the Bank’s balance sheet as available-for-sale and are marked to market.
No ABS investment has been made since August 2007. The quality of the ABS/RMBS portfolio remains stable and at the highest level, namely AAA. Three positions are rated below AAA and represent 4.80% of the Treasury’s ABS portfolio, or EUR 32 million and they have been downgraded respectively to Baa1, Aa1 and Aa3. Moreover, there is no default by their issuers to report.
Excluding the investment portfolio, the long-term holdings, which are composed of the Operational Bond Portfolios and the A2 Portfolio, amounted to 3.1 billion as of 31 De-cember 2008, of which 21.89% (EUR 673 million) consisted of securities emanating from a securitisation process.
Financial Report 200876EIB Group
The Bank has a portfolio of Asset Backed Commercial Paper, all of it rated A-1+/P-1. The outstandings as at 31 December 2008 amounted to EUR 0.2 billion.
T.2.4.2. Collateral on treasury transactions
Part of treasury transactions are tripartite reverse repur-chase agreements, for an amount of EUR 7 255 million (2007: EUR 4 612 million). These transactions are governed by a Tripartite Agreement Guidelines and are implemented depending on the acceptability of collateral and valuations parameters. The exposure is fully collateralized, with daily margin calls. The market value of the collateral portfolio is monitored and additional collateral is requested when needed in accordance with the underlying agreement.
The Bank also makes use of master netting agreements with counterparties
As part of the Tripartite Agreements, the Group has received securities that it is allowed to sell or re-pledge. The fair val-ue of the securities accepted under theses terms as at 31 December 2008 amounts to EUR 7 243 million (2007: EUR 4 611 million). None of these securities has been sold or re-pledged to third parties in 2007 and 2008. During the 2007 and 2008 years, the Group did not take possession of any of the above mentioned collaterals.
T.2.4.3. Securities lending activity
The market value of the bonds lent in the securities lending activities is at the end of 2008 of EUR 370 million (2007: EUR 965 million). These transactions are governed by an agreement signed with Northern Trust and the exposure arising from these transactions is fully collateralised, with daily margin calls.
As part of the securities lending agreement, the Group re-ceives securities, it is allowed to sell or repledge. The fair value of the collateral portfolio at 31 December 2008, ac-cepted under these terms, amounts to EUR 384 million (2007: EUR 992 million). None of these securities has been sold or re-pledged to third parties in 2007 and 2008.
T.2.5. Credit risk on derivatives
T.2.5.1. Credit risk policies for derivatives
The risk policy for derivative transactions is based on the definition of eligibility conditions and rating-related limits for swap counterparts. In order to reduce credit exposures, the Group has signed Credit Support Annexes with the majority of its swap counterparts and receives collaterals when the exposure exceeds certain contractually defined thresholds.
The credit risk with respect to derivatives lies in the loss which the Group would incur were a counterparty unable to honour its contractual obligations.
In view of the special nature and complexity of the deriva-tives transactions, a series of procedures has been put in
place to safeguard the Bank against losses arising out of the use of such instruments.
Contractual framework:
All the Group’s long-term derivatives transactions are con-cluded in the contractual framework of Master Swap Agree-ments and, where non-standard structures are covered, of Credit Support Annexes, which specify the conditions of exposure collateralisation. These are generally accepted and practised contract types.
Counterparty selection:
The minimum rating at the outset is set at A1, but excep-tionally certain counterparties rated A2/A3 have also been authorised, all their exposures being fully collateralised. The Group has the right of early termination if the rating drops below a certain level.
Limits have been set in terms of:
Total net present value of derivatives exposure with a •counterparty;
Unsecured exposure to a counterparty; •
Specific concentration limits expressed as nominal •amount.
All limits are dynamically adapted to the credit quality of the counterparty.
Monitoring:
The derivatives portfolio is regularly valued and compared against limits.
Collateralisation:
Derivatives exposure exceeding the limit for unse- •cured exposure is collateralised by cash and first-class bonds.
Very complex and illiquid transactions require collat- •eralisation over and above the current market value.
Both the derivatives portfolio with individual coun- •terparties and the collateral received are regularly valued, with a subsequent call for additional collat-eral or release.
The amount of collateral required depends on an assess-ment of the credit risk of the counterparty. Guidelines are implemented regarding the acceptability of collaterals and valuations parameters.
The main types of collateral obtained are cash or securi-ties.
The market value of the collateral is monitored and addi-tional collateral is requested when needed in accordance with the underlying agreement.

EIB Group – Financial Statements 77 EIB Group
T.2.5.2. Credit risk measurement for derivatives
The credit risk associated with derivatives varies according to a number of factors (such as interest and exchange rates) and generally corresponds to only a small portion of their notional amount.
The notional amount is a derivative’s underlying contract amount and is the basis upon which changes in the value of derivatives are measured. It provides an indication of the underlying volume of business transacted by the Group but does not provide any measure of risk. The majority of de-rivatives are negotiated as to amount, tenor and price, be-tween the Group and its counterparties, whether other professionals or customers (OTC).
In the Group’s case, where only mutually agreed derivatives are negotiated, the credit risk is evaluated on the basis of the “current exposure” method recommended by the Bank for International Settlements (BIS). Hence, the credit risk is
expressed in terms of the positive fair value or replacement value of the contracts, increased by the potential risks (add-on), contingent on the duration and type of transaction, weighted by a coefficient linked to the category of counter-party (BIS I weighted risk).
Positive replacement value represents the cost to the Group of replacing all transactions with a fair value in the Group’s favour if all the relevant counterparties of the Group were to default at the same time, and transactions could be re-placed instantaneously. Negative replacement value is the cost to the Group’s counterparties of replacing all their transactions with the Group where the fair value is in their favour if the Group were to default. The total positive and negative replacement values are included in the consoli-dated balance sheet separately.
The following table reports the nominal amount of the port-folio of Derivatives covered by ISDA agreements, as well as the exposure measured through the BIS I methodology.
The Net Market Exposure is the net present value of a swap portfolio net of collateral, if this amount is positive; in the case the amount is negative, the Net Market Exposure is null. It represents a measure of the losses the Bank could incur in case of default of the counterparty, after application of netting and using the collateral.
The BIS Credit Risk Equivalent is the sum of the Net Present Value of the swap plus an Add-On equal to the Notional Amount multiplied by a coefficient dependent on the structure of the swap and its maturity (according to the Basel Agreement), meant to cover potential future increases in exposures due to changing market conditions over the residual life of the swap.
The table below shows the concentration indexes the Group follows on it main derivative counterparts as at 31 December 2007 and 31 December 2008:
End of period 2008 (EUR million) 2007 (EUR million)
Nominal Value of outstanding Derivatives 373 675 331 207
Total BIS I Credit Risk Equivalent (after netting) 13 466 5 101
Weighted BIS I Credit Risk Equivalent (after netting) 2 680 1 007
Gross Exposure (after netting) 9 203 2 012
Total Net Market Exposure (1) 591 670(1) Positive exposure net of collaterals received.
2008 2007
Nominal Exposure (% of EIB derivative portfolio)
- Top 3 28.5% 28.8%
- Top 10 66.8% 66.9%
- Top 25 94.7% 95.2%
Net Market Exposure
- Top 3 47.6% 57.2%
- Top 10 92.0% 95.3%
- Top 25 100.0% 100.0%

Financial Report 200878EIB Group
The following tables show the maturities of currency swaps (excluding short-term currency swaps) and interest rate swaps, sub-divided according to their notional amount and the associated credit risk:
Grouped Ratings Percentage of Nominal Net Market Exposure (in EUR million)
CRE BIS I Swaps (in EUR million)
Moody’s or equivalent rating 2008 2007 2008 2007 2008 2007
Aaa 2.9% 3.3% 0 0 84 64
Aa1 to Aa3 64.5% 86.1% 406 649 7 403 4 366
A1 23.1% 8.7% 147 19 3 258 504
A2 to A3 9.5% 1.9% 37 2 2 720 165
Below A1 0.0% 0% 0 0 0 0
Non-rated 0.0% 0.0% 1 0 1 2
Total 100.0 % 100.0 % 591 670 13 466 5 101
Currency swaps at 31.12.2008 (in EUR million)
less than 1 year
1 year to 5 years
5 years to 10 years
more than 10 years
Total 2008
Notional amount 7 460 47 737 20 976 14 281 90 454
Net discounted value - 1 543 - 3 727 - 1 777 1 440 - 5 607
Credit risk (BIS I weighted) 19 739 439 603 1 800
Currency swaps at 31.12.2007 (in EUR million)
less than 1 year
1 year to 5 years
5 years to 10 years
more than 10 years
Total 2007
Notional amount 8 326 30 182 19 480 12 965 70 953
Net discounted value - 1 012 - 1 766 - 2 021 - 315 - 5 114
Credit risk (BIS I weighted) 53 423 311 277 1 064
The major part of derivatives transactions are concluded with counterparties rated at least A1. With exceptional conditions of over-collateralisation, counterparties rated A2 or A3 have been also accepted. Most of the portfolio is concentrated on counterparts rated A1 or above; however, during 2008, there has been a general deterioration of ratings of our swap counterparts.
Interest rate swaps at 31.12.2008 (in EUR million)
less than 1 year
1 year to 5 years
5 years to 10 years
more than 10 years
Total 2008
Notional amount 29 874 114 048 64 746 67 514 276 182
Net discounted value (*) 384 3 749 3 246 3 608 10 987
Credit risk (BIS I weighted) 90 1 092 1 168 1 660 4 010
Interest rate swaps at 31.12.2007 (in EUR million)
less than 1 year
1 year to 5 years
5 years to 10 years
more than 10 years
Total 2007
Notional amount 27 759 83 255 70 634 67 863 249 511
Net discounted value (*) 198 689 - 411 724 1 200
Credit risk (BIS I weighted) 76 361 571 903 1 911(*) The net discounted value of Credit Default Swaps (CDS) has been included with the rest of derivatives, since according to IAS39, CDS are treated as
derivatives, however, these transactions have not been included in the BIS computations, since in the Basel Agreement BIS I, they are assimilated to guarantees and their capital charge is computed in the loan portfolio.

EIB Group – Financial Statements 79 EIB Group
As at 31 December 2008, notional amounts of EUR 394 million (2007: EUR 419 million) of futures con-tracts and EUR 5 472 million of Forward Rate Agree-ments (2007: EUR nil), with respective fair values of EUR - 1.3 million (2007: EUR 2.9 million) and EUR 0.7 mil-lion (2007: EUR nil) and a maturity less than 1 year are outstanding.
The Bank also entered into one credit default swap con-tract for a nominal amount of EUR 172 million as at 31 December 2008 (2007: EUR 98 million) with a fair value of EUR 9.8 million (2007: EUR 4.9 million).
The Group does not generally enter into any options contracts in conjunction with its risk hedging policy. However, as part of its strategy of raising funds on the financial markets at a lesser cost, the Bank enters into borrowing contracts encompassing notably interest rate or stock exchange index options. Such borrowings are associated entirely with swap contracts with oppo-site market risk.
The ‘fair value’ of ‘plain vanilla’ swap transactions is their market value. For structured deals, the ‘fair value’ is com-puted using the income approach, using valuation tech-niques to convert future amounts to a single present amount (discounted). The estimate of fair value is based on the value indicated by marketplace expectations about those future amounts. Internal estimates and as-
sumptions might be used in the valuation techniques when the market inputs are not directly available.
All option contracts embedded in, or linked with, bor-rowings are negotiated over the counter. The structured deals include a variety of transactions dependent on interest rates, FX rates, inflation rates, stock indexes and IR volatilities.
Generally, there is a reduced credit risk on these swaps, because security exists in the form of regularly moni-tored collateral.
T.2.5.3. Collateral received for derivative transactions
As part of the ISDA agreements, the Group has received securities and cash that it is allowed to sell or repledge. The fair value of the securities accepted under theses terms as at 31 December 2008 amounts to EUR 9 071 mil-lion (2007: EUR 1 550 million) of which none has been sold or re-pledged to third parties.
During the 2007 and 2008 years, the Group did not take possession of any of these collaterals.
The collateral received for derivatives business amounts to EUR 9 071 million (2007: EUR 1 550 million), with the following composition:
Swap Collateral (in EUR million)
Moody’s or equivalent rating
Bonds Cash
Total 2008
Govt Supranational Agency Secured Bonds (Pfandbriefe)
Aaa 2 160 0 0 0 0 2 160
Aa1 to Aa3 1 148 0 0 0 0 1 148
A1 0 0 0 0 0 0
Below A1 116 0 0 0 0 116
Non-Rated 0 0 0 0 5 647 5 647
Total 2008 3 424 0 0 0 5 647 9 071
Swap Collateral (in EUR million)
Moody’s or equivalent rating
Bonds Cash
Total 2007
Govt Supranational Agency Secured Bonds (Pfandbriefe)
Aaa 865 0 0 0 0 865
Aa1 to Aa3 4 0 0 0 0 4
A1 224 0 0 0 0 224
Below A1 124 0 0 0 0 124
Non-Rated 0 0 0 0 333 333
Total 2007 1 217 0 0 0 333 1 550

Financial Report 200880EIB Group
T.3. Liquidity risk
Funding liquidity risk is the volatility in the economic value of, or in the income derived from, the Group’s posi-tions due to inability to meet payment obligations out of readily available liquid resources. Such an inability may force the Group to borrow at unattractive conditions. As such, the funding liquidity risk for the Group is related to the cost of borrowing and to capital market conditions.
T.3.1. Liquidity risk management
Liquidity risk management of the Bank
The main objective of liquidity policy is to assure that the Bank can always meet its payment obligations punctually and in full. The Bank manages the calendar of its new issues so as to maintain the global level of liquidity within the cho-sen range. Liquidity planning takes into account the Bank needs to service its debt, disbursements on loans and cash flows from the loan portfolio. It also takes into account the sizeable amount of signed but undisbursed loans, whose disbursement takes place at the borrower’s request.
Liquidity risk is managed prudently as, in contrast to com-mercial banks, the Bank does not have the natural sourc-
es of liquidity from the deposits of clients, nor recourse to central banks. The Bank pre-finances its commitments to avoid being forced to borrow, or to sell assets, when it does not have access to resources at a desirable cost level. Furthermore, adequate levels of liquidity contribute to the Bank’s financial stability and investors and rating agencies pay special attention to it.
The Bank further assures sound management of liquidity risk by maintaining a sufficient level of liquid assets, and by spreading the maturity dates of its placements accord-ing to the forecasts of liquidity needs. Liquidity risk policy also incorporates a floor on treasury levels. The Bank ‘s year-end total liquidity ratio (defined as a target percent-age of annual projected net cash flows) must at all times exceed 25% of the average forecast net annual cash flows for the following year.
Liquidity risk management of the Fund
The liquidity risk is managed in such a way as to protect the value of the paid–in capital, ensure an adequate level of liquidity to meet possible guarantee calls, private eq-uity commitments and administrative expenditure and earn a reasonable return on assets invested with due re-gard to minimisation of risk.
Maturity (at 31.12.2008)
not more than 3
months
3 months to 1 year
1 year to 5 years
more than 5 years
maturity undefined
Fair value adjustment
Total 2008
ASSETS
Cash in hand, central banks and post office banks
0
0
0
0
0
0
0
Treasury bills eligible for refinancing with central banks
63
193
1 082
679
0
0
2 017
Other loans and advances:
- Current accounts 276 0 0 0 0 0 276
- Others 21 745 0 0 0 0 0 21 745
22 021 0 0 0 0 0 22 021
Loans:
- Credit institutions 2 429 7 840 40 812 60 910 0 4 225 116 216
- Customers 1 962 7 767 46 375 117 536 0 2 011 175 651
4 391 15 607 87 187 178 446 0 6 236 291 867
Debt securities including fixed-income securities
2 967
789
3 201
4 273
0
0
11 230
Positive replacement value 0 0 0 0 0 21 862 21 862
Other assets 0 0 0 0 2 964 0 2 964
Total assets 29 442 16 589 91 470 183 398 2 964 28 098 351 961
T.3.2. Liquidity risk measurement
The table hereafter analyses the assets and liabilities of the Group by maturity on the basis of the period remaining be-tween the consolidated balance sheet date and the contractual maturity date (based on contractual undiscounted cash flows).
Assets and liabilities for which there is no contractual maturity date are classified under “Maturity undefined”.

EIB Group – Financial Statements 81 EIB Group
Maturity (at 31.12.2007)
not more than 3
months
3 months to 1 year
1 year to 5 years
more than 5 years
maturity undefined
Fair value adjustment
Total 2007
ASSETS
Cash in hand, central banks and post office banks
27
0
0
0
0
0
27
Treasury bills eligible for refinancing with central banks
65
180
1 060
968
0
0
2 273
Other loans and advances:
- Current accounts 286 0 0 0 0 0 286
- Others 15 793 24 0 0 0 0 15 817
16 079 24 0 0 0 0 16 103
Loans:
- Credit institutions 1 686 6 246 41 948 61 335 0 1 109 112 324
- Customers 1 949 7 358 43 376 102 498 0 1 217 156 398
3 635 13 604 85 324 163 833 0 2 326 268 722
Debt securities including fixed-income securities
2 400
1 160
3 733
3 723
0
0
11 016
Positive replacement value 0 0 0 0 0 9 061 9 061
Other assets 0 0 0 0 3 606 0 3 606
Total assets 22 206 14 968 90 117 168 524 3 606 11 387 310 808
LIABILITIES
Amounts owed to credit institutions 339 2 1 0 0 0 342
Debts evidenced by certificates 13 796 30 034 87 234 123 157 0 5 951 260 172
Negative replacement values 0 0 0 0 0 12 946 12 946
Capital, reserves and profit 0 0 0 0 34 572 0 34 572
Other liabilities 0 0 0 0 2 776 0 2 776
Total liabilities 14 135 30 036 87 235 123 157 37 348 18 897 310 808
OFF BALANCE SHEET
Contingent liabilities 0 0 0 0 3 773 0 3 773
Commitments 0 0 0 0 55 799 0 55 799
Total Off Balance Sheet 0 0 0 0 59 572 0 59 572
Maturity (at 31.12.2008)
not more than 3
months
3 months to 1 year
1 year to 5 years
more than 5 years
maturity undefined
Fair value adjustment
Total 2008
LIABILITIES
Amounts owed to credit institutions 5 958 1 0 0 0 0 5 959
Debts evidenced by certificates 18 090 23 409 113 219 112 271 0 17 512 284 501
Negative replacement value 0 0 0 0 0 17 474 17 474
Capital, reserves and profit 0 0 0 0 40 788 0 40 788
Other liabilities 0 0 0 0 3 239 0 3 239
Total liabilities 24 048 23 410 113 219 112 271 44 027 34 986 351 961
OFF BALANCE SHEET
Contingent liabilities 0 0 0 0 4 083 0 4 083
Commitments 0 0 0 0 60 874 0 60 874
Total Off Balance Sheet 0 0 0 0 64 957 0 64 957
Financial Report 200882EIB Group
The “investment portfolio” [Note B] consists mainly of fixed-income securities issued by first-class counterpar-ties, largely bonds issued by Member States, acquired with the intention of holding them until final maturity. See also Note A.4.7.
Some of the borrowings and associated swaps include early termination triggers or call options granted to the investors or the hedging swap counterparties. Certain li-abilities could therefore be redeemed at an earlier stage than their maturity date.
T.4. Market risk
Market risk is the risk that the net present value of future cash flows of financial instruments will fluctuate due to changes in market variables such as interest rates, foreign exchange rates and equity prices.
T.4.1. Market risk management
Market risk for the Bank:
As is the case with the “four-eyes principle” applied in lending activities via the Bank’s credit policies, so the market risk policy of the Bank establishes that the Risk management Directorate shall provide an opinion with respect to all financial activities of the Group that intro-duce material market risks, and with respect to financial transactions that may create credit risk, such as treasury hedging or derivatives operations.
Market risks are identified, measured, managed and re-ported according to a set of policies and procedures up-dated on a regular basis called the “Financial Risk and ALM Policy Guidelines” (FRPG). The general principles un-derpinning these policies are described below.
Stress testing is a widely used method to analyse the im-pact of possible scenarios on the Bank’s earnings and eco-nomic value of own funds, especially when analysis of historical market movements are viewed to be insufficient to assess future risks. Scenarios applied may relate to changes in market rates (interest rates, FX rates, spreads, equity prices etc.), liquidity conditions, or to worst-case events that may impact the former, such as sudden and adverse macroeconomic changes, simultaneous default of sizeable obligors, widespread system failures and the like.
Stress testing is performed on a regular basis and the re-sults of the change in the economic value of the Bank and of the change of the earnings profile is reported within the Bank’s market risk measurement process.
Market risk for the Fund:
The Fund’s market risk exposure arises mainly in the form of interest rate risk attached to cash and cash equivalent positions as well as investments in debt securities. Ap-proximately 50% of these assets held have an average
duration of up to 5 years, thereby safeguarding the Fund against the substantial fluctuations in its long term rev-enues.
T.4.2. Interest rate risk
Interest rate risk is the volatility in the economic value of, or in the income derived from, the Group’s positions due to adverse movements in market yields or the term struc-ture of interest rates. Exposure to interest rate risk occurs when there are differences in repricing and maturity char-acteristics of the different asset, liability and hedge instru-ments.
Interest rate risk management for the Bank:
In measuring and managing interest rate risk, the Bank refers to the relevant key principles of the Basel Commit-tee for Banking Supervision (BCBS). The main sources of interest rate risk are: repricing risk, yield curve risk, basis risk and spread risk. An interest rate risk that is particu-larly relevant for the Bank is spread risk. Spread risk is the volatility in the economic value of, or in the income de-rived from, the Bank’s positions due to movements in the funding or lending spread of the Bank.
The Bank manages its global structural interest rate posi-tion via a dedicated portfolio. The majority of the financial risk indicators and controls in use at the Bank apply to this portfolio. Financial indicators and controls for the rest of the activities outside this portfolio only relate to the risks, which are not transferred to it via the transfer pricing sys-tem, and which therefore remain with their respective activities, such as the equity risk in the venture capital activity or the interest rate or credit risks taken in those treasury portfolios predominantly managed for yield-enhancement purposes.
T.4.2.1. Value-at-Risk for the Own funds of the Group (Economic perspective)
EIB’s ALM strategy aims at maintaining a balanced and sustainable revenue profile as well as limiting the volatil-ity of the economic value of the Bank. A clear preference has been given to the revenue profile in light of the ob-jective of self-financing of the Bank’s growth, and given the existing accounting principles. This overall objective is achieved by investing EIB’s own funds according to a medium to long term investment profile, implying an own funds duration target of 4.5 – 5.5 years.
Apart from the duration target for own funds, the Bank’s balance sheet should be match-funded with respect to currency and interest rate characteristics. However, small deviations are authorised for operational reasons. The net residual positions that arise from outstanding operations are managed within pre-set limits to constrain market risk to minimum levels.
The Risk Management department quantifies the VaR of own funds for both interest rates and foreign exchange

EIB Group – Financial Statements 83 EIB Group
risk factors. It is measured on the Group’s positions using a 99% confidence level and a one-day time horizon. As at 31 December 2008, the VaR of the Group amounted to EUR 363 million (2007: EUR 124 million).
The computation is based on the so-called Riskmetrics methodology, which assumes a linear dependency be-tween the changes in portfolio or position values and the underlying risk factors. Given the nature of the positions held by the Group, the Bank deems this assumption ap-propriate to measure its exposure to interest rate risk. Volatility and correlation data are computed internally on the basis of historical market data. In the current context of financial crisis and highly volatile markets, the evolu-tion of the VaR of own funds reflects the effective increase of the volatility of interest rate and FX risk factors and not a change in the risk profile of the EIB positions.
More generally, the VaR does not purport to measure the worst loss that could be experienced. For this reason, it is complemented by regular stress testing. As of 31 Decem-
ber 2008, the impact of a 2% upward parallel shift of the interest rate curves would reduce the economic value of own funds by EUR 4 billion (2007: EUR 3.2 billion).
Among the financial instruments in the Bank’s portfolio, some deals (borrowings and associated swaps) may be redeemed before they get to maturity.
At cashflows level all such borrowings are fully hedged by swaps so that they can be considered being synthetic floating rate notes. Uncertainty arises from the maturity of such positions indexed to Libor/Euribor as they might be called before their final maturity.
Below is a summary of the features of the Bank’s callable portfolio as of 31 December 2007 and 31 December 2008, where the total nominal amount, the average natural ma-turity and the average expected maturity (both weighted by the nominal amount of the concerned transactions) are shown per funding currency and per main risk factor involved:
31/12/2008 Pay Currency
CZK EUR GBP PLN SKK USD Total
EUR Pay Notional (EUR million)
- 236
- 7 788
- 25
- 20
- 46
- 6 531
- 14 646
Average maturity date 16/09/2016 10/12/2018 24/09/2035 05/05/2026 25/08/2023 07/06/2029 21/08/2023
Average expected maturity 13/05/2010 08/11/2016 10/02/2010 24/05/2014 31/12/2015 23/05/2018 02/06/2017
31/12/2007 Pay Currency
CZK EUR GBP PLN SKK TWD USD Total
EUR Pay Notional (EUR million)
- 295
- 7 191
- 148
- 57
- 69
- 40
- 14 033
- 21 833
Average maturity date 14/01/2016 24/07/2018 23/09/2035 05/05/2026 14/08/2023 27/12/2010 14/01/2030 15/01/2026
Average expected maturity 06/02/2013 13/12/2016 17/05/2012 20/04/2020 24/05/2018 26/07/2010 21/04/2017 04/02/2017
31/12/2008
Risk factor Total
FX level IR curve level IR curve shape
EUR Pay Notional (EUR million) - 4 090 - 7 735 - 2 821 - 14 646
Average maturity date 07/09/2032 09/06/2019 13/01/2022 21/08/2023
Average expected maturity 10/04/2023 19/02/2013 01/09/2020 02/06/2017
31/12/2007
Risk factor Total
FX level IR curve level IR curve shape
EUR Pay Notional (EUR million) - 3 582 - 15 418 - 2 833 - 21 833
Average maturity date 20/12/2031 11/06/2025 19/10/2021 15/01/2026
Average expected maturity 20/09/2025 28/06/2014 15/05/2020 04/02/2017
By risk factor involved:
By funding currency (after swap):

Financial Report 200884EIB Group
T.4.2.2. Interest rate risk management for the Group (Earnings perspective)
The sensitivity of the Earnings quantifies the amount of net interest income that would change during the next 12 months if all interest rate curves rise by one percent-age point or decrease by one percentage point. Such exposure stems from the mismatch between interest rate repricing periods, volumes and rates of assets and liabili-ties that EIB accepts within the approved limits.
With the positions in place as of 31 December 2008, the Earnings would increase by EUR 12.6 million (2007: EUR 11.2 million) if interest rate increase by 100 basis points and decrease by EUR 12.9 million (2007: EUR 11.6 million) if interest rates decrease by 100 basis points.
The EIB computes the sensitivity measure with a dedi-cated software that simulates earnings on a deal by deal basis. The sensitivity of the Earnings is measured on an accrual basis and is calculated under the ‘’ongoing’’ as-sumption that, over the time horizon analysed, the Bank realizes the new loan business forecasted in the Corpo-rate Operational Plan, maintains exposures within ap-proved limits and executes monetary trades to refinance funding shortages or invest cash excesses. Accounting earnings are simulated on monthly time steps, assuming that all the fixed rate items carry their contractual rate and that all floating rate items are subject to interest rate repricings according to the interest rate scenario applied in the simulation. The monetary trades to refinance fund-ing shortages or invest cash excesses carry rates equal to the money market rates prevailing according to the inter-est rate scenario applied in the simulation. In line with the
current practice of the Bank, the model uses the hypoth-esis that simulated earnings are not distributed to the shareholders, but are used to refinance the Bank’s busi-ness. The administrative costs are projected according to the forecasts of the Corporate Operational Plan.
The sensitivity of the EIF is computed by taking into con-sideration the coupon repricings of all the positions present in the EIF treasury portfolio managed by the EIB on a deal by deal basis. Each fixed rate asset is assumed to be reinvested at maturity in a new asset with the same residual life of the previous one as of end of year’s date. Positions in floating rate assets are assumed to have quar-terly repricings.
T.4.3. Foreign exchange risk (in EUR million)
The FX risk is the volatility in the economic value of, or in the income derived from, the Group’s positions due to adverse movements of FX rates.
The Group’s is exposed to FX risk whenever there is a cur-rency mismatch between its assets and liabilities. FX risk also comprises the effect of unexpected and unfavoura-ble changes in the value of future cash flows caused by currency movements, such as the impact of FX rate changes on the Group’s future lending intermediation revenue.
The Group’s objective is to eliminate exchange risk by re-ducing net positions per currency through operations on the international foreign exchange markets. A FX hedging program was set up in 2004 in order to protect the known loan margins in USD and in GBP for the next 3 years.
T.4.3.1. Exchange position
Currency (at 31 December 2008)
EURO Pounds Sterling
US DollarsOther
currenciesSub-Total
except EurosTotal 2008
ASSETS
Cash in hand, balances with central banks and post office banks
0
0
0
0
0
0
Treasury bills eligible for refinancing with central banks
2 017
0
0
0
0
2 017
Other loans and advances:
- Current accounts 220 19 13 24 56 276
- Others 14 880 2 374 2 071 2 420 6 865 21 745
15 100 2 393 2 084 2 444 6 921 22 021
Loans and advances to:
- Credit institutions 70 993 15 029 26 438 3 756 45 223 116 216
- Customers 142 503 14 426 9 358 9 364 33 148 175 651
213 496 29 455 35 796 13 120 78 371 291 867
Debt securities including fixed-income securities
8 182
1 543
1 202
303
3 048
11 230
Positive replacement values 21 862 0 0 0 0 21 862
Other assets 2 352 240 209 163 612 2 964
Total assets 263 009 33 631 39 291 16 030 88 952 351 961

EIB Group – Financial Statements 85 EIB Group
Currency (at 31 December 2008)
EURO Pounds Sterling
US DollarsOther
currenciesSub-Total
except EurosTotal 2008
LIABILITIES
Amounts owed to credit institutions 5 624 0 316 19 335 5 959
Debts evidenced by certificates:
- Debt securities in issue 121 862 48 585 78 449 34 936 161 970 283 832
- Others 207 367 0 95 462 669
122 069 48 952 78 449 35 031 162 432 284 501
Negative replacement values 92 137 - 15 366 - 40 046 - 19 251 - 74 663 17 474
Capital, reserves and profit 40 788 0 0 0 0 40 788
Other liabilities 2 402 42 577 218 837 3 239
Total liabilities 263 020 33 628 39 296 16 017 88 941 351 961
Net position as at 31.12.2008 - 11 3 - 5 13 11
Currency (at 31 December 2007)
EURO Pounds Sterling
US DollarsOther
currenciesSub-Total
except EurosTotal 2007
ASSETS
Cash in hand, balances with central banks and post office banks
1 26 0 0 26 27
Treasury bills eligible for refinancing with central banks
2 273
0
0
0
0
2 273
Other loans and advances:
- Current accounts 233 11 23 19 53 286
- Others 9 418 1 649 4 008 742 6 399 15 817
9 651 1 660 4 031 761 6 452 16 103
Loans and advances to:
- Credit institutions 63 423 20 280 25 703 2 918 48 901 112 324
- Customers 120 875 17 678 9 761 8 084 35 523 156 398
184 298 37 958 35 464 11 002 84 424 268 722
Debt securities including fixed-income securities
7 783 1 861 1 146 226 3 233 11 016
Positive replacement values 9 061 0 0 0 0 9 061
Other assets 2 960 289 191 166 646 3 606
Total assets 216 027 41 794 40 832 12 155 94 781 310 808
LIABILITIES
Amounts owed to credit institutions 291 0 51 0 51 342
Debts evidenced by certificates:
- Debt securities in issue 111 133 59 473 58 752 29 921 148 146 259 279
- Others 207 613 0 73 686 893
Negative replacement values 111 340 60 086 58 752 29 994 148 832 260 172
Capital, reserves and profit 67 516 -18 353 -18 069 -18 148 -54 570 12 946
Other liabilities 34 572 0 0 0 0 34 572
2 319 63 94 300 457 2 776
Total liabilities 216 038 41 796 40 828 12 146 94 770 310 808
Net position as at 31.12.2007 -11 -2 4 9 11

Financial Report 200886EIB Group
T.4.3.2. Foreign exchange risk management
In compliance with its statutes, the Bank actively hedges its FX risk exposures.
The main objective of the Bank’s FX risk management policy is to minimise the impact of a variation of FX rates on the P&L account by keeping FX positions within the limits approved by the Management Committee.
Related to the quantification of the VaR of own funds for both interest rates and foreign exchange risk factors, refer to section T.4.2.1.
T.4.4. Equity price risk
Equity price risk is the risk that the fair values of equities decrease as the result of changes in the levels of equity indices and the value of individual equity investments.
Equity price risk is not a risk that the Group actively takes as a part of its mission. Equity price risk is limited to those stra-tegic activities approved by the Board of Directors (venture capital investments made by the Fund on behalf of the Bank and on its own resources; equity-like investments in the Structured Finance Facility; participation in the EBRD) and shares that have been received in the context of a financial restructuring of a publicly-quoted or privately held company the Group has lent to. In consideration of the exceptionality of said investments, the Group generally segregates these expo-sures from the rest of the balance sheet by using of specific provisions such as capital reserves. These activities are subject to special forms of monitoring and the resulting exposures are supported by sound capitalisation.
The value of privately held equity positions is not readily available for the purposes of monitoring and control on a con-tinuous basis. For such positions, the best indications available include prices for similar assets and the results of any relevant valuation techniques. These value indications must be used in compliance with recommended best practices.
The effect on Own Funds for the Group (as a result of a change in the fair value of equity investments at 31 December 2007 and 31 December 2008) due to a reasonable possible change in equity indices, with all other variables held constant is as follows:
Change in equity
price 2008 %
Effect on Own Funds 2008 in EUR ’000
Change in equity price 2007
%
Effect on Own Funds 2007 in EUR ’000
Venture Capital Operations - 10 - 196 775 (2) + 10 126 310 (2)
EBRD shares - 10 - 41 735 + 10 37 205
Eurotunnel - 55 (1) - 4 427 + 65 (1) 31 819
Infrastructure funds - 10 - 11 097 + 10 5 617
Investment funds - 10 - 2 676 n/a (3) n/a (3)
(1) The percentages correspond to one annualised standard deviation of the daily returns of the Eurotunnel shares on the quoted market. One annualised standard deviation has been applied to calculate the sensitivity of all the Eurotunnel positions (shares, Warrants and ORAs) held buy the Bank.
(2) The sensitivity of Venture Capital operations is calculated by the EIF based on the market risk of the positions on the public market.(3) Not present as of 31 December 2007.
T.5. Operational risk
The management of operational risk is performed at all levels within the organisation and is a responsibility of all the various departments of the Group. The Risk Management Directorate is responsible for defining the operational risk framework and related policies while the responsibility for implementing the framework as well as day-to-day opera-tional risk management lies with the Group’s operational departments.
The Bank employs an assessment methodology that takes into account all available information including loss history, results of risk self-assessment and the business and control environment through a set of Key Risk Indicators (KRIs) organ-ised in an Operational Risk Scorecard. A statistical model and a Value at Risk calculation engine complete the operational risk environment. The EIF is currently in the process of rolling out its own operational risk methodology which will be consistent with that of the Bank.
Information concerning operational risk events, losses and KRIs, and updates on the activities of the New Products Com-mittee, are regularly forwarded to the Bank’s senior management and to the Management Committee.

EIB Group – Financial Statements 87 EIB Group
Note U – Accounting classifications and fair values of financial assets and liabilities (in EUR million)
The table below sets out the Group’s classification of each class and category of assets and liabilities.
31 December 2008
Note
Trading
Designated at fair value through P/L
Held-to-maturity
Loans and receiva-
bles
Available-for-sale
Financial liabilities
measured at amor-
tised cost
Non financial assets/
liabilities
Total carrying amount
Cash in hand, balances with central banks and post office banks
0
0
0
0
0
0
0
0
Debt securities portfolios B 526 0 10 171 0 2 550 0 0 13 247
Loans and advances to credit institutions and to customers
C/D
0
59 257
0
254 633
0
0
0
313 890
Shares and other variable-yield securities
E
0
0
0
0
1 983
0
0
1 983
Intangible assets F 0 0 0 0 0 0 4 4
Property, furniture and equipment
F
0
0
0
0
0
0
316
316
Other assets H/S 21 862 0 0 0 0 0 160 22 022
Assets held for sale F 0 0 0 0 0 0 3 3
Prepayments and accrued income
0
0
0
0
0
0
37
37
22 388 59 257 10 171 254 633 4 533 0 520 351 502
Amounts owed to credit institutions
I
0
0
0
0
0
5 959
0
5 959
Debts evidenced by certificates
J
0
254 526
0
0
0
29 975
0
284 501
Other liabilities H/S 17 474 0 0 0 0 0 1 849 19 323
Accruals and deferred income
G
0
0
0
0
0
0
267
267
Provisions K 0 0 0 0 0 0 1 123 1 123
17 474 254 526 0 0 0 35 934 3 239 311 173

Financial Report 200888EIB Group
31 December 2007
Note
Trading
Designated at fair value through P/L
Held-to-maturity
Loans and receiva-
bles
Available-for-sale
Financial liabilities
measured at amor-
tised cost
Non financial assets/
liabilities
Total carrying amount
Cash in hand, balances with central banks and post office banks
0
0
0
27
0
0
0
27
Debt securities portfolios B 505 0 9 499 0 3 285 0 0 13 289
Loans and advances to credit institutions and to customers
C/D
0
43 523
0
241 302
0
0
0
284 825
Shares and other variable-yield securities
E
0
0
0
0
2 079
0
0
2 079
Intangible assets F 0 0 0 0 0 0 4 4
Property, furniture and equipment
F
0
0
0
0
0
0
286
286
Other assets H/S 9 061 0 0 0 0 0 145 9 206
Prepayments and accrued income
0
0
0
0
0
0
31
31
9 566 43 523 9 499 241 329 5 364 0 466 309 747
Amounts owed to credit institutions
I
0
0
0
0
0
342
0
342
Debts evidenced by certificates
J
0
231 449
0
0
0
28 723
0
260 172
Other liabilities H/S 12 946 0 0 0 0 0 1 466 14 412
Accruals and deferred income
G
0
0
0
0
0
0
271
271
Provisions K 0 0 0 0 0 0 1 039 1 039
12 946 231 449 0 0 0 29 065 2 776 276 236

EIB Group – Financial Statements 89 EIB Group
The table below sets out the fair value of each of the Group’s classes and categories of assets and liabilities.
Fair value is set to book value, for non financial assets and non financial liabilities.
31 December 2008 Trading Designated at fair value through P/L
Held-to-maturity
Loans and receiva-
bles
Available-for-sale
Financial liabilities
measured at amor-
tised cost
Non financial
assets/ liabilities
Total Fair value
Cash in hand, balances with central banks and post office banks
0
0
0
0
0
0
0
0
Debt securities portfolios 526 0 9 736 0 2 550 0 0 12 812
Loans and advances to credit institutions and to customers
0
59 257
0
255 748
0
0
0
315 005
Shares and other variable-yield securities
0
0
0
0
1 983
0
0
1 983
Intangible assets 0 0 0 0 0 0 4 4
Property, furniture and equipment
0
0
0
0
0
0
316
316
Other assets 21 862 0 0 0 0 0 160 22 022
Assets held for sale 0 0 0 0 0 0 3 3
Prepayments and accrued income
0
0
0
0
0
0
37
37
22 388 59 257 9 736 255 748 4 533 0 520 352 182
Amounts owed to credit institutions
0
0
0
0
0
5 959
0
5 959
Debts evidenced by certificates
0
254 526
0
0
0
31 412
0
285 938
Other liabilities 17 474 0 0 0 0 0 1 849 19 323
Accruals and deferred income
0
0
0
0
0
0
267
267
Provisions 0 0 0 0 0 0 1 123 1 123
17 474 254 526 0 0 0 37 371 3 239 312 610
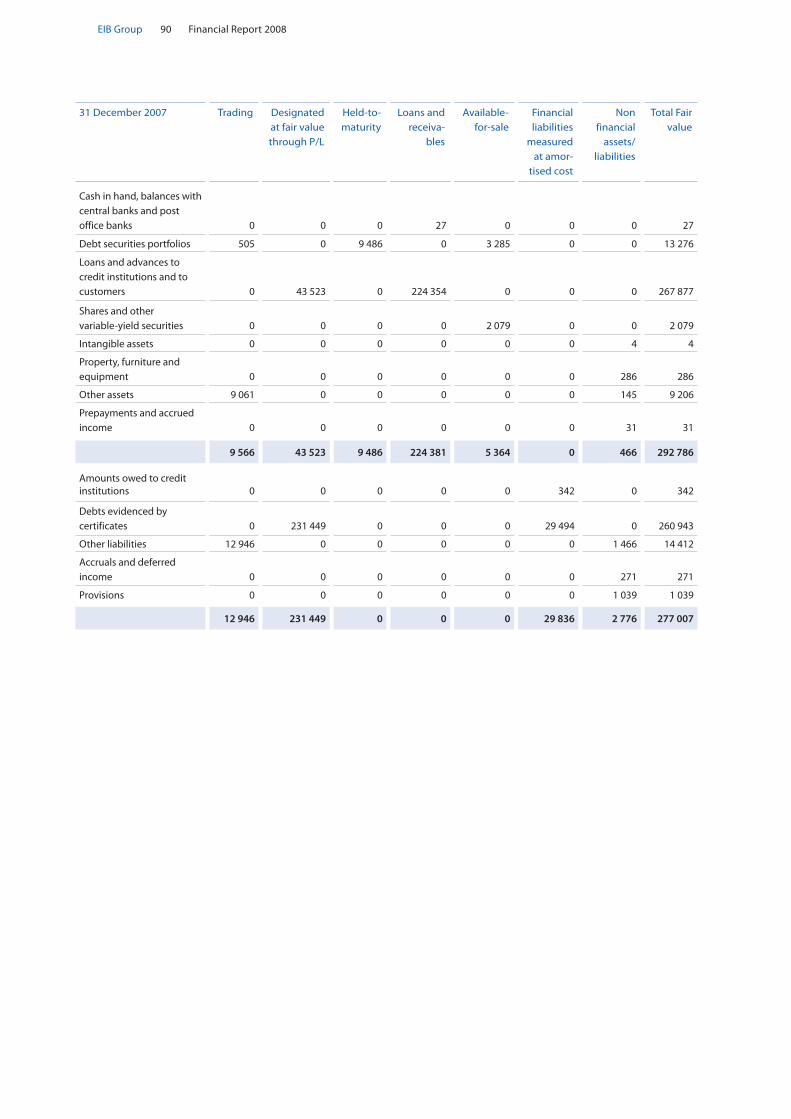
Financial Report 200890EIB Group
31 December 2007 Trading Designated at fair value through P/L
Held-to-maturity
Loans and receiva-
bles
Available-for-sale
Financial liabilities
measured at amor-
tised cost
Non financial
assets/ liabilities
Total Fair value
Cash in hand, balances with central banks and post office banks
0
0
0
27
0
0
0
27
Debt securities portfolios 505 0 9 486 0 3 285 0 0 13 276
Loans and advances to credit institutions and to customers
0
43 523
0
224 354
0
0
0
267 877
Shares and other variable-yield securities
0
0
0
0
2 079
0
0
2 079
Intangible assets 0 0 0 0 0 0 4 4
Property, furniture and equipment
0
0
0
0
0
0
286
286
Other assets 9 061 0 0 0 0 0 145 9 206
Prepayments and accrued income
0
0
0
0
0
0
31
31
9 566 43 523 9 486 224 381 5 364 0 466 292 786
Amounts owed to credit institutions
0
0
0
0
0
342
0
342
Debts evidenced by certificates
0
231 449
0
0
0
29 494
0
260 943
Other liabilities 12 946 0 0 0 0 0 1 466 14 412
Accruals and deferred income
0
0
0
0
0
0
271
271
Provisions 0 0 0 0 0 0 1 039 1 039
12 946 231 449 0 0 0 29 836 2 776 277 007

EIB Group – Financial Statements 91 EIB Group
31 December 2008
Trading
Designated at fair value through P/L
Held-to-maturity
Loans and receivables
Available-for-sale
Non financial
assets/ liabilities
Total maximum Exposure
Cash in hand, balances with central banks and post office banks
0
0
0
0
0
0
0
Debt securities portfolios 526 0 10 171 0 2 550 0 13 247
Loans and advances to credit institutions and to customers (including undisbursed amounts)
0
61 695
0
311 065
0
0
372 760
Shares and other variable-yield securities
0
0
0
0
1 983
0
1 983
Intangible assets 0 0 0 0 0 4 4
Property, furniture and equipment 0 0 0 0 0 316 316
Other assets 21 862 0 0 0 0 160 22 022
Assets held for sale 0 0 0 0 0 3 3
Prepayments and accrued income 0 0 0 0 0 37 37
22 388 61 695 10 171 311 065 4 533 520 410 372
31 December 2007
Trading
Designated at fair value through P/L
Held-to-maturity
Loans and receivables
Available-for-sale
Non financial
assets/ liabilities
Total maximum Exposure
Cash in hand, balances with central banks and post office banks
0
0
0
27
0
0
27
Debt securities portfolios 505 0 9 499 0 3 285 0 13 289
Loans and advances to credit institutions and to customers (including undisbursed amounts)
0
46 200
0
292 232
0
0
338 432
Shares and other variable-yield securities
0
0
0
0
2 079
0
2 079
Intangible assets 0 0 0 0 0 4 4
Property, furniture and equipment 0 0 0 0 0 286 286
Other assets 9 061 0 0 0 0 145 9 206
Prepayments and accrued income 0 0 0 0 0 31 31
9 566 46 200 9 499 292 259 5 364 466 363 354
The table below sets out the maximum exposure to credit risks of each of the Group’s classes and categories of assets and liabilities.

Financial Report 200892EIB Group
Note V – Segment reporting
The Group considers that lending constitutes its prime main business segment and venture capital operations to be its secondary main business segment: its organisation and entire management systems are mainly designed to support the lending and venture Capital business.
Consequently, the determining factors for segment reporting are:
primary determining factor: lending and venture capital as the main business segments; •
secondary determining factor: lending in terms of geographical spread. •
Information to be disclosed under the heading of geographical segment reporting is given in the following notes:
interest and similar income by geographical area (Note M.2); •
lending by country in which projects are located (Note D.3); •
tangible and intangible assets by country of location (Note F). •
Note W – Commitments, Contingent Liabilities, pledged assets and other memorandum items (in EUR ’000)
The Group utilizes various lending-related financial instruments in order to meet the financial needs of its customers. The Group issues commitments to extend credit, standby and other letters of credit, guarantees, commitments to enter into repurchase agreements, note issuance facilities and revolving underwriting facilities. Guarantees represent irrevocable assurances, subject to the satisfaction of certain conditions, that the Group will make payment in the event that the cus-tomer fails to fulfill its obligation to third parties.
The contractual amount of these instruments is the maximum amount at risk for the Group if the customer fails to meet its obligations. The risk is similar to the risk involved in extending loan facilities and is monitored with the same risk con-trol processes and specific credit risk policies.
The assets pledged by the Group are strictly for the purpose of providing collateral for the counterparty and amount as at December 31, 2008 to EUR 2.23 million (2007: EUR 1.61 million) in relation to its activities on Futures (classified as Held-to-Maturity) and to EUR 384 million (2007: EUR 992 million) in relation to its Securities Lending activities (classified as Held-to-maturity, AFS, and trading). The pledged assets will be returned to the Group when the underlying transaction is terminated but, in the event of the Group’s default, the counterparty is entitled to apply the collateral in order to settle the liability.
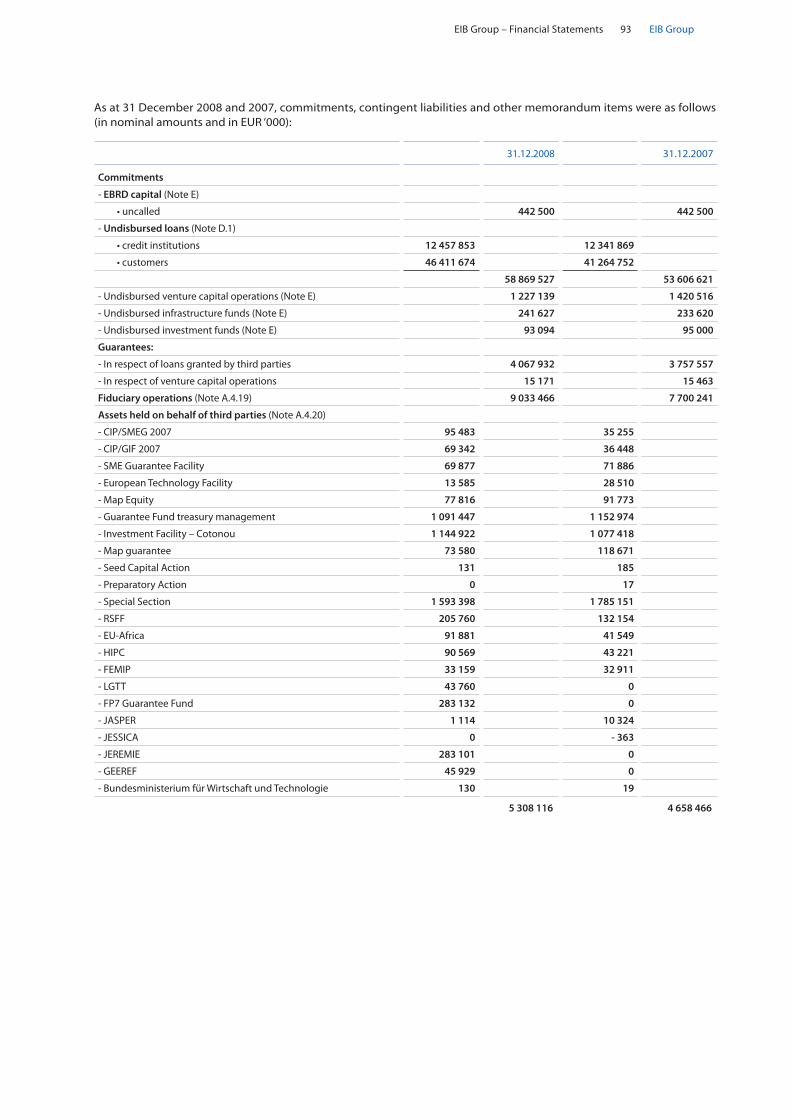
EIB Group – Financial Statements 93 EIB Group
As at 31 December 2008 and 2007, commitments, contingent liabilities and other memorandum items were as follows (in nominal amounts and in EUR ‘000):
31.12.2008 31.12.2007
Commitments
- EBRD capital (Note E)
•uncalled 442 500 442 500
- Undisbursed loans (Note D.1)
•creditinstitutions 12 457 853 12 341 869
•customers 46 411 674 41 264 752
58 869 527 53 606 621
- Undisbursed venture capital operations (Note E) 1 227 139 1 420 516
- Undisbursed infrastructure funds (Note E) 241 627 233 620
- Undisbursed investment funds (Note E) 93 094 95 000
Guarantees:
- In respect of loans granted by third parties 4 067 932 3 757 557
- In respect of venture capital operations 15 171 15 463
Fiduciary operations (Note A.4.19) 9 033 466 7 700 241
Assets held on behalf of third parties (Note A.4.20)
- CIP/SMEG 2007 95 483 35 255
- CIP/GIF 2007 69 342 36 448
- SME Guarantee Facility 69 877 71 886
- European Technology Facility 13 585 28 510
- Map Equity 77 816 91 773
- Guarantee Fund treasury management 1 091 447 1 152 974
- Investment Facility – Cotonou 1 144 922 1 077 418
- Map guarantee 73 580 118 671
- Seed Capital Action 131 185
- Preparatory Action 0 17
- Special Section 1 593 398 1 785 151
- RSFF 205 760 132 154
- EU-Africa 91 881 41 549
- HIPC 90 569 43 221
- FEMIP 33 159 32 911
- LGTT 43 760 0
- FP7 Guarantee Fund 283 132 0
- JASPER 1 114 10 324
- JESSICA 0 - 363
- JEREMIE 283 101 0
- GEEREF 45 929 0
- Bundesministerium für Wirtschaft und Technologie 130 19
5 308 116 4 658 466
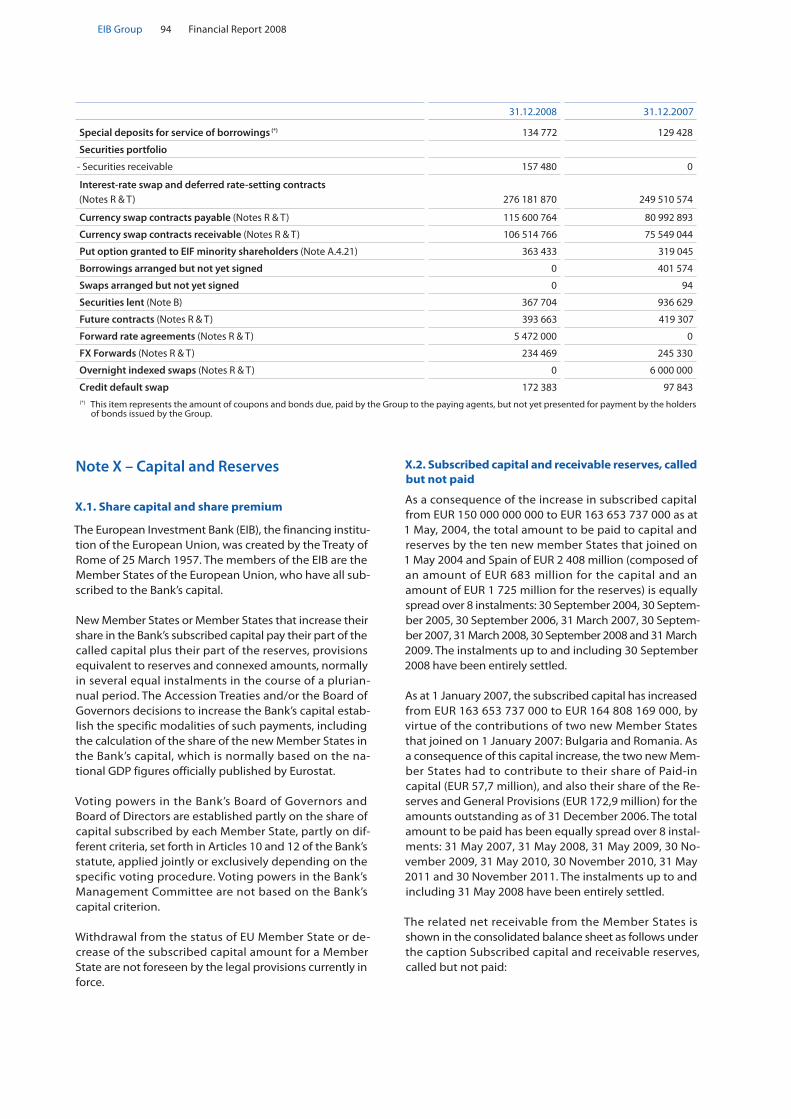
Financial Report 200894EIB Group
Note X – Capital and Reserves
X.1. Share capital and share premium
The European Investment Bank (EIB), the financing institu-tion of the European Union, was created by the Treaty of Rome of 25 March 1957. The members of the EIB are the Member States of the European Union, who have all sub-scribed to the Bank’s capital.
New Member States or Member States that increase their share in the Bank’s subscribed capital pay their part of the called capital plus their part of the reserves, provisions equivalent to reserves and connexed amounts, normally in several equal instalments in the course of a plurian-nual period. The Accession Treaties and/or the Board of Governors decisions to increase the Bank’s capital estab-lish the specific modalities of such payments, including the calculation of the share of the new Member States in the Bank’s capital, which is normally based on the na-tional GDP figures officially published by Eurostat.
Voting powers in the Bank’s Board of Governors and Board of Directors are established partly on the share of capital subscribed by each Member State, partly on dif-ferent criteria, set forth in Articles 10 and 12 of the Bank’s statute, applied jointly or exclusively depending on the specific voting procedure. Voting powers in the Bank’s Management Committee are not based on the Bank’s capital criterion.
Withdrawal from the status of EU Member State or de-crease of the subscribed capital amount for a Member State are not foreseen by the legal provisions currently in force.
X.2. Subscribed capital and receivable reserves, called but not paid
As a consequence of the increase in subscribed capital from EUR 150 000 000 000 to EUR 163 653 737 000 as at 1 May, 2004, the total amount to be paid to capital and reserves by the ten new member States that joined on 1 May 2004 and Spain of EUR 2 408 million (composed of an amount of EUR 683 million for the capital and an amount of EUR 1 725 million for the reserves) is equally spread over 8 instalments: 30 September 2004, 30 Septem-ber 2005, 30 September 2006, 31 March 2007, 30 Septem-ber 2007, 31 March 2008, 30 September 2008 and 31 March 2009. The instalments up to and including 30 September 2008 have been entirely settled.
As at 1 January 2007, the subscribed capital has increased from EUR 163 653 737 000 to EUR 164 808 169 000, by virtue of the contributions of two new Member States that joined on 1 January 2007: Bulgaria and Romania. As a consequence of this capital increase, the two new Mem-ber States had to contribute to their share of Paid-in capital (EUR 57,7 million), and also their share of the Re-serves and General Provisions (EUR 172,9 million) for the amounts outstanding as of 31 December 2006. The total amount to be paid has been equally spread over 8 instal-ments: 31 May 2007, 31 May 2008, 31 May 2009, 30 No-vember 2009, 31 May 2010, 30 November 2010, 31 May 2011 and 30 November 2011. The instalments up to and including 31 May 2008 have been entirely settled.
The related net receivable from the Member States is shown in the consolidated balance sheet as follows under the caption Subscribed capital and receivable reserves, called but not paid:
31.12.2008 31.12.2007
Special deposits for service of borrowings (*) 134 772 129 428
Securities portfolio
- Securities receivable 157 480 0
Interest-rate swap and deferred rate-setting contracts (Notes R & T)
276 181 870
249 510 574
Currency swap contracts payable (Notes R & T) 115 600 764 80 992 893
Currency swap contracts receivable (Notes R & T) 106 514 766 75 549 044
Put option granted to EIF minority shareholders (Note A.4.21) 363 433 319 045
Borrowings arranged but not yet signed 0 401 574
Swaps arranged but not yet signed 0 94
Securities lent (Note B) 367 704 936 629
Future contracts (Notes R & T) 393 663 419 307
Forward rate agreements (Notes R & T) 5 472 000 0
FX Forwards (Notes R & T) 234 469 245 330
Overnight indexed swaps (Notes R & T) 0 6 000 000
Credit default swap 172 383 97 843(*) This item represents the amount of coupons and bonds due, paid by the Group to the paying agents, but not yet presented for payment by the holders
of bonds issued by the Group.

EIB Group – Financial Statements 95 EIB Group
X.3. Capital management
Even though the EIB is not subject to formal supervision, it has generally voluntarily submitted to major EU banking regulations and adopted market “best practice”. In particular, this applies to the new banking regulation (“Basel II”), issued in 2004 by the Basel Committee on Banking Supervision, approved by the EU and the Member States in 2006, and applied in Internal Rating Based EU financial institutions since 1 January 2008 (2006/48/EC as of 14 June 2006).
The implementation of the “Advanced Internal Ratings Based Approach (Advanced IRB)” for credit risk and Advanced Measurement Approach (AMA) for operational risk has been done under the technical assistance of the Commission de Surveillance du Secteur Financier (CSSF).
In addition to the monitoring of Basel II minimum capital requirements, stress tests assess the sensitivity of capital require-ments to changes in the macroeconomic environment and in the activities of the Group.
As at 31 December 2008, EIB Group’s Pillar I tier 1 capital adequacy ratio decreased to 35.3% (from 37.2% at the end of 2007), compared to the Basel II minimum capital adequacy level of 8%.
In EUR ´000 31.12.2008 31.12.2007
Subscribed capital called but not paid (nominal value) 128 627 306 514
Net present value adjustment - 3 878 - 11 648
Subscribed capital called but not paid (carrying value) 124 749 294 866
Receivable reserve called but not paid (nominal value) 345 359 798 295
Net present value adjustment - 11 183 - 31 658
Receivable reserve called but not paid (carrying value) 334 176 766 637
458 925 1 061 503

Financial Report 200896EIB Group
31.12.2008 31.12.2007
NON-EURO CURRENCIES OF EU MEMBER STATES
Pound sterling 0.952500 0.73335
Swedish kronor 10.8700 9.4415
Czech koruna 26.875 26.628
Polish zloty 4.1535 3.5935
Hungarian forint 266.70 253.73
Slovak koruna 30.126 33.583
Danish kroner 7.4506 7.4583
NON-COMMUNITY CURRENCIES
United States dollar 1.3917 1.4721
Japanese yen 126.14 164.93
Swiss franc 1.4850 1.6547
South African rand 13.0667 10.0298
Norvegian krone 9.7500 7.9580
Franc CFA 770.67 655.96
Moroccan dirham 11.2288 11.3203
Mauritania ouguiya 361.02 364.72
Canadian dollar 1.6998 1.4449
Jordanian dinar 0.9894 1.0327
Australian dollar 2.0274 1.6757
Samoan tala 3.9280 3.4613
Swozi lilangeni 13.1758 9.9358
Dominican peso 49.199 48.220
Rwanda franc 780.97 789.32
Note Y – Conversion rates
The following conversion rates were used for establishing the balance sheets at 31 December 2008 and 31 December 2007:
Note Z – Post-Balance Sheet Events
On a proposal from the Management Committee, the Board of Directors reviewed these consolidated Financial Statements on 12 March 2009 and decided to submit them to the Governors for approval at their meeting to be held on 9 June 2009.

EIB Group – Financial Statements 97 EIB Group
STATEMENT OF SPECIAL SECTION (1) as at 31 December 2008 (in EUR ’000)
ASSETS 31.12.2008 31.12.2007
Turkey
From resources of Member States
Disbursed loans outstanding 10 746 14 631
Total (2) 10 746 14 631
Mediterranean Countries
From resources of the European Community
Disbursed loans outstanding 140 039 150 859
Risk capital operations
- amounts to be disbursed 212 352 170 085
- amounts disbursed 203 739 218 050
416 091 388 135
Total (3) 556 130 538 994
African, Caribbean and Pacific State and Overseas Countries and Territories
From resources of the European Community
• YaoundéConventions
Loans disbursed 16 299 17 626
Contributions to the formation of risk capital
- amounts disbursed 419 419
Total (4) 16 718 18 045
• LoméConventions
Operations from risk capital resources:
- amounts to be disbursed 75 148 144 405
- amounts disbursed 923 457 1 056 938
998 605 1 201 343
Operations from other resources
- amounts to be disbursed 7 274 7 274
- amounts disbursed 3 925 4 864
11 199 12 138
Total (5) 1 009 804 1 213 481
TOTAL 1 593 398 1 785 151

Financial Report 200898EIB Group
LIABILITIES 31.12.2008 31.12.2007
Funds under trust management
Under mandate from the European Communities
- Financial Protocols with the Mediterranean Countries 343 778 368 909
- Yaoundé Conventions 16 718 18 045
- Lomé Conventions 923 457 1 056 938
- Other resources under the Lomé Conventions 3 925 4 864
1 287 878 1 448 756
Under mandate from Member States 10 746 14 631
Total 1 298 624 1 463 387
Funds to be disbursed
On loans and risk capital operations in the Mediterranean countries 212 352 170 085
On operations from risk capital resources under the Lomé Conventions 75 148 144 405
On operations from other resources under the Lomé Conventions 7 274 7 274
Total 294 774 321 764
TOTAL 1 593 398 1 785 151
For information:
Total amounts disbursed and not yet repaid on loans on special conditions made available by the Commission in respect of which the Bank has accepted an EC mandate for recovering principal and interest:
a) Under the First, Second and Third Lomé Conventions: at 31.12.2008 = 709 988 (at 31.12.2007: 764 994)
b) Under Financial Protocols signed with the Mediterranean Countries: at 31.12.2008 = 109 396 (at 31.12.2007: 115 476)
Note (1): The Special Section was set up by the Board of Governors on 27 May 1963: under a Decision taken on 4 August 1977 its purpose was redefined as being that of recording financing operations carried out by the European Investment Bank for the account of and under mandate from third parties. However, for the Investment Facility under the Cotonou Agreement and the FEMIP Trust Fund separate Financial Statements are presented. In addition, since 2005, the EIB also prepares financial statements of different types for other mandates.
The Statement of Special Section reflects amounts disbursed or to be disbursed, less cancellations and repayments, under mandate from the European Community and the Member States. No account is taken in the Statement of Special Section of provisions or value adjustments, which may be required to cover risks associated with such operations. Amounts in foreign currency are translated at exchange rates prevailing on 31 December.
Note (2): Initial amount of contracts signed for financing projects in Turkey under mandate, for the account and at the risk of Member States.
Initial amount: 405 899
add: exchange adjustments 19 291
less: cancellations 215
repayments 414 229
- 414 444
10 746

EIB Group – Financial Statements 99 EIB Group
Note (4): Initial amount of contracts signed for financing projects in the Associated African States, Madagascar and Mau-ritius and the Overseas Countries, Territories and Departments (AASMM-OCTD) under mandate, for the account and at the risk of the European Community:
- loans on special conditions 139 483
- contributions to the formation of risk capital 2 503
Initial amount: 141 986
add: capitalised interest 1 178
exchange adjustments 9 839
11 017
less: cancellations 1 758
repayments 134 527
- 136 285
16 718
Note (5): Initial amount of contracts signed for financing projects in the African, Caribbean and Pacific States and the Over-seas Countries and Territories (ACP-OCT) under mandate, for the account and at the risk of the European Community:
Loans from risk capital resources:
- conditional and subordinated loans 3 116 097
- equity participations 120 984
Initial amount: 3 237 081
add: capitalised interest 8 074
less: cancellations 633 663
repayments 1 553 994
exchange adjustments 58 893
- 2 246 550
998 605
Loans from other resources:
Initial amount: 16 500
less: cancellations 1 321
repayments 3 931
exchange adjustments 49
- 5 301
11 199
1 009 804
Note (3): Initial amount of contracts signed for financing projects in the Maghreb and Mashreq countries, Malta, Cyprus, Turkey and Greece (EUR 10 million lent prior to accession to the EC on 1 January 1981) under mandate, for the account and at the risk of the European Community.
Initial amount: 903 007
less: exchange adjustments 12 029
cancellations 71 530
repayments 263 318
- 346 877
556 130

Financial Report 2008100EIB Group
Independent Auditor’s Report
We have audited the accompanying consolidated financial statements of the European Investment Bank, which show a profit of EUR 6,355.715 million and a total balance sheet of EUR 351,960.559 million and which comprise the con-solidated balance sheet as at December 31, 2008, the con-solidated income statement, the statement of movements in consolidated own funds, the consolidated cash flow statement for the year then ended, and a summary of sig-nificant accounting policies and other explanatory notes to the consolidated financial statements.
Management Committee’s responsibility for the con-solidated financial statements
The Management Committee is responsible for the prepa-ration and fair presentation of these consolidated financial statements in accordance with International Financial Re-porting Standards and with the general principles of the Directives of the European Union on the annual accounts and consolidated accounts of certain types of companies, banks and other financial institutions and insurance under-takings. This responsibility includes: designing, implement-ing and maintaining internal control relevant to the preparation and fair presentation of consolidated financial statements that are free from material misstatement, whether due to fraud or error, selecting and applying ap-propriate accounting policies, and making accounting es-timates that are reasonable in the circumstances.
Responsibility of the “Réviseur d’Entreprises”
Our responsibility is to express an opinion on these con-solidated financial statements based on our audit. We conducted our audit in accordance with International Standards on Auditing as adopted by the Luxembourg “Institut des Réviseurs d’Entreprises”. Those standards re-quire that we comply with ethical requirements and plan and perform the audit to obtain reasonable assurance
whether the consolidated financial statements are free from material misstatement.
An audit involves performing procedures to obtain audit evidence about the amounts and disclosures in the con-solidated financial statements. The procedures selected depend on the judgement of the “Réviseur d’Entreprises”, including the assessment of the risks of material misstate-ment of the consolidated financial statements, whether due to fraud or error. In making those risk assessments, the “Réviseur d’Entreprises” considers internal control rel-evant to the entity’s preparation and fair presentation of the consolidated financial statements in order to design audit procedures that are appropriate in the circumstanc-es, but not for the purpose of expressing an opinion on the effectiveness of the entity’s internal control.
An audit also includes evaluating the appropriateness of accounting policies used and the reasonableness of ac-counting estimates made by the Management Commit-tee, as well as evaluating the overall presentation of the consolidated financial statements. We believe that the audit evidence we have obtained is sufficient and appro-priate to provide a basis for our audit opinion.
Opinion
In our opinion, the consolidated financial statements give a true and fair view of the consolidated financial position of the European Investment Bank as of December 31, 2008, of its consolidated financial performance, of its movements in consolidated own funds and of its consoli-dated cash flows for the year then ended in accordance with International Financial Reporting Standards and with the general principles of the Directives of the European Union on the annual accounts and consolidated accounts of certain types of companies, banks and other financial institutions and insurance undertakings.
To the chairman of the Audit Committee of EUROPEAN INVESTMENT BANK Luxembourg
March 12, 2009
ERNST & YOUNG
Société Anonyme
Réviseurs d’Entreprises
Alain KINSCH Bernard LHOEST

EIB Group – Financial Statements 101 EIB Group
Luxembourg, 12 March 2009
The Audit Committee
C. KARMIOS O. KLAPPER G. SMYTH
Statement by the Audit Committee
The Audit Committee reports to the Board of Governors, the following statement being communicated to the Gov-ernors prior to their approval of the Annual Report and the financial statements for the past financial year.
Statement by the Audit Committee on the EIB con-solidated financial statements
The Committee, instituted in pursuance of Article 14 of the Statute and Article 25 of the Rules of Procedure of the European Investment Bank for the purpose of verifying that the operations of the Bank are conducted and its books kept in a proper manner, having
designated Ernst & Young as external auditors, re- •viewed their audit planning process, examined and discussed their reports,
noted that the opinion of Ernst & Young on the con- •solidated financial statements of the European Invest-ment Bank for the year ended 31 December 2008 is unqualified,
convened on a regular basis with the Heads of Directo- •rates and relevant services, met regularly the Head of Internal Audit and discussed the relevant internal audit reports, and studied the documents which it deemed necessary to examine in the discharge of its duties,
received assurance from the Management Committee •concerning the effectiveness of the internal control structure and internal administration,
and considering
the consolidated financial statements for the financial •year ending on 31 December 2008 as drawn up by the Board of Directors at its meeting on 12 March 2009,
that the foregoing provides a reasonable basis for its •statement and,
Articles 22, 23 & 24 of the Rules of Procedure, •
to the best of its knowledge and judgement:
confirms that the consolidated financial statements, com-prising the consolidated balance sheet, the consolidated income statement, the statement of movements in con-solidated own funds, the consolidated cash flow state-ment and the notes to the consolidated financial statements give a true and fair view of the financial posi-tion of the Bank as at 31 December 2008 in respect of its assets and liabilities, and of the results of its operations and cash flows for the year then ended.


EIB – Financial Statements 103 EIB Group
Financial StatementsEIB

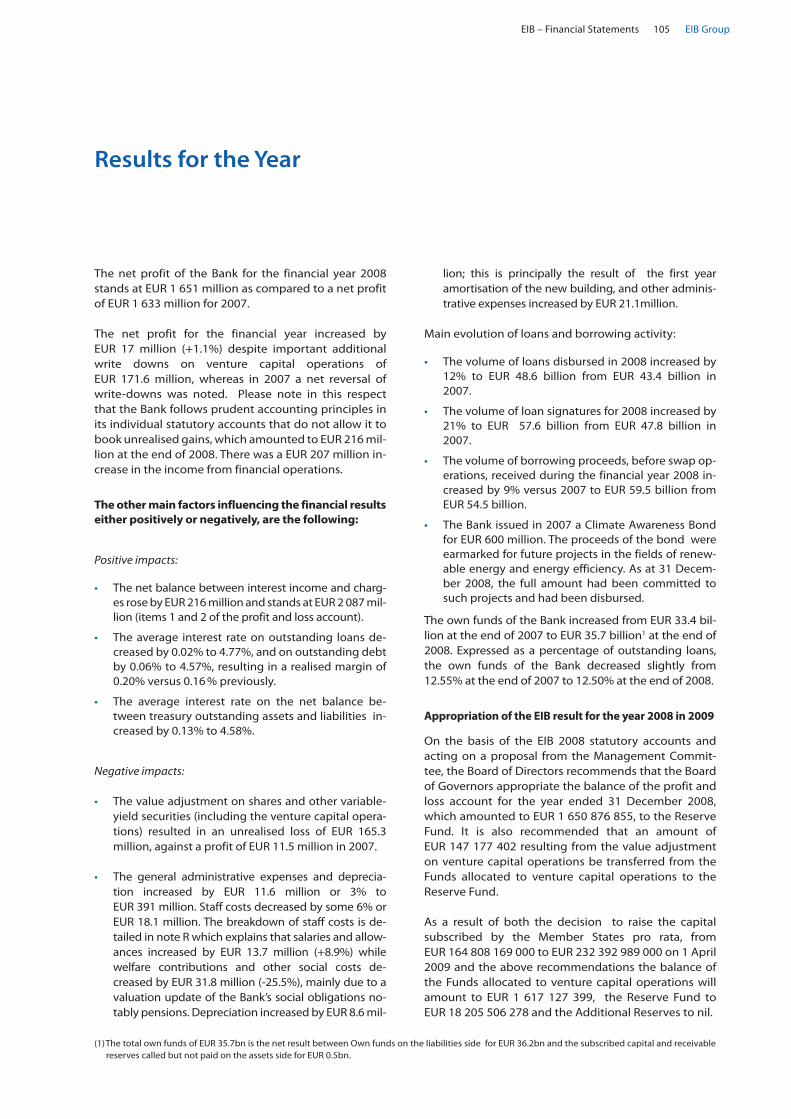
EIB – Financial Statements 105 EIB Group
Results for the Year
The net profit of the Bank for the financial year 2008 stands at EUR 1 651 million as compared to a net profit of EUR 1 633 million for 2007.
The net profit for the financial year increased by EUR 17 million (+1.1%) despite important additional write downs on venture capital operations of EUR 171.6 million, whereas in 2007 a net reversal of write-downs was noted. Please note in this respect that the Bank follows prudent accounting principles in its individual statutory accounts that do not allow it to book unrealised gains, which amounted to EUR 216 mil-lion at the end of 2008. There was a EUR 207 million in-crease in the income from financial operations.
The other main factors influencing the financial results either positively or negatively, are the following:
Positive impacts:
The net balance between interest income and charg- •es rose by EUR 216 million and stands at EUR 2 087 mil-lion (items 1 and 2 of the profit and loss account).
The average interest rate on outstanding loans de- •creased by 0.02% to 4.77%, and on outstanding debt by 0.06% to 4.57%, resulting in a realised margin of 0.20% versus 0.16 % previously.
The average interest rate on the net balance be- •tween treasury outstanding assets and liabilities in-creased by 0.13% to 4.58%.
Negative impacts:
The value adjustment on shares and other variable- •yield securities (including the venture capital opera-tions) resulted in an unrealised loss of EUR 165.3 million, against a profit of EUR 11.5 million in 2007.
The general administrative expenses and deprecia- •tion increased by EUR 11.6 million or 3% to EUR 391 million. Staff costs decreased by some 6% or EUR 18.1 million. The breakdown of staff costs is de-tailed in note R which explains that salaries and allow-ances increased by EUR 13.7 million (+8.9%) while welfare contributions and other social costs de-creased by EUR 31.8 million (-25.5%), mainly due to a valuation update of the Bank’s social obligations no-tably pensions. Depreciation increased by EUR 8.6 mil-
lion; this is principally the result of the first year amortisation of the new building, and other adminis-trative expenses increased by EUR 21.1million.
Main evolution of loans and borrowing activity:
The volume of loans disbursed in 2008 increased by •12% to EUR 48.6 billion from EUR 43.4 billion in 2007.
The volume of loan signatures for 2008 increased by •21% to EUR 57.6 billion from EUR 47.8 billion in 2007.
The volume of borrowing proceeds, before swap op- •erations, received during the financial year 2008 in-creased by 9% versus 2007 to EUR 59.5 billion from EUR 54.5 billion.
The Bank issued in 2007 a Climate Awareness Bond •for EUR 600 million. The proceeds of the bond were earmarked for future projects in the fields of renew-able energy and energy efficiency. As at 31 Decem-ber 2008, the full amount had been committed to such projects and had been disbursed.
The own funds of the Bank increased from EUR 33.4 bil-lion at the end of 2007 to EUR 35.7 billion1 at the end of 2008. Expressed as a percentage of outstanding loans, the own funds of the Bank decreased slightly from 12.55% at the end of 2007 to 12.50% at the end of 2008.
Appropriation of the EIB result for the year 2008 in 2009
On the basis of the EIB 2008 statutory accounts and acting on a proposal from the Management Commit-tee, the Board of Directors recommends that the Board of Governors appropriate the balance of the profit and loss account for the year ended 31 December 2008, which amounted to EUR 1 650 876 855, to the Reserve Fund. It is also recommended that an amount of EUR 147 177 402 resulting from the value adjustment on venture capital operations be transferred from the Funds allocated to venture capital operations to the Reserve Fund.
As a result of both the decision to raise the capital subscribed by the Member States pro rata, from EUR 164 808 169 000 to EUR 232 392 989 000 on 1 April 2009 and the above recommendations the balance of the Funds allocated to venture capital operations will amount to EUR 1 617 127 399, the Reserve Fund to EUR 18 205 506 278 and the Additional Reserves to nil.
(1) The total own funds of EUR 35.7bn is the net result between Own funds on the liabilities side for EUR 36.2bn and the subscribed capital and receivable reserves called but not paid on the assets side for EUR 0.5bn.

Financial Report 2008106EIB Group
Assets 31.12.2008 31.12.2007
1 Cash in hand, balances with central banks and post office banks 76 27 318
2. Treasury bills eligible for refinancing with central banks (Note B)
1 908 756 2 126 591
3. Loans and advances to credit institutions
a) repayable on demand 245 372 264 388
b) other loans and advances (Note C) 21 361 419 15 476 020
c) loans (Note D.1) 111 990 666 111 215 441
133 597 457 126 955 849
4. Loans and advances to customers
a) loans (Note D.1) 173 662 179 155 222 398
b) specific provisions (Note D.3) - 22 000 - 41 550
173 640 179 155 180 848
5. Debt securities including fixed-income securities (Note B)
a) issued by public bodies 454 413 451 974
b) issued by other borrowers 10 278 428 10 068 851
10 732 841 10 520 825
6. Shares and other variable-yield securities (Note E) 1 366 456 1 395 666
7. Participating Interests (Note E.2) 479 272 479 272
8. Intangible assets (Note F) 4 316 3 972
9. Property, furniture and equipment (Note F) 313 881 280 257
10. Other assets
a) sundry debtors (Note H) 148 584 125 211
148 584 125 211
11. Subscribed capital and receivable reserves, called but not paid (Note Y) 473 986
1 104 809
12. Prepayments and accrued income (Note I) 3 095 170 3 653 733
Total Assets 325 760 974 301 854 351
Off-balance-sheet items 31.12.2008 31.12.2007
Commitments
- EBRD capital (Note E.1)- uncalled 442 500 442 500
- EIF capital (Note E.2)- uncalled 1 457 600 1 457 600
- Undisbursed loans (Notes D.1 and W)- credit institutions 12 457 853 12 341 869
- customers 46 411 674 41 264 752
58 869 527 53 606 621
- Undisbursed venture capital operations (Note E.1) 1 088 046 1 252 992
- Undisbursed infrastructure funds (Note E.1) 241 627 233 620
- Undisbursed investment funds (Note E.1) 93 094 95 000
Guarantees (Note D)
- In respect of loans granted by third parties 246 621 149 779- In respect of venture capital operations 15 171 15 463
EIF treasury management 851 595 799 946
Guarantee Fund treasury management 1 091 447 1 152 974
FP7 Guarantee Fund treasury management 283 132 0
Balance sheet as at 31 December 2008 (in EUR ’000)
The accompanying notes form an integral part of these financial statments

EIB – Financial Statements 107 EIB Group
Liabilities 31.12.2008 31.12.2007
1. Amounts owed to credit institutions (Note J)
a) with agreed maturity dates or periods of notice 5 958 407 341 718
5 958 407 341 718
2. Debts evidenced by certificates (Note K)
a) debt securities in issue 266 320 259 253 328 921
b) others 668 769 892 400
266 989 028 254 221 321
3. Other liabilities
a) sundry creditors (Note H) 1 449 061 1 141 002
b) sundry liabilities 18 352 16 838
c) foreign exchange neutralization on currency swap contracts (Note K) 9 055 318 5 458 234
10 522 731 6 616 074
4. Accruals and deferred income (Notes G and I) 4 905 090 5 030 476
5. Provisions for liabilities and charges
a) pension plans and health insurance scheme (Note L) 1 187 653 1 097 574
b) provision for guarantees issued in respect of venture capital operations 5 781 5 781
1 193 434 1 103 355
6. Capital (Note Y)
- Subscribed 164 808 169 164 808 169
- Uncalled - 156 567 760 - 156 567 760
8 240 409 8 240 409
7. Reserves
a) reserve fund 16 480 817 16 480 817
b) additional reserves 5 305 876 5 245 781
21 786 693 21 726 598
8. Funds allocated to structured finance facility 2 750 000 1 250 000
9. Funds allocated to venture capital operations 1 764 305 1 690 940
10. Profit for the financial year 1 650 877 1 633 460
Total Liabilities 325 760 974 301 854 351
Off-balance-sheet items 31.12.2008 31.12.2007
Special deposits for service of borrowings (Note S) 134 772 129 428
Securities receivable 157 480 0
Nominal value of interest rate swap contracts (Note V.1) 276 181 870 249 510 574
Nominal value of currency swap contracts payable (Note V) 115 600 764 80 992 893
Nominal value of currency swap contracts receivable (Note V) 106 514 766 75 549 044
Nominal value of credit default swaps (Note V.1) 172 383 97 843
Nominal value of put option granted to EIF minority shareholders (Note E.2) 363 433 319 045
Borrowings arranged but not yet signed 0 401 574
Swaps arranged but not yet signed 0 94
Securities lending (Note B) 306 934 858 762
Futures contracts (Note V.2) 393 663 419 307
Forward rate agreement (Note V.2) 5 472 000 0
FX forward (Note V.2) 234 469 245 330
Nominal value of overnight Indexed swaps (Note V.2) 0 6 000 000
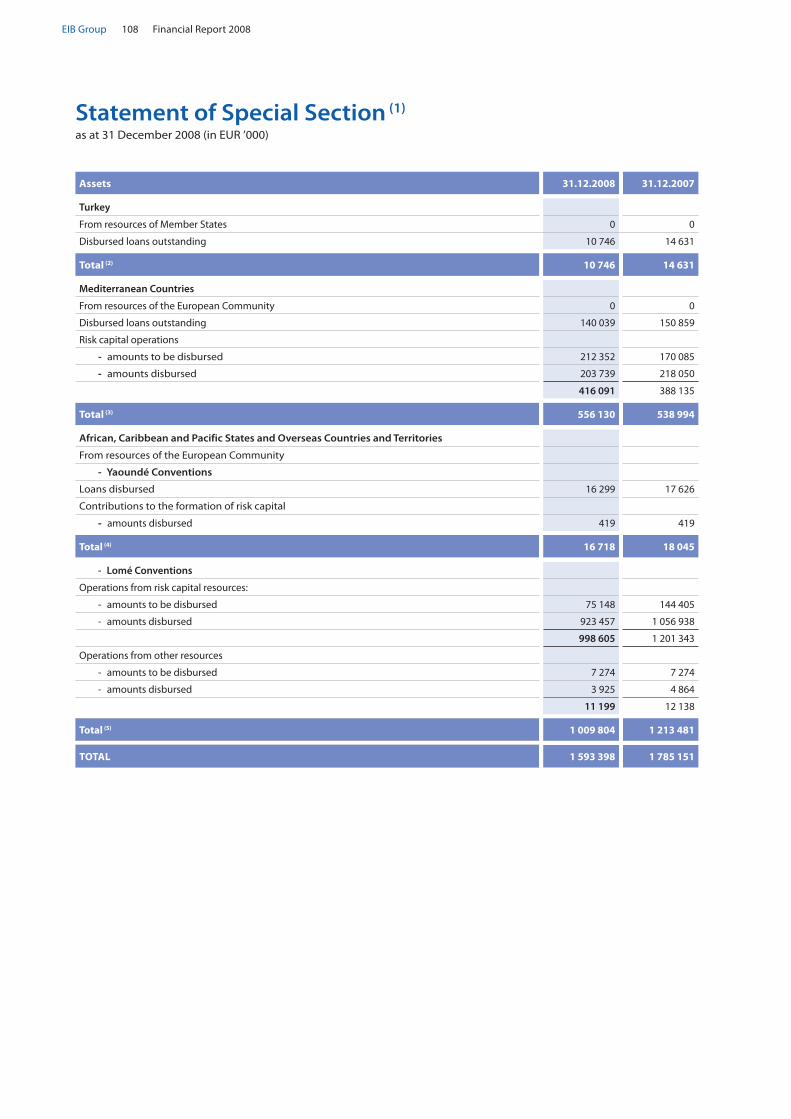
Financial Report 2008108EIB Group
Statement of Special Section (1) as at 31 December 2008 (in EUR ’000)
Assets 31.12.2008 31.12.2007
Turkey
From resources of Member States 0 0
Disbursed loans outstanding 10 746 14 631
Total (2) 10 746 14 631
Mediterranean Countries
From resources of the European Community 0 0
Disbursed loans outstanding 140 039 150 859
Risk capital operations
- amounts to be disbursed 212 352 170 085
- amounts disbursed 203 739 218 050
416 091 388 135
Total (3) 556 130 538 994
African, Caribbean and Pacific States and Overseas Countries and Territories
From resources of the European Community
- Yaoundé Conventions
Loans disbursed 16 299 17 626
Contributions to the formation of risk capital
- amounts disbursed 419 419
Total (4) 16 718 18 045
- Lomé Conventions
Operations from risk capital resources:
- amounts to be disbursed 75 148 144 405
- amounts disbursed 923 457 1 056 938
998 605 1 201 343
Operations from other resources
- amounts to be disbursed 7 274 7 274
- amounts disbursed 3 925 4 864
11 199 12 138
Total (5) 1 009 804 1 213 481
TOTAL 1 593 398 1 785 151
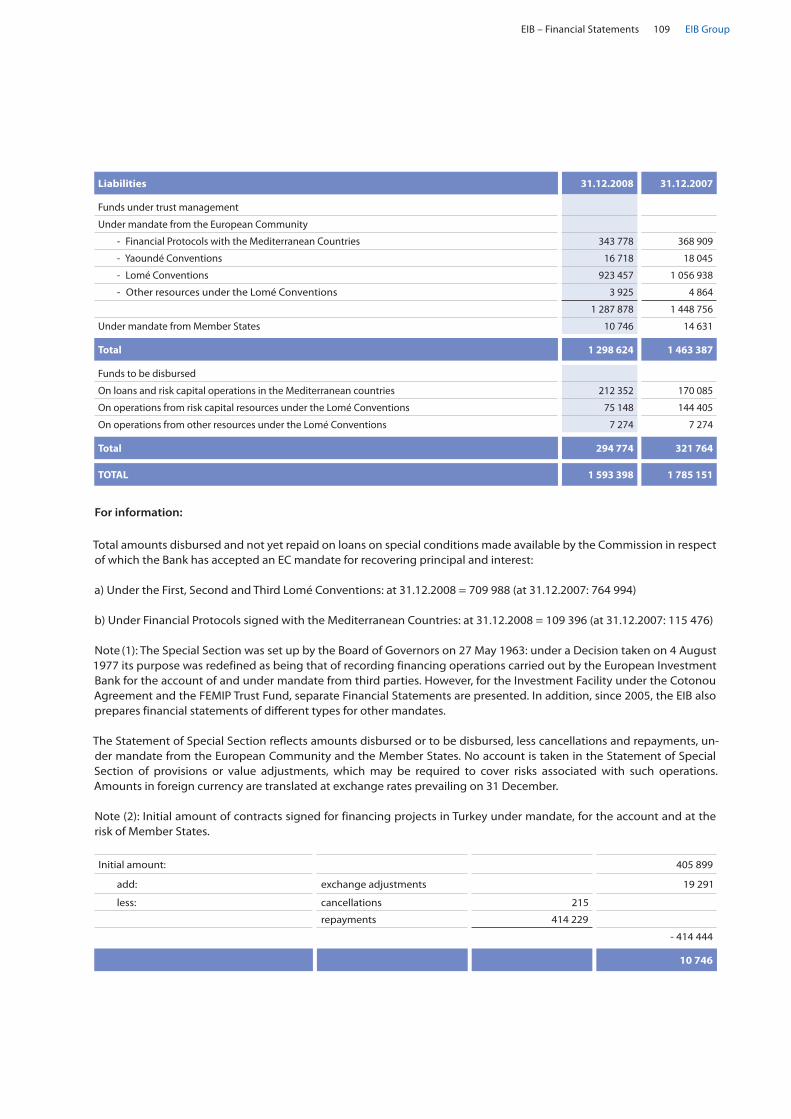
EIB – Financial Statements 109 EIB Group
Liabilities 31.12.2008 31.12.2007
Funds under trust management
Under mandate from the European Community
- Financial Protocols with the Mediterranean Countries 343 778 368 909
- Yaoundé Conventions 16 718 18 045
- Lomé Conventions 923 457 1 056 938
- Other resources under the Lomé Conventions 3 925 4 864
1 287 878 1 448 756
Under mandate from Member States 10 746 14 631
Total 1 298 624 1 463 387
Funds to be disbursed
On loans and risk capital operations in the Mediterranean countries 212 352 170 085
On operations from risk capital resources under the Lomé Conventions 75 148 144 405
On operations from other resources under the Lomé Conventions 7 274 7 274
Total 294 774 321 764
TOTAL 1 593 398 1 785 151
For information:
Total amounts disbursed and not yet repaid on loans on special conditions made available by the Commission in respect of which the Bank has accepted an EC mandate for recovering principal and interest:
a) Under the First, Second and Third Lomé Conventions: at 31.12.2008 = 709 988 (at 31.12.2007: 764 994)
b) Under Financial Protocols signed with the Mediterranean Countries: at 31.12.2008 = 109 396 (at 31.12.2007: 115 476)
Note (1): The Special Section was set up by the Board of Governors on 27 May 1963: under a Decision taken on 4 August 1977 its purpose was redefined as being that of recording financing operations carried out by the European Investment Bank for the account of and under mandate from third parties. However, for the Investment Facility under the Cotonou Agreement and the FEMIP Trust Fund, separate Financial Statements are presented. In addition, since 2005, the EIB also prepares financial statements of different types for other mandates.
The Statement of Special Section reflects amounts disbursed or to be disbursed, less cancellations and repayments, un-der mandate from the European Community and the Member States. No account is taken in the Statement of Special Section of provisions or value adjustments, which may be required to cover risks associated with such operations. Amounts in foreign currency are translated at exchange rates prevailing on 31 December.
Note (2): Initial amount of contracts signed for financing projects in Turkey under mandate, for the account and at the risk of Member States.
Initial amount: 405 899
add: exchange adjustments 19 291
less: cancellations 215
repayments 414 229
- 414 444
10 746

Financial Report 2008110EIB Group
Note (3): Initial amount of contracts signed for financing projects in the Maghreb and Mashreq countries, Malta, Cyprus, Turkey and Greece (EUR 10 million lent prior to accession to the EC on 1 January 1981) under mandate, for the account and at the risk of the European Community.
Initial amount: 903 007
less: exchange adjustments 12 029
cancellations 71 530
repayments 263 318
- 346 877
556 130
Note (4): Initial amount of contracts signed for financing projects in the Associated African States, Madagascar and Mau-ritius and the Overseas Countries, Territories and Departments (AASMM-OCTD) under mandate, for the account and at the risk of the European Community:
- loans on special conditions 139 483
- contributions to the formation of risk capital 2 503
Initial amount: 141 986
add: capitalised interest 1 178
exchange adjustments 9 839
11 017
less: cancellations 1 758
repayments 134 527
- 136 285
16 718
Note (5): Initial amount of contracts signed for financing projects in the African, Caribbean and Pacific States and the Overseas Countries and Territories (ACP-OCT) under mandate, for the account and at the risk of the European Community:
Loans from risk capital resources:
- conditional and subordinated loans 3 116 097
- equity participations 120 984
Initial amount: 3 237 081
add: capitalised interest 8 074
less: cancellations 633 663
repayments 1 553 994
exchange adjustments 58 893
- 2 246 550
998 605
Loans from other resources:
Initial amount: 16 500
less: cancellations 1 321
repayments 3 931
exchange adjustments 49
- 5 301
11 199
1 009 804
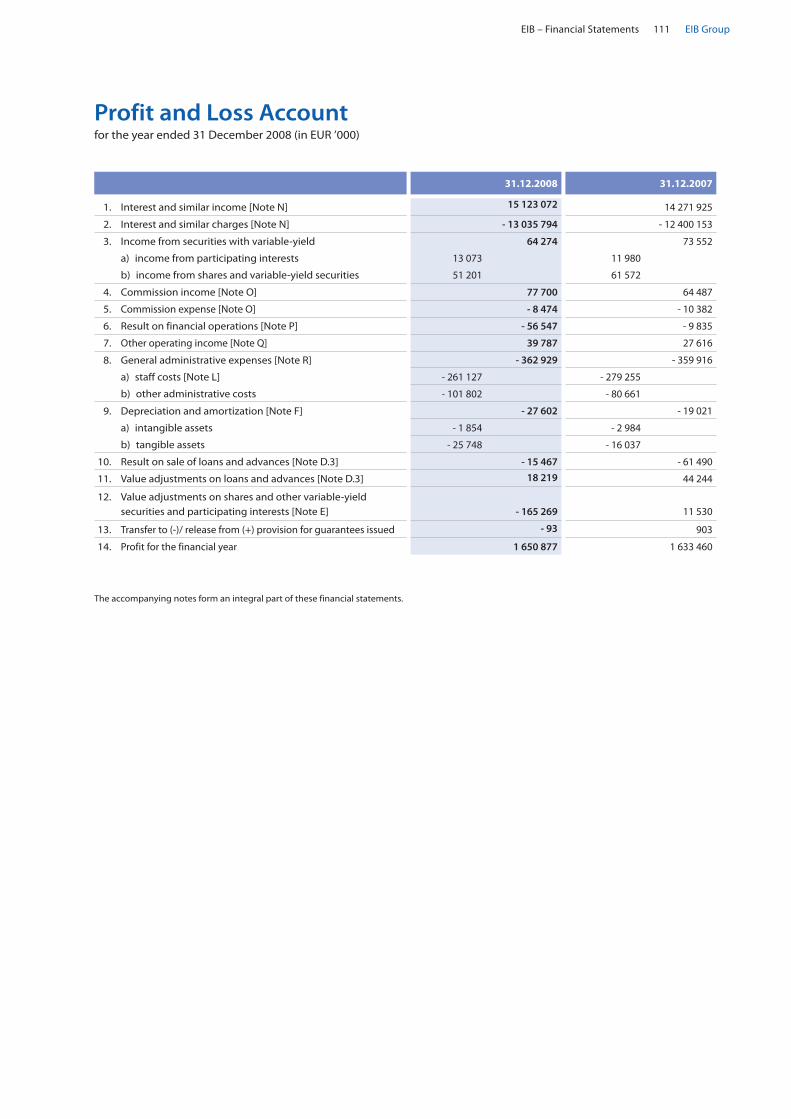
EIB – Financial Statements 111 EIB Group
Profit and Loss Account for the year ended 31 December 2008 (in EUR ’000)
31.12.2008 31.12.2007
1. Interest and similar income [Note N] 15 123 072 14 271 925
2. Interest and similar charges [Note N] - 13 035 794 - 12 400 153
3. Income from securities with variable-yield 64 274 73 552
a) income from participating interests 13 073 11 980
b) income from shares and variable-yield securities 51 201 61 572
4. Commission income [Note O] 77 700 64 487
5. Commission expense [Note O] - 8 474 - 10 382
6. Result on financial operations [Note P] - 56 547 - 9 835
7. Other operating income [Note Q] 39 787 27 616
8. General administrative expenses [Note R] - 362 929 - 359 916
a) staff costs [Note L] - 261 127 - 279 255
b) other administrative costs - 101 802 - 80 661
9. Depreciation and amortization [Note F] - 27 602 - 19 021
a) intangible assets - 1 854 - 2 984
b) tangible assets - 25 748 - 16 037
10. Result on sale of loans and advances [Note D.3] - 15 467 - 61 490
11. Value adjustments on loans and advances [Note D.3] 18 219 44 244
12. Value adjustments on shares and other variable-yield securities and participating interests [Note E]
- 165 269
11 530
13. Transfer to (-)/ release from (+) provision for guarantees issued - 93 903
14. Profit for the financial year 1 650 877 1 633 460
The accompanying notes form an integral part of these financial statements.

Financial Report 2008112EIB Group
Statement of movements in own funds (in EUR ’000) 31.12.2008 31.12.2007
Share Capital
- Subscribed capital 164 808 169 164 808 169
- Uncalled - 156 567 760 - 156 567 760
- Called capital 8 240 409 8 240 409
- Less: Capital called but not paid - 128 627 - 306 514
- Paid in capital 8 111 782 7 933 895
Reserves and profit for the year:
Reserve Fund
- Balance at beginning of the year 16 480 817 16 365 374
- Payable by Member States 0 115 443
- Balance at end of the year 16 480 817 16 480 817
- Less: Receivable from Member States - 345 359 - 798 295
- Paid-in balance at end of the year 16 135 458 15 682 522
Additional reserves
- Balance at beginning of the year 5 245 781 2 649 498
- Appropriation of prior year’s profit 1 633 460 2 584 026
- Payable by Member States 0 39 373
- Transfer to Funds allocated to structured finance facility - 1 500 000 0
- Transfer to Funds allocated to venture capital operations - 73 365 - 27 116
- Balance at end of the year 5 305 876 5 245 781
Funds allocated to structured finance facility
- Balance at beginning of the year 1 250 000 1 250 000
- Transfer from additional reserves 1 500 000 0
- Balance at end of the year 2 750 000 1 250 000
Funds allocated to venture capital operations
- Balance at beginning of the year 1 690 940 1 663 824
- Transfer from/to Additional reserves 73 365 27 116
- Balance at end of the year 1 764 305 1 690 940
Profit for the financial year 1 650 877 1 633 460
Total own funds 35 718 298 33 436 598
Own Funds and Appropriation of Profit
As at 1 January 2007, the subscribed capital has increased from EUR ‘000 163 653 737 to EUR ‘000 164 808 169, by virtue of the contributions of two new Member States : Bulgaria and Romania.
As a consequence of this capital increase, the two new Member States had to contribute to their share of Paid-in capital (EUR ‘000 57 722), and also their share of the Reserves and General Provisions (EUR ‘000 172 932) for the amounts out-standing as of 31 December 2006.
At its annual meeting on 3 June 2008, the Board of Governors decided to appropriate the balance of the profit and loss account for the year ended 31 December 2007, which amounted to EUR ‘000 1 633 460, to the Additional reserves.
The Board of Governors also decided to transfer an amount of EUR ‘000 1 500 000 from the Additional reserves to the Funds allocated to structured finance facility.
Furthermore, an amount of EUR ’000 73 365 resulting from the value adjustment on venture capital operations has also been transferred to the Funds allocated to venture capital operations from the Additional Reserves. Following this trans-fer, the Funds allocated to venture capital operations amount to EUR ‘000 1 764 305 and the Additional reserves to EUR ‘000 5 305 876.
The accompanying notes form an integral part of these financial statments

EIB – Financial Statements 113 EIB Group
Statement of Subscriptions to the Capital of the Bank as at 31 December 2008 (in EUR)
Member States Subscribed capital Uncalled capital (*) Paid-in and to be paid-in capital at 31.12.2008 (**)
GERMANY 26 649 532 500 25 316 065 017 1 333 467 483
FRANCE 26 649 532 500 25 316 065 017 1 333 467 483
ITALY 26 649 532 500 25 316 065 017 1 333 467 483
UNITED KINGDOM 26 649 532 500 25 316 065 017 1 333 467 483
SPAIN 15 989 719 500 15 191 419 977 798 299 523
NETHERLANDS 7 387 065 000 7 018 606 548 368 458 452
BELGIUM 7 387 065 000 7 018 606 548 368 458 452
SWEDEN 4 900 585 500 4 655 556 231 245 029 269
DENMARK 3 740 283 000 3 553 721 865 186 561 135
AUSTRIA 3 666 973 500 3 483 624 843 183 348 657
POLAND 3 411 263 500 3 240 700 325 170 563 175
FINLAND 2 106 816 000 2 001 475 188 105 340 812
GREECE 2 003 725 500 1 903 781 233 99 944 267
PORTUGAL 1 291 287 000 1 226 879 033 64 407 967
CZECH REPUBLIC 1 258 785 500 1 195 846 225 62 939 275
HUNGARY 1 190 868 500 1 131 325 075 59 543 425
IRELAND 935 070 000 888 429 814 46 640 186
ROMANIA 863 514 500 820 338 775 43 175 725
SLOVAK REPUBLIC 428 490 500 407 065 975 21 424 525
SLOVENIA 397 815 000 377 924 250 19 890 750
BULGARIA 290 917 500 276 371 625 14 545 875
LITHUANIA 249 617 500 237 136 625 12 480 875
LUXEMBOURG 187 015 500 177 687 377 9 328 123
CYPRUS 183 382 000 174 212 900 9 169 100
LATVIA 152 335 000 144 718 250 7 616 750
ESTONIA 117 640 000 111 758 000 5 882 000
MALTA 69 804 000 66 313 800 3 490 200
TOTAL 164 808 169 000 156 567 760 550 8 240 408 450
(*) Could be called by decision of the Board of Directors to such extent as may be required for the Bank to meet its obligations towards those who have made loans to it.
(**) Refer to Note Y for details on the payment schedule on capital to be paid-in.
At its meeting on 16 December 2008, the Board of Directors approved to submit the following proposal for a capital increase to the Board of Governors:
to raise the capital subscribed by the Member States pro-rata, from EUR 164 808 169 000 to EUR 232 392 989 000, on the 1− st April 2009.
to maintain the paid-in ratio for the capital increase at its current level of 5%.−
The accompanying notes form an integral part of these financial statements.
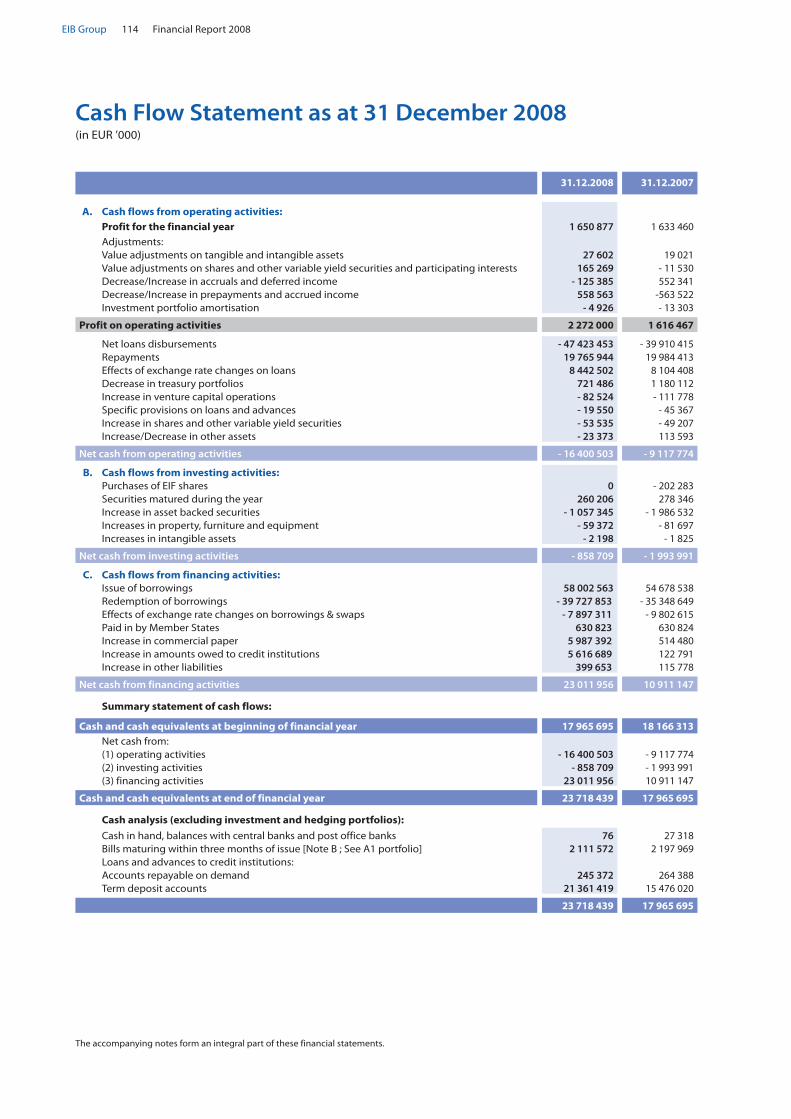
Financial Report 2008114EIB Group
Cash Flow Statement as at 31 December 2008 (in EUR ’000)
The accompanying notes form an integral part of these financial statements.
31.12.2008 31.12.2007
A. Cash flows from operating activities:Profit for the financial year 1 650 877 1 633 460
Adjustments:Value adjustments on tangible and intangible assets 27 602 19 021Value adjustments on shares and other variable yield securities and participating interests 165 269 - 11 530Decrease/Increase in accruals and deferred income - 125 385 552 341Decrease/Increase in prepayments and accrued income 558 563 -563 522Investment portfolio amortisation - 4 926 - 13 303
Profit on operating activities 2 272 000 1 616 467
Net loans disbursements - 47 423 453 - 39 910 415Repayments 19 765 944 19 984 413Effects of exchange rate changes on loans 8 442 502 8 104 408Decrease in treasury portfolios 721 486 1 180 112Increase in venture capital operations - 82 524 - 111 778Specific provisions on loans and advances - 19 550 - 45 367Increase in shares and other variable yield securities - 53 535 - 49 207Increase/Decrease in other assets - 23 373 113 593
Net cash from operating activities - 16 400 503 - 9 117 774
B. Cash flows from investing activities:Purchases of EIF shares 0 - 202 283Securities matured during the year 260 206 278 346Increase in asset backed securities - 1 057 345 - 1 986 532Increases in property, furniture and equipment - 59 372 - 81 697Increases in intangible assets - 2 198 - 1 825
Net cash from investing activities - 858 709 - 1 993 991
C. Cash flows from financing activities:Issue of borrowings 58 002 563 54 678 538Redemption of borrowings - 39 727 853 - 35 348 649Effects of exchange rate changes on borrowings & swaps - 7 897 311 - 9 802 615Paid in by Member States 630 823 630 824Increase in commercial paper 5 987 392 514 480Increase in amounts owed to credit institutions 5 616 689 122 791Increase in other liabilities 399 653 115 778
Net cash from financing activities 23 011 956 10 911 147
Summary statement of cash flows:
Cash and cash equivalents at beginning of financial year 17 965 695 18 166 313Net cash from: (1) operating activities - 16 400 503 - 9 117 774(2) investing activities - 858 709 - 1 993 991(3) financing activities 23 011 956 10 911 147
Cash and cash equivalents at end of financial year 23 718 439 17 965 695
Cash analysis (excluding investment and hedging portfolios):
Cash in hand, balances with central banks and post office banks 76 27 318Bills maturing within three months of issue [Note B ; See A1 portfolio] 2 111 572 2 197 969Loans and advances to credit institutions:Accounts repayable on demand 245 372 264 388Term deposit accounts 21 361 419 15 476 020
23 718 439 17 965 695
EIB – Financial Statements 115 EIB Group
Note A – Significant accounting policies
A.1. Accounting standards
The unconsolidated financial statements (the ‘Financial Statements’) of the European Investment Bank (the ‘Bank’ or ‘EIB’) have been prepared in accordance with the gen-eral principles of the Directive 86/635/EEC of the Council of the European Communities of 8 December 1986 on the annual accounts and consolidated accounts of banks and other financial institutions (the ‘Directive’), as amend-ed by Directive 2001/65/EC of 27 September 2001 and by Directive 2003/51/EC of 18 June 2003 on the annual and consolidated accounts of certain types of companies, banks and other financial institutions and insurance un-dertakings (the ‘Directives’). However, the Financial State-ments do not include any management report. The Bank prepares an Activity Report which is presented separately from the Financial Statements and its consistency with the Financial Statements is not audited.
On a proposal from the Management Committee, the Board of Directors decided on 12 March 2009 to submit the Financial Statements to the Governors for approval at their meeting on 9 June 2009.
In preparing the Financial Statements, the Management Committee is required to make estimates and assump-tions that affect reported income, expenses, assets, lia-bilities and disclosure of contingent assets and liabilities. Use of available information and application of judge-ment are inherent in the formation of estimates. Actual results in the future could differ from such estimates and the resulting differences may be material to the Fi-nancial Statements.
The Bank also publishes consolidated financial statements as of the same date as the annual Financial Statements.
A.2. Foreign currency translation
In accordance with Article 4(1) of its Statute, the EIB uses the euro (EUR), the single currency of the Member States participating in the third stage of Economic and Mone-tary Union, as the unit of measure for the capital ac-counts of Member States and for presenting its Financial Statements.
The Bank conducts its operations in the currencies of its Member States, in euro and in non-Community curren-cies.
Its resources are derived from its capital, borrowings and accumulated earnings in various currencies and are held, invested or lent in the same currencies.
Foreign currency transactions are translated at the ex-change rate prevailing on the date of the transaction.
The Bank’s assets and liabilities denominated in curren-cies other than in euro are translated at closing ex-change rates prevailing at the balance sheet date. The gain or loss arising from such translation is recorded in the profit and loss account.
The elements of the profit and loss accounts are trans-lated into euro monthly on the basis of the exchange rates prevailing at the end of each month.
A.3. Derivatives
The Bank uses derivative instruments, i.e. mainly curren-cy and interest rate swaps, as part of its asset and liabili-ty management activities to manage exposures to interest rate and foreign currency risks, including expo-sures arising from forecast transactions.
The majority of the Bank’s swaps are concluded with a view to hedging specific bond issues. The Bank enters into currency swaps, in which, at inception the proceeds of a borrowing are converted into a different currency, mainly as part of its resource-raising operations, and, thereafter, the Bank will obtain the amounts needed to service the borrowing in the original currency. The amounts corresponding to these operations are booked as off-balance sheet items at the date of the transaction.
The Bank also enters into currency, interest rate and overnight index swaps as part of its hedging operations on loans or for the global ALM position. The correspond-ing interest is accounted for on a prorata temporis basis. The nominal amounts of these swaps are booked as off-balance sheet items at the date of the transaction.
The Bank also enters into short-term currency swap con-tracts in order to adjust currency positions in its opera-tional treasury in relation to its benchmark currency, the euro, and to cater for demand for currencies in conjunc-tion with loan disbursements.
The Bank also enters into credit default swaps as part of its credit risk mitigation. The corresponding amounts are booked as off-balance sheet items at the date of the transaction.
European Investment Bank
Notes to the financial statementsas at 31 december 2008
Financial Report 2008116EIB Group
A.4. Financial assets
Financial assets are accounted for using the settlement date basis.
A.5. Cash and Cash Equivalents
The Bank defines cash equivalents as short-term, highly liquid securities and interest-earning deposits with orig-inal maturities of 90 days or less.
A.6. Treasury bills and other bills eligible for refinancing with central banks and debt securities including fixed-income securities
With a view to clarifying management of its liquid assets and consolidating its solvency, the Bank has established the following portfolio categories:
A.6.1. Investment portfolio
The investment portfolio consists of securities pur-chased with the intention of holding them to maturity. These securities are issued or guaranteed by:
Governments of the European Union, G10 countries •and their agencies;
Supranational public institutions, including multi- •national development banks.
These securities are initially recorded at purchase price or more exceptionally at transfer price. Value impair-ments are accounted for, if these are other than tempo-rary. The difference between entry price and redemption value is accounted for prorata temporis over the remain-ing life of the securities.
In 2006, the Bank decided to phase out the investment portfolio. Since then, the Bank did not make any new addition to the investment portfolio and will keep the existing portfolio lines until final maturity upon which the redemption proceeds of such matured securities will be invested in the operational portfolios described in paragraph A.6.2.
A.6.2. Operational portfolios
Operational money market portfolios A1 and A2 •
In order to maintain an adequate level of liquidity, the Bank purchases money market products with a maximum maturity of twelve months, in particular Treasury bills and negotiable debt securities issued by credit institutions. The securities in the A1 portfolio are held until their final maturity and presented in the Financial Statements at their nominal value. Value impairments are accounted for, if these are other than temporary. The securities in the A2
portfolio are available for sale and presented in the ac-counts at the lower of cost or market value. Value adjust-ments are recorded under item 6. Result on financial operations in the profit and loss account.
Treasury bills appear on the assets side of the balance sheet under item 2. Treasury bills eligible for refinancing with central banks.
Negotiable debt securities issued by credit institutions appear on the assets side of the balance sheet under item 5. Debt securities including fixed-income securities - b) issued by other borrowers.
Operational bond portfolios B1, B2 and B3 •
The B1 ‘Credit Spread’ portfolio comprises floating-rate and fixed-rate bonds issued or guaranteed by national governments, supranational institutions, financial institutions and corporations with a maximum residual maturity of 5 years. These securities are classified in the available for sale category and are presented in the Financial Statements at the lower of cost or market value. Value adjustments are recorded under item 6. Result on financial operations in the profit and loss account.
The B2 ‘Alternative investment’ portfolio comprises capital guaranteed notes, by issuers which meet the Bank’s Treasury investment criteria and with coupons linked to the performance of underlying Funds of Hedge Funds with initial maturities of approximately five years. The securities are available for sale and pre-sented in the accounts at the lower of cost or market value. Value adjustments are recorded under item 6. Result on financial operations in the profit and loss ac-count.
The B3 ‘Global Fixed income’ portfolio comprises listed securities with a maximum residual maturity of 10 years, issued and guaranteed by financial institutions. Securi-ties held in this portfolio are marked to market value in the balance sheet; the corresponding value adjustment is recorded under item 6. Result on financial operations in the profit and loss account.
A.6.3. Asset Backed Securities
This portfolio mainly consists of obligations in the form of bonds, notes or certificates issued by a Special Pur-pose Vehicle (SPV) or a trust vehicle. These securities are classified as held to maturity and recorded at purchase price. Value impairments are accounted for, if these are other than temporary.
A.7. Securities lending
In April 2003, the Bank signed an agreement for securi-ties lending with Northern Trust Global Investment act-

EIB – Financial Statements 117 EIB Group
ing as an agent to lend securities from the Investment Portfolio, the B1 ‘Credit Spread’ portfolio and the B3 ‘Glo-bal Fixed income’ portfolio.
Securities lent are recorded at the book value as an off balance-sheet item. Securities received as collateral un-der securities lending transactions are not recognized in the balance sheet unless control of the contractual rights that comprise these securities received is gained. Securities lent are not derecognised from the balance sheet unless control of the contractual rights that com-prise these securities transferred is relinquished. The Bank monitors the market value of the securities lent on a daily basis and provides or requests additional collat-eral in accordance with the underlying agreements.
Fees and interest received or paid are recorded as inter-est income or interest expense, on an accrual basis.
A.8. Loans and advances to credit institutions and customers
A.8.1. Loans and advances
Loans and advances are included in the assets of the Bank at their net disbursed amounts. Specific value adjustments have been made for loans and advances outstanding at the end of the financial year and presenting risks of non-recovery of all or part of their amounts. Such value adjustments are held in the same currency as the asset to which they relate. Value adjustments are accounted for in the profit and loss account as ‘Value adjustments on loans and advances’ and are deducted from the appropriate asset items on the balance sheet.
A.8.2. Interest on loans
Interest on loans is recorded in the profit and loss account on an accruals basis, i.e. over the life of the loans. On the balance sheet, accrued interest is included in ‘Prepayments and accrued income’ under assets. Value adjustments to interest amounts on these loans are determined on a case-by-case basis by the Bank’s Management and recorded under ‘Specific provisions’ under assets together with the relevant line item under assets.
A.8.3. Reverse repurchase and repurchase operations (reverse repos and repos)
The Bank enters into tripartite reverse repos for the pur-pose of optimising credit risk usage involved in assets held in operational portfolios.
Under a Tripartite repo a custodian/clearing agency ar-ranges for custody, clearing and settlement of repos transactions between the Bank and a third party. They operate under a standard global master purchase agree-ment and provides for delivery against payment system, substitution of securities, automatic marking to market,
reporting and daily administration by single agency which takes care of the risk on itself and automatic rollo-vers while does not insist on disclosing the identities by counterparties.
This type of operation is considered for the purposes of the Bank to be a loan (borrowing) at a guaranteed rate of interest. They are carried at the amounts of cash ad-vanced or received, plus accrued interest and are en-tered on the assets side of the balance sheet under asset item 3. Loans and advances to credit institutions – b) other loans and advances or liability item 1. Amounts owed to credit institutions – with agreed maturity dates or periods of notice.
Interest earned on reverse repurchase agreements and interest incurred on repurchase agreements is recog-nised as interest income or interest expense, over the life of each agreement.
A.8.4. Interest subsidies
Interest subsidies received in advance (see Note G) are deferred and recognised in the profit and loss account over the period from disbursement to repayment of the subsidised loan.
A.9. Shares, other variable-yield securities and par-ticipating interests
A.9.1. Shares and other variable-yield securities
Shares and other variable-yield securities are recorded at acquisition cost. At the balance sheet date, their car-rying value is adjusted to the lower of cost or market value. The Bank acquires shares and other variable-yield securities when it enters into venture capital operations, infrastructure funds or investment funds under the Structured Finance Facility (see Note A.15).
Investments in venture capital enterprises, infrastructure funds and investment funds represent shares and other variable-yield securities acquired for the longer term in the normal course of the Bank’s activities and are initially shown in the balance sheet at their original purchase cost. Based on the reports received from fund managers up to the balance sheet date, the portfolios of invest-ments are valued on a line-by-line basis at the lower of cost or attributable net asset value (‘NAV’), thus excluding any attributable unrealised gain that may be prevailing in the portfolio. The attributable NAV is determined through applying either the Bank’s percentage ownership in the underlying vehicle to the NAV reflected in the most re-cent report or, to the extent available, the value per share at the same date, submitted by the respective Fund Man-ager. The attributable NAV is adjusted for events having occurred between the date of the latest available NAV and the balance sheet date to the extent that such ad-justment is considered to be material. Unrealised losses due solely to administrative expenses and management

Financial Report 2008118EIB Group
fees of venture capital, infrastructure funds and invest-ment funds in existence for less than two years at the bal-ance sheet date are not taken into consideration in determining the attributable NAV.
A.9.2. Participating interests
Participating interests held represent medium and long-term investments and are accounted for at cost. Value impairments are accounted for, if these are other than temporary.
A.10. Property, furniture and equipment
Property, furniture and equipment include land, Bank-occupied properties, other machines and equipment.
Land and buildings are stated at acquisition cost less ac-cumulated depreciation. The value of the Bank’s head-quarters building in Luxembourg-Kirchberg and its buildings in Luxembourg-Hamm, Luxembourg-Weimer-shof and Lisbon is depreciated on the straight-line basis as set out below.
Permanent equipment, fixtures and fittings, furniture, office equipment and vehicles have been recorded in the balance sheet at their acquisition cost, less accumu-lated depreciation.
Depreciation is calculated on the straight-line basis over the estimated life of each item purchased, as set out be-low:
Buildings in Kirchberg, •Hamm and Weimershof 30 years
Building in Lisbon 25 years •
Permanent equipment, •fixtures and fittings 10 years
Furniture 5 years •
Office equipment and vehicles 3 years •
Works of art are depreciated in full in the year of acquisi-tion.
A.11. Intangible assets
Intangible assets comprise computer software. Software development costs are capitalized if they meet certain criteria relating to identifiability, to the probability that future economic benefits will flow to the enterprise and to the reliability of cost measurement.
Internally developed software meeting these criteria is car-ried at cost less accumulated depreciation calculated on the straight-line basis over three years from completion.
Software purchased is depreciated on the straight-line basis over its estimated life (2 to 5 years).
A.12. Pension plans and health insurance scheme
A.12.1. Pension plans
The Bank’s main pension scheme is a defined benefit pension scheme funded by contributions from staff and from the Bank which covers all employees. All contribu-tions of the Bank and its staff are invested in the assets of the Bank. These annual contributions are set aside and accumulated as a specific provision on the liabilities side of the Bank’s balance sheet, together with annual interest.
Commitments for retirement benefits are valued at least every year using the projected unit credit method, in or-der to ensure that the provision entered in the accounts is adequate. The latest valuation was carried out as at 30 September 2008, but updated as at 31 December 2008 with an extrapolation (roll forward method) for the last three months of 2008. The main actuarial assumptions used by the actuary are set out in Note L. Actuarial sur-pluses do not influence provisioning and deficits result in an additional specific provision.
The main pension scheme of the European Investment Fund (‘EIF’) is a defined benefit scheme funded by con-tributions from staff and from the EIF which covers all employees. The scheme entered into force in March 2003, replacing the previous defined contribution scheme. The funds allocated to the pension scheme are in the custody of and invested by the EIB, following the rules and principles applied by EIB for its own pension scheme.
A.12.2. Health insurance scheme
The Bank has set up its own health insurance scheme for the benefit of staff, financed by contributions from the Bank and its employees. The health insurance scheme is managed under the same principles as the pension scheme. The latest valuation was carried out as at 30 September 2008.
A.12.3. The Management Committee pension plan
The Management Committee pension plan is a defined benefit pension scheme funded by contributions from the Bank only which covers all Management Committee members. All contributions of the Bank are invested in the assets of the Bank. These annual contributions are set aside and accumulated as a specific provision on the liabilities side of the Bank’s balance sheet, together with annual interest.
A.13. Debts evidenced by certificates
Debts evidenced by certificates are presented in this ac-count at their redemption amounts. Transaction costs and premiums/ discounts are amortized in the profit and loss account on a straight line basis over the life of

EIB – Financial Statements 119 EIB Group
the debt through item ‘accruals and deferred income’ or ‘prepayments and accrued income’.
Interest expense on debt instruments is included in ‘In-terest and similar charges’ in the profit and loss account.
A.14. Fund for general banking risks and provision for guarantees issued
A.14.1. Fund for general banking risks
Until 31 December 2005, the Bank identified, as a sepa-rate balance sheet item, the amounts it decided to put aside to cover risks associated with loans and other fi-nancial operations, having regard to the particular risks attached to such operations.
Starting from 2006, the Bank no longer identifies such separate balance sheet item. The decision to release it completely does not affect the ability of the Bank to cover its risks. The Bank continues to compute the amount corresponding to the general banking risks for internal and disclosure purposes (see Note M), accord-ing to the existing methodology based on an internal mechanism used to evaluate the credit risk associated with each position and transaction of the Bank at year-end.
A.14.2. Provision for guarantees issued
This provision is intended to cover risks inherent in the Bank’s activity of issuing guarantees in favour of finan-cial intermediaries or issued in respect of loans granted by third parties. A provision for credit losses is estab-lished if there is objective evidence that the Bank will have to incur a credit loss in respect of a given guaran-tee granted.
A.15. Funds allocated to structured finance facility and to venture capital operations
A.15.1. Funds allocated to structured finance facility
This item comprises the cumulative amount of appro-priations from the annual result of the Bank, determined each year by the Board of Governors to facilitate the im-plementation of operations with a greater degree of risk for this new type of instrument.
A.15.2. Funds allocated to venture capital operations
This item comprises the cumulative amount of appro-priations from the annual result of the Bank, determined each year by the Board of Governors to facilitate instru-ments providing venture capital in the context of imple-menting the European Council Resolution on Growth and Employment.
Value adjustments on venture capital and structured fi-nance operations are accounted for in the profit and loss account. Upon appropriation of the Bank’s result, such value adjustments are taken into consideration for determining the amounts to be recorded in ’Funds allo-cated to structured finance facility’ and ‘Funds allocated to venture capital operations’.
A.16. Taxation
The Protocol on the Privileges and Immunities of the Eu-ropean Communities, appended to the Treaty of 8 April 1965 establishing a Single Council and a Single Commis-sion of the European Communities, stipules that the as-sets, revenues and other property of the Bank are exempt from all direct taxes.
A.17. Prepayments and accrued income – Accruals and deferred income
These accounts comprise:
Prepayments and accrued income: Expenditure incurred during the financial year but relating to a subsequent fi-nancial year, together with any income which, though relating to the financial year in question, is not due until after its expiry (principally interest on loans).
Accruals and deferred income: Income received before the balance sheet date but relating to a subsequent fi-nancial year, together with any charges which, though relating to the financial year in question, will be paid only in the course of a subsequent financial year (princi-pally interest on borrowings).
A.18. Interest and similar income
In addition to interest and commission income on loans and deposits and other revenue from the securities portfolio, the ‘Interest and similar income’ includes the indemnities received by the Bank for prepayments made by its borrowers. In order to maintain equivalent ac-counting treatment between income on loans and the cost of borrowings, the Bank amortises prepayment in-demnities received over the remaining life of the loans concerned.
A.19. Management of third-party funds
A.19.1. EIF treasury
The EIF treasury is managed by the Bank in accordance with the treasury management agreement signed be-tween the two parties in December 2000.

Financial Report 2008120EIB Group
A.19.2. Guarantee Fund
The Commission entrusted financial management of the Guarantee Fund to the EIB under an agreement signed between the two parties in November 1994.
A.19.3. Investment Facility
The Investment Facility, which is managed by the EIB, has been established within the framework of the Cot-onou Agreement on cooperation and development of the African, Caribbean and Pacific Group of States and the European Union and its Member States on 23 June 2000. The EIB prepares separate financial statements for the Investment Facility.
A.19.4. Femip Trust Fund
The Femip Trust Fund, which is also managed by the EIB, was set up to enhance the existing activities of the EIB in the Mediterranean Partner Countries, with the sup-port of a number of donor countries and with a view to directing resources to operations in certain priority sec-tors through the provision of technical assistance and risk capital. The EIB prepares separate financial state-ments for the Femip Trust Fund.
A.19.5. Risk-Sharing Finance Facility
The Risk-Sharing Finance Facility has been established within the framework of the Co-operation Agreement, entered into force on this 5th of June 2007, between The European Commission on behalf of the European Com-munity and the European Investment Bank. The EIB is set-ting up the RSFF, an instrument aimed at fostering investment for Europe in research, technological devel-opment and demonstration, as well as innovation, in par-ticular in the private sector. The EIB prepares separate financial statements for the Risk-Sharing Finance Facility.
A.19.6. Heavily Indebted Poor Countries (HIPC) Initiative
The HIPC Initiative (the “Initiative”) is an international debt relief mechanism that provides special assistance to the world’s poorest countries. It was launched in 1996 following a proposal from the World Bank and the Inter-national Monetary Fund (IMF). The principal objective of the initiative is to reduce the debt burden of poor coun-tries to sustainable. The EIB prepares separate financial statements for the HIPC Initiative.
A.19.7. EU-Africa Infrastructure Trust Fund (the ’Trust Fund’)
The Trust Fund has been created within the framework of the Trust Fund Agreement between the European Commission on behalf of the European Community as Founding Donor and the European Investment Bank as Manager, also open to Member States of the European Union which subsequently accede to this agreement as
Donors. On 9 February 2006, the European Commission and the European Investment Bank signed a Memoran-dum of Understanding (the “MoU”) to promote jointly the EU-Africa Infrastructure Partnership and, in particu-lar, to establish a supporting EU-Africa Infrastructure Trust Fund. The EIB prepares separate financial state-ments for the Trust Fund.
A.19.8. FP7 Guarantee Fund
The European Commission entrusted financial manage-ment of the FP7 Guarantee Fund to the EIB under an agreement signed between the two parties in Decem-ber 2007.
A.19.9. Loan Guarantee Instrument for Ten-T Projects
The Loan Guarantee Instrument for Ten-T Projects (“LGTT”) has been established within the framework of the Co-operation Agreement, entered into force on 11 January 2008, between the European Commission on behalf of the European Communities and the Euro-pean Investment Bank.
The Commission and the EIB are setting up the LGTT which aims at facilitating a greater private sector in-volvement in the financing of Trans-European transport networks infrastructure. The EIB prepares separate fi-nancial statements for the LGTT.
A.19.10. JASPERS
JASPERS (Joint Assistance to Support Projects in Euro-pean RegionS) is a major joint policy initiative of the EIB, European Commission (Regional Policy Directorate-General - DG Regio) and the European Bank for Recon-struction and Development (EBRD).
A.19.11. JESSICA
JESSICA (Joint European Support for Sustainable Invest-ment in City Aras) is an initiative developed by the Euro-pean Commission and the European Investment Bank (EIB), in collaboration with the Council of Europe Devel-opment Bank (CEB).
A.19.12. Special Section
The Special Section was set up by the Board of Gover-nors on 27 May 1963, under a Decision taken on 4 Au-gust 1977. Its purpose was redefined as being that of recording financing operations carried out by the Euro-pean Investment Bank for the account of and under mandate from third parties.
A.20. Reclassification of prior year figures
Certain prior-year figures have been reclassified to con-form with the current year’s presentation.

EIB – Financial Statements 121 EIB Group
Note B – Debt securities portfolio (in EUR ’000)
In addition to asset backed securities, which represent acquisitions of interests pools of loans or receivables in connec-tion with securitisation transactions, the debt securities portfolio is composed of the investment portfolio, the opera-tional money market portfolios A1 and A2 and the operational bonds B1 ‘Credit Spread’, B2 ‘Alternative Investment’ and B3 ‘Global Fixed Income’ portfolios. The detail of these portfolios and their classification as at 31 December 2008 and 2007 are as follows:
31.12.2008 31.12.2007
Treasury bills eligible for refinancing with central banks (listed) 1 908 756 2 126 591
Debt securities including fixed-income securities (of which EUR‘000 3 893 591 unlisted in 2008 and EUR ‘000 2 860 459 in 2007)
10 732 841
10 520 825
12 641 597 12 647 416
At 31.12.2008
Classification
Purchase price
Book value
Premiums/Discounts to
be amortized
Value at final maturity
Market value
Investment portfolio Held to Maturity 1 888 520 1 866 118 - 27 786 1 838 332 1 933 358
Operational money market portfolios:
- A1: money market securities with a max. 3 month maturity
Held to Maturity 2 111 572
2 111 572
0
2 111 572
2 111 572
- A2: money market securities with a max. 18 month maturity
Available for sale 1 358 601
1 356 580
0
1 359 098
1 359 527
Operational bond portfolios:
- B1: Credit Spread Available for sale 970 799 883 004 0 971 189 883 322
- B2: Alternative Investment Available for sale 150 000 145 685 0 150 000 145 685
- B3: Global Fixed Income Trading 503 978 512 365 0 494 000 512 365
Asset backed securities [Note D] Held to Maturity 5 766 273 5 766 273 0 5 766 273 5 300 242
12 749 743 12 641 597 - 27 786 12 690 464 12 246 071
At 31.12.2007
Classification
Purchase price
Book value
Premiums/Discounts to
be amortized
Value at final maturity
Market value
Investment portfolio Held to Maturity 2 148 726 2 121 399 - 32 066 2 089 333 2 142 477
Operational money market portfolios:
- A1: money market securities with a max. 3 month maturity
Held to Maturity 2 197 969
2 197 969
0
2 197 969
2 197 969
- A2: money market securities with a max. 18 month maturity
Available for sale 1 745 057
1 741 989
0
1 744 880
1 743 820
Operational bond portfolios:
- B1: Credit Spread Available for sale 1 247 822 1 232 342 0 1 247 925 1 232 433
- B2: Alternative Investment Available for sale 150 000 150 000 0 150 000 161 724
- B3: Global Fixed Income Trading 496 862 494 789 0 494 200 494 789
Asset backed securities [Note D] Held to Maturity 4 708 928 4 708 928 0 4 708 928 4 702 566
12 695 364 12 647 416 -32 066 12 633 235 12 675 778
The Bank enters into collateralized securities lending transactions that may result in credit exposure in the event that the counterparty to the transaction is unable to fulfill its contractual obligations. The Bank controls credit risk associated with these activities by monitoring counterparty credit exposure and collateral values on a daily basis and requiring ad-ditional collateral to be deposited with or returned to the Bank when deemed necessary.
The security lending activity amounts to EUR ‘000 306 934 at the end of December 2008 (2007: EUR ‘000 858 762).

Financial Report 2008122EIB Group
Note C – Loans and advances to credit institutions – other loans and advances (in EUR ’000)
The Bank enters into collateralized reverse repurchase and repurchase agreements transactions that may result in credit exposure in the event that the counterparty to the transaction is unable to fulfill its contractual obligations. The Bank controls credit risk associated with these activities by monitoring counterparty credit exposure and collateral values on a daily basis and requiring additional collateral to be deposited with or returned to the Bank when deemed necessary.
31.12.2008 31.12.2007
Term deposits 14 111 555 10 883 383
Tripartite reverse repos (*) 7 249 864 4 592 637
21 361 419 15 476 020
(*) These operations are carried out with a third-party custodian who undertakes, on the basis of a framework contract, to guarantee compliance with the contractual terms and conditions, notably with respect to:
- delivery against payment, - verification of collateral, - the collateral margin required by the lender which must always be available and adequate, with the market value of the securities being verified
daily by the said custodian, - organisation of substitute collateral provided that this meets all the contractual requirements.
Note D – Summary statement of loans and guarantees
D.1. Aggregate loans granted (in EUR ’000)
Aggregate loans granted comprise both the disbursed and undisbursed portions of loans. The analysis is as follows:
To intermediary credit institutions
Directly to final beneficiaries
Total 2008 Total 2007
Disbursed portion 111 990 666 173 662 179 285 652 845 266 437 839
Undisbursed loans 12 457 853 46 411 674 58 869 527 53 606 621
Aggregate loans granted 124 448 519 220 073 853 344 522 372 320 044 460
Asset backed securities portfolio [Note B] 5 766 273 4 708 928
Aggregate loans including asset backed securities portfolio [Note W] 350 288 645 324 753 388
D.2. Statutory ceiling on lending and guarantee operations (in EUR million)
Under the terms of Article 18 (5) of the Statute, the aggregate amount outstanding at any time of loans and guarantees granted by the Bank must not exceed 250% of its subscribed capital.
The present level of capital implies a ceiling of EUR 412 billion (2007: EUR 412 billion) in relation to aggregate loans and guarantees furnished; these currently total EUR 354 billion and are broken down as follows:
The Asset Backed Securities set out above are undertaken as loan substitutes and as such are considered as part of the aggregate loans (Note D). Some of these transactions have been structured by adding a credit or project related reme-dies, thus offering additional recourse.
The difference between book value and market value is quasi exclusively explained by the credit spread increase and does not really represent a value impairment. Therefore, no specific provision has been accounted for.

EIB – Financial Statements 123 EIB Group
31.12.2008 31.12.2007
Aggregate loans granted 344 522 320 044
Aggregate venture capital operations 2 634 2 716
Aggregate guarantees furnished in respect of loans granted by third parties and venture capital operations
262 165
Aggregate asset backed securities portfolio 5 766 4 709
Aggregate infrastructure funds 353 296
Aggregate investment funds 120 95
353 657 328 025
D.3. Specific provision for loans (in EUR ’000)
Movements in the specific provision are detailed below:
31.12.2008 31.12.2007
Provision at beginning of the year 41 550 86 917
Use for the year - 18 219 (**) - 64 917 (*)
Allowance during the year 0 20 673
Foreign exchange adjustment - 1 331 - 1 123
Provision at end of the year 22 000 41 550
(*) The amount of EUR ’000 64 917 was released following the sale during 2007 of loan assets for which a specific provision has previously been estab-lished. The sale of those loan assets resulted in a realized loss of EUR ’000 61 490.
(**) The amount of EUR ’000 18 219 was released following the sale during 2008 of loan assets for which a specific provision has previously been estab-lished. The sale of those loan assets resulted in a realised loss of EUR ’000 15 467.
Note E – Shares and other variable-yield securities and participating interests
E.1. Shares and other variable-yield securities
This item comprises (in EUR ’000):
Venture Capital Operations
EBRD Shares
Shares acquired following
loan assets restructuring
Infrastructure Funds
Investment funds
TOTAL
Cost
At 1 January 2008 1 462 981 157 500 53 253 62 514 0 1 736 248
Net additions / releases 82 524 0 - 22 380 49 151 26 764 136 059
At 31 December 2008 1 545 505 157 500 30 873 111 665 26 764 1 872 307
Value adjustments
At 1 January 2008 - 308 867 0 - 25 369 - 6 346 0 - 340 582
Net additions / releases - 171 570 0 1 655 4 646 0 - 165 269
At 31 December 2008 - 480 437 0 - 23 714 - 1 700 0 - 505 851
Net book value
At 31 December 2008 1 065 068 157 500 (1) 7 159 (2) 109 965 26 764 1 366 456
At 31 December 2007 1 154 114 157 500 27 884 56 168 0 1 395 666
(1) The amount of EUR ‘000 157 500 (2007: EUR ‘000 157 500) corresponds to the capital paid in by the Bank as at 31 December 2008 with respect to its subscription of EUR ‘000 600 000 to the capital of the EBRD.
The Bank holds 3.03 % of the subscribed capital. As at 31 December 2008 the share of underlying net equity of the Bank in EBRD amounts to EUR 420.4 million (2007: 368.8 million). This is based on the
audited 2007 financial statements prepared in accordance with International Financial Reporting Standards.

Financial Report 2008124EIB Group
In EUR million % held Total own funds Total net result Balance sheet
EBRD (31.12.2006) 3.03 12 172 2 389 30 691
EBRD (31.12.2007) 3.03 13 874 1 884 33 175(2) The total number of ordinary Eurotunnel shares held by the Bank as at 31 December 2008 is 1 596 713 (2007: 1 474 279), valued at EUR’000 6 133
(2007: EUR’000 17 691). The total number of Eurotunnel bonds redeemable in shares (ORA) held by the Bank as at 31 December 2008 is 12 422 (2007: 105 450), valued at EUR’000 1 026 (2007: EUR’000 10 193). Furthermore, the Bank holds 4 800 000 warrants valued at EUR 0 in the balance sheet at year-end (2007: 78 971 193 warrants). The sale during the 2008 year of ORAs and warrants resulted respectively in a realized profit of EUR 4.9 million and EUR 16.2 million.
The undisbursed amounts disclosed on Off-balance-sheet are respectively:
for venture capital operations EUR ‘000 1 088 046, •
for infrastructure funds EUR ‘000 241 627, •
for investment funds EUR ‘000 93 094. •
E.2. Participating interests
The account ‘participating interests’ for an amount of EUR ‘000 479 272 (2007: EUR ‘000 479 272) corresponds to the capi-tal paid in by the Bank in respect of its subscription which amounts to EUR ‘000 1 822 000 (2007: EUR ‘000 1 822 000) to the capital of the European Investment Fund, with its registered office in Luxembourg.
The Bank holds 63.60% (2007 – 65.78%) of the subscribed capital of the EIF amounting to EUR 2.77 billion (2007: EUR 2.77 billion). At the EIF Annual General Meeting of Shareholders held on 7 May 2007, it was decided to issue 1 000 new shares, identical to the 2 000 existing ones (nominal value EUR 1 million each, paid in ratio of 20%) between the 30 June 2007 and 30 June 2010. Out of the 1 000 new shares, 865 were subscribed on 31 December 2008 (2007: 770), and for the remainder there is an option for subscription over the next 2 years. By 30 June 2010, all shares not sub-scribed by the other shareholders will be subscribed by the Bank.
During 2008, the Bank did not sell any EIF shares (11 shares sold in 2007). With regard to the remaining 1 043 EIF shares, the EIB is offering to buy these shares at any time from the EIF’s other shareholders under a Replacement Share Pur-chase Undertaking at a price per share of EUR ‘000 348. This price corresponds to the part of each share in the called capital of the EIF, increased by the share premium account, the statutory reserves, the disclosed unrealised gains in ven-ture capital operations, the profit brought forward and the profit of the year and decreased by the dividend for the 2007 financial year. Given that the dividend for the year 2007 will still be due to the other shareholders, the dividend decided has been deducted from the price determined as described above.
The nominal value of the put option granted to EIF minority shareholders, shown as an off – balance sheet item, EUR ‘000 363 433 (2007 EUR ‘000 319 045) has been calculated on the basis of the 2007 audited EIF statutory accounts.

EIB – Financial Statements 125 EIB Group
Note F – Property, furniture, equipment and intangible assets (in EUR ’000)
Land
Luxembourg buildings
Lisbon building
Furniture and equipment
Total property, furniture and
equipment
Total intangible
assets
Historical cost
At 1 January 2008 10 085 313 717 349 61 580 385 731 5 539
Additions 0 40 060 0 19 312 59 372 2 198
Disposals 0 0 - 349 - 7 691 - 8 040 - 1 073
At 31 December 2008 10 085 353 777 0 73 201 437 063 6 664
Accumulated depreciation
At 1 January 2008 0 - 80 421 - 308 - 24 745 - 105 474 - 1 567
Depreciation 0 - 11 792 - 12 - 13 944 - 25 748 - 1 854
Disposals 0 0 320 7 720 8 040 1 073
At 31 December 2008 0 - 92 213 0 - 30 969 - 123 182 - 2 348
Net book value
At 31 December 2008 10 085 261 564 0 42 232 313 881 4 316
At 31 December 2007 10 085 233 296 41 36 835 280 257 3 972
All of the land and buildings are used by the Bank for its own activities. The Luxembourg buildings category includes cost relating to the construction of the new building for EUR ‘000 211 769 (2007: EUR ‘000 171 710), completed in 2008. The Lisbon building was sold in 2008.
Note G – Interest subsidies received in advance
Part of the amounts received from the European Commission through EMS (European Monetary System) arrangements has been made available as a long-term advance which is entered on the liabilities side under item 4. Accruals and de-ferred income and comprises:
amounts in respect of interest subsidies for loans granted for projects outside the Union, under Conventions signed •with the ACP States and Protocols concluded with the Mediterranean Countries;
interest subsidies, concerning certain lending operations put in place within the Union from the Bank’s own resourc- •es, made available in conjunction with the EMS under Council Regulation (EEC) No 1736/79 of 3 August 1979 and in conjunction with the financial mechanism established by the EFTA Countries under the EFTA Agreement signed on 2 May 1992;
amounts received in respect of interest subsidies for loans granted from EC resources under Council Decisions •78/870/EEC of 16 October 1978 (New Community Instrument), 82/169/EEC of 15 March 1982 and 83/200/EEC of 19 April 1983 and under Council Regulation (EEC) No 1736/79 of 3 August 1979 as amended by Council Regulation (EEC) No 2790/82 of 18 October 1982.
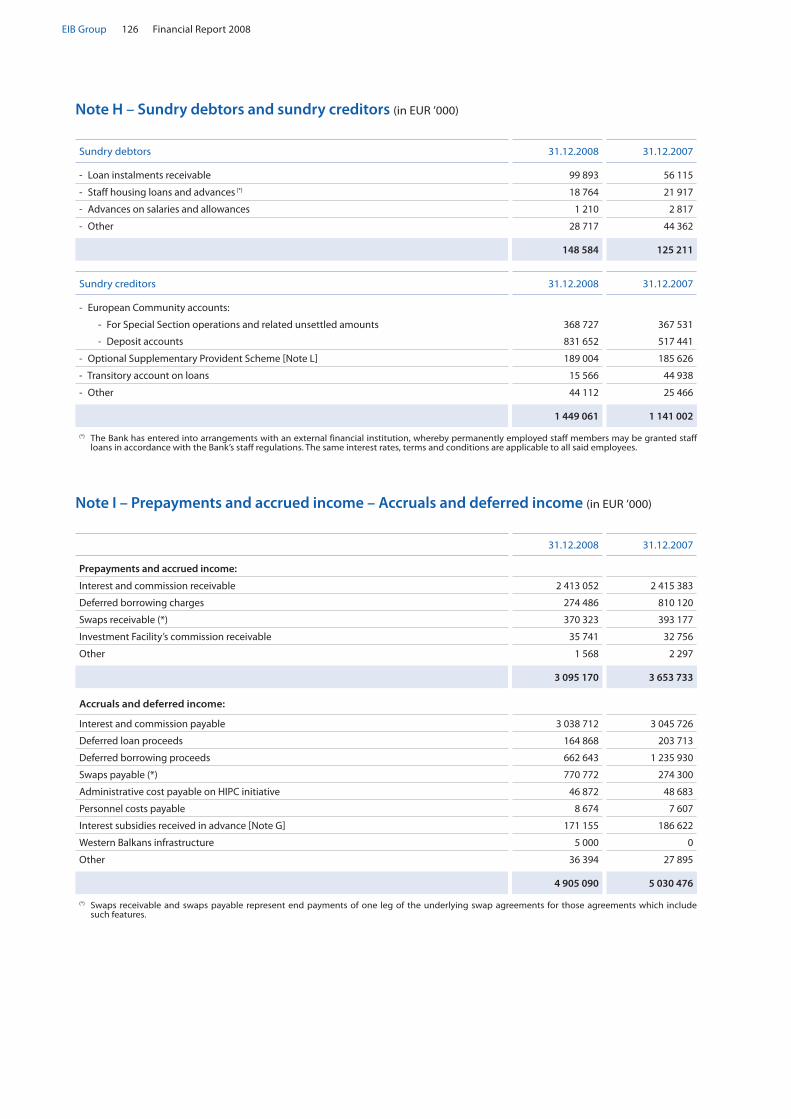
Financial Report 2008126EIB Group
Note H – Sundry debtors and sundry creditors (in EUR ’000)
Sundry debtors 31.12.2008 31.12.2007
- Loan instalments receivable 99 893 56 115
- Staff housing loans and advances (*) 18 764 21 917
- Advances on salaries and allowances 1 210 2 817
- Other 28 717 44 362
148 584 125 211
Sundry creditors 31.12.2008 31.12.2007
- European Community accounts:
- For Special Section operations and related unsettled amounts 368 727 367 531
- Deposit accounts 831 652 517 441
- Optional Supplementary Provident Scheme [Note L] 189 004 185 626
- Transitory account on loans 15 566 44 938
- Other 44 112 25 466
1 449 061 1 141 002
(*) The Bank has entered into arrangements with an external financial institution, whereby permanently employed staff members may be granted staff loans in accordance with the Bank’s staff regulations. The same interest rates, terms and conditions are applicable to all said employees.
Note I – Prepayments and accrued income – Accruals and deferred income (in EUR ’000)
31.12.2008 31.12.2007
Prepayments and accrued income:
Interest and commission receivable 2 413 052 2 415 383
Deferred borrowing charges 274 486 810 120
Swaps receivable (*) 370 323 393 177
Investment Facility’s commission receivable 35 741 32 756
Other 1 568 2 297
3 095 170 3 653 733
Accruals and deferred income:
Interest and commission payable 3 038 712 3 045 726
Deferred loan proceeds 164 868 203 713
Deferred borrowing proceeds 662 643 1 235 930
Swaps payable (*) 770 772 274 300
Administrative cost payable on HIPC initiative 46 872 48 683
Personnel costs payable 8 674 7 607
Interest subsidies received in advance [Note G] 171 155 186 622
Western Balkans infrastructure 5 000 0
Other 36 394 27 895
4 905 090 5 030 476
(*) Swaps receivable and swaps payable represent end payments of one leg of the underlying swap agreements for those agreements which include such features.
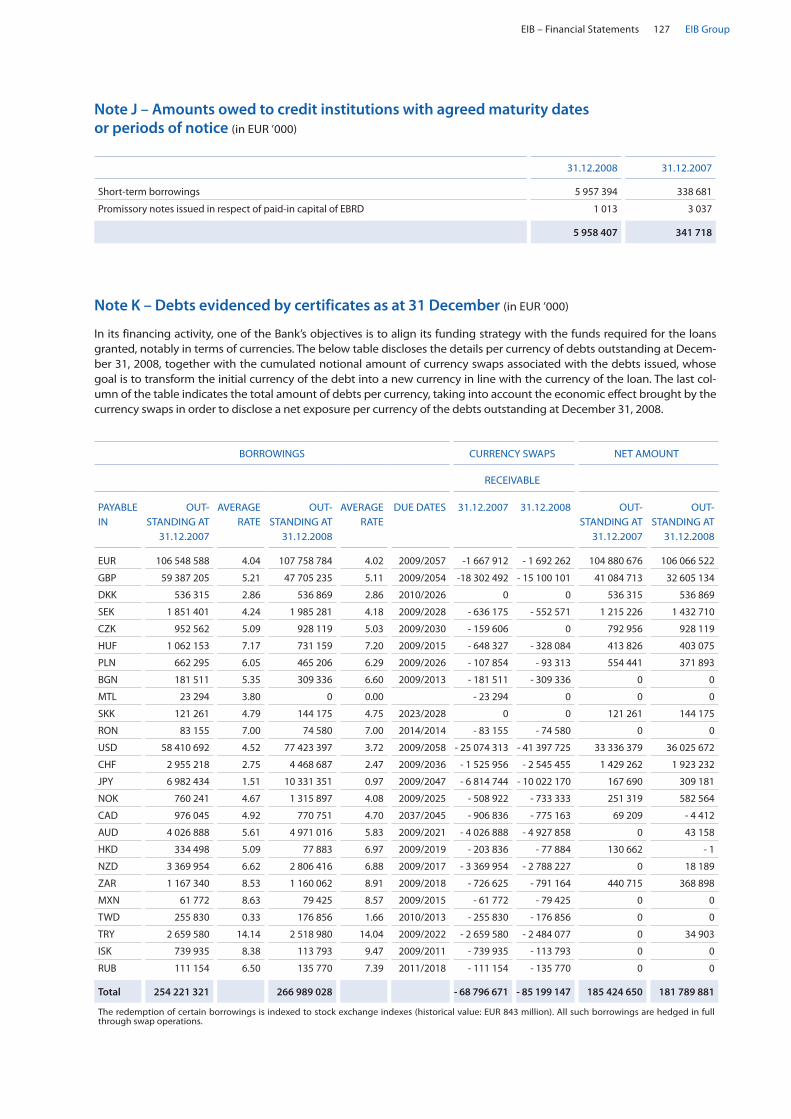
EIB – Financial Statements 127 EIB Group
Note J – Amounts owed to credit institutions with agreed maturity dates or periods of notice (in EUR ’000)
31.12.2008 31.12.2007
Short-term borrowings 5 957 394 338 681
Promissory notes issued in respect of paid-in capital of EBRD 1 013 3 037
5 958 407 341 718
Note K – Debts evidenced by certificates as at 31 December (in EUR ’000)
In its financing activity, one of the Bank’s objectives is to align its funding strategy with the funds required for the loans granted, notably in terms of currencies. The below table discloses the details per currency of debts outstanding at Decem-ber 31, 2008, together with the cumulated notional amount of currency swaps associated with the debts issued, whose goal is to transform the initial currency of the debt into a new currency in line with the currency of the loan. The last col-umn of the table indicates the total amount of debts per currency, taking into account the economic effect brought by the currency swaps in order to disclose a net exposure per currency of the debts outstanding at December 31, 2008.
BORROWINGS CURRENCY SWAPS NET AMOUNT
RECEIVABLE
PAYABLE IN
OUT-STANDING AT
31.12.2007
AVERAGE RATE
OUT-STANDING AT
31.12.2008
AVERAGE RATE
DUE DATES
31.12.2007
31.12.2008
OUT-STANDING AT
31.12.2007
OUT-STANDING AT
31.12.2008
EUR 106 548 588 4.04 107 758 784 4.02 2009/2057 -1 667 912 - 1 692 262 104 880 676 106 066 522
GBP 59 387 205 5.21 47 705 235 5.11 2009/2054 -18 302 492 - 15 100 101 41 084 713 32 605 134
DKK 536 315 2.86 536 869 2.86 2010/2026 0 0 536 315 536 869
SEK 1 851 401 4.24 1 985 281 4.18 2009/2028 - 636 175 - 552 571 1 215 226 1 432 710
CZK 952 562 5.09 928 119 5.03 2009/2030 - 159 606 0 792 956 928 119
HUF 1 062 153 7.17 731 159 7.20 2009/2015 - 648 327 - 328 084 413 826 403 075
PLN 662 295 6.05 465 206 6.29 2009/2026 - 107 854 - 93 313 554 441 371 893
BGN 181 511 5.35 309 336 6.60 2009/2013 - 181 511 - 309 336 0 0
MTL 23 294 3.80 0 0.00 - 23 294 0 0 0
SKK 121 261 4.79 144 175 4.75 2023/2028 0 0 121 261 144 175
RON 83 155 7.00 74 580 7.00 2014/2014 - 83 155 - 74 580 0 0
USD 58 410 692 4.52 77 423 397 3.72 2009/2058 - 25 074 313 - 41 397 725 33 336 379 36 025 672
CHF 2 955 218 2.75 4 468 687 2.47 2009/2036 - 1 525 956 - 2 545 455 1 429 262 1 923 232
JPY 6 982 434 1.51 10 331 351 0.97 2009/2047 - 6 814 744 - 10 022 170 167 690 309 181
NOK 760 241 4.67 1 315 897 4.08 2009/2025 - 508 922 - 733 333 251 319 582 564
CAD 976 045 4.92 770 751 4.70 2037/2045 - 906 836 - 775 163 69 209 - 4 412
AUD 4 026 888 5.61 4 971 016 5.83 2009/2021 - 4 026 888 - 4 927 858 0 43 158
HKD 334 498 5.09 77 883 6.97 2009/2019 - 203 836 - 77 884 130 662 - 1
NZD 3 369 954 6.62 2 806 416 6.88 2009/2017 - 3 369 954 - 2 788 227 0 18 189
ZAR 1 167 340 8.53 1 160 062 8.91 2009/2018 - 726 625 - 791 164 440 715 368 898
MXN 61 772 8.63 79 425 8.57 2009/2015 - 61 772 - 79 425 0 0
TWD 255 830 0.33 176 856 1.66 2010/2013 - 255 830 - 176 856 0 0
TRY 2 659 580 14.14 2 518 980 14.04 2009/2022 - 2 659 580 - 2 484 077 0 34 903
ISK 739 935 8.38 113 793 9.47 2009/2011 - 739 935 - 113 793 0 0
RUB 111 154 6.50 135 770 7.39 2011/2018 - 111 154 - 135 770 0 0
Total 254 221 321 266 989 028 - 68 796 671 - 85 199 147 185 424 650 181 789 881
The redemption of certain borrowings is indexed to stock exchange indexes (historical value: EUR 843 million). All such borrowings are hedged in full through swap operations.

Financial Report 2008128EIB Group
Note L – Provisions for liabilities and charges – pension plans and health insurance scheme (in EUR ’000)
The Defined Benefit Obligation in respect of future retirement and health insurance benefits was valued as at 30 Sep-tember 2008 by an independent actuary using the projected unit credit method. The actuarial valuation was updated as at 31 December 2008 with an extrapolation (‘roll forward’ method) for the last 3 months of 2008, using the prevailing market rates of 31 December 2008 and following assumptions (for the staff pension and medical plan):
a discount rate of 6.0% (2007: 5.52%) for determining the actuarial present value of benefits accrued in the pension •and health insurance schemes, corresponding to 14.46 year duration (2007: 14.19 year duration);
in the light of past experience, the Bank estimates that the overall expected remuneration of post-employment re- •serves are set at a rate of 1.5% above the discount rate mentioned above. As a consequence, the final discount rate used is 7.5% (2007: 7.02%);
a progressive retirement between the age of 55-65 (2007: retirement at the age of 55-65); •
a combined average impact of the increase in the cost of living and career progression of 4.5% (2007: 4%); •
probable resignation of 3% up to age 55 (same as 2007); •
a rate of adjustment of pensions of 2% per annum (same as 2007); •
use of the LPP 2005 actuarial tables (same as 2007); •
a medical cost inflation rate of 4% per annum (same as 2007). •
The provisions for liabilities and charges for these schemes are adjusted when needed (Note A.12.1) according to the actuarial valuation, as per the tables below. These adjustments have been accounted for in 2008 and are disclosed in the Profit and Loss account under staff costs.
The staff pension and the Management Committee pension plans provision are as follows (in EUR ‘000):
31.12.2008 31.12.2007
Staff Pension Plan:
Provision at beginning of the year 981 085 872 501
Payments made during the year - 38 710 - 32 909
Contribution arising from measures with a social character 0 13 300
Annual contributions and interest 108 718 128 193
Sub Total 1 051 093 981 085
Management Committee Pension Plan 32 637 31 739
Provision at 31 December 1 083 730 1 012 824
The above figures do not include the liability towards members of staff in respect of the Optional Supplementary Provi-dent Scheme (a defined contribution pension scheme). The corresponding amount of EUR 189 million (2007: EUR 186 million) is classified under ‘Sundry creditors’ (Note H).
The health insurance scheme provision is as follows (in EUR ’000):
31.12.2008 31.12.2007
Provision at beginning of the year 84 750 76 151
Payments made during the year - 7 661 - 7 204
Contribution arising from measures with a social character 9 000 665
Annual contributions and interest 17 834 15 138
Provision at 31 December 103 923 84 750
Total at 31 December 1 187 653 1 097 574
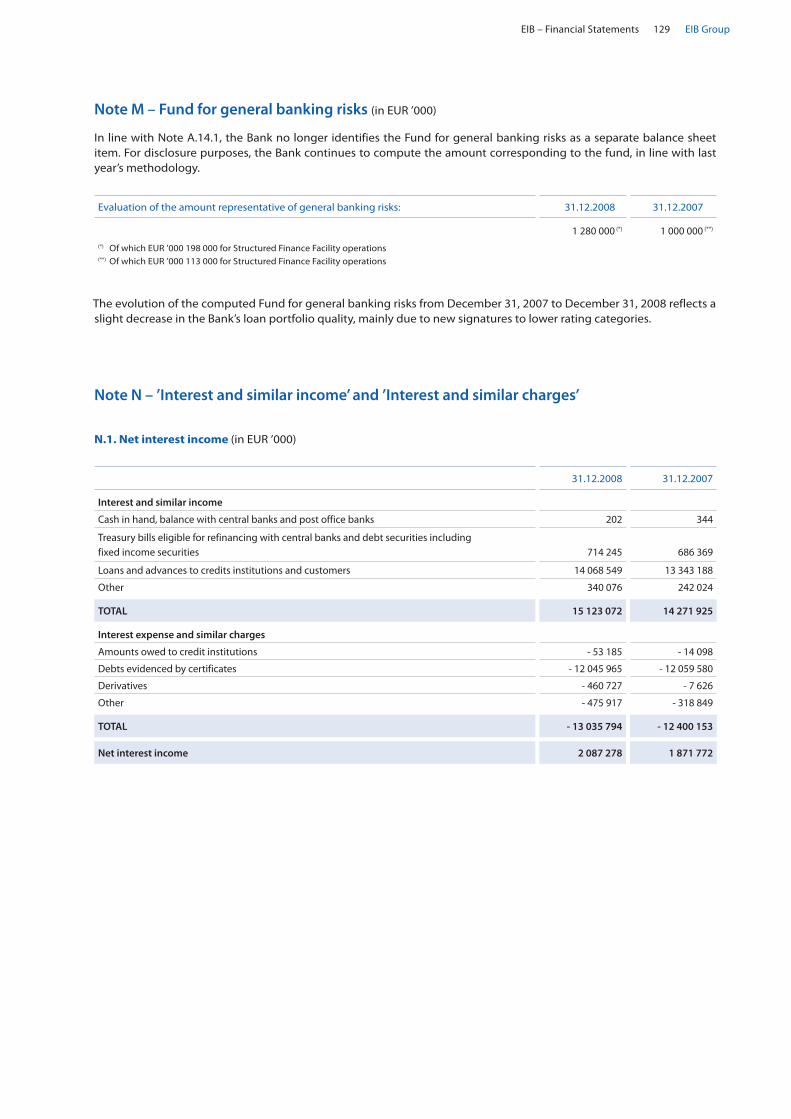
EIB – Financial Statements 129 EIB Group
Note M – Fund for general banking risks (in EUR ’000)
In line with Note A.14.1, the Bank no longer identifies the Fund for general banking risks as a separate balance sheet item. For disclosure purposes, the Bank continues to compute the amount corresponding to the fund, in line with last year’s methodology.
Evaluation of the amount representative of general banking risks: 31.12.2008 31.12.2007
1 280 000 (*) 1 000 000 (**)
(*) Of which EUR ’000 198 000 for Structured Finance Facility operations(**) Of which EUR ’000 113 000 for Structured Finance Facility operations
The evolution of the computed Fund for general banking risks from December 31, 2007 to December 31, 2008 reflects a slight decrease in the Bank’s loan portfolio quality, mainly due to new signatures to lower rating categories.
Note N – ’Interest and similar income’ and ’Interest and similar charges’
N.1. Net interest income (in EUR ’000)
31.12.2008 31.12.2007
Interest and similar income
Cash in hand, balance with central banks and post office banks 202 344
Treasury bills eligible for refinancing with central banks and debt securities including fixed income securities
714 245
686 369
Loans and advances to credits institutions and customers 14 068 549 13 343 188
Other 340 076 242 024
TOTAL 15 123 072 14 271 925
Interest expense and similar charges
Amounts owed to credit institutions - 53 185 - 14 098
Debts evidenced by certificates - 12 045 965 - 12 059 580
Derivatives - 460 727 - 7 626
Other - 475 917 - 318 849
TOTAL - 13 035 794 - 12 400 153
Net interest income 2 087 278 1 871 772

Financial Report 2008130EIB Group
N.2. Geographical analysis of ’Interest and similar income’ (in EUR ’000)
31.12.2008 31.12.2007
Germany 2 008 176 2 356 560
Spain 2 143 128 1 833 671
Italy 1 697 814 1 456 260
France 1 385 791 1 437 073
United Kingdom 1 058 937 1 211 146
Portugal 774 637 698 928
Greece 559 600 533 178
Austria 294 940 292 310
Poland 445 242 287 992
Finland 232 420 227 245
Hungary 294 328 197 499
Belgium 198 322 187 366
Czech Republic 229 290 180 895
Denmark 123 138 152 085
Netherlands 141 405 151 539
Ireland 128 691 137 067
Sweden 165 245 123 075
Romania 90 755 81 155
Slovenia 75 551 57 535
Slovak Republic 42 227 35 134
Luxembourg 27 125 34 002
Cyprus 38 896 29 550
Bulgaria 24 765 17 465
Latvia 23 012 16 017
Estonia 8 145 6 753
Lithuania 5 766 5 204
Malta 581 348
Total 12 217 927 11 747 052
Outside the European Union 889 208 795 520
Total 13 107 135 12 542 572
Income not analysed (1) 2 015 937 1 729 353
Total 15 123 072 14 271 925
(1) Income not analysed: •RevenuefromInvestmentportfolioandABSportfolios 354462 265949 •RevenuefromOperationalbondportfolios 77283 80419 •RevenuefromOperationalmoney-marketportfolios 282500 340001 •Revenuefrommoney-marketoperations 1301692 1042984 2 015 937 1 729 353

EIB – Financial Statements 131 EIB Group
Note O – ’Commission income’ and ’Commission expense’ (in EUR ’000)
31.12.2008 31.12.2007
Commission income
Investment Facility / Cotonou 35 741 32 756
Jaspers 14 933 10 529
Jessica 3 962 1 903
Yaoundé/Lomé conventions 10 371 10 227
Other Community institutions 12 693 9 072
77 700 64 487
Commission expense - 8 474 - 10 382
31.12.2008 31.12.2007
Value adjustment on operational treasury portfolio - 67 899 - 19 561
Gain and loss on operational treasury portfolio - 3 189 1 362
Gain and loss on long-term futures - 11 714 1 725
Foreign exchange gain/loss 13 122 4 634
Gain and loss on buy back of debts evidenced by certificates 3 430 1 082
Gain and loss on unwind of ALM swaps 21 125 923
Realised loss on sale of shares - 11 422 0
- 56 547 - 9 835
Note P – Result on financial operations (in EUR ’000)
31.12.2008 31.12.2007
Income from advisory activities 32 380 20 369
Reversal of previous years’ unutilized accruals 3 999 3 597
Other 3 408 3 650
39 787 27 616
Note Q – Other operating income (in EUR ’000)
31.12.2008 31.12.2007
Salaries and allowances (*) - 168 086 - 154 373
Welfare contributions and other social costs - 93 041 - 124 882
Staff costs - 261 127 - 279 255
Other general administrative expenses - 101 802 - 80 661
- 362 929 - 359 916
The number of persons employed by the Bank was 1 599 at 31 December 2008 (1 441 at 31 December 2007).(*) of which the amount for members of the Management Committee is EUR ‘000 2 821 at 31 December 2008 and EUR ‘000 2 655 at 31 December 2007.
Note R – General administrative expenses (in EUR ’000)
Note S – Special deposits for service of borrowings
This item represents the amount of coupons and bonds due, paid by the Bank to the paying agents, but not yet pre-sented for payment by the holders of bonds issued by the Bank.
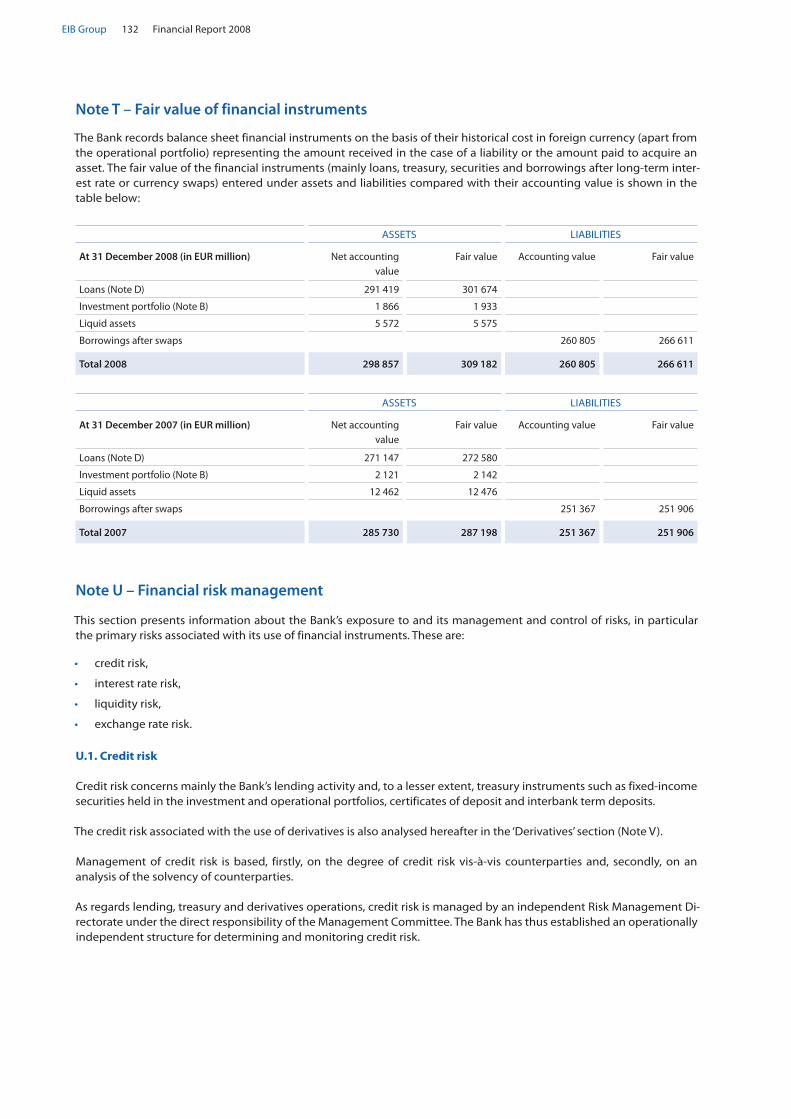
Financial Report 2008132EIB Group
Note T – Fair value of financial instruments
The Bank records balance sheet financial instruments on the basis of their historical cost in foreign currency (apart from the operational portfolio) representing the amount received in the case of a liability or the amount paid to acquire an asset. The fair value of the financial instruments (mainly loans, treasury, securities and borrowings after long-term inter-est rate or currency swaps) entered under assets and liabilities compared with their accounting value is shown in the table below:
ASSETS LIABILITIES
At 31 December 2008 (in EUR million) Net accounting value
Fair value Accounting value Fair value
Loans (Note D) 291 419 301 674
Investment portfolio (Note B) 1 866 1 933
Liquid assets 5 572 5 575
Borrowings after swaps 260 805 266 611
Total 2008 298 857 309 182 260 805 266 611
ASSETS LIABILITIES
At 31 December 2007 (in EUR million) Net accounting value
Fair value Accounting value Fair value
Loans (Note D) 271 147 272 580
Investment portfolio (Note B) 2 121 2 142
Liquid assets 12 462 12 476
Borrowings after swaps 251 367 251 906
Total 2007 285 730 287 198 251 367 251 906
Note U – Financial risk management
This section presents information about the Bank’s exposure to and its management and control of risks, in particular the primary risks associated with its use of financial instruments. These are:
credit risk, •
interest rate risk, •
liquidity risk, •
exchange rate risk. •
U.1. Credit risk
Credit risk concerns mainly the Bank’s lending activity and, to a lesser extent, treasury instruments such as fixed-income securities held in the investment and operational portfolios, certificates of deposit and interbank term deposits.
The credit risk associated with the use of derivatives is also analysed hereafter in the ‘Derivatives’ section (Note V).
Management of credit risk is based, firstly, on the degree of credit risk vis-à-vis counterparties and, secondly, on an analysis of the solvency of counterparties.
As regards lending, treasury and derivatives operations, credit risk is managed by an independent Risk Management Di-rectorate under the direct responsibility of the Management Committee. The Bank has thus established an operationally independent structure for determining and monitoring credit risk.

EIB – Financial Statements 133 EIB Group
U.1.1. Loans
In order to limit the credit risk on its loan portfolio, the Bank lends only to counterparties with demonstrated creditwor-thiness over the longer term and sound guarantees.
In order efficiently to measure and manage credit risk on loans, the Bank has graded its lending operations according to generally accepted criteria, based on the quality of the borrower, the guarantee and, where appropriate, the guarantor.
The structure of guarantors and borrowers relating to the loan portfolio as at 31 December 2008 is analysed below (in EUR million), including undisbursed portions:
Within the European Union
Guarantor (1)
Borrower Member
StatesPublic
institutions Zone ’A’
banksCorporates Total 2008 Total 2007
Member States 27 202 0 0 0 27 202 24 925
Public institutions 20 709 39 983 743 4 017 65 452 59 698
Zone ’A’ banks 10 982 40 105 47 655 16 500 115 242 114 734
Corporates 16 266 6 985 32 169 55 830 111 250 96 952
Total 2008 (1) (2) (3) (4) 75 159 87 073 80 567 76 347 319 146
Total 2007 (1) (2) (3) (4) 71 738 84 345 75 439 64 787 296 309
(1) This amount includes loans for which no formal guarantee independent from the borrower and the loan itself was required for a total of EUR 82 021 million as at 31 December 2008 (2007: EUR 90 063 million), the borrower’s level of solvency itself representing adequate security. In the event of cer-tain occurrences, appropriate contractual clauses ensure the Bank’s right to access independent security.
(2) This amount includes loans (2008: EUR 4 330 million, 2007: EUR 3 102 million) in risk-sharing operations.(3) This amount includes loans granted under the Facilities (2008: EUR 4 149 million, 2007: EUR 3 186 million). Loans granted under the Facilities are not
secured by guarantees of the Community budget or the Member States. Therefore, lending under the Facilities is from the Bank’s own resources and at the Bank’s own risk.
(4) This amount does not include asset backed securities (2008: EUR 5 766 million, 2007: EUR 4 709 million).
Loans outside the European Communities (apart from those under the Pre-Accession Facility and the Mediterranean Partnership Facility – the “Facilities”) are, in the last resort, secured by guarantees of the European Communities budget or the Member States (loans in the ACP Countries and the OCT). In all regions (South Africa, non-member Mediterrane-an Countries, Central and Eastern Europe, Asia and Latin America), apart from the ACP Countries and the OCT, in the case of loans secured by a sovereign guarantee, all risks are, in the last resort, covered by the European Communities budget.
The agreements decided by the Council of the European Union on 14 April 1997 (Decision 97/256/EC) introduced the concept of risk sharing whereby certain bank loans are secured by third-party guarantees with respect to the commer-cial risk, the budgetary guarantee applying in the case of political risks solely arising from currency non-transferability, expropriation, war and civil disturbance.
Outside the European Union
Secured by: 31.12.2008 31.12.2007
Member States 1 554 1 567
Community budget 28 152 (*) 25 270 (*)
Total 29 706 26 837
(*) of which EUR 4 330 million in risk-sharing operations as explained above (2007: EUR 3 102 million).

Financial Report 2008134EIB Group
LOANS FOR PROJECTS OUTSIDE THE UNION (in EUR million)
(including loans in the new Member States before accession)
BREAKDOWN OF LOANS BY GUARANTEE AS AT 31 DECEMBER
AGREEMENTOutstanding
31.12.2008Outstanding
31.12.2007
75 % Member States global guarantee - ACP/OCT Group 3 rd Lomé Convention 1 4 - ACP/OCT Group 4 th Lomé Convention 142 200 - ACP/OCT Group 4 th Lomé Convention/2 nd Financial Protocol 516 586
Total 75 % Member States global guarantee 659 790
75 % Member States guarantee - Cotonou partnership agreement 819 777 - Cotonou partnership 2nd agreement 76 0
Total 75 % Member States guarantee 895 777
Total Member States guarantee 1 554 1 567
100 % Community budget guarantee - South Africa - 300m - BG Decision 19.06.95 41 62 - ALA I - 750m 135 145 - ALA interim (100 % guarantee) -153m 5 22 - CEEC - 1bn - BG Decision 29.11.89 120 127 - CEEC - 3bn - BG Decision 02.05.94 618 730 - CEEC – 700m - BG Decision 18.04.91 9 17 - Russia – 100 m - 2001-2005 79 79 - Russia – 500 m - 2004-2007 230 230
Total 100 % Community budget guarantee 1 237 1 412
75 % Community budget guarantee - Mediterranean Protocols 988 1 180 - Yugoslavia – Art.18 (1984) 2 3 - Yugoslavia - 1 st Protocol 4 5 - Yugoslavia - 2 nd Protocol 16 40 - Slovenia - 1 st Protocol 62 71
Total 75 % Community budget guarantee 1 072 1 299
70 % Community budget guarantee - South Africa - 375m - Decision 29.01.97 128 165 - ALA II – 900m 175 200 - ALA interim (70 % guarantee: risk sharing) -122m 10 21 - Bosnia-Herzegovina - 100m 99/2001 89 92 - Euromed (EIB) - 2 310m - Decision 29.01.97 908 1 016 - FYROM - 150m – 1998/2000 117 126 - CEEC - 3 520m - Decision 29.01.97 1 627 1 790
Total 70 % Community budget guarantee 3 054 3 410
65 % Community budget guarantee - South Africa - 825m – 7/2000-7/2007 629 705 - South Africa – Decision 2/2007-12/2013 202 0 - ALA III – 2480m – 2/2000-7/2007 1 275 1 329 - ALA Decision – 2/2007-12/2013 791 304 - Euromed II - 6520m – 2/2000-1/2007 5 686 5 787 - South Eastern Neighbours – 9185m - 2/2000-7/2007 8 344 8 513 - Turkey special action – 450m – 2001-2006 324 347 - Turkey TERRA- 600m - 11/1999-11/2002 549 570 - PEV EE/CAS/RUS 1/2/2007-31/12/2013 170 0 - PEV MED 1/2/2007-31/12/2013 2 404 1 205 - Pre-Accession – 8 700m - 2007-2013 2 415 389
Total 65 % Community budget guarantee 22 789 19 149
Total Community budget guarantee 28 152 25 270
TOTAL 29 706 26 837

EIB – Financial Statements 135 EIB Group
Collateral on loans (EUR million)
Among other credit mitigant instruments, the Bank also uses pledges of financial securities. These pledges are formal-ized through a Pledge Agreement, enforceable in the relevant jurisdiction. The portfolio of collateral received in pledge contracts amounts to EUR 12 998 million (2007: EUR 11 123 million), with the following composition:
As at 31 December 2008 Loan Financial Collateral (in EUR million) (1)
Moody’s or equivalent rating
Bonds Equities & Funds
Cash
Total 2008
Govt
Supra-national
Agency
Secured Bonds (Pfandbriefe,
Cedulas)
Bank and Corporate
Bonds
ABS
Aaa 678 1 34 482 694 638 0 0 2 527
Aa1 to Aa3 1 193 0 0 50 1 937 151 0 0 3 331
A1 1 743 0 16 0 1 025 0 0 0 2 784
Below A1 2 500 0 28 0 1 199 0 0 0 3 727
Non-Rated 0 0 0 0 0 0 277 352 629
Total 2008 6 114 1 78 532 4 855 789 277 352 12 998
(1) Bonds are valued at their market value.
As at 31 December 2007 Loan Financial Collateral (in EUR million) (1)
Moody’s or equivalent rating
Bonds Equities & Funds
Cash
Total 2007
Govt
Supra-national
Agency
Secured Bonds (Pfandbriefe,
Cedulas)
Bank and Corporate
Bonds
ABS
Aaa 972 4 0 260 398 616 0 0 2 250
Aa1 to Aa3 1 583 0 0 12 1 604 146 0 0 3 345
A1 1 055 0 0 0 1 062 0 0 0 2 117
Below A1 1 619 0 21 0 1 051 0 0 0 2 691
Non-Rated 0 0 0 0 195 0 102 423 720
Total 2007 5 229 4 21 272 4 310 762 102 423 11 123
(1) Bonds are valued at their market value.
A breakdown of disbursed loans outstanding, including assets backed securities (in EUR million) at 31 December ac-cording to the sectors in which borrowers are engaged is set out below:
Maturity
Sector : not more than 1 year
1 year to 5 years more than 5 years Total 2008 Total 2007
Transport 4 022 17 631 69 060 90 713 85 237
Global loans 7 593 30 462 39 099 77 154 76 477
Energy 2 305 11 019 17 516 30 840 26 549
Industry 1 812 10 467 6 535 18 814 15 625
Health & education 492 3 408 14 601 18 501 15 636
Miscellaneous infrastructure 834 3 897 12 257 16 988 16 335
Water & sewerage 1 294 4 148 10 990 16 432 15 801
Services 794 3 335 8 177 12 306 11 192
Telecommunications 860 4 487 4 114 9 461 8 057
Agriculture, forestry & fisheries 50 64 96 210 238
TOTAL 2008 20 056 88 918 182 445 291 419
TOTAL 2007 17 322 87 187 166 638 271 147

Financial Report 2008136EIB Group
U.1.2. Treasury
The credit risk associated with treasury (securities, commercial paper, term accounts, etc.) is rigorously managed through selecting first-class counterparties and issuers.
Limits governing the structure of the securities portfolio and outstanding treasury instruments have been laid down by Management, in particular on the basis of the ratings awarded to counterparties by the rating agencies (these limits are reviewed regularly by the Risk Management Directorate).
The table below provides a percentage breakdown of the credit risk associated with the securities portfolio and treasury instruments in terms of the credit rating of counterparties and issuers (as at 31 December):
Moody’s or equivalent rating Securities portfolio % Treasury instruments %
Long-term rating: 2008 2007 2008 2007
- Aaa 52 55 1 4
- Aa1 to Aa3 41 41 39 61
- A1 to A3 7 4 57 32
Below A3 0 0 2 0
Short-term rating:
- A-1+P-1 0 0 1 3
Total 100 100 100 100
As part of its treasury management activities, the Bank holds investments in capital guarantee notes, the coupons of which embed options on the performance of funds of hedge funds. At 31 December 2008, the total nominal amount of such notes stood at EUR 150 million and are part of the Securities portfolio.
Collateral on Treasury transactions (EUR million)
Part of the Treasury transactions are tripartite reverse repos, for an amount of EUR 7 250 million (2007: EUR 4 593 mil-lion). These transactions are governed by a Tripartite Agreement, the exposure is fully collateralised, with daily margin calls. The market value of the collateral portfolio at 31 December 2008 amounts to EUR 7 243 million (2007: EUR 4 611 million), with the following classification:
Tripartite Agreements Collateral (in EUR million)
At 31 December 2008 Bonds Total 2008
Moody’s or equivalent rating
Govt
Supra-national
Agency
Secured Bonds
(Pfandbriefe, Cedulas)
Bank and Corporate
Bonds
ABS
Aaa 358 309 12 477 1 142 85 2 383
Aa1 to Aa3 844 0 10 4 1 955 0 2 813
A1 84 0 10 0 524 0 618
Below A1 513 0 0 0 916 0 1 429
Total 2008 1 799 309 32 481 4 537 85 7 243
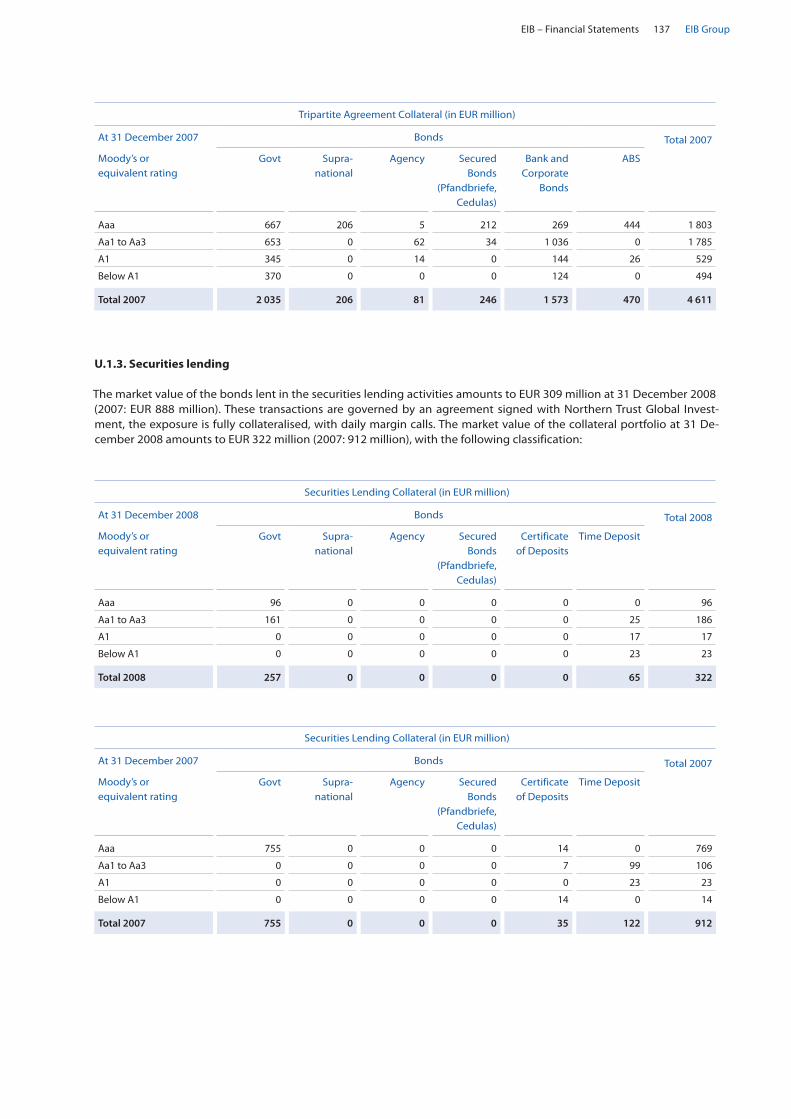
EIB – Financial Statements 137 EIB Group
Tripartite Agreement Collateral (in EUR million)
At 31 December 2007 Bonds Total 2007
Moody’s or equivalent rating
Govt
Supra-national
Agency
Secured Bonds
(Pfandbriefe, Cedulas)
Bank and Corporate
Bonds
ABS
Aaa 667 206 5 212 269 444 1 803
Aa1 to Aa3 653 0 62 34 1 036 0 1 785
A1 345 0 14 0 144 26 529
Below A1 370 0 0 0 124 0 494
Total 2007 2 035 206 81 246 1 573 470 4 611
U.1.3. Securities lending
The market value of the bonds lent in the securities lending activities amounts to EUR 309 million at 31 December 2008 (2007: EUR 888 million). These transactions are governed by an agreement signed with Northern Trust Global Invest-ment, the exposure is fully collateralised, with daily margin calls. The market value of the collateral portfolio at 31 De-cember 2008 amounts to EUR 322 million (2007: 912 million), with the following classification:
Securities Lending Collateral (in EUR million)
At 31 December 2008 Bonds Total 2008
Moody’s or equivalent rating
Govt
Supra-national
Agency
Secured Bonds
(Pfandbriefe, Cedulas)
Certificate of Deposits
Time Deposit
Aaa 96 0 0 0 0 0 96
Aa1 to Aa3 161 0 0 0 0 25 186
A1 0 0 0 0 0 17 17
Below A1 0 0 0 0 0 23 23
Total 2008 257 0 0 0 0 65 322
Securities Lending Collateral (in EUR million)
At 31 December 2007 Bonds Total 2007
Moody’s or equivalent rating
Govt
Supra-national
Agency
Secured Bonds
(Pfandbriefe, Cedulas)
Certificate of Deposits
Time Deposit
Aaa 755 0 0 0 14 0 769
Aa1 to Aa3 0 0 0 0 7 99 106
A1 0 0 0 0 0 23 23
Below A1 0 0 0 0 14 0 14
Total 2007 755 0 0 0 35 122 912

Financial Report 2008138EIB Group
U.2. Interest rate risk
The Bank has established an organisational structure for the asset-liability function, applying best practices in the finan-cial industry, and, in particular, an Asset-Liability Management Committee (ALCO) under the direct responsibility of the Bank’s Management Committee. Accordingly, it has decided on an asset-liability management strategy which involves maintaining an own funds duration of around 5 years, thereby safeguarding the Bank against substantial fluctuations in its long-term revenues.
As a result of the above objective of an own funds duration equal to around 5 years, an increase in interest rates of 0.01% on all currencies would result in a decrease of EUR 21.8 million (2007: EUR 15.5 million) in the net present value of the Bank’s own funds.
The following table illustrates the Bank’s exposure to interest rate risk. The table shows interest rate sensitive assets and liabilities classified as a function of their re-pricing in each of the indicated intervals and not on the accounting carrying amount :
Reindexation interval (in EUR million)
At 31 December 2008
not more than
3 months
3 months to 6 months
6 months to 1 year
1 year to 5 years
more than 5 years
Total 2008
Assets:
Loans 174 430 14 568 4 958 42 966 54 497 291 419
Net liquidity 9 598 - 4 525 - 84 1 848 601 7 438
184 028 10 043 4 874 44 814 55 098 298 857
Liabilities:
Borrowings after swaps - 178 920 - 13 503 - 4 594 - 25 167 - 38 621 - 260 805
Interest rate risk 5 108 - 3 460 280 19 647 16 477
At 31 December 2007
not more than
3 months
3 months to 6 months
6 months to 1 year
1 year to 5 years
more than 5 years
Total 2007
Assets:
Loans 166 227 10 769 3 656 41 030 49 465 271 147
Net liquidity 10 820 111 416 2 321 915 14 583
177 047 10 880 4 072 43 351 50 380 285 730
Liabilities:
Borrowings after swaps 181 325 6 985 1 716 25 881 35 460 251 367
Interest rate risk - 4 278 3 895 2 356 17 470 14 920

EIB – Financial Statements 139 EIB Group
U.3. Liquidity risk
The table hereafter analyses assets and liabilities by maturity on the basis of the period remaining between the balance sheet date and the contractual maturity date.
Assets and liabilities for which there is no contractual maturity date are classified under ’Maturity undefined’.
Liquidity Risk (in EUR million)
Maturity (at 31 December 2008)
not more than
3 months
3 months to 1 year
1 year to 5 years
more than 5 years
maturity undefined
Total 2008
ASSETS
Cash in hand, central banks and post office banks
0
0
0
0
0
0
Treasury bills eligible for refinancing with central banks
74
171
1 021
643
0
1 909
Other loans and advances:
- Current accounts 245 0 0 0 0 245
- Others 21 361 0 0 0 0 21 361
21 606 0 0 0 0 21 606
Loans:
- Credit institutions 2 429 7 840 40 812 60 910 0 111 991
- Customers 1 962 7 767 46 375 117 536 0 173 640
4 391 15 607 87 187 178 446 0 285 631
Debt securities including fixed-income securities
2 998
666
2 945
4 124
0
10 733
Other assets 0 0 0 0 5 882 5 882
Total assets 29 069 16 444 91 153 183 213 5 882 325 761
LIABILITIES
Amounts owed to credit institutions 5 957 1 0 0 0 5 958
Debts evidenced by certificates 18 090 23 409 113 219 112 271 0 266 989
Foreign exchange neutralization on currency swap contracts
1 496
1 255
4 463
1 841
0
9 055
Capital, reserves and profit 0 0 0 0 36 192 36 192
Other liabilities 0 0 0 0 7 567 7 567
Total liabilities 25 543 24 665 117 682 114 112 43 759 325 761

Financial Report 2008140EIB Group
Maturity (at 31 December 2007)
not more than
3 months
3 months to 1 year
1 year to 5 years
more than 5 years
maturity undefined
Total 2007
ASSETS
Cash in hand, central banks and post office banks
27
0
0
0
0
27
Treasury bills eligible for refinancing with central banks
47
159
995
926
0
2 127
Other loans and advances:
- Current accounts 264 0 0 0 0 264
- Others 15 452 24 0 0 0 15 476
15 716 24 0 0 0 15 740
Loans:
- Credit institutions 1 686 6 246 41 948 61 335 0 111 215
- Customers 1 949 7 358 43 376 102 498 0 155 181
3 635 13 604 85 324 163 833 0 266 396
Debt securities including fixed-income securities
2 404
1 095
3 510
3 512
0
10 521
Other assets 0 0 0 0 7 043 7 043
Total assets 21 829 14 882 89 829 168 271 7 043 301 854
LIABILITIES
Amounts owed to credit institutions 339 2 1 0 0 342
Debts evidenced by certificates 13 796 30 034 87 234 123 157 0 254 221
Foreign exchange neutralization on currency swap contracts
16
1 091
2 010
2 341
0
5 458
Capital, reserves and profit 0 0 0 0 34 541 34 541
Other liabilities 0 0 0 0 7 292 7 292
Total liabilities 14 151 31 127 89 245 125 498 41 833 301 854
Some of the borrowings and associated swaps include early termination triggers or call options granted to the investors or the hedging swap counterparties. Certain liabilities could therefore be redeemed at an earlier stage than their matu-rity date.
If all calls were to be exercised at their next contractual exercise date, cumulated early redemptions for the period 2009 - 2011 would amount to EUR 13.2 billion.

EIB – Financial Statements 141 EIB Group
U.4. Foreign exchange rate risk
The sources of foreign exchange rate risk are to be found in the margins on operations and in general expenses incurred in non-euro currencies. The Bank’s objective is to eliminate exchange risk by reducing net positions per currency through operations on the international foreign exchange markets.
An FX hedging program exists in order to protect the known loan margins in USD and in GBP for the next 3 years.
Foreign exchange position (in EUR million)
Currency at 31 December 2008 Euro Pounds Sterling
US Dollars Other currencies
Sub-Total except Euro
Total 2008
ASSETS
Cash in hand, central banks and post office banks
0
0
0
0
0
0
Treasury bills eligible for refinancing with central banks
1 909
0
0
0
0
1 909
Other loans and advances:
- Current accounts 193 16 12 24 52 245
- Others 14 508 2 369 2 067 2 417 6 853 21 361
14 701 2 385 2 079 2 441 6 905 21 606
Loans:
- Credit institutions 67 016 14 925 26 331 3 719 44 975 111 991
- Customers 140 731 14 304 9 292 9 313 32 909 173 640
207 747 29 229 35 623 13 032 77 884 285 631
Debt securities including fixed-income securities
7 691
1 541
1 199
302
3 042
10 733
Other assets 4 670 639 56 517 1 212 5 882
Total assets 236 718 33 794 38 957 16 292 89 043 325 761
LIABILITIES
Amounts owed to credit institutions 5 623 0 316 19 335 5 958
Debts evidenced by certificates:
- Debt securities in issue 107 552 47 338 77 423 34 007 158 768 266 320
- Others 207 367 0 95 462 669
107 759 47 705 77 423 34 102 159 230 266 989
Foreign exchange neutralization on currency swap contracts
81 629
- 14 697
- 39 354
- 18 523
- 72 574
9 055
Capital, reserves and profit 36 192 0 0 0 0 36 192
Other liabilities 5 523 785 578 681 2 044 7 567
Total liabilities 236 726 33 793 38 963 16 279 89 035 325 761
Net position - 8 1 -6 13
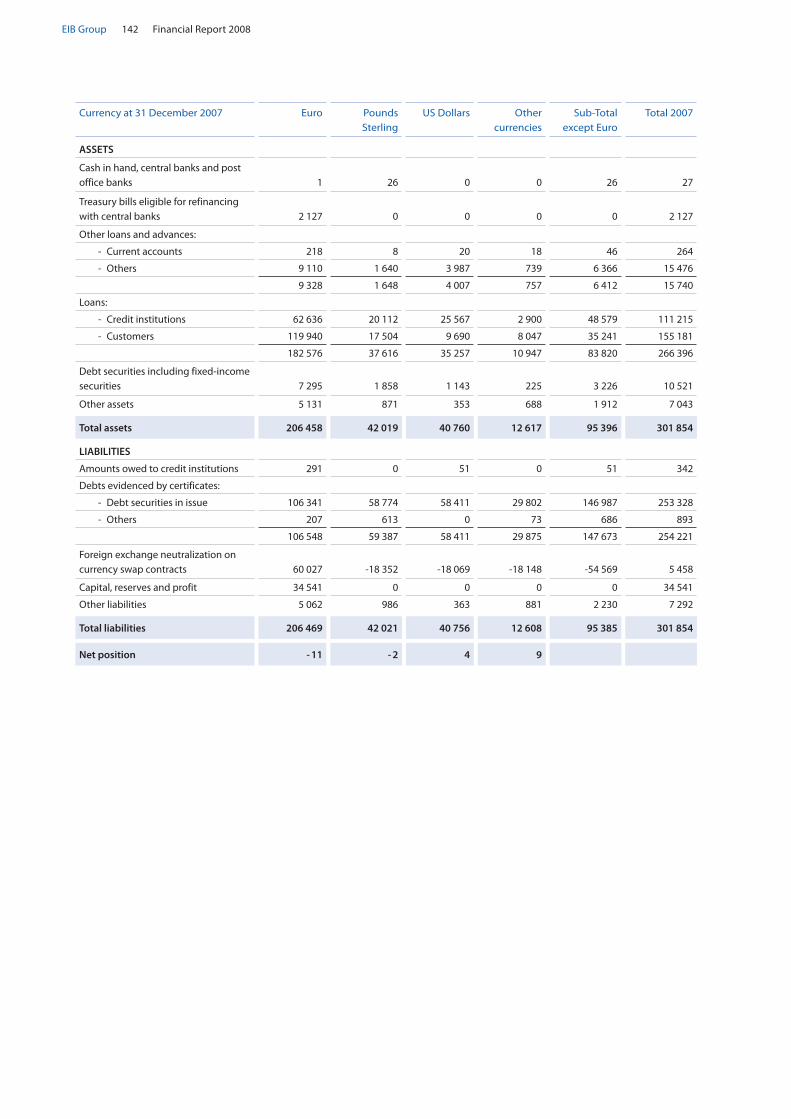
Financial Report 2008142EIB Group
Currency at 31 December 2007 Euro Pounds Sterling
US Dollars Other currencies
Sub-Total except Euro
Total 2007
ASSETS
Cash in hand, central banks and post office banks
1
26
0
0
26
27
Treasury bills eligible for refinancing with central banks
2 127
0
0
0
0
2 127
Other loans and advances:
- Current accounts 218 8 20 18 46 264
- Others 9 110 1 640 3 987 739 6 366 15 476
9 328 1 648 4 007 757 6 412 15 740
Loans:
- Credit institutions 62 636 20 112 25 567 2 900 48 579 111 215
- Customers 119 940 17 504 9 690 8 047 35 241 155 181
182 576 37 616 35 257 10 947 83 820 266 396
Debt securities including fixed-income securities
7 295
1 858
1 143
225
3 226
10 521
Other assets 5 131 871 353 688 1 912 7 043
Total assets 206 458 42 019 40 760 12 617 95 396 301 854
LIABILITIES
Amounts owed to credit institutions 291 0 51 0 51 342
Debts evidenced by certificates:
- Debt securities in issue 106 341 58 774 58 411 29 802 146 987 253 328
- Others 207 613 0 73 686 893
106 548 59 387 58 411 29 875 147 673 254 221
Foreign exchange neutralization on currency swap contracts
60 027
-18 352
-18 069
-18 148
-54 569
5 458
Capital, reserves and profit 34 541 0 0 0 0 34 541
Other liabilities 5 062 986 363 881 2 230 7 292
Total liabilities 206 469 42 021 40 756 12 608 95 385 301 854
Net position - 11 - 2 4 9
EIB – Financial Statements 143 EIB Group
Note V – Derivatives
Derivatives are contractual financial instruments, the value of which fluctuates according to trends in the un-derlying assets, interest rates, exchange rates or indices.
V.1. As part of funding and hedging activity
The Bank uses derivatives mainly as part of its funding strategy in order to bring the characteristics of the funds raised, in terms of currencies and interest rates, into line with those of loans granted and also to reduce funding costs. It uses also long-term swaps to hedge certain treasury transactions and for ALM purposes.
Long-term derivatives transactions are not used for trading, but only in connexion with fund-raising and for the reduction of market risk exposure.
All interest rate and currency swaps linked to the borrow-ing portfolio have maturities matching the correspond-ing borrowings and are therefore of a long-term nature.
The derivatives most commonly used are:
Currency swaps; •
Interest rate swaps; •
Asset swaps. •
V.1.1. Currency swaps
Currency swaps are contracts under which it is agreed to convert funds raised through borrowings into anoth-er currency and, simultaneously, a forward exchange contract is concluded to re-exchange the two curren-cies in the future in order to be able to repay the funds raised on the due dates.
V.1.2. Interest rate swaps
Interest rate swaps are contracts under which, generally, it is agreed to exchange floating-rate interest for fixed-rate interest or vice versa.
V.1.3. Asset swaps
Asset swaps are arranged for investments in bonds, in-cluded in the B1 portfolio, that do not have the desired cash-flow features. Specifically, swaps are used to con-vert investments into floating-rate instruments with 3-month coupon payment and reset frequency. Thus, the Bank eliminates interest-rate and/or exchange risk, while retaining, as intended, the credit risk.
Interest rate or currency swaps allow the Bank to modify the interest rate and currency structure of its borrowing portfolio in order to accommodate requests from its cli-ents and also to reduce funding costs by exchanging its advantageous access conditions to certain capital mar-kets with its counterparties.
Derivatives credit risk mitigation policy: •
The credit risk with respect to derivatives lies in the loss, which the Bank would incur where a counterparty would be unable to honour its contractual obligations.
In view of the special nature and complexity of the de-rivatives transactions, a series of procedures has been put in place to safeguard the Bank against losses arising out of the use of such instruments.
Contractual framework: •
All the EIB’s long-term derivatives transactions are con-cluded in the contractual framework of Master Swap Agreements and, where non-standard structures are covered, of Credit Support Annexes, which specify the conditions of exposure collateralisation. These are gen-erally accepted and practised contract types.
Counterparty selection: •
The minimum rating at the outset is set at A1, but ex-ceptionally certain counterparties rated A2/A3 have also been authorised, all their exposures being fully collater-alised. The EIB has the right of early termination if the rating drops below a certain level.
Limits: •
Limits have been set in terms of:
- Total net present value of derivatives exposure with a counterparty;
- Unsecured exposure to a counterparty;
- Specific concentration limits expressed as nomi-nal amount.
All limits are dynamically adapted to the credit quality of the counterparty.
Monitoring: •
The derivatives portfolio is regularly valued and com-pared against limits.
Collateralisation: •
- Derivatives exposure exceeding the limit for unse-cured exposure is collateralised by cash and first-class bonds.
- Very complex and illiquid transactions require col-lateralisation over and above the current market value.

Financial Report 2008144EIB Group
- Both the derivatives portfolio with individual counterparties and the collateral received are reg-ularly valued, with a subsequent call for additional collateral or release.
The credit risk associated with derivatives varies accord-ing to a number of factors (such as interest and exchange rates) and generally corresponds to only a small portion of their notional value. In the Bank’s case, where only mu-tually agreed derivatives are negotiated, the credit risk is evaluated on the basis of the ‘current exposure’ method recommended by the Bank for International Settlements
(BIS). Hence, the credit risk is expressed in terms of the positive ‘fair value’ or replacement value of the contracts, increased by the potential risks, contingent on the dura-tion and type of transaction, weighted by a coefficient linked to the category of counterparty (BIS I weighted risk).
The following tables show the maturities of currency swaps (excluding short-term currency swaps – see Note V.2) and interest rate swaps, sub-divided according to their notional amount and the associated credit risk. The notional amounts are disclosed off balance sheet.
Currency swaps at 31.12.2008 (in EUR million)
less than 1 year
1 year to 5 years
5 years to 10 years
more than 10 years
Total 2008
Notional amount 7 460 47 737 20 976 14 281 90 454
Net discounted value - 1 543 - 3 727 - 1 777 1 440 - 5 607
Credit risk (BIS I weighted) 19 739 439 603 1 800
Currency swaps at 31.12.2007 (in EUR million)
less than 1 year
1 year to 5 years
5 years to 10 years
more than 10 years
Total 2007
Notional amount 8 326 30 182 19 480 12 965 70 953
Net discounted value - 1 012 - 1 766 - 2 021 - 315 - 5 114
Credit risk (BIS I weighted) 53 423 311 277 1 064
Interest rate swaps at 31.12.2008 (in EUR million)
less than 1 year
1 year to 5 years
5 years to 10 years
more than 10 years
Total 2008
Notional amount 29 874 114 048 64 746 67 514 276 182
Net discounted value (*) 384 3 749 3 246 3 608 10 987
Credit risk (BIS I weighted) 90 1 092 1 168 1 660 4 010
Interest rate swaps at 31.12.2007 (in EUR million)
less than 1 year
1 year to 5 years
5 years to 10 years
more than 10 years
Total 2007
Notional amount 27 759 83 255 70 634 67 863 249 511
Net discounted value (*) 198 689 - 411 724 1 200
Credit risk (BIS I weighted) 76 361 571 903 1 911
(*) The net discounted value of Credit Default Swaps (CDS) has been included with the rest of derivatives (according to IAS39, CDS are treated as deriva-tives). However, these transactions have not been included in the BIS computations, since in the Basel Agreement BIS I, they are assimilated to guaran-tees and their capital charge is computed in the loan portfolio.
The Bank does not generally enter into any options contracts in conjunction with its risk hedging policy. However, as part of its strategy of raising funds on the financial markets at a lesser cost, the Bank enters into borrowing contracts encompassing notably interest rate or stock exchange index options. Such borrowings are entirely covered by swap contracts to hedge the corresponding market risk.
Tabulated below are the number and notional amounts of the various types of options embedded in borrowings:
Option embedded Stock exchange index Special structure coupon or similar
2008 2007 2008 2007 2008 2007
Number of transactions 405 429 6 3 359 322
Notional amount (in EUR million) 15 678 18 433 843 600 22 241 20 817
Net discounted value (in EUR million) 238 - 969 - 59 - 23 - 485 - 187

EIB – Financial Statements 145 EIB Group
The ‘fair value’ of ‘plain vanilla’ swap transactions is their market value. For structured deals, the ‘fair value’ is computed using the income approach, using valuation techniques to convert future amounts to a single present amount (dis-counted). The estimate of fair value is based on the value indicated by marketplace expectations about those future amounts. Internal estimates and assumptions might be used in the valuation techniques when the market inputs are not directly available.
All option contracts embedded in, or linked with, borrowings are negotiated over the counter. The structured deals in-clude a variety of transactions dependent on interest rates, FX rates, inflation rates, stock indexes and IR volatilities.
Generally, there is a reduced credit risk on these swaps, because security exists in the form of regularly monitored col-lateral.
Collateral (EUR million)
The collateral received for derivatives business amounts to EUR 9 071 million, with the following composition:
Swap Collateral (in EUR million)
Moody’s or equivalent rating
Bonds Cash
Total 2008 Govt Supranational Agency Secured Bonds
(Pfandbriefe)
Aaa 2 160 0 0 0 0 2 160
Aa1 to Aa3 1 148 0 0 0 0 1 148
A1 0 0 0 0 0 0
Below A1 116 0 0 0 0 116
Non-Rated 0 0 0 0 5 647 5 647
Total 2008 3 424 0 0 0 5 647 9 071
Swap Collateral (in EUR million)
Moody’s or equivalent rating
Bonds Cash
Total 2007 Govt Supranational Agency Secured Bonds
(Pfandbriefe)
Aaa 865 0 0 0 0 865
Aa1 to Aa3 4 0 0 0 0 4
A1 224 0 0 0 0 224
Below A1 124 0 0 0 0 124
Non-Rated 0 0 0 0 333 333
Total 2007 1 217 0 0 0 333 1 550

Financial Report 2008146EIB Group
Ratings exposure table: The major part of new derivatives transactions are concluded with counterparties rated at least A1. With exceptional conditions of over-collateralisation, counterparties rated A2 or A3 have been also accepted. Most of the portfolio is concentrated on counterparties rated A1 or above; however, during 2008, there has been a general deterioration of the ratings of our swap counterparties.
Grouped Ratings Percentage of Nominal
Net Market Exposure (in EUR million)
CRE BIS2 Swaps (in EUR million)
Moody’s or equivalent rating 2008 2007 2008 2007 2008 2007
Aaa 2.9% 3.3% 0 0 84 64
Aa1 to Aa3 64.5% 86.1% 406 649 7 403 4 366
A1 23.1% 8.7% 147 19 3 258 504
A2 to A3 9.5% 1.9% 37 2 2 720 165
Non-rated 0.0% 0.0% 1 0 1 2
Total 100.0 % 100.0 % 591 670 13 466 5 101
The Net Market Exposure is the net present value of a swap portfolio net of collateral, if positive (zero if negative). It rep-resents a measure of the losses the Bank could incur in case of default of the counterparty, after application of netting and using the collateral.
The BIS Credit Risk Equivalent is the sum of the Net Present Value of the swap plus an Add-On equal to the Notional Amount multiplied by a coefficient dependent on the structure of the swap and its maturity (according to the Basel Agreement), meant to cover potential future increases in exposures due to changing market conditions over the residu-al life of the swap.
V.1.4. Credit swaps
The Bank also entered into one credit default swap contract for a nominal amount of EUR 172 million as at 31 December 2008 (2007: EUR 98 million) with a fair value of EUR 9.8 million (2007: EUR 4.9 million).
V.2. As part of liquidity management
The Bank also enters into short-term currency swap contracts in order to adjust currency positions in its operational treasury in relation to its benchmark currency, the euro, and to cater for demand for currencies in conjunction with loan disbursements.
The notional amount of short-term currency swaps and short term forwards stood at EUR 16 296 million at 31 Decem-ber 2008, against EUR 4 841 million at 31 December 2007.
The notional amount of Overnight indexed swaps stood at EUR nil million at 31 December 2008 (EUR 6 000 million at 31 December 2007).
Long-term futures are also used by the Bank to adjust the medium-term (2y) interest rate exposure of its treasury bond portfolios. The notional amount of long-term futures stood at EUR 394 million at 31 December 2008 (2007: EUR 419 mil-lion), with a fair value of EUR - 1.3 million (2007: EUR 2.9 million).
Nominal amounts of EUR ‘000 5 472 million of Forward Rate Agreements with a fair value of EUR 0.7 million and a matu-rity less than 1 year are outstanding as at 31 December 2008.
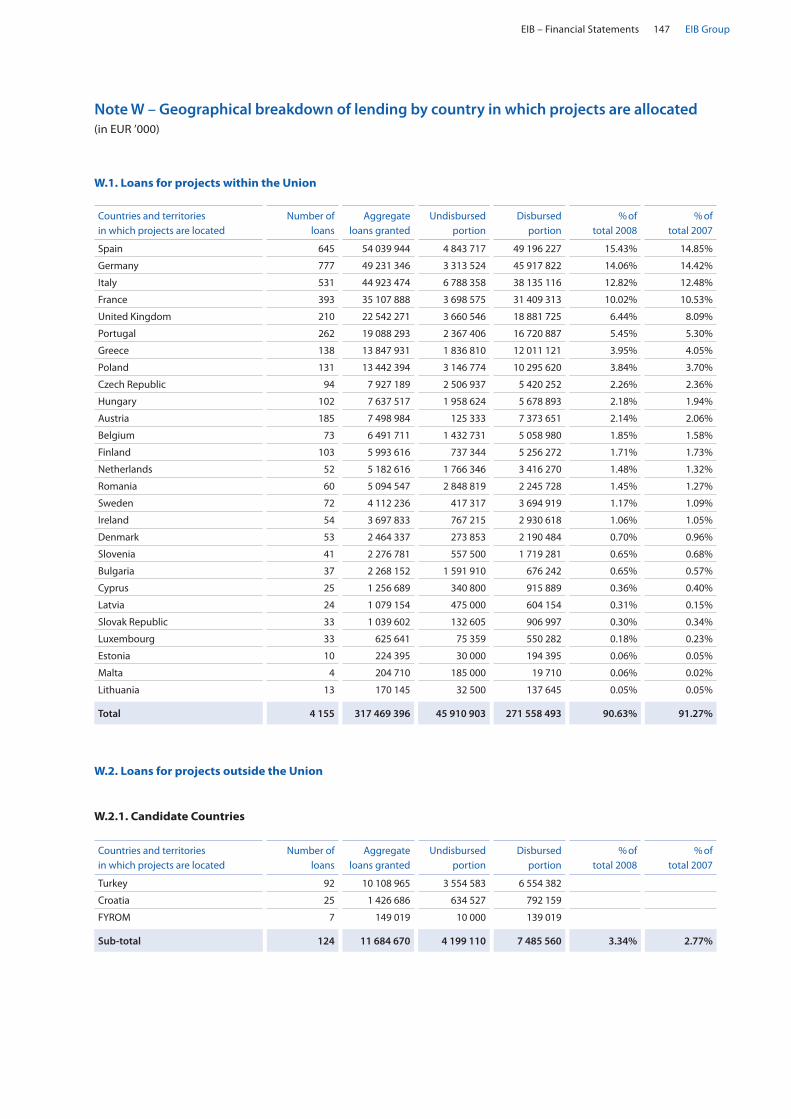
EIB – Financial Statements 147 EIB Group
Note W – Geographical breakdown of lending by country in which projects are allocated (in EUR ’000)
W.1. Loans for projects within the Union
Countries and territories in which projects are located
Number of loans
Aggregate loans granted
Undisbursed portion
Disbursed portion
% of total 2008
% of total 2007
Spain 645 54 039 944 4 843 717 49 196 227 15.43% 14.85%
Germany 777 49 231 346 3 313 524 45 917 822 14.06% 14.42%
Italy 531 44 923 474 6 788 358 38 135 116 12.82% 12.48%
France 393 35 107 888 3 698 575 31 409 313 10.02% 10.53%
United Kingdom 210 22 542 271 3 660 546 18 881 725 6.44% 8.09%
Portugal 262 19 088 293 2 367 406 16 720 887 5.45% 5.30%
Greece 138 13 847 931 1 836 810 12 011 121 3.95% 4.05%
Poland 131 13 442 394 3 146 774 10 295 620 3.84% 3.70%
Czech Republic 94 7 927 189 2 506 937 5 420 252 2.26% 2.36%
Hungary 102 7 637 517 1 958 624 5 678 893 2.18% 1.94%
Austria 185 7 498 984 125 333 7 373 651 2.14% 2.06%
Belgium 73 6 491 711 1 432 731 5 058 980 1.85% 1.58%
Finland 103 5 993 616 737 344 5 256 272 1.71% 1.73%
Netherlands 52 5 182 616 1 766 346 3 416 270 1.48% 1.32%
Romania 60 5 094 547 2 848 819 2 245 728 1.45% 1.27%
Sweden 72 4 112 236 417 317 3 694 919 1.17% 1.09%
Ireland 54 3 697 833 767 215 2 930 618 1.06% 1.05%
Denmark 53 2 464 337 273 853 2 190 484 0.70% 0.96%
Slovenia 41 2 276 781 557 500 1 719 281 0.65% 0.68%
Bulgaria 37 2 268 152 1 591 910 676 242 0.65% 0.57%
Cyprus 25 1 256 689 340 800 915 889 0.36% 0.40%
Latvia 24 1 079 154 475 000 604 154 0.31% 0.15%
Slovak Republic 33 1 039 602 132 605 906 997 0.30% 0.34%
Luxembourg 33 625 641 75 359 550 282 0.18% 0.23%
Estonia 10 224 395 30 000 194 395 0.06% 0.05%
Malta 4 204 710 185 000 19 710 0.06% 0.02%
Lithuania 13 170 145 32 500 137 645 0.05% 0.05%
Total 4 155 317 469 396 45 910 903 271 558 493 90.63% 91.27%
Countries and territories in which projects are located
Number of loans
Aggregate loans granted
Undisbursed portion
Disbursed portion
% of total 2008
% of total 2007
Turkey 92 10 108 965 3 554 583 6 554 382
Croatia 25 1 426 686 634 527 792 159
FYROM 7 149 019 10 000 139 019
Sub-total 124 11 684 670 4 199 110 7 485 560 3.34% 2.77%
W.2. Loans for projects outside the Union
W.2.1. Candidate Countries

Financial Report 2008148EIB Group
W.2.2. ACP States
Countries and territories in which projects are located
Number of loans
Aggregate loans granted
Undisbursed portion
Disbursed portion
% of total 2008
% of total 2007
Madagascar 2 263 645 154 068 109 577
Ghana 3 131 331 72 585 58 746
Mauritius 13 113 515 70 886 42 629
Namibia 11 111 912 35 000 76 912
Regional – West Africa 3 86 189 0 86 189
Dominican Republic 3 81 233 80 000 1 233
Cape Verde 2 64 404 47 000 17 404
Mozambique 6 62 080 0 62 080
Congo (Democratic Republic) 1 55 000 55 000 0
Senegal 3 53 880 35 000 18 880
Nigeria 1 50 000 50 000 0
Regional – Caribbean 3 49 161 9 000 40 161
Swaziland 3 43 188 17 410 25 778
Lesotho 4 40 724 14 300 26 424
Barbados 5 38 991 9 750 29 241
Kenya 2 36 991 0 36 991
Jamaica 6 33 176 0 33 176
Botswana 4 29 203 0 29 203
Zambia 2 29 096 0 29 096
Fiji Islands 1 24 500 24 500 0
Regional – Africa 2 22 504 0 22 504
Mauritania 2 19 880 0 19 880
Regional ACP 3 19 295 0 19 295
Burkina Faso 1 18 500 18 500 0
Malawi 2 18 166 15 750 2 416
Benin 1 13 000 13 000 0
Bahamas 2 9 725 0 9 725
Saint Vincent and The Grenadines 2 8 692 1 462 7 230
Zimbabwe 4 7 249 0 7 249
Saint Lucia 2 6 768 1 155 5 613
Gabon 1 3 751 0 3 751
Ivory Coast 1 1 302 0 1 302
Papua New Guinea 1 1 129 0 1 129
Grenada 1 839 0 839
Belize 1 248 0 248
Trinidad and Tobago 1 242 0 242
Sub-total 105 1 549 509 724 366 825 143 0.44% 0.47%

EIB – Financial Statements 149 EIB Group
W.2.3. Asia
Countries and territories in which projects are located
Number of loans
Aggregate loans granted
Undisbursed portion
Disbursed portion
% of total 2008
% of total 2007
China 5 1 048 337 699 362 348 975
India 2 163 749 150 000 13 749
Sri Lanka 4 153 923 45 000 108 923
Indonesia 4 124 911 14 750 110 161
Philippines 4 109 784 43 698 66 086
Vietnam 3 95 267 0 95 267
Pakistan 4 77 947 0 77 947
Maldives 1 47 722 0 47 722
Laos People`s Democratic Republic 1 36 684 0 36 684
Thailand 1 26 581 0 26 581
Bangladesh 1 21 636 0 21 636
Sub-total 30 1 906 541 952 810 953 731 0.54% 0.54%
W.2.4. Balkans
Countries and territories in which projects are located
Number of loans
Aggregate loans granted
Undisbursed portion
Disbursed portion
% of total 2008
% fin. year 2007
Serbia 42 1 485 873 762 878 722 995
Bosnia-Herzegovina 28 963 627 635 169 328 458
Albania 12 244 239 110 065 134 174
Montenegro 8 84 977 48 977 36 000
Sub-total 90 2 778 716 1 557 089 1 221 627 0.79% 0.68%
W.2.5. Central and Latin America
Countries and territories in which projects are located
Number of loans
Aggregate loans granted
Undisbursed portion
Disbursed portion
% of total 2008
% fin. year 2007
Brazil 14 726 804 200 000 526 804
Mexico 4 126 579 50 000 76 579
Peru 4 126 423 0 126 423
Colombia 1 90 795 0 90 795
Paraguay 1 72 554 36 626 35 928
Argentina 4 68 013 0 68 013
Panama 2 63 068 27 141 35 927
Regional-Andean Countries 2 50 510 40 000 10 510
Regional-Central America 3 43 661 28 366 15 295
Equador 1 36 764 0 36 764
Uruguay 3 28 634 6 354 22 280
Honduras 1 20 000 20 000 0
Costa Rica 1 15 602 0 15 602
Sub-total 41 1 469 407 408 487 1 060 920 0.42% 0.38%
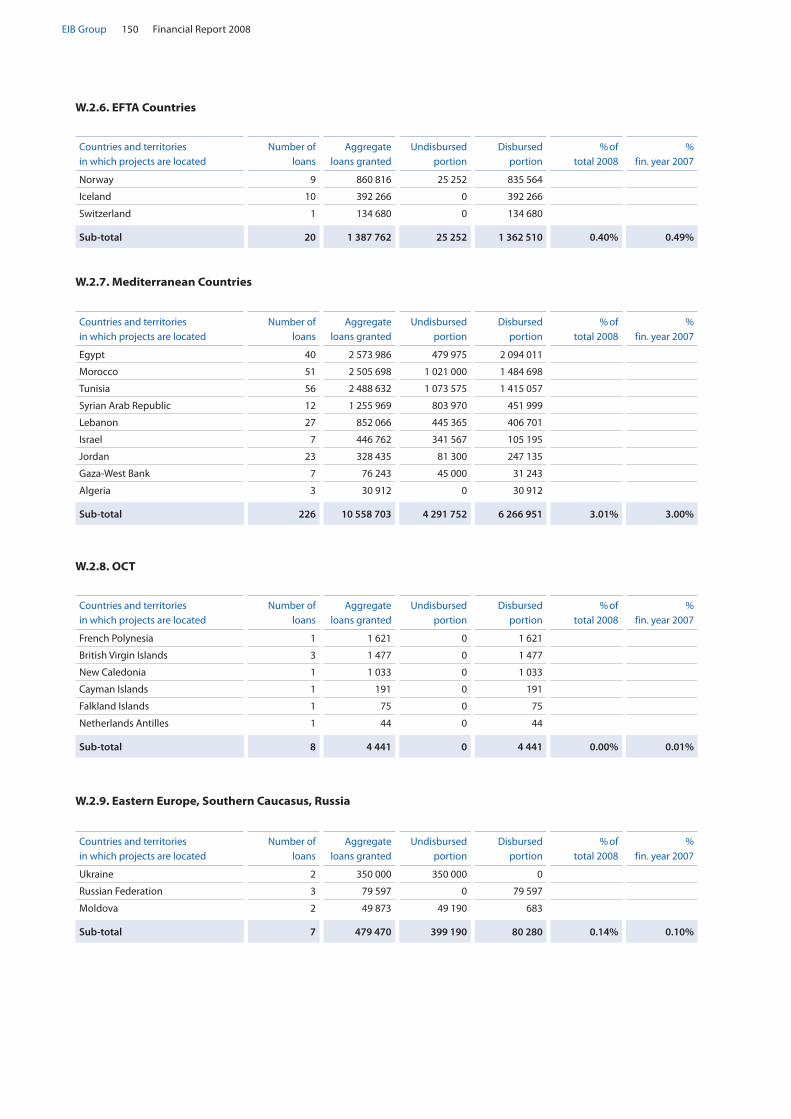
Financial Report 2008150EIB Group
W.2.6. EFTA Countries
Countries and territories in which projects are located
Number of loans
Aggregate loans granted
Undisbursed portion
Disbursed portion
% of total 2008
% fin. year 2007
Norway 9 860 816 25 252 835 564
Iceland 10 392 266 0 392 266
Switzerland 1 134 680 0 134 680
Sub-total 20 1 387 762 25 252 1 362 510 0.40% 0.49%
W.2.8. OCT
Countries and territories in which projects are located
Number of loans
Aggregate loans granted
Undisbursed portion
Disbursed portion
% of total 2008
% fin. year 2007
French Polynesia 1 1 621 0 1 621
British Virgin Islands 3 1 477 0 1 477
New Caledonia 1 1 033 0 1 033
Cayman Islands 1 191 0 191
Falkland Islands 1 75 0 75
Netherlands Antilles 1 44 0 44
Sub-total 8 4 441 0 4 441 0.00% 0.01%
W.2.9. Eastern Europe, Southern Caucasus, Russia
Countries and territories in which projects are located
Number of loans
Aggregate loans granted
Undisbursed portion
Disbursed portion
% of total 2008
% fin. year 2007
Ukraine 2 350 000 350 000 0
Russian Federation 3 79 597 0 79 597
Moldova 2 49 873 49 190 683
Sub-total 7 479 470 399 190 80 280 0.14% 0.10%
W.2.7. Mediterranean Countries
Countries and territories in which projects are located
Number of loans
Aggregate loans granted
Undisbursed portion
Disbursed portion
% of total 2008
% fin. year 2007
Egypt 40 2 573 986 479 975 2 094 011
Morocco 51 2 505 698 1 021 000 1 484 698
Tunisia 56 2 488 632 1 073 575 1 415 057
Syrian Arab Republic 12 1 255 969 803 970 451 999
Lebanon 27 852 066 445 365 406 701
Israel 7 446 762 341 567 105 195
Jordan 23 328 435 81 300 247 135
Gaza-West Bank 7 76 243 45 000 31 243
Algeria 3 30 912 0 30 912
Sub-total 226 10 558 703 4 291 752 6 266 951 3.01% 3.00%
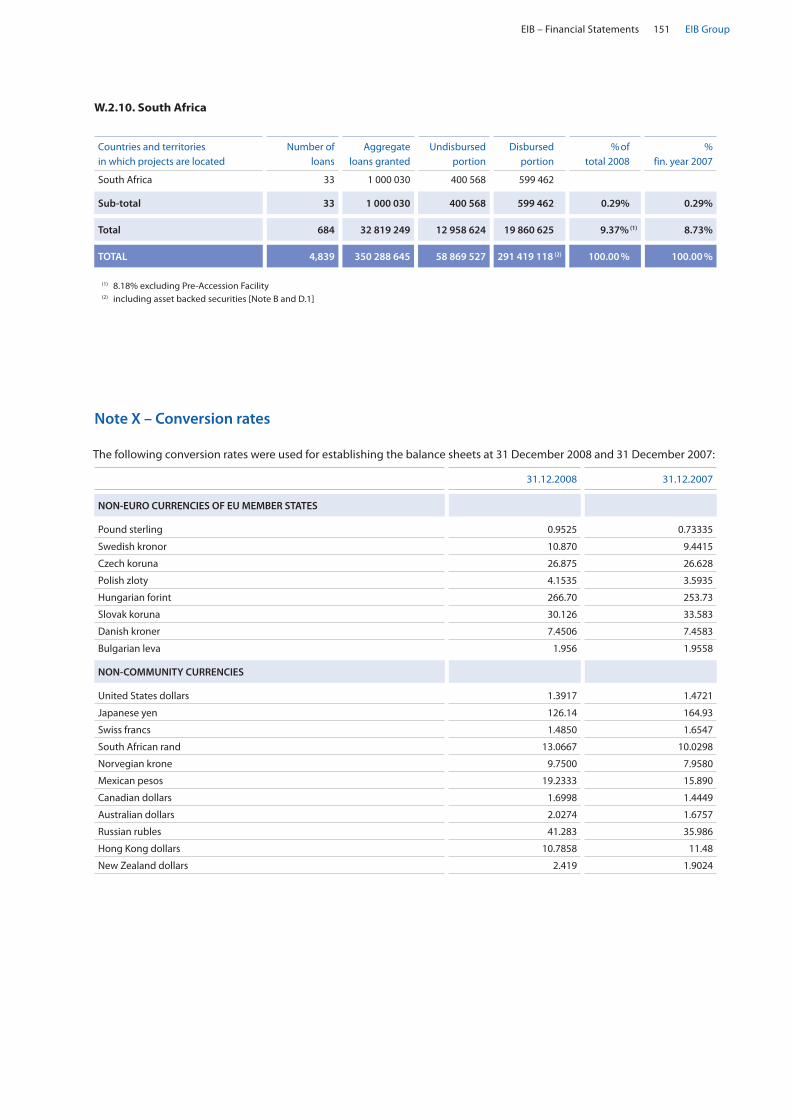
EIB – Financial Statements 151 EIB Group
W.2.10. South Africa
Countries and territories in which projects are located
Number of loans
Aggregate loans granted
Undisbursed portion
Disbursed portion
% of total 2008
% fin. year 2007
South Africa 33 1 000 030 400 568 599 462
Sub-total 33 1 000 030 400 568 599 462 0.29% 0.29%
Total 684 32 819 249 12 958 624 19 860 625 9.37% (1) 8.73%
TOTAL 4,839 350 288 645 58 869 527 291 419 118 (2) 100.00 % 100.00 %
(1) 8.18% excluding Pre-Accession Facility(2) including asset backed securities [Note B and D.1]
Note X – Conversion rates
The following conversion rates were used for establishing the balance sheets at 31 December 2008 and 31 December 2007:
31.12.2008 31.12.2007
NON-EURO CURRENCIES OF EU MEMBER STATES
Pound sterling 0.9525 0.73335
Swedish kronor 10.870 9.4415
Czech koruna 26.875 26.628
Polish zloty 4.1535 3.5935
Hungarian forint 266.70 253.73
Slovak koruna 30.126 33.583
Danish kroner 7.4506 7.4583
Bulgarian leva 1.956 1.9558
NON-COMMUNITY CURRENCIES
United States dollars 1.3917 1.4721
Japanese yen 126.14 164.93
Swiss francs 1.4850 1.6547
South African rand 13.0667 10.0298
Norvegian krone 9.7500 7.9580
Mexican pesos 19.2333 15.890
Canadian dollars 1.6998 1.4449
Australian dollars 2.0274 1.6757
Russian rubles 41.283 35.986
Hong Kong dollars 10.7858 11.48
New Zealand dollars 2.419 1.9024
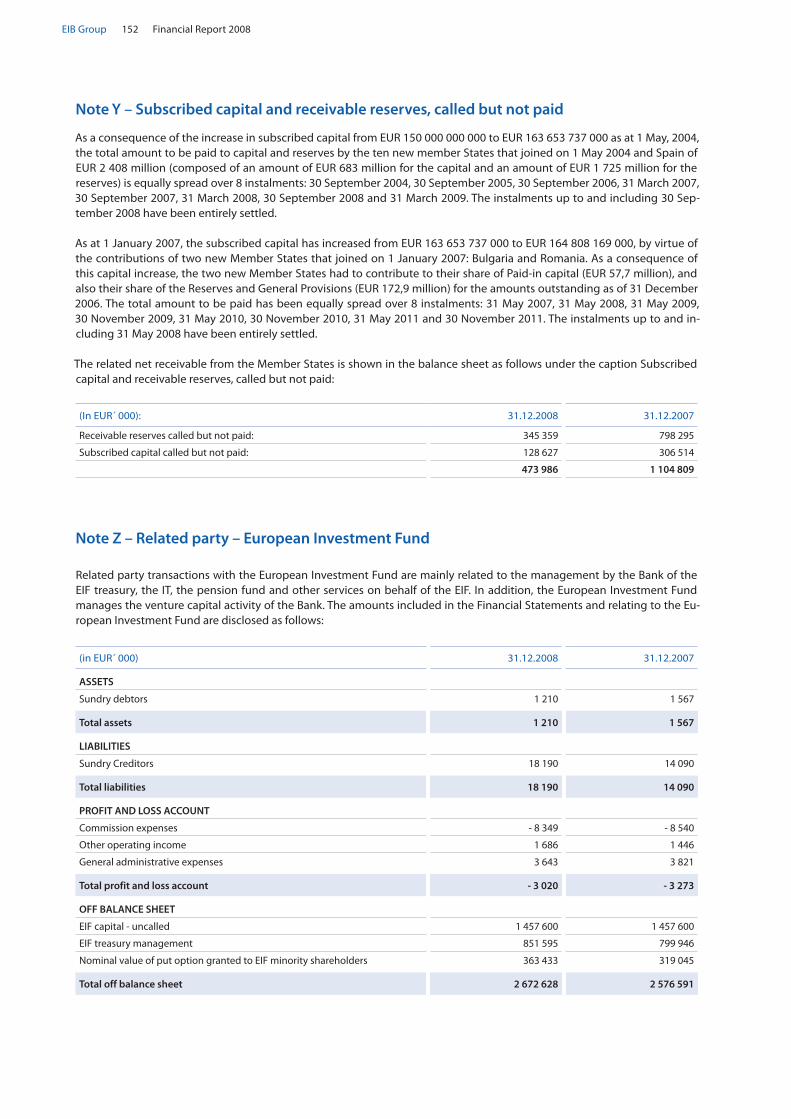
Financial Report 2008152EIB Group
Note Y – Subscribed capital and receivable reserves, called but not paid
As a consequence of the increase in subscribed capital from EUR 150 000 000 000 to EUR 163 653 737 000 as at 1 May, 2004, the total amount to be paid to capital and reserves by the ten new member States that joined on 1 May 2004 and Spain of EUR 2 408 million (composed of an amount of EUR 683 million for the capital and an amount of EUR 1 725 million for the reserves) is equally spread over 8 instalments: 30 September 2004, 30 September 2005, 30 September 2006, 31 March 2007, 30 September 2007, 31 March 2008, 30 September 2008 and 31 March 2009. The instalments up to and including 30 Sep-tember 2008 have been entirely settled.
As at 1 January 2007, the subscribed capital has increased from EUR 163 653 737 000 to EUR 164 808 169 000, by virtue of the contributions of two new Member States that joined on 1 January 2007: Bulgaria and Romania. As a consequence of this capital increase, the two new Member States had to contribute to their share of Paid-in capital (EUR 57,7 million), and also their share of the Reserves and General Provisions (EUR 172,9 million) for the amounts outstanding as of 31 December 2006. The total amount to be paid has been equally spread over 8 instalments: 31 May 2007, 31 May 2008, 31 May 2009, 30 November 2009, 31 May 2010, 30 November 2010, 31 May 2011 and 30 November 2011. The instalments up to and in-cluding 31 May 2008 have been entirely settled.
The related net receivable from the Member States is shown in the balance sheet as follows under the caption Subscribed capital and receivable reserves, called but not paid:
(In EUR´ 000): 31.12.2008 31.12.2007
Receivable reserves called but not paid: 345 359 798 295
Subscribed capital called but not paid: 128 627 306 514
473 986 1 104 809
Note Z – Related party – European Investment Fund
Related party transactions with the European Investment Fund are mainly related to the management by the Bank of the EIF treasury, the IT, the pension fund and other services on behalf of the EIF. In addition, the European Investment Fund manages the venture capital activity of the Bank. The amounts included in the Financial Statements and relating to the Eu-ropean Investment Fund are disclosed as follows:
(in EUR´ 000) 31.12.2008 31.12.2007
ASSETS
Sundry debtors 1 210 1 567
Total assets 1 210 1 567
LIABILITIES
Sundry Creditors 18 190 14 090
Total liabilities 18 190 14 090
PROFIT AND LOSS ACCOUNT
Commission expenses - 8 349 - 8 540
Other operating income 1 686 1 446
General administrative expenses 3 643 3 821
Total profit and loss account - 3 020 - 3 273
OFF BALANCE SHEET
EIF capital - uncalled 1 457 600 1 457 600
EIF treasury management 851 595 799 946
Nominal value of put option granted to EIF minority shareholders 363 433 319 045
Total off balance sheet 2 672 628 2 576 591
EIB – Financial Statements 153 EIB Group
Independent Auditor’s Report
We have audited the accompanying financial state-ments of the European Investment Bank, which show a profit of EUR 1,650.877 million and a total balance sheet of EUR 325,760.974 million and which comprise the bal-ance sheet as at December 31, 2008, the profit and loss account, the statement of Special Section, the own funds and appropriation profit, the statement of sub-scriptions to the capital of the Bank, the cash flow state-ment for the year then ended, and a summary of significant accounting policies and other explanatory notes to the financial statements.
Management Committee’s responsibility for the finan-cial statements
The Management Committee is responsible for the prep-aration and fair presentation of these financial statements in accordance with the general principles of the Direc-tives of the European Union on the annual accounts and consolidated accounts of certain types of companies, banks and other financial institutions and insurance un-dertakings. This responsibility includes: designing, imple-menting and maintaining internal control relevant to the preparation and fair presentation of financial statements that are free from material misstatement, whether due to fraud or error, selecting and applying appropriate ac-counting policies, and making accounting estimates that are reasonable in the circumstances.
Responsibility of the “Réviseur d’Entreprises”
Our responsibility is to express an opinion on these fi-nancial statements based on our audit. We conducted our audit in accordance with International Standards on Auditing as adopted by the Luxembourg “Institut des Réviseurs d’Entreprises”. Those standards require that we comply with ethical requirements and plan and per-form the audit to obtain reasonable assurance whether
the financial statements are free from material misstate-ment.
An audit involves performing procedures to obtain au-dit evidence about the amounts and disclosures in the financial statements. The procedures selected depend on the judgement of the “Réviseur d’Entreprises”, includ-ing the assessment of the risks of material misstatement of the financial statements, whether due to fraud or er-ror. In making those risk assessments, the “Réviseur d’Entreprises” considers internal control relevant to the entity’s preparation and fair presentation of the financial statements in order to design audit procedures that are appropriate in the circumstances, but not for the pur-pose of expressing an opinion on the effectiveness of the entity’s internal control.
An audit also includes evaluating the appropriateness of accounting policies used and the reasonableness of accounting estimates made by the Management Com-mittee, as well as evaluating the overall presentation of the financial statements. We believe that the audit evi-dence we have obtained is sufficient and appropriate to provide a basis for our audit opinion.
Opinion
In our opinion, the financial statements give a true and fair view of the financial position of the European Invest-ment Bank as of December 31, 2008, of its financial per-formance, of its own funds and appropriation profit, of its statement of Special Section, of its subscriptions to the capital of the Bank and of its cash flows for the year then ended in accordance with the general principles of the Directives of the European Union on the annual ac-counts and consolidated accounts of certain types of companies, banks and other financial institutions and insurance undertakings.
To the chairman of the Audit Committee of EUROPEAN INVESTMENT BANK Luxembourg
March 12, 2009
ERNST & YOUNG
Société Anonyme
Réviseurs d’Entreprises
Alain KINSCH Bernard LHOEST

Financial Report 2008154EIB Group
The Audit Committee
The Audit Committee reports to the Board of Governors, the following statement being communicated to the Governors prior to their approval of the Annual Report and the financial statements for the past financial year.
Statement by the Audit Committee on the Bank un-consolidated financial statements
The Committee, instituted in pursuance of Article 14 of the Statute and Article 25 of the Rules of Procedure of the European Investment Bank for the purpose of verify-ing that the operations of the Bank are conducted and its books kept in a proper manner, having
designated Ernst & Young as external auditors, re- •viewed their audit planning process, examined and discussed their reports,
noted that the opinion of Ernst & Young on the fi- •nancial statements of the European Investment Bank for the year ended 31 December 2008 is unqualified,
convened on a regular basis with the Heads of Direc- •torates and relevant services, met regularly the Head of Internal Audit and discussed the relevant internal audit reports, and studied the documents which it deemed necessary to examine in the discharge of its duties,
received assurance from the Management Commit- •tee concerning the effectiveness of the internal con-trol structure and internal administration,
and considering
the financial statements for the financial year ending •on 31 December 2008 as drawn up by the Board of Directors at its meeting on 12 March 2009,
that the foregoing provides a reasonable basis for its •statement and,
Articles 22, 23 & 24 of the Rules of Procedure, •
to the best of its knowledge and judgement:
confirms that the activities of the Bank are conducted in a proper manner, in particular with regard to risk man-agement and monitoring;
has verified that the operations of the Bank have been con-ducted and its books kept in a proper manner and that to this end, it has verified that the Bank’s operations have been carried out in compliance with the formalities and proce-dures laid down by the Statute and Rules of Procedure;
confirms that the financial statements, comprising the balance sheet, the statement of special section, the profit and loss account, the statement of own funds and appro-priation of profit, the statement of subscriptions to the capital of the Bank, the cash flow statement and the notes to the financial statements give a true and fair view of the financial position of the Bank as at 31 December 2008 in respect of its assets and liabilities, and of the results of its operations and cash flows for the year then ended.
Luxembourg, 12 March 2009
The Audit Committee
C. KARMIOS O. KLAPPER G. SMYTH

Investment Facility – Financial Statements 155 EIB Group
Financial StatementsInvestment Facility

Financial Report 2008156EIB Group
Income statement For the year 2008 (in EUR ’000)
Note Year to 31.12.2008
Year to 31.12.2007
Interest and similar income 5 61 097 46 580
Interest and similar expense 5 - 68 - 1 218
Net interest and similar income 61 029 45 362
Fees and commission income 6 2 632 1 396
Net fees and commission income 2 632 1 396
Net result on financial operations 7 - 19 425 - 8 005
Impairment charge for credit loss 11 - 52 675 - 2 770
Member States special contribution to general administrative expenses 13 17 871 32 756
General administrative expenses 8 - 35 741 - 32 756
Profit/Loss for the year - 26 309 35 983
The accompanying notes form an integral part of these financial statements.
Balance sheet At 31 December 2008 (in EUR ’000)
Note 2008 2007
ASSETS
Cash and cash equivalents 9 293 416 184 772
Derivative financial instruments 10 8 495 25 279
Loans and receivables 11 647 449 572 927
Of which accrued interest and receivable income 11 437 11 176
Financial investments - available-for-sale 12
Equity investment - available-for-sale 129 146 109 363
Amounts receivable from contributors 13 65 891 181 183
Other assets 14 525 3 894
Total Assets 1 144 922 1 077 418
LIABILITIES AND EQUITY
LIABILITIES
Derivative financial instruments 10 15 746 841
Deferred income 15 20 186 18 030
Amount owed to third parties 16 193 733 131 152
Other liabilities 17 4 277 916
Total Liabilities 233 942 150 939
EQUITY
Facility Member States Contribution called 18 845 000 830 000
Retained earnings 50 858 77 167
Fair value reserve 15 122 19 312
Total Equity 910 980 926 479
Total Liabilities and Equity 1 144 922 1 077 418
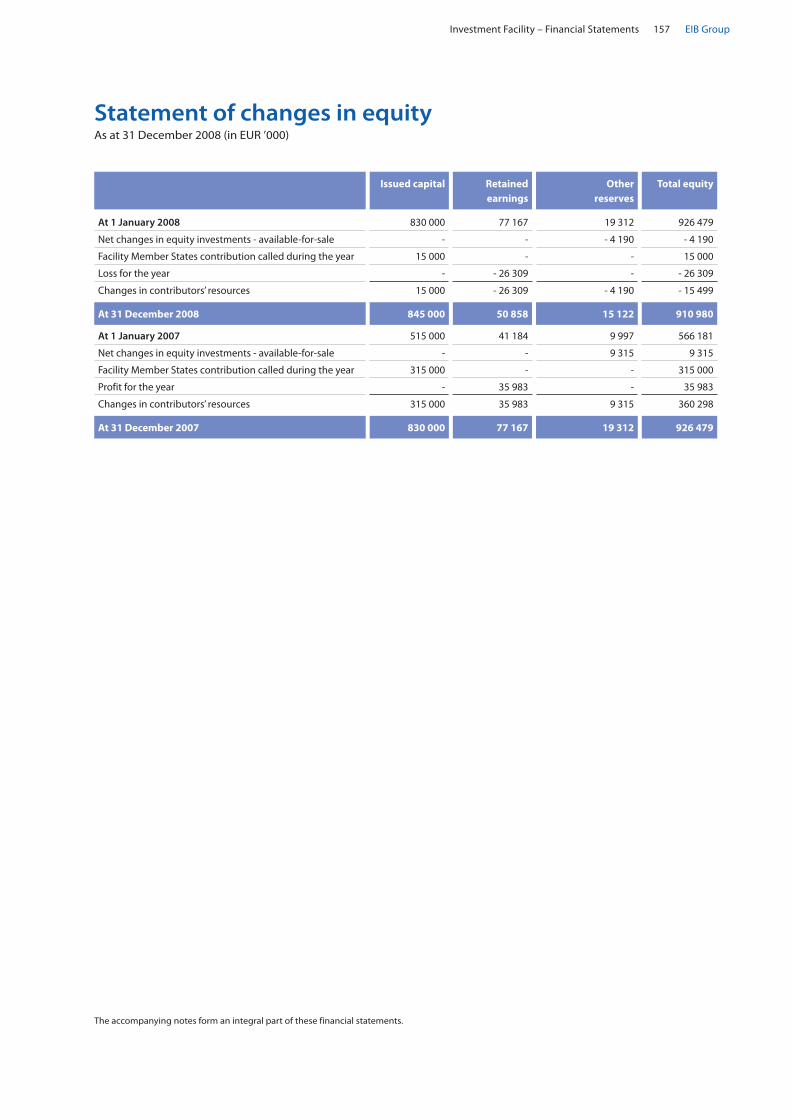
Investment Facility – Financial Statements 157 EIB Group
The accompanying notes form an integral part of these financial statements.
Statement of changes in equityAs at 31 December 2008 (in EUR ’000)
Issued capital Retained earnings
Other reserves
Total equity
At 1 January 2008 830 000 77 167 19 312 926 479
Net changes in equity investments - available-for-sale - - - 4 190 - 4 190
Facility Member States contribution called during the year 15 000 - - 15 000
Loss for the year - - 26 309 - - 26 309
Changes in contributors’ resources 15 000 - 26 309 - 4 190 - 15 499
At 31 December 2008 845 000 50 858 15 122 910 980
At 1 January 2007 515 000 41 184 9 997 566 181
Net changes in equity investments - available-for-sale - - 9 315 9 315
Facility Member States contribution called during the year 315 000 - - 315 000
Profit for the year - 35 983 - 35 983
Changes in contributors’ resources 315 000 35 983 9 315 360 298
At 31 December 2007 830 000 77 167 19 312 926 479

Financial Report 2008158EIB Group
Cash flow statement As at 31 December 2008 (in EUR ’000)
2008 2007
OPERATING ACTIVITIES
Profit / Loss for the financial year - 26 309 35 983
Adjustments
Impairment on equity investment available-for-sale 1 725 366
Impairment on loans 52 675 2 770
Interest capitalised - 12 022 - 6 747
Increase in deferred income 162 4 150
Profit on operating activities before changes in operating assets and liabilities 16 231 36 522
Net loan disbursement - 176 614 - 286 028
Repayments 73 748 34 214
Fair value movement on derivatives 31 689 - 15 965
Increase in equity investments available-for-sale - 41 641 - 43 143
Proceeds from equity investments available-for-sale 15 005 8 248
Increase / Decrease in other assets 3 369 - 2 456
Increase / Decrease in other liabilities 3 361 - 518
Net cash flows from operating activities - 74 852 - 269 126
FINANCING ACTIVITIES
Paid in by Facility Member States 15 000 315 000
Increase / Decrease in amount receivable from contributors 115 292 - 77 271
Net increase / decrease in amount payable from interest subsidies 59 596 - 3 273
Increase / Decrease in amount payable to third parties 2 985 - 538
Net cash flows from/(used in) financing activities 192 873 233 918
Net increase in cash and cash equivalents 118 021 - 35 208
Cash and cash equivalents at beginning of financial year 184 772 190 780
Effect of exchange rate changes on cash and cash equivalents - 9 377 29 200
Cash and cash equivalents at end of financial year 293 416 184 772
The accompanying notes form an integral part of these financial statements.

Investment Facility – Financial Statements 159 EIB Group
1. General information
The Investment Facility (the “Facility”) has been estab-lished within the framework of the Cotonou Agreement (the “Agreement”) on co-operation and development assistance negotiated between the African, Caribbean and Pacific Group of States (the “ACP States”) and the European Union and its Member States on 23 June 2000 and revised on 25 June 2005.
Financing under the Agreement is provided from EU Member States’ budgets and is disbursed according to financial protocols defined for successive five- to six-year periods. Within the framework of the Agreement and following the entry into force of a second finan-cial protocol on 1st July 2008 (covering the period 2008-2013), referred to as the 10th European Develop-ment Fund (EDF), the European Investment Bank (the
“EIB” or “the Bank”) is entrusted with the management of:
- the ACP Investment Facility (IF), a EUR 3 137 m risk-bearing revolving fund geared to fostering private sector investment in ACP countries;
- grants for the financing of interest rate subsidies worth EUR 400 m, of which up to EUR 40 m can be used to fund project-related technical assistance. In view of the phasing out of the EU-ACP sugar pro-tocol, up to EUR 100 m can be allocated to assist ACP sugar producers in adapting to changing world market conditions.
2. Significant accounting policies
2.1. Basis of preparation
In line with the Investment Facility Management Agree-ment the preparation of the financial statements of the Facility is guided by International Public Sector Account-ing Standards or International Financial Reporting Standards, as appropriate. The Facility’s financial state-ments have been prepared on the basis of the following significant accounting principles:
2.2. Significant accounting judgments and estimates
The preparation of financial statements requires the use of certain critical accounting estimates. It also re-quires management to exercise its judgment in the process of applying the Investment Facility’s account-ing policies. The areas involving a higher degree of judgment or complexity, or areas where assumptions and estimates are significant to the financial state-ments are disclosed.
The most significant use of judgments and estimates are as follows:
Fair value of financial instruments
Where the fair values of financial assets and financial lia-bilities recorded on the balance sheet cannot be derived from active markets, they are determined using a variety of valuation techniques that include the use of mathe-matical models. The input to these models is taken from observable markets where possible, but where this is not feasible, a degree of judgment is required in estab-lishing fair values. The judgments include considera-tions of liquidity and model inputs such as correlation and volatility for longer dated derivatives.
Impairment losses on loans and receivables
The Investment Facility reviews its problem loans and receivables at each reporting date to assess whether an allowance for impairment should be recorded in the in-come statement. In particular, judgment by manage-ment is required in the estimation of the amount and timing of future cash flows when determining the level of allowance required. Such estimates are based on as-sumptions about a number of factors and actual results may differ, resulting in future changes to the allowance. In addition to specific allowance against individually significant loans and receivables, the Investment Facility also makes a collective impairment allowance against exposures which, although not specifically identified as requiring a specific allowance, have a greater risk of de-fault than when originally granted.
This collective allowance is based on any deterioration in the internal rating of the loan or investment since it was granted or acquired. These internal ratings take into consideration factors such as any deterioration in coun-try risk, industry, and technological obsolescence, as well as identified structural weaknesses or deterioration in cash flows.
In principle, a loan is considered as non performing when payment of interest and principal are past due by 90 days or more and, at the same time, management considers that payment will be completely unlikely.
Valuation of unquoted available-for-sale equity investments
Valuation of unquoted available-for-sale equity invest-ments is normally based on one of the following:
recent arms length market transactions; •
current fair value of another instrument that is sub- •stantially the same;
Investment Facility
Notes to the financial statements

Financial Report 2008160EIB Group
the expected cash flows discounted at current rates •applicable for items with similar terms and risk char-acteristics; or
other valuation models. •
The determination of the cash flows and discount fac-tors for unquoted available-for-sale equity investments requires significant estimation. The Investment Facility calibrates the valuation techniques periodically and tests them for validity using either price from observa-ble current market transactions in the same instrument or from other available observable market data.
Impairment of available-for-sale financial investments
The Investment Facility treats available-for-sale equity investments as impaired when there has been a signifi-cant or prolonged decline in the fair value below its cost or where other objective evidence of impairment exists. The determination of what is “significant” or “prolonged” requires judgment. The Facility treats “significant” gen-erally as 30% or more and “prolonged” greater than 12 months. In addition, the Facility evaluates other factors, including normal volatility in share price for quoted eq-uities and the future cash flows and the discount factors for unquoted equities.
2.3. Change in accounting policies
The accounting policies adopted are consistent with those used in the previous financial years.
2.4. Summary of significant accounting policies
The balance sheet represents assets and liabilities in de-creasing order of liquidity and does not distinguish be-tween current and non-current items.
2.4.1. Foreign currency translation
The Investment Facility uses the Euro (EUR) for present-ing its financial statements, which is also the functional and presentational currency.
Foreign currency transactions are translated at the ex-change rate prevailing on the date of the transaction.
Monetary assets and liabilities denominated in curren-cies other than in Euro are translated into Euro at the exchange rate prevailing at the balance sheet date. The gain or loss arising from such translation is recorded in the income statement.
Non-monetary items that are measured in terms of his-torical cost in a foreign currency are translated using the exchange rates at the dates of the initial transactions. Non-monetary items measured at fair value in a foreign currency are translated using the exchange rates at the date when the fair value was determined.
Exchange differences arising on the settlement of trans-actions at rates different from those at the date of the transaction, and unrealized foreign exchange differenc-es on unsettled foreign currency monetary assets and liabilities, are either recognized in the income statement or within the equity reserve.
The elements of the income statement are translated into Euro on the basis of the exchange rates prevailing at the end of each month.
2.4.2. Cash and cash equivalents
The Investment Facility defines cash equivalents as cur-rent accounts or short-term deposits with original ma-turities of three months or less.
2.4.3. Financial assets other than derivatives
Financial assets are accounted for using the settlement date basis.
Loans
Loans originated by the Investment Facility are recog-nized in the assets of the Investment Facility when cash is advanced to borrowers. They are initially re-corded at cost (net disbursed amounts), which is the fair value of the cash given to originate the loan, in-cluding any transaction costs, and are subsequently measured at amortized cost, using the effective yield method, less any provision for impairment or uncol-lectability.
Available-for-sale financial investments
Available-for-sale financial investments are those which are designated as such or do not qualify to be classified as designated at fair value through profit or loss, held-to-maturity or loans and receivables. They include equi-ty instruments, investments in venture capital funds and other debt instruments.
After initial measurement, available-for-sale financial in-vestments are subsequently carried at fair value. Note the following details for the fair value measurement of equity investments, which can not be derived from ac-tive markets:
a. Venture capital funds
The fair value of each venture capital fund will be based on the latest available Net Asset Value (NAV), reported by the fund, if calculated based on international valua-tion standards. The Investment Facility may however de-cide to adjust the NAV reported by the fund if there are issues that may affect the valuation.

Investment Facility – Financial Statements 161 EIB Group
If no internationally recognized fair valuation standard is applied, the valuation will be conducted on the basis of the underlying portfolio.
b. Direct equity investments
The fair value of the investment will be based on the lat-est set of financial statements available, re-using, if ap-plicable, the same model as the one used at the acquisition of the participation.
Unrealized gains or losses on equity investments are re-ported in equity until such investments are sold, collect-ed or disposed of, or until such investment are determined to be impaired. If an available-for-sale in-vestment is determined to be impaired, the cumulative unrealized gain or loss previously recognized in equity is included in the income statement.
For unquoted investment, the fair value is determined by applying recognized valuation technique. These in-vestments are accounted for at cost when the fair value cannot be reliably measured.
Guarantees
Financial guarantees are initially recognized at fair value in the balance sheet under item “Financial guarantees”. Subsequent to initial recognition, the Investment Facili-ty’s liabilities under each guarantee are measured at the higher of the amortized premium and the best estimate of expenditure required to settle any financial obliga-tion arising as a result of the guarantee.
Any increase in the liability relating to financial guaran-tees is taken to the income statement under item “Im-pairment charge for credit loss”. The premium received is recognized in the income statement under item “Net fee and commission income” using the effective interest rate method over the life of the guarantee.
2.4.4. Impairment of financial assets
The Investment Facility assesses at each balance sheet date whether there is any objective evidence that a fi-nancial asset is impaired. A financial asset or a group of financial assets is deemed to be impaired if, and only if, there is objective evidence of impairment as a result of one or more events that has occurred after the initial recognition of the asset (an incurred “loss event”) and that loss event has an impact on the estimated future cash flows of the financial asset or the group of financial assets that can be reliably estimated.
Evidence of impairment may include indications that the borrower or a group of borrowers is experiencing significant financial difficulty, default or delinquency in interest or principal payments, the probability that they
will enter bankruptcy or other financial reorganization and where observable data indicate that there is a measurable decrease in the estimated future cash flows, such as changes in arrears or economic conditions that correlate with defaults.
For the loans outstanding at the end of the financial year and carried at amortized cost, impairments are made when presenting objective evidence of risks of non recovery of all or part of their amounts according to the original contractual terms or the equivalent value. If there is objective evidence that an impairment loss has been incurred, the amount of the loss is measured ac-cording to internal models used by the Bank to approxi-mate the likely loss or the loan recovery, which among other things evaluate the difference between the loans’ carrying amounts and the fair value of estimated futures cash flows of theses loans. The carrying amount of the asset is reduced through the use of an allowance ac-count and the amount of the loss is recognized in the income statement. Interest income continues to be ac-crued on the reduced carrying amount based on the ef-fective interest rate of the asset. Loans together with the associated allowance are written off when there is no realistic prospect of future recovery. If, in a subsequent year, the amount of the estimated impairment loss in-creases or decreases because of an event occurring after the impairment was recognized, the previously recog-nized impairment loss is increased or reduced by adjust-ing the allowance account.
For the available-for-sale financial investments, the In-vestment Facility assesses at each balance sheet date whether there is objective evidence that an investment is impaired. Objective evidence would include a signifi-cant or prolonged decline in the fair value of the invest-ment below its costs. Where there is evidence of impairment, the cumulative loss (measured as the dif-ference between the acquisition cost and the current fair value, less any impairment loss on that investment previously recognized in the income statement) is re-moved from equity and recognized in the income state-ment. Impairment losses on available-for-sale financial investments are not reversed through the income state-ment; increases in their fair value after impairment are recognized directly in equity.
For held-to-maturity investments the Investment Fa-cility assesses individually whether there is objective evidence for impairment. If there is objective evi-dence that an impairment loss has been incurred, the amount of the loss is measured as the difference be-tween the asset’s carrying amount and the present value of the estimated future cash flows. The carrying amount of the asset is reduced and the amount of the loss is recognised in the income statement. If, in a subsequent year, the amount of the estimated impair-ment loss decreases because of an event occurring after the impairment was recognised, any amount formerly charged are credited to the “Net result on fi-nancial operations”.

Financial Report 2008162EIB Group
The European Investment Bank’s Risk Management re-views financial assets for impairment at least once a year. Resulting adjustments include the unwinding of the dis-count in the income statement over the life of the asset, and any adjustments required in respect of a reassess-ment of the initial impairment.
2.4.5. Derivative financial instruments
Derivatives include cross currency swaps, cross currency interest rate swaps, currency forwards and warrants.
In the normal course of its activity, the Investment Facil-ity may enter into swap contracts with a view to hedge specific lending operations or into currency forward contract with a view to hedge it currency positions, de-nominated in actively traded currencies other than in Euro, in order to offset any gain or loss caused by for-eign exchange rate fluctuations.
However, the Investment Facility has not entered into any hedge accounting transactions as at 31 December 2008. Therefore, all derivatives are measured at fair value through the income statement. Fair values are derived primarily from discounted cash-flow models, option-pricing models and from third party quotes.
Warrants have been received by the Investment Facility as ancillary fees in the context of a lending operation.
Derivatives are recorded at fair value and carried as as-sets when their fair value is positive and as liabilities when their fair value is negative. Changes in the fair val-ue of derivative financial instruments are included in
“Net result on financial operations”.
2.4.6. Contributions
Contributions from Member States are recognized as re-ceivable in the balance sheet on the date of the Council Decision fixing the financial contribution to be paid by the Member States to the Investment Facility.
2.4.7. Interest income on loans
Interest on loans originated by the Investment Facility is recorded in the income statement (“Interest and similar income”) and on the balance sheet (“Loan and receiva-bles”) on an accrual basis using the effective interest rate, which is the rate that exactly discounts estimated future cash payments or receipts through the expected life of the loan to the net carrying amount of the loan. Once the recorded value of a loan has been reduced due to impairment, interest income continues to be rec-ognized using the original effective interest rate applied to the new carrying amount.
2.4.8. Interest subsidies
As part of its activity, the Investment Facility manages interest subsidies on behalf of the Member States.
The part of the Member States contributions allocated to the payment of interest subsidies is not accounted for in the Investment Facilityís equity but is classified as an amount owed to third parties.
2.4.9. Interest income on treasury
Under the terms of the Investment Facility and accord-ing to the Financial Regulation applicable to the 9th Eu-ropean Development Fund, the funds received by the EIB on behalf of the Investment Facility are recorded in an account in the Commission’s name. Interest on these deposits, placed by the Investment Facility with the EIB, is not accounted for by the Investment Facility as it is payable directly to the European Commission.
Reflows, being repayment of principal, interest or com-missions stemming from financial operations, and inter-est calculated on these reflows are accounted for within the Investment Facility.
2.4.10. Fees, commissions and dividends
Fees received in respect of services provided over a pe-riod of time are recognized as income as the services are provided. Commitment fees are deferred and recog-nized in income using the effective interest method over the period from disbursement to repayment of the related loan.
Dividends relating to available-for-sale equity invest-ments are recognized when received.
2.4.11. Taxation
The Protocol on the Privileges and Immunities of the Eu-ropean Communities, appended to the Treaty of 8 April 1965 establishing a Single Council and a Single Commis-sion of the European Communities, stipulates that the assets, revenues and other property of the Institutions of the Union are exempt from all direct taxes.
2.4.12. Reclassification of prior years figures
Where necessary, certain prior years figures have been reclassified to conform to changes to the current year’s presentation for comparative purpose.
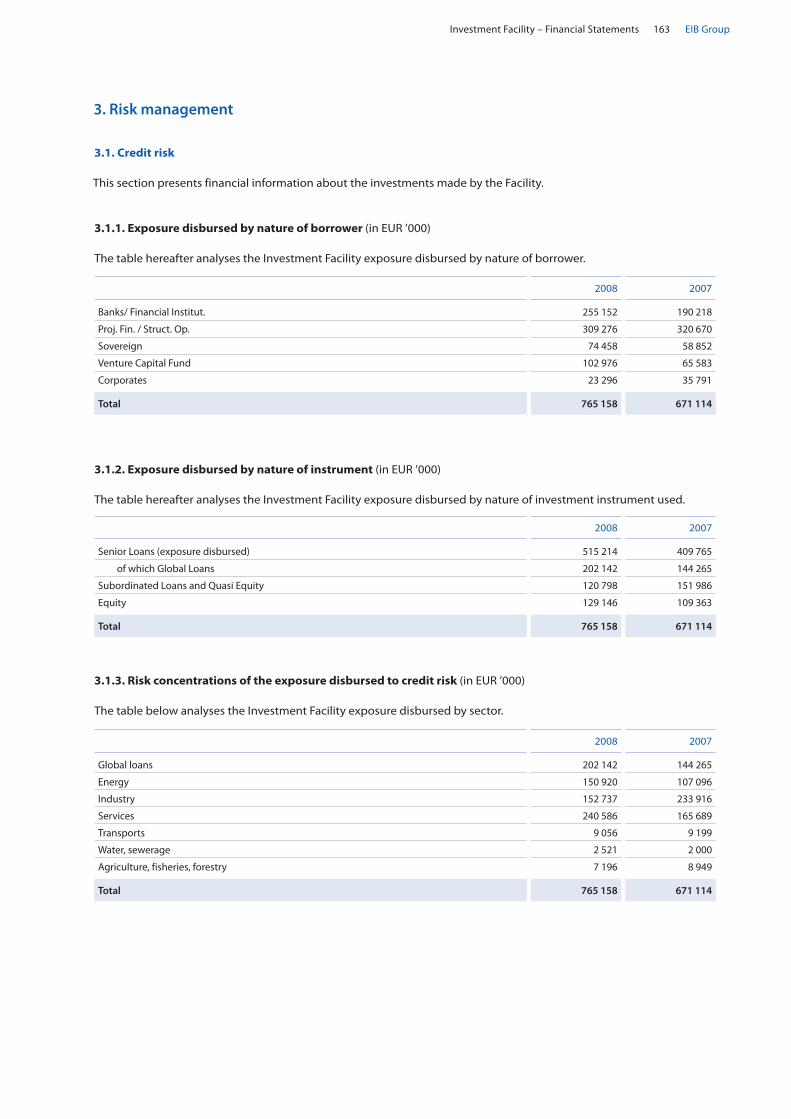
Investment Facility – Financial Statements 163 EIB Group
3. Risk management
3.1. Credit risk
This section presents financial information about the investments made by the Facility.
3.1.1. Exposure disbursed by nature of borrower (in EUR ’000)
The table hereafter analyses the Investment Facility exposure disbursed by nature of borrower.
3.1.2. Exposure disbursed by nature of instrument (in EUR ’000)
The table hereafter analyses the Investment Facility exposure disbursed by nature of investment instrument used.
2008 2007
Banks/ Financial Institut. 255 152 190 218
Proj. Fin. / Struct. Op. 309 276 320 670
Sovereign 74 458 58 852
Venture Capital Fund 102 976 65 583
Corporates 23 296 35 791
Total 765 158 671 114
2008 2007
Senior Loans (exposure disbursed) 515 214 409 765
of which Global Loans 202 142 144 265
Subordinated Loans and Quasi Equity 120 798 151 986
Equity 129 146 109 363
Total 765 158 671 114
3.1.3. Risk concentrations of the exposure disbursed to credit risk (in EUR ’000)
The table below analyses the Investment Facility exposure disbursed by sector.
2008 2007
Global loans 202 142 144 265
Energy 150 920 107 096
Industry 152 737 233 916
Services 240 586 165 689
Transports 9 056 9 199
Water, sewerage 2 521 2 000
Agriculture, fisheries, forestry 7 196 8 949
Total 765 158 671 114
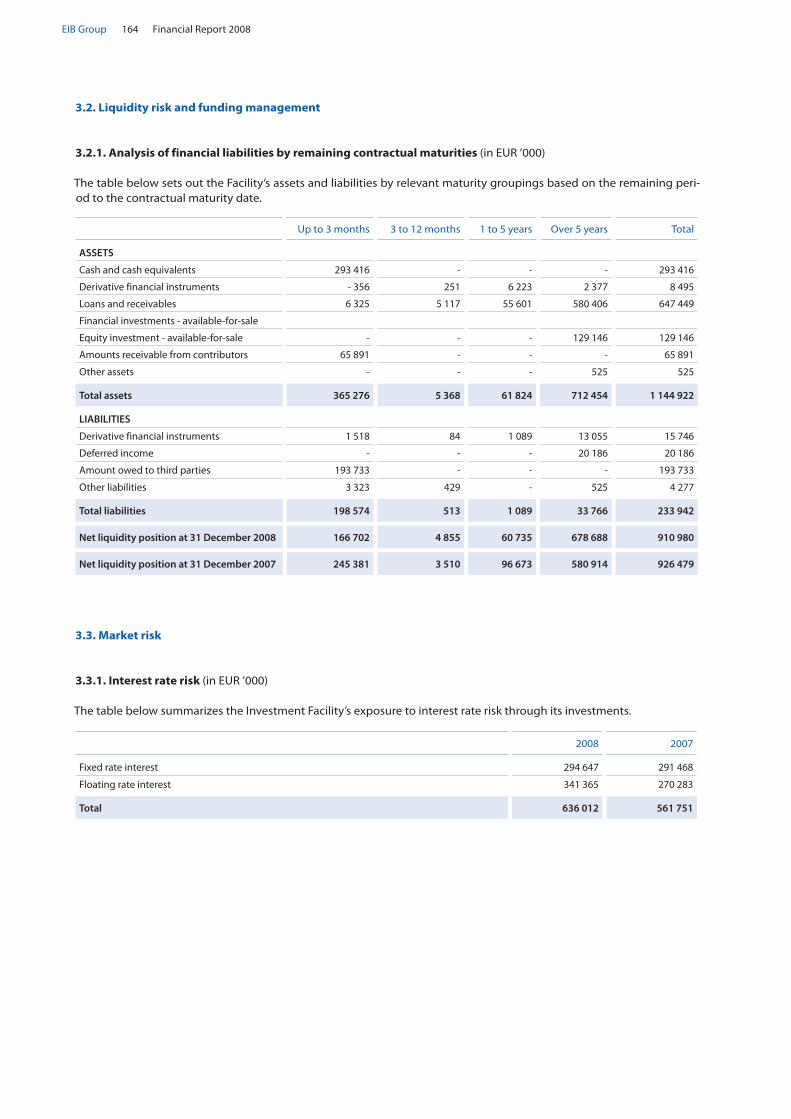
Financial Report 2008164EIB Group
Up to 3 months 3 to 12 months 1 to 5 years Over 5 years Total
ASSETS
Cash and cash equivalents 293 416 - - - 293 416
Derivative financial instruments - 356 251 6 223 2 377 8 495
Loans and receivables 6 325 5 117 55 601 580 406 647 449
Financial investments - available-for-sale
Equity investment - available-for-sale - - - 129 146 129 146
Amounts receivable from contributors 65 891 - - - 65 891
Other assets - - - 525 525
Total assets 365 276 5 368 61 824 712 454 1 144 922
LIABILITIES
Derivative financial instruments 1 518 84 1 089 13 055 15 746
Deferred income - - - 20 186 20 186
Amount owed to third parties 193 733 - - - 193 733
Other liabilities 3 323 429 - 525 4 277
Total liabilities 198 574 513 1 089 33 766 233 942
Net liquidity position at 31 December 2008 166 702 4 855 60 735 678 688 910 980
Net liquidity position at 31 December 2007 245 381 3 510 96 673 580 914 926 479
3.2. Liquidity risk and funding management
3.2.1. Analysis of financial liabilities by remaining contractual maturities (in EUR ’000)
The table below sets out the Facility’s assets and liabilities by relevant maturity groupings based on the remaining peri-od to the contractual maturity date.
3.3. Market risk
3.3.1. Interest rate risk (in EUR ’000)
The table below summarizes the Investment Facility’s exposure to interest rate risk through its investments.
2008 2007
Fixed rate interest 294 647 291 468
Floating rate interest 341 365 270 283
Total 636 012 561 751

Investment Facility – Financial Statements 165 EIB Group
3.3.2. Currency risk (or Foreign exchange risk) (in EUR ’000)
EUR USD CAD ACP/OCT Currencies Total
ASSETS
Cash and cash equivalents 267 381 26 035 - - 293 416
Derivative financial instruments 8 495 - - - 8 495
Loans and receivables 275 248 313 279 - 58 922 647 449
Financial investments - available-for-sale
Equity investment - available-for-sale 16 812 103 007 2 171 7 156 129 146
Amounts receivable from contributors 65 891 - - - 65 891
Other assets - - - 525 525
Total assets 633 827 442 321 2 171 66 603 1 144 922
LIABILITIES
Derivative financial instruments 15 746 - - - 15 746
Deferred income 20 186 - - - 20 186
Amount owed to third parties 193 733 - - - 193 733
Other liabilities 3 751 - - 526 4 277
Total liabilities 233 416 526 233 942
COMMITMENTS
Undisbursed loans and equity investments 680 763 284 893 - - 965 656
Guarantees drawn - - - 11 800 11 800
CONTINGENT LIABILITIES
Guarantees undrawn 105 000 - - - 105 000
Equity
Facility Member States Contribution called 845 000 - - - 845 000
Retained earnings 50 858 - - - 50 858
Fair value reserve - 8 562 23 854 - - 170 15 122
Total equity 887 296 23 854 - 170 910 980
Currency position as at 31 December 2008 - 486 885 418 467 2 171 66 247 -
Currency position as at 31 December 2007 - 371 311 333 168 - 3 460 41 603 -
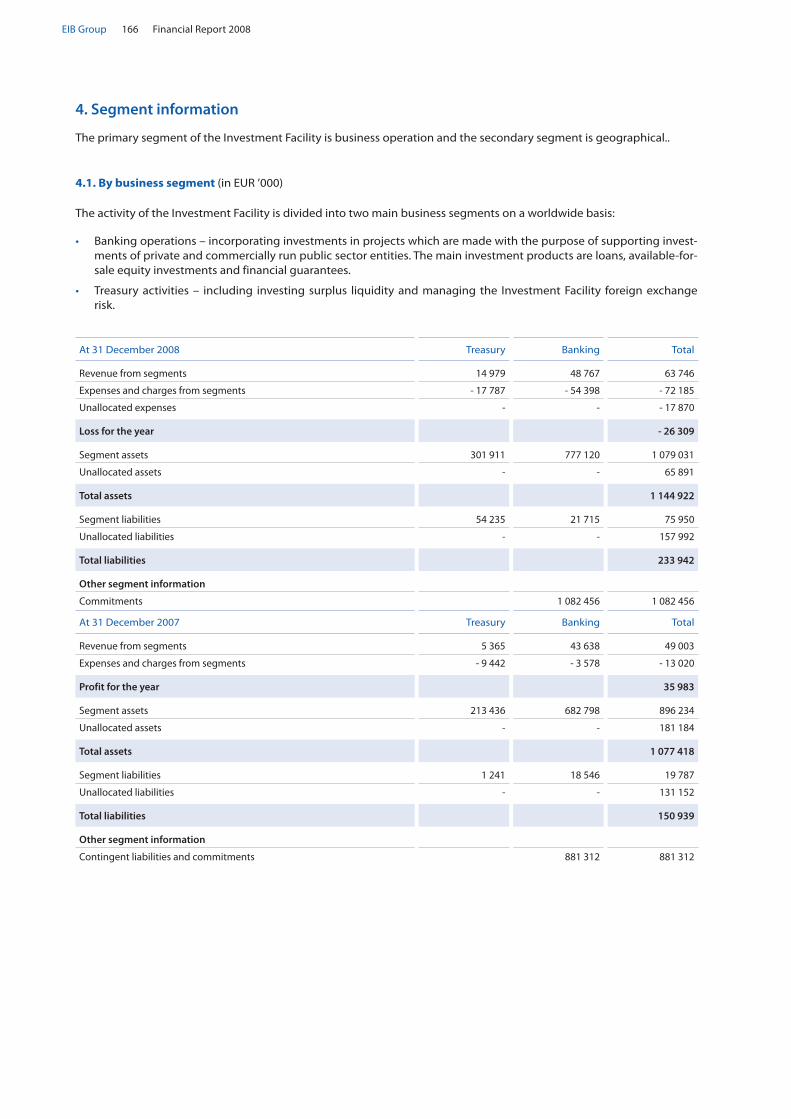
Financial Report 2008166EIB Group
4. Segment information
The primary segment of the Investment Facility is business operation and the secondary segment is geographical..
4.1. By business segment (in EUR ’000)
The activity of the Investment Facility is divided into two main business segments on a worldwide basis:
Banking operations – incorporating investments in projects which are made with the purpose of supporting invest- •ments of private and commercially run public sector entities. The main investment products are loans, available-for-sale equity investments and financial guarantees.
Treasury activities – including investing surplus liquidity and managing the Investment Facility foreign exchange •risk.
At 31 December 2008 Treasury Banking Total
Revenue from segments 14 979 48 767 63 746
Expenses and charges from segments - 17 787 - 54 398 - 72 185
Unallocated expenses - - - 17 870
Loss for the year - 26 309
Segment assets 301 911 777 120 1 079 031
Unallocated assets - - 65 891
Total assets 1 144 922
Segment liabilities 54 235 21 715 75 950
Unallocated liabilities - - 157 992
Total liabilities 233 942
Other segment information
Commitments 1 082 456 1 082 456
At 31 December 2007 Treasury Banking Total
Revenue from segments 5 365 43 638 49 003
Expenses and charges from segments - 9 442 - 3 578 - 13 020
Profit for the year 35 983
Segment assets 213 436 682 798 896 234
Unallocated assets - - 181 184
Total assets 1 077 418
Segment liabilities 1 241 18 546 19 787
Unallocated liabilities - - 131 152
Total liabilities 150 939
Other segment information
Contingent liabilities and commitments 881 312 881 312

Investment Facility – Financial Statements 167 EIB Group
At 31 December 2008 Revenues (*) Total assets Total liabilities Commitments
Caribbean and Pacific 3 694 116 572 - 146 588
Central and Eastern Africa 8 666 152 838 18 222 498 066
Regional Africa and ACP states 1 094 115 534 - 231 628
Southern Africa and Indian ocean - 31 571 206 744 554 108 892
West Africa and Sahel 11 574 182 160 2 427 97 282
Others (**) 371 074 212 739 -
Total - 6 543 1 144 922 233 942 1 082 456
4.2. By geographical segment (in EUR ’000)
The Investment Facility’s activities are divided into five regions for internal management purposes.
At 31 December 2007 Revenues (*) Total assets Total liabilities Commitments
Caribbean and Pacific 4 881 63 089 - 102 658
Central and Eastern Africa 4 560 114 401 15 837 414 592
Regional Africa and ACP States 4 253 77 923 - 163 377
Southern Africa and Indian Ocean 16 787 216 175 707 82 803
West Africa and Sahel 9 631 187 602 2 003 117 882
Others (**) - 418 228 132 392 -
Total 40 112 1 077 418 150 939 881 312
(*) Revenues represent the net profit on the Investment Facility’s operational activity (i.e. interest and similar income, interest subsidies, net fee and com-mission income, credit loss expense and impairment losses on financial investments).
(**) Under geographical segment “Others” are considered the amount payable to or receivable from the Member States or the European Investment Bank and the Investment Facility cash and cash equivalent.
5. Net interest income (in EUR ’000)
The main components of interest and similar income are as follows:
The main components of interest and similar expense are as follows:
2008 2007
Cash and short term funds 12 452 5 755
Loans and receivables 43 966 40 192
Interest subsidies 1 242 633
Derivative financial instruments 3 437 -
Total interest and similar income 61 097 46 580
2008 2007
Due to banks - - 441
Derivative financial instruments - - 738
Remuneration paid to EC - 68 - 39
Total interest and similar expense - 68 - 1 218

Financial Report 2008168EIB Group
6. Net fee and commission income (in EUR ’000)
The main components of net fee and commission income are as follows:
7. Net result on financial operations (in EUR ’000)
The main components of net result on financial operations are as follows:
2008 2007
Loans and receivables 2 340 1 136
Financial guarantees 292 260
Total fee and commission income 2 632 1 396
2008 2007
Fair value movement on derivatives - 31 689 15 965
Foreign exchange 13 972 - 24 631
Dividend income from financial investments
Equity investments – available-for-sale 17 24
- Quoted - -
- Unquoted 17 24
Gains less losses from financial investments
Equity investments – available-for-sale - 1 725 637
Net result on financial operations - 19 425 - 8 005
8. General administrative expenses (in EUR ’000)
General administrative expenses represent the actual costs incurred by the EIB for managing the Investment Facility less income generated from standard appraisal fees directly charged by the EIB to clients of the Investment Facility.
Under Council Decision of 8 April 2003, the Member states agreed to cover in full the expenses incurred by the EIB for the management of the Investment Facility for the first 5 years of the 9th European Development Fund.
Following the entry in force of the revised Cotonou Partnership Agreement on the 1st of July 2008, general administra-tive expenses are not covered anymore by the Member States. As a consequence, for the year 2008, the contribution from the Member States to the general administrative expenses covers only 50% of the total incurred during the year, representing KEUR 17.87.
2008 2007
Actual cost incurred by the EIB - 36 766 - 34 260
Income from appraisal fees charged to clients of the Facility 1 025 1 504
General administrative expenses - 35 741 - 32 756
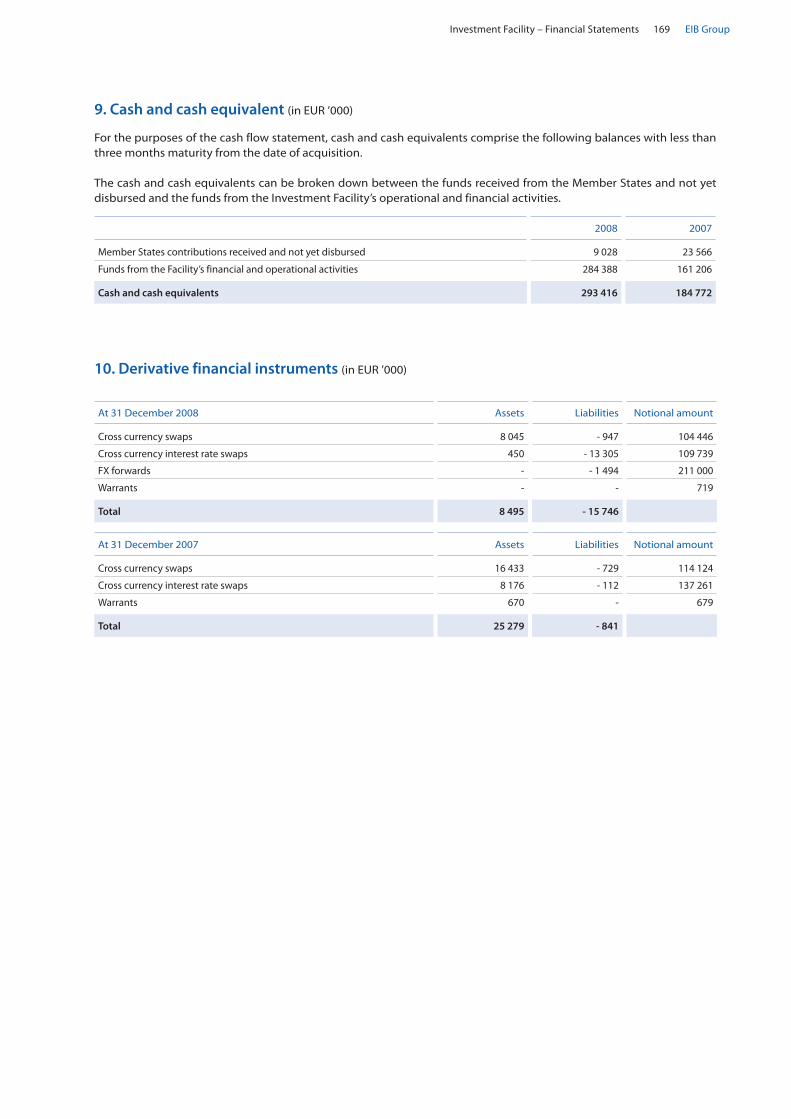
Investment Facility – Financial Statements 169 EIB Group
2008 2007
Member States contributions received and not yet disbursed 9 028 23 566
Funds from the Facility’s financial and operational activities 284 388 161 206
Cash and cash equivalents 293 416 184 772
9. Cash and cash equivalent (in EUR ’000)
For the purposes of the cash flow statement, cash and cash equivalents comprise the following balances with less than three months maturity from the date of acquisition.
The cash and cash equivalents can be broken down between the funds received from the Member States and not yet disbursed and the funds from the Investment Facility’s operational and financial activities.
10. Derivative financial instruments (in EUR ’000)
At 31 December 2008 Assets Liabilities Notional amount
Cross currency swaps 8 045 - 947 104 446
Cross currency interest rate swaps 450 - 13 305 109 739
FX forwards - - 1 494 211 000
Warrants - - 719
Total 8 495 - 15 746
At 31 December 2007 Assets Liabilities Notional amount
Cross currency swaps 16 433 - 729 114 124
Cross currency interest rate swaps 8 176 - 112 137 261
Warrants 670 - 679
Total 25 279 - 841

Financial Report 2008170EIB Group
11. Loans and receivables (in EUR ’000)
Global loans Senior loans Subordinated loans Total
At 1st January 2008 144 265 265 500 151 986 561 751
Impairment - 2 996 - 17 507 - 29 826 - 50 329
Change in amortised cost - 269 - 415 71 - 613
Disbursement 82 696 92 992 926 176 614
Repayments - 25 282 - 31 322 - 17 144 - 73 748
Interest capitalised - 676 11 346 12 022
Foreign exchange difference 3 728 3 148 3 439 10 315
At 31st December 2008 202 142 313 072 120 798 636 012
Accrued interest income and interest receivable 13 783
Impairment on accrued interest and receivable on loans - 2 346
Loans and receivables at 31st December 2008 647 449
At 1st January 2007 96 840 129 550 108 823 335 213
Impairment - - 549 - 2 221 - 2 770
Change in amortised cost - 22 -731 - 269 - 1 022
Disbursement 72 714 163 489 49 825 286 028
Repayments - 13 310 - 15 405 - 5 499 - 34 214
Interest capitalised - - 6 747 6 747
Foreign exchange difference - 11 957 - 10 854 - 5 420 - 28 231
At 31st December 2007 144 265 265 500 151 986 561 751
Accrued interest income and interest receivable 11 176
Loans and receivables at 31st December 2007 572 927
12. Financial investments
12.1. Equity investments – available-for-sale (in EUR ’000)
The main components of available-for-sale equity investments are as follows:
Equity investments available-for-sale 2008 2007
At 1st January 2008 109 363 66 449
Movement in fair value - 4 190 9 315
Impairment -1 725 - 366
Disbursement 41 641 43 143
Repayments - 15 005 - 8 248
Foreign exchange difference - 938 - 930
At 31st December 2008 129 146 109 363
13. Amounts receivable from contributors (in EUR ’000)
The main components of amounts receivable from contributors are as follows:
2008 2007
Contribution called but not paid 48 020 148 427
Special contribution to general administrative expenses 17 871 32 756
Total amounts receivable from contributors 65 891 181 183
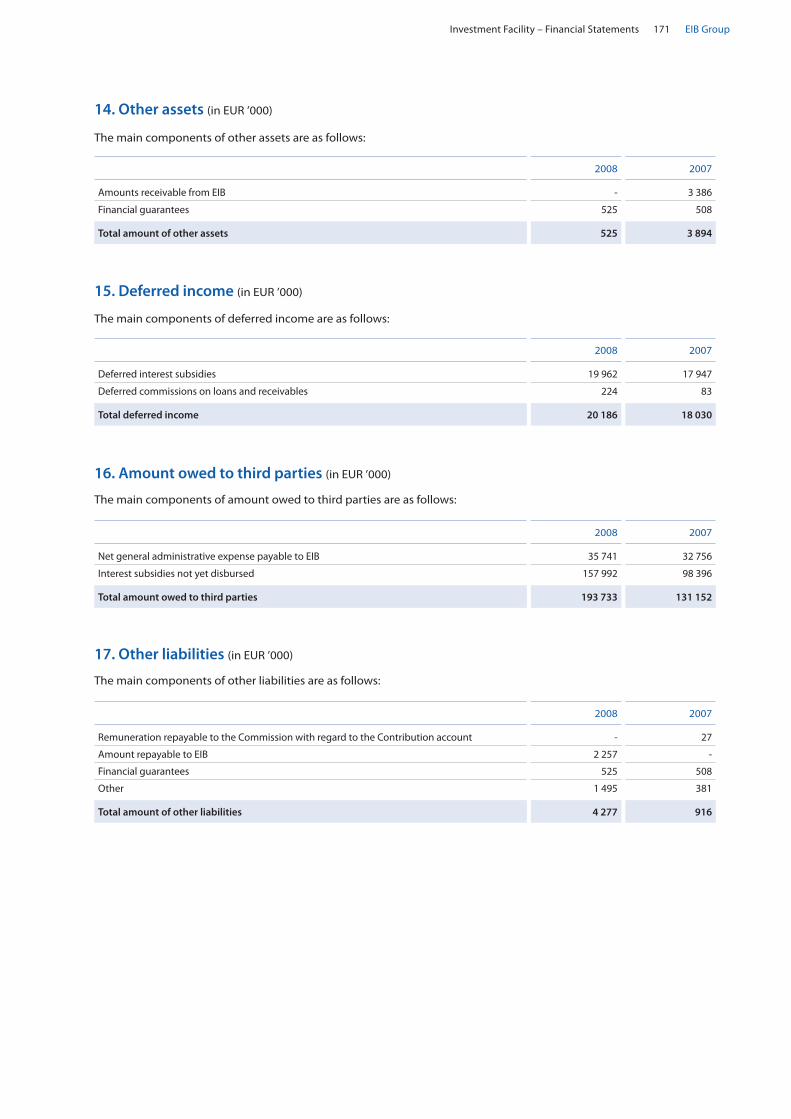
Investment Facility – Financial Statements 171 EIB Group
14. Other assets (in EUR ’000)
The main components of other assets are as follows:
15. Deferred income (in EUR ’000)
The main components of deferred income are as follows:
2008 2007
Amounts receivable from EIB - 3 386
Financial guarantees 525 508
Total amount of other assets 525 3 894
2008 2007
Deferred interest subsidies 19 962 17 947
Deferred commissions on loans and receivables 224 83
Total deferred income 20 186 18 030
17. Other liabilities (in EUR ’000)
The main components of other liabilities are as follows:
2008 2007
Remuneration repayable to the Commission with regard to the Contribution account - 27
Amount repayable to EIB 2 257 -
Financial guarantees 525 508
Other 1 495 381
Total amount of other liabilities 4 277 916
16. Amount owed to third parties (in EUR ’000)
The main components of amount owed to third parties are as follows:
2008 2007
Net general administrative expense payable to EIB 35 741 32 756
Interest subsidies not yet disbursed 157 992 98 396
Total amount owed to third parties 193 733 131 152

Financial Report 2008172EIB Group
18. Investment Facility Member States Contribution called (in EUR ’000)
Member States
Contribution to the Facility
Contribution to interest subsidies
Total contributed
Called and not paid (*)
Austria 22 393 5 035 27 428 1 457
Belgium 33 124 7 448 40 572 2 156
Denmark 18 083 4 066 22 149 1 177
Finland 12 507 2 812 15 319 814
France 205 335 46 170 251 505 13 365
Germany 197 392 44 384 241 776 12 848
Greece 10 562 2 375 12 937 687
Ireland 5 239 1 178 6 417 341
Italy 105 963 23 826 129 789 6 897
Luxembourg 2 450 551 3 001 160
Netherlands 44 109 9 918 54 027 2 871
Portugal 8 196 1 843 10 039 534
Spain 49 348 11 096 60 444 3 212
Sweden 23 069 5 187 28 256 1 501
United Kingdom 107 230 24 111 131 341 -
Total at 31 December 2008 845 000 190 000 1 035 000 48 020
Total at 31 December 2007 830 000 120 000 950 000 148 427
(*) On the 10 November 2008, the Council fixed the amount of financial contributions to be paid by each Member State by 21st January 2009.
19. Contingent liabilities and commitments (in EUR ’000)
2008 2007
Commitments
Undisbursed loans 777 597 669 117
Undisbursed commitment in respect of equity investments 188 059 88 204
Guarantees drawn 11 800 10 116
Contingent liabilities
Guarantees undrawn 105 000 113 875
Total 1 082 456 881 312
20. Subsequent events
There have been no material post balance sheet events which could require disclosure or adjustment to the 31 Decem-ber 2008 financial statements.
On a proposal from the Management Committee of the Bank, the Board of Directors of the Bank reviewed these finan-cial statements on 12 March 2009 and decided to submit them to the Board of Governors of the Bank for approval at their meeting to be held on 9 June 2009.

Investment Facility – Financial Statements 173 EIB Group
Independent Auditor’s Report
We have audited the accompanying financial state-ments of the Investment Facility, which show a loss of EUR 26,309,000 and a total balance sheet of EUR 1,144,922,000 and which comprise the balance sheet as at 31 December 2008, the income statement, the statement of changes in equity, the cash flow state-ment for the year then ended, and a summary of signifi-cant accounting policies and other explanatory notes.
Management Committee’s responsibility for the finan-cial statements
The Management Committee of the European Invest-ment Bank is responsible for the preparation and fair presentation of these financial statements in accord-ance with the measurement and recognition principles as described in Note 2 of the accompanying financial statements. This responsibility includes: designing, im-plementing and maintaining internal control relevant to the preparation and fair presentation of financial state-ments that are free from material misstatement, wheth-er due to fraud or error; selecting and applying appropriate accounting policies; and making account-ing estimates that are reasonable in the circumstances.
Responsibility of the “Réviseur d’Entreprises”
Our responsibility is to express an opinion on these fi-nancial statements based on our audit. We conducted our audit in accordance with International Standards on Auditing as adopted by the Luxembourg “Institut des Réviseurs d’Entreprises”. Those standards require that we comply with ethical requirements and plan and per-form the audit to obtain reasonable assurance whether
the financial statements are free from material misstate-ment.
An audit involves performing procedures to obtain au-dit evidence about the amounts and disclosures in the financial statements. The procedures selected depend on the judgment of the “Réviseur d’Entreprises”, includ-ing the assessment of the risks of material misstatement of the financial statements, whether due to fraud or er-ror. In making those risk assessments, the “Réviseur d’Entreprises” considers internal control relevant to the entity’s preparation and fair presentation of the financial statements in order to design audit procedures that are appropriate in the circumstances, but not for the pur-pose of expressing an opinion on the effectiveness of the entity’s internal control.
An audit also includes evaluating the appropriateness of accounting policies used and the reasonableness of accounting estimates made by the Management Com-mittee, as well as evaluating the overall presentation of the financial statements. We believe that the audit evi-dence we have obtained is sufficient and appropriate to provide a basis for our audit opinion.
Opinion
In our opinion, the financial statements give a true and fair view of the financial position of the Investment Fa-cility as of 31 December 2008, of its financial perform-ance, of its changes in equity and of its cash flows for the year then ended in accordance with the measure-ment and recognition principles as described in Note 2 of the accompanying financial statements.
To the chairman of the Audit Committee of EUROPEAN INVESTMENT BANK Luxembourg
Luxembourg, 12 March 2009
ERNST & YOUNG
Société Anonyme
Réviseurs d’Entreprises
Alain KINSCH Bernard LHOEST

Financial Report 2008174EIB Group
Luxembourg, 12 March 2009
The Audit Committee
C. KARMIOS O. KLAPPER G. SMYTH
Statement by the Audit Committee
The Audit Committee reports to the Board of Gover-nors, the following statement being communicated to the Governors prior to their approval of the Annual Re-port and the financial statements for the past financial year.
Statement by the Audit Committee on the Investment Facility financial statements
The Committee, instituted in pursuance of Article 14 of the Statute and Article 25 of the Rules of Procedure of the European Investment Bank for the purpose of verify-ing that the operations of the Bank are conducted and its books kept in a proper manner, having
designated Ernst & Young as external auditors, re- •viewed their audit planning process, examined and discussed their reports,
noted that the opinion of Ernst & Young on the fi- •nancial statements of the Investment Facility for the year ended 31 December 2008 is unqualified,
convened on a regular basis with the Heads of Direc- •torates and relevant services, and studied the docu-ments which it deemed necessary to examine in the discharge of its duties,
received assurance from the Management Commit- •tee concerning the effectiveness of the internal con-trol structure and internal administration,
and considering
the financial statements for the financial period end- •ing on 31 December 2008 as drawn up by the Board of Directors at its meeting on 12 March 2009,
that the foregoing provides a reasonable basis for its •statement and,
Articles 22, 23 & 24 of the Rules of Procedure, •
to the best of its knowledge and judgement:
confirms that the activities of the Investment Facility are conducted in a proper manner, in particular with regard to risk management and monitoring;
has verified that the operations of the Investment Facili-ty have been conducted and its books kept in a proper manner and that to this end, it has verified that the In-vestment Facility’s operations have been carried out in compliance with the formalities and procedures laid down by the Statute and Rules of Procedure;
confirms that the financial statements, comprising the balance sheet, the income statement, the statement of changes in equity, the cash flow statement and the notes to the financial statements give a true and fair view of the financial position of the Investment Facility as at 31 December 2008 in respect of its assets and lia-bilities, and of the results of its operations for the year then ended.
(1) The Financial Regulation applicable to the 10th European Development Fund in Article 134 with regard to the operations managed by the European Investment Bank states that these operations shall be subject to the audit and discharge procedures laid down in the Statute of the Bank for all of its operations. On this basis, the Audit Committee issues the above statement.

FEMIP Trust Fund – Financial Statements 175 EIB Group
Financial StatementsFEMIP Trust Fund

Financial Report 2008176EIB Group
Income statement For the year ended 31 December 2008 (in EUR ’000)
Balance sheet At 31 December 2008 (in EUR ’000)
Notes Year to 31.12.2008
Year to 31.12.2007
Interest and similar income 1 276 1 229
Net operating income 1 276 1 229
General administrative expenses 3 - 32 - 87
Projects financed 5 - 1 783 - 229
Net gain and loss on financial assets and liabilities designated at fair value through profit or loss
9
- 10
- 9
Other cost 4 - 17 -
Total operating expenses - 1 842 - 325
Profit/Loss of the financial year - 566 904
Notes 31.12.2008 31.12.2007
ASSETS
Cash and cash equivalents 2.3.3 32 708 32 450
Financial assets designated at fair value through profit or loss (Equity investments) 9 451 461
Total Assets 33 159 32 911
LIABILITIES AND EQUITY
Liabilities
Other liabilities 10 14 -
EQUITY
Contributions called 6 34 516 33 716
Accumulated deficits - 1 371 - 805
Total Equity 33 145 32 911
Total Liabilities and Equity 33 159 32 911
The accompanying notes form an integral part of these financial statements.

FEMIP Trust Fund – Financial Statements 177 EIB Group
Statements of changes in equityAt 31 December 2008 (in EUR ’000)
EC / Member States
Contributions
Accumulated deficits
Total equity
At 1 January 2008 33 716 - 805 32 911
Contribution called during the year 800 - 800
Loss for the year - - 566 - 566
Changes in contributors’ resources 800 - 566 234
At 31 December 2008 34 516 -1 371 33 145
EC/Member States
Contributions
Accumulated deficits
Total equity
At 1 January 2007 31 550 - 1 709 29 841
Contribution called during the year 2 166 - 2 166
Profit for the year - 904 904
Changes in contributors’ resources 2 166 904 3 070
At 31 December 2007 33 716 - 805 32 911
Cash flow statement for the year ended 31 December 2008 (in EUR ’000)
Year to 31.12.2008
Year to 31.12. 2007
OPERATING ACTIVITIES
Interest and similar income 1 276 1 229
General administrative expenses - 32 - 87
Projects financed - 1 783 - 229
Other cost - 3 -
Profit (loss) on operating activities before changes in operating assets and liabilities - 542 913
Increase in financial investments designated at fair value through profit or loss - - 470
Net cash flows from operating activities - 542 443
FINANCING ACTIVITIES
Paid in by contributors 800 2 166
Net cash flows from/(used in) financing activities 800 2 166
Net increase in cash and cash equivalents 258 2 609
Cash and cash equivalents at beginning of financial year 32 450 29 841
Cash and cash equivalents at end of financial year 32 708 32 450
The accompanying notes form an integral part of these financial statements.

Financial Report 2008178EIB Group
Notes to the financial statements
General information1.
In March 2002, the Barcelona European Council decided to enhance the existing activities of the European In-vestment Bank (the “Bank” or “EIB”) in the Mediterranean Partner Countries through the creation of the Facility for Euro-Mediterranean Investment and Partnership (the
“FEMIP”). The Council’s overall objective was to “stimu-late private sector development in the Mediterranean Partner Countries, in order to facilitate a higher level of economic growth consistent with the growth of the la-bour force in the region”.
The European Council of 12th December 2003 endorsed the conclusions reached on 25th November 2003 by the ECOFIN Council to reinforce the FEMIP within the Bank, leading to the creation of a ‘reinforced FEMIP’. In particu-lar, the ECOFIN Council decided to strengthen the FEMIP operations with a number of features and instruments in support of the private sector, including the establish-ment of a trust fund allowing resources to complement on a voluntary basis the Bank’s own resources as well as the financial resources provided to the Bank by the Eu-ropean Community budget.
The Bank and a number of donor countries entered into discussions to establish a trust fund (the “FEMIP Trust Fund” or the “Fund”) dedicated to the Mediterranean Partner Countries, directing resources to operations in certain priority sectors which can be enhanced through the provision of technical assistance or made viable via a risk capital operation.
By a decision dated 14th October 2004, the Bank’s Board of Directors approved the Rules relating to the estab-lishment and administration of the FEMIP Trust Fund (the “Rules”).
In line with Article 6.01(b) of the Rules “the financial year of the FEMIP Trust Fund shall be the calendar year, ex-cept for the first financial period, which shall begin with reception of the first contribution and end on 31 De-cember 2005.”
Significant accounting policies2.
Basis of preparation2.1.
The Fund’s financial statements have been prepared in accordance with International Financial Reporting Standards (IFRS) as adopted by the European Union.
These financial statements cover the year to 31 Decem-ber 2008 with the comparatives covering the year to 31 December 2007.
These financial statements are presented in Euro, which is also its functional currency. For the preparation of the financial statements, assets and liabilities denominated in currencies other than the Euro are translated into Euro at the spot rates of exchange prevailing on the bal-ance sheet date. The gain or loss arising from such trans-lation is recorded in the income statement. The elements of the income statement are translated into Euro month-ly on the basis of the exchange rates prevailing at the end of each month.
Significant accounting judgments 2.2. and estimates
The preparation of financial statements in conformity with IFRS requires the use of certain critical accounting estimates. It also requires management to exercise its judgment in the process of applying the Fund’s account-ing policies. The areas involving a higher degree of judg-ment or complexity, or areas where assumptions and estimates are significant to the financial statements are disclosed.
The most significant use of judgments and estimates are as follows:
Fair value of financial instruments
Where the fair values of financial assets and financial lia-bilities recorded on the balance sheet cannot be derived from active markets, they are determined using a variety of valuation techniques that include the use of mathe-matical models. The input to these models is taken from observable markets where possible, but where this is not feasible, a degree of judgment is required in estab-lishing fair values. The judgments include considera-tions of liquidity and model inputs such as correlation and volatility for longer dated derivatives.
Valuation of unquoted equity investments
Valuation of unquoted equity investments is normally based on one of the following:
recent arms length market transactions; •
current fair value of another instrument that is sub- •stantially the same;
the expected cash flows discounted at current rates •applicable for items with similar terms and risk char-acteristics; or
other valuation models. •

FEMIP Trust Fund – Financial Statements 179 EIB Group
However regarding the investments done on entities that are less than two years old, any decline in value is considered. Only foreign exchange rate impact is taken into consideration.
The determination of the cash flows and discount fac-tors for unquoted equity investments requires signifi-cant estimation. The Fund calibrates the valuation techniques periodically and tests them for validity using either price from observable current market transac-tions in the same instrument or from other available ob-servable market data.
Summary of significant accounting 2.3. policies
The balance sheet represents assets and liabilities in de-creasing order of liquidity and does not distinguish be-tween current and non-current items.
Contributions2.3.1.
Contributions, net of banking charges, are recognised in the balance sheet on the date when payment of a con-tribution by a contributor is received.
Disbursements for operations2.3.2.
Disbursements related to operations financed by the FEMIP Trust Fund are recorded as expenditures in the in-come statement as projects financed over the year dur-ing which the services are received.
Cash and cash equivalents2.3.3.
For the purpose of the statement of cash flows, cash and cash equivalents comprise balances with less than three months’ maturity from the date of acquisition, which are available for use at short notice and which are subject to insignificant risk of changes in value. This definition includes balances of cash and current accounts with the Bank. The liquid assets of the FEMIP Trust Fund, deposit-ed with the Bank, are remunerated based on the Euro Overnight Index Average (EONIA) and are all denomi-nated in EUR.
Financial assets other than derivatives2.3.4.
Financial assets are accounted for using the settlement date basis.
Financial investments
After initial measurement, financial investments are sub-sequently carried at fair value through profit or loss as they only concern investments in associates. IAS 28 au-thorizes Investments Funds to record investments done
in associates at fair value in accordance with IAS 39 and variations of fair value through profit or loss.
Note the following details for the fair value measure-ment of equity investment:
Venture capital funds
The fair value of each venture capital fund will be based on the Net Asset Value (NAV), reported by the fund, if calculated based on international valuation standard recognized to be compliant with IFRS. The Fund may however decide to adjust the NAV reported by the fund if there are issues that may affect the valuation.
If no internationally recognized fair valuation standard is applied, the valuation will be conducted on the basis of the underlying portfolio.
Direct equity investments
The fair value of the investment will be based on the lat-est set of financial statements available, re-using, if ap-plicable, the same model as the one used at the acquisition of the participation.
Unrealized gains or losses on equity investments are re-corded in the income statement.
For unquoted investment, the fair value is determined by applying recognized valuation technique. These in-vestments are accounted for at cost when the fair value cannot be reliably measured.
Taxation2.3.5.
The Protocol on the Privileges and Immunities of the Eu-ropean Communities, appended to the Treaty of 8 April 1965 establishing a Single Council and a Single Commis-sion of the European Communities, stipulates that the assets, revenues and other property of the Institutions of the Union are exempt from all direct taxes.
General administrative expenses3.
General administrative expenses are directly relating to the Fund and include an administrative and operation support and financial management fee payable to the Bank (hereafter referred to as the management fee). This is a total fixed fee of 4% of the total amount of the net contributions made available to the FEMIP Trust Fund. Such fee shall be payable out of the amount of the net contributions at the time the contribution is actually paid in.

Financial Report 2008180EIB Group
Other cost4.
Other cost totaling KEUR 17 represents KEUR 3 travel fees and KEUR 14 audit cost for the audit of the Trust Fund’s Financial Statements as at 31 December 2007 and 31 December 2008.
Projects financed 5.
In 2008 the following disbursements for technical assist-disbursements for technical assist-ance operations and other programmes totalling to EUR 1.783 million were made (2007: 4 disbursements for an amount of EUR 228 579):
Projects financed (EUR’ 000) 2008
Potential for biofuel production 104
Medinas 50
Review of economic and social impact of Microfinance
28
Developing renewable energies 75
Review of impact of Microfinance 28
Phenicia Seed Fund 75
METAC 500
Review of impact of Microfinance 19
Analysis on tourism strategies 81
Review of trade finance services 48
Perimeter of Loukkos 348
Blue plan 225
Wastewater for irrigation in Med 120
FEMIP Internship Program 82
Total 1 783
Contributions6.
As at 31 December 2008 all expected contributions from donors were received by the Trust Fund. The following table shows the detail of contributions received:
EC / Member StatesContribution to
the Fund (EUR’ 000)
Austria 1 000
Belgium 1 000
Cyprus 1 000
European Commission 1 000
Finland 1 000
France 4 000
Germany 2 000
Greece 2 000
Ireland 1 000
Italy 2 500
Luxembourg 1 000
Malta 1 000
Netherlands 2 000
Portugal 1 000
Spain 10 000
United Kingdom 3 016
Total 34 516

FEMIP Trust Fund – Financial Statements 181 EIB Group
Liquidity Position7.
The table below provides an analysis of assets, liabilities and contributors’ resources into relevant maturity groupings based on the remaining period from the balance sheet date to the contractual maturity date. It is presented under the most prudent consideration of maturity dates. Therefore, in the case of liabilities the earliest possible repayment date is shown, while for assets it is the latest possible repayment date.
Those assets and liabilities that do not have a contractual maturity date are grouped together in the “Maturity unde-fined” category.
Up to 3 months (in EUR’ 000)
Maturity undefined (in EUR’ 000)
Total (in EUR’ 000)
Assets
Cash and cash equivalents 32 708 - 32 708
Financial assets designated at fair value through profit or loss
- 451 451
Total Assets 32 708 451 33 159
Liabilities
Total Liabilities - 14 - - 14
Equity
Total Equity - - 33 145 - 33 145
Total Liabilities and Equity - 14 - 33 145 - 33 159
Net liquidity position at 31 December 2008 32 694 - 32 694 -
Cumulative net liquidity position at 31 December 2008 32 694 - -
Cumulative net liquidity position at 31 December 2007 32 450 - -
Interest Rate Risk8.
The FEMIP Trust Fund is exposed to an interest rate risk through its cash and cash equivalents deposited with the Bank, and remunerated based on the Euro Overnight Index Average (EONIA).

Financial Report 2008182EIB Group
Equity investments – at fair value through profit or loss (in EUR’000)9.
The main components of equity investments are as follows:
2008 2007
At the beginning of the financial year 461 -
Movement in fair value - -
Impairment - -
Change in amortized cost - -
Disbursement - 470
Interest capitalised - -
Repayments - -
Foreign exchange difference - 10 - 9
At the end of the financial year 451 461
This unquoted equity investment concerns an entity that is less than two years old. Any decline in fair value cannot be considered as at 31 December 2008. Only the foreign exchange impact has been taken into consideration.
Other liabilities10.
Other liabilities represent external audit cost for the annual audit of the FEMIP Trust Fund’s financial statements for the years 2007 and 2008.
Commitments (in EUR’000)11.
The Fund’s commitments as at 31 December 2008 and 31 December 2007 are as follows:
2008 2007
Commitments
Undisbursed commitment in respect of equity investments 1 530 1 530
Undisbursed commitment in respect of technical assistance 1 604 821
Total 3 134 2 351
Subsequent events12.
There have been no material post-balance sheet events, which would require disclosure or adjustment to the financial statements as at 31 December 2009.
The FEMIP Trust Fund Assembly of Donors has approved these financial statements by tacit procedure on or before 6 March 2009.
On a proposal from the Management Committee of the Bank, the Board of Directors of the Bank received these financial statements on 12 March 2009 who decided to submit them to the Governors for approval at their meeting to be held on 9 June 2009.

FEMIP Trust Fund – Financial Statements 183 EIB Group
Independent Auditor’s Report
We have audited the accompanying financial statements of the FEMIP Trust Fund, which show a loss of EUR 566,000 and a total balance sheet of EUR 33,159,000 and which comprise the balance sheet as at 31 Decem-ber 2008, the income statement, the statements of changes in equity, the cash flow statement for the year then ended, and a summary of significant accounting policies and other explanatory notes.
Management Committee’s responsibility for the finan-cial statements
The Management Committee of the European Invest-ment Bank is responsible for the preparation and fair presentation of these financial statements in accordance with International Financial Reporting Standards and with the general principles of the Directives of the Euro-pean Union on the annual accounts and consolidated accounts of certain type of companies, banks and other financial institutions and insurance undertakings. This responsibility includes: designing, implementing and maintaining internal control relevant to the preparation and fair presentation of financial statements that are free from material misstatement, whether due to fraud or er-ror; selecting and applying appropriate accounting poli-cies; and making accounting estimates that are reasonable in the circumstances.
Responsibility of the “Réviseur d’Entreprises”
Our responsibility is to express an opinion on these fi-nancial statements based on our audit. We conducted our audit in accordance with International Standards on Auditing as adopted by the Luxembourg “Institut des Réviseurs d’Entreprises”. Those standards require that we comply with ethical requirements and plan and perform
the audit to obtain reasonable assurance whether the fi-nancial statements are free from material misstatement.
An audit involves performing procedures to obtain audit evidence about the amounts and disclosures in the finan-cial statements. The procedures selected depend on the judgment of the “Réviseur d’Entreprises”, including the as-sessment of the risks of material misstatement of the fi-nancial statements, whether due to fraud or error. In making those risk assessments, the “Réviseur d’Entreprises” considers internal control relevant to the entity’s prepara-tion and fair presentation of the financial statements in order to design audit procedures that are appropriate in the circumstances, but not for the purpose of expressing an opinion on the effectiveness of the entity’s internal control.
An audit also includes evaluating the appropriateness of accounting policies used and the reasonableness of ac-counting estimates made by the Management Commit-tee, as well as evaluating the overall presentation of the financial statements. We believe that the audit evidence we have obtained is sufficient and appropriate to pro-vide a basis for our audit opinion.
Opinion
In our opinion, the financial statements give a true and fair view of the financial position of The FEMIP Trust Fund as of 31 December 2008, of its financial performance, of its changes in equity and of its cash flows for the year then ended in accordance with International Financial Reporting Standards and with the general principles of the Directives of the European Union on the annual ac-counts and consolidated accounts of certain types of companies, banks and other financial institutions and in-surance undertakings.
To the chairman of the Audit Committee of EUROPEAN INVESTMENT BANK Luxembourg
Luxembourg, 12 March 2009
ERNST & YOUNG
Société Anonyme
Réviseurs d’Entreprises
Alain KINSCH Bernard LHOEST

Financial Report 2008184EIB Group
The Audit Committee reports to the Board of Gover-nors, the following statement being communicated to the Governors prior to their approval of the Annual Re-port and the financial statements for the past financial year.
Statement by the Audit Committee on the FEMIP Trust Fund financial statements
The Committee, instituted in pursuance of Article 14 of the Statute and Article 25 of the Rules of Procedure of the European Investment Bank for the purpose of verify-ing that the operations of the Bank are conducted and its books kept in a proper manner, having
designated Ernst & Young as external auditors, re- •viewed their audit planning process, examined and discussed their reports,
noted that the opinion of Ernst & Young on the fi- •nancial statements of the FEMIP Trust Fund for the year ended 31 December 2008 is unqualified,
convened on a regular basis with the Heads of Direc- •torates and relevant services, and studied the docu-ments which it deemed necessary to examine in the discharge of its duties,
received assurance from the Management Commit- •tee concerning the effectiveness of the internal con-trol structure and internal administration,
and considering
the financial statements for the year ended 31 De- •cember 2008 as drawn up by the Board of Directors at its meeting on 12 March 2009,
that the foregoing provides a reasonable basis for its •statement and,
Articles 22, 23 & 24 of the Rules of Procedure, •
to the best of its knowledge and judgement:
confirms that the activities of the FEMIP Trust Fund are conducted in a proper manner, in particular with regard to risk management and monitoring;
has verified that the operations of the FEMIP Trust Fund have been conducted and its books kept in a proper manner and that to this end, it has verified that the FEMIP Trust Fund’s operations have been carried out in compliance with the formalities and procedures laid down by the Statute and Rules of Procedure;
confirms that the financial statements, comprising the balance sheet, the income statement, the statement of changes in equity, the cash flow statement and the notes to the financial statements give a true and fair view of the financial position of the FEMIP Trust Fund as at 31 Decem-ber 2008 in respect of its assets and liabilities, and of the results of its operations for the year then ended.
Statement by the Audit Committee
(1) The conditions with regard to the approval of Financial Statements of the FEMIP Trust Fund contained in the Rules Relating to the Establishment and Administration of the FEMIP Trust Fund state that the Financial Statements shall be subject to the presentation and approval laid down in the Statute of the Bank for its ordinary operations. On this basis, the Audit Committee issues the above statement.
Luxembourg, 12 March 2009
The Audit Committee
C. KARMIOS O. KLAPPER G. SMYTH
EU-Africa Infrastructure Trust Fund – Financial Statements 185 EIB Group
Financial StatementsEU-Africa Infrastructure Trust Fund
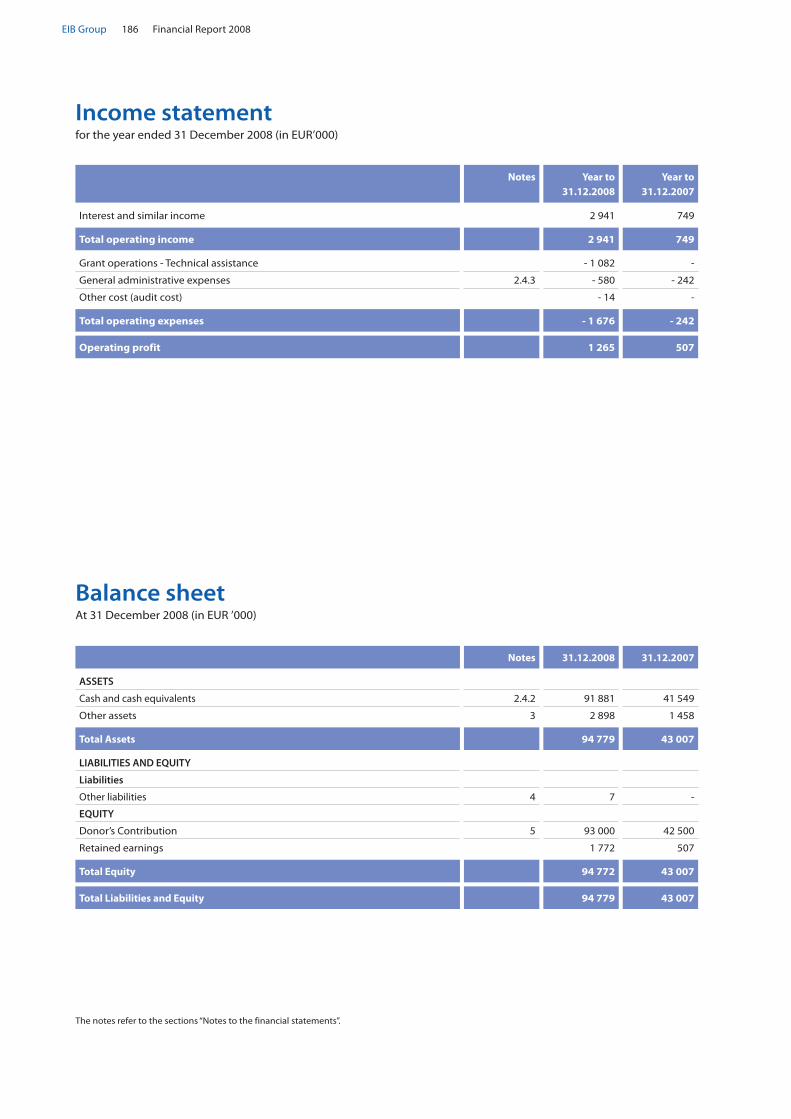
Financial Report 2008186EIB Group
Income statement for the year ended 31 December 2008 (in EUR’000)
Notes Year to 31.12.2008
Year to 31.12.2007
Interest and similar income 2 941 749
Total operating income 2 941 749
Grant operations - Technical assistance - 1 082 -
General administrative expenses 2.4.3 - 580 - 242
Other cost (audit cost) - 14 -
Total operating expenses - 1 676 - 242
Operating profit 1 265 507
The notes refer to the sections “Notes to the financial statements”.
Balance sheet At 31 December 2008 (in EUR ’000)
Notes 31.12.2008 31.12.2007
ASSETS
Cash and cash equivalents 2.4.2 91 881 41 549
Other assets 3 2 898 1 458
Total Assets 94 779 43 007
LIABILITIES AND EQUITY
Liabilities
Other liabilities 4 7 -
EQUITY
Donor’s Contribution 5 93 000 42 500
Retained earnings 1 772 507
Total Equity 94 772 43 007
Total Liabilities and Equity 94 779 43 007
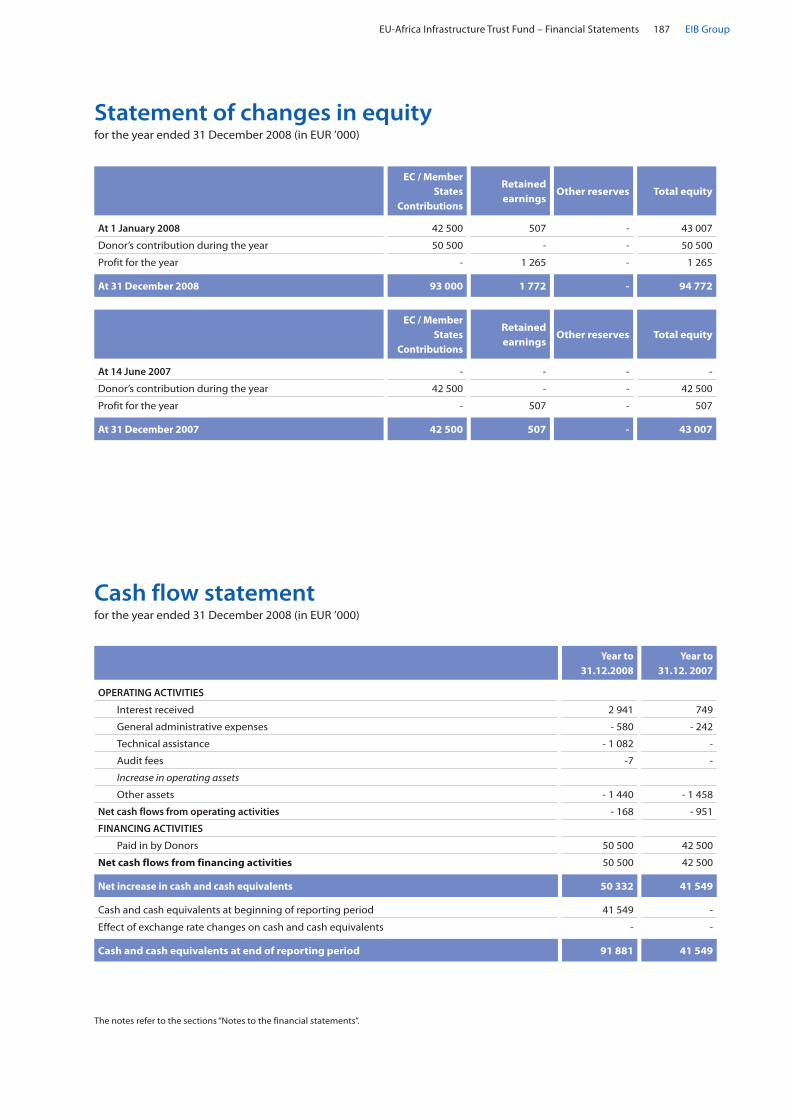
EU-Africa Infrastructure Trust Fund – Financial Statements 187 EIB Group
Statement of changes in equityfor the year ended 31 December 2008 (in EUR ’000)
EC / Member States
Contributions
Retained earnings
Other reserves Total equity
At 1 January 2008 42 500 507 - 43 007
Donor’s contribution during the year 50 500 - - 50 500
Profit for the year - 1 265 - 1 265
At 31 December 2008 93 000 1 772 - 94 772
EC / Member States
Contributions
Retained earnings
Other reserves Total equity
At 14 June 2007 - - - -
Donor’s contribution during the year 42 500 - - 42 500
Profit for the year - 507 - 507
At 31 December 2007 42 500 507 - 43 007
Cash flow statementfor the year ended 31 December 2008 (in EUR ’000)
Year to 31.12.2008
Year to 31.12. 2007
OPERATING ACTIVITIES
Interest received 2 941 749
General administrative expenses - 580 - 242
Technical assistance - 1 082 -
Audit fees -7 -
Increase in operating assets
Other assets - 1 440 - 1 458
Net cash flows from operating activities - 168 - 951
FINANCING ACTIVITIES
Paid in by Donors 50 500 42 500
Net cash flows from financing activities 50 500 42 500
Net increase in cash and cash equivalents 50 332 41 549
Cash and cash equivalents at beginning of reporting period 41 549 -
Effect of exchange rate changes on cash and cash equivalents - -
Cash and cash equivalents at end of reporting period 91 881 41 549
The notes refer to the sections “Notes to the financial statements”.

Financial Report 2008188EIB Group
General information1.
Following detailed consultations between EU Member States, the European Commission and the European In-vestment Bank (the “EIB”), the EU-Africa Infrastructure Trust Fund Agreement (“Agreement Constituting the Im-plementation Rules of the Trust Fund”) was signed in Brussels on 23 April 2007 by Donors and by EIB as Man-ager of the Trust Fund.
In accordance with this Agreement the key objective of the Trust Fund is to contribute to achieving the strategic objectives of the EU-Africa Partnership through target-ed funding of regional and cross-border infrastructure in Sub-Saharan Africa. The Trust Fund provides financial support by way of grants to eligible infrastructure projects alongside long-term loan finance made availa-ble by eligible financiers.
Typically, Trust Funds have a limited lifespan and can be wound-up once certain events occur. Article 11.2.1 of the Agreement includes the possibility to wind-up the EU-Africa Infrastructure Trust Fund on 31 December 2013.
The reporting period of the present financial statements covers the period from 1 January 2008 to 31 December 2008. The prior period figures cover the Trust Fund’s ini-tial period from 14 June 2007 (date of inception) to 31 December 2007.
Significant accounting policies2.
Basis of preparation2.1.
The Trust Fund’s financial statements have been pre-pared in accordance with International Financial Report-ing Standards (IFRS) as adopted by the European Union.
The accounting policies applied are in conformity with the IFRS and with the overall principles of the Directive 86/635/EEC of the Council of the European Communi-ties of 8 December 1986 on the annual accounts and consolidated accounts of banks and other financial in-stitutions, as amended by Directive 2001/65/EC of 27 September 2001 and by Directive 2003/51/EC of 18 June 2003 on the annual and consolidated accounts of cer-tain types of companies, banks and other financial insti-tutions and insurance undertakings (the “Directives”).
Significant accounting judgments 2.2. and estimates
The preparation of financial statements in conformity with IFRS requires the use of certain critical accounting estimates. It also requires management to exercise its judgment in the process of applying the Trust Fund’s ac-counting policies. The areas involving a higher degree of judgment or complexity, or areas where assumptions and estimates are significant to the financial statements are disclosed.
Change in accounting policies2.3.
In according with IAS 8 - Accounting Policies, Changes in Accounting Estimates and Errors, the Trust Fund has changed its accounting treatment of the recognition of management fees paid to the EIB on contributions re-ceived. In 2007, the full amount of management fees paid was recognised as general administrative expenses in the income statement. Given the general administra-tive nature of management fees paid, such fees shall be amortized throughout the lifespan of the Trust Fund. Therefore the Trust Fund has retroactively restated its 2007 financial statements to enable a comparable pres-entation on the 2008 financial statements.
This restatement has a positive impact on the 2007 in-come statement and equity of K EUR 1.458.
Summary of significant accounting 2.4. policies
The balance sheet represents assets and liabilities in de-creasing order of liquidity. Assets and liabilities concern exclusively current items.
Foreign currency translation2.4.1.
The Trust Fund uses the Euro (EUR) for presenting its fi-nancial statements, which is also the functional and presentational currency.
Foreign currency transactions are translated, in accord-ance with IAS 21, at the exchange rate prevailing on the date of the transaction.
Notes to the financial statements

EU-Africa Infrastructure Trust Fund – Financial Statements 189 EIB Group
Monetary assets and liabilities denominated in curren-cies other than in Euro are translated into Euro at the exchange rate prevailing at the balance sheet date. The gain or loss arising from such translation is recorded in the income statement.
Non-monetary items that are measured in terms of his-torical cost in a foreign currency are translated using the exchange rates at the dates of the initial transactions. Non-monetary items measured at fair value in a foreign currency are translated using the exchange rates at the date when the fair value was determined.
Exchange differences arising on the settlement of trans-actions at rates different from those at the date of the transaction, and unrealized foreign exchange differenc-es on unsettled foreign currency monetary assets and liabilities, are recognized in the income statement.
The elements of the income statement are translated into Euro on the basis of the exchange rates prevailing at the end of each month.
Cash and cash equivalents2.4.2.
The Trust Fund defines cash equivalents as current ac-counts or short-term deposits with original maturities of three months or less. The current account is one account opened in the EIB books in the name of the Trust Fund, called “EU-Africa Infrastructure Trust Fund Account”.
General administrative expenses2.4.3.
For managing the Trust Fund the EIB shall be granted with a standard one-off payment equal to 4% (four per-cent) of the aggregate amount of Contributions effec-tively made available to the Trust Fund. The administrative fee is intended to cover in full the costs associated with managing the Trust Fund.
The management fee paid to the EIB amounts to EUR 2 020 000 and EUR 1 700 000 for the financial year 2008 and the financial period 2007 respectively. General administrative expenses are recognised in the income statement on a pro-rata basis over the remaining lifespan period of the Trust Fund. As at 31 December 2008 K EUR 580 (2007: K EUR 242) are recognised in the income statement and K EUR 2 898 (2007: K EUR 1 458) are capitalized in the balance sheet as administrative fees paid in advance.
Interest income2.4.4.
According to the Agreement Constituting the Imple-mentation Rules of the Trust Fund, the EIB remunerates the cash on the current account.
In the financial year 2008, the interest income received in remuneration of the current account opened in EIB books amounts to EUR 2 941 156.
Contributions2.4.5.
In addition to the Founding Donor (the European Com-mission), any Member State of the European Union or any Member State Development Finance Agency may contribute funds in Euro to the Trust Fund Contributions are non-refundable.
Taxation2.4.6.
The Protocol on the Privileges and Immunities of the Eu-ropean Communities, appended to the Treaty of 8 April 1965 establishing a Single Council and a Single Commis-sion of the European Communities, stipulates that the assets, revenues and other property of the Institutions of the Union are exempt from all direct taxes.
Other assets3.
Other assets represent administrative fees paid in ad-vance to the EIB as laid down in Note 2.4.3.
Other liabilities4.
Other liabilities represent external audit cost for the au-dit of the Trust Fund’s financial statements as at 31 De-cember 2008.
Contribution to the Trust Fund5.
Contributions received from Donors as at 31 December 2008 are detailed below:
EC / Member StatesContribution to
the Fund (EUR’ 000)
Austria 1 000
European Commission 60 000
France 5 000
Germany 1 000
Greece 1 000
Italy 5 000
Luxembourg 2 000
Netherlands 2 000
Portugal 1 000
Spain 10 000
United Kingdom 5 000
Total 93 000

Financial Report 2008190EIB Group
Contingent Liabilities6.
Contingent liabilities of the Trust Fund are entirely com-posed of approved but not yet disbursed grant opera-tions. As at the balance sheet date they are totalling to EUR 62.2m, of which EUR 53.3m are within the scope of interest rate subsidies and EUR 8.9m within the scope of technical assistance. The Trust Fund Agreement (Arti-cle 6) foresees that disbursement of grant operations to the Project Financiers should normally commence with-in 15-months of formal approval of each grant opera-tion.
Subsequent events7.
There have been no material post balance sheet events which could require disclosure or adjustment to the 31 December 2008 financial statements.

EU-Africa Infrastructure Trust Fund – Financial Statements 191 EIB Group
Independent Auditor’s Report
We have audited the accompanying financial state-ments of the EU-AFRICA Infrastructure Trust Fund, which show a profit of EUR 1,265,000 and a total balance sheet of EUR 94,779,000 and which comprise the balance sheet as at 31 December 2008, the income statement, the statement of changes in equity and the cash flow statement for the period from 1 January 2008 to 31 De-cember 2008, and the notes to the financial statements.
Management Committee’s responsibility for the finan-cial statements
The Management Committee of the European Invest-ment Bank is responsible for the preparation and fair presentation of these financial statements in accord-ance with International Financial Reporting Standards and with the general principles of the Directives of the European Union on the annual accounts and consoli-dated accounts of certain type of companies, banks and other financial institutions and insurance undertakings. This responsibility includes: designing, implementing and maintaining internal control relevant to the prepa-ration and fair presentation of financial statements that are free from material misstatement, whether due to fraud or error; selecting and applying appropriate ac-counting policies; and making accounting estimates that are reasonable in the circumstances.
Responsibility of the “Réviseur d’Entreprises”
Our responsibility is to express an opinion on these fi-nancial statements based on our audit. We conducted our audit in accordance with International Standards on Auditing as adopted by the Luxembourg “Institut des Réviseurs d’Entreprises”. Those standards require that we comply with ethical requirements and plan and per-form the audit to obtain reasonable assurance whether
the financial statements are free from material misstate-ment.
An audit involves performing procedures to obtain au-dit evidence about the amounts and disclosures in the financial statements. The procedures selected depend on the judgment of the “Réviseur d’Entreprises”, includ-ing the assessment of the risks of material misstatement of the financial statements, whether due to fraud or er-ror. In making those risk assessments, the “Réviseur d’Entreprises” considers internal control relevant to the entity’s preparation and fair presentation of the financial statements in order to design audit procedures that are appropriate in the circumstances, but not for the pur-pose of expressing an opinion on the effectiveness of the entity’s internal control.
An audit also includes evaluating the appropriateness of accounting policies used and the reasonableness of accounting estimates made by the Management Com-mittee, as well as evaluating the overall presentation of the financial statements. We believe that the audit evi-dence we have obtained is sufficient and appropriate to provide a basis for our audit opinion.
Opinion
In our opinion, the financial statements give a true and fair view of the financial position of the EU-AFRICA Infra-structure Trust Fund as of 31 December 2008, of its fi-nancial performance, of its changes in equity and of its cash flows for the year then ended in accordance with International Financial Reporting Standards and with the general principles of the Directives of the European Union on the annual accounts and consolidated ac-counts of certain types of companies, banks and other financial institutions and insurance undertakings.
To the chairman of the Audit Committee of EUROPEAN INVESTMENT BANK Luxembourg
Luxembourg, 12 March 2009
ERNST & YOUNG
Société Anonyme
Réviseurs d’Entreprises
Alain KINSCH Bernard LHOEST

Financial Report 2008192EIB Group
Luxembourg, 12 March 2009
The Audit Committee
C. KARMIOS O. KLAPPER G. SMYTH
Statement by the Audit Committee
The Audit Committee reports to the Board of Gover-nors, the following statement being communicated to the Governors prior to their approval of the Annual Re-port and the financial statements for the past financial year.
Statement by the Audit Committee on the EU-Africa Infrastructure Trust Fund financial statements
The Committee, instituted in pursuance of Article 14 of the Statute and Article 25 of the Rules of Procedure of the European Investment Bank for the purpose of veri-fying that the operations of the Bank are conducted and its books kept in a proper manner, having
designated Ernst & Young as external auditors, re- •viewed their audit planning process, examined and discussed their reports,
noted that the opinion of Ernst & Young on the fi- •nancial statements of the EU-Africa Infrastructure Trust Fund for the period ended 31 December 2008 is unqualified,
convened on a regular basis with the Heads of Direc- •torates and relevant services, and studied the docu-ments which it deemed necessary to examine in the discharge of its duties,
received assurance from the Management Commit- •tee concerning the effectiveness of the internal con-trol structure and internal administration,
and considering
the financial statements for the period ended 31 De- •cember 2008 as drawn up by the Board of Directors at its meeting on 12 March 2009,
that the foregoing provides a reasonable basis for its •statement and,
Articles 22, 23 & 24 of the Rules of Procedure, •
to the best of its knowledge and judgement:
confirms that the activities of the EU-Africa Infrastructure Trust Fund are conducted in a proper manner, in particu-lar with regard to risk management and monitoring;
has verified that the operations of the EU-Africa Infra-structure Trust Fund have been conducted and its books kept in a proper manner and that to this end, it has veri-fied that the EU-AFRICA Infrastructure Trust Fund’s op-erations have been carried out in compliance with the formalities and procedures laid down by the Statute and Rules of Procedure;
confirms that the financial statements, comprising the balance sheet, the income statement, the statement of changes in equity, the cash flow statement and the notes to the financial statements give a true and fair view of the financial position of the EU-Africa Infrastruc-ture Trust Fund as at 31 December 2008 in respect of its assets and liabilities, and of the results of its operations for the period then ended.
(1) The conditions with regard to the approval of Financial Statements of the EU-Africa Infrastructure Trust Fund contained in the Agreement Constituting the Implementation Rules of the Trust Fund state that the Financial Statements shall be submitted to the EIB governing bodies according to the provi-sions laid down in respect of its own financial statements in the Statute. On this basis, the Audit Committee issues the above statement.

EIF – Financial Statements 193 EIB Group
Financial StatementsEIF

Financial Report 2008194EIB Group
Following our appointment by the Audit Board, we have audited the accompanying financial statements of the European Investment Fund, which comprise the balance sheet as at December 31, 2008, and the income statement, statement of changes in equity and cash flow statement for the year then ended, and a summary of significant accounting policies and other explanatory notes.
Management responsibility for the financial statement
The Management is responsible for the preparation and fair presentation of these financial statements in ac-cordance with International Financial Reporting Stand-ards as adopted by the European Union. This responsibility includes: designing, implementing and maintaining internal control relevant to the preparation and fair presentation of financial statements that are free from material misstatement, whether due to fraud or error; selecting and applying appropriate accounting policies; and making accounting estimates that are rea-sonable in the circumstances.
Responsibility of the “Réviseur d’Entreprises”
Our responsibility is to express an opinion on these fi-nancial statements based on our audit. We conducted our audit in accordance with International Standards on Auditing as adopted by the “Institut des Réviseurs d’Entreprises”. Those standards require that we comply with ethical requirements and plan and perform the audit to obtain reasonable assurance whether the fi-nancial statements are free from material misstate-ment.
An audit involves performing procedures to obtain au-dit evidence about the amounts and disclosures in the financial statements. The procedures selected depend on the judgement of the “Réviseur d’Entreprises”, in-cluding the assessment of the risks of material misstate-ment of the financial statements, whether due to fraud
or error. In making those risk assessments, the “Réviseur d’Entreprises” considers internal control relevant to the entity’s preparation and fair presentation of the finan-cial statements in order to design audit procedures that are appropriate in the circumstances, but not for the purpose of expressing an opinion on the effectiveness of the entity’s internal control.
An audit also includes evaluating the appropriateness of accounting policies used and the reasonableness of accounting estimates made by the Management, as well as evaluating the overall presentation of the finan-cial statements.
We believe that the audit evidence we have obtained is sufficient and appropriate to provide a basis for our au-dit opinion.
Opinion
In our opinion, the financial statements give a true and fair view of the financial position of European Invest-ment Fund as of December 31, 2008, and of its financial performance and its cash flows for the year then ended in accordance with International Financial Reporting Standards as adopted by the European Union.
ERNST & YOUNG Société Anonyme Réviseur d’Entreprises
Luxembourg, 10 March 2009
Independent Auditor’s Report
To the Audit Board of the EUROPEAN INVESTMENT FUND 96, boulevard Konrad Adenauer L-2968 Luxembourg
Olivier JORDANT Alain KINSCH

EIF – Financial Statements 195 EIB Group
Statement by The Audit Board
The Audit Board, set up pursuant to article 22 of the Statutes of the European Investment Fund (ElF),
acting in accordance with the customary standards •of the audit profession,
having designated ERNST & YOUNG Société •Anonyme Réviseur d’Entreprises as external auditor of the ElF pursuant to Art. 19 of the Rules of Proce-dure,
having studied the financial statements and such •documents which it deemed necessary to examine in the discharge of its duties,
having examined and discussed the report dated 10 •March 2009 drawn up by ERNST & YOUNG Société Anonyme Réviseur d’Entreprises,
noting that this report gives an unqualified opinion •on the financial statements of ElF for the financial period ending 31 December 2008,
having examined and discussed reports and opin- •ions issued by the EIF’s Internal Audit, Risk Manage-
ment and Compliance and Operational Risk functions,
having received assurance from the Chief Executive •in particular concerning the effectiveness of the in-ternal control systems, risk management and inter-nal administration,
considering Articles 17, 18 and 19 of the Rules of Procedure,
hereby confirms that to the best of its knowledge and judgement,
the operations of the Fund have been carried out in •compliance with the formalities and procedures laid down in the Statutes and the Rules of Procedure;
the financial statements, comprising the balance •sheet, income statements, cash flow statement, statement of changes in equity, and notes to the ac-counts of the European Investment Fund give a true and fair view of the financial position of the Fund as regards its assets and liabilities, and of the results of its operations for the financial year under review.
Luxembourg, 10 March 2009
The Audit Board
Tony MURPHY Gabriela PANTRING Ortwin KLAPPER

Financial Report 2008196EIB Group
Balance sheet as at 31 December 2008 (expressed in EUR)
Notes 31.12.2008 31.12.2007
ASSETS
Cash and cash equivalents 4.1 383 502 584 291 604 538
Investments:
Debt securities and other fixed income securities 4.2 495 733 011 522 470 401
Shares and other variable income securities 4.3 158 714 823 167 876 521
654 447 834 690 346 922
Non-current assets held for sale 4.4 7 139 812 0
Other assets 4.5 28 465 987 33 072 223
Intangible assets 4.6 1 869 793 1 161 484
Property, plant and equipment 4.7 433 673 8 245 595
TOTAL ASSETS 1 075 859 683 1 024 430 762
LIABILITIES
Financial liabilities 5.1
Financial guarantees 18 990 527 1 1439 133
Derivatives 2 604 242 1 579 264
Provisions for guarantees 5.2 8 983 874 5 056 087
3 0578 643 18 074 484
Retirement benefit obligations 5.3 16 984 934 13 232 407
Other liabilities and provision 5.4 14 223 570 7 758 556
Total Liabilities 61 787 147 39 065 447
EQUITY
Share capital 5.5
Subscribed 2 865 000 000 2 770 000 000
Uncalled (2 292 000 000) (2 216 000 000)
573 000 000 554 000 000
Share Premium 132 012 377 117 909 669
Statutory reserve 5.6 124 490 745 104 329 810
Retained earnings 5.6 146 435 341 136 353 969
Fair value reserve 5.7 3 022 993 22 369 530
Profit for the financial year 5.6 35 111 080 50 402 337
TOTAL EQUITY 1 014 072 536 985 365 315
TOTAL EQUITY and LIABILITIES 1 075 859 683 1 024 430 762
The notes are an integral part of these financial statements.

EIF – Financial Statements 197 EIB Group
Income statement for the year ended 31 December 2008 (expressed in EUR)
Notes 31.12.2008 31.12.2007
Net interest and similar income 7.1 38 494 827 30 231 070
Income from securities
Income from investments in shares and other variable income securities 4.3 4 598 262 6 674 654
Net income from guarantees operations 7.2 18 492 375 21 349 024
Commission income 7.3 23 405 855 29 072 382
Net loss on financial operations 7.4 (5 081 325) (1 020 711)
Other operating income 24 675 18 955
General administrative expenses 7.5
Staff costs:
- wages and salaries (19 241 179) (17 317 160)
- social security costs (3 237 576) (2 130 900)
(22 478 755) (19 448 060)
Other administrative expenses (7 546 298) (6 665 063)
(30 025 053) (26 113 123)
Depreciation of property, plant and equipment and intangible assets 4.6 & 4.7 (894 486) (1 219 062)
Impairment losses on available-for-sale investments (13 904 050) (8 590 852)
Profit for the financial year 35 111 080 50 402 337
The notes are an integral part of these financial statements.
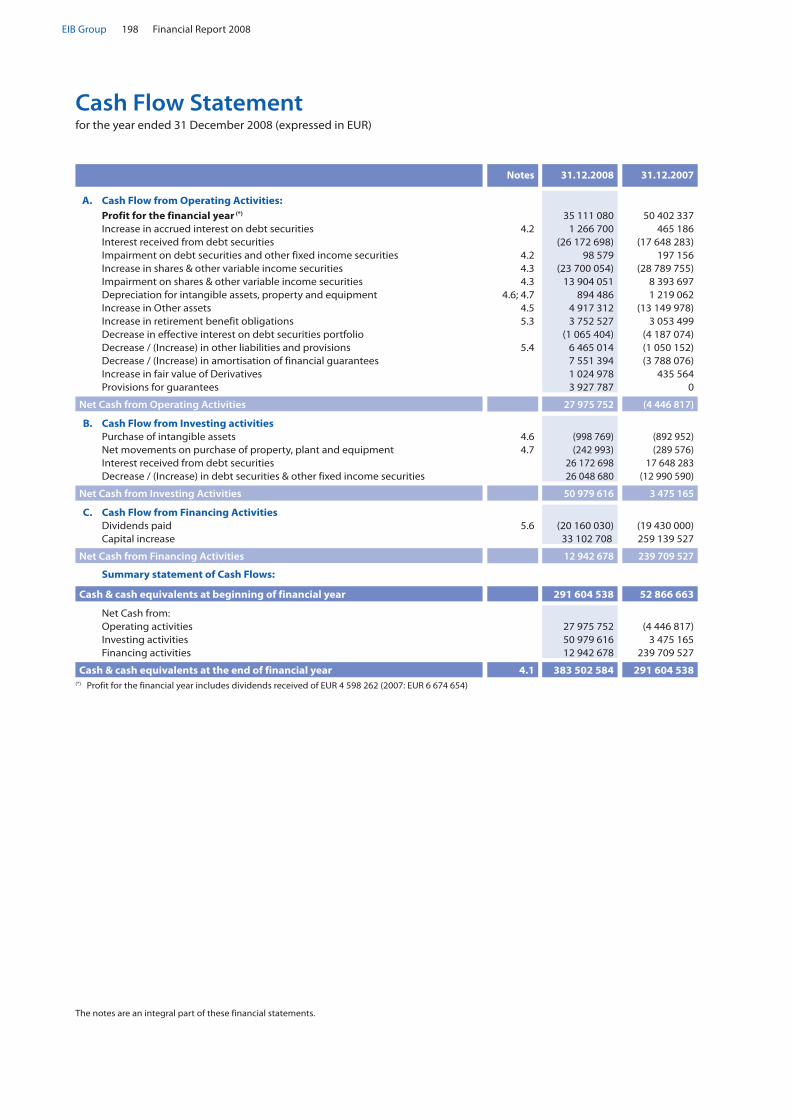
Financial Report 2008198EIB Group
Cash Flow Statementfor the year ended 31 December 2008 (expressed in EUR)
The notes are an integral part of these financial statements.
Notes 31.12.2008 31.12.2007
A. Cash Flow from Operating Activities:Profit for the financial year (*) 35 111 080 50 402 337Increase in accrued interest on debt securities 4.2 1 266 700 465 186Interest received from debt securities (26 172 698) (17 648 283)Impairment on debt securities and other fixed income securities 4.2 98 579 197 156Increase in shares & other variable income securities 4.3 (23 700 054) (28 789 755)Impairment on shares & other variable income securities 4.3 13 904 051 8 393 697Depreciation for intangible assets, property and equipment 4.6; 4.7 894 486 1 219 062Increase in Other assets 4.5 4 917 312 (13 149 978)Increase in retirement benefit obligations 5.3 3 752 527 3 053 499Decrease in effective interest on debt securities portfolio (1 065 404) (4 187 074)Decrease / (Increase) in other liabilities and provisions 5.4 6 465 014 (1 050 152)Decrease / (Increase) in amortisation of financial guarantees 7 551 394 (3 788 076)Increase in fair value of Derivatives 1 024 978 435 564Provisions for guarantees 3 927 787 0
Net Cash from Operating Activities 27 975 752 (4 446 817)
B. Cash Flow from Investing activitiesPurchase of intangible assets 4.6 (998 769) (892 952)Net movements on purchase of property, plant and equipment 4.7 (242 993) (289 576)Interest received from debt securities 26 172 698 17 648 283Decrease / (Increase) in debt securities & other fixed income securities 26 048 680 (12 990 590)
Net Cash from Investing Activities 50 979 616 3 475 165
C. Cash Flow from Financing ActivitiesDividends paid 5.6 (20 160 030) (19 430 000)Capital increase 33 102 708 259 139 527
Net Cash from Financing Activities 12 942 678 239 709 527
Summary statement of Cash Flows:
Cash & cash equivalents at beginning of financial year 291 604 538 52 866 663
Net Cash from: Operating activities 27 975 752 (4 446 817)Investing activities 50 979 616 3 475 165Financing activities 12 942 678 239 709 527
Cash & cash equivalents at the end of financial year 4.1 383 502 584 291 604 538(*) Profit for the financial year includes dividends received of EUR 4 598 262 (2007: EUR 6 674 654)

EIF – Financial Statements 199 EIB Group
Stat
emen
t o
f Ch
ang
es in
Eq
uit
y fo
r th
e ye
ar e
nd
ed 3
1 D
ecem
ber
200
8 (e
xpre
ssed
in E
UR)
No
teSu
bsc
rib
ed
Cap
ital
Cal
lab
le C
apit
alSh
are
Cap
ital
Shar
e Pr
emiu
mSt
atu
tory
R
eser
veR
etai
ned
Ea
rnin
gs
Fair
val
ue
Res
erve
Pro
fit f
or
the
Year
bef
ore
A
pp
rop
riat
ion
Tota
l Eq
uit
y
Bal
ance
as
at 0
1/01
/200
72
000
000
000
(1 6
00 0
00 0
00)
400
000
000
12 7
70 1
4284
899
624
126
638
689
19 6
35 7
6648
575
466
692
519
687
Ap
pro
pri
atio
n o
f pri
or
year
’s p
rofit
inc.
d
ivid
end
5.6
0 0
0 0
19
430
186
9
715
280
0
(48
575
466)
(1
9 43
0 00
0)
Shar
e is
sue
5.5
770
000
000
(616
000
000
)15
4 00
0 00
010
5 13
9 52
70
00
025
9 13
9 52
7
Fair
valu
e re
serv
e5.
70
00
00
02
733
764
02
733
764
Prof
it fo
r the
Yea
r0
00
00
00
50 4
02 3
3750
402
337
Bal
ance
as
at 3
1/12
/200
7 2
770
000
000
(2 2
16 0
00 0
00)
554
000
000
117
909
669
104
329
810
136
353
969
22 3
69 5
3050
402
337
985
365
315
Ap
pro
pria
tion
of p
rior y
ear’s
pro
fit in
c.
divi
dend
5.6
0 0
0 0
20
160
935
10
081
372
0
(50
402
337)
(20
160
030)
Shar
e is
sue
5.5
95 0
00 0
00(7
6 00
0 00
0)19
000
000
14 1
02 7
080
00
033
102
708
Fair
valu
e re
serv
e5.
70
00
00
0(1
9 34
6 53
7)0
(19
346
536)
Prof
it fo
r the
Yea
r0
00
00
00
35 1
11 0
8035
111
080
Bal
ance
as
at 3
1/12
/200
82
865
000
000
(2 2
92 0
00 0
00)
573
000
000
132
012
377
124
490
745
146
435
341
3 02
2 99
335
111
080
1 01
4 07
2 53
6
The
no
tes
are
an in
teg
ral p
art
of t
hes
e fin
anci
al s
tate
men
ts.

Financial Report 2008200EIB Group
European Investment Fund
Notes to the accounts for the year ended 31 December 2008 (expressed in EUR)
1. General
The EUROPEAN INVESTMENT FUND (hereafter the “Fund” or “EIF”) was incorporated on 14 June 1994, in Luxem-bourg, as an international financial institution. The ad-dress of its registered office is 96, boulevard Konrad Adenauer, L-2968 .
The primary task of the Fund, while providing adequate return on equity, is to contribute to the pursuit of Euro-pean Community objectives through
the provision of guarantees to financial institutions •that cover credits to small and medium sized entities (”SME”);
the acquisition, holding, managing and disposal of •equity participations;
the administration of special resources entrusted by •third parties, and
related activities. •
The Fund operates as a partnership of which the mem-bers are the European Investment Bank (hereafter the
“EIB”), the European Union, represented by the Commis-sion of the European Communities (the “Commission”), and a group of financial institutions of Member States of the European Union and of two candidate countries. The members of the Fund shall be liable for the obliga-tions of the Fund only up to the amount of their share of the capital subscribed and not paid in.
The financial year of the Fund runs from 1 January to 31 December each year.
The EIB has a majority shareholding in the Fund. Consequently the Fund is included in the consolidated accounts of the EIB Group. The consolidated accounts may be obtained from the registered office of the EIB at 100, boulevard Konrad Adenauer, L-2950 Luxembourg.
The Fund’s financial statements have been authorised for issue by the Board of Directors on 10 March 2009.
2. Significant accounting policies and ba-sis of preparation
2.1. Basis of preparation
The Fund’s financial statements have been prepared in accordance with International Financial Reporting Standards (IFRS), as issued by the International Account-ing Standards Board (IASB) and endorsed by the Euro-pean Union.
The financial statements have been prepared under the historical cost convention, as modified by the revalua-tion of available-for-sale financial assets, financial assets and financial liabilities at fair value through profit or loss including all derivative contracts which are valued at fair-value.
The preparation of financial statements in conformity with IFRS requires the use of certain critical accounting estimates. It also requires management to exercise its judgement in the process of applying the Fund’s policies. The areas involv-ing a higher degree of judgement or complexity, or areas where assumptions and estimates are significant to the fi-nancial statements, are disclosed in more detail below. Use of available information and application of judgement are inherent in the formation of estimates. Actual results in the future could differ from such estimates and the differences may be material to the financial statements.
Statement of compliance
The Fund’s financial statements have been prepared in accordance with International Financial Reporting Standards (IFRS) as adopted by the European Union.
Changes in presentation
The accounting policies adopted are consistent with those used in the previous year. Compared to the previ-ous year, changes have been made in the presentation and classification of the guarantees (Note 5.1) and the foreign exchange impact on impaired available-for-sale investments (Note 4.3):
Guarantees operations which were disclosed on a •gross basis in the caption “Financial Guarantees receivables” on the assets side of the balance sheet and in the caption “Financial Guarantees payables” on the liabilities side of the balance sheet as of 31 December 2007, are presented on a net basis as of 31 December 2008. For comparative purposes the same presentation was applied as of 31 December 2007.
The change of presentation has the effect of reducing the total assets by EUR 66 210 505 (2007: EUR 48 592 549). The change has no impact on the income statement and on the statement of changes in equity as of 31 Decem-ber 2008 and 31 December 2007.
In addition, a change in the disclosure of Derivatives op-erations at 31 December, 2007 in the Balance sheet has been made and has resulted in the reclassification of EUR 435 130 from caption “Assets” to “Liabilities”.

EIF – Financial Statements 201 EIB Group
Foreign exchange impact on impaired available-for- •sale investments which was accounted for in the caption “net loss on financial operations” as of 31 December 2007 are integrated in the caption “im-pairment losses on available-for sale investments” as of 31 December 2008. For comparative purposes the same presentation was applied as of 31 December 2007.
The change of presentation has the effect of a transfer of EUR 1 443 626 (2007: EUR 888 169) from “net loss on fi-nancial operations” to “impairment losses on available for sale investments”. The change has no impact on the balance sheet, the statement of changes in equity and on profit for the financial year.
2.2. Foreign currency translation
The Euro (EUR) is the functional and presentation cur-rency.
Non-monetary items, which include “Intangible assets” and “Tangible assets” denominated in a foreign currency, are reported using the exchange rate at the date of the transaction (historical cost). Exchange differences on non-monetary financial assets are a component of the change in their fair value. Depending on the classifica-tion of a non-monetary financial asset, exchange differ-ences are either recognized in the income statement or within the equity reserves. Non-monetary items meas-ured at fair value in a foreign currency are translated us-ing the exchange rates at the date when the fair value is determined.
Monetary items, which include all other assets and liabilities expressed in a currency other than EUR are reported using the closing foreign exchange rate ruling on the date of the closure of the financial statements, as issued by the European Central Bank. The exchange differences are recognised in the income statement in the period in which they arise.
Income and charges in foreign currencies are translated into EUR at the exchange rate ruling on the date of the transaction.
2.3. Investments
2.3.1. Classification and Measurement
Classification
The Fund classifies the investments in debt securities and shares in the category “Available For Sale” financial assets (“AFS”). The classification of the investments is de-termined at initial recognition.
AFS financial assets are non-derivative financial instru-ments that are either designated in this category at ini-tial recognition or not classified in any other categories.
Initial recognition and derecognition
Purchases and sales of AFS financial assets are initially recognised on trade date. They are initially recognised at fair value plus transaction costs. Fair value considera-tion is explained in the section below.
Financial assets are derecognised when the right to re-ceive cash flows from the financial assets has expired or where the EIF has substantially transferred all risks and rewards of ownership.
Subsequent measurement
AFS financial assets are subsequently measured at fair value. Changes in fair value of financial assets classified as AFS are directly recognised in the fair value reserve in the equity section of the balance sheet, until the finan-cial asset is derecognised or impaired. At this time, the cumulative gain or loss previously recognised in equity is recognised in the income statement.
Interest on AFS debt securities and other fixed income securities is calculated using the effective interest meth-od and is recognised in the income statements. Divi-dends on equity investments are recognised in the income statement when the Fund’s right to receive pay-ment is established.
Differences from currency translation from non-mone-tary financial assets, such as equity instruments, are rec-ognised in the fair value reserve in equity.
Impairment of financial assets
EIF assesses at each balance sheet date whether there is objective evidence that a financial asset or a group of financial assets is impaired. For equity securities, a significant or prolonged decline in the fair value of the security below its cost is considered in determining whether the securities are impaired. If any such evidence exists for AFS financial assets, the cumulative loss – measured as the difference between the acquisition cost and the current fair value, less any impairment loss on that financial asset previously recognised in the income statement – is removed from reserves and recognised in the income statement. Impairment losses on equity instruments previously recognised in the income statement are not reversed through the income statement. In contrast, if in a subsequent period, the fair value of a debt instrument classified as AFS increases and the increase can be objectively related to an event occurring after the impairment loss was recognised, the impairment loss is reversed through the income statement.

Financial Report 2008202EIB Group
The grading is defined as follows:
P-A At the time of the grading the fund’s rank falls into the first quartile of the peer group.
P-B At the time of the grading the fund’s rank falls into the second quartile of the peer group.
P-C At the time of the grading the fund’s rank falls into the third quartile of the peer group.
P-D At the time of the grading the fund’s rank falls into the fourth quartile of the peer group.
O-A No adverse signals or information so far.
O-B Presence of signals or information that – if no appropriate measures are quickly put in place – would be atypical for a first quartile fund. Absence of signals or information that would be inconsistent with an expected second quartile performance.
O-C Presence of signals or information that – if no appropriate measures are quickly put in place – would be atypical for an above average fund. Absence of signals or information that would be inconsistent with an expected third quartile performance.
O-D Events that if no appropriate measures are quickly put in place, will result in a sub-standard perform-ance or even in a failure or collapse of the private equity fund.
Expected performance grade
Operational Status Grade
2.3.2. Investments in shares and other variable in-come securities
Investments in venture capital funds are included in “Shares and other variable income securities”. They are acquired for the longer term in the normal course of the Fund’s activities.
a) Fair value considerations
Under the valuation technique, the fair value of venture capital (VC) funds is achieved by applying the aggregat-ed Net Asset Value (NAV) method. This valuation meth-od implicitly assumes that if the NAVs of underlying funds can be considered as equivalent to the fair value as determined under IAS 39, then the aggregation of the NAVs of all funds will itself be equivalent to the fair value as determined under IAS 39. If IAS 39 rules have not been followed, other guidelines might be accepta-ble (for example the International Private Equity and Venture Capital Valuation Guidelines, IPEV Guidelines, as published by the EVCA) and more detailed monitoring and review will be required.
In accordance with this method, the funds are classified into three categories:
Category I – funds that have adopted the fair value •requirements of IAS 39 or IPEV Guidelines for which a specific review is performed to ensure that the NAV is a reliable estimate of fair value.
Category II – funds that have adopted other valua- •tion guidelines (such as the former 2001 EVCA) or
standards that can be considered as in line with IAS 39 a specific review is performed to ensure that the NAV is a reliable estimate of fair value.
Category III –funds that have not adopted the fair •value requirements of IAS 39 or any other valuation guidelines in line with IAS 39.
Although it is assumed for category I that the NAV is a re-liable estimation of the fair value and specific review is performed for categories II and III, it must be stated that underlying investments have been estimated in the ab-sence of readily ascertainable market values. Because of the inherent uncertainty of valuation and current market conditions, actual results in the future could differ from the fund manager’s estimate of values and the difference may be material to the financial statements.
From a risk management perspective, the EIF has devel-oped over the last years, a tool-set to design, manage and monitor VC fund portfolios. This tool-set is based on an internal model, the Grading-based Economic Model (“GEM”), which allows EIF to systematically and consist-ently assess and verify funds’ operational quality, valua-tions and expected performances. This effort supported by the development of a proprietary IT system and inte-grated software (front to back) improves the investment decision process and the management of portfolio’s fi-nancial risks and of liquidities.
EIF’s internal grading methodology allows determining the monitoring coverage and intensity as well as the range for the expected performance.
The peer group is defined as the group of funds that have the same risk profile and exposure as the graded fund.

EIF – Financial Statements 203 EIB Group
b) Impairment considerations
Investments in shares and other variable income securities are assessed for objective evidence of impairment. Impairment losses are incurred only if there is objective evidence of impairment as a result of one or more events that occurred. A significant or prolonged decline in the fair value of an investment in an equity instrument below its cost is an objective evidence of impairment. On each official reporting date, the EIF analyses unrealised losses for impairment so as to determine whether they shall be recognised as impairment losses in the income statement or as changes in the fair value reserve.
The decline in value will be estimated as significant or prolonged when funds are graded P-D. In addition EIF de-fines quantitative thresholds for assessing what is signifi-cant and what is prolonged which allows the classification of the funds as follows:
funds with no indication of impairment; •
funds with an indication of potential impairment •which are reviewed for impairment by the Fund Risk committee;
funds showing an objective evidence of impairment •
Investments belonging to category III are valued at cost less impairment. When an investment falls under this cat-egory, the amount of impairment is calculated based on a matrix of fixed impairment percentages in tranches of 25 % depending on the operational and performance grading of the respective funds.
The fair value attributable NAV is determined through ap-plying either the Fund’s percentage ownership in the un-derlying vehicle to the net asset value reflected in the most recent report or, to the extent available, the precise share value at the same date, submitted by the respective Fund Manager. In order to bridge the interval between the last available NAV and the year-end reporting period, a monitoring procedure is performed and if necessary the reported NAV is adjusted.
2.3.3. Investments in debt securities and other fixed income securities
Debt securities and other fixed-income securities are categorised as follows:
floating rate notes with maturities exceeding one •year and fixed rate note other than commercial pa-pers are included in the “Investment portfolio” or in the “Available-for-Sale portfolio”.
money market instruments and long-term debt in- •struments with remaining maturities of less than three months are included in the “Operational port-folio”.
Securities held by the Fund are all listed on a recognised market. Consequently, the fair value of financial instru-ments is based on bid prices at the balance sheet date.
Premiums paid over the maturity value, discounts re-ceived in comparison to the maturity value of securities and interests on securities are calculated using the effec-tive interest method and are recognised in the income statement.
2.3.4. Investment in interests in joint ventures
Joint ventures are contractual agreements whereby EIF and other parties undertake an economic activity that is subject to joint control. The joint control is the con-tractually agreed sharing of control over an economic activity, and exists only when the strategic financial and operating decisions relating to the activity require the unanimous consent of the parties sharing the con-trol (the venturers).
EIF has elected to use the venture capital and similar en-tities exemption and not consolidate under this exemp-tion. In this case, the holdings in the joint ventures are upon initial recognition designated as at fair value through profit and loss and measured at fair value in ac-cordance to IAS 39, with changes in fair value recognised in profit and loss in the period of the change.
2.4. Classification and measurement of guarantee operations
Initial recognition and classification
EIF has undertaken a classification analysis of each guar-antee contract to determine if the definition of a finan-cial guarantee in accordance with IAS 39.9 is fulfilled. Financial guarantee contracts are contracts that require the issuer to make specified payments to reimburse the holder for a loss it incurs because a specified debtor fails to make payments when due in accordance with the terms of a debt instrument. If one of the definition crite-ria is not met, the contract is considered as a derivative.
In accordance with the classification, the guarantees contracts are classified either as “Financial Guarantees” or as “Derivatives”.
Financial Guarantees measurement
Financial Guarantees are initially recognised at fair val-ue plus transaction costs that are directly attributable to the issuance of the Financial Guarantees. At initial recognition, the fair value of the obligation to pay cor-responds to the Net Present Value (NPV) of expected premium inflows. EIF has developed a model to esti-mate the NPV. This calculation is performed at the start-ing date of each transaction
Subsequent to initial recognition, Financial Guarantees are measured at the higher of:
the amount determined in accordance with IAS 37 •Provisions, Contingent liabilities and Contingent As-sets; and

Financial Report 2008204EIB Group
the amount initially recognised less, when appropri- •ate, cumulative amortisation recognised in accord-ance with IAS 18 Revenue.
EIF’s amortisation of the amount initially recognised is in line with the risk profile of the transactions, namely a slow linear amortisation over the first two thirds of the Weighted Average Life (WAL) of the transaction, fol-lowed by a quicker linear amortisation down to zero at expected maturity date.
The best estimate of expenditure is determined in ac-cordance with IAS 37 (provisions, contingent liabilities and contingent assets). Guarantee provisions corre-spond to the cost of settling the obligation, the ex-pected loss, which is estimated based on all relevant factors and information existing at the balance sheet date.
Any increase or decrease in the liability relating to Fi-nancial Guarantees is taken to the income statement under “Net income from guarantee operations”.
Derivatives measurement
Guarantee transactions, which do not comply with the definition of a Financial Guarantee contract, are regarded as Derivatives in terms of IAS 39. A Derivative is a financial instrument or other contract whose value changes in response to the change in a specified underlying, and it is settled at a future date. At initial recognition and subsequent measurement, Derivatives are measured at fair value. The best approach for fair value will in this case be the market price. However, operations in which EIF acts as guarantor are typically illiquid. Hence EIF has derived a measurement based on an alternative valuation technique using as much market information as possible. The fair value of Derivatives equals to the net of the NPV of expected premium inflow and the cost of settling the exposure.
At initial measurement, the fair value equals zero. Sub-sequent to initial measurement, Derivatives are re-measured to fair value at each balance sheet date. All Derivatives are carried as financial assets when fair value is positive and as financial liabilities when fair value is negative. Gains and losses arising from changes in the fair value of Derivatives are immediately recognised in the income statement.
2.5. Other assets
Other assets include the funds designated to cover the pension liability and accrued commission income which have been classified as loans and receivables.
Loans and receivables are non-derivative financial as-sets with fixed or determinable payments that are not quoted in an active market.
2.6. Property and equipment and intangible assets
2.6.1. Intangible assets
Intangible assets are composed of internally generated software and purchased computer software, and they are accounted for at cost net of accumulated amortisa-tion and of impairment losses.
Direct costs associated with the development of software are capitalised provided that those costs are separately identifiable, that the software provides a future benefit to the Fund and the cost can be reliably measured. Maintenance costs are recognised as expenses during the period in which they occur. However costs to develop additional functionalities are recognised as separate intangible assets. Intangible assets are reviewed for indicators of impairment at the balance sheet date.
Intangible assets are amortised using the straight-line method over the following estimated useful lives:
Internally developed software: 3 years •
Software: 2 to 5 years •
2.6.2. Property and equipment
Property and equipment are stated at cost minus accu-mulated amortisation and impairment losses. Property and equipment are reviewed for indications of impair-ment at the balance sheet date.
Amortisation is calculated on a straight-line basis over the following estimated useful lives:
Fixtures and Fittings: 3 to 10 years •
Office Equipment: 3 to 5 years •
Computer Equipment and Vehicles: 3 years •
2.6.3. Non current assets held for sale
Non-current assets classified as held for sale includes as-sets reclassified from property and equipment for which the sale is highly probable and the asset is available for immediate sale in its current condition. They are classi-fied as held for sale as their carrying amounts will be re-covered through a sale transaction rather than through continuing use and are measured at the lower of carry-ing amount and fair value less costs to sell.
2.7. Employee benefits
2.7.1. Post-employment benefits
Pension fund
The EIF operates an unfunded pension plan of the de-fined benefit type as defined by IFRS, providing retire-

EIF – Financial Statements 205 EIB Group
ment benefits based on final salary. The cost of providing this benefit is calculated using the projected unit credit actuarial valuation method.
Actuarial gains and losses have been recognised using a faster method than the corridor approach, that is gains and losses are amortised over the average remaining working life of the population through the profit and loss account.
The Fund’s defined benefit scheme was initiated in March 2003 to replace the previous defined contribu-tion scheme. The scheme is funded by contributions from staff and the EIF. These funds are transferred to the EIB for management with the Bank’s own assets and ap-pear on the Fund’s balance sheet as an asset under the caption “other assets”.
The charge for the year, actuarial gains and losses, and the total defined benefit obligation are calculated annu-ally by qualified external actuaries.
Health insurance scheme
The Fund has subscribed to a health insurance scheme with an insurance company for the benefit of staff at re-tirement age, financed by contributions from the Fund and its employees. The entitlement is of a defined bene-fit type and is based on the employee remaining in serv-ice up to retirement age and the completion of a minimum service period. The expected costs of this benefit are accrued over the period of employment, us-ing a methodology similar to that for defined benefit pension plans. The health insurance liabilities are deter-mined based on actuarial calculations as per the same dates as the pension fund.
2.7.2. Short term employee benefits
Employee entitlements to annual leave are recognised when they accrue to employees. A provision is made for the estimated liability for outstanding annual leave as a result of services rendered by employees up to the bal-ance sheet date.
2.7.3. Other long-term employee benefits
An accrual for other long-term employee benefit costs re-lating to the period is included in the income statement under the caption “Staff Costs”, resulting in a provision for the estimated liability at the balance sheet date.
2.8. Other liabilities and provisions
Other liabilities are classified according to the substance of the contractual arrangements entered into. Trade payables are non-interest bearing liabilities and are stat-ed at amortised cost.
Provisions are recognised when the EIF has a present obligation, legal or constructive, as a result of a past event, and it is probable that the EIF will be required to settle that obligation.
2.9. Interest income and expenses
Interest income and interest expenses are recognised in the income statement for all interest bearing instruments on an accrual basis using the effective interest method based on the actual purchase price including direct trans-action costs. This is a method of calculating the amortised cost of a financial asset and allocating the interest income over the relevant period. The effective interest rate is the rate that exactly discounts estimated future cash receipts through the expected life of the financial instrument to the net carrying amount of the financial asset.
2.10. Net income from Guarantees operations
Net income from guarantee operations and guarantee commissions mainly includes:
Guarantee commissions received on Derivatives •contracts and net income arising from changes in the fair value of Derivatives;
Interest income on the discounting of the expected •premium inflows and any amortisation of the Finan-cial Guarantees.
2.11. Commission income
This caption is mainly made-up of fees and commissions on mandates and advisory activities.
Fees and commissions are generally recognised on an accrual basis when the service has been provided. Port-folio and management advisory and service fees are recognised based on the applicable service contracts, usually on a time-apportionate basis. Asset manage-ment fees related to investment funds are recognised over the period in which the service is provided.
2.12. Dividend income
Dividends are recognised in the income statement when the entity’s right to receive payment is established. They are included in the caption income from invest-ments in shares and other variable income securities.
2.13. Leases
The leases entered into by EIF as a lessee are operating leases under which all the risks and benefits of owner-ship are effectively retained by the lessor. Payments made under operating leases are charged to the income
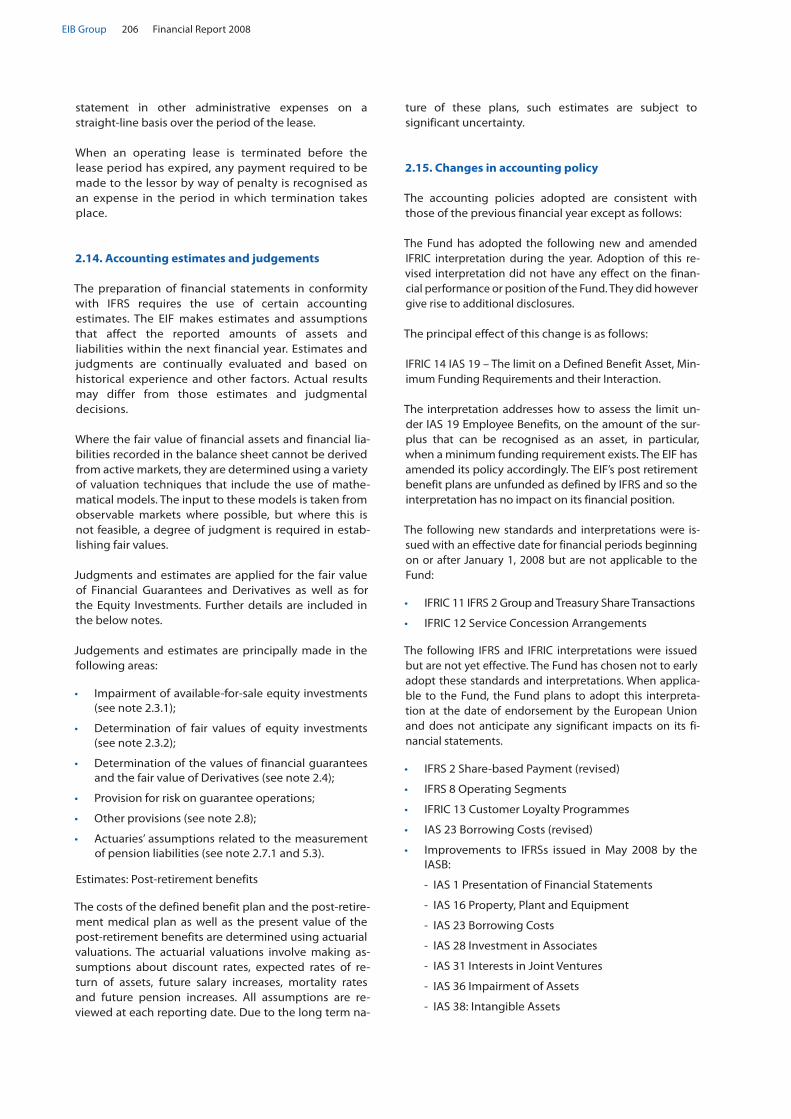
Financial Report 2008206EIB Group
statement in other administrative expenses on a straight-line basis over the period of the lease.
When an operating lease is terminated before the lease period has expired, any payment required to be made to the lessor by way of penalty is recognised as an expense in the period in which termination takes place.
2.14. Accounting estimates and judgements
The preparation of financial statements in conformity with IFRS requires the use of certain accounting estimates. The EIF makes estimates and assumptions that affect the reported amounts of assets and liabilities within the next financial year. Estimates and judgments are continually evaluated and based on historical experience and other factors. Actual results may differ from those estimates and judgmental decisions.
Where the fair value of financial assets and financial lia-bilities recorded in the balance sheet cannot be derived from active markets, they are determined using a variety of valuation techniques that include the use of mathe-matical models. The input to these models is taken from observable markets where possible, but where this is not feasible, a degree of judgment is required in estab-lishing fair values.
Judgments and estimates are applied for the fair value of Financial Guarantees and Derivatives as well as for the Equity Investments. Further details are included in the below notes.
Judgements and estimates are principally made in the following areas:
Impairment of available-for-sale equity investments •(see note 2.3.1);
Determination of fair values of equity investments •(see note 2.3.2);
Determination of the values of financial guarantees •and the fair value of Derivatives (see note 2.4);
Provision for risk on guarantee operations; •
Other provisions (see note 2.8); •
Actuaries’ assumptions related to the measurement •of pension liabilities (see note 2.7.1 and 5.3).
Estimates: Post-retirement benefits
The costs of the defined benefit plan and the post-retire-ment medical plan as well as the present value of the post-retirement benefits are determined using actuarial valuations. The actuarial valuations involve making as-sumptions about discount rates, expected rates of re-turn of assets, future salary increases, mortality rates and future pension increases. All assumptions are re-viewed at each reporting date. Due to the long term na-
ture of these plans, such estimates are subject to significant uncertainty.
2.15. Changes in accounting policy
The accounting policies adopted are consistent with those of the previous financial year except as follows:
The Fund has adopted the following new and amended IFRIC interpretation during the year. Adoption of this re-vised interpretation did not have any effect on the finan-cial performance or position of the Fund. They did however give rise to additional disclosures.
The principal effect of this change is as follows:
IFRIC 14 IAS 19 – The limit on a Defined Benefit Asset, Min-imum Funding Requirements and their Interaction.
The interpretation addresses how to assess the limit un-der IAS 19 Employee Benefits, on the amount of the sur-plus that can be recognised as an asset, in particular, when a minimum funding requirement exists. The EIF has amended its policy accordingly. The EIF’s post retirement benefit plans are unfunded as defined by IFRS and so the interpretation has no impact on its financial position.
The following new standards and interpretations were is-sued with an effective date for financial periods beginning on or after January 1, 2008 but are not applicable to the Fund:
IFRIC 11 IFRS 2 Group and Treasury Share Transactions •
IFRIC 12 Service Concession Arrangements •
The following IFRS and IFRIC interpretations were issued but are not yet effective. The Fund has chosen not to early adopt these standards and interpretations. When applica-ble to the Fund, the Fund plans to adopt this interpreta-tion at the date of endorsement by the European Union and does not anticipate any significant impacts on its fi-nancial statements.
IFRS 2 Share-based Payment (revised) •
IFRS 8 Operating Segments •
IFRIC 13 Customer Loyalty Programmes •
IAS 23 Borrowing Costs (revised) •
Improvements to IFRSs issued in May 2008 by the •IASB:
- IAS 1 Presentation of Financial Statements
- IAS 16 Property, Plant and Equipment
- IAS 23 Borrowing Costs
- IAS 28 Investment in Associates
- IAS 31 Interests in Joint Ventures
- IAS 36 Impairment of Assets
- IAS 38: Intangible Assets

EIF – Financial Statements 207 EIB Group
3. Financial risk management
3.1. Overview of EIF risk management
EIF aligns its risk management systems to changing eco-nomic conditions and evolving regulatory standards. It therefore adapts them on an ongoing basis as best mar-ket practices develop. Credit, market and operational systems are in place to control and report on the main risks inherent to its operations.
An independent Risk Management and Monitoring (RMM) division reports directly to the Deputy Chief Exec-utive. This segregation of duties and the “four-eyes” prin-ciple ensures an unbiased review of EIF’s business activities. Moreover, within the EIB Group context, RMM operates in close contact with the European Investment Bank’s Risk Management Directorate. RMM is divided into three teams: a Venture Capital (VC) Risk Management team, a Portfolio Guarantees & Securitisation (G&S) Risk Management team and a Monitoring & Administration (MA) team covering both business lines. RMM covers own resources, fully public mandates (RCM, G&E, SME GF 1998, 2001, 2007, JEREMIE, ERP Dachfonds), and non-fully pub-lic mandates (Dahlia, Neotec, iVCi and PVCi).
RMM’s functions include the collection of information (information gathering, checking, and inputting), the aggregation and analysis of information (assessment of financial risks, valuations, and cash flow projections), risk reporting, and advice. The main challenges and limi-tations to fulfil these functions are the complexity of structure of transactions in relatively opaque markets, the absence of transparent market values, and the long-term nature of the business (up to 10 years and more).
Generally, EIF aims to control its financial risks by creat-ing a well-diversified portfolio within the constraints imposed by shareholders or mandates. Exposures and risk-taking are monitored against predetermined toler-ances as determined by the Board of Directors, senior management or as set under mandates. The basis for an effective risk management process is the identification and analysis of existing and potential risks inherent in any product.
RMM covers EIF’s VC and G&S activities, monitors risk regularly on individual transactions as well as on a port-folio level, and assesses new and existing transactions. For this purpose, RMM:
reviews the risk management methodologies, proc- •esses, and instruments used in front office;
issues independent opinions on all transaction pro- •posals;
independently reviews internal ratings (G&S)/grades •(VC) assigned by front office;
applies stress testing scenarios on both portfolios; •and
checks limits. •
The Investment and Risk Management Committee chaired by the Deputy Chief Executive is responsible for reviewing the portfolio and on an ad-hoc basis to approve transactions prior to the Board.
3.2. The international financial crisis – impact on EIF's activities.
Guarantees
EIF’s own risk portfolio, due to its wide diversification, is likely to be impacted by the systemic risks stemming from the expected deterioration of the European credit and economic environment. Banks are becoming more reluctant to lend and are tightening their lending crite-ria. This bank behaviour is expected to have negative ef-fects on SME access to finance and more generally on the business cycle.
EIF expects SME default rates to increase significantly – also considering that recent default rate levels have been well below historical default rates.
Additional negative impacts are also expected with re-gard to recovery rates and as a result of the negative correlation between default and recovery rates.
EIF’s guarantees are valued as “marked-to-model”. The main impact on the valuation stems from the as-signed rating and the possible subsequent rating changes.
EIF has increased its monitoring efforts to identify po-tential negative rating migrations in a timely manner. The improvement of the monitoring is a continuous process and addresses nonetheless the current financial crisis.
EIF has strengthened the stress testing methodology, i.e. its scenario analysis with regard to portfolio rating movements and related impacts on capital allocation, expected losses, as well as on the P&L.
Venture capital
EIF’s own risk VC portfolio, due to its wide diversification, is likely to be impacted by the market risks stemming from the deterioration of the European economies and public markets.
EIF’s VC investments are valued according to best mar-ket practice and applicable industry valuation guide-lines.
EIF has intensified its monitoring done on the valuations reported by VC fund managers, but also on other spe-cific risks linked to the current crisis. EIF has also run more stringent stress test scenarios on its VC funds port-folios to assess the impact of a worsening and/or con-tinuation of the current crisis.

Financial Report 2008208EIB Group
Treasury
EIF Treasury management has benefited from the same measures taken by the EIB to manage its portfolio during the financial crisis (EIF treasury management is outsourced to EIB under a treasury management agreement).
Since the beginning of the credit and liquidity crisis in early August 2007, specific risk mitigation still in force today- have been put in place in line with those imple-mented for the EIB:
Suspension of the riskiest investments (ABSs, RMBS) •and greater selectivity in the choice of investments,
Monitoring of the performance of the markets, •
Reducing the maturity of the investments and, in •line with the investment guidelines, suspension of credit limits of counterparties impacted by rating downgrades.
In this context and in line with the asset management guidelines, disposal decisions were taken in relation to the downgrading of securities held in the portfolio, with certain losses incurred.
Organisationally within the EIB and EIF, action was taken to set up inter Directorate working parties and manage-ment committees with a view to facilitating communi-cation and rapid reaction at times of financial market instability.
3.3. Venture capital
3.3.1. Background
EIF is a fund of venture capital funds, taking equity par-ticipations in funds. EIF’s minority stakes in funds have catalyzed commitments from a wide range of investors. EIF’s VC operations are mainly focused on early-stage and seed capital. However, the portfolio is also expand-ing in well-established mid- and later-stage investments, which, generally speaking, have a lower risk profile.
Valuation review under IFRS
Part of the monitoring is the valuation review of VC funds under IFRS. This process includes different steps to get to what is called Operational Adjustment:
Collecting financial quarterly reports sent by the •fund managers as basis for valuation.
Assessing whether valuations are in line with best •market practice and applicable industry valuation guidelines. Through its monitoring, EIF produces re-ports that capture events relevant for valuation, such as:
“Flash reviews” of regular financial reporting re- •ceived from VC funds.
Monitoring visits. •
Any significant information with potential evalua- •tion impact.
Subsequent events reviews. •
Classification of funds: depending on the outcome •of the monitoring described above, funds will be judged as IFRS compliant or not. Following the anal-ysis performed above, the funds are classified into three categories as described in note 2.3.2.
Risk Committee: this committee comprises the Chief •Executive, the Deputy Chief Executive, the Head of front office, the Head of risk management and the Head of finance. The committee approves the im-pairment classification.
As a conclusion, EIF portfolio management systems are not mechanical exercises, as they rely on the judge-ment of experienced staff.
3.3.2. Portfolio overview:
All mandates
At the end of 2008, EIF’s total cumulative VC investments amounted to EUR 4.5 bn in terms of commitments. The investments were made in 299 funds and helped mobilize total capital of over EUR 27.89 bn with other investors. The majority of EIF’s VC activities are carried out on behalf of the EIB under the EUR 4 bn Risk Capital Mandate (RCM). Total signatures using EIB resources reached about EUR 3.5 bn. EIF also manages VC investments on behalf of the EC under G&E, MAP and since recently CIP mandates. The cumulative portfolio that EIF manages on behalf of EC was EUR 421 m at the end of December 2008.
EIF has also put in place joint investment facilities with five public and / or private partners.
EIF own resources
At the end of 2008, own-risk VC commitment (i.e. com-mitments given to underlying funds to invest) amount-ed to EUR 411 m (2007: EUR 413 m) EIF maintains a balanced portfolio with a focus on technology-oriented early-stage and general mid- and later-stage funds. EIF does not directly acquire participations in companies, but instead invests in selected VC funds, with the private sector investors providing at least 50 % of the equity. All investments are done on a pari-passu basis with other investors, granting then no specific rights (or obliga-tions) to EIF. All of EIF’s risk existing from its own-risk VC operations is fully covered by shareholders’ equity. As a subceiling, VC commitments may not exceed 50 % of shareholders’ equity, equivalent to EUR 498 502 555 at year-end 2008. Of the EUR 411 m of own-risk funds com-mitted at that time, EUR 272 m had been disbursed. VC

EIF – Financial Statements 209 EIB Group
Signatures Disbursements Capital Repayments Income & Dividends
31/12/2008 18.9 38.5 15.3 4.6
31/12/2007 70.6 47.6 18.9 6.7
The proportion of funds considered as impaired have increased from 14 % to 23 % of the EIF portfolio (see table) based on committed funds.
EIF yearly cash flow activity (EUR m)
Signatures
Funds Dec 2007 Dec 2008 +/-
Not impaired 347.0 309.2 -8.91 %
Impaired 56.3 91.6 +62.8 %
Impair. ( %) 14 % 23 %
VC assets not impaired vs. impaired (EUR m)
Diversification
EIF own resource portfolio can be considered as well diversified. As of 31 December 2008, EIF has committed EUR 411 m in 168 private equity funds with the biggest exposure amounting to EUR 15 m (4 % of total signatures). These PE funds have invested in more than 1 400 underlying portfolio companies.
In terms of vintage year, sector and stage the portfolio is well balanced, illustrated by the followings split by signature as at 31 December 2008:
investments are evaluated quarterly according to the best market practice industry valuation guidelines. Fol-lowing the methodology described in the note 3.3.1, EIF records value adjustments on a line by line basis, either through the profit and loss in case of impairment or through the fair value reserve, which forms part of EIF’s shareholder’s equity. Consequently, net disbursed own-risk funds (at cost) of EUR 178 m (vs. EUR 164 m at the end of 2007) are valued at EUR 159 m in EIF’s 2008 bal-ance sheet (vs. EUR 168 m at the end of 2007).
3.3.3. Significance of financial instruments for finan-cial position and performance
Activities
In terms of EIF VC portfolio activities, the year 2008 presents a decrease for the figures (signatures, dis-bursements and reflows) :

Financial Report 2008210EIB Group
Split per sector (signatures) in percentage Split per stage (signatures) in percentage
Finally, in terms of maturity, the EIF portfolio is still young. Its commitment weighted average age has increased from 4.2 years in 2007 to 5 years in 2008.
10 %Life Science
22 %ICT - Life Science
23 %ICT
45 %Generalist(Non-Tech.)
5 %Fund of
Funds/SpecialStructure
56 %Venture Capital (Seed to Expansion)
39 %Lower Med-Market
(Growth, SmallCap, Mid-Market)
Vintage year (signatures) in EUR m
1994 1995 1996 1997 1998 1999 2000 2002 2003 2004 2005 2006 2007 200820010
10
20
30
40
50
60
70
80
90

EIF – Financial Statements 211 EIB Group
3.4. Portfolio Guarantees & Securitisation (“G&S”)
3.4.1. Background
EIF extends portfolio guarantees to financial interme-diaries involved in SME financing, and by covering part of the risk faced by those institutions, it helps fa-cilitate funding access, and in turn, it helps to finance SMEs.
For its G&S business, over the last years, EIF staff has developed a tool-set to analyse portfolio guarantee and structured financial transactions in line with best market practices. Before EIF enters legally into a guarantee transaction, G&S, within the Transaction and Relationship Management department, assigns an internal rating to each new own risk guarantee transaction in accordance with the EIF Credit Risk Policy Guidelines. The rating is based on internal models, which analyse and summarise the transaction’s credit quality (expected loss concept), considering not only quantitative parameters but also qualitative aspects.
Capital allocation and pricing are functions of the ex-pected loss, i.e. they are risk adjusted and consequently vary according to the assigned rating. Over the past years EIF’s conservative capital allocation rules have al-ready taken into consideration the Basel II ideas. These rules have now been tailor-made in line with the Basel II framework.
The implementation of the Ratings Based Approach (RBA) for EIF’s G&S exposures has been done under the technical assistance of the “Commission de Surveillance du Secteur Financier” (CSSF) and in close cooperation with the EIB.
As the rating is based on a model, RMM – in the course of the independent opinion process and in line with the Model Review Procedure – conducts a model review for each new rating, as well as sample checks of updated ratings. The purpose of this procedure is to reduce the model risk and to establish guidelines applicable for the official EIF internal rating models. It defines, inter alia, that each basic model has to be independently re-viewed within EIF and that assumptions to adjust the basic model for individual transactions in the course of the rating process have to be documented, and re-viewed by RMM.
A transaction is eligible if the assigned rating falls between Aaa-B1. It is EIF’s intention to maintain an average rating portfolio of minimum Baa3. Once EIF guarantees a particular tranche, the individual internal rating assigned to such a tranche is reviewed quarterly upon closing. For each of the input variables a trigger value is defined and the internal rating model is re-run when the transaction performance triggers those limits.
Furthermore, the principle of “monitoring by exception” is applied. If there is an event which could cause an up-grade or a downgrade of a tranche an analysis and fur-ther review is triggered.
The G&S transactions are monitored regularly. The moni-toring process includes:
ongoing risk review of each existing G&S operation; •
checking compliance of contractual obligations by •the relevant counterparty (e.g. timely reporting, compliance with eligibility criteria, verification of fi-nancial covenants, timely payment of fees due, etc.);
assessing the expected evolution of each G&S opera- •tion in terms of its performance compared to ex-ante estimates set prior to signature of the operation;
apply rating stress testing scenarios and assess •whether the level of capital allocation and general provisions made for each operation are adequate and to propose, if deemed necessary, specific provi-sions for individual loss items;
establishing and maintaining of the “Watch list” •(for transactions rated below Ba2) in accordance with the internal guidelines. The potential down-grades are followed-up by a Watch List Operation Committee (consisting of staff from the G&S Divi-sion, RMM and the Legal Service) which proposes actions to the Investment and Risk Management Committee;
analysis of the Guarantee Portfolio as a whole (Port- •folio Review);
on-site monitoring visits; •
valuation of G&S in line with IFRS accounting rules •(Financial Guarantees & Derivatives).
3.4.2. Portfolio overview
Of the EUR 12.3 bn G&S exposure at risk at the end of 31 December 2008, EUR 3.8 bn (of which outstanding is EUR 3.7 bn) (31 % ) are for “own risk” activities. The re-maining EUR 8.5 bn (69 % ) relate to “trust” activities on behalf of the EC. These trust activities include EUR 4.8 bn under MAP, EUR 2.4 bn under the SME Guarantee Facility (SME GF) and EUR 1.3 bn under CIP.
EIF’s own-risk operations are based on three product types:
• Credit Enhancement Products accounted for 96.1 % of total own-risk outstanding guarantees (EUR 3.58 bn) as of end 2008. Credit enhancement is EIF’s core own-risk guarantee activity, accounting for EUR 834 m of own-risk signatures in 2008. Credit enhancement serves as an unconditional debt service guarantee (or as a credit default), covering a specific tranche of a SME loan portfolio, with a maximum weighted aver-age term of 15 years. The guarantee is called upon once a loss threshold has been reached in the relevant tranche.

Financial Report 2008212EIB Group
Credit Insurance Products accounted for 3.4 % of all •own-risk outstanding guarantees (EUR 127.2 m) as of end 2008. In these cases, the fund guarantees up to 50 % of a loan or loan portfolio extended to SMEs by a financial institution. 24 % of this portfolio (EUR 30.6 m) consists of the Growth and Environment Programme sponsored by the EU.
Structured Investment Vehicles (SIVs) accounted for •0.5 % of own-risk outstanding guarantees (EUR 17.7 m) at end 2008. In this instance, the EIF guarantees spe-cific tranches (EUR 10 m – EUR 50 m) of SIVs. These funds are set up to make mezzanine or equity invest-ments in SMEs that would not normally qualify for bank financing and therefore present a higher risk than typical special-purpose vehicles.
3.4.3. Portfolio quality and performance
End of 2008, the quality of the overall portfolio related to the number of transactions was at investment-grade
level (90 % against 89.2 % at end 2007). The weighted average internal rating was Baa2 (of which 75 % was confirmed by rating agencies and the remaining relied on EIF’s internal rating). A very low level of exposure to SIVs represented the riskiest portion of the portfolio, carrying an average internal rating of Ba1, while the saf-est guarantee facilities were credit insurance (A1) and credit enhancement (Baa2+).
At the end of 2008, 86 % of the transactions reviewed had a “neutral” outlook (“performance as expected”); 14 % transactions had a negative outlook and 5 transac-tions were downgraded.
The total exposure at risk (commitment less repayments) for EIF’s own risk guarantees amounts to EUR 3.8 m with the following split:
Weighted Average RatingExposure at risk (commitment minus repayment); in m EUR
% of total
2008 2007 2008 2007 2008 2007
Credit Enhancement Baa2 Baa1 3 658 3 367 95.30 % 93.34 %
Credit Insurance A1 A2 160 212 4.17 % 5.86 %
SIV Ba1 Ba1 17 25 0.45 % 0.70 %
Defaulted D D 3 3 0.08 % 0.10 %
Total 3 838 3 607 100.00 % 100.00 %
In 2008, no new contract was classified as defaulted. During the year 2008, guarantees have been called on 6 deals for a total amount paid of EUR 0.4 m. The port-folio’s overall weighted average life was stabilised at 4.7 years at end 2008, compared with 4.9 years at end 2007.
3.5. Treasury
3.5.1. Background
Treasury management has been outsourced to EIB under a treasury management agreement and is carried out ac-cording to EIF treasury guidelines.
EIF’s operations are not cash based but rather use share-holders’ equity, which is the basis for VC investments and capital allocation for guarantees. Consequently, EIF does not borrow funds.
The treasury is managed in such a way as to protect the value of the paid-in capital, to ensure an adequate level of liquidity to meet possible guarantee calls, PE commit-ments and administrative expenditure and earn a reason-able return on assets invested with due regard to minimisation of risk (see also section 3.1 on special risk mitigation measure adopted in the context of the finan-cial crisis).
3.5.2. Portfolio overview
The treasury portfolio is split into four distinct sub-port-folios:
the operational portfolio (containing short-term •instruments;
the investment portfolio and available for sale •portfolio (made up of long-term debt instruments; floating-rate and fixed rate instruments);
a cash portfolio. •

EIF – Financial Statements 213 EIB Group
31.12.2008 EUR
31.12.2007 EUR
Cash Portfolio 30 543 163 21 874 539
Operational portfolio 352 959 421 269 729 999
383 502 584 291 604 538
Investment and Available-for-sale portfolio 495 733 011 522 470 401
Total Treasury portfolio 879 235 595 814 074 939
31.12.2008 (EUR)
Loans and Receivable
Fair value through
profit and loss
Available for sale
Financial guarantees
Non- financial
assets / liabilities
Total
Fair value
Cash & cash equivalents 383 502 584 0 0 0 0 383 502 584 383 502 584
Investments:
Debt securities and other fixed income securities
0
0
495 733 011
0
0
495 733 011
495 733 011
Shares and other variable income securities
0
2 625 429
156 089 394
0
0
158 714 823
158 714 823
Non current assets held for sale
0
0
0
0
7 139 812
7 139 812
7 139 812
Other assets [note 4.5]
10 632 934
0
0
0
17 833 053
28 465 987
28 465 987
Total Assets 394 135 518 2 625 429 651 822 405 0 24 972 865 1 073 556 217 1 073 556 217
Financial liabilities:
Financial guarantees 0 0 18 990 527 0 18 990 527 18 990 527
Derivatives 0 2 604 242 0 0 0 2 604 242 2 604 242
Provisions for guarantees 8 983 874 8 983 874 8 983 874
Total Liabilities 0 2 604 242 0 18 990 527 8 983 874 30 578 643 30 578 643
3.6. Nature and extent of risks arising from financial instruments
The following tables provide information relating to the categories of financial instruments:
The portfolio’s average maturity is 2.66 years (2007: 3.79 years). In recent years, the EIF core business has surpassed treas-ury as the main income provider, accounting for 55 % of total income in 2008 (2007: 66 % ).
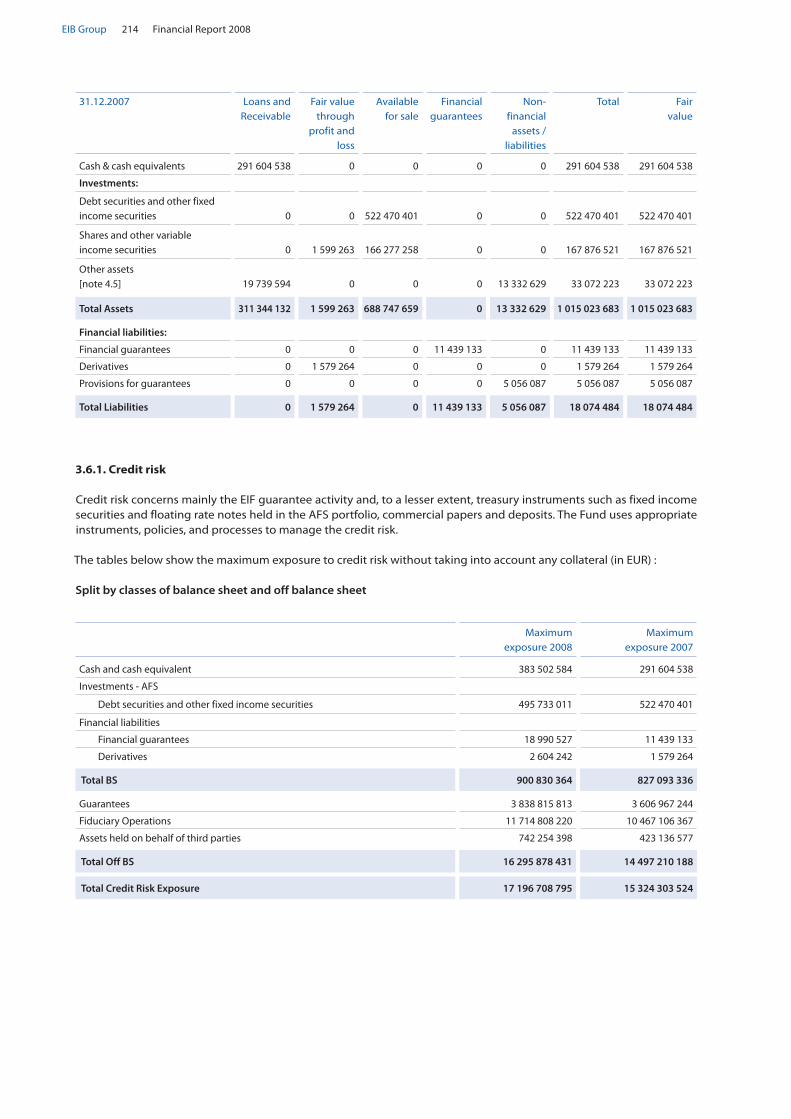
Financial Report 2008214EIB Group
31.12.2007
Loans and Receivable
Fair value through
profit and loss
Available for sale
Financial guarantees
Non- financial
assets / liabilities
Total
Fair value
Cash & cash equivalents 291 604 538 0 0 0 0 291 604 538 291 604 538
Investments:
Debt securities and other fixed income securities
0
0
522 470 401
0
0
522 470 401
522 470 401
Shares and other variable income securities
0
1 599 263
166 277 258
0
0
167 876 521
167 876 521
Other assets [note 4.5]
19 739 594
0
0
0
13 332 629
33 072 223
33 072 223
Total Assets 311 344 132 1 599 263 688 747 659 0 13 332 629 1 015 023 683 1 015 023 683
Financial liabilities:
Financial guarantees 0 0 0 11 439 133 0 11 439 133 11 439 133
Derivatives 0 1 579 264 0 0 0 1 579 264 1 579 264
Provisions for guarantees 0 0 0 0 5 056 087 5 056 087 5 056 087
Total Liabilities 0 1 579 264 0 11 439 133 5 056 087 18 074 484 18 074 484
3.6.1. Credit risk
Credit risk concerns mainly the EIF guarantee activity and, to a lesser extent, treasury instruments such as fixed income securities and floating rate notes held in the AFS portfolio, commercial papers and deposits. The Fund uses appropriate instruments, policies, and processes to manage the credit risk.
The tables below show the maximum exposure to credit risk without taking into account any collateral (in EUR) :
Split by classes of balance sheet and off balance sheet
Maximum exposure 2008
Maximum exposure 2007
Cash and cash equivalent 383 502 584 291 604 538
Investments - AFS
Debt securities and other fixed income securities 495 733 011 522 470 401
Financial liabilities
Financial guarantees 18 990 527 11 439 133
Derivatives 2 604 242 1 579 264
Total BS 900 830 364 827 093 336
Guarantees 3 838 815 813 3 606 967 244
Fiduciary Operations 11 714 808 220 10 467 106 367
Assets held on behalf of third parties 742 254 398 423 136 577
Total Off BS 16 295 878 431 14 497 210 188
Total Credit Risk Exposure 17 196 708 795 15 324 303 524

EIF – Financial Statements 215 EIB Group
3.6.1.A. Venture capital
For EIF own risk VC portfolio, there is no credit exposure as investments are always done through an equity participa-tion. As such, EIF is only exposed to market risk.
3.6.1.B. Portfolio guarantees & securitisation
Credit risk arises mainly from EIF’s guarantees transactions funded by own resources.
This risk is managed by conservative risk management policies covered by the statutory and Credit Risk Policy Guide-lines.
The statutes of the Fund limit own-risk guarantees to 3.0 x subscribed capital, which amounted to EUR 2.9 bn at end 2008. Hence, the EUR 3.8 bn exposure at risk at end 2008 was well below the statutory limit of EUR 8.7 bn.
EIF Credit Risk Policy Guidelines ensure that EIF continues to develop a diversified guarantee portfolio in terms of prod-uct range, geographic coverage, counterparty exposure, obligor exposure, industry concentration and also set out the capital allocation rules based on the ratings of the exposures.
Concentration risk is limited because of the granular nature of EIF’s transactions; typically the underlying portfolios are highly diversified in terms of single obligor concentration, sectors, and also with regard to regional diversification.
To cover concentration risk, EIF has strict limits (based on capital allocation) for individual transactions and on originator level (maximum aggregate exposures for originators and originator groups).
End of 2008, EIF’s overall own risk guarantee portfolio was spread over 20 countries. The largest nominal individual country net exposures were Italy, Belgium, UK and Portugal, which jointly accounted for 53 % of total guarantee com-mitments.
Own Funds guarantees: exposures at risk by country as of 31 December 2008:
Country Ccy 2008 EUR m 2008 share 2007 share
Austria EUR 1 0.0 % 0.1 %
Belgium EUR 467 12.2 % 13.1 %
Bulgaria EUR 70 1.8 % 1.4 %
Denmark DKK; EUR 162 4.2 % 4.5 %
Finland EUR 15 0.4 % 0.5 %
France EUR 53 1.4 % 1.7 %
Germany EUR 150 3.9 % 10.5 %
Greece EUR 61 1.6 % 1.7 %
Ireland EUR 4 0.1 % 0.1 %
Italy EUR 894 23.3 % 13.7 %
Netherlands EUR 194 5.1 % 4.0 %
Non EU EUR 20 0.5 % 0.5 %
Pan EU & Multi EUR 599 15.6 % 14.6 %
Poland PLN 89 2.3 % 2.2 %
Portugal EUR 279 7.3 % 7.7 %
Serbia EUR 50 1.3 % 0.0 %
Spain EUR 211 5.5 % 6.3 %
Sweden SEK 125 3.3 % 4.0 %
United Kingdom GBP; EUR 395 10.2 % 13.2 %
TOTAL 3 839 100 % 100 %

Financial Report 2008216EIB Group
In the context of EIF’s own risk guarantees operations, the credit risk is tracked since the very beginning on a deal-by-deal basis whilst adopting a different model analysis approach depending on the granularity and homogeneity of the underlying portfolios.
The industry sector exposures are analysed on a deal-by-deal basis through their impact on the ratings assigned by EIF to each transaction / tranche. For instance, dependent on the financial model to analyse the transaction, industry exposures can be reflected in diversity scores or can be in-directly captured through the assumption on default rate volatility, as a key model input variable.
Furthermore, concentration exposures are analysed in the context of each deal using qualitative measures such as current status and forecast for sectors with high concentrations in the portfolio. Exceptionally, some deals have a concentrated exposure in the same (broad) sector. This is typically captured through increased cred-it enhancement (e.g. subordination) to the benefit of EIF. Typically, deals with replenishing features have portfolio criteria, such as maximum single obligor, maximum top 5 obligors, and maximum industry concentration levels.
All together help to model industry concentration and portfolio correlation. Furthermore, the consideration of sector exposures is part of EIF’s overall portfolio analysis.
Counterparty risk is mitigated by the quality of EIF coun-terparties which are usually major market players. EIF performs additional on-site monitoring visits to ensure compliance with procedures and processes during the transaction life. Stress-test scenarios for the portfolio of guarantees, including extreme case assumptions, are regularly carried out to determine the ability of the capi-tal base to sustain adverse shocks.
Actual performance on the guarantees operations to date has been very satisfactory, reflecting the high cred-it quality of exposures, the diversification of assets and the granularity of the portfolio.
3.6.1.C. Treasury
The Fund is exposed to residual credit risk relating to its liquid assets portfolio. However, the EIF adheres to con-servative credit investment guidelines and internal lim-its. For each portfolio under the EIF’s management, the eligibility criteria for counterparts are fixed according to their nature and credit quality (as measured by their ex-ternal agency rating), while limits are fixed according to counterparts’ own funds.
Any currency arbitrage not directly required to carry out EIF’s operations is ruled out by the statutes.
AFS - Debt securities and other fixed income securities 2008 2007
Rating Amount in EUR In percentage Amount in EUR In percentage
AAA 332 070 748 68.33% 379 388 527 74.18%
AA1 0 0.00% 12 541 320 2.45%
AA2 19 461 862 4.00% 23 278 108 4.55%
AA3 36 078 102 7.42% 38 649 549 7.56%
AA+ 0 0.00% 0 0.00%
A1 48 966 722 10.08% 11 247 280 2.20%
A2 44 963 456 9.25% 41 417 450 8.10%
A3 0 0.00% 0 0.00%
BAA1 0 0.00% 4 811 728 0.94%
BAA2 4 420 961 0.91% 0 0.00%
NR * 0 0.00% 98 579 0.02%
P1** 0 0.00% 0 0.00%
Total 485 961 851 100 % 511 432 541 100 %
(*) Non-rated(**) Short-term rating, equivalent of (Aaa-A2)
The following tables outline the credit quality by investment grade of the Fund’s debt securities as on 31 December 2008 and 2007, based on external ratings. Figures are presented without accrued interests.
EIF treasury portfolio has delivered a performance within the expectations.

EIF – Financial Statements 217 EIB Group
3.6.2. Liquidity risk
The liquidity risk is closely related to the Fund’s solvency and to the confidence that creditors have in the Fund to meet its commitments. The treasury is managed in such a way as to protect the value of the paid-in capital, ensure an ade-quate level of liquidity to meet possible guarantee calls, private equity commitments and administrative expenditure and earn a reasonable return on assets invested with due regard to minimisation of risk.
The tables below show the Fund’s assets and liabilities classified into relevant maturity groupings based on the remaining period to the contractual maturity date. It is presented using the most prudent expectation of maturity dates. Therefore, in the case of liabilities the earliest possible repayment date is shown, while for assets it is the latest possible repayment date. Guarantees commitments are analysed with reference to their expected maturity date.
Maturity at 31.12.2008 (in EUR)
Not more than 3
months
3 months to 1 year
1 year to 5 years
More than 5 years
Undefined Maturity
Total
Cash and cash equivalent 383 502 584 0 0 0 0 383 502 584
Investments
Debt securities and other fixed income securities
11 465 733
101 124 388
259 575 018
123 567 872
0
495 733 011
Shares and other variable income securities
3 394 570
3 212 310
65 201 355
86 906 588
0
158 714 823
Non-current assets held for sale 0 7 139 812 0 0 0 7 139 812
Other assets 7 614 072 0 2 924 089 17 927 826 0 28 465 987
Intangible assets 198 241 525 588 1 145 964 0 0 1 869 793
Property, equipment 57 352 158 883 208 674 8 764 0 433 673
Total assets 406 232 552 112 160 981 329 055 100 228 411 050 0 1 075 859 683
Financial liabilities
Financial guarantees 79 654 819 482 14 442 448 3 648 943 0 18 990 527
Derivatives 149 257 611 939 789 1 406 693 0 2 604 242
Provisions for guarantees 2 153 622 0 6 830 252 0 0 8 983 874
Retirements benefit obligations 0 0 0 16 984 934 0 16 984 934
Other liabilities and provisions 6 616 028 3 506 496 0 4 101 046 0 14 223 570
Equity 0 0 0 0 1 014 072 536 1 014 072 536
Total liabilities 8 849 453 4 583 589 22 212 489 26 141 616 1 014 072 536 1 075 859 683
Net liquidity position at 31.12.2008 397 383 099 107 577 391 306 842 610 202 269 436 (1 014 072 536) 0
Cumulative liquidity position at 31.12.2008
397 383 099
504 960 490
811 803 100
1 014 072 536
0
0
Commitments to venture capital 34 172 142 23 810 943 134 962 799 217 917 078 0 410 862 962
Guarantees 609 261 744 379 737 730 1 955 768 091 894 048 248 0 3 838 815 813
Total Off BS 643 433 886 403 548 673 2 090 730 890 1 111 965 326 0 4 249 678 775

Financial Report 2008218EIB Group
Maturity at 31.12.2007 (in EUR)
Not more than 3
months
3 months to 1 year
1 year to 5 years
More than 5 years
Undefined Maturity
Total
Cash and cash equivalent 291 604 538 0 0 0 0 291 604 538
Investments
Debt securities and other fixed income securities
26 263 699
73 880 810
226 810 079
195 515 813
0
522 470 401
Shares and other variable income securities
3 078 893
13 081 039
72 402 857
79 313 732
0
167 876 521
Other assets 13 554 019 0 4 144 063 15 374 141 0 33 072 223
Intangible assets 592 51 068 1 109 824 0 0 1 161 484
Property, equipment 4 394 29 275 415 657 7 796 269 0 8 245 595
Total assets 334 506 135 87 042 192 304 882 479 297 999 955 0 1 024 430 762
Financial liabilities
Financial guarantees 0 439 797 10 147 746 851 590 0 11 439 133
Derivatives 0 582 930 65 920 930 414 0 1 579 264
Provisions for guarantees 0 0 5 056 087 0 0 5 056 087
Retirements benefit obligations 0 0 0 13 232 407 0 13 232 407
Other liabilities and provisions 1 880 898 2 844 388 50 000 2 983 270 0 7 758 556
Equity 0 0 0 0 985 365 315 985 365 315
Total liabilities 1 880 898 3 867 115 15 319 753 17 997 681 985 365 315 1 024 430 762
Net liquidity position at 31.12.2007 332 625 237 83 175 077 289 562 727 280 002 275 (985 365 315) 0
Cumulative liquidity position at 31.12.2007
332 625 237
415 800 314
705 363 041
985 365 315
0
0
Commitments to venture capital 29 100 371 49 405 259 106 032 678 228 749 142 0 413 287 450
Guarantees 228 885 425 192 150 747 2 361 417 882 825 324 501 0 3 607 778 555
Total Off BS 257 985 796 241 556 006 2 467 450 560 1 054 073 643 0 4 021 066 005
Guarantees issued on behalf of the EIF can also be analysed with reference to their current contractual maturity as follows:
Total Drawn Undrawn Total 31.12.2008 Total Drawn Undrawn Total 31.12.2007
Up to 5 years 343 115 823 30 799 194 373 915 017 462 218 868 42 879 931 505 098 799
From 5 to 10 years 1 584 257 058 19 225 705 1 603 482 763 1 328 407 368 43 087 734 1 371 495 102
From 10 to 15 years 786 654 567 16 641 150 803 295 717 1 018 783 584 29 022 657 1 047 806 241
Over 15 years 1 014 885 573 43 236 744 1 058 122 317 683 378 414 0 683 378 414
3 728 913 021 109 902 793 3 838 815 814 3 492 788 234 114 990 322 3 607 778 556
The amount disclosed in respect of issued guarantees represents the total commitment which refers to both the drawn and un-drawn principal amounts of the un-derlying loans and, if relevant, to the present value of the flow of future interest payments covered by the guarantees.
Of the above total amount, EUR 0 (2007: EUR 1 627 750) have been issued in favour of the EIB.
The drawn-down portion of the guarantees issued in-cludes an amount of EUR 949 857 representing the present value of future interest for guarantees contracts in default (2007: EUR 811 311).
3.6.2.A. Venture capital
The private equity market is by nature not liquid as the vehicles are closed-end funds with in general a 10-year lifetime. After the first closing, it is difficult for an inves-tor to get out from its position except if it can find a buyer through the secondary market.
The total commitments to venture capital funds are limited to 50 % of shareholders’ equity. EIF portfolio is well diversified in terms of vintage years which has a smoothing effect on its cash-flows. (see EIF own resource portfolio split by vintage year under section 3.3.3).

EIF – Financial Statements 219 EIB Group
31.12.2008 31.12.2007
Capital Charges EURm : 256 259
Capital Ceiling : 499 483
Utilisation: 51% 54%
Headroom: 243 224
Guarantees Drawn: 4 412 4 153
Guarantees Undrawn: 110 115
Maximum Exposure: 3 839 3 607
Aggregated Guarantee calls: 0.4 0.6
3.6.2.B. Portfolio guarantees & securitisation
The nature of EIF’s capital structure and the capital charge limits defined in the EIF Credit Risk Policy Guide-lines ensures a high degree of liquidity to cover unex-pected losses arising from the guarantee activity.
The total capital charge for guarantees is limited to 50 % of shareholders’ equity.
At year-end 2008, the capital charge represented 51 % of the limit versus 54 % in 2007.
3.6.2.C. Treasury
At the end of 2008, 68.33 % of the Fund’s liquid asset exposure was rated ‘AAA’. 11.43 % were rated ‘AA’-entities. In view of the quality of the securities held (averaging ‘AA+’), liquidity risk on this portfolio is not significant.
3.6.3. Market risk
3.6.3.1. Market risk-interest rate risk
More than half of the Fund’s income and operating cash flows are independent of changes in market interest rates. The Fund’s interest rate risk arises mainly from cash & cash equivalents positions as well as investments in debt securities.
3.6.3.1.A. Venture capital
VC being an equity product, sensitivity to interest rate is not performed.
3.6.3.1.B. Portfolio guarantees & securitisation
Transactions in which EIF acts as guarantor are typically in non liquid markets and representative market prices are not available. Hence, EIF has developed a mark-to-model approach to value these transactions, using external and internal ratings, information from the regular monitoring, and discounted cash-flow analysis.
The value of guarantee transactions classified as Finan-cial Guarantees are not subject to fluctuations on inter-
est rates during transactions’ life since valuations are carried under IAS 37 provisions rules.
Conversely, the guarantee transactions classified as De-rivatives (which do not comply with all the definition criteria of a financial guarantee contract in terms of IAS 39) are valued monthly and current market interest rates are inputted in the model. However, the interest rates used by the model are only applied to calculate the present value of expected premiums. Fluctuations in the interest rates do not carry any fluctuation to the EIF profit and loss accounts.
The interest rate risk impact on underlying portfolios is indirectly assessed by the portfolio quarterly review of the transactions’ performance.
At the end of 2008, own risk guarantees transactions classified as “Derivatives” amount to EUR 1.2 bn and rep-resent 31.6 % of total guarantee exposure at risk (EUR 3.8 bn). Capital allocation charges for Derivatives amounting to EUR 54.7 m represent 21.3 % of total guar-antee capital allocation charges (EUR 256 m).
3.6.3.1.C. Treasury
Approximately 80 % of the liquid assets held have an av-erage duration of up to 5 years, thereby safeguarding the Fund against the substantial fluctuations in its long term revenues.
Moreover, operations of a speculative nature shall not be authorised. Investment decisions are based on the interest rates available in the market at the time of in-vestment. Interest rate expectations shall not be taken into account.

Financial Report 2008220EIB Group
At 31.12.2008 (in EUR) Fixed rate Variable rate Total
Less than 3 months
3 months to 1 year
1 to 5 years More than 5 years
Cash & cash equivalents 383 502 584 0 0 0 0 383 502 584
AFS - Debt securities and other fixed income securities
10 892 068
96 282 103
209 243 693
107 300 813
72 014 334
495 733 011
Total 394 394 652 96 282 103 209 243 693 107 300 813 72 014 334 879 235 595
Percentage 44.86 % 10.95 % 23.80 % 12.20 % 8.19 % 100.00 %
At 31.12.2007 (in EUR) Fixed rate Variable rate Total
Less than 3 months
3 months to 1 year
1 to 5 years More than 5 years
Cash & cash equivalents 291 604 538 0 0 0 0 291 604 538
AFS - Debt securities and other fixed income securities
26 263 699
73 880 810
179 547 928
165 071 575
77 706 389
522 470 401
Total 317 868 237 73 880 810 179 547 928 165 071 575 77 706 389 814 074 939
Percentage 39.05 % 9.08 % 22.06 % 20.28 % 9.55 % 100.00 %
The average effective interest rate on term deposit in EUR is 4.49 % for the year 2008 (2007: 4.05 % ). The aver-age effective interest rate on the AFS securities portfolio in EUR is 4.35 % for 2008 (2007: 4.54 % ).
Sensitivity of earnings
The sensitivity of the earnings is an estimate of the change during the next 12 months in the earnings of the EIF treasury portfolio managed by the EIB if all interest rate curves rise by one percentage point or decrease by one percentage point. The sensitivity measure is com-puted by taking into consideration the coupon repric-ings of all the positions present in the portfolio on a deal by deal basis. Each fixed rate asset is assumed to be rein-vested at maturity in a new asset with the same residual life of the previous one as of 31.12.08. Positions in float-ing rate assets are assumed to have quarterly repricings. With the positions in place as of 31.12.07, the earnings of the EIF treasury portfolio would increase by EUR 2.8 mil-lion if interest rates increase by 100 basis points and de-crease by the same amount if interest rates decrease by 100 basis points. With the positions in place as of 31.12.08, the earnings of the EIF treasury portfolio would increase by EUR 3.4 million if interest rates increase by 100 basis points and decrease by the same amount if interest rates decrease by 100 basis points.
The following table illustrates the Fund’s exposure to interest rate risk (figures are presented at fair value):
Value at risk
As of 31.12.08, the value-at-risk of the EIF treasury portfo-lio was EUR 1. 9 million (EUR 1. 6 million as of 31.12.07). It was computed on the basis of the RiskMetrics VaR meth-odology, using a confidence level of 99 % and a 1 day time horizon. This means that the VaR figure represents the maximum loss over a one-day horizon such that the probability that the actual loss will be larger is 1 % . Given the nature of the EIF treasury positions, the choice of the RiskMetrics methodology is deemed appropriate to measure their exposure to interest rate risk. In the current context of financial crisis and highly volatile markets, the evolution of the VaR of own funds reflects the effective increase of the volatility of interest rate.
3.6.3.2. Market risk: Foreign currency risk
The following section provides information on the risk that fair values and future cash flows of financial assets fluctuate due to changes in foreign exchange rates.
The Fund’s objective is to reduce exchange risk by limit-ing its investment in out-currency. The Fund’s capital is denominated in EUR and the majority of its assets and liabilities are in that currency.
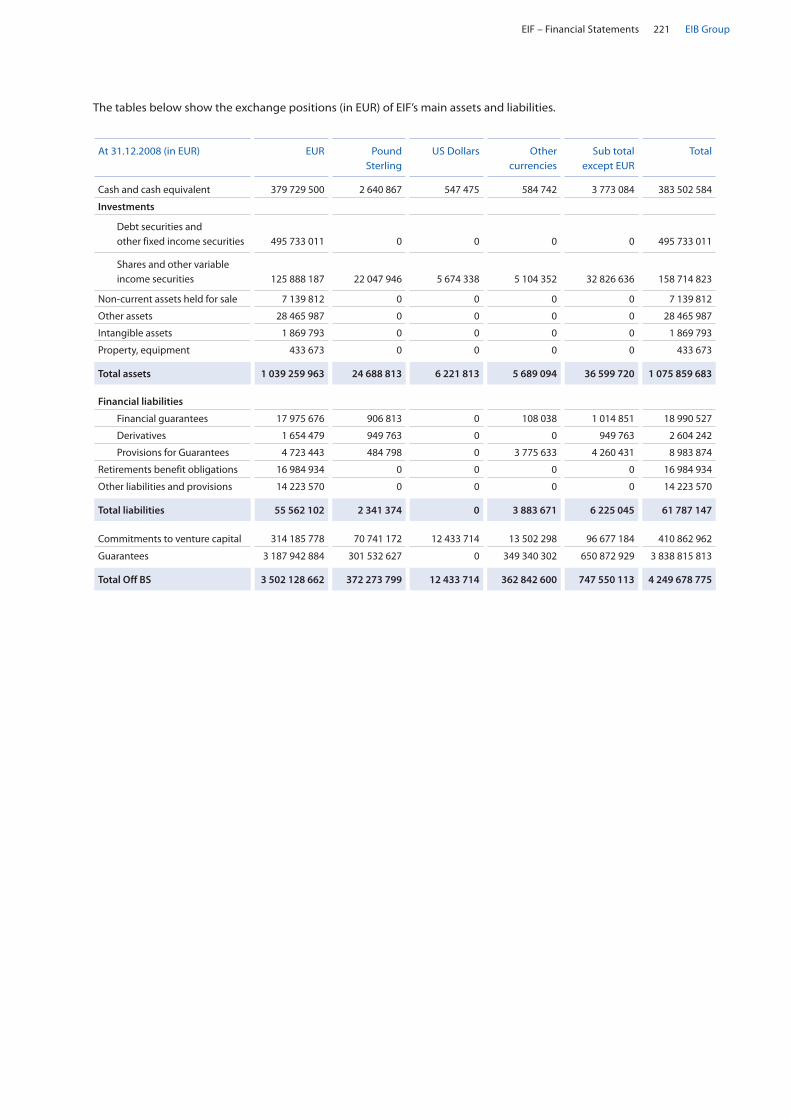
EIF – Financial Statements 221 EIB Group
At 31.12.2008 (in EUR) EUR Pound Sterling
US Dollars Other currencies
Sub total except EUR
Total
Cash and cash equivalent 379 729 500 2 640 867 547 475 584 742 3 773 084 383 502 584
Investments
Debt securities and other fixed income securities
495 733 011
0
0
0
0
495 733 011
Shares and other variable income securities
125 888 187
22 047 946
5 674 338
5 104 352
32 826 636
158 714 823
Non-current assets held for sale 7 139 812 0 0 0 0 7 139 812
Other assets 28 465 987 0 0 0 0 28 465 987
Intangible assets 1 869 793 0 0 0 0 1 869 793
Property, equipment 433 673 0 0 0 0 433 673
Total assets 1 039 259 963 24 688 813 6 221 813 5 689 094 36 599 720 1 075 859 683
Financial liabilities
Financial guarantees 17 975 676 906 813 0 108 038 1 014 851 18 990 527
Derivatives 1 654 479 949 763 0 0 949 763 2 604 242
Provisions for Guarantees 4 723 443 484 798 0 3 775 633 4 260 431 8 983 874
Retirements benefit obligations 16 984 934 0 0 0 0 16 984 934
Other liabilities and provisions 14 223 570 0 0 0 0 14 223 570
Total liabilities 55 562 102 2 341 374 0 3 883 671 6 225 045 61 787 147
Commitments to venture capital 314 185 778 70 741 172 12 433 714 13 502 298 96 677 184 410 862 962
Guarantees 3 187 942 884 301 532 627 0 349 340 302 650 872 929 3 838 815 813
Total Off BS 3 502 128 662 372 273 799 12 433 714 362 842 600 747 550 113 4 249 678 775
The tables below show the exchange positions (in EUR) of EIF’s main assets and liabilities.

Financial Report 2008222EIB Group
At 31.12.2007 (in EUR) EUR Pound Sterling
US Dollars Other currencies
Sub total except EUR
Total
Cash and cash equivalent 285 336 884 2 277 354 2 587 458 1 402 842 6 267 654 291 604 538
Investments
Debt securities and other fixed income securities
522 470 401
0
0
0
0
522 470 401
Shares and other variable income securities
122 267 894
35 053 480
5 150 527
5 404 620
45 608 627
167 876 521
Non-current assets held for sale 0 0 0 0 0 0
Other assets 33 072 223 0 0 0 0 33 072 223
Intangible assets 1 161 484 0 0 0 0 1 161 484
Property, equipment 8 245 595 0 0 0 0 8 245 595
Total assets 972 554 481 37 330 834 7 737 985 6 807 462 51 876 281 1 024 430 762
Financial liabilities
Financial guarantees 6 190 150 5 248 983 0 0 5 248 983 11 439 133
Derivatives 962 719 616 545 0 0 616 545 1 579 264
Provisions for Guarantees 5 056 087 0 0 0 0 5 056 087
Retirements benefit obligations 13 232 407 0 0 0 0 13 232 407
Other liabilities and provisions 7 758 556 0 0 0 0 7 758 556
Total liabilities 33 199 919 5 865 528 0 0 5 865 528 39 065 447
Commitments to venture capital 299 555 513 90 517 442 11 754 636 11 459 859 113 731 937 413 287 450
Guarantees 2 857 823 627 393 727 589 0 356 227 339 749 954 928 3 607 778 555
Total Off BS 3 157 379 140 484 245 031 11 754 636 367 687 198 863 686 865 4 021 066 005

EIF – Financial Statements 223 EIB Group
3.6.3.2.A. Venture capital
On the venture capital side, at 31 December 2008, cur-rency exposure for the investments funds can be split as follows:
(as % of the total fair value, EUR 159 million)
Foreign exchange rate risk
31.12.08 GBP +15 % GBP -15 %
Profit & loss account (EUR) Equity (Fair value reserve) (EUR) Profit & loss account (EUR) Equity (Fair value reserve) (EUR)
(496 478) (857 233) 143 150 857 366
31.12.07 GBP +10 % GBP -10 %
Profit & loss account (EUR) Equity (Fair value reserve) (EUR) Profit & loss account (EUR) Equity (Fair value reserve) (EUR)
(487 116) (1 404 834) 487 116 1 404 834
Closing rates at balance sheet date were (1 EUR/CCY):
31.12.07 31.12.08DKK 7.4583 7.4506GBP 0.73335 0.9525SEK 9.4415 10.87USD 1.4721 1.3917CHF 1.485
It has to be noted however, that these impacts are meas-ured at the fund level (impact on the net asset values denominated in out-currency). Therefore, they do not take into account indirect potential effects on the un-derlying portfolio companies which could be in out-cur-rencies. In practice most of the fund managers try to hedge the positions they could have in currency differ-ent of the fund main currencies.
However, the underlying investments are also well di-versified and the indirect exposure of EIF is following
4 %USD
2 %SEK
14 %GBP
79 %EUR
1 %DKK
<1 %Israël
1 %Other
4 %US Zone
8 %SEK
16 %GBP
58 %EU Zone
2 %DKK
8 %CEE
<1 %Asia 2 %
CHF
1 %NOK
As assets in the EIF balance sheet are recorded at the historical cost (e.g. for each separate operations (dis-bursements and capital repayments) with the exchange rate at the end of the month preceding the operation), they need to be readjusted at the exchange rate of the 31 December 2008.
For 2008, changes in foreign exchange rates for shares and other variable income amount to EUR - 9 412 160 out of which EUR - 7 968 533 have been recorded in the fair value reserve.
The sensitivity analysis is performed for all currencies representing more than 5 % of the total exposure. As of year end, only Pound Sterling falls into this category and has been stress tested with an increase / decrease of 15 % vs. the euro.
broadly the exposure at the fund level, as illustrated by the graph below:

Financial Report 2008224EIB Group
3.6.3.2.B. Portfolio guarantees & securitisation
The Own Risk guarantees portfolio is mainly denominat-ed in euros. As of end 2008, 83 % of exposure at risk (90 % of Fair Value) were in euros. The GBP is the main foreign currency exposure and represented 8 % of ex-posure at risk (9 % of Fair Value).
Non-euro guarantees operations considered as “Finan-cial Guarantees” do not carry any exchange rate risk with impact on EIF P&L accounts.
Breakdown of Assets Fair Value Exposure at risk breakdown
EIF is monitoring its non-euro exposure, performs regu-lar stress tests with regard to currency risk and the im-pact on unexpected loss. Additional capital charges on non-euro exposures are assumed and the outcome is compared with the available headroom. Analyses are done on what potential actions are required in order to limit the foreign exchange risk exposure. For Trust oper-ations the exchange risk is typically borne by the EIF counterparties. In some cases specific budgetary alloca-tions can be made in order to mitigate the risk taken by the intermediary. Related to Trust activities no currency exposures emerge on behalf of EIF.
3.6.3.2.C. Treasury
No risk is taken regarding EIF’s debt securities’ portfolio, as all investments in debt securities and other fixed in-come securities are denominated in EUR. Included in the above exchange positions are the financial assets classified by currency. It shows that risk regarding for-eign currency exchange rates is insignificant.
3.6.3.3.3. Market risk: public market risk
3.6.3.3.A. Venture capital
The specificities of private equity asset class make the use of traditional approaches to market risk analysis dif-ficult to apply. Market risk analysis requires the estima-tion of the correlation between the assessed asset class and the public market. This can be done based on the capital asset pricing model. This model requires estimat-ing the beta, i.e. a measure of risk relative to the market, which is estimated by regressing returns on an asset against a public market index.
While public market managers can rely on reliable statistical data to support their analysis, private equity and in particular venture capital lacks such data. Indeed, the analysis of PE returns, volatility and correlations is limited by the relatively short time series of the publicly available data, which are not fully representative of the market. Most of all, data does not fully capture
9 %GBP
90 %EUR
83 %EUR
1 %Others 4 %
DKK
3 %SEK2 %
PLN
8 %GBP
Non-euro G&S operations considered as “Derivatives” are required to be revaluated monthly. However, the currency risk is limited to the revaluation of the non- euro expected loss which is not material in size (EUR 0.2 m for 2008).
Own risk portfolio breakdowns by currency and assets fair value at 31 December 2008:

EIF – Financial Statements 225 EIB Group
the uncertainty of the asset class. Furthermore, as the standard performance measure used for private equity funds, the IRR, is capital-weighted, while for the public market assets, it is traditionally time-weighted, an analysis of correlation between private equity and other asset classes is not possible without significant
adjustments and therefore induces potentially important biases.
The EIF uses the beta of a listed PE index, LPX Europe in order to estimate the sensitivity of the valuation of EIF’s private equity investment to market prices.
Using the beta from LPX Europe and assuming market price movements of ±10 % , EIF’s private equity investments’ value would be impacted as follows:
Public market risk: ALL PRIVATE EQUITY
+10 % -10 %
Beta 1.3 Beta 1.3
Final Sensitivity: + 13 % Final Sensitivity: - 13 %
Profit & loss account (EUR)
Equity (Fair value reserve)
(EUR)
Total effect on Equity
Profit & loss account (EUR)
Equity (Fair value reserve)
(EUR)
Total effect on Equity
31.12.08 370 227 21 356 608 21 726 836 (5 998 656) (15 386 227) (21 384 883)
31.12.07 908 738 12 337 191 13 245 929 (940 745) (12 438 782) (13 379 527)
The above final sensitivity (i.e beta x +/- 10 % ) is applied to the net asset value giving an adjusted net asset value, which is then compared to the net paid in. The calculated value adjustment will then be recorded following the methodology described in the “background” part.
3.7. Fair value of financial assets and financial liabilities
These results can only be seen as indications of the potential sensitivity. Indeed, despite the notions of fair value, private equity is an appraised asset class, valued not by the consensus of many market players in an active and efficient market but by few experts, normally the fund managers who value each investment based on their views of the investment’s earnings potential and/or comparisons with other investments and following normally industry valuation guidelines.
Table setting out a comparison by categories of the carrying amounts and fair value of the Fund’s financial assets and li-abilities:
Carrying amount 2008 Fair value 2008 Carrying amount 2007 Fair value 2007
EUR EUR EUR EUR
Financial assets
Loans and receivables 394 135 518 394 135 518 311 344 133 311 344 133
Financial investments - AFS 651 822 405 651 822 405 687 423 673 687 423 673
Financial assets designated at fair value through P&L
2 625 429
2 625 429
1 511 249
1 511 249
TOTAL 1 048 583 352 1 048 583 352 1 000 279 055 1 000 279 055
Financial liabilities
Financial guarantees 18 990 527 18 990 527 11 439 133 11 439 133
Financial liabilities designated at fair value through P&L
2 604 242
2 604 242
1 579 264
1 579 264
Other liabilities 5 105 933 5 105 933 1 357 583 1 357 583
TOTAL 26 700 702 26 700 702 14 375 980 14 375 980
For loans and receivables as well as other liabilities, the carrying values approximate fair values.
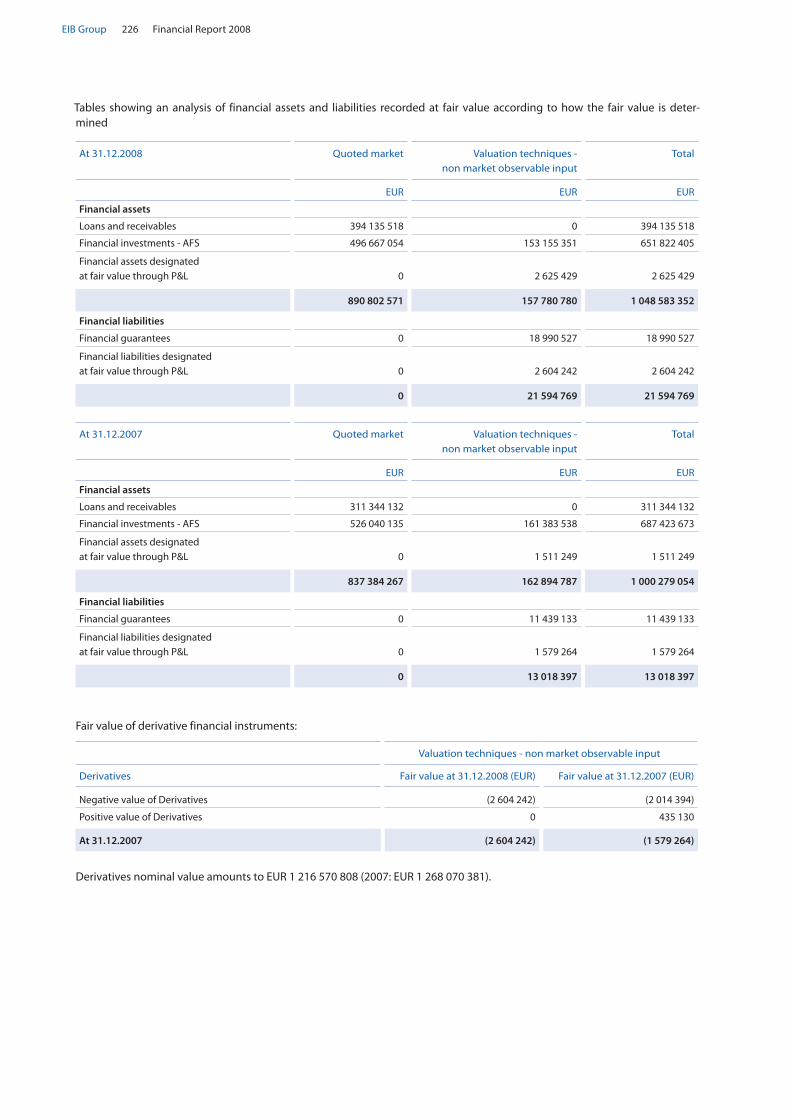
Financial Report 2008226EIB Group
Tables showing an analysis of financial assets and liabilities recorded at fair value according to how the fair value is deter-mined
At 31.12.2008 Quoted market Valuation techniques - non market observable input
Total
EUR EUR EUR
Financial assets
Loans and receivables 394 135 518 0 394 135 518
Financial investments - AFS 496 667 054 153 155 351 651 822 405
Financial assets designated at fair value through P&L
0
2 625 429
2 625 429
890 802 571 157 780 780 1 048 583 352
At 31.12.2007 Quoted market Valuation techniques - non market observable input
Total
EUR EUR EUR
Financial assets
Loans and receivables 311 344 132 0 311 344 132
Financial investments - AFS 526 040 135 161 383 538 687 423 673
Financial assets designated at fair value through P&L
0
1 511 249
1 511 249
837 384 267 162 894 787 1 000 279 054
Financial liabilities
Financial guarantees 0 18 990 527 18 990 527
Financial liabilities designated at fair value through P&L
0
2 604 242
2 604 242
0 21 594 769 21 594 769
Financial liabilities
Financial guarantees 0 11 439 133 11 439 133
Financial liabilities designated at fair value through P&L
0
1 579 264
1 579 264
0 13 018 397 13 018 397
Fair value of derivative financial instruments:
Derivatives nominal value amounts to EUR 1 216 570 808 (2007: EUR 1 268 070 381).
Valuation techniques - non market observable input
Derivatives Fair value at 31.12.2008 (EUR) Fair value at 31.12.2007 (EUR)
Negative value of Derivatives (2 604 242) (2 014 394)
Positive value of Derivatives 0 435 130
At 31.12.2007 (2 604 242) (1 579 264)

EIF – Financial Statements 227 EIB Group
4. Detailed disclosures relating to asset headings
4.1. Cash and cash equivalents
Cash and cash equivalents are defined as short-term assets, highly liquid securities. They include cash at bank and in hand, interest earning deposits with original maturities of 3 months or less and bank overdrafts.
The remaining life of cash and cash equivalents is as follows:
The effective interest rate on short-term bank deposits is 4.49 % (2007: 4.05 % ). These deposits have an average maturi-ty of 57 days (2007: 38 days).
4.2. Debt securities and other fixed-income securities
The Fund’s portfolio includes money market funds and other money market instruments; long-term debt instruments e.g. bonds, notes and other obligations.
Debt securities and other fixed-income securities are analysed as follows:
Debt securities and other fixed-income securities held by the Fund are all listed on an active market. Figures above are presented at fair value.
The Fund participates as lender in a Securities Lending and Borrowing Programme with three counterparties, the mar-ket value of securities lent at year-end amounts to EUR 60 948 198 (2007: EUR 77 319 235). Derecognition criteria in ac-cordance with IAS 39 are not fulfilled.
31.12.2008 EUR
31.12.2007 EUR
Repayable on demand 30 543 163 21 874 539
Up to three months 352 959 421 269 729 999
383 502 584 291 604 538
31.12.2008 EUR
31.12.2007 EUR
Available-for-Sale portfolio 149 137 396 128 936 612
of which accrued interests 1 529 023 1 398 823
Investment portfolio 346 595 615 393 533 789
of which accrued interests 8 242 136 9 639 036
495 733 011 522 470 401
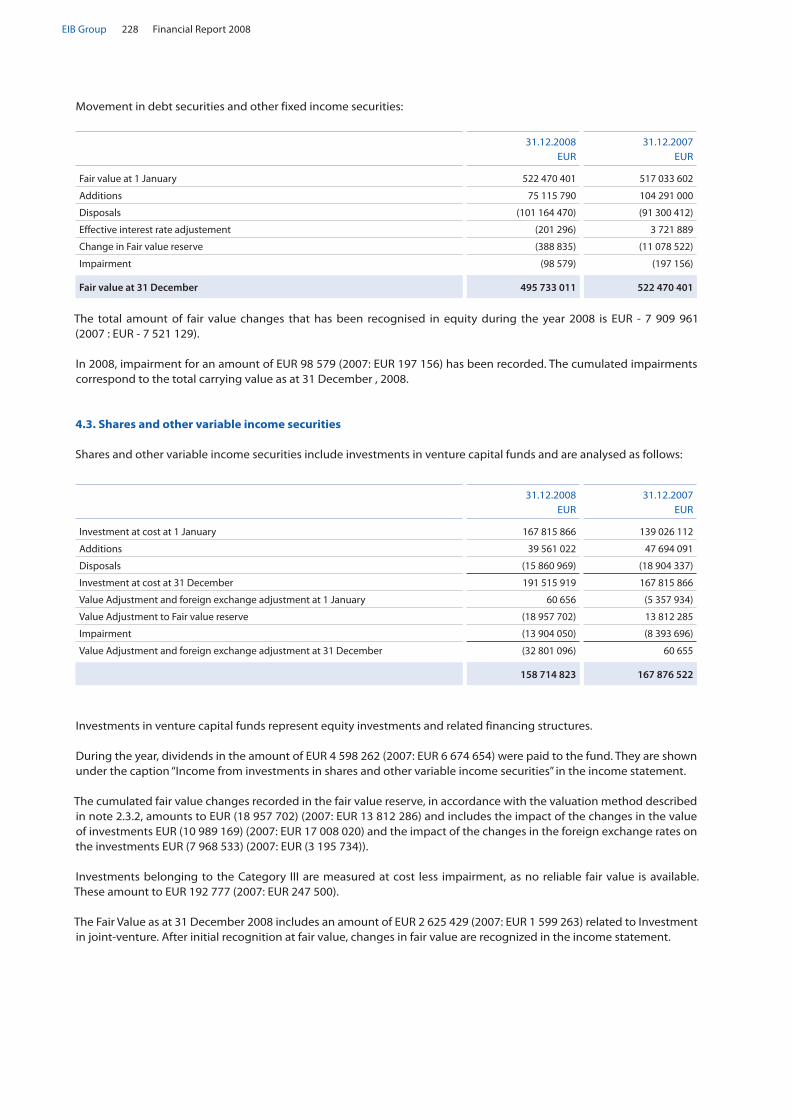
Financial Report 2008228EIB Group
Movement in debt securities and other fixed income securities:
The total amount of fair value changes that has been recognised in equity during the year 2008 is EUR - 7 909 961 (2007 : EUR - 7 521 129).
In 2008, impairment for an amount of EUR 98 579 (2007: EUR 197 156) has been recorded. The cumulated impairments correspond to the total carrying value as at 31 December , 2008.
4.3. Shares and other variable income securities
Shares and other variable income securities include investments in venture capital funds and are analysed as follows:
Investments in venture capital funds represent equity investments and related financing structures.
During the year, dividends in the amount of EUR 4 598 262 (2007: EUR 6 674 654) were paid to the fund. They are shown under the caption “Income from investments in shares and other variable income securities” in the income statement.
The cumulated fair value changes recorded in the fair value reserve, in accordance with the valuation method described in note 2.3.2, amounts to EUR (18 957 702) (2007: EUR 13 812 286) and includes the impact of the changes in the value of investments EUR (10 989 169) (2007: EUR 17 008 020) and the impact of the changes in the foreign exchange rates on the investments EUR (7 968 533) (2007: EUR (3 195 734)).
Investments belonging to the Category III are measured at cost less impairment, as no reliable fair value is available. These amount to EUR 192 777 (2007: EUR 247 500).
The Fair Value as at 31 December 2008 includes an amount of EUR 2 625 429 (2007: EUR 1 599 263) related to Investment in joint-venture. After initial recognition at fair value, changes in fair value are recognized in the income statement.
31.12.2008 EUR
31.12.2007 EUR
Fair value at 1 January 522 470 401 517 033 602
Additions 75 115 790 104 291 000
Disposals (101 164 470) (91 300 412)
Effective interest rate adjustement (201 296) 3 721 889
Change in Fair value reserve (388 835) (11 078 522)
Impairment (98 579) (197 156)
Fair value at 31 December 495 733 011 522 470 401
31.12.2008 EUR
31.12.2007 EUR
Investment at cost at 1 January 167 815 866 139 026 112
Additions 39 561 022 47 694 091
Disposals (15 860 969) (18 904 337)
Investment at cost at 31 December 191 515 919 167 815 866
Value Adjustment and foreign exchange adjustment at 1 January 60 656 (5 357 934)
Value Adjustment to Fair value reserve (18 957 702) 13 812 285
Impairment (13 904 050) (8 393 696)
Value Adjustment and foreign exchange adjustment at 31 December (32 801 096) 60 655
158 714 823 167 876 522
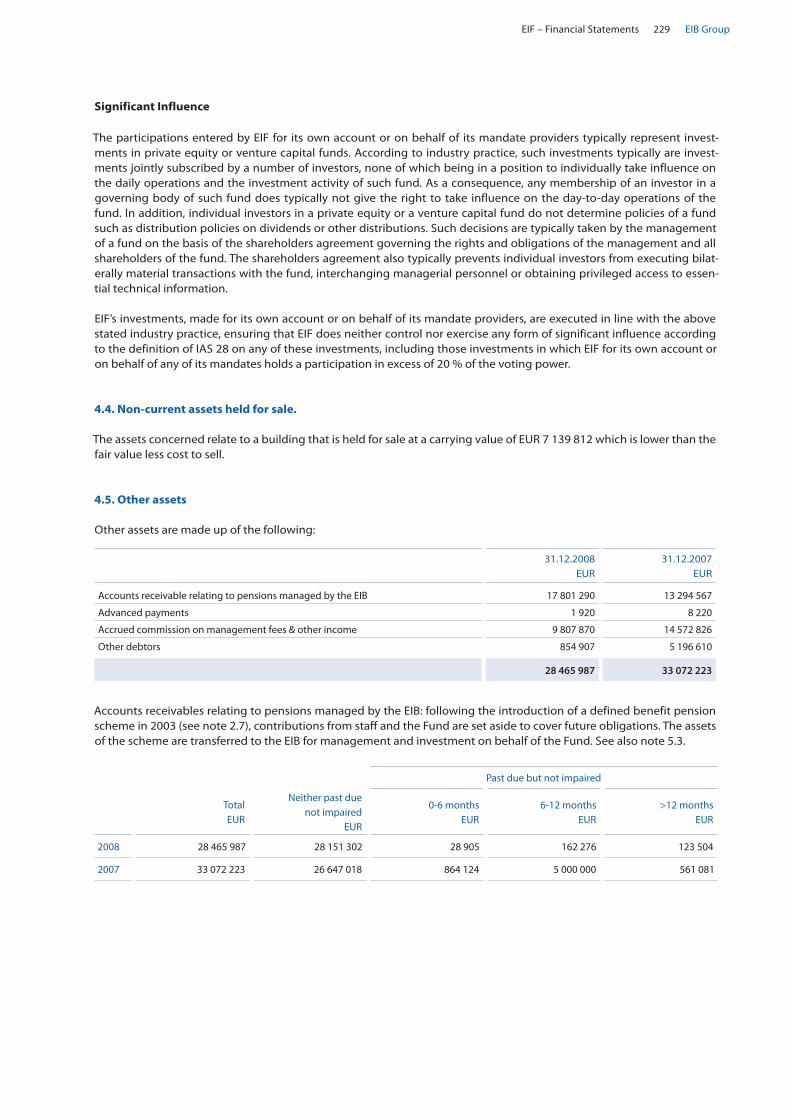
EIF – Financial Statements 229 EIB Group
4.4. Non-current assets held for sale.
The assets concerned relate to a building that is held for sale at a carrying value of EUR 7 139 812 which is lower than the fair value less cost to sell.
4.5. Other assets
Other assets are made up of the following:
Significant Influence
The participations entered by EIF for its own account or on behalf of its mandate providers typically represent invest-ments in private equity or venture capital funds. According to industry practice, such investments typically are invest-ments jointly subscribed by a number of investors, none of which being in a position to individually take influence on the daily operations and the investment activity of such fund. As a consequence, any membership of an investor in a governing body of such fund does typically not give the right to take influence on the day-to-day operations of the fund. In addition, individual investors in a private equity or a venture capital fund do not determine policies of a fund such as distribution policies on dividends or other distributions. Such decisions are typically taken by the management of a fund on the basis of the shareholders agreement governing the rights and obligations of the management and all shareholders of the fund. The shareholders agreement also typically prevents individual investors from executing bilat-erally material transactions with the fund, interchanging managerial personnel or obtaining privileged access to essen-tial technical information.
EIF’s investments, made for its own account or on behalf of its mandate providers, are executed in line with the above stated industry practice, ensuring that EIF does neither control nor exercise any form of significant influence according to the definition of IAS 28 on any of these investments, including those investments in which EIF for its own account or on behalf of any of its mandates holds a participation in excess of 20 % of the voting power.
31.12.2008 EUR
31.12.2007 EUR
Accounts receivable relating to pensions managed by the EIB 17 801 290 13 294 567
Advanced payments 1 920 8 220
Accrued commission on management fees & other income 9 807 870 14 572 826
Other debtors 854 907 5 196 610
28 465 987 33 072 223
Accounts receivables relating to pensions managed by the EIB: following the introduction of a defined benefit pension scheme in 2003 (see note 2.7), contributions from staff and the Fund are set aside to cover future obligations. The assets of the scheme are transferred to the EIB for management and investment on behalf of the Fund. See also note 5.3.
Past due but not impaired
Total EUR
Neither past due not impaired
EUR
0-6 months EUR
6-12 months EUR
>12 months EUR
2008 28 465 987 28 151 302 28 905 162 276 123 504
2007 33 072 223 26 647 018 864 124 5 000 000 561 081

Financial Report 2008230EIB Group
4.6. Intangible assets
Internally Generated Software EUR
Purchased Software EUR
Total EUR
At 01.01.2007
Cost 2 321 066 377 074 2 698 140
Accumulated depreciation (1 520 157) (346 353) (1 866 510)
Net book amount 800 909 30 721 831 630
Opening net book amount 800 909 30 721 831 630
Additions 773 516 119 436 892 952
Depreciation charge (508 645) (54 453) (563 098)
Closing net book amount 2007 1 065 780 95 704 1 161 484
At 01.01.2008
Cost 3 094 582 496 510 3 591 092
Accumulated depreciation (2 028 802) (400 806) (2 429 608)
Net book amount 1 065 780 95 704 1 161 484
Opening net book amount 1 065 780 95 704 1 161 484
Additions 912 719 86 050 998 769
Depreciation charge (211 433) (79 027) (290 460)
Closing net book amount 2008 1 767 066 102 727 1 869 793
At 31.12.2008
Cost 4 007 301 582 560 4 589 861
Accumulated depreciation (2 240 235) (479 833) (2 720 068)
Net book amount 1 767 066 102 727 1 869 793
There were no indications of impairment of intangible assets in either 2008 or 2007.
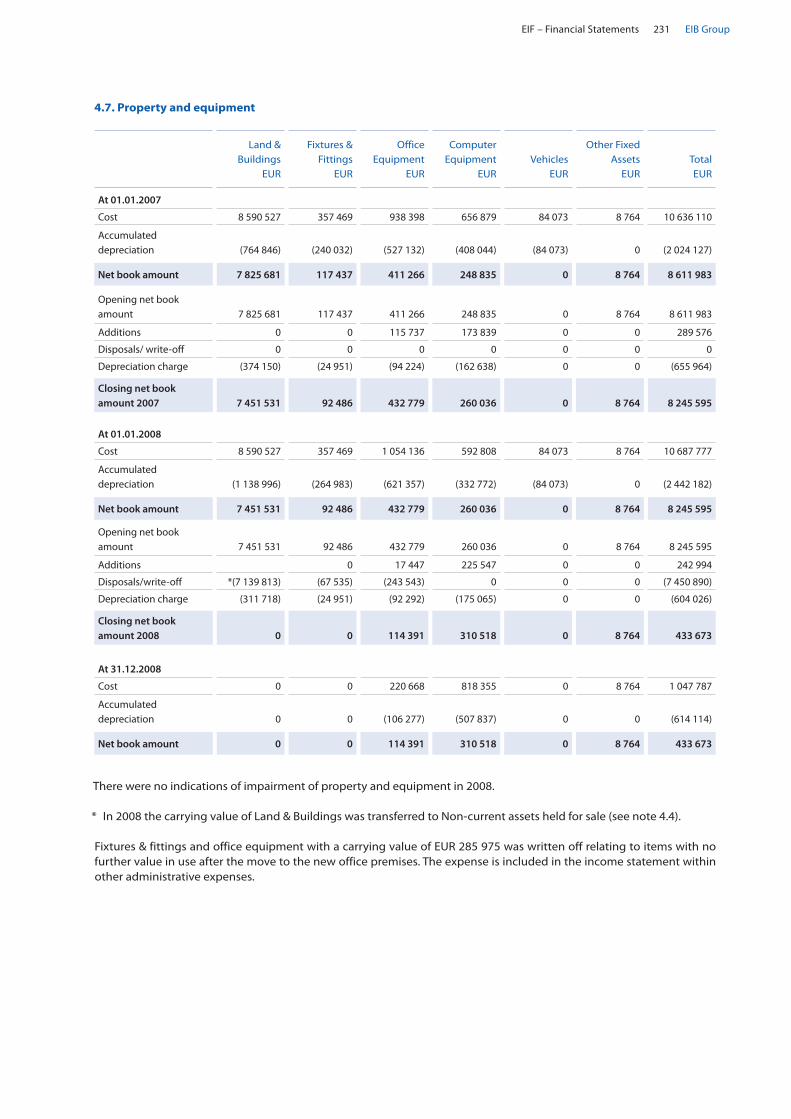
EIF – Financial Statements 231 EIB Group
4.7. Property and equipment
Land & Buildings
EUR
Fixtures & Fittings
EUR
Office Equipment
EUR
Computer Equipment
EUR
Vehicles
EUR
Other Fixed Assets
EUR
Total EUR
At 01.01.2007
Cost 8 590 527 357 469 938 398 656 879 84 073 8 764 10 636 110
Accumulated depreciation
(764 846)
(240 032)
(527 132)
(408 044)
(84 073)
0
(2 024 127)
Net book amount 7 825 681 117 437 411 266 248 835 0 8 764 8 611 983
Opening net book amount
7 825 681
117 437
411 266
248 835
0
8 764
8 611 983
Additions 0 0 115 737 173 839 0 0 289 576
Disposals/ write-off 0 0 0 0 0 0 0
Depreciation charge (374 150) (24 951) (94 224) (162 638) 0 0 (655 964)
Closing net book amount 2007
7 451 531
92 486
432 779
260 036
0
8 764
8 245 595
At 01.01.2008
Cost 8 590 527 357 469 1 054 136 592 808 84 073 8 764 10 687 777
Accumulated depreciation
(1 138 996)
(264 983)
(621 357)
(332 772)
(84 073)
0
(2 442 182)
Net book amount 7 451 531 92 486 432 779 260 036 0 8 764 8 245 595
Opening net book amount
7 451 531
92 486
432 779
260 036
0
8 764
8 245 595
Additions 0 17 447 225 547 0 0 242 994
Disposals/write-off *(7 139 813) (67 535) (243 543) 0 0 0 (7 450 890)
Depreciation charge (311 718) (24 951) (92 292) (175 065) 0 0 (604 026)
Closing net book amount 2008
0
0
114 391
310 518
0
8 764
433 673
At 31.12.2008
Cost 0 0 220 668 818 355 0 8 764 1 047 787
Accumulated depreciation
0
0
(106 277)
(507 837)
0
0
(614 114)
Net book amount 0 0 114 391 310 518 0 8 764 433 673
There were no indications of impairment of property and equipment in 2008.
* In 2008 the carrying value of Land & Buildings was transferred to Non-current assets held for sale (see note 4.4).
Fixtures & fittings and office equipment with a carrying value of EUR 285 975 was written off relating to items with no further value in use after the move to the new office premises. The expense is included in the income statement within other administrative expenses.

Financial Report 2008232EIB Group
5. Detailed disclosures relating to liability and equity headings
5.1. Financial liabilities
The movements relating to Financial Guarantees payables are set out below:
During the year 2008, a reclassification has been performed on the guarantee operations. Financial Guarantees and Derivatives, which were accounted for in the assets as “Financial Guarantees receivable” and “Derivatives” and in the li-abilities as “Financial guarantee payables” and “Derivatives” are presented on a net basis at 31 December, 2008 with comparative netted figures at 31 December, 2007. The opening balance 2007 of the Financial Guarantees has also been adjusted to reflect the reclassification of the provisions for guarantees. This represents an amount of EUR 3 398 599.
When a guarantee operation measured under IAS 39 is derecognised and treated under IAS 37, its value previously recorded under Financial Guarantees or the Derivatives is transferred to the caption provisions for guarantees.
(*) Additions mainly include the increase of provisions on guarantees operations EUR 6 209 350 (2007: EUR 1 122 670) but also the value of the guarantees operations transferred from IAS 39 to IAS 37 for an amount of EUR 67 186 (2007: EUR 0).
A reclassification of the 2007 provision for guarantees has been performed. This represents a total amount of EUR 5 056 087 at 31.12.07 of which EUR 1 657 488 reclassified from caption “Other liabilities and provisions” and EUR 3 398 599 from “Financial Guarantees payables”.
5.2. Provisions for guarantees
Net Financial Guarantees 31.12.2008 EUR
31.12.2007 EUR
Balance at the beginning of the financial year 11 439 133 15 227 211
Transfer relating to SME guarantees 0 366 472
Utilisation of the financial guarantees (353 016) (896 303)
Net increase/decrease in Financial Guarantees 7 971 596 (3 258 247)
Transfer to provision for guarantees (67 186) 0
Balance at the end of the financial year 18 990 527 11 439 133
Derivatives 31.12.2008 EUR
31.12.2007 EUR
Balance at 1 January 1 579 264 1 143 700
Fair value changes 1 024 978 435 564
Balance at 31 December 2 604 242 1 579 264
31.12.2008 EUR
31.12.2007 EUR
Balance at 1 January 5 056 087 6 450 518
Additions (*) 6 276 536 1 122 670
Release of provision (2 348 749) (2 517 101)
Balance at 31 December 8 983 874 5 056 087

EIF – Financial Statements 233 EIB Group
5.3. Retirement benefit obligations
The retirement benefit obligation consists of the pension scheme and the health insurance scheme as follows:
Retirement benefit obligations 31.12.2008 EUR
31.12.2007 EUR
Pension scheme 15 398 934 11 982 407
Health insurance scheme 1 586 000 1 250 000
16 984 934 13 232 407
Commitments in respect of retirement benefits as at 31 December, 2008 have been valued by an independent actuary using the projected unit credit method. The calculations are based on the following main assumptions:
The pension commitment as evaluated in the independent actuary report dated February 2009 amounts to EUR 12 024 000. As of December 2008, the Fund has allocated EUR 16 387 845 (2007: EUR 12 456 911) to the provisions relating to pensions to ensure full coverage of the commitments.
The health insurance obligation was measured by a full actuarial calculation at the end of 2008.
The movements in the “retirement benefit obligations” rounded to the nearest EUR 1 000 are as follows:
Principal Assumptions 2008 2007
Discount rate for obligations 6.00 % 5.52 %
Rate of future compensation increases 4.50 % 4.00 %
Rate of pension increases 2.00 % 2.00 %
Actuarial tables Swiss BVG 2005 Swiss BVG 2005
Net Periodic Benefit Cost as at 31.12.2008
EIF Pension EUR
Health Insurance EUR
Total 2008
Current net service cost 1 249 000 280 000 1 529 000
Interest cost 697 000 62 000 759 000
Amortisation of unrecognised gains/losses 37 000 (6 000) 31 000
Net Benefit Expense 1 983 000 336 000 2 319 000
Net Periodic Benefit Cost as at 31.12.2007
EIF Pension EUR
Health Insurance EUR
Total 2007
Current net service cost 1 258 000 0 1 258 000
Interest cost 477 000 0 477 000
Amortisation of unrecognised gains/losses 75 000 0 75 000
Net Benefit Expense 1 810 000 0 1 810 000
Employer contribution
As the plan is treated as unfunded under IAS 19, the employer contributions are determined as the difference between the net benefit payments and the staff contributions. Any amounts used to purchase benefits by employees are treated as negative benefit payments. In the past, the employer contributions, determined as described above, have been negative as purchases have exceeded the regular benefit payments. This trend is expected to continue and no employer contribu-tions are predicted for the next twelve months.

Financial Report 2008234EIB Group
Benefit Liabilities as at 31.12.2008
EIF Pension EUR
Health Insurance EUR
Total 2008
Present value of funded obligation 0 0 0
Present value of unfunded obligation 15 340 000 1 298 000 16 638 000
Unrecognised net actuarial gains / (losses) 59 000 288 000 347 000
Net liability 15 399 000 1 586 000 16 985 000
Benefit Liabilities as at 31.12.2007
EIF Pension EUR
Health Insurance EUR
Total 2007
Present value of funded obligation 0 0 0
Present value of unfunded obligation 12 628 000 1 120 000 13 748 000
Unrecognised net actuarial gains / (losses) (646 000) 130 000 (516 000)
Net liability 11 982 000 1 250 000 13 232 000
Changes in Defined Benefit Obligation as at 31.12.2008
EIF Pension EUR
Health Insurance EUR
Total 2008
Defined benefit obligation, Beginning of year 12 628 000 1 120 000 13 748 000
Net service cost 1 249 000 280 000 1 529 000
Interest cost 697 000 62 000 759 000
Employee contributions 812 000 812 000
Benefits Paid 622 000 622 000
Experience (Gain) / Loss 653 000 (6 000) 647 000
(Gain) / Loss due to assumption changes (1 321 000) (158 000) (1 479 000)
Defined benefit obligation 15 340 000 1 298 000 16 638 000
Changes in Defined Benefit Obligation as at 31.12.2007
EIF Pension EUR
Health Insurance EUR
Total 2007
Defined benefit obligation, Beginning of year 9 928 000 1 250 000 11 178 000
Net service cost 1 258 000 0 1 258 000
Interest cost 477 000 0 477 000
Employee contributions 682 000 0 682 000
Benefits Paid 561 000 0 561 000
Experience (Gain) / Loss 1 656 000 293 000 1 949 000
(Gain) / Loss due to assumption changes (1 934 000) (423 000) (2 357 000)
Defined benefit obligation 12 628 000 1 120 000 13 748 000
History of asset values
Amounts for the current and previous two periods are as follows:
2008 2007 2006
Fair value of Plan assets, End of year 0 0 0
Defined Benefit Obligation, End of year (16 638 000) (13 748 000) (9 928 000)
Surplus/ (Deficit) in the Plan (16 638 000) (13 748 000) (9 928 000)
Experience Gains/ (losses) on DBO (653 000) (406 000) (430 000)
Experience Gains/ (losses) on Plan Assets 0 0 0
The effect of a 1 % increase or decrease to the medical trend costs on the current service cost and interest cost, or the post-employment benefit obligation, would not have a material impact on the EIF’s accounts.

EIF – Financial Statements 235 EIB Group
Trade Creditors mainly includes payable amounts related to operations managed by EIF and other sundry items. Other payables mostly includes staff-related costs such Bonus, the Optional Supplementary Pension Scheme (OSPS) and the Severance Grant.
5.4. Other liabilities and provisions
31.12.2008 EUR
31.12.2007 EUR
Trade creditors 4 886 022 775 000
Other taxation and social security costs 3 510 1 182
Other payables 9 334 038 6 982 374
14 223 570 7 758 556
31.12.2008 30.06.2008 New shares issued
31.12.2007 of which
Authorised Shares 3 000 3 000
of which:
subscribed 2 865 95 2 770
un-subscribed 135 (95) 230
5.5. Share capital
The authorised capital amounts to EUR 3 billion, divided into 3 000 shares with a nominal value of EUR 1 000 000 each of which 2 865 have been issued. The shares confer rights of ownership of the assets of the Fund as described in Article 8 of its Statutes. Shareholders are entitled to any distribution of net profits, which is limited by the requirements of the statutory reserve.
New shares were issued on the 30th June 2008 from authorised share capital as follows:
The authorised and subscribed share capital of EUR 2 865 000 000 representing 2 865 shares is called and paid in for an amount of EUR 573 000 000 representing 20 % of the authorised and subscribed share capital.
Further payments of the subscribed but not paid in capital need the approval by the General meeting of shareholders.
The subscribed share capital is detailed as follows:
The capital is subscribed as follows:
31.12.2008 EUR
31.12.2007 EUR
Subscribed and paid in (20%) 573 000 000 554 000 000
Subscribed but not yet called (80%) 2 292 000 000 2 216 000 000
2 865 000 000 2 770 000 000
31.12.2008 Number of shares
31.12.2007 Number of shares
European Investment Bank 1 822 1 822
European Commission 786 691
Financial Institutions 257 257
2 865 2 770
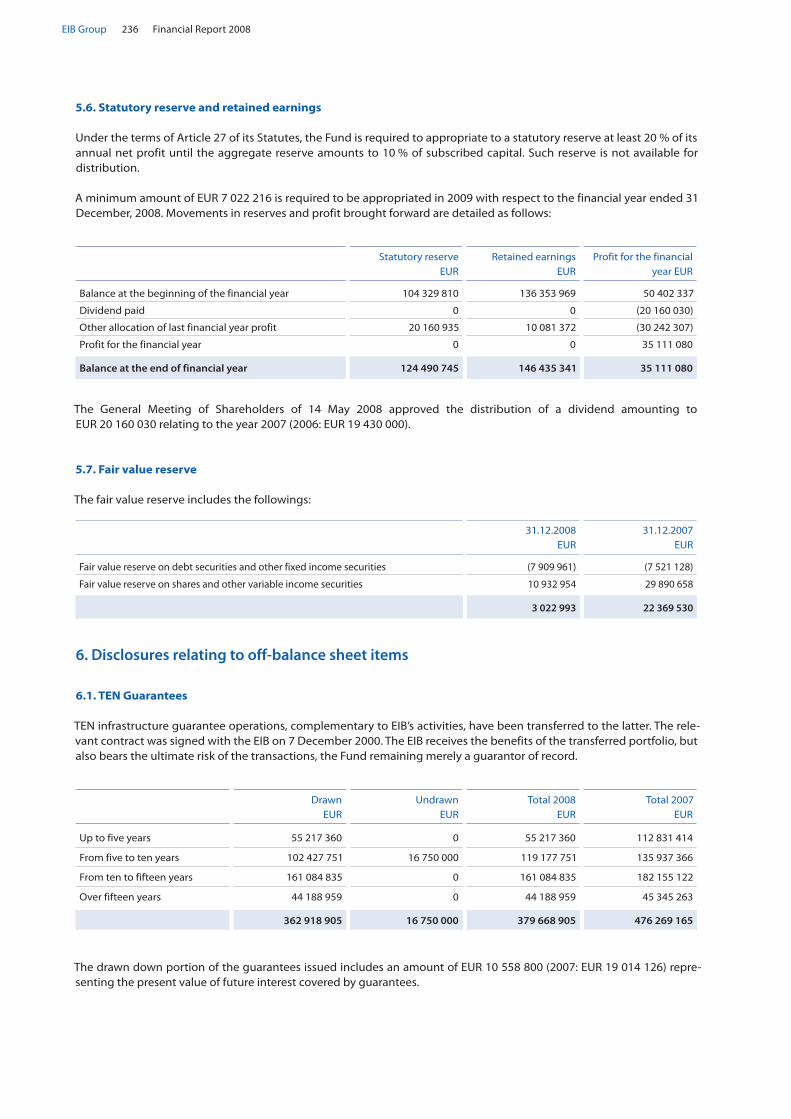
Financial Report 2008236EIB Group
5.6. Statutory reserve and retained earnings
Under the terms of Article 27 of its Statutes, the Fund is required to appropriate to a statutory reserve at least 20 % of its annual net profit until the aggregate reserve amounts to 10 % of subscribed capital. Such reserve is not available for distribution.
A minimum amount of EUR 7 022 216 is required to be appropriated in 2009 with respect to the financial year ended 31 December, 2008. Movements in reserves and profit brought forward are detailed as follows:
Statutory reserve EUR
Retained earnings EUR
Profit for the financial year EUR
Balance at the beginning of the financial year 104 329 810 136 353 969 50 402 337
Dividend paid 0 0 (20 160 030)
Other allocation of last financial year profit 20 160 935 10 081 372 (30 242 307)
Profit for the financial year 0 0 35 111 080
Balance at the end of financial year 124 490 745 146 435 341 35 111 080
The General Meeting of Shareholders of 14 May 2008 approved the distribution of a dividend amounting to EUR 20 160 030 relating to the year 2007 (2006: EUR 19 430 000).
5.7. Fair value reserve
The fair value reserve includes the followings:
31.12.2008 EUR
31.12.2007 EUR
Fair value reserve on debt securities and other fixed income securities (7 909 961) (7 521 128)
Fair value reserve on shares and other variable income securities 10 932 954 29 890 658
3 022 993 22 369 530
6. Disclosures relating to off-balance sheet items
6.1. TEN Guarantees
TEN infrastructure guarantee operations, complementary to EIB’s activities, have been transferred to the latter. The rele-vant contract was signed with the EIB on 7 December 2000. The EIB receives the benefits of the transferred portfolio, but also bears the ultimate risk of the transactions, the Fund remaining merely a guarantor of record.
Drawn EUR
Undrawn EUR
Total 2008 EUR
Total 2007 EUR
Up to five years 55 217 360 0 55 217 360 112 831 414
From five to ten years 102 427 751 16 750 000 119 177 751 135 937 366
From ten to fifteen years 161 084 835 0 161 084 835 182 155 122
Over fifteen years 44 188 959 0 44 188 959 45 345 263
362 918 905 16 750 000 379 668 905 476 269 165
The drawn down portion of the guarantees issued includes an amount of EUR 10 558 800 (2007: EUR 19 014 126) repre-senting the present value of future interest covered by guarantees.

EIF – Financial Statements 237 EIB Group
6.2. Assets held for third parties
Assets held for third parties, as set out below, represent trust accounts opened and maintained in the name of the Fund but for the benefit of the Commission, the EIB, the German Federal Ministry of Economics and Technology (Bundesministerium für Wirtschaft und Technologie
“BMWi”) and the Member States or regions in the frame-work of the Joint European Resources for Micro to Medium Enterprises (“JEREMIE”) jointly developed by the Commis-sion of the European Communities and EIF. Sums held in these accounts remain the property of the Commission, the EIB, the BMWi and the Member States or regions so long as they are not disbursed for the purposes set out in relation to each programme.
Under the SME Guarantee Facility (SMEG 1998, SMEG 2001 under the Multi-Annual Programme for enterprises (MAP) and SMEG 2007 under the Competitiveness and Innova-tion Framework Programme), the Fund is empowered to issue guarantees in its own name but on behalf and at the risk of the Commission.
Under the ETF Start-Up Facility (ESU 1998, ESU 2001 under the Multi-Annual Programme for enterprises (MAP), GIF 2007 under the Competitiveness and Innovation Frame-work Programme and the Technology Transfer Pilot Project (TTP)), the Fund is empowered to acquire, manage and dis-pose of ETF start-up investments, in its own name but on behalf and at the risk of the Commission.
The support provided by the Seed Capital Action is aimed at the long-term recruitment of additional investment managers by the venture capital funds to increase the number of qualified personnel and to reinforce the capaci-ty of the venture capital and incubator industries to cater for investments in seed capital.
Within the context of its venture capital activity, the Fund manages on behalf and at the risk of the EIB the European Technology Facilities (ETF) 1 and 2, which have been imple-mented by the Fund since 1998.
Within the framework of the Risk Capital Mandate signed with the EIB in 2000, the EIF took over the EIB’s existing venture capital portfolio, with further investments being funded as part of the “Innovation 2000 Initiative” of the EIB.
Under the ERP-EIF Dachfond agreement, initiated in 2004, the Fund manages venture capital activity on behalf, and at the risk of the BWMi.
The Fund is managing a European Commission facility, the Preparatory Action Facility (PA 2004 and PA 2005), on be-half of the EIB Group. The facility is particularly targeting micro-lending and will be used for grants to finance tech-nical assistance to SMEs, which must be coupled with an EIF guarantee or an EIB global loan. The Preparatory Action Facility 2004 was closed on 22 May 2008.
The support provided by the JEREMIE initiative is aimed at promoting SME access to finance and financial engineer-ing products, such as venture capital funds, guarantee funds and loan funds, to enterprises. The EIF has signed JEREMIE Funding Agreements with the following Member States/regions: Greece, Romania, Latvia, Lithuania, Langue-doc-Roussillon, Campania, Slovakia.
In the framework of the European Community in the Global Energy Efficiency and Renewable Energy Fund (GEEREF), the EIF manages the participation of the European Community in the fund and represents the Commission’s interests.
31.12.2008 EUR
31.12.2007 EUR
Preparatory Action Facility 2004 0 16 767
SMEG 1998 (SME Guarantee 1998) 69 876 991 71 885 622
ESU 1998 (ETF Start-up 1998) (*) 13 584 862 28 509 679
Seed Capital Action 131 012 185 233
SMEG 2001 (MAP Guarantee) 73 579 928 118 671 399
ESU 2001 (MAP Equity) (*) 77 815 569 91 773 212
CIP/ SMEG 07 95 483 380 35 255 356
CIP/ GIF 07 69 341 505 36 447 745
TTP 2 000 938 0
GEEREF Trusteeship 45 929 105 0
Trust accounts with the Commission (**) 447 743 290 382 745 013
Trust accounts with the EIB 11 279 987 40 372 364
Trust account with the BWMi 130 340 19 198
Trust account with member states/regions JEREMIE initiative 283 100 781 0
742 254 398 423 136 575(*) The figures above do not include the investment in venture capital, of EUR 44 578 139 for ESU 1998 (2007: EUR 44 597 618), EUR 68 703 612 for ESU 2001
(2007: EUR 53 806 983) and EUR 20 061 832 for GIF 07 (2007: EUR 0) made on behalf of the Commission that are included in 8.3.(**) The trust accounts with the Commission include cash at bank, money market balances, investments in securities at nominal value and the relevant security
accruals. They do not represent a final valuation of the relevant programmes.

Financial Report 2008238EIB Group
6.3. Fiduciary operations
Pursuant to Article 28 of its Statutes, the Fund may accept the tasks of administering special resources entrusted to it by third parties. In execution of this article, the Fund manages and disposes of investments in venture capital funds, in its own name but on behalf and at the risk of:
the EIB, in accordance with European Technology Facility, European Technology Facility 2 and Transfer, Implementa- •tion and Management of Risk Capital Investments (Risk Capital Mandate) agreements,
the Commission, in accordance with ETF Start-Up Facility, the High Growth and Innovative SME Facility and Seed •Capital Action agreements, and
the German Ministry of Economics and Technology (Bundesministerium für Wirtschaft und Technologie “BMWi”), in •accordance with ERP-EIF Dachfonds agreement.
The Fund is also empowered to issue guarantees in its own name but on behalf and at the risk of the Commission according to the Fiduciary and Management Agreement concluded with the Commission (SME Guarantee Facility). However, the EC programmes are only liable for a contracted percentage of the full signature amounts shown below, up to the limit of the agreed budgetary allocation.

EIF – Financial Statements 239 EIB Group
31.12.2008 EUR
31.12.2007 EUR
Guarantees committed on behalf of the Commission
Under the SMEG 1998 (*)
Drawn 2 400 280 834 2 407 638 575
Undrawn 0 1 664 115
Under the SMEG 2001 (*)
Drawn 4 786 634 503 4 629 662 857
Undrawn 0 276 876 349
Under the SMEG 2007 (*)
Drawn 164 687 322 0
Undrawn 1 144 037 678 0
Investments made on behalf of the Commission (**)
Under ESU 1998:
Net disbursed 55 405 030 55 992 520
Undrawn 4 182 900 8 727 939
Under ESU 2001:
Net disbursed 75 383 481 57 584 408
Undrawn 100 415 809 131 730 410
Under GIF 2007:
Net disbursed 20 470 347 0
Undrawn 118 709 818 10 000 000
Under Seed Capital Action:
Net disbursed 200 000 150 000
Undrawn 0 50 000
Investments made on behalf of the EIB (**)
Under EIB Risk Capital Mandate
Net disbursed 1 454 881 931 1 370 579 363
Undrawn 1 083 389 509 1 242 905 845
Under European Technology Facility
Net disbursed 120 954 616 124 725 313
Undrawn 22 116 482 28 434 532
Investments made on behalf of the External mandators (**)
Under ERP-EIF Dachfond
Net disbursed 71 256 541 47 514 956
Undrawn 91 801 419 72 869 186
11 714 808 220 10 467 106 367
(*) Those amounts are valued based on the valuation method described in note 2.3.(**) Those amounts are valued at current rate. The drawn amounts correspond to the net disbursed. The value adjustment calculation is performed based on the
valuation method described in note 2.3.
• a value adjustment has been estimated at EUR 316 052 706 (2007: EUR 83 639 222) leading to a net adjusted value of EUR 1 259 783 841 (2007: EUR 1 411 665 454), on the investments managed on behalf of the EIB.
• a value adjustment has been estimated at EUR 17 915 276 (2007: EUR 15 172 327) leading to a net adjusted value of EUR 133 343 582 (2007: EUR 98 404 600 estimated amount), on the investments made on behalf of the Commission.
Fiduciary operations concluded pursuant to the Fiduciary and Management Agreements are analysed as follows:
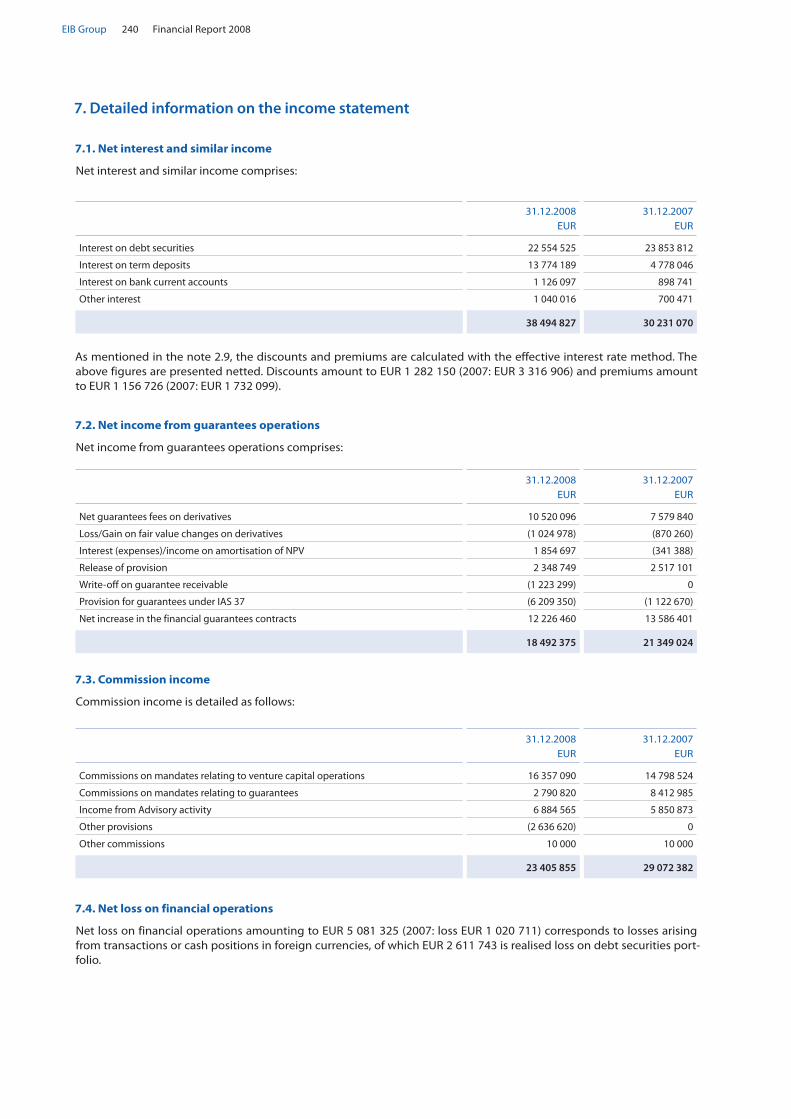
Financial Report 2008240EIB Group
7. Detailed information on the income statement
7.1. Net interest and similar income
Net interest and similar income comprises:
As mentioned in the note 2.9, the discounts and premiums are calculated with the effective interest rate method. The above figures are presented netted. Discounts amount to EUR 1 282 150 (2007: EUR 3 316 906) and premiums amount to EUR 1 156 726 (2007: EUR 1 732 099).
7.2. Net income from guarantees operations
Net income from guarantees operations comprises:
7.4. Net loss on financial operations
Net loss on financial operations amounting to EUR 5 081 325 (2007: loss EUR 1 020 711) corresponds to losses arising from transactions or cash positions in foreign currencies, of which EUR 2 611 743 is realised loss on debt securities port-folio.
7.3. Commission income
Commission income is detailed as follows:
31.12.2008 EUR
31.12.2007 EUR
Interest on debt securities 22 554 525 23 853 812
Interest on term deposits 13 774 189 4 778 046
Interest on bank current accounts 1 126 097 898 741
Other interest 1 040 016 700 471
38 494 827 30 231 070
31.12.2008 EUR
31.12.2007 EUR
Net guarantees fees on derivatives 10 520 096 7 579 840
Loss/Gain on fair value changes on derivatives (1 024 978) (870 260)
Interest (expenses)/income on amortisation of NPV 1 854 697 (341 388)
Release of provision 2 348 749 2 517 101
Write-off on guarantee receivable (1 223 299) 0
Provision for guarantees under IAS 37 (6 209 350) (1 122 670)
Net increase in the financial guarantees contracts 12 226 460 13 586 401
18 492 375 21 349 024
31.12.2008 EUR
31.12.2007 EUR
Commissions on mandates relating to venture capital operations 16 357 090 14 798 524
Commissions on mandates relating to guarantees 2 790 820 8 412 985
Income from Advisory activity 6 884 565 5 850 873
Other provisions (2 636 620) 0
Other commissions 10 000 10 000
23 405 855 29 072 382
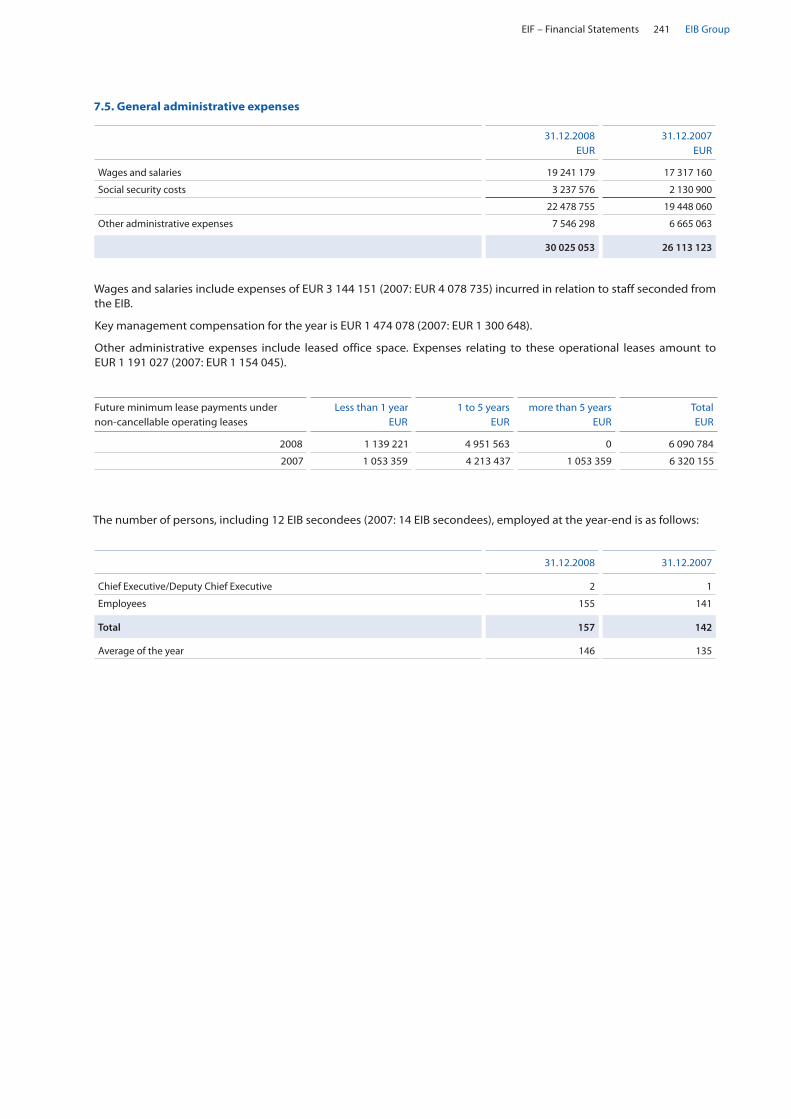
EIF – Financial Statements 241 EIB Group
Wages and salaries include expenses of EUR 3 144 151 (2007: EUR 4 078 735) incurred in relation to staff seconded from the EIB.
Key management compensation for the year is EUR 1 474 078 (2007: EUR 1 300 648).
Other administrative expenses include leased office space. Expenses relating to these operational leases amount to EUR 1 191 027 (2007: EUR 1 154 045).
The number of persons, including 12 EIB secondees (2007: 14 EIB secondees), employed at the year-end is as follows:
7.5. General administrative expenses
31.12.2008 EUR
31.12.2007 EUR
Wages and salaries 19 241 179 17 317 160
Social security costs 3 237 576 2 130 900
22 478 755 19 448 060
Other administrative expenses 7 546 298 6 665 063
30 025 053 26 113 123
31.12.2008 31.12.2007
Chief Executive/Deputy Chief Executive 2 1
Employees 155 141
Total 157 142
Average of the year 146 135
Future minimum lease payments under non-cancellable operating leases
Less than 1 year EUR
1 to 5 years EUR
more than 5 years EUR
Total EUR
2008 1 139 221 4 951 563 0 6 090 784
2007 1 053 359 4 213 437 1 053 359 6 320 155

Financial Report 2008242EIB Group
8. Related parties transactions
The European Investment Bank is the majority owner of the Fund with 63.6 % of the shares. The remaining percentage is held by the European Commission (27.4 % ) and the Financial Institutions (9 % ).
8.1. European Investment Bank
Related party transactions with the European Investment Bank are mainly related to the management by the Fund of the venture capital activity as described in the note 6.3. In addition, the European Investment Bank manages the EIF treasury, the IT, the pension fund and other services on behalf of the Fund. The amounts included in the financial state-ments and relating to the European Investment Bank are disclosed as follows:
31.12.2008 EUR
31.12.2007 EUR
ASSETS
Prepayments and accrued income 388 358 795 703
Other assets 17 801 290 13 294 567
LIABILITIES
Creditors 61 892 84 122
Other provisions 1 148 218 1 482 798
Accruals & deferred income 170 000 180 000
Capital paid in 364 400 000 364 400 000
OFF BALANCE SHEET
Guarantees Drawn 312 976 362 410 445 884
Guarantees undrawn 16 250 000 16 250 000
Assets held for third parties 11 279 987 40 372 364
Investments drawn in venture capital 1 575 836 547 1 495 304 677
Investments undrawn in venture capital 1 105 505 990 1 271 340 376
INCOME
Management fees 8 348 975 8 540 072
EXPENSES
Wages & Salaries 2 402 429 2 928 735
IT expenses 910 454 866 775
Services 1 609 858 1 134 982
Treasury management fees 406 496 337 176

EIF – Financial Statements 243 EIB Group
8.2. Commission of the European Communities
Related party transactions with the Commission are mainly related to the management by the Fund of the venture capi-tal and guarantees activities as described in the note 6.3. In addition, the Commission manages the EC programmes treasury on behalf of the Fund. The amounts included in the financial statements and relating to the Commission of the European Communities are disclosed as follows:
9. Capital management
Even though the EIB Group is not subject to formal supervision, it has generally voluntarily submitted to major EU bank-ing regulations and adopted market “best practice”. In particular, this applies to the new banking regulation (“Basel II”), issued in 2004 by the Basel Committee on Banking Supervision, approved by the EU and the Member States in 2006, and applied in Internal Rating Based EU financial institutions since 1 January 2008 (2006/48/EC as of 14 June 2006).
The implementation of the “Ratings Based Approach (RBA)” for EIF’s guarantee and securitisation exposures and the Sim-ple Risk -weight Approach for EIF’s VC portfolio has been done under the technical assistance of the Commission de Surveillance du Secteur Financier (CSSF) and in close cooperation with EIB.
In addition to the monitoring of Basel II minimum capital requirements, stress tests assess the sensitivity of capital re-quirements to changes in the macroeconomic environment and in the activities of the EIF.
10. Taxation
The Protocol on the Privileges and Immunities of the European Communities, appended to the Treaty of 29 Octo-ber 2004 establishing a Constitution for Europe, applies to the Fund, which means that the assets, revenues and other property of the Fund are exempt from all direct taxes.
31.12.2008 EUR
31.12.2007 EUR
ASSETS
Accounts Receivable 7 582 063 8 078 322
LIABILITIES
Accounts Payable 2 652 671 499 675
Capital paid in 157 200 000 138 200 000
OFF BALANCE SHEET
Guarantees Drawn 7 351 602 659 7 037 301 432
Guarantees undrawn 1 144 037 678 278 540 464
Assets held for third parties 401 814 184 382 745 013
Net disbursed in venture capital 151 458 858 113 726 928
Investments undrawn in venture capital 223 308 528 150 508 348
INCOME
Management fees 7 278 146 11 849 856
EXPENSES
Treasury management fees 138 950 57 528

Financial Report 2008244EIB Group
Please consult the Bank’s website for the updated list of existing offices and their contact details.
EIB Group Addresses
European Investment Bankwww.eib.org - U [email protected]
100, boulevard Konrad Adenauer 3 (+352) 43 79 1L-2950 Luxembourg 5 (+352) 43 77 04
European Investment Fundwww.eif.org - U [email protected]
96, boulevard Konrad Adenauer 3 (+352) 42 66 88 1L-2968 Luxembourg 5 (+352) 42 66 88 200
Printed in Mayenne by Jouve on MagnoSatin paper using vegetable oil-based inks. Certified in accordance with Forest Stew-ardship Council (FSC) rules, the paper consists of 100% virgin fibre (of which at least 50% from well-managed forests).


Volu
me
II
Annual Report 2008
Financial ReportVolume II
E u r o p e a n I n v e s t m e n t B a n k G r o u p • E u r o p e a n I n v e s t m e n t B a n k G r o u p • E u r o p e a n I n v e s t m e n t B a n k G r o u p • E u r o p e a n I n v e s t m e n t B a n k G r o u p
© EIB – 06/2009 – EN QH-AB-09-001-EN- C ISSN 1725-3446
E u r o p e a n I n v e s t m e n t B a n k G r o u p • E u r o p e a n I n v e s t m e n t B a n k G r o u p • E u r o p e a n I n v e s t m e n t B a n k G r o u p • E u r o p e a n I n v e s t m e n t B a n k G r o u p
Annual Report 2008 • Volume II
Ann
ual R
epor
t 200
8