annual report 2011
DESCRIPTION
Company annual report.TRANSCRIPT

1 120 ANNUAL REPORT

FOLLOW US ONLINE AT:
WEBSITE:
APPLIEDMATERIALS.COM
BLOG:
BLOG.AMAT.COM
APPLIED VENTURES, LLC:
APPLIEDMATERIALS.COM/ABOUT/VENTURES

A P P L I E D M AT E R I A L S 2 0 1 1
A N N U A L R E P O R T
Dear Fel low Stockholders ,
In fiscal 2011, Applied Materials posted record financial
results, delivering our highest-ever revenue, operating
cash flow and earnings per share. We increased net sales
by 10 percent from fiscal 2010 to $10.5 billion, generated
operating income of $2.4 billion, and earnings of $1.45
per share. We increased share repurchases by 34 percent
over last year and raised the dividend-per-share payment
by 14 percent. We also announced the largest acquisition
in the company’s history and issued $1.8 billion in senior
unsecured notes while preserving our investment grade
credit rating.
As we look forward, we are confident about the long-term
outlook for our markets as trends in mobility and clean
energy technology, combined with expanding consumer
groups in the emerging economies, drive growth in the
industries we serve. We enter 2012 in a strong financial
position and remain committed to our capital allocation
priorities of making organic and inorganic investments that
provide attractive long-term returns, increasing our dividend
in line with business growth, and using share repurchases as
a preferred means to return excess cash to stockholders.
Shortly after the close of our fiscal year, we completed
our acquisition of Varian Semiconductor Equipment
Associates, Inc. This acquisition extends Applied’s portfolio
with best-in-class ion implantation technology, a market
that represents an annual opportunity approaching $1.5
billion. Global demand for mobile devices is fueling new
innovations in the complex transistors at the heart of next
generation chips. The combination of Applied and Varian
creates the industry leader in transistor technologies.
Together, we will partner with our customers to find
innovative solutions for the smaller, faster, more power-
efficient devices that enable the mobility age.
Silicon Systems Group
These are exciting times in the electronics industry. We
are seeing the long-anticipated convergence of computing,
communications and content. New user interfaces and
open platforms are invigorating innovation throughout the
electronics supply chain. Smartphones and tablets are
fundamentally transforming the way we access and share
information, and while their adoption is still in its early
stages, they are already having an impact on our business
by fueling consumption of NAND Flash memory and driving
demand for advanced application processors.
Our Silicon Systems Group (SSG) delivered a solid
performance in 2011, increasing net sales to $5.4 billion
for the year. We launched 15 new products, refreshing and
extending our product line, while increasing our investment
in next generation technology to keep Moore’s Law alive
for the next decade. In parallel, the industry is preparing to
transition to 450mm wafers in the next five to seven years.
While we remain disciplined in managing our development
expenses, this increasingly complex environment plays
to Applied’s strengths, and we expect to play a key role
in these critical transitions. With our market leading
technology, broad product portfolio and talented team, we
are ideally positioned to grow faster than our markets in the
years ahead.
Display Group
The mobility trend is also evident in the flat panel display
industry. Our Display Group established leadership
positions in the emerging touch panel and high resolution
mobile display equipment markets, which accounted for
approximately one-third of the group’s $699 million of
revenue in 2011.
While mobility expands Applied’s opportunities in display,
the LCD television market remains the most important
driver of capital investment. Although global TV sales
continue to increase, the growth rate has not been sufficient
to drive new capacity additions in the near term, resulting in
one of the deepest equipment downturns in the industry’s
history. At the same time, the industry is entering a period
of incredible innovation. The leading manufacturers are
increasing their focus on improving the consumer’s visual
experience with higher resolution and 3D displays, creating
new equipment opportunities for our chemical vapor
deposition and physical vapor deposition technologies.

A P P L I E D M AT E R I A L S 2 0 1 1
A N N U A L R E P O R T
Applied Global Services
Applied Global Services (AGS) achieved record revenue
of $2.4 billion in 2011 driven by growth in our spare parts
and services businesses. By adopting our service solutions,
customers are able to optimize their factory productivity
and reduce overhead costs. Building on these advantages,
we increased the number of tools we have under service
contract in Asia by approximately 20 percent last year.
Asia is critical to AGS’ success as, over the next 5 years, we
expect 75 percent of global wafer starts will be in the region.
Looking Ahead
This is one of the most exciting periods in Applied
Materials’ history. There are an unprecedented number
of technology and market inflections that present
opportunities for us to collaborate more closely with our
customers and increase our share of the market. Every day
the creativity and hard work of our employees help enable
the global trends in electronics and clean energy that are
improving the lives of people around the world. These
trends provide an incredible platform for us to extend our
technology leadership, grow the company and create value
for our stockholders.
Thank you for supporting our company and our vision.
Sincerely,
Michael R. Splinter
Chairman, President and Chief Executive Officer
December 31, 2011
Energy and Environmental Solutions
2011 was an outstanding year for our Energy and
Environmental Solutions group (EES), with record net sales
of approximately $2 billion and operating income of $453
million. During a period of rapid capacity expansion in the
solar photovoltaic industry, we increased our market share
and delivered solid operating performance, capitalizing on
our strong product portfolio.
We expect double digit growth in panel installations next
year, reinforcing our positive long-term view of growth
in the global solar market. However, we expect weaker
demand for equipment in 2012 as the industry absorbs the
large amounts of capacity shipped over the past three years.
As the solar industry increases manufacturing scale, the
cost-learning curve is accelerating and we are entering
a zone of inflection where solar can compete with retail
electricity rates without subsidies. With module spot
prices approaching $1 per watt, competition between the
panel makers is intensifying, and advanced technology to
raise conversion efficiencies is becoming more important.
As a result, we expect that a large portion of equipment
demand in 2012 will be generated by products that enable
customers to upgrade their lines to increase module
efficiency and reduce cost.

A P P L I E D M AT E R I A L S 2 0 1 1
A N N U A L R E P O R T
This stockholder letter contains forward-looking statements, which are all statements other than those of historical fact, including those regarding Applied’s
performance, market and industry drivers and outlooks, capital allocation strategy, acquisition of Varian, products, R&D, market positions, opportunities, and
business outlooks. These statements are subject to known and unknown risks and uncertainties that could cause actual results to differ materially from those
expressed or implied by such statements, including the level of demand for Applied’s products, which is subject to many factors, such as uncertain global
economic and industry conditions, demand for electronic products and semiconductors, government renewable energy policies and incentives, and customers’
new technology and capacity requirements; Applied’s ability to (i) develop, deliver and support a broad range of products and expand its markets, (ii) plan and
manage its resources and production capability, (iii) successfully integrate Varian’s operations, product lines, technology and employees and realize synergies,
(iv) align its cost structure with business conditions, and (v) attract, motivate and retain key employees; and other risks described in Applied Materials’ SEC
filings. All forward-looking statements are based on management’s estimates, projections and assumptions as of the date hereof, and Applied undertakes no
obligation to update any forward-looking statements.
INDEPENDENT REGISTERED PUBLIC ACCOUNTING FIRMKPMG LLPMountain View, California
NUMBER OF REGISTERED STOCKHOLDERS4,192 (as of November 20, 2011)
STOCK LISTINGApplied Materials, Inc. is traded on The NASDAQ Global Select Market®
NASDAQ Symbol: AMAT
TRANSFER AGENTBy mail:Computershare Trust Company, N.A.Stockholder ServicesPO Box 43078Providence, Rhode Island 02940-3078
Overnight delivery:Computershare Trust Company, N.A.Stockholder Services250 Royall Street, M/S 1ACanton, Massachusetts 02021-1011Tel: (312) 360–5186 or (877) 388–5186Fax: (312) 601–4348Email: [email protected]
S TO C K H O L D E R S ’ I N F O R M AT I O N
INVESTOR CONTACTInvestor RelationsApplied Materials, Inc.3050 Bowers AvenuePO Box 58039, M/S 1261Santa Clara, California 95052–8039Tel: (408) 748–5227 or (800) 882–0373Fax: (408) 563–4606Email: [email protected]
CORPORATE HEADQUARTERSApplied Materials, Inc.3050 Bowers AvenueSanta Clara, California 95054–3298 MAILING ADDRESS AND TELEPHONEApplied Materials, Inc.3050 Bowers AvenuePO Box 58039Santa Clara, California 95052–8039Tel: (408) 727–5555
CORPORATE WEB SITEAdditional information can be found at www.appliedmaterials.com

[THIS PAGE INTENTIONALLY LEFT BLANK]

UNITED STATES SECURITIES AND EXCHANGE COMMISSIONWashington, D.C. 20549
Form 10-K(Mark one)
Í ANNUAL REPORT PURSUANT TO SECTION 13 OR 15(d)OF THE SECURITIES EXCHANGE ACT OF 1934For the fiscal year ended October 30, 2011
or‘ TRANSITION REPORT PURSUANT TO SECTION 13 OR 15(d)
OF THE SECURITIES EXCHANGE ACT OF 1934For the transition period from to
Commission file number 000-06920
Applied Materials, Inc.(Exact name of registrant as specified in its charter)
Delaware 94-1655526(State or other jurisdiction of
incorporation or organization)(I.R.S. Employer
Identification No.)
3050 Bowers Avenue, P.O. Box 58039Santa Clara, California
95052-8039(Zip Code)
(Address of principal executive offices)
Registrant’s telephone number, including area code:(408) 727-5555
Securities registered pursuant to Section 12(b) of the Act:Title of Each Class Name of Each Exchange on Which Registered
Common Stock, par value $.01 per share The NASDAQ Stock Market LLCSecurities registered pursuant to Section 12(g) of the Act:
NoneIndicate by check mark if the registrant is a well-known, seasoned issuer, as defined in Rule 405 of the Securities
Act. Yes Í No ‘Indicate by check mark if the registrant is not required to file reports pursuant to Section 13 or Section 15(d) of the
Act. Yes ‘ No ÍIndicate by check mark whether the registrant (1) has filed all reports required to be filed by Section 13 or 15(d) of the
Securities Exchange Act of 1934 during the preceding 12 months (or for such shorter period that the registrant was required tofile such reports), and (2) has been subject to such filing requirements for the past 90 days. Yes Í No ‘
Indicate by check mark whether the registrant has submitted electronically and posted on its corporate Web site, if any,every Interactive Data File required to be submitted and posted pursuant to Rule 405 of Regulation S-T (§232.405 of this chap-ter) during the preceding 12 months (or for such shorter period that the registrant was required to submit and post suchfiles). Yes Í No ‘
Indicate by check mark if disclosure of delinquent filers pursuant to Item 405 of Regulation S-K (§229.405 of this chapter)is not contained herein, and will not be contained, to the best of registrant’s knowledge, in definitive proxy or informationstatements incorporated by reference in Part III of this Form 10-K or any amendment to this Form 10-K. Í
Indicate by check mark whether the registrant is a large accelerated filer, an accelerated filer, a non-accelerated filer, or asmaller reporting company. See the definitions of “large accelerated filer,” “accelerated filer” and “smaller reporting company”in Rule 12b-2 of the Exchange Act. (Check one):Large accelerated filer Í Accelerated filer ‘ Non-accelerated filer ‘ Smaller reporting company ‘
(Do not check if a smaller reporting company)Indicate by check mark whether the registrant is a shell company (as defined in Rule 12b-2 of the
Act). Yes ‘ No ÍAggregate market value of the voting stock held by non-affiliates of the registrant as of May 1, 2011, based upon the clos-
ing sale price reported by the NASDAQ Global Select Market on that date: $20,652,343,218Number of shares outstanding of the registrant’s Common Stock, $.01 par value, as of November 20, 2011: 1,305,637,099
DOCUMENTS INCORPORATED BY REFERENCE:Portions of the definitive Proxy Statement for Applied Materials, Inc.’s 2012 Annual Meeting of Stockholders are
incorporated by reference into Part III of this Form 10-K.

Caution Regarding Forward-Looking Statements
Certain information in this Annual Report on Form 10-K (report or Form 10-K) of Applied Materials, Inc.and its subsidiaries (Applied or the Company), including “Management’s Discussion and Analysis of FinancialCondition and Results of Operations” in Item 7, is forward-looking in nature. All statements in this report,including those made by the management of Applied, other than statements of historical fact, are forward-looking statements.
Examples of forward-looking statements include statements regarding Applied’s future financial or operat-ing results, cash flows and cash deployment strategies, declaration of dividends, share repurchases, businessstrategies, projected costs, products, competitive positions, management’s plans and objectives for future oper-ations, research and development, growth opportunities, working capital, liquidity, financing plans, investmentportfolio and policies, cost controls, taxes, supply chain, manufacturing, properties, and legal proceedings andclaims; the acquisition of Varian Semiconductor Equipment Associates, Inc. and other businesses; customerdemand and spending; end-use demand; market and industry trends and outlooks; and general economic con-ditions. These forward-looking statements are based on management’s estimates, projections and assumptions asof the date hereof and include the assumptions that underlie such statements. Forward-looking statements maycontain words such as “may,” “will,” “should,” “could,” “would,” “expect,” “plan,” “anticipate,” “believe,”“estimate,” “potential” and “continue,” the negative of these terms, or other comparable terminology. Anyexpectations based on these forward-looking statements are subject to risks and uncertainties and other importantfactors, including those discussed in Part II, Item 1A, “Risk Factors,” below and elsewhere in this report. Otherrisks and uncertainties may be disclosed in Applied’s prior Securities and Exchange Commission (SEC) filings.These and many other factors could affect Applied’s future financial condition and operating results and couldcause actual results to differ materially from expectations based on forward-looking statements made in thisdocument or elsewhere by Applied or on its behalf. Applied undertakes no obligation to revise or update anyforward-looking statements.
The following information should be read in conjunction with the Consolidated Financial Statements andthe accompanying Notes to Consolidated Financial Statements included in this report.
2

APPLIED MATERIALS, INC.
FORM 10-K FOR THE FISCAL YEAR ENDED OCTOBER 30, 2011
TABLE OF CONTENTS
Page
PART IItem 1: Business . . . . . . . . . . . . . . . . . . . . . . . . . . . . . . . . . . . . . . . . . . . . . . . . . . . . . . . . . . . . . . . . . . . . . 4Item 1A: Risk Factors . . . . . . . . . . . . . . . . . . . . . . . . . . . . . . . . . . . . . . . . . . . . . . . . . . . . . . . . . . . . . . . . . . 19Item 1B: Unresolved Staff Comments . . . . . . . . . . . . . . . . . . . . . . . . . . . . . . . . . . . . . . . . . . . . . . . . . . . . . 32Item 2: Properties . . . . . . . . . . . . . . . . . . . . . . . . . . . . . . . . . . . . . . . . . . . . . . . . . . . . . . . . . . . . . . . . . . . . 33Item 3: Legal Proceedings . . . . . . . . . . . . . . . . . . . . . . . . . . . . . . . . . . . . . . . . . . . . . . . . . . . . . . . . . . . . . 34Item 4: Removed and Reserved . . . . . . . . . . . . . . . . . . . . . . . . . . . . . . . . . . . . . . . . . . . . . . . . . . . . . . . . . 34
PART IIItem 5: Market for Registrant’s Common Equity, Related Stockholder Matters and Issuer Purchases of
Equity Securities . . . . . . . . . . . . . . . . . . . . . . . . . . . . . . . . . . . . . . . . . . . . . . . . . . . . . . . . . . . . . . 35Item 6: Selected Financial Data . . . . . . . . . . . . . . . . . . . . . . . . . . . . . . . . . . . . . . . . . . . . . . . . . . . . . . . . . 38Item 7: Management’s Discussion and Analysis of Financial Condition and Results of Operations . . . . 39Item 7A: Quantitative and Qualitative Disclosures About Market Risk . . . . . . . . . . . . . . . . . . . . . . . . . . . . 63Item 8: Financial Statements and Supplementary Data . . . . . . . . . . . . . . . . . . . . . . . . . . . . . . . . . . . . . . . 63Item 9: Changes in and Disagreements with Accountants on Accounting and Financial Disclosure . . . . 63Item 9A: Controls and Procedures . . . . . . . . . . . . . . . . . . . . . . . . . . . . . . . . . . . . . . . . . . . . . . . . . . . . . . . . 63Item 9B: Other Information . . . . . . . . . . . . . . . . . . . . . . . . . . . . . . . . . . . . . . . . . . . . . . . . . . . . . . . . . . . . . 64
PART IIIItem 10: Directors, Executive Officers and Corporate Governance . . . . . . . . . . . . . . . . . . . . . . . . . . . . . . 66Item 11: Executive Compensation . . . . . . . . . . . . . . . . . . . . . . . . . . . . . . . . . . . . . . . . . . . . . . . . . . . . . . . . 66Item 12: Security Ownership of Certain Beneficial Owners and Management and Related Stockholder
Matters . . . . . . . . . . . . . . . . . . . . . . . . . . . . . . . . . . . . . . . . . . . . . . . . . . . . . . . . . . . . . . . . . . . . . . 67Item 13: Certain Relationships and Related Transactions, and Director Independence . . . . . . . . . . . . . . . 68Item 14: Principal Accounting Fees and Services . . . . . . . . . . . . . . . . . . . . . . . . . . . . . . . . . . . . . . . . . . . . 68
PART IVItem 15: Exhibits and Financial Statement Schedules . . . . . . . . . . . . . . . . . . . . . . . . . . . . . . . . . . . . . . . . . 69
Signatures . . . . . . . . . . . . . . . . . . . . . . . . . . . . . . . . . . . . . . . . . . . . . . . . . . . . . . . . . . . . . . . . . . . . 122
3

PART I
Item 1: Business
Incorporated in 1967, Applied, a Delaware corporation, provides manufacturing equipment, services andsoftware to the global semiconductor, flat panel display, solar photovoltaic (PV) and related industries. Applied’scustomers include manufacturers of semiconductor wafers and chips, flat panel liquid crystal displays (LCDs),solar PV cells and modules, and other electronic devices. These customers may use what they manufacture intheir own end products or sell the items to other companies for use in advanced electronic components. TheCompany’s fiscal year ends on the last Sunday in October.
Applied is the world’s largest semiconductor fabrication equipment supplier based on revenue, with thecapability to provide global deployment and support services. Applied also is the leading supplier of LCD fab-rication equipment to the flat panel display industry, and the leading supplier of solar PV manufacturing systemsto the solar industry, based on revenue.
Applied operates in four reportable segments: Silicon Systems Group, Applied Global Services, Display,and Energy and Environmental Solutions. Applied manages its business based upon these segments. A summaryof financial information for each reportable segment is found in Note 16 of Notes to Consolidated FinancialStatements. A discussion of factors that could affect Applied’s operations is set forth under “Risk Factors” inItem 1A, which is incorporated herein by reference.
Silicon Systems Group Segment
Applied’s Silicon Systems Group segment develops, manufactures and sells a wide range of manufacturingequipment used to fabricate semiconductor chips, also referred to as integrated circuits (ICs). Most chips are builton a silicon wafer base and include a variety of circuit components, such as transistors and other devices, that areconnected by multiple layers of wiring (interconnects). Applied offers systems that perform most of the primaryprocesses used in chip fabrication, including atomic layer deposition (ALD), chemical vapor deposition (CVD),physical vapor deposition (PVD), electrochemical deposition (ECD), rapid thermal processing (RTP), chemicalmechanical planarization (CMP), wet cleaning, and wafer metrology and inspection, as well as systems that etchor inspect circuit patterns on masks used in the photolithography process. Applied’s semiconductor manufactur-ing systems are used by integrated device manufacturers and foundries to build and package memory, logic andother types of chips.
Most chips currently are fabricated using 45 nanometer (nm) and larger linewidth dimensions, althoughApplied is also working with customers on leading-edge technology for advanced nodes using 32nm, 22nm andsmaller dimensions. To build a chip, the transistors, capacitors and other circuit components are first created onthe surface of the wafer by performing a series of processes to deposit and selectively remove portions of succes-sive film layers. Similar processes are then used to build the layers of wiring structures on the wafer. As the den-sity of the circuit components increases to enable greater computing capability in the same or smaller physicalarea, the complexity of building the chip also increases, necessitating more process steps to form smaller struc-tures and more intricate wiring schemes. A typical, simplified process sequence for building the wiring or inter-connect portion of a chip involves initially depositing a dielectric film layer onto the base layer of circuitcomponents using a CVD system. An etch system is then used to create openings and patterns in the dielectriclayer. To form the metal interconnects, these openings and patterns are filled with conducting material usingPVD and ECD technologies. A CMP step then polishes the wafer to achieve a flat surface. Additional deposition,etch and CMP steps are then performed to build up the layers needed to complete the interconnection of the cir-cuit elements. Advanced chip designs require more than 500 steps involving these and other processes to com-plete the manufacturing cycle.
While some device manufacturers are still using aluminum as the main conducting material for buildinginterconnect structures, most have transitioned to copper. Copper has lower resistance than aluminum and cancarry more current in a smaller area. Applied is the leading supplier of systems for manufacturing copper-basedchips, including equipment for depositing, etching and planarizing copper interconnect layers. Complementing
4

the transition to copper to improve chip speed is the use of low dielectric constant (low k) films to replace silicondioxide material as the insulator between the copper wiring structures. Applied also leads the industry in provid-ing systems for depositing low k dielectric films.
The transistor is another key area of the chip where semiconductor manufacturers are improving their devicedesigns to enhance performance. Applied has the industry’s largest portfolio of technically advanced products forbuilding smaller and faster transistors. One method of enhancing chip performance is strain engineering, a tech-nique that stretches or compresses the space between atoms, allowing electrical current to flow more quickly.Multiple strain films are typically used in advanced devices since they have an additive effect on increasing tran-sistor speed. Applied has a comprehensive portfolio of systems to enable these applications using CVD and epi-taxial deposition technologies.
Major chipmakers are integrating new high dielectric constant (high-k) and metal materials and processes intheir transistor gate structures to increase chip performance and reduce power consumption. Applied has a com-prehensive portfolio of fully characterized processes for building these high-k/metal gates. These solutionsinclude an integrated dielectric gate stack tool that combines four critical processes in a single system, a portfolioof metallization technologies using ALD and PVD, and an innovative high temperature etch system.
A new type of chip packaging is also emerging, known as three-dimensional (3D) ICs, as new consumerproducts demand higher performance in a smaller space. Providing greater functionality in a smaller footprint,3D-ICs stack multiple chips together and electrically connect them using deep holes, called through-silicon via(TSV) structures. Applied has the industry’s most comprehensive line of production-proven systems and proc-esses required for the majority of advanced packaging manufacturing steps, including etch, CVD, PVD, ECD,wafer cleaning and CMP systems. To facilitate the adoption of packaging technology, Applied is working withconsortiums and other equipment suppliers to lower customers’ implementation costs.
Some chip manufacturers have announced that they will be employing the new 3D manufacturing methodsto enhance chip performance. One method is based on new 3D transistor designs that replace the traditionaltwo-dimensional gate with a thin 3D gate. This new structure, targeted for the 22nm technology node and below,improves the performance and energy efficiency of the chip. In 2011, the Company introduced the Applied Cen-tura Conforma™ system, which uses conformal plasma doping technology to modify the electrical properties of3D and planar transistor structures.
Most of Applied’s semiconductor equipment products are single-wafer systems with multiple processchambers attached to a base platform. This enables each wafer to be processed separately in its own environment,allowing precise process control, while the system’s multiple chambers enable simultaneous, high productivitymanufacturing. Applied sells most of its single-wafer, multi-chamber systems on five basic platforms: the Cen-tura®, Endura®, Producer®, Raider® and Vantage® platforms. These platforms support ALD, CVD, PVD, ECD,etch and RTP technologies.
Over time, the semiconductor industry has migrated to increasingly larger wafers to build chips. The predom-inant or common wafer size used today for volume production of advanced chips is 300 millimeter (mm), or12-inch, wafers. Applied offers a comprehensive range of 300mm systems through its Silicon Systems Groupsegment. Applied also offers earlier-generation 200mm systems, as well as products and services to support all ofits systems, which are reported under its Applied Global Services segment.
The following summarizes Applied’s portfolio of products and their associated process technology areasreported under its Silicon Systems Group segment.
Deposition
Deposition is a fundamental step in fabricating a chip. During deposition, layers of dielectric (an insulator),barrier, or electrically conductive (typically metal) films are deposited or grown on a wafer. Applied currentlyprovides equipment to perform four types of deposition: ALD, CVD, ECD and PVD. In addition, Applied’s RTPsystems can be used to perform certain types of dielectric deposition.
5
Atomic Layer Deposition
ALD is an advanced technology in which atoms are deposited one layer at a time to build chip structures.This technology enables customers to fabricate thin films of either conducting or insulating material with uni-form coverage in nanometer-sized structures. One of the most critical areas of the transistor is its gate, which isbuilt by depositing layers of dielectric films. At the 22nm node and below, these film layers are so thin that theymust be atomically engineered. To meet this challenge, in 2011, Applied introduced its Applied CenturaIntegrated Gate Stack system with advanced ALD technology. The system builds ultrathin high-k film layers lessthan 2nm in thickness — about one hundred thousandth the width of a human hair.
Chemical Vapor Deposition
CVD is used to deposit dielectric and metal films on a wafer. During the CVD process, gases that containatoms of the material to be deposited react on the wafer surface, forming a thin film of solid material. Filmsdeposited by CVD may be silicon oxide, single-crystal epitaxial silicon, amorphous silicon, silicon nitride,dielectric anti-reflective coatings, low k dielectric (for highly efficient insulating materials), aluminum, titanium,titanium nitride, polysilicon, tungsten, refractory metals or silicides. Applied offers the following CVD productsand technologies:
The Applied Producer CVD platform — This high-throughput platform features Twin-Chamber®
modules that have two single-wafer process chambers per unit. Up to three Twin-Chamber modules can bemounted on each Producer platform, giving it a simultaneous processing capacity of six wafers. Manydielectric CVD processes can be performed on this platform. The highest productivity model of this systemis the Applied Producer GT, which has achieved rapid customer acceptance due to its fast wafer handlingperformance and compact design.
Low k Dielectric Films — Low k dielectric materials are used in copper-based chip designs to furtherimprove interconnect speed. Using conventional CVD equipment, the Applied Producer Black Diamond®
family of low k systems provides customers with a proven, cost-effective way to integrate a variety of low kfilms into advanced interconnect structures. In 2011, the Company introduced its third-generation low ktechnologies, the Applied Producer Black Diamond 3 system and Applied Producer Nanocure 3 system.Together, these products are designed to enable smaller, higher performance and more power-efficientdevices at 22nm and below.
Lithography-Enabling Solutions — Applied offers several technologies on the Producer system to helpchipmakers extend their current 193nm lithography tools, including a line of Applied APF® (advanced pat-terning film) films and Applied DARC® (dielectric anti-reflective coating) films. Together, they provide afilm stack with the precise dimensional control and compatibility needed to cost-effectively pattern nano-scale features without additional integration complexity.
Gap Fill Films — There are many steps during the chipmaking process in which very small and deep,or high aspect ratio (HAR), structures must be filled void-free with a dielectric film. Many of these applica-tions include the deposition of silicon oxides in substrate isolation structures, contacts and interconnects. Inaddition to its Applied Centura Ultima HDP-CVD® (high-density plasma CVD) and Applied ProducerHARP™ (high aspect ratio process) systems, the Company offers its breakthrough Applied ProducerEterna™ FCVD system. Targeted for 20nm and below chips, the Eterna system delivers a liquid-like filmthat flows freely into virtually any structure to provide void-free dielectric fill.
Strain Engineering Solutions — The Applied Producer HARP system also plays a key role in enhanc-ing transistor performance, enabling chipmakers to boost chip speed by depositing strain-inducing dielectricfilms. Offering the industry’s first integrated stress nitride deposition and ultraviolet (UV) cure solution, theApplied Producer Celera CVD delivers benchmark levels of high-stress tensile silicon nitride films. TheCompany also offers the Applied Centura SiNgenPlus low pressure CVD system for low temperature siliconnitride films. Used together, and in conjunction with silicon germanium (SiGe) films using Applied’sepitaxial deposition technologies, these systems can provide additive strain engineering benefits.
6
Through-Silicon Via Films — The Company has a comprehensive portfolio of products for TSV fab-rication, including the Applied Producer InVia™ system. This product uses a unique process to deposit thecritical oxide liner film layer in HAR TSV structures, enabling robust electrical isolation of the TSV, whichis vital for reliable device performance. For applications where higher temperatures can damage the manu-facturing process, the Applied Producer Avila™ CVD system allows high quality dielectric film depositionat stable substrate temperatures at a low cost of ownership.
Epitaxial Deposition — Epitaxial silicon (epitaxy or epi) is a layer of pure silicon grown in a uniformcrystalline structure on the wafer to form a high quality base for the device circuitry. Epi technology is usedin an increasing number of integrated circuit devices in both the wafer substrate and transistor areas of achip to enhance speed. The Applied Centura Epi system integrates pre- and post-epi processes on the samesystem to improve film quality and reduce production costs. This system is also used for SiGe epi technol-ogy, which reduces power usage and increases speed in certain types of advanced chips. For emerging tran-sistor designs, the Applied Centura RP Epi system offers selective epi processes to enable faster transistorswitching through strain engineering techniques.
Polysilicon Deposition — Polysilicon is a type of silicon used to form portions of the transistor struc-ture within the integrated circuit device. The Applied Centura Polygen™ LPCVD system is a single-wafer,multi-chamber product that deposits thin polysilicon films at high temperatures to create transistor gatestructures. To address the challenging requirements of shrinking gate dimensions, the Applied Centura DPNGate Stack system integrates chambers for decoupled plasma nitridation (DPN), RTP anneal and polysilicondeposition on one platform to enable superior film quality and material properties.
Tungsten Deposition — Tungsten is used in the contact area of a chip that connects the transistors tothe wiring circuitry. In aluminum-based devices, tungsten is also used in the structures that connect themultiple layers of aluminum wiring. Applied has two products for depositing tungsten: the Applied CenturaSprint® Tungsten CVD system for 90nm and below devices and the Applied Centura iSprint ALD/CVDsystem for more advanced applications. The latter product combines ALD technology and CVD chamberson the same platform.
Electrochemical Deposition
Electrochemical deposition is a process by which metal atoms from a chemical fluid (an electrolyte) aredeposited on the surface of an immersed object. Its main application in the semiconductor industry is to depositcopper in interconnect wiring structures. This process step follows the deposition of barrier and seed layers whichprevent the copper from contaminating other areas of the device, improve the adhesion of the copper film andenable electrodeposition to occur. Applied offers two ECD systems: the Applied Raider GT ECD for electro-plating advanced chip interconnect structures, and the Applied Raider S ECD for advanced TSV packagingapplications.
Physical Vapor Deposition
PVD is a physical process in which atoms of a gas, such as argon, are accelerated toward a metal target. Themetal atoms chip off, or sputter away, and are then deposited on the wafer. The Applied Endura PVD systemoffers a broad range of advanced metal deposition processes, including aluminum, aluminum alloys, cobalt, tita-nium/titanium nitride, tantalum/tantalum nitride, tungsten/tungsten nitride, nickel, vanadium and copper. In 2010,Applied celebrated the 20th year of its Applied Endura platform, the most successful metal deposition system inthe history of the semiconductor industry.
The Applied Endura CuBS (copper barrier/seed) PVD system is widely used by customers for fabricatingcopper-based chips. Using PVD technology, the system deposits a tantalum-based barrier film that preventscopper material from entering other areas of the device and then a copper seed layer that primes the structure forthe subsequent deposition of bulk copper. The Applied Endura CuBS RFX PVD system extends cost-effectiveCuBS technology to the 22nm node. The Applied Endura Avenir™ RF PVD system sequentially deposits the
7
multiple metal film layers that form the heart of the industry’s new, faster, metal gate transistors. The AppliedEndura iLB PVD/ALD system advances the state-of-the-art in ALD technology, enabling customers to shrinktheir speed-critical contact structures for 20nm and below devices.
Applied’s Endura system has also been used for many years in back-end applications to deposit metal layersbefore final bump or wire bonding packaging steps are performed. The Applied Charger™ UBM PVD system,which is specifically designed for under-bump metallization (UBM) and other back-end processes, features lineararchitecture for reliable performance and very high productivity at a low cost per wafer.
Etch
Etching is used many times throughout the integrated circuit manufacturing process to selectively removematerial from the surface of a wafer. Before etching begins, the wafer is coated with a light-sensitive film, calledphotoresist. A photolithography process then projects the circuit pattern onto the wafer. Etching removes materialonly from areas dictated by the photoresist pattern. Applied offers a wide range of systems for etching dielectric,metal and silicon films to meet the requirements of advanced processing.
Applied’s Producer Etch system utilizes the Twin-Chamber Producer platform to target cost-sensitive dielec-tric etch applications. To address advanced dielectric etch applications, the Applied Centura Enabler® E5 Etchsystem enables customers to create the 40:1 HAR contact features that are critical to the yield and performance of32nm and below DRAM and Flash memory chips. The Applied Centura Carina™ system uses innovative, high-temperature technology to deliver the etch capability essential for scaling logic and memory devices with high-k/metal gates at 45nm and below.
In 2011, the Company introduced its Applied Centris AdvantEdge™ Mesa™ silicon etch, which features anunprecedented eight process chambers for high wafer output and proprietary system intelligence software toassure every process on every chamber precisely matches. The system also saves on power, water and gas con-sumption, helping customers to lower operating costs and support their sustainable manufacturing initiatives. TheApplied Centura Mariana™ Trench Etch system provides customers with the capability to scale DRAM capaci-tors by enabling the etching of 80:1 aspect ratio structures. The Applied Centura Silvia™ system is specificallydesigned for etching small, deep holes for TSV applications in 3D-ICs. For etching metals, the Applied Opus™
AdvantEdge Metal Etch uses an optimized 5-chamber platform configuration that enables customers to extendaluminum interconnect technology and productivity for flash and DRAM memory applications.
Rapid Thermal Processing
RTP is a process in which a wafer is subjected to rapid bursts of intense heat that can take the wafer fromroom temperature to more than 1,000 degrees Celsius in less than 10 seconds. A rapid thermal process is usedmainly for annealing, which modifies the properties of deposited films. The Applied Centura Radiance®Plus andApplied Vantage RadOx™ RTP systems feature advanced RTP technology with differing platform designs.While the multi-chamber Centura platform offers exceptional process flexibility, the streamlined two-chamberVantage platform is designed for dedicated high-volume manufacturing. These single-wafer RTP systems arealso used for growing high quality oxide and oxynitride films, deposition steps that traditional large batch furna-ces can no longer achieve with the necessary precision and control.
Applied’s latest RTP systems address the critical need for controlling wafer temperature to increase chipperformance and yield. The laser-based Applied Vantage Astra™ millisecond anneal system abruptly raises thesurface temperature of the wafer locally to modify material properties at the atomic level. In 2011, the Companyintroduced the Applied Vantage Vulcan system, the first RTP system to heat the wafer entirely from the back-side. This system brings a new level of precision and control to the anneal process, allowing chipmakers to pro-duce more high performance devices per wafer.
Chemical Mechanical Planarization
The CMP process removes material from a wafer to create a flat (planarized) surface. This process allowssubsequent photolithography patterning steps to occur with greater accuracy and enables film layers to build with
8

minimal height variations. Applied has led the industry with its 300mm Applied Reflexion® LK system, withfeatures such as integrated cleaning, film measurement and process control capabilities. Applied’s latest CMPproduct, the Applied Reflexion GT system, has an innovative dual-wafer design that increases performance whilelowering system cost of ownership in fabricating copper interconnects and tungsten contacts.
Surface Preparation
Cleaning the surface of the wafer is critical to the adhesion and quality of films that are subsequentlydeposited in the chip fabrication process. Applied offers several surface preparation systems. The Applied RaiderSP can incorporate several types of cleaning methods, including spray, vapor, immersion, megasonics and annealtechnologies with automated single or dual-side wafer processing for high volume manufacturing.
Metrology and Wafer Inspection
Applied offers several products for measuring features and inspecting defects on the wafer during variousstages of the fabrication process. These systems enable customers to characterize and control critical dimension(CD) and defect issues, especially at advanced generation technology nodes.
Critical Dimension and Defect Review Scanning Electron Microscopes (CD-SEMs and DR-SEMs)
Scanning electron microscopes (SEMs) use an electron beam to form images of microscopic features of apatterned wafer at extremely high magnification. Applied’s SEM products provide customers with full automa-tion, along with the high accuracy and sensitivity needed for measuring very small CDs. The Applied Ver-itySEM® 4i metrology system uses proprietary SEM imaging technology to enable precise control of thelithography and etching processes, measuring CDs at a precision of less than 0.3nm. Applied’s OPC Check™
software for the VeritySEM system performs automated qualification of OPC-based (optical proximity correc-tion) chip designs, significantly reducing mask (see Mask Making section below) verification time over conven-tional manual methods.
DR-SEMs review defects on the wafer (such as particles, scratches or residues) that are first located by adefect detection system and then classify the defects to identify their source. The high-throughput, fully auto-matic Applied SEMVision™ Defect Analysis products enable customers to use this technology as an integral partof their production lines to analyze defects as small as 30nm with industry-leading throughput.
Wafer Inspection
Using deep ultraviolet (DUV) laser-based technology, defects can be detected on patterned wafers (waferswith printed circuit images) as they move between processing steps. Defects include particles, open circuit lines,and shorts between lines. The Applied UVision® 4 wafer inspection system detects yield-limiting defects in thecritical patterning layers of 22nm and below logic and memory devices. In 2011, the Company introduced theApplied DFinder system, the first darkfield wafer inspection system to use DUV laser scanning to detect particlesas small as 40nm in interconnect layers.
Mask Making
Masks are used by photolithography systems to transfer microscopic circuit designs onto wafers. Since animperfection in a mask may be replicated on the wafer, the mask must be virtually defect-free. Applied providessystems for etching and inspecting masks.
The Applied Centura Tetra™ X Advanced Reticle Etch system is an advanced etch tool for fabricatingleading-edge masks at 22nm and below. Applied’s Tetra line of systems has been used by mask makers world-wide to etch the majority of high-end masks over the last five years. The Company also addresses the challengesof detecting defects on 22nm masks with its Applied Aera3™ Mask inspection system. Using sophisticated aerialimaging technology, the Aera3 allows users to immediately see how the pattern on the mask will appear on the
9

wafer, revealing only the defects most likely to print and significantly reducing inspection time. These systemsalso address the challenge of fabricating emerging extreme ultraviolet (EUV) lithography masks.
Ion Implantation
With the acquisition of Varian Semiconductor Associates, Inc. (Varian) in November 2011, Applied beganto design, market, manufacture and service ion implantation systems. These systems are primarily used in themanufacture of transistors, which are a basic building block of ICs or microchips. Ion implantation systems cre-ate a beam of electrically charged particles called ions, which are implanted into transistor structures at preciselocations and depths, changing the electrical properties of the semiconductor device. These implantation systemsmay also be used in other areas of IC manufacture for modifying the material properties of the semiconductordevices, as well as in manufacturing crystalline-silicon solar cells and light-emitting diodes (LEDs).
Applied Global Services Segment
The Applied Global Services segment encompasses products and services designed to improve the perform-ance and productivity, and reduce the environmental impact, of the fab operations of semiconductor, LCD andsolar PV manufacturers. The in-depth expertise and best known methods of Applied’s extensive global supportinfrastructure enable Applied to continuously support customers’ production requirements. Trained customerengineers and process support engineers are deployed in more than a dozen countries. These engineers are usu-ally located at or near customers’ fab sites and service over 37,000 installed Applied systems, as well asnon-Applied systems. Applied offers the following general types of services and products:
Fab and Equipment Services — Applied offers a portfolio of fab-wide operations services to maintain andoptimize customers’ fabrication facilities. Applied Performance Services offers customers comprehensiveequipment support with performance-based pricing and predictable costs to enable improved cost of ownership.Included in this program is Applied’s ExpertConnect remote diagnostic capability, providing expert supportaround the clock.
Applied also offers its Total Parts Management program with spare parts manufactured to Applied’s stricttechnical specifications and quality standards.
In addition to advanced 300mm fabs, Applied offers a wide range of products and services to extend theproductive life of 200mm semiconductor fabs, including new and remanufactured 200mm equipment, systemenhancements and fab transition services. Designed to maximize productivity and lower cost of ownership, theseproducts also assist customers in implementing green manufacturing solutions. Applied’s 200mm systems areavailable in a broad range of production-proven technologies, including CVD, PVD, etch, implant, RTP, CMP,epitaxy, metrology and inspection tools.
Automation Systems — Applied offers automated factory-level and tool-level control software systems forsemiconductor, LCD and solar PV manufacturing facilities. These enterprise solutions include manufacturingexecution systems (MES) to automate the production of wafers and LCD and solar substrates, advanced processcontrol systems, and scheduling and materials handling control systems. The Applied SmartFactory™ MES soft-ware is a factory automation solution designed to help accelerate the production ramp of emerging technologiesfor solar PV, chip-packaging, and LED applications.
Applied also offers computerized maintenance management systems, performance tracking and modelingand simulation tools for improving asset utilization. Applied’s E3™ equipment engineering system solution, forexample, integrates all critical equipment automation and process control components. The AppliedSmartSched™ system is the semiconductor industry’s first predictive scheduling solution for optimizing themovement of wafers during the lithography process to reduce cycle time and increase tool utilization.
Thin Film Solar — As a result of Applied’s restructuring of its Energy and Environmental Solutions seg-ment in fiscal 2010, the Company discontinued sales to new customers of its fully-integrated SunFab™ thin filmsolar production lines, but continues to support existing SunFab customers with services, upgrades and capacity
10

increases through the Applied Global Services segment. Thin film solar technologies are well-suited for large-scale applications, such as utility scale solar farms and commercial rooftops, where space is not a constraint.
Display Segment
Applied’s products for manufacturing thin film transistor liquid crystal displays (TFT- LCDs) for tele-visions, personal computers (PCs), tablet PCs, smartphones and other consumer-oriented electronic applicationsare reported under its Display segment. While similarities exist between the technologies utilized in chipmakingand LCD fabrication, the most significant differences are in the size and composition of the substrate. Substratesused to manufacture LCD panels can be more than 120 times larger in area than 300mm wafers and are made ofglass, while wafers are made of silicon.
Applied supplies a wide range of systems that process and test different glass substrate sizes. To meet con-sumer demand for larger, more cost-effective LCD TVs, Applied’s latest generation (Gen) 10 systems can proc-ess substrates sized at approximately 2.85 x 3.05 meters, with each substrate enabling the production of up to six65-inch LCD TV screens. Applied is also extending its core LCD equipment technology into new mobility dis-play segments that require smaller, high-performance LCD or organic LED (OLED) screens and touch capa-bility.
For fabricating the transistor layer of these panels, Applied offers a line of plasma-enhanced CVD (PECVD)systems that use multi-chamber platform architecture to deposit dielectric and semiconducting films. In 2011, theCompany introduced the Applied AKT-20K PX PECVD system for manufacturing high-performance LCD andOLED displays for advanced smartphones and tablet PC products. The system deposits highly-uniformlow-temperature polysilicon (LTPS) films on 1.95m2 glass sheets that are three times larger than the previousstandard size, enabling larger, higher resolution screen sizes compared to previous-generation mobile products.
The AKT-PiVot™ 55KV system employs high-productivity, cost-efficient PVD technology to deposit metaland transparent conductive oxide films on the substrate. For manufacturing the color filter of LCD panels,Applied offers the AKT-NEW ARISTO™ for transparent conductive oxide film deposition. Providing customerswith new levels of productivity and flexibility, the Company introduced in 2011 the Applied AKT-AristoTwinsystem for manufacturing touch-enabled displays. The system features two independent processing tracks on asingle system, enabling customers to achieve 50% more capacity using half the manufacturing space.
To complement these systems, Applied also offers a line of electron beam test (EBT) systems for testingsubstrates during production for defective pixels and other imperfections, including the Gen-10 AKT-90K EBTproduct. Featuring one of the industry’s fastest and most accurate pixel test technologies with the lowest operat-ing cost, the EBT systems’ non-contact test technology enables the safe testing of high-value LCD TV panelswithout damaging or scratching the display.
Energy and Environmental Solutions Segment
The Energy and Environmental Solutions segment includes manufacturing systems to produce products forthe generation and conservation of energy. To increase the conversion efficiency and yields of solar PV devicesand help reduce the cost per watt of solar-generated electricity, Applied offers manufacturing solutions for wafer-based crystalline silicon (c-Si) applications.
Applied’s portfolio of solar PV wafer and cell fabrication technologies has made it the leading supplier ofc-Si equipment worldwide in terms of revenue. In addition to innovative technology, these systems offer keymanufacturing benefits to customers in high productivity, advanced ultra-thin wafer handling, and extensiveautomation.
Wafer manufacturing — Applied’s precision wafering systems crop and square silicon ingots into bricks andslice silicon bricks into thin wafers with high productivity and minimal silicon loss. These wafers are sub-sequently processed by cell manufacturing systems to create the PV cells used in making c-Si solar panels. The
11

Applied HCT wire saw cropper and squarer systems cut silicon ingots into bricks with high productivity andminimal silicon loss. The Applied HCT B5 wire saw, a leading wafer slicing system, was designed for large loadcapacity in volume manufacturing and has a unique four-position architecture that provides the load flexibilityfor optimizing yield and productivity.
Cell manufacturing — Applied offers a comprehensive line of automated metallization and test systems forc-Si cell manufacturing with its Applied Baccini products. These systems include high-precision printing capa-bility for increasing the efficiency of c-Si solar cells. In 2011, the Company introduced the Applied BacciniPegaso™ platform for next-generation solar cell manufacturing. In addition to increased yield and output, a keyfeature of the Pegaso system is its proprietary “smart” capabilities which bring a new level of precision and con-trol to the cell manufacturing process. The system’s modular architecture allows customers to rapidly add mod-ules for additional processing capability, reducing the time, cost and risk of implementing new cell designs.
Other products offered under the Energy and Environmental Solutions segment include roll-to-roll, vacuumweb coating systems for high-performance deposition of a range of films on flexible substrates for functional,aesthetic or optical properties. The Applied TopMet™ 4450, is the world’s largest and fastest roll-to-roll machinefor depositing ultra-thin aluminum films for flexible packaging applications. The Applied SmartWeb™ systemuses PVD technology to deposit critical multi-layer films required for fabricating advanced touch panels inmobile devices and other flexible electronic substrates. The system’s modular design allows up to 12 differentthin film layers to be deposited simultaneously on flexible material, enabling complex structures to be created ina single pass.
Backlog
Applied manufactures systems to meet demand represented by order backlog and customer commitments.Backlog consists of: (1) orders for which written authorizations have been accepted and assigned shipment datesare within the next 12 months, or shipment has occurred but revenue has not been recognized; (2) contractualservice revenue and maintenance fees to be earned within the next 12 months; and (3) orders for SunFab linesthat are anticipated to be recognized as revenue within the next 12 months. Applied’s backlog at any particulartime is not necessarily indicative of actual sales for any future periods, due to the potential for customer changesin delivery schedules or cancellation of orders.
Applied’s backlog decreased from $3.2 billion at October 31, 2010 to $2.4 billion at October 30, 2011.Applied’s backlog on any particular date is not necessarily indicative of actual sales for any succeeding period.Customers may delay delivery of products or cancel orders prior to shipment, subject to possible cancellationpenalties. Delays in delivery schedules and/or a reduction of backlog during any particular period could have amaterial adverse effect on Applied’s business and results of operations.
Manufacturing, Raw Materials and Supplies
Applied’s manufacturing activities consist primarily of assembly, test and integration of various proprietaryand commercial parts, components and subassemblies (collectively, parts) that are used to manufacture systems.Applied has implemented a distributed manufacturing model under which manufacturing and supply chain activ-ities are conducted in various countries, including the United States, Europe, Israel, Singapore, Taiwan and othercountries in Asia, and assembly of some systems is completed at customer sites. Applied uses numerous vendors,including contract manufacturers, to supply parts and assembly services for the manufacture and support of itsproducts. Although Applied makes reasonable efforts to assure that parts are available from multiple qualifiedsuppliers, this is not always possible. Accordingly, some key parts may be obtained from only a single supplier ora limited group of suppliers. Applied seeks to reduce costs and to lower the risks of manufacturing and serviceinterruptions by: (1) selecting and qualifying alternate suppliers for key parts; (2) monitoring the financial con-dition of key suppliers; (3) maintaining appropriate inventories of key parts; (4) qualifying new parts on a timelybasis; and (5) locating certain manufacturing operations in close proximity to suppliers and customers.
12

Research, Development and Engineering
Applied’s long-term growth strategy requires continued development of new products. Applied’s significantinvestment in research, development and engineering (RD&E) has generally enabled it to deliver new productsand technologies before the emergence of strong demand, thus allowing customers to incorporate these productsinto their manufacturing plans at an early stage in the technology selection cycle. Applied works closely with itsglobal customers to design systems and processes that meet their planned technical and production requirements.Product development and engineering organizations are located primarily in the United States, as well as inEurope, Israel, Taiwan and China. In addition, Applied outsources certain RD&E activities, some of which areperformed outside the United States, primarily in India. Process support and customer demonstration laboratoriesare located in the United States, China, Taiwan, Europe and Israel.
Applied’s investments in RD&E for product development and engineering programs to create or improveproducts and technologies over the last three years were as follows: $1.1 billion (11 percent of net sales) in fiscal2011, $1.1 billion (12 percent of net sales) in fiscal 2010 and $934 million (19 percent of net sales) in fiscal2009. Applied has spent an average of 13 percent of net sales in RD&E over the last five years. In addition toRD&E for specific product technologies, Applied maintains ongoing programs for automation control systems,materials research and environmental control that are applicable to its products.
In fiscal 2011, Applied developed logic and memory chip technologies to meet the requirements of manu-facturing below the 22nm node. These technologies include low k dielectrics and curing for interconnect struc-tures and high-k dielectric materials and ALD processes for fabricating transistor gates. Applied also focused onprocesses to help customers build new 3D gate structures. In addition, Applied continued to focus on optimizingthe cost-effectiveness of TSV technologies to enable their widespread implementation. TSV is an emerging sol-ution for interconnecting three dimensional chip stacks to provide better device performance, lower power con-sumption and the integration of heterogeneous devices. Applied is also investing in other new productdevelopment areas such as 450mm wafer systems. In the Display sector, Applied developed deposition systemsto enable larger OLED, LCD and touch-enabled displays. In solar, Applied focused on screen printing technologyto keep pace with cell manufacturers’ new higher-efficiency cell designs. A key development area was “smart”capability, which bring a new level of precision and control to the production process. RD&E also continued thedevelopment of products that enable lower-cost production of solar energy, production of LED devices for dis-play backlighting and general lighting, and other products to enable energy conservation.
In fiscal 2010, Applied developed new technology to enable next-generation 22nm and below chip designs.These systems were designed to help customers continue their drive to pack more transistors in the same spaceusing high-k/metal gate technologies and double patterning processes. Applied also developed technology forTSVs. In the solar PV area, Applied continued the development of its precision wafering and cell manufacturingproducts for lowering the cost of producing solar-generated electricity through advanced crystalline silicon tech-nology. RD&E also included activities to develop products that enable lower-cost production of solar energy,production of LED devices for display backlighting and general lighting, and other products to enable energyconservation.
In fiscal 2009, Applied focused on developing systems for semiconductor customers’ new chip designs with32nm and below geometries, including systems to enable faster transistors using strain engineering and high-k/metal gate technologies, as well as double patterning processes that enable customers to extend their existing193nm lithography tools through additional technology generations. Applied also focused on developingtechnology for manufacturing next-generation displays. RD&E also included activities to develop products thatenable lower-cost production of solar energy and other products to enable energy conservation.
13

Marketing and Sales
Net sales by geographic region, which are attributed according to the location of customers’ facilities, wereas follows:
2011 2010 2009
($) (%) ($) (%) ($) (%)
(In millions, except percentages)
China . . . . . . . . . . . . . . . . . . . . . . . . . . . . . . . . . . . . 2,574 24 1,557 16 635 13Taiwan . . . . . . . . . . . . . . . . . . . . . . . . . . . . . . . . . . . 2,093 20 2,750 29 1,026 21Korea . . . . . . . . . . . . . . . . . . . . . . . . . . . . . . . . . . . . 1,263 12 1,768 19 664 13Japan . . . . . . . . . . . . . . . . . . . . . . . . . . . . . . . . . . . . . 912 9 768 8 718 14Southeast Asia . . . . . . . . . . . . . . . . . . . . . . . . . . . . . 592 5 578 6 252 5
Asia Pacific . . . . . . . . . . . . . . . . . . . . . . . . . . . . . 7,434 70 7,421 78 3,295 66North America(*) . . . . . . . . . . . . . . . . . . . . . . . . . . . 1,963 19 1,147 12 966 19Europe . . . . . . . . . . . . . . . . . . . . . . . . . . . . . . . . . . . 1,120 11 981 10 753 15
Total . . . . . . . . . . . . . . . . . . . . . . . . . . . . . . . . . 10,517 100 9,549 100 5,014 100
(*) Primarily the United States.
Because of the highly technical nature of its products, Applied markets and sells products worldwide almostentirely through a direct sales force. Approximately 81 percent of Applied’s fiscal 2011 net sales were to regionsoutside of the United States.
General economic conditions impact Applied’s business and financial results. From time to time, the mar-kets in which products are sold experience weak economic conditions that may negatively impact sales.Applied’s business is usually not seasonal in nature, but it is highly cyclical, based on capital equipment invest-ment by major semiconductor, flat panel display, solar PV and other manufacturers. Customers’ expendituresdepend on many factors, including: anticipated market demand and pricing for semiconductors, LCDs, solar cellsand modules, and other substrates; the development of new technologies; customers’ factory utilization; capitalresources and financing; government policies and incentives; and global and regional economic conditions.
Information on net sales to unaffiliated customers and long-lived assets attributable to Applied’s geographicregions is included in Note 16 of Notes to Consolidated Financial Statements. The following companiesaccounted for at least 10 percent of Applied’s net sales in 2011, 2010, and/or 2009, which were for products inmultiple reportable segments.
2011 2010 2009
Samsung Electronics Co., Ltd. . . . . . . . . . . . . . . . . . . . . . . . . . . . . . . . . . . . . . . . . 12% 14% 10%Taiwan Semiconductor Manufacturing Company Limited . . . . . . . . . . . . . . . . . . 10% 11% *Intel Corporation . . . . . . . . . . . . . . . . . . . . . . . . . . . . . . . . . . . . . . . . . . . . . . . . . . 10% * 12%
* Less than 10%.
Competition
The industries in which Applied operates are highly competitive and characterized by rapid technologicalchange. Applied’s ability to compete generally depends on its ability to timely commercialize its technology,continually improve its products and develop new products that meet constantly evolving customer requirements.Significant competitive factors include technical capability and differentiation, productivity and cost-effectiveness. The importance of these factors varies according to customers’ needs, including product mix andrespective product requirements, applications, and the timing and circumstances of purchasing decisions. Sub-stantial competition exists in all areas of Applied’s business. Competitors range from small companies thatcompete with a single product and/or in a single region, to global, diversified companies with a range of
14

products. Applied’s ability to compete requires a high level of investment in RD&E, marketing and sales andglobal customer support activities. Management believes that many of Applied’s products have strong com-petitive positions.
The competitive environment for each segment is described below:
The semiconductor industry has been increasingly driven by consumer demand for lower-cost electronicproducts with increased capability. As a result, products within the Silicon Systems Group segment are subject tosignificant changes in customer requirements, including transitions to smaller dimensions, new materials and anincreasing number of applications. While certain existing technologies may be adapted to new requirements,some applications create the need for an entirely different technological approach. The rapid pace of techno-logical change can quickly diminish the value of current technologies and products and create opportunities forexisting and new competitors. Applied offers a broad portfolio of technologically differentiated products thatmust continuously evolve to satisfy customers’ requirements in order to compete effectively. Applied allocatesresources among its numerous product offerings and therefore may decide not to invest in an individual productto the same degree as competitors who specialize in fewer products. There are a number of competitors servingthe semiconductor manufacturing equipment industry, with some offering a single product line and others offer-ing multiple product lines. These competitors range from suppliers serving a single region to global, diversifiedcompanies. Factors that influenced the competitive environment for the Silicon Systems Group in fiscal 2011included a softening in semiconductor industry, despite higher demand for tablet computers, laptop computersand cellular phones. Device supply and demand dynamics led manufacturers to reduce their annual wafer fabequipment (WFE) capital spending, which is the major driver for Silicon Systems Group net sales.
Products and services within the Applied Global Services segment complement the Silicon Systems Group,Display, and Energy and Environmental Solutions segments’ products, in markets that are characterized bydemanding worldwide service requirements and a diverse group of numerous competitors. To compete effec-tively, Applied offers products and services to reduce costs, improve tool performance, and increase the pro-ductivity and energy efficiency of customers’ fab operations. Significant competitive factors includeproductivity, cost-effectiveness, and the level of technical service and support. The importance of these factorsvaries according to customers’ needs and the type of products or services offered. Customers with more sig-nificant operations and/or expertise may require fewer service products than customers who place greater reli-ance on an outsourcing model. Industry conditions that affected Applied Global Services’ sales of spares andservices in fiscal 2011 were principally manufacturing capacity and utilization rates of fabs.
Products in the Display segment are generally subject to strong competition from a number of major com-petitors. Applied holds established market positions with its technically-differentiated TFT-LCD manufacturingsolutions for PECVD, color filter PVD, PVD array, PVD touch panel, and TFT array testing, although its marketposition could change quickly due to customers’ evolving requirements. The competitive environment forApplied’s Display segment in fiscal 2011 was characterized by increased demand and capacity requirements formobile devices, such as smartphones and tablets PCs, which drove demand for high-performance displays andtouch screen devices. LCD TV demand and capacity also grew, but not as rapidly as in recent years. Importantfactors affecting the competitive position of Applied’s Display products include (i) industry trends, Applied’sability to innovate and develop new products, and the extent to which Applied’s products are technically-differentiated, (ii) which customers within a highly concentrated customer base are making capital equipmentinvestments, and (iii) Applied’s existing position at these customers.
Applied’s products within the Energy and Environmental Solutions segment compete in several diversemarket areas, including primarily the c-Si solar equipment market. All of these markets are characterized byextreme pressure to reduce customers’ overall production costs and improve performance. With respect to its c-Siequipment products, Applied competes with a number of other companies, some of which have significantexperience with solar applications and some of which are new entrants to the solar equipment business.
15

Patents and Licenses
Management believes that Applied’s competitive position significantly depends upon the Company’sresearch, development, engineering, manufacturing and marketing capabilities, and not just on its patent position.However, protection of Applied’s technological assets through enforcement of its intellectual property rights,including patents, is important. Therefore, Applied’s practice is to file patent applications in the United Statesand other countries for inventions that Applied considers significant. Applied has a substantial number of patentsin the United States and other countries, and additional applications are pending for new inventions. AlthoughApplied does not consider its business materially dependent upon any one patent, the rights of Applied and theproducts made and sold under its patents, taken as a whole, are a significant element of Applied’s business. Inaddition to patents, Applied also possesses other intellectual property, including trademarks, know-how, tradesecrets and copyrights.
Applied enters into patent and technology licensing agreements with other companies when managementdetermines that it is in Applied’s best interest to do so. Applied pays royalties under existing patent licenseagreements for the use, in several of its products, of certain patented technologies that are licensed to Applied.Applied also receives royalties from licenses granted to third parties. Royalties received from or paid to thirdparties have not been, and are not expected to be, material to Applied’s consolidated results of operations.
In the normal course of business, Applied periodically receives and makes inquiries regarding possible pat-ent infringement. In responding to such inquiries, it may become necessary or useful for Applied to obtain orgrant licenses or other rights. However, there can be no assurance that such licenses or rights will be available toApplied on commercially reasonable terms, or at all. If Applied is not able to resolve or settle claims, obtainnecessary licenses on commercially reasonable terms, and/or successfully prosecute or defend its position,Applied’s business, financial condition and results of operations could be materially and adversely affected.
Environmental Matters
Applied maintains a number of environmental, health and safety programs that are primarily preventive innature. As part of these programs, Applied regularly monitors ongoing compliance with applicable laws andregulations. In addition, Applied has trained personnel to conduct investigations of any environmental, health orsafety incidents, including, without limitation, spills, releases or possible contamination.
Compliance with federal, state and local environmental, health and safety provisions, including, withoutlimitation, those regulating the discharge of materials into the environment, remedial agreements and otheractions relating to the environment have not had, and are not expected to have, a material effect on Applied’scapital expenditures, competitive position, financial condition or results of operations.
The most recent report on Applied’s environmental, health and safety activities can be found in the Compa-ny’s latest Citizenship Report on its website at http://www.appliedmaterials.com/about/cr/sustainability. TheCitizenship Report is updated periodically. This website address is intended to be an inactive textual referenceonly. None of the information on, or accessible through, Applied’s website is part of this Form 10-K or isincorporated by reference herein.
Employees
At October 30, 2011, Applied employed approximately 13,000 regular employees and 900 temporaryemployees. In the high-technology industry, competition for highly-skilled employees is intense. Appliedbelieves that its future success is highly dependent upon its continued ability to attract, retain and motivate quali-fied employees. There can be no assurance that Applied will be able to attract, hire, assimilate, motivate andretain a sufficient number of qualified employees.
16

Executive Officers of the Registrant
The following table and notes set forth information about Applied’s executive officers as of October 30,2011:
Name of Individual Position
Michael R. Splinter(1) . . . . . Chairman of Board of Directors, President and Chief Executive OfficerGeorge S. Davis(2) . . . . . . . . Executive Vice President, Chief Financial OfficerMark R. Pinto(3) . . . . . . . . . . Executive Vice President, General Manager Energy and
Environmental SolutionsRandhir Thakur(4) . . . . . . . . Executive Vice President, General Manager Silicon SystemsJoseph Flanagan(5) . . . . . . . . Senior Vice President, Worldwide Operations and Supply ChainMary Humiston(6) . . . . . . . . Senior Vice President, Global Human ResourcesManfred Kerschbaum(7) . . . . Senior Vice President, Chief of StaffJoseph J. Sweeney(8) . . . . . . Senior Vice President, General Counsel and Corporate SecretaryChris Bowers(9) . . . . . . . . . . Group Vice President, Corporate InitiativesThomas T. Edman(10) . . . . . Group Vice President, General Manager Display Business GroupRon Kifer(11) . . . . . . . . . . . . Group Vice President, Chief Information OfficerCharlie Pappis(12) . . . . . . . . Group Vice President, General Manager Applied Global ServicesOmkaram Nalamasu(13) . . . . Corporate Vice President, Chief Technology OfficerThomas S. Timko(14) . . . . . . Corporate Vice President, Corporate Controller and Chief Accounting
Officer
(1) Mr. Splinter, age 61, has been President and Chief Executive Officer of Applied since April 2003 andChairman of the Board of Directors since March 2009. Prior to joining Applied, Mr. Splinter was an execu-tive at Intel Corporation (Intel), a manufacturer of chips and computer, networking and communicationsproducts, where Mr. Splinter held a number of positions in his 20 years at Intel, including Executive VicePresident and Director of Sales and Marketing and Executive Vice President and General Manager of theTechnology and Manufacturing Group.
(2) Mr. Davis, age 54, was promoted to Executive Vice President, Chief Financial Officer in December 2009,after serving as Senior Vice President, Chief Financial Officer, since December 2006, and appointed GroupVice President, Chief Financial Officer in November 2006. Previously, he had been Group Vice President,General Manager, Corporate Business Development since March 2005. From November 1999 to February2005, Mr. Davis served as Vice President and Corporate Treasurer, where he managed Applied’s worldwidetreasury operations and was responsible for investments, tax, financial risk management, and trade andexport matters. Mr. Davis joined Applied in 1999.
(3) Dr. Pinto, age 52, has held the position of Executive Vice President, General Manager Energy andEnvironmental Solutions since January 2011. Dr. Pinto was promoted to Executive Vice President inDecember 2009 and was previously Senior Vice President, General Manager, Energy and EnvironmentalSolutions and Display as well as corporate Chief Technology Officer. Prior to joining Applied in January2004, Dr. Pinto spent 19 years with Bell Laboratories (Bell Labs), a communications research anddevelopment company, and the Lucent Microelectronics Group, which later became Agere Systems Inc., anIC components company, most recently as Vice President of the Analog Products Division. Dr. Pinto holdsa Ph.D. in Electrical Engineering from Stanford University.
(4) Dr. Thakur, age 49, was promoted to Executive Vice President, General Manager Silicon Systems inDecember 2009, after serving as Senior Vice President, General Manager Silicon Systems since October2009. Previously, he was Senior Vice President, General Manager, Thin Film Solar and Display. He wasappointed Senior Vice President, General Manager, Strategic Operations when he rejoined Applied in May2008. He previously was with Applied from 2000 to 2005 in a variety of executive roles including GroupVice President, General Manager for Front End Products. From September 2005 to May 2008, Dr. Thakurserved as Executive Vice President of Technology and Fab Operations at SanDisk Corporation, a data stor-age solutions manufacturer, and as head of SanDisk’s worldwide operations. Prior to joining Applied in2000, Dr. Thakur served in leadership roles at Steag Electronic Systems AG, an electronics company, andMicron Technology, Inc., a semiconductor manufacturer.
17

(5) Mr. Flanagan, age 40, joined Applied as Senior Vice President, Worldwide Operations and Supply Chain inFebruary 2010. Prior to joining Applied, Mr. Flanagan held executive positions in global operations forNortel Networks Corporation, a telecommunications equipment manufacturer, since 2006, including Presi-dent of Nortel Business Services from August 2009 to February 2010, and Senior Vice President of GlobalOperations from August 2007 until August 2009. Previously, Mr. Flanagan held a number of positions from1993 to 2006 at General Electric Company (GE), a global infrastructure, finance and media company.
(6) Ms. Humiston, age 46, was named Senior Vice President, Global Human Resources in July 2011. She wasCorporate Vice President, Global Human Resources from July 2009 to June 2010 and then promoted toGroup Vice President in July 2010. Prior to July 2009, she served as the Corporate Vice President of HumanResources for both the Energy and Environmental Solutions and Display groups. Prior to joining Applied,Ms. Humiston was Vice President of Human Resources at Honeywell International Inc., which providestechnologies to address safety, security and energy, from October 2002 to June 2008, with responsibility forvarious corporate and international organizations. She previously held executive positions with PeoplePC,an internet service provider; Gap, Inc., an apparel retailer; and GE.
(7) Mr. Kerschbaum, age 57, was named Senior Vice President, Chief of Staff in September 2009. Prior to thathe served as Senior Vice President, General Manager, Applied Global Services from January 2005 to Sep-tember 2009. Mr. Kerschbaum was Senior Vice President, Global Operations from July 2004 to January2005 and from October 2002 to May 2003. From May 2003 to July 2004, he was Group Vice President,Foundation Engineering and Operations. From January 1996 to October 2002, he held various positions inApplied Materials North America, most recently as Group Vice President, General Manager, Applied Mate-rials North America. Mr. Kerschbaum has served in various other operations, customer service andengineering positions since joining Applied in 1983.
(8) Mr. Sweeney, age 63, has held the position of Senior Vice President, General Counsel and Corporate Secre-tary of Applied since July 2005, with responsibility for global legal affairs, intellectual property and secu-rity. From April 2002 to July 2005, Mr. Sweeney was Group Vice President, Legal Affairs and IntellectualProperty, and Corporate Secretary. Mr. Sweeney joined Applied in 1993.
(9) Mr. Bowers, age 51, has been Group Vice President, Corporate Initiatives since October 2009, working onenterprise wide transformation projects. From March 2008 to September 2009, he was Group Vice Presidentand General Manager of Corporate Services and Chief of Staff, working closely with executives on effec-tive business strategy execution. Prior to joining Applied, Mr. Bowers was a partner at the Hay Group, aglobal consulting firm, where he held various business leadership and consulting positions from 1992 to2008. Most recently, he was Director of Client Services in Europe, the Middle East and Africa, and amember of the Hay Group Global R&D Council. Prior to the Hay Group, Mr. Bowers was a member of theU.K. Special Forces.
(10) Mr. Edman, age 49, was appointed Group Vice President and General Manager of the Display BusinessGroup in February 2011. Previously, he served as Group Vice President and General Manager of CorporateBusiness Development and Global Corporate Affairs and Marketing from June 2006 to June 2011. Prior tojoining Applied, Mr. Edman served as President and Chief Executive Officer of Applied Films Corporationuntil the company was acquired by Applied in June 2006, and he held various executive positions at Mar-ubeni Specialty Chemicals, Inc., a distributor of specialty chemicals. Mr. Edman also serves on the govern-ing board of the FlexTech Alliance and on the Board of Directors of TTM Technologies, Inc. as Chairmanof its compensation committee.
(11) Mr. Kifer, age 60, joined Applied in May 2006 as Group Vice President and Chief Information Officer,Global Information Services. Prior to his appointment, Mr. Kifer spent five years with DHL, a global logis-tics company, in various executive management roles, most recently as the Senior Vice President and ChiefInformation Officer for North America, Asia Pacific and Emerging Markets.
(12) Mr. Pappis, age 50, has been Group Vice President and General Manager of Applied Global Services sinceSeptember 2009. He previously held positions in Applied Global Services as Corporate Vice President andGeneral Manager for the Semiconductor Service Solutions group and as general manager for EquipmentProductivity Services. He has held various other management positions since joining Applied in 1986.
18

(13) Dr. Nalamasu, age 53, was promoted to Corporate Vice President and Chief Technology Officer for Appliedin January 2011. Upon joining Applied in June 2006 to January 2011, Dr. Nalamasu was Corporate VicePresident and Deputy Chief Technology Officer and served as General Manager for Applied’s AdvancedTechnologies Group Dr. Nalamasu was Vice President of Research and a NYSTAR Distinguished Professorof Materials Science and Engineering at Rensselaer Polytechnic Institute from 2002 to 2006. Prior to that heheld various R&D leadership positions at Bell Labs and later Lucent Technologies, Inc., a tele-communications company, for 17 years.
(14) Mr. Timko, age 43, joined Applied in March 2010 as Corporate Vice President, Corporate Controller andChief Accounting Officer. From June 2006 until March 2010, Mr. Timko was with Delphi AutomotiveLLP, a supplier to the automotive, computing, communications, energy and consumer accessories markets,where he was most recently Chief Accounting Officer and Controller. He served as Assistant Controller forThe Interpublic Group of Companies, Inc., a global provider of advertising and marketing services, fromDecember 2004 to June 2006, and previously at Dover Corporation, a manufacturer of industrial products.Mr. Timko began his career in 1991 with PricewaterhouseCoopers LLC, a provider of audit and assurance,tax and advisory services, and is a certified public accountant.
Available Information
Applied’s website is http://www.appliedmaterials.com. Applied makes available free of charge, on orthrough its website, its annual, quarterly and current reports, and any amendments to those reports, as soon asreasonably practicable after electronically filing such reports with, or furnishing them to, the SEC. This websiteaddress is intended to be an inactive textual reference only. None of the information on, or accessible through,Applied’s website is part of this Form 10-K or is incorporated by reference herein.
Item 1A: Risk Factors
The following factors could materially affect Applied’s business, financial condition or results of operationsand should be carefully considered in evaluating the Company and its business, in addition to other informationpresented elsewhere in this report.
The industries that Applied serves are volatile and difficult to predict.
As a supplier to the global semiconductor, flat panel display, solar and related industries, Applied is subjectto business cycles, the timing, length and volatility of which can be difficult to predict and which vary by report-able segment. These industries historically have been cyclical due to sudden changes in customers’ manufactur-ing capacity and advanced technology requirements and spending, which depend in part on customers’ capacityutilization, production volumes, access to affordable capital, end-use demand, and inventory levels relative todemand, as well as the rate of technology transitions. These changes have affected the timing and amounts ofcustomers’ purchases and investments in technology, and continue to affect Applied’s orders, net sales, operatingexpenses and net income.
To meet rapidly changing demand in the industries it serves, Applied must accurately forecast demand andeffectively manage its resources and production capacity for each of its segments as well as across multiplesegments. During periods of decreasing demand, Applied must reduce costs and align its cost structure withprevailing market conditions; effectively manage its supply chain; and motivate and retain key employees. Dur-ing periods of increasing demand for its products, Applied must have sufficient manufacturing capacity andinventory to meet customer demand; effectively manage its supply chain; attract, retain and motivate a sufficientnumber of qualified employees; and continue to control costs. If Applied does not accurately forecast and timelyand appropriately adapt to changes in its business environment, Applied’s business, financial condition andresults of operations may be materially and adversely affected.
19

Applied is exposed to risks as a result of ongoing changes in the various industries in which it operates.
The global semiconductor, flat panel display, solar and related industries in which Applied operates arecharacterized by ongoing changes affecting some or all of these industries, including:
• increasing capital requirements for building and operating new fabrication plants and customers’ ability toraise the necessary capital, particularly when financial market conditions are difficult;
• differences in growth rates among the semiconductor, display and solar industries;
• the increasing importance of establishing, improving and maintaining strong relationships with customers;
• changes in end demand for electronic products over time and the effect of these changes on customers’businesses and, in turn, on demand for Applied’s products;
• abrupt and unforeseen shifts in the nature and amount of customer and end-user demand;
• the increasing cost and complexity for customers to move from product design to volume manufacturing,which may slow the adoption rate of new manufacturing technology;
• the need to continually reduce the total cost of manufacturing system ownership, due in part to greaterdemand for lower-cost consumer electronics compared to business information technology spending;
• the heightened importance to customers of system reliability and productivity and the effect on demandfor fabrication systems as a result of their increasing productivity, device yield and reliability;
• the increasing importance of, and difficulties in, developing products with sufficient differentiation toinfluence customers’ purchasing decisions;
• requirements for shorter cycle times for the development, manufacture and installation of manufacturingequipment;
• price and performance trends for semiconductor devices, LCDs and solar PVs, and the correspondingeffect on demand for such products;
• the increasing importance of the availability of spare parts to maximize the time that customers’ systemsare available for production;
• the increasing role for and complexity of software in Applied products; and
• the increasing focus on reducing energy usage and improving the environmental impact and sustainabilityassociated with manufacturing operations.
If Applied does not successfully manage the risks resulting from the ongoing changes in the semiconductor,flat panel display, solar and related industries, its business, financial condition and results of operations could bematerially and adversely affected.
Applied is exposed to risks as a result of ongoing changes specific to the semiconductor industry.
The greatest portion of Applied’s consolidated net sales and profitability historically has been derived fromsales of manufacturing equipment by the Silicon Systems Group to the global semiconductor industry. In addi-tion, a majority of the revenues of Applied Global Services is from sales of service products to semiconductormanufacturers. The semiconductor industry is characterized by ongoing changes particular to that industry inaddition to the general industry changes described in the preceding risk factor, including:
• the increasing cost of research and development due to many factors, including: decreasing linewidths ona chip; the use of new materials such as cobalt and yttrium; new and more complex device structures;more applications and process steps; increasing chip design costs; and the increasing cost and complexityof integrated manufacturing processes;
20

• the cost, technical complexity and timing of a proposed industry transition from 300mm to 450mmwafers, and the resulting effect on demand for manufacturing equipment and services;
• the need to reduce product development time, despite the increasing difficulty of technical challenges;
• the growing number of types and varieties of semiconductors and number of applications across multiplesubstrate sizes;
• changes in demand and differing market growth rates for (i) different electronic products, such as tablets,smartphones, and personal computers, and in turn (ii) different applications/devices, such as NAND Flash,DRAM, logic, foundry and MRAM, and the resulting effect on customers’ capital spending patterns andon Applied’s ability to compete in these market segments;
• the increasing cost and complexity for semiconductor manufacturers to move more technically advancedcapability and smaller linewidths to volume manufacturing, and the resulting impact on the rates of tech-nology transition and investment in capital equipment;
• challenges associated with generating organic growth in light of semiconductor manufacturers’ decreasingrate of capital expenditures as a percentage of revenue, and manufacturers’ increasing allocation of capitalinvestment to markets that Applied does not serve, such as lithography;
• the increasing frequency and complexity of technology transitions and inflections, such as ALD, 3-D tran-sistors, advanced interconnect, wafer-level packaging, and extreme ultraviolet lithography (EUV);
• shorter cycle times between customers’ order placement and product shipment, which may lead toinventory write-offs and manufacturing inefficiencies that decrease gross margin;
• technology developments in related markets, such as lithography, to which Applied may need to adapt;
• competitive factors that make it difficult to enhance market position;
• the importance of increasing market positions in larger market segments, such as etch and inspection;
• the increasing concentration of wafer starts in one country, Korea, where Applied’s service penetrationand service-revenue-per-wafer-start have been lower than in other regions; and
• the increasing fragmentation of semiconductor markets, leading certain markets to become too small tosupport the cost of a new fabrication plant, while others require less technologically advanced products.
If Applied does not successfully manage the risks resulting from the ongoing changes occurring in the semi-conductor industry, its business, financial condition and results of operations could be materially and adverselyaffected.
Applied is exposed to risks as a result of ongoing changes specific to the flat panel display industry.
The global flat panel display industry historically has experienced considerable volatility in capital equip-ment investment levels, due in part to the limited number of LCD manufacturers and the concentrated nature ofLCD end-use applications. Recently, industry growth has depended to a considerable extent on consumerdemand for increasingly larger and more advanced TVs, as well as smartphones and other mobile devices, whichdemand is highly sensitive to cost and improvements in technologies and features. In addition to the generalindustry changes described above in the second risk factor, the display industry is characterized by ongoingchanges particular to that industry, including:
• the planned expansion of manufacturing facilities in China by Chinese display manufacturers and manu-facturers from other countries, and the ability of non-Chinese manufacturers to obtain government appro-vals on a timely basis;
• the slowing rate of transition to larger substrate sizes for LCDs and the resulting effect on capital intensityin the industry and on Applied’s product differentiation, gross margin and return on investment;
21

• the increasing importance of new types of displays, such as low temperature polysilicon (LTPS) andOLEDs, and new touch panel films, such as anti-reflective and anti-fingerprint;
• the likelihood and timing of a transition to a new CVD backplane technology, metal oxide; and
• uncertainty with respect to future LCD technology end-use applications and growth drivers.
If Applied does not successfully manage the risks resulting from the ongoing changes occurring in the dis-play industry, its business, financial condition and results of operations could be materially and adverselyaffected.
Applied is exposed to risks as a result of ongoing changes specific to the solar industry.
An increasing portion of Applied’s business is in the emerging solar market, which, in addition to the gen-eral industry changes described above in the second risk factor, is characterized by ongoing changes specific tothe solar industry, including:
• the need to continually decrease the cost-per-watt of electricity produced by solar PV products to at orbelow grid parity by, among other things, reducing operating costs and increasing throughputs for solarPV manufacturing, and improving the conversion efficiency of solar PVs;
• the impact on demand for solar PV products arising from the cost of electricity generated by solar PVscompared to the cost of electricity from the existing grid or other energy sources;
• the varying energy policies of governments around the world and their effect in influencing the rate ofgrowth of the solar PV market, including the availability and amount of government incentives for solarpower such as tax credits, feed-in tariffs, rebates, renewable portfolio standards that require electricityproviders to sell a targeted amount of energy from renewable sources, and goals for solar installations ongovernment facilities;
• the growing number of solar PV manufacturers and increasing global production capacity for solar PVs,primarily in China;
• the filing by U.S. solar manufacturers of a regulatory unfair trade action against solar PVs from China,where most of Applied’s solar equipment sales are concentrated, which could result in the U.S. gov-ernment’s assessment of duties on solar cells and modules imported from China or other outcomes and, inturn, adversely impact demand for Applied’s products;
• the varying levels of operating and industry experience among solar PV manufacturers and the resultingdifferences in the nature and extent of customer support services requested from Applied;
• challenges associated with marketing and selling manufacturing equipment and services to a diverse anddiffuse customer base;
• the growth of market segments in which Applied does not participate, such as passivation and furnaces;
• the increasing number of government-affiliated entities in China that are becoming customers;
• the cost of polysilicon and other materials; and
• access to affordable financing and capital by customers and end-users.
In addition, current projections for global solar PV production exceed anticipated near-term, end-usedemand, which is heavily dependent on installed cost-per-watt, government policies and incentives, and theavailability of affordable capital. An oversupply of solar PVs that leads customers to delay or reduce investmentsin manufacturing capacity and new technology adversely impacts the sales growth rates and/or profitability ofApplied’s products. If Applied does not successfully manage the risks resulting from the ongoing changes occur-ring in the solar industry, its business, financial condition and results of operations could be materially andadversely affected.
22

Applied is exposed to risks associated with the difficult financial markets and uncertain global economy.
Continuing difficulties in the financial markets, national debt concerns in various regions, and uncertaintyregarding the global economy are posing challenges, and some governments may implement policies to controleconomic growth. The markets for semiconductors and flat panel displays in particular depend largely onconsumer spending, while the solar market depends in part on government incentives and the availability offinancing for PV installations. Economic uncertainty and related factors, including unemployment, inflation andfuel prices, exacerbate negative trends in business and consumer spending and may cause certain Appliedcustomers to push out, cancel, or refrain from placing orders for equipment or services, which may reduce netsales, reduce backlog, and affect Applied’s ability to convert backlog to sales. Difficulties in obtaining capital,uncertain market conditions, or reduced profitability may also cause some customers to scale back operations,exit businesses, merge with other manufacturers, or file for bankruptcy protection and potentially cease oper-ations, leading to customers’ reducing research and development funding and/or capital expenditures and, in turn,lower sales and/or additional inventory or bad debt expense for Applied. These conditions may also similarlyaffect key suppliers, which could impair their ability to deliver parts and result in delays for Applied’s productsor added costs. In addition, these conditions may lead to strategic alliances by, or consolidation of, other equip-ment manufacturers, which could adversely affect Applied’s ability to compete effectively.
Uncertainty about future economic and industry conditions also makes it more challenging for Applied toforecast its operating results, make business decisions, and identify and prioritize the risks that may affect itsbusiness, sources and uses of cash, financial condition and results of operations. Applied may be required toimplement additional cost reduction efforts, including restructuring activities, and/or modify its business model,which may adversely affect Applied’s ability to capitalize on opportunities in a market recovery.
In addition, Applied maintains an investment portfolio that is subject to general credit, liquidity, foreignexchange, market and interest rate risks. The risks to Applied’s investment portfolio may be exacerbated iffinancial market conditions deteriorate and, as a result, the value and liquidity of the investment portfolio, as wellas returns on pension assets, could be negatively impacted and lead to impairment charges. Applied also main-tains cash balances in various bank accounts globally in order to fund normal operations. If one or more of thesefinancial institutions become insolvent or are taken over by a government, it could limit Applied’s ability toaccess cash in the affected accounts.
If Applied does not timely and appropriately adapt to changes resulting from the uncertain macroeconomicenvironment and industry conditions, or to difficulties in the financial markets. Applied’s business, financialcondition or results of operations may be materially and adversely affected.
Applied must continually innovate and adapt its business and product offerings to respond to competitionand rapid technological changes.
As Applied operates in a highly competitive environment in which innovation is critical, its future successdepends on many factors, including the effective commercialization and customer acceptance of its equipment,services and related products. In addition, Applied must successfully execute its growth strategy, includingenhancing market share in existing markets, expanding into related markets, cultivating new markets and exceed-ing industry growth rates, while constantly improving its operational performance. The development,introduction and support of a broadening set of products in more collaborative, geographically diverse, open andvaried competitive environments have grown increasingly complex and expensive over time. Furthermore, newor improved products may entail higher costs and reduced profits. Applied’s performance may be adverselyaffected if it does not timely, cost-effectively and successfully:
• identify and address technology inflections, market changes, new applications, customer requirements andend-use demand;
• develop new products (including disruptive technologies), improve and/or develop new applications forexisting products, and adapt similar products for use by customers in different applications and/or marketswith varying technical requirements;
• appropriately price and achieve market acceptance of its products;
23

• differentiate its products from those of competitors and any disruptive technologies, and meet customers’performance specifications;
• maintain operating flexibility to enable different responses to different markets, customers and applica-tions;
• enhance its worldwide operations across all business segments to reduce cycle time, enable continuousquality improvement, reduce costs, and enhance design for manufacturability and design for service-ability;
• focus on sales and marketing strategies that foster strong customer relationships;
• allocate resources, including people and R&D funding, among Applied’s products and between the devel-opment of new products and the enhancement of existing products, as most appropriate and effective forfuture growth;
• reduce the cost, and improve the productivity of capital invested in R&D activities;
• accurately forecast demand, work with suppliers and meet production schedules for its products;
• improve its manufacturing processes and achieve cost efficiencies across product offerings;
• adapt to changes in value offered by companies in different parts of the supply chain;
• qualify products for evaluation and, in turn, volume manufacturing with its customers; and
• implement changes in its design engineering methodology, including those that enable reduction ofmaterial costs and cycle time, greater commonality of platforms and types of parts used in different sys-tems, greater effectiveness of product life cycle management, and reduced energy usage and environ-mental impact.
If Applied does not successfully manage these challenges, its business, financial condition and results ofoperations could be materially and adversely affected.
Operating in multiple industries, and the entry into new markets and industries, entail additional challengesand obligations.
As part of its growth strategy, Applied must successfully expand into related or new markets and industries,either with its existing products or with new products developed internally or obtained through acquisitions. Theentry into different markets involves additional challenges, including those arising from:
• the need to devote additional resources to develop new products for, and operate in, new markets;
• the need to develop new sales and marketing strategies and cultivate relationships with new customers;
• differing rates of profitability and growth among multiple businesses;
• Applied’s ability to anticipate demand, capitalize on opportunities, and avoid or minimize risks;
• the complexity of managing multiple businesses with variations in production planning, execution, supplychain management and logistics;
• the adoption of new business models;
• the need to undertake activities to grow demand for end-products;
• the need to develop and successfully implement adequate new business processes and systems;
• Applied’s ability to rapidly expand its operations to meet increased demand and the associated effect onworking capital;
• new materials, processes and technologies;
• the need to attract, motivate and retain employees with skills and expertise in these new areas;
24

• new and more diverse customers and suppliers, including some with limited operating histories, uncertainand/or limited funding, evolving business models and/or locations in regions where Applied does nothave, or has limited, operations;
• different customer service requirements;
• new or different competitors with potentially more financial or other resources, industry experience and/orestablished customer relationships;
• entry into new industries and countries, with differing levels of government involvement, laws and regu-lations, and business, employment and safety practices;
• third parties’ intellectual property rights; and
• the need to comply with, or work to establish, industry standards and practices.
In addition, Applied has begun applying for and receiving funding from United States and other governmentagencies for certain strategic development programs to increase its R&D resources and address new marketopportunities. As a condition to this government funding, Applied may be subject to certain record-keeping,audit, intellectual property rights-sharing and/or other obligations.
If Applied does not successfully manage the risks resulting from its diversification and entry into new mar-kets and industries, its business, financial condition and results of operations could be materially and adverselyaffected.
Applied is exposed to the risks of operating a global business.
In fiscal 2011, approximately 81 percent of Applied’s net sales were to customers in regions outside theUnited States. Certain of Applied’s R&D and manufacturing facilities, as well as suppliers to Applied, are alsolocated outside the United States, including in Singapore, Taiwan, China, Korea, Israel, Germany, Italy andSwitzerland. Applied is also expanding its business and operations in new countries. The global nature ofApplied’s business and operations presents challenges, including but not limited to those arising from:
• varying regional and geopolitical business conditions and demands;
• political and social attitudes, laws, rules, regulations and policies within countries that favor domesticcompanies over non-domestic companies, including customer- or government-supported efforts to pro-mote the development and growth of local competitors;
• customer- or government-supported efforts to influence Applied to conduct more of its operations in aparticular country, such as Korea and China;
• variations among, and changes in, local, regional, national or international laws and regulations (includingintellectual property, labor, tax, and import /export laws), as well as the interpretation and application ofsuch laws and regulations;
• global trade issues, including those related to the interpretation and application of import and exportlicenses, as well as international trade disputes;
• positions taken by governmental agencies regarding possible national commercial and/or security issuesposed by international business operations;
• fluctuating raw material, commodity and energy costs;
• challenges associated with managing more geographically diverse operations and projects, which requiresan effective organizational structure and appropriate business processes, procedures and controls;
• a more diverse workforce with different cultures, customs, business practices and worker expectations;
• variations in the ability to develop relationships with local customers, suppliers and governments;
• fluctuations in interest rates and currency exchange rates, including the relative strength or weakness ofthe U.S. dollar against the Japanese yen, euro, Taiwanese dollar, Israeli shekel or Chinese yuan;
25

• the need to provide sufficient levels of technical support in different locations around the world;
• political instability, natural disasters (such as earthquakes, floods or storms), pandemics, social unrest,terrorism or acts of war in locations where Applied has operations, suppliers or sales, or that may influ-ence the value chain of the industries that Applied serves;
• reliance on various information systems, data centers and software applications to conduct many aspectsof the Company’s business, which may be vulnerable to cyberattacks by third parties or breached due toemployee error, misuse or other causes that could result in business disruptions, loss of confidentialinformation, or other adverse consequences in the event that Applied’s firewalls and security processesand practices are ineffective;
• the need for an effective business continuity plan if a disaster or other event occurs that could disruptbusiness operations;
• the need to regularly reassess the size, capability and location of the Company’s global infrastructure andmake appropriate changes;
• cultural and language differences;
• shipping costs and/or delays;
• the need to continually improve the Company’s operating cost structure;
• difficulties and uncertainties associated with the entry into new countries;
• hiring and integration of an increasing percentage of new workers, including in countries such as Indiaand China;
• the increasing need for the workforce to be more mobile and work in or travel to different regions;
• uncertainties with respect to economic growth rates in various countries; and
• uncertainties with respect to growth rates for the manufacture and sales of semiconductors, LCDs andsolar PVs in the developing economies of certain countries.
Many of these challenges are present in China and Korea, which are experiencing significant growth ofcustomers, suppliers and competitors to Applied. Applied further believes that China and Korea present largepotential markets for its products and opportunity for growth over the long term, although at lower projectedlevels of profitability and margins for certain products than historically have been achieved in other regions.These challenges may materially and adversely affect Applied’s business, financial condition and results of oper-ations.
In addition, in March 2011, Japan experienced a significant earthquake, aftershocks, and tsunami thatresulted in widespread damage and business interruptions throughout the country, including those associated withradiation concerns arising from damage to a nuclear power plant. Certain of Applied’s customers and suppliersare located in Japan and Applied also has sales and service centers in the country. While Applied has not experi-enced any material impact on its business or operations to date and has taken actions to enhance its ability tomeet customers’ requirements, Applied cannot predict the extent of the impact the situation in Japan may have, ifany, on its future business and operations.
Applied is exposed to risks associated with a highly concentrated customer base.
Applied’s semiconductor and flat panel display customer bases historically have been, and are becomingeven more, highly concentrated as a result of economic and industry conditions. For example, in fiscal 2011,three semiconductor manufacturers accounted for 52 percent of Silicon Systems Group net sales, and three LCDmanufacturers accounted for 54 percent of Display net sales. Further, three customers accounted for 32 percent ofApplied’s consolidated net sales in fiscal 2011. Certain customers have experienced significant ownership ormanagement changes, consolidated with other manufacturers, outsourced manufacturing activities, or engaged in
26

collaboration or cooperation arrangements with other manufacturers. In addition, customers have entered intostrategic alliances or industry consortia that have increased the influence of key industry participants in technol-ogy decisions made by their partners. Also, certain semiconductor and display customers are making an increas-ingly greater percentage of their respective industry’s capital equipment investments. Customer concentrationwithin Applied’s solar customer base varies depending on the product line. For precision wafering systems, fivesolar manufacturers accounted for 57 percent of net sales in fiscal 2011, while the Baccini cell systems businesshas a more diffuse customer base. Applied’s customer base in each of the Display and Energy and EnvironmentalSolutions segments is also geographically-concentrated. In fiscal 2011, customers in China and Taiwanaccounted for a total of 78 percent of net sales for the Display segment, while customers in China accounted for80 percent of net sales for the Energy and Environmental Solutions segment.
In this environment, contracts or orders from a relatively limited number of manufacturers have accountedfor, and are expected to continue to account for, a substantial portion of Applied’s business, which may result inadded complexities in managing customer relationships and transactions and make it more challenging forApplied’s business units to generate organic growth. In addition, the mix and type of customers, and sales to anysingle customer, may vary significantly from quarter to quarter and from year to year. If customers do not placeorders, or they substantially reduce, delay or cancel orders, Applied may not be able to replace the business. AsApplied’s products are configured to customer specifications, changing, rescheduling or canceling orders mayresult in significant, non-recoverable costs. Major customers may also seek, and on occasion receive, pricing,payment, intellectual property-related, or other commercial terms that are less favorable to Applied. These fac-tors could have a material adverse effect on Applied’s business, financial condition and results of operations.
Manufacturing interruptions or delays could affect Applied’s ability to meet customer demand and lead tohigher costs, while the failure to estimate customer demand accurately could result in excess or obsoleteinventory.
Applied’s business depends on its timely supply of equipment, services and related products that meet therapidly changing technical and volume requirements of its customers, which depends in part on the timely deliv-ery of parts, components and subassemblies (collectively, parts) from suppliers, including contract manu-facturers. Some key parts are subject to long lead-times and/or obtainable only from a single supplier or limitedgroup of suppliers, and some sourcing or subassembly is provided by suppliers located in countries other than thecountries where Applied conducts its manufacturing, including China and Korea. Cyclical industry conditionsand the volatility of demand for manufacturing equipment increase capital, technical, operational and other risksfor companies throughout Applied’s supply chain. Further, the adverse conditions in the credit and financialmarkets and industry slowdowns in recent periods have caused, and may continue to cause, some suppliers toscale back operations, exit businesses, merge with other companies, or file for bankruptcy protection and possi-bly cease operations, potentially affecting Applied’s ability to obtain quality parts on a timely basis. Applied mayalso experience significant interruptions of its manufacturing operations, delays in its ability to deliver productsor services, increased costs or customer order cancellations as a result of:
• the failure or inability of suppliers to timely deliver sufficient quantities of quality parts on a cost-effectivebasis;
• volatility in the availability and cost of materials, including rare earth elements;
• difficulties or delays in obtaining required import or export approvals;
• information technology or infrastructure failures;
• natural disasters or other events (such as earthquakes, floods or storms, regional economic downturns,pandemics, social unrest, political instability, terrorism, or acts of war).
If a supplier fails to meet Applied’s requirements concerning quality, cost or other performance factors,Applied may transfer its business to alternative sources, which could entail manufacturing delays, additionalcosts, or other difficulties. In addition, if Applied needs to rapidly increase its business and manufacturingcapacity to meet increases in demand or expedited shipment schedules, this may exacerbate any interruptions in
27
Applied’s manufacturing operations and supply chain and the associated effect on Applied’s working capital.Moreover, if actual demand for Applied’s products is different than expected, Applied may purchase more/fewerparts than necessary or incur costs for canceling, postponing or expediting delivery of parts. If Applied purchasesinventory in anticipation of customer demand that does not materialize, or if customers reduce or delay orders,Applied may incur excess inventory charges. Any or all of these factors could materially and adversely affectApplied’s business, financial condition and results of operations.
Applied is exposed to risks associated with acquisitions and strategic investments.
Applied has made, and in the future intends to make, acquisitions of or investments in, companies, tech-nologies or products in existing, related or new markets for Applied. Most recently, in November 2011, Appliedcompleted its acquisition of Varian Semiconductor Associates, Inc. (Varian), which was the Company’s largestacquisition to date. Acquisitions involve numerous risks, including but not limited to:
• diversion of management’s attention from other operational matters;
• inability to complete acquisitions as anticipated or at all, which in certain circumstances may requireApplied to pay a termination fee to the target company;
• requirements imposed by government regulators in connection with their review of a transaction, whichmay include, among other things, divestitures and/or restrictions on the conduct of Applied’s existingbusiness or the acquired business;
• ineffective integration of operations, systems, technologies, products or employees of an acquired busi-ness;
• inability to realize anticipated synergies or other benefits;
• failure to commercialize purchased technologies;
• initial dependence on unfamiliar supply chains or relatively small supply partners;
• inability to capitalize on characteristics of new markets that may be significantly different from Applied’sexisting markets and where competitors may have stronger market positions and customer relationships;
• failure to attract, retain and motivate key employees from the acquired business;
• exposure to new operational risks, rules, regulations, worker expectations, customs and practices to theextent acquired businesses are located in regions where Applied has not historically conducted business;
• challenges associated with managing new, more diverse and more widespread operations, projects andpeople;
• inability to obtain and protect intellectual property rights in key technologies;
• inadequacy or ineffectiveness of an acquired company’s internal financial controls, disclosure controlsand procedures, and/or environmental, health and safety, anti-corruption, human resource, or other poli-cies or practices;
• impairment of acquired intangible assets and goodwill as a result of changing business conditions, techno-logical advancements or worse-than-expected performance of the segment;
• the risk of litigation or claims associated with a proposed or completed transaction;
• unknown, underestimated and/or undisclosed commitments or liabilities; and
• the inappropriate scale of acquired entities’ critical resources or facilities for business needs.
Applied also makes strategic investments in other companies, including companies formed as joint ventures,which may decline in value and/or not meet desired objectives. The success of these investments depends onvarious factors over which Applied may have limited or no control and, particularly with respect to joint ven-
28

tures, requires ongoing and effective cooperation with strategic partners. The risks to Applied’s strategic invest-ment portfolio may be exacerbated by unfavorable financial market and macroeconomic conditions and, as aresult, the value of the investment portfolio could be negatively impacted and lead to impairment charges. Merg-ers and acquisitions and strategic investments are inherently subject to significant risks. If Applied does not suc-cessfully manage the risks associated with acquisitions and strategic investments, its business, financial conditionand results of operations could be materially and adversely affected.
Applied used existing cash and incurred debt obligations to acquire Varian that could affect its ability torespond to changes in business conditions or otherwise adversely affect its business.
Applied financed the acquisition of Varian through a combination of existing cash balances and the netproceeds of senior unsecured notes in the aggregate principal amount of $1.75 billion issued on June 8, 2011. Thereduction in cash balances, assumed lower interest income, and payments on the debt obligations will reduce theavailability of cash flow for general corporate or other purposes, such as further mergers and acquisitions. This inturn may reduce Applied’s flexibility in responding to changes in its businesses and in the industries in which itoperates.
The ability to attract, retain and motivate key employees is vital to Applied’s success.
Applied’s success, competitiveness and ability to execute on its global strategies and maintain a culture ofinnovation depend in large part on its ability to attract, retain and motivate key employees, especially in criticalpositions and in growing markets. Achieving this objective may be difficult due to many factors, includingfluctuations in global economic and industry conditions, Applied’s organizational structure, competitors’ hiringpractices, cost reduction activities (including workforce reductions and unpaid shutdowns), availability of careerdevelopment opportunities, and the effectiveness of Applied’s compensation and benefit programs, including itsshare-based programs. If Applied does not successfully attract, retain and motivate key employees, Applied maybe unable to capitalize on its opportunities and its business, financial condition and operating results may bematerially and adversely affected.
The failure to successfully implement and conduct outsourcing activities and other operational initiativescould adversely affect results of operations.
To better align its costs with market conditions, locate closer to customers, enhance productivity, andimprove efficiencies, Applied conducts certain engineering, software development, manufacturing, sourcing andother operations in regions outside the United States, including India, Taiwan, China, and Korea. Applied hasimplemented a distributed manufacturing model, under which certain manufacturing and supply chain activitiesare conducted in various countries, including the United States, Europe, Israel, Singapore, Taiwan and othercountries in Asia, and assembly of some systems is completed at customer sites. In addition, Applied outsourcescertain functions to third parties, including companies in the United States, India, China, Korea, Malaysia andother countries. Outsourced functions include contract manufacturing, engineering, customer support, softwaredevelopment, information technology support, finance and administrative activities. The expanding role of thirdparty providers has required changes to Applied’s existing operations and the adoption of new procedures andprocesses for retaining and managing these providers, as well as redistributing responsibilities as warranted, inorder to realize the potential productivity and operational efficiencies, assure quality and continuity of supply,and protect the intellectual property of Applied and its customers, suppliers and other partners. If Applied doesnot accurately forecast the amount, timing and mix of demand for products, or if contract manufacturers or otheroutsource providers fail to perform in a timely manner or at satisfactory quality levels, Applied’s ability to meetcustomer requirements could suffer, particularly during a market upturn.
In addition, Applied is implementing a comprehensive program to better align its global organizations andprocesses, including initiatives to enhance the Asia supply chain and improve back office and information tech-nology infrastructure for more efficient transaction processing. Applied also is implementing a multi-year,company-wide program to transform certain business processes, including the transition to a single enterpriseresource planning (ERP) software system to perform various functions. The implementation of additional func-
29

tionality to the ERP system entails certain risks, including difficulties with changes in business processes thatcould disrupt Applied’s operations, such as its ability to track orders and timely ship products, project inventoryrequirements, manage its supply chain and aggregate financial and operational data. The implementation of newinitiatives may not achieve the anticipated benefits and may divert management’s attention from other opera-tional activities, negatively affect employee morale, or have other unintended consequences.
If Applied does not effectively develop and implement its outsourcing and relocation strategies, if requiredexport and other governmental approvals are not timely obtained, if Applied’s third party providers do not per-form as anticipated, or if there are delays or difficulties in enhancing business processes, Applied may not realizeanticipated productivity improvements or cost efficiencies, and may experience operational difficulties, increasedcosts (including energy and transportation), manufacturing interruptions or delays, inefficiencies in the structureand/or operation of its supply chain, loss of its intellectual property rights, quality issues, increased producttime-to-market, and/or inefficient allocation of human resources, any or all of which could materially andadversely affect Applied’s business, financial condition and results of operations.
Applied may incur impairment charges to goodwill or long-lived assets.
Applied has a significant amount of goodwill and other acquired intangible assets related to acquisitions.Goodwill and purchased intangible assets with indefinite useful lives are not amortized, but are reviewed forimpairment annually during the fourth quarter of each fiscal year, and more frequently when events or changes incircumstances indicate that the carrying value of an asset may not be recoverable. The review compares the fairvalue for each of Applied’s reporting units to its associated carrying value, including goodwill. Factors that couldlead to impairment of goodwill and intangible assets include adverse industry or economic trends, reduced esti-mates of future cash flows, declines in the market price of Applied common stock, changes in Applied’s strat-egies or product portfolio, and restructuring activities. Applied’s valuation methodology for assessingimpairment requires management to make judgments and assumptions based on historical experience and projec-tions of future operating performance. Applied may be required to record a charge to earnings during the periodin which an impairment of goodwill or amortizable intangible assets is determined to exist, which could materi-ally and adversely affect Applied’s results of operations.
Applied is exposed to various risks related to legal proceedings or claims and protection of intellectual prop-erty rights.
Applied from time to time is, and in the future may be, involved in legal proceedings or claims regarding pat-ent infringement, intellectual property rights, antitrust, environmental regulations, securities, contracts, productperformance, product liability, unfair competition, misappropriation of trade secrets, employment, workplace safety,and other matters. Applied also on occasion receives notification from customers who believe that Applied owesthem indemnification or other obligations related to claims made against such customers by third parties.
In February 2010, the Seoul Prosecutor’s Office for the Eastern District in Korea indicted certain employeesof Applied Materials Korea (AMK), including the former head of AMK who at the time of indictment was a vicepresident of Applied Materials, Inc., along with employees of several other companies, alleging the improperreceipt and use of confidential information of Samsung Electronics Co., Ltd. (Samsung), a major customer. Hear-ings on these matters are ongoing in the Seoul Eastern District Court. Applied and Samsung entered into asettlement agreement effective as of November 1, 2010, which resolves potential civil claims related to this mat-ter and which is separate from and does not affect the criminal proceedings.
Legal proceedings and claims, whether with or without merit, and associated internal investigations, may(1) be time-consuming and expensive to prosecute, defend or conduct; (2) divert management’s attention andother Applied resources; (3) inhibit Applied’s ability to sell its products; (4) result in adverse judgments fordamages, injunctive relief, penalties and fines; and/or (5) negatively affect Applied’s business. There can be noassurance regarding the outcome of current or future legal proceedings, claims or investigations. If Applied is notable to favorably resolve or settle legal proceedings or claims, or in the event of any adverse findings againstApplied or any of its employees, Applied’s business, financial condition and results of operations could bematerially and adversely affected and Applied may suffer harm to its reputation.
30

Applied’s success depends in significant part on the protection of its intellectual property and other rights.Infringement of Applied’s rights by a third party, such as the unauthorized manufacture or sale of equipment orspare parts, could result in uncompensated lost market and revenue opportunities for Applied. Applied’sintellectual property rights may not provide significant competitive advantages if they are circumvented,invalidated, rendered obsolete by the rapid pace of technological change, or if Applied does not adequately pro-tect or assert these rights. Furthermore, the laws and practices of other countries, including China, India, Taiwanand Korea, permit the protection and enforcement of Applied’s rights to varying extents, which may not be suffi-cient to adequately protect Applied’s rights. Applied previously entered into an arrangement with one of itscompetitors to decrease the risk of patent infringement lawsuits in the future. There can be no assurance that theintended results of this arrangement will be achieved or that Applied will be able to adequately protect itsintellectual property rights with the restrictions associated with the arrangement. If Applied is not able to favor-ably resolve or settle claims, obtain or enforce intellectual property rights, obtain necessary licenses on commer-cially reasonable terms, and/or successfully prosecute or defend its intellectual property position, Applied’sbusiness, financial condition and results of operations could be materially and adversely affected and Appliedmay suffer harm to its reputation.
Changes in tax rates or tax assets and liabilities could affect results of operations.
As a global company, Applied is subject to taxation in the United States and various other countries. Sig-nificant judgment is required to determine and estimate worldwide tax liabilities. Applied’s future annual andquarterly tax rates could be affected by numerous factors, including changes in the: (1) applicable tax laws;(2) amount and composition of pre-tax income in countries with differing tax rates; (3) plans of the Company topermanently reinvest certain funds held outside of the U.S.; or (4) valuation of Applied’s deferred tax assets andliabilities.
To better align with the increasingly international nature of its business, Applied is transitioning certainmanufacturing, supply chain, and other operations into Asia, bringing these activities closer to customers. Thesechanges are expected to result in a reduction of future operating costs. In Singapore, Applied has received author-ization to use tax incentives that provide that certain income earned in Singapore will be subject to tax holidaysor reduced income tax rates. To obtain the benefit of these tax provisions, Applied must meet requirements relat-ing to various activities. Applied’s ability to realize benefits from these provisions could be materially affected if,among other things, applicable requirements are not met, or if Applied incurs net losses for which it cannot claima deduction.
In addition, Applied is subject to regular examination by the Internal Revenue Service and other tax author-ities, and from time to time initiates amendments to previously filed tax returns. Applied regularly assesses the like-lihood of favorable or unfavorable outcomes resulting from these examinations and amendments to determine theadequacy of its provision for income taxes, which requires estimates and judgments. Although Applied believes itstax estimates are reasonable, there can be no assurance that the tax authorities will agree with such estimates.Applied may have to engage in litigation to achieve the results reflected in the estimates, which may be time-consuming and expensive. There can be no assurance that Applied will be successful or that any final determinationwill not be materially different from the treatment reflected in Applied’s historical income tax provisions andaccruals, which could materially and adversely affect Applied’s financial condition and results of operations.
Applied is subject to risks of non-compliance with environmental and safety regulations.
Applied is subject to environmental and safety regulations in connection with its global business operations,including but not limited to: regulations related to the development, manufacture and use of its products;recycling and disposal of materials used in its products or in producing its products; the operation of its facilities;and the use of its real property. The failure or inability to comply with existing or future environmental andsafety regulations, such as those related to climate change, could result in: (1) significant remediation liabilities;(2) the imposition of fines; (3) the suspension or termination of the development, manufacture, sale or use ofcertain of its products; (4) limitations on the operation of its facilities or ability to use its real property; and/or(5) a decrease in the value of its real property, each of which could have a material adverse effect on Applied’sbusiness, financial condition and results of operations.
31

Applied is exposed to various risks related to the regulatory environment.
Applied is subject to various risks related to: (1) new, different, inconsistent or even conflicting laws, rulesand regulations that may be enacted by executive order, legislative bodies and/or regulatory agencies in the coun-tries in which Applied operates; (2) disagreements or disputes between national or regional regulatory agenciesrelated to international trade; and (3) the interpretation and application of laws, rules and regulations. For exam-ple, as a public company with global operations, Applied is subject to the laws of multiple jurisdictions and therules and regulations of various governing bodies, including those related to financial and other disclosures,corporate governance, privacy, and anti-corruption. Changes in laws, regulations and standards may createuncertainty regarding compliance matters. Efforts to comply with new and changing regulations have resulted in,and are likely to continue to result in, increased general and administrative expenses and a diversion of manage-ment time and attention from revenue-generating activities to compliance activities. If Applied is found by acourt or regulatory agency not to be in compliance with applicable laws, rules or regulations, Applied could besubject to legal or regulatory sanctions, the public’s and customers’ perception of Applied could decline, andApplied’s business, financial condition and results of operations could be materially and adversely affected.
Item 1B: Unresolved Staff Comments
None.
32
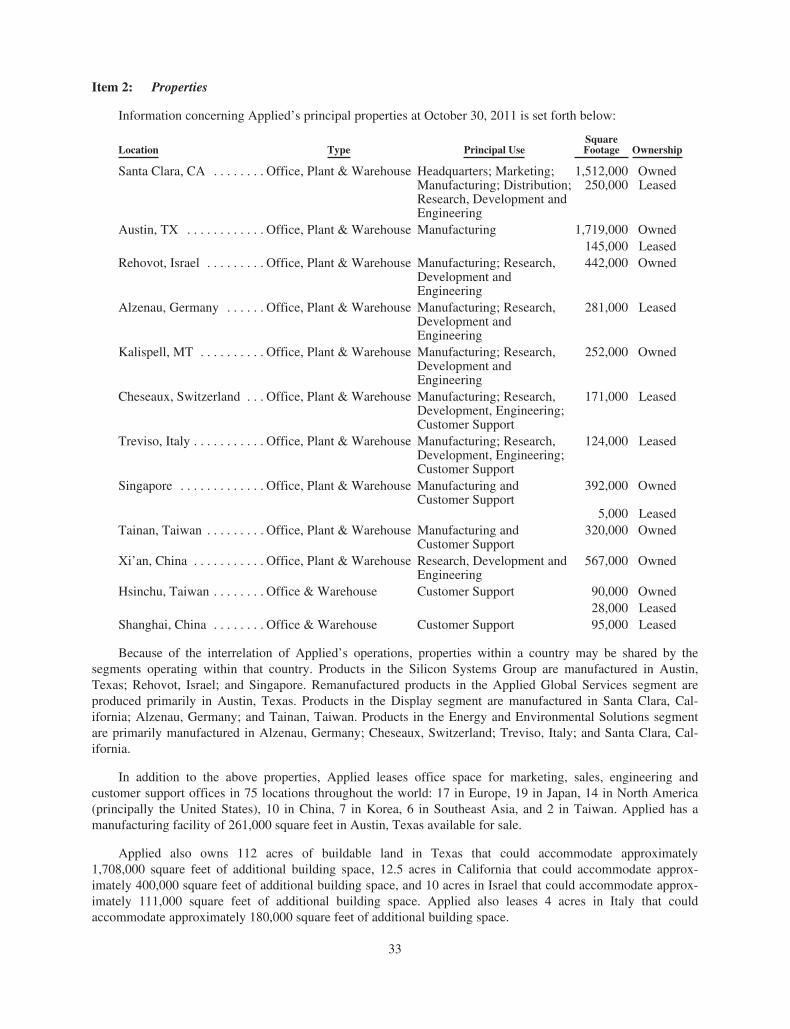
Item 2: Properties
Information concerning Applied’s principal properties at October 30, 2011 is set forth below:
Location Type Principal UseSquareFootage Ownership
Santa Clara, CA . . . . . . . . Office, Plant & Warehouse Headquarters; Marketing; 1,512,000 OwnedManufacturing; Distribution; 250,000 LeasedResearch, Development andEngineering
Austin, TX . . . . . . . . . . . . Office, Plant & Warehouse Manufacturing 1,719,000 Owned145,000 Leased
Rehovot, Israel . . . . . . . . . Office, Plant & Warehouse Manufacturing; Research,Development andEngineering
442,000 Owned
Alzenau, Germany . . . . . . Office, Plant & Warehouse Manufacturing; Research,Development andEngineering
281,000 Leased
Kalispell, MT . . . . . . . . . . Office, Plant & Warehouse Manufacturing; Research,Development andEngineering
252,000 Owned
Cheseaux, Switzerland . . . Office, Plant & Warehouse Manufacturing; Research,Development, Engineering;Customer Support
171,000 Leased
Treviso, Italy . . . . . . . . . . . Office, Plant & Warehouse Manufacturing; Research,Development, Engineering;Customer Support
124,000 Leased
Singapore . . . . . . . . . . . . . Office, Plant & Warehouse Manufacturing andCustomer Support
392,000 Owned
5,000 LeasedTainan, Taiwan . . . . . . . . . Office, Plant & Warehouse Manufacturing and
Customer Support320,000 Owned
Xi’an, China . . . . . . . . . . . Office, Plant & Warehouse Research, Development andEngineering
567,000 Owned
Hsinchu, Taiwan . . . . . . . . Office & Warehouse Customer Support 90,000 Owned28,000 Leased
Shanghai, China . . . . . . . . Office & Warehouse Customer Support 95,000 Leased
Because of the interrelation of Applied’s operations, properties within a country may be shared by thesegments operating within that country. Products in the Silicon Systems Group are manufactured in Austin,Texas; Rehovot, Israel; and Singapore. Remanufactured products in the Applied Global Services segment areproduced primarily in Austin, Texas. Products in the Display segment are manufactured in Santa Clara, Cal-ifornia; Alzenau, Germany; and Tainan, Taiwan. Products in the Energy and Environmental Solutions segmentare primarily manufactured in Alzenau, Germany; Cheseaux, Switzerland; Treviso, Italy; and Santa Clara, Cal-ifornia.
In addition to the above properties, Applied leases office space for marketing, sales, engineering andcustomer support offices in 75 locations throughout the world: 17 in Europe, 19 in Japan, 14 in North America(principally the United States), 10 in China, 7 in Korea, 6 in Southeast Asia, and 2 in Taiwan. Applied has amanufacturing facility of 261,000 square feet in Austin, Texas available for sale.
Applied also owns 112 acres of buildable land in Texas that could accommodate approximately1,708,000 square feet of additional building space, 12.5 acres in California that could accommodate approx-imately 400,000 square feet of additional building space, and 10 acres in Israel that could accommodate approx-imately 111,000 square feet of additional building space. Applied also leases 4 acres in Italy that couldaccommodate approximately 180,000 square feet of additional building space.
33

In connection with the acquisition of Varian in November 2011, Applied added owned and leased facilitiesaggregating 715,000 square feet. These facilities consist of a manufacturing facility located in Gloucester,Massachusetts and multiple international sales and service offices.
Applied considers the properties that it owns or leases as adequate to meet its current and future require-ments. Applied regularly assesses the size, capability and location of its global infrastructure and periodicallymakes adjustments based on these assessments.
Item 3: Legal Proceedings
The information set forth under “Legal Matters” in Note 15 of Notes to Consolidated Financial Statementsis incorporated herein by reference.
Item 4: (Removed and Reserved)
34

PART II
Item 5: Market for Registrant’s Common Equity, Related Stockholder Matters and Issuer Purchases ofEquity Securities
Market Information
The following table sets forth the high and low closing sale prices for the periods presented as reported onthe NASDAQ Global Select Market.
Price Range
High Low
Fiscal 2010First quarter . . . . . . . . . . . . . . . . . . . . . . . . . . . . . . . . . . . . . . . . . . . . . . . . . . . . . . . . $14.87 $11.89Second quarter . . . . . . . . . . . . . . . . . . . . . . . . . . . . . . . . . . . . . . . . . . . . . . . . . . . . . . $14.47 $11.80Third quarter . . . . . . . . . . . . . . . . . . . . . . . . . . . . . . . . . . . . . . . . . . . . . . . . . . . . . . . $14.00 $11.78Fourth quarter . . . . . . . . . . . . . . . . . . . . . . . . . . . . . . . . . . . . . . . . . . . . . . . . . . . . . . $12.35 $10.37Fiscal 2011First quarter . . . . . . . . . . . . . . . . . . . . . . . . . . . . . . . . . . . . . . . . . . . . . . . . . . . . . . . . $16.10 $12.37Second quarter . . . . . . . . . . . . . . . . . . . . . . . . . . . . . . . . . . . . . . . . . . . . . . . . . . . . . . $16.85 $14.46Third quarter . . . . . . . . . . . . . . . . . . . . . . . . . . . . . . . . . . . . . . . . . . . . . . . . . . . . . . . $15.24 $12.27Fourth quarter . . . . . . . . . . . . . . . . . . . . . . . . . . . . . . . . . . . . . . . . . . . . . . . . . . . . . . $12.62 $ 9.85
Applied’s common stock is traded on the NASDAQ Global Select Market under the symbol AMAT. As ofNovember 20, 2011, there were 4,192 registered holders of Applied common stock.
35

Performance Graph
The performance graph below shows the five-year cumulative total stockholder return on Applied commonstock during the period from October 29, 2006 through October 30, 2011. This is compared with the cumulativetotal return of the Standard & Poor’s 500 Stock Index and the RDG Semiconductor Composite Index over thesame period. The comparison assumes $100 was invested on October 29, 2006 in Applied common stock and ineach of the foregoing indices and assumes reinvestment of dividends, if any. Dollar amounts in the graph arerounded to the nearest whole dollar. The performance shown in the graph represents past performance and shouldnot be considered an indication of future performance.
COMPARISON OF 5 YEAR CUMULATIVE TOTAL RETURN*Among Applied Materials, Inc., the S&P 500 Index
and the RDG Semiconductor Composite Index
$0
$20
$40
$60
$80
$100
$120
$140
10/29/06 10/28/07 10/26/08 10/25/09 10/31/10 10/30/11
111
73
79
98 108115
68
8094
101
117
65
80
7780
Applied Materials, Inc. S&P 500 RDG Semiconductor Composite
* $100 invested on 10/29/06 in stock or 10/31/06 in index, including reinvestment of dividends.Indexes calculated on month-end basis.Copyright© 2011 S&P, a division of The McGraw-Hill Companies Inc. All rights reserved.
10/29/06 10/28/07 10/26/08 10/25/09 10/31/10 10/30/11
Applied Materials 100.00 110.51 67.66 78.53 76.51 79.98S&P 500 Index 100.00 114.56 73.21 80.38 93.66 101.24RDG Semiconductor Composite Index 100.00 116.74 64.72 79.94 98.31 107.61
Dividends
The following table summarizes the dividends declared by Applied’s Board of Directors during fiscal 2011:
Date declared Record date Payable date Amount per share
December 7, 2010 March 2, 2011 March 23, 2011 $ 0.07March 8, 2011 June 1, 2011 June 22, 2011 $ 0.08June 6, 2011 August 31, 2011 September 21, 2011 $ 0.08September 13, 2011 November 23, 2011 December 14, 2011 $ 0.08
During fiscal 2010, Applied’s Board of Directors declared three quarterly cash dividends in the amount of$0.07 per share each and one quarterly cash dividend in the amount of $0.06 per share. During fiscal 2009,Applied’s Board of Directors declared four quarterly cash dividends in the amount of $0.06 per share each. Divi-dends declared during fiscal 2011, 2010 and 2009 amounted to $408 million, $361 million and $320 million,
36

respectively. Applied currently anticipates that it will continue to pay cash dividends on a quarterly basis in thefuture, although the declaration and amount of any future cash dividend are at the discretion of the Board ofDirectors and will depend on Applied’s financial condition, results of operations, capital requirements, businessconditions and other factors, as well as a determination that cash dividends are in the best interests of Applied’sstockholders.
Repurchases of Applied Common Stock
The following table provides information as of October 30, 2011 with respect to the shares of common stockrepurchased by Applied during the fourth quarter of fiscal 2011.
PeriodTotal Number ofShares Purchased
AveragePrice Paidper Share
Total Number ofShares Purchased as
Part of PubliclyAnnounced Program*
Maximum DollarValue of Shares
That May Yet bePurchased Under
the Program*
(In millions, except per share amounts)
Month #1(August 1, 2011 to August 28, 2011) . . . . . 0.9 $11.44 0.9 $1,347
Month #2(August 29, 2011 to September 25,
2011) . . . . . . . . . . . . . . . . . . . . . . . . . . . . 10.5 $11.08 10.5 $1,231Month #3
(September 26, 2011 to October 30,2011) . . . . . . . . . . . . . . . . . . . . . . . . . . . . 4.5 $10.86 4.5 $1,182
Total . . . . . . . . . . . . . . . . . . . . . . . . . . . . . . . . 15.9 $11.04 15.9
* On March 8, 2010, the Board of Directors approved a stock repurchase program for up to $2.0 billion inrepurchases over the next three years, ending March 2013.
37

Item 6: Selected Financial Data
The following selected financial information has been derived from Applied’s historical audited con-solidated financial statements and should be read in conjunction with the consolidated financial statements andthe accompanying notes for the corresponding fiscal years:
Fiscal Year(1) 2011 2010 2009 2008 2007
(In millions, except percentages, per share amountsand number of employees)
Net sales . . . . . . . . . . . . . . . . . . . . . . . . . . . . . . . . . . . $10,517 $ 9,549 $ 5,014 $ 8,129 $ 9,735Gross margin . . . . . . . . . . . . . . . . . . . . . . . . . . . . . . . . $ 4,360 $ 3,715 $ 1,431 $ 3,443 $ 4,492(% of net sales) . . . . . . . . . . . . . . . . . . . . . . . . . . . . . . 41 39 29 42 46Research, development and engineering . . . . . . . . . . . $ 1,118 $ 1,143 $ 934 $ 1,104 $ 1,142(% of net sales) . . . . . . . . . . . . . . . . . . . . . . . . . . . . . . 11 12 19 14 12Marketing, selling, general and administrative . . . . . . $ 901 $ 942 $ 735 $ 965 $ 952(% of net sales) . . . . . . . . . . . . . . . . . . . . . . . . . . . . . . 9 10 15 12 10Operating income (loss) . . . . . . . . . . . . . . . . . . . . . . . $ 2,398 $ 1,384 $ (394) $ 1,355 $ 2,372(% of net sales) . . . . . . . . . . . . . . . . . . . . . . . . . . . . . . 23 14 (8) 17 24Income (loss) before income taxes . . . . . . . . . . . . . . . $ 2,378 $ 1,387 $ (486) $ 1,409 $ 2,440Effective tax rate (%) . . . . . . . . . . . . . . . . . . . . . . . . . 19 32 (37) 32 30Net income (loss) . . . . . . . . . . . . . . . . . . . . . . . . . . . . $ 1,926 $ 938 $ (305) $ 961 $ 1,710(% of net sales) . . . . . . . . . . . . . . . . . . . . . . . . . . . . . . 18 10 (6) 12 18Earnings (loss) per diluted share . . . . . . . . . . . . . . . . . $ 1.45 $ 0.70 $ (0.23) $ 0.70 $ 1.20Weighted average common shares, diluted . . . . . . . . . 1,330 1,349 1,333 1,375 1,427New orders . . . . . . . . . . . . . . . . . . . . . . . . . . . . . . . . . $10,142 $10,249 $ 4,097 $ 9,155 $ 9,677Order backlog . . . . . . . . . . . . . . . . . . . . . . . . . . . . . . . $ 2,392 $ 3,244 $ 2,735 $ 4,848 $ 3,655Working capital . . . . . . . . . . . . . . . . . . . . . . . . . . . . . . $ 7,561 $ 3,877 $ 3,749 $ 3,719 $ 4,226Long-term debt . . . . . . . . . . . . . . . . . . . . . . . . . . . . . . $ 1,947 $ 204 $ 201 $ 202 $ 202Cash dividends declared per common share . . . . . . . . $ 0.31 $ 0.27 $ 0.24 $ 0.24 $ 0.23Stockholders’ equity . . . . . . . . . . . . . . . . . . . . . . . . . . $ 8,800 $ 7,536 $ 7,095 $ 7,549 $ 7,821Total assets . . . . . . . . . . . . . . . . . . . . . . . . . . . . . . . . . $13,861 $10,943 $ 9,574 $11,006 $10,662Capital expenditures . . . . . . . . . . . . . . . . . . . . . . . . . . $ 209 $ 169 $ 249 $ 288 $ 265Regular employees . . . . . . . . . . . . . . . . . . . . . . . . . . . 12,973 13,045 12,619 14,824 14,550
(1) Each fiscal year ended on the last Sunday in October.
38
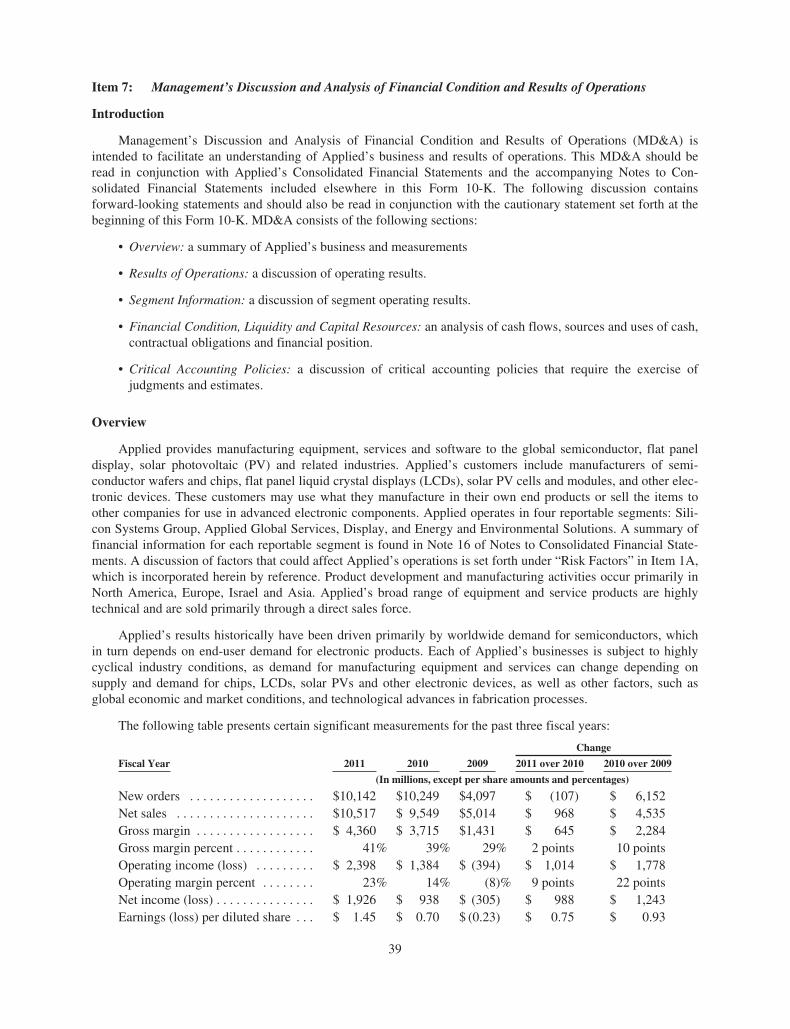
Item 7: Management’s Discussion and Analysis of Financial Condition and Results of Operations
Introduction
Management’s Discussion and Analysis of Financial Condition and Results of Operations (MD&A) isintended to facilitate an understanding of Applied’s business and results of operations. This MD&A should beread in conjunction with Applied’s Consolidated Financial Statements and the accompanying Notes to Con-solidated Financial Statements included elsewhere in this Form 10-K. The following discussion containsforward-looking statements and should also be read in conjunction with the cautionary statement set forth at thebeginning of this Form 10-K. MD&A consists of the following sections:
• Overview: a summary of Applied’s business and measurements
• Results of Operations: a discussion of operating results.
• Segment Information: a discussion of segment operating results.
• Financial Condition, Liquidity and Capital Resources: an analysis of cash flows, sources and uses of cash,contractual obligations and financial position.
• Critical Accounting Policies: a discussion of critical accounting policies that require the exercise ofjudgments and estimates.
Overview
Applied provides manufacturing equipment, services and software to the global semiconductor, flat paneldisplay, solar photovoltaic (PV) and related industries. Applied’s customers include manufacturers of semi-conductor wafers and chips, flat panel liquid crystal displays (LCDs), solar PV cells and modules, and other elec-tronic devices. These customers may use what they manufacture in their own end products or sell the items toother companies for use in advanced electronic components. Applied operates in four reportable segments: Sili-con Systems Group, Applied Global Services, Display, and Energy and Environmental Solutions. A summary offinancial information for each reportable segment is found in Note 16 of Notes to Consolidated Financial State-ments. A discussion of factors that could affect Applied’s operations is set forth under “Risk Factors” in Item 1A,which is incorporated herein by reference. Product development and manufacturing activities occur primarily inNorth America, Europe, Israel and Asia. Applied’s broad range of equipment and service products are highlytechnical and are sold primarily through a direct sales force.
Applied’s results historically have been driven primarily by worldwide demand for semiconductors, whichin turn depends on end-user demand for electronic products. Each of Applied’s businesses is subject to highlycyclical industry conditions, as demand for manufacturing equipment and services can change depending onsupply and demand for chips, LCDs, solar PVs and other electronic devices, as well as other factors, such asglobal economic and market conditions, and technological advances in fabrication processes.
The following table presents certain significant measurements for the past three fiscal years:
Change
Fiscal Year 2011 2010 2009 2011 over 2010 2010 over 2009
(In millions, except per share amounts and percentages)
New orders . . . . . . . . . . . . . . . . . . . $10,142 $10,249 $4,097 $ (107) $ 6,152Net sales . . . . . . . . . . . . . . . . . . . . . $10,517 $ 9,549 $5,014 $ 968 $ 4,535Gross margin . . . . . . . . . . . . . . . . . . $ 4,360 $ 3,715 $1,431 $ 645 $ 2,284Gross margin percent . . . . . . . . . . . . 41% 39% 29% 2 points 10 pointsOperating income (loss) . . . . . . . . . $ 2,398 $ 1,384 $ (394) $ 1,014 $ 1,778Operating margin percent . . . . . . . . 23% 14% (8)% 9 points 22 pointsNet income (loss) . . . . . . . . . . . . . . . $ 1,926 $ 938 $ (305) $ 988 $ 1,243Earnings (loss) per diluted share . . . $ 1.45 $ 0.70 $ (0.23) $ 0.75 $ 0.93
39

Fiscal 2011 and 2009 contained 52 weeks each, while fiscal 2010 contained 53 weeks.
Financial results for fiscal 2011 over fiscal 2010 reflected a decrease in total new orders, while net salesincreased to a record level and net income also increased. The decline in new orders reflected softening demandfor semiconductor, LCD and solar equipment in the second half of the year. The semiconductor industry wasnegatively impacted by uncertainty in the macroeconomic environment whereas the LCD and solar equipmentindustries were negatively impacted by overcapacity. In the fourth quarter of fiscal 2011, new orders were $1.6billion, down 33 percent from the prior quarter. For fiscal 2011, net sales increased year-over-year primarily dueto increased industry investment in crystalline-silicon (c-Si) solar equipment and higher sales of spares andrefurbished semiconductor equipment. Operating income for fiscal 2011 included favorable adjustments torestructuring reserves of $60 million, offset in part by asset impairment charges of $30 million, and a net gain onsale of facilities of $27 million. In fiscal 2010, Applied incurred charges totaling $486 million that included aplan to restructure its Energy and Environmental Solutions segment.
Financial results for fiscal 2010 over fiscal 2009 reflected significantly increased demand for manufacturingequipment and services due to more favorable global economic and industry conditions. The increase in totalorders from fiscal 2009 was primarily due to increased demand for semiconductor, display and c-Si solar PVproducts, partially offset by decreased demand for SunFab™ thin film solar lines. Net sales increased during fis-cal 2010 compared to fiscal 2009, due primarily to higher sales of semiconductor and display equipment. In fis-cal 2010, Applied incurred charges totaling $486 million that included a plan to restructure its Energy andEnvironmental Solutions segment, consisting of inventory-related charges of $330 million related to SunFab thinfilm solar equipment, asset impairment charges of $108 million, employee severance charges of $45 million, andother costs of $3 million. This action was in response to adverse market conditions for thin film solar, includingdelays in utility-scale solar adoption, solar panel manufacturers’ challenges in obtaining affordable capital,changes and uncertainty in government renewable energy policies, and competitive pressure from c-Si solartechnologies. As part of the restructuring, Applied discontinued sales to new customers of its fully-integratedSunFab lines but continued to offer individual tools for thin film solar manufacturing. Applied is supportingexisting SunFab customers with services, upgrades and capacity increases through its Applied Global Servicessegment and is continuing RD&E efforts to improve thin film panel efficiency and high-productivity deposition.Also in fiscal 2010, Applied incurred charges totaling $84 million associated with a restructuring program toreduce its global workforce as of October 25, 2009 by approximately 1,000 positions over a period of 18 months.
Fiscal 2009 financial results reflected significantly reduced demand for manufacturing equipment and serv-ices due to extremely unfavorable global economic and industry conditions, particularly in the first half of fiscal2009. Negative trends in consumer spending and pervasive economic uncertainty led some customers to dramati-cally reduce factory operations and to reduce their spending. In the second half of fiscal 2009, demand for semi-conductor and display equipment increased, but was still down significantly from fiscal 2008 levels. Fiscal 2009financial results included charges associated with restructuring programs.
In November 2011, Applied completed its acquisition of Varian Semiconductor Equipment Associates, Inc.(Varian) for an aggregate purchase price of approximately $4.2 billion, net of cash acquired. The acquisitionenhances Applied’s product portfolio with market-leading ion implantation technology and is expected to enableApplied to become the semiconductor industry leader in transistor technologies.
40

Results of Operations
The following table presents certain quarterly and full fiscal year financial information:
Fiscal Quarter FiscalYearFirst Second Third Fourth
(In millions, except per share amounts)
2011:New orders . . . . . . . . . . . . . . . . . . . . . . . . . . . . $2,971 $3,185 $2,390 $1,596 $10,142Net sales . . . . . . . . . . . . . . . . . . . . . . . . . . . . . . $2,686 $2,862 $2,787 $2,182 $10,517Gross margin . . . . . . . . . . . . . . . . . . . . . . . . . . $1,136 $1,189 $1,184 $ 852 $ 4,360Operating income . . . . . . . . . . . . . . . . . . . . . . . $ 674 $ 677 $ 687 $ 361 $ 2,398Net income . . . . . . . . . . . . . . . . . . . . . . . . . . . . $ 506 $ 489 $ 476 $ 456 $ 1,926Earnings per diluted share . . . . . . . . . . . . . . . . $ 0.38 $ 0.37 $ 0.36 $ 0.34 $ 1.45
2010:New orders . . . . . . . . . . . . . . . . . . . . . . . . . . . . $1,965 $2,533 $2,725 $3,026 $10,249Net sales . . . . . . . . . . . . . . . . . . . . . . . . . . . . . . $1,849 $2,296 $2,518 $2,886 $ 9,549Gross margin . . . . . . . . . . . . . . . . . . . . . . . . . . $ 711 $ 927 $ 860 $1,217 $ 3,715Operating income . . . . . . . . . . . . . . . . . . . . . . . $ 116 $ 386 $ 183 $ 699 $ 1,384Net income . . . . . . . . . . . . . . . . . . . . . . . . . . . . $ 83 $ 264 $ 123 $ 468 $ 938Earnings per diluted share . . . . . . . . . . . . . . . . $ 0.06 $ 0.20 $ 0.09 $ 0.35 $ 0.70
2009:New orders . . . . . . . . . . . . . . . . . . . . . . . . . . . . $ 903 $ 649 $1,072 $1,473 $ 4,097Net sales . . . . . . . . . . . . . . . . . . . . . . . . . . . . . . $1,333 $1,020 $1,134 $1,526 $ 5,014Gross margin . . . . . . . . . . . . . . . . . . . . . . . . . . $ 392 $ 156 $ 325 $ 559 $ 1,431Operating income (loss) . . . . . . . . . . . . . . . . . . $ (196) $ (293) $ (77) $ 173 $ (394)Net income (loss) . . . . . . . . . . . . . . . . . . . . . . . $ (133) $ (255) $ (55) $ 138 $ (305)Earnings (loss) per diluted share . . . . . . . . . . . $ (0.10) $ (0.19) $ (0.04) $ 0.10 $ (0.23)
Demand for manufacturing equipment historically has been volatile as a result of sudden changes in chip,LCD, and solar PV supply and demand and other factors, including global economic and market conditions andrapid technological advances in fabrication processes. Applied’s business was subject to cyclical industry con-ditions in fiscal 2011, 2010 and 2009. As a result of these conditions and the changing global economicenvironment, there were significant fluctuations in Applied’s quarterly new orders and net sales, both within andacross the three fiscal years. As of the end of fiscal 2011, the semiconductor, display and solar equipmentindustries were each in a capacity-driven downturn. The nature and timing of a recovery in capital equipmentinvestment are expected to depend largely on the macroeconomic environment.
41

New Orders
New orders by geographic region, which are attributed according to the location of customers’ facilities,were as follows:
2011Change
2011 over 2010 2010Change
2010 over 2009 2009
($) (%) (%) ($) (%) (%) ($) (%)
(In millions, except percentages)
Taiwan . . . . . . . . . . . . . . . . . . . . . . . . 2,235 22 (19) 2,760 27 342 625 15China . . . . . . . . . . . . . . . . . . . . . . . . . 2,066 20 (4) 2,155 21 188 749 18Korea . . . . . . . . . . . . . . . . . . . . . . . . . 1,286 13 (25) 1,703 17 205 559 14Japan . . . . . . . . . . . . . . . . . . . . . . . . . 1,001 10 35 741 7 40 531 13Southeast Asia . . . . . . . . . . . . . . . . . . 463 5 (31) 675 7 173 247 6
Asia Pacific . . . . . . . . . . . . . . . . . . 7,051 70 (12) 8,034 79 196 2,711 66North America(*) . . . . . . . . . . . . . . . 2,069 20 54 1,348 13 90 711 17Europe . . . . . . . . . . . . . . . . . . . . . . . . 1,022 10 18 867 8 28 675 17
Total . . . . . . . . . . . . . . . . . . . . . . 10,142 100 (1) 10,249 100 150 4,097 100
(*) Primarily the United States.
New orders of $10.1 billion for fiscal 2011 were down 1 percent from fiscal 2010. The decrease was primar-ily attributable to decreased demand for semiconductor equipment from memory customers and decreaseddemand for LCD equipment, partially offset by increased demand for touch panel tools from display customersand increased demand for c-Si equipment from solar manufacturers. Customers in China and Taiwan togetherrepresented 42 percent of total new orders for fiscal 2011.
From fiscal 2009 to fiscal 2010, new orders more than doubled to $10.2 billion. The increase was princi-pally due to greater demand for semiconductor equipment and services, primarily from memory and foundrycustomers, as well as increased demand for c-Si solar manufacturing products and display equipment. Theincrease in new orders reflected the general recovery in the semiconductor equipment industry and the LCDmarket from the steep downturn experienced in fiscal 2009. Customers in Taiwan and China together represented48 percent of total new orders for fiscal 2010.
New orders decreased 55 percent to $4.1 billion in fiscal 2009 compared to fiscal 2008. The decrease in neworders was across all segments, and particularly in the semiconductor and display businesses, reflecting the chal-lenging economic and industry conditions prevalent during fiscal 2009. Customer demand for semiconductor andLCD equipment began to recover in the second half of fiscal 2009. Customers in China, North America, andEurope combined represented 52 percent of total new orders for fiscal 2009.
New orders by reportable segment for the past three fiscal years were as follows:
2011Change
2011 over 2010 2010Change
2010 over 2009 2009
($) (%) (%) ($) (%) (%) ($) (%)
(In millions, except percentages)
Silicon Systems Group . . . . . . . . . . . 5,489 54 (5) 5,759 56 243 1,677 41Applied Global Services . . . . . . . . . . 2,333 23 7 2,183 21 85 1,179 29Display . . . . . . . . . . . . . . . . . . . . . . . . 636 6 (20) 799 8 178 287 7Energy and Environmental
Solutions . . . . . . . . . . . . . . . . . . . . 1,684 17 12 1,508 15 58 955 23
Total . . . . . . . . . . . . . . . . . . . . . . . . . . 10,142 100 (1) 10,249 100 150 4,098 100
For fiscal 2011 as compared to fiscal 2010, new orders by segment as well as the relative share of total neworders for the Silicon Systems Group and Display decreased, while new orders by segment as well as the relative
42

share of new orders in Applied Global Services and Energy and Environmental Solutions increased. For fiscal2010 as compared to fiscal 2009, new orders increased in all segments, with the relative share of total new ordersincreasing significantly for the Silicon Systems Group while the relative share of new orders in Applied GlobalServices and Energy and Environmental Solutions decreased by 8 percentage points each.
Applied’s backlog was $2.4 billion at October 30, 2011 as compared to $3.2 billion at October 31, 2010.Backlog adjustments were negative for fiscal 2011 and totaled $504 million, consisting primarily of orders withrevised shipment dates outside of Applied’s order policy and included $124 million in customer cancellations.Backlog decreased in fiscal 2011 from fiscal 2010 primarily due to decreases in new orders for the Silicon Sys-tems Group and Display, reflecting decreased demand for semiconductor equipment and a weaker LCD market,respectively. Backlog consists of: (1) orders for which written authorizations have been accepted and assignedshipment dates are within the next 12 months, or shipment has occurred but revenue has not been recognized;(2) contractual service revenue and maintenance fees to be earned within the next 12 months; and (3) orders forSunFab lines that are anticipated to be recognized as revenue within the next 12 months. Applied’s backlog atany particular time is not necessarily indicative of actual sales for any future periods, due to the potential forcustomer changes in delivery schedules or cancellation of orders. In the fourth quarter of fiscal 2011, approx-imately 45 percent of net sales in the Silicon Systems Group, Applied’s largest business segment, were for ordersreceived and shipped within the quarter.
Backlog by reportable segment as of October 30, 2011 and October 31, 2010 was as follows:
2011Change
2011 over 2010 2010
($) (%) (%) ($) (%)
(In millions, except percentages)
Silicon Systems Group . . . . . . . . . . . . . . . . . . . . . . . . . . . . . . . . . . . . . 913 38 (17) 1,099 34Applied Global Services . . . . . . . . . . . . . . . . . . . . . . . . . . . . . . . . . . . . 662 28 (15) 779 24Display . . . . . . . . . . . . . . . . . . . . . . . . . . . . . . . . . . . . . . . . . . . . . . . . . 337 14 (33) 505 16Energy and Environmental Solutions . . . . . . . . . . . . . . . . . . . . . . . . . . 480 20 (44) 861 26
Total . . . . . . . . . . . . . . . . . . . . . . . . . . . . . . . . . . . . . . . . . . . . . . . . . . . 2,392 100 (26) 3,244 100
Net Sales
Net sales by geographic region, which are attributed according to the location of customers’ facilities, wereas follows:
2011Change
2011 over 2010 2010Change
2010 over 2009 2009
($) (%) (%) ($) (%) (%) ($) (%)
(In millions, except percentages)
China . . . . . . . . . . . . . . . . . . . . . . . . . . 2,574 24 65 1,557 16 145 635 13Taiwan . . . . . . . . . . . . . . . . . . . . . . . . . 2,093 20 (24) 2,750 29 168 1,026 21Korea . . . . . . . . . . . . . . . . . . . . . . . . . . 1,263 12 (29) 1,768 19 166 664 13Japan . . . . . . . . . . . . . . . . . . . . . . . . . . 912 9 19 768 8 7 718 14Southeast Asia . . . . . . . . . . . . . . . . . . . 592 5 2 578 6 129 252 5
Asia Pacific . . . . . . . . . . . . . . . . . . . 7,434 70 — 7,421 78 125 3,295 66North America(*) . . . . . . . . . . . . . . . . 1,963 19 72 1,147 12 19 966 19Europe . . . . . . . . . . . . . . . . . . . . . . . . . 1,120 11 14 981 10 30 753 15
Total . . . . . . . . . . . . . . . . . . . . . . . 10,517 100 10 9,549 100 90 5,014 100
(*) Primarily the United States.
Net sales of $10.5 billion for fiscal 2011 increased 10 percent from fiscal 2010, primarily due to increasedindustry investment in c-Si solar equipment and higher sales of spares and refurbished semiconductor equipment.
43

Customers in China, North America, and Taiwan combined represented 63 percent of total net sales in fiscal2011. Net sales of $9.5 billion for fiscal 2010 increased 90 percent from fiscal 2009, primarily due to higher salesof semiconductor equipment. Customers in Taiwan and Korea combined represented 48 percent of total net salesin fiscal 2010. Net sales decreased 38 percent to $5.0 billion in fiscal 2009 compared to fiscal 2008, as a result ofsignificantly lower sales of equipment and services to semiconductor and display customers, partially offset byincreased sales of solar manufacturing equipment. Customers in Taiwan and North America combined repre-sented 40 percent of total net sales in fiscal 2009.
Net sales by reportable segment for the past three fiscal years were as follows:
2011Change
2011 over 2010 2010Change
2010 over 2009 2009
($) (%) (%) ($) (%) (%) ($) (%)
(In millions, except percentages)
Silicon Systems Group . . . . . . . . . . . . 5,415 51 2 5,304 56 171 1,960 39Applied Global Services . . . . . . . . . . . 2,413 23 29 1,865 20 34 1,397 28Display . . . . . . . . . . . . . . . . . . . . . . . . . 699 7 (22) 899 9 79 502 10Energy and Environmental
Solutions . . . . . . . . . . . . . . . . . . . . . 1,990 19 34 1,481 15 28 1,155 23
Total . . . . . . . . . . . . . . . . . . . . . . . . . . . 10,517 100 10 9,549 100 90 5,014 100
For fiscal 2011 as compared to fiscal 2010, net sales in the Silicon Systems Group remained essentially flatwhile net sales in Energy and Environment Solutions and Applied Global Services increased due to increaseddemand for c-Si equipment, and spare parts and refurbished equipment, respectively. Net sales in Displayreflected a decrease during fiscal 2011 as compared to fiscal 2010 due to a weaker LCD market. For fiscal 2011as compared to fiscal 2010, the relative share of total net sales in the Silicon Systems Group decreased, while therelative share of total net sales in Energy and Environmental Solutions increased. The increase in Energy andEnvironmental Solutions’ relative share of total net sales was due to increased demand for c-Si equipment.
Gross Margin
Gross margins for the past three fiscal years were as follows:
Change
2011 2010 2009 2011 over 2010 2010 over 2009
(In millions, except percentages)
Gross margin . . . . . . . . . . . . . . . . . . . . . . . . . . . . . . . . . $4,360 $3,715 $1,431 $ 645 $ 2,284Gross margin (% of net sales) . . . . . . . . . . . . . . . . . . . . 41% 39% 29% 2 points 10 points
The increase in gross margin as a percentage of net sales in fiscal 2011 from fiscal 2010 was principallyattributable to the absence of inventory-related charges incurred in fiscal 2010 associated with SunFab thin filmsolar equipment. The increase in gross margin as a percentage of net sales in fiscal 2010 from fiscal 2009 wasprincipally attributable to higher net sales, more favorable product mix, improved factory utilization, and con-tinued cost control measures, offset in part by inventory-related charges of $330 million associated with SunFabthin film solar equipment, which lowered gross margin for fiscal 2010 by approximately 3 percentage points.Gross margin during fiscal 2011, 2010 and 2009 included $48 million, $32 million and $28 million, respectively,of share-based compensation expense.
Research, Development and Engineering
Research, Development and Engineering (RD&E) expenses for the past three fiscal years were as follows:
Change
2011 2010 2009 2011 over 2010 2010 over 2009
(In millions)
Research, development and engineering . . . . . . . . . . . . . $1,118 $1,143 $934 $(25) $209
44

Applied’s future operating results depend to a considerable extent on its ability to maintain a competitiveadvantage in the equipment and service products it provides. Applied believes that it is critical to continue tomake substantial investments in RD&E to assure the availability of innovative technology that meets the currentand projected requirements of its customers’ most advanced designs. Applied historically has maintained itscommitment to investing in RD&E in order to continue to offer new products and technologies. RD&E expenseswere $1.1 billion (11 percent of net sales) in fiscal 2011, $1.1 billion (12 percent of net sales) in fiscal 2010, and$934 million (19 percent of net sales) in fiscal 2009. RD&E expense during fiscal 2011, 2010 and 2009 included$46 million, $43 million and $50 million, respectively, of share-based compensation expense. Developmentcycles range from 12 to 36 months depending on whether the product is an enhancement of an existing product,which typically has a shorter development cycle, or a new product, which typically has a longer developmentcycle. Most of Applied’s existing products resulted from internal development activities and innovations involv-ing new technologies, materials and processes. In certain instances, Applied acquires technologies, either inexisting or new product areas, to complement its existing technology capabilities and to reduce time to market.
In fiscal 2011, Applied developed logic and memory chip technologies to meet the requirements of manu-facturing below the 22nm node. These systems were designed to help semiconductor customers continue theirdrive to pack more transistors in the same space using high-k/metal gate technologies and double patterningprocesses. These technologies include low k dielectrics and curing for interconnect structures and high-k dielec-tric materials and ALD processes for fabricating transistor gates. Applied also focused on processes to help cus-tomers build new three-dimensional (3D) gate structures. In addition, Applied continued to focus on optimizingthe cost-effectiveness of through-silicon via (TSV) technologies to enable their widespread implementation. TSVtechnologies permit interconnecting 3D chip stacks to enable better device performance, lower power con-sumption and the integration of heterogeneous devices. Applied is also investing in other new product develop-ment areas such as 450mm wafer systems. In the Display sector, Applied developed deposition systems to enablelarger OLED, LCD and touch-enabled displays. In solar, Applied focused on screen printing technology to keeppace with cell manufacturers’ new higher-efficiency cell designs. Another key development area was “smart”capability, which brings a new level of precision and control to the PV production process.
In fiscal 2010, Applied developed new technology to enable next-generation 22nm and below chip designs.Applied also developed technology for TSVs. In the solar PV area, Applied continued the development of itsprecision wafering and cell manufacturing products for lowering the cost of producing solar-generated electricitythrough advanced c-Si technology. RD&E also included activities to develop products that enable lower-costproduction of solar energy, production of LED devices for display backlighting and general lighting, and otherproducts to enable energy conservation.
In fiscal 2009, Applied focused on developing systems for semiconductor customers’ new chip designs with32nm and below geometries, including systems to enable faster transistors using strain engineering and high-k/metal gate technologies, as well as double patterning processes that enable customers to extend their existing193nm lithography tools through additional technology generations. Applied also focused on developingtechnology for manufacturing next-generation displays. RD&E also included activities to develop products thatenable lower-cost production of solar energy and other products to enable energy conservation.
Selling, General and Administrative
Selling, general and administrative (SG&A) expenses for the past three fiscal years were as follows:
Change
2011 2010 2009 2011 over 2010 2010 over 2009
(In millions)
Selling, general and administrative . . . . . . . . . . . . . . . . . . . . $901 $942 $735 $(41) $207
The decrease in SG&A expenses for fiscal 2011 compared to fiscal 2010 reflected lower expenses as a resultof the restructuring of the Energy and Environmental Solutions segment that occurred in fiscal 2010. SG&Aexpenses for fiscal 2011 included $19 million in transaction costs associated with the acquisition of Varianannounced on May 4, 2011. SG&A expenses for fiscal 2010 included $10 million in transaction costs associated
45

with the acquisition of Semitool, Inc. The increase in SG&A expenses in fiscal 2010 from fiscal 2009 reflectedthe elimination of temporary salary reductions and shutdowns that occurred in fiscal 2009, and the resumption ofvariable compensation programs. SG&A expenses were 9 percent of net sales in fiscal 2011, 10 percent of netsales in fiscal 2010, and 15 percent of net sales in fiscal 2009. SG&A expenses during fiscal 2011, 2010 and2009 included $52 million, $51 million and $69 million, respectively, of share-based compensation expense.
Restructuring and Asset Impairments
Restructuring and asset impairment expenses for the past three fiscal years were as follows:
2011 2010 2009
Change
2011 over 2010 2010 over 2009
(In millions)
Restructuring and asset impairments, net . . . . . . . . . . . . . . . . $(30) $246 $156 $(276) $90
Results for fiscal 2011 included favorable adjustments of $60 million related to restructuring programcharges recorded in prior years offset in part by asset impairment charges of $30 million primarily related to cer-tain intangible assets.
Results for fiscal 2010 included restructuring charges of $129 million related to two restructuring programsannounced in fiscal 2010, and asset impairment charges of $117 million primarily related to a plan to restructurethe Energy and Environmental Solutions segment.
Results for fiscal 2009 included restructuring charges of $141 million primarily associated with a restructur-ing program announced in fiscal 2009, and asset impairment charges of $15 million related to wafer cleaningequipment.
For further details, see Note 11 of Notes to Consolidated Financial Statements.
Gain on Sale of Facilities, net
In the first quarter of fiscal 2011, Applied received $39 million in proceeds from the sale of a propertylocated in North America and incurred a loss of $1 million on the transaction. In the third quarter of fiscal 2011,Applied received $60 million in proceeds from the sale of another property located in North America andincurred a gain of $28 million on the transaction.
Interest and Other Expenses
Interest and other expenses for the past three fiscal years were as follows:
2011 2010 2009
Change
2011 over 2010 2010 over 2009
(In millions)
Interest and other expense . . . . . . . . . . . . . . . . . . . . . . . . . . . . . . $59 $21 $21 $38 $—
The increase in interest and other expense for fiscal 2011 from fiscal 2010 was primarily due to interest of$31 million payable on senior unsecured notes issued in fiscal 2011 and to fees of $8 million associated with abridge loan facility that was entered into and terminated during fiscal 2011. Interest and other expense for fiscal2010 compared to fiscal 2009 remained essentially flat.
Interest and Other Income, net
Interest and other income, net for the past three fiscal years was as follows:
2011 2010 2009
Change
2011 over 2010 2010 over 2009
(In millions)
Interest and other income, net . . . . . . . . . . . . . . . . . . . . . . . . . . . $42 $37 $48 $5 $(11)
46

The increase in interest and other income in fiscal 2011 from fiscal 2010 was primarily due to an increase ingains realized on sale of investment securities. The decrease in interest income in fiscal 2010 from fiscal 2009was primarily due to a decrease in interest rates.
Income Taxes
Income tax expenses for the past three fiscal years were as follows:
2011 2010 2009
Change
2011 over 2010 2010 over 2009
(In millions, except percentages)
Provision (benefit) for income taxes . . . . . . . . . . . . $452 $449 $(181) $ 3 $ 630Effective income tax rate . . . . . . . . . . . . . . . . . . . . . 19% 32% (37)% (13) points 69 points
The tax rate for fiscal 2011 was lower than the rate for the fiscal 2010 primarily due to an increase inincome in jurisdictions outside the U.S. with lower tax rates and a favorable U.S. Internal Revenue Service auditsettlement. The tax rate for fiscal 2011 further benefited from tax incentives offered in several jurisdictions andfrom the December 2010 reinstatement of the U.S. R&D tax credit retroactive to its prior expiration in December2009. The change in the fiscal 2010 tax rate from the fiscal 2009 rate was principally attributable to the incomebefore taxes for fiscal 2010 as opposed to the net loss before taxes incurred in fiscal 2009. The effective incometax rate for fiscal 2010 did not include the impact of the U.S. R&D tax credit from the time it expired inDecember 2009. Applied’s effective income tax rate depends on various factors, such as tax legislation, and thegeographic composition of Applied’s pre-tax income.
Segment Information
Applied reports financial results in four segments: Silicon Systems Group, Applied Global Services, Dis-play, and Energy and Environmental Solutions. A description of the products and services, as well as financialdata, for each reportable segment can be found in Note 16 of Notes to Consolidated Financial Statements.Applied does not allocate to its reportable segments certain operating expenses that it manages separately at thecorporate level. These unallocated costs include costs for share-based compensation; certain management,finance, legal, human resources, and RD&E functions provided at the corporate level; and unabsorbedinformation technology and occupancy. In addition, Applied does not allocate to its reportable segmentsrestructuring and asset impairment charges and any associated adjustments related to restructuring actions, unlessthese charges or adjustments pertain to a specific reportable segment.
The results for each reportable segment are discussed below.
Silicon Systems Group Segment
The Silicon Systems Group segment includes semiconductor capital equipment for deposition, etch, rapidthermal processing, chemical mechanical planarization, metrology and inspection, and wafer packaging.Development efforts are focused on solving customers’ key technical challenges, including transistor perform-ance and nanoscale patterning, and improving chip manufacturing productivity to reduce costs.
Certain significant measures for the past three fiscal years were as follows:
2011 2010 2009
Change
2011 over 2010 2010 over 2009
(In millions, except percentages)
New orders . . . . . . . . . . . . . . . . . . $5,489 $5,759 $1,677 $(270) (5)% $4,082 243%Net sales . . . . . . . . . . . . . . . . . . . . 5,415 5,304 1,960 111 2% 3,344 171%Operating income . . . . . . . . . . . . 1,764 1,892 201 (128) (7)% 1,691 841%Operating margin . . . . . . . . . . . . . 33% 36% 10% (3) points 26 points
47

New orders for the Silicon Systems Group by end use application for the past three fiscal years were as fol-lows:
2011 2010 2009
Foundry . . . . . . . . . . . . . . . . . . . . . . . . . . . . . . . . . . . . . . . . . . . . . . . . . . . . . . . . . 47% 41% 33%Memory . . . . . . . . . . . . . . . . . . . . . . . . . . . . . . . . . . . . . . . . . . . . . . . . . . . . . . . . . 28% 43% 38%Logic and other . . . . . . . . . . . . . . . . . . . . . . . . . . . . . . . . . . . . . . . . . . . . . . . . . . . 25% 16% 29%
100% 100% 100%
The following region accounted for at least 30 percent of total net sales for the Silicon Systems Groupsegment for one or more of the past three fiscal years:
2011 2010 2009
Change
2011 over 2010 2010 over 2009
(In millions, except percentages)
Taiwan . . . . . . . . . . . . . . . . . . . . . . . . . . . . . . $1,309 $1,976 $508 $(667) (34)% $1,468 289%
In fiscal 2011, customers in Taiwan accounted for 24 percent of total net sales for the Silicon SystemsGroup segment compared to 37 percent in fiscal 2010, and 26 percent in fiscal 2009.
Fiscal 2011 financial results reflected decreased demand for semiconductor manufacturing equipmentcompared to fiscal 2010, particularly in the second half of fiscal 2011, due primarily to uncertain globaleconomic conditions. In the fourth quarter of fiscal 2011, new orders were $925 million, a decrease of 25 percentcompared to the prior quarter. For fiscal 2011, new orders decreased by $270 million to $5.5 billion compared tofiscal 2010. The decrease in new orders was primarily due to reduced demand from memory customers. Net salesincreased by $111 million to $5.4 billion for fiscal 2011 compared to fiscal 2010. The increase in net sales wasprimarily due to increased investment by logic customers. Three customers accounted for 52 percent of net salesin this segment in fiscal 2011. Approximately 45 percent of net sales in the fourth quarter of fiscal 2011 were fororders received and shipped within the quarter, down from 49 percent in the third quarter of fiscal 2011. Thebook to bill ratio (new orders divided by net sales) decreased to 1.0 for fiscal 2011, reflecting decreased demand,compared to 1.1 for fiscal 2010. Operating income in fiscal 2011 was $1.8 billion, a decrease of $128 millionfrom the prior year. The decrease was due in part to a settlement agreement between Applied and Samsung Elec-tronics Co., Ltd (Samsung) that provided for volume-based rebates and other incentives to Samsung. Thedecrease was also due to operating expenses incurred as a result of headcount increases during fiscal 2011. In2011, Applied introduced the Applied Centura Conforma system which uses conformal plasma doping technol-ogy to modify the electrical properties of 3D and planar transistor structures.
Fiscal 2010 financial results reflected increased demand for manufacturing equipment over fiscal 2009 dueto improved global economic and industry conditions. New orders increased by $4.1 billion to $5.8 billion forfiscal 2010 compared to fiscal 2009. The significant increase in new orders was primarily from memory andfoundry customers and to a lesser extent logic customers, which reflected the general recovery in the semi-conductor equipment industry. The majority of fiscal 2010 new orders were for customers’ capacity expansions,while fiscal 2009 orders were primarily for customers’ new technology investments. Net sales increased by $3.3billion to $5.3 billion in fiscal 2010 compared to fiscal 2009. The increase in net sales was primarily due toincreased investment by memory and foundry customers. Four customers accounted for 51 percent of net sales inthis segment in fiscal 2010. Approximately 61 percent of net sales in the fourth quarter of fiscal 2010 were fororders received and shipped within the quarter. The book to bill ratio (new orders divided by net sales)increased to 1.1 for fiscal 2010, reflecting increased demand, compared to 0.9 for fiscal 2009. Operating incomeincreased by $1.7 billion to $1.9 billion for fiscal 2010 compared to fiscal 2009. The increase in operatingincome for fiscal 2010 was due to considerably higher revenue from semiconductor equipment sales andreflected the general recovery in the semiconductor equipment industry during fiscal 2010. Results for fiscal2010 included Semitool, which was acquired by Applied during the first quarter of fiscal 2010. In 2010, Appliedintroduced its Applied Reflexion GT CMP system, for fabricating copper interconnects and its Applied CenturaAdvantEdge Mesa silicon etch system for fabricating nano-scale circuit features with angstrom-level precision.
48

The Company also introduced the Applied Producer EternaFCVD system, which is targeted for 20nm and belowchips and delivers a liquid-like film that flows freely into virtually any structure to provide void-free dielectricfill.
Fiscal 2009 financial results reflected significantly reduced demand for manufacturing equipment due toextremely unfavorable global economic and industry conditions. Silicon Systems Group new orders decreased by$2.4 billion to $1.7 billion in fiscal 2009 compared to fiscal 2008. The decrease in new orders reflected sig-nificantly lower demand, primarily from memory and logic customers. Net sales decreased by $2.0 billion to$2.0 billion in fiscal 2009 compared to fiscal 2008. The decrease in net sales was due to decreased capitalinvestments, primarily by memory customers. The book to bill ratio decreased to 0.9 for fiscal 2009, reflectingsignificantly decreased demand, compared to 1.0 for fiscal 2008. Operating income decreased by $1.0 billion to$201 million in fiscal 2009 compared to fiscal 2008. The decrease in operating income was due to significantlylower sales resulting in lower factory absorption, partially offset by lower operating expenses from cost controlinitiatives. Operating income for fiscal 2009 also reflected an increase in bad debt expense. After an operatingloss in the first half of fiscal 2009, the Silicon Systems Group returned to operating profitability during the sec-ond half of the year, which was primarily driven by sales to foundry customers. During the year, the Companyintroduced a new platform specifically designed for under-bump metallization (UBM) and other back-end proc-esses, the Applied Charger UBM PVD system.
Applied Global Services Segment
The Applied Global Services segment encompasses technically differentiated products, including spares,services, certain earlier generation equipment products, and remanufactured equipment, to improve operatingefficiency, reduce operating costs, and lessen the environmental impact of semiconductor, display and solar cus-tomers’ factories. Customer demand for products and services is fulfilled through a global distribution systemwith trained service engineers located in close proximity to customer sites.
In fiscal 2010, as part of the restructuring of the Energy and Environmental Solutions segment, Applieddiscontinued sales to new customers of its fully-integrated SunFab thin film solar production lines but continuedto offer individual tools for thin film solar manufacturing. Applied is supporting existing SunFab customers withservices, upgrades and capacity increases through its Applied Global Services segment as these products areconsidered to have reached a particular stage in the product lifecycle and, effective in the first quarter of fiscal2011, Applied accounts for these products under its Applied Global Services segment.
Certain significant measures for the past three fiscal years were as follows:
2011 2010 2009
Change
2011 over 2010 2010 over 2009
(In millions, except percentages)
New orders . . . . . . . . . . . $2,333 $2,183 $1,179 $150 7% $1,004 85%Net sales . . . . . . . . . . . . . 2,413 1,865 1,397 548 29% 468 34%Operating income . . . . . . 482 337 115 145 43% 222 193%Operating margin . . . . . . 20% 18% 8% 2 points 10 points
Fiscal 2011 financial results reflected increased demand for services over fiscal 2010. In the fourth quarterof fiscal 2011, new orders were $564 million, a decrease of 8 percent compared to the prior quarter. For fiscal2011, new orders increased by $150 million to $2.3 billion compared to fiscal 2010. The increase in new orderswas due primarily to higher demand for spare parts and refurbished equipment. Net sales increased by $548 mil-lion to $2.4 billion for fiscal 2011, a record for the segment, compared to fiscal 2010. The increase in net saleswas primarily due to higher sales in spare parts and refurbished equipment and included $71 million in sales fortwo thin film solar projects. The book to bill ratio decreased to 1.0 for fiscal 2011, compared to 1.2 for fiscal2010. The decrease for fiscal 2011 reflected a higher increase in net sales year-over-year relative to demand.Operating income increased by $145 million to $482 million for fiscal 2011 compared to fiscal 2010. Theincrease in operating income for fiscal 2011 primarily reflected increased sales of spare parts and refurbishedequipment.
49

Fiscal 2010 financial results reflected increased demand for manufacturing services over fiscal 2009 due toimproved global economic and industry conditions. New orders increased by $1.0 billion to $2.2 billion for fiscal2010 compared to fiscal 2009. The increase in new orders was due primarily to higher demand for spare partsand refurbished equipment, reflecting customers’ higher factory utilization rates. Net sales increased by $468million to $1.9 billion for fiscal 2010 compared to fiscal 2009. The increase in net sales was primarily due tohigher sales in spare parts. The book to bill ratio increased to 1.2 for fiscal 2010, reflecting increased demand,compared to 0.8 for fiscal 2009. Operating income increased by $222 million to $337 million for fiscal 2010compared to fiscal 2009. The increase in operating income for fiscal 2010 primarily reflected increased sales ofspare parts.
Fiscal 2009 financial results reflected significantly reduced demand for manufacturing services due toextremely unfavorable global economic and industry conditions, as well as a significant reduction in the installedbase of 200mm systems. New orders decreased by $1.1 billion to $1.2 billion in fiscal 2009 compared to fiscal2008, due primarily to decreased demand for spares and refurbished equipment arising from semiconductormanufacturers’ low wafer production volumes. Net sales decreased by $932 million to $1.4 billion in fiscal 2009compared to fiscal 2008, reflecting lower sales of spares and refurbished equipment. Operating income decreasedby $430 million to $115 million in fiscal 2009 compared to fiscal 2008 as a result of lower sales volumes, whichled to lower infrastructure cost absorption, partially offset by lower operating expenses from cost control ini-tiatives. Operating income for fiscal 2009 also included an increase in bad debt expense. In the second half offiscal 2009, the Applied Global Services segment returned to operating profitability as sales of spares improved.The book to bill ratio decreased to 0.8 for fiscal 2009, reflecting significantly decreased demand, compared to 1.0for fiscal 2008.
Display Segment
The Display segment encompasses products for manufacturing LCDs for TVs, personal computers (PCs),tablet PCs, smart phones, and other consumer-oriented devices. The segment is focused on expanding marketshare by differentiation with larger-scale substrates, entry into new markets such as the LTPS and touch panelsectors, and development of products to enable cost reductions through productivity and uniformity.
Certain significant measures for the past three fiscal years were as follows:
2011 2010 2009
Change
2011 over 2010 2010 over 2009
(In millions, except percentages)
New orders . . . . . . . . . . . . . . . . . . . . . . $636 $799 $287 $(163) (20)% $512 179%Net sales . . . . . . . . . . . . . . . . . . . . . . . . 699 899 502 (200) (22)% 397 79%Operating income . . . . . . . . . . . . . . . . . 147 267 51 (120) (45)% 216 424%Operating margin . . . . . . . . . . . . . . . . . 21% 30% 10% (9) points 20 points
The following regions accounted for at least 30 percent of total net sales for the Display segment for one ormore of the past three fiscal years:
2011 2010 2009
Change
2011 over 2010 2010 over 2009
(In millions, except percentages)
China . . . . . . . . . . . . . . . . . . . . . . . . . . . . . . $330 $162 $ 53 $ 168 104% $109 206%Taiwan . . . . . . . . . . . . . . . . . . . . . . . . . . . . . $216 $311 $165 $ (95) (31)% $146 88%Korea . . . . . . . . . . . . . . . . . . . . . . . . . . . . . . $111 $334 $144 $(223) (67)% $190 132%
In fiscal 2011, customers in China accounted for 47 percent of total net sales for the Display segment com-pared to 18 percent in fiscal 2010, and 11 percent in fiscal 2009. Customers in Taiwan accounted for 31 percentof total net sales for the segment in fiscal 2011 compared to 35 percent in fiscal 2010, and 33 percent in fiscal2009. Customers in Korea accounted for 16 percent of total net sales for the Display segment in fiscal 2011compared to 37 percent in fiscal 2010, and 29 percent in fiscal 2009.
50
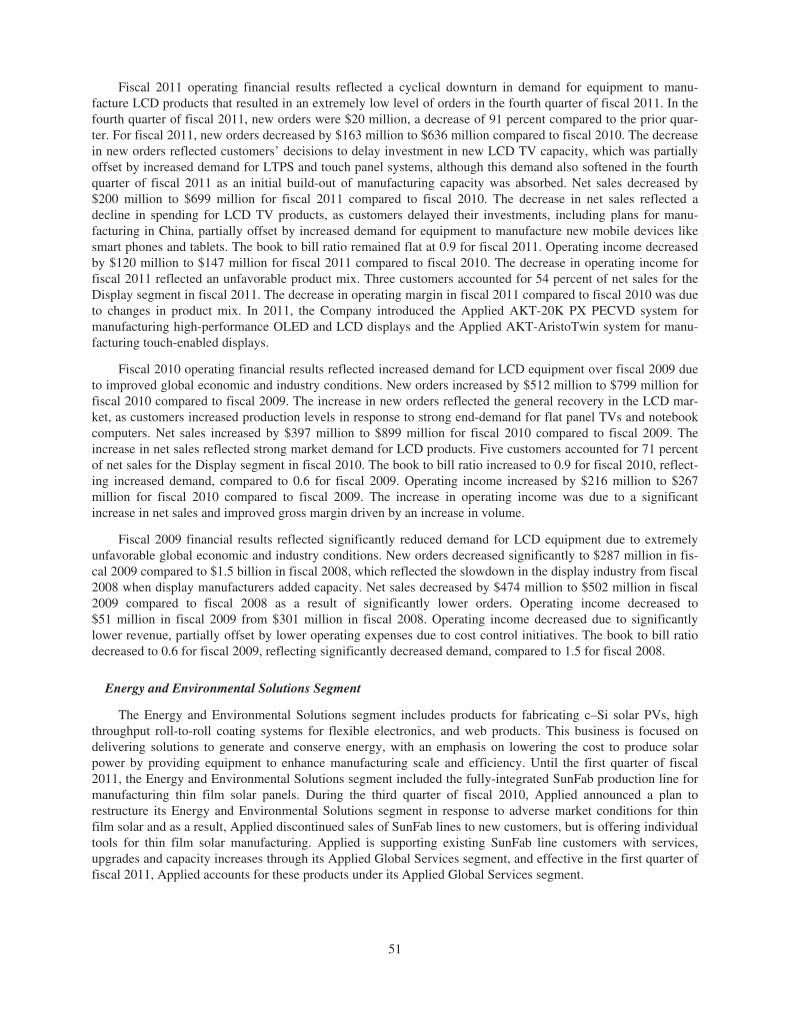
Fiscal 2011 operating financial results reflected a cyclical downturn in demand for equipment to manu-facture LCD products that resulted in an extremely low level of orders in the fourth quarter of fiscal 2011. In thefourth quarter of fiscal 2011, new orders were $20 million, a decrease of 91 percent compared to the prior quar-ter. For fiscal 2011, new orders decreased by $163 million to $636 million compared to fiscal 2010. The decreasein new orders reflected customers’ decisions to delay investment in new LCD TV capacity, which was partiallyoffset by increased demand for LTPS and touch panel systems, although this demand also softened in the fourthquarter of fiscal 2011 as an initial build-out of manufacturing capacity was absorbed. Net sales decreased by$200 million to $699 million for fiscal 2011 compared to fiscal 2010. The decrease in net sales reflected adecline in spending for LCD TV products, as customers delayed their investments, including plans for manu-facturing in China, partially offset by increased demand for equipment to manufacture new mobile devices likesmart phones and tablets. The book to bill ratio remained flat at 0.9 for fiscal 2011. Operating income decreasedby $120 million to $147 million for fiscal 2011 compared to fiscal 2010. The decrease in operating income forfiscal 2011 reflected an unfavorable product mix. Three customers accounted for 54 percent of net sales for theDisplay segment in fiscal 2011. The decrease in operating margin in fiscal 2011 compared to fiscal 2010 was dueto changes in product mix. In 2011, the Company introduced the Applied AKT-20K PX PECVD system formanufacturing high-performance OLED and LCD displays and the Applied AKT-AristoTwin system for manu-facturing touch-enabled displays.
Fiscal 2010 operating financial results reflected increased demand for LCD equipment over fiscal 2009 dueto improved global economic and industry conditions. New orders increased by $512 million to $799 million forfiscal 2010 compared to fiscal 2009. The increase in new orders reflected the general recovery in the LCD mar-ket, as customers increased production levels in response to strong end-demand for flat panel TVs and notebookcomputers. Net sales increased by $397 million to $899 million for fiscal 2010 compared to fiscal 2009. Theincrease in net sales reflected strong market demand for LCD products. Five customers accounted for 71 percentof net sales for the Display segment in fiscal 2010. The book to bill ratio increased to 0.9 for fiscal 2010, reflect-ing increased demand, compared to 0.6 for fiscal 2009. Operating income increased by $216 million to $267million for fiscal 2010 compared to fiscal 2009. The increase in operating income was due to a significantincrease in net sales and improved gross margin driven by an increase in volume.
Fiscal 2009 financial results reflected significantly reduced demand for LCD equipment due to extremelyunfavorable global economic and industry conditions. New orders decreased significantly to $287 million in fis-cal 2009 compared to $1.5 billion in fiscal 2008, which reflected the slowdown in the display industry from fiscal2008 when display manufacturers added capacity. Net sales decreased by $474 million to $502 million in fiscal2009 compared to fiscal 2008 as a result of significantly lower orders. Operating income decreased to$51 million in fiscal 2009 from $301 million in fiscal 2008. Operating income decreased due to significantlylower revenue, partially offset by lower operating expenses due to cost control initiatives. The book to bill ratiodecreased to 0.6 for fiscal 2009, reflecting significantly decreased demand, compared to 1.5 for fiscal 2008.
Energy and Environmental Solutions Segment
The Energy and Environmental Solutions segment includes products for fabricating c–Si solar PVs, highthroughput roll-to-roll coating systems for flexible electronics, and web products. This business is focused ondelivering solutions to generate and conserve energy, with an emphasis on lowering the cost to produce solarpower by providing equipment to enhance manufacturing scale and efficiency. Until the first quarter of fiscal2011, the Energy and Environmental Solutions segment included the fully-integrated SunFab production line formanufacturing thin film solar panels. During the third quarter of fiscal 2010, Applied announced a plan torestructure its Energy and Environmental Solutions segment in response to adverse market conditions for thinfilm solar and as a result, Applied discontinued sales of SunFab lines to new customers, but is offering individualtools for thin film solar manufacturing. Applied is supporting existing SunFab line customers with services,upgrades and capacity increases through its Applied Global Services segment, and effective in the first quarter offiscal 2011, Applied accounts for these products under its Applied Global Services segment.
51

Certain significant measures for the past three fiscal years were as follows:
2011 2010 2009
Change
2011 over 2010 2010 over 2009
(In millions, except percentages)
New orders . . . . . . . . . . . . . . . . . $1,684 $1,508 $ 955 $176 12% $ 553 58%Net sales . . . . . . . . . . . . . . . . . . . 1,990 1,481 1,155 509 34% 326 28%Operating income (loss) . . . . . . . 453 (466) (234) 919 197% (232) (99%)Operating margin . . . . . . . . . . . . 23% (31%) (20%) 54 points (11) points
The following regions accounted for at least 30 percent of total net sales for the Energy and EnvironmentalSolutions segment for one or more of the past three fiscal years:
2011 2010 2009
Change
2011 over 2010 2010 over 2009
(In millions, except percentages)
China . . . . . . . . . . . . . . . . . . . . . . . . . . . . $1,584 $935 $442 $ 649 69% $493 112%Europe . . . . . . . . . . . . . . . . . . . . . . . . . . . $ 58 $372 $452 $(314) (84)% $ (80) (18%)
In fiscal 2011, customers in China accounted for 80 percent of total net sales for the Energy and Environ-mental Solutions segment compared to 63 percent in fiscal 2010 and 38 percent in fiscal 2009. Customers inEurope accounted for 3 percent of total net sales for the segment in fiscal 2011 compared to 25 percent in fiscal2010, and 39 percent in fiscal 2009.
Fiscal 2011 financial results reflected increased demand for c-Si products in the first half of the year, whichrapidly declined in the second half of fiscal 2011 due to excess manufacturing capacity and customers’ decreasedaccess to capital. In the fourth quarter of fiscal 2011, new orders were $86 million, a decrease of 73 percentcompared to the prior quarter. For fiscal 2011, new orders increased by $176 million to $1.7 billion compared tofiscal 2010. The increase in new orders for fiscal 2011 reflected significantly increased demand for c-Si equip-ment, particularly wafering and metallization products. The increased demand was partially driven by govern-ment incentives for solar. Net sales increased by $509 million to $2.0 billion for fiscal 2011 compared to fiscal2010. The increase in net sales for fiscal 2011 primarily reflected higher sales to c-Si customers. Net sales infiscal 2010 included $539 million from sales of SunFab thin film lines. There were no sales of SunFab thin filmlines recognized in the Energy and Environmental Solutions segment in fiscal 2011. In fiscal 2011, customers inChina accounted for an increased proportion of the Energy and Environment Solutions segment’s results com-pared to prior years, including 78 percent of new orders. The book to bill ratio decreased to 0.8 for fiscal 2011compared to 1.0 for fiscal 2010. The decrease for fiscal 2011 reflected a higher increase in net sales year-over-year relative to demand. The Energy and Environmental Solutions segment reported operating income of $453million for fiscal 2011 compared to an operating loss of $466 million for fiscal 2010. Operating loss for fiscal2010 included charges totaling $486 million associated with the Energy and Environmental Solutions restructur-ing plan announced in July 2010. The increase in operating income for fiscal 2011 was also attributable to sig-nificantly higher net sales of c-Si equipment and included favorable adjustments of $36 million related to therestructuring program announced in the third quarter of fiscal 2010. The increase in operating margin for fiscal2011 was due to higher manufacturing volume for c-Si equipment. In 2011, the Applied Baccini Pegaso platformfor next-generation solar cell manufacturing was introduced.
In fiscal 2010, Applied incurred charges of $486 million that included a plan to restructure its Energy andEnvironmental Solutions segment as described above, consisting of inventory-related charges of $330 millionrelated to SunFab thin film solar equipment, asset impairment charges of $108 million, employee severancecharges of $45 million, and other costs of $3 million.
Fiscal 2010 financial results compared to fiscal 2009 reflected increased demand for c-Si products, offset byreduced demand for SunFab thin film solar manufacturing lines due to the challenging market conditions forutility-scale solar. New orders increased by $553 million to $1.5 billion for fiscal 2010 compared to fiscal 2009.The increase in orders reflected increased demand for c-Si products, particularly wafering and metallizationproducts, offset by reduced demand for SunFab lines. Net sales increased by $326 million to $1.5 billion for
52

fiscal 2010 compared to fiscal 2009. Net sales for fiscal 2010 primarily reflected higher sales to c-Si customersthan in fiscal 2009. The relative share of the segment’s net sales attributable to SunFab customers decreased to36 percent in fiscal 2010 from 44 percent in fiscal 2009. For fiscal 2010, customers in China and Europeaccounted for 88 percent of total net sales in this segment. The book to bill ratio increased to 1.0 for fiscal 2010compared to 0.8 for fiscal 2009. The operating loss in the Energy and Environmental Solutions segmentincreased by $232 million to $466 million for fiscal 2010 compared to fiscal 2009. The increase in operating losswas primarily due to restructuring, asset impairment and inventory-related charges of $486 million recognized inthe second and third quarters of fiscal 2010, and lower net sales to SunFab customers, partially offset byincreased sales of c-Si products and cost control initiatives. Results for the fourth quarter of fiscal 2010 reflectedcustomer final acceptance of two SunFab lines.
Fiscal 2009 financial results reflected reduced demand for c-Si products over fiscal 2008 offset in part byhigher demand for SunFab lines. New orders of $955 million in fiscal 2009 decreased from $1.3 billion in fiscal2008. The decrease in new orders was primarily due to decreased demand from c-Si customers and reflected thechallenging global economic environment, solar manufacturers’ difficulties in obtaining cost-effective capital,and a decrease in end demand. Net sales of $1.2 billion in fiscal 2009 increased from $819 million in fiscal 2008due to an increase in sales for SunFab lines. The operating loss of $234 million in fiscal 2009 increased from$206 million in fiscal 2008 due to an increase in RD&E expenses and unfavorable gross margins associated withinitial SunFab line start-ups, offset in part by cost control initiatives. The book to bill ratio decreased to 0.8 forfiscal 2009, reflecting significantly decreased demand, compared to 1.6 for fiscal 2008. In 2009, Appliedintroduced its Baccini Esatto Technology, a high precision, multi-step printing capability designed to increase theefficiency of c-Si solar cells.
Business Combinations
On May 4, 2011, Applied and Varian Semiconductor Equipment Associates, Inc. (Varian), a public com-pany manufacturer of semiconductor processing equipment and the leading supplier of ion implantation equip-ment used by chip makers around the world, announced the signing of a definitive merger agreement datedMay 3, 2011, under which Applied agreed to acquire Varian for $63 per share in cash.
In November 2011, Applied completed its acquisition of Varian. Beginning in the first quarter of fiscal2012, the acquired business will be included in results for the Silicon Systems Group and Applied Global Serv-ices segments.
The aggregate purchase price of the acquisition was approximately $4.2 billion, net of cash acquired, and isexpected to result in an increase in goodwill of approximately $2.5 billion and intangible assets of up to $1.5 bil-lion. Applied funded the transaction with a combination of existing cash balances and debt. On June 8, 2011,Applied issued senior unsecured notes (the Notes) in the aggregate principal amount of $1.75 billion and used thenet proceeds of the Notes to fund a portion of the consideration and certain costs associated with the acquisition.The indenture governing the Notes includes certain covenants with which Applied was in compliance atOctober 30, 2011. See Note 10 of Notes to 5 Financial Statements for additional discussion of long-term debt.
Varian designs, markets, manufactures and services ion implantation systems. These systems are primarilyused in the manufacture of transistors, which are a basic building block of ICs or microchips. Ion implantationsystems create a beam of electrically charged particles called ions, which are implanted into transistor structuresat precise locations and depths, changing the electrical properties of the semiconductor device. Theseimplantation systems may also be used in other areas of IC manufacture for modifying the material properties ofthe semiconductor devices, as well as in manufacturing crystalline-silicon solar cells and LEDs.
On December 21, 2009, Applied acquired Semitool, Inc., a public company based in the state of Montana,for a purchase price of $323 million in cash, net of cash acquired, pursuant to a tender offer and subsequentshort-form merger. The acquired business is a leading supplier of electrochemical plating and wafer surfacepreparation equipment used by semiconductor packaging and manufacturing companies globally. Applied’sprimary reasons for this acquisition were to complement its existing product offerings and to provide oppor-tunities for future growth. The acquired business is included in results for the Silicon Systems Group segment.
53

Semitool is a leading provider of wet chemical processing equipment, targeting wafer surface preparationand ECD plating applications for all areas of wafer fabrication, including device packaging. Semitool’s solutionsaddress critical applications within the semiconductor manufacturing process, and enable its customers to manu-facture more advanced semiconductor devices that feature higher levels of performance.
In November 2009, Applied acquired substantially all the assets, including the intellectual property, ofAdvent Solar, a developer of advanced technology for c-Si solar photovoltaic cells and modules (PVs), for apurchase price of $14 million. This acquisition complemented Applied’s portfolio of solar PV technologies andenhanced Applied’s opportunities in the c-Si equipment market. The acquisition is included in results for theEnergy and Environmental Solutions segment.
For further details, see Note 9 of Notes to Consolidated Financial Statements.
Recent Accounting Pronouncements
In September 2011, the FASB issued authoritative guidance to allow entities to use a qualitative approach totest goodwill for impairment. This authoritative guidance permits an entity to first perform a qualitative assess-ment to determine whether it is more likely than not that the fair value of a reporting unit is less than its carryingvalue. If it is concluded that this is the case, it is necessary to perform the two-step goodwill impairment test.Otherwise, the two-step goodwill impairment test is not required. This guidance is effective for annual andinterim goodwill impairment tests performed for fiscal years beginning after December 15, 2011 and earlieradoption is permitted. Applied elected to adopt this authoritative guidance in fiscal 2011. The implementation ofthis authoritative guidance had no impact on Applied’s financial position or results of operations.
In June 2011, the FASB issued authoritative guidance on the presentation of comprehensive income torequire an entity to present the total of comprehensive income, the components of net income, and the compo-nents of other comprehensive income either in a single continuous statement of comprehensive income or in twoseparate but consecutive statements. This authoritative guidance eliminates the option to present the componentsof other comprehensive income as part of the statement of equity. This guidance is effective for Applied in thefirst quarter of fiscal 2012, with early adoption permitted, and should be applied retrospectively. Theimplementation of this authoritative guidance will change only the presentation of comprehensive income andwill have no impact on Applied’s financial position or results of operations.
In May 2011, the FASB issued authoritative guidance to provide a consistent definition of fair value andensure that the fair value measurement and disclosure requirements are similar between U.S. GAAP and Interna-tional Financial Reporting Standards. This authoritative guidance limits the highest-and-best-use measure tononfinancial assets, permits certain financial assets and liabilities with offsetting positions in market or counter-party credit risks to be measured at a net basis, and provides guidance on the applicability of premiums and dis-counts. This authoritative guidance also expands the disclosures on Level 3 inputs by requiring quantitativedisclosure of the unobservable inputs and assumptions, as well as description of the valuation processes and thesensitivity of the fair value to changes in unobservable inputs. The new guidance will be effective for Applied inthe first quarter of fiscal 2012. The implementation of this authoritative guidance is not expected to have amaterial impact on Applied’s financial position or results of operations.
In December 2010, the FASB amended its existing guidance for goodwill and other intangible assets. Thisauthoritative guidance modifies Step 1 of the goodwill impairment test for reporting units with zero or negativecarrying amounts. For those reporting units, an entity is required to perform Step 2 of the goodwill impairmenttest if there are qualitative factors indicating that it is more likely than not that a goodwill impairment exists. Thequalitative factors are consistent with the existing guidance which requires goodwill of a reporting unit to betested for impairment between annual tests if an event occurs or circumstances change that would more likelythan not reduce the fair value of a reporting unit below its carrying amount. This authoritative guidance becomeseffective for Applied in the first quarter fiscal 2012. The implementation of this authoritative guidance is notexpected to have a material impact on Applied’s financial position or results of operations.
In December 2010, the FASB issued authoritative guidance on business combinations. This authoritativeguidance requires a public entity that presents comparative financial statements to disclose the revenue and
54
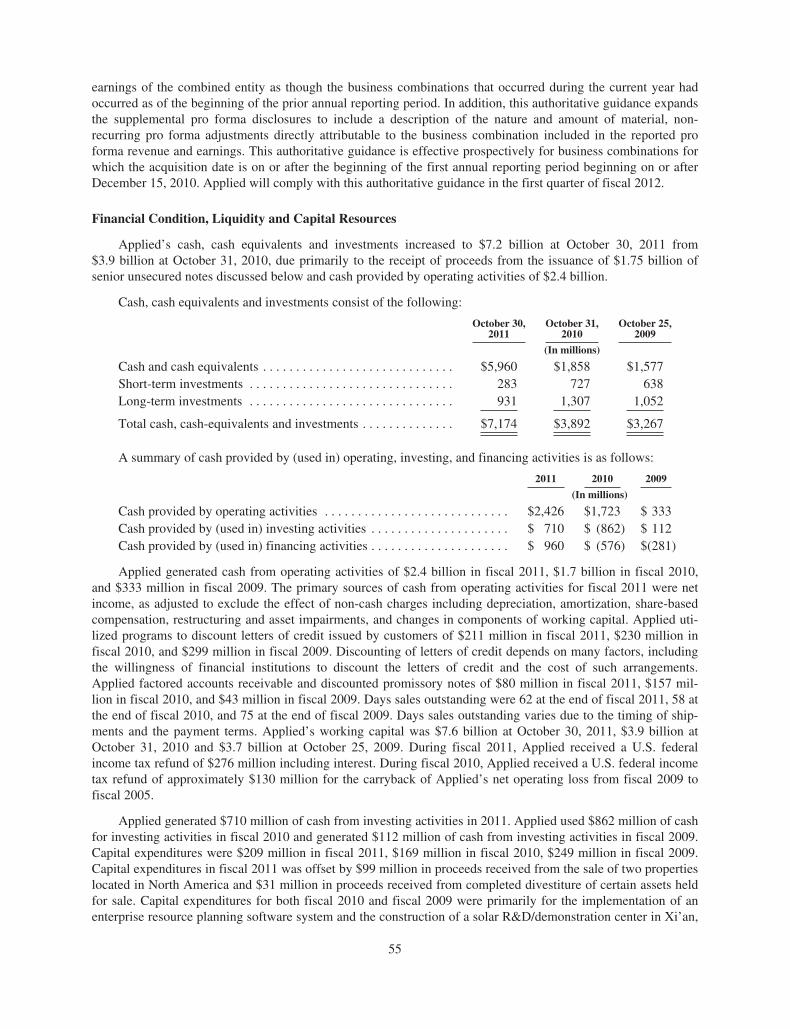
earnings of the combined entity as though the business combinations that occurred during the current year hadoccurred as of the beginning of the prior annual reporting period. In addition, this authoritative guidance expandsthe supplemental pro forma disclosures to include a description of the nature and amount of material, non-recurring pro forma adjustments directly attributable to the business combination included in the reported proforma revenue and earnings. This authoritative guidance is effective prospectively for business combinations forwhich the acquisition date is on or after the beginning of the first annual reporting period beginning on or afterDecember 15, 2010. Applied will comply with this authoritative guidance in the first quarter of fiscal 2012.
Financial Condition, Liquidity and Capital Resources
Applied’s cash, cash equivalents and investments increased to $7.2 billion at October 30, 2011 from$3.9 billion at October 31, 2010, due primarily to the receipt of proceeds from the issuance of $1.75 billion ofsenior unsecured notes discussed below and cash provided by operating activities of $2.4 billion.
Cash, cash equivalents and investments consist of the following:
October 30,2011
October 31,2010
October 25,2009
(In millions)
Cash and cash equivalents . . . . . . . . . . . . . . . . . . . . . . . . . . . . . $5,960 $1,858 $1,577Short-term investments . . . . . . . . . . . . . . . . . . . . . . . . . . . . . . . 283 727 638Long-term investments . . . . . . . . . . . . . . . . . . . . . . . . . . . . . . . 931 1,307 1,052
Total cash, cash-equivalents and investments . . . . . . . . . . . . . . $7,174 $3,892 $3,267
A summary of cash provided by (used in) operating, investing, and financing activities is as follows:
2011 2010 2009
(In millions)
Cash provided by operating activities . . . . . . . . . . . . . . . . . . . . . . . . . . . . $2,426 $1,723 $ 333Cash provided by (used in) investing activities . . . . . . . . . . . . . . . . . . . . . $ 710 $ (862) $ 112Cash provided by (used in) financing activities . . . . . . . . . . . . . . . . . . . . . $ 960 $ (576) $(281)
Applied generated cash from operating activities of $2.4 billion in fiscal 2011, $1.7 billion in fiscal 2010,and $333 million in fiscal 2009. The primary sources of cash from operating activities for fiscal 2011 were netincome, as adjusted to exclude the effect of non-cash charges including depreciation, amortization, share-basedcompensation, restructuring and asset impairments, and changes in components of working capital. Applied uti-lized programs to discount letters of credit issued by customers of $211 million in fiscal 2011, $230 million infiscal 2010, and $299 million in fiscal 2009. Discounting of letters of credit depends on many factors, includingthe willingness of financial institutions to discount the letters of credit and the cost of such arrangements.Applied factored accounts receivable and discounted promissory notes of $80 million in fiscal 2011, $157 mil-lion in fiscal 2010, and $43 million in fiscal 2009. Days sales outstanding were 62 at the end of fiscal 2011, 58 atthe end of fiscal 2010, and 75 at the end of fiscal 2009. Days sales outstanding varies due to the timing of ship-ments and the payment terms. Applied’s working capital was $7.6 billion at October 30, 2011, $3.9 billion atOctober 31, 2010 and $3.7 billion at October 25, 2009. During fiscal 2011, Applied received a U.S. federalincome tax refund of $276 million including interest. During fiscal 2010, Applied received a U.S. federal incometax refund of approximately $130 million for the carryback of Applied’s net operating loss from fiscal 2009 tofiscal 2005.
Applied generated $710 million of cash from investing activities in 2011. Applied used $862 million of cashfor investing activities in fiscal 2010 and generated $112 million of cash from investing activities in fiscal 2009.Capital expenditures were $209 million in fiscal 2011, $169 million in fiscal 2010, $249 million in fiscal 2009.Capital expenditures in fiscal 2011 was offset by $99 million in proceeds received from the sale of two propertieslocated in North America and $31 million in proceeds received from completed divestiture of certain assets heldfor sale. Capital expenditures for both fiscal 2010 and fiscal 2009 were primarily for the implementation of anenterprise resource planning software system and the construction of a solar R&D/demonstration center in Xi’an,
55

China. Capital expenditures for fiscal 2010 and fiscal 2009 also included investment to construct a facility inSingapore. Proceeds from sales and maturities of investments, net of purchases of investments, totaled$789 million for fiscal 2011 and $361 million in fiscal 2009. Purchases of investments, net of proceeds fromsales and maturities of investments, totaled $370 million in fiscal 2010.
Investing activities also included investments in technology and acquisitions of companies to allow Appliedto access new market opportunities or emerging technologies. In fiscal 2010, Applied acquired Semitool, a publiccompany based in the state of Montana, for $323 million, net of cash acquired. See Note 9 of Notes to Con-solidated Financial Statements for additional details.
Applied generated $960 million of cash from financing activities in fiscal 2011, consisting primarily of netproceeds received from the issuance of senior unsecured notes of $1.75 billion, as discussed further below.Applied used cash for financing activities in the amount of $576 million for fiscal 2010 and $281 million forfiscal 2009. Financing activities included payment of cash dividends to stockholders and issuances andrepurchases of common stock. Cash used to repurchase shares totaled $468 million in fiscal 2011, $350 millionin fiscal 2010, and $23 million in fiscal 2009. In March 2010, Applied’s Board of Directors approved a newstock repurchase program authorizing up to $2.0 billion in repurchases over the next three years ending in March2013. Proceeds from stock issuances related to equity compensation awards were $95 million in fiscal 2011,$129 million in fiscal 2010, and $62 million in fiscal 2009.
The following table summarizes the dividends declared by Applied’s Board of Directors during fiscal 2011:
Date declared Record date Payable date Amount per share
December 7, 2010 March 2, 2011 March 23, 2011 $ 0.07March 8, 2011 June 1, 2011 June 22, 2011 $ 0.08June 6, 2011 August 31, 2011 September 21, 2011 $ 0.08September 13, 2011 November 23, 2011 December 14, 2011 $ 0.08
During fiscal 2010, Applied’s Board of Directors declared three quarterly cash dividends in the amount of$0.07 per share each and one quarterly cash dividend in the amount of $0.06 per share. During fiscal 2009,Applied’s Board of Directors declared four quarterly cash dividends in the amount of $0.06 per share each quar-ter. Cash paid in dividends during fiscal 2011, 2010 and 2009 amounted to $397 million, $349 million and$319 million, respectively. Applied currently anticipates that cash dividends will continue to be paid on a quar-terly basis, although the declaration of any future cash dividend is at the discretion of the Board of Directors andwill depend on Applied’s financial condition, results of operations, capital requirements, business conditions andother factors, as well as a determination by the Board of Directors that cash dividends are in the best interests ofApplied’s stockholders.
Applied has credit facilities for unsecured borrowings in various currencies of up to $1.6 billion, of which$1.5 billion is comprised of a committed four-year revolving credit agreement with a group of banks that isscheduled to expire in May 2015. This agreement provides for borrowings in United States dollars at interestrates keyed to one of the two rates selected by Applied for each advance and includes financial and other cove-nants with which Applied was in compliance at October 30, 2011. Remaining credit facilities in the amount ofapproximately $105 million are with Japanese banks. Applied’s ability to borrow under these facilities is subjectto bank approval at the time of the borrowing request, and any advances will be at rates indexed to the banks’prime reference rate denominated in Japanese yen. No amounts were outstanding under any of these facilities atboth October 30, 2011 and October 31, 2010.
In fiscal 2011, Applied established a short-term commercial paper program of up to $1.5 billion. AtOctober 30, 2011, Applied did not have any commercial paper outstanding.
56
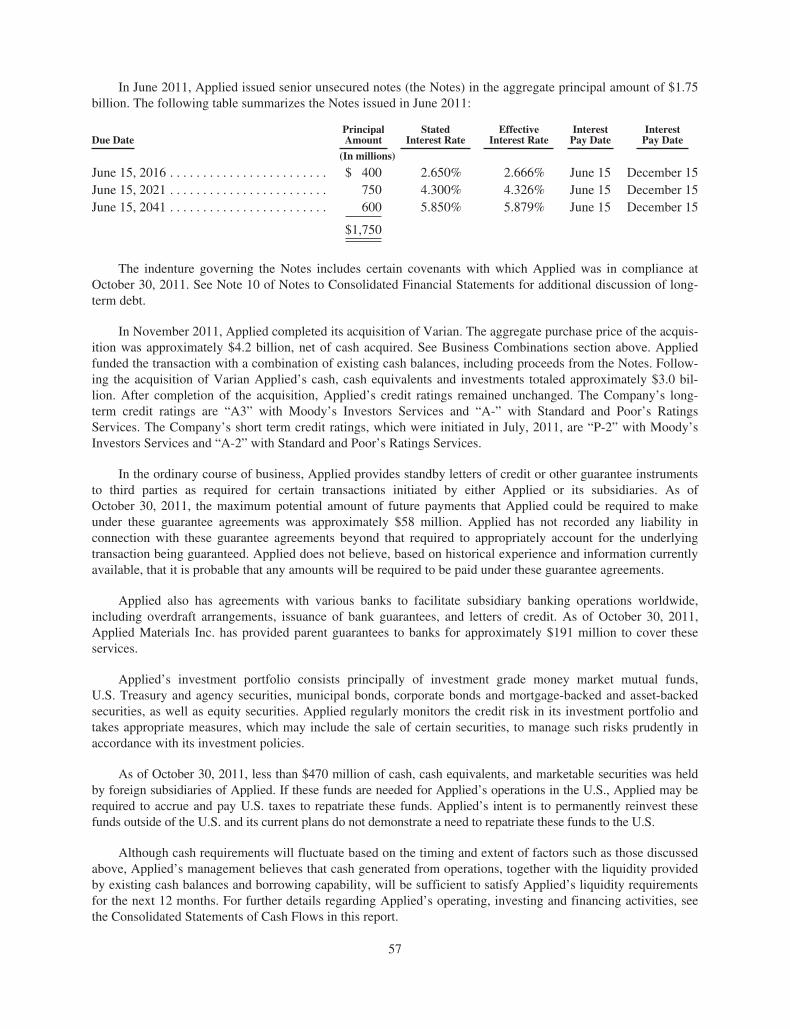
In June 2011, Applied issued senior unsecured notes (the Notes) in the aggregate principal amount of $1.75billion. The following table summarizes the Notes issued in June 2011:
Due DatePrincipalAmount
StatedInterest Rate
EffectiveInterest Rate
InterestPay Date
InterestPay Date
(In millions)
June 15, 2016 . . . . . . . . . . . . . . . . . . . . . . . . $ 400 2.650% 2.666% June 15 December 15June 15, 2021 . . . . . . . . . . . . . . . . . . . . . . . . 750 4.300% 4.326% June 15 December 15June 15, 2041 . . . . . . . . . . . . . . . . . . . . . . . . 600 5.850% 5.879% June 15 December 15
$1,750
The indenture governing the Notes includes certain covenants with which Applied was in compliance atOctober 30, 2011. See Note 10 of Notes to Consolidated Financial Statements for additional discussion of long-term debt.
In November 2011, Applied completed its acquisition of Varian. The aggregate purchase price of the acquis-ition was approximately $4.2 billion, net of cash acquired. See Business Combinations section above. Appliedfunded the transaction with a combination of existing cash balances, including proceeds from the Notes. Follow-ing the acquisition of Varian Applied’s cash, cash equivalents and investments totaled approximately $3.0 bil-lion. After completion of the acquisition, Applied’s credit ratings remained unchanged. The Company’s long-term credit ratings are “A3” with Moody’s Investors Services and “A-” with Standard and Poor’s RatingsServices. The Company’s short term credit ratings, which were initiated in July, 2011, are “P-2” with Moody’sInvestors Services and “A-2” with Standard and Poor’s Ratings Services.
In the ordinary course of business, Applied provides standby letters of credit or other guarantee instrumentsto third parties as required for certain transactions initiated by either Applied or its subsidiaries. As ofOctober 30, 2011, the maximum potential amount of future payments that Applied could be required to makeunder these guarantee agreements was approximately $58 million. Applied has not recorded any liability inconnection with these guarantee agreements beyond that required to appropriately account for the underlyingtransaction being guaranteed. Applied does not believe, based on historical experience and information currentlyavailable, that it is probable that any amounts will be required to be paid under these guarantee agreements.
Applied also has agreements with various banks to facilitate subsidiary banking operations worldwide,including overdraft arrangements, issuance of bank guarantees, and letters of credit. As of October 30, 2011,Applied Materials Inc. has provided parent guarantees to banks for approximately $191 million to cover theseservices.
Applied’s investment portfolio consists principally of investment grade money market mutual funds,U.S. Treasury and agency securities, municipal bonds, corporate bonds and mortgage-backed and asset-backedsecurities, as well as equity securities. Applied regularly monitors the credit risk in its investment portfolio andtakes appropriate measures, which may include the sale of certain securities, to manage such risks prudently inaccordance with its investment policies.
As of October 30, 2011, less than $470 million of cash, cash equivalents, and marketable securities was heldby foreign subsidiaries of Applied. If these funds are needed for Applied’s operations in the U.S., Applied may berequired to accrue and pay U.S. taxes to repatriate these funds. Applied’s intent is to permanently reinvest thesefunds outside of the U.S. and its current plans do not demonstrate a need to repatriate these funds to the U.S.
Although cash requirements will fluctuate based on the timing and extent of factors such as those discussedabove, Applied’s management believes that cash generated from operations, together with the liquidity providedby existing cash balances and borrowing capability, will be sufficient to satisfy Applied’s liquidity requirementsfor the next 12 months. For further details regarding Applied’s operating, investing and financing activities, seethe Consolidated Statements of Cash Flows in this report.
57

Off-Balance Sheet Arrangements
During the ordinary course of business, Applied provides standby letters of credit or other guarantee instru-ments to third parties as required for certain transactions initiated either by Applied or its subsidiaries. As ofOctober 30, 2011, the maximum potential amount of future payments that Applied could be required to makeunder these guarantee agreements was $58 million. Applied has not recorded any liability in connection withthese guarantee agreements beyond that required to appropriately account for the underlying transaction beingguaranteed. Applied does not believe, based on historical experience and information currently available, that itis probable that any amounts will be required to be paid under these guarantee agreements.
Applied also has agreements with various banks to facilitate subsidiary banking operations worldwide,including overdraft arrangements, issuance of bank guarantees, and letters of credit. As of October 30, 2011,Applied Materials Inc. has provided parent guarantees to banks for approximately $191 million to cover theseservices.
Applied also has operating leases for various facilities. Total rental expense for operating leases was$44 million for fiscal 2011, $44 million for fiscal 2010, and $55 million for fiscal 2009.
Contractual Obligations
The following table summarizes Applied’s contractual obligations as of October 30, 2011:
Payments Due by Period
Contractual Obligations TotalLess Than
1 Year1-3
Years3-5
YearsMore Than
5 Years
(In millions)
Long-term debt obligations . . . . . . . . . . . . . . . . . $1,951 $ — $ 1 $400 $1,550Interest expense associated with long-term debt
obligations . . . . . . . . . . . . . . . . . . . . . . . . . . . . 1,515 94 184 184 1,053Operating lease obligations . . . . . . . . . . . . . . . . . 108 33 36 18 21Purchase obligations* . . . . . . . . . . . . . . . . . . . . . . 3,184 3,153 29 2 —Other long-term liabilities . . . . . . . . . . . . . . . . . . 221 42 57 42 80
$6,979 $3,322 $307 $646 $2,704
* Represents Applied’s agreements to purchase goods and services consisting of Applied’s (a) outstandingpurchase orders for goods and services; and (b) contractual requirements to make specified minimum pay-ments even if Applied does not take delivery of the contracted goods.
In addition to the contractual obligations disclosed above, the Company has certain tax obligations. Grossinterest and penalties and unrecognized tax benefits that are not expected to result in payment or receipt of cashwithin one year have been reported as non-current liabilities on the Consolidated Balance Sheet. As ofOctober 30, 2011, the gross liability for unrecognized tax benefits was $59 million, exclusive of interest andpenalties. Increases or decreases to interest and penalties on uncertain tax positions are included in provision forincome taxes in the Consolidated Statement of Operations. Interest and penalties related to uncertain tax posi-tions were $1 million as of October 30, 2011 and $6 million as of October 31, 2010. All $1 million in interest andpenalties is classified as long-term payable in the Consolidated Balance Sheets. At this time, the Company isunable to make a reasonably reliable estimate of the timing of payments in individual years due to uncertaintiesin the timing of tax audit outcomes and, accordingly, such amounts are not included in the above contractualobligation table.
Critical Accounting Policies and Estimates
The preparation of consolidated financial statements and related disclosures in conformity with accountingprinciples generally accepted in the United States of America requires management to make judgments, assump-tions and estimates that affect the amounts reported. Note 1 of Notes to Consolidated Financial Statements
58

describes the significant accounting policies used in the preparation of the consolidated financial statements.Certain of these significant accounting policies are considered to be critical accounting policies.
A critical accounting policy is defined as one that is both material to the presentation of Applied’s con-solidated financial statements and that requires management to make difficult, subjective or complex judgmentsthat could have a material effect on Applied’s financial condition or results of operations. Specifically, thesepolicies have the following attributes: (1) Applied is required to make assumptions about matters that are highlyuncertain at the time of the estimate; and (2) different estimates Applied could reasonably have used, or changesin the estimate that are reasonably likely to occur, would have a material effect on Applied’s financial conditionor results of operations.
Estimates and assumptions about future events and their effects cannot be determined with certainty.Applied bases its estimates on historical experience and on various other assumptions believed to be applicableand reasonable under the circumstances. These estimates may change as new events occur, as additionalinformation is obtained and as Applied’s operating environment changes. These changes have historically beenminor and have been included in the consolidated financial statements as soon as they became known. In addi-tion, management is periodically faced with uncertainties, the outcomes of which are not within its control andwill not be known for prolonged periods of time. These uncertainties include those discussed in Part I, Item 1A,“Risk Factors.” Based on a critical assessment of its accounting policies and the underlying judgments anduncertainties affecting the application of those policies, management believes that Applied’s consolidated finan-cial statements are fairly stated in accordance with accounting principles generally accepted in the United Statesof America, and provide a meaningful presentation of Applied’s financial condition and results of operations.
Management believes that the following are critical accounting policies:
Revenue Recognition
Applied recognizes revenue when all four revenue recognition criteria have been met: persuasive evidenceof an arrangement exists; delivery has occurred or services have been rendered; seller’s price to buyer is fixed ordeterminable; and collectability is probable. Each sale arrangement may contain commercial terms that differfrom other arrangements. In addition, Applied frequently enters into contracts that contain multiple deliverables.Judgment is required to properly identify the accounting units of the multiple deliverable transactions and todetermine the manner in which revenue should be allocated among the accounting units. Moreover, judgment isused in interpreting the commercial terms and determining when all criteria of revenue recognition have beenmet in order for revenue recognition to occur in the appropriate accounting period. While changes in the alloca-tion of the estimated sales price between the units of accounting will not affect the amount of total revenuerecognized for a particular sales arrangement, any material changes in these allocations could impact the timingof revenue recognition, which could have a material effect on Applied’s financial condition and results of oper-ations.
In 2009, the Financial Accounting Standards Board issued amended revenue recognition guidance forarrangements with multiple deliverables and certain software sold with tangible products. This guidance elimi-nated the residual method of revenue recognition and allows the use of management’s best estimate of sellingprice for individual elements of an arrangement when vendor specific evidence or third party evidence isunavailable. Applied implemented this guidance prospectively beginning in the first quarter of fiscal 2010 fortransactions that were initiated or materially modified during fiscal 2010. The implementation of the new guid-ance had an insignificant impact on reported net sales compared to net sales under previous guidance, as the newguidance did not change the units of accounting within sales arrangements and the elimination of the residualmethod for the allocation of arrangement consideration had an inconsequential impact on the amount and timingof reported net sales.
Warranty Costs
Applied provides for the estimated cost of warranty when revenue is recognized. Estimated warranty costsare determined by analyzing specific product, current and historical configuration statistics and regional warranty
59
support costs. Applied’s warranty obligation is affected by product and component failure rates, material usageand labor costs incurred in correcting product failures during the warranty period. As Applied’s customerengineers and process support engineers are highly trained and deployed globally, labor availability is a sig-nificant factor in determining labor costs. The quantity and availability of critical replacement parts is anothersignificant factor in estimating warranty costs. Unforeseen component failures or exceptional componentperformance can also result in changes to warranty costs. If actual warranty costs differ substantially fromApplied’s estimates, revisions to the estimated warranty liability would be required, which could have a materialadverse effect on Applied’s business, financial condition and results of operations.
Allowance for Doubtful Accounts
Applied maintains an allowance for doubtful accounts for estimated losses resulting from the inability of itscustomers to make required payments. This allowance is based on historical experience, credit evaluations,specific customer collection history and any customer-specific issues Applied has identified. Changes in circum-stances, such as an unexpected material adverse change in a major customer’s ability to meet its financial obliga-tion to Applied or its payment trends, may require Applied to further adjust its estimates of the recoverability ofamounts due to Applied, which could have a material adverse effect on Applied’s business, financial conditionand results of operations.
Inventory Valuation
Inventories are generally stated at the lower of cost or market, with cost determined on a first-in, first-outbasis. The carrying value of inventory is reduced for estimated obsolescence by the difference between its costand the estimated market value based upon assumptions about future demand. Applied evaluates the inventorycarrying value for potential excess and obsolete inventory exposures by analyzing historical and anticipateddemand. In addition, inventories are evaluated for potential obsolescence due to the effect of known and antici-pated engineering change orders and new products. If actual demand were to be substantially lower than esti-mated, additional adjustments for excess or obsolete inventory may be required, which could have a materialadverse effect on Applied’s business, financial condition and results of operations.
Goodwill and Intangible Assets
Applied reviews goodwill and intangible assets for impairment whenever events or changes in circum-stances indicate that the carrying amount of these assets may not be recoverable, and also annually reviewsgoodwill and intangibles with indefinite lives for impairment. Intangible assets, such as purchased technology,are generally recorded in connection with a business acquisition. The value assigned to intangible assets is usu-ally based on estimates and judgments regarding expectations for the success and life cycle of products and tech-nology acquired. If actual product acceptance differs significantly from the estimates, Applied may be required torecord an impairment charge to reduce the carrying value of the reporting unit to its realizable value. The fairvalue of a reporting unit is estimated using both the income approach and the market approach taking intoaccount such factors as future anticipated operating results and estimated cost of capital. Management uses sig-nificant judgment when assessing goodwill for potential impairment, especially in emerging markets. A severedecline in market value could result in an unexpected impairment charge for impaired goodwill, which couldhave a material adverse effect on Applied’s business, financial condition and results of operations.
Income Taxes
The effective tax rate is highly dependent upon the geographic composition of worldwide earnings, tax regu-lations governing each region, non-tax deductible expenses incurred in connection with acquisitions and avail-ability of tax credits. Management carefully monitors the changes in many factors and adjusts the effectiveincome tax rate as required. If actual results differ from these estimates, Applied could be required to record avaluation allowance on deferred tax assets or adjust its effective income tax rate, which could have a materialadverse effect on Applied’s business, financial condition and results of operations.
60

Applied accounts for income taxes by recognizing deferred tax assets and liabilities using statutory tax ratesfor the effect of temporary differences between the book and tax bases of recorded assets and liabilities, netoperating losses and tax credit carryforwards. Deferred tax assets are also reduced by a valuation allowance if itis more likely than not that a portion of the deferred tax asset will not be realized. Management has determinedthat it is more likely than not that Applied’s future taxable income will be sufficient to realize its deferred taxassets, net of existing valuation allowance.
The calculation of tax liabilities involves significant judgment in estimating the impact of uncertainties inthe application of complex tax laws. Resolution of these uncertainties in a manner inconsistent with Applied’sexpectations could have a material impact on Applied’s results of operations and financial condition.
Non-GAAP Results
Management uses non-GAAP results to evaluate the Company’s operating and financial performance inlight of business objectives and for planning purposes. Applied believes these measures enhance investors’ abil-ity to review the Company’s business from the same perspective as the Company’s management and facilitatecomparisons of this period’s results with prior periods. The non-GAAP results presented below exclude theimpact of the following, where applicable: restructuring and asset impairment charges and any associatedadjustment related to restructuring actions, certain discrete tax items, certain acquisition-related costs, investmentimpairments, and gain or loss on sale of facilities. These non-GAAP measures are not in accordance with GAAPand may differ from non-GAAP methods of accounting and reporting used by other companies. The presentationof this additional information should not be considered a substitute for results prepared in accordance withGAAP.
Non-GAAP operating income for fiscal 2011 and 2010 were $2.4 billion and $1.7 billion, respectively. Non-GAAP operating loss for fiscal 2009 was $142 million.
Non-GAAP net income for fiscal 2011 and 2010 were $1.7 billion or $1.30 per share and $1.2 billion or$0.88 per share, respectively. Non-GAAP net loss for fiscal 2009 was $69 million or $0.05 per share.
61

The following table presents a reconciliation of the GAAP and non-GAAP results for the past three fiscalyears:
APPLIED MATERIALS, INC.
RECONCILIATION OF GAAP TO NON-GAAP RESULTS
Twelve Months Ended
(In millions, except per share amounts)October 30,
2011October 31,
2010October 25,
2009
Non-GAAP Operating Income (Loss)Reported operating income (loss) GAAP basis . . . . . . . . . . . . . . . . . . . . . . . . $2,398 $1,384 $ (394)Certain items associated with acquisitions1 . . . . . . . . . . . . . . . . . . . . . . . . . . 51 91 96Varian and Semitool deal cost . . . . . . . . . . . . . . . . . . . . . . . . . . . . . . . . . . . . . 19 10 —Restructuring charges and asset impairments2,3,4 . . . . . . . . . . . . . . . . . . . . . . (30) 246 156Gain on sale of facilities, net . . . . . . . . . . . . . . . . . . . . . . . . . . . . . . . . . . . . . . (27) — —
Non-GAAP operating income . . . . . . . . . . . . . . . . . . . . . . . . . . . . . . . . . . . . . $2,411 $1,731 $ (142)
Non-GAAP Net Income (Loss)Reported net income (loss) GAAP basis . . . . . . . . . . . . . . . . . . . . . . . . . . . . . $1,926 $ 938 $ (305)Certain items associated with acquisitions1 . . . . . . . . . . . . . . . . . . . . . . . . . . 51 91 96Varian and Semitool deal cost . . . . . . . . . . . . . . . . . . . . . . . . . . . . . . . . . . . . . 19 10 —Restructuring charges and asset impairments2,3,4 . . . . . . . . . . . . . . . . . . . . . . (30) 246 156Impairment of equity method investment and strategic investments . . . . . . . 3 13 84Gain on sale of facilities, net . . . . . . . . . . . . . . . . . . . . . . . . . . . . . . . . . . . . . . (27) — —Reinstatement of federal R&D tax credit . . . . . . . . . . . . . . . . . . . . . . . . . . . . (13) — —Resolution of audits of prior years’ income tax filings . . . . . . . . . . . . . . . . . . (203) — —Income tax effect of non-GAAP adjustments . . . . . . . . . . . . . . . . . . . . . . . . . (3) (117) (100)
Non-GAAP net income . . . . . . . . . . . . . . . . . . . . . . . . . . . . . . . . . . . . . . . . . . $1,723 $1,181 $ (69)
Non-GAAP Earnings (Loss) Per Diluted ShareReported earnings (loss) per diluted share GAAP basis . . . . . . . . . . . . . . . . . $ 1.45 $ 0.70 $ (0.23)Certain items associated with acquisitions . . . . . . . . . . . . . . . . . . . . . . . . . . . 0.03 0.05 0.05Varian and Semitool deal cost . . . . . . . . . . . . . . . . . . . . . . . . . . . . . . . . . . . . . 0.01 0.01 —Restructuring charges and asset impairments . . . . . . . . . . . . . . . . . . . . . . . . . (0.01) 0.12 0.08Impairment of equity method investment and strategic investments . . . . . . . — — 0.05Gain on sale of facilities, net . . . . . . . . . . . . . . . . . . . . . . . . . . . . . . . . . . . . . . (0.02) — —Reinstatement of federal R&D tax credit and resolution of audits of prior
years’ income tax filings . . . . . . . . . . . . . . . . . . . . . . . . . . . . . . . . . . . . . . . (0.16) — —Non-GAAP earnings (loss) per diluted share . . . . . . . . . . . . . . . . . . . . . . . . . $ 1.30 $ 0.88 $ (0.05)Weighted average number of diluted shares . . . . . . . . . . . . . . . . . . . . . . . . . . 1,330 1,349 1,333
1 These items are incremental charges attributable to acquisitions consisting of inventory fair value adjust-ments on products sold and amortization of purchased intangible assets.
2 Results for fiscal 2011 included favorable adjustments of $36 million related to a restructuring programannounced on July 21, 2010, $19 million related to a restructuring program announced on November 11,2009, and $5 million related to a restructuring program announced on November 12, 2008, offset by assetimpairment charges of $30 million primarily related to certain intangible assets.
3 Results for fiscal 2010 included asset impairment charges of $108 million and restructuring charges of $45million related to a restructuring program announced on July 21, 2010, restructuring charges of $84 millionassociated with a restructuring program announced on November 11, 2009, and asset impairment chargesof $9 million related to a facility held for sale.
62

4 Results for fiscal 2009 included restructuring charges of $141 million primarily associated with arestructuring program announced on November 12, 2008 and asset impairment charges of $15 millionrelated to wafer cleaning equipment.
Item 7A: Quantitative and Qualitative Disclosures About Market Risk
Applied is exposed to interest rate risk related to its investment portfolio and debt issuances. Applied’sinvestment portfolio includes fixed-income securities with a fair value of approximately $1.1 billion atOctober 30, 2011. These securities are subject to interest rate risk and will decline in value if interest ratesincrease. Based on Applied’s investment portfolio at October 30, 2011, an immediate 100 basis point increase ininterest rates would result in a decrease in the fair value of the portfolio of approximately $19 million. While anincrease in interest rates reduces the fair value of the investment portfolio, Applied will not realize the losses inthe consolidated statement of operations unless the individual fixed-income securities are sold prior to recoveryor the loss is determined to be other-than-temporary. At October 30, 2011, the carrying amount of debt issued byApplied was $1.9 billion with an estimated fair value of $2.2 billion. A hypothetical decrease in interest rates of100 basis points would result in an increase in the fair value of Applied’s debt issuances of approximately $215million at October 30, 2011.
Certain operations of Applied are conducted in foreign currencies, such as Japanese yen, euro, Israeli shekel,Taiwanese dollar and Swiss franc. Applied enters into currency forward exchange and option contracts to hedge aportion of, but not all, existing and anticipated foreign currency denominated transactions expected to occurwithin 24 months. Gains and losses on these contracts are generally recognized in income at the time that therelated transactions being hedged are recognized. Because the effect of movements in currency exchange rates oncurrency forward exchange and option contracts generally offsets the related effect on the underlying items beinghedged, these financial instruments are not expected to subject Applied to risks that would otherwise result fromchanges in currency exchange rates. Applied does not use derivative financial instruments for trading or spec-ulative purposes. Net foreign currency gains and losses were not material for fiscal 2011.
Item 8: Financial Statements and Supplementary Data
The consolidated financial statements required by this Item are set forth on the pages indicated atItem 15(a).
Item 9: Changes in and Disagreements with Accountants on Accounting and Financial Disclosure
None.
Item 9A: Controls and Procedures
Disclosure Controls and Procedures
As of the end of the period covered by this report, management of Applied conducted an evaluation, underthe supervision and with the participation of Applied’s Chief Executive Officer and Chief Financial Officer, ofthe effectiveness of the design and operation of Applied’s disclosure controls and procedures, as such term isdefined in Rule 13a-15(e) of the Securities Exchange Act of 1934 (the Exchange Act). Based upon that evalua-tion, Applied’s Chief Executive Officer and Chief Financial Officer concluded that Applied’s disclosure controlsand procedures were effective as of the end of the period covered by this report in ensuring that information
63

required to be disclosed was recorded, processed, summarized and reported within the time periods specified inthe SEC’s rules and forms, and to provide reasonable assurance that information required to be disclosed byApplied in such reports is accumulated and communicated to the Company’s management, including its ChiefExecutive Officer and Chief Financial Officer, as appropriate to allow timely decisions regarding required dis-closure.
Management’s Report on Internal Control over Financial Reporting
Applied’s management is responsible for establishing and maintaining adequate internal control over finan-cial reporting, as such term is defined in Rule 13a-15(f) of the Exchange Act. Under the supervision and with theparticipation of Applied’s Chief Executive Officer and Chief Financial Officer, management of Applied con-ducted an evaluation of the effectiveness of Applied’s internal control over financial reporting based upon theframework in “Internal Control — Integrated Framework” issued by the Committee of Sponsoring Organizationsof the Treadway Commission. Based on that evaluation, Applied’s management concluded that Applied’sinternal control over financial reporting was effective as of October 30, 2011.
KPMG LLP, an independent registered public accounting firm, has audited the consolidated financial state-ments included in this Form 10-K and, as part of the audit, has issued a report, included herein, on the effective-ness of Applied’s internal control over financial reporting as of October 30, 2011.
Changes in Internal Control over Financial Reporting
During the fourth quarter of fiscal 2011, there were no changes in the internal control over financial report-ing that materially affected, or are reasonably likely to materially affect, Applied’s internal control over financialreporting.
Inherent Limitations of Disclosure Controls and Procedures and Internal Control over Financial Report-ing
It should be noted that any system of controls, however well designed and operated, can provide onlyreasonable, and not absolute, assurance that the objectives of the system will be met. In addition, the design ofany control system is based in part upon certain assumptions about the likelihood of future events.
Item 9B: Other Information
None
64

REPORT OF INDEPENDENT REGISTERED PUBLIC ACCOUNTING FIRM
The Board of Directors and StockholdersApplied Materials, Inc.:
We have audited Applied Materials, Inc.’s (the Company) internal control over financial reporting as ofOctober 30, 2011, based on criteria established in Internal Control — Integrated Framework issued by theCommittee of Sponsoring Organizations of the Treadway Commission (COSO). The Company’s management isresponsible for maintaining effective internal control over financial reporting and for its assessment of the effec-tiveness of internal control over financial reporting, included in the accompanying Management’s Report onInternal Control over Financial Reporting in Item 9A. Our responsibility is to express an opinion on the Compa-ny’s internal control over financial reporting based on our audit.
We conducted our audit in accordance with the standards of the Public Company Accounting OversightBoard (United States). Those standards require that we plan and perform the audit to obtain reasonable assuranceabout whether effective internal control over financial reporting was maintained in all material respects. Ouraudit included obtaining an understanding of internal control over financial reporting, assessing the risk that amaterial weakness exists, and testing and evaluating the design and operating effectiveness of internal controlbased on the assessed risk. Our audit also included performing such other procedures as we considered necessaryin the circumstances. We believe that our audit provides a reasonable basis for our opinion.
A company’s internal control over financial reporting is a process designed to provide reasonable assuranceregarding the reliability of financial reporting and the preparation of financial statements for external purposes inaccordance with generally accepted accounting principles. A company’s internal control over financial reportingincludes those policies and procedures that (1) pertain to the maintenance of records that, in reasonable detail,accurately and fairly reflect the transactions and dispositions of the assets of the company; (2) provide reasonableassurance that transactions are recorded as necessary to permit preparation of financial statements in accordancewith generally accepted accounting principles, and that receipts and expenditures of the company are being madeonly in accordance with authorizations of management and directors of the company; and (3) provide reasonableassurance regarding prevention or timely detection of unauthorized acquisition, use, or disposition of the compa-ny’s assets that could have a material effect on the financial statements.
Because of its inherent limitations, internal control over financial reporting may not prevent or detect mis-statements. Also, projections of any evaluation of effectiveness to future periods are subject to the risk that con-trols may become inadequate because of changes in conditions, or that the degree of compliance with the policiesor procedures may deteriorate.
In our opinion, Applied Materials, Inc. maintained, in all material respects, effective internal control overfinancial reporting as of October 30, 2011, based on criteria established in Internal Control — Integrated Frame-work issued by the Committee of Sponsoring Organizations of the Treadway Commission.
We also have audited, in accordance with the standards of the Public Company Accounting Oversight Board(United States), the consolidated balance sheets of Applied Materials Inc. and subsidiaries as of October 30, 2011and October 31, 2010, and the related consolidated statements of operations, stockholders’ equity and compre-hensive income (loss), and cash flows for each of the years in the three-year period ended October 30, 2011. Inconnection with our audits of the consolidated financial statements, we also have audited financial statementschedule II. Our report dated December 6, 2011 expressed an unqualified opinion on those consolidated financialstatements and financial statement schedule.
/s/ KPMG LLP
KPMG LLP
Mountain View, CaliforniaDecember 6, 2011
65
PART III
Pursuant to Paragraph G(3) of the General Instructions to Form 10-K, portions of the information requiredby Part III of Form 10-K are incorporated by reference from Applied’s Proxy Statement to be filed with the SECin connection with the 2012 Annual Meeting of Stockholders (the Proxy Statement).
Item 10: Directors, Executive Officers and Corporate Governance
(1) Information regarding directors, including director nominations, and Applied’s audit committee andaudit committee financial expert, appears in the Proxy Statement under “Election of Directors,” and isincorporated herein by reference.
(2) For information with respect to Executive Officers, see Part I, Item 1 of this Annual Report onForm 10-K, under “Executive Officers of the Registrant.”
(3) Information regarding Section 16(a) beneficial ownership reporting compliance appears in theProxy Statement under “Section 16(a) Beneficial Ownership Reporting Compliance,” and is incorporated hereinby reference.
Applied has implemented the Standards of Business Conduct, a code of ethics with which every person whoworks for Applied and every member of the Board of Directors is expected to comply. If any substantiveamendments are made to the Standards of Business Conduct or any waiver is granted, including any implicitwaiver, from a provision of the code to Applied’s Chief Executive Officer, Chief Financial Officer or ChiefAccounting Officer, Applied will disclose the nature of such amendment or waiver on its website or in a reporton Form 8-K. The above information, including the Standards of Business Conduct, is available on Applied’swebsite under the Corporate Governance section at http://investors.appliedmaterials.com. This website address isintended to be an inactive, textual reference only. None of the material on, or accessible through, this website ispart of this report or is incorporated by reference herein.
Item 11: Executive Compensation
Information regarding executive compensation appears in the Proxy Statement under “Executive Compensa-tion and Related Information” and is incorporated herein by reference.
Information regarding compensation committee interlocks and insider participation appears in theProxy Statement under “Compensation Committee Interlocks and Insider Participation” and is incorporatedherein by reference.
Information regarding the compensation committee report appears in the Proxy Statement under “HumanResources and Compensation Committee Report” and is incorporated herein by reference.
66

Item 12: Security Ownership of Certain Beneficial Owners and Management and Related StockholderMatters
Information regarding the security ownership of certain beneficial owners and management appears in theProxy Statement, under “Principal Stockholders,” and is incorporated herein by reference.
The following table summarizes information with respect to options and other equity awards underApplied’s equity compensation plans as of October 30, 2011:
Equity Compensation Plan Information
Plan Category
(a)Number of
Securities to beIssued Upon Exercise
of Outstanding Options,Warrants and
Rights(1)
(b)Weighted AverageExercise Price of
Outstanding Options,Warrants and
Rights(2)
(c)Number of SecuritiesAvailable for Future
Issuance Under EquityCompensation Plans(Excluding Securities
Reflected inColumn(a))
(In millions, except prices)
Equity compensation plans approved bysecurity holders . . . . . . . . . . . . . . . . . . . . . . . 47 $10.85 137(3)
Equity compensation plans not approved bysecurity holders . . . . . . . . . . . . . . . . . . . . . . . 11(4) $16.98 73(5)
Total . . . . . . . . . . . . . . . . . . . . . . . . . . . . . . . . 58 $13.05 210
(1) Includes only options and restricted stock units (also referred to as “performance shares” under the AppliedMaterials, Inc. Employee Stock Incentive Plan) outstanding under Applied’s equity compensation plans, asno stock warrants or other rights were outstanding as of October 30, 2011.
(2) The weighted average exercise price calculation does not take into account any restricted stock units as theyhave a de minimis purchase price.
(3) Includes 50 million shares of Applied common stock available for future issuance under the Applied Materi-als, Inc. Employees’ Stock Purchase Plan. Of these 50 million shares, 2 million are subject to purchase dur-ing the purchase period in effect as of October 30, 2011.
(4) Includes options to purchase 1 million shares of Applied common stock assumed through various mergersand acquisitions, after giving effect to the applicable exchange ratios. The assumed options had a weightedaverage exercise price of $14.09 per share. No further shares are available for issuance under the plans underwhich these assumed awards were granted.
(5) Includes 3 million shares of Applied common stock available for future issuance under the Applied Materi-als, Inc. Stock Purchase Plan for Offshore Employees. Of these 3 million shares, 1 million are subject topurchase during the purchase period in effect as of October 30, 2011.
In addition to the options and other equity awards under Applied’s plans as of October 30, 2011described above, subsequent to the end of fiscal year 2011 and as part of the acquisition of Varian inNovember 2011, Applied assumed certain outstanding options under Varian’s two stock plans then in effect.After giving effect to the merger exchange ratio, these Varian options were converted into options to pur-chase 5 million shares of Applied common stock. The converted options had a weighted average exerciseprice of $4.85 per share. No further shares are available for issuance under the Varian plans.
Applied has the following equity compensation plans that have not been approved by stockholders:
2000 Global Equity Incentive Plan The 2000 Global Equity Incentive Plan (the 2000 Plan) was adoptedeffective as of June 21, 2000. The 2000 Plan provides for the grant of non-qualified stock options toemployees other than officers and directors. The administrator of the 2000 Plan (either the Board of Direc-
67

tors of Applied or a committee appointed by the Board) determines the terms and conditions of all stockoptions granted; provided, however, that (1) the exercise price generally may not be less than 100 percent ofthe fair market value (on the date of grant) of the stock covered by the option, and (2) the term of optionscan be no longer than 10 years (or 13 years in the event of death). A total of 147 million shares have beenauthorized for issuance under the 2000 Plan, and 70 million shares remain available for issuance as ofOctober 30, 2011.
Stock Purchase Plan for Offshore Employees The Stock Purchase Plan for Offshore Employees (theOffshore ESPP) was adopted effective as of October 16, 1995 for the benefit of employees of Applied’sparticipating affiliates (other than United States citizens or residents). The Offshore ESPP provides for thegrant of options to purchase shares of Applied common stock through payroll deductions pursuant to one ormore offerings. The administrator of the Offshore ESPP (the Board of Directors of Applied or a committeeappointed by the Board) determines the terms and conditions of all options prior to the start of an offering,including the purchase price of shares, the number of shares covered by the option and when the option maybe exercised. All options granted as part of an offering must be granted on the same date. Prior toDecember 7, 2009, a total of 16 million shares had been authorized for issuance under the Offshore ESPP.Effective December 7, 2009, Applied amended the Offshore ESPP to increase the number of shares avail-able for issuance under such plan by 5 million shares and correspondingly amended the stockholder-approved Applied Materials, Inc. Employees’ Stock Purchase Plan (the U.S. ESPP) to reduce the number ofshares available for issuance under such plan by 5 million shares. Accordingly, as of October 30, 2011 atotal of 21 million shares have been authorized for issuance under the Offshore ESPP, and 3 million sharesremain available for issuance. These plan amendments did not result in any increase in the total aggregatenumber of shares authorized for issuance under the Offshore ESPP and the U.S. ESPP.
Nonemployee Director Share Purchase Plan The Applied Materials, Inc. Nonemployee Director SharePurchase Plan was adopted effective March 22, 2005. The Nonemployee Director Share Purchase Plan pro-vides a method by which non-employee directors may purchase Applied common stock at 100% of fairmarket value on the purchase date by foregoing cash they have earned as retainer fees or meeting fees. Theshares generally are purchased at the same time the directors otherwise would have been paid the fees incash. Since the directors pay full fair market value for the shares, there is no reserved amount of sharesunder this plan and, accordingly, the table above does not include any set number of shares available forfuture issuance under the plan.
Applied Materials Profit Sharing Scheme The Applied Materials Profit Sharing Scheme was adoptedeffective July 3, 1996 to enable employees of Applied Materials Ireland Limited and its participating sub-sidiaries to purchase Applied common stock at 100% of fair market value on the purchase date. Under thisplan, eligible employees may elect to forego a certain portion of their base salary and certain bonuses theyhave earned and that otherwise would be payable in cash to purchase shares of Applied common stock atfull fair market value. Since the eligible employees pay full fair market value for the shares, there is noreserved amount of shares under this plan and, accordingly, the table above does not include any set numberof shares available for future issuance under the plan.
Item 13: Certain Relationships and Related Transactions, and Director Independence
The information appearing in the Proxy Statement under the heading “Certain Relationships and RelatedTransactions” is incorporated herein by reference.
The information appearing in the Proxy Statement under the heading “Director Independence” isincorporated herein by reference.
Item 14: Principal Accounting Fees and Services
Information regarding principal accounting fees and services and the audit committee’s preapproval policiesand procedures appears in the Proxy Statement under the headings “Fees Paid to KPMG LLP” and “Policy onAudit Committee’s Pre-Approval of Audit and Permissible Non-audit Services of Independent Registered PublicAccounting Firm,” is incorporated herein by reference.
68

PART IV
Item 15: Exhibits and Financial Statement Schedules
(a) The following documents are filed as part of this Annual Report on Form 10-K:
PageNumber
(1) Financial Statements:
Consolidated Statements of Operations for each of the years in the three-year period endedOctober 30, 2011 . . . . . . . . . . . . . . . . . . . . . . . . . . . . . . . . . . . . . . . . . . . . . . . . . . . . . . . . . . . . . . . . . 70
Consolidated Balance Sheets at October 30, 2011 and October 31, 2010 . . . . . . . . . . . . . . . . . . . . . . 71
Consolidated Statements of Stockholders’ Equity and Comprehensive Income (Loss) for each ofthe years in the three-year period ended October 30, 2011 . . . . . . . . . . . . . . . . . . . . . . . . . . . . . . . . . 72
Consolidated Statements of Cash Flows for each of the years in the three-year period endedOctober 30, 2011 . . . . . . . . . . . . . . . . . . . . . . . . . . . . . . . . . . . . . . . . . . . . . . . . . . . . . . . . . . . . . . . . . 73
Notes to Consolidated Financial Statements . . . . . . . . . . . . . . . . . . . . . . . . . . . . . . . . . . . . . . . . . . . . 74
Report of KPMG LLP, Independent Registered Public Accounting Firm . . . . . . . . . . . . . . . . . . . . . 116
(2) Exhibits:
The exhibits listed in the accompanying Index to Exhibits are filed or incorporated by reference aspart of this Annual Report on Form 10-K . . . . . . . . . . . . . . . . . . . . . . . . . . . . . . . . . . . . . . . . . . . . . . 117
(3) Financial Statement Schedule:
Schedule II — Valuation and Qualifying Accounts for each of the three years in the period endedOctober 30, 2011 . . . . . . . . . . . . . . . . . . . . . . . . . . . . . . . . . . . . . . . . . . . . . . . . . . . . . . . . . . . . . . . . . 124
All other schedules are omitted because they are not applicable or the required information is shown in theConsolidated Financial Statements or Notes thereto.
69

APPLIED MATERIALS, INC.
CONSOLIDATED STATEMENTS OF OPERATIONS
Fiscal Year 2011 2010 2009
(In millions, except per share amounts)
Net sales . . . . . . . . . . . . . . . . . . . . . . . . . . . . . . . . . . . . . . . . . . . . . . . . . . . . . . . $10,517 $9,549 $5,014Cost of products sold . . . . . . . . . . . . . . . . . . . . . . . . . . . . . . . . . . . . . . . . . . . . . 6,157 5,834 3,583
Gross margin . . . . . . . . . . . . . . . . . . . . . . . . . . . . . . . . . . . . . . . . . . . . . . . . . . . 4,360 3,715 1,431Operating expenses:
Research, development and engineering . . . . . . . . . . . . . . . . . . . . . . . . . . . . 1,118 1,143 934Selling, general and administrative . . . . . . . . . . . . . . . . . . . . . . . . . . . . . . . . 901 942 735Restructuring charges and asset impairments (Note 11) . . . . . . . . . . . . . . . . (30) 246 156Gain on sale of facilities, net (Note 7) . . . . . . . . . . . . . . . . . . . . . . . . . . . . . . (27) — —
Total operating expenses . . . . . . . . . . . . . . . . . . . . . . . . . . . . . . . . . . . . . . . . . . 1,962 2,331 1,825Income (loss) from operations . . . . . . . . . . . . . . . . . . . . . . . . . . . . . . . . . . . . . . 2,398 1,384 (394)Pre-tax loss of equity-method investment . . . . . . . . . . . . . . . . . . . . . . . . . . . . . — — 35Impairments of investments and strategic investments (Notes 3 and 4) . . . . . . 3 13 84Interest and other expenses (Note 10) . . . . . . . . . . . . . . . . . . . . . . . . . . . . . . . . 59 21 21Interest and other income, net . . . . . . . . . . . . . . . . . . . . . . . . . . . . . . . . . . . . . . 42 37 48
Income (loss) before income taxes . . . . . . . . . . . . . . . . . . . . . . . . . . . . . . . . . . . 2,378 1,387 (486)Provision (benefit) for income taxes . . . . . . . . . . . . . . . . . . . . . . . . . . . . . . . . . 452 449 (181)
Net income (loss) . . . . . . . . . . . . . . . . . . . . . . . . . . . . . . . . . . . . . . . . . . . . . . . . $ 1,926 $ 938 $ (305)
Earnings (loss) per share:Basic . . . . . . . . . . . . . . . . . . . . . . . . . . . . . . . . . . . . . . . . . . . . . . . . . . . . . . $ 1.46 $ 0.70 $ (0.23)Diluted . . . . . . . . . . . . . . . . . . . . . . . . . . . . . . . . . . . . . . . . . . . . . . . . . . . . $ 1.45 $ 0.70 $ (0.23)
Weighted average number of shares:Basic . . . . . . . . . . . . . . . . . . . . . . . . . . . . . . . . . . . . . . . . . . . . . . . . . . . . . . 1,319 1,340 1,333Diluted . . . . . . . . . . . . . . . . . . . . . . . . . . . . . . . . . . . . . . . . . . . . . . . . . . . . 1,330 1,349 1,333
See accompanying Notes to Consolidated Financial Statements.
70

APPLIED MATERIALS, INC.
CONSOLIDATED BALANCE SHEETS
October 30,2011
October 31,2010
(In millions, except per shareamounts)
ASSETSCurrent assets:
Cash and cash equivalents (Notes 3 and 4) . . . . . . . . . . . . . . . . . . . . . . . . . . . . . . . . . $ 5,960 $ 1,858Short-term investments (Notes 3 and 4) . . . . . . . . . . . . . . . . . . . . . . . . . . . . . . . . . . . 283 727Accounts receivable, net (Note 6) . . . . . . . . . . . . . . . . . . . . . . . . . . . . . . . . . . . . . . . . 1,532 1,831Inventories (Note 7) . . . . . . . . . . . . . . . . . . . . . . . . . . . . . . . . . . . . . . . . . . . . . . . . . . . 1,701 1,547Deferred income taxes, net (Note 14) . . . . . . . . . . . . . . . . . . . . . . . . . . . . . . . . . . . . . 580 513Other current assets . . . . . . . . . . . . . . . . . . . . . . . . . . . . . . . . . . . . . . . . . . . . . . . . . . . 299 289
Total current assets . . . . . . . . . . . . . . . . . . . . . . . . . . . . . . . . . . . . . . . . . . . . . . . . . 10,355 6,765Long-term investments (Notes 3 and 4) . . . . . . . . . . . . . . . . . . . . . . . . . . . . . . . . . . . . . 931 1,307Property, plant and equipment, net (Note 7) . . . . . . . . . . . . . . . . . . . . . . . . . . . . . . . . . . 866 963Goodwill (Note 8) . . . . . . . . . . . . . . . . . . . . . . . . . . . . . . . . . . . . . . . . . . . . . . . . . . . . . . 1,335 1,336Purchased technology and other intangible assets, net (Note 8) . . . . . . . . . . . . . . . . . . . 211 287Deferred income taxes and other assets (Note 14) . . . . . . . . . . . . . . . . . . . . . . . . . . . . . 163 285
Total assets . . . . . . . . . . . . . . . . . . . . . . . . . . . . . . . . . . . . . . . . . . . . . . . . . . . . . . . $13,861 $10,943
LIABILITIES AND STOCKHOLDERS’ EQUITYCurrent liabilities:
Current portion of long-term debt (Note 10) . . . . . . . . . . . . . . . . . . . . . . . . . . . . . . . . $ — $ 1Accounts payable and accrued expenses (Note 7) . . . . . . . . . . . . . . . . . . . . . . . . . . . . 1,520 1,766Customer deposits and deferred revenue (Note 7) . . . . . . . . . . . . . . . . . . . . . . . . . . . 1,116 847Income taxes payable (Note 14) . . . . . . . . . . . . . . . . . . . . . . . . . . . . . . . . . . . . . . . . . 158 274
Total current liabilities . . . . . . . . . . . . . . . . . . . . . . . . . . . . . . . . . . . . . . . . . . . . . . 2,794 2,888Long-term debt (Note 10) . . . . . . . . . . . . . . . . . . . . . . . . . . . . . . . . . . . . . . . . . . . . . . . . 1,947 204Employee benefits and other liabilities (Note 13) . . . . . . . . . . . . . . . . . . . . . . . . . . . . . . 320 315
Total liabilities . . . . . . . . . . . . . . . . . . . . . . . . . . . . . . . . . . . . . . . . . . . . . . . . . . . . . 5,061 3,407
Commitments and contingencies (Note 15)Stockholders’ equity (Note 12):
Preferred stock: $.01 par value per share; 1 shares authorized; no shares issued . . . . — —Common stock: $.01 par value per share; 2,500 shares authorized; 1,306 and 1,328
shares outstanding at 2011 and 2010, respectively . . . . . . . . . . . . . . . . . . . . . . . . . 13 13Additional paid-in capital . . . . . . . . . . . . . . . . . . . . . . . . . . . . . . . . . . . . . . . . . . . . . . 5,616 5,406Retained earnings . . . . . . . . . . . . . . . . . . . . . . . . . . . . . . . . . . . . . . . . . . . . . . . . . . . . 13,029 11,511Treasury stock: 573 and 537 shares at 2011 and 2010, respectively, net . . . . . . . . . . (9,864) (9,396)Accumulated other comprehensive income . . . . . . . . . . . . . . . . . . . . . . . . . . . . . . . . . 6 2
Total stockholders’ equity . . . . . . . . . . . . . . . . . . . . . . . . . . . . . . . . . . . . . . . . . . . . . . 8,800 7,536
Total liabilities and stockholders’ equity . . . . . . . . . . . . . . . . . . . . . . . . . . . . . . . . $13,861 $10,943
See accompanying Notes to Consolidated Financial Statements.
71

APPLIED MATERIALS, INC
CONSOLIDATED STATEMENTS OF STOCKHOLDERS’ EQUITYAND COMPREHENSIVE INCOME (LOSS)
AdditionalPaid-InCapital
AccumulatedOther
ComprehensiveIncome (Loss) Total
Common Stock RetainedEarnings
Treasury Stock
Shares Amount Shares Amount
(In millions)Balance at October 26, 2008 . . . . . . . . . . . . . . . . . . . 1,331 $13 $5,096 $11,601 513 $(9,134) $(27) $7,549Components of comprehensive loss, net of tax:Net loss . . . . . . . . . . . . . . . . . . . . . . . . . . . . . . . . . . . . — — — (305) — — — (305)Change in unrealized net gain on investments . . . . . . — — — — — — 45 45Change in unrealized net gain on derivative
instruments . . . . . . . . . . . . . . . . . . . . . . . . . . . . . . . — — — — — — (8) (8)Change in defined benefit plan liability . . . . . . . . . . . — — — — — — (12) (12)Change in retiree medical benefit . . . . . . . . . . . . . . . . — — — — — — (1) (1)Translation adjustments . . . . . . . . . . . . . . . . . . . . . . . — — — — — — 1 1
Comprehensive loss . . . . . . . . . . . . . . . . . . . . . . . . . . (280)Change in measurement date to apply authoritative
guidance on defined benefit plans . . . . . . . . . . . . . — — — (2) — — — (2)Dividends . . . . . . . . . . . . . . . . . . . . . . . . . . . . . . . . . . — — — (320) — — — (320)Share-based compensation . . . . . . . . . . . . . . . . . . . . . — — 147 — — — — 147Issuance under stock plans, net of a tax detriment of
$13 and other . . . . . . . . . . . . . . . . . . . . . . . . . . . . . 12 — (48) (40) (7) 111 — 23Common stock repurchases . . . . . . . . . . . . . . . . . . . . (2) — — — 2 (23) — (23)
Balance at October 25, 2009 . . . . . . . . . . . . . . . . . . . . . 1,341 $13 $5,195 $10,934 508 $(9,046) $ (2) $7,094Components of comprehensive income, net of tax:Net income . . . . . . . . . . . . . . . . . . . . . . . . . . . . . . . . . — — — 938 — — — 938Change in unrealized net gain on investments . . . . . . — — — — — — 4 4Change in unrealized net gain on derivative
instruments . . . . . . . . . . . . . . . . . . . . . . . . . . . . . . . — — — — — — 4 4Change in defined benefit plan liability . . . . . . . . . . . — — — — — — (6) (6)Translation adjustments . . . . . . . . . . . . . . . . . . . . . . . — — — — — — 2 2
Comprehensive income . . . . . . . . . . . . . . . . . . . . . . . 942Dividends . . . . . . . . . . . . . . . . . . . . . . . . . . . . . . . . . . — — — (361) — — — (361)Share-based compensation . . . . . . . . . . . . . . . . . . . . . — — 126 — — — — 126Issuance under stock plans, net of a tax detriment of
$28 and other . . . . . . . . . . . . . . . . . . . . . . . . . . . . . 16 — 85 — — — — 85Common stock repurchases . . . . . . . . . . . . . . . . . . . . (29) — — — 29 (350) — (350)
Balance at October 31, 2010 . . . . . . . . . . . . . . . . . . . . . 1,328 $13 $5,406 $11,511 537 $(9,396) $ 2 $7,536Components of comprehensive income, net of tax:Net income . . . . . . . . . . . . . . . . . . . . . . . . . . . . . . . . . . . — — — 1,926 — — — 1,926Change in unrealized net gain on investments . . . . . . . . — — — — — — (8) (8)Change in unrealized net gain on derivative
instruments . . . . . . . . . . . . . . . . . . . . . . . . . . . . . . . . . — — — — — — (4) (4)Change in defined benefit plan liability . . . . . . . . . . . . . — — — — — — 14 14Translation adjustments . . . . . . . . . . . . . . . . . . . . . . . . . — — — — — — 2 2
Comprehensive income . . . . . . . . . . . . . . . . . . . . . . . . . 1,930Dividends . . . . . . . . . . . . . . . . . . . . . . . . . . . . . . . . . . . . — — — (408) — — — (408)Share-based compensation . . . . . . . . . . . . . . . . . . . . . . . — — 146 — — — — 146Issuance under stock plans, net of a tax detriment of $5
and other . . . . . . . . . . . . . . . . . . . . . . . . . . . . . . . . . . . 14 — 64 — — — — 64Common stock repurchases . . . . . . . . . . . . . . . . . . . . . . (36) — — — 36 (468) — (468)
Balance at October 30, 2011 . . . . . . . . . . . . . . . . . . . . . 1,306 $13 $5,616 $13,029 573 $(9,864) $ 6 $8,800
See accompanying Notes to Consolidated Financial Statements.
72

APPLIED MATERIALS, INC.
CONSOLIDATED STATEMENTS OF CASH FLOWS
Fiscal Year 2011 2010 2009
(In millions)
Cash flows from operating activities:Net income (loss) . . . . . . . . . . . . . . . . . . . . . . . . . . . . . . . . . . . . . . . . . . . . . . . . . . . . . . . . . . . . $ 1,926 $ 938 $ (305)Adjustments required to reconcile net income (loss) to cash provided by operating activities:
Depreciation and amortization . . . . . . . . . . . . . . . . . . . . . . . . . . . . . . . . . . . . . . . . . . . . . . . . 246 305 291Net loss (gain) on dispositions and fixed asset retirements . . . . . . . . . . . . . . . . . . . . . . . . . . (13) 20 24Provision for bad debts . . . . . . . . . . . . . . . . . . . . . . . . . . . . . . . . . . . . . . . . . . . . . . . . . . . . . 5 17 63Restructuring charges and asset impairments . . . . . . . . . . . . . . . . . . . . . . . . . . . . . . . . . . . . (30) 246 156Deferred income taxes . . . . . . . . . . . . . . . . . . . . . . . . . . . . . . . . . . . . . . . . . . . . . . . . . . . . . . 122 (186) 19Net recognized loss on investments . . . . . . . . . . . . . . . . . . . . . . . . . . . . . . . . . . . . . . . . . . . . 19 20 10Pre-tax loss of equity method investment . . . . . . . . . . . . . . . . . . . . . . . . . . . . . . . . . . . . . . . — — 35Impairments of investments . . . . . . . . . . . . . . . . . . . . . . . . . . . . . . . . . . . . . . . . . . . . . . . . . . — 13 84Share-based compensation . . . . . . . . . . . . . . . . . . . . . . . . . . . . . . . . . . . . . . . . . . . . . . . . . . . 146 126 147Changes in operating assets and liabilities, net of amounts acquired:
Accounts receivable . . . . . . . . . . . . . . . . . . . . . . . . . . . . . . . . . . . . . . . . . . . . . . . . . . . . . . 292 (767) 587Inventories . . . . . . . . . . . . . . . . . . . . . . . . . . . . . . . . . . . . . . . . . . . . . . . . . . . . . . . . . . . . . (163) 145 360Other current assets . . . . . . . . . . . . . . . . . . . . . . . . . . . . . . . . . . . . . . . . . . . . . . . . . . . . . . (23) 179 36Other assets . . . . . . . . . . . . . . . . . . . . . . . . . . . . . . . . . . . . . . . . . . . . . . . . . . . . . . . . . . . . (38) (7) (7)Accounts payable and accrued expenses . . . . . . . . . . . . . . . . . . . . . . . . . . . . . . . . . . . . . . (221) 469 (660)Customer deposits and deferred revenue . . . . . . . . . . . . . . . . . . . . . . . . . . . . . . . . . . . . . . 267 (23) (362)Income taxes payable . . . . . . . . . . . . . . . . . . . . . . . . . . . . . . . . . . . . . . . . . . . . . . . . . . . . . (89) 262 (229)Employee benefits and other liabilities . . . . . . . . . . . . . . . . . . . . . . . . . . . . . . . . . . . . . . . (20) (34) 84
Cash provided by operating activities . . . . . . . . . . . . . . . . . . . . . . . . . . . . . . . . . . . . . . . . . . . . 2,426 1,723 333
Cash flows from investing activities:Capital expenditures . . . . . . . . . . . . . . . . . . . . . . . . . . . . . . . . . . . . . . . . . . . . . . . . . . . . . . . . (209) (169) (249)Cash paid for acquisitions, net of cash acquired . . . . . . . . . . . . . . . . . . . . . . . . . . . . . . . . . . — (323) —Proceeds from sale of facilities and dispositions . . . . . . . . . . . . . . . . . . . . . . . . . . . . . . . . . . 130 — —Proceeds from sales and maturities of investments . . . . . . . . . . . . . . . . . . . . . . . . . . . . . . . . 1,926 1,408 1,317Purchases of investments . . . . . . . . . . . . . . . . . . . . . . . . . . . . . . . . . . . . . . . . . . . . . . . . . . . . (1,137) (1,778) (956)
Cash provided by (used in) investing activities . . . . . . . . . . . . . . . . . . . . . . . . . . . . . . . . . . . 710 (862) 112
Cash flows from financing activities:Debt borrowings (repayments), net . . . . . . . . . . . . . . . . . . . . . . . . . . . . . . . . . . . . . . . . . . . . 1,744 (6) (1)Payments of debt issuance costs . . . . . . . . . . . . . . . . . . . . . . . . . . . . . . . . . . . . . . . . . . . . . . (14) — —Proceeds from common stock issuances . . . . . . . . . . . . . . . . . . . . . . . . . . . . . . . . . . . . . . . . 95 129 62Common stock repurchases . . . . . . . . . . . . . . . . . . . . . . . . . . . . . . . . . . . . . . . . . . . . . . . . . . (468) (350) (23)Payments of dividends to stockholders . . . . . . . . . . . . . . . . . . . . . . . . . . . . . . . . . . . . . . . . . (397) (349) (319)
Cash provided by (used in) financing activities . . . . . . . . . . . . . . . . . . . . . . . . . . . . . . . . . . . . 960 (576) (281)
Effect of exchange rate changes on cash and cash equivalents . . . . . . . . . . . . . . . . . . . . . . . . . 6 (3) 1
Increase in cash and cash equivalents . . . . . . . . . . . . . . . . . . . . . . . . . . . . . . . . . . . . . . . . . . . . 4,102 282 165Cash and cash equivalents — beginning of year . . . . . . . . . . . . . . . . . . . . . . . . . . . . . . . . . . . . 1,858 1,576 1,411
Cash and cash equivalents — end of year . . . . . . . . . . . . . . . . . . . . . . . . . . . . . . . . . . . . . . . . . $ 5,960 $ 1,858 $1,576
Supplemental cash flow information:Cash payments for income taxes . . . . . . . . . . . . . . . . . . . . . . . . . . . . . . . . . . . . . . . . . . . . . . $ 761 $ 388 $ 207Cash refunds from income taxes . . . . . . . . . . . . . . . . . . . . . . . . . . . . . . . . . . . . . . . . . . . . . . $ 289 $ 201 $ 72Cash payments for interest . . . . . . . . . . . . . . . . . . . . . . . . . . . . . . . . . . . . . . . . . . . . . . . . . . . $ 14 $ 14 $ 14
See accompanying Notes to Consolidated Financial Statements.
73

APPLIED MATERIALS, INC.
NOTES TO CONSOLIDATED FINANCIAL STATEMENTS
Note 1 Summary of Significant Accounting Policies
Principles of Consolidation and Basis of Presentation
The consolidated financial statements include the accounts of Applied Materials, Inc. and its subsidiaries(Applied or the Company) after elimination of intercompany balances and transactions. All references to a fiscalyear apply to Applied’s fiscal year which ends on the last Sunday in October. Fiscal 2011 and 2009 contained 52weeks each, while fiscal 2010 contained 53 weeks. Each fiscal quarter of 2011 and 2009 contained 13 weeks.The first quarter of fiscal 2010 contained 14 weeks, while the second, third, and fourth quarters of fiscal 2010contained 13 weeks.
Use of Estimates
The preparation of financial statements in conformity with accounting principles generally accepted in theUnited States of America requires management to make judgments, estimates and assumptions that affect theamounts reported in the financial statements and accompanying notes. Actual results could differ materially fromthose estimates. On an ongoing basis, Applied evaluates its estimates, including those related to accounts receiv-able and sales allowances, fair values of financial instruments, inventories, intangible assets and goodwill, usefullives of intangible assets and property and equipment, fair values of share-based awards, and income taxes,among others. Applied bases its estimates on historical experience and on various other assumptions that arebelieved to be reasonable, the results of which form the basis for making judgments about the carrying values ofassets and liabilities.
Cash Equivalents
All highly-liquid investments with a remaining maturity of three months or less at the time of purchase areconsidered to be cash equivalents. Cash equivalents consist primarily of investments in institutional moneymarket funds.
Investments
All of Applied’s investments are classified as available-for-sale at the respective balance sheet dates. Invest-ments classified as available-for-sale are recorded at fair value based upon quoted market prices, and any tempo-rary difference between the cost and fair value of an investment is presented as a separate component ofaccumulated other comprehensive income (loss). The specific identification method is used to determine thegains and losses on investments.
Inventories
Inventories are stated at the lower of cost or market, with cost determined on a first-in, first-out (FIFO)basis. Applied adjusts inventory carrying value for estimated obsolescence equal to the difference between thecost of inventory and the estimated market value based upon assumptions about future demand and market con-ditions. Applied fully reserves for inventories and noncancelable purchase orders for inventory deemed obsolete.Applied performs periodic reviews of inventory items to identify excess inventories on hand by comparingon-hand balances to anticipated usage using recent historical activity as well as anticipated or forecasted demand.If estimates of customer demand diminish further or market conditions become less favorable than those pro-jected by Applied, additional inventory adjustments may be required. During fiscal 2010, Applied incurredinventory-related charges, including $330 million associated with SunFab™ thin film solar equipment.
74

APPLIED MATERIALS, INC.
NOTES TO CONSOLIDATED FINANCIAL STATEMENTS — (Continued)
Property, Plant and Equipment
Property, plant and equipment is stated at cost. Depreciation is provided over the estimated useful lives ofthe assets using the straight-line method. Estimated useful lives for financial reporting purposes are as follows:buildings and improvements, 3 to 30 years; demonstration and manufacturing equipment, 3 to 5 years; software,3 to 5 years; and furniture, fixtures and other equipment, 3 to 15 years. Land improvements are amortized overthe shorter of 15 years or the estimated useful life. Leasehold improvements are amortized over the shorter offive years or the lease term.
Intangible Assets
Goodwill and indefinite-lived assets are not amortized, but are reviewed for impairment annually during thefourth quarter of each fiscal year. Purchased technology and other intangible assets are presented at cost, net ofaccumulated amortization, and are amortized over their estimated useful lives of 1 to 15 years using the straight-line method.
Long-Lived Assets
Applied reviews long-lived assets for impairment whenever events or changes in circumstances indicate thatthe carrying amount of these assets may not be recoverable. Applied assesses these assets for impairment basedon estimated future cash flows from these assets.
Business Combinations
Effective in the first quarter of fiscal 2010, Applied adopted revised authoritative guidance on businesscombinations that covers the measurement of acquirer shares issued as consideration for a business combination,the recognition of contingent consideration, the accounting for pre-acquisition gain and loss contingencies, therecognition of capitalized in-process research and development, the accounting for acquisition-related restructur-ing cost accruals, the treatment of acquisition-related transaction costs, and the recognition of changes in theacquirer’s income tax valuation allowance. This authoritative guidance also revised the accounting for bothincreases and decreases in a parent’s controlling ownership interest.
Research, Development and Engineering Costs
Research, development and engineering costs are expensed as incurred.
Sales and Value Added Taxes
Taxes collected from customers and remitted to governmental authorities are presented on a net basis in theaccompanying Consolidated Statements of Operations.
Income Taxes
Income tax expense is based on pretax earnings. Deferred tax assets and liabilities are recognized for theexpected tax consequences of temporary differences between the book and tax bases of recorded assets andliabilities, net operating losses and tax credit carryforwards.
Revenue Recognition
Applied recognizes revenue when all four revenue recognition criteria have been met: persuasive evidenceof an arrangement exists; delivery has occurred or services have been rendered; seller’s price to buyer is fixed or
75

APPLIED MATERIALS, INC.
NOTES TO CONSOLIDATED FINANCIAL STATEMENTS — (Continued)
determinable; and collectability is probable. Applied’s shipping terms are customarily FOB Applied shippingpoint or equivalent terms. Applied’s revenue recognition policy generally results in revenue recognition at thefollowing points: (1) for all transactions where legal title passes to the customer upon shipment, Applied recog-nizes revenue upon shipment for all products that have been demonstrated to meet product specifications prior toshipment; the portion of revenue associated with certain installation-related tasks is deferred, and that revenue isrecognized upon completion of the installation-related tasks; (2) for products that have not been demonstrated tomeet product specifications prior to shipment, revenue is recognized at customer technical acceptance; (3) fortransactions where legal title does not pass at shipment, revenue is recognized when legal title passes to the cus-tomer, which is generally at customer technical acceptance; (4) for arrangements containing multiple elementsand initiated at or prior to October 25, 2009, the last day of fiscal 2009, the revenue relating to the undeliveredelements is deferred at their estimated relative fair values until delivery of the deferred elements; and (5) forarrangements initiated or materially modified subsequent to October 25, 2009 containing multiple elements, therevenue relating to the undelivered elements is deferred using the relative selling price method utilizing estimatedsales prices until delivery of the deferred elements. Applied limits the amount of revenue recognition for deliv-ered elements to the amount that is not contingent on the future delivery of products or services, future perform-ance obligations or subject to customer-specified return or adjustment. In cases where Applied has sold productsthat have been demonstrated to meet product specifications prior to shipment, Applied believes that at the time ofdelivery, it has an enforceable claim to amounts recognized as revenue. The completed contract method is usedfor SunFab™ thin film production lines. Spare parts revenue is generally recognized upon shipment, and servicesrevenue is generally recognized over the period that the services are provided.
Applied elected to early adopt amended accounting standards issued by the Financial Accounting StandardsBoard (FASB) for multiple deliverable revenue arrangements on a prospective basis for applicable transactionsoriginating or materially modified after October 25, 2009. The standard changed the requirements for establish-ing separate units of accounting in a multiple element arrangement and requires the allocation of arrangementconsideration to each deliverable to be based on the relative selling price. The FASB also amended the account-ing standards for revenue recognition to exclude software that is contained in a tangible product from the scopeof software revenue guidance when the software is essential to the tangible product’s functionality.Implementation of this new authoritative guidance had an insignificant impact on reported net sales compared tonet sales under previous guidance, as the new guidance did not change the units of accounting within salesarrangements and the elimination of the residual method for the allocation of arrangement consideration had aninconsequential impact on the amount and timing of reported net sales.
For fiscal 2010 and subsequent periods, when a sales arrangement contains multiple elements, such ashardware and services and/or software products, Applied allocates revenue to each element based on a sellingprice hierarchy. The selling price for a deliverable is based on its vendor specific objective evidence (VSOE) ifavailable, third party evidence (TPE) if VSOE is not available, or estimated selling price (ESP) if neither VSOEnor TPE is available. Applied generally utilizes the ESP due to the nature of its products. In multiple elementarrangements where more-than-incidental software deliverables are included, revenue is allocated to each sepa-rate unit of accounting for each of the non-software deliverables and to the software deliverables as a group usingthe relative selling prices of each of the deliverables in the arrangement based on the aforementioned sellingprice hierarchy. If the arrangement contains more than one software deliverable, the arrangement considerationallocated to the software deliverables as a group is then allocated to each software deliverable using the guidancefor recognizing software revenue, as amended.
Derivative Financial Instruments
Applied uses financial instruments, such as forward exchange and currency option contracts, to hedge aportion of, but not all, existing and anticipated foreign currency denominated transactions typically expected tooccur within 24 months. The terms of currency instruments used for hedging purposes are generally consistent
76

APPLIED MATERIALS, INC.
NOTES TO CONSOLIDATED FINANCIAL STATEMENTS — (Continued)
with the timing of the transactions being hedged. The purpose of Applied’s foreign currency management is tomitigate the effect of exchange rate fluctuations on certain foreign currency denominated revenues, costs andeventual cash flows. All of Applied’s derivative financial instruments are recorded at fair value based uponquoted market prices for comparable instruments. For derivative instruments designated and qualifying as cashflow hedges of anticipated foreign currency denominated transactions, the effective portion of the gain or loss onthese hedges is reported as a component of accumulated other comprehensive income (loss) in stockholders’equity, and is reclassified into earnings when the hedged transaction affects earnings. If the transaction beinghedged fails to occur, or if a portion of any derivative is ineffective, the gain or loss on the associated financialinstrument is recorded promptly in earnings. For derivative instruments used to hedge existing foreign currencydenominated assets or liabilities, the gain or loss on these hedges is recorded promptly in earnings to offset thechanges in the fair value of the assets or liabilities being hedged. Applied does not use derivative financialinstruments for trading or speculative purposes.
Foreign Currency Translation
As of October 30, 2011, primarily all of Applied’s subsidiaries use the United States dollar as their func-tional currency. Accordingly, assets and liabilities of these subsidiaries are translated using exchange rates ineffect at the end of the period, except for non-monetary assets, such as inventories and property, plant andequipment, which are translated using historical exchange rates. Revenues and costs are translated using averageexchange rates for the period, except for costs related to those balance sheet items that are translated using histor-ical exchange rates. The resulting translation gains and losses are included in the Consolidated Statements ofOperations as incurred.
Concentrations of Credit Risk
Financial instruments that potentially subject Applied to significant concentrations of credit risk consistprincipally of cash equivalents, investments, trade accounts receivable and derivative financial instruments usedin hedging activities. Applied invests in a variety of financial instruments, such as, but not limited to, certificatesof deposit, corporate and municipal bonds, United States Treasury and agency securities, and asset-backed andmortgage-backed securities, and, by policy, limits the amount of credit exposure with any one financialinstitution or commercial issuer. Applied performs ongoing credit evaluations of its customers’ financial con-dition and generally requires no collateral to secure accounts receivable. Applied maintains an allowance reservefor potentially uncollectible accounts receivable based on its assessment of the collectability of accounts receiv-able. Applied regularly reviews the allowance by considering factors such as historical experience, credit quality,age of the accounts receivable balances, and current economic conditions that may affect a customer’s ability topay. In addition, Applied utilizes letters of credit to mitigate credit risk when considered appropriate. Applied isexposed to credit-related losses in the event of nonperformance by counterparties to derivative financial instru-ments, but does not expect any counterparties to fail to meet their obligations.
Recent Accounting Pronouncements
In September 2011, the FASB issued authoritative guidance to allow entities to use a qualitative approach totest goodwill for impairment. This authoritative guidance permits an entity to first perform a qualitative assess-ment to determine whether it is more likely than not that the fair value of a reporting unit is less than its carryingvalue. If it is concluded that this is the case, it is necessary to perform the two-step goodwill impairment test.Otherwise, the two-step goodwill impairment test is not required. This guidance is effective for annual andinterim goodwill impairment tests performed for fiscal years beginning after December 15, 2011 and earlieradoption is permitted. Applied elected to adopt this authoritative guidance in fiscal 2011. The implementation ofthis authoritative guidance had no impact on Applied’s financial position or results of operations.
77

APPLIED MATERIALS, INC.
NOTES TO CONSOLIDATED FINANCIAL STATEMENTS — (Continued)
In June 2011, the FASB issued authoritative guidance on the presentation of comprehensive income torequire an entity to present the total of comprehensive income, the components of net income, and the compo-nents of other comprehensive income either in a single continuous statement of comprehensive income or in twoseparate but consecutive statements. This authoritative guidance eliminates the option to present the componentsof other comprehensive income as part of the statement of equity. This guidance is effective for Applied in thefirst quarter of fiscal 2012, with early adoption permitted, and should be applied retrospectively. Theimplementation of this authoritative guidance will change only the presentation of comprehensive income andwill have no impact on Applied’s financial position or results of operations.
In May 2011, the FASB issued authoritative guidance to provide a consistent definition of fair value andensure that the fair value measurement and disclosure requirements are similar between U.S. GAAP and Interna-tional Financial Reporting Standards. This authoritative guidance limits the highest-and-best-use measure tononfinancial assets, permits certain financial assets and liabilities with offsetting positions in market or counter-party credit risks to be measured on a net basis, and provides guidance on the applicability of premiums anddiscounts. This authoritative guidance also expands the disclosures on Level 3 inputs by requiring quantitativedisclosure of the unobservable inputs and assumptions, as well as description of the valuation processes and thesensitivity of the fair value to changes in unobservable inputs. The new guidance will be effective for Applied inthe first quarter of fiscal 2012. The implementation of this authoritative guidance is not expected to have amaterial impact on Applied’s financial position or results of operations.
In December 2010, the FASB amended its existing guidance for goodwill and other intangible assets. Thisauthoritative guidance modifies Step 1 of the goodwill impairment test for reporting units with zero or negativecarrying amounts. For those reporting units, an entity is required to perform Step 2 of the goodwill impairmenttest if there are qualitative factors indicating that it is more likely than not that a goodwill impairment exists. Thequalitative factors are consistent with the existing guidance which requires goodwill of a reporting unit to betested for impairment between annual tests if an event occurs or circumstances change that would more likelythan not reduce the fair value of a reporting unit below its carrying amount. This authoritative guidance becomeseffective for Applied in the first quarter fiscal 2012. The implementation of this authoritative guidance is notexpected to have a material impact on Applied’s financial position or results of operations.
In December 2010, the FASB issued authoritative guidance on business combinations. This authoritativeguidance requires a public entity that presents comparative financial statements to disclose the revenue and earn-ings of the combined entity as though the business combinations that occurred during the current year hadoccurred as of the beginning of the prior annual reporting period. In addition, this authoritative guidance expandsthe supplemental pro forma disclosures to include a description of the nature and amount of material, non-recurring pro forma adjustments directly attributable to the business combination included in the reported proforma revenue and earnings. This authoritative guidance is effective prospectively for business combinations forwhich the acquisition date is on or after the beginning of the first annual reporting period beginning on or afterDecember 15, 2010. This authoritative guidance becomes effective for Applied in the first quarter of fiscal 2012.
Note 2 Earnings (Loss) Per Share
Basic earnings (loss) per share is determined using the weighted average number of common shares out-standing during the period. Diluted earnings (loss) per share is determined using the weighted average number ofcommon shares and potential common shares (representing the dilutive effect of stock options, restricted stockunits, and employee stock purchase plans shares) outstanding during the period. Applied’s net income (loss) hasnot been adjusted for any period presented for purposes of computing basic or diluted earnings (loss) per sharedue to the Company’s non-complex capital structure. For purposes of computing diluted earnings (loss) pershare, weighted average potential common shares do not include stock options with an exercise price greater thanthe average fair market value of Applied common stock for the period as the effect would be anti-dilutive.
78

APPLIED MATERIALS, INC.
NOTES TO CONSOLIDATED FINANCIAL STATEMENTS — (Continued)
Potential common shares have not been included in the calculation of diluted net loss per share for the fiscal yearended October 25, 2009 as the effect would be anti-dilutive. As such, the numerator and the denominator used incomputing both basic and diluted net loss per share for the fiscal year ended October 25, 2009 are the same.
2011 2010 2009
(In millions, except per share amounts)
Numerator:Net income (loss) . . . . . . . . . . . . . . . . . . . . . . . . . . . . . . . . . . . . . $1,926 $ 938 $ (305)
Denominator:Weighted average common shares outstanding . . . . . . . . . . . . . . 1,319 1,340 1,333Effect of dilutive stock options, restricted stock units and
employee stock purchase plans shares . . . . . . . . . . . . . . . . . . . 11 9 —
Denominator for diluted earnings (loss) per share . . . . . . . . . . . . 1,330 1,349 1,333
Basic earnings (loss) per share . . . . . . . . . . . . . . . . . . . . . . . . . . . . . $ 1.46 $ 0.70 $ (0.23)Diluted earnings (loss) per share . . . . . . . . . . . . . . . . . . . . . . . . . . . $ 1.45 $ 0.70 $ (0.23)
Potentially dilutive securities . . . . . . . . . . . . . . . . . . . . . . . . . . . . . . 16 34 85
Note 3 Cash, Cash Equivalents and Investments
Summary of Cash, Cash Equivalents and Investments
The following tables summarize Applied’s cash, cash equivalents and investments by security type:
October 30, 2011 Cost
GrossUnrealized
Gains
GrossUnrealized
LossesEstimatedFair Value
(In millions)
Cash . . . . . . . . . . . . . . . . . . . . . . . . . . . . . . . . . . . . . . . . . . . . . $ 297 $— $— $ 297
Cash equivalents:Money market funds . . . . . . . . . . . . . . . . . . . . . . . . . . . . . . 5,663 — — 5,663
Total Cash equivalents . . . . . . . . . . . . . . . . . . . . . . . . . . . . . . 5,663 — — 5,663
Total Cash and Cash equivalents . . . . . . . . . . . . . . . . . . . . . . $5,960 $— $— $5,960
Short-term and long-term investments:U.S. Treasury and agency securities . . . . . . . . . . . . . . . . . . $ 184 $ 1 $— $ 185Obligations of states and political subdivisions . . . . . . . . . 371 2 — 373U.S. commercial paper, corporate bonds and medium-
term notes . . . . . . . . . . . . . . . . . . . . . . . . . . . . . . . . . . . . 256 3 1 258Other debt securities* . . . . . . . . . . . . . . . . . . . . . . . . . . . . . 307 3 1 309
Total fixed income securities . . . . . . . . . . . . . . . . . . . . . . . . . 1,118 9 2 1,125Publicly traded equity securities . . . . . . . . . . . . . . . . . . . . . 8 19 — 27Equity investments in privately-held companies . . . . . . . . 62 — — 62
Total short-term and long-term investments . . . . . . . . . . . . . . $1,188 $28 $ 2 $1,214
Total Cash, Cash equivalents and Investments . . . . . . . . . . . . $7,148 $28 $ 2 $7,174
79

APPLIED MATERIALS, INC.
NOTES TO CONSOLIDATED FINANCIAL STATEMENTS — (Continued)
October 31, 2010 Cost
GrossUnrealized
Gains
GrossUnrealized
LossesEstimatedFair Value
(In millions)
Cash . . . . . . . . . . . . . . . . . . . . . . . . . . . . . . . . . . . . . . . . . . . . . $ 701 $— $— $ 701
Cash equivalents:Money market funds . . . . . . . . . . . . . . . . . . . . . . . . . . . . . . 1,139 — — 1,139Obligations of states and political subdivisions . . . . . . . . . 18 — — 18
Total Cash equivalents . . . . . . . . . . . . . . . . . . . . . . . . . . . . . . 1,157 — — 1,157
Total Cash and Cash equivalents . . . . . . . . . . . . . . . . . . . . . . $1,858 $— $— $1,858
Short-term and long-term investments:U.S. Treasury and agency securities . . . . . . . . . . . . . . . . . . $ 665 $ 8 $— $ 673Obligations of states and political subdivisions . . . . . . . . . 500 5 — 505U.S. commercial paper, corporate bonds and medium-
term notes . . . . . . . . . . . . . . . . . . . . . . . . . . . . . . . . . . . . 502 7 — 509Other debt securities* . . . . . . . . . . . . . . . . . . . . . . . . . . . . . 261 3 1 263
Total fixed income securities . . . . . . . . . . . . . . . . . . . . . . . . . 1,928 23 1 1,950Publicly traded equity securities . . . . . . . . . . . . . . . . . . . . . 9 16 — 25Equity investments in privately-held companies . . . . . . . . 59 — — 59
Total short-term and long-term investments . . . . . . . . . . . . . . $1,996 $39 $ 1 $2,034
Total Cash, Cash equivalents and Investments . . . . . . . . . . . . $3,854 $39 $ 1 $3,892
* Other debt securities consist primarily of investment grade asset-backed and mortgage-backed securities.
Maturities of Investments
The following table summarizes the contractual maturities of Applied’s investments at October 30, 2011:
CostEstimatedFair Value
(In millions)
Due in one year or less . . . . . . . . . . . . . . . . . . . . . . . . . . . . . . . . . . . . . . . . . . . . . $ 253 $ 254Due after one through five years . . . . . . . . . . . . . . . . . . . . . . . . . . . . . . . . . . . . . . 556 559Due after five years . . . . . . . . . . . . . . . . . . . . . . . . . . . . . . . . . . . . . . . . . . . . . . . . 3 3No single maturity date . . . . . . . . . . . . . . . . . . . . . . . . . . . . . . . . . . . . . . . . . . . . . 376 398
$1,188 $1,214
Securities with no single maturity date include publicly-traded and privately-held equity securities, andasset-backed and mortgage-backed securities.
80

APPLIED MATERIALS, INC.
NOTES TO CONSOLIDATED FINANCIAL STATEMENTS — (Continued)
Gains and Losses on Investments
Gross realized gains and losses on sales of investments during fiscal 2011, 2010, and 2009 were as follows:
2011 2010 2009
(In millions)
Gross realized gains . . . . . . . . . . . . . . . . . . . . . . . . . . . . . . . . . . . . . . . . . . . . . . . . $20 $6 $ 9Gross realized losses . . . . . . . . . . . . . . . . . . . . . . . . . . . . . . . . . . . . . . . . . . . . . . . $ 4 $2 $10
At October 30, 2011, Applied had a gross unrealized loss of $2 million related to its investment portfoliodue to a decrease in the fair value of certain fixed income securities. Applied regularly reviews its investmentportfolio to identify and evaluate investments that have indications of possible impairment. Factors considered indetermining whether an unrealized loss was considered to be temporary, or other-than-temporary and thereforeimpaired, include: the length of time and extent to which fair value has been lower than the cost basis; the finan-cial condition, credit quality and near-term prospects of the investee; and whether it is more likely than not thatApplied will be required to sell the security prior to recovery. Generally, the contractual terms of investments inmarketable securities do not permit settlement at prices less than the amortized cost of the investments. Applieddetermined that the gross unrealized losses on its marketable securities at October 30, 2011 and October 31, 2010were temporary in nature and therefore it did not recognize any impairment of its marketable securities for fiscal2011 or fiscal 2010. During fiscal 2009, Applied determined that the gross unrealized losses on its marketablesecurities at October 25, 2009 were other than temporary in nature and therefore recognized $2 million inimpairment charges associated with its marketable securities.
The following table provides the fair market value of Applied’s investments with unrealized losses that arenot deemed to be other-than-temporarily impaired as of October 30, 2011.
In Loss Position forLess Than 12 Months Total
Fair Value
GrossUnrealized
Losses Fair Value
GrossUnrealized
Losses
(In millions)
U.S. commercial paper, corporate bonds and medium-termnotes . . . . . . . . . . . . . . . . . . . . . . . . . . . . . . . . . . . . . . . . . . . . . . . $ 38 $1 $ 38 $1
Other debt securities . . . . . . . . . . . . . . . . . . . . . . . . . . . . . . . . . . . . . 77 1 77 1
Total . . . . . . . . . . . . . . . . . . . . . . . . . . . . . . . . . . . . . . . . . . . . . . . . . $115 $2 $115 $2
The following table provides the fair market value of Applied’s investments with unrealized losses that arenot deemed to be other-than-temporarily impaired as of October 31, 2010.
In Loss Position forLess Than 12 Months Total
Fair Value
GrossUnrealized
Losses Fair Value
GrossUnrealized
Losses
(In millions)
Other debt securities . . . . . . . . . . . . . . . . . . . . . . . . . . . . . . . . . . . . . $56 $1 $56 $1
Unrealized gains and temporary losses on investments classified as available-for-sale are included withinaccumulated other comprehensive income, net of any related tax effect. Upon realization, those amounts arereclassified from accumulated other comprehensive income to results of operations.
81

APPLIED MATERIALS, INC.
NOTES TO CONSOLIDATED FINANCIAL STATEMENTS — (Continued)
Note 4 Fair Value Measurements
Applied’s financial assets are measured and recorded at fair value, except for equity investments held inprivately-held companies. These equity investments are generally accounted for under the cost method ofaccounting and are periodically assessed for other-than-temporary impairment when events or circumstancesindicate that an other-than-temporary decline in value may have occurred. Applied’s nonfinancial assets, such asgoodwill, intangible assets, and property, plant and equipment, are recorded at cost and are assessed for impair-ment when events or circumstances indicate that an other-than-temporary decline in value may have occurred.
Fair Value Hierarchy
Applied uses the following fair value hierarchy, which prioritizes the inputs to valuation techniques used tomeasure fair value into three levels and bases the categorization within the hierarchy upon the lowest level ofinput that is available and significant to the fair value measurement:
• Level 1 — Quoted prices in active markets for identical assets or liabilities;
• Level 2 — Observable inputs other than Level 1 that are observable, either directly or indirectly, such asquoted prices for similar assets or liabilities, quoted prices in markets that are not active, or other inputsthat are observable or can be corroborated by observable market data for substantially the full term of theassets or liabilities; and
• Level 3 — Unobservable inputs that are supported by little or no market activity and that are significant tothe fair value of the assets or liabilities.
Applied’s investments are comprised primarily of debt securities that are classified as available-for-sale andrecorded at their fair values. In determining the fair value of investments, Applied uses pricing information frompricing services that value securities based on quoted market prices and models that utilize observable marketinputs. In the event a fair value estimate is unavailable from a pricing service, Applied generally obtainsnon-binding price quotes from brokers. Applied then reviews the information provided by the pricing services orbrokers to determine the fair value of its short-term and long-term investments. In addition, to validate pricinginformation obtained from pricing services, Applied periodically performs supplemental analysis on a sample ofsecurities. Applied reviews any significant unanticipated differences identified through this analysis to determinethe appropriate fair value.
Investments with remaining effective maturities of 12 months or less from the balance sheet date are classi-fied as short-term investments. Investments with remaining effective maturities of more than 12 months from thebalance sheet date are classified as long-term investments. As of October 30, 2011, substantially all of Applied’savailable-for-sale, short-term and long-term investments were recognized at fair value that was determined basedupon observable inputs.
82

APPLIED MATERIALS, INC.
NOTES TO CONSOLIDATED FINANCIAL STATEMENTS — (Continued)
Assets and Liabilities Measured at Fair Value on a Recurring Basis
Financial assets and liabilities (excluding cash balances) measured at fair value on a recurring basis aresummarized below as of October 30, 2011 and October 31, 2010:
October 30, 2011 October 31, 2010
Level 1 Level 2 Level 3 Total Level 1 Level 2 Level 3 Total
(In millions) (In millions)
Assets:Money market funds . . . . . . . . . . . . . . . $5,663 $ — $— $5,663 $1,139 $ — $— $1,139U.S. Treasury and agency securities . . . 109 76 — 185 153 520 — 673U.S. commercial paper, corporate bonds
and medium-term notes . . . . . . . . . . . — 258 — 258 — 509 — 509Obligations of states and political
subdivisions . . . . . . . . . . . . . . . . . . . . — 373 — 373 — 523 — 523Other debt securities . . . . . . . . . . . . . . . — 309 — 309 — 263 — 263Publicly traded equity securities . . . . . . 27 — — 27 25 — — 25Foreign exchange derivative assets . . . . — 1 — 1 — 6 — 6
Total . . . . . . . . . . . . . . . . . . . . . . . . . . . . $5,799 $1,017 $— $6,816 $1,317 $1,821 $— $3,138
Liabilities:Foreign exchange derivative
liabilities . . . . . . . . . . . . . . . . . . . . . . $ — $ (1) $— $ (1) $ — $ (1) $— $ (1)
Total . . . . . . . . . . . . . . . . . . . . . . . . . . . . $ — $ (1) $— $ (1) $ — $ (1) $— $ (1)
There were no significant transfers in and out of Level 1 and Level 2 fair value measurements and Applieddid not have any financial assets measured at fair value on a recurring basis within Level 3 fair value measure-ments during either the fiscal years ended October 30, 2011 or October 31, 2010.
Assets and Liabilities Measured at Fair Value on a Non-recurring Basis
Equity investments in privately-held companies are generally accounted for under the cost method ofaccounting and are periodically assessed for other-than-temporary impairment when an event or circumstanceindicates that an other-than-temporary decline in value may have occurred. If Applied determines that an other-than-temporary impairment has occurred, the investment will be written down to its estimated fair value based onavailable information, such as pricing in recent rounds of financing, current cash positions, earnings and cashflow forecasts, recent operational performance and any other readily available market data. Equity investments inprivately-held companies totaled $62 million at October 30, 2011, of which $40 million of investments wereaccounted for under the cost method of accounting and $22 million of investments had been measured at fairvalue on a non-recurring basis due to an other-than-temporary decline in value. Equity investments in privately-held companies totaled $59 million at October 31, 2010, of which $40 million of investments were accounted forunder the cost method of accounting and $19 million of investments had been measured at fair value on anon-recurring basis due to an other-than-temporary decline in value.
During fiscal 2011, Applied determined that certain of its equity investments in privately-held companieswere other-than-temporarily impaired and, accordingly, recognized impairment charges in the amount of $3 mil-lion. During fiscal 2010, Applied determined that certain of its equity investments in privately-held companieswere other-than-temporarily impaired and, accordingly, recognized impairment charges in the amount of $13million. Impairment charges associated with financial assets for fiscal 2009 totaled $84 million, consisting of the
83

APPLIED MATERIALS, INC.
NOTES TO CONSOLIDATED FINANCIAL STATEMENTS — (Continued)
following: equity method investment, $45 million; publicly-traded equity securities, $20 million; equity invest-ments in privately-held companies, $17 million; and marketable securities, $2 million.
The following tables present the balances of equity securities at October 30, 2011 and October 31, 2010 thathad been measured at fair value on a non-recurring basis, using the process described above, and the impairmentcharges recorded during the fiscal year then ended:
Level 1 Level 2 Level 3
Impairment ofEquity Investmentsin Privately-Held
Companies
(In millions)
Equity investments in privately-held companiesmeasured at fair value on a non-recurring basisduring fiscal 2011 . . . . . . . . . . . . . . . . . . . . . . . . . . $— $— $22 $3
Level 1 Level 2 Level 3
Impairment ofEquity Investmentsin Privately-Held
Companies
(In millions)
Equity investments in privately-held companiesmeasured at fair value on a non-recurring basisduring fiscal 2010 . . . . . . . . . . . . . . . . . . . . . . . . . . $— $— $19 $13
Other
The carrying amounts of Applied’s financial instruments, including cash and cash equivalents, accountsreceivable, notes payable, and accounts payable and accrued expenses, approximate fair value due to the shortmaturities of these financial instruments. At October 30, 2011, the carrying amount of long-term debt was $1.9billion and the estimated fair value was $2.2 billion. At October 31, 2010, the carrying amount of long-term debtwas $206 million and the estimated fair value was $238 million. The estimated fair value of long-term debt isdetermined by Level 2 inputs and is based primarily on quoted market prices for the same or similar issues.
Note 5 Derivative Instruments and Hedging Activities
Derivative Financial Instruments
Applied conducts business in a number of foreign countries, with certain transactions denominated in localcurrencies, such as Japanese yen, euro, Israeli shekel, Taiwanese dollar and Swiss franc. Applied uses derivativefinancial instruments, such as forward exchange contracts and currency option contracts, to hedge certain fore-casted foreign currency denominated transactions expected to occur typically within the next 24 months. Thepurpose of Applied’s foreign currency management is to mitigate the effect of exchange rate fluctuations on cer-tain foreign currency denominated revenues, costs and eventual cash flows. The terms of currency instrumentsused for hedging purposes are generally consistent with the timing of the transactions being hedged. Applieddoes not use derivative financial instruments for trading or speculative purposes.
Derivative instruments and hedging activities, including foreign currency exchange contracts, are recog-nized on the balance sheet at fair value. Changes in the fair value of derivatives that do not qualify for hedgetreatment, as well as the ineffective portion of any hedges, are recognized currently in earnings. All of Applied’sderivative financial instruments are recorded at their fair value in other current assets or in accounts payable andaccrued expenses.
84

APPLIED MATERIALS, INC.
NOTES TO CONSOLIDATED FINANCIAL STATEMENTS — (Continued)
Hedges related to anticipated transactions are designated and documented at the inception of the hedge ascash flow hedges and are typically entered into once per month. Cash flow hedges are evaluated for effectivenessquarterly. The effective portion of the gain or loss on these hedges is reported as a component of accumulatedother comprehensive income or loss (AOCI) in stockholders’ equity and is reclassified into earnings when thehedged transaction affects earnings. The majority of the after-tax net income or loss related to derivative instru-ments included in AOCI at October 30, 2011 is expected to be reclassified into earnings within 12 months.Changes in the fair value of currency forward exchange and option contracts due to changes in time value areexcluded from the assessment of effectiveness. Both ineffective hedge amounts and hedge components excludedfrom the assessment of effectiveness are recognized in earnings. If the transaction being hedged is no longerprobable to occur, or if a portion of any derivative is deemed to be ineffective, Applied promptly recognizes thegain or loss on the associated financial instrument in general and administrative expenses. The amount recog-nized due to discontinuance of cash flow hedges that were probable not to occur by the end of the originallyspecified time period was not significant for fiscal 2011 or 2010. The amount recognized due to discontinuanceof cash flow hedges that were probable not to occur by the end of the originally specified time period was $25million for fiscal 2009.
Additionally, forward exchange contracts are generally used to hedge certain foreign currency denominatedassets or liabilities. These derivatives are typically entered into once per month and are not designated for hedgeaccounting treatment. Accordingly, changes in the fair value of these hedges are recorded in earnings to offset thechanges in the fair value of the assets or liabilities being hedged.
Fair values of derivative instruments were as follows:
Asset Derivatives Liability Derivatives
Balance SheetLocation
October 30,2011
October 31,2010
Balance SheetLocation
October 30,2011
October 31,2010
(In millions) (In millions)Derivatives Designated as Hedging Instruments
Foreign exchange contracts . . . . . . . . . . . .Other current
assets $ 1 $5Accruedexpenses $ 1 $ 1
Derivatives Not Designated as Hedging Instruments
Foreign exchange contracts . . . . . . . . . . . .Other current
assets $— $1Accruedexpenses $— $—
Total derivatives . . . . . . . . . . . . . . . . . . . . . $ 1 $6 $ 1 $ 1
85

APPLIED MATERIALS, INC.
NOTES TO CONSOLIDATED FINANCIAL STATEMENTS — (Continued)
The effect of derivative instruments on the Consolidated Statement of Operations for fiscal years endedOctober 30, 2011 and October 31, 2010 were as follows:
2011 2010
Effective Portion
Ineffective Portionand Amount
Excluded fromEffectiveness
Testing Effective Portion
IneffectivePortion and
AmountExcluded
fromEffectiveness
Testing
Location of Gainor (Loss)
Reclassifiedfrom AOCI into
Income orRecognized in
Income
Gain or(Loss)
Recognizedin AOCI
Gain or(Loss)
Reclassifiedfrom AOCI
intoIncome
Gain or(Loss)
Recognized inIncome
Gain or(Loss)
Recognizedin AOCI
Gain or(Loss)
Reclassifiedfrom AOCI
intoIncome
Gain or(Loss)
Recognizedin Income
(In millions) (In millions)Derivatives in Cash FlowHedging Relationships
Foreign exchange contracts . . . Cost of productssold $ (4) $ (1) $ (6) $ 1 $(4) $ (2)
Foreign exchange contracts . . . General andadministrative — 4 (1) — (1) (2)
Foreign exchange contracts . . .
Research,development and
engineering — — — — (1) —
Total . . . . . . . . . . . . . . . . . . . . . $ (4) $ 3 $ (7) $ 1 $(6) $ (4)
2011 2010
Location ofGain or(Loss)
Recognized inIncome
Amount ofGain or(Loss)
Recognizedin Income
(In millions)Derivatives Not Designated as Hedging Instruments
Foreign exchange contracts . . . . . . . . . . . . . . . . . . . . . . . . . . . . . . . . . . . . . . . .General and
administrative $(4) $(20)
Total . . . . . . . . . . . . . . . . . . . . . . . . . . . . . . . . . . . . . . . . . . . . . . . . . . . . . . . . . . $(4) $(20)
Derivative-related activity in accumulated other comprehensive loss, net of taxes, was as follows:
2011 2010
(In millions)
Unrealized gain on derivative instruments at beginning of year . . . . . . . . . . . . . . . . . . . . $ 4 $—Increase (decrease) in fair value of derivative instruments . . . . . . . . . . . . . . . . . . . . . . . . (2) 2Gain (loss) reclassified into earnings, net . . . . . . . . . . . . . . . . . . . . . . . . . . . . . . . . . . . . . (2) 2
Unrealized gain, net, on derivative instruments at end of year . . . . . . . . . . . . . . . . . . . . . $— $ 4
86

APPLIED MATERIALS, INC.
NOTES TO CONSOLIDATED FINANCIAL STATEMENTS — (Continued)
Credit Risk Contingent Features
If Applied’s credit rating were to fall below investment grade, it would be in violation of credit risk con-tingent provisions of the derivative instruments discussed above, and certain counterparties to the derivativeinstruments could request immediate payment on derivative instruments in net liability positions. The aggregatefair value of all derivative instruments with credit-risk related contingent features that were in a net liability posi-tion was immaterial as of October 30, 2011.
Entering into foreign exchange contracts with banks exposes Applied to credit-related losses in the event ofthe banks’ nonperformance. However, Applied’s exposure is not considered significant.
Note 6 Accounts Receivable, Net
Applied has agreements with various financial institutions to sell accounts receivable and discount promis-sory notes from selected customers. Applied also discounts letters of credit through various financial institutions.Applied sells its accounts receivable without recourse. Details of discounted letters of credit, factored accountsreceivable and discounted promissory notes for fiscal years ended October 30, 2011, October 31, 2010 andOctober 25, 2009 were as follows:
2011 2010 2009
(In millions)
Discounted letters of credit . . . . . . . . . . . . . . . . . . . . . . . . . . . . . . . . . . . . . . . . $211 $230 $299Factored accounts receivable and discounted promissory notes . . . . . . . . . . . . 80 157 43
Total . . . . . . . . . . . . . . . . . . . . . . . . . . . . . . . . . . . . . . . . . . . . . . . . . . . . . . . . . $291 $387 $342
Financing charges on the sale of receivables and discounting of letters of credit are included in interestexpense in the accompanying Consolidated Statements of Operations and were not material for all years pre-sented.
Accounts receivable are presented net of allowance for doubtful accounts of $73 million at October 30, 2011and $74 million at October 31, 2010. Applied sells principally to manufacturers within the semiconductor, dis-play and solar industries. While Applied believes that its allowance for doubtful accounts is adequate and repre-sents Applied’s best estimate as of October 30, 2011, Applied will continue to closely monitor customer liquidityand other economic conditions, which may result in changes to Applied’s estimates regarding collectability.
Note 7 Balance Sheet Detail
October 30,2011
October 31,2010
(In millions)
InventoriesCustomer service spares . . . . . . . . . . . . . . . . . . . . . . . . . . . . . . . . . . . . . . . . . $ 328 $ 324Raw materials . . . . . . . . . . . . . . . . . . . . . . . . . . . . . . . . . . . . . . . . . . . . . . . . . 407 260Work-in-process . . . . . . . . . . . . . . . . . . . . . . . . . . . . . . . . . . . . . . . . . . . . . . . 336 500Finished goods . . . . . . . . . . . . . . . . . . . . . . . . . . . . . . . . . . . . . . . . . . . . . . . . . 630 463
$1,701 $1,547
87

APPLIED MATERIALS, INC.
NOTES TO CONSOLIDATED FINANCIAL STATEMENTS — (Continued)
Included in finished goods inventory is $224 million at October 30, 2011, and $148 million at October 31,2010, of newly-introduced systems at customer locations where the sales transaction did not meet Applied’srevenue recognition criteria as set forth in Note 1. Finished goods inventory includes $140 million and $117 mil-lion of evaluation inventory at October 30, 2011 and October 31, 2010, respectively.
Useful LifeOctober 30,
2011October 31,
2010
(In years) (In millions)
Property, Plant and Equipment, NetLand and improvements . . . . . . . . . . . . . . . . . . . . . . . . . . . . . . . . . . $ 163 $ 227Buildings and improvements . . . . . . . . . . . . . . . . . . . . . . . . . . . . . . 3-30 1,155 1,234Demonstration and manufacturing equipment . . . . . . . . . . . . . . . . . 3-5 686 670Furniture, fixtures and other equipment . . . . . . . . . . . . . . . . . . . . . . 3-15 722 719Construction in progress . . . . . . . . . . . . . . . . . . . . . . . . . . . . . . . . . . 12 19
Gross property, plant and equipment . . . . . . . . . . . . . . . . . . . . . . . . 2,738 2,869Accumulated depreciation . . . . . . . . . . . . . . . . . . . . . . . . . . . . . . . . (1,872) (1,906)
$ 866 $ 963
In fiscal 2011, Applied received $99 million in proceeds from the sale of two properties located in NorthAmerica and recognized a net gain of $27 million on the transactions. Applied also completed the divestiture ofcertain assets held for sale for proceeds of $31 million.
October 30,2011
October 31,2010
(In millions)
Accounts Payable and Accrued ExpensesAccounts payable . . . . . . . . . . . . . . . . . . . . . . . . . . . . . . . . . . . . . . . . . . . . . . $ 484 $ 658Compensation and employee benefits . . . . . . . . . . . . . . . . . . . . . . . . . . . . . . . 455 435Warranty . . . . . . . . . . . . . . . . . . . . . . . . . . . . . . . . . . . . . . . . . . . . . . . . . . . . . 168 155Dividends payable . . . . . . . . . . . . . . . . . . . . . . . . . . . . . . . . . . . . . . . . . . . . . . 104 93Other accrued taxes . . . . . . . . . . . . . . . . . . . . . . . . . . . . . . . . . . . . . . . . . . . . . 81 99Interest payable . . . . . . . . . . . . . . . . . . . . . . . . . . . . . . . . . . . . . . . . . . . . . . . . 31 1Restructuring reserve . . . . . . . . . . . . . . . . . . . . . . . . . . . . . . . . . . . . . . . . . . . . 11 104Other . . . . . . . . . . . . . . . . . . . . . . . . . . . . . . . . . . . . . . . . . . . . . . . . . . . . . . . . 186 221
$1,520 $1,766
Other accrued expenses included contractual termination obligation charges of $2 million and $40 million asof October 30, 2011 and October 31, 2010, respectively.
October 30,2011
October 31,2010
(In millions)
Customer Deposits and Deferred RevenueCustomer deposits . . . . . . . . . . . . . . . . . . . . . . . . . . . . . . . . . . . . . . . . . . . . . . $ 249 $407Deferred revenue . . . . . . . . . . . . . . . . . . . . . . . . . . . . . . . . . . . . . . . . . . . . . . . 867 440
$1,116 $847
88

APPLIED MATERIALS, INC.
NOTES TO CONSOLIDATED FINANCIAL STATEMENTS — (Continued)
Applied typically receives deposits on future deliverables from customers in the Energy and EnvironmentalSolutions and Display segments. In certain instances, customer deposits may be received from customers in theApplied Global Services segment.
Note 8 Goodwill, Purchased Technology and Other Intangible Assets
Goodwill and Purchased Intangible Assets
Applied’s methodology for allocating the purchase price relating to purchase acquisitions is determinedthrough established and generally accepted valuation techniques. Goodwill is measured as the excess of the costof the acquisition over the sum of the amounts assigned to tangible and identifiable intangible assets acquiredless liabilities assumed. Applied assigns assets acquired (including goodwill) and liabilities assumed to one ormore reporting units as of the date of acquisition. Typically, acquisitions relate to a single reporting unit and thusdo not require the allocation of goodwill to multiple reporting units. If the products obtained in an acquisition areassigned to multiple reporting units, the goodwill is distributed to the respective reporting units as part of thepurchase price allocation process.
Goodwill and purchased intangible assets with indefinite useful lives are not amortized, but are reviewed forimpairment annually during the fourth quarter of each fiscal year and whenever events or changes in circum-stances indicate that the carrying value of an asset may not be recoverable. The process of evaluating the poten-tial impairment of goodwill and intangible assets requires significant judgment, especially in emerging markets.Applied regularly monitors current business conditions and other factors including, but not limited to, adverseindustry or economic trends, restructuring actions and lower projections of profitability that may impact futureoperating results.
In fiscal 2011, Applied adopted authoritative guidance which allow entities to use a qualitative approach totest goodwill for impairment. This authoritative guidance permits an entity to first perform a qualitative assess-ment to determine whether it is more likely than not that the fair value of a reporting unit is less than its carryingvalue. If it is concluded that this is the case, it is necessary to perform the two-step goodwill impairment test.Otherwise, the two-step goodwill impairment test is not required. Under the two-step goodwill impairment test,Applied would in the first step compare the estimated fair value of each reporting unit to its carrying value.Applied’s reporting units are consistent with the reportable segments identified in Note 16, Industry SegmentOperations, which are based on the manner in which Applied operates its business and the nature of those oper-ations. Applied determines the fair value of each of its reporting units based on a weighting of income and mar-ket approaches. Under the income approach, Applied calculates the fair value of a reporting unit based on thepresent value of estimated future cash flows. Estimated future cash flows will be impacted by a number of factorsincluding anticipated future operating results, estimated cost of capital and/or discount rates. Under the marketapproach, Applied estimates the fair value based on market multiples of revenue or earnings for comparablecompanies, as appropriate. If the fair value of the reporting unit exceeds the carrying value of the net assetsassigned to that unit, goodwill is not impaired and no further testing is performed. If the carrying value of the netassets assigned to the reporting unit exceeds the fair value of the reporting unit, then Applied would perform thesecond step of the impairment test in order to determine the implied fair value of the reporting unit’s goodwill.Applied would then allocate the fair value of the reporting unit to all of the assets and liabilities of that unit, as ifApplied had acquired the reporting unit in a business combination, with the fair value of the reporting unit beingthe “purchase price.” The excess of the “purchase price” over the carrying amounts assigned to assets andliabilities represents the implied fair value of goodwill. If Applied determined that the carrying value of a report-ing unit’s goodwill exceeded its implied fair value, Applied would record an impairment charge equal to the dif-ference.
89

APPLIED MATERIALS, INC.
NOTES TO CONSOLIDATED FINANCIAL STATEMENTS — (Continued)
Applied performed a qualitative assessment to test goodwill for impairment in the fourth quarter of fiscal2011 and determined that it was more likely than not that each of its reporting units fair value exceeded its carry-ing value and that it was not necessary to perform the two-step goodwill impairment test.
At October 31, 2010, the purchased intangible assets with indefinite lives consisted primarily of a tradename. In fiscal 2011, Applied negotiated the divestiture of certain assets and determined the trade name, whichwas included in assets held for sale, to be impaired, and, accordingly, recorded $18 million of impairment charg-es.
In fiscal 2011, Applied transferred its SunFab thin film solar product from the Energy and EnvironmentalSolutions segment to the Applied Global Services segment. As a result of this transfer, Applied reallocated $17million of goodwill from its Energy and Environmental Solutions segment to its Applied Global Services seg-ment.
Details of goodwill and other indefinite-lived intangible assets were as follows:
October 30, 2011 October 31, 2010
Goodwill
OtherIntangible
Assets Total Goodwill
OtherIntangible
Assets Total
(In millions)
Silicon Systems Group . . . . . . . . . . . . . . . . . . . . . . . $ 381 $— $ 381 $ 381 $— $ 381Applied Global Services . . . . . . . . . . . . . . . . . . . . . . 193 — 193 177 18 195Display . . . . . . . . . . . . . . . . . . . . . . . . . . . . . . . . . . . 116 — 116 116 — 116Energy and Environmental Solutions . . . . . . . . . . . . 645 — 645 662 — 662
Carrying amount . . . . . . . . . . . . . . . . . . . . . . . . . . . . $1,335 $— $1,335 $1,336 $18 $1,354
Finite-Lived Purchased Intangible Assets
Applied amortizes purchased intangible assets with finite lives using the straight-line method over the esti-mated economic lives of the assets, ranging from 1 to 15 years.
Applied evaluates long-lived assets for impairment whenever events or changes in circumstances indicatethe carrying value of an asset group may not be recoverable. Applied assesses the fair value of the assets basedon the amount of the undiscounted future cash flow that the assets are expected to generate and recognizes animpairment loss when estimated undiscounted future cash flow expected to result from the use of the asset, plusnet proceeds expected from disposition of the asset, if any, are less than the carrying value of the asset. WhenApplied identifies an impairment, Applied reduces the carrying value of the group of assets to comparable mar-ket values, when available and appropriate, or to its estimated fair value based on a discounted cash flowapproach.
Intangible assets, such as purchased technology, are generally recorded in connection with a business acquis-ition. The value assigned to intangible assets is usually based on estimates and judgments regarding expectationsfor the success and life cycle of products and technology acquired. Applied evaluates the useful lives of itsintangible assets each reporting period to determine whether events and circumstances require revising theremaining period of amortization. In addition, Applied reviews intangible assets for impairment when events orchanges in circumstances indicate their carrying value may not be recoverable. Management considers suchindicators as significant differences in actual product acceptance from the estimates, changes in the competitiveand economic environment, technological advances, and changes in cost structure.
90

APPLIED MATERIALS, INC.
NOTES TO CONSOLIDATED FINANCIAL STATEMENTS — (Continued)
Details of finite-lived intangible assets were as follows:
October 30, 2011 October 31, 2010
PurchasedTechnology
OtherIntangible
Assets TotalPurchasedTechnology
OtherIntangible
Assets Total
(In millions)
Silicon Systems Group . . . . . . . . . . . . . . . . . . . . . $ 310 $ 20 $ 330 $ 310 $ 20 $ 330Applied Global Services . . . . . . . . . . . . . . . . . . . . 28 40 68 32 61 93Display . . . . . . . . . . . . . . . . . . . . . . . . . . . . . . . . . 110 33 143 110 33 143Energy and Environmental Solutions . . . . . . . . . . 105 232 337 105 232 337
Gross carrying amount . . . . . . . . . . . . . . . . . . . . . $ 553 $ 325 $ 878 $ 557 $ 346 $ 903
Silicon Systems Group . . . . . . . . . . . . . . . . . . . . . $(256) $ (8) $(264) $(247) $ (6) $(253)Applied Global Services . . . . . . . . . . . . . . . . . . . . (20) (31) (51) (19) (43) (62)Display . . . . . . . . . . . . . . . . . . . . . . . . . . . . . . . . . (102) (25) (127) (96) (23) (119)Energy and Environmental Solutions . . . . . . . . . . (48) (177) (225) (37) (163) (200)
Accumulated amortization . . . . . . . . . . . . . . . . . . $(426) $(241) $(667) $(399) $(235) $(634)
Carrying amount . . . . . . . . . . . . . . . . . . . . . . . . . . $ 127 $ 84 $ 211 $ 158 $ 111 $ 269
In fiscal 2011, Applied entered into an agreement to divest certain assets held in the Applied Global Serv-ices segment and determined certain identified purchased technology and finite-lived intangible assets, whichwere included in the assets held for sale, to be impaired, and, accordingly, recorded $6 million of impairmentcharges. The gross carrying amount of the divested amortized intangible assets was approximately $25 million.In fiscal 2010, Applied incurred intangible impairment charges of $31 million related to a plan to restructure itsEnergy and Environmental Solutions segment.
Amortization expense was $52 million, $82 million and $89 million for fiscal 2011, 2010 and 2009,respectively.
As of October 30, 2011, future estimated amortization expense is expected to be as follows:
AmortizationExpense
(In millions)
2012 . . . . . . . . . . . . . . . . . . . . . . . . . . . . . . . . . . . . . . . . . . . . . . . . . . . . . . . . . . . . . . . . . . . 502013 . . . . . . . . . . . . . . . . . . . . . . . . . . . . . . . . . . . . . . . . . . . . . . . . . . . . . . . . . . . . . . . . . . . 482014 . . . . . . . . . . . . . . . . . . . . . . . . . . . . . . . . . . . . . . . . . . . . . . . . . . . . . . . . . . . . . . . . . . . 402015 . . . . . . . . . . . . . . . . . . . . . . . . . . . . . . . . . . . . . . . . . . . . . . . . . . . . . . . . . . . . . . . . . . . 252016 . . . . . . . . . . . . . . . . . . . . . . . . . . . . . . . . . . . . . . . . . . . . . . . . . . . . . . . . . . . . . . . . . . . 17Thereafter . . . . . . . . . . . . . . . . . . . . . . . . . . . . . . . . . . . . . . . . . . . . . . . . . . . . . . . . . . . . . . 31
$211
Note 9 Business Combinations
Varian Semiconductor Equipment Associates, Inc.
On May 4, 2011, Applied and Varian Semiconductor Equipment Associates, Inc. (Varian), a public com-pany manufacturer of semiconductor processing equipment and the leading supplier of ion implantation equip-ment used by chip makers around the world, announced the signing of a definitive merger agreement datedMay 3, 2011, under which Applied agreed to acquire Varian for $63 per share in cash.
91

APPLIED MATERIALS, INC.
NOTES TO CONSOLIDATED FINANCIAL STATEMENTS — (Continued)
As described in Note 17, Subsequent Events, on November 10, 2011, Applied completed its acquisition ofVarian. Applied’s primary reasons for this acquisition were to complement its existing product offerings and toprovide opportunities for future growth. Beginning in the first quarter of fiscal 2012, the acquired business willbe included in results for the Silicon Systems Group and Applied Global Services segments.
The aggregate purchase price of the acquisition was approximately $4.2 billion, net of cash acquired, andApplied funded the transaction with a combination of existing cash, including proceeds from long-term debtissued in June 2011. See Note 10 for additional discussion of long-term debt.
Semitool, Inc. and Advent Solar
On December 21, 2009, Applied acquired Semitool, Inc. (Semitool), a public company based in the state ofMontana, for a purchase price of $323 million in cash, net of cash acquired, pursuant to a tender offer and sub-sequent short-form merger. The acquired business is a leading supplier of electrochemical plating and wafer sur-face preparation equipment used by semiconductor packaging and manufacturing companies globally. Applied’sprimary reasons for this acquisition were to complement its existing product offerings and to provide oppor-tunities for future growth. The acquired business is included in results for the Silicon Systems Group segment.
In November 2009, Applied acquired substantially all the assets, including the intellectual property, ofAdvent Solar, a developer of advanced technology for c-Si solar photovoltaic cells and modules (PVs), for apurchase price of $14 million.
Applied allocated the purchase price of each of these acquisitions to tangible assets, liabilities and identifi-able intangible assets acquired, based on their estimated fair values. The excess of purchase price over theaggregate fair values was recorded as goodwill. The fair value assigned to identifiable intangible assets acquiredwas based on estimates and assumptions made by management. These estimates were determined through estab-lished and generally accepted calculation techniques. Applied calculated the fair value of the tangible andintangible assets acquired to allocate the purchase prices at the respective acquisition dates. Based upon thesecalculations, the purchase prices for the above acquisitions were allocated as follows:
Fair Market ValuesAcquisitions
2010
(In millions)
Cash and cash equivalents . . . . . . . . . . . . . . . . . . . . . . . . . . . . . . . . . . . . . . . . . . . . . . . . . . $ 39Accounts receivable, net . . . . . . . . . . . . . . . . . . . . . . . . . . . . . . . . . . . . . . . . . . . . . . . . . . . . 38Inventories . . . . . . . . . . . . . . . . . . . . . . . . . . . . . . . . . . . . . . . . . . . . . . . . . . . . . . . . . . . . . . 62Other current assets . . . . . . . . . . . . . . . . . . . . . . . . . . . . . . . . . . . . . . . . . . . . . . . . . . . . . . . 4Property and equipment, net . . . . . . . . . . . . . . . . . . . . . . . . . . . . . . . . . . . . . . . . . . . . . . . . . 46Goodwill . . . . . . . . . . . . . . . . . . . . . . . . . . . . . . . . . . . . . . . . . . . . . . . . . . . . . . . . . . . . . . . . 165Purchased intangible assets . . . . . . . . . . . . . . . . . . . . . . . . . . . . . . . . . . . . . . . . . . . . . . . . . 93
Total assets acquired . . . . . . . . . . . . . . . . . . . . . . . . . . . . . . . . . . . . . . . . . . . . . . . . . . . . 447Accounts payable and accrued expenses . . . . . . . . . . . . . . . . . . . . . . . . . . . . . . . . . . . . . . . (47)Other liabilities . . . . . . . . . . . . . . . . . . . . . . . . . . . . . . . . . . . . . . . . . . . . . . . . . . . . . . . . . . . (25)
Total liabilities assumed . . . . . . . . . . . . . . . . . . . . . . . . . . . . . . . . . . . . . . . . . . . . . . . . . . (72)
Purchase price allocated . . . . . . . . . . . . . . . . . . . . . . . . . . . . . . . . . . . . . . . . . . . . . . . . . . . . $375
92

APPLIED MATERIALS, INC.
NOTES TO CONSOLIDATED FINANCIAL STATEMENTS — (Continued)
UsefulLife
PurchasedIntangible Assets
2010
(In years) (In millions)
Developed technology . . . . . . . . . . . . . . . . . . . . . . . . . . . . . . . . . . . . . . . . 6 - 10 $66Customer relationships . . . . . . . . . . . . . . . . . . . . . . . . . . . . . . . . . . . . . . . . 8 11Trade names . . . . . . . . . . . . . . . . . . . . . . . . . . . . . . . . . . . . . . . . . . . . . . . . 3 - 10 6Patents and trademarks . . . . . . . . . . . . . . . . . . . . . . . . . . . . . . . . . . . . . . . . 7 - 10 5Backlog . . . . . . . . . . . . . . . . . . . . . . . . . . . . . . . . . . . . . . . . . . . . . . . . . . . . 1 4Other . . . . . . . . . . . . . . . . . . . . . . . . . . . . . . . . . . . . . . . . . . . . . . . . . . . . . . 5 1
Total purchased intangible assets . . . . . . . . . . . . . . . . . . . . . . . . . . . . . . $93
The results of operations of Semitool were not material in relation to those of Applied for any of the periodspresented herein.
Goodwill is not amortized but is reviewed at least annually for impairment and purchased technology isamortized over its useful life of 1 to 15 years.
Note 10 Borrowing Facilities and Long-Term Debt
Applied has credit facilities for unsecured borrowings in various currencies of up to $1.6 billion, of which$1.5 billion is comprised of a committed four-year revolving credit agreement with a group of banks that isscheduled to expire in May 2015. This agreement provides for borrowings in United States dollars at interestrates keyed to one of the two rates selected by Applied for each advance and includes financial and other cove-nants with which Applied was in compliance at October 30, 2011. Remaining credit facilities in the amount ofapproximately $105 million are with Japanese banks. Applied’s ability to borrow under these facilities is subjectto bank approval at the time of the borrowing request, and any advances will be at rates indexed to the banks’prime reference rate denominated in Japanese yen. No amounts were outstanding under any of these facilities atboth October 30, 2011 and October 31, 2010.
Long-term debt outstanding as of October 30, 2011 was as follows:
Due DatePrincipalAmount
StatedInterest Rate
EffectiveInterest Rate
InterestPay Date
InterestPay Date
(In millions)
June 15, 2016 . . . . . . . . . . . . . . . . . . . . . . . . . . . . $ 400 2.650% 2.666% June 15 December 15October 15, 2017 . . . . . . . . . . . . . . . . . . . . . . . . . 200 7.125% 7.190% April 15 October 15June 15, 2021 . . . . . . . . . . . . . . . . . . . . . . . . . . . . 750 4.300% 4.326% June 15 December 15June 15, 2041 . . . . . . . . . . . . . . . . . . . . . . . . . . . . 600 5.850% 5.879% June 15 December 15Other debt . . . . . . . . . . . . . . . . . . . . . . . . . . . . . . . 1
1,951Total unamortized discount . . . . . . . . . . . . . . . . . (4)
Total long-term debt . . . . . . . . . . . . . . . . . . . . . . . $1,947
93

APPLIED MATERIALS, INC.
NOTES TO CONSOLIDATED FINANCIAL STATEMENTS — (Continued)
Long-term debt outstanding as of October 31, 2010 was as follows:
Due DatePrincipalAmount
StatedInterest Rate
EffectiveInterest Rate
InterestPay Date
InterestPay Date
(In millions)
October 15, 2017 . . . . . . . . . . . . . . . . . . . . . . . . . $200 7.125% 7.190% April 15 October 15Other debt . . . . . . . . . . . . . . . . . . . . . . . . . . . . . . 5
205Current portion . . . . . . . . . . . . . . . . . . . . . . . . . . (1)
Total long-term debt . . . . . . . . . . . . . . . . . . . . . . $204
In June 2011, Applied issued senior unsecured notes due 2016, 2021, and 2041 in the aggregate principalamount of $1.75 billion (collectively, the Notes) pursuant to the terms of an indenture and first supplementalindenture (collectively, the Indenture). The Indenture contains certain covenants with which Applied was incompliance at October 30, 2011. The Notes were sold in a public offering pursuant to a registration statement onForm S-3 and related preliminary prospectus supplement filed with the Securities and Exchange Commission(SEC) on June 1, 2011, and a related final prospectus supplement filed with the SEC on June 2, 2011. Appliedused the net proceeds of the Notes to fund a portion of the consideration payable in, and certain costs associatedwith, Applied’s acquisition of Varian.
Applied has debt agreements that contain financial and other covenants. These covenants require Applied tomaintain certain minimum financial ratios. At October 30, 2011, Applied was in compliance with all such cove-nants.
Note 11 Restructuring Charges and Asset Impairments
The following table summarizes major components of the restructuring and asset impairment charges duringfiscal 2011, 2010 and 2009:
2011 2010 2009
(In millions)
Provision for restructuring reserves, severance . . . . . . . . . . . . . . . . . . . . . . . . . . . . . . . . . . . . $(60) $129 $142Provision for restructuring reserves, facilities . . . . . . . . . . . . . . . . . . . . . . . . . . . . . . . . . . . . . — — (3)Asset impairments . . . . . . . . . . . . . . . . . . . . . . . . . . . . . . . . . . . . . . . . . . . . . . . . . . . . . . . . . . 30 117 17
Total . . . . . . . . . . . . . . . . . . . . . . . . . . . . . . . . . . . . . . . . . . . . . . . . . . . . . . . . . . . . . . . . . . . . . $(30) $246 $156
94

APPLIED MATERIALS, INC.
NOTES TO CONSOLIDATED FINANCIAL STATEMENTS — (Continued)
Changes in restructuring reserves for fiscal 2011, 2010, and 2009 related to other restructuring plans andfacilities realignment programs initiated in prior periods were as follows:
Severance Facilities Total
(In millions)
Balance, October 26, 2008 . . . . . . . . . . . . . . . . . . . . . . . . . . . . . . . . . . . $ 5 $15 $ 20Provision for restructuring reserves . . . . . . . . . . . . . . . . . . . . . . . . . . . . 145 — 145Consumption of reserves . . . . . . . . . . . . . . . . . . . . . . . . . . . . . . . . . . . . (121) (7) (128)Adjustment of restructuring reserves . . . . . . . . . . . . . . . . . . . . . . . . . . . (3) (3) (6)
Balance, October 25, 2009 . . . . . . . . . . . . . . . . . . . . . . . . . . . . . . . . . . . 26 5 31Provision for restructuring reserves . . . . . . . . . . . . . . . . . . . . . . . . . . . . 149 — 149Consumption of reserves . . . . . . . . . . . . . . . . . . . . . . . . . . . . . . . . . . . . (56) — (56)Adjustment of restructuring reserves . . . . . . . . . . . . . . . . . . . . . . . . . . . (20) — (20)
Balance, October 31, 2010 . . . . . . . . . . . . . . . . . . . . . . . . . . . . . . . . . . . 99 5 104Consumption of reserves . . . . . . . . . . . . . . . . . . . . . . . . . . . . . . . . . . . . (33) — (33)Adjustment of restructuring reserves . . . . . . . . . . . . . . . . . . . . . . . . . . . (60) — (60)
Balance, October 30, 2011 . . . . . . . . . . . . . . . . . . . . . . . . . . . . . . . . . . . $ 6 $ 5 $ 11
On July 21, 2010, Applied announced a plan to restructure its Energy and Environmental Solutions segment,which was expected to impact between 400 to 500 positions globally. During fiscal 2010, Applied incurredemployee severance charges of $45 million associated with this program. During fiscal 2011, as a result ofchanges in Applied’s operating environment and business requirements, Applied revised its workforce reductionunder this program to approximately 200 positions and recorded a favorable adjustment of $36 million. As ofOctober 30, 2011, the remaining severance accrual associated with restructuring reserves under this program was$1 million.
On November 11, 2009, Applied announced a restructuring program to reduce its global workforce as ofOctober 25, 2009 by approximately 1,300 to 1,500 positions, or 10 to 12 percent, over a period of 18 months.During the first quarter of fiscal 2010, Applied recorded restructuring charges of $104 million associated withthis program. During the third quarter of fiscal 2010, as a result of changes in business requirements, Appliedrevised its global workforce reduction under this program to approximately 1,000 positions and recorded afavorable adjustment of $20 million. The improved economic environment continued in the first half of fiscal2011, and as a result Applied recorded an additional favorable adjustment of $19 million. As of October 30,2011, the remaining severance accrual associated with restructuring reserves under this program was $5 million.
In November 12, 2008, Applied initiated a restructuring program to reduce its global workforce by approx-imately 2,000 positions. During fiscal 2009, Applied incurred employee severance charges of $145 million asso-ciated with this program and $17 million in asset impairments. The restructuring charges consisted of employee-related costs to reduce the Company’s workforce through a combination of attrition, voluntary separation andother workforce reduction programs. During fiscal 2011, Applied favorably adjusted the severance accrual asso-ciated with this program by $5 million. As of October 30, 2011, no severance accrual remained under this pro-gram.
In fiscal 2011, Applied incurred impairment charges of $24 million associated with certain intangible assetsand purchased technology. See Note 8 of the Notes to Consolidated Financial Statements. Applied also incurredasset impairment charges of $3 million related to certain fixed assets.
In fiscal 2010, Applied recorded asset impairment charges of $108 million related to the restructuring of itsEnergy and Environmental Solutions segment and of $9 million to write down a facility to its estimated fair value
95

APPLIED MATERIALS, INC.
NOTES TO CONSOLIDATED FINANCIAL STATEMENTS — (Continued)
based on prices for comparable local properties. The facility was reclassified as an asset held for sale. In fiscal2011, Applied recorded additional impairment charges of $3 million related to this facility.
Note 12 Stockholders’ Equity, Comprehensive Income and Share-Based Compensation
Accumulated Other Comprehensive Income (Loss)
Components of accumulated other comprehensive income (loss), on an after-tax basis where applicable,were as follows:
October 30,2011
October 31,2010
(In millions)
Unrealized gain on investments, net . . . . . . . . . . . . . . . . . . . . . . . . . . . . . . . . $ 17 $ 25Unrealized gain on derivative instruments qualifying as cash flow
hedges . . . . . . . . . . . . . . . . . . . . . . . . . . . . . . . . . . . . . . . . . . . . . . . . . . . . . — 4Pension liability . . . . . . . . . . . . . . . . . . . . . . . . . . . . . . . . . . . . . . . . . . . . . . . . (25) (39)Cumulative translation adjustments . . . . . . . . . . . . . . . . . . . . . . . . . . . . . . . . 14 12
$ 6 $ 2
Stock Repurchase Program
On March 8, 2010, Applied’s Board of Directors approved a new stock repurchase program authorizing upto $2.0 billion in repurchases over the next three years ending in March 2013. Under this authorization, Appliedrenewed its systematic stock repurchase program and may also make supplemental stock repurchases from timeto time, depending on market conditions, stock price and other factors.
The following table summarizes Applied’s stock repurchases for fiscal 2011, 2010, and 2009:
2011 2010 2009
(In millions, except per share amounts)
Shares of common stock repurchased . . . . . . . . . . . . . . . . . . . . 36 29 2Cost of stock repurchased . . . . . . . . . . . . . . . . . . . . . . . . . . . . . $ 468 $ 350 $ 23Average price paid per share . . . . . . . . . . . . . . . . . . . . . . . . . . . $12.88 $12.15 $11.80
Applied records treasury stock purchases under the cost method using the first-in, first-out (FIFO) method.Upon reissuance of treasury stock, amounts in excess of the acquisition cost are credited to additional paid incapital. If Applied reissues treasury stock at an amount below its acquisition cost and additional paid in capitalassociated with prior treasury stock transactions is insufficient to cover the difference between the acquisitioncost and the reissue price, this difference is recorded against retained earnings. During fiscal 2009, shares oftreasury stock were issued under Applied’s Employee Stock Purchase Plans at an aggregate value that was lessthan the treasury stock’s acquisition price, resulting in $40 million being recorded against retained earnings.
Dividends
The following table summarizes the dividends declared by Applied’s Board of Directors during fiscal 2011:
Date declared Record date Payable date Amount per share
December 7, 2010 March 2, 2011 March 23, 2011 $ 0.07March 8, 2011 June 1, 2011 June 22, 2011 $ 0.08June 6, 2011 August 31, 2011 September 21, 2011 $ 0.08September 13, 2011 November 23, 2011 December 14, 2011 $ 0.08
96

APPLIED MATERIALS, INC.
NOTES TO CONSOLIDATED FINANCIAL STATEMENTS — (Continued)
During fiscal 2010, Applied’s Board of Directors declared three quarterly cash dividends in the amount of$0.07 per share each and one quarterly cash dividend in the amount of $0.06 per share. During fiscal 2009,Applied’s Board of Directors declared four quarterly cash dividends in the amount of $0.06 per share each quar-ter. Dividends declared during fiscal 2011, 2010 and 2009 amounted to $408 million, $361 million and$320 million, respectively. Applied currently anticipates that cash dividends will continue to be paid on a quar-terly basis, although the declaration of any future cash dividend is at the discretion of the Board of Directors andwill depend on Applied’s financial condition, results of operations, capital requirements, business conditions andother factors, as well as a determination by the Board of Directors that cash dividends are in the best interests ofApplied’s stockholders.
Share-Based Compensation
Applied has adopted stock plans that permit grants to employees of share-based awards, including stockoptions, restricted stock and restricted stock units (also referred to as “performance shares” under Applied’sprincipal equity compensation plan, the Employee Stock Incentive Plan). In addition, the Employee StockIncentive Plan provides for the automatic grant of restricted stock units to non-employee directors and permitsthe grant of share-based awards to consultants. Applied also has two Employee Stock Purchase Plans, one gen-erally for United States employees and a second for employees of international subsidiaries (collectively, ESPP),which enable eligible employees to purchase Applied common stock.
During fiscal 2011, 2010, and 2009, Applied recognized share-based compensation expense related to stockoptions, ESPP shares, restricted stock units and restricted stock. Total share-based compensation and related taxbenefits were as follows:
2011 2010 2009
(In millions)
Share-based compensation . . . . . . . . . . . . . . . . . . . . . . . . . . . . . . . . . . . . . . . . $146 $126 $147Tax benefit recognized . . . . . . . . . . . . . . . . . . . . . . . . . . . . . . . . . . . . . . . . . . . $ 42 $ 38 $ 41
The effect of share-based compensation on the results of operations for fiscal 2011, 2010, and 2009 was asfollows:
2011 2010 2009
(In millions)
Cost of products sold . . . . . . . . . . . . . . . . . . . . . . . . . . . . . . . . . . . . . . . . . . . . . $ 48 $ 32 $ 28Research, development, and engineering . . . . . . . . . . . . . . . . . . . . . . . . . . . . . 46 43 50Selling, general and administrative . . . . . . . . . . . . . . . . . . . . . . . . . . . . . . . . . . 52 51 69
Total share-based compensation . . . . . . . . . . . . . . . . . . . . . . . . . . . . . . . . . . $146 $126 $147
The cost associated with share-based awards that are subject solely to time-based vesting requirements, lessexpected forfeitures, is recognized over the awards’ service period for the entire award on a straight-line basis.The cost associated with performance-based equity awards is recognized for each tranche over the service period,based on an assessment of the likelihood that the applicable performance goals will be achieved.
At October 30, 2011, Applied had $219 million in total unrecognized compensation expense, net of esti-mated forfeitures, related to grants of stock options, restricted stock units and restricted stock, and shares issuedunder Applied’s ESPP, which will be recognized over a weighted average period of 2.6 years. At October 30,2011, there were 157 million shares available for stock option, restricted stock unit, restricted stock grants andother share-based awards, and an additional 54 million shares available for issuance under the ESPP.
97

APPLIED MATERIALS, INC.
NOTES TO CONSOLIDATED FINANCIAL STATEMENTS — (Continued)
Stock Options
Applied grants options to purchase, at future dates, shares of its common stock to employees and con-sultants. The exercise price of each stock option equals the fair market value of Applied common stock on thedate of grant. Options typically vest over three to four years, subject to the grantee’s continued service withApplied through the scheduled vesting date, and expire no later than seven years from the grant date. The fairvalue of each option grant is estimated on the date of grant using the Black-Scholes option pricing model. Thismodel was developed for use in estimating the value of publicly traded options that have no vesting restrictionsand are fully transferable. Applied’s employee stock options have characteristics significantly different fromthose of publicly traded options. There were no stock options granted during fiscal 2011 and 2010. The weightedaverage assumptions used in the model for options granted in fiscal 2009 are outlined in the following table:
2009
Stock Options:Dividend yield . . . . . . . . . . . . . . . . . . . . . . . . . . . . . . . . . . . . . . . . . . . . . . . . . . . . . . . . . . . . . . . . 2.8%Expected volatility . . . . . . . . . . . . . . . . . . . . . . . . . . . . . . . . . . . . . . . . . . . . . . . . . . . . . . . . . . . . . 49.9%Risk-free interest rate . . . . . . . . . . . . . . . . . . . . . . . . . . . . . . . . . . . . . . . . . . . . . . . . . . . . . . . . . . . 1.26%Expected life (in years) . . . . . . . . . . . . . . . . . . . . . . . . . . . . . . . . . . . . . . . . . . . . . . . . . . . . . . . . . 3.0
The computation of the expected volatility assumption used in the Black-Scholes calculations for new grantsis based on a combination of historical and implied volatilities. When establishing the expected life assumption,Applied periodically reviews historical employee exercise behavior with respect to option grants.
The weighted average grant date fair value of options granted during fiscal 2009 was $2.52.
Options outstanding had an aggregate intrinsic value of $58 million, $73 million and $109 million atOctober 30, 2011, October 31, 2010, and October 25, 2009, respectively. The total grant date fair value ofoptions granted during fiscal 2009 was $62 million. The total intrinsic value of options exercised during fiscal2011, 2010 and 2009 was $23 million, $15 million and $1 million, respectively. The total fair value of optionsthat vested during fiscal 2011, 2010 and 2009 was $17 million, $21 million and $14 million, respectively. Cashreceived from stock option exercises was $41 million, $78 million and $9 million, during fiscal 2011, 2010 and2009, respectively. The actual tax benefit realized for the tax deductions from options exercised for fiscal 2011,2010 and 2009 totaled $11 million, $4 million and $0.4 million, respectively.
Stock option activity for fiscal 2011, 2010 and 2009 was as follows:
2011 2010 2009
Shares
WeightedAverageExercise
Price Shares
WeightedAverageExercise
Price Shares
WeightedAverageExercise
Price
(In millions, except per share amounts)
Outstanding, beginning of year . . . . . . 51 $15.04 73 $14.72 61 $17.71Granted and assumed . . . . . . . . . . . . . . — $ — — $ — 24 $ 8.58Exercised . . . . . . . . . . . . . . . . . . . . . . . (5) $ 9.21 (7) $10.88 (1) $11.44Canceled and forfeited . . . . . . . . . . . . . (16) $20.28 (15) $15.64 (11) $17.73
Outstanding, end of year . . . . . . . . . . . 30 $13.05 51 $15.04 73 $14.72
Exercisable, end of year . . . . . . . . . . . . 24 $14.23 37 $17.39 50 $17.53
98

APPLIED MATERIALS, INC.
NOTES TO CONSOLIDATED FINANCIAL STATEMENTS — (Continued)
The following table summarizes information with respect to options outstanding and exercisable atOctober 30, 2011:
Options Outstanding Options Exercisable
Range ofExercise Prices
Number ofShares
WeightedAverageExercise
Price
WeightedAverage
RemainingContractual
Life
AggregateIntrinsic
ValueNumber of
Shares
WeightedAverageExercise
Price
AggregateIntrinsic
Value
(In millions) (In years) (In millions) (In millions) (In millions)
$0.01 — $9.99 . . . . . . . . . . . . . . . 14 $ 8.58 2.36 $58 8 $ 8.58 $33$10.00 — $19.99 . . . . . . . . . . . . . 16 $17.08 0.82 — 16 $17.08 —$20.00 — $29.99 . . . . . . . . . . . . . — $21.91 2.14 — — $21.91 —
30 $13.05 1.56 $58 24 $14.23 $33
Options exercisable and expectedto become exercisable . . . . . . . . 30 $13.08 1.55 $58
Restricted Stock Units and Restricted Stock
Restricted stock units are converted into shares of Applied common stock upon vesting on a one-for-onebasis. Restricted stock has the same rights as other issued and outstanding shares of Applied common stockexcept these shares have no right to dividends and are held in escrow until the award vests. Restricted stock unitsand awards of restricted stock typically are scheduled to vest over three to four years. Vesting of restricted stockunits and restricted stock usually is subject to the grantee’s continued service with Applied and, in some cases,achievement of specified performance goals. The compensation expense related to these awards is determinedusing the fair market value of Applied common stock on the date of the grant, and the compensation expense isrecognized over the vesting period. Beginning in fiscal 2007, Applied initiated a performance-based equity awardprogram for named executive officers and other key employees. Awards of restricted stock units or restrictedstock granted under this program (performance-based awards) become eligible to vest only if specific perform-ance goals set by the Human Resources and Compensation Committee of Applied’s Board of Directors (theCommittee) are achieved and then will vest only if the grantee remains employed by Applied through each appli-cable vesting date.
The performance goals require the achievement of targeted adjusted annual operating profit margin levelscompared to Applied’s peer companies in at least one of the four fiscal years beginning with the fiscal year of thegrant and that Applied’s annual adjusted operating profit margin is positive in such year. An award that hasbecome eligible for time-based vesting based on achievement of the performance goals will vest as to 25% of theaward on December 19 of each of the four calendar years starting in the calendar year of the grant, provided thatthe grantee remains employed by Applied through each scheduled vesting date. Performance-based awards thatdo not become eligible for time-based vesting in a particular year may become eligible for time-based vesting insubsequent years up until the fourth fiscal year after grant, after which they are forfeited if the required perform-ance goals have not been achieved. The fair value of these performance-based awards is estimated using the fairmarket value of Applied common stock on the date of the grant and assumes that the specified performance goalswill be achieved. If achieved, these awards vest over a specified remaining service period as described above. Ifthe performance goals are not met, no compensation expense is recognized and any previously recognized com-pensation expense is reversed. The expected cost of each award is reflected over the service period and is reducedfor estimated forfeitures. The Committee approved the grant of 2 million performance-based restricted stockunits and 0.1 million performance-based shares of restricted stock under this program in each of fiscal 2011,2010 and 2008. There were no performance-based awards granted in fiscal 2009. With respect to theperformance-based awards granted in fiscal 2011, as of October 30, 2011, 100 percent of the awards had been
99

APPLIED MATERIALS, INC.
NOTES TO CONSOLIDATED FINANCIAL STATEMENTS — (Continued)
earned, subject to additional time-based vesting requirements. With respect to the performance-based awardsgranted in fiscal 2010, as of October 30, 2011, 82 percent of the awards had been earned, subject to additionaltime-based vesting requirements. The remaining 18 percent of the awards may still be earned, depending onfuture performance in one or both of fiscal years 2012 and 2013. As of October 30, 2011, 90 percent of theperformance-based awards granted in fiscal 2008, were earned.
A summary of the changes in restricted stock units outstanding under Applied’s equity compensation plansduring fiscal 2011 are presented below:
Shares
WeightedAverage
Grant DateFair Value
WeightedAverage
RemainingContractual Term
AggregateIntrinsic
Value
(In millions, except per share amounts)
Non-vested restricted stock units and restricted stock atOctober 31, 2010 . . . . . . . . . . . . . . . . . . . . . . . . . . . . . . . . . . . 18 $13.33 2.8 Years $227
Granted . . . . . . . . . . . . . . . . . . . . . . . . . . . . . . . . . . . . . . . . . . . . 17 12.62Vested . . . . . . . . . . . . . . . . . . . . . . . . . . . . . . . . . . . . . . . . . . . . . (5) 14.64Canceled . . . . . . . . . . . . . . . . . . . . . . . . . . . . . . . . . . . . . . . . . . . (2) 13.11
Non-vested restricted stock units and restricted stock atOctober 30, 2011 . . . . . . . . . . . . . . . . . . . . . . . . . . . . . . . . . . . 28 12.64 2.8 $345
Non-vested restricted stock units and restricted stock expectedto vest . . . . . . . . . . . . . . . . . . . . . . . . . . . . . . . . . . . . . . . . . . . . 24 12.52 2.7 $304
The actual tax benefit realized for the tax deductions from vested restricted stock units totaled $22 million ineach of fiscal 2011, 2010 and 2009.
Employee Stock Purchase Plans
Under the ESPP, substantially all employees may purchase Applied common stock through payrolldeductions at a price equal to 85 percent of the lower of the fair market value of Applied common stock at thebeginning or end of each 6-month purchase period, subject to certain limits. Based on the Black-Scholes optionpricing model, the weighted average estimated fair value of purchase rights under the ESPP was $3.03 per sharefor the year ended October 30, 2011, $2.76 per share for the year ended October 31, 2010 and $3.19 per share forthe year ended October 25, 2009. The number of shares issued under the ESPP during fiscal 2011, 2010 and 2009was 6 million, 5 million and 7 million, respectively. At October 30, 2011, there were 54 million available forfuture issuance under the ESPP. Compensation expense is calculated using the fair value of the employees’ pur-chase rights under the Black-Scholes model. Underlying assumptions used in the model for fiscal 2011, 2010 and2009 are outlined in the following table:
2011 2010 2009
ESPP:Dividend yield . . . . . . . . . . . . . . . . . . . . . . . . . . . . . . . . . . . . . . . . . . . . . . . . . . . 2.53% 2.44% 2.37%Expected volatility . . . . . . . . . . . . . . . . . . . . . . . . . . . . . . . . . . . . . . . . . . . . . . . . 31.1% 33.3% 58.8%Risk-free interest rate . . . . . . . . . . . . . . . . . . . . . . . . . . . . . . . . . . . . . . . . . . . . . . 0.09% 0.19% 0.33%Expected life (in years) . . . . . . . . . . . . . . . . . . . . . . . . . . . . . . . . . . . . . . . . . . . . 0.5 0.5 0.5
100

APPLIED MATERIALS, INC.
NOTES TO CONSOLIDATED FINANCIAL STATEMENTS — (Continued)
Note 13 Employee Benefit Plans
Employee Bonus Plans
Applied has various employee bonus plans. A discretionary bonus plan provides for the distribution of apercentage of pre-tax income to Applied employees who are not participants in other performance-basedincentive plans, up to a maximum percentage of eligible compensation. Other plans provide for bonuses toApplied’s executives and other key contributors based on the achievement of profitability and/or other specifiedperformance criteria. Charges under these plans were $319 million for fiscal 2011, $320 million for fiscal 2010,and no charges for fiscal 2009.
Employee Savings and Retirement Plan
Applied’s Employee Savings and Retirement Plan (401(k) Plan) is qualified under Sections 401(a) and(k) of the Internal Revenue Code. Eligible employees may make salary deferral and catch-up contributions underthe 401(k) Plan on a pre-tax basis. Applied matches a percentage of each participant’s salary deferral con-tributions with cash contributions. Plan participants who were employed by Applied or any of its affiliates on orafter January 1, 2010 became 100% vested in their Applied matching contribution account balances. Participantsmay direct that funds held in their 401(k) Plan accounts, including any Applied matching contributions, beinvested in any of the diversified investment funds available under the 401(k) Plan or within certain limits in theApplied Materials, Inc. Common Stock Fund (Stock Fund), which invests solely in shares of Applied commonstock. The Stock Fund is a non-leveraged employee stock ownership plan (within the meaning of Sec-tion 4975(e)(7) of the Internal Revenue Code) and, as a result, participants have the option of specifying that anyfuture cash dividends paid on shares held in the Stock Fund be either reinvested in the Stock Fund or distributeddirectly to them in cash no later than 90 days after the calendar year for which the dividends were paid. Applied’smatching contributions under this plan were approximately $27 million for fiscal 2011; $25 million, net of$1 million in forfeitures, for fiscal 2010; and $24 million, net of $1 million in forfeitures, for fiscal 2009.
Defined Benefit Pension Plans of Foreign Subsidiaries and Other Post-Retirement Benefits
Several of Applied’s foreign subsidiaries have defined benefit pension plans covering substantially all oftheir eligible employees. Benefits under these plans are typically based on years of service and final averagecompensation levels. The plans are managed in accordance with applicable local statutes and practices. Applieddeposits funds for certain of these plans with insurance companies, pension trustees, government-managedaccounts, and/or accrues the expense for the unfunded portion of the benefit obligation on its ConsolidatedFinancial Statements. Applied’s practice is to fund the various pension plans in amounts sufficient to meet theminimum requirements as established by applicable local governmental oversight and taxing authorities.Depending on the design of the plan, local custom and market circumstances, the liabilities of a plan may exceedqualified plan assets. The differences between the aggregate projected benefit obligations and aggregate planassets of these plans have been recorded as liabilities by Applied and are included in employee benefits andaccrued expenses in the Consolidated Balance Sheets. In fiscal 2009, Applied changed the measurement date forits defined and postretirement benefit plan assets and obligations from an interim date to Applied’s fiscal yearend.
Applied also has a post-retirement plan that provides certain medical and vision benefits to eligible retireeswho are at least age 55 and whose years of service plus their age equals at least 65 at their date of retirement. Aneligible retiree also may elect coverage for an eligible spouse or domestic partner who is not eligible for Medi-care. Coverage under the plan generally ends for both the retiree and spouse or domestic partner upon becomingeligible for Medicare. Applied’s liability under this post-retirement plan, which was included in other long-termliabilities in the Consolidated Balance Sheets, was $13 million at October 30, 2011 and $12 million atOctober 31, 2010.
101

APPLIED MATERIALS, INC.
NOTES TO CONSOLIDATED FINANCIAL STATEMENTS — (Continued)
A summary of the changes in benefit obligations and plan assets, which includes post-retirement benefits,for fiscal 2011 and 2010 is presented below.
2011 2010
(In millions, except percentages)Change in projected benefit obligationBeginning projected benefit obligation . . . . . . . . . . . . . . . . . . . . . . . . . . . . . . . . . . . . . . . . . . . . . . . . $ 309 $ 279Service cost . . . . . . . . . . . . . . . . . . . . . . . . . . . . . . . . . . . . . . . . . . . . . . . . . . . . . . . . . . . . . . . . . . . . . 15 13Interest cost . . . . . . . . . . . . . . . . . . . . . . . . . . . . . . . . . . . . . . . . . . . . . . . . . . . . . . . . . . . . . . . . . . . . . 14 13Plan participants’ contributions . . . . . . . . . . . . . . . . . . . . . . . . . . . . . . . . . . . . . . . . . . . . . . . . . . . . . 1 1Actuarial (gain) loss . . . . . . . . . . . . . . . . . . . . . . . . . . . . . . . . . . . . . . . . . . . . . . . . . . . . . . . . . . . . . . (26) 25Curtailments, settlements and special termination benefits . . . . . . . . . . . . . . . . . . . . . . . . . . . . . . . . (9) (9)Foreign currency exchange rate changes . . . . . . . . . . . . . . . . . . . . . . . . . . . . . . . . . . . . . . . . . . . . . . 5 (7)Benefits paid . . . . . . . . . . . . . . . . . . . . . . . . . . . . . . . . . . . . . . . . . . . . . . . . . . . . . . . . . . . . . . . . . . . . (8) (6)Plan amendments and business combinations . . . . . . . . . . . . . . . . . . . . . . . . . . . . . . . . . . . . . . . . . . . 2 —
Ending projected benefit obligation . . . . . . . . . . . . . . . . . . . . . . . . . . . . . . . . . . . . . . . . . . . . . . . . . . $ 303 $ 309
Ending accumulated benefit obligation . . . . . . . . . . . . . . . . . . . . . . . . . . . . . . . . . . . . . . . . . . . . . $ 273 $ 279
Range of assumptions to determine benefit obligationsDiscount rate . . . . . . . . . . . . . . . . . . . . . . . . . . . . . . . . . . . . . . . . . . . . . . . . . . . . . . . . . . . . . . . . . . . . 1.7% - 6.5% 1.5% - 5.6%Rate of compensation increase . . . . . . . . . . . . . . . . . . . . . . . . . . . . . . . . . . . . . . . . . . . . . . . . . . . . . . 2.0% - 5.0% 2.0% - 5.0%Change in plan assetsBeginning fair value of plan assets . . . . . . . . . . . . . . . . . . . . . . . . . . . . . . . . . . . . . . . . . . . . . . . . . . . $ 162 $ 110Return on plan assets . . . . . . . . . . . . . . . . . . . . . . . . . . . . . . . . . . . . . . . . . . . . . . . . . . . . . . . . . . . . . . 3 7Employer contributions . . . . . . . . . . . . . . . . . . . . . . . . . . . . . . . . . . . . . . . . . . . . . . . . . . . . . . . . . . . . 26 61Plan participants’ contributions . . . . . . . . . . . . . . . . . . . . . . . . . . . . . . . . . . . . . . . . . . . . . . . . . . . . . 1 1Foreign currency exchange rate changes . . . . . . . . . . . . . . . . . . . . . . . . . . . . . . . . . . . . . . . . . . . . . . 2 (3)Divestitures, settlements and business combinations . . . . . . . . . . . . . . . . . . . . . . . . . . . . . . . . . . . . . (3) (8)Benefits paid . . . . . . . . . . . . . . . . . . . . . . . . . . . . . . . . . . . . . . . . . . . . . . . . . . . . . . . . . . . . . . . . . . . . (8) (6)
Ending fair value of plan assets . . . . . . . . . . . . . . . . . . . . . . . . . . . . . . . . . . . . . . . . . . . . . . . . . . . . . $ 183 $ 162
Funded status . . . . . . . . . . . . . . . . . . . . . . . . . . . . . . . . . . . . . . . . . . . . . . . . . . . . . . . . . . . . . . . . . . . . $ (120) $ (147)
Amounts recognized in the consolidated balance sheetsNoncurrent asset . . . . . . . . . . . . . . . . . . . . . . . . . . . . . . . . . . . . . . . . . . . . . . . . . . . . . . . . . . . . . . . . . $ 13 $ —Current liability . . . . . . . . . . . . . . . . . . . . . . . . . . . . . . . . . . . . . . . . . . . . . . . . . . . . . . . . . . . . . . . . . . (3) (3)Noncurrent liability . . . . . . . . . . . . . . . . . . . . . . . . . . . . . . . . . . . . . . . . . . . . . . . . . . . . . . . . . . . . . . . (130) (144)
Total . . . . . . . . . . . . . . . . . . . . . . . . . . . . . . . . . . . . . . . . . . . . . . . . . . . . . . . . . . . . . . . . . . . . . . . . . . $ (120) $ (147)
Estimated amortization from accumulated other comprehensive loss into net periodicbenefit cost over the next fiscal year
Actuarial loss . . . . . . . . . . . . . . . . . . . . . . . . . . . . . . . . . . . . . . . . . . . . . . . . . . . . . . . . . . . . . . . . . . . . 1 2
Total . . . . . . . . . . . . . . . . . . . . . . . . . . . . . . . . . . . . . . . . . . . . . . . . . . . . . . . . . . . . . . . . . . . . . . . . . . $ 1 $ 2
Amounts recognized in accumulated other comprehensive lossNet actuarial loss . . . . . . . . . . . . . . . . . . . . . . . . . . . . . . . . . . . . . . . . . . . . . . . . . . . . . . . . . . . . . . . . . $ 27 $ 48Prior service cost (credit) . . . . . . . . . . . . . . . . . . . . . . . . . . . . . . . . . . . . . . . . . . . . . . . . . . . . . . . . . . (4) (4)
Total . . . . . . . . . . . . . . . . . . . . . . . . . . . . . . . . . . . . . . . . . . . . . . . . . . . . . . . . . . . . . . . . . . . . . . . . . . $ 23 $ 44
Plans with projected benefit obligations in excess of plan assetsProjected benefit obligation . . . . . . . . . . . . . . . . . . . . . . . . . . . . . . . . . . . . . . . . . . . . . . . . . . . . . . . . $ 259 $ 309Fair value of plan assets . . . . . . . . . . . . . . . . . . . . . . . . . . . . . . . . . . . . . . . . . . . . . . . . . . . . . . . . . . . $ 126 $ 162Plans with accumulated benefit obligations in excess of plan assetsAccumulated benefit obligation . . . . . . . . . . . . . . . . . . . . . . . . . . . . . . . . . . . . . . . . . . . . . . . . . . . . . $ 225 $ 225Fair value of plan assets . . . . . . . . . . . . . . . . . . . . . . . . . . . . . . . . . . . . . . . . . . . . . . . . . . . . . . . . . . . $ 116 $ 106
102
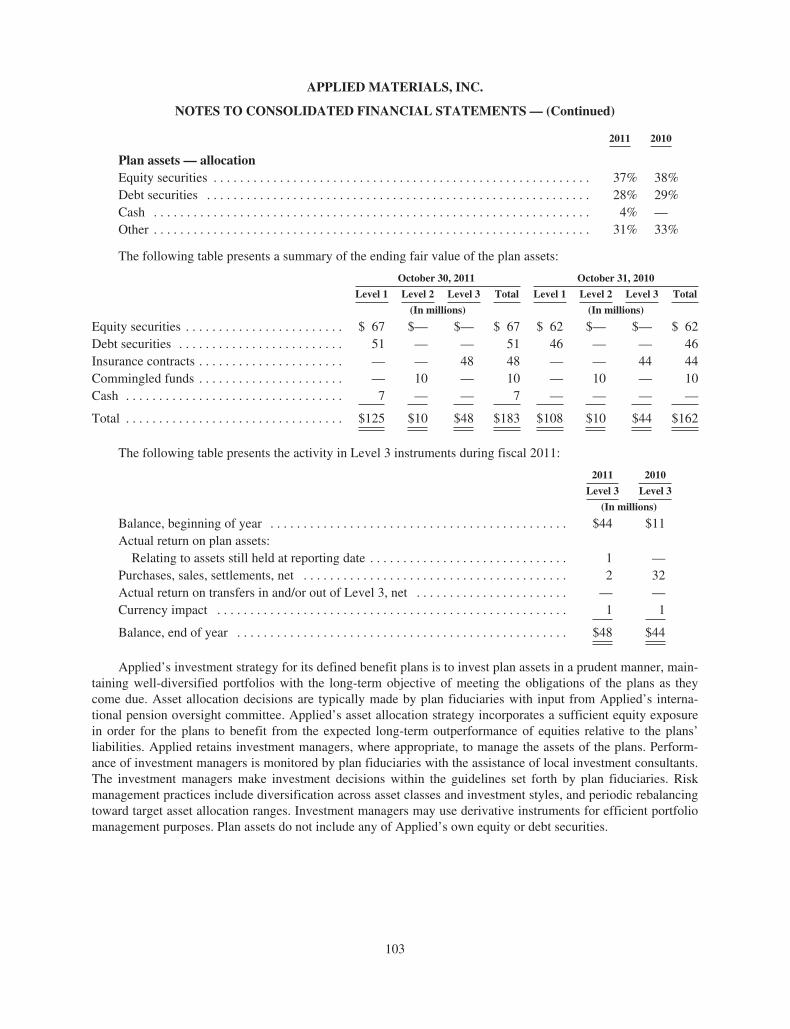
APPLIED MATERIALS, INC.
NOTES TO CONSOLIDATED FINANCIAL STATEMENTS — (Continued)
2011 2010
Plan assets — allocationEquity securities . . . . . . . . . . . . . . . . . . . . . . . . . . . . . . . . . . . . . . . . . . . . . . . . . . . . . . . . . 37% 38%Debt securities . . . . . . . . . . . . . . . . . . . . . . . . . . . . . . . . . . . . . . . . . . . . . . . . . . . . . . . . . . 28% 29%Cash . . . . . . . . . . . . . . . . . . . . . . . . . . . . . . . . . . . . . . . . . . . . . . . . . . . . . . . . . . . . . . . . . . 4% —Other . . . . . . . . . . . . . . . . . . . . . . . . . . . . . . . . . . . . . . . . . . . . . . . . . . . . . . . . . . . . . . . . . . 31% 33%
The following table presents a summary of the ending fair value of the plan assets:
October 30, 2011 October 31, 2010
Level 1 Level 2 Level 3 Total Level 1 Level 2 Level 3 Total
(In millions) (In millions)
Equity securities . . . . . . . . . . . . . . . . . . . . . . . . $ 67 $— $— $ 67 $ 62 $— $— $ 62Debt securities . . . . . . . . . . . . . . . . . . . . . . . . . 51 — — 51 46 — — 46Insurance contracts . . . . . . . . . . . . . . . . . . . . . . — — 48 48 — — 44 44Commingled funds . . . . . . . . . . . . . . . . . . . . . . — 10 — 10 — 10 — 10Cash . . . . . . . . . . . . . . . . . . . . . . . . . . . . . . . . . 7 — — 7 — — — —
Total . . . . . . . . . . . . . . . . . . . . . . . . . . . . . . . . . $125 $10 $48 $183 $108 $10 $44 $162
The following table presents the activity in Level 3 instruments during fiscal 2011:
2011 2010
Level 3 Level 3
(In millions)
Balance, beginning of year . . . . . . . . . . . . . . . . . . . . . . . . . . . . . . . . . . . . . . . . . . . . . $44 $11Actual return on plan assets:
Relating to assets still held at reporting date . . . . . . . . . . . . . . . . . . . . . . . . . . . . . . 1 —Purchases, sales, settlements, net . . . . . . . . . . . . . . . . . . . . . . . . . . . . . . . . . . . . . . . . 2 32Actual return on transfers in and/or out of Level 3, net . . . . . . . . . . . . . . . . . . . . . . . — —Currency impact . . . . . . . . . . . . . . . . . . . . . . . . . . . . . . . . . . . . . . . . . . . . . . . . . . . . . 1 1
Balance, end of year . . . . . . . . . . . . . . . . . . . . . . . . . . . . . . . . . . . . . . . . . . . . . . . . . . $48 $44
Applied’s investment strategy for its defined benefit plans is to invest plan assets in a prudent manner, main-taining well-diversified portfolios with the long-term objective of meeting the obligations of the plans as theycome due. Asset allocation decisions are typically made by plan fiduciaries with input from Applied’s interna-tional pension oversight committee. Applied’s asset allocation strategy incorporates a sufficient equity exposurein order for the plans to benefit from the expected long-term outperformance of equities relative to the plans’liabilities. Applied retains investment managers, where appropriate, to manage the assets of the plans. Perform-ance of investment managers is monitored by plan fiduciaries with the assistance of local investment consultants.The investment managers make investment decisions within the guidelines set forth by plan fiduciaries. Riskmanagement practices include diversification across asset classes and investment styles, and periodic rebalancingtoward target asset allocation ranges. Investment managers may use derivative instruments for efficient portfoliomanagement purposes. Plan assets do not include any of Applied’s own equity or debt securities.
103

APPLIED MATERIALS, INC.
NOTES TO CONSOLIDATED FINANCIAL STATEMENTS — (Continued)
A summary of the components of net periodic benefit costs and the weighted average assumptions used fornet periodic benefit cost and benefit obligation calculations for fiscal 2011, 2010 and 2009 is presented below.
2011 2010 2009
(In millions, except percentages)
Components of net periodic benefit costService cost . . . . . . . . . . . . . . . . . . . . . . . . . . . . . . . . . . . . . . . . . . . . . $ 15 $ 13 $ 13Interest cost . . . . . . . . . . . . . . . . . . . . . . . . . . . . . . . . . . . . . . . . . . . . . 14 13 12Expected return on plan assets . . . . . . . . . . . . . . . . . . . . . . . . . . . . . . (11) (7) (7)Amortization of actuarial loss . . . . . . . . . . . . . . . . . . . . . . . . . . . . . . . 2 1 1Settlement loss . . . . . . . . . . . . . . . . . . . . . . . . . . . . . . . . . . . . . . . . . . 2 1 1Curtailment gain . . . . . . . . . . . . . . . . . . . . . . . . . . . . . . . . . . . . . . . . . (4) — (2)
Net periodic benefit cost . . . . . . . . . . . . . . . . . . . . . . . . . . . . . . . . . . . $ 18 $ 21 $ 18
Weighted average assumptionsDiscount rate . . . . . . . . . . . . . . . . . . . . . . . . . . . . . . . . . . . . . . . . . . . . 4.33% 4.76% 5.00%Expected long-term return on assets . . . . . . . . . . . . . . . . . . . . . . . . . . 6.39% 6.92% 7.43%Rate of compensation increase . . . . . . . . . . . . . . . . . . . . . . . . . . . . . . 3.42% 3.30% 3.67%
Asset return assumptions are derived based on actuarial and statistical methodologies, from analysis of long-term historical data relevant to the country in which each plan is in effect and the investments applicable to thecorresponding plan. The discount rate for each plan was derived by reference to appropriate benchmark yields onhigh quality corporate bonds, allowing for the approximate duration of both plan obligations and the relevantbenchmark yields.
Future expected benefit payments for the pension plans and the post-retirement plan over the next ten fiscalyears are: $11 million in fiscal 2012, $11 million in fiscal 2013, $16 million in fiscal 2014, $17 million in fiscal2015, $17 million in fiscal 2016, and $98 million collectively for fiscal years 2017 through 2021. Company con-tributions to these plans for fiscal 2012 are expected to be approximately $24 million.
Executive Deferred Compensation Plans
Applied sponsors two unfunded deferred compensation plans, the Executive Deferred Compensation Plan(Predecessor EDCP) and the 2005 Executive Deferred Compensation Plan (2005 EDCP), under which certainemployees may elect to defer a portion of their following year’s eligible earnings. The Predecessor EDCP wasfrozen as of December 31, 2004 such that no new deferrals could be made under the plan after that date and theplan would qualify for “grandfather” relief under Section 409A of the Internal Revenue Code. The PredecessorEDCP participant accounts continue to be maintained under the plan and credited with deemed interest. The 2005EDCP was implemented by Applied effective as of January 1, 2005 and is intended to comply with the require-ments of Section 409A of the Internal Revenue Code. Amounts payable, including accrued deemed interest,totaled $59 million at October 30, 2011 and $66 million at October 31, 2010, which were included in other long-term liabilities in the Consolidated Balance Sheets.
104
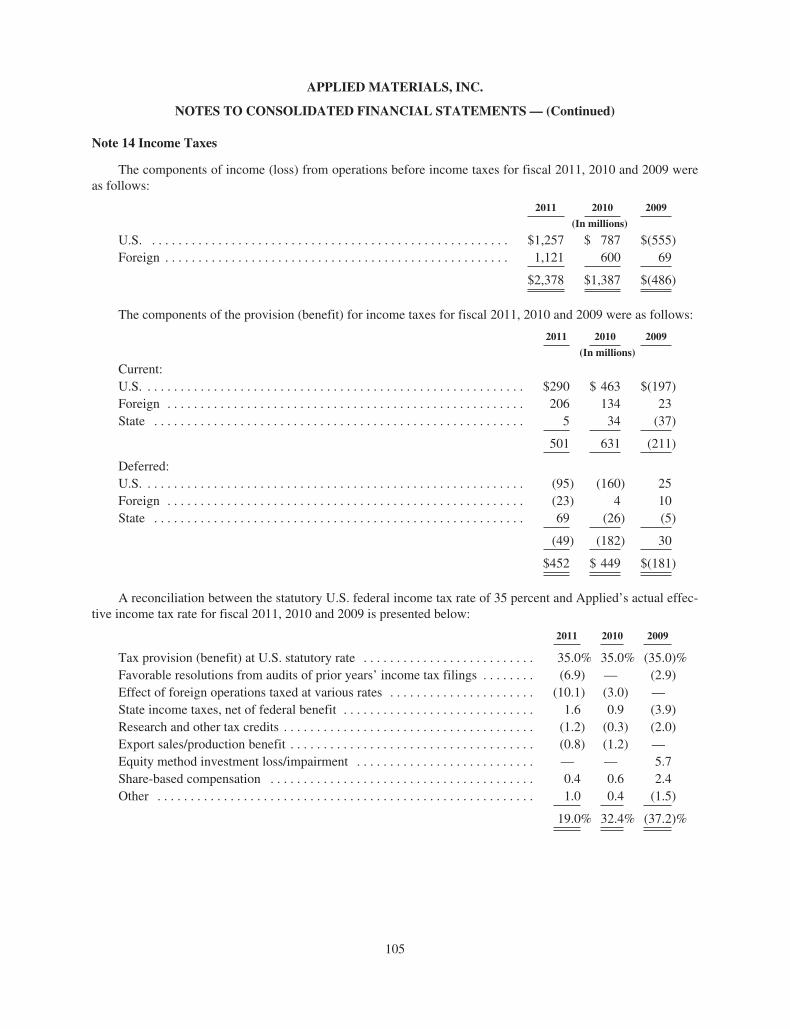
APPLIED MATERIALS, INC.
NOTES TO CONSOLIDATED FINANCIAL STATEMENTS — (Continued)
Note 14 Income Taxes
The components of income (loss) from operations before income taxes for fiscal 2011, 2010 and 2009 wereas follows:
2011 2010 2009
(In millions)
U.S. . . . . . . . . . . . . . . . . . . . . . . . . . . . . . . . . . . . . . . . . . . . . . . . . . . . . . . $1,257 $ 787 $(555)Foreign . . . . . . . . . . . . . . . . . . . . . . . . . . . . . . . . . . . . . . . . . . . . . . . . . . . . 1,121 600 69
$2,378 $1,387 $(486)
The components of the provision (benefit) for income taxes for fiscal 2011, 2010 and 2009 were as follows:
2011 2010 2009
(In millions)
Current:U.S. . . . . . . . . . . . . . . . . . . . . . . . . . . . . . . . . . . . . . . . . . . . . . . . . . . . . . . . . . $290 $ 463 $(197)Foreign . . . . . . . . . . . . . . . . . . . . . . . . . . . . . . . . . . . . . . . . . . . . . . . . . . . . . . 206 134 23State . . . . . . . . . . . . . . . . . . . . . . . . . . . . . . . . . . . . . . . . . . . . . . . . . . . . . . . . 5 34 (37)
501 631 (211)
Deferred:U.S. . . . . . . . . . . . . . . . . . . . . . . . . . . . . . . . . . . . . . . . . . . . . . . . . . . . . . . . . . (95) (160) 25Foreign . . . . . . . . . . . . . . . . . . . . . . . . . . . . . . . . . . . . . . . . . . . . . . . . . . . . . . (23) 4 10State . . . . . . . . . . . . . . . . . . . . . . . . . . . . . . . . . . . . . . . . . . . . . . . . . . . . . . . . 69 (26) (5)
(49) (182) 30
$452 $ 449 $(181)
A reconciliation between the statutory U.S. federal income tax rate of 35 percent and Applied’s actual effec-tive income tax rate for fiscal 2011, 2010 and 2009 is presented below:
2011 2010 2009
Tax provision (benefit) at U.S. statutory rate . . . . . . . . . . . . . . . . . . . . . . . . . . 35.0% 35.0% (35.0)%Favorable resolutions from audits of prior years’ income tax filings . . . . . . . . (6.9) — (2.9)Effect of foreign operations taxed at various rates . . . . . . . . . . . . . . . . . . . . . . (10.1) (3.0) —State income taxes, net of federal benefit . . . . . . . . . . . . . . . . . . . . . . . . . . . . . 1.6 0.9 (3.9)Research and other tax credits . . . . . . . . . . . . . . . . . . . . . . . . . . . . . . . . . . . . . . (1.2) (0.3) (2.0)Export sales/production benefit . . . . . . . . . . . . . . . . . . . . . . . . . . . . . . . . . . . . . (0.8) (1.2) —Equity method investment loss/impairment . . . . . . . . . . . . . . . . . . . . . . . . . . . — — 5.7Share-based compensation . . . . . . . . . . . . . . . . . . . . . . . . . . . . . . . . . . . . . . . . 0.4 0.6 2.4Other . . . . . . . . . . . . . . . . . . . . . . . . . . . . . . . . . . . . . . . . . . . . . . . . . . . . . . . . . 1.0 0.4 (1.5)
19.0% 32.4% (37.2)%
105
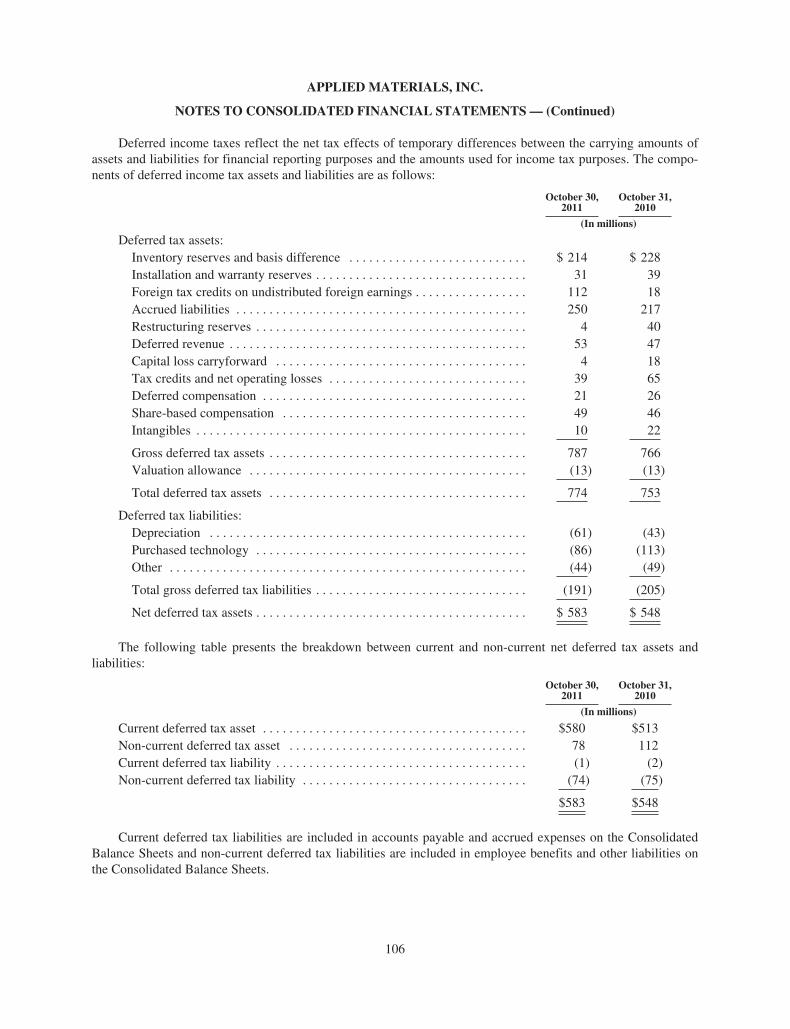
APPLIED MATERIALS, INC.
NOTES TO CONSOLIDATED FINANCIAL STATEMENTS — (Continued)
Deferred income taxes reflect the net tax effects of temporary differences between the carrying amounts ofassets and liabilities for financial reporting purposes and the amounts used for income tax purposes. The compo-nents of deferred income tax assets and liabilities are as follows:
October 30,2011
October 31,2010
(In millions)
Deferred tax assets:Inventory reserves and basis difference . . . . . . . . . . . . . . . . . . . . . . . . . . . $ 214 $ 228Installation and warranty reserves . . . . . . . . . . . . . . . . . . . . . . . . . . . . . . . . 31 39Foreign tax credits on undistributed foreign earnings . . . . . . . . . . . . . . . . . 112 18Accrued liabilities . . . . . . . . . . . . . . . . . . . . . . . . . . . . . . . . . . . . . . . . . . . . 250 217Restructuring reserves . . . . . . . . . . . . . . . . . . . . . . . . . . . . . . . . . . . . . . . . . 4 40Deferred revenue . . . . . . . . . . . . . . . . . . . . . . . . . . . . . . . . . . . . . . . . . . . . . 53 47Capital loss carryforward . . . . . . . . . . . . . . . . . . . . . . . . . . . . . . . . . . . . . . 4 18Tax credits and net operating losses . . . . . . . . . . . . . . . . . . . . . . . . . . . . . . 39 65Deferred compensation . . . . . . . . . . . . . . . . . . . . . . . . . . . . . . . . . . . . . . . . 21 26Share-based compensation . . . . . . . . . . . . . . . . . . . . . . . . . . . . . . . . . . . . . 49 46Intangibles . . . . . . . . . . . . . . . . . . . . . . . . . . . . . . . . . . . . . . . . . . . . . . . . . . 10 22
Gross deferred tax assets . . . . . . . . . . . . . . . . . . . . . . . . . . . . . . . . . . . . . . . 787 766Valuation allowance . . . . . . . . . . . . . . . . . . . . . . . . . . . . . . . . . . . . . . . . . . (13) (13)
Total deferred tax assets . . . . . . . . . . . . . . . . . . . . . . . . . . . . . . . . . . . . . . . 774 753
Deferred tax liabilities:Depreciation . . . . . . . . . . . . . . . . . . . . . . . . . . . . . . . . . . . . . . . . . . . . . . . . (61) (43)Purchased technology . . . . . . . . . . . . . . . . . . . . . . . . . . . . . . . . . . . . . . . . . (86) (113)Other . . . . . . . . . . . . . . . . . . . . . . . . . . . . . . . . . . . . . . . . . . . . . . . . . . . . . . (44) (49)
Total gross deferred tax liabilities . . . . . . . . . . . . . . . . . . . . . . . . . . . . . . . . (191) (205)
Net deferred tax assets . . . . . . . . . . . . . . . . . . . . . . . . . . . . . . . . . . . . . . . . . $ 583 $ 548
The following table presents the breakdown between current and non-current net deferred tax assets andliabilities:
October 30,2011
October 31,2010
(In millions)
Current deferred tax asset . . . . . . . . . . . . . . . . . . . . . . . . . . . . . . . . . . . . . . . . $580 $513Non-current deferred tax asset . . . . . . . . . . . . . . . . . . . . . . . . . . . . . . . . . . . . 78 112Current deferred tax liability . . . . . . . . . . . . . . . . . . . . . . . . . . . . . . . . . . . . . . (1) (2)Non-current deferred tax liability . . . . . . . . . . . . . . . . . . . . . . . . . . . . . . . . . . (74) (75)
$583 $548
Current deferred tax liabilities are included in accounts payable and accrued expenses on the ConsolidatedBalance Sheets and non-current deferred tax liabilities are included in employee benefits and other liabilities onthe Consolidated Balance Sheets.
106

APPLIED MATERIALS, INC.
NOTES TO CONSOLIDATED FINANCIAL STATEMENTS — (Continued)
A valuation allowance is recorded to reflect the estimated amount of deferred tax assets that may not be real-ized. In fiscal 2011, the valuation allowance against capital loss carryforwards was released due to recognition ofsufficient capital gains. A valuation allowance was established against California Research and DevelopmentCredit carryforward where it is believed that it is not more likely than not that the carryforward will be realized.
The Company has been granted tax holidays for certain of its subsidiaries in Singapore and Israel. The taxbenefit arising from these tax holidays was $128 million for 2011 ($0.10 per diluted share), The tax holidaysexpire at various times through 2025, excluding potential renewals, and are subject to certain conditions withwhich the Company expects to comply.
For fiscal 2011, U.S. income taxes have not been provided for approximately $1.0 billion of cumulativeundistributed earnings of several non-U.S. subsidiaries. Applied intends to reinvest these earnings indefinitely inoperations outside of the U.S. If these earnings were distributed to the United States in the form of dividends orotherwise, or if the shares of the relevant foreign subsidiaries were sold or otherwise transferred, the Companywould be subject to additional U.S. income taxes (subject to an adjustment for foreign tax credits) and foreignwithholding taxes. Determination of the amount of unrecognized deferred income tax liability related to theseearnings is not practicable.
At October 30, 2011, Applied has a California research and development tax credit carryforward of $13million which has an unlimited life. Applied also has net operating loss carryforwards in foreign jurisdictions of$64 million. The carryforwards have lives ranging from five years to indefinite. Management believes it is morelikely than not that all loss and tax credit carryforwards at October 30, 2011, net of valuation allowance, will beutilized in future periods.
Applied’s income taxes payable have been reduced by the tax benefits associated with employee stockoption transactions. These benefits, credited directly to stockholders’ equity, amounted to $4 million for fiscal2011, $2 million for fiscal 2010, and $1 million for fiscal 2009 with a corresponding reduction to taxes payableof $4 million in fiscal 2011, $2 million for fiscal 2010, and $1 million for fiscal 2009.
Applied maintains liabilities for uncertain tax positions. These liabilities involve considerable judgment andestimation and are continuously monitored by management based on the best information available. A reconcilia-tion of the beginning and ending balances of the total amounts of gross unrecognized tax benefits is as follows:
2011 2010
(In millions)
Beginning balance of gross unrecognized tax benefits . . . . . . . . . . . . . . . . . . . . . . . . . $ 328 $325Settlements with tax authorities . . . . . . . . . . . . . . . . . . . . . . . . . . . . . . . . . . . . . . . . . . . (314) —Increases in tax positions for current years . . . . . . . . . . . . . . . . . . . . . . . . . . . . . . . . . . 45 3Decreases in tax positions for prior years . . . . . . . . . . . . . . . . . . . . . . . . . . . . . . . . . . . — —
Ending balance of gross unrecognized tax benefits . . . . . . . . . . . . . . . . . . . . . . . . . . . . $ 59 $328
As of October 30, 2011, Applied had unrecognized tax benefits, net of federal deduction for state tax, of $59million, all of which, if recognized, would result in a reduction of Applied’s effective tax rate.
As of October 30, 2011, the gross liability for unrecognized tax benefits was $59 million, exclusive of inter-est and penalties. Increases or decreases to interest and penalties on uncertain tax positions are included in provi-sion for income taxes in the Consolidated Statement of Operations. Interest and penalties related to uncertain taxpositions were $1 million as of October 30, 2011 and $6 million as of October 31, 2010. All $1 million in interestand penalties were classified as a long-term liability in the Consolidated Balance Sheets.
107

APPLIED MATERIALS, INC.
NOTES TO CONSOLIDATED FINANCIAL STATEMENTS — (Continued)
In fiscal 2011, Applied received a refund of $276 million, including interest, as a result of settling anInternal Revenue Service (IRS) audit for fiscal years 2006 and 2007. This resulted in the recognition of a taxbenefit of $176 million in the Consolidated Statement of Operations for fiscal 2011, which was net of previouslyrecognized tax benefits.
During fiscal 2011, the IRS began an examination of Applied’s federal income tax returns for fiscal years2009 and 2008. Applied believes it has adequately reserved for any income tax uncertainties that may arise as aresult of this examination.
A number of Applied’s tax returns remain subject to examination by taxing authorities. These includeU.S. federal returns for fiscal 2008 and later years, California returns for fiscal 2006 and later years, tax returnsfor certain other states for fiscal 2006 and later years, and tax returns in certain jurisdictions outside of the UnitedStates for fiscal 2004 and later years.
The timing of the resolution of income tax examinations, as well as the amounts and timing of various taxpayments that may be part of the settlement process, is highly uncertain. This could cause large fluctuations inthe balance sheet classification of current assets and non-current assets and liabilities. Applied does not expect amaterial change in unrecognized tax benefits in the next 12 months.
Note 15 Warranty, Guarantees and Contingencies
Leases
Applied leases some of its facilities and equipment under non-cancelable operating leases and has options torenew most leases, with rentals to be negotiated. Total rent expense was $44 million for fiscal 2011, $44 millionfor fiscal 2010, and $55 million for fiscal 2009.
As of October 30, 2011, future minimum lease payments is expected to be as follows:
Lease Payments
(In millions)
2012 . . . . . . . . . . . . . . . . . . . . . . . . . . . . . . . . . . . . . . . . . . . . . . . . . . . . . . . . . . . . . . . . . $ 332013 . . . . . . . . . . . . . . . . . . . . . . . . . . . . . . . . . . . . . . . . . . . . . . . . . . . . . . . . . . . . . . . . . 222014 . . . . . . . . . . . . . . . . . . . . . . . . . . . . . . . . . . . . . . . . . . . . . . . . . . . . . . . . . . . . . . . . . 142015 . . . . . . . . . . . . . . . . . . . . . . . . . . . . . . . . . . . . . . . . . . . . . . . . . . . . . . . . . . . . . . . . . 102016 . . . . . . . . . . . . . . . . . . . . . . . . . . . . . . . . . . . . . . . . . . . . . . . . . . . . . . . . . . . . . . . . . 8Thereafter . . . . . . . . . . . . . . . . . . . . . . . . . . . . . . . . . . . . . . . . . . . . . . . . . . . . . . . . . . . . 21
$108
Warranty
Changes in the warranty reserves during fiscal 2011 and 2010 were as follows:
2011 2010
(In millions)
Beginning balance . . . . . . . . . . . . . . . . . . . . . . . . . . . . . . . . . . . . . . . . . . . . . . . . . . . . $ 155 $ 117Provisions for warranty . . . . . . . . . . . . . . . . . . . . . . . . . . . . . . . . . . . . . . . . . . . . . . . . 170 152Consumption of reserves . . . . . . . . . . . . . . . . . . . . . . . . . . . . . . . . . . . . . . . . . . . . . . . (157) (114)
Ending balance . . . . . . . . . . . . . . . . . . . . . . . . . . . . . . . . . . . . . . . . . . . . . . . . . . . . . . . $ 168 $ 155
108

APPLIED MATERIALS, INC.
NOTES TO CONSOLIDATED FINANCIAL STATEMENTS — (Continued)
Applied products are generally sold with a 12-month warranty period following installation. The provisionfor the estimated cost of warranty is recorded when revenue is recognized. Parts and labor are covered under theterms of the warranty agreement. The warranty provision is based on historical experience by product, config-uration and geographic region. Quarterly warranty consumption is generally associated with sales that occurredduring the preceding four quarters, and quarterly warranty provisions are generally related to the current quarter’ssales.
Guarantees
In the ordinary course of business, Applied provides standby letters of credit or other guarantee instrumentsto third parties as required for certain transactions initiated by either Applied or its subsidiaries. As ofOctober 30, 2011, the maximum potential amount of future payments that Applied could be required to makeunder these guarantee agreements was approximately $58 million. Applied has not recorded any liability inconnection with these guarantee agreements beyond that required to appropriately account for the underlyingtransaction being guaranteed. Applied does not believe, based on historical experience and information currentlyavailable, that it is probable that any amounts will be required to be paid under these guarantee agreements.
Applied also has agreements with various banks to facilitate subsidiary banking operations worldwide,including overdraft arrangements, issuance of bank guarantees, and letters of credit. As of October 30, 2011,Applied Materials Inc. has provided parent guarantees to banks for approximately $191 million to cover theseservices.
Legal Matters
Varian Shareholder Litigation
In connection with the proposed acquisition of Varian announced in May 2011, the Louisiana MunicipalPolice Employees Retirement Systems filed a lawsuit (the “LMPERS lawsuit”) on July 23, 2011, for itself and onbehalf of a putative class of Varian stockholders, in the U.S. District Court for the District of Massachusettsagainst Varian and its directors, as well as Applied and Applied’s acquisition subsidiary. The LMPERS com-plaint alleged that Varian’s directors breached their fiduciary duties in connection with the transaction and thatApplied aided and abetted such alleged breaches. The lawsuit sought, among other things, an order rescinding theMerger Agreement, an injunction preventing consummation of the transaction, a constructive trust in favor of theplaintiff class, and attorneys’ fees. On July 25, 2011, plaintiff in the LMPERS lawsuit filed motions for expediteddiscovery and for a preliminary injunction to prevent a shareholder vote on the merger. The Court denied plain-tiff’s motion for expedited discovery on August 1, 2011 and denied plaintiff’s motion for a preliminaryinjunction on August 8, 2011. On August 30, 2011, the LMPERS plaintiff voluntarily dismissed its lawsuit with-out prejudice.
Jusung
Applied has been engaged in several lawsuits and patent and administrative proceedings with JusungEngineering Co., Ltd. and/or Jusung Pacific Co., Ltd. (Jusung) in Taiwan and South Korea since 2003, and morerecently in China, involving technology used in manufacturing LCDs. Applied believes that it has meritoriousclaims and defenses against Jusung that it intends to pursue vigorously.
In 2004, Applied filed a complaint for patent infringement against Jusung in the Hsinchu District Court inTaiwan seeking damages and a permanent injunction for infringement of a patent related to chemical vapordeposition (CVD) equipment. Jusung filed a counterclaim against Applied. On December 31, 2010, the HsinchuDistrict Court announced that it had ruled against Applied and dismissed the lawsuit and Jusung’s counterclaim.Applied appealed the dismissal of its lawsuit and Jusung appealed the dismissal of its counterclaim. Jusung
109

APPLIED MATERIALS, INC.
NOTES TO CONSOLIDATED FINANCIAL STATEMENTS — (Continued)
unsuccessfully sought invalidation of Applied’s CVD patent in the Taiwanese Intellectual Property Office(TIPO). In September 2010, the Taipei Supreme Administrative Court dismissed Jusung’s appeal of the TIPO’sdecision. In 2009, Jusung filed a second action with the TIPO seeking invalidation of Applied’s CVD patent,which action remains pending.
In 2006, Applied filed an action in the TIPO challenging the validity of a Jusung patent related to separa-bility of the transfer chamber on a CVD tool. Jusung sued Applied and AKT America in Hsinchu District Courtin Taiwan alleging infringement of the same patent. In March 2009, the Hsinchu District Court dismissedJusung’s lawsuit, and in October, 2010, the Taiwan Intellectual Property Court dismissed Jusung’s appeal. Sepa-rately, the TIPO granted Applied’s request for invalidation and also revoked Jusung’s patent. In January 2010,the Taiwan Intellectual Property Court granted Jusung’s appeal of the TIPO decision revoking its patent andremanded the matter to the TIPO for reconsideration of validity. TIPO subsequently granted another party’srequest for invalidation of Jusung’s patent. Jusung appealed to the Taiwan Intellectual Property Court andApplied intervened in the appeal. On May 12, 2011, the Taiwan Intellectual Property Court dismissed Jusung’sappeal. Jusung has appealed this decision to the Taipei Supreme Administrative Court. In November 2009,Applied filed an action in China with the Patent Reexamination Board of the State Intellectual Property Officeseeking to invalidate this patent. On June 18, 2010, the Patent Reexamination Board issued a decision invalid-ating Jusung’s patent in China. Jusung appealed to the Beijing No. 1 Intermediate People’s Court and on June 13,2011, this Court dismissed Jusung’s appeal. Jusung appealed this decision to the Beijing High People’s Court inJuly 2011, and Jusung’s appeal remains pending.
In 2006, Jusung filed a complaint of private prosecution in the Taipei District Court of Taiwan alleging thatApplied’s outside counsel received from the Court and used a copy of an expert report that Jusung had filed inthe ongoing patent infringement lawsuits that Jusung had intended to remain confidential. The complaint namesas defendants Applied’s outside counsel in Taiwan, as well as Michael R. Splinter, Applied’s Chairman, Presi-dent and Chief Executive Officer, as the statutory representative of Applied. The Taipei District Court dismissedthe private prosecution complaint, and the matter was transferred to the Taipei District Attorney’s Office. TheTaipei District Attorney’s Office issued five separate rulings not to prosecute, each of which Jusung appealed. Inthe first five instances, the Taiwan High Court District Attorney returned the matter to the Taipei District Attor-ney’s Office for further consideration. In response to the sixth ruling not to prosecute, the Taiwan High CourtDistrict Attorney dismissed Jusung’s appeal. Jusung subsequently petitioned to the Taipei District Court for atrial and Jusung’s petition remains pending.
Korea Criminal Proceedings
In February 2010, the Seoul Prosecutor’s Office for the Eastern District of Korea (the Prosecutor’s Office)indicted employees of several companies for the alleged improper receipt and use of confidential informationbelonging to Samsung Electronics Co., Ltd. (Samsung), a major Applied customer based in Korea. The Prose-cutor’s Office did not name Applied or any of its subsidiaries as a party to the criminal action. The individualscharged included the former head of Applied Materials Korea (AMK), who at the time of the indictment was avice president of Applied Materials, Inc., and certain other AMK employees. Hearings on these matters areongoing in the Seoul Eastern District Court. Applied and Samsung entered into a settlement agreement effectiveas of November 1, 2010, which resolves potential civil claims related to this matter, which is separate from anddoes not affect the criminal proceedings.
From time to time, Applied receives notification from third parties, including customers and suppliers, seek-ing indemnification, litigation support, payment of money or other actions by Applied in connection with claimsmade against them. In addition, from time to time, Applied receives notification from third parties claiming thatApplied may be or is infringing or misusing their intellectual property or other rights. Applied also is subject tovarious other legal proceedings and claims, both asserted and unasserted, that arise in the ordinary course ofbusiness.
110

APPLIED MATERIALS, INC.
NOTES TO CONSOLIDATED FINANCIAL STATEMENTS — (Continued)
Although the outcome of the above-described matters or these claims and proceedings cannot be predictedwith certainty, Applied does not believe that any of these proceedings or other claims will have a materialadverse effect on its consolidated financial condition or results of operations.
Note 16 Industry Segment Operations
Applied’s four reportable segments are: Silicon Systems Group, Applied Global Services, Display, andEnergy and Environmental Solutions. Applied’s chief operating decision-maker has been identified as the Presi-dent and Chief Executive Officer, who reviews operating results to make decisions about allocating resourcesand assessing performance for the entire company. Segment information is presented based upon Applied’smanagement organization structure as of October 30, 2011 and the distinctive nature of each segment. Futurechanges to this internal financial structure may result in changes to Applied’s reportable segments.
Each reportable segment is separately managed and has separate financial results that are reviewed byApplied’s chief operating decision-maker. Each reportable segment contains closely related products that areunique to the particular segment. Segment operating income is determined based upon internal performancemeasures used by Applied’s chief operating decision-maker.
Applied derives the segment results directly from its internal management reporting system. The accountingpolicies Applied uses to derive reportable segment results are substantially the same as those used for externalreporting purposes. Management measures the performance of each reportable segment based upon several met-rics including orders, net sales and operating income. Management uses these results to evaluate the performanceof, and to assign resources to, each of the reportable segments. Applied does not allocate to its reportable seg-ments certain operating expenses that it manages separately at the corporate level, which include costs related toshare-based compensation; certain management, finance, legal, human resources, and research, development andengineering functions provided at the corporate level; and unabsorbed information technology and occupancy. Inaddition, Applied does not allocate to its reportable segments restructuring and asset impairment charges and anyassociated adjustments related to restructuring actions, unless these charges or adjustments pertain to a specificreportable segment. Segment operating income excludes interest income/expense and other financial charges andincome taxes. Management does not consider the unallocated costs in measuring the performance of the report-able segments.
In fiscal 2010, as part of the restructuring of the Energy and Environmental Solutions segment, Applieddiscontinued marketing of its fully-integrated SunFab production lines but continued to offer individual tools forthin film solar manufacturing. Applied is supporting existing SunFab customers with services, upgrades andcapacity increases through its Applied Global Services segment as these products are considered to have reacheda particular stage in the product lifecycle. Effective in the first quarter of fiscal 2011, Applied accounts for thinfilm products under its Applied Global Services segment.
The Silicon Systems Group segment includes semiconductor capital equipment for etch, rapid thermal proc-essing, deposition, chemical mechanical planarization, metrology and inspection, and wafer packaging.
The Applied Global Services segment includes technically differentiated products and services to improveoperating efficiency, reduce operating costs and lessen the environmental impact of semiconductor, display andsolar customers’ factories. Applied Global Services’ products consist of spares, services, certain earlier gen-eration products, remanufactured equipment, and products that have reached a particular stage in the productlifecycle. Customer demand for these products and services is fulfilled through a global distribution system withtrained service engineers located in close proximity to customer sites.
The Display segment includes products for manufacturing LCDs for TVs, personal computers, video-enabled devices and touch panel applications.
111

APPLIED MATERIALS, INC.
NOTES TO CONSOLIDATED FINANCIAL STATEMENTS — (Continued)
The Energy and Environmental Solutions segment includes products for fabricating crystalline-silicon (c-Si)solar photovoltaic cells and modules, high throughput roll-to-roll coating systems for flexible electronics andweb products, and systems used in the manufacture of energy-efficient glass.
Information for each reportable segment as of October 30, 2011, October 31, 2010 and October 25, 2009and for the fiscal years then ended, is as follows:
Net SalesOperating
Income (Loss)Depreciation/Amortization
CapitalExpenditures
SegmentAssets
(In millions)
2011:Silicon Systems Group . . . . . . . . . . . . . . . . . . . . $ 5,415 $1,764 $ 52 $ 59 $2,036Applied Global Services . . . . . . . . . . . . . . . . . . . 2,413 482 13 7 1,337Display . . . . . . . . . . . . . . . . . . . . . . . . . . . . . . . . 699 147 7 31 459Energy and Environmental Solutions . . . . . . . . . 1,990 453 34 16 1,438
Total Segment . . . . . . . . . . . . . . . . . . . . . . . . . $10,517 $2,846 $106 $113 $5,270
2010:Silicon Systems Group . . . . . . . . . . . . . . . . . . . . $ 5,304 $1,892 $ 66 $ 39 $2,317Applied Global Services . . . . . . . . . . . . . . . . . . . 1,865 337 25 5 1,285Display . . . . . . . . . . . . . . . . . . . . . . . . . . . . . . . . 899 267 8 5 419Energy and Environmental Solutions . . . . . . . . . 1,481 (466) 57 41 1,402
Total Segment . . . . . . . . . . . . . . . . . . . . . . . . . $ 9,549 $2,030 $156 $ 90 $5,423
2009:Silicon Systems Group . . . . . . . . . . . . . . . . . . . . $ 1,960 $ 201 $ 53 $ 23 $1,195Applied Global Services . . . . . . . . . . . . . . . . . . . 1,397 115 34 15 1,043Display . . . . . . . . . . . . . . . . . . . . . . . . . . . . . . . . 502 51 12 15 445Energy and Environmental Solutions . . . . . . . . . 1,155 (234) 80 51 1,853
Total Segment . . . . . . . . . . . . . . . . . . . . . . . . . $ 5,014 $ 133 $179 $104 $4,536
In fiscal 2011, Applied entered into an agreement to divest certain assets held in the Applied Global Serv-ices segment and determined certain identified intangible assets and purchased technology to be impaired.Operating results for fiscal 2011 included impairment charges of $24 million, which were reported in the AppliedGlobal Services segment.
In fiscal 2010, Applied recorded charges related to a plan to restructure its Energy and Environmental Sol-utions segment totaling $405 million, which included inventory related charges of $247 million related to SunFabthin film solar equipment, asset impairment charges of $110 million, employee severance charges of $45 million,and other costs of $3 million. These charges were reported in the Energy and Environmental Solutions segment.Operating results in the Energy and Environmental Solutions segment for fiscal 2011 included favorable adjust-ments of $36 million related to this restructuring program.
112

APPLIED MATERIALS, INC.
NOTES TO CONSOLIDATED FINANCIAL STATEMENTS — (Continued)
Reconciliations of segment operating results to Applied consolidated totals for fiscal 2011, 2010 and 2009are as follows:
2011 2010 2009
(In millions)
Total segment operating income . . . . . . . . . . . . . . . . . . . . . . . . . . . . . . . . $2,846 $2,030 $ 133Corporate and unallocated costs . . . . . . . . . . . . . . . . . . . . . . . . . . . . . . . . (496) (553) (371)Restructuring charges and asset impairments . . . . . . . . . . . . . . . . . . . . . . 21 (93) (156)Gain on sale of facility . . . . . . . . . . . . . . . . . . . . . . . . . . . . . . . . . . . . . . . . 27 — —
Income (loss) from operations . . . . . . . . . . . . . . . . . . . . . . . . . . . . . . . . . . $2,398 $1,384 $(394)
Reconciliations of depreciation and amortization expense to Applied consolidated totals for fiscal 2011,2010 and 2009 are as follows:
2011 2010 2009
(In millions)
Total segment depreciation and amortization . . . . . . . . . . . . . . . . . . . . . . . . . . $106 $156 $179Depreciation on shared facilities and information technology assets . . . . . . . . 140 149 112
Consolidated depreciation and amortization . . . . . . . . . . . . . . . . . . . . . . . . . . . $246 $305 $291
Reconciliations of capital expenditures to Applied consolidated totals for fiscal 2011, 2010 and 2009 are asfollows:
2011 2010 2009
(In millions)
Total segment capital expenditures . . . . . . . . . . . . . . . . . . . . . . . . . . . . . . . . . . $113 $ 90 $104Shared facilities and information technology assets . . . . . . . . . . . . . . . . . . . . . 96 79 145
Consolidated capital expenditures . . . . . . . . . . . . . . . . . . . . . . . . . . . . . . . . . . . $209 $169 $249
Reconciliations of segment assets to Applied consolidated totals as of October 30, 2011, October 31, 2010and October 25, 2009 are as follows:
October 30,2011
October 31,2010
October 25,2009
(In millions)
Total segment assets . . . . . . . . . . . . . . . . . . . . . . . . . . . . . . . . . $ 5,270 $ 5,423 $4,536Cash and investments . . . . . . . . . . . . . . . . . . . . . . . . . . . . . . . . 7,174 3,892 3,267Allowance for bad debts . . . . . . . . . . . . . . . . . . . . . . . . . . . . . . (73) (74) (68)Deferred income taxes . . . . . . . . . . . . . . . . . . . . . . . . . . . . . . . . 658 625 455Other current assets . . . . . . . . . . . . . . . . . . . . . . . . . . . . . . . . . . 90 93 337Common property, plant and equipment . . . . . . . . . . . . . . . . . . 620 740 821Other assets . . . . . . . . . . . . . . . . . . . . . . . . . . . . . . . . . . . . . . . . 122 244 226
Consolidated total assets . . . . . . . . . . . . . . . . . . . . . . . . . . . . . . $13,861 $10,943 $9,574
113

APPLIED MATERIALS, INC.
NOTES TO CONSOLIDATED FINANCIAL STATEMENTS — (Continued)
For geographical reporting, revenue is attributed to the geographic location in which the customers’ facili-ties are located. Long-lived assets consist primarily of property, plant and equipment and equity-method invest-ments, and are attributed to the geographic location in which they are located. Net sales and long-lived assets bygeographic region were as follows:
Net SalesLong-lived
Assets
(In millions)
2011:North America(1) . . . . . . . . . . . . . . . . . . . . . . . . . . . . . . . . . . . . . . . . . . . . . . $ 1,963 $ 623
China . . . . . . . . . . . . . . . . . . . . . . . . . . . . . . . . . . . . . . . . . . . . . . . . . . . . . . . . 2,574 81Taiwan . . . . . . . . . . . . . . . . . . . . . . . . . . . . . . . . . . . . . . . . . . . . . . . . . . . . . . . 2,093 33Korea . . . . . . . . . . . . . . . . . . . . . . . . . . . . . . . . . . . . . . . . . . . . . . . . . . . . . . . . 1,263 8Europe . . . . . . . . . . . . . . . . . . . . . . . . . . . . . . . . . . . . . . . . . . . . . . . . . . . . . . . 1,120 128Japan . . . . . . . . . . . . . . . . . . . . . . . . . . . . . . . . . . . . . . . . . . . . . . . . . . . . . . . . 912 7Southeast Asia . . . . . . . . . . . . . . . . . . . . . . . . . . . . . . . . . . . . . . . . . . . . . . . . . 592 71
Total outside North America . . . . . . . . . . . . . . . . . . . . . . . . . . . . . . . . . . . . 8,554 328
Consolidated total . . . . . . . . . . . . . . . . . . . . . . . . . . . . . . . . . . . . . . . . . . . . $10,517 $ 951
2010:North America(1) . . . . . . . . . . . . . . . . . . . . . . . . . . . . . . . . . . . . . . . . . . . . . . $ 1,147 $ 715
China . . . . . . . . . . . . . . . . . . . . . . . . . . . . . . . . . . . . . . . . . . . . . . . . . . . . . . . . 1,557 78Taiwan . . . . . . . . . . . . . . . . . . . . . . . . . . . . . . . . . . . . . . . . . . . . . . . . . . . . . . . 2,750 32Korea . . . . . . . . . . . . . . . . . . . . . . . . . . . . . . . . . . . . . . . . . . . . . . . . . . . . . . . . 1,768 5Europe . . . . . . . . . . . . . . . . . . . . . . . . . . . . . . . . . . . . . . . . . . . . . . . . . . . . . . . 981 95Japan . . . . . . . . . . . . . . . . . . . . . . . . . . . . . . . . . . . . . . . . . . . . . . . . . . . . . . . . 768 5Southeast Asia . . . . . . . . . . . . . . . . . . . . . . . . . . . . . . . . . . . . . . . . . . . . . . . . . 578 65
Total outside North America . . . . . . . . . . . . . . . . . . . . . . . . . . . . . . . . . . . . 8,402 280
Consolidated total . . . . . . . . . . . . . . . . . . . . . . . . . . . . . . . . . . . . . . . . . . . . $ 9,549 $ 995
2009:North America(1) . . . . . . . . . . . . . . . . . . . . . . . . . . . . . . . . . . . . . . . . . . . . . . $ 966 $ 803
China . . . . . . . . . . . . . . . . . . . . . . . . . . . . . . . . . . . . . . . . . . . . . . . . . . . . . . . . 635 98Taiwan . . . . . . . . . . . . . . . . . . . . . . . . . . . . . . . . . . . . . . . . . . . . . . . . . . . . . . . 1,026 33Korea . . . . . . . . . . . . . . . . . . . . . . . . . . . . . . . . . . . . . . . . . . . . . . . . . . . . . . . . 664 5Europe . . . . . . . . . . . . . . . . . . . . . . . . . . . . . . . . . . . . . . . . . . . . . . . . . . . . . . . 753 115Japan . . . . . . . . . . . . . . . . . . . . . . . . . . . . . . . . . . . . . . . . . . . . . . . . . . . . . . . . 718 7Southeast Asia . . . . . . . . . . . . . . . . . . . . . . . . . . . . . . . . . . . . . . . . . . . . . . . . . 252 57
Total outside North America . . . . . . . . . . . . . . . . . . . . . . . . . . . . . . . . . . . . 4,048 315
Consolidated total . . . . . . . . . . . . . . . . . . . . . . . . . . . . . . . . . . . . . . . . . . . . $ 5,014 $1,118
(1) Primarily the United States.
114

APPLIED MATERIALS, INC.
NOTES TO CONSOLIDATED FINANCIAL STATEMENTS — (Continued)
The following companies accounted for at least 10 percent of Applied’s net sales in fiscal 2011, 2010, and/or 2009, which were for products in multiple reportable segments.
2011 2010 2009
Samsung Electronics Co., Ltd. . . . . . . . . . . . . . . . . . . . . . . . . . . . . . . . . . . . . . . . . 12% 14% 10%Taiwan Semiconductor Manufacturing Company Limited . . . . . . . . . . . . . . . . . . 10% 11% *Intel Corporation . . . . . . . . . . . . . . . . . . . . . . . . . . . . . . . . . . . . . . . . . . . . . . . . . . 10% * 12%
* Less than 10%.
Note 17 Subsequent Events
On November 10, 2011, Applied completed its acquisition of Varian. The aggregate purchase price of theacquisition was approximately $4.2 billion, net of cash acquired. The transaction was funded with a combinationof cash and proceeds of long-term debt issued in June 2011. Following the acquisition of Varian Applied’s cash,cash equivalents and investments totaled approximately $3.0 billion.
Note 18 Unaudited Quarterly Consolidated Financial Data
Fiscal Quarter
First Second Third Fourth Fiscal Year
(In millions, except per share amounts)
2011:Net sales . . . . . . . . . . . . . . . . . . . . . . . . . . . . . . . . . . . . . . . . . . $2,686 $2,862 $2,787 $2,182 $10,517Gross margin . . . . . . . . . . . . . . . . . . . . . . . . . . . . . . . . . . . . . . $1,136 $1,189 $1,184 $ 852 $ 4,360Net income . . . . . . . . . . . . . . . . . . . . . . . . . . . . . . . . . . . . . . . . $ 506 $ 489 $ 476 $ 456 $ 1,926Earnings per diluted share . . . . . . . . . . . . . . . . . . . . . . . . . . . . $ 0.38 $ 0.37 $ 0.36 $ 0.34 $ 1.45
2010:Net sales . . . . . . . . . . . . . . . . . . . . . . . . . . . . . . . . . . . . . . . . . . $1,849 $2,296 $2,518 $2,886 $ 9,549Gross margin . . . . . . . . . . . . . . . . . . . . . . . . . . . . . . . . . . . . . . $ 711 $ 927 $ 860 $1,217 $ 3,715Net income . . . . . . . . . . . . . . . . . . . . . . . . . . . . . . . . . . . . . . . . $ 83 $ 264 $ 123 $ 468 $ 938Earnings per diluted share . . . . . . . . . . . . . . . . . . . . . . . . . . . . $ 0.06 $ 0.20 $ 0.09 $ 0.35 $ 0.70
115

REPORT OF INDEPENDENT REGISTERED PUBLIC ACCOUNTING FIRM
The Board of Directors and StockholdersApplied Materials, Inc.:
We have audited the accompanying consolidated balance sheets of Applied Materials, Inc. and subsidiaries(the Company) as of October 30, 2011 and October 31, 2010, and the related consolidated statements of oper-ations, stockholders’ equity and comprehensive income (loss), and cash flows for each of the years in the three-year period ended October 30, 2011. In connection with our audits of the consolidated financial statements, wealso have audited financial statement schedule II. These consolidated financial statements and financial statementschedule are the responsibility of the Company’s management. Our responsibility is to express an opinion onthese consolidated financial statements and financial statement schedule based on our audits.
We conducted our audits in accordance with the standards of the Public Company Accounting OversightBoard (United States). Those standards require that we plan and perform the audit to obtain reasonable assuranceabout whether the financial statements are free of material misstatement. An audit includes examining, on a testbasis, evidence supporting the amounts and disclosures in the financial statements. An audit also includes assess-ing the accounting principles used and significant estimates made by management, as well as evaluating theoverall financial statement presentation. We believe that our audits provide a reasonable basis for our opinion.
In our opinion, the consolidated financial statements referred to above present fairly, in all material respects,the financial position of Applied Materials, Inc. and subsidiaries as of October 30, 2011 and October 31, 2010,and the results of their operations and their cash flows for each of the years in the three-year period endedOctober 30, 2011, in conformity with U.S. generally accepted accounting principles. Also in our opinion, therelated financial statement schedule, when considered in relation to the basic consolidated financial statementstaken as a whole, presents fairly, in all material respects, the information set forth therein.
As discussed in Note 1 to the consolidated financial statements, the Company adopted Accounting Stan-dards Codification Topic 805, Business Combinations, during the year ended October 31, 2010.
We also have audited, in accordance with the standards of the Public Company Accounting Oversight Board(United States), Applied Materials, Inc.’s internal control over financial reporting as of October 30, 2011, basedon criteria established in Internal Control—Integrated Framework issued by the Committee of Sponsoring Orga-nizations of the Treadway Commission (COSO), and our report dated December 6, 2011 expressed anunqualified opinion on the effectiveness of the Company’s internal control over financial reporting.
/S/ KPMG LLP
KPMG LLP
Mountain View, CaliforniaDecember 6, 2011
116

INDEX TO EXHIBITS
These Exhibits are numbered in accordance with the Exhibit Table of Item 601 of Regulation S-K:
Exhibit No. Description
2.1** Agreement and Plan of Merger dated as of May 3, 2011, among Applied Materials, Inc.,Barcelona Acquisition Corp. and Varian Semiconductor Equipment Associates, Inc., incorporatedby reference to Applied’s Form 8-K (file no. 000-06920) filed on May 4, 2011.
3.1 Certificate of Incorporation of Applied Materials, Inc., as amended and restated through March 10,2009, incorporated by reference to Applied’s Form 10-Q for the quarter ended April 26, 2009 (fileno. 000-06920) filed June 3, 2009.
3.2 Certificate of Designation, Preferences and Rights of the Terms of the Series A Junior Participat-ing Preferred Stock dated as of July 9, 1999, incorporated by reference to Applied’s Form 10-Qfor the quarter ended August 1, 1999 (file no. 000-06920) filed September 14, 1999.
3.3 Bylaws of Applied Materials, Inc., as amended and restated through December 8, 2008,incorporated by reference to Applied’s Form 8-K (file no. 000-06920) filed December 10, 2008.
4.1 Form of Indenture (including form of debt security) between Applied Materials, Inc. and HarrisTrust Company of California, as Trustee, incorporated by reference to Applied’s Form 8-K (fileno. 000-06920) filed August 17, 1994.
4.2 Indenture, dated June 8, 2011, by and between Applied Materials, Inc. and U.S. Bank NationalAssociation, incorporated by reference to Applied’s Form 8-K (file no. 000-06920) filed June 10,2011.
4.3 First Supplemental Indenture, dated June 8, 2011, by and between Applied Materials, Inc. andU.S. Bank National Association, incorporated by reference to Applied’s Form 8-K (fileno. 000-06920) filed June 10, 2011.
10.1* Applied Materials, Inc. Executive Deferred Compensation Plan, as amended and restated onApril 1, 1995, incorporated by reference to Applied’s Form 10-Q for the quarter ended April 30,1995 (file no. 000-06920) filed June 7, 1995.
10.2* Amendment No. 1 to the Applied Materials, Inc. Executive Deferred Compensation Plan,incorporated by reference to Applied’s Form 10-Q for the quarter ended July 26, 1998 (fileno. 000-06920) filed September 9, 1998.
10.3* Amendment No. 2 to the Applied Materials, Inc. Executive Deferred Compensation Plan,incorporated by reference to Applied’s Form 10-Q for the quarter ended July 26, 1998 (fileno. 000-06920) filed September 9, 1998.
10.4 Form of Indemnification Agreement between Applied Materials, Inc. and Non-Employee Direc-tors, dated June 11, 1999, incorporated by reference to Applied’s Form 10-K for fiscal year 1999(file no. 333-88777) filed January 31, 2000.
10.5 Form of Indemnification Agreement between Applied Materials, Inc. and certain of its officers,incorporated by reference to Applied’s Form 10-K for fiscal year 1999 (file no. 333-88777) filedJanuary 31, 2000.
10.6* Applied Materials, Inc. amended and restated 2000 Global Equity Incentive Plan, incorporated byreference to Applied’s Form 10-K for fiscal year 2002 (file no. 000-06920) filed January 23, 2003.
10.7 Applied Materials Profit Sharing Scheme, incorporated by reference to Applied’s S-8 (fileno. 333-45011) filed January 27, 1998.
10.8* Term Sheet for employment of Michael R. Splinter, as amended and restated December 8, 2008,incorporated by reference to Applied’s Form 10-Q for the quarter ended January 25, 2009 (fileno. 000-06920) filed March 3, 2009.
10.9 Binding Memorandum of Understanding between Applied Materials, Inc. and Novellus Systems,Inc. dated September 20, 2004, incorporated by reference to Applied’s Form 8-K (fileno. 000-06920) filed September 24, 2004. (Confidential treatment has been granted for theredacted portions of the agreement.)
117

Exhibit No. Description
10.10* Applied Materials, Inc. Nonemployee Director Share Purchase Plan, incorporated by reference toApplied’s Form 10-Q for the quarter ended May 1, 2005 (file no. 000-06920) filed May 31, 2005.
10.11* Election Form to Receive Shares in lieu of Retainer and/or Meeting Fees for use under the AppliedMaterials, Inc. Nonemployee Director Share Purchase Plan, incorporated by reference toApplied’s Form 10-Q for the quarter ended May 1, 2005 (file no. 000-06920) filed May 31, 2005.
10.12* Applied Materials, Inc. amended and restated Relocation Policy, incorporated by reference toApplied’s Form 8-K (file no. 000-06920) filed October 31, 2005.
10.13* Amendment No. 3 to the Applied Materials, Inc. Executive Deferred Compensation Plan,incorporated by reference to Applied’s Form 10-K for fiscal year 2005 (file no. 000-06920) filedDecember 14, 2005.
10.14* Amendment No. 4 to the Applied Materials, Inc. Executive Deferred Compensation Plan,incorporated by reference to Applied’s Form 10-K for fiscal year 2005 (file no. 000-06920) filedDecember 14, 2005.
10.15* Form of Non-Qualified Stock Option Grant Agreement for use under the Applied MaterialsEmployee Stock Incentive Plan, as amended, incorporated by reference to Applied’s Form 10-Qfor the quarter ended July 30, 2006 (file no. 000-06920) filed August 31, 2006.
10.16* Form of Non-Qualified Stock Option Grant Agreement for use under the Applied Materials, Inc.2000 Global Equity Incentive Plan, as amended, incorporated by reference to Applied’sForm 10-Q for the quarter ended July 30, 2006 (file no. 000-06920) filed August 31, 2006.
10.17* Form of Performance Shares Agreement for use under the Applied Materials, Inc. Employee StockIncentive Plan, as amended, incorporated by reference to Applied’s Form 10-Q for the quarterended July 30, 2006 (file no. 000-06920) filed August 31, 2006.
10.18* Applied Materials, Inc. amended and restated Employee Financial Assistance Plan (as ofDecember 18, 2008), incorporated by reference to Applied’s Form 10-Q for the quarter endedJanuary 25, 2009 (file no. 000-06920) filed March 3, 2009.
10.19* Form of Non-Qualified Stock Option Grant Agreement for use under the Applied Materials, Inc.Employee Stock Incentive Plan, as amended, incorporated by reference to Applied’s Form 10-Qfor the quarter ended April 29, 2007 (file no. 000-06920) filed May 30, 2007.
10.20* Form of Non-Qualified Stock Option Grant Agreement for use under the Applied Materials, Inc.2000 Global Equity Incentive Plan, as amended, incorporated by reference to Applied’sForm 10-Q for the quarter ended April 29, 2007 (file no. 000-06920) filed May 30, 2007.
10.21* Form of Performance Share Agreement for use under the Applied Materials, Inc. Employee StockIncentive Plan, as amended, incorporated by reference to Applied’s Form 10-Q for the quarterended April 29, 2007 (file no. 000-06920) filed May 30, 2007.
10.22* Form of Restricted Stock Agreement for use under the Applied Materials, Inc. Employee StockIncentive Plan, as amended, incorporated by reference to Applied’s Form 10-Q for the quarterended April 29, 2007 (file no. 000-06920) filed May 30, 2007.
10.23* Applied Materials, Inc. amended and restated 2005 Executive Deferred Compensation Plan,incorporated by reference to Applied’s Form 8-K (file no. 000-06920) filed July 13, 2007.
10.24* Form of Performance Shares Agreement for use under the Applied Materials, Inc. Employee StockIncentive Plan, as amended, incorporated by reference to Applied’s Form 10-K for fiscal year2007 (file no. 000-06920) filed December 14, 2007.
10.25* Form of Performance Shares Agreement for Nonemployee Directors for use under the AppliedMaterials, Inc. Employee Stock Incentive Plan, as amended, incorporated by reference toApplied’s Form 10-K for fiscal year 2007 (file no. 000-06920) filed December 14, 2007.
10.26* Form of Non-Qualified Stock Option Grant Agreement for use under the Applied Materials, Inc.Employee Stock Incentive Plan, as amended, incorporated by reference to Applied’s Form 10-Kfor fiscal year 2007 (file no. 000-06920) filed December 14, 2007.
118
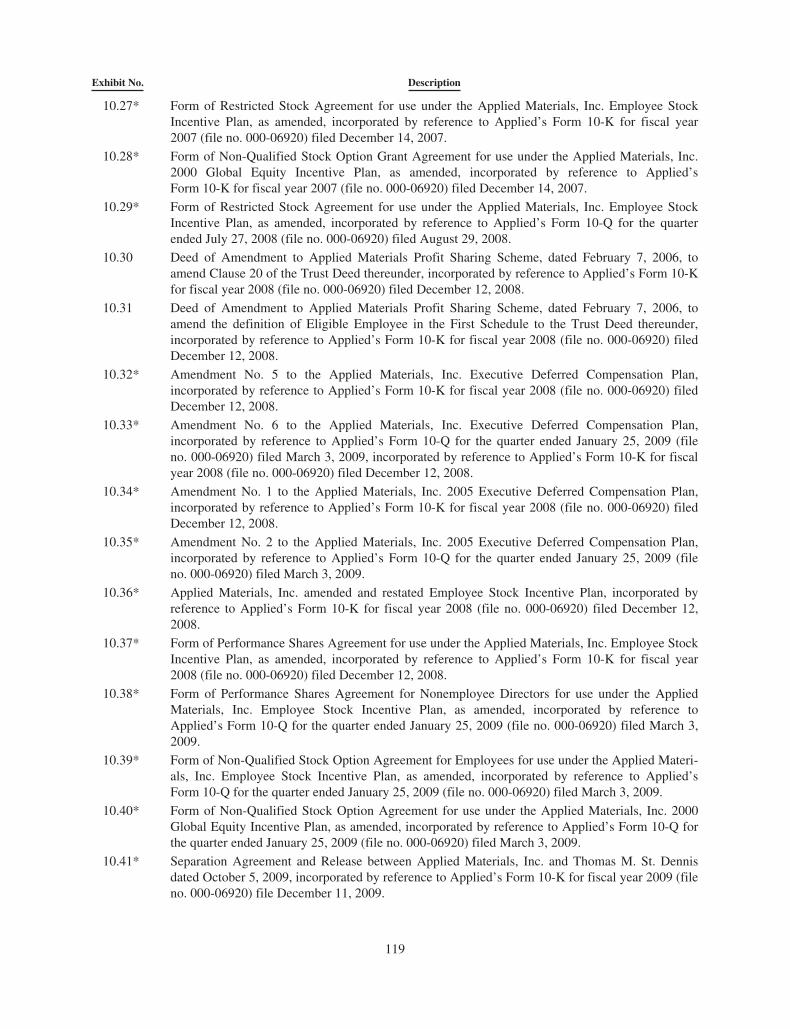
Exhibit No. Description
10.27* Form of Restricted Stock Agreement for use under the Applied Materials, Inc. Employee StockIncentive Plan, as amended, incorporated by reference to Applied’s Form 10-K for fiscal year2007 (file no. 000-06920) filed December 14, 2007.
10.28* Form of Non-Qualified Stock Option Grant Agreement for use under the Applied Materials, Inc.2000 Global Equity Incentive Plan, as amended, incorporated by reference to Applied’sForm 10-K for fiscal year 2007 (file no. 000-06920) filed December 14, 2007.
10.29* Form of Restricted Stock Agreement for use under the Applied Materials, Inc. Employee StockIncentive Plan, as amended, incorporated by reference to Applied’s Form 10-Q for the quarterended July 27, 2008 (file no. 000-06920) filed August 29, 2008.
10.30 Deed of Amendment to Applied Materials Profit Sharing Scheme, dated February 7, 2006, toamend Clause 20 of the Trust Deed thereunder, incorporated by reference to Applied’s Form 10-Kfor fiscal year 2008 (file no. 000-06920) filed December 12, 2008.
10.31 Deed of Amendment to Applied Materials Profit Sharing Scheme, dated February 7, 2006, toamend the definition of Eligible Employee in the First Schedule to the Trust Deed thereunder,incorporated by reference to Applied’s Form 10-K for fiscal year 2008 (file no. 000-06920) filedDecember 12, 2008.
10.32* Amendment No. 5 to the Applied Materials, Inc. Executive Deferred Compensation Plan,incorporated by reference to Applied’s Form 10-K for fiscal year 2008 (file no. 000-06920) filedDecember 12, 2008.
10.33* Amendment No. 6 to the Applied Materials, Inc. Executive Deferred Compensation Plan,incorporated by reference to Applied’s Form 10-Q for the quarter ended January 25, 2009 (fileno. 000-06920) filed March 3, 2009, incorporated by reference to Applied’s Form 10-K for fiscalyear 2008 (file no. 000-06920) filed December 12, 2008.
10.34* Amendment No. 1 to the Applied Materials, Inc. 2005 Executive Deferred Compensation Plan,incorporated by reference to Applied’s Form 10-K for fiscal year 2008 (file no. 000-06920) filedDecember 12, 2008.
10.35* Amendment No. 2 to the Applied Materials, Inc. 2005 Executive Deferred Compensation Plan,incorporated by reference to Applied’s Form 10-Q for the quarter ended January 25, 2009 (fileno. 000-06920) filed March 3, 2009.
10.36* Applied Materials, Inc. amended and restated Employee Stock Incentive Plan, incorporated byreference to Applied’s Form 10-K for fiscal year 2008 (file no. 000-06920) filed December 12,2008.
10.37* Form of Performance Shares Agreement for use under the Applied Materials, Inc. Employee StockIncentive Plan, as amended, incorporated by reference to Applied’s Form 10-K for fiscal year2008 (file no. 000-06920) filed December 12, 2008.
10.38* Form of Performance Shares Agreement for Nonemployee Directors for use under the AppliedMaterials, Inc. Employee Stock Incentive Plan, as amended, incorporated by reference toApplied’s Form 10-Q for the quarter ended January 25, 2009 (file no. 000-06920) filed March 3,2009.
10.39* Form of Non-Qualified Stock Option Agreement for Employees for use under the Applied Materi-als, Inc. Employee Stock Incentive Plan, as amended, incorporated by reference to Applied’sForm 10-Q for the quarter ended January 25, 2009 (file no. 000-06920) filed March 3, 2009.
10.40* Form of Non-Qualified Stock Option Agreement for use under the Applied Materials, Inc. 2000Global Equity Incentive Plan, as amended, incorporated by reference to Applied’s Form 10-Q forthe quarter ended January 25, 2009 (file no. 000-06920) filed March 3, 2009.
10.41* Separation Agreement and Release between Applied Materials, Inc. and Thomas M. St. Dennisdated October 5, 2009, incorporated by reference to Applied’s Form 10-K for fiscal year 2009 (fileno. 000-06920) file December 11, 2009.
119

Exhibit No. Description
10.42* Applied Materials, Inc. Stock Purchase Plan for Offshore Employees, amended and restated effec-tive December 7, 2009, incorporated by reference to Applied’s Form S-8 (file no. 333-165035)filed February 23, 2010.
10.43* Applied Materials, Inc. Employees’ Stock Purchase Plan, amended and restated effectiveFebruary 23, 2010, incorporated by reference to Applied’s Post-Effective Amendment No. 2 toRegistration Statement on Form S-8 (file no. 333-143377) filed February 23, 2010.
10.44* Amendment No. 7 to the Applied Materials, Inc. Executive Deferred Compensation Plan,incorporated by reference to Applied’s Form 10-Q for the quarter ended May 2, 2010 (fileno. 000-06920) filed June 9, 2010.
10.45* Amendment No. 3 to the Applied Materials, Inc. 2005 Executive Deferred Compensation Plan,incorporated by reference to Applied’s Form 10-Q for the quarter ended May 2, 2010 (fileno. 000-06920) filed June 9, 2010.
10.46* Amended and Restated Applied Materials, Inc. Senior Executive Bonus Plan, incorporated byreference to Applied’s Form 10-Q for the quarter ended May 2, 2010 (file no. 000-06920) filedJune 9, 2010.
10.47* Form of Performance Share Agreement for use under the Applied Materials, Inc. Employee StockIncentive Plan, as amended, incorporated by reference to Applied’s Form 10-Q for the quarterended May 2, 2010 (file no. 000-06920) filed June 9, 2010.
10.48* Form of Restricted Stock Agreement for use under the Applied Materials, Inc. Employee StockIncentive Plan, as amended, incorporated by reference to Applied’s Form 10-Q for the quarterended May 2, 2010 (file no. 000-06920) filed June 9, 2010.
10.49* Retirement Agreement and Release between Applied Materials, Inc. and Franz Janker dated July10, 2010, incorporated by reference to Applied’s Form 10-Q for the quarter ended August 1, 2010(file no. 000-06920) filed September 3, 2010.
10.50* Amended and Restated Applied Materials, Inc. Applied Incentive Plan, incorporated by referenceto Applied’s Form 10-K for the fiscal year ended October 31, 2011 (file no. 000-06920) filedDecember 10, 2010.
10.51* Amendment No. 8 to the Applied Materials, Inc. Executive Deferred Compensation Plan,incorporated by reference to Applied’s Form 10-Q for the quarter ended January 30, 2011 (fileno. 000-06920) filed February 28, 2011.
10.52* Amendment No. 4 to the Applied Materials, Inc. 2005 Executive Deferred Compensation Plan,incorporated by reference to Applied’s Form 10-Q for the quarter ended January 30, 2011 (file no.000-06920) filed February 28, 2011.
10.53 Settlement Agreement between Applied Materials, Inc. and Samsung Electronics Co., Ltd. datedNovember 1, 2010, incorporated by reference to Applied’s Form 10-Q/A for the quarter endedJanuary 30, 2011 (file no. 000-06920) filed May 19, 2011. (Confidential treatment has beengranted for the redacted portions of the agreement.)
10.54 Bridge Loan Agreement, dated as of May 25, 2011, among Applied Materials, Inc., JPMorganChase Bank, N.A., as administrative agent, and other lenders named therein, incorporated byreference to Applied’s Form 10-Q/A for the quarter ended July 31, 2011 (file no. 000-06920) filedNovember 18, 2011.
10.55 Credit Agreement, dated as of May 25, 2011, among Applied Materials, Inc., JPMorgan ChaseBank, N.A., as administrative agent, and other lenders named therein, incorporated by reference toApplied’s Form 10-Q/A for the quarter ended July 31, 2011 (file no. 000-06920) filedNovember 18, 2011.
21 Subsidiaries of Applied Materials, Inc.
23 Consent of Independent Registered Public Accounting Firm, KPMG LLP.
24 Power of Attorney
120

Exhibit No. Description
31.1 Certification of Chief Executive Officer Pursuant to Section 302 of the Sarbanes-Oxley Act of2002.
31.2 Certification of Chief Financial Officer Pursuant to Section 302 of the Sarbanes-Oxley Act of2002.
32.1 Certification Pursuant to 18 U.S.C. Section 1350, as adopted pursuant to Section 906 of theSarbanes-Oxley Act of 2002.
32.2 Certification Pursuant to 18 U.S.C. Section 1350, as adopted pursuant to Section 906 of theSarbanes-Oxley Act of 2002.
101.INS XBRL Instance Document
101.SCH XBRL Taxonomy Extension Schema Document
101.CAL XBRL Taxonomy Extension Calculation Linkbase Document
101.DEF XBRL Taxonomy Extension Definition Linkbase Document
101.LAB XBRL Taxonomy Extension Label Linkbase Document
101.PRE XBRL Taxonomy Extension Presentation Linkbase Document
* Indicates a management contract or compensatory plan or arrangement, as required by Item 15(a)3.
** Schedules and certain exhibits to this agreement have been omitted pursuant to Item 601(b)(2) of RegulationS-K. Applied hereby undertakes to furnish supplementally copies of any of the omitted schedules andexhibits upon request by the Securities and Exchange Commission.
121
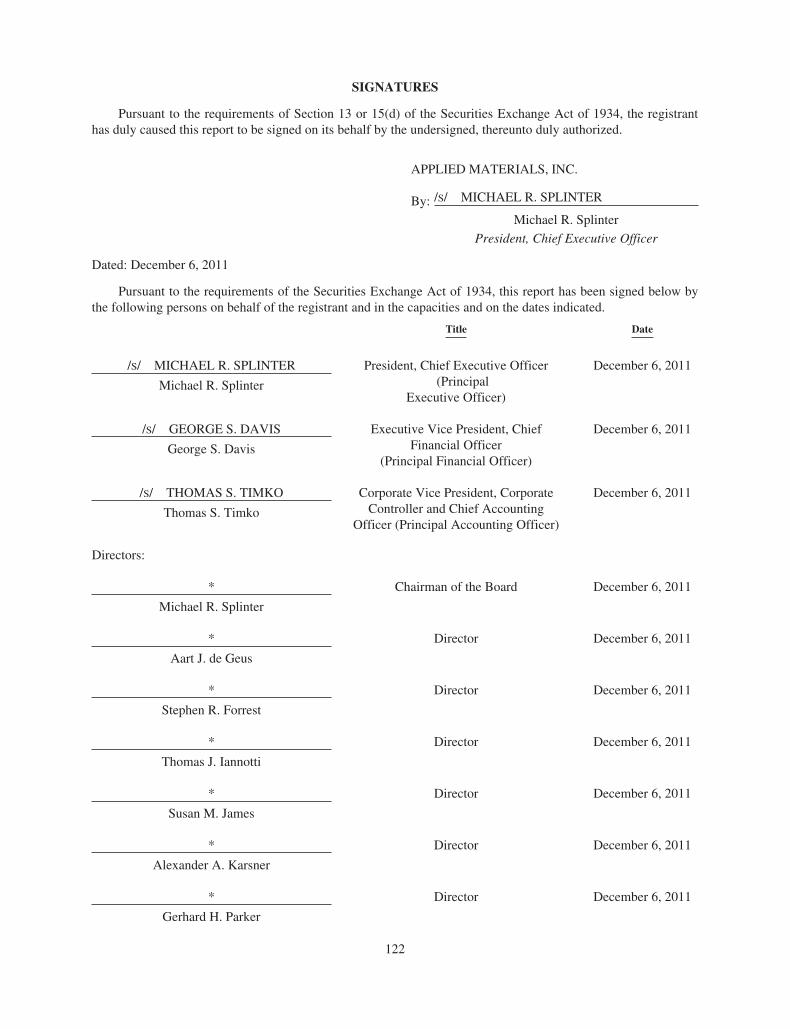
SIGNATURES
Pursuant to the requirements of Section 13 or 15(d) of the Securities Exchange Act of 1934, the registranthas duly caused this report to be signed on its behalf by the undersigned, thereunto duly authorized.
APPLIED MATERIALS, INC.
By: /S/ MICHAEL R. SPLINTER
Michael R. Splinter
President, Chief Executive Officer
Dated: December 6, 2011
Pursuant to the requirements of the Securities Exchange Act of 1934, this report has been signed below bythe following persons on behalf of the registrant and in the capacities and on the dates indicated.
Title Date
/S/ MICHAEL R. SPLINTER
Michael R. Splinter
President, Chief Executive Officer(Principal
Executive Officer)
December 6, 2011
/S/ GEORGE S. DAVIS
George S. Davis
Executive Vice President, ChiefFinancial Officer
(Principal Financial Officer)
December 6, 2011
/S/ THOMAS S. TIMKO
Thomas S. Timko
Corporate Vice President, CorporateController and Chief Accounting
Officer (Principal Accounting Officer)
December 6, 2011
Directors:
*
Michael R. Splinter
Chairman of the Board December 6, 2011
*
Aart J. de Geus
Director December 6, 2011
*
Stephen R. Forrest
Director December 6, 2011
*
Thomas J. Iannotti
Director December 6, 2011
*
Susan M. James
Director December 6, 2011
*
Alexander A. Karsner
Director December 6, 2011
*
Gerhard H. Parker
Director December 6, 2011
122

Title Date
*
Dennis D. Powell
Director December 6, 2011
*
Willem P. Roelandts
Director December 6, 2011
*
James E. Rogers
Director December 6, 2011
*
Robert H. Swan
Director December 6, 2011
Representing a majority of the members of the Board of Directors.
* By /s/ MICHAEL R. SPLINTER
Michael R. Splinter
Attorney-in-Fact**
** By authority of the power of attorney filed herewith.
123

SCHEDULE II
VALUATION AND QUALIFYING ACCOUNTSALLOWANCE FOR DOUBTFUL ACCOUNTS
Fiscal Year
Balance atBeginning ofFiscal Year
Additions —Charged to
IncomeDeductions —
Recoveries
Deductions —Not Charged to
Income
Balance atEnd of
Fiscal Year
(In millions)
2011 . . . . . . . . . . . . . . . . . . . . . . . . . . . . . . . $74 $ 5 $(6) $— $732010 . . . . . . . . . . . . . . . . . . . . . . . . . . . . . . . $67 $17 $(7) $ (3) $742009 . . . . . . . . . . . . . . . . . . . . . . . . . . . . . . . $ 5 $63 $(1) $— $67
124

© Applied Materials, Inc. 2012. Applied Materials, the Applied Materials logo and other trademarks so
designed or otherwise indicated as product names or services, are trademarks of Applied Materials, Inc.
in the U.S. and other countries. All other product names and service marked contained herein are the
trademarks of their respective owners. All rights reserved. Printed in the U.S.A. 1/12 33,000K

W W W. A P P L I E D M AT E R I A L S . C O M
3 0 5 0 B O W E R S AV E N U EP O B O X 5 8 0 3 9S A N TA C L A R A , C A L I F O R N I A 9 5 0 5 2 - 8 0 3 9T E L : (4 0 8 ) 7 2 7- 5 5 5 5