annual report 2013 - telenor · pdf filetelenor annual report 2013 ... adding 1.6 million...
TRANSCRIPT
Annual Report 2013
Telenor Annual Report 2013
CONTENT
Dear Shareholder /01/
Report from the Board of Directors 2013 /02/
FINANCIAL STATEMENTS TELENOR GROUP
Consolidated Income Statement /22/
Consolidated Statement of Comprehensive Income /23/
Consolidated Statement of Financial Position /24/
Consolidated Statement of Cash Flows /25/
Consolidated Statement of Changes in Equity /26/
Notes to the Consolidated Financial Statements /27/
FINANCIAL STATEMENTS TELENOR ASA
Income Statement /98/
Statement of Comprehensive Income /99/
Statement of Financial Position /100/
Statement of Cash Flows /101/
Statement of Changes in Equity /102/
Notes to the Financial Statements /103/
Responsibility Statement /117/
Auditor’s Report for 2013 /118/
Statement from the Corporate Assembly of Telenor ASA /120/
Financial Calendar 2014 /120/
Key Figures /121/
Report on Social Responsibility /122/
Telenor Group’s Operations /130/
/PAGE 01/
TELENOR ANNUAL REPORT 2013
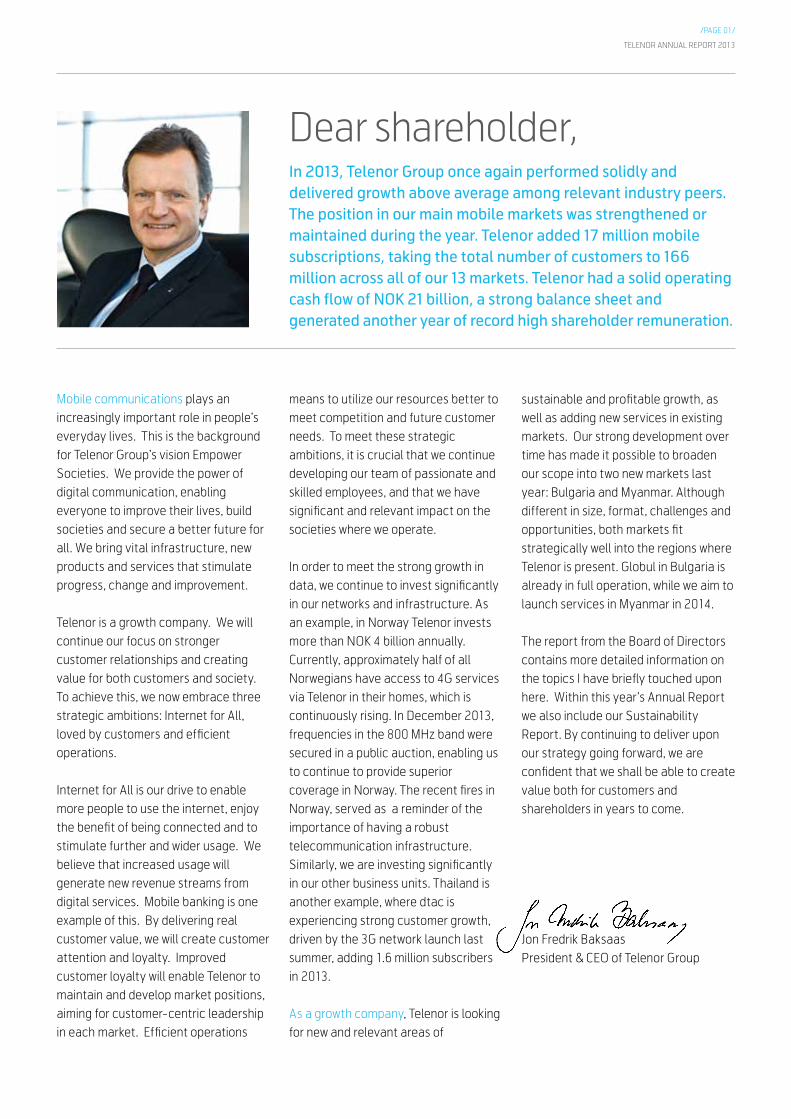
In 2013, Telenor Group once again performed solidly and delivered growth above average among relevant industry peers. The position in our main mobile markets was strengthened or maintained during the year. Telenor added 17 million mobile subscriptions, taking the total number of customers to 166 million across all of our 13 markets. Telenor had a solid operating cash flow of NOK 21 billion, a strong balance sheet and generated another year of record high shareholder remuneration.
Mobile communications plays an increasingly important role in people’s everyday lives. This is the background for Telenor Group’s vision Empower Societies. We provide the power of digital communication, enabling everyone to improve their lives, build societies and secure a better future for all. We bring vital infrastructure, new products and services that stimulate progress, change and improvement.
Telenor is a growth company. We will continue our focus on stronger customer relationships and creating value for both customers and society. To achieve this, we now embrace three strategic ambitions: Internet for All, loved by customers and efficient operations.
Internet for All is our drive to enable more people to use the internet, enjoy the benefit of being connected and to stimulate further and wider usage. We believe that increased usage will generate new revenue streams from digital services. Mobile banking is one example of this. By delivering real customer value, we will create customer attention and loyalty. Improved customer loyalty will enable Telenor to maintain and develop market positions, aiming for customer-centric leadership in each market. Efficient operations
means to utilize our resources better to meet competition and future customer needs. To meet these strategic ambitions, it is crucial that we continue developing our team of passionate and skilled employees, and that we have significant and relevant impact on the societies where we operate.
In order to meet the strong growth in data, we continue to invest significantly in our networks and infrastructure. As an example, in Norway Telenor invests more than NOK 4 billion annually. Currently, approximately half of all Norwegians have access to 4G services via Telenor in their homes, which is continuously rising. In December 2013, frequencies in the 800 MHz band were secured in a public auction, enabling us to continue to provide superior coverage in Norway. The recent fires in Norway, served as a reminder of the importance of having a robust telecommunication infrastructure. Similarly, we are investing significantly in our other business units. Thailand is another example, where dtac is experiencing strong customer growth, driven by the 3G network launch last summer, adding 1.6 million subscribers in 2013.
As a growth company, Telenor is looking for new and relevant areas of
sustainable and profitable growth, as well as adding new services in existing markets. Our strong development over time has made it possible to broaden our scope into two new markets last year: Bulgaria and Myanmar. Although different in size, format, challenges and opportunities, both markets fit strategically well into the regions where Telenor is present. Globul in Bulgaria is already in full operation, while we aim to launch services in Myanmar in 2014.
The report from the Board of Directors contains more detailed information on the topics I have briefly touched upon here. Within this year’s Annual Report we also include our Sustainability Report. By continuing to deliver upon our strategy going forward, we are confident that we shall be able to create value both for customers and shareholders in years to come. Jon Fredrik Baksaas President & CEO of Telenor Group
Dear shareholder,
TELENOR ANNUAL REPORT 2013Report from the Board of Directors 2013
/PAGE 02/
Report from the Board of Directors 2013
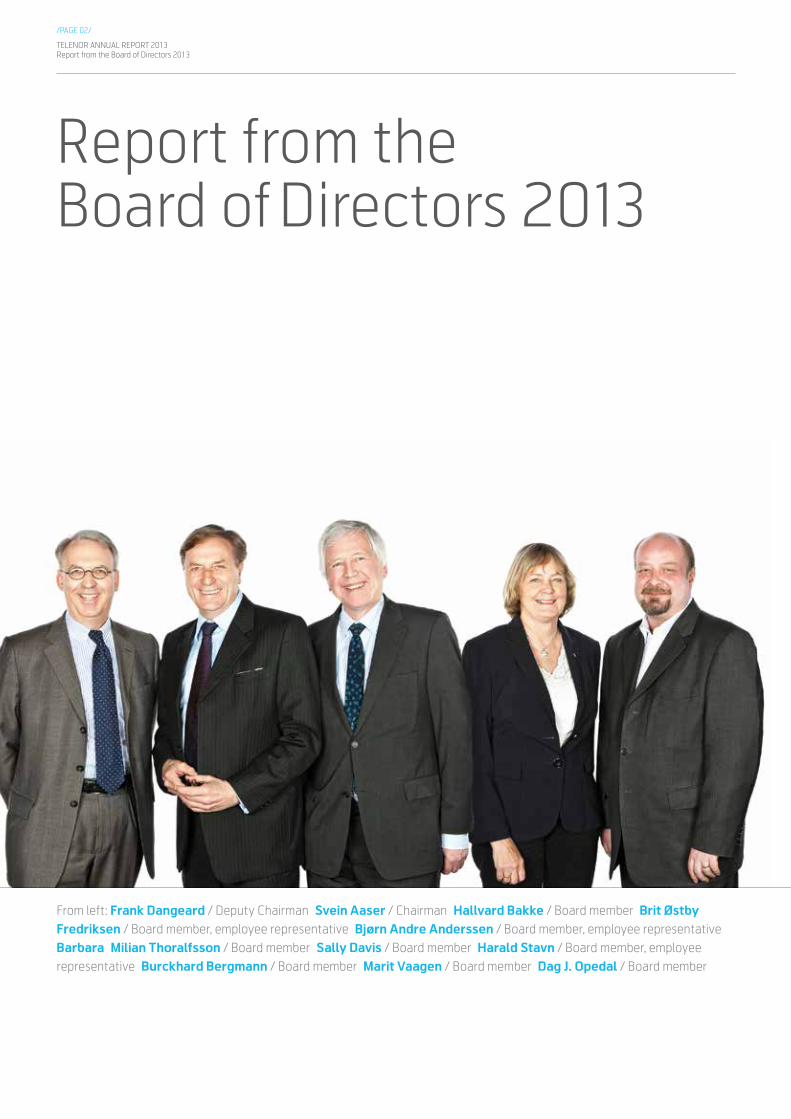
From left: Frank Dangeard / Deputy Chairman Svein Aaser / Chairman Hallvard Bakke / Board member Brit Østby Fredriksen / Board member, employee representative Bjørn Andre Anderssen / Board member, employee representative Barbara Milian Thoralfsson / Board member Sally Davis / Board member Harald Stavn / Board member, employee representative Burckhard Bergmann / Board member Marit Vaagen / Board member Dag J. Opedal / Board member

TELENOR ANNUAL REPORT 2013Report from the Board of Directors 2013
/PAGE 03/
2013 was a year of further growth and expansion, as well as solid financial results for Telenor
Group. The company entered two new markets, Myanmar and Bulgaria, and has continued
to perform solidly compared to its European peers. By focusing on what customers want and
aiming to bring connectivity to all people in its markets, Telenor captures the spirit of the
ever-changing digital world.
Svein Aaser, Chairman of the Board
TELENOR ANNUAL REPORT 2013Report from the Board of Directors 2013
/PAGE 04/
Internet for All The telecommunications industry continues to progress rapidly and plays an increasingly important role in people’s everyday lives. As the world goes digital, Telenor Group is strate-gically managing the transition from voice to data and has integrated its Internet for All ambition into the company strategy for 2014-2016.
Telenor’s Internet for All ambition, a movement to connect the unconnected in its markets, is built on the belief that the internet is for everyone. This drives the company’s focus on providing innovative telecommunications and digital services based on actual needs
of people in its markets. These needs include financial services, knowledge access, and affordable and accessible health services. It’s about using these services to help transform the lives of individuals, which in turn stimulates societies to grow and progress. By building infrastructure and providing access to the mobile network, including rural areas of countries, Telenor can contribute to the creation of jobs, business development and improved social conditions.
Telenor believes that the internet must be accessible to everyone, and that mobile internet is a significant tool to reduce the digital divide. 3G and 4G
coverage represent the future of high speed mobile internet access.
In 2013, dtac made progress in its ongoing 3G network upgrade (called TriNet) across Thailand, and Grameenphone also launched 3G, with an aim to reach 3G coverage in all districts within 2014.
DiGi, in Malaysia, continues to lead in mobile data penetration among Telenor markets, on par with Telenor Sweden for mobile data usage over 4G. In Scandinavia, Telenor has introduced data-centric pricing to capture greater value from data traffic.
1) EBITDA before other items less capex excluding investments in licences and spectrum
Key figures 2013
• 1% organic revenue growth
• 17 million new subscribers
• EBITDA before other items of NOK 36 billion
• Operating cash flow of NOK 21 billion 1)
• Proposed dividend NOK 7.00 per share
In 2013, Telenor Group broadened its geographical footprint across Asia and
Europe, by entering Myanmar and Bulgaria. Telenor also embarked on its three-
pillar strategy to provide Internet for All, be loved by customers and deliver
efficient operations.

TELENOR ANNUAL REPORT 2013Report from the Board of Directors 2013
/PAGE 05/
Telenor’s Internet for All ambition extends beyond high-speed networks, as the company is also spearheading the smart use of technologies to optimise network performance and enable access to internet services over 2G networks, such as in India. Uninor aims to be best in basics, an aim that extends to data usage, and offering affordable and accessible services tailored to customer needs.
The internet brings substantial benefits but also risks. Telenor is uniquely positioned to deliver the internet responsibly, in collaboration with other stakeholders, due to its ethical platform, and longstanding cooperation with governmental organisations and other stakeholders.
Turning the huge demand for mobile data into value is the single most important revenue opportunity for Telenor in the coming years. Within Telenor’s footprint, the biggest growth opportunities are in the Asian markets due to the limited fixed infrastructure and great demand for mobile data. Telenor’s Asian operations currently cover around 1.2 billion people, and approximately 140 million of these people are Telenor subscribers. Of those, only around 10% are active mobile data users. Our Internet for All strategy aims to capture this significant revenue potential.
Delivering customer valueTelenor Group has a customer-centric strategy and continuously works to understand its customer base better and put customers first. Proof of success is when satisfied customers promote Telenor and the brand to others. Consequently, customer feedback is at the centre of the company’s decision-making.
Leadership philosophy and company culture are key elements for trans-forming a business into a true service provider and customer-centric comp-any. Simplicity, hassle-free and easy-to-use offers, as well as innovation are paramount to meet customers’ needs in an ever-changing digital world. During 2013, Telenor increased its focus on those criteria.
Only by delivering real customer value will Telenor create customer attention and loyalty. Strong customer loyalty will enable Telenor to increase its market share and become a customer prefer red market leader.
Higher growth relies on the ability to win new and retain existing mobile subscribers, and to strengthen the ties between Telenor and its customers – delivering what they truly value. Net Promoter Score (NPS) and Closed Feedback Loops (CFL) are important tools in working to become a customer-centric leader. Solid insights are needed to create more targeted product and price packages, that aim to improve the customer experience and retention, and to drive cost efficiency. As an example, Telenor introduced data-centric pricing models in Sweden during the year, offering customised bundles to consumers.
In addition, the company has utilised data derived from customer insight to tailor and target its offers. Telenor also further developed its global partner-ships with companies including Facebook, Twitter and Wikipedia, to create value for its customers by adding additional services such as Wikipedia Zero and free Facebook Messenger. For a second year in a row, Telenor organised a global Customer First Day, mobilising its employees across all business units and markets in a
celebration of customers.
As customer preferences evolve, digital channels increase in share of com-merce. Telenor will develop digital distribution capabilities and assets to stay competitive. In the company’s growth markets, Telenor will also strengthen distribution channels to the mass market. The customer service organisation is a vital touch point between Telenor and its customers. With the abundance of devices and services, customers need more advanced support and Telenor will develop its customer service via all of its channels to deliver on new expectations and service volumes.
Operational Efficiency To Telenor Group, efficient operations means utilising its resources to better meet future customer needs. Improving efficiency and changing how Telenor operates will contribute to a better customer experience, and in turn improve growth and value creation.
Telenor is progressing on its cost efficiency agenda and targets gross savings of NOK 5 billion by 2015. To deliver on this goal and improve agility, the company is paying particular attention to its network, IT and other global activities. Telenor formed a new common shared service center for network and IT services in the CEE region during the past year, while Telenor Denmark embarked on its journey to radically simplify product and service offerings, switch to a more innovative IT platform and share mobile networks with Telia. In Sweden, the company implemented new operating models and executed a sales and network transformation. Telenor’s Thai operations are moving from a con-cession to a licence regime, expected to also contribute to significant cost

TELENOR ANNUAL REPORT 2013Report from the Board of Directors 2013
/PAGE 06/
savings going forward. The company has also implemented a network strategy and new operating model in Norway. In addition, Telenor continued to focus on energy cost management during the year as energy costs in network operations represent about 2 percent of Telenor’s total operating expenses.
In 2013, total nominal operating expenses were flat compared with the two previous years at around NOK 40 billion, despite regulatory cost challenges. New data demands result in new requirements for networks, and Telenor sees network quality as a lever for differentiation. During the year, Telenor continued to implement net-works that are faster, smarter, more robust and available, high-performing and more efficient. The company will also carry on utilising network sharing to improve cost and quality positions in our markets and aims to transform IT to become an enabler for superior customer experiences.
Clear ambitions and targets along with dynamic resource allocation and a well-developed performance culture have resulted in efficiency gains in several of Telenor’s markets, including India, Malaysia, Sweden and Bangladesh. Telenor is further developing this performance management culture, including the proven performance management model in Uninor, to make it applicable and suitable for all business units across the Group.
Norway Over the year, Telenor Norway has continued to invest in fixed and mobile network infrastructure to capture increasing demand for mobile data capacity, high-speed internet and TV, as well as improve cost efficiency. During 2013, Telenor Norway also built
an entirely new core network infra-structure, which over time will handle all fixed and mobile broadband traffic.
Following the successful introduction of bundled tariffs in 2011, Telenor Norway introduced data-centric mobile pricing in 2013 to further increase bundle penetration, stimulate data usage and monetise data growth, thus securing healthy, long-term returns on Telenor’s mobile network investments.
In December, Telenor Norway was allocated new spectrum in an auction, which will enable Telenor to maintain its unrivalled market position and offer nation-wide 4G services within a few years.
Driven by market demand, Telenor Norway has continued to invest in fibre network accesses to increase fixed broadband and TV revenues and compensate for a declining digital subscriber line, DSL, customer base.
During 2013, Telenor Norway’s efficiency agenda has shown promising results, and through optimisation of fixed network technologies, re-engineering of business processes and simplification of product portfolios, Telenor Norway will target significant efficiency improvements, benefiting customers and enabling future network investments.
In December 2012, the EFTA Surveillance Authority (ESA) and Norwegian Competition Authority launched investigations, which are still pending. See note 33 for further information.
From concession to licence regime in ThailandThe regulatory framework in Thailand is going through a transition from a
concession regime to a licencing regime. Dtac has a concession with state-owned enterprise CAT which expires in 2018. A full transition to a licencing regime is an important milestone for Thailand. Telenor expects a significant reduction in regulatory costs over time as a result of the migration to the new licence regime.
Thailand conducted its first-ever licence auction in October 2012, and dtac won licences and spectrum to deliver nationwide 3G services. The licence cost was NOK 2.4 billion, with a yearly spectrum charge of 5.75 percent of revenue. Telenor and dtac are currently planning to upgrade and expand its network with an investment budget of approximately NOK 6 billion , as the telecom sector in Thailand is poised for significant growth in data demand on the back of the new 3G licences.
The authorities are planning to conduct an LTE 1800Mhz spectrum auction scheduled for September 2014. Telenor supports the auction and encourages the authorities to include additional spectrum which is currently under its concession, as this would provide significant benefits to Thai consumers and the Thai economy. Maintaining an open economy and continuing the transition towards a more liberal telecom sector is crucial for further investments from foreign investors.
Licence in India secured for next 20 yearsIn India, Telenor was able to secure fresh licences through its legal entity Telewings Communications Services Private Limited. This comprises a licence and spectrum for 20 years in six circles which covers more than 600 million people: UP West, UP East, Bihar, Maharashtra, Andhra Pradesh and

TELENOR ANNUAL REPORT 2013Report from the Board of Directors 2013
/PAGE 07/
Gujarat. The business transfer from Unitech Wireless to Telewings Communications Services Private Limited was completed in 2013. Telenor also received approval from the Foreign Investment Promotion Board to increase its ownership in Telewings Communications Services Private Limited to 74 percent at the end of 2013. A capital contribution of INR 9.8 billion was completed by Telenor in December 2013, increasing its ownership interest to 74 percent.
Uninor, which has established itself as a successful mass market operator in India, continues to implement its «Sabse Sasta» strategy, promising its customers to be the cheapest alternative for basic services. Uninor’s revenue pick-up during 2013 is proof of a successful market strategy. As a result, and in order to cater for continued subscriber growth, Telenor in 2014 is redeploying the 5,000 sites from the areas the company exited in 2012.
On 13 February 2014, Uninor in India confirmed that it has successfully acquired additional spectrum in the 1800 MHz band in four of its six existing circles – UP East, UP West, Bihar and Jharkhand and Andhra Pradesh - and in the new circle of Assam. With these auctions, Uninor’s footprint now increases to seven circles.
Expanding into new geographiesTelenor Group’s geographical footprint covers both advanced and growing economies, offering growth oppor-tunities and profitability. The company’s strong development over the past decade has made it possible to further broaden its geographic reach, entering two new markets last year: Bulgaria and Myanmar.
In April, Telenor signed an agreement to
acquire mobile operator Globul, the second largest mobile operator in Bulgaria, for a total amount of EUR 717 million on a cash and debt free basis. At the end of 2013, the company had 4 million subscribers and a 36 percent subscriber market share. Globul was consolidated into Telenor Group on 1 August.
When Myanmar Authorities invited international telecommunication operators to participate in the auction for two telecommunication licences, 91 international companies filed their expression of interest. Following a structured and efficient auction process the Government on June 27 announced that Telenor was a successful applicant for one of the two telecommunication licences. The licence includes spectrum in the 900MHz and 2.1GHz band and is valid for 15 years. With a population of 60 million and less than 10 percent of the population currently having access to mobile services, Myanmar represents a solid business opportunity for Telenor in Asia. Telenor will build on its global and regional experience to establish itself as a successful mass market operator in the country.
During 2013, Telenor entered into a consultation process with the authorities to finalise details of the policy framework. This process was not concluded by the end of 2013. However, Telenor signed its licence agreement with Myanmar authorities on January 30, 2014. Telenor targets EBITDA break-even in Myanmar within three years after the licence award. The total peak funding, defined as the licence fee plus accumulated losses until operating cash flow break-even, is expected to be around USD 1 billion. The licence fee is USD 500 million. In the past year, Telenor Group also appointed a management team for its operations in
Myanmar and started an employee recruitment process.
Separately, Telenor Group, Schibsted Media Group and Singapore Press Holdings (SPH) decided to team up during 2013, to create two joint ventures in online classifieds and provide high-quality online classified services to people in Asia and South America.
VimpelCom VimpelCom Ltd. continues to be an important investment for Telenor Group. VimpelCom Ltd. has continued to deliver solid financial returns to Telenor. In addition to solid results, the investment also presents challenges and risks.
In 2013, Altimo’s conversion of its preferred shares diluted Telenor’s economic interest to 33.05%. Yet Telenor’s voting interest remained unchanged at 42.95%. In total, Telenor received NOK 8.1 billion (USD 1.4 billion) in dividends from VimpelCom Ltd., including delayed payments and extra-ordinary dividends after Altimo’s conversion of its 128.5 million preferred shares in April. On 15 October, Telenor entered the conversion window for its 305 million preferred shares, which remains open until mid-April 2016. The board of directors was re-elected at the Annual General Meeting in April, and VimpelCom Ltd. moved its listing from NYSE to NASDAQ in September.
VimpelCom Ltd.’s supervisory board consists of nine members, of which three are from Telenor Group including Telenor’s CEO and President Jon Fredrik Baksaas, EVP and Head of Europe Kjell- Morten Johnsen and Head of Russia Ole Bjørn Sjulstad. In 2013, VimpelCom Ltd. reported an organic sales and Ebitda decline of 2 percent and 1 percent
TELENOR ANNUAL REPORT 2013Report from the Board of Directors 2013
/PAGE 08/
respectively compared with 2012. The company reported a full year net loss of USD 1.4 billion, including USD 2.9 billion non-cash impairments in the Ukraine and Canada.
On 12 March 2014, VimpelCom Ltd. announced that it faces investigations by both the U.S. Securities and Exchange Commission and Dutch authorities related to its operations in Uzbekistan. On 18 March 2014, VimpelCom Ltd. further reported that it is also the focus of an investigation by the U.S. Department of Justice related to the same operations. Telenor Group is not under investigation. Nonetheless, as a minority shareholder Telenor has been summoned as a witness.
FinancialsRevenues in 2013 were NOK 104.0 billion, a reported growth of 2.3% compared to NOK 101.7 billion in 2012. The organic revenue growth of 1% was mainly the result of continued growth in our Asian operations, in addition to strong handset sales. The reported revenue growth was higher than the organic revenue growth, primarily due to the depreciation of the Norwegian Krone towards most of the business units reporting currencies and the inclusion of Globul.
EBITDA 2) before other income and expenses increased by NOK 3.0 billion to NOK 35.9 billion, while the corre-sponding EBITDA margin of 34.5% improved by 2.2 percentage points from 2012 as a consequence of better performance in India, Sweden and Thailand, in addition to positive effects from the Bulgarian operation. This was partly offset by a deteriorating market in Denmark and lower margin contri bution from Norway and other operations.
The operating profit was NOK 21.3
billion compared to NOK 9.8 billion in 2012. Profit before taxes was NOK 17.8 billion compared to NOK 10.8 billion in 2012. Operating profit in 2012 was negatively affected by an impairment of tangible fixed assets in Uninor of NOK 3.9 billion and NOK 4.0 billion related to goodwill in Telenor Denmark. Share of net income of associated companies in 2013 was NOK -1.2 billion compared to NOK 2.8 billion in 2012, due to the inclusion of Telenor’s share of two significant impairments made by VimpelCom Ltd. in Q4 2013. Net financial expenses increased slightly to NOK 1.9 billion from NOK 1.8 billion in 2012. Income taxes in 2013 were NOK 5.7 billion, up from NOK 1.7 billion in 2012, which included positive tax effects from recognition of deferred tax assets relating to Telenor Pakistan (NOK 1.0 billion) and provision of loss on internal receivables against Unitech Wireless ( NOK 2.5 billion).
Telenor’s net income in 2013 was NOK 12.1 billion, or NOK 5.74 per share. The corresponding figure for 2012 was a net income of NOK 9.0 billion, or NOK 5.63 per share.
Total investments in 2013 amounted to NOK 23.9 billion, of which NOK 17.0 billion were capital expenditure (capex) and NOK 6.9 billion were investments in businesses. The total capex decreased by NOK 4.5 billion compared to 2012. When excluding investments in new spectrum and licences in 2013 of NOK 2.4 billion in total, capex increased by NOK 2.4 billion. Capital expenditure as a proportion of revenues, excluding licences and spectrum, increased from 12.1% in 2012 to 14.1% in 2013.
Net cash inflow from operating activities during 2013 was NOK 37.0 billion, an increase of NOK 13.0 billion compared to 2012. This is mainly
explained by higher EBITDA of NOK 3.2 billion and higher dividends received during 2013 of NOK 7.8 billion, mainly from VimpelCom Ltd. In addition, less income tax paid, positive currency effects and improved working capital contributed with a further NOK 2.1 billion.
Net cash outflow to investing activities during 2013 was NOK 20.6 billion, a decrease of NOK 2.3 billion compared to 2012. The decrease is due to lower investments in network equipment and licences of NOK 1.3 billion. In addition, there were lower cash outflows to acquisitions of subsidiaries, associated companies and joint ventures of NOK 1.5 billion. This is explained by a net cash outflow in 2013 of NOK 4.5 billion, related to the acquisition of Globul and a NOK 1.5 billion investment in SnT Classifieds and 701 Search Pte in cooperation with Schibsted Media Group and Singapore Press Holdings. In 2012, investments included the purchase of VimpelCom Ltd. shares of NOK 7.0 billion and NOK 0.5 billion in fibre companies.
Net cash outflow to financing activities during 2013 was NOK 13.8 billion, an increase of NOK 9.1 billion compared to 2012. This is mainly due to a decrease in net borrowings of NOK 11.0 billion and higher dividends paid to shareholders of Telenor ASA of NOK 1.3 billion, partially offset by lower dividends to minority interests of NOK 3.3 billion.
Cash and cash equivalents increased by NOK 3.2 billion in 2013 to NOK 12.0 billion as of 31 December 2013.
At the end of 2013, total assets in the consolidated statement of financial position amounted to NOK 181.0 billion, with an equity ratio (including non-controlling interests) of 42.6%
2) See definition and reconciliation of EBITDA in note 5 to the consolidated financial statements

TELENOR ANNUAL REPORT 2013Report from the Board of Directors 2013
/PAGE 09/
compared to NOK 167.9 billion and 45.5%, respectively, at the end of 2012. Total current liabilities at the end of 2013 were NOK 44.4 billion compared to NOK 43.9 billion at the end of 2012. Net interest-bearing liabilities increased from NOK 33.1 billion at the end of 2012 to NOK 39.4 billion by the end of 2013. Telenor completed the share buyback programme for 2013, returning NOK 4.0 billion to the shareholders. With the dividends of NOK 9.2 billion paid out in May 2013, this resulted in an all-time-high shareholder remuneration. In the Board’s view, Telenor Group holds a satisfactory financial position. For 2013, the return on capital employed (ROCE) 3) was 14% compared to 11% in 2012.
Telenor’s annual report for 2012 contained an outlook for 2013 which was later specified and updated in the quarterly reports. The full year results are aligned with the outlook from the third quarter of 2013 with organic revenue growth of 1%, EBITDA margin before other items of 34% and capex to sales of 14%.
The financial statements are adjusted compared to the preliminary and unaudited 2013 results reported 12 February 2014. The adjustments relates to Telenor’s share of significant events and transactions in VimpelCom Ltd. of NOK 4 449 million which arises from the impairment losses related to Ukraine and Canada. This is done according to the financial information for the fourth quarter of 2013 released by VimpelCom Ltd. on 6 March 2014.
In accordance with section 3-3a of the Norwegian Accounting Act, the Board confirms that the prerequisites for the going concern assumption exist and that the financial statements have been prepared based on the going concern principle.
Telenor Group operationsTelenor Group’s 13 main operations cover the Nordic region, Central and Eastern Europe and Asia. Telenor Group also holds an economic stake of 33% in VimpelCom Ltd. In addition to mobile, Telenor’s operations in Norway, Sweden and Denmark offer fixed tele-communication services. The Group’s core business also includes Telenor Broadcast, which has a leading position in the Nordic market for TV services and satellite broadcasting.
Please note that all comments below are based on the development in local currency for 2013 compared to 2012, unless otherwise stated.
NorwayRapid changes affected mobile offerings in the Norwegian market throughout the year towards included voice and messaging on the most common bundles. Competition now revolves around network quality, data buckets and value-added services included in mobile tariffs. Telenor Norway experienced healthy customer uptake and by the end of the year the number of mobile subscriptions surpassed 3.2 million. Migration to bundled tariffs continued and the share of contract mobile subscriptions on a bundled tariff passed 66% in the consumer segment in 2013, supported by smartphones and expanding 4G population coverage. Total revenues declined by 2%. Revenues from the mobile operation decreased by 2% mainly as a result of lower interconnect rates and a one-time correction to mobile revenues in the second quarter. Fixed revenues declined by 1%. This decline is lower than in the previous year driven by a somewhat lower decline in fixed telephony revenues and stronger growth in Internet and TV revenues. The EBITDA margin before
other income and expenses increased slightly to 43%, driven by an increased gross margin partly offset by higher operating expenses. In 2013, Telenor Norway invested more than NOK 4.4 billion in infrastructure for fixed and mobile services. LTE was made available in over 100 municipalities in Norway and the LTE population coverage surpassed 50%. Throughout the year, Telenor Norway increased the fibre to the home footprint and customer base to a total of 81,000 subscribers. In October, the mobile retail store chain Telekiosken, with more than 80 shops, was acquired to develop Telenor’s retail service concept further. In December, Telenor Norway gained access to a sufficient share of resources in the 800, 900 and 1800 MHz frequency bands in an auction, to further strengthen the superior network position in the Norwegian market.
SwedenSupported by the launch of data centric and sharable mobile tariffs, Telenor Sweden experienced a growing subscription base during 2013. By the end of the year the mobile subscription base reached 2.5 million. The com-petition in the Swedish mobile market was focused on bundled and sharable subscriptions and mobile broadband offerings with voice and messaging included free of charge. Sweden has surpassed a 70% smartphone pene-tration, which is among the highest in the world. Revenues in local currency declined by 2%. Revenues from the mobile operation decreased by 2% as a result of reduced interconnect rates and roaming charges together with lower handset sales. Revenues from fixed operations increased by 1%. Continued reduction in the number of telephony subscriptions resulted in a 19% decline in telephony revenues, offset by increased revenues from
3) Return on capital employed (ROCE) is based on net income excluding financial and non-recurring items.
TELENOR ANNUAL REPORT 2013Report from the Board of Directors 2013
/PAGE 10/
broadband customers. The acquisition in January 2014 of Tele 2’s fibre and cable business will support a stronger footprint in the broadband market going forward. The EBITDA margin before other income and expenses improved by 4 percentage points or SEK 480 million, reaching 30% for 2013, due to improved gross profit and an effect from several cost efficiency activities. Capital expenditure increased by 11% as a result of high activity related to the 3G swap and improvement of 4G capacity and coverage. In Sweden, Telenor and Tele2 have a network and spectrum sharing agreement for 2G and 4G through the infrastructure joint venture Net4Mobility. For the 3G network, Telenor has a sharing agreement with Hi3G Access through the joint venture 3GIS.
DenmarkDuring 2013, competition in the mobile market continued with large voice and data bundles at reduced prices. Consequently, the general price level has been significantly lowered, further deteriorating profits in the Danish mobile market. Data centric tariffs with free voice and messaging included have been launched by all operators.
Telenor Denmark experienced significant subscription losses during 2013, mainly in the consumer segment. The contract subscription base has shown some signs of stabilisation during the last quarter of the year. At the end of 2013, Telenor Denmark had 1.8 million mobile subscriptions and around 65% of Telenor’s customers were smartphone users. Total revenues in local currency decreased by 17% while revenues from the mobile operation also decreased by 17%, mainly due to reduced retail prices and subscription base together with lower interconnect rates and roaming charges. As a result
of decreased number of telephony and Internet subscriptions, revenues from the fixed line operation declined by 18%. The EBITDA margin before other income and expenses remained stable at 20%, supported by a 5% decrease in operating expenses. Capital expen diture excluding licence fee, was 20% less than previous year due to the effects from network sharing agreement. In Denmark, Telenor has a network and spectrum sharing agreement with Telia for all techno logies through the infrastructure joint venture TT Netværket P/S.
BroadcastIn the Nordic market for TV services, Telenor Broadcast maintained its leading position in 2013. Revenues increased by 3%, or 1% excluding positive currency effects, from strong performance in all operations. EBITDA increased by 7%, and the EBITDA margin by 1 percentage point to 31%. Capital expenditure increased mainly due to digital audio broadcasting (DAB) network investments in Norkring in Norway and ground equipment preparations related to the satellite Thor 7 in Telenor Satellite Broadcasting.
HungaryThe Hungarian macroeconomic situation remained challenging in 2013, putting pressure on retail sales and household consumption. At the end of 2013, Telenor Hungary had 3.3 million mobile subscriptions and 33% of Telenor’s customers were smartphone users. Telenor experienced a 3% revenue decline in local currency, mainly due to continued reduction in interconnect rates and roaming charges. The EBITDA margin before other income and expenses in 2013 was 35%, an increase of 2 percentage points compared to 2012. The increase was mainly related to reduced interconnect
rates, lower operating expenses and only one telecommunication tax in effect, as the first crisis tele-communication tax was abolished from 1 January 2013, partly offset by increased handset subsidies. The rate for the telecommunication tax was increased from 1 August 2013 and a total amount of NOK 343 million was recognised for the tax in 2013, having an effect on the EBITDA margin of approximately 9 percentage points. The capital expenditure excluding licences was stable compared to 2012, with the major part relating to rollout of 3G and 4G. NOK 636 million was recognised for the extension of the 900 MHz and 1800 MHz frequency rights until 2022. The usage of the EGSM licence awarded in an auction January 2012, but suspended following a Court decision, was also secured until 2022.
Globul – BulgariaOn 1 August 2013, Telenor acquired 100% of the shares in Bulgarian mobile operator Globul for NOK 5.1 billion. Globul is consolidated from 1 August 2013. In 2013, the telecom market decreased as a consequence of the reduction in interconnect rates. At the end of 2013, Globul had 4 million mobile subscriptions, of which 21% were smartphone users. Revenues for 2013 in local currency decreased by 9%, mainly driven by reduced interconnect rates in addition to lower prices. The EBITDA margin before other items decreased by 2 percentage points due to lower revenues.
SerbiaIn 2013, the Serbian economy continued with challenging macro-economic conditions, and the telecom market experienced reduced growth throughout the year. Competition in the mobile market focused on attractive handset subscriptions in addition to
/PAGE 11/
TELENOR ANNUAL REPORT 2013Report from the Board of Directors 2013
subsidising subscription fees. At the end of 2013, Telenor in Serbia had 3.2 million mobile subscriptions, of which 25% were smartphone users. Telenor is estimated to have slightly increased its market share with a solid subscriber base and continued growth in the share of contract subscriptions. Revenue in local currency increased by 3%, driven by increased ARPU and an on average larger subscription base in 2013 than 2012. The 2% growth in ARPU was partly driven by increased recovery of handset subsidies. The EBITDA margin before other income and expenses decreased by 1 percentage point to 39%, mainly as a result of lower gross margin following increased handset subsidies.
MontenegroThe mobile market in Montenegro decreased in 2013. Telenor’s revenues in local currency decreased by 11% following lower ARPU driven by reduction in interconnect rates and reduced subscriber base. The EBITDA margin before other income and expenses in 2013 was 40%, a reduction of 3 percentage points from 2012. At the end of 2013, Telenor Montenegro had 0.4 million mobile subscriptions. 26% of Telenor’s customers were smartphone users.
dtac - ThailandThe Thai telecom market experienced a continuous strong demand for data and smartphones as the operators increase 3G network coverage on the 850MHz frequency band. At the end of 2013, dtac had a mobile subscriber base of 27.9 million. Around 18% of the customers were 3G service users. Revenues in local currency increased by 6% driven by increased number of subscriptions and handset sales partly offset by reduced interconnect rates. Underlying service revenues in local
currency increased by 10%. The EBITDA margin before other income and expenses was 32%, a 2% increase from 2012 driven by reduction in interconnect costs and reduced regulatory fees. Capital expenditure remains high as investments in 3G on the 850 MHz frequency band are continued into investment in the new 3G network on 2.1 Ghz.
dtac Network Company Ltd., a subsidiary of dtac, was awarded a 3G licence in the 2.1 GHz frequency band in December 2012. The roll out started in June and by the end of 2013, the company had commissioned 5,900 sites. These sites provide better customer experience with lower regulatory fees.
DiGi - MalaysiaContinued high demand for mobile data services, smartphones and tablets drives the market growth in Malaysia and these are also the main factors driving growth in DiGi. By year-end, DiGi’s mobile subscriber base reached 11.0 million, of which 37% were smartphone users. Revenues in local currency increased by 6%, driven by high demand for mobile Internet and handset sales as well as a larger subscription base. The EBITDA margin before other income and expenses decreased by 1 percentage point to 45% as higher international traffic and handset costs more than offset the positive impact of efficiency gains. Capital expenditure increased slightly and was mainly related to expansion of network coverage and capacity, modernisation of IT systems and the network modernisation programme which was completed in 2013.
Grameenphone - BangladeshWith real mobile penetration estimated at 44%, there is still a large untapped
potential for future growth of telecom in Bangladesh by reaching a larger share of the rural population, albeit from lower income segments, diluting the average revenue per subscriber. A 3G licence was awarded to Grameenphone on 12 September 2013 for a period of 15 years. Commercial 3G services were successfully launched on 8 October 2013 and this has started to increase data revenues. Grameenphone increased its total revenues in local currency by 5%, where an 18% subscription growth primarily in rural areas was partly offset by the new tariff directive implemented last year. The EBITDA margin before other income and expenses declined by 2 percentage points, to 51%. Capital expenditure, excluding licences and spectrum, increased slightly as roll-out of 3G services was initiated last quarter of 2013 and will continue into 2014. At year-end, Grameenphone had 47.1 million mobile subscriptions and 225,000 active 3G subscribers with an estimated smartphone penetration of around 5%.
PakistanTotal revenues in local currency increased by 3% driven by growth in subscriptions and usage, but negatively affected by several regulatory restrictions including government enforced network closures and a slow-down of economic growth in Pakistan. By year-end, the mobile subscription base had reached 33.4 million with a smartphone penetration estimated at less than 7%. Telenor has been providing mobile financial services in Pakistan for almost five years and currently offers a broad range of services, reaching a growing share of the un-banked population of Pakistan. Competition among branchless banking providers is intensified as several new players have entered the market,
TELENOR ANNUAL REPORT 2013Report from the Board of Directors 2013
/PAGE 12/
and revenues from financial services contributed with approximately 2 percentage points to the overall revenue growth. The EBITDA margin before other income and expenses was reduced by 2 percentage points to 38%. A continued worsening of the energy situation, with both price hikes and increased average outage hours, negatively affected operating expenses. Capital expenditure increased due to the network modernisation which was finalised during Q4.
Uninor – IndiaOn 2 February 2012, the Supreme Court of India cancelled 122 cellular phone licences granted by the Government of India in 2008, including 22 licences granted to Unitech Wireless (Uninor). After a settlement with the former partner, a new entity, Telewings, secured spectrum in 6 of the former 13 circles in which Uninor had operations. Telewings is a company controlled by Telenor ASA, and in November 2013 Uninor’s business in these 6 circles was transferred to Telewings.
Despite the regulatory uncertainty, Uninor employees have delivered on bringing affordable voice services to the Indian mass market by successfully implementing an ultra-low cost operating model. Strong subscriber uptake, both relative to competitors and in absolute numbers, has been achieved and at the end of 2013, Uninor had 28.0 million subscriptions. As a result of closure of circles, revenues ended at NOK 3.0 billion, compared to NOK 3.7 billion in 2012. Underlying revenue growth in the 6 remaining operating circles came in at 18%. Strong cost focus and efficient network operation results in an EBITDA of NOK -0.6 billion, an improvement from NOK -2.0 billion in 2012.
For supplementary segment information, reference is made to note 5 to the consolidated financial statements.
Innovation and ResearchInnovation is crucial to the evolution of Telenor’s business models and to improve operations in today’s data and customer centric age. In 2013, Telenor spent NOK 2.8 billion on innovation, of which NOK 0.4 billion were costs related to research and development. In comparison, the total spend was NOK 2.5 billion in 2012, of which 0.3 billion were costs related to research and development.
Investments in new infrastructure, including 4G/LTE across Telenor’s business units including the Nordic markets, contributed heavily to the innovation spend. The advanced networks will be able to accommodate the high quality use of innovative services.
Through close cooperation with global partners, vendors and customers, Telenor is able to leverage on expertise and cutting-edge technology solutions. As a result, Telenor is able to create innovative offerings that are relevant for local markets and meet customer needs. For example, Grameenphone’s SMS-based solution for maintenance of tube wells to ensure safe drinking water in Bangladesh, developed in partnership with HYSAWA, received the 2013 mBillionth award, which recognises innovation in telecom and mobile content.
Telenor continues to focus its resources on what customers truly value. In 2013, Telenor Group revamped its marketing strategy process to comprise insights, strategy development and performance tracking, into a common marketing
platform. To support this, Telenor has introduced customer journey mapping and service design, as well as value-based segmentation models.
Telenor drives industrialisation programmes across Telenor Group, while multiple industrial initiatives in all business units are ongoing. These span from IT services and networks, to future customer services and global sourcing initiatives. In May, a new global unit was established, Global Shared Services, and in this area, Telenor has successfully partnered with Accenture to implement a new structure across the entire group to increase efficiency. In addition, a Global Roaming unit has been launched to make use of traffic volume and scale in all business units in innovative ways.
During 2013, Telenor refocused its efforts within digital services, resulting in an organisational set-up designed to deliver on fewer and more focused services. During the year, Telenor Digital launched a number of third-party services with partners such as Wikimedia, Opera Software and Facebook in several Asian markets. Life insurance products were introduced in Bangladesh and Pakistan, as well as mobile savings products in the latter. In addition, the acquisition of KBC Banka in Serbia was finalised in December. Tapstorm, a software as a service provider, was launched in three markets in 2013, while Telenor Connexion, a provider of machine-to-machine services, continued to deliver strong results. In addition, the roll out of the global backend infrastructure continued, while direct operator billing continued its positive development. Telenor also entered into a collaboration with Mozilla on Firefox OS to develop a low-cost smartphone alternative. The first Telenor Firefox

/PAGE 13/
TELENOR ANNUAL REPORT 2013Report from the Board of Directors 2013
phones were launched in Serbia, Hungary and Montenegro in 2013.
Telenor has also strengthened its research efforts through its Telenor Research unit. Research programmes are established to provide new insights tailored for Telenor within consumer and market dynamics, and technology shifts. Researchers aim to gain new insights about customer behavior, how customers can better be served and how Telenor can better manage the transformation from manual to digital touch-points and offerings.
Telenor Research aims to understand the changes in market dynamics, as data access is becoming the most important part of our service offering. Furthermore, this group looks into the potential disruptive impact of new technologies on business models and positions. Through close collaboration with EU projects, researchers have found innovative ways of utilising the scarce resource of spectrum through cognitive radio. To contribute to and position Telenor for the coming 5G mobile networks, research is conducted on Smart Future Networks. Extensive research has also been done on Near Field Communication services supporting the development of a new mobile payment service, ValYou. This research demonstrates how new technologies can be used to create business opportunities, increase customer satisfaction and improve operational efficiency.
In 2013, Telenor Research continued to build solid relationships with Norwegian academia, and extended its partnership program with several renowned inter-national institutions, including MIT, Harvard, Northeastern and Cambridge. Through an open innovation model, Telenor Research is collaborating with
Harvard and UN Global Pulse to use telecom data to better predict societal development needs. This research can help improve disease and disaster relief, by enabling cooperation between industry, government, academia and the end user.
People DevelopmentBy year-end 2013, Telenor Group employed about 34,000 people across 13 countries. This workforce represents great diversity, in regards to nationality, education, gender, age and cultural background. Some 81% of the employees in Telenor are non-Norwegians and 34% of the total workforce are women. The share of women in management positions in 2013 was 21% , compared with 23% in 2012. The share of women in Telenor ASA’s Board of Directors was 36% last year, the same as in 2012. Two out of nine members of the company’s Group Executive Management are female per year-end 2013, constituting 22%.
In addition, Telenor has been running the Open Mind program since 1996, making it easier for people with physical disabilities or immigrants to enter employment.
The company’s vision to empower societies is intended to further motivate employees by understanding how Telenor’s business can impact peoples’ lives and society. Telenor’s corporate culture and its way of doing business (Telenor Way) is defined by the company’s mission, the Code of Conduct, Leadership Expectations, Policies and Manuals and Telenor’s corporate values: keep promises, make it easy, be respectful and be inspiring.
In 2013, Telenor started to place special focus on three areas: Engagement, Competence and Change.
Telenor sees great importance in keeping its employees highly engaged. It has therefore concretised ambitious targets on the Employee Engagement Index (EEI), measured in an annual survey, towards 2016. Consequently EEI has also been included as a perform-ance KPI for all operations. All employees are invited to take part in the survey and the following workshop-process. In 2013, the EEI has continued the positive development from the last years to a score of 78% on a global level (3% higher than in 2012).
Unrivalled competence of Telenor’s employees is needed to succeed now and in the future. Telenor’s portfolio of global training programs (Telenor Academies) has been further developed and trained 241 global talents in 2013. In order to strengthen the leadership pipeline, a special focus has been on top executives and talents, where 185 leaders went through an appraisal process that concluded in individual development plans. Telenor has also identified five critical competences where a gap closure strategy has been made.
As change always has been a major premise for the industry, it is increas-ingly important to manage it in a sustainable way. In 2013, Telenor has focused on governing how change is implemented by updating guidelines. A taskforce has also been established to support change initiatives. A toolbox and training programs for managers, with 150 managers participating in 2013, is made available to ensure change-competence throughout the group.
Telenor has a global process for employee development and perform-ance and has started to develop a global framework for career- and competence development. Due to
TELENOR ANNUAL REPORT 2013Report from the Board of Directors 2013
/PAGE 14/
extensive internal mobility at Telenor Group, a Global Employment Company was formed in Malaysia last year, in order to make the process more efficient.
SustainabilityThe Norwegian Parliament adopted in 2013 a statutory duty for large comp-anies to report on how they follow up material sustainability issues.
The statement on how the company is delivering on its social responsibility can be found in a separate and more detailed section of the Annual Report for 2013, see pages 122-129.
Risk FactorsWhen operating across multiple markets, Telenor Group is exposed to a range of financial, regulatory, operational, industry and reputational risks that may adversely affect the business.
Financial riskFinancial risks are continuously monitored and analysed. Financial risk includes credit risks, liquidity risks, currency risk and interest rate risks. Measures are taken to mitigate these risks and reduce the probability for financial losses.
Telenor Group is exposed to credit risk mainly related to accounts receivable, deposits with financial institutions, financial derivatives and investment in Government debt securities. In 2013, Telenor Group had no credit losses due to defaults of financial institutions or Government securities.
Financial flexibility is a key priority for Telenor Group. The liquidity risk is low and financial flexibility is maintained through a diversified set of funding sources. As at 31 December 2013,
Telenor’s net debt/EBITDA ratio was 1.1. This is well within the cap of 2.0x as stated in the financial policy.
69% of the Group’s revenues is derived from operations with a functional currency other than the Norwegian Krone. Currency fluctuations affect the value of investment in foreign operations when translating financial statements into Norwegian Kroner. Telenor Group seeks to hedge its net investment in foreign operations by allocating currency debt on the basis of relevant market values and market capabilities. The most significant debt currencies for Telenor Group are Euros, US dollars, Swedish Krona, Thai Baht and Malaysian Ringgits.
Exchange rate risk exists when Telenor ASA or any of its subsidiaries enter into transactions in foreign currencies. Committed cash flows in foreign currencies equivalent to NOK 50 million or more are hedged if feasible.
Telenor Group is exposed to fluctuations in interest rates through funding and liquidity management activities. The Group’s treasury policy states that the interest rate duration on the debt portfolio shall be in the interval from 0 to 5 years. The duration was 2.0 years as of 31 December 2013. The risk is managed using both fixed and floating rate debt, as well as interest rate derivatives.
Regulatory riskTelenor Group’s operations are subject to extensive regulatory requirements. Unfavourable regulatory developments and regulatory uncertainty could adversely affect the Group’s results and business prospects, see also note 33 of Consolidated Financial Statements.
In several of the countries where
Telenor Group operates, the govern-ment has imposed sector specific taxes and levies, as a measure to improve state finances. The introduction of, or increase in, sector specific taxes and levies may adversely impact the Group’s business.
Telenor Group depends on licences, access to spectrum and numbering resources in order to provide tele-communications services. Spectrum processes, including renewal of existing spectrum licences in some markets, are expected over the next 2–3 years. If the Group is not successful in acquiring spectrum licences or is required to pay higher rates than expected, this might impact the Group’s business strategy, and/or the Group could be required to make additional investments to maximise the utilisation of existing spectrum.
In most of the countries where the Group operates, the wholesale market (e.g. copper and fibre access, MTR, site sharing etc.) is to some extent regulated. Changes to terms and conditions for wholesale access (including regulated prices) may negatively impact the Group’s business. Furthermore, the transition from voice to data services is influenced by a number of regulatory levers, e.g. MTR levels and net neutrality provisions.
Within the EU, the Commission has proposed a set of initiatives including elimination of roaming fees, clearer rules for net neutrality and a more harmonised approach to spectrum across Europe. Certain elements – if implemented in their current form – may negatively affect the Telenor operations in Europe.
In India, the Government in the November 2012 auction allowed all

/PAGE 15/
TELENOR ANNUAL REPORT 2013Report from the Board of Directors 2013
quashed licences to be eligible for an offset (the licence fee paid in the 2008 auction). The terms and conditions for how to receive the refund from the cancelled licences belonging to Uninor have still not been settled with the Government. For further information see Note 33.
In Myanmar, with an immature state bureaucracy, implementation of rules and regulations as well as meeting the licence obligations in the recently acquired mobile licence constitutes a risk.
In Thailand, the Foreign Dominance regulations constitute a risk despite the matter being subject to GATS process in Geneva.
Further, CAT and dtac have a substantial number of disputes and disagreements related to the understanding and reach of the concession agreements. This also includes how the new 3G regime is to be understood in relation to the concession agreements. Dtac is of the opinion that the company is operating in accordance with applicable laws and regulations and refutes any allegations from CAT that dtac is operating in violation of concession agreements.
Operational risk The introduction of new business models and technologies in the telecom sector may lead to structural changes and different competitive dynamics within the industry. Failure to meet maturing demands in the marketplace has the potential to impact the Group’s position in service offerings, customer relationships and the value chain. This may adversely impact the Group’s operational results.
Telenor Group’s portfolio of companies
competes on several dimensions, e.g. product portfolio, price, network quality, network coverage, reliability, sales, distribution and service differentiation. Revenue growth is partly dependent on new products, services, technologies and applications. If such new releases are not technically or commercially successful, or if limitations in existing or new services and products affect the customer experience, Telenor Group’s ability to attract or retain customers may be impaired.
The quality and reliability of Telenor Group’s telecommunications services depends on the stability of its network and the networks of other service providers with which it interconnects. These networks are vulnerable to damage or service interruptions. Repeated, prolonged or catastrophic network or IT system failures could damage the Group’s reputation and ability to attract and retain subscribers.
Telenor Group depends on key suppliers and third-party providers for supply and maintenance of equipment and services that the company needs to develop its network and operate its business. Problems that manifest in relation to the supply chain may adversely affect the Group’s business and results of operations.
Telenor Group’s local partners or other co-shareholders may fail to adequately support the companies in which Telenor has invested, or disagree with the Group’s strategy and business plans. This may prevent these companies from operating or competing effectively, and temporarily or permanently reduce the Group’s cash flow from these companies.
Across Telenor Group’s portfolio of operations there is depth of experience
and knowledge on a broad range of market-related, technical and partner engagement matters that have direct relevance beyond individual business units. Inability to leverage this asset across the Group may contribute to sub-optimisation.
Telenor Group handles substantial volumes of confidential information. Loss, mismanagement or unauthorised disclosure of such information, e.g. through cybersecurity attacks, could adversely affect the Group’s business and reputation.
Concern has been expressed that electromagnetic signals from mobile handsets and base stations may pose health risks. Any substantiation of such claims may adversely affect the Group’s business and results of operations.
The growing scale of Telenor Group’s international operations brings with it the potential for exposure to fraud and corruption, both internally and among external stakeholders who may have a differing set of business values from those under which Telenor Group operates. Failure to adhere to the values that Telenor Group commits to in our global operations may damage customer perception of the Telenor brand as well as adversely impact the Group’s results of operations.
Telenor Group operates in countries where there is a history of political instability and violence. Any recurrence or escalation of such events, including social unrest, terrorist attacks and war, may prevent the Group from operating its business effectively. Telenor Group actively monitors the environments in the countries where it operates and takes additional steps to protect its employees, assets and overall business when necessary. Crisis Management is
TELENOR ANNUAL REPORT 2013Report from the Board of Directors 2013
/PAGE 16/
practiced in Telenor, and the company prioritises the safety of its employees in the event of an emergency.
Social and environment riskWith the wide international endorsement of the UN Guiding Principles on Business and Human Rights and the human rights chapter of the OECD Guidelines for Multinational Enterprises we expect growing attention on the responsibility of businesses to respect human rights. From a Telenor perspective, the main challenges related to respecting human rights are two-pronged. The first is related to challenges to privacy and freedom of expression and potential government misuse of access to telecom data and networks. We see that while telecommunications enable the exchange of ideas and expression of opinions, occasions where governments request access to our data and networks may sometimes present human rights risks. The second relates to understanding risks related to new market entry, particularly in Bulgaria and Myanmar. In both cases, Telenor believes active engagement with stakeholders is important to understanding and mitigating risks.
Across all Telenor’s markets children and young people are accessing online content at an increasingly rapid pace. At Telenor we are confident that this access enriches the lives of children, enabling them to share, engage, learn and be entertained. Children will explore, and there are real risks associated with their ICT use. The risks do not necessarily always translate in to harm, however.
In terms of climate-related regulatory risks, Telenor may face higher operational costs related to carbon taxes, rising energy prices and
internationally binding agreements. However, the risk for the mobile industry in short to medium term is moderate due to low direct carbon emissions from its operations.
Climate-related physical risks include extreme weather conditions and higher sea levels. These types of events may cause disruptions or catastrophic damage to infrastructure, such as network base stations and electrical power lines. Telenor’s Asian operations are exposed to risks related to infrastructure, including threats of flooding, tropical cyclones and rising sea levels. Telenor’s Nordic operations face risk to infrastructure due to increased frequency of storms and more extreme winter weather conditions.
Electronic waste contains toxic materials that may present health hazards and run the risk of environ-mental damage through land contami-nation or water and air pollution. It is important for Telenor to reuse and recycle network equipment and to ensure that these processes are conducted according to internationally recognised standards and regulations.
Risk managementTelenor’s risk management objective is to earn competitive returns from its various business activities at acceptable risk levels and without compromising its vision, values and codes and conducts. Risk management is integrated within the Group’s annual strategy planning process, and key risks highlighted therein by business units are tracked through various Group Review processes. Business Units report their strategic risk matrix in their annual strategy plan, based on a thorough risk assessment process. Group Strategy aggregates risks from the Business Unit
strategy plans, analyses other significant risks across the group and presents Telenor’s strategic risks to the Board of Directors. Each Business Unit is responsible for updating their company level risk register on a regular basis. Business Units provide quarterly updates to strategic risks reported in the strategy plan and also report key strategic risks that have emerged, including the status of actions to mitigate the risks. Business Units are required to align risk management prosesess closely with existing business and management processes locally. All managers are required to assume responsibility for risk management within their areas of responsibility and ensure that risk management is embedded in day to day business processes.
Shares and Shareholder IssuesThe Telenor share is listed on the Oslo Stock Exchange (OSE). Including reinvested dividends, the total return of the Telenor share was 35% in 2013, whereas the benchmark index STOXX Europe 600 Telecommunications Index Gross Return (SXKGR) increased by 39%. The Oslo Stock Exchange Benchmark Index (OSEBX) increased by 24%. The Telenor share closed at NOK 144.60 at year-end 2013, corre-sponding to an equity value of NOK 219 billion. At year-end, Telenor’s share capital was NOK 9,099,745,626, divided into 1,516,624,271 ordinary shares. The share capital was reduced by NOK 259,941,210 in 2013. This was done by cancelling 19,943,900 own shares and by redeeming 23,379,635 shares held by the Kingdom of Norway through the Ministry of Trade, Industry and Fisheries. The company had approx imately 42,300 shareholders at year-end, a decline of around 2% from the previous year. The 20 largest share holders held 77% of the registered shares. North

/PAGE 17/
TELENOR ANNUAL REPORT 2013Report from the Board of Directors 2013
American institutional investors owned 13%, while UK institutional investors and other European institutional investors held 7% and 8% of the company, respect ively. Norwegian institutional investors, including the Norwegian state, held 64% of the total issued share capital at year-end. Telenor owned 7.0 million treasury shares as of 31 December 2013, of which 7.0 million were held for the purpose of cancellation.
Based on the total number of treasury shares held for cancellation and subject to approval by the AGM in 2014, around 8.2 million of the Ministry of Trade,Industry and Fisheries’ Telenor shares will be redeemed for a consideration of approximately NOK 1.1 billion. This is a part of an agreement entered into in 2013 between Telenor and the Ministry, so that the Ministry’s ownership stake in Telenor of 53.97% will remain unaffected if Telenor repurchased shares for cancellation. For more comprehensive information, reference is made to note 35 to the consolidated financial statements.
Through active communication with the capital market and shareholders in 2013, Telenor ensured that significant information required for an external evaluation of the Telenor Group’s securities was published in accor-dance with applicable rules and guidelines.
Corporate GovernanceCorporate Governance ReportTelenor ASA is a publicly limited liability company established under Norwegian law. The Telenor shares are listed on the Oslo Stock Exchange. As an issuer of shares, Telenor complies and operates in accordance with rules governing the Norwegian stock
exchange, including the at any time applicable rules on Continuing Obligations of Listed Companies as approved by Oslo Børs ASA, with reference to the Norwegian Code of Practice for Corporate Governance (the «Code of Practice») issued by the Norwegian Corporate Governance Board (NCGB). The details of Telenor Group’s corporate governance principles and practices, pursuant to Section 3-3b of the Norwegian Accounting Act, and how Telenor operates in accordance with the NCBG’s Code of Practice, including any deviations, is explained in the Board of Director’s separate yearly «Report on Corporate Governance». The Report on Corporate Governance is publicly disclosed on Telenor’s web page.
Telenor’s Principles for Corporate Governance The Board emphasises the importance of maintaining a high standard of corporate governance across Telenor Group, in line with Norwegian and international generally accepted rules and recommendations. Sound corporate governance is a key success factor when conducting business in a global, highly competitive and changing market, and ensures the greatest possible value creation over time in the best interests of Telenor’s shareholders, employees and other stakeholders. Telenor’s principles for Corporate Governance are subject to regular discussions and annual review by the Board of Directors.
Transparency and trustful cooperation between all parties and stakeholders involved in the Telenor Group is a prerequisite for good business ethics and corporate governance. The Board of Directors has a strong focus on implementing a high ethical standard
across the Telenor Group. The Telenor Code of Conduct sets out rules and guidelines on how Board members, managers, employees and anyone acting for or on behalf of Telenor are expected to conduct business.
To ensure operationalization of good and efficient corporate governance, Telenor has adapted a governance framework, including the Telenor Code of Conduct and a set of policies and manuals, processes and systems on monitoring and reporting. The governance framework is a key management tool. Telenor works continuously to improve its governance regime, and to ensure that documents, training and control mechanisms are current and adequate. The governing documents are adapted and implemented in all subsidiaries where Telenor has operational control.
The Board will continue to maintain and further develop our strong ethical platform and corporate governance standard as one key factor for Telenor’s business integrity and continuing strong performance.
Working Committees of the BoardThe Board of Directors has appointed three preparatory working committees of the Board: The Governance and Remuneration Committee, the Ethics and Sustainability Committee and the Audit Committee. The Board Committees report to the Board of Directors of Telenor ASA in connection with the scope of work described in the sections above. Each member of the Board has access to all working documents including the minutes from the Committee meetings.
TELENOR ANNUAL REPORT 2013Report from the Board of Directors 2013
/PAGE 18/
The Governance and Remuneration CommitteeThe Governance and Remuneration Committee is composed of the following four members of the Board: Svein Aaser (Chairman of the Committee), Burckhard Bergmann, Sally Davis and Bjørn André Anderssen (employee representative). The Committee held eight meetings in 2013. The average attendance at the Committee meetings was 91%.
The Committee oversees that Telenor adheres to generally accepted high standards of Corporate Governance and maintains a corporate culture that encourages good corporate governance. It is also the task of the Committee to ensure that Telenor has relevant management and control bodies and processes. Further, the Committee considers Telenor’s remuneration policy and programs, including bonus programs and share-based schemes, and presents recommendations to the Board of Directors for decision. The Committee annually evaluates the President and CEO’s total remuneration and presents recommendations to the Board of Directors for decision. During 2013, the Committee has had a particularly focus on executive bonus plans, Succession Planning and development of governance processes. The work on executive bonus plans was initiated in order to simplify the bonus plans and strengthen how different aspects of short and long-term performance were rewarded. The revised executive bonus plan has been simplified both with regards to the number of compensation elements and with regards to KPI structure and design. Succession Planning was discussed based on detailed evaluation about the performance and potential of executive management in the whole Group. The process has contributed to a robust
leadership pipeline in Telenor Group. The Committee also discussed corporate governance and plans for assessing the governance processes and results. In 2014, the Committee will focus particularly on monitoring and review of governance processes.
The Ethics and Sustainability CommitteeThe Ethics and Sustainability Committee is composed of four members of the Board. At year-end 2013, the members were Frank Dangeard (Chairman of the Commitee), Hallvard Bakke, Marit Vaagen and Brit Østby Fredriksen (employee represen-tative). The Ethics and Sustainability Committee held eight meetings in 2013. The average attendance at the Committee meetings was 91%.
The Committee supports the Board in fulfilling its responsibilities with respect to ethics and compliance as stated in law, code of practices and the Code of Conduct and accompanying governing documents. The Committee also supports the Board with respect to corporate responsibility; the manner in which Telenor’s activities affects people, society and the environment. The Committee further oversees Telenor’s efforts to ensure good internal occupational Health, Safety, Security and Environment (HSSE) practices throughout the Group, as well as Telenor’s processes and performance for HSSE and sustainability in the supply chain. During 2013, the Committee has had a particularly focus on Ethics and Compliance, Corporate Responsibility, Occupational Health, Safety and Security, internal audits and Risk Assessments. Special attention was given to personnel safety, cyber security, Telenor Group’s investment in VimpelCom and Telenor’s preparations for entry into Myanmar. For 2014, the
Committee will continue to monitor these processes including use of internal audits, and with a particular focus on cyber security and Telenor’s entry into Myanmar.
The Audit CommitteeThe Audit Committee is composed of the following three members of the Board: Dag J. Opedal (Chairman of the Committee), Barbara Milian Thoralfsson and Harald Stavn (employee representative). The Committee held seven meetings in 2013. The average attendance at the Committee meetings was 100%.
The Committee supports the Board in fulfilling its responsibilities with respect to financial reporting, internal control over financial reporting and auditing matters. The Committee oversees the procedures to identify financial and operational risks as well as understand and assess risk exposures and mitigating actions. The Committee also supports the Board in fulfilling its responsibilities with respect to ethics and compliance, as related to accounting and auditing matters according to the Code of Conduct and accompanying governing documents. In addition to fulfilling its responsibilities as described above, the Audit Committee had a particular focus on financial priorities and ambitions for the period 2014-2016.
Composition and work of the board of directorsRole and Responsibility of the BoardThe Board of Directors of Telenor ASA is responsible for the administration of the Telenor Group and for safeguarding the proper organization of the business. The Board of Directors shall supervise the day-to-day management and the company’s business in general. The Board shall, to the degree necessary,
/PAGE 19/
TELENOR ANNUAL REPORT 2013Report from the Board of Directors 2013
approve strategies, business plans and rolling forecasts for the activities of the company and its subsidiaries. The Telenor Group strategy (2012-2014) is available at www.telenor.com/about-us/our-strategy
The Board of Directors issues instructions for its own work as well as for the Chief Executive Officer, with particular emphasis on clear internal allocation of responsibilities and duties. The Board emphasises the importance on gaining valuable insights and being well informed on relevant technological, regulatory and market developments. During 2013, the Board conducted visits to several of Telenor operations in Asia. The Board systematically evaluates its performance, activities and expertise by undertaking a yearly self-assessment. External resources are used to facilitate the self-assessment and the evaluation of the self-assessment, as recommended by the NCBG’s Norwegian Code of Practice for Corporate Governance. The Board’s self-assessment is presented to the Nomination Committee.
Composition of the BoardTelenor’s Board of Directors shall have a diverse composition and competence tailored to meet the company’s needs. By year-end 2013, Telenor’s Board of Directors consisted of eleven Board Members, of which three are employee-elected members as required by Norwegian company law. None of the Board members, apart from the employee representatives, are employees of Telenor or have carried out work for Telenor. The management is not represented on the board, and all shareholder representatives on the board are independent. Information regarding the background, education and other board positions of each Board Member is available on www.telenor.
com/about-us/corporate-governance/board-of-directors
Telenor’s Corporate Assembly, a distinctly Norwegian body pursuant to Norwegian law, elects members to the Board and the Chairman of the Board. Other tasks of the Corporate Assembly are to supervise the Board of Directors’ and the CEO’s management of the company, see further on www.telenor.com/about-us/corporate-governance/corporate-assembly
In May 2013, the Corporate Assembly re-elected Svein Aaser as Chairman of the Board for a period of up to two years. Marit Vaagen was elected as new member of the Board for a period of up to two years, replacing Liselott Kilaas. Furthermore, Hallvard Bakke, Burckhard Bergmann, Frank Dangeard, Sally Davis, Dag J. Opedal and Barbara Milian Thoralfsson were re-elected as members of the Board for a period of up to two years. Employee representatives to the Board, Brit Østby Fredriksen, Harald Stavn and Bjørn André Anderssen, were re-elected by the employee representatives in the Corporate Assembly in December 2013. The Board of Directors held 12 Board meetings in 2013. The average attendance at the Board meetings was 97%.
Events after the reporting periodTelenor MyanmarOn 30 January 2014, Telenor Group announced that it has signed an agreement with the Union Government of Myanmar for a nationwide tele-communication licence. The licence includes spectrum in the 900MHz and 2.1GHz bands and is valid for 15 years effective from 5 February 2014. The licence fee is USD 500 million. The Group plans to provide network coverage for 90% of the population in
Myanmar within five years.
IndiaOn 13 February 2014, Uninor in India confirmed that it has successfully acquired additional spectrum in the 1800 MHz band in four of its six existing circles – Uttar Pradesh East, Uttar Pradesh West, Bihar and Jharkhand and Andhra Pradesh - and in the new circle of Assam at an investment of INR 8,447 million. With these auctions, Uninor’s footprint now increases to seven circles.
Telenor ASATelenor ASA issued two bonds under the EMTN programme on 12 March 2014: one SEK 2.3 billion bond with fixed coupon rate of 2.375% and one SEK 1.1 billion bond with floating coupon rate of 3M Stibor + 0.63%, both with final maturity 19 March 2019.
Outlook for 2014Based on the current Group structure, excluding Myanmar and with currency rates as of 31 December 2013, Telenor expects low single digit organic revenues growth, stable EBITDA margin before other income and expenses and capital expenditures as a proportion of revenues, excluding licences and spectrum, of around 16%.
Annual result and allocationTelenor ASA’s net income for the year 2013 was NOK 21,312 million, after receipt of a group contribution of NOK 25,534 million. The Board proposes the following allocation: Transferred to retained earnings: NOK 21,312 million.
After this allocation, Telenor ASA’s equity, after deduction of share capital, is NOK 48,559 million. The objective for Telenor’s dividend policy is to distribute 50-80% of normalised net income and aim for a nominal increase in the dividend per share. To maintain a strong

TELENOR ANNUAL REPORT 2013Report from the Board of Directors 2013
/PAGE 20/
financial position to ensure access to funding, Telenor’s main priority is to keep reported net debt/EBITDA below 2.0. As of 31 December 2013 the reported net debt ratio was 1.12 (1.03 as of 31 December 2012). The proposed cancellation of shares will reduce the equity available for distribution as dividend by NOK 1.0 billion
At the Annual General Meeting in May 2014, the Board will propose a dividend of NOK 7 per share for 2013 to be paid in May/June 2014, in total NOK 10.6 billion.
Fornebu, 18 March 2014
Svein Aaser Frank Dangeard Chairman Deputy Chairman
Hallvard Bakke Dr. Burckhard Bergmann Marit Vaagen Sally Davis Dag J. Opedal Board member Board member Board member Board member Board member
Barbara Milian Thoralfsson Bjørn André Anderssen Brit Østby Fredriksen Harald Stavn Jon Fredrik Baksaas Board member Board member Board member Board member President & CEO

/PAGE 21/
TELENOR ANNUAL REPORT 2013Report from the Board of Directors 2013
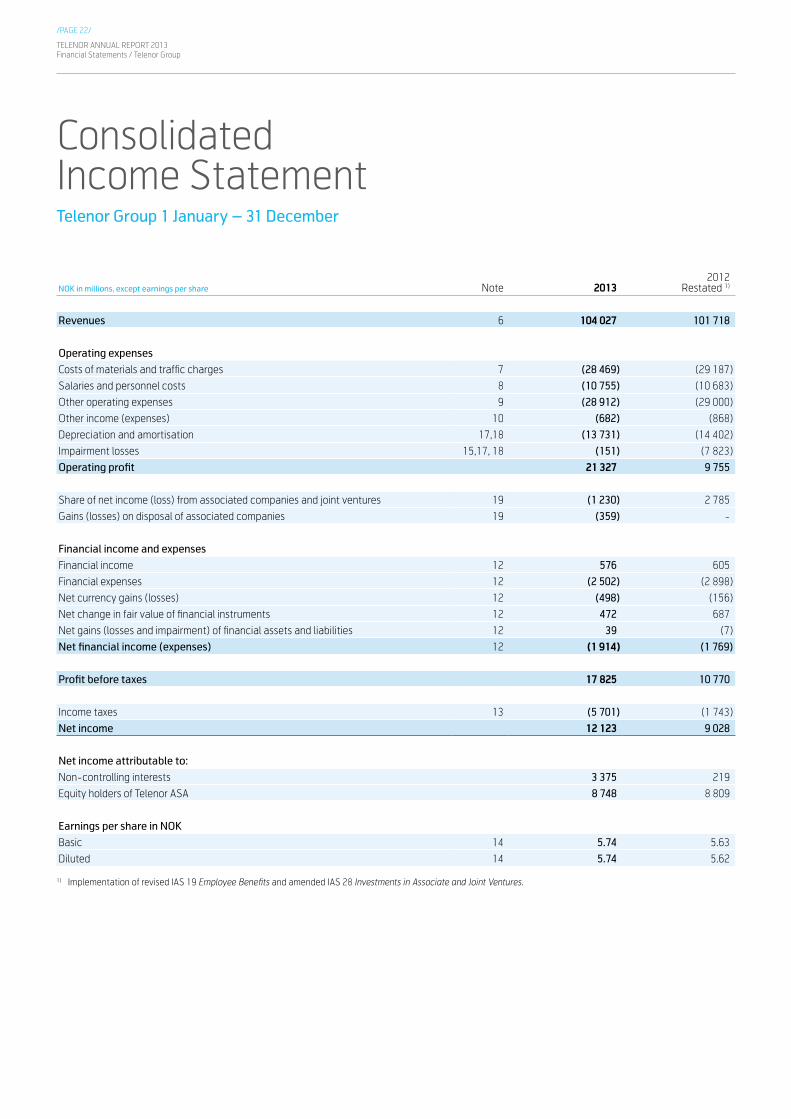
/PAGE 22/
TELENOR ANNUAL REPORT 2013Financial Statements / Telenor Group
NOK in millions, except earnings per share Note 20132012
Restated 1)
Revenues 6 104 027 101 718
Operating expenses
Costs of materials and traffic charges 7 (28 469) (29 187)
Salaries and personnel costs 8 (10 755) (10 683)
Other operating expenses 9 (28 912) (29 000)
Other income (expenses) 10 (682) (868)
Depreciation and amortisation 17,18 (13 731) (14 402)
Impairment losses 15,17, 18 (151) (7 823)
Operating profit 21 327 9 755
Share of net income (loss) from associated companies and joint ventures 19 (1 230) 2 785
Gains (losses) on disposal of associated companies 19 (359) -
Financial income and expenses
Financial income 12 576 605
Financial expenses 12 (2 502) (2 898)
Net currency gains (losses) 12 (498) (156)
Net change in fair value of financial instruments 12 472 687
Net gains (losses and impairment) of financial assets and liabilities 12 39 (7)
Net financial income (expenses) 12 (1 914) (1 769)
Profit before taxes 17 825 10 770
Income taxes 13 (5 701) (1 743)
Net income 12 123 9 028
Net income attributable to:
Non-controlling interests 3 375 219
Equity holders of Telenor ASA 8 748 8 809
Earnings per share in NOK
Basic 14 5.74 5.63
Diluted 14 5.74 5.62
1) Implementation of revised IAS 19 Employee Benefits and amended IAS 28 Investments in Associate and Joint Ventures.
Consolidated Income StatementTelenor Group 1 January – 31 December

/PAGE 23/
TELENOR ANNUAL REPORT 2013Financial Statements / Telenor Group
NOK in millions Note 20132012
Restated 1)
Net income 12 123 9 028
Other comprehensive income (loss)
Translation differences on net investments in foreign operations 23 7 688 (4 531)
Income taxes 125 114
Amount reclassified from equity to income statement on disposal 23 55 14
Net gain (loss) on hedge of net investments 23, 28 (4 030) 1 335
Income taxes 1 130 (374)
Amount reclassified from equity to income statement on disposal 23 (7) -
Net gain on available-for-sale investments 23 18 13
Amount reclassified from equity to income statement on disposal 23 - 5
Share of other comprehensive income (loss) from associated companies 23 192 (1 540)
Amount reclassified from equity to income statement on disposal 23 240 -
Items that may be reclassified subsequently to income statement 5 410 (4 964)
Remeasurement of defined benefit pension plans 23, 25 (1 246) 1 805
Income taxes 337 (504)
Items that will not be reclassified to income statement (908) 1 301
Other comprehensive income (loss), net of taxes 4 502 (3 663)
Total comprehensive income (loss) 16 626 5 365
Total comprehensive income (loss) attributable to:
Non-controlling interests 3 566 273
Equity holders of Telenor ASA 13 059 5 092
1) Implementation of revised IAS 19 Employee Benefits and amended IAS 28 Investments in Associate and Joint Ventures.
Consolidated Statement of Comprehensive IncomeTelenor Group 1 January – 31 December
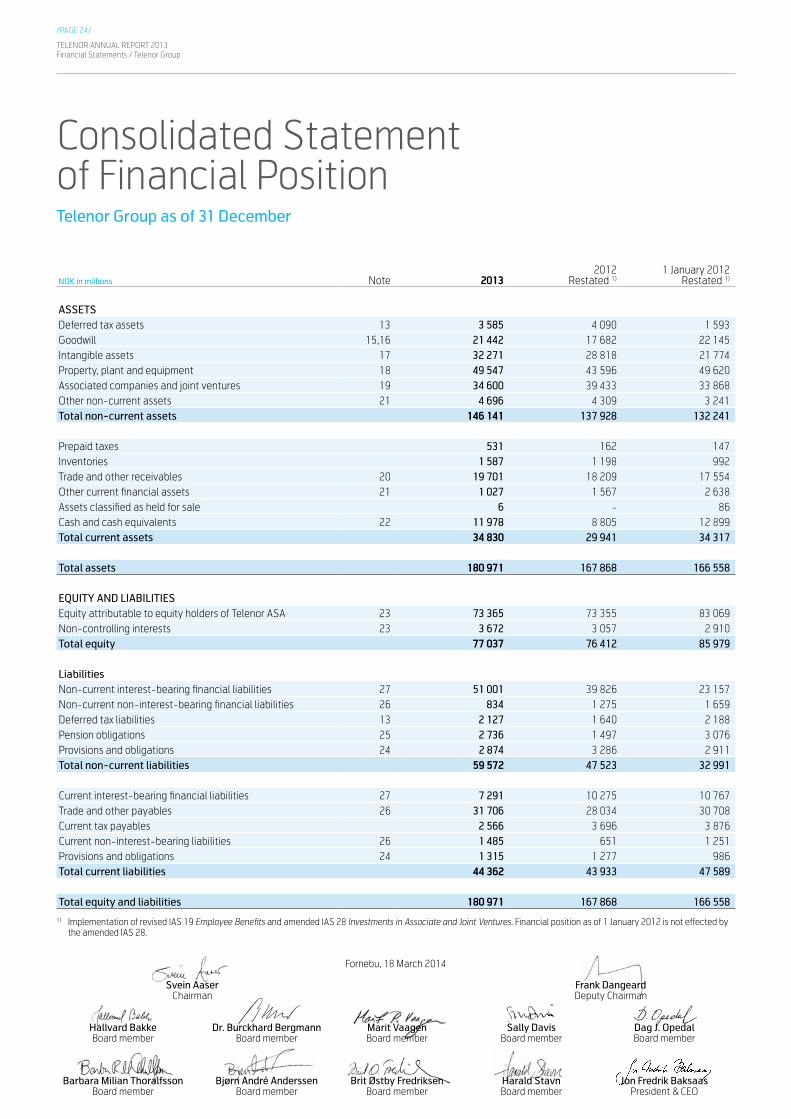
/PAGE 24/
TELENOR ANNUAL REPORT 2013Financial Statements / Telenor Group
NOK in millions Note 20132012
Restated 1)1 January 2012
Restated 1)
ASSETSDeferred tax assets 13 3 585 4 090 1 593Goodwill 15,16 21 442 17 682 22 145Intangible assets 17 32 271 28 818 21 774Property, plant and equipment 18 49 547 43 596 49 620Associated companies and joint ventures 19 34 600 39 433 33 868Other non-current assets 21 4 696 4 309 3 241Total non-current assets 146 141 137 928 132 241
Prepaid taxes 531 162 147Inventories 1 587 1 198 992Trade and other receivables 20 19 701 18 209 17 554Other current financial assets 21 1 027 1 567 2 638Assets classified as held for sale 6 - 86Cash and cash equivalents 22 11 978 8 805 12 899Total current assets 34 830 29 941 34 317
Total assets 180 971 167 868 166 558
EQUITY AND LIABILITIESEquity attributable to equity holders of Telenor ASA 23 73 365 73 355 83 069Non-controlling interests 23 3 672 3 057 2 910Total equity 77 037 76 412 85 979
LiabilitiesNon-current interest-bearing financial liabilities 27 51 001 39 826 23 157Non-current non-interest-bearing financial liabilities 26 834 1 275 1 659Deferred tax liabilities 13 2 127 1 640 2 188Pension obligations 25 2 736 1 497 3 076Provisions and obligations 24 2 874 3 286 2 911Total non-current liabilities 59 572 47 523 32 991
Current interest-bearing financial liabilities 27 7 291 10 275 10 767Trade and other payables 26 31 706 28 034 30 708Current tax payables 2 566 3 696 3 876Current non-interest-bearing liabilities 26 1 485 651 1 251Provisions and obligations 24 1 315 1 277 986Total current liabilities 44 362 43 933 47 589
Total equity and liabilities 180 971 167 868 166 558
1) Implementation of revised IAS 19 Employee Benefits and amended IAS 28 Investments in Associate and Joint Ventures. Financial position as of 1 January 2012 is not effected by the amended IAS 28.
Consolidated Statement of Financial PositionTelenor Group as of 31 December
Fornebu, 18 March 2014
Svein Aaser Frank Dangeard Chairman Deputy Chairman
Hallvard Bakke Dr. Burckhard Bergmann Marit Vaagen Sally Davis Dag J. Opedal Board member Board member Board member Board member Board member
Barbara Milian Thoralfsson Bjørn André Anderssen Brit Østby Fredriksen Harald Stavn Jon Fredrik Baksaas Board member Board member Board member Board member President & CEO
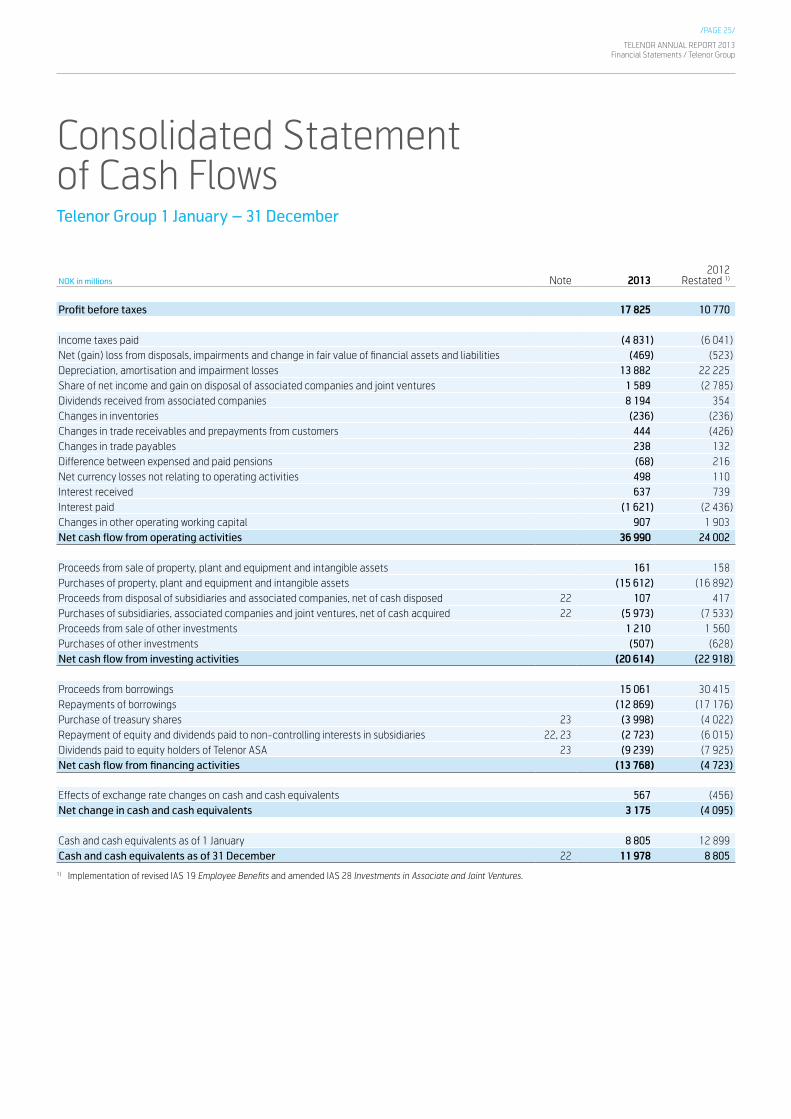
/PAGE 25/
TELENOR ANNUAL REPORT 2013Financial Statements / Telenor Group
NOK in millions Note 20132012
Restated 1)
Profit before taxes 17 825 10 770
Income taxes paid (4 831) (6 041)Net (gain) loss from disposals, impairments and change in fair value of financial assets and liabilities (469) (523)Depreciation, amortisation and impairment losses 13 882 22 225Share of net income and gain on disposal of associated companies and joint ventures 1 589 (2 785)Dividends received from associated companies 8 194 354Changes in inventories (236) (236)Changes in trade receivables and prepayments from customers 444 (426)Changes in trade payables 238 132Difference between expensed and paid pensions (68) 216Net currency losses not relating to operating activities 498 110Interest received 637 739Interest paid (1 621) (2 436)Changes in other operating working capital 907 1 903Net cash flow from operating activities 36 990 24 002
Proceeds from sale of property, plant and equipment and intangible assets 161 158Purchases of property, plant and equipment and intangible assets (15 612) (16 892)Proceeds from disposal of subsidiaries and associated companies, net of cash disposed 22 107 417Purchases of subsidiaries, associated companies and joint ventures, net of cash acquired 22 (5 973) (7 533)Proceeds from sale of other investments 1 210 1 560Purchases of other investments (507) (628)Net cash flow from investing activities (20 614) (22 918)
Proceeds from borrowings 15 061 30 415Repayments of borrowings (12 869) (17 176)Purchase of treasury shares 23 (3 998) (4 022)Repayment of equity and dividends paid to non-controlling interests in subsidiaries 22, 23 (2 723) (6 015)Dividends paid to equity holders of Telenor ASA 23 (9 239) (7 925)Net cash flow from financing activities (13 768) (4 723)
Effects of exchange rate changes on cash and cash equivalents 567 (456)Net change in cash and cash equivalents 3 175 (4 095)
Cash and cash equivalents as of 1 January 8 805 12 899Cash and cash equivalents as of 31 December 22 11 978 8 805
1) Implementation of revised IAS 19 Employee Benefits and amended IAS 28 Investments in Associate and Joint Ventures.
Consolidated Statement of Cash FlowsTelenor Group 1 January – 31 December
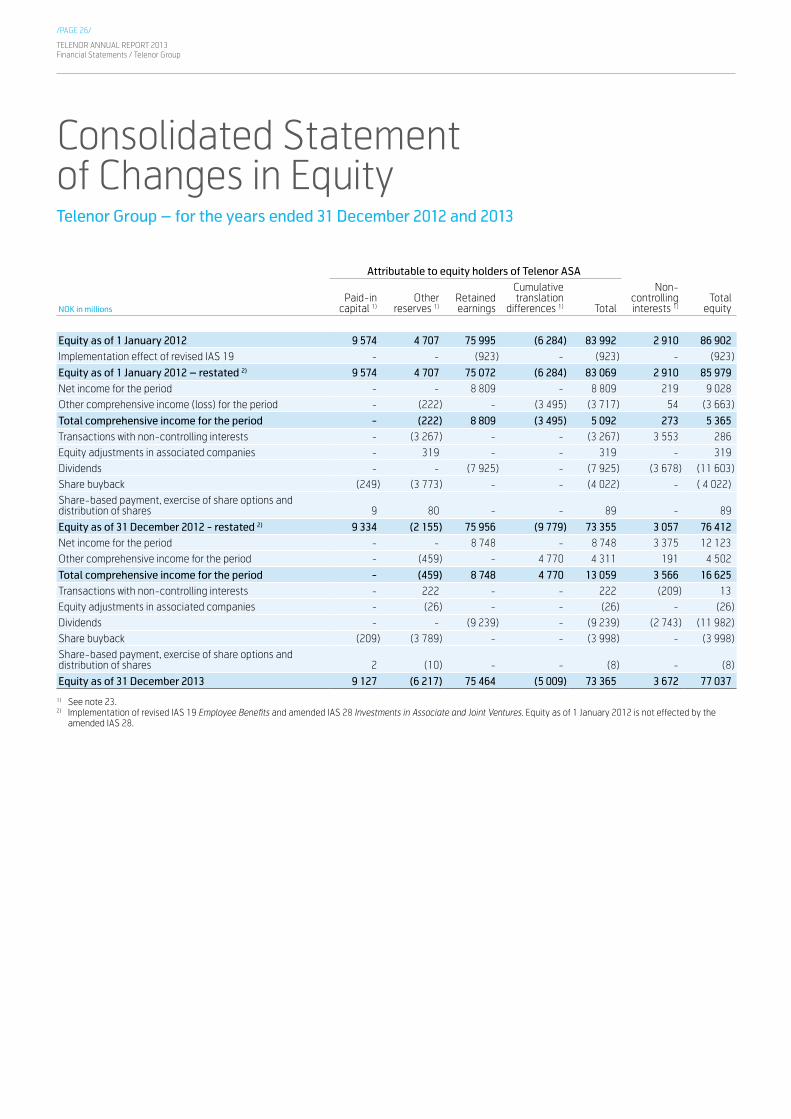
/PAGE 26/
TELENOR ANNUAL REPORT 2013Financial Statements / Telenor Group
Attributable to equity holders of Telenor ASA
NOK in millionsPaid-in
capital 1) Other
reserves 1) Retained earnings
Cumulative translation
differences 1) Total
Non- controlling interests 1)
Total equity
Equity as of 1 January 2012 9 574 4 707 75 995 (6 284) 83 992 2 910 86 902Implementation effect of revised IAS 19 - - (923) - (923) - (923)
Equity as of 1 January 2012 – restated 2) 9 574 4 707 75 072 (6 284) 83 069 2 910 85 979Net income for the period - - 8 809 - 8 809 219 9 028 Other comprehensive income (loss) for the period - (222) - (3 495) (3 717) 54 (3 663)
Total comprehensive income for the period - (222) 8 809 (3 495) 5 092 273 5 365Transactions with non-controlling interests - (3 267) - - (3 267) 3 553 286Equity adjustments in associated companies - 319 - - 319 - 319Dividends - - (7 925) - (7 925) (3 678) (11 603)Share buyback (249) (3 773) - - (4 022) - ( 4 022)Share-based payment, exercise of share options and distribution of shares 9 80 - - 89 - 89
Equity as of 31 December 2012 - restated 2) 9 334 (2 155) 75 956 (9 779) 73 355 3 057 76 412 Net income for the period - - 8 748 - 8 748 3 375 12 123Other comprehensive income for the period - (459) - 4 770 4 311 191 4 502
Total comprehensive income for the period - (459) 8 748 4 770 13 059 3 566 16 625Transactions with non-controlling interests - 222 - - 222 (209) 13Equity adjustments in associated companies - (26) - - (26) - (26)Dividends - - (9 239) - (9 239) (2 743) (11 982)Share buyback (209) (3 789) - - (3 998) - (3 998)Share-based payment, exercise of share options and distribution of shares 2 (10) - - (8) - (8)
Equity as of 31 December 2013 9 127 (6 217) 75 464 (5 009) 73 365 3 672 77 037
1) See note 23.2) Implementation of revised IAS 19 Employee Benefits and amended IAS 28 Investments in Associate and Joint Ventures. Equity as of 1 January 2012 is not effected by the
amended IAS 28.
Consolidated Statement of Changes in EquityTelenor Group – for the years ended 31 December 2012 and 2013
/PAGE 27/
TELENOR ANNUAL REPORT 2013Notes to the Financial Statements / Telenor Group
Notes to the ConsolidatedFinancial StatementsTelenor Group
01 General information, compliance and changes in International Financial Reporting Standards
02 Summary of significant accounting policies03 Critical accounting judgments and key sources of estimation
uncertainty04 Business Combinations05 Segments06 Revenues07 Costs of materials and traffic charges08 Salaries and personnel costs09 Other operating expenses10 Other income and expenses11 Research and development costs12 Financial income and expenses13 Income taxes14 Earnings per share15 Goodwill16 Impairment testing17 Intangible assets18 Property, plant and equipment
19 Associated companies and joint arrangements20 Trade and other receivables21 Other non-current assets and current financial assets22 Additional cash flow information23 Additional equity information24 Provisions and obligations25 Pension obligations26 Trade and other payables and non-interest bearing liabilities27 Interest-bearing liabilities28 Managing capital and financial risk management29 Fair values of financial instruments30 Pledges and guarantees31 Contractual obligations32 Related parties33 Commitments and contingencies34 Remuneration to management etc.35 Number of shares, ownership etc.36 Events after the reporting period
Contents notes/00/

TELENOR ANNUAL REPORT 2013Notes to the Financial Statements / Telenor Group
/PAGE 28/
/01/ General information, compliance and changes in international Financial Reporting Standards
General informationTelenor ASA (the Company) is a limited liability company incorporated in Norway. The Company is subject to the provisions of the Norwegian Act relating to Public Limited Liability Companies. The Company’s principal offices are located at Snarøyveien 30, N-1331 Fornebu, Norway. Telephone number: +47 678 90 000. Telenor is a telecommunication company and the principal activities of the Company and its subsidiaries (the Group) are described in note 5 Segments.
These consolidated financial statements have been approved for issuance by the Board of Directors on 18 March 2014 and is subject to approval by the Annual General Meeting on 14 May 2014.
Statement of complianceFrom 1 January 2005, as required by the European Union’s IAS Regulation and the Norwegian Accounting Act, the Company has prepared its consolidated financial statements in accordance with International Financial Reporting Standards («IFRS») as adopted by the European Union («EU»). References to «IFRS» hereafter should be construed as references to IFRS as adopted by the EU.
Adoption of new and revised standards and interpretationsThe accounting policies adopted are consistent with those of the previous financial year, except for implementation of new accounting standards as described below.
The Group has early adopted the following new and revised standards with effect from 1 January 2013. The new and revised standards are adopted with retrospective effect:
• IFRS 10 Consolidated Financial Statements. IFRS 10 replaced the portion of IAS 27 Consolidated and Separate Financial Statements that addressed the consolidated financial statements. The changes introduced by IFRS 10 require management to exercise significant judgement to determine which entities are controlled, and therefore are required to be consolidated by a parent, compared with the requirements that were in IAS 27. The implementation of IFRS 10 did not have any effect for the Group.
• IFRS 11 Joint Arrangements. IFRS 11 replaced IAS 31 Interests in Joint Ventures. IFRS 11 deals with how a joint arrangement of which two or more parties have joint control should be classified. SIC-13 Jointly Controlled Entities – Non-monetary Contributions by Venturers has been withdrawn upon the issuance of IFRS 11. Under IFRS 11, joint arrangements are classified as joint operations or joint ventures, depending on the rights and obligations of the parties to the arrangements. In contrast, under IAS 31, there were three types of joint arrangements: jointly controlled entities, jointly controlled assets and jointly controlled operations.
Joint operations under IFRS 11 shall be recognised in relation to The Groups interests in the assets, including its share of assets held jointly, its liabilities, including its share of liabilities incurred jointly, its revenue and expenses, including its share of expenses incurred jointly.
Joint ventures under IFRS 11 are required to be accounted for using the equity method of accounting, whereas jointly controlled entities under IAS 31 could be accounted for using the equity method of accounting or proportionate accounting.
This change had limited effect for the Group since the joint ventures as of 2012 are joint operations under the new IFRS and the Group applied the proportionate method of consolidation for these arrangements.
• IFRS 12 Disclosure of Interest in Other Entities. IFRS 12 includes all of the disclosures that were previously in IAS 27 related to consolidated financial statements, as well as all of the disclosures that were previously included in IAS 31 and IAS 28 Investments in Associates and Joint Ventures. These disclosures relate to an entity’s interests in subsidiaries, joint arrangements, associates and structured entities.
• IAS 27 Separate Financial Statements. As a consequence of the new IFRS 10 and IFRS 12, what remains of IAS 27 is limited to accounting for subsidiaries, jointly controlled entities, and associates in separate financial statements. The amended version of IAS 27 did not have any effect for the Group.
• IAS 28 Investments in Associates and Joint Ventures. As a consequence of the new IFRS 11, IAS 28 has been amended and describes the application of the equity method to both investments in joint ventures and associates. As a consequence of the amendments, an entity shall not remeasure the retained interest if an investment in an associate becomes an investment in a joint venture or vice versa. The change shall be applied retrospectively. Consequently, the Group’s recognised share of fair value gain from the increase in VimpelCom’s stake in Euroset from 49.9% to 50.0% in 2012 has been reversed. The consolidated financial statements for 2012 have been restated with the following impacts(for further information see note 20 in the Group’s Annual Report 2012):
NOK in millions 2012
Consolidated Statement of Financial Position
Associated companies and joint ventures (1 203)
Consolidated Income Statement
Share of net income from associated companies and joint ventures (1 258)
Consolidated Statement of Comprehensive Income
Other comprehensive income (loss) 55
Effect on earnings per share in NOK
Basic (0.80)
Diluted (0.80)
The following standards and interpretations adopted with effect from 1 January 2013 have implementation impact on the Group’s consolidated financial statements:
• IFRS 13 Fair Value Measurement. IFRS 13 establishes a single source of guidance under IFRS for all fair value measurements. IFRS 13 does not change when an entity is required to use fair value, but rather provides guidance on how to measure fair value under IFRS when fair value is required or permitted. IFRS 13 had limited effect on the Group’s financial position and performance. IFRS 13 also requires some additional disclosures.

/PAGE 29/
TELENOR ANNUAL REPORT 2013Notes to the Financial Statements / Telenor Group
• IAS 1 Presentation of Financial statements – amended. The amendment to IAS 1 changes the grouping of items presented in Other Comprehensive Income. Items that may be reclassified (or ‘recycled’) to profit or loss (when specific conditions are met) are presented separately from items that will never be reclassified. The amendment affects presentation of the Consolidated Statement of Comprehensive Income only and has no impact on the Group’s financial position or performance.
• IAS 19 (as revised in 2011) Employee Benefits. The IASB has issued numerous amendments to IAS 19. These range from fundamental changes such as: to eliminate the corridor approach and recognise all actuarial gains and losses in Other Comprehensive Income as they occur; to immediately recognise all past service costs; and to replace interest cost
and expected return on plan assets with a net interest amount that is calculated by applying the discount rate to the net defined benefit liability (asset). The changes shall be applied retrospectively and as a consequence, Telenor recognised the impact of these changes as of the date of initial application (1 January 2012) against the opening balance in equity.
Due to the change in the method of calculating the net interest amount Telenor is of the opinion that the presentation of net interest cost element as financial items gives better information of the Group’s financial performance and has decided to present net interest amount as financial items in the consolidated income statement. This change is applied retrospectively and the consolidated income statements for 2012 are restated.
The implementation effects of the changes in IAS 19 including the reclassification of the net interest amount are:NOK in millions As of 31 December 2013 As of 31 December 2012 As of 1 January 2012
Consolidated Statement of Financial Position
Deferred tax assets 131 (194) 318
Associated companies - (99) (99)
Pension obligations 512 (671) 1 142
Equity (381) 378 (923)
NOK in millions 2013 2012
Consolidated Income Statement
Pension costs (45) 93
Financial expenses (47) (86)
Income taxes 22 (7)
Net income (loss) (70) -
Consolidated Statement of Comprehensive Income
Net income (70) -
Other comprehensive income (loss), net of taxes *) (908) 1 301
Total Comprehensive income (loss) (978) 1 301
Effect on earnings per share in NOK
Basic (0.05) -
Diluted (0.05) -
*) Effect recognised in Other comprehensive income for the year of 2012 is due to the change of discount rate used to determine pension obligations as of 31 December 2012. The effect recognised in Other comprehensive income for the year 2013 is mainly due to implementation of new mortality risk table and disability risk table. Please refer to Note 25 for more information about the assumptions used.

TELENOR ANNUAL REPORT 2013Notes to the Financial Statements / Telenor Group
/PAGE 30/
The following standards and interpretations adopted with effect from 1 January 2013 have no implementation impact on the Group’s consolidated financial statements:
• IFRS 7 Financial Instruments – Disclosures. The IASB has introduced new disclosure requirements in IFRS 7. These disclosures would provide users with information that is useful in (a) evaluating the effect of potential effect of netting arrangements on an entity’s financial position and (b) analysing and comparing financial statements prepared in accordance with IFRS. The amendment affects disclosure only and has no impact on the Group’s financial position or performance.
• Improvements to IFRSs (2009-2011 cycle). The changes are primarily in order to remove inconsistencies and to clarify the wording of standards and interpretations. There are separate transition provisions for each standard. These did not have any effect for the Group.
At the date of authorisation of these financial statements, the following standards and interpretations that could affect the Group were issued but not effective:
• IFRS 9 Financial Instruments (effective from 1 January 2015, but not approved by the EU). The standard replaces the classification and measurement requirements for financial assets in IAS 39. Financial assets with basic loan features that are held for the purpose of collecting contractual cash flows shall be measured at amortised cost, unless one opts to measure these assets at fair value. All other financial assets shall be measured at fair value. The potential impact of the standard on the Group’s consolidated financial statements has not been concluded.
• IAS 19 Amendment: Employee Contribution (effective from 1 July 2014, but not approved by the EU). The amendments clarify the accounting for contributions from employees or third parties when the requirements for such contributions are set out in the formal terms of a defined benefit plan. The objective of the amendments is to provide a more straight-forward alternative for accounting when the employee contributions payable in a particular period are linked solely to the employee’s service rendered in that period. The potential impact of the standard on the Group’s consolidated financial statements has not been concluded.
• IAS 32 Amendment: Offsetting Financial Assets and Financial Liabilities (effective from 1 January 2014). The amendment clarifies the meaning of ‘currently has a legally enforceable right of set-off’; and that some gross settlement systems may be considered equivalent to net settlement. The amendment has no impact on the Group’s current financial position or performance.
• IAS 39 Amendment: Novation of Derivatives and Continuation of Hedge Accounting (effective from 1 January 2014). The amendment to IAS 39 allows the continuation of hedge accounting when a derivative is novated to a clearing counterparty and certain conditions are met. The novation of a hedging instrument should not be considered an expiration or termination giving rise to the discontinuation of hedge accounting when a hedging derivative is novated:• as a consequence of laws and regulations, or the
introduction of laws and regulations, one or more clearing counterparties replace the original counterparty; and
• any changes in terms of the novated derivative are limited to those necessary to effect the replacement of the counterparty.
The amendment will have no impact on the Group’s current financial position or performance.
• Improvements to IFRSs - 2010-2012 cycle (effective from 1 July 2014, but not approved by the EU). The changes are primarily in order to remove inconsistencies and to clarify the wording of standards and interpretations. There are separate transition provisions for each standard. These will not have any effect for the Group.
• Improvements to IFRSs - 2011-2013 cycle (effective from 1 July 2014, but not approved by the EU). The changes are primarily in order to remove inconsistencies and to clarify the wording of standards and interpretations. There are separate transition provisions for each standard. These will not have any effect for the Group.
• IFRIC 21 Levies (effective from 1 January 2014). The interpretation addresses the accounting for levies that are recognised in accordance with IAS 37, in addition to the accounting for a liability to pay a levy whose timing and amount is certain. The Interpretation clarify that the obligating event that gives rise to a liability to pay a levy is the activity that triggers the payment of the levy as identified by the legislation. The interpretation has no impact on the Group’s current financial position or performance.
The management anticipates that these standards and interpretations will be adopted at the dates stated above provided that the standards and interpretations are approved by the EU.
/PAGE 31/
TELENOR ANNUAL REPORT 2013Notes to the Financial Statements / Telenor Group
Summary of significant accounting policies
Basis of preparationThe consolidated financial statements have been prepared on a historical cost basis, except for financial assets available for sale (primarily shares owned less than 20%) and derivative financial instruments, which are carried at fair value. Loans, receivables and other financial obligations are carried at amortised cost.
The consolidated financial statements are presented in Norwegian Kroner (NOK). Amounts are rounded to the nearest million, unless otherwise stated. As a result of rounding differences, amounts and percentages may not add up to the total.
Basis of consolidation and non-controlling interestsThe consolidated financial statements include the financial statements of Telenor ASA and entities controlled by Telenor ASA (the Group). Control is achieved when the company is exposed, or has rights, to variable returns from its involvement with the investee and has the ability to affect those returns through its power over the investee. Control normally exists when the Group has more than 50% of the voting power through ownership or agreements, except where non-controlling interests are such that a non-controlling shareholder is able to prevent the Group from exercising control.
In addition control may exist without having 50% voting power through ownership or agreements as a consequence of de facto control. De facto control is the ability to exercise control through the majority of the votes at the General Meeting and at the Board of Directors meeting, without the legal right to exercise unilateral control. Control may also exist through potentially voting rights, such as options. Such potential voting rights are only considered if they are substantive.
The financial statements of the subsidiaries are prepared for the same reporting periods as the parent company. Consistent accounting policies are used. The results of subsidiaries acquired or disposed of during the year are included in the income statement from the date when control is obtained and until the control ceases, respectively. Intercompany transactions, balances, revenues and expenses and unrealised Group internal profit or losses are eliminated on consolidation.
Non-controlling interests in subsidiaries are presented within equity separately from the equity attributable to the owners of the parent. Non-controlling interests consist either of the proportionate fair value of net identifiable assets or of fair value of those interests at the date of the business combination and the non-controlling interests’ share of changes in equity since the date of the business combination. The principle for measuring non-controlling interests is determined separately for each business combination.
A change in ownership interest of a subsidiary, without a loss of control, is accounted for as an equity transaction. Consideration in excess of or lower than carrying amount of non-controlling interests is recognised against the equity attributable to the owners of the parent. If the Group loses control over a subsidiary it derecognises the assets, liabilities, non-controlling interest and any cumulative translation differences in relation to the subsidiary. Any investment retained at the date when control is lost is measured at fair value and a gain/loss is recognised.
Foreign currency translationThe consolidated financial statements are presented in NOK, which is Telenor ASA’s functional currency. Transactions in foreign currencies are initially recognised in the functional currency at the exchange rate at the date of the transaction. Monetary assets and liabilities denominated in foreign currencies are translated to the functional currency using the exchange rate at the reporting date. All exchange differences are recognised in the income statement with the exception of exchange differences on foreign currency borrowings that provide a hedge against a net investment in a foreign entity, or monetary items that are regarded as a part of the net investments. These exchange differences are recognised as a separate component of other comprehensive income until the disposal of the net investment or settlement of the monetary item, at which time they are recognised in the income statement. Tax charges and credits attributable to exchange differences on those borrowings are also recognised in other comprehensive income. Non-monetary items that are measured at historical cost in foreign currency are translated using the exchange rates at the dates of the initial transactions.
The Group has foreign entities with functional currency other than NOK. At the reporting date, the assets and liabilities of foreign entities with functional currencies other than NOK are translated into NOK at the rate of exchange at the reporting date and their income statements are translated at the average exchange rates for the year. The translation differences arising from the translation are recognised in other comprehensive income until the disposal of the net investment, at which time they are recognised in the income statement.
Current/non-current classificationAn asset is classified as current when it is expected to be realised or is intended for sale or consumption in the Group’s normal operating cycle, it is held primarily for the purpose of being traded, or it is expected/due to be realised or settled within twelve months after the reporting date. Other assets are classified as non-current. A liability is classified as current when it is expected to be settled in the Group’s normal operating cycle, is held primarily for the purpose of being traded, the liability is due to be settled within twelve months after the reporting period or if the Group does not have an unconditional right to defer settlement of the liability for at least twelve months after the reporting period. All other liabilities as classified as non-current.
Financial instruments, other than those held for trading, are classified based on maturity, and hedging instruments are classified consistent with the underlying hedged item. Deferred revenues and costs related to connection are classified as current as they relate to the Group’s normal operating cycle.
Business combinationsThe acquisition of subsidiaries is accounted for using the acquisition method. Acquisition costs incurred are expensed and included in operating expenses. When the Group acquires a business, it assesses the identifiable assets acquired and liabilities assumed for appropriate classification and designation in accordance with the contractual terms, economic circumstances and relevant conditions as at the acquisition date.
The acquiree’s identifiable assets, liabilities and contingent liabilities that meet the conditions for recognition are recognised at their fair values at the acquisition date, except for non-current
/02/

TELENOR ANNUAL REPORT 2013Notes to the Financial Statements / Telenor Group
/PAGE 32/
assets that are classified as held for sale and recognised at fair value less cost to sell, and deferred tax assets and liabilities which are recognised at nominal value.
Goodwill arising on acquisition is recognised as an asset measured at the excess of the sum of the consideration transferred, the fair value of any previously held equity interests and the amount of any non-controlling interests in the aquiree over the net amounts of the identifiable assets acquired and the liabilities assumed. If, after reassessment, the Group’s interest in the net fair value of the acquiree’s identifiable assets, liabilities and contingent liabilities exceeds the total consideration of the business combination, the excess is recognised in the income statement immediately.
Any contingent consideration to be transferred by the acquirer will be recognised at fair value at the acquisition date. Subsequent changes to the fair value of the contingent consideration which is deemed to be an asset or liability will be recognised in the income statement as financial income or expense. If the contingent consideration is classified as equity, it will not be remeasured and subsequent settlement will be accounted for within equity.
If the business combination is achieved in stages, the fair value of the Group’s previously held equity interest in the acquiree is remeasured to fair value at the acquisition date through the income statement.
Investments in associated companiesAn associated company is an entity over which the Group has significant influence and that is not a subsidiary or a joint arrangement. Significant influence is the power to participate in the financial and operating policy decisions of the investee but without the ability to have control over those policies. Significant influence normally exists when the Group has 20% to 50% voting power through ownership or agreements. Investments in associated companies are accounted for using the equity method.
Interests in joint arrangementsA joint arrangement is a contractual arrangement whereby the Group and other parties undertake an economic activity that is subject to joint control. That is when the strategic financial and operating policy decisions relating to the activities of the joint arrangement require the unanimous consent of the parties sharing control. Joint arrangements are classified as joint operations or joint ventures, depending on the rights to the assets and obligations for the liabilities of the parties to the arrangements. If the parties to the joint arrangement have rights to the net assets of the arrangement, the arrangement is a joint venture. If the parties have rights to the assets and obligations for the liabilities relating to the arrangement, the arrangement is a joint operation.
The Group recognise in relation to its interest in a joint operation its assets, including its share of assets held jointly, its liabilities, including its share of liabilities incurred jointly, its revenue and expenses, including its share of expenses incurred jointly. Adjustments are made where necessary to bring the accounting policies in line with those of the Group. The accounting for joint operations structured through separate vehicles reflects the Groups involvement in the assets and liabilities and not the joint operations involvement with other joint operators.
Any goodwill arising on the acquisition of the Group’s interest in a joint operation is accounted for in accordance with the Group’s
accounting policy for goodwill arising on the acquisition of a subsidiary (see above). Where the Group transacts with its joint operation, unrealised profits and losses are eliminated to the extent of the Group’s interest in the joint venture.
Interests in joint ventures are accounted for using the equity method.
Equity methodThe results and assets and liabilities of associated companies and joint ventures are accounted for using the equity method of accounting. Under the equity method, investments are carried in the consolidated statement of financial position at cost and adjusted for post-acquisition changes in the Group’s share of the net assets of the investees (i.e. comprehensive income and equity adjustments), less any impairment in the value of the investments. Adjustments are made where necessary to bring the accounting policies in line with those of the Group. Losses in excess of the Group’s interest in such companies, including any long-term loans and receivables that, in substance, form part of the Group’s net investment, are not recognised unless the Group has incurred legal or constructive obligations or made payments on behalf of these associated companies or joint ventures.
Any goodwill is included in the carrying amount of the investment and is assessed for impairment as part of the investment. At each reporting date the Group evaluates if there are identified indications that the investment may be impaired. If there are such indications, the recoverable amount of the investment is estimated in order to determine the extent of the impairment loss (if any).
Where a Group entity transacts with an associate or joint venture of the Group, unrealised profits or losses are eliminated or deferred to the extent of the Group’s interest in the relevant associated company.
The share of net result, including amortisation of excess values, impairment losses and reversal of impairment losses is presented as a separate line item in the income statement between operating profit (loss) and financial items. Gains and losses on disposals are presented separately. The share of other comprehensive income is recognised in the Group’s comprehensive income. Other equity adjustments in the investees are recognised in the statement of changes in equity.
Financial statements as of the reporting date are for some investments not available before the Group issues its quarterly financial information. In such instances, the share of net income of the investment is recognised in the consolidated financial statements with a one quarter lag. Adjustments are made for the effects of publicly available information on significant transactions or events that occur between the latest interim financial reporting of the investee and the date of the consolidated financial statements of the Group. To ensure consistency in reporting in quarterly and annual reports, the figures in the annual report are not updated in situations where the financial statements for the investee are made available between the issuance of the quarterly report for the fourth quarter and the issuance of the annual report, unless the financial statements of the investee contains information about significant transactions or events.
/PAGE 33/
TELENOR ANNUAL REPORT 2013Notes to the Financial Statements / Telenor Group
GoodwillGoodwill arising in a business combination is not amortised. Goodwill does not generate cash flows independently of other assets or groups of assets and is allocated to the cash-generating units (defined below) expected to benefit from the synergies of the combination that gave rise to the goodwill. Cash-generating units to which goodwill has been allocated are tested for impairment annually or more frequently if there is any indication that the cash-generating unit may be impaired. If the recoverable amount (the higher of fair value less cost to sell and value in use) of the cash-generating unit is less than the carrying amount of the cash-generating unit an impairment loss is recognised. The impairment losses are first used to reduce the carrying amount of any goodwill and then used to reduce the carrying amount of the other assets of the unit pro-rata on the basis of the carrying amount of the individual assets. The carrying amount of any individual asset is not reduced below its individual recoverable amount or zero. An impairment loss recognised for goodwill is not reversed in a subsequent period if the fair value of the cash-generating unit recovers. Any impairment is presented as impairment losses in the income statement.
On disposal of businesses, the attributable amount of goodwill is included in the determination of the gain or loss on disposal.
Cash-generating unitsA cash-generating unit is the smallest identifiable group of assets that generates cash inflows that are largely independent of the cash inflows from other assets or groups of assets. In identifying whether cash inflows from an asset (or group of assets) are largely independent of the cash inflows from other assets (or groups of assets), the management considers various factors including how management monitors the entity’s operations (such as by product or service lines, businesses or geographical areas). Goodwill is monitored and tested for the group of cash-generating units combined in markets where the fixed and mobile operations are monitored and reported as one operating segment. The group of cash-generating units is in any case not larger than an operating segment determined in accordance with IFRS 8 Operating Segments.
Revenue recognition and measurementRevenues are recognised when goods are delivered or services rendered, to the extent that it is probable that the economic benefits from the transactions will flow to the Group and the revenues can be reliably measured. Revenues are measured at the fair value of the consideration received or receivable, net of discounts and sales related taxes. Consideration receivables are discounted with a discount rate reflecting the credit risk when appropriate, normally when credit terms exceed 12 months. Sales related taxes are regarded as collected on behalf on the authorities.
Revenues primarily comprise sale of• Services: subscription and traffic fees, connection fees,
interconnection fees, roaming charges, fees for leased lines and leased networks, fees for data network services and fees for TV distribution and satellite services.
• Customer equipment is primarily mobile devices/phones.
Subscription and traffic feesRevenues from subscription fees are recognised over the subscription period while revenues from voice and non-voice
services are recognised upon actual use. Consideration from the sale of prepaid cards to customers where services have not been rendered at the reporting date is deferred until actual usage or when the cards are expired or forfeited.
Connection feesConnection fees that are charged and not allocated to the other elements of an arrangement are deferred and recognised over the periods in which the fees are expected to be earned. The earning period is the expected period of the customer relationship and is based on past history of churn and expected development in the individual Group companies.
When connection fees are charged in multiple element arrangements where discounts are provided on other identifiable components in the transactions, the connection fees are allocated to sale of the discounted equipment or services, limited to the amount of the discounts, and recognised as revenues at the same time as the equipment or services are recognised as revenues.
Customer equipmentRevenues from sales of customer equipment are normally recognised when the equipment, including the related significant risks and rewards of ownership, is transferred to the buyer and the Group retains neither continuing managerial involvement to the degree usually associated with ownership nor effective control over the goods sold.
Multiple element arrangementsWhen the Group delivers multiple services and/or equipment as part of one contract or arrangement, the consideration is allocated to the separate identifiable components if the delivered item has value to the customer on a standalone basis and there is objective and reliable evidence of the fair value of the undelivered items. The consideration is allocated between the elements based on their relative fair values, and recognition of the revenue allocated to the delivered item is limited to the amount that is not contingent on the delivery of additional items or other specified performance criteria.
Discounts Discounts are often provided in the form of cash discounts or free products and services delivered by the Group or by external parties. Discounts are recognised on a systematic basis over the period the discount is earned. Cash discounts are recognised as a reduction of revenue. Free products and services given as part of sales transactions are recognised as multiple element arrangements as described above.
PresentationThe determination of whether the Group is acting as principal or agent in a transaction is based on an evaluation of the substance of the transaction, the responsibility for providing the goods or services and setting prices and the underlying financial risks and rewards. Where the Group acts as a principal, the revenues are recognised on a gross basis. This requires revenue to comprise the gross value of the transaction billed to the customers, after trade discounts, with any related expenses charged as operating costs. Where the Group acts as an agent, the expenses are offset against the revenues and the resulting net revenues represent the margins or commissions earned for providing services in the capacity of an agent.
TELENOR ANNUAL REPORT 2013Notes to the Financial Statements / Telenor Group
/PAGE 34/
Revenues from roaming are, based on the above, recognised gross in line with general accepted accounting principles within the telecommunications industry.
Revenues from transit traffic are assessed according to the above criteria and are recognised gross or net depending on whether the Group acts as a principal or agent in the transactions.
Licence fees payable to telecommunications authorities that are calculated on the basis of revenue share arrangements are not offset against the revenues. Instead, they are recognised as licence costs because the Group is considered to be the primary obligor.
Interest and dividend incomeInterest income is accrued on a time proportion basis that reflects an effective yield on the asset. Interest income related to the Groups banking operations are included within revenue, other interest income is included in financial income in the income statement. Dividend income from investments is recognised when the Group’s rights to receive payment have been established (declared by the General Meeting or otherwise).
PensionsThe Group operates various post-employment plans, including both defined benefit and defined contribution plans. The Group’s liability recognised in the statement of financial position related to defined benefit plans is the present value of the defined benefit obligation at the end of the reporting period less the fair value of plan assets. The defined benefit obligation is calculated annually by independent actuaries using the projected unit credit method. The present value of the defined benefit obligation is determined by discounting the estimated future cash outflows using interest rates of high-quality corporate bonds that are denominated in the currency in which the benefits will be paid, and that have terms to maturity approximating to the terms of the related pension obligation.
The Group recognise service cost, comprising of current service cost, past service cost and non-routine settlements, as salaries and personnel costs in the income statement. Gains and losses on curtailments, which also form part of service cost, are presented as part of «other income and expenses» in the income statement. Net interest expense or income is recognised as financial expense in the income statement.
Remeasurements, comprising of actuarial gains and losses and the return on plan assets (excluding net interest) are recognised in the statement of comprehensive income. Remeasurements are not subsequently reclassified to the income statement.
Past service cost are recognised in the income statement on the earlier of the date of the plan amendment or curtailment, and the date that the Group recognises restructuring related costs. A curtailment occurs when the Group either is demonstrably committed to make a material reduction in the number of employees covered by a plan or amends the terms of a defined benefit plan such that a material element of future service by current employees will no longer qualify for benefits or will qualify only for reduced benefits.
Payments to defined contribution plans are expensed as incurred. When sufficient information is not available to use defined benefit accounting for a multi-employer plan that is a defined benefit plan,
the plan is accounted for as if it were a defined contribution plan.
LeasingThe Group may enter into arrangements that do not take the legal form of a lease but convey a right to use assets in return for payments. Determining whether the arrangements are, or contain, leases is based on the substance of the arrangements and requires an assessment of whether: (a) fulfilment of the arrangements is dependent on the use of a specific asset or assets; and (b) the arrangements convey a right to use the assets.
Leases are classified as finance leases whenever the terms of the lease transfer substantially all the risks and rewards incidental to ownership to the lessee. All other leases are classified as operating leases. The assessment for the classification of leases is based on the substance of the transactions.
The Group as lessorReceivables on assets leased to others under finance leases are presented at an amount equal to the net investment in the leases. The finance income is allocated using a constant periodic rate of return on the net investment over the lease term. Direct costs incurred that are directly attributable to negotiating and arranging the leases, are included in the receivables.
Lease income from operating leases is recognised on a straight-line basis over the lease terms. Incentives provided to the lessees are aggregated and recognised as a reduction of income on a straight-line basis over the lease terms. Initial direct costs incurred in negotiating and arranging an operating lease are included in the carrying amounts of the leased assets and recognised as an expense over the lease term on the same basis as the lease. Contingent rents are recognised as revenue in the period in which they are earned.
The Group as lesseeAssets held under finance leases are recognised as assets of the Group at their fair value at the inception of the leases or, if lower, at the present value of the minimum lease payments. The liabilities to the lessor are recognised as finance lease obligations in the statement of financial position. Lease payments are apportioned between finance expenses and reduction of the lease liability to achieve a constant periodic rate of interest on the remaining balance of the liability.
Lease payments under operating leases are recognised in the income statement on a straight-line basis over the lease terms. Incentives received on negotiating or renewing the operating leases are also amortised on a straight-line basis over the lease terms. Prepaid lease payments made on entering into operating leases or acquiring leaseholds are recognised in the statement of financial position and amortised on a straight line basis over the lease term.
Financial instrumentsA financial instrument is defined as any contract that gives rise to a financial asset of one entity and a financial liability or equity instrument of another entity. The Group has classified financial assets and liabilities into the following classes: trade receivables and other current and non-current financial assets, available for sale investments (equity securities), cash and cash equivalents, trade payables and other non-interest bearing financial liabilities, interest-bearing liabilities and derivatives.
/PAGE 35/
TELENOR ANNUAL REPORT 2013Notes to the Financial Statements / Telenor Group
The categorisation of the financial instrument for measurement purposes is done based on the nature and purpose of the financial instrument and is determined at the initial recognition. The Group does not apply the fair value option.
The Group has financial assets classified in the following categories: fair value through profit or loss, loans and receivables and available-for-sale. Financial assets at fair value through profit or loss consist of assets held for trading and include derivatives. Loans and receivables consist of unquoted non-derivative assets with fixed or determinable payments. Financial assets available-for-sale consist of non-derivative assets designated as available for sale or assets that are not classified in one of the other categories.
The financial instruments are recognised in the Group’s statement of financial position as soon as the Group becomes a party to the contractual provisions of the instrument, using trade date accounting. Financial assets and liabilities are offset and the net amount presented in the statement of financial position when the Group has the intention and legally enforceable right to settle the contracts net, otherwise the financial assets and liabilities are presented gross.
Trade receivables and other current and non-current financial assetsTrade receivables and other current and non-current financial assets include trade receivables, other financial non-current interest-bearing and non-interest-bearing assets (including bonds and commercial papers with original maturity beyond three months and excluding capital contribution to the Telenor Pension Fund, which is a part of the class equity securities). These assets are part of the category loans and receivables and are measured on initial recognition at fair value and subsequently measured at amortised cost using the effective interest rate method adjusted for provision for any impairment. Impairment for estimated irrecoverable amounts is recognised in the income statement when a loss event and objective evidence that the asset is impaired, exist. The impairment is calculated by taking into account the historic evidence of the level of bad debt experienced for customer types and the aging of the receivable balance. Individual trade receivables are impaired when management assess them not to be wholly or partially collectible.
Equity securitiesEquity securities include available for sale investments and capital contribution to Telenor Pension Fund that are a part of the category financial assets available-for-sale investments, and assets held for trading that are a part of the category financial assets at fair value through profit or loss.
Equity securities in the category financial assets available-for-sale are initially measured at fair value plus directly attributable transaction costs, and are subsequently measured at fair value. Unrealised gains and losses arising from changes in fair value are recognised directly in other comprehensive income until the investment is disposed of or is determined to be impaired, at which time the cumulative gain or loss previously recognised in other comprehensive income is recognised in the income statement for the period. Equity securities available for sale are considered impaired and an impairment loss is taken to the income statement if the reduction in value is significant or prolonged. Impairment losses recognised for equity investments classified as available-
for-sale are not subsequently reversed through the income statement.
Equity securities in the category financial assets at fair value through profit or loss are initially and subsequently measured at fair value. Gains and losses arising from changes in fair value are recognised in the income statement on the line net change in fair value of financial instruments at fair value through profit or loss.
Cash and cash equivalentsCash and cash equivalents include cash, bank deposits, fixed rate bonds and commercial paper with original maturity of three months or less.
Trade payables and other non-interest bearing financial liabilitiesTrade payables and other non-interest bearing financial liabilities include trade payables, liabilities to associated companies and other current and non-current non-interest bearing financial liabilities. These liabilities are a part of the category financial liabilities at amortised cost and are initially recognised in the statement of financial position at fair value, and subsequently measured at amortised cost using the effective interest rate method.
Interest-bearing liabilitiesInterest-bearing liabilities include bonds and commercial papers, bank loans and overdrafts, and are classified in the category financial liabilities at amortised cost. These liabilities are initially measured at fair value net of transaction costs, and are subsequently measured at amortised cost using the effective interest-rate method. In addition, where fair value hedge accounting is applied the hedged liabilities are also adjusted for gains and losses attributable to the risk being hedged. On extinguishment of debt, in whole or in part, the difference between the carrying amount of the liability and the consideration paid is recognised in the income statement.
DerivativesThe Group uses derivative financial instruments such as forward currency contracts, interest rate swaps, cross currency interest rate swaps and, to a small extent, interest rate options to hedge its risks associated with interest rate and foreign currency fluctuations. The Group does not use derivative financial instruments for trading purposes.
The derivative financial instruments are measured at fair value. Any gains or losses arising from changes in fair value on derivatives that are not cash flow hedges or hedges of net investments are recognised in the income statement as financial income or expense. The accounting for fair value hedges and hedges of net investments are described below.
Derivatives embedded in other financial instruments or other non-financial host contracts are treated as separate derivatives when their risk and economic characteristics are not closely related to those of the host contract and the host contract is not carried at fair value with unrealised gains or losses recognised in the income statement. Currency derivatives embedded in committed purchase or sales contracts are not bifurcated and recognised at fair value if the contract requires payments denominated in either the functional currency of one of the parties to the contract or in a commonly used currency for purchase or sales in the relevant economic environment.
TELENOR ANNUAL REPORT 2013Notes to the Financial Statements / Telenor Group
/PAGE 36/
Derivatives are recognised without any offsetting; as assets when the value is positive and as liabilities when the value is negative, as long as the Group has no intention or legally enforceable right to settle the contracts net.
HedgingThe Group applies hedge accounting for hedges that meet the criteria for hedge accounting. The Group has fair value hedges and hedges of net investments in foreign operations.
At the inception of each hedge relationship, the Group designates and documents the hedge accounting relationship, risk management objective and strategy for undertaking the hedge. The documentation includes identification of the hedging instrument, the hedged item or transaction, the nature of the risk being hedged and how the entity will assess the hedging instrument’s effectiveness in offsetting the exposure to change in the hedged item’s fair value or cash flows attributable to the hedged risk. Such hedges are expected to be highly effective in achieving offsetting changes in fair value or cash flows and are assessed on an ongoing basis to determine that they actually have been highly effective throughout the financial reporting periods for which they were designated.
Hedge relationships that meet the requirements for hedge accounting are accounted for in the Group’s consolidated financial statements as follows:
Fair value hedgesThe Group uses fair value hedges primarily to hedge interest rate risk of fixed-rate interest-bearing liabilities and currency risk for interest-bearing liabilities.
Fair value hedges are hedges of the Group’s exposure to changes in the fair value of a recognised asset or liability or an unrecognised firm commitment, or an identified portion of such, that is attributable to a particular risk and could affect the income statement. For fair value hedges, the carrying amount of the hedged item is adjusted for gains and losses attributable to the risk being hedged. The derivative is also measured at fair value and gains and losses from both the hedging instrument and the hedged item are recognised in the income statement.
The Group discontinues fair value hedge accounting if the hedging instrument expires or is sold, terminated or exercised, the hedge no longer meets the criteria for hedge accounting or the Group revokes the designation. The fair value adjustment to the hedged object attributable to the risk being hedged at de-designation will be amortised in the income statement over the remaining time to maturity.
Hedges of a net investmentA hedge of a net investment in a foreign operation is accounted for in a similar way to a cash flow hedge. Foreign exchange gains or losses on the hedging instrument relating to the effective portion of the hedge are recognised directly in other comprehensive income while any foreign exchange gains or losses relating to the ineffective portion are recognised in the income statement. On disposal of the foreign entity, the cumulative value of foreign exchange gains or losses recognised directly in other comprehensive income is transferred to the income statement.
Income taxesCurrent tax assets and liabilities are measured at the amount expected to be recovered or paid to the tax authorities. Deferred tax assets and liabilities are calculated using the liability method with full allocation for all temporary differences between the tax base and the carrying amount of assets and liabilities in the consolidated financial statements, including tax losses carried forward. Deferred tax assets and liabilities are not recognised if the temporary difference arises from the initial recognition of goodwill or in respect of temporary differences associated with investments in subsidiaries, associates or joint ventures where the timing of the reversal of the temporary difference can be controlled and it is probable that the temporary difference will not reverse in the foreseeable future.
For undistributed earnings in subsidiaries, deferred tax is provided for to the extent it is expected that retained earnings will be distributed in the foreseeable future. For undistributed earnings in associated companies, deferred tax is provided for because the Group cannot control the timing of the reversal of the temporary differences. Deferred taxes are calculated on undistributed earnings in foreign subsidiaries and associated companies based on the estimated taxation on transfer of funds to the parent company, based on the enacted tax rates and regulation as of the end of the reporting period.
The Group treats expenses as tax deductible and income as not taxable based on interpretation of relevant laws and regulations and when it is assessed as probable that such treatment will be sustained in a tax review. The Group records provisions relating to uncertain or disputed tax positions at the amount expected to be paid. The provision is reversed if the disputed tax position is settled in favour of the Group and can no longer be appealed.
Deferred tax assets are recognised in the statement of financial position to the extent it is more likely than not that the tax assets will be utilised. The enacted tax rates at the end of the reporting period and undiscounted amounts are used. Deferred tax assets and liabilities are offset when there is a legally enforceable right to offset current tax assets against current tax liabilities and the Group is able to and intends to settle its current tax assets and liabilities on a net basis.
A change in deferred tax assets and liabilities as a result of change in tax rates is recognised in profit or loss, except to the extent that it relates to items that previously was recognised in other comprehensive income or directly in equity.
InventoriesInventories are valued at the lower of cost or net realisable value for products that will be sold as a separate item. Inventories that will be sold as part of a transaction with several items, which is expected to earn net income, are not considered as an indicator of write down, even though the allocated sales price in the transaction is lower than the cost. Cost is determined using the FIFO or weighted average method.
Costs related to connection feesInitial direct costs incurred in earning connection fees are deferred over the same period as the revenue, limited to the amount of the deferred revenue. Costs incurred consist primarily of the first payment of distributor commission, costs for credit check, cost
/PAGE 37/
TELENOR ANNUAL REPORT 2013Notes to the Financial Statements / Telenor Group
of the SIM card, the cost of the printed new customer information package, costs of installation work and expenses for order handling. In most instances, the costs associated with connection fees exceed the revenues and are expensed as incurred.
Advertising costs, marketing and sales commissionsAdvertising costs, marketing and sales commissions are expensed as incurred.
Property, plant and equipmentProperty, plant and equipment are recognised at cost less accumulated depreciation and accumulated impairment losses, if any. Depreciation is calculated to reduce the cost of assets, other than land which is not depreciated, to their estimated residual value, if any, over their estimated useful lives. The cost to be capitalised as part of the asset, includes direct and incremental costs and, for qualifying assets, borrowing costs. If payment is deferred beyond normal credit term, its cost is the cash price equivalent. Depreciation commences when the assets are ready for their intended use.
Assets held under finance leases and leasehold improvements are depreciated over their expected useful lives on the same basis as owned assets or, where shorter, the term of the relevant lease.
The gain or loss arising on the disposal or retirement of an item of property, plant and equipment is determined as the difference between the sales proceeds and the carrying amount of the asset and is reported as «other income (expense)» in the income statement as part of operating profit or loss.
Estimated useful life, depreciation method and residual value are evaluated at least annually. The straight-line depreciation method is used as this best reflects the consumption of the assets, which often is the passage of time. Residual value is estimated to be zero for most assets, except for commercial buildings and vehicles which the Group does not expect to use for the assets’ whole economic lives.
Repair and maintenance is expensed as incurred. If new parts are capitalised, replaced parts are derecognised and any remaining net carrying amount is recognised in operating profit (loss) as loss on disposal.
An exchange of assets is recognised at fair value if the transaction has commercial substance and the value of the assets can be measured reliably. If these criteria are not met, the carrying amount of the old assets is carried forward for the new assets.
Intangible assetsIntangible assets acquired separately are measured initially at cost. The cost to be capitalised as part of the asset, includes direct and incremental costs and, for qualifying assets, borrowing costs. If payment of an intangible asset is deferred beyond normal credit term, its cost is the cash price equivalent. The cost of intangible assets acquired in a business combination is the fair value at the date of acquisition. Following initial recognition, intangible assets are carried at cost less any accumulated amortisation and accumulated impairment losses, if any.
Intangible assets with finite lives are amortised over the useful lives. Useful lives and amortisation method for intangible assets with finite useful life are reviewed at least annually. The straight-
line amortisation method is used for most intangible assets as this best reflects the consumption of the assets. The amortisation period for customer base is the expected customer relationship and the amortisation method is based on historical experience of churn for the individual businesses.
Gains and losses arising from derecognition of an intangible asset are measured at the difference between the net sales proceeds and the carrying amount of the asset and are reported as «other income (expense)» in the income statement as part of operating profit. Research and development costsDevelopment expenditures that meet the criteria for recognition, i.e. that it is probable that the expected future economic benefits that are attributable to the asset will flow to the entity and the cost can be measured reliably, are capitalised. The assets are amortised over their expected useful life once the asset is available for use. Costs incurred during the research stage of a project, as well as maintenance and training costs, are expensed as incurred.
Development costs that do not meet the criteria of capitalisation are expensed as incurred.
Impairment of property, plant and equipment and intangible assets other than goodwillAt each reporting date the Group evaluates if there are identified indications that property, plant and equipment or intangible assets may be impaired. If there are such indications, the recoverable amount of the assets is estimated in order to determine the extent of the impairment loss (if any). Intangible assets with indefinite useful life and intangible assets not yet brought into use are assessed for impairment annually. Where it is not possible to estimate the recoverable amount of an individual asset, the Group determines the recoverable amount of the cash-generating unit to which the asset belongs.
An asset’s recoverable amount is the higher of fair value less costs to sell and value in use. In assessing value in use, the estimated future cash flows are discounted to their present value using a discount rate that reflects current market assessments of the time value of money and the risks specific to the asset or the cash-generating unit to which the asset belongs.
If the recoverable amount of an asset (or cash-generating unit) is estimated to be less than its carrying amount, the carrying amount of the asset (or cash-generating unit) is reduced to its recoverable amount. The impairment losses are recognised in the income statement. Where impairment losses are subsequently reversed, the carrying amount of the asset (cash-generating unit) is increased to the updated estimate of its recoverable amount so that the increased carrying amount does not exceed the carrying amount that would have been recognised had no impairment losses been recognised for the asset (or cash-generating unit) in prior years. The reversal of impairment losses are recognised in the income statement.
ProvisionsProvisions such as workforce reductions, onerous contracts and legal claims are recognised when the Group has a present legal or constructive obligation as a result of past events, it is probable that an outflow of resources will be required to settle the obligation, and

TELENOR ANNUAL REPORT 2013Notes to the Financial Statements / Telenor Group
/PAGE 38/
the amount has been reliably estimated. Provisions are measured at the management’s best estimate of the expenditure required to settle the obligation at the reporting date, and are discounted to present value.
Asset retirement obligationsAn asset retirement obligation exists where the Group has a legal or constructive obligation to remove an asset and restore the site. Where the Group is required to settle an asset retirement obligation, the Group has estimated and capitalised the net present value of the obligations and increased the carrying value of the related asset. The cash flows are discounted at a pre-tax risk-free rate as risks are reflected in the cash flows. Subsequent to the initial recognition, an accretion expense is recognised as finance cost relating to the asset retirement obligation, and the capitalised cost is expensed as ordinary depreciation with the related asset. The effects on the net present value of any subsequent changes to the gross removal costs or discount rates adjust the carrying value of assets and liabilities, and are expensed over the remaining estimated useful life of the related assets.
Share-based paymentsThe Group has issued two different share-based payments programs to management and employees. Bonus shares in these programs are awarded net after tax and considered to be both equity-settled and cash-settled share-based payments, due to the included tax effect and the provision for social security tax.
Equity-settled share-based payments are measured at fair value (excluding the effect of non-market-based vesting conditions) at the date of grant. The fair value determined at the grant date of the equity-settled share-based payments is expensed over the vesting period, based on the Group’s estimate of the shares that will eventually vest, adjusted for the effect of non-market-based vesting conditions.
Cash-settled share-based payments are measured at fair value of the liability. The liability is remeasured at each reporting date.
Statement of cash flowsThe Group presents the statement of cash flows using the indirect method. Cash inflows and outflows are shown separately for investing and financing activities, while operating activities include both cash and non-cash line items. Interest received and paid and dividends received are reported as a part of operating activities. Dividends distributed (both by Telenor ASA and by subsidiaries with non-controlling interests) are included as a part of financing activities. Value Added Tax and other similar taxes are regarded as collection of tax on behalf of authorities, and are reported net.
The statement of cash flows includes discontinued operations prior to their disposal.
Treasury sharesOwn equity instruments which are reacquired (treasury shares) are deducted from equity. No gain or loss is recognised in the income statement on the purchase, sale, issue or cancellation of the Company’s own equity instruments.
/PAGE 39/
TELENOR ANNUAL REPORT 2013Notes to the Financial Statements / Telenor Group
Critical accounting judgements and key sources of estimation uncertainty
Critical judgements in applying the Group’s accounting policiesThe preparation of consolidated financial statements in accordance with IFRS requires management to make judgements, estimates and assumptions that affect the reported amounts of revenues, expenses, assets and liabilities, and the disclosures of contingent liabilities, at the end of the reporting period. However, uncertainty about these assumptions and estimates could result in outcomes that require a material adjustment to the carrying amount of the asset or liability affected within the next financial year.
The following represents a summary of the critical accounting judgements the management has made in the process of applying the Group’s accounting policies:
Consolidation of DiGiThe Group’s ownership interest in DiGi is 49.0%. The Group consolidates DiGi.
DiGi is listed on Bursa Malaysia Securities Berhad and the shares in DiGi are widely dispersed. As the Group owns 49% of the shares, 98% of the shares have to be present at the General Meeting for the Group not to have the majority of the votes at the General Meeting. As a consequence of this and based on experience from past general meetings, the Group has the power to direct DiGi’s activities. The Group’s assessment is that the ability to exercise control is upheld through a majority of the votes at the General Meeting and at Board of Directors meetings. Consolidation based on de facto control is assessed on an ongoing basis.
Key sources of estimation uncertainty - critical accounting estimatesA critical accounting estimate is one which is both important to the presentation of the Group’s financial position and results and requires management’s most difficult, subjective or complex judgements, often as a result of the need to make important estimates based on assumptions about the outcome of matters that are inherently uncertain. Management evaluates such estimates on an ongoing basis, based upon historical results and experience, consultations with experts, trends and other methods which management considers reasonable under the circumstances, as well as forecasts as to how these might change in the future.
Revenue recognitionThe Group’s revenues primarily consist of revenues from sale of communication and broadcasting services and periodic subscriptions. The Group offers subscribers, via multiple element arrangements, a number of different services with different price plans, and provides discounts of various types and forms often in connection with different campaigns, over the contractual or average customer relationship period. The Group offers products where the customer can pay by instalments over a given period. The Group also sells wholesale services to other operators and vendors in different countries and across borders. Management has to make estimates related to allocation of revenue between different products delivered, relying to some extent, on information from other operators on the value of services delivered. Management also makes estimates of the final outcome in instances where the other parties dispute the amounts charged. Furthermore, management has to estimate the average customer relationship for revenue that is initially recognised as deferred
revenue in the statement of financial position and recognised in the income statement over a future period, e.g. connection fee.
Pension obligations and pension plan assets, see note 25Calculation of net pension obligations (the difference between pension obligations and pension plan assets) are made based on certain key estimates and assumptions. The discount rate is one of the most significant assumptions. The Norwegian Accounting Standards Board reassessed whether there is a deep market for high quality corporate bonds (OMF) in Norway in 2012 and subsequently opened up for using OMF or government bonds as basis for setting the discount rate. In 2013 the market for OMF has expanded further, both in relation to outstanding volume and turn over, hence Telenor regards OMF as being high quality corporate bonds with sufficient depth in the OMF market. Based on this assessment The Group uses OMF as basis for setting the discount rate. A sensitivity analysis for changes in certain actuarial assumptions and how they influence the pension obligations and the pension costs is included in note 25. The basis for the other assumptions is also described in this note.
Depreciation and amortisation, see note 17 and 18Depreciation and amortisation expenses are based on management’s estimates of residual value, depreciation and amortisation method and the useful life of property, plant and equipment and intangible assets. Estimates may change due to technological developments, competition, changes in market conditions and other factors and may result in changes in the estimated useful life and in the amortisation or depreciation charges. Technological developments are difficult to predict and the Group’s views on the trends and pace of development may change over time. Critical estimates in the evaluations of useful lives for tangible and intangible assets include, but are not limited to, remaining licence or concession period and expected developments in technology and markets. The useful lives of property, plant and equipment and intangible assets are reviewed at least annually taking into consideration the factors mentioned above and all other important relevant factors. Estimated useful lives for similar types of assets may vary between different entities in the Group due to local factors such as growth rate, maturity of the market, history and expectations for replacements or transfer of assets, climate and quality of components used. A change in estimated useful life is a change in accounting estimate, and depreciation and amortisation plans are adjusted prospectively.
Impairment, see note 15, 16, 17 and 18The Group has made significant investments in property, plant and equipment, intangible assets, goodwill and other investments. Goodwill, intangible assets with indefinite useful life and intangible assets not yet in use are tested for impairment annually or more often if indicators of impairment exist, whereas other assets are tested for impairment when circumstances indicate there may be a potential impairment. Factors that indicate impairment which trigger impairment testing include the following: significant fall in market values; significant underperformance relative to historical or projected future operating results; significant changes in the use of the assets or the strategy for the overall business, including assets that are decided to be phased out or replaced and assets that are damaged or taken out of use; significant negative industry or economic trends; significant loss of market share; significant unfavourable regulatory and court decisions and significant cost overruns in the development of assets.
/03/
TELENOR ANNUAL REPORT 2013Notes to the Financial Statements / Telenor Group
/PAGE 40/
Estimating recoverable amounts of assets and companies must in part be based on management’s evaluations, including determining appropriate cash-generating units, determining the discount rate, estimates of future performance, revenue generating capacity of the assets and assumptions of the future market conditions. Recessionary effects and increased macroeconomic risks may impact the estimates of future performance and discount rates used in estimating recoverable amounts of assets. Changes in circumstances and in management’s evaluations and assumptions may give rise to impairment losses in the relevant periods. A significant part of the Group’s operations is in countries with emerging markets. The political, regulatory and economical situation in these countries may change rapidly and global financial turmoil and recession may have a significant impact on these countries.
There are significant variations between different markets with respect to growth, mobile penetration, ARPU, market share and similar parameters, resulting in differences in EBITDA margins. The future developments of EBITDA margins are important in the Group’s impairment assessments, and the long-term estimates of EBITDA margins are highly uncertain. In particular, this is the case for emerging markets that are still not in a mature phase.
Deferred tax assets, see note 13Deferred tax assets are recognised to the extent that it is probable that the tax assets will be realised. Significant judgement is required to determine the amount that can be recognised and depends foremost on the expected timing, level of taxable profits as well as tax planning strategies and the existence of taxable temporary differences. The judgements relate primarily to tax losses carried forward in some of the Group’s foreign operations. When an entity has a history of recent losses the deferred tax asset arising from unused tax losses is recognised only to the extent that there is convincing evidence that sufficient future taxable profit will be generated. Estimated future taxable profit is not considered as convincing evidence unless the entity has demonstrated the ability of generating significant taxable profit for the current year or there are certain other events providing sufficient evidence of future taxable profit. Uncertainty related to new transactions and events and the interpretation of new tax rules may also affect these judgements.
Associated companies, see note 19The Group has as of 31 December 2013 an ownership interest of 33.05% in VimpelCom Ltd. (VimpelCom) and accounts for the investment in VimpelCom in accordance with the equity method. Financial statements of VimpelCom as of the reporting date were not available before the Board of Telenor ASA approved its unaudited interim consolidated financial statements for the fourth quarter 2013. VimpelCom is listed (New York Stock Exchange) and the company is not able to provide financial information to one investor without providing equivalent information to all other investors at the same time. As a consequence, the share of net income from VimpelCom has been recognised in the consolidated financial statements of the Group with a one quarter lag. Thus, share of net income from VimpelCom for the year includes share of net income for the period 1 October to 30 September.
Adjustments are made for the effects of publicly available information on any significant transactions and events that occur between the latest interim financial reporting from VimpelCom and the date of the Group’s consolidated financial statements. Such adjustments require significant judgement.
Tax uncertainty, legal proceedings, claim and regulatory discussions, see also note 13 and 33The Group is subject to various legal proceedings, disputes and claims including regulatory discussions related to the Group’s business, licences, tax positions, investments etc., the outcomes of which are subject to significant uncertainty. Management evaluates, among other factors, the degree of probability of an unfavourable outcome and the ability to make a reasonable estimate of the amount of loss. Unanticipated events or changes in these factors may require the Group to increase or decrease the amount to be accrued for any matter or accrue for a matter that has not been previously accrued because it was not considered probable or a reasonable estimate could not be made.
Through the operations in many emerging markets, the Group is involved in legal proceedings, including regulatory discussions. The legal systems in these countries are, to varying degrees, less predictable than the Norwegian legal system. Accordingly, management’s estimates relating to legal proceedings and regulatory issues in these countries involve a relatively higher level of uncertainty.

/PAGE 41/
TELENOR ANNUAL REPORT 2013Notes to the Financial Statements / Telenor Group
Business combinations
Globul – BulgariaOn 1 August 2013, Telenor acquired 100 % of the voting shares of Cosmo Bulgaria Mobile EAD (Globul) and Germanos Telecom Bulgaria EAD (Germanos), two private companies in Bulgaria, for NOK 5.1 billion. The acquisition related transaction cost was NOK 28 million. Globul is the second largest mobile operator in Bulgaria. Germanos, which is a retail network, is a major commercial partner of Globul in Bulgaria. The acquisition of Globul and Germanos («Globul Bulgaria») strengthens Telenor’s position in Europe.
The purchase price allocation, which was performed with assistance from third-party valuation experts, has been determined to be provisional. The purchase price allocation is provisional pending the final assessment of the identifiable assets. The table below discloses preliminary fair values as reported the interim report as of 30 September 2013 and as per 31 December 2013:
/04/
NOK in millionsPreliminary fair values as of acquisition
date as per 31 December 2013Preliminary fair values as of acquisition
date as per the third quarter report
Customer Base 1 573 1 573
Licences 491 491
Other intangible assets 111 116
Property, Plant & Equipment 1 493 1 496
Other assets 737 728
Bank and cash balances 678 678
Total assets 5 083 5 082
Deferred tax liability 186 184
Non-Current Liabilities 1 095 1 095
Current Liabilities 707 775
Total liabilities 1 988 2 054
Net identifiable assets 3 095 3 028
Goodwill 2 042 2 187
Total consideration for the shares, satisfied by cash 5 137 5 215
The fair value of the trade receivables amounts to NOK 248 million. The gross amount of trade receivables is NOK 425 million. It is expected that fair value of the trade receivables will be collected.
The goodwill of NOK 2.0 billion comprises the value of expected synergies arising from the acquisition, including modernisation of the network. None of the goodwill recognised is expected to be deductible for income tax purposes.
For the period between the date of acquisition and 31 December 2013, Globul Bulgaria has contributed NOK 1,151 million to Revenue and NOK -87 million to Profit before tax of the Group. If the business combination had taken place at the beginning of the year, Revenue would have been NOK 105,507 million and Profit before tax for the Group would have been NOK 17,649 million.
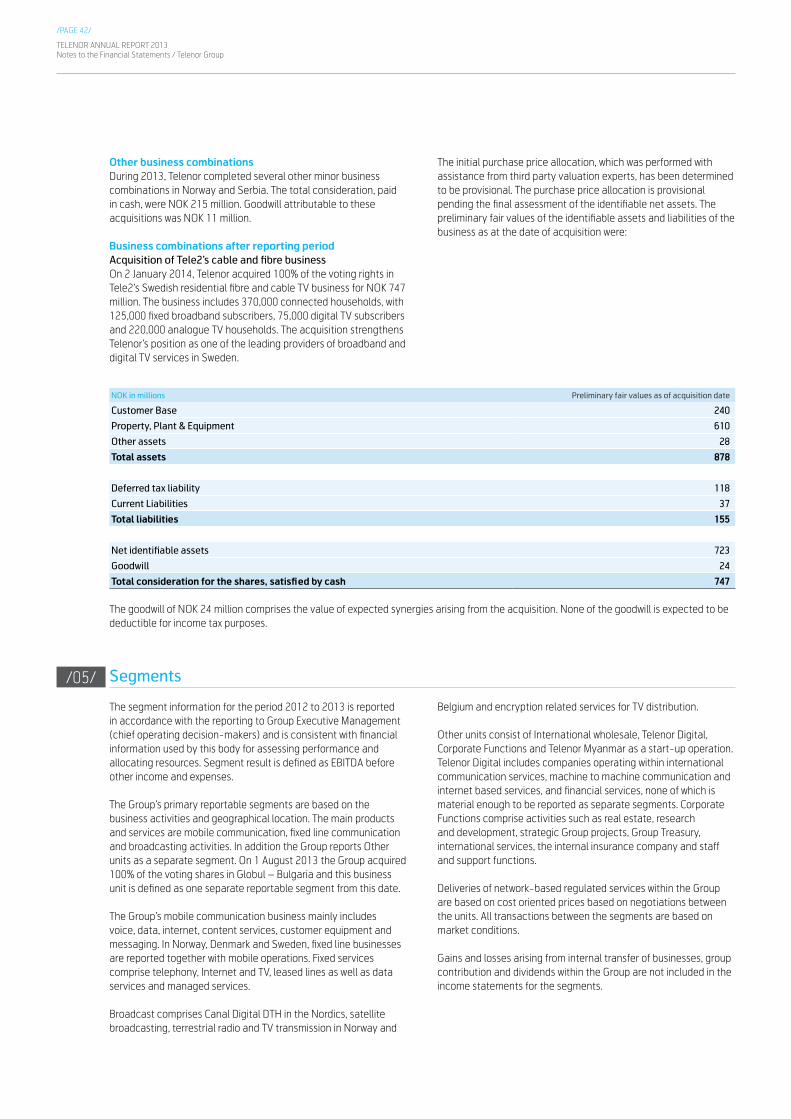
TELENOR ANNUAL REPORT 2013Notes to the Financial Statements / Telenor Group
/PAGE 42/
Other business combinationsDuring 2013, Telenor completed several other minor business combinations in Norway and Serbia. The total consideration, paid in cash, were NOK 215 million. Goodwill attributable to these acquisitions was NOK 11 million.
Business combinations after reporting periodAcquisition of Tele2’s cable and fibre businessOn 2 January 2014, Telenor acquired 100% of the voting rights in Tele2’s Swedish residential fibre and cable TV business for NOK 747 million. The business includes 370,000 connected households, with 125,000 fixed broadband subscribers, 75,000 digital TV subscribers and 220,000 analogue TV households. The acquisition strengthens Telenor’s position as one of the leading providers of broadband and digital TV services in Sweden.
The initial purchase price allocation, which was performed with assistance from third party valuation experts, has been determined to be provisional. The purchase price allocation is provisional pending the final assessment of the identifiable net assets. The preliminary fair values of the identifiable assets and liabilities of the business as at the date of acquisition were:
NOK in millions Preliminary fair values as of acquisition date
Customer Base 240
Property, Plant & Equipment 610
Other assets 28
Total assets 878
Deferred tax liability 118
Current Liabilities 37
Total liabilities 155
Net identifiable assets 723
Goodwill 24
Total consideration for the shares, satisfied by cash 747
The goodwill of NOK 24 million comprises the value of expected synergies arising from the acquisition. None of the goodwill is expected to be deductible for income tax purposes.
Segments
The segment information for the period 2012 to 2013 is reported in accordance with the reporting to Group Executive Management (chief operating decision-makers) and is consistent with financial information used by this body for assessing performance and allocating resources. Segment result is defined as EBITDA before other income and expenses.
The Group’s primary reportable segments are based on the business activities and geographical location. The main products and services are mobile communication, fixed line communication and broadcasting activities. In addition the Group reports Other units as a separate segment. On 1 August 2013 the Group acquired 100% of the voting shares in Globul – Bulgaria and this business unit is defined as one separate reportable segment from this date.
The Group’s mobile communication business mainly includes voice, data, internet, content services, customer equipment and messaging. In Norway, Denmark and Sweden, fixed line businesses are reported together with mobile operations. Fixed services comprise telephony, Internet and TV, leased lines as well as data services and managed services.
Broadcast comprises Canal Digital DTH in the Nordics, satellite broadcasting, terrestrial radio and TV transmission in Norway and
Belgium and encryption related services for TV distribution.
Other units consist of International wholesale, Telenor Digital, Corporate Functions and Telenor Myanmar as a start-up operation. Telenor Digital includes companies operating within international communication services, machine to machine communication and internet based services, and financial services, none of which is material enough to be reported as separate segments. Corporate Functions comprise activities such as real estate, research and development, strategic Group projects, Group Treasury, international services, the internal insurance company and staff and support functions.
Deliveries of network-based regulated services within the Group are based on cost oriented prices based on negotiations between the units. All transactions between the segments are based on market conditions.
Gains and losses arising from internal transfer of businesses, group contribution and dividends within the Group are not included in the income statements for the segments.
/05/
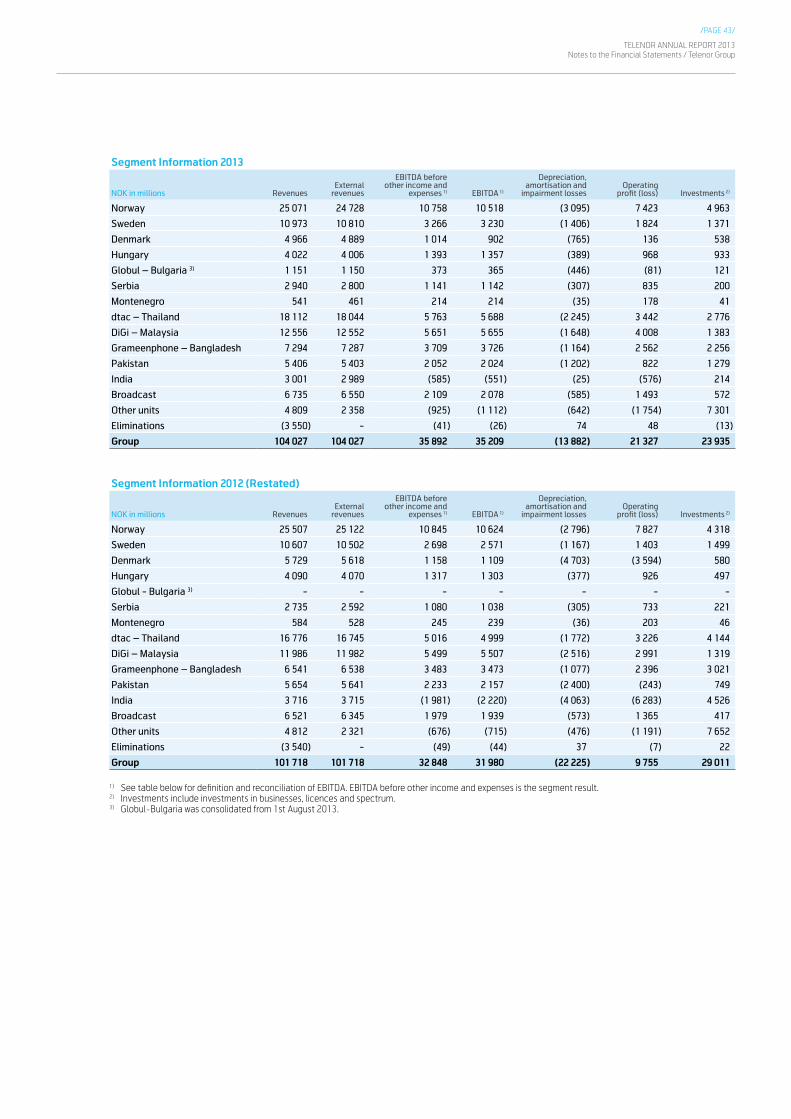
/PAGE 43/
TELENOR ANNUAL REPORT 2013Notes to the Financial Statements / Telenor Group
Segment Information 2013
NOK in millions RevenuesExternal
revenues
EBITDA before other income and
expenses 1) EBITDA 1)
Depreciation, amortisation and
impairment lossesOperating
profit (loss) Investments 2)
Norway 25 071 24 728 10 758 10 518 (3 095) 7 423 4 963
Sweden 10 973 10 810 3 266 3 230 (1 406) 1 824 1 371
Denmark 4 966 4 889 1 014 902 (765) 136 538
Hungary 4 022 4 006 1 393 1 357 (389) 968 933
Globul – Bulgaria 3) 1 151 1 150 373 365 (446) (81) 121
Serbia 2 940 2 800 1 141 1 142 (307) 835 200
Montenegro 541 461 214 214 (35) 178 41
dtac – Thailand 18 112 18 044 5 763 5 688 (2 245) 3 442 2 776
DiGi – Malaysia 12 556 12 552 5 651 5 655 (1 648) 4 008 1 383
Grameenphone – Bangladesh 7 294 7 287 3 709 3 726 (1 164) 2 562 2 256
Pakistan 5 406 5 403 2 052 2 024 (1 202) 822 1 279
India 3 001 2 989 (585) (551) (25) (576) 214
Broadcast 6 735 6 550 2 109 2 078 (585) 1 493 572
Other units 4 809 2 358 (925) (1 112) (642) (1 754) 7 301
Eliminations (3 550) - (41) (26) 74 48 (13)
Group 104 027 104 027 35 892 35 209 (13 882) 21 327 23 935
Segment Information 2012 (Restated)
NOK in millions RevenuesExternal
revenues
EBITDA before other income and
expenses 1) EBITDA 1)
Depreciation, amortisation and
impairment lossesOperating
profit (loss) Investments 2)
Norway 25 507 25 122 10 845 10 624 (2 796) 7 827 4 318
Sweden 10 607 10 502 2 698 2 571 (1 167) 1 403 1 499
Denmark 5 729 5 618 1 158 1 109 (4 703) (3 594) 580
Hungary 4 090 4 070 1 317 1 303 (377) 926 497
Globul - Bulgaria 3) - - - - - - -
Serbia 2 735 2 592 1 080 1 038 (305) 733 221
Montenegro 584 528 245 239 (36) 203 46
dtac – Thailand 16 776 16 745 5 016 4 999 (1 772) 3 226 4 144
DiGi – Malaysia 11 986 11 982 5 499 5 507 (2 516) 2 991 1 319
Grameenphone – Bangladesh 6 541 6 538 3 483 3 473 (1 077) 2 396 3 021
Pakistan 5 654 5 641 2 233 2 157 (2 400) (243) 749
India 3 716 3 715 (1 981) (2 220) (4 063) (6 283) 4 526
Broadcast 6 521 6 345 1 979 1 939 (573) 1 365 417
Other units 4 812 2 321 (676) (715) (476) (1 191) 7 652
Eliminations (3 540) - (49) (44) 37 (7) 22
Group 101 718 101 718 32 848 31 980 (22 225) 9 755 29 011
1) See table below for definition and reconciliation of EBITDA. EBITDA before other income and expenses is the segment result.2) Investments include investments in businesses, licences and spectrum.3) Globul-Bulgaria was consolidated from 1st August 2013.
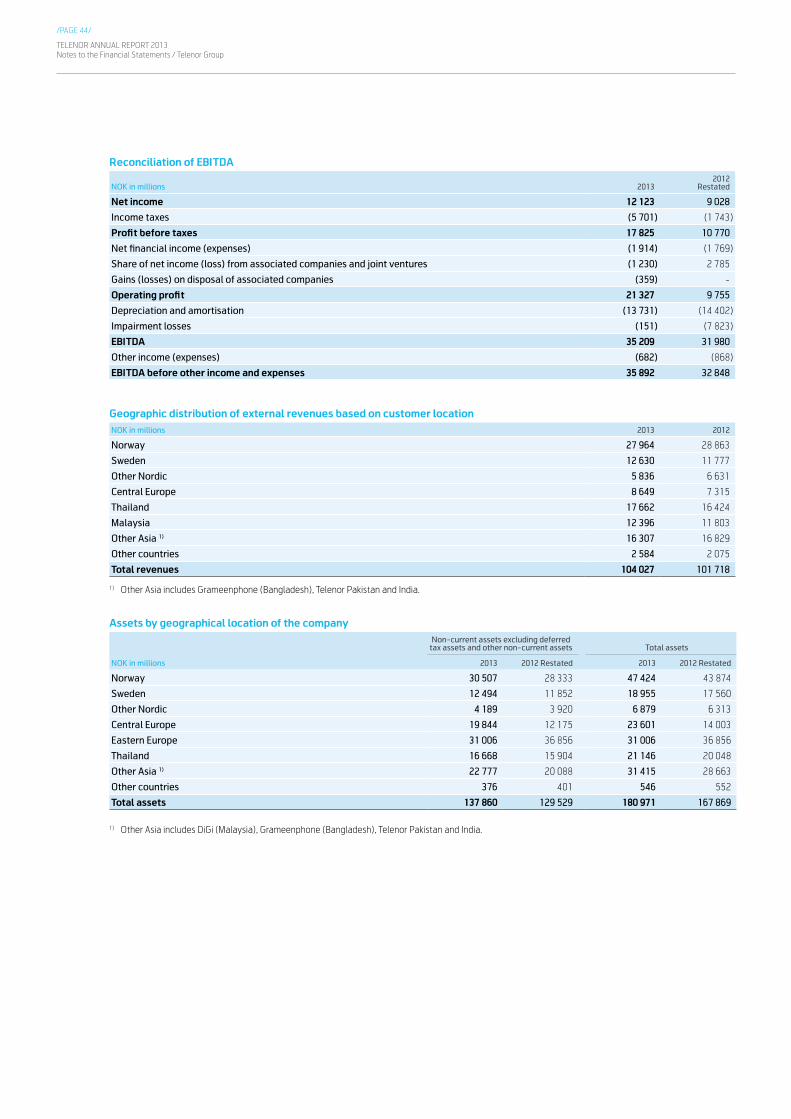
TELENOR ANNUAL REPORT 2013Notes to the Financial Statements / Telenor Group
/PAGE 44/
Reconciliation of EBITDA
NOK in millions 20132012
Restated
Net income 12 123 9 028
Income taxes (5 701) (1 743)
Profit before taxes 17 825 10 770
Net financial income (expenses) (1 914) (1 769)
Share of net income (loss) from associated companies and joint ventures (1 230) 2 785
Gains (losses) on disposal of associated companies (359) -
Operating profit 21 327 9 755
Depreciation and amortisation (13 731) (14 402)
Impairment losses (151) (7 823)
EBITDA 35 209 31 980
Other income (expenses) (682) (868)
EBITDA before other income and expenses 35 892 32 848
Geographic distribution of external revenues based on customer locationNOK in millions 2013 2012
Norway 27 964 28 863
Sweden 12 630 11 777
Other Nordic 5 836 6 631
Central Europe 8 649 7 315
Thailand 17 662 16 424
Malaysia 12 396 11 803
Other Asia 1) 16 307 16 829
Other countries 2 584 2 075
Total revenues 104 027 101 718
1) Other Asia includes Grameenphone (Bangladesh), Telenor Pakistan and India.
Assets by geographical location of the companyNon-current assets excluding deferred
tax assets and other non-current assets Total assets
NOK in millions 2013 2012 Restated 2013 2012 Restated
Norway 30 507 28 333 47 424 43 874
Sweden 12 494 11 852 18 955 17 560
Other Nordic 4 189 3 920 6 879 6 313
Central Europe 19 844 12 175 23 601 14 003
Eastern Europe 31 006 36 856 31 006 36 856
Thailand 16 668 15 904 21 146 20 048
Other Asia 1) 22 777 20 088 31 415 28 663
Other countries 376 401 546 552
Total assets 137 860 129 529 180 971 167 869
1) Other Asia includes DiGi (Malaysia), Grameenphone (Bangladesh), Telenor Pakistan and India.
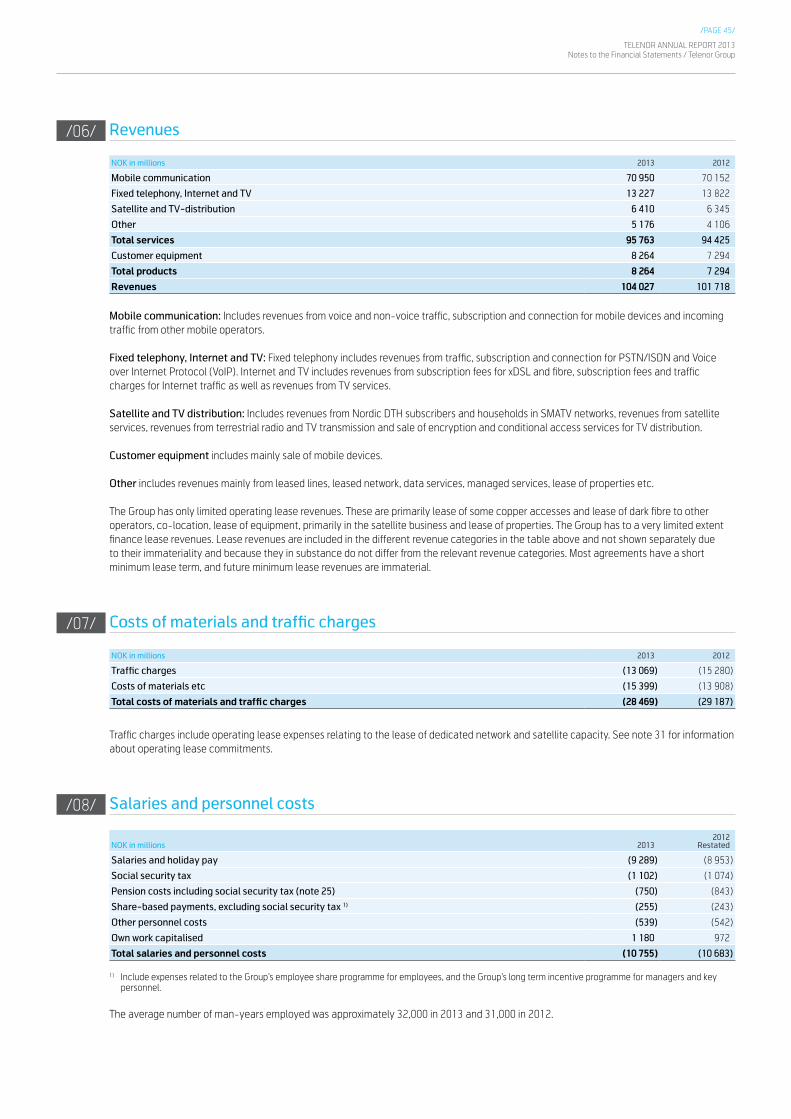
/PAGE 45/
TELENOR ANNUAL REPORT 2013Notes to the Financial Statements / Telenor Group
Revenues
NOK in millions 2013 2012
Mobile communication 70 950 70 152
Fixed telephony, Internet and TV 13 227 13 822
Satellite and TV-distribution 6 410 6 345
Other 5 176 4 106
Total services 95 763 94 425
Customer equipment 8 264 7 294
Total products 8 264 7 294
Revenues 104 027 101 718
Mobile communication: Includes revenues from voice and non-voice traffic, subscription and connection for mobile devices and incoming traffic from other mobile operators.
Fixed telephony, Internet and TV: Fixed telephony includes revenues from traffic, subscription and connection for PSTN/ISDN and Voice over Internet Protocol (VoIP). Internet and TV includes revenues from subscription fees for xDSL and fibre, subscription fees and traffic charges for Internet traffic as well as revenues from TV services.
Satellite and TV distribution: Includes revenues from Nordic DTH subscribers and households in SMATV networks, revenues from satellite services, revenues from terrestrial radio and TV transmission and sale of encryption and conditional access services for TV distribution.
Customer equipment includes mainly sale of mobile devices.
Other includes revenues mainly from leased lines, leased network, data services, managed services, lease of properties etc.
The Group has only limited operating lease revenues. These are primarily lease of some copper accesses and lease of dark fibre to other operators, co-location, lease of equipment, primarily in the satellite business and lease of properties. The Group has to a very limited extent finance lease revenues. Lease revenues are included in the different revenue categories in the table above and not shown separately due to their immateriality and because they in substance do not differ from the relevant revenue categories. Most agreements have a short minimum lease term, and future minimum lease revenues are immaterial.
Costs of materials and traffic charges
NOK in millions 2013 2012
Traffic charges (13 069) (15 280)
Costs of materials etc (15 399) (13 908)
Total costs of materials and traffic charges (28 469) (29 187)
Traffic charges include operating lease expenses relating to the lease of dedicated network and satellite capacity. See note 31 for information about operating lease commitments.
Salaries and personnel costs
NOK in millions 20132012
Restated
Salaries and holiday pay (9 289) (8 953)
Social security tax (1 102) (1 074)
Pension costs including social security tax (note 25) (750) (843)
Share-based payments, excluding social security tax 1) (255) (243)
Other personnel costs (539) (542)
Own work capitalised 1 180 972
Total salaries and personnel costs (10 755) (10 683)
1) Include expenses related to the Group’s employee share programme for employees, and the Group’s long term incentive programme for managers and key personnel.
The average number of man-years employed was approximately 32,000 in 2013 and 31,000 in 2012.
/06/
/07/
/08/

TELENOR ANNUAL REPORT 2013Notes to the Financial Statements / Telenor Group
/PAGE 46/
Other operating expenses
NOK in millions 2013 2012
Operating leases of buildings, land and equipment (3 217) (3 438)
Other cost of premises, vehicles, office equipment etc (1 911) (1 991)
Operation and maintenance (5 271) (5 111)
Concession fees (6 124) (5 742)
Marketing and sales commission (6 332) (6 702)
Advertising (2 142) (2 011)
Consultancy fees and external personnel (1 773) (2 012)
Other (2 141) (1 993)
Total other operating expenses (28 912) (29 000)
Other income and expenses
NOK in millions 2013 2012
Gains on disposals of fixed assets and operations 182 237
Losses on disposals of fixed assets and operations (213) (398)
Expenses for workforce reduction and onerous (loss) contracts (648) (692)
Other (3) (16)
Total other income (expenses) (682) (868)
Expenses for workforce reductions and onerous (loss) contracts in 2013 were mainly related to restructuring of operations in Telenor Digital, and workforce reductions in Telenor Norway, Telenor Denmark,Telenor Sweden, Corporate Functions and Grameenphone. Expenses for workforce reductions and onerous (loss) contracts in 2012 were related to restructuring of operations in India, and workforce reductions in Telenor Norway, Telenor Sweden, Telenor Denmark and Telenor ASA. See also note 24.
Research and development costs
Research and development costs that have been recognised in the income statement amount to NOK 351 million in 2013 (NOK 325 million in 2012). Expensed research and development activities relate to new technologies, new services and products, security in the network and new usages of the existing network. The amount above exclude development recognised as intangible assets or property, plant and equipment in the statement of financial position.
/09/
/10/
/11/

/PAGE 47/
TELENOR ANNUAL REPORT 2013Notes to the Financial Statements / Telenor Group
Financial income and expenses
NOK in millions 20132012
Restated
Interest income on cash and cash equivalents 392 444
Other financial income 184 161
Total financial income 576 605
Interest expenses on financial liabilities measured at amortised cost (2 114) (2 385)
Other financial expenses (388) (513)
Total financial expenses (2 502) (2 898)
Foreign currency gains 12 556 10 485
Foreign currency losses (13 054) (10 641)
Net foreign currency gains (losses) (498) (156)
Net change in fair value of financial instruments at fair value through profit or loss 22 490
Net change in fair value of hedging instruments and hedged items 450 198
Net change in fair value of financial instruments 472 687
Net gains (losses and impairment) of financial assets and liabilities 39 (7)
Net financial income (expenses) (1 914) (1 769)
The decrease in financial income in 2013 compared with 2012 is mainly due to decreased interest rates on cash and cash equivalents, and less interest-bearing placements in high-yielding currencies. The decrease in financial expenses in 2013 compared with 2012 is mainly due to decreased interest rates on interest-bearing debt and derivatives, and less debt in high-yielding currencies.
Net foreign currency losses are caused by intercompany positions and unhedged external positions. Gross currency movements are high compared to the net amount. The main reason is that currency effects on external funding in Telenor ASA are offset by currency effects on intercompany receivables in the internal bank.
Income taxes
NOK in millions 20132012
Restated
Profit before taxes 17 825 10 770
Current taxes (3 392) (5 698)
Deferred taxes (2 309) 3 956
Income tax expense (5 701) (1 743)
Current taxes decreased in 2013 as compared to 2012, mainly due to the tax deductible losses on internal receivables against the Indian entity, Unitech Wireless, after the business transfer from Unitech Wirelss to Telewings was completed in 2013. See more information below.
The tax deductible losses on internal receivables mentioned above decrease deferred tax asset in 2013. In 2012 the deferred tax income recognised was mainly related to recognition of deferred tax asset of NOK 2.5 billion based on provision for loss on internal receivables against Unitech Wireless and recognition of (previously not recognised) deferred tax asset of NOK 1.0 billion based on unused tax losses carried forward in Telenor Pakistan.
/12/
/13/

TELENOR ANNUAL REPORT 2013Notes to the Financial Statements / Telenor Group
/PAGE 48/
Effective tax rate The table below reconciles the reported income tax expense to the expected income tax expense according to the Norwegian corporate income tax rate of 28%. It also discloses the main elements of the tax expense. Selected line items are commented below the table.
NOK in millions 20132012
Restated
Income tax expense at corporate income tax rate in Norway (28%) (4 991) (3 016)
Tax rates outside Norway different from 28% 359 467
Effect of changes in tax rates (321) (5)
Share of net income from associated companies and joint ventures (444) 778
Non-taxable and non-deductible items (307) (49)
Impairment of goodwill that is not tax deductible - (984)
Current and deferred taxes on retained earnings in subsidiaries and associated companies (251) (315)
Deferred tax assets not recognised current year (638) (2 283)
Change in previously not recognised deferred tax assets - 841
Tax effect of loss on internal receivables 427 2 517
Resolution of disputed item 501 -
Other (36) 306
Income tax expense (5 701) (1 743)
Effective tax rate in % 32.0 16.2
Tax rates outside Norway different from 28% Significant effects are related to the fact that dtac (Thailand: 20%), DiGi (Malaysia: 25%), Telenor Sweden (22%) and Telenor Serbia (15%) have tax rates lower than 28%, while Grameenphone Ltd. (Bangladesh: 40%) and Telenor Pakistan (34%) have higher tax rates.
Effect of changes in tax ratesEffects are related to increase in tax rate in Bangladesh from 35% to 40% with effect from 1 January 2012 and decrease in tax rate in Norway from 28% to 27% with effect from 1 January 2014.
Share of net income from associated companies and joint ventures Share of net income from associated companies and joint ventures is recognised on an after tax basis and is therefore excluded from the Group’s tax expense.
Impairment of goodwill that is not tax deductible Goodwill impairment is related to Telenor Denmark in 2012, see note 15 and 16.
Current and deferred taxes on retained earnings in subsidiaries and associated companies This line includes current taxes on dividends received, as well as change in deferred tax liability (primarily withholding tax) the Group has recognised on undistributed earnings in subsidiaries and associated companies outside of Norway. Undistributed retained earnings in foreign subsidiaries for which deferred taxes have not been provided amount to NOK 1.7 billion in 2013 (NOK 1.4 billion in 2012).
Deferred tax assets not recognised current yearThis line primarily relates to India in 2013 and 2012.
Change in previously not recognised deferred tax assetsFor 2012, the line mainly relates to recognition of deferred tax asset based on unused tax losses carried forward in Telenor Pakistan. See below for further details.
Tax effect of loss on internal receivablesIn 2012, Telenor ASA repaid, as guarantor, all of Unitech Wireless’s interest-bearing borrowings, amounting to NOK 10.6 billion. Deferred tax asset amounting to NOK 2.5 billion was recognised in 2012 based on provision for loss on internal receivables against Unitech Wireless as it was clear that the business in Unitech Wireless would be wound up subsequent to the completion of the expected business transfer from Unitech Wireless to the new Indian entity Telewings. In 2013, the business transfer from Unitech Wireless to Telewings was completed, and hence the accumulated loss was finally determined and treated as tax deductible in 2013.
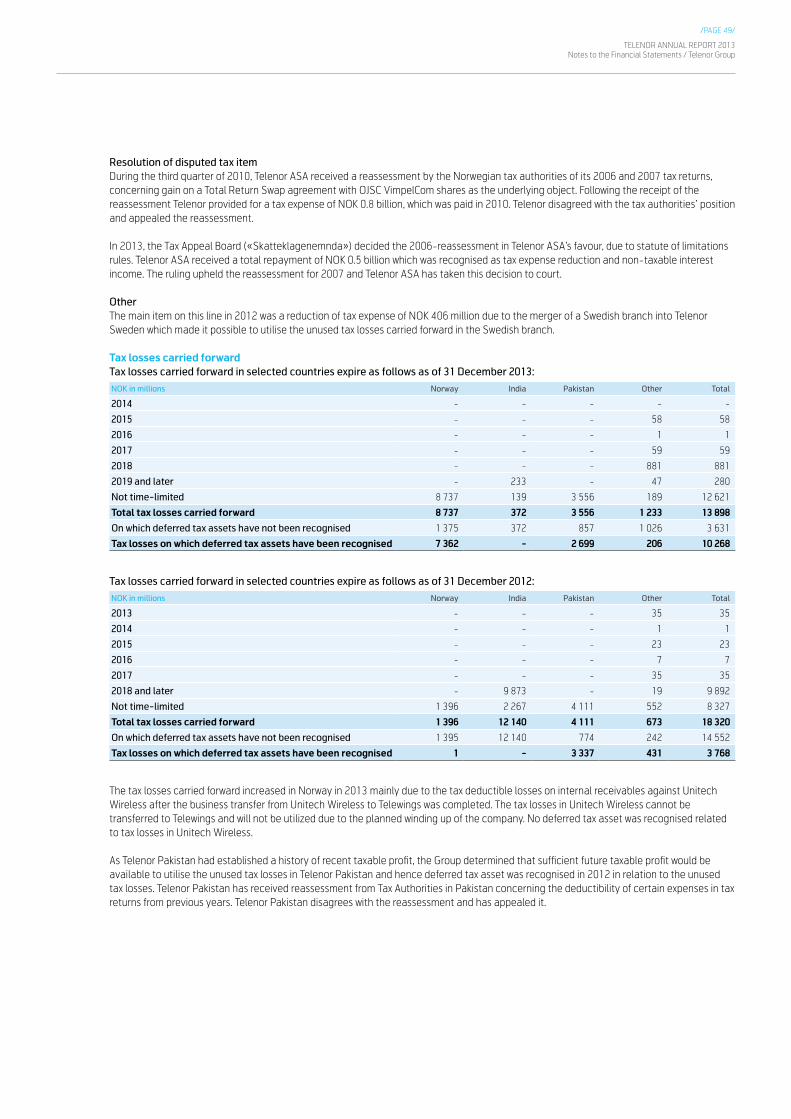
/PAGE 49/
TELENOR ANNUAL REPORT 2013Notes to the Financial Statements / Telenor Group
Resolution of disputed tax itemDuring the third quarter of 2010, Telenor ASA received a reassessment by the Norwegian tax authorities of its 2006 and 2007 tax returns, concerning gain on a Total Return Swap agreement with OJSC VimpelCom shares as the underlying object. Following the receipt of the reassessment Telenor provided for a tax expense of NOK 0.8 billion, which was paid in 2010. Telenor disagreed with the tax authorities’ position and appealed the reassessment.
In 2013, the Tax Appeal Board («Skatteklagenemnda») decided the 2006-reassessment in Telenor ASA’s favour, due to statute of limitations rules. Telenor ASA received a total repayment of NOK 0.5 billion which was recognised as tax expense reduction and non-taxable interest income. The ruling upheld the reassessment for 2007 and Telenor ASA has taken this decision to court.
OtherThe main item on this line in 2012 was a reduction of tax expense of NOK 406 million due to the merger of a Swedish branch into Telenor Sweden which made it possible to utilise the unused tax losses carried forward in the Swedish branch.
Tax losses carried forward Tax losses carried forward in selected countries expire as follows as of 31 December 2013:
NOK in millions Norway India Pakistan Other Total
2014 - - - - -
2015 - - - 58 58
2016 - - - 1 1
2017 - - - 59 59
2018 - - - 881 881
2019 and later - 233 - 47 280
Not time-limited 8 737 139 3 556 189 12 621
Total tax losses carried forward 8 737 372 3 556 1 233 13 898
On which deferred tax assets have not been recognised 1 375 372 857 1 026 3 631
Tax losses on which deferred tax assets have been recognised 7 362 - 2 699 206 10 268
Tax losses carried forward in selected countries expire as follows as of 31 December 2012:
NOK in millions Norway India Pakistan Other Total
2013 - - - 35 35
2014 - - - 1 1
2015 - - - 23 23
2016 - - - 7 7
2017 - - - 35 35
2018 and later - 9 873 - 19 9 892
Not time-limited 1 396 2 267 4 111 552 8 327
Total tax losses carried forward 1 396 12 140 4 111 673 18 320
On which deferred tax assets have not been recognised 1 395 12 140 774 242 14 552
Tax losses on which deferred tax assets have been recognised 1 - 3 337 431 3 768
The tax losses carried forward increased in Norway in 2013 mainly due to the tax deductible losses on internal receivables against Unitech Wireless after the business transfer from Unitech Wireless to Telewings was completed. The tax losses in Unitech Wireless cannot be transferred to Telewings and will not be utilized due to the planned winding up of the company. No deferred tax asset was recognised related to tax losses in Unitech Wireless.
As Telenor Pakistan had established a history of recent taxable profit, the Group determined that sufficient future taxable profit would be available to utilise the unused tax losses in Telenor Pakistan and hence deferred tax asset was recognised in 2012 in relation to the unused tax losses. Telenor Pakistan has received reassessment from Tax Authorities in Pakistan concerning the deductibility of certain expenses in tax returns from previous years. Telenor Pakistan disagrees with the reassessment and has appealed it.
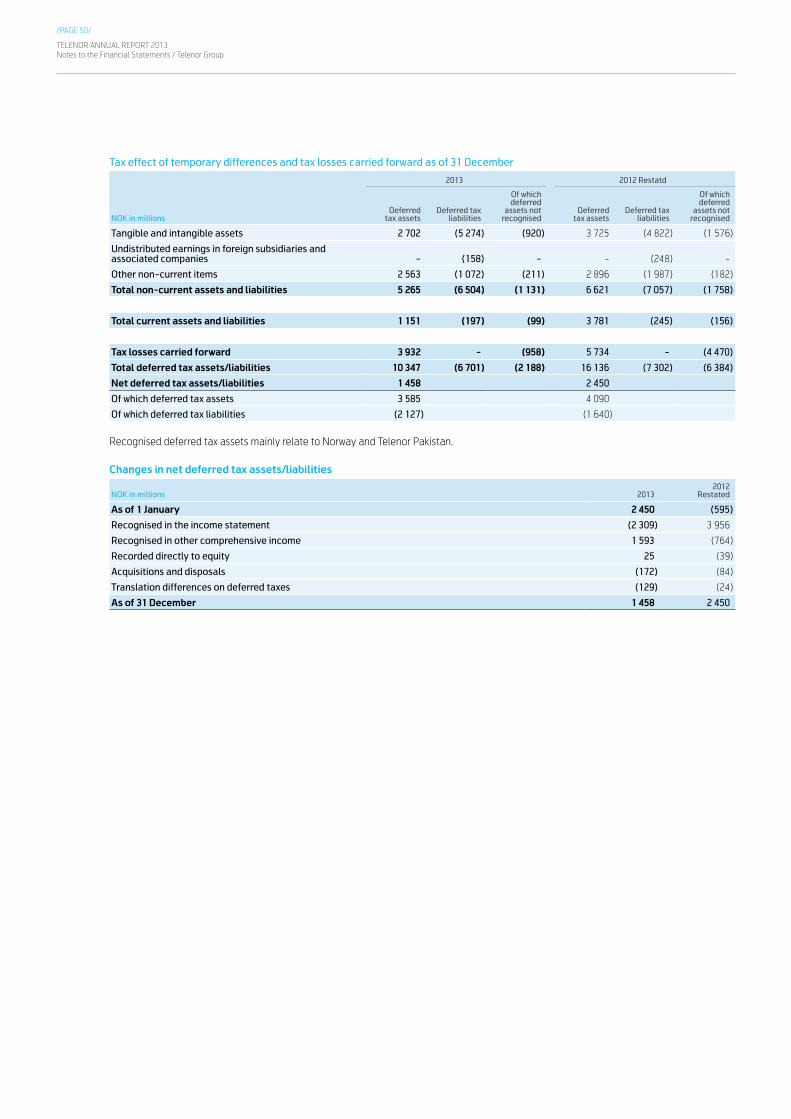
TELENOR ANNUAL REPORT 2013Notes to the Financial Statements / Telenor Group
/PAGE 50/
Tax effect of temporary differences and tax losses carried forward as of 31 December
2013 2012 Restatd
NOK in millionsDeferred
tax assetsDeferred tax
liabilities
Of whichdeferred
assets notrecognised
Deferredtax assets
Deferred taxliabilities
Of whichdeferred
assets notrecognised
Tangible and intangible assets 2 702 (5 274) (920) 3 725 (4 822) (1 576)
Undistributed earnings in foreign subsidiaries and associated companies - (158) - - (248) -
Other non-current items 2 563 (1 072) (211) 2 896 (1 987) (182)
Total non-current assets and liabilities 5 265 (6 504) (1 131) 6 621 (7 057) (1 758)
Total current assets and liabilities 1 151 (197) (99) 3 781 (245) (156)
Tax losses carried forward 3 932 - (958) 5 734 - (4 470)
Total deferred tax assets/liabilities 10 347 (6 701) (2 188) 16 136 (7 302) (6 384)
Net deferred tax assets/liabilities 1 458 2 450
Of which deferred tax assets 3 585 4 090
Of which deferred tax liabilities (2 127) (1 640)
Recognised deferred tax assets mainly relate to Norway and Telenor Pakistan.
Changes in net deferred tax assets/liabilities
NOK in millions 20132012
Restated
As of 1 January 2 450 (595)
Recognised in the income statement (2 309) 3 956
Recognised in other comprehensive income 1 593 (764)
Recorded directly to equity 25 (39)
Acquisitions and disposals (172) (84)
Translation differences on deferred taxes (129) (24)
As of 31 December 1 458 2 450

/PAGE 51/
TELENOR ANNUAL REPORT 2013Notes to the Financial Statements / Telenor Group
Earnings per share
The calculations of the basic and diluted earnings per share attributable to the ordinary equity holders of Telenor ASA are based on the following income and share data:
Earnings
NOK in millions, except earnings per share 20132012
Restated
Net income attributable to the equity holders of Telenor ASA 8 748 8 809
Net income for the purpose of diluted earnings per share 8 748 8 809
Basic earnings per share 5.74 5.63
Diluted earnings per share 5.74 5.62
Number of shares In thousands 2013 2012
Weighted average number of shares for the purpose of basic earnings per share 1 523 181 1 565 065
Effect of potential dilutive shares:
Share options and bonus shares 2 047 2 390
Weighted average number of shares for the purpose of diluted earnings per share 1 525 228 1 567 455
The denominators for the purposes of calculating both basic and diluted earnings per share have been adjusted for the effects of acquisition of treasury shares.
Goodwill
NOK in millionsTelenor
DenmarkTelenor Sweden
Telenor Hungary
dtac Thailand
Telenor Serbia
Globul Bulgaria Broadcast Other 1) Total
Accumulated cost
As of 1 January 2012 7 166 5 240 3 839 2 374 5 445 - 1 752 1 303 27 118
Translation differences (406) (93) 94 (92) (534) - 1 (31) (1 061)
Arising on acquisition of subsidiaries - 236 - - - - - - 236
Derecognised on disposal of subsidiaries - - - - - - (4) - (4)
As of 31 December 2012 6 760 5 383 3 933 2 282 4 911 - 1 749 1 272 26 289
Translation differences - 578 484 45 586 140 6 29 1 867
Arising on acquisition of subsidiaries - - - - - 2 042 - 11 2 053
Reallocation of goodwill - (6) - - - - - 42 36
Derecognised on disposal of subsidiaries - - - - - - - (24) (24)
As of 31 December 2013 6 760 5 955 4 417 2 327 5 497 2 182 1 755 1 330 30 221
Accumulated impairment losses
As of 1 January 2012 (2 968) (231) - - (1 508) - (125) (140) (4 973)
Translation differences 168 4 - - 148 - 1 1 322
Impairment losses (3 960) - - - - - - - (3 960)
Derecognised on disposal of subsidiaries - - - - - - 4 - 4
As of 31 December 2012 (6 760) (227) - - (1 360) - (120) (139) (8 607)
Translation differences - (25) - - (162) - (3) (5) (195)
Derecognised on disposal of subsidiaries - - - - - - - 24 24
As of 31 December 2013 (6 760) (252) - - (1 522) - (123) (120) (8 778)
Carrying amount
As of 31 December 2013 - 5 703 4 417 2 327 3 975 2 182 1 632 1 210 21 442
As of 31 December 2012 - 5 156 3 933 2 282 3 551 - 1 632 1 130 17 682
1) Others includes primarily DiGi (Malaysia), Telenor Montenegro and Telenor Norway (Datametrix and Canal Digital Cable).
See note 16 for impairment testing.
/14/
/15/
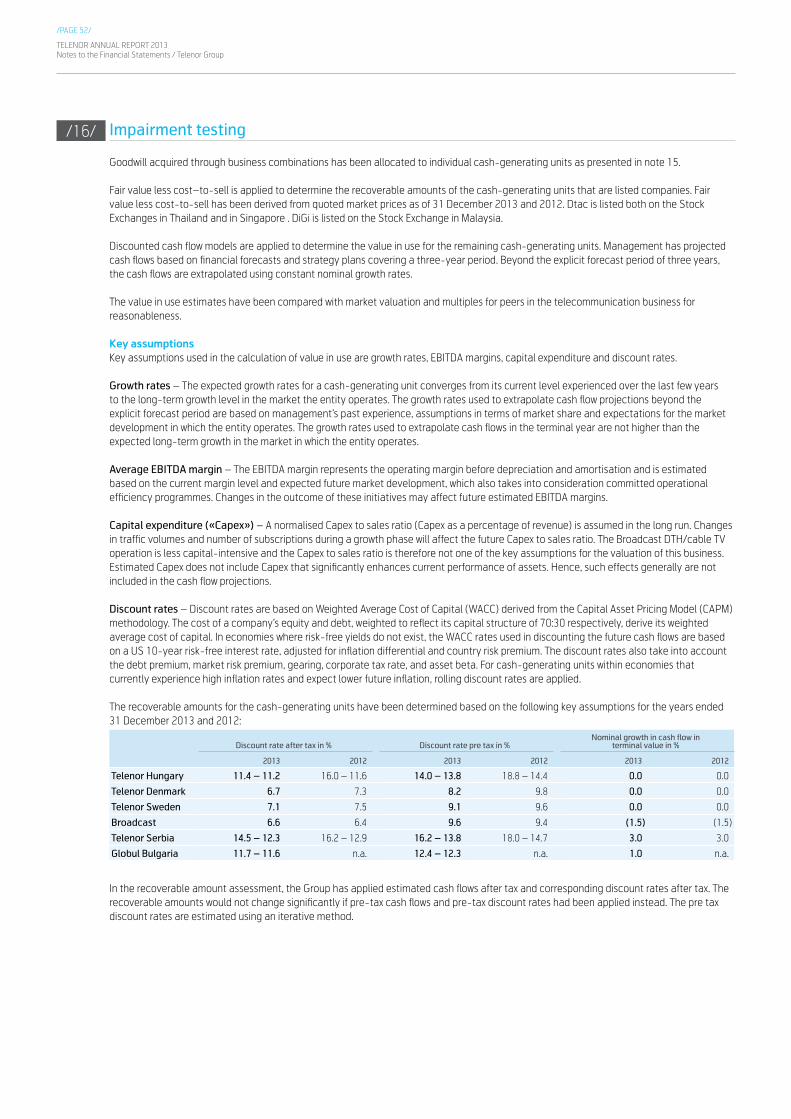
TELENOR ANNUAL REPORT 2013Notes to the Financial Statements / Telenor Group
/PAGE 52/
Impairment testing
Goodwill acquired through business combinations has been allocated to individual cash-generating units as presented in note 15.
Fair value less cost–to-sell is applied to determine the recoverable amounts of the cash-generating units that are listed companies. Fair value less cost-to-sell has been derived from quoted market prices as of 31 December 2013 and 2012. Dtac is listed both on the Stock Exchanges in Thailand and in Singapore . DiGi is listed on the Stock Exchange in Malaysia.
Discounted cash flow models are applied to determine the value in use for the remaining cash-generating units. Management has projected cash flows based on financial forecasts and strategy plans covering a three-year period. Beyond the explicit forecast period of three years, the cash flows are extrapolated using constant nominal growth rates. The value in use estimates have been compared with market valuation and multiples for peers in the telecommunication business for reasonableness.
Key assumptionsKey assumptions used in the calculation of value in use are growth rates, EBITDA margins, capital expenditure and discount rates.
Growth rates – The expected growth rates for a cash-generating unit converges from its current level experienced over the last few years to the long-term growth level in the market the entity operates. The growth rates used to extrapolate cash flow projections beyond the explicit forecast period are based on management’s past experience, assumptions in terms of market share and expectations for the market development in which the entity operates. The growth rates used to extrapolate cash flows in the terminal year are not higher than the expected long-term growth in the market in which the entity operates.
Average EBITDA margin – The EBITDA margin represents the operating margin before depreciation and amortisation and is estimated based on the current margin level and expected future market development, which also takes into consideration committed operational efficiency programmes. Changes in the outcome of these initiatives may affect future estimated EBITDA margins.
Capital expenditure («Capex») – A normalised Capex to sales ratio (Capex as a percentage of revenue) is assumed in the long run. Changes in traffic volumes and number of subscriptions during a growth phase will affect the future Capex to sales ratio. The Broadcast DTH/cable TV operation is less capital-intensive and the Capex to sales ratio is therefore not one of the key assumptions for the valuation of this business. Estimated Capex does not include Capex that significantly enhances current performance of assets. Hence, such effects generally are not included in the cash flow projections.
Discount rates – Discount rates are based on Weighted Average Cost of Capital (WACC) derived from the Capital Asset Pricing Model (CAPM) methodology. The cost of a company’s equity and debt, weighted to reflect its capital structure of 70:30 respectively, derive its weighted average cost of capital. In economies where risk-free yields do not exist, the WACC rates used in discounting the future cash flows are based on a US 10-year risk-free interest rate, adjusted for inflation differential and country risk premium. The discount rates also take into account the debt premium, market risk premium, gearing, corporate tax rate, and asset beta. For cash-generating units within economies that currently experience high inflation rates and expect lower future inflation, rolling discount rates are applied.
The recoverable amounts for the cash-generating units have been determined based on the following key assumptions for the years ended 31 December 2013 and 2012:
Discount rate after tax in % Discount rate pre tax in %Nominal growth in cash flow in
terminal value in %
2013 2012 2013 2012 2013 2012
Telenor Hungary 11.4 – 11.2 16.0 – 11.6 14.0 – 13.8 18.8 – 14.4 0.0 0.0
Telenor Denmark 6.7 7.3 8.2 9.8 0.0 0.0
Telenor Sweden 7.1 7.5 9.1 9.6 0.0 0.0
Broadcast 6.6 6.4 9.6 9.4 (1.5) (1.5)
Telenor Serbia 14.5 – 12.3 16.2 – 12.9 16.2 – 13.8 18.0 – 14.7 3.0 3.0
Globul Bulgaria 11.7 – 11.6 n.a. 12.4 – 12.3 n.a. 1.0 n.a.
In the recoverable amount assessment, the Group has applied estimated cash flows after tax and corresponding discount rates after tax. The recoverable amounts would not change significantly if pre-tax cash flows and pre-tax discount rates had been applied instead. The pre tax discount rates are estimated using an iterative method.
/16/
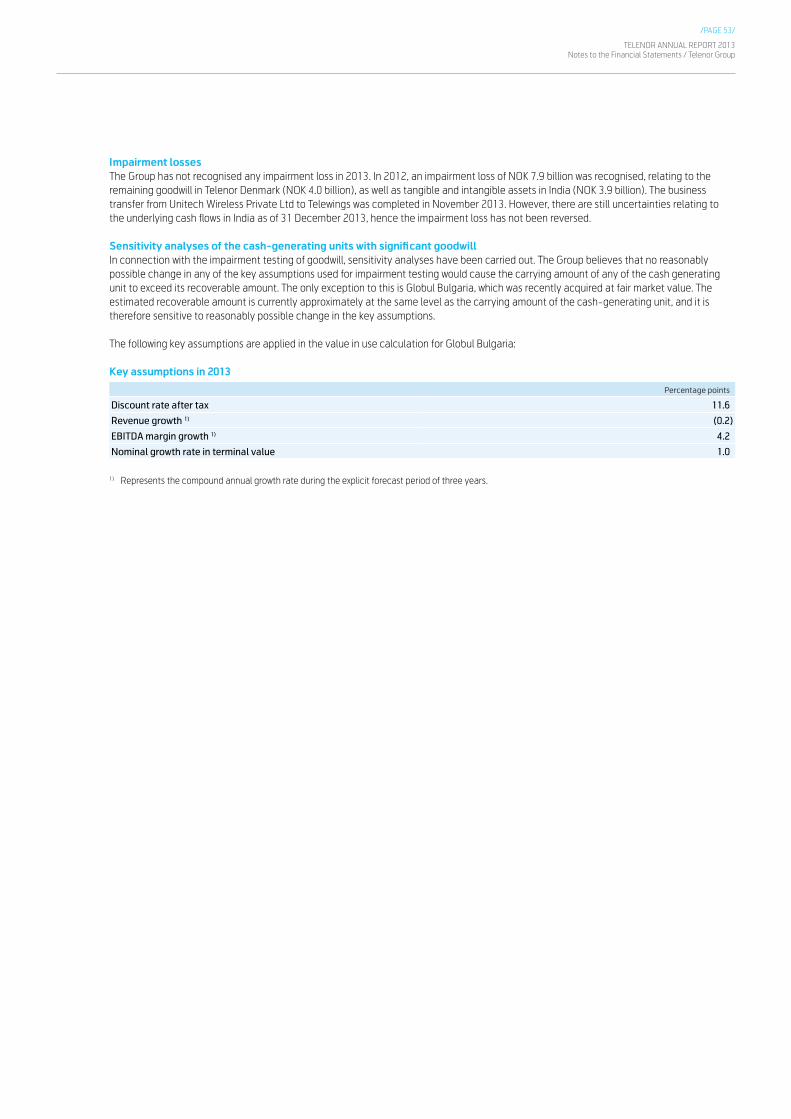
/PAGE 53/
TELENOR ANNUAL REPORT 2013Notes to the Financial Statements / Telenor Group
Impairment lossesThe Group has not recognised any impairment loss in 2013. In 2012, an impairment loss of NOK 7.9 billion was recognised, relating to the remaining goodwill in Telenor Denmark (NOK 4.0 billion), as well as tangible and intangible assets in India (NOK 3.9 billion). The business transfer from Unitech Wireless Private Ltd to Telewings was completed in November 2013. However, there are still uncertainties relating to the underlying cash flows in India as of 31 December 2013, hence the impairment loss has not been reversed.
Sensitivity analyses of the cash-generating units with significant goodwillIn connection with the impairment testing of goodwill, sensitivity analyses have been carried out. The Group believes that no reasonably possible change in any of the key assumptions used for impairment testing would cause the carrying amount of any of the cash generating unit to exceed its recoverable amount. The only exception to this is Globul Bulgaria, which was recently acquired at fair market value. The estimated recoverable amount is currently approximately at the same level as the carrying amount of the cash-generating unit, and it is therefore sensitive to reasonably possible change in the key assumptions.
The following key assumptions are applied in the value in use calculation for Globul Bulgaria:
Key assumptions in 2013
Percentage points
Discount rate after tax 11.6
Revenue growth 1) (0.2)
EBITDA margin growth 1) 4.2
Nominal growth rate in terminal value 1.0
1) Represents the compound annual growth rate during the explicit forecast period of three years.
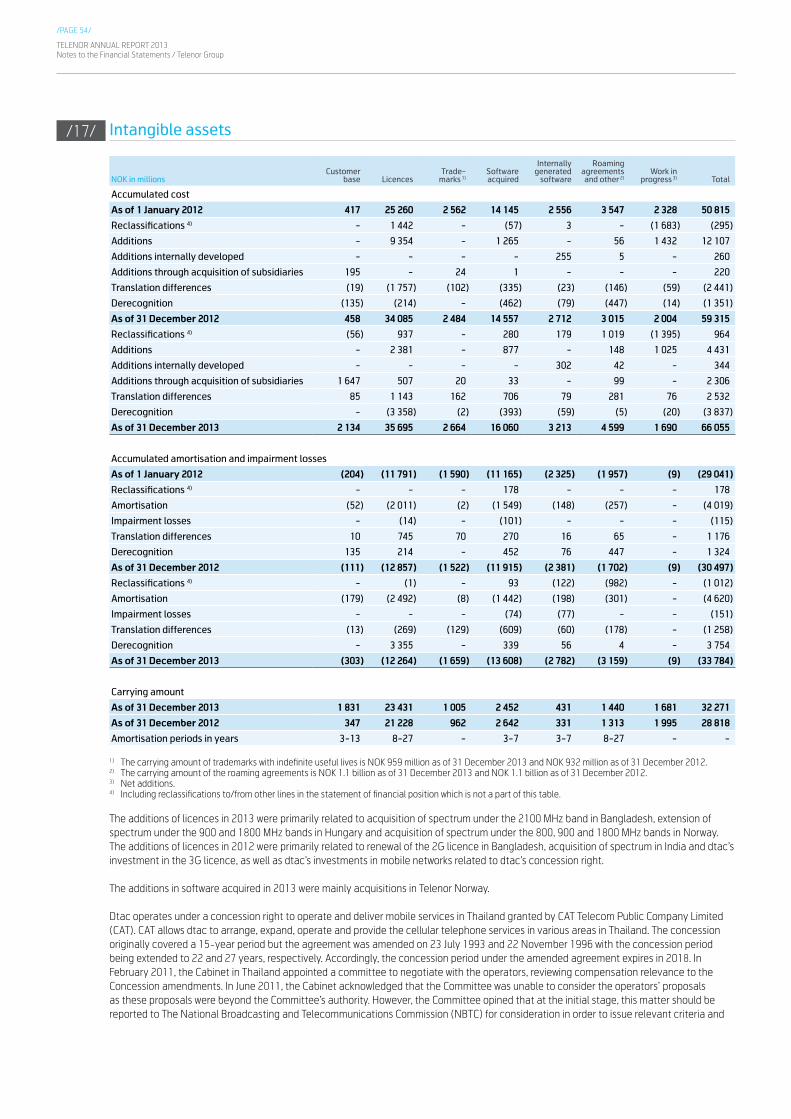
TELENOR ANNUAL REPORT 2013Notes to the Financial Statements / Telenor Group
/PAGE 54/
Intangible assets
NOK in millionsCustomer
base LicencesTrade-
marks 1)Softwareacquired
Internallygenerated
software
Roaming agreements and other 2)
Work inprogress 3) Total
Accumulated cost
As of 1 January 2012 417 25 260 2 562 14 145 2 556 3 547 2 328 50 815
Reclassifications 4) - 1 442 - (57) 3 - (1 683) (295)
Additions - 9 354 - 1 265 - 56 1 432 12 107
Additions internally developed - - - - 255 5 - 260
Additions through acquisition of subsidiaries 195 - 24 1 - - - 220
Translation differences (19) (1 757) (102) (335) (23) (146) (59) (2 441)
Derecognition (135) (214) - (462) (79) (447) (14) (1 351)
As of 31 December 2012 458 34 085 2 484 14 557 2 712 3 015 2 004 59 315
Reclassifications 4) (56) 937 - 280 179 1 019 (1 395) 964
Additions - 2 381 - 877 - 148 1 025 4 431
Additions internally developed - - - - 302 42 - 344
Additions through acquisition of subsidiaries 1 647 507 20 33 - 99 - 2 306
Translation differences 85 1 143 162 706 79 281 76 2 532
Derecognition - (3 358) (2) (393) (59) (5) (20) (3 837)
As of 31 December 2013 2 134 35 695 2 664 16 060 3 213 4 599 1 690 66 055
Accumulated amortisation and impairment losses
As of 1 January 2012 (204) (11 791) (1 590) (11 165) (2 325) (1 957) (9) (29 041)
Reclassifications 4) - - - 178 - - - 178
Amortisation (52) (2 011) (2) (1 549) (148) (257) - (4 019)
Impairment losses - (14) - (101) - - - (115)
Translation differences 10 745 70 270 16 65 - 1 176
Derecognition 135 214 - 452 76 447 - 1 324
As of 31 December 2012 (111) (12 857) (1 522) (11 915) (2 381) (1 702) (9) (30 497)
Reclassifications 4) - (1) - 93 (122) (982) - (1 012)
Amortisation (179) (2 492) (8) (1 442) (198) (301) - (4 620)
Impairment losses - - - (74) (77) - - (151)
Translation differences (13) (269) (129) (609) (60) (178) - (1 258)
Derecognition - 3 355 - 339 56 4 - 3 754
As of 31 December 2013 (303) (12 264) (1 659) (13 608) (2 782) (3 159) (9) (33 784)
Carrying amount
As of 31 December 2013 1 831 23 431 1 005 2 452 431 1 440 1 681 32 271
As of 31 December 2012 347 21 228 962 2 642 331 1 313 1 995 28 818
Amortisation periods in years 3-13 8-27 - 3-7 3-7 8-27 - -
1) The carrying amount of trademarks with indefinite useful lives is NOK 959 million as of 31 December 2013 and NOK 932 million as of 31 December 2012.2) The carrying amount of the roaming agreements is NOK 1.1 billion as of 31 December 2013 and NOK 1.1 billion as of 31 December 2012.3) Net additions.4) Including reclassifications to/from other lines in the statement of financial position which is not a part of this table.
The additions of licences in 2013 were primarily related to acquisition of spectrum under the 2100 MHz band in Bangladesh, extension of spectrum under the 900 and 1800 MHz bands in Hungary and acquisition of spectrum under the 800, 900 and 1800 MHz bands in Norway. The additions of licences in 2012 were primarily related to renewal of the 2G licence in Bangladesh, acquisition of spectrum in India and dtac’s investment in the 3G licence, as well as dtac’s investments in mobile networks related to dtac’s concession right.
The additions in software acquired in 2013 were mainly acquisitions in Telenor Norway.
Dtac operates under a concession right to operate and deliver mobile services in Thailand granted by CAT Telecom Public Company Limited (CAT). CAT allows dtac to arrange, expand, operate and provide the cellular telephone services in various areas in Thailand. The concession originally covered a 15-year period but the agreement was amended on 23 July 1993 and 22 November 1996 with the concession period being extended to 22 and 27 years, respectively. Accordingly, the concession period under the amended agreement expires in 2018. In February 2011, the Cabinet in Thailand appointed a committee to negotiate with the operators, reviewing compensation relevance to the Concession amendments. In June 2011, the Cabinet acknowledged that the Committee was unable to consider the operators’ proposals as these proposals were beyond the Committee’s authority. However, the Committee opined that at the initial stage, this matter should be reported to The National Broadcasting and Telecommunications Commission (NBTC) for consideration in order to issue relevant criteria and
/17/

/PAGE 55/
TELENOR ANNUAL REPORT 2013Notes to the Financial Statements / Telenor Group
measures. At present, the final conclusion of the Cabinet or the way the Cabinet would exercise its discretion on this matter is still unknown to the Group. However, the Group believes the amendments were entered into in good faith, that the amendments are legitimate and that the state was not harmed by them.
The service concession of dtac is accounted for under the Intangible Asset Model according to IFRIC 12 Service Concession Arrangements. The carrying amount of the concession right is NOK 7.3 billion as of 31 December 2013 (NOK 7.9 billion as of 31 December 2012) and is amortised on a straight-line basis over the remaining concession period. Replacements and extensions are capitalised as intangible assets and amortised over the remaining useful life of the concession. Repair and maintenance are expensed as incurred.
The carrying amounts of licences as of 31 December 2013 in Uninor and Grameenphone are NOK 3.9 billion and NOK 3.6 billion (NOK 4.0 billion and NOK 2.2 billion as of 31 December 2012) respectively. The carrying amount of licence in dtac (other than concession right) as of 31 December 2013 is NOK 2.3 billion (NOK 2.3 billion as of 31 December 2012). The following table sets forth the mobile spectrum licences that the Group holds as of 31 December 2013:
Spectrum (MHz) Bandwidth (MHz) Type/technology Licence expiration
Telenor Norway
800 2×10 Technology neutral 2033
900 2×10.1 + 2×5 Technology neutral 2017/2033
1800 2×10 + 2×10 Technology neutral 2028/2033
2100 2×19.8 Technology neutral 2032
2600 2×40 Technology neutral 2022
Telenor Sweden
800 2x10 a) Technology neutral 2035
900 2x6 b) + 2×5 Technology neutral 2025
1800 2×5 + 2×20 + 2x10 c) Technology neutral 2017/2027/2037
2100 2×19.8 + 1×5 Technology neutral 2025
2600 2x40 d) Technology neutral 2023
Telenor Denmark
800 2x10 e) Technology neutral 2034
900 2×9 Technology neutral 2019
1800 2×19.4 Technology neutral 2017
2100 2×15 + 1×5 3G 2021
2600 2×20 + 1×10 Technology neutral 2030
Telenor Hungary
900 2×8 + 2×1.8 2G/3G/4G 2022
1800 2×30 2G/3G/4G 2022
2100 2×15 + 1×5 3G 2019
Telenor Serbia
900 2×9.6 2G 2026
1800 2×10 2G 2026
2100 2×15 + 1×5 3G 2026
Telenor Montenegro
900 2×9.6 + 2×3.6 2G 2016/2017
1800 2×20 + 2×9.6 2G 2016/2017
2100 2×15 + 1×5 + 2×10 3G 2022/2017
Globul, Bulgaria
900 2×9.4 + 2×1.8 Technology Neutral 2021
1800 2×10 Technology Neutral 2021
2100 2×10 3G 2025
dtac, Thailand
850 2x10 f) 3G 2018
1800 2×49.8 f) 2G 2018
2100 2×15 3G/4G 2027

TELENOR ANNUAL REPORT 2013Notes to the Financial Statements / Telenor Group
/PAGE 56/
DiGi, Malaysia
900 2×2 2G 2015
1800 2×25 2G 2015
2100 2×15 3G 2018
2600 2×10 4G 2017
Grameenphone, Bangladesh
900 2×7.4 2G 2026
1800 2×7.2 + 2×7.4 2G 2026
2100 2×10 3G/4G 2028
Telenor Pakistan
900 2×4.8 2G 2019
1800 2×8.8 2G 2019
Uninor, India
1800 2x5 g) 2G 2032
a) The licence is awarded to Net4Mobility (a joint operation with Tele 2 owned 50% by the Group).b) The licence is held by Net4Mobility (a joint operation with Tele 2 owned 50% by the Group).c) The licence is held by Net4Mobility (a joint operation with Tele 2 owned 50% by the Group).d) Tele 2 and the Group transferred their respective licences (2×20 MHz) in the 2600 MHz band to Net4Mobility on 2 July 2012.e) Jointly owned 50% with Telia.f) Under concession agreement with CAT. g) In the following circles: Andhra Pradesh, Bihar and Jharkhand, Maharashtra, Gujarat, Uttar Pradesh East and Uttar Pradesh West.
The trademarks with indefinite useful lives are mainly represented by the trademark of dtac. Cash-generating units to which trademarks with indefinite useful lives relate are tested for impairment annually or more frequently if there is any indication that the cash-generating unit may be impaired. See note 16 for impairment testing of the cash-generating units. When assessing an indefinite useful life of a particular trademark, the Group considers whether no foreseeable limit exists on its use and a normal level of sales and marketing expense is incurred to maintain that specific trademark.
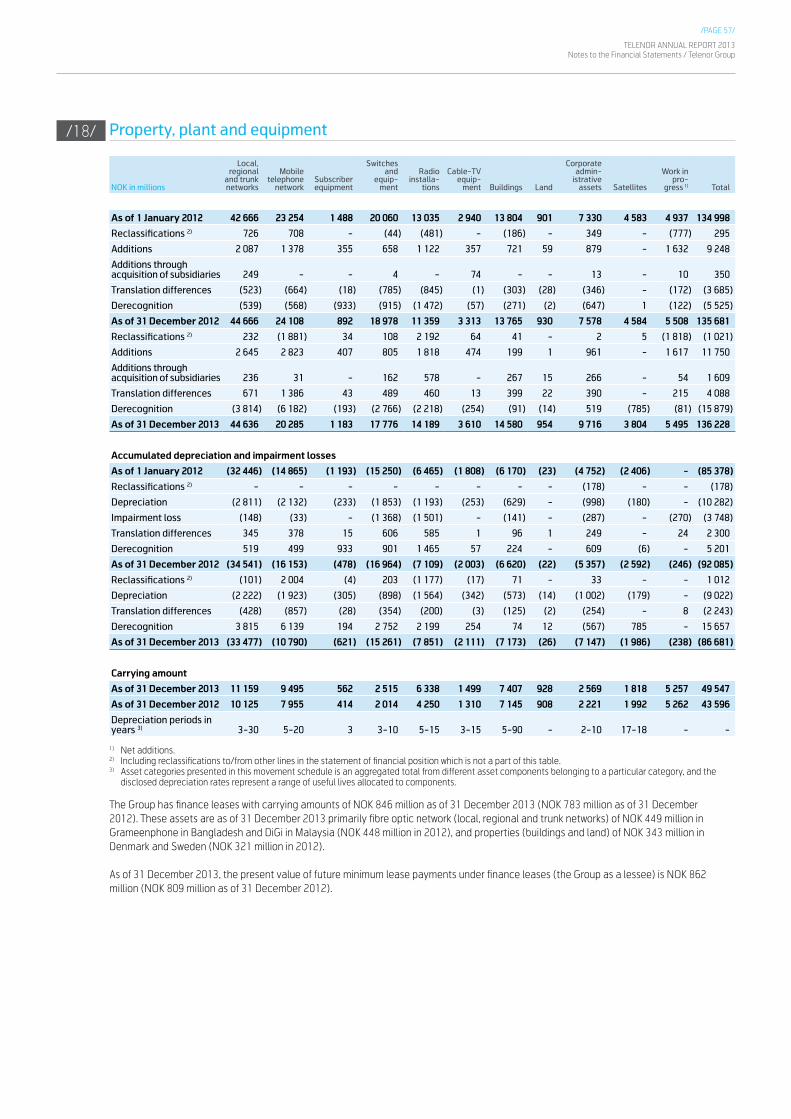
/PAGE 57/
TELENOR ANNUAL REPORT 2013Notes to the Financial Statements / Telenor Group
Property, plant and equipment
NOK in millions
Local, regional
and trunk networks
Mobile telephone
network Subscriber equipment
Switches and
equip-ment
Radioinstalla-
tions
Cable-TVequip-
ment Buildings Land
Corporate admin-
istrative assets Satellites
Work inpro-
gress 1) Total
As of 1 January 2012 42 666 23 254 1 488 20 060 13 035 2 940 13 804 901 7 330 4 583 4 937 134 998
Reclassifications 2) 726 708 - (44) (481) - (186) - 349 - (777) 295
Additions 2 087 1 378 355 658 1 122 357 721 59 879 - 1 632 9 248
Additions through acquisition of subsidiaries 249 - - 4 - 74 - - 13 - 10 350
Translation differences (523) (664) (18) (785) (845) (1) (303) (28) (346) - (172) (3 685)
Derecognition (539) (568) (933) (915) (1 472) (57) (271) (2) (647) 1 (122) (5 525)
As of 31 December 2012 44 666 24 108 892 18 978 11 359 3 313 13 765 930 7 578 4 584 5 508 135 681
Reclassifications 2) 232 (1 881) 34 108 2 192 64 41 - 2 5 (1 818) (1 021)
Additions 2 645 2 823 407 805 1 818 474 199 1 961 - 1 617 11 750
Additions through acquisition of subsidiaries 236 31 - 162 578 - 267 15 266 - 54 1 609
Translation differences 671 1 386 43 489 460 13 399 22 390 - 215 4 088
Derecognition (3 814) (6 182) (193) (2 766) (2 218) (254) (91) (14) 519 (785) (81) (15 879)
As of 31 December 2013 44 636 20 285 1 183 17 776 14 189 3 610 14 580 954 9 716 3 804 5 495 136 228
Accumulated depreciation and impairment losses
As of 1 January 2012 (32 446) (14 865) (1 193) (15 250) (6 465) (1 808) (6 170) (23) (4 752) (2 406) - (85 378)
Reclassifications 2) - - - - - - - - (178) - - (178)
Depreciation (2 811) (2 132) (233) (1 853) (1 193) (253) (629) - (998) (180) - (10 282)
Impairment loss (148) (33) - (1 368) (1 501) - (141) - (287) - (270) (3 748)
Translation differences 345 378 15 606 585 1 96 1 249 - 24 2 300
Derecognition 519 499 933 901 1 465 57 224 - 609 (6) - 5 201
As of 31 December 2012 (34 541) (16 153) (478) (16 964) (7 109) (2 003) (6 620) (22) (5 357) (2 592) (246) (92 085)
Reclassifications 2) (101) 2 004 (4) 203 (1 177) (17) 71 - 33 - - 1 012
Depreciation (2 222) (1 923) (305) (898) (1 564) (342) (573) (14) (1 002) (179) - (9 022)
Translation differences (428) (857) (28) (354) (200) (3) (125) (2) (254) - 8 (2 243)
Derecognition 3 815 6 139 194 2 752 2 199 254 74 12 (567) 785 - 15 657
As of 31 December 2013 (33 477) (10 790) (621) (15 261) (7 851) (2 111) (7 173) (26) (7 147) (1 986) (238) (86 681)
Carrying amount
As of 31 December 2013 11 159 9 495 562 2 515 6 338 1 499 7 407 928 2 569 1 818 5 257 49 547
As of 31 December 2012 10 125 7 955 414 2 014 4 250 1 310 7 145 908 2 221 1 992 5 262 43 596
Depreciation periods in years 3) 3-30 5-20 3 3-10 5-15 3-15 5-90 - 2-10 17-18 - -
1) Net additions. 2) Including reclassifications to/from other lines in the statement of financial position which is not a part of this table. 3) Asset categories presented in this movement schedule is an aggregated total from different asset components belonging to a particular category, and the
disclosed depreciation rates represent a range of useful lives allocated to components.
The Group has finance leases with carrying amounts of NOK 846 million as of 31 December 2013 (NOK 783 million as of 31 December 2012). These assets are as of 31 December 2013 primarily fibre optic network (local, regional and trunk networks) of NOK 449 million in Grameenphone in Bangladesh and DiGi in Malaysia (NOK 448 million in 2012), and properties (buildings and land) of NOK 343 million in Denmark and Sweden (NOK 321 million in 2012).
As of 31 December 2013, the present value of future minimum lease payments under finance leases (the Group as a lessee) is NOK 862 million (NOK 809 million as of 31 December 2012).
/18/

TELENOR ANNUAL REPORT 2013Notes to the Financial Statements / Telenor Group
/PAGE 58/
Associated companies and joint arrangements
Associated companies and joint ventures
NOK in millions 20132012
Restated 1)
Balance as of 1 January 39 222 33 623
Additions 1 581 7 009
Disposals (129) -
Share of net income (loss) 2) (1 230) 2 785
Equity transactions including dividends (8 220) (44)
Share of other comprehensive income 192 (1 540)
Translation differences 3 023 (2 611)
Balance as of 31 December 34 439 39 222
of which investments carried at a negative value 3) 161 211
Carrying amount of investments in associated companies and joint ventures 34 600 39 433
of which investment in VimpelCom Ltd 31 005 36 856
of which investment in Others 3 595 2 577
1) See note 1. 2) Share of net income (loss) includes the Group’s share of net income (loss) after taxes, amortisation of excess values, impairment losses and adjustment for
differences in accounting policies. 3) Carrying amount of investment in Riks TV AS (an associated company) is carried at negative value where the Group has other long-term interests that in
substance form part of the capital invested (classified against long-term receivables on associates), and a corresponding liability above and beyond the capital invested (classified as provision).
During 2013, the Group acquired interests of 50.0% and 33.3% in SnT Classifieds and 701 Search Pte. Ltd. respectively for a total consideration of NOK 1.5 billion, in cooperation with Schibsted Media Group and Singapore Press Holdings. The companies will provide high-quality online classified services in selected key markets in Asia and South America.
Additions in 2012 primarily related to the acquisition of 305 million preferred shares of VimpelCom Ltd. from Weather Investments II S.a.r.l. for a consideration of NOK 2.9 billion and 65 million common shares of VimpelCom Ltd for a consideration of NOK 4.1billion.
Market values (quoted market value) of the Group’s ownership interest in listed associated companies as of 31 December 2013 were NOK 45.7 billion and NOK 804 million for VimpelCom Ltd and Evry ASA (included in Others), respectively. The recoverable amounts, for impairment assessment, of VimpelCom Ltd. and Evry ASA are based on the Group’s estimated fair value less cost-to-sell.
VimpelCom Ltd. VimpelCom Ltd. is an associated company to the Group which is accounted for using the equity method. VimpelCom Ltd. is incorporated in Bermuda, headquartered in the Netherlands, and is listed on the NASDAQ-100 Index. VimpelCom Ltd. is a telecommunication company providing range of wireless, fixed and broadband internet services in 17 markets across Europe, North America, Africa and Asia. On 12 March 2014, VimpelCom Ltd. announced that it faces investigations by both the U.S. Securities and Exchange Commission and Dutch authorities related to its operations in Uzbekistan. On 18 March 2014, VimpelCom Ltd. further reported that it is also the focus of an investigation by the U.S. Department of Justice related to the same operations.
As of 31 December 2013, the Group owns 33.0% of VimpelCom Ltd. (economic ownership interest) with a voting share of 43.0%. The Group owns 305 million convertible preferred shares of VimpelCom Ltd., with voting rights but no entitlement to dividend. The Group has an option to convert these preferred shares into common shares at prevailing market price during the time period starting from 15 October 2013 until 15 April 2016. During 2013, total dividend of NOK 8.1 billion was received from VimpelCom Ltd.
On 16 April 2013, Altimo Cooperatief U.A («Altimo») converted its 128.5 million preferred shares (with no economic interest) into common shares of VimpelCom Ltd. by paying USD 10.84 per share (USD 1.3 billion in total). As a consequence of Altimo’s conversion of preferred shares, the Group’s economic interest was diluted from 35.7% to 33.0%, whereas the Group’s voting interest remained unaffected. The deemed disposal of the economic interest in VimpelCom Ltd. resulted in an accounting loss of NOK 385 million recognised in the income statement in 2013.
The Group includes VimpelCom Ltd.’s published results with a one quarter lag, see note 3 for further details. Accordingly, share of net income from VimpelCom Ltd. in 2013 consists of share of net income for the fourth quarter of 2012 (excluding significant transactions and events recognised by the Group in 2012), the first three quarters of 2013, and significant transactions and events for the fourth quarter of 2013 amounting to NOK 4.4 billion, see below for further details.
On 6 March 2014, VimpelCom Ltd. released financial information for the fourth quarter of 2013. Reported net loss attributable to VimpelCom Ltd.’s shareholders for the fourth quarter was USD 2.7 billion, which includes an impairment loss of USD 2.1 billion related to goodwill of Ukraine (Kyivstar) and an impairment loss of USD 0.8 billion related to remaining assets in Canada (Wind Mobile). In accordance with the accounting policy for associated companies, the Group has adjusted for its share of significant transactions and events amounting to USD 757 million (NOK 4.4 billion) which represents the Group’s share of the impairment losses amounting to USD 943 million (NOK 5.5 billion)
/19/
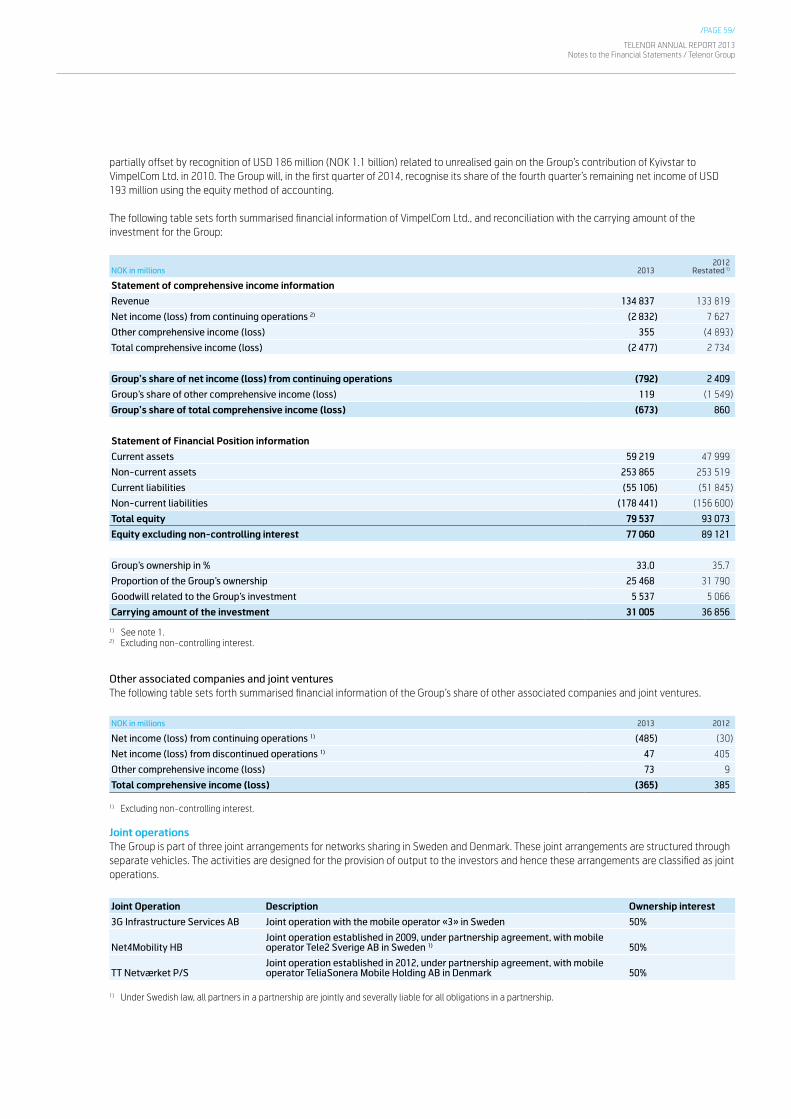
/PAGE 59/
TELENOR ANNUAL REPORT 2013Notes to the Financial Statements / Telenor Group
partially offset by recognition of USD 186 million (NOK 1.1 billion) related to unrealised gain on the Group’s contribution of Kyivstar to VimpelCom Ltd. in 2010. The Group will, in the first quarter of 2014, recognise its share of the fourth quarter’s remaining net income of USD 193 million using the equity method of accounting.
The following table sets forth summarised financial information of VimpelCom Ltd., and reconciliation with the carrying amount of the investment for the Group:
NOK in millions 20132012
Restated 1)
Statement of comprehensive income information
Revenue 134 837 133 819
Net income (loss) from continuing operations 2) (2 832) 7 627
Other comprehensive income (loss) 355 (4 893)
Total comprehensive income (loss) (2 477) 2 734
Group’s share of net income (loss) from continuing operations (792) 2 409
Group’s share of other comprehensive income (loss) 119 (1 549)
Group’s share of total comprehensive income (loss) (673) 860
Statement of Financial Position information
Current assets 59 219 47 999
Non-current assets 253 865 253 519
Current liabilities (55 106) (51 845)
Non-current liabilities (178 441) (156 600)
Total equity 79 537 93 073
Equity excluding non-controlling interest 77 060 89 121
Group’s ownership in % 33.0 35.7
Proportion of the Group’s ownership 25 468 31 790
Goodwill related to the Group’s investment 5 537 5 066
Carrying amount of the investment 31 005 36 856
1) See note 1.2) Excluding non-controlling interest.
Other associated companies and joint venturesThe following table sets forth summarised financial information of the Group’s share of other associated companies and joint ventures.
NOK in millions 2013 2012
Net income (loss) from continuing operations 1) (485) (30)
Net income (loss) from discontinued operations 1) 47 405
Other comprehensive income (loss) 73 9
Total comprehensive income (loss) (365) 385
1) Excluding non-controlling interest.
Joint operationsThe Group is part of three joint arrangements for networks sharing in Sweden and Denmark. These joint arrangements are structured through separate vehicles. The activities are designed for the provision of output to the investors and hence these arrangements are classified as joint operations.
Joint Operation Description Ownership interest
3G Infrastructure Services AB Joint operation with the mobile operator «3» in Sweden 50%
Net4Mobility HBJoint operation established in 2009, under partnership agreement, with mobile operator Tele2 Sverige AB in Sweden 1) 50%
TT Netværket P/SJoint operation established in 2012, under partnership agreement, with mobile operator TeliaSonera Mobile Holding AB in Denmark 50%
1) Under Swedish law, all partners in a partnership are jointly and severally liable for all obligations in a partnership.

TELENOR ANNUAL REPORT 2013Notes to the Financial Statements / Telenor Group
/PAGE 60/
Trade and other receivables
NOK in millions Category 2013 2012
Trade receivables 10 967 10 122
Provision for bad debt (1 417) (1 033)
Total trade receivables LAR 1) 9 550 9 090
Other current receivables
Interest-bearing receivables 472 440
Accrued revenues 4 445 3 842
Receivables on associated companies and joint ventures 425 450
Receivables on employees 14 6
Other non-interest-bearing receivables 1 755 1 791
Provision for bad debt (20) (19)
Total other current receivables LAR 1) 7 091 6 509
Prepaid expenses
Deferred costs related to connection revenues 217 258
Prepaid leases that are amortised 141 162
Prepaid expenses 2 703 2 189
Total prepaid expenses NF 2) 3 060 2 610
Total trade and other receivables 19 701 18 209
1) LAR: Loans and receivables.2) NF: Non-financial assets and liabilities.
Specification of provision for bad debt:NOK in millions 2013 2012
Provision as of 1 January (1 052) (985)
Change during the year (110) (117)
Acquisition of subsidiaries (200) -
Currency and other effects (76) 50
Provision as of 31 December (1 437) (1 052)
Realised losses for the year (456) (317)
Recovered amounts previously provided 66 81
Specification of the age distribution of trade receivables:
Past due on the reporting date in the following periods:
NOK in millionsCarrying amount
Not past due on the reporting date
less than 30 days
between 30 and 60 days
between 61 and 90 days
between 91 and 180 days
between 181 and 365 days
more than 365 days
As of 31 December 2013
Trade receivables 10 967 6 632 1 568 394 405 359 455 1 154
Provision for bad debt (1 417) (78) (21) (41) (50) (162) (238) (827)
Total trade receivables 9 550 6 555 1 547 353 355 197 217 328
As of 31 December 2012
Trade receivables 10 122 6 184 1 777 420 204 354 370 813
Provision for bad debt (1 033) (58) (11) (32) (40) (97) (168) (627)
Total trade receivables 9 090 6 127 1 766 388 164 257 202 186
For the trade and other current receivables that are not impaired or past due there are no indicators at the date of the reporting that the debtors will not be able to meet their payment obligations.
/20/
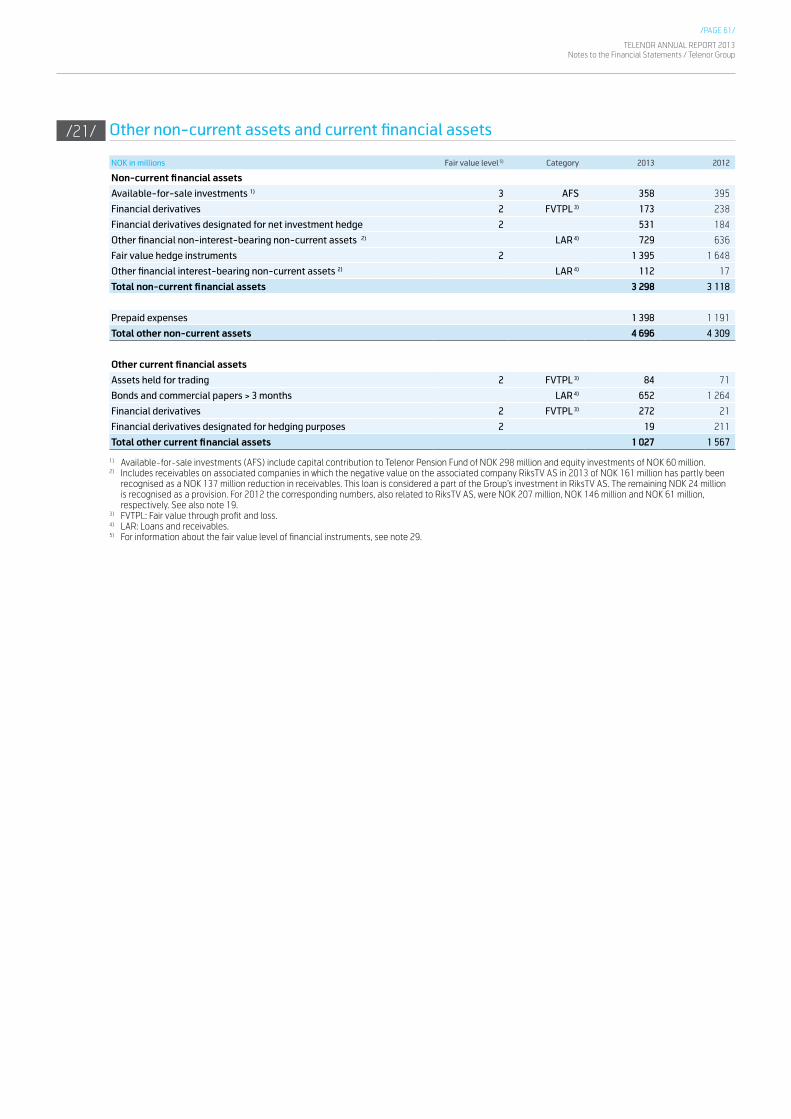
/PAGE 61/
TELENOR ANNUAL REPORT 2013Notes to the Financial Statements / Telenor Group
Other non-current assets and current financial assets
NOK in millions Fair value level 5) Category 2013 2012
Non-current financial assets
Available-for-sale investments 1) 3 AFS 358 395
Financial derivatives 2 FVTPL 3) 173 238
Financial derivatives designated for net investment hedge 2 531 184
Other financial non-interest-bearing non-current assets 2) LAR 4) 729 636
Fair value hedge instruments 2 1 395 1 648
Other financial interest-bearing non-current assets 2) LAR 4) 112 17
Total non-current financial assets 3 298 3 118
Prepaid expenses 1 398 1 191
Total other non-current assets 4 696 4 309
Other current financial assets
Assets held for trading 2 FVTPL 3) 84 71
Bonds and commercial papers > 3 months LAR 4) 652 1 264
Financial derivatives 2 FVTPL 3) 272 21
Financial derivatives designated for hedging purposes 2 19 211
Total other current financial assets 1 027 1 567
1) Available-for-sale investments (AFS) include capital contribution to Telenor Pension Fund of NOK 298 million and equity investments of NOK 60 million.2) Includes receivables on associated companies in which the negative value on the associated company RiksTV AS in 2013 of NOK 161 million has partly been
recognised as a NOK 137 million reduction in receivables. This loan is considered a part of the Group’s investment in RiksTV AS. The remaining NOK 24 million is recognised as a provision. For 2012 the corresponding numbers, also related to RiksTV AS, were NOK 207 million, NOK 146 million and NOK 61 million, respectively. See also note 19.
3) FVTPL: Fair value through profit and loss.4) LAR: Loans and receivables.5) For information about the fair value level of financial instruments, see note 29.
/21/

TELENOR ANNUAL REPORT 2013Notes to the Financial Statements / Telenor Group
/PAGE 62/
Additional cash flow information
Acquisitions and disposals of subsidiaries, associated companies and joint venturesThe table below shows the effects on the consolidated statement of financial position from acquisitions and disposals of subsidiaries, associated companies and joint ventures.
NOK in millions 2013 2012
Purchase of subsidiaries, associated companies and joint ventures
Associated companies and joint ventures 1 527 7 009
Other non-current assets 6 026 808
Current assets 1 605 79
Liabilities (2 255) (417)
Gain recognised on bargain purchase (12) -
Total consideration 6 890 7 479
Cash payments related to acquisitions (6 886) (7 581)
Cash in subsidiaries acquired 914 48
Purchases of subsidiaries, associated companies and joint ventures, net of cash acquired (5 973) (7 533)
Disposals of subsidiaries and associated companies
Associated companies 60 -
Other non-current assets 53 -
Current assets 63 1
Liabilities (92) (1)
Non-controlling interests 9 -
Gains (losses) and translation adjustments on disposals 20 -
Sales price 114 -
Proceeds received as sale consideration 119 417
Cash in subsidiaries disposed (12) (1)
Proceeds from disposal of subsidiaries and associated companies, net of cash disposed of 107 416
Acquisitions of associated companies and joint ventures in 2013 mainly relate to the acquisition of SnT Classifieds and 701 Search Pte, in cooperation with Schibsted Media Group and Singapore Press Holdings for a consideration of NOK 1.5 billion. Acquisitions of associated companies in 2012 were primarily related to the acquisition of 305 million preferred shares of VimpelCom Ltd. from Weather Investments II S.a.r.l. for a consideration of NOK 2.9 billion and 65 million common shares of VimpelCom Ltd. for a consideration of NOK 4.1 billion. Please refer to note 19 for further information. Acquisition of subsidiaries in 2013 is mainly related to acquisition of Globul for a consideration of NOK 5.1 billion. See also note 4 for further information.
Cash and cash equivalents as of 31 DecemberNOK in millions 2013 2012
Cash and cash equivalents in the Group’s cash pool systems 7 045 4 567
Cash and cash equivalents outside the Group’s cash pool systems 4 933 4 238
Total cash and cash equivalents 11 978 8 805
The Group has established cash pool systems. Under these agreements, Telenor ASA is the Group account holder and the other companies in the Group are sub-account holders or participants. The banks can offset balances in their favour against deposits, so that the net position represents the net balance between the bank and the Group account holder.
Subsidiaries in which the Group owns less than 90% of the shares are normally not participants in the Group’s cash pool systems, held by Telenor ASA. As of 31 December 2013 and 2012, the major part of the cash and cash equivalents outside the Group’s cash pool systems relates to India, DiGi, Grameenphone, dtac and Telenor Serbia.
Included in cash and cash equivalents, there are restricted bank accounts amounting to NOK 464 million as of 31 December 2013 and NOK 141 million as of 31 December 2012.
/22/

/PAGE 63/
TELENOR ANNUAL REPORT 2013Notes to the Financial Statements / Telenor Group
Dividends paid to non-controlling interests in subsidiariesDuring 2013, dividends paid to non-controlling interest in subsidiaries amounted to NOK 2.7 billion. This consists of dividends paid to non-controlling interests in DiGi by NOK 1.2 billion, dtac by NOK 0.8 billion and Grameenphone by NOK 0.7 billion.
During 2012, dividends paid to non-controlling interests in subsidiaries amounted to NOK 6.0 billion. This consists of dividends paid to non-controlling interests in dtac by NOK 3.1 billion, of which NOK 2.3 billion was declared in 2011 but paid in 2012, in DiGi by NOK 2.3 billion and Grameenphone by NOK 0.7 billion.
Significant non-cash transactionsThere were no significant non-cash transactions during 2013.
During 2012 licences were acquired with deferred payments totalling NOK 4.7 billion. The deferred payments related to the licence acquisitions in India by NOK 2.9 billion, in dtac by NOK 1.1 billion and in Gramenphone by NOK 0.6 billion.
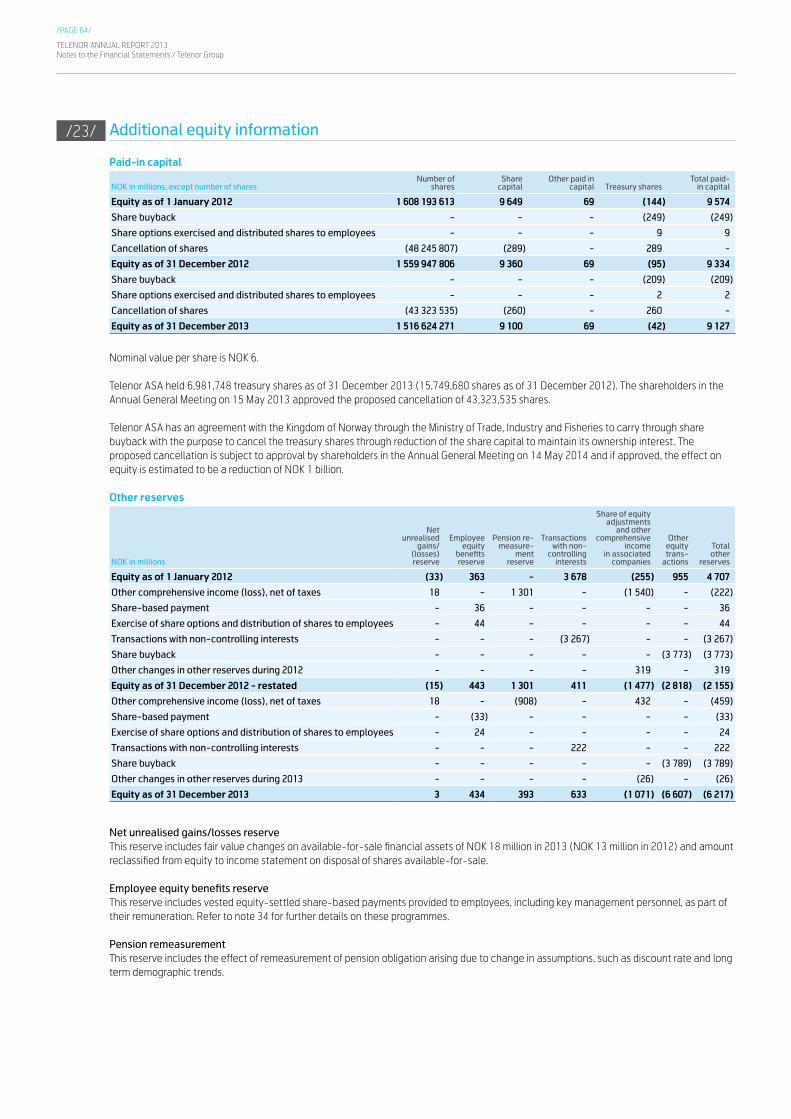
TELENOR ANNUAL REPORT 2013Notes to the Financial Statements / Telenor Group
/PAGE 64/
Additional equity information
Paid-in capital
NOK in millions, except number of sharesNumber of
sharesShare
capitalOther paid in
capital Treasury sharesTotal paid-
in capital
Equity as of 1 January 2012 1 608 193 613 9 649 69 (144) 9 574
Share buyback - - - (249) (249)
Share options exercised and distributed shares to employees - - - 9 9
Cancellation of shares (48 245 807) (289) - 289 -
Equity as of 31 December 2012 1 559 947 806 9 360 69 (95) 9 334
Share buyback - - - (209) (209)
Share options exercised and distributed shares to employees - - - 2 2
Cancellation of shares (43 323 535) (260) - 260 -
Equity as of 31 December 2013 1 516 624 271 9 100 69 (42) 9 127
Nominal value per share is NOK 6.
Telenor ASA held 6,981,748 treasury shares as of 31 December 2013 (15,749,680 shares as of 31 December 2012). The shareholders in the Annual General Meeting on 15 May 2013 approved the proposed cancellation of 43,323,535 shares.
Telenor ASA has an agreement with the Kingdom of Norway through the Ministry of Trade, Industry and Fisheries to carry through share buyback with the purpose to cancel the treasury shares through reduction of the share capital to maintain its ownership interest. The proposed cancellation is subject to approval by shareholders in the Annual General Meeting on 14 May 2014 and if approved, the effect on equity is estimated to be a reduction of NOK 1 billion.
Other reserves
NOK in millions
Net unrealised
gains/(losses) reserve
Employee equity
benefits reserve
Pension re-measure-
ment reserve
Trans actions with non-
controlling interests
Share of equityadjustments
and other comprehensive
incomein associated
companies
Other equity trans-
actions
Total other
reserves
Equity as of 1 January 2012 (33) 363 - 3 678 (255) 955 4 707
Other comprehensive income (loss), net of taxes 18 - 1 301 - (1 540) - (222)
Share-based payment - 36 - - - - 36
Exercise of share options and distribution of shares to employees - 44 - - - - 44
Transactions with non-controlling interests - - - (3 267) - - (3 267)
Share buyback - - - - - (3 773) (3 773)
Other changes in other reserves during 2012 - - - - 319 - 319
Equity as of 31 December 2012 - restated (15) 443 1 301 411 (1 477) (2 818) (2 155)
Other comprehensive income (loss), net of taxes 18 - (908) - 432 - (459)
Share-based payment - (33) - - - - (33)
Exercise of share options and distribution of shares to employees - 24 - - - - 24
Transactions with non-controlling interests - - - 222 - - 222
Share buyback - - - - - (3 789) (3 789)
Other changes in other reserves during 2013 - - - - (26) - (26)
Equity as of 31 December 2013 3 434 393 633 (1 071) (6 607) (6 217)
Net unrealised gains/losses reserveThis reserve includes fair value changes on available-for-sale financial assets of NOK 18 million in 2013 (NOK 13 million in 2012) and amount reclassified from equity to income statement on disposal of shares available-for-sale.
Employee equity benefits reserveThis reserve includes vested equity-settled share-based payments provided to employees, including key management personnel, as part of their remuneration. Refer to note 34 for further details on these programmes.
Pension remeasurementThis reserve includes the effect of remeasurement of pension obligation arising due to change in assumptions, such as discount rate and long term demographic trends.
/23/
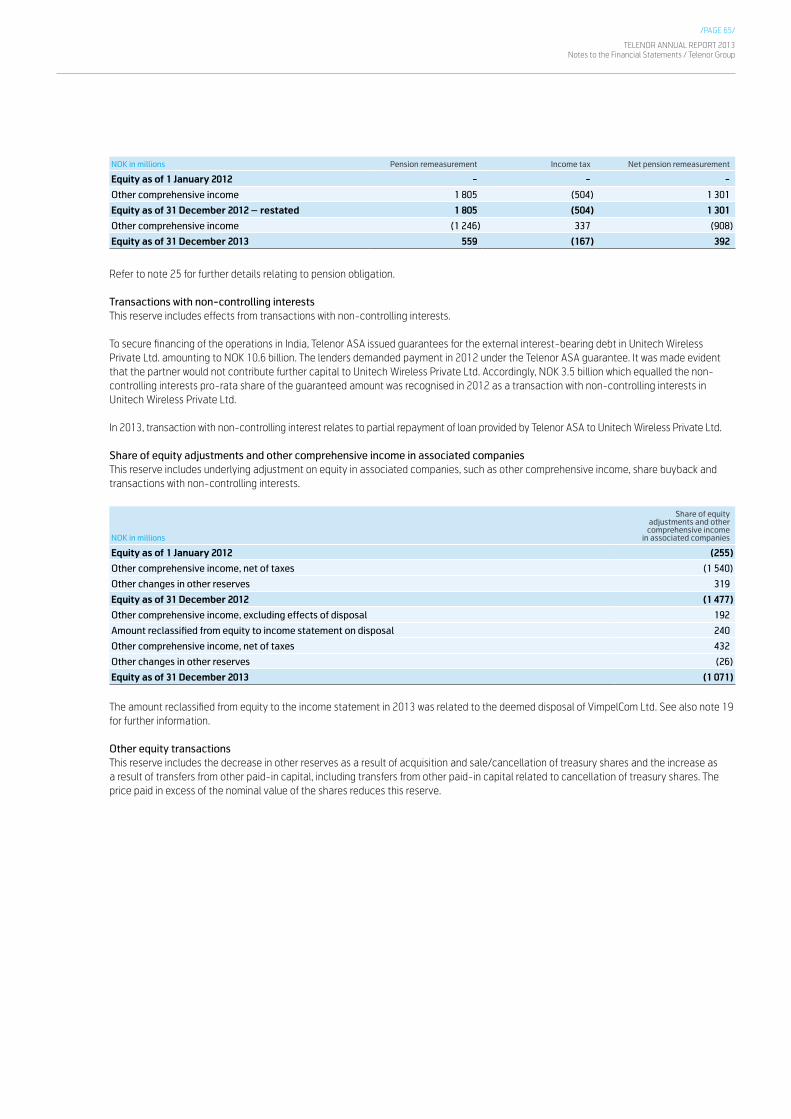
/PAGE 65/
TELENOR ANNUAL REPORT 2013Notes to the Financial Statements / Telenor Group
NOK in millions Pension remeasurement Income tax Net pension remeasurement
Equity as of 1 January 2012 - - -
Other comprehensive income 1 805 (504) 1 301
Equity as of 31 December 2012 – restated 1 805 (504) 1 301
Other comprehensive income (1 246) 337 (908)
Equity as of 31 December 2013 559 (167) 392
Refer to note 25 for further details relating to pension obligation.
Transactions with non-controlling interestsThis reserve includes effects from transactions with non-controlling interests.
To secure financing of the operations in India, Telenor ASA issued guarantees for the external interest-bearing debt in Unitech Wireless Private Ltd. amounting to NOK 10.6 billion. The lenders demanded payment in 2012 under the Telenor ASA guarantee. It was made evident that the partner would not contribute further capital to Unitech Wireless Private Ltd. Accordingly, NOK 3.5 billion which equalled the non-controlling interests pro-rata share of the guaranteed amount was recognised in 2012 as a transaction with non-controlling interests in Unitech Wireless Private Ltd.
In 2013, transaction with non-controlling interest relates to partial repayment of loan provided by Telenor ASA to Unitech Wireless Private Ltd.
Share of equity adjustments and other comprehensive income in associated companiesThis reserve includes underlying adjustment on equity in associated companies, such as other comprehensive income, share buyback and transactions with non-controlling interests.
NOK in millions
Share of equityadjustments and other
comprehensive incomein associated companies
Equity as of 1 January 2012 (255)
Other comprehensive income, net of taxes (1 540)
Other changes in other reserves 319
Equity as of 31 December 2012 (1 477)
Other comprehensive income, excluding effects of disposal 192
Amount reclassified from equity to income statement on disposal 240
Other comprehensive income, net of taxes 432
Other changes in other reserves (26)
Equity as of 31 December 2013 (1 071)
The amount reclassified from equity to the income statement in 2013 was related to the deemed disposal of VimpelCom Ltd. See also note 19 for further information.
Other equity transactionsThis reserve includes the decrease in other reserves as a result of acquisition and sale/cancellation of treasury shares and the increase as a result of transfers from other paid-in capital, including transfers from other paid-in capital related to cancellation of treasury shares. The price paid in excess of the nominal value of the shares reduces this reserve.

TELENOR ANNUAL REPORT 2013Notes to the Financial Statements / Telenor Group
/PAGE 66/
Cumulative translation differences
NOK in millionsForeign currency
translation
Netinvestment
hedge Taxes
NetTranslationdifferences
Equity as of 1 January 2012 (6 964) 1 650 (970) (6 284)
Changes during 2012, excluding effects of disposal (4 584) 1 335 (259) (3 509)
Amount reclassified from equity to income statement on disposal 14 - - 14
Net changes during 2012 (4 570) 1 335 (259) (3 495)
Equity as of 31 December 2012 - restated (11 534) 2 985 (1 229) (9 779)
Changes during 2013, excluding effects of disposal 7 496 (4 030) 1 255 4 722
Amount reclassified from equity to income statement on disposal 55 (7) - 48
Net changes during 2013 7 552 (4 037) 1 255 4 770
Equity as of 31 December 2013 (3 983) (1 052) 26 (5 009)
The amount reclassified from equity to income statement in 2013 was related to the deemed disposal of VimpelCom Ltd.
In 2013, the translation difference on net investment in foreign operations was affected by depreciation of the Norwegian Krone against almost all the functional currencies of the Group’s investments. The appreciation of the US Dollar by 9%, the Swedish Krone by 11% and the Danish Krone by 14% had the most significant impact.
In 2012, the translation difference on net investment in foreign operations was mainly affected by appreciation of the Norwegian krone against the functional currencies of the Group`s major investments. The depreciation of the US Dollar by 7%, the Serbian Dinar by 10%, the Indian Rupee by 10% and the Danish Krone by 6% had the most significant impact.
Dividends paid and proposed
2013 2012
Dividends
Dividend per share in NOK – paid 6.00 5.00
Dividend per share in NOK - proposed by the Board of Directors 7.00 6.00
Total dividends of NOK 9.2 billion were paid in 2013, while NOK 7.9 billion were paid in 2012.
In respect of 2013, the Board of Directors propose a dividend of NOK 7.00 per share. This dividend is subject to approval by shareholders in the Annual General Meeting on 14 May 2014 and has not been included as a liability in the financial statements of 2013. The proposed dividend, if approved, will be paid out to all shareholders registered on the Norwegian Central Securities Depository (VPS) on 19 May 2014. The total estimated dividend to be paid is NOK 10.6 billion.
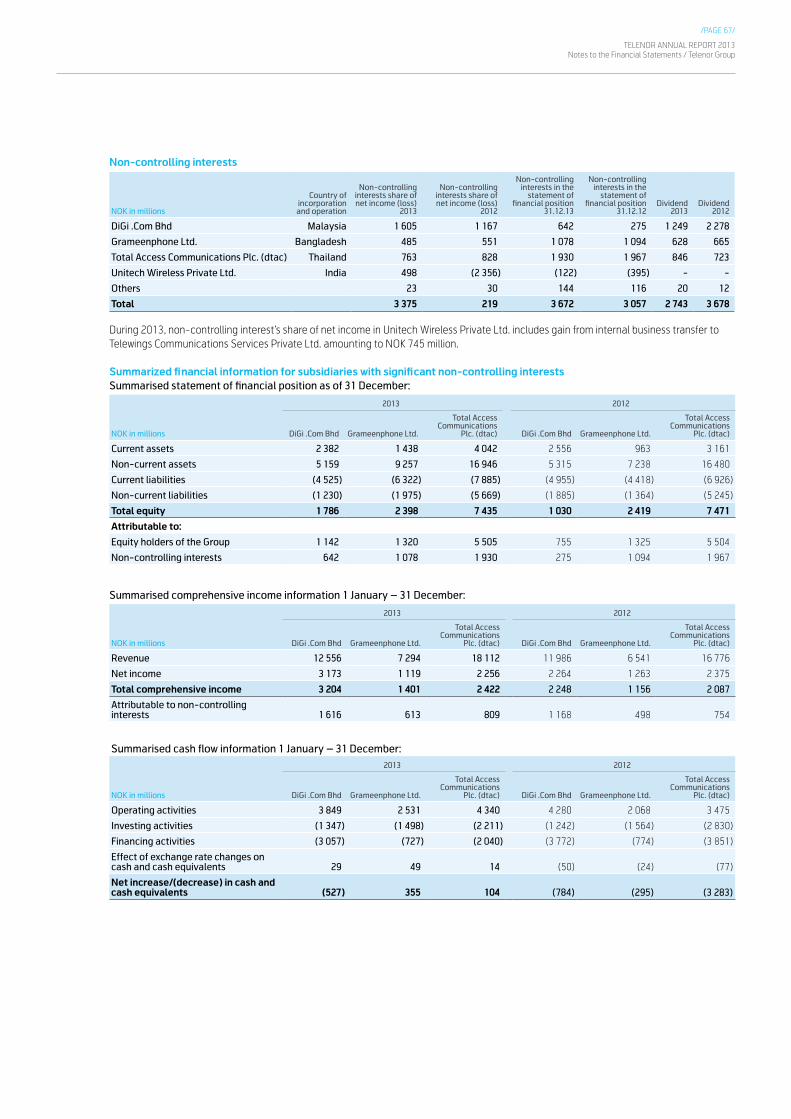
/PAGE 67/
TELENOR ANNUAL REPORT 2013Notes to the Financial Statements / Telenor Group
Non-controlling interests
NOK in millions
Country of incorporation and operation
Non-controlling interests share of net income (loss)
2013
Non-controlling interests share of net income (loss)
2012
Non-controlling interests in the
statement of financial position
31.12.13
Non-controlling interests in the
statement of financial position
31.12.12Dividend
2013Dividend
2012
DiGi .Com Bhd Malaysia 1 605 1 167 642 275 1 249 2 278
Grameenphone Ltd. Bangladesh 485 551 1 078 1 094 628 665
Total Access Communications Plc. (dtac) Thailand 763 828 1 930 1 967 846 723
Unitech Wireless Private Ltd. India 498 (2 356) (122) (395) - -
Others 23 30 144 116 20 12
Total 3 375 219 3 672 3 057 2 743 3 678
During 2013, non-controlling interest’s share of net income in Unitech Wireless Private Ltd. includes gain from internal business transfer to Telewings Communications Services Private Ltd. amounting to NOK 745 million.
Summarized financial information for subsidiaries with significant non-controlling interestsSummarised statement of financial position as of 31 December:
2013 2012
NOK in millions DiGi .Com Bhd Grameenphone Ltd.
Total Access Communications
Plc. (dtac) DiGi .Com Bhd Grameenphone Ltd.
Total Access Communications
Plc. (dtac)
Current assets 2 382 1 438 4 042 2 556 963 3 161
Non-current assets 5 159 9 257 16 946 5 315 7 238 16 480
Current liabilities (4 525) (6 322) (7 885) (4 955) (4 418) (6 926)
Non-current liabilities (1 230) (1 975) (5 669) (1 885) (1 364) (5 245)
Total equity 1 786 2 398 7 435 1 030 2 419 7 471
Attributable to:
Equity holders of the Group 1 142 1 320 5 505 755 1 325 5 504
Non-controlling interests 642 1 078 1 930 275 1 094 1 967
Summarised comprehensive income information 1 January – 31 December:
2013 2012
NOK in millions DiGi .Com Bhd Grameenphone Ltd.
Total Access Communications
Plc. (dtac) DiGi .Com Bhd Grameenphone Ltd.
Total Access Communications
Plc. (dtac)
Revenue 12 556 7 294 18 112 11 986 6 541 16 776
Net income 3 173 1 119 2 256 2 264 1 263 2 375
Total comprehensive income 3 204 1 401 2 422 2 248 1 156 2 087
Attributable to non-controlling interests 1 616 613 809 1 168 498 754
Summarised cash flow information 1 January – 31 December:2013 2012
NOK in millions DiGi .Com Bhd Grameenphone Ltd.
Total Access Communications
Plc. (dtac) DiGi .Com Bhd Grameenphone Ltd.
Total Access Communications
Plc. (dtac)
Operating activities 3 849 2 531 4 340 4 280 2 068 3 475
Investing activities (1 347) (1 498) (2 211) (1 242) (1 564) (2 830)
Financing activities (3 057) (727) (2 040) (3 772) (774) (3 851)
Effect of exchange rate changes on cash and cash equivalents 29 49 14 (50) (24) (77)
Net increase/(decrease) in cash and cash equivalents (527) 355 104 (784) (295) (3 283)
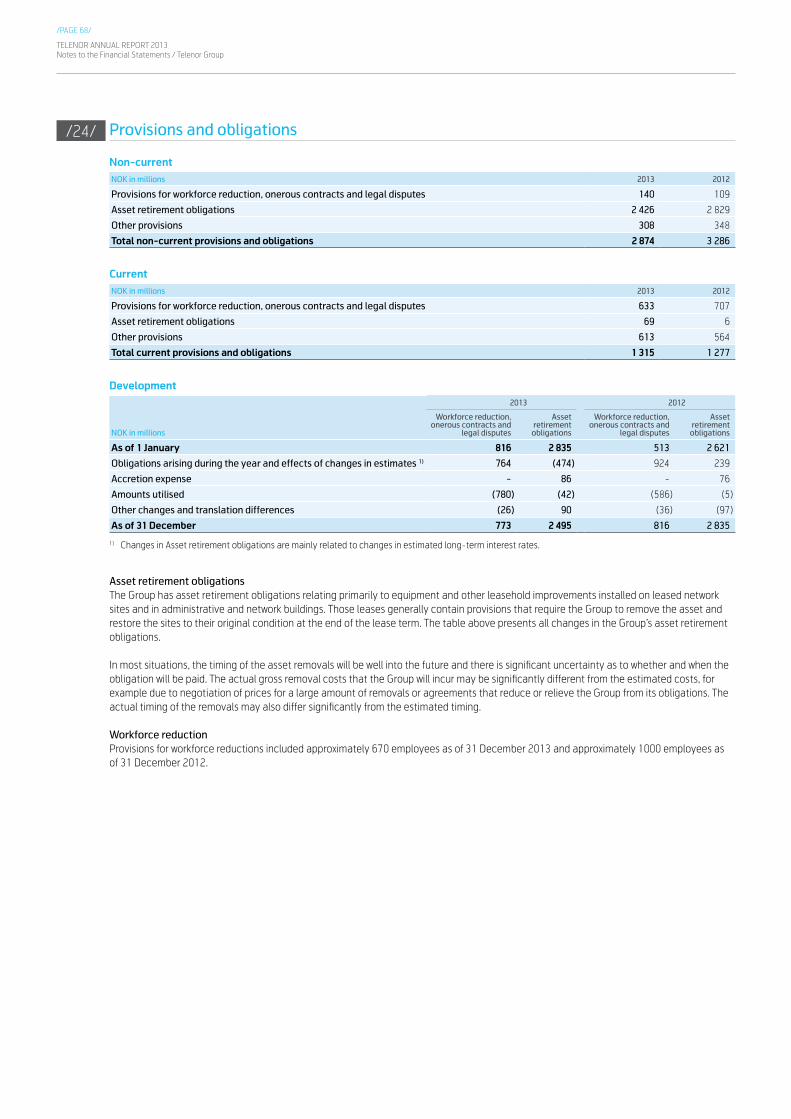
TELENOR ANNUAL REPORT 2013Notes to the Financial Statements / Telenor Group
/PAGE 68/
Provisions and obligations
Non-currentNOK in millions 2013 2012
Provisions for workforce reduction, onerous contracts and legal disputes 140 109
Asset retirement obligations 2 426 2 829
Other provisions 308 348
Total non-current provisions and obligations 2 874 3 286
CurrentNOK in millions 2013 2012
Provisions for workforce reduction, onerous contracts and legal disputes 633 707
Asset retirement obligations 69 6
Other provisions 613 564
Total current provisions and obligations 1 315 1 277
Development
NOK in millions
2013 2012
Workforce reduction, onerous contracts and
legal disputes
Asset retirement
obligations
Workforce reduction, onerous contracts and
legal disputes
Asset retirement
obligations
As of 1 January 816 2 835 513 2 621
Obligations arising during the year and effects of changes in estimates 1) 764 (474) 924 239
Accretion expense - 86 - 76
Amounts utilised (780) (42) (586) (5)
Other changes and translation differences (26) 90 (36) (97)
As of 31 December 773 2 495 816 2 835
1) Changes in Asset retirement obligations are mainly related to changes in estimated long-term interest rates.
Asset retirement obligationsThe Group has asset retirement obligations relating primarily to equipment and other leasehold improvements installed on leased network sites and in administrative and network buildings. Those leases generally contain provisions that require the Group to remove the asset and restore the sites to their original condition at the end of the lease term. The table above presents all changes in the Group’s asset retirement obligations.
In most situations, the timing of the asset removals will be well into the future and there is significant uncertainty as to whether and when the obligation will be paid. The actual gross removal costs that the Group will incur may be significantly different from the estimated costs, for example due to negotiation of prices for a large amount of removals or agreements that reduce or relieve the Group from its obligations. The actual timing of the removals may also differ significantly from the estimated timing.
Workforce reductionProvisions for workforce reductions included approximately 670 employees as of 31 December 2013 and approximately 1000 employees as of 31 December 2012.
/24/
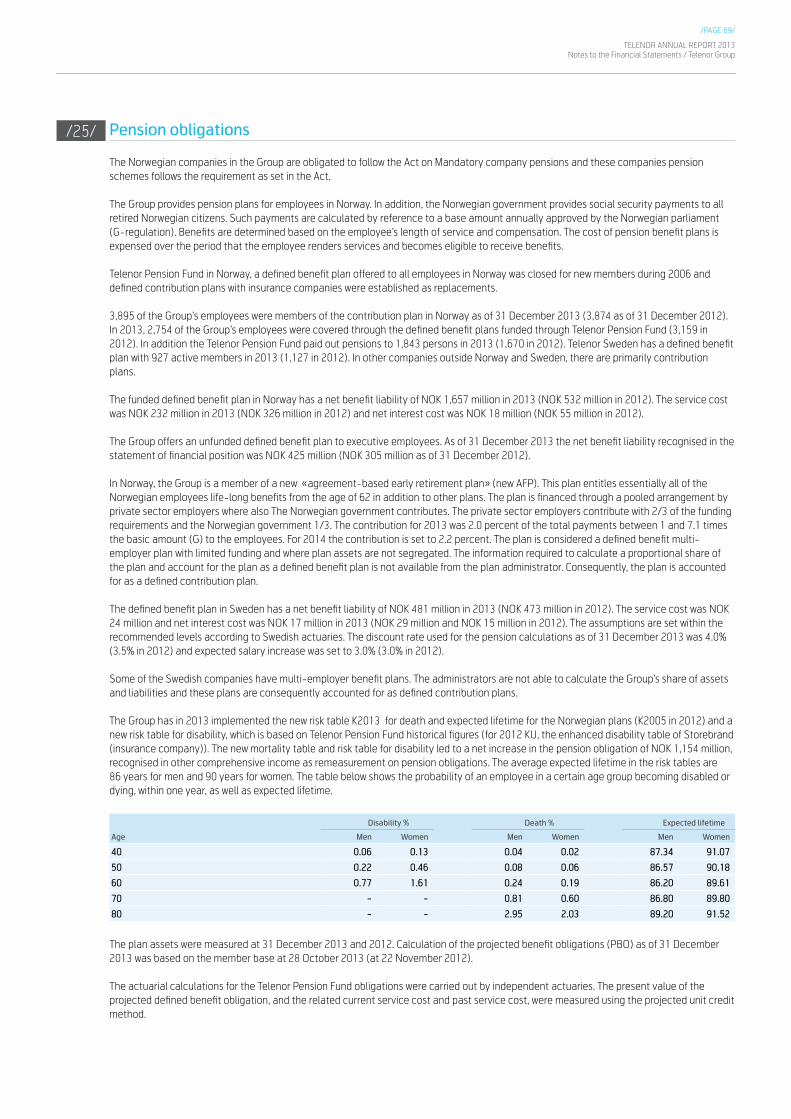
/PAGE 69/
TELENOR ANNUAL REPORT 2013Notes to the Financial Statements / Telenor Group
Pension obligations
The Norwegian companies in the Group are obligated to follow the Act on Mandatory company pensions and these companies pension schemes follows the requirement as set in the Act.
The Group provides pension plans for employees in Norway. In addition, the Norwegian government provides social security payments to all retired Norwegian citizens. Such payments are calculated by reference to a base amount annually approved by the Norwegian parliament (G-regulation). Benefits are determined based on the employee’s length of service and compensation. The cost of pension benefit plans is expensed over the period that the employee renders services and becomes eligible to receive benefits.
Telenor Pension Fund in Norway, a defined benefit plan offered to all employees in Norway was closed for new members during 2006 and defined contribution plans with insurance companies were established as replacements.
3,895 of the Group’s employees were members of the contribution plan in Norway as of 31 December 2013 (3,874 as of 31 December 2012). In 2013, 2,754 of the Group’s employees were covered through the defined benefit plans funded through Telenor Pension Fund (3,159 in 2012). In addition the Telenor Pension Fund paid out pensions to 1,843 persons in 2013 (1,670 in 2012). Telenor Sweden has a defined benefit plan with 927 active members in 2013 (1,127 in 2012). In other companies outside Norway and Sweden, there are primarily contribution plans.
The funded defined benefit plan in Norway has a net benefit liability of NOK 1,657 million in 2013 (NOK 532 million in 2012). The service cost was NOK 232 million in 2013 (NOK 326 million in 2012) and net interest cost was NOK 18 million (NOK 55 million in 2012).
The Group offers an unfunded defined benefit plan to executive employees. As of 31 December 2013 the net benefit liability recognised in the statement of financial position was NOK 425 million (NOK 305 million as of 31 December 2012).
In Norway, the Group is a member of a new «agreement-based early retirement plan» (new AFP). This plan entitles essentially all of the Norwegian employees life-long benefits from the age of 62 in addition to other plans. The plan is financed through a pooled arrangement by private sector employers where also The Norwegian government contributes. The private sector employers contribute with 2/3 of the funding requirements and the Norwegian government 1/3. The contribution for 2013 was 2.0 percent of the total payments between 1 and 7.1 times the basic amount (G) to the employees. For 2014 the contribution is set to 2.2 percent. The plan is considered a defined benefit multi-employer plan with limited funding and where plan assets are not segregated. The information required to calculate a proportional share of the plan and account for the plan as a defined benefit plan is not available from the plan administrator. Consequently, the plan is accounted for as a defined contribution plan.
The defined benefit plan in Sweden has a net benefit liability of NOK 481 million in 2013 (NOK 473 million in 2012). The service cost was NOK 24 million and net interest cost was NOK 17 million in 2013 (NOK 29 million and NOK 15 million in 2012). The assumptions are set within the recommended levels according to Swedish actuaries. The discount rate used for the pension calculations as of 31 December 2013 was 4.0% (3.5% in 2012) and expected salary increase was set to 3.0% (3.0% in 2012).
Some of the Swedish companies have multi-employer benefit plans. The administrators are not able to calculate the Group’s share of assets and liabilities and these plans are consequently accounted for as defined contribution plans.
The Group has in 2013 implemented the new risk table K2013 for death and expected lifetime for the Norwegian plans (K2005 in 2012) and a new risk table for disability, which is based on Telenor Pension Fund historical figures (for 2012 KU, the enhanced disability table of Storebrand (insurance company)). The new mortality table and risk table for disability led to a net increase in the pension obligation of NOK 1,154 million, recognised in other comprehensive income as remeasurement on pension obligations. The average expected lifetime in the risk tables are 86 years for men and 90 years for women. The table below shows the probability of an employee in a certain age group becoming disabled or dying, within one year, as well as expected lifetime.
Disability % Death % Expected lifetime
Age Men Women Men Women Men Women
40 0.06 0.13 0.04 0.02 87.34 91.07
50 0.22 0.46 0.08 0.06 86.57 90.18
60 0.77 1.61 0.24 0.19 86.20 89.61
70 - - 0.81 0.60 86.80 89.80
80 - - 2.95 2.03 89.20 91.52
The plan assets were measured at 31 December 2013 and 2012. Calculation of the projected benefit obligations (PBO) as of 31 December 2013 was based on the member base at 28 October 2013 (at 22 November 2012).
The actuarial calculations for the Telenor Pension Fund obligations were carried out by independent actuaries. The present value of the projected defined benefit obligation, and the related current service cost and past service cost, were measured using the projected unit credit method.
/25/
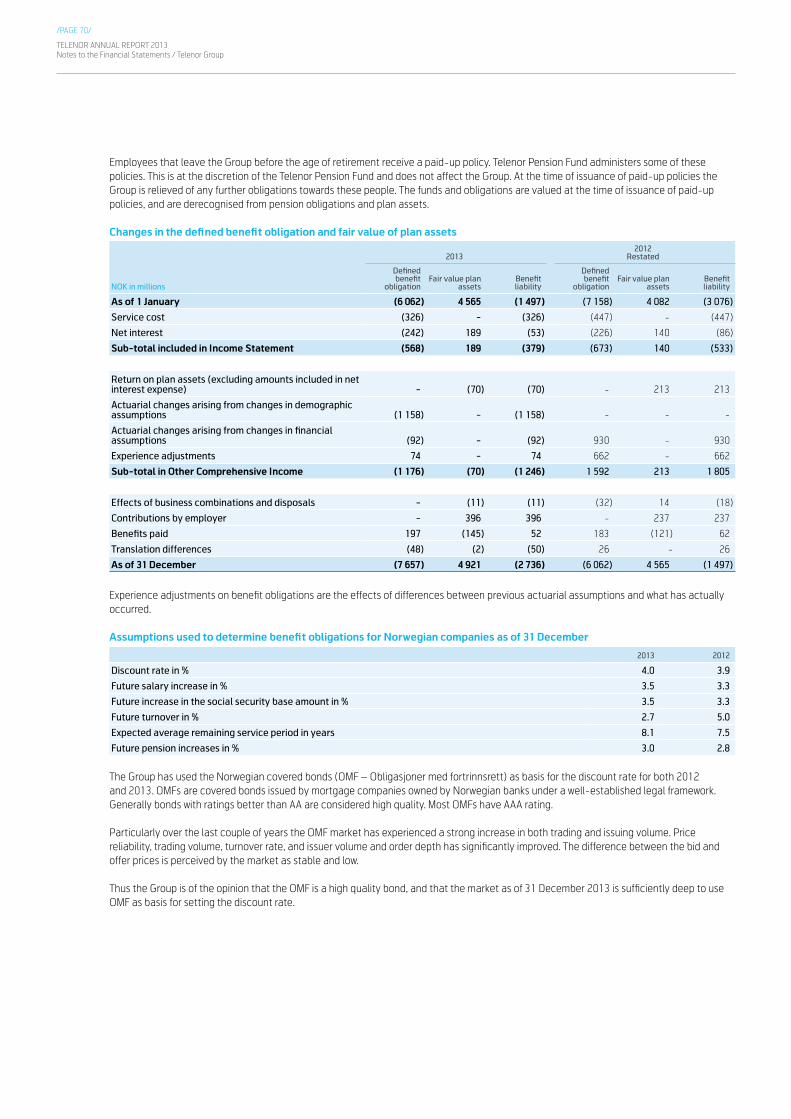
TELENOR ANNUAL REPORT 2013Notes to the Financial Statements / Telenor Group
/PAGE 70/
Employees that leave the Group before the age of retirement receive a paid-up policy. Telenor Pension Fund administers some of these policies. This is at the discretion of the Telenor Pension Fund and does not affect the Group. At the time of issuance of paid-up policies the Group is relieved of any further obligations towards these people. The funds and obligations are valued at the time of issuance of paid-up policies, and are derecognised from pension obligations and plan assets.
Changes in the defined benefit obligation and fair value of plan assets
20132012
Restated
NOK in millions
Defined benefit
obligationFair value plan
assetsBenefit liability
Defined benefit
obligationFair value plan
assetsBenefit liability
As of 1 January (6 062) 4 565 (1 497) (7 158) 4 082 (3 076)
Service cost (326) - (326) (447) - (447)
Net interest (242) 189 (53) (226) 140 (86)
Sub-total included in Income Statement (568) 189 (379) (673) 140 (533)
Return on plan assets (excluding amounts included in net interest expense) - (70) (70) - 213 213
Actuarial changes arising from changes in demographic assumptions (1 158) - (1 158) - - -
Actuarial changes arising from changes in financial assumptions (92) - (92) 930 - 930
Experience adjustments 74 - 74 662 - 662
Sub-total in Other Comprehensive Income (1 176) (70) (1 246) 1 592 213 1 805
Effects of business combinations and disposals - (11) (11) (32) 14 (18)
Contributions by employer - 396 396 - 237 237
Benefits paid 197 (145) 52 183 (121) 62
Translation differences (48) (2) (50) 26 - 26
As of 31 December (7 657) 4 921 (2 736) (6 062) 4 565 (1 497)
Experience adjustments on benefit obligations are the effects of differences between previous actuarial assumptions and what has actually occurred.
Assumptions used to determine benefit obligations for Norwegian companies as of 31 December
2013 2012
Discount rate in % 4.0 3.9
Future salary increase in % 3.5 3.3
Future increase in the social security base amount in % 3.5 3.3
Future turnover in % 2.7 5.0
Expected average remaining service period in years 8.1 7.5
Future pension increases in % 3.0 2.8
The Group has used the Norwegian covered bonds (OMF – Obligasjoner med fortrinnsrett) as basis for the discount rate for both 2012 and 2013. OMFs are covered bonds issued by mortgage companies owned by Norwegian banks under a well-established legal framework. Generally bonds with ratings better than AA are considered high quality. Most OMFs have AAA rating.
Particularly over the last couple of years the OMF market has experienced a strong increase in both trading and issuing volume. Price reliability, trading volume, turnover rate, and issuer volume and order depth has significantly improved. The difference between the bid and offer prices is perceived by the market as stable and low.
Thus the Group is of the opinion that the OMF is a high quality bond, and that the market as of 31 December 2013 is sufficiently deep to use OMF as basis for setting the discount rate.

/PAGE 71/
TELENOR ANNUAL REPORT 2013Notes to the Financial Statements / Telenor Group
Components of net periodic benefit cost
NOK in millions 20132012
Restated
Service cost (326) (447)
Net interest cost (53) (86)
Net periodic benefit costs (379) (533)
Contribution plan costs (427) (411)
Total pension costs charged to the income statement for the year (806) (944)
Where of reported as other expense (note 10) (3) (16)
Where of reported as pension cost (note 8) (750) (843)
Where of reported as net interest cost (note 12) (53) (86)
The table below shows an estimate of the potential effects of changes in the key assumptions for the defined benefit plans in Norway. The following estimates are based on facts and circumstances as of 31 December 2013. Actual results may deviate materially from these estimates.
NOK in millions Discount rateFuture salary
IncreaseSocial securitybase amount
Annualadjustmentsto pensions Turnover
Change in % is percentage points -1% +1% -1% +1% -1% +1% -1% +1% -4% +4%
Changes in:
Benefit obligations 1 308 (1 015) (603) 636 174 (230) (707) 849 156 (155)
Telenor Pension Fund’s weighted average asset allocations as of 31 December, by asset category were as follows:
Asset categories
2013 2012
Bonds % 61 62
Equity securities % 31 27
Real-estates % 8 9
Other % - 2
Total 100 100
The bond investments are in securities issued by the Norwegian government, Norwegian municipals, financial institutions and corporations. Bonds held in foreign currencies are to a large extent currency hedged. Equity investments are both in Norwegian and foreign securities. Currency hedging for foreign equity securities is evaluated per investment.
The Telenor Pension Fund owns real-estates previously held by the Group. The values of these were set based on evaluations made by an independent Project and Construction Management Company. Approximately 40% of the buildings measured in market value are used by the Group through internal rental contracts.
The Group expects to contribute approximately NOK 398 million to the Telenor Pension Fund in 2014.
The following payments are expected benefits payment from the Norwegian defined benefit plan in future years:
NOK in millions 2013
Within the next 12 months (next annual reporting period) 119
Between 2 and 5 years 548
Next 5 years 899
Total expected payments next 10 years 1 566
The average duration of the Norwegian defined benefit plan obligation at the end of the reporting period is 16.2 years.
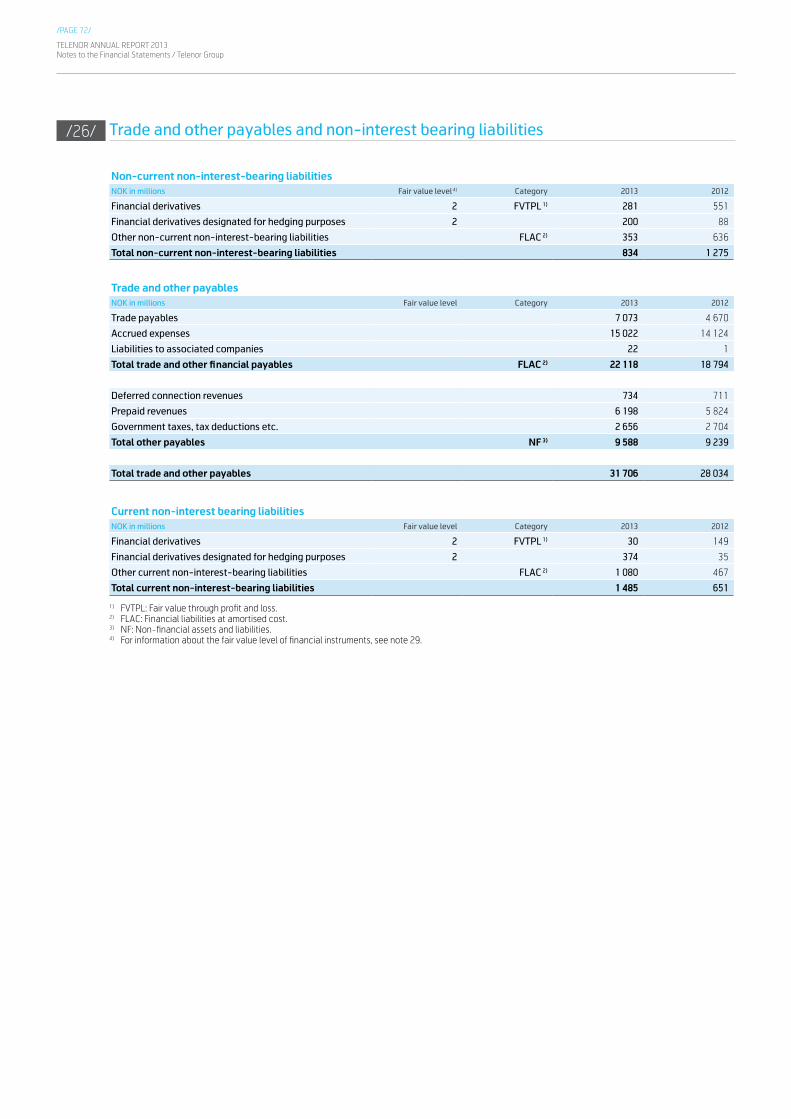
TELENOR ANNUAL REPORT 2013Notes to the Financial Statements / Telenor Group
/PAGE 72/
Trade and other payables and non-interest bearing liabilities
Non-current non-interest-bearing liabilitiesNOK in millions Fair value level 4) Category 2013 2012
Financial derivatives 2 FVTPL 1) 281 551
Financial derivatives designated for hedging purposes 2 200 88
Other non-current non-interest-bearing liabilities FLAC 2) 353 636
Total non-current non-interest-bearing liabilities 834 1 275
Trade and other payablesNOK in millions Fair value level Category 2013 2012
Trade payables 7 073 4 670
Accrued expenses 15 022 14 124
Liabilities to associated companies 22 1
Total trade and other financial payables FLAC 2) 22 118 18 794
Deferred connection revenues 734 711
Prepaid revenues 6 198 5 824
Government taxes, tax deductions etc. 2 656 2 704
Total other payables NF 3) 9 588 9 239
Total trade and other payables 31 706 28 034
Current non-interest bearing liabilitiesNOK in millions Fair value level Category 2013 2012
Financial derivatives 2 FVTPL 1) 30 149
Financial derivatives designated for hedging purposes 2 374 35
Other current non-interest-bearing liabilities FLAC 2) 1 080 467
Total current non-interest-bearing liabilities 1 485 651
1) FVTPL: Fair value through profit and loss.2) FLAC: Financial liabilities at amortised cost.3) NF: Non-financial assets and liabilities.4) For information about the fair value level of financial instruments, see note 29.
/26/
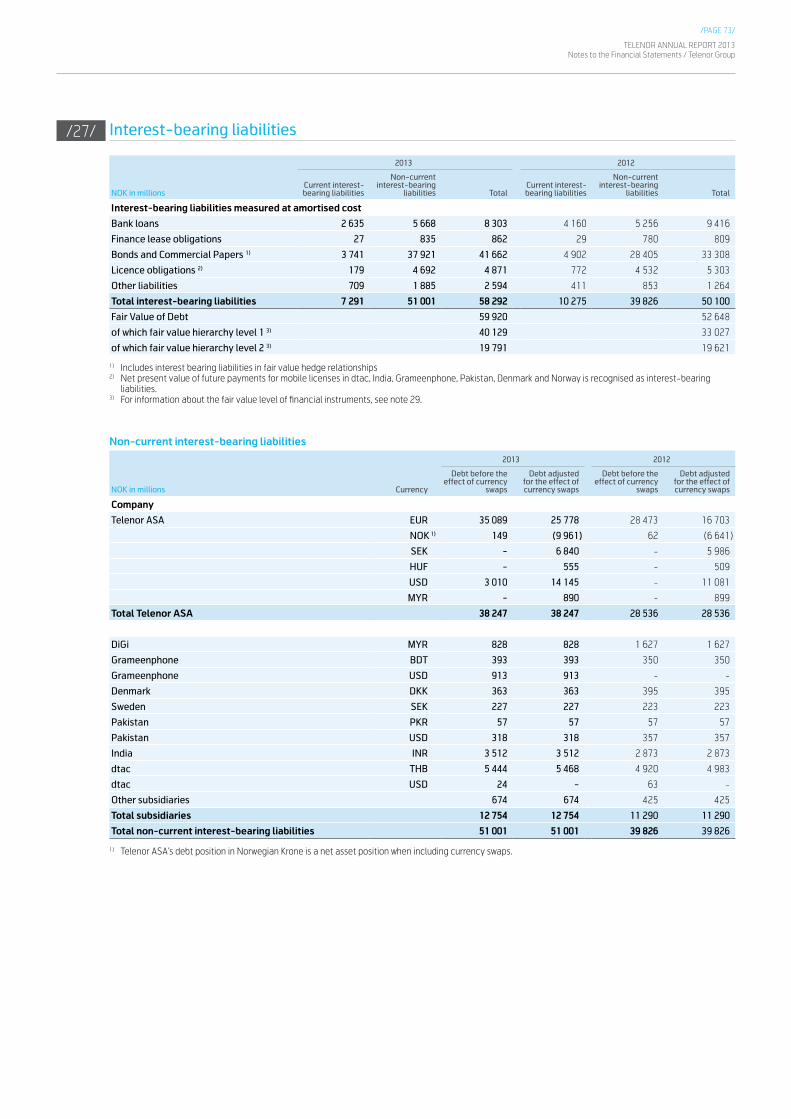
/PAGE 73/
TELENOR ANNUAL REPORT 2013Notes to the Financial Statements / Telenor Group
Interest-bearing liabilities
2013 2012
NOK in millionsCurrent interest-bearing liabilities
Non-current interest-bearing
liabilities TotalCurrent interest-bearing liabilities
Non-current interest-bearing
liabilities Total
Interest-bearing liabilities measured at amortised cost
Bank loans 2 635 5 668 8 303 4 160 5 256 9 416
Finance lease obligations 27 835 862 29 780 809
Bonds and Commercial Papers 1) 3 741 37 921 41 662 4 902 28 405 33 308
Licence obligations 2) 179 4 692 4 871 772 4 532 5 303
Other liabilities 709 1 885 2 594 411 853 1 264
Total interest-bearing liabilities 7 291 51 001 58 292 10 275 39 826 50 100
Fair Value of Debt 59 920 52 648
of which fair value hierarchy level 1 3) 40 129 33 027
of which fair value hierarchy level 2 3) 19 791 19 621
1) Includes interest bearing liabilities in fair value hedge relationships2) Net present value of future payments for mobile licenses in dtac, India, Grameenphone, Pakistan, Denmark and Norway is recognised as interest-bearing
liabilities. 3) For information about the fair value level of financial instruments, see note 29.
Non-current interest-bearing liabilities
2013 2012
NOK in millions Currency
Debt before the effect of currency
swaps
Debt adjusted for the effect of currency swaps
Debt before the effect of currency
swaps
Debt adjusted for the effect of currency swaps
Company
Telenor ASA EUR 35 089 25 778 28 473 16 703
NOK 1) 149 (9 961) 62 (6 641)
SEK - 6 840 - 5 986
HUF - 555 - 509
USD 3 010 14 145 - 11 081
MYR - 890 - 899
Total Telenor ASA 38 247 38 247 28 536 28 536
DiGi MYR 828 828 1 627 1 627
Grameenphone BDT 393 393 350 350
Grameenphone USD 913 913 - -
Denmark DKK 363 363 395 395
Sweden SEK 227 227 223 223
Pakistan PKR 57 57 57 57
Pakistan USD 318 318 357 357
India INR 3 512 3 512 2 873 2 873
dtac THB 5 444 5 468 4 920 4 983
dtac USD 24 - 63 -
Other subsidiaries 674 674 425 425
Total subsidiaries 12 754 12 754 11 290 11 290
Total non-current interest-bearing liabilities 51 001 51 001 39 826 39 826
1) Telenor ASA’s debt position in Norwegian Krone is a net asset position when including currency swaps.
/27/
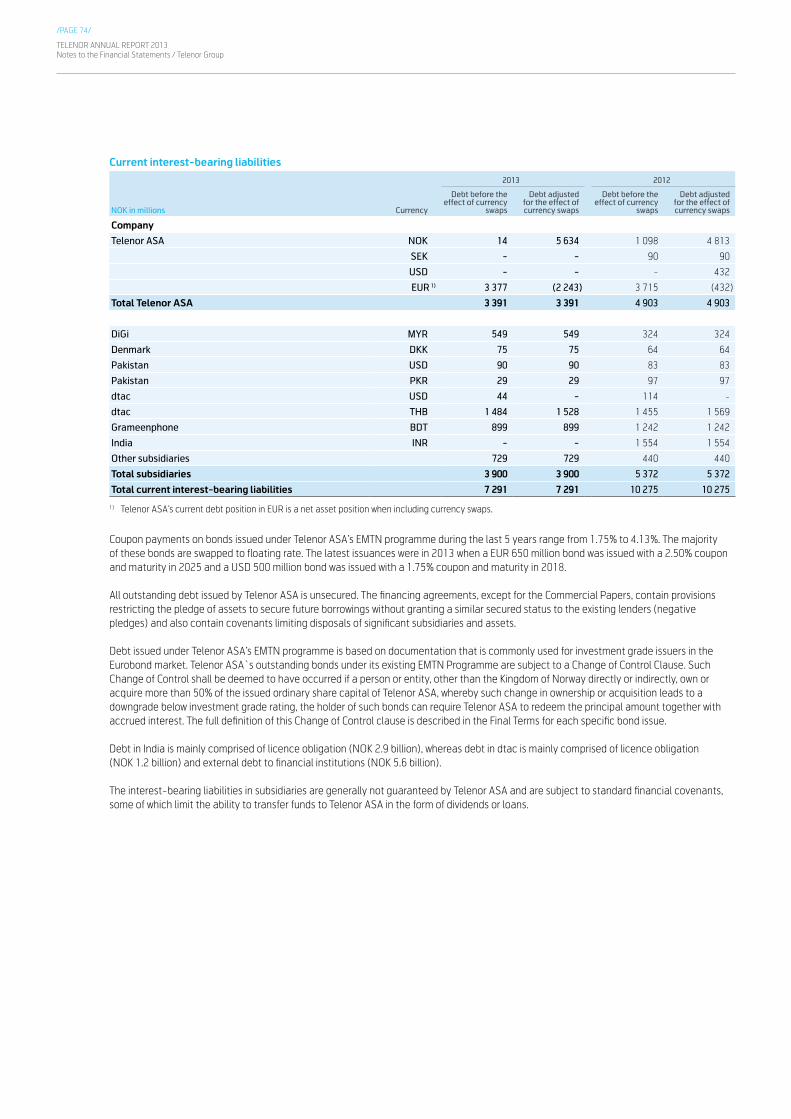
TELENOR ANNUAL REPORT 2013Notes to the Financial Statements / Telenor Group
/PAGE 74/
Current interest-bearing liabilities
2013 2012
NOK in millions Currency
Debt before the effect of currency
swaps
Debt adjusted for the effect of currency swaps
Debt before the effect of currency
swaps
Debt adjusted for the effect of currency swaps
Company
Telenor ASA NOK 14 5 634 1 098 4 813
SEK - - 90 90
USD - - - 432
EUR 1) 3 377 (2 243) 3 715 (432)
Total Telenor ASA 3 391 3 391 4 903 4 903
DiGi MYR 549 549 324 324
Denmark DKK 75 75 64 64
Pakistan USD 90 90 83 83
Pakistan PKR 29 29 97 97
dtac USD 44 - 114 -
dtac THB 1 484 1 528 1 455 1 569
Grameenphone BDT 899 899 1 242 1 242
India INR - - 1 554 1 554
Other subsidiaries 729 729 440 440
Total subsidiaries 3 900 3 900 5 372 5 372
Total current interest-bearing liabilities 7 291 7 291 10 275 10 275
1) Telenor ASA’s current debt position in EUR is a net asset position when including currency swaps.
Coupon payments on bonds issued under Telenor ASA’s EMTN programme during the last 5 years range from 1.75% to 4.13%. The majority of these bonds are swapped to floating rate. The latest issuances were in 2013 when a EUR 650 million bond was issued with a 2.50% coupon and maturity in 2025 and a USD 500 million bond was issued with a 1.75% coupon and maturity in 2018.
All outstanding debt issued by Telenor ASA is unsecured. The financing agreements, except for the Commercial Papers, contain provisions restricting the pledge of assets to secure future borrowings without granting a similar secured status to the existing lenders (negative pledges) and also contain covenants limiting disposals of significant subsidiaries and assets.
Debt issued under Telenor ASA’s EMTN programme is based on documentation that is commonly used for investment grade issuers in the Eurobond market. Telenor ASA`s outstanding bonds under its existing EMTN Programme are subject to a Change of Control Clause. Such Change of Control shall be deemed to have occurred if a person or entity, other than the Kingdom of Norway directly or indirectly, own or acquire more than 50% of the issued ordinary share capital of Telenor ASA, whereby such change in ownership or acquisition leads to a downgrade below investment grade rating, the holder of such bonds can require Telenor ASA to redeem the principal amount together with accrued interest. The full definition of this Change of Control clause is described in the Final Terms for each specific bond issue.
Debt in India is mainly comprised of licence obligation (NOK 2.9 billion), whereas debt in dtac is mainly comprised of licence obligation (NOK 1.2 billion) and external debt to financial institutions (NOK 5.6 billion).
The interest-bearing liabilities in subsidiaries are generally not guaranteed by Telenor ASA and are subject to standard financial covenants, some of which limit the ability to transfer funds to Telenor ASA in the form of dividends or loans.

/PAGE 75/
TELENOR ANNUAL REPORT 2013Notes to the Financial Statements / Telenor Group
Managing capital and financial risk management
Telenor Group’s capital allocation priorities are:1. Maintain a strong financial position2. Offer an attractive shareholder remuneration3. Disciplined and selective approach in terms of mergers and acquisitions (M&A)
The main priority of maintaining a strong financial position is targeted by keeping reported net debt/EBITDA below 2.0 in order to ensure access to funding. As of 31 December 2013, the reported net debt/EBITDA ratio was 1.12 (1.03 as of 31 December 2012) and Telenor ASA’s long term credit rating was «A3/stable outlook» by Moody’s Investors Service and «A-/positive outlook» by Standard & Poor’s (S&P). The ratings were unchanged throughout the year, however, S&P changed its outlook from «stable» to «positive» in October 2013.
The Group’s capital structure consist of interest bearing debt as disclosed in note 27, cash and cash equivalents and equity attributable to the shareholders of Telenor ASA as presented in the consolidated statement of changes in equity and in note 23.
In order to adjust the capital structure, the Group may adjust the amount of dividends paid to shareholders, return capital to shareholders, acquire or sell treasury shares or issue new shares. In 2013 Telenor’s total shareholder remuneration was NOK 11.4 billion , comprised of NOK 9.4 billion 1) of ordinary dividends paid out in May 2013 (NOK 6.00 per share) and NOK 2.0 billion of share buybacks. NOK 0.9 billion of the buybacks were open market repurchases carried out in August and September 2013, whereas the remaining NOK 1.1 billion consist of the Norwegian State’s pro rata share of the buyback. Cancellation of the shares and the payout to the Norwegian State pursuant to the buyback programme will be proposed at the annual general meeting in May 2014. The 2013-2014 share buyback programme comprised of 1% of the registered shares, equivalent to around 15.2 million shares including the pro rata state owned shares.
Telenor ASA has an agreement with the Kingdom of Norway through the Ministry of Trade, Industry and Fisheries to carry through share buybacks with the purpose to cancel these shares through write-down of the share capital to maintain its ownership interest. See notes 23, 32 and 35 for further description.
The Board of Telenor ASA has proposed to pay a dividend of NOK 7.00 per share for the fiscal year 2013, payable in May 2014. The objective is to distribute 50-80% of normalised net income, and aim for a nominal increase in the dividend per share. The proposed dividend represents a pay-out ratio of 73%.
Financial risk Telenor ASA’s treasury function is responsible for funding, foreign exchange risk, interest rate risk, credit risk and liquidity management for the parent company and for companies owned more than 90% directly or indirectly by Telenor ASA. Subsidiaries owned less than 90% normally have stand-alone financing. The Group has limited activities related to interest rate and currency trading (other than hedging activities).
Liquidity riskThe Group emphasises financial flexibility. An important part of this emphasis is to minimise liquidity risk through ensuring access to a diversified set of funding sources. Telenor ASA issues debt in the domestic and international capital markets mainly in the form of Commercial Paper and bonds. The Group uses Euro Commercial Paper, U.S. Commercial Paper, Euro Medium Term Note and the Norwegian domestic capital market to secure satisfactory financial flexibility. Telenor ASA has committed syndicated revolving credit facilities of a total of EUR 2.8 billion, of which EUR 2.0 billion with maturity in 2016 and the remaining EUR 0.8 billion with maturity in 2017. None of the revolving credit facilities have been used as of 31 December 2013.
When permissible by local rules and regulations, subsidiaries owned 90% or more are parts of Telenor ASA’s cash management framework agreement. They participate in Telenor ASA’s cash pool systems and place their excess liquidity with the internal bank in Group Treasury. Subsidiaries owned less than 90% have established their own cash management framework agreements for banking services, their own cash pool systems and place their excess liquidity externally.
Telenor ASA and each subsidiary shall have sufficient sources of liquidity to cover expected needs during the next 12 months. Liquidity to fund acquisitions are considered separately.
The debt portfolio of Telenor ASA and each subsidiary with external debt shall have a balanced maturity profile. The Group’s debt maturities shall be spread relatively even over a time horizon of at least 10 years by issuing bonds and commercial papers in order to reduce the Group’s liquidity risk. The debt maturity profile is presented below. For information about duration please refer to chapter «Interest rate risk».
1) Based on 100% of registered shares (1,516,624,271 shares)
/28/
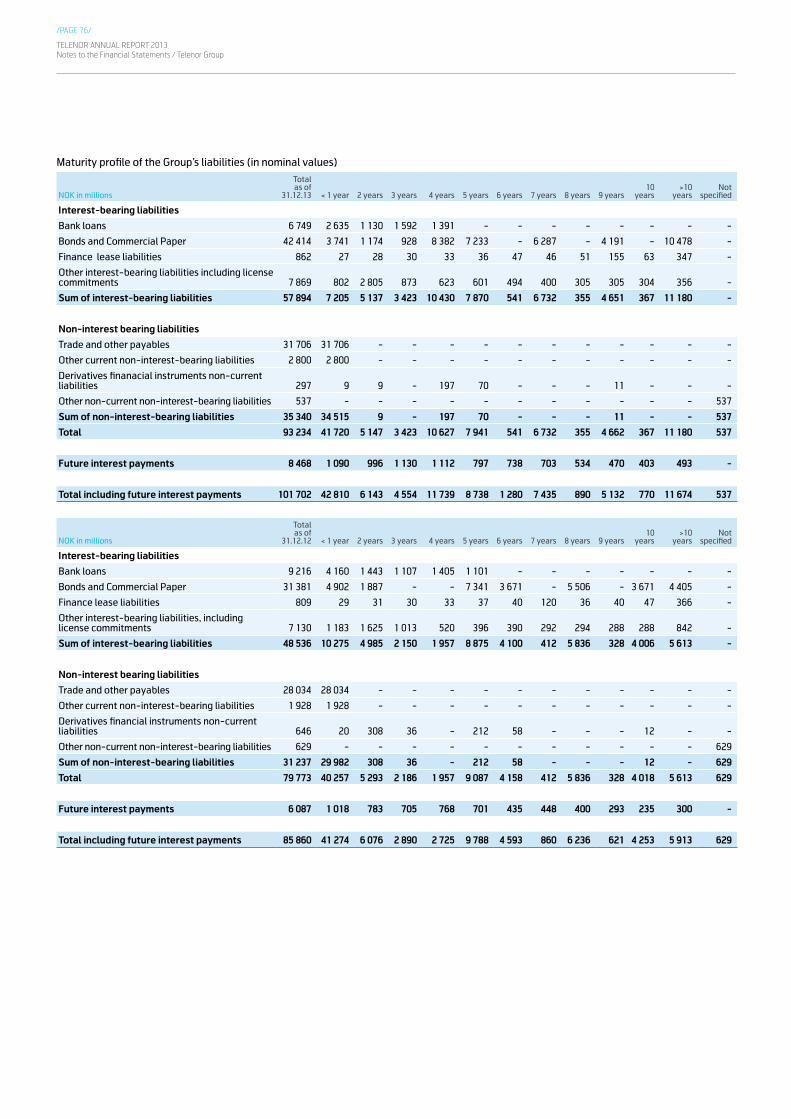
TELENOR ANNUAL REPORT 2013Notes to the Financial Statements / Telenor Group
/PAGE 76/
Maturity profile of the Group’s liabilities (in nominal values)
NOK in millions
Total as of
31.12.13 < 1 year 2 years 3 years 4 years 5 years 6 years 7 years 8 years 9 years10
years>10
yearsNot
specified
Interest-bearing liabilities
Bank loans 6 749 2 635 1 130 1 592 1 391 - - - - - - - -
Bonds and Commercial Paper 42 414 3 741 1 174 928 8 382 7 233 - 6 287 - 4 191 - 10 478 -
Finance lease liabilities 862 27 28 30 33 36 47 46 51 155 63 347 -
Other interest-bearing liabilities including license commitments 7 869 802 2 805 873 623 601 494 400 305 305 304 356 -
Sum of interest-bearing liabilities 57 894 7 205 5 137 3 423 10 430 7 870 541 6 732 355 4 651 367 11 180 -
Non-interest bearing liabilities
Trade and other payables 31 706 31 706 - - - - - - - - - - -
Other current non-interest-bearing liabilities 2 800 2 800 - - - - - - - - - - -
Derivatives finanacial instruments non-current liabilities 297 9 9 - 197 70 - - - 11 - - -
Other non-current non-interest-bearing liabilities 537 - - - - - - - - - - - 537
Sum of non-interest-bearing liabilities 35 340 34 515 9 - 197 70 - - - 11 - - 537
Total 93 234 41 720 5 147 3 423 10 627 7 941 541 6 732 355 4 662 367 11 180 537
Future interest payments 8 468 1 090 996 1 130 1 112 797 738 703 534 470 403 493 -
Total including future interest payments 101 702 42 810 6 143 4 554 11 739 8 738 1 280 7 435 890 5 132 770 11 674 537
NOK in millions
Total as of
31.12.12 < 1 year 2 years 3 years 4 years 5 years 6 years 7 years 8 years 9 years10
years>10
yearsNot
specified
Interest-bearing liabilities
Bank loans 9 216 4 160 1 443 1 107 1 405 1 101 - - - - - - -
Bonds and Commercial Paper 31 381 4 902 1 887 - - 7 341 3 671 - 5 506 - 3 671 4 405 -
Finance lease liabilities 809 29 31 30 33 37 40 120 36 40 47 366 -
Other interest-bearing liabilities, including license commitments 7 130 1 183 1 625 1 013 520 396 390 292 294 288 288 842 -
Sum of interest-bearing liabilities 48 536 10 275 4 985 2 150 1 957 8 875 4 100 412 5 836 328 4 006 5 613 -
Non-interest bearing liabilities
Trade and other payables 28 034 28 034 - - - - - - - - - - -
Other current non-interest-bearing liabilities 1 928 1 928 - - - - - - - - - - -
Derivatives financial instruments non-current liabilities 646 20 308 36 - 212 58 - - - 12 - -
Other non-current non-interest-bearing liabilities 629 - - - - - - - - - - - 629
Sum of non-interest-bearing liabilities 31 237 29 982 308 36 - 212 58 - - - 12 - 629
Total 79 773 40 257 5 293 2 186 1 957 9 087 4 158 412 5 836 328 4 018 5 613 629
Future interest payments 6 087 1 018 783 705 768 701 435 448 400 293 235 300 -
Total including future interest payments 85 860 41 274 6 076 2 890 2 725 9 788 4 593 860 6 236 621 4 253 5 913 629
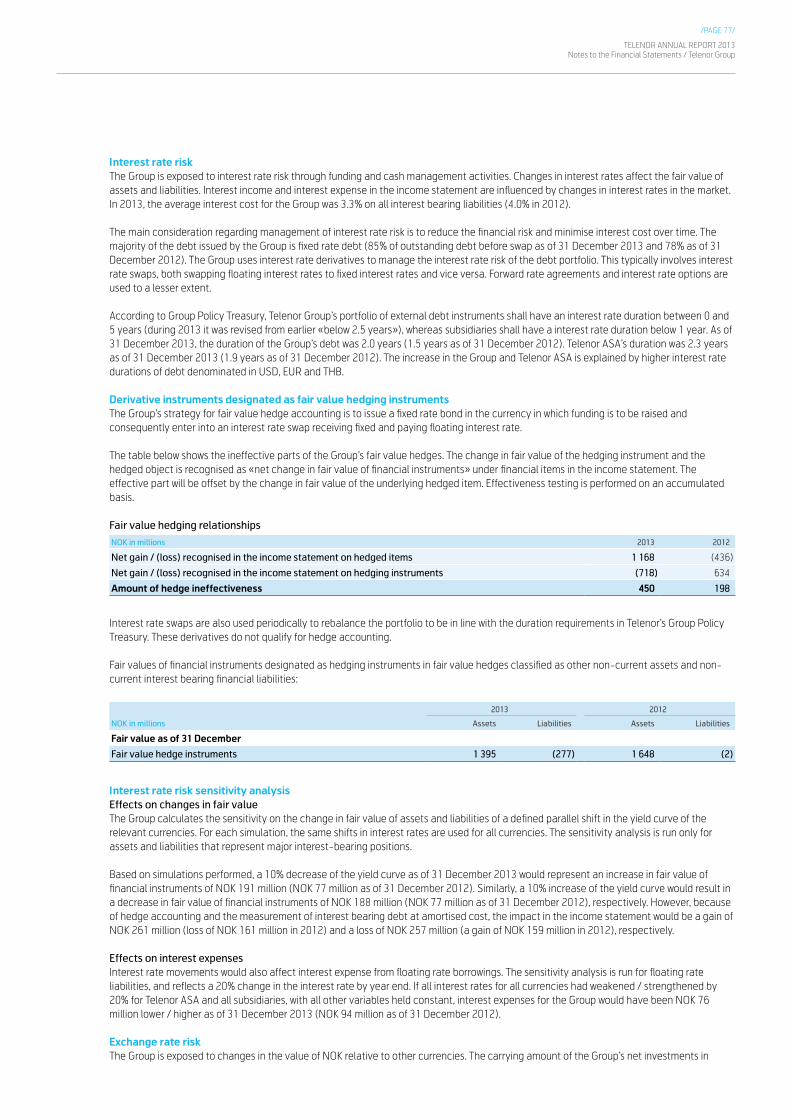
/PAGE 77/
TELENOR ANNUAL REPORT 2013Notes to the Financial Statements / Telenor Group
Interest rate riskThe Group is exposed to interest rate risk through funding and cash management activities. Changes in interest rates affect the fair value of assets and liabilities. Interest income and interest expense in the income statement are influenced by changes in interest rates in the market. In 2013, the average interest cost for the Group was 3.3% on all interest bearing liabilities (4.0% in 2012).
The main consideration regarding management of interest rate risk is to reduce the financial risk and minimise interest cost over time. The majority of the debt issued by the Group is fixed rate debt (85% of outstanding debt before swap as of 31 December 2013 and 78% as of 31 December 2012). The Group uses interest rate derivatives to manage the interest rate risk of the debt portfolio. This typically involves interest rate swaps, both swapping floating interest rates to fixed interest rates and vice versa. Forward rate agreements and interest rate options are used to a lesser extent.
According to Group Policy Treasury, Telenor Group’s portfolio of external debt instruments shall have an interest rate duration between 0 and 5 years (during 2013 it was revised from earlier «below 2.5 years»), whereas subsidiaries shall have a interest rate duration below 1 year. As of 31 December 2013, the duration of the Group’s debt was 2.0 years (1.5 years as of 31 December 2012). Telenor ASA’s duration was 2.3 years as of 31 December 2013 (1.9 years as of 31 December 2012). The increase in the Group and Telenor ASA is explained by higher interest rate durations of debt denominated in USD, EUR and THB.
Derivative instruments designated as fair value hedging instruments The Group’s strategy for fair value hedge accounting is to issue a fixed rate bond in the currency in which funding is to be raised and consequently enter into an interest rate swap receiving fixed and paying floating interest rate.
The table below shows the ineffective parts of the Group’s fair value hedges. The change in fair value of the hedging instrument and the hedged object is recognised as «net change in fair value of financial instruments» under financial items in the income statement. The effective part will be offset by the change in fair value of the underlying hedged item. Effectiveness testing is performed on an accumulated basis.
Fair value hedging relationships
NOK in millions 2013 2012
Net gain / (loss) recognised in the income statement on hedged items 1 168 (436)
Net gain / (loss) recognised in the income statement on hedging instruments (718) 634
Amount of hedge ineffectiveness 450 198
Interest rate swaps are also used periodically to rebalance the portfolio to be in line with the duration requirements in Telenor’s Group Policy Treasury. These derivatives do not qualify for hedge accounting.
Fair values of financial instruments designated as hedging instruments in fair value hedges classified as other non-current assets and non-current interest bearing financial liabilities:
2013 2012
NOK in millions Assets Liabilities Assets Liabilities
Fair value as of 31 December
Fair value hedge instruments 1 395 (277) 1 648 (2)
Interest rate risk sensitivity analysisEffects on changes in fair valueThe Group calculates the sensitivity on the change in fair value of assets and liabilities of a defined parallel shift in the yield curve of the relevant currencies. For each simulation, the same shifts in interest rates are used for all currencies. The sensitivity analysis is run only for assets and liabilities that represent major interest-bearing positions.
Based on simulations performed, a 10% decrease of the yield curve as of 31 December 2013 would represent an increase in fair value of financial instruments of NOK 191 million (NOK 77 million as of 31 December 2012). Similarly, a 10% increase of the yield curve would result in a decrease in fair value of financial instruments of NOK 188 million (NOK 77 million as of 31 December 2012), respectively. However, because of hedge accounting and the measurement of interest bearing debt at amortised cost, the impact in the income statement would be a gain of NOK 261 million (loss of NOK 161 million in 2012) and a loss of NOK 257 million (a gain of NOK 159 million in 2012), respectively.
Effects on interest expensesInterest rate movements would also affect interest expense from floating rate borrowings. The sensitivity analysis is run for floating rate liabilities, and reflects a 20% change in the interest rate by year end. If all interest rates for all currencies had weakened / strengthened by 20% for Telenor ASA and all subsidiaries, with all other variables held constant, interest expenses for the Group would have been NOK 76 million lower / higher as of 31 December 2013 (NOK 94 million as of 31 December 2012).
Exchange rate riskThe Group is exposed to changes in the value of NOK relative to other currencies. The carrying amount of the Group’s net investments in
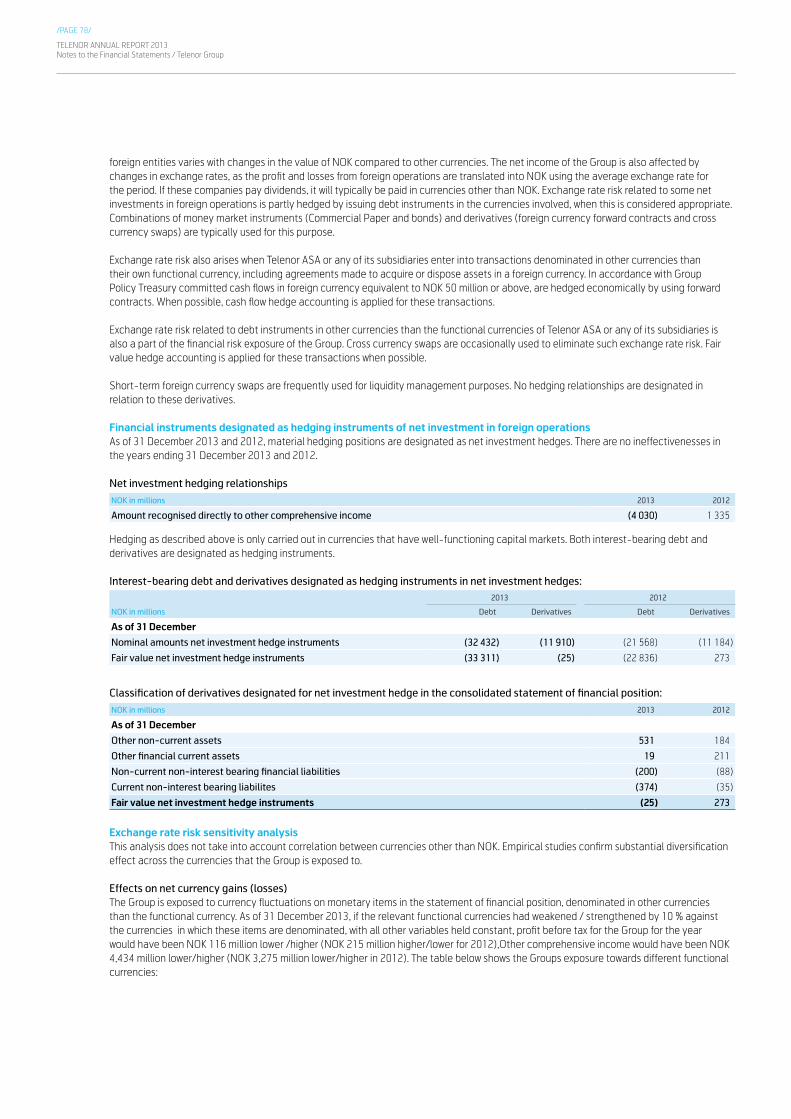
TELENOR ANNUAL REPORT 2013Notes to the Financial Statements / Telenor Group
/PAGE 78/
foreign entities varies with changes in the value of NOK compared to other currencies. The net income of the Group is also affected by changes in exchange rates, as the profit and losses from foreign operations are translated into NOK using the average exchange rate for the period. If these companies pay dividends, it will typically be paid in currencies other than NOK. Exchange rate risk related to some net investments in foreign operations is partly hedged by issuing debt instruments in the currencies involved, when this is considered appropriate. Combinations of money market instruments (Commercial Paper and bonds) and derivatives (foreign currency forward contracts and cross currency swaps) are typically used for this purpose.
Exchange rate risk also arises when Telenor ASA or any of its subsidiaries enter into transactions denominated in other currencies than their own functional currency, including agreements made to acquire or dispose assets in a foreign currency. In accordance with Group Policy Treasury committed cash flows in foreign currency equivalent to NOK 50 million or above, are hedged economically by using forward contracts. When possible, cash flow hedge accounting is applied for these transactions.
Exchange rate risk related to debt instruments in other currencies than the functional currencies of Telenor ASA or any of its subsidiaries is also a part of the financial risk exposure of the Group. Cross currency swaps are occasionally used to eliminate such exchange rate risk. Fair value hedge accounting is applied for these transactions when possible.
Short-term foreign currency swaps are frequently used for liquidity management purposes. No hedging relationships are designated in relation to these derivatives.
Financial instruments designated as hedging instruments of net investment in foreign operations As of 31 December 2013 and 2012, material hedging positions are designated as net investment hedges. There are no ineffectivenesses in the years ending 31 December 2013 and 2012.
Net investment hedging relationships
NOK in millions 2013 2012
Amount recognised directly to other comprehensive income (4 030) 1 335
Hedging as described above is only carried out in currencies that have well-functioning capital markets. Both interest-bearing debt and derivatives are designated as hedging instruments.
Interest-bearing debt and derivatives designated as hedging instruments in net investment hedges:2013 2012
NOK in millions Debt Derivatives Debt Derivatives
As of 31 December
Nominal amounts net investment hedge instruments (32 432) (11 910) (21 568) (11 184)
Fair value net investment hedge instruments (33 311) (25) (22 836) 273
Classification of derivatives designated for net investment hedge in the consolidated statement of financial position:
NOK in millions 2013 2012
As of 31 December
Other non-current assets 531 184
Other financial current assets 19 211
Non-current non-interest bearing financial liabilities (200) (88)
Current non-interest bearing liabilites (374) (35)
Fair value net investment hedge instruments (25) 273
Exchange rate risk sensitivity analysisThis analysis does not take into account correlation between currencies other than NOK. Empirical studies confirm substantial diversification effect across the currencies that the Group is exposed to.
Effects on net currency gains (losses)The Group is exposed to currency fluctuations on monetary items in the statement of financial position, denominated in other currencies than the functional currency. As of 31 December 2013, if the relevant functional currencies had weakened / strengthened by 10 % against the currencies in which these items are denominated, with all other variables held constant, profit before tax for the Group for the year would have been NOK 116 million lower /higher (NOK 215 million higher/lower for 2012),Other comprehensive income would have been NOK 4,434 million lower/higher (NOK 3,275 million lower/higher in 2012). The table below shows the Groups exposure towards different functional currencies:
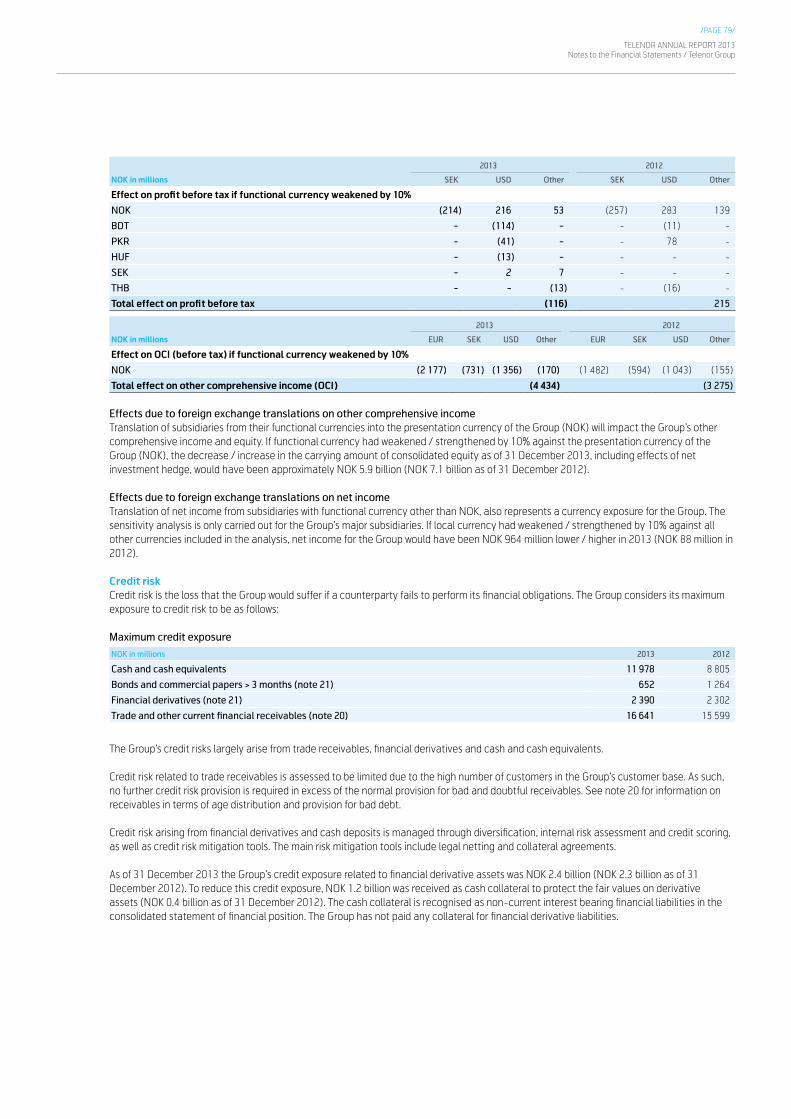
/PAGE 79/
TELENOR ANNUAL REPORT 2013Notes to the Financial Statements / Telenor Group
2013 2012
NOK in millions SEK USD Other SEK USD Other
Effect on profit before tax if functional currency weakened by 10%
NOK (214) 216 53 (257) 283 139
BDT - (114) - - (11) -
PKR - (41) - - 78 -
HUF - (13) - - - -
SEK - 2 7 - - -
THB - - (13) - (16) -
Total effect on profit before tax (116) 215
2013 2012
NOK in millions EUR SEK USD Other EUR SEK USD Other
Effect on OCI (before tax) if functional currency weakened by 10%
NOK (2 177) (731) (1 356) (170) (1 482) (594) (1 043) (155)
Total effect on other comprehensive income (OCI) (4 434) (3 275)
Effects due to foreign exchange translations on other comprehensive incomeTranslation of subsidiaries from their functional currencies into the presentation currency of the Group (NOK) will impact the Group’s other comprehensive income and equity. If functional currency had weakened / strengthened by 10% against the presentation currency of the Group (NOK), the decrease / increase in the carrying amount of consolidated equity as of 31 December 2013, including effects of net investment hedge, would have been approximately NOK 5.9 billion (NOK 7.1 billion as of 31 December 2012).
Effects due to foreign exchange translations on net incomeTranslation of net income from subsidiaries with functional currency other than NOK, also represents a currency exposure for the Group. The sensitivity analysis is only carried out for the Group’s major subsidiaries. If local currency had weakened / strengthened by 10% against all other currencies included in the analysis, net income for the Group would have been NOK 964 million lower / higher in 2013 (NOK 88 million in 2012).
Credit riskCredit risk is the loss that the Group would suffer if a counterparty fails to perform its financial obligations. The Group considers its maximum exposure to credit risk to be as follows:
Maximum credit exposure
NOK in millions 2013 2012
Cash and cash equivalents 11 978 8 805
Bonds and commercial papers > 3 months (note 21) 652 1 264
Financial derivatives (note 21) 2 390 2 302
Trade and other current financial receivables (note 20) 16 641 15 599
The Group’s credit risks largely arise from trade receivables, financial derivatives and cash and cash equivalents.
Credit risk related to trade receivables is assessed to be limited due to the high number of customers in the Group’s customer base. As such, no further credit risk provision is required in excess of the normal provision for bad and doubtful receivables. See note 20 for information on receivables in terms of age distribution and provision for bad debt.
Credit risk arising from financial derivatives and cash deposits is managed through diversification, internal risk assessment and credit scoring, as well as credit risk mitigation tools. The main risk mitigation tools include legal netting and collateral agreements.
As of 31 December 2013 the Group’s credit exposure related to financial derivative assets was NOK 2.4 billion (NOK 2.3 billion as of 31 December 2012). To reduce this credit exposure, NOK 1.2 billion was received as cash collateral to protect the fair values on derivative assets (NOK 0.4 billion as of 31 December 2012). The cash collateral is recognised as non-current interest bearing financial liabilities in the consolidated statement of financial position. The Group has not paid any collateral for financial derivative liabilities.

TELENOR ANNUAL REPORT 2013Notes to the Financial Statements / Telenor Group
/PAGE 80/
Fair values of financial instruments
Principles for estimating fair valuesBased on the characteristics of the financial instruments that are recognised in the financial statements, the financial instruments are grouped into classes and categories. The estimated fair values of the Group’s financial instruments are based on available market prices and the valuation methodologies per class are described below.
Fair value hierarchyThe Group measures fair values using the following fair value hierarchy that reflects the significance of the inputs used in measuring fair value.
Level 1: Quoted prices (unadjusted) in active markets for identical financial instrumentsLevel 2: Inputs other than quoted prices included within Level 1 that are observable for assets or liabilities, either directly (i.e. as prices)
or indirectly (i.e. derived from prices). Level 3: Inputs for assets or liabilities that are not based on observable market data (unobservable inputs).
Interest-bearing liabilitiesFair values of interest-bearing liabilities as shown in note 27 are based on quoted prices where available. Interest-bearing liabilities that are not traded in an active market have been estimated using yield curves, which incorporates estimates of the Telenor ASA credit spread. The credit curves have been extrapolated using indicative prices on debt issuance by Telenor ASA for different maturities. The yield curves have been interpolated from cash and swap curves observed in the market for different currencies and maturities.
Trade receivables and other current and non-current financial assetsFor trade receivables and other current receivables, the carrying amount is assessed to be a reasonable approximation of fair value. The effect of not discounting is considered to be immaterial for this class of financial instruments.
Trade payables and other non-interest-bearing financial liabilitiesFor trade payables and other non-interest-bearing financial liabilities, the carrying amount is assessed to be a reasonable approximation of fair value. The effect of not discounting is considered to be immaterial for this class of financial instruments.
Equity investmentsFair values for listed shares are based on quoted prices at the end of the reporting period. Fair value of unlisted shares is estimated by using commonly used valuation techniques, or measured at cost if the investment does not have a quoted market price in an active market and the fair value cannot be reliably measured.
Cash and cash equivalentsThe fair value for this class of financial instruments is assessed to be equal to the nominal amount.
Derivatives Fair value of currency swaps, foreign currency forward contracts and interest rate swaps is estimated based on calculating the net present value of future cash flows, using interest rate curves, exchange rates and currency spreads as of 31 December 2013 and 2012, respectively.
/29/
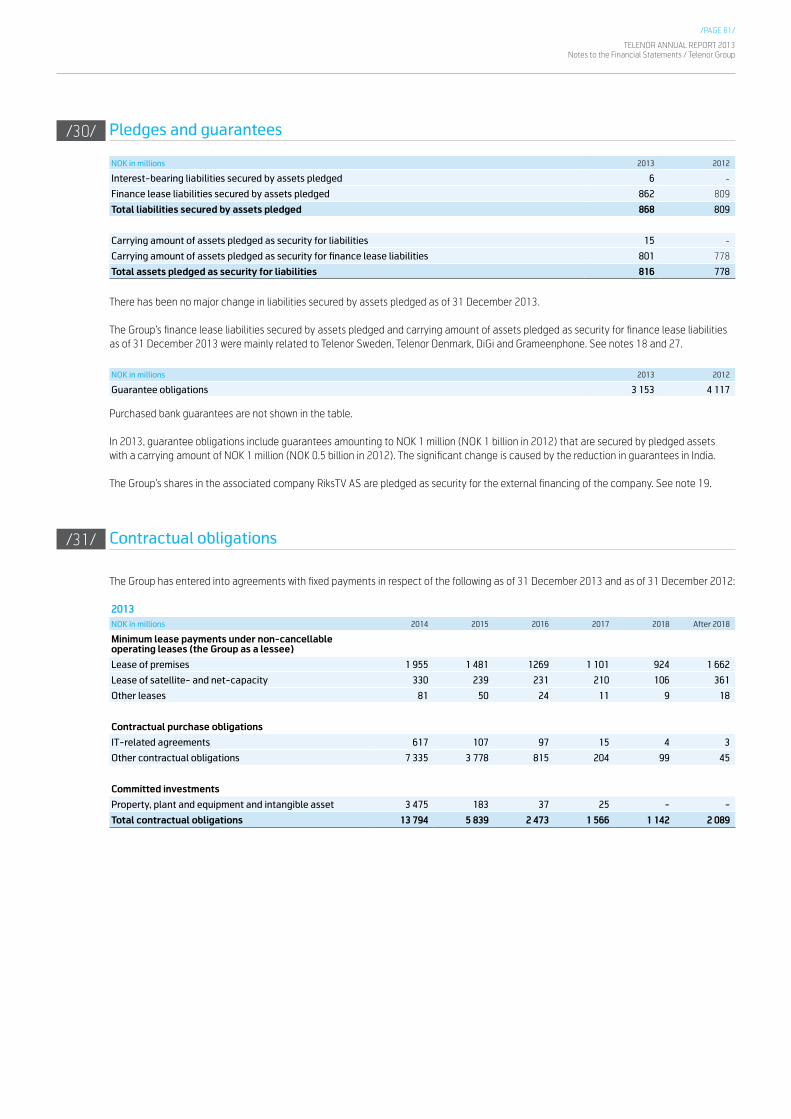
/PAGE 81/
TELENOR ANNUAL REPORT 2013Notes to the Financial Statements / Telenor Group
Pledges and guarantees
NOK in millions 2013 2012
Interest-bearing liabilities secured by assets pledged 6 -
Finance lease liabilities secured by assets pledged 862 809
Total liabilities secured by assets pledged 868 809
Carrying amount of assets pledged as security for liabilities 15 -
Carrying amount of assets pledged as security for finance lease liabilities 801 778
Total assets pledged as security for liabilities 816 778
There has been no major change in liabilities secured by assets pledged as of 31 December 2013.
The Group’s finance lease liabilities secured by assets pledged and carrying amount of assets pledged as security for finance lease liabilities as of 31 December 2013 were mainly related to Telenor Sweden, Telenor Denmark, DiGi and Grameenphone. See notes 18 and 27.
NOK in millions 2013 2012
Guarantee obligations 3 153 4 117
Purchased bank guarantees are not shown in the table.
In 2013, guarantee obligations include guarantees amounting to NOK 1 million (NOK 1 billion in 2012) that are secured by pledged assets with a carrying amount of NOK 1 million (NOK 0.5 billion in 2012). The significant change is caused by the reduction in guarantees in India.
The Group’s shares in the associated company RiksTV AS are pledged as security for the external financing of the company. See note 19.
Contractual obligations
The Group has entered into agreements with fixed payments in respect of the following as of 31 December 2013 and as of 31 December 2012:
2013NOK in millions 2014 2015 2016 2017 2018 After 2018
Minimum lease payments under non-cancellable operating leases (the Group as a lessee)
Lease of premises 1 955 1 481 1269 1 101 924 1 662
Lease of satellite- and net-capacity 330 239 231 210 106 361
Other leases 81 50 24 11 9 18
Contractual purchase obligations
IT-related agreements 617 107 97 15 4 3
Other contractual obligations 7 335 3 778 815 204 99 45
Committed investments
Property, plant and equipment and intangible asset 3 475 183 37 25 - -
Total contractual obligations 13 794 5 839 2 473 1 566 1 142 2 089
/30/
/31/
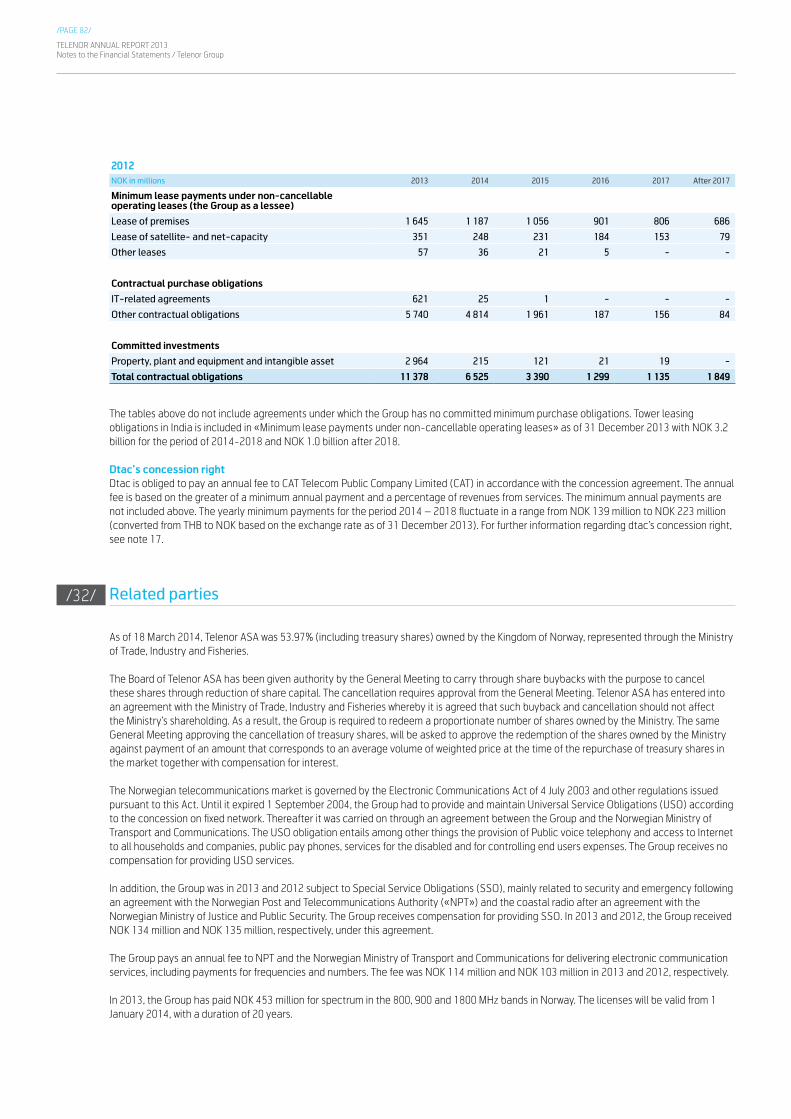
TELENOR ANNUAL REPORT 2013Notes to the Financial Statements / Telenor Group
/PAGE 82/
2012NOK in millions 2013 2014 2015 2016 2017 After 2017
Minimum lease payments under non-cancellable operating leases (the Group as a lessee)
Lease of premises 1 645 1 187 1 056 901 806 686
Lease of satellite- and net-capacity 351 248 231 184 153 79
Other leases 57 36 21 5 - -
Contractual purchase obligations
IT-related agreements 621 25 1 - - -
Other contractual obligations 5 740 4 814 1 961 187 156 84
Committed investments
Property, plant and equipment and intangible asset 2 964 215 121 21 19 -
Total contractual obligations 11 378 6 525 3 390 1 299 1 135 1 849
The tables above do not include agreements under which the Group has no committed minimum purchase obligations. Tower leasing obligations in India is included in «Minimum lease payments under non-cancellable operating leases» as of 31 December 2013 with NOK 3.2 billion for the period of 2014-2018 and NOK 1.0 billion after 2018.
Dtac’s concession rightDtac is obliged to pay an annual fee to CAT Telecom Public Company Limited (CAT) in accordance with the concession agreement. The annual fee is based on the greater of a minimum annual payment and a percentage of revenues from services. The minimum annual payments are not included above. The yearly minimum payments for the period 2014 – 2018 fluctuate in a range from NOK 139 million to NOK 223 million (converted from THB to NOK based on the exchange rate as of 31 December 2013). For further information regarding dtac’s concession right, see note 17.
Related parties
As of 18 March 2014, Telenor ASA was 53.97% (including treasury shares) owned by the Kingdom of Norway, represented through the Ministry of Trade, Industry and Fisheries.
The Board of Telenor ASA has been given authority by the General Meeting to carry through share buybacks with the purpose to cancel these shares through reduction of share capital. The cancellation requires approval from the General Meeting. Telenor ASA has entered into an agreement with the Ministry of Trade, Industry and Fisheries whereby it is agreed that such buyback and cancellation should not affect the Ministry’s shareholding. As a result, the Group is required to redeem a proportionate number of shares owned by the Ministry. The same General Meeting approving the cancellation of treasury shares, will be asked to approve the redemption of the shares owned by the Ministry against payment of an amount that corresponds to an average volume of weighted price at the time of the repurchase of treasury shares in the market together with compensation for interest.
The Norwegian telecommunications market is governed by the Electronic Communications Act of 4 July 2003 and other regulations issued pursuant to this Act. Until it expired 1 September 2004, the Group had to provide and maintain Universal Service Obligations (USO) according to the concession on fixed network. Thereafter it was carried on through an agreement between the Group and the Norwegian Ministry of Transport and Communications. The USO obligation entails among other things the provision of Public voice telephony and access to Internet to all households and companies, public pay phones, services for the disabled and for controlling end users expenses. The Group receives no compensation for providing USO services.
In addition, the Group was in 2013 and 2012 subject to Special Service Obligations (SSO), mainly related to security and emergency following an agreement with the Norwegian Post and Telecommunications Authority («NPT») and the coastal radio after an agreement with the Norwegian Ministry of Justice and Public Security. The Group receives compensation for providing SSO. In 2013 and 2012, the Group received NOK 134 million and NOK 135 million, respectively, under this agreement.
The Group pays an annual fee to NPT and the Norwegian Ministry of Transport and Communications for delivering electronic communication services, including payments for frequencies and numbers. The fee was NOK 114 million and NOK 103 million in 2013 and 2012, respectively.
In 2013, the Group has paid NOK 453 million for spectrum in the 800, 900 and 1800 MHz bands in Norway. The licenses will be valid from 1 January 2014, with a duration of 20 years.
/32/

/PAGE 83/
TELENOR ANNUAL REPORT 2013Notes to the Financial Statements / Telenor Group
The Group provides mobile and fixed telephony services, leased lines, customer equipment, Internet connections, TV distributions and other services to the state and companies controlled by the state in the normal course of business and at arms-length prices. The Group also purchases services, such as postal services, in the normal course of business and at arms-length prices. Details of such transactions are not included in this note.
The Group sold transmission capacity and related services in the digital and analog terrestrial transmission network to Norsk Rikskringkasting AS of NOK 247 million in 2013 and NOK 173 million in 2012.
Transactions with associated companies
2013 2012
NOK in millions Sales to Purchases from Sales to Purchases from
949 2 549 1 082 2 314
In 2013 and 2012, sales to associated companies include network access charges to Norges Televisjon AS of NOK 326 million and NOK 303 million, respectively. In addition, sales in 2013 and 2012 include delivery of Nordic Connect and Managed Services to Evry ASA of NOK 207 million and NOK 232 million, respectively. Sales to VimpelCom Group amount to NOK 380 million in 2013 and NOK 458 million in 2012.
Purchases from associated companies in 2013 and 2012 include distribution rights from C More Group AB of NOK 660 million and NOK 673 million, respectively. Purchases in 2013 and 2012 also include purchases of IT services from Evry ASA of NOK 474 million and NOK 461 million, respectively. A substantial part of the purchases in 2013 and 2012 concerns sales and marketing support for distributors of the Group’s products and services in Norway.
Purchases from VimpelCom Group amount to NOK 362 million in 2013 and NOK 354 million in 2012.
The Group’s shares in the associated company RiksTV AS are pledged as collateral for debt in the company. Furthermore, the Group has provided fulfilment guarantees of NOK 75 million in favour of the associated company Norges Television AS.
For information of receivables on associated companies, see note 20 and 21. The Group had no significant payables or debt to associated companies as of 31 December 2013 and 2012.
Transactions with subsidiaries have been eliminated on consolidation and do not represent related party transactions. See note 15 Related Parties and note 16 Shares in Subsidiaries in the financial statements of Telenor ASA for further details. The same applies to transactions with joint operations, see note 19.
For compensation of key management personnel, see note 34.
Commitments and contingencies
The Group is involved in a number of legal proceedings in various forms. While acknowledging the uncertainties of litigation, the Group is of the opinion that based on the information currently available, these matters will be resolved without any material adverse effect individually or in the aggregate on the Group’s financial position. No provisions have been made for the regulatory matters and legal disputes discussed in this note. For legal disputes, in which the Group assesses it to be probable (more likely than not) that an economic outflow will be required to settle the obligation, provisions have been made based on management’s best estimate.
See note 13 for tax disputes.
Grameenphone1) BTRC – Audit claimIn April 2011, Bangladesh Telecommunication Regulatory Commission (BTRC) announced its intention to conduct an audit of the existing mobile operators in Bangladesh. As part of this initiative, BTRC appointed a Chartered Accountant firm for conducting the audit of Grameenphone. On 3 October 2011 Grameenphone received a claim amounting to approximately NOK 2.2 billion from BTRC referring to findings of the audit that the regulator carried out over a few months from April 2011 related to circumstances from the establishment of Grameenphone until today. Grameenphone has contended and clarified to BTRC and the Chartered Accountant firm that acceptable audit standards and practices have not been followed during and after the audit and the claims made remain unfounded, unsubstantiated and without merit. As a consequence, Grameenphone filed a title suit in the Civil Court of first instance on 17 October 2011 against BTRC seeking an injunction restraining BTRC from claiming the said demand and filed an Appeal in the High Court Division (HCD) of the Supreme Court of Bangladesh seeking an order of injunction against the claim made by BTRC. On 20 October 2011 HCD directed the parties to maintain ‘as is situation’ (status quo) in respect of the claim made by BTRC for a period of six months from 20 December 2011 and this was later extended until May 2013. In this period BTRC may present arguments to the court why the claim shall remain valid. On 15 May 2013, the High Court Division extended the stay order for the claim until the final hearing of the appeal.
/33/
TELENOR ANNUAL REPORT 2013Notes to the Financial Statements / Telenor Group
/PAGE 84/
2) BTRC – Claim in relation to licence renewal Grameenphone received a notification from BTRC on 17 October 2011 for ‘Notification of Award of Licence Renewal’ which included a claim for payment of additional spectrum fee of up to approx. NOK 280 million for 7.4 MHz spectrum granted in 2008, based on retrospective application of Market Competition Factor (MCF) as introduced in the new Licence Renewal Guidelines of 2011. The same notification also demanded that all payments shall be made ‘without any deductions’, contrary to the rule of National Board of Revenue (NBR) that the applicable VAT must be deducted at source by Grameenphone and submitted to NBR. Grameenphone won the first set of legal proceedings in High Court, but BTRC appealed to the Supreme Court which sent the case back to the High Court for further proceedings. On 13 February 2012, the High Court rejected the claim from BTRC. On the same day, the High Court also directed Grameenphone to add 15% VAT amount to BTRC’s receivables and pay an additional 15% VAT to National Board of Revenue (NBR). The Court allowed Grameenphone to obtain rebate on this VAT thereby, limiting Grameenphone’s total renewal cost to 100%. As the proposed rebate mechanism is not workable under present VAT scheme, Grameenphone has filed a petition with the Appellate Division. Meanwhile, NBR sent formal notice on 1 April 2012 for payment of VAT of NOK 168 million on renewal fees (which was withheld) and accordingly Grameenphone paid to NBR with protest. On 16 July 2012, the appellate division of the Supreme Court granted Grameenphone Leave to Appeal. On 29 November 2012, Grameenphone obtained certified copy of the Leave Granting Order from the Appellate Division and is preparing to file the Appeal as required. No new developments happened during 2013.
3) SIM tax on replacement SIM cardsOn 16 May 2012, National Board of Revenue issued a notice to Grameenphone claiming SIM tax and interest of NOK 1.1 billion on replacement SIM cards issued during the period from July 2007 to December 2011. Grameenphone challenged the demand by a writ petition before the High Court which passed a Stay Order on the operation of the demand valid until 13 September 2013. In mid 2013, a special commission, appointed by the Government, was set up to review this case, in respect of all operators. As of today, this commission had not reached any conclusions.
dtac1) Dispute between TOT, CAT and dtac regarding Access Charge/InterconnectionOn 17 May 2006, the National Telecommunications Commission (NTC) (presently known as the National Broadcasting and Telecommunications Commission (NBTC)) issued the Notification on Use and Interconnection of Telecommunications Network of 2006 (Notification) applicable to telecommunication licencees who have its own telecommunication network, requiring the licencees to interconnect with each other on request, where the interconnection provider is entitled to apply an interconnection charge that reflects its costs.
On 17 November 2006, dtac issued a written notification informing TOT Public Company Limited (TOT) and CAT Telecom Public Company Limited (CAT) that dtac would no longer apply the rates for calculating the access charge under the Access Charge Agreements entered into with TOT on the basis that the rate and the collection of access charge under the Access Charge Agreements were contrary to the law in a number of respects. dtac also informed TOT and CAT that it would pay the interconnection charge to TOT when dtac and TOT have entered into an interconnection charge agreement in accordance with the Notification.
On 9 May 2011, TOT filed a plaint with the Central Administrative Court requiring the court to order dtac and CAT to jointly pay access charge to TOT, together with the default interests, in the amount of approximately NOK 21 billion. dtac submitted a defense to the court on 26 January 2012. Presently, this case is under consideration of the Central Administrative Court. The net effect (before income taxes) in ceasing to recognise the access charge under the Access Charge Agreements from 18 November 2006 to 31 December 2013 amounts to NOK 11.9 billion in reduced expenses.
dtac is also in dispute with TOT in a matter related to the negotiation and entering into an interconnection agreement between TOT and dtac’s respective networks. dtac requested on 2 October 2006 a negotiation of such agreement between the parties, pursuant to the Notification. The matter has been through various administrative and court proceedings, which has concluded that TOT is obligated to commence negotiations with dtac. TOT still rejects the entering into an interconnection agreement and has appealed the matter to Supreme Administrative Court. The matter is now under consideration of the Court.
2) Disputes between dtac and CAT regarding revenue sharing payment under Concession Agreement. On 11 January 2008, CAT submitted a claim to the Arbitration Institute requesting dtac to make concession revenue sharing payments for the 12th – 16th concession years (16 September 2002 to 15 September 2006) amounting to NOK 4.3 billion including penalties. The basis for the claim is the fact that revenue share paid by dtac to CAT was made after deduction of excise tax. Dtac’s opinion is that it was entitled to do so by virtue of the resolutions made by the Thai Council of Ministers in February 2003 and a letter issued by CAT allowing such deduction. On 28 May 2012, the Arbitral Tribunal rendered an award in favor of dtac and dismissed CAT ’s claim for Excise tax on Revenue Sharing Payment. However, on 31 August 2012, CAT filed a lawsuit with the Central Administrative Court in order to revoke the arbitration award. Presently, this case is under the court’s consideration.
On 31 August 2011, CAT filed a lawsuit with the Arbitration Institute requesting dtac to pay additional revenue sharing on interconnection charge for the concession year 16th (16 September 2006 to 15 September 2007) in the amount of NOK 747 million plus penalty interest at the rate of 15% p.a. from 16 December 2007 based on the ground that dtac has no right to deduct any interconnect expenses from its revenue and has no right to exclude interconnect revenue from its revenue to be calculated for the revenue sharing (payment of concession fee) to CAT under the Concession Agreement.
/PAGE 85/
TELENOR ANNUAL REPORT 2013Notes to the Financial Statements / Telenor Group
On 16 November 2012, CAT filed a new statement of claim to the Arbitration Tribunal requesting for additional revenue sharing for the 17th concession year (16 September 2007 to 15 September 2008) in the amount of NOK 750 million (including VAT) plus penalty interest at the rate of 15% p.a.
On 23 April 2013, CAT filed a new statement of claim to the Arbitration Tribunal requesting for additional revenue sharing for the 18th concession year (16 September 2008 to 15 September 2009) from dtac in the amount of NOK 652 million, plus penalty interest at the rate of 15% p.a.
On 10 January 2014, CAT sent a letter to dtac requesting for additional revenue sharing for the 19th concession year (16 September 2009 to 15 September 2010) in the amount of NOK 656 million.
On 13 March 2014, CAT sent a letter to dtac requesting for additional revenue sharing for the 20th concession year (16 September 2010 to 15 September 2011) in the amount of NOK 709 million.
CAT and dtac have a number of disputes and disagreements over understanding and reach of the concession agreements. This also includes how the new 3G regime is to be understood in relation to the concession agreements. dtac is of the opinion that the company is operating in accordance with applicable laws and regulations and refutes any allegations from CAT that dtac is operating in violation of concession agreements.
3) Foreign ownershipOne of dtacs competitors, True Move made a number of complaints to the Thai Police and the Thai Ministry of Commerce early in 2011 that dtac is in breach of the Foreign Business Act (FBA) limiting foreign ownership to 49% of the share capital without special permission.
In addition, on 22 September 2011, one of dtac’s minority shareholders (holding 100 shares in dtac) filed a complaint against state agency, National Broadcasting and Telecommunication Commission (NBTC), with the Central Administrative Court alleging that NBTC (as an administrative agency) has negligently not performed its duties by allowing dtac to operate telecom business. Therefore, the Central Administrative Court has issued a summon requesting dtac to be a co-defendant to this case. The management is of the opinion that the Group’s ownership structure in dtac was established, and is, in accordance with Thai law as well as the established practices in Thailand.
IndiaOn 2 February 2012, the Indian Supreme Court quashed all 122 2G licences awarded in 2008, including those granted to Unitech Wireless. Following this decision, the Supreme Court ordered that the 2G licences and spectrum should be auctioned. The spectrum auction was completed in November 2012 and the Group, through Telewings, secured spectrum licences in 6 circles. It is of the management’s understanding that the original licence payment of INR 16.6 billion ( approximately NOK 1.7 billion) made by Unitech Wireless in 2008 is allowed to be offset against spectrum payments in Telewings in auctions held in November 2012. This is confirmed by a letter from Ministry of Communication and IT on 3 March 2014. However, the detailed implementation of this is not yet concluded. The Supreme Court order dated 15 February 2013 opens up for possible retroactive spectrum fee payments for the licences quashed by the Supreme Court order on 2 February 2012, applicable to the licensees who have continued business until new licences were issued. The possible financial implications of the Supreme Court order dated 15 February, 2013 are unknown.
Telenor PakistanThe Federal Board of Revenue (FBR), has alleged that the Cellular Mobile Operators (CMOs) have altogether evaded Federal Excise Duty (FED) in the total amount of NOK 2,8 billion in relation to the FED which was payable by them on interconnect charges. The alleged liability for Telenor Pakistan was approximately NOK 0.8 billion.
The CMO’s joint position is that all applicable FED has been duly paid by the CMOs on the services provided by them and, therefore, no further payment of FED on interconnect charges is payable by them under law. Hence, no evasion of FED has taken place. In order to resolve the issue, the CMOs had previously agreed with the FBR that they would, from 1 July 2012, make the payment of FED on interconnect charges in accordance with the new procedure stipulated by the FBR. In return for the CMOs’ agreement to do so, on 30 June 2012 the FBR issued a Statutory Regulatory Order (SRO) exempting the CMOs from their previous alleged liability for the FED payable on interconnect charges over the last 5 years. However, the SRO was not published in the Official Gazette by the FBR, and thereby it did not attain the requisite legal effect.
The National Accountability Bureau (NAB) has started an enquiry on the basis that it had received information of alleged corrupt payments to the FBR for the issuance of the SRO. All the CMOs are participating in the enquiry. The CMOs also collectively decided to challenge the chargeability of the FED on interconnect charges through a writ petition in the Islamabad High Court. On 8 January 2014, the High Court declared recovery notice from FBR null and void. The court decision was appealed by the FBR on 24 January 2014 and in a subsequent hearing on 27 January 2014, the court decided to maintain status quo in the matter.
Telenor Norge ASThe EFTA Surveillance Authority (ESA) and the Norwegian Competition Authority initiated on 4 December 2012 an investigation against Telenor Norge AS regarding possible abuse of dominant market position and/or possible anti-competitive practices. The investigation is still ongoing pursuant to Articles 53 and 54 of the EEA Agreement and comprises mobile communication services at wholesale and retail level in Norway, including voice, SMS, MMS and data, as well as mobile services sold in bundles that include other products/services.
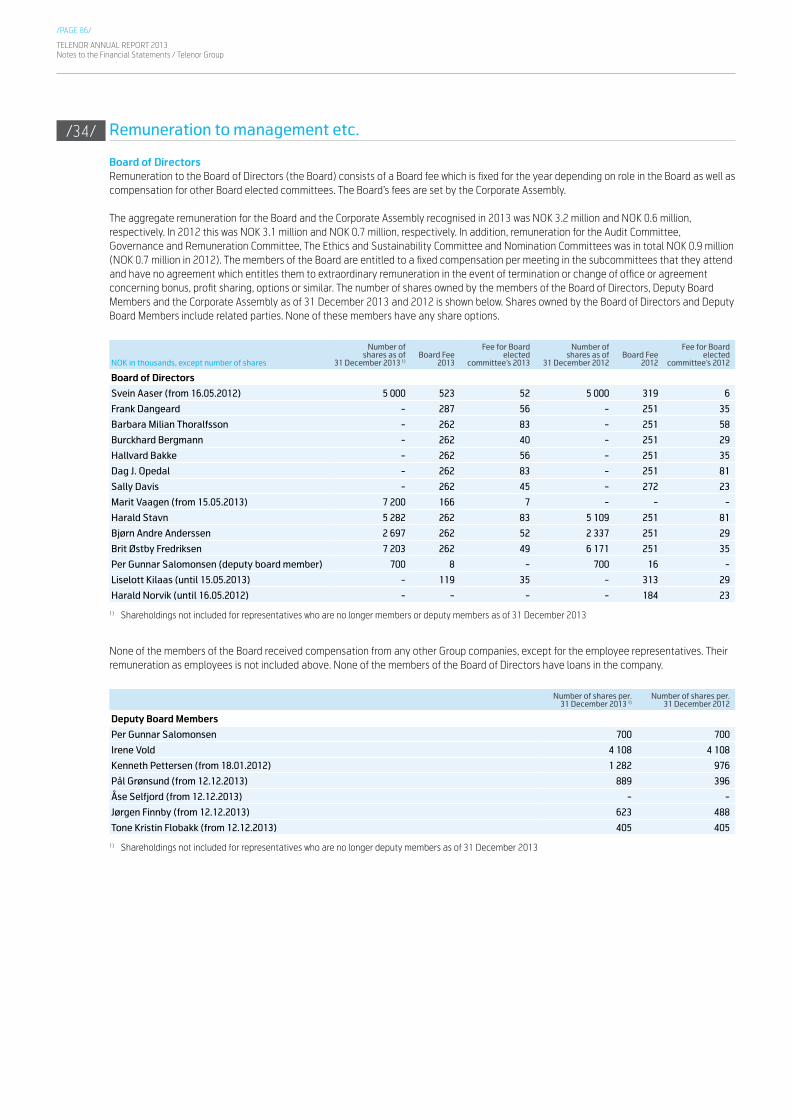
TELENOR ANNUAL REPORT 2013Notes to the Financial Statements / Telenor Group
/PAGE 86/
Remuneration to management etc.
Board of Directors Remuneration to the Board of Directors (the Board) consists of a Board fee which is fixed for the year depending on role in the Board as well as compensation for other Board elected committees. The Board’s fees are set by the Corporate Assembly.
The aggregate remuneration for the Board and the Corporate Assembly recognised in 2013 was NOK 3.2 million and NOK 0.6 million, respectively. In 2012 this was NOK 3.1 million and NOK 0.7 million, respectively. In addition, remuneration for the Audit Committee, Governance and Remuneration Committee, The Ethics and Sustainability Committee and Nomination Committees was in total NOK 0.9 million (NOK 0.7 million in 2012). The members of the Board are entitled to a fixed compensation per meeting in the subcommittees that they attend and have no agreement which entitles them to extraordinary remuneration in the event of termination or change of office or agreement concerning bonus, profit sharing, options or similar. The number of shares owned by the members of the Board of Directors, Deputy Board Members and the Corporate Assembly as of 31 December 2013 and 2012 is shown below. Shares owned by the Board of Directors and Deputy Board Members include related parties. None of these members have any share options.
NOK in thousands, except number of shares
Number of shares as of
31 December 2013 1)Board Fee
2013
Fee for Board elected
committee’s 2013
Number of shares as of
31 December 2012 Board Fee
2012
Fee for Board elected
committee’s 2012
Board of Directors
Svein Aaser (from 16.05.2012) 5 000 523 52 5 000 319 6
Frank Dangeard - 287 56 - 251 35
Barbara Milian Thoralfsson - 262 83 - 251 58
Burckhard Bergmann - 262 40 - 251 29
Hallvard Bakke - 262 56 - 251 35
Dag J. Opedal - 262 83 - 251 81
Sally Davis - 262 45 - 272 23
Marit Vaagen (from 15.05.2013) 7 200 166 7 - - -
Harald Stavn 5 282 262 83 5 109 251 81
Bjørn Andre Anderssen 2 697 262 52 2 337 251 29
Brit Østby Fredriksen 7 203 262 49 6 171 251 35
Per Gunnar Salomonsen (deputy board member) 700 8 - 700 16 -
Liselott Kilaas (until 15.05.2013) - 119 35 - 313 29
Harald Norvik (until 16.05.2012) - - - - 184 23
1) Shareholdings not included for representatives who are no longer members or deputy members as of 31 December 2013
None of the members of the Board received compensation from any other Group companies, except for the employee representatives. Their remuneration as employees is not included above. None of the members of the Board of Directors have loans in the company.
Number of shares per. 31 December 2013 1)
Number of shares per. 31 December 2012
Deputy Board Members
Per Gunnar Salomonsen 700 700
Irene Vold 4 108 4 108
Kenneth Pettersen (from 18.01.2012) 1 282 976
Pål Grønsund (from 12.12.2013) 889 396
Åse Selfjord (from 12.12.2013) - -
Jørgen Finnby (from 12.12.2013) 623 488
Tone Kristin Flobakk (from 12.12.2013) 405 405
1) Shareholdings not included for representatives who are no longer deputy members as of 31 December 2013
/34/

/PAGE 87/
TELENOR ANNUAL REPORT 2013Notes to the Financial Statements / Telenor Group
Number of shares as of 31 December 2013 1)
Number of shares as of 31 December 2012
Corporate Assembly
Anders Skjævestad (chairman from 16.05.2012) 100 100
Roger Rønning 2 181 1 780
Astri Skare - 112
Jan Otto Eriksen 3 646 2 837
Stein Erik Olsen 1 973 1 489
Magnhild Øvsthus Hanssen 2 656 2 397
Hege Karita Ottesen (observer from 12.12.2013) 899 825
Mai Britt Thune (observer) 3 551 3 167
Tor Henrik Hanken (deputy member from 12.12.2013) 232 -
Morten Fallstein (deputy member) 682 682
May-Iren Arnøy (deputy member from 12.12.2013) 24 -
Berthe Randmel (deputy member from 12.12.2013) 538 -
Baard Myhre (deputy member) 1 235 935
Espen Egeberg Christiansen (deputy member) 460 280
Dag Fredriksen (deputy member from 12.12.2013) 3 295 -
Håkon Berdal (deputy member) 3 136 2 539
1) Shareholdings not included for representatives who are no longer members as of 31 December 2013 and who do not have shares during 2012 and 2013.
Statement on the Group CEO and Group Executive Management remunerationThe statement on the Group CEO and Group Executive Management remuneration is established according to the following requirements:• Norwegian act on public limited liability companies (allmennaksjeloven) • The accounting act (regnskapsloven)• The Government’s policy on the remuneration of leading personnel issued by the Norwegian Ministry of Trade, Industry and Fisheries with
effect from 1 April 2011• The Norwegian Code of Practice for Corporate Governance
1. Remuneration policyThe objective of the Group’s remuneration policy is to ensure that reward in Telenor Group shall contribute to attracting, engaging and retaining the right employees to deliver sustainable value for shareholders in accordance with the Telenor way.
The following key remuneration principles apply:1. Reward for performance
Rewards shall be based on the results of an individual’s overall performance evaluated against objective and transparent criteria.2. Support balanced goals
Reward should be tied to a balanced combination of goals that align individual’s goal with Telenor’s business goals and the economic interests of its shareholders.
3. Offer competitive total reward Telenor seeks to offer total reward packages that are attractive and competitive (without taking the lead) both within the organization, as well as in the local labour market.
2. Remuneration governance The Board of Directors (the Board) has appointed a separate Governance and Remuneration Committee (GRC) which acts as an advisor for the Board of Directors and the Group CEO and is responsible for monitoring, evaluating and recommending executive remuneration and Group remuneration programmes.
The committee comprises of the Chairman of the Board, two of the shareholder elected Board members and one employee representative. The Group CEO normally attends the Committee meetings. Other representatives of the management attend upon notice; the Committee may dismiss their attendance when appropriate, and likewise call for attendance from other relevant sources. The secretary of the Board acts as secretary of the Committee unless otherwise agreed.
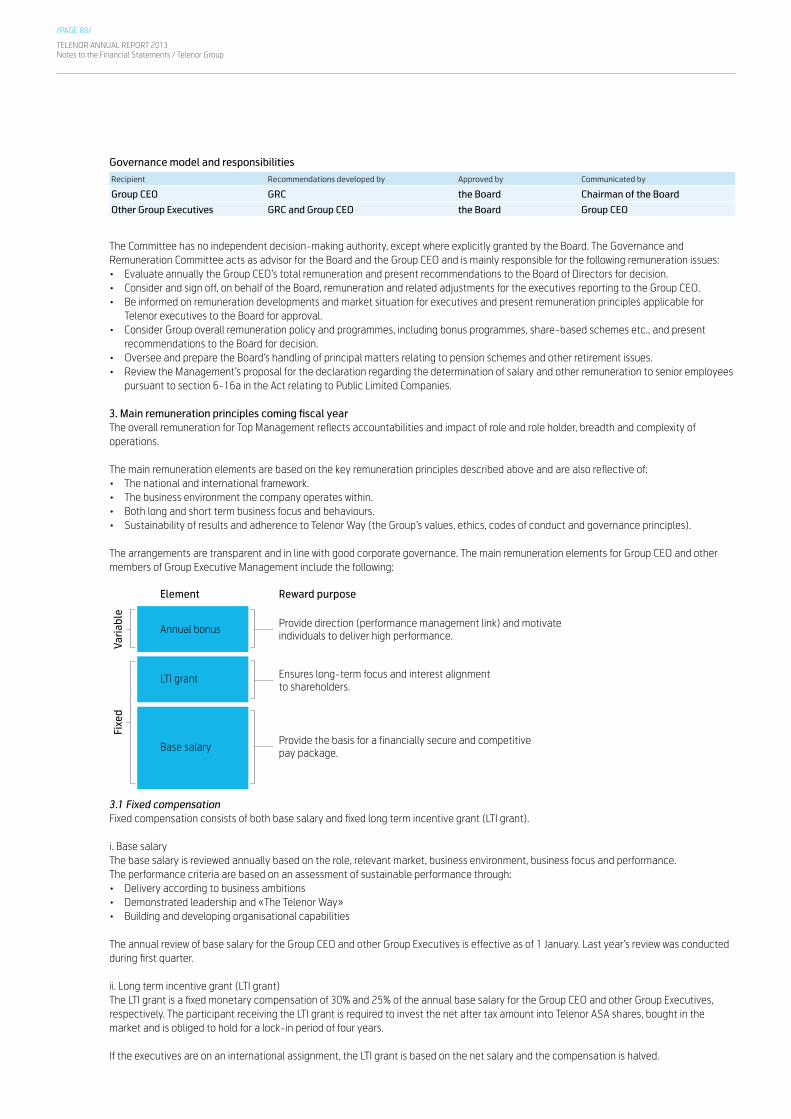
TELENOR ANNUAL REPORT 2013Notes to the Financial Statements / Telenor Group
/PAGE 88/
Governance model and responsibilities
Recipient Recommendations developed by Approved by Communicated by
Group CEO GRC the Board Chairman of the Board
Other Group Executives GRC and Group CEO the Board Group CEO
The Committee has no independent decision-making authority, except where explicitly granted by the Board. The Governance and Remuneration Committee acts as advisor for the Board and the Group CEO and is mainly responsible for the following remuneration issues:• Evaluate annually the Group CEO’s total remuneration and present recommendations to the Board of Directors for decision. • Consider and sign off, on behalf of the Board, remuneration and related adjustments for the executives reporting to the Group CEO. • Be informed on remuneration developments and market situation for executives and present remuneration principles applicable for
Telenor executives to the Board for approval.• Consider Group overall remuneration policy and programmes, including bonus programmes, share-based schemes etc., and present
recommendations to the Board for decision.• Oversee and prepare the Board’s handling of principal matters relating to pension schemes and other retirement issues.• Review the Management’s proposal for the declaration regarding the determination of salary and other remuneration to senior employees
pursuant to section 6-16a in the Act relating to Public Limited Companies.
3. Main remuneration principles coming fiscal yearThe overall remuneration for Top Management reflects accountabilities and impact of role and role holder, breadth and complexity of operations.
The main remuneration elements are based on the key remuneration principles described above and are also reflective of: • The national and international framework.• The business environment the company operates within.• Both long and short term business focus and behaviours.• Sustainability of results and adherence to Telenor Way (the Group’s values, ethics, codes of conduct and governance principles).
The arrangements are transparent and in line with good corporate governance. The main remuneration elements for Group CEO and other members of Group Executive Management include the following:
3.1 Fixed compensationFixed compensation consists of both base salary and fixed long term incentive grant (LTI grant).
i. Base salaryThe base salary is reviewed annually based on the role, relevant market, business environment, business focus and performance.The performance criteria are based on an assessment of sustainable performance through:• Delivery according to business ambitions• Demonstrated leadership and «The Telenor Way»• Building and developing organisational capabilities
The annual review of base salary for the Group CEO and other Group Executives is effective as of 1 January. Last year’s review was conducted during first quarter.
ii. Long term incentive grant (LTI grant)The LTI grant is a fixed monetary compensation of 30% and 25% of the annual base salary for the Group CEO and other Group Executives, respectively. The participant receiving the LTI grant is required to invest the net after tax amount into Telenor ASA shares, bought in the market and is obliged to hold for a lock-in period of four years.
If the executives are on an international assignment, the LTI grant is based on the net salary and the compensation is halved.
Reward purpose
Provide the basis for a financially secure and competitive pay package.
Element
Annual bonus
LTI grant
Base salary
Varia
ble
Fixe
d
Provide direction (performance management link) and motivate individuals to deliver high performance.
Ensures long-term focus and interest alignment to shareholders.

/PAGE 89/
TELENOR ANNUAL REPORT 2013Notes to the Financial Statements / Telenor Group
Eligibility to the LTI grant is limited to:1. Group CEO and other Group Executives 2. Other direct reports to the Group CEO3. Management and experts of business areas, subsidiaries and group functions according to the following criteria:
a. the position and individual is important in realising the Telenor Group ambitions;b. the individual has demonstrated behaviour in line with our value- and performance oriented framework; c. the individual is expected to continue in a role covered by the Programme;d. the individual will not retire during the first year of the programme; e. the individual is considered critical for Business Unit(s) and is flexible to relocate if required for realizing group ambitions; f. the individual has been identified as a retention risk and difficult to replace with similar capability.
If the participant leaves Telenor during the lock-in period, the participant has to repay to Telenor an amount equal to the quoted market value of shares held at the time of resignation. If the participant leaves Telenor during the lock-in period due to circumstances within Telenor, the participant is not obliged to repay the value of the shares held.
3.2 Variable pay / Annual bonusThe variable pay consists of the annual bonus. Variable pay is annually capped at 50% of the fixed compensation (in line with the Government’s guidelines on the remuneration of leading personnel). Total variable pay is calculated based on individual bonus scorecards and long term performance of total shareholder return (TSR) of Telenor shares (TSR multiplier).
The bonus payments are subject to vacation pay, but not included in the pensionable earnings.
The Group CEO and other Group Executives should at a minimum have, and keep, shareholdings corresponding to the value of one annual base salary. In order to fulfil this requirement, the executive is required to invest up to 20% of the bonus payment in Telenor ASA shares.
i. Individual annual bonus scorecardsEach individual will have a bonus scorecard with defined key performance indicators (KPIs). The KPIs may be based on goals and objectives which are defined at group, region, business unit or individual level in the following KPI areas: • Growth• Profitability• Efficiency• Customer satisfaction• Business strategy• Holistic assessment based on sustainability of results and adherence to the Telenor Way
The specific design of individual bonus scorecards, with regards to KPIs and weights of these, will reflect the role and responsibility of a particular position.
The individual’s ‘overall bonus achievement’ is based on performance evaluated against these. The individual bonus achievement may range between 0% - 100%.
Bonus potential for achievement of target performance level for the Group CEO and other Group Executives is 25% of the annual bonus basis (annual base salary including the fixed LTI grant).
ii. TSR multiplierThe individual achievement in the bonus scorecards can be increased by a Total Shareholder Return Multiplier (TSR multiplier). The TSR multiplier’s effect on the individual achievement is based on the absolute and relative Total Shareholder return of the Telenor ASA share.
Requirements for the TSR multiplier to come into effect:• Telenor ASA share must have an absolute positive TSR over the two year period from December 2012 to December 2014 • Telenor ASA share performs better than the performance benchmark (index) 1)
The TSR multiplier is calculated based on TSR performance for the period from December 2012 to December 2014. The TSR multiplier will be used in calculation for bonus 2014, paid out in 2015.
TSR multiplier design:• If the gross return on the Telenor ASA share develops better than the performance benchmark (index), over the two year period from
December 2012 to December 2014, the TSR multiplier will vary from 1 to maximum 2, corresponding to Telenor ASA share’s performance of 0 percentage to 15 percentage points above the index, respectively.
• The value of the TSR multiplier increases linearly between 0 and 15 percentage points.
The calculation of total bonus achievement if a TSR multiplier comes into effect is: [Bonus achievement in %] x [TSR multiplier].
1) The performance benchmark (index) is the STOXX® Europe 600 Telecommunications index (SXKGR).
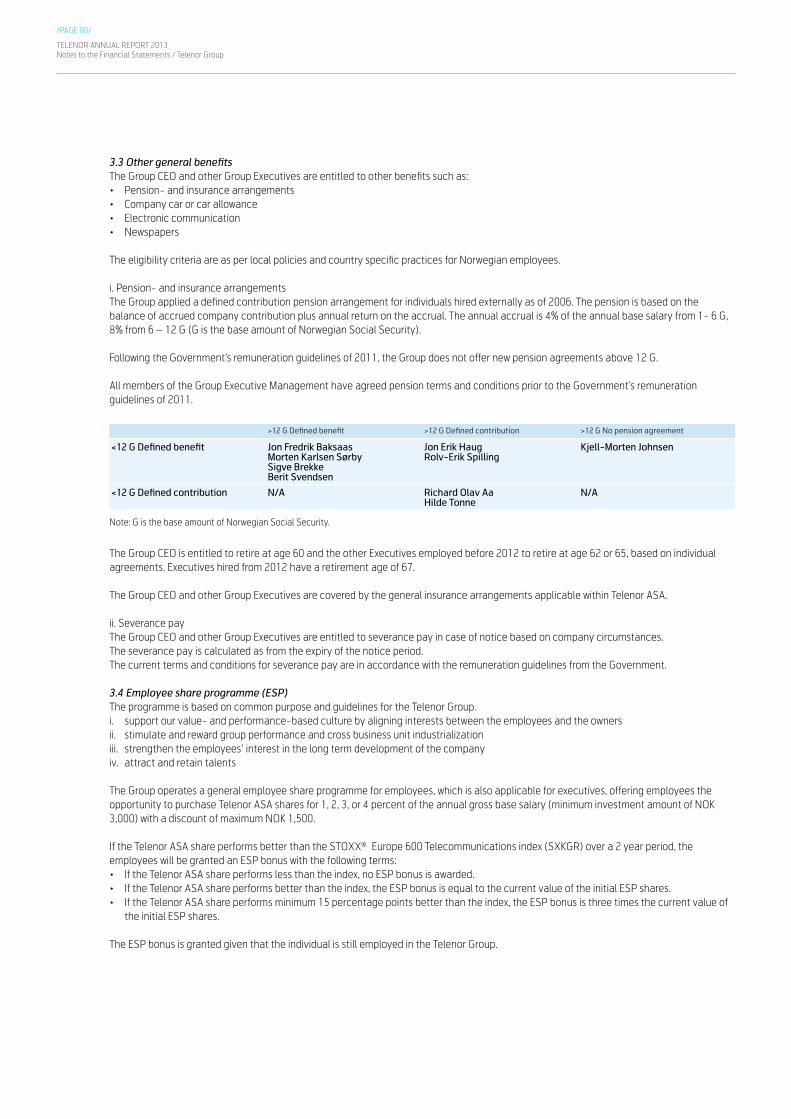
TELENOR ANNUAL REPORT 2013Notes to the Financial Statements / Telenor Group
/PAGE 90/
3.3 Other general benefitsThe Group CEO and other Group Executives are entitled to other benefits such as: • Pension- and insurance arrangements • Company car or car allowance• Electronic communication• Newspapers
The eligibility criteria are as per local policies and country specific practices for Norwegian employees.
i. Pension- and insurance arrangementsThe Group applied a defined contribution pension arrangement for individuals hired externally as of 2006. The pension is based on the balance of accrued company contribution plus annual return on the accrual. The annual accrual is 4% of the annual base salary from 1- 6 G, 8% from 6 – 12 G (G is the base amount of Norwegian Social Security).
Following the Government’s remuneration guidelines of 2011, the Group does not offer new pension agreements above 12 G.
All members of the Group Executive Management have agreed pension terms and conditions prior to the Government’s remuneration guidelines of 2011.
>12 G Defined benefit >12 G Defined contribution >12 G No pension agreement
<12 G Defined benefit Jon Fredrik BaksaasMorten Karlsen SørbySigve BrekkeBerit Svendsen
Jon Erik HaugRolv-Erik Spilling
Kjell-Morten Johnsen
<12 G Defined contribution N/A Richard Olav AaHilde Tonne
N/A
Note: G is the base amount of Norwegian Social Security.
The Group CEO is entitled to retire at age 60 and the other Executives employed before 2012 to retire at age 62 or 65, based on individual agreements. Executives hired from 2012 have a retirement age of 67.
The Group CEO and other Group Executives are covered by the general insurance arrangements applicable within Telenor ASA.
ii. Severance payThe Group CEO and other Group Executives are entitled to severance pay in case of notice based on company circumstances. The severance pay is calculated as from the expiry of the notice period. The current terms and conditions for severance pay are in accordance with the remuneration guidelines from the Government.
3.4 Employee share programme (ESP)The programme is based on common purpose and guidelines for the Telenor Group. i. support our value- and performance-based culture by aligning interests between the employees and the ownersii. stimulate and reward group performance and cross business unit industrializationiii. strengthen the employees’ interest in the long term development of the companyiv. attract and retain talents
The Group operates a general employee share programme for employees, which is also applicable for executives, offering employees the opportunity to purchase Telenor ASA shares for 1, 2, 3, or 4 percent of the annual gross base salary (minimum investment amount of NOK 3,000) with a discount of maximum NOK 1,500.
If the Telenor ASA share performs better than the STOXX® Europe 600 Telecommunications index (SXKGR) over a 2 year period, the employees will be granted an ESP bonus with the following terms: • If the Telenor ASA share performs less than the index, no ESP bonus is awarded. • If the Telenor ASA share performs better than the index, the ESP bonus is equal to the current value of the initial ESP shares.• If the Telenor ASA share performs minimum 15 percentage points better than the index, the ESP bonus is three times the current value of
the initial ESP shares.
The ESP bonus is granted given that the individual is still employed in the Telenor Group.

/PAGE 91/
TELENOR ANNUAL REPORT 2013Notes to the Financial Statements / Telenor Group
4. Remuneration principles and implementation previous fiscal yearThe remuneration principles applied in 2013 for the Group CEO and other Group Executives are basically the same as explained above for 2014. Group CEO and other Group Executives had the opportunity to receive a LTI bonus in 2013. The LTI bonus for 2013 program was discontinued. The TSR multiplier is effective from 2014 as described above. The LTI bonus for 2011 program paid out in 2013 is described in section 4.2 below.
Share based programmes, which started in 2010, awarded bonus shares to participants in 2013. This award was based on Telenor ASA share performance relative to the respective benchmarked indexes. The participants of both these programmes are required to purchase Telenor ASA shares for the net bonus awarded in each programme.
4.1 Employee share programmeEmployee share programme (ESP) 2012 was implemented with the same terms and conditions as explained in the previous section.
ESP 2011 resulted in bonus shares in 2013. Based on the above performance criteria the 2011 programme ended with the Telenor ASA share beating the benchmarked index (SXKGR) by 44 percentage points.
4.2 Long term incentive bonus (LTI bonus)In 2013 the Executive Management had the opportunity to receive a Long term incentive bonus (LTI bonus) from the LTI programme 2011, in addition to the annual bonus for 2012.
Long Term Incentive (LTI) programme 2011 was implemented with the following terms and conditions: • The participant in the LTI programme is entitled to an LTI bonus after the first two years of the programme period if the performance
benchmark is achieved. • The participant is obliged to invest the whole net LTI bonus, if any, in Telenor ASA shares with further obligation to hold during the defined
lock-in period of the programme.
Performance benchmark:• The gross return on the Telenor ASA share develops better relative to the STOXX® Europe 600 Telecommunications index (SXKGR) over
the two year period from December 2010 to December 2012.
LTI bonus terms:• If the Telenor ASA share performs less than the index, no LTI bonus is awarded. • If the Telenor ASA share performs better than the index, the LTI bonus is equal to the current value of the initial LTI shares. • If the Telenor ASA share performs minimum 15 percentage points better than the index, the LTI bonus is three times the current value of
the initial LTI shares.
If the calculated variable pay exceeds 50% of fixed compensation for the full year, the variable pay cap is enforced by calculating the annual bonus first and then any LTI bonus is reduced.
If the executives are on an international assignment, any LTI bonus is net and hence, following the same methodology as the initial LTI grant, reduced to half of the current value.
If the participant leaves Telenor during the lock-in period, the participant has to repay to Telenor an amount equal the market value of shares held. If the participant leaves Telenor during the lock-in period due to circumstances within Telenor, the participant is not obliged to repay the value of the shares held.
The Telenor ASA share gross return beat the benchmarked index by 44 percentage points and thereby resulted in a 3:1 matching LTI bonus for the participants in the LTI programme 2011.
In 2013 the total variable pay (annual bonus and LTI bonus) for some members of Group Executive Management was capped at 50% of their respective fixed compensation term for the year. This is according to the Government’s guidelines on the remuneration of leading personnel.

TELENOR ANNUAL REPORT 2013Notes to the Financial Statements / Telenor Group
/PAGE 92/
Actual remuneration to the Group CEO and Group Executive Management During 2013, the Group Executive Management consisted of the following members:
Member Position
Jon Fredrik Baksaas Group Chief Executive Officer (CEO)
Morten Karlsen Sørby *) EVP and Head of Strategy and Regulatory Affairs
Sigve Brekke EVP and Head of Asia region
Richard Olav Aa EVP and Group Chief Financial Officer (CFO)
Hilde M. Tonne EVP and Head of Group Industrial Development
Berit Svendsen EVP and Chief Executive Officer Norway
Kjell-Morten Johnsen EVP and Head of Europe region
Rolv-Erik Spilling EVP and Head of Digital Services
Jon Erik Haug EVP and Head of Group People Development
*) Morten Karlsen Sørby was a member of GEM until 31 December 2013.
Aggregate remuneration including pension cost for the Group Executive Management was NOK 72.3 million in 2013 and NOK 71.9 million in 2012. The pension costs included in these figures were NOK 11.0 million in 2013 and NOK 11.2 million in 2012. The remuneration includes the long term incentive granted in 2013 and 2012. See description in the statement above. For details see tables below.
None of the members of the Group Executive Management have loans in the company
Remuneration to Group Executive Management 2013
Fixed compensation (while being member
of the GEM)
Variable pay (capped at 50% of fixed
compensation for the full year)
Other benefits 1)
Total salary and other
taxable income 5)
Pension benefit
earned 2) TotalNOK in thousandsBase
salary
Long term incentive (LTI)
grantAnnual bonus
paid 2013
Long term incentive
bonus paid 2013
Jon Fredrik Baksaas 5 300 1 545 2 101 1 322 1 240 11 507 3 259 14 766
Morten Karlsen Sørby 3 250 787 1 165 853 1 057 7 113 1 955 9 067
Sigve Brekke 3a), 7a) 3 100 375 1 312 630 5 982 11 398 1 716 13 114
Richard Olav Aa 3 000 725 1 079 784 731 6 318 1 017 7 336
Hilde M. Tonne 2 535 634 815 643 213 4 840 897 5 737
Berit Svendsen 2 425 587 884 - 372 4 268 1 166 5 434
Kjell-Morten Johnsen 8a) 3 435 834 1 421 702 376 6 768 167 6 935
Rolv-Erik Spilling 8b) 2 350 587 573 502 222 4 235 394 4 629
Jon Erik Haug 8c) 2 350 587 990 479 430 4 836 425 5 261
Remuneration to Group Executive Management 2012
Fixed compensation (while being member of
the GEM)
Variable pay (capped at 50% of fixed
compensation for the full year)
Other benefits 1)
Total salary and other
taxable income 5)
Pension benefit
earned 2) TotalNOK in thousandsBase
salary
Long term incentive
(LTI) grant
Annual bonus paid
2012
Long term incentive
bonus paid 2012
Jon Fredrik Baksaas 5 150 1 519 1 884 1 441 770 10 764 3 246 14 010
Morten Karlsen Sørby 3 150 777 1 038 921 773 6 659 1 728 8 387
Sigve Brekke 3a), 7b) 2 987 367 1 154 527 5 128 10 163 1 742 11 905
Richard Olav Aa 2 900 696 995 799 341 5 732 928 6 660
Hilde M. Tonne 3b), 7c) 2 310 245 836 289 3 087 6 768 662 7 430
Berit Svendsen 6) 2 350 595 419 - 223 3 587 1 096 4 683
Kjell-Morten Johnsen 3c), 6), 7d), 8a) (from 11 May 2012) 4) 1 509 - 869 295 3 026 5 699 121 5 820
Rolv-Erik Spilling 8b) (from 1 November 2012) 4) 392 - - - 34 426 61 487
Jon Erik Haug 8c) (from 1 November 2012) 4) 392 - - - 96 488 62 550
Oddvar Hesjedal (until 31 October 2012) 4) 1 875 534 761 667 199 4 036 1 093 5 129
Kristin Skogen Lund (until 31 October 2012) 4) 2 267 671 787 905 261 4 891 4 4 895
Bjørn Magnus Kopperud (until 10 May 2012) 4) 767 570 - - 172 1 508 455 1 963
All figures are exclusive social security tax.

/PAGE 93/
TELENOR ANNUAL REPORT 2013Notes to the Financial Statements / Telenor Group
1) Include items such as vacation allowance beyond ordinary monthly pay, insurance, company car benefit or car allowance, taxable bonus shares related to employee share programme etc.
For Sigve Brekke, Kjell Morten Johnsen (only in 2012) and Hilde Tonne (only in 2012), expatriate allowances as well as tax benefit on net salary, LTI grant, annual bonus, LTI bonus and benefits are included due to their international assignments. Also for these members, benefits such as accommodation, travel, children’s education, etc. are included.
2) The calculations of pension benefits earned are based on the same actuarial and other assumptions as used in the pension benefit calculations in note 25.3) The individual’s base salary figures presented in the table for 2013 reflect net amounts, while for 2012 the base salary figures reflect gross amounts. The
individual has entitlement to guaranteed net annual salary due to international assignment. In addition, LTI grant, annual bonus and LTI bonus are paid out on net basis. a) In 2012 Sigve Brekke received guaranteed net salary of NOK 3,000,000. b) During 2012, Hilde Tonne received a guaranteed net salary of NOK 1,166,675. c) During 2012, Kjell-Morten Johnsen received a guaranteed net salary of NOK 686,668.
4) The compensation is based on individual’s respective period in the Group Executive Management.5) For number of options granted and outstanding as well as their terms, see section on options and shares below.6) Variable pay consisting of annual bonus and LTI bonus paid during the year is related to the individual’s former position other than Group Executive
Management in the year before. 7) LTI bonus figures reflect capped amounts after enforcing the variable pay cap for those applicable as explained in the main remuneration principles. Variable
pay (annual bonus plus LTI bonus) divided by fixed compensation (‘annual’ base salary per 1 January plus LTI grant) can be maximum 50%. For those having guaranteed net salary, their variable pay as well as the cap are based on net amounts. For those who have served for less than one full year in Group Executive Management, the calculation was based on annualized amounts. a) Sigve Brekke was entitled to net NOK 3,100, 000 per 1 January 2013. The LTI grant, annual bonus and LTI bonus were paid out on net basis. He also received
an extra-ordinary bonus of net NOK 261,000. As a result the variable pay received exceeded 50% of the fixed salary. b) Sigve Brekke was entitled to net NOK 3,000,000 per 1 January 2012. He received net LTI grant of NOK 367,191, net annual bonus of NOK 1,154,000 and
capped net LTI bonus of NOK 527,000. c) Hilde Tonne was entitled to net NOK 2,000,000 per 1 January 2012. She received net LTI grant of NOK 245,343, net annual bonus of NOK 836,000 and
capped net LTI bonus of NOK 289,000. d) Kjell-Morten Johnsen was entitled to net NOK 2,060,000 per 1 January 2012. He received net LTI grant of NOK 202,365, net annual bonus of NOK 868,636
and net LTI bonus of NOK 294,849. The calculations of variable pay were based on his former position abroad in 2011. 8) The base salary for the individual includes compensation for pension of base salary above 12G. This compensation is equivalent to the amount given below:
a) Kjell-Morten Johnsen: 15% of base salary. b) Rolv-Erik Spilling: 12.5% of base salary above 12G.c) Jon Erik Haug: 7% of base salary.
Individual terms
Name
Agreed period ofnotice, monthsbase salary
Severance paymonths base Salary Pension benefits
Jon Fredrik Baksaas 6 months
24 months. In case of new position the severance pay is reduced by 75% of income in new position
60% defined benefit of a defined pension-qualifying income of NOK 4,955,194 (per 01.01.2013) until the age of 70, thereafter 58%. The pension-qualifying income cap is adjusted with CPI-ATE (consumer price index adjusted for changes in indirect taxes and excluding energy products) January 1 every year. Retirement age 60.
Morten Karlsen Sørby 6 months 6 months60% defined benefit of base salary until the age of 72, thereafter 58%. Retirement age 62.
Sigve Brekke 6 months 6 months60% defined benefit of base salary until the age of 75, thereafter 58%. Retirement age 65.
Richard Olav Aa 6 months 6 months
Defined contribution, 4% of 1 – 6 G, 8% of 6-12 G and 30% of base salary above 12 G. In addition, annual contribution of 10% of base salary for early retirement scheme. Retirement age 65.
Hilde Tonne 6 months 6 months
Defined contribution, 4% of 1 – 6 G, 8% of 6-12 G and 30% of base salary above 12 G. In addition, annual contribution of 10% of base salary for early retirement scheme. Retirement age 65.
Berit Svendsen 6 months 6 months60% defined benefit of base salary until the age of 72, thereafter 58%. Retirement age 62.
Kjell-Morten Johnsen 6 months 6 months 66% defined benefit of base salary up to 12 G. Retirement age 67.
Rolv-Erik Spilling 6 months 6 months66% defined benefit of base salary up to 12 G. Defined contribution, 15% of base salary above 12 G. Retirement age 67.
Jon Erik Haug 6 months 6 months66% defined benefit of base salary up to 12 G. Defined contribution, 15% of Base salary above 12 G. Retirement age 67.
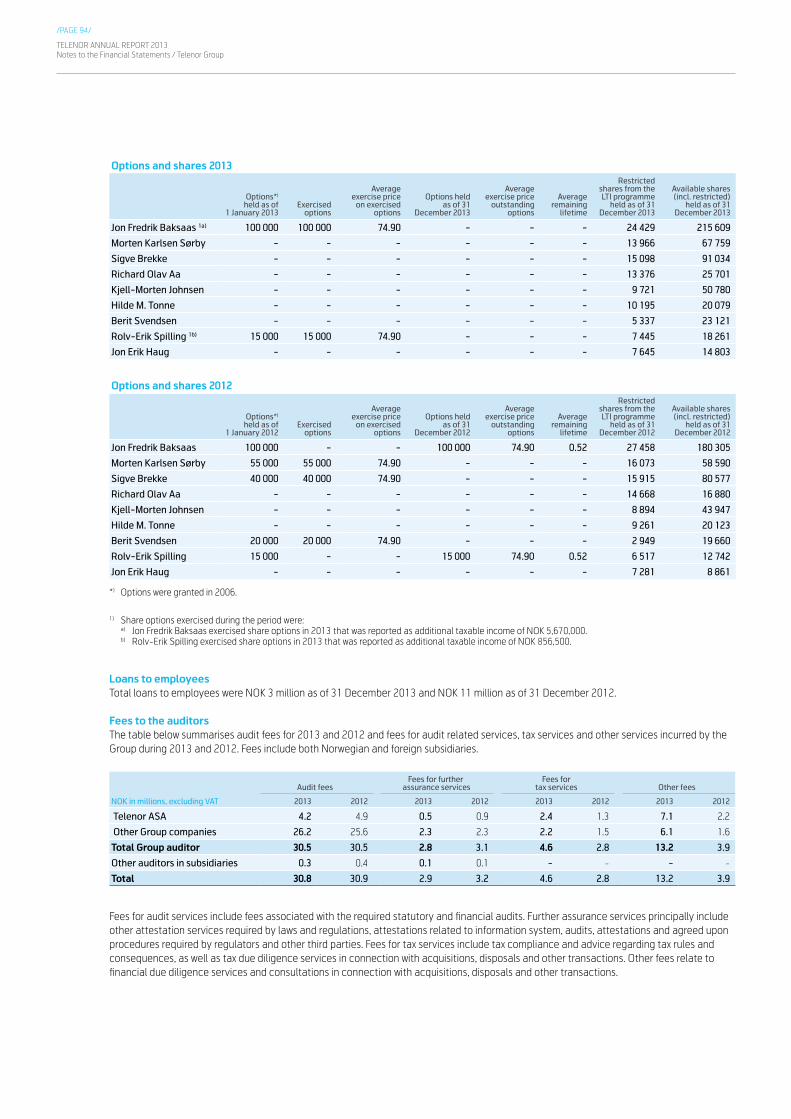
TELENOR ANNUAL REPORT 2013Notes to the Financial Statements / Telenor Group
/PAGE 94/
Options and shares 2013
Options*) held as of
1 January 2013Exercised
options
Average exercise price
on exercised options
Options held as of 31
December 2013
Average exercise price
outstanding options
Average remaining
lifetime
Restricted shares from the LTI programme
held as of 31 December 2013
Available shares (incl. restricted)
held as of 31 December 2013
Jon Fredrik Baksaas 1a) 100 000 100 000 74.90 - - - 24 429 215 609
Morten Karlsen Sørby - - - - - - 13 966 67 759
Sigve Brekke - - - - - - 15 098 91 034
Richard Olav Aa - - - - - - 13 376 25 701
Kjell-Morten Johnsen - - - - - - 9 721 50 780
Hilde M. Tonne - - - - - - 10 195 20 079
Berit Svendsen - - - - - - 5 337 23 121
Rolv-Erik Spilling 1b) 15 000 15 000 74.90 - - - 7 445 18 261
Jon Erik Haug - - - - - - 7 645 14 803
Options and shares 2012
Options*) held as of
1 January 2012Exercised
options
Average exercise price
on exercised options
Options held as of 31
December 2012
Average exercise price
outstanding options
Average remaining
lifetime
Restricted shares from the LTI programme
held as of 31 December 2012
Available shares (incl. restricted)
held as of 31 December 2012
Jon Fredrik Baksaas 100 000 - - 100 000 74.90 0.52 27 458 180 305
Morten Karlsen Sørby 55 000 55 000 74.90 - - - 16 073 58 590
Sigve Brekke 40 000 40 000 74.90 - - - 15 915 80 577
Richard Olav Aa - - - - - - 14 668 16 880
Kjell-Morten Johnsen - - - - - - 8 894 43 947
Hilde M. Tonne - - - - - - 9 261 20 123
Berit Svendsen 20 000 20 000 74.90 - - - 2 949 19 660
Rolv-Erik Spilling 15 000 - - 15 000 74.90 0.52 6 517 12 742
Jon Erik Haug - - - - - - 7 281 8 861
*) Options were granted in 2006.
1) Share options exercised during the period were:a) Jon Fredrik Baksaas exercised share options in 2013 that was reported as additional taxable income of NOK 5,670,000. b) Rolv-Erik Spilling exercised share options in 2013 that was reported as additional taxable income of NOK 856,500.
Loans to employeesTotal loans to employees were NOK 3 million as of 31 December 2013 and NOK 11 million as of 31 December 2012.
Fees to the auditors The table below summarises audit fees for 2013 and 2012 and fees for audit related services, tax services and other services incurred by the Group during 2013 and 2012. Fees include both Norwegian and foreign subsidiaries.
Audit feesFees for further
assurance servicesFees for
tax services Other fees
NOK in millions, excluding VAT 2013 2012 2013 2012 2013 2012 2013 2012
Telenor ASA 4.2 4.9 0.5 0.9 2.4 1.3 7.1 2.2
Other Group companies 26.2 25.6 2.3 2.3 2.2 1.5 6.1 1.6
Total Group auditor 30.5 30.5 2.8 3.1 4.6 2.8 13.2 3.9
Other auditors in subsidiaries 0.3 0.4 0.1 0.1 - - - -
Total 30.8 30.9 2.9 3.2 4.6 2.8 13.2 3.9
Fees for audit services include fees associated with the required statutory and financial audits. Further assurance services principally include other attestation services required by laws and regulations, attestations related to information system, audits, attestations and agreed upon procedures required by regulators and other third parties. Fees for tax services include tax compliance and advice regarding tax rules and consequences, as well as tax due diligence services in connection with acquisitions, disposals and other transactions. Other fees relate to financial due diligence services and consultations in connection with acquisitions, disposals and other transactions.
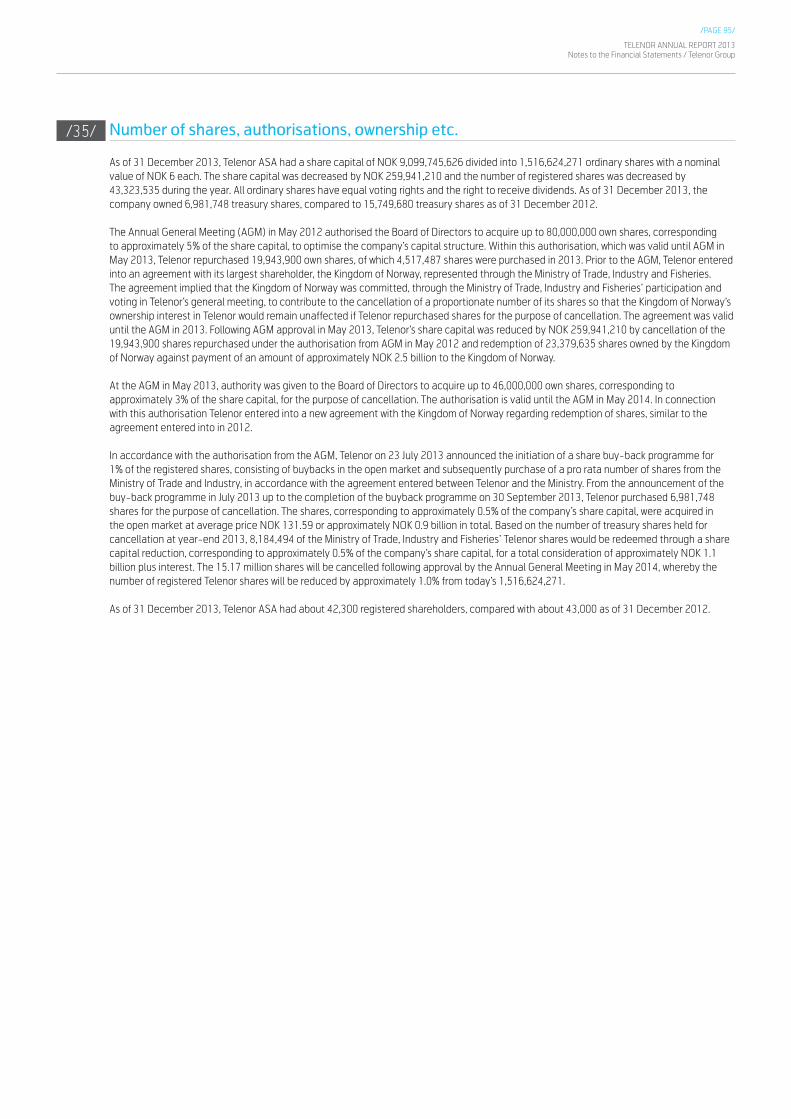
/PAGE 95/
TELENOR ANNUAL REPORT 2013Notes to the Financial Statements / Telenor Group
Number of shares, authorisations, ownership etc.
As of 31 December 2013, Telenor ASA had a share capital of NOK 9,099,745,626 divided into 1,516,624,271 ordinary shares with a nominal value of NOK 6 each. The share capital was decreased by NOK 259,941,210 and the number of registered shares was decreased by 43,323,535 during the year. All ordinary shares have equal voting rights and the right to receive dividends. As of 31 December 2013, the company owned 6,981,748 treasury shares, compared to 15,749,680 treasury shares as of 31 December 2012.
The Annual General Meeting (AGM) in May 2012 authorised the Board of Directors to acquire up to 80,000,000 own shares, corresponding to approximately 5% of the share capital, to optimise the company’s capital structure. Within this authorisation, which was valid until AGM in May 2013, Telenor repurchased 19,943,900 own shares, of which 4,517,487 shares were purchased in 2013. Prior to the AGM, Telenor entered into an agreement with its largest shareholder, the Kingdom of Norway, represented through the Ministry of Trade, Industry and Fisheries. The agreement implied that the Kingdom of Norway was committed, through the Ministry of Trade, Industry and Fisheries’ participation and voting in Telenor’s general meeting, to contribute to the cancellation of a proportionate number of its shares so that the Kingdom of Norway’s ownership interest in Telenor would remain unaffected if Telenor repurchased shares for the purpose of cancellation. The agreement was valid until the AGM in 2013. Following AGM approval in May 2013, Telenor’s share capital was reduced by NOK 259,941,210 by cancellation of the 19,943,900 shares repurchased under the authorisation from AGM in May 2012 and redemption of 23,379,635 shares owned by the Kingdom of Norway against payment of an amount of approximately NOK 2.5 billion to the Kingdom of Norway.
At the AGM in May 2013, authority was given to the Board of Directors to acquire up to 46,000,000 own shares, corresponding to approximately 3% of the share capital, for the purpose of cancellation. The authorisation is valid until the AGM in May 2014. In connection with this authorisation Telenor entered into a new agreement with the Kingdom of Norway regarding redemption of shares, similar to the agreement entered into in 2012.
In accordance with the authorisation from the AGM, Telenor on 23 July 2013 announced the initiation of a share buy-back programme for 1% of the registered shares, consisting of buybacks in the open market and subsequently purchase of a pro rata number of shares from the Ministry of Trade and Industry, in accordance with the agreement entered between Telenor and the Ministry. From the announcement of the buy-back programme in July 2013 up to the completion of the buyback programme on 30 September 2013, Telenor purchased 6,981,748 shares for the purpose of cancellation. The shares, corresponding to approximately 0.5% of the company’s share capital, were acquired in the open market at average price NOK 131.59 or approximately NOK 0.9 billion in total. Based on the number of treasury shares held for cancellation at year-end 2013, 8,184,494 of the Ministry of Trade, Industry and Fisheries’ Telenor shares would be redeemed through a share capital reduction, corresponding to approximately 0.5% of the company’s share capital, for a total consideration of approximately NOK 1.1 billion plus interest. The 15.17 million shares will be cancelled following approval by the Annual General Meeting in May 2014, whereby the number of registered Telenor shares will be reduced by approximately 1.0% from today’s 1,516,624,271.
As of 31 December 2013, Telenor ASA had about 42,300 registered shareholders, compared with about 43,000 as of 31 December 2012.
/35/
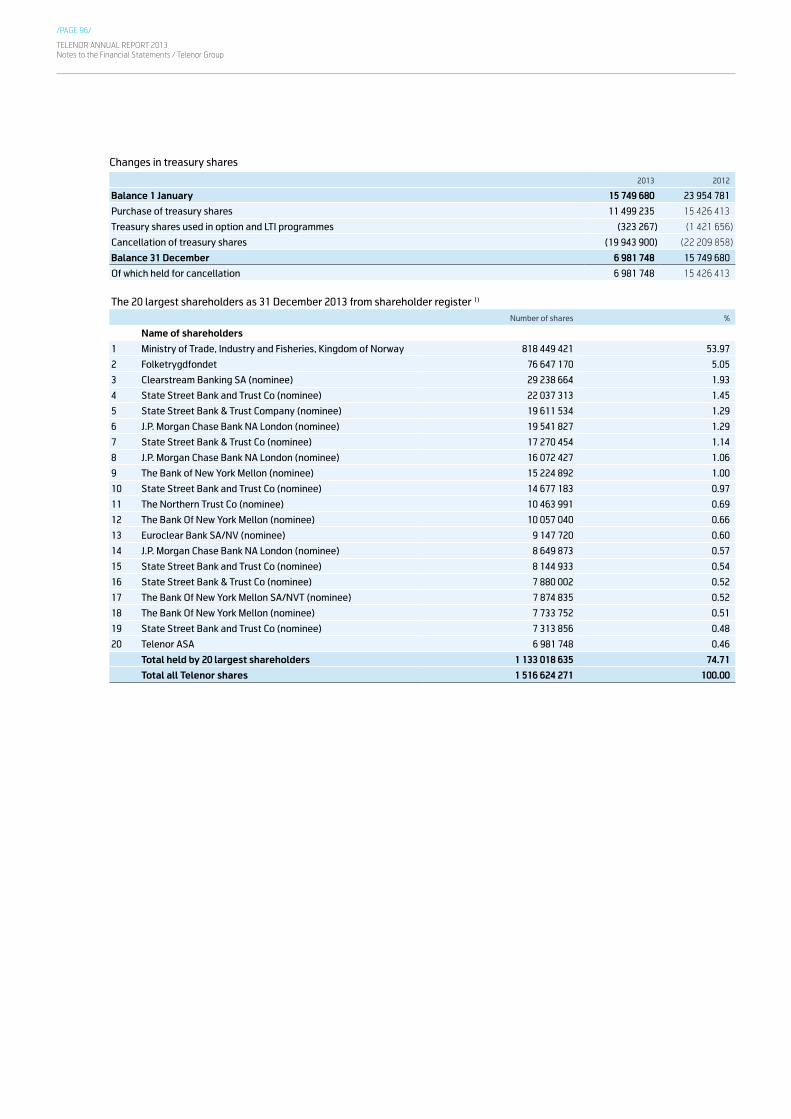
TELENOR ANNUAL REPORT 2013Notes to the Financial Statements / Telenor Group
/PAGE 96/
Changes in treasury shares
2013 2012
Balance 1 January 15 749 680 23 954 781
Purchase of treasury shares 11 499 235 15 426 413
Treasury shares used in option and LTI programmes (323 267) (1 421 656)
Cancellation of treasury shares (19 943 900) (22 209 858)
Balance 31 December 6 981 748 15 749 680
Of which held for cancellation 6 981 748 15 426 413
The 20 largest shareholders as 31 December 2013 from shareholder register 1)
Number of shares %
Name of shareholders
1 Ministry of Trade, Industry and Fisheries, Kingdom of Norway 818 449 421 53.97
2 Folketrygdfondet 76 647 170 5.05
3 Clearstream Banking SA (nominee) 29 238 664 1.93
4 State Street Bank and Trust Co (nominee) 22 037 313 1.45
5 State Street Bank & Trust Company (nominee) 19 611 534 1.29
6 J.P. Morgan Chase Bank NA London (nominee) 19 541 827 1.29
7 State Street Bank & Trust Co (nominee) 17 270 454 1.14
8 J.P. Morgan Chase Bank NA London (nominee) 16 072 427 1.06
9 The Bank of New York Mellon (nominee) 15 224 892 1.00
10 State Street Bank and Trust Co (nominee) 14 677 183 0.97
11 The Northern Trust Co (nominee) 10 463 991 0.69
12 The Bank Of New York Mellon (nominee) 10 057 040 0.66
13 Euroclear Bank SA/NV (nominee) 9 147 720 0.60
14 J.P. Morgan Chase Bank NA London (nominee) 8 649 873 0.57
15 State Street Bank and Trust Co (nominee) 8 144 933 0.54
16 State Street Bank & Trust Co (nominee) 7 880 002 0.52
17 The Bank Of New York Mellon SA/NVT (nominee) 7 874 835 0.52
18 The Bank Of New York Mellon (nominee) 7 733 752 0.51
19 State Street Bank and Trust Co (nominee) 7 313 856 0.48
20 Telenor ASA 6 981 748 0.46
Total held by 20 largest shareholders 1 133 018 635 74.71
Total all Telenor shares 1 516 624 271 100.00

/PAGE 97/
TELENOR ANNUAL REPORT 2013Notes to the Financial Statements / Telenor Group
The 20 largest shareholders as 31 December 2013, beneficial ownership 2)
Number of shares %
Name of shareholders
1 Ministry of Trade, Industry and Fisheries, Kingdom of Norway 818 449 421 53.97
2 Folketrygdfondet 76 647 170 5.05
3 Franklin Resources, Inc. 40 628 168 2.68
4 BlackRock, Inc. 31 202 891 2.06
5 FMR LLC 24 880 369 1.64
6 UBS AG 22 738 171 1.50
7 DNB ASA 19 993 102 1.32
8 SAFE Investment Company Limited 19 738 680 1.30
9 JPMorgan Chase & Company 13 350 949 0.88
10 State Street Corporation 13 099 853 0.86
11 Wellington Management Company, LLP 10 850 450 0.72
12 Kommunal Landspensjonskasse 10 647 278 0.70
13 Standard Life Investments Ltd. 9 965 024 0.66
14 Danske Bank Group 8 412 384 0.55
15 The Vanguard Group, Inc. 8 312 065 0.55
16 Deutsche Bank AG 8 264 726 0.54
17 Storebrand Kapitalforvaltning AS 8 125 782 0.54
18 William Blair & Company, L.L.C. 7 932 906 0.52
19 APG Groep N.V. 7 853 072 0.52
20 Manning & Napier Advisors, LLC 7 704 888 0.51
Total held by 20 largest shareholders 1 168 797 349 77.07
Total shares 1 516 624 271 100.00
1) Source: VPS share register2) The data is provided by Nasdaq OMX and is obtained through an analysis of beneficial ownership and fund manager information provided in replies to
disclosure of ownership notices issued to all custodians on the Telenor VPS share register. Every reasonable effort has been made to verify the data, however neither Telenor nor Nasdaq OMX can guarantee the accuracy of the analysis.
Events after the reporting period
Telenor MyanmarOn 30 January 2014, Telenor Group announced that it has signed an agreement with the Union Government of Myanmar for a nationwide telecommunication licence. The licence includes spectrum in the 900MHz and 2.1GHz bands and is valid for 15 years effective from 5 February 2014. The licence fee is USD 500 million. The Group plans to provide network coverage for 90% of the population in Myanmar within five years.
IndiaOn 13 February 2014, Uninor in India confirmed that it has successfully acquired additional spectrum in the 1800 MHz band in four of its six existing circles – Uttar Pradesh East, Uttar Pradesh West, Bihar and Jharkhand and Andhra Pradesh - and in the new circle of Assam at an investment of INR 8.4 billion. With these auctions, Uninor’s footprint now increases to seven circles.
Telenor ASATelenor ASA issued two bonds under the EMTN programme on 12 March 2014: one SEK 2.3 billion bond with fixed coupon rate of 2.375% and one SEK 1.1 billion bond with floating coupon rate of 3M Stibor + 0.63%, both with final maturity 19 March 2019.
/36/

/PAGE 98/
TELENOR ANNUAL REPORT 2013Financial Statements / Telenor ASA
NOK in millions Note 20132012
Restated
Revenues 1 505 591
Operating expenses
Salaries and personnel costs 2, 3 (780) (836)
Other operating expenses 4 (882) (1 041)
Depreciation, amortisation and impairment losses 8 (59) (128)
Total operating expenses (1 721) (2 005)
Operating profit (loss) (1 216) (1 414)
Financial income and expenses
Financial income 6 27 572 38 636
Financial expenses 6 (3 266) (5 248)
Net currency gains (losses) 6 (1 689) 244
Net change in fair value of financial instruments 6 423 71
Net gains (losses and impairment) of financial assets 6 (56) (162)
Net financial income (expenses) 6 22 984 33 541
Profit before taxes 21 768 32 127
Income taxes 7 (456) (264)
Net income 21 312 31 863
Income StatementTelenor ASA 1 January – 31 December
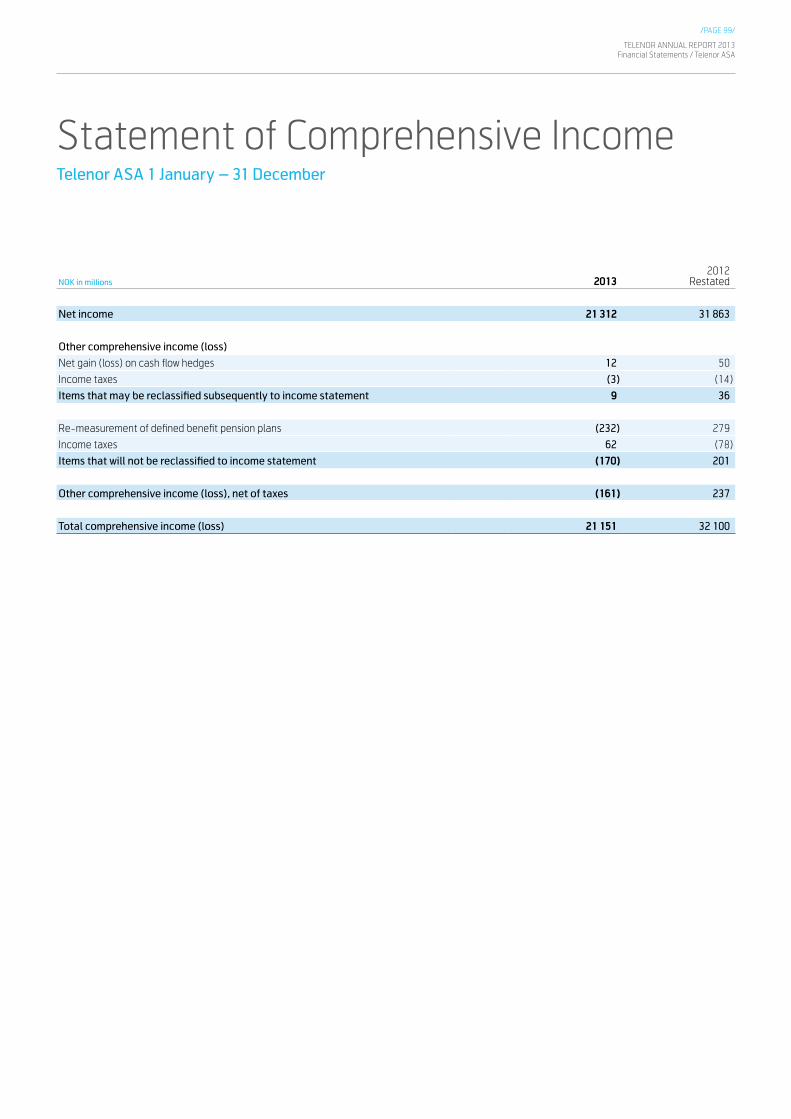
/PAGE 99/
TELENOR ANNUAL REPORT 2013Financial Statements / Telenor ASA
NOK in millions 20132012
Restated
Net income 21 312 31 863
Other comprehensive income (loss)
Net gain (loss) on cash flow hedges 12 50
Income taxes (3) (14)
Items that may be reclassified subsequently to income statement 9 36
Re-measurement of defined benefit pension plans (232) 279
Income taxes 62 (78)
Items that will not be reclassified to income statement (170) 201
Other comprehensive income (loss), net of taxes (161) 237
Total comprehensive income (loss) 21 151 32 100
Statement of Comprehensive IncomeTelenor ASA 1 January – 31 December
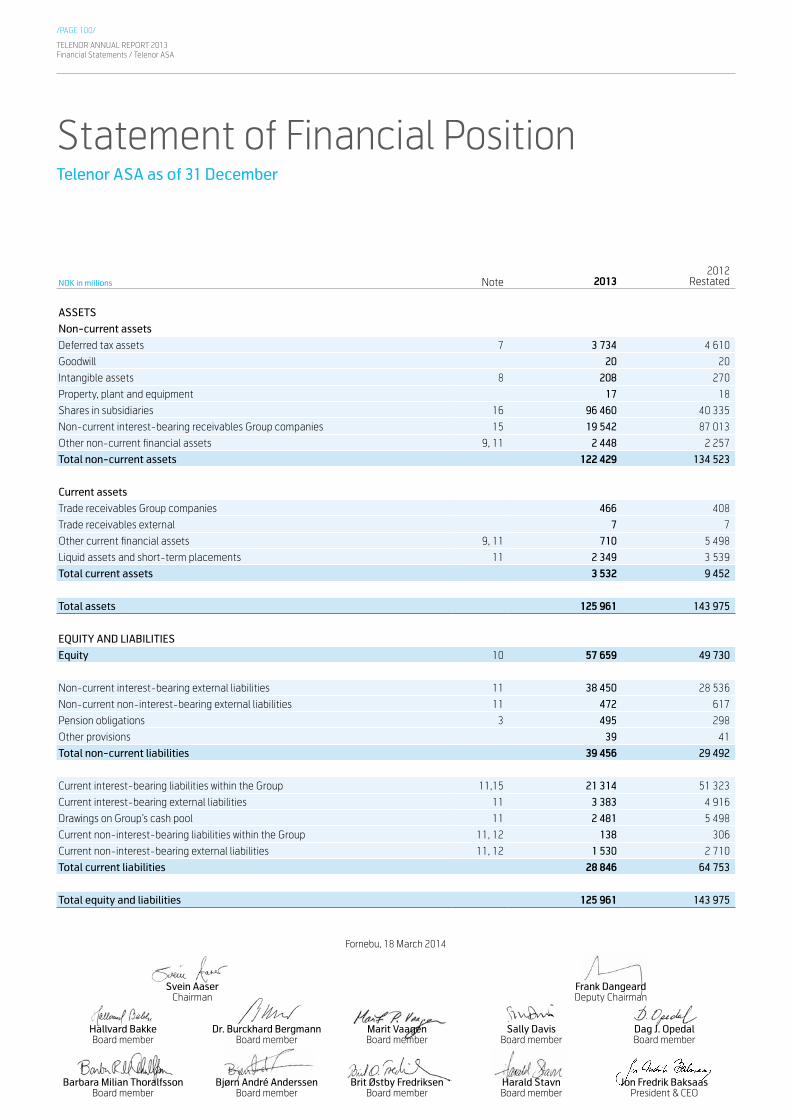
/PAGE 100/
TELENOR ANNUAL REPORT 2013Financial Statements / Telenor ASA
NOK in millions Note 20132012
Restated
ASSETS
Non-current assets
Deferred tax assets 7 3 734 4 610
Goodwill 20 20
Intangible assets 8 208 270
Property, plant and equipment 17 18
Shares in subsidiaries 16 96 460 40 335
Non-current interest-bearing receivables Group companies 15 19 542 87 013
Other non-current financial assets 9, 11 2 448 2 257
Total non-current assets 122 429 134 523
Current assets
Trade receivables Group companies 466 408
Trade receivables external 7 7
Other current financial assets 9, 11 710 5 498
Liquid assets and short-term placements 11 2 349 3 539
Total current assets 3 532 9 452
Total assets 125 961 143 975
EQUITY AND LIABILITIES
Equity 10 57 659 49 730
Non-current interest-bearing external liabilities 11 38 450 28 536
Non-current non-interest-bearing external liabilities 11 472 617
Pension obligations 3 495 298
Other provisions 39 41
Total non-current liabilities 39 456 29 492
Current interest-bearing liabilities within the Group 11,15 21 314 51 323
Current interest-bearing external liabilities 11 3 383 4 916
Drawings on Group’s cash pool 11 2 481 5 498
Current non-interest-bearing liabilities within the Group 11, 12 138 306
Current non-interest-bearing external liabilities 11, 12 1 530 2 710
Total current liabilities 28 846 64 753
Total equity and liabilities 125 961 143 975
Statement of Financial PositionTelenor ASA as of 31 December
Fornebu, 18 March 2014
Svein Aaser Frank Dangeard Chairman Deputy Chairman
Hallvard Bakke Dr. Burckhard Bergmann Marit Vaagen Sally Davis Dag J. Opedal Board member Board member Board member Board member Board member
Barbara Milian Thoralfsson Bjørn André Anderssen Brit Østby Fredriksen Harald Stavn Jon Fredrik Baksaas Board member Board member Board member Board member President & CEO

/PAGE 101/
TELENOR ANNUAL REPORT 2013Financial Statements / Telenor ASA
NOK in millions 2013 2012
Profit before taxes 21 768 32 127
Income taxes paid (1 187) (1 486)
Net (gains) losses, impairment and change in fair value of financial assets and liabilities (388) 163
Depreciation, amortisation and impairment losses 59 128
Net currency (gains) losses not relating to operating activities 1 603 (249)
Net changes in interest accruals against Group companies (1 174) (1 763)
Provision for guarantees 1 354 (6 072)
Interest received 326 336
Interest paid (1 020) (1 221)
Net changes in other accruals 3 481 (3 083)
Net cash flow from operating activities 24 822 18 880
Proceeds from sale of property, plant and equipment and intangible assets 25 28
Purchases of property, plant and equipment and intangible assets (36) (61)
Purchases of and capital increase in subsidiaries (50) (4)
Proceeds from sale of other investments 496 1 194
Purchases of other investments (29) (21)
Net cash flow from investing activities 406 1 136
Proceeds from borrowings 12 016 16 516
Repayments of borrowings (7 640) (3 611)Net change in Group’s cash pool (14 776) (19 700)
Purchase of treasury shares (3 998) (4 022)
Dividends paid to equity holders of Telenor ASA (9 239) (7 925)
Net cash flow from financing activities (23 635) (18 742)
Effect on cash and cash equivalents of changes in foreign exchange rates 234 (3)
Net change in cash and cash equivalents 1 827 1 271
Cash and cash equivalents as of 1 January (1 959) (3 230)
Cash and cash equivalents as of 31 December (132) (1 959)
Specification of cash and cash equivalents:
Liquid assets and short term placements 2 349 3 539
Drawing from Group’s cash pool (2 481) (5 498)
Cash and cash equivalents as of 31 December (132) (1 959)
Statement of Cash FlowsTelenor ASA 1 January – 31 December
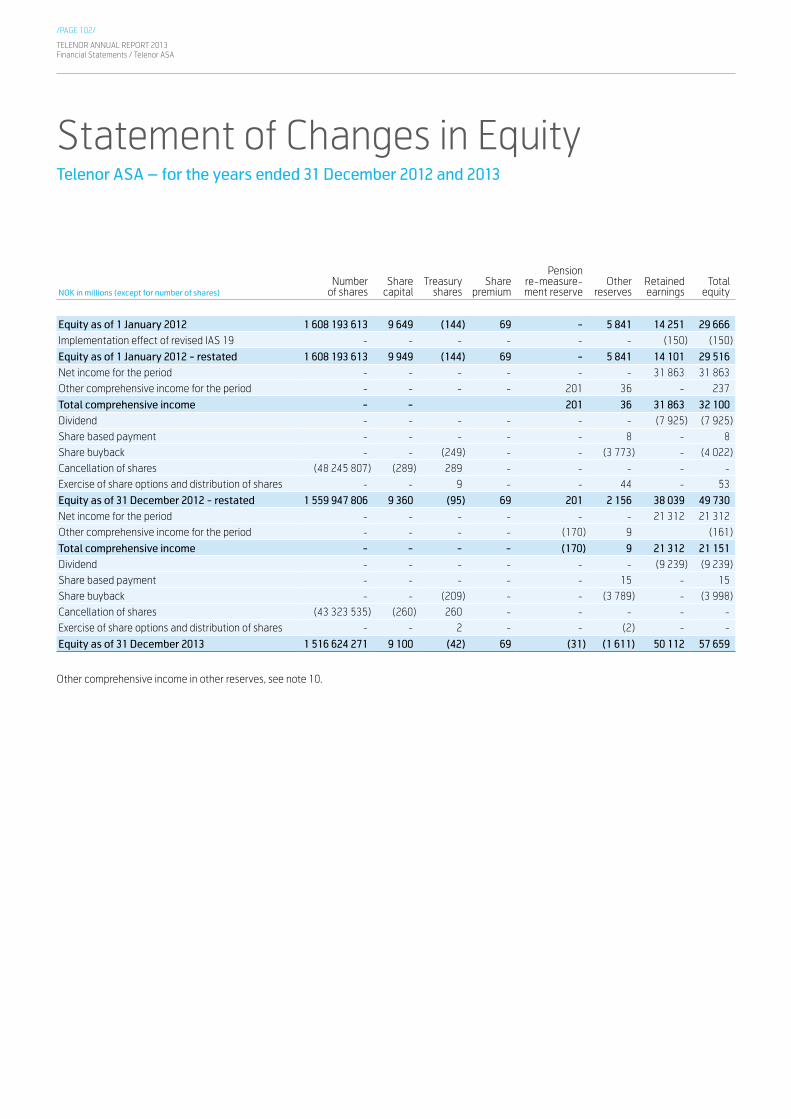
/PAGE 102/
TELENOR ANNUAL REPORT 2013Financial Statements / Telenor ASA
NOK in millions (except for number of shares)Number
of sharesShare
capitalTreasury
sharesShare
premium
Pension re-measure-ment reserve
Other reserves
Retainedearnings
Total equity
Equity as of 1 January 2012 1 608 193 613 9 649 (144) 69 - 5 841 14 251 29 666Implementation effect of revised IAS 19 - - - - - - (150) (150)
Equity as of 1 January 2012 - restated 1 608 193 613 9 949 (144) 69 - 5 841 14 101 29 516Net income for the period - - - - - - 31 863 31 863Other comprehensive income for the period - - - - 201 36 - 237
Total comprehensive income - - 201 36 31 863 32 100Dividend - - - - - - (7 925) (7 925)Share based payment - - - - - 8 - 8Share buyback - - (249) - - (3 773) - (4 022)Cancellation of shares (48 245 807) (289) 289 - - - - -Exercise of share options and distribution of shares - - 9 - - 44 - 53
Equity as of 31 December 2012 - restated 1 559 947 806 9 360 (95) 69 201 2 156 38 039 49 730Net income for the period - - - - - - 21 312 21 312Other comprehensive income for the period - - - - (170) 9 (161)
Total comprehensive income - - - - (170) 9 21 312 21 151Dividend - - - - - - (9 239) (9 239)Share based payment - - - - - 15 - 15Share buyback - - (209) - - (3 789) - (3 998)Cancellation of shares (43 323 535) (260) 260 - - - - -Exercise of share options and distribution of shares - - 2 - - (2) - -
Equity as of 31 December 2013 1 516 624 271 9 100 (42) 69 (31) (1 611) 50 112 57 659
Other comprehensive income in other reserves, see note 10.
Statement of Changes in EquityTelenor ASA – for the years ended 31 December 2012 and 2013

/PAGE 103/
TELENOR ANNUAL REPORT 2013Notes to the Financial Statements / Telenor ASA
Notes to theFinancial StatementsTelenor ASA
01 General information and summary of significant accounting principles
02 Salaries and personnel costs03 Pension obligations04 Other operating expenses05 Research and development costs06 Financial income and expenses07 Income taxes08 Intangible assets
09 Other financial assets10 Equity and dividends11 Financial instruments and risk management12 Current non-interest-bearing liabilities13 Guarantees14 Contractual obligations15 Related parties16 Shares in subsidiaries17 Events after the reporting period
General information and summary of significant accounting principles
Telenor ASA is a holding company and contains the Group Management, Corporate Functions, Research and Development and the Group’s internal bank (Group Treasury).
The financial statements have been prepared in accordance with simplified IFRS pursuant to the Norwegian Accounting Act § 3-9 and regulations regarding simplified application of IFRS issued by the Ministry of Finance on 21 January 2008.
The accounting policies adopted in Telenor ASA are consistent with those of the previous financial year, except for implementation of new accounting standards as described in note 1 of the consolidated financial statements. The implementation effects of the changes in revised IAS 19 including the reclassification of the net interest amount are:
NOK in millions As of 31 December 2013 As of 31 December 2012 As of 1 January 2012
Statement of Financial Position
Deferred tax assets 35 (19) 59
Pension obligations 128 (70) 209
Equity (93) 51 (150)
NOK in millions 2013 2012
Income Statement
Pension costs (1) 14
Financial expenses (8) (14)
Income taxes 3 -
Net income (loss) (7) -
Statement of Comprehensive Income
Net income (7) -
Other comprehensive income (loss), net of taxes *) (170) 201
Total Comprehensive income (loss) (177) 201
*) Effect recognised in Other comprehensive income for the year of 2012 is due to the change of discount rate used to determine pension obligations as of 31 December 2012. The effect recognised in Other comprehensive income for the year 2013 is mainly due to implementation of new mortality risk table and disability risk table. Please refer to note 25 in the consolidated financial statements for more information about the assumptions used.
/01/
Contents notes/00/
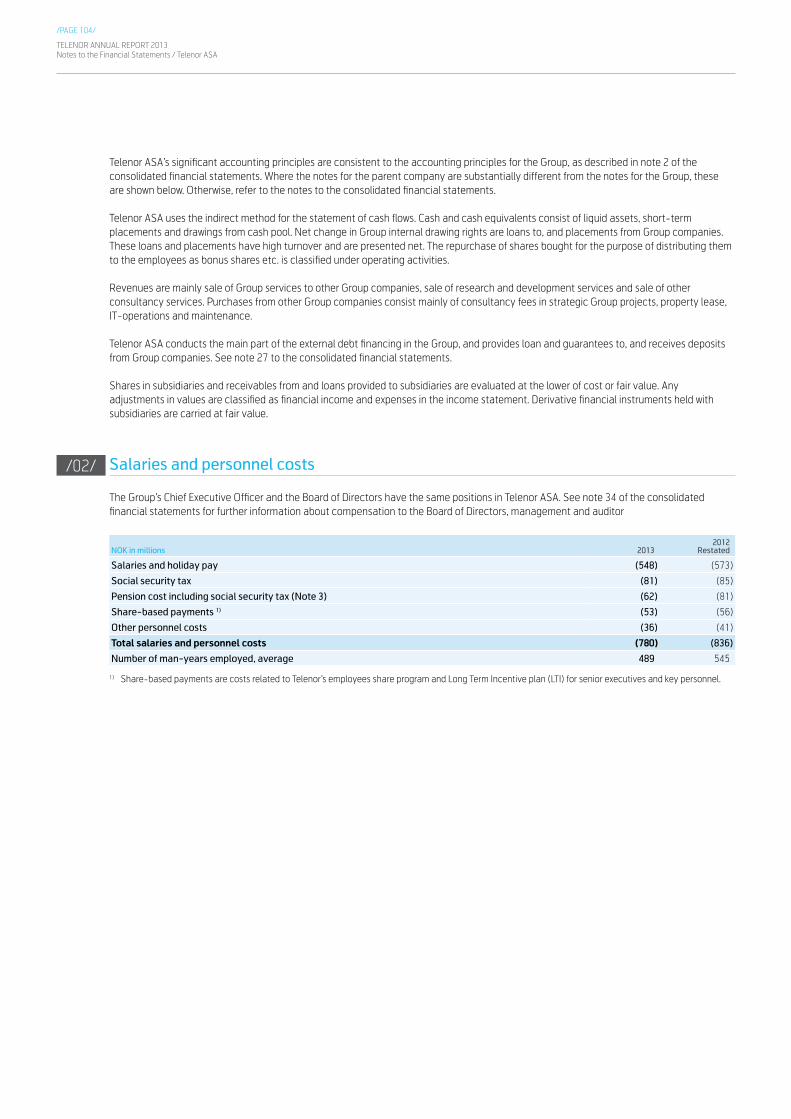
TELENOR ANNUAL REPORT 2013Notes to the Financial Statements / Telenor ASA
/PAGE 104/
Telenor ASA’s significant accounting principles are consistent to the accounting principles for the Group, as described in note 2 of the consolidated financial statements. Where the notes for the parent company are substantially different from the notes for the Group, these are shown below. Otherwise, refer to the notes to the consolidated financial statements.
Telenor ASA uses the indirect method for the statement of cash flows. Cash and cash equivalents consist of liquid assets, short-term placements and drawings from cash pool. Net change in Group internal drawing rights are loans to, and placements from Group companies. These loans and placements have high turnover and are presented net. The repurchase of shares bought for the purpose of distributing them to the employees as bonus shares etc. is classified under operating activities.
Revenues are mainly sale of Group services to other Group companies, sale of research and development services and sale of other consultancy services. Purchases from other Group companies consist mainly of consultancy fees in strategic Group projects, property lease, IT-operations and maintenance.
Telenor ASA conducts the main part of the external debt financing in the Group, and provides loan and guarantees to, and receives deposits from Group companies. See note 27 to the consolidated financial statements.
Shares in subsidiaries and receivables from and loans provided to subsidiaries are evaluated at the lower of cost or fair value. Any adjustments in values are classified as financial income and expenses in the income statement. Derivative financial instruments held with subsidiaries are carried at fair value.
Salaries and personnel costs
The Group’s Chief Executive Officer and the Board of Directors have the same positions in Telenor ASA. See note 34 of the consolidated financial statements for further information about compensation to the Board of Directors, management and auditor
NOK in millions 20132012
Restated
Salaries and holiday pay (548) (573)
Social security tax (81) (85)
Pension cost including social security tax (Note 3) (62) (81)
Share-based payments 1) (53) (56)
Other personnel costs (36) (41)
Total salaries and personnel costs (780) (836)
Number of man-years employed, average 489 545
1) Share-based payments are costs related to Telenor’s employees share program and Long Term Incentive plan (LTI) for senior executives and key personnel.
/02/
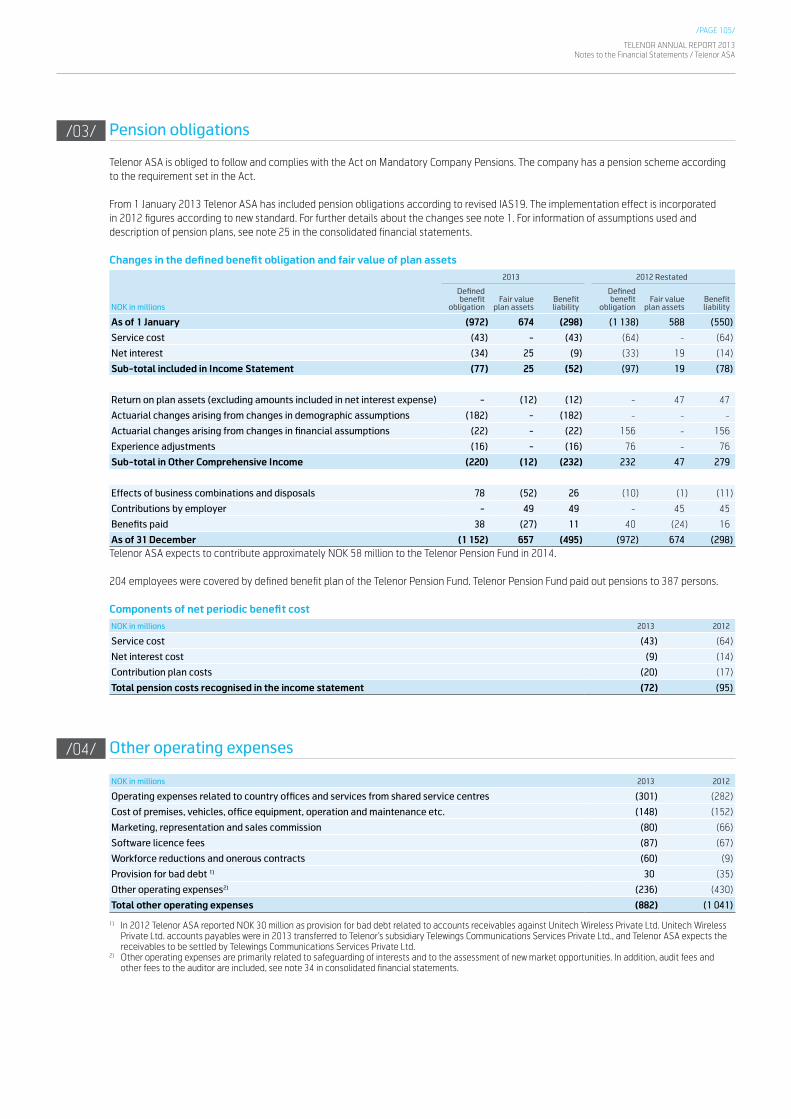
/PAGE 105/
TELENOR ANNUAL REPORT 2013Notes to the Financial Statements / Telenor ASA
Pension obligations
Telenor ASA is obliged to follow and complies with the Act on Mandatory Company Pensions. The company has a pension scheme according to the requirement set in the Act.
From 1 January 2013 Telenor ASA has included pension obligations according to revised IAS19. The implementation effect is incorporated in 2012 figures according to new standard. For further details about the changes see note 1. For information of assumptions used and description of pension plans, see note 25 in the consolidated financial statements.
Changes in the defined benefit obligation and fair value of plan assets
NOK in millions
2013 2012 Restated
Defined benefit
obligationFair value
plan assetsBenefit liability
Defined benefit
obligationFair value
plan assetsBenefit liability
As of 1 January (972) 674 (298) (1 138) 588 (550)
Service cost (43) - (43) (64) - (64)
Net interest (34) 25 (9) (33) 19 (14)
Sub-total included in Income Statement (77) 25 (52) (97) 19 (78)
Return on plan assets (excluding amounts included in net interest expense) - (12) (12) - 47 47
Actuarial changes arising from changes in demographic assumptions (182) - (182) - - -
Actuarial changes arising from changes in financial assumptions (22) - (22) 156 - 156
Experience adjustments (16) - (16) 76 - 76
Sub-total in Other Comprehensive Income (220) (12) (232) 232 47 279
Effects of business combinations and disposals 78 (52) 26 (10) (1) (11)
Contributions by employer - 49 49 - 45 45
Benefits paid 38 (27) 11 40 (24) 16
As of 31 December (1 152) 657 (495) (972) 674 (298)Telenor ASA expects to contribute approximately NOK 58 million to the Telenor Pension Fund in 2014.
204 employees were covered by defined benefit plan of the Telenor Pension Fund. Telenor Pension Fund paid out pensions to 387 persons.
Components of net periodic benefit costNOK in millions 2013 2012
Service cost (43) (64)
Net interest cost (9) (14)
Contribution plan costs (20) (17)
Total pension costs recognised in the income statement (72) (95)
Other operating expenses
NOK in millions 2013 2012
Operating expenses related to country offices and services from shared service centres (301) (282)
Cost of premises, vehicles, office equipment, operation and maintenance etc. (148) (152)
Marketing, representation and sales commission (80) (66)
Software licence fees (87) (67)
Workforce reductions and onerous contracts (60) (9)
Provision for bad debt 1) 30 (35)
Other operating expenses2) (236) (430)
Total other operating expenses (882) (1 041)
1) In 2012 Telenor ASA reported NOK 30 million as provision for bad debt related to accounts receivables against Unitech Wireless Private Ltd. Unitech Wireless Private Ltd. accounts payables were in 2013 transferred to Telenor’s subsidiary Telewings Communications Services Private Ltd., and Telenor ASA expects the receivables to be settled by Telewings Communications Services Private Ltd.
2) Other operating expenses are primarily related to safeguarding of interests and to the assessment of new market opportunities. In addition, audit fees and other fees to the auditor are included, see note 34 in consolidated financial statements.
/03/
/04/

TELENOR ANNUAL REPORT 2013Notes to the Financial Statements / Telenor ASA
/PAGE 106/
Research and development costs
Research and development expenses in Telenor ASA were NOK 203 million in 2013 and NOK 204 million in 2012. Research and development activities relate to new technologies and secure full utilization of existing technologies and network.
Financial income and expenses
NOK in millions 20132012
Restated
Interest income from Group companies 1 927 3 094
Group contribution and dividends from subsidiaries 1) 25 534 35 251
Other financial income 93 20
Other financial income from Group companies 2) 18 271
Total financial income 27 572 38 636
Interest expenses Group companies (720) (1 329)
Interest expenses (external) (882) (948)
Loss on guarantees for subsidiaries 3) (1 620) (2 841)
Other financial expenses (44) (130)
Total financial expenses (3 266) (5 248)
Foreign currency gain 2 637 1 270
Foreign currency loss (4 326) (1 026)
Net foreign currency gains (1 689) 244
Net change in fair value of financial instruments at fair value through profit or loss (27) (127)
Net change in fair value of hedging instruments and hedged items 450 198
Net change in fair value of financial instruments 423 71
Impairment losses on loans to Group companies (6) (125)
Impairment losses on shares in subsidiaries 4) (50) (37)
Net gains (losses and impairment) on financial assets (56) (162)
Net financial income (expenses) 22 984 33 541
1) Group contribution and dividends received from Group companies is recognised as financial income in the year it is approved by the General Meeting in the relevant company and Telenor ASA obtains the right to the Group contribution. In 2013 Telenor ASA received and recognised NOK 6.6 billion in taxable Group contribution and NOK 0.1 billion in tax-free Group contribution, which related to the financial year 2012. In addition an extraordinary dividend of NOK 1.4 billion and extraordinary tax-free Group contribution of NOK 17.4 billlion relating to the financial year 2013 was received. In 2012 Telenor ASA received and recognized NOK 3.9 billion in taxable Group contribution, NOK 31.2 billion in tax-free Group contribution and NOK 0.2 billion in dividends, which related to the financial year 2011. The Group contribution for the financial year 2013 is estimated to be NOK 6.1 billion and this will be recognised in 2014.
2) Other financial income from Group Companies is mainly related to commissions for guarantees given, see note 13. Telenor ASA provided debt guarantees on behalf of Unitech Wireless Private Ltd. and recognised income of NOK 17 million related to the guarantee commission fee in 2013 and NOK 266 million in 2012.
3) In 2012, the lenders demanded payment on Telenor ASA’s debt guarantees on behalf of Unitech Wireless Private Ltd. , and payments were executed during the third quarter of 2012 with a total of NOK 10,620 million. The claims towards Unitech Wireless Private Ltd. regarding recourse under guarantees and guarantee commission fees were written down with NOK 6,072 million in 2011 and NOK 2,841 million in 2012 based on the best estimate of recoverable amount at that time. In 2013, the operations, assets and liabilities were transferred from Unitech Wireless Private Ltd. to Telewings Communications Services Private Ltd. Telenor ASA’s claims towards Unitech Wireless Private Ltd. related to the paid guarantees and guarantee fees were not part of the transfer. In 2013, Telenor ASA received partial payment of the recourse claims . The rest of the claims is written down resulting in expense of NOK 1,620 million for 2013.
4) Impairment losses on shares in subsidiaries are in 2013 related to impairment of shares in Telenor Digital Services AS and in 2012 are related to impairment of shares in Aeromobile Holding AS.
/05/
/06/

/PAGE 107/
TELENOR ANNUAL REPORT 2013Notes to the Financial Statements / Telenor ASA
Income taxes
NOK in millions 2013 2012
Profit before taxes 21 768 32 127
Current taxes - (1 660)
Current withholding tax (9) (11)
Resolution of disputed items and adjustment in previous years’ current income tax 488 (10)
Change in deferred taxes (935) 1 417
Income tax expense (456) (264)
Tax basis:
Profit before taxes 21 768 32 127
Non-taxable interest income related to resolution of disputed items (68) -
Non-deductible expenses and tax-free income 63 98
Group contribution previous year (6 600) (3 900)
Group contribution previous year – tax-free (18 934) (31 351)
Changes in temporary differences recognised in income statement (9 713) 2 354
Group contribution current year 6 151 6 600
Loss carry-forward 7 333 -
Tax basis for the year - 5 928
Current taxes at corporate income tax rate in Norway (28%) - 1 660
Effective tax rate
Income tax expense at corporate income tax rate in Norway (28%) (6 095) (8 996)
Non-deductible expenses and tax-free income (18) (27)
Received Group contribution, tax-free 5 302 8 778
Withholding tax paid during the year used for income deduction (9) (9)
Resolution of disputed item 501 -
Other (1) (10)
Effect of changes in tax rates (136) -
Income tax expense (456) (264)
Effective tax rate in % 2.1% 0.8%
NOK in millions 2013 2012 Changes
Temporary differences as of 31 December
Non-current assets 53 59 (6)
Interest element in connection with fair value hedges of liabilities (581) (1 749) 1 168
Other non-current receivables (3) (73) 70
Financial derivatives 801 907 (106)
Losses on guarantees - (8 891) 8 891
Currency revaluation reserves - 312 (312)
Other accruals for liabilities (82) (90) 8
Pension liabilities (495) (298) (197)
Group contribution (6 151) (6 600) 449
Unutilised tax credits carried forward (40) (39) (1)
Unutilized loss carried-forward (7 333) - (7 333)
Total temporary differences as of 31 December (13 831) (16 462) 2 631
Tax rate 27% 28%
Net deferred tax assets 3 734 4 610 (876)
Changes in net deferred tax assets
Recorded to other comprehensive income 1) 59
Recognised in the income statement (935)
1) Deferred taxes recognised in other income items in total income is primarily related to tax on the value change in derivatives that are designated as hedging instruments in cash flow hedges and re-measurement of defined benefit pension plans due to implementation of revised IAS 19. Other comprehensive income elements are presented gross in the comprehensive income with the related tax effect on a separate line.
/07/

TELENOR ANNUAL REPORT 2013Notes to the Financial Statements / Telenor ASA
/PAGE 108/
The statutory tax rate in Norway is changed from 28% to 27% effective from 1 January 2014.
Resolution of disputed item is related to refund of taxes paid due to reassessment of 2006 tax returns. During the third quarter of 2010, Telenor ASA received a reassessment by the Norwegian tax authorities of its 2006 and 2007 tax returns, concerning gain on a Total Return Swap agreement with OJSC VimpelCom shares as the underlying object. Following the receipt of the reassessment Telenor provided for a tax expense of NOK 0.8 billion, which was paid in 2010. Telenor disagreed with the tax authorities’ position and appealed the reassessment. In 2013, the Tax Appeal Board («Skatteklagenemnda») decided the 2006-reassessment in Telenor ASA’s favour, due to statute of limitations rules. Telenor ASA received a total repayment of NOK 0.5 billion, which was recognised as tax expense reduction with NOK 482 million and non-taxable interest income with NOK 68 million. The ruling upheld the reassessment for 2007 and Telenor ASA has taken this decision to court.
In 2012, the external lenders of Unitech Wireless Private Ltd. demanded payment on guarantee which Telenor ASA provided on behalf of Unitech Wireless Private Ltd. The payments were executed during the third quarter of 2012 with a total of NOK 10,620 million. The operation in Unitech Wireless Private Ltd. was in 2013 transferred to Telewings Communications Services Private Ltd., and Telenor ASA has only received partial recourse for claims under the guarantees. Losses related to the recourse rights and claim for guarantee commission are hence finally determined, and are treated as tax-deductible losses on operation realized in 2013. Of these losses, NOK 1,052 million is related to currency loss.
Telenor ASA claimed in 2012 a tax deduction for losses on interest income of NOK 46 million, related to the loans to Aero Mobile Holding AS. The loss was realized in June 2012, when Telenor ASA became the new owner. The loss is split between NOK 8 million recognized in net income in 2012 and NOK 36 million recognized as interest income in the period 2009 to 2011. In 2009, Telenor ASA made provision for losses on guarantees for liabilities in the subsidiary AeroMobile Ltd., which for tax purposes were treated as unrealised loss (temporary differences). In 2013, Telenor ASA has received a partial settlement of recouse claim under the guarantee with NOK 5 million and NOK 35 million has been treated as a realized business loss.

/PAGE 109/
TELENOR ANNUAL REPORT 2013Notes to the Financial Statements / Telenor ASA
Intangible assets
2013
NOK in millionsAccumulated cost
as of 1 January Additions Disposals
Amortisationsand impairment
losses
Accumulated amortisations
and impairment losses
Carryingamountas of 31
December
Licences and legal rights (12 - 15 years) 345 - (12) (30) (157) 176
Software purchased (5 years) 421 12 - (24) (406) 27
Work in progress 25 3 (23) - - 5
Total intangible assets 791 15 (35) (54) (563) 208
2012
NOK in millionsAccumulated cost
as of 1 January Additions Disposals
Amortisationsand impairment
losses
Accumulated amortisations
and impairment losses
Carryingamountas of 31
December
Licences and legal rights (12 - 15 years) 538 20 (213) (57) (139) 206
Software purchased (5 years) 419 15 (13) (64) (382) 39
Work in progress 8 17 - - - 25
Total intangible assets 965 52 (226) (121) (521) 270
Other financial assets
NOK in millions 2013 2012
Capital contribution in Telenor Pension Fund 1) 298 298
Other financial assets external 2 150 1 959
Total other non-current financial assets 2 448 2 257
Short-term interest-bearing receivables Group companies - 351
Receivables Group companies 2) 290 4 265
Short term placement > 3 months - 496
Other current financial assets external 420 386
Total other current financial assets 710 5 498
1) The amount capitalised in the statement of financial position is the cost price, which equals fair value. Telenor ASA holds the entire core capital in the Telenor Pension Fund. The capital contribution to Telenor Pension Fund is classified as available for sale.
2) The recourse rights and receivable for guarantees fees against Unitech Wireless Private Ltd. had a net book value of NOK 2,269 million at the end of 2012. In 2013 business in Unitech Wireless Private Ltd. was transferred to Telewings Communications Services Private Ltd. Telenor ASA has received partial recourse for claims under the guarantees, see note 6 for more information. The remaining change in receivables against Group companies is related to payment of group contribution for 2011.
/08/
/09/

TELENOR ANNUAL REPORT 2013Notes to the Financial Statements / Telenor ASA
/PAGE 110/
Equity and dividends
Allocation of equity and dispositions over the last 2 years is shown in a separate table, see statement of changes in shareholders’ equity.Nominal value per share is NOK 6. As of 31 December 2013 Telenor ASA had 6,981,748 treasury shares.
2013 2012
Dividends
Dividends per share in NOK – paid 6.00 5.00
Dividends per share in NOK - proposed by the Board of Directors 7.00 6.00
Total dividends for 2012 of NOK 9.2 billion were paid in May 2013. The Board of Directors proposes payment of dividends of NOK 10.6 billion to shareholders for 2013.
Telenor ASA has an agreement with the Kingdom of Norway through the Ministry of Trade, Industry and Fisheries to carry through share buybacks with the purpose to cancel these shares through reduction of the share capital to maintain its ownership interest. The proposed cancellation is subject to approval by shareholder in the annual General Meeting on 14 May 2014 and if approved, the estimated effect on equity is NOK 1 billion.
Financial instruments and risk management
Risk managementTelenor ASA’s treasury function is responsible for financial risk management including liquidity management, interest rate risk, managing foreign exchange risk, credit risk and capital management. The activities in the treasury function are performed according to policies and procedures approved by the Board of Directors of Telenor ASA. The management and the board in Telenor ASA receive on regular basis information regarding the financial area of the company.
Short-term and long-term financial flexibility is in focus, and Telenor ASA issues debts in Norwegian and foreign capital market mainly through certificates and bonds. In addition, Telenor ASA has established committed syndicated revolving credit facilities of EUR 2.0 billion with maturity in 2016 and of EUR 0.8 billion with maturity in 2017.
Financing of the Group’s investing activities and the Group’s cash flows implies that Telenor ASA is exposed to interest rate risk related to interest income and interest costs taken to income statement, as a result of changes in interest rates in the market. Changes in the market rates also influences fair value of assets and liabilities.
Telenor ASA is exposed to currency risk related to changes in value of NOK compared to other currencies, as a result of debt held in other currencies than NOK. Currency risk also influences the value of Telenor ASA’s net investment hedges in foreign countries which will fluctuate accordingly the changes in the NOK rate.
The Company has credit risk related to receivables and financial instruments with positive value against external parties and other companies in the Group.
Telenor ASA uses derivatives as forward currency contracts and interest rate swaps to manage the risk exposure related to changes in currency and interest rates. All derivative contracts are measured at fair value with changes through profit and loss. This also applies to derivative contracts for Group companies. If the derivatives are designated for cash flow hedge accounting or as part of a hedge of net investment , the changes in fair value are recognised as other comprehensive income.
See also note 2 ‘Summary of significant accounting policies’ and note 28 ‘Managing capital and financial risk management’ in the consolidated financial statements where financial risks and accounting for financial instruments are explained in detail.
Fair value of financial instrumentsPrinciples for estimating fair valuesBased on the characteristics of the financial instruments that are recognised in the financial statement, these are grouped into the classes and categories described below. The estimated fair values of the financial instruments are based on market prices and the valuation methodologies per class are described below.
/10/
/11/

/PAGE 111/
TELENOR ANNUAL REPORT 2013Notes to the Financial Statements / Telenor ASA
Fair value hierarchyTelenor ASA measures fair values using the following fair value hierarchy that reflects the significance of the inputs used in measuring the fair value of financial instruments in the Fair value through profit and loss and Available for sale categories:
Level 1: Quoted prices (unadjusted) in active markets for identical financial instrumentsLevel 2: Inputs other than quoted prices included within Level 1 that are observable for the asset or liability, either directly (i.e. as prices)
or indirectly (i.e. derived from prices). Level 3: Inputs for assets or liabilities that are not based on observable market data (unobservable inputs).
Interest-bearing liabilitiesFair values of interest-bearing liabilities are based on quoted prices where available. Interest-bearing liabilities that are not traded in an active market have been calculated using yield curves, which incorporates estimates of the Telenor ASA credit spread. The credit curve has been extrapolated using indicative prices on debt issuance by Telenor ASA for different maturities. The yield curves have been interpolated from cash and swap curves observed in the market for different currencies and maturities.
Trade receivables and other current and non-current financial assetsFor trade receivables and other current receivables, the nominal amount is assessed to be a reasonable approximation of fair value. The effect of not discounting is considered to be immaterial for this class of financial instruments.
Equity investmentsFair values for listed shares are based on quoted prices at the end of the reporting period. Fair value of unlisted shares is calculated using commonly used valuation techniques, or measured at cost if the investment does not have a quoted market price in an active market and the fair value cannot be reliably measured.
Trade payables and other non-interest bearing financial liabilitiesFor trade payables and other non-interest bearing financial liabilities the nominal amount is assessed to be a reasonable approximation of fair value. The effect of not discounting is considered to be immaterial for this class of financial instruments.
Cash and cash equivalentsThe fair value for this class of financial instruments is assessed to be equal to the nominal amount.
Derivatives Fair values of currency swaps, foreign currency forward contracts and interest rate swaps are estimated based on calculating the net present value of future cash flows, using interest rate curves, exchange rates and currency spreads as of 31 December 2013 and 2012, respectively.
The table below shows the maturity profile for Telenor ASA’s liabilities in nominal values:
2013
NOK in millionsCarrying amount
Nominal amount 2014 2015-2017 2018-2022 2023->
Interest-bearing liabilities
Bonds and Commercial Paper 41 504 41 116 3 370 9 557 17 711 10 478
Other interest-bearing liabilities 329 329 14 39 23 254
Total interest-bearing liabilities external 41 833 41 444 3 383 9 595 17 734 10 732
Other Interest-bearing liabilities Telenor Group 21 314 21 314 21 314 - - -
Drawing on Group cash pools 2 481 2 481 2 481 - - -
Interest-bearing liabilities Telenor Group 23 795 23 795 23 795 - - -
Non-interest bearing liabilities
Trade and other payables external 937 937 937 - - -
Trade and other payables Telenor Group 128 128 128 - - -
Derivative financial instruments non-current liabilities 878 878 406 382 82 9
Other non-current non-interest-bearing liabilities 197 197 197 - - -
Total non-interest-bearing liabilities 2 140 1 541 1 262 197 82 -
Total 67 768 66 781 28 440 9 793 17 815 10 732
Future interest payments 7 767 845 2 833 3 193 897
Total including future interest payments 74 548 29 285 12 625 21 009 11 629
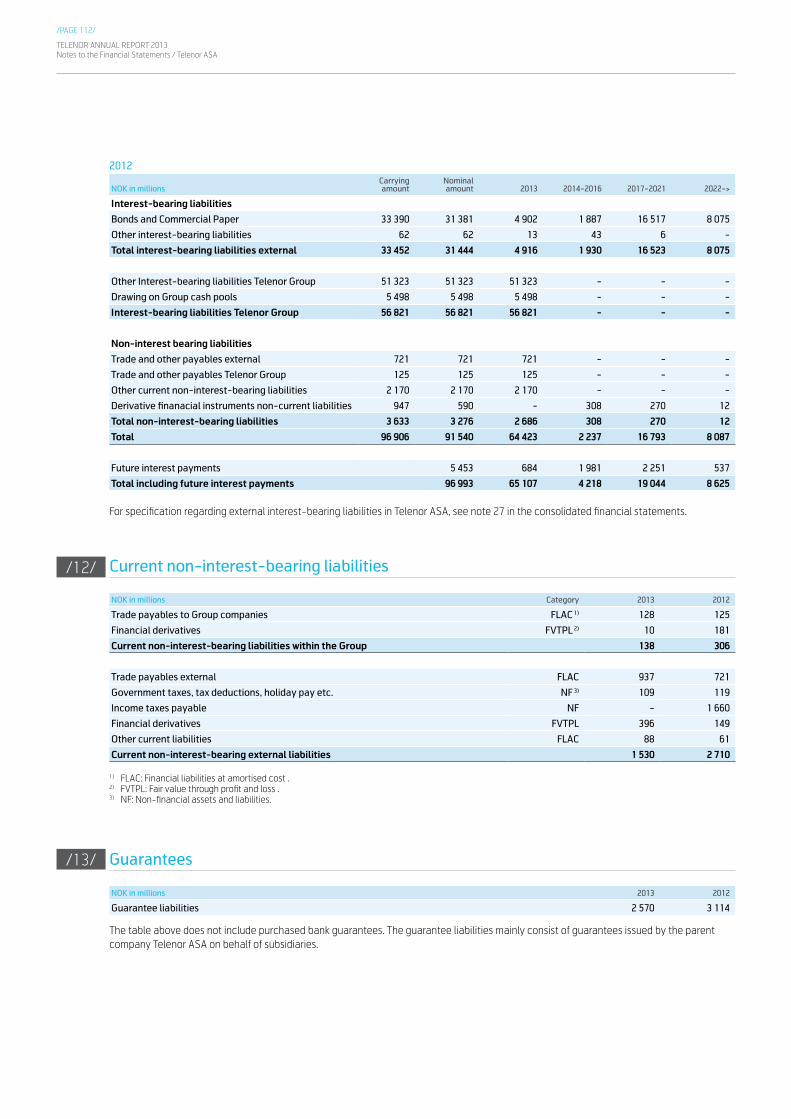
TELENOR ANNUAL REPORT 2013Notes to the Financial Statements / Telenor ASA
/PAGE 112/
2012
NOK in millionsCarrying amount
Nominal amount 2013 2014-2016 2017-2021 2022->
Interest-bearing liabilities
Bonds and Commercial Paper 33 390 31 381 4 902 1 887 16 517 8 075
Other interest-bearing liabilities 62 62 13 43 6 -
Total interest-bearing liabilities external 33 452 31 444 4 916 1 930 16 523 8 075
Other Interest-bearing liabilities Telenor Group 51 323 51 323 51 323 - - -
Drawing on Group cash pools 5 498 5 498 5 498 - - -
Interest-bearing liabilities Telenor Group 56 821 56 821 56 821 - - -
Non-interest bearing liabilities
Trade and other payables external 721 721 721 - - -
Trade and other payables Telenor Group 125 125 125 - - -
Other current non-interest-bearing liabilities 2 170 2 170 2 170 - - -
Derivative finanacial instruments non-current liabilities 947 590 - 308 270 12
Total non-interest-bearing liabilities 3 633 3 276 2 686 308 270 12
Total 96 906 91 540 64 423 2 237 16 793 8 087
Future interest payments 5 453 684 1 981 2 251 537
Total including future interest payments 96 993 65 107 4 218 19 044 8 625
For specification regarding external interest-bearing liabilities in Telenor ASA, see note 27 in the consolidated financial statements.
Current non-interest-bearing liabilities
NOK in millions Category 2013 2012
Trade payables to Group companies FLAC 1) 128 125
Financial derivatives FVTPL 2) 10 181
Current non-interest-bearing liabilities within the Group 138 306
Trade payables external FLAC 937 721
Government taxes, tax deductions, holiday pay etc. NF 3) 109 119
Income taxes payable NF - 1 660
Financial derivatives FVTPL 396 149
Other current liabilities FLAC 88 61
Current non-interest-bearing external liabilities 1 530 2 710
1) FLAC: Financial liabilities at amortised cost .2) FVTPL: Fair value through profit and loss .3) NF: Non-financial assets and liabilities.
Guarantees
NOK in millions 2013 2012
Guarantee liabilities 2 570 3 114
The table above does not include purchased bank guarantees. The guarantee liabilities mainly consist of guarantees issued by the parent company Telenor ASA on behalf of subsidiaries.
/12/
/13/
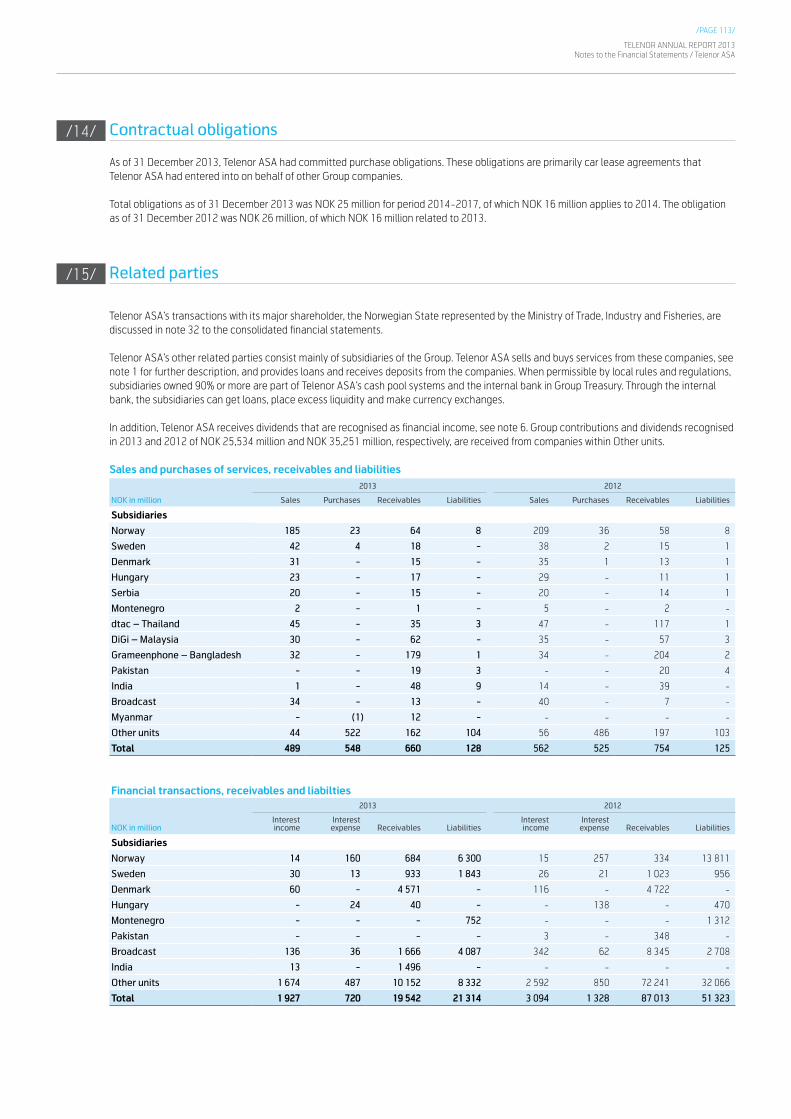
/PAGE 113/
TELENOR ANNUAL REPORT 2013Notes to the Financial Statements / Telenor ASA
Contractual obligations
As of 31 December 2013, Telenor ASA had committed purchase obligations. These obligations are primarily car lease agreements that Telenor ASA had entered into on behalf of other Group companies.
Total obligations as of 31 December 2013 was NOK 25 million for period 2014-2017, of which NOK 16 million applies to 2014. The obligation as of 31 December 2012 was NOK 26 million, of which NOK 16 million related to 2013.
Related parties
Telenor ASA’s transactions with its major shareholder, the Norwegian State represented by the Ministry of Trade, Industry and Fisheries, are discussed in note 32 to the consolidated financial statements.
Telenor ASA’s other related parties consist mainly of subsidiaries of the Group. Telenor ASA sells and buys services from these companies, see note 1 for further description, and provides loans and receives deposits from the companies. When permissible by local rules and regulations, subsidiaries owned 90% or more are part of Telenor ASA’s cash pool systems and the internal bank in Group Treasury. Through the internal bank, the subsidiaries can get loans, place excess liquidity and make currency exchanges.
In addition, Telenor ASA receives dividends that are recognised as financial income, see note 6. Group contributions and dividends recognised in 2013 and 2012 of NOK 25,534 million and NOK 35,251 million, respectively, are received from companies within Other units.
Sales and purchases of services, receivables and liabilities2013 2012
NOK in million Sales Purchases Receivables Liabilities Sales Purchases Receivables Liabilities
Subsidiaries
Norway 185 23 64 8 209 36 58 8
Sweden 42 4 18 - 38 2 15 1
Denmark 31 - 15 - 35 1 13 1
Hungary 23 - 17 - 29 - 11 1
Serbia 20 - 15 - 20 - 14 1
Montenegro 2 - 1 - 5 - 2 -
dtac – Thailand 45 - 35 3 47 - 117 1
DiGi – Malaysia 30 - 62 - 35 - 57 3
Grameenphone – Bangladesh 32 - 179 1 34 - 204 2
Pakistan - - 19 3 - - 20 4
India 1 - 48 9 14 - 39 -
Broadcast 34 - 13 - 40 - 7 -
Myanmar - (1) 12 - - - - -
Other units 44 522 162 104 56 486 197 103
Total 489 548 660 128 562 525 754 125
Financial transactions, receivables and liabilties2013 2012
NOK in millionInterest income
Interest expense Receivables Liabilities
Interest income
Interest expense Receivables Liabilities
Subsidiaries
Norway 14 160 684 6 300 15 257 334 13 811
Sweden 30 13 933 1 843 26 21 1 023 956
Denmark 60 - 4 571 - 116 - 4 722 -
Hungary - 24 40 - - 138 - 470
Montenegro - - - 752 - - - 1 312
Pakistan - - - - 3 - 348 -
Broadcast 136 36 1 666 4 087 342 62 8 345 2 708
India 13 - 1 496 - - - - -
Other units 1 674 487 10 152 8 332 2 592 850 72 241 32 066
Total 1 927 720 19 542 21 314 3 094 1 328 87 013 51 323
/14/
/15/
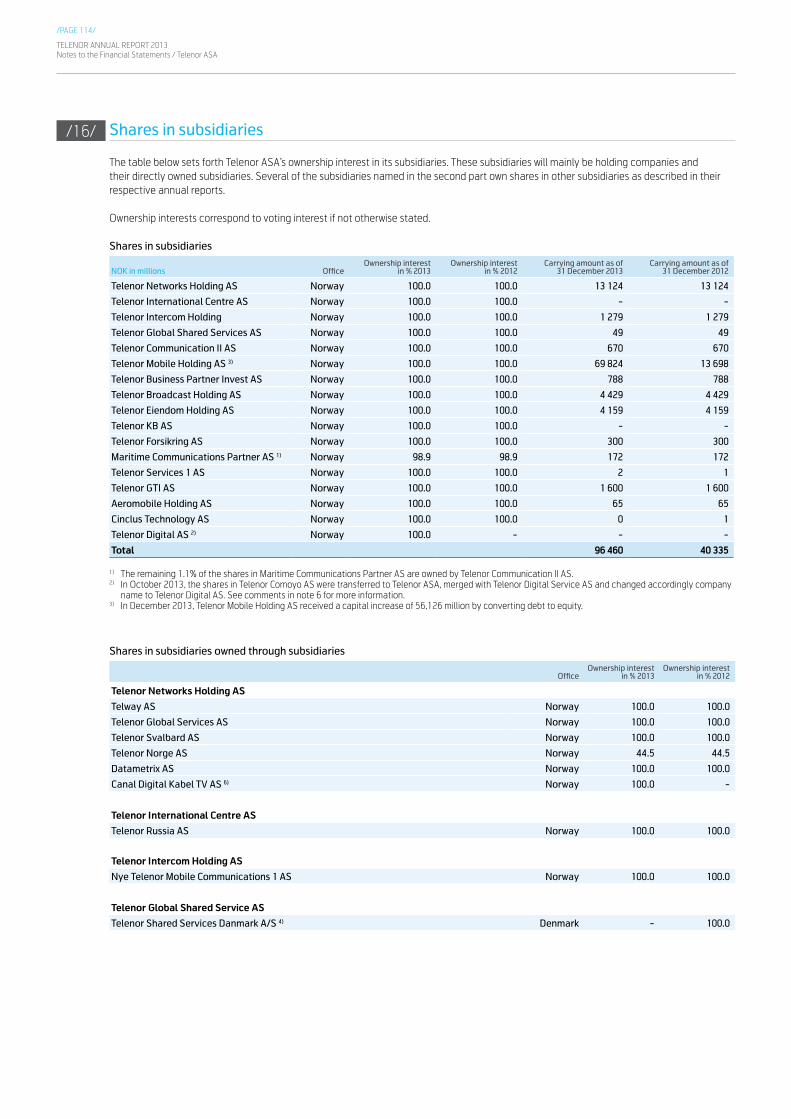
TELENOR ANNUAL REPORT 2013Notes to the Financial Statements / Telenor ASA
/PAGE 114/
Shares in subsidiaries
The table below sets forth Telenor ASA’s ownership interest in its subsidiaries. These subsidiaries will mainly be holding companies and their directly owned subsidiaries. Several of the subsidiaries named in the second part own shares in other subsidiaries as described in their respective annual reports.
Ownership interests correspond to voting interest if not otherwise stated.
Shares in subsidiaries
NOK in millions OfficeOwnership interest
in % 2013Ownership interest
in % 2012Carrying amount as of
31 December 2013Carrying amount as of
31 December 2012
Telenor Networks Holding AS Norway 100.0 100.0 13 124 13 124
Telenor International Centre AS Norway 100.0 100.0 - -
Telenor Intercom Holding Norway 100.0 100.0 1 279 1 279
Telenor Global Shared Services AS Norway 100.0 100.0 49 49
Telenor Communication II AS Norway 100.0 100.0 670 670
Telenor Mobile Holding AS 3) Norway 100.0 100.0 69 824 13 698
Telenor Business Partner Invest AS Norway 100.0 100.0 788 788
Telenor Broadcast Holding AS Norway 100.0 100.0 4 429 4 429
Telenor Eiendom Holding AS Norway 100.0 100.0 4 159 4 159
Telenor KB AS Norway 100.0 100.0 - -
Telenor Forsikring AS Norway 100.0 100.0 300 300
Maritime Communications Partner AS 1) Norway 98.9 98.9 172 172
Telenor Services 1 AS Norway 100.0 100.0 2 1
Telenor GTI AS Norway 100.0 100.0 1 600 1 600
Aeromobile Holding AS Norway 100.0 100.0 65 65
Cinclus Technology AS Norway 100.0 100.0 0 1
Telenor Digital AS 2) Norway 100.0 - - -
Total 96 460 40 335
1) The remaining 1.1% of the shares in Maritime Communications Partner AS are owned by Telenor Communication II AS.2) In October 2013, the shares in Telenor Comoyo AS were transferred to Telenor ASA, merged with Telenor Digital Service AS and changed accordingly company
name to Telenor Digital AS. See comments in note 6 for more information. 3) In December 2013, Telenor Mobile Holding AS received a capital increase of 56,126 million by converting debt to equity.
Shares in subsidiaries owned through subsidiaries
OfficeOwnership interest
in % 2013Ownership interest
in % 2012
Telenor Networks Holding AS
Telway AS Norway 100.0 100.0
Telenor Global Services AS Norway 100.0 100.0
Telenor Svalbard AS Norway 100.0 100.0
Telenor Norge AS Norway 44.5 44.5
Datametrix AS Norway 100.0 100.0
Canal Digital Kabel TV AS 6) Norway 100.0 -
Telenor International Centre AS
Telenor Russia AS Norway 100.0 100.0
Telenor Intercom Holding AS
Nye Telenor Mobile Communications 1 AS Norway 100.0 100.0
Telenor Global Shared Service AS
Telenor Shared Services Danmark A/S 4) Denmark - 100.0
/16/
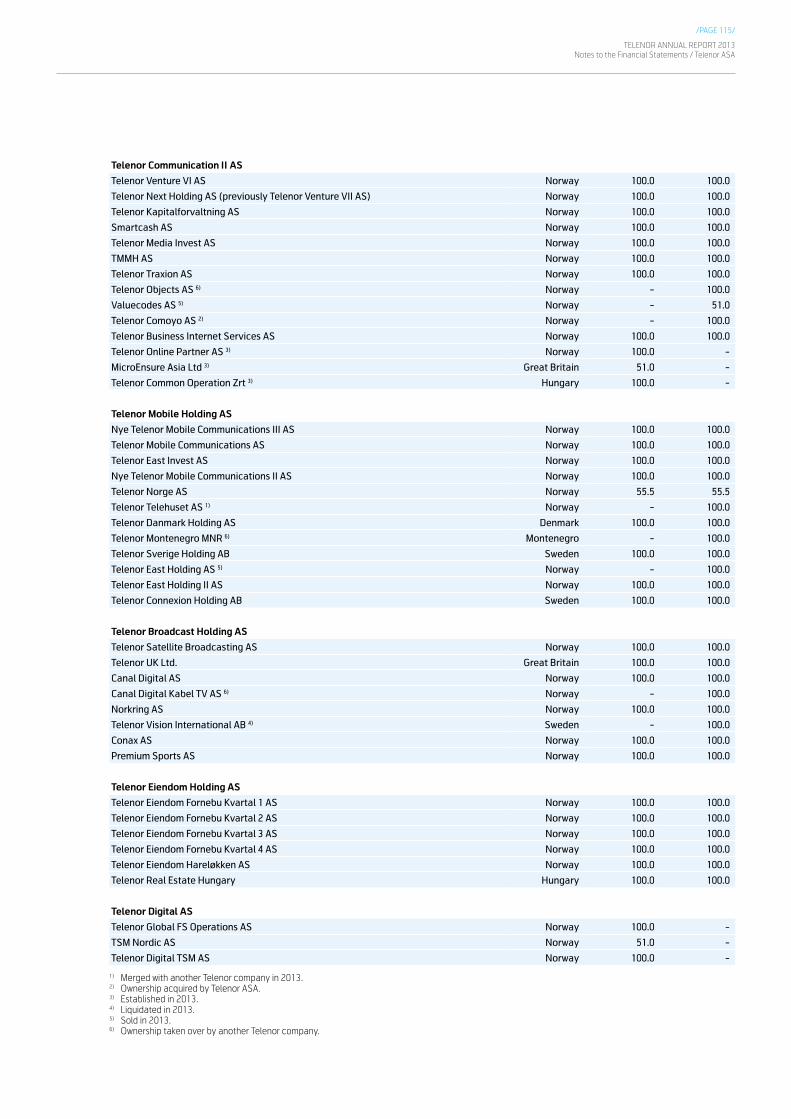
/PAGE 115/
TELENOR ANNUAL REPORT 2013Notes to the Financial Statements / Telenor ASA
Telenor Communication II AS
Telenor Venture VI AS Norway 100.0 100.0
Telenor Next Holding AS (previously Telenor Venture VII AS) Norway 100.0 100.0
Telenor Kapitalforvaltning AS Norway 100.0 100.0
Smartcash AS Norway 100.0 100.0
Telenor Media Invest AS Norway 100.0 100.0
TMMH AS Norway 100.0 100.0
Telenor Traxion AS Norway 100.0 100.0
Telenor Objects AS 6) Norway - 100.0
Valuecodes AS 5) Norway - 51.0
Telenor Comoyo AS 2) Norway - 100.0
Telenor Business Internet Services AS Norway 100.0 100.0
Telenor Online Partner AS 3) Norway 100.0 -
MicroEnsure Asia Ltd 3) Great Britain 51.0 -
Telenor Common Operation Zrt 3) Hungary 100.0 -
Telenor Mobile Holding AS
Nye Telenor Mobile Communications III AS Norway 100.0 100.0
Telenor Mobile Communications AS Norway 100.0 100.0
Telenor East Invest AS Norway 100.0 100.0
Nye Telenor Mobile Communications II AS Norway 100.0 100.0
Telenor Norge AS Norway 55.5 55.5
Telenor Telehuset AS 1) Norway - 100.0
Telenor Danmark Holding AS Denmark 100.0 100.0
Telenor Montenegro MNR 6) Montenegro - 100.0
Telenor Sverige Holding AB Sweden 100.0 100.0
Telenor East Holding AS 5) Norway - 100.0
Telenor East Holding II AS Norway 100.0 100.0
Telenor Connexion Holding AB Sweden 100.0 100.0
Telenor Broadcast Holding AS
Telenor Satellite Broadcasting AS Norway 100.0 100.0
Telenor UK Ltd. Great Britain 100.0 100.0
Canal Digital AS Norway 100.0 100.0
Canal Digital Kabel TV AS 6) Norway - 100.0
Norkring AS Norway 100.0 100.0
Telenor Vision International AB 4) Sweden - 100.0
Conax AS Norway 100.0 100.0
Premium Sports AS Norway 100.0 100.0
Telenor Eiendom Holding AS
Telenor Eiendom Fornebu Kvartal 1 AS Norway 100.0 100.0
Telenor Eiendom Fornebu Kvartal 2 AS Norway 100.0 100.0
Telenor Eiendom Fornebu Kvartal 3 AS Norway 100.0 100.0
Telenor Eiendom Fornebu Kvartal 4 AS Norway 100.0 100.0
Telenor Eiendom Hareløkken AS Norway 100.0 100.0
Telenor Real Estate Hungary Hungary 100.0 100.0
Telenor Digital AS
Telenor Global FS Operations AS Norway 100.0 -
TSM Nordic AS Norway 51.0 -
Telenor Digital TSM AS Norway 100.0 -
1) Merged with another Telenor company in 2013.2) Ownership acquired by Telenor ASA.3) Established in 2013.4) Liquidated in 2013.5) Sold in 2013.6) Ownership taken over by another Telenor company.

TELENOR ANNUAL REPORT 2013Notes to the Financial Statements / Telenor ASA
/PAGE 116/
Other significant subsidiaries (owned through holding companies)
Office
Telenor Sverige AB Sweden
Sonofon AS Denmark
DiGi.Com Bhd Malaysia
Telenor Magyarország Zrt Hungary
Telenor d.o.o. Serbia
Telenor Pakistan (Private) Ltd. Pakistan
Total Access Communications Plc. (dtac) Thailand
Grameenphone Ltd. Bangladesh
Unitech Wireless Private Limited India
Telewings Communications Services Private Ltd. India
Cosmo Bulgaria Mobile EAD Bulgaria
Events after the reporting period
Telenor ASA issued two bonds under the EMTN programme on 12 March 2014: one SEK 2.3 billion bond with fixed coupon rate of 2.375% and one SEK 1.1 billion bond with floating coupon rate of 3M Stibor + 0.63%, both with final maturity 19 March 2019.
/17/
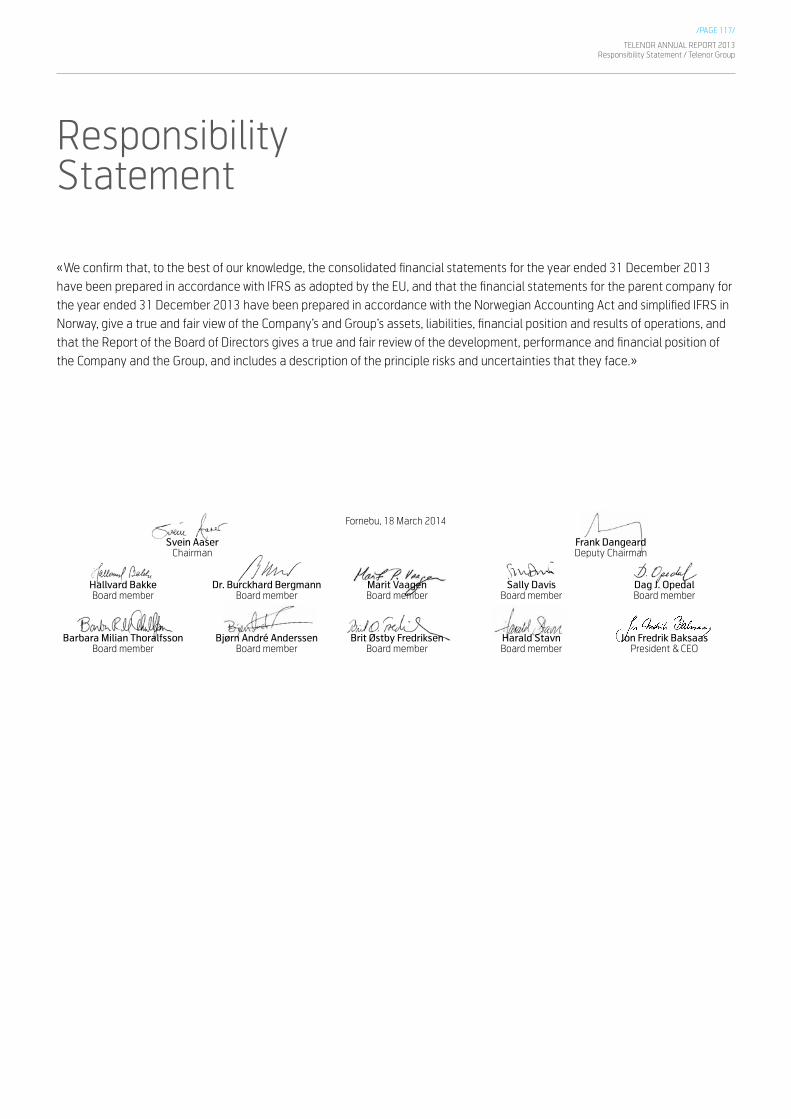
/PAGE 117/
TELENOR ANNUAL REPORT 2013Responsibility Statement / Telenor Group
Responsibility Statement
«We confirm that, to the best of our knowledge, the consolidated financial statements for the year ended 31 December 2013 have been prepared in accordance with IFRS as adopted by the EU, and that the financial statements for the parent company for the year ended 31 December 2013 have been prepared in accordance with the Norwegian Accounting Act and simplified IFRS in Norway, give a true and fair view of the Company’s and Group’s assets, liabilities, financial position and results of operations, and that the Report of the Board of Directors gives a true and fair review of the development, performance and financial position of the Company and the Group, and includes a description of the principle risks and uncertainties that they face.»
Fornebu, 18 March 2014
Svein Aaser Frank Dangeard Chairman Deputy Chairman
Hallvard Bakke Dr. Burckhard Bergmann Marit Vaagen Sally Davis Dag J. Opedal Board member Board member Board member Board member Board member
Barbara Milian Thoralfsson Bjørn André Anderssen Brit Østby Fredriksen Harald Stavn Jon Fredrik Baksaas Board member Board member Board member Board member President & CEO

/PAGE 118/
Statsautoriserte revisorer Ernst & Young AS Dronning Eufemias gate 6, NO-0191 Oslo Oslo Atrium, P.O.Box 20, NO-0051 Oslo
Foretaksregisteret: NO 976 389 387 MVA Tlf: +47 24 00 24 00 Fax: +47 24 00 29 01 www.ey.no Medlemmer av den norske revisorforening
A member firm of Ernst & Young Global Limited
To the Annual Shareholders' Meeting of Telenor ASA
AUDITOR’S REPORT
Report on the financial statements
We have audited the accompanying financial statements of Telenor ASA, comprising the financial statements for the Parent Company and the Group. The financial statements of the Parent Company and the Group comprise the statement of financial position as at 31 December 2013, the income statement, the statements of comprehensive income, cash flows and changes in equity for the year then ended as well as a summary of significant accounting policies and other explanatory information.
The Board of Directors' and Chief Executive Officer's responsibility for the financial statements
The Board of Directors and Chief Executive Officer are responsible for the preparation and fair presentation of these financial statements in accordance with the Norwegian Accounting Act and accounting standards and practices generally accepted in Norway for the financial statements of the Parent Company and the International Financial Reporting Standards as adopted by the EU for the financial statements of the Group, and for such internal control as the Board of Directors and Chief Executive Officer determine is necessary to enable the preparation of financial statements that are free from material misstatement, whether due to fraud or error.
Auditor’s responsibility
Our responsibility is to express an opinion on these financial statements based on our audit. We conducted our audit in accordance with laws, regulations, and auditing standards and practices generally accepted in Norway, including International Standards on Auditing. Those standards require that we comply with ethical requirements and plan and perform the audit to obtain reasonable assurance about whether the financial statements are free from material misstatement.
An audit involves performing procedures to obtain audit evidence about the amounts and disclosures in the financial statements. The procedures selected depend on the auditor’s judgment, including the assessment of the risks of material misstatement of the financial statements, whether due to fraud or error. In making those risk assessments, the auditor considers internal control relevant to the entity’s preparation and fair presentation of the financial statements in order to design audit procedures that are appropriate in the circumstances, but not for the purpose of expressing an opinion on the effectiveness of the entity’s internal control. An audit also includes evaluating the appropriateness of accounting policies used and the reasonableness of accounting estimates made by management, as well as evaluating the overall presentation of the financial statements.
We believe that the audit evidence we have obtained is sufficient and appropriate to provide a basis for our audit opinion on the financial statements for the Parent Company and the Group.
TELENOR ANNUAL REPORT 2013Auditor’s Report 2013 / Telenor Group
Auditor’s Report 2013
Statsautoriserte revisorerErnst & Young AS
Dronning Eufemias gate 6, NO-0191 OsloOslo Atrium, P.O.Box 20, NO-0051 Oslo
Foretaksregisteret: NO 976 389 387 MVATlf: +47 24 00 24 00Fax: +47 24 00 29 01www.ey.noMedlemmer av den norske revisorforening

/PAGE 119/
2
A member firm of Ernst & Young Global Limited
Opinion on the financial statements of the Parent Company
In our opinion, the financial statements of Telenor ASA have been prepared in accordance with laws and regulations and present fairly, in all material respects, the financial position of the Company as at 31 December 2013 and its financial performance and cash flows for the year then ended in accordance with the Norwegian Accounting Act and accounting standards and practices generally accepted in Norway.
Opinion on the financial statements of the Group
In our opinion, the financial statements of the Group have been prepared in accordance with laws and regulations and present fairly, in all material respects, the financial position of the Group as at 31 December 2013 and its financial performance and cash flows for the year then ended in accordance with the International Financial Reporting Standards as adopted by the EU.
Report on other legal and regulatory requirements
Opinion on the Board of Directors’ report and on the statements on corporate governance and corporate social responsibility
Based on our audit of the financial statements as described above, it is our opinion that the information presented in the Directors’ report and in the reports on corporate governance and social responsibility concerning the financial statements, the going concern assumption and the proposal for the allocation of the result is consistent with the financial statements and complies with the law and regulations.
Opinion on registration and documentation
Based on our audit of the financial statements as described above, and control procedures we have considered necessary in accordance with the International Standard on Assurance Engagements (ISAE) 3000, «Assurance Engagements Other than Audits or Reviews of Historical Financial Information», it is our opinion that the Board of Directors and Chief Executive Officer have fulfilled their duty to ensure that the Company's accounting information is properly recorded and documented as required by law and generally accepted bookkeeping practice in Norway.
Oslo, 18 March 2014 ERNST & YOUNG AS Anders Gøbel State Authorised Public Accountant (Norway) (This translation from Norwegian has been made for information purposes only.)
TELENOR ANNUAL REPORT 2013Auditor’s Report 2013 / Telenor Group
2

/PAGE 120/
TELENOR ANNUAL REPORT 2013
Statement from the CorporateAssembly of Telenor ASA
Financial Calendar 2014
On 19 March 2014, the Corporate Assembly of Telenor ASA passed the following resolution.
The Corporate Assembly recommended that the Annual General Meeting approves the Board’s proposal for Financial Statement for Telenor Group and Telenor ASA for 2013 and recommends a dividend payment of NOK 7.0 per share, in total NOK 10.6 billion, to be paid in 2014, and a transfer of NOK 21.31 billion to retained earnings.
07 May 2014 Telenor’s result for the 1st quarter 201414 May 2014 Annual General Meeting 201423 July 2014 Telenor’s result for the 2nd quarter 201429 October 2014 Telenor’s result for the 3rd quarter 2014

/PAGE 121/
TELENOR ANNUAL REPORT 2013Key Figures
2009 1) 2010 1) 2011 1)2012
Restated 1) 2013 1)
Organic revenue growth 2) 0% 6% 7% 5% 1%
EBITDA margin 3) 32.5% 30.8% 31.0% 32.3% 34.5%
EBIT margin 13.6% 13.2% 10.5% 9.6% 20.5%
Capex/Sales 16.5% 12.2% 11.6% 12.1% 14.1%
Operating cash flow margin 4) 16.0% 18.6% 19.4% 20.2% 20.4%
Net interest-bearing liabilities 5) 26 332 19 276 17 231 33 082 39 395
Net interest-bearing liabilities/EBITDA 0.85 0.67 0.57 1.03 1.12
Earnings per share 5.22 8.69 4.45 5.63 5.74
ROCE 6) 10.9% 9.9% 7.4% 11.0% 13.8%
Total Return 7) 75.1% 20.6% 7.8% 20.1% 34.9%
1) Figures as reported in each year.2) Organic revenue is defined as revenue adjusted for the effects of acquisition and disposal of operations and currency effects.3) EBITDA margin before other income and expenses.4) Operating cash flow is defined as EBITDA before other income and expenses – Capex, excluding licences and spectrum.5) Starting from 2011, net interest-bearing liabilities is defined as interest-bearing debt excluding net present value of licence liabilities.6) Return on capital employed (ROCE) is based on net income excluding financial and non-recurring items.7) Dividends are reinvested on ex-dates.
Key Figures
DisclaimerThis report contains statements regarding the future in connection with Telenor’s growth initiatives, profit figures, outlook,strategies and objectives. All statements regarding the future are subject to inherent risks and uncertainties, and many factorscan lead to actual profits and developments deviating substantially from what has been expressed or implied in such statements.

/PAGE 122/
TELENOR ANNUAL REPORT 2013Report on Social Responsibility
IntroductionThe Norwegian Parliament adopted in 2013 a statutory duty for large companies to report on how they follow up material sustainability issues. These changes in the Norwegian Accounting Act require this report to be provided by the Board of Directors to be published in the annual report or in another public document referred to in the report.
The amendment requires that large enterprises must account for what the company is doing to integrate respect for human rights, labour rights and social issues, the environment and anti-corruption in their business strategies, in their daily operations and in their relationship with stakeholders. The report shall at least contain information on policies, principles, procedures and standards the company uses to integrate the above considerations.
In addition to the requirements in the Norwegian Accounting Act, Telenor Group is committed to the disclosure of its social and environmental performance, focusing on material issues and communicating its progress
in line with stakeholder expectations.
The 10 focus areas covered in this report on social responsibility are based on a materiality assessment process in 2013 in line with stakeholder expectations and the assessment has been conducted based on Global Reporting Initiative (GRI) G4 guidelines. More information at www.telenor.com/sustainability.
The Board of Directors of Telenor ASA has decided that the statement on how the company is delivering on material social responsibility issues should be given as a separate section in the annual report for 2013.
Governing principles, policies and manualsTelenor Group has adopted a code of conduct, governance principles, policies and manuals that we use to integrate material sustainability issues into our business strategies, in our daily operations and in our relationship with stakeholders. These internal rules are adapted and implemented in all subsidiaries where the Telenor Group
has operational control. More information at www.telenor.com/about-us/corporate-governance.
Human rightsFrom policies to actionAt Telenor, respect for human rights is important for how we run our business. We believe we can contribute to the fulfilment of rights through the many opportunities that connectivity and mobile services bring. We should also observe that potential negative impacts in societies from our business activities could occur.
Our commitment to human rights is long standing and integrated in our top governing document – the Code of Conduct – as well as our Supplier Conduct Principles, and various policies. We have also expressed our stance in the Telenor Group Human Rights Principles.
Our main focus is understanding risks and integrating mitigating actions into our business processes, through continuous improvement. Two key risk areas have been in particular focus in
Report on Social Responsibility

/PAGE 123/
TELENOR ANNUAL REPORT 2013Report on Social Responsibility
2013. The first is related to challenges to privacy and freedom of expression, and potential government misuse of access to telecom data and networks. We see that while telecommunications enable the exchange of ideas and expression of opinions, occasions where governments request access to our data and networks may present human rights risks. The second relates to understanding risks related to new market entry. In both cases, Telenor believes active engagement with stakeholders is important to understanding and mitigating risks.
Status and looking forwardIn 2013, we reviewed current policies from the perspective of respect for human rights. As part of our annual update of Group-level policies we updated our requirements in several areas including corporate responsibility, privacy as well as investments.
Telenor is a founding member of the «Telecommunications Industry Dialogue on Freedom of Expression and Privacy», which in March 2013 launched a two-year collaboration with the «Global Network Initiative» and a set of guiding principles.
In 2013, we updated our policy requirements related to handling authorities’ requests for personal data. The process itself was particularly valuable as it highlighted some of the key challenges our business units face. Dialogue with stakeholders and the «Telecommunications Industry Dialogue on Freedom of Expression and Privacy» guiding principles provided useful input.
In 2013, we developed a human rights toolkit to help our business units embark on their own due diligence processes, as well as piloted training concepts for key employees.
During 2013, a key focus area was to understand potential human rights implications when going into new markets like Bulgaria and Myanmar. With respect to the latter we conducted a human rights due diligence in 2012. This due diligence formed the basis for our key focus on human rights issues related to supply chain sustainability, privacy and freedom of expression, land rights and conflict areas, as well as wider sustainability challenges like corruption, employees’ safety and security, and environment.
As we continue our work on human rights, we will focus on implementation and training. Our ambition is to have all our business units conduct a human rights due diligence, as well as provide tailored training for key employees to raise awareness and understanding of how to address authorities’ requests, for example.
Labour rightsFrom policies to action Telenor is committed to respecting labour rights principles as laid down in the UN Global Compact and the ILO’s fundamental conventions. These principles relate to respecting the rights to freedom of association and collective bargaining, the elimination of forced labour, child labour and discrimination in the workplace, and are reflected in Telenor’s Code of Conduct, Group Policy People and Supplier Conduct Principles.
Telenor believes in employee involvement, through management dialogue with employees or their recognised employee representatives. Throughout Telenor Group we are promoting partnership based on a good and trusting dialogue.
Status and looking forwardIn 2013 Telenor established the Telenor
Works Council – Europe (TWC-E), where European employee representatives meet with the Telenor Group Management. TWC-E held two meetings in its first year, with the objective of enhancing information exchange and discussions in relation to transnational issues.
In 2013, Telenor entered into a global agreement with UNI Global Union, in order to establish a platform and framework for dialogue on fundamental labour rights.
During 2013 Telenor strengthened its commitment to employee involvement in operations throughout the group, and in several of our Asian operations employee involvement is provided for through local cooperation bodies (People Councils) where employee representatives meet with the management.
Going forward, we aim to develop employee involvement throughout Telenor Group further, utilising the employees’ experiences and insight.
Ethics and anti-corruptionFrom policies to action Telenor endorses the 10 principles of the UN Global Compact (UNGC) which present clear standards for business ethics. As a member of the UNGC, we report annually on our progress on embedding our ethical culture in all parts of our organisation. Telenor Group’s commitment to integrity and transparency is clearly stated in our Code of Conduct. This is a document that is signed by all employees upon joining the company, and re-signed whenever substantial updates are made.
Telenor is firmly opposed to corruption in all forms and is committed to doing
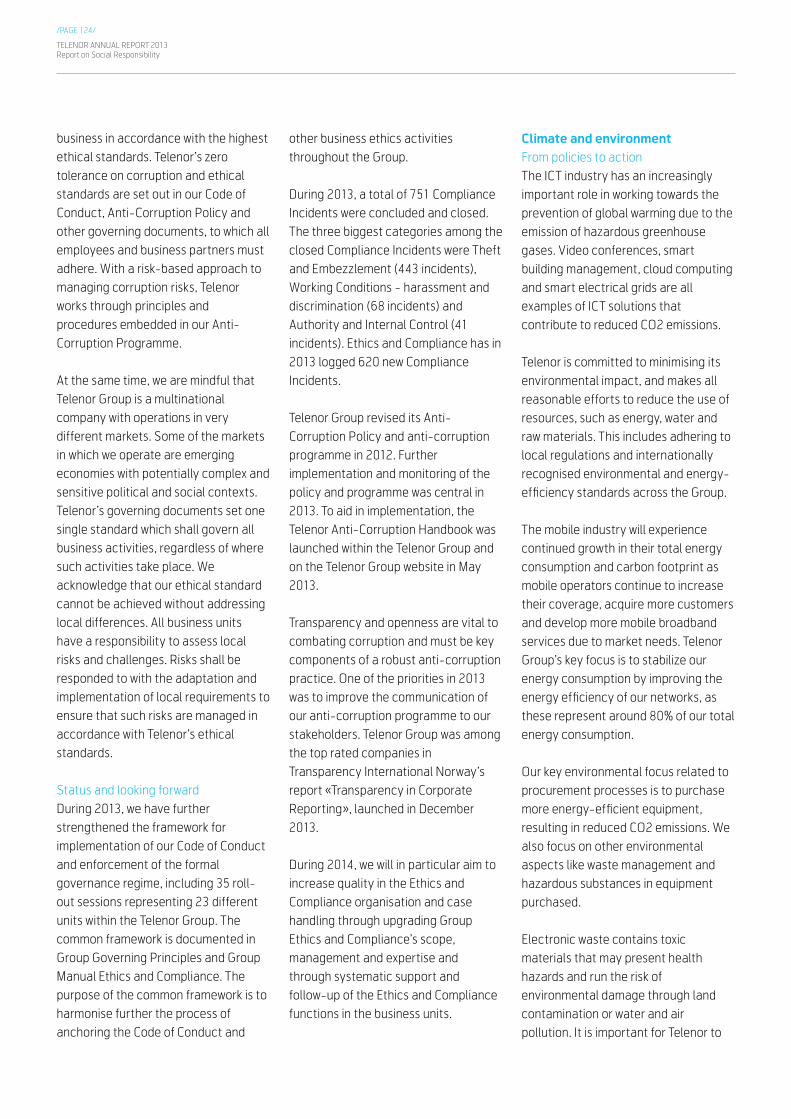
/PAGE 124/
TELENOR ANNUAL REPORT 2013Report on Social Responsibility
business in accordance with the highest ethical standards. Telenor’s zero tolerance on corruption and ethical standards are set out in our Code of Conduct, Anti-Corruption Policy and other governing documents, to which all employees and business partners must adhere. With a risk-based approach to managing corruption risks, Telenor works through principles and procedures embedded in our Anti-Corruption Programme.
At the same time, we are mindful that Telenor Group is a multinational company with operations in very different markets. Some of the markets in which we operate are emerging economies with potentially complex and sensitive political and social contexts. Telenor’s governing documents set one single standard which shall govern all business activities, regardless of where such activities take place. We acknowledge that our ethical standard cannot be achieved without addressing local differences. All business units have a responsibility to assess local risks and challenges. Risks shall be responded to with the adaptation and implementation of local requirements to ensure that such risks are managed in accordance with Telenor’s ethical standards.
Status and looking forwardDuring 2013, we have further strengthened the framework for implementation of our Code of Conduct and enforcement of the formal governance regime, including 35 roll-out sessions representing 23 different units within the Telenor Group. The common framework is documented in Group Governing Principles and Group Manual Ethics and Compliance. The purpose of the common framework is to harmonise further the process of anchoring the Code of Conduct and
other business ethics activities throughout the Group.
During 2013, a total of 751 Compliance Incidents were concluded and closed. The three biggest categories among the closed Compliance Incidents were Theft and Embezzlement (443 incidents), Working Conditions - harassment and discrimination (68 incidents) and Authority and Internal Control (41 incidents). Ethics and Compliance has in 2013 logged 620 new Compliance Incidents.
Telenor Group revised its Anti-Corruption Policy and anti-corruption programme in 2012. Further implementation and monitoring of the policy and programme was central in 2013. To aid in implementation, the Telenor Anti-Corruption Handbook was launched within the Telenor Group and on the Telenor Group website in May 2013.
Transparency and openness are vital to combating corruption and must be key components of a robust anti-corruption practice. One of the priorities in 2013 was to improve the communication of our anti-corruption programme to our stakeholders. Telenor Group was among the top rated companies in Transparency International Norway’s report «Transparency in Corporate Reporting», launched in December 2013.
During 2014, we will in particular aim to increase quality in the Ethics and Compliance organisation and case handling through upgrading Group Ethics and Compliance’s scope, management and expertise and through systematic support and follow-up of the Ethics and Compliance functions in the business units.
Climate and environmentFrom policies to action The ICT industry has an increasingly important role in working towards the prevention of global warming due to the emission of hazardous greenhouse gases. Video conferences, smart building management, cloud computing and smart electrical grids are all examples of ICT solutions that contribute to reduced CO2 emissions.
Telenor is committed to minimising its environmental impact, and makes all reasonable efforts to reduce the use of resources, such as energy, water and raw materials. This includes adhering to local regulations and internationally recognised environmental and energy-efficiency standards across the Group.
The mobile industry will experience continued growth in their total energy consumption and carbon footprint as mobile operators continue to increase their coverage, acquire more customers and develop more mobile broadband services due to market needs. Telenor Group’s key focus is to stabilize our energy consumption by improving the energy efficiency of our networks, as these represent around 80% of our total energy consumption.
Our key environmental focus related to procurement processes is to purchase more energy-efficient equipment, resulting in reduced CO2 emissions. We also focus on other environmental aspects like waste management and hazardous substances in equipment purchased.
Electronic waste contains toxic materials that may present health hazards and run the risk of environmental damage through land contamination or water and air pollution. It is important for Telenor to

/PAGE 125/
TELENOR ANNUAL REPORT 2013Report on Social Responsibility
reuse and recycle network equipment and handsets. We ensure that these processes are conducted according to internationally recognised standards and regulations.
Status and looking forwardIn 2013, total energy consumption in Telenor Group decreased by nearly 4% to a total of approximately 3200 GWh. The associated emissions of green-house gases in Telenor Group decreased by almost 9% to an estimated total of 1.1 million tonnes of CO2.
In 2013, Carbon Disclosure Project’s Global 500 Climate Change Report ranked Telenor Group third in the Climate Disclosure Leadership Index among the world’s largest tele-communications companies – up from 10th place last year.
In 2013, the Dow Jones Sustainability Indexes again ranked Telenor Group with the highest score for the reported climate strategy reached by a company in the mobile telecommunications sector.
In 2013, more than half of our procurement processes with contract value larger than USD 250,000 have been using a specified set of sustain-ability criteria.
In 2013, more than 120,000 meetings were carried out in Telenor’s global organisation using video conferencing and virtual meeting solutions instead of actual travel.
Mobile handset recycling initiatives have been established in nine business units: Telenor Hungary, Telenor Serbia, Telenor Montenegro, DiGi in Malaysia, dtac in Thailand, Telenor Sweden, Telenor Denmark, Telenor Norway and
Globul in Bulgaria. During 2013, a total of approximately 225,000 mobile handsets and mobile batteries were collected and recycled in an appropriate way.
Looking forward, our key climate measure is to improve the energy efficiency of all business units – such as network modernisation and integration of energy requirements in procurement processes.
For 2014, a key focus area will be electronic waste management. Our aim is to implement complete recycling programmes in all business units. We will also strengthen our policy on waste management.
Sustainable supply chainFrom policies to action Telenor strives for high standards and continuous improvement in our own operations and throughout the entire supply chain. Telenor has adopted a set of Supplier Conduct Principles (SCPs) for all contracting parties of Telenor. The SCP is based on internationally recognised standards and includes human rights, health and safety, labour rights, environment and anti-corruption.
Building capacity and reinforcing the understanding of employee health and safety, labour rights and environmental management among suppliers is important, but also time-consuming, work.
Improvement of supply chain sustain-ability in our operations can only be achieved through close cooperation with the supplier, and the goal of continuous improvement must always remain in focus.
Status and looking forwardIn 2013, Telenor continued to work proactively and systematically within the area of supply chain sustainability. The focus has been on mitigation of supply chain risk, health and safety of our suppliers’ employees and anti-corruption work in the supply chain. To secure the quality of this, Telenor carried out close to 2,000 supplier inspections across the Group in 2013. To date, Telenor has carried out more than 10,000 such sustainability inspections in our supply chain.
Telenor uses an Agreement of Responsible Business Conduct that legally binds our suppliers to following the Telenor SCP and to accepting active monitoring of the supplier by Telenor. By the end of 2013, Telenor had signed a total of close to 14,000 such agreements on responsible business conduct constituting 98% of our suppliers.
Capacity building of suppliers by HSSE training and awareness was also highly prioritised in 2013, and a total of more than 550 HSSE training sessions for suppliers were completed. Further in 2013, approximately 40,000 supplier employees completed various Telenor awareness programmes such as «People First».
Through participating in The Joint Audit Cooperation (JAC) of telecommuni-cations operators (currently 11 members), Telenor gained access to the results of 38 sustainability audits of global suppliers in 2013, and Telenor executed six audits of global suppliers on behalf of JAC in 2013.
In 2013 Telenor continued to be an active member in the UN Global Compact Supply Chain Advisory Group, and was at the forefront in producing
/PAGE 126/
TELENOR ANNUAL REPORT 2013Report on Social Responsibility
the «UN Global Compact Anti-Corruption Guideline for Supply Chain».
In 2014, we will conduct at least as many supplier inspections and audits as the previous year.
Occupational health, safety and securityFrom policies to action Telenor Group focuses on maintaining a positive working environment and a culture that nurtures occupational health, safety and security (OHS&S). The company works across all of its business units to maintain and improve its readiness for security and safety risks.
Telenor’s OHS&S approach covers its employees, as well as contractors, vendors and suppliers. We believe that the health, safety, security and wellbeing of our employees are vital to our business and make a difference in employee engagement and productivity, e.g. by reducing absenteeism, and thus saving costs.
Telenor faces a range of OHS&S-related challenges in the markets in which it operates. Traffic-related incidents remain a challenge, and Telenor has also seen an increase in violent crime, political instability, economic uncertainty and instability in some markets. The company has also noted threats to its retail shops and other facilities in some of our markets as mobile devices have increasingly become a target for theft.
Status and looking forwardFor the whole Group, the Lost-Time Injury Frequency (LTIF) for Telenor in 2013 was 0.3 (number of lost-time injuries per million worked hours).
OHS&S awareness and training was a priority in 2013 and close to 43,000 employees and in-house contractors attended awareness training.
In 2013, Telenor had two work-related fatalities in Pakistan: In March, an employee of Tameer Bank died when a suicide bomber attacked a security checkpoint in Peshawar city. The employee was visiting retailers as the blast occurred. In July, a base station security guard (in-house contractor) was killed by unknown person(s). No work-related fatalities of first-line suppliers were reported in 2013.
Telenor will continue to work with our partners and vendors to monitor and implement health and safety measures and provide them with proactive support in OHS&S matters.
Enabling servicesFrom policies to action Telenor Group’ business strategy states that we have a significant impact on the societies where we operate. We also have an opportunity to play a role in the digitalisation of societies and we aim to further improve the way we work with our business environment, with a focus on local regulatory frameworks, societal expectations and stakeholder perceptions.
The mobile phone is increasingly a tool for improving people’s lives. Telenor believes that the mobile phone can help transform the lives of individuals; allowing financial inclusion, access to knowledge, and making health services affordable and accessible for all. From this, societies are empowered to grow and progress. Bringing the benefits of mobile communication to a wider audience is one of Telenor’s key objectives. This is what Telenor calls «Enable».
This thinking also underpins our approach to bridging the digital divide. We work systematically to ensure digital inclusion through extending physical area coverage, as well as enabling people to benefit from our communi-cation services, be it through improved accessibility, provision of training or through innovative services like mobile banking.
In order for Telenor to develop new services that are useful to, and trusted by, the end-users, collaboration with local and international partners is required . Government authorities, NGOs and international organisations can help us ensure that our services meet the actual needs of people in that society, and that they are implemented professionally.
Status and looking forwardAs of 2013, Telenor has currently rolled out the 4G mobile technology standard in five countries and 3G in eight countries, with more countries on the roadmap. By 2016, nearly all of our markets will have 3G or 4G. Six of our operations have also rolled out or are evaluating WiFi offerings. In our mature markets we are adding network capacity to sustain and improve the mobile data user experience as networks become congested.
In Thailand, dtac joined forces with UNICEF to launch the «best start» initiative, which will provide free mobile information services to promote healthy mothers and children. The mobile phone will serve as the tool to convey life-saving information to pregnant women and newly mothers, to allow newborns the best possible start in life, underpinning one of the UN Millenium Goals.

/PAGE 127/
TELENOR ANNUAL REPORT 2013Report on Social Responsibility
In 2013, Telenor Group continued its work on «Enable projects» in Serbia, connecting the Roma population, along with its efforts to banking the unbanked in Pakistan through Easypaisa.
The dtac and Rak Ban Kerd project *1677 Farmer Information Superhighway in Thailand that aims at empowering farmers through access to essential agricultural information from their mobile phones, reached their target of 220,000 subscribers in 2013.
In 2013, Grameenphone expanded its pilot on telemedicine in Bangladesh. An additional 20 telemedicine sites with community health workers were equipped to provide live consultations with physicians with the help of digital imaging and communication in telemedicine. More than 3,000 consultations have so far been provided.
In 2013, Telenor and the Wikimedia Foundation continued their partnership in building on the commitment to bring Wikipedia to Telenor customers free of data charges. Telenor has now launched Wikipedia Zero in Montenegro and Malaysia, Thailand and Bangladesh. The partnership is committed to launching in Serbia, Pakistan, India and Myanmar in 2014.
In 2014, Telenor aims to continue expanding the reach of its Enable initiatives through a global partnership agreement with UNICEF. By joining forces with UNICEF we wish to leverage the reach and capability of connectivity for child survival and development with a focus on our markets in Asia.
Privacy and data protectionFrom policies to action Data privacy and protection of personal data is paramount to earning this trust.
We take pride in our attempts to safeguard the integrity of the vast volumes of information we process. Even though national requirements vary throughout our operations, we strive to be transparent and informative about how we handle our customers’ and employees’ personal information.
Technology has enabled communi-cation, but it has also enabled surveillance. Mobile users are increasingly looking at how their privacy is safeguarded, irrespective of tech-nologies, business models and data flows.
The mobile industry needs to find mobile-friendly ways to help users make informed decisions about their personal information and privacy. Another key challenge is to ensure that user privacy is respected and protected by those designing and building new services and applications.
All customer data shall be managed with confidentiality, in accordance with strict standards, so as to prevent any unauthorised access. In a wider perspective, this responsibility also involves respecting crucial human rights such as freedom of expression.
Status and looking forwardIn 2013, Telenor adopted the GSMA Mobile Privacy Initiative Accountability Framework to ensure that we are accountable for our implementation of the GSMA Privacy Design Guidelines for Mobile Application Development.
Telenor Group will continue to improve our common internal framework for how we process personal information in all our business operations. We are committed to ensuring that all our business units take action to prevent any unauthorised access to personal
data, and to ensure a safe and sound development of new services and applications. Many of these will utilize customer generated data in many forms and fashions, and the wider industry needs to strike a proper balance between privacy and security and data analysis.
Digital responsibilitiesFrom policies to action Across all Telenor’s markets children and young people are accessing online content at an increasingly rapid pace. At Telenor we are confident that this access enriches the lives of children, enabling them to share, engage, learn and be entertained. As technological innovation continues to produce new communication channels, it is important that the ICT industry continues to develop its insight into understanding changing user patterns and the challenges they pose.
Within the digital ecosystem, we see a need for better interaction between children, parents and teachers. Children will explore, and there are real risks associated with their ICT use. These risks need to be acknowledged by the people who are closest to the children. Our main challenge going into 2014 is to grow the understanding among our target groups and the demand for positive content and tools equipped with appropriate safety features.
Status and looking forwardIn the spring of 2013 Telenor Group presented the findings of a report called Building Digital Resilience. The report focuses on 12 markets where Telenor has operations and outlines many of the challenges young ICT users are facing today, as well as the level of maturity and resilience in each of those societies. The report found that among 100 million children who
/PAGE 128/
TELENOR ANNUAL REPORT 2013Report on Social Responsibility
will go online for the first time by 2017, 85 million will use a mobile device as their first access point.
Telenor has continued discussions within two European alliances for online child safety, the ICT Coalition and the CEO Coalition. As part of this effort Telenor also initiated work to develop a bookmarklet that can be pre-installed on mobile handsets and easily allow consumers to report findings of harmful and illegal online content.
In 2013, Telenor became the head sponsor of the non-governmental organisation ECPAT in Sweden. ECPAT is a global network of organisations dedicated to ending the commercial sexual exploitation of children. Telenor has supported ECPAT since 2005 and has also been blocking Child Sexual Abuse Images in cooperation with the National Police.
On Children’s Rights Day in 2013, UNICEF’s National Committee in Hungary and Telenor Hungary announced new programmes and tools created to protect children’s online privacy by providing education on children’s rights and combating digital harassment. Part of Telenor’s contribution will be channelled to UNICEF’s international fund to finance international education initiatives.
Telenor has also made a commitment to promoting UNICEF’s HelpAPP through its key channels. This innovative mobile app aims to help children who have been subject to abuse or harassment.
One of the critical factors in our work on digital responsibility going forward is not only to engage with the children themselves, but also with their parents and teachers. To do this we will seek opportunities to build alliances with
capable organisations that strive to mitigate the risks children are facing.
Financial contribution to societyFrom policies to action Telenor is committed to operate correctly according to tax laws and regulations by paying taxes at the level of what we are legally obliged to.
Telecommunications is a local business relying on fixed, physical infrastructure, and Telenor Group employs thousands of highly skilled experts and employees in local markets. Local contributions to society in the form of employment of experts, investments and taxation are comparably greater from telecommuni-cations than from many other services.
Infrastructure and innovative services have a vital effect on business development, economic growth and personal opportunities. Investments in business, equipment and engineering works are a direct contribution to local contractors and employment. And finally, our industry makes a substantial fiscal contribution to national budgets all over the world.
Mobile operators make several sector-specific fiscal contributions to states. Radio spectrum is usually auctioned off for exclusive use, against considerable payment. Those revenues accrue to national budgets, in much the same way as petroleum or mining licences. National finances also benefit from other legitimate revenues such as fees covering real costs of spatial and technical regulation services. There is universal support for the principle of paying for radio spectrum, or contributing to the real costs of regulation – a support shared by governments and industry alike.
StatusIn 2013, Telenor Group actually paid NOK 4.8 billion in corporate income taxes in all our markets. Further, capital expenditures in all our operations were NOK 17.0 billion and we employed more than 34,000 people across the 13 markets in Europe and Asia. During 2013 we saw an increasing trend of diverging tax levels between different industries, within the same country.
Sector-specific taxation, i.e. the levy of higher taxes such as import duties, gross revenue taxes, revenue share, indirect taxes, etc., on some industries and not others, was intensified in several European countries in the wake of the financial crisis, especially after the crisis year of 2009. France, Greece, Slovakia, Croatia, Serbia and Hungary were among the nations that issued sector-specific taxation on the telecoms industry during the crisis, often against broadly accepted principles of taxation.
A recent study by Deloitte on behalf of the GSMA, shows that an average of 19 countries witnessed an increasing gap between the taxation of telecoms companies, and the taxation of other industries, between 2008 and 2012. Countries where Telenor operates, and which increased one or more general or sector-specific taxes between 2009 and 2013, included Serbia, Hungary, Montenegro, and Bangladesh. The increasing tax gap at the expense of mobile operators was largely attributed to the introduction of a «crisis tax» in Hungary, while the increasing tax burden on the industry in Bangladesh was attributable to several import duties, recurring spectrum fees, and other extraordinary liabilities contrary to global tax principles. Countries in which we operate, that reduced important levies and taxes, included Sweden and Thailand.
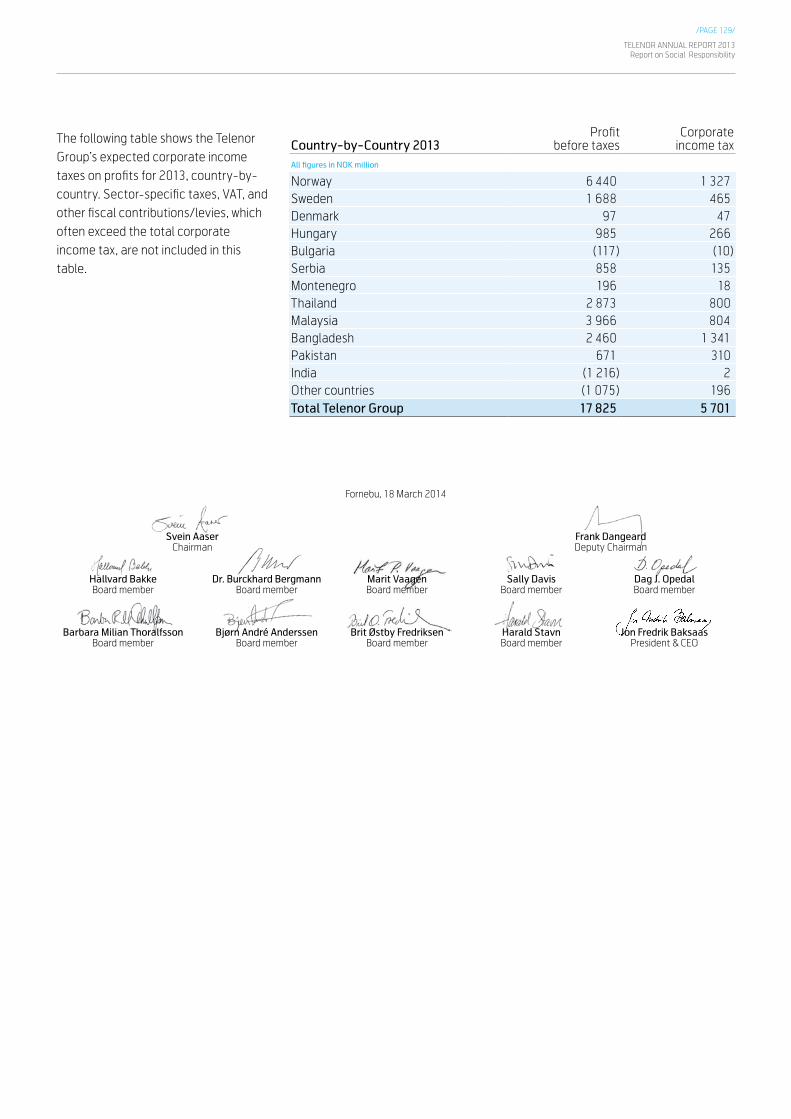
/PAGE 129/
TELENOR ANNUAL REPORT 2013Report on Social Responsibility
The following table shows the Telenor Group’s expected corporate income taxes on profits for 2013, country-by-country. Sector-specific taxes, VAT, and other fiscal contributions/levies, which often exceed the total corporate income tax, are not included in this table.
Country-by-Country 2013Profit
before taxesCorporate
income taxAll figures in NOK million
Norway 6 440 1 327Sweden 1 688 465Denmark 97 47Hungary 985 266Bulgaria (117) (10)Serbia 858 135Montenegro 196 18Thailand 2 873 800Malaysia 3 966 804Bangladesh 2 460 1 341Pakistan 671 310India (1 216) 2Other countries (1 075) 196Total Telenor Group 17 825 5 701
Fornebu, 18 March 2014
Svein Aaser Frank Dangeard Chairman Deputy Chairman
Hallvard Bakke Dr. Burckhard Bergmann Marit Vaagen Sally Davis Dag J. Opedal Board member Board member Board member Board member Board member
Barbara Milian Thoralfsson Bjørn André Anderssen Brit Østby Fredriksen Harald Stavn Jon Fredrik Baksaas Board member Board member Board member Board member President & CEO

/PAGE 130/
TELENOR ANNUAL REPORT 2013Telenor Group’s Operations
The Telenor Group is listed on the Oslo Stock Exchange
Telenor
NorwayTelenor is the country’s leading telecommunications operator.
Telenor
SwedenTelenor is the third largest mobile operator in Sweden.
Telenor
DenmarkTelenor is the second largest mobile operator in Denmark.
Telenor
HungaryTelenor is the second largest mobile operator in Hungary.
Telenor
SerbiaTelenor is the largest mobile operator in Serbia.
Telenor
Montenegro Telenor is the largest mobile operator in Montenegro.
Globul
Bulgaria Globul is the second largest operator in Bulgaria.
A glance at theTelenor Group
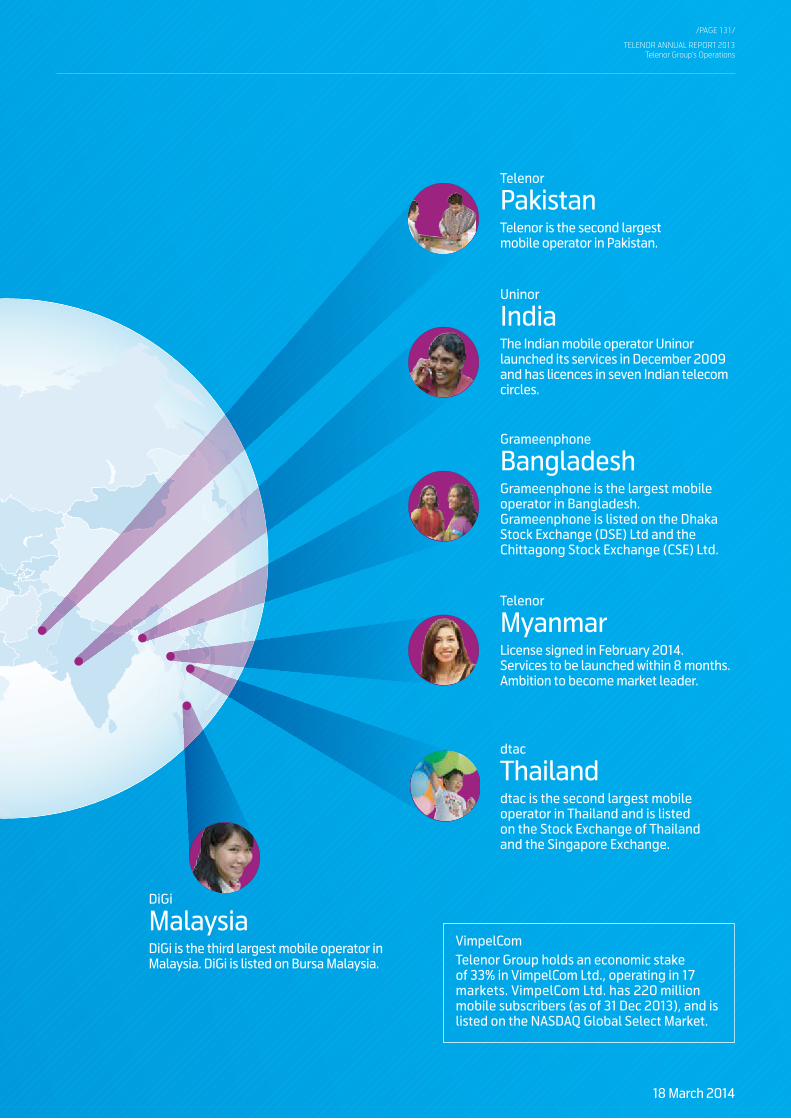
/PAGE 131/
TELENOR ANNUAL REPORT 2013Telenor Group’s Operations
Telenor
PakistanTelenor is the second largest mobile operator in Pakistan.
Telenor
MyanmarLicense signed in February 2014. Services to be launched within 8 months. Ambition to become market leader.
Uninor
IndiaThe Indian mobile operator Uninor launched its services in December 2009 and has licences in seven Indian telecom circles.
Grameenphone
BangladeshGrameenphone is the largest mobile operator in Bangladesh. Grameenphone is listed on the Dhaka Stock Exchange (DSE) Ltd and the Chittagong Stock Exchange (CSE) Ltd.
dtac
Thailanddtac is the second largest mobile operator in Thailand and is listed on the Stock Exchange of Thailand and the Singapore Exchange.
DiGi
MalaysiaDiGi is the third largest mobile operator in Malaysia. DiGi is listed on Bursa Malaysia.
VimpelComTelenor Group holds an economic stake of 33% in VimpelCom Ltd., operating in 17 markets. VimpelCom Ltd. has 220 million mobile subscribers (as of 31 Dec 2013), and is listed on the NASDAQ Global Select Market.
18 March 2014

www.telenor.com
2141
137
• Bo
lt Co
mm
unic
atio
n AS
• b
oltc
omm
unic
atio
n.no