annual report 2014 - despec bilgisayar report_2014.pdf · annual report 2014 3 ... we are...
TRANSCRIPT


ANNUAL REPORT 2014

ANNUAL REPORT 2014
3
CONTENTS
COMPANY
SECTOR OF OPERATION
OPERATION
CORPORATE GOVERNANCE PRINCIPLES
COMPLIANCE REPORT
INDEPENDENT AUDITOR'S REPORT
FINANCIAL STATEMENTS AND NOTES
6-13
14-35
36-39
40-51
52-53
54-109
1
2
3
4
5
6

ANNUAL REPORT 2014
4

ANNUAL REPORT 2014
5
Dear Shareholders, employees and business partners,
We are submitting 2014 Annual Report to your concerns. In the first section of the report, there are information about company, sector, subsidiaries, and operation structure. In the second half of the report, there are corporate governance principles, Independent Auditors’ Report, Financial Statement & Notes to Financials. Furthermore, I would like to give you brief information about our companies’ activities performed in 2014, sector and Turkish economy
In 2014, economic view was affected because of fluctuations in money market, low growth rate, unemployment problems, high debts which are the remnants from crises. Although, World economy cannot reach the numbers before crises, developing countries revised growth speed towards down, affected the trust of economies negatively.
While USA was developping growth numbers with revisions on spreading strategies when compared to developping countries, specifially Japan and Europe have been unsuccessful. Petol prices per barrel dropped from 115 USD to 50 USD. This decrease in petrol prices affected petrol exporters negatively such Russia Venezuela. On the other hand, it contributed positively to petrol importers such Turkey and India.
As there were plenty of fluctuations in global markets, our country has faced with fluctuations. Growth expectation was realized as 2,9 %. Unemployment rate was realized as 9,9 %. Although these negative developments, some improvements have been seen in the last quarter in the market. Central Bank has increased overnigh interest rate from 8% to 10% because of fluctuations started since september.
In the accordance with these developments in world economies, our country has done 158 billion USD export, 242 billion USD import and total foreign trade volüme reached 400 billion USD.
According to the Data publiched by IDC for IT Sector, Turkish IT Sector achieved 0,5 % shrinkage in 2014 and reached 6,4 billion USD. Hardware market size reached 4,2 billion USD with 2,8 % shrinkage, software market size reached 792 million USD with 8,4 % growth, service market size reached 1,3 billion USD with 2 %. Growth expectation for 2015 is 5 %. Our company achieved 165 million TRL net sales revenue with 17 % growth and 8,2 million TRL net profit in 2014. We will continue to grow in 2015 with increasing demand for tablet prod-ucts, reaching the targeted volume with added brands into our product portfolio, seizing the opportunity of new mobile products.
In this year as previous years, we will continue our business understanding which is focused on careful risk management, making more sensitive cost analyses, profit orientation, managing the sales and stock targets in successful level, creating faster solution for our business partners in Anatolia with mobile channel sales teams who are widespread in Anatolia and prioritizing productivity.
I would like to express my gratitude to all who contributed to our success, to our employees, business partners, suppliers and our share-holders who made significant contribution to our success.
Yours Faithfully,
Erol BİLECİK
Chairman

Company01

ANNUAL REPORT 2014
7
Brief and Historical Background of the CompanyDespec Bilgisayar Pazarlama ve Ticaret A.Ş. distributes consumables (toner, Inkjet cartridge, Rib-bon, back-up products, paper and accessories) in IT sector. It was established on 04.01.1995 and started its operations towards the end of 1998.
Despec Group B.V. which has the head office in Holland became 50 % shareholder of Despec A.Ş. in May in 1998. Despec Group B.V. sold its 6.975.000 shares to Despec International FZCO located in Dubai on 27.01.2014. The other major shareholder of Despec A.Ş. is Desbil Teknolojik Ürünler A.Ş. that Mr Erol Bilecik is the owner with % 100. Mr Erol Bilecik is the founder and % 38.30 shareholder of Indeks Bilgisayar Sistemleri Mühendislik Sanayi ve Ticaret A.Ş. which opera-tes in Turkish IT sector and distributes IT products.
Despec has a large product portfolio that includes many foremost brands in the world. HP products (particularly printer toner and cartridges) generate the majority of its sales. The company distributes consumable products of HP, Oki, Imation, Sony, Canon, Targus, TDK, Memorex, Trust, Steelseries, Dexim and Lexmark. In addition, Despec acts sub-distributor for consumable products of Xerox, Kingston, Panasonic, Samsung, Epson, Emtec, and Brother.
Despec International FZCO is company concentrated in sales of IT consumables to dealers. The foremost world brands in Electronic office materials, IT peripherals, digital equipments, photograp-hy and telecommunication accessories exist in its product portfolio. Despec International FZCO operates in Middle East, Africa and Turkey. It conducts almost its whole operations by marketing IT consumable products of HP, Oki, Canon and Lexmark.
The address of the company’s head office: Merkez Mahallesi. Erseven Sokak. No:8/3 34396 Şişli/İSTANBUL. In addition, the company has two branches as in Ankara and İzmir.
Product Groups
Laser Toner Magnetic MediaInkjet Cartridge Printer RibbonAccessories Paper

ANNUAL REPORT 2014
8
Breakdown of Sales on Product Category Based
Accessories8,80%Printer Ribbon
1,76% Side Parts
7,94%
Inkjet Cartridge 27,26%
Magnetic Media4,29%
Laser Toner49,42%
Paper0,53%
Changes in the Share Price throughout the Year: DESPEC in ISE: Having held an IPO in December 2010, our company’s shares are traded in Istanbul Stock Exchange (ISE) national market under the code of “DESPC”. The ISE-100 index opened at 67.367 in 2014, closed at 85.721 on 31.12.2014 with the increase of 27 %.
The TRL/USD exchange rate opened at 2,1304 at the beginning of the year, had some fluctuations during the year and closed the year at 2,3189, US Dollar devalued by 8.5% within the year.
The year-end value of 1 share was TRL 2,52, whereas its value was 1,23 at the beginning of the year. According to the closing value on the last transaction day of the year, the value of our Com-pany is TRL 57.960.000.
Capital and Shareholding StructureAs of 31.12.2014, the shareholding structure of our Company is as follows:
Shareholder's Name Country Shares % Number of SharesDesbil Teknoloij Ürünler A.Ş. (*) Turkey 30,25 % 6.956.268
Despec Group B.V. Turkey 30,33 % 6.975.000
Public Offering - 39,35 % 9.050.000
Other Turkey 0,07 % 18.732
TOTAL 23.000.000
(*)Desbil Teknoloij Ürünler A.Ş. has 112.997 numbers of shares in Public Offering section.

ANNUAL REPORT 2014
9
Despec Group B.V. sold its 6.975.000 shares to Despec International FZCO located in Dubai on 27.01.2014.
Share certificates of Despec Bilgisayar Pazarlama Ticaret A.Ş. began to be traded in Istanbul Stock Exchange, as of December 2010. Its capital, which was TRL 11,000,000 before public offering, has increased to TRL 11,500,000 following the public offering. Despec Bilgisayar Pazarlama Ticaret A.Ş. has adopted authorised capital system and the upper limit of authorised capital of our Com-pany was determined as TRL 25,000,000.
According to the Board Decision taken on 14.03.2012 with 2012/03 number, it was decided to increase the capital of the company from 11.500.000 TRL to 23.000.000 TRL with staying in the upper limit of authorised capital of our Company was determined as TRL 25,000,000. The increase amount of 11.500.000 TRL was decided to compensate from internal sources. Capital increase was registered on 20.04.2012 with 8087 number and published in Turkish Trade Registration Newspa-per on 27.04.2012.
The capital of our Company is TRL 23,000,000 out of which TRL 4.000 is composed of Group A registered shares and TRL 22.996.000 is composed of Group B bearer shares.
Group A shares have privilege in the election of board of directors, but Group B shares do not have any privileges. Half plus one of the members of the Board of Directors are elected from the candidates nominated by the Group A shareholders.
Data on Financial Structure
LIQUIDITY RATIOS 31.12.2014 32.12.2014Current Ratio 4,02 3,22
Liquidity Ratio 2,71 2,23
OPERATING RATIOS (*) 31.12.2014 32.12.2014Receivables Turnover 75 67
Payables Turnover 35 35
Inventory Turnover 41 36
(*) The figures in quarterly financial accounts have been taken into consideration in the calculation of averages.
PROFITABILITY RATIOS 31.12.2014 32.12.2014Gross Profit Margin 10,1% 11,5%
Operating Profit Margin 7,0% 9,9%
Net Profit Margin 5,0% 6,2%
Profit Margin Before Tax 6,3% 8,3%
Shareholders' Equity Profitability 15,9% 18,0%

ANNUAL REPORT 2014
10
FINANCIAL STRUCTURE RATIOS 31.12.2013 31.12.2012Shareholders' Equity / Total Liabilities 74,8% 68,7%
Short Term Liabilities / Total Liabilities 24,6% 30,9%
Long Term Liabilities / Total Liabilities 0,5% 0,5%
Bank Loans / Total Liabilities 0,0% 0,0%
Awards achieved & Distributorship UndertakenAs of 31.12.2014, there is not any distributorship or awards achieved.
Board of Directors, Auditing Board and Auditing CommitteeBoard of Directors:Members of the Board of Directors were elected for a duration of three years, and in the Gene-ral Assembly held on 09.05.2014, published in the Turkish Commercial Register Gazette dated 10.06.2014 with No. 8587.
Board of Directors
Name & Surname Title Term of OfficeNevres Erol Bilecik Chairman 3 Years
Oğuz Gülmen Vice Chairman 3 Years
Salih Baş Board Member 3 Years
Halil Duman Board Member 3 Years
Riyaz Amirali Jamal Board Member 3 Years
Faisal Riyaz Jamal Board Member 3 Years
Hasan Tahsin Tuğrul Independent Board Member 3 Years
Sedat Sami Ömeroğlu Independent Board Member 3 Years
Audit Committee
Name & Surname TitleSedat Sami Ömeroğlu Chairman of the Committee
Hasan Tahsin Tuğrul Member of the Committee

ANNUAL REPORT 2014
11
Corporate Governance Committee
Name & Surname TitleSedat Sami Ömeroğlu Chairman of the Committee
Salih Baş MemberHalil Duman MemberKerim Işık Member
Risk Detection Committee
Name & Surname TitleSedat Sami Ömeroğlu Chairman of the Committee ( Independent Member)
Hasan Tahsin Tuğrul Member ( Independent Member)Halil Duman Member
Board of DirectorsThe Board of Directors of the company consists of 5 members. Curricula Vitae of the board members are given below.
Nevres Erol Bilecik, Chairman: Erol Bilecik was born in 1962 in Antakya. He completed his primary, secondary and college education in the same city. In 1986, he graduated from computer engineering, Istanbul Technical University. After his graduation, he started working in Nixdorf Computer as System Analyst and worked in this company for two years.
Erol Bilecik established Index A.Ş. in 1989 and took in charge as General Manager. He is stil CEO of Index Bilgisayar A.Ş., Despec A.Ş., Datagate A.Ş., Neteks A.Ş, Neotech A.Ş. and Teklos A.Ş. in INDEX GROUP
In meantime, He took in charge as the chairman of Turkish Information Technology Industrialists & Busi-nessmen Association which is one of the oldest non-governmental organizations in Turkish Information Technology Sector and Foundation of İTU (Istanbul Technical University). He is married and has two children. He speaks English.
Riyaz Amirali Jamal, Board Member: Riyaz Jamal was born in 1955. Riyaz Jamal who is a Ca-nadian citizen took over his family business in 1987. In 1990, he opened Despec England Branch in London. He became a partnership with Van Dorp Despec and opened Despec’s first Middle East branch in Jebel Ali Free Zone in 1993.
In 2006, he established Despec International FZCO Dubai and this company acquired Despec Group BV. with % 100. Furthermore, he sold % 70 of Despec International FZCO shares to Dubai International Investment LLC (DIFC). Share of Riyaz Amirali Jamal increased to % 70 in Despec Interna-tional FZCO in 2012.

ANNUAL REPORT 2014
12
As he started his professional career 25 years before with distributorship of computer and printer pro-ducts, his company became the main distributor of computer OEM components and consumables in Canada and Europe.
He is an entrepreneur specialised and experienced in international business management, drawing strategic vision & planning, organisation management, mergers and acquisitions. In addition, he is an mechanical engineer and knows English, African and Indian languages. He is married and has two children.
Oğuz Gülmen, Vice Chairman and General Manager: Oğuz Gülmen was born in 1957 and graduated from London University, Department of Computer Science. Between 1881 and 1988, he worked for Denizcilik Bankası IT Department, Türkiye Şişecam Fabrikaları and Lever respectively as system analyst. Between 1988 and 1993, he worked for Siemens Nixdorf and 3M Elektrik companies as Sales Representative, between 1993 and 1996, he worked for Ford Otosan company as Planning Manager. In 1996, he left Ford Otosan and was appointed to İndeks Bilgisayar as Assistant General Manager. In 1998, he was appointed to Despec Bilgisayar A.Ş. as General Manager. He still acts General Manager and Vice Chairman of Despec A.Ş. He is married and has 1 child. He speaks English
Salih Baş, Board Member: Salih Baş was born in 1965, and graduated from Anadolu University, Department of Business Administration. He has been working for Index Group since 1990. In 2003, while he was acting as the Assistant General Manager -Finance & Accounting for indeks Bilgisayar Sistemleri Muhendislik Sanayi ve Ticaret A.Ş., he was appointed as the General Manager and Vice Chairman of the Board of Directors of Datagate Bilgisayar Malzemeleri Ticaret A.fi.. He currently acts as the Deputy Chairman for the companies, İndeks Bilgisayar Sistemleri Muhendislik Sanayi ve Tica-ret A.Ş, Teklos Teknoloji Lojistik Hizmetleri A.Ş., Homend Elektrikli Cihazlar San. Ve Ticaret A.Ş., İnfin Bilgisayar Ticaret A.Ş. and Desbil Teknolojik Urunler Ticaret A.Ş., and as one of the members of the Board of Directors for the companies Despec Bilgisayar Pazarlama ve Ticaret A.Ş., Neotech Teknolojik Urunler Dağıtım A.Ş. and Neteks iletişim Ürünleri Dağıtım A.Ş. Salih Baş is married and has one child. He speaks English.
Halil Duman, Board Member: He was born in Giresun, in 1965. He completed his primary, secon-dary and high school education in Bulancak. In 1987, he graduated from Business Administration of Marmara University. He started working in accounting department of construction company called Yücelen Inşaat A.Ş. In a little while, he became a CFO (Chief Financial Officer) and conducted this duty for thirteen years. After he left this position, he started working for Indeks Bilgisayar A.Ş. as CFO (Chief Financial Officer). In December 8th, 2003, he was appointed as Assistant General Manager with the title of CFO. He is still acting as Board Member of the group companies and also acts as a Board Member. He gained Official Certified Chartered Accountant title and is a member of ACCA in Istanbul. He is married and has two children.
Faisal Riyaz Jamal, Board Member: He completed his primary and secondary education in the UK.
He worked for S&P in Business Development Section as Intern in 2005. He graduated from Kings’ Collage London 2006. He worked in sales division in Despec International FZCO and became Bo-ard Member. Except this, he has taken a volunteer role in many organizations. He has been manager for IFT4 Security & Logistics company for 2 years. He became the organizer for European Youth Camp

ANNUAL REPORT 2014
13
in 2006. He participated as shareholder in Aga Khan Fund. In 2004, he worked as health and se-curity responsible in a group for child camp named Caring & Sharing. Between 2003 and 2004, he has taken a role in High 4 Life charity.
Hasan Tahsin Tuğrul, Independent Board Member: He was born in Bursa, in 1952. After he comp-leted his high school education in Pertevniyal High School, he graduated from İstanbul Technical University, Department of Machine Engineering. He also achieved his High Engineer diploma from the same University. Pertevniyal Lisesi’ni bitirdikten sonra İstanbul Teknik Üniversitesi’nden 1973’de Makina Mühendisi, 1975’te “Yüksek Mühendis” olarak mezun oldu. He worked for Turkish Atom Energy Com-mission as Associate and Group Manager between 1974-1977. He started working for Alarko-Alsim as Offer Engineer. End of 1978, he left Alarko and switched to aluminium sector and started working free. He is the founder of ALTAŞ Aluminyum Sanayi ve Ticaret A.Ş. that still produces profile aluminium. He acts as Chairman of this company. He is Shareholder and Chairman of Shareholder Board of Narpa Limited Şti and Kabin Sistemleri Limited Şti, Board Member of İndeks Bilgisayar AŞ, Datagate Bilgisayar Malzemeleri AŞ and Despec Bilgisayar Pazarlama AŞ. He is Member of Kocaeli Chamber of Industry, Gebze Chamber of Trade, DEIK-External Economic Relation Board, ITU Alumni Club, TM-MOB Machine Engineers Chamber, Gebze Rotary Club and Manning Foundation. He is still acting as Assembly President of Kocaeli Chamber of Industry, Vice Chairman of TOBB Council, Board Mem-ber of TÜSSİDE, Auditing Board Member of Tubitak Teknokent A.Ş., Credit Assesment Board Member of KOSGEB, Enterpreneur Committee Member of TOSB, Board Member of ITU Alumni Club, Board Member of ITU Arı Teknokent A.Ş., Board Member of ITU Cultural A.Ş., Board Member of ITU 3M R&D, Board Member of Manning Foundation.
Sedat Sami Ömeroğlu, He was born in İstanbul, in 1956. He graduated from Yıldız Technical Uni-versity in 1982, Department of Electric Engineering. As Electric-Electronic Engineer, he became one of the first engineers who dealth with Computer since 1980. After graduation, he worked for two tech-nology companies as technical service engineer and executive manager. In 1995, he established his own company namely Endüstriyel ve Bilimsel Test Teknolojileri, Ar-Ge ve İleri Otomasyon Mühendisliği San. ve Tic. A.Ş. (shortly E3TAM) that operate in artificial vision and forward automation engineering in the basic of computer based test and control systems. E3TAM as the pilot in usage of computers in the industry for control purposes, has the title of the first SME company that conducts research in artificial vision, robot vision technologies besides execution of many industrial and scientific projects in both domestically and internationally. He was one of the founders in Industrial Automation Industrialists Association – ENOSAD that conducts practices in Industrial Automation field in 2004. Sedat Sami Ömeroğlu is the 4th term president of ENOSAD since May 2011. He is married and has a daughter.
Other Managers
Name & Surname Title E-mail addressİlter ÇELİK Sales Manager [email protected]

Sector Of Operation02

ANNUAL REPORT 2014
15
2.1 IT Sector2.1.1 Turkish IT MarketThe usage of computers in Turkey started in the end of the 1980’s. Although there was a very rapid development in the sector between the years of 1990 and 1995, usage of computers were limited to mostly financial sector, governmental units, big businesses and universities. In the second half of the 1990’s, the increase in the usage of computers made the IT sector one of the most rapidly growing sectors in Turkey. According to the data issued by International Data Corporation (“IDC”), the Turkish Information and Communication Technologies (“IT”) sector achieved a compound annual growth rate (“CAGR”) of 20% between 1997 and 2000. In 2000, the Turkish IT sector has reached its greatest business volume thus far with 2.3 billion USD, whereas that figure reduced to 1.2 billion USD with 49% recession in 2001 because of the economical crisis that was encountered in the end of 2000 and the postponement of the demand of IT investments by public and private sectors. The figures achieved in 2000 were again caught only in 2004, with a business volume of 2.4 million USD. In other words, it took 4 years to eliminate the effects of the crises. However, one should also consider that one of the causes of the shrinkage of the business volume was the continuously price reduction of products, which is the structural feature of the IT Industry.
According to IDC’s research, IT market achieved growth from 2009 to 2010 with 10,4 %, from 2010 to 2011 with 8,1 % and from 2011 to 2012 with 15 %, from 2012 to 2013 with % 9. In 2014, sector faced with % 0,5 shrinkage because of high penetration of smart phones.
Turkish IT Market Business Volume (Mio $)
MN USD
CAGR(12-18F): %2,1
7.200
7.000
7.400
6.800
6.600
6.400
6.200
6.000
5.800
2012
6.257
6.445 6.411
6.607
6,8486.994
7.213
2013 2014 2015F 2016F 2017F 2018F-1%
-1%
0%
1%
1%
2%
2%
3%
3%
4%
4%
5.600IT Sector Business Volume
% Growth
Source: IDC 2014
According to the 2012 Turkey IT Expenditures Research conducted by IDC, the Turkish IT market is expected to have a 2,1 % compound annual growth rate (CAGR) in the period between 2012 and 2018, reaching 7,2 billion USD in 2018. IT investment demands deferred in the 2001 crisis period have been started to be realized with the appearance of the increasing stable outlook of the economy and these investment expenditures have been one of the most powerful dynamics of the market in the first 5 years following 2001. New investments that increased after merger and acqui-sition operations in all sectors, beginning in the finance and telecommunication sectors and spread

ANNUAL REPORT 2014
16
to other sectors from 2005 on, technology replacement investments, increased IT investment made by the government as part of e-government projects, increase in the internet usage rates and finally, in the number of the users who follow up the rapidly developing technology became the driving forces of the market between 2005 and 2008. Although the first quarter of 2008 started very fa-vourably, the sector started to lose its strength due to the suit brought to close AKP, a slowdown was experienced in the third quarter when not so many negative results were observed. However, with the last quarter, the sector was affected by the global financial crisis that started at the beginning of October, and thus, the quarter was closed with a double-digit shrinkage. 2009 was experienced as a year when the wounds of the crisis were bandaged; the effects of the crisis in the first quarter dimi-nished with the effect of the VAT cut applied for 6 months, including the second and third quarters, and positive growth was recorded in the fourth quarter. In 2010, IT sector achieved quite gradual growth after constitutional referendum particularly static summer season. In 2011, particularly in the second half of the year, IT sector was affected negatively by currency fluctuations sourced by debt crisis of European Countries.
On the other hand, if the share of the end-users in the market is monitored in the period between 1995 and 2005, it would be clearly seen that the market structure has changed considerably.
Changes in the Market Share of End Users
1995
2000
2005
2009
2010
2011
2012
2013
2014 16% 9% 12% 15% 48%
2015 F 16% 8% 11% 15% 50%
18% 9% 13% 14% 46%
17%
7%
7%
11% 14% 14% 44%
18% 11% 15% 14% 42%
17% 13% 16% 14% 40%
18% 14% 16% 14% 38%
38% 30% 20% 5%
22%
25% 35% 23%
25% 25% 10%
10%
18%
1995 2000 2005 2009 2010 2011 2012 2013 2014
16%18%17%18%17%18%38% 22%25%
9%9%11%11%13%14%30% 35% 25%
12%13%14%15%16%16%20% 23% 25%
15%14%7% 14%14%14%14%5% 10%
48%
2015 T
16%
8%
11%
15%
50%46%7% 44%42%40%38%10% 18%
Public Institutions
Financial Sector
Private Sector
SME
Individual Users
Source: IDC 2014
It is estimated that the rate of the number of PC in operating status to the total population has increa-sed from 8% to 27% in the period between 1995 and end of 2010, and that the rate of the internet users to the total population has increased from 10% to 37% in the same period. This indicates that PC ownership and internet usage rates increased over 3 times in the last 15 years. PC ownership and internet usage rates have increased by 67% and 40%, respectively in the last 5 years. Compa-ring to the country data published by ITU above, it is clear that Turkey is far below the developed countries with respect to the PC ownership and internet users rate and that there is a long distance to be covered in this field. The PC and internet penetration in Turkey between 2005 and 2015F has developed as shown in the following graphics.

ANNUAL REPORT 2014
17
Trends in Internet & PC Penetrations
55%
2016F
68%
2016F
25%
44%
60%64%
52%58%
2005 2011 2012 2103 2014 2015F0
30
60
10
20
40
50
15%
34%
40%46%
50% 52%
2005 2011 2012 2103 2014 2015F0
20
40
60
80
PC Penetration Internet Penetration
Source: IDC 2014
IT Ownership Rates in Houses
100
80
60
40
20
0
Year Desktop PC Mobile PCMobile Phones Smart TV
Game Console
DigitalCamera
23.83.1090.52010 16.833.8
27.83.8091.92011 34.3 22.6
27.14.6093.22012 31.8 27.1
30.5 28.157.393.72013 31.4
2014 27.25.612.496.127.6 40.1
2010
2011
2012
2013
2014
According to the results of “Households IT Usage Research” published by the Turkish Statistical Institute (TÜİK) in April 2013, the PC and internet usage rates of individuals are 53,5% and 53,8%, respectively. The survey indicates that computer and internet usage rates of people between 16 and 74 ages are 62,7% and 63,5% for men and 44,3% and 44,1% for women, respectively.

ANNUAL REPORT 2014
18
The age group in which the rate of computer and internet usage is highest is 16-24.These rates are higher in men than women in all age groups. By educational level, the population who use the computer and internet most are graduates of first degree and higher education levels.
According to the report results, PC and internet usage rates have increased by 7% and 10%, res-pectively in the period between 2013 and 2014. Another interesting feature of the report is that although the computer and internet usage rate of the rural population is lower than the urban po-pulation, the computer and internet usage rates increased by 3% and 3%, respectively, in the rural areas. Although the increasing rate is pleasing, it is clear that the computer and internet usage rate in the urban areas is 2 times higher than the rural areas.
Comparison of computer and internet usage on area based (rural & urban) (%) (2013-2014)
Computer usage rate Change
Internet usage rate Change
2013 2014 % 2013 2014 %Computer and internet users Turkey 49,9 53,5 7% 48,9 53,8 10%
In the last three months Turkey 44,3 46,9 6% 43,2 48,5 12%
Between three months and one year Turkey 2,6 3,0 16% 3,1 2,6 -17%
Over 1 year Turkey 3,0 3,6 20% 2,7 2,7 4%
Never used Turkey 50,1 46,5 -7% 51,1 46,2 -10%
Computer and internet usage
■ Computer Usage■ Internet Usage
Turkey53,3
53,6
53,6
53,7
53,7
53,4
53,4
53,5
53,5
53,8
53,8
53,9
2.1.2. IT Market Comparison in the World and TurkeyAccording to IDC’s report regarding growth rates between countries, the highest growth rate from 2013 to 2014 was seen in Egypt with 33 % and respectively Israel with 4 %, Saudi Arabia and South Africa with 1 %. Other countries faced with shrinkage, Ukraine had highest shrinkage with -53 %. Turkey had % -8 % shrinkage in 2014 unfortunately.

ANNUAL REPORT 2014
19
World IT Market – Country Based PC Market Growth Analysis 2013-2014 (Quantity)
Countries Russia Turkey Saudi Arabia South Africa UAE Ukraine Israel Egypt Algeria Kazakhistan Qatar Morocco
2013 10,237,232 3,062,053 1,863,564 1,692,609 2,035,057 2,381,454 745,771 533,726 525,399 709,917 305,304 333,824
2014 7,910,976 2,823,121 1,874,685 1,707,368 1,689,166 1,117,859 773,438 708,015 456,113 407,543 300,610 292,138
Growth % -23% -8% 1% 1% -17% --53% 4% 33% -13% -43% -2% -12%
■ 2013■ 2014
10.000.000
8.000.000
6.000.000
4.000.000
2.000.000
0
Source: IDC 2014
10.000.000
8.000.000
6.000.000
14.000.000
12.000.000
4.000.000
2.000.000
0
■ 2013■ 2014
Countries Germany UK France Italy Spain Poland Netherland Turkey Swiss Belgium Norway CzechRep. Austria Romamia Portugai Greece Ireland
2013 10,890 9,331 8,449 3,917 2,619 2,836 2,457 3,062 1,591 1,427 1,105 1,000 995 627 643 543 485
2014 12,934 10,903 9,379 4,547 3,619 3,063 2,896 2,823 1,653 1,593 1,265 1,191 1,036 781 772 746 529
Büyüme 19% 17% 11% 16% 38% 8% 18% -8% 4% 12% 14% 19% 4% 25% 20% 37% 9%
Source: IDC 2014
2.2 Sub-segments of the ICT SectorTurkish IT sector is essentially separated into three main groups, namely hardware, software and IT services. According to the Turkey results published by IDC in 2014, the business volume of the Tur-kish Information and Communication Technologies (IT) market reached 6,2 billion USD in 2012. The same report shows that the share of the “Hardware”, “Software” and “IT Services” sub-segments in the total market are 66,1 %, 12,3 % and 21,6 %, respectively. This indicates that the Turkish IT sector has got a structure where “hardware” is predominant with respect to income created.

ANNUAL REPORT 2014
20
IT Sector Expenditures, 2012-2018F (mio US$)
Source: IDC 2014
Turkish IT Market 2012-2018F (Mio US$)
Source: IDC 2014
IT Sector Contents (x m $ ) 2012 2013 2014 2015F 2016F 2017F 2018FTotal BT 6,257 $ 6,445 $ 6,411 $ 6,607 $ 6,848 $ 6,994 $ 7,213 $
Service 1,192 $ 1,356 $ 1,383 $ 1,472 $ 1,616 $ 1,754 $ 1,890 $
Software 680 $ 730 $ 792 $ 863 $ 937 $ 1,014 $ 1,089 $
Hardware 4,385 $ 4,359 $ 4,236 $ 4,273 $ 4,295 $ 4,227 $ 4,234 $
Server 232 $ 227 $ 220 $ 232 $ 251 $ 270 $ 289 $
PC 2,294 $ 2,072 $ 1,916 $ 1,859 $ 1,786 $ 1,625 $ 1,548 $
Tablet 355 $ 499 $ 380 $ 477 $ 525 $ 564 $ 589 $
Data Storage 160 $ 182 $ 190 $ 209 $ 225 $ 240 $ 258 $
Printers and Peripherals 515 $ 560 $ 692 $ 652 $ 647 $ 653 $ 662 $
IT Sector Contents (x m $ ) 2012 2013 2014 2015F 2016F 2017F 2018FHardware 4,385 $ 4,359 $ 4,236 $ 4,273 $ 4,295 $ 4,227 $ 4,234 $
Software 680 $ 730 $ 792 $ 863 $ 937 $ 1,014 $ 1,089 $
Service 1,192 $ 1,356 $ 1,383 $ 1,472 $ 1,616 $ 1,754 $ 1,890 $
Total IT 6,257 $ 6,445 $ 6,411 $ 6,607 $ 6,848 $ 6,994 $ 7,213 $Growth % - 3.0 % - 0.5 % 3.1 % 3.6 % 2.1 % 3.1 %
Growth on Segments 2012 2013 2014 2015F 2016F 2017F 2018FHardware - -0.6 % - 2.8 % 0.9 % 0.5 % -1.6 % 0.2 %
Software - 7.4 % 8.4 % 9.0 % 8.6 % 8.2 % 7.4 %
Service - 13.7 % 2.0 % 6.4 % 9.8 % 8.5 % 7.8 %
Distribution on Segments 2012 2013 2014 2015F 2016F 2017F 2018FHardware 70.1 % 67.6 % 66.1 % 64.7 % 62.7 % 60.4 % 58.7 %
Software 10.9 % 11.3 % 12.3 % 13.1 % 13.7 % 14.5 % 15.1 %
Servis 19.1 % 21.0 % 21.6 % 22.3 % 23.6 % 25.1 % 26.2 %
Turkey Smart Phone Market ( x m $ ) 2012 2013 2014 2015F 2016F 2017F 2018F
Smart Mobile Phone 1,854 $ 3,475 $ 4,341 $ 4,511 $ 4,533 $ 4,589 $ 4,656 $
Growth % - 87.4 % 24.9 % 3.9 % 0.5 % 1.2 % 1.5 %

ANNUAL REPORT 2014
21
According to the 2014 Turkey IT Expenditures Survey conducted by IDC, the Turkish IT market is expected to have a 2,1 % compound annual growth rate (CAGR) in the period between 2012 and 2018F, reaching7,2 billion USD in 2018. These estimates are based on the anticipated growth rates, investments anticipated to be made by companies rapidly as they were deferred due to the crises of 2001 and 2008, effects of IT expenditures incurred by the public sector for e-transformation pro-jects on IT consumption, increased use of IT in education, anticipated increased rate of the use of internet and mobile technologies and replacement investments to be caused by new technologies. Contribution of smart phone products will be much higher to sector growth in 2015.
2.2.1 Hardware MarketHardware market in Turkish IT sector is the sub-segment having the biggest share regarding the sales amounts of 1999 – 2009, with the ratios changing between 57% and 74%. The hardware sector did not achieve growth from 2013 to 2014.
Growth Rates & Targets of Hardware Expenditures in IT Sector, 2012-2018F (Mio USD,%)(M USD,%)
(mily
on U
SD)
CAGR(12-18F): 2,1%
IT Sector Business Volume
% Growth
4400
4350
4300
4250
4200
4150
2012 2013 2014 2015 F 2016 F 2017 F 2018 F-4%
-2%
-3%
-1%
1%
2%
-2%
-3%
-1%
0%
1%
4100
4.385
4.236
4.2734.295
4.227 4.234
4.359
Source: IDC 2014
2.2.1.1 PC Market:The hardware sub-group consisting of Desktop PCs, portable PCs (“Laptop PCs”, “Notebooks”), Ser-vers and Peripherals is monitored via the sales data in PC market which represent a very significant portion of the total sales. Accordingly, total sales of the PC market were realized as 3,062,053 in 2013, whereas such total number (both notebook and desktop) decreased to 2,823,121 units with an shrinkage of 8 % in 2014.
However, when the sales in the PC market are considered by quantity excluding the server market, it is noticed that portable PCs have gained majority in this market for the first time in 2009. Beginning

ANNUAL REPORT 2014
22
from the year 2004, supplying portable PCs with high performance, increased mobility possibility with their lighter structure and affordable prices to the consumers has enabled significant increases in their sales, and finally, sales of portable PCs have surpassed those of desktop PCs in 2009.
The developments at PC market are closely related with the ongoing projects in public and educatio-nal sectors. The stable growth in demand of the consumers is also considered as another significant factor on this issue. The growing retail chains and financial opportunities offered to the consumers by these chains have been the most important driving forces for the PC sales. Besides, noticing the benefits of mobile computing systems by the corporate companies is seen as another important reason for the growth. At this point, one may clearly see from then market sales figures that the de-mand by the small and large enterprises seeking productivity for portable PCs as an important part of mobile data systems has increased.
Turkish IT Market on Main Form Based 2013 – 2014
Desktop
971,142927,382
Mobile PC
2,090,9111,895,739
Total
3,062,0532,823,121
20132014
-5% -9% -8%Growth
Mobile PC
Desktop 32 % 33 %
68% 67%
20132014
Source: IDC 2014
Besides the producers which have international brands, a considerable part of hardware production both inside and outside the country is performed with the main components that are obtained from the global computer parts suppliers by big and small-sized companies. Over time, these factors have transformed the hardware product market and the especially PC market into a low added value structure in which the competition is highly sensitive to the price.

ANNUAL REPORT 2014
23
Home Forms PC Market with nominal Turkey 2013-2014 (tablets included)
Mobile PC
Desktop 20 % 17 %
43% 34%
Tablet 37% 49%
Desktop
971,142927,382
Mobile PC
2,090,9111,895,739
Tablet
1,811,8612,754,029
20132014
-5% -9% 52%
Total
4,873,9145,577,150
14%Growth
20132014
Source: IDC 2014
Turkish PC Market on Buyers Based, 2014
20132014
IndividualCustomers
2,2341,915
InstitutionalCustomers
208291
Growth % -14% 40%
SME
620617
0%
Market Share % 68% 10% 22%
0
3.000
1.000
2.000
■ 2013■ 2014
Source: IDC 2014

ANNUAL REPORT 2014
24
2013
2014
250
0
500
2.000
750
1.000
2.500
1.500
1.750
2.250
1.250
2013 2,234 13 107 50 109 231 280 38
2014 1,915 11 142 52 124 263 230 86
Growth% -14% -15% 33% 4% 14% 14% -18% 126%
Market Share% 68% 0% 5% 2% 4% 9% 8% 3%
End User Education GovernmentLarge Firms(500-999)
SME(100-999)
SME(10-99)
SME(1-9)
Large Firms1000+
Source: IDC 2014
According to IDC’s Turkish PC Market Report, end user has the biggest market share in 2014.
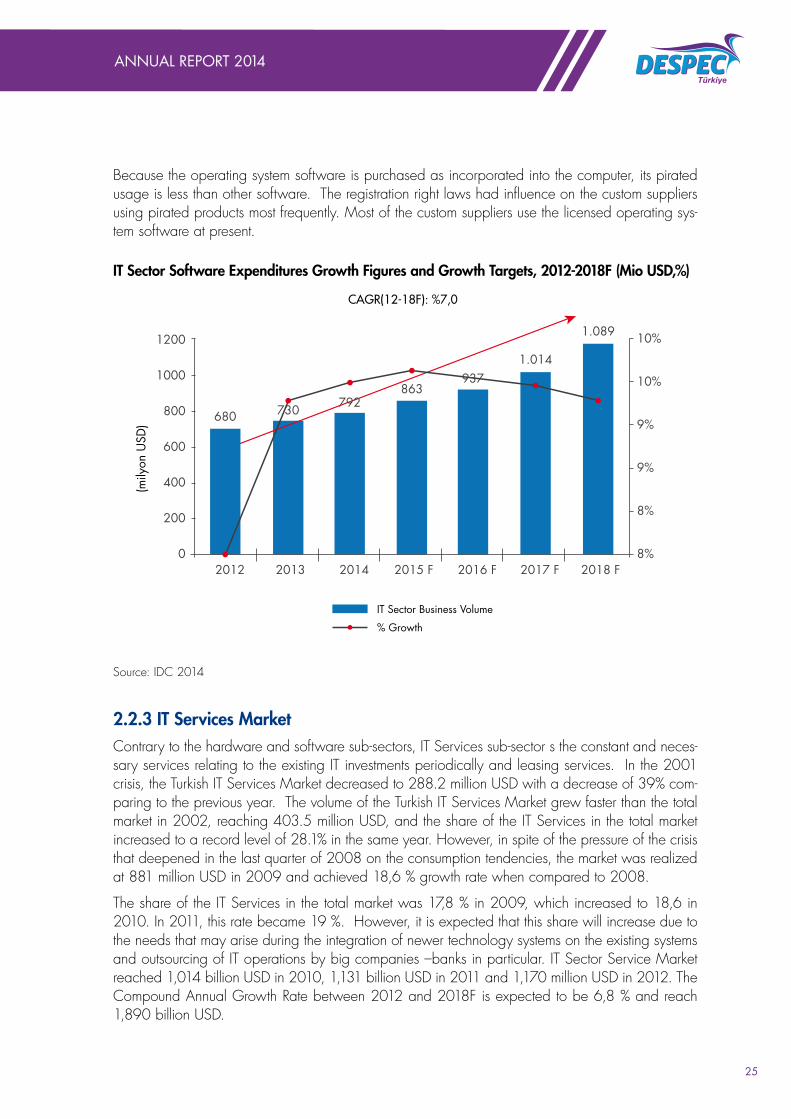
2.2.2 Software MarketThe size of the software sub-group increased from USD 276 million in 1999 to USD 377.3 million in 2000. However, in the 2001 crisis, just like in hardware sector, software sector decreased to USD 172.3 million with shrinkage of about 54% and volume became 215 million USD in 2002. In 2009 it reached 635 million USD. Although, the pressure of the crises that has deepened in the last quarter of 2008 on the consumption tendencies, the sales of the Turkish Software Market reached 635 million USD with growth of 19 % in 2009, contrary to the dramatic shrinkage of the 2001 crisis. IT sector software market achieved growth of 5,3 % from 2007 to 2008. The volume of IT Sector software market reached 696 million USD in 2010, 784 million USD in 2011. According to IDC’s, it is expected IT Sector software market to achieve Compound Annual Growth Rate of 7 % between 2012 and 2018F and reach 1,089 billion USD.
As of the end of 2010, the share of the software sub-group in the entire IT market in terms of the total turnover is at very low levels in comparison with Europe and America with 13,3 % share, mainly because of pirated usages. Microsoft Office, being a commonly used program, is the most pirated program. The laws which were enacted by the Turkish Parliament in 1995 for purpose of ensuring the protection of the registration rights decreased the pirated usage rate. According to the estimations of our company, while 70% of the software is illegally used in Turkey, this rate is around 35% in the USA.
ANNUAL REPORT 2014
25
Because the operating system software is purchased as incorporated into the computer, its pirated usage is less than other software. The registration right laws had influence on the custom suppliers using pirated products most frequently. Most of the custom suppliers use the licensed operating sys-tem software at present.
IT Sector Software Expenditures Growth Figures and Growth Targets, 2012-2018F (Mio USD,%)
(mily
on U
SD)
CAGR(12-18F): %7,0
1000
1200
800
600
680 730
863937
1.014
1.089
400
200
2012 2013 2014 2015 F 2016 F 2017 F 2018 F8%
9%
8%
9%
10%
10%
0
IT Sector Business Volume
% Growth
792
Source: IDC 2014
2.2.3 IT Services MarketContrary to the hardware and software sub-sectors, IT Services sub-sector s the constant and neces-sary services relating to the existing IT investments periodically and leasing services. In the 2001 crisis, the Turkish IT Services Market decreased to 288.2 million USD with a decrease of 39% com-paring to the previous year. The volume of the Turkish IT Services Market grew faster than the total market in 2002, reaching 403.5 million USD, and the share of the IT Services in the total market increased to a record level of 28.1% in the same year. However, in spite of the pressure of the crisis that deepened in the last quarter of 2008 on the consumption tendencies, the market was realized at 881 million USD in 2009 and achieved 18,6 % growth rate when compared to 2008.
The share of the IT Services in the total market was 17,8 % in 2009, which increased to 18,6 in 2010. In 2011, this rate became 19 %. However, it is expected that this share will increase due to the needs that may arise during the integration of newer technology systems on the existing systems and outsourcing of IT operations by big companies –banks in particular. IT Sector Service Market reached 1,014 billion USD in 2010, 1,131 billion USD in 2011 and 1,170 million USD in 2012. The Compound Annual Growth Rate between 2012 and 2018F is expected to be 6,8 % and reach 1,890 billion USD.

ANNUAL REPORT 2014
26
IT Sector IT Services Growth Figures and Growth Targets, 2012-2018F (Mio USD,%)
(mily
on U
SD)
CAGR(12-18F): %6,82000
1500
1.192
1.3561.472
1.6181.754
1.890
1000
500
2012 2013 2014 2015F 2016F 2017F 2018F0%
4%
2%
8%
6%
12%
10%
16%
14%
0
IT Sector Business Volume
% Growth
1.383
Source: IDC 2014
İndeks Bilgisayar in the ICT Sector:
In Turkey, Top 500 ICT Companies Ranking performed every year by Interpro Medya A.Ş., our company ranked ninth in the general ranking based on turnover achieved in 2013 among the com-panies including telephone operators and mobile phone sellers. On the other hand, it ranked first, like the previous years, in the category of companies selling only computers. Further, it ranked first in seven IT categories.
2013 Top ICT Companies Revenue Range (Sales Revenue)2013 Sort Company USD (mio)
1 Türk Telecom 6.924
2 Turkcell 5.988
3 Vodafone 3.375
4 Avea 2.015
5 TTNET 1.766
6 Gen-pa 1.534
7 Teknosa 1.280
8 KVK Teknoloji 1.043
9 Index Computer 848
10 Brighstar 718
ANNUAL REPORT 2014
27
Important Events in the IT Sector in 2014:
Important events that occurred in the Turkish IT Sector in 2014 are listed below:
1. In particular, widespread of Tablets and Smart Phones affected the sales of mobile and desktop PCs.
2. Mobile speakers.
3. Robot terms.
4. Cloud implementations(Google Drive, Mega, Dropbox)
5. 3D Printing systems
6. Smart white goods
7. Wearable technologies
8. Social media in communication
2.3 Growth of the Turkish IT Sector:
Factors Inciting the Growth of the Turkish IT Sector:
• Invetsment to Natioanl Education: Government started making huge investment to education in the context of “Fatih Project”. The implementation of this project started in 2011 in selected 52 scho-ols. This project is considered not only 2011, it will also cover next few years and will contribute to growth of IT Sector. In 2014, auction and and implementations of this projects continued.
• Rapidly Increasing Usage of Technology: All business and public companies recognise the value of the increasing control over sources, development of productivity, expanding the business volume and analysing the customer requirements by using the technological devices.
• Economic Performance: The development of the IT market was struck down by the economic crises of 2001 and 2008. After the economic crisis, Turkey entered a recovery period with strict economic policies. Economic stability makes a direct positive effect on IT investments.
• Changing Economic Structure: The importance of service sector increased, with a decrease of agriculture in the economy in Turkey in the last ten years. The increasing operations in the service sector instigate the IT investments especially in retail, wholesale, logistics, financial services, profes-sional and personal services markets.
• Import and Export: According to the statistics published by TUIK, the import volume reached 243 billion USD, export volume reached 158 billion USD and total foreign trade volume reached 400 billion USD in 2014.
• Telecommunication Sector: Turkey made major progress in the telecommunication sector with respect to the compliance with the EU and catching up with the global changes in the recent years. As part of the process of the accession of Turkey to the European Union, the chapter “Information Society and Media” was opened and the negotiations have started on 19 December 2008 beca-use Turkey has met the criteria for the chapter to be opened. On the other hand, the chapter “Infor-mation Society and Media” in the Third National Program, which was adopted on 31 December

ANNUAL REPORT 2014
28
2008 to schedule the commitments of Turkey for harmonisation with the EU acquisition, commits to complete necessary arrangements in 2009 and 2010.This commitment aims at the liberalization of the electronic communication sector, creation of good working competition atmosphere, catching up with the development in information and communication fields and establishment of infrastructure and legal foundations for the related fields. Accordingly, it is estimated that a resource of about 8 million Euros will be needed for the institutional structuring for purpose of the harmonization with and implementation of the EU acquits.
The enforcement of the Electronic Communication Law, which had been on the agenda of the telecommunication sector for five years from 2003, on 10 November 2008 and the enforcement of the Authorisation Regulation on Electronic Communication on 28 May 2009 are some of the favourable events that occurred in the recent years. In addition to the foregoing, the ¬enforcement of the Number Porting Regulation at the beginning of July may be considered one of the most important steps taken for introduction of the third generation electronic communication service.
Rapid progress of technological developments makes impact on every part of our lives and creates some concepts such as information economy and internet economy. Extraordinary developments in the IT sector go beyond the country borders of the goods and finance markets and take the world into an economic globalization. Besides such progress in the IT technology, telecommunication se-ctor also experiences many developments. As a consequence, it is inevitable that the countries that cannot keep up with such developments will remain behind the technologically advanced countries.
• Retail Sector: Competition in the Turkish retail sector is intensifying. Investments made by interna-tional actors in the Turkish market increasingly continue. Media Markt, Dixons, Darty, Electro World and Best Buy have also been included in the chain stores in Turkey in the recent years. Entrance of the international actors into the Turkish market has made a favourable effect on the growth rate of the sector. It is the first time Best Buy and Media Markt has met in the Turkish market in 2009. However, Best Buy announced that they decided to leave Turkish Market in 2011. One of the biggest local retailers, Bimeks was offered to public in 2011.
• Growing Individual Consumer Market: It is obvious that consumers use the IT more than before. Opportunity of payment by instalment with credit cards and growth of retail markets rapidly support the growth of the individual consumer market. PC usage of end users and their demand for perip-herals have increased from 7% to 38% of the market between 1995 and 2009. Accordingly, the structure of the market has changed, and individual consumers have represented the biggest share in the end user market since 2007. In 2010, individual user portion became 40 %, 42 % in 2011 and 44 % in 2012. Individual users became dominant player in BT Sector.
• Internet Technology and Portals: Corporate usage of internet technology is still improving. Data portals become common via internet banking. The public sector is the main factor instigating the portal turnovers due to the e-government projects. Telecommunication, production, insurance and distribution sectors use portals for developing business with partners and suppliers, enhance com-munication and cooperation with customers and develop the management of the internal business processes. Internet usage will increase with the new Turkish Trade Code coming into power.
• Privatization: Income obtained from privatization has increased considerably in the last 5-6 years. According to the data obtained from the Turkish Privatization Administration, the income obta-ined from privatization was 187 million USD in 2003, 1.3 billion USD in 2004, 8.2 billion USD in 2005, 4.3 bn USD in 2007, 6.3 billion USD in 2008 and 2.3 billion USD in 2009. 1.225 million

ANNUAL REPORT 2014
29
USD, 600 million USD and 440 million USD out of 2.3 bn USD obtained in 2009 was resulted from the privatization of Başkent Elektrik, Sakarya Elektrik and Meram Elektrik, respectively. In 2010, 3,1 billion USD privatisation was made. This number became 1,4 billion USD in 2011, 3 billion USD in 2012, 12,4 billion USD in 2013 and.
Milyon ($)
Years
13000
12000
11000
10000
9000
8000
7000
6000
5000
4000
3000
2000
1000
19862003
2004
8.240 8.222 8.096
4.259
6.2596.341
2.275
3.082 3.021
12.486
1.358
592
1.283
2005 2006 2007 2008 2009 2010 2011 2012 2013 2014 20150
Source: Prime Ministry Privatization Commission
Investments made following the privatizations by the new owners of the privatized companies in new infrastructure and technological optimization efforts supported the growth in the IT sector.
• Direct Foreign Investment Inflow: Direct foreign capital investments in developing countries such as Turkey, make important contribution to the development of the country economy. It makes direct contribution to the improvement of IT investments.
The economic reforms implemented by Turkey just after the 2001 crisis and the macroeconomic stability, together with the political stability, contributed to the improvement of the business and invest-ment environment and broadened the horizon of the companies in their investment decisions. With the economic and political stability environment, Turkey utilized foreign resources in considerable amounts. The amount of the direct foreign investment flowed into Turkey was 1,2 bn USD between 1994 and 2003, 1.8 bn USD in 2003, 2.8 bn USD in 2004, 10 bn USD in 2005, 20.2 bn USD in 2006, 22 bn USD in 2007 and 19,5 bn in 2008. With the effect of the global crisis towards the end of 2008, the foreign capital investments decreased with 56 % in 2009 and went down to 8,4 bn USD. In 2010, it remained as 9 bn USD level with 7 % increase. In 2011, this number increased 77 % and reached 16 bn USD, it was realized as 12,4 bn USD in 2012. Foreign Direct Investment Flow can be seen below according to the research of YASED- International Investors Association sourced by Turkish Republic Central Bank.

ANNUAL REPORT 2014
30
International Direct Forign Investment Flow to Turkey
0
5
10
15
20
25
0
%0,40
%0,80
%1,20
%1,60
%0,20
%0,60
%1,00
%1,40
0,2 0,8 1,0
3,4
1,1 1,72,8
10,0
20,2
22,0
19,8
8,6 9,1
16,1
13,3 12,4 12,1
2000
1990
’s
1980
’s
2001
2002
2003
2004
2005
2006
2007
2008
2009
2010
2011
2012
2013
2014
FDI in Turkey $ Billion
Share in Global FDI
Source: YASED-International Investors Association:TRCB Sources Research
Direct Foreign Investment Inflow to Turkey on Sector Based (2010-2014)
Manufacturing22,1%
Electricity, Gas 17,0%
Real Estate Service 1,7%
Financial Services 23,7%
Wholesale and RetailTrade 4,6%
Transportation, Storage 1,5%
Real Estate 23,0%
Other 2,5%
Construction 3,9%

ANNUAL REPORT 2014
31
Million $ 2010 2011 2012 2013 2014Industrial Sector 2.887 8.038 5.480 4.819 4.666
Services 3.288 8.067 6.236 5.000 3.972
Agriculture 81 32 43 47 61
Outflows -35 -1.991 -663 -568 -254
Other Capital (net) 371 -23 521 10 -623
Real Estate (net) 2.494 2.013 2.636 3.049 4.321
Total 9.086 16.136 13.283 12.357 12.143
Source: YASED-International Investors Association
The highest inflow was into the industrial sector with 41,1% since 2010 until today. The manufactu-ring sector and energy sector wgitch are the main sields of operation in the Industrial sector, stood for 22% and 17% of the entire inflow respectively. The service sevtor had a share of 40,6 of the entire inflow. Finance and Insurance activities which are the main operation field in the service sector accounted 24% of the entire inflow.
3. Turkish IT Consumables Market:The products Despec distributes consist of almost IT consumable products. Furthermore, it would be helpful to give more information regarding IT Sector Consumables Market.
IT Consumables Market is one of the important sub groups of IT Sector Hardware Main Group. Turkish IT Consumables Market consist of some basic products groups such as printer consumables (Inkjet printer cartridges, laser printer toners and printer bands), magnetic media (magnetic tape, CD…etc.) products, printer photograph papers and PC accessories.
The growth in IT Consumables Market has a positive relation with the new investment and usage of existing computer and printer field. Consumables Market Business Expenditure has only minor and limited effects with the contribution of continuous demand of consumables needs during the general economic fluctuations when compared to IT Sector Total Business Expenditure.
According to the analysis made on the basis of sales numbers of producers, the business volume of IT Consumables toner and cartridge market was 139 million USD in 2005. This number reached 222,8 million USD in 2008 with 17,1 % yearly growth rate. With the global crisis occurred in 2009 and affected all world countries afterwards, it became 210 million USD. The share of IT Consum-ables sub Group was 3,7 % in Turkish Total IT Market and 4,3 % in IT Hardware Main Group. In 2010, IT Consumables Market reached 232 million USD. In 2011, Consumables market reached 240 million USD with 3,5 % growth, in 2013 and 2014,it reached 290 million USD. It is expected to have shrinkage in 2015.

ANNUAL REPORT 2014
32
350
300
250
200
150
100
50
2005 2006 2007 2008 2009 2010 2011 2012 2013 2014 2015F0
139
159192
223232 240
290 290 290 282
210
Source: Index Group
Laser Printer Toners, Inkjet Printer Cartridges and Printer Bands called Printer consumables is the dominant products with 60-65 % of whole IT consumables Market. PC accessories are the second biggest section with 35-40 % Consumables Market.
Turkish IT Consumables Laser Toner and Inkjet Cartridges Market (Million USD)
2006 2007 2008 2009 2010 2011 2012 2013 2014 2015FLaser Toner Inkjet Cartridge 159 192 223 210 232 240 290 290 290 282
Growth 14,4% 20,6% 16,2% -5,6% 10,4% 3,4% 21% 0% 0% -0,3%
Source: Index Group
3.1.Turkish “Printer Consumables” MarketTurkish Printer Toners and Inkjet Cartridges Business Volume reached 138,9 million USD in 2005, 210,3 million USD in 2009. Furthermore, it reached 290 million USD in 2012. This market can be categorized in three groups as Original Products, Equipotent Products and Re-Fill Products. Increase of toner and cartridge consumption with the increase of printer usage became an important cost issue during financial crisis.
As a result of this perception, it was created competition for branded or original cartridge distributors as some medium sized companies started to use re-fill products instead of originals or branded prod-ucts. However, the activities of small companies which provide refill products were limited as the producers invented and sold the new generation laser printer toners that do not allow refill activity at all. Although, these types of low performance products are harmful for printers in long term, the market share of these products are 15-17 % of whole branded or original toner and cartridge market as estimated, because of customer demand.
On the other hand, the yearly printer sales and branded cartridges & toner sales have ½ rates in European Countries. This rate approximately 1/1,2 in Turkey. After every crisis, it is observed that

ANNUAL REPORT 2014
33
the consumers tend to original product with economic recovery by considering price/performance balance.
PC penetration rate increased up to 25 % even upper levels with the contribution of increasing indi-vidual consumption and the improving retail channel in the recent years. In parallel to this, computer ownership in houses, as a result of this case, printer ownership increased as well. In addition, in-crease in the area of computer usage affected the printer usage and resulted in increase in cartridge and toner consumption. Although, the main player of the market was individual consumer in 2009 and 2010, it is estimated that SMEs can become important player with the decrease of economic crisis’s negative effect in the 5 years in the market.
3.2.Turkey PC Accessories MarketPC accessories are the second biggest sub product groups with 35-40 % market share in Turkish IT Consumables Market. Microsoft, A4 Tech, Logitech, Trust, Targus, Belkin, Case Logic, Apple and Genius are the important players of PC accessories market.
PC accessories were stated in five years growth plans of Despec due to dynamic structure of the market and the upside potential that market has. Therefore, the company plans to increase PC ac-cessories market share up to 35 % or higher levels as its printer consumables market share in the next five years.
3.3. Turkey Magnetic Ambient Products MarketAlthough, the market shrinks year by year as PC market trends go towards mobility and digital data storage capacity increases, Magnetic ambient products are the third biggest sub group of Turkish IT Consumables Market. HP, Imation, TDK, Sony and Toshiba can be considered as important players of the market.
4. Despec Bilgisayar Malzemeleri Ticaret A.Ş. in SectorAs Despec is the biggest distributor of Turkish IT Consumables Market, it operates by keeping many world foremost brands in its large product portfolio. While the 85-90 % of Despec’s sales consist of printer consumables (Laser printer toners and Inkjet printer cartridges), the rest of the sales consist of PC accessories, Magnetic ambient (Magnetic type, CD…etc.) and printer photograph papers. HP, Imation, OKI, Sony, Canon, Xerox, Lexmark, Panasonic, IBM, TDK, Memorex, Brother, Samsung, Trust, Dexim, Steerseries, Emtec and Targus are the main brands Despec distributes. Despec Bilgisayar Breakdown of Sales on main segments (%)
2008 2009 2010 2011 2012 2013 2014
Accessories 5,1% 5,5% 5,7% 4,3% 5,98% 12,46% 16,74%
Paper 1,0% 0,9% 1,2% 1,0% 1% 0,7% 0,53%
Laser Toner & Inkjet Cartridge 86,8% 85,7% 87,1% 89,9% 87,62% 81,59% 76,68%
Magnetic Media 4,1% 5,6% 3,7% 2,5% 2,79% 2,76% 4,29%
Printer Ribbon 3,0% 2,3% 2,3% 2,2% 2,61% 2,49% 1,76%
Total 100% 100% 100% 100% 100% 100% 100%
Source: Despec Bilgisayar

ANNUAL REPORT 2014
34
Despec Bilgisayar is serving to its 3.000 dealers with approximately 2.050 types of products. Distri-bution of consumables is very similar to other IT Products’ distribution. Wholesalers sell to sub-whole-saler or small dealers. Some dealers make sales to the end user directly.
Despec is the biggest distributor in IT Consumables Market. Ekip Elektronik and Arena Bilgisayar follows Despec Bilgisayar respectively.
It is observed that PC accessories display untidy structure when compared to others. The distributors as small or big operate in PC accessories sector with different brands.
Despec was ranked as the first company according to sales results research done by Interpromedya in Turkish IT Companies Range “Consumables Category” since 1998 which is establishment date of Despec.
The brands and main product groups Despec distributes are as follows;
Toner Cartridge
Product Groups
Hewlett Packard, Canon, Oki, IBM, Lexmark
Brands
Ink Cartridge Hewlett Packard, Canon, IBM, Lexmark
Ribbon Oki
Back-up Products Sony, Imation, TDK, Merorex
Side Parts Targus, Trust
Accessories Imation, Trust, Targus, Emtec, Dexim, Steelseries
Paper Products Hewlett Packard, Canon, Oki,
In addition, Despec distributes Xerox, Kingston, Panasonic, Samsung and Brother consumables products as sub Distributor.

ANNUAL REPORT 2014
35

Operation03
ANNUAL REPORT 2014
37
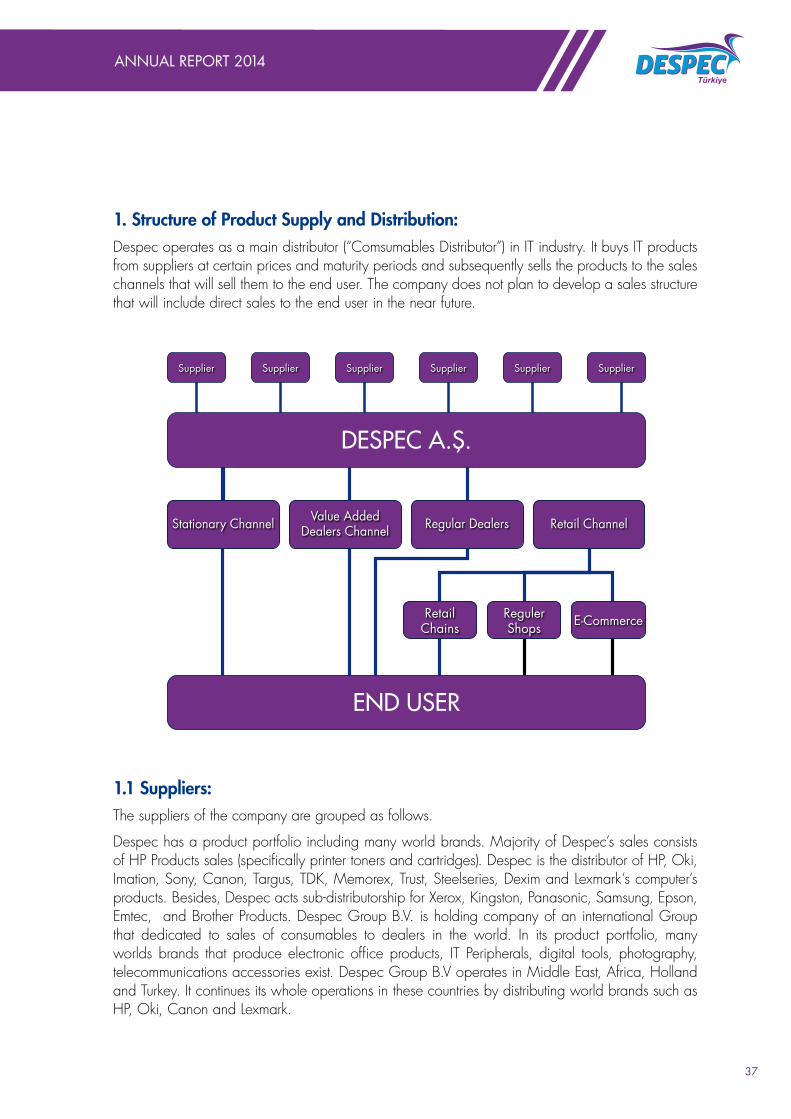
1. Structure of Product Supply and Distribution:Despec operates as a main distributor (“Comsumables Distributor”) in IT industry. It buys IT products from suppliers at certain prices and maturity periods and subsequently sells the products to the sales channels that will sell them to the end user. The company does not plan to develop a sales structure that will include direct sales to the end user in the near future.
1.1 Suppliers:The suppliers of the company are grouped as follows.
Despec has a product portfolio including many world brands. Majority of Despec’s sales consists of HP Products sales (specifically printer toners and cartridges). Despec is the distributor of HP, Oki, Imation, Sony, Canon, Targus, TDK, Memorex, Trust, Steelseries, Dexim and Lexmark’s computer’s products. Besides, Despec acts sub-distributorship for Xerox, Kingston, Panasonic, Samsung, Epson, Emtec, and Brother Products. Despec Group B.V. is holding company of an international Group that dedicated to sales of consumables to dealers in the world. In its product portfolio, many worlds brands that produce electronic office products, IT Peripherals, digital tools, photography, telecommunications accessories exist. Despec Group B.V operates in Middle East, Africa, Holland and Turkey. It continues its whole operations in these countries by distributing world brands such as HP, Oki, Canon and Lexmark.
Stationary Channel Value AddedDealers Channel Regular Dealers Retail Channel
DESPEC A.Ş.
END USER
Supplier Supplier Supplier Supplier Supplier Supplier
RetailChains
RegulerShops E-Commerce

ANNUAL REPORT 2014
38
1.2 Distribution Channel:As a distribution company, Despec buys the products from suppliers. Furthermore, it resells them to the sales channels which sell to the end user. The structure of distribution channels which Despec sells to and which sell IT consumable products to the end user in Turkey is summarised below:
1.2.1. Value Added Dealers:With respect to the number of people they employ, companies in this channel have 25-100 employees. These companies are more limited with respect to capital but thanks to their young and dynamic structures, they are able to make quick decisions and operate on low margins by keeping costs down. Their target group is multinational companies and corporate customers with generally one location.
Distributors support these companies with respect to finance, logistics, and product information. These companies do not have an intensive relationship with the manufacturers. The numbers of these companies are more than 500 all over Turkey.
1.2.2. Regular Dealers (Classic):These are pretty small companies with a staff of 5 to 25. They do not have their own unique solutions. Their target is SMEs and the home market. They number at least 4.000 to 5.000 and are the biggest group in the IT industry.
These companies carry out their operations fully with distributor company resources. Their sales are more directed towards OEM products and peripherals than branded products.
1.2.3. Retail ChannelIn the recent years, Retail Chains diversified and reached huge transaction volume with the reason of investments made by local chains shops and the investment also made by international chains in this category. Furthermore, Food Chain Shops and Dowry Shops increased their business volume. Majority of home market needs is provided by above mentioned chain shops in Turkey. For Despec, there are 3 types of retail groups:
i. Retail Chains:
The retail chains are big groups having more than one store under the same brand such as Tek-nosa, Bimeks, Vatan, Gold, Media Markt , Darty, Electro world, Teknolojiks, NT, Yalçınlar, Evkur, Metro, Real, Tesco/ Kipa. The main function of some groups of this category is computer, while some of them such food markets and dowry shops are chains dealing with computer as a secon-dary business.
ii. Regular Computer Stores (Classic):
These stores are small companies where the owner of the store and a few sales representatives work and they operate with limited resources. They are totally focused on computers.

ANNUAL REPORT 2014
39
iii. E-Retail:
This channel is based on virtual markets which open virtual stores and operate in the internet medi-um. Due to the widespread usage of the internet in the recent years, the number of the companies operating in this channel is increasingly growing. The companies such as Hepsiburada, e-store are the examples of this type of channel.
2. LogisticDespec has 1400 square meters logistic area and local warehouses in Ankara and İzmir branches. In addition, it has logistic fleet consisting of lorries. Other IT Products Distributors use Delivery company or Logistic company. Despec believes that having own logistic team provides advantages on invoicing and collection in deed. The company uses a software programme created specifically for IT Products and ensure stock control, inventory management, customer performance tracking and reporting. In addition, Despec has intention to use GPS system to control Logistic Fleet in the field in the near future.
3. Invoicing and CollectionDespec makes sales to almost all companies dealing with computer and IT products.
This kind of dealers, which are estimated as number about 5,000 in total in Turkey, are considered Regular Dealer (Classic Dealers).
Credit Committee: Credit claims of the dealers are submitted to the Credit committee that does meetings every week on a regular basis for this purpose. These meeting are organized with headed of CFO (Assistant General Manager responsible for Financial and Operational Affairs), Assistant CFO, Finance Manager, Credit & Risk Manager and Sales Managers of related customers.
4. Technical Support and Customer ServiceThe Company does not provide after sale service. Instead, it directs its customers to the companies of each product authorised to provide service. It is because the suppliers prefer their own solution partner to provide service to the end user.
5. Marketing and SalesDue to the structure of the IT industry, the technologies and prices of the products that Despec distributes are subject to frequent changes and improvements. Therefore, an efficient and effective inventory management and rate of inventory turnover may make significant impact on the operational performance of companies.
Considering the dynamic structure of the industry, Despec assigns one product manager for each group of product. The product managers have the mission of understanding the requirements of the sales groups with differing targets and objectives are comprehended better and therefore, the Company provides better service to such groups, following up the market and technology trends, executing the marketing activities.
Exchange of information with customers are provided via web, e-mail and fax.

Corporate Governance Principles Compliance Report04
ANNUAL REPORT 2014
41
1. Corporate Governance Principles Compliance ReportOur Company complies with and applies the Corporate Governance Principles published by the Capital Markets Board within the operating period between 01.01.2014 and 31.12.2014. These principles are adopted by the company management. Some of these principles were adopted immediately, and works continue to fulfil the deficiencies.
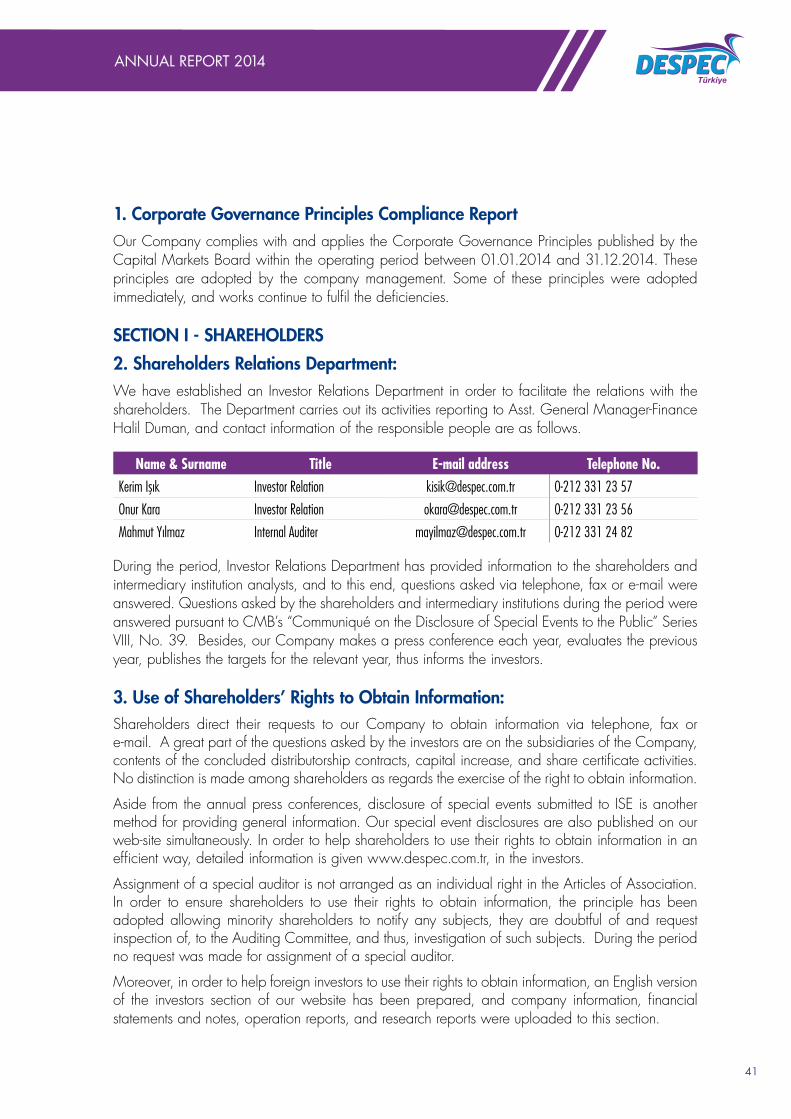
SECTION I - SHAREHOLDERS2. Shareholders Relations Department:We have established an Investor Relations Department in order to facilitate the relations with the shareholders. The Department carries out its activities reporting to Asst. General Manager-Finance Halil Duman, and contact information of the responsible people are as follows.
Name & Surname Title E-mail address Telephone No. Kerim Işık Investor Relation [email protected] 0-212 331 23 57
Onur Kara Investor Relation [email protected] 0-212 331 23 56
Mahmut Yılmaz Internal Auditer [email protected] 0-212 331 24 82
During the period, Investor Relations Department has provided information to the shareholders and intermediary institution analysts, and to this end, questions asked via telephone, fax or e-mail were answered. Questions asked by the shareholders and intermediary institutions during the period were answered pursuant to CMB’s “Communiqué on the Disclosure of Special Events to the Public” Series VIII, No. 39. Besides, our Company makes a press conference each year, evaluates the previous year, publishes the targets for the relevant year, thus informs the investors.
3. Use of Shareholders’ Rights to Obtain Information:Shareholders direct their requests to our Company to obtain information via telephone, fax or e-mail. A great part of the questions asked by the investors are on the subsidiaries of the Company, contents of the concluded distributorship contracts, capital increase, and share certificate activities. No distinction is made among shareholders as regards the exercise of the right to obtain information.
Aside from the annual press conferences, disclosure of special events submitted to ISE is another method for providing general information. Our special event disclosures are also published on our web-site simultaneously. In order to help shareholders to use their rights to obtain information in an efficient way, detailed information is given www.despec.com.tr, in the investors.
Assignment of a special auditor is not arranged as an individual right in the Articles of Association. In order to ensure shareholders to use their rights to obtain information, the principle has been adopted allowing minority shareholders to notify any subjects, they are doubtful of and request inspection of, to the Auditing Committee, and thus, investigation of such subjects. During the period no request was made for assignment of a special auditor.
Moreover, in order to help foreign investors to use their rights to obtain information, an English version of the investors section of our website has been prepared, and company information, financial statements and notes, operation reports, and research reports were uploaded to this section.

ANNUAL REPORT 2014
42
4. Information on General Assembly:2013 General Assembly of our Company was held on 09.05.2014. The General Assembly
resolved the followings unanimously :
- Acceptance of the accounts of the 2013 Balance Sheet and Income Statement,
- Acquittal and discharge of the Board Members and Auditors with respect to the accounts in 2013, and
- Hiring Güreli Yeminli Mali Müşavirlik ve Bağımsız Denetim Hizmetleri A.Ş. for Independent Audit Services to be provided for the 2014 financial statements,
- Distributing % 65 of 2013 net profitable amount as the first dividend.
- Profit distribution regarding 2013 is as follows,
The Company has a net profit after tax amounting to TRL 8.753.592,00 given in its financial statements for the year 2013, which were prepared pursuant to Communiqué of the Capital Markets Board Series XI, No. 29.
- TL 589.266,89 which composes 5% of the net profit, i.e. TL 11.785.337,72 according to the legal records will be retained as the 1st Issue Reserve Fund,
- The First Dividend will be distributed in amount of gross TL 5.321.468,82 (TL 0,2313682 for 1 share with a nominal value of TL 1 in the rate of 23,136821 %) and net TL 4.523.248,50 (TL 0,1966630 for 1 share with a nominal value of TL 1 in the rate of 19,666298 %), corresponding 65% of the net distributable profit, i.e. TL 8.186.875,11 found by adding donation of 25.000 TRL and deducting the 1st Issue Reserve Fund in amount of TL 589.266,89 from TL 8.753.592,00 which is the net profit after tax.
- Allocation of 417.146,88 TRL as the second reserve funds,
- Starting for profit distribution on 27 May 2014,
- Allocation of the remaining amount as extraordinary reserve funds,
- General Assembly was informed about commercial activity with relations of Board Members. It is stated that there was no suspicious cases in these transactions. All the transactions are legally recorded in books and suitable with commercial law.
5. Voting Rights and Minority Rights:In general, there is no privilege concerning voting rights. However,
• Pursuant to the Article 9 “Board of Directors and its Term of Office” of the Company’s Articles of Association, “Half plus one of the members of the Board of Directors are elected from the candidates nominated by the Group A shareholders.”
• Pursuant to Article 12 “General Assembly” of the Articles of Association, the rights given to the shareholders who represent at least one-tenth of the principal capital by the Articles 341, 348, 356, 359, 366, 367 and 377 of the Turkish Code of Commerce, shall be used by shareholders who represent at least one-twentieth of the principal capital.

ANNUAL REPORT 2014
43
• There is no company, holding shares in cross-ownership. Pursuant to the above explained provision of the Articles of Association, the method of minority shares’ representation in the board of directors and use of accumulated votes is not applicable.
6. Dividend Distribution Policy and Deadline for Dividend Distribution:Our Company’s Dividend Distribution Policy is to distribute in cash or in bonus share, or partly in cash and partly in bonus share, provided that it is no less than the minimum amounts stipulated by the Capital Market legislation, considering long-term growth and strategies, investments and fund requirements, profitability and the expectations of shareholders, excluding the special conditions required by extraordinary conditions in the economic conditions.
7. Transfer of Shares:The Articles of Association of the Company does not contain any articles limiting the transfer of shares.
SECTION 2 - PUBLIC DISCLOSURE AND TRANSPARENCY8. Company Information Disclosure Policy The company information disclosure policy was formed in accordance with Article 20 of the articles of association regulating “Public Disclosure and Transparency”.
Disclosure of information to the public is made pursuant to the relevant provisions of the capital markets legislation.
An information policy for public disclosure is prepared and announced to the public. Information to be disclosed to the public are submitted to the use of public in a timely, accurate, complete, understandable, interpretable, accessible and equal manner.
Ethical rules of the Company shall be determined by the Board of Directors and submitted to the information of the General Assembly. Implementations of ethical rules are announced to the public. Company’s principles on social responsibility are also included within these rules.
In use of shareholder’s rights, it is complied with the relevant legislation, to which the Company is subject to, this Articles of Association, and other In-Company regulations. The Board of Directors takes the necessary measures to ensure use of shareholder’s rights. For the purpose of extending the shareholders’ right to get information, submission of any information which may affect the use of rights to the shareholders in electronic media is considered with great care.
Annual operation report, financial statements and reports, dividend distribution suggestion, articles of association amendment proposals, organisation changes, and other important information regarding the activities of the Company to be kept accessible to shareholders’ inspection in the head office and branches of the Company and in electronic format at the Company website considered with great care.
Commercial relations with the Group companies and other partners are performed within the scope of market prices.

ANNUAL REPORT 2014
44
Due care shall be given in preparation of the periodical financial statements and statement footnotes to reflect actual financial condition of the Company, and to ensure that Company Operation Report provides detailed information on the activities of company.
Consultancy activities and Independent Audit Companies are separated. Independent Audit Company is elected for maximum 5 periods. Independence of such companies is strictly protected.
Accordingly, new distributorship agreements were disclosed to the public by the Chairman of the Board and General Managers via disclosure of special events. Names and duties of people responsible as regards the information policy are given below.
Name & Surname TitleN.Erol Bilecik Chairman of the Board
Oğuz Gülmen General Manager - Despec
Our Company’s website at www.despec.com.tr is used as a communication channel pursuant to the points determined in CMB’s Corporate Governance Principles, for the use of shareholders, investors, intermediary institution analysts, and other stakeholders.
9. Disclosure of Special Events:The Company was opened to public on 08/12/2010. In 2014, 19 special events announcement were made to the public.
10. Company Website and Contents:Our Company has a website at the address of www.despec.com.tr. Our website includes commercial register information, final status of partnership and management structure, members of the Board of Directors, Auditing Board, Auditing Committee, information on general assembly, Company’s Articles of Association, periodical financial statements and reports, independent auditor’s report, annual reports, information on public offering, and disclosure of special events made by the Company.
11. Disclosure of the Company’s Ultimate Controlling Individual Shareholder/ Shareholders:Following public offering, our Company’s ultimate controlling individual shareholders are given below.
Shareholder's Name Country Shares %Nevres Erol Bilecik (*) T.C. 30,25 %
(*) Nevres Erol Bilecik owns 99,99 % of Desbil Teknolojik Ürünler A.Ş. which owns Despec A.Ş. with 30,25 %.
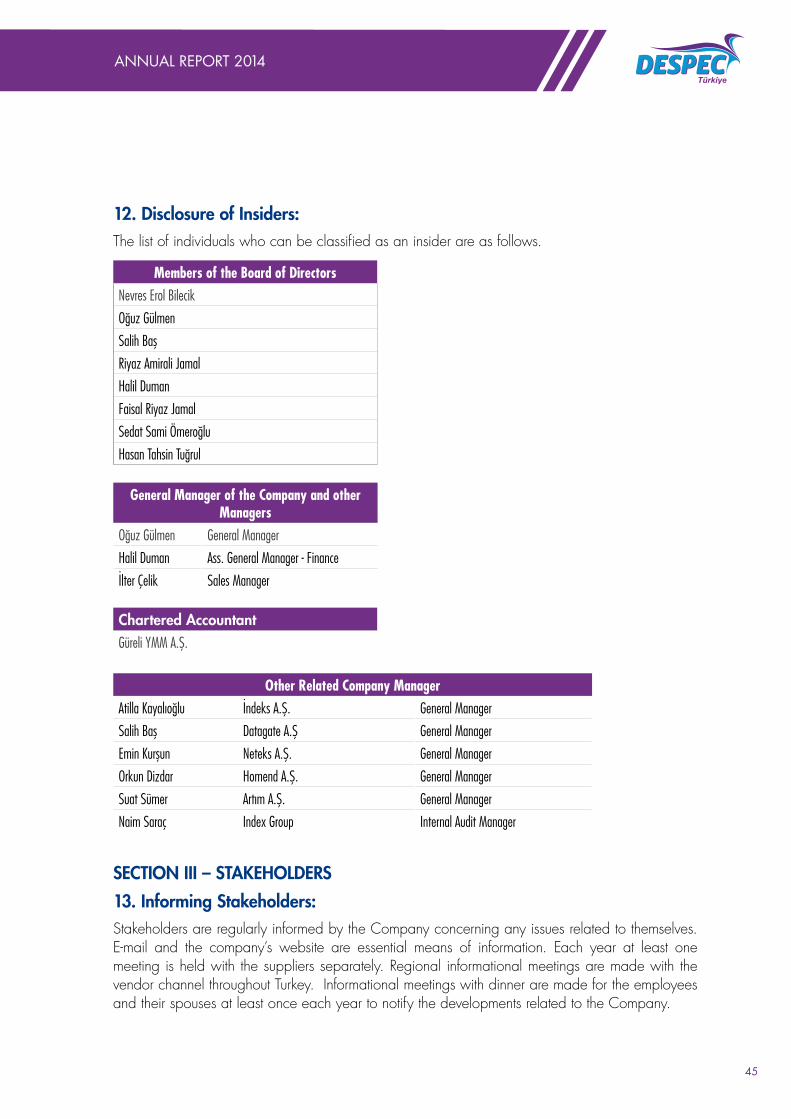
ANNUAL REPORT 2014
45
12. Disclosure of Insiders: The list of individuals who can be classified as an insider are as follows.
Members of the Board of DirectorsNevres Erol Bilecik
Oğuz Gülmen
Salih Baş
Riyaz Amirali Jamal
Halil Duman
Faisal Riyaz Jamal
Sedat Sami Ömeroğlu
Hasan Tahsin Tuğrul
General Manager of the Company and other Managers
Oğuz Gülmen General Manager
Halil Duman Ass. General Manager - Finance
İlter Çelik Sales Manager
Chartered AccountantGüreli YMM A.Ş.
Other Related Company Manager Atilla Kayalıoğlu İndeks A.Ş. General Manager
Salih Baş Datagate A.Ş General Manager
Emin Kurşun Neteks A.Ş. General Manager
Orkun Dizdar Homend A.Ş. General Manager
Suat Sümer Artım A.Ş. General Manager
Naim Saraç Index Group Internal Audit Manager
SECTION III – STAKEHOLDERS13. Informing Stakeholders:Stakeholders are regularly informed by the Company concerning any issues related to themselves. E-mail and the company’s website are essential means of information. Each year at least one meeting is held with the suppliers separately. Regional informational meetings are made with the vendor channel throughout Turkey. Informational meetings with dinner are made for the employees and their spouses at least once each year to notify the developments related to the Company.
ANNUAL REPORT 2014
46
14. Participation of the Stakeholders in the Management:There is no special arrangement for participation of the stakeholders in the management. However, within the scope of vendor directed special channel programs, product supply and sales policies of suppliers are performed in conjunction.
15. Human Resources Policy:The human resources policy of our Company, which is also published on www.index.com.tr is as following:
Our personnel policy is based on the target of becoming a company admired and appreciated by all our employees.
Essential criteria composing our personnel policy are;
• Ensuring that our employees do not worry about their future,
• Ensuring that the employees have confidence in the managers and the company,
• Measuring the performance of all employees, and managing the success criteria in line with these measurements,
• Displaying a transparent management,
• Ensuring easy access to management,
• Ensuring that employees have freedom and convenience of expression,
• Caring about work discipline,
• Ensuring that all personnel work not individually but with a team spirit,
• Caring about career planning,
• Organizing social activities,
• Providing efficient working environment and conditions.
The satisfaction of the personnel of our Company is measured via “Personnel Satisfaction Survey” conducted each year, the areas that need to be improved are determined and corrective steps are taken.
There is no discrimination, under no circumstances, based on ethnic origin, sex, colour, race, religion or other faiths in our Company. No complaints of discrimination have been filed to the management.
16. Information on Relations with the Clients and Suppliers:Achieving customer satisfaction in marketing and sale of products and services is one of our important and indispensable targets. To achieve it, in-company procedures were prepared and are currently applied. Visits are made to customers and suppliers, and occasionally customer satisfaction surveys are made to learn their expectations and find solutions. As a result of such works, it was awarded ISO 9001:2000 in 2004.

ANNUAL REPORT 2014
47
Product Supply and Distribution Structure;
The company operates as a main distributor (“IT Consumables distributor”) in IT industry. It buys IT products from suppliers at certain prices and maturity periods and subsequently sells the products to the sales channels that will sell them to the end user. The company does not plan to develop a sales structure that will include direct sales to the end user in the near future.
Suppliers;
The suppliers of the company consist of International producers and suppliers. Therefore, Despec imports the products and distribute these products.
17. Social Responsibility:We show respect to the society, nature and environment, national values, customs and traditions; in the light of our transparency principle, we provide reliable information to shareholders and stakeholders, also considering the rights and benefits of our Company, in a timely, accurate, full, understandable, analysable and easily accessible condition, on the company management, financial and legal status; we comply with the laws of the Republic of Turkey; we act in accordance with the legislation in force in all our operations and decisions. During the year, no lawsuits were filed against the Company for environmental issues.
SECTION IV - BOARD OF DIRECTORS 18. The Structure and Composition of the Board of Directors and Independent Members:
Board of Directors Title Executive/Non-Executive Nevres Erol Bilecik Chairman Non-Executive
Oğuz Gülmen Vice Chairman Executive
Salih Baş Member Non-Executive
Riyaz Amirali Jamal Member Non-Executive
Halil Duman Member Executive
Attila Kayalıoğlu Member Non-Executive
Faisal Riyaz Jamal Member Non-Executive
Sedat Sami Ömeroğlu Independent Member Non-Executive
Hasan Tahsin Tuğrul Independent Member Non-Executive
There are no independent members in the Board of Directors, and election of independent members was not provided in the Articles of Association. Each year, in the Ordinary General Assembly meetings, permission is given to the Chairman and Members of the Board of Directors, pursuant to Articles 334 and 335 of the Turkish Code of Commerce, to perform the works, in person or on behalf of other people, included in the subject of the Company, and to become partners in

ANNUAL REPORT 2014
48
companies performing these types of activities, and to perform other relevant operations. Other affiliates of the Company are represented in the Board of Directors. As these companies operate in the IT sector but have different specialization areas, it is permitted to the Members of the Board of Directors to perform tasks in other companies.
19. Qualifications of Board Members:Minimum and essential qualifications required in the Members of the Board of Directors are regulated in Article 9 “Board of Directors and Its Term of Office” of the Company’s Articles of Association. All Members of the Board of Directors meet the qualifications listed in CMB’s Corporate Governance Principles, Section IV, Articles 3.1.1, 3.1.2 and 3.1.3.
20. Mission, Vision and Strategic Goals of the Company:Our Company’s mission is to “Continue its leadership by providing service as a main supply centre of IT products for all companies in the computer channel considering their changing requirements”. This definition has been determined by the Board of Directors and announced to the general public through the website of the Company.
Our Company’s vision is to “Be an IT Distributor capable of meeting all requirements of the computer channel from one single point.”
Managers each year prepare a business plan and submit to the Board of Directors, which upon approval becomes effective as of the first week of January. Strategic business plan, income and expenditure budgets, which are prepared at the beginning of December, are evaluated by the Board of Directors which convenes regularly each month.
21. Risk Management Mechanism and Internal Control:Risk management has an important place within the constant activities of our Company. Main starting point of risk management is identification and follow-up of all risks, which our Company has confronted with or it is probable to confront. Our managers target to ensure that applications which improve and develop risk management are constantly implemented in the Company. Current and probable risks of our Company are categorized as follows:
a- Payment Risk: Dealer channel, which is described as regular dealers within the distribution structure, has low capital structure. This group of dealers, which is considered to have a number of approx. 5,000, is transferred frequently, therefore, their opening and closing ratio is rather high. The Company makes sales to almost all companies dealing with the trading of computer. Despec signed receivables insurance with Euler Hermes Insurance Company on 01.04.2013 valid for 2 years.
b- Constant Renewal of Product Technologies: The most important feature of the sector we operate in is that technology and prices of the products are constantly changed and renewed. Companies who fail to adjust their inventory turnover to this change may face with the risk of loss.
c- High Competition in the Sector and Profit Margins: Manufacturer companies in the sector have a high competition worldwide as brands. The competition of manufacturer companies reflects to the prices in the national market. For companies which have weak financing and cost structure, this situation causes an important risk.
ANNUAL REPORT 2014
49
d- Exchange Rate Risk: A great part of the IT products are imported from foreign countries or purchased from domestic sources in foreign currency. When buying products the Company is often credited in foreign currency, and then payments are made in these currencies. Companies, which do not formulate their sales policy based on product-in-currency, are faced with loss risk when foreign exchange rate increases.
e- No exclusivity clause in appointing of distributors by the manufacturer companies: In distributorship contracts made with manufacturer companies there is no reciprocal exclusivity relation. Manufacturer companies, when appointing distributors, may appoint other distributors as well according to the conditions of the market, and distributor companies may sign distributorship contracts with other manufacturer companies.
f- Changes made in importation regimes: Changes occasionally made by the Governments in importation regimes effect the importation positively, but such changes may sometimes have negative effects as well.
Due to the foregoing risks and for controlling all assets and liabilities of the Company, an Internal Audit Department reporting directly to the Chairman of the Board is established. Further, our current accounts and risk management department investigates our dealers. These inquiries are intended to reveal current account relations of the dealers with other suppliers, their relations with banks and other financial institutions and whether they issue any bad cheques or not. Credit Committee: The reports on the computer companies which completed their first year in the industry and those whose credit line has been extended are drawn up by the risk control analysts and presented to the credit committee that meets in certain days each week. The credit committee determines credit lines for each company according to the data from their investigation, past payment data and sales performance. The credit committee determines the working method, and if required, asks dealers to submit a cheque endorsed by a third party or give a further security in mortgage form. Credit lines exceeding a certain amount are evaluated at the weekly meetings of the executive committee, and any excess of credit lines is subject to the approval of the executive committee.
22. Authority and Responsibilities of the Members of the Board of Directors and Managers:Authority and Responsibilities of the Members of the Board of Directors and Managers are defined in the Articles of Association with reference to the relevant provisions of the Turkish Code of Commerce.
23. Principles of Activity of the Board of Directors:The Board of Directors has convened 17 times within the period. The agenda and statements relating to the meeting are passed to the Members of the Board of Directors in advance. Such communication is handled by the secretary of the Chairman of the Board.
While no resolutions are made in some of the discussed topics, the minutes of the topics which were resolved are not disclosed to the public. On the other hand, important subjects resolved in the meeting of the Board of Directors are announced to the general public through Disclosure of Special Events.

ANNUAL REPORT 2014
50
24. Prohibitions Concerning Transactions and Competition with the Company:The required permission was granted by the General Assembly to the Members of the Board of Directors to carry out transactions and competition with the Company as specified in Articles 395 and 396 of the Turkish Commercial Code.
25. Ethical Rules:The Board of Directors of the Company has formulated the ethical rules for the employees. These rules are included in the prospectus which was published during the public offering of the company, and can be found in the investors section of the company website at the address of www.despec.com.tr.
26. Number, Structure and Independence of Committees Established by the Board of Directors:For the Auditing Committee of our Company, Mr. Sedat Sami Ömeroğlu and Mr. Hasan Tahsin Tuğrul were elected by Board of Directors’ Decision with the decision number 3. Auditing Committee was elected audit and inspect the accounting system and financial data of the Company, control whether the financial statements reflected the actual financial status, and found out compliance to generally accepted accounting principles and financial legislation.
At the meeting of the Board of Directors of the Company held on 19.06.2012, it was resolved by decision number 03 to establish a Corporate Governance Committee, and to elect Sedat Sami Ömeroğlu, who is a Board Member, as the Chairman of the Committee, and Salih Baş and Halil Duman, who are Board Members, as the members of the Committee.
At the meeting of the Board of Directors of the Company held on 13.06.2013, it was resolved to establish a Risk Detection Committee, and to elect Sedat Sami Ömeroğlu, who is Independent Board Member, as the Chairman of the Committee, and Hasan Tahsin Tuğrul and Halil Duman, who are Board Members, as the members of the Committee.
27. Remuneration of the Board of Directors:Nevres Erol Bilecik and Oğuz Gülmen who are responsible in the Executive Board, Independent Board Members Sedat Sami Ömeroğlu and Hasan Tahsin Tuğrul get remuneration.
The Company did not lend any money, extend any credit, extend a personal credit through a third party, nor provided any guarantees to or in favour of any Member of the Board of Directors or any Manager of the Company.

ANNUAL REPORT 2014
51

Independent Auditor's Report05

ANNUAL REPORT 2014
53
INDEPENDENT AUDITORS’ REPORT ON THE FINANCIAL STATEMENTS To the Board of Directors of Despec Bilgisayar Pazarlama ve Ticaret Anonim Şirketi;
Introduction
1) We have audited the accompanying statement of financial position of Despec Bilgisayar Pazarlama ve Ticaret Anonim Şirketi (the Company) as at December 31, 2014 and the related statement of profit or loss and statement of other comprehensive income, statement of changes in equity and statement of cash flows for the year then ended and a summary of significant accounting policies and explanatory notes.
Company Management ’s Responsibility for the Financial Statements
2) Company’s management is responsible for the preparation and fair presentation of financial statements in accordance with the Turkish Accounting Standards published by the Public Oversi-ght Accounting and Auditing Standards Authority (“POA”) of Turkey and for such internal controls as management determines is necessary to enable the preparation and fair presentation of financial statements that are free from material misstatement, whether due to error and/or fraud.
Independent Auditor's Responsibility
3) Our responsibility is to express an opinion on these financial statements based on our audit. Our audit was conducted in accordance with standards on auditing issued by the Capital Markets Board of Turkey and standards on auditing issued by POA. Those standards require that ethical requirements are complied with and that the independent audit is planned and perfor-med to obtain reasonable assurance whether the financial statements are free from material misstatement.
4) Independent audit involves performing independent audit procedures to obtain independent audit evidence about the amounts and disclosures in the financial statements. The independent audit procedures selected depend on our professional judgment, including the assessment of the risks of material misstatement of the financial statements, whether due to error and/or fraud. In making those risk assessments, the Company’s internal control system is taken into consideration our purpose, however, is not to express an opinion on the effectiveness of internal control system but to design independent audit procedures that are appropriate for the circumstances in order to identify the relation between the financial statements prepared by the Company and its internal control system. Our independent audit includes also evaluating the appropriateness of accounting policies used and the reasonableness of accounting estimates made by the Com-pany’s management as well as evaluating the overall presentation of the financial statements.
5) We believe that the audit evidence we have obtained during our independent audit is sufficient and appropriate to provide a basis for our audit opinion

Financal Statements & Footnotes06

ANNUAL REPORT 2014
55
STATEMENT OF FINANCIAL POSITION (BALANCE SHEET) (TL)
NotesAudited
Current PeriodDecember 31, 2014
Audited Previous Period
December 31, 2013ASSETSCurrent Assets 68.155.039 70.488.377Cash and Cash Equivalents 6 1.409.794 5.197.544
Financial Investments 7 79.636 57.282
Trade Receivables 10 39.720.174 36.169.689
- Receivables from Related Parties 10-37 1.683.633 66.916
- Other 10 38.036.541 36.102.773
Other Receivables 11 1.866.915 4.602.887
- Receivables from Related Parties 11-37 1.857.777 4.541.945
- Other 11 9.138 60.942
Derivative Instruments 12 68.442 145.450
Inventories 13 22.208.437 21.665.596
Prepaid Expenses 15 527.801 664.546
Current Tax Assets 26 - -
Other Current Assets 26 2.273.840 1.985.383
(Subtotal) 68.155.039 70.488.377Fixed Assets Held for Sale Purposes 34 - -
Non-Current Assets 685.940 369.332Financial Investments 7 10.190 10.190
Other Receivables - -
- Other Receivables from Related Parties - -
- Other - -
Investments Evaluated by Equity Method 16 - -
Investment Properties 17 18.280 18.280
Tangible Assets 18 377.909 213.374
Intangible Assets 19 10.173 5.145
- Goodwill 19 - -
- Other 19 10.173 5.145
Prepaid Expenses 15 - -
Deferred Tax Assets 35 269.388 122.343
TOTAL ASSSETS 68.840.979 70.857.709
The accompanying notes are integral parts of the financial statements.

ANNUAL REPORT 2014
56
STATEMENT OF FINANCIAL POSITION (BALANCE SHEET) (TL)Notes
Audited Current Period
December 31, 2014
Audited Previous Period
December 31, 2013LIABILITIES
Short-Term Liabilities 16.938.713 21.872.338
Short-Term Financial Liabilities 8 - -
Short-term Portion of Long-term Financial Liabilities 8 - -
Other Financial Liabilities 9 - -
Trade Payables 10 14.013.554 18.752.741
-Trade Payables to Related Parties 10-37 318.932 232.373
-Other 10 13.694.622 18.520.368
Employee Benefit Obligations 20 45.385 39.259
Other Payables 11 188.595 1.419.503
-Other Payables to Related Parties 11-37 111.146 1.331.881
-Other 11 77.449 87.622
Derivative Instruments 12 - -
Deferred Earnings 15 716.501 587.292
Profit Tax Liabilities 35 777.230 892.549
Short-Term Provisions 22 1.197.448 180.994
- Provisions for Employee Benefits 24 - -
-Other Short-Term Provisions 22 1.197.448 180.994
Other Short-Term Liabilities 26 - -
(Subtotal) 16.938.713 21.872.338
Liabilities Related to Fixed Assets Held for Sale Purposes 34 - -
Long-Term Liabilities 378.282 331.595
Long-Term Provisions 24 378.282 331.595
- Provisions for Employee Benefits 24 378.282 331.595
-Other Long-Term Provisions 24 - -
Deferred Tax Liabilities 35 - -
Other Long-Term Liabilities 26 - -
SHAREHOLDER’S EQUITY 51.523.984 48.653.776
Parent Company Shareholders’ Equity 27 51.523.984 48.653.776
Paid-in Capital 23.000.000 23.000.000
Difference in Capital Adjustments 437.133 437.133
Shares buyback(-) - -
Share Premium 2.967.707 2.967.707
Other Comprehensive Income or Expenses not to be Reclassified to profit or loss (32.310) (53.981)
- Revaluation and gain/loss arising from Measurement (32.310) (53.981)
Other Comprehensive Income or Expenses to be Reclassified to profit or loss 606.110 (630.460)
- Foreign Currency Translation Differences 606.110 606.110
- Hedging - -
- Other Gains/Losses - -
Restricted Profit Reserves 5.136.093 4.129.678
Retained Earning 11.239.245 8.813.537
Net Profit/(Loss) 8.170.006 8.753.592
Non-Controlling Interests 27 - -
TOTAL LIABILITIES 68.840.979 70.857.709
The accompanying notes are integral parts of the financial statements.

ANNUAL REPORT 2014
57
PROFİT OR LOSS AND OTHER COMPREHENSIVE INCOME STATEMENTS (TL)
NotesAudited
January 1, 2014 December 31, 2014
Audited January 1, 2013
December 31, 2013
OPERATING INCOME
Sales 28 164.743.507 141.404.625
Cost of Sales (-) 28 (148.056.838) (125.194.899)
GROSS PROFIT 16.686.669 16.209.726
General Administrative Expenses (-) 29 (4.486.912) (4.526.493)
Marketing, Sales and Distribution (-) 29 (2.670.611) (1.943.817)
Other Operating Income 31 7.292.502 6.420.821
Other Operating Expenses (-) 31 (5.325.853) (2.191.836)
OPERATION PROFIT / (LOSS) 11.495.795 13.968.401
Share in Profit / (Loss) of Investments Evaluated According to Equity Method - -
Income from Investment Activities 32 760 4.047
Loss from Investment Activities (-) 32 - -
OPERATING PROFIT/LOSS BEFORE FINANCIAL INCOME/EXPENSE 11.496.556 13.972.448
Financial Income 33 2.934.298 3.446.215
Financial Expense (-) 33 (4.124.759) (5.659.920)
CONTINUED OPERATIONS PROFIT / (LOSS) BEFORE TAX 10.306.094 11.758.743
Continued Operations Tax Profit / (Loss) (2.136.088) (3.005.151)
- Current Period Tax Income /(Expense) 35 (2.288.551) (3.003.242)
- Deferred Tax Income / (Expense) 35 152.463 (1.909)
Distribution of Profit / (Loss) of the Period 8.170.006 8.753.592
Non-Controlling Interest 27 - -
Parent Company Share 27 8.170.006 8.753.592
Earnings / (Loss) Per Share 36 0,355218 0,380591
OTHER COMPREHENSIVE INCOME - -
Items Not To Be Reclassified in Profit / Loss 21.671 (53.981)
Actuarial gain and loss arising from defined benefit plans 27.089 (67.476)
Items not to be reclassified to profit or loss in subsequent periods related Tax (5.418) 13.495
- Deferred Tax Income/(Expense) (5.418) 13.495
Items to Be Reclassified to Profit or Loss in Subsequent Periods - 3.185.725
Foreign Currency Exchange Differences - 3.187.302
Hedge Fund 27 - (1.577)
OTHER COMPREHENSIVE INCOME 21.671 3.131.744
TOTAL COMPREHENSIVE INCOME/EXPENSES - -
Distribution of Total Comprehensive Income/Expenses 8.191.677 11.885.336
Non-Controlling Interest - -
Parent Company Shares 8.191.677 11.885.336
The accompanying notes are integral parts of the financial statements.

ANNUAL REPORT 2014
58
CASH FLOW STATEMENT (TL)
Audited Current Period
Audited Previous Period
Notes January 1,2014December 31, 2014
January 1,2013December 31, 2013
A. CASH FLOW PROVIDED FROM OPERATIONS 1.821.317 5.410.327
Net Profit / (Loss) 10.306.094 11.758.743
Adjustments: 263.911 (1.084.377)
Depreciation and Amortization Adjustment 18-19 117.890 81.804
Change in Provision for Termination Indemnities (+) 24 48.379 127.626
Termination Indemnities Paid(-) 24 (1.692) (24.034)
Receivables Rediscount (+) 10 34.876 222.736
Current Period Provision for Doubtful Receivables (+) 10 670 22.020
Provision for Inventory Impairment (+) 13 548.954 108.961
Unrealized Currency Exchange (Income)/ Loss on Loans - -
Rediscount on Notes Payable (-) 10 23.509 (67.935)
Accrued Income 26 (799.128) (23.069)
Provision for Price Differences 22 1.016.454 (365.513)
Lawsuit Provisions 22 - -
Fixed Asset or Long-Term Investment Earnings (-) 7 - -
Interest Expense (+) 33 1.592.394 1.195.484
Interest Income(-) 32 (2.318.395) (2.362.457)
Changes in Working Capital (7.070.819) (3.789.744)
Inventories Increase/Decrease 13 (1.091.795) (8.778.552)
Trade Receivables Increase/Decrease 10 (3.586.031) (10.667.129)
Other Receivables 11 2.735.972 9.109.786
Increase in Financial Assets Available for Sale (-) 7 - -
Decrease in Trade Payables (-) 10 (4.762.696) 4.923.135
Other Changes (+)/(-) 864.639 1.649.862
Other Payables 11 (1.230.908) (26.846)
Cash Inflow Provided/(Used) From Activities: 3.499.186 6.884.622
Other Liabilities Increase/Decreases 26 - -
Interest Paid (Net) 32-33 726.001 1.166.973
Tax Payments (-) 22 (2.403.870) (2.641.268)
B) CASH FLOW USED IN INVESTMENT OPERATIONS (287.453) 12.418
Cash Outflow from Acquisitions of Tangible and İntangibel Assets 18-19 (287.453) (20.601)
Cash Provided from Sales of Tangible and Intangible Assets 18-19 - 33.019
C. CASH FLOW FROM FINANCIAL ACTIVITIES (5.321.469) (5.004.059)
Cash Inflow from Financial Debt 8 - -
Financial Payables Payments 8 - -
Share Premium 27 - -
Capital Increase 27 - -
Dividends Paid (-) 27 (5.321.469) (5.004.059)
NET INCREASE / DECREASE OF CASH AND CASH EQUİVALENTS BEFORE THE EFFECT OF FOREIGN CURRENCY TRANSLATIONS (3.787.605) 418.686
D. EFFECT OF FOREIGN CURRENCY TRANSLATIONS ON CASH AND CASH EQUIVALENTS - -
NET INCREASE / DECREASE OF CASH AND CASH EQUİVALENTS (3.787.605) 418.686
E)ENDING BALANCE OF CASH AND CASH EQUIVALENTS 5.197.357 4.778.671
BEGINNING BALANCE OF CASH AND CASH EQUIVALENTS 1.409.752 5.197.357
The accompanying notes are integral parts of the financial statements.
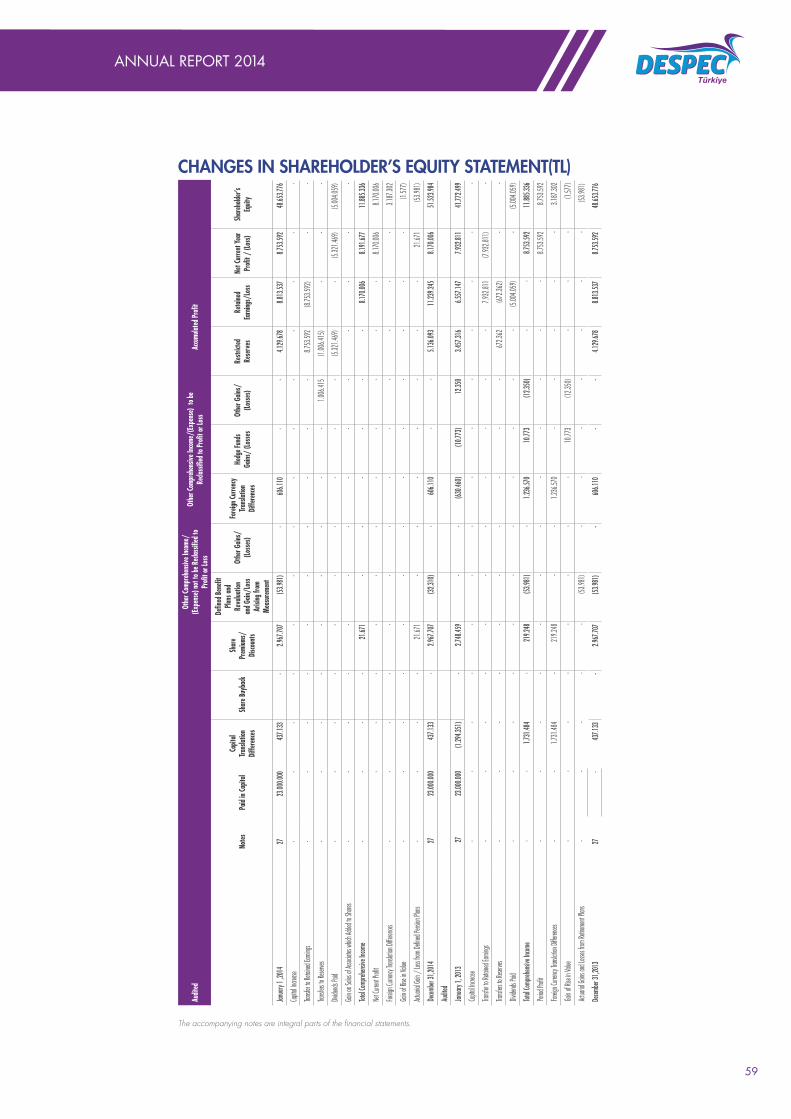
ANNUAL REPORT 2014
59
The accompanying notes are integral parts of the financial statements.
Audit
edOt
her C
ompre
hens
ive In
come/
(Expe
nse)
not t
o be R
eclas
sified
to
Profi
t or L
oss
Othe
r Com
prehe
nsive
Incom
e/(Ex
pens
e) to
be
Recla
ssifie
d to P
rofit o
r Los
sAc
cumula
ted Pr
ofit
Notes
Paid
in Ca
pital
Capit
al Tra
nslat
ion
Differ
ences
Share
Buyb
ackSh
are
Prem
iums/
Dis
counts
Defin
ed Be
nefit
Pla
ns an
d Re
valua
tion
and G
ain/L
oss
Arisi
ng fr
om
Meas
ureme
nt
Othe
r Gain
s/
(Losse
s)
Forei
gn Cu
rrency
Tra
nslat
ion
Differ
ences
Hedg
e Fun
ds
Gains
/ (Lo
sses
Othe
r Gain
s/
(Losse
s)Re
strict
ed
Rese
rves
Re
taine
d Ea
rning
s/Lo
ssNe
t Curr
ent Y
ear
Profi
t / (L
oss)
Share
holde
r’s
Equit
y
Janua
ry 1 ,
2014
27
23.00
0.000
43
7.133
-
2.96
7.707
(53
.981)
- 60
6.110
-
- 4.
129.6
78
8.81
3.537
8.
753.5
92
48.65
3.776
Capita
l Incre
ase-
--
--
--
--
--
--
-
Transf
er to
Retain
ed Ear
nings
--
--
--
--
--
8.753
.592
(8.75
3.592
)-
-
Transf
ers to
Reser
ves-
--
--
--
--
1.006
.415
(1.00
6.415
) -
--
Divide
nds Pa
id-
--
--
--
--
-(5
.321.4
69)
-(5
.321.4
69)
(5.00
4.059
)
Gain
on Sa
les of
Assoc
iates w
hich A
dded t
o Shar
es-
--
--
--
--
--
--
-
Total
Compre
hensi
ve Inc
ome
--
--
21.67
1-
--
--
-8.1
70.00
68.1
91.67
711
.885.3
36
Net C
urrent
Profi
t-
--
--
--
--
--
8.170
.006
8.170
.006
Foreig
n Curr
ency T
ransla
tion D
ifferen
ces-
--
--
--
--
--
--
3.187
.302
Gain
of Ris
e in Va
lue-
--
--
--
--
--
--
(1.57
7)
Actuar
ial Ga
in / L
oss fro
m De
fined
Pensio
n Plan
s-
--
-21
.671
--
--
--
-21
.671
(53.9
81)
Decem
ber 31
,2014
27
23.00
0.000
437
.133
-
2.96
7.707
(32
.310)
-
60
6.110
-
-
5.136
.093
11.23
9.245
8.1
70.00
651
.523.9
84
Audit
ed
Janua
ry 1,
2013
27
23.00
0.000
(1.29
4.351
)
-
2
.748.4
59-
- (63
0.460
)
(10
.773)
12.3
50
3.45
7.316
6.55
7.147
7.9
32.81
1
41
.772.4
99
Capita
l Incre
ase-
--
--
--
--
--
--
-
Transf
er to
Retain
ed Ear
nings
--
--
--
--
--
-7.9
32.81
1(7
.932.8
11)
-
Transf
ers to
Reser
ves-
--
--
--
--
-67
2.362
(672
.362)
--
Divide
nds Pa
id-
--
--
--
--
--
(5.00
4.059
)-
(5.00
4.059
)
Total
Compre
hensi
ve Inc
ome
--
1.731
.484
-21
9.248
(53.98
1)-
1.236
.570
10.77
3(12
.350)
--
8.753
.592
11.88
5.336
Period
Profi
t-
--
--
--
--
--
-8.7
53.59
28.7
53.59
2
Foreig
n Curr
ency T
ransla
tion D
ifferen
ces-
-1.7
31.48
4-
219.2
48-
-1.2
36.57
0-
--
--
3.187
.302
Gain
of Ris
e in Va
lue-
--
--
--
-10
.773
(12.3
50)
--
-(1
.577)
Actuar
ial Ga
ins an
d Loss
es fro
m Re
tireme
nt Pla
ns-
--
--
(53.9
81)
--
--
--
-(5
3.981
)
Decem
ber 31
,2013
27
-
4
37.13
3
-
2.967
.707
(53.98
1) -
606.1
10
-
-4.1
29.67
8
8.81
3.537
8
.753.5
9248
.653.7
76
CHANGES IN SHAREHOLDER’S EQUITY STATEMENT(TL)
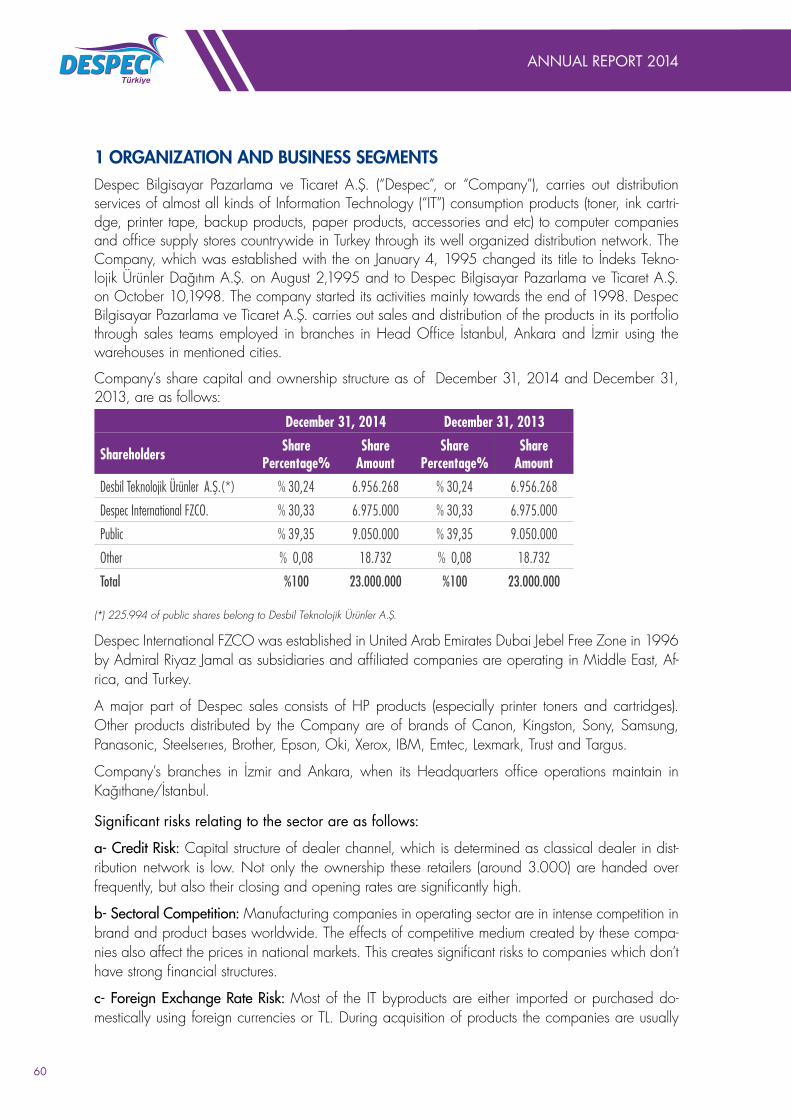
ANNUAL REPORT 2014
60
1 ORGANIZATION AND BUSINESS SEGMENTSDespec Bilgisayar Pazarlama ve Ticaret A.Ş. (“Despec”, or “Company”), carries out distribution services of almost all kinds of Information Technology (“IT”) consumption products (toner, ink cartri-dge, printer tape, backup products, paper products, accessories and etc) to computer companies and office supply stores countrywide in Turkey through its well organized distribution network. The Company, which was established with the on January 4, 1995 changed its title to İndeks Tekno-lojik Ürünler Dağıtım A.Ş. on August 2,1995 and to Despec Bilgisayar Pazarlama ve Ticaret A.Ş. on October 10,1998. The company started its activities mainly towards the end of 1998. Despec Bilgisayar Pazarlama ve Ticaret A.Ş. carries out sales and distribution of the products in its portfolio through sales teams employed in branches in Head Office İstanbul, Ankara and İzmir using the warehouses in mentioned cities.
Company’s share capital and ownership structure as of December 31, 2014 and December 31, 2013, are as follows:
December 31, 2014 December 31, 2013
Shareholders Share Percentage%
Share Amount
Share Percentage%
Share Amount
Desbil Teknolojik Ürünler A.Ş.(*) % 30,24 6.956.268 % 30,24 6.956.268
Despec International FZCO. % 30,33 6.975.000 % 30,33 6.975.000
Public % 39,35 9.050.000 % 39,35 9.050.000
Other % 0,08 18.732 % 0,08 18.732
Total %100 23.000.000 %100 23.000.000
(*) 225.994 of public shares belong to Desbil Teknolojik Ürünler A.Ş.
Despec International FZCO was established in United Arab Emirates Dubai Jebel Free Zone in 1996 by Admiral Riyaz Jamal as subsidiaries and affiliated companies are operating in Middle East, Af-rica, and Turkey.
A major part of Despec sales consists of HP products (especially printer toners and cartridges). Other products distributed by the Company are of brands of Canon, Kingston, Sony, Samsung, Panasonic, Steelserıes, Brother, Epson, Oki, Xerox, IBM, Emtec, Lexmark, Trust and Targus.
Company’s branches in İzmir and Ankara, when its Headquarters office operations maintain in Kağıthane/İstanbul.
Significant risks relating to the sector are as follows:
a- Credit Risk: Capital structure of dealer channel, which is determined as classical dealer in dist-ribution network is low. Not only the ownership these retailers (around 3.000) are handed over frequently, but also their closing and opening rates are significantly high.
b- Sectoral Competition: Manufacturing companies in operating sector are in intense competition in brand and product bases worldwide. The effects of competitive medium created by these compa-nies also affect the prices in national markets. This creates significant risks to companies which don’t have strong financial structures.
c- Foreign Exchange Rate Risk: Most of the IT byproducts are either imported or purchased do-mestically using foreign currencies or TL. During acquisition of products the companies are usually

ANNUAL REPORT 2014
61
indebted in foreign currencies and payments are also made in same currencies. The companies which do not adopt their sales policies using currencies in which they purchase the products may encounter foreign exchange losses if rates increase.
d- The distribution agreements made with producers are not exclusive: There is no mutual exclu-sivity in distributorship agreements made with producer companies. In distributorship agreements according to market conditions producers can assign other distributorships, whereas in the meantime distributors can also sign distributorship agreements with other producers.
Based on the facts that the Company is active in the sector for many years and maintains a high level of knowhow, the Company management considers the risk of agreement cancellation is ext-remely low.
e- Amendments made in import regimes: The amendments made by governments in some periods regarding import regimes may affect import both positively and negatively.
The addresses of the Company’s main office and branches are as follows:
Main Office: Merkez Mah. Erseven Sok. No: 8/3 34406 Kağıthane / İSTANBUL. The Company also has branches in Ankara and İzmir.
Branch Addresses are as follows:
Ankara Branch: Çetin Emeç Bulvarı Öveçler 4.Cadde No:4/9 Dikmen/ANKARA
İzmir Branch: 1370 Sokak No: 26 35320 Çankaya/İZMİR
The average number of employees of the Company as of December 31, 2014 is 31.(December 31, 2013:29). All of the employees are assigned with administrative duties.
2 PRINCIPLES RELATED TO THE PRESENTATION OF THE FINANCIAL STATEMENTS2.01 Basic Principles for the Presentation The Company maintains its books of accounts and statutory financial statement in accordance with Turkish Commercial Code and accounting principles determined in tax legislations. Accompanying financial statements include adjustments and classifications made on legal books in line with the generally accepted accounting principles issued by Capital Markets Boards (CMB).
The accompanying financial statements are prepared in accordance with Capital Market Board’s Communique “Priciples of Financial Reporting in Capital Markets”(“Communique”) which was publis-hed in the Official Gazette dated June 13,2013 and numbered 28676 Series: II,No.14.1 and that communique was repealed.
The Company is applied in accordance with Turkish Accounting Standards / Turkish Financial Re-porting Standards (“TAS / TFRS”) and its addendum and interpretations issued by Public Oversight Accounting.In accordance with CMB’s code article 14. Decisions are made as determining the implementation by committee for financial reporting principle,procedures and principles,providing apparentness and comprehensible or providing secure uniformity of implementation.Corporates are required to comply with this decision.
The accompanying financial statements are prepared in accordance with communiqué numbered II-14.1,financial statements and footnotes are presented according to the formats which must be applied dated June 7, 2014 by CMB.
ANNUAL REPORT 2014
62
In the scope of the related CMB’s communiqué, the entities are allowed to prepare a complete or condensed set of interim financial statements in accordance with TAS 34, “Interim Financial Repor-ting”. In this respect, the Company has preferred to prepare complete set of financial statements and prepared the aforementioned complete set of financial statements in compliance with POA Financial Reporting Standards.
The accompanying financial statements were approved by its Board of Directors for the period as of date March 2, 2015. Board of Directors has the authority to change the financial statements.
The Company determined its functional currency as USD in accordance with Turkish Accounting Standards (“TAS”) 21 “‘The Effects of Changes in Foreign Exchange Rates”, due to the fact that the significant part of sales and purchases are USD based. Until June 30,2013,the main outlines applied during translation of financial statements which were prepared in USD to Turkish Lira .
Due to the fact that an important portion of purchases and sales are based on the TL currency, the function currency of the Company has been changed to TL on July 1st 2013. As a result, all transa-ctions occurring after July 1st 2013 are recorded in the TL currency.
The non-monetary items present in the December 31, 2014 financial statements have been accepted as the USD currency until June 30, 2013. The transactions in the non-monetary items that take place after this date are recorded in TL due to the change in the functional currency to the TL currency.
The same accounting technique has been used regarding non-monetary items in the statement of profit or loss and for all transactions until June 30, 2013 have been converted using the average USD currency rate. Any transaction occurring after July 1, 2013 has been recorded using the TL currency.
2.02 Dealing with the Inflation Effects in Hyper-Inflationary PeriodsAccording to the decision dated March 17, 2005 with No:11/367 made by the CMB, the inflation accounting is no longer effective for the periods after January 1, 2005 for the companies that are operating in Turkey and preparing financial statements in accordance with CMB standards. The-refore, practise of International Accounting Standards 29 “Financial Reporting on Hyper-Inflationist Economies” ended after January 01, 2005.
2.03 Changes in Accounting PoliciesThe changes to the current accounting policies can be performed if it is necessary or the changes will provide more appropriate and reliable presentation of the transactions and events related to the financial position, performance and the cash flow of the Company that affect the financial sta-tements of the Company. If the changes in accounting policies affects the prior periods, policy is applied to the prior period financial statements as if it is applied before. There were not any chan-ges in accounting policies in the current period.
2.04 Changes in Accounting Estimates and ErrorsAccounting estimates are made based on reliable information and using appropriate estimation methods. However, if new or additional information becomes available or the circumstances, which the initial estimates based on, change, then the estimates are reviewed and revised, if necessary. If the change in the accounting estimates is only related to a sole period, then only that period’s

ANNUAL REPORT 2014
63
financial statements are adjusted. On the other hand, if the amendments are related to the current as well as the forthcoming periods, then both current and forthcoming periods’ financial statements are adjusted.
In instances where the accounting estimates affect both current and forthcoming periods, then description and monetary value of the estimate is disclosed in the notes to the financial statements. However; if the affect of the accounting estimate to the financial statement is not determinable, then it is not disclosed in the notes to the financial statements. The Company management uses accounting estimates related to issues such as determination of useful lives of tangible and intangible assets, actuarial assumptions used in termination indemnity calculation, provisions for pending law suits and proceedings in favor of and/or against the Company and provisions for decrease in value of inventories. Detailed explanations on the used estimates were made the following changes in the accounting estimates used in the related notes located below.
TAS 21 The Effects of Changes in Foreign Exchange Rates Standard defines that functional currency is the currency of the primary economic environment in which the entity operates. The primary eco-nomic environment in which an entity operates is normally the one in which it primarily generates and expends cash. An entity considers the following factors in determining its functional currency; the currency that mainly influences sales prices for goods and services (this will often be the currency in which sales prices for its goods and services are denominated and settled); and of the country who-se competitive forces and regulations mainly determine the sales prices of its goods and services and the currency that mainly influences labor, material and other costs of providing goods or servi-ces (this will often be the currency in which such costs are denominated and settled). The Company Management reviews accounting estimations about functional currency and accounting policies in every period. In this context in the evaluation ,it has been decided to change the functional currency as USD as from January 1, 2013 considering the last year realization and forward-looking expecta-tions. The effects of accounting policy changes result of forward-looking expectations applied on a going forward according to TAS 21 Paragraph 35-37. In other words every items of the company has been converted to new functional currency using the foreign currency exchange on the date of June 30,2013 which is the conversion date and the amounts formed after the conversion has been considered as historical cost for non-monetary items.
TAS 19 In accordance with the revised standard, actuarial gain / loss related to employee benefits which were stated in profit or loss in the previous periods were recognized in other comprehensive income.
Important Accounting Evaluations, Estimations and Assumptions
During preparation of financial statements Company management makes assumptions and estimates effecting the amounts of reported assets and liabilities, which effect contingent liabilities and com-mitments as of balance sheet date and income and expense items as of reporting period. Actual results may differ from the estimations made. Estimates are reviewed regularly and when it is required necessary adjustments are reflected to the financial statements in the period they are realized.
Assumptions made taking the basic reasons of interpretations, which can affect the amounts presen-ted in the financial statements significantly and estimates which exist as of balance sheet date or are expected to occur in the future, into consideration, are explained in the following paragraphs:

ANNUAL REPORT 2014
64
• Actuarial assumptions relating to Termination Indemnity Liabilities ( Discount rates, expected salary increases and reassignment rates of employees). (Note:24)
• The Company calculates depreciation according to straight line method according to the use-ful lives of fixed assets. The expected useful lives residual values and depreciation method is re-viewed annually for any changes in estimates and proactively adjusted in case of any changes. There were not any changes in estimates related with depreciation calculations. (Note:18-19)
• The Company makes provision for receivable when there conditions indicate that collectabi-lity of these receivables are dubious whether there are not any legal processes initiated related to these receivables or not. The Company receives guarantees for receivables from companies which are considered to carry collection risks. (Note:10)
• The inventories are reflected to the financial statements with the lesser of cost or net realizable value. The effect of technological developments on the inventories of the company are taken into consideration during the calculation of impairment. (Note:13)
• The Company receives commissions from producer Company’s according to sales or procu-rement volumes using predetermined commission rates. The commission incomes are recorded according to accrual basis. (Note:26)
2.05 Summary of Significant Accounting PoliciesThe significant accounting policies used in the preparation of the financial statements are as follows:
2.05.01 Revenue Recognition
The Company recognizes income in fair value according to the accrual basis, when the Company reasonably determines the income and economic benefit is probable.
Revenue from the sale of goods is recognized when all the following conditions are gratified:
• The significant risks and the ownership of the goods are transferred to the buyer;• The Company refrains the managerial control over the goods and the effective control over
the goods sold;• The revenue can be measured reasonably;• It is probable that the the economic benefits related to transaction will flow to the entitiy;• The costs incurred or will be incurred in conjuction with the transaction can be measured
reliably.
Interest income is accrued in the related period after discounting the cash inflows which will be rece-ived from the principal amount in the expected term using the efficient interest rate which discounts the mentioned cash inflows to recorded values.
When there is a significant amount of financing in sales, the fair value is determined by discounting the future cash flows using the embedded interest rate. The difference is reflected to the financial statements according to accrual basis.
Despec sales consists mainly of IT byproducts of HP (especially printer toners and cartridges).
Other products distributed by the Company are products of Canon, Epson, OKI, Xerox, IBM, Emtec, Lexmark, Trust and Targus. 90 % - 95 % of inventory purchases are provided from the first ten major suppliers. Purchases from HP cover approximately 60 % - 80 % of total inventory purchases

ANNUAL REPORT 2014
65
A major part of procurements of the Company are made directly from producers. The fluctuations in prices which may occur according to market conditions are covered by producer companies to provide price competitiveness. Other than this, losses related to defect products are paid to the Company by producers. Moreover, related to massive procurement of Public Sector or Private Se-ctor companies, special prices are provided by the producers and the best pricing conditions are offered to companies operating in these sectors. In line with the dynamic and changing structure of IT Sector, the Company is supported directly and continuously by producers regarding new products and technologies.
The Company markets and sells the products imported from producers companies, which the Com-pany has signed distributorship agreements. All of the sales are made via retailer channel, which consists of approximately 3.000 retailers, and there are no sales made directly to end users by the Company. Almost 50-65 % of the sales are made through ten major retailers.
When the products in inventories are sold with prices lower than acquisition costs in line with the demand of producers according to their marketing strategies, there are payments made with the explanation of inventory protection. These payments are deducted from the cost of inventories. On the other hand sales commissions obtained in line with the sales volumes are added to sales.
2.05.02 Inventory Valuation
Inventories are stated either at the lower of acquisition cost or net realizable value. The Company’s inventories consist of cartridge, toner, tape and paper. The inventory costing method used by the Company is “First in First out (FIFO)”. Net realizable value is the estimated selling price in the ordinary course of business less the estimated costs of completion and the estimated costs necessary to make the sale.
The Company also calculates net realizable values of commercial goods and reflects provision for decrease in value when there are indications of value decrease. (Not:13)
2.5.03 Tangible Fixed Assets
For Assets acquired in and after 2005, the tangible assets are reflected to the financial statements by deducting their accumulated depreciation from their cost. For assets that were acquired before January 01, 2005, the tangible fixed assets are presented on the financial statements based on their cost value, which is adjusted according to the inflationary effects as of December 31, 2004. Depreciation is calculated using the straight-line method based on their useful lives. The following rates, determined in accordance with the useful lives of the fixed assets, are used in calculation of depreciation.
Useful Life (Year)
- Furniture’s and Fixtures 4-10
- Motor Vehicles 5-10
- Leasehold Improvements 5-10
If the carrying amount of a tangible asset is more than the expected recoverable amount, the net book value is decreased to recoverable amount by making provision.
The profit and loss arisen from fixed asset sales are determined by comparing the net book value with the sales price and the difference is recorded as operating profit or loss.
ANNUAL REPORT 2014
66
2.05.04 Intangible Assets
Intangible assets acquired before January 01, 2005 are carried at acquisition costs adjusted for inflation; whereas those purchased in and purchased after January 01, 2005 are carried forward at their acquisition cost less accumulated amortization.
Intangible fixed assets comprise of information systems and software rights expenses. Amortization is calculated using the straight-line method between 3 and 10 years period.
2.05.05 Leasings
The Company does not have any financial leasing transaction. The Company is lessee of various operational leases. In operational leases the lessor retains the significant risks and benefits related to the leased asset. Expenses incurred relating to these leases is recorded as expense in the income statement according to straight line method. The most important operational leasing of the Company is the rent for Company center from the related İndeks Bilgisayar Sistemeleri Mühendislik Sanayi Ticaret A.Ş. (İndeks A.Ş.) Leasing process is carried out an annual and rents are invoiced as a monthly by İndeks A.Ş.Company’s logistic servise is invoiced as a monthly by Teklos Teknoloji Lojistik Hizmetleri A.Ş. (Teklos A.Ş.). The purchases from related parties are disclosed in Note: 37.
2.05.06 Impairment of Assets
Assets that have an indefinite useful life, such as goodwill, are not subject to amortization but they are annually tested for impairment. Assets that are subject to amortization are reviewed for impair-ment whenever events or changes in circumstances indicate that the carrying amount may not be recoverable. An impairment loss is recognized for the amount by which the asset’s carrying amount exceeds its recoverable amount. The recoverable amount is the higher of an asset’s fair value less costs to sell and value in use. For the purposes of assessing impairment, assets are grouped at the lowest levels for which there are separately identifiable cash flows. Non-financial assets that suffered impairment are reviewed for possible reversal of impairment at each reporting date.
2.05.07 Borrowings Costs
The borrowing costs are recognized as expense when they are incurred. Borrowing costs that are directly attributable to the acquisition, construction or production of a qualifying asset shall be capi-talized as part of the cost of that asset. The capitalization of borrowing costs as part of the cost of a qualifying asset shall commence, when expenditures and borrowing costs for the asset are incurred, continues until that asset becomes available for sale. Expenditures on a qualifying asset include only those expenditures that have resulted in payments of cash, transfers of other assets or the assumption of interest-bearing liabilities. There are no capitalized borrowing costs in current period related to qualifying assets.
2.05.08Financial Instruments
(i) Financial Assets
Investments are recognized and derecognized on trade date where the purchase of sales of an investment is under a contract, whose terms require delivery of the investment within the timeframe establıshed by the market concerned and are initially measured at fair value, net of transaction costs except for those financial assets aclassified as fair value through profit or loss which are initially

ANNUAL REPORT 2014
67
measured at fair value.Other financial assets are classified as “financial assets, whose fair value differences are reflected to the profit or loss”, “financial assets held to the maturity”, “financial assets available for-sale” and “loans and receivables.
Prevailing Interest Method
Prevailing interest method is the valuation of financial asset with their amortized cost and allocation of interest income to the relevant period. Prevailing interest rate is that discounts the estimated cash flow for the expected life of financial instrument or where appropriate a shorter period. Income related to financial assets, except the “financial assets, whose fair value differences are reflected to the profit or loss”, is calculated by using the prevailing interest rate.
a) Financial Assets Whose Fair Value Differences Are Reflected to the Profit or Loss
“Financial assets whose fair value differences are reflected to the profit or loss”, are the financial assets that are held for trading purposes. If a financial asset is acquired for trading purposes, it is classified in this category. Also, derivative instruments, which are not exempt from financial risk, are also classified as “Financial assets whose fair value differences are reflected to the profit or loss”. These financial assets are classified as current assets.
b) Financial Assets Which Will Be Held to the Maturity
Debt instruments, which the Company has the intention and capablity to hold to maturity, and/or have fixed or determinable payment arrangement are classified as “Investments Held to the Maturity”. Financial asset that will be held to the maturity, are recorded after deducting the impa-irment from the cost basis, which has been amortized with prevailing interest method. All relevant income is calculated using the prevailing interest method.
c) Financial Assets Available-For-Sale
Financial assets, which are “Available-for-Sale” are either (a) financial assets, which will not be held to maturity or (b) financial assets, which are not held for trading purposes. Financial assets Available-for-Sale are recorded with their fair value if their fair value can be determined reliably. Marketable securities are shown at their cost basis unless their fair value can be reliably measured or have an active trading market. Profit or loss pertaining to the financial assets Ava-ilable-for-Sale is not recorded on the income statement. The fluctuation in the fair value of these assets are shown in the statement of shareholders’ equity. Where the investment is disposed of or is determined to be impaired, the cumulative gain or loss previously recognized is includeded in profit or loss for the period. Provisions recorded in the income statement pertaining to the impair-ment of financial asset Available-for-Sale can not be reversed from the income statement in future periods. Except equity instruments classified as available-for-sale, if impairment loss decreases in next period and if therein decreasing can be related to an event occurred after the accounting of impairment loss, impairment loss accounted before, can be cancelled in income statement.The Company classified all of the existing financial assets as Available for Sale Financial Assets. Company’s as of period is not available financial asset for sale.
d) Loans and Receivables
Trade receivables, other receivables, and loans are initially recognized at their fair value. Sub-sequently, receivables and loans are measured at amortized cost using the effective interest method. In the case of interest on loans and receivables negligible, registered value of loan and receivables is accepted as fair value.

ANNUAL REPORT 2014
68
Impairment of financial assets
Financial assets, other than those at fair value through profit or loss, are assessed for indication of impairment at each statatement of financial position date. Financial assets are impaired, where there is objective evidence that, as a result of one or more events that occurred after the initial recognition of the financial asset, the estimated future cash flows of the investment have been impacted. For financial assets carried at amortized cost, the amount of the impairment is the difference between the asset’s carrying amount and the present value of estimated future cash flows, discounted at the original effective interest rate.
The carrying amount of the financial asset is reduced with the impairment loss directly for all financial assets with the exception of trade receivables, where the carrying amount is reduced through the use of an allowance account. When a trade receivable is uncollectible, it is written off against the allowance account. Subsequent recoveries of amounts previously written off are reversed against the allowance account. Changes in the carrying amount of the allowance account are recognized in profit or loss.
With the exception of available for sale equity instruments, if, in a subsequent period, the amount of the impairment loss decreases and the decrease can be related objectively to an event occurring after the impairment was recognized, the previously recognized impairment loss is reversed through profit or loss to the extent that the carrying amount of the investment at the date the impairment is reversed does not exceed what the amortized cost would have been had the impairment not been recognized.
With respect to available-for-sale equity securities, any increase in fair value subsequent to an impa-irment loss is recognized directly in equity.
Cash and Cash Equivalents
Cash and cash equivalents are cash, demand deposit and other short-term highly liquid investments, which their maturities are three months or less from the date as of acquisition, that are readily conver-tible to a known amount of cash and are subject to an insignificant risk of changes in value.
(ii) Financial Liabilities
Financial liabilities and equity instruments are classified based on arrangements according to the ag-reement, and definition of financial liability and equity instrument. Agreement which embodies right of assets after deducting all the liabilities, is a financial instrument based on equity. Accounting poli-cies for the financial liabilities and the financial instruments based on equity are determined below.
Financial liabilities are classified as financial liabilities whose fair value differences are reflected to the profit / (loss) or other financial liabilities.
a) Financial Liabilities Whose Fair Value Differences Are Reflected to the Profit / (Loss)
“Financial liabilities whose fair value differences are reflected to the profit /loss” are recorded at fair value and are re-evaluated at the end of each balance sheet date. Changes in fair value are recognized in the income statement. Recognized net earnings and/or losses in the income statement also include interest payments made for this financial liability.
b) Other Financial Liabilities
None.

ANNUAL REPORT 2014
69
2.05.09 Effects of Currency FluctuationsAll transactions, denominated in foreign currencies, are converted into TL by the exchange rate ruling at the transaction date. All foreign currency denominated monetary assets and liabilities stated at the balance sheet are converted into TL by the exchange rate ruling at the balance sheet date.
2.05.10 Earnings per Share
Earnings per share in the income statement is calculated by dividing net income by the weighted average number of common shares outstanding for the period.In Turkey, companies are allowed to increase their share capital by distributing “bonus shares” from retained earnings. These bonus shares are deemed as issued shares while calculating the net earnings per share. Accordingly, the retrospective effect for those share distributions is taken into consideration in deter-mining the weighted-average number of shares outstanding used in this calculation.
2.05.11 Events after the Balance Sheet Date
Events after the Balance Sheet Date cover all events that occur between the balance sheet date and the publication date of the financial statements. If there is substantial evidence that the subsequent events existed or arose after the balance sheet date, these events are disclosed and explained in the notes to the financial statements. (Note: 40)The Company adjusts its financial statements if the above-explained subsequent events require any adjustments.
2.05.12 Provisions, Contingent Liabilities and Assets
A provision is recognized when an entity has a present obligation (legal or constructive) as a result of a past event; it is probable that an outflow of resources embodying economic benefits will be required to settle the obligation; and reliable estimate can be made of the amount of the obligation.
Contingent liabilities and assets are not reflected to financial statements but disclosed in the notes to the financial statements. The entity recognizes a provision for the part of the obligation, for which an outflow of resources embodying economic benefits is probable, except in the extremely rare circumstances where no reliable estimate can be made.
2.05.13. Related Parties
IAS 24 “Related Parties” defines related parties as the parties which can control the counterparty directly or indirectly through share ownership, rights based on agreement, family relation and etc. or which can affect the decisions of the counterparty significantly. Shareholders and Company ma-nagement is also considered as related parties. Transactions held with related parties comprise of transfer of resources and liabilities between related parties with or without value.
In the accompanying financial statements shareholders, companies which are indirectly in capital relation with the Company, board of director’s members, senior managers and other administrative senior personnel are considered as related parties. Including any manager of the Company (ad-ministrative or other), administrative senior personnel are the personnel who have direct or indirect authority and responsibility for activity planning, management and control. Transactions with related parties are disclosed in Note: 37.

ANNUAL REPORT 2014
70
2.05.14 Taxation and Deferred Tax
Income tax expense represents the sum of the tax currently payable and deferred tax.
Current tax
The tax currently payable is based on taxable profit for the year. Taxable profit differs from profit as reported in the income statement because it excludes items of income or expense that are taxable or deductible in other years and it further excludes items that are never taxable or deductible. The Company’s liability for current tax is calculated using tax rates that have been enacted or substanti-vely enacted by the balance sheet date.
Deferred tax
Deferred tax is recognized on differences between the carrying amounts of assets and liabilities in the financial statements and the corresponding tax bases which is used in the computation of taxable profit, and is accounted for using the balance sheet liability method. Deferred tax liabilities are generally recognized for all taxable temporary differences and deferred tax assets are recog-nized for all deductible temporary differences to the extent that it is probable that taxable profits will be available against whichthose deductible temporary differences can be utilized. Such assets and liabilities are not recognized if the temporary difference arises from goodwill or from the initial recognition (other than in a business combination) of other assets and liabilities in a transaction that affects neither the taxable profit nor the accounting profit.
Deferred tax liabilities are recognized for taxable temporary differences associated with investments in subsidiaries and associates, and interests in joint ventures, except where the Company is able to control the reversal of the temporary difference and it is probable that the temporary difference will not reverse in the foreseeable future. Deferred tax assets arising from deductible temporary differences associated with such investments and interests are only recognized to the extent that it is probable that there will be sufficient taxable profits against which to utilize the benefits of the temporary differences and they are expected to reverse in the foreseeable future.
The carrying amount of deferred tax assets is reviewed at each balance sheet date and reduced to the extent that it is no longer probable that sufficient taxable profits will be available to allow all or part of the asset to be recovered.
Deferred tax assets and liabilities are measured at the tax rates that are expected to apply in the period in which the liability is settled or the asset realized, based on tax rates (and tax laws) that have been enacted or substantively enacted by the balance sheet date. The measurement of de-ferred tax liabilities and assets reflects the tax consequences that would follow from the manner in which the Company expects, at the reporting date, to recover or settle the carrying amount of its assets and liabilities.
Current and deferred tax for the period
Current and deferred tax are recognized as an expense or income to the income statement, except when they relate to items credited or debited directly to equity, in which case the tax is also recogni-zed directly in the equity, or where they arise from the initial accounting for a business combination. In the case of a business combination, the tax effect is taken into account in calculating goodwill or determining the excess of the acquirer’s interest in the net fair value of the acquirer’s identifiable assets, liabilities and contingent liabilities over cost.

ANNUAL REPORT 2014
71
Taxes stated in financial statements contain changes in current and deferred taxes for the period. Company calculates current period tax and deferred tax over the period results.
Offsetting Tax Income and Liablities
Deferred tax assets and liabilities are offset when there is a legally enforceable right to set off current tax assets against current tax liabilities and when they relate to income taxes levied by the same taxation authority and the Company intends to settle its current tax assets and liabilities on a net basis.
Corporate tax amounts are offset with prepaid corporate tax as they are related. Deferred tax assets and liabilities are also offset.
2.05.15 Retirement Pay
According to Turkish Labor Law, employee termination benefit is reflected in the financial statements, when the termination indemnities are deserved. Such payments are considered as being part of defined retirement benefit plan as per TAS No.19 “Employee Benefits”.
The retirement benefit obligation recognized in the financial statements represents the present value of the defined benefit obligation as adjusted for unrecognized gains and losses.Interest cost inclu-ded in retirement pay is presented in retirement pay expense in the income statement.
2.05.16 Cash flow statement
Cash and cash equivalents are stated at their fair values in the balance sheet. The cash and cash equivalents comprises cash in hand, bank deposits and highly liquid investments.
On cash flow statement, the Company classifies period’s cash flows as operating, investment and financing activities.Cash inflow provided from operating activities denotes cash inflow provided from main activities of the Company.
Cash flow concerned with investment activities shows cash used and provided from investment ac-tivities (asset investments and financial investments).
Cash flow concerned with investment activities represents sources used from financial activities and pay-back of these funds.
2.06 Comparative Information and Adjustment of the Previous Period Financial Statements The comparative financial statements have been presented to enable to perform the financial posi-tion and the performance trend analysis. All necessary adjustments are made in previous financial statements to present consistent and comparative financial statements, if required.
2.07 OffsettingThe financial assets and liabilities in the financial statements are offset and the net amount reported in the balance sheet, where there is a legally enforceable right to offset the recognized amounts, and there is an intention to settle on a net basis or realize the asset and settle the liability simultane-ously.

ANNUAL REPORT 2014
72
2.08 Investment PropertyInvestment property is classified as property which is held where the main objective is for rent and/or capital gains income. As of the date of the balance sheet the investment property has been ref-lected in the attached financial tables based on their acquisition price. The company’s investment property consists of land (Note: 17).
2.09 New and Revised International Financial Reporting Standardsi) Summary of the new standards, amendments, interpretations and resolutions which are effective as at January 1, 2014;
• TFRS 10,11, TAS 27 (Amendment) : “Consolidated financial statements”: ‘exceptions for the con-solidation of subsidiaries’ and These amendments mean that many funds and similar entities will be exempt from consolidating most of their subsidiaries. Instead they will measure them at fair value through profit or loss and classify as financial assets . The amendments give an exception to entities that meet an ‘investment entity’ definition.
• TAS 32 “Financial Instruments : Presentation ” (Amendment) : The amendment updates the app-lication guidance in TAS 32, to clarify some of the requirements for offsetting financial assets and financial liabilities on the statement of financial position.
• TAS 36 “Impairment of Assets” (Amendment) : This amendment addresses the disclosure of information about the recoverable amount of impaired assets if that amount is based on fair value less costs of disposal.
• TAS 39 “Financial Instruments : Recognition anf Measurement ” (Amendment) : This amendment provides relief from discontinuing hedge accounting when novation of a hedging instrument to a central counterparty meets specified criteria.
• TFRIC Interpretation 21 “Legal Fees and Taxes”: The interpretation clarifies that an entity re-cognizes a liability for a levy when the activity that triggers payment, as identified by the relevant legislation, occurs. It also clarifies that a levy liability is accrued progressively only if the activity that triggers payment occurs over a period of time, in accordance with the relevant legislation. For a levy that is triggered upon reaching a minimum threshold, the interpretation clarifies that no liability should be recognized before the specified minimum threshold is reached.
The amendments and interpretations had no significant impact on the financial statements of the Company in the current period.
ii) The new standard, Amendments and interpretations that are not effective or an early adop-tion is not used by the Compan as of December 31,2014 are as follows:
• TFRS 9 “Financial Instruments: Classification and Explanation” : TFRS 9 introduces new requi-rements for classifying and measuring financial assets and liabilities.The amendments made to TFRS 9 will mainly affect the classification and measurement of financial assets and measurement of fair value of a fair value option financial liability attributable to credit risk is presented under other com-prehensive income.The date of mandotary application of the amenmends are deferred at January 1,2018.Early adoption is permitted.(These amendments are not published as yet, by POA )

ANNUAL REPORT 2014
73
• TAS 19 “Defined Benefit Plans: Employee Contributions” (Amendment) : TAS 19 Defined Benefit Plans: Employee Contributions (Amendment) TAS 19 requires an entity to consider contributions from employees or third parties when accounting for defined benefit plans. The amendments cIarif~’ that, if the amount of the contributions is independent of the number of years of service, an entity is permitted to recognise such contributions as a reduction in the service cost in the period in which the service is rendered, instead of allocating the contributions to the periods of service. These amend-ments are to be retrospectively applied for annual periods beginning on or after July 1, 2014.
• TAS 16 “Property,Plant and Equipment” and TAS 38 “Intangible Assets” (Amendment) : The amendments , have prohibited the use of revenue-based depreciation for property, plant and equ-ipment and significantly limiting the use of revenue-based amortisation for intangible assets. The amendments are effective prospectively for annual periods beginning on or after January 1, 2016. Earlier application is permitted.
• TFRS 11 “Accounting for Acquisition of Interests in Joint Operations” (Amendment) : The amend-ments clarify whether TFRS 3 Business Combinations applies when an entity acquires an interest in a joint operation that meets that standard’s definition of a business. The amendments require business combination accounting to be applied to acquisitions of interests in a joint operation that constitutes a business. The amendments apply prospectively for annual periods beginning on or after 1 January 2016. Early adoption is permitted.
Annual Improvements to TAS/TFRS
In September 2014, Public Oversight Authority (POA) has issued the below amendments to the standards in relation to “Annual Improvements - 2010—2012 Cycle” and “Annual Improvements - 2011—2013 Cycle. The changes are effective for annual reporting periods beginning on or after July 1, 2014.
Annual Improvements 2010-2012 Cycle
• TFRS 2 “Share Based Payment” (Amendment) : Definitions relating to vesting conditions have changed and performance condition and service condition are defined in order to clari~’ various issues. The amendment is effective prospectively.
• TFRS 3 “Business Combinations” (Amendment) : Contingent consideration in a business acquisiti-on that is not classified as equity is subsequently measured at fair value through profit or loss whether or not it falls within the scope of TFRS 9 Financial Instruments. The amendment is effective for business combinations prospectively.
• TFRS 8 “Operating Segments” (Amendment) : Operating segments may be combined/aggrega-ted if they are consistent with the core principle of the standard.The reconciliation of segment assets to total assets is only required to be disclosed if the reconciliation is reported to the chief operating decision maker. The amendments are effective retrospectively.
• TAS 16 “Property, Plant and Equipment” and TAS 38 “Intangible Assets” (Amendment) : Clarifies that revaluation can be performed, Adjust the gross carrying amount of the asset to market value or determine the market value of the carrying amount and adjust the gross carrying amount proporti-onately so that the resulting carrying amount equals the market value. The amendment is effective retrospectively.

ANNUAL REPORT 2014
74
• TAS 24 “Related Party Disclosures”(Amendment) : The amendment clarifies that a management entity, an entity that provides key management personnel services, is a related party subject to the related party disclosures. The amendment is effective retrospectively.
Annual Improvements 2011-2013 Cycle
• TFRS 3 “Business Combinations” (Amendment) : The amendment clarifies that Joint arrangements are outside the scope of TFRS 3, not just joint ventures.The scope exception applies only to the accounting in the financial statements of the joint arrangement itself. The amendment is effective prospectively.
• TFRS 13 “Basis for Conclusions on Fair Value Measurement” : The portfolio exception in TFRS 13 can be applied not only to financial assets and financial liabilities but also all other contracts in the scope of TAS 39. The amendment is effective prospectively.
• TAS 40 “Investment Property” (Amendment) : The amendment clarifies the interrelationship of TFRS 3 and TAS 40 when classifying property as investment property or owner-occupied property. The amendment is effective prospectively.
The Company do not expect that these standards and interpretations will have significant impact on the financial statements of the Company.
iii) Summary of the new standards, amendments and interpretations that are issued by the International Accounting Standards Board (IASB) but not issued by POA.
The following standards, interpretations and amendments to existing IFRS standards are issued by the IASB but not yet effective up to the date of issuance of the consolidated financial statements. However, these standards, interpretations and amendments to existing IFRS standards are not yet adopted/issued by the POA, thus they do not constitute part of TFRS. The Company will make the necessary changes to its financial statements after the new standards and interpretations are issued and become effective under TFRS.
• IFRS 14 “Regulatory Deferral Accounts” : The standard permits first time adopters of IFRS to conti-nue using previous GAAP to account for regulatory deferral account balances. The interim standard is effective for financial reporting periods beginning on or after 1 January 2016, although early adoption is permitted.
• IFRS 15 “Revenue from Contracts with Customers” : In May 2014, the IASB issued IFRS 15 Reve-nue from Contracts with Customers. The new five-step model in the standard provides the recognition and measurement requirements of revenue. The standard applies to revenue from contracts with customers and provides a model for the sale of some non-financial assets that are not an output of the entity’s ordinary activities (e.g., the sale of property, plant and equipment or intangibles). IFRS 15 is effective for reporting periods beginning on or after January 1, 2017, with early adoption permitted. Entities will transition to the new standard following either a full retrospective approach or a modified retrospective approach. The modified retrospective approach would allow the standard to be applied beginning with the current period, with no restatement of the comparative periods, but additional disclosures are required.

ANNUAL REPORT 2014
75
• IFRS 10 “ Consolidated Financial Statements ve IAS 28 “Investor and its Associate or Joint Ven-ture ” (Amendment) : The amendments address the conflict between the existing guidance on con-solidation and equity accounting. The amendments require the full gain to be recognized when the assets transferred meet the definition of a business. The amendments apply prospectively for annual periods beginning on or after 1 January 2016. Early adoption is permitted.
• IAS 27 “Separate Financial Statements” (Amendment) : The amendment address the option to use the equity method to account for investments in subsidiaries and associates in an entity’s se-parate financial statements. Therefore, an entity must account for these investments either; at cost,in accordance with IFRS 9 (or lAS 39) or using the equity method the entity must apply the same ac-counting for each category of investments.The amendment is effective for annual periods beginning on or after January 1, 2016. The amendments must be applied retrospectively. Early application is permitted.
• IFRS 9 “Financial Instruments” (Final standard) : The final version of IFRS 9 brings together the classification and measurement, impairment and hedge accounting phases of the IASB’s project to replace IAS 39 Financial Instruments: Recognition and Measurement. IFRS 9 is built on a logical, single classification and measurement approach for financial assets that reflects the business model in which they are managed and their cash flow characteristics. Built upon this is a forward-looking expected credit loss model that will result in more timely recognition of loan losses and is a single model that is applicable to all financial instruments subject to impairment accounting. In addition, IFRS 9 addresses the so-called ‘own credit’ issue, whereby banks and others book gains through profit or loss as a result of the value of their own debt falling due to a decrease in credit worthiness when they have elected to measure that debt at fair value. The Standard also includes an improved hedge accounting model to better link the economics of risk management with its accounting treat-ment. IFRS 9 is effective for annual periods beginning on or after 1 January 2018.
• IAS 1 “Presentation of Financial Statements” (Amendment) : Those amendments include nar-row-focus improvements in the following five areas: Materiality, disaggregation and subtotals, notes structure, disclosure of accounting policies, presentation of items of other comprehensive income arising from equity accounted investments. The amendments are applicable for annual periods begin-ning on or after January 1, 2016. Earlier application is permitted.
Improvements at IFRS
Annual Improvements 2010-2012 Cycle
• IFRS 13 ”Fair Value Measurment” (Amendment) : As clarified in the Basis for Conclusions short-term receivables and payables with no stated interest rates can be held at invoice amounts when the effect of discounting is immaterial. The amendment is effective immediately.
Annual Improvements 2012-2014 Cycle
The amendments are applicable for annual periods beginning on or after January 1, 2016. Earlier application is permitted.

ANNUAL REPORT 2014
76
• IFRS 5 ”Fixed Assets Held For Sale Purposes And Discontinued Operations” (Amendment)
• IFRS 7 “Financial Instruments: Explanation” (Amendment)
• IAS 19 “Employee Benefits” (Amendment)
• IAS 34 “Interim Financial Reporting” (Amendment)
Potential impact of the financial statements in future periods of the implementation of the above standards are evaluated.
3 BUSINESS COMBINATIONSNone.
4 BUSINESS PARTNERSHIPSNone.
5 REPORTING FINANCIAL INFORMATION BY SEGMENTSThe Company operates solely in information technologies sector and Company management con-siders that segment reporting is not required.
6 CASH AND CASH EQUIVALENTSCash and Cash Equivalents for the periods ended are as follows:
Maturity of the reverse repo is 1-3 days and TL 42 in December 31, 2014 interest accrual has been made. Reverse repo is made in USD and interest rate of USD is 6,38%.
Maturity of the reverse repo is 1-3 days and TL 187 in December 31, 2013 interest accrual has been made. Reverse repo is made in USD and interest rate is between 1,12 % and 1,82%.
The cash and cash equivalents balance shown in the statement of cash flows is net of interest income accruals, as follows:
Account Name December 31, 2014 December 31, 2013 Cash and Cash equivalents 1.409.794 5.197.544
Interest Income Accruals (-) (42) (187)
Total 1.409.752 5.197.357
Account Name December 31, 2014 December 31, 2013 Cash 23.959 24.441
Bank(Demand Deposit) 812.419 3.317.400
Financial Assets Which Will Be Held to the Maturity (Reverse Repo)) 240.042 1.384.289
Credit Card Slips 333.374 471.414
Total 1.409.794 5.197.544

ANNUAL REPORT 2014
77
Company does not have any term or blocked account. Generally the payments received by credit cards are collected from bank in the following days after the sales. Gain/Loss in exchange diffe-rences are reported in Financial Gain/Loss account in Financial Statements.
7 FINANCIAL INVESTMENTSThe company’s short-term and long-term financial investments are as follows:
Account Name December 31, 2014 December 31, 2013 Stock (İndeks) (*) 79.636 57.282
Long Term Securities (**) 10.190 10.190
Total 89.826 67.472
(*)The Indeks Bilgisayar Sistemleri Mühendislik Sanayi ve Ticaret A.Ş shares found in the above mentioned short term financial investment have been valued based on their market price and have been recorded in the financial statements accordingly.
According to IFRS 13 Fair Value Measurement Standard; when measuring for fair value and relating explanations, in or-der to increase consistency and comparison, a fair value hierarchy has been created in order to categorize the valuation methods used. Level 1 inputs are based off of comparing the Company’s assets with similar assets or comparing their liabilities with active market quotes. When evaluating the Company’s shares the 2. Session of the BIST on December 31, 2014 was used as a basis for measurement.
(**)1.000 shares of İnterpromedya Yayıncılık Etkinlik Yönetim ve Pazarlama A.Ş. was purchased for TL 10.000 during 2011. The share capital of İnterpromedya A.Ş. is TL 500.000 and the Company has a share percentage of 0,2 %.
The movement of the Company’s Long-Term Financial Asset and Investments are as below.
Account Name December 31, 2014 December 31, 2013 Appreciation of Financial Asset 10.190 9.437
Foreign Currency Translation Differences - 753
Total 10.190 10.190
8 SHORT-TERM and LONG-TERM FINANCIAL LIABILITIES
December 31, 2014
The Company has no Short-Term Liability as of December 31, 2014
December 31, 2014
The Company has no Long-Term Liability as of December 31, 2014.
December 31, 2013
The Company has no Short-Term Liability and no Long-Term Liability as of December 31, 2013
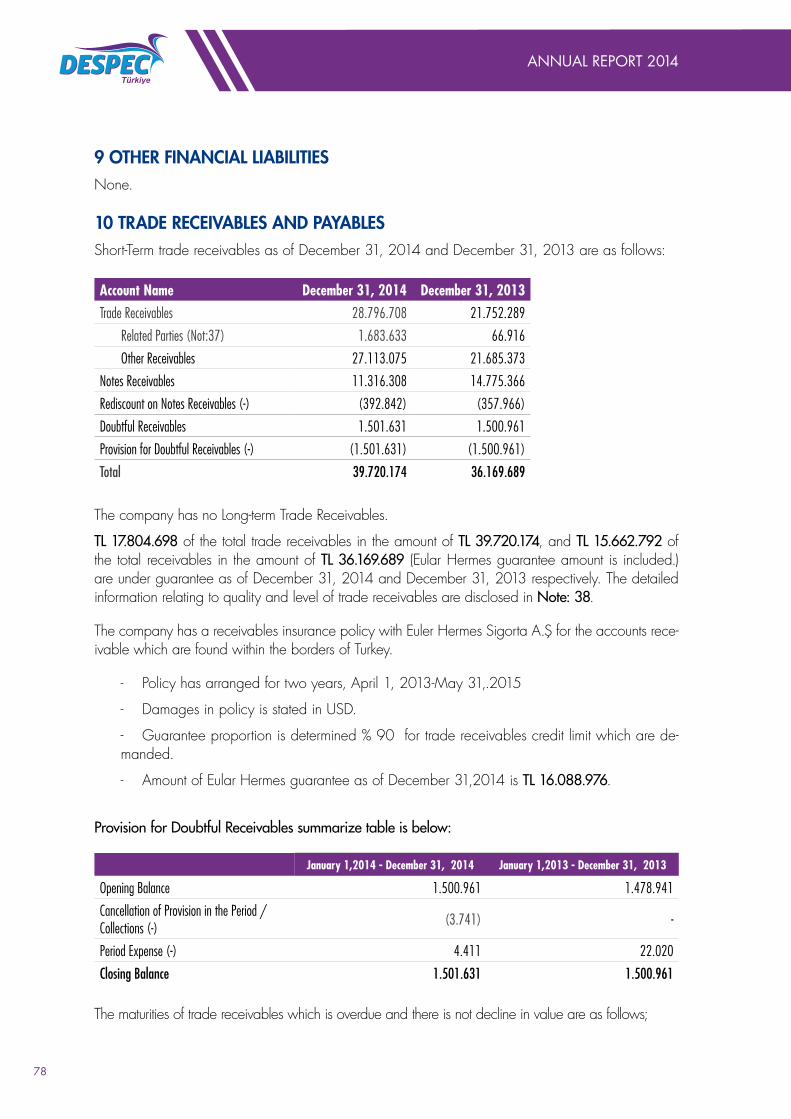
ANNUAL REPORT 2014
78
9 OTHER FINANCIAL LIABILITIESNone.
10 TRADE RECEIVABLES AND PAYABLESShort-Term trade receivables as of December 31, 2014 and December 31, 2013 are as follows:
Account Name December 31, 2014 December 31, 2013 Trade Receivables 28.796.708 21.752.289
Related Parties (Not:37) 1.683.633 66.916
Other Receivables 27.113.075 21.685.373
Notes Receivables 11.316.308 14.775.366
Rediscount on Notes Receivables (-) (392.842) (357.966)
Doubtful Receivables 1.501.631 1.500.961
Provision for Doubtful Receivables (-) (1.501.631) (1.500.961)
Total 39.720.174 36.169.689
The company has no Long-term Trade Receivables.
TL 17.804.698 of the total trade receivables in the amount of TL 39.720.174, and TL 15.662.792 of the total receivables in the amount of TL 36.169.689 (Eular Hermes guarantee amount is included.) are under guarantee as of December 31, 2014 and December 31, 2013 respectively. The detailed information relating to quality and level of trade receivables are disclosed in Note: 38.
The company has a receivables insurance policy with Euler Hermes Sigorta A.Ş for the accounts rece-ivable which are found within the borders of Turkey.
- Policy has arranged for two years, April 1, 2013-May 31,.2015
- Damages in policy is stated in USD.
- Guarantee proportion is determined % 90 for trade receivables credit limit which are de-manded.
- Amount of Eular Hermes guarantee as of December 31,2014 is TL 16.088.976.
Provision for Doubtful Receivables summarize table is below:
January 1,2014 - December 31, 2014 January 1,2013 - December 31, 2013
Opening Balance 1.500.961 1.478.941
Cancellation of Provision in the Period /Collections (-) (3.741) -
Period Expense (-) 4.411 22.020
Closing Balance 1.501.631 1.500.961
The maturities of trade receivables which is overdue and there is not decline in value are as follows;

ANNUAL REPORT 2014
79
December 31, 2014 December 31, 20130-3 months 516.576 59.661
3-12 months 108.121 9.802
1-5 years - -
Total 624.697 69.463
Short – Term Trade payables for the periods ended are as follows:
Account Name December 31, 2014 December 31, 2013 Trade Payables 13.414.154 17.261.970
Other Trade Payables 13.095.222 17.029.597
Related Parties (note:37) 318.932 232.373
Notes Payables 686.932 1.601.812
Rediscount on Notes Payables(-) (87.532) (111.041)
Total 14.013.554 18.752.741
Company’s Long-Term Trade Payable for periods ended are not available.
The average term of collection of trade receivables varies between 60-80 days. The average term of payments varies between 30-40 days. Compound interest rate of domestic government bonds is used as prevailing interest rate for rediscount of trade receivables and payables in TL. Also Libor and Eurobond are used for trade receivables and payables in USD and EURO.
11 OTHER RECEIVABLES AND PAYABLESShort-term other receivables for the years ended are as follows:
Account Name December 31, 2014 December 31, 2013 Due from Personnel 1.922 4.807
Other Related Parties Receivables (Note:37) 1.857.777 4.541.945
Deposits and Guarantees Given 7.216 56.135
Total 1.866.915 4.602.887
Company’s Long-Term Other Receivable for periods ended are not available.
The quality and level of risks in other receivables are explained in Note: 38.
Short-term other payables for the years ended are as follows:
Account Name December 31, 2014 December 31, 2013 Taxes, and Duties Payable 77.449 87.622
Non-commercial Payables to Related Parties (Note:37) 111.146 1.331.881
Total 188.595 1.419.503
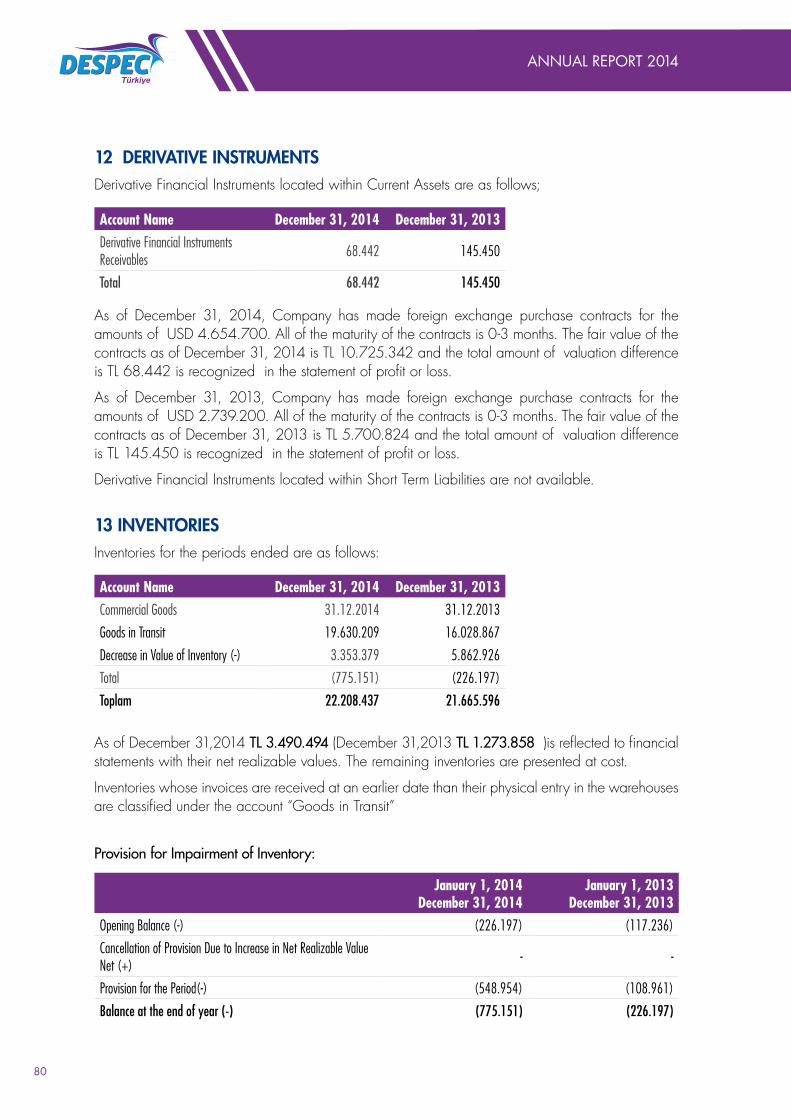
ANNUAL REPORT 2014
80
12 DERIVATIVE INSTRUMENTSDerivative Financial Instruments located within Current Assets are as follows;
Account Name December 31, 2014 December 31, 2013 Derivative Financial Instruments Receivables 68.442 145.450
Total 68.442 145.450
As of December 31, 2014, Company has made foreign exchange purchase contracts for the amounts of USD 4.654.700. All of the maturity of the contracts is 0-3 months. The fair value of the contracts as of December 31, 2014 is TL 10.725.342 and the total amount of valuation difference is TL 68.442 is recognized in the statement of profit or loss.
As of December 31, 2013, Company has made foreign exchange purchase contracts for the amounts of USD 2.739.200. All of the maturity of the contracts is 0-3 months. The fair value of the contracts as of December 31, 2013 is TL 5.700.824 and the total amount of valuation difference is TL 145.450 is recognized in the statement of profit or loss.
Derivative Financial Instruments located within Short Term Liabilities are not available.
13 INVENTORIES Inventories for the periods ended are as follows:
Account Name December 31, 2014 December 31, 2013 Commercial Goods 31.12.2014 31.12.2013
Goods in Transit 19.630.209 16.028.867
Decrease in Value of Inventory (-) 3.353.379 5.862.926
Total (775.151) (226.197)
Toplam 22.208.437 21.665.596
As of December 31,2014 TL 3.490.494 (December 31,2013 TL 1.273.858 )is reflected to financial statements with their net realizable values. The remaining inventories are presented at cost.
Inventories whose invoices are received at an earlier date than their physical entry in the warehouses are classified under the account “Goods in Transit”
Provision for Impairment of Inventory:
January 1, 2014 December 31, 2014
January 1, 2013 December 31, 2013
Opening Balance (-) (226.197) (117.236)
Cancellation of Provision Due to Increase in Net Realizable Value Net (+) - -
Provision for the Period(-) (548.954) (108.961)
Balance at the end of year (-) (775.151) (226.197)

ANNUAL REPORT 2014
81
The inventories are presented with the lesser of cost and net realizable value in the financial state-ments.
There are not any inventories given as a guarantee for payables. The information related to the insurance coverage on assets is disclosed in Note: 22.
TL 148.056.838 and TL 125.194.899 are the costs of goods sold as of December 31,2014 and December 31, 2013 respectively.
14 BIOLOGICAL ASSETSNone.
15 PREPAID EXPENSES AND DEFERRED INCOME
Short-Term :
Short-term prepaid expenses as of December 31, 2014 and December 31, 2013 are as follows:
Account Name December 31, 2014 December 31, 2013 Prepaid Expenses for Following Months 162.360 363.302
Advances Given 365.441 301.244
Total 527.801 664.546
Deferred Incomes as of December 31, 2014 and December 31, 2013 are as follows:
Account Name December 31, 2014 December 31, 2013 Advances Received 243.531 315.554
Income for the following Months 472.970 271.738Total 716.501 587.292
Long-Term :
Company has no prepaid expenses as of December 31, 2014 and December 31, 2013.
Company has no deferred incomes as of December 31, 2014 and December 31, 2013.
16 INVESTMENTS EVALUATED BY EQUITY METHODNone.
17 INVESTMENT PROPERTYThe Company’s Investment Properties are as follows:
Account Name December 31, 2014 December 31, 2013 Lands 18.280 18.280
Total 18.280 18.280

ANNUAL REPORT 2014
82
Account Name January 1, 2014 Purchases Disposals
Foreign Currency Translation Differences
December 31, 2014
Lands 18.280 - - - 18.280
Total 18.280 - - 18.280
Account Name January 1, 2013 Purchases Disposals
Foreign Currency Translation Differences
December 31, 2013
Lands 16.929 - - 1.351 18.280
Total 16.929 - 1.351 18.280
The investment property of the Company consists of the land located in Mersin the Company adopted cost method for evaluation of investment properties. There are not any liens on investment properties. The Company does not receive any rent income from this property. According to the inspection made by the Company management in the area in which the land is located, the current value is estimated to be between TL 20.000 – TL 25.000
18 TANGIBLE ASSETSTangible Assets for the periods ended are as follows:
Account Name December 31, 2014 December 31, 2013 Cost 863.650 583.625
Accumulated Depreciation (485.741) (370.251)
Total 377.909 213.374
December 31, 2014
Cost
Account Name January 1, 2014 Acquisitions Disposals Translation
DifferencesDecember 31, 2014
Vehicles 132.121 - - - 132.121
Furniture & Fixtures 256.811 31.966 - - 288.777
Leasehold Improvements 194.693 248.059 - - 442.752
Total 583.625 280.025 - - 863.650

ANNUAL REPORT 2014
83
Accumulated Depreciation
Account Name January 1, 2014
Period Depreciation Disposals Translation
DifferencesDecember 31, 2014
Vehicles 43.059 26.898 - - 69.957
Furniture & Fixtures 200.632 27.908 - - 228.540
Leasehold Improvements 126.560 60.684 - - 187.244
Total 370.251 115.490 - - 485.741Net Value 213.374 377.909
December 31, 2013
Cost
Account Name January 1, 2013 Acquisitions Disposals Translation
DifferencesDecember 31, 2013
Vehicles 192.064 - 70.752 10.809 132.121
Furniture & Fixtures 222.875 15.184 - 18.752 256.811
Leasehold Improvements 180.303 - - 14.390 194.693
Total 595.242 15.184 70.752 43.951 583.625
Accumulated Depreciation
Account Name January 1, 2014
Period Depreciation Disposals Translation
DifferencesDecember 31, 2014
Vehicles 51.576 25.828 37.733 3.388 43.059
Furniture & Fixtures 163.420 21.827 - 15.385 200.632
Leasehold Improvements 85.397 32.222 - 8.941 126.560
Total 300.393 79.877 37.733 27.714 370.251Net Value 294.849 213.374
Other Information:
Depreciation and amortization expenses are recorded under operational expenses. The insurance coverage on assets is disclosed in Note: 22. There are not any liens or other restrictions on assets.
19 INTANGIBLE ASSETSThe Company’s Intangible Assets as of the end of the period is as follows:
Account Name December 31, 2014 December 31, 2013 Cost 151.164 143.736
Accumulated Depreciation (140.991) (138.591)
Total 10.173 5.145

ANNUAL REPORT 2014
84
December 31, 2014
Cost
Account Name January 1, 2014 Acquisitions Disposals Translation
DifferencesDecember 31, 2014
Other Intangible Assets 143.736 7.428 - - 151.164
Total 143.736 - - - 151.164
Accumulated Depreciation
Account Name January 1, 2014
Period Depreciation Disposals Translation
DifferencesDecember 31, 2014
Other Intangible Assets 138.591 2.400 - - 140.991
Total 138.591 2.400 - - 140.991
Net Value 5.145 10.173
December 31, 2013
Cost
Account Name January 1, 2013 Acquisitions Disposals Translation
DifferencesDecember 31, 2013
Other Intangible Assets 127.780 5.417 - 10.539 143.736
Total 127.780 5.417 - 10.539 143.736
Accumulated Depreciation
Account Name January 1, 2013
Period Depreciation Disposals Translation
DifferencesDecember 31, 2013
Other Intangible Assets 126.447 1.927 - 10.217 138.591
Total 126.447 1.927 - 10.217 138.591
Net Value 1.333 5.145
Depreciation and amortization expenses are recorded under operational expenses.

ANNUAL REPORT 2014
85
20 PAYABLES RELATED TO EMPLOYEE BENEFITSPayables Related to Employee Benefits as of December 31,2014 and December 31,2013 are as follows:
Account Name December 31, 2014 December 31, 2013 Social Security Institution Payable 45.385 39.259
Total 45.385 39.259
21 GOVERNMENT GRANT AND ASSISTANCENone.
22 PROVISIONS, CONTINGENT LIABILITIES AND ASSETS
i) Provisions
Account Name December 31, 2014 December 31, 2013 Provisions for Price Differences 1.197.448 180.994
Total 1.197.448 180.994
December 31, 2014
Provisions for Price and Invoice Differences
As of January 1 180.994
Additional Provisions 1.197.448
Payment (180.994)
Total 1.197.448
December 31, 2013
Provisions for Price and Invoice Differences
As of January 1 546.507
Additional Provisions 180.994
Payment (546.507)
Total 180.994
ii) Contingent Assets and Liabilities;
Lawsuits against the Company
There is no any litigation initiated against Company.
Lawsuits filed by the Company
For litigations filed by the Company, provision is made in financial statements in the amount of TL 1.501.631. (December 31,2013: TL 1.500.961)
iii) Commitments not presented in the Liabilities of the Statement of Financial Position;
December 31, 2014
TL USD EUROGuarantee Letters Given 37.541 1.550.000 1.950.000
Total 37.541 1.550.000 1.950.000

ANNUAL REPORT 2014
86
December 31, 2013
TL USD EUROGuarantee Letters Given 4.200 1.550.000 1.950.000
Total 4.200 1.550.000 1.950.000
iv ) The ratio of Mortgages and Guarantees Given to Shareholders’ Equity is as follows;
Mortgages & Guarantees Given by the Company December 31,2014
December 31,2013
A. Total amount of M&G Given on behalf of the Company 9.132.201 9.038.540
B. Total amount of M&G Given on behalf of the Subsidiaries and Affiliated Companies subject to full consolidation - -
C. Total Amount of M&G Given on behalf of the third person liability in order to sustain usual business activities.
D. Total Amount of other M&G Given - -
i. Total Amount of M&G Given on behalf of main shareholder
ii. Total Amount of M&G Given on behalf of other affiliated companies which can not be classified under section B and C. - -
iii. Total Amount of M&G Given on behalf of the third person that cannot be classified under section C.
Total 9.132.201 9.038.540
The amounts stated above are provisions expressed in Turkish Lira as period ends.
The ratio of Mortgages and Guarantees Given to Shareholders’ Equity is 0 %. (December 31, 2013: %0)
v) Mortgages and Guarantees on Assets;
There are not any restrictions on assets.
vi) Total Insurance Coverage on Assets:
December 31, 2014
Type of Insured Assets USD TL Commercial Goods 10.675.000 -
Vehicles - 106.470
Plants, Machinery and Equipment 35.000 -
Total 10.710.000 106.470
December 31, 2013
Type of Insured Assets USD TL Commercial Goods 6.120.000 -
Vehicles - 106.470
Plants, Machinery and Equipment 590.000 -
Total 6.710.000 106.470

ANNUAL REPORT 2014
87
23 COMMITMENTSNone.
24 EMPLOYEE TERMINATION BENEFITS
Account Name December 31, 2014 December 31, 2013Provision for Termination Indemnity 378.282 331.595
Total 378.282 331.595
In context of current Labor Law, liability of payment of legal benefit for termination indemnity arises when terminated employment contract is qualified for termination indemnity. In addition, according to currently operated Social Insurance Law making payment to employee, who has the right of se-verance with termination indemnity, is a legal liability As of January 1st 2015, termination indemnity upper limit is monthly TL 3.541,37 (December 31,2013: TL 3.438,22).
Termination indemnity payable is not subjected to any legal funding.
Termination indemnity payable, is calculated by forecasting the present value of currently working employee’s possible future liabilities IAS 19 (“Employee Termination Benefits”), predicts to build up Company’s liabilities with using actuarial valuation techniques in context of defined benefit plans. According to these predictions, actuarial assumptions used in calculation of total liabilities are as follows:
Base assumption is the inflation parallel increase of maximum liability of each year Applied discount rate must represent expected real discount rate after the adjustment of future inflation As of December 31,2014, provisions in financial statement are calculated by forecasting the present value of currently working employee’s possible future liabilities. The provisions at the balance sheet dates have been calculated assuming an annual inflation rate of 6 % and a discount rate of 10%. As a result, the real discount rate is calculated as 3,77 % (December 31, 2013: 3,29%). The assumptions made by the company related to real discount rates are reviewed annually. There were not any changes in discount assumptions in the current period.
The possibility of dismissing regarding termination indemnity liabilities is %97,18 as of December 31, 2014. (December 31, 2013; %97,81)
January 1 , 2014 December 31, 2014
January 1 , 2014 December 31, 2013
January 1 331.595 228.003
Current Period Service Cost 40.868 37.350
Interest Cost 33.160 22.800
Actuarial Income/(Loss) (27.089) 67.476
Loss Composed on Payment 1.440 -
Paid (1.692) (24.034)
Closing Balance 378.282 331.595

ANNUAL REPORT 2014
88
Provision expense (income) for termination indemnities are recognized the accounts as follows;
January 1, 2014 December 31, 2014
January 1, 2013 December 31, 2013
General Administration Expenses 75.468 60.150
Other from Operations (Incomes) - -
The amount accounted in (Profit) / Loss 75.468 60.150
Actuarial Loss accounted in Other Comprehensive Income (27.089) 67.476
Total Expense / (Income) 48.379 127.626
According to the regulation under IAS 19 released on January 1, 2013 actuarial losses and gains are to be recorded under other comprehensive income in Shareholder’s Equity.In the current period acturial loss amount was TL 27.089 Deferred tax effect of this amount was also taken into conside-ration and stated in other comprehensive statement of profit or loss and as a result of this transaction the amount of other comprehensive was TL 5.418.
January 1, 2014 December 31, 2014
Actuarial Loss accounted in Other Comprehensive Income (27.089)
Tax Effect: % 20 5.418
Net Amount (21.671)
In the previous period acturial accounted was TL 67.476 . Deferred tax effect of this amount was also taken into consideration and stated in other comprehensive statement of profit or loss and as a result of this transaction the net amount of other comprehensive was TL 13.495.
January 1, 2013 December 31, 2013
Actuarial Loss accounted in Other Comprehensive Income 67.476
Tax Effect: % 20 (13.495)
Net Amount 53.981
25 CURRENT TAX ASETS and LIABILITIES Yoktur.
26 OTHER ASSETS AND LIABILITIESOther Current Assets for the years ended, are as follows:
Account Name December 31, 2014 December 31, 2013Ciro Primi Gelir Tahakkuku 1.420.609 621.481
Devreden KDV 795.122 1.359.424
İş Avansları 58.109 4.478
Toplam 2.273.840 1.985.383
The Company does not have Other Non-Current Assets as of period ends.

ANNUAL REPORT 2014
89
27 SHAREHOLDER’S EQUITY
i) Non-Controlling Interests
None.
ii) Capital / Cross Shareholding Adjustment
The capital of the Company, which is TL 23.000.000, consists of A Group shares issued to the name as paid-in capital is TL 4.000, B Group shares issued to the beer as paid-in capital is TL 22.996.000.A Group Shareholders have privilege in Board of Directors Election, B Group Sha-reholders do not have any privilege. A Group registered shares belong to Desbil Teknolojik Ürünler Dağıtım A.Ş.(The ultimate control of Desbil belongs to Nevres Erol Bilecik).
Capital and shareholder structure of the Company as of December 31, 2014 and December 31, 2013 are as follows;
December 31, 2014 December 31, 2013
Shareholder Share Percentage % Share Amount Share
Percentage % Share Amount
Desbil Teknolojik Ürünler A.Ş. % 30,25 6.956.268 % 30,25 6.956.268
Despec İnternational FZCO. % 30,33 6.975.000 % 30,33 6.975.000
Public Shares % 39,35 9.050.000 % 39,35 9.050.000
Other % 0,07 18.732 % 0,07 18.732
Total %100 23.000.000 %100 23.000.000
Despec International FZCO was established in United Arab Emirates Dubai Jebel Ali Free Zone in 1996 by Admiral Riyaz Jamal as subsidiaries and affiliated companies are operating in Middle East, Africa, and Turkey.
Decision of The Board of Directors meeting dated March 14, 2012 and nr. 2012/03, TL 11.500.000 issued capital of the company to be increased to TL 23.000.000 with the rate of 100% on condition that to be in upper limits of TL 25.000.000 registered capital, to be composed increased capital amount as TL 11.500.000 from internal resource.
According to the 9th article of Articles of Association titled “Board of Directors and Term” A Group bearer shareholders have the privilege to determine the members of Board of Directors. When the Board of Directors consist of 5 or 6 members 4, when consists of 7 or 8 members5 and when consists of 9 members 6 members are nominated from the candidates presented by Group A sha-reholders. Even though the B Group shares, which were offered to public gain the majority, since the A Group shareholders have the aforementioned privilege, the management sovereignty will not be lost. In any case the sovereignty will continue to belong to A Group shareholders.
iii) Share Premium/Discount
Capital reserves consist of share issue premiums. There is not movement in the current period.

ANNUAL REPORT 2014
90
iv) Other Comprehensive Income / Expense not to be Reclassifield to Profit or (Loss)
Other Comprehensive Income / Expense not to be Reclassifield to Profit or Loss for the periods ended, are as follows:
Account Name December 31, 2014 December 31, 2013Actuarial Gain/(Loss) (40.387) (67.476)
Tax Effect 8.077 13.495
Actuarial Gain/(Loss) (Net) (32.310) (53.981)
Revaluation and Gain/Loss Arising from Measurement (32.310) (53.981)
Other Comprehensive Income/Expense not to be Reclassifield to Profit or (Loss) (32.310) (53.981)
Movement Table is as follows;
December 31, 2014 December 31, 2013Opening Balance, January 1 (53.981) -
Addition (Note:24) 27.089 (67.476)
Deferred Tax Offset (-) (Note:24, Note:35) (5.418) 13.495
Closing Balance (32.310) (53.981)
v) Other Comprehensive Income/(Expense) to be Reclassified to Profit or (Loss)
Account Name December 31, 2014 December 31, 2013Currency Translation Differences 606.110 606.110
Tax Effect - -
Currency Translation Differences (Net) 606.110 606.110
Cash flow hedging Gains and Losses (*) - -
Tax Effect - -
Hedging Gains and Losses (Net) - -
Other Comprehensive Income or (Expense) to be Reclassified in Profit or (Loss) 606.110 606.110
(*) Details can be found in Note 12.
Currency Translation Differences movement table for the periods ended, is as follows:
December 31, 2014 December 31, 2013As of January 1 606.110 (630.460)
Addition - 1.236.570
Transfer to Profit/Loss Statement - -
Closing Balance 606.110 606.110
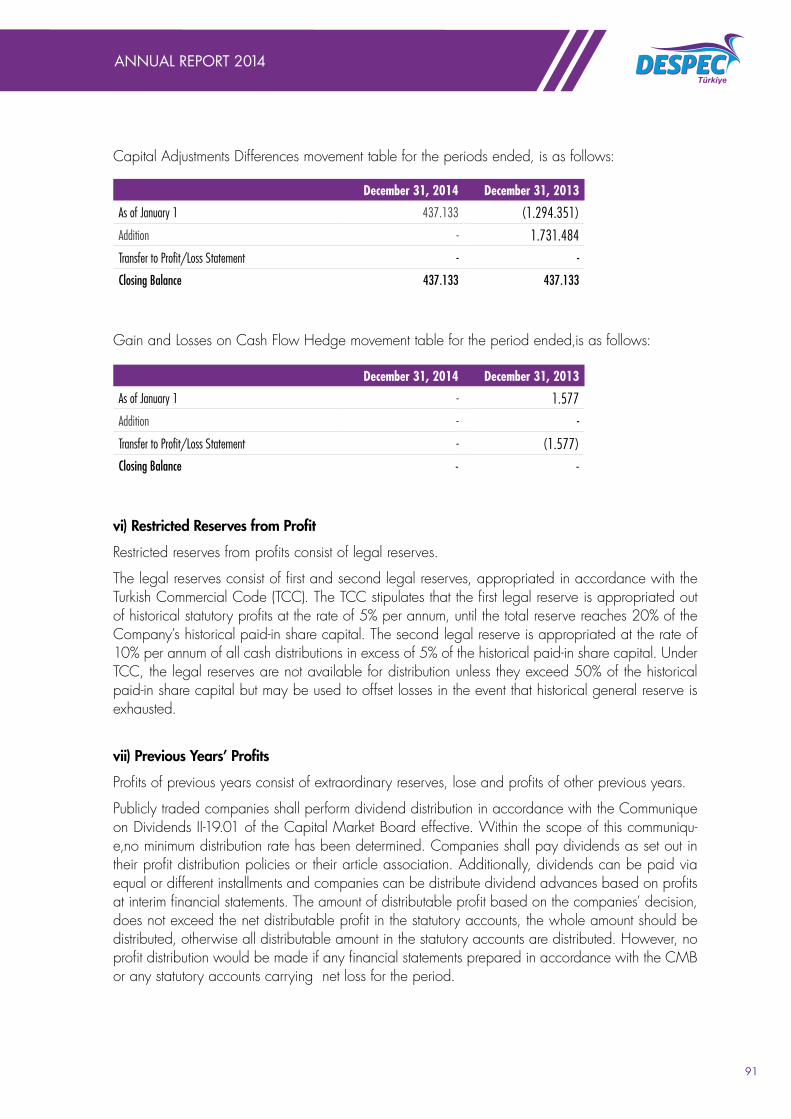
ANNUAL REPORT 2014
91
Capital Adjustments Differences movement table for the periods ended, is as follows:
December 31, 2014 December 31, 2013
As of January 1 437.133 (1.294.351)Addition - 1.731.484Transfer to Profit/Loss Statement - -Closing Balance 437.133 437.133
Gain and Losses on Cash Flow Hedge movement table for the period ended,is as follows:
December 31, 2014 December 31, 2013
As of January 1 - 1.577Addition - -Transfer to Profit/Loss Statement - (1.577)Closing Balance - -
vi) Restricted Reserves from Profit
Restricted reserves from profits consist of legal reserves.
The legal reserves consist of first and second legal reserves, appropriated in accordance with the Turkish Commercial Code (TCC). The TCC stipulates that the first legal reserve is appropriated out of historical statutory profits at the rate of 5% per annum, until the total reserve reaches 20% of the Company’s historical paid-in share capital. The second legal reserve is appropriated at the rate of 10% per annum of all cash distributions in excess of 5% of the historical paid-in share capital. Under TCC, the legal reserves are not available for distribution unless they exceed 50% of the historical paid-in share capital but may be used to offset losses in the event that historical general reserve is exhausted.
vii) Previous Years’ Profits
Profits of previous years consist of extraordinary reserves, lose and profits of other previous years.
Publicly traded companies shall perform dividend distribution in accordance with the Communique on Dividends II-19.01 of the Capital Market Board effective. Within the scope of this communiqu-e,no minimum distribution rate has been determined. Companies shall pay dividends as set out in their profit distribution policies or their article association. Additionally, dividends can be paid via equal or different installments and companies can be distribute dividend advances based on profits at interim financial statements. The amount of distributable profit based on the companies’ decision, does not exceed the net distributable profit in the statutory accounts, the whole amount should be distributed, otherwise all distributable amount in the statutory accounts are distributed. However, no profit distribution would be made if any financial statements prepared in accordance with the CMB or any statutory accounts carrying net loss for the period.

ANNUAL REPORT 2014
92
Shareholders’ Equity as of December 31, 2014 and December 31, 2013 are as follows:
Account Name December 31, 2014 December 31, 2013Capital 23.000.000 23.000.000
Capital Adjustments Differences 437.133 437.133
Share Premium 2.967.707 2.967.707 Other Comprehensive Income/Expense to be Reclassified in Profit/Loss (32.310) (53.981)
- Revaluation and Gain/Loss Arising from Measurement (32.310) (53.981)
- Hedging (Not:9) - -
Foreign Currency Translation Adjustments 606.110 606.110
Restricted Reserves From Profit 5.136.093 4.129.678
- Legal Reserves 5.136.093 4.129.678
Previous Years’ Profits 11.239.245 8.813.537
Net Period Loss/ Profit 8.170.006 8.753.592
Total 51.5 23.984 48.653.776
28 REVENUE AND COST OF SALES
Revenue and cost of sales for the periods ended December 31, 2014 and December 31, 2013 are as follows:
Account Name January 1, 2014 December 31, 2014
January 1, 2013 December 31, 2013
Domestic Sales 166.304.538 142.035.792
Foreign Sales 901.648 264.275
Other Sales(-) 8.344.734 5.507.787
Sales Returns (-) (10.261.611) (6.266.143)
Sales Discounts (-) (426.445) (102.245)
Other Discounts (-) (119.357) (34.841)
Net Sales 164.743.507 141.404.625 Cost of Sales (-) (148.056.838) (125.194.899)
Gross Profit 16.686.669 16.209.726
Depreciation and amortization expenses are considered as general expenses so they are presented under Operating Expenses.

ANNUAL REPORT 2014
93
Provision for impairment of inventory expenses are accounted for under the cost of sales account group.
29 RESEARCH AND DEVELOPMENT, MARKETING, SALES & DISTRIBUTION EX-PENSES AND GENEREAL ADMINISTRATION EXPENSES
The Operational Expenses for the periods ended December 31, 2014 and December 31, 2013 are as follows:
Account Name January 1, 2014 December 31, 2014
January 1, 2013 December 31, 2013
General Administration Expenses (-) (4.486.912) (4.526.493)
Marketing, Sales & Distribution Expenses (-) (2.670.611) (1.943.817)
Total Operating Expenses (7.157.523) (6.470.310)
30 EXPENSES RELATED TO THEIR NATURE
Expenses Related to Their Nature of the Company for the periods ended December 31, 2014 and December 31, 2013 are as follows:
Account Name January 1, 2014 December 31, 2014
January 1, 2013 December 31, 2013
- Personnel Expenses (3.985.205) (3.925.747)
- Transportation and Storage Expenses (516.519) (452.652)
- Advertisement Expense (651.179) (692.127)
- Rental Expense (413.895) (266.530)
- Consultancy and Audit Expenses (184.671) (192.103)
- Outsourced Benefits and Services (172.230) (202.076)
- Sales and Foreign Trade Expense (68.172) (79.274)
- Other Expenses (1.165.652) (659.801)
Total Operating Expenses (7.157.523) (6.470.310)
Essential part of accounting,finance,consultancy,current accounts,transportation,storage,import,export and rent services of Company are provided by İndeks Bilgisayar A.Ş. and Teklos Lojistik A.Ş. which are group Company.Against these services, it is invoiced to the Company monthly.These amounts are stated under operational expenses.Information about invoice amount which are invoiced by related companies are shown in Note 37.

ANNUAL REPORT 2014
94
31 OTHER OPERATING INCOME / EXPENSE
Other income / expense for the periods ended December 31, 2014 and December 31, 2013 are as follows:
Account Name January 1, 2014 December 31, 2014
January 1, 2013 December 31, 2013
Other Income 7.292.502 6.420.821
Provisions for Doubtful Receivables Released - -
Eliminated Interest From Revenue 1.833.512 1.813.811
Current Period Rediscount Income 87.534 111.042
Previous Period Rediscount Cancellation 357.966 135.230
Foreign Exchange Gain (Trade Receivables and Payables) 4.992.742 4.343.748
Other Income And Profit 20.748 16.990
Other Expenses (-) (5.325.852) (2.191.836)
Eliminated Interest From Purchases (511.114) (407.847)
Rediscount Expense of the Period (392.842) (357.966)
Cancellation of Previous Period’s Rediscount (111.042) (43.106)
Foreign Exchange Loss (Trade Receivables and Payables) (3.925.187) (1.342.056)
Other Expens and Loss (-)(*) (385.667) (40.861)
Other Income / Expense (Net) 1.966.650 4.228.985
(*)Other Expenses and Losses are consist of in non-deductible Expenses such as tax, penalty, motor vehicle tax and special communications taxes.
32 INCOME / EXPENSE FROM INVESTMENT ACITIVITIES
Income from Investment Activities for the periods ended December 31, 2014 and December 31, 2013 are as follows:
Account Name January 1, 2014 December 31, 2014
January 1, 2013 December 31, 2013
Dividend Income 760 4.047
Income from Investment Operations 760 4.047
There are no Expense from Investment Activities for the period ended December 31, 2014 and December 31, 2013 are as follows:
33 FINANCIAL INCOME / EXPENSE
Financial Income for the period ended December 31, 2014 and December 31, 2013 are as follows:
Account Name January 1, 2014 December 31, 2014
January 1, 2013 December 31, 2013
Interest Income 484.883 548.646
Foreign Exchange Gain 2.449.414 2.897.569
Total 2.934.297 3.446.215

ANNUAL REPORT 2014
95
Financial Expense for the periods ended December 31, 2014 and December 31, 2013 are as follows:
Account Name January 1, 2014 December 31, 2014
January 1, 2013 December 31, 2013
Bank and Interest Expenses (1.081.280) (787.637)
Foreign Exchange Losses (3.043.479) (4.872.283)
Total (4.124.759) (5.659.920)
There is no capitalized financial expense of Company for current period.
34 FIXED ASSETS HELD FOR SALE PURPOSES AND DISCONTINUED OPERATIONS None.
35 TAX ASSETS AND LIABILITIESThe Company’s tax income / (expense) are composed of current period’s corporate tax expense and deferred tax income / (expense).
The tax assets and liabilities of the Company as of December 31, 2014 and December 31, 2013 are as follows:
Account Name January 1, 2014 December 31, 2014
January 1, 2013 December 31, 2013
Provision for Current Period Tax (-) (2.288.551) (3.003.242)
Deferred Tax Income / (Expense) 152.463 (1.909)
Total Tax Income / (Expense) (2.136.088) (3.005.151)
Account Name December 31, 2014 December 31, 2013
Provision for Current Period Tax (-) 2.288.551 3.003.242
Prepaid Taxes (-) (1.511.321) (2.110.693)
Total Tax Payable Net 777.230 892.549
i) Provision for Current Period Tax
Companies calculate their temporary taxes on their quarterly financial profits in Turkey. Corporate income as of the temporary tax periods, temporary tax rate of 20 % over the corporate income was calculated and prepaid taxes deducted from taxation on income.
According to Turkish Corporate Tax Law, losses can be carried forward to offset the future taxable income for a maximum period of 5 years. On the other hand, such losses cannot be carried back to offset previous years’ profits.
According to Corporate Tax Law’s Article: 20, the corporate tax is imposed by the taxpayer’s tax returns. There is no prosedure for a final and definitive agreement on tax assessments. Annual corpo-rate tax returns are submitted until the 25th of April following the closing of the accounting year. Moreover, the tax authorities have the right to examine the tax returns and the related accounting records within five years.
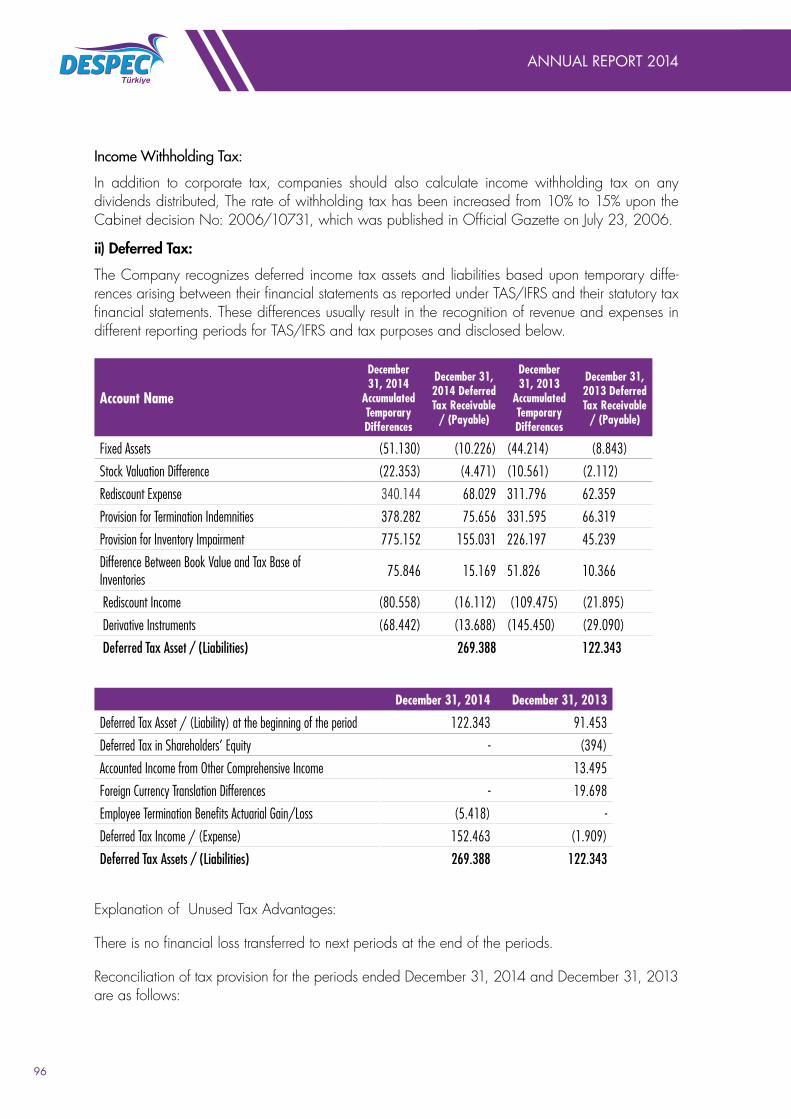
ANNUAL REPORT 2014
96
Income Withholding Tax:
In addition to corporate tax, companies should also calculate income withholding tax on any dividends distributed, The rate of withholding tax has been increased from 10% to 15% upon the Cabinet decision No: 2006/10731, which was published in Official Gazette on July 23, 2006.
ii) Deferred Tax:
The Company recognizes deferred income tax assets and liabilities based upon temporary diffe-rences arising between their financial statements as reported under TAS/IFRS and their statutory tax financial statements. These differences usually result in the recognition of revenue and expenses in different reporting periods for TAS/IFRS and tax purposes and disclosed below.
Account Name
December 31, 2014
Accumulated Temporary Differences
December 31, 2014 Deferred Tax Receivable
/ (Payable)
December 31, 2013
Accumulated Temporary Differences
December 31, 2013 Deferred Tax Receivable
/ (Payable)
Fixed Assets (51.130) (10.226) (44.214) (8.843)
Stock Valuation Difference (22.353) (4.471) (10.561) (2.112)
Rediscount Expense 340.144 68.029 311.796 62.359
Provision for Termination Indemnities 378.282 75.656 331.595 66.319
Provision for Inventory Impairment 775.152 155.031 226.197 45.239
Difference Between Book Value and Tax Base of Inventories 75.846 15.169 51.826 10.366
Rediscount Income (80.558) (16.112) (109.475) (21.895)
Derivative Instruments (68.442) (13.688) (145.450) (29.090)
Deferred Tax Asset / (Liabilities) 269.388 122.343
December 31, 2014 December 31, 2013
Deferred Tax Asset / (Liability) at the beginning of the period 122.343 91.453
Deferred Tax in Shareholders’ Equity - (394)
Accounted Income from Other Comprehensive Income 13.495
Foreign Currency Translation Differences - 19.698
Employee Termination Benefits Actuarial Gain/Loss (5.418) -
Deferred Tax Income / (Expense) 152.463 (1.909)
Deferred Tax Assets / (Liabilities) 269.388 122.343
Explanation of Unused Tax Advantages:
There is no financial loss transferred to next periods at the end of the periods.
Reconciliation of tax provision for the periods ended December 31, 2014 and December 31, 2013 are as follows:

ANNUAL REPORT 2014
97
Reconciliation of Tax Provision: January 1, 2014 December 31, 2014
January 1, 2013 December 31, 2013
Profit from Continuing Operations 10.306.094 11.758.743
Tax Rate % 20 (2.061.219) (2.351.749)
Tax Effect :Tax Effect of Foreign Currency Translation Differences of Equity Items - (637.460)
- Non-Deductible Expenses (74.869) (15.942)
Deferred Tax Income (2.136.088) (3.005.151)
36 EARNINGS PER SHAREEarnings per share are calculated by dividing net income available to common shareholders by the weighted average number of common shares outstanding for the period. Calculation of earnings per share/loss is as follow:
Account Name January 1, 2014 December 31, 2014
January 1, 2013 December 31, 2013
Current Period Profit / (Loss) 8.170.006 8.753.592
Average Number of Shares 23.000.000 23.000.000
Earnings / (Loss) per Share 0,3552 0,3806
37 RELATED PARTIES DISCLOSURES
a) Receivables from Payables and Related Parties are as follows;
Receivables Payables
December 31, 2014 Trade Receivables Non-Trade Receivables Trade Receivables Non-Trade
Receivablesİndeks A.Ş. - - 267.781 -
Desbil A.Ş. - 1.857.777 - -
Ortaklaradan Alacak/Borçlar - - - 109.146
Neotech A.Ş. 145 - - -
Teklos A.Ş. - - 46.142 -
İnfin A.Ş. 1.683.488 - - 2.000
Datagate A.Ş. - - 4.799 -
Neteks Dış Ticaret A.Ş. - - 210 -
Homend A.Ş. - - - -
Artım A.Ş. - - - -
Total 1.683.633 1.857.777 318.932 111.146

ANNUAL REPORT 2014
98
Receivables Payables
December 31, 2014 Trade Receivables
Non-Trade Receivables
Trade Receivables
Non-Trade Receivables
İndeks A.Ş. - - 198.424 -
Desbil A.Ş. - 1.592.125 - -
Ortaklaradan Alacak/Borçlar - - - 1.331.881
Neotech A.Ş. - 171 - -
Teklos A.Ş. - - 33.949 -
İnfin A.Ş. - 2.913.980 - -
Datagate A.Ş. - 25.229 - -
Neteks A.Ş. - 79 - -
Homend A.Ş. 66.916 - - -
Personelden Alacaklar - - - -
Artım A.Ş. - 10.361 - -
Total 66.916 4.541.945 232.373 1.331.881
The interest rates for USD, EURO and TL are % (2,5-5) % (2,5-5) ve % (10-15) in December 31.2014.
The interest rates for USD, EURO and TL are % (4-4,5) % (4-4,5) ve % (7,5-12) in December 31, 2013.
b) Acquisitions from Related Parties and Sales to Related Parties are as follows;
December 31, 2014
Sales to Related Parties
Sales of Goodsand Services
General Expense Allocation
Interest and Foreign Exchange
Income
Total Income / Sales
Artım A.Ş. 32 - 2.581 2.613
Datagate A.Ş. 79.402 111.125 14.053 204.580
Desbil A.Ş. - - 403.992 403.992
Homend A.Ş. 125 - 4.505 4.630
İndeks A.Ş. 557.510 9.070 28.544 595.124
İnfin A.Ş. - - 555.447 555.447
Neotech A.Ş. 188 - 1.034 1.222
Neteks A.Ş. 815 - 892 1.707
Teklos A.Ş. - 87.107 3.002 90.109
Total 638.072 207.302 1.014.050 1.859.424

ANNUAL REPORT 2014
99
Purchases from Related Parties
Purchases of Goods and Services
General Expense Allocation
Interest and Foreign Exchange Income
Total Expenses / Purchases
Artım A.Ş. 11.451 - 2.279 13.730
Datagate A.Ş. 1.046.252 4.084 6.640 1.056.976
Desbil A.Ş. - - 196.605 196.605
Homend A.Ş. 2.605 - 1.059 3.664
İndeks A.Ş. 1.018.301 1.344.562 31.378 2.394.241
İnfin A.Ş. - - 307.735 307.735
Neotech A.Ş. 34.368 - 649 35.017
Neteks A.Ş. 5.534 - 199 5.733
Teklos A.Ş. 38.177 714.505 5.575 758.257
Total 2.156.688 2.063.151 552.119 4.771.958
There is no taken or given guarantee in between related parties
December 31, 2013
Sales to Related Parties
Sales of Goodsand Services
General Expense Allocation
Interest and Foreign Exchange Income
Total Income / Sales
Artım A.Ş. 1.350 - 471 1.821
Datagate A.Ş. 143.749 772 2.285 146.806
Desbil A.Ş. - - 239.634 239.634
Homend A.Ş. 918 - 117.642 118.560
İndeks A.Ş. 153.394 7.694 636.772 797.860
İnfin A.Ş. 499 - 576.985 577.484
Neotech A.Ş. (788) - 305 (483)
Neteks A.Ş. 339 - 20 359
Teklos A.Ş. - - 870 870
Total 299.461 8.466 1.574.984 1.882.911
Purchases from Related Parties
Purchases of Goods and Services
General Expense Allocation
Interest and Foreign Exchange Income
Total Expenses / Purchases
Datagate A.Ş. 62.472 - 397 62.867
Desbil A.Ş. - - 17.697 17.697
Homend A.Ş. 2.822 - 51.926 54.748
İndeks A.Ş. 1.341.076 1.607.884 83.016 3.031.978
İnfin A.Ş. - - 52.627 52.627
Neotech A.Ş. 7.862 1.653 82 9.597
Neteks A.Ş. - 454 46 500
Teklos A.Ş. 19.964 296.150 7.495 323.609
Total 1.434.196 1.906.141 213.286 3.553.623

ANNUAL REPORT 2014
100
There is no taken or given guarantee in between related parties.
Company calculates interest by USD, EUR and TL for current account balance in period, interest rates range from 3 %, 3 % , 11,25 %, respectively. Interest rate is (4-4,5 %) , (4-4,5 %) and (7,5-12 %) respectively in 2013.
Benefits and Services Provided for Senior Management;
Account Name December 31, 2014 December 31, 2013
Short-Term Benefits provided to Employees 1.239.216 1.131.986
Employment Termination Benefits - -
Other long term benefits - -
Total 1.239.216 1.131.986
Benefits and salary provided to Management Staff consist of general manager salary, assistant general manager salary.
38 NATURES AND LEVEL OF RISKS ARISING OUT OF FINANCIAL INSTRUMENTS
(a) Capital risk management
The Company, while trying to maintain the continuity of its activities in capital management on one hand, aims to increase its profitability by using the balance between debts and resources on the other hand.
The capital structure of the Company consists of debts containing the credits explained in note 8, cash and cash equivalents explained in note 6 and resource items containing respectively issued capital, capital reserves, profit reserves and profits of previous years explained in note 27.
Risks, associated with each capital class, and the capital cost are evaluated by the senior ma-nagement. It is aimed that the capital structure will be stabilized by means of new borrowings or repaying the existing debts as well as dividend payments and new share issuances based on the senior management evaluations.
The Company follows the capital by using debt/total capital rate. This rate is found by dividing the net debt by total capital. The net debt is calculated by excluding the cash and cash equivalent amounts from the total debt amount (including credits, leasing and commercial debts as indicated in the statement of financial position). Total capital is calculated as resources plus net debt as indicated in the statement of financial position.
Net Debt / Equity Ratio as of December 31, 2014 and December 31, 2013 are as follows:
December 31, 2014 December 31, 2013Total Liabilities 17.316.995 22.203.933
Negative: Cash and Cash Equivalents (1.409.794) (5.197.544)
Net Liabilities 15.907.201 17.006.389
Total Equity 51.523.984 48.653.776
Total Capital 67.431.185 65.660.165
Net Liabilities/Total Capital Rate 0,2359 0,2590
ANNUAL REPORT 2014
101
(b) Important Accounting Policies
The Company’s important accounting policies relating to financial instruments are presented in the Note 2.
(c) Risks Exposed
The Company, due to its activities, is exposed to changes in exchange rates (see article d) and interest rates (see article f).The Company, as it holds the financial instruments, also bears the risk of other party not meeting the requirements of the agreement. (Article e)
Market risks seen at the level of Company are measured according to the sensitivity analysis prin-ciple. Market risks faced by the Company in current period or the process of undertaking the faced risks or the process of the measure of faced risks was not changed according to previous year.
(d) Rate risk management
Most of the IT byproducts are either imported or purchased domestically using foreign currencies. During acquisition of products the companies are usually indebted in foreign currencies and pay-ments are also made in same currencies. The companies which do not adopt their sales policies using currencies in which they purchase the products may encounter foreign exchange losses if rates increase.
Against the rate risk Despec determines the sales currencies in the currency which the inventories are purchased. However, according to the market conditions sales are made in different currencies in some periods. Especially in order not to bear f/x rate risk forward transactions are made in periods with volatile f/x rates.
The Company management evaluates and follows the balance of assets and liabilities in Turkish Lira and Euro type as open position.
If there is %10 increase on the general level of exchange rates and all other variables are fixed as of December
31, 2014, profit before tax will be amount of TL 2.054.940(December 31, 2013: TL 2.790.913)

ANNUAL REPORT 2014
102
Foreign Exchange Rate Sensitivity Analysis Table
December 31, 2014Profit / (Loss)
Appreciation of Foreign Exchange
Devaluationof Foreign Currency
In the event of 10% value change of US Dollar against TL;
1- US Dollar Net Asset / Liability 1.641.298 (1.641.298)
2- The part, hedged from US Dollar Risk (-) - -
3- US Dollar Net Effect (1+2) 1.641.298 (1.641.298)
In the event of 10% value change of Euro against TL
4- Euro Net Asset/ (Liabilities) 413.643 (413.643)
5- The part, hedged from Euro Risk (-) - -
6- Euro Net Effect (4+5) 413.643 (413.643)
In the event of 10% value change of Other against TL;
7- Other Net Foreign Currency Asset/(Liabilities) - -
11- The part, hedged from Other Risk (-) - -
9-Other Foreign Currency Assets Net Effect (7+8) - -
Total 2.054.940 (2.054.940)
Foreign Exchange Rate Sensitivity Analysis Table
December 31, 2013Profit / (Loss)
Appreciation of Foreign Exchange
Devaluationof Foreign Currency
In the event of 10% value change of US Dollar against TL;
1- US Dollar Net Asset / Liability 2.166.809 (2.166.809)
2- The part, hedged from US Dollar Risk (-) - -
3- US Dollar Net Effect (1+2) 2.166.809 (2.166.809)
In the event of 10% value change of Euro against TL
4- Euro Net Asset/ (Liabilities) 624.104 (624.104)
5- The part, hedged from Euro Risk (-) - -
6- Euro Net Effect (4+5) 624.104 (624.104)
In the event of 10% value change of Other against TL;
7- Other Net Foreign Currency Asset/(Liabilities) - -
11- The part, hedged from Other Risk (-) - -
9-Other Foreign Currency Assets Net Effect (7+8) - -
Total 2.790.914 (2.790.914)

ANNUAL REPORT 2014
103
Table
of F
oreig
n Ex
chan
ge P
ositi
on
Dece
mber
31,
201
4De
cemb
er 3
1, 2
013
Am
ount
in TL
USD
EURO
Amou
nt in
TLUS
DEU
RO
1. Tr
ade R
eceiv
ables
19.
867.
767
6.9
63.9
64
1.3
18.4
78
20.
834.
345
6.8
14.2
17
2.1
42.2
65
2a. M
oneta
ry Fin
ancia
l Asse
ts 4
.926
.139
1
.898
.681
1
85.5
17
13.
215.
423
6.1
26.6
03
47.
476
2b. N
on-M
oneta
ry Fin
ancia
l Asse
ts -
- -
- -
-
3. O
ther
- -
- -
- -
4. Cu
rrent
Asse
ts To
tal (1
+2+3
) 24
.793.9
05
8.86
2.645
1.
503.9
95
34.04
9.769
12
.940.8
20
2.18
9.742
5. Tr
ade R
eceiv
ables
- -
- -
- -
6a. M
oneta
ry Fin
ancia
l Asse
ts -
- -
- -
-
6b. N
on-M
oneta
ry Fin
ancia
l Asse
ts -
- -
- -
-
7. O
ther
- -
- -
- -
8. Fix
ed As
sets
Total
(5+6
+7)
- -
- -
- -
9. To
tal As
sets
(4+8
) 24
.793.9
05
8.86
2.645
1.
503.9
95
34.04
9.769
12
.940.8
20
2.18
9.742
10. T
rade P
ayab
les (3
.624.9
34)
(1.51
9.916
) (3
5.594
) (5
.745
.612
) (2
.614
.994
) (5
5.99
6)
11. F
inanc
ial Li
abilit
ies -
- -
- -
-
12a.
Othe
r Mon
etary
Liabil
ities
(619
.568
) (2
64.8
14)
(1.9
46)
(395
.021
) (1
73.5
07)
(8.4
13)
12b.
Othe
r Non
-Mon
etary
Liabil
ities
- -
- -
- -
13. T
otal S
hort
Term
Liab
ilities
(10+
11+1
2) (4
.244.5
02)
(1.78
4.730
) (3
7.540
) (6
.140.6
34)
(2.78
8.501
) (6
4.409
)
14. T
rade P
ayab
les -
- -
- -
-
15. F
inanc
ial Li
abilit
ies -
- -
- -
-
16a.
Othe
r Mon
etary
Liabil
ities
- -
- -
- -
16b.
Othe
r Non
-Mon
etary
Liabil
ities
- -
- -
- -
17. T
otal L
ong T
erm Li
abilit
ies (1
4+15
+16)
- -
- -
- -
18. T
otal L
iabilit
ies (1
3+17
) (4
.244.5
02)
(1.78
4.730
) (3
7.540
) (6
.140.6
34)
(2.78
8.501
) (6
4.409
)
19. N
et As
set/
(Liab
ility)
Posit
ion of
Deri
vativ
e Ins
trume
nts of
f the
State
ment
of fin
ancia
l pos
ition (
19a-1
9b)
(10.
725.
342)
(4.6
54.7
00)
- (5
.700.8
24)
(2.67
1.051
) -
19a.
Total
Amou
nt of
Hedg
ed As
sets
- -
- -
- -
19b.
Total
Amou
nt of
Hedg
ed Li
abilit
ies
10.
725.
342
4.6
54.7
00 -
5.7
00.8
24
2.6
71.0
51
-
20. N
et Fo
reign
Exch
ange
Asse
t / (L
iabilit
y) Po
sition
(9-1
8+19
)9.8
24.06
1 2
.423.2
14
1.46
6.454
22
.208.3
11
7.48
1.268
2.
125.3
33
21. M
oneta
ry It
ems N
et Fo
reign
Exch
ange
Asse
t / (l
iabilit
y) po
sition
(1+2
a+5+
6a-1
0-11
-12a
-14-
15-1
6a)
20.54
9.403
7.
077.9
14
1.46
6.454
27
.909.1
35
10.15
2.319
2.
125.3
33
22. T
otal F
air Va
lue of
Fina
ncial
Instr
umen
ts Us
ed fo
r the
Forei
gn Ex
chan
ge H
edge
-
- -
- -
-
23. T
he Am
ount
of He
dged
part
of Fo
reign
Exch
ange
Asse
ts (1
0.79
3.78
3) (4
.654
.700
) -
(5.8
46.2
75)
(2.7
39.2
00)
-
23. T
he Am
ount
of He
dged
part
of Fo
reign
Exch
ange
Liab
ilities
- -
- -
- -
23. E
xpor
t 9
01.6
47
- -
264.
275
- -
24. Im
port
82.
264.
952
- -
82.
551.
927
- -

ANNUAL REPORT 2014
104
Dece
mber
31,
2014
Rece
ivable
sDe
posit
at B
anks
Tra
de R
eceiv
ables
Othe
r Rec
eivab
lesRe
lated
Par
tyOt
her
Relat
ed P
arty
Othe
rNo
teNo
te
Maxim
um cr
edit r
isk in
curred
as of
the d
ate of
repo
rting (
A+B+
C+D+
E)1.6
83.63
338
.036.5
401.8
57.77
79.1
381.0
52.46
1 -
The pa
rt of m
axim
um ris
k secu
red by
guara
ntee e
tc. -
17.80
4.698
- -
A. Ne
t boo
k valu
e of fi
nanci
al ass
ets wh
ich ar
e und
ue or
which
did n
ot de
cline i
n valu
e1.6
83.63
337
.411.8
431.8
57.77
79.1
3810
-111.0
52.46
16
B. Bo
ok va
lue of
finan
cial a
ssets w
hich c
ondit
ions a
re ren
egoti
ated,
and
which
othe
rwise
would
be co
unted
as ov
erdue
or de
clined
in va
lue60
1.870
10-11
6
C. Ne
t boo
k valu
e of a
ssets,
overd
ue bu
t did
not d
ecline
in va
lue.
- 22
.827
- -
-
- The
part s
ecured
by gu
arante
e etc.
- 22
.827
- -
-
D. Ne
t boo
k valu
es of
assets
declin
ed in
value
- -
- 10
-11 -
6 -
Overd
ue (g
ross b
ook v
alue)
- -
- -
-
- De
cline i
n valu
e (-)
- 1.5
01.63
1 -
- 10
-11 -
6 -
The pa
rt of n
et val
ue se
cured
by gu
arante
e etc.
- (1
.501.6
31)
- -
10-11
- 6
- Un
due (
gross
book
value
) -
- -
- 10
-11 -
6 -
Declin
e in v
alue (
-) -
- -
- 10
-11 -
6 -
The pa
rt of n
et val
ue se
cured
by gu
arante
e etc.
- -
- -
10-11
- 6
E. Ele
ments
conta
ining
cred
it risk
off th
e stat
emen
t of fi
nanci
al po
sition
- -
- -
10-11
-
CREDIT TYPES INCURRED IN RESPECT OFFINANCIAL INSTRUMENT TYPES

ANNUAL REPORT 2014
105
Rece
ivable
sDe
posit
at B
anks
Decem
ber 3
1,201
3 Tra
de R
eceiv
ables
Othe
r Rec
eivab
les
Relat
ed P
arty
Othe
rRe
lated
Par
tyOt
her
Note
Note
Maxim
um cre
dit ris
k incur
red as
of th
e date
of re
portin
g (A+
B+C+
D+E)
66.91
636
.102.7
734.5
41.94
560
.942
4.701
.689
- The
part o
f maxi
mum
risk se
cured
by gua
rantee
etc.
- 15
.662.7
92 -
-
A. Ne
t book
value
of fin
ancial
assets
which
are u
ndue o
r whic
h did n
ot dec
line in
value
66.91
636
.033.3
114.5
41.94
560
.942
10-11
4.701
.689
6
B. Bo
ok val
ue of
financ
ial ass
ets wh
ich co
ndition
s are
renego
tiated
, and
which
oth
erwise
would
be co
unted
as ove
rdue o
r decl
ined in
value
64.84
210
-11
C. Net
book v
alue o
f asse
ts, ove
rdue b
ut did
not d
ecline
in val
ue. -
4.620
- -
-
- The
part s
ecured
by gu
arante
e etc.
- 4.6
20 -
- -
D. Ne
t book
value
s of a
ssets d
ecline
d in va
lue -
- -
10-11
- 6
- Ov
erdue
(gross
book
value)
- -
- -
-
- De
cline in
value
(-) -
1.500
.961
- -
10-11
- 6
- The
part o
f net
value
secure
d by g
uarant
ee etc
. -
(1.5
00.96
1) -
- 10
-11 -
6 -
Undue
(gros
s book
value
) -
- -
- 10
-11 -
6 -
Declin
e in va
lue (-)
- -
- -
10-11
- 6
- The
part o
f net
value
secure
d by g
uarant
ee etc
. -
- -
- 10
-11 -
6E. E
lement
s conta
ining c
redit r
isk of
f the s
tatem
ent of
financ
ial pos
ition
- -
- -
10-11
-

ANNUAL REPORT 2014
106
December 31, 2014
Receivables Trade Receivables Trade Receivables1-30 Days Overdue 516.576 -
1-3 Months Overdue 108.121 -
More than 3 Months Overdue - -
The part of net value secured by guarantee etc. 22.827 -
December 31, 2013
Receivables Trade Receivables Trade Receivables1-30 Days Overdue 59.660 -
1-3 Months Overdue 9.802 -
More than 3 Months Overdue - -
The part of net value secured by guarantee etc. 4.620 -
(e) Credit Risk Management:
The Company’s credit risk management exposed from trade receivables. Trade receivables mostly consist from receivables from dealers. The Company has set up an effective control system over its dealers and the risk is monitorized by credit risk management team and Company Management. The Company has set limits for every dealer and these limits are revised if it is necessary. The taking adequate guarantee from dealers is another method for the risk management. There is no significant trade receivable risk for the Company, because the Company has receivables from a wide range of customers instead of a small number customers and significant amounts. Trade receivables are evaluated by taking into consideration of Company’s past experience and current economic situation and these receivables are presented with their net values in the statement of financial position after the proper provisions for doubtful receivables are made. The low profit margins by force of the sectoral conditions make collection and credit risk manage-ment policies important and the Company management show sensivity in these situations. The detailed information about the collection and risk management policies are as follows;
The Company starts executive proceedings and / or litigates for the receivables overdue for a few mont-hs. The Company can configure terms for dealers in difficult situations. The low profit margins by force of the sectoral conditions make collection of receivables important. There is a risk management team to minimize the risk of collections and the sales are realized by making credibility evaluations. The sales to new or risky dealers are made in cash collection.
The Company is selling products to a wide range of institutions which are selling or buying computer and its equipments. The capital structure of the dealers classified as “classic dealers” in the distribution channel is low. It is estimated that there are about 5.000 dealers in this group in Turkey and in terms of risk mana-gement to minimize the receivable risk of Despec by taking steps and establishing its own organization and working system. The steps taken by the Company are as follows;
The sales to new customers which have no experience more than 1 year: The sales to new customers which have no experience more than 1 year are made in cash collection.
The information team involved in receivable and risk management department consists of 2 staff and this team is monitoring the dealers continuously.
Credit Committee: The information about the customers which has experience more than 1 year in the se-ctor and the customers which are demanding an increase for the credit limit are prepared by the informati-on team and presented to credit committee every week. Credit committee consists of Senior Vice President

ANNUAL REPORT 2014
107
of Finance, Finance Manager, Accounting Manager, information team staff and the Sale Manager of related Customer. Credit Committee establish credit limits to related customers by taking into consideration the information gained from the information team, past payments and sale performances. The Credit Committee determines the conditions and if it is needed they demand for guarantees, mortgages, etc.
Trade receivables are evaluated by taking into consideration the Company policies and procedures and the trade receivables are shown with their net value after the provisions for doubtful receivables are made in the financial statements. (Note: 10)
The company made an insurance policy agreement which contains trade receivables insurance in Turkey with Euler Hermes Sigorta A.Ş.
- Policy has arranged for two years, April 01,2013-May 31,2015.
- Damages in policy is stated in USD.
- Guarantee proportion is determined % 90 for trade receivables credit limit which are demanded.
(f) Management of interest rate risk
The interest rates of loan are fixed.
Table of Interest Position December 31, 2014 December 31, 2013Fixed Interest Financial InstrumentsFinancial Assets 240.042 1.384.289
Financial Liabilities - -
Floating Rate Financial InstrumentsFinancial Assets - -
Financial Liabilities - -
(g) Analysis Relating to Other Risks
Risks Relating to Share etc. Financial Instruments
The Company isn’t holding marketable securities which are traded in the Istanbul Stock Exchange.
(h) Liquidity risk management
The Company tries to manage the liquidity risk by maintaining the continuation of sufficient funds and loan reserves by means of matching the financial instruments and terms of liabilities by following the cash flow regularly.
Liquidity Risk Tables
Prudent liquidity risk management signifies maintaining sufficient cash, the utility of fund sources by sufficient credit transactions and the ability to close out market positions.
Risk of existing or future possible debt requirements being fundable is managed by maintaining the continu-ation of availability of sufficient numbers and high quality credit providers.
The table below indicates the term divisions of derivative and non-derivative financial liabilities of the Com-pany in TL currency.

ANNUAL REPORT 2014
108
December 31, 2014
Expected Terms Book Value
Cash Outflows Total As Per the
Agreement
Less than 3 Months
3-12 Months 1-5 Years More than
5 Years
Non-Derivative Financial Liabilities 14.491.065 14.578.598 14.578.598 - - -
Bank Loans - - - - - -
Trade Liabilities 14.013.554 14.101.087 14.101.087 - - -
Other Liabilities 477.511 477.511 477.511 - - -
Expected Terms Book Value
Cash Outflows Total As Per the
Agreement
Less than 3 Months
3-12 Months 1-5 Years More than
5 Years
Derivative Financial Liabilities 68.442 9.259 9.259 - - - Derivative Cash Inflows 10.793.784 10.793.783 10.793.783 - - -
Derivative Cash Outflows (10.725.342) (10.784.524) (10.784.524) - - -
December 31, 2013
Expected Terms Book Value
Cash Outflows Total As Per the
Agreement
Less than 3 Months
3-12 Months 1-5 Years More than
5 Years
Non-Derivative Financial Liabilities 20.527.057 20.638.098 20.638.098 - - -
Bank Loans - - - - - -
Trade Liabilities 18.752.741 18.863.782 18.863.782 - - -
Other Liabilities 1.774.316 1.774.316 1.774.316 - - -
Expected Terms Book Value
Cash Outflows Total As Per the
Agreement
Less than 3 Months
3-12 Months 1-5 Years More than
5 Years
Derivative Financial Liabilities 145.450 118.881 118.881 - - - Derivative Cash Inflows 5.846.275 5.846.275 5.846.275 - - -
Derivative Cash Outflows (5.700.825) (5.727.394) (5.727.394) - - -

ANNUAL REPORT 2014
109
39 FINANCIAL INSTRUMENTS (DECLARATIONS WITHIN THE CONTEXT OF FAIR VALUE AND HEDGINGThe Company considers that the recorded values of financial instruments reflect the fair values.
Aims at financial risk management
The finance department of the Company is responsible for maintaining the access to financial markets regu-larly and observing and managing the financial risks incurred in relation with the activities of the Company. The said risks include market risk (including foreign exchange risk, fair interest rate risk and price risk), credit risk, liquidity risk and cash receiving risk.
The Company uses the forward exchange agreements out of derivative financial instruments for the purpose of decreasing the effects of these risks and being protected from financial risk against the same. The Com-pany has no speculative financial instruments (including derivative financial instruments) and does not involve in any activity relating to the sale or purchase of such instruments.
40 EVENTS AFTER STATEMENT OF FINANCIAL POSITION DATENone.
41 OTHER ISSUESNone.
