annual report 2014 - home - tryg tryg annual report 2014_12-34188.pdf · english versions of the...
TRANSCRIPT

Annual report 2014
2Annual report 2014 | Tryg A/S |
Menu – Management’s review
MANAGEMENT’S REVIEW
3 Income overview
4 Introduction: World-class insurance
5 Events in 2014
6 Targets and strategy
10 Financial targets and outlook
11 Tryg’s results
14 Private
Tryg is the second-largest insurance company in the Nordic region. We are the largest player in Denmark and the third-largest in Norway. In Sweden, we are the fifth-largest company in the market.
We offer a broad range of insurance products to both private individuals and businesses.
Our 3,600 employees provide peace of mind for 2.7 million customers and handle more than 850,000 claims on a yearly basis.
Our ambition is to become the world’s best insurance company.
Editor Investor Relations | Publication 28 January 2015 | Layout amo design
16 Commercial
18 Corporate
20 Sweden
22 Investment activities
24 Capital and risk management
26 Shareholder information
28 Corporate governance
32 Supervisory Board
34 Group Executive Management
36 Corporate Social Responsibility in Tryg
FINANCIAL STATEMENTS
38 Financial statements
105 Group chart
106 Glossary
107 Products
Learn more
Reference to further information at tryg.com.
Reference to further information in the
annual report.
Reference to menu.
This is a translation of the Danish annual report 2014. In case of any discrepancy between the Danish and the English versions of the annual report 2014, the Danish version shall apply.

3Annual report 2014 | Tryg A/S |
Income overview
DKKm Q4 2014 Q4 2013 2014 2013 2012 2011 2010
Gross premium income 4,646 4,737 18,652 19,504 20,314 19,948 18,894Technical result 775 546 3,032 2,496 2,492 1,572 460Investment return after insurance technical interest 13 154 360 588 585 61 550
Profit/loss before tax 768 639 3,302 2,993 3,017 1,603 1,006
Profit/loss on continuing business 633 564 2,547 2,373 2,180 1,148 741
Profit/loss 640 565 2,557 2,369 2,208 1,140 593
Run-off gains/losses, net of reinsurance 338 247 1,131 970 1,015 944 824 Key figures Total equity 11,119 11,107 11,119 11,107 10,979 9,007 8,458Return on equity after tax (%) 23.0 20.5 23.0 21.5 22.1 13.1 6.6Number of shares 31 December (1,000) 57,824 59,374 57,824 59,374 60,695 60,373 60,634Earnings per share of DKK 25 43.7 39.4 36.5 18.9 9.5Net asset value per share (DKK) 192.3 187.1 180.9 149.2 139.5Dividend per share (DKK) 29.0 a) 27.0 26.0 6.5 4.0Price/Earnings 15.8 13.3 11.8 16.8 21.7
Premium growth in local currencies -0.1 -2.4 -1.1 -2.7 -0.1 3.6 3.9
Gross claims ratio 64.1 74.9 67.8 73.9 72.2 79.1 80.0Net reinsurance ratio 4.7 -1.2 1.8 -1.8 -0.4 -2.5 1.6
Claims ratio, net of ceded business 68.8 73.7 69.6 72.1 71.8 76.6 81.6Gross expense ratio 14.9 15.4 14.6 15.6 16.4 16.6 16.7
Combined ratio 83.7 89.1 84.2 87.7 88.2 93.2 98.3
Combined ratio exclusive of run-off 91.0 94.3 90.3 92.7 93.2 97.9 102.7Run-off, net of reinsurance (%) -7.3 -5.2 -6.1 -5.0 -5.0 -4.7 -4.4Large claims, net of reinsurance (%) 4.3 1.1 3.1 2.1 2.3 2.7 3.8Weather claims, net of reinsurance (%) 2.6 8.8 2.4 3.2 1.8 3.6 6.3 Combined ratio on business areas Private 82.4 87.7 82.5 86.0 87.7 92.7 97.5Commercial 74.5 85.8 79.4 85.4 81.3 89.6 99.0Corporate 90.4 94.7 89.8 91.7 91.4 93.6 96.3Sweden 98.3 88.2 92.0 91.2 95.3 102.9 105.7
a) Proposed dividend
| Menu – Management’s review

Annual report 2014 | Tryg A/S | | Menu – Management’s review 4
World-class insurance price, the Supervisory Board will propose to the
upcoming annual general meeting that the share be
split in the ratio 1:5.
Success culture yields results
In recent years, Tryg has seen many major changes,
and we appreciate the positive effect they have had
on our results. It is also important to emphasise that
this journey has only been possible because of the
hard work that our employees put in every day. We
are well on the way to creating the success culture
that is necessary to ensure that everyone in our
organisation contributes to realising our ambitious
targets – and we have positive expectations for the
work to be undertaken in the coming year. We will
focus fully on the many initiatives that are to ensure
that we will be able to offer a positive customer
experience and achieve world-class financial results
– and thereby create peace of mind and value for
customers, employees and shareholders.
Jørgen Huno Rasmussen Morten Hübbe
Chairman Group CEO
Our ambition is to make Tryg the world’s best insur-
ance company. However, this will only be possible
if we have our customers’ support and maintain
our positive financial development. With this end in
mind, in 2014 we continued our work to implement
a number of important initiatives to strengthen Tryg’s
insurance operations in a permanent way. We have
streamlined our internal processes across the organi-
sation and made structural changes to ensure that
the machine driving the entire business is geared to
supporting our most important mission – to deliver a
world-class customer experience. At the same time,
these initiatives have led to substantial improve-
ments in our financial results. The profit for the year
totalled DKK 2,557m, equivalent to a return on equity
of 23.0%, while the combined ratio was 84.2.
In 2014, we managed to realise considerable
savings, which means that we are now close to
achieving our targets for 2015. We have raised the
bar for 2017, and will strive for further efficiency
improvements of DKK 750m (see page 8). In
addition, we will optimise our customer service
business procedures.
In 2014, we acquired three smaller companies
and portfolios, as we believe that we will be able to
use our strong position to integrate these in
our business. For this reason, acquisitions are
something that we will continue to focus on in
the coming years.
Positive customer experience yields results
We will step up our efforts to become even better
at guiding and servicing our customers. The aim is
for our customers to be so satisfied with our ser-
vices that they will stay with Tryg, buy more – and
recommend us to others. This is the ambition be-
hind the many strategic customer initiatives we are
currently working on, and we have set up concrete
and ambitious targets for this work.
An important aspect of the customer experience
is that the price customers pay for their insurance
is fair and competitive. For this reason, another
strategic focus area is that we must become even
better at developing and pricing products to fulfil
our customers’ needs and to reflect the individual
risk. In 2014 we launched a number of price-
differentiated products which have been very well
received by our customers. This boosts our sales,
reduces our claims ratio and ultimately results in
more satisfied customers. We expect that our con-
tinued focus on this area will enable us to become
even quicker and better at launching new products
in the coming years.
Efficient risk management
Risk management is an essential part of running an
insurance business in relation to both customers
and shareholders. For this reason, risk management
constitutes a central element of our strategy, and in
our day-to-day operations we focus on streamlining
and continuously optimising it. The Supervisory
Board defines the overall framework for our risk
exposure – both in terms of our core business, the
Group’s investments and the overall capital level,
which must strike the right balance between risk
and rules on the one hand and Tryg’s general targets
on the other.
Higher returns for shareholders
It must be attractive to be a shareholder in Tryg – and
we strive to ensure that our increasing returns will
also benefit our shareholders. The improved result
combined with Tryg’s low investment risk allows us
to offer our shareholders an attractive distribution
while still maintaining a solid capital base. For this
reason, the Supervisory Board proposes a dividend of
DKK 29 per share in accordance with our dividend
policy of distributing 60-90% of the profit for the year
and having an increasing dividend in nominal terms.
We also see share buy back as an effective way of
increasing value creation for our shareholders. In
2014, we completed a share buy back programme
of DKK 1bn, and in 2015 we have initiated another
DKK 1bn programme. The share price also reflected
the previous year’s value creation with a return of
36.5%, including dividend. Based on the high share

Annual report 2014 | Tryg A/S | | Menu – Management’s review 5
The fewest complaints The
Insurance Complaints Board
published its annual state-
ment of com plaints, showing
that Tryg once again had the
fewest complaints relative to
market share within motor,
house and contents insurance.
Acquisition of pet portfolio
Tryg’s branch in Sweden,
Moderna, acquired the
renewal right for Optimal
Djuförsäkring’s portfolio of
pet insurance products.
Acquisition of Securator
Tryg acquired Securator,
thereby further consolidat-
ing its position in the Nordic
countries as a market-lead-
ing provider of additional
cover for electronic equip-
ment.
New motorcycle insurance
Tryg launched a new motorcycle insurance product in Denmark,
where customers are now able to take out separate cover in addition
to third-party liability insurance. Another extension option requested
by customers is Roadside Assistance. Customers now have the
opportunity to tailor this new insurance far better to their needs.
Read more about motorcycle insurance at tryg.dk.
Capital Markets Day Tryg held its Capital Markets Day in London,
where the Executive Mana gement presented, among other things, new
financial targets and customer targets up to 2017. The aim is a return on
equity for 2017 of 21% or more, a combined ratio of 87 or less and an
expense ratio of 14 or less. The customer targets aim for an increase
in the retention rate of 1 percentage point, an increase in the share of
customers with three or more products of 5 percentage points and a
doubling of the Net Promoter Score (NPS).
Share buy back
programme initiated
On 2 January, Tryg initiated
an extraordinary share buy
back, which was completed
on 19 December 2014. Tryg
acquired own shares for an
amount totalling DKK 1bn.
Moderna, insurance broker
of the year For the second
year running, Tryg’s branch
in Sweden, Moderna, was
named insurance broker
of the year within the Cor-
porate brokerage business.
Tryg’s ‘A-’ maintained
The credit rating agency
Standard & Poor’s re-
confirmed Tryg and Tryg
Garanti’s ‘A-/stable’ rating.
Extended annual travel insurance On 1 August, the new blue EU health
insurance card was introduced in Denmark, replacing the old yellow
public health card. The blue card does not provide the same cover
when travelling in the EU as the yellow card. Tryg extended its annual
travel insurance to ‘all inclusive’, offering our customers the same cover
as before. Read more about annual travel insurance at tryg.dk.
Cloudburst in Copenhagen On 30 August, central Copenhagen was hit
by a heavy cloudburst. Approx. 2,300 claims were reported, primarily
by business owners. As a result of claims prevention measures, the
extent of damage was much less than after the cloudburst in 2011.
IT transition
Tryg migrated to a new IT
platform, and the change to
its new IT operations pro-
vider TCS was implemented
successfully. In January, Tryg
concluded a five-year agree-
ment, which will provide
better operational reliability
and reduce costs.
Four new price-differentiated products in Private As part of its price
differentiation project, Tryg launched new house, short-term travel,
dog and cat insurance policies. Prices are adjusted according to the
customer’s risk. Read more about Tryg’s products at tryg.dk.
Floods hit Norway On 30 October, the western part of Norway was
hit by floods. Tryg received 120 claims, the majority of which were
processed in 2014.
Tryg acquired
agricultural portfolio
Tryg acquired the renewal
right to Codan’s agricultural
portfolio of approximately
1,600 smaller agricultural
customers. More than 80%
of the former Codan
customers opted to be
covered by Tryg’s insurance
products.
Automatic claims handling
Tryg’s Swedish branch, Mod-
erna, launched an automatic
claims handling system. The
customer registers a claim
online, and the entire claims
handling process is perform-
ed automatically, including
claims payment. When the
process is completed, it is
notified with a text message.
Three new price-differenti-
ated products Tryg launched
three new price-differentiated
products in Norway: leisure
boat, group life and com-
pany car insurances. The
products were well-received,
with high sales rates and
improved risk selection.
January February Marts April May June July August September October November December
Events in 2014

Annual report 2014 | Tryg A/S | | Menu – Management’s review 6
Our purpose
We create peace of mind and value for
customers, employees and shareholders.
Our ambition
To become the world's best insurance
company.
Our values
Our values are highly integrated in our
culture and consistent with our purpose.
• We meet people with respect,
openness and trust.
• We show initiative, share knowledge
and take responsibility.
• We deliver solutions based on quality
and simplicity.
• We create sustainable results.
Targets and strategy
Tryg’s ambition is to create peace of mind and
value for customers, employees and shareholders,
and this must be at the core of everything we do.
Tryg’s ambition is to become the world’s best insur-
ance company. This ambition lies at the heart of all
the strategic measures implemented in Tryg.
Tryg has identified the fundamental values of our
company, which will help us meet our targets and
support the company’s ambition.
Our customers – our most important asset
Our customers are our most important asset. Tryg
strives to continuously strengthen our customer
relationship through advice, products, concepts,
claims handling and claims prevention. In 2014,
we focused on customer-oriented initiatives and
will intensify this focus further in the coming
years. Tryg’s target is to offer world-class service
in all dealings with our customers. A very import-
ant part of achieving this objective is that our
customers’ issues are resolved quickly at all times.
This must be evaluated from the customer’s
perspective, and for Tryg this means that we will
have to introduce far-reaching changes in our
internal business procedures so that the first-line
employee will be able to resolve and close the
vast majority of cases.
Tryg believes that loyal customers and solid finan-
cial results are deeply intertwined. Loyal customers
have a high retention rate. This means that the
cost of attracting new customers can be kept low,
which contributes to a low expense ratio. Like
Tryg’s efficiency programme, a high retention rate
is of value to customers because it strengthens our
results and competitive position and reduces the
need to increase prices.
Our employees – our most important resource
Our employees are our most important resource
and will ensure that our vision to become the
world’s best insurance company becomes a reality.
An important part of achieving this is that all
employees feel that they have an opportunity to
be successful. Clear and ambitious targets must
be set for each individual employee, and regular
feedback must be provided.
Tryg wants a higher level of employee satisfaction
compared to the financial sector in the Nordic
region. Tryg’s employee satisfaction survey 2014
showed that employee satisfaction had increased
markedly since 2013 and was now on a level with
the Nordic financial sector. The target is for em-
ployee satisfaction to surpass that of the Nordic
financial sector in 2015.
Value creation for our shareholders
Tryg’s shareholders must see Tryg as a company
which sets ambitious targets and achieves them.
In 2012, Tryg presented a number of ambitious
financial targets for the period up until 2015. Tryg
is well on its way to achieving these targets, which
meant that it was natural to set out a range of
new and equally ambitious targets, which were
presented in connection with the Capital Markets
Day in November 2014.
Tryg strives for a shareholder-friendly dividend
policy, and has in recent years paid out a steadily
increasing dividend combined with share buy back.
Stable Nordic insurance market
The Nordic insurance market is characterised
by consumers and businesses who have largely
covered their insurance needs, combined with
relatively low economic growth. Profitability in the
insurance industry is generally high due to the fact
that the vast majority of the companies focus on
earnings instead of growth. However, competition
is fierce and intensified in 2014, especially in the
Danish market where new players entered the
market in the form of price portals offering com-
parisons of insurance prices. Tryg generally recom-
mends that customers use Tryg’s own website, or
alternatively one of the insurance industries’ own
comparison sites, which are not required to pay
the suppliers of the comparison portals.
The market situation in Denmark and Norway has
been stable for most of 2014. Consumer optimism
in Denmark increased slightly, reflected in increas-
ing real estate prices, especially for flats. Unem-
ployment was stable at a level of around 5%.
Total car sales in 2014 were 3.8% higher than in
2013, and characterised in particular by increased
sales of small cars. Norway’s economy was also

Annual report 2014 | Tryg A/S | | Menu – Management’s review 7
Customer targets 2017
• NPS + 100%
• Retention rate + 1 pp
• Customers ≥3 products + 5 pp
Financial targets 2017
• Return on equity of ≥21% after tax
• Combined ratio ≤87
• Expense ratio ≤14
Financial targets 2015
• Return on equity of 20% after tax
• Combined ratio ≤90
• Expense ratio <15
erable focus on customers through, among other
things, the strategic initiative Customer journey
& success culture. Based on the progress realised
in the individual areas and the new activities in
the pipeline, the financial targets have now been
upgraded for the period up to 2017. The custom-
er-related targets were established on the basis
of the experience gained in connection with the
work throughout the year with Customer journey
& success culture.
Tryg is looking to offer a customer experience that
makes our customers feel they can recommend
us to others. For this reason, we have set a target
of doubling the Net Promoter Score (NPS) up to
the end of 2017. The NPS shows the likelihood
of customers recommending Tryg in general. The
NPS for 2014 was 15; however, with considerable
variation between the different areas, from -11 in
Commercial Norway to 25 in Private Denmark.
The target for the end of 2017 is 30.
The retention rate is generally high in Tryg. It
expresses the extent to which customers will re-
select Tryg as their insurance company. However,
Tryg wishes to raise the retention rate further
by 1 percentage point between now and 2017.
Customers with multiple insurance products are
generally more satisfied and contribute to profit-
ability. For this reason, Tryg is keen to increase the
share of customers with three or more products
by 5 percentage points.
Strategic initiatives
Tryg has set up four strategic initiatives to support
the financial and customer targets. The strategic
initiatives planned for 2015 are all a natural exten-
sion of the initiatives for 2014. In other words, we
are building on the foundations laid during the
previous strategy period.
Strategic initiatives 2014
• Price differentiation
• Customer journey & success culture
• Cost and claims reduction
• IT stability
Strategic initiatives 2015
• Next level pricing
• Customer journey & success culture
• Leading in efficiency
• IT stability and digitisation
Next level pricing
Price differentiation was an important initiative in
both 2013 and 2014. Up to the end of 2014, more
than 20 new price-differentiated products were
developed, which also shows that the time it takes
to develop new products has been significantly
reduced, down by almost 50% since 2012.
At the end of 2014, 75% of the tariffs are assessed
to be on a par with those of our major competitors
against less than a third at the start 2013.
The new price-differentiated products proved their
worth, with improved rates of sales to new custom-
ers and a lower claims ratio. For our customers this
means that our pricing is more correct and better
reflects the individual risk.
relatively stable with an unemployment rate at
around 3.5% and a low interest rate level. Car sales
in Norway increased by 1.4% in 2014. Towards the
end of the year, the financial situation in Norway
deteriorated due to a sharp decline in oil prices
leading to a drop in the value of the Norwegian
krone. This development has reduced expectations
for economic growth and employment with the
risk of a recession in Norway in 2015.
Targets
Tryg has worked hard to realise its targets for 2015,
which were announced in 2012. 2014 saw consid-
How is the NPS defined?
The basic principle of the recommendation rate, the Net Promoter Score (NPS)®, is that each customer
can be divided into three categories: Promoters, Passives and Detractors. The NPS is based on the fol-
lowing question: Would you recommend Tryg to a friend or colleague? The NPS is expressed as a value
between -100 and 100. Example: If we ask 100 customers, and we score 9-10 with 50 customers and
1-6 with 40 customers, our NPS will be: 50-40 = 10
1 2 3 4 5 6 7 8 9 10
Detractors Passives Promoters
NPS = –Promoters Detractors

Annual report 2014 | Tryg A/S | | Menu – Management’s review 8
In the coming years, Tryg will continue its work
to improve pricing and the use of its own and
external data. Also, we will still be focusing on time
to market. The ambition is to further reduce de-
velopment time to five months, and in connection
with this to update the pricing of the individual
products annually.
More differentiated pricing will also strengthen the
business areas’ scope for performing segmenta-
tion and subsequent selection. This will be based
on a comparison of own data with external data
and then selecting the customers that we believe
to be the most profitable. This selection will
reduce the claims level and ensure more efficient
use of our distribution channels, which will also
have a positive impact on the cost level. Tariffs
must be improved further, and the objective is
that, from 2017, Tryg will have tariffs which for
25% of the portfolio are more advanced than
those of our major competitors.
Customer journey & success culture
Customer journey & success culture was a new stra-
tegic initiative in 2014. The objective is to improve
customer experience and thus loyalty by strength-
ening the customer culture within Tryg.
In order to find out more about how customers
perceive Tryg, we introduced SMS follow-ups after
customer contact. In 2014, more than 144,000
SMS text messages were sent to request feedback
from customers, and we then followed up on the
customers’ reactions. The results were generally
very satisfactory. To gain a common understanding,
the Group Executive Management also took their
turn at calling both satisfied and dissatisfied custom-
ers as part of following up on the SMS messages.
All dissatisfied customers are contacted in order to
obtain valuable input to improve customer service.
To enhance the internal customer culture, an inter-
nal training course was initiated. This has involved
customers are given wider authority, and that
procedures are adjusted to streamline customer
service. In this way, we aim to ensure that the first-
line employee will be able to resolve and close the
case 90% of the time. The target of increasing the
number of customers with three or more products
also has a direct bearing on the NPS, as these
customers have higher NPS scores.
Leading in efficiency
The most important initiative to improve results in
2013 and 2014 was the measures to reduce expens-
es and claims. In 2012, we set up an overall target of
saving DKK 1,000m by year-end 2015. At the end of
2014, claims costs were down by approximately
DKK 700m, while expenses had been reduced by
DKK 250m. This means that savings of approximately
DKK 50m are yet to be realised.
In November 2014, we set new targets for the
efficiency programme corresponding to a total of
DKK 750m by 2017, namely DKK 500m related to
the procurement of claims services and administra-
tion and DKK 250m related to expenses. With only
DKK 50m remaining for the 2015 expense targets,
the additional savings to be achieved by 2017 will
be DKK 700m, bringing the total target for the two
efficiency programmes to DKK 1,700m.
Expense reduction will be achieved by a continued
focus on outsourcing, improvement of the retention
rate and efficiency gains deriving from more efficient
customer service, for which the target, as men-
tioned above, is for 90% of all customer enquiries
to be processed and closed by the first-line
employee.
more than 4,500 days of teaching, where the focus
is on improving our customers’ experience of Tryg.
Also, in 2015, an executive for customer experi-
ence is appointed for each of the main business
areas.
We performed several NPS surveys of the degree
to which customers recommend the company
in 2014. The results gradually improved over the
year from 10 in the first surveys to 15 by the end
of 2014, which shows that the initiatives had an
effect.
Up to 2017, we will continue to focus on initiatives
to improve our customers’ perception of Tryg with
the aim of achieving a significant increase in the
NPS. Experience from customer interviews and
surveys shows that quickly processing a customer
enquiry is the most important factor in terms
of giving customers a positive experience. This
requires that the employees engaged in servicing
Annual report 2014 | Tryg A/S |
Camp. TravelWorkers’compensation
Workers’compensation
Contents
Holidayhome
Van HouseMotor-cycle
Cat Dog Short-term travel
Building- commercial
ContentsDenmark
Norway
Sweden
House Illness House-owner
Motor Group life
Accident
Company car
Boat
Boat Holidayhome
2013 2014

Annual report 2014 | Tryg A/S | 9| Menu – Management’s review
M&A
In 2014, Tryg acquired three smaller com-
panies and portfolios, as we will be able to
use our strong position to integrate these in
our business. This is something that we will
continue to focus on in the coming years.
Targets – claims procurement 2015-2017
DKKm
500
400
300
200
100
02015 2016
100
150
250 500
Total target2017
Targets – expenses 2015-2017
DKKm
250
200
150
100
50
02015 2016
50
75
125 250
Total target2017
Claims reductions will be realised by continuing
to streamline procurement of claims services. The
number of suppliers has been reduced significantly
in recent years, and it is possible to reduce this
figure even further, which will contribute to reducing
claims. In addition, the use of new process manage-
ment systems for repairing building damage, in
particular, will lead to a reduction in claims, just
as efficiency improvements in staff functions and
the claims organisation will also make a positive
contribution.
IT stability and digitisation
IT stability is important for being able to offer our
customers efficient service in claims handling, sales,
service and policy renewal. IT stability was not sat-
isfactory in 2013, for which reason Tryg launched a
strategic initiative to strengthen this area. As a result,
an agreement with a new IT operations provider, Tata
Consultancy Services Limited (TCS), was concluded
in 2014. This will provide Tryg with a more modern
IT platform. The change of IT providers in 2014
has been completed, and it was a demanding but
successful process. Also in 2014, an IT development
outsourcing agreement was concluded with Accen-
ture, which will give Tryg a more flexible develop-
ment model and access to new competencies.
Together, the new agreements will ensure better
operational stability, while reducing costs.
It is important for customers that we are able to
offer a digital service. To accommodate this, Tryg
is continuously developing new solutions to meet
customer needs. The target for 2017 is that 80%
of claim notifications are handled digitally, and that
50% of all other transactions with customers are
effected digitally. This will require the development
of an improved digital platform and integrating the
work on digital solutions in Tryg’s culture.
Corporate Social Responsibility
In Tryg, Corporate Social Responsibility is an
integrated part of our core business which is to
create peace of mind and value for our customers,
employees and shareholders. This means that Cor-
porate Social Responsibility is always taken into
account in our business decisions, when we im-
prove and develop products and services, optimise
our operations and otherwise contribute positively
to society at large through our activities.

Annual report 2014 | Tryg A/S | | Menu – Management’s review 10
Financial targets 2017
• Return on equity of ≥21% after tax
• Combined ratio ≤87
• Expense ratio ≤14
Financial targets 2015
• Return on equity of 20% after tax
• Combined ratio ≤90
• Expense ratio <15
Financial targets and outlook
of claims services and administration and
DKK 250m related to expenses, in the period up
to and including 2017.
Tryg expects that the development in gross
premium income will be slightly negative to
unchanged in 2015 and on a par with the growth
in GDP in 2016.
Tryg has a solid reserve position, which was also
confirmed in connection with an external review
by KPMG in 2014. This review has strengthened
Tryg's assessment of its reserve position, and it is
therefore deemed likely that the run-off level in the
coming years will be higher than that realised in
previous years.
The interest rate used for discounting Tryg’s tech-
nical provisions is historically low, and we do not
expect any significant interest rate increases in the
short term. A higher interest rate level will have a
positive effect on Tryg’s results.
Earnings in 2015
The value of the Norwegian krone fell in 2014,
which had a negative impact on Tryg’s operating
profit. The share of equity held in Norwegian
kroner and Swedish kronor is continuously
hedged in the financial markets.
In 2015, weather claims net of reinsurance and
large claims are expected to be unchanged at
DKK 500m and DKK 550m, respectively.
The investment portfolio is generally divided into
a match portfolio corresponding to the technical
provisions and a free portfolio. The objective is for
the return on the match portfolio and changes in
the technical provisions due to interest changes
to be neutral when taken together.
The return on bonds in the free portfolio will vary,
but considering the current interest rate level, a
low current return is expected. For shares and
property, the expectations are a return of 7% and
6%, respectively.
Investment activities include other types of invest-
ment income and expenses, especially the costs
of managing the investments, gains and losses on
foreign currency hedges and interest paid on loans.
Tax rates have gradually been lowered in Den-
mark, Norway and Sweden in recent years. In
We will strive to become even
more efficient up to 2017.
Tor Magne Lønnum | Group CFO
Denmark, the tax rate was 24.5% in 2014 and will
be reduced to 22% up to 2016. The Norwegian tax
rate was 27%, while the Swedish rate was 22%.
When calculating the total tax payable, it should
also be taken into account that gains and losses
on shareholdings are not taxed in Norway. All in
all, this will cause the expected tax payable for an
average year to be reduced from around 23-24%
to 22-23% for 2015.
Annual report 2014 | Tryg A/S |
With the results for 2014, we are close to having
delivered on the 2015 financial targets announced
in 2012. We have raised the bar for the period up
to 2017, and have presented new and ambitious
financial targets and customer targets.
To ensure that we realise these financial targets,
Tryg is launching a new efficiency programme. The
aim is to reduce expenses and claims by a total of
DKK 750m, DKK 500m related to the procurement

Annual report 2014 | Tryg A/S | | Menu – Management’s review 11
With a return on equity of 23.0% and a combined
ratio of 84.2, Tryg once again delivered a
satisfactory result in line with the defined targets
of a return on equity of 20% and a combined
ratio below 90. This result was achieved despite
a slightly higher total level of weather claims
and large claims in 2014 than in 2013. The
improvement of the technical result was mainly the
result of Tryg’s efficiency programme, but is also
attributable to the effect of the many new price-
differentiated products launched in recent years.
2014 saw intensive work on increasing customer
loyalty in the different business areas. Together
with the improved products and the targeted
selection, this had a positive impact on results.
The efficiency programme affected results
positively by DKK 395m, corresponding to
an improvement of the combined ratio by
approximately 2 percentage points. In 2014, the
efficiency programme once again made it possible
to avoid any major general price increases, and
the prices have largely only been adjusted to
take account of claims inflation. If unsatisfactory
development of products or segments is identified,
selective price measures may of course be taken.
In 2014, many price-differentiated products were
developed, primarily for new customers. However,
a large part of the portfolio was converted in 2014
to ensure that all customers have the most up-to-
date products. This conversion is also contributing
to making Tryg’s processes more efficient, as old
products may be discontinued. It also ensures that
staff will only have one product to consider in their
advisory and claims work.
The investment return was DKK 360m, and was
especially affected by increasing equity prices, a
low interest rate level and a domicile write-down
of DKK 106m in Q4 2014. The primary purpose
of the investment business is to support the
insurance business, and the aim is to have a low
risk profile. The investment return for 2014 was
thus higher than what was generally expected.
Premiums
Premium income totalled DKK 18,652m
(DKK 19,504m), representing a fall of 1.1% when
measured in local currencies. The development
in premium income was expected in view of the
initiatives implemented to improve profitability
in recent years. In 2014, Private saw an improved
development trend, accounting for about 50%
of the Group’s premium income. Both the
development in the number of customers and
the development in sales for the new price-
differentiated products, in particular, improved in
2014 relative to 2013. The improvements in both
2013 and 2014 were primarily due to efficiency
improvements and a strengthened customer
focus, which had a significant positive effect on the
development in premium income. Commercial’s
retention rate was improved in 2014, particularly
in the Danish part, but there is a general need to
boost sales to achieve a positive development of
the portfolio. The Swedish business also required
significant structural measures within both pricing
and distribution, which, in combination with the
termination of the distribution agreement with
Nordea, caused the premium income to fall in
2014. For Corporate, growth was positive at 1.1%
(-2.9%), which is satisfactory. For this business
area, Tryg is prepared for larger fluctuations in
premium income due to the competitive situation
and the focus on having a profitable portfolio.
Bank insurance is an important distribution
channel, and Tryg has a sound agreement with
Nordea on bank insurance in Denmark and
Norway, while Tryg sells to and services Nordea’s
Liv & Pension customers. In Sweden, Tryg has a
distribution agreement with Danske Bank, which
has distributed insurance for Tryg on the Swedish
market since the spring of 2014.
In 2014, Tryg acquired a number of small
companies and portfolios, including Securator,
a market-leading provider of additional cover for
electronic equipment in Denmark. In addition, Tryg
acquired the renewal right for Codan’s agricultural
portfolio, which has been successfully integrated
in Tryg’s agricultural portfolio. Also, Tryg acquired
a small Swedish portfolio within pet insurance.
These acquisitions have shown that Tryg is capable
of successfully integrating portfolios and achieving
synergies that support Tryg’s objectives and create
value for its shareholders. This is also something
that Tryg will focus on in the coming years.
Financial highlights 2014
• The profit after tax for the year was
DKK 2,557m (DKK 2,369m).
• The return on equity after tax was 23.0%
(21.5%).
• Technical result improved to DKK 3,032m
(DKK 2,496m).
• Combined ratio of 84.2 (87.7).
• Premium income reduced by 1.1%
(-2.7%).
• Claims ratio, net of ceded business,
of 69.6 (72.1).
• Expense ratio improved to 14.6 (15.6)
and 15.3, excluding one-off effects.
• Investment return, after transfer to
insurance, of DKK 360m (DKK 588m).
• Proposed dividend of DKK 29 per share.
• Share split in the ratio 1:5 to be approved
at the annual general meeting in 2015.
• Share buy back of DKK 1bn in 2015.
Tryg’s results

Annual report 2014 | Tryg A/S | | Menu – Management’s review 12
Claims
The gross claims ratio was 67.8 (73.9), and the
claims ratio, net of ceded business, which covers
both claims and business ceded as a percentage of
gross premiums, was 69.6 (72.1). The claims level
is due to a combination of better procurement of
claims services and administration of DKK 282m,
corresponding to 1.5%, and an overall higher level
of weather and large claims of 5.5% (5.3%). The
run-off level was slightly higher at 6.1% (5.0%),
which reflects a solid level of provisions.
The claims measures implemented have first and
foremost included improved agreements with
car repair shops, but 2014 also saw initiatives
that have improved the procurement of claims
services within contents insurance, among
other things in the form of the agreement with
Scalepoint, which benefits both customers and
Tryg. Customers are offered freedom of choice
among claims products, and Tryg has access to
favourable purchasing agreements and updated
prices for similar products, which is particularly
important in the field of electronics claims. Fixed-
price agreements were introduced for a number of
defined standard house and building repairs. At the
end of 2014, Tryg started using the IN4MO system
for the management of all processes and deliveries
in connection with building claims. This system
will contribute to reducing claims expenses in the
coming years, and allows all stakeholders to follow
the progress when damage is being repaired, which
will improve customer experience.
The gross claims ratio improved to 67.8 (73.9),
which is especially attributable to better
procurement of claims services and administration
of DKK 282m, particularly related to purchasing
agreements within contents insurance, web
auctions for extensive damage repairs and the
introduction of fixed-price agreements for a
number of house and building repairs.
Tryg’s focused work on claims prevention bore
fruit when we received several cloudburst claims in
Q3 2014. The extent of damage was considerably
lower than in connection with the cloudburst in
the Copenhagen area in July 2011. A significant
reason for this was the many preventative measures
launched after the cloudburst in 2011. After this
cloudburst, Tryg offered customers an inspection
of their homes and required them to place their
belongings in basements above floor level. In
addition, in case of repeated claims, Tryg required
customers to install an anti-flooding device.
Moreover, the limit of cover for basement rooms
was reduced, and a higher excess was introduced.
Tryg has concluded a lateral reinsurance agreement
running from 1 July 2014 to 30 June 2015. When
the total storm and cloudburst claims expenses
exceed DKK 300m, the agreement will cover the
next DKK 600m. To be covered by the agreement,
a claims event must exceed DKK 20m. Storm and
cloudburst claims amounted to approximately
DKK 220m in the second half of 2014, which means
that after another approximately DKK 80m of claims,
this agreement will provide cover in the first half of
2015. This is one example of how Tryg strives to
achieve stability in the results of the insurance business.
Large claims amounted to 3.1% in 2014 (2.1%)
and weather claims 2.4% (3.2%). The level of large
claims and weather claims was DKK 1,021m, which
largely corresponds to the level of DKK 1,050m
which is expected for an average year.
The run-off level stood at 6.1% (5.0%), which
underlines Tryg’s solid provisions coverage, as was
announced on the Capital Markets Day in November
2014. The run-off gain was highest in Corporate,
because the share of long-term business in the form
of workers’ compensation, in particular, is larger
than for the other business areas.
Expenses
The expense ratio was 14.6 (15.6). Adjusted for
one-off effects related to the Norwegian pension
scheme and the change of IT suppliers in Q2 2014,
the expense ratio was 15.3. The improvement of 0.3
percentage points was achieved through the ongoing
efficiency programme and should be seen in the light
of the expense ratio target of less than 15 in 2015
and 14 or less in 2017.
The efficiency programme contributed DKK 113m in
2014, corresponding to an impact on the expense
ratio of 0.6 percentage points. The initiatives comprised
a reduction in the number of employees, particularly
in the staff functions, but also in the business areas.
Tryg has generally focused on reducing complexity,
just as the number of offices has been reduced.
Sourcing has also been an im portant initiative in
2014, which was demonstrated in particular in the
change of IT suppliers from CSC to TCS, while IT
development was outsourced to Accenture. Sourcing
will continue to contribute to reducing the expense
level in the years to come. In 2014, the number of
employees was reduced from 3,703 to 3,599.
The expense level is also affected by increases in
the payroll tax in Denmark, from 10.9% to 11.4% in
2014. The tax will gradually increase and will stand
at 12.3% in 2021. However, this will not affect Tryg’s
target of an expense ratio of below 15 in 2015 and of
14 or less in 2017.
Profit/loss on discontinued business
The profit on discontinued business was DKK 10m
in 2014, and comprised gains on provisions,
primarily relating to the marine run-off business.
Gross Net
Weather claims
DKKm
2,000
1,600
1,200
800
400
0
Expected level, net for 2014: DKK 500m
201420132010 2011 2012
Large claims
DKKm
1,500
1,200
900
600
300
0
Gross Net
Expected level, net for 2014: DKK 550m
201420132010 2011 2012

Annual report 2014 | Tryg A/S | | Menu – Management’s review 13
Investment return
The investment return was DKK 360m (DKK 588m)
in 2014. Tryg’s investment portfolio is divided into
a match portfolio and a free portfolio.
The match portfolio totalled DKK 29.5bn,
and was made up of bonds which match the
insurance provisions so that fluctuations resulting
from interest rate changes are offset to the
greatest possible extent. The free portfolio is a
diversified portfolio of real estate, equities and
bonds which largely reflect the company’s total
equity. At 31 December 2014, the value of the
free portfolio totalled DKK 12.4bn. The return on
the match portfolio was DKK 181m (DKK 40m)
after transfer to insurance technical interest.
The return on the free investment portfolio
was DKK 548m (DKK 891m). The return was
impacted by price increases for equities, in
particular. The return on the equity portfolio
was positive at 10.0%. Bonds produced a
return of 2.1% and, for high-yield and emerging
market bonds in particular, there was a high
return in 2014.
Other financial income and expenses were
negative (net) by DKK 369m, partly due to the
usual interest expenses relating to subordinate
loans, foreign currency hedging and expenses for
investment activities, and partly due to a write-
down of owner-occupied property of DKK 106m.
Gains on foreign currency hedges relating to
equity and intercompany balances stood at
approximately DKK 260m due to a fall in the price
of the Norwegian and Swedish currencies. Foreign
currency hedging is aligned with Tryg’s objective of
having a generally low risk profile.
Tax
Tax on profit for the year totalled DKK 755m,
or 23% of the profit before tax. In 2014, Tryg
paid DKK 512m in income tax as well as various
payroll taxes totalling DKK 332m, making the total
payment DKK 844m in 2014.
Capital position
Tryg’s equity totalled DKK 11,119m (DKK 11,107m)
at the end of 2014. Tryg determines the individual
solvency requirement according to the Danish
Financial Supervisory Authority’s guidelines. The
individual solvency requirement was DKK 6,560m
at the end of 2014, and is measured based on the
adequate capital base, which amounted to
DKK 9,938m. After recognition of a share buy
back, Tryg’s surplus cover is DKK 3,378m,
corresponding to 51%.
In Q2 2014, the Danish Financial Supervisory
Authority performed an ordinary inspection. The
inspection confirmed the authority’s favourable
opinion on risk management, reserve and capital
position.
On 19 June 2014, the Financial Supervisory
Authority of Norway made an announcement
concerning issues associated with Solvency II. In the
announcement, the Financial Supervisory Authority
of Norway estimates that the Norwegian Natural
Perils Pool and the Norwegian guarantee scheme in
their current form should only to a limited extent be
included in the capital adequacy calculation.
Tryg’s capital adequacy calculation includes about
NOK 1.2bn from the Norwegian Natural Perils Pool
and the Norwegian guarantee scheme after tax. This
matter has not been clarified further in Q4 2014.
In relation to Solvency II, final clarification of the
expected future profit and the future recognition of
subordinate loan capital is still pending; this will have
a positive impact on Tryg’s capital. The final Solvency
II rules will take effect from 1 January 2016.
Dividend policy
According to Tryg’s dividend policy, the aim is
to pay out 60-90% of the profit for the year, and
for the dividend to be steadily increasing. For
2014, a dividend of DKK 29 (DKK 27) per share is
proposed, corresponding to a total of DKK 1,731m
(DKK 1,656m), which amounts to 68% of the profit
for the year.
In 2014, a share buy back of DKK 1bn was
completed, and on the Capital Markets Day on 5
November, Tryg announced that from 2 January
2015 and throughout the year, an additional share
buy back of DKK 1bn will be initiated.
Events after the balance sheet
In the opinion of Management, from the balance
sheet date to the present date no other matters
of major significance have arisen that are likely
to materially influence the assessment of the
company’s financial position.
Financial highlights Q4 2014
• Profit after tax of DKK 640m
(DKK 565m).
• Technical result of DKK 775m
(DKK 546m).
• Combined ratio of 83.7 (89.1).
• Weather claims impacted the combined
ratio by 2.6 percentage points (8.8).
• Large claims impacted the combined
ratio by 4.3 percentage points (1.1).
• Expense ratio of 14.9 (15.4).
• The investment return was DKK 13m
(DKK 154m), and was affected by a
write-down of DKK 106m relating to
the domicile in Ballerup.
Results for Q4 2014
The profit after tax totalled DKK 640m for Q4 2014
(DKK 565m) based on a technical result of DKK 775m
(DKK 546m), an improvement of 42%. The investment
return was DKK 13m (DKK 154m), and this was
affected by a write-down of DKK 106m relating to the
domicile in Ballerup. The combined ratio was 83.7
(89.1), and was only slightly impacted by weather
claims, which stood at 2.6 (8.8). The large claims
level was 4.3 (1.1) and was affected by a higher large
claims level in both Commercial and Corporate. At
7.3 (5.2), the run-off level was considerably higher,
which reflects Tryg’s solid level of provisions.
The premium level in local currencies fell by 0.1%
(-2.4%) and was affected by premiums relating to
Securator of DKK 24m.

Annual report 2014 | Tryg A/S | | Menu – Management’s review 14
Key figures – Private DKKm Q4 2014 Q4 2013 2014 2013
Gross premium income 2,249 2,290 9,051 9,366Gross claims -1,468 -1,731 -6,129 -6,596Gross expenses -337 -334 -1,311 -1,418
Profit/loss on gross business 444 225 1,611 1,352Profit/loss on ceded business -48 57 -23 -43Insurance technical interest, net of reinsurance 4 4 24 26
Technical result 400 286 1,612 1,335Run-off gains/losses, net of reinsurance 47 72 357 310
Key ratios Premium growth in local currencies -0.2 -1.7 0.0 -2.2
Gross claims ratio 65.3 75.6 67.7 70.4Net reinsurance ratio 2.1 -2.5 0.3 0.5Claims ratio, net of ceded business 67.4 73.1 68.0 70.9Gross expense ratio 15.0 14.6 14.5 15.1
Combined ratio 82.4 87.7 82.5 86.0Combined ratio exclusive of run-off 84.5 90.8 86.4 89.3Run-off, net of reinsurance (%) -2.1 -3.1 -3.9 -3.3Large claims, net of reinsurance (%) 0.0 0.4 0.1 0.1Weather claims, net of reinsurance (%) 2.6 8.0 2.5 3.2
Financial highlights 2014
• Technical result improved by DKK 277m
to DKK 1,612m (DKK 1,335m).
• Combined ratio improved by 3.5
percentage points to 82.5 (86.0).
• Gross premiums in local currencies
were unchanged (-2.2%).
• Significant reduction of the expense
ratio to 14.5 (15.1).
Private
Emphasis was on customer focus,
and this will be intensified further
in the coming years.
Lars Bonde | Group Executive Vice President, Private
Private encompasses the sale of insurance
products to private individuals in Denmark and
Norway. Sales are effected via call centres, the
Internet, Tryg’s own agents, franchisees (Norway),
interest organisations, car dealers, estate agents
and Nordea’s branches. The business area
accounts for 49% of the Group’s total premium
income.
Results
The technical result for 2014 was DKK 1,612m
(DKK 1,335m), with a combined ratio of 82.5
(86.0). The improvement was achieved mainly
through Tryg’s efficiency programme, but there
was also a positive impact from the many new
price-differentiated products in combination with
improved selection. The improved profitability,
which resulted from better pricing and selection,
meant that only limited extraordinary price increases
were implemented in 2014. Also, the claims level
was positively affected by a lower level of weather
claims and a considerably higher run-off level than in
2013. The expense ratio was reduced considerably
from 15.1 to 14.5, which was achieved concurrently
with a largely unchanged premium income.
Premiums
The development in gross premium income was
significantly improved in 2014. Premium income
was maintained, while 2013 saw a reduction
of 2.2% in local currencies. The improved
development was expected, and is the result of
many years of focusing on improving profitability. In
2014, significant efforts were directed at improving
customers’ perception of Tryg, and combined
with the fact that the prices were only increased
in line with inflation, this meant that the retention
rate was high. The increased customer focus in
combination with improved price-differentiated
products and selection had a positive impact on the
development in sales in both Denmark and Norway.
The improved price-differentiated products in
combination with improved selection have made
Tryg more attractive to profitable customers, which
will also result in a slight increase in premiums.
The development in premium income in Denmark
is still affected by the sale of small cars which
generally have more safety features. This leads
to a reduction in both premiums and claims. In
addition, competition on the Danish car market

| Menu – Management’s review 15Annual report 2014 | Tryg A/S |
When Jan Koch’s father had a stroke in
Spain last August, Tryg’s annual travel insur-
ance covered the expenses for his stay in a
private hospital and home transport, and
the Danish emergency call centre provided
extra peace of mind. “I felt safe knowing that
my father was in good hands, and I received
regular updates on the situation from a
dedicated contact at Tryg,” says Jan Koch.
Without his travel insurance, Jan Koch’s
father would have had to be treated in a
public hospital in Spain and pay for his treat-
ment. “My advice is that everyone should
take out travel insurance. It provides peace
of mind now that the yellow health card no
longer covers,” says Jan Koch. Read
more about Tryg’s annual travel insurance
at tryg.dk.
Peace of mind on holiday In 2014, public health insurance cover was reduced for travel in Europe. With Tryg’s annual travel insurance, our customers can still feel safe while on holiday.
in particular was more intense, which resulted in
a reduction of the premium level for the market
as a whole. In that connection, Tryg has been able
to capitalise on the enhanced competitiveness
achieved through the efficiency programme.
The reduction in premium income in Private in
Denmark was 1.4% (-3.8%).
Developments in Norway were affected by
competition from small market players, while the
new price-differentiated products and improved
selection also had a positive impact. Growth in
Private in Norway was 1.5% (-0.3%), and generally
developed positively throughout the year.
Claims
The gross claims ratio amounted to 67.7 (70.4), and
the claims ratio, net of ceded business, was 68.0
(70.9). The underlying improvement amounted
to 1.6 percentage points, and is attributable in
particular to the efficiency programme implemented
as well as the initial effects of the price differentiation
and improved selection. The level of weather claims
was largely unchanged, with a higher level in the
first three quarters and a considerably lower level
in Q4 relative to 2013. The expenses for weather
claims amounted to 2.5 (3.2). Run-off gains/losses
improved the combined ratio by 3.9 (3.3) and were
thus slightly higher than in 2013.
Expenses
The expense ratio was 14.5 (15.1). The expense
level was affected by the one-off effects of the
Norwegian pension scheme and the change of IT
suppliers. Adjusted for this, the expense ratio was
Financial highlights Q4 2014
• Technical result of DKK 400m
(DKK 286m).
• Combined ratio of 82.4 (87.7).
• Claims ratio, net of ceded business,
of 67.4 (73.1).
• Expense ratio of 15.0 (14.6).
15.3. The nominal expenses were considerably
reduced as a result of a reduction in staff costs as
part of the efficiency programme and continued
optimisation of the distribution costs, in particular.
The number of employees was reduced from
923 at the end of 2013 to 903 in 2014, reflecting
an increase in distribution and a reduction in
administration.
Results for Q4 2014
The technical result totalled DKK 400m (DKK 286m)
and was positively affected by a low level of
weather claims. In addition, the run-off gains
were at a lower level at 2.1 (3.1), and, all in all, the
results were positively affected by the efficiency
programme. The combined ratio was 82.4 (87.7)
in Q4 2014. Gross premiums were reduced by
0.2% (-1.7%). The retention rate in Denmark was
increased to 89.6 (89.2), while the retention rate
in Norway was 87.0 (87.2). The gross claims ratio
was 65.3 (75.6), and the claims ratio, net of ceded
business, was 67.4 (73.1). The expense ratio was
15.0 (14.6).

Annual report 2014 | Tryg A/S | | Menu – Management’s review 16
Key figures – Commercial DKKm Q4 2014 Q4 2013 2014 2013
Gross premium income 1,050 1,080 4,190 4,411Gross claims -580 -797 -2,673 -2,978Gross expenses -164 -193 -664 -820
Profit/loss on gross business 306 90 853 613Profit/loss on ceded business -39 64 8 29Insurance technical interest, net of reinsurance 3 3 14 12
Technical result 270 157 875 654Run-off gains/losses, net of reinsurance 126 76 310 265
Key ratios Premium growth in local currencies -1.8 -1.2 -3.0 -2.9
Gross claims ratio 55.2 73.8 63.8 67.5Net reinsurance ratio 3.7 -5.9 -0.2 -0.7Claims ratio, net of ceded business 58.9 67.9 63.6 66.8Gross expense ratio 15.6 17.9 15.8 18.6
Combined ratio 74.5 85.8 79.4 85.4Combined ratio exclusive of run-off 86.5 92.8 86.8 91.4Run-off, net of reinsurance (%) -12.0 -7.0 -7.4 -6.0Large claims, net of reinsurance (%) 4.2 0.3 4.3 4.5Weather claims, net of reinsurance (%) 2.6 15.7 1.9 4.5
Financial highlights 2014
• Technical result of DKK 875m
(DKK 654m).
• Combined ratio of 79.4 (85.4).
• Gross premiums reduced by 3.0% (-2.9%).
• Significant improvement of the expense
ratio to 15.8 (18.6).
Commercial
Commercial encompasses the sale of insurance
products to small and medium-sized businesses in
Denmark and Norway. Sales are effected by Tryg’s
own sales force, brokers, franchisees (Norway),
customer centres as well as through group agree-
ments. The business area accounts for 23% of
the Group’s total premium income.
Results
In 2014, Commercial continued its positive
development and improved the results significantly
relative to 2013. The technical result was improved
to DKK 875m (DKK 654m), with a combined ratio
of 79.4 (85.4).
This shows that the efforts to improve the results
in Commercial have borne fruit, and that the area
contributes positively to achieving the Group’s
objectives. The improvement in results was
achieved through both the efficiency programme
and the impact of previous profitability measures.
In addition, new price-differentiated products were
introduced in Commercial. These increased the
rate of sales and reduced the need for discounts to
adjust the price based on the risk.
It has been very important to reduce the expense
level to improve the competitive situation. Against
this background, it is very satisfactory that the
expense ratio has been reduced to 15.8 (18.6),
which was achieved concurrently with a reduction
of the premium level. Adjusted for one-off effects
related to the Norwegian pension scheme and the
change of IT suppliers, the expense ratio was 16.9.
Premiums
A combined fall in premium income of 3.0%
(-2.9%) was realised, when measured in local
currencies. The largely unchanged development
comprised a reduction in the Danish business of
4.5% and growth in the Norwegian business of
0.6%. The reduction in Denmark is attributable to
the important measures implemented in previous
years as well as the fact that the smaller Danish
companies are still struggling financially.
The growth in the Norwegian business has
been achieved through, among other things, a
significant increase in sales from the franchise
distribution channel, which is attributable to a
number of factors, including sales and service
training for commercial products. The change
in the setup of Commercial and Corporate led
to an increase in premiums of approximately
DKK 900m. The new additions have now been fully
integrated and included in Commercial’s service
concepts. Similarly, the acquisition of the renewal
Integration of customers from Cor-
porate and an acquired agricultural
portfolio were important focus areas.
Trond Bøe Svestad | Group Executive Vice President, Commercial

| Menu – Management’s review 17Annual report 2014 | Tryg A/S |
Back to work in no time Anja Holt’s claim was processed smoothly and quickly, which meant that she was able to get back to work soon after suffering a slipped disc.
When Anja Holt suffered a slipped disc, her
Norwegian employer’s treatment insurance
with Tryg provided cover. “I was treated by
the best experts, which ensured that I was
quickly back on my feet,” says Anja Holt.
The treatment insurance guarantees short
treatment times and covers, among other
things, costs relating to diagnosis, surgery
and rehabilitation. For Anja, the insurance
ensured that she was able to get back to
work quickly. In addition to easing Anja’s dis-
comfort, the short treatment time minimised
the loss suffered by her employer. “The time
from reporting the injury to the operating
table was very short, and I was back at work
after only six weeks. This meant that my
employer did not have to manage without
me for long,” says Anja Holt.
Financial highlights Q4 2014
• Technical result of DKK 270m
(DKK 157m).
• Combined ratio of 74.5 (85.8).
• Claims ratio, net of ceded business,
of 58.9 (67.9).
• Expense ratio of 15.6 (17.9).
right for Codan’s agricultural portfolio progressed
very satisfactorily with considerable positive
support and full integration in Commercial.
The retention rate improved significantly to 87.0
(86.1) in 2014 in the Danish part of Commercial,
while the Norwegian part saw a small improve-
ment to 87.8 (87.6).
For Commercial, improving sales is thus the
most important factor for improving premium
development.
Claims
The gross claims ratio amounted to 63.8 (67.5),
and the claims ratio, net of ceded business, was
63.6 (66.8). The low level is attributable to both the
historic profitability measures, the implementation
of price-differentiated products and the efficiency
programme. The level of weather claims was 1.9
(4.5), and was positively affected by mild winter
weather in Q4 in both Denmark and Norway.
At 4.3 (4.5), the level of large claims was largely
unchanged relative to 2013, while the run-off level
was somewhat higher at 7.4 (6.0).
Expenses
The expense ratio was 15.8 (18.6), and adjusted
for one-off effects related to the Norwegian
pension scheme and the change of IT suppliers,
the expense ratio was 16.9. This development is
very satisfactory and was achieved by means of the
efficiency programme and structural adjustments
in the Commercial organisation. This comprises,
among other things, changes in the distribution
structure and synergies in connection with the
integration of the business transferred from
Corporate. Reducing the expense level will continue
to be an important focus area for Commercial in the
coming years, which will contribute to improving
competitiveness and supporting the Group’s
expense ratio reduction target.
Results for Q4 2014
A technical result of DKK 270m (DKK 157m) was
posted, and this was primarily affected by milder
weather in Q4, a high level of large claims and a
high level of run-off gains.
The combined ratio was 74.5 (85.8), and was
affected by the lower level of weather claims, a
higher level of large claims and a high run-off level.
Gross premiums fell by 1.8% (-1.2%) in Q4, which
was a positive development relative to 2014 as a
whole. The retention rate in Denmark was 87.0
(86.1), while it was 87.8 (87.6) in Norway. The
gross claims ratio was 55.2 (73.8), the claims ratio,
net of ceded business, was 58.9 (67.9), and the
expense ratio was 15.6 (17.9).
Annual report 2014 | Tryg A/S | | Menu – Management’s review 18
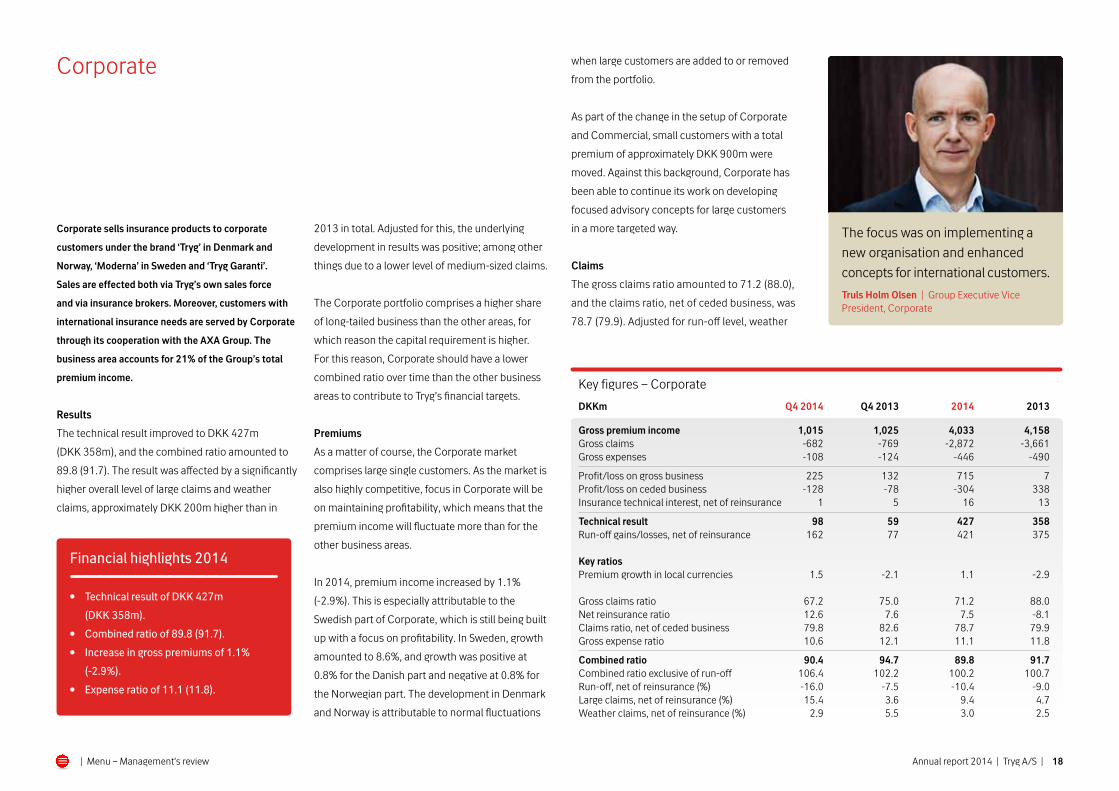
Key figures – Corporate DKKm Q4 2014 Q4 2013 2014 2013
Gross premium income 1,015 1,025 4,033 4,158Gross claims -682 -769 -2,872 -3,661Gross expenses -108 -124 -446 -490
Profit/loss on gross business 225 132 715 7Profit/loss on ceded business -128 -78 -304 338Insurance technical interest, net of reinsurance 1 5 16 13
Technical result 98 59 427 358Run-off gains/losses, net of reinsurance 162 77 421 375
Key ratios Premium growth in local currencies 1.5 -2.1 1.1 -2.9
Gross claims ratio 67.2 75.0 71.2 88.0Net reinsurance ratio 12.6 7.6 7.5 -8.1Claims ratio, net of ceded business 79.8 82.6 78.7 79.9Gross expense ratio 10.6 12.1 11.1 11.8
Combined ratio 90.4 94.7 89.8 91.7Combined ratio exclusive of run-off 106.4 102.2 100.2 100.7Run-off, net of reinsurance (%) -16.0 -7.5 -10.4 -9.0Large claims, net of reinsurance (%) 15.4 3.6 9.4 4.7Weather claims, net of reinsurance (%) 2.9 5.5 3.0 2.5
Financial highlights 2014
• Technical result of DKK 427m
(DKK 358m).
• Combined ratio of 89.8 (91.7).
• Increase in gross premiums of 1.1%
(-2.9%).
• Expense ratio of 11.1 (11.8).
Corporate
The focus was on implementing a
new organisation and enhanced
concepts for international customers.
Truls Holm Olsen | Group Executive Vice President, Corporate
2013 in total. Adjusted for this, the underlying
development in results was positive; among other
things due to a lower level of medium-sized claims.
The Corporate portfolio comprises a higher share
of long-tailed business than the other areas, for
which reason the capital requirement is higher.
For this reason, Corporate should have a lower
combined ratio over time than the other business
areas to contribute to Tryg’s financial targets.
Premiums
As a matter of course, the Corporate market
comprises large single customers. As the market is
also highly competitive, focus in Corporate will be
on maintaining profitability, which means that the
premium income will fluctuate more than for the
other business areas.
In 2014, premium income increased by 1.1%
(-2.9%). This is especially attributable to the
Swedish part of Corporate, which is still being built
up with a focus on profitability. In Sweden, growth
amounted to 8.6%, and growth was positive at
0.8% for the Danish part and negative at 0.8% for
the Norwegian part. The development in Denmark
and Norway is attributable to normal fluctuations
when large customers are added to or removed
from the portfolio.
As part of the change in the setup of Corporate
and Commercial, small customers with a total
premium of approximately DKK 900m were
moved. Against this background, Corporate has
been able to continue its work on developing
focused advisory concepts for large customers
in a more targeted way.
Claims
The gross claims ratio amounted to 71.2 (88.0),
and the claims ratio, net of ceded business, was
78.7 (79.9). Adjusted for run-off level, weather
Corporate sells insurance products to corporate
customers under the brand ‘Tryg’ in Denmark and
Norway, ‘Moderna’ in Sweden and ‘Tryg Garanti’.
Sales are effected both via Tryg’s own sales force
and via insurance brokers. Moreover, customers with
international insurance needs are served by Corporate
through its cooperation with the AXA Group. The
business area accounts for 21% of the Group’s total
premium income.
Results
The technical result improved to DKK 427m
(DKK 358m), and the combined ratio amounted to
89.8 (91.7). The result was affected by a significantly
higher overall level of large claims and weather
claims, approximately DKK 200m higher than in

Annual report 2014 | Tryg A/S | | Menu – Management’s review 19| Menu – Management’s review
During the cloudburst in August 2014, twice
as much rain fell on Copenhagen as in the
cloudburst in July 2011. Nevertheless, Tivoli’s
loss was only one third of that suffered in 2011,
which was the result of preventive measures
initiated by Tivoli and Tryg that year.
“After the cloudburst in 2011, we teamed
up with Tryg to prepare an emergency plan
and implement preventive measures to
ensure that we are fully prepared for such
cloudbursts,” says Mogens Ramsløv, Vice
President of Tivoli.
Tryg and Tivoli prevent cloudburst damage After the cloudburst in Copenhagen in 2011, Tivoli suffered a double-digit million kroner loss. The preventive measures proved their worth when a cloudburst hit again in 2014.
Financial highlights Q4 2014
• Technical result of DKK 98m (DKK 59m).
• Combined ratio of 90.4 (94.7).
• Claims ratio, net of ceded business, of
79.8 (82.6).
• Expense ratio of 10.6 (12.1).
claims and large claims, the claims ratio, net of
ceded business, was significantly better than in
2013, which underlines the profitability focus
in Corporate. However, at the same time, it
must be concluded that the claims level for the
Swedish part was less satisfactory towards the
end of the year.
Providing advice on risks is an integral part of
Corporate’s advisory concept, and this has been
extended further in recent years, which has had
a positive impact on the claims level.
Expenses
The expense ratio was 11.1 (11.8), and adjusted
for one-off effects related to the Norwegian
pension scheme and IT operating expenses,
the expense ratio was 11.6.
The development in the expense level is
satisfactory viewed in the context of the efforts
to improve competitiveness and the financial
results. The coming years will see a focus on
streamlining the handling of large customers even
more and reducing the expense level further.
The number of employees was reduced from 365
at the end of 2013 to 279 at the end of 2014. Of
this, approximately 60 positions were moved in
connection with the new division of Corporate
and Commercial.
Results for Q4 2014
The technical result was DKK 98m (DKK 59m),
and the combined ratio was 90.4 (94.7). The
improved result is especially attributable to the
claims level, but also to a significantly lower
expense level.
Gross premiums rose by 1.5% (-2.1%) in Q4,
almost corresponding to the level for the full year.
The claims level was 67.2 (75.0), and the claims
ratio, net of ceded business, was 79.8 (82.6) and
was affected by both a high level of large claims
and a high run-off level.
Also, the claims ratio reflected a good underlying
improvement, adjusted for run-off, large claims
and weather claims. The expense ratio was
10.6 (12.1), which was a satisfactory low level,
underlining Corporate’s focus on having a
competitive expense level.

Annual report 2014 | Tryg A/S | | Menu – Management’s review 20
Key figures – Sweden DKKm Q4 2014 Q4 2013 2014 2013
Gross premium income 338 348 1,399 1,587Gross claims -252 -250 -998 -1,178Gross expenses -75 -67 -268 -280
Profit/loss on gross business 11 31 133 129Profit/loss on ceded business -5 10 -21 9Insurance technical interest, net of reinsurance 1 3 6 11
Technical result 7 44 118 149Run-off gains/losses, net of reinsurance 3 22 43 20
Key ratios Premium growth in local currencies 1.6 -10.6 -7.4 -4.9
Gross claims ratio 74.6 71.8 71.3 74.2Net reinsurance ratio 1.5 -2.9 1.5 -0.6Claims ratio, net of ceded business 76.1 68.9 72.8 73.6Gross expense ratio 22.2 19.3 19.2 17.6
Combined ratio 98.3 88.2 92.0 91.2Combined ratio exclusive of run-off 99.2 94.5 95.1 92.5Run-off, net of reinsurance (%) -0.9 -6.3 -3.1 -1.3Weather claims, net of reinsurance (%) 1.5 2.3 1.5 1.4
Financial highlights 2014
• Technical result of DKK 118m (DKK
149m).
• Combined ratio of 92.0 (91.2).
• Gross premiums reduced by 7.4% (-4.9%)
as a result of the termination of the
agreement with Nordea.
• Expense ratio of 19.2 (17.6).
Sweden
Sweden comprises the sale of insurance products
to private customers under the ‘Moderna’ brand.
Moreover, insurance is sold under the brands
Atlantica, Bilsport & MC, Securator and Moderna
Djurförsäkringar. Sales are effected via Tryg’s own
salespeople, call centres and the Internet. The
business area accounts for 7% of the Group’s total
premium income.
Results
The results of this business area have improved
significantly in recent years. The combined
ratio for 2014 was largely at the same level as
in 2013, and was achieved in a year which saw
an expected gradual reduction of the Nordea
portfolio as a result of terminating the partner
agreement in Sweden. In 2014, the cooperation
with Danske Bank in Sweden was gradually
expanded, and new, small portfolios were
acquired. In addition, the important agreement
with Elkjöp on product insurance distribution
has been extended. At the same time, significant
structural measures were also implemented in
2014 with regard to distribution, as a result of
which the call centre in Luleå was closed, with
only one call centre remaining based in Malmö.
The technical result was DKK 118m (DKK 149m).
This was achieved through a continued focus
on profitability within the broad private market
and the usual sound results in the niche areas
comprising leisure boats, motorcycles and
product insurance.
Premiums
Premium income was reduced by 7.4%
(-4.9%). This reduction was primarily due to
the mentioned termination of the partner
agreement with Nordea, just as the number of
partner agreements in general was reduced,
including ICA and Villaägerne (The house
owners) in Sweden, to ensure profitability.
This development was countered through the
continued development of the cooperation with
Danske Bank and the acquisition of the company
Securator, which is a market-leading provider
of extended guarantee insurance for electronic
equipment in Denmark, as well as the acquisition
of a small portfolio within insurance for pets.
Towards the end of the year, it could be con-
cluded that the level of sales was now generally
higher than before the agreement with Nordea
was terminated. This was achieved through the
establishment of one call centre in Malmö.
Cross-selling, automatic claims
handling and the integration of
Securator were focus areas.
Per Fornander | Group Executive Vice President, Sweden

| Menu – Management’s review 21Annual report 2014 | Tryg A/S |
Financial highlights Q4 2014
• Technical result of DKK 7m (DKK 44m).
• Combined ratio of 98.3 (88.2).
• Claims ratio, net of ceded business,
of 76.1 (68.9).
• Expense ratio of 22.2 (19.3).
Claims
The gross claims ratio amounted to 71.3 (74.2), and
the claims ratio, net of ceded business, was 72.8
(73.6). The largely unchanged claims ratio, net of
ceded business, is satisfactory and positively affected
by the gradual reduction of the Nordea portfolio,
while it is negatively affected by a few mid-sized
claims and an increasing claims frequency within
contents insurance. Claims handling in Moderna is
characterised by a high degree of efficiency, and the
introduction of automatic claims handling without
claims handlers continues. The claims handling is
determined by the type of claim, the customer’s
claims history and a number of other factors. Tryg
sees great potential in this kind of claims handling for
the Group as a whole. This is also a very efficient form
of claims handling for customers, as a large portion
of claims are registered and finalised on the same
day, which results in high customer satisfaction and a
positive effect on the claims level.
Run-off amounted to 3.1% (1.3%), which reflects
that the Swedish part of the business has now also
built a solid reserve position.
Expenses
The expense ratio was 19.2 (17.6), or 18.8
excluding one-off effects. The higher expense level
is related to the reduction in premium income.
It was expected that the expense ratio would
increase, as it was not possible to adapt to a
considerably lower premium level in the short term.
Accordingly, in the coming years, initiatives will be
implemented to ensure a reduction in expenses.
The centralisation of customer service and
telemarketing in Malmö was completed in 2014,
which means that the corresponding function in
Luleå has now finally been closed.
Results for Q4 2014
The technical result was DKK 7m (DKK 44m),
and the combined ratio was 98.3 (88.2).
Gross premiums increased by 1.6% in Q4 and were
positively affected by the inclusion of the premium
income from Securator. Securator accounted for
DKK 24m in Q4.
The claims ratio was 74.6 (71.8), and the claims
ratio, net of ceded business, was 76.1 (68.9). The
higher claims ratio compared to the same period in
2013 is attributable to a lower level of run-off gains
and the run-off gains achieved in Q4 2013 on the
provisions made during the year.
The expense ratio was 22.2 (19.3), and the number of
employees was increased from 356 to 382. Excluding
employees associated with the portfolios acquired,
the number of employees was reduced by 22.

Annual report 2014 | Tryg A/S | | Menu – Management’s review 22
Key figures – investments DKKm Q4 2014 Q4 2013 2014 2013
Free portfolio, gross return 154 283 548 891Match portfolio, regulatory deviation and performance 39 38 181 40Other financial income and expenses -180 -167 -369 -343
Total investment return 13 154 360 588
Financial highlights 2014
• Investment return of DKK 360m
(DKK 588m).
• Return on match portfolio of DKK 181m
(DKK 40m).
• Gross return on free portfolio of DKK
548m (DKK 891m).
Investment activities
The purpose of the investment activities is
primarily to support the insurance business
by minimising the impact of interest and
exchange rate fluctuations and by managing
the investments in the best possible way while
taking account of market risk and capital use.
At 31 December 2014, the investment portfolio
totalled DKK 41.9bn. The investment portfolio is
divided into a match portfolio and a free portfolio
of DKK 29.5bn and DKK 12.4bn, respectively.
The sole purpose of the match port-folio is to
hedge fluctuations in the discounting of insurance
provisions and thus reduce the interest rate risk
attaching to Tryg’s claims provisions. In addition
to transferring the change in the value of the
commitments, the match portfolio will also
provide interest on the provisions to transfer
insurance technical interest. The free investment
portfolio generally corresponds to equity and is
invested in bonds, real estate and equities.
Another purpose of the investment activities is to
reduce the impact of exchange rate fluctuations.
This is done by means of hedging, which in terms
of expenses is included under other financial
income and expenses.
Hedging covers the currency risk in the Norwegian
and Swedish branches, and especially towards
the end of 2014, it protected against fluctuations
due to a significant drop in the Norwegian krone.
Without this hedging, which relates to Tryg's equity
and intercompany balances, equity in 2014 would
be approximately DKK 260m lower.
Financial markets in 2014
Activity in the global economy gradually gained
momentum in the course of 2014, especially in
the USA and the UK. However, growth in Europe
was a little more restrained, while the Chinese
and Japanese economies also slowed down. The
central banks also had a bearing on the agenda
in 2014. While the American central bank cut
back its monetary easing by reducing its monthly
acquisition of bonds, the European central bank
eased its monetary policy on several occasions
to boost the economy. In the Nordic countries,
the Norwegian central bank’s interest rate cut
was particularly noteworthy, and was primarily
driven by the marked fall in oil prices. The
general impression of 2014 is a global economy
with historically low inflation, interest rates and
commodity prices plus growth which is still low
and which is primarily being driven by America.
The uncertainty in the financial markets has
primarily been due to one-off events such
as Russia’s annexation of the Crimea, the
demonstrations in Hong Kong and the new
tensions in the Middle East.
Investment return 2014
The investment return was affected by both
positive equity and credit markets and falling
interest rates as well as good performance.
The return on the free portfolio was DKK 548m,
while the return on the match portfolio was
DKK 181m. After financial income and expenses
of DKK -369m, the total investment return
amounted to DKK 360m.
The result of the match portfolio comprises
performance of DKK 104m and a regulatory
deviation of DKK 77m. The positive performance
was primarily due to the selected local bonds
doing well relative to the local market.
The regulatory deviation is explained by the fact
that the commitments are primarily calculated on
the basis of euro swaps, while hedging is local. The
difference between euro swaps and Norwegian
swaps, in particular, explains most of the regulatory
deviation. The interest rate difference between, for
example, the two-year European and Norwegian

Annual report 2014 | Tryg A/S | | Menu – Management’s review 23
Return – free portfolio Return Return (%) Return Return (%) Investment assetsDKKm Q4 2014 Q4 2014 2014 2014 31.12.2014 31.12.2013 Government bonds 9 3.3 15 4.7 279 501Covered bonds 24 0.5 78 1.6 5,188 4,736Emerging market bonds -3 -0.6 23 5.9 410 387High-yield bonds 4 0.5 35 5.2 910 802Other a) -5 -0.5 17 1.4 1,085 1,944
Interest rate and credit exposure 29 0.4 168 2.1 7,872 8,370
Equity exposure 75 3.2 250 10.0 2,470 2,966
Investment property 50 2.4 130 6.4 2,099 2,022
Total gross return 154 1.2 548 4.4 12,441 13,358
a) Bank deposits and derivative financial instruments hedging interest rate risk and credit risk.
Return – match portfolio Return ReturnDKKm Q4 2014 2014
Return, match portfolio 340 1,336Value adjustments, changed discount rate -217 -741Transferred to insurance technical interest -84 -414
Match, regulatory deviation and performance 39 181
Hereof: Match, regulatory deviation 31 77Match, performance 8 104
swap rates is now only 1 percentage point, which is
the lowest level since 2009.
In addition, the development in the financial
markets resulted in positive returns on equities,
credit exposure and the bond position in the
free portfolio. The return was DKK 548m,
corresponding to 4.4% on the average invested
capital for the period. The return on Tryg’s equity
portfolio was DKK 250m, or 10.0%. The reduction
of the interest rate level in 2014 combined with the
positive return on high-yield bonds and emerging
market bonds resulted in a return of DKK 168m,
or 2.1%. Real estate investments contributed
positively with DKK 130m. The value of the
properties in Norway increased slightly, while the
situation is largely unchanged in Denmark.
Other financial income and expenses
Other financial income and expenses totalled
DKK -369m in 2014. This item comprises a
Financial highlights Q4 2014
• Investment return of DKK 13m
(DKK 154m).
• Return on match portfolio of DKK 39m
(DKK 38m).
• Return on free portfolio of DKK 154m
(DKK 283m).
• Write-down of owner-occupied property
of DKK 106m.
number of elements, of which the largest are the
expense relating to Tryg’s hedging of the currency
risk of DKK 95m, as mentioned above, and the
expenses relating to Tryg’s subordinate loan of
DKK 90m. The value of Tryg’s domicile in Ballerup
was wrote down by DKK 106m.
Investment activities in Q4 2014
The gross return on Tryg’s free investment
portfolio in Q4 was DKK 154m. The return on
the bond portfolio was DKK 29m for the quarter,
while the equity portfolio contributed a return of
DKK 75m. The return on the real estate portfolio
was DKK 50m.
The match portfolio yielded a positive regulatory
deviation of DKK 31m in Q4 2014 after transfer to
insurance, while the result of match performance
was DKK 8m.
After other financial income and expenses of
DKK 180m, the total return on Tryg’s investment
activities was DKK 13m in Q4.

| Menu – Management’s review 24Annual report 2014 | Tryg A/S |
The main concept of insurance is that of spreading
risk. By pooling risks from a large number of cus-
tomers, an insurance company’s risks are spread
more evenly and are also more predictable, there-
by reducing the capital required to cover negative
fluctuations. The assessment and management of
Tryg’s aggregate risk and the associated capital re-
quirements therefore constitute a central element
in the management of an insurance company.
Risk profile and appetite
Tryg’s Supervisory Board defines the framework for
the company’s target risk appetite and thereby also
the capital which must be available to cover any
losses. The risk appetite is described in Tryg’s pol-
icies via exposure limits for different types of risk.
The fundamental insurance risk is managed via
limits for the size of single large commitments and
via the use of reinsurance, thereby limiting the
maximum cost of large claims, expenses due to a
storm, cloudburst or other event which affects a
number of insurance customers simultaneously.
Moreover, the insurance risk is managed through
geographical limitations and by refraining from
offering certain types of insurance such as aviation
and marine insurance. Operating within these
limits, Tryg’s risk will depend on the company’s
choice of exposure within different segments and
industries in the insurance market.
Another example of the operationalisation of risk ap-
petite is the management of the investment risk via
exposure limits within different asset classes (shares
and property etc.) and the management of the total
interest risk via Tryg’s match strategy. This prescribes
that Tryg’s investment assets corresponding to the
technical provisions must be invested in interest-
bearing assets, the interest rate sensitivity of which
precisely matches and thereby hedges the interest
rate sensitivity of the discounted provisions.
Good risk management requires, among other
things, the ongoing identification and quantifi-
cation of risk factors, subsequent reduction of
undesired risks and the reporting of the whole risk
scenario. The quantification consists, among other
things, of a calculation of the capital requirements
and, against this background, an annual review is
made of the framework for Tryg’s risk appetite.
To support the work with risk management, the
Supervisory Board has appointed a special Risk
Committee, whose task is to focus on the Board’s
Capital and risk management

Annual report 2014 | Tryg A/S | | Menu – Management’s review 25
Capital
DKKm
10,000
8,000
6,000
4,000
2,000
0
Capital requrement Bu�er
Individual Solvency Solvency II a)
6,560
3,378
8,276
1,662
responsibility in terms of capital and risk
management.
Capital requirement and management
Capital management is based on Tryg’s internal
capital model. The capital model is based on the
risk profile, and thus takes account of the compo-
sition of the insurance portfolio, the geographical
spread, the provision profile, the reinsurance
programme, the investment portfolio and Tryg’s
profitability in general. The model calculates the
statutory capital requirement (Individual Solvency
Requirement) with a 99.5% certainty level, such
that Tryg would statistically be able to honour
claims in 199 out of 200 years.
At the end of 2014, the Individual Solvency Re-
quirement totalled DKK 6,560m (DKK 6,366m in
2013). The capital required to meet the Individual
Solvency Requirement is called the adequate
capital base. At the end of 2014, this totalled DKK
9,938m after dividend, corresponding to a surplus
cover of DKK 3,378m or 51%.
The Supervisory Board regularly assesses the need
for capital adjustments. In practice, extraordinary
adjustments are made through share buy backs.
The assessments are made in the company’s capital
plan, in which the Individual Solvency Requirement
is projected on the basis of Tryg’s budgets. The
projection is partly based on whether it will accom-
modate the initiatives addressed in the company’s
strategy for the coming three years, and also on the
most significant risks from the company’s risk iden-
tification. Adequacy is measured in relation to Tryg’s
strategic targets (including in respect of return on
equity and capital buffer) and its dividend policy.
Against the background of the expected satisfactory
results for 2014 and the solid capital position, a de-
cision was made in November 2014 to implement
an extraordinary share buy back totalling DKK 1bn.
The share buy back takes place between 2 January
2015 and the end of the year. Moreover, at the an-
nual general meeting to be held on 25 March 2015,
the Board will propose that dividend of DKK 29 per
share be paid, corresponding to the distribution of
DKK 1,731m. Looking ahead, Tryg has decided to
start paying dividend twice a year, the first time be-
ing in connection with the half-year report 2015.
In conjunction with the capital plan, a contingency
plan has been prepared which describes specific
measures that may be introduced in the short
term, should the company’s desired capital posi-
tion be threatened. Both the capital plan and the
contingency plan have been approved by Tryg’s
Supervisory Board.
Tryg’s capital base consists of equity and subordinate
loan capital. The relative sizes of these two categories
are subject to ongoing assessment with a view to
maintaining an optimum structure which takes ac-
count of the target return on equity, the capital costs
and the desired financial flexibility. In 2015, this will
be reassessed in connection with the refinancing of
Tryg’s subordinate loan of EUR 150m. This refinan-
cing will take the future Solvency II rules into account.
At the end of 2014, Tryg’s total subordinate loan
capital amounted to 16% of equity, with total inter-
est expenses of DKK 90m. Read more about
Tryg’s subordinated loan in Note 1 on page 47.
Towards Solvency II
The coming European solvency rules, Solvency II,
will enter into force on 1 January 2016.
Under Solvency II, a company is allowed to calcu-
late its capital requirement using an internal model
approved by the Financial Supervisory Authority.
Tryg expects its internal model to be approved so
that it can continue to be used by the company. If
the approval process takes longer than expected,
it will be necessary to use the Solvency II standard
model for a period, which will result in a lower
solvency surplus.
When Solvency II enters into force, the concept
of ‘adequate capital base’ will be replaced by the
Solvency II concept of ‘own funds’. There are still
some unresolved issues as to the interpretation of
this capital calculation method, which may have a
significant impact on Tryg’s capital situation. The
capital elements still to be clarified are:
a) Tryg’s expectations as regards the future Solvency II standard model are based on the Danish Financial Supervisory Authority’s revised Executive Order on Solvency and Operating Plans for Insurance Companies which came into force on 1 January 2014.
• Norwegian Natural Perils Pool, which may have
a negative effect of DKK -1 to 0bn. Tryg expects
that Norwegian Natural Perils Pool will still
be available as a tier 2 capital element when
Solvency II has entered into force.
• Norwegian warranty provision, which may
have a negative effect of DKK -0.2 to 0bn. Tryg
expects that the warranty provision will still be
available as a tier 1 or tier 2 capital element
under Solvency II.
• The Solvency II assessment of premium provi-
sions will contribute positively with DKK 0.5 to
0.7bn to the own funds statement (expected
future profit).
• An increased possibility for raising subordinate
loan capital amounts from DKK 1.5 to 2.5bn.
Tryg thus expects an overall positive capital effect
in connection with the transition to Solvency II.
The Solvency II provisions also introduce a require-
ment for an Own Risk and Solvency Assessment
(ORSA). Tryg has for several years prepared ORSA
reports, which assess the general risk scenario
and propose improvements. In 2014, such a risk
assessment was also carried out and considered
by the company’s day-to-day management and
Supervisory Board, which are consequently enter-
ing 2015 with a fully updated view of Tryg’s risk
profile. Read more about Tryg’s risk manage-
ment in Note 1 on page 47.
Standard & Poor’s
In 2014, Tryg achieved an ‘A-’ rating from the credit
rating agency Standard & Poor’s, and aims to
maintain this rating.

Annual report 2014 | Tryg A/S | | Menu – Management’s review 26
Free �oat – geographical distribution
Denmark
UK
USA
Nordic region
Others
At 31 December 2014
52
14
14
14
6
Per cent
Shareholders
60
9
14
17
Per cent
At 31 December 2014
TryghedsGruppen
Large Danish shareholders a)
Large international shareholders a)
Small shareholders
a) Shareholders holding more than 10,000 shares. Free float is excluding TryghedsGruppen.
Tryg is a listed company, and it is important that
decisions to invest in the Tryg share can be made
on an informed basis. A high priority is therefore
given to having an open and ongoing dialogue with
shareholders, analysts and other stakeholders.
Investor Relations (IR) is responsible for communi-
cation with the equity market as well as for contact
to rating agencies and bond investors.
After publication of interim and annual reports,
Tryg’s management and IR hold investor meetings
to discuss the company’s development with inves-
tors and analysts. In addition, Tryg participates in a
number of financial conferences. In 2014, investor
meetings were held in the financial centres in
Europe, the USA, Canada and Asia.
The Tryg share is followed closely by 21 analysts,
who continuously update their expectations for and
views on the share. See a list of analysts and their
recommendations of Tryg at tryg.com > Investor.
The Tryg share
The Tryg share is listed on NASDAQ Copenhagen
and is covered by the C20 index (OMX C20 CAP),
comprising the 20 most traded shares on the
exchange. In accordance with the recommenda-
tions issued by NASDAQ Copenhagen, Tryg does
not comment on financial results or outlook two
weeks before the publication of interim reports
and four weeks before the publication of the
annual report. All financial information is published
on tryg.com in both Danish and English. It is pos-
sible to subscribe to interim and annual reports,
news and RSS feeds on the website. It is also
possible to follow @Tryg IR on Twitter.
In 2014, the Tryg share rose from 524.5 to 689.0.
Including a dividend of DKK 27 per share, the share
rose by 36.5% (31.4% excluding dividend). By com-
parison, the OMX C20 CAP index rose by 20.9% in
2014, while the index of insurance shares in Europe,
Euro STOXX Insurance, rose by 9.8%.
NASDAQ in Copenhagen is still the primary ex-
change where most of the trading in the Tryg share
takes place. In 2014, NASDAQ Copenhagen ac-
counted for 50% of the turnover of the Tryg share.
In addition, 15% of trading in 2014 was carried
out on alternative exchanges (MTF trades), led by
BATS Chi-X as the largest alternative exchange. This
means that NASDAQ and the alternative exchanges
account for two-thirds of the trading that impacts
the liquidity of the share, and thereby determines
the price of the Tryg share. Other trading platforms
such as OTC (over-the-counter) and dark pools
represent a large share of the remaining trade, but
it takes place outside of the established exchanges
and MTFs and thus does not have a direct impact
on the price of and the liquidity in the share.
In 2014, shares totalling DKK 1bn, corresponding
to approximately 1.8 million shares, were repur-
chased. This had a positive impact on the turnover
of the Tryg share. The total turnover (including
OTC trades) of the share increased from 43 million
shares in 2013 to 49 million shares in 2014.
Share capital and ownership
Tryg had a total share capital of DKK 1,492,387,900
on 31 December 2014. This comprised one share
class (59,695,516 shares with a nominal value
of DKK 25), and all shares rank pari passu. The
majority shareholder, TryghedsGruppen smba,
Denmark, owns 60% of the shares and is the only
shareholder owning more than 5% of the share
capital. TryghedsGruppen invests in peace-of-mind
and healthcare providers in the Nordic region, and
supports non-profit-making activities.
At Tryg’s annual general meeting on 25 March
2015, it will be proposed to split each share of
DKK 25 into five shares of DKK 5. The reason for
this is that the Tryg share has seen a positive de-
velopment, bringing the price up to more than DKK
600, which makes it the second-most expensive
share in the C20 index. In addition, the share split
is expected to increase the liquidity of the share.
At the end of 2014, there was a free float of 40% of
the shares, divided among approximately 27,000
registered shareholders. The 200 largest share-
holders owned 89% of the shares.
At the end of 2014, and after the share buy back
programme, Tryg held 1,871,579 own shares,
corresponding to 3.1% of the share capital. At the
coming annual general meeting, the Supervisory
Board will propose to cancel the repurchased shares.
Shareholder information

Annual report 2014 | Tryg A/S | | Menu – Management’s review 27
Financial calendar 2015
25 March 2015 Annual general meeting
26 March 2015 Tryg shares trade ex-dividend
30 March 2015 Payment of dividend based on
annual results 2014
15 April 2015 Interim report for Q1 2015
10 July 2015 Half-year report 2015
13 July 2015 Tryg shares trade ex-dividend
15 July 2015 Payment of dividend based on
half-year results 2015
9 October 2015 Interim report for Q1-Q3 2015
Distribution
DKKm 2014a) 2013 2012 2011 2010
Dividend 1,731 1,656 1,594 400 256Dividend per share (DKK) 29 27 26 6.52 4Payout ratio 68% 70% 72% 35% 43%Extraordinary share buy back 1,000 1,000 800 0 0
a) Dividend proposed by the Supervisory Board for adoption by the annual general meeting.
The Supervisory Board encourages all shareholders to participate at the annual general meeting, where they have the opportunity to ask questions to the Chairman of the Supervisory Board and the Group CEO.
Semi-annual dividend from 2015
In connection with Tryg’s Capital Markets Day in
November 2014, it was announced that the Super-
visory Board has decided to pay out semi-annual
dividend from the second half of 2015. This means
that the next payout in March 2015 will be based
on the profit for 2014, after which time all future
payouts will be based on the half-year results.
Tryg’s dividend policy aims to achieve stability in
the distribution on a full-year basis. The dividend
policy reflects our expectations of high earnings
in the insurance business and a low risk profile
within the investment activities, as well as the
requirement to have a solid capital position
based on Tryg’s internal capital model (Individual
Solvency). Tryg’s internal capital model provides
the framework for the company’s capital require-
ment until this is replaced by the Solvency II rules.
Tryg’s dividend policy is based on the following
assumptions:
• A general objective of creating long-term value
for the company’s shareholders.
• A competitive dividend policy in comparison
with those of our Nordic competitors.
• Distribution of 60-90% of the profit after tax.
• Aspiration to distribute a dividend which is steadily
increasing in nominal terms on a full-year basis.
• The capital level must at all times reflect the
return on equity targets and the statutory
capital requirements.
• The capital level may extraordinarily be
adjusted through a share buy back.
Based on Tryg’s dividend policy and the satisfactory
2014 results, the Supervisory Board will propose
a dividend of DKK 29 per share, corresponding to
DKK 1,731m, at the 2015 annual general meeting.
This corresponds to payment of 68% of the profit
after tax.
In connection with the Capital Markets Day, it was
announced that it had been decided to initiate an
extraordinary share buy back of DKK 1bn starting
on 2 January 2015. This decision was made against
the background of Tryg’s solid capital position and
expected earnings.
Annual general meeting
Tryg’s annual general meeting will be held on
25 March 2015 at 14:00 at Falkoner Centret,
Falkoner Allé 9, 2000 Frederiksberg, Denmark.
The notice will be advertised in the daily press in
February 2015 and will be sent to shareholders,
if requested. The annual general meeting will
also be announced on tryg.com.
The company announcements issued in 2014
are available at tryg.com > Investor > News.
Annual report 2014 | Tryg A/S | | Menu – Management’s review 28
Tryg focuses on managing the company in accordance
with the principles for good corporate governance
and generally complies with the recommendations.
The Danish recommendations have been prepared by
the Committee on Corporate Governance and most
recently updated in 2014. The Recommendations
on Corporate Governance can be found at corpo-
rategovernance.dk. At tryg.com, Tryg has published
the statutory corporate governance report based on
the ‘comply or explain’ principle for each individual
recommendation. This section on corporate govern-
ance is an excerpt of the corporate governance report.
Download Tryg’s statutory corporate governance
report at tryg.com > Investor > Download.
Dialogue between Tryg, shareholders
and other stakeholders
The Investor Relations (IR) department main-
tains regular contact with analysts and inves-
tors. Together with the Executive Management,
Investor Relations organises investor meetings and
conference calls and participates in conferences in
Denmark and abroad. IR also communicates with
stakeholders in the social media via Twitter@TrygIR.
The Supervisory Board (Board) is informed of the
dialogue with investors and other stakeholders
on a regular basis. In November 2014, Tryg held
a Capital Markets Day for analysts, investors and
journalists, where among other things, new finan-
cial targets and customer targets for the period up
to 2017 were presented.
Tryg has adopted an Investor Relations policy which
states, among other things, that all company an-
nouncements and financial statements are published
in Danish and English and that Tryg publishes interim
financial statements each quarter. Moreover, Tryg
prepares quarterly investor presentations which are
used in the dialogue with investors and analysts. All
announcements, financial statements, investor pres-
entations and newsletters are available at tryg.com.
This material provides all stakeholders with a compre-
hensive picture of Tryg’s position and performance.
The consolidated financial statements are presented
in accordance with IFRS. At tryg.com, stakeholders
are able to subscribe to press releases and company
announcements as well as insider trading announce-
ments. A number of internal guidelines ensure that
the disclosure of price-sensitive information com-
plies with the stock exchange codes of conduct.
Tryg has adopted a number of policies which describe
the relationship between different stakeholders.
See the IR policy at tryg.com > Investor > IR
contacts > IR policy, and the CSR policy at tryg.
com > CSR > CSR strategy > CSR policy.
Annual general meeting
Tryg holds an annual general meeting every year.
As required by the Danish Companies Act and the
Articles of Association, the annual general meeting
is convened via a company announcement and at
tryg.com subject to at least three weeks’ notice.
Shareholders may also opt to receive the notice by
post or email. The notice contains information about
time and venue as well as an agenda for the meeting.
All shareholders are encouraged to attend the an-
nual general meeting. The annual general meeting
is held by personal attendance as the Board values
personal contact with the Group’s shareholders.
Shareholders may propose items to be included
on the agenda for the annual general meeting,
and may ask questions before and at the meeting.
Shareholders may vote in person at the annual
general meeting, by post or appoint the Board
or a third party as their proxy. Shareholders may
consider each item on the agenda. The proxy
form and form for voting by post are available at
tryg.com prior to the annual general meeting.
Share and capital structure
Tryg’s share capital comprises a single share
class, and all shares rank pari passu. The majority
shareholder, TryghedsGruppen smba, owns 60%
of the issued shares and is the only shareholder
owning more than 5% of the company’s shares.
The Board ensures that Tryg’s capital structure is in
line with the needs of the Group and the interests
of its shareholders and that it complies with the
requirements applicable to Tryg as a financial
undertaking. Tryg has adopted a capital plan and
a contingency capital plan, which are reviewed
annually by the Board.
Depending on the development in results, each
year the Board proposes a dividend and possibly
an extraordinary share buy back, if further adjust-
ment of the capital structure is required. At the an-
nual general meeting on 25 March 2015, the Board
will propose a half-year dividend from the second
half of 2015. In 2014, the annual general meeting
authorised the Board to allow Tryg to acquire own
shares amounting to up to 10% of the share capital
until 3 April 2019. On 2 January 2014, Tryg initi-
ated a share buy back programme which ran until
19 December 2014. Tryg acquired own shares for
an amount of DKK 1bn. On 2 January 2015, Tryg
initiated a new share buy back programme total-
ling DKK 1bn, which runs until the end of 2015.
Duties, responsibilities and composition
of the Supervisory Board
The Board is responsible for the central strategic
management and financial control of Tryg and for
ensuring that the business is organised in a sound
way. This is achieved by monitoring targets and
framework on the basis of regular and systematic
reviews of the strategy and risks. The Executive
Management reports to the Board on strategies
and action plans, market developments and group
performance, funding issues, capital resources and
special risks. The Board holds one annual strategy
seminar to decide on and/or adjust the Group’s
strategy with a view to sustaining value creation in
the company. The Executive Management works
with the Board to ensure that the Group’s strategy
is developed and monitored. The Board ensures
that the necessary competencies and financial re-
sources are available for Tryg to achieve its strategic
targets. The Board specifies its activities in a set of
rules of procedure and an annual cycle for its work.
Corporate governance
Annual report 2014 | Tryg A/S | | Menu – Management’s review 29
Total remuneration of the Supervisory Board in 2014 Audit Risk RemunerationDKK Fee Committee Committee Committee Total
Jørgen Huno Rasmussen 990,000 135,000 1,125,000Torben Nielsen 660,000 225,000 150,000 1,035,000Paul Bergqvist 330,000 90,000 420,000Anya Eskildsen 330,000 90,000 420,000Vigdis Fossehagen 330,000 90,000 420,000Ida Sofie Jensen 330,000 330,000Bill-Owe Johansson 330,000 330,000Lone Hansen 330,000 330,000Jesper Hjulmand 330,000 150,000 100,000 580,000Lene Skole 330,000 150,000 100,000 580,000Tina Snejbjerg 330,000 100,000 430,000Mari Thjømøe 330,000 150,000 100,000 580,000
Board members elected by the annual general
meeting are up for election each year at the annual
general meeting. See pages 32-33 for information
on when the individual members joined the Board,
were re-elected and when their current election
period expires. To ensure the integration of new
talent on the Board, members elected by the
annual general meeting may hold office for a maxi-
mum of nine years. Furthermore, members of the
Board must retire at the first annual general meet-
ing following their 70th birthday. The Board has 12
members, five men and seven women (including
one male and three female employee representa-
tives). The Board has members from Denmark,
Sweden and Norway. Women are thus not under-
represented on Tryg’s Supervisory Board.
Eight members of the Board are elected by the
annual general meeting for a term of one year. Of
the eight members elected at the annual general
meeting, four are independent persons as stated
in recommendation 3.2.1 in Recommendations on
Corporate Governance, while the other four mem-
bers are dependent persons as they are appointed
by the majority shareholder TryghedsGruppen.
See details about the independent board
members in the section Supervisory Board on
pages 32-33 and at tryg.com> Governance
> Management> Supervisory Board.
The Board performs an annual evaluation of its work
and skills to ensure that it possesses the expertise re-
quired to perform its duties in the best possible way.
In 2014, external assistance was brought in to
contribute to this, which resulted in the recruit-
ment of a new member for the Board in 2015. The
Board focuses on the following qualifications and
skills: management experience, financial insights,
knowledge of insurance, including the organisation
of insurance companies, product development of
financial services, reinsurance, capital requirements
and special accounting principles in insurance law,
accounting insights, financial knowledge and experi-
ence, M&A experience, market insights and interna-
tional experience. See CVs and descriptions
of the skills in the section Supervisory Board on
pages 32-33 and at tryg.com> Governance
> Management > Supervisory Board.
Duties and composition of the Executive
Management
Each year, the Board reviews and adopts the
rules of procedure of the Board and the Executive
Management with relevant policies, guidelines and
instructions describing reporting requirements and
requirements for communication with the Execu-
tive Management. Financial legislation also requires
the Executive Management to disclose all relevant
information to the Board and report on compliance
with limits defined by the Board and in legislation.
The Board considers the composition, develop-
ment, risks and succession plans of the Executive
Management in connection with the annual evalu-
ation of the Executive Management, and regularly
in connection with board meetings.
Each year, the Board discusses Tryg’s activities to
guarantee diversity at management levels. Tryg at-
taches importance to diversity at all management
levels. Tryg has prepared an action plan which sets
out specific targets to ensure diversity and equal
opportunities and access to management positions
for qualified men and women. In 2014, the propor-
tion of women at management level was 36.5%
against 34.6% in 2013. It is Tryg’s target to increase
the total proportion of women at management
level to 38% in 2015. See the action plan at
tryg.com > CSR.
Board committees
Tryg has an Audit Committee, a Risk Committee,
a Nomination Committee and a Remuneration
Committee. The framework of the committees’
work is defined in their terms of reference.
The board committees’ terms of reference can
be found at tryg.com > Governance > Management
> Super visory Board > Board committees, includ-
ing descriptions of members, meeting frequency,
responsibilities and activities during the year.
See the tasks of the board committees in 2014 at
tryg.com > Governance > Management > Supervi-
sory Board > Board committees.
Three out of four members of the Audit Com-
mittee and the Risk Committee, including the
chairman of the committees, are independent
persons. Of the four members of the Remunera-
tion Committee, one member is an independent
person, while one out of two members of the
Nomination Committee is independent. Board
committee members are elected primarily based
on special skills that are considered important by
the Board. Involvement of the employee repre-
sentatives in the committees is also considered
important. The committees exclusively prepare
matters for decision by the entire Board. The
special skills of all members are also described
at tryg.com.
Remuneration of Management
Tryg has adopted a remuneration policy for the
Board and the Executive Management, including
general guidelines for incentive pay.

Annual report 2014 | Tryg A/S | | Menu – Management’s review 30
a) At time of allocation.
Total remuneration of the Executive Management in 2014 Value of Car/ Total fixed matching TotalDKK Basic salary Pension car allowance salary shares a) fee
Morten Hübbe 8,928,218 2,232,055 255,000 11,415,273 850,000 12,265,273Tor Magne Lønnum 5,022,283 1,184,610 154,564 6,361,457 550,000 6,911,457Lars Bonde 4,385,281 1,096,320 255,000 5,736,602 400,000 6,136,602
The remuneration policy for 2014 was adopted by
the Board in December 2013 and by the annual
general meeting on 3 April 2014.
The Chairman of the Board reports on Tryg’s remu-
neration policy each year in connection with the con-
sideration of the annual report at the annual general
meeting. The Board’s proposal for the remuneration
of the Board for the current financial year is also sub-
mitted for approval by the shareholders at the annual
general meeting. See the remuneration policy at
tryg.com > Governance > Remuneration.
Remuneration of Supervisory Board
Members of Tryg’s Board receive a fixed fee and
are not comprised by any form of incentive or
severance programme or pension scheme. Their
remuneration is based on trends in peer com-
panies, taking into account board members’
required skills, efforts and the scope of the Board’s
work, including the number of meetings. The re-
muneration received by the Chairman of the Board
is triple that received by ordinary members, while
the Deputy Chairman’s remuneration is double that
received by ordinary members of the Board.
Remuneration of Executive Management
Members of the Executive Management are em-
ployed on a contractual basis, and all terms of their
remuneration are established by the Board. This
is based on the work and results of the individual
members of the Executive Management and on the
need to attract and retain the most highly qualified
members of the Executive Management. The fixed
pay element must be competitive and appropriate
for the market and provide sufficient motivation for
all members of the Executive Management to do
their best to achieve the company’s defined targets.
The Executive Management’s remuneration con-
sists of a fixed pay element, pension and a variable
pay element. The variable pay element constitutes
only a limited part of the overall remuneration. The
Board can decide that the fixed pay be supple-
mented with a variable pay element of up to 10%
of the fixed basic pay including pension at the time
of allocation. The variable pay element consists of
a matching shares programme. Four years after
the purchase by a member of the Executive Man-
agement of a specified number of shares, such
member is allocated a corresponding number of
free shares in Tryg. The purpose of the matching
shares programme is both to retain members of
the Executive Management, and to create a joint
financial interest between the Executive Manage-
ment and shareholders. Read more about the
matching shares programme in the remuneration
policy at tryg.com > Governance > Remuneration.
Some members of the Executive Management
still have unexercised share options, which were
allocated under a previous programme. See
Note 6 on page 66.
Each member of the Executive Management is
entitled to 12 months’ notice of termination and
12 months’ severance pay. However, the Group
CEO is entitled to 12 months’ notice of termination
and 18 months’ severance pay.
Each member of the Executive Management
has 25% of the basic salary paid into a pension
scheme. Up until 31 July 2014, the Group CFO
received a defined-benefit pension, disbursed from
the retirement date. The benefit is determined by
the final salary and how long the Group CFO has
been covered by the defined-benefit pension.
On 1 August 2014, Tor Magne Lønnum changed
to a Danish employment contract with a pension
scheme of 25% of his basic salary.
Financial reporting, risk management and auditing
Being an insurance business, Tryg is subject to
the risk management requirements of the Danish
Financial Business Act. In its policies, the Board
defines Tryg’s risk management framework as
regards insurance risk, investment risk and oper-
ational risk, as well as IT security. Guidelines are
issued by the Board to the Executive Management.
Risks associated with new financial reporting rules
and accounting policies are monitored and consid-
ered by the Audit Committee, the finance manage-
ment and the internal auditors. Material legal and
tax-related issues and the financial reporting of
such issues are assessed on an ongoing basis.
Other risks associated with the financial
reporting are described in the section Capital and
risk management on pages 24-25 and in Note
1 Risk management on page 47.
Tryg engages in ongoing risk identification, map-
ping insurance risks and other risks related to
realising the Group’s strategy or which may have
a potentially substantial impact on the Group’s
financial position. The process involves registering
and continually monitoring the risks identified. In
2014, Tryg undertook an Own Risk and Solvency
Assessment (ORSA). The purpose of the ORSA is to
link strategy, risk management and solvency, as the
aim of the ORSA is to ensure a sensible correlation
between the strategy for assuming risks and the
available capital over a period of three to five years.
The Board and the Executive Management ap-
prove and monitor the Group’s overall policies
and guidelines, procedures and controls in
important risk areas. They receive reports about
developments in these areas and about the ways
in which the frameworks are used. The Board
checks that the company’s risk management and
internal controls are effective. Non-compliance
with the frameworks and guidelines established
by the Board is reported to the Board. The Risk
Committee monitors the risk management on an
ongoing basis and reports quarterly to the Board.

| Menu – Management’s review 31
Tryg has published the statutory corporate
governance report based on the ‘comply
or explain’ principle for each individual
recommendation. Download the report at
tryg.com > Investor > Download.
The Group’s internal control systems are based
on clear organisational structures and guidelines,
general IT controls and segregation of functions,
which are supervised by the internal auditors. Tryg
has a decentralised set-up whereby risk managers
in the business areas carry out controlling tasks
for the risk management environment and Tryg’s
compliance function.
The Executive Management has established a
formal process for the Group comprising monthly
reporting, including for example budget and
deviation reports.
Risk management is an integral part of Tryg’s
business operations. The Group seeks at all times
to minimise the risk of unnecessary losses in order
to optimise returns on the company’s capital.
Read more about Tryg’s risk management
in the section Capital and risk management on
pages 24-25 and in Note 1 on page 47.
Whistleblowing scheme
Tryg has set up an Ethical Hotline (whistleblowing
scheme), which allows employees, customers
or business partners to report any serious wrong-
doing or suspected irregularities. Reporting takes
place in confidence to the Chairman of the Audit
Committee. Read more about Tryg’s Ethical
Hotline at tryg.com > Governance > Ethical
Hotline.
Audit
The Board ensures monitoring by competent and
independent auditors. The Group’s internal auditor
attends all board meetings. The independent
auditor attends the annual board meeting at
which the annual report is presented.
Each year, the annual general meeting appoints an
independent auditor recommended by the Board.
After a call where five external auditors were
evaluated, at the beginning of 2014 the Board
decided to recommend Deloitte, and Deloitte was
reappointed at the annual general meeting in April
2014. At least once a year, the internal and inde-
pendent auditors meet with the Audit Committee
without the presence of the Executive Manage-
ment. The Chairman of the Audit Committee deals
with any matters that need to be reported to the
Board.
Internal audit
Tryg has set up an internal audit department which
regularly reviews the quality of the Group’s internal
control systems and business procedures. It is
responsible for planning, performing and reporting
the audit work to the Board.
Deviations and explanations
Tryg complies with the Recommendations on
Corporate Governance with the exception of the
recommendation for the number of independent
members of the board committees, with which Tryg
complies partially; see item 3.4.2 of the Recom-
mendations on Corporate Governance. The
deviation is explained in Tryg’s statutory corporate
governance report, which is available at tryg.com
> Investor > Download.
Annual report 2014 | Tryg A/S |

Annual report 2014 | Tryg A/S | | Menu – Management’s review 32
Paul Bergqvist b)
Born 1946. Joined: 2006. Nationality: Swedish. Professional board member. Former CEO of Carlsberg A/S.
Educational background: Economist and engineer. Chairman: Sveriges Bryggerier AB, East Capital Explorer AB, Pieno Zvaigzdes AB, Norrköpings Segel Sällskap andÖstkinds Häradsallmänning. Board member: Tryg A/S, Tryg Forsikring A/S and Green carrier AB.Committee memberships: Remuneration Committee in Tryg A/S. Number of shares held: 100Change in portfolio in 2014: 0
Paul Bergqvist has international management and board experi-ence within M&A, strategic development, marketing, brand-ing and financial manage-ment. Being a Swedish citizen, Paul Bergqvist has special knowledge of Swedish market conditions.
Torben Nielsen b)
Deputy ChairmanBorn 1947. Joined: 2011. Nationality: Danish. Profession-al board member. Adjunct Pro-fessor, CBS. Former Governor of Danmarks Nationalbank.
Education: Savings bank educated, Graduate Diplomas in Organisation and Work Sociology, Credit and Financing. Chairman: Investeringsforenin-gen Sparinvest, Investeringsfore-ningen Sparinvest Sicav, Luxem-bourg, EIK banki p/f, Færøerne, Capital Market Partners and Museum Sydøstdanmark. Deputy Chairman: Tryg A/S, Tryg Forsikring A/S and Sydbank A/S.Board member: Sampension KP Livsforsikring A/S, Dansk Land-brugs Realkredit and Executive Board of Bombebøssen.Committee memberships: Audit Committee (Chairman), Risk Committee (Chairman), Nomi-nation Committee in Tryg A/S. Number of shares held: 3,500Change in portfolio in 2014: 0
Torben Nielsen has special skills in the fields of management, finance, financial services and risk management as former Gover-nor of Danmarks Nationalbank.
Jørgen Huno Rasmussen a)
ChairmanBorn 1952. Joined: 2012. Nationality: Danish. Profes-sional board member. Adjunct Professor, CBS. Former Group CEO of the FLSmidth Group.
Educational background: Graduate Diploma in Organisa-tion, Graduate Engineer and Lic.techn. Chairman: Tryg A/S, Tryg Forsik - ring A/S, TryghedsGruppen smba, the Lundbeck Foundation and LundbeckFond Invest A/S.Board member: Rambøll Group A/S, Bladt Industries A/S, Terma A/S, Haldor Topsøe A/S, Otto Mønsted A/S and Thomas B. Thriges Fond. Committee memberships: Remuneration Committee (Chairman), Nomination Com-mittee (Chairman) in Tryg A/S.Number of shares held: 366Change in portfolio in 2014: 0
As former CEO of FLSmidth, Jørgen Huno Rasmussen has experience in international management of listed com-panies and special skills within strategy, business development, communication, risk manage-ment and finance.
Anya Eskildsen a)
Born 1968. Joined: 2013. Nationality: Danish. President of Niels Brock Copenhagen Business College.
Education: MSc in Political Science, the certified IoD Board Program.Board member: Tryg A/S and Tryg Forsikring A/S, Trygheds-Gruppen smba, California In-ternational Business University and Lær for Livet.Committee memberships: Remuneration Committee in Tryg A/S. Member of the Danish Growth Council, Nykredits Regionsråd, Danish Chinese Business Forum, minister- appointed GS coordinator, VL 21, Copen hagen Rotary and NOCA.Number of shares held: 0
Anya Eskildsen has experience within financial management, strategic management, commu-nication and marketing, innova-tion and ideas generation and international system exports.
Supervisory Board
Members of the Board are elected for a term of one year. Employee representatives are, however, elected for a term of four years. The next election of employee representatives will be held in 2016.
a) Dependent member of the Supervisory Board.b) Independent member of the Supervisory Board, as per the definition in
Recommendations on Corporate Governance.
Lone Hansen
Employee representative Born 1966. Joined: 2012. Nationality: Danish. Chairman of the Association for Tied Agents and Key Account Managers in Tryg. Employed in 1990.
Education: Certified commer-cial insurance agent. Various insurance and sales courses and negotiation training.Board member: Tryg A/S and Tryg Forsikring A/S.Other duties: Member of the Insurance Agent Committee of the Financial Services Union Denmark.Number of shares held:106Change in portfolio in 2014: +20
Vigdis Fossehagen
Employee representative Born 1955. Joined: 2012. Nationality: Norwegian. Chairman of Finansforbundet, Tryg Norway. Employed in 1996.
Education: Educated in the area of agricultural mechanics.Board member: Tryg A/S and Tryg Forsikring A/S.Committee memberships: Remuneration Committee in Tryg A/S and Lay Judge in the District Court of Bergen. Number of shares held: 20Change in portfolio in 2014: +20

Annual report 2014 | Tryg A/S | | Menu – Management’s review 33
Supervisory Board
Mari Thjømøe b)
Born 1962. Joined: 2012. Nationality: Norwegian. Professional board member and independent advisor.
Education: Master of Economics and Business Administration, Financial Analyst (CFA). Manage-ment programme, London and Harvard Business School. Chairman: Seilsport Maritimt Forlag AS. Board member: Tryg A/S, Tryg Forsikring A/S, Argentum Fondsinvesteringer as, Nordic Mining ASA, Forskningskonsernet Sintef, E-CO Energi, Scatec Solar ASA, Avinor, Sevan Marine ASA. Committee memberships: Audit Committee and Risk Committee, Tryg A/S. Audit Committee, Sevan Marine ASA and E-CO (Chairman), Audit Committee, Scatec Solar ASA and Remuneration Com-mittee, Argentum. Number of shares held: 300Change in portfolio in 2014: 0
Mari Thjømøe has experience from international manage-ment, strategy, finance, capital management, investor relations, branding and special knowledge of the insurance market, and special insights into Norwegian market as a Norwegian citizen.
Ida Sofie Jensen a)
Born 1958. Joined: 2013. Nationality: Danish. Director General of Lif (Danish Association of the Pharmaceuti-cal Industry). Director General of the subsidiary DLI (Dansk Lægemiddel Information A/S).
Education: MSc in Political Science, European Health Leadership Programme IN-SEAD, Executive Management Programme INSEAD, Executive Program Columbia Business School.Board member: Tryg A/S and Tryg Forsikring A/S, Trygheds-Gruppen smba, Plougmann & Vingtoft A/S and Den Erhvervs-drivende Fond Hans Knudsen Instituttet.Number of shares held: 173Change in portfolio in 2014: +79
Ida Sofie Jensen has experience from business operations and the health sector as well as management, strategy, politics and finance.
Jesper Hjulmand a)
Born 1963. Joined: 2010. Nationality: Danish. CEO of SEAS-NVE A.m.b.a.
Education: MSc in Economics and Business Administration and Lieutenant-Colonel of the Danish Air Force Reserve. Chairman: Association of Danish Energy and Distribution Com-panies (DEA), Energi Danmark A/S, Fibia P/S, SEAS-NVE Vind AB, SEAS-NVE Strømmen A/S.Deputy Chairman: Trygheds-Gruppen smba.Board member: Tryg A/S, Tryg Forsikring A/S, DI General Council, Dansk Energi and Danish Intelligent Energy Alliance.Committee memberships: Audit Committee and Risk Committee in Tryg A/S, Executive Director Committee of Dansk Energi (Chairman) and Green Commit-tee, Region Zealand (Chairman). Number of shares held: 1,750Change in portfolio in 2014: 0
From his positions with SEAS-NVE, Jesper Hjulmand has experience within M&A, strategy, organisa tional and management development, communication and business development.
Bill-Owe Johansson
Employee representativeBorn 1959. Joined: 2010. Nationality: Swedish.Claims handler in Moderna (Swedish branch). Employed in 2002.
Education: Insurance training.Board member: Tryg A/S and Tryg Forsikring A/S.Number of shares held: 220Change in portfolio in 2014: +20
Members of the Supervisory Board are elected for a term of one year. Employee representatives are, however, elected for a term of four years. The next election of employee representatives will be held in 2016.
a) Dependent member of the Supervisory Boardb) Independent member of the Supervisory Board, as per the definition in
Recommendations on Corporate Governance.
Tina Snejbjerg
Employee representativeBorn 1962. Joined: 2010. Nationality: Danish.Head of Section in Tryg’s staff association. Employed in 1987.
Education: Insurance training. Board member: Tryg A/S and Tryg Forsikring A/S.Committee memberships: Risk Committee in Tryg A/S and DFL’s General Council.Number of shares held: 106Change in portfolio in 2014: +20
Lene Skole b)
Born 1959. Joined: 2010. Nationality: Danish. CEO of the Lundbeck Foundation.
Education: A.P. Møller Group’s international shipping educa-tion, Graduate Diploma in Financing and various interna-tional management pro-grammes. Board member: Tryg A/S, Tryg Forsikring A/S and ALK.Committee memberships: Audit Committee and Risk Committee in Tryg A/S and Audit Commit-tee in ALK. Number of shares held: 745Change in portfolio in 2014: 0
Lene Skole has experience from international companies, among other things through her previous work in Coloplast and The Maersk Company Ltd., UK. Lene Skole has skills within strategy, finance, financing and communication.

Group Executive ManagementStanding from left: Trond Bøe Svestad, Tor Magne Lønnum, Jesper Joensen, Morten Hübbe, Per Fornander, Lars Bonde and Truls Holm Olsen.
34Annual report 2014 | Tryg A/S | | Menu – Management’s review

Annual report 2014 | Tryg A/S | | Menu – Management’s review 35
Morten Hübbe CEO/Group CEO
Born 1972. Employed in 2002. Joined the Group Executive Management in 2003. Member of the Executive Management and the Group Executive Management.
Education: BSc in International Business Administration and Modern Languages, MSc in Finance and Accounting and management programme at Wharton.
Board member: Tryg Ejendomme A/S, Ejendomsselskabet af 8. maj 2008 A/S and Tjenestemændenes Forsikring.
Number of shares held: 13,453 Change in portfolio in 2014: +1,693
Truls Holm Olsen Group Executive Vice President, Corporate and Country Manager in Norway
Born 1964. Employed in 1998. Joined the Group Executive Management in 2009.
Education: LL.M.
Board member: Tryg Garantiforsikring A/S, Norsk Naturskadepool and Tryg Almennyttige Stiftelse. Member of the committee of shareholders of Livsforsikringsselskapet Nordea Liv Norge AS.
Number of shares held: 3,305 Change in portfolio in 2014: +598
Per Fornander Group Executive Vice President and Country Manager in Sweden
Born 1963. Employed in 2011. Joined the Group Executive Management in 2011.
Education: Marketing DIHM, IHM Business School, Stockholm.
Board member: Tryg Garantiforsikring A/S, Svensk Försäkring, Försäkringsbranschens Arbetsgivarorganisation, Försäkringsbranschens Pensionskassa, Securator A/S (Chairman) and Moderna Djurförsäkring i Norr AB.
Number of shares held: 3,372 Change in portfolio in 2014: +582
Jesper Joensen Group Executive Vice President, Claims
Born 1963. Employed in 1992. Joined the Group Executive Management in 2013.
Education: Agricultural economist, certified insurance agent.
Number of shares held: 1,673 Change in portfolio in 2014: +587
Lars Bonde Group Executive Vice President, Private, Country Manager in Denmark and COO
Born 1965. Employed in 1998. Joined the Group Executive Management in 2006. Member of the Executive Management and the Group Executive Management.
Education: Insurance training, LL.M.
Board member: The Danish Employers’ Association for the Financial Sector, Tjenestemændenes Forsikring, Forsikringsakademiet, the Danish Insurance Association and Cphbusiness.
Number of shares held: 5,411 Change in portfolio in 2014: +806
Trond Bøe Svestad Group Executive Vice President, Commercial
Born 1967. Employed in 2013. Joined the Group Executive Management in 2013.
Education: Master of Management, Business/Commerce and Bachelor of Commerce.
Number of shares held: 780 Change in portfolio in 2014: +587
Group Executive Management
Tor Magne Lønnum CFO/Group CFO
Born 1967. Employed in 2011. Joined the Group Executive Management in 2011. Member of the Executive Management and the Group Executive Management.
Education: State-authorised public accountant, Executive Master of Business and Administration, University of Bristol and École Nationale des Ponts et Chaussées.
Board member: Tryg Garantiforsikring A/S, Thermo- pylae AS (Chairman) and Finansnæringens Felles-organisasjon, TGS Nopec ASA and P/f Bakkafrost.
Number of shares held: 6,000 Change in portfolio in 2014: +1,090
Rikke Larsen, former Group Executive Vice President, People and Reputation left the Group Executive Management in October 2014.

Annual report 2014 | Tryg A/S | | Menu – Management’s review 36
Waste
Kg
200,000
160,000
120,000
80,000
40,000
0ResidualIron & metalBio wasteIT, batteries
& lightsources
Paper &corrugatedcardboard
Carbon emissions
Tonnes
3,000
2,500
2,000
1,500
1,000
500
0
2013 2014
MotorAir travelHeating oilElectrici�
Employee mix
No.
1,800
1,500
1,200
900
600
300
0Flexi jobNon-
Western background a)
Age<50 yrs
Age30-49 yrs
Age<30 yrs
WomenMen
Corporate Social Responsibility in Tryg Statutory Corporate Social Responsibility report
Tryg’s ambition is to create peace of mind and value
for customers, employees and shareholders. Cor-
porate Social Responsibility therefore constitutes an
integral part of our core business and plays a key role
in connection with the development and improve-
ment of our products and services as well as the opti-
misation of our operations and our activities. In Tryg,
Corporate Social Responsibility is associated primar-
ily with our insurance products, our history and our
expertise, and our efforts focus on climate, claims
prevention, inclusion and employee well-being.
Our efforts are based on the principles of the United
Nations Global Compact and the United Nations
Guiding Principles on Business and Human Rights;
these focus on the possibilities and risks inherent
in our business activities with regard to the climate,
human rights, labour rights and anti-corruption.
Tryg’s CSR policy is approved annually by the Super-
visory Board. Download the policy at tryg.com >
CSR > CSR strategy > CSR policy.
Climate
For Tryg, it is crucial to consistently promote sus-
tainable initiatives which can prevent and address
the issue of climate-related damage which we
experience in our daily work with customers and
suppliers. To provide the best possible solutions,
we engage in cooperation and partnerships with
public authorities and researchers, and together
we develop contingency plans and solutions which
can ensure that local areas, buildings and pro-
cesses are geared to withstanding climate change.
Read more at tryg.com > CSR > Thematic
areas > Climate.
Preventing water and storm damage
In Tryg, we work actively to prevent and minimise
the risk of damage and not only help once the
damage has happened. Tryg focuses on how cus-
tomers can avoid storm damage, and offers for ex-
ample to check their basements for free. By being
aware of the risk of flooding due to cloudbursts, it
is possible to take preventive action and mitigate
or avoid damage.
Carbon emissions
Our aim is to reduce Tryg’s environmental impact,
and each year we measure our carbon emissions
and waste volumes. Most of the daily carbon emis-
sions are associated with the lighting and heating
of our offices, as well as car and plane travel.
Tryg has defined carbon emission targets since 2007,
and initiatives have been implemented to reduce
carbon emissions at our offices in Ballerup and in
Bergen. At the same time, focus has been on reduc-
ing carbon emissions from travel by plane and car.
In 2014, carbon emissions were reduced by 48.1%
relative to 2007. The target for 2015 is a reduction
of 50% relative to 2007. The reduction was primarily
due to the reduced consumption of heating oil, as
the office in Bergen made more use of heat pumps
instead of oil boilers for heating, which also explains
the increase in electricity consumption. Read
more about the climate initiatives at tryg.com
> CSR > Thematic areas > Climate.
Human rights
In Tryg, we respect human rights in all aspects of our
work, and we want to improve our preventive efforts
to minimise the risk of human rights violations.
Also, we focus on the well-being of our employees
and their right to a healthy and safe workplace. Tryg
wants to respect and promote the human rights
and labour rights that are relevant to our business
and activity areas. This applies both internally and
in relations with our customers, suppliers, inves-
tors and partners. Our efforts focus primarily on
inclusion, equality and labour rights as well as data
protection. Read more at tryg.com > CSR
> Thematic areas > Well-being > Labour rights.
Inclusion
Tryg welcomes diversity, and we ensure non-discrim-
ination through equal treatment of all our employees,
regardless of gender, age, disabilities, ethnic origin,
sexual orientation and religion. As a workplace
characterised by diversity and the representation of
different perspectives, we increase the quality of our
services by having a better understanding of our cus-
tomers and their requirements. In 2014, 4% of Tryg’s
Danish employees were of non-Western origin; thus
a) Non-Western background has been compiled by Statistics Denmark.
The carbon emissions chart covers both Norway and Denmark; air travel also includes Sweden.

Annual report 2014 | Tryg A/S | | Menu – Management’s review 37
we did not meet our target of 4.2%. We will consist-
ently focus on increasing the share of employees
of non-Western origin even though this is not
a specific KPI in 2015. To make the most of our
employees’ linguistic and cultural expertise, in 2014
we launched a new insurance advisory service for
our private customers called 6 languages. The new
initiative was welcomed both by our employees
and by our customers, of whom 280 made use of
the service. Read more about inclusion in Tryg
at tryg.com > CSR > Thematic areas > Inclusion.
Read more about guidance in six languages at
tryg.dk > Privat > Kontakt os > Other languages.
Equal rights
To ensure compliance with section 99b of the Danish
Financial Statements Act on equal gender represen-
tation at management level, Tryg is devoting targeted
efforts to ensuring gender equality with regard to
pay as well as equal career opportunities. We have
an action plan aimed at ensuring the representation
of more women in management, and in 2014 the
target of a 2% increase was almost met with 36.5%
against 34.6% in 2013. The target figure for 2015
is 38% for more women in management. Read
more about women in management at tryg.com
> CSR > CSR strategy > Plans of action.
Everyday peace of mind
In 2014, Tryg was the first Danish insurance com-
pany to roll out a hotline ‘Tryg i Livet’ counselling
service. The purpose is to ensure peace of mind for
our Tryg Plus customers in their daily lives by offer-
ing free counselling by psychologists who can help
them tackle crises or even prevent a problem from
developing into a crisis. Customers have unlim-
ited access to the service, which is anonymous to
guarantee confidentiality between counsellor and
customer. ‘Tryg i Livet’ has been welcomed by our
customers, and the initiative will continue in 2015.
Active steps to reduce burglaries in Denmark
Tryg has introduced a number of initiatives to reduce
burglaries. As the first insurance company in Den-
mark, Tryg is offering synthetic DNA marking to cus-
tomers. Through customers marking their valuable
possessions, we are supporting police investigations
of burglaries and ensuring that burglars can be linked
to the crime scene. In other countries, DNA marking
has been shown to be an effective deterrent against
burglary. Tryg has launched an experiment in Sønder-
borg, with the aim of documenting the preventive
effect of DNA marking in Denmark. The purpose is to
raise awareness of the benefits of DNA marking with
a view to the long-term crime prevention.
Data protection
As part of our daily work, we handle sensitive
information from our customers, and it is crucial
that they trust our handling of their personal data.
In 2014, we therefore held four workshops about
personal data protection in Denmark.
In the past, Tryg used to send all information contain-
ing sensitive personal data to our customers by
ordinary mail. However, in 2014, Tryg implemented
an email solution which makes it possible to send
encrypted emails. Hence, Tryg has further improved
our data protection standards, while at the same
time ensuring that customers receive our communi-
cations as quickly as possible.
Tryg Plus customers are helped in case of theft or
abuse of their personal data. In 2014, 240 Danish
and 49 Norwegian customers contacted Tryg ID.
Read more about data protection in Tryg at
tryg.com > CSR > Thematic areas > Prevention
> Data protection.
Anti-corruption
To create the best possible conditions for providing
peace of mind, it is important that we encourage
our employees to maintain high moral standards, to
conduct themselves in an ethically correct fashion
and in compliance with applicable legislation. To
make it easier for our employees to observe all
relevant rules and instructions, Tryg is continuously
updating the internal code of conduct which all
employees must know and adhere to. Through Tryg's
Ethical Hotline (whistleblowing scheme) employees
and external stakeholders are able to report, in con-
fidentiality, any suspected instances of non-com-
pliance with the guidelines or breaches of the law.
The whistleblower scheme was applied four times
in 2014. Read more about the ethical hotline at
tryg.com > Governance > Ethical Hotline.
CSR in sourcing
To ensure that Tryg’s values and fundamental
desire to run a responsible business are also
reflected in the way they do business, our suppliers
are required to conduct themselves in a socially
responsible manner. Among other things, suppli-
ers of automobile services to our customers and
services to our business units must report annually
on specific initiatives and results in the environ-
mental area and with respect to human rights,
labour rights and anti-corruption. In 2014, 25
caravan workshops reported on their CSR efforts,
and in 2015 an additional 400 car repairers will be
required to report.
Global Reporting Initiative
Tryg’s monitoring and reporting of our CSR
efforts are based on the Global Reporting
Initiative G3. Read more about the
reporting system at globalreporting.org.
Read more about Tryg’s CSR KPIs at
tryg.com > CSR > CSR strategy > CSR KPIs.
Complaints
Customers who feel discriminated against
in their relations with Tryg can complain.
They can do so by sending an email to
Tryg employees who are exposed to discrimi-
nation in their daily work must first contact
their immediate superior. If this does not
solve the problem, employees can contact
their union representative or HR.
Responsible investments
In Tryg, we screen our investments to make
sure that they do not have a negative impact
on the environment, human rights and anti-
corruption. The screening is carried out by
Nordea Invest and Skagen Fondene, both of
which have signed UN Principles for Responsi-
ble Investment (UN PRI). Read more about
responsible investments at tryg.com > CSR.

38
Menu – Financial statements 2014
TRYG GROUP
Note Statement by the Supervisory
Board and the Executive
Management 39
Independent auditor’s reports 40
Financial highlights 41
Income statement 42
Statement of comprehensive
income 43
Statement of financial position 44
Statement of changes in equity 45
Cash flow statement 46
1 Risk and capital management 47
2 Operating segments 58
2 Geographical segments 60
2 Technical result, net of
reinsurance, by line of business 62
3 Premium income, net of
reinsurance 64
4 Insurance technical interest,
net of reinsurance 64
5 Claims, net of reinsurance 64
6 Insurance operating costs,
net of reinsurance 64
7 Interest income and
dividends etc. 69
8 Value adjustments 69
9 Tax 69
10 Profit/loss on discontinued
and divested business 69
11 Intangible assets 70
12 Property, plant and equipment 72
13 Investment property 73
14 Equity investments in associates 73
15 Financial assets 75
16 Reinsurers’ share 77
17 Current tax 77
18 Equity 77
19 Premium provisions 78
19 Claims provisions 78
20 Pensions and similar liabilities 79
21 Deferred tax 81
22 Other provisions 81
23 Amounts owed to credit
institutions 81
24 Debt relating to unsettled
funds transactions and repos 81
25 Earnings per share 81
26 Contractual obligations,
collateral and contingent
liabilities 82
27 Acquisition of subsidiaries 84
28 Related parties 84
29 Financial highlights 85
30 Accounting policies 86
TRYG A/S (PARENT COMPANY)
Income statement – Tryg A/S
(parent company) 95
Statement of financial position
– Tryg A/S (parent company) 96
Statement of changes in equity
(parent company) 97
Notes (parent company) 98
REPORTING FOR Q4
Quarterly outline 101
Geographical
segments 103
INFORMATION
Other key ratios 104
Group chart 105
Glossary 106
Product overview 107
Disclaimer 108
Tryg’s Group consolidated financial statements are prepared in accordance with IFRS and published in Danish and English.
Annual report 2014 | Tryg A/S | | Menu – Financial statements
39Annual report 2014 | Tryg A/S | | Menu – Financial statements
Executive Management
Morten Hübbe Tor Magne Lønnum Lars BondeGroup CEO Group CFO Group Executive Vice President and COO
Supervisory Board
Jørgen Huno Rasmussen Torben Nielsen Paul Bergqvist Anya Eskildsen Vigdis Fossehagen Lone HansenChairman Deputy Chairman
Jesper Hjulmand Ida Sofie Jensen Bill-Owe Johansson Lene Skole Tina Snejbjerg Mari Thjømøe
Ballerup, 28 January 2015
The Supervisory Board and the Executive Manage-
ment have today considered and adopted the
annual report for 2014 of Tryg A/S and the Tryg
Group.
The consolidated financial statements have been
prepared in accordance with the International
Financial Reporting Standards as adopted by the
EU, and the financial statements of the parent
company have been prepared in accordance with
the Danish Financial Business Act. In addition, the
annual report has been presented in accordance
with additional Danish disclosure requirements for
the annual reports of listed financial enterprises.
In our opinion, the accounting policies applied are
appropriate, and the annual report gives a true and
fair view of the Group’s and the parent company’s
assets, liabilities and financial position at 31
December 2014 and of the results of the Group’s
and the parent company’s operations and the cash
flows of the Group for the financial year
1 January-31 December 2014.
Furthermore, in our opinion the Management’s
report gives a true and fair view of developments
in the activities and financial position of the Group
and the parent company, the results for the year
and of the Group’s and the parent company’s
financial position in general and describes signifi-
cant risk and uncertainty factors that may affect
the Group and the parent company.
We recommend that the annual report be adopted
by the shareholders at the annual general meeting.
Statement by the Supervisory Board and the Executive Management

40Annual report 2014 | Tryg A/S | | Menu – Financial statements
financial services companies as well as for the
preparation of parent financial statements that give
a true and fair view in accordance with the Danish
Financial Business Act and Danish disclosure
requirements for listed financial services compa-
nies, and for such internal control as management
determines is necessary to enable the preparation
and fair presentation of consolidated and parent
financial statements that are free from material
misstatement, whether due to fraud or error.
Auditor’s responsibility
Our responsibility is to express an opinion on the
consolidated and parent financial statements based
on our audit. We conducted our audit in accord-
ance with International Standards on Auditing
and additional requirements under Danish audit
regulation. This requires that we comply with ethi-
cal requirements and plan and perform the audit
to obtain reasonable assurance about whether
the con solidated and parent financial statements
are free from material misstatement. An audit
involves performing procedures to obtain audit
evidence about the amounts and disclosures in
the consolidated and parent financial statements.
The procedures selected depend on the auditor’s
judgement, including the assessment of the risks
of material misstatements of the consolidated and
parent financial statements, whether due to fraud
or error. In making those risk assessments, the audi-
tor considers internal control relevant to the entity’s
To the shareholders of Tryg A/S
Report on the consolidated financial statements and parent financial statements
We have audited the consolidated and parent fi-
nancial statements of Tryg A/S for the financial year
1 January to 31 December 2014, page 41-100,
which comprise the income statement, statement
of comprehensive income, statement of financial
position, statement of changes in equity and notes,
including the accounting policies, for the Group as
well as for the parent company, and the consolidat-
ed cash flow statement. The consolidated financial
statements are prepared in accordance with Inter-
national Financial Reporting Standards as adopted
by the EU and the parent financial statements are
prepared in accordance with the Danish Financial
Business Act. In addition, the consolidated and
parent financial statements are prepared in accord-
ance with Danish disclosure requirements for listed
financial services companies.
Management’s responsibility for the consolidated
financial statements and parent financial statements
Management is responsible for the preparation
of consolidated financial statements that give a
true and fair view in accordance with International
Financial Reporting Standards as adopted by the
EU and Danish disclosure requirements for listed
Independent auditor’s reports
preparation of consolidated and parent financial
statements that give a true and fair view in order to
design audit procedures that are appropriate in the
circumstances, but not for the purpose of express-
ing an opinion on the effectiveness of the entity’s in-
ternal control. An audit also includes evaluating the
appropriateness of accounting policies used and
the reasonableness of accounting estimates made
by management, as well as the overall presentation
of the consolidated and parent financial statements.
We believe that the audit evidence is sufficient and
appropriate to provide a basis for our audit opinion.
Our audit has not resulted in any qualification.
Opinion
In our opinion, the consolidated financial state-
ments give a true and fair view of the Group’s
financial position at 31 December 2014, and of
the results of its operations and cash flows for the
financial year 1 January to 31 December 2014 in
accordance with International Financial Reporting
Standards as adopted by the EU and Danish dis-
closure requirements for listed financial services
companies. Moreover, in our opinion, the parent
financial statements give a true and fair view of the
parent company’s financial position at 31 December
2014, and of the results of its operations for the
financial year 1 January to 31 December 2014 in
accordance with the Danish Financial Business
Act and Danish disclosure requirements for listed
financial services companies.
Statement on the mangement’s review
Pursuant to the Danish Financial Business Act, we
have read the mangement’s review. We have not
performed any further procedures in addition to
the audit of the consolidated and parent financial
statements. On this basis, it is our opinion that the
information provided in the mangement’s review is
consistent with the consolidated and parent finan-
cial statements.
Ballerup, 28 January 2015
Deloitte
Statsautoriseret Revisionspartnerselskab
Jens Ringbæk
State Authorised Public Accountant
Lone Møller Olsen
State Authorised Public Accountant

41Annual report 2014 | Tryg A/S | | Menu – Financial statements
Financial highlights
The gross expense ratio without adjustment is calculated as the ratio of actual gross insurance operating costs to gross premium income. Other key ratios are calculated in accordance with ’Recommendations & Financial Ratios 2010’ issued by the Danish Society of Financial Analysts. The adjustment, which is made pursuant to the Danish Financial Supervisory Authority’s and the Danish Society of Financial Analysts’ definitions of expense ratio and combined ratio, involves the addition of a calculated expense (rent) in respect of owner-occupied property based on a calculated market rent and the deduction of actual depreciation and operating costs on owner-occupied property. a) Profit/loss on discontinued and divested business after
tax includes mainly Marine Hull insurance, which was divested in 2010 and 2014 and the Finnish branch of Tryg Forsikring, which was sold in 2012.
DKKm 2014 2013 2012 2011 2010
Gross premium income 18,652 19,504 20,314 19,948 18,894Gross claims -12,650 -14,411 -14,675 -15,783 -15,111Total insurance operating costs -2,689 -3,008 -3,295 -3,271 -3,136
Profit/loss on gross business 3,313 2,085 2,344 894 647Profit/loss on ceded business -341 349 86 507 -311Insurance technical interest, net of reinsurance 60 62 62 171 124
Technical result 3,032 2,496 2,492 1,572 460Investment return after insurance technical interest 360 588 585 61 550Other income and costs -90 -91 -60 -30 -4
Profit/loss before tax 3,302 2,993 3,017 1,603 1,006Tax -755 -620 -837 -455 -265
Profit/loss on continuing business 2,547 2,373 2,180 1,148 741Profit/loss on discontinued and divested business after tax a) 10 -4 28 -8 -148
Profit/loss for the year 2,557 2,369 2,208 1,140 593
Run-off gains/losses, net of reinsurance 1,131 970 1,015 944 824 Statement of financial position Total provisions for insurance contracts 31,692 32,939 34,355 34,220 32,031Total reinsurers' share of provisions for insurance contracts 1,938 2,620 2,317 2,067 1,588Total equity 11,119 11,107 10,979 9,007 8,458Total assets 52,224 53,371 55,022 53,362 50,591 Key ratios Gross claims ratio 67.8 73.9 72.2 79.1 80.0Net reinsurance ratio 1.8 -1.8 -0.4 -2.5 1.6Claims ratio, net of ceded business 69.6 72.1 71.8 76.6 81.6Gross expense ratio 14.6 15.6 16.4 16.6 16.7
Combined ratio 84.2 87.7 88.2 93.2 98.3
Gross expense ratio without adjustment 14.4 15.4 16.2 16.4 16.6Operating ratio 83.8 87.2 87.8 92.2 97.6Relative run-off gains/losses 4.8 3.9 4.1 4.0 3.9Return on equity after tax (%) 23.0 21.5 22.1 13.1 6.6
Solvency ratio (Solvency I – ratio between base capital and weighted assets) 87 90 90 112 125

42Annual report 2014 | Tryg A/S | | Menu – Financial statements
DKKm 2014 2013
Note Investment activities 14 Income from associates 10 6 Income from investment property 94 97 7 Interest income and dividends 949 1,029 8 Value adjustments -95 115 7 Interest expenses -115 -112 Administration expenses in connection with investment activities -69 -64
Total investment return 774 1,071
4 Return on insurance provisions -414 -483
Total investment return after insurance technical interest 360 588
Other income 81 100 Other costs -171 -191
Profit/loss before tax 3,302 2,993 9 Tax -755 -620
Profit/loss on continuing business 2,547 2,373
10 Profit/loss on discontinued and divested business 10 -4
Profit/loss for the year 2,557 2,369
25 Earnings per share of DKK 25 – continuing business 43.5 39.4 Diluted earnings per share of DKK 25 – continuing business 43.5 39.3 Earnings per share of DKK 25 43.7 39.4 Diluted earnings per share of DKK 25 43.7 39.3
DKKm 2014 2013
Note General insurance Gross premiums written 18,672 19,820 Ceded insurance premiums -1,059 -1,220 Change in premium provisions 268 36 Change in reinsurers' share of premium provisions -57 24
3 Premium income, net of reinsurance 17,824 18,660
4 Insurance technical interest, net of reinsurance 60 62
Claims paid -13,695 -14,059 Reinsurance cover received 1,361 1,034 Change in claims provisions 1,045 -352 Change in the reinsurers' share of claims provisions -688 406
5 Claims, net of reinsurance -11,977 -12,971
Bonus and premium discounts -288 -352
Acquisition costs -1,955 -2,227 Administration expenses -734 -781
Acquisition costs and administration expenses -2,689 -3,008 Reinsurance commissions and profit participation from reinsurers 102 105
6 Insurance operating costs, net of reinsurance -2,587 -2,903
2 Technical result 3,032 2,496
Income statement

43Annual report 2014 | Tryg A/S | | Menu – Financial statements
DKKm 2014 2013
Note Profit/loss for the year 2,557 2,369
Other comprehensive income
Other comprehensive income which cannot subsequently be reclassified as profit or loss Change in equalisation provision and other provisions 26 0 Revaluation of owner-occupied property for the year 2 9 Tax on revaluation of owner-occupied property for the year 0 -3 Actuarial gains/losses on defined-benefit pension plans -46 179 Tax on actuarial gains/losses on defined-benefit pension plans 12 -54
-6 131
Other comprehensive income which can subsequently be reclassified as profit or loss Exchange rate adjustments of foreign entities for the year -178 -326 Hedging of currency risk in foreign entities for the year 191 305 Tax on hedging of currency risk in foreign entities for the year -47 -76
-34 -97
Total other comprehensive income -40 34
Comprehensive income 2,517 2,403
Statement of comprehensive income

44Annual report 2014 | Tryg A/S | | Menu – Financial statements
DKKm 2014 2013
Note Assets 11 Intangible assets 984 758
Operating equipment 97 122 Owner-occupied property 1,153 1,304 Assets under construction 11 0
12 Total property, plant and equipment 1,261 1,426
13 Investment property 1,828 1,831
14 Equity investments in associates 225 215
Total investments in associates 225 215
Equity investments 128 150 Unit trust units 3,884 3,741 Bonds 37,175 36,971 Deposits with credit institutions 667 1,301 Derivative financial instruments 1,318 692
Total other financial investment assets 43,172 42,855
15 Total investment assets 45,225 44,901
Reinsurers' share of premium provisions 219 237 19 Reinsurers' share of claims provisions 1,719 2,383
16 Total reinsurers' share of provisions for insurance contracts 1,938 2,620
Receivables from policyholders 1,232 1,088
Total receivables in connection with direct insurance contracts 1,232 1,088 Receivables from insurance enterprises 208 299 Other receivables 222 1,027
15 Total receivables 1,662 2,414
17 Current tax assets 0 145 Cash at bank and in hand 505 553
Total other assets 505 698
Interest and rent receivable 337 406 Other prepayments and accrued income 312 148
Total prepayments and accrued income 649 554
Total assets 52,224 53,371
Statement of financial position
DKKm 2014 2013
Note Equity and liabilities 18 Equity 11,119 11,107
1 Subordinate loan capital 1,768 1,818
19 Premium provisions 5,810 6,212 19 Claims provisions 25,272 26,087 Provisions for bonuses and premium discounts 610 640
Total provisions for insurance contracts 31,692 32,939
20 Pensions and similar obligations 342 791 21 Deferred tax liability 1,022 1,057 22 Other provisions 83 73
Total provisions 1,447 1,921
Debt relating to direct insurance 565 447 Debt relating to reinsurance 188 330 23 Amounts owed to credit institutions 116 6 24 Debt relating to unsettled funds transactions and repos 2,902 2,821 15 Derivative financial instruments 799 514 17 Current tax liabilities 429 409 Other debt 1,153 1,033
Total debt 6,152 5,560
Accruals and deferred income 46 26
Total equity and liabilities 52,224 53,371
1 Risk and capital management 26 Contractual obligations, collateral and contingent liabilities 27 Acquisition of subsidiaries 28 Related parties 29 Financial highlights 30 Accounting policies

45Annual report 2014 | Tryg A/S | | Menu – Financial statements
Statement of changes in equity
Proposed dividend per share DKK 29 (DKK 27 in 2013) Dividend per share is calculated as the total dividend proposed by the Supervisory Board after the end of the financial year divided by the number of shares at the end of the year (59,695,516 shares). The dividend is not paid until approved by the shareholders at the annual general meeting.
The possible payment of dividend from Tryg Forsikring A/S to Tryg A/S is influenced by contingency fund provisions of DKK 2,622m (DKK 3,020m in 2013). The contingency fund provisions can be used to cover losses in connection with the settlement of insurance provisions or otherwise for the benefit of the insured.
a) Other reserves contains Norwegian Natural Perils Pool
Reserve for Share Revaluation- exchange rate Equalisation- Other Retained ProposedDKKm capital reserves adjustment reserve reservesa) earnings dividend Total
Equity at 31 December 2013 1,533 78 49 61 888 6,842 1,656 11,107 2014 Profit/loss for the year 60 -81 847 1,731 2,557Other comprehensive income 2 -34 -15 41 -34 -40
Total comprehensive income 0 2 -34 45 -40 813 1,731 2,517
Nullification of own shares -41 41 0Dividend paid -1,656 -1,656Dividend own shares 59 59Purchase and sale of own shares -1,005 -1,005Exercise of share options 49 49Issue of employee shares 45 45Issue of share options and matching shares 3 3
Total changes in equity in 2014 -41 2 -34 45 -40 5 75 12
Equity at 31 December 2014 1,492 80 15 106 848 6,847 1,731 11,119
Equity at 31 December 2012 1,533 72 146 61 1,044 6,529 1,594 10,979 2013 Profit/loss for the year -156 869 1,656 2,369Other comprehensive income 0 6 -97 0 0 125 0 34
Total comprehensive income 0 6 -97 0 -156 994 1,656 2,403
Dividend paid -1,594 -1,594Dividend, own shares 15 15Purchase and sale of own shares -800 -800Exercise of share options 100 100Issue of share options and matching shares 4 4
Total changes in equity in 2013 0 6 -97 0 -156 313 62 128
Equity at 31 December 2013 1,533 78 49 61 888 6,842 1,656 11,107

46Annual report 2014 | Tryg A/S | | Menu – Financial statements
DKKm 2014 2013
Note Financing Exercise of share options/purchase of own shares (net) -956 -700 Subordinate loan capital 0 316 Dividend paid -1,656 -1,594 Change in amounts owed to credit institutions 110 -8
Financing, continuing business -2,502 -1,986
Total financing -2,502 -1,986
Change in cash and cash equivalents, net -37 88 Additions relating to purchase of subsidiaries 14 0 Exchange rate adjustment of cash and cash equivalents, 1 January -25 -39
Change in cash and cash equivalents, gross -48 49
Cash and cash equivalents at 1 January 553 504
Cash and cash equivalents at 31 December 505 553
DKKm 2014 2013
Note Cash from operating activities Premiums 18,139 19,610 Claims -13,584 -14,048 Ceded business 229 -63 Costs -2,862 -3,032 Change in other debt and other amounts receivable -190 -1
Cash flow from insurance activities 1,732 2,466
Interest income 995 1,006 Interest expenses -115 -142 Dividend received 39 19 Taxes -512 -1,017 Other income and costs -90 -91
Cash from operating activities, continuing business 2,049 2,241
Cash from operating activities, discontinued and divested business -58 25
Total cash flow from operating activities 1,991 2,266
Investments Purchase and refurbishment of real property -14 -18 Sale of real property 7 2 Purchase/sale of equity investments and unit trust units (net) 291 -128 Purchase/sale of bonds (net) -386 657 Deposits with credit institutions 630 -420 Purchase/sale of operating equipment (net) -17 -6 Acquisition of intangble assets -228 0 Hedging of currency risk 191 305
Investments, continuing business 474 392
Total investments 474 -192
Cash flow statement

47
Notes
Annual report 2014 | Tryg A/S | | Menu – Financial statements
Line of defence
Executive Management
Supervisory Board
• Risk management• Compliance• Aktuarial function
2. Line of defence
• Internal audit
3. Line of defence External audit
• Operational control• Business controls
1. Line of defence • Risk appetite• Capital• Strategy• Crisis management
Supervisory Board’sRisk Committee
• Contingency• Control• Risk identi�cation• Risk management
Executive Management
Systematic risk assessment Reporting
InsuranceRisk Committee
Model Risk Committee
Investment Risk Committee
Operational Risk Committee
Risk reporting Recommen-dations
Policies Policies
Tryg's risk management environment
Supervisory Board
Risk management environment
1 Risk and capital management
Risk management in Tryg The Supervisory Board defines the company’s risk appetite through its business model and strategy, and this is operationalised through the company’s policies. The company’s risk management forms the basis for the risk profile being in line with the specified risk appetite at all times.
Tryg’s risk profile is continuously measured, quanti-fied and reported to the management and the Super-visory Board.
Given that the requirements for the Supervisory Board’s involvement in the company’s capital and risk management are considerable and ever-growing, Tryg’s Supervisory Board has decided to set up a special Risk Committee to address these topics sepa-rately in the course of the year. The Committee meets five times a year for a detailed review of various risk management topics and regularly keeps the entire Supervisory Board up-to-date on the status.
Tryg’s risk management is organised into three levels of control. The first level of control is handled in the business where the company’s policies are imple-
mented, and day-to-day compliance is verified on a regular basis. Risk management at the first level of control is supported by decentralised risk managers affiliated with the individual areas.
At the second level of control, there is the risk management function which ensures consistent risk management across the organisation, among other things. The risk management function measures and assesses risks at group level and prepares continuous reporting to the management and the Supervisory Board. Among other things, this involves an ongoing identification and assessment of the most significant risks in the company. Furthermore, the function pre-pares specific recommendations in relation to capital management, reinsurance, interest rate risk identifica-tion and more. Tryg’s risk management function is also responsible for determining the company’s capital requirements and for assessing whether the calculated solvency requirement is reasonable given the identified risks.
At the second level, there is also Tryg’s committee en-vironment which deals with and monitors risk topics of a more principal and interdisciplinary nature.
How is the actual risk profile measured?
Tactically- Risk reports- Internal controls- Capital model- Stress tests
What risk profile does Tryg want?
- Business model- Strategy- Policies
How is this supported?
Tactically- Policies- Capital plan- Contingency plan
Operationally- Frameworks- Limitations- Instructions- Allocated capital- Contingency plans
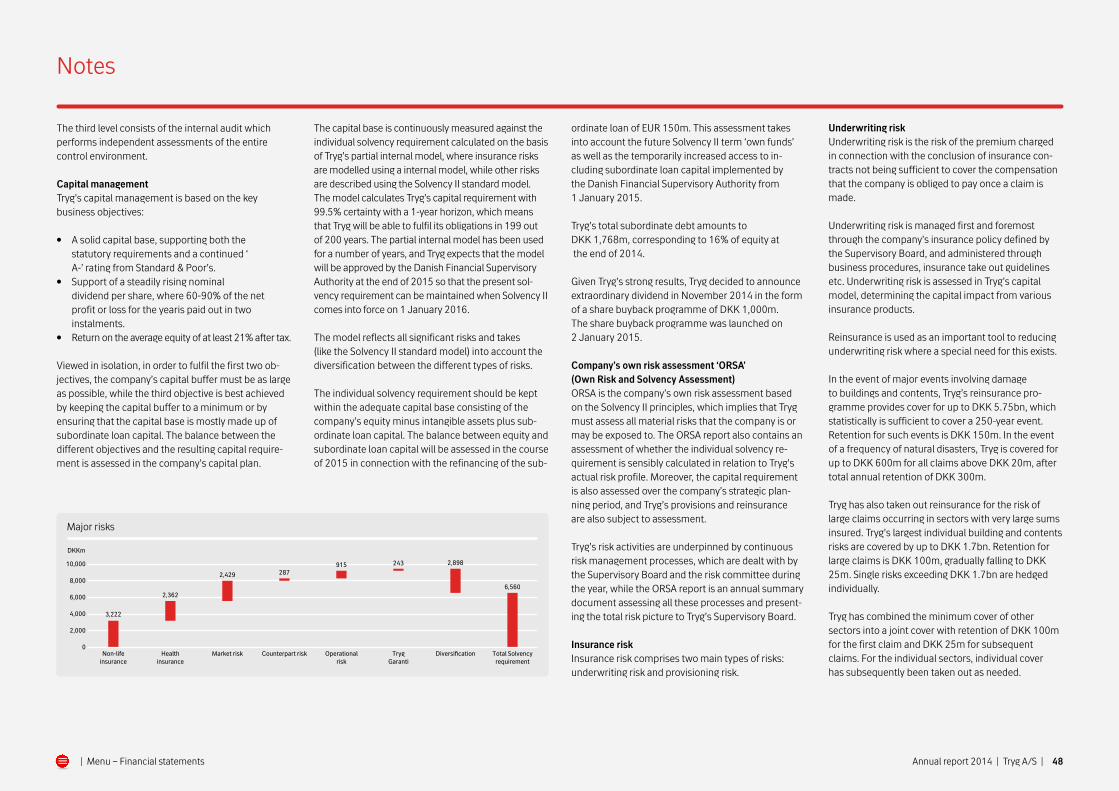
48
Notes
Annual report 2014 | Tryg A/S | | Menu – Financial statements
Major risks
DKKm
10,000
8,000
6,000
4,000
2,000
0Non-life
insuranceHealth
insuranceMarket risk Counterpart risk Operational
riskTryg
GarantiDiversi cation Total Solvency
requirement
3,222
2,362
2,429 287915 243 2,898
6,560
The third level consists of the internal audit which performs independent assessments of the entire control environment.
Capital managementTryg’s capital management is based on the key business objectives:
• A solid capital base, supporting both the statutory requirements and a continued ‘ A-’ rating from Standard & Poor’s.
• Support of a steadily rising nominal dividend per share, where 60-90% of the net profit or loss for the yearis paid out in two instalments.
• Return on the average equity of at least 21% after tax.
Viewed in isolation, in order to fulfil the first two ob-jectives, the company’s capital buffer must be as large as possible, while the third objective is best achieved by keeping the capital buffer to a minimum or by ensuring that the capital base is mostly made up of subordinate loan capital. The balance between the different objectives and the resulting capital require-ment is assessed in the company’s capital plan.
The capital base is continuously measured against the individual solvency requirement calculated on the basis of Tryg’s partial internal model, where insurance risks are modelled using a internal model, while other risks are described using the Solvency II standard model. The model calculates Tryg’s capital requirement with 99.5% certainty with a 1-year horizon, which means that Tryg will be able to fulfil its obligations in 199 out of 200 years. The partial internal model has been used for a number of years, and Tryg expects that the model will be approved by the Danish Financial Supervisory Authority at the end of 2015 so that the present sol-vency requirement can be maintained when Solvency II comes into force on 1 January 2016.
The model reflects all significant risks and takes (like the Solvency II standard model) into account the diversification between the different types of risks.
The individual solvency requirement should be kept within the adequate capital base consisting of the company’s equity minus intangible assets plus sub-ordinate loan capital. The balance between equity and subordinate loan capital will be assessed in the course of 2015 in connection with the refinancing of the sub-
ordinate loan of EUR 150m. This assessment takes into account the future Solvency II term ‘own funds’ as well as the temporarily increased access to in-cluding subordinate loan capital implemented by the Danish Financial Supervisory Authority from 1 January 2015.
Tryg’s total subordinate debt amounts to DKK 1,768m, corresponding to 16% of equity at the end of 2014.
Given Tryg’s strong results, Tryg decided to announce extraordinary dividend in November 2014 in the form of a share buyback programme of DKK 1,000m. The share buyback programme was launched on 2 January 2015.
Company’s own risk assessment ‘ORSA’ (Own Risk and Solvency Assessment)ORSA is the company’s own risk assessment based on the Solvency II principles, which implies that Tryg must assess all material risks that the company is or may be exposed to. The ORSA report also contains an assessment of whether the individual solvency re-quirement is sensibly calculated in relation to Tryg’s actual risk profile. Moreover, the capital requirement is also assessed over the company’s strategic plan-ning period, and Tryg’s provisions and reinsurance are also subject to assessment.
Tryg’s risk activities are underpinned by continuous risk management processes, which are dealt with by the Supervisory Board and the risk committee during the year, while the ORSA report is an annual summary document assessing all these processes and present-ing the total risk picture to Tryg’s Supervisory Board.
Insurance riskInsurance risk comprises two main types of risks: underwriting risk and provisioning risk.
Underwriting riskUnderwriting risk is the risk of the premium charged in connection with the conclusion of insurance con-tracts not being sufficient to cover the compensation that the company is obliged to pay once a claim is made.
Underwriting risk is managed first and foremost through the company’s insurance policy defined by the Supervisory Board, and administered through business procedures, insurance take out guidelines etc. Underwriting risk is assessed in Tryg’s capital model, determining the capital impact from various insurance products.
Reinsurance is used as an important tool to reducing underwriting risk where a special need for this exists.
In the event of major events involving damage to buildings and contents, Tryg’s reinsurance pro-gramme provides cover for up to DKK 5.75bn, which statistically is sufficient to cover a 250-year event. Retention for such events is DKK 150m. In the event of a frequency of natural disasters, Tryg is covered for up to DKK 600m for all claims above DKK 20m, after total annual retention of DKK 300m.
Tryg has also taken out reinsurance for the risk of large claims occurring in sectors with very large sums insured. Tryg’s largest individual building and contents risks are covered by up to DKK 1.7bn. Retention for large claims is DKK 100m, gradually falling to DKK 25m. Single risks exceeding DKK 1.7bn are hedged individually.
Tryg has combined the minimum cover of other sectors into a joint cover with retention of DKK 100m for the first claim and DKK 25m for subsequent claims. For the individual sectors, individual cover has subsequently been taken out as needed.

49
Notes
Annual report 2014 | Tryg A/S | | Menu – Financial statements
For Tryg’s subsidiary Tryg Garantiforsikring A/S, the maximum retention is DKK 30m.
The use of reinsurance creates a natural counterparty risk. This risk be handled by applying a wide range of rein-surers with at least an ‘A’ rating and USD 100m in capital.
Provisioning riskProvisioning risk relates to the risk of Tryg’s insurance provisions proving to be inadequate. The Supervisory Board lays down the overall framework for the han-dling of provisioning risk in the insurance policy, while the overall risk is measured in the capital model. The uncertainty associated with the calculation of claims provisions affects Tryg’s results through the run-off on provisions.
Long-tail provisions in particular are subject to inter-est rate and inflation risk. Interest rate risk is hedged by means of Tryg’s match portfolio which corre-sponds to the discounted claims provisions. In order to counter the inflation risk of Danish workers’ com-pensation claims provisions, Tryg has bought zero coupon inflation swaps.
Tryg determines the claims provisions via statistical calculations and individual assessments. At the end of 2014, Tryg’s claims provisions totalled DKK 25,272m with an average duration of 3.7 years. The duration expresses the average length of time from the provi-sion is determined until the compensation is paid and varies considerably from sector to sector.
Investment riskThe overall framework for managing investment risk is defined by the Supervisory Board in Tryg’s investment policy. In overall terms, Tryg’s investment portfolio is divided into a match portfolio and a free portfolio.
The match portfolio corresponds to the value of the discounted claims provisions and is designed to hedge
Sensitivity analysis
Insurance risk DKKm 2014 2013
Effect of 1% change in: Combined ratio (1 percentage point) +/- 184 +/- 192Claim frequency (1 percentage point) +/- 1,369 +/- 1,437Average claim +/- 122 +/- 139Premium rates +/- 190 +/- 190 Provisioning risk 1% change in inflation in person-related lines of business +/- 715 +/- 68410% error in the assessment of long-tail lines of business (workers’ compensation, motor liability, liability, accident) +/- 1,752 +/- 1,753
Investment riskInterest rate market Effect of 1% increase in interest curve: Impact on interest-bearing securities -880 -849Higher discounting of claims provisions 793 755Net impact of interest rate increase -87 -94Impact of Norwegian pension obligation a) 87 282 Equity market 15% decline in equity market -393 -398Impact of derivatives -72 -35 Real estate market 15% decline in real estate markets -488 -499 Currency market Equity: 15% decline in exposed currency (exclusive of EUR) relative to DKK -835 -1,031Impact of derivatives 791 985Net impact of exchange rate decline -44 -46Technical result per year: Impact of 15% change in NOK and SEK exchange rates relative to DKK +/- 230 +/- 195
a) Additional sensitivity information can be found in Note 20 ‘Pensions and similar obligations’
the interest rate sensitivity of these to the widest possible extent. Tryg carries out daily monitoring, fol-low-up and risk management of the Group’s interest rate risk. The swap and bond portfolio is thus adjusted continuously to minimise the net interest rate risk.
In practice, it is not possible or expedient to aim for a complete match. The administration costs alone associated with a complete match mean that, in practice, a certain degree of mismatch is acceptable within an appropriate limit defined in the investment policy. Add to this that the provisions are discounted using a mathematical interest rate curve specified by the Danish Financial Supervisory Authority, which cannot be perfectly replicated in the market, for which reason a certain degree of mismatch must be accepted for regulatory reasons.
In addition, the free portfolio is subject to the frame-work defined by the Supervisory Board through the investment policy. The purpose of the free portfolio is to achieve the highest possible return relative to risk. Tryg’s shareholdings constitute the company’s largest investment risk. At the end of 2014, the equity portfo-lio accounted for 5.7% of the total investment assets. This share is expected to be at a similar level in 2015.
Tryg’s property portfolio mainly comprises owner- occupied and investment properties, the value of which is adjusted based on the conditions on the property market through internal valuations backed by external valuations. At the end of 2014, investment properties accounted for 4.9%, while owner-occupied properties accounted for 2.7% of the total investment assets. Property investments are expected to be at a similar level in 2015.
Tryg’s does not wish to speculate in foreign currency, but since Tryg invests and operates its insurance busi-ness in other currencies than Danish kroner, Tryg is exposed to currency risk. Tryg is primarily exposed to
50
Notes
Annual report 2014 | Tryg A/S | | Menu – Financial statements
fluctuations in the other Scandinavian currencies due to its ongoing insurance activities. Premiums earned and compensation paid in other currencies create a natural currency hedge, for which reason other risk mitigation measures are not required in this area. How-ever, the part of equity held in other currencies than Danish kroner will be exposed to currency risk. This risk is hedged on an ongoing basis using currency swaps.
In addition to the above-mentioned risks, Tryg is ex-posed to credit, counterparty and concentration risk. These risks primarily relate to exposures in high-yield bonds, emerging market debt exposures as well as Tryg’s investments in AAA-rated Nordic and European government and mortgage bonds. These risks are also managed through the investment policy and the framework for reinsurance defined in the insurance policy. For an insurance company like Tryg, liquidity risk is practically non-existent, as premium payments fall due before claims payments.
Operational riskOperational risk relates to errors or failures in internal procedures, fraud, breakdown of infrastructure, IT security and similar factors. As operational risks are mainly internal, Tryg focuses on an adequate control environment for its operations. In practice, this work is organised by means of procedures, controls and guidelines covering the various aspects of the Group’s operations. Tryg has also set up a security and investi-gation unit to handle internal fraud, IT security, physi-cal security and contingency plans.
The Supervisory Board defines the overall framework for managing operational risk in Tryg’s IT security policy and operational risk policy. These risks are controlled via the Operational Risk Committee.
Tryg has set up a crisis management structure to deal with the eventuality that Tryg is hit by major crises.
This comprises a Crisis Management Team at Group level, national contingency teams at country level and finally business contingency in the individual areas. Tryg has prepared contingency plans to address the most important areas. In addition, comprehensive IT contingency plans have been established, primarily focusing on the business-critical systems.
Other risks
Strategic riskThe strategic risk is the risk of loss as a result of Tryg’s chosen strategic position. The strategic position cov-ers both business transactions, IT strategy, choice of business partners and changed market conditions.
Tryg’s strategic position is determined by Tryg’s Supervisory Board in close collaboration with the Group Executive Management. Before determining the strategic position, the strate-gic decisions are subjected to a risk assessment, explaining the risk of the chosen strategy to Tryg’s Supervisory Board and Group Executive Management.
Compliance riskCompliance risk is the risk of loss as a result of lack of compliance with rules and regulations.
The handling of compliance risk is coordinated cen-trally via the Group’s legal department, which, among other things, sits on industry committees in connec-tion with legislative monitoring, ensures implementa-tion in Tryg through business procedures and partici-pates in the ongoing training of the organisation.
Certain parts of the operationalisation take place via the decentralised risk manager structure, ensuring additional anchoring in the individual business areas.
Emerging riskEmerging risk covers new risks or known risks, with changing characteristics.
The management of this type of risk will be handled in the individual business areas, which monitor the mar-ket and adapt the products as the conditions change. In the event of a change in insurance terms, it is en-sured that Tryg’s reinsurance cover is consistent with the new conditions.
One example of this is drone insurance, where Tryg in 2014 decided to insure commercial purpose drones of up to 25 kg. In this context, there has been an ongo-ing dialogue with Tryg’s reinsurers to ensure that Tryg does not accept risks without having considered and identified the specific risk at the desired level.

51
Notes
Annual report 2014 | Tryg A/S | | Menu – Financial statements
Claims provisions – estimated accumulated claims – DKKm
Gross 2004 2005 2006 2007 2008 2009 2010 2011 2012 2013 2014
Estimated accumulated claims End of year 10,443 11,172 10,954 11,879 12,451 13,811 16,056 16,386 13,905 13,754 13,074 1 year later 10,468 11,065 11,214 12,464 13,775 14,456 16,154 16,783 13,877 14,065 2 years later 10,334 10,916 10,747 13,017 13,645 14,475 16,103 16,776 13,814 3 years later 10,224 10,539 10,957 12,994 13,657 14,264 15,982 16,726 4 years later 9,962 10,666 10,893 12,993 13,616 14,145 15,892 5 years later 10,035 10,609 10,884 12,898 13,523 14,044 6 years later 9,814 10,514 10,862 12,771 13,491 7 years later 9,702 10,526 10,825 12,764 8 years later 9,666 10,499 10,641 9 years later 9,625 10,393 10 years later 9,393 9,393 10,393 10,641 12,764 13,491 14,044 15,892 16,726 13,814 14,065 13,074 144,298Cumulative payments to date -9,174 -9,898 -9,939 -11,764 -11,900 -12,489 -13,801 -14,331 -10,964 -10,249 -6,214 -120,724
Provisions before discounting, end of year 219 495 702 999 1,592 1,555 2,091 2,395 2,850 3,816 6,860 23,574Discounting -10 -48 -68 -89 -130 -123 -133 -129 -138 -144 -156 -1,167Reserves from 2003 and prior years 2,194Other 671Gross claims provisions, end of year 25,272

52
Notes
Annual report 2014 | Tryg A/S | | Menu – Financial statements
Claims provisions – estimated accumulated claims – DKKm
Ceded business 2004 2005 2006 2007 2008 2009 2010 2011 2012 2013 2014
Estimated accumulated claims End of year 775 924 278 503 163 287 674 1,465 240 556 262 1 year later 790 819 278 469 227 357 751 2,171 271 969 2 years later 828 824 265 482 193 335 745 2,292 311 3 years later 827 819 296 488 183 290 721 2,334 4 years later 813 844 297 507 183 293 731 5 years later 823 840 292 478 170 298 6 years later 823 825 290 507 176 7 years later 812 825 292 498 8 years later 810 817 290 9 years later 814 829 10 years later 814 814 829 290 498 176 298 731 2,334 311 969 262 7,512Cumulative payments to date -757 -797 -282 -484 -162 -288 -562 -2,171 -269 -570 -91 -6,434
Provisions before discounting, end of year 56 32 8 14 14 10 169 163 42 399 170 1,078Discounting -3 -1 0 0 -1 0 -2 -3 -1 -4 -2 -18Reserves from 2003 and prior years 212Other 447Reinsurers' share of claims provisions, end of year 1,719

53
Notes
Annual report 2014 | Tryg A/S | | Menu – Financial statements
Claims provisions – estimated accumulated claims – DKKm
Net of reinsurance 2004 2005 2006 2007 2008 2009 2010 2011 2012 2013 2014
Estimated accumulated claims End of year 9,668 10,248 10,676 11,377 12,288 13,524 15,381 14,921 13,666 13,198 12,813 1 year later 9,678 10,246 10,936 11,995 13,548 14,099 15,403 14,612 13,606 13,096 2 years later 9,506 10,092 10,483 12,535 13,452 14,140 15,359 14,483 13,503 3 years later 9,397 9,720 10,661 12,506 13,474 13,973 15,260 14,392 4 years later 9,149 9,822 10,596 12,486 13,433 13,852 15,161 5 years later 9,212 9,770 10,592 12,420 13,354 13,745 6 years later 8,991 9,689 10,571 12,264 13,316 7 years later 8,890 9,702 10,533 12,266 8 years later 8,856 9,682 10,351 9 years later 8,811 9,564 10 years later 8,580 8,580 9,564 10,351 12,266 13,316 13,745 15,161 14,392 13,503 13,096 12,813 136,786Cumulative payments to date -8,417 -9,101 -9,657 -11,280 -11,737 -12,201 -13,239 -12,160 -10,696 -9,679 -6,124 -114,291
Provisions before discounting, end of year 163 463 694 986 1,578 1,545 1,922 2,232 2,808 3,417 6,690 22,497Discounting -8 -47 -68 -89 -129 -123 -130 -126 -137 -140 -153 -1,149Reserves from 2003 and prior years 1,981Other 224Claims provisions, net of reinsurance, end of year 23,553 Other provisions comprise the claims provisions for Tryg Garantiforsikring A/S. The amounts in foreign currency in the table are translated to Danish kroner using the exchange rate at 31 December 2014 to prevent the impact of exchange rate fluctuations.

54
Notes
Annual report 2014 | Tryg A/S | | Menu – Financial statements
Claims provisions (continued)
Expected cash flow, not discounted DKKm 0-1 year 1-2 years 2-3 years > 3 years Other Total
2014 Premium provisions, gross 5,337 130 124 133 86 5,810Premium provisions, ceded -156 0 0 0 -22 -178Claims provisions, gross 9,041 4,282 2,716 9,945 678 26,662Claims provisions, ceded -529 -311 -199 -263 -451 -1,753
13,693 4,101 2,641 9,815 291 30,541
2013 Premium provisions, gross 5,765 136 131 144 36 6,212Premium provisions, ceded -219 0 0 0 -18 -237Claims provisions, gross 9,701 4,513 2,897 10,489 816 28,416Claims provisions, ceded -844 -255 -258 -496 -603 -2,456
14,403 4,394 2,770 10,137 231 31,935
Other comprises Tryg Garantiforsikring A/S and from 2014 premium provisions in Securator A/S.

55
Notes
Annual report 2014 | Tryg A/S | | Menu – Financial statements
DKKm 2014 2013
Investment risk
Bond portfolio including interest derivatives Duration 1 year or less 16,622 18,748Duration 1 year-5 years 13,925 14,000Duration 5-10 years 4,129 3,188Duration more than 10 years 2,836 2,403
Total 37,512 38,339
Duration 2.2 2.3
The option adjusted duration is used to measure duration. The option adjustment relates primarilyto Danish mortgage bonds and reflects the expected duration-shortening effect of the borrower'soption to cause the bond to be redeemed through the mortgage institution at any point in time.
Listed shares 2014 2013
Nordic countries 413 393United Kingdom 207 141Rest of Europe 674 793United States 1,096 892Asia etc. 563 591
Total 2,953 2,810
The portfolio of unlisted shares totals 128 150
The share portfolio includes exposure from share derivaties of DKK 477m (DKK 325m in 2013)Unlisted equity investments are based on an estimated market price.
Exposure to exchange rate risk 2014 2013
Assets and Assets and debt Hedge Exposure debt Hedge Exposure
USD 1,952 -1,918 34 1,387 -1,335 52EUR 530 706 1,236 524 664 1,188GBP 79 -69 10 81 -91 -10NOK 3,701 -3,507 194 3,226 -2,981 245SEK 1,076 -998 78 1,306 -1,280 26Other 541 -474 67 565 -379 186
Total 1,619 1,707
Impact of exchange rate fluctuations in SEK and NOK on technical result
Change excl. Currency currency 2014 2013 Change effect effect
Gross premium income 18,652 19,504 -852 -642 -210Gross claims -12,650 -14,411 1,761 437 1,324Total insurance operating costs -2,689 -3,008 319 86 233
Profit/loss on gross business 3,313 2,085 1,228 -119 1,347Profit/loss on ceded business -341 349 -690 10 -700Insurance technical interest, net of reinsurance 60 62 -2 -3 1
Technical result 3,032 2,496 536 -112 648
Change excl. Currency currency 2013 2012 Change effect effect
Gross premium income 19,504 20,314 -810 -253 -557Gross claims -14,411 -14,675 264 161 103Total insurance operating costs -3,008 -3,295 287 38 249
Profit/loss on gross business 2,085 2,344 -259 -54 -205Profit/loss on ceded business 349 86 263 11 252Insurance technical interest, net of reinsurance 62 62 0 -1 1
Technical result 2,496 2,492 4 -44 48

56
Notes
Annual report 2014 | Tryg A/S | | Menu – Financial statements
Impact of exchange rate fluctuations in SEK and NOK on the statement of financial position
Change excl. Currency currency DKKm 2014 2013 Change effect effect
Assets Intangible assets 984 758 226 -30 256Total property, plant and equipment 1,261 1,426 -165 -36 -129Investment property 1,828 1,831 -3 -25 22Investments in associates 225 215 10 -1 11Other financial investment assets 43,172 42,855 317 -1,391 1,708Reinsurers' share of provisions for insurance contracts 1,938 2,620 -682 -62 -620Receivables 1,662 2,414 -752 -65 -687Other assets 505 698 -193 -19 -174Prepayments and accrued income 649 554 95 -9 104
Total assets 52,224 53,371 -1,147 -1,638 491
Equity and liabilities Equity 11,119 11,107 12 13 -1Subordinate loan capital 1,768 1,818 -50 -50 0Provisions for insurance contracts 31,692 32,939 -1,247 -1,062 -185Total provisions 1,447 1,921 -474 -84 -390Other debt 6,152 5,560 592 -453 1,045Accruals and deferred income 46 26 20 -2 22
Total equity and liabilities 52,224 53,371 -1,147 -1,638 491
Credit risk 2014 2013 Bond portfolio by ratings DKKm % DKKm %
AAA to A 36,930 99.3 36,456 98.6Other 244 0.7 514 1.4Not rated 1 - 1 0.0
Total 37,175 100.0 36,971 100.0
Reinsurance balances
AAA to A 1,447 90.7 2,268 94.2Other 1 0.1 1 0.0Not rated 147 9.2 140 5.8
Total 1,595 100.0 2,409 100.0
Liquidity risk Maturity of the Group’s financial obligations including interest 2014 0-1 years 1-5 years > 5 years Total
Subordinate loan capital 87 243 2,209 2,539Amounts owed to credit institutions 116 0 0 116Debt relating to unsettled funds transactions and repos 2,902 0 0 2,902Derivative financial instruments 428 225 189 842Other debt 2,335 0 0 2,335
5,868 468 2,398 8,734
2013
Subordinate loan capital 89 356 2,558 3,003Amounts owed to credit institutions 6 0 0 6Debt relating to unsettled funds transactions and repos 2,821 0 0 2,821Derivative financial instruments 219 199 125 543Other debt 2,219 0 0 2,219
5,354 555 2,683 8,592
Interest on loans for a perpetual term has been recognised for the first fifteen years.

57Annual report 2014 | Tryg A/S | | Menu – Financial statements
Subordinate loan capital Bond loan Bond loan EUR 150m NOK 800m 2014 2013 2014 2013
The fair value of the loan at the statement of financial position date 1,106 1,127 714 741The fair value of the loan at the statment of financial position date is based on a price of 99 101 108 105Total capital losses and costs at the statement of the financial position date 3 5 4 5Interest expenses for the year 50 50 40 33Effective interest rate 4.5% 4.1% 3.6% 4.8%
Loan terms: Lender Listed bonds Listed bondsPrincipal EUR 150m NOK 800mIssue price 99.017 100Issue date December 2005 March 2013Maturity year 2025 PerpetualLoan may be called by lender as from 2015 2023Repayment profile Interest-only Interest-onlyInterest structure 4.5% (until 2015) 3.75 % above NIBOR 3M (until 2023) 2.1% above EURIBOR 3M (from 2015) 4.75 % above NIBOR 3M (from 2023)
The share of capital included in the calculation of the capital base total DKK 1,496m (DKK 1,551m in 2013). The loans are initially recognised at fair value on the date on which a loan is entered and subsequently measured at amortised cost. The loans are taken by Tryg Forsikring A/S. The credi-tors have no option to call the loans before maturity or otherwise terminate the loan agreements. The loans are automatically accelerated upon the liquida-tion or bankruptcy of Tryg Forsikring A/S. Prices used for determination of fair value in respect of both loans are based on actual traded prices from Bloomberg.
Notes

58Annual report 2014 | Tryg A/S | | Menu – Financial statements
DKKm Private Commercial Corporate Sweden Other Group
2 Operating segments 2014
Gross premium income 9,051 4,190 4,033 1,399 -21 18,652 Gross claims -6,129 -2,673 -2,872 -998 22 -12,650 Gross operating expenses -1,311 -664 -446 -268 0 -2,689
Profit/loss on ceded business -23 8 -304 -21 -1 -341 Insurance technical interest, net of reinsurance 24 14 16 6 0 60
Technical result 1,612 875 427 118 0 3,032 Other items -475
Profit/loss 2,557
Run-off gains/losses, net of reinsurance 357 310 421 43 0 1,131
Intangible assets 37 600 347 984 Equity investments in associates 225 225 Reinsurers' share of premium provisions 10 12 197 0 0 219 Reinsurers' share of claims provisions 154 346 1,181 38 0 1,719 Other assets 49,077 49,077
Total assets 52,224
Premium provisions 2,423 1,425 1,163 799 0 5,810 Claims provisions 6,062 6,742 10,754 1,714 0 25,272 Provisions for bonuses and premium discounts 488 51 62 9 0 610 Other liabilities 9,413 9,413
Total liabilities 41,105
Description of segments Please refer to the accounting principles for a description of operating segments. Amounts relating to eliminations, restructuring expenses and discontinued and divested business are included under 'Other'. Other assets and liabilities are managed at Group level and are therefore not allocated to the individual segments but are included under 'Other'. Costs are allocated according to specific keys, which are believed to provide the best estimate of assessed resource consumption.
Notes

59Annual report 2014 | Tryg A/S | | Menu – Financial statements
DKKm Private Commercial Corporate Sweden Other Group
2 Operating segments 2013
Gross premium income 9,366 4,411 4,158 1,587 -18 19,504 Gross claims -6,596 -2,978 -3,661 -1,178 2 -14,411 Gross operating expenses -1,418 -820 -490 -280 0 -3,008
Profit/loss on ceded business -43 29 338 9 16 349 Insurance technical interest, net of reinsurance 26 12 13 11 0 62
Technical result 1,335 654 358 149 0 2,496 Other items -127
Profit/loss 2,369
Run-off gains/losses, net of reinsurance 310 265 375 20 0 970
Intangible assets 463 295 758 Equity investments in associates 215 215 Reinsurers' share of premium provisions 8 9 219 1 0 237 Reinsurers' share of claims provisions 265 404 1,641 73 0 2,383 Other assets 49,778 49,778
Total assets 53,371
Premium provisions 2,727 1,281 1,374 830 0 6,212 Claims provisions 6,377 6,462 11,491 1,757 0 26,087 Provisions for bonuses and premium discounts 507 29 94 10 0 640 Other liabilities 9,325 9,325
Total liabilities 42,264
Notes
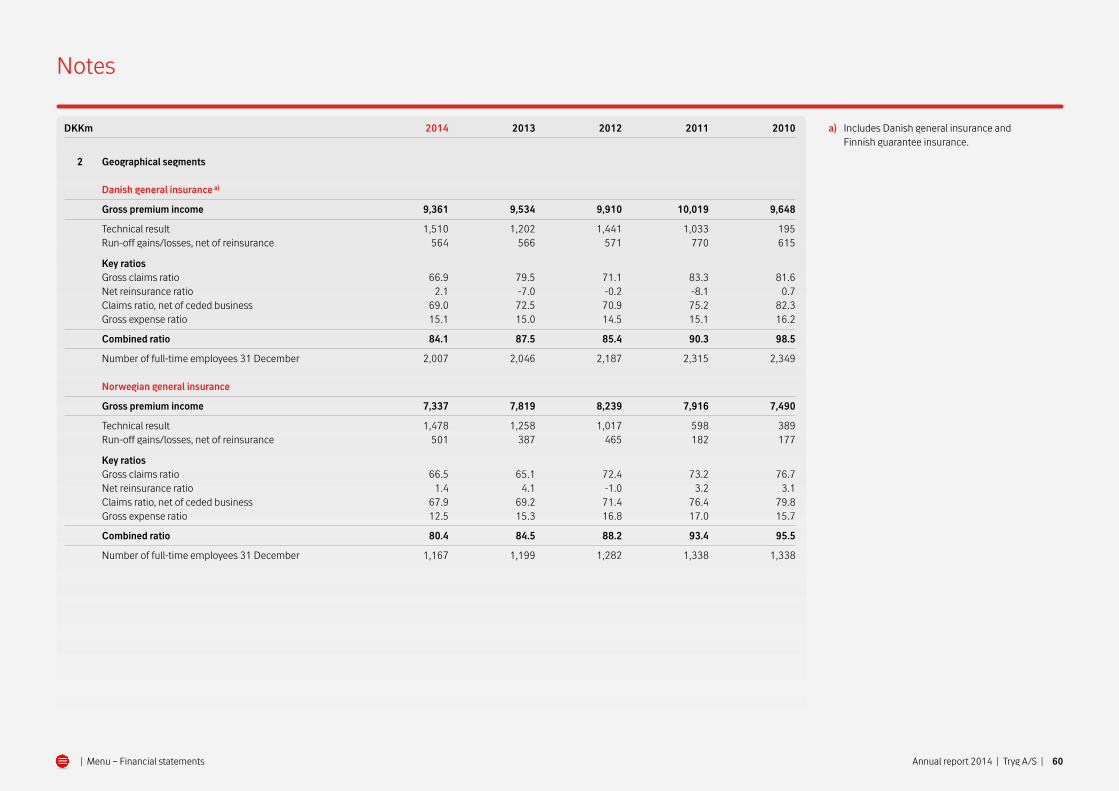
60Annual report 2014 | Tryg A/S | | Menu – Financial statements
DKKm 2014 2013 2012 2011 2010
2 Geographical segments Danish general insurance a)
Gross premium income 9,361 9,534 9,910 10,019 9,648
Technical result 1,510 1,202 1,441 1,033 195 Run-off gains/losses, net of reinsurance 564 566 571 770 615
Key ratios Gross claims ratio 66.9 79.5 71.1 83.3 81.6 Net reinsurance ratio 2.1 -7.0 -0.2 -8.1 0.7 Claims ratio, net of ceded business 69.0 72.5 70.9 75.2 82.3 Gross expense ratio 15.1 15.0 14.5 15.1 16.2
Combined ratio 84.1 87.5 85.4 90.3 98.5
Number of full-time employees 31 December 2,007 2,046 2,187 2,315 2,349
Norwegian general insurance
Gross premium income 7,337 7,819 8,239 7,916 7,490
Technical result 1,478 1,258 1,017 598 389 Run-off gains/losses, net of reinsurance 501 387 465 182 177
Key ratios Gross claims ratio 66.5 65.1 72.4 73.2 76.7 Net reinsurance ratio 1.4 4.1 -1.0 3.2 3.1 Claims ratio, net of ceded business 67.9 69.2 71.4 76.4 79.8 Gross expense ratio 12.5 15.3 16.8 17.0 15.7
Combined ratio 80.4 84.5 88.2 93.4 95.5
Number of full-time employees 31 December 1,167 1,199 1,282 1,338 1,338
a) Includes Danish general insurance and Finnish guarantee insurance.
Notes
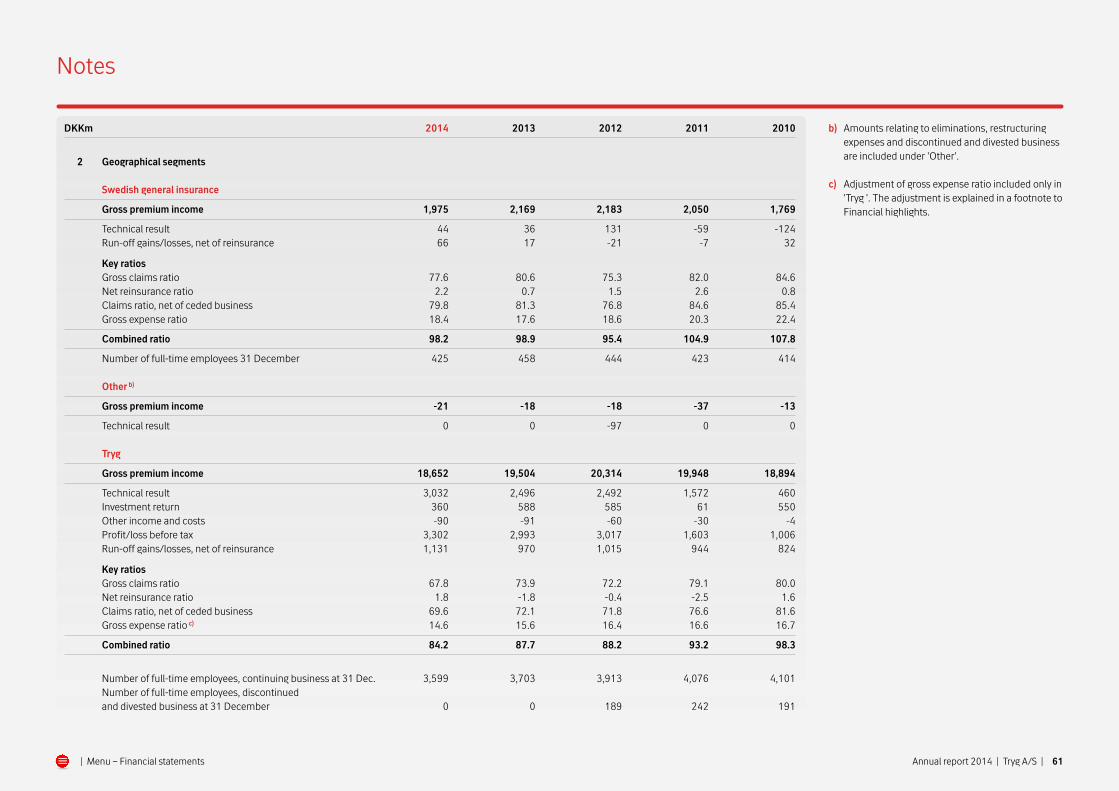
61Annual report 2014 | Tryg A/S | | Menu – Financial statements
DKKm 2014 2013 2012 2011 2010
2 Geographical segments Swedish general insurance
Gross premium income 1,975 2,169 2,183 2,050 1,769
Technical result 44 36 131 -59 -124 Run-off gains/losses, net of reinsurance 66 17 -21 -7 32
Key ratios Gross claims ratio 77.6 80.6 75.3 82.0 84.6 Net reinsurance ratio 2.2 0.7 1.5 2.6 0.8 Claims ratio, net of ceded business 79.8 81.3 76.8 84.6 85.4 Gross expense ratio 18.4 17.6 18.6 20.3 22.4
Combined ratio 98.2 98.9 95.4 104.9 107.8
Number of full-time employees 31 December 425 458 444 423 414
Other b)
Gross premium income -21 -18 -18 -37 -13
Technical result 0 0 -97 0 0
Tryg
Gross premium income 18,652 19,504 20,314 19,948 18,894
Technical result 3,032 2,496 2,492 1,572 460 Investment return 360 588 585 61 550 Other income and costs -90 -91 -60 -30 -4 Profit/loss before tax 3,302 2,993 3,017 1,603 1,006 Run-off gains/losses, net of reinsurance 1,131 970 1,015 944 824
Key ratios Gross claims ratio 67.8 73.9 72.2 79.1 80.0 Net reinsurance ratio 1.8 -1.8 -0.4 -2.5 1.6 Claims ratio, net of ceded business 69.6 72.1 71.8 76.6 81.6 Gross expense ratio c) 14.6 15.6 16.4 16.6 16.7
Combined ratio 84.2 87.7 88.2 93.2 98.3
Number of full-time employees, continuing business at 31 Dec. 3,599 3,703 3,913 4,076 4,101 Number of full-time employees, discontinued and divested business at 31 December 0 0 189 242 191
b) Amounts relating to eliminations, restructuring expenses and discontinued and divested business are included under 'Other'.
c) Adjustment of gross expense ratio included only in 'Tryg '. The adjustment is explained in a footnote to Financial highlights.
Notes

62
Notes
Annual report 2014 | Tryg A/S | | Menu – Financial statements
2 Technical result, net of reinsurance, by line of business Accident and Worker’s Motor comprehensive Marine, aviation and DKKm health Health care compensation Motor TPL insurance cargo insurance
2014 2013 2014 2013 2014 2013 2014 2013 2014 2013 2014 2013
Gross premiums written 1,692 1,798 313 324 951 1,039 2,098 2,322 3,747 3,986 353 359
Gross premium income 1,663 1,740 314 326 970 1,007 2,134 2,298 3,715 3,884 320 344Gross claims - 1,212 - 1,282 - 223 - 209 - 155 - 394 - 1,556 - 1,728 - 2,295 - 2,532 - 256 - 167Gross operating expenses - 224 - 219 - 37 - 29 - 108 - 128 - 337 - 403 - 555 - 602 - 39 - 39Profit/loss on ceded business - 7 - 3 - 1 0 - 8 - 36 - 51 - 36 16 - 2 21 - 91Insurance technical interest, net of reinsurance 5 4 1 1 3 - 6 7 7 11 14 1 1
Technical result 225 240 54 89 702 443 197 138 892 762 47 48
Gross claims ratio 72.9 73.7 71.0 64.1 16.0 39.1 72.9 75.2 61.8 65.2 80.0 48.5 Combined ratio 86.8 86.4 83.1 73.0 27.9 55.4 91.1 94.3 76.3 80.7 85.6 86.3
Claims frequency a) 4.5% 4.4% 128.3% 108.8% 17.4% 16.8% 5.6% 5.7% 18.1% 19.4% 19.8% 21.0%Average claims DKK b) 33,560 36,905 4,334 4,918 79,102 89,638 22,248 24,059 10,376 10,644 111,361 68,910 Total claims 37,228 36,480 50,173 45,694 9,463 9,209 72,195 73,973 224,791 238,955 2,470 2,621
Fire and contents Fire and contents Credit and guarantee Tourist assistance (Private) (Commercial) Change of ownership Liability insurance insurance insurance
2014 2013 2014 2013 2014 2013 2014 2013 2014 2013 2014 2013
Gross premiums written 4,453 4,739 2,556 2,651 62 66 985 986 338 336 573 569
Gross premium income 4,492 4,693 2,535 2,632 65 79 979 978 327 326 568 571Gross claims - 3,139 - 3,405 - 1,957 - 1,933 - 63 - 52 - 917 - 848 16 - 888 - 450 - 425Gross operating expenses - 671 - 794 - 376 - 419 - 12 - 8 - 148 - 135 - 45 - 47 - 79 - 80Profit/loss on ceded business 22 - 21 - 113 - 126 0 0 - 10 50 - 188 629 - 2 - 1Insurance technical interest, net of reinsurance 12 18 7 10 0 0 3 3 1 2 2 2
Technical result 716 491 96 164 - 10 19 - 93 48 111 22 39 67
Gross claims ratio 69.9 72.6 77.2 73.4 96.9 65.8 93.7 86.7 -4.9 272.4 79.2 74.4 Combined ratio 84.3 89.9 96.5 94.1 115.4 75.9 109.8 95.4 66.4 93.9 93.5 88.6
Claims frequency a) 7.6% 9.0% 15.8% 23.1% 9.2% 8.1% 11.3% 11.6% 0.1% 0.3% 19.4% 14.0%Average claims DKK b) 9,615 10,508 62,035 56,519 20,263 25,531 81,763 59,246 1,068,663 6,994,362 5,673 8,265 Total claims 333,943 348,296 29,686 38,033 4,255 4,349 10,454 10,566 83 127 79,007 54,848
a) The claims frequency is calculated as the number of claims incurred in the year in proportion to the average number of insurance contracts in the year. b) Average claims are total claims before run-off in the year relative to the number of claims in the year.

63Annual report 2014 | Tryg A/S | | Menu – Financial statements
2 Technical result, net of reinsurance, by line of business Other Total exclusive of Norwegian Group Life DKKm insurance Norwegian Group Life one-year policies Total
2014 2013 2014 2013 2014 2013 2014 2013
Gross premiums written 75 101 18,196 19,276 476 544 18,672 19,820
Gross premium income 84 102 18,166 18,980 486 524 18,652 19,504Gross claims - 14 - 24 - 12,221 - 13,887 - 429 - 524 - 12,650 - 14,411Gross operating expenses - 15 - 74 - 2,646 - 2,977 - 43 - 31 - 2,689 - 3,008Profit/loss on ceded business - 20 - 12 - 341 351 0 - 2 - 341 349Insurance technical interest, net of reinsurance 1 0 54 56 6 6 60 62
Technical result 36 - 8 3,012 2,523 20 - 27 3,032 2,496
Gross claims ratio 16.7 23.5 67.3 73.2 88.3 100.0 67.8 73.9 Combined ratio 58.3 107.8 83.7 87.2 97.1 106.3 84.2 87.7
Average claims DKK b) 59,818 63,990 Total claims 220 210
Notes

64
Notes
Annual report 2014 | Tryg A/S | | Menu – Financial statements
DKKm 2014 2013
3 Premium income, net of reinsurance Direct insurance 18,872 19,740 Indirect insurance 67 83
18,939 19,823 Unexpired risk provision 1 33
18,940 19,856 Ceded direct insurance -1,067 -1,161 Ceded indirect insurance -49 -35
17,824 18,660
Direct insurance, by location of risk 2014 2013
Gross Ceded Gross Ceded
Denmark 9,488 -689 9,709 -719 Other EU countries 1,943 -30 2,162 -39 Other countries 7,442 -348 7,902 -403
18,873 -1,067 19,773 -1,161
DKKm 2014 2013
4 Insurance technical interest, net of reinsurance Return on insurance provisions 414 483 Discounting transferred from claims provisions -354 -421
60 62
5 Claims, net of reinsurance Claims -13,376 -15,273 Run-off previous years, gross 726 862
-12,650 -14,411 Reinsurance cover received 268 1,332 Run-off previous years, reinsurers' share 405 108
-11,977 -12,971
DKKm 2014 2013
6 Insurance operating costs, net of reinsurance Commissions regarding direct insurance contracts -395 -379 Other acquisition costs -1,560 -1,848
Total acquisition costs -1,955 -2,227 Administration expenses -734 -781
Insurance operating costs, gross -2,689 -3,008 Commission from reinsurers 102 105
-2,587 -2,903
Administative expenses include fee to the auditors appointed by the annual general meeting: Deloitte -11 -13
-11 -13
The fee is divided into: Statutory audit -3 -6 Tax advice -1 -1 Other services -7 -6
-11 -13
Expenses have been incurred for the Group´s Internal Audit Department. -10 -11 In the calculation of the expense ratio, costs are stated exclusive of depreciation and operating costs
on the owner-occupied property but including a calculated rent concerning the owner-occupied pro-perty based on a calculated market rent of DKK 38m. (DKK 41m in 2013).

65
Notes
Annual report 2014 | Tryg A/S | | Menu – Financial statements
DKKm 2014 2013
6 Insurance operating costs, gross, classified by type Commissions -395 -379 Staff expenses -1,463 -1,802 Other staff expenses -213 -224 Office expenses, fees and headquarter expenses -459 -411 IT operating and maintenance costs, software expenses -272 -237 Depreciation, amortisation and impairment losses and write-downs -108 -110 Other income 221 155
-2,689 -3,008
Total lease expenses amount to DKK 26m (DKK 30m in 2013) Insurance operating costs and claims include the following staff expenses: Salaries and wages -2,098 -2,122 Commision -7 -8 Allocated share options and matching shares -3 -4 Pension plans 143 -362 Other social security costs -5 -5 Payroll tax -351 -355
-2,321 -2,856
Remuneration for the Supervisory Board and Executive Management
is disclosed in note 28 'Related parties'. Average number of full-time employees during the year (continuing business) 3,639 3,800

Tryg did not allocate share options in 2014. At 31 December 2014, the share option plan com-prised 53.380 share options (229.883 share options at 31 December 2013). Each share option entitles the holder to acquire one existing share with a nominal value of DKK 25 in Tryg A/S. The share option plan entitles the holders to buy 0,1 % of the share capital in Tryg A/S if all share options are exercised.
In 2014, the fair value of share options recognised in the consolidated income statement amounted to DKK 0m (DKK 2m in 2013). At 31 December 2014, a total amount of DKK 78m was recognised for share option programmes issued in 2006-2011. Fair values at the time of allocation are based on the Black & Scholes option pricing formula.
There are no resigned Group Executive Managers with outstanding options at 31 December 2014. Risk-takers are included under ‘Other senior employees’.
The following assumptions were applied in calculating the market value of outstanding share options at the time of allocation: The expected volatility is based on the average volatility of Tryg shares. The expected term is 4 years, corresponding to the average exercise period of 3 to 5 years.
The risk-free interest rate is based on a bullet loan with the same term as the expected term of the options at the time of allocation. The calculation is based on the strike price as set out in the option agreement and the average share price at the time of allocation.
The dividend payout ratio is not included in the calcu-lation as the strike price is reduced by dividends paid in order to prevent option holders from being placed at a disadvantage in connection with the company’s dividend payments. The assumptions for calculating the market value at the end of term are based on the same principles as for the market value at the time of allocation.
66Annual report 2014 | Tryg A/S | | Menu – Financial statements
DKKm
6 Share option programmes Spec. of outstanding options: TOTAL NUMBERS FAIR VALUE
Per option Total value Total Other at time of at time of Per option value at Group Executive senior Other allocation allocation at 31 Dec. 31 Dec. 2014 Management employees employees Total DKK DKKm DKK DKKm
Allocation 2009-2011 Allocated in 2009-2011, 1 January 49,041 147,990 32,852 229,883 94/75/72 18 273/262 50 Exercised -26,351 -119,818 -26,084 -172,253 94/75/72 -13 273/262 -36 Expired 0 -1,600 -2,650 -4,250 94/75/72 0 273/262 0
Outstanding options from 2009-2011 allocation 31 Dec. 2014 22,690 26,572 4,118 53,380 5 14
Number of options exercisable 31 Dec. 2014 22,690 26,572 4,118 53,380
2013
Allocation 2008-2011 Allocated in 2008-2011, 1 January 92,818 391,877 66,580 551,275 69/94/75/72 42 238/226/238 99 Exercised -43,777 -227,782 -28,201 -299,760 69/94/75/72 -23 238/226/238 -43 Cancelled -7,525 -3,427 -10,952 69/94/75/72 -1 238/226/238 -2 Expired -8,580 -2,100 -10,680 69/94/75/72 -1 238/226/238 0
Outstanding options from 2008-2011 allocation 31 Dec. 2013 49,041 147,990 32,852 229,883 18 54
Number of options exercisable 31 Dec. 2013 40,756 53,727 9,046 103,529
Notes

67Annual report 2014 | Tryg A/S | | Menu – Financial statements
DKKm
6 Share option programmes (continued) Spec. of outstanding options:
Year of allocation Years of exercise 1 Jan. 2014 Allocation Exercised Cancelled Expired 31 Dec. 2014
2009 2012-2014 40,908 0 -36,658 0 -4,250 0 2010 2013-2015 62,621 0 -18,577 0 0 44,044 2011 2014-2016 126,354 0 -117,018 0 0 9,336
Outstanding options 31 December 2014 229,883 0 -172,253 0 -4,250 53,380
The assumptions by calculating the marketvalue at time of allocation
Average share price at time Average term Average exercise of allocation Expected Expected Risk-free to maturity share price Year of allocation Years of exercise DKK Volatility maturity interest rate 31 Dec. 2014 31 Dec. 2014
2009 2012-2014 313.51 37.70% 4 years 2.80% 0.00 0.00 2010 2013-2015 320.04 29.20% 4 years 2.70% 0.08 273.02 2011 2014-2016 295.83 30.00% 4 years 3.00% 0.55 261.90
Notes

68Annual report 2014 | Tryg A/S | | Menu – Financial statements
DKKm
6 Matching shares TOTAL NUMBERS FAIR VALUE
Average per Total value Average per matching share at time of matching share Total value Group Executive Other senior at grant date allocation at 31 Dec. at 31 Dec. Management employees Total DKK DKKm DKK DKKm
2014
Allocated in 2014 3,471 6,011 9,482 515 5 689 7
Matching shares tildelt 2014 pr. 31.12.14 3,471 6,011 9,482 515 5 689 7
Allocated in 2011-2013 14,855 12,368 27,223 339 9 689 19
Cancelled 0 -2,644 -2,644 339 0 689 -2
Matching shares allocated in 2011-2013 at 31.12.14 14,855 9,724 24,579 339 9 689 17
2013
Allocated in 2011-2013 14,855 12,368 27,223 339 9 525 14
Cancelled 0 -1,993 -1,993 339 0 525 -1
Matching shares allocated in 2011-2013 at 31.12.13 14,855 10,375 25,230 339 9 525 13
In 2011-2014, Tryg entered into an agreement on matching shares for the Executive Management and selected other senior employees as a consequence of the Group’s remuneration policy. The Executive Man-agement and selected risk-takers are allocated one share in Tryg A/S for each share that the Executive Management member or risk-taker acquires in Tryg A/S at market rate for liquid cash at a contractuallyagreed sum. The shares are reported at market value and are accrued over the 4-year maturation period. In 2014, the reported fair value of matching shares for the Group amounted to DKK 3m (DKK 2m in 2013). At 31 December 2014, a total amount of DKK 7m was recognised for matching shares.
Bonus programmme In 2014 Tryg has adopted a bonus program based on share-based compensation and awards made in cash. The plan is designed to reward employees for their contribution to the performance of the Group and has conditions related to the financial performance. Each employee has the opportunity to decide on one of the two compensation elements. The recognition of the bonus program in 2014 constituting DKK 71 m.
Notes

69
Notes
Annual report 2014 | Tryg A/S | | Menu – Financial statements
DKKm 2014 2013
7 Interest and dividends Interest income and dividends Dividends 39 19 Interest income, cash at bank and in hand 8 18 Interest income, bonds 893 984 Interest income, other 9 8
949 1,029
Interest expenses Interest expenses subordinate loan capital and credit institutions -90 -89 Interest expenses, other -25 -23
-115 -112
834 917
8 Value adjustments Value adjustments concerning financial assets or liabilities
at fair value with value adjustment in the income statement: Equity investments -18 -42 Unit trust units 354 578 Share derivatives 17 30 Bonds -129 -250 Interest derivatives 596 -300 Other loans 2 -5
822 11
Value adjustments concerning assets or liabilities that cannot be attributed to IAS 39: Investment property 23 -17 Owner-occupied property -106 -76 Discounting -741 298 Other statement of financial position items -93 -101
-917 104
-95 115
Exchange rate adjustments concerning financial assets or liabilities which cannot be stated at fair value total DKK -179m (DKK -146m in 2013)
DKKm 2014 2013
9 Tax Tax on accounting profit/loss -809 -749 Difference between Danish and foreign tax rates -58 -58 Tax adjustment, previous years -8 -2 Adjustment of non-taxable income and costs 140 152 Change in valuation of tax assets -24 -20 Change in tax rate 6 58 Other taxes -2 -1
-755 -620
Effective tax rate % % Tax on accounting profit/loss 24.5 25.0 Difference between Danish and foreign tax rates 1.5 2.0 Tax adjustment, previous years 0.5 0.0 Adjustment of non-taxable income and costs -4.0 -5.0 Change in valuation of tax assets 1.0 1.0 Change in tax rate -0.5 -2.0
23.0 21.0
10 Profit/loss on discontinued and divested business Gross premium income -3 202 Gross claims 31 -149 Total insurance operating costs -14 -55
Profit/loss on gross business 14 -2 Insurance technical interest, net of reinsurance 0 1
Technical result 14 -1 Other income and costs 0 1
Profit/loss before tax 14 0
Tax -4 -4
Profit/loss on discontinued and divested business 10 -4

70
Notes
Annual report 2014 | Tryg A/S | | Menu – Financial statements
DKKm
11 Intangible assets Trademarks Assets and customer under con- Goodwill relations Software a) struction a) Total
2014 Cost Cost at 1 January 381 171 936 270 1,758 Exchange rate adjustments -23 -11 -14 -1 -49 Transferred from assets under construction 0 0 86 -86 0 Additions for the year 188 40 28 107 363 Disposals for the year 0 0 -8 0 -8
Cost at 31 December 546 200 1,028 290 2,064
Amortisation and write-downs Amortisation and write-downs at 1 January 0 -89 -819 -92 -1,000 Exchange rate adjustments 0 5 12 0 17 Amortisation for the year -4 -20 -82 0 -106 Reversed amortisation 0 0 9 0 9
Amortisation and write-downs at 31 December -4 -104 -880 -92 -1,080
Carrying amount at 31 December 542 96 148 198 984
DKKm
11 Intangible assets Trademarks Assets and customer under con- Goodwill relations Software a) struction a) Total
2013 Cost Cost at 1 January 397 178 869 227 1,671 Exchange rate adjustments -16 -7 -26 -1 -50 Transferred from asset under construction 0 0 77 -77 0 Additions for the year 0 0 16 121 137
Cost at 31 December 381 171 936 270 1,758
Amortisation and write-downs Amortisation and write-downs at 1 January 0 -73 -747 -92 -912 Exchange rate adjustments 0 3 22 0 25 Amortisation for the year 0 -19 -81 0 -100 Impairment losses and write-downs for the year 0 0 -13 0 -13
Amortisation and write-downs at 31 December 0 -89 -819 -92 -1,000
Carrying amount at 31 December 381 82 117 178 758
a) Hereof developed in-house DKK 245m (DKK 245m at 31 December 2013)

71
Notes
Annual report 2014 | Tryg A/S | | Menu – Financial statements
11 Intangible assets (continued)
Impairment testIn 2014, Tryg acquired Securator A/S, Optimal Djurförsäkring i Norr AB and Codan's agricultural portfolio. The insurance activities were incorporated into the Tryg Group's business structure.
Goodwill At 31 December 2014, management performed an impairment test of the carrying amount of goodwill based on the allocation of the cost of goodwill to the cash-generating unit, which consists of Moderna and Securator, respectively.
Assumptions for impairment test:The Value-in-use method is used. Moderna In 2009, Tryg acquired Moderna Försäkringar Sak AB, Modern Re S.A., Netviq AB and MF Bilsport & MC Specialförsäkringar. The insurance activities were incorporated into the Tryg Group's business structure in 2009 and are reported under Sweden. In 2010, the companies, excluding Modern Re S.A., were merged into Tryg For-sikring A/S as Moderna Forsäkringar, a branch of Tryg Forsikring A/S. Modern Re S.A. was discontinued in 2011.
The cash flows appearing from the latest budgets approved by management for the next 3 financial years a re used when calculating the value in use of Moderna. The cash flows in the latest budget period have been extrapolated for financial years after the budget periods (terminal period) and adjusted for expected growth rates determined on the basis of expectations for the general economic growth. The required return is based on an assessment of the risk profile of the tested business activities compared with the market's expectations for the Group.
The impairment test shows a calculated value in use of approximately DKK 1.4bn relative to a recognised eq-uity of DKK 0.5bn and does not indicate any impairment.
SecuratorThe test for Securator A/S is based on the valuation at the time of acquisition due to the short ownership period and the lack of indications of impairment since the acquisition.
The cash flows appearing from the latest budgets approved by management for the next 3 financial years are used when calculating the value in use of Securator. The cash flows in the latest budget period have been extrapolated for financial years after the budget periods (terminal period) and adjusted for expected growth rates determined on the basis of expectations for the general economic growth. The required return is based on an assessment of the risk profile of the tested business activities compared with the market’s expectations for the Group.
The impairment test shows a calculated value in use of approximately DKK 238m relative to a recognised equity of DKK 174m and does not indicate any impairment.
11 Intangible assets (continued) Assumed annual Assumed annual Required return 2014 groeth 0-10 years growth > 10 years before tax
Moderna 2.0% 1.0% 12.7% Securator 3,0-36,0% 3.0% 10.8%
Assumed annual Assumed annual Required return 2013 groeth 0-10 years growth > 10 years before tax
Moderna 2.0% 0.0% 12.5%
Trademarks and customer relationsAs at 31 December 2014, management performed a test of the carrying amounts of trademarks and customer relations as an integral part of the goodwill test.
The impairment test of the acquired agricultural portfolio is based on renewal and retention rates, which are on the expected level. The test did not indicate any impairment.
Software and assets under constructionAs at 31 December 2014, management performed a test of the carrying amounts of software and assets under construction. The impairment test compares the carrying amount with the estimated present value of future cash flows. The test indicated impairment of a small number of projects, resulting in impairment losses. The total impairment of intangible assets amounts to DKK 0m (DKK 13m in 2013).

72Annual report 2014 | Tryg A/S | | Menu – Financial statements
12 Property, plant and equipment Owner-occupied Assets under DKKm Operating equipment property construction Total
2014 Cost Cost at 1 January 237 1,738 85 2,060 Exchange rate adjustments -5 -29 -2 -36 Additions for the year 9 2 11 22
Cost at 31 December 241 1,711 94 2,046
Accumulated depreciation and value adjustments Accumulated depreciation and value adjustments at 1 January -115 -434 -85 -634 Exchange rate adjustments 2 -5 2 -1 Depreciation for the year -31 -15 0 -46 Value adjustments for the year at revalued amount in income statement 0 -106 0 -106 Value adjustments for the year at revalued amount in other comprehensive income 0 2 0 2
Accumulated depreciation and value adjustments at 31 December -144 -558 -83 -785
Carrying amount at 31 December 97 1,153 11 1,261
2013 Cost Cost at 1 January 228 1,786 101 2,115 Exchange rate adjustments -8 -60 -6 -74 Transferred from assets under construction 0 10 -10 0 Additions for the year 18 2 0 20 Disposals for the year -1 0 0 -1
Cost at 31 December 237 1,738 85 2,060
Accumulated depreciation and value adjustments Accumulated depreciation and value adjustments at 1 January -90 -343 -90 -523 Exchange rate adjustments 3 -9 5 -1 Depreciation for the year -28 -15 0 -43 Value adjustments for the year at revalued amount in income statement 0 -76 0 -76 Value adjustments for the year at revalued amount in other comprehensive income 0 9 0 9
Accumulated depreciation and value adjustments at 31 December -115 -434 -85 -634
Carrying amount at 31 December 122 1,304 0 1,426
The following return percentages have been applied: Return percentages, weighted average 2014 2013
Office property 6.7 6.7
External experts were involved in valuing the owner-occupied properties.
Impairment testProperty, plant and equipmentA valuation of the owner-occupied property has been carried out, including the improvements made, and a revaluation of DKK 2m relating to the domicile in Ber-gen was subsequently included in other comprehen-sive income (DKK 9m in 2013) and impairment of DKK 106m relating to the domicile in Ballerup in the income statement (DKK 76m in 2013). The impair-ment test performed for operating equipment did not indicate any impairment.
In determining the fair value of the properties, not only publicly available market data are included, cor-responding to the ‘non-observable input’ in the fair value hierarchy.
No reclassifications have been made between this category and other categories in the fair value hierar-chy during the year.
Notes
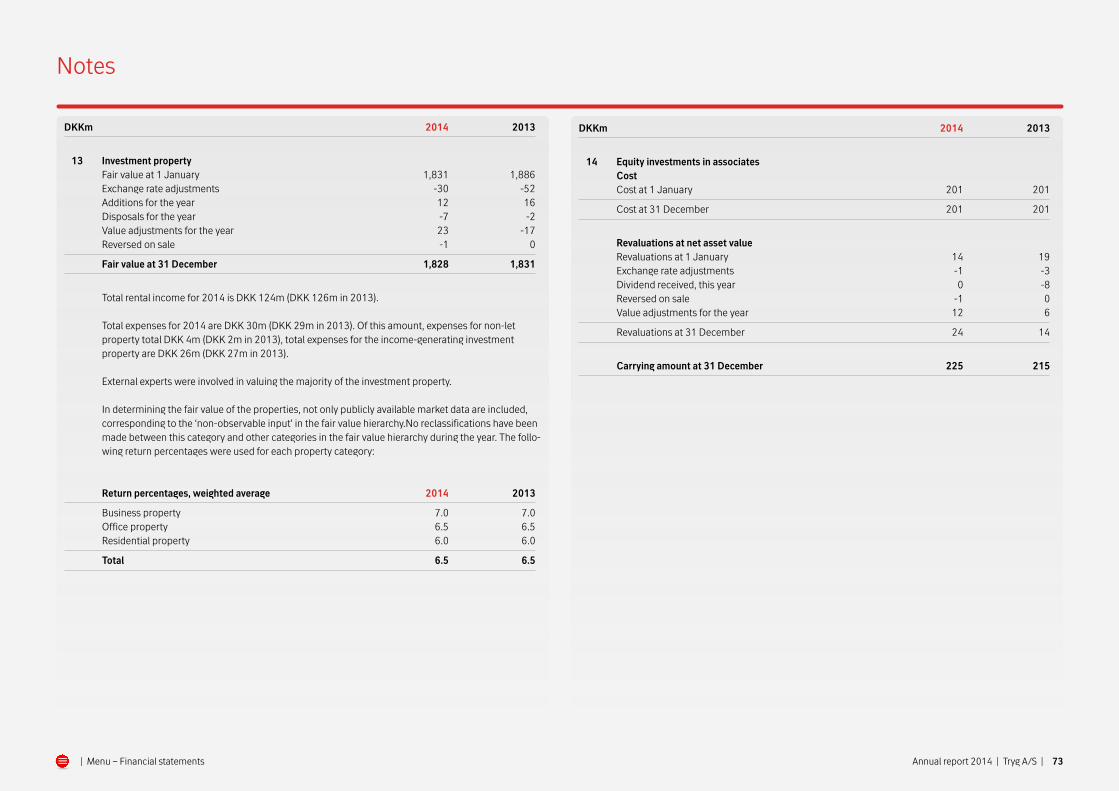
73
Notes
Annual report 2014 | Tryg A/S | | Menu – Financial statements
DKKm 2014 2013
13 Investment property Fair value at 1 January 1,831 1,886 Exchange rate adjustments -30 -52 Additions for the year 12 16 Disposals for the year -7 -2 Value adjustments for the year 23 -17 Reversed on sale -1 0
Fair value at 31 December 1,828 1,831
Total rental income for 2014 is DKK 124m (DKK 126m in 2013).
Total expenses for 2014 are DKK 30m (DKK 29m in 2013). Of this amount, expenses for non-let property total DKK 4m (DKK 2m in 2013), total expenses for the income-generating investment property are DKK 26m (DKK 27m in 2013).
External experts were involved in valuing the majority of the investment property.
In determining the fair value of the properties, not only publicly available market data are included, corresponding to the ‘non-observable input’ in the fair value hierarchy.No reclassifications have been made between this category and other categories in the fair value hierarchy during the year. The follo-wing return percentages were used for each property category:
Return percentages, weighted average 2014 2013
Business property 7.0 7.0 Office property 6.5 6.5 Residential property 6.0 6.0
Total 6.5 6.5
DKKm 2014 2013
14 Equity investments in associates Cost Cost at 1 January 201 201
Cost at 31 December 201 201
Revaluations at net asset value Revaluations at 1 January 14 19 Exchange rate adjustments -1 -3 Dividend received, this year 0 -8 Reversed on sale -1 0 Value adjustments for the year 12 6
Revaluations at 31 December 24 14
Carrying amount at 31 December 225 215

74Annual report 2014 | Tryg A/S | | Menu – Financial statements
DKKm
14 Equity investments in associates (continued) Shares in associates according to the latest annual report:
Profit/loss Ownership Name and registered office Assets Liabilities Equity Revenue for the year share in %
2014 Komplementarselskabet af 1. marts 2006 ApS, Denmark 0 0 0 0 0 50 Ejendomsselskabet af 1. marts 2006 P/S, Denmark 936 240 696 47 36 30 AS Eidsvåg Fabrikker, Norway 54 7 47 18 4 28 2013 Komplementarselskabet af 1. marts 2006 ApS, Denmark 0 0 0 0 0 50 Ejendomsselskabet af 1. marts 2006 P/S, Denmark 394 0 394 26 12 50 AS Eidsvåg Fabrikker, Norway 52 7 45 16 6 28 Bilskadeinstituttet AS, Norge 5 0 5 2 0 30
Individual estimates are made of the degree of influence under the contracts made.
Notes

75
Notes
Annual report 2014 | Tryg A/S | | Menu – Financial statements
DKKm
15 Financial assets (Continued) Fair value hierarchy for financial instruments measured at fair value in the statement of financial position Non- Qouted Observable observable market price input input Total
2014 Equity investments 0 0 128 128 Unit trust units 3,884 0 0 3,884 Bonds 22,259 14,915 1 37,175 Deposits with credit institutions 667 0 0 667 Derivative financial instruments, assets 0 1,318 0 1,318 Derivative financial instruments, debt 0 -799 0 -799
26,810 15,434 129 42,373
2013 Equity investments 0 0 150 150 Unit trust units 3,741 0 0 3,741 Bonds 25,068 11,903 0 36,971 Deposits with credit institutions 1,301 0 0 1,301 Derivative financial instruments, assets 0 692 0 692 Derivative financial instruments, debt 0 -514 0 -514
30,110 12,081 150 42,341
Financial instruments measured at fair value in the statement of financial position on the basis of non-observable input: 2014 2013
Carrying amount at 1 January 150 209 Exchange rate adjustments -4 -10 Gains/losses in the income statement -18 -48 Purchases 8 3 Sales -8 -4 Transfers to/from the group 'non-observable input' 1 0
Carrying amount at 31 December 129 150
Gains/losses in the income statement for assets held at the statement of financial position date recognised in value adjustments -18 -42
Bonds measured on the basis of observable inputs consist of Norwegian bonds issued by banks and to some extent Danish semi-liquid bonds, where no quoted prices based on actual trades are available. No significant reclassifications have been made between the categories 'Quoted prices' and 'Observable input' in 2014. Inflation derivatives are measured at fair value on the basis of non-observable input and are included under claims provisions at a fair value of DKK -438m (DKK -166m in 2013).
DKKm 2014 2013
15 Financial assets Financial assets at fair value with value adjustments in the income statement 43,030 42,782 Derivative financial instruments at fair value used for hedge
accounting with value adjustment in other comprehensive income 142 73 Receivables measured at amortised cost with value adjustment in the income statement 2,167 3,112
Total financial assets 45,339 45,967
Financial assets at amortised cost only deviate to a minor extent from fair value. Financial liabilities Derivative financial instruments at fair value with value adjustments in the income statement 799 514 Financial liabilities at fair value with value adjustment in the income statement 7,121 6,864
Total financial liabilities 7,920 7,378
Information on valuation of subordinate loan capital at fair value is stated in note 1. Other financial li-abilities measured at amortised cost only deviate to a minor extent from fair value.

76
Notes
Annual report 2014 | Tryg A/S | | Menu – Financial statements
DKKm
15 Financial assets (continued) Derivative financial instruments used in connection with hedging of foreign entities for accounting purposes Gains and losses on hedges charged to other comprehensive income
2014 Gains Losses Net
Gains and losses at 1 January 1,787 -1,988 -201 Value adjustments for the year 365 -174 191
Gains and losses at 31 December 2,152 -2,162 -10
2013 Gains Losses Net
Gains and losses at 1 January 1,447 -1,953 -506 Value adjustments for the year 340 -35 305
Gains and losses at 31 December 1,787 -1,988 -201
Value adjustments Value adjustments of foreign entities recognised in other comprehensive income in the amount of:
2014 2013
Value adjustments at 1 January 201 527 Value adjustment for the year -178 -326
Value adjustments at 31 December 23 201
DKKm 2014 2013
15 Financial assets (continued) Sensitivity information Impact on equity from the following changes: Interest rate increase of 0.7-1.0 percentage point 34 -18 Interest rate fall of 0.7-1.0 percentage point -95 -41 Equity price fall of 12 % -371 -349 Fall in property prices of 8 % -239 -266 Exchange rate risk (VaR 99) -11 -25 Loss on counterparties of 8 % -399 -396 The impact on the income statement is similar to the impact on equity. The statement complies with
the disclosure requirements set out in the Executive Order on Financial Reports for Insurance Companies and Multi-Employer Occupational Pension Funds issued by the Danish FSA.
Derivative financial instruments Derivatives with value adjustments in the income statement at fair value:
2014 2013
Fair value Fair value in statement in statement of finacial of finacial Nominal position Nominal position
Interest derivatives 25,882 434 26,015 88 Share derivatives 477 0 325 3 Exchange rate derivatives 7,790 85 9,352 87
Derivatives according to statement of financial position 34,149 519 35,692 178 Inflation derivatives, recognised in claims provisions 3,221 -438 3,311 -166
Total derivative financial instruments 37,370 81 39,003 12 Due after less than 1 year 19,438 86 16,003 -58 Due within 1 to 5 years 9,720 -70 14,169 55 Due after more than 5 years 8,212 65 8,831 15
Derivatives, repos and reverses are used continuously as part of the cash and risk management carried out by Tryg and its portfolio managers.

77
Notes
Annual report 2014 | Tryg A/S | | Menu – Financial statements
DKKm 2014 2013
17 Current tax Net current tax at 1 January -264 -652 Exchange rate adjustments 26 64 Current tax for the year -632 -631 Current tax on equity entries -47 -76 Adjustment of current tax in respect of previous years -24 14 Tax paid for the year 512 1,017
Net current tax at 31 December -429 -264
Current tax is recognised in the statement of finansiel position as follows: Under assets, current tax 0 145 Under liabilities, current tax -429 -409
Net current tax -429 -264
18 Equity Number of shares Shares outstanding Own shares Number of shares of 25 DKK (1,000) 2014 2013 2014 2013
Number of shares at 1 January 59,374 60,695 1,942 621 Bought during the year -1,793 -1,621 1,793 1,621
Cancellation in connection with buyback programme 0 0 -1,620 0
Used in connection with exercise of incentive programme 243 300 -243 -300
Number of shares at 31 December 57,824 59,374 1,872 1,942
Number of shares as a percentage of issued shares at 31 December 96.86 96.83 3.14 3.17 Nominal value at 31 december (DKKm) 1,446 1,484 47 49
Pursuant to the authorisation granted by the shareholders, Tryg may acquire up to 10.0% of the share capital in the period up until 3 April 2019. Own shares are acquired for use in the Group's incentive programme and as part of the share buyback programme.
DKKm 2014 2013
15 Financial assets (continued) Receivables Receivables from insurance enterprises 1,439 1,387 Reverse repos 0 885 Other receivables 223 142
1,662 2,414
Specification of write-downs on receivables from insurance contracts: Write-downs at 1 January 112 113 Exchange rate adjustments -4 -7 Transferred to assets held for sale and write-downs and reversed write-downs for the year -1 6
Write-downs at 31 December 107 112
Receivables are written down in full when submitted for debt collection. The write-down is reversed if payment is subsequently received from debt collection and amounts to DKK 54m (DKK 43m in 2013).
Receivables in connection with insurance contracts include overdue receivables totalling: Falling due: Within 90 days 164 194 After 90 days 122 108
286 302
Including writedowns of due amounts 107 112 Other receivables do not contain overdue receivables
16 Reinsurer's share Reinsurers' share 1,958 2,647 Write-downs after impairment test -20 -27
1,938 2,620
Impairment test As at 31 December 2014, management performed a test of the carrying amount of total reinsurers'
share of provisions for insurance contracts. The impairment test resulted in impairment charges total-ling DKK 20m (DKK 27m in 2013). Write-downs for the year include reversed write-downs totalling DKK 0m (DKK 0m in 2013). There is no overdue reinsurers' share other than the share alredy provided for.

78
Notes
Annual report 2014 | Tryg A/S | | Menu – Financial statements
DKKm Gross Ceded Net of reinsurance
19 Claims provisions 2014 Claims provisions at 1 January 25,271 -1,780 23,491 Value adjustments of provisions , beginning of year -839 58 -781
24,432 -1,722 22,710
Paid in the financial year in respect of the current year -6,215 90 -6,125 Paid in the financial year in respect of prior years -6,917 1,143 -5,774
-13,132 1,233 -11,899
Change in claims in the financial year in respect of the current year 12,835 -251 12,584 Change in claims in the financial year in respect of prior years -638 -481 -1,119
12,197 -732 11,465
Discounting and exchange rate adjustments 1,104 -51 1,053 Claims provisions at 31 December 24,601 -1,272 23,329 Other a) 671 -447 224
25,272 -1,719 23,553
2013 Total at 1 January 26,842 -1,893 24,949 Value adjustments of provisions, beginning of year -1,569 126 -1,443
25,273 -1,767 23,506
Paid in the financial year in respect of the current year -6,571 43 -6,528 Paid in the financial year in respect of prior years -6,604 628 -5,976
-13,175 671 -12,504
Change in claims in the financial year in respect of the current year 13,902 -562 13,340 Change in claims in the financial year in respect of prior years -854 -103 -957
13,048 -665 12,383
Discounting and exchange rate adjustment 125 -19 106
Claims provisions at 31 December 25,271 -1,780 23,491 Other a) 816 -603 213
26,087 -2,383 23,704
a) Comprises claims provisions for Tryg Garantiforsikring A/S.
DKKm 2014 2013
18 Equity (continued) Capital adequacy Equity according to annual report 11,119 11,107 Proposed dividend -1,731 -1,656 Solvency requirements of subsidiaries – 50% -2,353 -2,307
Tier 1 Capital 7,035 7,144 Subordinate loan capital 1,496 1,551 Solvency requirements of subsidiaries – 50% -2,353 -2,307
Capital base 6,178 6,388
Weighted assets 7,122 7,111
Solvency ratio (Solvency I – ratio between capital base and weighted assets) 87 90
The capital base and the solvency ratio are calculated in accordance with the Danish Financial Business Act.
19 Premium provisions Premium provision at 1 January 6,176 6,658 Value adjustments of provisions, beginning of year -202 -335 Paid in the financial year 17,692 18,740 Change in premiums in the financial year -17,951 -18,881 Exchange rate adjustments 9 -6
Premium provisions at 31 December 5,724 6,176 Other a) 86 36
5,810 6,212
a) Comprises premium provisions for Tryg Garantiforsikring A/S and Securator A/S.

79
Notes
Annual report 2014 | Tryg A/S | | Menu – Financial statements
DKKm 2014 2013
20 Pensions and similar obligations (continued) Specification of pension cost for the year: Present value of pensions earned during the year 38 56 Interest expense on accrued pension obligation 39 42 Expected return on plan assets -33 -23 Accrued employer contributions 6 11 Effect associated with change in agreement -421 0
Total year's cost of defined-benefit plans -371 86
The premium for the following financial years is estimated at: 53 78 Number of active persons and number of pensioners 1,289 1,376
Estimated distribution of plan assets: % %
Shares 10 10 Bonds 73 73 Property 15 15 Other 2 2
Average return on plan assets 2.7 3.3 Weighted average duration of the defined benefit obligation 18 18 Assumptions used: Discount rate 2.1 3.3 Estimated return on pension funds 2.1 3.3 Salary adjustments 3.3 3.8 Pension adjustments 0.1 3.5 G adjustments 3.0 3.5 Turnover 7.0 7.0 Employer contributions 14.1 14.0 Mortality table K2013 K2013
DKKm 2014 2013
20 Pensions and similar obligations Jubilees 62 68
Recognised liability 62 68
Defined-benefit pension plans: Present value of pension obligations funded through operations 63 86 Present value of pension obligations funded through establishment of funds 1,227 1,671
Pension obligation, gross 1,290 1,757 Fair value of plan assets 1,010 1,034
Pension obligation, net 280 723
Specification of change in recognised pension obligations: Recognised pension obligation at 1 January 1,756 2,151 Adjustment regarding plan changes not recognised in the income statement and expected estimate deviation a) -421 0 Exchange rate adjustments -123 -278 Present value of pensions earned during the year 41 63 Capital cost of previously earned pensions 38 39 Acturial gains/losses 58 -157 Paid during the period -59 -62
Recognised pension obligation at 31 December 1,290 1,756
Change in carrying amount of plan assets: Carrying amount of plan assets at 1 January 1,033 1,109 Exchange rate adjustments -72 -144 Investments in the year 57 81 Estimated return on pension funds 32 21 Acturial gains/losses 4 10 Paid during the period -44 -44
Carrying amount of plan assets at 31 December 1,010 1,033
Total pensions and similar obligations at 31 December 280 723
Total recognised obligation at 31 December 342 791
a) The change of the pension scheme in Norway is carried out in the same way as has been done for other major financial companies in Norway and causes a reduction in the provision.

80
Notes
Annual report 2014 | Tryg A/S | | Menu – Financial statements
DKKm
20 Pensions and similar obligations (continued) Description of the Swedish plan Moderna Försäkringar, a branch of Tryg Forsikring A/S, complies with the Swedish industry pension
agreement, the FTP plan, which is insured with Försäkringsbranschens Pensionskassa – FPK. Under the terms of the agreement, the Group’s Swedish branch has undertaken, along with the other busi-nesses in the collaboration, to pay the pensions of the individual employees in accordance with the applicable rules.
The FTP plan is primarily a defined-benefit plan in terms of the future pension benefits. FPK is unable to
provide sufficient information for the Group to use defined-benefit accounting. For this reason, the Group has accounted for the plan as if it were a defined-contribution plan in accordance with IAS 19.30.
This years premium paid to FPK amounted to DKK 16m, which is about 2 % of the annual premium in FPK (2013). FPK writes in its interim report for 2014 that it had a collective consolidation ratio of 110 at 30 June 2014 (consolidation ratio of 114 at 30 June 2013). The collective consolidation ratio is defined as the fair value of the plan assets relative to the total collective pension obligations.
DKKm 2014 2013
20 Pensions and similar obligations (continued) Sensitivity information The sensitivity analysis is based on a change in one of the assumptions, assuming that all other as-
sumptions remain constant. In reality, this is rarely the case, and changes to some assumptions may be subject to covariance. The sensitivity analysis has been carried out using the same method as the actuarial calculation of the pension provisions in the statement of financial position.
Impact on equity from the following changes: Interest rate increase of 0.3 percentage point 27 80 Interest rate decrease of 0.3 percentage point -30 -70 Pay increase rate, increase of 1 percentage point -55 -65 Pay increase rate, decrease of 1 percentage point 45 69 Turnover, increase of 2.0 percentage point 49 66 Turnover, decrease of 2.0 percentage point -61 -84 Description of the Norwegian plan In the Norwegian part of the group, about half of the employees have a defined-benefit pension plan.
The plans are based on the employees' expected final pay, providing the members of the plan with a guaranteed level of pension benefits throughout their lives. The pension benefits are determined by the employees' term of employment and salary at the time of retiring. Employees having made contri-butions for a full period of contribution are guaranteed a pension corresponding to 66% of their final pay. As of 2014, pensions being disbursed are no longer regulated in step with the basic amount of old-age pension paid in Norway (G regulation), but are subject to a minimum regulation.
Under the present defined-benefit plan, members earn a free policy entitlement comprising disability cover, spouse and cohabitant cover and children's pension.
The pension funds are managed by Nordea Liv & Pension and regulated by local legislation and practice.

81
Notes
Annual report 2014 | Tryg A/S | | Menu – Financial statements
DKKm 2014 2013
22 Other provisions Other provisions at 1 January 73 98 Change in provisions 10 -25
Other provisions 31 December 83 73
Other provisions relate to provisions for the Group’s own insurance claims and restructuring costs. The provision for restructuring costs has been reassessed and amounts to DKK 79m (DKK 23m at 31 December 2013).
23 Amounts owed to credit institutions Overdraft facilities 116 6
116 6
24 Debt relating to unsettled funds transactions and repos Unsettled fund transactions 885 148 Repo debt 2,017 2,673
2,902 2,821
Unsettled fund transactions include debt for bonds purchased in 2013 and 2014; however, with settlement in 2014 and 2015, respectively.
25 Earnings per share Profit/loss from continuing business 2,547 2,373 Profit/loss on discontinued and divested business 10 -4
Profit/loss for the year 2,557 2,369 Average number of shares (1,000) 58,504 60,155 Diluted number of shares (1,000) 54 104
Diluted average number of shares (1,000) 58,558 60,259
Earnings per share, continuing business 43.5 39.4 Diluted earnings per share, continuing business 43.5 39.3 Earnings per share 43.7 39.4 Diluted earnings per share 43.7 39.3 Earnings per share, discontinued and divested business 0.2 0.0 Diluted earnings per share, discontinued and divested business 0.2 0.0
DKKm 2014 2013
21 Deferred tax Tax asset Operating equipment 11 14 Debt and provisions 60 105 Capitalised tax loss 1 6
72 125
Tax liability Intangible rights 77 75 Land and buildings 229 227 Bonds and loans secured by mortgages 3 45 Contingency funds 785 835
1,094 1,182
Deferred tax 1,022 1,057
Unaccrued timing differences of statement of financial position items 146 122
Development in deferred tax Deferred tax at 1 January 1,057 1,143 Exchange rate adjustments -62 -119 Change in deferred tax relating to change in tax rate -6 -50 Change in deferred tax previous years -16 16 Change in capitalised tax loss 6 5 Change in deferred tax taken to the income statement 22 -7 Change in valuation of tax asset 24 20 Change in deferred tax taken to equity -3 49
Deferred tax at 31 December 1,022 1,057
Tax value of non-capitalised tax loss Denmark 18 18 Sweden 2 3 Finland 0 1
The loss in Tryg A/S cannot be utilised in the Danish joint taxation scheme. The loss can be carried forward indefinitely. Loss determined according to Swedish and Finnish rules can be carried forward indefinitely.
The losses are not recognised as tax assets until it has been substantiated that the company can gen-
erate sufficient future taxable income to offset the tax loss. The total current and deferred tax relating to items recognised in equity is recognised in the statement of financial position in the amount of DKK 14m (DKK -133m at 31 December 2013).

82
Notes
Annual report 2014 | Tryg A/S | | Menu – Financial statements
DKKm 2014 2013
26 Contractual obligations, collateral and contingent liabilities (continued) Collateral Tryg Forsikring A/S and Tryg Garantiforsikring A/S have
registered the following assets as having been held as security for the insurance provisions: Equity investments in associates 15 18 Equity investments 128 150 Unit trust units 3,884 3,741 Bonds 34,273 34,867 Deposits with credit institutions 667 1,301 Receivables relating to reinsurance 439 585 Interest and rent receivable 337 403 Equity investments in and receivables from Group undertakings which have been eliminated in the consolidated financial statements 1,730 1,944
Total 41,473 43,009
DKKm
26 Contractual obligations, collateral and contingent liabilities Contractual obligations
Obligations due by period 2014 <1 year 1-3 years 3-5 years > 5 years Total
Operating leases 62 101 71 67 301 Other contractual obligations 410 83 0 0 493
472 184 71 67 794
2013
Operating leases 150 182 75 73 480 Other contractual obligations 298 12 0 0 310
448 194 75 73 790
Tryg has signed the following contracts with amounts above DKK 50m: Outsourcing agreement with TCS for DKK 193m for a 4 year period, which expires in 2017. Lease contracts on premises for DKK 265m. The contracts expire after 5 years. Operation of mainframe contract of DKK 62m, which expires in late 2017. Telephony services contract with Telenor for DKK 84m, which expires in 2015 and 2017 respectively. Collateral The Danish companies in the Tryg Group are jointly taxed with TryghedsGruppen smba. The compa-
nies and the other jointly taxed companies are liable for any obligations to withhold taxes at source on interest, royalties, dividends and income taxes etc. in respect of the jointly taxed companies.

83Annual report 2014 | Tryg A/S | | Menu – Financial statements
DKKm
26 Contractual obligations, collateral and contingent liabilities (continued) Offsetting and collateral in relation to financial assets and obligations Collateral which is not offset in the statement of financial position
According to the Bonds as colla- Gross amount statement of teral for repos/ Collateral before offsetting Offsetting financial position reverse repos in cash Net amount
2014 Assets Derivative financial instruments 1,318 0 1,318 0 -1,324 -6
1,318 0 1,318 0 -1,324 -6
Liabilities Repo debt 2,017 0 2,017 -2,017 -1 -1 Derivative financial instruments 799 0 799 0 -767 32 Inflation derivatives, recognised in claims provisions 438 0 438 0 -448 -10
3,254 0 3,254 -2,017 -1,216 21
2013 Assets Reverse repos 885 0 885 -885 0 0 Derivative financial instruments 692 0 692 0 -553 139
1,577 0 1,577 -885 -553 139
Liabilities Repo debt 2,673 0 2,673 -2,673 0 0 Derivative financial instruments 514 0 514 0 -433 81 Inflation derivatives, recognised in claims provisions 166 0 166 0 -155 11
3,353 0 3,353 -2,673 -588 92
Contingent liabilities Companies in the Tryg Group are party to a number of disputes in Denmark, Norway and Sweden. Management believes that the outcome of disputes will not affect the Group's financial position signifi-cantly beyond the obligations recognized in the state-ment of financial position at 31 December 2014.
Notes

84
Notes
Annual report 2014 | Tryg A/S | | Menu – Financial statements
DKKm 2014 2013
27 Acquisition of subsidiaries (continued) The determination of the pro forma amounts for premium income and profit for the period is based
on the following significant assumptions: • Premiums and claims have been calculated on the basis of the fair values determined in the
pre-acquisition balance sheets for premium and claims provisions, rather than the original carrying amounts.
• Other costs, including depreciation of property, plant and equipment and amortisation of intangible assets, have been calculated on the basis of the fair values determined in the pre-acquisition balance sheets, rather than the original carrying amounts.
28 Related parties The group has no related parties with a decisive influence other than the parent company, Trygheds-
Gruppen smba and the subsidiaries of TryghedsGruppen smba (other related parties). Related parties with significant influence include the Supervisory Board, the Executive Management and their mem-bers’ family.
Premium income - Parent company (TryghedsGruppen smba) 0.3 0.3 - Key management 0.3 0.4 - Other related parties 2.5 1.9
Claims payments - Parent company (TryghedsGruppen smba) 0.1 0.2 - Key management 0.1 0.1 - Other related parties 0.3 0.2
DKKm 2014
27 Acquisition of subsidiaries In June 2014 the Tryg Group has taken control of Securator A/S and in September 2014 of Optimal
Djurförsäkring i Norr AB by acquiring all shares in the companies. Securator A/S is a Danish market leader within the sale and brokering of multi-annual product insurance via dealers in the electronics and telecommunications sector and supermarket chains. The acquisition is expected to increase Tryg's market share within product insurance by providing access to Securator A/S's customer port-folio and distribution channels. Optimal Djurförsäkring i Norr AB is a swedish market leader within the sale of pet insurance. Tryg also expects to realise cost savings through synergies.
Intangible assets Intangible assets 0 Equipment 1 Receivables, other assets and accrued income 65 Provisions for insurance contracts -37 Other provisions 0 Debt and accruals and deferred income -40
Net assets acquired -11
Goodwill 188
Purchase price 177
Hereof cash 14
Purchase price in cash 163
The Group has not incurred any significant acquisition costs in connection with the acquisition. In connection with the acquisitions, a sum was paid which exceeds the fair value of the identifiable ac-quired assets, liabilities and contingent liabilities. This positive balance is mainly attributable to ex-pected synergies between the activities in the acquired enterprises and the Group’s existing activities, future growth opportunities as well as the staff of the acquired enterprises. These synergies have not been recognised separately from goodwill as they are not separately identifiable. Goodwill is not ex-pected to be deductible for tax purposes.
The enterprises are included in premium income and in the results for the year with an insignificant amount due to the short ownership period and the Management believes that these pro forma figu-res reflect the Group’s earnings level after the acquisition of the enterprises and that the amounts may therefore form the basis for comparisons in subsequent financial years.

85
Notes
Annual report 2014 | Tryg A/S | | Menu – Financial statements
DKKm
28 Related parties (continued) The members of the Supervisory Board in Tryg A/S are paid with a fixed remunaration and are not
covered by the incentive schemes. The Executive Management is paid a fixed remuneration and pension. The variable salary is awarded
in the form of a matching share programme, see 'Corporate governance'. Besides this, the directors have free car appropriate to their position as well as other market conformal employee benefits.
Each member of the Executive Management is entitled to 12 months' notice and severance pay equal to 12 months’ salary plus pension contribution (Group CEO is entitled to severance pay equal to 18 months' salary). Members of the Executive Management can assert no further claims in this respect, for example claims for compensation pursuant to Sections 2a and/or 2b of the Dansih Salaried Em-ployees Act, as such claims are regarded as being included in the severance pay.
Risk-takers are defined as employees whose activities have a significant influence on the company’s risk profile. The Supervisory Board decides which employees should be considered to be risk-takers.
Parent company Tryghedsgruppen smba TryghedsGruppen smba controls 60% of the shares in Tryg A/S. Intra-group trading involved:: 2014 2013 - Providing and receiving services 1 0 - Interest expenses 0 6 Transactions between TryghedsGruppen smba and Tryg A/S are conducted on an arm's length basis. Intra-group transactions: Administration fee, etc. is fixed on a cost-recovery basis. Intra-group accounts are offset and carry in-
terest on market terms. The companies in the Tryg Group have entered into reinsurance contracts on market terms.
Transactions with Group undertakings have been eliminated in the consolidated financial statements in accordance with the accounting policies.
29 Financial highlights Please refer to page 41.
DKKm
28 Related parties (continued) Specification of remuneration Number of Basis Variable 2014 persons salary salary Pension Total a)
Supervisory Board 12 7 0 0 7 Executive Management 3 19 2 4 25 Risk-takers 10 22 1 5 28
25 48 3 9 60
a) Exclusive of severance pay
Number Serverance Of which retired: of persons pay
Risk-takere 2 0
2 0
There has not been paid any severance pay of more than DKK 1m. Number of Basis Variable 2013 persons salary salary Pension Total a)
Supervisory Board 14 7 0 0 7 Executive Management 3 18 1 4 23 Risk-takers 10 20 0 5 25
27 45 1 9 55
a) Exclusive of severance pay
Number Serverance Of which retired: of persons pay
Bestyrelse 2 0 Risk-takere 1 5
3 5
The maximum amount paid in severance pay to an individual is DKK 5m.
Fees are charges incurred during the financial year. Variable salary includes the charges for matching shares, which are recognised over 4 years and share options, which are recognised over 3 years. Refer-ence is made to section 'Corporate governance' of the management's review on the corresponding dis-bursements. The Executive Management and risk-takers are included in incentive programmes. Please refer to note 6 for information concerning this.

86
Notes
Annual report 2014 | Tryg A/S | | Menu – Financial statements
30 Accounting policies
The consolidated financial statements are prepared in accordance with the International Financial Reporting Standards (IFRS) as per adopted by the EU on 31 De-cember 2014 and in accordance with the Danish Stat-utory Order on Adoption of IFRS.
The annual report of the parent company is prepared in accordance with the executive order on financial re-ports presented by insurance companies and lateral pension funds issued by the Danish FSA. The devia-tions from the recognition and measurement require-ments of IFRS are:
• Investments in subsidiaries are valued according to the equity method, whereas under IFRS valua-tion is made at cost or fair value. Furthermore the requirements regarding presentation and disclo-sure are less comprehensive than under IFRS.
• The Danish FSA’s executive order does not allow pro-visions for deferred tax of contingency reserves allo-cated from untaxed funds. Deferred tax and the other comprehensive income of the parent company have been adjusted accordingly on the transition to IFRS.
Change in accounting policiesSome of the Group's assets, mainly "Investment prop-erty" of DKK 191m in 2013, have been reclassified to "Investments in associates" following the implemen-tation of IFRS 11 and IAS 28, according to which the Group's interest in joint ventures must be accounted for using the equity method. So far, property has been recognised using the pro-rata method. A reclassifica-tion has been made in respect of other debt of DKK 431m in 2013 from the main item "Accruals and de-ferred income" to "Total debt". The reclassification is due to change in due date.
The distribution on segments between Commercial an Corporate as to medium sized enterprise has been altered during H1 2014.
The comparative figures have been restated to reflect the above changes. Except as noted above, the account-ing policies have been applied consistently with last year.
Accounting regulation
Implementation of changes to accounting standards and interpretation in 2014 The International Accounting Standards Board (IASB) has issued a number of changes to the international accounting standards, and the International Financial Reporting Interpretations Committee (IFRIC) has also issued a number of interpretations.
No standards or interpretations have been imple-mented for the first time for the accounting year that began on 1st January 2014 that will have a significant impact on the group.
New or amended standards and interpretations that have been implemented but have not significantly af-fected the group:
• Amendments to IAS 39 ‘novations of derivaties’• IFRS 10 ‘ Consolidated Financial Statements’• IFRS 11 ‘Joint Arrangements’• IFRS 12 ‘Disclosure of interests in Other Entities’• Amendments to IFRS 10, 11 and 12 ‘transitional
guidedance’• IAS 27 (as revised in 2011) ‘Separate Financial
Statements’• IAS 28 (as revised in 2011) ‘Investments in
Associates and Joint Ventures’• IFRIC 21 ‘Levies’• Amendments to IAS 19 ‘Clarify the requirements
that relate to how contributions from employees or third parties that are linked to service should be attributed to periodes of service’
• Amendments to IAS 32 ‘offsetting of assets and liabilities’
• Amendments to IAS 36 ‘Recoverable Amount Disclosures for Non-financial Assets’
Future orders, standards and interpretations that the group has not implemented and which have still not entered into force:
• IFRS 7 ‘Deferral of mandatory effective dates’ b)
• Amendments to IFRS 2 ‘Definition of ‘vesting condition’’ a)
• Amendments to IFRS 3 ‘accounting for contingent consideration’ a)
• Amendments to IFRS 3 ‘scope exception for joint ventures’ a)
• Amendments to IFRS 8 ‘aggregation of segments, reconciliation of segment assets’ a)
• Amendments to IFRS 13 ‘scope of the portfolio exception in paragraph 52’ a)
• Amendments to IAS 16 and IAS 38 ‘proportionate restatement of accumulated depreciation on revaluation’ a)
• Amendments to IAS 24 ‘management entities’ a)
• Amendments to IAS 40 ‘interrelationship between IFRS 3 and IAS 40’ a)
• IFRS 14 ‘Regulatory Deferral Accounts’ c)
• Amendments to IAS 16 ‘Clarification of acceptable methods of depreciatioon and amotisation’ c)
• Amendments to IAS 19 ‘Actuarial assumptions: discount rate’ c)
• Amendments to IAS 27 ‘reinstating the equity method as an accounting option for investments in subsidiaries, joint ventures and associates in an entity’s separate financial statements’ c)
• Amendments to IAS 28 ‘regarding the sale or contribution of assets between an investor and its associate or joint venture’ c)
• Amendments to IAS 34 ‘Other disclosures’ c)
• Amendments to IAS 38 ‘Clarification of acceptable methods of depreciatioon and amotisation’ c)
• IFRS 15 ‘Revenue from Contracts with Customers’ d)
• IFRS 9 ‘Financial Instruments’ e)
a) enters into force for the accounting year commencing 1 July 2014 or later.
b) enters into force for the accounting year commencing 1 January 2015 or later.
c) enters into force for the accounting year commencing 1 January 2016 or later.
d) enters into force for the accounting year commencing 1 January 2017 or later.
e) enters into force for the accounting year commencing 1 January 2018 or later.
The changes will be implemented going forward from 2015.
As for now the changes will not significantly affect the Group
Changes to accounting estimatesThere have been no changes to the accounting estimates in 2014.
Significant accounting estimates and assessmentsThe preparation of financial statements under IFRS requires the use of certain critical accounting esti-mates and requires management to exercise its judge-ment in the process of applying the Group’s account-ing policies. The areas involving a higher degree of judgement or complexity, or areas where assump-tions and estimates are significant to the consolidated financial statements are:
• Liabilities under insurance contracts• Valuation of defined benefit plans • Fair value of financial assets and liabilities• Valuation of property • Measurement of goodwill, Trademarks
and Customer relations
Liabilities under insurance contractsEstimates of provisions for insurance contracts repre-sent the Group’s most critical accounting estimates, as these provisions involve a number of uncertainty factors.
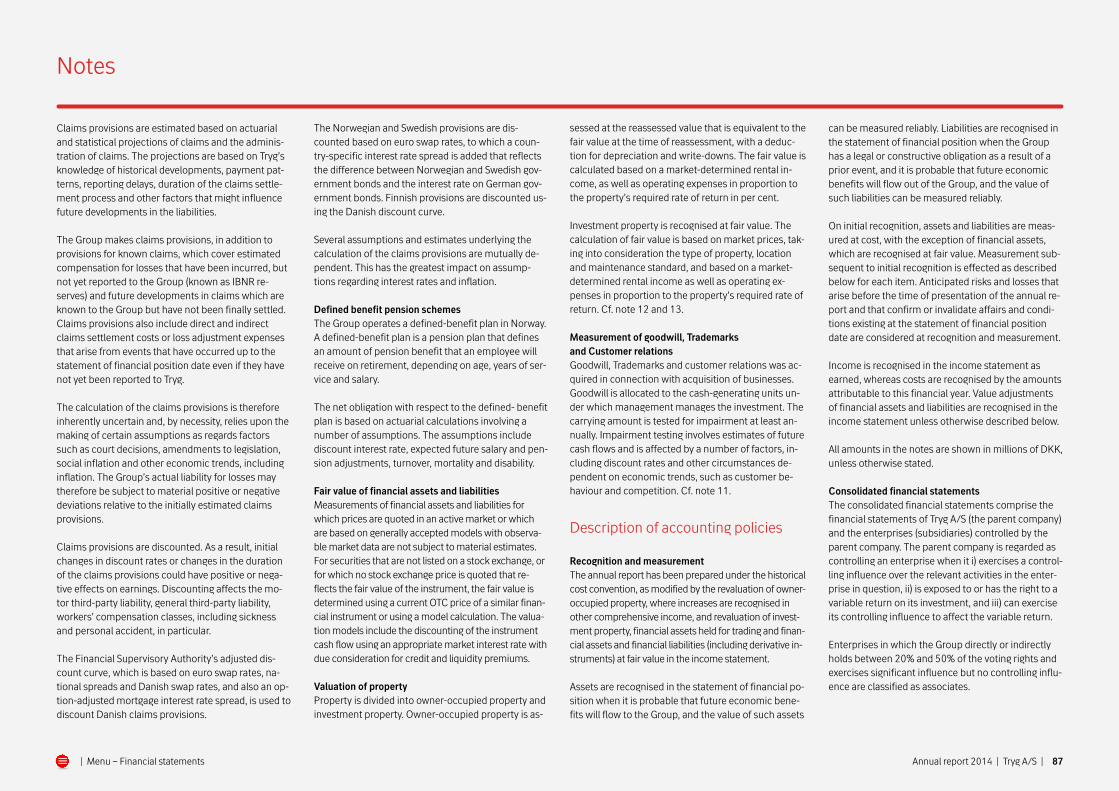
87
Notes
Annual report 2014 | Tryg A/S | | Menu – Financial statements
Claims provisions are estimated based on actuarial and statistical projections of claims and the adminis-tration of claims. The projections are based on Tryg’s knowledge of historical developments, payment pat-terns, reporting delays, duration of the claims settle-ment process and other factors that might influence future developments in the liabilities.
The Group makes claims provisions, in addition to provisions for known claims, which cover estimated compensation for losses that have been incurred, but not yet reported to the Group (known as IBNR re-serves) and future developments in claims which are known to the Group but have not been finally settled. Claims provisions also include direct and indirect claims settlement costs or loss adjustment expenses that arise from events that have occurred up to the statement of financial position date even if they have not yet been reported to Tryg.
The calculation of the claims provisions is therefore inherently uncertain and, by necessity, relies upon the making of certain assumptions as regards factors such as court decisions, amendments to legislation, social inflation and other economic trends, including inflation. The Group’s actual liability for losses may therefore be subject to material positive or negative deviations relative to the initially estimated claims provisions.
Claims provisions are discounted. As a result, initial changes in discount rates or changes in the duration of the claims provisions could have positive or nega-tive effects on earnings. Discounting affects the mo-tor third-party liability, general third-party liability, workers’ compensation classes, including sickness and personal accident, in particular.
The Financial Supervisory Authority’s adjusted dis-count curve, which is based on euro swap rates, na-tional spreads and Danish swap rates, and also an op-tion-adjusted mortgage interest rate spread, is used to discount Danish claims provisions.
The Norwegian and Swedish provisions are dis-counted based on euro swap rates, to which a coun-try-specific interest rate spread is added that reflects the difference between Norwegian and Swedish gov-ernment bonds and the interest rate on German gov-ernment bonds. Finnish provisions are discounted us-ing the Danish discount curve.
Several assumptions and estimates underlying the calculation of the claims provisions are mutually de-pendent. This has the greatest impact on assump-tions regarding interest rates and inflation.
Defined benefit pension schemesThe Group operates a defined-benefit plan in Norway. A defined-benefit plan is a pension plan that defines an amount of pension benefit that an employee will receive on retirement, depending on age, years of ser-vice and salary.
The net obligation with respect to the defined- benefit plan is based on actuarial calculations involving a number of assumptions. The assumptions include discount interest rate, expected future salary and pen-sion adjustments, turnover, mortality and disability.
Fair value of financial assets and liabilitiesMeasurements of financial assets and liabilities for which prices are quoted in an active market or which are based on generally accepted models with observa-ble market data are not subject to material estimates. For securities that are not listed on a stock exchange, or for which no stock exchange price is quoted that re-flects the fair value of the instrument, the fair value is determined using a current OTC price of a similar finan-cial instrument or using a model calculation. The valua-tion models include the discounting of the instrument cash flow using an appropriate market interest rate with due consideration for credit and liquidity premiums.
Valuation of propertyProperty is divided into owner-occupied property and investment property. Owner-occupied property is as-
sessed at the reassessed value that is equivalent to the fair value at the time of reassessment, with a deduc-tion for depreciation and write-downs. The fair value is calculated based on a market-determined rental in-come, as well as operating expenses in proportion to the property’s required rate of return in per cent.
Investment property is recognised at fair value. The calculation of fair value is based on market prices, tak-ing into consideration the type of property, location and maintenance standard, and based on a market- determined rental income as well as operating ex-penses in proportion to the property’s required rate of return. Cf. note 12 and 13.
Measurement of goodwill, Trademarks and Customer relationsGoodwill, Trademarks and customer relations was ac-quired in connection with acquisition of businesses. Goodwill is allocated to the cash-generating units un-der which management manages the investment. The carrying amount is tested for impairment at least an-nually. Impairment testing involves estimates of future cash flows and is affected by a number of factors, in-cluding discount rates and other circumstances de-pendent on economic trends, such as customer be-haviour and competition. Cf. note 11.
Description of accounting policies
Recognition and measurementThe annual report has been prepared under the historical cost convention, as modified by the revaluation of owner-occupied property, where increases are recognised in other comprehensive income, and revaluation of invest-ment property, financial assets held for trading and finan-cial assets and financial liabilities (including derivative in-struments) at fair value in the income statement.
Assets are recognised in the statement of financial po-sition when it is probable that future economic bene-fits will flow to the Group, and the value of such assets
can be measured reliably. Liabilities are recognised in the statement of financial position when the Group has a legal or constructive obligation as a result of a prior event, and it is probable that future economic benefits will flow out of the Group, and the value of such liabilities can be measured reliably.
On initial recognition, assets and liabilities are meas-ured at cost, with the exception of financial assets, which are recognised at fair value. Measurement sub-sequent to initial recognition is effected as described below for each item. Anticipated risks and losses that arise before the time of presentation of the annual re-port and that confirm or invalidate affairs and condi-tions existing at the statement of financial position date are considered at recognition and measurement.
Income is recognised in the income statement as earned, whereas costs are recognised by the amounts attributable to this financial year. Value adjustments of financial assets and liabilities are recognised in the income statement unless otherwise described below.
All amounts in the notes are shown in millions of DKK, unless otherwise stated.
Consolidated financial statementsThe consolidated financial statements comprise the financial statements of Tryg A/S (the parent company) and the enterprises (subsidiaries) controlled by the parent company. The parent company is regarded as controlling an enterprise when it i) exercises a control-ling influence over the relevant activities in the enter-prise in question, ii) is exposed to or has the right to a variable return on its investment, and iii) can exercise its controlling influence to affect the variable return.
Enterprises in which the Group directly or indirectly holds between 20% and 50% of the voting rights and exercises significant influence but no controlling influ-ence are classified as associates.

88
Notes
Annual report 2014 | Tryg A/S | | Menu – Financial statements
Basis of consolidationThe consolidated financial statements are prepared on the basis of the financial statements of Tryg A/S and its subsidiaries. The consolidated financial state-ments are prepared by combining items of a uniform nature. The financial statements used for the consoli-dation are prepared in accordance with the Group’s accounting policies.
On consolidation, intra-group income and costs, intra-group accounts and dividends, and gains and losses arising on transactions between the consolidated en-terprises are eliminated.
Items of subsidiaries are fully recognised in the con-solidated financial statements.
Business combinationsNewly acquired or newly established enterprises are recognised in the consolidated financial statements from the date of acquisition and the date of formation, respectively. The date of acquisition is the date on which control of the acquired enterprise actually passes to Tryg. Divested or discontinued enterprises are recognised in the consolidated statement of com-prehensive income up to the date of disposal or the settlement date. The date of disposal is the dateon which control of the divested enterprise actually passes to a third party.
The purchase method is applied for new acquisitions if the Group gains control of the acquired enterprise. Subsequently, identifiable assets, liabilities and con-tingent liabilities in the acquired enterprises are meas-ured at fair value at the date of acquisition. Non-cur-rent assets which are acquired with the intention of selling them are, however, measured at fair value less expected selling costs.
Restructuring costs are recognised in the pre-acquisi-tion balance sheet only if they constitute an obligation for the acquired enterprise.
The tax effect of revaluations is taken into account. The acquisition price of an enterprise consists of the fair value of the price paid for the acquiredenterprise. If the final determination of the price is conditional upon one or more future events, such events are recognised at their fair values at the date of acquisition. Costs relating to the acquisition are rec-ognised in the income statement as incurred.
Any positive balances (goodwill) between the acquisi-tion price of the acquired enterprise, the value of mi-nority interests in the acquired enterprise and the fair value of previously acquired equity investments, on the one hand, and the fair value of the acquired as-sets, liabilities and contingent liabilities, on the other hand, are recognised as an asset under intangible as-sets, and are tested for impairment at least once a year. If the carrying amount of the asset exceeds its recoverable amount, it is impaired to the lower recov-erable amount.
In the event of negative balances (negative goodwill), the calculated fair values, the calculated acquisition price of the enterprise, the value of minority interests in the acquired enterprise and the fair value of previ-ously acquired equity investments are revalued. If the balance is still negative, the amount is recognised as income in the income statement.
If, at the date of acquisition, there is uncertainty as to the identification or measurement of acquired assets, liabilities or contingent liabilities or the determination of the acquisition price, initial recognition is based on a preliminary determination of values. The preliminar-ily determined values may be adjusted or additional assets or liabilities may be recognised up to 12 months after the acquisition, provided that new infor-mation has come to light regarding matters existing at the date of acquisition which would have affected the determination of the values at the date of acquisition, had such information been known.
As a general rule, subsequent changes in estimates of conditional acquisition prices are recognised directly in the income statement.
Currency translationA functional currency is determined for each of the re-porting entities in the Group. The functional currency is the currency used in the primary economic environ-ment in which the reporting entity operates. Transac-tions in currencies other than the functional currency are transactions in foreign currencies.
On initial recognition, transactions in foreign curren-cies are translated into the functional currency using the exchange rate applicable at the transaction date. Assets and liabilities denominated in foreign curren-cies are translated using the exchange rates applica-ble at the statement of financial position date. Trans-lation differences are recognised in the income statement under price adjustments.
On consolidation, the assets and liabilities of the Group’s foreign operations are translated using the exchange rates applicable at the statement of finan-cial position date. Income and expense items are translated using the average exchange rates for the period. Exchange rate differences arising on transla-tion are classified as other comprehensive income and transferred to the Group’s translation reserve.
Such translation differences are recognised as income or as expenses in the period in which the activities are divested. All other foreign currency translation gains and losses are recognised in the income statement.
The presentation currency in the annual report is DKK.
Segment reportingSegment information is based on the Group’s man-agement and internal financial reporting system and
supports the management decisions on allocation of resources and assessment of the Group’s results di-vided into segments.
The operational business segments in the Tryg are Pri-vate, Commercial, Corporate and Sweden. Private en-compasses the sale of insurances to private individuals in Denmark and Norway. Commercial encom passes the sale of insurances to small and medium sized businesses, in Denmark and Norway. Corporate sells insurances to industrial clients primarily in Denmark, Norway and Sweden. In addition, Corporate handles all business involving brokers. Sweden encompasses the sale of insurance products to private individuals in Sweden as well as sale of Product insurances in the nordic region.
Geographical information is presented on the basis of the economic environment in which the Tryg Group operates. The geographical areas are Denmark, Nor-way and Sweden.
Segment income and segment costs as well as seg-ment assets and liabilities comprise those items that can be directly attributed to each individual segment and those items that can be allocated to the individual segments on a reliable basis. Unallocated items pri-marily comprise assets and liabilities concerning in-vestment activity managed at Group level.
Key ratiosEarnings per share (EPS) are calculated according to IAS 33. This and other key ratios are calculated in ac-cordance with Recommendations and Ratios 2010 is-sued by the Danish Society of Financial Analysts and the Executive Order on Financial Reports for Insur-ance Companies and Multi-Employer Occupational Pension Funds issued by the Danish Financial Super-visory Authority.

89
Notes
Annual report 2014 | Tryg A/S | | Menu – Financial statements
Income statement
PremiumsPremium income represents gross premiums written during the year, net of reinsurance premiums and ad-justed for changes in premium pro- visions, corre-sponding to an accrual of premiums to the risk period of the policies, and in the reinsurers’ share of the pre-mium provisions.
Premiums are calculated as premium income in ac-cordance with the risk exposure over the cover period, calculated separately for each individual insurance contract. The calculation is generally based on the pro rata method, although this is adjusted for an unevenly divided risk between lines of business with strong seasonal variations or for policies lasting many years.
The portion of premiums received on contracts that relate to unexpired risks at the statement of financial position date is reported under premium provisions.
The portion of premiums paid to reinsurers that relate to unexpired risks at the statement of financial posi-tion date is reported as the reinsurers’ share of pre-mium provisions.
Technical interestAccording to the Danish FSA’s executive order, techni-cal interest is presented as a calculated return on the year's average insurance liability provisions, net of re-insurance. The calculated interest return for grouped classes of risks is calculated as the monthly average provision plus an actual interest from the present yield curve for each individual group of risks. The in-terest is applied according to the expected run-off pattern of the provisions.
Insurance technical interest is reduced by the portion of the increase in net provisions that relates to un-winding.
ClaimsClaims are claims paid during the year and adjusted for changes in claims provisions less the reinsurers’ share. In addition, the item includes run-off gains/losses in respect of previous years. The portion of the increase in provisions which can be ascribed to un-winding is transferred to insurance technical interest.
Claims are shown inclusive of direct and indirect claims handling costs, including costs of inspecting and assessing claims, costs to combat and mitigate damage and other direct and indirect costs associated with the handling of claims incurred.
Changes in claims provisions due to changes in yield curve and exchange rates are recognised as a price adjustment.
Tryg hedges the risk of changes in future pay and price figures for provisions for workers’ compensation. Tryg uses zero coupon inflation swaps acquired with a view to hedging the inflation risk. Value adjustments of these swaps are included in claims, thereby reducing the ef-fect of changes to inflation expectations under claims.
Bonus and premium discountsBonuses and premium discounts represent antici-pated and refunded premiums to policyholders, where the amount refunded depends on the claims record, and for which the criteria for payment have been defined prior to the financial year or when the insurance was taken out.
Insurance operating expensesInsurance operating costs represent acquisition costs and administration expenses less reinsurance com-missions received. Expenses relating to acquiring and renewing the insurance portfolio are recognised at the time of writing the business. Underwriting commis-sion is recognised when a legal obligation occurs and is accrued over the term of the policy. Administration expenses are all other expenses attributable to the administration of the insurance portfolio. Administra-tion expenses are accrued to match the financial year.
LeasingLeases are classified either as operating or finance leases. The assessment of the lease is based on crite-ria such as ownership, right of purchase when the lease term expires, considerations as to whether the asset is custom- made, the lease term and the present value of the lease payments.
Assets held under operating leases are not recognised in the statement of financial position, but the lease payments are recognised in the income statement over the term of the lease, corresponding to the eco-nomic lifetime of the asset. The Group has no assets held under finance leases.
Share-based paymentThe Tryg Group’s incentive programmes comprise share option programmes, employee shares and matching shares.
Share option programmeThe value of services received as consideration for op-tions granted is measured at the fair value of the op-tions.
Equity-settled share options are measured at fair value at the time of allocation and recognised under staff expenses over the period from the time of alloca-tion until vesting. The balancing item is recognised di-rectly in equity.
The options are issued at an exercise price that corre-sponds to the market price of the Group’s shares at the time of allocation plus 10%. No other vesting con-ditions apply. Special provisions are in place concern-ing sickness and death and in case of change to the Group’s capital position etc.
The share option agreement entitles the employee to the options unless the employee resigns his position or is dismissed due to breach of the contract of employ-ment. In case of termination due to restructuring or re-tirement, the employee is still entitled to the options.
The share options are exercisable exclusively during a 13-day period, which starts the day after the publica-tion of full-year, half-year and quarterly reports and in accordance with Tryg’s in-house rules on trading in the Group’s shares. The options are settled in shares. A part of the Group’s holding of own shares is re-served for settlement of the options allocated.
On initial recognition of the share options, the number of options expected to vest for employees and mem-bers of the Executive Management is estimated. Sub-sequently, adjustment is made for changes in the esti-mated number of vested options to the effect that the total amount recognised is based on the actual num-ber of vested options. The value for retired employees who retain their right to options is reported for the re-maining period of the financial year in which the em-ployee retires.
The fair value of the options granted is estimated us-ing the Black & Scholes option model. The calculation takes into account the terms and conditions of the share options granted.
Employee sharesAccording to established rules, the Group’s employees can be granted a bonus in the form of employee shares. When the bonus is granted, employees can choose between receiving shares or cash. The ex-pected value of the shares will be expensed over the vesting period. The scheme will be treated as a com-plex financial instrument, consisting of the right to cash settlement and the right to request delivery of shares. The difference between the value of shares and the cash payment is recognised in equity and is not remeasured. The remainder is treated as a liability and is remeasured until the time of exercise, such that the total recognition is based on the actual number of shares or the actual cash amount.
Matching sharesMembers of Executive Management and risk takers have been allocated shares in accordance with the “Matching shares” scheme. Under Matching shares,

90
Notes
Annual report 2014 | Tryg A/S | | Menu – Financial statements
the individual management member or risk takers is allocated one share in Tryg A/S for each share the Ex-ecutive management member or risk taker acquires in Tryg A/S at the market rate for certain liquid cash at a contractually agreed sum in connection with the Matching share programme. The holder acquires the shares in the open window following publication of the annual report for the pre-vious year. The shares (matching shares) are provided free of charge, four years after the time of purchase. The holder may not sell the shares until six months af-ter the matching time.
The shares are recognised at market value and are ac-crued over the four-year maturation period, based on the market price at the time of acquisition. Recogni-tion is from the end of the month of acquisition under staff expenses with a balancing entry directly in eq-uity. If an Executive Management member or risk-taker retires during the maturation period but remains entitled to shares, the remaining expense is recog-nised in the current accounting year.
Investment activitiesIncome from associates includes the Group’s share of the associates’ net profit.
Income from investment properties before fair value adjustment represents the profit from property opera-tions less property management expenses.
Interest and dividends represent interest earned and dividends received during the financial year.
Realised and unrealised investment gains and losses, including gains and losses on derivative financial in-struments, value adjustment of investment property, foreign currency translation adjustments and the ef-fect of movements in the yield curve used for dis-counting, are recognised as price adjustments.
Investment management charges represent expenses relating to the management of investments including salary and management fees on the investment area.
Other income and expensesOther income and expenses include income and ex-penses which cannot be ascribed to the Group´s in-surance portfolio or investment assets, including the sale of products for Nordea Liv & Pension.
Discontinued and divested businessDiscontinued and divested business is consolidated in one item in the income statement and supplemented with disclosure of the discontinued and divested busi-ness in a note to the financial statements. Discontin-ued and divested business includes gross premiums, gross claims, gross costs, profit/loss on ceded busi-ness, insurance technical interest net of reinsurance, investment return after insurance technical interest, other income and costs and tax in respect of the dis-continued business. Any reversal of earlier impair-ment is recognised under other income and costs.The statement of financial position items concerning discontinued activities are reported unchanged under the respective entries whereas assets and liabilities con-cerning divested activities are consolidated under one item as assets held for sale and liabilities held for sale.
The comparative figures, including five-year financial highlights and key ratios, have been restated to reflect discontinued business. Discontinued and divested business in the income statement includes the profit/loss after tax of the run-off for the marine hull busi-ness and the divested activities in the Finnish branch in 2012. Discontinued business also comprises the Tryg Forsikring A/S run-off business.
Statement of financial position
Intangible assetsGoodwillGoodwill was acquired in connection with acquisition of business. Goodwill is calculated as the difference between the cost of the undertaking and the fair value of acquired identifiable assets, liabilities and contin-gent liabilities at the time of acquisition. Goodwill is allocated to the cash-generating units under which
management manages the investment and is recog-nised under intangible assets. Goodwill is not amor-tised but is tested for depreciation at least once per year.
Trademarks and customer relationsTrademarks and customer relations have been identi-fied as intangible assets on acquisition. The intangible assets are recognised at fair value at the time of ac-quisition and amortised on a straight-line basis over the expected economic lifetime of 5–12 years.
SoftwareAcquired computer software licences are capitalised on the basis of the costs incidental to acquiring and bringing to use the specific software. The costs are amortised based on an estimated economic lifetime of up to 4 years.
Costs for group developed software that are directly connected with the production of identifiable and unique software products, where there is sufficient certainty that future earnings will exceed the costs in more than one year, are reported as intangible assets. Direct costs include personnel costs for software de-velopment and directly attributable relevant fixed costs. All other costs connected with the development or maintenance of software are continuously charged as expenses.
After completion of the development work, the asset is amortised according to the straight-line method over the assessed economic lifetime, though over a maximum of 4 years. The amortisation basis is re-duced by any impairment and write-downs.
Assets under constructionGroup-developed intangibles are recorded under the entry “Assets under construction” until they are put into use, whereupon they are reclassified as software and are amortized in accordance with the amortiza-tion periods stated above.
Fixed assetsOperating equipmentFixtures and operating equipment are measured at cost less accumulated depreciation and any accumu-lated impairment losses. Cost encompasses the pur-chase price and costs directly attributable to the ac-quisition of the relevant assets until the time when such assets are ready to be brought into use.
Depreciation of operating equipment is calculated us-ing the straight-line method over its estimated eco-nomic lifetime as follows:
• IT, 4 years• Vehicles, 5 years• Furniture, fittings and equipment, 5-10 years
Leasehold improvements are depreciated over the ex-pected economic lifetime, however maximally the term of the lease.
Gains and losses on disposals and retired assets are determined by comparing proceeds with carrying amounts. Gains and losses are recognised in the in-come statement. When revalued assets are sold, the amounts included in the revaluation reserves are transferred to retained earnings.
Land and buildingsLand and buildings are divided into owner-occupied property and investment property. The Group’s owner-occupied properties consist of the head office buildings in Ballerup and Bergen and a small number of holiday homes. The remaining properties are clas-sified as investment property.
Owner-occupied propertyOwner-occupied property is property that is used in the Group’s operations. Owner-occupied properties are measured in the statement of financial position at their revalued amounts, being the fair value at the date of revaluation, less any subsequent accumulated depreciation and impairment losses. Revaluations are
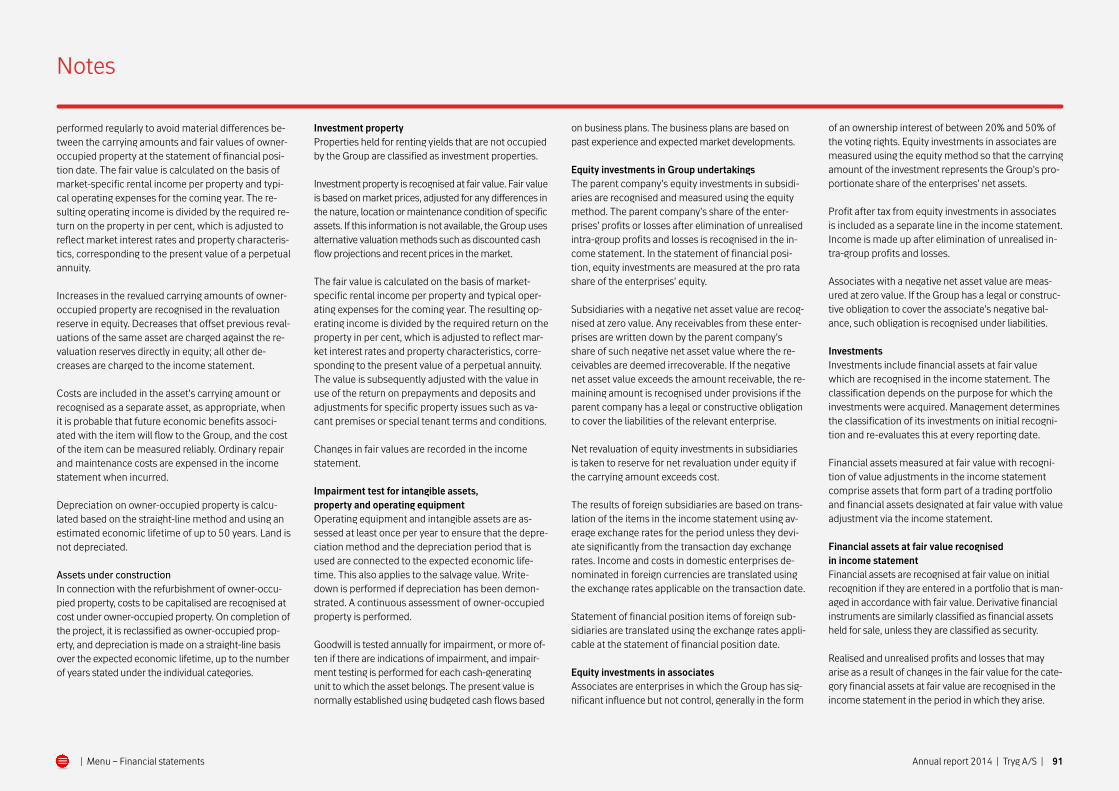
91
Notes
Annual report 2014 | Tryg A/S | | Menu – Financial statements
performed regularly to avoid material differences be-tween the carrying amounts and fair values of owner-occupied property at the statement of financial posi-tion date. The fair value is calculated on the basis of market-specific rental income per property and typi-cal operating expenses for the coming year. The re-sulting operating income is divided by the required re-turn on the property in per cent, which is adjusted to reflect market interest rates and property characteris-tics, corresponding to the present value of a perpetual annuity.
Increases in the revalued carrying amounts of owner-occupied property are recognised in the revaluation reserve in equity. Decreases that offset previous reval-uations of the same asset are charged against the re-valuation reserves directly in equity; all other de-creases are charged to the income statement.
Costs are included in the asset’s carrying amount or recognised as a separate asset, as appropriate, when it is probable that future economic benefits associ-ated with the item will flow to the Group, and the cost of the item can be measured reliably. Ordinary repair and maintenance costs are expensed in the income statement when incurred.
Depreciation on owner-occupied property is calcu-lated based on the straight-line method and using an estimated economic lifetime of up to 50 years. Land is not depreciated.
Assets under constructionIn connection with the refurbishment of owner-occu-pied property, costs to be capitalised are recognised at cost under owner-occupied property. On completion of the project, it is reclassified as owner-occupied prop-erty, and depreciation is made on a straight-line basis over the expected economic lifetime, up to the number of years stated under the individual categories.
Investment propertyProperties held for renting yields that are not occupied by the Group are classified as investment properties.
Investment property is recognised at fair value. Fair value is based on market prices, adjusted for any differences in the nature, location or maintenance condition of specific assets. If this information is not available, the Group uses alternative valuation methods such as discounted cash flow projections and recent prices in the market.
The fair value is calculated on the basis of market-specific rental income per property and typical oper-ating expenses for the coming year. The resulting op-erating income is divided by the required return on the property in per cent, which is adjusted to reflect mar-ket interest rates and property characteristics, corre-sponding to the present value of a perpetual annuity. The value is subsequently adjusted with the value in use of the return on prepayments and deposits and adjustments for specific property issues such as va-cant premises or special tenant terms and conditions.
Changes in fair values are recorded in the income statement.
Impairment test for intangible assets, property and operating equipmentOperating equipment and intangible assets are as-sessed at least once per year to ensure that the depre-ciation method and the depreciation period that is used are connected to the expected economic life-time. This also applies to the salvage value. Write-down is performed if depreciation has been demon-strated. A continuous assessment of owner-occupied property is performed.
Goodwill is tested annually for impairment, or more of-ten if there are indications of impairment, and impair-ment testing is performed for each cash-generating unit to which the asset belongs. The present value is normally established using budgeted cash flows based
on business plans. The business plans are based on past experience and expected market developments.
Equity investments in Group undertakingsThe parent company’s equity investments in subsidi-aries are recognised and measured using the equity method. The parent company’s share of the enter-prises’ profits or losses after elimination of unrealised intra-group profits and losses is recognised in the in-come statement. In the statement of financial posi-tion, equity investments are measured at the pro rata share of the enterprises’ equity.
Subsidiaries with a negative net asset value are recog-nised at zero value. Any receivables from these enter-prises are written down by the parent company’s share of such negative net asset value where the re-ceivables are deemed irrecoverable. If the negative net asset value exceeds the amount receivable, the re-maining amount is recognised under provisions if the parent company has a legal or constructive obligation to cover the liabilities of the relevant enterprise.
Net revaluation of equity investments in subsidiaries is taken to reserve for net revaluation under equity if the carrying amount exceeds cost.
The results of foreign subsidiaries are based on trans-lation of the items in the income statement using av-erage exchange rates for the period unless they devi-ate significantly from the transaction day exchange rates. Income and costs in domestic enterprises de-nominated in foreign currencies are translated using the exchange rates applicable on the transaction date.
Statement of financial position items of foreign sub-sidiaries are translated using the exchange rates appli-cable at the statement of financial position date.
Equity investments in associatesAssociates are enterprises in which the Group has sig-nificant influence but not control, generally in the form
of an ownership interest of between 20% and 50% of the voting rights. Equity investments in associates are measured using the equity method so that the carrying amount of the investment represents the Group’s pro-portionate share of the enterprises’ net assets.
Profit after tax from equity investments in associates is included as a separate line in the income statement. Income is made up after elimination of unrealised in-tra-group profits and losses.
Associates with a negative net asset value are meas-ured at zero value. If the Group has a legal or construc-tive obligation to cover the associate’s negative bal-ance, such obligation is recognised under liabilities.
InvestmentsInvestments include financial assets at fair value which are recognised in the income statement. The classification depends on the purpose for which the investments were acquired. Management determines the classification of its investments on initial recogni-tion and re-evaluates this at every reporting date.
Financial assets measured at fair value with recogni-tion of value adjustments in the income statement comprise assets that form part of a trading portfolio and financial assets designated at fair value with value adjustment via the income statement.
Financial assets at fair value recognised in income statementFinancial assets are recognised at fair value on initial recognition if they are entered in a portfolio that is man-aged in accordance with fair value. Derivative financial instruments are similarly classified as financial assets held for sale, unless they are classified as security.
Realised and unrealised profits and losses that may arise as a result of changes in the fair value for the cate-gory financial assets at fair value are recognised in the income statement in the period in which they arise.

92
Notes
Annual report 2014 | Tryg A/S | | Menu – Financial statements
Financial assets are derecognised when the rights to receive cash flows from the financial assets have ex-pired, or if they have been transferred, and the Group has also transferred substantially all risks and rewards of ownership. Financial assets are recognised and derecognised on a trade date basis, the date on which the Group commits to purchase or sell the asset.
The fair values of quoted securities are based on stock exchange prices at the statement of financial position date. For securities that are not listed on a stock exchange, or for which no stock exchange price is quoted that reflects the fair value of the instrument, the fair value is determined using valuation tech-niques. These include the use of similar recent arm’s length transactions, reference to other similar instru-ments or discounted cash flow analysis.
Derivative financial instruments and hedge accountingThe Group’s activities expose it to financial risks, in-cluding changes in share prices, foreign exchange rates, interest rates and inflation. Forward exchange con-tracts and currency swaps are used for currency hedg-ing of portfolios of shares, bonds, hedging of foreign entities and insurance statement of financial position items. Interest rate derivatives in the form of futures, forward contracts, repos, swaps and FRAs are used to manage cash flows and interest rate risks related to the portfolio of bonds and insurance provisions. Share de-rivatives in the form of futures and options are used from time to time to adjust share exposures.
Derivative financial instruments are reported from the trading date and are measured in the statement of fi-nancial position at fair value. Positive fair values of de-rivatives are recognised as derivative financial instru-ments under assets. Negative fair values of derivatives are recognised under derivative financial instruments under liabilities. Positive and negative values are only offset when the company is entitled or intends to make net settlement of more financial instruments.
Calculation of value is generally performed on the ba-sis of rates supplied by Danske Bank with relevant in-formation providers and is checked by the Group’s valuation technicians. Discounting on the basis of market interest rates is applied in the case of deriva-tive financial instruments involving an expected future cash flow.
Recognition of the resulting gain or loss depends on whether the derivative is designated as a hedging in-strument and, if so, the nature of the item being hedged. The Group designates certain derivatives as hedges of investments in foreign entities. Changes in the fair value of derivatives that are designated and qualify as net investment hedges in foreign entities and which provide effective currency hedging of the net in-vestment are recognised directly in equity. The net as-set value of the foreign entities estimated at the begin-ning of the financial year is hedged 90-100% by entering into short-term forward exchange contracts according to the requirements of hedge accounting. Changes in the fair value relating to the ineffective por-tion are recognised in the income statement. Gains and losses accumulated in equity are included in the income statement on disposal of the foreign entity.
Reinsurers’ share of provisions for insurance contractsContracts entered into by the Group with reinsurers un-der which the Group is compensated for losses on one or more contracts issued by the Group and that meet the classification requirements for insurance contracts are classified as reinsurers’ share of provisions for insur-ance contracts. Contracts that do not meet these classi-fication requirements are classified as financial assets.
The benefits to which the Group is entitled under its reinsurance con- tracts held are recognised as assets and reported as reinsurers’ share of provisions for in-surance contracts.
Amounts receivable from reinsurers are measured con-sistently with the amounts associated with the rein-sured insurance contracts and in accordance with the terms of each reinsurance contract.
Changes due to unwinding are recognised in insurance technical interest. Changes due to changes in the yield curve or foreign exchange rates are recognised as price adjustments.
The Group continuously assesses its reinsurance assets for impairment. If there is objective evidence that the reinsurance asset is impaired, the Group reduces the carrying amount of the reinsurance asset to its recover-able amount. Impairment losses are recognised in the income statement.
ReceivablesTotal receivables comprise accounts receivable from policyholders and insurance companies as well as other accounts receivable. Other receivables primarily contain accounts receivable in connection with property Receiva-bles that arise as a result of insurance contracts are classified in this category and are reviewed for impair-ment as a part of the impairment test of accounts re-ceivable.
Receivablesare recognised initially at fair value and are subsequently assessed at amortised cost. The income statement includes an estimated reservation for expected unobtainable sums when there is a clear indication of as-set impairment. The reservation entered is assessed as the difference between the carrying amount of an asset and the present value of expected future cash flows.
Other assetsOther assets include current tax assets and cash at bank and in hand. Current tax assets are receivables concerning tax for the year adjusted for on-account payments and any prior-year adjustments. Cash at bank and in hand is recognised at nominal value at the statement of financial position date.
Prepayments and accrued incomePrepayments include expenses paid in respect of sub-sequent financial years and interest receivable. Ac-crued underwriting commission relating to the sale of insurance products is also included.
EquityShare capitalShares are classified as equity when there is no obli-gation to transfer cash or other assets. Costs directly attributable to the issue of equity instruments are shown in equity as a deduction from the proceeds, net of tax.
Revaluation reservesRevaluation of owner-occupied property is recognised in other comprehensive income unless the revalua-tion offsets a previous impairment loss.
Foreign currency translation reserveAssets and liabilities of foreign entities are recognised using the exchange rate applicable at the statement of financial position date. Income and expense items are recognised using the average monthly exchange rates for the period. Any resulting differences are recog-nised in Other comprehensive income. When an en-tity is wound up, the balance is transferred to the in-come statement. The hedging of the currency risk in respect of foreign entities is also offset in other com-prehensive income in respect of the part that con-cerns the hedge.
Contingency fund reservesContingency fund reserves are recognised as part of retained earnings under equity. The reserves may only be used when so permitted by the Danish Financial Supervisory Authority and when it is for the benefit of the policyholders. The Norwegian contingency fund reserves include provisions for the Norwegian Natural Perils Pool and security reserve. The Danish and Swedish provisions comprise contingency fund provi-sions. Deferred tax on the Norwegian and Swedish contingency fund reserves is allocated.

93
Notes
Annual report 2014 | Tryg A/S | | Menu – Financial statements
DividendsProposed dividend is recognised as a liability at the time of adoption by the shareholders at the annual general meeting (date of declaration).
Own sharesThe purchase and sale sums of own shares and divi-dends thereon are taken directly to retained earnings under equity. Own shares include shares acquired for incentive programmes and share buyback pro-gramme.
Proceeds from the sale of own shares in connection with the exercise of share options or matching shares are taken directly to equity.
Subordinate loan capitalSubordinate loan capital is recognised initially at fair value, net of trans- action costs incurred. Subordinate loan capital is subsequently stated at amortised cost; any difference between the proceeds (net of transac-tion costs) and the redemption value is recognised in the income statement over the borrowing period us-ing the effective interest method.
Provisions for insurance contractsPremiums written are recognised in the income state-ment (premium income) proportionally over the pe-riod of coverage and, where necessary, adjusted to re-flect any time variation of the risk. The portion of premiums received on in-force contracts that relates to unexpired risks at the statement of financial posi-tion date is reported as premium provisions. Premium provisions are generally calculated according to a best estimate of expected payments throughout the agreed risk period; however, as a minimum as the part of the premium calculated using the pro rata temporis principle until the next payment date. Adjustments are made to reflect any risk variations. This applies to gross as well as ceded business.
Claims and claims handling costs are expensed in the income statement as incurred based on the estimated liability for compensation owed to policyholders or third parties sustaining losses at the hands of the pol-icy- holders. They include direct and indirect claims handling costs that arise from events that have oc-curred up to the statement of financial position date even if they have not yet been reported to the Group. Claims provisions are estimated using the input of as-sessments for individual cases reported to the Group and statistical analyses for the claims incurred but not reported and the expected ultimate cost of more complex claims that may be affected by external fac-tors (such as court decisions). The provisions include claims handling costs.
Claims provisions are discounted. Discounting is based on a yield curve reflecting duration applied to the expected future payments from the provision. Dis-counting affects the motor liability, professional liabil-ity, workers’ compensation and personal accident and health insurance classes, in particular. Provisions for bonuses and premium discounts etc. represent amounts expected to be paid to policyhold-ers in view of the claims experience during the finan-cial year.
Claims provisions are determined for each line of business based on actuarial methods. Where such business lines encompass more than one business area, short-tailed claims provisions are distributed based on number of claims reported while long-tailed claims provisions are distributed based on premiums earned. The models currently used are Chain-Ladder, Bornhuetter-Ferguson, the Loss Ratio method and De Vylder’s credibility method. Chain-Ladder techniques are used for lines of business with a stable run-off pat-tern. The Bornhuetter-Ferguson method, and some-
times the Loss Ratio method, are used for claims years in which the previous run-off provides insuffi-cient information about the future run-off perfor-mance. De Vylder’s credibility method is used for ar-eas that are somewhere in between the Chain-Ladder and Bornhuetter-Ferguson/Loss Ratio methods, and may also be used in situations that call for the use of exposure targets other than premium volume, for ex-ample the number of insured.
The provision for annuities under workers’ compensa-tion insurance is calculated on the basis of a mortality corresponding to the G82 calculation basis (official mortality table).
In some instances, the historic data used in the actu-arial models is not necessarily predictive of the ex-pected future development of claims. For example, this is the case with legislative changes where an a priori estimate is used for premium increases related to the expected increase in claims. In connection with legislative changes, the same estimate is used for de-termining the change in the level of claims. Subse-quently, this estimate is maintained until new loss his-tory materialises which can be used for re-estimation.
Several assumptions and estimates underlying the calculation of the claims provisions are mutually de-pendent. Most importantly, this can be expected to be the case for assumptions relating to interest rates and inflation.
Workers’ compensation is an area in which explicit in-flation assumptions are used, with annuities for the insured being indexed based on the workers’ compen-sation index. An inflation curve that reflects the mar-ket’s inflation expectations plus a real wage spread is used as an approximation to the workers’ compensa-tion index.
For other lines of business, the inflation assumptions, because present only implicitly in the actuarial mod-els, will cause a certain lag in predicting the level of fu-ture losses when a change in inflation occurs. On the other hand, the effect of discounting will show imme-diately as a consequence of inflation changes to the extent that such changes affect the interest rate.
Other correlations are not deemed to be significant.
Liability adequacy testTests are continuously performed to ensure the ade-quacy of the insurance provisions. In performing these tests, current best estimates of future cash flows of claims, gains and direct and indirect claims handling costs are used. Any deficiency results in an increase in the relevant provision, and the adjustment is recognised in the income statement.
Employee benefitsPension obligationsThe Group operates various pension schemes. The schemes are funded through contributions to insur-ance companies or trustee-administered funds. In Norway, the Group operates a defined-benefit plan. In Denmark, the Group operates a defined-contribution plan. A defined-contribution plan is a pension plan un-der which the Group pays fixed contributions into a separate entity (a fund) and will have no legal or con-structive obligation to pay further contributions. In Sweden, the Group complies with the industry pension agreement, FTP-Planen. FTP-Planen is primarily a de-fined-benefit plan as regards the future pension bene-fits. Försäkringsbranschens Pensionskassa (FPK) is unable to provide sufficient information for the Group to use defined-benefit accounting. The plan is there-fore accounted for as a defined-contribution plan.

94
Notes
Annual report 2014 | Tryg A/S | | Menu – Financial statements
For the defined-benefit plan recognised in the state-ment of financial position, an annual actuarial calcula-tion is made of the capital value of the future benefits to which employees are entitled as a result of their employment with the group so far and which must be disbursed according to the plan. The capital value is calculated using the Projected Unit Credit Method, which are based on input Cf. note 20.
The capital value of the pension obligations less the fair value of any plan assets is recognised in the state-ment of financial position under pension assets and pension obligations, respectively, depending on whether the net amount is an asset or a liability.
In case of changes to assumptions concerning the discounting factor, inflation, mortality and disability or in case of differences between expected and realised returns on pension assets, actuarial gains or losses ensue. These gains and losses are recognised under other comprehensive income.
In case of changes to the benefits stemming from the employees' employment with the group so far,a change is seen in the actuarially calculated capital value which is considered as pension costs for previ-ous financial years. The change is recognised in the results immediately. Net finance costs for the year are recognised in the investment return. All other costs are recognised under insurance operating costs.The plan is closed for new business.
Other employee benefitsEmployees of the Group are entitled to a fixed pay-ment when they reach retirement and when they have been employed with the Group for 25 and for 40 years. The Group recognises this liability at the time of signing the contract of employment.
In special instances, the employee can enter into a contract with the Group to receive compensation for loss of pension benefits caused by reduced working hours. The Group recognises this liability based on statistical models.
Income tax and deferred taxThe Group expenses current tax according to the tax laws of the jurisdictions in which it operates. Current tax liabilities and current tax receivables are recog-nised in the statement of financial position as esti-mated tax on the taxable income for the year, adjusted for change in tax on prior years’ taxable income and for tax paid under the on-account tax scheme.
Deferred tax is measured according to the statement of financial position liability method on all timing dif-ferences between the tax and accounting value of as-sets and liabilities. Deferred income tax is measured using the tax rules and tax rates that apply in the rele-vant countries on the statement of financial position date when the deferred tax asset is realised or the de-ferred income tax liability is settled.
Deferred income tax assets, including the tax value of tax losses carried forward, are recognised to the ex-tent that it is probable that future taxable profit will be realised against which the temporary differences can be offset.
Deferred income tax is provided on temporary differ-ences concerning investments, except where Tryg controls when the temporary difference will be real-ised, and it is probable that the temporary difference will not be realised in the foreseeable future.
Other provisionsProvisions are recognised when the Group has a legal or constructive obligation as a result of an event prior
to or at the statement of financial position date, and it is probable that future economic benefits will flow out of the Group. Provisions are measured at the best es-timate by management of the expenditure required to settle the present obligation. The measurement of provisions is based on a discounting of the costs nec-essary to settle the obligation if this has a significant effect on the measurement of the obligation.
Provisions for restructurings are recognised as obliga-tions when a detailed formal restructuring plan has been announced prior to or at the statement of finan-cial position date at the latest to the persons affected by the plan.
Own insurance is included under other provisions. The provisions apply to the Group’s own insurance claims and are reported when the damage occurs ac-cording to the same principle as the Group’s other claims provisions.
DebtDebt comprises debt in connection with direct insur-ance and reinsurance, amounts owed to credit institu-tions, current tax obligations and other debt. Deriva-tive financial instruments are assessed at fair value according to the same practice that applies to finan-cial assets. Other liabilities are assessed at amortised cost based on the effective interest method.
Cash flow statementThe consolidated cash flow statement is presented using the direct method and shows cash flows from operating, investing and financing activities as well as the Group’s cash and cash equivalents at the begin-ning and end of the financial year. No separate cash flow statement has been prepared for the parent company because it is included in the consolidated cash flow statement.
Cash flows from operating activities are calculated whereby major classes of gross cash receipts and gross cash payments are disclosed.
Cash flows from investing activities comprise pay-ments in connection with the purchase and sale of in-tangible assets, property, plant and equipment as well as financial assets and deposits with credit institu-tions.
Cash flows from financing activities comprise changes in the size or composition of Tryg’s share capital and related costs as well as the raising of loans, repayments of interest-bearing debt and the payment of dividends.
Cash and cash equivalents comprise cash and de-mand deposits.

95Annual report 2014 | Tryg A/S | | Menu – Financial statements
DKKm 2014 2013
Note Statement of comprehensive income Profit/loss for the year 2,557 2,367
Other comprehensive income
Other comprehensive income which cannot subsequently be reclassified as profit or loss Change in equalisation provision and other provisions 26 0 Revaluation of owner-occupied property for the year 2 9 Tax on revaluation of owner-occupied property for the year 0 -3 Actuarial gains/losses on defined-benefit pension plans -46 179 Tax on actuarial gains/losses on defined-benefit pension plans 12 -54
-6 131
Other comprehensive income which can subsequently be reclassified as profit or loss Exchange rate adjustments of foreign entities for the year -178 -326 Hedging of currency risk in foreign entities for the year 191 305 Tax on hedging of currency risk in foreign entities for the year -47 -76
-34 -97
Total other comprehensive income -40 34
Comprehensive income 2,517 2,401
DKKm 2014 2013
Note Investment activities 1 Income from Group undertakings 2,600 2,410 Interest expenses 0 1 Administration expenses in connection with investment activities -7 -6
Total investment return 2,593 2,405
2 Other expenses -51 -52
Profit/loss before tax 2,542 2,353
3 Tax 15 14
Profit/loss on continuing business 2,557 2,367
Profit/loss for the year 2,557 2,367
Proposed distribution for the year: Dividend 1,731 1,656 Transferred to reserve for net revaluation according to the equity method 143 817 Transferred to retained profit 683 -106
2,557 2,367
Income statement for Tryg A/S (parent company)

96Annual report 2014 | Tryg A/S | | Menu – Financial statements
DKKm 2014 2013
Note Assets 4 Equity investments in Group undertakings 11,843 11,740
Total investments in Group undertakings 11,843 11,740
Total investment assets 11,843 11,740
5 Current tax assets 14 14 Cash at bank and in hand 0 1
Total other assets 14 15
Total assets 11,857 11,755
Equity and liabilities Equity 11,134 11,122
Debt to Group undertakings 718 629 Other debt 5 4
Total debt 723 633
Total equity and liabilities 11,857 11,755
6 Deferred tax assets 7 Capital adequacy 8 Contractual obligations, contingent liabilities and collateral 9 Related parties 10 Reconciliation of profit/loss and equity 11 Accounting policies
Statement of financial position for Tryg A/S (parent company)

97Annual report 2014 | Tryg A/S | | Menu – Financial statements
Share Revaluation Retained Proposed DKKm capital reserves earnings dividend Total
Equity at 31 December 2013 1,533 4,753 3,180 1,656 11,122
2014 Profit/loss for the year 143 683 1,731 2,557Other comprehensive income -40 -40
Total comprehensive income 0 103 683 1,731 2,517Nullification of own shares -41 41 0Dividend paid -1,656 -1,656Dividend own shares 59 59Purchase and sale of own shares -1,005 -1,005Exercise of share options 49 49Issue of employee shares 45 45Issue of share options and matching shares 3 3
Total changes in equity in 2014 -41 103 -125 75 12
Equity at 31 December 2014 1,492 4,856 3,055 1,731 11,134
Equity at 31 December 2012 1,533 3,902 3,967 1,594 10,996
2013 Profit/loss for the year 817 -106 1,656 2,367Other comprehensive income 34 34
Total comprehensive income 0 851 -106 1,656 2,401Dividend paid -1,594 -1,594Dividend, own shares 15 15Purchase and sale of own shares -800 -800Exercise of share options 100 100Issue of share options and matching shares 4 4
Total changes in equity in 2013 0 851 -787 62 126
Equity at 31 December 2013 1,533 4,753 3,180 1,656 11,122
Statement of changes in equity (parent company)
Proposed dividend per share DKK 29 (DKK 27 in 2013 )Dividend per share is calculated as the total dividend proposed by the Supervisory Board after the end of the financial year divided by the total number of sha-res at the end of the year (59,695,516 shares). The di-vidend is not paid until approved by the shareholdersat the annual general meeting.
The possible payment of dividend from Tryg Forsikring A/S to Tryg A/S is influenced by contingency fund provisions of DKK 2,622m (DKK 3,020m in 2013). The contingency fund provisions can be used to cover losses in connection with the settlement of insurance provisions or otherwise for the benefit of the insured.

98Annual report 2014 | Tryg A/S | | Menu – Financial statements
DKKm 2014 2013
1 Income from Group undertakings Tryg Forsikring A/S 2,600 2,410
2,600 2,410
2 Other expenses Administration expenses -51 -52
-51 -52
Remuneration for the Executive Management is paid partly by Tryg A/S and partly by Tryg Forsikring
A/S and Tryg Forsikring, a Norwegian branch of Tryg Forsikring A/S and is charged to Tryg A/S via the cost allocation.
Remuneration for the Supervisory Board, the Executive Management and risk-takers can be seen from note 28 concerning related parties of the Tryg Group. Refer to Note 6 of the consolidated financial statements for a specification of the audit fee.
Average number of full-time employees for the year 13 11 3 Tax Reconciliation of tax costs Tax on profit/loss for the year 14 14 Tax adjustments, previous years 1 0
15 14
Effective tax rate % %
Tax on profit/loss for the year 24.5 25.0 Tax adjustment, previous years 0.5 0.0
25.0 25.0
DKKm 2014 2013
4 Equity investments in Group undertakings Cost Cost at 1 January 6,987 6,987
Cost at 31 December 6,987 6,987
Revaluation and impairment to net asset value Revaluation and impairment at 1 January 4,753 3,902 Revaluations for the year 1,759 2,445 Dividend paid -1,656 -1,594
Revaluation and impairment at 31 December 4,856 4,753
Carrying amount at 31 December 11,843 11,740
Name and registered office Ownership share in % Equity
2014 Tryg Forsikring A/S, Ballerup 100 11,843
2013 Tryg Forsikring A/S, Ballerup 100 11,740
5 Current tax assets Tax receivable at 1 January 14 24 Current tax for the year 14 14 Adjustment of current tax in respect of previous years 0 0 Tax paid for the year -14 -24
Tax receivable at 31 December 14 14
Notes

99Annual report 2014 | Tryg A/S | | Menu – Financial statements
DKKm 2014 2013
6 Deferred tax assets Capitalised tax losses Tryg A/S 0 0
Non-capitalised tax losses Tryg A/S 18 18
The loss in Tryg A/S can only be utilised in Tryg A/S. The loss can be carried forward indefinitely. The losses are not recognised as tax assets until it has been substantiated
that the company can generate sufficient future taxable income to offset the tax losses.
7 Capital adequacy Equity according to annual report 11,134 11,122 Proposed dividend -1,731 -1,656 Solvency requirements of subsidiaries – 50% -2,353 -2,307
Tier 1 capital 7,050 7,159 Subordinate loan capital 1,496 1,551 Solvency requirements of subsidiaries – 50% -2,353 -2,307
Capital base 6,193 6,403
Weighted items 7,137 7,126
Solvency ratio (Solvency I – ratio between capital base and weighted assets) 87 90
DKKm 2014 2013
8 C ontractual obligations, contingent liabilities and collateral The Danish companies in the Tryg Group are jointly taxed with TryghedsGruppen smba. The compa-
nies and the other jointly taxed companies are liable for any obligations to withhold taxes at source on interest, royalties, dividends and income taxes etc. in respect of the jointly taxed companies.
Companies in the Tryg Group are party to a number of disputesin Denmark, Norway and Sweden. Management believes that the outcome of these legal proceedings will not affect the Group's financial position over and above the receivables and liabilities recognised in the statement of financial position at 31 December 2014.
9 Related parties Tryg A/S has no related parties with a controlling influence other than the parent company, Trygheds-
Gruppen smba. Related parties with a significant influence include the Supervisory Board, the Execu-tive Management and their members’ related family. Related parties are the same as for the Tryg Group; please see Note 28 in the consolidated financial statements.
Parent company TryghedsGruppen smba TryghedsGruppen smba controls 60% of the shares in Tryg A/S.
Transactions with Group undertakings and associates Tryg A/S exercises full control over Tryg Forsikring A/S. Intra-group trading involved - Providing and receiving services -15 -23 - Intra-group accounts' -718 -629 Administration fee, etc. is settled on a cost-recovery basis. Intra-group accounts are offset and carry interest on market terms.
Notes

100Annual report 2014 | Tryg A/S | | Menu – Financial statements
DKKm 2014 2013
10 Reconciliation of profit/loss and equity The executive order on application of International Financial Reporting Standards for companies sub-
ject to the Danish Financial Business Act issued by the Danish FSA requires disclosure of differences between the format of the annual report under International Financial Reporting Standards and the rules issued by the Danish FSA. The following is a reconciliation of profit/loss and equity.
Reconciliation of profit/loss Profit/loss – IFRS 2,557 2,369 Change during the year of deferred tax provisions for contingency funds 0 -2
Profit/loss – Danish FSA executive order 2,557 2,367
Reconciliation of equity Equity – IFRS 11,119 11,107 Deferred tax provisions for contingency funds 15 17 Change during the year of deferred tax provisions for contingency funds 0 -2
Equity – Danish FSA executive order 11,134 11,122
11 Accounting policies Please refer to Tryg Group's accounting policies.
Notes

101Annual report 2014 | Tryg A/S | | Menu – Financial statements
Q4 Q3 Q2 Q1 Q4 Q3 Q2 Q1 Q4 DKKm 2014 2014 2014 2014 2013 2013 2013 2013 2012
Privat
Gross premium income 2,249 2,289 2,275 2,238 2,290 2,329 2,363 2,384 2,449
Technical result 400 445 494 273 286 440 364 245 326
Key ratios Gross claims ratio 65.3 64.6 69.0 72.1 75.6 64.7 68.5 72.9 70.1Net reinsurance ratio 2.1 1.1 -2.6 0.4 -2.5 1.7 0.8 1.8 1.1Claims ratio, net of reinsurance 67.4 65.7 66.4 72.5 73.1 66.4 69.3 74.7 71.2Gross expense ratio 15.0 15.1 12.4 15.5 14.6 15.1 15.6 15.3 15.6
Combined ratio 82.4 80.8 78.8 88.0 87.7 81.5 84.9 90.0 86.8
Combined ratio exclusive of run-off 84.5 85.3 82.4 93.7 90.8 84.0 89.0 93.5 88.4
Commercial
Gross premium income 1,050 1,045 1,053 1,042 1,080 1,075 1,124 1,132 1,129
Technical result 270 188 224 193 157 230 153 114 146
Key ratios Gross claims ratio 55.2 63.9 72.1 63.9 73.8 56.0 69.5 70.5 65.9Net reinsurance ratio 3.7 0.9 -5.6 0.3 -5.9 3.5 -1.1 0.8 2.1Claims ratio, net of reinsurance 58.9 64.8 66.5 64.2 67.9 59.5 68.4 71.3 68.0Gross expense ratio 15.6 17.5 12.6 17.7 17.9 19.5 18.3 18.6 18.7
Combined ratio 74.5 82.3 79.1 81.9 85.8 79.0 86.7 89.9 86.7
Combined ratio exclusive of run-off 86.5 92.1 81.9 86.9 92.8 87.3 94.5 91.0 92.8
Corporate
Gross premium income 1,015 999 1,030 989 1,025 1,025 1,062 1,046 1,107
Technical result 98 130 180 19 59 42 139 118 131
Key ratios Gross claims ratio 67.2 63.0 73.3 81.5 75.0 122.9 88.5 66.2 75.2Net reinsurance ratio 12.6 13.0 0.1 4.6 7.6 -38.2 -12.2 10.1 0.9Claims ratio, net of reinsurance 79.8 76.0 73.4 86.1 82.6 84.7 76.3 76.3 76.1Gross expense ratio 10.6 11.5 9.5 12.6 12.1 11.6 10.9 12.5 11.9
Combined ratio 90.4 87.5 82.9 98.7 94.7 96.3 87.2 88.8 88.0
Combined ratio exclusive of run-off 106.4 94.9 86.8 113.4 102.2 104.8 94.4 101.7 99.7
Q4 2014 | Quarterly outline
A more detailed version of the table can be seen at tryg.com >investor > Downloads.
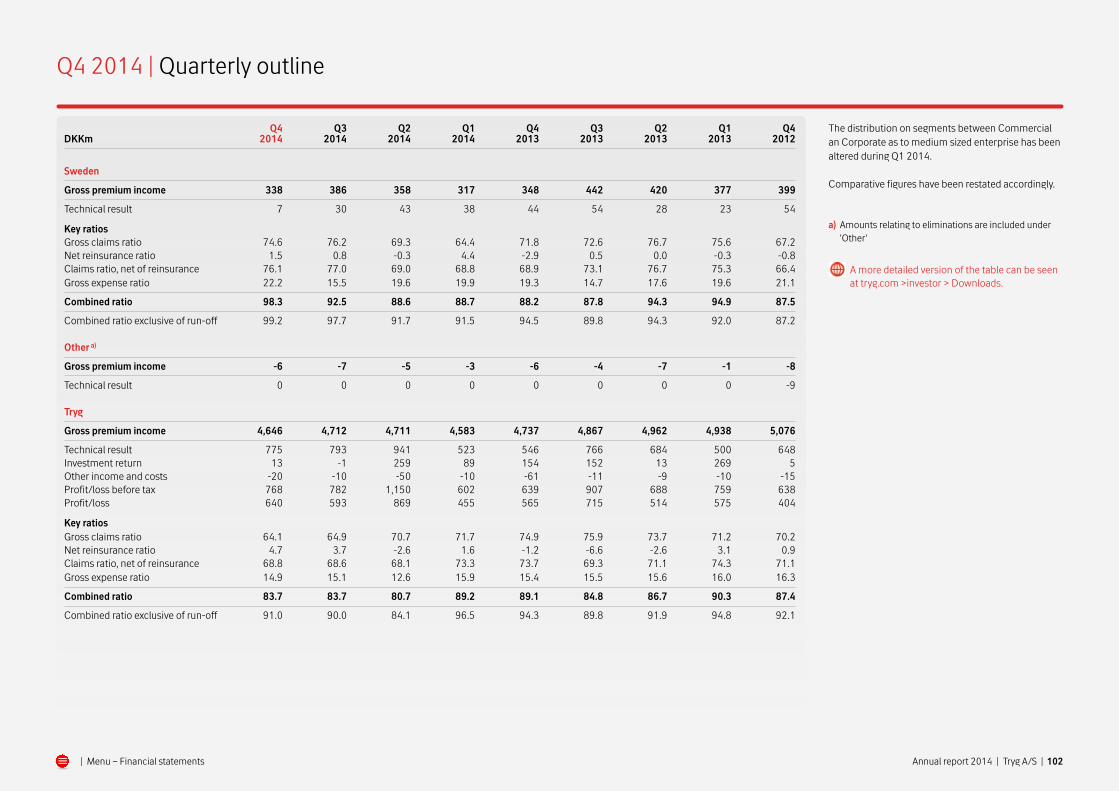
102Annual report 2014 | Tryg A/S | | Menu – Financial statements
Q4 Q3 Q2 Q1 Q4 Q3 Q2 Q1 Q4 DKKm 2014 2014 2014 2014 2013 2013 2013 2013 2012
Sweden
Gross premium income 338 386 358 317 348 442 420 377 399
Technical result 7 30 43 38 44 54 28 23 54
Key ratios Gross claims ratio 74.6 76.2 69.3 64.4 71.8 72.6 76.7 75.6 67.2Net reinsurance ratio 1.5 0.8 -0.3 4.4 -2.9 0.5 0.0 -0.3 -0.8Claims ratio, net of reinsurance 76.1 77.0 69.0 68.8 68.9 73.1 76.7 75.3 66.4Gross expense ratio 22.2 15.5 19.6 19.9 19.3 14.7 17.6 19.6 21.1
Combined ratio 98.3 92.5 88.6 88.7 88.2 87.8 94.3 94.9 87.5
Combined ratio exclusive of run-off 99.2 97.7 91.7 91.5 94.5 89.8 94.3 92.0 87.2
Other a)
Gross premium income -6 -7 -5 -3 -6 -4 -7 -1 -8
Technical result 0 0 0 0 0 0 0 0 -9
Tryg
Gross premium income 4,646 4,712 4,711 4,583 4,737 4,867 4,962 4,938 5,076
Technical result 775 793 941 523 546 766 684 500 648Investment return 13 -1 259 89 154 152 13 269 5Other income and costs -20 -10 -50 -10 -61 -11 -9 -10 -15Profit/loss before tax 768 782 1,150 602 639 907 688 759 638Profit/loss 640 593 869 455 565 715 514 575 404
Key ratios Gross claims ratio 64.1 64.9 70.7 71.7 74.9 75.9 73.7 71.2 70.2Net reinsurance ratio 4.7 3.7 -2.6 1.6 -1.2 -6.6 -2.6 3.1 0.9Claims ratio, net of reinsurance 68.8 68.6 68.1 73.3 73.7 69.3 71.1 74.3 71.1Gross expense ratio 14.9 15.1 12.6 15.9 15.4 15.5 15.6 16.0 16.3
Combined ratio 83.7 83.7 80.7 89.2 89.1 84.8 86.7 90.3 87.4
Combined ratio exclusive of run-off 91.0 90.0 84.1 96.5 94.3 89.8 91.9 94.8 92.1
The distribution on segments between Commercial an Corporate as to medium sized enterprise has been altered during Q1 2014.
Comparative figures have been restated accordingly.
a) Amounts relating to eliminations are included under 'Other'
A more detailed version of the table can be seen at tryg.com >investor > Downloads.
Q4 2014 | Quarterly outline

103Annual report 2014 | Tryg A/S | | Menu – Financial statements
Q4 Q4 DKKm 2014 2013 2014 2013
Danish general insurance a)
Gross premium income 2,346 2,364 9,361 9,534
Technical result 651 128 1,510 1,202Run-off gains/losses, net of reinsurance 262 124 564 566
Key ratios Gross claims ratio 52.1 86.0 66.9 79.5Net reinsurance ratio 7.9 -6.6 2.1 -7.0Claims ratio, net of ceded business 60.0 79.4 69.0 72.5Gross expense ratio 12.4 15.4 15.1 15.0
Combined ratio 72.4 94.8 84.1 87.5
Number of full-time employees 31 December 2,007 2,046
Norwegian general insurance
Gross premium income 1,839 1,885 7,337 7,819
Technical result 190 412 1,478 1,258Run-off gains/losses, net of reinsurance 86 117 501 387
Key ratios Gross claims ratio 73.1 59.4 66.5 65.1Net reinsurance ratio 0.9 5.3 1.4 4.1Claims ratio, net of ceded business 74.0 64.7 67.9 69.2Gross expense ratio 16.0 13.9 12.5 15.3
Combined ratio 90.0 78.6 80.4 84.5
Number of full-time employees 31 Dec. 1,167 1,199
Swedish general insurance
Gross premium income 467 494 1,975 2,169
Technical result -66 6 44 36Run-off gains/losses, net of reinsurance -10 6 66 17
Key ratios Gross claims ratio 89.1 80.0 77.6 80.6Net reinsurance ratio 3.9 0.8 2.2 0.7Claims ratio, net of ceded business 93.0 80.8 79.8 81.3Gross expense ratio 21.4 18.8 18.4 17.6
Combined ratio 114.4 99.6 98.2 98.9
Number of full-time employees 31 Dec. 425 458
Q4 Q4 DKKm 2014 2013 2014 2013
Other b)
Gross premium income -6 -6 -21 -18
Technical result 0 0 0 0
Tryg
Gross premium income 4,646 4,737 18,652 19,504
Technical result 775 546 3,032 2,496Investment return 13 154 360 588Other income and costs -20 -61 -90 -91Profit/loss before tax 768 639 3,302 2,993Run-off gains/losses, net of reinsurance 338 247 1,131 970
Nøgletal Gross claims ratio 64.1 74.9 67.8 73.9Net reinsurance ratio 4.7 -1.2 1.8 -1.8Claims ratio, net of ceded business 68.8 73.7 69.6 72.1Gross expense ratio C) 14.9 15.4 14.6 15.6
Combined ratio 83.7 89.1 84.2 87.7
Number of full-time employees, continuing business at 31 Dec. 3,599 3,703Number of full-time employees, discontinued and divested business at 31 Dec. 0 0
a) Includes Danish general insurance and Finnish guarantee insurance.b) Amounts relating to eliminations are included under 'Other'.c) Adjustment of gross expense ratio included only in 'Tryg '.
The adjustment is explained in a footnote to Financial highlights.
Q4 2014 | Geographical segments
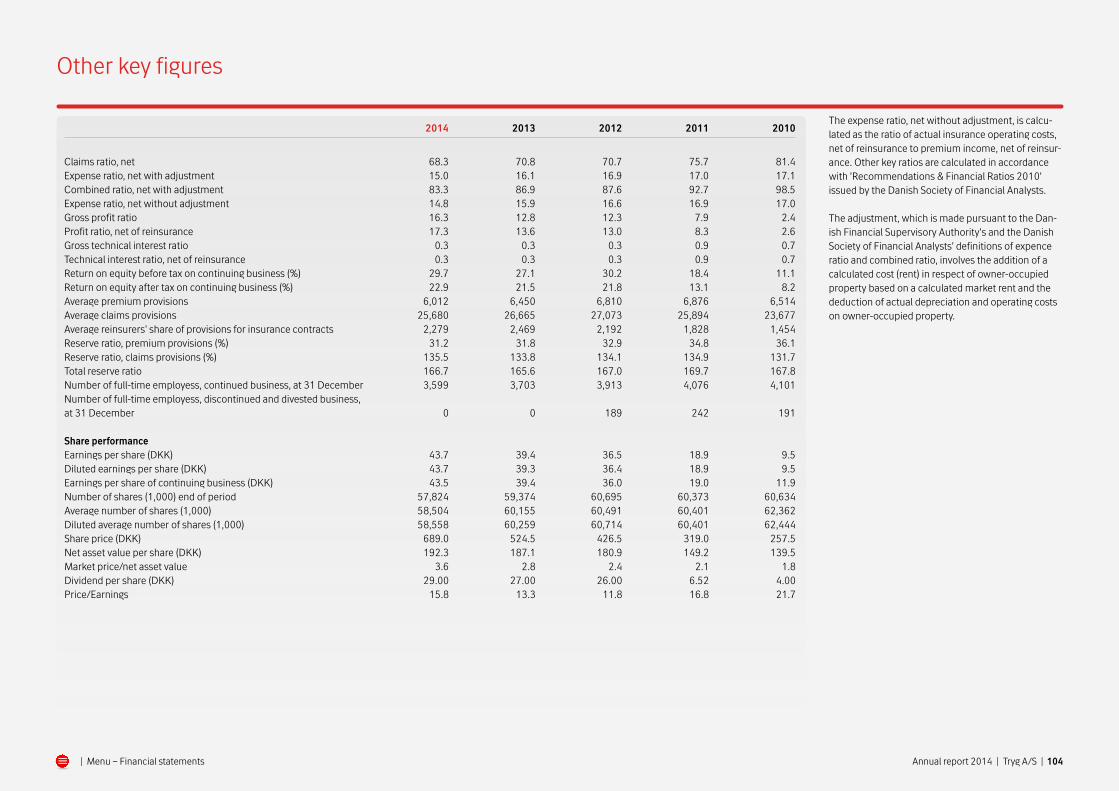
104Annual report 2014 | Tryg A/S | | Menu – Financial statements
Other key figures
2014 2013 2012 2011 2010
Claims ratio, net 68.3 70.8 70.7 75.7 81.4Expense ratio, net with adjustment 15.0 16.1 16.9 17.0 17.1Combined ratio, net with adjustment 83.3 86.9 87.6 92.7 98.5Expense ratio, net without adjustment 14.8 15.9 16.6 16.9 17.0Gross profit ratio 16.3 12.8 12.3 7.9 2.4Profit ratio, net of reinsurance 17.3 13.6 13.0 8.3 2.6Gross technical interest ratio 0.3 0.3 0.3 0.9 0.7Technical interest ratio, net of reinsurance 0.3 0.3 0.3 0.9 0.7Return on equity before tax on continuing business (%) 29.7 27.1 30.2 18.4 11.1Return on equity after tax on continuing business (%) 22.9 21.5 21.8 13.1 8.2Average premium provisions 6,012 6,450 6,810 6,876 6,514Average claims provisions 25,680 26,665 27,073 25,894 23,677Average reinsurers' share of provisions for insurance contracts 2,279 2,469 2,192 1,828 1,454Reserve ratio, premium provisions (%) 31.2 31.8 32.9 34.8 36.1Reserve ratio, claims provisions (%) 135.5 133.8 134.1 134.9 131.7Total reserve ratio 166.7 165.6 167.0 169.7 167.8Number of full-time employess, continued business, at 31 December 3,599 3,703 3,913 4,076 4,101Number of full-time employess, discontinued and divested business, at 31 December 0 0 189 242 191 Share performance Earnings per share (DKK) 43.7 39.4 36.5 18.9 9.5Diluted earnings per share (DKK) 43.7 39.3 36.4 18.9 9.5Earnings per share of continuing business (DKK) 43.5 39.4 36.0 19.0 11.9Number of shares (1,000) end of period 57,824 59,374 60,695 60,373 60,634Average number of shares (1,000) 58,504 60,155 60,491 60,401 62,362Diluted average number of shares (1,000) 58,558 60,259 60,714 60,401 62,444Share price (DKK) 689.0 524.5 426.5 319.0 257.5Net asset value per share (DKK) 192.3 187.1 180.9 149.2 139.5Market price/net asset value 3.6 2.8 2.4 2.1 1.8Dividend per share (DKK) 29.00 27.00 26.00 6.52 4.00Price/Earnings 15.8 13.3 11.8 16.8 21.7
The expense ratio, net without adjustment, is calcu-lated as the ratio of actual insurance operating costs, net of reinsurance to premium income, net of reinsur-ance. Other key ratios are calculated in accordance with ’Recommendations & Financial Ratios 2010’ issued by the Danish Society of Financial Analysts.
The adjustment, which is made pursuant to the Dan-ish Financial Supervisory Authority’s and the Danish Society of Financial Analysts’ definitions of expence ratio and combined ratio, involves the addition of a calculated cost (rent) in respect of owner-occupied property based on a calculated market rent and the deduction of actual depreciation and operating costs on owner-occupied property.

Annual report 2014 | Tryg A/S | | Menu – Management’s review 105
Tryg A/S
Tryg Forsikring A/S
Tryg Garanti-forsikring A/S
(Dansk Kaution)
Tryg Garanti(Norwegian branch)
Moderna Garanti(Swedish branch)
Tryg Garanti(Finnish branch)
ModernaFörsäkringar
(Swedish branch)
Optimal Djurförsäkring
i Norr AB(Sweden)
Respons Inkasso AS
(Norway)
Tryg Forsikring(Norwegian branch)
Ejendoms-selskabet
af 8. maj 2008A/S
Vesta Eiendom AS
(Norway)
Thunesvei 2 AS
(Norway)
Tryg Ejendomme A/S
(Denmark)
Komplementar-selskabet
af 1. marts 2006 ApS (50%)
Ejendoms-selskabet af 1. marts
2006 P/S (30%)
Company Branch
Group chart at 1 January 2015. Companies and branches are wholly owned by Danish owners and domiciled in Denmark, unless otherwise stated.
Group chart
Securator A/S(Denmark)
Claims Management A/S
(Denmark)
ANS Grensen 3(99%)
(Norway)

Annual report 2014 | Tryg A/S | | Menu – Management’s review 106
Capital baseEquity plus share of subordinate loan capital and less intangible assets, tax asset, discounting, equalisation reserve and proposed dividend.
Claims ratio, net of ceded businessGross claims ratio + net reinsurance ratio
Combined ratioThe sum of the gross claims ratio, the net reinsurance ratio and the gross expense ratio.
Danish general insuranceComprises the legal entities Tryg Forsikring A/S (excluding the Norwegian and Swedish branches), Tryg Garantiforsikring A/S (including Finnish branch) and Securator A/S.
Diluted average number of sharesAverage number of shares adjusted for number of share options which may potentially dilute.
DiscountingExpresses recognition in the financial statements of expected future payments at a value below the nomi-nal amount, as the recognised amount carries interest until payment. The size of the discount depends on the market-based discount rate applied and the ex-pected time to payment.
Dividend per shareProposed dividend
Number of shares at year-end
Earnings per share
Profit or loss for the year x 100
Average number of shares
Earnings per share of continuing business
Diluted earnings from continuing business after tax
Diluted average number of shares
Gross claims ratioGross claims x 100
Gross premium income
Gross expense ratioCalculated as the ratio of gross insurance operating costs, including adjustment and gross premium income. The adjustment involves the deduction of depreciation and operating costs on the owner-occupied property and the addition of a calculated cost (rent) concerning the owner-occupied property based on a calculated market rent.
Gross insurance operating costs with adjustment x 100
Gross premium income
Gross expense ratio without adjustment
Gross insurance operating costs x 100
Gross premium income
Gross premium incomeCalculated as gross premium income adjusted for change in gross premium provisions, less bonuses and premium discounts.
Gross profit ratio
Technical result x 100
Gross premium income
Gross technical interest ratio
Insurance technical interest net of reinsurance x 100
Gross premium income
Individual solvencyNew Danish solvency requirements for insurance companies comprising the companies’ own determi-nation of their capital requirements calculated using their own methods.
The rules entered into force on 1 January 2008, and the figures must be reported to the Danish Financial Supervisory Authority four times a year.
Market price/net asset value
Share price
Net asset value per share
Net asset value per share
Year-end equity
Number of shares at year-end
Net reinsurance ratio
Profit or loss from reinsurance x 100
Gross premium income
Norwegian general insuranceComprises Tryg Forsikring A/S, Norwegian branch, and the Norwegian branch of Tryg Garantiforsikring A/S.
Operating ratioCalculated as the combined ratio plus insurance tech-nical interest in the denominator.
Claims + insurance operating costs + profit or loss from reinsurance x 100
Gross premium income + insurance technical interest
Percentage return on equity after tax
Profit for the year after tax x 100
Average equity
Price/EarningsShare price
Earnings per share
Relative run-off gains/lossesRun-off gains/losses net of reinsurance relative to claims provisions net of reinsurance, beginning of year.
Reserve ratio, claims provisions
Claims provisions x 100
Gross premium income
Reserve ratio, premium provisions
Premium provisions x 100
Gross premium income
Run-off gains/lossesThe difference between the claims provisions at the beginning of the financial year (adjusted for foreign currency translation adjustments and discounting ef-fects) and the sum of the claims paid during the finan-cial year and that part of the claims provisions at the end of the financial year pertaining to injuries and damage occurring in earlier financial years.
Tier 1 capitalEquity less proposed dividend and share of capital claims in subsidiaries.
Total reserve ratioReserve ratio, claims provisions + premium provisions
Solvency IINew solvency requirements for insurance companies issued by the EU Commission. The new rules are ex-pected to come into force in 2016, at the earliest.
Solvency ratio (Solvency I)Ratio between capital base and weighted assets.
Swedish general insuranceComprises Tryg Forsikring A/S, Swedish branch, and the Swedish branch of Tryg Garantiforsikring A/S.
UnwindingUnwinding of discounting takes place with the passage of time as the expected time to payment is reduced. The closer the time of payment, the smaller the discount. This gradual increase of the provision is not recognised under claims, but under technical interest in the income statement.
GlossaryThe financial highlights and key ratios of Tryg have been prepared in accordance with the Executive Order issued by the Danish Financial Supervisory Authority on the Financial Reports for Insurance Companies and Multi-Employer Occupational Pension Funds and also comply with ‘Recommendations & Financial Ratios 2010’ issued by the Danish Society of Financial Analysts.
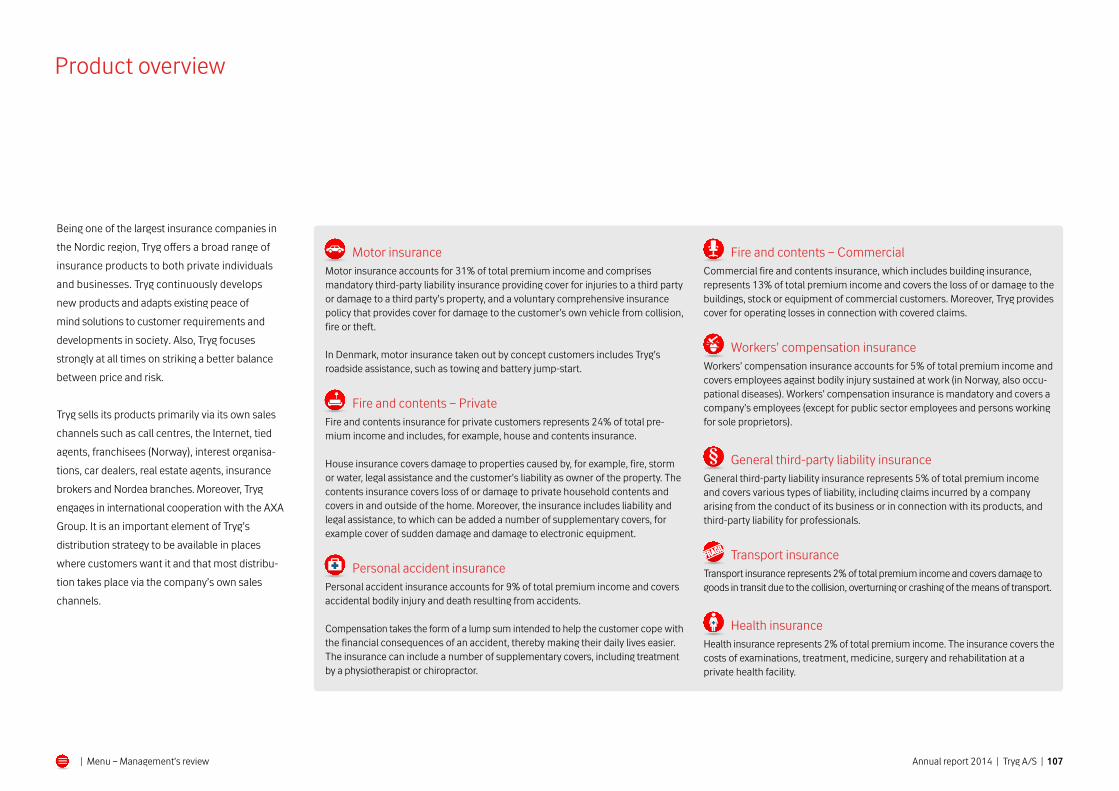
Annual report 2014 | Tryg A/S | | Menu – Management’s review 107
Motor insuranceMotor insurance accounts for 31% of total premium income and comprises mandatory third-party liability insurance providing cover for injuries to a third party or damage to a third party’s property, and a voluntary comprehensive insurance policy that provides cover for damage to the customer’s own vehicle from collision, fire or theft.
In Denmark, motor insurance taken out by concept customers includes Tryg’s roadside assistance, such as towing and battery jump-start.
Fire and contents – Private Fire and contents insurance for private customers represents 24% of total pre-mium income and includes, for example, house and contents insurance.
House insurance covers damage to properties caused by, for example, fire, storm or water, legal assistance and the customer’s liability as owner of the property. The contents insurance covers loss of or damage to private household contents and covers in and outside of the home. Moreover, the insurance includes liability and legal assistance, to which can be added a number of supplementary covers, for example cover of sudden damage and damage to electronic equipment.
Personal accident insurance Personal accident insurance accounts for 9% of total premium income and covers accidental bodily injury and death resulting from accidents.
Compensation takes the form of a lump sum intended to help the customer cope with the financial consequences of an accident, thereby making their daily lives easier. The insurance can include a number of supplementary covers, including treatment by a physiotherapist or chiropractor.
Fire and contents – Commercial Commercial fire and contents insurance, which includes building insurance, represents 13% of total premium income and covers the loss of or damage to the buildings, stock or equipment of commercial customers. Moreover, Tryg provides cover for operating losses in connection with covered claims.
Workers’ compensation insurance Workers’ compensation insurance accounts for 5% of total premium income and covers employees against bodily injury sustained at work (in Norway, also occu-pational diseases). Workers’ compensation insurance is mandatory and covers a company’s employees (except for public sector employees and persons working for sole proprietors).
General third-party liability insurance General third-party liability insurance represents 5% of total premium income and covers various types of liability, including claims incurred by a company arising from the conduct of its business or in connection with its products, and third-party liability for professionals.
Transport insurance Transport insurance represents 2% of total premium income and covers damage to goods in transit due to the collision, overturning or crashing of the means of transport.
Health insurance Health insurance represents 2% of total premium income. The insurance covers the costs of examinations, treatment, medicine, surgery and rehabilitation at a private health facility.
Being one of the largest insurance companies in
the Nordic region, Tryg offers a broad range of
insurance products to both private individuals
and businesses. Tryg continuously develops
new products and adapts existing peace of
mind solutions to customer requirements and
developments in society. Also, Tryg focuses
strongly at all times on striking a better balance
between price and risk.
Tryg sells its products primarily via its own sales
channels such as call centres, the Internet, tied
agents, franchisees (Norway), interest organisa-
tions, car dealers, real estate agents, insurance
brokers and Nordea branches. Moreover, Tryg
engages in international cooperation with the AXA
Group. It is an important element of Tryg’s
distribution strategy to be available in places
where customers want it and that most distribu-
tion takes place via the company’s own sales
channels.
Product overview

Annual report 2014 | Tryg A/S | | Menu – Management’s review 108
Disclaimer
Certain statements in this annual report are based
on the beliefs of our management as well as
assumptions made by and information currently
available to management. Statements regarding
Tryg’s future operating results, financial position,
cash flows, business strategy, plans and future
objectives other than statements of historical fact
can generally be identified by the use of words
such as ‘targets’, ‘believes’, ‘expects’, ‘aims’,
‘intends’, ‘plans’, ‘seeks’, ‘will’, ‘may’, ‘anticipates’,
‘would’, ‘could’, ‘continues’ or similar expressions.
A number of different factors may cause the
actual performance to deviate significantly
from the forward-looking statements in this
annual report, including but not limited to
general economic developments, changes in the
competitive environ ment, developments in the
financial markets, extraordinary events such as
natural disasters or terrorist attacks, changes in
legislation or case law and reinsurance. Should
one or more of these risks or uncertainties
materialise, or should any underlying assumptions
prove to be incorrect, Tryg’s actual financial
condition or results of operations could
materially differ from that described herein as
anticipated, believed, estimated or expected.
Tryg is not under any duty to update any of the
forward-looking statements or to conform such
statements to actual results, except as may be
required by law. Read more in the chapter
Capital and risk management in the annual
report on page 24-25, and in Note 1 on
page 47, for a description of some of the factors
which may affect the Group’s performance or
the insurance industry.