solvency & financial condition report (sfcr) - tryg & financial condition... · 15 b.6 the...
TRANSCRIPT

Solvency & Financial Condition Report (SFCR) 2016

| Contents
Contents
3 SUMMARY
4 A. BUSINESS AND PERFORMANCE
4 A.1 Business
5 A.2 Underwriting performance
7 A.3 Investment performance
8 A.4 Performance of other activities
8 A.5 Any other information
9 B. SYSTEM OF GOVERNANCE
9 B.1 General information on
system of governance
11 B.2 Fit-and-proper requirements
12 B.3 Risk management system
14 B.4 Internal control system
15 B.5 Internal audit function
15 B.6 The actuarial function
16 B.7 Outsourcing
16 B.8 Any other information
Tryg A/S Klausdalsbrovej 601, 2750 Ballerup, Denmark | CVR no. 26460212 | Publication 16 May 2017 | Layout amo design
17 C. RISK PROFILE
17 C.1 Underwriting risk
18 C.2 Market risk
20 C.3 Credit risk/counterparty risk
21 C.4 Liquidity risk
21 C.5 Operational risk
21 C.6 Any other material risk
21 C.7 Any other information
22 D. VALUATION FOR SOLVENCY PURPOSES
23 D.1 Assets
24 D.2 Technical provisions
25 D.3 Other liabilities
26 D.4 Alternative methods
for valuation
26 D.5 Any other information
27 E. CAPITAL MANAGEMENT
27 E.1 Own funds
29 E.2 Solvency Capital Requirement
and Minimum Capital Requirement
29 E.3 Use of the duration-based
equity risk sub-module in
the calculation of the Solvency
Capital Requirement
29 E.4 Differences between the
standard formula and any internal
model used
31 E.5 Non-compliance with the
Minimum Capital Requirement and
non-compliance with the Solvency
Capital Requirement
31 E.6 Any other information
2SFCR 2016 | Tryg A/S |
32 APPENDIX
33 Appendix A Undertakings in
the scope of the Tryg Group
34 Appendix B Premiums, claims
and expenses by country, Tryg Group
36 Appendix C Premiums, claims
and expenses by line of business,
Tryg Group
41 Appendix D Balance sheet, Tryg Group
42 Appendix E Own funds, Tryg Group
44 Appendix F Solvency Capital
Requirement – standard formula,
Tryg Group
45 Appendix G Solvency Capital
Requirement – partial internal model,
Tryg Group

SFCR 2016 | Tryg A/S | | Contents 3
Summary
The Solvency & Financial Condition Report
contains a description of Tryg Group’s activities
at the end of 2016, based on EU legislation for
Solvency II and the executive order issued
by the Danish FSA.
Business
Tryg Forsikring has insurance operations in Den-
mark and through branches in the other Nordic
countries. The company is owned by Tryg A/S,
which is partly owned (60%) by TryghedsGruppen
smba. Tryg’s main lines of business are Fire and
other damage to property insurance, account-
ing for 34% of gross premium income and Motor
vehicle insurance accounting for 30%.
Tryg’s profit after tax amounted to DKK 2,471m in
2016 (DKK 1,969m in 2015) and was impacted by
one-offs. One-offs was primarily related to write-
downs on intangibles and extraordinary capital
gain from the sale of properties. Return on equity
amounted to 26.2% and solvency ratio was 194.
System of governance
Tryg has a two-tier governance system, according
to which the Executive Board is responsible for the
daily management of operations, reporting directly
to Tryg’s Supervisory Board. The Executive Board
comprises the CEO, CFO and COO.
The Executive Board has appointed the persons
responsible for the three key functions: Actuary,
Compliance and Risk Management, and the
Supervisory Board has appointed the person re-
sponsible for the last key function: Internal Audit.
The functions are based on the principle of
‘three lines of defence’. This is to ensure robust
governance and effective communication.
On 1 January 2016, Tryg changed its manage-
ment structure. The Nordic business areas were
transferred to national business areas with new
managers heading the areas.
Risk profile
Tryg’s business model is focused on producing
a robust insurance technical result, while the
primary purpose of the investment activities is to
support the insurance operation and thus reduce
volatility. At the same time, reinsurance is used to
limit catastrophe risk, reduce capital requirements
and ensure a stable result.
Tryg’s own risk and solvency Assessment, ORSA, is
based on Solvency II principles, which implies that
Tryg must assess all material risks that the com-
pany is or may be exposed to. Tryg´s risk activities
are implemented via continuous risk management
processes, where main results are reported to the
Supervisory Board during the year.
Valuation for solvency purposes
The Solvency II balance sheet is prepared in
accordance with EU legislation on Solvency II and
the Danish executive order. The Group’s statutory
financial statements are prepared in accordance
with IFRS and the Danish Statutory Order on
Adoption of IFRS.
The main differences between the statutory finan-
cial statements and the Solvency II balance sheet
concerning recognition and measurement are:
the value of intangible assets and the value of total
provisions for insurance contracts.
Capital management
Tryg’s capital and risk management policy pre-
scribes that Tryg must aim for a conservative and
stable risk profile on an overall level. This includes
a solid capital position, which at the same time
supports Tryg’s target for return on equity and divi-
dend policy. The solvency level (i.e. the own funds)
is primarily impacted by the net profit and
by paid dividends.
Tryg’s own funds currently consist of Tier 1 and 2
capital, such as shareholders’ equity and subordi-
nated loans. In 2016, the own funds were impacted
by, amongst other things, the issue of a new sub-
ordinated loan of SEK 1,000m. Additionally, dividend
paid impacted the own funds over the year.
The calculation of Tryg’s Solvency Capital Require-
ment is based on a partial internal model; insurance
risks, underwriting and reserving risks, are modelled
using an internal model, while other risks primarily
market and operational risks are modelled using the
standard Solvency II model.
In 2016, the acquisition of Skandia’s child portfolio
was completed. The portfolio had little effect on the
overall Solvency Capital Requirement.

Group legal structure
Group chart at 1 January 2017. Companies and branches are wholly owned by Danish owners and domiciled in Denmark, unless otherwise stated.
See also appendix A.
Company
Branch
SFCR 2016 | Tryg A/S | | Contents 4
A.1 Business
Solvency II came into effect as of 1 January
2016 hence Solvency II valuation comparison
figures for 2015 are not available.
Tryg Group
Tryg A/S is partly owned by TryghedsGruppen smba
with an ownership of 60%. No other owner holds
10% or more of the capital or the voting rights.
In 2016, Tryg established the life insurance com-
pany Tryg Livsforsikring A/S. The activity of Tryg
Livsforsikring is child and adult accident insurance,
which is part of the portfolio Tryg acquired from
Skandia. For this part of the portfolio, there are
no renewals. The portfolio integrated in Moderna
Försäkringar is renewed.
Supervisory authority
The Danish Financial Supervisory Authority
Århusgade 110, 2100 Copenhagen Ø.
Telephone: +45 33 55 82 82
External auditor
Deloitte, Statsautoriseret Revisionspartnerselskab
Weidekampsgade 6, 2300 Copenhagen S.
A. Business and performance
Business segments
Tryg has four business areas:
Private encompasses the sale of insurance prod-
ucts to private individuals in Denmark and Norway.
Sales are effected via call centres, the internet,
Tryg’s own agents, franchisees (Norway), interest
organisations, car dealers, estate agents and
Nordea’s branches. The business area accounts
for 49% of the Group’s total premium income.
Commercial encompasses the sale of insurance
products to small and medium-sized businesses in
Tryg A/S(Denmark)
Tryg Forsikring A/S(Denmark)
ModernaFörsäkringar
(Branch Sweden)
Tryg Forsikring (Branch Finland)
Tryg Forsikringincl. Enter
(Branch Norway)
TrygLivsforsikring A/S
(Denmark)
Respons Inkasso AS(Norway)
Thunesvei 2 AS(Norway)
Tryg Ejendomme A/S
(Denmark)
ANS Grensen 3(99%)
(Norway)
Denmark and Norway. Sales are effected by Tryg’s
own sales force, brokers, franchisees (Norway),
customer centres as well as group agreements.
The business area accounts for 22% of the
Group’s total premium income.
Corporate sells insurance products to corporate
customers under the brands ‘Tryg’ in Denmark and
Norway, ‘Moderna’ in Sweden and ‘Tryg Garanti’.
Sales are effected both via Tryg’s own sales force
and via insurance brokers. Moreover, customers
with international insurance needs are served by
Corporate through its cooperation with the AXA
Group. The business area accounts for 22%
of the Group’s total premium income.
Sweden comprises the sale of insurance
products to private customers under the
‘Moderna’ brand. Moreover, insurance is sold
under the brands Atlantica, Bilsport & MC,
Securator and Moderna Barnforsakringar and
Moderna Djurförsäkringar. Sales take place
through its own sales force, call centres, partners
and online. The business area accounts for 7%
of the Group’s total premium income.
Per cent
Fire and other damage to proper�
Motor vechicle insurance
Income protection insurance 1)
Workers’ compensation insurance
General liabili�
Other
34
30
12
56
13
Lines of business
1) Corresponds to Tryg’s accident insurance
The line of business definition in this report is according to Solvency II. Line of business definition in Tryg’s annual report is according to the Danish FSA.
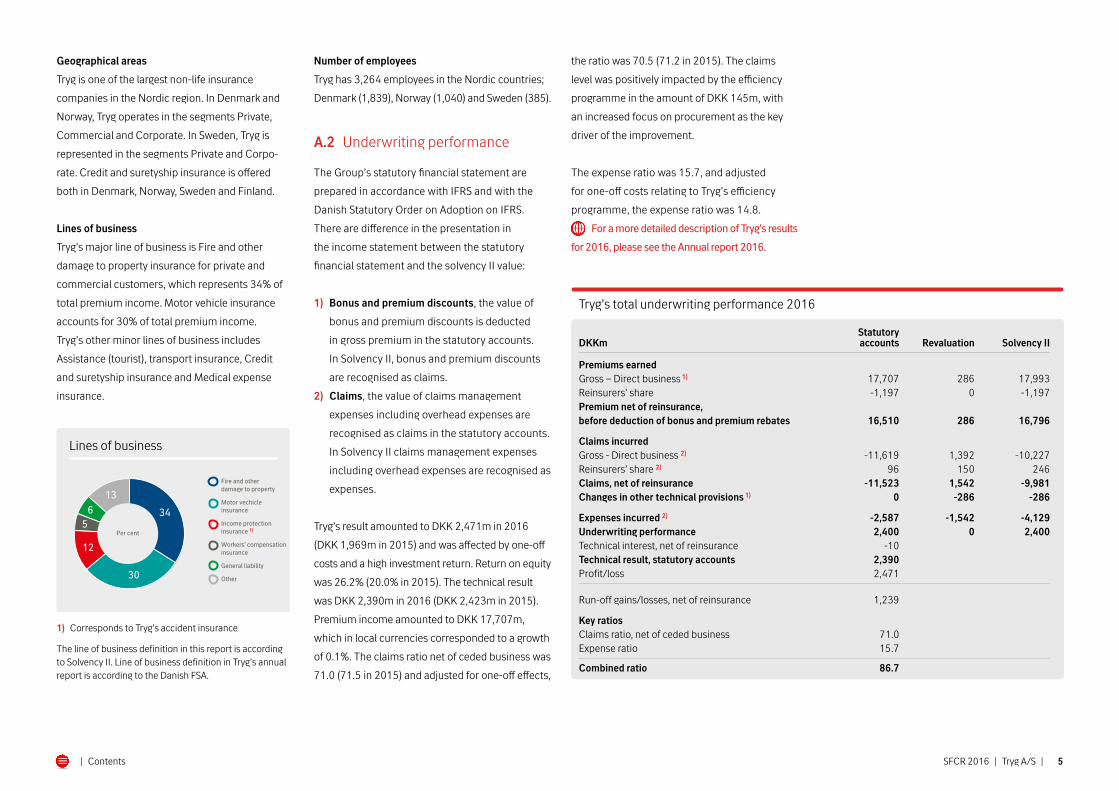
Tryg’s total underwriting performance 2016
Statutory DKKm accounts Revaluation Solvency II Premiums earnedGross – Direct business 1) 17,707 286 17,993Reinsurers’ share -1,197 0 -1,197Premium net of reinsurance, before deduction of bonus and premium rebates 16,510 286 16,796
Claims incurred Gross - Direct business 2) -11,619 1,392 -10,227Reinsurers’ share 2) 96 150 246Claims, net of reinsurance -11,523 1,542 -9,981Changes in other technical provisions 1) 0 -286 -286
Expenses incurred 2) -2,587 -1,542 -4,129Underwriting performance 2,400 0 2,400Technical interest, net of reinsurance -10 Technical result, statutory accounts 2,390 Profit/loss 2,471
Run-off gains/losses, net of reinsurance 1,239
Key ratios Claims ratio, net of ceded business 71.0 Expense ratio 15.7
Combined ratio 86.7
SFCR 2016 | Tryg A/S | | Contents 5
Geographical areas
Tryg is one of the largest non-life insurance
companies in the Nordic region. In Denmark and
Norway, Tryg operates in the segments Private,
Commercial and Corporate. In Sweden, Tryg is
represented in the segments Private and Corpo-
rate. Credit and suretyship insurance is offered
both in Denmark, Norway, Sweden and Finland.
Lines of business
Tryg’s major line of business is Fire and other
damage to property insurance for private and
commercial customers, which represents 34% of
total premium income. Motor vehicle insurance
accounts for 30% of total premium income.
Tryg’s other minor lines of business includes
Assistance (tourist), transport insurance, Credit
and suretyship insurance and Medical expense
insurance.
Number of employees
Tryg has 3,264 employees in the Nordic countries;
Denmark (1,839), Norway (1,040) and Sweden (385).
A.2 Underwriting performance
The Group’s statutory financial statement are
prepared in accordance with IFRS and with the
Danish Statutory Order on Adoption on IFRS.
There are difference in the presentation in
the income statement between the statutory
financial statement and the solvency II value:
1) Bonus and premium discounts, the value of
bonus and premium discounts is deducted
in gross premium in the statutory accounts.
In Solvency II, bonus and premium discounts
are recognised as claims.
2) Claims, the value of claims management
expenses including overhead expenses are
recognised as claims in the statutory accounts.
In Solvency II claims management expenses
including overhead expenses are recognised as
expenses.
Tryg’s result amounted to DKK 2,471m in 2016
(DKK 1,969m in 2015) and was affected by one-off
costs and a high investment return. Return on equity
was 26.2% (20.0% in 2015). The technical result
was DKK 2,390m in 2016 (DKK 2,423m in 2015).
Premium income amounted to DKK 17,707m,
which in local currencies corres ponded to a growth
of 0.1%. The claims ratio net of ceded business was
71.0 (71.5 in 2015) and adjusted for one-off effects,
the ratio was 70.5 (71.2 in 2015). The claims
level was positively impacted by the efficiency
programme in the amount of DKK 145m, with
an increased focus on procurement as the key
driver of the improvement.
The expense ratio was 15.7, and adjusted
for one-off costs relating to Tryg’s efficiency
programme, the expense ratio was 14.8.
For a more detailed description of Tryg’s results
for 2016, please see the Annual report 2016.

Tryg’s total underwriting performance by geographical areas 2016
Statutory DKKm Denmark Norway Sweden Other accounts Revaluation Solvency II
Premiums earnedGross – Direct business 1) 9,467 6,371 1,888 -19 17,707 286 17,993Reinsurers’ share -652 -477 -87 19 -1,197 0 -1,197Premium net of reinsurance, before deduction of bonus and premium rebates 8,815 5,894 1,801 0 16,510 286 16,796
Claims incurred Gross – Direct business2) -6,029 -4,072 -1,442 -76 -11,619 1,392 -10,227Reinsurers’ share 2) -12 107 13 -12 96 150 246Claims, net of reinsurance -6,041 -3,965 -1,429 -88 -11,523 1,542 -9,981Changes in other technical provisions 1) 0 -286 -286
Expenses incurred 2) -1,171 -929 -325 -162 -2,587 -1,542 -4,129Underwriting performance 1,603 1,000 47 -250 2,400 0 2,400Technical interest, net of reinsurance -16 13 -7 -10 Technical result, statutory accounts 1,587 1,013 40 -250 2,390 Profit/loss 2,471
Run-off gains/losses, net of reinsurance 509 678 52 1,239
Key ratios Claims ratio, net of ceded business 69.7 69.0 79.7 71.0 Expense ratio 13.4 15.2 17.8 15.7
Combined ratio 83.1 84.2 97.5 86.7
SFCR 2016 | Tryg A/S | | Contents 6
Underwriting performance by material
geographical areas See appendix B.
Denmark
The underwriting performance was DKK 1,603m
for 2016 (DKK 1,375m in 2015), with a combined
ratio of 83.1 (85.2 in 2015). The development was
attributable to a combination of a positive impact
from the efficiency programme and a lower level
of large claims and weather claims. The expense
ratio improved by 0.5 percentage points. Premiums
increased by 1.3% in Denmark, mainly due to an in-
crease in Private. Premiums decreased in Commer-
cial, due to price hikes to improve profitability for
property, which among other things led to a drop in
the market share for large agricultural customers.
Norway
The underwriting performance was DKK 1,000m
for 2016 (DKK 822m in 2015), with a combined
ratio of 84.2 (87.9 in 2015). The development was
attributable to a combination of a positive impact
from the efficiency programme and a lower level of
large claims and weather claims. The expense ratio
increased by 0.3 percentage points.
The development in premiums in local currencies
was -1.8% and was mainly due to the competitive
market situation, loss of a number of large cus-
tomers and the weakened Norwegian economy.
Sweden
Sweden’s result declined to DKK 47m in 2016
(DKK 328m in 2015). The result for 2016 was
impacted by challenges in respect of extended
warranty insurance for electronic products and
profit-sharing agreements. The combined ratio
was 97.5 (82.7 in 2015), impacted by lower
run-off but also a higher level of large claims.
Premiums increased by 0.7%. The increase was
mainly due to the acquisition of the Skandia child
insurance portfolio, which is highly profitable and
characterised by high retention levels.
1) The value of bonus and premium discounts is deducted in gross premium in the statutory account. In Solvency II, bonus and premium discounts are recognised as claims.2) The value of claims management expenses including overhead expenses are recognised as claims in the statutory accounts. In Solvency II, claims management expenses including overhead expenses are recognised as expenses.

Investment income and expenses split by asset classes 2016
Interest, dividend and direct result Value DKKm from property adjustments Total
Real estate 105 524 629Equity – unlisted 10 120 130Government bonds 1 0 1Corporate bonds 641 -83 558 Collective investments Undertakings 15 190 205 Derivatives 0 62 62Deposits and cash equivalents 4 0 4
Gross result 776 813 1,589 Subordinate loan capital -88 0 -88Other expenses -112 -65 -177
Total investment return 576 748 1,324Return on insurance provisions -149 -188 -337
Total investment return after return on insurance provision 427 560 987
SFCR 2016 | Tryg A/S | | Contents 7
Underwriting performance by line of business
The combined ratio for 2016 was on a par with
2015, representing a positive development for Fire
and other damage to property and Income protec-
tion, but a negative development in Motor vehicle
liability. See appendix C.
A.3 Investment performance
The investment return was positive by DKK 987m
in 2016 (DKK -22m in 2015). The return was
impacted by the sale of investment properties and
domiciles announced in December 2016, which
had a positive impact of DKK 500m.
Investment performance in match
portfolio and free portfolio
Tryg’s total investment portfolio is divided into two
portfolios – a match portfolio and a free portfolio –
to optimise risk management and solvency and to
achieve the highest possible risk-adjusted return.
The total market value of Tryg’s investment
portfolio was DKK 41.1bn at the end of 2016. The
investment portfolio consists of a match portfolio
of DKK 29.1bn and a free portfolio of DKK 12bn.
The match portfolio is composed of fixed-income
assets that match the insurance liabilities, so that
fluctuations in market values of discounted liabili-
ties and fixed-income assets resulting from interest
rate changes are offset to the greatest possible
extent. The free portfolio is predominantly invested
in fixed-income securities with a short duration, but
also in equities and properties. The strategy for the
free portfolio is to achieve the highest possible risk-
adjusted return taking into consideration, amongst
other things, risk, liquidity and capital consumption.
The return on the free portfolio was DKK 939m
(DKK 232m in 2015), and the return on the match
portfolio less the amount transferred to the insur-
ance business was DKK 210m (DKK -16m in 2015).
1) Gross premium earned according to statutory accounts. Lines of business according to Solvency II.
Tryg’s underwriting performance by lines of business 2016
Premium Underwriting CombinedDKKm earned, gross1) performance ratio Income protection insurance 2,061 464 77.5Workers’ compensation insurance 858 560 34.7Motor vehicle liability insurance 1,858 312 83.2Other motor insurance 3,537 572 83.8Fire and other damage to property insurance 6,020 391 93.5General liability insurance 984 137 86.1Other insurance 2,389 -36 101.5
Total 17,707 2,400 86.7

SFCR 2016 | Tryg A/S | | Contents 8
Return – match portfolio 2016
DKKm
Return, match portfolio 547Value adjustments, changed discount rate -188Transferred to insurance technical interest -149
Match, regulatory deviation and performance 210
Hereof: Match, regulatory deviation 47Match, performance 163
The net result of the match portfolio is the
difference between the return on the portfolio
and the amount transferred to the technical result.
Since the beginning of 2016, Tryg has been hedging
the interest rate risk of its Danish liabilities, partly
using Danish swaps and partly also Euro swaps.
When the yield difference between Danish and
Euro swap rates decreases, the regulatory devia-
tion should produce a positive result; however,
when the yield difference increases, the result
is likely to be negative. In 2016, the spread nar-
rowed, driving a regulatory deviation of DKK 47m.
The most important driver of ‘performance’ is
the difference in yields between Danish, Norwe-
gian and Swedish covered bonds and equivalent
swap rates. In 2016, the ‘performance’ result was
un usually high of DKK 163m. Spreads narrowed
substantially, driven by the so-called ‘quantitative
easing’ enabled by the bond-buying programme
of the European Central Bank.
Investment gains and losses recognised
directly in equity
The net assets of the branches in Norway and
Sweden are adjusted for changes in exchange
rates by DKK 51m during the year (DKK -89m in
2015). According to IFRS, these value adjustments
are recognised in other compre hensive income
together with the result of the hedging of the
same items DKK -50m (DKK 86m in 2015).
A.4 Performance of other activities
Other income and expenses of DKK 104m and
DKK -261m (DKK 81 and DKK -172m in 2015)
include income and expenses which cannot be
ascribed to the Group’s insurance portfolio or
investment assets, including the sale of products
for Nordea Liv & Pension.
In 2016, Other expenses were impacted by
the write-down of goodwill in the amount of
DKK 100m related to the acquisition of Securator.
Operating and financial leasing
Tryg has operating leasing arrangements related to
the renting of offices and cars. Tryg has no financial
leasing arrangements.
A.5 Any other information
No other information.
1) Senior/Bank deposits less than 1 year and derivative financial instruments hedging interest rate risk and credit risk.2) In addition to the equity portfolio exposure is futures contracts of DKK 97m.
Return – free portfolio 2016
Investment assetsDKKm % 30.12.2016
Government bonds 1 0.4 322Covered bonds 69 1.8 4,464Inflation linked bonds 41 8.1 539Investment grade credit -14 -0.9 546Emerging market bonds 41 9.5 447High-yield bonds 81 10.6 730Other 1) -23 0 220
Interest rate and credit exposure 196 2.8 7,268
Equity exposure 2) 194 8.4 2,187
Investment property 549 26.1 2,540
Total gross return 939 8.0 11,995
Operating leases 2016
DKKm Obligations due by period
<1 year 1-3 years 3-5 years > 5 years Total
140 246 299 260 945

SFCR 2016 | Tryg A/S | | Contents 9
B.1 General information on system of governance
Management
Tryg is governed by a two-tier system, in which
the Supervisory Board and the Executive Board
manage Tryg’s affairs. The Supervisory Board is
responsible for the overall management of Tryg
(including the appointment of the Executive Board
and the internal auditor), for ensuring the respon-
sible organisation of Tryg’s business, for its corpo-
rate strategy and for evaluating the applicability
of the capital contingency programme.
The Supervisory Board has 13 members. Members
of the Supervisory Board are elected for a term of
one year. Employee representatives are, however,
elected for a term of four years. Of the nine mem-
bers elected at the annual general meeting, five
are independent persons, whereas the other four
members are appointed by the majority share-
holder, TryghedsGruppen.
The Supervisory Board is responsible for the
central strategic management and financial control
of Tryg and for ensuring that the business is organ-
B. System of governance
ised in a sound way. This is achieved by monitoring
targets and frameworks through regular and
systematic reviews of the strategy and risks. The
Executive Board reports to the Supervisory Board
on strategy and action plans, market develop-
ments and Group performance, funding issues,
capital resources and special risks. The Supervi-
sory Board holds an annual strategy seminar to
decide on and/or adjust the Group’s strategy with
a view to sustaining value creation in the company.
The Executive Board works with the Supervisory
Board to ensure that the Group’s strategy is de-
veloped and monitored. The Supervisory Board
ensures that the necessary skills and financial
resources are available for Tryg to achieve its
strategic targets. The Supervisory Board specifies
its activities in a set of rules of procedure and an
annual cycle for its work.
Committees
Tryg has an Audit Committee, a Risk Committee,
a Nomination Committee and a Remuneration
Committee. In 2016, Tryg set up a temporary IT
Committee to allow the Supervisory Board to
work more closely with Tryg’s IT strategy.
The committees exclusively prepare matters for
decision by the entire Supervisory Board.
The work of the committees is defined in the
terms of reference which are available on tryg.com.
Audit Committee
The Audit Committee has four members, of whom
three are independent, and is chaired by the
Deputy Chairman of the Supervisory Board. The
main responsibilities of the Audit Committee are:
• Review the Group’s technical provisions.
• Review the methodology for and calculations
of the Group’s Solvency Capital Requirement.
• Review the efficiency of the Group’s
contingency plans.
• Assess the Group’s internal control procedures
to prevent fraud.
• Supervise the audit work performed by the
external auditors.
• Review and discuss the results of the work of the
internal and external auditors and supervise man-
agement’s follow-up on the recommendations
reported by the internal and external auditors.
• Ensure that the Group is being monitored by
independent auditors and by internal auditors.
The Audit Committee has knowledge of, and expe-
rience in, financial matters as well as accounting
and audit matters in listed companies.
Risk Committee
The Risk Committee has five members, of whom
three are independent, and is chaired by the
Deputy Chairman of the Supervisory Board.
The main responsibilities of the Risk Committee
are to monitor the company’s risk management
systems, review the Group’s risk assessment and
assess and monitor the efficiency of the risk man-
agement environment. The Risk Committee also
reviews the calculation of capital requirements and
the internal process for calibration and operation
of Tryg’s partial internal model. The Risk Commit-
tee monitors the capital and risk management
on an ongoing basis and reports quarterly to the
Supervisory Board.
Nomination Committee
Tryg’s Nomination Committee has three members,
of whom two are independent and is chaired by
the Chairman of the Supervisory Board. The main
responsibilities of the Nomination Committee are:
• Define the qualifications required of the
Supervisory Board and the Executive Board.
• Outline the structure, size, composition and
results of the Supervisory Board and Executive
Board.
• Outline the competencies, skills, knowledge
and experience of each member of the
Supervisory Board and the Executive Board.
• Consider suggestions from relevant persons,
including shareholders and members of the
Supervisory Board and the Executive Board, con-
cerning candidates for management positions.
• Propose an action plan to the Supervisory
Board on the future composition of the Super-
visory Board, including proposals for specific
changes.
SFCR 2016 | Tryg A/S | | Contents 10
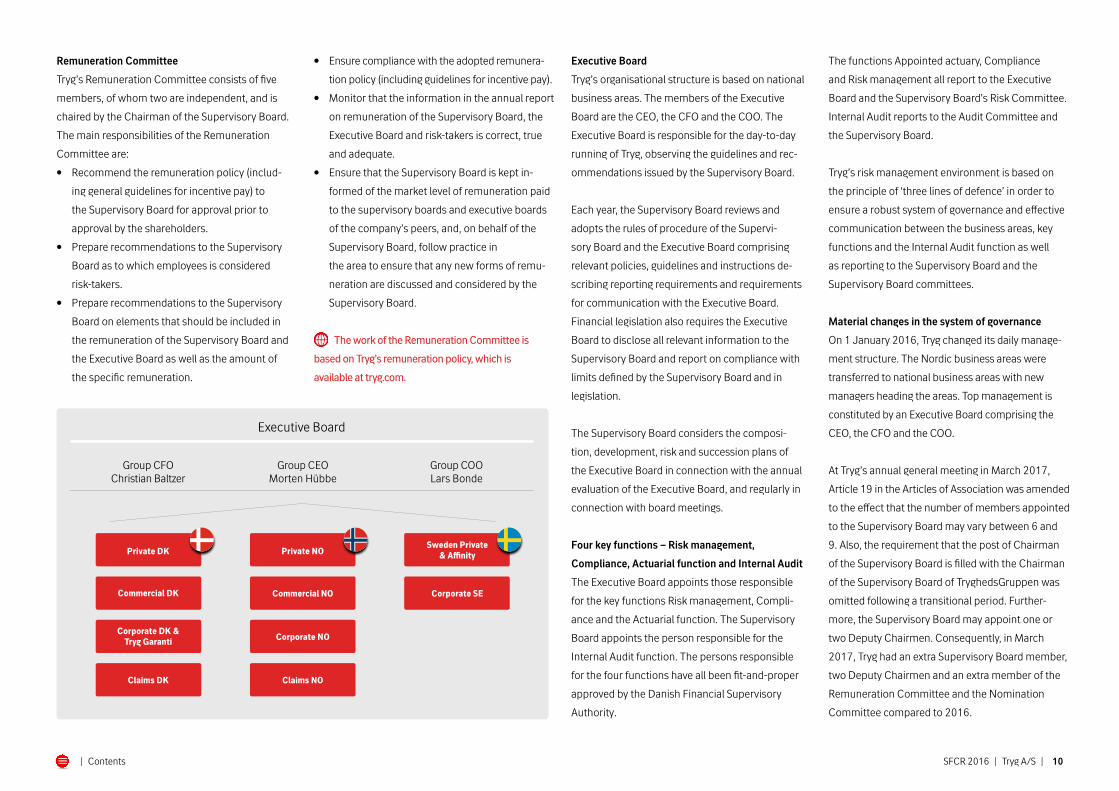
Remuneration Committee
Tryg’s Remuneration Committee consists of five
members, of whom two are independent, and is
chaired by the Chairman of the Supervisory Board.
The main responsibilities of the Remuneration
Committee are:
• Recommend the remuneration policy (includ-
ing general guidelines for incentive pay) to
the Supervisory Board for approval prior to
approval by the shareholders.
• Prepare recommendations to the Supervisory
Board as to which employees is considered
risk-takers.
• Prepare recommendations to the Supervisory
Board on elements that should be included in
the remuneration of the Supervisory Board and
the Executive Board as well as the amount of
the specific remuneration.
• Ensure compliance with the adopted remunera-
tion policy (including guidelines for incentive pay).
• Monitor that the information in the annual report
on remuneration of the Supervisory Board, the
Executive Board and risk-takers is correct, true
and adequate.
• Ensure that the Supervisory Board is kept in-
formed of the market level of remuneration paid
to the supervisory boards and executive boards
of the company’s peers, and, on behalf of the
Supervisory Board, follow practice in
the area to ensure that any new forms of remu-
neration are discussed and considered by the
Supervisory Board.
The work of the Remuneration Committee is
based on Tryg’s remuneration policy, which is
available at tryg.com.
Executive Board
Tryg’s organisational structure is based on national
business areas. The members of the Executive
Board are the CEO, the CFO and the COO. The
Executive Board is responsible for the day-to-day
running of Tryg, observing the guidelines and rec-
ommendations issued by the Supervisory Board.
Each year, the Supervisory Board reviews and
adopts the rules of procedure of the Supervi-
sory Board and the Executive Board comprising
relevant policies, guidelines and instructions de-
scribing reporting requirements and requirements
for communication with the Executive Board.
Financial legislation also requires the Executive
Board to disclose all relevant information to the
Supervisory Board and report on compliance with
limits defined by the Supervisory Board and in
legislation.
The Supervisory Board considers the composi-
tion, development, risk and succession plans of
the Executive Board in connection with the annual
evaluation of the Executive Board, and regularly in
connection with board meetings.
Four key functions – Risk management,
Compliance, Actuarial function and Internal Audit
The Executive Board appoints those responsible
for the key functions Risk management, Compli-
ance and the Actuarial function. The Supervisory
Board appoints the person responsible for the
Internal Audit function. The persons responsible
for the four functions have all been fit-and-proper
approved by the Danish Financial Supervisory
Authority.
The functions Appointed actuary, Compliance
and Risk management all report to the Executive
Board and the Supervisory Board’s Risk Committee.
Internal Audit reports to the Audit Committee and
the Supervisory Board.
Tryg’s risk management environment is based on
the principle of ‘three lines of defence’ in order to
ensure a robust system of governance and effective
communication between the business areas, key
functions and the Internal Audit function as well
as reporting to the Supervisory Board and the
Supervisory Board committees.
Material changes in the system of governance
On 1 January 2016, Tryg changed its daily manage-
ment structure. The Nordic business areas were
transferred to national business areas with new
managers heading the areas. Top management is
constituted by an Executive Board comprising the
CEO, the CFO and the COO.
At Tryg’s annual general meeting in March 2017,
Article 19 in the Articles of Association was amended
to the effect that the number of members appointed
to the Supervisory Board may vary between 6 and
9. Also, the requirement that the post of Chairman
of the Supervisory Board is filled with the Chairman
of the Supervisory Board of TryghedsGruppen was
omitted following a transitional period. Further-
more, the Supervisory Board may appoint one or
two Deputy Chairmen. Consequently, in March
2017, Tryg had an extra Supervisory Board member,
two Deputy Chairmen and an extra member of the
Remuneration Committee and the Nomination
Committee compared to 2016.
Executive Board
Private DK
Commercial DK
Claims DK
Corporate DK &Tryg Garanti
Private NO
Commercial NO
Claims NO
Corporate NO
Sweden Private& Affinity
Corporate SE
Group CEOMorten Hübbe
Group CFO Christian Baltzer
Group COOLars Bonde

SFCR 2016 | Tryg A/S | | Contents 11
Remuneration
1.c.1. Remuneration of management
Tryg has adopted a remuneration policy for the Su-
pervisory Board and the Executive Board, including
general guidelines for incentive pay. The remunera-
tion policy for 2017 was adopted by the Supervisory
Board in January 2017 and approved by the annual
general meeting on 8 March 2017. The Board’s pro-
posal for the remuneration of the Supervisory Board
for the current financial year were approved by the
shareholders at the annual general meeting.
1.c.2. Remuneration of Supervisory Board
Members of Tryg’s Supervisory Board receive a
fixed fee and are not comprised by any form of
incentive or severance programme or pension
scheme. Their remuneration is based on trends in
peer companies, taking into account the required
skills, efforts and the scope of the Supervisory
Board’s work, including the number of meetings
held. The remuneration received by the Chair-
man of the Board is three times that received by
ordinary members, while the Deputy Chairman’s
remuneration is twice that received by ordinary
members of the Supervisory Board.
1.c.3. Remuneration of Executive Board
Members of the Executive Board are employed on
a contractual basis, and all terms of their remu-
neration are established by the Supervisory Board
within the framework of the approved remunera-
tion policy. Tryg wants to strike an appropriate
balance between management remuneration,
predictable risk and value creation for the share-
holders in the short and long term.
The Executive Board’s remuneration consists of
a base salary, a pension contribution of 25% of
the base salary and other benefits. The base sal-
ary must be competitive and appropriate for the
market and provide sufficient motivation for all
members of the Executive Board to do their best to
achieve the company’s defined targets. The Super-
visory Board can decide that the base salary should
be supplemented with a variable pay element of up
to 50% of the fixed base salary including pension.
The variable pay element consists of a Matching
Shares Programme. Members of the Executive
Board may, using taxed funds, buy shares
(so-called investment shares) in Tryg A/S at the
market price for a predefined amount. Four years
after such purchase, Tryg will grant one matching
share per investment share free of charge. Matching
is conditional upon the fulfilment of additional con-
ditions such as continued employment and back
testing (testing prior to matching, to ensure that the
criteria forming the basis of the calculation of the
variable salary are still met at the time of matching).
The purpose of the Matching Shares Programme
is to ensure the alignment of interests between the
Executive Board and the company’s shareholders.
The Supervisory Board evaluates the performance
of the Executive Board against the targets set by
the Supervisory Board for the fiscal year. The over-
all fulfilment of the weighted targets determines
the number of investment shares offered to each
member of the Executive Board.
Material transactions
The Group has no related parties with a deci-
sive influence other than the parent company,
TryghedsGruppen smba, and the subsidiaries of
TryghedsGruppen smba (other related parties).
Related parties with significant influence include
the members of the Supervisory Board and the
Executive Board. TryghedsGruppen smba controls
60% of the shares in Tryg A/S.
Transactions between TryghedsGruppen smba and
Tryg A/S are conducted on an arm’s length basis.
Intra-group transactions including administration
fees etc. are fixed on a cost-recovery basis. Intra-
group accounts are offset and carry interest on
market terms.
The members of the Executive Board receive a
fixed remuneration and pension. A variable salary
element is awarded in the form of a Matching
Shares Programme. Besides this, the members of
the Executive Board have free cars appropriate to
their position as well as other market-conforming
employee benefits. Each member of the Executive
Board is entitled to 12 months’ notice and sever-
ance pay equal to 12 months’ salary plus pension
contributions. Group CEO is entitled to severance
pay equal to 18 months’ salary.
Risk-takers are defined as employees whose activi-
ties have a significant influence on the company’s
risk profile. The Supervisory Board decides which
employees should be considered to be risk-takers.
The risk-takers are remunerated in accordance
with Tryg’s remuneration policy.
B.2 Fit-and-proper requirements
Requirements concerning skills, knowledge
and expertise – persons who run the company
The Supervisory Board has identified the following
qualifications and skills which the Supervisory Board
wishes to be present among the Board members:
• Knowledge about insurance issues, includ-
ing insight into the organisation of insurance
companies, product development of financial
services, reinsurance, capital requirements and
special insurance-legal accounting principles.
• In addition, managerial experience, financial
insight, insight into accounting, financial
knowledge and experience, M&A experience,
market insight and international experience.
As a financial business, Tryg is under an obligation
to observe Section 64 of the Danish Financial Busi-
ness Act concerning members of the Supervisory
Board and the Executive Board. In this connection,
Tryg must ensure that a member of the Supervisory
Board or the Executive Board at any time possesses
the necessary knowledge, professional compe-
tence and experience to exercise his/her function
or perform his/her job.
Tryg has appointed four key functions and, in
this connection, prepared functional descriptions
for each of these four functions. These func-
tional descriptions state which requirements the
persons in these key functions must fulfil. Com-
mon for these key functions is that they must be
independent from one another.

Risk policies
Overall risk management policy
• Risk management• Internal controls• Capital structure• Reporting to the Danish Financial Supervisory Authority• Adequate information in the report on solvency and financial status (SFCR)• Own risk and solvency assessment (ORSA)
Insurance risks• Underwriting• Technical provisions• Reinsurance
Operational risk1) and IT security
Outsourcing Investments• Management of assets
and liabilities• Liquidity• Concentration
Partial internal model• Validation (policy)• Model changes (policy)
The underlying risk policies
SFCR 2016 | Tryg A/S | | Contents 12
Process for accessing the fitness and
propriety of the persons who effectively run
the company or have other key functions
When hiring new persons, an assessment is made
as to whether they are fit and proper. In this con-
nection, the assessment must be based on the
concrete position which is being filled. As regards
members of the Supervisory Board and the Execu-
tive Board, it is ensured, in particular, that both
the Supervisory Board and the Executive Board as
entities possess the necessary knowledge but also
adequate diversity in terms of the qualifications,
knowledge and experience of their members.
Moreover, it is ensured that the requirements set
out in the rules of procedure of the Supervisory
Board and Executive Board are observed. The
mentioned assessment of the Tryg management
also applies to the subsidiaries of the Group.
Where individual board members, the Nomin-
ation Committee or the Executive Board of Tryg
(as regards directorships in Group subsidiaries)
find that a Board member, a member of one of the
Supervisory Board committees or the whole of the
Supervisory Board is in need of new knowledge
or new competence, the Supervisory Board may
decide to initiate education, either using Tryg’s
own resources or external teachers. New Board
members are educated in pursuance of statutory
requirements relating hereto.
The Supervisory Board regularly, and at least once
a year, decides which persons – in addition to the
members of management reported to the Danish
Business Authority and the four persons responsi-
ble for the key functions – must be understood to
participate in managing the company. The Super-
visory Board secretariat keeps a list of these.
B.3 Risk management system
Risk management system
Tryg has adopted a number of policies, guidelines
and business procedures contributing to the
management of risk activities such as underwriting
and reinsurance, claims handling, investments, IT
security etc. These guidelines are also supported
by a power of attorney structure which defines who
may take various actions. Altogether, these policies,
guidelines and business procedures constitute the
internal framework within which the business must
act. In Tryg, a general risk management policy con-
stitutes the framework for a number of underlying
risk policies, which reflect the Supervisory Board’s
guidelines for specific risk areas in more detail.
Risk appetite is also part of the internal risk frame-
work, and it is defined as the risk Tryg is willing to
take in order to achieve the company’s strategic
targets. This means that the risk appetite is the
instrument for connecting the strategic targets
with the operational operations. The risk appetite
sums up the considerations and decisions behind
the framework set out in the policies, whereas the
risk strategy describes how this is implemented in
practice.
Organisation
The overall responsibility for Tryg’s risk manage-
ment is organisationally anchored with the CRO
in Group Risk in the business area Group Finance,
whereas the business areas are responsible for
implementing adequate risk management within
their own area. On a daily basis, the Risk Manage-
ment department works with, e.g., the anchoring 1) Includes operational risks which are not covered by any of the other underlying policies. Consequently, operational risks associated with, e.g.,
investments are comprised by the investment policy etc.

Risk management environment
Authori� line and reporting line
Further reporting line
Supervisory Board’s Risk Committee
Model Risk Committee
Insurance Risk Committee
Operational Risk Committee
Investment RiskCommittee
Supervisory Board
Executive Board
Risk Committee
Investment Committee
Supervisory Board's Audit Committee
Lines of defence
• Compliance• Actuarial function• Risk management• Internal audit function
2nd line of defence
• Internal audit
3rd line of defence External audit
Reporting
Right to be heard, cf. dra� for Executive order on Management
• Business Management
1st line of defence
Supervisory Board’sRisk Committee
Supervisory Board’sAudit Committee
Executive Board
Supervisory Board
SFCR 2016 | Tryg A/S | | Contents 13
of risk management processes at Group level as
well as reporting to the Supervisory Board and the
Supervisory Board’s Risk Committee. To ensure
adequate risk management processes in all parts
of Tryg and in order to keep risk management as
close to the business as possible, a matrix organi-
sation has been established with decentralised risk
managers in all business areas.
The decentralised risk managers facilitate the
risk management within their own business area.
They report, however, to a central risk manager in
Risk Management, who ensures coordination and
standardisation of risk management processes
across business areas and countries. The decen-
tralised risk managers form an essential part of
Tryg’s second line of defence.
All business areas and staff functions have ap-
pointed a decentralised risk manager whose
job is to assist, advise and instruct the business
management in questions relating to risk manage-
ment and compliance as well as to ensure the
implementation of processes, controls and reports
planned by the Risk Management and Compliance
functions. The decentralised risk managers have
full access to independently report to the manager
of their own business area as well as the Risk
Management and Compliance function.
Risk management in Tryg is divided into ‘three
lines of defence’, with the business areas consti-
tuting the first line of defence, Risk Management,
the Actuarial function, Compliance and Internal
Audit function monitoring the business as the sec-
ond line of defence, and the Internal Audit auditing
all of Tryg in the third line of defence and reporting
directly to the Supervisory Board, cf. figure ‘Lines
of defence’.
Key functions
Tryg’s Executive Board has appointed three key
persons for the Compliance, Actuarial and Risk
Management functions. The Internal audit func-
tion is handled by the Internal Audit and the key
person is appointed by the Supervisory Board.
With the implementation of the four key functions
comes a requirement for independence, which
Tryg has ensured by placing the Risk Management
function under Management Support, the Compli-
ance function under Group Legal & Compliance
Nordic, the Actuarial function under Asset Liability
Management and the Internal audit function under
the Internal Audit. Furthermore, Tryg has estab-
lished a number of subcommittees to ensure the
firm management of risks in Tryg and coordination
across the business areas.
Internal Risk Committees
The Model Risk Committee is a technical com-
mittee whose main purpose is to maintain and
oversee the model governance associated with
the approved partial internal model, including the
handling of validation reports and model changes.
The Insurance Risk Committee facilitates discus-
sions of portfolio and risk in relation to risk-taking,
and initiates and participates in work groups
on new products to be recommended to the
Executive Board’s Risk Committee as well as the
implementation of the insurance risk policy.

SFCR 2016 | Tryg A/S | | Contents 14
The Operational Risk Committee advises on the
handling of and decisions concerning operational
risks in the business areas, creates the framework
of preparedness in Tryg, monitors operational risks
falling outside the risk areas of the other commit-
tees and implements the policy on operational
risks and IT security.
The Investment Risk Committee monitors risk-
taking in investments and ensures that this is in
accordance with the investment policy.
Overall, Tryg’s committee environment has been
established, among other things, to ensure the
firm management of risks in Tryg and the adequate
involvement of key persons.
Own risk and solvency assessment (ORSA) process
ORSA is the company’s own risk and solvency
assessment based on the Solvency II principles,
which implies that Tryg must assess all material
risks to which the company is or may be exposed.
The ORSA report also contains an assessment of
whether the calculation of the solvency capital
requirement is reasonable and reflects Tryg’s
actual risk profile. Moreover, the projected capital
requirement is also assessed over the company’s
strategic planning period. Tryg’s risk activities are
implemented via continuous risk management
processes, where the main results are reported to
the Supervisory Board and the Supervisory Board’s
Risk Committee during the year.
The ORSA report is an annual summary document
assessing all these processes and presenting the
total risk picture to Tryg’s Supervisory Board.
It is the Supervisory Board’s responsibility to have
the overview of risks associated with Tryg’s busi-
ness model, and to assess whether the processes
used to determine the accurate risk profile of Tryg
are adequate.
The result of Tryg’s substantial risk management
processes constitutes the scope of the Supervisory
Board’s own risk and solvency assessment. The
information is delivered by Risk Management.
In 2015, Tryg applied and received approval from
the Danish FSA of its partial internal model. Within
this application, Tryg enclosed thorough docu-
mentation of the model, documenting among
other things why the model is more appropriate in
specific areas compared to the standard formula.
The model is used to calculate a solvency capital
requirement which reflects Tryg’s risk profile.
In addition, Tryg’s partial internal model is used
to assess the risk-taking limits set out in the
investment policy, taking into account the savings
achieved in the solvency capital requirement.
This is further described in section E.
B.4 Internal control system
Tryg’s internal control system
The business areas (first line) carry out internal
controls in Tryg to such an extent that significant
risks are detected/monitored and creating
reasonable certainty of:
• Operational efficiency and quality (fraud
controls, UW, sales and claims controls etc.)
• Reliability of data and reporting
• Compliance with internal and external
adjustments
The respective persons responsible for Risk
management, for Compliance and for the Actuarial
department ensure that adequate controls are
carried out in the second line of defence, whereas
the Internal audit function provides the Executive
Board with its assessment of the adequacy and
efficiency of the internal control system.
The internal controls in Tryg have been designed
to be efficient and risk-based. This means that
activities posing risks with the highest probability
and consequence are subject to frequent controls,
whereas other activities may be subject to ad-hoc
controls based on a concrete risk assessment of
the area of activity.
All controls are independent. In the first line
of defence, the controls are carried out as self-
regulation in the same department in which the
controlled activities are carried out. The second
and third lines of defence are subject to a strict
requirement for independency, which means that
the controls are carried out by a department other
than the one in which the controlled activities have
been performed. In practice, this means that the in-
spector may not be reporting to the same leader as
the employees who have performed the controlled
activities. Where the requirement for separation of
functions cannot be observed in the second or third
line of defence for practical reasons or where con-
flicts of interest indicate that the controls cannot
be carried out in an adequate way, an independent
party participates or reviews the controls.
The business areas support the internal control
environment by providing access to the systems,
reports, resources and tools needed to carry out
the controls. The completion of internal controls
is documented, and the results are reported to the
managers of the controlled business units, who
are responsible for follow-up on essential errors
and risks detected by the controls, and who must
prepare necessary action plans to mitigate these
going forward. The action plans set out the planned
follow-up, The decentralised risk managers oversee
that necessary follow-up is carried out in time and
that significant risks which have been identified by
the controls are included in the risk identification
process. Lack of follow-up on controls is reported
to the relevant second-line function.
Description of how the compliance
function is implemented
Tryg’s Compliance function is responsible for con-
trolling and assessing whether Tryg’s methods and
procedures for detecting and mitigating the risk of
violating the law are effective.
The compliance function advises Tryg, including
Tryg’s Executive Board, on observance of the finan-
cial legislation applying to the company, assesses
the consequences of legislative changes and identi-
fies and assesses the risk of non-observance of the
financial legislation or internal set of rules.
The person responsible for compliance receives
reporting on reports to Tryg’s whistleblower line
and is responsible for reporting these reports to
Tryg’s Risk and Audit Committees.

SFCR 2016 | Tryg A/S | | Contents 15
Compliance work is planned in consideration of
materiality and risk, including the risk of influencing
Tryg’s reputation and potential risks of fines due to
violations of the law.
The Compliance function ensures that a risk analy-
sis is prepared, covering the significant compliance
risks of the company and which forms the basis of
the work of this function.
Every year, the compliance function prepares a
draft compliance plan, which is sent to Tryg’s Risk
Committee and the Risk Committee of the Super-
visory Board. The person responsible for compli-
ance may choose to take action not included in
the plan based on a concrete consideration of risk.
Subject to approval by the Executive Board, the
compliance tasks may be left to organisational
units outside the Compliance function. The Execu-
tive Board has decided that the Compliance func-
tion may instruct the decentralised risk managers
to carry out compliance controls, for example es-
tablishing the framework for compliance controls
carried out decentrally.
B.5 Internal audit function
How Tryg’s internal audit function is implemented
Pursuant to the Executive Order on Auditing of
Financial Undertakings etc. as well as Financial
Groups (the executive order on auditing) and the ex-
ecutive order on managing and governing insurance
companies (the executive order on management) as
well as the EU Commission’s regulation 2015/35/EU,
Tryg has established an internal Audit function,
which is managed by the Head of Internal Audit.
Tryg’s Supervisory Board has adopted a policy and
functional description for the Internal Audit depart-
ment. The functional description and the policy
establish the basis, powers and tasks of the Internal
audit function, including guidelines on cooperation
with the other key functions: Risk Management,
Compliance and the Actuarial function.
In order to ensure the independence and objectiv-
ity of the Head of Internal Audit, this person may
only be hired and fired by the Supervisory Board,
to which this person is responsible. The Head of
Internal Audit must live up to the fit-and-proper
requirements set out by the Danish Financial Su-
pervisory Authority as well as a number of further
requirements such as requirements concern-
ing the prohibition of speculative transactions,
protection against conflicts of interest and specific
requirements for education and competence.
In order to ensure that the Head of Internal Audit
and the employees performing internal audits
maintain their independence from Tryg, including
the areas being audited, the Supervisory Board
has decided on a number of restrictions for the
employees of the Internal Audit function, including
prohibition against loans etc. from Tryg, bonus
schemes, insider rules and duty of confidentiality.
Each year, Internal Audit prepares a plan for its
tasks, which must be approved by the Supervisory
Board. The plan is based on a risk analysis. The
tasks are organised on the basis of materiality
and risk. Consequently, the plan is based on a risk
analysis, making sure that the most material and
risk-related areas are audited according to a three-
year plan. The results and conclusions of the work
of the Internal Audit are reported to Tryg’s Audit
Committee on a quarterly basis, and at least once
a year to the Supervisory Board.
How Tryg’s internal audit function maintains its
independence and objectivity from the activities
it reviews
Internal Audit is organised independently of the
rest of the Tryg organisation and reports directly to
the Audit Committee. The Head of Internal Audit is
employed by the Supervisory Board. The head of
the Internal Audit department receives a fixed sal-
ary and pension but no variable pay elements.
B.6 The actuarial function
The Executive Board appoints the person respon-
sible for the function (’the actuarial responsible’).
The person responsible for Tryg’s actuarial function
is Tryg’s Chief Actuary. The person responsible for
the actuarial function must meet with the require-
ments of the Danish Financial Supervisory Author-
ity for the key functions, i.e. be fit and proper and
have adequate knowledge about Tryg’s insurance
operations and extensive professional knowledge
about actuarial mathematics and financial math-
ematics.
For the subsidiary Tryg Livsforsikring A/S, the
Executive Board has appointed a separate actuary
responsible to meet the requirements of the
Danish Financial Supervisory Authority.
The Executive Board must ensure that the actuarial
function is provided with adequate resources and,
in consultation with the person responsible for
the actuarial function, decide on the staffing of the
actuarial function. The function is not to be consid-
ered an organisational unit in Tryg, but may consist
of employees from more than one department.
The person responsible for the actuarial function
is responsible for maintaining an updated list of
employees in the function and for ensuring that the
employees in the actuarial function have the right
education and necessary knowledge about the
professional standards and technical provisions to
ensure that the tasks are handled according to the
functional description.
The Executive Board must ensure that the person
responsible for the actuarial function receives all
information necessary for the performance of the
work with technical provisions.
In order to ensure that the actuarial function is able
to perform its duties, all essential decisions involv-
ing an aspect of the technical provisions, including
decisions on new and significantly changed prod-
ucts, reinsurance and M&A, must be presented to
the actuarial function for an assessment. This must
be done in a timely manner for the actuarial func-
tion to be able to give an opinion on the impact of
such decisions in relation to insurance provisions,
before making a final decision.

SFCR 2016 | Tryg A/S | | Contents 16
B.7 Outsourcing
Tryg continuously assesses whether any Group
activities should be outsourced. This is based on
an overall assessment of possible quality improve-
ments and cost savings.
Any decisions on outsourcing are made by Tryg’s
Supervisory Board subject to a recommendation
from the Executive Board. Prior to any decision
being made, an analysis is made of whether the
activities are suitable for outsourcing, the possible
risks for Tryg and how these risks may be mitigated
adequately, including transitional and operational
as well as exit risks.
When choosing a supplier, it is considered how
the identified risks can be overcome/mitigated
adequately by choosing a specific supplier. A de-
scription is made of the needs of the outsourcing
company and the requirements which is to be met
by the supplier.
The selection of a supplier is based on a meticu-
lous selection procedure, which, among other
things, emphasises the supplier’s background,
experience, reputation and solidity, experiences
with the contracting party in question from previ-
ous cooperation, the supplier’s organisation and
employees, the service offered, the price and
the fact that there are no conflicts of interest. In
connection with the selection, it is ensured that
the supplier has the necessary ability and capacity
and such permissions as are required pursuant to
applicable legislation in order to be able to handle
the outsourced tasks satisfactorily.
Assessment of the adequacy of the system
Tryg’s management system is deemed to be
adequate given the nature, scope and complexity
of the risks associated with the company’s
operations.
B.8 Any other information
No other information.
SFCR 2016 | Tryg A/S | 16

%
50
40
30
20
10
0
Denmark Norway Sweden
Capital charge
SFCR 2016 | Tryg A/S | | Contents 17
C.1 Underwriting risk
Business model and exposure
For a description of Tryg’s business model,
see section A.1.
Assessments of Tryg’s actual risk profile are
performed on an ongoing basis throughout the
year. Prior to the acceptance of an insurance risk,
the exposure is quantified via technical under-
writing based on tariffs and for larger risks also
an individual assessment of the risk. Individual
large risk exposures are managed through the
use of reinsurance, and the aggregate risk profile
taking into account the degree of risk diversifica-
tion is again further managed through reinsurance
programmes for particular risk types or lines of
business.
The resulting risk profile is quantified in Tryg’s par-
tial internal capital model, which is also applied to
allocate equity to the individual business areas and
lines of business in accordance with the remaining
risk within these entities. The allocated equity in
percentage of premium (capital charge) is shown
for geographical segments in the figure ’Capital
charge’. The capital charge is used to determine
the risk premium required to support a certain
return on equity. Sweden has a significantly higher
capital charge compared to Denmark and Norway
as some lines of business (for example Motor Third
Party Liability) have a longer tail as claims are paid
as annuities as opposed to a lump sum.
In Tryg’s partial internal model, Denmark and
Norway are modelled internally, while Sweden is
currently assessed using the standard formula.
The quantified risk profile is assessed on a quarterly
basis, and is supplemented by a risk identification
process, whereby each business area reports
foreseeable risks that may affect their business
in a short and long-term perspective.
Tryg’s Supervisory Board’s insurance risk policy
and guidelines specify limits and conditions for
underwriting, which serves to limit the risk profile.
The fundamental processes of evaluating, quanti-
fying and controlling the insurance risks are:
• Tryg’s price and tariff analysis, which ensures
that the price properly reflects the risk taken
• The internal capital model, which quantifies
the remaining risk after reinsurance and diversi-
fication, and sets the target for earnings margin
• Technical provision analysis to evaluate
the development in accident years within
all lines of business
Furthermore, the insurance risk is evaluated in the
risk identification process – a process undertaken
quarterly to identify the development of new risks.
In addition, reviews of the technical provisions are
performed quarterly, evaluating the appropriate-
ness of Tryg’s reserving methods.
Risk concentrations – underwriting risk
Risk concentration for insurance risk can broadly
be split into two types (i) concentration by events
and (ii) concentration by location. Concentra-
tion by events can occur for the property area,
where the main perils are windstorm, cloudburst
and flooding, and similarly for the liability areas
serial claims can cause a concentration of losses.
Concentration by location occurs where a single
risk or a number of different risks represent a large
loss potential in the case of physical damage to a
particular area (fire, terror etc.).
Tryg’s reinsurance programmes cover concentra-
tions by events up to approximately 250-year
events, and for weather-related events additional
cover is arranged to limit the annual net loss in the
case of multiple events. For the concentration by
location, reinsurance cover is established on an in-
dividual basis to cover the estimated maximum loss
(EML) of the risk, and additional cover is established
to cover any EML breakthroughs. For selected top
risks, additional protection is provided (only) to
avoid any additional capital charge from the Sol-
vency II man-made CAT scenario, which considers
the total sum insured within a 200-metre radius,
without regard for risk-preventing measures and
loss probabilities.
Risk mitigation – underwriting risk
Tryg uses risk mitigation within all significant areas.
The effect of these steps is measured and reported
continuously and when relevant included in the
calculation of Tryg’s solvency capital requirement.
The most significant types of mitigation for under-
writing risk are:
Reinsurance: Proportional reinsurance is used in
special areas (guarantee, fish farming) to balance
the portfolio mix to a level where diversification
ensures optimum effect.
C. Risk profile

Insurance risk
DKKm 2016 2015
Effect of 1 percentage point change in: Combined ratio (1 percentage point) +/- 175 +/- 177
Provisioning risk 1% change in inflation on person-related lines of business1) +/- 436 +/- 47610% error in the assessment of long-tailed lines of business (workers’ compensation, motor liability, liability, accident) +/- 1,800 +/- 1,671
%
220
210
200
190
180
170Q4 2016
2016
+20% -20%
Equi�
+20% -20%
Proper�
+100 -100bps bps
Interest
+100 -100bps bps
Spread
+20% -20%
NOK / DKK
+20% -20%
SEK / DKK
-100 bpsUFR
Solvency II ratio sensitivities
SFCR 2016 | Tryg A/S | | Contents 18
Tryg’s reinsurance programme and facultative rein-
surance are used to reduce the risk for large claims
on both portfolios and individual large risks.
Inflation risk on workers’ compensation: Workers’
compensation claims are regulated by a workers’
compensation index, which is linked to inflation.
This risk is covered by inflation swaps.
In general, Tryg’s insurance policy contains limits
which ensure that Tryg does not accept risks that
are not within the Supervisory Board’s risk appetite.
Continuous follow-up is performed to ensure com-
pliance with the limits set out in the insurance policy.
In case of major events involving damage to build-
ings and contents, Tryg’s reinsurance programme
provides protection for up to DKK 5.75bn, which
statistically is sufficient to cover at least a 250-year
event. Retention for such events is DKK 150m.
In the event of frequent natural disasters, Tryg is
covered for up to DKK 600m, after total annual
retention of DKK 300m.
Tryg has also taken out reinsurance of the risk of
large claims occurring in sectors with very large
sums insured. Tryg’s largest individual building
and contents risks are covered by up to DKK 2bn.
Retention for large claims is DKK 100m, gradually
dropping to DKK 25m. Single risks exceeding
DKK 2bn are covered individually. Tryg has com-
bined the minimum cover for other sectors into a
joint cover with retention of DKK 100m for the first
claim and DKK 25m for subsequent claims. For the
individual sectors, specific covers have been taken
out as needed. The use of reinsurance naturally
creates a counterparty risk. This risk is handled by
using a wide range of reinsurers with at least an ‘A’
rating and a minimum of DKK 750m in capital.
Stress test and sensitivity analysis
– underwriting risk
Tryg performs stress tests of insurance risks based
on the scenarios illustrated in table ’Insurance risk’.
The scenarios reflect the change in Tryg’s result in
case of a 1 percentage point change in combined
ratio. In addition, the table illustrates the effect of
a 1% change in inflation and the effect of a 10 %
shock to the technical provisions for long tailed
business.
Additional stress and sensibility of the solvency
ratio to changes in market values are reported in the
investor community as shown in figure ’Solvency II
ratio sensitivities’
Finally the capital plan and projections (updated
quarterly, see section E ) illustrates the long
term sensibility of the solvency ratio to various
strategic decisions and potential negative
deviations in profitability.
C.2 Market risk
Composition and exposure
In overall terms, Tryg’s investment portfolio is
divided into a match portfolio and a free portfolio.
The match portfolio corresponds to the value of
the discounted claims reserves and is designed
to hedge the interest rate sensitivity of these as
closely as possible. Tryg carries out daily monitor-
ing, follow-up and risk management of the Group’s
interest rate risk. The free portfolio is subject to
the framework defined by the Supervisory Board
through the investment policy. The purpose of
the free portfolio is to generate the highest pos-
sible return relative to risk. Tryg’s equity portfolio
constitutes the company’s largest investment risk.
At the end of 2016, the equity portfolio accounted
for 5.4% of total investment assets. Tryg’s property
portfolio comprises investment properties, the
value of which is adjusted based on conditions in
the property market through internal valuations
backed by external valuations. At the end of 2016,
investment properties accounted for 6.3%. Tryg
does not wish to undertake any currency exposure,
but since Tryg invests and operates its insurance
business in currencies other than Danish kroner,
Tryg is exposed to currency risk. Tryg is primarily
exposed to fluctuations in the other Scandinavian
currencies due to its insurance activities.
1) Including the effect of the zero coupon inflation swap.

Equities
Cov. bonds
Inv. proper�
High yield
Investment grade
Emerging markets
In�ation linked bonds
Govenment bonds
Other
DKK 12 bn
18
37
31
21
65
44
Per cent
Free portfolio 2016
Cov. bonds
Bonds / deposits
98
2
Per cent
DKK 29.1bn
Match portfolio 2016
100
80
60
40
20
0
Nordics EU ex. Nordics
EM/OtherNorth America
High-yield & Emerging-market
Inv. proper�Equi�Bonds
%
Asset classes by geography
100
80
60
40
20
0
Match Free Total
BBB-B LOWERAA-AAAA
%
Fixed income portfolio credit rating
SFCR 2016 | Tryg A/S | | Contents 19
Premiums earned and claims paid in other cur-
rencies create a natural currency hedge, for which
reason other risk mitigation measures are not re-
quired in this area. However, the part of equity held
in currencies other than Danish kroner is exposed
to currency risk. This risk is hedged on an ongoing
basis by means of currency swaps. In addition
to the above-mentioned risks, Tryg is exposed to
credit, counterparty and concentration risks. These
risks primarily relate to exposures in high-yield
bonds, emerging-market debt exposures as well
as Tryg’s investments in ‘AAA’-rated Nordic and
European government and mortgage bonds. These
risks are also managed through the investment
policy and the reinsurance framework defined in
the insurance policy.
The figures ’Free portfolio 2016’ and ’Match
portfolio 2016’ illustrate the split of Tryg’s assets
between the free portfolio and the match portfolio.
Risk concentration – market risk
The overall framework for managing investment
risk is defined by the Supervisory Board in Tryg’s
investment policy. In this policy, predefined limits
on investment assets and counterparties appear,
which means that the concentration risk is limited.
The investment risk is managed by looking at total
exposure and capital consumption by asset class
(bonds, shares, properties etc.). A very important
element in managing Tryg’s investment risk is the
company’s matching strategy, according to which
invested assets corresponding to the technical
provisions must be invested in interest-bearing
assets, where the interest rate sensitivity of these
assets matches and thereby hedges the interest
rate sensitivity of the discounted provisions as
closely as possible. The so-called match portfolio
represents approximately 70% of total group
investments, while the free portfolio (the capital of
the company) represents the remaining 30%.
The figures ’Fixed income portfolio credit rating’
and ’Asset classes by geography’ show the
geographical exposure and the rating of the
match and the free portfolio.
Risk mitigation – market risk
The significant areas where Tryg uses risk mitiga-
tion within market risk are:
Investment The match portfolio must be invested
in interest-bearing instruments with the same
interest sensitivity as the discounted technical
provisions, given any point on the interest rate
curve. This means that Tryg’s total interest rate
sensitivity is minimised. The match portfolio
represents approximately 70% of the total invest-
ment assets.
Currency risk is mitigated through the use of
currency swaps, with the net exposure against
the most significant currencies being rebalanced
to 0 on a monthly basis. The currency sensitivity
corresponding to Tryg’s solvency level is mitigated
by placing subordinated loans in the same cur-
rencies, which are included in the solvency capital
requirement. The size of the subordinated loans
is determined when minimising the net currency
sensitivity.
The free portfolio does not contain risk-mitigating
elements. The purpose of the free portfolio is to
maximise the investment return within the ac-
cepted investment risk as defined by the Supervi-
sory Board in the investment policy.
The total risk associated with the free portfolio
represents approximately 25% of Tryg’s total risks.
The development in the free portfolio, including
compliance with the investment policy limits, is
monitored and reported on a regular basis.

Credit risk
2016 2015 Bond portfolio by ratings DKKm % DKKm %
AAA to A 35,233 99.9 35,181 98.5Other 20 0.1 523 1.5Not rated 1 - 1 0.0
Total 35,254 100.0 35,705 100.0 Reinsurance balances
AAA to A 1,536 90.7 2,772 95.9Other 0 - 0 0.0Not rated 157 9,3 120 4.1
Total 1,693 100.0 2,892 100.0
Investment risk
DKKm 2016 2015
Interest rate market Effect of 1% increase in interest curve: Impact of interest-bearing securities -1,131 -940Higher discounting of claims provisions 1,061 947Net effect of interest rate rise -70 7Impact of Norwegian pension obligation 173 153
Equity market 15% decline in equity market -365 -341Impact of derivatives -15 -7
Real estate market 15% decline in real estate markets -229 -480
Currency market Equity: 15% decline in exposed currency (exclusive of EUR) relative to DKK -763 -647Impact of derivatives 728 614Net impact of exchange rate decline -35 -33Technical result per year: Impact of 15% change in NOK and SEK exchange rates relative to DKK +/- 158 +/- 176
SFCR 2016 | Tryg A/S | | Contents 20
Stress test and sensitivity analysis – market risk
Tryg carries out stress tests of market risks
based on scenarios illustrated in the table
’Investment risk’.
The scenarios show how much Tryg’s result will
change in case of the following events:
• A 1 percentage point change in the interest
rate curve
• A 15% drop in the equity market
• A 15% drop in the real estate market
• A 15% drop in the value of currencies to
which Tryg is exposed
C.3 Credit risk/counterparty risk
The credit risk associated with reinsurance is
managed under Tryg’s policies and guidelines.
The policy includes a minimum rating for reinsur-
ers, ensuring that the credit risk will be kept at an
acceptable level. Among other things, Tryg’s insur-
ance policy states that reinsurers must have
a high rating to ensure a strong level of solvency.
The table ’Credit risk’ shows the counterparties
by rating – including counterparties regarding
reinsurance and investment.
It is observed that the majority of Tryg’s counter-
parties have a rating of ‘A’ or higher. Furthermore,
the counterparty risk is addressed by the solvency
capital requirement, since the counterparty risk
module in the standard formula takes this into
consideration.
Credit risk in the investment area is also addressed
by the investment policy. This policy lists the ratings
which must be maintained by Tryg’s counterparty
under specific asset classes.
Concentration of counterparties
Counterparties within market risk are
mentioned in section C.2.
Stress test and sensitivity analysis
In Tryg, credit risk is calculated using the standard
formula, which indicates the effect of a counter-
party with a certain rating being unable to fulfil its
obligations.
At the end of Q4 2016, the calculated credit risk
was DKK 234m before diversification.
The solvency capital requirement and the
accuracy of the solvency capital requirement are
further discussed in section E.

SFCR 2016 | Tryg A/S | | Contents 21
on the protection of personal data could increase
the regulation of the treatment of information and
data, of which Tryg needs to be aware. In this con-
text, the leakage of customer data, cyber-attacks
and insider information poses an operational risk.
As operational risks are mainly internal, Tryg focus-
es on ensuring an adequate control environment
for its operations. In practice, this work is organised
by means of procedures, controls and guidelines
covering the various aspects of the Group’s opera-
tions. The Supervisory Board defines the overall
framework for managing operational risk in Tryg’s
IT security policy and operational risk policy.
These risks are controlled via the Operational Risk
Committee. A special crisis management structure
has been set up to deal with the eventuality that
Tryg is hit by a major crisis. This comprises a Crisis
Management Team at Group level, national contin-
gency teams at country level and finally business
contingency teams in the individual areas. Tryg has
prepared contingency plans for the most important
areas. In addition, comprehensive IT contingency
plans have been established, primarily focusing on
business-critical systems.
Furthermore, to improve the protection of
information, assets and profitability, the internal
IT security procedures and contingency plans
implemented by Tryg follow normal market condi-
tions. This is done by ensuring the documents are
compliant with the ISO standards.
To mitigate its operational risks, Tryg has estab-
lished automatic data controls. In addition, Tryg
regularly performs internal controls to detect any
breaches within compliance and to detect poten-
tial internal or external fraud.
In the areas of investment and IT, outsourcing poses
a material risk. Outsourcing actualises several risks
in the areas of data security, fraud, treatment of
information and compliance. Even though inter-
nal controls and assessments of compliance are
performed for the outsourced activities, experience
shows that the need for systemic follow-up grows as
the number of sourced partners in Tryg increases.
C.6 Any other material risk
No other information.
C.7 Any other information
No other information.
1) Interest on loans for a perpetual term has been recognised for the first fifteen years.
C.4 Liquidity risk
For an insurance company like Tryg, liquidity risk is
practically non-existent, as premium payments fall
due before claims payments. The only significant
assets in Tryg’s balance sheet which by nature are
somewhat illiquid are the property portfolio.
Through the monitoring of excess liquidity defined in
Tryg’s policies and procedures established for meas-
uring expected and realised net cash flows, including
potential M&A business, the total liquidity needs in
both the short and medium term are covered.
C.5 Operational risk
The role of operational risk management is to
support the profitability of Tryg’s business, which
is done minimising potential financial losses and
reputational damage. These operational risks
relate to errors or failures in internal procedures,
fraud, the breakdown of infrastructure, IT security
and similar factors.
The treatment of information and data is an ad-
ditional risk of relevance to Tryg. An EU regulation
Liquidity risk – Maturity of the Group’s financial obligations including interest
2016 (DKKm) 0-1 years 1-5 years > 5 years Total
Subordinate loan capital 1) 98 392 3,547 4,037Amounts owed to credit institutions 178 0 0 178Debt relating to unsettled funds transactions and repos 1,732 0 0 1,732Derivative financial instruments 650 112 -53 709Other debt 2,501 0 0 2,501
5,159 504 3,494 9,157
2015 (DKKm)
Subordinate loan capital 1) 66 263 3,362 3,691Amounts owed to credit institutions 64 0 0 64Debt relating to unsettled funds transactions and repos 4,074 0 0 4,074Derivative financial instruments 181 219 259 659Other debt 2,291 0 0 2,291
6,676 482 3,621 10,779

Balance sheet 2016
Statutory Solvency II DKKm accounts value Revaluation value
Assets Intangible assets 1) 884 -884 0
Total property, plant and equipment 49 49
Investment property 2,323 2,323
Total investments in associates 218 218Equity investments 48 48Unit trust units 3,950 3,950Bonds 4) 35,254 224 35,478Derivative financial instruments 1,000 1,000
Total other financial investment assets 40,252 224 40,476
Total investment assets 42,793 224 43,017
Total reinsurers’ share of provisions for insurance contracts 2) 2,034 -80 1,954
Total receivables in connection with direct insurance contracts 1,108 1,108Receivables from insurance enterprises 183 183Own shares 6) 0 871 871Other receivables 1,646 1,646
Total receivables 2,937 871 3,808
Total other assets 475 475
Total prepayments and accrued income 3) + 4) 689 -221 468
Total assets 49,861 -90 49,771
Equity and liabilities Equity 9,437 108 9,545
Subordinated loan capital 5) 2,567 820 3,387
Total provisions for insurance contracts 2) 31,527 -1,251 30,276
Deferred tax liability 3) 702 27 729Pensions and similar liabilities and other provision 470 470
Total provisions 1,172 27 1,199
Debt relating to direct insurance and reinsurance 981 981Amounts owed to credit institutions 178 178Debt relating to unsettled funds transactions and repos 1,732 1,732Derivative financial instruments 702 702Other debt 3) 1,520 3 1,523
Total debt 5,113 3 5,116
Accruals and deferred income 3) 45 203 248
Total equity and liabilities 49,861 -90 49,771
SFCR 2016 | Tryg A/S | | Contents 22
The Solvency II balance sheet is prepared in
accordance with EU legislation on Solvency II and
a Danish Executive Order (Executive Order no. 1761
of 15 December 2015). See appendix D.
Fair value of assets and liabilities
As a base rule, assets and liabilities are valued at the
amount for which they could be exchanged between
knowledgeable willing parties in an arm’s-length
transaction, in the following referred to as fair value.
Assets are recognised in the balance sheet when
it is probable that future economic benefits will
flow to the Group, and the value of such assets can
be measured reliably. Liabilities are recognised in
the balance sheet when the Group has a legal or
constructive obligation as a result of a prior event,
and it is probable that future economic benefits
will flow out of the Group, and the value of such
liabilities can be measured reliably.
The Group’s statutory financial statements are pre-
pared in accordance with IFRS and with the Danish
Statutory Order on Adoption on IFRS.
The main differences between the statutory finan-
cial statements and the solvency balance sheet are:
Recognition and measurement
1) Intangible assets are not recognised in the
solvency balance sheet unless reliable evidence
exists that the intangible assets could be sold
and at what price. In the statutory accounts
intangible assets are recognised.
2) Total provisions for insurance contracts, profit
margin is not included in the provisions in the
solvency balance sheet. In the statutory finan-
cial accounts profit margin is recognised.
3) Tax, related to solvency II adjustments related
to bullet 1 and 2.
Presentation
4) Bonds, the value of bonds includes accrued
interests in the solvency balance sheet. In the
statutory financial accounts interests are pre-
sented as prepayments and accrued income.
D. Valuation for solvency purposes
SFCR 2016 | Tryg A/S | | Contents 23
5) Norwegian Natural Perils Pool, the value of
Norwegian Natural Perils Pool are presented
as subordinated loan capital. In the statutory
financial statements Norwegian Natural Perils
Pool are recognised as equity.
6) Own shares, the value of own shares are pre-
sented as assets in the solvency balance sheet.
In the statutory financial accounts own shares
are recognised directly to retained earnings
under equity.
D.1 Assets
Intangible assets
Intangible assets, such as goodwill, trademarks,
customer relations and software, are not recog-
nised in the balance sheet as a base rule, unless
reliable evidence exists that the intangible assets
could be sold and at what price. Though goodwill
is never recognised in the balance sheet.
Fixed assets
Operating equipment
Fixtures and operating equipment are measured
at cost less accumulated depreciation and any ac-
cumulated impairment losses. Cost encompasses
the purchase price and costs directly attributable
to the acquisition of the relevant assets until the
time when such assets are ready to be brought
into use. The cost value less accumulated depre-
ciation is used as a proxy for fair value, which is
considered a true and fair view of the value.
Investment property
Properties held for renting yields that are not oc-
cupied by the Group are classified as investment
properties.
Investment properties are recognised at fair value.
Fair value is based on market prices, adjusted for any
differences in the nature, location or maintenance
condition of specific assets. If this information is
not available, the Group uses alternative valuation
methods such as discounted cash flow projections
and recent prices obtained in the market.
The fair value is calculated on the basis of market-
specific rental income per property and typical op-
erating expenses for the coming year. The resulting
operating income is divided by the required return
on the property in per cent, which is adjusted
to reflect market interest rates and property
characteristics, corresponding to the present value
of a perpetual annuity. The value is subsequently
adjusted with the value in use of the return on
prepayments and deposits and adjustments for
specific property issues such as vacant premises
or special terms and conditions of leases.
Investments
Investments include financial assets at fair value
which are recognised in the income statement.
The classification depends on the purpose for
which the investments were acquired. Manage-
ment determines the classification of its invest-
ments on initial recognition and re-evaluates
this at every reporting date. The value of bonds
includes accrued interests.
Financial assets are recognised at fair value on initial
recognition if they are entered in a portfolio that is
managed in accordance with fair value.
Derivative financial instruments
The Group is exposed to financial risks, including
changes in share prices, foreign exchange rates,
interest rates and inflation. Forward exchange
contracts and currency swaps are used for currency
hedging of portfolios of shares, bonds, hedging of
foreign entities and insurance items in the state-
ment of financial position. Interest rate derivatives in
the form of futures, forward contracts, repos, swaps
and FRAs are used to manage cash flows and inter-
est rate risks related to the portfolio of bonds and
insurance provisions. Share derivatives in the form
of futures and options are used from time to time to
adjust share exposures.
Derivative financial instruments are reported from
the trading date and are measured in the statement
of financial position at fair value. Positive fair values
of derivatives are recognised as derivative financial
instruments under assets. Negative fair values of
derivatives are recognised under derivative financial
instruments under liabilities. Positive and negative
values are only offset when the company is entitled
or intends to make net settlement of more financial
instruments.
Value is generally calculated on the basis of rates
supplied by Danske Bank with relevant information
providers and is checked by the Group’s valuation
technicians. Discounting on the basis of market inter-
est rates is applied in the case of derivative financial
instruments involving an expected future cash flow.
Reinsurers’ share of provisions
for insurance contracts
Contracts entered into by the Group with reinsur-
ers under which the Group is compensated for
losses on one or more contracts issued by the
Group and that meet the classification require-
ments for insurance contracts are classified as
reinsurers’ share of provisions for insurance con-
tracts. Contracts that do not meet these classifica-
tion requirements are classified as financial assets.
The benefits to which the Group is entitled under
its reinsurance contracts held are recognised as as-
sets and reported as reinsurers’ share of provisions
for insurance contracts. Amounts receivable from
reinsurers are measured consistently with the
amounts associated with the reinsured insurance
contracts and in accordance with the terms of
each reinsurance contract.
Receivables
Total receivables comprise accounts receivable
from policyholders and insurance companies as
well as other accounts receivable. Other receiva-
bles primarily contain accounts receivable in
connection with property.
Receivables that arise as a result of insurance
contracts are classified in this category and are
reviewed for impairment as part of the impairment
test of accounts receivable. Receivables are re-
cognised initially at fair value and are subsequently
assessed at amortised cost. The income statement
includes an estimated reservation for expected
unobtainable sums when there is a clear indication
of asset impairment. The reservation entered is

SFCR 2016 | Tryg A/S | | Contents 24
assessed as the difference between the carry-
ing amount of an asset and the present value of
expected future cash flows. The cost value is used
as a proxy for fair value, which is considered a true
and fair view of the recognised value.
Own shares
The purchase and sale sums of own shares are
recognised as assets. Own shares include shares
acquired for incentive programmes and share
buy back programme.
Other assets
Other assets include current tax assets and cash at
bank and in hand. Current tax assets are receivables
concerning tax for the year adjusted for on-account
payments and any prior-year adjustments. Cash
at bank and in hand is recognised at nominal value
at the balance sheet date. Prepayments include
expenses paid in respect of subsequent financial
years. Accrued underwriting commission relating to
the sale of insurance products is also included.
D.2 Technical provisions
Provisions for insurance contracts
Liabilities under insurance contracts
Estimates of provisions for insurance contracts
represent the Group’s most critical accounting
estimates, as these provisions involve a number of
uncertainty factors.
Claims provisions are management’s best estimate
based on actuarial and statistical projections of
claims and administration of claims including a
margin incorporating the uncertainty related to the
range of actuarial scenarios and other short and
long-term risks not reflected in standard actuarial
models. The projections are based on Tryg’s know-
ledge of historical developments, payment patterns,
reporting delays, duration of the claims settlement
process and other factors that might influence
future developments in the liabilities.
The Group makes claims provisions, in addition to
provisions for known claims, which cover estimated
compensation for losses that have been incurred,
but not yet reported to the Group (known as IBNR
reserves) and future developments in claims which
are known to the Group but have not been finally
settled. Claims provisions also include direct and
indirect claims settlement costs or loss adjustment
expenses that arise from events that have occurred
up to the statement of financial position date even
if they have not yet been reported to Tryg.
The calculation of the claims provisions is therefore
inherently uncertain and, by necessity, relies upon
the making of certain assumptions as regards factors
such as court decisions, amendments to legislation,
social inflation and other economic trends, including
inflation. The Group’s actual liability for losses may
therefore be subject to material positive or negative
deviations relative to the initially estimated claims
provisions. Claims provisions are discounted. As a
result, initial changes in discount rates or changes
in the duration of the claims provisions could have a
positive or negative effect on earnings. Discounting
affects the motor third-party liability, general third-
party liability, workers’ compensation classes, in-
cluding sickness and personal accident, in particular.
The Financial Supervisory Authority’s discount
curve, which is based on EIOPA’s yield curves, is
used to discount Danish, Norwegian and Swedish
claims provisions in relation to the relevant func-
tional currencies.
Several assumptions and estimates underlying the
calculation of the claims provisions are mutually
dependent. This has the greatest impact on as-
sumptions regarding interest rates and inflation.
Premium provisions are generally calculated ac-
cording to a best estimate of expected payments
throughout the agreed risk period; however, as a
minimum as the part of the premium calculated
using the pro rata temporis principle until the next
payment date. Adjustments are made to reflect
any risk variations. This applies to gross as well as
ceded business.
Claims and claims handling costs are expensed in
the income statement as incurred based on the esti-
mated liability for compensation owed to policyhold-
ers or third parties sustaining losses at the hands of
the policyholders. They include direct and indirect
claims handling costs that arise from events that
have occurred up to the statement of financial posi-
tion date even if they have not yet been reported to
the Group. Claims provisions are estimated using the
input of assessments for individual cases reported
to the Group and statistical analyses for the claims
incurred but not reported and the expected ultimate
cost of more complex claims that may be affected by
external factors (such as court decisions). The provi-
sions include claims handling costs.
Claims provisions are discounted. Discounting is
based on a yield curve reflecting duration applied to
the expected future payments from the provision.
Discounting affects the motor liability, professional li-
ability, workers’ compensation and personal accident
and health insurance classes, in particular. Provisions
for bonuses and premium discounts etc. represent
amounts expected to be paid to policyholders in view
of the claims experience during the financial year.
Claims provisions are determined for each line of
business based on actuarial methods. Where such
business lines encompass more than one business
area, short-tailed claims provisions are distributed
based on the number of claims reported, while
long-tailed claims provisions are distributed based
on premiums earned. The models currently used are
Chain-Ladder, Bornhuetter-Ferguson, the Loss Ratio
method and De Vylder’s credibility method. Chain-
Ladder techniques are used for lines of business with
a stable run-off pattern. The Bornhuetter-Ferguson
method, and sometimes the Loss Ratio method, are
used for claims years in which the previous run-off
provides insufficient information about the future
run-off performance. De Vylder’s credibility method
is used for areas that are somewhere in between the
Chain-Ladder and Bornhuetter-Ferguson/Loss Ratio
methods, and may also be used in situations that call
for the use of exposure targets other than premium
volume, for example the number of insured.
The provision for annuities under workers’ com-
pensation insurance is calculated on the basis of a
mortality corresponding to the G82 calculation basis
(official mortality table).

SFCR 2016 | Tryg A/S | | Contents 25
In some instances, the historic data used in the
actuarial models is not necessarily predictive of
the expected future development of claims. For
example, this is the case with legislative changes
where a priori estimate is used for premium
increases related to the expected increase in
claims. In connection with legislative changes, the
same estimate is used for determining the change
in the level of claims. Subsequently, this estimate
is maintained until new loss history materialises
which can be used for re-estimation.
Several assumptions and estimates underlying the
calculation of the claims provisions are mutually
dependent. Most importantly, this can be expected
to be the case for assumptions relating to interest
rates and inflation.
Workers’ compensation is an area in which explicit
inflation assumptions are used, with annuities for
the insured being indexed based on the work-
ers’ compensation index. An inflation curve that
reflects the market’s inflation expectations plus a
real wage spread is used as an approximation to
the workers’ compensation index.
For other lines of business, the inflation assump-
tions, because present only implicitly in the actu-
arial models, will cause a certain lag in predicting
the level of future losses when a change in inflation
occurs. On the other hand, the effect of discount-
ing will show immediately as a consequence of
inflation changes to the extent that such changes
affect the interest rate.
Other correlations are not deemed to be
significant.
Tests are continuously performed to ensure the
adequacy of the insurance provisions. In perform-
ing these tests, current best estimates of future
cash flows of claims, gains and direct and indirect
claims handling costs are used.
D.3 Other liabilities
Subordinated loan capital
Subordinated loan capital is recognised initially at
fair value, net of transaction cost incurred. Subor-
dinate loan capital is subsequently stated at amor-
tised cost; and the redemption value is recognised
in the income statement over the borrowing period
using the effective interest method. Norwegian
Natural Perils Pool is presented as subordinated
loan capital.
Pension obligations
The Group operates various pension schemes. The
schemes are funded through contributions to in-
surance companies or trustee-administered funds.
In Norway, the Group operates a defined-benefit
plan. In Denmark, the Group operates a defined-
contribution plan. A defined-contribution plan is
a pension plan under which the Group pays fixed
contributions into a separate entity (a fund) and
has no legal or constructive obligation to pay fur-
ther contributions. In Sweden, the Group complies
with the industry pension agreement, FTP-Planen.
FTP-Planen is primarily a defined-benefit plan as
regards the future pension benefits. Försäkrings-
branschens Pensionskassa (FPK) is unable to
provide sufficient information for the Group to use
defined-benefit accounting. The plan is therefore
accounted for as a defined-contribution plan.
For the defined-benefit plan recognised in the
balance sheet, an annual actuarial calculation is
made of the capital value of the future benefits to
which employees are entitled as a result of their
employment with the Group so far and which must
be disbursed according to the plan. The capital
value is calculated using the Projected Unit Credit
Method.
The capital value of the pension obligations less
the fair value of any plan assets is recognised in the
balance sheet under pension assets and pension
obligations, respectively, depending on whether
the net amount is an asset or a liability.
In case of changes to assumptions concerning the
discounting factor, inflation, mortality and disabil-
ity or in case of differences between expected and
realised returns on pension assets, actuarial gains
or losses ensue.
Other employee benefits
Tryg’s employees are entitled to a fixed payment
when they reach retirement and when they have
been employed with the Group for 25 and for 40
years. The Group recognises this liability at the
time of signing the contract of employment. In
special instances, the employee can enter into a
contract with Tryg to receive compensation for loss
of pension benefits caused by reduced working
hours. The Group recognises this liability based on
statistical models.
Income tax and deferred tax
The Group expenses current tax according to the
tax laws of the jurisdictions in which it operates.
Current tax liabilities and current tax receivables
are recognised in the balance sheet as estimated
tax on the taxable income for the year, adjusted for
change in tax on prior years’ taxable income and
for tax paid under the on-account tax scheme.
Deferred tax is measured according to the state-
ment of financial position liability method on all
timing differences between the tax and accounting
value of assets and liabilities. Deferred income tax
is measured using the tax rules and tax rates that
apply in the relevant countries on the statement
of financial position date when the deferred tax
asset is realised or the deferred income tax liability
is settled.
Deferred income tax assets, including the tax value
of tax losses carried forward, are recognised to the
extent that it is probable that future taxable profit
will be realised against which the temporary differ-
ences can be offset.
Deferred income tax is provided on temporary
differences concerning investments, except where
Tryg controls when the temporary difference will be
realised, and it is probable that the temporary differ-
ence will not be realised in the foreseeable future.
Other provisions
Provisions are recognised when the Group has a
legal or constructive obligation as a result of an
event prior to or at the statement of financial posi-
tion date, and it is probable that future economic

SFCR 2016 | Tryg A/S | | Contents 26
benefits will flow out of the Group. Provisions are
measured at the best estimate by management of
the expenditure required to settle the present obli-
gation. Provisions for restructurings are recognised
as obligations when a detailed formal restructur-
ing plan has been announced prior to or at the
balance sheet date at the latest to the persons
affected by the plan.
Own insurance is included under other provisions.
The provisions apply to the Group’s own insurance
claims and are reported when the damage occurs
according to the same principle as the Group’s
other claims provisions.
Debt
Debt comprises debt in connection with direct
insurance and reinsurance, amounts owed to credit
institutions, current tax obligations and other debt.
Derivative financial instruments are assessed at fair
value according to the same practice that applies
to financial assets. Other liabilities are assessed
at amortised cost based on the effective interest
method as a reasonable proxy for fair value.
D.4 Alternative methods for
valuation
The Group does not use alternative methods
for valuation except those mentioned in D.1.
D.5 Any other information
No other information.
SFCR 2016 | Tryg A/S | 26

Own funds
Total Tier 1 Tier 1 Tier 2 DKKm Own funds Unrestricted Restricted
Ordinary share capital (gross of own shares) 1,413 1,413Surplus funds 5,187 5,187Reconciliation reserve 57 57Subordinated liabilities 3,387 655 2,732
Total basic own funds 10,044 6,657 655 2,732
Total eligible own funds to meet SCR 9,850 6,657 655 2,538
Total eligible own funds to meet MCR 7,769 6,657 655 457
SFCR 2016 | Tryg A/S | | Contents 27
E.1 Own funds
Tryg’s capital and risk management policy pre-
scribes that Tryg must aim for a conservative and
stable risk profile on an overall level. This includes a
solid capital position, which at the same time sup-
ports Tryg’s strategic return on equity target
and dividend policy.
The dividend policy prescribes to aim for a stable
and nominally increasing dividend corresponding to
a payout ratio between 60% and 90%. Any excess
capital is paid out as extraordinary dividend. The
ordinary dividend is paid out on a quarterly basis.
The aim of a stable dividend means that Tryg’s
solvency ratio will absorb any earnings fluctuations.
This also means that Tryg does not operate with a
fixed minimum solvency level. According to the poli-
cy, the solvency ratio must be kept at a level where it
can absorb predictable shocks on a long-term basis
without the solvency of Tryg being at risk.
The capital plan, which is determined yearly by
the Supervisory Board, shows the expected devel-
opment in Tryg’s Solvency Capital Requirement
and capital buffer over a multi-year period, taking
into account the chosen strategy, the dividend
policy and the latest income forecasts. The capi-
tal plan establishes that the chosen strategy and
business plan can be realised with a reasonable
development in the solvency ratio, and that real-
istic negative deviations from current prognoses
can be absorbed. The capital contingency plan
addresses the eventuality that the assumptions
underlying the capital plan do not hold.
The Supervisory Board and its Risk Committee
consider the development of Tryg’s Solvency
Capital Requirement and capital buffer on a
quarterly basis.
Composition of own funds
Tryg’s own funds consist of Tier 1 and 2 capital,
of which some of the Tier 1 capital is restricted.
See appendix E.
Tier 1 unrestricted own funds consist of share
capital, surplus funds (primarily retained earnings
and expected profits included in future premiums),
and reconciliation reserves. During 2016, the
Tier 1 unrestricted own funds changed due to the
distribution of total dividend of DKK 2,770m and a
DKK 1,000m share buy back programme.
Tier 1 restricted own funds consist of a subordi-
nated loan of NOK 800m with perpetual maturity.
The only changes during the reporting period are
due to currency effects.
Tier 2 own funds consist of subordinated loans,
described in further detail below, and capital held for
the Norwegian Natural Perils Pool. During the year,
the Tier 2 capital was affected by a new subordi-
nated loan of SEK 1,000m corresponding to roughly
DKK 800m. Due to the restrictions on eligible Tier
2 capital, only some of the loan is considered as eligi-
ble own funds.
The funds related to the Norwegian Natural Perils
Pool are classified as Tier 2 capital according to the
updated regulations for the pool.
Differences between Tryg’s equity and own funds
Below, we list the main differences between equity in
the Group’s financial statement and own funds
for solvency purposes:
• Dividends are deducted from own funds upfront
when they are declared, but treated as equity
in the financial statements until distributed
(DKK 2,017m).
• Expected profits included in future premiums
are not part of equity but eligible in own funds
(DKK 970m).
• Intangible assets are deducted from own
funds but included in equity (DKK 884m).
• Tax elements related to valuation differences.
Expected profits and intangible assets
(DKK -27m).
• Subordinated loans are not included in
equity but partly eligible in own funds as
restricted Tier 1 and Tier 2 capital, see below
(DKK 2,732m before cap).
E. Capital management

14,000
12,000
10,000
8,000
6,000
4,000
10,286
2,471 -1,770
-1,000-1,000
120664 79 9,850
Own funds 31 Dec 2016
MiscellaneousChanges in subordinated
debt
Changes in intangible
assets
Declared extraordinary
cash dividends 2017
Extraordinary share buy back 2016
Ordinary cash dividends
ResultsOwn funds 1 Jan 2016
DKKm
Own funds
Loan terms
Bond loan Bond loan Bond loan NOK 800m NOK 1,400m SEK 1,000m
Lender Listed bonds Listed bonds Listed bondsPrincipal NOK 800m NOK 1,400m SEK 1,000mIssue price 100 100 100Issue date March 2013 November 2015 May 2016Maturity year Perpetual 2045 2046Loan may be called by lender as from 2023 2025 2021Repayment profile Interest-only Interest-only Interest-onlyInterest structure 3.75 % above NIBOR 3M (until 2023) 2.75 % above NIBOR 3M (until 2025) 2.75% above STIBOR 3M (until 2026) 4.75 % above NIBOR 3M (from 2023) 3.75 % above NIBOR 3M (from 2025) 3.75% above STIBOR 3M (from 2026)
Eligibilty of Tier 2 capital
DKKm
Tier 2, NOK 1,400m 1,145Tier 2, SEK 1,000m 779Tier 2, Norwegian NPP 822Costs from taking out the loans -14Total tier 2 capital 2,732Cap on 50% for tier 2 and 3 capital -194Total eligible tier 2 capital 2,538
SFCR 2016 | Tryg A/S | | Contents 28
Additional Information on Tryg’s own funds
The original intention was for the loan of
NOK 800m (March 2013) to be classified as
eligible Tier 2 own funds under Solvency II, and the
terms therefore contain a clause that the loan can
be repaid if regulations are changed in such a way
that the loan is no longer classified as Tier 2 own
funds. However, EIOPA has subsequently speci-
fied in the guidelines that this type of repayment
within the first five years is inconsistent with the
delegated acts, and therefore the loan cannot be
classified as Tier 2 own funds. Due to transitional
regulations, the loan is, however, to be classified
as Tier 1 own funds. See section 16 of the Danish
executive order on calculation of capital base
(Danish executive order no. 1724).
Tryg does not have ancillary own funds and does
not deduct any elements from the own funds
except for Tier 2 own funds based on eligibility,
as mentioned earlier.
Tryg Livsforsikring A/S has own funds of
DKK 146m corresponding to a solvency ratio of
287. As a legal entity, Tryg Livsforsikring A/S has
its own capital plan. The dividend policy states that
all excess capital is distributed to Tryg Forsikring A/S
and the capital contingency plan also states that
any capital inadequacy will be handled by a capital
infusion from Tryg Forsikring A/S since Tryg Livs-
forsikring A/S is a fully owned subsidiary and capi-
tal management is performed on a group basis.
Terms for Tryg’s subordinated loans
At year-end 2016, Tryg had three subordinated
loans fulfilling the Tier 1 or Tier 2 requirements.
These are:
• Tier 1, from March 2013 (call 2023),
NOK 800m
• Tier 2, from November 2015 (call 2025),
NOK 1,400m
• Tier 2, from May 2016 (call 2021),
SEK 1,000m
The terms of the loans are listed in the annual
report and are shown in the table 'Loan terms'.
The creditors have no option of calling the loans
before maturity or otherwise terminating the loan
agreements. The loans are automatically acceler-
ated upon the liquidation or bankruptcy of Tryg
Forsikring A/S. First possible calls of the above-
mentioned loans are in 2021, 2023 and 2025.
As regards the eligibility of the Tier 2 own funds,
Tryg’s Tier 2 own funds are capped as shown in the
table 'Eligibility of Tier 2 capital'.

8,000
6,000
4,000
2,000
0
-2,000
-4,000Market Health Life Default Non-life Operational Diversi�cationDeferred
tax
3,6254,441
-1,514
2,044
8234
9112,188
3,488
-1,155 -3.492 -2.641
Standard formula Partial internal model
SCRQ4 2016
6,2595,077
DKKm
SCR components
SFCR 2016 | Tryg A/S | | Contents 29
E.2 Solvency Capital Requirement and Minimum Capital Requirement
Tryg’s Solvency Capital Requirement is calculated
on the basis of a partial internal model, where insur-
ance risks are modelled using an internal model,
while other risks are described using the Solvency II
standard model. The model calculates Tryg’s capital
requirement for a 99.5% solvency level with a 1-year
horizon, which means that Tryg will be able to fulfil
its obligations in 199 out of 200 years. The partial
internal model has been applied for a number of
years and was approved by the Danish Financial
Supervisory Authority in November 2015.
The Solvency Capital Requirement (SCR) was
DKK 5,137m on 1 January 2016 and DKK 5,077m
on 31 December 2016. The Minimum Capital Re-
quirement on 31 December was DKK 2,285m. The
figure below shows the total SCR and the marginal
SCR’s for the BSCR split into submodules together
with the adjustment module and the operational risk
module for both the partial internal model and the
standard formula. See also appendix F and G.
Tryg only applies an internal model on the insurance
risks, and hence there will only be a difference on
the Health and Non-life modules, and consequently
also the adjustment module (deferred tax).
The capital requirement in the Life underwriting
module stems from Tryg Livsforsikring A/S. This
subsidiary has very little effect on Tryg’s overall SCR.
The standalone SCR for Tryg Livsforsikring A/S
is DKK 51m.
Input for the calculation of
the Minimum Capital Requirement
The Minimum Capital Requirement is calculated
according to Articles 248-253 in the Solvency II
delegated acts. This means that the calculation
takes the Solvency Capital Requirement, the
Absolute Minimum Capital Requirement, the best
estimate technical provisions, and the net premi-
ums written during the last 12 months as input.
Changes to the Solvency Capital Requirement
In September 2016, Skandia’s child insurance
portfolio was integrated into Tryg’s portfolio.
The portfolio affects both the life module and
the health module in the standard formula.
The Skandia portfolio had little effect on the
overall SCR.
E.3 Use of the duration-based equity risk sub-module in the calculation of the Solvency Capital Requirement
Not relevant for Tryg.
E.4 Differences between the standard formula and any internal model used
Tryg’s use of the partial internal model
The partial internal model is widely used
within Tryg and has a significant impact on the
decision-making processes in different areas of
the organisation:
• SCR calculation
• Capital allocation
• Reinsurance
• Dividends and capital planning
• Other ad hoc uses
The SCR calculation is the quarterly assessment
of Tryg’s capital requirement, approved by the Su-
pervisory Board and reported to the supervisors.
Internally, the SCR calculations are updated on a
monthly basis to support a more frequent update
of risk taking in Tryg.
One of the main uses of the partial internal model
is for capital allocation. Based on marginal SCRs,
Tryg allocates its equity to business units and in-
dividual products. This allows the business to use
the allocated capital as part of decision-making
processes and follow-up on strategic measures,
e.g. return on equity performance and product
gap analysis to underwriting of large clients and
affinity groups. The allocated capital also serves
as input for quarterly risk reports, where each
business unit’s material risks are described.
The SCR is calculated net of reinsurance, and
hence Tryg’s reinsurance programme has a
substantial impact on the SCR calculation. In the
process of buying reinsurance, Tryg considers the
effects on capital through the internal model and
its capital allocation to measure the effects on
the SCR and the expected return on equity.
As a part of Tryg’s risk management process,
the capital plan and capital contingency plan are
updated. In this process, multi-year projections of
the SCR are calculated and stressed. The capital
plan assesses alternative business scenarios,
which among other things serve as a base for as-
sessing potential ordinary and extraordinary cash
dividends.
Additional uses of the internal model include:
• Strategic considerations related to
the portfolio mix
• Underwriting support
• Setting the risk appetite for the
Investment Department
• M&A
• Capital calculator for investment decisions

Structure of the partial internal model
Premium Reserve
(Health)
Premium Reserve
(Non-Life)
Solvency Capital Requirement (SCR)
Adjustment (deferred tax)
Health
Non-SLT
Lapse Lapse
Catastrophe
Market
Similar to life insurance techniques
(SLT)
Basic SCR
Catastrophe
Operational
Life Non-Life Intangible AssetsDefault
SFCR 2016 | Tryg A/S | | Contents 30
Methods used in the internal model
In Tryg’s partial internal model, the insurance
risks for material parts of the portfolios in Den-
mark and Norway are modelled using an internal
model, while other risks are described using the
Solvency II standard model.
The standard formula calculates marginal capital
requirements using predetermined charges and
then correlates the marginal requirements into an
overall capital requirement. The internal model has
the same structure as the standard formula, but
the marginal capital requirements are estimated
differently. For the underwriting risk, Tryg uses
conventional recognised statistical methods to
fit a distribution. For the reserve risk, Tryg has
developed a stochastic model around the methods
used in the reserving unit. Thus, Tryg models the
distribution of the reserves and estimated ultimate
losses based on the company’s reserving models
and infers the distribution of future run-off from
this. The more direct approach, where a distribu-
tion is fitted directly to the run-off results from the
accounts, has been rejected, since this will typically
lead to marked underestimation of the capital
requirement.
The modules covered by the partial internal model
replace the equivalent modules in the standard
formula. Thus, the integration of the insurance
risks into the standard formula is done in such
a way that the structure of the solvency capital
requirement follows the structure of the standard
formula. For the integration of the internal model
with the standard formula to make sense, the
internal model is based on the same risk measure
and time horizon as the standard formula, i.e. the
SCR is calculated as a 99.5% Value-at-Risk with a
one-year horizon.
Data used in the internal model
Before data is used in the internal model, it goes
through a process of controls and quality assess-
ments in order to reflect the risk profile of Tryg in the
best possible way. This process is well described in
the documentation of the internal model.
Structure of the partial internal model. The red boxes are modelled internally.

SFCR 2016 | Tryg A/S | | Contents 31
E.5 Non-compliance with the Minimum Capital Requirement and non-compliance with the Solvency Capital Requirement
Tryg A/S, Tryg Forsikring A/S, and Tryg Livs-
forsikring A/S are compliant with the Minimum
Capital Requirement and the Solvency Capital
Requirement and have not previously been
non-compliant with any of these.
E.6 Any other information
As an overall part of Tryg’s capital management,
Tryg regularly monitors the impact of paying out
ordinary and extraordinary dividends.
The purpose of Tryg’s dividend policy is to achieve
a high degree of stability in the annual distribu-
tion. The dividend policy reflects our expectations
of high earnings in the insurance business and a
low-risk profile in our investment activities, as well
as the requirement to have a solid capital position
based on Tryg’s internal capital model (Solvency
Capital Requirement).
Tryg’s dividend policy is based on the following
assumptions:
• A general objective of creating long-term
value for the company’s shareholders.
• A competitive dividend policy in comparison
with those of our Nordic competitors.
• Distribution of 60-90% of the profit after tax.
• Ambition of distributing a dividend which
is steadily increasing in nominal terms on
a full-year basis.
• The capital level must at all times reflect
the return on equity targets and the
statutory capital requirements.
• The capital level may extraordinarily
be adjusted through the distribution
of extraordinary dividend.
The Q4 cash dividend is approved at the annual
general meeting. As of Q1 2017, Tryg pays out
quarterly dividend.
SFCR 2016 | Tryg A/S | 31

SFCR 2016 | Tryg A/S | | Contents 32
Contents – Appendix
33 Appendix A Undertakings in
the scope of Tryg Group
34 Appendix B Premiums, claims
and expenses by country, Tryg Group
36 Appendix C Premiums, claims and
expenses by line of business, Tryg Group
41 Appendix D Balance sheet, Tryg Group
42 Appendix E Own funds, Tryg Group
44 Appendix F Solvency Capital Requirement
– standard formula, Tryg Group
45 Appendix G Solvency Capital Requirement
– partial internal model, Tryg Group
SFCR 2016 | Tryg A/S | 32| Contents

| Contents 33SFCR 2016 | Tryg A/S |
Type of code Identification code of of the ID of Legal Name of Type of Category Supervisory Contry, DKKm the undertaking the undertaking the undertaking undertaking Legal form (mutual/non mutual) Authority
Denmark 53070 2 Tryg Forsikring A/S 2 Private limited company 2 The Danish Financial Supervisory AuthorityDenmark 63031 2 Tryg livsforsikring A/S 1 Private limited company 2 The Danish Financial Supervisory AuthorityDenmark 31369878 2 Tryg Ejendomme A/S 10 private limited company 2 ErhvervsstyrelsenNorway 956331013 2 Respons Inkasso AS 10 private limited company 2 BrønnøysundregistreneNorway 946919845 2 Thunesvei AS 10 private limited company 2 Brønnøysundregistrene
Ranking criteria (in the group currency)
Turn over defined Written premiums as the gross revenue net of reinsurance under IFRS or local Total balance Total balance Total balance ceded under IFRS GAAP for other types sheet (for EEA sheet (for other sheet (non- or local GAAP of undertakings (re)insurance regulated regulated for (re)insurance or insurance Underwriting Investment Total Accounting Contry, DKKm undertakings) undertakings) undertakings) undertakings holding companies performance performance performance standard
Denmark 49,527 0 0 16,594 0 2,311 925 2,525 2Denmark 1,146 0 0 38 0 40 -13 21 2Denmark 0 0 3,000 0 629 0 0 490 2Norway 6 0 0 0 1 0 0 1 2Norway 0 0 130 0 7 0 0 7 2
Inclusion in the scope Group solvency Criteria of influence of Group supervision calculation
% used for the establishment Method used and of accounting Proportional share under method 1, consolidated used for group Date of decision if treatment of Contry, DKKm % capital share accounts % voting rights Other criteria Level of influence solvency calculation YES/NO art, 214 is applied the undertaking
Denmark 100 100 100 - 1 100% 1 - 1Denmark 100 100 100 - 1 100% 1 - 1Denmark 100 100 100 - 1 0% 1 - 1Norway 100 100 100 - 1 0% 1 - 1Norway 100 100 100 - 1 0% 1 - 1
Appendix A Undertakings in the scope of Tryg GroupAppendix I: Quantitative reporting templates | Undertakings in the scope of the Group | S.32.01.g

| Contents 34SFCR 2016 | Tryg A/S |
Appendix B Premiums, claims and expenses by country, Tryg GroupAppendix I: Quantitative reporting templates | Premiums, claims and expenses by country | S.05.02.g
Top 5 countries (by amount of gross premiums written)
Total Top 5 and Non-life obligations, DKKm Home contry Finland Norway Sweden home country
Premiums written Gross – Direct Business 9,580 35 6,256 1,933 17,804Gross – Proportional reinsurance accepted 0 0 0 0 0Gross – Non-proportional reinsurance accepted 0 0 0 0 0Reinsurers’ share 620 21 482 87 1,210Net 8,960 14 5,774 1,846 16,594
Premiums earned Gross – Direct Business 9,603 34 6,421 1,913 17,970Gross – Proportional reinsurance accepted 0 0 0 0 0Gross – Non-proportional reinsurance accepted 0 0 0 0 0Reinsurers’ share 648 21 444 85 1,197Net 8,955 13 5,977 1,828 16,773
Claims incurred Gross – Direct Business -5,307 -8 -3,614 -1,292 -10,220Gross – Proportional reinsurance accepted 0 0 0 0 0Gross – Non-proportional reinsurance accepted 0 0 0 0 0Reinsurers’ share -159 -2 -75 -10 -246Net -5,148 -5 -3,539 -1,282 -9,974
Changes in other technical provisions Gross – Direct Business -211 0 -50 -24 -286Gross – Proportional reinsurance accepted 0 0 0 0 0Gross – Non-proportional reinsurance accepted 0 0 0 0 0Reinsurers’ share 0 0 0 0 0Net -211 0 -50 -24 -286
Expenses incurred -2,272 6 -1,388 -476 -4,130
Other expenses 0
Total expenses -4,130

| Contents 35SFCR 2016 | Tryg A/S |
Appendix B Premiums, claims and expenses by country, Tryg Group (continued)Appendix I: Quantitative reporting templates | Premiums, claims and expenses by country | S.05.02.g
Top 5 countries (by amount of gross premiums written) Total Top 5 and Life obligations, DKKm 1) Home contry Sweden home country
Premiums written Gross 38 0 38Reinsurers’ share 0 0 0Net 38 0 38
Premiums earned Gross 23 0 23Reinsurers’ share 0 0 0Net 23 0 23
Claims incurred Gross -7 0 -7Reinsurers’ share 0 0 0Net -7 0 -7
Changes in other technical provisions Gross 0 0 0Reinsurers’ share 0 0 0Net 0 0 0
Expenses incurred 1 0 1
Other expenses 0
Total expenses 1
1) In 2016, Tryg established the life insurance company Tryg Livsforsikring A/S. The activity of Tryg Livsforsikring is child and adult accident insurance, which is part of the portfolio Tryg acquired from Skandia. For this part of the portfolio, there are no renewals. The portfolio integrated in Moderna Försäkringar is renewed.
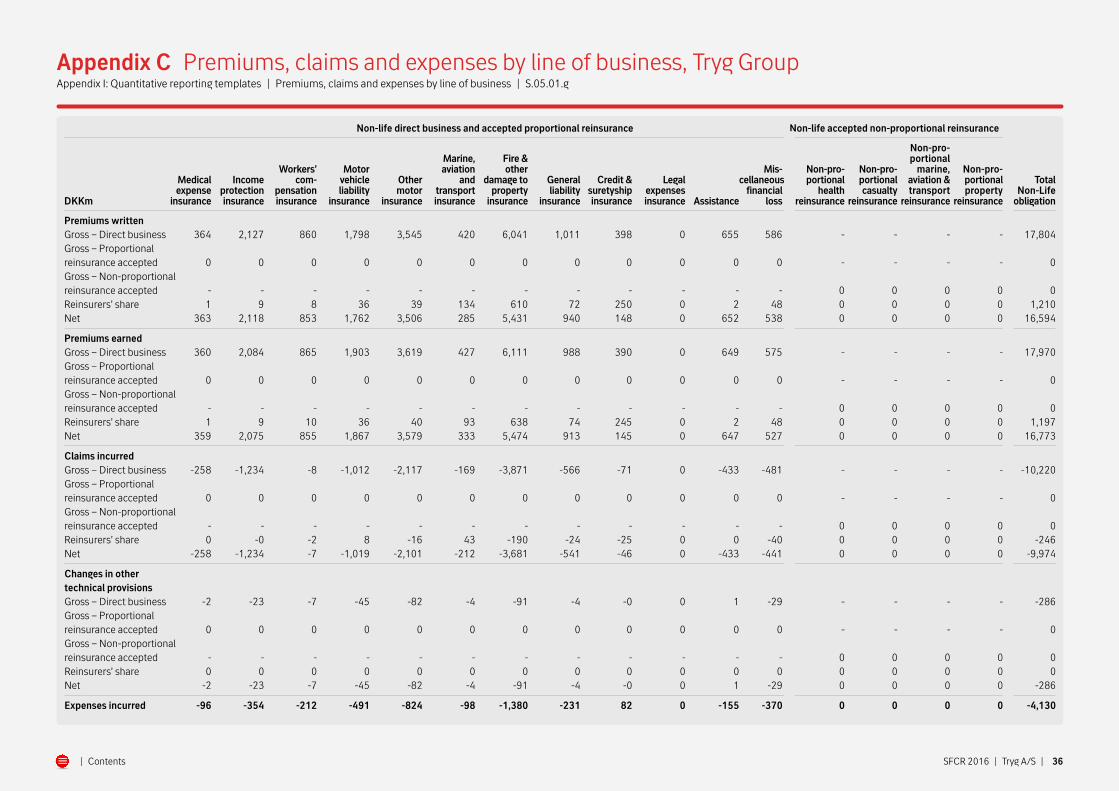
| Contents 36SFCR 2016 | Tryg A/S |
Non-life direct business and accepted proportional reinsurance Non-life accepted non-proportional reinsurance
Non-pro- Marine, Fire & portional Workers’ Motor aviation other Mis- Non-pro- Non-pro- marine, Non-pro- Medical Income com- vehicle Other and damage to General Credit & Legal cellaneous portional portional aviation & portional Total expense protection pensation liability motor transport property liability suretyship expenses financial health casualty transport property Non-Life DKKm insurance insurance insurance insurance insurance insurance insurance insurance insurance insurance Assistance loss reinsurance reinsurance reinsurance reinsurance obligation
Premiums written Gross – Direct business 364 2,127 860 1,798 3,545 420 6,041 1,011 398 0 655 586 - - - - 17,804Gross – Proportional reinsurance accepted 0 0 0 0 0 0 0 0 0 0 0 0 - - - - 0Gross – Non-proportional reinsurance accepted - - - - - - - - - - - - 0 0 0 0 0Reinsurers’ share 1 9 8 36 39 134 610 72 250 0 2 48 0 0 0 0 1,210Net 363 2,118 853 1,762 3,506 285 5,431 940 148 0 652 538 0 0 0 0 16,594
Premiums earned Gross – Direct business 360 2,084 865 1,903 3,619 427 6,111 988 390 0 649 575 - - - - 17,970Gross – Proportional reinsurance accepted 0 0 0 0 0 0 0 0 0 0 0 0 - - - - 0Gross – Non-proportional reinsurance accepted - - - - - - - - - - - - 0 0 0 0 0Reinsurers’ share 1 9 10 36 40 93 638 74 245 0 2 48 0 0 0 0 1,197Net 359 2,075 855 1,867 3,579 333 5,474 913 145 0 647 527 0 0 0 0 16,773
Claims incurred Gross – Direct business -258 -1,234 -8 -1,012 -2,117 -169 -3,871 -566 -71 0 -433 -481 - - - - -10,220Gross – Proportional reinsurance accepted 0 0 0 0 0 0 0 0 0 0 0 0 - - - - 0Gross – Non-proportional reinsurance accepted - - - - - - - - - - - - 0 0 0 0 0Reinsurers’ share 0 -0 -2 8 -16 43 -190 -24 -25 0 0 -40 0 0 0 0 -246Net -258 -1,234 -7 -1,019 -2,101 -212 -3,681 -541 -46 0 -433 -441 0 0 0 0 -9,974
Changes in other technical provisions Gross – Direct business -2 -23 -7 -45 -82 -4 -91 -4 -0 0 1 -29 - - - - -286Gross – Proportional reinsurance accepted 0 0 0 0 0 0 0 0 0 0 0 0 - - - - 0Gross – Non-proportional reinsurance accepted - - - - - - - - - - - - 0 0 0 0 0Reinsurers’ share 0 0 0 0 0 0 0 0 0 0 0 0 0 0 0 0 0Net -2 -23 -7 -45 -82 -4 -91 -4 -0 0 1 -29 0 0 0 0 -286
Expenses incurred -96 -354 -212 -491 -824 -98 -1,380 -231 82 0 -155 -370 0 0 0 0 -4,130
Appendix C Premiums, claims and expenses by line of business, Tryg GroupAppendix I: Quantitative reporting templates | Premiums, claims and expenses by line of business | S.05.01.g

| Contents 37SFCR 2016 | Tryg A/S |
Non-life direct business and accepted proportional reinsurance Non-life accepted non-proportional reinsurance
Non-pro- Marine, Fire & portional Workers’ Motor aviation other Mis- Non-pro- Non-pro- marine, Non-pro- Medical Income com- vehicle Other and damage to General Credit & Legal cellaneous portional portional aviation & portional Total expense protection pensation liability motor transport property liability suretyship expenses financial health casualty transport property Non-Life DKKm insurance insurance insurance insurance insurance insurance insurance insurance insurance insurance Assistance loss reinsurance reinsurance reinsurance reinsurance obligation
Administrative expenses Gross – Direct business -5 -33 -11 -53 -81 -13 -117 -22 104 0 -10 -100 - - - - -341Gross – Proportional reinsurance accepted 0 0 0 0 0 0 0 0 0 0 0 0 - - - - 0Gross – Non-proportional reinsurance accepted - - - - - - - - - - - - 0 0 0 0 0Reinsurers’ share 0 0 0 0 0 0 0 0 0 0 0 0 0 0 0 0 0Net -5 -33 -11 -53 -81 -13 -117 -22 104 0 -10 -100 0 0 0 0 -341
Investment management expenses Gross – Direct business 0 0 0 0 0 0 0 0 0 0 0 0 - - - - 0Gross – Proportional reinsurance accepted 0 0 0 0 0 0 0 0 0 0 0 0 - - - - 0Gross – Non-proportional reinsurance accepted - - - - - - - - - - - - 0 0 0 0 0Reinsurers’ share 0 0 0 0 0 0 0 0 0 0 0 0 0 0 0 0 0Net 0 0 0 0 0 0 0 0 0 0 0 0 0 0 0 0 0
Claims management expenses Gross – Direct business -34 -53 -70 -104 -180 -20 -307 -51 -6 0 -40 -92 - - - - -956Gross – Proportional r einsurance accepted 0 0 0 0 0 0 0 0 0 0 0 0 - - - - 0Gross – Non-proportional reinsurance accepted - - - - - - - - - - - - 0 0 0 0 0Reinsurers’ share 0 0 0 0 0 0 0 0 0 0 0 0 0 0 0 0 0Net -34 -53 -70 -104 -180 -20 -307 -51 -6 0 -40 -92 0 0 0 0 -956
Acquisition expenses Gross – Direct business -21 -134 -49 -148 -250 -28 -428 -70 -0 0 -46 -33 - - - - -1,206Gross – Proportional reinsurance accepted 0 0 0 0 0 0 0 0 0 0 0 0 - - - - 0Gross – Non-proportional reinsurance accepted - - - - - - - - - - - - 0 0 0 0 0Reinsurers’ share 0 0 0 0 0 0 0 0 0 0 0 0 0 0 0 0 0Net -21 -134 -49 -148 -250 -28 -428 -70 -0 0 -46 -33 0 0 0 0 -1,206
Appendix C Premiums, claims and expenses by line of business, Tryg Group (continued)Appendix I: Quantitative reporting templates | Premiums, claims and expenses by line of business | S.05.01.g

| Contents 38SFCR 2016 | Tryg A/S |
Non-life direct business and accepted proportional reinsurance Non-life accepted non-proportional reinsurance
Non-pro- Marine, Fire & portional Workers’ Motor aviation other Mis- Non-pro- Non-pro- marine, Non-pro- Medical Income com- vehicle Other and damage to General Credit & Legal cellaneous portional portional aviation & portional Total expense protection pensation liability motor transport property liability suretyship expenses financial health casualty transport property Non-Life DKKm insurance insurance insurance insurance insurance insurance insurance insurance insurance insurance Assistance loss reinsurance reinsurance reinsurance reinsurance obligation
Overhead expenses Gross – Direct business -36 -135 -81 -187 -313 -38 -528 -88 -16 0 -59 -145 - - - - -1,626Gross – Proportional reinsurance accepted 0 0 0 0 0 0 0 0 0 0 0 0 - - - - 0Gross – Non-proportional reinsurance accepted - - - - - - - - - - - - 0 0 0 0 0Reinsurers’ share 0 0 0 0 0 0 0 0 0 0 0 0 0 0 0 0 0Net -36 -135 -81 -187 -313 -38 -528 -88 -16 0 -59 -145 0 0 0 0 -1,626
Other expenses 0
Total expenses -4,130
Appendix C Premiums, claims and expenses by line of business, Tryg Group (continued)Appendix I: Quantitative reporting templates | Premiums, claims and expenses by line of business | S.05.01.g

| Contents 39SFCR 2016 | Tryg A/S |
Life insurance Life reinsurance
Annuities stemming Annuities stemming from non-life insurance Index-linked from non-life contracts and relating to Insurance and insurance contracts insurance obligations Health with profit unit-linked Other life and relating to health other than health Health Life Total Life DKKm insurance participation insurance insurance insurance obligations insurance obligations reinsurance reinsurance obligation
Premiums written Gross 38 0 0 0 0 0 0 0 38Reinsurers’ share 0 0 0 0 0 0 0 0 0Net 38 0 0 0 0 0 0 0 38
Premiums earned Gross 23 0 0 0 0 0 0 0 23Reinsurers’ share 0 0 0 0 0 0 0 0 0Net 23 0 0 0 0 0 0 0 23
Claims incurred Gross -7 0 0 0 0 0 0 0 -7Reinsurers’ share 0 0 0 0 0 0 0 0 0Net -7 0 0 0 0 0 0 0 -7
Changes in other technical provisions Gross 0 0 0 0 0 0 0 0 0Reinsurers’ share 0 0 0 0 0 0 0 0 0Net 0 0 0 0 0 0 0 0 0
Expenses incurred 1 0 0 0 0 0 0 0 1Administrative expenses Gross 0 0 0 0 0 0 0 0 0Reinsurers’ share 0 0 0 0 0 0 0 0 0Net 0 0 0 0 0 0 0 0 0
Investment management expenses Gross 0 0 0 0 0 0 0 0 0Reinsurers’ share 0 0 0 0 0 0 0 0 0Net 0 0 0 0 0 0 0 0 0
Claims management expenses Gross 1 0 0 0 0 0 0 0 1Reinsurers’ share 0 0 0 0 0 0 0 0 0Net 1 0 0 0 0 0 0 0 1
Appendix C Premiums, claims and expenses by line of business, Tryg Group (continued)Appendix I: Quantitative reporting templates | Premiums, claims and expenses by line of business | S.05.01.g

| Contents 40SFCR 2016 | Tryg A/S |
Life insurance Life reinsurance
Annuities stemming Annuities stemming from non-life insurance Index-linked from non-life contracts and relating to Insurance and insurance contracts insurance obligations Health with profit unit-linked Other life and relating to health other than health Health Life Total Life DKKm insurance participation insurance insurance insurance obligations insurance obligations reinsurance reinsurance obligation
Acquisition expenses Gross 0 0 0 0 0 0 0 0 0Reinsurers’ share 0 0 0 0 0 0 0 0 0Net 0 0 0 0 0 0 0 0 0
Overhead expenses Gross 0 0 0 0 0 0 0 0 0Reinsurers’ share 0 0 0 0 0 0 0 0 0Net 0 0 0 0 0 0 0 0 0
Other expenses - - - - - - - - 0
Total expenses - - - - - - - - 1
Total amount of surrenders 0 0 0 0 0 0 0 0 0
Appendix C Premiums, claims and expenses by line of business, Tryg Group (continued)Appendix I: Quantitative reporting templates | Premiums, claims and expenses by line of business | S.05.01.g
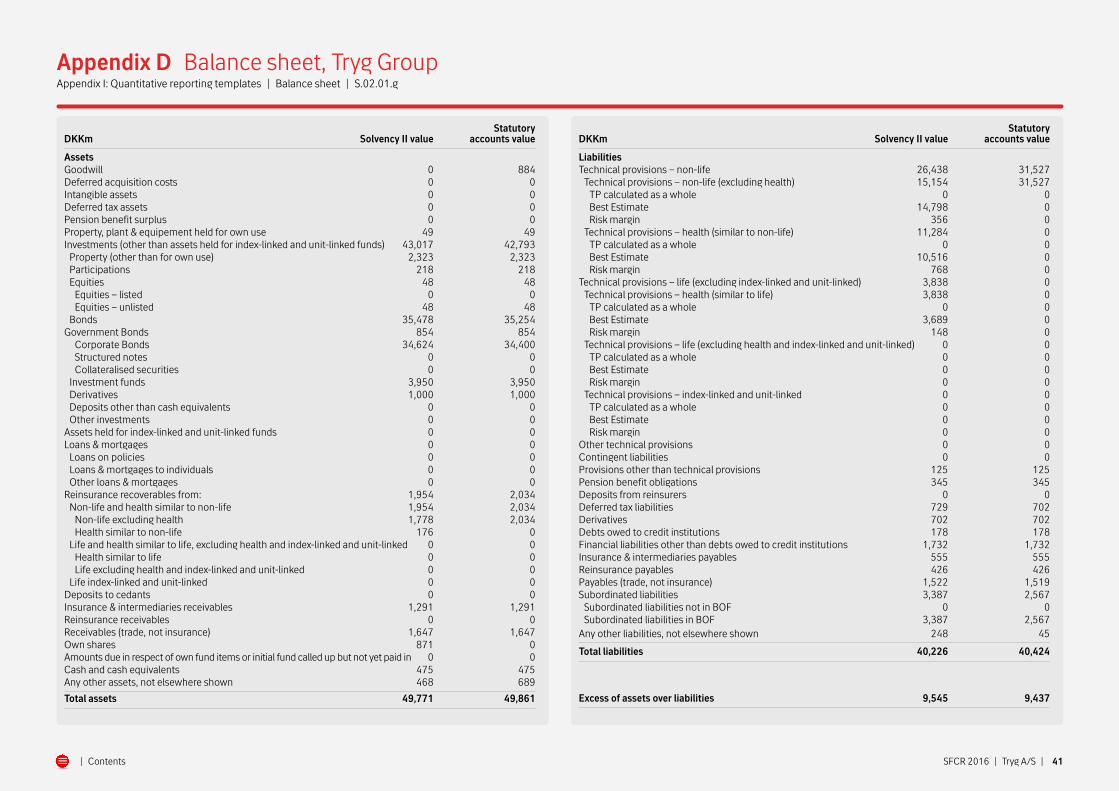
| Contents 41SFCR 2016 | Tryg A/S |
Statutory DKKm Solvency II value accounts value
Assets Goodwill 0 884Deferred acquisition costs 0 0Intangible assets 0 0Deferred tax assets 0 0Pension benefit surplus 0 0Property, plant & equipement held for own use 49 49Investments (other than assets held for index-linked and unit-linked funds) 43,017 42,793 Property (other than for own use) 2,323 2,323 Participations 218 218 Equities 48 48 Equities – listed 0 0 Equities – unlisted 48 48 Bonds 35,478 35,254Government Bonds 854 854 Corporate Bonds 34,624 34,400 Structured notes 0 0 Collateralised securities 0 0 Investment funds 3,950 3,950 Derivatives 1,000 1,000 Deposits other than cash equivalents 0 0 Other investments 0 0Assets held for index-linked and unit-linked funds 0 0Loans & mortgages 0 0 Loans on policies 0 0 Loans & mortgages to individuals 0 0 Other loans & mortgages 0 0Reinsurance recoverables from: 1,954 2,034 Non-life and health similar to non-life 1,954 2,034 Non-life excluding health 1,778 2,034 Health similar to non-life 176 0 Life and health similar to life, excluding health and index-linked and unit-linked 0 0 Health similar to life 0 0 Life excluding health and index-linked and unit-linked 0 0 Life index-linked and unit-linked 0 0Deposits to cedants 0 0Insurance & intermediaries receivables 1,291 1,291Reinsurance receivables 0 0Receivables (trade, not insurance) 1,647 1,647Own shares 871 0Amounts due in respect of own fund items or initial fund called up but not yet paid in 0 0Cash and cash equivalents 475 475Any other assets, not elsewhere shown 468 689
Total assets 49,771 49,861
Statutory DKKm Solvency II value accounts value
Liabilities Technical provisions – non-life 26,438 31,527 Technical provisions – non-life (excluding health) 15,154 31,527 TP calculated as a whole 0 0 Best Estimate 14,798 0 Risk margin 356 0 Technical provisions – health (similar to non-life) 11,284 0 TP calculated as a whole 0 0 Best Estimate 10,516 0 Risk margin 768 0Technical provisions – life (excluding index-linked and unit-linked) 3,838 0 Technical provisions – health (similar to life) 3,838 0 TP calculated as a whole 0 0 Best Estimate 3,689 0 Risk margin 148 0 Technical provisions – life (excluding health and index-linked and unit-linked) 0 0 TP calculated as a whole 0 0 Best Estimate 0 0 Risk margin 0 0 Technical provisions – index-linked and unit-linked 0 0 TP calculated as a whole 0 0 Best Estimate 0 0 Risk margin 0 0Other technical provisions 0 0Contingent liabilities 0 0Provisions other than technical provisions 125 125Pension benefit obligations 345 345Deposits from reinsurers 0 0Deferred tax liabilities 729 702Derivatives 702 702Debts owed to credit institutions 178 178Financial liabilities other than debts owed to credit institutions 1,732 1,732Insurance & intermediaries payables 555 555Reinsurance payables 426 426Payables (trade, not insurance) 1,522 1,519Subordinated liabilities 3,387 2,567 Subordinated liabilities not in BOF 0 0 Subordinated liabilities in BOF 3,387 2,567Any other liabilities, not elsewhere shown 248 45
Total liabilities 40,226 40,424
Excess of assets over liabilities 9,545 9,437
Appendix D Balance sheet, Tryg GroupAppendix I: Quantitative reporting templates | Balance sheet | S.02.01.g

| Contents 42SFCR 2016 | Tryg A/S |
Appendix E Own funds, Tryg GroupAppendix I: Quantitative reporting templates | Own funds | S.23.01.g
Basic own funds, DKKm Total Tier 1 – unrestricted Tier 1 – restricted Tier 2 Tier 3
Ordinary share capital (gross of own shares) 1,413 1,413 - 0 -Non-available called but not paid in ordinary share capital at group level 0 0 - 0 -Share premium account related to ordinary share capital 0 0 - 0 -Iinitial funds, members’ contributions or the equivalent basic own – fund item for mutual and mutual-type undertakings 0 0 - 0 -Subordinated mutual member accounts 0 - 0 0 0Non-available subordinated mutual member accounts at group level 0 - 0 0 0Surplus funds 5,187 5,187 - - -Non-available surplus funds at group level 0 0 - - -Preference shares 0 - 0 0 0Non-available preference shares at group level 0 - 0 0 0Share premium account related to preference shares 0 - 0 0 0Non-available share premium account related to preference shares at group level 0 - 0 0 0Reconciliation reserve 57 57 - - -Subordinated liabilities 3,387 - 655 2,733 0Non-available subordinated liabilities at group level 0 - 0 0 0An amount equal to the value of net deferred tax assets 0 - - - 0The amount equal to the value of net deferred tax assets not available at the group level 0 - - - 0Other items approved by supervisory authority as basic own funds not specified above 0 0 0 0 0Non available own funds related to other own funds items approved by supervisory authority 0 0 0 0 0Minority interests (if not reported as part of a specific own fund item) 0 0 0 0 0Non-available minority interests at group level 0 0 0 0 0 Own funds from the financial statements that should not be represented by the reconciliation reserve and do not meet the criteria to be classified as Solvency II own funds Own funds from the financial statements that should not be represented by the reconciliation reserve and do not meet the criteria to be classified as Solvency II own funds 0
Deductions Total Tier 1 – unrestricted Tier 1 – restricted Tier 2 Tier 3
Deductions for participations in financial and credit institutions 0 0 0 0 -whereof deducted according to art 228 of the Directive 2009/138/EC 0 0 0 0 -Deductions for participations where there is non-availability of information (Article 229) 0 0 0 0 0Deduction for participations included by using D&A when a combination of methods is used 0 0 0 0 0Total of non-available own fund items 0 0 0 0 0Total deductions 0 0 0 0 0
Total basic own funds after deductions Total Tier 1 – unrestricted Tier 1 – restricted Tier 2 Tier 3
Total basic own funds after deductions 10,044 6,657 655 2,733 0

| Contents 43SFCR 2016 | Tryg A/S |
Appendix E Own funds, Tryg Group (continued)Appendix I: Quantitative reporting templates | Own funds | S.23.01.g
Ancillary own funds, DKKm Total Tier 1 – unrestricted Tier 1 – restricted Tier 2 Tier 3
Unpaid and uncalled ordinary share capital callable on demand 0 - - 0 -Unpaid and uncalled initial funds, members’ contributions or the equivalent basic own fund item for mutual and mutual – type undertakings, callable on demand 0 - - 0 -Unpaid and uncalled preference shares callable on demand 0 - - 0 0A legally binding commitment to subscribe and pay for subordinated liabilities on demand 0 - - 0 0Letters of credit and guarantees under Article 96(2) of the Framework Directive 0 - - 0 -Letters of credit and guarantees other than under Article 96(2) of the Framework Directive 0 - - 0 0Supplementary members calls under Article 96(3) of the Framework Directive 0 - - 0 -Supplementary members calls – other than under Article 96(3) of the Framework Directive 0 - - 0 0Non available ancillary own funds at group level 0 - - 0 0Other ancillary own funds 0 - - 0 0Credit Institutions, investment firms, financial insitutions, alternative investment fund manager, financial institutions 0 0 0 0 -Institutions for occupational retirement provision 0 0 0 0 -Non regulated entities carrying out financial activities 0 0 0 0 -Total own funds of other financial sectors 0 0 0 0 -Own funds aggregated when using the D&A and combination of method 0 0 0 0 0Own funds aggregated when using the D&A and a combination of method net of IGT 0 0 0 0 0Total available own funds to meet the consolidated group SCR (excluding own funds from other financial sector and from the undertakings included via D&A ) 10,044 6,657 655 2,733 0Total eligible own funds to meet the consolidated group SCR (excluding own funds from other financial sector and from the undertakings included via D&A ) 9,850 6,657 655 2,539 0Total eligible own funds to meet the minimum consolidated group SCR 7,769 6,657 655 457 -Total ancillary own funds 0 - - 0 0Total eligible own funds to meet the group SCR (including own funds from other financial sector and from the undertakings included via D&A ) 9,850 6,657 655 2,539 0 Consolidated Group SCR 5,077 Minimum consolidated Group SCR (Article 230) 2,285 Ratio of Eligible own funds to the consolidated Group SCR 194% Ratio of Eligible own funds to Minimum Consolidated Group SCR 340% SCR for entities included with D&A method 0 Group SCR 5,077 Ratio of Eligible own funds to group SCR 194% Reconciliation reserve Excess of assets over liabilities 9,545Own shares (included as assets on the balance sheet) 871Forseeable dividends and distributions 2,017Other basic own fund items 6,600Restricted own fund items due to ring fencing 0Other non available own funds 0Reconciliation reserve 57Expected profits -Expected profits included in future premiums (EPIFP) – Life business 0Expected profits included in future premiums (EPIFP) – Non- life business 970Total EPIFP 970

| Contents 44SFCR 2016 | Tryg A/S |
Appendix F Solvency Capital Requirement – standard formula, Tryg GroupAppendix I: Quantitative reporting templates | Solvency Capital Requirement – for undertakings on standard formula or partial internal models | S.25.01.g
Allocation from adjustments Gross due to RFF and Net solvency capital solvency capital Matching adjust- Solvency Capital Requirement calculated using standard formula, DKKm requirement requirement ments portfolios
Market risk 2,044 2,044 0Counterparty default risk 234 234 0Life underwriting risk 8 8 0Health underwriting risk 3,625 3,625 0Non-life underwriting risk 4,441 4,441 0Diversification -3,492 -3,492 -Intangible asset risk 0 0 -
Basic Solvency Capital Requirement 6,861 6,861 -
Calculation of Solvency Capital Requirement Adjustment due to RFF/MAP nSCR aggregation 0 Operational risk 911 Loss-absorbing capacity of technical provisions 0 Loss-absorbing capacity of deferred taxes -1,514 Capital requirement for business operated in accordance with Art. 4 of Directive 2003/41/EC 0 Solvency Capital Requirement excluding capital add-on 6,259 Capital add-on already set 0
Solvency capital requirement for undertakings under consolidated method 6,259
Other information on SCR Capital requirement for duration-based equity risk sub-module 0 Total amount of Notional Solvency Capital Requirements for remaining part 0 Total amount of Notional Solvency Capital Requirements for ring fenced funds 0 Total amount of Notional Solvency Capital Requirement for matching adjustment portfolios 0 Diversification effects due to RFF nSCR aggregation for article 304 0 Method used to calculate the adjustment due to RFF/MAP nSCR aggregation Net future discretionary benefits 0 Minimum consolidated group solvency capital requirement 2,816
Information on other entities Capital requirement for other financial sectors (Non-insurance capital requirements) 0 Capital requirement for other financial sectors (Non-insurance capital requirements) – Credit institutions, investment firms and financial institutions, alternative investment funds managers, UCITS management companies 0 Capital requirement for other financial sectors (Non-insurance capital requirements) – Institutions for occupational retirement provisions 0 Capital requirement for other financial sectors (Non-insurance capital requirements) – Capital requirement for non-regulated entities carrying out financial activities 0 Capital requirement for non-controlled participation requirements 0 Capital requirement for residual undertakings 0
Overall SCR SCR for undertakings included via D and A 0
Solvency capital requirement 6,259

| Contents 45SFCR 2016 | Tryg A/S |
Appendix G Solvency Capital Requirement – partial internal model, Tryg GroupAppendix I: Quantitative reporting templates | Solvency Capital Requirement – for undertakings using the standard formula and partial internal model | S.25.02.g
DKKm
Allocation from Consideration of the adjustments due to future management Calculation of the RFF and matching actions regarding Components Solvency Capital adjustments technical provisions Unique number of component description Requirement portfolios and/or deferred taxes Amount modelled
1 Market risk 2,044 0 - 02 Counterparty default risk 234 0 - 03 Life underwriting risk 8 0 - 04 Health underwriting risk 2,188 0 - 1,0585 Non-life underwriting risk 3,488 0 - 2,3996 Intangible asset risk 0 0 - 07 Operational risk 911 0 - 08 LAC Technical Provisions 0 0 - 09 LAC Deferred Taxes -1,155 0 - 0
Calculation of Solvency Capital Requirement Total undiversified components 7,718 Diversification -2,641 Adjustment due to RFF/MAP nSCR aggregation 0 Capital requirement for business operated in accordance with Art, 4 of Directive 2003/41/EC 0 Solvency capital requirement excluding capital add-on 5,077 Capital add-ons already set 0 Solvency capital requirement for undertakings under consolidated method 5,077 Other information on SCR Amount/estimate of the overall loss-absorbing capacity of technical provisions 0 Amount/estimate of the overall loss-absorbing capacity of deferred taxes 0 Capital requirement for duration-based equity risk sub-module 0 Total amount of Notional Solvency Capital Requirements for remaining part 0 Total amount of Notional Solvency Capital Requirement for ring fenced funds 0 Total amount of Notional Solvency Capital Requirement for matching adjustment portfolios 0 Diversification effects due to RFF nSCR aggregation for article 304 0 Method used to calculate the adjustment due to RFF/MAP nSCR aggregation Net future discretionary benefits 0 Minimum consolidated group solvency capital requirement 2,285 Information on other entities Capital requirement for other financial sectors (Non-insurance capital requirements) 0 Capital requirement for other financial sectors (Non-insurance capital requirements) – Credit institutions, investment firms and financial institutions, alternative investment funds managers, UCITS management companies 0 Capital requirement for other financial sectors (Non-insurance capital requirements) – Institutions for occupational retirement provisions 0 Capital requirement for other financial sectors (Non-insurance capital requirements) – Capital requirement for non- regulated entities carrying out financial activities 0 Capital requirement for non-controlled participation requirements 0 Capital requirement for residual undertakings 0 Overall SCR SCR for undertakings included via D and A 0 Solvency capital requirement 5,077