group solvency and financial condition report 2021
TRANSCRIPT

Group Solvency andFinancial Condition ReportThe United Kingdom Mutual Steam Ship Assurance Association Limited
Year ended 20th February 2021

Group Solvency and Financial Condition
Report
The United Kingdom Mutual Steam Ship Assurance Association Limited
Year ended 20 February 2021

1 | P a g e
Contents
A. Summary ..................................................................................................... 3
Directors’ Statement ........................................................................................ 4
A.1. Business ................................................................................................. 12
A.2. Underwriting performance ...................................................................... 13
A.3. Investment performance ......................................................................... 15
A.4. Performance from other activities ........................................................... 16
A.5. Any other information ............................................................................. 16
B. System of Governance .............................................................................. 17
B.1. General Information on the System of Governance ................................ 17
B.1.1. Overview.............................................................................................. 17
B.1.1.1. Committee Structure ......................................................................... 17
B.1.1.2. Key Functions ................................................................................... 18
B.1.2. Remuneration ...................................................................................... 18
B.1.3. Related party transactions ................................................................... 18
B.1.4. Board remuneration ............................................................................. 19
B.2. Fit and Proper Requirements.................................................................. 19
B.3. Risk Management System ...................................................................... 19
B.4. Internal Control System .......................................................................... 25
B.5. Internal Audit Function ............................................................................ 26
B.6. Actuarial Function ................................................................................... 26
B.7. Outsourcing ............................................................................................ 27
B.8. Any Other Information ............................................................................ 28
C. Risk Profile ................................................................................................ 29
C.1. Underwriting Risk ................................................................................... 29
C.2. Market Risk ............................................................................................ 31
C.3. Credit Risk .............................................................................................. 32
C.4. Liquidity Risk .......................................................................................... 33
C.5. Operational Risk ..................................................................................... 34
C.6. Other Material Risks ............................................................................... 34
C.7. Any Other Information ............................................................................ 34
D. Valuation for Solvency Purposes ............................................................... 35
D.1. Assets .................................................................................................... 35
D.2.Technical Provisions ............................................................................... 37
D.3. Other liabilities ........................................................................................ 40
D.4. Alternative methods of valuation ............................................................ 41
D.5. Any other information ............................................................................. 41

2 | P a g e
E. Capital Management ................................................................................. 42
E.1 Own funds ............................................................................................... 42
E.2 Solvency Capital Requirement and Minimum Capital Requirement ........ 44
E.3 Use of the duration-based equity risk sub-module in the calculation of the Solvency Capital Requirement ....................................................................... 44
E.4 Differences between internal model used and the standard formula ....... 44
E.5 Non-compliance with the Minimum Capital Requirement and non-compliance with the Solvency Capital Requirement ...................................... 46
E.6 Any other information .............................................................................. 46
E.7 Impact of COVID-19 on the Group .......................................................... 47
Appendix ........................................................................................................ 49
UKC Solo information .................................................................................... 49
1. UKC Solo Valuation for Solvency Purposes .............................................. 49
1.1 UKC Solo Assets .................................................................................... 49
1.2. UKC Technical Provisions....................................................................... 50
1.3. UKC other liabilities ................................................................................. 52
2. UKC Capital Management ......................................................................... 53
2.1 UKC Own funds ....................................................................................... 53
2.2 UKC Solvency Capital Requirement and Minimum Capital Requirement 54

3 | P a g e
A. Summary This Solvency and Financial Condition Report (“SFCR”) covers the Business and Performance of The United Kingdom Mutual Steam Ship Assurance Association Limited (“UKC” (solo basis) or “the Group”). It also covers the System of Governance, Risk Profile, Valuation for Solvency Purposes and Capital Management. The ultimate Administrative Body that has the responsibility for all of these matters is the Group Board of Directors, with the help of various governance and control functions that it has put in place to monitor and manage the business. The Group’s internal model has been approved for the calculation of the underwriting risk elements of the Solvency Capital Requirement (“SCR”) with the remainder calculated using the standard formula.
Business and performance for the Group
2021 2020 Performance Indicator (UK GAAP basis) $000 $000
Combined ratio 149.6% 120%
Investment result 53,434 106,414
Total comprehensive (loss) / income after tax (51,796) 54,401
For SCR purposes the Group’s total eligible own funds stood at $612.4 million (2020: $714.4 million). This includes an allowance for the ancillary own funds available to the Group as approved by the regulator. Eligible own funds cover the SCR of $331.3 million (2020: $329.4 million) with a capital adequacy ratio of 184.8% (2020: 216.9%). The Minimum Consolidated Group SCR is $69.8 million (2020: $70.1 million) leading to a capital adequacy ratio of 639.6% (2020: 784.5%). For SCR purposes UKC (solo basis) eligible own funds stood at $565.6 million (2020: $683.0 million). Eligible own funds cover the SCR of $240.7 million (2020: $268.2 million) with a capital adequacy ratio of 234.9% (2020: 254.7%).
4 | P a g e
Directors’ Statement We acknowledge our responsibility for preparing the SFCR in all material respects in accordance with the PRA Rules and the Solvency II Regulations. We are satisfied that:
a) throughout the financial year in question, the Group has complied in all material respects with the requirements of the PRA Rules and the Solvency II Regulations as applicable to the insurer; and
b) it is reasonable to believe that the Group has continued so to comply subsequently and will continue so to comply in future.
Director For and on behalf of the United Kingdom Mutual Steam Ship Assurance Association Limited 1 July 2021

5 | P a g e
Report of the external independent auditor to the Directors of The United Kingdom Mutual Steam Ship Assurance Association Limited pursuant to Rule 4.1 (2) of the External Audit Chapter of the PRA Rulebook applicable to Solvency II firms.
Report on the Audit of the relevant elements of the Group Solvency and Financial Condition Report Opinion Except as stated below, we have audited the following documents prepared by The United Kingdom Mutual Steam Ship Assurance Association Limited (‘UKC’) and subsidiaries (together ‘the Group’) as at 20 February 2021:
The ‘Valuation for solvency purposes’ and ‘Capital Management’ sections of the Group Solvency and Financial Condition Report of The United Kingdom Mutual Steam Ship Assurance Association Limited as at 20 February 2021, (‘the Narrative Disclosures subject to audit’);
Group templates S.02.01.02, S.23.01.22, S32.01.22 (‘the Group Templates subject to audit’); and
UKC Company templates S.02.01.02, S17.01.02, S.23.01.01, S28.01.01 (‘the Company Templates subject to audit’).
The Narrative Disclosures subject to audit and the Templates subject to audit are collectively referred to as the ‘relevant elements of the Group Solvency and Financial Condition Report’. We are not required to audit, nor have we audited, and as a consequence do not express an opinion on the Other Information which comprises:
information contained within the relevant elements of the Group Solvency and Financial Condition Report set out about above which are, or derive from the Solvency Capital Requirement, as identified in the Appendix to this report
The ‘Summary’, ‘Business and performance’, ‘System of governance’ and ‘Risk profile’ elements of the Group Solvency and Financial Condition Report;
Group templates S05.01.02, S05.02.01, S.25.02.22, S.25.03.22.
UKC Company templates S05.01.02, S05.02.01;
the written acknowledgement by management of their responsibilities, including for the preparation of the Group Solvency and Financial Condition Report (‘the Responsibility Statement’);

6 | P a g e
Information which pertains to an undertaking that is not a Solvency II undertaking and has been prepared in accordance with PRA rules other than those implementing the Solvency II Directive or in accordance with an EU instrument other than the Solvency II regulations. ‘the sectoral information’.
To the extent the information subject to audit in the relevant elements of the Group Solvency and Financial Condition Report includes amounts that are totals, sub-totals or calculations derived from the Other Information, we have relied without verification on the Other Information. In our opinion, the information subject to audit in the relevant elements of the Group Solvency and Financial Condition and the relevant templates of the Group and UKC as at 20 February 2021 is prepared, in all material respects, in accordance with the financial reporting provisions of the PRA Rules and Solvency II regulations on which they are based, as modified by relevant supervisory modifications, and as supplemented by supervisory approvals and determination. Basis for opinion We conducted our audit in accordance with International Standards on Auditing (UK) (ISAs (UK)), including ISA (UK) 800 and ISA (UK) 805. Our responsibilities under those standards are further described in the Auditor’s Responsibilities for the Audit of the relevant elements of the Group Solvency and Financial Condition Report section of our report. We are independent of UKC and the Group in accordance with the ethical requirements that are relevant to our audit of the Group Solvency and Financial Condition Report in the UK, including the FRC’s Ethical Standard as applied to public interest entities, and we have fulfilled our other ethical responsibilities in accordance with these requirements. We believe that the audit evidence we have obtained is sufficient and appropriate to provide a basis for our opinion. Conclusions relating to going concern In auditing the SFCR, we have concluded that the Directors’ use of the going concern basis of accounting in the preparation of the SFCR is appropriate. Our evaluation of the Directors’ assessment of the Group’s ability to continue to adopt the going concern basis of accounting included:
Review of the latest available Own Risk and Solvency Assessment (‘ORSA’) return to ensure compliance with regulatory solvency requirements, noting the Company to be in excess of the minimum solvency requirement;
Checked the solvency through reference of sufficiency of assets to meet liabilities and the adequacy of regulatory capital;
Review of the Group’s budget for the next 12 months considering the validity of assumptions made; and

7 | P a g e
Enquiries of the Directors and scrutiny of management information, board minutes and regulatory correspondence to ascertain the existence of undisclosed events or obligations that may cast doubt on the Group’s ability to continue as a going concern.
Based on the work we have performed, we have not identified any material uncertainties relating to events or conditions that, individually or collectively, may cast significant doubt on the Group’s ability to continue as a going concern for a period of at least twelve months from when the Group SFCR are authorised for issue. Our responsibilities and the responsibilities of the Directors with respect to going concern are described in the relevant sections of this report. Emphasis of Matter – Basis of Accounting We draw attention to the ‘Valuation for solvency purposes’ section of the Group Solvency and Financial Condition Report, which describe the basis of accounting. The Group Solvency and Financial Condition Report is prepared in compliance with the financial reporting provisions of the PRA Rules and Solvency II regulations, and therefore in accordance with a special purpose financial reporting framework. The Group Solvency and Financial Condition Report is required to be published, and intended users include but are not limited to the Prudential Regulation Authority. As a result, the Group Solvency and Financial Condition Report may not be suitable for another purpose. Our opinion is not modified in respect of these matters. Other Information The Directors are responsible for the Other Information. Our opinion on the relevant elements of the Group Solvency and Financial Condition Report does not cover the Other Information and, we do not express an audit opinion or any form of assurance conclusion thereon. In connection with our audit of the Group Solvency and Financial Condition Report, our responsibility is to read the Other Information and, in doing so, consider whether the Other Information is materially inconsistent with the relevant elements of the Group Solvency and Financial Condition Report, or our knowledge obtained in the audit, or otherwise appears to be materially misstated. If we identify such material inconsistencies or apparent material misstatements, we are required to determine whether there is a material misstatement in the relevant elements of the Group Solvency and Financial Condition Report or a material misstatement of the Other Information. If, based on the work we have performed, we conclude that there is a material misstatement of this Other Information, we are required to report that fact. We have nothing to report in this regard.

8 | P a g e
Responsibilities of Directors for the Group Solvency and Financial Condition Report The Directors are responsible for the preparation of the Group Solvency and Financial Condition Report in accordance with the financial reporting provisions of the PRA rules and Solvency II regulations which have been modified by the modifications, and supplemented by the approvals and determinations made by the PRA under section 138A of FSMA, the PRA Rules and Solvency II regulations on which they are based. The Directors are also responsible for such internal control as they determine is necessary to enable the preparation of a Group Solvency and Financial Condition Report that is free from material misstatement, whether due to fraud or error. Auditor’s Responsibilities for the Audit of the relevant elements of the Group Solvency and Financial Condition Report It is our responsibility to form an independent opinion as to whether the relevant elements of the Group Solvency and Financial Condition Report are prepared, in all material respects, with financial reporting provisions of the PRA Rules and Solvency II regulations on which they are based. Extent to which the audit was capable of detecting irregularities, including fraud Irregularities, including fraud, are instances of non-compliance with laws and regulations. We design procedures in line with our responsibilities, outlined above, to detect material misstatements in respect of irregularities, including fraud. The extent to which our procedures are capable of detecting irregularities, including fraud is detailed below:
Obtaining an understanding of the legal and regulatory framework applicable to the Group’s operations and the control environment in monitoring compliance with laws and regulations;
Review of correspondence with the Prudential Regulation Authority (‘PRA’) and Financial Conduct Authority (‘FCA’);
Review of the assumptions and methodology applied by the Group in the valuation of the Best estimate to consider whether the methods utilised are in compliance with Technical Actuarial Standards (TAS 100: Principles for Technical Actuarial Work and TAS 200: Insurance), using our actuaries as auditors experts;
Enquiries of management;
Review of minutes of board meetings throughout the period; and
Agreement of the Group SFCR to underlying supporting documentation. Our objectives are to obtain reasonable assurance about whether the relevant elements of the Group Solvency and Financial Condition Report are free from material misstatement, whether due to fraud or error, and to issue an auditor’s report that includes our opinion. Reasonable assurance is a high level of assurance, but it is not a guarantee that an audit conducted in accordance with

9 | P a g e
ISAs (UK) will always detect a material misstatement when it exists. Misstatements can arise from fraud or error and are considered material if, individually or in the aggregate, they could reasonably be expected to influence the decision making or the judgement of the users taken on the basis of the Group Solvency and Financial Condition Report.
A further description of our responsibilities for the audit of the financial statements is located on the Financial Reporting Council’s website at: https://www.frc.org.uk/Our-Work/Audit/Audit-and-assurance/Standards-and-guidance/Standards-and-guidance-for-auditors/Auditors-responsibilities-for-audit/Description-of-auditors-responsibilities-for-audit.aspx Other Matters The Group and UKC have authority to calculate their Group Solvency Capital Requirement and Company Solvency Capital Requirement using a partial internal model (‘‘the Model’’) approved by the Prudential Regulation Authority in accordance with the Solvency II Regulations. In forming our opinion (and in accordance with PRA Rules), we are not required to audit the inputs to, design of, operating effectiveness of and outputs from the Model, or whether the Model is being applied in accordance with the Group’s or UKC’s application or approval order. Report on Other Legal and Regulatory Requirements. Sectoral Information In our opinion, in accordance with Rule 4.2 of the External Audit Chapter of the PRA Rulebook, the sectoral information has been properly compiled in accordance with the PRA rules and EU instruments relating to that undertaking from information provided by members of the group and the relevant insurance group undertaking. Other Information In accordance with Rule 4.1 (3) of the External Audit Chapter of the PRA Rulebook for Solvency II firms we are required to consider whether the Other Information is materially inconsistent with our knowledge obtained in the audit of the Group’s and UKC’s statutory financial statements. If, based on the work we have performed, we conclude that there is a material misstatement of this other information, we are required to report that fact. We have nothing to report in this regard.
Alexander Barnes (Senior Statutory Auditor)For and on behalf of BDO LLP, Statutory Auditor55 Baker St,LondonW1U 7EU 7 July 2021

10 | P a g e
Appendix – relevant elements of the Group Solvency and Financial Condition Report that are not subject to audit Group internal model The relevant elements of the Group Solvency and Financial Condition Report that are not subject to audit comprise:
The following elements of Group template S.02.01.02: – Row R0550: Technical provisions – non-life (excluding health) –
risk margin – Row R0590: Technical provisions – health (similar to non-life) –
risk margin – Row R0640: Technical provisions – health (similar to life) – risk
margin – Row R0680: Technical provisions – life (excluding health and
index-linked and unit-linked) – risk margin – Row R0720: Technical provisions – Index-linked and unit-linked
– risk margin
The following elements of Group template S.22.01.22: – Column C0030 – Impact of transitional on technical provisions – Row R0010 – Technical provisions – Row R0090 – Solvency Capital Requirement
The following elements of Group template S.23.01.22: – Row R0020: Non-available called but not paid in ordinary share
capital at group level – Row R0060: Non-available subordinated mutual member
accounts at group level – Row R0080: Non-available surplus at group level – Row R0100: Non-available preference shares at group level – Row R0120: Non-available share premium account related to
preference shares at group level – Row R0150: Non-available subordinated liabilities at group level – Row R0170: The amount equal to the value of net deferred tax
assets not available at the group level – Row R0190: Non-available own funds related to other own funds
items approved by supervisory authority – Row R0210: Non-available minority interests at group level – Row R0380: Non-available ancillary own funds at group level – Rows R0410 to R0440 – Own funds of other financial sectors – Row R0680: Group SCR – Row R0740: Adjustment for restricted own fund items in respect
of matching adjustment portfolios and ring fenced funds – Row R0750: Other non-available own funds
Elements of the Narrative Disclosures subject to audit identified as ‘unaudited’.

11 | P a g e
Appendix – relevant elements of the Solvency and Financial Condition Report that are not subject to audit Solo partial internal model The relevant elements of the Solvency and Financial Condition Report that are not subject to audit comprise:
The following elements of template S.02.01.02: – Row R0550: Technical provisions – non-life (excluding health) –
risk margin – Row R0590: Technical provisions – health (similar to non-life) –
risk margin – Row R0640: Technical provisions – health (similar to life) – risk
margin – Row R0680: Technical provisions – life (excluding health and
index-linked and unit-linked) – risk margin – Row R0720: Technical provisions – Index-linked and unit-linked
– risk margin
The following elements of template S.12.01.02: – Row R0100: Technical provisions calculated as a sum of BE and
RM – Risk margin – Rows R0110 to R0130 – Amount of transitional measure on
technical provisions
The following elements of template S.17.01.02: – Row R0280: Technical provisions calculated as a sum of BE and
RM – Risk margin – Rows R0290 to R0310 – Amount of transitional measure on
technical provisions
The following elements of template S.22.01.21: – Column C0030 – Impact of transitional measure on technical
provisions – Row R0010 – Technical provisions – Row R0090 – Solvency Capital Requirement
The following elements of template S.23.01.01: – Row R0580: SCR – Row R0740: Adjustment for restricted own fund items in respect
of matching adjustment portfolios and ring fenced funds
The following elements of template S.28.01.01: – Row R0310: SCR
Elements of the Narrative Disclosures subject to audit identified as ‘unaudited’.

12 | P a g e
A.1. Business Corporate information The United Kingdom Mutual Steam Ship Assurance Association Limited (“UKC”) is incorporated in the United Kingdom as a company limited by guarantee without share capital. UKC is the parent company of the Group, which writes Marine Protection and Indemnity risks. Group structure The principal activity of the Group during the year was the insurance and reinsurance of marine protecting and indemnity risks on behalf of its Members. The Group operates as a single business, but has the following corporate structure.
The United Kingdom Mutual Steam Ship Assurance Association Limited (“UKC”) writes all of the Club’s direct business either directly, through branches in Hong Kong, Singapore and Japan, or via a reinsurance arrangement with UKNV as discussed below. UKC was previously known as The United Kingdom Mutual Steam Ship Assurance Association (Europe) Limited, changing its name just after the year end on 20 February 2021.
The United Kingdom Mutual Steam Ship Assurance Association (Bermuda) Limited (“UKB”) reinsures 90% of UKC’s business (net of external reinsurances).
The United Kingdom Mutual Steam Ship Assurance Association (London) Limited (“UKL”) is in run-off and used to reinsure 100% of its liabilities to UKC. On 30 December 2020, UKL transferred all of its liabilities to UKC by way of a legal process. The Association will be made dormant when regulatory permission is relinquished.
UK P&I Club N.V. (“UKNV”) was established as the Club’s “Brexit” solution in order to continue to operate throughout the EU. This started underwriting in 2019 and renewed all of the Club’s EEA business in February 2020. On 31 December 2020, UKC transferred all of its historical EEA liabilities to
UK ClubUKC
UK (Bermuda)UKB
UK (London)UKL
UK (Netherlands)UKNV
Hydra

13 | P a g e
UKNV by way of a legal process. In addition, UKNV provides a fronting solution for a number of other mutual insurance companies managed by Thomas Miller. This business is 100% reinsured back to the fronted insurer so that the Club does not retain any of the risk.
Hydra ‘Cell’ – The Club is a member of the International Group which has its own reinsurance captive, a segregated cell company in Bermuda. The Club owns 100% of its own cell and this cell is included the Group’s consolidated financial statements.
Under Solvency II valuation requirements Hydra is treated as a third party reinsurer. Therefore, the Group’s interest in Hydra is not consolidated in the Solvency II balance sheet, but treated as an investment.
The Group has received a waiver from the PRA to present a single Group SFCR that incorporates the results of both the Group and UKC. The main part of this SFCR presents the Group results, unless otherwise stated. The results of UKC on a solo basis are detailed in Appendix 1. Other information The authority responsible for the financial supervision and review of the SFCR and RSR of the Group is the Prudential Regulatory Authority which is located at 20 Moorgate, London EC2R 6DA. UKB is regulated by the Bermuda Monetary Authority (“BMA”) which is located at 43 Victoria Street, Hamilton, HMJX Bermuda. UKNV is regulated by De Nederlandsche Bank (“DNB”) which is located at Postbus 98, 1000 AB Amsterdam, Spaklerweg 4, 1096 BA Netherlands. The external auditor of the Group is BDO LLP which is located at 55 Baker Street, London, W1U 7EU, United Kingdom.
A.2. Underwriting performance Underwriting performance measures The Group’s target is to call sufficient premium to cover its claims and expenses as measured by the combined ratio. Since claims vary from one year to another, the Group considers performance against this target over the medium term by monitoring the average financial year combined ratio. To achieve the combined ratio target, the Group focuses on disciplined underwriting based on appropriate risk selection as informed by a thorough understanding of risk. The Group employs techniques such as programmes for loss prevention and efficient reinsurance purchase to manage the risk accepted. S.05.02.01 includes a geographical split of the Group’s business based on the country in which the Member is located.

14 | P a g e
The Group mainly operates the line of business: Protection and Indemnity insurance for the shipping community. However, the Group also fronts business (mostly professional indemnity insurance) on behalf of a number of other mutual insurance companies managed by Thomas Miller (the Group’s manager). This business is 100% reinsured back to the fronted company, so that the Group does not retain any of the risk. Recent Underwriting performance The Group’s target is to call sufficient premium to meet claims and expenses over the medium term. The average combined ratio over the last eight years exceeds 100% (excluding supplementary calls and mutual premium discounts) and therefore the Group has exceeded its underwriting target over recent years. It should be noted that the Group has discounted mutual premium rates three times in the previous eight years. The total discount amounts to $25 million. Table 3: Recent underwriting performance Amounts in $000 2021 2020
Income
Gross premium earned 286,376 305,037
Outward reinsurance premiums (76,624) (60,386)
Net earned premium 209,752 244,651
Investment return transferred from the non-technical account
53,434
106,414
Other income 1,647 741
Total income 264,833 351,806
Expenses
Net claims paid (241,029) (280,771)
Change in provision for claims (31,477) 29,064
Net claims incurred (272,506) (251,707)
Net operating expenses (43,843) (43,724)
Total expenses (316,349) (295,431)
Balance on technical account (51,516) 56,375
The outbreak of COVID-19 materially affected the Club’s passenger book through a combination of COVID-related claims and premium reductions as trading ceased. This was exacerbated by some particularly poor experience on those largest claims falling into the International Group (“IG”) Pool and some late claims deteriorations (much of which were also linked to the IG Pool). Total expenses were broadly in line with the previous year. The overall surplus was transferred to reserves.

15 | P a g e
A.3. Investment performance In accordance with the investment policy, the investment mandate is updated on a regular basis. The asset allocation established within the mandate is principally determined to ensure that future cash flows arising from liabilities (principally claims reserves) are matched by available assets of the correct currency and duration. Effective risk management is therefore the principal driver of investment allocation. Having established a matched portfolio, limited investment risk is accepted to achieve the best return available from the surplus assets. Some factors that may influence future investment return are:
Market performance – as affected by macro-economic, political or other factors
Capital allocation and risk profile – determining the risk accepted into the portfolio
Portfolio management – including asset allocation (both strategic and tactical)
Asset allocation The following table provides the breakdown of the investment portfolio. Asset allocation within the Group The investment portfolio includes investment in equities, government and corporate bonds. The total portfolio returned $53.4 million (2020: $106.4 million) (including currency gains) over the 2020/21 financial year. Investment returns per the financial statements are further detailed in the table below: Table 4: Investment performance as disclosed within the financial statements Year-ending Feb 2021 Income Net Realised
Gains/(loss) Net
Unrealised Gains
Total Investment
Return
Equity securities 2,987 24,985 6,542 34,514 Debt securities 16,454 19,588 (9,146) 26,896 Cash and Cash equivalents
53 - - 53
Other Investment Charges (8,029) - - (8,029)
Total Net Investment Return
11,465 44,573 (2,604) 53,434
Year-ending Feb 2020 Income Net Realised Gains
Net Unrealised
Gains
Total Investment
Return
Equity securities 11,412 4,817 38,282 54,511 Debt securities 17,512 9,033 34,990 61,534 Cash and Cash equivalents
848 - - 848
Other Investment Charges (10,479) - - (10,479)
Total Net Investment Return
19,292 13,850 73,272 106,414

16 | P a g e
A.4. Performance from other activities As noted in A.2. all of the Group’s activities relate to its core business.
A.5. Any other information Occupational disease arrangements with Randall & Quilter At the start of the year, an arrangement was reached with an external insurer, Randall and Quilter (R&Q) in respect of the Club’s occupational disease claims. This arrangement comes in two distinct parts:
UKC entered into a reinsurance contract with subsidiaries of Randall & Quilter Investment Holdings Ltd (“R&Q”), materially reducing the scope for further claims deterioration.
A legal transfer of the UK Club’s occupational disease liabilities to R&Q, removing the Club’s exposure to these claims. It is expected that the transfer will take place in 2021.
This arrangement should eliminate the Club’s future exposure to these long-tailed, a consequently volatile, liabilities (the vast majority of which relate to asbestos exposures in the second half of the last century) and improve the Club’s solvency position.

17 | P a g e
B. System of Governance
B.1. General Information on the System of Governance
B.1.1. Overview The Board of UKC, as the ultimate parent undertaking, directs and has responsibility for all activities of the Group. The Board of UKC consists of five ship-owner Directors, drawn principally from the ship-owner Members; two specialist Directors and two Managers with executive responsibilities. The Board has outsourced the day to day management of the Group to a third party, Thomas Miller P&I Ltd (and Thomas Miller (Bermuda) Ltd for UKB and Thomas Miller B.V. for UKNV), or “the Managers”. The Board consider that the System of Governance is appropriate for the nature, scale and complexity of the inherent risks facing the Group. Several committees support the Board as discussed below.
B.1.1.1. Committee Structure The Members’ Committee (“MEMCO”) MEMCO provides a forum for Members to play an enhanced role in the governance of the Club in relation to mutual Member issues and provides Members’ perspective on matters which are relevant to the business of the Club. Group Audit & Risk Committee (“GARCO”) GARCO is responsible for monitoring the risk management system and internal control framework against the Board’s risk appetite. GARCO directs the internal audit function and oversees the external audit function to gain assurance over significant risks. Strategy Committee (“STRATCO”) STRATCO assists the Board in formulating strategy and providing reports and recommendations on strategic issues and any other issues affecting the Group. The Committee meets on an ad-hoc basis and specifically conducts an annual review of a strategic risk assessment and a review of strategy. Ship & Membership Quality Committee (“QUALCO”) QUALCO provides the Board with advice regarding the criteria used to establish the suitability of Members. QUALCO also considers whether individual ships or fleets meet the underwriting criteria.

18 | P a g e
Nominations Committee (“NOMCO”) NOMCO ensures that the Board continues to be composed of suitably qualified and skilled individuals. It also makes recommendations to ensure that the Committees of the Board are composed of individuals appropriate to the respective roles. Investment Committee (“IVCO”) IVCO makes recommendations to the Board in respect of the Investment Mandate and reviews in detail the performance of the investment portfolio.
B.1.1.2. Key Functions The Managers The Group has no direct employees, except within the Japan Branch, and as such the Board relies on the Managers for day-to-day management duties. The Investment Managers Investment of the Group's funds is conducted by the Investment Managers in accordance with the Board’s Investment Policies and is subject to internal compliance procedures.
B.1.2. Remuneration
The Group outsources all executive matters to the Managers in accordance with the Management Agreements. The Managers operate a formal performance and merit-based remuneration policy aimed at paying competitive and appropriate remuneration consistent with the long-term interest of the business. The Group’s Remuneration Policy sets out how the Managers are remunerated under a management fee agreement. The Board agrees this periodically.
B.1.3. Related party transactions
As a mutual, the Group is controlled by its Members. All mutual policyholders of UKC and UKNV are also Members of UKC. Consequently, there are insurance transactions between related parties, but these are the only transactions between the Group and its Members. All of the shipowner Directors are representatives of Member companies and have no financial interests in the Group, other than the insurance of their ships entered in the Group, which is arranged on an arm’s length basis, and the Member interests of their companies.

19 | P a g e
B.1.4. Board remuneration
Directors are paid an annual fee and an attendance fee for each meeting. There are no variable components to the Directors’ remuneration.
B.2. Fit and Proper Requirements The Group has in place a Fit & Proper Policy that sets out its approach to the fitness and propriety of the persons responsible for running the Group, including executive senior management and key function holders. All persons within the scope of the Group's Fit and Proper policy must have the professional qualifications, knowledge and experience and demonstrate the sound judgement necessary to discharge their areas of responsibility competently. They must be of good repute and demonstrate in their personal behaviour and business conduct character, integrity and honesty. As part of the assessment, consideration is given to potential conflicts of interest and financial soundness. The Board members must collectively possess sufficient knowledge, competence and experience to direct and oversee the Group’s affairs effectively. The Managers maintain role specifications for all executive roles that are within the scope of the Fit and Proper policy which detail the key competencies and duties for each position. Fit and proper assessments are carried out by the Compliance Officer both annually through declarations and formally every three years. No person is permitted to undertake their own assessment. The Group’s Fit & Proper Policy applies to:
All Directors of Group companies;
All employees of the Managers who are members of the Thomas Miller’s senior management; and
Persons within the Managers responsible for key functions.
B.3. Risk Management System
The Group’s risk management system is the same across all entities within the Group.
The Group’s Risk Management System The Group uses a Risk Management Framework to design an effective risk management system with an integrated approach to risk management and the application of the three lines of defence:

20 | P a g e
1st line of defence: business units and all staff not included in the second and third lines of defence, process and risk owners;
2nd line of defence: risk management and compliance functions; and
3rd line of defence: internal and external audit. The risk management system incorporates the accurate and appropriate identification, recording, analysis, reporting and mitigation of risk. The Board has:
a clearly defined and well-documented risk management strategy;
adequate written policies;
appropriate processes and procedures;
appropriate reporting procedures;
reports on the material risks faced by the Group and on the effectiveness of the risk management system; and
a suitable Own Risk and Solvency Assessment (“ORSA”). The risk management system not only covers the risks included in the calculation of the Solvency Capital Requirement but also other risks to which the Group is exposed and which are considered by the Group to be materially relevant to its business. The risk management system is consistently applied to the Group. The Partial Internal Model (“PIM”) The internal model is a key risk management tool within the Risk Management Framework. It has been developed by the Actuarial Function in conjunction with the Managers’ Risk Committee which fulfils the Risk Management Function of the Group. The underwriting element of the model replaces the underwriting module of the standard formula SCR in the calculation of the Group’s SCR. As such, it is referred to as the partial internal model, or PIM. The PIM is subject to additional governance and validation requirements. The Managers’ Risk Committee is responsible for determining the scope of the internal model and the PIM. The internal model is used to analyse the impact of any risk management decisions and changes to the risk profile falling within the scope of the model on the regulatory and internal capital requirements. In particular, the Own Solvency Needs Assessment will be calculated whenever the model is used to determine the capital implications of any changes to the risk profile. The results of these analyses are reported in the ORSA. All uses of the model are recorded in an internal model uses log, maintained by the Actuarial Function. The Actuarial Function also carried out an annual model performance review on the PIM, with the results reported to the Managers’ Risk Committee and subsequently presented to GARCO and the Board. The review may result in decisions to change the scope of, or otherwise improve, the model. The use of the PIM is subject to the Internal Model Governance Framework which covers processes and controls applied. Changes to the PIM are subject

21 | P a g e
to the Internal Model Change Policy and validation is carried out in accordance with the Internal Model Validation Policy. The risk management system also has a coherent focus on data and IT infrastructure governance and appropriate policies and standards to outline the framework within which responsibilities are exercised. It is supported by a robust internal control system and is designed to identify measure, manage, monitor and report significant risks to the achievement of the business objectives. Risk Management Strategy The objectives of the Group’s risk management strategy are to identify, measure, monitor, manage and report in a consistent, continuous and timely fashion, on the basis of the Group’s risk appetite as set by the Board and documented in the Corporate Plan. The Risk Management Framework helps both support and relay the Group’s business plan strategy throughout the organisation by ensuring that those factors that may advance or impede the achievement of strategic and operational objectives are managed by strong controls. The risks to which the Group is exposed are recorded in the Business Risk Log. Key Risks A list of key risks has been compiled by the Board and senior management based on their experience and expert judgement in running the business. This list provides a high-level overview of the principal risks faced by the business which, individually or in combination, may have a significant, substantial or severe impact on the Group. Implementation of the Risk Management Strategy: Risk Policies and Procedures The Group’s strategy is specified in more detail through its policies and Corporate Plan which underpin its day-to-day business. It sets out the systematic application of management policies, procedures and practices that are used to identify, manage and communicate risk to facilitate Board decision-making and to provide an effective system of risk management. Policies have been developed for all material risks to which the Group is exposed. They define the Group’s approach to risk management overall and more specifically the risk for which the policy has been written. The policies establish the controls, procedures, limits and escalation to ensure that the risks are managed in line with risk appetite. Specific procedures, where appropriate, have been developed to provide full understanding of the means by which the first and second lines of defence will implement the strategy. The policies also include appropriate reporting procedures to ensure that information relating to the component elements of the risk management is routinely reported to GARCO and to the Board.

22 | P a g e
Risk Appetite The Group’s risk appetite is articulated in its Risk Appetite Statement, which is a document owned by the Board and reviewed on a regular basis as new risks emerge, or at least annually.
The Board bears ultimate responsibility for the management of risk and for maintaining a sound system of internal control that supports the achievement of the business strategy, policies, aims and objectives of the Group. GARCO supports the Board by providing oversight of the Risk Management Function. Business Risk Log: Assessment, Measurement and Management Risks to the business that could inhibit it achieving its business plan objectives are described in the Business Risk Log, together with the consequences should the risk materialise. Emerging Risk Log Risk Owners identify potential emerging risks which are then discussed at the Managers’ Risk Committee meeting and included in an emerging risk log which is reviewed annually by GARCO. Risk Rating A rating for each risk is determined by assessing its probability and impact of the event if it occurs. The rating assists the Board with the prioritisation and management of risks and demonstrates the importance of the mitigation or controls in place. The assessment of each risk is on the basis of Inherent Risk and Residual Risk after taking into account the strength of current risk management procedures in place. All risks on the Business Risk Log are re-assessed on an ongoing basis and at least annually by the Managers and by GARCO and the Board. Each Risk Owner or function head continuously monitors the risks for which they are responsible.

23 | P a g e
Own Risk and Solvency Assessment (“ORSA”) The ORSA is the process used by the Group to manage its financial and solvency position over the period of its Corporate Plan. The ORSA Overview report is the culmination of this process into a report reviewed by the Board. The key elements of the ORSA process are:
An analysis of recent performance;
Assessment of the risk profile; and
Consideration of business planning and stress scenarios. The ORSA overview document is produced twice each year in May and October. GARCO reviews the ORSA and recommends it for approval and use by the Board. The Board reviews and approves the ORSA and considers appropriate actions for the Group such as:
Capital related decisions;
Renewal considerations;
Reassessment of risk profile and risk appetite; and
Additional risk mitigating actions such as reinsurance. The Board assesses the adequacy of capital over the business plan time-horizon against its risk appetite. To date these assessments indicate that the Group is adequately capitalised. Stress and Scenario testing Stress and scenario tests are presented within the Group’s ORSA overview document and are assessed at a Group level. These are based upon the business plan and project the financials over the next four years. The solvency position is considered relative to the Group’s risk appetite statement. The Group’s most recent ORSA Overview report focused on the impact of COVID-19. In line with the Club’s risk profile, the scenario testing results show that the Group is most vulnerable to significant investment losses and high claims experience. However, the Club benefits from significant reinsurance cover and is expected to continue to meet its capital requirements in all scenarios. Risk Controls The Group’s Risk Management Framework has been developed to manage risks across the business, using internal control policies, procedures and processes to control risks. Whereas ultimate control for each risk rests with the Board, day-to-day control is exercised by the Risk Owners unless otherwise stated, as set out in the Business Risk Log. The appropriateness and effectiveness of controls is monitored and confirmed by Risk Owners and, for key controls, independently assessed by the Risk Officer.

24 | P a g e
Risk Mitigation Reinsurance One of the key risk mitigation techniques available is reinsurance. The Group considers its whole account reinsurance options leading up to a new policy year. Proposed reinsurance arrangements are analysed by the Actuarial Function, using the internal model, and the Reinsurance Committee. International Group Pool This can be considered to be a specialised form of reinsurance. The International Group Pool allows for large insurance risks to be shared between its thirteen P&I club members. The International Group also arranges an excess of loss reinsurance programme to cover the largest risks. Other risk mitigation techniques may be utilised from time to time, for example the use of hedging instruments to mitigate the risk of swings in foreign exchange rates. Risk Reporting Procedures Risk Owners are required to provide six-monthly reports on the risks for which they are responsible, based on a template of questions compiled by the Risk Officer. These reports are summarised into key themes and form the basis of an annual Risk Report to GARCO which is then escalated to the Board. Any amendments to the Business Risk Log proposed by Risk Owners, such as changes to controls or risk descriptions or potential amendments to the ratings are discussed with GARCO for recommendation for approval by the Board. Risk Owners also identify operational risk loss or near miss events. Integrated and embedded into the organisational structure and decision-making processes The Risk Management Function is fulfilled by the Risk Officer and the Managers’ Risk Committee. The function maintains an organisation-wide and aggregated view of the risk profile of the Group, including monitoring risk tolerances against appetite, and advising on how risks might impact the business singly and in combination. This analysis includes stress and scenario testing. The integration of risk management processes with business activities is performed through the requirement for business function heads, who are also risk owners, to focus on risk management on an ongoing basis whilst ensuring that the risks for which they are responsible remain within risk tolerance. This demonstrates the proactive application of risk management techniques to support the business processes and decision-making for which they are also responsible in their day-to-day insurance business activities.

25 | P a g e
B.4. Internal Control System
Internal control is defined as a continually operating process effected by the Group’s Boards, GARCO, the Managers, all staff and systems and designed to support the Group in achieving its business plan objectives through efficient and effective operations and to protect its resources. Each Risk Owner, as named in the Business Risk Log, is responsible for the application of the Internal Control Framework and the design, development, implementation, documentation and maintenance of effective internal control processes in their area and reporting thereon. Control activities Control activities are the actions taken or systems put in place to address business risks, protect assets and ensure that all material control failures and issues are identified and managed. The control activities are embedded into plans, policies, procedures, systems and business processes. Their effectiveness relies on the level of compliance by management and staff. Control environment The Managers are responsible for establishing and maintaining an effective control environment throughout the organisation. In furtherance of that, there is a culture which values the highest levels of integrity in the staff, together with openness and honesty in relation to the conduct and reporting of all activities. Policies, procedures and processes are designed to define and support effective, efficient and appropriate activities at every level of the business. GARCO seeks assurance and provides, through the processes set out in the Compliance policy or through internal audit, assurance to the Board that the scope and quality of compliance monitoring and reporting on regulatory compliance are sufficient to ensure the effectiveness of this Policy and of the management of regulatory compliance risk. All reviews are carried out at least annually and ad hoc as circumstances require. Internal Audit is authorised to investigate and challenge any actions or concerns without influence from the business; be independent of operational business functions and without undue influence from the Board or other functions/management; have unfettered and direct access to all activities in its area of responsibility, including all documentation, systems, staff, Management, executive and non-executive Board members; and have direct access to the Chairman of GARCO. Compliance function The Board bears ultimately responsibility for Regulatory Compliance, and is supported by GARCO. The Group takes a risk-based approach to regulatory compliance, focussing on preventing breaches to regulatory principles and other rules and informing the relevant regulators of any that are material, or must be reported to regulators on a mandatory basis.

26 | P a g e
The Compliance Function advises on and promotes compliance with applicable laws, regulatory requirements and administrative provisions and coordinates and monitors implementation of policies, processes and procedures to achieve compliance across the business, and manages regulatory compliance risk. The impact of Regulatory developments is monitored by the Compliance function. Breaches and associated remedial action are posted to the Operational Risk Database.
B.5. Internal Audit Function Internal Audit is the (“third line of defence”) in the Group’s internal control framework, established to provide independent assurance that the systems of internal control established by management (“first line”) and the monitoring and oversight provided by the Risk Management and Compliance Functions (“second line” ) are fit for purpose and operating effectively. The objectives of the Internal Audit Function are to provide independent assurance that business risks are identified and are being well managed and controlled by effective systems of internal control. The Internal Audit function is provided by the Managers who employ an independent Head of Internal Audit (“HIA”) who in turn reports to the Chair of GARCO. The HIA may engage third parties to conduct some audits under his/her management if it is felt that specific technical skills are required or where insufficient general audit resource is available. Independence The Internal Audit Function is independent from the organisational activities audited and free to exercise its assignments without impairment and on its own initiative in all areas. It is not authorised to carry out any operational work on behalf of any area of any business. The Head of Internal Audit reports directly to the Chair of GARCO.
B.6. Actuarial Function
The Board is ultimately responsible for ensuring an effective Actuarial Function. This function is performed by the Thomas Miller (“TM”) Actuarial Team, led by its Group Chief Actuary. The Actuarial Function is independent of the Group’s management team and therefore able to undertake its duties in an objective, fair and independent manner. However, for operational purposes, the Actuarial Function is integrated into the Group’s internal control system through its role on the Managers’ committees and attendance at Board meetings.

27 | P a g e
The Actuarial Function makes a significant contribution to the Group’s Risk Management Framework by operating its capital model and running the ORSA process and related decisions.
B.7. Outsourcing The Group outsources all functions, including controlled functions, to the Managers. The Managers aim to provide a governance framework to facilitate the Group’s strategic plan whilst managing risks. The Managers of UKC are Thomas Miller P&I Limited (“TM P&I”). The Managers of UKB are Thomas Miller Holdings Ltd Bermuda (“TMB”). The Managers of UKNV are Thomas Miller B.V. (“TMBV”). TM P&I operates through several committees, all of which report to the TM P&I Board. These committees include risk, finance, operations, reinsurance, data governance and credit worthiness.
The Group has in place an outsourcing policy which is directed at services or activities which are particularly important or critical to the business (“material business activities”). A material business activity is one that has the potential, if disrupted, to have a significant impact on the business’ operations or its ability to manage risks effectively. Management outsourcing The Group has no internal executive function and its management is wholly outsourced to the Managers under management agreements. In order to comply with its regulatory obligations, the Board has developed monitoring and reporting procedures which it has delegated to GARCO to monitor. The risk control and reporting procedures to be followed by the Managers form part of their obligations under the management agreement. Investment management outsourcing Management of the Group’s investments is outsourced to Thomas Miller Investment Limited, part of Thomas Miller, under investment management agreements. The performance of the investment managers is monitored and supervised by the Board and its Investment Committee. Internal audit outsourcing The Group’s internal audit function is outsourced to Thomas Miller Internal Audit. Internal Audit is supervised by GARCO and the Board.

28 | P a g e
Oversight The Board bears ultimate responsibility for outsourced functions, services, or activities and related governance. The Board are supported by GARCO which reviews outsourcing arrangements and the Manager’s Board which monitors the activities of the Group, including outsourcing.
B.8. Any Other Information
The Group considers no other information material to be disclosed.

29 | P a g e
C. Risk Profile The key areas of risk impacting the Group can be classified as follows: 1. Underwriting risk – incorporating underwriting and reserving risk; 2. Market risk – incorporating investment risk, interest rate risk and currency
rate risk; 3. Credit risk – being the risk that a counterparty is unable to pay amounts in
full when due; 4. Liquidity risk – being the risk that cash may not be available to pay
obligations as they fall due; and 5. Operational risk – being the risk of failure of internal processes or controls.
The Board has established its appetite for risk in relation to its business strategy and available resources. The Board seeks to maximise its resources by effective risk management techniques. Therefore, a risk management system has been developed to identify and mitigate risk. As part of the risk management system, the Board has developed an internal model to cover underwriting risk. The model is tailored specifically to the underwriting risk accepted by the Group and therefore provides the Board with the expected outcome and risk surrounding business planning scenarios. This allows the Board to consider more accurately the effectiveness and efficiency of risk mitigation techniques such as reinsurance. The model is designed to encompass the full spectrum of underwriting risks to which the Group is exposed.
C.1. Underwriting Risk The Group mainly operates the line of business: Protection and Indemnity insurance for the shipping community. However it also frontings (mainly professional indemnity) business on behalf of a number of mutual insurance companies. This fronted business is 100% reinsured back to the fronted entity, so that the Club does not retain any of the risk Underwriting risk is the risk that the Group’s net insurance obligations (i.e. claims less premiums) are different to expectations. The Group considers the risk of existing obligations (Reserve Risk) separately to the risk of future obligations (Premium Risk). Reserve risk is managed by the Group’s reserving policy. The Group establishes provisions for unpaid claims, both reported and unreported, and related expenses to cover its expected ultimate liability. These provisions are established through the application of actuarial techniques and assumptions. In order to minimise the risk of understating these provisions, the assumptions made and actuarial techniques employed are reviewed in detail by management and GARCO.
30 | P a g e
The Board considers that the liability for insurance claims recognised in the consolidated statement of financial position is adequate. However, actual experience will differ from the expected outcome. Premium risk is managed by an underwriting policy which establishes underwriting practices in order to meet business needs and satisfy regulatory control. This is supplemented with a robust forecasting approach undertaken as part of the ORSA process. The underwriting process is based on a thorough understanding of the risk accepted. This understanding is enhanced as:
The Group mainly operates the line of business: Protection and Indemnity insurance for the shipping community. However, the Group also fronts business (mostly professional indemnity insurance) on behalf of a number of other mutual insurance companies managed by Thomas Miller (the Group’s manager). This business is 100% reinsured back to the fronted company, so that the Group does not retain any of the risk.
The Board and Members Committee of the Group include representatives from a cross section of the shipping community, giving insight into changes in the risks written over time.
Underwriting authority is delegated to specific individuals who operate under set underwriting parameters and the ongoing guidance and review of senior management.
Underwriting Risk is mitigated via the Group’s reinsurance programme or 100% reinsurance back to fronted entities. The programme comprises excess of loss reinsurance cover purchased jointly with other members of the International Group, the International Group Pooling Agreement and reinsurance for claims below the Pool deductible. The underwriting risk incurred on the EEA fronted professional indemnity business TT, ITIC, UKWR and PAMIA and this is 100% reinsured back to the respective club. The excess of loss reinsurance cover purchased jointly with other members of the International Group provides cover for claims arising from mutual business which exceed $100 million up to a limit of $3.1 billion. The International Group Pooling agreement provides a sharing of claims costs between thirteen member Clubs. The share attributable to each member is calculated for each policy year on an agreed formula including an adjustment for each Club’s historic loss record on the Pool. In addition, part of the International Group Pool is reinsured to a captive reinsurance vehicle, Hydra. The Group has its own segregated cell within Hydra which transacts only with the Group and its subsidiaries. Hydra also accepts a proportion of the risk covered by the joint reinsurance contract for claims above $30 million.

31 | P a g e
In addition to the reinsurance purchased externally, the primary insurer, UKC reinsures 90.0% of its residual risks to UKB.
C.2. Market Risk Market risk within equity investments arises through fluctuations in market valuations. Market risk in the fixed interest investment valuations arises through changes in interest rates, corporate bond spreads and foreign currency exchange rates. Such movements will affect not only the investments, but also the value of other assets and liabilities such as premium income, claims payments and reinsurance recoveries. The Group has an investment policy in place to manage exposure to its investments, and this is monitored by regular reports from the investment managers. Further discussion of this arrangement is provided below under the “prudent person principle”. The prudent person principle Under the Group’s investment policy, all of its investments are invested and managed in accordance with the ‘prudent person principle’, meaning that duties of the Investment Managers are discharged with the care, skill, prudence and diligence that a prudent person acting in a like capacity would use in the conduct of an enterprise of like character and aims. More specifically the portfolio:
is invested in assets and instruments whose risk can properly be identified, measured, monitored, managed, controlled and reported;
ensures the security, quality and liquidity of the portfolio as a whole;
is appropriate to the nature, currency and duration of the Group’s insurance liabilities;
includes derivative instruments only where they contribute to a reduction of risks or efficient portfolio management;
includes only a prudent level of unlisted investments and assets;
is diversified to avoid excessive reliance on any asset, issuer or group, or geographical area.
The Group’s funds are invested by the Investment Managers in accordance with parameters set by an Investment Mandate. The Investment Mandate provides a framework to the Investment Managers for the management and stewardship of the investment assets in conformity with the business and investment objectives and sets the parameters within which the Group’s assets may be invested. It is considered and approved by the Board on an annual basis and ad hoc as required and is subject to the Group’s Investment Policy. The Investment Managers report to the Board at each meeting.
32 | P a g e
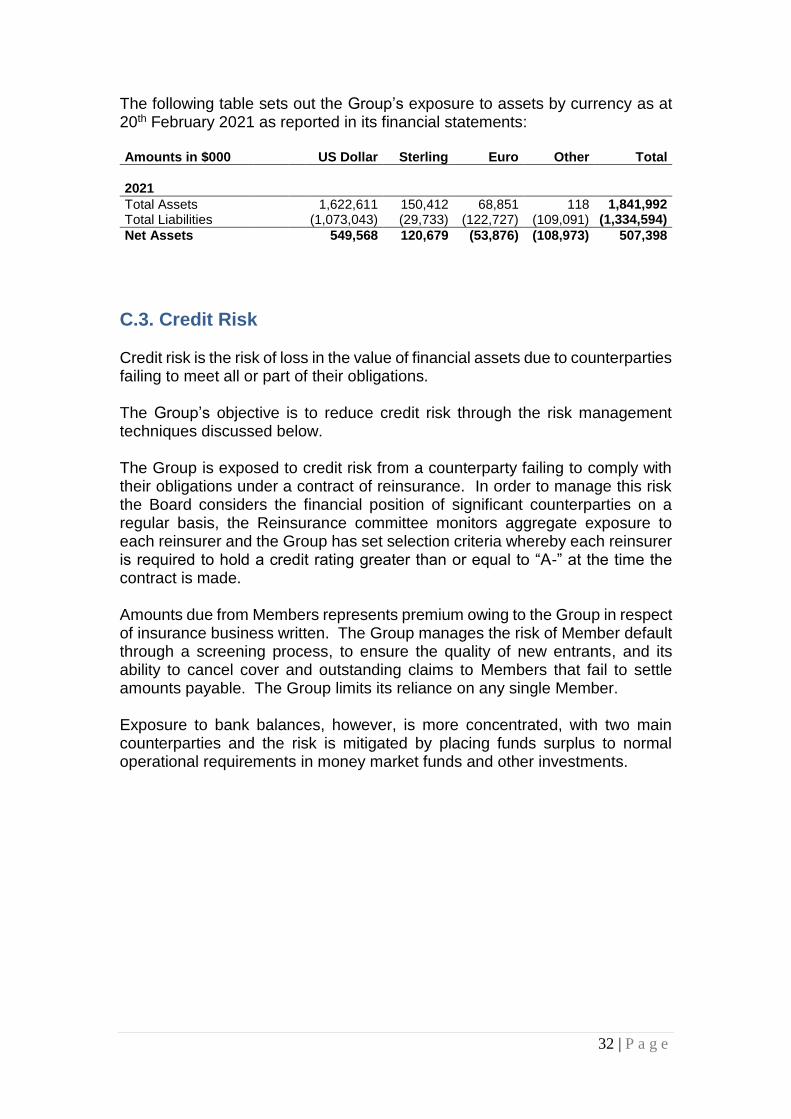
The following table sets out the Group’s exposure to assets by currency as at 20th February 2021 as reported in its financial statements: Amounts in $000 US Dollar Sterling Euro Other Total
2021
Total Assets 1,622,611 150,412 68,851 118 1,841,992 Total Liabilities (1,073,043) (29,733) (122,727) (109,091) (1,334,594)
Net Assets 549,568 120,679 (53,876) (108,973) 507,398
C.3. Credit Risk Credit risk is the risk of loss in the value of financial assets due to counterparties failing to meet all or part of their obligations. The Group’s objective is to reduce credit risk through the risk management techniques discussed below. The Group is exposed to credit risk from a counterparty failing to comply with their obligations under a contract of reinsurance. In order to manage this risk the Board considers the financial position of significant counterparties on a regular basis, the Reinsurance committee monitors aggregate exposure to each reinsurer and the Group has set selection criteria whereby each reinsurer is required to hold a credit rating greater than or equal to “A-” at the time the contract is made. Amounts due from Members represents premium owing to the Group in respect of insurance business written. The Group manages the risk of Member default through a screening process, to ensure the quality of new entrants, and its ability to cancel cover and outstanding claims to Members that fail to settle amounts payable. The Group limits its reliance on any single Member. Exposure to bank balances, however, is more concentrated, with two main counterparties and the risk is mitigated by placing funds surplus to normal operational requirements in money market funds and other investments.

33 | P a g e
The following table shows the Group’s assets by counterparty rating as at 20th February 2021 as reported in the Group’s financial statements: Amounts in US$000s AAA AA A Not
readily available/ not rated
Total
2021
Financial investments 345,808 361,908 - 342,084 1,049,800 Cash and cash equivalents - 99,686 139,023 - 238,709 Derivative financial instruments - - 9,122 - 9,122 Debtors - - - 98,813 98,813 Reinsurers' share of technical provisions
- 83,256 291,758 67,975 442,989
Other - 1,091 1,468 - 2,559
Total 345,808 545,941 441,371 508,873 1,841,992
C.4. Liquidity Risk
Liquidity risk is the risk that cash may not be available to pay obligations as they fall due. The Group has adopted an investment policy which requires the maintenance of significant holdings in short term deposits to ensure sufficient funds are available to cover anticipated liabilities and unexpected levels of demand. Short term cash needs are monitored to ensure the most efficient investment of cash balances. The following table outlines the future maturity of assets held by the Group as reported in its financial statements:
Amounts in US$000s Short term
assets
Within 1 year
1-2 years
2-5 years
Over 5 years
Total
2021
Financial investments 341,905 - 58,744 282,464 366,687 1,049,800
Cash and cash equivalents
238,709 - - - - 238,709
Derivative financial instruments
- 4,833 2,158 2,130 - 9,122
Debtors 6,369 92,444 - - - 98,813
Reinsurers' share of technical provisions
- 155,106 79,621 115,547 92,715 442,989
Other 2,559 - - - - 2,559
Total 589,542 252,383 140,524 400,141 459,402 1,841,992
As further disclosed in appendix S.23.01.01, expected loss in future premium is estimated to be $68.3 million. However, it should be noted that this estimated loss is based upon future cash flows as required by Solvency II and does not therefore necessarily correspond to the estimated surplus under Financial Reporting Standards (“FRS”) accounting principles. Entities are required to

34 | P a g e
report this figure on a gross basis. As a consequence for the Group, this figure excludes the impact of reinsurance arrangements, in particular the pooling agreement.
C.5. Operational Risk Operational risk is defined as the risk of direct or indirect loss resulting from inadequate or failed internal processes, people and systems or from external events. In order to mitigate such risks all key processes and controls are documented in a procedural manual. This manual is embedded into the organisation and available to all staff. Compliance with the procedures and controls documented within the manual is audited on a regular basis through quality control checks and the internal audit function which is directed and reviewed by GARCO. A human resource manual and including all key policies have also been documented. The Managers are protected against loss through errors and omissions through the purchase of insurance cover. The Group therefore benefits indirectly from this cover.
C.6. Other Material Risks The Group has not identified any other material risks that it considers necessary for disclosure.
C.7. Any Other Information COVID-19 will have an impact on the Club’s risk profile and this is discussed further in section E.7 on page 47.

35 | P a g e
D. Valuation for Solvency Purposes For presentational purposes, Hydra has been deconsolidated and treated as an investment in both the Solvency II and FRS sections in all tables that follow in order to facilitate the appropriate comparison between Solvency II and FRS valuation bases. In the Group’s FRS financial statements, Hydra is consolidated in the Group result. The treatment outlined above did not have a material impact on the Group’s free reserves, however it does affect the classification of amounts. Under Solvency II Hydra is treated as a third party reinsurer and not consolidated as part of the group as further discussed in A.1.
D.1. Assets
Valuation of Group’s assets as at 20 February 2021:
Solvency II
Solvency II
FRS FRS
2021 2020 2021 2020
$000s $000s $000s $000s
Investments 1,102,600 1,163,455 1,092,083 1,133,026
Reinsurance share of technical provisions
697,996 404,940 441,758 239,420
Insurance and reinsurance receivables
15,225 11,337 90,274 71,034
Receivables (trade, not insurance) 9,380 7,679 8,766 7,160
Cash and cash equivalents 85,325 57,209 85,325 57,209
Any other assets not elsewhere shown
7,045 3,337 7,045 3,384
Total classified under the SII allocation rule
1,917,571 1,647,957 1,725,251 1,511,233
The above table presents amounts using Solvency II and FRS valuation bases respectively. For classification purposes, amounts have been aggregated using Solvency II adjustment and classification methodologies. Refer to appendix S.02.01.02 for a full Solvency II balance sheet. The Group’s assets are valued using the following principles:
Investments Investments are carried at market value. Market value is calculated using the bid price at the close of business on the balance sheet date. The market value of foreign currency investments is translated at the rate of exchange ruling at the balance sheet date.

36 | P a g e
Fair values of investments traded in active markets are measured at bid price. Where there is no active market, fair value is measured by reference to other factors such as independent valuation reports. A financial instrument is regarded as quoted in an active market if quoted prices are readily and regularly available from an exchange, dealer, broker, industry Group, pricing service or regulatory agency, and those prices represent actual and regularly occurring market transactions on an arm’s length basis. If the above criteria are not met, the market is regarded as being inactive. Derivatives are initially recognised at fair value on the date on which a derivative contract is entered into and are subsequently re-measured at their fair value. All derivatives are carried as assets when the fair value is positive and as liabilities when the fair value is negative. The fair value of foreign exchange forward contracts is based on current forward exchange rates. Hydra Insurance Company operates through several segregated cells. The Group controls one of these cells and all transactions of the cell are in respect of its business. Therefore, this Hydra cell is consolidated into the results of the Group for the purposes of the financial statements. Under Solvency II valuation requirements Hydra is treated as a third party reinsurer. Therefore, the Group’s interest in Hydra is not consolidated in the Solvency II balance sheet, but treated as an investment using a Solvency II valuation basis. Reinsurance share of technical provisions Reinsurance share of technical provisions is valued consistent with gross technical provisions. Refer to D.2. for further details. Cash and cash equivalents Cash and cash equivalents include cash at bank or in hand. The carrying value of these balances is considered to be a suitable proxy for fair value. Insurance and reinsurance receivables These represent balances that are due for existing insurance and reinsurance contracts. Due to the short term nature of these balances, the carrying amount is considered to be a suitable proxy for its fair value. When these amounts are not yet due, they are included as a future cash flow in the calculation of technical provisions. Under statutory accounting requirements, these balances are presented separately on the face of the balance sheet whether they are due or not yet due.

37 | P a g e
Receivables (trade, not insurance) This balance includes sundry, short term receivable balances the value and settlement of which contains little to no uncertainty. Due to the short-term nature of these items, the carrying amount is considered to be a suitable proxy for its fair value. Any other assets not elsewhere shown These represent all asset balances not included above. These items are all of a short-term nature and as such, their carrying amounts are considered to be a suitable proxy for its fair values. There is no material differences between the valuation used for Solvency purposes and the valuation used in the Group's financial statements.
D.2.Technical Provisions Group’s technical provisions as at 20 February 2021 were as follows:
2021 2020
$000s $000s
Gross best estimate 1,385,935 1,035,001
Risk Margin 59,888 53,831
Reinsurance best estimate (697,997) (404,940)
Net technical provisions 747,826 683,892
Technical provisions This relates to the Group’s insurance liabilities, which mainly fall under the P&I “marine, aviation and transport” line of business under Solvency II, with fronted entities largely categorised as “general liability”. As well as claims arising from Members (direct and assumed) and fronted entities, the Group also participates in the International Group of P&I Clubs and so shares claim amounts above a certain level with other participating P&I Clubs. Solvency II requires the technical provisions to be calculated as the sum of a best estimate and a risk margin. The best estimate is valued as the probability-weighted average of future cash flows, taking account of the time value of money, and the risk margin is calculated on a cost-of-capital basis. In addition, for the best estimate, there are three elements to consider: claims, premiums and expenses. The calculation of the different elements of the technical provisions is discussed below. Claims The claims outstanding element of the technical provisions is calculated using standard actuarial techniques to project the cash flows (including chain ladder and Bornhuetter-Ferguson methods). The key assumptions related to the initial

38 | P a g e
expected claims cost for each policy year and the projected notified claims development pattern. These methods are considered appropriate given the longevity and stability of the Group and its claims handling processes. Allowance is also made for claims on contracts bound, but for which coverage has not yet incepted (corresponding to the premium provision). These cash flows are the most uncertain element of the technical provisions. The uncertainty involved was further discussed in Section C1 on Underwriting Risk. Premiums The premiums element of the best estimate covers (i) the outstanding instalments of premium on expired business that are payable but not yet due on the valuation date (corresponding to the provision for claims outstanding); and (ii) the premium payable but not yet due on bound but not incepted business (corresponding to the premium provision). Nearly all of the Group’s policies are coterminous with its financial year. As such, the renewal is completed and therefore bound before the financial year end. The consequence is that nearly a full year’s worth of business is recognised as bound but not incepted business. Expenses When calculating the best estimate, a provision is made for all expense cash flows incurred in servicing insurance obligations. This includes both direct and overhead expenses, as well as investment management expenses. The provision is calculated directly in respect of the provision for claims outstanding (for expired business) and a corresponding amount is derived in respect of the premium provision (for bound but not incepted business). Risk margin The risk margin is calculated based on the requirement to hold capital to meet the SCR until all claims liabilities are settled and a cost-of-capital rate of 6.0% per annum. The SCR in this context is made up of Underwriting Risk, Counterparty Default Risk and Operational Risk only; assets are assumed to be invested in such a way that Market Risk will be zero. A detailed analysis has been carried out to determine the run off profile of these risks. The results of this analysis have been used to project the SCRs required in future time periods. Reinsurance recoverables This relates to the Group’s expected recoverables from its reinsurance arrangements at the valuation date. It is made up of two elements: reinsurance recoveries and reinsurance premiums. These are valued on a consistent basis with the corresponding claims and premiums elements of the technical provisions. In addition, an adjustment is made to take account of expected losses due to default of the reinsurance counterparties.

39 | P a g e
Differences between FRS and Solvency II technical provisions A reconciliation of FRS technical provisions to Solvency II technical provisions is provided below:
Gross RI Net Note $000s $000s $000s
FRS technical provisions 1,288,949 442,989 845,960
Adjustments to best estimate valuation basis 1 84,902 158,748 (73,846)
Reallocations 2 (51,221) (5,800) (45,421)
Adjustment to expense reserve 3 19,308 0 19,308
Provision for contracts bound but not incepted 4 73,871 43,545 30,326
Reinsurance counterparty default adjustment 5 0 (11,933) 11,933
Effects of discounting 6 (29,874) (24,402) (5,472)
Hydra 0 94,850 (94,850)
Solvency II technical provisions before risk margin
1,385,935 697,997 687,938
Risk Margin 1 59,888 0 59,888
Total Solvency II technical provisions 1,445,823 697,997 747,826
Notes 1. Adjustments to best estimate valuation basis Since the Solvency II technical provisions figure is a true best estimate, the FRS technical provisions are adjusted for the following items:
All margins for prudence are removed;
A provision is made for events not in data (“ENID”) to represent a true average of future outcomes;
Technical provisions are stated both gross and net of reinsurance; and
An additional Solvency II risk margin which is intended to represent a notional market value adjustment.
2. Reallocations This is based on the elimination of unearned premium and reallocation of various amounts from the FRS balance sheet to Solvency II technical provisions. The Solvency II balance sheet contains no concept of deference of premium, and as such any such balances are eliminated upon transition to the Solvency II balance sheet. Furthermore under Solvency II valuation methodologies, all future cash flows are included in the calculation of technical provisions. More specifically, any amount not yet due shall be included as a future cash inflow under the calculation of Solvency II technical provisions. As a result, these amounts are reallocated from the accounting balance sheet to technical provisions on the Solvency II balance sheet.

40 | P a g e
3. Adjustment to expense reserve Unlike FRS, Solvency II recognises all expense cash flows incurred in servicing insurance obligations. This includes both direct and overhead expenses, as well as investment management expenses. As such, an adjustment is made. 4. Provision for contracts bound but not incepted Solvency II valuation methodology requires contracts to be recognised when the insurer becomes party to the insurance contract. Usually, an undertaking becomes a party to the contract when the contract between the undertaking and the policyholder is legally formalised. A large proportion of the Group’s policies are coterminous with its financial year. The consequence is that nearly a full year’s worth of business is recognised as Bound But Not Incepted (“BBNI”) business. A provision on the Solvency II balance sheet, known as the “premium provision”, is made for future premiums, claims and expenses that relate to BBNI business. 5. Reinsurance counterparty default adjustment For the Solvency II balance sheet, amounts recoverable from reinsurance counterparties must be adjusted for the expected losses due to the risk of counterparty defaults. This adjustment approximates the expected present value of the losses in the event of default, weighted by the probability of default for each counterparty. Under the current accounting basis, a provision for bad debts is only made where there is objective evidence that counterparty may default on its obligation. 6. Effects of discounting Since Solvency II technical provisions take into account the time value of money, an adjustment is made for the discounting of all future cash flows, based on risk-free interest rates. This includes an adjustment for items previously discounted at rates other than the risk-free rate.
D.3. Other liabilities
Valuation of the Group’s other liabilities as at 20 February 2021:
Figures in $’000s Solvency II FRS
2021 2020 2021 2020
Technical provisions 1,445,823 1,088,831 1,177,137 957,030
Derivatives 9,470 147 9,470 147
Insurance & intermediaries payables 5,254 6,735 5,254 6,735
Reinsurance payables 5,003 71 31,730 5,820
Payables, trade not insurance 927 1,304 927 1,304
Any other liabilities, not shown elsewhere
4,348 1,161 4,348 2,669
Total classified under the SII allocation rule 1,470,825 1,098,249 1,228,866 973,704

41 | P a g e
The above table presents amounts using Solvency II and FRS valuation bases respectively. For classification purposes, amounts have been aggregated using Solvency II classification methodologies. The Group’s other liabilities are valued using the following principles: Technical provisions The valuation principles of technical provisions are further detailed in D.2. Reinsurance payables These represent balances that are due to be paid for existing reinsurance contracts. When these amounts are not yet due to be paid, they are included as a future cash flow in the calculation of reinsurance technical provisions. Under statutory accounting requirements, these balances are presented separately on the face of the balance sheet whether they are due or not yet due. Payables (trade, not insurance) This balance includes sundry, short term payable balances the value and settlement of which contains little to no uncertainty. Due to the short-term nature of these items, the carrying amount is considered to be a suitable proxy for its fair value. Any other liabilities not elsewhere shown All other amounts comprise balances not included in liabilities above. Due to its short-term nature, the carrying amount is considered a suitable proxy for its fair value.
D.4. Alternative methods of valuation
The Group does not utilise any alternative methods of valuation.
D.5. Any other information
The Group has not identified any other information that it considers material to be disclosed.

42 | P a g e
E. Capital Management
E.1 Own funds 2021 2020 $000s $000s
SCR ratio 184.8% 216.9%
SCR 331,330
329,430
Eligible capital 612,411 714,424
Excess / (shortfall) 281,081 384,995
Minimum consolidated Group SCR Ratio
639.6%
784.5%
Minimum consolidated Group SCR
69,847
70,073
Eligible capital 446,746 549,709
Excess / (shortfall) 363,914 479,636
Tier 1 Basic own funds 446,746 549,709
Tier 2 Ancillary own funds 165,665 164,715
As a mutual insurer with no share capital the Group’s capital structure consists of two types of own funds: 1. Accumulated income and expenditure account reserve and reconciliation
reserve, which falls under Tier 1 and counts as Basic Own Funds (“BOF”). These funds may be fully utilised to meet both the SCR and MCR.
2. According to its rules, the Group is entitled to make unlimited calls for supplementary premium to be made on Members. When received, they would become Tier 1 loss absorbent BOF and therefore count as Tier 2 Ancillary Own Funds (“AOF”) for regulatory solvency purposes.
The PRA has granted approval to UKC for a method of calculating AOF. Under the Solvency II regulations, up to 50.0% of the SCR may be covered by these funds. This amounted to $165.6 million of tier 2 AOF being eligible towards SCR coverage. Absent of this requirement, the AOF calculation method would result in an amount of $331.3 million. As far as possible, the Group seeks to provide certainty over the insurance costs borne by Members and therefore would only make a supplementary call in extreme circumstances. These circumstances might include, but are not limited to, being unable to meet its regulatory capital requirements or other internal or external capital measures.
No items have been deducted from own funds and there are no significant restrictions affecting the availability and transferability of own funds.

43 | P a g e
The Minimum consolidated Group SCR is $69.8 million. Information, objectives, policies and processes for managing own funds The Group’s objective under its Corporate Plan is to maintain its total capital resources (own funds) in line with its risk appetite statement over the insurance cycle. The Group forecasts its capital over a 4 year planning horizon as part of its ORSA process. Material differences between equity as shown in the financial statements and the excess of assets over liabilities The table below provides a reconciliation of the capital reported within the Financial Statements to that within the Solvency II balance sheet.
2021 2020 $000s $000s
Financial Statements 507,398 559,194
Solvency II gross technical provisions adjustment (268,686) (131,801)
Of which reallocations from FRS balance sheet (74,385) (59,178)
Solvency II RI technical provisions adjustment 256,238 165,520
Of which reallocations from FRS balance sheet 26,677 7,210
Hydra valuation adjustment 10,517 30,429
Deconsolidation of Hydra balance sheet (11,013) (21,665)
Total Solvency II basic own funds 446,746 549,709
The most material adjustment to reserves is as a result of the differences in valuation of technical provisions. Refer to D.1 to D.3 for a discussion of the differences between the bases.

44 | P a g e
E.2 Solvency Capital Requirement and Minimum Capital Requirement
SCR and MCR The table below summarises the capital requirements for the current period. Further details can be found in appendices S.25.02.21:
2021 2020 $000s $000s
SCR 331,330 329,430
Made up of
Operational risk 41,578 31,050
Market risk 152,066 189,363
Underwriting & reserving risk 161,180 144,194
Counterparty default risk 72,876 62,202
Diversification effects (96,370) (97,374)
Minimum Consolidated Group SCR
69,847
70,073
The Group SCR is calculated on the basis that UKC is the ultimate parent of the Group. This is further discussed in section A.1. The SCR has increased slightly from $329.4m to $331.3m, driven by increases in Underwriting risk, Operational risk and Counterparty default risk offset by decreases in Market Risk, particularly Equity risk and Spread risk.
E.3 Use of the duration-based equity risk sub-module in the calculation of the Solvency Capital Requirement
The Group does not use this sub-module.
E.4 Differences between internal model used and the standard formula The Group has an internal model which it uses for all key decisions as part of its ORSA process. It also has approval from the regulator to use this model to calculate its SCR under Solvency II as described below. Internal Model Scope The standard formula is made up of four broad risk categories: underwriting risk (which includes premium risk and reserve risk), counterparty default risk, market risk and operational risk. Most of these risk categories are thought to be broadly appropriate for the Group on the grounds that the Group’s exposure to

45 | P a g e
these risks should not be materially different to that of a typical insurer that the standard formula was designed for. However, as a P&I insurer, the Group’s risk profile for underwriting risk is very different to that of typical insurers in the marine, aviation and transport insurance line of business. Consequently, it is inadequately reflected by the standard formula. This is exacerbated by the fact that the standard formula does not adequately reflect the Group’s reinsurance structure. Accordingly, the Group has elected to use a partial internal model to replace the underwriting risk module of the standard formula SCR in respect of P&I business. All other risk modules within the SCR are calculated according to the standard formula. In addition, from this year-end, the Club is fronting a small amount of non-P&I business and the underwriting risk in respect of this business is calculated according to the standard formula. The improvements to the calculation of the underwriting risk module for P&I risks mean that the resulting partial internal model SCR better reflects the Group’s risk profile. Partial Internal Model – Underwriting Risk modelling approach A high-level summary of the partial internal model and the modelling techniques used are outlined below.
The Partial Internal Model is a stochastic model built using industry standard software. It is consistent with the risk measures (1-in-200 value at risk) and time period (1 year) adopted by the standard formula.
Premium Risk – Claims are modelled separately for the key classes of business (Chartered, Owned, Pool and Non-Poolable risks). For each of these classes, claims are modelled by frequency and severity for attritional and large claims separately.
Reserve Risk – Claims are modelled separately for the Group’s key reserving classes (Chartered, Owned (including Non-Poolable), Pool and Occupational Disease). Due to the complexities of these risks and associated reinsurance structures, standard industry methodologies (e.g. chain ladder bootstraps) are not always valid. The Group therefore uses different approaches for modelling each of these risk classes including; an in-house developed individual claims development methodology; modified chain ladder bootstraps; and scenario based approaches.
The nature and appropriateness of the data used in the internal model The key data sources used in the model are: The historical exposure and claims history of the Chartered, Owned and
Non-Poolable classes.
The historical exposure and claims history of the Pool class, which is collected from all members of the International Group and collated within the International Group Data Collection Portal (DCP).
As part of the Group’s Solvency II implementation project a significant level of work was undertaken in order to validate and document these data items. Various checks and controls are now carried out as part of business as usual activity, which ensure that the data continues to meet Solvency II standards in
46 | P a g e
relation to completeness, accuracy and appropriateness. In addition to these ongoing controls, the key data elements used for reserving (and the Group’s Internal Model) are reviewed against Solvency II standards as part of the annual Actuarial Function Data Opinion.
E.5 Non-compliance with the Minimum Capital Requirement and non-compliance with the Solvency Capital Requirement
The Group has fully complied with the SCR and MCR requirements during the period under review. Refer to section E.2 for results of the SCR / MCR Calculations.
E.6 Any other information The Group’s own funds are fully available and transferable and therefore no deductions are required. The Group does not apply any undertaking specific parameters within the calculation of the SCR.

47 | P a g e
E.7 Impact of COVID-19 on the Group The COVID-19 pandemic has had a significant impact on lives and economies across the World. However, it has not materially affected the Club’s ability to service its Members. A Business Impact on Insurance Operations During the year, the Club’s Managers adopted remote working practices in all offices in line with local guidelines. These operations continued without interruption or detriment to service. Indeed the Club provided many Members with general advice to assist with their own operations and manage their risks. Furthermore, the use of digital communication technologies helped to increase the Club’s engagement with Members and Brokers. Overall, COVID increased the Club’s combined ratio for the year by nearly 20%. Most of this arose from COVID-related claims, but the Club also experienced a reduction in premium as a result of reduced shipping activity leading to policy endorsements, sales and scrapping. In line with its reinsurance policy, the Club’s reinsurance programme is well diversified and placed with at least A- rated reinsurers. No reinsurance defaults have been experienced. Furthermore, the Club has not seen any material defaults from its Members’ premium obligations either. Impact on Investment Operations The Club’s portfolio fell by 5% to the end of March 2020 as investment markets reacted to the outbreak of COVID-19, with global lockdowns drastically reducing economic activity. As lockdowns eased and fiscal and monetary stimulus kicked in, global stock markets rallied strongly to recover most or all of their losses by the summer. This was later boosted with good news on vaccine development in the autumn. Consequently, the Club’s portfolio returned a rather remarkable 5.6% during the year. As the Club remains financially strong, it is able to retain its long-term approach to investments. Nevertheless, the outlook for future returns appears volatile and expected returns are likely to be lower than seen than in recent years. The Club maintains a large proportion of its assets in highly liquid asset classes. As such, it does not expect any material cash flow risk. B System of Governance There have not been any material changes in the system of governance as a result of COVID-19. C Risk Profile The Club’s ORSA process considers the Club’s risk profile on an ongoing basis and it concludes that the Club’s risk profile has not been materially affected by

48 | P a g e
COVID-19. The following discussion considers the underlying risk profile changes as result of COVID-19. Underwriting Risk COVID claims are typically not large and the largest exposures arise from passenger ships. As cruising has stopped, the risk was significantly reduced. It may increase as cruising restarts, but there will be many precautions to minimise that risk. As such, underwriting risk is expected to remain broadly stable. Market Risk The Club’s strong financial position allows it to be a long-term investor and not unduly react to short-term market fluctuations. However, the Club’s approach to matching assets and liabilities controls the level of market risk taken. The Club maintains a large proportion of its assets in highly liquid asset classes. As such, it does not expect any material cash flow risk. Counterparty Default Risk In line with its reinsurance policy, the Club’s reinsurance programme is well diversified and placed with at least A- rated reinsurers. Consequently, the Club does not expect material reinsurance defaults. Furthermore, the Club does not expect material defaults from its Members’ premium obligations. Operational Risk Operational risk has increased as a result of COVID-19 as key staff may be either directly or indirectly affected by the virus. Furthermore, working remotely may increase cyber risks due to greater reliance on electronic communication. D Valuation for Solvency Purposes COVID-19 will not change the approach to the valuation of assets and liabilities. However the actual values will clearly vary in line with emerging experience. E Capital Management The Club’s strong financial position means that it has maintained its coverage of all its regulatory and rating requirements. These are monitored continuously. The stress and scenario tests undertaken as part of the Club’s ORSA process indicate that this position is expected to continue.

49 | P a g e
Appendix
UKC Solo information The Group has received a waiver from the PRA to present a single Group SFCR that incorporates the result of both the Group and UKC on a solo basis. The main part of this SFCR presents the Group results, unless otherwise stated. The results of UKC on a solo basis are detailed in this appendix.
1. UKC Solo Valuation for Solvency Purposes
1.1 UKC Solo Assets
Valuation of UKC’s assets as at 20 February 2021:
Figures in $’000s Solvency II FRS
2021 2020 2021 2020
Investments 401,938 440,957 152,000 111,955
Reinsurance share of technical provisions 1,330,983 991,946 1,183,384 883,399
Insurance and reinsurance receivables 10,908 9,749 51,698 67,579
Receivables (trade, not insurance) 10,963 6,010 10,902 5,958
Cash and cash equivalents 63,876 47,475 63,876 47,475
Any other assets not elsewhere shown 43,016 120,010 14,258 75,769
1,861,684 1,616,147 1,476,118 1,192,135
The above table presents amounts at Solvency II and FRS valuation bases respectively. For classification purposes, an aggregated Solvency II classification of amounts has been used in order to best demonstrate any valuation differences between the two bases. Refer to UKC appendix S.02.01.02 for a full Solvency II balance sheet. UKC’s assets are valued in accordance with the Group’s valuation principles further detailed in D.1.

50 | P a g e
1.2. UKC Technical Provisions
Net technical provisions as at 20th February 2021:
2021 2020
$000s $000s
Gross best estimate 1,385,563 1,036,663
Risk Margin 26,744 23,000
Reinsurance best estimate (1,330,983) (991,946)
Net technical provisions 81,324 67,717
Refer to UKC QRTs S.17.01.02 and S.19.01.21 in the appendices for further details on technical provisions. UKC’s technical provisions are valued in accordance with the Group valuation principles further detailed in D.2. Differences between FRS and Solvency II technical provisions A reconciliation of FRS technical provisions to Solvency II technical provisions is provided below:
Gross RI Net Note $000s $000s $000s
FRS technical provisions 1,256,134 1,183,384 72,750
Adjustments to best estimate valuation basis 1 111,036 117,584 (6,548)
Reallocations 2 (51,202) (44,969) (6,232)
Adjustment to expense reserve 3 19,308 17,377 1,931
Provision for contracts bound but not incepted 4 79,847 100,312 (20,465)
Reinsurance counterparty default adjustment 5 0 (12,494) 12,494
Effects of discounting 6 (29,560) (28,638) (922)
Hydra 0 (1,573) 1,573
Solvency II technical provisions before risk margin
1,385,563 1,330,983 54,580
Risk Margin 1 26,744 0 26,744
Total Solvency II technical provisions 1,412,307 1,330,983 81,324
Notes 1. Adjustments to best estimate valuation basis Since the Solvency II technical provisions figure is a true best estimate, the FRS technical provisions are adjusted for the following items:
All margins for prudence are removed
A provision is made for events not in data (“ENID”) to represent a true average of future outcomes

51 | P a g e
Technical provisions are stated both gross and net of reinsurance
An additional Solvency II risk margin which is intended to represent a notional market value adjustment.
2. Reallocations This is based on the elimination of unearned premium and reallocation of various amounts from the FRS balance sheet to Solvency II technical provisions. The Solvency II balance sheet contains no concept of deference of premium, and as such any such balances are eliminated upon transition to the Solvency II balance sheet. Furthermore under Solvency II valuation methodologies, all future cash flows are included in the calculation of technical provisions. More specifically, any amount not yet due shall be included as a future cash inflow under the calculation of Solvency II technical provisions. As a result, these amounts are reallocated from the accounting balance sheet to technical provisions on the Solvency II balance sheet. 3. Adjustment to expense reserve Unlike FRS, Solvency II recognises all expense cash flows incurred in servicing insurance obligations. This includes both direct and overhead expenses, as well as investment management expenses. As such, an adjustment is made. 4. Provision for contracts bound but not incepted Solvency II valuation methodology requires contracts to be recognised when the insurer becomes party to the insurance contract. Usually, an undertaking becomes a party of the contract when the contract between undertaking and policyholder is legally formalised. A large proportion of the UKC’s policies are coterminous with its financial year. The consequence is that nearly a full year’s worth of business is recognised as Bound But Not Incepted (“BBNI”) business. A provision on the Solvency II balance sheet, known as the “premium provision”, is thus made for future premiums, claims and expenses that relate to BBNI business. 5. Reinsurance counterparty default adjustment For the Solvency II balance sheet, amounts recoverable from reinsurance counterparties must be adjusted for the expected losses due to counterparty default. This adjustment approximates the expected present value of the losses in the event of default, weighted by the probability of default for each counterparty. Under the current accounting basis, a provision for bad debts is only made where there is objective evidence that counterparty may default on its obligation. 6. Effects of discounting Since Solvency II technical provisions take into account the time value of money, an adjustment is made for the discounting of all future cash flows,

52 | P a g e
based on risk-free interest rates. This includes an adjustment for items previously discounted at rates other than the risk-free rate.
1.3. UKC other liabilities
Valuation of UKC’s other liabilities as at 20 February 2021:
Figures in $000s Solvency II FRS
2021 2020 2021 2020
Technical provisions 1,412,307 1,059,663 1,256,135 954,622
Insurance & intermediaries payables
3,491 6,348 3,491 6,348
Reinsurance payables 76 71 5,876 5,820
Payables, trade not insurance
232 674 232 674
Any other liabilities, not shown elsewhere
403 466 404 467
1,416,509 1,067,222 1,266,137 967,931
The above table presents amounts using Solvency II and FRS valuation basis respectively. For classification purposes, amounts have been aggregated using Solvency II classification methodologies. UKC’s other liabilities are valued in accordance with the Group’s valuation principles further detailed in D.3.

53 | P a g e
2. UKC Capital Management
2.1 UKC Own funds
2021 2020
$000s $000s
SCR ratio 234.9% 254.7%
SCR 240,764 268,178
Eligible capital 565,557 683,013
Excess / (shortfall) 324,793 414,835
MCR Ratio 739.6% 818.7%
MCR 60,191 67,045
Eligible capital 445,175 548,924
Excess / (shortfall) 384,984 481,880
Tier 1 Basic own funds 445,175 548,924
Tier 2 ancillary own funds 120,382 134,089
UKC’s principles for capital management are in accordance with the Group’s capital management principles further detailed in section E. The PRA has granted an approval for a method of calculation of ancillary own funds (“AOF”) to UKC. The method results in AOFs of $120.4 million.
Under the Solvency II regulations, up to 50.0% of the SCR may be covered by these funds. This amounted to $120.4 million of tier 2 ancillary own funds being eligible towards SCR coverage. In absence of this requirement, the AOF calculation method would result in an amount of $329 million. Material differences between equity as shown in the financial statements and the excess of assets over liabilities The table below provides a reconciliation of the capital reported within the Financial Statements to that within the Solvency II balance sheet.
2021 2020
$000s $000s
Financial Statements 209,982 224,204
Solvency II gross technical provisions adjustment (156,172) (105,041)
Of which reallocations from FRS balance sheet (11,971) (13,538)
Solvency II RI technical provisions adjustment 147,598 108,547
Of which reallocations from FRS balance sheet 5,800 5,749
Solvency II revaluation of subsidiaries 249,938 329,003
Total Solvency II basic own funds 445,175 548,924

54 | P a g e
The most material adjustment to reserves is as a result of the differences in valuation of technical provisions. Refer to 1.1 to 1.3 for a discussion of the differences between the bases.
2.2 UKC Solvency Capital Requirement and Minimum Capital Requirement
SCR and MCR Below table summarises the capital requirements for the current period. Further details can be found in UKC appendices S.25.02.21 and S.28.01.01.
2021 2020
$000s $000s
SCR 240,764 268,178
Made up of
Operational risk 41,567 31,100
Market risk 151,594 199,225
Underwriting & reserving risk 11,986 12,329
Counterparty default risk 88,672 79,825
Diversification effects (53,055) (53,452)
MCR 60,191 67,045
The SCR has been calculated using partial internal model and the standard formula as described in section E.4. The SCR has decreased from $268.2m to $240.8m, a decrease of $27.4m over the year. This is driven by a reduction in market risk as a result of a fall in the value of UKB, which is recognised as an investment on UKC’s Solvency II balance sheet and a change in treatment in respect of UKC’s holding in UKNV. The inputs into the MCR are net premium ($48.6 million) and net technical provisions ($54.6 million) as further detailed in UKC appendix S.28.01.01.

ukpandi.com

THE UNITED
KINGDOM MUTUAL
STEAM SHIP
ASSURANCE
ASSOCIATION LIMITED
Solvency and Financial
Condition Report
Disclosures
20 February
2021
(Monetary amounts in USD thousands)

General information
Participating undertaking name THE UNITED KINGDOM MUTUAL STEAM SHIP ASSURANCE ASSOCIATION LIMITED
Group identification code 213800QWNPYB4MEE1U70
Type of code of group LEI
Country of the group supervisor GB
Language of reporting en
Reporting reference date 20 February 2021
Currency used for reporting USD
Accounting standards Local GAAP
Method of Calculation of the group SCR Partial internal model
Method of group solvency calculation Method 1 is used exclusively
Matching adjustment No use of matching adjustment
Volatility adjustment No use of volatility adjustment
Transitional measure on the risk-free interest rate No use of transitional measure on the risk-free interest rate
Transitional measure on technical provisions No use of transitional measure on technical provisions
List of reported templates
S.02.01.02 - Balance sheet
S.05.01.02 - Premiums, claims and expenses by line of business
S.05.02.01 - Premiums, claims and expenses by country
S.23.01.22 - Own Funds
S.25.02.22 - Solvency Capital Requirement - for groups using the standard formula and partial internal model
S.25.02.22 - Solvency Capital Requirement - for groups using the standard formula and partial internal model
S.32.01.22 - Undertakings in the scope of the group

S.02.01.02
Balance sheet
Solvency II
value
Assets C0010
R0030 Intangible assets
R0040 Deferred tax assets
R0050 Pension benefit surplus
R0060 Property, plant & equipment held for own use 0
R0070 Investments (other than assets held for index-linked and unit-linked contracts) 1,102,600
R0080 Property (other than for own use) 0
R0090 Holdings in related undertakings, including participations 24,818
R0100 Equities 316,186
R0110 Equities - listed 235,360
R0120 Equities - unlisted 80,826
R0130 Bonds 677,736
R0140 Government Bonds 561,909
R0150 Corporate Bonds 115,826
R0160 Structured notes 0
R0170 Collateralised securities 0
R0180 Collective Investments Undertakings 74,739
R0190 Derivatives 9,122
R0200 Deposits other than cash equivalents 0
R0210 Other investments 0
R0220 Assets held for index-linked and unit-linked contracts
R0230 Loans and mortgages 0
R0240 Loans on policies 0
R0250 Loans and mortgages to individuals
R0260 Other loans and mortgages
R0270 Reinsurance recoverables from: 697,996
R0280 Non-life and health similar to non-life 697,996
R0290 Non-life excluding health 697,996
R0300 Health similar to non-life
R0310 Life and health similar to life, excluding index-linked and unit-linked 0
R0320 Health similar to life
R0330 Life excluding health and index-linked and unit-linked
R0340 Life index-linked and unit-linked
R0350 Deposits to cedants 0
R0360 Insurance and intermediaries receivables 8,419
R0370 Reinsurance receivables 6,806
R0380 Receivables (trade, not insurance) 9,380
R0390 Own shares (held directly)
R0400 Amounts due in respect of own fund items or initial fund called up but not yet paid in 0
R0410 Cash and cash equivalents 85,325
R0420 Any other assets, not elsewhere shown 7,045
R0500 Total assets 1,917,571

S.02.01.02
Balance sheet
Solvency II
value
Liabilities C0010
R0510 Technical provisions - non-life 1,445,823
R0520 Technical provisions - non-life (excluding health) 1,445,823
R0530 TP calculated as a whole
R0540 Best Estimate 1,385,935
R0550 Risk margin 59,888
R0560 Technical provisions - health (similar to non-life) 0
R0570 TP calculated as a whole
R0580 Best Estimate
R0590 Risk margin
R0600 Technical provisions - life (excluding index-linked and unit-linked) 0
R0610 Technical provisions - health (similar to life) 0
R0620 TP calculated as a whole
R0630 Best Estimate
R0640 Risk margin
R0650 Technical provisions - life (excluding health and index-linked and unit-linked) 0
R0660 TP calculated as a whole
R0670 Best Estimate
R0680 Risk margin
R0690 Technical provisions - index-linked and unit-linked 0
R0700 TP calculated as a whole
R0710 Best Estimate
R0720 Risk margin
R0740 Contingent liabilities
R0750 Provisions other than technical provisions 246
R0760 Pension benefit obligations
R0770 Deposits from reinsurers
R0780 Deferred tax liabilities
R0790 Derivatives 9,470
R0800 Debts owed to credit institutions
R0810 Financial liabilities other than debts owed to credit institutions
R0820 Insurance & intermediaries payables 5,007
R0830 Reinsurance payables 5,003
R0840 Payables (trade, not insurance) 927
R0850 Subordinated liabilities 0
R0860 Subordinated liabilities not in BOF
R0870 Subordinated liabilities in BOF 0
R0880 Any other liabilities, not elsewhere shown 4,349
R0900 Total liabilities 1,470,825
R1000 Excess of assets over liabilities 446,746

S.05.01.02
Non-life
Motor vehicle
liability
insurance
Other motor
insurance
Marine,
aviation and
transport
insurance
Fire and other
damage to
property
insurance
General
liability
insurance
C0040 C0050 C0060 C0070 C0080 C0200
Premiums written
R0110 Gross - Direct Business 754 292,455 905 19,257 313,370
R0120 Gross - Proportional reinsurance accepted
R0130 Gross - Non-proportional reinsurance accepted
R0140 Reinsurers' share 754 118,262 791 16,452 136,259
R0200 Net 0 174,192 114 2,804 177,111
Premiums earned
R0210 Gross - Direct Business 82 279,293 128 6,873 286,376
R0220 Gross - Proportional reinsurance accepted
R0230 Gross - Non-proportional reinsurance accepted
R0240 Reinsurers' share 82 108,734 111 5,813 114,740
R0300 Net 0 170,558 17 1,061 171,636
Claims incurred
R0310 Gross - Direct Business 65 487,496 62 4,683 492,306
R0320 Gross - Proportional reinsurance accepted
R0330 Gross - Non-proportional reinsurance accepted
R0340 Reinsurers' share 65 300,932 62 4,683 305,742
R0400 Net 0 186,564 0 0 186,564
Changes in other technical provisions
R0410 Gross - Direct Business
R0420 Gross - Proportional reinsurance accepted
R0430 Gross - Non-proportional reinsurance accepted
R0440 Reinsurers' share
R0500 Net
R0550 Expenses incurred -52 89,684 -42 1,001 90,591
R1200 Other expenses -16,406
R1300 Total expenses 74,185
Premiums, claims and expenses by line of business
Line of Business for: non-life insurance and reinsurance obligations (direct
business and accepted proportional reinsurance)
Total
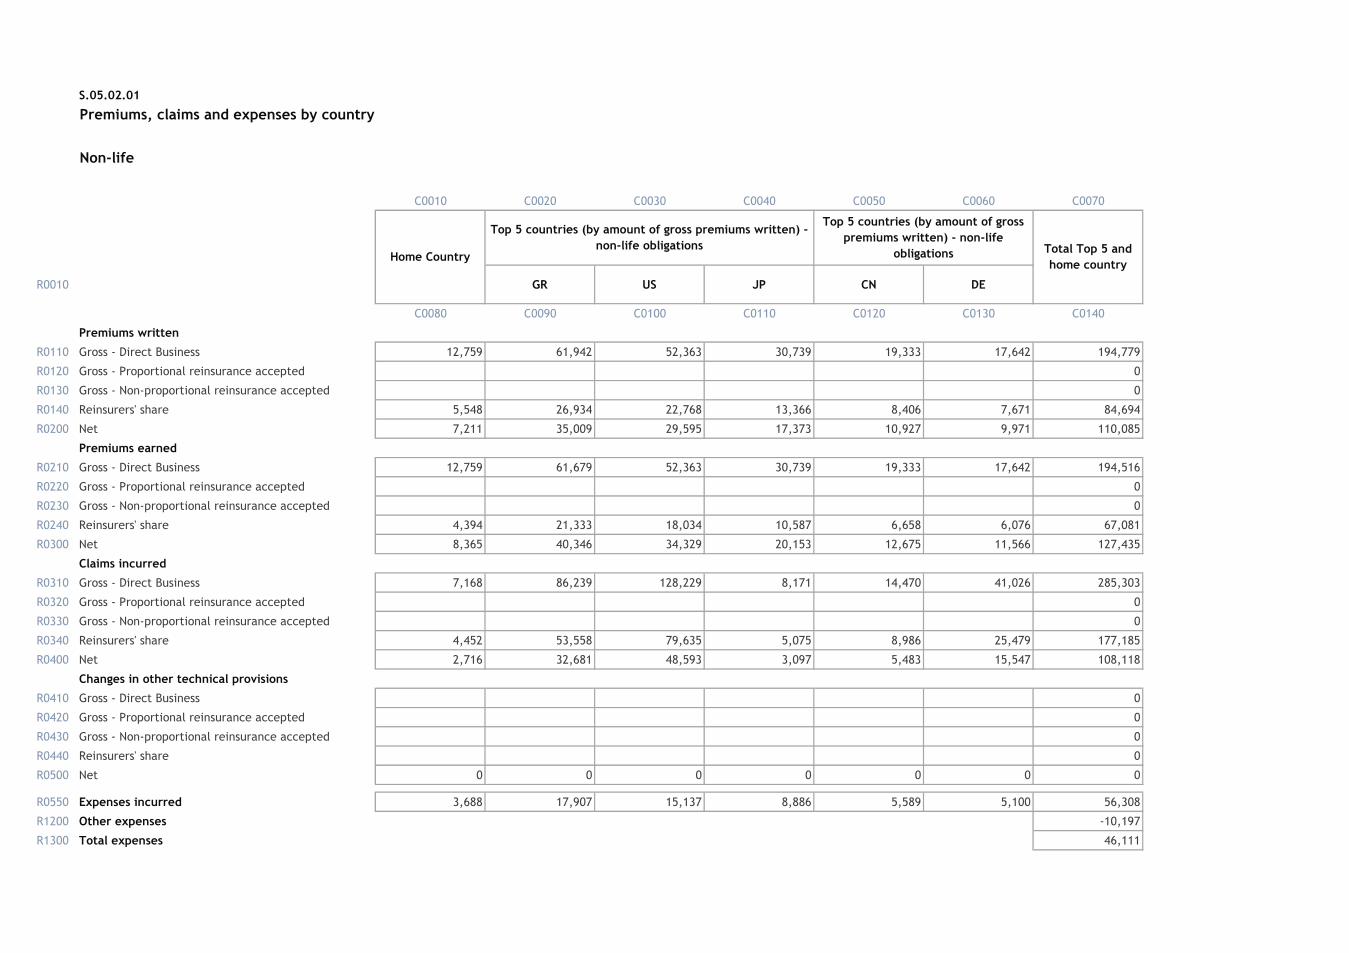
S.05.02.01
Premiums, claims and expenses by country
Non-life
C0010 C0020 C0030 C0040 C0050 C0060 C0070
R0010 GR US JP CN DE
C0080 C0090 C0100 C0110 C0120 C0130 C0140
Premiums written
R0110 Gross - Direct Business 12,759 61,942 52,363 30,739 19,333 17,642 194,779
R0120 Gross - Proportional reinsurance accepted 0
R0130 Gross - Non-proportional reinsurance accepted 0
R0140 Reinsurers' share 5,548 26,934 22,768 13,366 8,406 7,671 84,694
R0200 Net 7,211 35,009 29,595 17,373 10,927 9,971 110,085
Premiums earned
R0210 Gross - Direct Business 12,759 61,679 52,363 30,739 19,333 17,642 194,516
R0220 Gross - Proportional reinsurance accepted 0
R0230 Gross - Non-proportional reinsurance accepted 0
R0240 Reinsurers' share 4,394 21,333 18,034 10,587 6,658 6,076 67,081
R0300 Net 8,365 40,346 34,329 20,153 12,675 11,566 127,435
Claims incurred
R0310 Gross - Direct Business 7,168 86,239 128,229 8,171 14,470 41,026 285,303
R0320 Gross - Proportional reinsurance accepted 0
R0330 Gross - Non-proportional reinsurance accepted 0
R0340 Reinsurers' share 4,452 53,558 79,635 5,075 8,986 25,479 177,185
R0400 Net 2,716 32,681 48,593 3,097 5,483 15,547 108,118
Changes in other technical provisions
R0410 Gross - Direct Business 0
R0420 Gross - Proportional reinsurance accepted 0
R0430 Gross - Non-proportional reinsurance accepted 0
R0440 Reinsurers' share 0
R0500 Net 0 0 0 0 0 0 0
R0550 Expenses incurred 3,688 17,907 15,137 8,886 5,589 5,100 56,308
R1200 Other expenses -10,197
R1300 Total expenses 46,111
Home Country
Top 5 countries (by amount of gross premiums written) -
non-life obligations
Top 5 countries (by amount of gross
premiums written) - non-life
obligations Total Top 5 and
home country

S.23.01.22
Own Funds
Basic own funds before deduction for participations in other financial sector TotalTier 1
unrestricted
Tier 1
restrictedTier 2 Tier 3
C0010 C0020 C0030 C0040 C0050
R0010 Ordinary share capital (gross of own shares) 0 0 0
R0020 Non-available called but not paid in ordinary share capital at group level 0
R0030 Share premium account related to ordinary share capital 0 0 0
R0040 Initial funds, members' contributions or the equivalent basic own-fund item for mutual and mutual-type undertakings 0 0 0
R0050 Subordinated mutual member accounts 0 0 0 0
R0060 Non-available subordinated mutual member accounts at group level 0
R0070 Surplus funds 0 0
R0080 Non-available surplus funds at group level 0 0
R0090 Preference shares 0 0 0 0
R0100 Non-available preference shares at group level 0
R0110 Share premium account related to preference shares 0 0 0 0
R0120 Non-available share premium account related to preference shares at group level 0
R0130 Reconciliation reserve 446,746 446,746
R0140 Subordinated liabilities 0 0 0 0
R0150 Non-available subordinated liabilities at group level 0
R0160 An amount equal to the value of net deferred tax assets 0 0
R0170 The amount equal to the value of net deferred tax assets not available at the group level 0 0
R0180 Other items approved by supervisory authority as basic own funds not specified above 0 0 0 0 0
R0190 Non available own funds related to other own funds items approved by supervisory authority 0
R0200 Minority interests (if not reported as part of a specific own fund item) 0
R0210 Non-available minority interests at group level 0
R0220 Own funds from the financial statements that should not be represented by the reconciliation reserve and do not meet the criteria to be classified as Solvency II own funds
R0230 Deductions for participations in other financial undertakings, including non-regulated undertakings carrying out financial activities 0
R0240 whereof deducted according to art 228 of the Directive 2009/138/EC 0
R0250 Deductions for participations where there is non-availability of information (Article 229) 0
R0260 Deduction for participations included by using D&A when a combination of methods is used 0
R0270 Total of non-available own fund items 0 0 0 0 0
R0280 Total deductions 0 0 0 0 0
R0290 Total basic own funds after deductions 446,746 446,746 0 0 0
Ancillary own funds
R0300 Unpaid and uncalled ordinary share capital callable on demand 0
R0310 Unpaid and uncalled initial funds, members' contributions or the equivalent basic own fund item for mutual and mutual - type undertakings, callable on demand 0
R0320 Unpaid and uncalled preference shares callable on demand 0
R0330 A legally binding commitment to subscribe and pay for subordinated liabilities on demand 0
R0340 Letters of credit and guarantees under Article 96(2) of the Directive 2009/138/EC 0
R0350 Letters of credit and guarantees other than under Article 96(2) of the Directive 2009/138/EC 0
R0360 Supplementary members calls under first subparagraph of Article 96(3) of the Directive 2009/138/EC 165,665 165,665
R0370 Supplementary members calls - other than under first subparagraph of Article 96(3) of the Directive 2009/138/EC 0
R0380 Non available ancillary own funds at group level 0
R0390 Other ancillary own funds 0
R0400 Total ancillary own funds 165,665 165,665 0
Own funds of other financial sectors
R0410 Credit Institutions, investment firms, financial institutions, alternative investment fund managers, UCITS management companies 0
R0420 Institutions for occupational retirement provision 0
R0430 Non regulated entities carrying out financial activities 0
R0440 Total own funds of other financial sectors 0 0 0 0 0

S.23.01.22
Own Funds
Basic own funds before deduction for participations in other financial sector TotalTier 1
unrestricted
Tier 1
restrictedTier 2 Tier 3
C0010 C0020 C0030 C0040 C0050
Own funds when using the D&A, exclusively or in combination of method 1
R0450 Own funds aggregated when using the D&A and combination of method 0
R0460 Own funds aggregated when using the D&A and combination of method net of IGT 0
R0520 Total available own funds to meet the consolidated group SCR (excluding own funds from other financial sector and from the undertakings included via D&A ) 612,411 446,746 0 165,665 0
R0530 Total available own funds to meet the minimum consolidated group SCR 446,746 446,746 0 0
R0560 Total eligible own funds to meet the consolidated group SCR (excluding own funds from other financial sector and from the undertakings included via D&A ) 612,411 446,746 0 165,665 0
R0570 Total eligible own funds to meet the minimum consolidated group SCR (group) 446,746 446,746 0 0
R0610 Minimum consolidated Group SCR 69,847
R0650 Ratio of Eligible own funds to Minimum Consolidated Group SCR 639.60%
R0660 Total eligible own funds to meet the group SCR (including own funds from other financial sector and from the undertakings included via D&A ) 612,411 446,746 0 165,665 0
R0680 Group SCR 331,330
R0690 Ratio of Eligible own funds to group SCR including other financial sectors and the undertakings included via D&A 184.83%
Reconcilliation reserve C0060
R0700 Excess of assets over liabilities 446,746
R0710 Own shares (held directly and indirectly)
R0720 Forseeable dividends, distributions and charges
R0730 Other basic own fund items 0
R0740 Adjustment for restricted own fund items in respect of matching adjustment portfolios and ring fenced funds 0
R0750 Other non available own funds
R0760 Reconciliation reserve 446,746
Expected profits
R0770 Expected profits included in future premiums (EPIFP) - Life business
R0780 Expected profits included in future premiums (EPIFP) - Non- life business -68,388
R0790 Total Expected profits included in future premiums (EPIFP) -68,388

S.25.02.22
Unique number
of componentComponent description
Calculation of the
Solvency Capital
Requirement
Amount modelled USP Simplifications
Row C0010 C0020 C0030 C0070 C0090 C0120
1 1 Market Risk 152,066 9
2 2 Counterparty Default Risk 72,876 9
3 5 Non-Life underwriting risk 161,180 161,180 9
4 7 Operational risk 41,578 9
USP Key
For life underwriting risk:
1 - Increase in the amount of
annuity benefits
9 - None
USP Key
For health underwriting risk:
1 - Increase in the amount of
annuity benefits
2 - Standard deviation for NSLT
health premium risk
3 - Standard deviation for NSLT
health gross premium risk
4 - Adjustment factor for non-
proportional reinsurance
5 - Standard deviation for NSLT
health reserve risk
9 - None
USP Key
For non-life underwriting risk:
4 - Adjustment factor for non-
proportional reinsurance
6 - Standard deviation for non-life
premium risk
7 - Standard deviation for non-life
gross premium risk
8 - Standard deviation for non-life
reserve risk
9 - None
Solvency Capital Requirement -
for groups using the standard formula and partial internal model

S.25.02.22
Solvency Capital Requirement - for groups using the standard formula and partial internal model
Calculation of Solvency Capital Requirement C0100
R0110 Total undiversified components 427,700
R0060 Diversification -96,370
R0160 Capital requirement for business operated in accordance with Art. 4 of Directive 2003/41/EC
R0200 Solvency capital requirement excluding capital add-on 331,330
R0210 Capital add-ons already set
R0220 Solvency capital requirement for undertakings under consolidated method 331,330
Other information on SCR
R0300 Amount/estimate of the overall loss-absorbing capacity of technical provisions
R0310 Amount/estimate of the overall loss-absorbing capacity ot deferred taxes 0
R0400 Capital requirement for duration-based equity risk sub-module
R0410 Total amount of Notional Solvency Capital Requirements for remaining part
R0420 Total amount of Notional Solvency Capital Requirement for ring fenced funds
R0430 Total amount of Notional Solvency Capital Requirement for matching adjustment portfolios
R0440 Diversification effects due to RFF nSCR aggregation for article 304
R0470 Minimum consolidated group solvency capital requirement 69,847
Information on other entities
R0500 Capital requirement for other financial sectors (Non-insurance capital requirements) 0
R0510
R0520 Institutions for occupational retirement provisions
R0530 Capital requirement for non- regulated entities carrying out financial activities
R0540 Capital requirement for non-controlled participation requirements
R0550 Capital requirement for residual undertakings
Overall SCR
R0560 SCR for undertakings included via D and A
R0570 Solvency capital requirement 331,330
Credit institutions, investment firms and financial institutions, alternative investment funds managers, UCITS management companies

S.32.01.22
Undertakings in the scope of the group
CountryIdentification code of the
undertaking
Type of code of
the ID of the
undertaking
Legal Name of the undertaking Type of undertaking Legal form
Category
(mutual/non
mutual)
Supervisory Authority % capital share
Row C0010 C0020 C0030 C0040 C0050 C0060 C0070 C0080 C0180
1 GB 213800QWNPYB4MEE1U70 LEI THE UNITED KINGDOM MUTUAL STEAM SHIP ASSURANCE ASSOCIATION (EUROPE) LIMITEDNon life insurance undertaking Company limited by guarantee Mutual Prudential Regulatory Authority 100.00%
2 BM 213800IFVOX63ELTKM29 LEI THE UNITED KINGDOM MUTUAL STEAM SHIP ASSURANCE ASSOCIATION (BERMUDA) LIMITEDReinsurance undertaking Company limited by guarantee Mutual Bermuda Regulatory Authority 100.00%
3 BM IPIR Specific code INTERNATIONAL P&I REINSURANCE COMPANY LTD Reinsurance undertaking Company limited by shares Non-mutual Isle of Man Financial Services Authority 100.00%
4 NL 724500T310DRX4FA7I75 LEI UK P&I CLUB N.V. Non life insurance undertaking Company limited by guarantee Non-mutual Dutch National Bank 100.00%
Criteria of influence

S.32.01.22
Undertakings in the scope of the group
CountryIdentification code of the
undertaking
Type of code of
the ID of the
undertaking
Row C0010 C0020 C0030
1 GB 213800QWNPYB4MEE1U70 LEI
2 BM 213800IFVOX63ELTKM29 LEI
3 BM IPIR Specific code
4 NL 724500T310DRX4FA7I75 LEI
Group solvency calculation
% used for the
establishment of
consolidated
accounts
% voting rights Other criteria Level of influence
Proportional share used
for group solvency
calculation
YES/NODate of decision if
art. 214 is applied
Method used and under method 1, treatment of the
undertaking
C0190 C0200 C0210 C0220 C0230 C0240 C0250 C0260
100.00% 100.00% Dominant 100.00% Included in the scope Method 1: Full consolidation
100.00% 100.00% Dominant 100.00% Included in the scope Method 1: Full consolidation
100.00% 100.00% Dominant 100.00% Included in the scope Method 1: Full consolidation
100.00% 100.00% Dominant 100.00% Included in the scope Method 1: Full consolidation
Criteria of influenceInclusion in the scope of Group
supervision

THE UNITED
KINGDOM MUTUAL
STEAM SHIP
ASSURANCE
ASSOCIATION LIMITED
Solvency and Financial
Condition Report
Disclosures
20 February
2021
(Monetary amounts in USD thousands)

General information
Undertaking name THE UNITED KINGDOM MUTUAL STEAM SHIP ASSURANCE ASSOCIATION LIMITED
Undertaking identification code 213800QWNPYB4MEE1U70
Type of code of undertaking LEI
Type of undertaking Non-life undertakings
Country of authorisation GB
Language of reporting en
Reporting reference date 20 February 2021
Currency used for reporting USD
Accounting standards Local GAAP
Method of Calculation of the SCR Partial internal model
Matching adjustment No use of matching adjustment
Volatility adjustment No use of volatility adjustment
Transitional measure on the risk-free interest rate No use of transitional measure on the risk-free interest rate
Transitional measure on technical provisions No use of transitional measure on technical provisions
List of reported templates
S.02.01.02 - Balance sheet
S.05.01.02 - Premiums, claims and expenses by line of business
S.05.02.01 - Premiums, claims and expenses by country
S.17.01.02 - Non-Life Technical Provisions
S.19.01.21 - Non-Life insurance claims
S.23.01.01 - Own Funds
S.25.02.21 - Solvency Capital Requirement - for undertakings using the standard formula and partial internal model
S.25.02.21 - Solvency Capital Requirement - for undertakings using the standard formula and partial internal model
S.28.01.01 - Minimum Capital Requirement - Only life or only non-life insurance or reinsurance activity

S.02.01.02
Balance sheet
Solvency II
value
Assets C0010
R0030 Intangible assets
R0040 Deferred tax assets
R0050 Pension benefit surplus
R0060 Property, plant & equipment held for own use 0
R0070 Investments (other than assets held for index-linked and unit-linked contracts) 401,938
R0080 Property (other than for own use) 0
R0090 Holdings in related undertakings, including participations 318,445
R0100 Equities 0
R0110 Equities - listed
R0120 Equities - unlisted
R0130 Bonds 79,556
R0140 Government Bonds 79,556
R0150 Corporate Bonds 0
R0160 Structured notes 0
R0170 Collateralised securities 0
R0180 Collective Investments Undertakings 3,937
R0190 Derivatives
R0200 Deposits other than cash equivalents 0
R0210 Other investments 0
R0220 Assets held for index-linked and unit-linked contracts
R0230 Loans and mortgages 0
R0240 Loans on policies 0
R0250 Loans and mortgages to individuals
R0260 Other loans and mortgages
R0270 Reinsurance recoverables from: 1,330,983
R0280 Non-life and health similar to non-life 1,330,983
R0290 Non-life excluding health 1,330,983
R0300 Health similar to non-life 0
R0310 Life and health similar to life, excluding index-linked and unit-linked 0
R0320 Health similar to life
R0330 Life excluding health and index-linked and unit-linked
R0340 Life index-linked and unit-linked
R0350 Deposits to cedants 0
R0360 Insurance and intermediaries receivables 4,075
R0370 Reinsurance receivables 6,833
R0380 Receivables (trade, not insurance) 10,963
R0390 Own shares (held directly) 0
R0400 Amounts due in respect of own fund items or initial fund called up but not yet paid in 0
R0410 Cash and cash equivalents 63,876
R0420 Any other assets, not elsewhere shown 43,016
R0500 Total assets 1,861,684

S.02.01.02
Balance sheet
Solvency II
value
Liabilities C0010
R0510 Technical provisions - non-life 1,412,307
R0520 Technical provisions - non-life (excluding health) 1,412,307
R0530 TP calculated as a whole 0
R0540 Best Estimate 1,385,563
R0550 Risk margin 26,743
R0560 Technical provisions - health (similar to non-life) 0
R0570 TP calculated as a whole 0
R0580 Best Estimate 0
R0590 Risk margin 0
R0600 Technical provisions - life (excluding index-linked and unit-linked) 0
R0610 Technical provisions - health (similar to life) 0
R0620 TP calculated as a whole
R0630 Best Estimate
R0640 Risk margin
R0650 Technical provisions - life (excluding health and index-linked and unit-linked) 0
R0660 TP calculated as a whole
R0670 Best Estimate
R0680 Risk margin
R0690 Technical provisions - index-linked and unit-linked 0
R0700 TP calculated as a whole
R0710 Best Estimate
R0720 Risk margin
R0740 Contingent liabilities 0
R0750 Provisions other than technical provisions
R0760 Pension benefit obligations
R0770 Deposits from reinsurers
R0780 Deferred tax liabilities
R0790 Derivatives
R0800 Debts owed to credit institutions
R0810 Financial liabilities other than debts owed to credit institutions
R0820 Insurance & intermediaries payables 3,491
R0830 Reinsurance payables 76
R0840 Payables (trade, not insurance) 232
R0850 Subordinated liabilities 0
R0860 Subordinated liabilities not in BOF
R0870 Subordinated liabilities in BOF 0
R0880 Any other liabilities, not elsewhere shown 404
R0900 Total liabilities 1,416,509
R1000 Excess of assets over liabilities 445,175

S.05.01.02
Non-life
Medical
expense
insurance
Income
protection
insurance
Workers'
compensation
insurance
Motor vehicle
liability
insurance
Other motor
insurance
Marine,
aviation and
transport
insurance
Fire and
other damage
to property
insurance
General
liability
insurance
Credit and
suretyship
insurance
Legal
expenses
insurance
AssistanceMisc.
financial lossHealth Casualty
Marine,
aviation and
transport
Property
C0010 C0020 C0030 C0040 C0050 C0060 C0070 C0080 C0090 C0100 C0110 C0120 C0130 C0140 C0150 C0160 C0200
Premiums written
R0110 Gross - Direct Business 219,875 219,875
R0120 Gross - Proportional reinsurance accepted 57,930 57,930
R0130 Gross - Non-proportional reinsurance accepted 0
R0140 Reinsurers' share 229,231 229,231
R0200 Net 48,574 48,574
Premiums earned
R0210 Gross - Direct Business 219,875 219,875
R0220 Gross - Proportional reinsurance accepted 57,930 57,930
R0230 Gross - Non-proportional reinsurance accepted 0
R0240 Reinsurers' share 229,231 229,231
R0300 Net 48,574 48,574
Claims incurred
R0310 Gross - Direct Business 454,743 454,743
R0320 Gross - Proportional reinsurance accepted 48,417 48,417
R0330 Gross - Non-proportional reinsurance accepted 0
R0340 Reinsurers' share 483,832 483,832
R0400 Net 19,328 19,328
Changes in other technical provisions
R0410 Gross - Direct Business 0
R0420 Gross - Proportional reinsurance accepted 0
R0430 Gross - Non-proportional reinsurance accepted 0
R0440 Reinsurers' share 0
R0500 Net 0 0
R0550 Expenses incurred 45,514 45,514
R1200 Other expenses -1,401
R1300 Total expenses 44,113
Premiums, claims and expenses by line of business
Line of Business for: non-life insurance and reinsurance obligations (direct business and accepted proportional reinsurance)Line of business for: accepted non-proportional
reinsurance
Total

S.05.02.01
Premiums, claims and expenses by country
Non-life
C0010 C0020 C0030 C0040 C0050 C0060 C0070
R0010 GR US JP CN DE
C0080 C0090 C0100 C0110 C0120 C0130 C0140
Premiums written
R0110 Gross - Direct Business 10,106 49,061 41,474 24,347 15,313 13,974 154,274
R0120 Gross - Proportional reinsurance accepted 2,653 12,881 10,889 6,392 4,020 3,669 40,505
R0130 Gross - Non-proportional reinsurance accepted 0
R0140 Reinsurers' share 10,528 51,112 43,207 25,364 15,953 14,558 160,722
R0200 Net 2,231 10,831 9,156 5,375 3,380 3,085 34,057
Premiums earned
R0210 Gross - Direct Business 10,106 49,061 41,474 24,347 15,313 13,974 154,274
R0220 Gross - Proportional reinsurance accepted 2,653 12,881 10,889 6,392 4,020 3,669 40,505
R0230 Gross - Non-proportional reinsurance accepted 0
R0240 Reinsurers' share 10,528 51,112 43,207 25,364 15,953 14,558 160,722
R0300 Net 2,231 10,831 9,156 5,375 3,380 3,085 34,057
Claims incurred
R0310 Gross - Direct Business 6,621 79,659 118,445 7,548 13,366 37,896 263,534
R0320 Gross - Proportional reinsurance accepted 705 8,481 12,611 804 1,423 4,035 28,059
R0330 Gross - Non-proportional reinsurance accepted 0
R0340 Reinsurers' share 7,045 84,755 126,021 8,030 14,221 40,320 280,392
R0400 Net 281 3,386 5,034 321 568 1,611 11,201
Changes in other technical provisions
R0410 Gross - Direct Business 0
R0420 Gross - Proportional reinsurance accepted 0
R0430 Gross - Non-proportional reinsurance accepted 0
R0440 Reinsurers' share 0
R0500 Net 0 0 0 0 0 0 0
R0550 Expenses incurred 2,092 10,156 8,585 5,040 3,170 2,892 31,934
R1200 Other expenses -983
R1300 Total expenses 30,952
Home Country
Top 5 countries (by amount of gross premiums written) -
non-life obligations
Top 5 countries (by amount of gross
premiums written) - non-life
obligations Total Top 5 and
home country

S.17.01.02
Non-Life Technical Provisions
Medical
expense
insurance
Income
protection
insurance
Workers'
compensation
insurance
Motor vehicle
liability
insurance
Other motor
insurance
Marine,
aviation and
transport
insurance
Fire and other
damage to
property
insurance
General
liability
insurance
Credit and
suretyship
insurance
Legal expenses
insuranceAssistance
Miscellaneous
financial loss
Non-
proportional
health
reinsurance
Non-
proportional
casualty
reinsurance
Non-
proportional
marine,
aviation and
transport
reinsurance
Non-
proportional
property
reinsurance
C0020 C0030 C0040 C0050 C0060 C0070 C0080 C0090 C0100 C0110 C0120 C0130 C0140 C0150 C0160 C0170 C0180
R0010 Technical provisions calculated as a whole 0 0
R0050
Total Recoverables from reinsurance/SPV and Finite Re after
the adjustment for expected losses due to counterparty default
associated to TP calculated as a whole
0
Technical provisions calculated as a sum of BE and RM
Best estimate
Premium provisions
R0060 Gross 74,625 74,625
R0140
Total recoverable from reinsurance/SPV and Finite Re
after the adjustment for expected losses due to
counterparty default
92,471 92,471
R0150 Net Best Estimate of Premium Provisions -17,847 -17,847
Claims provisions
R0160 Gross 1,310,939 1,310,939
R0240
Total recoverable from reinsurance/SPV and Finite Re
after the adjustment for expected losses due to
counterparty default
1,238,512 1,238,512
R0250 Net Best Estimate of Claims Provisions 72,427 72,427
R0260 Total best estimate - gross 1,385,563 1,385,563
R0270 Total best estimate - net 54,580 54,580
R0280 Risk margin 26,743 26,743
Amount of the transitional on Technical Provisions
R0290 Technical Provisions calculated as a whole 0
R0300 Best estimate 0
R0310 Risk margin 0
R0320 Technical provisions - total 1,412,307 1,412,307
R0330
Recoverable from reinsurance contract/SPV and
Finite Re after the adjustment for expected losses due to
counterparty default - total
1,330,983 1,330,983
R0340Technical provisions minus recoverables from
reinsurance/SPV and Finite Re - total81,324 81,324
Direct business and accepted proportional reinsurance Accepted non-proportional reinsurance
Total Non-Life
obligation

S.19.01.21
Non-Life insurance claims
Total Non-life business
Z0020 Accident year / underwriting year
Gross Claims Paid (non-cumulative)
(absolute amount)
C0010 C0020 C0030 C0040 C0050 C0060 C0070 C0080 C0090 C0100 C0110 C0170 C0180
Year
0 1 2 3 4 5 6 7 8 9 10 & +
R0100 Prior -59,626 -59,626 -59,626
R0160 2012 35,469 68,764 43,719 27,846 4,894 6,548 2,762 2,279 436 574 574 193,291
R0170 2013 47,296 71,896 55,146 30,024 12,430 9,869 3,528 7,896 2,696 2,696 240,778
R0180 2014 53,495 96,301 69,396 30,495 51,171 15,362 14,410 6,509 6,509 337,139
R0190 2015 50,993 57,445 29,617 16,905 13,700 18,451 5,866 5,866 192,977
R0200 2016 27,886 56,481 38,859 27,535 19,915 21,108 21,108 191,784
R0210 2017 45,546 44,282 47,179 28,893 22,082 22,082 187,982
R0220 2018 52,409 59,520 48,977 23,099 23,099 184,005
R0230 2019 37,642 68,125 52,590 52,590 158,357
R0240 2020 48,591 51,228 51,228 99,819
R0250 2021 75,523 75,523 75,523
R0260 Total 201,648 1,802,030
Gross Undiscounted Best Estimate Claims Provisions
(absolute amount)
C0360
C0200 C0210 C0220 C0230 C0240 C0250 C0260 C0270 C0280 C0290 C0300
Year
0 1 2 3 4 5 6 7 8 9 10 & +
R0100 Prior 205,211 187,038
R0160 2012 0 0 0 0 0 45,699 27,874 22,892 18,513 16,266 15,126
R0170 2013 0 0 0 0 47,506 28,396 19,362 7,295 4,190 4,348
R0180 2014 0 0 0 102,138 74,721 46,368 34,876 20,414 19,364
R0190 2015 0 0 84,253 61,251 48,317 25,992 17,872 17,471
R0200 2016 0 208,625 165,635 125,302 87,550 66,617 64,781
R0210 2017 159,016 174,181 101,915 66,172 48,461 47,762
R0220 2018 205,048 197,781 184,615 178,719 173,139
R0230 2019 275,167 183,870 120,693 118,183
R0240 2020 192,031 371,793 363,089
R0250 2021 305,222 300,636
R0260 Total 1,310,939
Underwriting Year
Development year In Current
year
Sum of years
(cumulative)
Year end
(discounted
data)
Development year

S.23.01.01
Own Funds
Basic own funds before deduction for participations in other financial sector as foreseen in article 68 of Delegated Regulation 2015/35 TotalTier 1
unrestricted
Tier 1
restrictedTier 2 Tier 3
C0010 C0020 C0030 C0040 C0050
R0010 Ordinary share capital (gross of own shares) 0 0 0
R0030 Share premium account related to ordinary share capital 0 0 0
R0040 Initial funds, members' contributions or the equivalent basic own-fund item for mutual and mutual-type undertakings 0 0 0
R0050 Subordinated mutual member accounts 0 0 0 0
R0070 Surplus funds 0 0
R0090 Preference shares 0 0 0 0
R0110 Share premium account related to preference shares 0 0 0 0
R0130 Reconciliation reserve 445,175 445,175
R0140 Subordinated liabilities 0 0 0 0
R0160 An amount equal to the value of net deferred tax assets 0 0
R0180 Other own fund items approved by the supervisory authority as basic own funds not specified above 0 0 0 0 0
R0220 Own funds from the financial statements that should not be represented by the reconciliation reserve and do not meet the criteria to be classified as Solvency II own funds 0
R0230 Deductions for participations in financial and credit institutions 0
R0290 Total basic own funds after deductions 445,175 445,175 0 0 0
Ancillary own funds
R0300 Unpaid and uncalled ordinary share capital callable on demand 0
R0310 Unpaid and uncalled initial funds, members' contributions or the equivalent basic own fund item for mutual and mutual - type undertakings, callable on demand 0
R0320 Unpaid and uncalled preference shares callable on demand 0
R0330 A legally binding commitment to subscribe and pay for subordinated liabilities on demand 0
R0340 Letters of credit and guarantees under Article 96(2) of the Directive 2009/138/EC 0
R0350 Letters of credit and guarantees other than under Article 96(2) of the Directive 2009/138/EC 0
R0360 Supplementary members calls under first subparagraph of Article 96(3) of the Directive 2009/138/EC 0
R0370 Supplementary members calls - other than under first subparagraph of Article 96(3) of the Directive 2009/138/EC 120,382 120,382
R0390 Other ancillary own funds 0
R0400 Total ancillary own funds 120,382 120,382 0
Available and eligible own funds
R0500 Total available own funds to meet the SCR 565,557 445,175 0 120,382 0
R0510 Total available own funds to meet the MCR 445,175 445,175 0 0
R0540 Total eligible own funds to meet the SCR 565,557 445,175 0 120,382 0
R0550 Total eligible own funds to meet the MCR 445,175 445,175 0 0
R0580 SCR 240,764
R0600 MCR 60,191
R0620 Ratio of Eligible own funds to SCR 234.90%
R0640 Ratio of Eligible own funds to MCR 739.61%
Reconcilliation reserve C0060
R0700 Excess of assets over liabilities 445,175
R0710 Own shares (held directly and indirectly) 0
R0720 Foreseeable dividends, distributions and charges
R0730 Other basic own fund items 0
R0740 Adjustment for restricted own fund items in respect of matching adjustment portfolios and ring fenced funds 0
R0760 Reconciliation reserve 445,175
Expected profits
R0770 Expected profits included in future premiums (EPIFP) - Life business
R0780 Expected profits included in future premiums (EPIFP) - Non- life business 17,847
R0790 Total Expected profits included in future premiums (EPIFP) 17,847

S.25.02.21
Unique number
of componentComponent description
Calculation of the
Solvency Capital
Requirement
Amount modelled USP Simplifications
Row C0010 C0020 C0030 C0070 C0090 C0120
1 1 Market Risk 151,594 9
2 2 Counterparty Default Risk 88,672 9
3 5 Non-Life underwriting risk 11,986 11,986 9
4 7 Operational risk 41,567 9
USP Key
For life underwriting risk:
1 - Increase in the amount of
annuity benefits
9 - None
USP Key
For health underwriting risk:
1 - Increase in the amount of
annuity benefits
2 - Standard deviation for NSLT
health premium risk
3 - Standard deviation for NSLT
health gross premium risk
4 - Adjustment factor for non-
proportional reinsurance
5 - Standard deviation for NSLT
health reserve risk
9 - None
USP Key
For non-life underwriting risk:
4 - Adjustment factor for non-
proportional reinsurance
6 - Standard deviation for non-life
premium risk
7 - Standard deviation for non-life
gross premium risk
8 - Standard deviation for non-life
reserve risk
9 - None
Solvency Capital Requirement -
for undertakings using the standard formula and partial internal model

S.25.02.21
Solvency Capital Requirement - for undertakings using the standard formula and partial internal model
Calculation of Solvency Capital Requirement C0100
R0110 Total undiversified components 293,818
R0060 Diversification -53,055
R0160 Capital requirement for business operated in accordance with Art. 4 of Directive 2003/41/EC
R0200 Solvency capital requirement excluding capital add-on 240,764
R0210 Capital add-ons already set
R0220 Solvency capital requirement 240,764
Other information on SCR
R0300 Amount/estimate of the overall loss-absorbing capacity of technical provisions
R0310 Amount/estimate of the overall loss-absorbing capacity ot deferred taxes
R0400 Capital requirement for duration-based equity risk sub-module
R0410 Total amount of Notional Solvency Capital Requirements for remaining part
R0420 Total amount of Notional Solvency Capital Requirement for ring fenced funds
R0430 Total amount of Notional Solvency Capital Requirement for matching adjustment portfolios
R0440 Diversification effects due to RFF nSCR aggregation for article 304
Approach to tax rate C0109
R0590 Approach based on average tax rate
Calculation of loss absorbing capacity of deferred taxesLAC DT
C0130
R0640 Amount/estimate of LAC DT
R0650 Amount/estimate of LAC DT justified by reversion of deferred tax liabilities
R0660 Amount/estimate of LAC DT justified by reference to probable future taxable economic profit
R0670 Amount/estimate of AC DT justified by carry back, current year
R0680 Amount/estimate of LAC DT justified by carry back, future years
R0690 Amount/estimate of Maximum LAC DT

S.28.01.01
Minimum Capital Requirement - Only life or only non-life insurance or reinsurance activity
Linear formula component for non-life insurance and reinsurance obligations C0010
R0010 MCRNL Result 12,422
Net (of
reinsurance/SPV) best
estimate and TP
calculated as a whole
Net (of reinsurance)
written premiums in
the last 12 months
C0020 C0030
R0020 Medical expense insurance and proportional reinsurance 0
R0030 Income protection insurance and proportional reinsurance 0
R0040 Workers' compensation insurance and proportional reinsurance 0
R0050 Motor vehicle liability insurance and proportional reinsurance 0
R0060 Other motor insurance and proportional reinsurance 0
R0070 Marine, aviation and transport insurance and proportional reinsurance 54,580 48,574
R0080 Fire and other damage to property insurance and proportional reinsurance 0
R0090 General liability insurance and proportional reinsurance 0
R0100 Credit and suretyship insurance and proportional reinsurance 0
R0110 Legal expenses insurance and proportional reinsurance 0
R0120 Assistance and proportional reinsurance 0
R0130 Miscellaneous financial loss insurance and proportional reinsurance 0
R0140 Non-proportional health reinsurance 0
R0150 Non-proportional casualty reinsurance 0
R0160 Non-proportional marine, aviation and transport reinsurance 0
R0170 Non-proportional property reinsurance 0
Linear formula component for life insurance and reinsurance obligations C0040
R0200 MCRL Result 0
Net (of
reinsurance/SPV) best
estimate and TP
calculated as a whole
Net (of
reinsurance/SPV) total
capital at risk
C0050 C0060
R0210 Obligations with profit participation - guaranteed benefits
R0220 Obligations with profit participation - future discretionary benefits
R0230 Index-linked and unit-linked insurance obligations
R0240 Other life (re)insurance and health (re)insurance obligations
R0250 Total capital at risk for all life (re)insurance obligations
Overall MCR calculation C0070
R0300 Linear MCR 12,422
R0310 SCR 240,764
R0320 MCR cap 108,344
R0330 MCR floor 60,191
R0340 Combined MCR 60,191
R0350 Absolute floor of the MCR 4,328
R0400 Minimum Capital Requirement 60,191