annual report 2015 beautiful answers start with brave...
TRANSCRIPT

Beautiful answers start with brave questions.
A N N UA L R E P O RT 2 0 1 5
Beautiful answers start with brave questions.

“We are the catalyst for discoveries that spark the senses & transform the everyday.”

DE A R FE L LOW S H A R E HOLD E R S ,
C U S TOME R S & E M P L OYE E S
Andreas FibigChairman and Chief Executive Officer
IFF’s new purpose statement encapsulates 126 years of innovation and a deeply rooted ambition to explore new frontiers. It illuminates how, at the heart of our company, we are fueled by a sense of discovery, constantly asking “what if?” to address today’s challenges and envision tomorrow’s opportunities. This powerful statement grew out of our refreshed business strategy—Vision 2020—to ensure that we continue to lead where we compete and maintain our focus on what matters most: our customers, consumers, employees, and shareholders.
Vision 2020 influences the way we do business. It guides our efforts to accelerate profitable growth, build greater differentiation and maximize shareholder value. When we communicated our long-term financial targets, established objectives to drive mergers and acquisitions, and improved our capital allocation distribution—we underscored our commitment to the strategy. Further, we reprioritized our expansive R&D initiatives, progressed our sustainability goals and recharged our story with a fresh brand platform and visuals.
I am pleased to share that, along with these accomplishments, we delivered strong financial results. Due in large part to the diversity of our business and our recent acquisitions, we achieved 5% sales growth, an 8% increase in adjusted operating profit* and an 11% improvement in adjusted EPS* growth—all on a currency neutral basis. We also increased our dividend by 20% and repurchased 1.1 million of our shares to reach a total payout ratio of adjusted net income of 66%—above our target range of 50 to 60%—and completed the cross-listing of our shares
on Euronext Paris—an important step in facilitating broader ownership of IFF shares in the European capital markets.
We are proud of our results, but we also know that the world around us is changing. We see the profound dynamics of an increasing and diverse population, unprecedented climate change, and pervasive market volatility. Our only choice is to adapt and to evolve. This is in our DNA—to be nimble, to adjust and to transform to meet the needs of a changing environment.
Today is no different. We continue to thrive because we bring people together—employees, customers and partners—to create products that meet the present and future needs of consumers. Collaboration generates ideas and defines our role not only in the flavors and fragrances industry, but with adjacent businesses as well.
Our Vision 2020 strategy consists of four pillars:
• InnovatingFirsts
• WinningWhereWeCompete
• BecomingourCustomers’PartnerofChoice
• StrengtheningandExpandingthePortfolio
These pillars are rooted in our foundation of Talent and Organization, Continuous Improvement, and Sustainability.
As you will see on the following pages, while still in its early stages, our Vision 2020 strategy has already realized several exciting accomplishments.
See reconciliation of GAAP to Non-GAAP financial measures in Exhibit A at end of this report

2
Innovating Firsts

3
Fragrance delivery systems via encapsulation remain a must-win platform because it provides the greatest opportunity across all categories. We are pioneers in this technology. In 2006, we launched our first encapsulation product for Fabric Care—a solid growth driver and key in differentiating brands we support. In 2015, our encapsulation-related sales increased to the mid-teens. We expect this success to continue as we enhance and evolve our technology and as we expand into new areas, such as personal care products.
We are on our way to assume a leadership position in new molecule development by 2020. The resulting fragrance ingredients provide a greater competitive advantage for our perfumers to use in their formulas and allow us increased differentiation among our peers. In 2015, we commercialized four captive fragrance ingredients—a 50% increase from our annual average over the last decade—providing greater confidence in our accelerated growth ambition. We also launched Amber Extreme™ —a previously captive fragrance ingredient— for broad use within the fragrance industry.
We will strengthen our leadership position in naturals by continuing to develop responsible products. One route is to create innovative and unique specialty scents derived from natural ingredients. We also intend to expand our portfolio of key ”Living” ingredients—which are critical to the Fine Fragrance and Beauty Care categories—by sourcing new botanicals, mastering cultivation, and performing extraction.
Uniting IFF expertise in natural ingredients and our unique R&D pipeline with Lucas Meyer Cosmetics’ (LMC) cosmetics ingredients innovation has strengthened our product offerings—and enabled IFF to differentiate in the very attractive skin care and hair care segments. LMC has a strong commercialization pipeline of captive new molecules that comprises active ingredients, including anti-aging and anti-wrinkle formulations; functional ingredients, including emulsifiers and cooling effects; and delivery systems, including long lasting effects. In 2015, LMC commercialized five patent- protected molecules demonstrating a robust pipeline that underscores our excellent position to capture the growth potential in the short and long term.
In Flavors, our aim is to address consumers’ ever-growing need for health and wellness offerings. Today’s consumers are more proactive about their health than ever before and, as a result, our major customers are prioritizing modulation solutions. We are helping to meet this growing need. This year, we launched two natural modulators and our Savory and Sweet modulation technologies grew strong double-digits.
Recent success in Latin America—a region with strong double-digit growth in 2015—reveals that there is still room for innovative and cost-effective solutions. One exciting global project on the horizon is a powder encapsulation system that delivers improved flavors at the lowest possible price.
We understand and realize the future needs of our customers and consumers by building robust R&D platforms that deliver consumer-preferred solutions. Dedicated to driving differentiation, our goals for Vision 2020 are clear and achievable: for Fragrances, we aim to be the undisputed leader in delivery systems, new molecules and naturals; for Flavors, we are focused on modulation, delivery systems and naturals.

4
Winning Where We Compete

5
2015 was all about identifying key markets, categories and customers primed for growth.
We initiated strategies across both our Flavors and Fragrances business units to achieve a leadership position in our home market of North America—a market with over $4.5 billion in potential. As part of this initiative and aligned with our renewed focus on M&A, we acquired Ottens Flavors and moved from #3 to #2 Flavors partner in North America. With a solid reputation for outstanding customer service and diverse flavor technologies, Ottens Flavors provides tremendous opportunities to leverage in the future.
Our increased strategic efforts in the fast-growing economies of Africa and the Middle East reveal significant progress, including sales in the regions showing mid-teens growth on a currency neutral basis. We’ve also aligned our operations to fully support the efforts of our global customers who recognize the potential benefits of expanding into promising markets.
We turned our attention to specific value-enhancing categories, including Fine Fragrances and Home Care, as well as key growth customers across both business units. For Fine Fragrances, we intend to increase growth by focusing on fast-growing end-market customers, concentrating on several fast-moving, smaller brands in order to increase our position.
In Home Care, the largest consumer fragrance category in North America, we plan to leverage our global center of excellence to further accelerate growth. This year, the category was up high-single-digits globally and mid-single-digits in North America, further evidence that our strategy is on the right track.

6
Becoming Our Customers’ Partner of Choice
In 2015, we launched our refreshed branding, unveiling a new website, purpose statement, visual identity, and tone of voice. All of which are geared towards showcasing IFF’s vision, imagination, and innovative focus to customers, employees, and of course, shareholders.
It was also a year of considerable progress —and customers took note. We won the North American Innovation Award for thought-leadership with one of our largest Flavors customers. In Fine Fragrance, we received a supplier excellence award—an achievement designed to honor top-performing business partners. Our recently acquired Lucas Meyers
Cosmetics won the 2015 Gold Award for the Innovation Zone Best Active Ingredient at the renownedIn-cosmeticsAsiaConference.
When it comes to winning future business, however, we know that it is imperative to stay on our customers’ core lists. We are achieving this by investing in our R&D capabilities, developing consumer insights, and expanding our understanding of regulatory requirements. In 2015, we reaffirmed or expanded our core list status with four key customers, including our largest Fragrance customer and two Flavors customers, one based in North America and the other, global.
Commercial excellence —this is our goal. To achieve it, we are building upon our efforts to offer our customers in-depth and local consumer insights, industry-leading innovation, outstanding service, and the highest quality products available. This is how we remain an essential partner and provide incremental business opportunities for our customers and for IFF.

7

8

9
The highlights of 2015 include two acquisitions and the signing of two R&D collaborations. These developments helped us power our portfolio across the businesses and throughout the regions in which we operate. Our acquisition of Ottens Flavors strengthened our operations in North America, improved our market share, and increased our ability to meet the needs of our regional accounts by leveraging their go-to-market strategy.
We also expanded into a new business platform with Lucas Meyer Cosmetics, a company that develops, manufactures, and markets innovative ingredients for the cosmetics and personal care industry. This partnership combines the unique strengths and resources of both companies—our fragrance expertise, global commercial network, leadership in natural ingredients, and unique R&D pipeline with LMC’s research and cosmetics ingredients innovation. As a result, we’ve increased our
product offerings and are now one of our customer’s partners of choice in the expansive skin care and hair care segment.
“Open innovation” is more than just a phrase at IFF, it’s a way of business. This is why we are working with our customers in a visionary capacity. We have already established collab-orations with fashion schools and leading academic institutions like Duke University and the University of Liverpool where we are exploring flavor modulation and fragrance delivery systems, respectively. Collaboration is the basis for good business and we are tenacious in our pursuit of strong partnerships.
We are ambitious and we are capable. Our goal is to add $500 million to $1 billion in additional sales by the year 2020. We believe these opportunities will allow us to tap into areas of expertise beyond the walls of IFF, leading to sustainable growth.
Strengthening and Expanding the PortfolioMergers and acquisitions, partnerships, and collaborations are essential to the success of Vision 2020 and to our overall portfolio. We are targeting opportunities—within our industry and near adjacencies—to develop new technologies and to expand our geographic and business opportunities. All of this must be done in a way that makes strong strategic sense and leverages our expertise in science and technology.

10
Building Our Talent Pipeline

11
WORKFORCE PLANNING
As part of Vision 2020, we shaped a Workforce Planning Roadmap that defines the talent requirements necessary to deliver our future strategy. A core element of the workforce plan is to predict required profiles in IFF’s most critical skillsets. This insight then guides and focuses talent mapping and talent acquisition into the most important areas.
PIPELINE SCHOOLS
We built and enhanced our internal technical schools and leadership programs to ensure we provide best-in-class training and a steady talent pipeline.
Over the last 15 years, our Perfumery School selected and prepared many successful perfumers, leveraging a rigorous curriculum and guidance from IFF’s expert “noses.” In 2015, we refreshed the curriculum and delivery model to meet the complexity of being a perfumer in a rapidly changing global environment.
We also celebrated the first graduating class of our Flavorist School, where participants built a greater understanding of flavors applications and developed creative techniques.
In 2015, we launched our new Scent Design School and successfully graduated our first class. Students develop olfactive skills and gain an understanding of consumer insights, creative strategy, finance and project management, preparing them fully for this critical role.
Lastly, we designed the first-ever R&D academy in 2015, where participants strengthen their business and finance acumen, learn frameworks and tools to extend innovation beyond the lab and enhance project planning and execution skills.
LEADERSHIP DEVELOPMENT
Capitalizing on our existing Mastering Business Agility program, which is delivered in partnership with the INSEAD Graduate Business School, we are graduating our third class of high-potential global leaders. To date, over half of our graduates have been promoted at least once and others have had significant expansion of their roles.
RECRUITING
We launched a comprehensive social media recruitment strategy that allows us to target and engage with top talent—not just active job-seekers. Social media enables us to develop relationships with candidates early on, so that IFF is top-of-mind when they consider making their next career move.
By penetrating more deeply into the external talent pool using our mobile-enabled careers page, posting on niche job-boards, and partnering with new vendors, we have increased the diversity of our candidate pools. This is great news for IFF as we hire the employees who will continue to deliver global solutions to global customers.
2015 was the year we experienced the benefits of our fully integrated talent architecture. Talent development is a top priority at IFF and a key enabler to our Vision 2020 strategy and beyond. In an industry filled with specialized roles, it is critical that we support our employees in both their technical and leadership capabilities to build long-lasting careers. Our global integrated talent process prepares employees for the opportunities of tomorrow and differentiates our talent in a competitive market.
Building Our Talent Pipeline

12
Creating a Sustainable Future
2015 was a successful year of sustainability for IFF. Our accomplishments were extensive. We were recognized by the CDP for a perfect score in carbon management: 100 in disclosure and an “A” in performance, which puts us in the top 5% of companies worldwide. We demonstrated a commitment to a low carbon global economy by supporting the United Nations (UN) Climate Change Conference (COP21) in Paris. Leading up to this event, we showed action leadership by joining the 100% Renewable Energy effort
and the World Business Council for Sustainable Development. We also signed President Obama’s American Business Act on Climate Pledge and Pope Francis’ encyclical “On Care for Our Common Home,” and confirmed our commitment to the UN Global Compact’s universal sustainability principles.
We are proud to be considered a responsible and reliable company in our customers’ supply chains. This year, we demonstrated industry

13
leadership by joining Together for Sustainability. We also achieved Roundtable for Sustainable Palm Oil certification in multiple facilities and gained For Life certification for Turkish rose, patchouli, basil, and vetiver. Our manufacturing facilities surpassed our corporate-wide 2020 water reduction goal of 25%, so we set a new goal for a 50% reduction by 2020. We also began construction of the industry’s first major wind turbine at our facility in Tilburg, the Netherlands.
We are excited by the progress we have made in 2015 and look forward to future opportunities as we work to further embed sustainability throughout IFF and our entire value chain.
Sustainability and innovation —at IFF, they work together. Our sustainability strategy involves both social and environmental improvements—from the raw materials we source responsibly to our eco-efficient manufacturing facilities to the carefully designed products that consider critical sustainability attributes. Increasingly, customers and consumers are demanding responsible products from conscientious companies throughout the supply chain. We think this is a good thing and we are doing our part by focusing on important sustainability issues such as global climate change, water scarcity, increasing world population, and health & wellness.

14
Vision 2020 fuels our passion for exploration, sustainability and success. As we’ve already seen, it provides us with a framework to meet—and exceed—the ideals of our customers, consumers, employees, and shareholders.

C U R R E N CY N E U T R A L R E S U LTS
Flavors
11%NORTH AMERICA
Reflecting additional sales related to the acquisition of Ottens Flavors, double-digit growth in Dairy and mid-single-digit growth in Sweet 16%
LATIN AMERICA
All categoriesreported growth
4%EAME
Driven by a high-single-digit increase in Savory and mid-single-digit growth in Beverage
2%GREATER ASIA
Led by new win performance in Savory, Dairy and Beverage
++
+
+
C U R R E N CY N E U T R A L R E S U LTS
Fragrances
5%CONSUMER FRAGRANCE
Led by double-digit growth in Fabric Care, high-single-digit growth in Home Care and a mid-single-digit increase in Hair Care
1%FINE FRAGRANCE
EAME grew 6% due to strong new wins
2%FRAGRANCEINGREDIENTS
Performance primarily driven by the acquisition of Lucas Meyer Cosmetics
4%TOTAL SALES
F U L L-Y E A R 2 0 1 5 R E S U LTS
Company Financials
*Currency Neutral, Adjusted Operating Profit, and Adjusted Diluted EPS are Non-GAAP metrics. Please see our GAAP to Non-GAAP Reconciliation at IFF.com.
CurrencyNeutral
Net
CurrencyImpact
11%
3%
Adjusted EPS*
2%
8%
AdjustedOperating Pro�t*
5%
(2)%
Sales*
6%TOTAL SALES
8%
6%
7%

10-KInternational Flavors & Fragrances

UNITED STATES SECURITIES AND EXCHANGE COMMISSIONWashington, D.C. 20549
FORM 10-KÍ ANNUAL REPORT PURSUANT TO SECTION 13 OR 15(d)
OF THE SECURITIES EXCHANGE ACT OF 1934For the fiscal year ended December 31, 2015
OR‘ TRANSITION REPORT PURSUANT TO SECTION 13 OR 15(d)
OF THE SECURITIES EXCHANGE ACT OF 1934For the transition period from to
Commission File Number 1-4858
INTERNATIONAL FLAVORS & FRAGRANCES INC.(Exact name of registrant as specified in its charter)
NEW YORK 13-1432060(State or other jurisdiction
of incorporation or organization)(I.R.S. Employer Identification No.)
521 WEST 57TH STREET, NEW YORK, N.Y. 10019(Address of principal executive offices) (Zip Code)
Registrant’s telephone number, including area code (212) 765-5500SECURITIES REGISTERED PURSUANT TO SECTION 12(b) OF THE ACT:Title of Each Class Name of Each Exchange on Which Registered
Common Stock, par value New York Stock Exchange121⁄2¢ per share
SECURITIES REGISTERED PURSUANT TO SECTION 12(g) OF THE ACT:None
Indicate by check mark if the registrant is a well-known seasoned issuer, as defined in Rule 405 of the SecuritiesAct. Yes Í No ‘
Indicate by check mark if the registrant is not required to file reports pursuant to Section 13 or Section 15(d) of theAct. Yes ‘ No Í
Indicate by check mark whether the registrant (1) has filed all reports required to be filed by Section 13 or 15(d) of the SecuritiesExchange Act of 1934 during the preceding 12 months (or for such shorter period that the registrant was required to file such reports),and (2) has been subject to such filing requirements for the past 90 days. Yes Í No ‘
Indicate by check mark whether the registrant has submitted electronically and posted on its corporate Website, if any, everyInteractive Data File required to be submitted and posted pursuant to Rule 405 of Regulation S-T (§232.405 of this chapter) during thepreceding 12 months (or for such shorter period that the registrant was required to submit and post such files). Yes Í No ‘
Indicate by check mark if disclosure of delinquent filers pursuant to Item 405 of Regulation S-K (§229.405 of this chapter) is notcontained herein, and will not be contained, to the best of registrant’s knowledge, in definitive proxy or information statementsincorporated by reference in Part III of this Form 10-K or any amendments to this Form 10-K. ‘
Indicate by check mark whether the registrant is a large accelerated filer, an accelerated filer, a non-accelerated filer, or a smallerreporting company. See the definitions of “large accelerated filer,” “accelerated filer” and “smaller reporting company” in Rule 12b-2of the Exchange Act.
Large accelerated filer Í Accelerated filer ‘ Non-accelerated filer ‘ Smaller reporting company ‘
Indicate by check mark whether the registrant is a shell company (as defined in Rule 12b-2 of the ExchangeAct). Yes ‘ No Í
For the purpose of reporting the following market value of registrant’s outstanding common stock, the term “affiliate” refers topersons, entities or groups which directly or indirectly control, are controlled by, or are under common control with the registrant anddoes not include individual executive officers, directors or less than 10% shareholders. The aggregate market value of registrant’scommon stock not held by affiliates as of June 30, 2015 was $8,921,565,803.
As of February 15, 2016, there were 79,867,884 shares of the registrant’s common stock, par value 121⁄2¢ per share, outstanding.
DOCUMENTS INCORPORATED BY REFERENCEPortions of the registrant’s proxy statement for the 2016 Annual Meeting of Shareholders (the “IFF 2016 Proxy Statement”) are
incorporated by reference in Part III of this Form 10-K.
INTERNATIONAL FLAVORS & FRAGRANCES INC.
TABLE OF CONTENTS
PAGE
PART I
ITEM 1. Business . . . . . . . . . . . . . . . . . . . . . . . . . . . . . . . . . . . . . . . . . . . . . . . . . . . . . . . . . . . . . . . . . . . 3
ITEM 1A. Risk Factors . . . . . . . . . . . . . . . . . . . . . . . . . . . . . . . . . . . . . . . . . . . . . . . . . . . . . . . . . . . . . . . . 13
ITEM 1B. Unresolved Staff Comments . . . . . . . . . . . . . . . . . . . . . . . . . . . . . . . . . . . . . . . . . . . . . . . . . . . 25
ITEM 2. Properties . . . . . . . . . . . . . . . . . . . . . . . . . . . . . . . . . . . . . . . . . . . . . . . . . . . . . . . . . . . . . . . . . . 25
ITEM 3. Legal Proceedings . . . . . . . . . . . . . . . . . . . . . . . . . . . . . . . . . . . . . . . . . . . . . . . . . . . . . . . . . . . 26
ITEM 4. Mine Safety Disclosures . . . . . . . . . . . . . . . . . . . . . . . . . . . . . . . . . . . . . . . . . . . . . . . . . . . . . . 28
PART II
ITEM 5. Market for Registrant’s Common Equity, Related Stockholder Matters and Issuer Purchasesof Equity Securities . . . . . . . . . . . . . . . . . . . . . . . . . . . . . . . . . . . . . . . . . . . . . . . . . . . . . . . . . . 29
ITEM 6. Selected Financial Data . . . . . . . . . . . . . . . . . . . . . . . . . . . . . . . . . . . . . . . . . . . . . . . . . . . . . . . 31
ITEM 7. Management’s Discussion and Analysis of Financial Condition and Results ofOperations . . . . . . . . . . . . . . . . . . . . . . . . . . . . . . . . . . . . . . . . . . . . . . . . . . . . . . . . . . . . . . . . . 35
ITEM 7A. Quantitative and Qualitative Disclosures About Market Risk . . . . . . . . . . . . . . . . . . . . . . . . . 59
ITEM 8. Financial Statements and Supplementary Data . . . . . . . . . . . . . . . . . . . . . . . . . . . . . . . . . . . . . 60
ITEM 9. Changes in and Disagreements with Accountants on Accounting and FinancialDisclosure . . . . . . . . . . . . . . . . . . . . . . . . . . . . . . . . . . . . . . . . . . . . . . . . . . . . . . . . . . . . . . . . . 60
ITEM 9A. Controls and Procedures . . . . . . . . . . . . . . . . . . . . . . . . . . . . . . . . . . . . . . . . . . . . . . . . . . . . . . 60
ITEM 9B. Other Information . . . . . . . . . . . . . . . . . . . . . . . . . . . . . . . . . . . . . . . . . . . . . . . . . . . . . . . . . . . 60
PART III
ITEM 10. Directors, Executive Officers and Corporate Governance . . . . . . . . . . . . . . . . . . . . . . . . . . . . 61
ITEM 11. Executive Compensation . . . . . . . . . . . . . . . . . . . . . . . . . . . . . . . . . . . . . . . . . . . . . . . . . . . . . . 61
ITEM 12. Security Ownership of Certain Beneficial Owners and Management and RelatedStockholder Matters . . . . . . . . . . . . . . . . . . . . . . . . . . . . . . . . . . . . . . . . . . . . . . . . . . . . . . . . . . 61
ITEM 13. Certain Relationships and Related Transactions and Director Independence . . . . . . . . . . . . . . 61
ITEM 14. Principal Accountant Fees and Services . . . . . . . . . . . . . . . . . . . . . . . . . . . . . . . . . . . . . . . . . . 61
PART IV
ITEM 15. Exhibits and Financial Statement Schedules . . . . . . . . . . . . . . . . . . . . . . . . . . . . . . . . . . . . . . 62
SIGNATURES . . . . . . . . . . . . . . . . . . . . . . . . . . . . . . . . . . . . . . . . . . . . . . . . . . . . . . . . . . . . . . . . . . . . . . . 108
2

PART I
When used in this report, the terms “IFF,” “the Company,” “we,” “us” and “our” mean InternationalFlavors & Fragrances Inc., and its subsidiaries.
ITEM 1. BUSINESS.
We are a leading global creator of flavors and fragrances (including cosmetic active ingredients) that areused in the food, beverage, personal care or household products industries. Our flavor and fragrance compoundscombine a number of ingredients to produce proprietary formulas created by our flavorists and perfumers.Utilizing our capabilities in consumer insight, research and product development (“R&D”) and creativeexpertise, we partner with our customers to provide innovative and differentiated product offerings that driveconsumer preference. We believe that this collaborative approach will generate market share gains for ourcustomers.
Our approximately 6,700 employees, 34 manufacturing facilities and 33 creative centers are located in 35different countries. We collaborate with our customers to develop the 38,000 products we provide our customersin approximately 150 countries. We believe we are well positioned to serve both our global customers as well asthe increasing number of regional and specialty consumer goods producers. In addition, through our acquisitionof Lucas Meyer Cosmetics (“Lucas Meyer”) in 2015, we have added to our portfolio active and functionalingredients, botanicals and delivery systems to support our customers’ cosmetic and personal care product lines.
We principally compete in the flavors and fragrances market, which is part of a larger market whichsupplies a wide variety of ingredients and compounds that are used in consumer products. The broader marketincludes large multinational companies and smaller regional and local participants that supply products such asseasonings, texturizers, spices, enzymes, certain food-related commodities, fortified products and cosmeticingredients. The global market for flavors and fragrances has expanded consistently, primarily as a result of anincrease in demand for, as well as an increase in the variety of, consumer products containing flavors andfragrances. The flavors and fragrances markets in which we compete were estimated by management to be $18.0billion in 2014, and are forecasted to grow to approximately $21.6 billion by 2019, primarily driven by expectedgrowth in emerging markets.
2014 2019
5.9%
4.5%
1.7%
2.2%
5.2%2.4LATAM
GreaterAsia
Africa &Mid-East
Europe
NorthAmerica
4.8
1.6
4.6
4.6
$18.0
3.1
6.4
2
5
5.1
$21.6 CAGR
Total Global F&F Market ($bn)
(14-19)
~75%growth
expected inemergingmarkets
Source: Company estimates based on IAL Consultants: Overview of the GlobalFlavours & Fragrances market (9th edition, 2014).
3

In 2015, we achieved sales of approximately $3.0 billion, making us one of the top four companies in theglobal flavors and fragrances sub-segment of the broader ingredients and compounds market. Within the flavorsand fragrances sub-segment of this broader market, the top four companies represent approximately two-thirds ofthe total estimated sales. In late 2015, we expanded our capabilities and product offerings into cosmetic activesthrough our acquisition of Lucas Meyer. We estimate the market size for cosmetic active ingredients to beapproximately $1.5 billion as of 2015. We believe that our diversified business platform consisting of expansivegeographic coverage, a broad product portfolio and a global and regional customer base, positions us to achievelong-term growth as the flavors and fragrances markets expand.
We operate in two business segments, Flavors and Fragrances. In 2015, our Flavors business represented48% of our sales, while our Fragrances business represented 52% of sales. Our business is geographicallydiverse, with sales to customers in the four regions set forth below:
Region % of 2015 Sales
Europe, Africa, Middle East . . . . . . . . . . . . . . . . . . . . . . . . . . . . . . . . . . . . . . . . . . . . . . . . . . . . . . . 31%Greater Asia . . . . . . . . . . . . . . . . . . . . . . . . . . . . . . . . . . . . . . . . . . . . . . . . . . . . . . . . . . . . . . . . . . . . 28%North America . . . . . . . . . . . . . . . . . . . . . . . . . . . . . . . . . . . . . . . . . . . . . . . . . . . . . . . . . . . . . . . . . . 24%Latin America . . . . . . . . . . . . . . . . . . . . . . . . . . . . . . . . . . . . . . . . . . . . . . . . . . . . . . . . . . . . . . . . . . 17%
We are committed to winning in emerging markets. We believe that significant future growth potential forthe flavors and fragrances industry, and for our business, exists in the emerging markets (all markets exceptNorth America, Japan, Australia, and Western, Southern and Northern Europe). Over the past five years ourcurrency neutral growth rate in emerging markets have outpaced that of developed markets. Despite currentchallenges experienced during 2015 in certain emerging markets, such as Brazil, Argentina and China, we expectthis long-term trend to continue for the foreseeable future.
We have had operations in some of the largest emerging markets for multiple decades. As a result of theseestablished operations, sales in emerging markets represented 51% of 2015 sales, up from 50% in 2014. As ourcustomers in emerging markets grow their businesses, they will have the ability to leverage our long-standingpresence and our extensive market knowledge to help drive their brands. During 2015, our 25 largest customersaccounted for 52% of our sales. Sales to our largest customer accounted for 12% of our sales for each of the lastthree fiscal years. These sales were principally in our Fragrances business.
For financial information about our operating segments and the geographic areas in which we do business,please see Note 13 of our Consolidated Financial Statements included in this Form 10-K.
Vision 2020 Strategy
During 2015, we announced our Vision 2020 strategy, which focuses on building differentiation andaccelerating growth. Our Vision 2020 strategy has four pillars:
(1) Innovating Firsts — We seek to strengthen our position and drive differentiation in priority R&Dplatforms. We are sharply focused on key initiatives that are grounded in consumer needs, such asmodulation, proteins and textures for flavors, new molecules and digital scents for fragrances, and deliverysystems and naturals across both business units. In 2015, we launched four captive molecules to be usedexclusively by our perfumers, and commercialized two new natural taste modulators.
(2) Win Where We Compete — Our goal is to achieve a #1 or #2 market leadership position in key marketsand categories and with specific customers. For example, we believe that there is opportunity to furtherimprove our market share position in North America, where innovation-centric customers are expected tocontinue to drive one of the world’s largest flavor and fragrance markets. In the Middle East and Africa,which are among the fastest-growing regions globally, many of our international and domestic customersare strategizing to penetrate these key markets and we believe that we can leverage our existing
4

relationships with them to increase our participation in these markets. In addition, we are targeting specificend-use categories, such as Home Care and Fine Fragrances, and customers, where innovation and creativitywill fuel growth.
(3) Become Our Customers’ Partner of Choice — Our goal is to attain commercial excellence by providingour customers with in-depth local consumer understanding, industry-leading innovation, outstanding serviceand the highest quality products. In 2015, we won the North America innovation award with one of ourlargest flavor customers, which recognizes partners for their thought leadership. In addition, one of ourglobal fragrance customers presented us with their Supplier Excellence award, an achievement designed toacknowledge their top performing business partners. We believe the addition of Lucas Meyer to ourFragrances business enhances our capabilities and product offerings needed to be a partner of choice. Webelieve that becoming our customers’ partner of choice will lead to incremental business opportunities forour customers and us.
(4) Strengthen and Expand the Portfolio — We actively pursue value-creation through partnerships,collaborations, and acquisitions within flavors, fragrances and adjacencies. We prioritize opportunities thatprovide (i) access to new technologies, (ii) the ability to increase our market share in key markets and withkey customers or (iii) access to adjacent products or services that will position us to leverage our expertisein science and technology and our customer base. As part of this pillar, we are targeting $500 million to $1billion of incremental sales growth through acquisitions by 2020.
During 2015, we completed two acquisitions that are aligned with our Vision 2020 strategy. Through ouracquisition of Ottens Flavors in May 2015, we strengthened our flavors market position in North Americaand increased our capabilities to serve small and mid-sized customers. We believe our acquisition of LucasMeyer will expand our ingredients offerings into the cosmetic industry and thereby allow us to build greatercustomer intimacy and drive penetration into the skin care and hair care businesses.
Our Product Offerings
Flavors
Flavors are the key building blocks that impart taste experiences in food and beverage products and, as such,play a significant role in determining consumer preference of the end products in which they are used. As aleading creator of flavor compounds, we help our customers deliver on the promise of delicious and healthyfoods and drinks that appeal to consumers. While we are a global leader, our Flavors business is more regional innature, with different formulas that reflect local taste preferences. We create our flavors in our regional creativecenters that allow us to satisfy local taste preferences, while also helping to ensure regulatory compliance andproduction standards. We develop thousands of different flavors and taste offerings for our customers, most ofwhich are tailor-made. We continually develop new formulas in order to meet changing consumer preferencesand customer needs.
Our Flavors compounds are ultimately used by our customers in the following four end-use categories ofconsumer goods: (1) Savory, for use in soups, sauces, condiments, prepared meals, meat and poultry, potatochips and other savory snacks; (2) Beverages, for use in juice drinks, carbonated beverages, flavored waters andspirits, (3) Sweet, for use in bakery products, candy, chewing gum and cereal and (4) Dairy, for use in all dairyproducts such as yogurt, ice cream and cheese and other products that have a creamy flavor. We also offer a widerange of quality vanilla extracts and a variety of flavor solutions that build on our understanding of vanilla.
Our Vision 2020 Strategy in Flavors builds upon our strengths and focuses on addressing industry trendsthat will allow us to differentiate ourselves from our competitors and deliver accelerated growth. These trendsinclude:
(1) Consumer Demand for Fresh, Authentic and Natural Products. As evidenced by recent trends in productlabeling, consumers increasingly seek to understand what they are consuming. Our objective is to expand ournaturals capabilities by offering our customers naturals and proprietary ingredients.
5

(2) Consumer Demand for Products That Promote Health and Wellness. Consumers, especially those indeveloped markets such as the United States and Western Europe, are increasingly seeking to focus on productswhich promote health and wellness and taste good. Often, this demand is translated into a desire to provideconsumer products with reduced fat and salt. Our objective is to capture a significant share of this shift inconsumer demand by continuing to expand our modulation technology, delivery systems and our naturals andproprietary ingredients.
(3) Expansion of Consumer Food Companies. The number of participants in the food industry continues toexpand drastically, with mid-sized regional companies and companies focused on niche-product categoriesjoining the traditional global companies to drive and accelerate product innovation. We intend to look forinnovative and value-creating methods for serving this growing customer base as evidenced by our recentacquisition of Ottens Flavors which we believe will permit us to further penetrate small and mid-sized customersby delivering tailored solutions with the necessary agility, speed and responsiveness.
(4) New Sources of Protein. Sustainability concerns are driving the food industry to evaluate non-traditionalsources of protein. As part of our R&D initiatives we seek to develop a comprehensive understanding of flavorinteraction with protein and texture and develop taste solutions for new or alternative protein sources.
Fragrances
We are a global leader in the creation of fragrance compounds that are integral elements in the world’sfinest perfumes and best-known consumer products, within fabric care, home care, personal wash, hair care andtoiletries. Our Fragrance business is a vertically integrated operation, originating with the development in ourresearch laboratories of naturals, synthetic and proprietary molecules and innovative delivery systems,progressing to our manufacturing facilities that produce these ingredients in a consistent, high-quality and cost-effective manner and transitioning to our creative centers where our perfumers partner with our customers tocreate unique fragrance compounds for use in a variety of end-use products.
By providing our fragrance development teams an extensive portfolio of innovative, high-quality and cost-effective ingredients to support their creativity, we are able to provide our customers with a unique identity fortheir brands. These ingredients or fragrance compounds can then be combined with our innovative deliverysystems, including (i) our proprietary encapsulation technology, which consists of individual fragrance dropletscoated with a protective polymetric shell to deliver superior fragrance performance throughout a product’slifecycle and (ii) our exclusive polymer delivery system, PolyIFF, which is a “solid fragrance” technology thatallows us to add scent to functional or molded plastic. These delivery systems are key differentiators that fuel thegrowth of our consumer fragrance compounds.
Our Fragrances business derives revenues from two sources, Fragrance Compounds and Ingredients.
Fragrance Compounds. Fragrance Compounds are unique and proprietary combinations of multiple ingredientsthat are ultimately used by our customers in their consumer goods. Our creative and commercial teams withinFragrance Compounds are organized into two broad categories: Fine Fragrances and Consumer Fragrances:
‰ Fine Fragrances — Fine Fragrances focuses on perfumes and colognes. IFF’s scientists and perfumerscollaborate to develop new molecules, new natural extractions, and innovative processes that enlivenperfumers’ palettes and help them create unique, inspiring fragrances. We have created some of theindustry-leading fine fragrance classics as well as cutting-edge niche fragrances, as evidenced by thenumber of top sellers and the successes of our new launches.
‰ Consumer Fragrances — Our Consumer Fragrances include five end-use categories of products:
• Fabric Care — laundry detergents, fabric softeners and specialty laundry products;
• Home Care — household cleaners, dishwashing detergents and air fresheners;
6

• Personal Wash, including bar soap and shower gel;
• Hair Care; and
• Toiletries.
Ingredients. While the principal role of our fragrance ingredients facilities is to support our FragranceCompounds business, we utilize our excess manufacturing capacity to manufacture and sell certain fragranceingredients to third parties. We believe that this business allows us to leverage our fixed costs while maintainingthe security of supply for our perfumers and ultimately our customers. Ingredients available for sale to thirdparties include innovative ingredients that leverage our manufacturing experience as well as a limited amount ofcost-competitive, commodity ingredients. As our Fragrance Compounds business grows, we expect that thepercentage of capacity allocated to the production of fragrance ingredients for sale to third parties will decrease.
With approximately 1,000 separate fragrance, active and functional cosmetic active ingredients, plusadditional botanicals and delivery systems acquired in the recent Lucas Meyer transaction, we believe we are aleader in the industry with the breadth of our product portfolio.
Our Vision 2020 strategy in Fragrances builds upon our strengths to differentiate ourselves from ourcompetitors and deliver accelerated growth. Specifically, we intend to focus on:
(1) Consumer Demand for Natural and Organic Products. Increased demand for natural ingredients is aprimary driver of future growth in Fine Fragrances. We believe that our in-house naturals operations, led byLaboratoire Monique Rémy (“LMR”) in Grasse, France, are industry leading in the processing of qualitymaterials and offer decades of experience understanding natural products and perfecting the process oftransforming naturals, such as narcissus, jasmine and blackcurrant bud, into pure absolutes that retain the uniquefragrance of their origin. Our objective is to expand our naturals capabilities by offering our clients naturals andproprietary ingredients.
(2) Transparency in Labeling. As consumers worldwide seek to require transparency in labeling, ourcustomers will progressively seek to differentiate their products through proprietary molecules and uniquedelivery systems. A major emphasis of our research program is the creation of new proprietary molecules andingredients.
(3) Sustainability. Consumers aspire to purchase products that are earth-friendly and sustainable. As part ofVision 2020, we have committed to strengthen our sustainable practices and become the leader within ourindustry.
(4) Delivery Systems. We continue to invest in our delivery system technologies, including expansion of ourmarket-leading encapsulation technology, which we believe will allow us to differentiate our products and thoseof our customers. Our encapsulation technology extends, controls the release of and increases aromas in a varietyof consumer products. With our acquisition of Lucas Meyer, we expanded our portfolio to offer multi-functionaldelivery systems with cosmetic actives that work to enhance skin penetration, protect the active againstinteractions with other ingredients, provide long-lasting release, facilitate formulation of challenging ingredientsand allow a better-targeted action.
Our Fragrances business collaborates with some of the world’s leading art and fashion schools to tap intothe creative minds of the future leaders of fashion and design. We collaborate with scientists, writers, artists,musicians and film makers to expose our perfumers to new and constantly evolving creative territories andapproaches.
7

Research and Product Development Process
Consumer Insights
We believe that the first step to creating a unique scent or taste experience begins with gaining insight intothe consumer. By developing a deep understanding of what consumers value and prefer, we are better able tofocus our R&D and creative efforts. Our quest to bring new, exciting, and winning ideas to our clients beginswith insight into the consumer.
Our consumer insight and marketing teams work tirelessly interpreting trends, monitoring product launches,analyzing quantitative market data, and conducting several hundred thousand consumer interviews annually. Oursensory experts direct research programs exploring topics such as fragrance performance, the psychophysics ofsensory perception (including chemesthetic properties such as warming, cooling, and tingling), the genetic basisfor flavor and fragrance preference, and the effects of aromas on mood, performance, health, and well-being.
Based on this information, we develop innovative programs to evaluate potential products that enable us tounderstand the emotional connections between a prospective product and the consumer. We believe this ability topinpoint the likelihood of a product’s success translates into stronger brand equity, resulting in increased returnsand greater market share gains for our customers as well as IFF.
Research and Development
We consider our R&D development infrastructure to be one of our key competencies and we focus andinvest substantial resources in the research and development of new and innovative compounds, formulas andtechnologies and the application of these to our customers’ products. We spend approximately 8% of our sales onthe research, development and implementation of new molecules, compounds and technologies that help ourcustomers respond to changing consumer preferences. Using the knowledge gained from our Consumer Insightsprogram, we strategically focus our resources around key R&D platforms that address consumer needs orpreferences, or anticipate future preferences. By aligning our resources around these platforms, we ensure theproper support and focus for each program so that it can be further developed and eventually accepted forcommercial application. As a result of this investment, we have been granted 305 patents in the United Statessince 2000, including 15 in 2015, and we have developed many unique molecules and delivery systems for ourcustomers that are used as the foundations of successful flavors and fragrances around the world.
We principally conduct our R&D activities in Union Beach, New Jersey, where we employ scientists andapplication engineers who collaborate with our five other R&D centers around the world, to support the:
‰ discovery of new materials;
‰ development of new technologies, such as delivery systems;
‰ creation of new compounds; and
‰ enhancement of existing ingredients and compounds.
As of December 31, 2015, we employed about 1,400 people globally in R&D activities. We spent $246.1million, $253.6 million and $259.8 million, or approximately 8%, 8% and 9% of sales in 2015, 2014 and 2013,respectively, on R&D activities.
Our ingredients research program discovers molecules found in natural substances and creates newmolecules that are subsequently tested for their sensorial value. To broaden our offerings of natural, innovativeand unique products, we seek collaborations with research institutions and other companies throughout the world.We have established a number of such collaborations, for example, our ongoing relationship with Amyris, tostrengthen the pipeline of new and innovative molecules that we expect to launch in the coming years. To furtherstrengthen and broaden technology offerings and capabilities, we acquired Lucas Meyer in 2015 to expand ourproduct portfolio of ingredients for the cosmetic and personal care industries.
8

The development of new and customized flavor and fragrance compounds is a complex process calling uponthe combined knowledge of our scientists, flavorists and perfumers. Scientists from various disciplines work inproject teams with flavorists and perfumers to develop flavor and fragrance compounds with consumer preferredperformance characteristics. The development of new flavor and fragrance compounds requires (i) an in-depthknowledge of the flavor and fragrance characteristics of the various ingredients we use, (ii) an understanding ofhow the many ingredients in a consumer product interact and (iii) the creation of controlled release and deliverysystems to enhance flavor and fragrance performance. To facilitate this process, we have a scientific advisoryboard comprised of five leading scientists that provide external perspectives and independent feedback on ourR&D initiatives.
Creative Application
We also have a network of 33 creative centers around the world where we create or adapt the basic flavorsor fragrances that we have developed in the R&D process to commercialize for use in our customers’ consumerproducts. Our global creative teams consist of perfumers, fragrance evaluators and flavorists, as well asmarketing, consumer insights and technical application experts, from a wide range of cultures and nationalities.In close partnership with our customers’ product development groups, our creative teams create the scents andtastes that our customers are seeking in order to satisfy consumer demands in each of their markets.
Development of new flavors and fragrances is driven by a variety of sources including requests from ourcustomers, who are in need of a specific flavor or fragrance for use in a new or modified consumer product, or asa result of internal initiatives stemming from our Consumer Insights program. Our product development teamworks in partnership with our scientists and researchers to optimize the consumer appeal of the flavor orfragrance. A collaborative process between our researchers, our product development team and our customersthen follows to perfect the flavor or fragrance so that it is ready to be included in the final consumer product.
In addition to creating new flavors and fragrances, our researchers and product development teams advisecustomers on ways to improve their existing products by adjusting or substituting current ingredients with morereadily accessible or less expensive materials or by modifying the current ingredients to produce an enhancedyield. This often results in creating a better value proposition for our customers.
Our flavor and fragrance compound formulas are treated as trade secrets and remain our proprietary asset.Our business is not materially dependent upon any individual patent, trademark or license.
Supply Chain
We have an integrated supply chain from raw material sourcing through manufacturing, quality assurance,regulatory compliance and distribution, which permits us to provide our customers with consistent qualityproducts on a timely and cost-effective basis.
Procurement
We use both natural and synthetic ingredients in our compounds. We purchase approximately 9,000different raw materials from about 2,500 domestic and international suppliers. Approximately half of thematerials we purchase are naturals or crop-related items and the other half are synthetics and chemicals. Naturalingredients are derived from flowers, fruits and other botanical products as well as from animal products. Theycontain varying numbers of organic chemicals that are responsible for the fragrance or flavor of the naturalproduct. Natural products are purchased in processed or semi-processed form. Some are used in compounds inthe state in which they are purchased and others are used after further processing. Natural products, together withvarious chemicals, are also used as raw materials for the manufacture of synthetic ingredients by chemicalprocesses. Our flavor products also include extracts and seasonings derived from various fruits, vegetables, nuts,herbs and spices as well as microbiologically-derived ingredients. We manufacture most of our syntheticingredients for use in our fragrance compounds as well as for sale to others.
9

In order to ensure our supply of raw materials, achieve favorable pricing and provide timely transparencyregarding inflationary trends to our customers, we continue to be focused on (i) implementing a forward-buystrategy, (ii) entering into supplier relationships to gain access to supplies that we do not have, (iii) implementingindexed pricing, (iv) reducing the complexity of our formulations and (v) evaluating whether it is more profitableto buy or make an ingredient. We are also concentrating on local country sourcing with our own procurementprofessionals.
Manufacturing and Distribution
We have 34 manufacturing sites around the world that support more than 38,000 products. Our majormanufacturing facilities are located in the United States, the Netherlands, Spain, Great Britain, Turkey, Brazil,Mexico, China, India, and Singapore. Our supply chain initiatives in developing markets are focused onincreasing capacity and investments in key technologies. Within our more mature markets, we tend to focus onconsolidation and cost optimization as well as implementing new technologies. In addition to our ownmanufacturing facilities, we develop relationships with third parties that permit us to expand access to thetechnologies, capabilities and capacity that we need to better serve our customers.
Based on the regional nature of the Flavors business and the concerns regarding the transportability of rawmaterials, we have established smaller manufacturing facilities in our local markets that are focused on localneeds. Products within the Fragrances business are typically composed of compounds that are more stable andmore transportable around the world. Consequently, we have fewer manufacturing facilities within ourFragrances business, which produce compounds and ingredients for global distribution.
In 2015, we continued to invest in our facilities. We expanded our flavors facility located nearJohannesburg, South Africa, to add flavor creation, application and sensory laboratories, and a pilot plant. Weopened a new flavors facility in the U.S. near Chicago, Illinois and a new creative center and expansion of ourmanufacturing facilities in Gebze, Turkey. In addition to ongoing construction of a new manufacturing facility inJakarta, Indonesia, we recently approved a new capital project to construct a second manufacturing facility inChina and also initiated a study regarding our existing footprint and manufacturing capabilities that serve theIndian market.
Sustainability
As a leading global creator of flavors and fragrances for a wide variety of consumer products, sustainabilityhas been an important part of how we do business. Our sustainability strategy, which is closely aligned with ourVision 2020 strategy, was first formalized in 2011 and consists of four pillars: our products; our impact; oursources; and our people. While the industry and our Company constantly evolve, we are committed to conductingour business in line with our dedication to the environment, to society and to the shareholders, customers andothers that have placed their confidence in us. In 2015, we became a member of the World Business Council forSustainable Development. We also became the first flavors and fragrances company to join the Together forSustainability initiative and enter into growing consortium of multinational companies committed to ensuringsustainable practices throughout the supply chain. We were recognized by the CDP, earning a perfect score of100 in disclosure and an A in performance for our strategies and actions to mitigate climate change. In addition,IFF-LMR Naturals received its fourth For Life Social Responsibility designation, in cooperation with our Vetiverpartner in Haiti. The For Life designation recognizes an organization’s adherence to specific sustainabilitycriteria, including transparency, environmental responsibility, fair working conditions and positive relations withproducers and local communities.
Governmental Regulation
We develop, produce and market our products in a number of jurisdictions throughout the world and aresubject to federal, regional and local legislation and regulations in each of the various countries. Our flavor andmany of our fragrance products are intended for the food, beverage and pharmaceutical industries, which are
10

subject to strict quality and regulatory standards. As a result, we are required to meet these strict standards which,in recent years, have become increasingly stringent.
In addition, we are subject to various rules relating to health, work safety and the environment at the localand international levels in the various countries in which we operate. Our manufacturing facilities throughout theworld are subject to environmental standards relating to air emissions, sewage discharges, the use of hazardousmaterials, waste disposal practices and clean-up of existing environmental contamination. In recent years, therehas been a significant increase in the stringency of environmental regulation and enforcement of environmentalstandards, and the costs of compliance have risen significantly. We expect that the trend of increased regulationwill continue in the future.
Our products and operations are subject to regulation by governmental agencies in each of the markets inwhich we operate. These agencies include (1) the Food and Drug Administration and equivalent internationalagencies that regulate flavors and other ingredients in consumer products, (2) the Environmental ProtectionAgency and equivalent international agencies that regulate our manufacturing facilities, (3) the OccupationalSafety and Health Administration and equivalent international agencies that regulate the working conditions inour manufacturing, research laboratories and creative centers, (4) local and international agencies that regulatetrade and customs, (5) the Drug Enforcement Administration and other local or international agencies thatregulate controlled chemicals that we use in our operations and (6) the Chemical Registration/Notificationauthorities that regulate chemicals that we use in, or transport to, the various countries in which we manufactureand/or market our products. We have seen an increase in registration and reporting requirements concerning theuse of certain chemicals in a number of countries.
Competition
The flavors and fragrances market is part of a larger market which supplies a variety of ingredients andcomponents that consumer products companies utilize in their products. The broader market includes largemultinational companies or smaller regional and local participants which supply products such as seasonings,texturizers, spices, enzymes, certain food-related commodities, fortified products and cosmetic ingredients.
The market for flavors and fragrances is highly competitive. Based on annual sales, our main competitorsconsist of (1) the three other large global flavor and fragrance manufacturers, Givaudan, Firmenich and Symrise,(2) mid-sized companies, (3) numerous local and regional manufacturers and (4) consumer product companieswho may develop their own flavors or fragrances. We, together with the other top three companies, representapproximately two-thirds of the total estimated sales in the global flavors and fragrances sub-segment of thebroader market.
We believe that our ability to compete successfully in the flavors and fragrances sub-market is based on(1) our understanding of consumers, (2) innovation, arising from the creative skills of our perfumers andflavorists and the technological advances resulting from our research and development activities, (3) our abilityto create products which are tailor-made for our customers’ needs, (4) developing strong customer intimacy and(5) driving efficiency in all that we do.
Large multinational customers and, increasingly, mid-sized customers, may limit the number of theirsuppliers by placing some on “core lists,” giving them priority for development and production of their new ormodified products.
To compete more successfully in this environment, we must make continued investments in customerrelationships and tailor our research and development efforts to anticipate customers’ needs, provide effectiveservice and secure and maintain inclusion on certain “core lists.”
Employee Relations
At December 31, 2015, we had approximately 6,700 employees worldwide, of whom approximately 1,550are employed in the United States. We believe that relations with our employees are good.
11

Availability of Reports
We make available free of charge on or through the Investor Relations link on our website, www.iff.com, allmaterials that we file electronically with the Securities and Exchange Commission (“SEC”), including our annualreport on Form 10-K, quarterly reports on Form 10-Q, current reports on Form 8-K and amendments to thosereports, filed or furnished pursuant to Section 13(a) or 15(d) of the Securities Exchange Act of 1934, as amended,as soon as reasonably practicable after electronically filing such materials with, or furnishing them to, the SEC.During the period covered by this Form 10-K, we made all such materials available through our website as soonas reasonably practicable after filing such materials with the SEC.
You may also read and copy any materials filed by us with the SEC at the SEC’s Public Reference Room at100 F Street, N.E., Washington, D.C. 20549, and you may obtain information on the operation of the PublicReference Room by calling the SEC in the United States at 1-800-SEC-0330. In addition, the SEC maintains anInternet website, www.sec.gov, that contains reports, proxy and information statements and other informationthat we file electronically with the SEC.
A copy of our Corporate Governance Guidelines, Code of Business Conduct and Ethics, and the charters ofthe Audit Committee, Compensation Committee and Nominating and Governance Committee of the Board ofDirectors are posted on the Investor Relations section of our website, www.iff.com.
Our principal executive offices are located at 521 West 57th Street, New York, New York 10019(212-765-5500).
Executive Officers of Registrant
The current executive officers of the Company, as of March 1, 2016, are listed below.
Andreas Fibig . . . . . . . . . . . . . . . . . . 54 Chairman of the Board and Chief Executive OfficerAlison A. Cornell . . . . . . . . . . . . . . . 53 Executive Vice President and Chief Financial OfficerNicolas Mirzayantz . . . . . . . . . . . . . . 53 Group President, FragrancesMatthias Haeni . . . . . . . . . . . . . . . . . 50 Group President, FlavorsAhmet Baydar . . . . . . . . . . . . . . . . . . 63 Executive Vice President, Research and DevelopmentAngelica T. Cantlon . . . . . . . . . . . . . 64 Executive Vice President, Chief Human Resources OfficerAnne Chwat . . . . . . . . . . . . . . . . . . . 56 Executive Vice President, General Counsel and Corporate SecretaryFrancisco Fortanet . . . . . . . . . . . . . . . 47 Executive Vice President, Operations
Andreas Fibig has served as our Chairman since December 2014 and Chief Executive Officer sinceSeptember 2014. Mr. Fibig has been a member of our Board of Directors since 2011. From 2008 to 2014,Mr. Fibig served as President and Chairman of the Board of Management of Bayer HealthCare Pharmaceuticals,the pharmaceutical division of Bayer AG. Prior to this position, Mr. Fibig held a number of positions ofincreasing responsibility at Pfizer Inc., a research-based pharmaceutical company, including as Senior VicePresident in the US Pharmaceutical Operations group from 2007 through 2008 and as President, Latin America,Africa and Middle East from 2006 through 2007.
Alison A. Cornell has served as our Executive Vice President and Chief Financial Officer since July 2015.Prior to joining us, Ms. Cornell served as Corporate Senior Vice President and Chief Financial Officer ofCovance Inc., a global drug development company, a position to which she was promoted in May 2012 afterserving in two vice president positions of increasing responsibility. Prior to joining Covance in 2004, Ms. Cornellspent 19 years with AT&T, where she held leadership roles and positions of increasing responsibility.Ms. Cornell holds a Bachelor of Arts in psychology and a Master of Business Administration in marketing fromRutgers University. She is a graduate of the Program for Management Development at Harvard Business School,as well as numerous other professional development programs.
12

Nicolas Mirzayantz has served as our Group President, Fragrances since January 2007, and originally joinedour Company in 1988. Prior to his appointment as Group President, Fragrances, he served as a member of ourTemporary Office of the Chief Executive Officer from October 1, 2009 until February 2010, our Senior VicePresident, Fine Fragrance and Beauty Care and Regional Manager North America, from March 2005 toDecember 2006, our Senior Vice President, Fine Fragrance and Beauty Care from October 2004 to February2005, and our Vice President Global Fragrance Business Development from February 2002 to September 2004.
Matthias Haeni has served as our Group President, Flavors since April 2014. Mr. Haeni joined us in 2007 inthe role of Regional General Manager, Flavors Greater Asia. In 2010, Mr. Haeni transferred to Hilversum, TheNetherlands where he served as Regional General Manager for Flavors Europe, Africa, and the Middle East(EAME).
Ahmet Baydar has served as our Executive Vice President, Research and Development since August 2015,as our Senior Vice President, Research and Development from September 2010 to August 2015, and as our VicePresident, Global Fragrance Research from February 2009 to August 2010. Prior to joining us, Dr. Baydar servedas a Director of Shave Care and Integrated Shaving Systems at The Procter & Gamble Company, a brandedconsumer packaged goods company, and Vice President of R&D-Personal Care at The Gillette Company, apersonal care products company.
Angelica T. Cantlon has served as our Executive Vice President, Chief Human Resources Officer sinceAugust 2015 and as our Senior Vice President, Human Resources from August 2009 to August 2015. Prior tojoining us, Ms. Cantlon served as Senior Vice President-International Chief Administrative Officer of MetLife,Inc., an insurance and financial services company, from June 2005 to August 2009, and Senior Vice President-Human Resources Business Leader, of Metlife from September 1999 to June 2005.
Anne Chwat has served as our Executive Vice President, General Counsel and Corporate Secretary sinceAugust 2015 and as our Senior Vice President, General Counsel and Corporate Secretary from April 2011 toAugust 2015. Prior to joining us, Ms. Chwat served as Executive Vice President and General Counsel of BurgerKing Holdings, Inc., a fast food hamburger restaurant company, from September 2004 to April 2011. FromSeptember 2000 to September 2004, Ms. Chwat served in various positions at BMG Music (now Sony MusicEntertainment), including as Senior Vice President, General Counsel and Chief Ethics and Compliance Officer.
Francisco Fortanet has served as Executive Vice President, Operations since August 2015 and as SeniorVice President, Operations from February 27, 2012 to August 2015. Mr. Fortanet joined our Company in 1995,and has served as our Vice President, Global Manufacturing Compounding from January 2007 to February 2012,our Vice President, Global Manufacturing from January 2006 to January 2007, our Regional Director of NorthAmerica Operations from December 2003 to January 2005, the Project Manager of a Special Project in IFFIreland from May 2003 to December 2003 and as our Plant Manager in Hazlet, New Jersey from October 1999 toMay 2003.
ITEM 1A. RISK FACTORS.
We routinely encounter and address risks in conducting our business. Some of these risks may cause ourfuture results to be different — sometimes materially different — than we presently anticipate. Below are certainimportant operational and strategic risks that could adversely affect our business. How we react to materialfuture developments, as well as how our competitors react to those developments, could also affect our futureresults.
Our business is highly competitive, and if we are unable to compete effectively our sales and results ofoperations will suffer.
The market for flavors and fragrances is highly competitive. We face vigorous competition from companiesthroughout the world, including multinational and specialized flavor, fragrance and cosmetic ingredients
13

companies, as well as consumer product companies who may develop their own flavors, fragrances or cosmeticingredients. In the flavors industry, we also face increasing competition from ingredient suppliers that haveexpanded their portfolios to include flavor offerings. Some of our competitors specialize in one or more of ourproduct sub-segments, while others participate in many of our product sub-segments. In addition, some of ourglobal competitors may have greater resources than we do or may have proprietary products that could permitthem to respond to changing business and economic conditions more effectively than we can. Consolidation ofour competitors may exacerbate these risks. As we are new to cosmetic ingredients, we may face greatercompetition-related risks in this industry than with our core historic flavor and fragrances business.
Competition in our business is based on innovation, product quality, regulatory compliance, pricing, qualityof customer service, the support provided by marketing and application groups, and understanding of consumers.It is difficult for us to predict the timing, scale and success of our competitors’ actions in these areas. Thediscovery and development of new flavor and fragrance materials, protection of the Company’s intellectualproperty and development and retention of key employees are important issues in our ability to compete in ourbusiness. Increased competition by existing or future competitors, including aggressive price competition, couldresult in the potential loss of substantial sales or create the need for us to reduce prices or increase spending andthis could have an adverse impact on sales and profitability.
During 2015, our 25 largest customers accounted for 52% of our sales, and sales to our largest customeraccounted for 12% of our sales in each of the last three fiscal years. Disruption of sales to this customer or any ofour other large customers for an extended period of time could adversely affect our business or financial results.
Large multinational customers, and increasingly, mid-sized customers are unilaterally limiting the numberof their suppliers or rationalizing the number of products that they offer to increase their margins andprofitability. As part of these initiatives, these customers are creating “core lists” of suppliers and giving these“core lists” suppliers priority for new or modified products. Recently, these customers are making inclusion ontheir “core lists” contingent upon a supplier providing more favorable commercial terms which may adverselyaffect our margins. These, and other profitability initiatives being pursued by our customers, reduce the marketopportunity for which we compete and subject the volume and pricing of the remaining suppliers to downwardpressure. To compete more successfully in this environment, we must continue to make investments in customerrelationships and tailor product research and development in order to anticipate customers’ needs, deliversupplies that contribute to our customers’ profitability, provide effective service and offer competitive cost-in-use solutions to secure and maintain inclusion on certain “core lists” and our share of our customers’ purchases.If we are unable to do so, it could adversely impact our future results of operations.
We may not be able to successfully identify and complete sufficient acquisitions to meet our Vision 2020strategy, and even if we are able to do so, we may not realize the anticipated benefits of these acquisitions.
As part of our new Vision 2020 strategy, we intend to add between $500 million and $1.0 billion of salesgrowth through acquisitions within the flavors and fragrances industries and adjacencies. During 2015, wenegotiated and closed two acquisitions which align with this strategic objective. Specifically, in May 2015, wecompleted the acquisition of Ottens Flavors, a flavor supplier and developer and in July 2015, we completed theacquisition of Lucas Meyer Cosmetics, a developer, manufacturer and marketer of cosmetic active ingredients.
Identifying suitable acquisition candidates can be difficult, time-consuming and costly, and we may not beable to identify suitable candidates or complete acquisitions in a timely manner, on a cost-effective basis or at all.Even if we complete an acquisition, we may not realize the anticipated benefits of such acquisition. Our recentacquisitions have required, and any similar future transactions may also require, significant efforts andexpenditures, including with respect to integrating the acquired business with our historical business. We mayencounter unexpected difficulties, or incur unexpected costs, in connection with acquisition activities andintegration efforts, which include:
‰ diversion of management attention from managing our historical core business;
‰ potential disruption of our historical core business of the acquired business;
14

‰ the strain on, and need to continue to expand, our existing operational, technical, financial andadministrative infrastructure;
‰ the challenges related to the lack of experience in operating in the geographical or product markets of theacquired business;
‰ challenges in controlling additional costs and expenses in connection with and as a result of theacquisition;
‰ the difficulties in assimilating employees and corporate cultures or in integrating systems and controls;
‰ difficulties in anticipating and responding to actions that may be taken by competitors in response to theacquisitions;
‰ potential loss of key employees, customers, suppliers or other partners of the acquired business; and
‰ the assumption of and exposure to unknown or contingent liabilities of acquired businesses.
If any of our acquisitions do not perform as anticipated for any of the reasons noted above or otherwise,there could be a negative impact on our results of operations and financial condition.
The failure of key information technology systems or a breach of our information security may adverselyaffect our ability to conduct our business, subject us to increased operating costs and expose us tolitigation.
We rely on information technology systems, including some managed by third-party providers, to conductbusiness and support our business processes, including product formulas, product development, sales, orderprocessing, production, distribution, finance and intra-company communications throughout the world. Thesesystems may be susceptible to disruptions or outages due to fire, floods, power loss, telecommunications failures,natural disasters, cyber attacks and similar events, or due to the poor performance of third-party providers.Effective response to such disruptions will require effort and diligence on the part of our employees and third-party providers to avoid any adverse impact to our business. In addition, our systems and proprietary data storedelectronically may be vulnerable to computer viruses, cybercrime, computer hacking and similar informationsecurity breaches, which in turn could result in the unauthorized release or misuse of confidential or proprietaryinformation about our business (including, but not limited to, the trade secrets upon which we rely to protect ourproprietary fragrance and flavor formulations), employees, or customers, and disrupt our operations. Dependingon their nature and scope, these threats could potentially lead to improper use of our systems and networks,manipulation and destruction of data or product non-compliance. The occurrence of any of these events couldadversely affect our sales, subject us to increased operating costs and expose us to litigation.
The industries in which our customers operate are expanding and becoming increasingly decentralized,and if we and/or our customers are unable to adjust, our operating results and future growth may beadversely affected.
Our customers include large food and beverage companies, which operate in highly competitive industriesand rely on continued consumer demand for their products. In recent years many of our customers have facedgrowing competition from mid-size regional companies and companies focused on niche-product categoriesdriving and accelerating product innovation. Consequently, the food and beverage industry is expanding andbecoming increasingly decentralized. If our customers fail to adequately address the challenges pertaining to thisexpansion and decentralization of business, it may adversely affect their operations or financial performance, andcould have a corresponding material adverse effect on us. If our global customers’ market shares continue toerode and we are unable to gain market share with small and mid-sized customers in this evolved environment,our operating results and future growth could be adversely affected.
We have made investments in and are expanding our business into emerging markets, which exposes us tocertain risks.
As part of our growth strategy, we have increased our presence in emerging markets by expanding ourmanufacturing presence, sales organization and product offerings in these markets, and we expect to continue to
15

focus on expanding our business in these markets. In addition to the currency and international operation risksdescribed below, our operations in these markets may be subject to a variety of other risks. Emerging marketstypically have a consumer base with limited or fluctuating disposable income and customer demand in thesemarkets may fluctuate accordingly. As a result, decrease in customer demand in emerging markets may have anadverse effect on our ability to execute our growth strategy. In addition, emerging markets may have weak legalsystems which may affect our ability to enforce our intellectual property and contractual rights, exchangecontrols, unstable governments and privatization or other government actions that may affect taxes, subsidies andincentive programs and the flow of goods and currency. In conducting our business, we move products from onecountry to another and may provide services in one country from a subsidiary located in another country.Accordingly, we are vulnerable to abrupt changes in customs and tax regimes that may have significant negativeimpacts on our financial condition and operating results.
We may not successfully develop and introduce new products that meet our customers’ needs, which mayadversely affect our results of operations.
Our ability to differentiate ourselves and deliver growth in line with our Vision 2020 strategy largelydepends on our ability to successfully develop and introduce new products and product improvements that meetour customers’ needs, and ultimately appeal to consumers. Innovation is a key element of our ability to developand introduce new products. We cannot be certain that we will successfully achieve our innovation goals, such asthe development of new molecules, new and expanded delivery systems and other technologies. We currentlyspend approximately 8% of our sales on research and development; however, such investments may onlygenerate future revenues to the extent that we are able to successfully develop products that meet our customers’specifications, can be delivered at an acceptable cost in use and are accepted by the targeted consumer market.Furthermore, there may be significant lag times from the time we incur R&D costs to the time that these R&Dcosts may result in increased revenue. Consequently, even when we “win” a project, our ability to generaterevenues as a result of these investments is subject to numerous customer, economic and other risks that areoutside of our control, including delays by our customers in the launch of a new product, the level of promotionalsupport for the launch, poor performance of our third-party vendors, anticipated sales by our customers not beingrealized or changes in market preferences or demands, or disruptive innovations by competitors.
Increasing awareness of health and wellness are driving changes in the consumer products industry, and ifwe are unable to react in a timely and cost-effective manner, our results of operations and future growthmay be adversely affected.
We must continually anticipate and react, in a timely and cost-effective manner, to changes in consumerpreferences and demands, including changes in demand driven by increasing awareness of health and wellnessand demands for transparency with respect to product ingredients. Consumers, especially in developedeconomies such as the United States and Western Europe, are shifting away from products containing artificialingredients to “all natural,” healthier alternatives. In addition, there has been a growing demand by consumersand governmental agencies to provide more transparency in product labeling and our customers have been takingsteps to address this demand, including by voluntarily providing product-specific fragrance ingredientsdisclosure. These two trends could affect the types and volumes of our flavors and fragrances that our customersinclude in their product offerings. If we are unable to react to or anticipate these trends in a timely and cost-effective manner, our results of operations and future growth may be adversely affected.
We may not succeed in establishing and maintaining collaborations, joint ventures or partnerships, andsuch arrangements may not lead to development or commercialization of products, which may limit ourability to execute our Vision 2020 strategy and adversely affect our future growth.
From time to time and in line with our new Vision 2020 strategy, we may evaluate and enter intocollaborations, joint ventures or partnerships to enhance our research and development efforts. Our ability togenerate revenues from such collaborations will depend on our partners’ abilities and efforts to successfullyperform the functions assigned to them in these arrangements. The process of establishing and maintaining
16

collaborative relationships is difficult, time-consuming to negotiate, document and implement. We may not besuccessful in our efforts to establish and implement collaborations or other alternative arrangements should wechoose to enter into such arrangements, and the terms of the arrangements may not be favorable to us.Additionally, collaborations may not lead to development or commercialization of products in the most efficientmanner, or at all. If we are unable to establish and maintain collaborative relationships on acceptable terms or tosuccessfully transition terminated collaborative agreements, it could limit our ability to execute our Vision 2020strategy and adversely affect our future growth.
The impact of currency fluctuation or devaluation in the international markets in which we operate maynegatively affect our results of operations.
We have significant operations outside the United States, the results of which are reported in the localcurrency and then translated into United States dollars at applicable exchange rates for inclusion in ourconsolidated financial statements. The exchange rates between these currencies and the United States dollar havefluctuated and will continue to do so in the future. Changes in exchange rates between these local currencies andthe United States dollar will affect the recorded levels of sales, profitability, assets and/or liabilities. Forexample, the weakening of the Euro and several emerging market currencies in 2015 resulted in approximately$33 million impact on operating profit versus 2014. Additionally, volatility in currency exchange rates mayadversely impact our financial condition, cash flows or liquidity. Although we employ a variety of techniques tomitigate the impact of exchange rate fluctuations, including sourcing strategies and a limited number of foreigncurrency hedging activities, we cannot guarantee that such hedging and risk management strategies will beeffective, and our results of operations could be adversely affected.
Our international operations are subject to regulatory, political and other risks that could materially andadversely affect our revenues, cash flows or financial position.
We operate on a global basis, with manufacturing and sales facilities in the United States, Europe, Africa,the Middle East, Latin America, and Greater Asia. During 2015, 77% of our net sales were to customers outsidethe United States and we intend to continue expansion of our international operations. As a result, our business isincreasingly exposed to risks inherent in international operations. These risks, which can vary substantially bylocation, are also described in many of the risk factors in this section and include the following:
‰ governmental laws, regulations and policies adopted to manage national economic conditions, such asincreases in taxes, austerity measures that may impact consumer spending, monetary policies that mayimpact inflation rates, currency fluctuations and sustainability of resources;
‰ changes in environmental, health and safety regulations, such as the continued implementation of theEuropean Union’s REACH regulations, and the burdens and costs of our compliance with suchregulations;
‰ the imposition of tariffs, quotas, trade barriers, other trade protection measures and import or exportlicensing requirements, which could adversely affect our cost or ability to import raw materials or exportour flavors or fragrances to surrounding markets;
‰ risks and costs arising from language and cultural differences;
‰ changes in the laws and policies that govern foreign investment in the countries in which we operate,including the risk of expropriation or nationalization, and the costs and ability to repatriate the profit thatwe generate in these countries;
‰ risks and costs associated with political and economic instability, bribery and corruption, and social andethnic unrest in the countries in which we operate;
‰ difficulty in recruiting and retaining trained local personnel;
‰ national and regional labor strikes in the countries in which we operate; or
17

‰ the risks of operating in developing or emerging markets in which there are significant uncertaintiesregarding the interpretation, application and enforceability of laws and regulations and the enforceabilityof contract rights and intellectual property rights.
These factors may increase in importance as we expand our operations in emerging markets as part of ourgrowth strategy, and the occurrence of any one or more of these factors could increase our costs and adverselyaffect our results of operations.
Volatility and challenging economic conditions may adversely affect demand for consumer products usingflavors and fragrances (including cosmetic active ingredients) may have a negative impact on ouroperating results and future growth.
Our flavors and fragrances (including cosmetic active ingredients) are components of a wide assortment ofglobal consumer products throughout the world. Historically, demand for consumer products using flavors andfragrances (including cosmetic active ingredients) was stimulated and broadened by changing social habits andconsumer needs, population growth, an expanding global middle-class and general economic growth, especiallyin emerging markets. The global economy has experienced significant recessionary pressures and declines inconsumer confidence and economic growth. While some segments of the global economy appear to berecovering, the ongoing global recessionary economic environment in Europe has, and may in the near future,increase unemployment and underemployment, decrease salaries and wage rates, increase inflation or result inother market-wide cost pressures that will adversely affect demand for consumer products in both developed andemerging markets.
In addition, growth rates in the emerging markets have moderated from previous levels. Reduced consumerspending may cause changes in our customer orders including reduced demand for our flavors and fragrances(including cosmetic active ingredients), or order cancellations. For example, recent challenging economicconditions in China and Latin America, which culminated in the weakening of the Chinese yuan, Brazilian realand Argentinian peso, have undermined consumer confidence and resulted in our customers throughout theemerging markets taking a more cautious approach to managing their inventory.
The timing of placing of orders and the amounts of these orders are generally at our customers’ discretion.Customers may cancel, reduce or postpone orders with us on relatively short notice. Significant cancellations,reductions or delays in orders by customers could affect our quarterly results.
It is currently anticipated that these challenging economic conditions will continue during 2016. To theextent that the volatility in global economic conditions continues, our sales, profitability and overall operatingresults could be adversely affected.
Our success depends on attracting and retaining talented people within our business. Significant shortfallsin recruitment or retention could adversely affect our ability to compete and achieve our strategic goals.
Attracting, developing, and retaining talented employees, including our perfumers and flavorists, is essentialto the successful delivery of our products and success in the marketplace. Competition for these employees canbe intense. The ability to attract and retain talented employees is critical in the development of new products andtechnologies which is an integral component of our growth strategy. However, we may not be able to attract andretain such employees in the future. If we experience significant shortfalls in recruitment or retention, our abilityto effectively compete with our competitors and to grow our business could be adversely affected.
Failure to comply with environmental protection laws may cause us to close, relocate or operate one ormore of our plants at reduced production levels, which could adversely affect our operating results andfuture growth.
Our business operations and properties are subject to extensive and increasingly stringent federal, state,local and foreign laws and regulations pertaining to protection of the environment, including air emissions,
18

sewage discharges, the use of hazardous materials, waste disposal practices and clean-up of existingenvironmental contamination. Failure to comply with these laws and regulations or any future changes to themmay result in significant consequences to us, including the need to close or relocate one or more of ourproduction facilities, administrative, civil and criminal penalties, liability for damages and negative publicity. Ifwe are unable to meet production requirements, we can lose customer orders, which can adversely affect ourfuture growth or we may be required to make incremental capital investments to ensure supply. For example, in2015 Chinese authorities notified us of compliance issues pertaining to the emission of odors from several of ourplants in China and, consequently, our Flavors facility in China was temporarily idled and another facility wasrequired to modify its production schedule. As a result of these issues, we invested approximately $6.5 million inodor-abatement equipment at these facilities and have approved a new capital project of approximately $45million to construct a second flavors manufacturing facility in China. Such idling of facilities or productionmodifications has caused or may cause customers to seek alternate suppliers due to concerns regarding supplyinterruptions and these customers may not return or may order at reduced levels even once issues are remediated.If these non-compliance issues reoccur in China or occur or in any other jurisdiction, we may lose business andmay be required to incur capital spending above previous expectations, close a plant, or operate a plant atsignificantly reduced production levels on a permanent basis, and our operating results and cash flows fromoperations may be adversely affected.
Our ongoing optimization of our manufacturing facilities may not be as effective as we anticipate, and wemay fail to realize the expected cost savings and increased efficiencies.
As part of our strategy, we seek to enhance our manufacturing efficiency and align our geographicmanufacturing footprint with our expectations of future growth and technology needs. Many of our facilities arelocated in close proximity to our customers in order to minimize both our customers’ and our own costs.However, we may not have sufficient demand to utilize all of our production capacity and may be required toship excess products to other regions in which we operate, which will increase our costs and decrease ourmargins. To operate more efficiently and control costs, from time to time we also execute rationalizationactivities, which include manufacturing facility consolidations. For example, we are in the midst of relocating ourIngredients facility in Hangzhou, China and constructing a new flavors site in Indonesia. We have also initiated astudy regarding our existing footprint and manufacturing capabilities that serve the Indian market. The spendingassociated with these projects may result in capital spending above previous expectations. Our ability to realizeanticipated cost savings, synergies and revenue enhancements from these activities may be affected by a numberof factors and may pose significant risks, including:
‰ the risk that we may be unable to integrate successfully the relocated manufacturing operations;
‰ the risk that we may be unable to effectively reduce overhead, coordinate management and integrate andretain employees of the relocated manufacturing operations;
‰ the risk that we may face difficulties in implementing and maintaining consistent standards, controls,procedures, policies and information systems;
‰ potential strains on our personnel, systems and resources and diversion of attention from other priorities;and
‰ unforeseen or contingent liabilities of the relocated manufacturing operations.
Furthermore, our rationalization and consolidation actions may not be as effective as we anticipate, and wemay fail to realize the cost savings we expect from these actions. Actual charges, costs and adjustments due tothese activities may vary materially from our estimates, and these activities may require cash and non-cashintegration and implementation costs or charges in excess of budgeted amounts, which could offset any suchsavings and other synergies and therefore could have an adverse effect on our margins.
Volatility and increases in the price of raw materials, energy and transportation could harm our profits.
We use many different raw materials for our business, including essential oils, extracts and concentratesderived from fruits, vegetables, flowers, woods and other botanicals, animal products, raw fruits, organic
19
chemicals and petroleum-based chemicals. While raw material costs have been relatively stable during 2015,historically, we have experienced a considerable amount of price volatility in natural products that representapproximately half of our raw material purchases. Availability and pricing of these natural products can beimpacted by crop size and quality, weather, alternative land use, and other factors which we cannot control.
If we are unable to increase the prices to our customers of our fragrance or flavor products to offset rawmaterial and other input cost increases, or if we are unable to achieve cost savings to offset such cost increases,we could fail to meet our cost expectations and our profits and operating results could be adversely affected.Increases in prices of our products to customers may lead to declines in volume, and we may not be able toaccurately predict the volume impact of price increases, which could adversely affect our financial condition andresults of operations.
Similarly, commodities and energy prices are subject to significant volatility caused by market fluctuations,supply and demand, currency fluctuations, production and transportation disruptions, and other world events. Aswe source many of our raw materials globally to help ensure quality control, if the cost of energy, shipping ortransportation increases and we are unable to pass along these costs to our customers, our profit margins wouldbe adversely affected. Furthermore, increasing our prices to our customers could result in long-term salesdeclines or loss of market share if our customers find alternative suppliers or choose to reformulate theirconsumer products to use fewer ingredients, which could have an adverse long-term impact on our results ofoperations.
To mitigate our sourcing risk, we maintain strategic stock levels for critical items. However, if we do notaccurately estimate the amount of raw materials that will be used for the geographic region in which we will needthese materials, our margins could be adversely affected.
Our reliance on a limited base of suppliers may result in a disruption to our business and may adverselyaffect our financial results.
For certain raw materials, we rely on a limited number of suppliers and we may not have readily availablealternatives. If we are unable to maintain our supplier arrangements and relationships and are unable to obtain thequantity, quality and price levels needed for our business, or if any of our key suppliers becomes insolvent orexperiences other financial distress, we could experience disruptions in production and our financial results couldbe adversely affected.
If we are unable to maintain the integrity of our raw materials, supply chain and finished goods, it mayresult in regulatory non-compliance, litigation costs, and harm to our reputation, all of which mayadversely impact sales and our results of operations.
The development, manufacture and sale of our products are subject to various regulatory requirements ineach of the countries in which our products are developed, manufactured and sold. In addition, we are subject toproduct safety and compliance requirements established by the industry or similar oversight bodies. We use avariety of strategies, methodologies and tools to (i) identify current product standards, (ii) assess relative risks inour supply chain that can impact product integrity, (iii) monitor internal and external performance and (iv) testraw materials and finished goods to minimize the likelihood of product or process non-compliance.
Gaps in our operational processes could adversely affect the quality of our finished products and result in aregulatory non-compliance event. If a product non-compliance event were to go undetected, it could subject us tocustomer claims, recalls, penalties, litigation costs and settlements, remediation costs or loss of sales. As ourflavors, fragrances and cosmetic actives are used as ingredients in many products meant for human use orconsumption, these consequences would be exacerbated if we or our customer did not identify the defect beforethe product reaches the consumer and there was a resulting impact at the consumer level. Such a result could leadto potentially large scale adverse publicity, recalls and potential consumer litigation. Furthermore, adversepublicity about our products, including concerns about product safety or similar issues, whether real or perceived,
20

could harm our reputation and result in an immediate adverse effect on our sales and customer relationships, aswell as require us to utilize significant resources to rebuild our reputation.
A disruption in our operations or our supply chain could adversely affect our business and financialresults.
As a company engaged in research and development, manufacturing and distribution on a global scale, weare subject to the risks inherent in such activities, including industrial accidents, environmental events, strikesand other labor disputes, disruptions in supply chain or information systems,disruption or loss of key research ormanufacturing sites, product quality control, safety, licensing requirements and other regulatory issues, as well asnatural disasters and other external factors over which we have no control. While we have research anddevelopment and manufacturing facilities throughout the world, many of these facilities are extremelyspecialized and certain of our facilities are the sole source of a specific ingredient or product. If our research anddevelopment activities or the manufacturing of ingredients or products were disrupted, the cost of relocating orreplacing these activities or reformulating these ingredients or products may be substantial, which could result inproduction or development delays or otherwise have an adverse effect on our margins, operating results andfuture growth.
Our performance may be adversely impacted if we are not successful in managing our inventory and/orworking capital balances.
We evaluate our inventory balances of materials based on shelf life, expected sourcing levels, known usesand anticipated demand based on forecasted customer order activity and changes in our product/sales mix.Efficient inventory management is a key component of our business success, financial returns and profitability.To be successful, we must maintain sufficient inventory levels and an appropriate product/sales mix to meet ourcustomers’ demands, without allowing those levels to increase to such an extent that the costs associated withstoring and holding other inventory adversely impact our financial results. If our buying decisions do notaccurately predict sourcing levels, customer trends or our expectations about customer needs are inaccurate, wemay have to take unanticipated markdowns or impairment charges to dispose of the excess or obsolete inventory,which can adversely impact our financial results. Additionally, we believe excess inventory levels of rawmaterials with a short shelf life in our manufacturing facilities subjects us to the risk of increased inventoryshrinkage. If we are not successful in managing our inventory balances and shrinkage, our results of and cashflows from operations may be negatively affected.
We sell certain accounts receivable on a non-recourse basis to unrelated financial institutions under“factoring” agreements that are sponsored, solely and individually, by certain customers. The cost ofparticipating in these programs was immaterial to our results in all periods. Should we choose not to participate,or if these programs were no longer available, it could reduce our cash flows from operations in the period inwhich the arrangement ends.
We could be adversely affected by violations of the U.S. Foreign Corrupt Practices Act or similar U.S. orforeign anti-bribery and anti-corruption laws and regulations in the jurisdictions in which we operate.
The global nature of our business, the significance of our international revenue and our focus on emergingmarkets create various domestic and local regulatory challenges and subject us to risks associated with ourinternational operations. The U.S. Foreign Corrupt Practices Act, or FCPA, and similar anti-bribery and anti-corruption laws and regulations in other countries generally prohibit companies and their intermediaries frommaking improper payments to foreign officials for the purpose of obtaining or keeping business or for othercommercial advantage. In addition, U.S. public companies are required to maintain records that accurately andfairly represent their transactions and have an adequate system of internal accounting controls. Under the FCPA,U.S. companies may be held liable for the corrupt actions taken by directors, officers, employees, agents, or otherstrategic or local partners or representatives. As such, if we or our intermediaries fail to comply with therequirements of the FCPA or similar legislation, governmental authorities in the United States and elsewhere
21

could seek to impose substantial civil and/or criminal fines and penalties which could have a material adverseeffect on our business, reputation, operating results and financial condition.
We operate or may pursue opportunities in some jurisdictions, such as China, India, Brazil and Africa,which pose potentially elevated risks of fraud or corruption or increased risk of internal control issues. In certainjurisdictions, compliance with anti-bribery laws may conflict with local customs and practices. From time totime, we have conducted and will conduct internal investigations of the relevant facts and circumstances, controltesting and compliance reviews, and take remedial actions, when appropriate, to help ensure that we are incompliance with applicable corruption and similar laws and regulations. Detecting, investigating and resolvingactual or alleged violations of the FCPA or similar laws is expensive and could consume significant time andattention of our senior management. We could be subject to inquiries or investigations by government and otherregulatory bodies. Any allegations of non-compliance with the FCPA or similar laws could have a disruptiveeffect on our operations in such jurisdiction over the near term, including interruptions of business or loss ofthird-party relationships, which may negatively impact our results of operations or financial condition. Anydetermination that our operations or activities are not in compliance with the FCPA or similar laws could exposeus to severe criminal or civil penalties or other sanctions, significant fines, termination of necessary licenses andpermits, and penalties or other sanctions that may harm our business and reputation.
Our ability to compete effectively depends on our ability to protect our intellectual property rights.
We rely on patents and trade secrets to protect our intellectual property rights. We often rely on trade secretsto protect our proprietary fragrance and flavor formulations, as this does not require us to publicly fileinformation regarding our intellectual property. From time to time, a third party may claim that we haveinfringed upon or misappropriated their intellectual property rights, or a third party may infringe upon ormisappropriate our intellectual property rights. We could incur significant costs in connection with legal actionsto assert our intellectual property rights against third parties or to defend ourselves from third party assertions ofinvalidity, infringement or misappropriation or other claims. Any settlement or adverse judgment resulting fromsuch litigation could require us to obtain a license to continue to use the intellectual property rights that are thesubject of the claim, or otherwise restrict or prohibit our use of such intellectual property rights. Any requiredlicensing fees may not be available to us on acceptable terms, if at all. For those intellectual property rights thatare protected as trade secrets, this litigation could result in even higher costs, and potentially the loss of certainrights, since we would not have a perfected intellectual property right that precludes others from making, usingor selling our products or processes. The ongoing trend among our customers towards more transparent labelingcould further diminish our ability to effectively protect our proprietary flavor formulations.
For intellectual property rights that we seek to protect through patents, we cannot be certain that theserights, if obtained, will not later be opposed, invalidated, or circumvented. In addition, even if such rights areobtained in the United States, the laws of some of the other countries in which our products are or may be sold donot protect intellectual property rights to the same extent as the laws of the United States. If other parties were toinfringe on our intellectual property rights, or if a third party successfully asserted that we had infringed on theirintellectual property rights, it could materially and adversely affect our future results of operations by(i) reducing the price that we could obtain in the marketplace for products which are based on such rights,(ii) increasing the royalty or other fees that we may be required to pay in connection with such rights or(iii) limiting the volume, if any, of such products that we can sell.
Our results of operations may be negatively impacted by the outcome of uncertainties related to litigation.
From time to time we are involved in a number of legal claims and litigation, including claims related tointellectual property, product liability, environmental matters and indirect taxes. We cannot predict the ultimateoutcome of such litigation. In addition, we cannot provide assurance that future events will not result in anincrease in the number of claims or require an increase in the amount accrued for any such claims, or requireaccrual for one or more claims that has not been previously accrued. In addition, if we were found liable, wecould be subject to certain indemnification claims. There can be no assurance that our insurance will be adequate
22

to protect us from all material expenses related to pending and future claims or that such levels of insurance willbe available in the future at economical prices.
The level of returns on pension and postretirement plan assets and the actuarial assumptions used forvaluation purposes could affect our earnings and cash flows in future periods. Changes in governmentregulations could also affect our pension and postretirement plan expenses and funding requirements.
The funding obligations for our pension plans are impacted by the performance of the financial markets,particularly the equity markets, and interest rates. Funding obligations are determined under governmentregulations and are measured each year based on the value of assets and liabilities on a specific date. If thefinancial markets do not provide the long-term returns that are expected under the governmental fundingcalculations, we could be required to make larger contributions. The equity markets can be very volatile, andtherefore our estimate of future contribution requirements can change dramatically in relatively short periods oftime. Similarly, changes in interest rates and legislation enacted by governmental authorities can impact thetiming and amounts of contribution requirements. An adverse change in the funded status of the plans couldsignificantly increase our required contributions in the future and adversely impact our liquidity.
Assumptions used in determining projected benefit obligations and the fair value of plan assets for ourpension and other postretirement benefit plans are determined by us in consultation with outside consultants andadvisors. In the event that we determine that changes are warranted in the assumptions used, such as the discountrate, expected long-term rate of return on assets, or expected health care costs, our future pension andpostretirement benefit expenses could increase or decrease. Due to changing market conditions or changes in theparticipant population, the assumptions that we use may differ from actual results, which could have a significantimpact on our pension and postretirement liabilities and related costs and funding requirements.
Any future impairment of our tangible or intangible long-lived assets may adversely impact ourprofitability.
A significant portion of our assets consists of long-lived assets, including tangible assets such as ourmanufacturing facilities, and intangible assets and goodwill. As of December 31, 2015, we had recorded $1.2billion of intangible assets and goodwill including goodwill and intangible assets related to our acquisitions.Long-lived assets are subject to an impairment analysis whenever events or changes in circumstances indicate thecarrying amount of the asset may not be recoverable. Additionally, goodwill is subject to an impairment test atleast annually. Indicators such as underperformance relative to historical or projected future operating results,changes in the Company’s strategy for its overall business or use of acquired assets, unexpected negativeindustry or economic trends, decreased market capitalization relative to net book values, unanticipatedcompetitive activities, change in consumer demand, loss of key personnel and acts by governments and courtsmay signal that an asset has become impaired. To the extent any of our acquisitions do not perform asanticipated, whether due to internal or external factors, the value of such assets may be negatively affected andwe may be required to record impairment charges. Our results of operations and financial position in futureperiods could be negatively impacted should future impairments of our long-lived assets, including intangibleassets or goodwill occur.
Changes in our tax rates, the adoption of new United States or international tax legislation, or changes inexisting tax laws could expose us to additional tax liabilities that may affect our future results.
We are subject to taxes in the United States and numerous foreign jurisdictions. Our future effective taxrates could be affected by changes in the mix of earnings in countries with differing statutory tax rates, changesin the valuation of deferred tax assets and liabilities, changes in liabilities for uncertain tax positions, cost ofrepatriations or changes in tax laws or their interpretation. Any of these changes could have a material adverseeffect on our profitability.
We have and will continue to implement transfer pricing policies among our various operations located indifferent countries. These transfer pricing policies are a significant component of the management and
23
compliance of our operations across international boundaries and overall financial results. Many countriesroutinely examine transfer pricing policies of taxpayers subject to their jurisdiction, challenge transfer pricingpolicies aggressively where there is potential non-compliance and impose significant interest charges andpenalties where non-compliance is determined. There can be no assurance that a governmental authority will notchallenge these policies more aggressively in the future or, if challenged, that we will prevail. We could suffersignificant costs related to one or more challenges to our transfer pricing.
We are subject to the continual examination of our income tax returns by the Internal Revenue Service andforeign tax authorities in those countries in which we operate, and we may be subject to assessments or audits inthe future in any of the countries in which we operate. The final determination of tax audits and any relatedlitigation could be materially different from our historical income tax provisions and accruals, and while we donot believe the results that follow would have a material adverse effect on our financial condition, such resultscould have a material effect on our income tax provision, net income or cash flows in the period or periods inwhich that determination is made.
In addition, a number of international legislative and regulatory bodies have proposed legislation and beguninvestigations of the tax practices of multinational companies and, in the European Union (“EU”), the taxpolicies of certain EU member states. One of these efforts has been led by the OECD, an international associationof 34 countries including the United States, which has finalized recommendations to revise corporate tax, transferpricing, and tax treaty provisions in member countries. Since 2013, the European Commission (“EC”) has beeninvestigating tax rulings granted by tax authorities in a number of EU member states with respect to specificmultinational corporations to determine whether such rulings comply with EU rules on state aid, as well as morerecent investigations of the tax regimes of certain EU member states. Under EU law, selective tax advantages forparticular taxpayers that are not sufficiently grounded in economic realities may constitute impermissible stateaid. If the EC determines that a tax ruling or tax regime violates the state aid restrictions, the tax authorities of theaffected EU member state may be required to collect back taxes for the period of time covered by the ruling. Inlate 2015 and early 2016, the EC declared that tax rulings by tax authorities in Luxembourg, the Netherlands andBelgium did not comply with the EU state aid restrictions. If the EC were to successfully challenge tax rulingsapplicable to us in any of the EU member states in which we are subject to taxation, we could be exposed toincreased tax liabilities.
Our operations may be affected by greenhouse emissions and climate change and related regulations.
The availability of raw materials and energy supplies fluctuate in markets throughout the world. Climatechange may also affect the availability and price of key raw materials, including natural products used in themanufacture of our products. In order to mitigate the risk of price increases and shortages, our purchasers havedeveloped various sourcing strategies, including multiple suppliers, inventory management systems, variousgeographic suppliers and long-term agreements to mitigate risk.
In addition to market forces, there are various regulatory efforts relating to climate change that may increasethe cost of raw materials, particularly energy used to operate our facilities, that could materially impact ourfinancial condition, results of operations and cash flows.
The potential government regulation of certain of our product development initiatives is uncertain, and wemay be subject to adverse consequences if we fail to comply with applicable regulations.
As part of our ingredients research program, we seek to collaborate with research institutions and companiesthroughout the world, including biotechnology companies. However, it is unclear whether any of our productdevelopments will be classified as genetically modified food products subject to regulation as a biotechnologyproduct. The manufacture of biotechnology products is subject to applicable Current Good ManufacturingPractice (cGMP) regulations as prescribed by the Food and Drug Administration and the applicable standardsprescribed by European Commission and the competent authorities of European Union Member States and toother rules and regulations prescribed by foreign regulatory authorities. Compliance with these regulations can be
24

expensive and time consuming. Such regulation could also subject us to requirements for labeling andtraceability, which may cause our customers to avoid our affected products and seek our competitors’ products.This may result in our inability to realize any benefit from our investment and have an adverse effect on ouroperating results.
ITEM 1B. UNRESOLVED STAFF COMMENTS.
None.
ITEM 2. PROPERTIES.
Our principal properties are as follows:
Location Operation
United StatesCarrollton, TX(1) . . . . . . . . . . . . Production of flavor compounds; flavor laboratories.Hazlet, NJ(1) . . . . . . . . . . . . . . . . Production of fragrance compounds; fragrance laboratories.Jacksonville, FL . . . . . . . . . . . . Production of fragrance ingredients.New York, NY(1) . . . . . . . . . . . . Fragrance laboratories; corporate headquarters.South Brunswick, NJ(1) . . . . . . . Production of flavor compounds and ingredients; flavor laboratories.Union Beach, NJ . . . . . . . . . . . . Research and development center.
FranceNeuilly(1) . . . . . . . . . . . . . . . . . . Fragrance laboratories.Grasse . . . . . . . . . . . . . . . . . . . . Production of flavor and fragrance ingredients; fragrance laboratories.
Great BritainHaverhill . . . . . . . . . . . . . . . . . . Production of flavor compounds and ingredients, and fragrance
ingredients; flavor laboratories.Netherlands
Hilversum . . . . . . . . . . . . . . . . . Flavor and fragrance laboratories.Tilburg . . . . . . . . . . . . . . . . . . . Production of flavor compounds and ingredients, and fragrance
compounds.
SpainBenicarló . . . . . . . . . . . . . . . . . . Production of fragrance ingredients.
ArgentinaGarin . . . . . . . . . . . . . . . . . . . . . Production of flavor compounds and ingredients, and fragrance
compounds; flavor laboratories.
BrazilRio de Janeiro . . . . . . . . . . . . . . Production of fragrance compounds.São Paulo . . . . . . . . . . . . . . . . . Flavor and fragrance laboratories.Taubate . . . . . . . . . . . . . . . . . . . Production of flavor compounds and ingredients.
MexicoTlalnepantla . . . . . . . . . . . . . . . Production of flavor and fragrance compounds; flavor and fragrance
laboratories.
IndiaMumbai(2) . . . . . . . . . . . . . . . . . Flavor and fragrance laboratories.Chennai(2) . . . . . . . . . . . . . . . . . Production of flavor compounds and ingredients, and fragrance
compounds; flavor laboratories.
AustraliaDandenong . . . . . . . . . . . . . . . . Production of flavor compounds and flavor ingredients.
25

Location Operation
ChinaGuangzhou(3) . . . . . . . . . . . . . . . Production of flavor compounds.Guangzhou(3) . . . . . . . . . . . . . . . Production of fragrance compounds.Shanghai(4) . . . . . . . . . . . . . . . . . Flavor and fragrance laboratories.Xin’anjiang(5) . . . . . . . . . . . . . . Production of fragrance ingredients.Zhejiang(3) . . . . . . . . . . . . . . . . . Production of fragrance ingredients.
IndonesiaJakarta . . . . . . . . . . . . . . . . . . . . Production of flavor compounds and ingredients; flavor and fragrance
laboratories.
JapanGotemba . . . . . . . . . . . . . . . . . . Production of flavor compounds.Tokyo . . . . . . . . . . . . . . . . . . . . Flavor and fragrance laboratories.
SingaporeJurong(4) . . . . . . . . . . . . . . . . . . . Production of flavor and fragrance compounds.Science Park(1) . . . . . . . . . . . . . . Flavor and fragrance laboratories.
TurkeyGebze . . . . . . . . . . . . . . . . . . . . Production of flavor compounds.
IsraelKibbutz Givat-Oz(3) . . . . . . . . . . Flavor and fragrance ingredients manufacturing and laboratories.
(1) Leased.(2) We have a 93.4% interest in the subsidiary company that owns this facility.(3) Land is leased and building and machinery and equipment are owned.(4) Building is leased and machinery and equipment are owned.(5) We have a 90% interest in the subsidiary company that leases the land and owns the buildings and machinery.
Our principal executive offices and New York laboratory facilities are located at 521 West 57th Street, NewYork City.
ITEM 3. LEGAL PROCEEDINGS.
We are subject to various claims and legal actions in the ordinary course of our business.
Tax Claims
During 2013, the Company reached a settlement with the Spanish tax authorities with respect to assesmentsimposed in connection with the 2011 fiscal year audit, and paid Euro 3.9 million ($5.2 million based on theexchange rate at the payment date).
With respect to the audits of 2002-2003 fiscal years, the Spanish tax authorities imposed assessmentsaggregating Euro 22.4 million ($28.6 million), including aggregate estimated interest. The Company appealedthese assessments, however, in February 2013, the Appellate Court upheld the administrative ruling with respectto the 2003 tax assessment and the related tax avoidance claims. The Company decided not to pursue the appealsprocess with respect to the 2003 tax assessment and paid Euro 20.8 million ($27.3 million based on the exchangerate at the respective payment dates) in connection with the 2003 tax assessment in 2013. In June 2013, theAppellate Court ruled against us on our appeal of the 2002 income tax assessment and related claims, which theCompany also decided not to appeal. However, this case did not have a related tax exposure associated with it. Inan unrelated matter, there was a remaining aggregate assessment related to the 2002 fiscal year of Euro1.9 million ($2.3 million) as of December 31, 2014, which was under appeal. During the first quarter of 2015, theCompany received a favorable ruling on this appeal and accordingly, reversed the total reserve related to the2002 fiscal year (with a value of Euro 1.9 million or $2.3 million).
26

In addition to the above, the Company was also a party to four dividend withholding tax controversies inSpain in which the Spanish tax authorities alleged that the Company’s Spanish subsidiaries underpaidwithholding taxes during the 1995-2001 fiscal years. The Company had previously appealed each of thesecontroversies. During 2012, the Company received unfavorable decisions on the first three cases. As a result ofthese rulings, during 2012 the Company (i) recorded charges (including estimated interest) of approximately$12.0 million after-tax and (ii) made payments of Euro 9.8 million ($12.8 million based on exchange rate at therespective payment dates). The fourth case was heard by the Spanish National High Court in October 2014, andwe received a favorable ruling. Accordingly, during the fourth quarter of 2014, we reversed the total reserverelated to the 2001 fiscal year (with a value of Euro 3.6 million of $4.3 million). As of December 31, 2015, alldividend withholding tax controversies in Spain have now been resolved. The Company made total payments ofEuro 4.5 million ($4.9 million) during the second quarter of 2015 related to the resolution of the threecontroversies.
Separately, the Spanish tax authorities alleged claims for a capital tax in a case arising from similarallegations as the income tax cases (discussed in further detail in Note 10). In connection with the 2002 incometax assessment ruling discussed in Note 10, the Appellate Court rejected one of the two bases upon which webased our capital tax position. On January 22, 2014, we filed an appeal and in order to avoid future interest costsin the event our appeal was unsuccessful, we paid Euro 9.8 million ($11.2 million, representing the principalamount) during the first quarter of 2014. On February 24, 2016, we received a favorable ruling on our appealfrom the Spanish Supreme Court which overruled a lower court ruling. As a result of this decision, we havereversed the previously recorded provision of Euro 9.8 million ($10.5 million) for the year ended December 31,2015.
We do not currently believe that any of our pending tax assessments, even if ultimately resolved against us,would have a material impact on our financial condition.
Environmental
Over the past 20 years, various federal and state authorities and private parties have claimed that we are aPotentially Responsible Party (“PRP”) as a generator of waste materials for alleged pollution at a number ofwaste sites operated by third parties located principally in New Jersey and have sought to recover costs incurredand to be incurred to clean up the sites.
We have been identified as a PRP at eight facilities operated by third parties at which investigation and/orremediation activities may be ongoing. We analyze our potential liability on at least a quarterly basis. We accruefor environmental liabilities when they are probable and estimable. We estimate our share of the total future costfor these sites to be less than $5 million.
While joint and several liability is authorized under federal and state environmental laws, we believe theamounts we have paid and anticipate paying in the future for clean-up costs and damages at all sites are notmaterial and will not have a material adverse effect on our financial condition, results of operations or liquidity.This assessment is based upon, among other things, the involvement of other PRPs at most of the sites, the statusof the proceedings, including various settlement agreements and consent decrees, and the extended time periodover which payments will likely be made. There can be no assurance, however, that future events will not requireus to materially increase the amounts we anticipate paying for clean-up costs and damages at these sites, and thatsuch increased amounts will not have a material adverse effect on our financial condition, results of operations orcash flows.
Other
In March 2012, ZoomEssence, Inc. filed a complaint against the Company in the U.S. District Court of NewJersey alleging trade secret misappropriation, breach of contract and unjust enrichment in connection with certainspray dry technology disclosed to the Company. In connection with the claims, ZoomEssence is seeking an
27

injunction and monetary damages. ZoomEssence initially sought a temporary restraining order and preliminaryinjunction, but the Court denied these applications in an order entered on September 27, 2013, finding thatZoomEssence had not demonstrated a likelihood of success on the merits of its claims. The Court subsequentlyreferred the matter to mediation, however the private mediation session did not result in a resolution of thedispute. On November 3, 2014, ZoomEssence amended its complaint against the Company to include allegationsof breach of the duty of good faith and fair dealing, fraud in the inducement, and misappropriation of confidentialand proprietary information. On November 13, 2014, the Company filed a counterclaim against ZoomEssencealleging trade secret misappropriation, breach of contract, breach of the implied covenant of good faith and fairdealing, unjust enrichment, misappropriation of confidential and proprietary information, common law unfaircompetition, tortious interference with contractual relations, and conversion. The case is currently proceedingthrough discovery with a trial on the merits anticipated in early 2017. The Company denies the allegations andwill vigorously defend and pursue its position in Court. At this stage of the litigation, based on the informationcurrently available to the Company, management does not believe that this matter represents a material losscontingency.
We are also a party to other litigation arising in the ordinary course of our business. We do not expect theoutcome of these cases, singly or in the aggregate, to have a material effect on our consolidated financialcondition.
ITEM 4. MINE SAFETY DISCLOSURES.
Not applicable.
28

PART II
ITEM 5. MARKET FOR REGISTRANT’S COMMON EQUITY, RELATED STOCKHOLDERMATTERS AND ISSUER PURCHASES OF EQUITY SECURITIES.
Market Information.
Our common stock is traded principally on the New York Stock Exchange. The high and low stock pricesfor each quarter during the last two years were:
2015 2014
Quarter High Low High Low
First . . . . . . . . . . . . . . . . . . . . . . . . . . . . . . . . . . . . . . . . . . $123.08 $ 97.59 $ 97.91 $82.91Second . . . . . . . . . . . . . . . . . . . . . . . . . . . . . . . . . . . . . . . . 120.61 108.82 105.61 91.31Third . . . . . . . . . . . . . . . . . . . . . . . . . . . . . . . . . . . . . . . . . 118.87 100.02 105.84 95.51Fourth . . . . . . . . . . . . . . . . . . . . . . . . . . . . . . . . . . . . . . . . 122.64 106.91 104.00 91.64
Approximate Number of Equity Security Holders.
Title of ClassNumber of shareholders of record
as of February 15, 2016
Common stock, par value 121⁄2¢ per share 2,012
Dividends.
Cash dividends declared per share for each quarter during the two most recent fiscal years were as follows:
Quarter 2015 2014
First . . . . . . . . . . . . . . . . . . . . . . . . . . . . . . . . . . . . . . . . . . . . . . . . . . . . . . . . . . . . . . . . $0.47 $0.39Second . . . . . . . . . . . . . . . . . . . . . . . . . . . . . . . . . . . . . . . . . . . . . . . . . . . . . . . . . . . . . . 0.47 0.39Third . . . . . . . . . . . . . . . . . . . . . . . . . . . . . . . . . . . . . . . . . . . . . . . . . . . . . . . . . . . . . . . 0.56 0.47Fourth . . . . . . . . . . . . . . . . . . . . . . . . . . . . . . . . . . . . . . . . . . . . . . . . . . . . . . . . . . . . . . 0.56 0.47
Our current intention is to return 50%-60% of adjusted Net Income through a combination of dividends andshare repurchases; however, the payment of dividends and share repurchases is determined by our Board ofDirectors (“Board”) at its discretion based on various factors, and no assurance can be provided as to futuredividends.
Performance Graph.
Total Return To Shareholders(1)
(Includes reinvestment of dividends)
ANNUAL RETURN PERCENTAGEYears Ending
Company Name / Index 2011 2012 2013 2014 2015
International Flavors & Fragrances . . . . . . . . . . . . . . . . . (3.81) 29.72 31.59 19.95 20.22S&P 500 Index . . . . . . . . . . . . . . . . . . . . . . . . . . . . . . . . . 2.11 16.00 32.39 13.69 1.38Peer Group . . . . . . . . . . . . . . . . . . . . . . . . . . . . . . . . . . . . 9.69 8.21 19.83 7.98 5.54
INDEXED RETURNSYears Ending
Company Name / Index
BasePeriod2010 2011 2012 2013 2014 2015
International Flavors &Fragrances . . . . . . . . . . . . . . . . . $100 $ 96.19 $124.78 $164.20 $196.95 $236.78
S&P 500 Index . . . . . . . . . . . . . . . . 100 102.11 118.45 156.82 178.29 180.75Peer Group . . . . . . . . . . . . . . . . . . . 100 109.69 118.69 142.23 153.58 162.09
29

Peer Group Companies(2)
Alberto Culver Company (included through 5/9/11) Hormel Foods Corp.
Avon Products Inc. Kellogg Co.
Campbell Soup Co. Estee Lauder Companies, Inc.
Church & Dwight Co. Inc. McCormick & Company, Inc.
Clorox Company McDonald’s Corp.
Coca-Cola Company Nestle SA
Colgate-Palmolive Co. Pepsico Inc.
ConAgra Foods, Inc. Procter & Gamble Co.
Edgewell Personal Care (included since 7/1/15) Revlon Inc.
General Mills Inc. Sensient Technologies Corp.
Heinz (HJ) Co. (included through 6/7/13) Unilever NV
Hershey Company YUM! Brands Inc.
Hillshire Brands Co. (included through 8/28/14)
Total Shareholder Return Performance Graph
$0
$50
$100
$150
$300
$250
$200
12/31/2010 12/31/2011 12/31/2012 12/31/2013 12/31/2014 12/31/2015
International Flavors & Fragrances S&P 500 Index Peer Group
(1) The Cumulative Shareholder Return assumes that the value of an investment in our Common Stock andeach index was $100 on December 31, 2010, and that all dividends were reinvested.
(2) Due to the international scope and breadth of our business, we believe that a Peer Group comprisinginternational public companies, which are representative of the customer group to which we sell ourproducts, is the most appropriate group against which to compare shareholder returns. Alberto CulverCompany ceased trading on May 9, 2011 and has only been included through that date. In July 2012, SaraLee Corp. spun off certain of its businesses and changed its name to Hillshire Brands Co. Heinz (HJ) Co
30

was acquired by Hawk Acquisition Holding Corp on June 7, 2013 and has only been included through thatdate. Hillshire Brands Co was acquired by Tyson Foods on August 28, 2014 and has only been includedthrough that date. Edgewell Personal Care has been included starting from July 1, 2015 when it spun offfrom Energizer Holdings.
Issuer Purchases of Equity Securities.
The table below reflects shares of common stock we repurchased during the fourth quarter of 2015.
Period
Total Number ofShares
Repurchased(1)
AveragePrice Paidper Share
Total Number ofShares Purchased as
Part of PubliclyAnnounced Program
Approximate Dollar Valueof Shares That May Yetbe Purchased Under the
Program
October 1 — 31, 2015 . . . . . . . . . . . . . . 137,589 $110.48 137,589 $262,496,041November 1 — 30, 2015 . . . . . . . . . . . . 121,600 115.11 121,600 248,498,869December 1 — 31, 2015 . . . . . . . . . . . . 98,721 119.10 98,721 236,740,882
Total . . . . . . . . . . . . . . . . . . . . . . . . . . . 357,910 $114.90 357,910 $236,740,882
(1) Shares were repurchased pursuant to the repurchase program originally announced in December 2012, withrepurchases beginning in the first quarter of 2013. In August 2015, the Board of Directors amended theprogram, authorizing an additional $250 million and extending the program through December 31, 2017.Repurchases under the amended program are limited to $500 million in total repurchase price, and theexpiration date is December 31, 2017. Authorization of the repurchase program may be modified,suspended, or discontinued at any time.
ITEM 6. SELECTED FINANCIAL DATA.
INTERNATIONAL FLAVORS & FRAGRANCES INC.QUARTERLY FINANCIAL DATA (UNAUDITED)
The following selected consolidated financial data is derived from our Consolidated Financial Statements.This data should be read in conjunction with the Consolidated Financial Statements and Notes thereto, and withItem 7, Management’s Discussion and Analysis of Financial Condition and Results of Operations.
(DOLLARS IN THOUSANDS EXCEPT PER SHARE DATA) Net Income Per Share
Net Sales Gross Profit(a) Net Income(b) Basic Diluted(c)(e)
Quarter 2015 2014 2015 2014 2015 2014 2015 2014 2015 2014
First . . . . . . $ 774,907 $ 770,224 $ 346,277 $ 341,412 $128,258 $106,707 $1.58 $1.31 $1.57 $1.30Second . . . . 767,541 788,414 345,040 352,647 105,374 110,285 1.30 1.35 1.29 1.35Third . . . . . 765,092 773,813 347,126 340,111 106,447 107,415 1.32 1.32 1.31 1.31Fourth(d) . . . 715,649 756,082 313,156 327,980 79,168 90,136 0.99 1.11 0.98 1.10
$3,023,189 $3,088,533 $1,351,599 $1,362,150 $419,247 $414,543 $5.19 $5.09 $5.16 $5.06
31

Included in the above quarterly results are the following:(DOLLARS IN THOUSANDS EXCEPT PERSHARE DATA) (a) (b) (c) Description
Q1 2015Operational improvement initiatives . . . . . . . $ 281 $ 211 $ — Related to accelerated depreciation associated with a plant
closing in Asia.Restructuring and other charges . . . . . . . . . . — 121 — Restructuring costs associated with the Fragrance Ingredients
Rationalization.Acquisition related costs and adjustments . . . — 325 — Transaction costs related to the acquisition of Ottens Flavors.Tax settlements . . . . . . . . . . . . . . . . . . . . . . . . — (10,478) (0.13) Settlements due to favorable tax rulings in jurisdictions for
which reserves were previously recorded for ongoing taxdisputes.
Q2 2015Operational improvement initiatives . . . . . . . 281 211 — Related to accelerated depreciation associated with a plant
closing in Asia.Restructuring and other charges . . . . . . . . . . — (233) — Restructuring costs associated with the Fragrance Ingredients
Rationalization.Acquisition related costs and adjustments . . . 844 5,691 0.07 Transaction costs related to the acquisition of Ottens Flavors
and Lucas Meyer as well as expense related to the fair valuestep up of inventory on the Ottens Flavors acquisition.
Q3 2015Operational improvement initiatives . . . . . . . 279 209 — Related to accelerated depreciation associated with a plant
closing in Asia.Acquisition related costs and adjustments . . . 2,465 6,001 0.07 Transaction costs related to the acquisition of Ottens Flavors
and Lucas Meyer as well as expense related to the fair valuestep up of inventory on the Lucas Meyer acquisition.
Q4 2015Operational improvement initiatives . . . . . . . 274 205 — Related to accelerated depreciation associated with a plant
closing in Asia.Restructuring and other charges . . . . . . . . . . — 5,402 0.07 Severance costs associated with various restructuring
activities.Acquisition related costs and adjustments . . . 3,515 99 — Transaction costs related to the acquisition of Ottens Flavors
and Lucas Meyer as well as expense related to the fair valuestep up of inventory on the Lucas Meyer acquisition.
Accelerated Contingent Consideration . . . . . . — 7,192 0.09 Represents the acceleration of the contingent considerationpayment related to the Aromor acquisition.
Reversal of Spanish capital tax charge . . . . . — (7,582) (0.09) To reverse the previously recorded provision related to theSpanish capital tax case as a result of the favorable rulingreceived on February 24, 2016.
Q1 2014Operational improvement initiatives . . . . . . . 369 279 — Associated with plant closings and other organizational
realignments in Europe and Asia.Restructuring and other charges . . . . . . . . . . 2,250 1,541 0.02 Accelerated depreciation associated with the Fragrance
Ingredients Rationalization.Q2 2014Operational improvement initiatives . . . . . . . 263 196 — Associated with plant closings and other organizational
realignments in Europe and Asia.Restructuring and other charges . . . . . . . . . . 2,850 1,972 0.02 Accelerated depreciation associated with the Fragrance
Ingredients Rationalization.Q3 2014Operational improvement initiatives . . . . . . . 282 212 — Associated with plant closings and other organizational
realignments in Europe and Asia.Restructuring and other charges . . . . . . . . . . 395 0.01 Restructuring costs associated with the Fragrance Ingredients
Rationalization.Q4 2014Operational improvement initiatives . . . . . . . 1,628 1,218 0.01 Associated with plant closings and other organizational
realignments in Europe and Asia.Restructuring and other charges . . . . . . . . . . 251 — Restructuring costs associated with the Fragrance Ingredients
Rationalization.Gain on Sale of Asset . . . . . . . . . . . . . . . . . . . — (470) — Net gain related to the sale of a non-operating asset.Spanish Tax . . . . . . . . . . . . . . . . . . . . . . . . . . . — (3,825) (0.05) Associated with the favorable ruling of the 2011 Spanish
dividend withholding case.
(d) Q4-2014 includes the impact of an extra week in 2014 (as discussed in Note 1 of the Consolidated Financial Statements). This impactwas not material to our results of operations for the year ended December 31, 2014.
(e) The sum of the 2015 Net Income per diluted share by quarter does not equal the earnings per share for the full year due to rounding.
32

INTERNATIONAL FLAVORS & FRAGRANCES INC.FIVE-YEAR SUMMARY
(DOLLARS IN THOUSANDS EXCEPT PER SHARE AMOUNTS)
2015 2014 2013 2012 2011
Consolidated Statement of Income DataNet sales . . . . . . . . . . . . . . . . . . . . . . . . . . . . . . . . . . . . . . . . $3,023,189 $3,088,533 $2,952,896 $2,821,446 $2,788,018Cost of goods sold(a) . . . . . . . . . . . . . . . . . . . . . . . . . . . . . . . 1,671,590 1,726,383 1,668,691 1,645,912 1,683,362
Gross profit . . . . . . . . . . . . . . . . . . . . . . . . . . . . . . . . . . . . . . 1,351,599 1,362,150 1,284,205 1,175,534 1,104,656Research and development expenses . . . . . . . . . . . . . . . . . . 246,101 253,640 259,838 233,713 219,781Selling and administrative expenses(b) . . . . . . . . . . . . . . . . . 509,557 514,891 505,877 453,535 443,974Restructuring and other charges, net(c) . . . . . . . . . . . . . . . . . 7,594 1,298 2,151 1,668 13,172
Operating profit . . . . . . . . . . . . . . . . . . . . . . . . . . . . . . . . . . 588,347 592,321 516,339 486,618 427,729Interest expense . . . . . . . . . . . . . . . . . . . . . . . . . . . . . . . . . . 46,062 46,067 46,767 41,753 44,639Other (income) expense, net(d) . . . . . . . . . . . . . . . . . . . . . . . 3,184 (2,807) (15,638) 1,450 9,544Income before taxes . . . . . . . . . . . . . . . . . . . . . . . . . . . . . . . 539,101 549,061 485,210 443,415 373,546Taxes on income(e) . . . . . . . . . . . . . . . . . . . . . . . . . . . . . . . . 119,854 134,518 131,666 189,281 106,680
Net income . . . . . . . . . . . . . . . . . . . . . . . . . . . . . . . . . . . . . . $ 419,247 $ 414,543 $ 353,544 $ 254,134 $ 266,866
Percentage of net sales . . . . . . . . . . . . . . . . . . . . . . . . . 13.9 13.4 12.0 9.0 9.6Percentage of average shareholders’ equity . . . . . . . . . 26.9 27.7 26.0 21.5 25.3
Net income per share — basic . . . . . . . . . . . . . . . . . . . . . . . $ 5.19 $ 5.09 $ 4.32 $ 3.11 $ 3.30Net income per share — diluted . . . . . . . . . . . . . . . . . . . . . $ 5.16 $ 5.06 $ 4.29 $ 3.09 $ 3.26Average number of diluted shares (thousands) . . . . . . . . . . 80,891 81,494 81,930 81,833 81,467
Consolidated Balance Sheet DataCash and cash equivalents . . . . . . . . . . . . . . . . . . . . . . . . . . $ 181,988 $ 478,573 $ 405,505 $ 324,422 $ 88,279Receivables, net . . . . . . . . . . . . . . . . . . . . . . . . . . . . . . . . . . 537,896 493,768 524,493 499,443 472,346Inventories . . . . . . . . . . . . . . . . . . . . . . . . . . . . . . . . . . . . . . 589,019 568,729 533,806 540,658 544,439Property, plant and equipment, net . . . . . . . . . . . . . . . . . . . 732,794 720,268 687,215 654,641 608,065Goodwill and intangible assets, net . . . . . . . . . . . . . . . . . . . 1,247,393 752,041 696,197 702,270 708,345Total assets . . . . . . . . . . . . . . . . . . . . . . . . . . . . . . . . . . . . . . 3,721,454 3,494,621 3,331,731 3,246,192 2,965,581Bank borrowings, overdrafts and current portion of long-
term debt . . . . . . . . . . . . . . . . . . . . . . . . . . . . . . . . . . . . . . 132,349 8,090 149 150,071 116,688Long-term debt . . . . . . . . . . . . . . . . . . . . . . . . . . . . . . . . . . . 937,844 934,232 932,665 881,104 778,248Total Shareholders’ equity(f) . . . . . . . . . . . . . . . . . . . . . . . . 1,594,990 1,522,689 1,467,051 1,252,555 1,107,407
Other DataCurrent ratio(g) . . . . . . . . . . . . . . . . . . . . . . . . . . . . . . . . . . . 2.0 3.3 2.9 2.5 2.3Additions to property, plant and equipment . . . . . . . . . . . . $ 101,030 $ 143,182 $ 134,157 $ 126,140 $ 127,457Depreciation and amortization expense . . . . . . . . . . . . . . . . 89,597 89,354 83,227 76,667 75,327Cash dividends declared per share . . . . . . . . . . . . . . . . . . . . $ 2.06 $ 1.72 $ 1.46 $ 1.30 $ 1.16Number of shareholders of record at year-end . . . . . . . . . . 2,013 2,105 2,255 2,430 2,587Number of employees at year-end . . . . . . . . . . . . . . . . . . . . 6,732 6,211 6,000 5,715 5,644
(a) The 2015 amount includes $6,825 ($4,516 after tax) of costs related to the fair value step-up of inventory for the OttensFlavors and Lucas Meyer acquisitions and $1,115 ($836 after tax) of operational improvement initiative costs in Europe andAsia. The 2014 amount includes $7,641 ($5,221 after tax) of accelerated depreciation associated with the FragranceIngredients rationalization and operational improvement initiative costs in Europe and Asia. The 2013 amount includes$8,770 ($6,084 after tax) of accelerated depreciation associated with the Fragrance Ingredients rationalization and severallocations in Asia.
(b) The 2015 amount includes $10,530 ($7,582 after tax) of reversal of the previously recorded provision for the Spanish capitaltax case, $7,192 of expense for the acceleration of the contingent consideration payments related to the Aromor acquisition.The 2013 amount includes $13,011 ($9,108 after tax) of expense associated with the Spanish capital tax case and $33,495($29,846 after tax) in 2011 of costs associated with the Mane patent litigation settlement.
(c) Restructuring and other charges $5,292 after tax in 2015, $844 after tax in 2014, $1,398 after tax in 2013, $1,047 after tax in2012, and $9,444 after tax in 2011 were the result of various restructuring and reorganization programs of the Company.
33

(d) The 2014 amount includes $723 ($470 after tax) and the 2013 amount includes $14,155 ($8,522 after tax) of net gainsrelated to the sale of non-operating assets.
(e) The 2015 amount includes $10,478 of settlements due to favorable tax rulings in jurisdictions for which reserves werepreviously recorded for ongoing tax disputes. The 2012 amount includes after tax charges of $72,362 related to the overallSpanish tax settlement.
(f) Includes noncontrolling interest for all periods presented.(g) Current ratio is equal to current assets divided by current liabilities.
34

ITEM 7. MANAGEMENT’S DISCUSSION AND ANALYSIS OF FINANCIAL CONDITION ANDRESULTS OF OPERATIONS.
(UNLESS INDICATED OTHERWISE, DOLLARS IN MILLIONS EXCEPT PER SHARE AMOUNTS)
Overview
Company background
We create, manufacture and supply flavors and fragrances (including cosmetic active ingredients) that areused in the food, beverage, personal care and household products industries either in the form of compounds orindividual ingredients, including cosmetic active ingredients. Our flavors and fragrance compounds combine anumber of ingredients that are blended, mixed or reacted together to produce proprietary formulas created by ourflavorists and perfumers.
Flavors are the key building blocks that impart taste experiences in food and beverage products and, as such,play a significant role in determining consumer preference of the end products in which they are used. As aleading creator of flavors, we help our customers deliver on the promise of delicious and healthy foods anddrinks that appeal to consumers. While we are a global leader, our flavors business is more regional in nature,with different formulas that reflect local taste preferences. Our flavors compounds are ultimately used by ourcustomers in four end-use categories: (1) Savory, (2) Beverages, (3) Sweet and (4) Dairy.
We are a global leader in the creation of fragrance compounds that are integral elements in the world’sfinest perfumes and best-known consumer products, within fabric care, home care, personal wash, hair care andtoiletries products. Our Fragrances business consists of Fragrance Compounds and Fragrance Ingredients. OurFragrance Compounds are defined into broad categories, (1) Fine Fragrances and (2) Consumer Fragrances.Consumer Fragrances consists of five end-use categories of products: (1) Fabric Care, (2) Home Care,(3) Personal Wash, (4) Hair Care and (5) Toiletries. In addition, Fragrance Ingredients, that are used internallyand sold to third parties, including customers and competitors, for use in preparation of compounds, and cosmeticactive ingredients, which consist of active and functional ingredients, are included in the Fragrances businessunit.
The flavors and fragrances market is part of a larger market which supplies a wide variety of ingredients andcompounds that are used in consumer products. The broader market includes large multinational companies orsmaller regional and local participants which supply products such as seasonings, texturizers, spices, enzymes,certain food-related commodities, fortified products and cosmetic active ingredients. The global market forflavors and fragrances has expanded consistently, primarily as a result of an increase in demand for, as well as anincrease in the variety of, consumer products containing flavors and fragrances. In 2014, the flavors andfragrances market, in which we compete, was estimated by management to be at least $18 billion and isforecasted to grow to approximately $21.6 billion by 2019, primarily driven by expected growth in emergingmarkets; however the exact size of the global market is not available due to fragmentation of data. We estimatethe market size for cosmetic active ingredients to be approximately $1.5 billion as of 2015. We, together with theother top three companies, are estimated to represent approximately two-thirds of the total estimated sales in theglobal flavors and fragrances sub-segment of the broader market.
Development of new flavors and fragrance compounds is driven by a variety of sources, including requestsfrom our customers, who are in need of a specific flavor or fragrance for use in a new or modified consumerproduct, or as a result of internal initiatives stemming from our consumer insights program. Our productdevelopment team works in partnership with our scientists and researchers to optimize the consumer appeal ofthe flavor or fragrance. It then becomes a collaborative process between our researchers, our productdevelopment team and our customers to perfect the flavor or fragrance so that it is ready to be included in thefinal consumer product.
35

2015 Overview
During the third quarter of 2015, we completed the acquisition of 100% of the outstanding shares of LucasMeyer Cosmetics, a business of Unipex Group, (“Lucas Meyer”) for approximately Euro 284.0 million ($312.0million). (The total shares acquired include shares effectively acquired pursuant to put and call optionagreements). This acquisition did not have a material impact on our Consolidated Statement of ComprehensiveIncome. The acquisition strengthened and expanded Fragrance Ingredients.
During the second quarter of 2015, we completed the acquisition of 100% of the outstanding shares ofHenry H. Ottens Manufacturing Co., Inc. (“Ottens Flavors”) for $198.9 million. The acquisition did not have amaterial impact on our consolidated financial statements. The acquisition strengthened our flavors marketposition in the targeted North American market.
Our 25 largest customers accounted for 52% of total sales in 2015; this percentage has remained fairlyconstant for several years. Sales to our largest customer across all end-use categories accounted for 12% of oursales for each of the last three fiscal years. A key factor for commercial success is inclusion on our strategiccustomers’ core supplier lists, which provides opportunities to win new business. We are on the core supplierlists of a large majority of our global and strategic customers within Fragrances and Flavors.
Sales in 2015 declined 2% on a reported basis but increased 5% on a currency neutral basis (which excludesthe effects of changes in currency), with the effects of acquisitions contributing approximately 2% to bothreported and currency neutral basis growth rates. Flavors achieved currency neutral growth of 6%, includingapproximately half of the growth coming from acquisitions. Fragrances achieved currency neutral growth of 4%in 2015, including approximately a quarter of the growth coming from acquisitions. The currency neutral growthof 3%, excluding acquisitions, reflects new win performance (net of losses) in both Flavors and FragranceCompounds partially offset by volume erosion on existing business principally driven by our customers’ productline rationalization and inventory management efforts. In addition, our Flavors business was negatively impactedby volume erosion in North America (NOAM) as well as weak demand and lost business in China (principallyassociated with facility issues). Additionally, Fragrance Ingredients sales were up 2%, which was driven entirelyby the inclusion of acquisitions. Overall, our 2015 results continued to be driven by our strong emerging marketpresence that represented 51% of total sales and experienced 5% currency neutral growth in 2015. From ageographic perspective, all regions delivered currency neutral growth on a consolidated basis in 2015; led byLatin America (LA) with 9% currency neutral sales growth.
36

The year 2014 included an extra week of activity, due to the timing of our fiscal year-end (as discussed inNote 1 of the Consolidated Financial Statements). The impact of this week was not material to our results ofoperations for the year ended December 31, 2014.
2015 Sales by Business Unit
52% Fragrances
48% Flavors
Sales by Destination(DOLLARS IN MILLIONS) 2015
Percentof sales 2014
Percentof sales 2013
Percentof sales
Europe, Africa and Middle East (EAME) . . . . . . . . . . . . . $ 946 31% $1,042 34% $ 972 33%Greater Asia (GA) . . . . . . . . . . . . . . . . . . . . . . . . . . . . . . . . 839 28% 856 28% 823 28%North America (NOAM) . . . . . . . . . . . . . . . . . . . . . . . . . . 718 24% 690 22% 681 23%Latin America (LA) . . . . . . . . . . . . . . . . . . . . . . . . . . . . . . 520 17% 501 16% 477 16%
Total net sales, as reported . . . . . . . . . . . . . . . . . . . . . $3,023 $3,089 $2,953
Year Ended December 31,
Sales by End-Use Product Category 2015 2014 2013
Flavor Compounds . . . . . . . . . . . . . . . . . . . . . . . . . . . . . . . . . . . . . . . . . . . . . . . . . . . . . . . 48% 47% 48%Consumer Fragrances . . . . . . . . . . . . . . . . . . . . . . . . . . . . . . . . . . . . . . . . . . . . . . . . . . . . . 32% 32% 32%Fine Fragrances . . . . . . . . . . . . . . . . . . . . . . . . . . . . . . . . . . . . . . . . . . . . . . . . . . . . . . . . . . 10% 11% 11%Fragrance Ingredients . . . . . . . . . . . . . . . . . . . . . . . . . . . . . . . . . . . . . . . . . . . . . . . . . . . . . 10% 10% 9%
Total Net Sales . . . . . . . . . . . . . . . . . . . . . . . . . . . . . . . . . . . . . . . . . . . . . . . . . . . . . . 100% 100% 100%
FINANCIAL PERFORMANCE OVERVIEW
Reported sales for 2015 decreased 2% year-over-year (including approximately 2% growth fromacquisitions). We continue to benefit from our diverse portfolio of end-use product categories and geographiesand had currency neutral sales growth in all four regions and in Consumer Fragrances and Flavor Compounds.Both Flavors and Fragrances benefited from new win performance (net of losses) and the effect of acquisitions,that were partially offset by volume erosion on existing business principally driven by our customers’ productline rationalization and inventory management efforts. In addition, our Flavors business was negatively impactedby volume erosion in NOAM as well as weak demand and lost business in China (principally associated withfacility issues). Exchange rate variations represented a 7% decrease in year-over-year sales. The effect ofexchange rates can vary by business and region depending upon the mix of sales by country as well as therelative percentage of local sales priced in U.S. dollars versus local currencies. Currency neutral sales growth,including acquisitions, was 5% in 2015. We saw good currency neutral sales growth during each quarter of 2015,despite the impact of volume erosion on existing business. We believe that market conditions and the macro-economic environment will continue to be challenging in many markets in 2016. This lower growth environmentcombined with a stronger U.S. dollar and the reset of the incentive compensation program is expected to pressureour currency neutral operating profit growth and, consequently, we expect currency neutral operating profitgrowth in 2016 to be mid single-digits, including acquisitions.
On a long-term basis, we expect that sales growth for the industry will generally be in line with theunderlying assumptions that support our long-term strategic goals, albeit with some risk in the near term given
37

the continuing global economic uncertainty. We believe changing social habits resulting from increaseddisposable income, improved focus on personal health and wellness awareness should help drive growth of ourconsumer product customers’ businesses.
Gross margin increased 60 basis points (bps) year-over-year. Included in 2015 was $7.9 million ofacquisition-related inventory “step-up” costs and costs associated with operational improvement initiatives,compared to $7.6 million of costs related to accelerated depreciation included in Cost of goods sold andoperational improvement initiatives included in 2014. Excluding these items, gross margin increased 60 bpscompared to the prior year period. The increase was principally driven by productivity initiatives. We ended2015 in a relatively benign raw material cost environment. We believe that we will continue to see higher priceson certain categories (such as naturals including citrus and vanilla) that will be offset by benefits associated withoil-based derivatives that are expected to continue in 2016. We continue to seek improvements in our marginsthrough operational performance, cost reduction efforts and mix enhancement.
Operating profit decreased $4.0 million to $588.3 million (19.5% of sales) in 2015 compared to $592.3million (19.2% of sales) in 2014. Included in 2015 were acquisition related costs of $18.3 million, the reversal ofthe previously recorded provision for the Spanish capital tax case of $10.5 million, accelerated contingentconsideration payments of $7.2 million, Restructuring and other charges, net of $7.6 million and operationalimprovement initiative costs of $1.1 million, compared to operational improvement initiative costs of $2.5million, Restructuring and other charges, net of $1.3 million and $5.1 million of accelerated depreciation in 2014.Excluding these charges, adjusted operating profit was $612.1 million (20.2% of sales) for 2015 versus $601.3million (19.5% of sales) for 2014. Foreign currency changes had an unfavorable impact on operating profit ofapproximately 6% in 2015.
Cash flows from operations were $433.6 million or 14.3% of sales in 2015 as compared to cash flows fromoperations of $518.4 million, or 16.8% of sales, during 2014. The decrease in operating cash flows in 2015 ascompared to 2014 is principally related to the impact of higher pension contributions, increased core workingcapital requirements (trade receivables, inventories and accounts payable), and increased requirements related tovarious operating items (including taxes, employee benefits and prepaids).
Our capital spend was $101.0 million (3.3% of sales) during 2015. Given our intent to construct a newflavors facility in China, the continuation of our Indonesia project and carryover payments from 2015, we expectthat capital spending in 2016 will be approximately 5% of sales (net of potential grants and other reimbursementsfrom government authorities).
38

Results of Operations
Year Ended December 31, Change
(DOLLARS IN THOUSANDS EXCEPT PER SHARE AMOUNTS) 2015 2014 20132015 vs.
20142014 vs.
2013
Net sales . . . . . . . . . . . . . . . . . . . . . . . . . . . . . . . . . . . . . $3,023,189 $3,088,533 $2,952,896 (2.1)% 4.6%Cost of goods sold . . . . . . . . . . . . . . . . . . . . . . . . . . . . . 1,671,590 1,726,383 1,668,691 (3.2)% 3.5%
Gross profit . . . . . . . . . . . . . . . . . . . . . . . . . . . . . . . . . . 1,351,599 1,362,150 1,284,205Research and development (R&D) expenses . . . . . . . . 246,101 253,640 259,838 (3.0)% (2.4)%Selling and administrative (S&A) expenses . . . . . . . . . 509,557 514,891 505,877 (1.0)% 1.8%Restructuring and other charges, net . . . . . . . . . . . . . . . 7,594 1,298 2,151 485.1% (39.7)%
Operating profit . . . . . . . . . . . . . . . . . . . . . . . . . . . . . . . 588,347 592,321 516,339Interest expense . . . . . . . . . . . . . . . . . . . . . . . . . . . . . . . 46,062 46,067 46,767 —% (1.5)%Other expense (income), net . . . . . . . . . . . . . . . . . . . . . 3,184 (2,807) (15,638) (213.4)% (82.1)%
Income before taxes . . . . . . . . . . . . . . . . . . . . . . . . . . . . 539,101 549,061 485,210Taxes on income . . . . . . . . . . . . . . . . . . . . . . . . . . . . . . 119,854 134,518 131,666 (10.9)% 2.2%
Net income . . . . . . . . . . . . . . . . . . . . . . . . . . . . . . . . . . . $ 419,247 $ 414,543 $ 353,544
Net income per share — diluted . . . . . . . . . . . . . . . . . . $ 5.16 $ 5.06 $ 4.29 2.0% 17.9%Gross margin . . . . . . . . . . . . . . . . . . . . . . . . . . . . . . . . . 44.7% 44.1% 43.5% 60.0 60.0R&D as a percentage of sales . . . . . . . . . . . . . . . . . . . . 8.1% 8.2% 8.8% (10.0) (60.0)S&A as a percentage of sales . . . . . . . . . . . . . . . . . . . . 16.9% 16.7% 17.1% 20.0 (40.0)Operating margin . . . . . . . . . . . . . . . . . . . . . . . . . . . . . . 19.5% 19.2% 17.5% 30.0 170.0Adjusted operating margin(1) . . . . . . . . . . . . . . . . . . . . . 20.2% 19.5% 18.3% 70.0 120.0Effective tax rate . . . . . . . . . . . . . . . . . . . . . . . . . . . . . . 22.2% 24.5% 27.1% (230.0) (260.0)
Segment net salesFlavors . . . . . . . . . . . . . . . . . . . . . . . . . . . . . . . . . . . . . . $1,442,951 $1,457,055 $1,422,739 (1.0)% 2.4%Fragrances . . . . . . . . . . . . . . . . . . . . . . . . . . . . . . . . . . . 1,580,238 1,631,478 1,530,157 (3.1)% 6.6%
Consolidated . . . . . . . . . . . . . . . . . . . . . . . . . . . . . . . . . $3,023,189 $3,088,533 $2,952,896
(1) Adjusted operating margin for the twelve months ended December 31, 2015 excludes acquisition relatedcosts of $18.3 million, reversal of the previously recorded provision for the Spanish capital tax case of $10.5million, accelerated contingent consideration payments of $7.2 million, Restructuring and other charges, netof $7.6 million and operational improvement initiative costs of $1.1 million. Adjusted operating margin forthe twelve months ended December 31, 2014 excludes the operational improvement initiative costs of $2.5million, Restructuring and other charges, net of $1.3 million and $5.1 million of accelerated depreciationincluded in Cost of goods sold related to the Fragrance Ingredients Rationalization and several locations inAsia. Adjusted operating margin for the twelve months ended December 31, 2013 excludes the operationalimprovement initiative costs of $2.3 million, Restructuring and other charges, net of $2.2 million, $6.7million of accelerated depreciation included in Cost of goods sold related to the Fragrance IngredientsRationalization and several locations in Asia, and the Spanish capital tax charge of $13.0 million.
Cost of goods sold includes the cost of materials and manufacturing expenses; raw materials generallyconstitute 70% of the total. R&D expenses relate to the development of new and improved molecules andtechnologies, technical product support and compliance with governmental regulations. S&A expenses includeexpenses necessary to support our commercial activities and administrative expenses principally associated withstaff groups that support our overall operating activities.
39

2015 IN COMPARISON TO 2014
Sales
Sales for 2015 totaled $3.0 billion, a decrease of 2% from the prior year. Excluding currency impacts, salesincreased 5%. The currency neutral growth reflects new win performance (net of losses) in both Flavors andFragrance Compounds partially offset by volume erosion on existing business principally driven by ourcustomers’ product line rationalization and inventory management efforts. In addition, our Flavors business wasnegatively impacted by volume erosion in North America (NOAM) as well as weak demand and lost business inChina (principally associated with facility issues). On both a reported and currency neutral basis, the effect ofacquisitions was approximately 2% to net sales amounts. In addition, Fragrance Ingredients sales were up 2% ona currency neutral basis. Overall organic currency neutral growth includes 5% growth from emerging marketsand 1% from developed markets.
Flavors Business Unit
Flavors sales in 2015 decreased 1% on a reported basis but increased 6% on a currency neutral basis versusthe prior year period. Acquisitions accounted for approximately half of the net sales growth on a currency neutralbasis. Overall growth was primarily due to mid single-digit growth in Beverage combined with high single-digitgrowth in Dairy and low single-digit growth in Savory. Regionally, the Flavors business delivered currencyneutral growth across all regions, led by LA at 16% driven by double-digit gains in Beverage, Savory and Dairy.Sales growth in GA of 2% was led by low single-digit gains in Savory and Dairy, which more than offset lowsingle-digit declines in Sweet. Sales growth in EAME of 4% was driven by mid single-digit gains in Savory andBeverage. NOAM sales growth of 11% was primarily driven by high double-digit growth in Sweet and Dairy anddouble-digit growth in Beverage. EAME performance continues to be led by our performance in the emergingmarket countries within the region. Globally, Flavors growth was led by mid single-digit growth in emergingmarkets. Overall, emerging markets represented approximately 52% of total Flavors sales.
Fragrances Business Unit
Fragrances sales in 2015 declined 3% on a reported basis and increased 4% on a currency neutral basis.Acquisitions accounted for approximately one quarter of the currency neutral sales growth. Year-over-year, 2015currency neutral sales performance was led by double-digit growth in Fabric Care, high single-digit growth inHome Care, mid single-digit growth in Hair Care and low single-digit growth in Fragrance Ingredients and FineFragrance. Currency neutral growth within the regions was led by EAME at 7% reflecting double-digit gains inthe Fabric Care and mid single-digit growth in Fine Fragrance and Fragrance Ingredients. LA experiencedcurrency neutral sales growth of 6% reflecting double-digit gains in Fabric Care, Home Care and Hair Carecategories as well as low single-digit gains in Fragrance Ingredients, which offset mid single-digit declines inFine Fragrance. GA had currency neutral sales growth of 3% reflecting high single-digit gains in FragranceIngredients and mid single-digit gains in Fabric Care. NOAM currency neutral sales declined 2% reflectingdouble-digit declines in Toiletries, high single-digit declines in Fragrance Ingredients and mid single-digitdeclines in Fine Fragrance which more than offset mid to high single-digit gains in Home Care and Fabric Care.Overall, emerging markets represented 49% of total Fragrances sales.
40

Sales Performance by Region and Category
% Change in Sales — 2015 vs 2014
FineFragrances
ConsumerFragrances Ingredients
TotalFrag. Flavors Total
NOAM . . . . . . . . . . . . . . . . Reported -5% 1% -7% -2% 11% 4%EAME . . . . . . . . . . . . . . . . . Reported -9% -8% -7% -8% -11% -9%
Currency Neutral(1) 6% 8% 4% 7% 4% 5%LA . . . . . . . . . . . . . . . . . . . . Reported -10% 7% 1% 2% 7% 4%
Currency Neutral(1) -5% 10% 3% 6% 16% 9%GA . . . . . . . . . . . . . . . . . . . . Reported -2% — % 3% — % -3% -2%
Currency Neutral(1) -1% 2% 8% 3% 2% 2%Total . . . . . . . . . . . . . . . . . . Reported -8% -1% -5% -3% -1% -2%
Currency Neutral(1) 1% 5% 2% 4% 6% 5%
(1) Currency neutral sales growth is calculated by translating prior year sales at the exchange rates for thecorresponding 2015 period.
‰ NOAM Flavors sales increased 11%, which included the impact of acquisitions, primarily reflects highdouble-digit growth in Sweet and Dairy and double-digit growth in Beverage. Total Fragrances declined2%, reflecting double-digit declines in Toiletries, high single-digit declines in Fragrance Ingredients andmid single-digit declines in Fine Fragrance, which more than offset mid single-digit gains in Home Careand Fabric Care.
‰ EAME Flavors currency neutral growth of 4% primarily reflects mid single-digit gains in Savory andBeverage. Total Fragrances currency neutral growth of 7% was driven by double-digit gains in the FabricCare and mid single-digit growth in Fine Fragrance and Fragrance Ingredients, which included the impactof acquisitions.
‰ LA Flavors currency neutral sales growth of 16% was driven by double-digit gains in Beverage, Savoryand Dairy. Total Fragrances currency neutral growth of 6% reflects double-digit gains in Fabric Care,Home Care and Hair Care categories as well as low single-digit gains in Fragrance Ingredients, whichoffset mid single-digit declines in Fine Fragrance.
‰ GA Flavors currency neutral sales growth of 2% was led by low single-digit gains in Savory and Dairy,which more than offset low single-digit declines in Sweet. Total Fragrances currency neutral growth of3% primarily reflects high single-digit gains in Fragrance Ingredients and mid single-digit gains in FabricCare.
Cost of Goods Sold
Cost of goods sold, as a percentage of sales, decreased 60 bps, on a reported and adjusted basis, to 55.3% in2015 compared to 55.9% in 2014 (or 55.0% and 55.6% on an adjusted basis in 2015 and 2014, respectively).Included in cost of goods sold was $7.9 million of acquisition related costs (including $6.8 million of inventory“step-up” costs) and operational improvement initiative costs in 2015 and $7.6 million of charges related torestructuring and operational improvement initiative costs in 2014.
Research and Development (R&D)
R&D expenses, as a percentage of sales, decreased slightly from the prior year period at 8.1% in 2015compared to 8.2% in 2014. The decrease was principally driven by lower incentive compensation expense in2015.
41

Selling and Administrative (S&A)
S&A, as a percentage of sales, increased 20 bps to 16.9% versus 16.7%. The increase in S&A expenses wasprincipally due to acquisition-related expenses which were partially offset by lower incentive compensationexpense and the reversal of the previously recorded provision related to the Spanish capital tax case of $10.5million.
Restructuring and Other Charges
Restructuring and other charges primarily consist of separation costs for employees, including severance,outplacement and other benefit costs.
Restructuring Charges(In Thousands)
2015 2014
Flavors . . . . . . . . . . . . . . . . . . . . . . . . . . . . . . . . . . . . . . . . . . . . . . . . . . . . . . . . . . . . . . . . . . . $4,198 $ —Fragrances . . . . . . . . . . . . . . . . . . . . . . . . . . . . . . . . . . . . . . . . . . . . . . . . . . . . . . . . . . . . . . . . 1,347 1,298Global . . . . . . . . . . . . . . . . . . . . . . . . . . . . . . . . . . . . . . . . . . . . . . . . . . . . . . . . . . . . . . . . . . . . 2,049 —
Total . . . . . . . . . . . . . . . . . . . . . . . . . . . . . . . . . . . . . . . . . . . . . . . . . . . . . . . . . . . . . . . . . . . . . $7,594 $1,298
2015 Severance and Contingent Consideration Charges
During the fourth quarter of 2015, we established a series of initiatives that are expected to streamline ourmanagement structure, simplify decision-making and accountability, better leverage and align our capabilitiesacross the organization and improve efficiency of our global manufacturing and operations network. As a result,we recorded a pre-tax charge of $7.6 million, included in restructuring and other charges, net, related toseverance and related costs pertaining to approximately 150 positions that will be affected. The total cost of theplan is expected to be approximately $10 million with the remaining charges relating principally to accelerateddepreciation. The Company expects to realize pre-tax savings of approximately $7-$9 million once fullyimplemented in the second half of 2017, half of which is expected to be realized in 2016.
Separately, we recorded a charge of $7.2 million, included in Selling and administrative expenses,associated with the acceleration from 2016 to 2015 of contingent consideration payments from the Aromoracquisition that were triggered by certain of the management structure changes noted above.
Fragrance Ingredients Rationalization — 2014
In 2014, we closed our fragrance ingredients manufacturing facility in Augusta, Georgia and consolidatedproduction into other Company facilities. In connection with this closure, we incurred charges of $13.8 million,consisting primarily of $10.3 million in accelerated depreciation of fixed assets, $2.2 million in personnel-relatedcosts and $1.3 million in plant shutdown and other related costs. We recorded total charges of $7.4 millionduring 2013, consisting of $2.2 million of pre-tax charges related to severance included in Restructuring andother charges, net and $5.2 million of non-cash charges related to accelerated depreciation included in Cost ofgoods sold. During 2014, we recorded $1.3 million of plant shutdown and other related costs included inRestructuring and other charges, net as well as an additional $5.1 million of non-cash charges related toaccelerated depreciation included in Cost of goods sold. As a result of this closure, 43 positions have beeneliminated. During 2015, we recorded a net credit of $0.5 million principally related to the reversal of severanceaccruals.
42

Operating Results by Business Unit
We evaluate the performance of business units based on segment profit which is defined as operating profitbefore Restructuring and certain non-recurring items, Interest expense, Other expense, net and Taxes on income.See Note 13 to our Consolidated Financial Statements for the reconciliation to Income before taxes.
For the Year EndedDecember 31,
(DOLLARS IN THOUSANDS) 2015 2014
Segment profit:Flavors . . . . . . . . . . . . . . . . . . . . . . . . . . . . . . . . . . . . . . . . . . . . . . . . . . . . . . . . . . . . . . $318,476 $331,257Fragrances . . . . . . . . . . . . . . . . . . . . . . . . . . . . . . . . . . . . . . . . . . . . . . . . . . . . . . . . . . . 321,764 335,447Global Expenses . . . . . . . . . . . . . . . . . . . . . . . . . . . . . . . . . . . . . . . . . . . . . . . . . . . . . . (28,180) (65,443)
Restructuring and other charges, net . . . . . . . . . . . . . . . . . . . . . . . . . . . . . . . . . . . . . . . . . . . (7,594) (1,298)Spanish capital tax charge reversal . . . . . . . . . . . . . . . . . . . . . . . . . . . . . . . . . . . . . . . . . . . . 10,530 —Operational improvement initiative costs . . . . . . . . . . . . . . . . . . . . . . . . . . . . . . . . . . . . . . . (1,115) (7,642)Acquisition related costs . . . . . . . . . . . . . . . . . . . . . . . . . . . . . . . . . . . . . . . . . . . . . . . . . . . . (18,342) —Accelerated contingent consideration . . . . . . . . . . . . . . . . . . . . . . . . . . . . . . . . . . . . . . . . . . (7,192) —
Operating Profit . . . . . . . . . . . . . . . . . . . . . . . . . . . . . . . . . . . . . . . . . . . . . . . . . . . . . . . . . . . $588,347 $592,321
Profit marginFlavors . . . . . . . . . . . . . . . . . . . . . . . . . . . . . . . . . . . . . . . . . . . . . . . . . . . . . . . . . . . . . . 22.1% 22.7%Fragrances . . . . . . . . . . . . . . . . . . . . . . . . . . . . . . . . . . . . . . . . . . . . . . . . . . . . . . . . . . . 20.4% 20.6%Consolidated . . . . . . . . . . . . . . . . . . . . . . . . . . . . . . . . . . . . . . . . . . . . . . . . . . . . . . . . . 19.5% 19.2%
Flavors Business Unit
Flavors segment profit decreased $12.8 million to $318.5 million in 2015 (22.1% of sales) from $331.3million (22.7% of sales) in the comparable 2014 period. The decrease in segment profit and profit margin wasdriven by unfavorable foreign currency impacts, scale up costs of new sites in Turkey and Indonesia and otherone-off costs, including incremental operating costs associated with the China Flavors facility. These costs wereonly partially offset by favorable volume growth, productivity initiatives, sales mix and a slight impact from theaddition of Ottens Flavors.
Fragrances Business Unit
Fragrances segment profit decreased $13.7 million to $321.8 million in 2015 (20.4% of sales), compared to$335.4 million (20.6% of sales) reported in 2014. The decrease in segment profit and profit margin wasprincipally driven by unfavorable foreign currency impacts, which were partially offset by favorable volumegrowth, sales mix and a slight impact from the addition of Lucas Meyer.
Global Expenses
Global expenses represent corporate and headquarter-related expenses which include legal, finance, humanresources and R&D and other administrative expenses that are not allocated to an individual business unit. In2015, Global expenses were $28.2 million compared to $65.4 million during 2014. The decrease is principallydriven by lower incentive compensation expense and the favorable impact of our cash flow hedging program.
Interest Expense
In 2015, interest expense remained comparable with the prior year at $46.1 million. Average cost of debtwas 4.5% for the 2015 period compared to 4.9% in 2014.
Other Expense (Income), Net
Other expense (income), net decreased approximately $6.0 million to $3.2 million of expense in 2015 versus $2.8million of income in 2014. This decrease is primarily driven by lower foreign exchange gains on working capital andlower mark-to-market adjustments on deferred compensation plan assets during 2015 compared to the 2014 period.
43
Income Taxes
The effective tax rate was 22.2% in 2015 as compared to 24.5% in 2014. Excluding the $2.6 million taxbenefit associated with the pretax restructuring charges and operational improvement initiatives, the $6.2 millionbenefit associated with acquisition related costs, the $10.5 million tax settlement received in 2015 due tofavorable tax rulings in Spain and another jurisdiction as well as the $2.9 million charge related to the reversal ofthe previously recorded provision for the Spanish capital tax case, the adjusted tax rate for 2015 was 24.2%.Excluding the $2.6 million tax benefit associated with the pretax restructuring charges and operationalimprovement initiative costs as well as the $3.8 million tax benefit related to the reserve reversal for the 2001Spanish dividend withholding tax case (as discussed in Note 10 of the Consolidated Financial Statements), theadjusted tax rate for 2014 was 25.3%. The year-over-year reduction reflects a benefit from lower cost ofrepatriation and loss provisions which were partially offset by mix of earnings.
2014 IN COMPARISON TO 2013
Sales
Sales for 2014 totaled $3.1 billion, an increase of 5% from the prior year on both a reported and currencyneutral basis, with the acquisition of Aromor adding approximately 1% to both reported and currency neutralbasis amounts. The currency neutral growth reflected new win performance (net of losses) in both Flavors andFragrance Compounds partially offset by volume erosion on existing business. In addition, Fragrance Ingredientssales were up 18% (which includes the benefit of the Aromor acquisition). Overall currency neutral growth wasdriven by 6% growth in emerging markets.
Flavors Business Unit
In 2014, Flavors sales increased 2% on a reported basis and 4% on a currency neutral basis versus 2013. Theoverall performance reflects new wins offset by volume erosion on existing business. Overall high single-digitgrowth in Beverage combined with low single-digit growth in Savory and mid single-digit growth in Dairy waspartially offset by low single-digit declines in Sweet. Regionally, the Flavors business delivered currency neutralgrowth in LA, EAME and GA, led by LA, while sales declined in NOAM. Sales in LA were driven by highdouble-digit gains in Beverage. Sales in GA were led by mid single-digit gains in Savory and sales in EAMEwere driven by double-digit gains in Beverage. The declines in NOAM were primarily driven by low single-digitdeclines in Beverage and Sweet, which were only partially offset by double-digit gains in Dairy. EAMEperformance continues to be led by our performance in the emerging market countries within the region.Globally, Flavors growth was led by high single-digit growth in emerging markets. Overall, emerging marketsrepresented approximately 52% of total Flavors sales.
Fragrances Business Unit
In 2014, the Fragrances business was up 7% in both reported and currency neutral terms versus 2013. Year-over-year, 2014 currency neutral sales performance was led by double-digit growth in Fragrance Ingredients,high single-digit growth in Fabric Care and mid single-digit growth in Hair Care categories, as well as lowsingle-digit growth in Fine Fragrances. Currency neutral growth within the regions was led by GA at 11%reflecting double-digit gains in the Fabric Care and Fragrance Ingredients. EAME experienced currency neutralsales growth of 8% reflecting double-digit gains in Fragrance Ingredients and high single-digit gains in FabricCare. LA had currency neutral sales growth of 3% reflecting double-digit gains in Hair Care and Personal Wash.NOAM currency neutral sales increased 4% reflecting double-digit gains in Home Care and mid to high single-digit gains in Fabric Care and Hair Care categories that more than offset low single-digit declines in FragranceIngredients. Overall, emerging markets represented 47% of total Fragrances sales.
44

Sales Performance by Region and Category
% Change in Sales — 2014 vs 2013
FineFragrances
ConsumerFragrances Ingredients
TotalFrag. Flavors Total
NOAM . . . . . . . . . . . . . . . . . Reported 1% 8% -1% 4% -1% 1%EAME . . . . . . . . . . . . . . . . . . Reported 4% 4% 33% 9% 5% 7%
Currency Neutral(1) 2% 3% 32% 8% 4% 6%LA . . . . . . . . . . . . . . . . . . . . . Reported -2% 3% 3% 2% 12% 5%
Currency Neutral(1) 1% 4% 3% 3% 16% 7%GA . . . . . . . . . . . . . . . . . . . . . Reported 8% 7% 31% 10% 0% 4%
Currency Neutral(1) 9% 8% 33% 11% 3% 6%Total . . . . . . . . . . . . . . . . . . . Reported 2% 5% 18% 7% 2% 5%
Currency Neutral(1) 2% 5% 18% 7% 4% 5%
(1) Currency neutral sales growth is calculated by translating prior year sales at the exchange rates for thecorresponding 2014 period.
‰ NOAM reported sales growth of 1% reflecting a decline of 1% in Flavors as double-digit growth in Dairywas more than offset by volume declines in Sweet and Beverage, and 4% growth in Fragrances.Consumer Fragrances sales were up 8% versus last year as new wins and volume gains in Home Care andFabric Care were only partially offset by lower volumes on existing business in Fragrance Ingredients.
‰ EAME currency neutral growth reflects 4% growth in Flavors primarily resulting from double-digit gainsin Beverages. This growth was mainly due to new wins within our emerging markets in the region, aswell as volume increases. Total Fragrances growth of 8% was driven by double-digit growth in FragranceIngredients as well as high single-digit growth in Fabric Care.
‰ LA currency neutral sales growth of 7% was driven by double-digit gains in Flavors, driven by Beverage.Total Fragrances growth reflects double-digit gains in Hair Care and mid single-digit gains in FabricCare.
‰ GA delivered currency neutral sales growth of 6%, led by mid single-digit gains in Savory. BothConsumer Fragrances and Fine Fragrances experienced high single-digit growth led by double-digitgrowth in Fabric Care and high single-digit growth in Fine Fragrances. In addition, GA experiencedFragrance Ingredients currency neutral sales growth of 33%.
Cost of Goods Sold
Cost of goods sold, as a percentage of sales, decreased 60 bps, on both a reported and adjusted basis, to55.9% in 2014 compared to 56.5% in 2013 (or 55.6% and 56.2% on an adjusted basis in 2014 and 2013,respectively). Included in cost of goods sold was $7.6 million of charges related to restructuring and operationalimprovement initiative costs in 2014 and $8.8 million of restructuring and operational improvement initiativecosts in 2013.
Research and Development (R&D)
R&D expenses decreased approximately $6.2 million versus the prior year. Overall, R&D expensesdecreased 60 bps as a percentage of sales from 8.8% in 2013 to 8.2% in 2014. This decrease is primarily drivenby lower incentive compensation expense.
Selling and Administrative (S&A)
S&A, as a percentage of sales, decreased 40 bps to 16.7% versus 17.1%. Excluding the $13.0 millionSpanish capital tax charge (as discussed in Note 18 to the Consolidated Financial Statements) in 2013, adjustedS&A expenses, as a percentage of sales, were 16.7% in 2013, consistent with the current year.
45

Restructuring and Other Charges
Restructuring and other charges primarily consist of separation costs for employees, including severance,outplacement and other benefit costs.
Restructuring Charges(In Thousands)
2014 2013
Flavors . . . . . . . . . . . . . . . . . . . . . . . . . . . . . . . . . . . . . . . . . . . . . . . . . . . . . . . . . . . . . . . . . . . $ — $ —Fragrances . . . . . . . . . . . . . . . . . . . . . . . . . . . . . . . . . . . . . . . . . . . . . . . . . . . . . . . . . . . . . . . . 1,298 2,151Global . . . . . . . . . . . . . . . . . . . . . . . . . . . . . . . . . . . . . . . . . . . . . . . . . . . . . . . . . . . . . . . . . . . . — —
Total . . . . . . . . . . . . . . . . . . . . . . . . . . . . . . . . . . . . . . . . . . . . . . . . . . . . . . . . . . . . . . . . . . . . . $1,298 $2,151
Fragrance Ingredients Rationalization
In 2014, we closed our fragrance ingredients manufacturing facility in Augusta, Georgia and consolidatedproduction into other Company facilities. In connection with this closure in 2014, we incurred charges of $13.8million, consisting primarily of $10.3 million in accelerated depreciation of fixed assets, $2.2 million inpersonnel-related costs and $1.3 million in plant shutdown and other related costs. We recorded total charges of$7.4 million during 2013, consisting of $2.2 million of pre-tax charges related to severance included inRestructuring and other charges, net and $5.2 million of non-cash charges related to accelerated depreciationincluded in Cost of goods sold. During 2014, we recorded $1.3 million of plant shutdown and other related costsincluded in Restructuring and other charges, net as well as an additional $5.1 million of non-cash charges relatedto accelerated depreciation included in Cost of goods sold. As a result of this closure, 43 positions wereeliminated.
Other
During 2013, we reversed $1.2 million of employee-related liabilities, offset by $0.6 million of additionalcosts incurred related to the European Rationalization Plan announced in 2009. Additionally, during 2013, werecorded a charge of $1.7 million related to the Strategic Initiative, which began in 2011.
Operating Results by Business Unit
We evaluate the performance of business units based on segment profit which is defined as operating profitbefore Restructuring and certain non-recurring items, Interest expense, Other expense, net and Taxes on income.See Note 13 to our Consolidated Financial Statements for the reconciliation to Income before taxes.
For the Year EndedDecember 31,
(DOLLARS IN THOUSANDS) 2014 2013
Segment profit:Flavors . . . . . . . . . . . . . . . . . . . . . . . . . . . . . . . . . . . . . . . . . . . . . . . . . . . . . . . . . . . . . . $331,257 $323,562Fragrances . . . . . . . . . . . . . . . . . . . . . . . . . . . . . . . . . . . . . . . . . . . . . . . . . . . . . . . . . . . 335,447 283,651Global Expenses . . . . . . . . . . . . . . . . . . . . . . . . . . . . . . . . . . . . . . . . . . . . . . . . . . . . . . (65,443) (66,942)
Restructuring and other charges, net . . . . . . . . . . . . . . . . . . . . . . . . . . . . . . . . . . . . . . . . . . . (1,298) (2,151)Spanish capital tax charge . . . . . . . . . . . . . . . . . . . . . . . . . . . . . . . . . . . . . . . . . . . . . . . . . . . — (13,011)Operational improvement initiative costs . . . . . . . . . . . . . . . . . . . . . . . . . . . . . . . . . . . . . . . (7,642) (8,770)
Operating Profit . . . . . . . . . . . . . . . . . . . . . . . . . . . . . . . . . . . . . . . . . . . . . . . . . . . . . . . . . . . $592,321 $516,339
Profit marginFlavors . . . . . . . . . . . . . . . . . . . . . . . . . . . . . . . . . . . . . . . . . . . . . . . . . . . . . . . . . . . . . . 22.7% 22.7%Fragrances . . . . . . . . . . . . . . . . . . . . . . . . . . . . . . . . . . . . . . . . . . . . . . . . . . . . . . . . . . . 20.6% 18.5%Consolidated . . . . . . . . . . . . . . . . . . . . . . . . . . . . . . . . . . . . . . . . . . . . . . . . . . . . . . . . . 19.2% 17.5%
46

Flavors Business Unit
Flavors segment profit totaled $331.3 million in 2014 (22.7% of sales) consistent with $323.6 million(22.7% of sales) in the comparable 2013 period. The increase in segment profit was driven by lower incentivecompensation expense.
Fragrances Business Unit
Fragrances segment profit totaled $335.4 million in 2014 (20.6% of sales), compared to $283.7 million(18.5% of sales) reported in 2013. The improvement in segment profit and profit margin was primarily due tostrong sales growth combined with gross margin expansion, ongoing cost discipline, and lower incentivecompensation expense.
Global Expenses
Global expenses represent corporate and headquarter-related expenses which include legal, finance, humanresources and R&D and other administrative expenses that are not allocated to an individual business unit. In2014, Global expenses were $65.4 million compared to $66.9 million during 2013. The decrease is principallydriven by lower incentive compensation expense.
Interest Expense
In 2014, interest expense decreased $0.7 million to $46.1 million, as a result of the refinancing of our debtin 2013. Average cost of debt was 4.9% for the 2014 period compared to 4.7% in 2013.
Other (Income) Expense, Net
Other (income) expense, net decreased approximately $12.8 million to $2.8 million of income in 2014versus $15.6 million of income in 2013. The decrease was largely driven by a $14.2 million gain related to thesale of non-operating assets that occurred during 2013.
Income Taxes
The effective tax rate was 24.5% in 2014 as compared to 27.1% in 2013. Excluding the $2.6 million taxbenefit associated with the pretax restructuring charges and operational improvement initiative costs as well asthe $3.8 million tax benefit related to the reserve reversal for the 2001 Spanish dividend withholding tax case (asdiscussed in Note 10 of the Consolidated Financial Statements), the adjusted tax rate for 2014 was 25.3%.Excluding the tax charge of $6.2 million related to the 2002-2003 income tax cases (as discussed in Note 10 ofthe Consolidated Financial Statements) and net of the $3.9 million tax benefit associated with the pretax Spanishcapital tax charge (as discussed in Note 18 of the Consolidated Financial Statements), the adjusted tax rate for2013 was 25.7%. The year-over-year reduction reflects a benefit from mix of earnings and lower loss provisionspartially offset by a higher cost of repatriation.
Liquidity and Capital Resources
CASH AND CASH EQUIVALENTS
We had cash and cash equivalents of $182.0 million at December 31, 2015 compared to $478.6 million atDecember 31, 2014, of which $130.1 million of the balance at December 31, 2015 was held outside the UnitedStates. Cash balances held in foreign jurisdictions are, in most circumstances, available to be repatriated to theUnited States; however, they would be subject to United States federal income taxes, less applicable foreign taxcredits. We have not provided U.S. income tax expense on substantially all of the accumulated undistributedearnings of our foreign subsidiaries because we have the ability and plan to reinvest these indefinitely.
Effective utilization of the cash generated by our international operations is a critical component of our taxstrategy. Strategic dividend repatriation from foreign subsidiaries creates U.S. taxable income, which enables usto realize U.S. deferred tax assets. We regularly repatriate, in the form of dividends from our non-U.S.
47

subsidiaries, a portion of our current year earnings to fund financial obligations in the U.S. These repatriations ofcurrent year earnings totaled $184.6 million, $248.0 million and $128.0 million in 2015, 2014 and 2013,respectively.
CASH FLOWS FROM OPERATING ACTIVITIES
Operating cash flows in 2015 were $433.6 million compared to $518.4 million in 2014 and $407.6 millionin 2013. The decrease in operating cash flows in 2015 as compared to 2014 is principally related to the impact ofhigher pension contributions, increased core working capital requirements and increased requirements related tovarious operating items (including taxes, employee benefits and prepaids). Included in 2014 was payment of$11.2 million to the Spanish government related to a capital tax case and included in 2013 was $48 million ofcash payments related to the Spanish tax cases.
Working capital (current assets less current liabilities) totaled $713.8 million at year-end 2015 compared to$1,191.2 million at December 31, 2014. This decrease in working capital of $477.4 million primarily reflects adecrease in cash balances principally resulting from the acquisitions of Ottens Flavors and Lucas Meyer during2015 as well as higher payable balances. We sold certain accounts receivable on a non-recourse basis tounrelated financial institutions under “factoring” agreements that are sponsored, solely and individually, bycertain customers. We believe that participating in the factoring programs strengthens our relationships withthese customers and provides operational efficiencies. We estimate that, as a result of participating in theprograms, there was a beneficial impact to cash inflows from operations of approximately $3.4 million, $33.1million and $6.5 million in 2015, 2014 and 2013, respectively. The cost of participating in these programs wasimmaterial to our results in all periods.
CASH FLOWS USED IN INVESTING ACTIVITIES
Net investing activities in 2015 utilized $577.2 million compared to $221.3 million and $105.4 million in2014 and 2013, respectively. The increase in cash paid for investing activities is primarily driven by theacquisitions of Ottens Flavors and Lucas Meyer during 2015. We acquired 100% of the outstanding shares ofOttens Flavors and Lucas Meyer for approximately $188.5 million (net of cash acquired) and $304.9 million (netof cash acquired), respectively.
Additions to property, plant and equipment were $101.0 million, $143.2 million and $134.2 million in 2015,2014 and 2013, respectively (net of grants and other reimbursements from government authorities). Theseinvestments largely arise from our ongoing focus to align our manufacturing facilities with our customer demand,primarily in emerging markets and new technology consistent with our strategy, but also reflect approximately$6.5 million in odor-abatement equipment which was invested to address environmental issues at one of ourflavors facilities in China.
In light of our intent to construct a new flavors facility in China, our relocation of our Ingredients facility inHangzhou, China and the continuation of our Indonesia project we expect that capital spending in 2016 will beapproximately 5% of sales (net of potential grants and other reimbursements from government authorities).
CASH FLOWS (USED IN) PROVIDED BY FINANCING ACTIVITIES
Net financing activities in 2015 had an outflow of $131.3 million compared to an outflow of $202.3 millionand an outflow of $217.0 million in 2014 and 2013, respectively. The decrease in outflow of cash used infinancing activities in 2015 as compared to 2014 principally reflects higher incremental dividend payments andtreasury share repurchases in 2015 which were more than offset by proceeds from the drawdown on the revolvingcredit facility during 2015. The decrease in outflow of cash used in financing activities in 2014 compared to 2013principally reflects higher incremental dividend payments and treasury share repurchases in 2014 which weremore than offset by the repayment of long-term debt of $100 million made in 2013.
At December 31, 2015, we had $1,070.2 million of debt outstanding compared to $942.3 millionoutstanding at December 31, 2014.
48

We paid dividends totaling $158.9 million, $133.2 million and $87.3 million in 2015, 2014 and 2013,respectively. The cash dividend declared per share in 2015, 2014 and 2013 was $2.06, $1.72 and $1.46,respectively.
In December 2012, the Board of Directors authorized a $250 million share repurchase program, whichcommenced in the first quarter of 2013. In August 2015, the Board of Directors approved an additional $250million share repurchase authorization and extension through December 31, 2017. Based on the total remainingamount of $237 million available under the repurchase program, approximately 2.0 million shares, or 2.5% ofshares outstanding (based on the market price and shares outstanding as of December 31, 2015) could berepurchased under the program as of December 31, 2015. The purchases will be made from time to time on theopen market or through private transactions as market and business conditions warrant. Repurchased shares willbe placed into treasury stock. The ultimate level of purchases will be a function of the daily purchase limitsestablished in the pre-approved program according to the share price at that time.
CAPITAL RESOURCES
Operating cash flow provides the primary source of funds for capital investment needs, dividends paid toshareholders and debt repayments. We anticipate that cash flows from operations and availability under ourexisting credit facilities are sufficient to meet our investing and financing needs for at least the next eighteenmonths. We regularly assess our capital structure, including both current and long-term debt instruments, ascompared to our cash generation and investment needs in order to provide ample flexibility and to optimize ourleverage ratios. Based on our leverage ratios and general market interest rate expectations, we anticipateevaluating refinancing opportunities during 2016. We believe our existing cash balances are sufficient to meetour debt service requirements.
During the third quarter of 2015, we acquired Lucas Meyer for approximately $304.9 million (net of cashacquired), which was funded from existing resources.
During the second quarter of 2015, we acquired Ottens Flavors for approximately $188.5 million (net ofcash acquired), which was funded from existing resources.
Credit Facility and Senior Notes
We supplement short-term liquidity with access to capital markets, mainly through bank credit facilities andissuance of commercial paper. We did not issue commercial paper during 2015 and 2014.
Credit Facility
There are two tranches under the credit facility. The Tranche A facility is available in U.S. dollars, Euros,Swiss francs, Japanese yen and British sterling in an aggregate amount up to an equivalent of $456.0 million,with a sublimit of $25.0 million for swing line borrowings. The Tranche B facility is available in Euros, Swissfrancs, Japanese yen and British sterling in an aggregate amount up to an equivalent of $494.0 million. The creditfacility is available for general corporate purposes. Borrowings under the credit facility bear interest at an annualrate of LIBOR plus a margin, currently 112.5 bps, linked to our credit rating. The interest rate under our creditfacility at December 31, 2015 was 1.13%. The credit facility contains various affirmative and negativecovenants, including the requirement for us to maintain, at the end of each fiscal quarter, a ratio of net debt forborrowed money to adjusted EBITDA in respect of the previous 12-month period of not more than 3.25 to 1.Based on this ratio, at December 31, 2015 our covenant compliance would provide overall borrowing capacity of$1,429.3 million.
As of December 31, 2015 we had $131.2 million borrowings under the credit facility. The amount which weare able to draw down on under the credit facility is limited by financial covenants as described in more detailbelow. Our drawdown capacity on the credit facility was $790.7 million at December 31, 2015. See Note 9 to theConsolidated Financial Statements for further information on the credit facility.
49

At December 31, 2015 and 2014 we were in compliance with all financial and other covenants, includingthe net debt to adjusted EBITDA ratio. At December 31, 2015 our Net Debt/adjusted EBITDA(1) ratio was 1.24 to1 as defined by the credit facility, well below the financial covenants of existing outstanding debt. Failure tocomply with the financial and other covenants under our debt agreements would constitute default and wouldallow the lenders to accelerate the maturity of all indebtedness under the related agreement. If such accelerationwere to occur, we would not have sufficient liquidity available to repay the indebtedness. We would likely haveto seek amendments under the agreements for relief from the financial covenants or repay the debt with proceedsfrom the issuance of new debt or equity, and/or asset sales, if necessary. We may be unable to amend theagreements or raise sufficient capital to repay such obligations in the event the maturities are accelerated.
(1) Adjusted EBITDA and Net Debt, which are non-GAAP measures used for these covenants, are calculated inaccordance with the definition in the debt agreements. In this context, these measures are used solely toprovide information on the extent to which we are in compliance with debt covenants and may not becomparable to adjusted EBITDA and Net Debt used by other companies. Reconciliations of adjustedEBITDA to net income and net debt to total debt are as follows:
12 Months EndedDecember 31,
(DOLLARS IN MILLIONS) 2015 2014
Net income . . . . . . . . . . . . . . . . . . . . . . . . . . . . . . . . . . . . . . . . . . . . . . . . . . . . . . . . . . . . . . . . $419.2 $414.5Interest expense . . . . . . . . . . . . . . . . . . . . . . . . . . . . . . . . . . . . . . . . . . . . . . . . . . . . . . . . . . . . 46.1 46.1Income taxes . . . . . . . . . . . . . . . . . . . . . . . . . . . . . . . . . . . . . . . . . . . . . . . . . . . . . . . . . . . . . . . 119.9 134.5Depreciation and amortization . . . . . . . . . . . . . . . . . . . . . . . . . . . . . . . . . . . . . . . . . . . . . . . . 89.6 89.4Specified items(1) . . . . . . . . . . . . . . . . . . . . . . . . . . . . . . . . . . . . . . . . . . . . . . . . . . . . . . . . . . . . 14.8 1.3Non-cash items(2) . . . . . . . . . . . . . . . . . . . . . . . . . . . . . . . . . . . . . . . . . . . . . . . . . . . . . . . . . . . 22.5 18.9
Adjusted EBITDA . . . . . . . . . . . . . . . . . . . . . . . . . . . . . . . . . . . . . . . . . . . . . . . . . . . . . . . . . . . $712.1 $704.7
(1) Specified items for the 12 months ended December 31, 2015 of $14.8 million consist of restructuringcharges and the acceleration of the contingent consideration related to the Aromor acquisition as discussedin Note 2 to the Consolidated Financial Statements. Specified items for the 12 months ended December 31,2014 of $1.3 million consist of restructuring charges related to the Fragrance Ingredients Rationalization.
(2) Non-cash items represent all other adjustments to reconcile net income to net cash provided by operationsas presented on the Statement of Cash Flows, including gain on disposal of assets, stock-basedcompensation and pension settlement/curtailment.
December 31,
(DOLLARS IN MILLIONS) 2015 2014
Total debt . . . . . . . . . . . . . . . . . . . . . . . . . . . . . . . . . . . . . . . . . . . . . . . . . . . . . . . . . . . . . . . $1,070.2 $ 942.3Adjustments:
Deferred gain on interest rate swaps . . . . . . . . . . . . . . . . . . . . . . . . . . . . . . . . . . . . . . (3.2) (5.2)Cash and cash equivalents . . . . . . . . . . . . . . . . . . . . . . . . . . . . . . . . . . . . . . . . . . . . . . (182.0) (478.6)
Net debt . . . . . . . . . . . . . . . . . . . . . . . . . . . . . . . . . . . . . . . . . . . . . . . . . . . . . . . . . . . . . . . . . $ 885.0 $ 458.5
Senior Notes
Senior Notes — 2013. In April 2013, we issued $300.0 million face amount of 3.20% Senior Notes (“SeniorNotes — 2013”) due 2023 at a discount of $0.3 million, to take advantage of attractive borrowing rates andmaintain efficiency and flexibility in our capital structure, and received proceeds of $297.8 million. The SeniorNotes -2013 bear interest at a rate of 3.20% per year, with interest payable on May 1 and November 1 of eachyear, commencing on November 1, 2013. See Note 9 to the Consolidated Financial Statements for furtherinformation on the Senior Notes — 2013.
50

Senior Notes — 2007. In September 2007, we issued an aggregate of $500.0 million of senior unsecurednotes in four series, with $250.0 million due in 2017, $100.0 million due in 2019, $50 million due in 2022 and$100.0 million due in 2027. See Note 9 to the Consolidated Financial Statements for further information on theSenior Notes — 2007.
Senior Notes — 2006. In 2006, we issued an aggregate of $375.0 million of senior unsecured notes in fourseries, of which $250.0 million has been repaid, and the remaining $125.0 million is due in 2016. See Note 9 tothe Consolidated Financial Statements for further information on the Senior Notes — 2006.
Other Commitments
Compliance with existing governmental requirements regulating the discharge of materials into theenvironment has not materially affected our operations, earnings or competitive position. In 2015 and 2014, wespent $9.3 million and $4.3 million on capital projects and $19.0 million and $19.2 million, respectively, inoperating expenses and governmental charges for the purpose of complying with such regulations. Expendituresfor these purposes will continue for the foreseeable future. In addition, we are party to a number of proceedingsbrought under the Comprehensive Environmental Response, Compensation and Liability Act or similar statestatutes. It is expected that the impact of any judgments in or voluntary settlements of such proceedings will notbe material to our financial condition, results of operations or liquidity.
CONTRACTUAL OBLIGATIONS
At December 31, 2015, we had contractual payment obligations due within the time periods as specified inthe following table:
Payments Due
Contractual Obligations(Dollars In Millions) Total 2016 2017-2018 2019-2020
2021 andthereafter
Borrowings(1) . . . . . . . . . . . . . . . . . . . . . . . . . . . . . . . . . . . . . . . . $1,056 $125 $250 $231 $450Interest on borrowings(1) . . . . . . . . . . . . . . . . . . . . . . . . . . . . . . . 231 47 66 44 74Operating leases(2) . . . . . . . . . . . . . . . . . . . . . . . . . . . . . . . . . . . . 256 33 52 40 131Pension funding obligations(3) . . . . . . . . . . . . . . . . . . . . . . . . . . . 84 28 56 — —Postretirement obligations(4) . . . . . . . . . . . . . . . . . . . . . . . . . . . . 78 5 9 10 54Purchase commitments(5) . . . . . . . . . . . . . . . . . . . . . . . . . . . . . . 121 88 33 — —
Total . . . . . . . . . . . . . . . . . . . . . . . . . . . . . . . . . . . . . . . . . . . . . . $1,826 $326 $466 $325 $709
(1) See Note 9 to the Consolidated Financial Statements for a further discussion of our various borrowingfacilities.
(2) Operating leases include facility and other lease commitments executed in the normal course of thebusiness, including sale leaseback obligations included in Note 9 of the Notes to the Consolidated FinancialStatements. Further details concerning worldwide aggregate operating leases are contained in Note 19 of theNotes to the Consolidated Financial Statements.
(3) See Note 15 of the Notes to the Consolidated Financial Statements for a further discussion of our retirementplans. Anticipated funding obligations are based on current actuarial assumptions. The projectedcontributions beyond fiscal year 2018 are not currently determinable.
(4) Amounts represent expected future benefit payments for our postretirement benefit plans.(5) Purchase commitments include agreements for raw material procurement and contractual capital
expenditures. Amounts for purchase commitments represent only those items which are based onagreements that are enforceable and legally binding.
The table above does not include $24.2 million of the total unrecognized tax benefits for uncertain taxpositions and approximately $0.8 million of associated accrued interest. Due to the high degree of uncertaintyregarding the timing of potential cash flows, we are unable to make a reasonable estimate of the amount andperiod in which the remaining liabilities might be paid.
51

Critical Accounting Policies and Use of Estimates
Our significant accounting policies are more fully described in Note 1 to the Consolidated FinancialStatements. As disclosed in Note 1, the preparation of financial statements in conformity with U.S. generallyaccepted accounting principles (“GAAP”) requires management to make estimates and assumptions that affectreported amounts and accompanying disclosures. These estimates are based on management’s best judgment ofcurrent events and actions that we may undertake in the future. Actual results may ultimately differ fromestimates.
Those areas requiring the greatest degree of management judgment or deemed most critical to our financialreporting involve:
The periodic assessment of potential impairment of goodwill. We currently have goodwill of $941.4 million.In assessing the potential for impairment of goodwill, management uses the most current actual and forecastedoperating data available and current market based assumptions in accordance with the criteria in ASC 350. TheCompany has identified four reporting units: (1) Flavors, (2) Fragrance Compounds (3) Fragrance Ingredientsand (4) Cosmetic Active Ingredients.
The Company performed the annual goodwill impairment test, utilizing the two-step approach for theFlavors, Fragrance Compounds and Fragrance Ingredients reporting units, by assessing the fair value of ourreporting units based on discounted cash flows. We completed our annual goodwill impairment test as ofNovember 30, 2015, which indicated no impairment of goodwill, as the estimated fair values substantiallyexceeded the carrying values of each of these reporting units. Given the recent date of the acquisition of LucasMeyer, we utilized the qualitative approach for the Cosmetic Active Ingredients reporting unit, which indicatedno impairment of goodwill.
The analysis and evaluation of income taxes. We account for taxes under the asset and liability method.Under this method, deferred income taxes are recognized for temporary differences between the financialstatement and tax return bases of assets and liabilities. A valuation allowance is recognized if, based on theweight of available evidence, it is more likely than not that some portion or all of the deferred tax asset will notbe realized. The assessment of the need for a valuation allowance requires management to make estimates andassumptions about future earnings, reversal of existing temporary differences and available tax planningstrategies. If actual experience differs from these estimates and assumptions, the recorded deferred tax asset maynot be fully realized resulting in an increase to income tax expense in our results of operations.
The Company has not established deferred tax liabilities for substantially all undistributed foreign earningsas it has plans to and intends to indefinitely reinvest those earnings to finance foreign activities. Theunrecognized deferred tax liability on these undistributed earnings approximates $233.6 million.
We are subject to income taxes in the U.S. and numerous foreign jurisdictions. Significant judgment isrequired in evaluating our uncertain tax positions and determining our provision for income taxes. We firstdetermine whether it is “more likely than not” that we would sustain our tax position if the relevant tax authoritywere to audit the position with full knowledge of all the relevant facts and other information. For those taxpositions that meet this threshold, we measure the amount of tax benefit based on the largest amount of taxbenefit that we have a greater than 50% chance of realizing in a final settlement with the relevant authority.Those tax positions failing to qualify for initial recognition are recognized in the first interim period in whichthey meet the more likely than not standard. This evaluation is made at the time that we adopt a tax position andwhenever there is new information and is based upon management’s evaluation of the facts, circumstances andinformation available at the reporting date. We maintain a cumulative risk portfolio relating to all of ouruncertainties in income taxes in order to perform this analysis, but the evaluation of our tax positions requiressignificant judgment and estimation in part because, in certain cases, tax law is subject to varied interpretation,and whether a tax position will ultimately be sustained may be uncertain. We do not currently believe that any ofour pending tax assessments, even if ultimately resolved against us, would have a material impact on our resultsof operations and cash flows.
52

The evaluation of potential litigation and environmental liabilities, where changing circumstances, rulesand regulations require regular reassessment of related practices and anticipated costs. We are subject to certainlegal claims regarding products and other matters, as well as environmental-related matters. Significantmanagement judgment is involved in determining when it is probable that a liability has been incurred and theextent to which it can be reasonably estimated.
We regularly assess potential liabilities with respect to all legal claims based on the most recent availableinformation, in consultation with outside counsel we have engaged on our behalf to handle the defense of suchmatters. To the extent a liability is considered to be probable and reasonably estimable, we recognize acorresponding liability; if the reasonably estimated liability is a range, we recognize that amount considered mostlikely, or in the absence of such a determination, the minimum reasonably estimated liability. To the extent suchclaims are covered by various insurance policies, we separately evaluate the right to recovery and estimate therelated insurance claim receivable. Management judgments involve determination as to whether a liability hasbeen incurred, the reasonably estimated amount of that liability, and any potential insurance recovery.
We regularly evaluate potential environmental exposure in terms of total estimated cost and the viability ofother potentially responsible parties (“PRP’s”) associated with our exposure. Recorded liabilities are adjustedperiodically as remediation efforts progress and additional information becomes available. Critical managementassumptions relate to expected total costs to remediate and the financial viability of PRP’s to share such costs.
Determination of the various assumptions employed in the valuation of pension and retiree health careexpense and associated obligations. Amounts recognized in the Consolidated Financial Statements related topension and other postretirement benefits are determined from actuarial valuations. Inherent in such valuationsare assumptions including expected return on plan assets, discount rates at which the liabilities could be settled,rates of increase in future compensation levels, mortality rates and health care cost trend rates. Theseassumptions are updated annually and are disclosed in Note 13 to the Consolidated Financial Statements. Inaccordance with GAAP, actual results that differ from the assumptions are accumulated and amortized overfuture periods and, therefore, affect expense recognized and obligations recorded in future periods.
We consider a number of factors in determining and selecting assumptions for the overall expected long-term rate of return on plan assets. We consider the historical long-term return experience of our assets, thecurrent and expected allocation of our plan assets, and expected long-term rates of return. We derive theseexpected long-term rates of return with the assistance of our investment advisors. We base our expectedallocation of plan assets on a diversified portfolio consisting of domestic and international equity securities, fixedincome, real estate, and alternative asset classes.
We consider a variety of factors in determining and selecting our assumptions for the discount rate atDecember 31. For the U.S. plans, the discount rate was based on the internal rate of return for a portfolio ofMoody’s Aaa, Aa and Merrill Lynch AAA-AA high quality bonds with maturities that are consistent with theprojected future benefit payment obligations of the plan. The rate of compensation increase for all plans and themedical cost trend rate for the applicable U.S. plans are based on plan experience.
With respect to the U.S. plans, the expected rate of return on plan assets was determined based on an assetallocation model using the current target allocation, real rates of return by asset class and an anticipated inflationrate. The target asset allocation consists of approximately: 40% in equity securities and 60% in fixed incomesecurities. The plan has achieved a compounded annual rate of return of 6.9% over the previous 20 years. AtDecember 31, 2015, the actual asset allocation was: 41% in equity securities; 58% in fixed income securities; and1% in cash equivalents.
The expected rate of return for the non-U.S. plans employs a similar set of criteria adapted for localinvestments, inflation rates and in certain cases specific government requirements. The target asset allocation, forthe non-U.S. plans, consists of approximately: 40% — 70% in fixed income securities; 15% — 40% in equitysecurities; 5% — 20% in real estate; and 5% — 10% in alternative investments. At December 31, 2015, theactual asset allocation was: 55% in fixed income investments; 27% in equity investments; 7% in real estateinvestments; 9% in alternative investments and 2% in cash and cash equivalents.
53
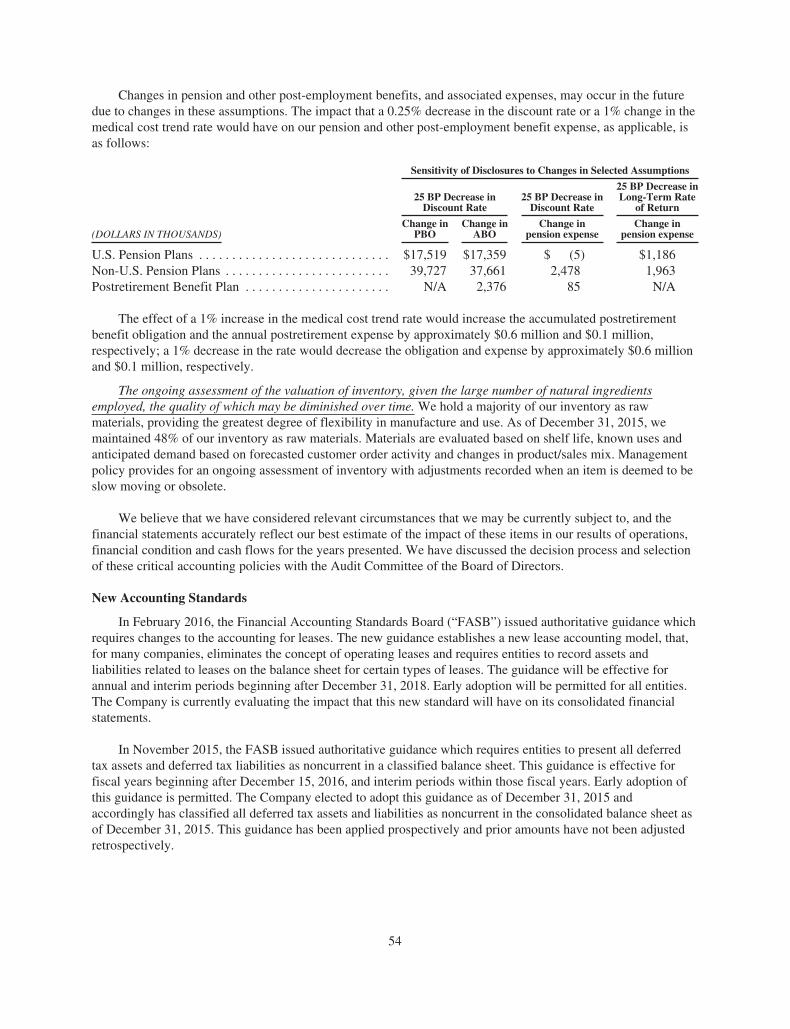
Changes in pension and other post-employment benefits, and associated expenses, may occur in the futuredue to changes in these assumptions. The impact that a 0.25% decrease in the discount rate or a 1% change in themedical cost trend rate would have on our pension and other post-employment benefit expense, as applicable, isas follows:
Sensitivity of Disclosures to Changes in Selected Assumptions
25 BP Decrease inDiscount Rate
25 BP Decrease inDiscount Rate
25 BP Decrease inLong-Term Rate
of Return
(DOLLARS IN THOUSANDS)Change in
PBOChange in
ABOChange in
pension expenseChange in
pension expense
U.S. Pension Plans . . . . . . . . . . . . . . . . . . . . . . . . . . . . . $17,519 $17,359 $ (5) $1,186Non-U.S. Pension Plans . . . . . . . . . . . . . . . . . . . . . . . . . 39,727 37,661 2,478 1,963Postretirement Benefit Plan . . . . . . . . . . . . . . . . . . . . . . N/A 2,376 85 N/A
The effect of a 1% increase in the medical cost trend rate would increase the accumulated postretirementbenefit obligation and the annual postretirement expense by approximately $0.6 million and $0.1 million,respectively; a 1% decrease in the rate would decrease the obligation and expense by approximately $0.6 millionand $0.1 million, respectively.
The ongoing assessment of the valuation of inventory, given the large number of natural ingredientsemployed, the quality of which may be diminished over time. We hold a majority of our inventory as rawmaterials, providing the greatest degree of flexibility in manufacture and use. As of December 31, 2015, wemaintained 48% of our inventory as raw materials. Materials are evaluated based on shelf life, known uses andanticipated demand based on forecasted customer order activity and changes in product/sales mix. Managementpolicy provides for an ongoing assessment of inventory with adjustments recorded when an item is deemed to beslow moving or obsolete.
We believe that we have considered relevant circumstances that we may be currently subject to, and thefinancial statements accurately reflect our best estimate of the impact of these items in our results of operations,financial condition and cash flows for the years presented. We have discussed the decision process and selectionof these critical accounting policies with the Audit Committee of the Board of Directors.
New Accounting Standards
In February 2016, the Financial Accounting Standards Board (“FASB”) issued authoritative guidance whichrequires changes to the accounting for leases. The new guidance establishes a new lease accounting model, that,for many companies, eliminates the concept of operating leases and requires entities to record assets andliabilities related to leases on the balance sheet for certain types of leases. The guidance will be effective forannual and interim periods beginning after December 31, 2018. Early adoption will be permitted for all entities.The Company is currently evaluating the impact that this new standard will have on its consolidated financialstatements.
In November 2015, the FASB issued authoritative guidance which requires entities to present all deferredtax assets and deferred tax liabilities as noncurrent in a classified balance sheet. This guidance is effective forfiscal years beginning after December 15, 2016, and interim periods within those fiscal years. Early adoption ofthis guidance is permitted. The Company elected to adopt this guidance as of December 31, 2015 andaccordingly has classified all deferred tax assets and liabilities as noncurrent in the consolidated balance sheet asof December 31, 2015. This guidance has been applied prospectively and prior amounts have not been adjustedretrospectively.
54

In September 2015, the FASB issued authoritative guidance relating to the adjustments made during themeasurement period for items in a business combination. Specifically, the new guidance would requireadjustments related to the finalization of estimates to be recorded in the period when they are determined and toprovide certain additional disclosures. This guidance is effective for fiscal years beginning after December 15,2015, including interim periods within those fiscal years. The Company has determined that the adoption of thisguidance will not have a significant impact on its consolidated financial statements.
In July 2015, the FASB issued authoritative guidance relating to the measurement of inventory costs, whichmore closely aligns the measurement of inventory in Generally Accepted Accounting Principles with themeasurement of inventory in International Financial Reporting Standards. This guidance is effective for yearsbeginning after December 15, 2016, including interim periods within those fiscal years. The Company does notexpect that the adoption of this guidance will have a significant impact on its consolidated financial statements.
In May 2014, the FASB issued authoritative guidance to clarify the principles to be used to recognizerevenue and, in August 2015, issued authoritative guidance delaying the effective adoption date of that guidanceby one year. The guidance is applicable to all entities and, based on the revised adoption date, is effective forannual and interim periods beginning after December 15, 2017. Adoption as of the original effective date ispermitted. The Company is currently evaluating the impact that this new standard will have on its consolidatedfinancial statements.
In April 2015, the FASB issued authoritative guidance which provides a practical expedient related to themeasurement date of defined benefit plan assets and obligations. This guidance is effective for annual andinterim periods beginning after December 15, 2015. The Company adopted this guidance as of December 31,2015 and it did not have a significant impact on its consolidated financial statements.
In April 2015, the FASB issued authoritative guidance which requires that debt issuance costs related to arecognized debt liability be presented in the balance sheet as a direct deduction from the carrying amount of thatdebt liability. This guidance is effective for annual and interim periods beginning after December 15, 2015. TheCompany has determined that the adoption of this guidance will not have a significant impact on its consolidatedfinancial statements.
In February 2015, the FASB issued authoritative guidance related to accounting for the consolidation ofcertain legal entities. The guidance will change the analysis that a reporting entity must perform to determine thecriteria for consolidating certain types of entities. This guidance is effective for annual and interim periodsbeginning after December 15, 2015. The Company has determined that the adoption of this guidance will nothave a significant impact on its consolidated financial statements.
Non-GAAP Financial Measures
The Company uses non-GAAP financial operating measures in this Annual Report, including: (i) currencyneutral sales (which eliminates the effects that result from translating its international sales in U.S. dollars),(ii) adjusted operating profit and operating profit margin (which excludes the acquisition related costs, reversal ofthe previously recorded provision for the Spanish capital tax case, operational improvement initiative andrestructuring charges) and (iii) adjusted effective tax rate (which excludes the sale of a non-operating assets, taxand litigation settlements, restructuring charges, acquisition related costs, reversal of the previously recordedprovision for the Spanish capital tax case and operational improvement initiative costs). The Company alsoprovides the non-GAAP measures adjusted EBITDA (which excludes certain specified items and non-cash itemsas set forth in the Company’s debt agreements) and net debt (which is adjusted for deferred gain on interest rateswaps and cash and cash equivalents) solely for the purpose of providing information regarding the Company’scompliance with debt covenants contained in its debt agreements.
We have included each of these non-GAAP measures in order to provide additional information regardingour underlying operating results and comparable year-over-year performance. Such information is supplementalto information presented in accordance with GAAP and is not intended to represent a presentation in accordance
55

with GAAP. In discussing our historical and expected future results and financial condition, we believe it ismeaningful for investors to be made aware of and to be assisted in a better understanding of, on a period-to-period comparable basis, financial amounts both including and excluding these identified items, as well as theimpact of exchange rate fluctuations, on operating results and financial condition. We believe such additionalnon-GAAP information provides investors with an overall perspective of the period-to-period performance of ourbusiness. In addition, management internally reviews each of these non-GAAP measures to evaluate performanceon a comparative period-to-period basis in terms of absolute performance, trends and expected futureperformance with respect to our business. A material limitation of these non-GAAP measures is that suchmeasures do not reflect actual GAAP amounts; for example, costs associated with operational improvements andrestructuring activities involve actual cash outlays. We compensate for such limitations by using these measuresas one of several metrics, including GAAP measures. These non-GAAP measures may not be comparable tosimilarly titled measures used by other companies.
A. Foreign Currency Reconciliation
For the Year EndedDecember 31, 2015
Operating Profit
% Change — Reported (GAAP) . . . . . . . . . . . . . . . . . . . . . . . . . . . . . . . . . . . . . . . . . . . . . . . . -1%Items impacting comparability(1) . . . . . . . . . . . . . . . . . . . . . . . . . . . . . . . . . . . . . . . . . . . . . . . . . 3%% Change — Adjusted (Non-GAAP) . . . . . . . . . . . . . . . . . . . . . . . . . . . . . . . . . . . . . . . . . . . . 2%Currency Impact . . . . . . . . . . . . . . . . . . . . . . . . . . . . . . . . . . . . . . . . . . . . . . . . . . . . . . . . . . . . . . 6%% Change Year-over-Year — Currency Neutral Adjusted (Non-GAAP)** . . . . . . . . . . . . 8%
(1) Includes items impacting comparability of $34.2 million for the twelve months ended December 31, 2015and includes $8.9 million of items impacting comparability for the twelve months ended December 31,2014.
** Currency neutral amount is calculated by translating prior year amounts at the exchange rates used for thecorresponding 2015 period. Currency neutral operating profit also eliminates the year-over-year impact ofcash flow hedging.
B. Acquisition Related Intangible Asset Amortization
The Company tracks the amount of amortization recorded on recent acquisitions in order to monitor itsprogress with respect to its Vision 2020 goals. The following amounts were recorded with respect to recentacquisitions:
(DOLLARS IN THOUSANDS)For the Year EndedDecember 31, 2015
Ottens Flavors . . . . . . . . . . . . . . . . . . . . . . . . . . . . . . . . . . . . . . . . . . . . . . . . . . . . . . . . . . . . . . . $4,310Lucas Meyer Cosmetics . . . . . . . . . . . . . . . . . . . . . . . . . . . . . . . . . . . . . . . . . . . . . . . . . . . . . . . . $3,249
Cautionary Statement Under the Private Securities Litigation Reform Act of 1995
Statements in this Annual Report, which are not historical facts or information, are “forward-lookingstatements” within the meaning of The Private Securities Litigation Reform Act of 1995. Such forward-lookingstatements are based on management’s current assumptions, estimates and expectations and include statementsconcerning (i) our ability to achieve long-term sustainable growth and increase shareholder value, (ii) growthpotential in the emerging markets, (iii) our ability to generate returns above cost of capital, (iv) our competitiveposition in the market and expected financial results in 2016, (v) expected savings from profit improvementinitiatives, and (vi) expected capital expenditures and cost pressures in 2016. These forward-looking statementsshould be evaluated with consideration given to the many risks and uncertainties inherent in the Company’sbusiness that could cause actual results and events to differ materially from those in the forward-lookingstatements. Certain of such forward-looking information may be identified by such terms as “expect”,“anticipate”, “believe”, “outlook”, “may”, “estimate”, “should” and “predict” similar terms or variations thereof.Such forward-looking statements are based on a series of expectations, assumptions, estimates and projections
56

about the Company, are not guarantees of future results or performance, and involve significant risks,uncertainties and other factors, including assumptions and projections, for all forward periods. Actual results ofthe Company may differ materially from any future results expressed or implied by such forward-lookingstatements. Such factors include, among others, the following:
‰ the Company’s ability to implement its Vision 2020 strategy;
‰ the Company’s ability to successfully identify and complete acquisitions in line with its Vision 2020strategy, and to realize the anticipated benefits of those acquisitions;
‰ the Company’s ability to effectively compete in its market, and to successfully develop new andcompetitive products that appeal to its customers and consumers;
‰ changes in consumer preferences and demand for the Company’s products or a decline in consumerconfidence and spending;
‰ the Company’s ability to benefit from its investments and expansion in emerging markets;
‰ the impact of currency fluctuations or devaluations in the principal foreign markets in which theCompany operates, including the devaluation of the Euro;
‰ the economic and political risks associated with the Company’s international operations, includingcurrent challenging economic conditions in China and Latin America;
‰ the impact of any failure of the Company’s key information technology systems or a breach ofinformation security;
‰ the Company’s ability to attract and retain talented employees;
‰ the Company’s compliance with environmental protection laws;
‰ the Company’s ability to realize expected cost savings and efficiencies from its profitability improvementinitiatives and other optimization activities;
‰ volatility and increases in the price of raw materials, energy and transportation;
‰ fluctuations in the quality and availability of raw materials;
‰ the impact of a disruption in the Company’s supply chain or its relationship with its suppliers;
‰ any adverse impact on the availability, effectiveness and cost of the Company’s hedging and riskmanagement strategies;
‰ the Company’s ability to successfully manage its working capital and inventory balances;
‰ uncertainties regarding the outcome of, or funding requirements, related to litigation or settlement ofpending litigation, uncertain tax positions or other contingencies;
‰ the effect of legal and regulatory proceedings, as well as restrictions imposed on the Company, itsoperations or its representatives by U.S. and foreign governments;
‰ adverse changes in federal, state, local and international tax legislation or policies and adverse results oftax audits, assessments, or disputes; and
‰ changes in market conditions or governmental regulations relating to our pension and postretirementobligations.
The foregoing list of important factors does not include all such factors, nor necessarily present them inorder of importance. In addition, you should consult other disclosures made by the Company (such as in ourother filings with the Securities and Exchange Commission (“SEC”) or in company press releases) for otherfactors that may cause actual results to differ materially from those projected by the Company. Please refer toPart I. Item 1A., Risk Factors, of this 2015 Form 10-K for additional information regarding factors that couldaffect the Company’s results of operations, financial condition and liquidity.
57

The Company intends its forward-looking statements to speak only as of the time of such statements anddoes not undertake or plan to update or revise them as more information becomes available or to reflect changesin expectations, assumptions or results. The Company can give no assurance that such expectations or forward-looking statements will prove to be correct. An occurrence of, or any material adverse change in, one or more ofthe risk factors or risks and uncertainties referred to in this report or included in our other periodic reports filedwith the SEC could materially and adversely impact our operations and our future financial results.
Any public statements or disclosures by IFF following this report that modify or impact any of the forward-looking statements contained in or accompanying this report will be deemed to modify or supersede such outlookor other forward-looking statements in or accompanying this report.
58

ITEM 7A. QUANTITATIVE AND QUALITATIVE DISCLOSURES ABOUT MARKET RISK.
We operate on a global basis and are exposed to currency fluctuation related to the manufacture and sale ofour products in currencies other than the U.S. dollar. The major foreign currencies involve the markets in theEuropean Union, Great Britain, Mexico, Brazil, China, India, Indonesia, Australia and Japan, although all regionsare subject to foreign currency fluctuations versus the U.S. dollar. We actively monitor our foreign currencyexposures in all major markets in which we operate, and employ a variety of techniques to mitigate the impact ofexchange rate fluctuations, including foreign currency hedging activities.
We have established a centralized reporting system to evaluate the effects of changes in interest rates,currency exchange rates and other relevant market risks. Our risk management procedures include the monitoringof interest rate and foreign exchange exposures and hedge positions utilizing statistical analyses of cash flows,market value and sensitivity analysis. However, the use of these techniques to quantify the market risk of suchinstruments should not be construed as an endorsement of their accuracy or the accuracy of the relatedassumptions. For the year ended December 31, 2015, the Company’s exposure to market risk was estimatedusing sensitivity analyses, which illustrate the change in the fair value of a derivative financial instrumentassuming hypothetical changes in foreign exchange rates and interest rates.
We enter into foreign currency forward contracts with the objective of reducing exposure to cash flowvolatility associated with foreign currency receivables and payables, and with anticipated purchases of certainraw materials used in operations. These contracts, the counterparties to which are major international financialinstitutions, generally involve the exchange of one currency for a second currency at a future date, and havematurities not exceeding twelve months. The gain or loss on the hedging instrument and services is recorded inearnings at the same time as the transaction being hedged is recorded in earnings. At December 31, 2015, theCompany’s foreign currency exposures pertaining to derivative contracts exist with the Euro, Japanese Yen,South African Rand, British Pound, Canadian Dollar and Australian Dollar. Based on a hypothetical decrease orincrease of 10% in the applicable balance sheet exchange rates (primarily against the U.S. dollar), the estimatedfair value of the Company’s foreign currency forward contracts would increase or decrease by approximately $36million. However, any change in the value of the contracts, real or hypothetical, would be significantly offset bya corresponding change in the value of the underlying hedged items.
We have also used non-U.S. dollar borrowings and foreign currency forward contracts, to hedge the foreigncurrency exposures of our net investment in certain foreign subsidiaries, primarily in the European Union. Basedon a hypothetical decrease or increase of 10% in the value of the U.S. dollar against the Euro, the estimated fairvalue of the Company’s foreign currency forward contracts would change by approximately $10 million.However, any change in the value of the contracts, real or hypothetical, would be significantly offset by acorresponding change in the value of the underlying hedged items.
We use derivative instruments as part of our interest rate risk management strategy. The derivativeinstruments used are comprised principally of fixed to variable rate interest rate swaps based on the LIBOR plusan interest mark up. The notional amount, interest payment and maturity date of the swaps match the principal,interest payment and maturity date of the related debt and the swaps are valued using observable benchmarkrates. Based on a hypothetical decrease or increase of one percentage point in LIBOR, the estimated fair value ofthe Company’s interest rate swaps would change by less than $8 million.
At December 31, 2015, the fair value of our fixed rate debt was $982 million. Based on a hypotheticaldecrease of 10% in interest rates, the estimated fair value of the Company’s fixed debt would increase by $7million.
We purchase certain commodities, such as natural gas, electricity, petroleum based products and certaincrop related items. We generally purchase these commodities based upon market prices that are established withthe vendor as part of the purchase process. In general, we do not use commodity financial instruments to hedgecommodity prices.
59

ITEM 8. FINANCIAL STATEMENTS AND SUPPLEMENTARY DATA.
See index to Consolidated Financial Statements on page 62. See Item 6 on page 31 for supplementalquarterly data.
ITEM 9. CHANGES IN AND DISAGREEMENTS WITH ACCOUNTANTS ON ACCOUNTING ANDFINANCIAL DISCLOSURE.
None.
ITEM 9A. CONTROLS AND PROCEDURES.
Evaluation of Disclosure Controls and Procedures and Changes in Internal Control over FinancialReporting.
Our Chief Executive Officer and Chief Financial Officer, with the assistance of other members of ourmanagement, have evaluated the effectiveness of our disclosure controls and procedures as of the end of theperiod covered by this Annual Report on Form 10-K. Based on such evaluation, our Chief Executive Officer andChief Financial Officer have concluded that our disclosure controls and procedures are effective as of the end ofthe period covered by this Annual Report on Form 10-K.
We have established controls and procedures designed to ensure that information required to be disclosed inthe reports that we file or submit under the Exchange Act is recorded, processed, summarized and reported withinthe time periods specified in the Commission’s rules and forms and is accumulated and communicated tomanagement, including the principal executive officer and the principal financial officer, to allow timelydecisions regarding required disclosure.
Our Chief Executive Officer and Chief Financial Officer have concluded that there have not been anychanges in our internal control over financial reporting during the fourth quarter that have materially affected, orare reasonably likely to materially affect, our internal control over financial reporting.
Management’s Report on Internal Control Over Financial Reporting.
Our management is responsible for establishing and maintaining adequate internal control over financialreporting as defined in Rules 13a-15(f) and 15d-15(f) under the Securities Exchange Act of 1934. Our internalcontrol over financial reporting is a process designed to provide reasonable assurance regarding the reliability offinancial reporting and the preparation of financial statements for external purposes in accordance with generallyaccepted accounting principles.
Because of its inherent limitations, internal control over financial reporting may not prevent or detectmisstatements. Also, projections of any evaluation of effectiveness to future periods are subject to the risk thatcontrols may become inadequate because of changes in conditions, or that the degree of compliance with thepolicies or procedures may deteriorate.
Management assessed the effectiveness of our internal control over financial reporting as of December 31,2015. In making this assessment, management used the criteria set forth by the Committee of SponsoringOrganizations of the Treadway Commission (“COSO”) in its 2013 Internal Control — Integrated Framework.
Based on this assessment, management determined that, as of December 31, 2015, our internal control overfinancial reporting was effective.
PricewaterhouseCoopers LLP, our independent registered public accounting firm, has audited theeffectiveness of our internal control over financial reporting as of December 31, 2015 as stated in their reportwhich is included herein.
ITEM 9B. OTHER INFORMATION.
None.
60

PART III
ITEM 10. DIRECTORS, EXECUTIVE OFFICERS AND CORPORATE GOVERNANCE.
The information relating to directors and nominees of the Company is set forth in the IFF 2016 ProxyStatement and is incorporated by reference herein. The information relating to Section 16(a) beneficial ownershipreporting compliance that appears in the IFF 2016 Proxy Statement is also incorporated by reference herein. SeePart I, Item 1 of this Form 10-K for information relating to the Company’s Executive Officers.
We have adopted a Code of Business Conduct and Ethics (the “Code of Ethics”) that applies to all of ouremployees, including our chief executive officer and our chief financial officer (who is also our principalaccounting officer). We have also adopted a Code of Conduct for Directors and a Code of Conduct for ExecutiveOfficers (together with the Code of Ethics, the “Codes”). The Codes are available through the Investors —Corporate Governance link on our website www.iff.com.
Only the Board of Directors or the Audit Committee of the Board may grant a waiver from any provision ofour Codes in favor of a director or executive officer, and any such waiver will be publicly disclosed. We willdisclose substantive amendments to and any waivers from the Codes provided to our chief executive officer andprincipal financial officer (principal accounting officer), as well as any other executive officer or director, on theCompany’s website: www.iff.com.
The information regarding the Company’s Audit Committee and its designated audit committee financialexperts is set forth in the IFF 2016 Proxy Statement and such information is incorporated by reference herein.
The information concerning procedures by which shareholders may recommend director nominees is setforth in the IFF 2016 Proxy Statement and such information is incorporated by reference herein.
ITEM 11. EXECUTIVE COMPENSATION.
The information relating to executive compensation and the Company’s policies and practices as they relateto the Company’s risk management is set forth in the IFF 2016 Proxy Statement and such information isincorporated by reference herein; except that the information under the caption “Compensation CommitteeReport” shall be deemed “furnished” with this report and shall not be deemed “filed” with this report, notdeemed incorporated by reference into any filing under the Securities Act of 1933 except only as may beexpressly set forth in any such filing by specific reference.
ITEM 12. SECURITY OWNERSHIP OF CERTAIN BENEFICIAL OWNERS AND MANAGEMENTAND RELATED STOCKHOLDER MATTERS.
The information relating to security ownership of management, certain beneficial owners and theCompany’s equity plans is set forth in the IFF 2016 Proxy Statement and such information is incorporated byreference herein.
ITEM 13. CERTAIN RELATIONSHIPS AND RELATED TRANSACTIONS, AND DIRECTORINDEPENDENCE.
The information regarding certain relationships and related party transactions and director independence isset forth in the IFF 2016 Proxy Statement and such information is incorporated by reference herein.
ITEM 14. PRINCIPAL ACCOUNTANT FEES AND SERVICES.
The information regarding the independent registered public accounting firm (“independent accountant”)fees and services and the Company’s pre-approval policies and procedures for audit and non-audit servicesprovided by the Company’s independent accountant are set forth in the IFF 2016 Proxy Statement and suchinformation is incorporated by reference herein.
61

PART IV
ITEM 15. EXHIBITS AND FINANCIAL STATEMENT SCHEDULES.
(a)(1) FINANCIAL STATEMENTS: The following consolidated financial statements, related notes, andindependent registered public accounting firm’s report are included in this report on Form 10-K:
Report of Independent Registered Public Accounting Firm . . . . . . . . . . . . . . . . . . . . . . . . . . . . . . . . . . . . . . . 63Consolidated Statement of Income and Comprehensive Income for the years ended December 31, 2015,
2014 and 2013 . . . . . . . . . . . . . . . . . . . . . . . . . . . . . . . . . . . . . . . . . . . . . . . . . . . . . . . . . . . . . . . . . . . . . . . . 64Consolidated Balance Sheet as of December 31, 2015 and 2014 . . . . . . . . . . . . . . . . . . . . . . . . . . . . . . . . . . . 65Consolidated Statement of Cash Flows for the years ended December 31, 2015, 2014 and 2013 . . . . . . . . . . 66Consolidated Statement of Shareholders’ Equity . . . . . . . . . . . . . . . . . . . . . . . . . . . . . . . . . . . . . . . . . . . . . . . 67Notes to Consolidated Financial Statements . . . . . . . . . . . . . . . . . . . . . . . . . . . . . . . . . . . . . . . . . . . . . . . . . . . 68
(a)(3) EXHIBITS . . . . . . . . . . . . . . . . . . . . . . . . . . . . . . . . . . . . . . . . . . . . . . . . . . . . . . . . . . . . . . . . . . . . 105
(a)(2) FINANCIAL STATEMENT SCHEDULES
Schedule II — Valuation and Qualifying Accounts and Reserves for the years ended December 31, 2015,2014 and 2013 . . . . . . . . . . . . . . . . . . . . . . . . . . . . . . . . . . . . . . . . . . . . . . . . . . . . . . . . . . . . . . . . . . . . . . . . S-1
All other schedules are omitted because they are not applicable or the required information is shown in thefinancial statements or notes thereto.
62

REPORT OF INDEPENDENT REGISTERED PUBLIC ACCOUNTING FIRM
To the Board of Directors and Shareholders of International Flavors & Fragrances Inc.:
In our opinion, the consolidated financial statements listed in the index appearing under item 15(a)(1)present fairly, in all material respects, the financial position of International Flavors and Fragrances Inc. and itssubsidiaries at December 31, 2015 and December 31, 2014 and the results of their operations and their cash flowsfor each of the three years in the period ended December 31, 2015 in conformity with accounting principlesgenerally accepted in the United States of America. In addition, in our opinion, the financial statement schedulelisted in index appearing under Item 15(a)(2) presents fairly, in all material respects, the information set forththerein when read in conjunction with the related consolidated financial statements. Also in our opinion, theCompany maintained, in all material respects, effective internal control over financial reporting as ofDecember 31, 2015 based on criteria established in Internal Control — Integrated Framework 2013 issued by theCommittee of Sponsoring Organizations of the Treadway Commission (COSO). The Company’s management isresponsible for these financial statements and financial statement schedule, for maintaining effective internalcontrol over financial reporting and for its assessment of the effectiveness of internal control over financialreporting, included in Management’s Report on Internal Control over Financial Reporting, appearing underItem 9A. Our responsibility is to express opinions on these financial statements, on the financial statementschedule, and on the Company’s internal control over financial reporting based on our integrated audits. Weconducted our audits in accordance with the standards of the Public Company Accounting Oversight Board(United States). Those standards require that we plan and perform the audits to obtain reasonable assurance aboutwhether the financial statements are free of material misstatement and whether effective internal control overfinancial reporting was maintained in all material respects. Our audits of the financial statements includedexamining, on a test basis, evidence supporting the amounts and disclosures in the financial statements, assessingthe accounting principles used and significant estimates made by management, and evaluating the overallfinancial statement presentation. Our audit of internal control over financial reporting included obtaining anunderstanding of internal control over financial reporting, assessing the risk that a material weakness exists, andtesting and evaluating the design and operating effectiveness of internal control based on the assessed risk. Ouraudits also included performing such other procedures as we considered necessary in the circumstances. Webelieve that our audits provide a reasonable basis for our opinions.
As discussed in Note 1 to the consolidated financial statements, the Company changed the manner in whichit presents deferred income taxes in 2015.
A company’s internal control over financial reporting is a process designed to provide reasonable assuranceregarding the reliability of financial reporting and the preparation of financial statements for external purposes inaccordance with generally accepted accounting principles. A company’s internal control over financial reportingincludes those policies and procedures that (i) pertain to the maintenance of records that, in reasonable detail,accurately and fairly reflect the transactions and dispositions of the assets of the company; (ii) provide reasonableassurance that transactions are recorded as necessary to permit preparation of financial statements in accordancewith generally accepted accounting principles, and that receipts and expenditures of the company are being madeonly in accordance with authorizations of management and directors of the company; and (iii) provide reasonableassurance regarding prevention or timely detection of unauthorized acquisition, use, or disposition of thecompany’s assets that could have a material effect on the financial statements.
Because of its inherent limitations, internal control over financial reporting may not prevent or detectmisstatements. Also, projections of any evaluation of effectiveness to future periods are subject to the risk thatcontrols may become inadequate because of changes in conditions, or that the degree of compliance with thepolicies or procedures may deteriorate.
/s/ PricewaterhouseCoopers LLP
New York, New YorkMarch 1, 2016
63

INTERNATIONAL FLAVORS & FRAGRANCES INC.
CONSOLIDATED STATEMENT OF INCOME AND COMPREHENSIVE INCOME
Year Ended December 31,
(DOLLARS IN THOUSANDS EXCEPT PER SHARE AMOUNTS) 2015 2014 2013
Net sales . . . . . . . . . . . . . . . . . . . . . . . . . . . . . . . . . . . . . . . . . . . . . . . . . . $3,023,189 $3,088,533 $2,952,896Cost of goods sold . . . . . . . . . . . . . . . . . . . . . . . . . . . . . . . . . . . . . . . . . . . 1,671,590 1,726,383 1,668,691
Gross profit . . . . . . . . . . . . . . . . . . . . . . . . . . . . . . . . . . . . . . . . . . . . . . . . 1,351,599 1,362,150 1,284,205Research and development expenses . . . . . . . . . . . . . . . . . . . . . . . . . . . . 246,101 253,640 259,838Selling and administrative expenses . . . . . . . . . . . . . . . . . . . . . . . . . . . . . 509,557 514,891 505,877Restructuring and other charges, net . . . . . . . . . . . . . . . . . . . . . . . . . . . . . 7,594 1,298 2,151
Operating profit . . . . . . . . . . . . . . . . . . . . . . . . . . . . . . . . . . . . . . . . . . . . . 588,347 592,321 516,339Interest expense . . . . . . . . . . . . . . . . . . . . . . . . . . . . . . . . . . . . . . . . . . . . . 46,062 46,067 46,767Other expense (income), net . . . . . . . . . . . . . . . . . . . . . . . . . . . . . . . . . . . 3,184 (2,807) (15,638)
Income before taxes . . . . . . . . . . . . . . . . . . . . . . . . . . . . . . . . . . . . . . . . . 539,101 549,061 485,210Taxes on income . . . . . . . . . . . . . . . . . . . . . . . . . . . . . . . . . . . . . . . . . . . . 119,854 134,518 131,666
Net income . . . . . . . . . . . . . . . . . . . . . . . . . . . . . . . . . . . . . . . . . . . . . . . . 419,247 414,543 353,544
Other comprehensive income (loss):Foreign currency translation adjustments . . . . . . . . . . . . . . . . . . . . . . . . . (124,156) (69,064) (10,556)(Losses) gains on derivatives qualifying as hedges . . . . . . . . . . . . . . . . . (2,970) 16,383 (3,794)Pension and postretirement liability adjustment . . . . . . . . . . . . . . . . . . . . 54,117 (95,038) 25,264
Comprehensive income . . . . . . . . . . . . . . . . . . . . . . . . . . . . . . . . . . . . . . . $ 346,238 $ 266,824 $ 364,458
2015 2014 2013
Net income per share — basic . . . . . . . . . . . . . . . . . . . . . . . . . . . . . . . . . . $ 5.19 $ 5.09 $ 4.32Net income per share — diluted . . . . . . . . . . . . . . . . . . . . . . . . . . . . . . . . $ 5.16 $ 5.06 $ 4.29
See Notes to Consolidated Financial Statements
64

INTERNATIONAL FLAVORS & FRAGRANCES INC.
CONSOLIDATED BALANCE SHEET
December 31,
(DOLLARS IN THOUSANDS) 2015 2014
ASSETSCurrent Assets:Cash and cash equivalents . . . . . . . . . . . . . . . . . . . . . . . . . . . . . . . . . . . . . . . . . . . . . . . . . . . . . . . . $ 181,988 $ 478,573Receivables:
Trade . . . . . . . . . . . . . . . . . . . . . . . . . . . . . . . . . . . . . . . . . . . . . . . . . . . . . . . . . . . . . . . . . . . . 546,125 502,915Allowance for doubtful accounts . . . . . . . . . . . . . . . . . . . . . . . . . . . . . . . . . . . . . . . . . . . . . . . (8,229) (9,147)
Inventories . . . . . . . . . . . . . . . . . . . . . . . . . . . . . . . . . . . . . . . . . . . . . . . . . . . . . . . . . . . . . . . . . . . . 589,019 568,729Deferred income taxes . . . . . . . . . . . . . . . . . . . . . . . . . . . . . . . . . . . . . . . . . . . . . . . . . . . . . . . . . . . — 27,709Prepaid expenses and other current assets . . . . . . . . . . . . . . . . . . . . . . . . . . . . . . . . . . . . . . . . . . . . 146,981 141,248
Total Current Assets . . . . . . . . . . . . . . . . . . . . . . . . . . . . . . . . . . . . . . . . . . . . . . . . . . . . . . . . . 1,455,884 1,710,027
Property, plant and equipment, net . . . . . . . . . . . . . . . . . . . . . . . . . . . . . . . . . . . . . . . . . . . . . . . . . 732,794 720,268Goodwill . . . . . . . . . . . . . . . . . . . . . . . . . . . . . . . . . . . . . . . . . . . . . . . . . . . . . . . . . . . . . . . . . . . . . . 941,389 675,484Other intangible assets, net . . . . . . . . . . . . . . . . . . . . . . . . . . . . . . . . . . . . . . . . . . . . . . . . . . . . . . . 306,004 76,557Deferred income taxes . . . . . . . . . . . . . . . . . . . . . . . . . . . . . . . . . . . . . . . . . . . . . . . . . . . . . . . . . . . 166,323 183,047Other assets . . . . . . . . . . . . . . . . . . . . . . . . . . . . . . . . . . . . . . . . . . . . . . . . . . . . . . . . . . . . . . . . . . . 119,060 129,238
Total Assets . . . . . . . . . . . . . . . . . . . . . . . . . . . . . . . . . . . . . . . . . . . . . . . . . . . . . . . . . . . . . . . . . . . $ 3,721,454 $ 3,494,621
LIABILITIES AND SHAREHOLDERS’ EQUITYCurrent Liabilities:Bank borrowings, overdrafts and current portion of long-term debt . . . . . . . . . . . . . . . . . . . . . . . . $ 132,349 $ 8,090Accounts payable . . . . . . . . . . . . . . . . . . . . . . . . . . . . . . . . . . . . . . . . . . . . . . . . . . . . . . . . . . . . . . . 302,473 216,038Dividends payable . . . . . . . . . . . . . . . . . . . . . . . . . . . . . . . . . . . . . . . . . . . . . . . . . . . . . . . . . . . . . . 44,824 37,968Other current liabilities . . . . . . . . . . . . . . . . . . . . . . . . . . . . . . . . . . . . . . . . . . . . . . . . . . . . . . . . . . 262,482 256,712
Total Current Liabilities . . . . . . . . . . . . . . . . . . . . . . . . . . . . . . . . . . . . . . . . . . . . . . . . . . . . . . 742,128 518,808
Other Liabilities:Long-term debt . . . . . . . . . . . . . . . . . . . . . . . . . . . . . . . . . . . . . . . . . . . . . . . . . . . . . . . . . . . . . . . . . 937,844 934,232Deferred gains . . . . . . . . . . . . . . . . . . . . . . . . . . . . . . . . . . . . . . . . . . . . . . . . . . . . . . . . . . . . . . . . . 43,260 46,535Retirement liabilities . . . . . . . . . . . . . . . . . . . . . . . . . . . . . . . . . . . . . . . . . . . . . . . . . . . . . . . . . . . . 242,383 354,333Other liabilities . . . . . . . . . . . . . . . . . . . . . . . . . . . . . . . . . . . . . . . . . . . . . . . . . . . . . . . . . . . . . . . . . 160,849 118,024
Total Other Liabilities . . . . . . . . . . . . . . . . . . . . . . . . . . . . . . . . . . . . . . . . . . . . . . . . . . . . . . . 1,384,336 1,453,124
Commitments and Contingencies (Note 18)Shareholders’ Equity:Common stock 12 1⁄2¢ par value; authorized 500,000,000 shares; issued 115,858,190 shares as of
December 31, 2015 and 2014; and outstanding 80,022,291 and 80,777,590 shares as ofDecember 31, 2015 and 2014 . . . . . . . . . . . . . . . . . . . . . . . . . . . . . . . . . . . . . . . . . . . . . . . . . . . 14,470 14,470
Capital in excess of par value . . . . . . . . . . . . . . . . . . . . . . . . . . . . . . . . . . . . . . . . . . . . . . . . . . . . . 140,802 140,008Retained earnings . . . . . . . . . . . . . . . . . . . . . . . . . . . . . . . . . . . . . . . . . . . . . . . . . . . . . . . . . . . . . . . 3,604,254 3,350,734Accumulated other comprehensive loss:
Cumulative translation adjustments . . . . . . . . . . . . . . . . . . . . . . . . . . . . . . . . . . . . . . . . . . . . . (297,498) (173,342)Accumulated gains on derivatives qualifying as hedges . . . . . . . . . . . . . . . . . . . . . . . . . . . . . 9,401 12,371Pension and postretirement liability adjustment . . . . . . . . . . . . . . . . . . . . . . . . . . . . . . . . . . . (325,342) (379,459)
Treasury stock, at cost — 35,835,899 and 35,080,600 shares as of December 31, 2015 and2014 . . . . . . . . . . . . . . . . . . . . . . . . . . . . . . . . . . . . . . . . . . . . . . . . . . . . . . . . . . . . . . . . . . . . . . . (1,555,769) (1,446,221)
Total Shareholders’ Equity . . . . . . . . . . . . . . . . . . . . . . . . . . . . . . . . . . . . . . . . . . . . . . . . . . . 1,590,318 1,518,561
Noncontrolling interest . . . . . . . . . . . . . . . . . . . . . . . . . . . . . . . . . . . . . . . . . . . . . . . . . . . . . . . . . . 4,672 4,128
Total Shareholders’ Equity including noncontrolling interest . . . . . . . . . . . . . . . . . . . . . . . . . 1,594,990 1,522,689
Total Liabilities and Shareholders’ Equity . . . . . . . . . . . . . . . . . . . . . . . . . . . . . . . . . . . . . . . . . . . $ 3,721,454 $ 3,494,621
See Notes to Consolidated Financial Statements
65

INTERNATIONAL FLAVORS & FRAGRANCES INC.
CONSOLIDATED STATEMENT OF CASH FLOWS
Year Ended December 31,
(DOLLARS IN THOUSANDS) 2015 2014 2013
Cash flows from operating activities:Net income . . . . . . . . . . . . . . . . . . . . . . . . . . . . . . . . . . . . . . . . . . . . . . . . . . . $ 419,247 $ 414,543 $ 353,544Adjustments to reconcile to net cash provided by operating activities:
Depreciation and amortization . . . . . . . . . . . . . . . . . . . . . . . . . . . . . . . . 89,597 89,354 83,227Deferred income taxes . . . . . . . . . . . . . . . . . . . . . . . . . . . . . . . . . . . . . . 13,043 23,350 (484)Gain on disposal of assets . . . . . . . . . . . . . . . . . . . . . . . . . . . . . . . . . . . (622) (3,768) (17,841)Stock-based compensation . . . . . . . . . . . . . . . . . . . . . . . . . . . . . . . . . . . 23,160 22,648 23,736Pension contributions . . . . . . . . . . . . . . . . . . . . . . . . . . . . . . . . . . . . . . . (67,897) (43,982) (52,897)
Changes in assets and liabilities, net of acquisitions:Trade receivables . . . . . . . . . . . . . . . . . . . . . . . . . . . . . . . . . . . . . . (91,712) (2,635) (53,156)Inventories . . . . . . . . . . . . . . . . . . . . . . . . . . . . . . . . . . . . . . . . . . . (37,628) (40,042) 4,822Accounts payable . . . . . . . . . . . . . . . . . . . . . . . . . . . . . . . . . . . . . . 89,273 19,403 21,313Accruals for incentive compensation . . . . . . . . . . . . . . . . . . . . . . . (17,399) (30,947) 24,518Other current payables and accrued expenses . . . . . . . . . . . . . . . . 29,124 (30,982) (1,244)Other assets/liabilities, net . . . . . . . . . . . . . . . . . . . . . . . . . . . . . . . (14,608) 101,448 22,024
Net cash provided by operating activities . . . . . . . . . . . . . . . . . . . . . . . . . . . 433,578 518,390 407,562
Cash flows from investing activities:Cash paid for acquisitions, net of cash received (including $15 million
of contingent consideration related to the Aromor acquisition in2014) . . . . . . . . . . . . . . . . . . . . . . . . . . . . . . . . . . . . . . . . . . . . . . . . . . (493,424) (102,500) —
Additions to property, plant and equipment . . . . . . . . . . . . . . . . . . . . . . (101,030) (143,182) (134,157)Proceeds from disposal of assets . . . . . . . . . . . . . . . . . . . . . . . . . . . . . . 4,302 3,295 27,312Maturity of net investment hedges . . . . . . . . . . . . . . . . . . . . . . . . . . . . . 12,128 3,304 646Proceeds from life insurance contracts . . . . . . . . . . . . . . . . . . . . . . . . . 868 17,750 793
Net cash used in investing activities . . . . . . . . . . . . . . . . . . . . . . . . . . . . . . . (577,156) (221,333) (105,406)
Cash flows from financing activities:Cash dividends paid to shareholders . . . . . . . . . . . . . . . . . . . . . . . . . . . (158,870) (133,239) (87,347)Net change in revolving credit facility borrowings and overdrafts . . . . 136,826 8,332 (283,225)Deferred financing costs . . . . . . . . . . . . . . . . . . . . . . . . . . . . . . . . . . . . — (1,023) (2,800)Repayments of debt . . . . . . . . . . . . . . . . . . . . . . . . . . . . . . . . . . . . . . . . — — (100,000)Proceeds from issuance or drawdown of long-term debt . . . . . . . . . . . . — 3,609 297,786Proceeds from issuance of stock under stock plans . . . . . . . . . . . . . . . . 886 1,864 3,799Excess tax benefits on stock-based payments . . . . . . . . . . . . . . . . . . . . 12,055 6,330 6,112Purchase of treasury stock . . . . . . . . . . . . . . . . . . . . . . . . . . . . . . . . . . . (122,193) (88,203) (51,363)
Net cash used in financing activities . . . . . . . . . . . . . . . . . . . . . . . . . . . . . . . (131,296) (202,330) (217,038)
Effect of exchange rate changes on cash and cash equivalents . . . . . . . . . . . (21,711) (21,659) (4,035)
Net change in cash and cash equivalents . . . . . . . . . . . . . . . . . . . . . . . . . . (296,585) 73,068 81,083Cash and cash equivalents at beginning of year . . . . . . . . . . . . . . . . . . . . 478,573 405,505 324,422
Cash and cash equivalents at end of year . . . . . . . . . . . . . . . . . . . . . . . . . $ 181,988 $ 478,573 $ 405,505
Cash paid for:Interest, net of amounts capitalized . . . . . . . . . . . . . . . . . . . . . . . . . . . . . . . . $ 46,760 $ 46,106 $ 48,165Income taxes . . . . . . . . . . . . . . . . . . . . . . . . . . . . . . . . . . . . . . . . . . . . . . . . . . $ 102,734 $ 92,087 $ 138,940Noncash investing activities:Accrued capital expenditures . . . . . . . . . . . . . . . . . . . . . . . . . . . . . . . . . . . . . $ 26,030 $ 14,376 $ 21,744
See Notes to Consolidated Financial Statements
66
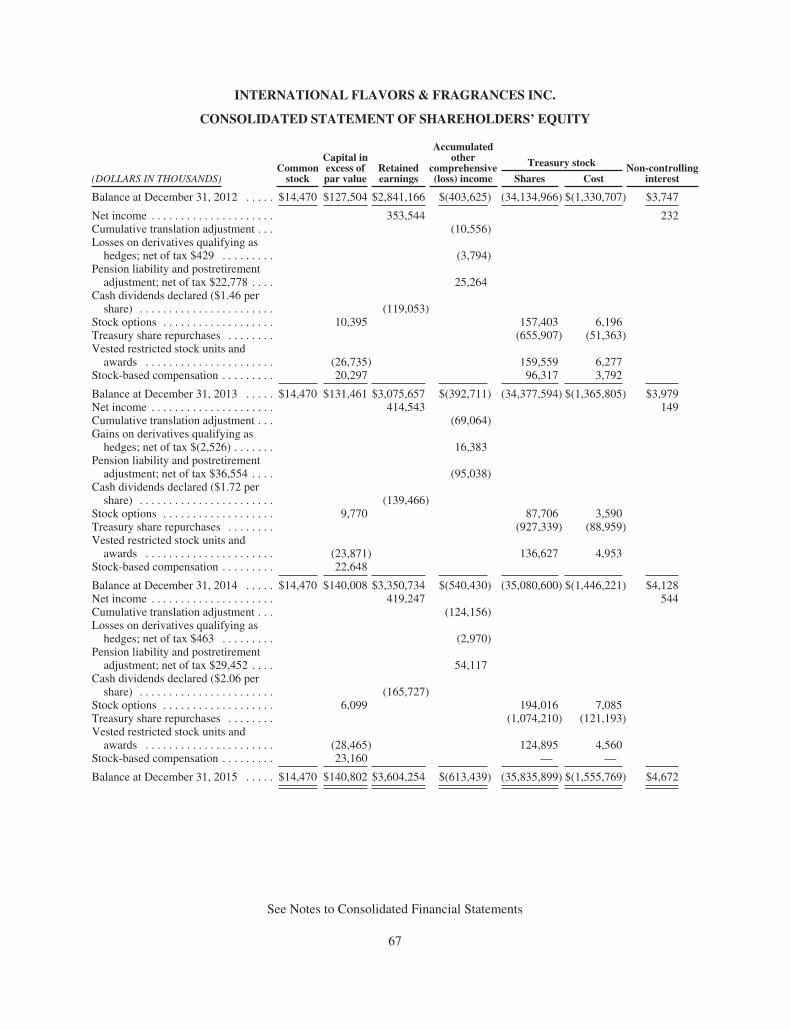
INTERNATIONAL FLAVORS & FRAGRANCES INC.
CONSOLIDATED STATEMENT OF SHAREHOLDERS’ EQUITY
(DOLLARS IN THOUSANDS)Common
stock
Capital inexcess ofpar value
Retainedearnings
Accumulatedother
comprehensive(loss) income
Treasury stock Non-controllinginterestShares Cost
Balance at December 31, 2012 . . . . . $14,470 $127,504 $2,841,166 $(403,625) (34,134,966) $(1,330,707) $3,747
Net income . . . . . . . . . . . . . . . . . . . . . 353,544 232Cumulative translation adjustment . . . (10,556)Losses on derivatives qualifying as
hedges; net of tax $429 . . . . . . . . . (3,794)Pension liability and postretirement
adjustment; net of tax $22,778 . . . . 25,264Cash dividends declared ($1.46 per
share) . . . . . . . . . . . . . . . . . . . . . . . (119,053)Stock options . . . . . . . . . . . . . . . . . . . 10,395 157,403 6,196Treasury share repurchases . . . . . . . . (655,907) (51,363)Vested restricted stock units and
awards . . . . . . . . . . . . . . . . . . . . . . (26,735) 159,559 6,277Stock-based compensation . . . . . . . . . 20,297 96,317 3,792
Balance at December 31, 2013 . . . . . $14,470 $131,461 $3,075,657 $(392,711) (34,377,594) $(1,365,805) $3,979Net income . . . . . . . . . . . . . . . . . . . . . 414,543 149Cumulative translation adjustment . . . (69,064)Gains on derivatives qualifying as
hedges; net of tax $(2,526) . . . . . . . 16,383Pension liability and postretirement
adjustment; net of tax $36,554 . . . . (95,038)Cash dividends declared ($1.72 per
share) . . . . . . . . . . . . . . . . . . . . . . . (139,466)Stock options . . . . . . . . . . . . . . . . . . . 9,770 87,706 3,590Treasury share repurchases . . . . . . . . (927,339) (88,959)Vested restricted stock units and
awards . . . . . . . . . . . . . . . . . . . . . . (23,871) 136,627 4,953Stock-based compensation . . . . . . . . . 22,648
Balance at December 31, 2014 . . . . . $14,470 $140,008 $3,350,734 $(540,430) (35,080,600) $(1,446,221) $4,128Net income . . . . . . . . . . . . . . . . . . . . . 419,247 544Cumulative translation adjustment . . . (124,156)Losses on derivatives qualifying as
hedges; net of tax $463 . . . . . . . . . (2,970)Pension liability and postretirement
adjustment; net of tax $29,452 . . . . 54,117Cash dividends declared ($2.06 per
share) . . . . . . . . . . . . . . . . . . . . . . . (165,727)Stock options . . . . . . . . . . . . . . . . . . . 6,099 194,016 7,085Treasury share repurchases . . . . . . . . (1,074,210) (121,193)Vested restricted stock units and
awards . . . . . . . . . . . . . . . . . . . . . . (28,465) 124,895 4,560Stock-based compensation . . . . . . . . . 23,160 — —
Balance at December 31, 2015 . . . . . $14,470 $140,802 $3,604,254 $(613,439) (35,835,899) $(1,555,769) $4,672
See Notes to Consolidated Financial Statements
67

INTERNATIONAL FLAVORS & FRAGRANCES INC.NOTES TO CONSOLIDATED FINANCIAL STATEMENTS
NOTE 1. NATURE OF OPERATIONS AND SUMMARY OF SIGNIFICANT ACCOUNTINGPOLICIES
Nature of Operations International Flavors & Fragrances Inc. and its subsidiaries (the “Registrant,”“IFF,” “the Company,” “we,” “us” and “our”) is a leading creator and manufacturer of flavors and fragrances(including cosmetic active ingredients) used to impart or improve flavor or fragrance in a wide variety ofconsumer products. Our products are sold principally to manufacturers of perfumes and cosmetics, hair and otherpersonal care products, soaps and detergents, cleaning products, dairy, meat and other processed foods,beverages, snacks and savory foods, sweet and baked goods, and pharmaceutical and oral care products.
Fiscal Year End The Company has historically operated on a 52/53 week fiscal year generally ending onthe Friday closest to the last day of the year. For ease of presentation, December 31 is used consistentlythroughout the financial statements and notes to represent the period-end date. The 2015 and 2013 fiscal yearswere 52 week periods and the 2014 fiscal year was a 53 week period. For the 2015, 2014 and 2013 fiscal years,the actual closing dates were January 1, January 2 and December 27, respectively.
Use of Estimates The preparation of financial statements in conformity with accounting principlesgenerally accepted in the United States requires management to make estimates and assumptions that affect thereported amounts and accompanying disclosures. These estimates are based on management’s best knowledge ofcurrent events and actions the Company may undertake in the future. Actual results may ultimately differ fromestimates.
Principles of Consolidation The consolidated financial statements include the accounts of InternationalFlavors & Fragrances Inc. and those of its subsidiaries. Significant intercompany balances and transactions havebeen eliminated. To the extent a subsidiary is not wholly-owned, any related noncontrolling interest is includedas a separate component of Shareholders’ Equity. Any applicable expense (income) attributable to thenoncontrolling interest is included in Other expense, net in the accompanying Consolidated Statement of Incomeand Comprehensive Income due to its immateriality and, as such, is not presented separately.
Revenue Recognition The Company recognizes revenue when the earnings process is complete. Thisgenerally occurs when (i) title and risk of loss have been transferred to the customer in accordance with the termsof sale and (ii) collection is reasonably assured. Sales are reduced, at the time revenue is recognized, forapplicable discounts, rebates and sales allowances based on historical experience. Related accruals are includedin Other current liabilities in the accompanying Consolidated Balance Sheet.
Foreign Currency Translation The Company translates the assets and liabilities of non-U.S. subsidiariesinto U.S. dollars at year-end exchange rates. Income and expense items are translated at average exchange ratesduring the year. Cumulative translation adjustments are shown as a separate component of Shareholders’ Equity.
Research and Development Research and development (“R&D”) expenses relate to the development ofnew and improved flavors or fragrances, technical product support and compliance with governmental regulation.All research and development costs are expensed as incurred.
Cash Equivalents Cash equivalents include highly liquid investments with maturities of three months orless at date of purchase.
Accounts Receivable The Company sells certain accounts receivable on a non-recourse basis to unrelatedfinancial institutions under “factoring” agreements that are sponsored, solely and individually, by certaincustomers. The Company accounts for these transactions as sale of receivables, removes the receivables sold
68

from its financial statements, and records cash proceeds when received by the Company. The increase in cashfrom operations was $3.4 million, $33.1 million and $6.5 million in 2015, 2014 and 2013, respectively. The costof participating in these programs was immaterial to our results in all periods.
Inventories Inventories are stated at the lower of cost (on a weighted average basis) or market. Ourinventories consisted of the following:
December 31,
(DOLLARS IN THOUSANDS) 2015 2014
Raw materials . . . . . . . . . . . . . . . . . . . . . . . . . . . . . . . . . . . . . . . . . . . . . . . . . . . . . . . . . . $282,181 $275,161Work in process . . . . . . . . . . . . . . . . . . . . . . . . . . . . . . . . . . . . . . . . . . . . . . . . . . . . . . . . . 17,450 17,705Finished goods . . . . . . . . . . . . . . . . . . . . . . . . . . . . . . . . . . . . . . . . . . . . . . . . . . . . . . . . . . 289,388 275,863
Total . . . . . . . . . . . . . . . . . . . . . . . . . . . . . . . . . . . . . . . . . . . . . . . . . . . . . . . . . . . . . $589,019 $568,729
Long-Lived Assets
Property, Plant and Equipment Property, plant and equipment are recorded at cost. Depreciation iscalculated on a straight-line basis, principally over the following estimated useful lives: buildings andimprovements, 10 to 40 years; machinery and equipment, 3 to 20 years; information technology hardware andsoftware, 3 to 7 years; and leasehold improvements which are included in buildings and improvements, theestimated life of the improvements or the remaining term of the lease, whichever is shorter.
Finite-Lived Intangible Assets Finite-lived intangible assets include customer relationships, patents, tradenames, technological know-how and other intellectual property valued at acquisition, and amortized on astraight-line basis over periods ranging from 6 to 30 years.
The Company reviews long-lived assets for impairment when events or changes in business conditionsindicate that their full carrying value may not be recovered. An estimate of undiscounted future cash flowsproduced by an asset or group of assets is compared to the carrying value to determine whether impairmentexists. If assets are determined to be impaired, the loss is measured based on an estimate of fair value usingvarious valuation techniques, including a discounted estimate of future cash flows.
Goodwill Goodwill represents the difference between the total purchase price and the fair value ofidentifiable assets and liabilities acquired in business acquisitions.
In assessing the potential for impairment of goodwill, management uses the most current actual andforecasted operating data available and current market based assumptions in accordance with the criteria in ASC350. The Company has identified four reporting units: (1) Flavors, (2) Fragrance Compounds, (3) FragranceIngredients and (4) Cosmetic Actives Ingredients. These reporting units were determined based on the level atwhich the performance is measured and reviewed by segment management.
The Company performed the annual goodwill impairment test utilizing the two-step approach for theFlavors, Fragrance Compounds and Fragrance Ingredients reporting units, by assessing the fair value of thereporting units based on discounted cash flows. The Company completed its annual goodwill impairment test asof November 30, 2015, which indicated no impairment of goodwill, as the estimated fair values substantiallyexceeded the carrying values of each of these reporting units. Given the recent date of the acquisition of LucasMeyer, the Company utilized the qualitative approach for the Cosmetic Active Ingredients reporting unit, whichindicated no impairment of goodwill.
Income Taxes The Company accounts for taxes under the asset and liability method. Under this method,deferred income taxes are recognized for temporary differences between the financial statement and tax returnbases of assets and liabilities, based on enacted tax rates and other provisions of the tax law. The effect of a
69

change in tax laws or rates on deferred tax assets and liabilities is recognized in income in the period in whichsuch change is enacted. Future tax benefits are recognized to the extent that realization of such benefits is morelikely than not, and a valuation allowance is established for any portion of a deferred tax asset that managementbelieves may not be realized.
The Company recognizes uncertain tax positions that it has taken or expects to take on a tax return. Pursuantto accounting requirements, the Company first determines whether it is “more likely than not” its tax positionwill be sustained if the relevant tax authority were to audit the position with full knowledge of all the relevantfacts and other information. For those tax positions that meet this threshold, the Company measures the amountof tax benefit based on the largest amount of tax benefit that it has a greater than 50% chance of realizing in afinal settlement with the relevant authority. Those tax positions failing to qualify for initial recognition arerecognized in the first interim period in which they meet the more likely than not standard. The Companymaintains a cumulative risk portfolio relating to all of its uncertainties in income taxes in order to perform thisanalysis, but the evaluation of its tax positions requires significant judgment and estimation in part because, incertain cases, tax law is subject to varied interpretation, and whether a tax position will ultimately be sustainedmay be uncertain.
The Company regularly repatriates a portion of current year earnings from select non–U.S. subsidiaries. Noprovision has been made for additional taxes on undistributed earnings of subsidiary companies that are intendedand planned to be indefinitely invested in such subsidiaries. The Company intends to, and has plans to, reinvestthese earnings indefinitely in its foreign subsidiaries to fund local operations and/or capital projects.
Interest and penalties related to unrecognized tax benefits are recognized as a component of income taxexpense.
Retirement Benefits Current service costs of retirement plans and postretirement health care and lifeinsurance benefits are accrued. Prior service costs resulting from plan improvements are amortized over periodsranging from 10 to 20 years.
Financial Instruments Derivative financial instruments are used to manage interest and foreign currencyexposures. The gain or loss on the hedging instrument is recorded in earnings at the same time as the transactionbeing hedged is recorded in earnings. The associated asset or liability related to the open hedge instrument isrecorded in Prepaid expenses and other current assets or Other current liabilities, as applicable.
The Company records all derivative financial instruments on the balance sheet at fair value. Changes in aderivative’s fair value are recognized in earnings unless specific hedge criteria are met. If the derivative isdesignated as a fair value hedge, the changes in the fair value of the derivative and of the hedged itemattributable to the hedged risk are recognized in Net income. If the derivative is designated as a cash flow hedge,the effective portions of changes in the fair value of the derivative are recorded in Accumulated othercomprehensive income (“AOCI”) in the accompanying Consolidated Balance Sheet and are subsequentlyrecognized in Net income when the hedged item affects earnings. Ineffective portions of changes in the fair valueof cash flow hedges, if any, are recognized as a charge or credit to earnings.
Software Costs The Company capitalizes direct internal and external development costs for certainsignificant projects associated with internal-use software and amortizes these costs over 7 years. Neitherpreliminary evaluation costs nor costs associated with the software after implementation are capitalized. Costsrelated to projects that are not significant are expensed as incurred.
Shipping and Handling Costs Net sales include shipping and handling charges billed to customers. Costof goods sold includes all costs incurred in connection with shipping and handling.
70

Net Income Per Share Net income per share is based on the weighted average number of sharesoutstanding. A reconciliation of shares used in the computations of basic and diluted net income per share is asfollows:
Number of Shares
(SHARES IN THOUSANDS) 2015 2014 2013
Basic . . . . . . . . . . . . . . . . . . . . . . . . . . . . . . . . . . . . . . . . . . . . . . . . . . . . . . . . . . . . . 80,449 80,936 81,322Assumed dilution under stock plans . . . . . . . . . . . . . . . . . . . . . . . . . . . . . . . . . . . . 442 558 608
Diluted . . . . . . . . . . . . . . . . . . . . . . . . . . . . . . . . . . . . . . . . . . . . . . . . . . . . . . . . . . . 80,891 81,494 81,930
An immaterial amount of Stock Settled Appreciation Rights (“SSARs”) were excluded from thecomputation of diluted net income per share at December 31, 2015. There were no stock options or SSARsexcluded from the computation in 2014 and 2013.
The Company has issued shares of Purchased Restricted Stock (“PRS”) which contain nonforfeitable rightsto dividends and thus are considered participating securities which are required to be included in the computationof basic and diluted earnings per share pursuant to the two-class method. The two-class method was notpresented since the difference between basic and diluted net income per share for both common shareholders andPRS shareholders was approximately $0.01 per share for each year and the number of PRS outstanding as ofDecember 31, 2015, 2014 and 2013 was immaterial. Net income allocated to such PRS during 2015, 2014 and2013 was approximately $2.0 million, $2.4 million and $2.3 million, respectively.
Stock-Based Compensation Compensation cost of all share-based awards is measured at fair value on thedate of grant and recognized over the service period for which awards are expected to vest. The cost of suchshare-based awards is principally recognized on a straight-line attribution basis over their respective vestingperiods, net of estimated forfeitures.
New Accounting Standards
In February 2016, the Financial Accounting Standards Board (“FASB”) issued authoritative guidance whichrequires changes to the accounting for leases. The new guidance establishes a new lease accounting model, that,for many companies, eliminates the concept of operating leases and requires entities to record assets andliabilities related to leases on the balance sheet for certain types of leases. The guidance will be effective forannual and interim periods beginning after December 31, 2018. Early adoption will be permitted for all entities.The Company is currently evaluating the impact that this new standard will have on its consolidated financialstatements.
71

In November 2015, the FASB issued authoritative guidance which requires entities to present all deferredtax assets and deferred tax liabilities as noncurrent in a classified balance sheet. This guidance is effective forfiscal years beginning after December 15, 2016, and interim periods within those fiscal years. Early adoption ofthis guidance is permitted. The Company elected to adopt this guidance as of December 31, 2015 andaccordingly has classified all deferred tax assets and liabilities as noncurrent in the consolidated balance sheet asof December 31, 2015. This guidance has been applied prospectively and prior amounts have not been adjustedretrospectively. Had it been applied retroactively, the amounts in the consolidated balance sheet as ofDecember 31, 2014, would have been as follows:
December 31, 2014
(DOLLARS IN THOUSANDS) As PresentedPresentation if adoption
were retroactive
Deferred Tax:Assets
Current . . . . . . . . . . . . . . . . . . . . . . . . . . . . . . . . . . . . . . . . . . . . . . . . . . . $ 27,709 $ —Noncurrent . . . . . . . . . . . . . . . . . . . . . . . . . . . . . . . . . . . . . . . . . . . . . . . . 183,047 208,455
LiabilitiesCurrent . . . . . . . . . . . . . . . . . . . . . . . . . . . . . . . . . . . . . . . . . . . . . . . . . . . (882) —Noncurrent . . . . . . . . . . . . . . . . . . . . . . . . . . . . . . . . . . . . . . . . . . . . . . . . (11,882) (10,463)
Total Net Deferred Tax Asset . . . . . . . . . . . . . . . . . . . . . . . . . . . . . . $197,992 $197,992
In September 2015, the FASB issued authoritative guidance relating to the adjustments made during themeasurement period for items in a business combination. Specifically, the new guidance would requireadjustments related to the finalization of estimates to be recorded in the period when they are determined and toprovide certain additional disclosures. This guidance is effective for fiscal years beginning after December 15,2015, including interim periods within those fiscal years. The Company has determined that the adoption of thisguidance will not have a significant impact on its consolidated financial statements.
In July 2015, the FASB issued authoritative guidance relating to the measurement of inventory costs, whichmore closely aligns the measurement of inventory in Generally Accepted Accounting Principles with themeasurement of inventory in International Financial Reporting Standards. This guidance is effective for yearsbeginning after December 15, 2016, including interim periods within those fiscal years. The Company does notexpect that the adoption of this guidance will have a significant impact on its consolidated financial statements.
In May 2014, the FASB issued authoritative guidance to clarify the principles to be used to recognizerevenue and, in August 2015, issued authoritative guidance delaying the effective adoption date of that guidanceby one year. The guidance is applicable to all entities and, based on the revised adoption date, is effective forannual and interim periods beginning after December 15, 2017. Adoption as of the original effective date ispermitted. The Company is currently evaluating the impact that this new standard will have on its consolidatedfinancial statements.
In April 2015, the FASB issued authoritative guidance which provides a practical expedient related to themeasurement date of defined benefit plan assets and obligations. This guidance is effective for annual andinterim periods beginning after December 15, 2015. The Company adopted this guidance as of December 31,2015 and it did not have a significant impact on its consolidated financial statements.
In April 2015, the FASB issued authoritative guidance which requires that debt issuance costs related to arecognized debt liability be presented in the balance sheet as a direct deduction from the carrying amount of thatdebt liability. This guidance is effective for annual and interim periods beginning after December 15, 2015. TheCompany has determined that the adoption of this guidance will not have a significant impact on its consolidatedfinancial statements.
72

In February 2015, the FASB issued authoritative guidance related to accounting for the consolidation ofcertain legal entities. The guidance will change the analysis that a reporting entity must perform to determine thecriteria for consolidating certain types of entities. This guidance is effective for annual and interim periodsbeginning after December 15, 2015. The Company has determined that the adoption of this guidance will nothave a significant impact on its consolidated financial statements.
Reclassifications and Revisions
Certain reclassifications have been made to the prior years’ financial statements to conform with the 2015presentation. Additionally, an adjustment has been made to accounts payable and accrued liabilities to correct theclassification of certain amounts included in the accompanying December 31, 2014 consolidated balance sheetand a corresponding adjustment has been made to the December 31, 2014 and 2013 consolidated statements ofcash flows. These revisions are not considered material to the previously issued financial statements.
NOTE 2. RESTRUCTURING AND OTHER CHARGES
Restructuring and other charges primarily consist of separation costs for employees including severance,outplacement and other benefit costs.
2015 Severance and Contingent Consideration Charges
During the fourth quarter of 2015, the Company established a series of initiatives that are intended tostreamline its management structure, simplify decision-making and accountability, better leverage and align itscapabilities across the organization and improve efficiency of its global manufacturing and operations network.As a result, the Company recorded a pre-tax charge of $7.6 million, included in restructuring and other charges,net, related to severance and related costs pertaining to approximately 150 positions that will be affected. Thetotal cost of the plan is expected to be approximately $10 million with the remaining charges relating principallyto accelerated depreciation. The Company expects the plan to be fully implemented in the second half of 2017.
Separately, the Company recorded a charge of $7.2 million, included in Selling and administrative expenses,associated with the acceleration from 2016 to 2015 of contingent consideration payments from the Aromoracquisition, that were triggered by certain of the management structure changes noted above.
Fragrance Ingredients Rationalization — 2014
In 2014, the Company closed its fragrance ingredients manufacturing facility in Augusta, Georgia andconsolidated production into other Company facilities. In connection with this closure, the Company incurredcharges of $13.8 million, consisting primarily of $10.3 million in accelerated depreciation of fixed assets, $2.2million in personnel-related costs and $1.3 million in plant shutdown and other related costs. The Companyrecorded total charges of $7.4 million during 2013, consisting of $2.2 million of pre-tax charges related toseverance included in Restructuring and other charges, net and $5.2 million of non-cash charges related toaccelerated depreciation included in Cost of goods sold. During 2014, the Company recorded $1.3 million ofplant shutdown and other related costs included in Restructuring and other charges, net as well as an additional$5.1 million of non-cash charges related to accelerated depreciation included in Cost of goods sold. As a result ofthis closure, 43 positions have been eliminated. During 2015, the Company recorded a net credit of $0.5 millionprincipally related to the reversal of severance accruals.
Other
During 2013, the Company recorded $1.1 million net expense related to prior year restructuring plans.
73

Rollforward of Liability
Movements in related accruals during 2013, 2014 and 2015 are as follows:
(DOLLARS IN THOUSANDS)Employee-
Related
Asset -Related/and
Other Total
Balance at January 1, 2013 . . . . . . . . . . . . . . . . . . . . . . . . . . . . . . . . . . . . . . $ 3,149 $ — $ 3,149Additional charges (reversals), net . . . . . . . . . . . . . . . . . . . . . . . . . . . . . . . . 2,151 5,250 7,401Non-cash charges . . . . . . . . . . . . . . . . . . . . . . . . . . . . . . . . . . . . . . . . . . . . . . — (5,250) (5,250)Payments and other costs . . . . . . . . . . . . . . . . . . . . . . . . . . . . . . . . . . . . . . . . (3,184) — (3,184)
Balance at December 31, 2013 . . . . . . . . . . . . . . . . . . . . . . . . . . . . . . . . . . . 2,116 — 2,116Additional charges (reversals), net . . . . . . . . . . . . . . . . . . . . . . . . . . . . . . . . (46) 6,444 6,398Non-cash charges . . . . . . . . . . . . . . . . . . . . . . . . . . . . . . . . . . . . . . . . . . . . . . (5,100) (5,100)Payments and other costs . . . . . . . . . . . . . . . . . . . . . . . . . . . . . . . . . . . . . . . . (1,311) (1,344) (2,655)
Balance at December 31, 2014 . . . . . . . . . . . . . . . . . . . . . . . . . . . . . . . . . . . 759 — 759Additional charges (reversals), net . . . . . . . . . . . . . . . . . . . . . . . . . . . . . . . . 7,594 — 7,594Non-cash charges . . . . . . . . . . . . . . . . . . . . . . . . . . . . . . . . . . . . . . . . . . . . . . — — —Payments and other costs . . . . . . . . . . . . . . . . . . . . . . . . . . . . . . . . . . . . . . . . (471) — (471)
Balance at December 31, 2015 . . . . . . . . . . . . . . . . . . . . . . . . . . . . . . . . . . . $ 7,882 $ — $ 7,882
NOTE 3. ACQUISITIONS
2015 Activity
Lucas Meyer
During the third quarter of 2015, the Company completed the acquisition of 100% of the outstanding sharesof Lucas Meyer Cosmetics, a business of Unipex Group (“Lucas Meyer”). (The total shares acquired includeshares effectively acquired pursuant to put and call option agreements). The acquisition was accounted for underthe purchase method. Lucas Meyer was acquired in order to strengthen and expand Fragrance Ingredients. Totalconsideration was approximately Euro 284.0 million ($312.0 million), including approximately $4.8 million ofcash acquired. The Company paid Euro 282.0 million (approximately $309.7 million) for this acquisition, whichwas funded from existing resources, and recorded a liability of approximately Euro 2.0 million (approximately$2.2 million). The purchase price exceeded the fair value of existing net assets by approximately $289.5 million.The excess was allocated principally to identifiable intangible assets (approximately $164.5 million), goodwill(approximately $184.7 million) and approximately $52.0 million to deferred taxes. Goodwill represents theexcess of the purchase price over the fair value of net assets acquired. Separately identifiable intangible assets areprincipally related to customer relationships and proprietary technology. The intangible assets are beingamortized using lives ranging from 10-30 years. The purchase price allocation is preliminary pending finalvaluations of intangible assets, principally related to the valuation of customer relationships, allocation of assetvalues by legal entity and determination of useful lives. The purchase price allocation is expected to becompleted by the first half of 2016. No pro forma financial information for 2015 is presented as the impact of theacquisition was immaterial to the Consolidated Statement of Comprehensive Income.
Ottens Flavors
During the second quarter of 2015, the Company completed the acquisition of 100% of the outstandingshares of Henry H. Ottens Manufacturing Co., Inc. (“Ottens Flavors”). The acquisition was accounted for underthe purchase method. Ottens Flavors was acquired in order to strengthen the IFF Flavors business in NorthAmerica. The Company paid $198.9 million (including $10.4 million of cash acquired) for this acquisition,which was funded from existing resources. The purchase price exceeded the fair value of existing net assets by$162.1 million. The excess was allocated principally to identifiable intangible assets ($80.0 million) and
74

goodwill ($82.1 million, which is deductible for tax purposes). Goodwill represents synergies from the additionof Ottens Flavors to the Company’s existing Flavors business. Separately identifiable intangible assets areprincipally related to customer relationships and proprietary flavors technology. The intangible assets are beingamortized using lives ranging from 5-17 years. The purchase price allocation was completed during the fourthquarter of 2015. No pro forma financial information for 2015 is presented as the impact of the acquisition isimmaterial.
2014 Activity
Aromor
During the first quarter of 2014, the Company completed the acquisition of 100% of the equity of AromorFlavors and Fragrances Ltd. (“Aromor”). The acquisition was accounted for under the purchase method. Aromoris part of the IFF Fragrances Ingredients business and was acquired in order to strengthen this business andprovide cost-effective quality materials for use in our formula creations. The Company paid $102.6 million(including $0.1 million of cash acquired) for this acquisition, which was funded out of existing cash resources.The purchase price exceeded the carrying value of existing net assets by $54.7 million. The excess was allocatedprincipally to identifiable intangible assets ($53.3 million), goodwill ($9.9 million) and $8.5 million to deferredtax liabilities. Separately identifiable intangible assets are principally related to technological know-how. Theintangible assets are being amortized using lives ranging from 13-19 years. Additionally, the considerationincluded $15.0 million related to post-combination contingent consideration, held in escrow, which was beingexpensed as earned by the selling shareholders. During the fourth quarter of 2015, the Company recorded acharge of $7.2 million associated with the acceleration from 2016 to 2015 of contingent consideration paymentswhich was triggered by the change in management structure as disclosed in Note 2.
NOTE 4. PROPERTY, PLANT AND EQUIPMENT, NET
Property, plant and equipment consists of the following amounts:
(DOLLARS IN THOUSANDS)
December 31,
2015 2014
Asset TypeLand . . . . . . . . . . . . . . . . . . . . . . . . . . . . . . . . . . . . . . . . . . . . . . . . . . . . . . . . . . . . . . . $ 22,896 $ 16,448Buildings and improvements . . . . . . . . . . . . . . . . . . . . . . . . . . . . . . . . . . . . . . . . . . . . 538,096 411,157Machinery and equipment . . . . . . . . . . . . . . . . . . . . . . . . . . . . . . . . . . . . . . . . . . . . . . 991,746 935,340Information technology . . . . . . . . . . . . . . . . . . . . . . . . . . . . . . . . . . . . . . . . . . . . . . . . 183,759 257,092Construction in process . . . . . . . . . . . . . . . . . . . . . . . . . . . . . . . . . . . . . . . . . . . . . . . . 75,786 146,709
1,812,283 1,766,746Accumulated depreciation . . . . . . . . . . . . . . . . . . . . . . . . . . . . . . . . . . . . . . . . . . . . . . (1,079,489) (1,046,478)
$ 732,794 $ 720,268
Depreciation expense was $74.8 million for the year ended December 31, 2015, and $82.0 million and $77.0million for the years ended December 31, 2014 and 2013, respectively.
75

NOTE 5. GOODWILL AND OTHER INTANGIBLE ASSETS, NET
Goodwill
Movements in goodwill during 2013, 2014 and 2015 are as follows:
(DOLLARS IN THOUSANDS) Goodwill
Balance at January 1, 2013 . . . . . . . . . . . . . . . . . . . . . . . . . . . . . . . . . . . . . . . . . . . . . . . . . . . . . . . . . . . . $665,582Acquisitions . . . . . . . . . . . . . . . . . . . . . . . . . . . . . . . . . . . . . . . . . . . . . . . . . . . . . . . . . . . . . . . . . . . . . . . —
Balance at December 31, 2013 . . . . . . . . . . . . . . . . . . . . . . . . . . . . . . . . . . . . . . . . . . . . . . . . . . . . . . . . . 665,582Acquisitions . . . . . . . . . . . . . . . . . . . . . . . . . . . . . . . . . . . . . . . . . . . . . . . . . . . . . . . . . . . . . . . . . . . . . . . 9,902
Balance at December 31, 2014 . . . . . . . . . . . . . . . . . . . . . . . . . . . . . . . . . . . . . . . . . . . . . . . . . . . . . . . . . 675,484Acquisitions . . . . . . . . . . . . . . . . . . . . . . . . . . . . . . . . . . . . . . . . . . . . . . . . . . . . . . . . . . . . . . . . . . . . . . . 265,905
Balance at December 31, 2015 . . . . . . . . . . . . . . . . . . . . . . . . . . . . . . . . . . . . . . . . . . . . . . . . . . . . . . . . . $941,389
Goodwill by segment is as follows:
December 31,
(DOLLARS IN THOUSANDS) 2015 2014
Flavors . . . . . . . . . . . . . . . . . . . . . . . . . . . . . . . . . . . . . . . . . . . . . . . . . . . . . . . . . . . . . . . . . . $401,494 $319,479Fragrances . . . . . . . . . . . . . . . . . . . . . . . . . . . . . . . . . . . . . . . . . . . . . . . . . . . . . . . . . . . . . . . 539,895 356,005
Total . . . . . . . . . . . . . . . . . . . . . . . . . . . . . . . . . . . . . . . . . . . . . . . . . . . . . . . . . . . . . . . $941,389 $675,484
Other Intangible Assets
Other intangible assets, net consist of the following amounts:
December 31,
(DOLLARS IN THOUSANDS) 2015 2014
Asset TypeCustomer relationships . . . . . . . . . . . . . . . . . . . . . . . . . . . . . . . . . . . . . . . . . . . . . . . . . . . . $ 293,799 $ 82,155Trade names & patents . . . . . . . . . . . . . . . . . . . . . . . . . . . . . . . . . . . . . . . . . . . . . . . . . . . . 34,182 11,460Technological know-how . . . . . . . . . . . . . . . . . . . . . . . . . . . . . . . . . . . . . . . . . . . . . . . . . . 112,393 107,691Other . . . . . . . . . . . . . . . . . . . . . . . . . . . . . . . . . . . . . . . . . . . . . . . . . . . . . . . . . . . . . . . . . . 22,711 17,370
Total carrying value . . . . . . . . . . . . . . . . . . . . . . . . . . . . . . . . . . . . . . . . . . . . . . . . . . 463,085 218,676Customer relationships . . . . . . . . . . . . . . . . . . . . . . . . . . . . . . . . . . . . . . . . . . . . . . . . . . . . (66,324) (56,235)Trade names & patents . . . . . . . . . . . . . . . . . . . . . . . . . . . . . . . . . . . . . . . . . . . . . . . . . . . . (10,282) (8,686)Technological know-how . . . . . . . . . . . . . . . . . . . . . . . . . . . . . . . . . . . . . . . . . . . . . . . . . . (65,258) (62,699)Other . . . . . . . . . . . . . . . . . . . . . . . . . . . . . . . . . . . . . . . . . . . . . . . . . . . . . . . . . . . . . . . . . . (15,217) (14,499)
Total accumulated amortization . . . . . . . . . . . . . . . . . . . . . . . . . . . . . . . . . . . . . . . . . (157,081) (142,119)
Other intangible assets, net . . . . . . . . . . . . . . . . . . . . . . . . . . . . . . . . . . . . . . . . . . . . . $ 306,004 $ 76,557
Amortization expense was $15.0 million for the year ended December 31, 2015, and $7.3 million and $6.1million for the years ended December 31, 2014 and 2013, respectively. Estimated annual amortization is $21.3million for the years 2016 through 2018, $20.5 million for the year 2019 and $19.8 million for 2020.
76
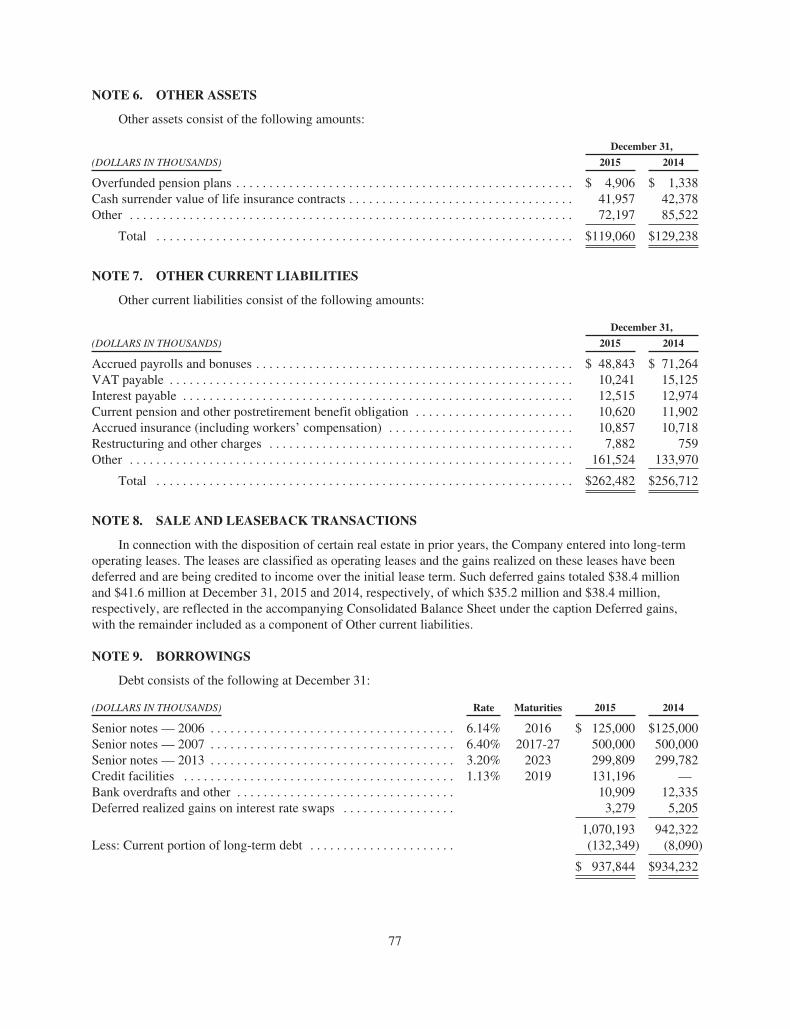
NOTE 6. OTHER ASSETS
Other assets consist of the following amounts:
December 31,
(DOLLARS IN THOUSANDS) 2015 2014
Overfunded pension plans . . . . . . . . . . . . . . . . . . . . . . . . . . . . . . . . . . . . . . . . . . . . . . . . . . . $ 4,906 $ 1,338Cash surrender value of life insurance contracts . . . . . . . . . . . . . . . . . . . . . . . . . . . . . . . . . . 41,957 42,378Other . . . . . . . . . . . . . . . . . . . . . . . . . . . . . . . . . . . . . . . . . . . . . . . . . . . . . . . . . . . . . . . . . . . 72,197 85,522
Total . . . . . . . . . . . . . . . . . . . . . . . . . . . . . . . . . . . . . . . . . . . . . . . . . . . . . . . . . . . . . . . $119,060 $129,238
NOTE 7. OTHER CURRENT LIABILITIES
Other current liabilities consist of the following amounts:
December 31,
(DOLLARS IN THOUSANDS) 2015 2014
Accrued payrolls and bonuses . . . . . . . . . . . . . . . . . . . . . . . . . . . . . . . . . . . . . . . . . . . . . . . . $ 48,843 $ 71,264VAT payable . . . . . . . . . . . . . . . . . . . . . . . . . . . . . . . . . . . . . . . . . . . . . . . . . . . . . . . . . . . . . 10,241 15,125Interest payable . . . . . . . . . . . . . . . . . . . . . . . . . . . . . . . . . . . . . . . . . . . . . . . . . . . . . . . . . . . 12,515 12,974Current pension and other postretirement benefit obligation . . . . . . . . . . . . . . . . . . . . . . . . 10,620 11,902Accrued insurance (including workers’ compensation) . . . . . . . . . . . . . . . . . . . . . . . . . . . . 10,857 10,718Restructuring and other charges . . . . . . . . . . . . . . . . . . . . . . . . . . . . . . . . . . . . . . . . . . . . . . 7,882 759Other . . . . . . . . . . . . . . . . . . . . . . . . . . . . . . . . . . . . . . . . . . . . . . . . . . . . . . . . . . . . . . . . . . . 161,524 133,970
Total . . . . . . . . . . . . . . . . . . . . . . . . . . . . . . . . . . . . . . . . . . . . . . . . . . . . . . . . . . . . . . . $262,482 $256,712
NOTE 8. SALE AND LEASEBACK TRANSACTIONS
In connection with the disposition of certain real estate in prior years, the Company entered into long-termoperating leases. The leases are classified as operating leases and the gains realized on these leases have beendeferred and are being credited to income over the initial lease term. Such deferred gains totaled $38.4 millionand $41.6 million at December 31, 2015 and 2014, respectively, of which $35.2 million and $38.4 million,respectively, are reflected in the accompanying Consolidated Balance Sheet under the caption Deferred gains,with the remainder included as a component of Other current liabilities.
NOTE 9. BORROWINGS
Debt consists of the following at December 31:
(DOLLARS IN THOUSANDS) Rate Maturities 2015 2014
Senior notes — 2006 . . . . . . . . . . . . . . . . . . . . . . . . . . . . . . . . . . . . . 6.14% 2016 $ 125,000 $125,000Senior notes — 2007 . . . . . . . . . . . . . . . . . . . . . . . . . . . . . . . . . . . . . 6.40% 2017-27 500,000 500,000Senior notes — 2013 . . . . . . . . . . . . . . . . . . . . . . . . . . . . . . . . . . . . . 3.20% 2023 299,809 299,782Credit facilities . . . . . . . . . . . . . . . . . . . . . . . . . . . . . . . . . . . . . . . . . 1.13% 2019 131,196 —Bank overdrafts and other . . . . . . . . . . . . . . . . . . . . . . . . . . . . . . . . . 10,909 12,335Deferred realized gains on interest rate swaps . . . . . . . . . . . . . . . . . 3,279 5,205
1,070,193 942,322Less: Current portion of long-term debt . . . . . . . . . . . . . . . . . . . . . . (132,349) (8,090)
$ 937,844 $934,232
77

Commercial Paper
Commercial paper issued by the Company generally has terms of 30 days or less. There were no outstandingcommercial paper borrowings at December 31, 2015 or 2014.
Senior Notes — 2013
On April 4, 2013, the Company issued $300.0 million face amount of 3.20% Senior Notes (“SeniorNotes — 2013”) due 2023 at a discount of $0.3 million. The Company received proceeds related to the issuanceof these Senior Notes — 2013 of $297.8 million which was net of the $0.3 million discount and a $1.9 millionunderwriting discount (recorded as deferred financing costs). In addition, the Company incurred $0.9 million ofother deferred financing costs in connection with the debt issuance. The discount and deferred financing costs arebeing amortized as interest expense over the term of the Senior Notes — 2013. The Senior Notes — 2013 bearinterest at a rate of 3.20% per year, with interest payable on May 1 and November 1 of each year, commencingon November 1, 2013. The Senior Notes — 2013 mature on May 1, 2023. Upon 30 days’ notice to holders of theSenior Notes — 2013, the Company may redeem the Senior Notes — 2013 for cash in whole, at any time, or inpart, from time to time, prior to maturity, at redemption prices that include accrued and unpaid interest and amake-whole premium. However, no make-whole premium will be paid for redemptions of the Senior Notes —2013 on or after February 1, 2023. The Indenture provides for customary events of default and contains certainnegative covenants that limit the ability of the Company and its subsidiaries to grant liens on assets, to enter intosale-leaseback transactions or to consolidate with or merge into any other entity or convey, transfer or lease all orsubstantially all of the Company’s properties and assets. In addition, subject to certain limitations, in the event ofthe occurrence of both (1) a change of control of the Company and (2) a downgrade of the Senior Notes — 2013below investment grade rating by both Moody’s Investors Services, Inc. and Standard & Poor’s Ratings Serviceswithin a specified time period, the Company will be required to make an offer to repurchase the Senior Notes —2013 at a price equal to 101% of the principal amount of the Senior Notes — 2013, plus accrued and unpaidinterest to the date of repurchase.
Senior Notes — 2007
On September 27, 2007, the Company issued $500 million of Senior Unsecured Notes (“Senior Notes —2007”) in four series under the Note Purchase Agreement (“NPA”): (i) $250 million in aggregate principalamount of 6.25% Series A Senior Notes due September 27, 2017, (ii) $100 million in aggregate principal amountof 6.35% Series B Notes due September 27, 2019, (iii) $50 million in aggregate principal amount of 6.50%Series C Notes due September 27, 2022, and (iv) $100 million in aggregate principal amount of 6.79% Series DNotes due September 27, 2027.
Senior Notes — 2006
In 2006, the Company issued $375 million of Senior Unsecured Notes (“Senior Notes — 2006”) in fourseries under another NPA: (i) $50 million in aggregate principal amount of 5.89% Series A Senior Notes dueJuly 12, 2009, (ii) $100 million in aggregate principal amount of 5.96% Series B Notes due July 12, 2011,(iii) $100 million in aggregate principal amount of 6.05% Series C Notes due July 12, 2013, and (iv) $125million in aggregate principal amount of 6.14% Series D Notes due July 12, 2016. In 2009, 2011 and 2013, theCompany repaid $50 million, $100 million and $100 million, respectively, upon maturity of the first three seriesof the Senior Notes — 2006.
Maturities on our outstanding Senior Notes — 2006, Senior Notes — 2007 and Senior Notes — 2013 atDecember 31, 2015 were: 2016, $125 million; 2017, $250 million; 2019, $100 million; 2022 and thereafter, $450million. There is no debt maturing in 2018, 2020 or 2021.
Credit Facility
On April 4, 2014, the Company and certain of its subsidiaries amended and restated the Company’s existingcredit agreement with Citibank, N.A., as administrative agent. The credit agreement, as amended, provides for a
78

revolving loan facility in an aggregate amount up to an equivalent of $950 million (the “Credit Facility”). Underthe Credit Facility, Tranche A is available to borrowers in U.S. dollars, euros, Swiss francs, Japanese yen andBritish sterling in an aggregate amount up to an equivalent of approximately $456 million, with a sublimit of $25million for swing line borrowings. Tranche B of the Credit Facility is available to borrowers in euros, Swissfrancs, Japanese yen and British sterling in an aggregate amount up to an equivalent of approximately $494million.
The Credit Facility is available for general corporate purposes of each borrower and its subsidiaries. Theobligations under the Credit Facility are unsecured and the Company has guaranteed the obligations of each otherborrower under the Credit Facility. The 2014 amendment to the Credit Facility extended the maturity date of thefacility to April 4, 2019. Borrowings under the Credit Facility bear interest at an annual rate of LIBOR plus amargin, currently 112.5 bps, linked to our credit rating. The Company pays a commitment fee on the aggregateunused commitments; such fee is not material. The Credit Facility contains various affirmative and negativecovenants, including the requirement for the Company to maintain, at the end of each fiscal quarter, a ratio of netdebt for borrowed money to adjusted EBITDA (Earnings Before Interest, Taxes, Depreciation and Amortization)in respect of the previous 12-month period of not more than 3.25 to 1. As of December 31, 2015, the Companywas in compliance with all covenants under this Credit Facility. The Company had $131.2 million borrowingsoutstanding under the Credit Facility as of December 31, 2015, with $790.7 million still available for additionalborrowings. As the Credit Facility is a multi-year revolving credit agreement, the Company classifies as long-term debt the portion that it has the intent and ability to maintain outstanding longer than 12 months.
Short term borrowings, including the current portion of the Senior Notes — 2006, the Credit facilityborrowings and bank overdrafts, were outstanding in several countries and averaged $203.0 million in 2015 and$3.0 million in 2014. The highest levels were $415.4 million in 2015, $8.8 million in 2014, and $295.8 million in2013. The 2015 weighted average interest rate of these borrowings, based on balances outstanding at the end ofeach month, was 2.67%. These rates compare with 4.13% and 0.35%, respectively, in 2014 and 2013.
Other
The estimated fair value at December 31, 2015 of our Senior Notes — 2006, Senior Notes — 2007 andSenior Notes — 2013 was approximately $127.7 million, $563.9 million and $290.8 million, respectively, and isdiscussed in further detail in Note 15.
During 2013, the Company entered into multiple interest rate swap agreements effectively converting thefixed rate on a portion of our long-term Senior Notes to a variable short-term rate based on the LIBOR plus aninterest markup.
In March 2008, the Company realized an $18 million gain on the termination of an interest rate swap, whichhas been deferred and is being amortized as a reduction to interest expense over the remaining term of the relateddebt. The balance of this deferred gain was $3.3 million at December 31, 2015.
NOTE 10. INCOME TAXES
Earnings before income taxes consisted of the following:
December 31,
(DOLLARS IN THOUSANDS) 2015 2014 2013
U.S. income (loss) before taxes . . . . . . . . . . . . . . . . . . . . . . . . . . . . . . . . . . . . . $ 29,792 $ 17,650 $ (20,727)Foreign income before taxes . . . . . . . . . . . . . . . . . . . . . . . . . . . . . . . . . . . . . . . 509,309 531,411 505,937
Total income before taxes . . . . . . . . . . . . . . . . . . . . . . . . . . . . . . . . . . . . . . . . . $539,101 $549,061 $485,210
79

The income tax provision consisted of the following:
December 31,
(DOLLARS IN THOUSANDS) 2015 2014 2013
CurrentFederal . . . . . . . . . . . . . . . . . . . . . . . . . . . . . . . . . . . . . . . . . . . . . . . . . . . . $ 7,648 $ 1,175 $ 8,658State and local . . . . . . . . . . . . . . . . . . . . . . . . . . . . . . . . . . . . . . . . . . . . . . 199 264 1,246Foreign . . . . . . . . . . . . . . . . . . . . . . . . . . . . . . . . . . . . . . . . . . . . . . . . . . . . 98,964 109,729 122,246
106,811 111,168 132,150
DeferredFederal . . . . . . . . . . . . . . . . . . . . . . . . . . . . . . . . . . . . . . . . . . . . . . . . . . . . 14,379 20,795 (4,686)State and local . . . . . . . . . . . . . . . . . . . . . . . . . . . . . . . . . . . . . . . . . . . . . . 399 113 262Foreign . . . . . . . . . . . . . . . . . . . . . . . . . . . . . . . . . . . . . . . . . . . . . . . . . . . . (1,735) 2,442 3,940
13,043 23,350 (484)
Total income taxes . . . . . . . . . . . . . . . . . . . . . . . . . . . . . . . . . . . . . . . . . . . . . . . $119,854 $134,518 $131,666
Effective Tax Rate Reconciliation
A reconciliation between the U.S. federal statutory income tax rate to our actual effective tax rate is asfollows:
December 31,
2015 2014 2013
Statutory tax rate . . . . . . . . . . . . . . . . . . . . . . . . . . . . . . . . . . . . . . . . . . . . . . . . . . . . . . . . . 35.0% 35.0% 35.0%Difference in effective tax rate on foreign earnings and remittances . . . . . . . . . . . . . . . . . (10.7) (9.9) (10.2)Unrecognized tax benefit, net of reversals . . . . . . . . . . . . . . . . . . . . . . . . . . . . . . . . . . . . . (0.8) 0.8 1.0Spanish tax charges . . . . . . . . . . . . . . . . . . . . . . . . . . . . . . . . . . . . . . . . . . . . . . . . . . . . . . . (0.4) — 1.3Spanish dividend withholdings . . . . . . . . . . . . . . . . . . . . . . . . . . . . . . . . . . . . . . . . . . . . . . — (0.7) —State and local taxes . . . . . . . . . . . . . . . . . . . . . . . . . . . . . . . . . . . . . . . . . . . . . . . . . . . . . . 0.1 0.1 0.2Other, net . . . . . . . . . . . . . . . . . . . . . . . . . . . . . . . . . . . . . . . . . . . . . . . . . . . . . . . . . . . . . . . (1.0) (0.8) (0.2)
Effective tax rate . . . . . . . . . . . . . . . . . . . . . . . . . . . . . . . . . . . . . . . . . . . . . . . . . . . . . . . . . 22.2% 24.5% 27.1%
Our effective tax rate reflects the benefit from having significant operations outside the U.S. that are taxedat rates that are lower than the U.S. federal rate of 35%. Included in the 2015 effective tax rate was a $10.5million benefit related to favorable tax rulings in Spain and another jurisdiction for which reserves werepreviously recorded. Included in the 2014 effective tax rate is a $3.8 million tax benefit related to the reservereversal for the 2001 Spanish dividend withholding tax case. Included in the 2013 effective tax rate is a $6.2million tax charge related to the 2002-2003 Spanish income tax cases as discussed below. The 2015, 2014 and2013 effective tax rates were also favorably impacted by the reversals of liabilities for uncertain tax positions of$2.8 million, $2.3 million and $4.9 million, respectively, principally due to statutory expiry and effectivesettlement.
80

Deferred Taxes
The deferred tax assets consist of the following amounts:
December 31,
(DOLLARS IN THOUSANDS) 2015 2014
Employee and retiree benefits . . . . . . . . . . . . . . . . . . . . . . . . . . . . . . . . . . . . . . . . . . . . . . $ 128,429 $ 164,542Credit and net operating loss carryforwards(1) . . . . . . . . . . . . . . . . . . . . . . . . . . . . . . . . . . 183,594 180,296Trademarks and other . . . . . . . . . . . . . . . . . . . . . . . . . . . . . . . . . . . . . . . . . . . . . . . . . . . . . 143,727 169,088Amortizable R&D expenses . . . . . . . . . . . . . . . . . . . . . . . . . . . . . . . . . . . . . . . . . . . . . . . . 56,091 48,982Other, net . . . . . . . . . . . . . . . . . . . . . . . . . . . . . . . . . . . . . . . . . . . . . . . . . . . . . . . . . . . . . . 14,026 17,320
Gross deferred tax assets . . . . . . . . . . . . . . . . . . . . . . . . . . . . . . . . . . . . . . . . . . . . . . 525,867 580,228Property, plant and equipment, net . . . . . . . . . . . . . . . . . . . . . . . . . . . . . . . . . . . . . . . . . . . (11,337) (7,275)Trademarks and other . . . . . . . . . . . . . . . . . . . . . . . . . . . . . . . . . . . . . . . . . . . . . . . . . . . . . (72,710) (19,393)
Gross deferred tax liabilities . . . . . . . . . . . . . . . . . . . . . . . . . . . . . . . . . . . . . . . . . . . . (84,047) (26,668)Valuation allowance(1) . . . . . . . . . . . . . . . . . . . . . . . . . . . . . . . . . . . . . . . . . . . . . . . . (339,395) (355,568)
Total net deferred tax assets . . . . . . . . . . . . . . . . . . . . . . . . . . . . . . . . . . . . . . . . $ 102,425 $ 197,992
(1) During 2015 and 2014, the Company increased its deferred tax assets by $10.0 million and decreased itsdeferred tax assets by $81.0 million, respectively, relating to an adjustment to the 2014 and 2013 foreign netoperating loss carryforwards, respectively. The entire adjustments of $10.0 million and $81.0 million wereoffset by corresponding adjustments in valuation allowances. These adjustments are not considered materialto the previously issued financial statements.
Net operating loss carryforwards were $144.1 million and $140.6 million at December 31, 2015 and 2014,respectively. If unused, $4.2 million will expire between 2016 and 2035. The remainder, totaling $139.9 million,may be carried forward indefinitely. Tax credit carryforwards were $42.0 million and $40.0 million atDecember 31, 2015 and 2014, respectively. If unused, the credit carryforwards will expire between 2016 and2035.
The U.S. consolidated group has historically generated taxable income after the inclusion of foreigndividends. As such, the Company is not in a federal net operating loss position. This allows IFF and its U.S.subsidiaries to realize tax benefits from the reversal of temporary differences and the utilization of its federal taxcredits before the expiration of the applicable carryforward periods. The Company has not factored any futuretrends, other than inflation, in its U.S. taxable income projections. The corresponding U.S. federal taxableincome is sufficient to realize $128.7 million in deferred tax assets as of December 31, 2015.
The majority of states in the U.S. where IFF and its subsidiaries file income tax returns allow a 100%foreign dividend exclusion, effectively converting the domestic companies’ reversing temporary differences intonet operating losses. As there is significant doubt with respect to realizability of these net operating losses, theCompany has established a full valuation allowance against these deferred tax assets.
Of the $186.1 million deferred tax asset for net operating loss carryforwards and credits at December 31,2015, the Company considers it unlikely that a portion of the tax benefit will be realized. Accordingly, avaluation allowance of $136.8 million of net operating loss carryforwards and $9.5 million of tax credits hasbeen established against these deferred tax assets, respectively. In addition, due to realizability concerns, theCompany established a valuation allowance against certain other net deferred tax assets of $193.1 million.
81

Uncertain Tax Positions
A reconciliation of the beginning and ending amount of unrecognized tax benefits is as follows:
December 31,
(DOLLARS IN THOUSANDS) 2015 2014 2013
Balance of unrecognized tax benefits at beginning of year . . . . . . . . . . . . . . . . . . $ 23,055 $21,553 $ 41,153Gross amount of increases in unrecognized tax benefits as a result of positions
taken during a prior year . . . . . . . . . . . . . . . . . . . . . . . . . . . . . . . . . . . . . . . . . . 18 1,795 7,364Gross amount of decreases in unrecognized tax benefits as a result of positions
taken during a prior year . . . . . . . . . . . . . . . . . . . . . . . . . . . . . . . . . . . . . . . . . . (43) (823) (993)Gross amount of increases in unrecognized tax benefits as a result of positions
taken during the current year . . . . . . . . . . . . . . . . . . . . . . . . . . . . . . . . . . . . . . . 12,011 5,378 4,951The amounts of decreases in unrecognized benefits relating to settlements with
taxing authorities . . . . . . . . . . . . . . . . . . . . . . . . . . . . . . . . . . . . . . . . . . . . . . . . (10,221) — (26,712)Reduction in unrecognized tax benefits due to the lapse of applicable statute of
limitation . . . . . . . . . . . . . . . . . . . . . . . . . . . . . . . . . . . . . . . . . . . . . . . . . . . . . . (622) (4,848) (4,210)
Balance of unrecognized tax benefits at end of year . . . . . . . . . . . . . . . . . . . . . . . $ 24,198 $23,055 $ 21,553
At December 31, 2015, 2014 and 2013, there are $24.2 million, $22.3 million, and $21.6 million,respectively, of unrecognized tax benefits recorded to Other liabilities and $0.7 million recorded to Other currentliabilities for 2014. If these unrecognized tax benefits were recognized, all the benefits and related interest wouldbe recorded as a benefit to income tax expense.
For the year ended December 31, 2015, the Company reduced its liabilities for interest and penalties by $1.4million, net, and $0.1 million, net, and $5.2 million, net for the years ended 2014 and 2013, respectively,principally due to payments made pursuant to the Spanish tax settlement, as discussed below. At December 31,2015, 2014 and 2013, the Company had accrued $0.8 million, $1.7 million and $2.3 million, respectively, ofinterest and penalties classified as Other liabilities and $0.5 million in 2014 recorded to Other current liabilities.
As of December 31, 2015, the Company’s aggregate provisions for uncertain tax positions, includinginterest and penalties, was $25.0 million, associated with various tax positions asserted in foreign jurisdictions,none of which is individually material.
Other
Tax benefits credited to Shareholders’ equity totaled $0.2 million, $0.2 million and $0.6 million for 2015,2014 and 2013, respectively, associated with stock option exercises and Purchased Restricted Stock (“PRS”)dividends.
U.S. income taxes and foreign withholding taxes associated with the repatriation of earnings of its foreignsubsidiaries were not provided on a cumulative total of $1.6 billion of undistributed earnings of foreignsubsidiaries. The Company intends to, and has plans to, reinvest these earnings indefinitely in our foreignsubsidiaries to fund local operations and/or capital projects. The unrecognized deferred tax liability on theseundistributed earnings approximates $233.6 million.
The Company has ongoing income tax audits and legal proceedings which are at various stages ofadministrative or judicial review, of which the material items are discussed below. In addition, the Company hasother ongoing tax audits and legal proceedings that relate to indirect taxes, such as value-added taxes, capital tax,sales and use and property taxes, which are discussed in Note 18.
82

Spanish Tax Items
During 2013, the Company reached a settlement with the Spanish tax authorities with respect to assesmentsimposed in connection with the 2011 fiscal year audit, and paid Euro 3.9 million ($5.2 million based on theexchange rate at the payment date).
With respect to the audits of 2002-2003 fiscal years, the Spanish tax authorities imposed assessmentsaggregating Euro 22.4 million ($28.6 million), including aggregate estimated interest. The Company appealedthese assessments, however, in February 2013, the Appellate Court upheld the administrative ruling with respectto the 2003 tax assessment and the related tax avoidance claims. The Company decided not to pursue the appealsprocess with respect to the 2003 tax assessment and paid Euro 20.8 million ($27.3 million based on the exchangerate at the respective payment dates) in connection with the 2003 tax assessment in 2013. In June 2013, theAppellate Court ruled against us on our appeal of the 2002 income tax assessment and related claims, which theCompany also decided not to appeal. However, this case did not have a related tax exposure associated with it. Inan unrelated matter, there was a remaining aggregate assessment related to the 2002 fiscal year of Euro1.9 million ($2.3 million) as of December 31, 2014. During the first quarter of 2015, the Company received afavorable ruling on this appeal and accordingly, reversed the total reserve related to the 2002 fiscal year (with avalue of Euro 1.9 million or $2.3 million).
In addition to the above, the Company was also a party to four dividend withholding tax controversies inSpain in which the Spanish tax authorities alleged that the Company’s Spanish subsidiaries underpaidwithholding taxes during the 1995-2001 fiscal years. The Company had previously appealed each of thesecontroversies. During 2012, the Company received unfavorable decisions on the first three cases. As a result ofthese rulings, during 2012 the Company (i) recorded charges (including estimated interest) of approximately$12.0 million after-tax and (ii) made payments of Euro 9.8 million ($12.8 million based on exchange rate at therespective payment dates). The fourth case was heard by the Spanish National High Court in October, 2014 andwe received a favorable ruling. Accordingly, during the fourth quarter of 2014, we reversed the total reserverelated to the 2001 fiscal year (with a value of Euro 3.6 million or $4.3 million). As of December 31, 2015, thethree dividend withholding tax controversies in Spain have now been resolved. The Company made totalpayments of Euro 4.5 million ($4.9 million) during the second quarter of 2015 related to the resolution of thesethree controversies.
In addition, the Company has several other tax audits in process and has open tax years with various taxingjurisdictions that range primarily from 2005 to 2014. Based on currently available information, the Companydoes not believe the ultimate outcome of any of these tax audits and other tax positions related to open tax years,when finalized, will have a material impact on its financial position.
NOTE 11. SHAREHOLDERS’ EQUITY
Dividends
Cash dividends declared per share were $2.06, $1.72 and $1.46 in 2015, 2014 and 2013, respectively. TheConsolidated Balance Sheet reflects $44.8 million of dividends payable at December 31, 2015. This amountrelates to a cash dividend of $0.56 per share declared in December 2015 and paid in January 2016. Dividendsdeclared, but not paid as of December 31, 2014 and December 31, 2013 were $38.0 million ($0.47 per share) and$31.7 million ($0.39 per share), respectively.
Share Repurchases
In December 2012, the Board of Directors authorized a $250 million share repurchase program, whichcommenced in the first quarter of 2013. In August 2015, the Board of Directors approved an additional $250million share repurchase authorization and extension through December 31, 2017. Based on the total remainingamount of $236.7 million available under the repurchase program, approximately 2.0 million shares, or 2.5% ofshares outstanding (based on the market price and shares outstanding as of December 31, 2015) could be
83
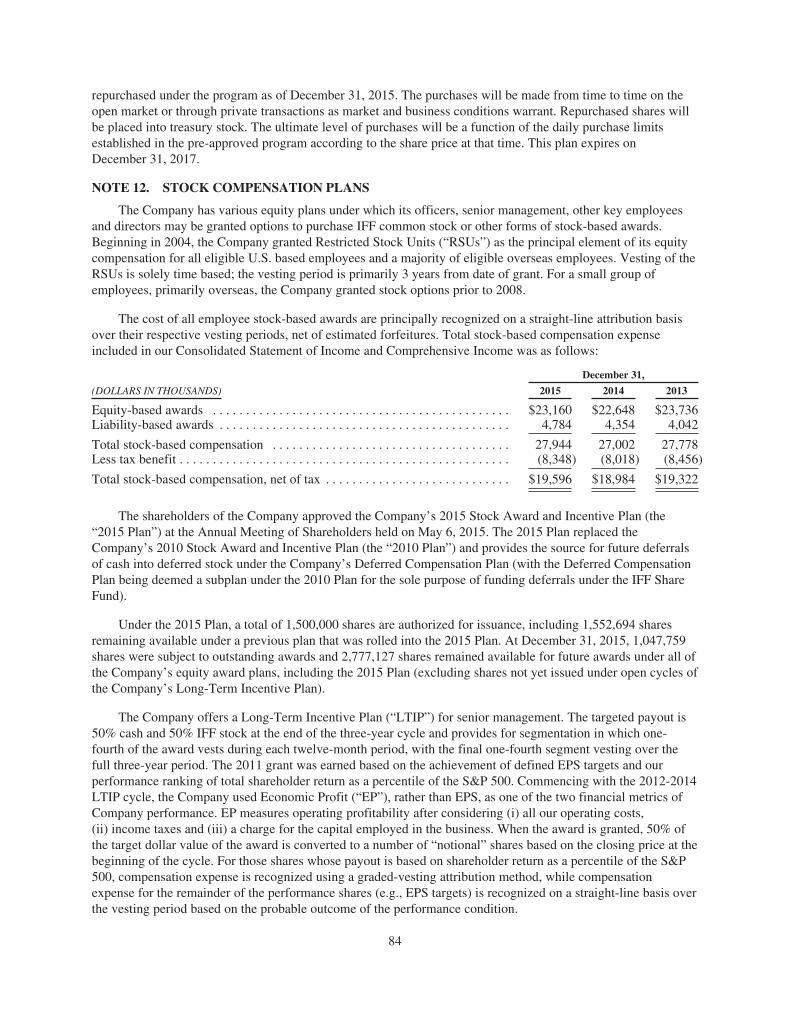
repurchased under the program as of December 31, 2015. The purchases will be made from time to time on theopen market or through private transactions as market and business conditions warrant. Repurchased shares willbe placed into treasury stock. The ultimate level of purchases will be a function of the daily purchase limitsestablished in the pre-approved program according to the share price at that time. This plan expires onDecember 31, 2017.
NOTE 12. STOCK COMPENSATION PLANS
The Company has various equity plans under which its officers, senior management, other key employeesand directors may be granted options to purchase IFF common stock or other forms of stock-based awards.Beginning in 2004, the Company granted Restricted Stock Units (“RSUs”) as the principal element of its equitycompensation for all eligible U.S. based employees and a majority of eligible overseas employees. Vesting of theRSUs is solely time based; the vesting period is primarily 3 years from date of grant. For a small group ofemployees, primarily overseas, the Company granted stock options prior to 2008.
The cost of all employee stock-based awards are principally recognized on a straight-line attribution basisover their respective vesting periods, net of estimated forfeitures. Total stock-based compensation expenseincluded in our Consolidated Statement of Income and Comprehensive Income was as follows:
December 31,
(DOLLARS IN THOUSANDS) 2015 2014 2013
Equity-based awards . . . . . . . . . . . . . . . . . . . . . . . . . . . . . . . . . . . . . . . . . . . . . $23,160 $22,648 $23,736Liability-based awards . . . . . . . . . . . . . . . . . . . . . . . . . . . . . . . . . . . . . . . . . . . . 4,784 4,354 4,042
Total stock-based compensation . . . . . . . . . . . . . . . . . . . . . . . . . . . . . . . . . . . . 27,944 27,002 27,778Less tax benefit . . . . . . . . . . . . . . . . . . . . . . . . . . . . . . . . . . . . . . . . . . . . . . . . . . (8,348) (8,018) (8,456)
Total stock-based compensation, net of tax . . . . . . . . . . . . . . . . . . . . . . . . . . . . $19,596 $18,984 $19,322
The shareholders of the Company approved the Company’s 2015 Stock Award and Incentive Plan (the“2015 Plan”) at the Annual Meeting of Shareholders held on May 6, 2015. The 2015 Plan replaced theCompany’s 2010 Stock Award and Incentive Plan (the “2010 Plan”) and provides the source for future deferralsof cash into deferred stock under the Company’s Deferred Compensation Plan (with the Deferred CompensationPlan being deemed a subplan under the 2010 Plan for the sole purpose of funding deferrals under the IFF ShareFund).
Under the 2015 Plan, a total of 1,500,000 shares are authorized for issuance, including 1,552,694 sharesremaining available under a previous plan that was rolled into the 2015 Plan. At December 31, 2015, 1,047,759shares were subject to outstanding awards and 2,777,127 shares remained available for future awards under all ofthe Company’s equity award plans, including the 2015 Plan (excluding shares not yet issued under open cycles ofthe Company’s Long-Term Incentive Plan).
The Company offers a Long-Term Incentive Plan (“LTIP”) for senior management. The targeted payout is50% cash and 50% IFF stock at the end of the three-year cycle and provides for segmentation in which one-fourth of the award vests during each twelve-month period, with the final one-fourth segment vesting over thefull three-year period. The 2011 grant was earned based on the achievement of defined EPS targets and ourperformance ranking of total shareholder return as a percentile of the S&P 500. Commencing with the 2012-2014LTIP cycle, the Company used Economic Profit (“EP”), rather than EPS, as one of the two financial metrics ofCompany performance. EP measures operating profitability after considering (i) all our operating costs,(ii) income taxes and (iii) a charge for the capital employed in the business. When the award is granted, 50% ofthe target dollar value of the award is converted to a number of “notional” shares based on the closing price at thebeginning of the cycle. For those shares whose payout is based on shareholder return as a percentile of the S&P500, compensation expense is recognized using a graded-vesting attribution method, while compensationexpense for the remainder of the performance shares (e.g., EPS targets) is recognized on a straight-line basis overthe vesting period based on the probable outcome of the performance condition.
84

The 2011-2013 cycle concluded at the end of 2013 and an aggregate 65,735 shares of our common stockwere issued in March 2014. The 2012-2014 cycle concluded at the end of 2014 and an aggregate 90,062 shares ofour common stock were issued in March 2015. The 2013-2015 cycle concluded at the end of 2015 and anaggregate 73,134 shares of our common stock will be issued in March 2016.
In 2006, our Board approved the Equity Choice Program (the “Program”) for senior management. Thisprogram continues under the 2010 Plan. Eligible employees can choose from among three equity alternatives andwill be granted such equity awards up to certain dollar awards depending on the participant’s grade level. Aparticipant may choose among (1) Stock Settled Appreciation Rights (“SSARs”), (2) RSUs or (3) PRS. No stockoptions were granted in 2015, 2014 or 2013.
SSARs
SSARs granted become exercisable on the third anniversary of the grant date and have a maximum term of7 years. An immaterial amount of SSARS was granted in 2015. No SSARs were granted in 2014 or 2013.
SSARs and options activity were as follows:
(SHARE AMOUNTS IN THOUSANDS)Shares Subject toSSARs/Options
WeightedAverage Exercise
Price
SSARs/Options
Exercisable
Balance at December 31, 2014 . . . . . . . . . . . . . . . . . . . . . . . . . . . . 151 $51.13 116Exercised . . . . . . . . . . . . . . . . . . . . . . . . . . . . . . . . . . . . . . . . . (113) 64.66
Balance at December 31, 2015 . . . . . . . . . . . . . . . . . . . . . . . . . . . . 38 $52.10 38
The weighted average exercise price of our SSARs and options exercisable at December 31, 2015, 2014 and2013 were $52.10, $47.92 and $41.70, respectively. The following tables summarize information concerningcurrently outstanding and exercisable SSARs and options.
SSARs and options outstanding at December 31, 2015 were as follows:
Price Range
NumberOutstanding
(in thousands)
Weighted AverageRemaining
Contractual Life(in years)
WeightedAverage
Exercise Price
AggregateIntrinsic Value(in thousands)
$26 – $30 . . . . . . . . . . . . . . . . . . . . . . . . . . . . 1 0.4 $30.48$31 – $35 . . . . . . . . . . . . . . . . . . . . . . . . . . . . — 0.0 —$36 – $40 . . . . . . . . . . . . . . . . . . . . . . . . . . . . 5 0.4 36.00$41 – $50 . . . . . . . . . . . . . . . . . . . . . . . . . . . . — 0.0 —$51 – $60 . . . . . . . . . . . . . . . . . . . . . . . . . . . . 24 1.4 52.80$61 – $65 . . . . . . . . . . . . . . . . . . . . . . . . . . . . 8 2.4 62.13
38 $52.59 $2,566
SSARs and options exercisable as of December 31, 2015 were as follows:
Price Range
NumberExercisable
(in thousands)
Weighted AverageRemaining
Contractual Life(in years)
WeightedAverage
Exercise Price
AggregateIntrinsic Value(in thousands)
$26 – $30 . . . . . . . . . . . . . . . . . . . . . . . . . . . . 1 0.4 $30.48$31 – $35 . . . . . . . . . . . . . . . . . . . . . . . . . . . . — 0.0 —$36 – $40 . . . . . . . . . . . . . . . . . . . . . . . . . . . . 5 0.4 36.00$41 – $50 . . . . . . . . . . . . . . . . . . . . . . . . . . . . — 0.0 —$51 – $60 . . . . . . . . . . . . . . . . . . . . . . . . . . . . 24 1.4 52.80$61 – $65 . . . . . . . . . . . . . . . . . . . . . . . . . . . . 8 2.4 62.13
38 $52.10 $2,565
85

The total intrinsic value of options/SSARs exercised during 2015, 2014 and 2013 totaled $7.3 million, $7.5million and $11.3 million, respectively.
As of December 31, 2015, there was less than $0.1 million of total unrecognized compensation cost relatedto non-vested SSARs granted; such cost is expected to be recognized over a period of 2.34 years.
Restricted Stock Units
The Company has granted RSUs to eligible employees and directors. Such RSUs are subject to forfeiture ifcertain employment conditions are not met. RSUs principally vest 100% at the end of 3 years and contain noperformance criteria provisions. An RSU’s fair value is calculated based on the market price of our stock at dateof grant, with an adjustment to reflect the fact that such awards do not participate in dividend rights. Theaggregate fair value is amortized to expense ratably over the vesting period.
RSU activity was as follows:
(SHARE AMOUNTS IN THOUSANDS)Number of
Shares
Weighted AverageGrant Date FairValue Per Share
Balance at December 31, 2014 . . . . . . . . . . . . . . . . . . . . . . . . . . . . . . . . . . . . . . . . 522 $ 74.83Granted . . . . . . . . . . . . . . . . . . . . . . . . . . . . . . . . . . . . . . . . . . . . . . . . . . . . . . 189 112.02Vested . . . . . . . . . . . . . . . . . . . . . . . . . . . . . . . . . . . . . . . . . . . . . . . . . . . . . . . (196) 60.50Forfeited . . . . . . . . . . . . . . . . . . . . . . . . . . . . . . . . . . . . . . . . . . . . . . . . . . . . . (20) 93.20
Balance at December 31, 2015 . . . . . . . . . . . . . . . . . . . . . . . . . . . . . . . . . . . . . . . . 495 $ 93.88
The total fair value of RSUs which vested during the year ended December 31, 2015 was $22.9 million.
As of December 31, 2015, there was $19.7 million of total unrecognized compensation cost related to non-vested RSUs granted under the equity incentive plans; such cost is expected to be recognized over a weightedaverage period of 1.9 years.
Purchased Restricted Stock
For PRS awards granted in 2013 and 2014, the grant provides for eligible employees to purchase restrictedshares of IFF stock and put into an escrow account. For each share put in escrow by the eligible employee, theCompany matches with a grant of a share of restricted stock or, for non-U.S. participants, a restricted stock unit.The shares generally vest on the third anniversary of the grant date, are subject to continued employment andother specified conditions and pay dividends if and when paid by us. Holders of PRS have, in most instances, allof the rights of stockholders, except that they may not sell, assign, pledge or otherwise encumber such shares.RSUs provide no such rights. During 2015, the Company made a change to the PRS awards granted to U.S.participants. Prior to the change, U.S. participants received a share of restricted stock. Subsequent to the change,on a prospective basis U.S. participants began to receive a restricted stock unit instead of a share of restrictedstock. Restricted stock units pay dividend equivalents and do not have voting rights. The Company issued 52,577shares of PRS in 2015 for an aggregate purchase price of $6.2 million covering 26,288 purchased shares, 99,091shares of PRS in 2014 for $9.7 million covering 49,545 purchased shares and 101,326 shares in 2013 for $7.8million covering 50,633 purchased shares.
PRS activity was as follows:
(SHARE AMOUNTS IN THOUSANDS)Number of
Shares
Weighted AverageGrant Date FairValue Per Share
Balance at December 31, 2014 . . . . . . . . . . . . . . . . . . . . . . . . . . . . . . . . . . . . . . . . 380 $ 57.36Granted . . . . . . . . . . . . . . . . . . . . . . . . . . . . . . . . . . . . . . . . . . . . . . . . . . . . . . 53 118.10Vested . . . . . . . . . . . . . . . . . . . . . . . . . . . . . . . . . . . . . . . . . . . . . . . . . . . . . . . (206) 32.18Forfeited . . . . . . . . . . . . . . . . . . . . . . . . . . . . . . . . . . . . . . . . . . . . . . . . . . . . . (8) 96.46
Balance at December 31, 2015 . . . . . . . . . . . . . . . . . . . . . . . . . . . . . . . . . . . . . . . . 219 $ 94.03
86

The total fair value of PRS which vested during the year ended December 31, 2015 was $24.1 million.
As of December 31, 2015, there was $7.2 million of total unrecognized compensation cost related to non-vested PRS granted under the equity incentive plans; such cost is expected to be recognized over a weightedaverage period of 2.0 years.
Liability Awards
The Company has granted Cash RSUs to eligible employees that are paid out 100% in cash upon vesting.Such RSUs are subject to forfeiture if certain employment conditions are not met. Cash RSUs principally vest100% at the end of three years and contain no performance criteria provisions. A Cash RSU’s fair value iscalculated based on the market price of our stock at date of our closing period and is accounted for as a liabilityaward. The aggregate fair value is amortized to expense ratably over the vesting period.
Cash RSU activity was as follows:
(SHARE AMOUNTS IN THOUSANDS) Cash RSUsWeighted Average Fair
Value Per Share
Balance at December 31, 2014 . . . . . . . . . . . . . . . . . . . . . . . . . . . . . . . . . . . . 106 $100.85Granted . . . . . . . . . . . . . . . . . . . . . . . . . . . . . . . . . . . . . . . . . . . . . . . . . . . 34 119.64Vested . . . . . . . . . . . . . . . . . . . . . . . . . . . . . . . . . . . . . . . . . . . . . . . . . . . (38) 117.17Forfeited . . . . . . . . . . . . . . . . . . . . . . . . . . . . . . . . . . . . . . . . . . . . . . . . . . (3) 115.24
Balance at December 31, 2015 . . . . . . . . . . . . . . . . . . . . . . . . . . . . . . . . . . . . 99 $119.64
The total fair value of Cash RSUs which vested during the year ended December 31, 2015 was $4.5 million.
As of December 31, 2015, there was $5.0 million of total unrecognized compensation cost related to non-vested Cash RSUs granted under the equity incentive plans; such cost is expected to be recognized over aweighted average period of 1.8 years. The aggregate compensation cost will be adjusted based on changes in theCompany’s stock price.
NOTE 13. SEGMENT INFORMATION
The Company is organized into two operating segments, Flavors and Fragrances; these segments align withthe internal structure used to manage these businesses. Flavor compounds are sold to the food and beverageindustries for use in consumer products such as prepared foods, beverages, dairy, food and sweet products.Fragrances is comprised of (1) Fragrance Compounds, which are ultimately used by our customers in two broadcategories: Fine Fragrances, including perfumes and colognes and Consumer Fragrances, including fragrancecompounds for personal care (e.g., soaps), household products (e.g., detergents and cleaning agents) and beautycare, including toiletries; (2) Fragrance Ingredients, consisting of synthetic and natural ingredients that can becombined with other materials to create unique fine fragrance and consumer compounds; and (3) CosmeticActive Ingredients, consisting of active and functional ingredients, botanicals and delivery systems to support ourcustomers’ cosmetic and personal care product lines. Major fragrance customers include the cosmetics industry,including perfume and toiletries manufacturers, and the household products industry, including manufacturers ofsoaps, detergents, fabric care, household cleaners and air fresheners.
Our Chief Operating Decision Maker evaluates the performance of these operating segments based onsegment profit which is defined as operating profit before Restructuring, global expenses (as discussed below)and certain non-recurring items, Interest expense, Other income (expense), net and Taxes on income.
The Global expenses caption represents corporate and headquarters-related expenses which include legal,finance, human resources, certain incentive compensation expenses and other R&D and administrative expensesthat are not allocated to individual operating segments. Unallocated assets are principally cash and cashequivalents and other corporate and headquarters-related assets.
87

Our reportable segment information is as follows:
December 31,
(DOLLARS IN THOUSANDS) 2015 2014 2013
Net salesFlavors . . . . . . . . . . . . . . . . . . . . . . . . . . . . . . . . . . . . . . . . . . . . . . . . $1,442,951 $1,457,055 $1,422,739Fragrances . . . . . . . . . . . . . . . . . . . . . . . . . . . . . . . . . . . . . . . . . . . . . 1,580,238 1,631,478 1,530,157
Consolidated . . . . . . . . . . . . . . . . . . . . . . . . . . . . . . . . . . . . . . . $3,023,189 $3,088,533 $2,952,896
December 31,
(DOLLARS IN THOUSANDS) 2015 2014
Segment assetsFlavors . . . . . . . . . . . . . . . . . . . . . . . . . . . . . . . . . . . . . . . . . . . . . . . . $1,607,577 $1,539,254Fragrances . . . . . . . . . . . . . . . . . . . . . . . . . . . . . . . . . . . . . . . . . . . . . 1,989,020 1,753,477Global assets . . . . . . . . . . . . . . . . . . . . . . . . . . . . . . . . . . . . . . . . . . . 124,857 201,890
Consolidated . . . . . . . . . . . . . . . . . . . . . . . . . . . . . . . . . . . . . . . $3,721,454 $3,494,621
December 31,
(DOLLARS IN THOUSANDS) 2015 2014 2013
Segment profit:Flavors . . . . . . . . . . . . . . . . . . . . . . . . . . . . . . . . . . . . . . . . . . . . . . . . $ 318,476 $ 331,257 $ 323,562Fragrances . . . . . . . . . . . . . . . . . . . . . . . . . . . . . . . . . . . . . . . . . . . . . 321,764 335,447 283,651Global expenses . . . . . . . . . . . . . . . . . . . . . . . . . . . . . . . . . . . . . . . . . (28,180) (65,443) (66,942)
Restructuring and other charges, net . . . . . . . . . . . . . . . . . . . . . . . . . . . . . (7,594) (1,298) (2,151)Spanish capital tax charge/reversal(1) . . . . . . . . . . . . . . . . . . . . . . . . . . . . 10,530 — (13,011)Acquisition related costs(2) . . . . . . . . . . . . . . . . . . . . . . . . . . . . . . . . . . . . (18,342) — —Operational improvement initiative costs(3) . . . . . . . . . . . . . . . . . . . . . . . (1,115) (7,642) (8,770)Accelerated contingent consideration(4) . . . . . . . . . . . . . . . . . . . . . . . . . . (7,192) — —
Operating Profit . . . . . . . . . . . . . . . . . . . . . . . . . . . . . . . . . . . . . . . . . . . . . 588,347 592,321 516,339
Interest expense . . . . . . . . . . . . . . . . . . . . . . . . . . . . . . . . . . . . . . . . . . . . . (46,062) (46,067) (46,767)Other income (expense), net(5) . . . . . . . . . . . . . . . . . . . . . . . . . . . . . . . . . (3,184) 2,807 15,638
Income before taxes . . . . . . . . . . . . . . . . . . . . . . . . . . . . . . . . . . . . . . . . . $ 539,101 $ 549,061 $ 485,210
Profit marginFlavors . . . . . . . . . . . . . . . . . . . . . . . . . . . . . . . . . . . . . . . . . . . . . . . . 22.1% 22.7% 22.7%Fragrances . . . . . . . . . . . . . . . . . . . . . . . . . . . . . . . . . . . . . . . . . . . . . 20.4% 20.6% 18.5%Consolidated . . . . . . . . . . . . . . . . . . . . . . . . . . . . . . . . . . . . . . . . . . . 19.5% 19.2% 17.5%
(1) The Spanish capital tax charge/reversal represents the charge recorded during the year ended December 31,2013 as a result of the unfavorable ruling of the Spanish capital tax case from 2002, which was reversedduring the year ended December 31, 2015.
(2) Acquisition related costs relate to the acquisitions of Ottens Flavors and Lucas Meyer during the year endedDecember 31, 2015.
(3) Operational improvement initiative costs relate to the closing of a smaller facility in Europe and certainmanufacturing activities in Asia, while transferring production to larger facilities in each respective region.
(4) Acceleration of contingent consideration payments related to the Aromor acquisition.(5) Other income (expense), net includes a $14.2 million gain on the sale of non-operating assets for the year
ended December 31, 2013.
88
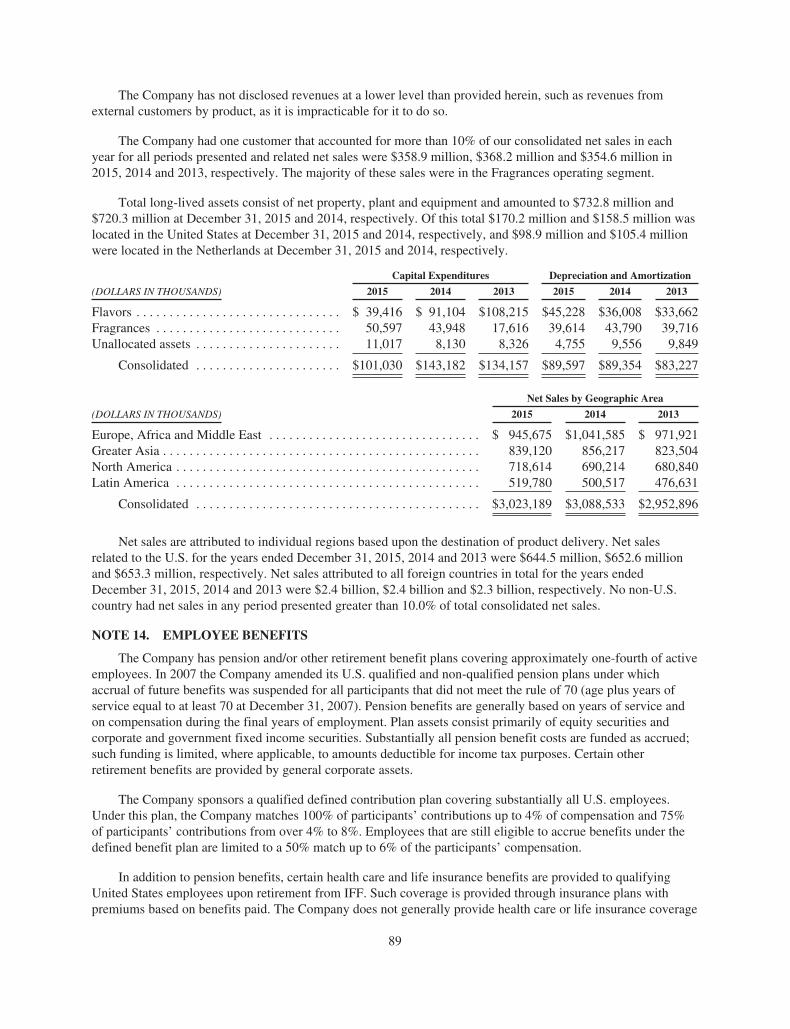
The Company has not disclosed revenues at a lower level than provided herein, such as revenues fromexternal customers by product, as it is impracticable for it to do so.
The Company had one customer that accounted for more than 10% of our consolidated net sales in eachyear for all periods presented and related net sales were $358.9 million, $368.2 million and $354.6 million in2015, 2014 and 2013, respectively. The majority of these sales were in the Fragrances operating segment.
Total long-lived assets consist of net property, plant and equipment and amounted to $732.8 million and$720.3 million at December 31, 2015 and 2014, respectively. Of this total $170.2 million and $158.5 million waslocated in the United States at December 31, 2015 and 2014, respectively, and $98.9 million and $105.4 millionwere located in the Netherlands at December 31, 2015 and 2014, respectively.
Capital Expenditures Depreciation and Amortization
(DOLLARS IN THOUSANDS) 2015 2014 2013 2015 2014 2013
Flavors . . . . . . . . . . . . . . . . . . . . . . . . . . . . . . . $ 39,416 $ 91,104 $108,215 $45,228 $36,008 $33,662Fragrances . . . . . . . . . . . . . . . . . . . . . . . . . . . . 50,597 43,948 17,616 39,614 43,790 39,716Unallocated assets . . . . . . . . . . . . . . . . . . . . . . 11,017 8,130 8,326 4,755 9,556 9,849
Consolidated . . . . . . . . . . . . . . . . . . . . . . $101,030 $143,182 $134,157 $89,597 $89,354 $83,227
Net Sales by Geographic Area
(DOLLARS IN THOUSANDS) 2015 2014 2013
Europe, Africa and Middle East . . . . . . . . . . . . . . . . . . . . . . . . . . . . . . . . $ 945,675 $1,041,585 $ 971,921Greater Asia . . . . . . . . . . . . . . . . . . . . . . . . . . . . . . . . . . . . . . . . . . . . . . . . 839,120 856,217 823,504North America . . . . . . . . . . . . . . . . . . . . . . . . . . . . . . . . . . . . . . . . . . . . . . 718,614 690,214 680,840Latin America . . . . . . . . . . . . . . . . . . . . . . . . . . . . . . . . . . . . . . . . . . . . . . 519,780 500,517 476,631
Consolidated . . . . . . . . . . . . . . . . . . . . . . . . . . . . . . . . . . . . . . . . . . . $3,023,189 $3,088,533 $2,952,896
Net sales are attributed to individual regions based upon the destination of product delivery. Net salesrelated to the U.S. for the years ended December 31, 2015, 2014 and 2013 were $644.5 million, $652.6 millionand $653.3 million, respectively. Net sales attributed to all foreign countries in total for the years endedDecember 31, 2015, 2014 and 2013 were $2.4 billion, $2.4 billion and $2.3 billion, respectively. No non-U.S.country had net sales in any period presented greater than 10.0% of total consolidated net sales.
NOTE 14. EMPLOYEE BENEFITS
The Company has pension and/or other retirement benefit plans covering approximately one-fourth of activeemployees. In 2007 the Company amended its U.S. qualified and non-qualified pension plans under whichaccrual of future benefits was suspended for all participants that did not meet the rule of 70 (age plus years ofservice equal to at least 70 at December 31, 2007). Pension benefits are generally based on years of service andon compensation during the final years of employment. Plan assets consist primarily of equity securities andcorporate and government fixed income securities. Substantially all pension benefit costs are funded as accrued;such funding is limited, where applicable, to amounts deductible for income tax purposes. Certain otherretirement benefits are provided by general corporate assets.
The Company sponsors a qualified defined contribution plan covering substantially all U.S. employees.Under this plan, the Company matches 100% of participants’ contributions up to 4% of compensation and 75%of participants’ contributions from over 4% to 8%. Employees that are still eligible to accrue benefits under thedefined benefit plan are limited to a 50% match up to 6% of the participants’ compensation.
In addition to pension benefits, certain health care and life insurance benefits are provided to qualifyingUnited States employees upon retirement from IFF. Such coverage is provided through insurance plans withpremiums based on benefits paid. The Company does not generally provide health care or life insurance coverage
89

for retired employees of foreign subsidiaries; such benefits are provided in most foreign countries bygovernment-sponsored plans, and the cost of these programs is not material.
The Company offers a non-qualified Deferred Compensation Plan (“DCP”) for certain key employees andnon-employee directors. Eligible employees and non-employee directors may elect to defer receipt of salary,incentive payments and Board of Directors’ fees into participant directed investments, which are generallyinvested by the Company in individual variable life insurance contracts it owns that are designed to informallyfund savings plans of this nature. The cash surrender value of life insurance is based on the net asset values of theunderlying funds available to plan participants. At December 31, 2015 and December 31, 2014, the ConsolidatedBalance Sheet reflects liabilities of $34.6 million and $33.9 million, respectively, related to the DCP in Otherliabilities and $13.9 million and $19.0 million, respectively, included in Capital in excess of par value related tothe portion of the DCP that will be paid out in IFF shares.
The total cash surrender value of life insurance contracts the Company owns in relation to the DCP andpost-retirement life insurance benefits amounted to $42.0 million and $42.4 million at December 31, 2015 and2014, respectively, and are recorded in Other assets in the Consolidated Balance Sheet.
The plan assets and benefit obligations of our defined benefit pension plans are measured at December 31 ofeach year.
U.S. Plans Non-U.S. Plans
(DOLLARS IN THOUSANDS) 2015 2014 2013 2015 2014 2013
Components of net periodic benefit costService cost for benefits earned . . . . . . . . . . . . $ 3,144 $ 3,057 $ 3,644 $ 15,866 $ 14,142 $ 16,423Interest cost on projected benefit obligation . . . 23,705 25,090 23,284 25,389 33,360 31,103Expected return on plan assets . . . . . . . . . . . . . (32,405) (27,647) (26,320) (50,437) (49,861) (47,793)Net amortization of deferrals . . . . . . . . . . . . . . . 21,390 17,656 24,600 12,864 10,584 9,337Settlements and curtailments . . . . . . . . . . . . . . . — — — — 43 215
Net periodic benefit cost . . . . . . . . . . . . . . . . . . 15,834 18,156 25,208 3,682 8,268 9,285Defined contribution and other retirement
plans . . . . . . . . . . . . . . . . . . . . . . . . . . . . . . . . 7,104 7,854 7,326 7,028 6,323 4,094
Total expense . . . . . . . . . . . . . . . . . . . . . . . . . . . $ 22,938 $ 26,010 $ 32,534 $ 10,710 $ 14,591 $ 13,379
Changes in plan assets and benefitobligations recognized in OCI
Net actuarial loss . . . . . . . . . . . . . . . . . . . . . . . . $ 7,623 $ 50,918 $ 3,848 $138,652Recognized actuarial loss . . . . . . . . . . . . . . . . . (21,207) (17,345) (13,629) (10,874)Prior service cost . . . . . . . . . . . . . . . . . . . . . . . . — 216 459 (10,814)Recognized prior service cost . . . . . . . . . . . . . . (183) (311) 765 248Currency translation adjustment . . . . . . . . . . . . — — (25,230) (30,441)
Total recognized in OCI (before tax effects) . . $(13,767) $ 33,478 $(33,787) $ 86,771
90

Postretirement Benefits
(DOLLARS IN THOUSANDS) 2015 2014 2013
Components of net periodic benefit costService cost for benefits earned . . . . . . . . . . . . . . . . . . . . . . . . . . . . . . . . . . . . . $ 966 $ 1,295 $ 1,526Interest cost on projected benefit obligation . . . . . . . . . . . . . . . . . . . . . . . . . . . 3,904 4,896 4,503Net amortization and deferrals . . . . . . . . . . . . . . . . . . . . . . . . . . . . . . . . . . . . . (4,476) (4,109) (3,040)
Expense . . . . . . . . . . . . . . . . . . . . . . . . . . . . . . . . . . . . . . . . . . . . . . . . . . . . . . . $ 394 $ 2,082 $ 2,989
Changes in plan assets and benefit obligations recognized in OCINet actuarial (gain) . . . . . . . . . . . . . . . . . . . . . . . . . . . . . . . . . . . . . . . . . . . . . . $ (1,557) $ 7,706Recognized actuarial loss . . . . . . . . . . . . . . . . . . . . . . . . . . . . . . . . . . . . . . . . . (1,331) (540)Prior service credit . . . . . . . . . . . . . . . . . . . . . . . . . . . . . . . . . . . . . . . . . . . . . . . (33,902) —Recognized prior service credit . . . . . . . . . . . . . . . . . . . . . . . . . . . . . . . . . . . . . 5,807 4,649
Total recognized in OCI (before tax effects) . . . . . . . . . . . . . . . . . . . . . . . . . . . $(30,983) $11,815
The amounts expected to be recognized in net periodic cost in 2016 are:
(DOLLARS IN THOUSANDS) U.S. Plans Non-U.S. PlansPostretirement
Benefits
Actuarial loss recognition . . . . . . . . . . . . . . . . . . . . . . . . . . . . . . . . . $5,484 $13,863 $ 1,369Prior service cost (credit) recognition . . . . . . . . . . . . . . . . . . . . . . . . 62 (729) (6,789)
Weighted-average actuarialassumption used to determine expense
U.S. Plans Non-U.S. Plans
2015 2014 2013 2015 2014 2013
Discount rate . . . . . . . . . . . . . . . . . . . . . . . . . . . . . . . . . . . . . 3.90% 4.70% 4.10% 2.74% 4.18% 4.14%Expected return on plan assets . . . . . . . . . . . . . . . . . . . . . . . 7.30% 7.30% 7.30% 6.24% 6.27% 6.26%Rate of compensation increase . . . . . . . . . . . . . . . . . . . . . . . 3.25% 3.25% 3.25% 2.00% 2.66% 2.73%
91

Changes in the postretirement benefit obligation and plan assets, as applicable, are detailed in the followingtable:
U.S. Plans Non-U.S. Plans Postretirement Benefits
(DOLLARS IN THOUSANDS) 2015 2014 2015 2014 2015 2014
Benefit obligation at beginning ofyear . . . . . . . . . . . . . . . . . . . . . . . . . . . $625,479 $ 544,602 $965,266 $ 818,578 $113,497 $105,521
Service cost for benefits earned . . . . . . . 3,144 3,057 15,866 14,142 966 1,295Interest cost on projected benefit
obligation . . . . . . . . . . . . . . . . . . . . . . 23,705 25,090 25,389 33,360 3,904 4,896Actuarial (gain) loss . . . . . . . . . . . . . . . . (36,338) 79,855 (47,883) 236,096 (1,557) 7,706Plan amendments . . . . . . . . . . . . . . . . . . — 216 459 (10,814) (33,902) —Adjustments for expense/tax contained
in service cost . . . . . . . . . . . . . . . . . . . — — (1,976) (2,087) — —Plan participants’ contributions . . . . . . . — — 1,790 2,096 809 1,024Benefits paid . . . . . . . . . . . . . . . . . . . . . . (28,479) (27,341) (29,121) (32,134) (6,569) (6,945)Curtailments / settlements . . . . . . . . . . . — — — (9,270) — —Translation adjustments . . . . . . . . . . . . . — — (69,550) (86,413) — —Acquisitions/Transferred Liabilities . . . . — — — 1,712 — —
Benefit obligation at end of year . . . . . . $587,511 $ 625,479 $860,240 $ 965,266 $ 77,148 $113,497
Fair value of plan assets at beginning ofyear . . . . . . . . . . . . . . . . . . . . . . . . . . . $501,801 $ 448,851 $852,893 $ 799,670
Actual return on plan assets . . . . . . . . . . (11,556) 56,584 (3,271) 135,947Employer contributions . . . . . . . . . . . . . 38,545 23,707 29,352 20,282Participants’ contributions . . . . . . . . . . . — — 1,790 2,096Benefits paid . . . . . . . . . . . . . . . . . . . . . . (28,479) (27,341) (29,121) (32,134)Settlements . . . . . . . . . . . . . . . . . . . . . . . — — — —Translation adjustments . . . . . . . . . . . . . — — (61,029) (74,680)Acquisitions/Transferred Assets . . . . . . . — — — 1,712
Fair value of plan assets at end ofyear . . . . . . . . . . . . . . . . . . . . . . . . . . . $500,311 $ 501,801 $790,614 $ 852,893
Funded status at end of year . . . . . . . . . . $ (87,200) $(123,678) $ (69,626) $(112,373)
U.S. Plans Non-U.S. Plans
(DOLLARS IN THOUSANDS) 2015 2014 2015 2014
Amounts recognized in the balance sheet:Other assets . . . . . . . . . . . . . . . . . . . . . . . . . . . . . . . . . . . . . . . . . . $ — $ — $ 4,096 $ 1,338Other current liabilities . . . . . . . . . . . . . . . . . . . . . . . . . . . . . . . . . (3,866) (3,887) (613) (608)Retirement liabilities . . . . . . . . . . . . . . . . . . . . . . . . . . . . . . . . . . . (83,334) (119,791) (73,109) (113,103)
Net amount recognized . . . . . . . . . . . . . . . . . . . . . . . . . . . . . . . . . $(87,200) $(123,678) $(69,626) $(112,373)
U.S. Plans Non-U.S. Plans Postretirement Benefits
(DOLLARS IN THOUSANDS) 2015 2014 2015 2014 2015 2014
Amounts recognized in AOCI consist of:Net actuarial loss . . . . . . . . . . . . . . . . . . . . $165,093 $178,677 $324,068 $360,070 $ 18,169 $ 21,057Prior service cost (credit) . . . . . . . . . . . . . . 203 387 (8,482) (10,697) (38,453) (10,358)
Total AOCI (before tax effects) . . . . . . . . . $165,296 $179,064 $315,586 $349,373 $(20,284) $ 10,699
92

U.S. Plans Non-U.S. Plans
(DOLLARS IN THOUSANDS) 2015 2014 2015 2014
Accumulated Benefit Obligation — end of year . . . . . . . . . . $583,346 $616,004 $837,272 $942,103
Information for Pension Plans with an ABO in excess ofPlan Assets:
Projected benefit obligation . . . . . . . . . . . . . . . . . . . . . . . . . . . . $587,511 $625,479 $609,922 $695,552Accumulated benefit obligation . . . . . . . . . . . . . . . . . . . . . . . . . 583,346 616,004 586,954 672,389Fair value of plan assets . . . . . . . . . . . . . . . . . . . . . . . . . . . . . . . 500,311 501,801 536,200 581,841
Weighted-average assumptions used to determineobligations at December 31
Discount rate . . . . . . . . . . . . . . . . . . . . . . . . . . . . . . . . . . . . . . . . 4.20% 3.90% 3.03% 2.74%Rate of compensation increase . . . . . . . . . . . . . . . . . . . . . . . . . . 3.25% 3.25% 1.98% 2.00%
(DOLLARS IN THOUSANDS) U.S. PlansNon-U.S.
PlansPostretirement
Benefits
Estimated Future Benefit Payments2016 . . . . . . . . . . . . . . . . . . . . . . . . . . . . . . . . . . . . . . . . . . . . . . . . . . . . . 31,284 26,660 4,4702017 . . . . . . . . . . . . . . . . . . . . . . . . . . . . . . . . . . . . . . . . . . . . . . . . . . . . . 32,583 26,806 4,5162018 . . . . . . . . . . . . . . . . . . . . . . . . . . . . . . . . . . . . . . . . . . . . . . . . . . . . . 33,850 28,996 4,6382019 . . . . . . . . . . . . . . . . . . . . . . . . . . . . . . . . . . . . . . . . . . . . . . . . . . . . . 35,262 29,709 4,7322020 . . . . . . . . . . . . . . . . . . . . . . . . . . . . . . . . . . . . . . . . . . . . . . . . . . . . . 36,132 28,931 4,8402021-2025 . . . . . . . . . . . . . . . . . . . . . . . . . . . . . . . . . . . . . . . . . . . . . . . . 187,429 160,179 23,997
ContributionsRequired Company Contributions in the Following Year (2016) . . . . . $ 3,947 $ 24,331 $ 4,470
The Company considers a number of factors in determining and selecting assumptions for the overallexpected long-term rate of return on plan assets. The Company considers the historical long-term returnexperience of our assets, the current and expected allocation of our plan assets and expected long-term rates ofreturn. The Company derives these expected long-term rates of return with the assistance of our investmentadvisors. The Company bases its expected allocation of plan assets on a diversified portfolio consisting ofdomestic and international equity securities, fixed income, real estate and alternative asset classes. The assetallocation is monitored on an ongoing basis.
The Company considers a variety of factors in determining and selecting our assumptions for the discountrate at December 31. For the U.S. plans, the discount rate was based on the internal rate of return for a portfolioof Moody’s Aaa, Aa and Merrill Lynch AAA-AA high quality bonds with maturities that are consistent with theprojected future benefit payment obligations of the plan. The rate of compensation increase for all plans and themedical cost trend rate for the applicable U.S. plans are based on plan experience.
U.S. Plans Non-U.S. Plans
2015 2014 2015 2014
Percentage of assets invested in:Cash and cash equivalents . . . . . . . . . . . . . . . . . . . . . . . . . . . . . . . . . . . . . . . . . . . . 1% 1% 2% 1%Equities . . . . . . . . . . . . . . . . . . . . . . . . . . . . . . . . . . . . . . . . . . . . . . . . . . . . . . . . . . 41% 40% 27% 26%Fixed income . . . . . . . . . . . . . . . . . . . . . . . . . . . . . . . . . . . . . . . . . . . . . . . . . . . . . . 58% 59% 55% 62%Property . . . . . . . . . . . . . . . . . . . . . . . . . . . . . . . . . . . . . . . . . . . . . . . . . . . . . . . . . . 0% 0% 7% 7%Alternative and other investments . . . . . . . . . . . . . . . . . . . . . . . . . . . . . . . . . . . . . . 0% 0% 9% 4%
With respect to the U.S. plans, the expected return on plan assets was determined based on an assetallocation model using the current target allocation, real rates of return by asset class and an anticipated inflationrate. The target investment allocation is 40% equity securities and 60% fixed income securities.
93

The expected annual rate of return for the non-U.S. plans employs a similar set of criteria adapted for localinvestments, inflation rates and in certain cases specific government requirements. The target asset allocation, forthe non-U.S. plans, consists of approximately: 40% — 70% in fixed income securities; 15% — 40% in equitysecurities; 5% — 20% in real estate; and 5% — 10% in alternative investments.
The following tables present our plan assets for the U.S. and non-U.S. plans using the fair value hierarchy asof December 31, 2015 and 2014. Our plans’ assets were accounted for at fair value and are classified in theirentirety based on the lowest level of input that is significant to the fair value measurement. Our assessment of thesignificance of a particular input to the fair value measurement requires judgment, and may affect the valuationof fair value assets and their placement within the fair value hierarchy levels. For more information on adescription of the fair value hierarchy, see Note 15.
U.S. Plans for the year endedDecember 31, 2015
(DOLLARS IN THOUSANDS) Level 1 Level 2 Level 3 Total
Cash Equivalents . . . . . . . . . . . . . . . . . . . . . . . . . . . . . . . . . . . . . . $ — $ 4,767 $— $ 4,767Equity SecuritiesU.S. Common Stock . . . . . . . . . . . . . . . . . . . . . . . . . . . . . . . . . . . . 37,024 — — 37,024Non-U.S. Common Stock . . . . . . . . . . . . . . . . . . . . . . . . . . . . . . . . — — — —Balanced Funds . . . . . . . . . . . . . . . . . . . . . . . . . . . . . . . . . . . . . . . — 8,845 — 8,845Pooled Funds . . . . . . . . . . . . . . . . . . . . . . . . . . . . . . . . . . . . . . . . . — 159,800 — 159,800Fixed Income SecuritiesGovernment & Government Agency Bonds . . . . . . . . . . . . . . . . . — 11,070 — 11,070Mutual Funds . . . . . . . . . . . . . . . . . . . . . . . . . . . . . . . . . . . . . . . . . — 190,274 — 190,274Corporate Bonds . . . . . . . . . . . . . . . . . . . . . . . . . . . . . . . . . . . . . . . — 77,754 — 77,754Municipal Bonds . . . . . . . . . . . . . . . . . . . . . . . . . . . . . . . . . . . . . . — 10,006 — 10,006
Total . . . . . . . . . . . . . . . . . . . . . . . . . . . . . . . . . . . . . . . . . . . . . . . . $37,024 $462,516 $— $499,540
Receivables . . . . . . . . . . . . . . . . . . . . . . . . . . . . . . . . . . . . . . . . . . . $ 771
Total . . . . . . . . . . . . . . . . . . . . . . . . . . . . . . . . . . . . . . . . . . . . . . . . $500,311
U.S. Plans for the year endedDecember 31, 2014
(DOLLARS IN THOUSANDS) Level 1 Level 2 Level 3 Total
Cash Equivalents . . . . . . . . . . . . . . . . . . . . . . . . . . . . . . . . . . . . . . $ — $ 3,829 $— $ 3,829Equity SecuritiesU.S. Common Stock . . . . . . . . . . . . . . . . . . . . . . . . . . . . . . . . . . . . 37,278 — — 37,278Non-U.S. Common Stock . . . . . . . . . . . . . . . . . . . . . . . . . . . . . . . . 1,635 — — 1,635Balanced Funds . . . . . . . . . . . . . . . . . . . . . . . . . . . . . . . . . . . . . . . — 9,270 — 9,270Pooled Funds . . . . . . . . . . . . . . . . . . . . . . . . . . . . . . . . . . . . . . . . . — 154,559 — 154,559Fixed Income SecuritiesGovernment & Government Agency Bonds . . . . . . . . . . . . . . . . . — 10,620 — 10,620Mutual Funds . . . . . . . . . . . . . . . . . . . . . . . . . . . . . . . . . . . . . . . . . — 212,007 — 212,007Corporate Bonds . . . . . . . . . . . . . . . . . . . . . . . . . . . . . . . . . . . . . . . — 63,057 — 63,057Municipal Bonds . . . . . . . . . . . . . . . . . . . . . . . . . . . . . . . . . . . . . . — 9,100 — 9,100
Total . . . . . . . . . . . . . . . . . . . . . . . . . . . . . . . . . . . . . . . . . . . . . . . . $38,913 $462,442 $— $501,355
Receivables . . . . . . . . . . . . . . . . . . . . . . . . . . . . . . . . . . . . . . . . . . . $ 446
Total . . . . . . . . . . . . . . . . . . . . . . . . . . . . . . . . . . . . . . . . . . . . . . . . $501,801
94

Non-U.S. Plans for the year endedDecember 31, 2015
(DOLLARS IN THOUSANDS) Level 1 Level 2 Level 3 Total
Cash . . . . . . . . . . . . . . . . . . . . . . . . . . . . . . . . . . . . . . . . . . . . . $ 13,239 $ — $ — $ 13,239Equity SecuritiesU.S. Large Cap . . . . . . . . . . . . . . . . . . . . . . . . . . . . . . . . . . . . . 74,306 17,118 — 91,424U.S. Mid Cap . . . . . . . . . . . . . . . . . . . . . . . . . . . . . . . . . . . . . . . 262 — — 262U.S. Small Cap . . . . . . . . . . . . . . . . . . . . . . . . . . . . . . . . . . . . . 230 — — 230Non-U.S. Large Cap . . . . . . . . . . . . . . . . . . . . . . . . . . . . . . . . . 73,578 12,372 — 85,950Non-U.S. Mid Cap . . . . . . . . . . . . . . . . . . . . . . . . . . . . . . . . . . 2,175 — — 2,175Non-U.S. Small Cap . . . . . . . . . . . . . . . . . . . . . . . . . . . . . . . . . 226 — — 226Emerging Markets . . . . . . . . . . . . . . . . . . . . . . . . . . . . . . . . . . . 33,291 2,152 — 35,443Fixed Income SecuritiesU.S. Treasuries/Government Bonds . . . . . . . . . . . . . . . . . . . . . 67 — — 67Non-U.S. Treasuries/Government Bonds . . . . . . . . . . . . . . . . . 121,552 55,184 — 176,736Non-U.S. Corporate Bonds . . . . . . . . . . . . . . . . . . . . . . . . . . . . 56,238 174,626 — 230,864Non-U.S. Asset-Backed Securities . . . . . . . . . . . . . . . . . . . . . . — 26,132 — 26,132Non-U.S. Other Fixed Income . . . . . . . . . . . . . . . . . . . . . . . . . 1,625 — — 1,625Alternative Types of InvestmentsInsurance Contracts . . . . . . . . . . . . . . . . . . . . . . . . . . . . . . . . . . 299 36,447 — 36,746Hedge Funds . . . . . . . . . . . . . . . . . . . . . . . . . . . . . . . . . . . . . . . — — 17,034 17,034Absolute Return Funds . . . . . . . . . . . . . . . . . . . . . . . . . . . . . . . 2,566 16,603 — 19,169Real EstateNon-U.S. Real Estate . . . . . . . . . . . . . . . . . . . . . . . . . . . . . . . . — 13,985 39,307 53,292
Total . . . . . . . . . . . . . . . . . . . . . . . . . . . . . . . . . . . . . . . . . . . . . $379,654 $354,619 $56,341 $790,614
Non-U.S. Plans for the year endedDecember 31, 2014
(DOLLARS IN THOUSANDS) Level 1 Level 2 Level 3 Total
Cash . . . . . . . . . . . . . . . . . . . . . . . . . . . . . . . . . . . . . . . . . . . . . . . . . $ 10,792 $ — $ — $ 10,792Equity SecuritiesU.S. Large Cap . . . . . . . . . . . . . . . . . . . . . . . . . . . . . . . . . . . . . . . . . 64,852 8,295 — 73,147Non-U.S. Large Cap . . . . . . . . . . . . . . . . . . . . . . . . . . . . . . . . . . . . . 83,671 5,853 — 89,524Non-U.S. Mid Cap . . . . . . . . . . . . . . . . . . . . . . . . . . . . . . . . . . . . . . 145 — — 145Non-U.S. Small Cap . . . . . . . . . . . . . . . . . . . . . . . . . . . . . . . . . . . . . 33 — — 33Emerging Markets . . . . . . . . . . . . . . . . . . . . . . . . . . . . . . . . . . . . . . . 52,664 1,214 — 53,878Fixed Income SecuritiesU.S. Treasuries/Government Bonds . . . . . . . . . . . . . . . . . . . . . . . . . 47 — — 47Non-U.S. Treasuries/Government Bonds . . . . . . . . . . . . . . . . . . . . . 163,143 100,544 — 263,687Non-U.S. Corporate Bonds . . . . . . . . . . . . . . . . . . . . . . . . . . . . . . . . 62,630 186,837 — 249,467Non-U.S. Asset-Backed Securities . . . . . . . . . . . . . . . . . . . . . . . . . . — 16,375 — 16,375Non-U.S. Other Fixed Income . . . . . . . . . . . . . . . . . . . . . . . . . . . . . 1,409 — — 1,409Alternative Types of InvestmentsInsurance Contracts . . . . . . . . . . . . . . . . . . . . . . . . . . . . . . . . . . . . . . 316 — — 316Hedge Funds . . . . . . . . . . . . . . . . . . . . . . . . . . . . . . . . . . . . . . . . . . . — — 14,775 14,775Other . . . . . . . . . . . . . . . . . . . . . . . . . . . . . . . . . . . . . . . . . . . . . . . . . 904 — — 904Absolute Return Funds . . . . . . . . . . . . . . . . . . . . . . . . . . . . . . . . . . . — 17,135 — 17,135Private Equity Funds . . . . . . . . . . . . . . . . . . . . . . . . . . . . . . . . . . . . . — — 6 6Real EstateNon-U.S. Real Estate(1) . . . . . . . . . . . . . . . . . . . . . . . . . . . . . . . . . . . — 11,697 49,556 61,253
Total . . . . . . . . . . . . . . . . . . . . . . . . . . . . . . . . . . . . . . . . . . . . . . . . . $440,606 $347,950 $64,337 $852,893
(1) The 2014 presentation was revised by $44.6 million to correctly present assets as level 3 instead of level 2.
95

Cash and cash equivalents are primarily held in registered money market funds which are valued using amarket approach based on the quoted market prices of identical instruments. Other cash and cash equivalents arevalued daily by the fund using a market approach with inputs that include quoted market prices for similarinstruments.
Equity securities are primarily valued using a market approach based on the quoted market prices ofidentical instruments. Pooled funds are typically common or collective trusts valued at their net asset values(NAVs).
Fixed income securities are primarily valued using a market approach with inputs that include broker quotesand benchmark yields.
Derivative instruments are valued by the custodian using closing market swap curves and market derivedinputs.
Real estate values are primarily based on valuation of the underlying investments, which include inputs suchas cost, discounted future cash flows, independent appraisals and market comparable data.
Hedge funds are valued based on valuation of the underlying securities and instruments within the funds.Quoted market prices are used when available and NAVs are used for unquoted securities within the funds.
Absolute return funds are actively managed funds mainly invested in debt and equity securities and arevalued at their NAVs.
The following table presents a reconciliation of Level 3 non-U.S. plan assets held during the year endedDecember 31, 2015:
Non-U.S. Plans
(DOLLARS IN THOUSANDS)Real
EstatePrivateEquity
HedgeFunds Total
Ending balance as of December 31, 2014 . . . . . . . . . . . . . . . . . . . . . . . . . $ 49,556 $ 6 $14,775 $64,337Actual return on plan assets . . . . . . . . . . . . . . . . . . . . . . . . . . . . . . . . . . . (10,249) (6) 2,259 (7,996)
Ending balance as of December 31, 2015 . . . . . . . . . . . . . . . . . . . . . . . . . $ 39,307 $— $17,034 $56,341
The following weighted average assumptions were used to determine our postretirement benefit expense andobligation for the years ended December 31:
Expense Liability
2015 2014 2015 2014
Discount rate . . . . . . . . . . . . . . . . . . . . . . . . . . . . . . . . . . . . . . . . . . . . . . . . . . . . 3.90% 4.80% 4.20% 3.90%Current medical cost trend rate . . . . . . . . . . . . . . . . . . . . . . . . . . . . . . . . . . . . . . 5.80% 6.50% 7.15% 5.80%Ultimate medical cost trend rate . . . . . . . . . . . . . . . . . . . . . . . . . . . . . . . . . . . . . 4.75% 4.75% 4.75% 4.75%Medical cost trend rate decreases to ultimate rate in year . . . . . . . . . . . . . . . . . 2023 2021 2023 2023
Sensitivity of Disclosures to Changes in Selected Assumptions
25 BP Decrease in DiscountRate
25 BP Decrease inDiscount Rate
25 BP Decrease inLong-Term Rate of
Return
(DOLLARS IN THOUSANDS)Change in
PBOChange in
ABOChange in
pension expenseChange in pension
expense
U.S. Pension Plans . . . . . . . . . . . . . . . . . . . . . . . . . $17,519 $17,359 $ (5) $1,186Non-U.S. Pension Plans . . . . . . . . . . . . . . . . . . . . . 39,727 37,661 2,478 1,963Postretirement Benefit Plan . . . . . . . . . . . . . . . . . . N/A 2,376 85 N/A
96

The effect of a 1% increase in the medical cost trend rate would increase the accumulated postretirementbenefit obligation and the annual postretirement expense by approximately $0.6 million and $0.1 million,respectively; a 1% decrease in the rate would decrease the obligation and expense by approximately $0.6 millionand $0.1 million, respectively.
The Company contributed $35.1 million and $29.4 million to its qualified U.S. pension plans and non-U.S.pension plans in 2015, respectively. The Company made $3.5 million in benefit payments with respect to its non-qualified U.S. pension plan. In addition, $6.6 million of payments were made with respect to the Company’sother postretirement plans.
NOTE 15. FINANCIAL INSTRUMENTS
Fair Value
Accounting guidance on fair value measurements specifies a hierarchy of valuation techniques based onwhether the inputs to those valuation techniques are observable or unobservable. Observable inputs reflectmarket data obtained from independent sources, while unobservable inputs reflect our market assumptions. Thesetwo types of inputs create the following fair value hierarchy:
‰ Level 1 — Quoted prices for identical instruments in active markets.
‰ Level 2 — Quoted prices for similar instruments in active markets; quoted prices for identical or similarinstruments in markets that are not active; and model-derived valuations in which all significant inputsand significant value drivers are observable in active markets.
‰ Level 3 — Valuations derived from valuation techniques in which one or more significant inputs orsignificant value drivers are unobservable.
This hierarchy requires us to use observable market data, when available, and to minimize the use ofunobservable inputs when determining fair value. The Company determines the fair value of structured liabilities(where performance is linked to structured interest rates, inflation or currency risks) using the London InterBankOffer Rate (“LIBOR”) swap curve and forward interest and exchange rates at period end. Such instruments areclassified as Level 2 based on the observability of significant inputs to the model. The Company does not haveany instruments classified as Level 1 or Level 3, other than those included in pension asset trusts included inNote 14.
These valuations take into consideration the Company’s credit risk and its counterparties’ credit risk. Theestimated change in the fair value of these instruments due to such changes in its own credit risk (or instrument-specific credit risk) was immaterial as of December 31, 2015.
The amounts recorded in the balance sheet (carrying amount) and the estimated fair values of financialinstruments at December 31 consisted of the following:
2015 2014
(DOLLARS IN THOUSANDS)CarryingAmount
FairValue
CarryingAmount
FairValue
Cash and cash equivalents(1) . . . . . . . . . . . . . . . . . . . . . . . . . . . . . . $181,988 $181,988 $478,573 $478,573Credit facilities and bank overdrafts(2) . . . . . . . . . . . . . . . . . . . . . . 142,105 142,105 12,335 12,335Long-term debt:(3)
Senior notes — 2006 . . . . . . . . . . . . . . . . . . . . . . . . . . . . . . . . 125,000 127,717 125,000 133,137Senior notes — 2007 . . . . . . . . . . . . . . . . . . . . . . . . . . . . . . . . 500,000 563,855 500,000 587,650Senior notes — 2013 . . . . . . . . . . . . . . . . . . . . . . . . . . . . . . . . 299,809 290,830 299,782 296,290
(1) The carrying amount of cash and cash equivalents approximates fair value due to the short maturity of thoseinstruments.
(2) The carrying amount of our credit facilities and bank overdrafts approximates fair value as the interest rateis reset frequently based on current market rates as well as the short maturity of those instruments.
97

(3) The fair value of our long-term debt was calculated using discounted cash flows applying current interestrates and current credit spreads based on our own credit risk.
Derivatives
The Company periodically enters into foreign currency forward contracts with the objective of reducingexposure to cash flow volatility associated with its intercompany loans, foreign currency receivables andpayables and anticipated purchases of certain raw materials used in operations. These contracts generally involvethe exchange of one currency for a second currency at a future date, have maturities not exceeding twelve monthsand are with counterparties which are major international financial institutions.
In 2003, the Company executed a 10-year Yen — U.S. dollar currency swap related to the monthly sale andpurchase of products between the U.S. and Japan which has been designated as a cash flow hedge. This swapmatured in January 2013.
During the years ended December 31, 2015 and 2014, the Company entered into several forward currencycontracts which qualified as net investment hedges, in order to mitigate a portion of our net Europeaninvestments from foreign currency risk. The effective portions of net investment hedges are recorded in othercomprehensive income (“OCI”) as a component of Foreign currency translation adjustments in the accompanyingConsolidated Statement of Income and Comprehensive Income. Realized gains/(losses) are deferred in AOCIwhere they will remain until the net investments in our European subsidiaries are divested. Ten of these forwardcurrency contracts matured during the year ended December 31, 2015. The outstanding forward currencycontacts have remaining maturities of less than one year.
During the year ended December 31, 2015 and 2014, the Company continued to enter into several forwardcurrency contracts which qualified as cash flow hedges. The objective of these hedges is to protect against thecurrency risk associated with forecasted U.S. dollar (USD) denominated raw material purchases made by Euro(EUR) functional currency entities which result from changes in the EUR/USD exchange rate. The effectiveportions of cash flow hedges are recorded in OCI as a component of Gains/(Losses) on derivatives qualifying ashedges in the accompanying Consolidated Statement of Income and Comprehensive Income. Realized gains/(losses) in AOCI related to cash flow hedges of raw material purchases are recognized as a component of Cost ofgoods sold in the accompanying Consolidated Statement of Income and Comprehensive Income in the sameperiod as the related costs are recognized.
During 2014 and 2013, the Company entered into interest rate swap agreements that effectively convertedthe fixed rate on a portion of our long-term borrowings to a variable short-term rate based on the LIBOR plus aninterest markup. These swaps are designated as fair value hedges. Amounts recognized in Interest expense wereimmaterial for the year ended December 31, 2014.
During Q1 2013, the Company entered into three interest rate swaps to hedge the anticipated issuance offixed-rate debt, which are designated as cash flow hedges. The effective portions of cash flow hedges arerecorded in OCI as a component of Losses/gains on derivatives qualifying as hedges in the accompanyingConsolidated Statement of Income and Comprehensive Income. During the second quarter of 2013, the Companyterminated these swaps and incurred a loss of $2.7 million, which it will amortize as Interest expense over the lifeof the Senior Notes — 2013 (discussed in Note 9).
The following table shows the notional amount of the Company’s derivative instruments outstanding as ofDecember 31, 2015 and December 31, 2014:
(DOLLARS IN THOUSANDS)December 31,
2015December 31,
2014
Forward currency contracts . . . . . . . . . . . . . . . . . . . . . . . . . . . . . . . . . . . . . . . . . . . . $256,200 $191,150Interest rate swaps . . . . . . . . . . . . . . . . . . . . . . . . . . . . . . . . . . . . . . . . . . . . . . . . . . . $775,000 $425,000
98

The following tables show the Company’s derivative instruments measured at fair value (Level 2 of the fairvalue hierarchy) as reflected in the Consolidated Balance Sheets as of December 31, 2015 and December 31,2014 (in thousands):
December 31, 2015
Fair Value ofDerivatives
Designated asHedging
Instruments
Fair Value ofDerivatives NotDesignated as
HedgingInstruments
Total FairValue
Derivative assets(a)
Foreign currency contracts . . . . . . . . . . . . . . . . . . . . . . . . . . . . . $ 6,560 $3,700 $10,260Interest rate swaps . . . . . . . . . . . . . . . . . . . . . . . . . . . . . . . . . . . . 1,210 — 1,210
$ 7,770 $3,700 $11,470Derivative liabilities(b)
Foreign currency contracts . . . . . . . . . . . . . . . . . . . . . . . . . . . . . $ 2,106 $3,022 $ 5,128
December 31, 2014
Fair Value ofDerivatives
Designated asHedging
Instruments
Fair Value ofDerivatives NotDesignated as
HedgingInstruments
Total FairValue
Derivative assets(a)
Foreign currency contracts . . . . . . . . . . . . . . . . . . . . . . . . . . . . . $16,637 $4,398 $21,035Interest rate swaps . . . . . . . . . . . . . . . . . . . . . . . . . . . . . . . . . . . . 683 — 683
$17,320 $4,398 $21,718Derivative liabilities(b)
Foreign currency contracts . . . . . . . . . . . . . . . . . . . . . . . . . . . . . $ 6 $1,055 $ 1,061
(a) Derivative assets are recorded to Prepaid expenses and other current assets in the Consolidated BalanceSheet.
(b) Derivative liabilities are recorded as Other current liabilities in the Consolidated Balance Sheet.
The following table shows the effect of the Company’s derivative instruments which were not designated ashedging instruments in the Consolidated Statement of Income and Comprehensive Income for the years endedDecember 31, 2015 and December 31, 2014 (in thousands):
Derivatives Not Designated as Hedging Instruments
Amount of GainFor the years ended
December 31, Location of GainRecognized in
Income on Derivative2015 2014
Foreign currency contract . . . . . . . . . . . . . . . . . . . . . . . . . . $8,644 $25,678 Other (income) expense, net
Most of these net gains (losses) offset any recognized gains (losses) arising from the revaluation of therelated intercompany loans during the same respective periods.
99

The following table shows the effect of the Company’s derivative instruments designated as cash flow andnet investment hedging instruments in the Consolidated Statement of Income and Comprehensive Income for theyears ended December 31, 2015 and December 31, 2014 (in thousands):
Amount of Gain or(Loss) Recognized inOCI on Derivative(Effective Portion) Location of Gain or
(Loss) Reclassifiedfrom AccumulatedOCI into Income
(Effective Portion)
Amount of Gain or(Loss) Reclassifiedfrom AccumulatedOCI into Income
(Effective Portion)
For the years endedDecember 31,
For the years endedDecember 31,
2015 2014 2015 2014
Derivatives in Cash Flow HedgingRelationships:
Forward currency contract . . . . . . . . . . . . . . . . . . . (3,244) 16,109 Cost of goods sold 16,250 (3,675)Interest rate swaps(2) . . . . . . . . . . . . . . . . . . . . . . . . 274 274 Interest expense (274) (274)
Derivatives in Net Investment HedgingRelationships:
Forward currency contract . . . . . . . . . . . . . . . . . . . 5,231 7,415 N/A — —
Total . . . . . . . . . . . . . . . . . . . . . . . . . . . . . . . . . . . . $ 2,261 $23,798 $15,976 $(3,949)
(1) Ten year swap executed in 2003, matured in January 2013.(2) Interest rate swaps were entered into as pre-issuance hedges for the $300 million bond offering.
The ineffective portion of the above noted cash flow hedges and net investment hedges was not material forthe years ended December 31, 2015 and 2014.
The Company expects approximately $8.2 million (net of tax), of derivative gains included in AOCI atDecember 31, 2015, based on current market rates, will be reclassified into earnings within the next twelvemonths. The majority of this amount will vary due to fluctuations in foreign currency exchange rates.
NOTE 16. ACCUMULATED OTHER COMPREHENSIVE INCOME (LOSS)
The following tables present changes in the accumulated balances for each component of othercomprehensive income, including current period other comprehensive income and reclassifications out ofaccumulated other comprehensive income:
(DOLLARS IN THOUSANDS)
ForeignCurrency
TranslationAdjustments
(Losses) Gains onDerivatives
Qualifying asHedges
Pension andPostretirement
LiabilityAdjustment Total
Accumulated other comprehensive loss, net of tax,as of December 31, 2014 . . . . . . . . . . . . . . . . . . . . . $(173,342) $ 12,371 $(379,459) $(540,430)
OCI before reclassifications . . . . . . . . . . . . . . . . . (124,156) 13,006 33,410 (77,740)Amounts reclassified from AOCI . . . . . . . . . . . . . — (15,976) 20,707 4,731
Net current period other comprehensive income(loss) . . . . . . . . . . . . . . . . . . . . . . . . . . . . . . . . . . . . . (124,156) (2,970) 54,117 (73,009)
Accumulated other comprehensive loss, net of tax,as of December 31, 2015 . . . . . . . . . . . . . . . . . . . . . $(297,498) $ 9,401 $(325,342) $(613,439)
100

(DOLLARS IN THOUSANDS)
ForeignCurrency
TranslationAdjustments
(Losses) Gains onDerivatives
Qualifying asHedges
Pension andPostretirement
LiabilityAdjustment Total
Accumulated other comprehensive (loss) income,net of tax, as of December 31, 2013 . . . . . . . . . . . . $(104,278) $ (4,012) $(284,421) $(392,711)
OCI before reclassifications . . . . . . . . . . . . . . . . . (69,064) 12,434 (111,915) (168,545)Amounts reclassified from AOCI . . . . . . . . . . . . . — 3,949 16,877 20,826
Net current period other comprehensive income(loss) . . . . . . . . . . . . . . . . . . . . . . . . . . . . . . . . . . . . . (69,064) 16,383 (95,038) (147,719)
Accumulated other comprehensive loss, net of tax,as of December 31, 2014 . . . . . . . . . . . . . . . . . . . . . $(173,342) $12,371 $(379,459) $(540,430)
The following table provides details about reclassifications out of accumulated other comprehensive incometo the Consolidated Statement of Comprehensive Income:
(DOLLARS IN THOUSANDS)December 31,
2015December 31,
2014
Affected Line Item in theConsolidated Statement
of Comprehensive Income
(Losses) gains on derivatives qualifying as hedgesForeign currency contracts . . . . . . . . . . . . . . . . . . . $ 18,571 $ (4,426) Cost of goods soldInterest rate swaps . . . . . . . . . . . . . . . . . . . . . . . . . . (274) (274) Interest expense
(2,321) 751 Provision for income taxes
$ 15,976 $ (3,949) Total, net of income taxes
(Losses) gains on pension and postretirement liabilityadjustments
Settlements / Curtailments . . . . . . . . . . . . . . . . . . . $ — $ (43)(a)
Prior service cost . . . . . . . . . . . . . . . . . . . . . . . . . . . 6,389 (63)(a)
Actuarial losses . . . . . . . . . . . . . . . . . . . . . . . . . . . . (36,167) (28,219)(a)
9,071 11,448 Provision for income taxes
$(20,707) $(16,877) Total, net of income taxes
(a) The amortization of prior service cost and actuarial loss is included in the computation of net periodicbenefit cost. Refer to Note 14 to the Consolidated Financial Statements — Employee Benefits for additionalinformation regarding net periodic benefit cost.
NOTE 17. CONCENTRATIONS OF CREDIT RISK
The Company does not have significant concentrations of risk in financial instruments. Temporaryinvestments are made in a well-diversified portfolio of high-quality, liquid obligations of government, corporateand financial institutions. There are also limited concentrations of credit risk with respect to trade receivablesbecause the Company has a large number of customers who are spread across many industries and geographicregions. The Company’s larger customers are each spread across many sub-categories of its segments andgeographical regions. The Company had one customer that accounted for more than 10% of its consolidated netsales in each year for all periods presented.
NOTE 18. COMMITMENTS AND CONTINGENCIES
Lease Commitments
Minimum rental payments under non-cancelable operating leases are $33.4 million in 2016, $28.5 million in2017, $23.3 million in 2018, and from 2019 and thereafter through 2041, the aggregate lease obligations are
101

$171.3 million. The corresponding rental expense amounted to $33.6 million, $34.4 million and $32.4 million forthe years ended December 31, 2015, 2014 and 2013, respectively. None of our leases contain escalation clausesand they do not require capital improvement funding.
Guarantees and Letters of Credit
The Company has various bank guarantees and letters of credit which are available for use to support itsongoing business operations and to satisfy governmental requirements associated with pending litigation invarious jurisdictions.
At December 31, 2015, the Company had total bank guarantees and standby letters of credit ofapproximately $36.2 million with various financial institutions. Included in the above aggregate amount is a totalof $13.1 million for other assessments in Brazil for various income tax and indirect tax disputes related to fiscalyears 1998-2011. There were no material amounts utilized under the standby letters of credit as of December 31,2015.
In order to challenge the assessments in these cases in Brazil, the Company has been required to and hasseparately pledged assets, principally property, plant and equipment to cover assessments in the amount ofapproximately $12.0 million as of December 31, 2015.
Lines of Credit
The Company has various lines of credit which are available to support its ongoing business operations. Asof December 31, 2015, the Company had available lines of credit (in addition to the Credit Facility as discussedin Note 9) of approximately $70.7 million with various financial institutions. There were no material amountsdrawn down pursuant to these lines of credit as of December 31, 2015.
Litigation
The Company assesses contingencies related to litigation and/or other matters to determine the degree ofprobability and range of possible loss. A loss contingency is accrued in the Company’s consolidated financialstatements if it is probable that a liability has been incurred and the amount of the loss can be reasonablyestimated. Because litigation is inherently unpredictable and unfavorable resolutions could occur, assessingcontingencies is highly sensitive and requires judgments about future events. On at least a quarterly basis, theCompany reviews contingencies related to litigation to determine the adequacy of accruals. The amount ofultimate loss may differ from these estimates and further events may require the Company to increase or decreasethe amounts it has accrued on any matter.
Periodically, the Company assesses its insurance coverage for all known claims, where applicable, takinginto account aggregate coverage by occurrence, limits of coverage, self-insured retentions and deductibles,historical claims experience and claims experience with its insurance carriers. The liabilities are recorded atmanagement’s best estimate of the probable outcome of the lawsuits and claims, taking into consideration thefacts and circumstances of the individual matters as well as past experience on similar matters. At each balancesheet date, the key issues that management assesses are whether it is probable that a loss as to asserted orunasserted claims has been incurred and if so, whether the amount of loss can be reasonably estimated. TheCompany records the expected liability with respect to claims in Other liabilities and expected recoveries from itsinsurance carriers in Other assets. The Company recognizes a receivable when it believes that realization of theinsurance receivable is probable under the terms of the insurance policies and its payment experience to date.
Environmental
Over the past 20 years, various federal and state authorities and private parties have claimed that we are aPotentially Responsible Party (“PRP”) as a generator of waste materials for alleged pollution at a number ofwaste sites operated by third parties located principally in New Jersey and have sought to recover costs incurredand to be incurred to clean up the sites.
102

The Company has been identified as a PRP at eight facilities operated by third parties at which investigationand/or remediation activities may be ongoing. The Company analyzes its potential liability on at least a quarterlybasis and accrues for environmental liabilities when they are probable and estimable. The Company estimates itsshare of the total future cost for these sites to be less than $5 million.
While joint and several liability is authorized under federal and state environmental laws, the Companybelieves the amounts it has paid and anticipates paying in the future for clean-up costs and damages at all sitesare not and will not have a material adverse effect on its financial condition, results of operations or liquidity.This assessment is based upon, among other things, the involvement of other PRPs at most of the sites, the statusof the proceedings, including various settlement agreements and consent decrees and the extended time periodover which payments will likely be made. There can be no assurance, however, that future events will not requirethe Company to materially increase the amounts it anticipates paying for clean-up costs and damages at thesesites, and that such increased amounts will not have a material adverse effect on its financial condition, results ofoperations or cash flows.
China Odor Matter
During 2015, the Company was notified by Chinese authorities of compliance issues pertaining to theemission of odors from several of its plants in China. As a result, the Company’s Flavors facility in China wastemporarily idled and another facility was required to modify its production schedule. Accordingly, the Companyinvested approximately $6.5 million in odor-abatement equipment at these facilities to address these issues.
If the Company is required to close a plant, or operate one at significantly reduced production levels on apermanent basis, the Company may be required to record charges that could have a material impact on itsconsolidated financial results of operations, financial position and cash flows in future periods.
Other Contingencies
The Company has contingencies involving third parties (such as labor, contract, technology or product-related claims or litigation) as well as government-related items in various jurisdictions in which it operatespertaining to such items as value-added taxes, other indirect taxes, customs and duties and sales and use taxes. Itis possible that cash flows or results of operations, in any period, could be materially affected by the unfavorableresolution of one or more of these contingencies.
The most significant government-related contingencies exist in Brazil. With regard to the Brazilian matters,the Company believes they have valid defenses for the underlying positions under dispute; however, in order topursue these defenses, the Company is required to, and have provided, bank guarantees and pledged assets in theaggregate amount of $25.1 million. The Brazilian matters take an extended period of time to proceed through thejudicial process and there are a limited number of rulings to date.
In March 2012, ZoomEssence, Inc. filed a complaint against the Company in the U.S. District Court of NewJersey alleging trade secret misappropriation, breach of contract and unjust enrichment in connection with certainspray dry technology disclosed to the Company. In connection with the claims, ZoomEssence is seeking aninjunction and monetary damages. ZoomEssence initially sought a temporary restraining order and preliminaryinjunction, but the Court denied these applications in an order entered on September 27, 2013, finding thatZoomEssence had not demonstrated a likelihood of success on the merits of its claims. The Court subsequentlyreferred the matter to mediation, however the private mediation session did not result in a resolution of thedispute. On November 3, 2014, ZoomEssence amended its complaint against the Company to include allegationsof breach of the duty of good faith and fair dealing, fraud in the inducement, and misappropriation of confidentialand proprietary information. On November 13, 2014, the Company filed a counterclaim against ZoomEssencealleging trade secret misappropriation, breach of contract, breach of the implied covenant of good faith and fairdealing, unjust enrichment, misappropriation of confidential and proprietary information, common law unfaircompetition, tortious interference with contractual relations, and conversion. The case is currently proceeding
103

through discovery with a trial on the merits anticipated in early 2017. The Company denies the allegations andwill vigorously defend and pursue its position in Court. At this stage of the litigation, based on the informationcurrently available to the Company, management does not believe that this matter represents a material losscontingency.
Based on the information available as of December 31, 2015, the Company estimates a range of reasonablypossible loss related to all of the matters above of $0-$31 million.
Separately, the Spanish tax authorities alleged claims for a capital tax in a case arising from similarallegations as the income tax cases (discussed in further detail in Note 10). In connection with the 2002 incometax assessment ruling discussed in Note 10, the Appellate Court rejected one of the two bases upon which webased our capital tax position. On January 22, 2014, we filed an appeal and in order to avoid future interest costsin the event our appeal was unsuccessful, we paid Euro 9.8 million ($11.2 million, representing the principalamount) during the first quarter of 2014. On February 24, 2016, we received a favorable ruling on our appealfrom the Spanish Supreme Court which overruled a lower court ruling. As a result of this decision, we havereversed the previously recorded provision of Euro 9.8 million ($10.5 million) for the year ended December 31,2015.
104

(a)(3) EXHIBITS
ExhibitNumber Description
3(i) Restated Certificate of Incorporation of the Company, incorporated by reference to Exhibit 10(g)to Registrant’s Report on Form 10-Q filed on August 12, 2002.
3(ii) By-laws of the Registrant, effective as of February 6, 2014, incorporated by reference toExhibit 3(ii) to Registrant’s Report on Form 8-K filed on December 17, 2015.
4.1 Note Purchase Agreement, dated as of July 12, 2006, by and among International Flavors &Fragrances Inc. and the various purchasers named therein, incorporated by reference toExhibit 4.7 to Registrant’s Report on Form 8-K filed on July 13, 2006.
4.2 Form of Series A, Series B, Series C and Series D Senior Notes incorporated by reference toExhibit 4.8 to Registrant’s Report on Form 8-K filed on July 13, 2006.
4.3 Note Purchase Agreement, dated as of September 27, 2007, by and among International Flavors& Fragrances Inc. and the various purchasers named therein, incorporated by reference toExhibit 4.7 to Registrant’s Report on Form 8-K filed on October 1, 2007.
4.4 Form of Series A, Series B, Series C and Series D Senior Notes incorporated by reference toExhibit 4.8 of Registrant’s Report on Form 8-K filed on October 1, 2007.
*10.1 Letter Agreement between International Flavors & Fragrances Inc. and Andreas Fibig, datedMay 26, 2014, incorporated by reference to Exhibit 10.1 to the Registrant’s Report on Form 8-Kfiled on May 28, 2014.
*10.2 Supplemental Retirement Plan, adopted by the Registrant’s Board of Directors on October 29,1986 as amended and restated through October 9, 2007, incorporated by reference to Exhibit 10.5to Registrant’s Report on Form 10-K filed on February 27, 2008.
*10.3 2000 Stock Award and Incentive Plan, adopted by the Registrant’s Board of Directors onMarch 9, 2000 as amended and restated through October 9, 2007, incorporated by reference toExhibit 10.6 to Registrant’s Report on Form 10-K filed on February 27, 2008.
*10.4 2015 Stock Award and Incentive Plan, as Amended and Restated as of February 6, 2014,incorporated by reference to Annex 1 of the Registrant’s definitive proxy statement onSchedule 14A Filed with the SEC on March 18, 2015.
*10.5 2000 Supplemental Stock Award Plan, adopted by the Registrant’s Board of Directors onNovember 14, 2000 as amended and restated through October 9, 2007, incorporated by referenceto Exhibit 10.7 to Registrant’s Report on Form 10-K filed on February 27, 2008.
*10.6 Form of Non-Employee Director’s Restricted Stock Units Agreement under International Flavors& Fragrances Inc. 2000 Stock Award and Incentive Plan, incorporated by reference toExhibit 10.7 to Registrant’s Report on Form 10-Q filed on October 31, 2007.
*10.7 Form of U.S. Restricted Stock Units Agreement under International Flavors & Fragrances Inc.2000 Stock Award and Incentive Plan incorporated by reference to Exhibit 10.5 to Registrant’sReport on Form 10-Q filed on October 31, 2007.
*10.8 Form of U.S. Stock Settled Appreciation Rights Agreement under International Flavors &Fragrances Inc. 2000 Stock Award and Incentive Plan, incorporated by reference to Exhibit 10.6to Registrant’s Report on Form 10-Q filed on October 31, 2007.
*10.9 Form of Restricted Stock Units Agreement under International Flavors & Fragrances Inc. 2000Stock Award and Incentive Plan incorporated by reference to Exhibit 10.2 to Registrant’s Reporton Form 10-Q filed on August 5, 2009.
105

ExhibitNumber Description
*10.10 Form of Purchased Restricted Stock Agreement under International Flavors & Fragrances Inc.2000 Stock Award and Incentive Plan incorporated by reference to Exhibit 10.1 to Registrant’sReport on Form 10-Q filed on August 5, 2009.
*10.11 Form of Employee Stock Option Agreement under International Flavors & Fragrances Inc. 2000Stock Award and Incentive Plan, incorporated by reference to Exhibit 10.1 to Registrant’s Reporton Form 10-Q filed on November 9, 2004.
*10.12 Form of International Flavors & Fragrances Inc. Stock Option Agreement under 2000 StockOption Plan for Non-Employee Directors, incorporated by reference to Exhibit 10.2 toRegistrant’s Report on Form 10-Q filed on November 9, 2004.
*10.13 Amended and Restated Executive Severance Policy, as Amended through and includingMarch 11, 2015, incorporated by reference to Exhibit 10.2 to Registrant’s Report on Form 10-QFiled on May 12, 2015.
*10.14 Director Charitable Contribution Program, adopted by the Board of Directors on December 8,2009, incorporated by reference to Exhibit 10.38 to Registrant’s Report on Form 10-K filed onFebruary 25, 2010.
*10.15 Form of Director/Officer Indemnification Agreement incorporated by reference to Exhibit 10.1 toRegistrant’s Report on Form 8-K filed on July 28, 2008.
*10.16 Credit Agreement, dated as of November 9, 2011, Amended and Restated as of April 4, 2014,among International Flavors & Fragrances Inc., International Flavors & Fragrances(Luxembourg) S.à r.l., International Flavors & Fragrances (Nederland) Holding B.V.,International Flavors & Fragrances I.F.F. (Nederland) B.V., IFF Worldwide (Gibraltar) Limitedand IFF Aroma Esans Sanayi Ve Ticaret Anonim Sirketi, as borrowers, the banks, financialinstitutions and other institutional lenders party thereto, and Citibank, N.A. as administrativeagent, incorporated by reference to Exhibit 10.1 to Registrant’s Report on Form 8-K filed onApril 8, 2014.
*10.17 Amendment No. 1 to the Credit Agreement, dated as of June 2, 2014, among InternationalFlavors & Fragrances Inc., International Flavors & Fragrances (Luxembourg) S.à.r.l.,International Flavors & Fragrances (Nederland) Holding B.V., International Flavors &Fragrances I.F.F. (Nederland) B.V., IFF Worldwide (Gibraltar) Limited and IFF Aroma EsansSanayi Ve Ticaret Anonim Sirketi, the various financial institutions as are parties to the CreditAgreement, and Citibank, N.A. as administrative agent, incorporated by reference to Exhibit 10.3to Registrant’s Report on Form 10-Q filed on August 5, 2014.
*10.18 Form of Executive Death Benefit Plan Agreement incorporated by reference to Exhibit 10.27 toRegistrant’s Report on Form 10-K filed on February 28, 2012.
*10.19 Deferred Compensation Plan, as amended and restated December 12, 2011 incorporated byreference to Exhibit 10.28 to Registrant’s Report on Form 10-K filed on February 28, 2012.
*10.20 Form of U.S. Stock Settled Appreciation Rights Agreement under International Flavors &Fragrances Inc. 2010 Stock Award and Incentive Plan incorporated by reference to Exhibit 10.29to Registrant’s Report on Form 10-K filed on February 28, 2012.
*10.21 Form of Restricted Stock Units Award Agreement under International Flavors & Fragrances Inc.2015 Stock Award and Incentive Plan incorporated by reference to Exhibit 10.36 to Registrant’sReport on Form 10-Q filed on May 12, 2015.
*10.22 Form of Purchased Restricted Stock Agreement under International Flavors & Fragrances Inc.2010 Stock Award and Incentive Plan incorporated by reference to Exhibit 10.31 to Registrant’sReport on Form 10-K filed on February 28, 2012.
106

ExhibitNumber Description
*10.23 Form of Non-Employee Director’s Restricted Stock Units Agreement under International Flavors& Fragrances Inc. 2015 Stock Award and Incentive Plan incorporated by reference to Exhibit10.7 to Registrant’s Report on Form 10-K filed on May 12, 2015.
*10.24 Form of Annual Incentive Plan Award Agreement under International Flavors & Fragrances Inc.2015 Stock Award and Incentive Plan, incorporated by reference to Exhibit 10.3 to Registrant’sReport on Form 10-Q Filed on May 12, 2015.
*10.25 Form of Long-Term Incentive Plan Award Agreement under International Flavors & FragrancesInc. 2015 Stock Award and Incentive Plan.
*10.26 Restricted Stock Units Award Agreement, dated as of June 13, 2014, between InternationalFlavors and Fragrances Inc. and Nicolas Mirzayantz, incorporated by reference to Exhibit 10.5 toRegistrant’s Report on Form 10-Q Filed on August 5, 2014.
*10.27 Form of Equity Choice Program Award Agreement under International Flavors & Fragrances Inc.2015 Stock Award and Incentive Plan incorporated by reference to Exhibit 10.1 to Registrant’sReport on Form 10-Q Filed on November 9, 2015.
21 List of Principal Subsidiaries.
23 Consent of PricewaterhouseCoopers LLP.
31.1 Certification of Andreas Fibig pursuant to Section 302 of the Sarbanes-Oxley Act of 2002.
31.2 Certification of Alison A. Cornell pursuant to Section 302 of the Sarbanes-Oxley Act of 2002.
32 Certification of Andreas Fibig and Alison A. Cornell pursuant to 18 U.S.C. Section 1350 asadopted pursuant to the Sarbanes-Oxley Act of 2002.
101.INS XBRL Instance Document
101.SCH XBRL Taxonomy Extensions Schema
101.CAL XBRL Taxonomy Extension Calculation Linkbase
101.DEF XBRL Taxonomy Extension Definition Linkbase
101.LAB XBRL Taxonomy Extension Label Linkbase
101.PRE XBRL Taxonomy Extension Presentation Linkbase
* Management contract or compensatory plan or arrangement
107

SIGNATURES
Pursuant to the requirements of Section 13 or 15(d) of the Securities Exchange Act of 1934, the Registranthas duly caused this report to be signed on its behalf by the undersigned, thereunto duly authorized.
INTERNATIONAL FLAVORS & FRAGRANCESINC.
By: /s/ Alison A. Cornell
Name: Alison A. Cornell
Title: Executive Vice President andChief Financial Officer
Dated: March 1, 2016
Pursuant to the requirements of the Securities Exchange Act of 1934, this report has been signed below bythe following persons on behalf of the registrant and in the capacities and on the dates indicated:
Signature Title Date
/s/ Andreas FibigAndreas Fibig
Chairman of the Board, ChiefExecutive Officer and Director(Principal Executive Officer)
March 1, 2016
/s/ Alison A. CornellAlison A. Cornell
Executive Vice President andChief Financial Officer
March 1, 2016
/s/ Richard A. O’LearyRichard A. O’Leary
Senior Vice President, Controllerand Chief Accounting Officer
March 1, 2016
/s/ Marcello V. BottoliMarcello V. Bottoli
Director March 1, 2016
/s/ Linda B. BuckLinda B. Buck
Director March 1, 2016
/s/ Michael DuckerMichael Ducker
Director March 1, 2016
/s/ David R. EpsteinDavid R. Epstein
Director March 1, 2016
/s/ Roger W. Ferguson, Jr.Roger W. Ferguson, Jr.
Director March 1, 2016
/s/ John F. FerraroJohn F. Ferraro
Director March 1, 2016
/s/ Christina GoldChristina Gold
Director March 1, 2016
/s/ Henry W. Howell, Jr.Henry W. Howell, Jr.
Director March 1, 2016
/s/ Katherine M. HudsonKatherine M. Hudson
Director March 1, 2016
/s/ Dale F. MorrisonDale F. Morrison
Director March 1, 2016
108

INTERNATIONAL FLAVORS & FRAGRANCES INC. AND SUBSIDIARIES
SCHEDULE II — VALUATION AND QUALIFYING ACCOUNTS AND RESERVES
(IN THOUSANDS)
For the Year Ended December 31, 2015
Balance atbeginningof period
Additions(deductions)charged tocosts andexpenses
Accountswritten
offTranslationadjustments
Balance atend ofperiod
Allowance for doubtful accounts . . . . . . . . . . . . . . . . $ 9,147 $ 590 $ 60 $ (1,568) $ 8,229Valuation allowance on credit and operating loss
carryforwards and other net deferred tax assets . . . 355,568 16,445(1) — (32,618) 339,395
For the Year Ended December 31, 2014
Balance atbeginningof period
Additions(deductions)charged tocosts andexpenses
Accountswritten
offTranslationadjustments
Balance atend ofperiod
Allowance for doubtful accounts . . . . . . . . . . . . . . . . $ 10,493 $ 222 $ (554) $ (1,014) $ 9,147Valuation allowance on credit and operating loss
carryforwards and other net deferred tax assets . . . 503,990 (92,204)(2) — (56,218) 355,568
For the Year Ended December 31, 2013
Balance atbeginningof period
Additions(deductions)charged tocosts andexpenses
Accountswritten
offTranslationadjustments
Balance atend ofperiod
Allowance for doubtful accounts . . . . . . . . . . . . . . . . $ 9,293 $ 1,984 $(1,059) $ 275 $ 10,493Valuation allowance on credit and operating loss
carryforwards and other net deferred tax assets . . . 450,733 38,360(3) — 14,897 503,990
(1) The 2015 amount includes an adjustment to the 2014 foreign net operating loss carryforwards in the amountof $10.0 million, as discussed in Note 10 of the Consolidated Financial Statements.
(2) The 2014 amount includes an adjustment to the 2013 foreign net operating loss carryforwards in the amountof $81.0 million, as discussed in Note 10 of the Consolidated Financial Statements.
(3) The 2013 amount includes an adjustment to the 2012 foreign net operating loss carryforwards in the amountof $29.9 million, as discussed in Note 10 of the Consolidated Financial Statements.
S-1

INTERNATIONAL FLAVORS & FRAGRANCES INC.
INVESTOR INFORMATION
ANNUAL MEETING
The Annual Meeting of Shareholders will be held at 61 rue de Villiers, Neuilly-sur-Seine, France on May 2,2016 at 3:00 p.m local time/9:00 a.m., EDT.
IFF will be furnishing proxy materials to shareholders on the internet, rather than mailing printed copies ofthose materials to each shareholder. A Notice of Internet Availability of Proxy Materials will be mailed to eachshareholder on or about March 17, 2016, which will provide instructions as to how shareholders may access andreview the proxy materials for the 2016 Annual Meeting on the website referred to in the Notice or, alternatively,how to request a printed copy of the proxy materials be sent to them by mail.
TRANSFER AGENT AND REGISTRAR
American Stock Transfer & Trust Company59 Maiden LaneNew York, New York 10038800-937-5449www.amstock.com
LISTED
New York Stock Exchange
Euronext Paris
INDEPENDENT REGISTERED PUBLIC ACCOUNTING FIRM
PricewaterhouseCoopers LLP
WEBSITE
www.iff.com

Exhibit AInternational Flavors & Fragrances
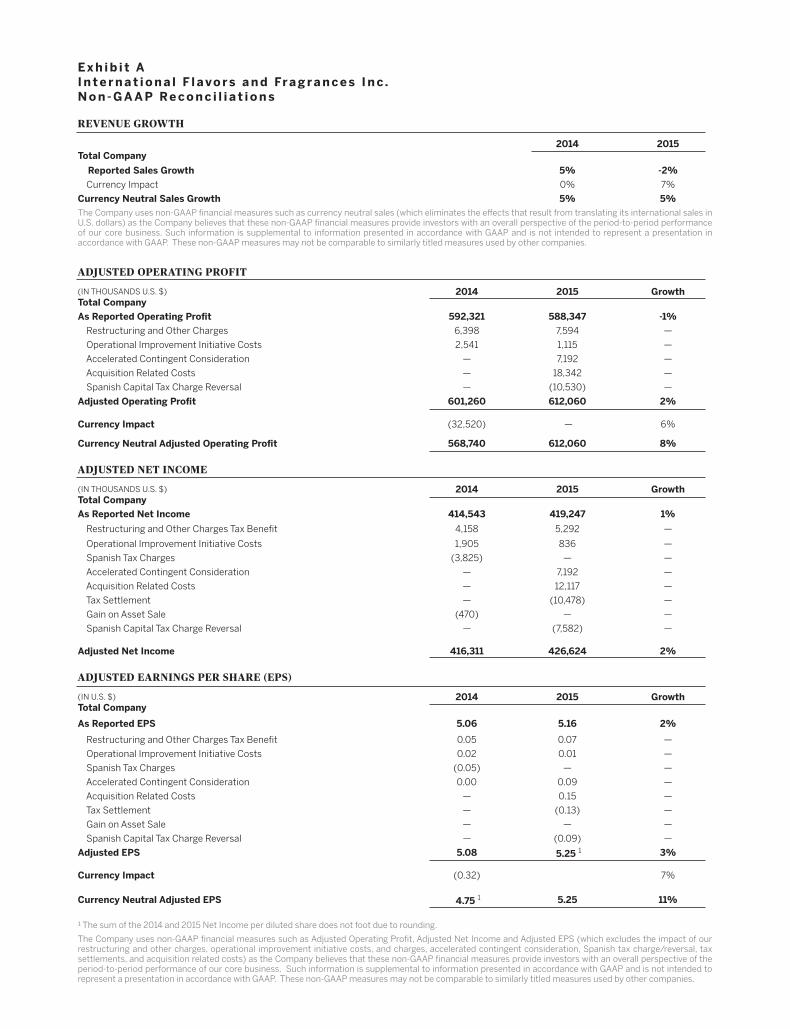
Ex h i b i t A
I n t e r n a t i o n a l F l a vo r s a n d Fra g ra n c e s I n c .
N o n - G A A P Re c o n c i l i a t i o n s
REVENUE GROWTH
2014 2015
Total Company
Reported Sales Growth 5% -2%
Currency Impact 0% 7%
Currency Neutral Sales Growth 5% 5%
The Company uses non-GAAP financial measures such as currency neutral sales (which eliminates the effects that result from translating its international sales in U.S. dollars) as the Company believes that these non-GAAP financial measures provide investors with an overall perspective of the period-to-period performance of our core business. Such information is supplemental to information presented in accordance with GAAP and is not intended to represent a presentation in accordance with GAAP. These non-GAAP measures may not be comparable to similarly titled measures used by other companies.
ADJUSTED OPERATING PROFIT
(IN THOUSANDS U.S. $) 2014 2015 GrowthTotal Company
As Reported Operating Profit 592,321 588,347 -1%
Restructuring and Other Charges 6,398 7,594 —
Operational Improvement Initiative Costs 2,541 1,115 —
Accelerated Contingent Consideration — 7,192 —
Acquisition Related Costs — 18,342 —
Spanish Capital Tax Charge Reversal — (10,530) —
Adjusted Operating Profit 601,260 612,060 2%
Currency Impact (32,520) — 6%
Currency Neutral Adjusted Operating Profit 568,740 612,060 8%
ADJUSTED NET INCOME
(IN THOUSANDS U.S. $) 2014 2015 GrowthTotal Company
As Reported Net Income 414,543 419,247 1%
Restructuring and Other Charges Tax Benefit 4,158 5,292 —
Operational Improvement Initiative Costs 1,905 836 —
Spanish Tax Charges (3,825) — —
Accelerated Contingent Consideration — 7,192 —
Acquisition Related Costs — 12,117 —
Tax Settlement — (10,478) —
Gain on Asset Sale (470) — —
Spanish Capital Tax Charge Reversal — (7,582) —
Adjusted Net Income 416,311 426,624 2%
ADJUSTED EARNINGS PER SHARE (EPS)
(IN U.S. $) 2014 2015 GrowthTotal Company
As Reported EPS 5.06 5.16 2%
Restructuring and Other Charges Tax Benefit 0.05 0.07 —
Operational Improvement Initiative Costs 0.02 0.01 —
Spanish Tax Charges (0.05) — —
Accelerated Contingent Consideration 0.00 0.09 —
Acquisition Related Costs — 0.15 —
Tax Settlement — (0.13) —
Gain on Asset Sale — — —
Spanish Capital Tax Charge Reversal — (0.09) —
Adjusted EPS 5.08 5.25 1 3%
Currency Impact (0.32) 7%
Currency Neutral Adjusted EPS 4.75 1 5.25 11%
¹ The sum of the 2014 and 2015 Net Income per diluted share does not foot due to rounding.
The Company uses non-GAAP financial measures such as Adjusted Operating Profit, Adjusted Net Income and Adjusted EPS (which excludes the impact of our restructuring and other charges, operational improvement initiative costs, and charges, accelerated contingent consideration, Spanish tax charge/reversal, tax settlements, and acquisition related costs) as the Company believes that these non-GAAP financial measures provide investors with an overall perspective of the period-to-period performance of our core business. Such information is supplemental to information presented in accordance with GAAP and is not intended to represent a presentation in accordance with GAAP. These non-GAAP measures may not be comparable to similarly titled measures used by other companies.

Design by Fusion Media, Inc. www.fusionhome.com© 2016 International Flavors & Fragrances Inc. All rights reserved.
Board of DirectorsMarcello V. Bottoli 2
Operating PartnerAdventInternational
Dr. Linda B. Buck, Ph.D. 3
Nobel Prize-Winning University of Washington Affiliate
Professor, Howard Hughes Medical Institute Investigator,
and Member of the Fred Hutchinson Cancer Research Center
Michael Ducker 2 President and Chief Executive OfficerFedExFreight
David Epstein 1 Division Head & Chief Executive OfficerNovartisPharmaceuticals
Roger W. Ferguson, Jr. 2 *
President and Chief Executive Officer TIAA
Andreas FibigChairman of the Board and Chief Executive OfficerInternationalFlavors&FragrancesInc.
John Ferraro 1
Former Global Chief Operating OfficerErnst&Young
Christina Gold 2, 3 Former Chief Executive Officer and PresidentTheWesternUnionCompany
Henry W. Howell, Jr. 1, 3 *
Former Managing DirectorJ.P.Morgan&Co.,Inc.
Katherine M. Hudson 1 *
Former President and Chief Executive OfficerBradyCorporation
Dale F. Morrison 1, 3 +
Founding PartnerTriPointeCapitalPartners
1 Audit Committee
2 Compensation Committee
3 Nominating and Governance Committee
* Indicates Chairperson+ Lead Director
LeadershipAndreas FibigChairman of the Board and Chief Executive Officer
Ahmet BaydarExecutive Vice President, Research and Development
Angelica T. CantlonExecutive Vice President and Chief Human Resources Officer
Anne ChwatExecutive Vice President, General Counsel
and Corporate Secretary
Alison A. CornellExecutive Vice President and Chief Financial Officer
Francisco FortanetExecutive Vice President, Operations
Matthias HaeniGroup President, Flavors
Nicolas MirzayantzGroup President, Fragrances

24
Global Headquarters
521 West 57th Street | New York, NY 10019 | 212.765.5500www.iff.com
This report is printed on paper containing post consumer fiber. The paper used in this report is also certified under the Forest Stewardship Council™ guidelines.