annual report 2015–2016 - pilbara regional council · during 2016, one of these regional advocacy...
TRANSCRIPT

1
AnnuAl RepoRt2015–2016

2
AdvAncingthe pilbARAAnnuAl RepoRt2015–2016
Message from the Chairperson
The Pilbara Regional Council Governance Model
Appointed Representatives
PRC Organisational Values
Message from the Chief Executive Officer
Year in Review
Independent Audit Report
Statutory Reports
Financial Report
3
4
5
6
8
9
17
19
21

3
messAgefRom thechAiRpeRson
2016 … what a year it has been. The media appears focused on the demise of our region but it’s hard tosee the reality in this. Certainly life as we knew it has changed but the Pilbara continues to move forwardalbeit at a slower but some could argue more sensible pace.
Despite the Pilbara having been a primary driver of contributions to national revenue and having beenunderprepared for the previous boom, at all levels of government, it seems barely believable that both theFederal and the State governments appear unwilling to invest further in the development of criticalinfrastructure in the north-west. This is despite the Commonwealth noting the strategic importance ofdeveloping northern Australia, and the Pilbara Development Commission identifying a significant portfolio of projects that would yield measurable economic benefit to the country. I refer of course to the development of a common-use facility at Lumsden Point to take advantage of the proximity to large multi-nationalcorporations and to service the rapidly growing level of agricultural investment in the region.
The City of Karratha has been a clear illustration of the yield from these infrastructure investments, with a large and stable population that has seen school enrollments actually growing despite the economic slowdown. We hear the ‘Pilbara has had its fair share’ rhetoric at every turn, however this is easily refuted by noting that sensible countries, companies and individuals invest in areas where there is the highest potential for return.
This is no more evident than in the tourism space, where we continue to be held to an artificial geographicalstructure that has tourism marketing for the Pilbara, one third of the State, managed by an organization based outside of this area. The Pilbara needs to take control of our own destiny and market our assets, known best by us, to the greater West Australia, Australia and indeed the world. Let us treat others to the wonders of the beautiful Karajini and naturally occurring beauty found throughout the magnificent Pilbara.
My Chairperson’s message for the 2016 annual report is clear – we all need to focus on developmentinitiatives that will build and support sustainable communities of the north west. The region already enjoysaccess to resources, proximity to markets, presence of huge multinational corporations, and interest from overseas investors. Our challenge is to come together to unlock as much of this potential as possible.
Cr Lynne CraigieChairperson
4
goveRnAnce model
The Councillors, Chief Executive Officer and staff, through a combined effort, are responsible for successfully leading and managing the PRC.
The organisation is accountable to its member local governments, and regularly publishes detailed financial statements and project performance reports for the review of its members.
Councillors
The four local governments arerepresented by the eight-member Pilbara Regional Council. Two Councillors are nominated from each member local government, governing for the interests of their town or shire and for the broader Pilbara region.
Council
The Chairperson and seven Councillors establish the strategic context ofthe PRC and govern to ensure that key objectives are met. The Council monitors the activities of the CEO and management team and ensures that the PRC remains true to its Constitution, vision and mission.
Council Meetings
Ordinary meetings of the Council are held primarily at the State Library in Perth, as well as in the Pilbara. Members of the public are welcome to attend Council meetings and are able to pose questions on specific issues of concern.
Chief Executive Officer
A Chief Executive Officer is employed by the Council to deliver the functions of the local government, and to service the requirements of members. The CEO employs a staff to deliver services and carry out directions of the Council. The CEO is responsible for all operationalaspects of the PRC, and is accountable to the Council for the performance of the organisation.
External Advisors
The PRC engages a number of specialist external advisors to assist in the management of its affairs. These advisors include auditors, legal counsel, project managers, financial advisors, information technology support, et al.
Contractors
As a project-driven member services organisation, the PRC occasionally engage with contractors to deliver components of some projects. All contractors work within the Council’s project governance framework, and under the specific direction of a nominated project manager.
Shire of Ashburton Shire of East Pilbara City of Karratha Town of Port Hedland

5
Appointed RepResentAtives
Cr Kerry WhiteShire President
Cr Glen DellarCouncilor
Cr Anita GraceCouncilor
Cr Lynne CraigieShire President
Cr Peter LongMayor
Cr John LallyCouncilor
Cr Kelly HowlettMayor
Cr Camilo BlancoCouncilor

6

7

8
messAge fRom the ceoIt is with pleasure that I present the 2016 Annual Report for the Pilbara Regional Council (PRC). It has been an eventful for the PRC; with a significant shift in the economy, a Federal Election announced, a State budget that offers some challenges for the Pilbara region, and a number of new Councillors joining the PRC.
Working in this dynamic environment, the PRC has sought to maintain relationships at all tiers of Government and across all major parties; maintaining open lines of communication to advocate for and on behalf of the region. Regular briefings have been held with parliamentarians and key staffers to ensure that they are familiar with key regional issues, and that the PRC’s position in these issues is clearly articulated. The value of this activity has been clearly illustrated through engagement during matters such as the proposed closure of remote aboriginal communities and other contentious issues, along with regular repeat access to key decision makers and influencers in both State and Federal Government.
These messages have been bolstered with closer alignment to both the Federal Government’s intent for developing northern Australia, and with the blueprint issued by the Pilbara Development Commission. This alignment has facilitated more targeted messaging that resonates with the recipients in both the Federal and State political environments. An enduring challenge for the Pilbara Regional Council is to select key advocacy initiatives for which the organisation is able to form a strong position– and to then exert some influence towards change. In a region that contributes such a significant portion of the Commonwealth and State revenues, and that is populated by industry giants, this is no easy task.
During 2016, one of these regional advocacy activities involved hosting the EASTxWEST Forum in Shenzhen, China. The main forum was attended by nearly 150 delegates; drawn from all tiers of Government as well as the private sector. A broad speaker lineup covered a diverse range of topics throughout the Forum, and the event was showcased at the Gala Dinner sponsored by Pardoo Beef. The event was delivered on time, scope and budget; with very positive press and sponsor reviews. The event highlighted that significant investment in agriculture and tourism offer opportunities for future regional diversification.
Our member local governments and our core partnership group continue to stimulate new opportunities to provide regional services to the governments of the Pilbara. During 2016, these activities encompassed historic building conservation, regional training, destination marketing, payroll processing, green waste processing, land deconstraint, and a number of studies. I’d like to take this opportunity to thank the Pilbara Development Commission, the Department of Local Government & Communities, the Department of Regional Development, Tourism WA, and our other partners who have contributed strongly to our successes in FY16.
FY17 offers a similar wealth of opportunities for service delivery to our member local governments, and I look forward to reporting the outcomes of these activates throughout the year to come.
Tony FridayChief Executive Officer

9
fY16 YeAR in RevieW
sAving moneY
Less CompLianCe Burden
Land De-ConstraintReduced the administrative functions associated with obtaining land tenure over all sites secured and managing all de-constraining activities. Regional Rating StrategyLeveraged economies of scale to regionally procure the reviewed and assessment of current rating strategies. Strategies were benchmarked against peers and evaluated. Rating efforts and individual rating model were produced to assist and inform future rating decisions.
Tourism Capacity BuildingRemoved separate authorisation and costs by centrally coordinating the delivery of a business case for a potential Camping with Custodian site on behalf of Tourism WA.
ATTRACTING FUNDS
Old Onslow ConservationThe project secured a total of $1,150,000 of State Agreement funds towards the outcomes of the project
pRoJect benefits And tAngible outcomes
with no matching contribution from either the PRC, or its members.
East x West ForumThe project secured a total of $72,500 in sponsorships and $160,082 in ticket sales. Conducted a successful economic forum that (overtime) will yield positive investment outcomes for the region. 134 Australian delegated and 137 Chinese attendees.
Tourism Capacity BuildingRemoved separate authorization and costs by centrally coordinating the delivery of a business case for a potential Camping with Custodian site on behalf of Tourism WA.
BeTTer supporTinG our memBers
Payroll ProcessingReduced the administrative functions to free up 0.5 FTE per participating members to perform other duties.
Training for Staff and CouncillorsThe project saved $27,090 this year by leveraging economies of scale for all procurement activities.
BeTTer supporTinG our CommuniTies
Volunteering Capacity BuildingLeveraged existing Welcome Wi-Fi infrastructure to encourage travellers to register their interest in volunteering.
Regional EventsCelebrated the rich and diverse heritage of the Pilbara by engaging with the Pilbara community to collect historical images that were used to create a visual display of the Pilbara’s history.
10
sAving time
mAKing life eAsieR
reduCed dupLiCaTion
Payroll ProcessingThe project saved an estimated 0.5 FTE a year to participating members.
Tourism Capacity BuildingReduced the administrative functions associated with applying for a diversifi cation permit. Centrally managing all activites to TWA’s satisfaction on behalf of their Camping with Custodians program.
Training for Staff and CouncillorsSaved an estimated 107.5 hours of works by centralising the procurement activities, travel arrangements and general administrative functions associated with the delivery of training sessions.
Visitor Centres Website ManagementProviding a single point of contact for all development activities.
Regional Tendering and ContractsReduced administrative functions associated with the procurement of 3 regional activities (green waste, solar audit, rating strategy) to free up an estimated 0.2 FTE.
Solar Feasibility StudyEvaluated the feasibility and viability of turning 25 nominated public buildings to renewable solar energy. The study outlined a number of discussion point that could lead a cost savings and return on investment.
GIS System and DataSystem implementation and delivery of user training for a fi t-for-purpose and fl exible GIS system at the Shire of Ashburton, Town of Port Hedland and Shire of East Pilbara. Users can now overlay of combine separate “thematic layers” of information to identify patters that may otherwise not be obvious. The implementation also integrates with existing infrastructure including IT Vision’s SynergySoft and receives automatic updates from SLP.
GoinG diGiTaL
Online Development ServicesOnline access for lodgement, payment and tracking the status of building applications, a more continent DIY service that is saving residents as well as staff time.
Pilbara Research OnlineComprehensive database of regularly updated new data about the Pilbara, referencing hundreds of articles, journals, and academic papers.
Regional EventsLeverage the Welcome Wi-Fi to create temporary pop-up advertisement for members and nominated community events throughout the region. (The Karajini experience ads were viewed 2,821 times across the whole network during March/April).
Welcome Wi-Fi (Rest Stops and Public Centres) 30,000+ unique visitors, and 70,000+ total users of the infrastructure in FY16.
Visitor Centres Websites ManagementDelivered the Marble Bar website for a total cost $1,020 – www.marblebar.org.au
Volunteering Capacity BuildingInnovative use of technology to offer access to targeted volunteering opportunities using the Welcome Wi-Fi.
easier inTeraCTions
Old Onslow ConservationWorked collaboratively with multiple stakeholders to re-invigorate stalled project and deliver outcomes against Chevron’s State Agreement, regional tourism objectives, and Shire of Ashburton Heritage obligations.
ADVOCACY
ANWT Board PositionMade direct and specifi c representation to ANWT and Tourism WA seeking to deepen and broaden Pilbara-focused destination marketing activities. Conducted a media campaign seeking to highlight inequities in fl ight pricing between the eastern and western seaboards.
Visitor Centres Websites ManagementProvisioned an estimated $25,000 cost savings in website changes and development compared to market rate. Works included making the Karratha VIC website mobile friendly and establishing Marble Bar VIC web presence.
11
Regional Reforms (Remote Aboriginal Communities)Made direct and specifi c representation to all tiers of government regarding proposed closure of Remote Aboriginal Communities.
Differential RatingCoordinated communication between members and the Department of Local Government and Communities (DLGC)regarding issues surrounding the approval of differential rating schemes, and brokered senior level meetings to advocate a regional position.
Transient WorkforcesDeveloped a regional position and made specifi c representation to all tiers of government and many segments of industry.
Regional EventsIn conjuction with the Australia China Business Council (ACBC) and Chamber of Commerce WA (CCIWA), coordinated a visit by the Chinese Consulate General to the City of Karratha.
11
East x West ForumPromoted the North West of Australia as an attractive investment destination by hosting a public forum in Shenzhen, China.
inCrease reGionaL CoLLaBoraTion and ConsisTenCY
Karratha & Hedland TAG: Active, meaningful and informed participation through knowledge sharing and collaboratioin with regional tourism groups.
reGionaL serViCe deLiVerY
Contribution to the PTPDP (Signage)Appraised signage infrastructure required to support the drive tourism market in the Pilbara. Regional strategy document published with clear, prioritised and costed initiatives for individual member LGAs and PRC to consider.
Contribution to the PTPDP (Trails)Appraised 72 Pilbara trails for length, diffi culty, targeted user groups, risks, maintenance, current/desired condition, heritage value and linkage to the 3 thematic experiences.

12
documents pRoduced goveRnAnce / mAnAgement
Regional Rating StrategyIndividual rating model per membersDesktop Solar PV Feasibility Report (for nominated public buildings)Newman CCTV Business case for live monitoring solutionsDigital Engagement StrategyRegional Trails BlueprintRegional Signage StrategyAshburton River Mouth Boat ramp feasibility study and technical designs Pilbara Enterprise Zone financial and economic model, proposal for policy and regulatory changes and supporting marketing materials.Designated Area Migration Agreement submission including an Operational PlanRegional VIC Online Booking Portal business caseQuarterly VIC Website analytics report PRC web and social media performance reportWelcome Wi-Fi usage report (monthly report for members, tourism groups and VICs)Agreed regional position statements for:
1.2.3.
4.
5.6.7.8.
9.
10.
11.
12.
13.
14.
Digital and Mobile Engagement PlanPeedamulla Camping with Custodians Business CasePardoo Tourism Feasibility StudyOld Onslow Conservation Management StrategyOld Onslow Interpretation PlanOnslow Tourism Plan
15.16.
17.18.19.20.
Closure of Remote Aboriginal CommunitiesDifferential RatingsTransient workforcesDAMA PEZ
Good GoVernanCe
Detailed compliance calendar maintained and reviewed fortnightly 6 Council meetings 2 Audit and Risk Committee meetings 1 missed compliance date (Auditor failed to file with the Department of Local Government and Communities (DLGC)
Internal Audits and Reviews Portfolio Governance Project Governance Records Management Risk Management Admin Procedures Workplace Safety
External Audits and Reviews Annual DLGC Audit Land Deconstraint Project Audit
peopLe
All staff completed performance reviews.
Employee turnover 2 redundancies 0 resignations 0 HR complaints received
13
Team Building Activity Chineses Language Workshop Applied Corporate Law RAC Defensive Driving
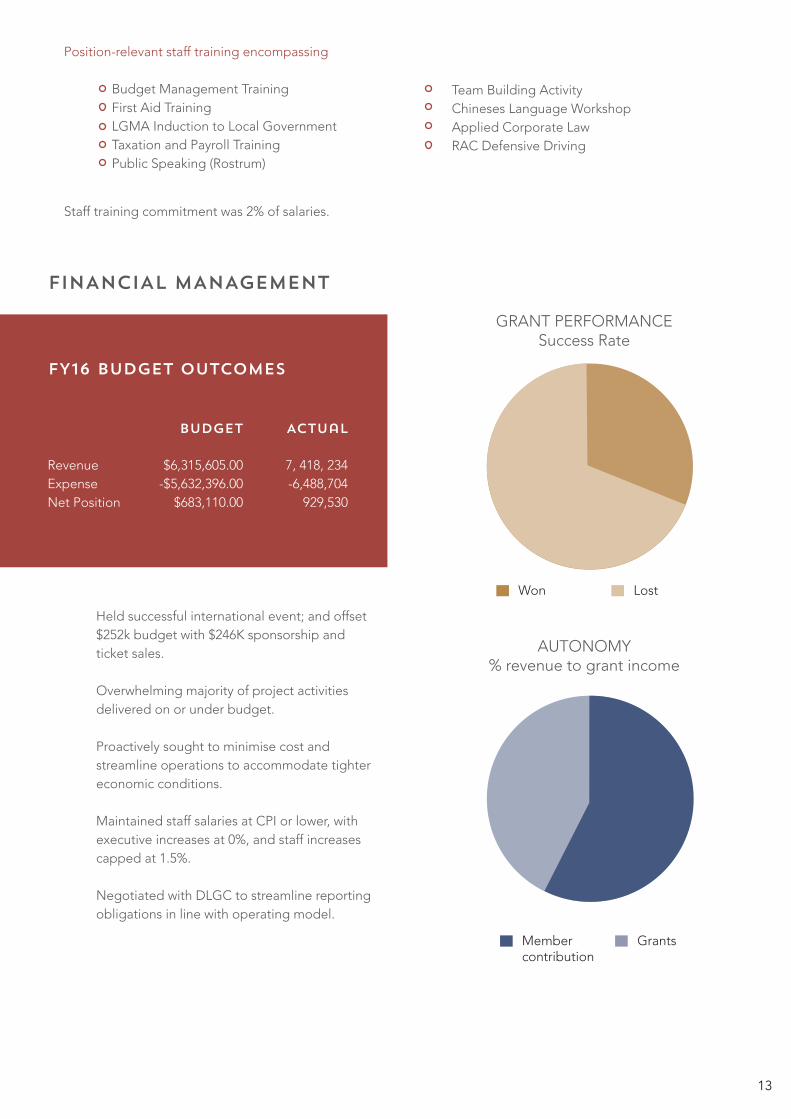
Held successful international event; and offset $252k budget with $246K sponsorship and ticket sales.
Overwhelming majority of project activities delivered on or under budget.
Proactively sought to minimise cost and streamline operations to accommodate tighter economic conditions.
Maintained staff salaries at CPI or lower, with executive increases at 0%, and staff increases capped at 1.5%.
Negotiated with DLGC to streamline reporting obligations in line with operating model.
finAnciAl mAnAgement
fY16 budget outcomes
Membercontribution
Grants
Won Lost
GRANT PERFORMANCESuccess Rate
AUTONOMY% revenue to grant income
Position-relevant staff training encompassing Budget Management Training First Aid Training LGMA Induction to Local Government Taxation and Payroll Training Public Speaking (Rostrum)
7, 418, 234-6,488,704
929,530
$6,315,605.00-$5,632,396.00
$683,110.00
RevenueExpenseNet Position
Actualbudget
Staff training commitment was 2% of salaries.

14
Old Onslow Augmented Reality
During FY16, the PRC has worked with leading edge technology providers to identify and investigate an augmented reality solution to assist with the interpretation of the Old Onslow conservation site. If implemented, this tool will allow visitors to ‘see’ Old Onlsow as it once was through the lens of their mobile devices. It will provide cultural and historical context, and bring meaning to the visual experience.
Welcome Wi-Fi Advertising
Durying FY16, the PRC utilized the Welcome Wi-Fi network of travellers that were passing through the region to raise awareness of the even and to promote regional attractions.
Volunteer Capacity Building
During FY16, the PRC partnered with the Department of Local Government and Communities and Volunteering WA to develop a volunteering portal that presents visitors to the region with volunteering positions in their immediate vicinity. Hailed as a very successful technology solution, both the DLGC and Volunteering WA have ought to extend this concept into other jurisdictions.
Online Time Sheets and Leave Applications
Building on its successful Payroll Processing project, durying FY16 the PRC worked with technology vendor IT Vision to offer additioinal functionality to participating Pilbara local governments. Implementation has now commenced to extend the payroll processing environment encompass online time sheets and online leave applications, both previously unavailable to Pilbara local government employees.
innovAtion
Camping with Custodians
The PRC, in partnership with Tourism WA, identified and validated a potential Camping with Custodians tourism site at Peedamulla Station in the Shire of Ashburton. Over the FY16 period, the PRC has worked with Tourism WA and the traditional owners to complete the project planning phase and secure funding for the implementation of the campground. Currently, we are working to secure the necessary permits in order to begin the construction phase of the project.
FB new page likes
190
TotalImpressions
213,173
Total postreach
128,031
Tweets
419
Number offollowers
674
Profile visits
9,864
sociAl mediA summARY
16.17.
18.19.20.21.
stAKeholdeR engAgement
Each project within portfolio has endorsed project reference group.
Delivered successful partnering activities with Tourism WA, Pilbara Development Commission, Volunteering WA, Pardoo Beef, and AustCham Beijing.
Interest in attending the PRC council meetings has become such that we are no longer able to accommodate all attendees at the PRC premises. Speakers and other external attendees now regularly contact the PRC in advance seeking meeting dates and other information.

15
background
Staff at the Pilbara Regional Council joined Kiva in August 2015. Kiva is a not-for-profit micro-financing organisation based in San Francisco. Founded in 2005, Kiva’s mission is to connect people through lending that alleviates poverty. For as little as $25USD, lenders can improve people’s lives by investing in their future.
How Kiva works
A borrower applies for a loan through Kiva, which goes through an underwriting and approval process. The loan is posted to the Kiva website to seek support from lenders. Lenders contribute in increments of $25 or more to ‘crowd fund’ the loan, which has a specified ‘loan goal’. Once the goal is reached, the borrower receives the funds. Borrowers repay the loans and lenders use repayments to fund new loans, donate or withdraw the money.
Lending activity
As at 30 June 2016, the PRC has raised a total of $1,820 AUD and have lent funds to over 73 borrowers from thirty-five (35) countries in thirteen (13) different sectors. 71% of staff contribute financially to the program, and 29% of staff contribute ‘in-kind’ through administration and research duties.
coRpoRAtegiving pRogRAm

16
Countries we have lent to
Colombia Education
Costa Rica Food
Ecuador Health
El Salvador Housing
Georgia Manufacturing
Ghana Personal Use
Guatemala Retail
Honduras Services
India Transportation
Indonesia
Jordan
Kenya
Lao People’s Democratic Republic
Lebanon
Madagascar
Mexico
Mozambique
Nicaragua
Pakistan
Palestine
Paraguay
Peru
Philippines
Rwanda
Sierra Leone
Tajikistan
Tanzania
Togo
Uganda
Ukraine
Vietnam
countries 35 / 77 sectors 13 / 15
Sectors we have lent to
Education
Food
Health
Housing
Manufacturing
Personal Use
Retail
Services
Transportation
29%
71%
Non-financial
Financial
STAFF ENGAGEMENT RATIO

17
independent AuditoR’s RepoRt
Level 1 10 Kings Park Road West Perth WA 6005 Correspondence to: PO Box 570 West Perth WA 6872 T +61 8 9480 2000 F +61 8 9322 7787 E [email protected] W www.grantthornton.com.au
Grant Thornton Audit Pty Ltd ACN 130 913 594 a subsidiary or related entity of Grant Thornton Australia Ltd ABN 41 127 556 389 ‘Grant Thornton’ refers to the brand under which the Grant Thornton member firms provide assurance, tax and advisory services to their clients and/or refers to one or more member firms, as the context requires. Grant Thornton Australia Ltd is a member firm of Grant Thornton International Ltd (GTIL). GTIL and the member firms are not a worldwide partnership. GTIL and each member firm is a separate legal entity. Services are delivered by the member firms. GTIL does not provide services to clients. GTIL and its member firms are not agents of, and do not obligate one another and are not liable for one another’s acts or omissions. In the Australian context only, the use of the term ‘Grant Thornton’ may refer to Grant Thornton Australia Limited ABN 41 127 556 389 and its Australian subsidiaries and related entities. GTIL is not an Australian related entity to Grant Thornton Australia Limited. Liability limited by a scheme approved under Professional Standards Legislation. Liability is limited in those States where a current scheme applies.
Independent Auditor’s Report To the Members of the Pilbara Regional Council We have audited the accompanying financial report of the Pilbara Regional Council (the “Council”), which comprises the statement of financial position as at 30 June 2016, the statement of comprehensive income by nature or type, statement of comprehensive income by program, statement of changes in equity and statement of cash flows for the year then ended, notes comprising a summary of significant accounting policies and other explanatory information to the financial report and the statement by the Chief Executive Officer.
Responsibility of the Council for the financial report The Council of the Pilbara Regional Council is responsible for the preparation and fair presentation of the financial report in accordance with Australian Accounting Standards (including the Australian Accounting Interpretations) and the Local Government Act 1995 Part 6. This responsibility includes establishing and maintaining internal control relevant to the preparation and fair presentation of the financial report that is free from material misstatement, whether due to fraud or error; selecting and applying appropriate accounting policies; and making accounting estimates that are reasonable in the circumstances.
Auditor’s responsibility Our responsibility is to express an opinion on the financial report based on our audit. We conducted our audit in accordance with Australian Auditing Standards. These Auditing Standards require that we comply with relevant ethical requirements relating to audit engagements and plan and perform the audit to obtain reasonable assurance whether the financial report is free from material misstatement.
An audit involves performing procedures to obtain audit evidence about the amounts and disclosures in the financial report. The procedures selected depend on the auditor’s judgement, including the assessment of the risks of material misstatement of the financial report, whether due to fraud or error. In making those risk assessments, the auditor considers internal control relevant to the entity’s preparation and fair presentation of the financial report in order to design audit procedures that are appropriate in the circumstances, but not for the purpose of expressing an opinion on the effectiveness of the entity’s internal control. An audit also includes evaluating the appropriateness of accounting policies used and the reasonableness of accounting estimates made by the Council, as well as evaluating the overall presentation of the financial report.

18
We performed the procedures to assess whether in all material respects the financial report presents fairly, in accordance with the Local Government Act 1995 Part 6 and Australian Accounting Standards (including the Australian Accounting Interpretations), a view which is consistent with our understanding of the Council’s financial position and of its performance.
We believe that the audit evidence we have obtained is sufficient and appropriate to provide a basis for our audit opinion.
Independence
In conducting our audit, we have complied with the applicable independence requirements of the Accounting Professional and Ethical Standards Board.
Auditor’s opinion In our opinion, the financial report of the Pilbara Regional Council: (i) presents fairly, in all material respects, the Council’s financial position as at 30 June
2016 and of its performance and cashflows for the year then ended; (ii) complies with Australian Accounting Standards (including the Australian
Accounting Interpretations); and (iii) is prepared in accordance with the requirements of the Local Government Act 1995
Part 6 (as amended) and Regulations under that Act. Statutory Comp liance
I did not, during the course of my audit, become aware of any instance where the Council did not comply with the requirements of the Local Government Act 1995 and Local Government (Financial Management) Regulations 1996 as they relate to financial statements.
GRANT THORNTON AUDIT PTY LTD Chartered Accountants
M A Petricevic Partner - Audit & Assurance Perth, 26 October 2016
Level 1 10 Kings Park Road West Perth WA 6005 Correspondence to: PO Box 570 West Perth WA 6872 T +61 8 9480 2000 F +61 8 9322 7787 E [email protected] W www.grantthornton.com.au
Grant Thornton Audit Pty Ltd ACN 130 913 594 a subsidiary or related entity of Grant Thornton Australia Ltd ABN 41 127 556 389 ‘Grant Thornton’ refers to the brand under which the Grant Thornton member firms provide assurance, tax and advisory services to their clients and/or refers to one or more member firms, as the context requires. Grant Thornton Australia Ltd is a member firm of Grant Thornton International Ltd (GTIL). GTIL and the member firms are not a worldwide partnership. GTIL and each member firm is a separate legal entity. Services are delivered by the member firms. GTIL does not provide services to clients. GTIL and its member firms are not agents of, and do not obligate one another and are not liable for one another’s acts or omissions. In the Australian context only, the use of the term ‘Grant Thornton’ may refer to Grant Thornton Australia Limited ABN 41 127 556 389 and its Australian subsidiaries and related entities. GTIL is not an Australian related entity to Grant Thornton Australia Limited. Liability limited by a scheme approved under Professional Standards Legislation. Liability is limited in those States where a current scheme applies.
Independent Auditor’s Report To the Members of the Pilbara Regional Council We have audited the accompanying financial report of the Pilbara Regional Council (the “Council”), which comprises the statement of financial position as at 30 June 2016, the statement of comprehensive income by nature or type, statement of comprehensive income by program, statement of changes in equity and statement of cash flows for the year then ended, notes comprising a summary of significant accounting policies and other explanatory information to the financial report and the statement by the Chief Executive Officer.
Responsibility of the Council for the financial report The Council of the Pilbara Regional Council is responsible for the preparation and fair presentation of the financial report in accordance with Australian Accounting Standards (including the Australian Accounting Interpretations) and the Local Government Act 1995 Part 6. This responsibility includes establishing and maintaining internal control relevant to the preparation and fair presentation of the financial report that is free from material misstatement, whether due to fraud or error; selecting and applying appropriate accounting policies; and making accounting estimates that are reasonable in the circumstances.
Auditor’s responsibility Our responsibility is to express an opinion on the financial report based on our audit. We conducted our audit in accordance with Australian Auditing Standards. These Auditing Standards require that we comply with relevant ethical requirements relating to audit engagements and plan and perform the audit to obtain reasonable assurance whether the financial report is free from material misstatement.
An audit involves performing procedures to obtain audit evidence about the amounts and disclosures in the financial report. The procedures selected depend on the auditor’s judgement, including the assessment of the risks of material misstatement of the financial report, whether due to fraud or error. In making those risk assessments, the auditor considers internal control relevant to the entity’s preparation and fair presentation of the financial report in order to design audit procedures that are appropriate in the circumstances, but not for the purpose of expressing an opinion on the effectiveness of the entity’s internal control. An audit also includes evaluating the appropriateness of accounting policies used and the reasonableness of accounting estimates made by the Council, as well as evaluating the overall presentation of the financial report.

19
Freedom of Information
In accordance with Section 96 and 97 of the Freedom of Information Act 1992, Council is required to publish an Information Statement which details the process of applying for information under the Act, as well as information that the Council provides outside the Act. During 2015/16 the PRC received no applications under the Freedom of Information Act 1992.
Disability Access and Inclusion Plan
The Pilbara Regional Council has developed a Disability Access and Inclusion Plan to ensure that people with disabilities are included and can access and use facilities, services and functions provided by the PRC.
The plan is reviewed biennially, at which time it may be amended and extended as new strategies are identified and priorities change. For the purposes of this Plan, the World Health Organisation’s definition of disability is utilised: “Disability is a loss or reduction of functional ability which results from an impairment. An impairment is defined as an anatomical or functional
stAtutoRY RepoRts
abnormality or loss which may or may not result in a disability.”
The PRC DAIP includes: Principles applicable to people with disabilities; A disability anti-discrimination statement; Functions, facilities and services provided by the PRC; A statement of Outcomes relevant to this Plan; and Strategies to improve access and inclusion in the PRC
The PRC DAIP can be accessed via Council¹s website at www.prc.wa.gov.au
National Competition Policy
Under the terms of the Competition Principles Agreement between the Commonwealth and the States, Local Governments, including Regional Councils, are required to report on their operations in relation to competition principles, in order to determine whether any inequities occur. In the event that there are any areas found where competition principles are not equitable, the Local Government is required to provide a plan for achieving competitive neutrality or determine why it is in the best interests of the community for the inequity to continue.
1.
2.3.
4.
5.
20
The Pilbara Regional Council did not, during the 2015/2016 financial year, engage in any activities which affected competitive neutrality.
Legislation Review
The Pilbara Regional Council has no legislation in place that is subject to review.
Public Interest Disclosure Act
The Pilbara Regional Council did not have any reportable matters relating to the Public Interest Disclosure Act.
Payments to Employees
In accordance with the requirements of s19B of the Local Government (Administration) Regulations 1996 (as amended), there is one employee of the Pilbara Regional Council entitled to a salary of $100,000 or more.
Purchasing Policy
The Regional Council maintained compliance with the Local Government Act, for all purchases of goods and/or
services ensuring consistency and value for money for all purchasing activities.
State Records Act
Being a very small authority, records are maintained in a paper format with some electronic records. The State Records Act 2000 states that an organisation must review its Plan within five years of the approval date. The PRC reviewed its Record Keeping Plan in 2011/2012 and received approval of its Record Keeping Plan from the State Records Commission in March 2012.
Conduct of Certain Officials – Local Government Act 1995
Section 5.53 of the Local Government Act states that the annual report is to contain details of entries made under section 5.121 during the financial year in the register of complaints. For the 2015-2016 financial year, there were no entries made in the Register of Complaints.

21
finAnciAl RepoRt foR thefinAnciAl YeAR ended30th June 2016
Statement by Chief Executive Officer
Statement of Comprehensive Income by Nature or Type
Statement of Financial Position
Statements of Changes in Equity
Statement of Cash Flows
Rate Setting Statement
Notes to and Forming Part of the Financial Report
22
23
24
25
26
27
28

22
stAtement bY the ceo
The attached financial report of the Regional Council being the annual financial report and other information for the
financial year ended 30 June 2016 are in my opinion properly drawn up to present fairly the financial position of the
Regional Council at 30th June 2016 and the results of the operations for the financial year then ended in accordance
with the Australian Accounting Standards and comply with the provisions of the Local Government Act 1995 and the
regulations under that Act.
Signed as authorisation of issue on the 26 October 2016
Anthony Friday
Chief Executive Officer

23
Operating Grants, Subsidies and ContributionsFees and ChargesInterest Earnings
Employee CostsMaterials and ContractsUtility ChargesDepreciation on Non-Current AssetsInsurance ExpensesOther Expenditure
2,026,588-
122,2662,148,854
27262(a)
1,888,95141,247
103,6032,033,801
Revenue
Expenses
note 2016$
2015$
1,492,50033,00067,396
1,592,896
2016budget
$
2(a)
Changes on revaluation of non-current assetsTotal Other Comprehensive Income
Loss on Asset Disposal
Net Result
-
(3,553,220)
-
(4,052,500)
-
(1,674,065)
(3,553,220) (4,052,500) (1,674,065)
--
--
--
Other Comprehensive Income
Total Comprehensive Income
19
10
stAtement of compRehensive income bY nAtuRe oR tYpe
FOR THE YEAR ENDED 30th June 2016
This statement is to be read in conjunction with the accompanying notes.
(733,650)(4,640,097)
(21,600)(4,500)
(25,000)(220,549)
(5,645,396)(4,052,500)
(690,244)(4,782,109)
(15,333)(3,118)
(21,188)(190,082)
(5,702,074)(3,553,220)
(602,809)(2,870,772)
(9,641)(5,156)
(23,431)(196,057)
(3,707,866)(1,674,065)

24
Cash and Cash EquivalentsTrade and Other Receivables
Provisions
Property, Plant and Equipment
Current LiabilitiesTrade and Other PayablesProvisions
45
9
6
79
1,748,789357,724
4,992,46289,939
13,925 14,766
--
3,118
618,10521,978
32,93232,096
Current Assets
Non-Current Assets
Non-Current Liabilities
EquityRetained Surplus
Total Equity
1,452,505
1,452,505
5,005,725
5,005,725
note 2016$
2015$
STATEMENT OF FINANCIAL POSITION
AS AT 30th June 2016
This statement is to be read in conjunction with the accompanying notes.
Total Current Liabilities
Total Current Assets 2,106,513
2,106,513
640,083 65,028
13,925654,008
1,452,505 5,005,725
14,76679,794
5,082,401
5,085,5193,118Total Non-Current Assets
Total Assets
Total Liabilities
Net Assets
Total Non-Current Liabilities
25
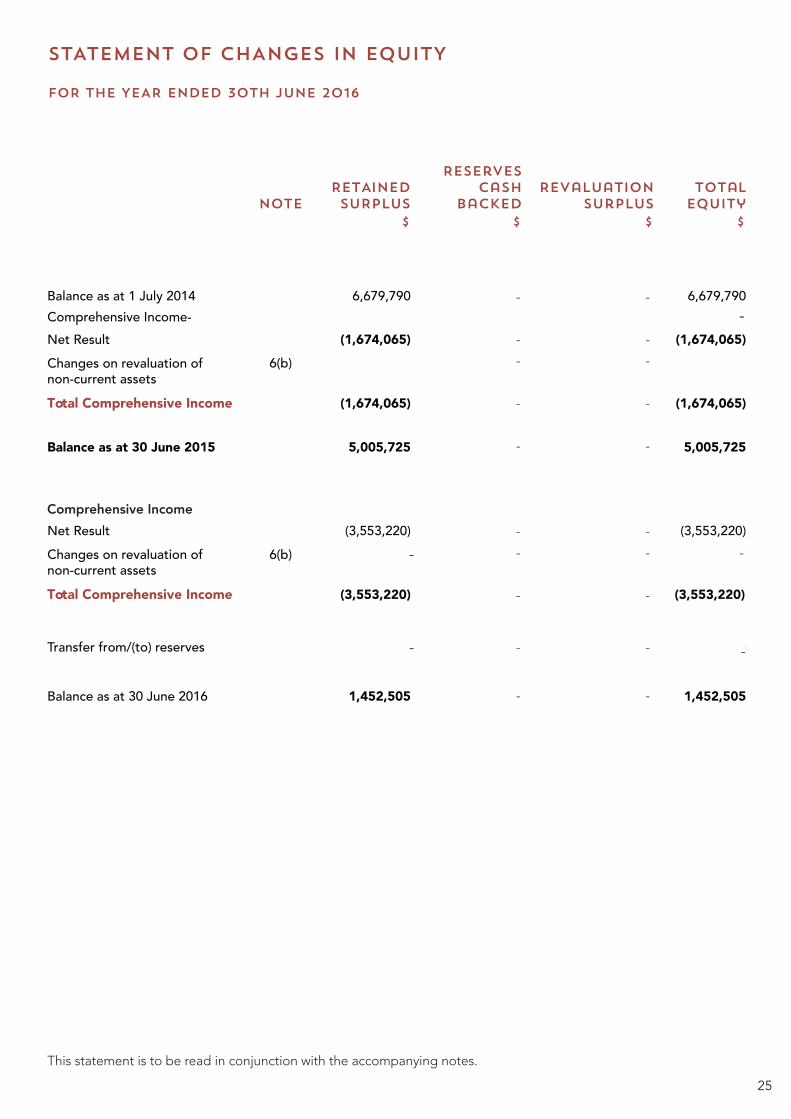
STATEMENT OF CHANGES IN EQUITY
FOR THE YEAR ENDED 30th June 2016
Revenue
noteRetAinedsuRplus
Revaluationsurplus
totalequity
Reservescash
backed
Balance as at 1 July 2014 6,679,790 6,679,790Comprehensive Income-Net Result (1,674,065)
6(b)
6(b)
(1,674,065)
Changes on revaluation ofnon-current assetsTotal Comprehensive Income
Net Result (3,553,220) (3,553,220)Changes on revaluation ofnon-current assets
Transfer from/(to) reserves
Balance as at 30 June 2016 1,452,505 1,452,505
Total Comprehensive Income
Balance as at 30 June 2015
(1,674,065)
5,005,725 5,005,725
(3,553,220) (3,553,220)
(3,553,220) (3,553,220)
(1,674,065)
$$ $$
-
-
-
$$ $ $
-
This statement is to be read in conjunction with the accompanying notes.
Comprehensive Income
-
-
-
-
-
-
-
-
-
-
-
-
-
-
-
-
-
- -
- -

26
Operating Grants, Subsidies and ContributionsFees and chargesInterest EarningsGoods and Services Tax
Payments for Purchase of Property, Plant & EquipmentProceeds from Sales of Fixed AssetsNet Cash Provided By (Used In)Investment Activities
Net Increase (Decrease) in Cash HeldCash at Beginning of the YearCash and Cash Equivalentsat the End of the Year
(3,243,673)4,992,462
1,748,789
(3,933,217)4,634,192
700,975
(2,007,273)6,999,735
4,992,462
Employee CostsMaterials and ContractsUtility ChargesInsurance ExpensesGoods and Services TaxOther Expenditure
2,092,062-
122,266306,288
2,520,616
(710,947)(4,246,464)
(13,445)(21,188)
(577,951)(194,294)
(5,764,289)
(584,254)(2,874,400)
(9,641)(23,431)
(570,747)(184,951)
(4,247,424)
1,830,05741,247
103,603268,652
2,243,559Payments
Net Cash Provided By (Used In)Operating Activities (3,243,673)12 (b)
12 (a)
note 2016$
2015$
---
---
(3,408)-
(3,408)
---
(754,795)(4,625,597)
(21,600)(25,000)
(330,000)(220,549)
(5,977,541)
1,613,92833,00067,396
330,0002,044,324
2016budget
$
(3,933,217) (2,003,865)
Net Cash Provided By (Used In)Financing Activities -- -
Cash Flows from Investing Activities
STATEMENT OF CASH FLOWS
FOR THE YEAR ENDED 30TH JUNE 2016
-
This statement is to be read in conjunction with the accompanying notes.

27
GovernanceGeneral Purpose FundingCommunity amenitiesRecreation and cultureTransportEconomic Services
1,505,862122,266
-346,664
-174,062
2,148,854
1,025,50067,396
-500,000
--
1,592,896
1,562,380103,603
-300,00067,818
-2,033,801
Governance
Community amenities
Recreation and culture
Transport
Economic Services
(Profit/Loss on Asset Disposals
Movement resulting in impairment of assets
Movement in Employee Benefit Provisions
(Non-Current)
Depreciation and Amortisation on Assets
Capital Expenditure and RevenuePurchase Furniture and Equipment
Proceeds from Disposal of Fixed Assets
Transfer to reserves (restricted assets)
Transfers to reserves (restricted assets)
ADD Estimated Surplus/(Deficit) July 1 B/Fwd
LESS Estimated Surplus/(Deficit) June 30 C/Fwd
Total Amount Raised from General Rate
19
2a
6b
19
10
10
21(a)
21(a)
21(a)
-
-
8,500
4,500
-
-
-
-
4,722,610
(683,110)-
-
-
(841)
3,118
-
-
-
-
5,017,372
1,466,429-
-
11,105
3,853
3,118
5,156
(3,408)
-
6,674,731
5,017,372-
(5,281,554)
-
(267,328)
-
(153,192)
(4,835,396)
-
(700,000)
-
(110,000)
(1,852,193)
(24,584)
(43,533)
-
Revenue
Expenses
Adjustments for Cash Budgets Requirements
Net Result Excluding Rates
note 2016$
2015Actual
$
2016budget
$
(5,702,074) (5,645,396) (3,707,866)
(3,553,220) (4,052,500) (1,674,065)
RATE SETTING STATEMENT
FOR THE YEAR ENDED 30TH JUNE 2016
5,156
-
-
(3,408)
This statement is to be read in conjunction with the accompanying notes.
(1,787,556)

28
1. SIGNIFICANT ACCOUNTING POLICIES
(a) Basis of Preparation
The financial report comprises general purpose financial statements which have been prepared in accordance with Australian Accounting Standards (as they apply to local governments and not-for-profit entities), Australian Accounting Interpretations, other authoritative pronouncements of the Australian Accounting Standards Board, the Local Government Act 1995 and accompanying regulations. Material accounting policies which have been adopted in the preparation of this financial report are presented below and have been consistently applied unless stated otherwise.
Except for cash flow and rate setting information, the report has been prepared on the accrual basis and is bases on historical costs, modified, where applicable, by the measurement at fair value of selected non-current assets, financial assets and liabilities.
Critical Accounting Estimates
The preparation of a financial report in conformity with Australian Accounting Standards requires management to make judgements, estimates and assumptions that effect the application of policies and reported amounts of assets and liabilities, income and expenses.
The estimates and associated assumptions are based on historical experience and various other factors that are believed to be reasonable under the circumstances; the results from which form the basis of making the judgments about carrying values of assets and liabilities that are not readily apparent form other sources. Actual results may differ from these estimates.
The Local Government Reporting Entity
All funds through which the Regional Council controls resources to carry on its functions have been included in the financial statements forming part of this financial report.
In the process of reporting on the local government as a single unit, all transactions and balances between those Funds (for example, loans and transfers between Funds) have been eliminated.
(b) Goods and Services Tax (GST)
Revenues, expenses and assets are recognised net of the amount of GST, except where the amount of GST incurred is not recoverable from the Australian Taxation Office (ATO).
Receivables and payables are stated inclusive of GST receivable or payable.
The net amount of GST recoverable from, or payable to, the ATO is included with receivables or payables in the statement of financial position.
Cash flows are presented on a gross basis. The GST components of cash flows arising from investing of financing activities which are recoverable from, or payable to, the ATO are presented as operating cash flows.
notes to And foRming pARt of the finAnciAl RepoRt
As of 30th June 2016

29
(c) Cash and Cash Equivalents
Cash and cash equivalents include cash on hand, cash at bank, deposits available on demand with banks and other short term highly liquid investments that are readily convertible to known amounts of cash and which are subject to an insignificant risk of changes in value and bank overdrafts.
Bank overdrafts are reported as short term borrowings in current liabilities in the statement of financial position.
(d) Trade and Other Receivables
Trade and other receivables include amounts due from ratepayers for unpaid rates and service charges and other amounts due from third parties for goods sold and services performed in the ordinary course of business.
Receivables expected to be collected within 12 months of the end of the reporting period are classified as non-current assets.
Collectability of trade and other receivables is reviewed on an ongoing basis. Debts that are known to be uncollectible are written off when identified. An allowance for doubtful debts is raised when there is objective evidence that they will not be collectible.
(e) Inventories
General
Inventories are measured at the lower of cost and net realisable value.
Net realisable value is the estimated selling price of the ordinary course of business less the estimated costs of completion and the estimated costs necessary to make the sale.
Land held for sale
Land held for development and sale is valued at the lower of cost and net realisable value. Cost includes the cost of acquisition, development, borrowing costs and holding costs until completion of development. Finance costs and holding charges incurred after development is completed are expensed.
Gains and losses are recognised in profit or loss at the time of signing an unconditional contract of sale if significate risks and rewards, and effective control over the land, are passed on to the buyer at this point.
Land held for sale is classified as current except where it is held as non-current based on the Council’s intentions to release for sale.
(f) Fixed Assets
Each class of fixed assets within either property, plant and equipment or infrastructure, is carried at cost or fair value as indicated, less where applicable, any accumulated depreciation and impairment losses.
Mandatory Requirement to Revalue Non-Current Assets
Effective from 1 July 2012, the Local Government (Financial Management) Regulations were amended and the measurement of non-current assets at Fair Value became mandatory.
The amendments allow for a phasing in of fair value in relation to fixed assets over three years as follows:
(a) for the financial year on 30 June 2013, the fair value of all the assets of the local government that are plant and equipment; and
(b) for the financial year ending on 30 June 2014, the fair value of all of the assets of the local government.
(i) that are plant and equipment and(ii) that are – (I) land and buildings: (II) infrastructure;and
(c) for a financial year ending on or after 30 June 2015, the fair value of all of the assets of the local government.
Thereafter, in accordance with the regulations, each asset class must be revalued at least every 3 years.
In 2013, the Regional Council commenced the process of adopting Fair Value in accordance with the regulations.
Relevant disclosures, in accordance with the requirements of Australian Accounting Standards, have been made in the financial report as necessary.
Land under control
In accordance with Local Government (Financial Management) Regulation 16(a), the Regional Council was required to include as an asset (by 30 June 2013), Crown Land operated by the local government as a golf course, showground, racecourse or other sporting or recreational facility of State or Regional significance.

30
Upon initial recognition, these assets were recorded at cost in accordance with AASB 116. They were then classified as land and revalued along with other land in accordance with the other policies detailed in this Note.
Initial Recognition and Measurement between Mandatory Revaluation Dates
All assets are initially recognised at cost and subsequently revalued in accordance with the mandatory measurement framework detailed above.
In relation to this initial measurement, cost is determined as the fair value of assets given as consideration plus costs incidental to the acquisition. For assets acquired at no cost for nominal consideration, cost is determined as fair value at the date of acquisition. The cost of non-current assets constructed by the Regional Council includes the cost of all materials used in construction, direct labour on the project and appropriate proportion of variable and fixed overheads.
Individual assets acquired between initial recognition and the next revaluation of the asset class in accordance with the mandatory measurement framework detailed above, are carried at costs less accumulated depreciation as management believes this approximates fair value. They will be subject to subsequent revaluation at the next anniversary date in accordance with the mandatory measurement framework detailed above.
Revaluation
Increases in the carrying amount arising on revaluation of assets are credited to a revaluation surplus in equity. Decreases that offset previous increases of the same asset are recognised against revaluation surplus directly in equity. All other decreases are recognised profit and loss.
Land Under Roads
In Western Australia, all land under roads is Crown Land, the responsibility for managing which, is vested in local government.
Effective as at 1 July 2008, Council elected not to recognise any value for land under roads acquired on or before 30 June 2008. This accords with the treatment
available in Australian Accounting Standards AASB 1051 Land Under Roads and the fact Local Government (Financial Management) Regulation 16(a)(i) prohibits local governments from recognising such land as an asset.In respect of land under roads acquired on or after 1 July 2008, as detailed above, Local Government (Financial Management) Regulation 16(a)(i) prohibits local governments from recognising such land as an asset.
Whist such treatment is inconsistent with the requirements of AASB 1051, Local Government (Financial Management) Regulation 4(2) provides in the event of such an inconsistency, the Local Government (Financial Management) Regulations prevail.
Consequently, any land under roads, acquired on or after 1 July 2008 is not included as an asset of the Council.
Depreciation
The depreciable amount of all fixed assets including buildings but excluding freehold land, are depreciated on a straight-line basis over the individual asset’s useful life from time to time the asset is held ready for use. Leasehold improvements are depreciated over the shorter of either the unexpired period of the lease or the estimated useful life of the improvements.
When an item of property, plant and equipment is revalued, any accumulated depreciation at the date of revaluation is treated in one of the following ways:
(a) Restated proportionately with the change in the gross carrying amount of the asset so that the carrying amount of the asset after revaluation equals its revalued amount; or
(b) Eliminated against the gross carrying amount of the asset and the net amount restated to the revalued amount of the asset.Major depreciation periods used for each class of depreciable asset are:
Furniture and (Internal) Equipment- computers and peripherals 32% 4 to 10 years- other electronic equipment 18% 4 to 10 years- furniture 9% 4 to 10 years
The assets residual values and useful lives are reviewed,
notes to And foRming pARt of the finAnciAl RepoRt
foR the YeAR ended 30th June 2016
1. significAnt Accounting policies >>

31
and adjusted if appropriate, at the end of each reporting period.
An asset’s carrying amount is written down immediately to its recoverable amount if the asset’s carrying amount is greater than its estimated recoverable amount.
Gains and losses on disposals are determined by the comparing proceeds with the carrying amount. These gains and losses are included in the statement of comprehensive income in the period in which they arise.
Capitalisation Threshold
Expenditure on items of equipment under $3,000 is not capitalised. Rather, it is expensed and is recorded on an asset inventory listing.
(g) Fair Value of Assets and Liabilities
When performing a revaluation, the Regional Council uses a mix of both independent and management valuations using the following as a guide.
Fair Value is the price that the Regional Council would receive to sell the asset or would have to pay to transfer a liability, in an orderly (i.e. unforced) transaction between independent, knowledgeable and willing market participants at the measurement date.
As far as value is a market-based measure, the closest equivalent observable market pricing information is used to determine fair value. Adjustments to market values may be made having regard to the characteristics of the specific asset or liability. The fair values of assets that are not traded in an active market are determined using one or more valuation techniques. These valuation techniques maximise, to the extent possible, the use of observable data.
To the extent possible, market information is extracted from either the principal market for the asset or liability (i.e. the market with the greatest volume and level of activity for the asset or liability) or, in the absence of such a market, the most advantageous market available to the entity at the end of the reporting period (i.e. the market that maximises the receipts from the sale of the asset after taking into account transaction costs and transport costs.
For non-financial assets, the fair value measurement also takes into account a market participants ability to use the assets in its highest and best use or to sell it to another market participant that would use the asset in its highest and best use.
Fair Value Hierarchy
AASB 13 requires the disclosure of fair value information of the fair value hierarchy, which categorises fair value measurement into one of the three possible levels based on the lowest level that an input is significant to the measurement can be categorised as follows:
Valuation techniquesThe Regional Council selects a valuation technique that is appropriate in the circumstances and for which sufficient data is available to measure fair value. The availability of sufficient and relevant data primarily depends on the specific characteristics of the asset or liability being measured. The valuation techniques selected by the Regional Council are consistent with one or more of the following valuation approaches:
Market approachValuation techniques that use prices and other relevant information generated by the market transactions for identical or similar assets or liabilities.
Income approachValuation techniques that convert estimated future cash flows or income and expenses into a single discounted present value.
Level 1Measurements based on quoted prices (unadjusted) in active markets for identical assets or liabilities that the entity can access at the measurement date.
Level 2Measurements based on the inputs other than quoted prices included in Level 1 that are observable for the assets or liability, either directly or indirectly.
Level 3Measurements based on unobservable inputs for the asset or liability.
The fair values of assets and liabilities that are not traded in an active market are determined using one or more valuation techniques. These valuation techniques maximise, to the extent possible, the use of observable market data. If all significant inputs required to measure fair value are observable, the asset or liability is included in Level 2. If one or more significant inputs are not based on observable market data, the asset or liability is included in Level 3.

32
Cost approachValuation techniques that reflect the current replacement cost of an asset at its current service capacity.
Each valuation technique requires inputs that reflect the assumptions that buyers and sellers would use when pricing the asset or liability., including assumptions about risks. When selecting a valuation technique, the Regional Council gives priority to those techniques that maximise the use of observable inputs and minimise the use of unobservable inputs. Inputs that are developed using market data (such as publicly available information on actual transactions) and reflect the assumptions that buyers and sellers would generally use when pricing the asset or liability are considered observable, whereas inputs for which market data is not available and therefore are developed using the best information available about such assumptions are considered unobservable.
As detailed above, the mandatory measurement framework imposed by the Local Government (Financial Management) Regulations requires, as a minimum, all assets carried at a revalued amount to be revalued at least every 3 years.
(h) Financial Instruments
Initial Recognition and MeasurementFinancial assets and financial liabilities are recognised when the Regional Council becomes a party to the contractual provisions to the instrument. For financial assets, this is equivalent to the dated that the Regional Council commits itself to either the purchase or sale of the asset (i.e. trade date accounting is adopted).
Financial instruments are initially measured at fair value plus transaction costs, except where the instrument is classified ‘at fair value through profit or loss’, in which case transaction costs are expensed to the profit or loss immediately.
Classification and Subsequent MeasurementFinancial instruments are subsequently measured at fair value, amortised cost using the effective interest rate method or cost.
Amortised cost is calculated as:
(a) the amount in which the financial asset or financial liability is measured at initial recognition;
(b) less principal repayments and any reduction for impairment and
(c) plus or minus the cumulative amortisation of the difference, if any, between the amount initially recognised and the maturity amount calculated using the effective interest rate method.
The effective interest method is used to allocate interest income or interest expense over the relevant period and is equivalent to the rate that discounts estimated future cash payments or receipts (including fees, transaction costs and other premiums or discounts) through the expected life (or when this cannot be reliably predicted, the contractual term of the financial instrument to the net carrying amount of the financial asset or financial liability. Revisions to expected future net cash flows will necessitate an adjustment to the carrying value with a consequential recognition of an income or expense in profit or loss.
(i) Financial assets at fair value through profit and loss
Financial assets are classified at “fair value through profit or loss” when they are held for trading for the purpose of short-term profit taking. Such assets are subsequently measured at fair value with changes in carrying amount being included in profit or loss. Assets in this category are classified as current assets.
(ii) Loans and receivables
Loans and receivables are non-derivative financial assets with fixed or determinable payments that are not quoted in an active market and are subsequently measured at amortised cost. Gains or losses are recognised in profit or loss.
Loans and receivables are included in current assets where they are expected to mature within 12 months after the end of the reporting period.
(iii) Held-to-maturity investments
notes to And foRming pARt of the finAnciAl RepoRt
foR the YeAR ended 30th June 2016
1. significAnt Accounting policies >>

33
Held-to-maturity investments are non-derivative financial assets with fixed maturities and fixed or determinable payments that the Regional Council has the positive intention and ability to hold onto maturity. They are subsequently measured at amortised cost. Gains or losses are recognised in profit or loss.
Held-to -maturity investments are included in non-current assets, where they are expected to mature within 12 months after the end of the reporting period. All other investments are classified non-current.
(iv) Available-for -sale financial assets
Available-for-sale financial assets are non-derivative financial assets that are either not suitable to be classified into other categories of financial assets due to their nature, or they are designated as such by management. They comprise investments in the equity of other entities where there is neither a fixed maturity nor fixed or determinable payments.
They are subsequently measured at fair value with changes in such fair value (i.e. gains or losses) recognised in other comprehensive income (except for impairment losses). When the financial asset is derecognised, the cumulative gain or loss pertaining to that asset previously recognised in other comprehensive income is reclassified into profit and loss.
Available-for-sale financial assets are included in current assets where they are expected to be sold within 12 months after the end of the reporting period. All other available-for-sale financial assets are classified as non-current.
(v) Financial Liabilities
Non-derivative liabilities (excluding financial guarantees) are subsequently measured at amortised cost. Gains and losses are recognised in profit or loss.
Impairment
A financial asset is deemed to be impaired if, and only it, there is objective evidence of impairment as a result of one or more events (a “loss event”) having occurred, which will have an impact on the estimated future cash flows of the financial asset(s).
In the case of available-for-sale financial assets, a significant or prolonged decline in the market value of the instrument is considered a loss event. Impairment losses are recognised in profit or loss immediately. Also, any cumulative decline in fair value previously recognised
in other comprehensive decline in fair value previously recognised in other comprehensive income is reclassified to profit or loss at this point.
In the case of financial assets carried at amortised cost, loss events may include: indications that the debtors or a group of debtors are experiencing significant financial difficulty, default or delinquency in interest or principal payments; indications that they will enter bankruptcy or other financial reorganisation; and changes in arrears or economic conditions that correlate with defaults.
For financial assets carried at amortised cost (including loans and receivables), a separate allowance account is used to reduce the carrying amount of financial assets impaired by credit losses after having taken all possible measures of recovery, if management establishes that the carrying amount cannot be recovered by any means, at that point the written-off amounts are charged to the allowance account or the carrying amount of impaired financial assets is reduced directly if no impairment amount was previously recognised in the allowance account.
Derecognition
Financial assets are derecognised where the contractual rights to receipt of cash flows expire or the asset is transferred to another party whereby the Regional Council is no longer has any significant continual involvement in the risks and benefits associated with the asset.
Financial liabilities are derecognised where the related obligations are discharged, cancelled or expired. The difference between the carrying amount of the financial liability extinguished or transferred to another party and the fair value of the consihhderation paid, including the transfer of non-cash assets or liabilities assumed, is recognised in profit or loss.
(i) Impairment of Assets
In accordance with Australian Accounting Standard the Regional Council’s assets, other than inventories, are assessed at each reporting date to determine whether there is any indication they may be impaired.
Where such an indication exists, and impairment test is carried out on the asset by comparing the recoverable amount of the asset, being the higher of the asset’s fair value less costs to sell ad value in use, to the asset’s carrying amount.
Any excess of the asset’s carrying amount over its

34
recoverable amount is recognised immediately in profit or loss unless the asset is carried and revalued amount in accordance with another Standard (e.g. AASB 116) whereby any impairment loss of a revalued asset is treated as a revaluation decrease in accordance with that other standard.
For non-cash generating assets such as roads, drains public buildings and the like, value in use is represented by the depreciated replacement cost of the asset.
(j) Trade and other Payables
Trade and other payables represent liabilities for goods and services provided to the Regional Council prior to the end of financial year that are unpaid and arise when the Regional Council becomes obliged to make future payments in respect of these good and services. The amounts are unsecured, are recognised as a current liability and are normally paid within 30 days of recognition.
(k) Employee Benefits
Short-Term Employee BenefitsProvision is made for the Regional Council’s obligations for short-term employee benefits. Short-term employee benefits are benefits (other than termination benefits) that are expected to be settled wholly before 12 months after the end of the annual reporting period in which the employees render the related service, including wages, salaries and sick leave. Short-term employee benefits are measured at the (undiscounted) amounts expected to be paid when the obligation is settled.
The Regional Council’s obligations for short-term employee benefits such as wages, salaries and sick leave are recognised as part of current trade and other payables in the statement of financial position. The Regional Council’s obligations for employees’ annual leave and long service leave entitlements are recognised as provisions in the statement of financial position.
Other Long-Term Employee BenefitsProvision is made for employees’ long service leave and annual leave entitlements not expected to be settled wholly within 12 months after the end of the annual reporting period in which the employees render the
related service. Other long-term employee benefits are measured at present value of the expected future payments to be made to employees. Expected future payments incorporate anticipated future wage and salary levels, durations of service and employee departures are discounted at rates determined by reference to market yields at the end of the reporting period on government bonds that have maturity dates that approximate the terms of the obligations. Any remeasurements for changes in assumptions of obligations for other long-term employee benefits are recognised in profit or loss in the periods in which changes occur.
The Regional Council’s obligations for long-term employee benefits are presented as non-current provisions in its statement of financial position, except where the Regional Council does not have an unconditional right to defer settlement for at least 12 months after the end of the reporting period, in which case the obligations are presented as current provisions.
(l) Borrowing Costs
Borrowing costs are recognised as an expense when incurred except where they are directly attributable to the acquisition, construction or production of a qualifying asset. Where in this case, they are capitalised as part of the particular asset is substantially ready for its intended use or sale.
(m) Provisions
Provisions are recognised when the Regional Council has a present legal or constructive obligation, as a result of past events, for which it its probable that an outflow of economic benefits will result and that outflow can be reliably measured.
(n) Leases
Leases of fixed assets where substantially all the risks and benefits incidental to the ownership of the asset, but not legal ownership, are transferred to the Regional Council, are classified as finance leases.
Finance leases are capitalised recording an asset and a liability at the lower amounts equal to the fair value of the leased property for the present value of the minimum
notes to And foRming pARt of the finAnciAl RepoRt
foR the YeAR ended 30th June 2016
1. significAnt Accounting policies >>

35
lease payments. Lease payments are allocated between the reduction of the lease liability and the lease interest expense for the period.
Leased assets are depreciated on a straight line basis over the shorter of the estimated useful lives or the lease term.
Lease payments for operating leases, where substantially all the risks and benefits remain with the lessor, are charged as expenses in the periods in which they are incurred.
Lease incentives under operating leases are recognised as a liability and amortised on a straight line basis over the life of the lease term.
(o) Investment in Associates
An associate is an entity over which the Regional Council has significant influence. Significant influence is the power to participate in the financial operating policy decisions of that entity but is not control or joint control of these policies. Investments in associates are accounted for in the financial statements by applying the equity method of accounting, whereby the investment is initially recognised at cost and adjusted thereafter for the post-acquisition change in the Regional Council’s share of net assets of the associate. In addition, the Regional Council’s share of the profit or loss of the associate is included in the Regional Council’s profit or loss.
The carrying amount of the investment includes, where applicable, goodwill relating to the associate.
Any discount on acquisition, whereby the Regional Council’s share of the net fair value of the associate exceeds the cost of the investment, is recognised in profit or loss in the period in which the investment is acquired.
Profits and losses resulting from transactions between the Regional Council and the associate are eliminated to the extent of the Regional Council’s interest in the associate.
When the Regional Council’s share of losses is an associate equals or exceeds its interest in the associate, the Regional Council discontinues recognising its share of further losses unless it has incurred legal or constructive obligations or made payments on behalf of the associate.
When the associate subsequently makes profits, the Regional Council will resume recognising its share of those profits once its share of the profits equals the share of the losses not recognised.
(p) Interest in Joint Arrangements
Joint arrangements represent the contractual sharing of control between parties in a business venture unanimous decisions about relevant activities are required.
Separate joint venture entities providing venturers with an interest to net assets are classified as a joint venture and accounted for using the equity method. Refer to note 1 (o) for a description of the equity method of accounting.
Joint venture operations represent arrangements whereby joint operators maintain direct interests in which asset and exposure to each liability of the arrangement. The Regional Council’s interest in the assets, liabilities, revenue and expenses of joint operations are included in the respective line items of the financial statements. Information about the joint ventures is set out in note 14.
(q) Rates, Grants, Donations, and Other Contributions
Rates, grants, donations and other contributions are recognised as revenues when the local government obtains control over the assets comprising the contributions.Control over assets acquired from rates is obtained at the commencement of the rating period or, where earlier, upon receipt of the rates.
Where contributions recognised as revenues during the reporting period were obtained on the condition that they be expended in a particular manner or used over a particular period, and those conditions were undischarged as the reporting date, the nature of and amounts pertaining to those undischarged conditions are disclosed in Note 2(c). That note also discloses the amount of contributions recognised as revenues in a previous reporting period which were obtained in the respect of the local government’s operations for the current reporting period.
(r) Superannuation
The Regional Council contributes to a number of Superannuation Funds on behalf of employees. All funds to which the Regional Council contributes are defined contribution plans.
(s) Current and Non-Current Classification
In the determination of whether an asset or liability is current or non-current, consideration is given to the time when each asset or liability is expected to be settled. The asset or liability is classified as current if it is expected to be settled within the next 12 months, being the Regional
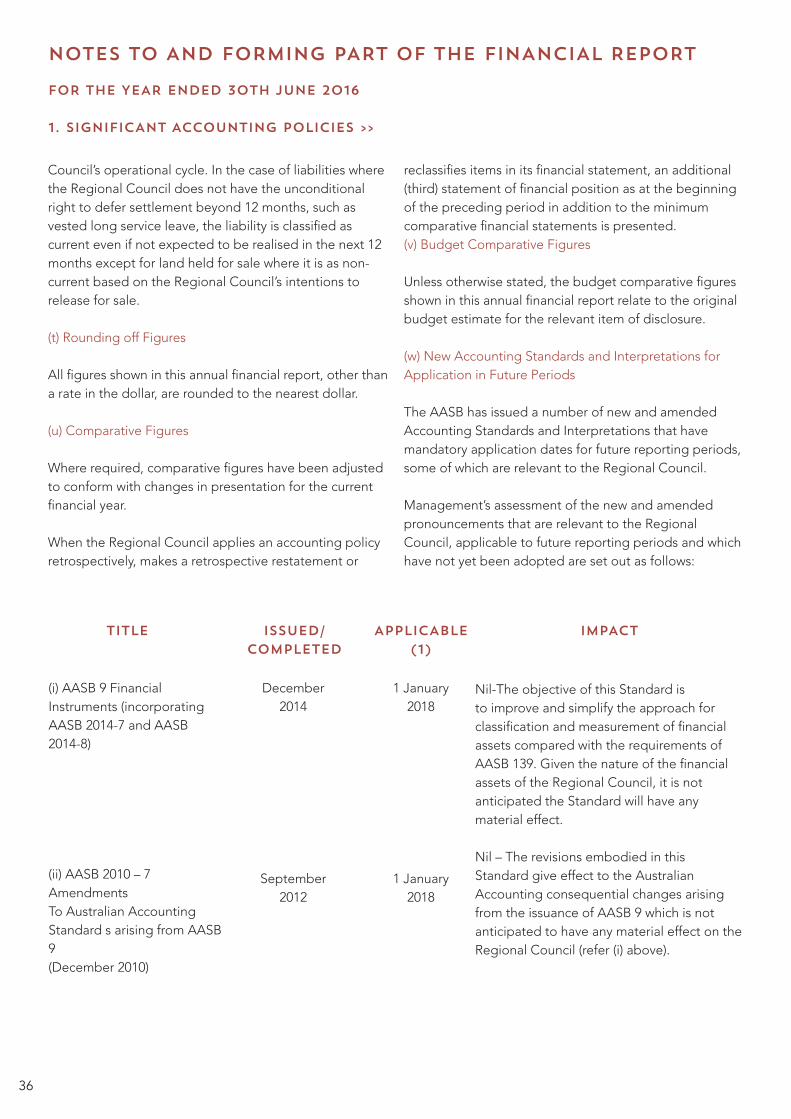
36
Council’s operational cycle. In the case of liabilities where the Regional Council does not have the unconditional right to defer settlement beyond 12 months, such as vested long service leave, the liability is classified as current even if not expected to be realised in the next 12 months except for land held for sale where it is as non-current based on the Regional Council’s intentions to release for sale.
(t) Rounding off Figures
All figures shown in this annual financial report, other than a rate in the dollar, are rounded to the nearest dollar.
(u) Comparative Figures
Where required, comparative figures have been adjusted to conform with changes in presentation for the current financial year.
When the Regional Council applies an accounting policy retrospectively, makes a retrospective restatement or
Nil-The objective of this Standard isto improve and simplify the approach for classification and measurement of financial assets compared with the requirements of AASB 139. Given the nature of the financial assets of the Regional Council, it is not anticipated the Standard will have any material effect.
Nil – The revisions embodied in thisStandard give effect to the Australian Accounting consequential changes arising from the issuance of AASB 9 which is not anticipated to have any material effect on the Regional Council (refer (i) above).
(i) AASB 9 FinancialInstruments (incorporatingAASB 2014-7 and AASB2014-8)
(ii) AASB 2010 – 7AmendmentsTo Australian AccountingStandard s arising from AASB9(December 2010)
1 January2018
1 January2018
December2014
September2012
issued/completed
title ApplicAble(1)
impAct
notes to And foRming pARt of the finAnciAl RepoRt
FOR THE YEAR ENDED 30th June 2016
1. significAnt Accounting policies >>
reclassifies items in its financial statement, an additional (third) statement of financial position as at the beginning of the preceding period in addition to the minimum comparative financial statements is presented.(v) Budget Comparative Figures
Unless otherwise stated, the budget comparative figures shown in this annual financial report relate to the original budget estimate for the relevant item of disclosure.
(w) New Accounting Standards and Interpretations for Application in Future Periods
The AASB has issued a number of new and amended Accounting Standards and Interpretations that have mandatory application dates for future reporting periods, some of which are relevant to the Regional Council.
Management’s assessment of the new and amended pronouncements that are relevant to the Regional Council, applicable to future reporting periods and which have not yet been adopted are set out as follows:

37
This Standard amends AASB 11: Joint Ar-rangements to requirethe acquirer of an interest(both initial and additional) in a joint op-eration in which the activity constitutes a business,as defined in AASB 3: Business Combina-tions, to apply all of the principles on busi-ness combinations accounting in AASB 3 and other Australian Accounting Standards except for those principles that conflict with the guidance in AASB 11;and disclose the information required by AASB 3 and other Australian AccountingStandards for businesscombinations.
Since adoption of this Standard would impact only acquisitions of interests in joint operations on or after 1 January 2016, man-agement believes it is impracticable at this stage to provide a reasonable estimateof such impact on the Regional Council’s financial statements.
Consequential changes to various Stan-dards arising from the issuanceof AASB 15.
It will require changes to reflect the impact of AASB 15.
(iv) AASB 2014-3 Amendments to Australian Accounting Standards - Accounting for Acquisitions of Interests in Joint Operations
[AASB 1 & AASB 11]
(v) AASB 2014-5 Amendments toAustralian Accounting Standardsarising from AASB 15
1 January2016
1 January2016
August2014
August2014
1 January2017
December2014
issued/completed
title ApplicAble(1)
impAct
This Standard establishes principlesfor entities to apply to report usefulinformation to users of financialstatements about the nature, amount, timing and uncertainty of revenue and cash flows arising from a contract with a customer.
This effect of this Standard willdepend upon the nature of futuretransactions the Regional Council has with those third parties it has with. It may or may not be significant.
(AASB 1, 3, 4, 5, 7, 101, 102,108, 112, 118, 121, 127, 128,131, 132, 136, 139, 1023, &1038 and Interpretations 2, 5,10, 12, 19 & 127)(iii) AASB 15 Revenue fromContracts with Customers

38
(1) Applicable to reporting periods commencing on or after the given date.
(x) Adoption of New and Revised Accounting StandardsDuring the current year, the Regional Council adopted all of the new and revised Australian Accounting Standards and Interpretations which were compiled, became mandatory and which were applicable to its operations.
These new and revised standards were:AASB 2013-9AASB 2014-4AASB 2015-2AASB 2015-3
Most of the Standards adopted had a minimal effect on the accounting and reporting practices of the Regional Council as they did not have a significant impact on the accounting or reporting practices or were either not applicable, largely editorial in nature, were revisions to help ensure consistency with presentation, recognition and measurement criteria of IFRSs or related to topics not relevant to operations.
The objective of this Standard is to extend the scope of AASB 124 Related Party Disclosures to include not-for-profit sectorentities.
The Standard is expected to have a significant disclosure impact on the financial report of the Regional Council as both Elected Members and SeniorManagement will be deemed tobe Key Management Personneland resultant disclosures will benecessary.
The standard removes classification of leases as either operating leases or finance leases for the lessee effectivelytreating all leases as financeleases.
Although the Regional Council anticipate the adoption of AASB 16 may have an impact of the financial statements, it is impartible at this stage to provide a reasonable estimate of such impact.
(vi) AASB 2015-6 Amend-ments toAustralian Accounting Stan-dards- Extending Related PartyDisclosures to Not-for-ProfitPublic Sector Entities
[AASB 10, 124 & 1049]
(vii) AASB 16 Leases
1 July2016
1 January2019
March2015
1 January2016
issued/completed
title
(w) New Accounting Standards and Interpretations for Application in Future Periods (Continued)
notes to And foRming pARt of the finAnciAl RepoRt
foR the YeAR ended 30th June 2016
1. significAnt Accounting policies >>

39
(a) Net Result
The Net Result includes:(i) Charging as an Expense:
Significant expense and revenueEconomic ServicesGovernance
Auditors Remuneration - Audit of the financial report
DepreciationFurniture and Equipment
Significant RevenueGovernanceRecreation & Culture
Other Revenue
Significant Revenue (Refer Above)
Interest Earnings- Other Funds
190,520200,000
314,485300,000
8,500
390,520
390,520
614,485
614,485
8,721
5,1563,118
-(3,425,541)
(1,734,496)-
2016$
2016$
2016$
2016ActuAl
$
2015ActuAl
$
2015$
2016$
2015$
2015$
2015$
The significant expense in 2015 relates to expenditure for the coastal locations and rest stops project that the Pilbara Regional Council was project managing on behalf of the member local governments.The significant expense in 2016 relates to the Land Deconstraint Project.
The significant revenue in 2016 relates to a government grant received for the Land Deconstraint project and grant for Old Onslow Heritage works; and in 2015 relates to project management income and a grant for Old Onslow Heritage works.
notes to And foRming pARt of the finAnciAl RepoRt
foR the YeAR ended 30th June 2016
2. revenue and expenses

40
(b) Statement of Objective
In order to discharge its responsibilities to the community, the Regional Council has developed a set of operational and financial objectives. These objectives have been established both on an overall basis, reflected by the Regional Council’s Community Vision, and for each of its broad activities/programs.
Community Vision
Efficient, cooperative and sustainable local government across the Pilbara, contributing to a region of social and economic prosperity.Regional Council operations as disclosed in these financial statements encompass the following service orientated activities/programs.
Governance
objective:
To provide a decision making process for the efficient allocation of scarce resources.
activities:
Includes the activities of members of council and the administrative support available to the council for the provision of governance of the Regional Council and project management services. Other costs relate to the task of assisting elected members on matters which do not concern specific council services.
General Purpose Funding
objective:
To collect revenue to allow for the provision of services.
activities:
Rates, general purpose government grants and interest revenue.
Community Amenities
objective:
To provide services required by the community
activities:
Project Management services relating to effluent control.
Recreation and Culture
objective:
To establish and effectively manage infrastructure and resource which will help the social well-being of the community.
activities:
Project management services relating to historical and other cultural facilities.
Economic Services
objective:
To help promote the shire and its economic wellbeing.
activities:
Project management relating to tourism and area promotion.
notes to And foRming pARt of the finAnciAl RepoRt
foR the YeAR ended 30th June 2016
2. revenue and expenses >>

41
Grant/Contribution
Waste Authority Grant
RDL - CLGF Regional Grant 11/12
DLG - RBP Migration
Members - Tourism Short Stay
PRC Member Project Contributions
RDL - Land Deconstraint
DLG – DAMA & Payroll Processing
DSD – Old Onslow Heritage Works
PDC – Tourism Capacity Grant
DoT – Regional Boating Facilities
LotteryWest - Tourism Plan
Wheatstone Project
Total
Function/ Activity
$
Governance
Recreation
Governance
Economic
Governance
Governance
Governance
Recreation
Economic
Economic
Economic
Culture
Received (2) 2014/15
$
-
-
-
-
-
163,999
125,000
300,000
50,000
-
-
-
638,999
Received (2) 2015/16
$
-
-
-
-
-
-
52,000
200,000
-
104,062
70,000
146,664
572,726
Expended (3) 2015/16
$
-
-
-
-
-
(3,425,541)
(52,000)
(267,327)
(50,000)
-
-
-
(3,794,868)
Expended (3)2014/15
$
-
(1,683,515)
(47,026)
-
-
(101,318)
(125,000)
(43,533)
-
-
-
-
(2,000,392)
OpeningBalance (1)
1-Jul-14
$
60,000
1,683,515
47,026
36,036
451,029
3,643,471
-
-
-
-
-
-
5,921,077
ClosingBalance (1)
30-June 2015
$
60,000
-
-
36,036
451,029
3,706,152
-
256,467
50,000
-
-
-
4,559,684
ClosingBalance
30-Jun-16
$
60,000
-
-
36,036
451,029
280,611
-
189,140
-
104,062
70,000
146,664
1,337,542
Notes:
(1) - Grants/contributions recognised as revenue in a previous reporting period which were not expended at the close of the previous reporting
period.
(2) - New grants/contributions which were recognised as revenues during the reporting period and which had not yet been fully expended in the
manner specified by the contributor.
(3) - Grants/contributions which had been recognised as revenues in a previous reporting period or received in the current reporting period and
which were expended in the current reporting period in the manner specified by the contributor.
(c) Conditions Over Grants/Contributions

42
3. PROGRAM NOTE 2016$
Revenue
GovernanceGeneral Purpose FundingCommunity amenitiesRecreation and culture
TransportEconomic Services ExpensesGovernanceCommunity amenitiesRecreation and culture
TransportEconomic Services
Net Result
4. CASH AND CASH EQUIVALENTS
Unrestricted Restricted
Unspent Grants and Contributions
5. TRADE AND OTHER RECEIVABLES
CurrentSundry DebtorsATO Refundable
6. PROPERTY, PLANT & EQUIPMENT
Land and BuildingsFurniture and Equipment at:- Additions after valuation - costLess Accumulated Depreciation
1,505,862122,266
-346,664
- 174,062
2,148,854(5,281,554)
-(267,328)
-(153,192)
(5,702,074)
(3,553,220)
note
898,312 850,477
1,748,789
1,337,542
17,782 339,942 357,724
3,408(3,408)
-
2016$
2015$
432,7784,559,6844,992,462
4,559,684
89,939-
89,939
3,408(290)
3,118
1,505,862122,266
-346,664
-174,062
2,148,854
(5,281,554)-
(267,328)-
(153,192)(5,702,074)(3,553,220)
Governance General Purpose Funding Community amenities Recreation and culture Transport Economic Services
Expenses
Governance Community amenities Recreation and cultureTransport Economic Services
Net Result
(a) Property, Plant and Equipment
1,748,789
357,724
4,992,462
89,939
3,118
2(c)
The fair value of property, plant and equipment is determined at least every three years in accordance with legislative requirements.
Additions since the date of valuation are shown as cost, given they were acquired at arms-length and any accumulated depreciation
reflects the usage of service potential, it is considered the recorded written down value approximates fair value. At the end of each
intervening period the valuation is reviewed and where appropriate the fair value is updated to reflect current market conditions.
This process is considered to be in accordance with Local Government (Financial Management) Regulation 17A (2) which requires
property, plant and equipment to be shown at fair value
notes to And foRming pARt of the finAnciAl RepoRt
foR the YeAR ended 30th June 2016

43
(b). Movements in Carrying Amounts
(c). Fair Value Measurements
Movement in the carrying amounts of each class of property, plant and equipment between the beginning and the end of the current financial year.
Level 3 inputs are based on assumptions with regards to future values and patterns of consumption utilising current information. If the basis of these assumptions were varied, they have the potential to result in a significantly higher or lower fair value measurement. During the period there were no changes in the valuation techniques used by the local government to determine the fair value of property, plant and equipment using either level 2 or level 3 inputs.
Furniture andEquipment
Furniture andEquipment
3
Total Property,Plant and Equipment
3,118 (3,118)
(3,118)3,118
-
-
-
-
-
-
-
-
-
-
-
-
Balance atBeginning
of the Year$
AssetClass
Fair ValueHeirarchy
ValuationTechnique
Basis ofValuation
Date of LastValuation
Inputsused
Additions$
(Disposals)$
RevaluationIncrements
(Decrements)$
Depreciation(Expense)
$Transfers
$
CarryingAmount
at the End of Year
2016$
2015$
Impairment(Losses)
Reversals$
Market approach using recent
observable market data for similar
assets/ cost approach using
depreciated cost
Independent registered
valuers
June 2015 Purchase costs and current condition (Level 2) residual
values and remaining usefullife assessments
(level3 inputs)
7. TRADE AND OTHER PAYABLES
Current
Sundry CreditorsAccrued Salaries and WagesATO Liabilities
591,09527,010
-
3,56726,3363,029
618,105 32,932
CarryingAmount at the
End of Year$

44
For the purposes of the Statement of Cash Flows, cash includes cash and cash equivalents, net of outstanding bank overdrafts. Cash at the end of the reporting period is reconciled to the related items in the Statement of Financial Position as follows:
8. LONG-TERM BORROWINGS
9. PROVISIONS
10. REVALUATION SURPLUS
11. MEMBER COUNCIL’S EQUITY IN PILBARA REGIONAL COUNCIL
12. NOTES TO THE STATEMENT OF CASH FLOWS
total$
The Regional Council did not have any long term borrowings at the reporting date.
Opening balance as at 1 July 2015Non-Current provisions
Additional provisionsBalance as at 30 June 2016
(a) Reconciliation of Cash
Cash and Cash Equivalents1 ,748,789 700,975 4,992,462
Comprises
Non-current
Current
32,096 32,096
32,096
(10,118)21,978
21,978 21,978
13,92535,90321,978
-
35,90310,959)
-
46,862
14,766
provision forAnnual
leave
2016$
2015$
2016budget
$
Revaluation surpluses have risen onrevaluation of the following classes ofnon-current assets:TOTAL ASSET REVALUATION SURPLUS
-2015
Shire of AshburtonShire of East PilbaraCity of KarrathaTown of Port Hedland
363,126.25363,126.25363,126.25363,126.25
1,456,896.00
25%25%25%25%
1,251,431.251,251,431.251,251,431.251,251,431.25
5,005,725.00
(10,959))(
-
13,92513,925
13,925(841
-
14,766
14,766
provision forlong service
leave
-2016
- -
1,748,789
notes to And foRming pARt of the finAnciAl RepoRt
foR the YeAR ended 30th June 2016

45
(b) Reconciliation of Net Cash Provided by Operating Activities to Net Result
(c) Undrawn Borrowing Facilities Credit Standby Arrangements
2016budget
$2015
$
2016budget
$2015
$
2016$
Net Result
The Regional Council had no known contingent liabilities as at 30 June 2016.
The Shire did not have any future capital expenditure commitments at the reporting date.
Non-cash flows in Net resultDepreciation
(Profit)/Loss on Sale of AssetFair value adjustments to financialAssets at fair value through profit or loss
(Increase)/Decrease in ReceivablesIncrease/(Decrease) in PayablesIncrease/(Decrease) in Provisions
Changes in assets and liabilities
(267,785)585,173(10,959)
(3,243,673)
14,500121,429(21,146)
(3,933,217)
(51,212)(319,048)
24,199
(2,003,865)
(3,553,220) (4,052,500)( 1,674,065)
3,1184 ,500 5,156
11,105
Bank overdraft limitBank overdraft at a balance dateCredit Card limitCredit Card Balance at Balance DateTotal Amount of Credit Unused
Loan facilitiesLoan facilities - currentLoan facilities - non-currentTotal facilities in use at balance dateUnused loan facilities at balance date
-----------
-----------
13. CONTINGENT LIABILITIES
(a) Operating Lease Commitments
14. CAPITAL AND LEASING COMMITMENTS
Non-cancellable operating leases contracted for but notcapitalised in the accounts.Payable:- not later than one year35,51650,837- later than one year but not later than five years52,57614,459- later than five years
(4,052,500)
3,118 4,500
(1,674,065)
Net Cash from Operating Activities
2016
$
2015
$
Non-cancellable operating leases contracted for but not capitalised in the accounts.
Payable:- not later than one year- later than one year but not later than five years- later than five years
35,51652,576
-88,092
50,83714,459
-65,296
- - -
- -
The Shire did not have any future capital expenditure commitments at the reporting date.

46
18. TRUST FUNDS
Information relating to the Asset Consumption Ratio and the Asset Renewal Funding Ratio can be found at Supplementary Ratio
The Regional Council had no monies held in Trust as at 30 June 2016.
19. DISPOSALS OF ASSETS – 2015/16 FINANCIAL YEAR
The Regional Council did not dispose any assets during 2015-16.
Notes:
The Regional Council is not involved in any joint venture arrangements.
The above ratios are calculated as follows:
15. JOINT VENTURE ARRANGEMENTS
16. TOTAL ASSETS CLASSIFIED BY FUNCTION AND ACTIVITY
17. FINANCIAL RATIOS
GovernanceRecreation and cultureEconomic ServicesUnallocated
Current RatioAsset Sustainability RatioDebt Service Cover RatioOperating Surplus RatioOwn Source Revenue Coverage Ratio
8.040.66
-(11.56)
0.04
3.29--
(29.06)0.02
3.120.61
-11.20.03
633,689--
818,816
2015$
2016$
1,452,505
3,680,699256,46786,036
1,062,317
5,085,519
2016 2015 2014
Current Ratio
Asset Sustainability Ratio
Debt Service Cover Ratio
current assets minus restricted assetscurrent liabilities minus liabilities associated
with restricted assets
capital renewal and replacement expendituredepreciation expense
annual operating surplus before interest and depreciationprincipal and interest
Operating Surplus Ratio operating revenue minus operating expenseown source operating revenue
Own Source Revenue Coverage Ratio own source operating revenueoperating expense
notes to And foRming pARt of the finAnciAl RepoRt
FOR THE YEAR ENDED 30th June 2016
Information on Page 49 of this document.
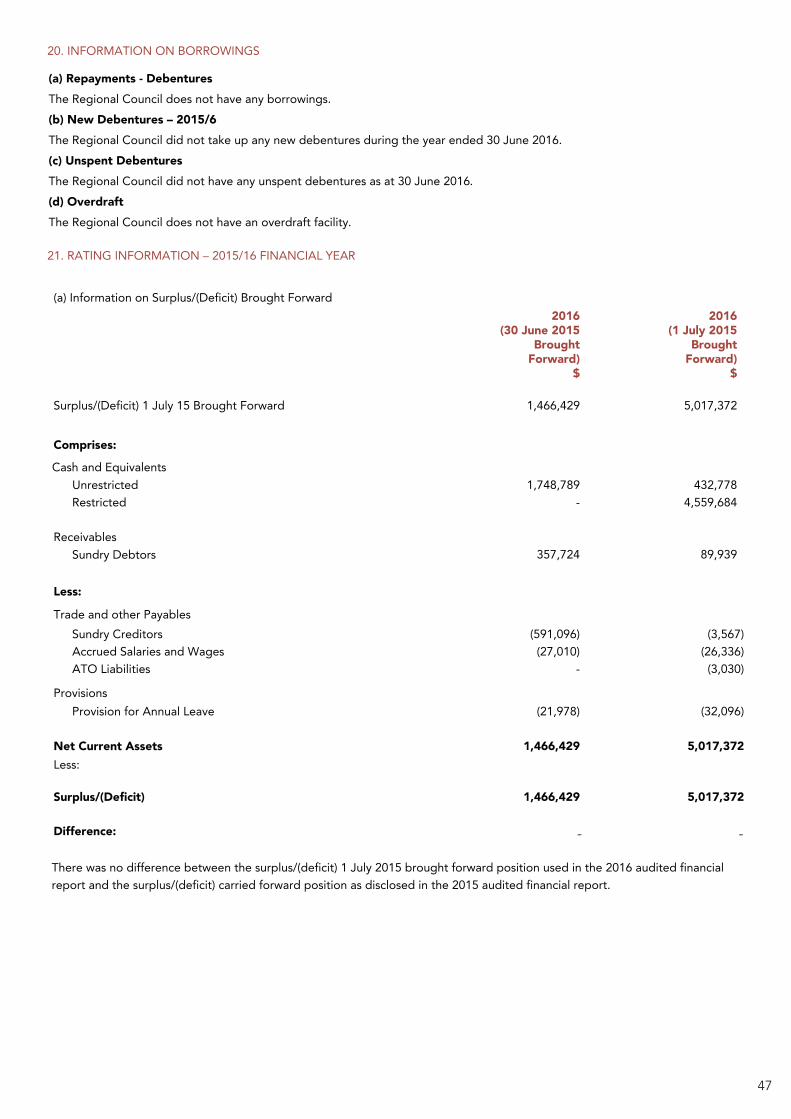
47
20. INFORMATION ON BORROWINGS
21. RATING INFORMATION – 2015/16 FINANCIAL YEAR
(a) Repayments - DebenturesThe Regional Council does not have any borrowings.(b) New Debentures – 2015/6The Regional Council did not take up any new debentures during the year ended 30 June 2016.(c) Unspent DebenturesThe Regional Council did not have any unspent debentures as at 30 June 2016.(d) OverdraftThe Regional Council does not have an overdraft facility.
(a) Information on Surplus/(Deficit) Brought Forward
Surplus/(Deficit) 1 July 15 Brought Forward
Comprises:
Less:
Less:
Difference:
2016(30 June 2015
BroughtForward)
$
2016(1 July 2015
BroughtForward)
$
1,466,429 5,017,372
UnrestrictedRestricted
Sundry Debtors
Cash and Equivalents
Receivables
Trade and other Payables
Provision for Annual LeaveProvisions
Net Current Assets
1,748,789-
357,724
432,7784,559,684
89,939
Sundry CreditorsAccrued Salaries and WagesATO Liabilities
1,466,429
(21,978)
1,466,429
(591,096)(27,010)
-
5,017,372
(32,096)
5,017,372
(3,567)(26,336)(3,030)
There was no difference between the surplus/(deficit) 1 July 2015 brought forward position used in the 2016 audited financial report and the surplus/(deficit) carried forward position as disclosed in the 2015 audited financial report.
- -

48
29. ELECTED MEMBERS REUMERATION
The following fees, expenses and allowances were paid to council members and/or the president.
Meeting Fees
Chairperson’s Allowance
2016$
7,560
1,000
6,020
1,000
10,000
1,000
2016$
2015$
8,560 7,020 11,000
22. SPECIFIED AREA RATE– 2015/16 FINANCIAL YEAR
The Regional Council did not impose any Specified Area Rates.
23. SERVICE CHARGES – 2015/16 FINANCIAL YEAR
The Regional Council did not impose any service charges.
24. DISCOUNTS, INCENTIVES, CONCESSIONS, & WRITE-OFFS -2015/16 FINANCIAL YEAR
The Regional Council did not offer any discounts, incentives or concessions, and did not write off any money.
25. INTEREST CHARGES AND INSTALMENTS -2015/16 FINANCIAL YEAR
The Regional Council did not impose any interest or instalment charges for the payment of rates.
26. FEES & CHARGES
27. GRANT REVENUE
Grants, subsidies and contributions are included as operating revenues in the Statement of Comprehensive Income:
28. EMPLOYEE NUMBERS
Governance 41,247-
2016$
2015$
By Nature and Type:
The number of full-time
equivalent employees at balance date
Operating Grants, Subsidies and Contributions
1,888,9512,026,588
1,888,95
1,888,95
1
1
2,026,588
2,026,588
By Program:
Governance
Recreation and culture
Economic Services
1,521,1331,505,862
300,000346,664
67,818174,062
2016$
2015$
6 7
notes to And foRming pARt of the finAnciAl RepoRt
FOR THE YEAR ENDED 30th June 2016

49
Carrying ValueFair Value
2016$
2015$
2016$
2015$Financial Assets
Financial Liabilities
Cash and cash equivalents
Payables
Borrowings
Receivables
1,748,789
357,724
2,106,513
618,105
-
618,105
1,748,789
357,724
2,106,513
618,105
-
618,105-
4,992,462
89,939
5,082,401
32,932
-
32,932
4,992,462
89,939
5,082,401
-
-
-
30. MAJOR LAND TRANSACTIONSThe Regional Council did not participate in any major land transactions during FY 2015/2016.
31. TRADING UNDERTAKINGS AND MAJOR TRADING UNDERTAKINGSThe Regional Council did not participate in any trading undertakings or major trading undertakings during the 2015/16 financial year.
32. FINANCIAL RISK MANAGMENTThe Regional Council’s activities expose it to a variety of financial risks including price risk, credit risk, liquidity risk and interest rate risk. The Regional Council’s overall risk management focuses on the unpredictability of financial mar-kets and seeks to minimise potential adverse effects on the financial performance of the Regional Council.
The Regional Council does not engage in transactions expressed in foreign currencies and is therefore not foreign currency risk.
Financial risk management is carried out by the finance area under policies approved by the Council.The Regional Council held the following financial instruments at balance date:
Fair value is determined as follows:
Cash and cash equivalents, receivables, payables – estimated to the carrying value which approximates net market value.
Borrowings, held to maturity investments, estimated future cash flows discounted by the current market interest rates applicable to assets and liabilities with similar risk profiles.
Financial assets at fair value through profit and loss, available for sale financial assets – based on quoted market pric-es at the reporting date or independent valuation.
(a) Cash and Cash Equivalents Financial assets at fair value through profit and loss Available-for-sale financial assets Held-to-maturity investments
The Regional Council’s objective is to maximise its return on cash and investments whilst maintaining an adequate level of liquidity and preserving capital. The finance area manages the cash and investments portfolio with the assistance of independent advisers (where applicable). Council has an investment policy and the policy is subject to review by Council. An Investment Report is provided to Council on a monthly basis setting out the make-up and performance of the portfolio.
Carrying Value Fair Value

50
The major risk associated with investments is price risk - the risk that the capital value of investments may fluctuate due to changes in market prices, whether these changes are caused by factors specific to individual financial in-struments of their issuers or factors affecting similar instruments traded in a market. Cash and investments are also subject to interest rate risk - the risk that movements in interest rates could affect returns.
Another risk associated with cash is credit risk – the risk that a contracting entity will not complete its obligations under a financial instrument resulting in a financial loss to the Regional Council.
The Regional Council manages these risks by diversifying its portfolio and only investing investments authorised by Local Government (Financial Management) Regulation 19C. Council also seeks advice from independent advisers (where considered necessary) before placing any cash and investments.
Notes
(1) Sensitivity percentages based on management’s expectation of future possible market movements.
(b) Receivables
The Regional Council’s major receivables comprise rates and annual charges and user charges and fees. The major risk associated with these receivables is credit risk – the risk that the debts may not be repaid. The Regional Council manages this risk by monitoring outstanding debt and employing debt recovery encourages ratepayers to pay rates by the due date through incentives.
Credit risk on rates and annual charges is minimised by the ability of the Regional Council to recover the sea secured charge over the land – that is, the land can be sold to recover the debt.The Regional Council is to charge interest on overdue rates and annual charges at higher than market rates, which further encourages payment.
The level of outstanding receivables is reported to Council monthly and benchmarks are set and monitored for acceptable collection performance.
The Regional Council makes suitable provision for doubtful receivables as required and carries out credit most non-rate debtors.
There are no material receivables that have been subject to a re-negotiation of repayment terms.
The profile of the Regional Council’s credit risk at balance date was:
Impact of a 1% (1) movement in rates on cashand investments:- Equity- Statement of Comprehensive Income
Percentage of Other Receivables- Current- Overdue
2016$
17,48817,488
2016
95%5%
2015$
49,92549,925
2015
41%59%
notes to And foRming pARt of the finAnciAl RepoRt
FOR THE YEAR ENDED 30th June 2016

51
(c) Payables / Borrowings
Payables and borrowings are both subject to liquidity risk – that is the risk that insufficient funds may be on hand to meet payment obligations as and when they fall due. The Regional Council manages this risk by monitoring its cash flow requirements and liquidity levels and maintaining a cash buffer. Payment terms can be extended and overdraft facilities drawn upon if required.
The contractual undiscounted cash flows of the Regional Council’s Payables and Borrowings are set out in theLiquidity Sensitivity Table below:
The Regional Council has no borrowings.
Ratio Information
The following information relates to those ratios which only require attestation they have been checked and are sup-ported by the verifiable information. It does not form part of the audited financial report.
2016
PayablesBorrowings
Asset Consumption RatioAnnual Renewal Funding Ratio
The above ratios are calculated as follows:
Asset Consumption Ratio
Asset Renewal Funding Ratio
depreciated replacement costs of assetscurrent replacement cost of depreciable assets
NPV of planned capital renewal over 10 yearsNPV of required capital expenditure over 10 years
618,105-
618,105
Due within1 year
$
Due Between 1-5 years
$
Due After
5 years$
2016
Totalcontractualcash flows
$
2015
Carryingvalues
$
2014
32,932-
32,932
---
---
32,932-
32,932
32,932-
32,932
---
---
--
0.92N/A
0.61N/A
618,105-
618,105
618,105-
618,105
2015
PayablesBorrowings

52
2/662 Newcastle StreetLeederville WA 6007
+61 8 9467 2456www.prc.wa.gov.au
pilbararegionalcouncil
@PilbaraRC