annual report 2016 - srigroup.co.jp · and executive offi cers 28 financial section 90 global...
TRANSCRIPT

Public Relations Department3-6-9, Wakinohama-cho, Chuo-ku, Kobe, Hyogo 651-0072, JapanTEL: (078) 265-3004 FAX: (078) 265-3113
http://www.srigroup.co.jp/english/ PRINTED IN JAPAN
Annual Report
2016
SU
MIT
OM
O R
UB
BE
R IN
DU
ST
RIE
S A
NN
UA
L R
EP
OR
T 2
01
6

Composition of Net Sales by Business Segment
CREATING THE WORLD’S BEST VALUE
Japan
North AmericaEurope
Asia
Others
40.6%
17.5%7.3%
20.8%
13.8%
Composition of Net Sales by Business Location
Tire business
86%
Sports business
9%
Industrial andOther Products
business
5%
Aiming to become a corporate group that provides the world’s best value in all of our fi elds of business
Long-Term Vision:
The Sumitomo Rubber Group’s operations cover three business segments: Tire, Sports and Industrial and Other Products. In line with “VISION 2020,” a long-term vision that sets targets for fi scal 2020, the Group is pushing forward initiatives to achieve stable business growth. In the Tire business, the Group boasts a high share of the domestic fuel-effi cient tire market and is proactively expanding its market presence overseas, particularly in emerging countries, where demand is expected to grow over the long term, as well as in North America and Europe. In the Sports business, the Group develops premium golf goods and tennis equipment while engaging in the wellness promotion business, which includes fi tness club operations. In the Industrial and Other Products business, the Group is striving to expand sales of vibration control dampers and medical rubber parts, which have great growth potential.

1Sumitomo Rubber Industries Annual Report 2016
Cautionary Statements with Respect to Forward-Looking StatementsStatements made in this annual report with respect to Sumitomo Rubber Industries, Ltd.’s current plans, estimates, strategies and beliefs, and other statements that are not historical facts, are forward-looking state-ments about the future performance of the Sumitomo Rubber Group. These statements are based on the Company’s and the Group’s assumptions and beliefs in light of the information currently available to them. Sumitomo Rubber Industries cautions that a number of potential risks and uncertainties could cause actual results to differ materially from those discussed in the forward-looking statements and advises readers not to place undue reliance on them.
ContentsIntroduction Management Strategy Operating Base
Financial Section
2 At a Glance
4 Message from the President
8 Special Feature 1:
10 Special Feature 2:
14 Review of Operations 14 Tire Business 16 Sports Business 18 Industrial and Other Products Business
20 R&D Activities and Intellectual Property Strategies
22 CSR Activities
24 Corporate Governance
27 Directors, Corporate Auditors and Executive Offi cers
28 Financial Section
90 Global Network
91 Investor Information
In addition to promoting our ongoing initiatives under three growth engines aimed at achieving VISION 2020, we have initiated new strategies to achieve further business expansion in Europe and North America. Furthermore, to ensure the more effi cient execution of these growth engine strategies, the Group transitioned from a conventional centrally controlled system headquartered in Japan to a fl exible global management structure with offi cers in three major regions: Asia and Oceania, Europe and Africa, and the Americas.
Becoming a true global player by achieving both high profi tability and high growth
Pursuing increased value for all stakeholders and greater happiness for all employees
Three Growth Engines of VISION 2020
1 2 3NEXT Market Expansion
NEXT Technology Evolution
NEXT Category Innovation
Taking on the Challenges of New Markets
An Insatiable Drive for Innovation
Entering New Business Fields
• Entry into Emerging Markets • Growth in the Chinese Market• Expansion of Agricultural Tire
Business in Asia• Business Expansion in
Europe and North America
• Developing Products to Support Our Growth
• “Second-to-None” Technologies • Environmentally Friendly Products• Breakthroughs in Golf Clubs/Ball
Fly Distance
• Supplying to Overseas Car Makers
• Promoting Vibration Control Technologies
• Developing the Health Care Business
2020: Realizationof Group
Vision
New Initiatives
The World’s Best Value
The world’s best onsite operational skills, research and development capabilities and technical skills
Industry-leading earnings power
Our Global Management Structure
Insatiable Drive for Innovation

2 Sumitomo Rubber Industries Annual Report 2016
Sports Industrial and Other ProductsTire
1,000
0
(Billions of yen)
600
200
400
2012
710.2780.6
837.6 848.7805.0798.5
756.7
2013 2014 2015 201620162015
800
JGAAP
Net Sales
IFRS
Sales Revenue
(Yr)
IFRS
Composition of Sales Revenue by Business Segment
Tire business
85.7%
Sports business
9.6%
Industrial andOther Products business
4.7%
2016 (Yr)
2012
67.4
9.5 9.6 10.59.3 8.8
74.6
88.078.9
71.0
89.2
73.3
2013 2014 2015 201620162015
11.29.7
(Billions of yen)
JGAAPOrdinary Income
(Ratio)
IFRSOperating Profit
(Ratio)
(Yr)
100
0
60
20
40
80
Operating Profit, Ordinary Income
Operating Profit Ratio, Ordinary Income Ratio
North America
17.5%Japan
40.6%
Europe
7.3%
Asia
20.8%
Others
13.8%
IFRS
Composition of Sales Revenue by Region
2016 (Yr)
80
0
20
40
2012
35.5
5.0 5.7 6.4 6.6 6.2
44.8
53.2 55.849.9
72.0
41.4
2013 2014 2015 201620162015
60
9.0
5.5
(Billions of yen)
JGAAPNet Income
(Ratio)
IFRSProfit Attributable to
Owners of Parent (Ratio)
(Yr)
Net Income Net Income Ratio
At a Glance
100
0
(Billions of yen)
60
20
40
2012
69.7
9.8 9.9 10.39.1 9.2
77.186.3
77.1 74.378.9
74.9
2013 2014 2015 201620162015
80
9.9 9.9
JGAAPOperating Income
(Ratio)
IFRSBusiness Profit
(Ratio)
Sports Industrial and Other Products
Business Profit Ratio, Operating Income Ratio
Tire
(Yr)
80
0
20
40
2012
62.8 58.9
49.6
58.9
49.6
2013 2014 2015 201620162015
60
(Billions of yen)
JGAAPIFRS
Capital Expenditures
(Yr)
57.4 58.6
30
0
10
20
2012
19.5
2.8
21.823.5 23.4 24.324.3
2013 2014 2015 201620162015
25
5
15 2.93.2
2.8 2.8 2.8 3.0
23.4
(Billions of yen)
JGAAPIFRS
R&D Expenses and R&D Expenses to Sales Revenue /Net Sales
(Yr)
R&D Expenses R&D Expenses to Net Sales
100
0
20
60
40
2012
8.7
37.4
54.0
86.0
56.2
86.0
2013 2014 2015 201620162015
80
(Billions of yen)
JGAAPIFRS
Free Cash Flow
(Yr)
14.5
Sales revenue in fi scal 2016 decreased 5.2% year on year to ¥756.7 billion due mainly to the effect of the appreciation of the yen.
Sales revenue in fi scal 2016 is composed as follows: Tire business sales 85.7%, Sports business sales 9.6%, and Industrial and Other Products business sales 4.7%.
Backed by growing sales in the replacement and original equipment markets overseas, overseas sales as a percentage of consolidated sales revenue stood at 59.4%.
After deducting tax expenses, profi t attributable to owners of parent decreased 42.5% year on year due mainly to the effect of the appreciation of the yen.
Business profi t* (corresponding to operating income under JGAAP) declined 5.0% year on year due mainly to yen appreciation. * Business profi t = sales revenue – (cost of sales + selling, general and administrative expenses)
R&D expenses in fi scal 2016 edged up ¥0.9 billion year on year to ¥24.3 billion. The primary use of funds was for new product development involving the Company’s proprietary material development technology.
Operating profi t (corresponding to ordinary income under JGAAP) decreased 17.8% year on year due mainly to the effect of the appreciation of the yen. In addition, operating profi t in the previous fi scal year was temporarily boosted by extraordi-nary income (recorded under the then prevailing accounting treatment) recognized in connection with the dissolution of an alliance with The Goodyear Tire & Rubber Company. Please note, the fi gure calculated for fi scal 2015 under IFRS is greater than that originally calculated under JGAAP.
Free cash fl ow for fi scal 2016 was a positive ¥86.0 billion. This was due mainly to an infl ux of cash in connection with the posting of profi t before tax, a decrease in inventories, a decrease in trade and other receivables and the sale of stock associated with the dissolution of an alliance with The Goodyear Tire & Rubber Company.
Total capital expenditures amounted to ¥49.6 billion and included such major uses of funds as investment in the Tire business for upgrading and streamlining domestic production facilities and improving labor effi ciency as well as in boosting the capacities of factories in South Africa and Turkey.

3Sumitomo Rubber Industries Annual Report 2016
1,200
0
600
2012
737.5
33.1
867.5973.6 936.2 899.6897.6
2013 2014 2015 201620162015
80
0
40
300 20
900 60
45.3 47.8
38.042.5 45.3 48.0
932.4
(Billions of yen) (%)
JGAAPTotal Assets and
Equity Ratio
IFRSTotal Assets and Equity Ratio*
(Yr)
Total Assets Equity Ratio* Ratio of Equity attributable to owners of parent
400
0
200
2012
275.9
1.1
302.1 295.7260.6
203.0204.2
2013 2014 2015 201620162015
2.0
0
1.0
100 0.5
300 1.5
0.60.5
0.9
0.70.6
0.5
261.9
(Times)(Billions of yen)
(Yr)
JGAAPIFRS
Interest-Bearing Debt and Debt-to-Equity Ratio
Interest-Bearing Debt Debt-to-Equity Ratio
The Number of Employees in Japan and Overseas (consolidated basis)
40,000
20,000
10,000
0
(Number of employees)
2012 2013 2014 2015 2016
Domestic Overseas
33,79233,18530,224
26,77323,507
30,000
(Yr)
300
0
100
50
150
2012
135
171
203 213190
274
158
2013 2014 2015 201620162015
250
200
(Yen)
JGAAPNet Income per Share**
IFRSBasic Profit per Share*
(Yr)
* Based on profit attributable to owners of parent ** Based on net income attributable to owners of parent
20
0
10
2012 2013 2014 2015 201620162015
5
15
17.5
8.4
9.7
8.2
16.0
9.9
15.6
9.6
13.314.3
9.4
11.7
8.18.1
ROA (operating income base)ROE* ROE = (Net income / Average of total equity at the beginning and end of the fiscal year) x 100** ROA = (Business profit / Average of total assets at the beginning and end of the fiscal year) x 100
(%)
(Yr)
JGAAPIFRS
ROE* and ROA**
Total CO2 Emissions
800
400
200
0
2012 2013 2014 2015 2016
701703670656600
(1,000 t-CO2)
Six domestic factories Nine overseas factories
(Yr)
761
60
0
20
10
30
2012
30
40
5055 5555
2013 2014 2015 201620162015
50
40
55
(Yen)
JGAAPIFRS
Cash Dividends per Share
(Yr)
49,750 52,150 54,40060,600 61,500
Tire Production Capacity
70,000
50,000
40,000
60,000
30,000
20,000
10,000
0
(Tons/month)
2012 2013 2014 2015 2016 (Yr)
Thailand Brazil
South Africa
Changshu, China Hunan, China
Turkey The United States
Izumiotsu IndonesiaMiyazakiShirakawa Nagoya
10,000
6,000
4,000
2,000
0
2012 2013 2014 2015 2016
8,7457,8497,680
6,971
8,000
Number of Domestic and Overseas Patents
(Number of patents held)
Domestic Overseas
(Yr)
7,790
Note: The comments presented above are based on IFRS fi gures and values.
CO2 emissions from domestic factories declined, while emissions from overseas factories increased, with total emissions during fi scal 2016 increasing year on year.
The total number of employees grew by 607 year on year due to expansions in workforces overseas, especially in Turkey and Thailand, aimed at boosting production volume.
The number of patents held by the Company increased both in Japan and overseas.
Annual per share cash dividends for fi scal 2016 totaled ¥55 and included an interim dividend of ¥30 per share.
Total assets as of the fi scal 2016 year-end were down ¥34.8 billion year on year to ¥897.6 billion, refl ecting such factors as a decrease in other fi nancial assets despite an increase in cash and cash equivalents.
Basic profi t per share for fi scal 2016 stood at ¥157.6. This item is calculated by dividing profi t attributable to owners of the parent by the weighted average number of common shares outstanding during the period.
ROE fell 7.8 percentage points year on year to 9.7% due to an increase in total equity and a decrease* in profi t attributable to owners of parent. ROA declined 0.2 of a percentage point year on year to 8.2%, refl ecting a decrease in business profi t and other factors. * The decrease is attributable to the dissolution of an alliance with The Goodyear Tire & Rubber Company in fi scal 2015
Tire production capacity totaled 61,500 tons per month, up 1.5% compared with the previous fi scal year thanks to a rise in the production capacities of our factories in Turkey and South Africa.
Interest-bearing debt at the end of fi scal 2016 decreased ¥57.6 billion year on year to ¥204.2 billion. Refl ecting this, the debt-to-equity ratio improved 0.1 of a percentage point to 0.5 times.

4 Sumitomo Rubber Industries Annual Report 2016
Message from the President
From the fiscal year ending December 31, 2016, the Group, as
a truly global corporation, adopted the International Financial
Reporting Standards (IFRS). The adoption is expected to improve
the compatibility of our financial data with systems used by capital
markets worldwide and enhance the Group’s quality of manage-
ment with regard to subsidiaries. For presentation purposes, con-
solidated figures for the previous fiscal year and comparisons
thereto are based on IFRS. In addition, the Company uses business
profit* as its unique management indicator. This new management
indicator is intended to allow the ongoing evaluation of each busi-
ness segment’s performance as the Group aims toward sustainable
growth in the medium and long term. The Group also believes that
the indicator provides useful information for users of the consoli-
dated financial statements to assess its operating results.
During fiscal 2016, the U.S. economy continued to expand,
and the European economy enjoyed steady growth overall. China
maintained a high growth rate despite slowing down, and the
Indian economy remained firm. In countries like Russia and Brazil,
however, stagnant market conditions persisted.
In Japan, the economy remained weak. Capital investment
and private-sector consumption stagnated mainly because the
strong yen during the period rendered the outlook for corporate
earnings uncertain.
As for the business environment surrounding the Group, nat-
ural rubber and crude oil prices stayed relatively low throughout
the fiscal year despite gradual increases that gave way to a sharp
rise toward the year-end. Turning to foreign exchange rates, the
yen continued to appreciate throughout the period (except against
a number of emerging nations’ currencies), which had a large
impact on sales prices.
Against this backdrop, the Group worked to raise sales of
high-value-added products, including fuel-efficient tires, while pro-
actively entering new markets and business fields with the aim of
realizing VISION 2020—the Group’s long-term vision that sets
IFRS Voluntarily Adopted in Fiscal 2016
Ikuji IkedaPresident and CEO, Representative Director

5Sumitomo Rubber Industries Annual Report 2016
targets for 2020. To this end, we rallied our Groupwide strengths to support initiatives aimed at driving business growth and improv-ing profi tability. As a result, consolidated sales revenue decreased 5% year on year to ¥756.7 billion, business profi t* (which represents operating profi t under JGAAP) fell 5% year on year to ¥74.9 billion, operat-ing profi t declined 18% year on year to ¥73.3 billion, and net
profi t** decreased 43% to ¥41.4 billion. Thus, revenue and profi t were down, a situation largely attributable to the appreciation of the yen. For details about the difference between JGAAP and IFRS, see the table above.
* Sales revenue – (Cost of sales + Selling, general and administrative expenses)** Profi t attributable to owners of parent
During fi scal 2016, we actively promoted various measures in line with the fi rst year of the newly formulated medium-term manage-ment plan. With regard to Group operations, we reinforced the new three-region management structure spanning the Americas, Europe and Africa, and Asia and the Pacifi c, which replaced the previous organization focused on the Head Offi ce in Japan. At the same time, we bolstered our development, production and sales networks in Europe and the United States, where we now enjoy increasing market fl exibility. In the Americas, we worked hard to increase production capacity at U.S. factories, especially for SUV tires, which are in high demand. At factories in Brazil, we promoted the local production of truck and bus tires, which are expected to see an increase in demand. Moreover, we continued to grow the value of the Falken brand, maintaining our sponsorship contract with Major League Baseball. In the Europe and Africa region, the Turkish factory serving as a supply base for the European market that came on line in 2015 is continuing to steadily ramp up its production capacity. Our South
African factory, which makes highly functional tires for SUVs and passenger cars, is also increasing its production capacity. In the Asia and Pacifi c region, China introduced voluntary regulations regarding fuel-effi cient tires in September 2016. We launched SP TOURING R1 and ENASAVE EC300+ tires in line with these new regulations, and sales have been brisk. On the sales front, we reinforced development efforts for a new Chinese sales channel called D-Guard and worked to expand the number of stores handling Falken brand tires in China, India and Australia. And, in Japan, we launched Dunlop brand WINTER MAXX 02 tires in August 2016. These tires received rave reviews for their ability to deliver a long-lived excellent performance on icy road surfaces. Then, in December 2016, we agreed to the acquisition of the overseas Dunlop trademark and the Dunlop brand sport goods and licensing businesses. Thanks to this deal, Sumitomo Rubber now owns the Dunlop trademark in areas outside of Europe, the United States, India and Australia, enabling it to proactively expand the Dunlop brand around the world. Our focus will be on improving
Progress of the Medium-Term Five-Year Management Plan
Consolidated Fiscal 2016 Results
JGAAP
Actual FY2016 Actual FY2015 y-o-y
Net sales 805.0 848.7 95%
Operating income (ratio)
74.3 (9.2%)
77.1(9.1%)
96%
Ordinary income (ratio)
71.0(8.8%)
78.9(9.3%)
90%
Profi t attributable to owners of
parent49.9 55.8 89%
IFRS
Actual FY2016 Actual FY2015 y-o-y
Sales revenue 756.7 798.5 95%
Business profi t (ratio)
74.9 (9.9%)
78.9(9.9%)
95%
Operating profi t (ratio)
73.3(9.7%)
89.2(11.2%)
82%
Profi t attributable to owners of
parent41.4 72.0 57%
(Billions of yen) (Billions of yen)

6 Sumitomo Rubber Industries Annual Report 2016
Micheldever tire retail outlet PROTYRE
The global economic outlook is ever more uncertain due in part to the anticipated impact of Brexit on the European Union and poten-tial global repercussions of the new U.S. administration’s conserva-tive policies. Such uncertainty is expected to grow due to rising crude oil and natural rubber prices, exchange rate trends and the manifestation of geopolitical risks. In Japan, consumer confi dence may deteriorate due to concerns about fi nancial instability and the murky global economic outlook. As for the Sumitomo Rubber Group’s results forecast for fi scal 2017, a fall in profi t is inevitable given the climbing raw material prices amid the very harsh business environment. We expect sales revenue to rise 12% year on year to ¥850 billion, business profi t to decline 33% to ¥50 billion, operating profi t to decrease 32% to ¥50 billion and net profi t to fall 20% to ¥33 billion.
We anticipate sales increases in all our business categories, namely the Tire, Sports and Industrial and Other Products busi-nesses. On the other hand, we project declines in business profi t for the Tire business, down 35% year on year, and the Sports busi-ness, a fall of 30%, due mainly to rising raw material prices. However, we do expect the Industrial and Other Products business to see business profi t rise 12% as a result of the sales increase. Moreover, we are confi dent that as of December 31, 2017, our tire production capacity will have expanded 2% year on year to 62,800 tons per month, an increase of 4% in annual production volume to 663,000 tons, and predict the annual utilization rate will be 89%.
Outlook for the Fiscal Year Ending December 31, 2017
brand value, with efforts directed by Dunlop International Co., Ltd., a brand management company founded on February 1, 2017. Also in the Tire business, we acquired the U.K. tire sales com-pany Micheldever Group Ltd. on February 10, 2017, in line with our drive to expand sales in Europe and the United States. The United Kingdom is key to this expansion, being the second largest tire market in Europe after Germany. The Micheldever Group boasts a large share of the market with annual sales of around 6 million tires. With this acquisition, we intend to bolster the Falken brand’s presence in the U.K. market.
Making major progress toward successfully implementing the medium-term management plan
Moving from a structure focused on theHead Offi ce in Japan to a three-region structure
Strengthening development, production andsales network structure in Europe and the United States
Acquiring the overseas Dunlop brand business
Acquiring a major U.K. tire sales company

7Sumitomo Rubber Industries Annual Report 2016
As part of the Sumitomo Group, the Group believes that acting in
line with the Sumitomo Business Spirit is in itself acting to fulfill
CSR. The spirit incorporates the strong sense of mission that
Sumitomo businesses must not only benefit themselves; they
must also benefit the nation and society as a whole.
To invigorate its CSR activities and be a corporate group
that earns the trust of society, the Group has formulated its CSR
Philosophy and its CSR Guideline comprising five ideals:
Green (green initiative), Ecology (ecological process), Next (next-
generation product development), Kindness (kindness to employ-
ees) and Integrity (integrity for stakeholders). Every year, in line
with the guideline, we set initiative goals while establishing
high-priority indicators (materiality) and promoting the PDCA cycles.
Overview of CSR Policy and Initiatives
The Company considers the return of profits to shareholders to be
a high-priority issue. Accordingly, the Company has established a
basic policy of ensuring long-term sustainable returns to sharehold-
ers while comprehensively reviewing the levels of dividend payout
ratios on a consolidated basis, performance prospects and retained
earnings. For fiscal 2016, annual cash dividends totaled ¥55 per
share, comprising a year-end dividend of ¥25 per share in line with
the initial forecast and an interim dividend of ¥30 per share.
Accordingly, the consolidated payout ratio stood at 34.9%.
Amid rising economic uncertainty, the Group continues to
work toward the realization of its Long-Term Vision. We are work-
ing to expand business and strengthen our earnings capabilities by
fostering the greater growth of existing business and creating new
sources of revenue.
We sincerely ask for your continued understanding and support.
Dividend Policy
As a good corporate citizen, the Group aims to contribute to social
and economic development through its business activities. We
therefore endeavor to ensure comprehensively sound corporate
governance. Operating in line with the corporate governance
code, we will continue to work to secure sustainable business
growth and medium- to long-term corporate value. As a global
company, we carefully listen to international voices and are actively
taking on progressive initiatives.
Corporate Governance

8 Sumitomo Rubber Industries Annual Report 2016
Special Feature 1: Our Global Management Structure
The Americas
Realizing Speedier Decision Making with a Three-Region StructureIn April 2016, the Group transitioned from a conventional centrally controlled system headquartered in Japan to a structure with head offi ces in three major regions: Asia and Oceania, Europe and Africa, and the Americas. Under the new structure, Japan serves as the global head offi ce and offers guidance and support to the three regions. The executives assigned to each head offi ce have taken a central role in strengthening alliances between locations while also swiftly promoting measures aimed at integrat-ing production and sales structures to respond to the unique characteristics of their respective domains. The increased speed in decision making will strengthen our fl exible global management structure and lead to greater progress going forward. We got off to a strong start. We worked to reinforce our network structure and upgrade our production sys-tem, focusing on Europe and the United States, where we have gained greater market fl exibility since dissolving our alliance with The Goodyear Tire & Rubber Company.
USA factory
Initiating the supply of Falken tires for the Jeep Compass
We are retaining our Major League Baseball sponsorship contract
In the Americas, our initial focus is on expanding production capac-ity. At our USA factory—which manufactures tires for light trucks and passenger cars, especially in-demand SUV tires—we are working to increase our production capacity from the current 5,000 tires per day to 10,000 tires per day by the end of 2019. This is in line with our goal of boosting sales of high-value-added tires in North America. In Brazil, with an eye on ensuring a stable supply chain and avoiding foreign exchange risks, we are gearing up to begin the local manufacture of truck and bus tires, demand for which is expected to increase. Production is slated to begin in March 2019 with a capacity of 500 tires per day. In addition, we plan to step up the production of tires for passenger cars and light trucks, raising the volume from the current 15,000 to 18,000 per day by the end of 2019, further enhancing our competitiveness in South America. As for our development system, the United States Technical Center commenced full-scale operations in January 2017 while our U.S. Tire Test Course added the evaluation of four-wheeled vehicle tires to its existing expertise in two-wheeled vehicle tires in March 2017. By strengthening our development and evaluation capabilities, we have created a local development system able to quickly deliver high-quality tires that meet customer needs in the Americas. On the sales front, we will begin providing OEM tires to Volkswagen for the Golf Alltrack and to Jeep for the Compass for the North American market, thus steadily increasing the number of cars equipped with Sumitomo Rubber tires. As for promotion activi-ties, we aim to continue increasing the value of the Falken brand in part by retaining our Major League Baseball sponsorship contract.

9Sumitomo Rubber Industries Annual Report 2016
Europe and AfricaOn the production side of things, we are moving steadily ahead with plans at our Turkish factory to implement our proprietary Taiyo produc-tion system and thereby improve our high-performance tire supply capacity. We are striving to enhance production capacity at our South African factory as well, focusing on high-performance tires for passen-ger cars and SUVs, while working on plans to introduce production equipment for truck and bus tires. As a result, in this region as well, production capacity is steadily expanding. As for our development system, in August 2017 in Hanau, Germany, the European Technical Center commenced full operations. With this new center, we have established a system for the delivery of high-quality tires that meet customer needs in Europe and Africa. In the area of sales, we shifted away from a conventional sales net-work structure centered on Germany to a model that applies country-specifi c sales strategies across Europe with the aim of growing our cus-tomer base. In February 2017, we acquired U.K.-based Micheldever Group Ltd. (hereinafter “MD”) with the aim of expanding the presence of the Falken brand in the U.K. market. The MD subsidiary Micheldever Tyre Services Ltd. is a major British tire wholesale and retail company. Across the U.K., it has over 6,000 outlets, including retail operations and auto repair shops that handle tire wholesale operations, while it directly manages about a hundred tire retail outlets under the “PROTYRE” name. It also sells around six million tires per year on the U.K. replace-ment market. This acquisition has signifi cantly strengthened our business expansion in Europe. Moreover, we will enter a Falken BMW in the Nurburgring 24-Hour Race in addition to the Falken Porsche, which began compet-ing last year. And we will retain our sponsorship contract with “FC Ingolstadt 04,” a fi rst-tier team in Germany’s Bundesliga professional football league. We will begin supplying OEM tires to SEAT, S.A.* for the new SUV Ateca and to ŠKODA AUTO a.s.* for the Superb. The number of companies adopting Sumitomo Rubber OEM tires is steadily growing.
*Part of the Volkswagen Group
We enhanced our competitiveness in the Nurburgring 24-Hour Race
Initiating the supply of Falken tires for the SEAT Ateca
We are retaining our sponsorship contract with “FC Ingolstadt 04”
We are ramping up the expansion of the D-Guard chain in China
In Asia and Oceania, we are actively promoting initiatives to enhance product quality and expand our retail network. As for products, we are working to expand our lineup of eco-friendly tires in Asia, where more environmental regulation is expected. In China, voluntary regulations encouraging the use of fuel-effi cient tires went into effect in September 2016. The Company was already ahead of the game, coming out with SP TOURING R1 and ENASAVE EC300+ tires, which conform to the new standards. We also fully promoted these two products in other Asian markets, heightening our presence in the eco-friendly tire market. Also in China, we ramped up our expansion of the D-Guard chain, which provides general automotive maintenance services. The number of stores in the country carrying Falken brand tires is now around 600, bringing the total number of stores carrying Falken or Dunlop brand tires up to about 6,000. Meanwhile, in the burgeoning Indian market, the number of stores carrying Falken brand tires has grown to roughly 1,200. In addition, the number of Falken Pulse stores, which carry Falken brand tires in Australia, is up to 150.
Note: The number of stores is as of the end of 2016.
Asia and Oceania

10 Sumitomo Rubber Industries Annual Report 2016
Technological breakthroughs
Creating Innovative Tires to Contribute to Sound Social DevelopmentWith an eye to achieving VISION 2020—the Group’s long-term vision that sets targets for fi scal 2020—the Sumitomo Rubber Group is pushing forward with the expansion of sales of such high-value-added products as fuel-effi cient tires, rallying all its strengths to secure business growth and greater earnings capabilities. At the same time, we aim to benefi t the global environment through the advancement of tire technologies. In this regard, we believe that our product development strengths lie in three areas: innovative materials, fuel effi ciency and resource saving. Accordingly, our efforts to create environment-friendly tire technologies are centered on three key product categories: fossil resource-free tires, fuel-effi cient tires and runfl at tires. In addition to these initiatives, we are striving to achieve technological breakthroughs related to highly functional biomass materials obtained from natural sources as well as next-generation tire technologies that will enhance driving safety and promote resource and energy conservation. In short, we are actively developing products that will boast superior value by leveraging proprietary Sumitomo Rubber Industries technologies.
Fossil resource-free
tires
Fuel-effi cient tires
Highly functional biomass materials Next-generation tire technologies
Runfl at tires
• Promote the use of naturally derived materials• Create naturally derived materials with greater
functionality
• Airless Tire Technology GYROBLADE• Sealant Tire Technology CORESEAL
Special Feature 2: Insatiable Drive for Innovation
Three aspects in which our tire technologies can help preserve
the environment
Innovative materials
t
Fueleffi ciency
RRu
Resourcesaving

11Sumitomo Rubber Industries Annual Report 2016
Fossil resource-free
tire
Fuel-Effi cient Tires
Since 2001, the Group has been engaged in the development of fossil resource-free tires, in other words, products made using no oil, coal or other fossil resources. In 2013, the Group launched ENASAVE 100, the world’s fi rst* 100% fossil resource-free tire. The ENASAVE 100 was developed through the application of our R&D accomplishments in the area of naturally derived materials, refl ecting improvements in the quality of raw materials and the creation of a totally new material. Composed of only naturally derived materials, it boasts enhanced fuel effi ciency, wet grip perfor-mance and driving comfort as well as improvements in other basic performance requirements. In short, ENASAVE 100 is the embodiment of our efforts to reduce our environmental burden through the pursuit of innovative materials, fuel effi ciency and resource-saving technologies.
100% Fossil Resource-Free Tires ENASAVE 100
Enhancing Three, Often Contradictory, Performance Requirements
In 2015, the Sumitomo Rubber Group successfully completed the development of its proprietary ADVANCED 4D NANO DESIGN material development technology, which enables the precise con-trol and simultaneous enhancement of the three, often contradictory, tire performance require-ments—fuel effi ciency, wet grip performance and wear resistance—through in-depth analysis and the seamless simulation of the structure of natural rubber on scales that range from the micron to the nanometer levels. Drawing on this technology, we were able to develop and commercialize the ENASAVE NEXT II, which boasts a 51% improvement in anti-wear performance compared with the preceding ENASAVE NEXT and, like its predecessor, has been awarded the coveted “AAA-a” ranking—the highest possible—under Japan’s tire labeling system. The new tire was released in November 2016 as a fl agship fuel-effi cient tire under the Dunlop brand. Furthermore, we released the LE MANS V, which boasts remarkably enhanced driving comfort and quietness in addition to a 27% improve-ment in resistance against uneven abrasion compared with the previous model LE MANS 4, under the Dunlop brand in February 2017.
The ADVANCED 4D NANO DESIGN material development technology was granted the Tire Technology of the Year title at the Tire Technology Expo 2017 held in Europe. It was also chosen by the Minister of Education, Culture, Sports, Science and Technology to receive a Prize for Science and Technology under the 2017 Commendation for Science and Technology. These recognitions attest to the solid reputation that our technology enjoys in Japan and overseas.
Innovative materialsUse of biomass materials
Fuel effi ciencyRanked “AA” in Japan’s
offi cial tire labeling system
Resource savingA 19%* improvement in anti-wear performance *Comparison with ENASAVE 97
Reducing the environmental burden in multiple ways
51 sizes 10 sizes
ENASAVE NEXT II
* Since the use of synthetic rubber became the industry standard (based on Sumitomo Rubber Industries’ own research).
12 Sumitomo Rubber Industries Annual Report 2016
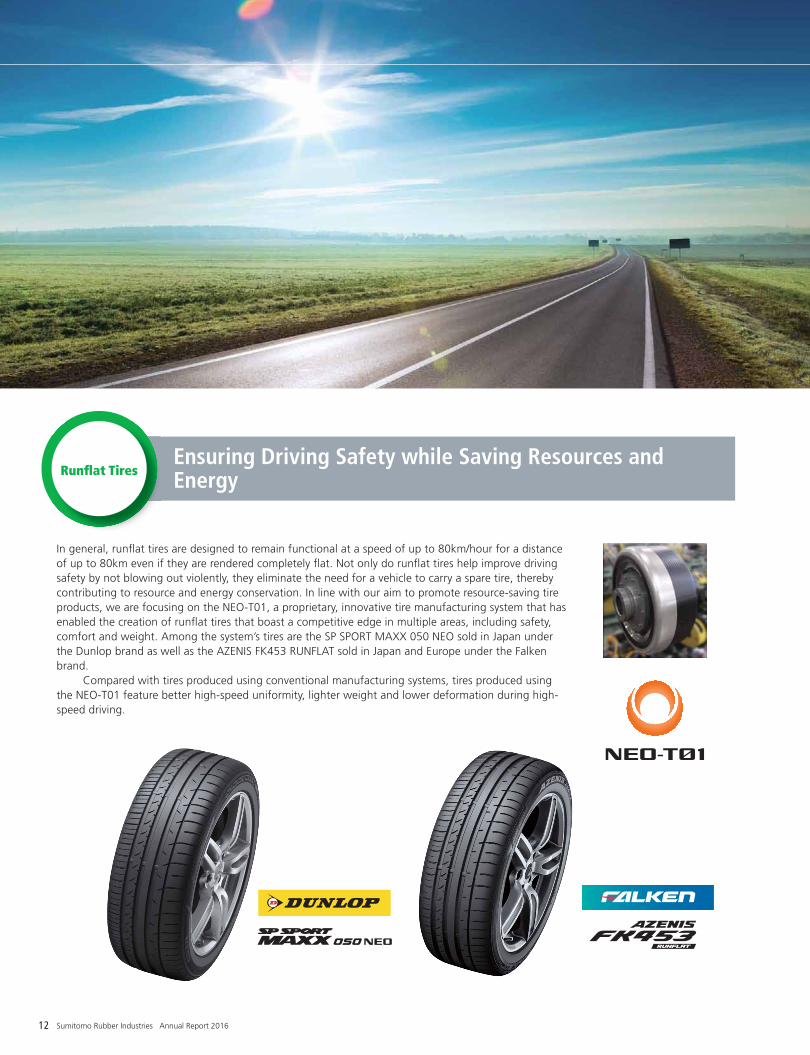
In general, runfl at tires are designed to remain functional at a speed of up to 80km/hour for a distance of up to 80km even if they are rendered completely fl at. Not only do runfl at tires help improve driving safety by not blowing out violently, they eliminate the need for a vehicle to carry a spare tire, thereby contributing to resource and energy conservation. In line with our aim to promote resource-saving tire products, we are focusing on the NEO-T01, a proprietary, innovative tire manufacturing system that has enabled the creation of runfl at tires that boast a competitive edge in multiple areas, including safety, comfort and weight. Among the system’s tires are the SP SPORT MAXX 050 NEO sold in Japan under the Dunlop brand as well as the AZENIS FK453 RUNFLAT sold in Japan and Europe under the Falken brand. Compared with tires produced using conventional manufacturing systems, tires produced using the NEO-T01 feature better high-speed uniformity, lighter weight and lower deformation during high-speed driving.
Runfl at TiresEnsuring Driving Safety while Saving Resources and Energy

13Sumitomo Rubber Industries Annual Report 2016
Artist’s rendering of natural rubber synthesis mechanism
Highly Functional Biomass Materials
Developing New Natural Rubber Sources
Currently, Asian countries account for 90% of the world’s natural rubber pro-duction. The geographical distribution of these producers and potential impact of transportation and other operations on the environment pose a number of challenges. In response, the Group turned its attention to the Russian dandelion and initiated research on this plant, which can be cultivated in a range of regions throughout the world. The use of Russian dandelion as a source of nat-ural rubber is expected to help the Group optimize its supply system and pro-duce tires with superior performance and eco friendliness.
Next-Generation Tire Technologies
Sealant
Prevents air leakage by immediately sealing a puncture when the stabbing object falls away from the tire
Tire Interior
Tire Exterior
Promote the Use of Naturally Derived
Materials
Create Naturally Derived Materials
with Greater Functionality
Eliminating the Need for Spare TiresNext-Generation Tire Technologies
Analysis of the Terminal Group of Natural Rubber Molecular
With regard to natural rubber extracted from Para rubber trees, we have suc-cessfully analyzed the structure of the molecule and its terminal group, to this end employing high-performance analyzers that support a proprietary Sumitomo Rubber Industries method. Having uncovered previously unknown details of such structure, our fi ndings are expected to lead to the development of superior natural rubber materials that enhance tires’ fuel effi ciency and anti-wear performance and are easier to process.
GYROBLADE
This technology produces a tire that meets basic performance requirements* but has no need to be fi lled with air. Because there is no need to maintain an optimal air pressure, such a tire is immune to fl ats. GYROBLADE thus greatly decreases the vehicle repair workload while reducing the environmental bur-den by eliminating the need to carry spare tires.
CORESEAL
A sealant with high adhesiveness and viscosity designed to be applied to the lining of a tire tread, CORESEAL prevents air leakage from a tire when the tread is punctured* through its entire thickness. By immediately seal-ing the puncture, this technology helps tires retain suffi cient air pressure even in circumstances where tires may otherwise go fl at due to contact with stabbing objects.
Research on the Biosynthesis Mechanisms of Natural Rubber
We have identifi ed three distinct proteins that play key roles in the biosyn-thesis of natural rubber in a Para rubber tree. Looking ahead, we will apply these research results in such areas as the selection of rubber tree species with greater yields and the search for non-plant sources of sub-stances found in natural rubber.
A Russian dandelion
Molecular-level analysis of the termi-nal group structure of natural rubber
Four types of terminal group structure
terminal 1
terminal 3
terminal 2
terminal 4
Tire tread
Special resin spoke
Metal wheel
* (1) Supporting vehicle weight; (2) Transferring driving and braking power to the road; (3) Absorbing and dampening shock; and (4) Changing or maintaining vehicle direction
* Prevents air leakage when a tire tread has been punctured by a nail or other foreign object of up to 5mm in diameter, regardless of whether the object remains lodged in the tread or falls out

Fiscal 2016 Results
Sales revenue in the Tire business decreased 5% year on year to ¥648,445 million, while business prof-it* fell 8% to ¥67,924 million. In fi scal 2016, although there were moderate upturns in natural rub-ber and crude oil prices, overall market prices remained low. Sales prices for Group products were particularly impacted by the appreciation of the yen. Nevertheless, the Group pressed ahead with its efforts to further boost sales of such high-value-added prod-ucts as fuel-effi cient tires, expand into new markets and take measures aimed at driving growth and improving earn-ings capabilities across the entire Group. As a result of these efforts and heavy snowfalls in eastern Japan, domestic winter tire sales were fi rm. However, overall sales revenue and profi t in the Tire business decreased due to a decline in domestic automo-bile production volume and the impact
14 Sumitomo Rubber Industries Annual Report 2016
TIREBUSINESS
New Findings from Our Research on Natural Rubber Biosynthesis Published in elife Researchers at Sumitomo Rubber Industries have identifi ed three distinct proteins that play key roles in the biosyn-thesis of natural rubber in a Para rubber tree. With relevant research fi ndings fea-tured in elife, an open-access science magazine, this discovery has been widely recognized across the industry as signifi -cant as the details of such biosynthesis mechanisms were previously unknown.
• The Sumitomo Rubber Group manufactures and sells tires, mainly the Dunlop and Falken brands.
• The Sumitomo Rubber Group actively promotes the Dunlop brand lineup, which features fuel-
effi cient and long- lasting tires with greater value for users.• The Group is stepping up
marketing in Europe, the United States and Japan by leveraging its lineup of Falken brand tires with superior functionality and product quality.
Monomer
HRT1 HRBP REF
Natural Rubber
HRT1: Hevea rubber transferase 1
HRBP: HRT1-REF bridging protein
REF: Rubber elongation factor
A paper featured in “eLife”
Three proteins that play key roles in natural rubber biosynthesis
Review of Operations
Sumitomo Rubber Industries Wins Tire Technology of the YearAt the Tire Technology Expo 2017, we were granted the Tire Technology of the Year title. This title was awarded in recognition of our technological strengths as well as groundbreaking advancements in tire material development made possible by our ADVANCED 4D NANO DESIGN, a technology that enables the simultaneous enhancement of the three, often contra-dictory, tire performance requirements—fuel effi ciency, wet grip performance and wear resistance—through the analysis of the inner structure of rubber constituent and large-scale simulation of tire performance.
51 sizes
10 sizes

15Sumitomo Rubber Industries Annual Report 2016
of the disadvantageous exchange rates on overseas operations.
Domestic Replacement MarketIn the domestic replacement market, sales rev-enue exceeded the level of the previous fi scal year. With respect to summer tires, we expanded sales mainly of the ENASAVE series, which are long-lasting and fuel-effi cient tires sold under the Dunlop brand, and LE MANS 4, which are long-lasting and fuel-effi cient tires that boast superior driving comfort and are equipped with SILENT CORE, a special noise-absorbing sponge. We also expanded sales of high-performance tires, including the premi-um product AZENIS FK453 while making efforts to enhance brand awareness, such as through our co-sponsorship of Red Bull Air Race Chiba 2016 under the Falken brand. With respect to winter tires, shipments showed solid growth due to the nationwide early launch of WINTER MAXX 02 studless tires, which provide the best on-ice perfor-mance in Dunlop history and maintain a high
degree of both “long-lasting effectiveness” and “long life performance,” as well as the impact of heavy snowfalls in November in East Japan, including the Tokyo metropolitan area.
Domestic Original Equipment MarketIn the domestic original equipment market, sales revenue fell below the level of the previ-ous fi scal year, as automobile production vol-ume fell below the level of the previous fi scal year, despite our continued efforts mainly focusing on fuel-effi cient tires to expand the volume delivered of high-value-added tires.
Overseas Replacement MarketIn the overseas replacement market, sales vol-umes increased in North America and Europe as well as in other regions, such as the Middle East, Africa, and Central and South America; however, sales revenue fell below the level of the previous fi scal year due to the effect of yen appreciation.
Overseas Original Equipment MarketIn the overseas original equipment market, sales volumes increased in Brazil—where we started to deliver our products last year—
Thailand and South Africa. Furthermore, in North America and Europe, deliveries, mainly to overseas automakers, continued to expand and therefore sales volumes exceeded the pre-vious fi scal year levels. However, sales revenue fell below the level of the previous fi scal year due to the effect of yen appreciation.
Fiscal 2017 Outlook
In the domestic market, we will continuously introduce new products to further increase our presence in the fuel-effi cient tire fi eld. In overseas markets, we will continue to seek sales expansion in emerging nations while striving to increase the presence of the Falken brand in the U.K. market by leveraging the capabilities of Micheldever Group Ltd., a British tire sales company that we acquired in February 2017. In terms of production, we will pursue investment aimed at boosting our manufacturing capacity in such countries as the United States, Brazil, Turkey and South Africa, thereby augmenting the Group’s sup-ply structure.
Year-on-Year Increase/ Decrease in Tire Sales Volume
(Yr)
(Billions of yen)
2012
619.4 681.1
731.2 732.2 696.3
2013 2014 2015 201620162015
800
0
600
200
400
682.2 648.4
JGAAP
Net Sales
IFRS
Sales Revenue
100
0
80
20
60
40
63.1
10.2 10.3 10.7 10.0 9.810.8 10.5
69.9
78.473.1
67.974.0
67.9
2012 2013 2014 2015 201620162015 (Yr)
(Billions of yen)
JGAAP
Operating Income(Ratio)
IFRS
Business Profit(Ratio)
Business Profit, Operating Income
Business Profit Ratio, Operating Income Ratio
* Business Profi t = Sales revenue – (Cost of sales + Selling, general and administrative expenses)** From the fi scal year ending December 31, 2016, the Group voluntarily adopted the International Financial Reporting
Standards (IFRS).
* Defi ned by Sumitomo Rubber Industries, Ltd. as its primary management indicator. Business profi t = sales revenue – (cost of sales + selling, general and administrative expenses)
15 sizes 44 sizes
2015 2016
Domestic original equipment -8% -4%
Overseas original equipment +1% +5%
Domestic replacement -7% +1%
Overseas replacement +6% +4%
Total ±0% +3%
Total sales volume (thousand of tires) 109,620 112,640

16 Sumitomo Rubber Industries Annual Report 2016
SPORTSBUSINESS
• With Dunlop Sports Co. Ltd. serving as the principal operating company, the Group produces and markets such goods as golf clubs and balls as well as tennis rackets, tennis balls and other tennis equipment.
• In its mainstay golf product lineups, Dunlop Sports has introduced the XXIO, SRIXON and Cleveland Golf brands on a global scale.
• Tennis equipment is manufactured and marketed under the Dunlop and SRIXON brands. In addition, a sales agency contract has been signed with the French company BABOLAT VS S.A.
• Dunlop Sports launched a wellness promotion business, comprising a fi tness club business and a golf and tennis school businesses, expanding it to create a third business pillar for the segment.
• Dunlop Sports is listed on the fi rst section of the Tokyo Stock Exchange.
XXIO9
CLEVELAND 588 RTX 2.0
SRIXON Z
SRIXON Z-STAR
No.1 ranking in terms of value of domestic shipments in 2016 for• Golf clubs
• Golf balls
• Tennis rackets
• Tennis balls
These 2016 market share estimates are based on data in the Sports Goods Industry 2017 report compiled by Yano Research Institute Ltd.
Professional golfer, Hideki Matsuyama
Golfers Supported by SRIXON Demonstrate Outstanding Performance around the WorldA number of leading Japanese and over-seas professional golfers have entered into equipment sponsorship agreements with Dunlop Sports. Among these are such players as Hideki Matsuyama and Lee Bomi, who have earned brilliant scores while using SRIXON golf goods.

17Sumitomo Rubber Industries Annual Report 2016
SRIXON REVO CV3.0
DUNLOP FORT / SRIXON
increased, even though the number of golf course visitors declined from the level of the previous fi scal year, and we won the top share2 again in the current period in terms of sales of golf clubs and golf balls. However, sales revenue fell below the level of the previ-ous fi scal year in the golf goods market in Japan as a whole, partly because of a switcho-ver in the golf apparel business to licensed sales through DESCENTE LTD. in the current fi scal year. In the tennis goods market in Japan, we earned the top share2 in terms of sales of ten-nis rackets. However, sales revenue fell below the level of the previous fi scal year due to the sluggish growth of the tennis goods market. In overseas golf goods markets, we made aggressive efforts to globally expand sales of our SRIXON, XXIO and Cleveland Golf brands. However, due to the effect of yen appreciation, sales revenue fell below the level of the previous fi scal year. As a result, sales revenue in the Sports business fell below the level of the previous fi scal year, while business profi t increased mainly due to a decrease in purchasing costs resulting from yen appreciation.
Fiscal 2017 Outlook
For golf goods, we will continue to win the top share in the domestic market by promot-ing sales of our fl agship golf club XXIO 9, as well as the SRIXON and Cleveland Golf brands. For golf balls, we will progressively introduce new products including the premi-um XXIO brand and the SRIXON brand. In overseas markets as well, we will continue to pursue sales expansion for the XXIO, SRIXON and Cleveland Golf golf clubs and increase the market share of SRIXON golf balls. For tennis goods, we will strive to enhance the recognition of the SRIXON brand among users worldwide. In furtherance of this effort, we have signed an equipment sponsorship agreement with Agnieszka Radwanska, a leading female tennis player ranked third in the world.3 We will also launch new SRIXON rackets while endeavoring to expand sales by, for example, organizing sales campaigns for tennis balls. As for the wellness business, we will continue to step up new openings of com-pact gyms.
Figures are rounded to the nearest ¥0.1 billion. Percentage fi gures are rounded to the nearest whole number
100
0
80
40
20
60
2012
61.363.3
70.577.6
72.977.8
72.8
2013 2014 2015 201620162015 (Yr)
(Billions of yen)
JGAAP
Net Sales
IFRS
Sales Revenue
5
0
4
2
1
3
4.5
7.36.0
4.5
2.6
6.0
3.3
5.9
4.0
3.2
2.0
4.4
2.6
4.3
2012 2013 2014 2015 201620162015 (Yr)
(Billions of yen)
JGAAP
Operating Income(Ratio)
IFRS
Business Profit(Ratio)
Business Profit, Operating Income
Business Profit Ratio, Operating Income Ratio
Fiscal 2016 Results
Sales revenue in the Sports business decreased 6% from the previous fi scal year to ¥72,772 million, while business profi t1 increased 63% to ¥4,303 million. In the golf goods market in Japan, sales of our fl agship XXIO 9 golf clubs steadily
Reliable and professional quality, capable of helping players advance their golf skills
Cleveland Golf’s distinct short game strengths come to the fore for all players
The culmination of a wealth of proprietary Dunlop technologies that benefi ts all golfers
from beginners to professionals
YOUR PRESTIGE PARTNER WHERE SCORING MATTERSDEDICATED TO IMPROVING YOUR GAME
Sales Breakdown (Billions of yen)
1. Defi ned by Sumitomo Rubber Industries, Ltd. as its primary management indicator. Business profi t = Sales revenue – (Cost of sales + Selling, general and administrative expenses)
2. Market share in terms of storefront sales by retailers based on YPS data compiled by Yano Research Institute Ltd.
3. Ranking as of December 26, 2016
* Business Profi t = Sales revenue – (Cost of sales + Selling, general and administrative expenses)** From the fi scal year ending December 31, 2016, the Group voluntarily adopted the International Financial Reporting
Standards (IFRS).
y-o-y comparison
2016 Amount %
Golf goods 53.7 (5.3) -9%
Clubs 32.8 (3.5) -10%
Balls 14.0 (0.8) -6%
Shoes and accessories 6.9 (1.0) -12%
Tennis goods 6.2 (0.3) -4%
Licensing revenue and other 12.9 0.6 +5%
Total 72.9 (5.0) -6%

18 Sumitomo Rubber Industries Annual Report 2016
• The Industrial and Other Products business offers a wide variety of products encompassing medical rubber parts, precision rubber parts for printers and photocopiers, vibration control dampers, fl oor coating materials, marine fend-ers, rubber valves, artifi cial turf for sporting use, rubber gloves, rubber gas tubes and porta-ble ramps for wheelchair use. The Company covers diverse needs that range from daily life to industrial applications.
INDUSTRIAL AND OTHER PRODUCTSBUSINESS
The MIRAIE damper for conventional post and beam structures
Expanding Sales of Vibration Control Units for HousingThanks to proprietary Sumitomo Rubber Industries technology in the area of high damping rubber, MIRAIE brand vibration control units for housing are capable of absorbing up to 70%* of the kinetic energy of an earthquake trem-or while boasting a product life of up to 90 years. As of December 31, 2016, MIRAIE units have been installed in more than 19,000 houses since the launch of the brand. After the Kumamoto earthquake struck in 2016, the MIRAIE brand earned an even greater reputation as none of the houses equipped with these units collapsed in the disaster.
Stepping Up Our Medical Rubber Parts BusinessEfforts are now under way to expand operations related to medical rubber parts in the European market, with Lonstroff AG—a Switzerland-based company that became a Group member in 2015—serving as a key player in this fi eld.
* Based on the results of in-house shake table experiments simulating real-life earthquake intensity

19Sumitomo Rubber Industries Annual Report 2016
Fiscal 2016 Results
Sales revenue in the Industrial and Other Products business decreased 8% year on year to ¥35,479 million, while business profi t* increased 27% to ¥2,673 million. In the vibration control business, under the MIRAIE brand, a series of vibration control units for housing, sales have grown steadily, with the sales volume reaching our annual tar-get of 6,000 units. Although a number of houses were damaged when the Kumamoto earthquake struck in April 2016, none of the houses equipped with MIRAIE units collapsed, leading to even more positive customer reviews for this product line. As for medical rubber parts, we have been developing our global operations, especially in Europe, with Switzerland-based Lonstroff AG serving as the core production base. Meanwhile, precision rubber parts for printers and photocopiers saw
decreased revenue due to the effect of poor foreign exchange rates in addition to produc-tion cutbacks due to deteriorating market con-ditions for printers and photocopiers. Infrastructure-based products and materials for such applications as sports facilities, civil works and marine facilities were weak, mainly due to delay in completion of facilities. As a result, sales revenue in the Industrial and Other Products business fell below the level of the previous fi scal year. However, profi t increased mainly due to reduction of expenses.
Fiscal 2017 Outlook
In the business fi elds of precision rubber parts for printers and photocopiers, we will cultivate
new markets and new customers. In the vibration control business, we will make efforts to further develop a line of prod-ucts focusing on the MIRAIE brand and pro-vide high-quality products capable of supporting the safety of housing. In medical rubber parts, we will pursue further global business development centered on the European market. In the infrastructure-based business, we will deal with port improvement facilities, from which we have already received orders in association with demand stemming from the upcoming Tokyo Olympics, while seizing opportunities related to facility devel-opment projects that will materialize in the future, thereby expanding sales. We will continue to develop and supply various products that are high-value-added in terms of quality and function and to seek fur-ther business growth.
Precision rubber parts for printers and photocopiersPrecision rubber parts for printers and photocopiers require accuracy on a micrometer scale. With production bases in Japan, China and Vietnam, Sumitomo Rubber Industries meets the needs of a wide variety of customers.
Medical rubber partsExercising thorough quality control, Sumitomo Rubber Industries offers safe and high-quality medical rubber parts.
Vibration control dampers for buildingsOur vibration control dampers made using a special high damping rubber protect buildings and housing complexes from swaying due to high winds and earthquake tremors. We are accelerating our expansion into earthquake-prone Turkey and Taiwan with these products.
50
0
40
20
10
30
2012
29.533.2
35.938.9
35.738.5
35.5
2013 2014 2015 201620162015 (Yr)
(Billions of yen)
JGAAP
Net Sales
IFRS
Sales Revenue
6
0
5
3
2
4
1
2.17.2
9.6
12.9
4.9
5.65.77.6
3.2
1.9 2.02.22.7
2012 2013 2014 2015 201620162015
4.6
(Yr)
(Billions of yen)
JGAAP
Operating Income(Ratio)
IFRS
Business Profit(Ratio)
Business Profit, Operating Income
Business Profit Ratio, Operating Income Ratio
1. Defi ned by Sumitomo Rubber Industries, Ltd. as its primary management indicator. Business profi t = Sales revenue – (Cost of sales + Selling, general and administrative expenses)
* Business Profi t = Sales revenue – (Cost of sales + Selling, general and administrative expenses)** From the fi scal year ending December 31, 2016, the Group voluntarily adopted the International Financial Reporting
Standards (IFRS).

20 Sumitomo Rubber Industries Annual Report 2016
Coordinated Utilization of Cutting-Edge Research Facilities
Tyre Technical CenterEquipped with state-of-the-art testing and measuring machines, the Tyre Technical Center is the Group’s main tire R&D facility.
Our accomplishments in the development of cutting-edge tire products are largely thanks to this proprietary material development technology created through the combined utilization of the three world-class facilities: SPring-8, a large-scale synchrotron radiation facility; the Japan Proton Accelerator Research Complex (J-PARC), which boasts high-intensity proton accelerator facilities; and the K computer.
R&D Activities and Intellectual Property Strategies
Constantly targeting new value creation, the Sumitomo Rubber Group engages proactively in research and development (R&D). In addition to these efforts, the Group preserves the fruits of its research as intellectual property and has established structures to fully capitalize on its intellectual property rights.
equivalent to 3.2% of consolidated sales revenue.
Tire Business“What tire technology can do for the global environment”—Guided by this underlying concept, the Group’s R&D efforts to create environment-friendly products focus on three things: innovative materials, fuel effi ciency and resource conservation, with the Tyre Technical Center, located near the Kobe Head Offi ce, serving as the core facility. Our latest accomplishments in tire devel-opment included the November 2016 release of the ENASAVE NEXT II long-lasting, fuel-effi cient tire under the Dunlop brand. The ENASAVE NEXT II is the fi rst product to be created using ADVANCED 4D NANO DESIGN since the establishment of this new material development technology in 2015. In addition, ADVANCED 4D NANO DESIGN was chosen to receive the 28th Society of Rubber Science and Technology, Japan Award in May 2016 and was named Tire Technology of the Year* at the annual Tire Technology Expo held in Europe in February 2017. These recognitions attest to the solid reputation that our tech-nology enjoys in Japan and overseas. Meanwhile, in the development of bio-mass materials, we have pushed ahead with our efforts to enhance the functionalities of the naturally derived materials used in the ENASAVE 100, a series of 100% fossil resource-free tires. As a result, we successfully developed a highly functional biomass mate-rial that serves as a softener and enhances the resilience of natural rubber. Incorporating this material, we have created the WINTER MAXX 02, which boasts improved perfor-mance on icy roads and meets its initial performance parameters for a longer period of time, launching the new tire under the Dunlop brand in August 2016. Moreover, basic research on aimed at improving the qualities of natural rubber con-tinues. We have identifi ed the mechanism by
which proteins participate in the biosynthesis of natural rubber in a Para rubber tree. We also conducted a successful in-depth analysis of the structure of natural rubber’s molecular chain end. These fi ndings are expected to facilitate the production of superior natural rubber that will help enhance the fuel effi -ciency and anti-wear performance of tires to be developed going forward. In fi scal 2016, R&D expenses in the Tire business totaled ¥21.0 billion.
Sports Business R&D sections are hard at work at both Dunlop Sports and Cleveland Golf Company Inc. Dunlop Sports pursues the development, evaluation and verifi cation of new technolo-gies and products, employing cutting-edge computer simulations. For example, we have upgraded our pro-prietary “Digital Impact” simulation technology, which enables the precise analy-sis—in increments of a 100 millionth of a second—of what transpires at the moment of the impact when a golf club hits a ball. The upgraded “Digital Impact II” extends this capability to cover the timeframes before and after impact while tapping into the fi eld of human dynamics to refl ect such factors as unique way each player addresses the ball. This technology is helping to signifi cantly accelerate the development of new golf balls and clubs. In golf clubs, we developed and released the NEW XXIO PRIME under the XXIO brand. This club incorporates a “stretch fi ll” material in its shaft, enhancing the fl exibility and strength of club’s fore-end and the portion near the grip. With a shaft that is even easier to control and swing, the NEW XXIO PRIME helps players drive balls farther with less effort. In golf balls, we introduced the SRIXON Z-STAR series under the SRIXON brand. With
R&D Expenses R&D Expenses to Sales Revenue
30
0
25
20
15
10
5
19.521.8
23.5 23.4 24.3
2.8 2.8 2.8 2.83.2
(Billions of yen)
(Yr)2012 2013 2014 2015 2016
Year on Year
+3.8%¥24.3 billion
R&D Activities
With the Sumitomo Rubber Industries’ R&D organization and facilities as its core, the Sumitomo Rubber Group promotes R&D activities in wide-ranging fi elds—the Tire, Sports, Industrial and Other Product busi-nesses—in close cooperation with its subsidiaries and affi liates around the world. Total R&D expenses in the fi scal year under review amounted to ¥24.3 billion,
* Please see page 14
R&D Expenses and R&D Expenses to Sales Revenue
Realistic ModelingRubber Structural Analysis
Simulation
Large-Scale Synchrotron Radiation Facility
K computer
Proton Accelerator & Experimental Facility
Rubber Behavioral Analysis

21Sumitomo Rubber Industries Annual Report 2016
Golf Science CenterWith the ability to comprehensively measure, analyze and evaluate golf equipment, our Golf Science Centers boast a wealth of data covering wide-ranging subjects, including the relationships between the golf swing forms of various golfers and such equipment as clubs and balls.
A rolling resistance testing machine
a core structure optimized for driving shots and incorporating the 338 Speed Dimple Pattern for a powerful-trajectory, the SRIXON Z-STAR enables players to hit longer distances. Moreover, this series boasts superior spin per-formance even after surface damage from wedge shots is incurred thanks to a high-durability, ultra-thin, super-soft 0.5 mm urethane cover as well as a NEW Spin Skin coating. In fi scal 2016, R&D expenses in the Sports business totaled ¥1.4 billion.
Industrial and Other Products businessWe are actively developing new products aimed at accommodating consumer needs in such fi elds as vibration control units using high damping rubber, medical rubber parts and precision rubber parts for printers and photocopiers. In the fi eld of vibration control units, we have been engaged in co-development with Central-NEXCO Technical Marketing Company Limited and Denka Company Limited, thereby commercializing a long-lasting rubber bearing for bridges* that boasts improved ozone resistance. In fi scal 2016, R&D expenses in the Industrial and Other Products business totaled ¥1.8 billion.
Intellectual Property Strategies Basic Policy
The Sumitomo Rubber Group proactively carries out intellectual property activities that support its businesses. The Group has set forth a basic policy with regard to such activities in accordance with VISION 2020, a long-term vision established in 2012. Specifi cally, the Group undertakes intellec-tual property activities focusing on three
pillars, namely: 1) securing intellectual proper-ty rights with regard to such industrial properties as patents, utility models, designs and trademarks; 2) exercising such rights against the infringement of the Group’s intel-lectual properties; and 3) eliminating risk by developing a structure to protect the Group’s rights from violation by third parties.
Current Status of Basic Policy ImplementationThe current status of the basic policy is as presented below. Thanks to the success of intellectual property training for employees and the introduction of a structure that con-nects technological development to patent application, Sumitomo Rubber Industries has successfully accumulated an even greater number of patents with signifi cant business potential. The Group seeks to effectively utilize the intellectual property rights that it has acquired, defending such rights against infringement worldwide. For example, in Europe the Group diligently fi les litigation against infringement while in Asia it is strengthening cooperation with national administrative bodies to ensure that products that infringe on the Group’s rights, including imitations and copies, are seized by customs or, when possible, their production sites are identifi ed and dealt with. To secure the competitive advantage of its products and earn greater trust, the Sumitomo Rubber Group will constantly rein-force the structure it has built to ensure the protection of its intellectual property rights against such infringement.
Responding to GlobalizationIn step with the rapid expansion of its over-seas operations, the scope of the Sumitomo Rubber Group’s intellectual property activities is growing worldwide, encompassing not only Japan but also the United States, Europe and such Asian countries as China as well as
Russia and countries in South America, the Middle East and Africa. Refl ecting this, efforts are now under way to nurture human resources and reinforce our structure for handling intellectual properties. In particular, the Group is providing training sessions not only for Intellectual Property department members but also for employees at every operational base with the aim of upgrading the competencies of the entire workforce. Such action is facilitating the development of a structure that ensures intellectual property activities are carried out smoothly and seamlessly on a Groupwide basis. To reinforce the intellectual property structure, it is essential to cooperate with such external organizations as legal fi rms, patent offi ces, patent agents, research agencies and administrative bodies in Japan and overseas. With the aim of strengthening the connections between the Group and these organizations as well as across-the-board communication, the Sumitomo Rubber Group implements projects that involve inter-nal and external collaborations. Moreover, the Group renewed its in-house Intellectual Property Management System while reorganizing its relevant depart-ments, with the aim of improving operational effi ciencies and ensuring that information is shared globally. Through the renewal and reorganization, the Group established a net-work that connects all of its operational bases and agencies around the world. These actions also facilitated a switchover from paper-based to paperless operations that utilize a workfl ow system and database, signifi cantly accelerat-ing the Group’s operations with regard to intellectual property rights and enhancing the system’s security. Focusing on the abovementioned three pillars, the Group will promote the more effi -cient implementation of intellectual property activities encompassing all regions worldwide.
* A rubber part placed between a bridge girder and sup-port column to cancel out the effects of fl exure, expan-sion and contraction on structural integrity

22 Sumitomo Rubber Industries Annual Report 2016
GREEN INITIATIVE
CSR PHILOSOPHY
FUNDAMENTAL PHILOSOPHY OF THE SUMITOMO RUBBER GROUP’S CSR ACTIVITIES
CSR GUIDELINE
Green
1. Helping to curb global warming by planting trees2. Fostering better relationships with local
communities through tree planting3. Protecting biodiversity
ECOLOGICALPROCESSEcology
4. Creating a low-carbon society5. Building a recycling-oriented society6. Managing environmental pollutants7. Implementing worldwide environmental management
NEXT-GENERATION PRODUCT DEVELOPMENTNext
8. Developing environmentally friendly products9. Pursuing safety and comfort, economy, and quality
KINDNESS TO EMPLOYEESKindness
10. Fostering human resource development and making jobs rewarding
11. Creating a safe, employee-friendly workplace12. Achieving a work-life balance13. Promoting diversity14. Respect for human rights
15. Ensuring thorough corporate governance16. Ensuring thorough compliance17. Promoting dialog with stakeholders18. Keeping social contribution in constant motion19. Supply chain management
INTEGRITY FOR STAKEHOLDERSIntegrity
The Sumitomo Rubber Group carries out its GENKI Activities, which proactively contribute to the environment and communities, in order to become a trusted corporate citizen and part of a sustainable society.
1,660,000
Number of trees planted since 2009
100%
Percent of domestic factories that have switched from heavy oil to cleaner
natural gas as boiler fuel
0%
Percent of the Group’s production facility waste disposed of in landfi lls
CSR Activities
http://www.srigroup.co.jp/english/csr/For details on the Group’s CSR activities, please read the Sumitomo Rubber Group CSR Report, which is also available on the Group website.
The Sumitomo Rubber Group proactively promotes CSR activities under the assumption that not only should efforts be made to raise economic value, but that it is essential to enhance social value as well. These endeavors are undertaken in order to realize sustainable growth and the creation of value, as stated in the Group’s VISION 2020 long-term vision.

23Sumitomo Rubber Industries Annual Report 2016
Committed to fulfi lling its social responsibilities, Sumitomo Rubber Industries utilizes its business resources to promote Groupwide CSR activities. For example, the “MIRAI Project” aimed at helping pre-serve traditional culture and the natural environment as well as a “GREEN Project” mangrove tree planting ini-tiative, have been funded by a portion of the Company’s sales of ENASAVE fuel-effi cient tires. Moreover, the Company conducts tire safety inspection campaigns in regions all across Japan while allocating part of proceeds from its rubber glove sales to the “1 Pair for 1 Love” tree planting initiative under way on the island of Borneo, Malaysia.
To commemorate its 100th anniversary in 2009, the Group commenced the “One Million Trees for Local Forests Project,” aiming to plant one million trees over the next 20 years at its production bases and in their neighboring areas in Japan and overseas. Under this project, Group employees gather seeds, raise them into seedlings and plant them in nearby moun-tain areas with the aim of preserving biodiversity. As part of the project, local residents are invited to interact and work hand in hand with employees in forest development activities. The One Million Trees for Local Forests Project thus encompasses a variety of initiatives, and employees from domestic and overseas business sites have proven enthusiastic participants. As of the end of 2016, the number of trees planted reached 1,660,000. Furthermore, in fi s-cal 2016 six domestic business sites participated in the Group’s ongoing initiatives to nurture and protect endangered species.
To better address needs of communities and tackle issues they are now facing, the Sumitomo Rubber Group holds periodic stakeholder dialogs to which it invites neighboring residents, government offi cials, volunteer groups and educational institutions. In 2016, one such dialog was held at our factory in Malaysia. Furthermore, the Group has compiled Procurement Guidelines encompassing the CSR Code of Conduct, wherein the Company calls for its suppliers to perform CSR activities or cooperate with it in its pursuit of these activities. In addition, the Company sends out questionnaires to each supplier in order to assess their CSR efforts while hosting training sessions aimed at addressing relevant matters and exchanging opinions with participants.
In July 2009, Sumitomo Rubber Industries established the Sumitomo Rubber CSR Fund. As part of initiatives supported by the fund, Sumitomo Rubber Industries introduced a matching-gift program in which the Company deducts ¥200 each month from the salaries of participating employees as a donation to the fund, matching these contributions with an equivalent donation. The scope of activities that the fund helps subsidize includes: environmental preservation activities, including biodiversity promotion; disaster relief; traffi c safety; and fi nding solutions to social issues besetting the communities around indi-vidual Group business sites. In the seventh round of subsidies granted in April 2016, the number of recipients totaled 32 organizations, including one recipient overseas. Also, the Sumitomo Rubber Group maintains an in-house CSR commendation system to recognize activities deemed to be of particular excellence every fi scal year-end. In 2016, there were 42 candidates from business units throughout the Group, 34 of whom received awards.
CSR Topics
CSR Activities Connected with Our Business Activities
Striving to Preserve the Environment
Stakeholder Dialogs
Closely Engaged with Community Issues
A “Genki no Mori” forest development activity(Sasayama City, Hyogo Prefecture)
The Dunlop tire safety inspection campaign The “MIRAI Project” aimed at restoring traditional stepped rice paddies
(Mimasaka-cho, Okayama Prefecture)
Fiscal 2016 CSR commendation award ceremony
Participants in the stakeholder dialog held at our factory in Malaysia

24 Sumitomo Rubber Industries Annual Report 2016
Corporate Governance
Corporate Governance Structure
Overview Sumitomo Rubber Industries has adopted a corporate system with a Board of Auditors and maintains directors, a general meeting of shareholders, account-ing auditors and the following bodies. The Company’s Board of Directors deliberates and determines matters of managerial importance and supervises directors’ execution of operations. As of March 30, 2017, the Board of Directors was composed of 11 members, three of whom were external directors. Corporate auditors independently audit directors’ execution of operations. As of March 30, 2017, the Company maintained a structure of fi ve corporate auditors, two of whom were full-time corporate auditors. Full-time corporate auditors attend important internal meetings and confi rm important docu-ments for approval. The Board of Auditors is composed of all of the Company’s corporate auditors. To reinforce the management auditing function, three of the fi ve cor-porate auditors serve as external auditors, securing a structure to conduct fair and objective audits. In addition to the abovementioned organizations stipulated under Japan’s Corporation Law, the Company established a Management Committee com-posed of internal directors and executive offi cers appointed by the president, who concurrently serves as a representative director. With the attendance of full-time corporate auditors, the Management Committee makes prompt
Management Committee(Business Execution)
(Establishment of Business Plans)
Executive Officers
Each Business Operation Division
General Meeting of Shareholders
Board of AuditorsCorporate Auditors
(Legal Audit)
Audit Department (Legal Audit)
(Evaluation of Operational Efficiency) (Operational Guidance)
Independent Auditors
Internal Control Auditors
Corporate Attorney
Chairman and Director
President andRepresentative Director
Business Execution
Scope of Internal Control
Auditing Nomination and Compensation Committee
Chaired by an Independent External DirectorIndependent External Directors and
Corporate Auditors Comprise Majority Discusses Nomination of Directors
and Their Compensation
Human Resources & General Affairs Department, Legal Department
Compliance Counseling Room(Corporate Ethics Helpline)
Corporate Philosophy, Code of Conduct
Corporate Ethics Committee
Internal Audit
Business Audit
Advice
Audit
Board of Directors(Management Supervising)
Decision making on important business execution
Report Appointment/Dismissal
Cooperation
Appointment/Dismissal
Cooperation
Report Appointment/Supervision
Report
Report
Report Appointment/Dismissal
Guidance
Propo-sal
Consul-tation
CooperationCooperation
Cooperation
Cooperation
Report
Examination
Report
LegalCompliance
Reinforcement of Corporate
Ethics
Business Audit
AccountingAudit
The Sumitomo Rubber Group’s basic manage-ment policy is to enhance its corporate value as a promising and reliable global company for the benefi t of all stakeholders, including shareholders. Under this policy, the Group considers the enhancement of corporate gov-ernance as a major management objective in its efforts to better fulfi ll its social responsi-bility and enhance its transparency. This poli-cy will help to strengthen Group management and establish deep relation-ships of trust with society, while ensuring Groupwide business effi ciency.

25Sumitomo Rubber Industries Annual Report 2016
managerial decisions based on discussions or the reporting of matters considered to be important to management. Furthermore, the Company adopted an executive offi cer system in March 2003. This system was put in place with the aim of establishing a management structure that promotes the separation of management supervision and execution, clarifi es the rights and responsibilities of each business and promptly responds to changes in the business environment. As of March 30, 2017, there were 25 executive offi cers, 19 of whom did not serve concurrently as directors. To realize even greater corporate value, in 2016 the Company estab-lished the Nomination and Compensation Committee as a voluntary initiative to enhance objectivity and transparency in the nomination of directors and determination of their compensation. Chaired by an inde-pendent external director, this committee serves as an advisory body for the Board of Directors, with the majority of members consisting of inde-pendent external directors and independent external corporate auditors.
Reasons for Adopting the Aforementioned StructureGuided by the Sumitomo Business Spirit as well as its Corporate Philosophy, the Sumitomo Rubber Group maintains a basic management policy of sustainably enhancing its corporate value as a promising and reliable global company acting for the benefi t of all stakeholders, includ-ing shareholders. To that end, the Group continually strives to deliver attractive offerings, greater user comfort and other value for consumers. Under this policy, the Group considers the enhancement of corporate governance a major management objective, as it aims to ensure Groupwide business effi ciency, establish deep relationships of trust with society and maintain fair and even more transparent operations. Accordingly, the Group currently believes that the aforementioned corpo-rate governance structure is best suited to facilitating these pursuits.
Implementation and Status of the Internal Control SystemBased on compliance with social norms, which are stipulated in the Company’s Code of Conduct, Sumitomo Rubber Industries maintains the guideline that corporate activities must adhere to laws and ordinances, social norms and standards of public decency. Moreover, the Company has established systems to ensure that in the execution of their duties, directors comply with laws and the Company’s Articles of Incorporation and that Group operations undertaken by the Company and its subsid-iaries are always appropriate, thereby securing strict legal compliance. In addition to complying with laws and its Articles of Incorporation, Sumitomo Rubber Industries aims to fulfi ll its corporate social responsibili-ties and, to this end, has established a strict code of corporate ethics while pursuing sound business operations. To that end, the Company formulated “Regulations on Corporate Ethics Activities” in February 2003. Simultaneously and in line with these regulations, the Company established the Corporate Ethics Committee, which meets on a quarterly basis and is chaired by the president, with the aim of strengthening its Groupwide compliance system. Furthermore, Sumitomo Rubber Industries set up a compliance counseling room directly controlled by the president as a corporate ethics helpline for employees. This enables the Corporate Ethics Committee to investigate any problems that arise within the Group and give suffi cient attention to ensuring that those employees who come forward are not penalized. With a close eye on legal issues,
the Company also takes such measures as seeking advice from corporate attorneys as circumstances demand.
Implementation and Status of the Risk Management SystemWith regard to a variety of management risks that could exert a signifi -cant impact on Group operations, including issues with product quality, legal requirements, environmental concerns, credit, accidents and disas-ters, each division and department undertakes preemptive analyses of potential risks and formulates appropriate countermeasures, which are discussed at management meetings in accordance with the risk manage-ment rules. When conducting risk analysis and formulating countermeasures, the Company requests on an as-needed basis advice and instruction from specialists, such as corporate attorneys. For cross-departmental risks, each administration department works in close collaboration with related divisions and departments in their respective areas of operation to conduct Companywide countermeasures. Furthermore, Sumitomo Rubber Industries established a Risk Management Committee based on its risk management rules. Chaired by the president, the Risk Management Committee meets twice a year to control Groupwide risk management activities and investigates such activities to confi rm the effectiveness of the risk management system. Should signifi cant risks materialize, or be expected to materialize, the Company president will establish a risk control headquarters based on the risk management rules.
Internal Audits and Audits by Corporate AuditorsIn accordance with audit plans and policies set out by the Board of Auditors, each corporate auditor attends important meetings, including Board of Directors’ meetings; hears reports on the status of job execution from directors and internal audits; reviews important approval docu-ments; and implements on-site audits at the Head Offi ce, major business sites and subsidiaries while working closely with accounting auditors to ensure that audits are conducted in an appropriate manner. Sumitomo Rubber Industries’ internal audit function is the responsi-bility of the Audit Department. Under the direct control of the president, the Audit Department is composed of 13 staff and one fulltime assistant to the corporate auditors. The Audit Department conducts audits of the Group as a whole and evaluates the effectiveness of its internal control system over the Group’s fi nancial reporting. In accordance with audit pol-icies and annual internal audit plans, the Audit Department implements onsite audits of the Head Offi ce, major business sites and affi liates to evaluate the effi cacy, effi ciency and degree of compliance adequacy in connection with the execution of operations at each division and depart-ment and related Group company. On the completion of an internal audit, the results and any recommendations for improvement are report-ed to the president and the Board of Auditors in an effort to ensure reciprocal collaboration. The Audit Department and accounting auditors facilitate closer collaboration as needed to fulfi ll their duties. For accounting audits, the Company has entered into an audit agree-ment with KPMG AZSA LLC in line with the Corporation and the Financial Instruments and Exchange Laws. In the fi scal year under review, Mr. Kenichiro Kuroki, Mr. Hirofumi Tani and Mr. Takaaki Mitsui, were pri-marily responsible for accounting audits as certifi ed public accountants (CPAs), with 23 other CPAs serving as their assistants alongside 17 staff

members at KPMG AZSA LLC. Looking at the Company’s corporate auditors, Mr. Toshiyuki Noguchi has served the Company in the fi eld of accounting and fi nancial affairs for many years, while Mr. Yasuyuki Sasaki, who has long served the Company as well as Sumitomo Electric Industries, Ltd., boasts extensive experience in the same fi eld. In addition, Mr. Morihiro Murata is a CPA and tax accountant. Leveraging their experience, they contributed their expert knowledge on fi nance and accounting to the Company.
External Directors and External Corporate AuditorsSumitomo Rubber Industries has three external directors and three exter-nal corporate auditors. Director Keizo Kosaka leverages his abundant knowledge as a law-yer who excels at corporate legal affairs to provide valuable comments and opinions from an objective perspective. Therefore, the Company anticipates that he will continue to help enhance its corporate gover-nance. Director Fumikiyo Uchioke leverages his experience as a serving member of the board at Sumitomo Electric Industries, Ltd. to provide valuable advice and opinions regarding the broad aspects of the Company’s operations. Therefore, the Company expects that he will make constant contributions to the enhancement of its corporate gover-nance. Director Kenji Murakami, who has served as the president and repre-sentative director of Daiwa House Industry Co., Ltd., leverages his experience in corporate management to provide valuable advice and opinions regarding the broad aspects of the Company’s operations. Therefore, the Company expects that he will help the Company strengthen corporate governance. Corporate auditor Tadao Kagono, a university professor specializing in business administration, leverages his academic expertise and consid-erable knowledge to provide opinions on directors’ execution of operations from an objective perspective. Therefore, the Company antici-pates that he will help reinforce its auditing system. Corporate auditor Morihiro Murata, a CPA and tax accountant boasting considerable knowledge of fi nance and accounting, leverages his expertise as well as auditing experience as an external director who concurrently attends the Audit and Supervisory Committee at Kagome Co., Ltd. and as an Outside Audit & Supervisory Board Member at KOKUYO Co., Ltd. to provide opinions on directors’ execution of opera-tions from an objective perspective. Therefore, the Company expects that he will help strengthen the Company’ auditing system. Corporate auditor Tetsuji Akamatsu, who served as the president of KINREI CORPORATION and as a corporate auditor at Cogene Techno Service Co., Ltd. (currently, Creative Techno Solution Co., Ltd.), leverages his experience in corporate management to provide opinions on direc-tors’ execution of operations from an objective perspective. Therefore, the Company expects that he will help the Company reinforce its audit-ing system. In appointing external directors and external corporate auditors, Sumitomo Rubber Industries has acted in line with its in-house standards for assessing the independence of candidates for these personnel. The Company is thus confi dent that the interests of its external directors and external corporate auditors are not in confl ict with the interests of gener-al shareholders.
Remuneration of Directors and Corporate Auditors
A breakdown of fi scal 2016 remuneration by position, total amount of remuneration by type and the number of per-sons to be paid, is as follows.
Remuneration Amount and the Company’s Policies for Determining Its Calculation MethodSumitomo Rubber Industries’ remuneration for directors and executive offi cers consists of basic compensation and bonuses. The basic compen-sation is determined based comprehensively on each individual’s position, duties and responsibilities as well as the Company’s business results. Directors’ compensation is paid within the framework approved at the Company’s General Meeting of Shareholders. The amount of each bonus is determined in accordance with an evaluation of the Company’s business results as well as each director’s business execution. The amount of remuneration for corporate auditors is determined in discussions among corporate auditors and paid within the framework approved at the Company’s General Meeting of Shareholders. Although stock-based incentives are not paid, the Company encour-ages the purchase of its stock through a stockholding association scheme for directors and executive offi cers. When determining the amount of bonuses, the Company also takes into account the contribu-tions made by each individual to the progress of medium- and long-term business plans. In these ways, the Company is providing directors and executive offi cers with incentives to achieve sustainable business growth. As for performance-based remuneration and stock options linked to medium- and long-term business results, the Company will engage in ongoing in-house discussions as well as dialog with its shareholders to assess the optimal timing for the introduction and determine the form of remuneration. The Company determines the amount of remuneration for directors and executive offi cers based on a resolution of the Board of Directors’ after examining proposals submitted by the Nomination and Compensation Committee, which discusses the matter from objective and unbiased viewpoints, with independent external directors compris-ing the majority of members.
26 Sumitomo Rubber Industries Annual Report 2016
Notes: 1. The number of persons to be paid refers to the total number of remuneration recipients.2. As of December 31, 2016, Sumitomo Rubber Industries had 11 directors and fi ve
corporate auditors. Any difference between these numbers and the numbers of persons to be paid is attributable to one director who retired during the fi scal year under review.
3. In accordance with a resolution at the 123rd Ordinary General Meeting of Shareholders held on March 26, 2015, the maximum total amount of remuneration for directors and corporate auditors was set at ¥800 million per year (of which ¥70 million per year is for external directors) and ¥100 million per year, respectively. In fi scal 2016, the Company paid ¥492 million in total to 12 directors, including one director who retired during said fi scal year, and ¥74 million in total to fi ve corporate auditors.
Total amount of remu-neration(Millions of
yen)
Total amount of remuneration by type(Millions of yen) Number of
persons to be paidBasic com-
pensationStock
optionsBonuses
Retirement benefi ts
Directors (excluding external directors)
466 351 — 115 — 9
Corporate auditors (excluding external corporate auditors)
49 49 — — — 2
External directors and external corporate auditors
51 51 — — — 6

27Sumitomo Rubber Industries Annual Report 2016
Directors, Corporate Auditors and Executive Offi cers(As of March 30, 2017)
Board of Directors
Corporate Auditors Executive Offi cers
Corporate Auditor (Full-time)Toshiyuki Noguchi
Corporate Auditor (Full-time)Yasuyuki Sasaki
Corporate Auditor (External)*Tadao Kagono
Corporate Auditor (External)*Morihiro Murata
Corporate Auditor (External)*Tetsuji Akamatsu
Senior Executive Offi cerNaofumi Harada
Senior Executive Offi cerNaoki Yamada
Senior Executive Offi cerTakanori Aoi
Senior Executive Offi cerHidekazu Nishiguchi
Executive Offi cerNorifumi Fujimoto
Executive Offi cerMasaharu Ono
Executive Offi cerTetsuhiko Yoshioka
Executive Offi cerTakashi Kono
Executive Offi cerToshihiko Komatsu
Executive Offi cerTomohiko Masuta
Executive Offi cerKiyoshige Muraoka
Executive Offi cerMasatsugu Nishino
Executive Offi cerEiichi Masuda
Executive Offi cerKenji Saito
Executive Offi cerHirotoshi Murakami
Executive Offi cerRichard Smallwood
Executive Offi cerNaofumi Yanetani
Executive Offi cerAtsuhiko Tanaka
Executive Offi cerFumikazu Yamashita
* Registered as independent directors and corporate auditors in accordance with regulations stipulated by the Tokyo Stock Exchange
President and CEO, Representative DirectorIkuji Ikeda
Representative Director and Executive Vice PresidentHiroaki Tanaka
Representative Director and Managing Executive Offi cerMinoru Nishi
Director and Senior Executive Offi cerKenji Onga
Director (External)*Keizo Kosaka
Director (External)*Fumikiyo Uchioke
Director (External)*Kenji Murakami
Director and Senior Executive Offi cerYasutaka Ii
Director and Senior Executive Offi cerHiroki Ishida
Director and Senior Executive Offi cerYutaka Kuroda
Director and Senior Executive Offi cerSatoru Yamamoto

28 Sumitomo Rubber Industries Annual Report 2016
11-Year Summary of Consolidated Financial DataSumitomo Rubber Industries, Ltd. and Its Consolidated Subsidiaries
Financial Section
Millions of yen Millions of yen
IFRS JGAAP JGAAP
Years ended December 31 2016 2015 2016 2015 2014 2013 2012 2011 2010 2009 2008 2007 2006
For the year:
Sales revenue2 / Net sales1 ¥756,696 ¥798,483 ¥804,964 ¥848,663 ¥837,647 ¥780,609 ¥710,247 ¥676,904 ¥604,549 ¥524,535 ¥604,974 ¥567,307 ¥534,086
Cost of sales (499,650) (528,393) 496,680 523,217 511,616 486,704 450,226 445,426 387,678 334,249 412,824 368,783 342,856
Selling, general and administrative expenses (182,130) (191,237) 233,959 248,379 239,780 216,850 190,298 177,554 169,300 161,547 166,491 153,398 154,440
Business profit3 / Operating income1 74,916 78,853 74,325 77,067 86,251 77,055 69,723 53,924 47,571 28,739 25,659 45,126 36,790
Operating profit2 73,284 89,173 — — — — — — — — — — —
Profit attributable owners of the parent company2, 4 / Net income1, 4 41,364 71,976 49,937 55,834 53,206 44,794 35,451 28,386 21,427 9,093 1,021 19,499 27,586
Depreciation and amortization1 51,248 51,419 53,442 55,145 48,204 43,279 36,278 37,606 37,885 37,425 35,475 30,165 27,052
Capital expenditures 49,606 58,911 49,606 58,911 62,814 57,270 56,889 48,515 32,055 32,484 49,601 53,205 45,308
R&D expenses 24,257 23,372 24,257 23,372 23,543 21,822 19,539 19,274 18,698 17,983 19,351 18,223 17,291
Cash flows from operating activities 128,190 86,864 128,190 86,995 108,941 77,012 76,643 18,945 69,725 64,525 25,879 56,594 23,872
Cash flows from investing activities (42,144) (30,672) (42,144) (32,991) (71,584) (68,275) (62,167) (51,569) (35,400) (34,260) (58,067) (65,167) (33,923)
Cash flows from financing activities (71,055) (52,707) (71,055) (50,554) (32,507) (5,824) (15,835) 28,009 (25,634) (22,781) 34,088 8,692 14,687
At year-end:
Total assets ¥897,634 ¥932,432 ¥899,646 ¥936,154 ¥973,587 ¥867,464 ¥737,528 ¥671,611 ¥622,243 ¥613,230 ¥639,941 ¥671,117 ¥606,938
Total equity2 / Net assets1 459,541 451,837 461,688 453,768 446,960 358,844 271,103 222,175 212,964 209,052 202,642 250,799 223,852
Total equity attributable to owners of parent 429,316 422,287 431,870 423,857 413,374 329,813 244,165 197,661 189,684 187,028 180,940 227,780 202,003
Interest-bearing debt 204,218 261,867 203,024 260,631 295,747 302,113 275,876 274,216 241,250 261,572 275,746 239,573 219,372
Yen
Yen
Per share amounts:
Basic profit per share2 / Net income1 ¥ 157.69 ¥ 274.38 ¥ 190.37 ¥ 212.85 ¥ 202.82 ¥ 170.76 ¥ 135.13 ¥ 108.20 ¥ 81.67 ¥34.66 ¥3.89 ¥74.31 ¥105.13
Cash dividends per share 55.00 55.00 55.00 55.00 50.00 40.00 30.00 23.00 20.00 18.00 18.00 20.00 20.00
Percent
Percent
Key ratios and metrics:
Business profit ratio3 / Operating income ratio1 9.9% 9.9% 9.2% 9.1% 10.3% 9.9% 9.8% 8.0% 7.9% 5.5% 4.2% 8.0% 6.9%
ROE 9.7 17.5 11.7 13.3 14.3 15.6 16.0 14.7 11.4 4.9 0.5 9.1 14.7
ROA (Business profit base / operating income base ) 8.2 8.4 8.1 8.1 9.4 9.6 9.9 8.3 7.7 4.6 3.9 7.1 6.3
Ratio of equity attributable to owners of parent2 / Equity ratio1 47.8 45.3 48.0 45.3 42.5 38.0 33.1 29.4 30.5 30.5 28.3 33.9 33.3
Tire sales volume (millions of tires) 11,264 10,962 11,264 10,962 10,914 10,042 9,648 9,488 9,087 7,649 8,734 8,170 7,555
Number of employees 33,792 33,197 33,788 33,185 30,224 26,773 23,507 22,320 22,242 20,832 20,369 18,410 16,031
Number of shares issued at year-end 263,043,057 263,043,057 263,043,057 263,043,057 263,043,057 263,043,057 263,043,057 263,043,057 263,043,057 263,043,057 263,043,057 263,043,057 263,043,057
Number of treasury stock at year-end 726,168 724,513 726,168 724,513 720,365 715,318 710,059 707,026 704,248 699,745 696,200 688,541 658,071
Notes: 1 Based on JGAAP 2 Based on IFRS 3 Defined by Sumitomo Rubber Industries, Ltd. as its primary management indicator, business profit is calculated using the following formula: Sales revenue – (Cost of sales +
Selling, general and administrative expenses) 4 Profit attributable to owners of the parent company is as calculated under IFRS while net income represents net income attributable to owners of the parent calculated under
JGAAP.

28 29Sumitomo Rubber Industries Annual Report 2016 Sumitomo Rubber Industries Annual Report 2016
11-Year Summary of Consolidated Financial DataSumitomo Rubber Industries, Ltd. and Its Consolidated Subsidiaries
Financial Section
Millions of yen Millions of yen
IFRS JGAAP JGAAP
Years ended December 31 2016 2015 2016 2015 2014 2013 2012 2011 2010 2009 2008 2007 2006
For the year:
Sales revenue2 / Net sales1 ¥756,696 ¥798,483 ¥804,964 ¥848,663 ¥837,647 ¥780,609 ¥710,247 ¥676,904 ¥604,549 ¥524,535 ¥604,974 ¥567,307 ¥534,086
Cost of sales (499,650) (528,393) 496,680 523,217 511,616 486,704 450,226 445,426 387,678 334,249 412,824 368,783 342,856
Selling, general and administrative expenses (182,130) (191,237) 233,959 248,379 239,780 216,850 190,298 177,554 169,300 161,547 166,491 153,398 154,440
Business profit3 / Operating income1 74,916 78,853 74,325 77,067 86,251 77,055 69,723 53,924 47,571 28,739 25,659 45,126 36,790
Operating profit2 73,284 89,173 — — — — — — — — — — —
Profit attributable owners of the parent company2, 4 / Net income1, 4 41,364 71,976 49,937 55,834 53,206 44,794 35,451 28,386 21,427 9,093 1,021 19,499 27,586
Depreciation and amortization1 51,248 51,419 53,442 55,145 48,204 43,279 36,278 37,606 37,885 37,425 35,475 30,165 27,052
Capital expenditures 49,606 58,911 49,606 58,911 62,814 57,270 56,889 48,515 32,055 32,484 49,601 53,205 45,308
R&D expenses 24,257 23,372 24,257 23,372 23,543 21,822 19,539 19,274 18,698 17,983 19,351 18,223 17,291
Cash flows from operating activities 128,190 86,864 128,190 86,995 108,941 77,012 76,643 18,945 69,725 64,525 25,879 56,594 23,872
Cash flows from investing activities (42,144) (30,672) (42,144) (32,991) (71,584) (68,275) (62,167) (51,569) (35,400) (34,260) (58,067) (65,167) (33,923)
Cash flows from financing activities (71,055) (52,707) (71,055) (50,554) (32,507) (5,824) (15,835) 28,009 (25,634) (22,781) 34,088 8,692 14,687
At year-end:
Total assets ¥897,634 ¥932,432 ¥899,646 ¥936,154 ¥973,587 ¥867,464 ¥737,528 ¥671,611 ¥622,243 ¥613,230 ¥639,941 ¥671,117 ¥606,938
Total equity2 / Net assets1 459,541 451,837 461,688 453,768 446,960 358,844 271,103 222,175 212,964 209,052 202,642 250,799 223,852
Total equity attributable to owners of parent 429,316 422,287 431,870 423,857 413,374 329,813 244,165 197,661 189,684 187,028 180,940 227,780 202,003
Interest-bearing debt 204,218 261,867 203,024 260,631 295,747 302,113 275,876 274,216 241,250 261,572 275,746 239,573 219,372
Yen
Yen
Per share amounts:
Basic profit per share2 / Net income1 ¥ 157.69 ¥ 274.38 ¥ 190.37 ¥ 212.85 ¥ 202.82 ¥ 170.76 ¥ 135.13 ¥ 108.20 ¥ 81.67 ¥34.66 ¥3.89 ¥74.31 ¥105.13
Cash dividends per share 55.00 55.00 55.00 55.00 50.00 40.00 30.00 23.00 20.00 18.00 18.00 20.00 20.00
Percent
Percent
Key ratios and metrics:
Business profit ratio3 / Operating income ratio1 9.9% 9.9% 9.2% 9.1% 10.3% 9.9% 9.8% 8.0% 7.9% 5.5% 4.2% 8.0% 6.9%
ROE 9.7 17.5 11.7 13.3 14.3 15.6 16.0 14.7 11.4 4.9 0.5 9.1 14.7
ROA (Business profit base / operating income base ) 8.2 8.4 8.1 8.1 9.4 9.6 9.9 8.3 7.7 4.6 3.9 7.1 6.3
Ratio of equity attributable to owners of parent2 / Equity ratio1 47.8 45.3 48.0 45.3 42.5 38.0 33.1 29.4 30.5 30.5 28.3 33.9 33.3
Tire sales volume (millions of tires) 11,264 10,962 11,264 10,962 10,914 10,042 9,648 9,488 9,087 7,649 8,734 8,170 7,555
Number of employees 33,792 33,197 33,788 33,185 30,224 26,773 23,507 22,320 22,242 20,832 20,369 18,410 16,031
Number of shares issued at year-end 263,043,057 263,043,057 263,043,057 263,043,057 263,043,057 263,043,057 263,043,057 263,043,057 263,043,057 263,043,057 263,043,057 263,043,057 263,043,057
Number of treasury stock at year-end 726,168 724,513 726,168 724,513 720,365 715,318 710,059 707,026 704,248 699,745 696,200 688,541 658,071
Notes: 1 Based on JGAAP 2 Based on IFRS 3 Defined by Sumitomo Rubber Industries, Ltd. as its primary management indicator, business profit is calculated using the following formula: Sales revenue – (Cost of sales +
Selling, general and administrative expenses) 4 Profit attributable to owners of the parent company is as calculated under IFRS while net income represents net income attributable to owners of the parent calculated under
JGAAP.

30 Sumitomo Rubber Industries Annual Report 2016
The Company has adopted IFRS in place of Japanese GAAP from the consolidated financial results for the fiscal year ended December 31, 2016. Therefore, consolidated figures for the previous fiscal year and comparisons are based on IFRS. In addition, the Company has used busi-ness profit as its unique management indicator. It is calculated by deducting the total of cost of sales and selling, general and administra-tive expenses from sales revenue.
Scope of ConsolidationThe Sumitomo Rubber Group’s consolidated financial statements include those of Sumitomo Rubber Industries and its 73 consolidated subsidiar-ies as well as 3 equity-method affiliates. In fiscal 2016, ended December 31, 2016, two subsidiaries were newly included in the Company’s scope of consolidation while six subsidiaries were excluded. Of the two newly included subsidiaries, one tire business subsidiary, which engages in sales in Taiwan, was included. Another, a sports business subsidiary, was included due to its increased importance to the Group. The six subsidiaries excluded were all tire busi-ness subsidiaries. One of the subsidiaries was absorbed into Sumitomo Rubber Industries, Ltd. and the other five were liquidated Chinese subsidiaries. Two companies were excluded from the scope of equity-method affilia-tion. One of the companies was liquidated and the other was excluded due to a revision of the scope of consolidation following the adoption of IFRS.
Business EnvironmentDuring fiscal 2016, the U.S. economy saw continued expansion and gradual economic growth was seen in Europe, albeit at different paces among the various countries and regions. The rate of economic growth slowed in China, but remained relatively high. The Indian economy also showed continued solid growth. Meanwhile, the economies in countries like Russia and Brazil continued to be stagnant. In addition, the overall global economy weakened due to increased geopolitical risks around the world, growing uncertainty about the European economy due to Brexit and rising concern about future policies in light of the U.S. presi-dential election results. The Japanese economy remained weak due to such factors as weak capital investment and personal consumption that reflect uncertainty about corporate earnings mainly caused by further yen appreciation during the current fiscal year.
Looking at the business environment surrounding the Group, natural rubber and crude oil prices were at relatively low levels through the current fiscal year, though they rebounded moderately and soared towards the fiscal year-end. Meanwhile, sales prices were significantly affected by foreign exchange rates, due to further yen appreciation against currencies except some emerging currencies during the current fiscal year.
Revenues and EarningsIn fiscal 2016, consolidated sales revenue fell 5.2% from the previous fiscal year to ¥756,696 million. Overseas sales decreased 4.5% to ¥449,406 million and the overseas sales ratio increased 0.5 percentage points to 59.4%. The cost of sales declined 5.4% year on year to ¥499,650 million. The cost of sales ratio increased slightly, edging up 0.2 of a percentage point year on year to 66.0% of sales revenue due to intensifying sales competi-tion linked to the decline in global tire demand. Gross profit fell 4.8% to ¥257,046 million. Selling, general and administrative expenses fell 4.8% year on year to ¥182,130 million. This was mainly attributable to the continued appreci-ation of the yen. The ratio of selling, general and administrative expenses to sales revenue edged up 0.1 of a percentage point year on year to 24.1%. As a result, business profit, which is sales revenue less cost of sales and selling, general and administrative expenses, declined 5.0% to ¥74,916 and the business profit ratio remained unchanged at 9.9%. Operating profit for the fiscal year under review decreased 17.8% to ¥73,284 million. Profit before tax fell 21.2% to ¥70,093 million. The decline in the three indicators above is attributable to the effects from the dissolution of the alliance with The Goodyear Tire & Rubber Company in the previous fiscal year. Income tax expenses rose 84.4% to ¥27,822 million and the effective tax rate increased 22.7 percentage points to 39.7%. Profit attributable to owners of the parent fell 42.5% to ¥41,364 million. Per share profit attributable to owners of the parent totaled ¥1,636.63. ROE (on a profit attributable to owners of the parent basis) declined 7.8 percentage points to 9.7% due to the drop in profit attrib-utable to owners of the parent.
Management’s Discussion and Analysis
Domestic Sales Revenue Overseas Sales RevenueDomestic Sales Overseas Sales Overseas Sales Ratio
1,000
0
(Billions of yen) (%)
800
400
200
600
100
0
80
40
20
60
2012
710.2
780.6837.6 848.7
805.0798.5756.7
2013 2014 2015 201620162015
JGAAP
Domestic and Overseas SalesDomestic and Overseas Sales Revenue
IFRS
47.451.1 52.7
56.3 56.9
(Yr)
58.9 59.4
1,000
600
800
400
200
100
60
80
40
20
Tire Production Volume Utilization Rate
0 0
(Thousands of tons) (%)
(Yr)2012 2013 2014 2015 2016
Tire Production Volume and Utilization Rate
525
92 9095
9187
534588 598
636
120
80
100
60
40
20
0
(Millions of tires)
(Yr)2012 2013 2014 2015 2016
Tire Sales Volume
96.48100.42
109.14 109.62112.64

31Sumitomo Rubber Industries Annual Report 2016
Results by Industry SegmentTire BusinessSales in the Tire business decreased 5.0% year on year to ¥648,445 million and business profit fell 8.2% to ¥67,924 million. The Group’s worldwide marketing efforts, particularly in the robust U.S. market, led to an increase in sales volume. However, in step with a fall in raw material prices, product prices declined and competition intensified, especially in the overseas replacement market, with such unfavorable factors as the appreciation of the yen suppressing revenues. On the earnings front, however, a fall in sales prices contributed to a ¥20,700 million decrease in profit. A decline in raw material prices, however, helped boost profit ¥26,500 million along with a ¥10,900 million increase provided by robust sales of winter tires and a boost in sales volume. Nevertheless, there was an overall decline in earnings due in part to an increase in fixed costs that mainly reflected the Company’s acquisition of a North American plant and a rise in expenses due to the reinforcement of the marketing structure.
Sports BusinessSales in the Sports business fell 6.4% year on year to ¥72,772 million, while business profit grew 63.3% to ¥4,303 million. Although Dunlop Sports’ flagship XXIO9 series golf clubs enjoyed steady growth in domestic sales, sales revenue decreased primarily due to the appreciation of the yen and conversion of the golf wear business into a licensing business with DESCENTE Ltd. from fiscal 2016. However, business profit rose thanks in part to reduced costs on the back of the appreciation of the yen.
Industrial and Other Products BusinessSales in the Industrial and Other Products business fell 7.8% year on year to ¥35,479 million, while business profit rose 26.7% to ¥2,673 million. Sales of MIRAIE brand vibration control units for housing remained firm. Sales of medical rubber parts expanded globally, especially in Europe, where the Group’s Switzerland-based subsidiary forms the core of the business. On the other hand, sales revenue decreased mainly due to a fall in revenues from precision rubber parts for printers and photo-copiers as the market worsened and production decreased while the yen appreciated. Another contributing factor was sluggish sales of infrastruc-ture-related products mainly due to delays in the completion of proper-ties. Business profit, however, increased primarily owing to cost controls.
R&D ExpensesResearch and development expenses increased 3.8% year on year to ¥24,257 million. The ratio of such expenses to consolidated sales revenue rose 0.3 of a percentage point year on year to 3.2%. The Tire business accounted for ¥20,966 million of these expenses, up 5.5% from the previous fiscal year, the Sports business ¥1,449 million, down 9.6%, and the Industrial and Other Products business ¥1,842 million, down 3.3%.
DividendsSumitomo Rubber Industries recognizes that the return of gains to shareholders is a priority issue. Backed by the comprehensive assessment of dividend payout ratios on a consolidated basis, performance pros-pects and the level of retained earnings, the Company maintains a basic policy of steadily rewarding shareholders over the long term. In addition, in accordance with a resolution the Company distributes retained earn-ings twice a year as dividends. The year-end dividend payment is decided on at the General Shareholders’ meeting, while the interim dividend payment is determined at the Board of Directors’ meeting. The full-year dividend for fiscal 2016 remained unchanged from that of the previous fiscal year at ¥55 per share and comprised a ¥25 interim dividend and a ¥30 year-end dividend. The dividend payout ratio on a consolidated basis was 34.9%.
Financial PositionTotal assets as of December 31, 2016, were down ¥34,798 million yearon year to ¥897,634 million. Total current assets decreased ¥8,802 million to ¥412,559 million. This was due mainly to decreases in trade and other receivable and inventories. Total noncurrent assets decreased ¥25,996 million to ¥485,075 million, due mainly to a decrease in investment securities with the selling of shares in The Goodyear Tire & Rubber Company following the disso-lution of the alliance as well as a drop mainly in property, plant and equipment attributable to the appreciation of the yen. As of the end of the fiscal year under review, total liabilities were down ¥42,502 million year on year to ¥438,093 million. Interest-bearing debt as of the fiscal 2016 year-end decreased ¥57,649 million to ¥204,218 million. As a result, the debt-to-equity ratio decreased from 0.6 times to 0.5 times, a 0.1 point improvement compared with the previous fiscal year-end.
Business Profit Ratio/Operating Income RatioBusiness Profit Operating Income
100
0
(Billions of yen) (%)
75
50
25
20
0
15
10
5
2012
69.7
77.1
86.3
77.174.3
78.974.9
2013 2014 2015 201620162015
JGAAP
Operating Income (Ratio)Business Profit (Ratio)
IFRS
9.8 9.9 10.3
9.1 9.2
(Yr)
9.9 9.9
100
60
80
40
20
25
15
20
10
5
Operating Profit Operating Profit Ratio
0 0
(Billions of yen) (%)
(Yr)2015 2016
Operating Profit (Ratio)
IFRS
89.2
73.3
11.29.7
49.9
55.853.2
80
0
(Billions of yen) (%)
60
40
20
40
0
30
20
10
2012
35.5
44.8
72.0
41.4
2013 2014 2015 201620162015
JGAAP
Net Income and ROEProfit Attributable to Owners of Parent and ROE
IFRS
17.5
9.7
(Yr)
ROEProfit attributable to owners of the parent company
11.713.314.3
15.616.0

32 Sumitomo Rubber Industries Annual Report 2016
Total equity at the fiscal year-end was ¥459,541 million. Equity attrib-utable to owners of parent was ¥429,316 million. Equity attributable to owners of parent per share stood at ¥1,636.63. The equity attributable to owners of parent ratio was up 2.5 percentage points to 47.8%. Despite the decline in total assets, ROA (on an business profit basis) declined 0.2 of a percentage point to 8.2% in step with the decrease in business profit.
Capital ExpendituresDuring the fiscal year under review, the Group’s capital expenditures amounted to ¥49,606 million, a year-on-year decrease of 15.8%. The Tire business accounted for ¥46,384 million of the total, down 17.0% year on year. Funds were used mainly for domestic facility renovation aimed at streamlining production with an eye to improving labor effi-ciency as well as for the augmentation of production capacities of the Group’s South African and Turkish facilities. The Sports business spent ¥2,002 million, 9.8% more than in the previous fiscal year. Funds were spent mainly for business sites overseas to help them develop a more robust marketing structure. The Industrial and Other Products business used ¥1,220 million, down 0.5% year on year, mainly for overseas facili-ties. The necessary funds were furnished through a combination of cash on hand and borrowings.
Cash FlowsNet cash provided by operating activities totaled ¥128,190 million. The main contributors to cash inflows were the posting of profit before tax totaling ¥70,093 million, the posting of depreciation and amortization of ¥51,248 million, a decrease in inventories of ¥3,802 million and a ¥4,518 million decrease in notes and accounts receivable. Cash outflows included a ¥1,190 million decrease in trade and other payables. Net cash used in investing activities totaled ¥42,144 million. The primary contributor to cash outflows was ¥48,222 million spent for the purchase of property, plant and equipment to reinforce production capacity. Cash inflows included proceeds totaling ¥10,353 from the sale of shares in The Goodyear Tire & Rubber Company in connection with the aforementioned dissolution of the alliance agreement. As a result, free cash flow, which is computed by subtracting net cash used in investing activities from net cash provided by operating activities, was a positive balance of ¥86,046 million.
Net cash used in financing activities included net repayments of short-term loans, corporate bonds and long-term debt totaling ¥54,447 million as well as the payment of cash dividends totaling ¥15,739 million. As a result, as of the end of the fiscal year under review, cash and cash equivalents after adjusting for the effect of exchange rate changes totaled ¥66,492 million. Over the years ahead, the Sumitomo Rubber Group plans to step up capital expenditure, mainly to meet expanding demand overseas, by reinforcing production capacity. Simultaneously, the Group aims to expand the inflow of cash from operating activities by increasing sales volumes and improving profitability. In other words, the Group will make every effort to not only ensure business growth but also to secure its liquidity and improve its financial standing.
OutlookWith regard to the outlook for the global economy, there was a growing sense of uncertainty about the future due to factors that included the impact of Brexit on the United Kingdom and the European Union as well as the global effects of the protectionist policies of the new U.S. admin-istration. Economic uncertainty is expected to further increase amid concerns about rising prices of crude oil and natural rubber, foreign exchange trends and the manifestation of geopolitical risks. As for Japan’s economic prospects, consumer confidence is likely to be undercut by the effects of the financial uncertainty and global economic uncertainty. With the aim of addressing issues related to this severe business envi-ronment, the Group will take on various tasks while considering the risk factors mentioned in the following “Risk Information” section. In the Tire business, Sumitomo Rubber Industries will maintain and enhance its presence in the domestic fuel-efficient tire market and, to this end, will leverage its unique and cutting-edge technology to intro-duce new items in this category. Overseas, the Company will aim for ongoing sales expansion in emerging nations. On January 5, 2017, the Company announced it would buy all the shares of the British tire sales company Micheldever Group Ltd. and completed the acquisition on February 10. With this acquisition, the Company intends to heighten the market presence of its Falken brand in the United Kingdom. In addition, the Company will aggressively work to penetrate the European and U.S. markets, as it now possesses improved marketing flexibility in these
1,000
0
(Billions of yen) (%)
750
500
250
20
0
15
10
5
2012
932.4897.6
2013 2014 2015 201620162015
JGAAP
Total Assets and ROA
IFRS
(Yr)
8.4 8.2
8.1 8.1
9.49.69.9
899.6936.2
973.6
867.5
737.5
Total Assets
ROA (Business Profit base / Operating Income Base)
203.0
260.6
295.7302.1
275.9
350
0
(Billions of yen) (Times)
250
200
50
3.5
0
2.5
300 3.0
2.0
0.5
100 1.0
150 1.5
2012
261.9
204.2
2013 2014 2015 201620162015
JGAAP
Interest-Bearing Debt and Debt-to-Equity Ratio
IFRS
0.60.5
(Yr)
Interest-Bearing Debt Debt-to-Equity Ratio
0.50.6
0.70.9
1.1
300
0
(Yen) (%)
250
150
100
300
0
250
150
200 200
100
50 50
2012
274
158
2013 2014 2015 201620162015
JGAAP
Net Income per Share*Basic Profit per share*
IFRS
(Yr)
*Based on Profit Attributable to Owners of ParentBasic Profit per Share and Net Income per Share
213203
171
135
190

33Sumitomo Rubber Industries Annual Report 2016
regions. In concert with these efforts aimed at expanding sales in markets worldwide, the Company will develop a supply structure that will support sustainable business growth. In the Sports business, the Company will proactively introduce new golf goods and tennis equipment with the aim of securing greater market share in Japan and overseas. In the wellness promotion business, the Company will expand the network of its Gym Style 24 facilities to boost sales. In the Industrial and Other Products business, the Company will engage in marketing activities centered on such growth fields as the vibration-control damper business as well as precision rubber parts for printers and photocopiers and medical rubber parts. In particular, the Company will strive to penetrate markets in Europe and elsewhere in the world. At the same time, the Company will also pursue business expansion in infrastructure-related and other businesses by meeting the needs of upgraded port properties already ordered due to demand caused by the Tokyo Olympics as well as properties to be built going forward.
Risk InformationThe Sumitomo Rubber Group has identified the following key risk factors that may affect its business performance and financial position. Risk factors related to future business results were determined based on information available to management as of the end of the fiscal year under review. The Group recognizes that such risks may occur, and it strives to address them accordingly.
Exchange Rate FluctuationsExchange rate fluctuations influence the value of the Group’s exports, raw material procurement, foreign currency-denominated assets, liabili-ties and financial statements. The appreciation of the yen against foreign currencies such as the U.S. dollar may have an adverse effect on the Group’s business performance and financial position. Since the Group has raised its consolidated overseas sales ratio from 25.2% in fiscal 2001 to 59.4% in fiscal 2016 (under IFRS), the possibility exists that its results may be further affected by exchange rate fluctuations. The Sumitomo Rubber Group utilizes forward-exchange contracts and maintains a balance in its export and import activities on an individual currency
basis with the aim of minimizing its exposure to exchange rate fluctua-tions. Such precautions, however, may not be sufficient to avoid all possible exchange rate fluctuation risks.
Change in Raw Material PricesThe Sumitomo Rubber Group’s principal raw materials are natural rubber, petrochemicals and metals. The Group’s operating results may thus be affected by price increases in natural rubber, crude oil, steel and other related materials.
Changes in Interest RatesPromoting the reduction of interest-bearing debt to improve its financial standing, the Group also implements countermeasures to minimize the risk of changes in interest rates by using diversified financing methods and interest rate swaps. Despite these efforts, the Group’s operating results and financial position may be affected in the event of rising fund procurement costs due to an increase in interest rates in the medium and long terms.
Product QualityIn accordance with prescribed quality standards, the Sumitomo Rubber Group undertakes full-scale measures to assure product quality. Yet it is difficult to reduce the number of defective products and customer complaints to zero. To offset the possibility of any claims for damages resulting from defective products, the Group retains appropriate indem-nity insurance. Despite this initiative, there is the possibility that a claim may occur that cannot be compensated by insurance. Furthermore, costs associated with the resolution of claims as well as product recalls or exchanges may arise. Such incidents may affect the Group’s operating results, financial position and social standing.
DisastersConcentrating on Japan and other Asian countries, the Sumitomo Rubber Group develops its business on a global scale. The Group’s oper-ating results may be affected directly or indirectly by such events as natural disasters, disease, war and terrorism. Such events may have a negative impact on the Group’s operating results.
461.7453.8447.0
358.8
271.1
Total Equity Net Assets Equity RatioEquity Ratio
500
0
(Billions of yen) (%)
400
200
100
100
0
80
40
300 60
20
2012
451.8 459.5
2013 2014 2015 201620162015
JGAAP
Net Assets and Equity RatioTotal Equity and Equity Ratio*
IFRS
(Yr)
45.3
47.8 45.3 48.042.5
38.033.1
*Ratio of Equity Attributable to Owners of Parent
70
0
(Billions of yen)
50
30
20
60
40
10
2012 2013 2014 2015 201620162015
JGAAP
Capital Expenditures/Depreciation and Amortization
IFRS
(Yr)
Capital Expenditures Depreciation and Amortization
45.745.8
49.6
58.9
49.6
58.962.8
58.657.4
45.946.5
41.437.5
31.8
86.0
54.0
37.4
8.7
14.5
140
-80
(Billions of yen)
100
60
80
20
0
-20
-40
120
40
-60
2012 2013 2014 2015 201620162015
JGAAP
Cash Flows
IFRS
(Yr)
Cash Flows from Operating ActivitiesCash Flows from Investing ActivitiesFree Cash Flows
86.9
128.2
-33.0-42.1
-71.6-68.3-62.2
-30.7-42.1
128.2
87.0
108.9
77.076.6
56.2
86.0

34 Sumitomo Rubber Industries Annual Report 2016
Consolidated Financial Statements(1) Consolidated Financial Statements
Consolidated Statement of Financial PositionSumitomo Rubber Industries, Ltd. and Its Consolidated Subsidiaries
Millions of yen
Note
Date of transition to IFRS
As of Jan. 1, 2015 As of Dec. 31, 2015 As of Dec. 31, 2016
Assets
Current assets
Cash and cash equivalents 7, 19 ¥ 53,653 ¥ 53,556 ¥ 66,492
Trade and other receivables 8, 19 212,395 189,940 182,855
Other financial assets 19 3,919 5,470 3,821
Inventories 9 140,301 144,507 138,993
Other current assets 16,906 27,888 20,398
Total current assets 427,174 421,361 412,559
Non-current assets
Property, plant and equipment 10 362,434 371,130 363,293
Goodwill 11 5,895 15,623 15,351
Intangible assets 11 15,332 20,793 21,445
Investments accounted for using equity method 13 47,742 4,045 4,071
Other financial assets 19 54,146 56,743 41,239
Net defined benefit assets 17 22,356 24,167 20,635
Deferred tax assets 18 13,686 13,100 13,888
Other non-current assets 5,665 5,470 5,153
Total non-current assets 527,256 511,071 485,075
Total assets ¥954,430 ¥932,432 ¥897,634

35Sumitomo Rubber Industries Annual Report 2016
Millions of yen
Note
Date of transition to IFRS
As of Jan. 1, 2015 As of Dec. 31, 2015 As of Dec. 31, 2016
Liabilities and Equity
Liabilities
Current liabilities
Bonds and loans payable 15, 19 ¥113,299 ¥125,173 ¥ 77,056
Trade and other payables 14, 19 128,798 119,763 120,236
Other financial liabilities 12, 19 2,415 2,352 2,624
Income tax payable 12,714 3,517 9,960
Provisions 16 6,184 5,160 7,350
Other current liabilities 30,307 29,189 34,777
Total current liabilities 293,717 285,154 252,003
Non-current liabilities
Bonds and loans payable 15, 19 178,357 130,877 121,556
Other financial liabilities 12, 19 5,389 5,539 4,577
Net defined benefit liabilities 17 18,140 22,821 22,188
Provisions 16 1,039 1,214 1,197
Deferred tax liabilities 18 10,256 10,110 12,154
Other non-current liabilities 17,440 24,880 24,418
Total non-current liabilities 230,621 195,441 186,090
Total liabilities 524,338 480,595 438,093
Equity
Capital stock 20 42,658 42,658 42,658
Capital surplus 20 37,789 37,916 37,937
Retained earnings 304,150 360,143 389,970
Treasury stock 20 (559) (567) (570)
Other components of equity 20 14,621 (17,863) (40,679)
Total equity attributable to owners of the parent 398,659 422,287 429,316
Non-controlling interests 28 31,433 29,550 30,225
Total equity 430,092 451,837 459,541
Total liabilities and equity ¥954,430 ¥932,432 ¥897,634

36 Sumitomo Rubber Industries Annual Report 2016
Consolidated Statement of IncomeSumitomo Rubber Industries, Ltd. and Its Consolidated Subsidiaries
Consolidated Statement of Comprehensive IncomeSumitomo Rubber Industries, Ltd. and Its Consolidated Subsidiaries
Millions of yen
Note Jan.1 to Dec. 31, 2015 Jan.1 to Dec. 31, 2016
Sales revenue 6 ¥798,483 ¥756,696
Cost of sales (528,393) (499,650)
Gross profit 270,090 257,046
Selling, general and administrative expenses 22 (191,237) (182,130)
Other income 23 13,487 3,930
Other expenses 23 (3,167) (5,562)
Operating profit 89,173 73,284
Financial income 24 2,604 3,168
Financial expenses 24 (8,439) (6,416)
Share of (Profit) loss of entities accounted for using equity method 13 5,613 57
Profit before tax 88,951 70,093
Income tax expenses 18 (15,087) (27,822)
Profit for the year 73,864 42,271
Profit attributable to:
Owners of the parent company 71,976 41,364
Non-controlling interests 28 1,888 907
Profit for the year ¥ 73,864 ¥ 42,271
Earning per share
Basic earning per share (Yen) 25 ¥274.38 ¥157.69
Millions of yen
Note Jan.1 to Dec. 31, 2015 Jan.1 to Dec. 31, 2016
Profit for the year ¥73,864 ¥42,271
Other comprehensive income
Items that will not be reclassified to profit or loss
Financial assets measured at fair value through other comprehensive income 21 477 (84)
Remeasurements of defined benefit plan 21 1,216 (1,471)
Share of other comprehensive income of associates accounted for using equity method 21 (2,803) —
Items that may be reclassified subsequently to profit or loss
Cash flow hedges 21 (113) 312
Currency translation differences of foreign operations 21 (33,557) (19,216)
Share of other comprehensive income of associates accounted for using equity method 21 (1) —
Other comprehensive income, net of tax (34,781) (20,459)
Total comprehensive income for the year ¥39,083 ¥21,812
Total comprehensive income for the year attributable to:
Owners of the parent company 38,444 22,669
Non-controlling interests 639 (857)
Total comprehensive income for the year ¥39,083 ¥21,812
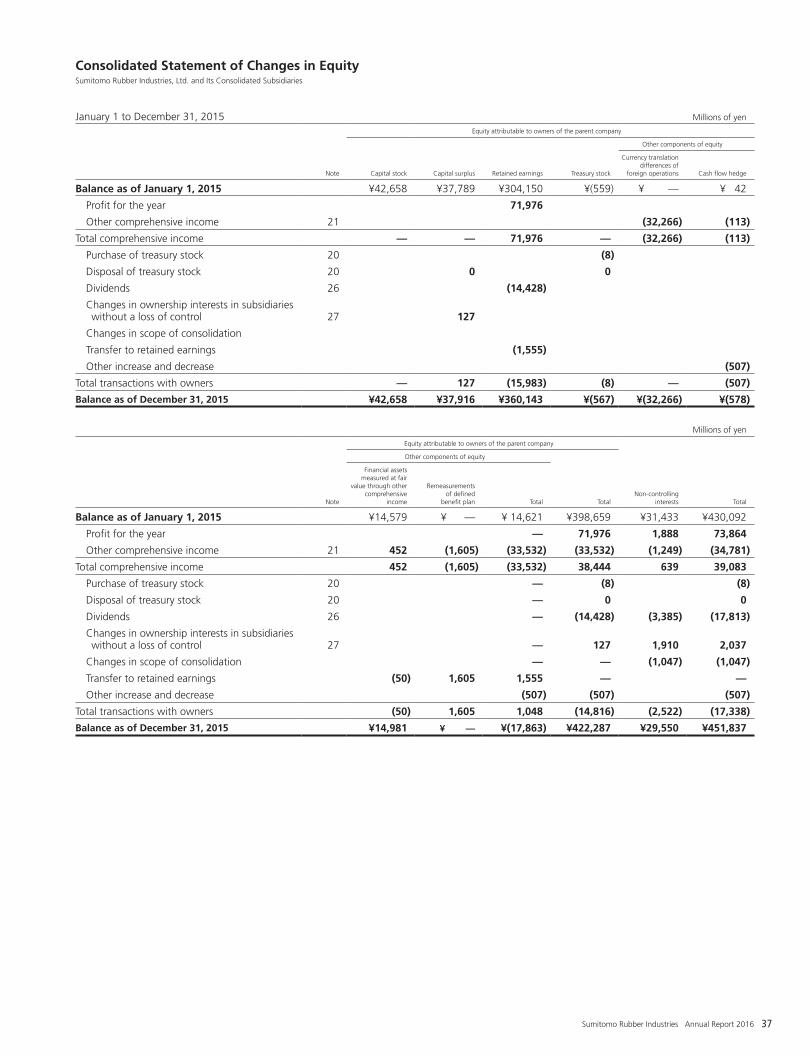
37Sumitomo Rubber Industries Annual Report 2016
Consolidated Statement of Changes in EquitySumitomo Rubber Industries, Ltd. and Its Consolidated Subsidiaries
January 1 to December 31, 2015 Millions of yen
Note
Equity attributable to owners of the parent company
Capital stock Capital surplus Retained earnings Treasury stock
Other components of equity
Currency translation differences of
foreign operations Cash flow hedge
Balance as of January 1, 2015 ¥42,658 ¥37,789 ¥304,150 ¥(559) ¥ — ¥ 42
Profit for the year 71,976
Other comprehensive income 21 (32,266) (113)
Total comprehensive income — — 71,976 — (32,266) (113)
Purchase of treasury stock 20 (8)
Disposal of treasury stock 20 0 0
Dividends 26 (14,428)
Changes in ownership interests in subsidiaries without a loss of control 27 127
Changes in scope of consolidation
Transfer to retained earnings (1,555)
Other increase and decrease (507)
Total transactions with owners — 127 (15,983) (8) — (507)
Balance as of December 31, 2015 ¥42,658 ¥37,916 ¥360,143 ¥(567) ¥(32,266) ¥(578)
Millions of yen
Note
Equity attributable to owners of the parent company
Non-controlling interests Total
Other components of equity
Total
Financial assets measured at fair
value through other comprehensive
income
Remeasurements of defined
benefit plan Total
Balance as of January 1, 2015 ¥14,579 ¥ — ¥ 14,621 ¥398,659 ¥31,433 ¥430,092
Profit for the year — 71,976 1,888 73,864
Other comprehensive income 21 452 (1,605) (33,532) (33,532) (1,249) (34,781)
Total comprehensive income 452 (1,605) (33,532) 38,444 639 39,083
Purchase of treasury stock 20 — (8) (8)
Disposal of treasury stock 20 — 0 0
Dividends 26 — (14,428) (3,385) (17,813)
Changes in ownership interests in subsidiaries without a loss of control 27 — 127 1,910 2,037
Changes in scope of consolidation — — (1,047) (1,047)
Transfer to retained earnings (50) 1,605 1,555 — —
Other increase and decrease (507) (507) (507)
Total transactions with owners (50) 1,605 1,048 (14,816) (2,522) (17,338)
Balance as of December 31, 2015 ¥14,981 ¥ — ¥(17,863) ¥422,287 ¥29,550 ¥451,837

38 Sumitomo Rubber Industries Annual Report 2016
January 1 to December 31, 2016 Millions of yen
Note
Equity attributable to owners of the parent company
Capital stock Capital surplus Retained earnings Treasury stock
Other components of equity
Currency translation differences of
foreign operations Cash flow hedge
Balance as of January 1, 2016 ¥42,658 ¥37,916 ¥360,143 ¥(567) ¥(32,266) ¥(578)
Profit for the year 41,364
Other comprehensive income 21 (17,391) 312
Total comprehensive income — — 41,364 — (17,391) 312
Purchase of treasury stock 20 (3)
Disposal of treasury stock 20 0 0
Dividends 26 (15,739)
Changes in ownership interests in subsidiaries without loss of control 21
Changes in scope of consolidation
Transfer to retained earnings 4,202
Other increase and decrease 81
Total transactions with owners — 21 (11,537) (3) — 81
Balance as of December 31, 2016 ¥42,658 ¥37,937 ¥389,970 ¥(570) ¥(49,657) ¥(185)
Millions of yen
Note
Equity attributable to owners of the parent company
Non-controlling interests Total
Other components of equity
Total
Financial assets measured at fair
value through other comprehensive
income
Remeasurements of defined
benefit plan Total
Balance as of January 1, 2016 ¥14,981 ¥ — ¥(17,863) ¥422,287 ¥29,550 ¥451,837
Profit for the year — 41,364 907 42,271
Other comprehensive income 21 (83) (1,533) (18,695) (18,695) (1,764) (20,459)
Total comprehensive income (83) (1,533) (18,695) 22,669 (857) 21,812
Purchase of treasury stock 20 — (3) (3)
Disposal of treasury stock 20 — 0 0
Dividends 26 — (15,739) (1,314) (17,053)
Changes in ownership interests in subsidiaries without loss of control — 21 2,574 2,595
Changes in scope of consolidation — — 272 272
Transfer to retained earnings (5,735) 1,533 (4,202) — —
Other increase and decrease 81 81 81
Total transactions with owners (5,735) 1,533 (4,121) (15,640) 1,532 (14,108)
Balance as of December 31, 2016 ¥ 9,163 ¥ — ¥(40,679) ¥429,316 ¥30,225 ¥459,541

39Sumitomo Rubber Industries Annual Report 2016
Consolidated Statement of Cash FlowsSumitomo Rubber Industries, Ltd. and Its Consolidated Subsidiaries
Millions of yen
Note Jan.1 to Dec. 31, 2015 Jan.1 to Dec. 31, 2016
Cash flows from operating activities
Profit before tax ¥ 88,951 ¥ 70,093
Depreciation and amortization 51,419 51,248
Impairment loss 345 395
Interest and dividends income (2,360) (2,413)
Interest expenses 4,476 3,712
Share of (profit) loss of entities accounted for using equity method (5,613) (57)
Loss (gain) on sales and retirement of non-current assets 875 672
Loss (gain) on sales of shares of subsidiaries and associates (9,067) —
Decrease (increase) in inventories (8,579) 3,802
Decrease (increase) in trade and other receivables 19,275 4,518
Increase (decrease) in trade and other payables (13,460) (1,190)
Other, net (5,034) 7,820
Subtotal 121,228 138,600
Interest received 1,488 1,749
Dividend income received 874 659
Interest expense paid (4,290) (3,446)
Income taxes paid (32,436) (9,372)
Net cash provided by (used in) operating activities 86,864 128,190
Cash flows from investing activities
Purchase of property, plant and equipment (57,706) (48,222)
Proceeds from sales of property, plant and equipment 968 440
Purchase of intangible assets (4,232) (5,170)
Purchase of investment securities (152) (89)
Proceeds from sales of investment securities 81 10,353
Proceeds from purchase of shares of subsidiaries resulting in change in scope of consolidation — 120
Purchase of shares of subsidiaries resulting in change in scope of consolidation 27 (17,463) —
Proceeds from sales of shares of subsidiaries resulting in change in scope of consolidation 2,837 —
Proceeds from sales of shares of associates 45,471 —
Payment for transfer of business (1,910) —
Other, net 1,434 424
Net cash provided by (used in) investing activities (30,672) (42,144)
Cash flows from financing activities
Net increase (decrease) in short-term loans payable (6,204) (24,829)
Proceeds from long-term debt and newly issued bonds 955 14,673
Repayments of long-term debt and redemption of bonds (29,289) (44,291)
Proceeds from contributions of non-controlling interests 3,717 2,604
Cash dividends paid 26 (14,428) (15,739)
Cash dividends paid to non-controlling interests (3,385) (1,314)
Purchase of shares of non-controlling interests (1,714) (19)
Other, net (2,359) (2,140)
Net cash provided by (used in) financing activities (52,707) (71,055)
Effect of exchange rate changes on cash and cash equivalents (3,582) (2,055)
Net increase (decrease) in cash and cash equivalents (97) 12,936
Cash and cash equivalents at the beginning of current period 7 53,653 53,556
Cash and cash equivalents at the end of current period 7 ¥ 53,556 ¥ 66,492

40 Sumitomo Rubber Industries Annual Report 2016
1. Preparation of Consolidated Financial Statements(1) In accordance with Article 93 of the Ordinance on Terminology, Forms and Preparation Methods of Consolidated Financial Statements
(Ordinance of the Ministry of Finance No. 28 of October 30, 1976, hereinafter “the Ordinance on Consolidated Financial Statements”), the accompanying consolidated financial statements of Sumitomo Rubber Industries, Ltd. (hereinafter “the Company”) have been pre-pared in conformity with International Financial Reporting Standards (IFRS).
(2) The Company’s financial statements have been prepared in accordance with the Ordinance on Terminology, Forms and Preparation Methods of Financial Statements, etc. (Ordinance of the Ministry of Finance No. 59 of November 27, 1963).
The Company has prepared its financial statements in conformity with Article 127 of the aforementioned ordinance as a “Specified Company” stipulated in said article.
2. Audit In accordance with Article 193-2, Paragraph 1 of the Financial Instruments and Exchange Law, the Company’s consolidated financial state-ments for the January 1 through December 31, 2016 fiscal period and financial statements covering its operations during said period have been audited by KPMG AZSA LLC.
3. Special Measures to Ensure the Accuracy of the Consolidated Financial Statements and Systematic Conformity with IFRS
The Company undertakes special measures to ensure the accuracy and relevance of its consolidated financial statements and other key doc-uments while developing systems to coordinate those documents in conformity with IFRS. Details follow. (1) To ensure the latest accounting standards are reflected in its accounting practices, the Company updates its systems to accommodate
changes in said standards and maintains membership in such organizations as the Financial Accounting Standards Foundation, which holds seminars that the Company participates in.
(2) In regard to the adoption of IFRS, the Company stays abreast of updates and standards published by the International Accounting Standards Board, with the aim of remaining apprised of the latest standards. Moreover, the Company developed consolidated accounting policies in conformity with IFRS and applies these policies in its accounting treatment.
Accounting Status Sumitomo Rubber Industries, Ltd. and Its Consolidated Subsidiaries

41Sumitomo Rubber Industries Annual Report 2016
1. Reporting Company Sumitomo Rubber Industries, Ltd. (hereinafter the “Company”) is based in Japan. The consolidated financial statements presented herein comprise the operating results for the fiscal year ended December 31, 2016 recorded by the Sumitomo Rubber Group and the Company’s affiliates. For a description of the Group’s primary business activities, please refer to Note 6. “Segment Information.”
2. Basis for Preparation(1) Compliance with IFRS In accordance with Article 93 of “the Ordinance on Terminology, Forms, and Preparation Methods of Consolidated Financial Statements” (Ordinance of the Ministry of Finance No. 28 in 1976), the Group’s consolidated financial statements have been prepared in conformity with International Financial Reporting Standards (IFRS), as the Company meets the requirements concerning the “Designated International Accounting Standards Specified Company” prescribed in Article 1-2. The consolidated financial statements presented herein were approved by Ikuji Ikeda, Representative Director and President of the Company, on May 10, 2017. The Sumitomo Rubber Group adopted IFRS from the current fiscal year, which extended from January 1 to December 31, 2016. Accordingly, the consolidated financial statements presented in this report are the Company’s first such IFRS-compliant documents. The date of transition to IFRS was January 1, 2015, and these consolidated financial statements were subject to the provisions of the IFRS 1 “First-time Adoption of International Financial Reporting Standards” (hereinafter “IFRS 1”). The impacts of the transition to IFRS on the Group’s financial position, business performance and cash flows as of the date of transition to IFRS, as well as year-on-year comparisons, are presented in Note 31. “First-Time Adoption of IFRS.” (2) Basis for MeasurementsAs stated in Note 3. “Significant Accounting Policies,” the consolidated financial statements have been prepared based on historical cost, except for specific financial instruments that are measured at fair value. (3) Presentation Currency and UnitThe Company uses Japanese yen as the primary functional currency for its operations and as the presentation currency used in preparing its consolidated financial statements. Figures are rounded to the nearest million yen.(4) Early Adoption of New StandardsThe Sumitomo Rubber Group complies with IFRS in effect at December 31, 2016. The Group is an early adopter of IFRS 9 “Financial Instruments” (revised in July 2014).
3. Significant Accounting PoliciesUnless otherwise noted, the accounting policies described below have been consistently applied throughout the entirety of each fiscal year pre-sented in the consolidated financial statements (including the consolidated statement of financial position as of the date of transition to IFRS). (1) Basis for Consolidation (i) SubsidiariesA subsidiary is defined as a company under the control of the Sumitomo Rubber Group. The term “control” refers to the Group’s exposure or entitlement to variable returns due to its involvement in the management of said company, the returns of which the Group is able to impact through the exercise of its power. The financial statements of subsidiaries are included in the scope of consolidation from the date that control over said company is established to the date that such control is relinquished. All intragroup balances, transactions within the Group as well as unrealized profit and loss resulting from transactions within the Group are eliminated in preparation of the consolidated financial statements. A subsidiary’s comprehensive income is allocated to owners of the parent and non-controlling interests even when that portion attribut-able to non-controlling interests is negative. To disclose the most accurate information, the operating results of subsidiaries whose fiscal year end differs from that of the parent com-pany are subject to provisional closing. This is undertaken at the closing date of the consolidated financial results, with the results of the pro-visional closing included therein. Changes in equity held by the Group in subsidiaries under its control are treated as capital transactions. The difference between adjust-ments for non-controlling interests and the fair value of such interests is classified as equity attributable to owners of the parent and directly recognized as capital.
(ii) AffiliatesAn affiliate is defined as a company over which the Group exerts neither sole nor joint control but nevertheless is able to exert significant influence with regard to financial and management decisions. Investments in affiliates are accounted for using equity method from the date on which the Group gains significant influence until the date on which it ceases to hold that influence.
Notes to Consolidated Financial StatementsSumitomo Rubber Industries, Ltd. and Its Consolidated Subsidiaries

42 Sumitomo Rubber Industries Annual Report 2016
(2) Business CombinationsBusiness combinations are accounted for using the “Acquisition Method.” Identifiable assets, identifiable liabilities and contingent liabilities acquired in a business combinations are measured at fair value as of the date of acquisition. Acquisition-related costs incurred by a business combination are accounted for as an expense in the period incurred. Non-controlling interests are identified separately from equity held by the Group. The Group chooses its non-controlling interests in the acquire based on a) fair value or b) the proportion of the non-controlling interest’s share in the net value of identifiable assets and liabilities of the acquire on a transaction by transaction basis respectively. Goodwill is measured when the total of a) the price of business combination, b) the value of non-controlling interests acquired and c) the fair value of equity capital in the investee held by the acquiring company prior to the new acquisition surpasses d) the net value of the invest-ee’s identifiable assets and liabilities as of the date of acquisition. Goodwill thus is measured as the excess of the total of a), b) and c) over d). In cases where the total of a), b) and c) falls short of the value of d) due to a bargain purchase, the difference is recognized as profit or loss. The Group applies the exemption under IFRS 1, and does not apply IFRS 3, “Business Combinations,” (hereinafter “IFRS 3”) retrospective-ly to business combinations recognized before the transition date.
(3) Foreign Currencies Translation(i) Foreign Currency Denominated Transactions The financial statements of Sumitomo Rubber Group subsidiaries have been prepared based on functional currencies, that is, the primary currencies of the respective business economies in which each subsidiary conducts business operations. Transactions denominated in other foreign currencies have been translated into the functional currencies of the relevant subsidiaries using exchange rates at the date of the transactions or rates that approximate the exchange rates at the dates of the transactions. Monetary assets and liabilities denominated in foreign currencies as of each fiscal year-end have been translated into the functional cur-rencies using the exchange rates at the fiscal year-end. Exchange differences resulting from translation and settlements are recognized as profit or loss. However, financial assets measured through other comprehensive income and exchange differences resulting from cash flow hedging are recognized as other comprehensive income.
(ii) Foreign OperationsThe assets and liabilities of foreign operations have been translated into Japanese yen using the exchange rates at the fiscal year-end. Income and expenses recorded by such foreign operations have been translated into Japanese yen using the average exchange rate during the fiscal year, except for cases of significant exchange rate movements during the fiscal year. Exchange differences resulting from the trans-lation of financial statements of foreign operations are recognized in other comprehensive income (or loss). The exchange differences are included in other components of equity as “currency translation differences of foreign operations.” The Group applies the exemptions under IFRS 1, and the cumulative translation differences that existed at the transition date are trans-ferred to retained earnings.
(4) Cash and Cash EquivalentsCash and cash equivalents consist of a) cash on hand, b) readily available deposits and c) short-term highly liquid investments with original maturities of three months or less that entail insignificant price fluctuation risk.
(5) Financial Instruments(i) Financial Assets Other than Derivatives i. Classification The Group classifies financial assets other than derivatives into the following categories: (a) those measured at amortized cost; (b) those
measured at fair value through other comprehensive income; and (c) those measured at fair value through profit or loss. (a) Financial assets measured at amortized cost Financial assets are measured at amortized cost when the following conditions are met: •Containedwithinabusinessmodelwiththeobjectiveofholdingfinancialassetsinordertocollectcontractualcashflows •Thecontractual termsof thefinancialassetgive riseon specifieddates tocashflows thatare solelypaymentsofprincipaland
interest on the outstanding principal (b) Financial assets measured at fair value through other comprehensive income: (b. 1) Debt equivalents Financial assets are classified as debt equivalents when the following conditions are met: •Containedwithinabusinessmodelwhoseobjectiveisachievedbybothcollectingcontractualcashflowsandsellingfinancialassets •Thecontractual termsof thefinancialassetgive riseon specifieddates tocashflows thatare solelypaymentsofprincipaland
interest on the principal amount outstanding (b. 2) Equity equivalents Excluding the financial assets classified as (b. 1) above, the Group holds investments that are equity equivalents (excluding assets
held for trading) that would otherwise meet the requirements of (a) above. Once any such investment is recognized as an equity equivalent, the Group’s decision to present subsequent changes in fair value in other comprehensive income becomes irrevocable.
In addition, as the Sumitomo Rubber Group exercised the exemption stipulated in IFRS 1, the Group remeasured the value of its investments in equity equivalents at fair value through other comprehensive income based on conditions as of the date of transition to IFRS.

43Sumitomo Rubber Industries Annual Report 2016
(c) Financial assets measured at fair value through profit or loss Financial assets that do not meet the criteria of (a) or (b) above are measured at fair value through profit or loss. The Sumitomo Rubber
Group has not classified any of its investments in debt equivalents in this category as it aims to promote accounting consistency.
ii. Initial Recognition and Measurement The Sumitomo Rubber Group recognizes trade and other receivables as of their accrual date. As for all other financial assets, the
Sumitomo Rubber Group undertakes the initial recognition as of the transaction date on which the Group becomes a signatory on con-tracts for such assets. The value of all financial assets, except for those classified as financial assets measured at fair value through profit or loss, reflects initial measurements based on the total of fair value and transaction costs.
iii. Subsequent Measurement To remeasure the value of financial assets after initial recognition, the Group applies the following methods by asset category. (a) Financial assets measured at amortized cost The Group undertakes subsequent measurement using amortized cost based on the effective interest method. (b) Financial assets measured at fair value through other comprehensive income (b.1) Debt equivalents Changes in the fair value of financial assets in this category, excluding gains and losses attributable to impairment and foreign
exchange, are recognized as other comprehensive income until the Group derecognizes said assets. After derecognition, previously recognized other comprehensive income is reclassified to profit or loss.
(b.2) Equity equivalents Changes in the fair value of financial assets in this category are recognized as other comprehensive income. In cases where the
Group derecognizes said assets or the fair value of such assets falls significantly, previously recognized other comprehensive income is directly reclassified to retained earnings. In addition, dividends derived from these financial assets are recognized as profit.
(c) Financial assets measured at fair value through profit or loss Following initial recognition, the value of financial assets in this category is measured at fair value. Changes in the fair value are rec-
ognized as profit or loss.
iv. Impairment of Financial Assets The Sumitomo Rubber Group recognizes an allowance for doubtful accounts to counter expected credit loss in relation to financial assets
measured at amortized cost.
Determination of a significant increase in credit risk At every fiscal year-end, the Group evaluates whether there has been a significant increase in the credit risk of financial assets after initial
recognition by comparing the default risk of such assets at the account closing date and at the date of initial recognition. In addition, the Group undertakes the aforementioned evaluation based on changes in default risk following the initial recognition. To
determine whether there has been a change in the default risk of financial assets, the Group takes the following factors into consideration. •Significantchangesinratingsbyexternalcreditratingagencies •Downwardrevisionsininternalcreditratings •Deteriorationinthebusinessperformanceofborrowers •Informationaboutlapsesinmaturitydates
Measurement of expected credit loss Expected credit loss refers to the present value of differences between contractual cash flows that are due to the Group in accordance
with the contract; and the cash flows that the Group expects to receive. The allowance for doubtful accounts associated with financial assets is determined at an amount equal to the present value of the expected credit loss over the lifetime of such assets if the credit risk has increased significantly since initial recognition or at an amount equal to the expected credit loss over the 12-month period if the credit risk of such assets has not increased significantly.
However, notwithstanding the above, the allowance for doubtful accounts associated with operating receivables that include no sig-nificant financial elements is determined at an amount equal to lifetime expected credit loss.
Allowance for doubtful accounts in relation to financial assets is recognized as profit or loss. In cases where the allowance for doubtful accounts decreases, the reversal of such allowance is recognized as profit or loss.
v. Derecognition of Financial Assets Financial assets are derecognized if the Group’s contractual rights to the cash flows expire or if the Group transfers such rights or other-
wise transfers substantially all the risks and rewards of ownership of the financial assets. If there is no reasonable expectation for the partial or full collection of the Group’s claims associated with a financial asset, the Group
directly deducts the value from the carrying amount of total financial assets.

44 Sumitomo Rubber Industries Annual Report 2016
(ii) Financial Liabilities Other than Derivatives i. Classification The Group classifies financial liabilities other than derivatives as those measured at amortized cost.
ii. Initial Recognition and Measurement The Group undertakes the initial recognition of debt securities issued by the Group at the date of issuance. All other financial liabilities
are subject to initial recognition undertaken at the transaction date, that is, the date on which the Group became a signatory to con-tracts associated with such liabilities. All financial liabilities are measured at fair value less transaction cost.
iii. Subsequent Measurement To remeasure the value of financial liabilities, the Group uses amortized cost based on the effective interest method.
iv. Derecognition of Financial Liabilities Financial liabilities are derecognized when they have been extinguished, that is, when the obligation specified in the contract is dis-
charged, cancelled or expired.
(iii) Offset of Financial Assets and Liabilities Financial assets and liabilities are offset only when the Group currently has a legally enforceable right to offset the transactions and intends either to settle on a net basis or to simultaneously realize the financial assets and settle the financial liabilities. The outcome of such offset is included in the consolidated statement of financial position.
(iv) Derivatives and Hedge Accounting The Group utilizes such derivatives as forward exchange contracts and interest rate swaps as hedges against foreign exchange risk and inter-est rate risk. These derivatives are initially measured at fair value as of the contract date. The Group undertakes subsequent remeasurement using fair value. When derivatives are designated as eligible hedging instruments, accounting treatment methods for changes in the fair value of such derivatives are determined by hedging objective and designation. When they are not designated as such, the changes in the fair value of such derivatives are recognized as profit or loss. i. Qualifying Criteria for Hedge Accounting When a derivative transaction is initiated, the Group documents the relationship between hedging instruments and hedged items as well
as its risk management goals and strategies for various hedging transactions, with the aim of evaluating whether the hedge relationship meets hedge accounting requirements. Moreover, from the inception of hedging, the performance of derivatives (used for hedge trans-actions to offset changes in the fair value of or cash flows from hedged items) is constantly evaluated and documented to determine whether they meet all the applicable hedging efficacy requirements. The evaluation of hedge effectiveness is undertaken at the earlier of the closing date of each fiscal year or whenever a significant change in circumstances may affect hedge effectiveness requirements.
ii. Accounting Treatment of Qualifying Hedge Relationships Derivatives that meet the strict criteria for hedge accounting are treated as follows.
Fair value hedge Changes in the fair value of hedging instruments are recognized as profit or loss. Changes in the fair value of hedged items are adjusted
in the carrying amount of such items and recognized as profit or loss.
Cash flow hedges The effective portion of gain or loss on hedging instruments is recognized as other comprehensive income, while the ineffective portion
is recognized immediately as profit or loss in the consolidated statement of income. If a hedged forecast transaction subsequently results in the recognition of non-financial assets or non-financial liabilities, the Group
directly transfers cash flow hedge reserves to the initial cost or other carrying amount of such assets or liabilities. Cash flow hedge reserves, other than those derived from the aforementioned cash flow hedges, are reclassified to profit or loss in the
same period or periods during which the hedged expected future cash flow affects profit or loss. However, if the initial amount is negative and the partial or full recovery of such amount may not be expected in the future, the esti-
mated loss is immediately reclassified to profit or loss. Cash flow hedge reserves are retained until cash flows are generated even when the Group decides to discontinue hedge accounting,
provided that the future generation of cash flows from hedged accounts is expected. However, if the future generation of such cash flows cannot be expected, cash flow hedge reserves are immediately reclassified to profit or loss.
(v) Fair Value of Financial InstrumentsTo determine the fair value of financial instruments being traded in active markets as of the reporting dates for each fiscal year, the Group refers to quoted market prices. The fair value of financial instruments without active markets is calculated using appropriate valuation models.
(6) Inventories Inventories are stated at the lower of acquisition cost or net realizable value. Historical cost is calculated mainly based on the gross average method and includes purchase price, processing cost and all other expenses incurred in bringing such inventories to their present location and state. Net realizable value is calculated by deducting the estimated cost of completion as well as relevant variable selling expenses from selling prices estimated in the course of regular business operations.

45Sumitomo Rubber Industries Annual Report 2016
(7) Property, Plant and EquipmentAll property, plant and equipment is stated at acquisition cost less accumulated depreciation and accumulated impairment loss. Acquisition cost includes any costs directly attributable to the acquisition of the assets, their dismantlement , removal and restoration cost, as well as borrowing costs that are directly attributable to the acquisition, construction or production of a qualifying assets. Subsequent expenditures are included in the carrying amount of the asset or recognized as a separate asset, as appropriate, only when it is probable that future economic benefits associated with the item will flow to the Group and the cost of the item can be measured reliably. The carrying amount of the replaced part is derecognized. Other expenses for maintenance and repair are recognized as profit or loss as incurred. The depreciation of assets other than land and construction in progress is calculated using the straight-line method over their estimated useful lives. The estimated useful lives of primary assets by category are as follows: •Buildingandstructures: 2to60years •Machinery,equipmentandvehicles: 2to20years •Tools,furnitureandfixture: 1to20years The depreciation methods, residual values and estimated useful lives are reviewed at the end of each fiscal year, and if any changes are made, those changes are applied prospectively as a change in an accounting estimate.
(8) Intangible Assets (i) Goodwill Goodwill resulting from the acquisition of subsidiaries is stated as an intangible asset. Matters regarding the measurement of goodwill as of the initial recognition are presented in “(2) Business Combinations.” Goodwill is mea-sured at the amount of acquisition cost less accumulated impairment loss. Goodwill is not amortized and is subject to impairment testing. Matters regarding the impairment of such assets are presented in “(10) Impairment of Non-Financial Assets.” The Group undertakes the initial recognition of intangible assets acquired through business combination and recognized as separate from goodwill at fair value as of the date of acquisition. Except for those with indefinite useful lives, such assets are amortized using the straight-line method over their estimated useful lives.
(ii) Other Intangible Assets Other intangible assets acquired on an individual basis are stated at acquisition cost less accumulated amortization and impairment loss if their useful lives are definite. Such assets are amortized using the straight-line method over their estimated useful lives. The value of intangi-ble assets with indefinite useful lives is stated at acquisition cost less accumulated impairment loss. The estimated useful lives of major intangible assets are as follows: •Software: 3to5yearsThe amortization methods for assets and their residual value and estimated useful lives are reviewed at the end of every fiscal year. Changes in these factors are subsequently reflected in future accounting periods which changes affect as accounting estimates.
(9) Leases Leases are classified as finance leases if substantially all the risks and rewards incidental to ownership of such assets are transferred to the Group. Other leases are classified as operating leases. Lease assets and liabilities resulting from finance lease transactions are recognized at the lower of the fair value of leased properties calculat-ed at the inception of the lease or the present value of the minimum lease payments. In accordance with applicable accounting policies, such assets are depreciated after initial recognition by using the straight-line method over their estimated useful life, or if shorter, the term of lease. Lease payments for operating leases are recognized as expenses using the straight-line method over the lease terms and presented in the consolidated statement of income.
(10) Impairment of Non-Financial Assets Property, plant and equipment and intangible assets are reviewed for impairment whenever there is an indication that the carrying amount of such assets may not be recoverable due to unforeseen events or changes in circumstance. The carrying amount of said assets in excess of the recoverable amount is recognized as impairment loss. In addition, the recoverable amount is the higher of fair value less selling cost or value in use. In calculating value in use, estimated future cash flows are discounted to their present value using a discount rate that reflects the time value of money and risks specific to the assets. When assets are reviewed for impairment, they are grouped into minimum units (cash-generating units) where individual cash flows can be identified. Intangible assets with indefinite useful lives and intangible assets that are not yet available for use are not subject to amortization. The recoverable amount of such assets is estimated annually and is subject to impairment testing. Goodwill is also subject to annual impairment testing, with its carrying amount representing acquisition costs less accumulated impairment loss. To perform impairment testing, the Group allocates goodwill to individual cash-generating units or cash-generating unit groups that are expected to bring benefits by creating synergies attributable to business combination. As for property, plant and equipment and intangible assets (excluding goodwill) for which impairment has been recognized previously, the Group evaluates the possibility of reversal of impairment at the end of each reporting period.

46 Sumitomo Rubber Industries Annual Report 2016
(11) Non-Current Assets Held for Sale (Disposal Group)Of assets and asset groups whose value is expected to be recovered through sale and not through ongoing use, those that can be sold immediately in present condition are classified as assets held for sale when plans call for completing the sale within one year and the Group’s management is committed to executing the sale. Assets classified as such are measured at the lower of carrying amount or fair value less selling cost.
(12) Employee Benefits(i) Short-Term Employee BenefitsShort-term employee benefits are not subject to discount and are recognized as expenses whenever relevant services have been provided. Whenever a reliable estimation can be undertaken, bonuses and the cost of paid leave are recognized as liabilities based on the estimated cost in accordance with the applicable schemes to which the Group has legal or constructive obligations.
(ii) Postretirement Benefit Plans i. Defined Benefit Plans The Company and some of its subsidiaries have adopted defined benefit plans. Assets and liabilities recognized in relation to said plans
are classified by individual plan, with their value being determined by deducting the fair value of plan assets from the present value of the defined benefit obligation at the end of reporting period. Defined benefit obligation is calculated annually by independent actuaries using the projected unit credit method. With the determination of the discount period based on the residual term until the future pay-ment date in each fiscal year, the discount rate applied is determined by reference to market yields on high-quality corporate bonds at the end of the corresponding reporting period.
Actuarial differences resulting from adjustments based on performance and changes in actuarial assumptions are immediately reclassi-fied to retained earnings after recognizing them in other comprehensive income for the period in which such differences were recorded.
Prior service costs are recognized as profit or loss for the period in which such costs were incurred.
ii. Defined Contribution Plans: The Company and some of its subsidiaries have adopted defined contribution plans. Upon payment, each defined contribution is recog-
nized as employee benefit cost since the retirement benefit cost of such plans entails no additional obligation. Such contribution is the sole expense associated with these plans.
(iii) Other Long-Term Employee BenefitsLiabilities due to long-term employee benefits (other than retirement benefits) are calculated by estimating the future amount for benefits that employees will have earned as consideration for their services in the current and prior fiscal years and discounting such amount in order to determine the present values.
(13) ProvisionsProvisions are recognized when the Group has a present legal or constructive obligation as a result of past events; settlement is expected to result in an outflow of resources embodying economic benefits: and the amount of obligation can be reliably estimated. In cases where the effect of the time value of money is material, the amount of a provision is measured at the present value of expenditures expected to be required to settle the obligation after applying a discount rate (pre-tax rate) that reflects current market assessments and risks specific to the liability. Increases due to passage of time are recognized as financial expenses.
(i) Provision for Loss on Voluntary Recall of Products This item represents the amount of reliably estimated loss that may directly arise from a product recall in the fiscal year under review or later and other relevant expenses.
(ii) Provision for Sales ReturnsThis item is provided for losses incurred on the return of tires that are sold but subsequently returned. The amount is based on an estimate using the average rate of such returns in prior years.
(iii) Asset Retirement ObligationThis item represents estimated expenses for returning leased offices and buildings to their original condition. The amount is expected to be paid after the passage of one year or later and is affected by future business plans and other factors.
(14) Equity (i) Common shareIn terms of common share, capital stock and capital surplus are stated at the issuance price.
(ii) Treasury Stock Treasury stock is evaluated at acquisition cost and deducted from equity. Proceeds or losses are not recognized at the time of the purchase, sale or retirement. However, differences between the carrying amount and proceeds from sales are recognized as capital surplus.
(15) Revenue RecognitionRevenues consist of the fair value of consideration or receivables received resulting from the sales of goods and the provision of services in the course of ordinary business operations of the Group. The Group recognizes revenues as follows.

47Sumitomo Rubber Industries Annual Report 2016
(i) Sale of GoodsRevenues from the sale of goods are recognized when: the underlying significant risk and economic value associated with the ownership of goods have been transferred to the buyer; the Group has no ongoing involvement in the management of the sold goods nor substantial control over them; future economic benefits associated with the transactions are highly likely to be secured by the Group; and the amount of relevant costs and revenues can be measured with reliability. Specifically, such revenues are recognized in according to the timing of trans-fer the principal risk and economic value associated with ownership to the buyer, such as the goods are loaded on vessels, delivered to or accepted by the buyer following final inspection. Revenues from the sale of goods are measured at the fair value of considerations or receivables determined by contracts between the Group and the buyer or user of the goods. The effect of discounts and rebates, where applicable, may be reasonably calculated based on past transactions and deducted from sales revenue.
(ii) Provision of ServicesRevenues from rendering services are recognized when: future economic benefits associated with the transactions are highly likely to be secured by the Group; the costs entailed, including those for completing the transaction, and ensuing revenues can be reliably measured; and the progress of such transaction can be reliably measured at the end of fiscal year. Revenues from rendering services are thus recognized by reference to the stage of completion of the transaction.
(iii) Royalty IncomeThe Group has entered into licensing agreements granting rights to the manufacture of its products and to the use of its technologies to third parties. Royalty income associated with licensing is recognized on an accrual basis in accordance with the substance of relevant agreements.
(iv) Interest IncomeInterest income is recognized using the effective interest method. If loans and receivables have been impaired, the Group decreases their car-rying amount to a recoverable amount. The recoverable amount is discount estimates of future cash flows based on the initial effective inter-est rates set for the financial instruments. Interest income associated with the impaired loans and receivables is recognized using initial interest rates.
(v) Dividend Income Dividend income is recognized when the Group establishes its right to receive dividends.
(16) Government GrantsRecognition of eligibility for the receipt of government grants may be secured if conditions for the receipt of grants have been met and rea-sonable guarantee for the receipt could be obtained. Grants for the acquisition of assets are recognized as revenues with regularity over the useful lives of the related assets, with unearned grant income being included in liabilities as deferred income. Grants for other business expenses are recognized as revenues in the fiscal year in which relevant expenses are recognized.
(17) Income TaxesIncome tax expenses consist of current income taxes and deferred taxes. As such they are recognized as loss or profit, with the exception of taxes on items recognized as other comprehensive income or taxes directly included in equity. Income tax expenses are calculated using the statutory tax rates and tax laws enforced or substantially enforced at the end of the fiscal year in countries where taxable income is generated from business activities undertaken by the Company and its subsidiaries. Deferred tax assets and liabilities are recognized using the asset and liability method on the basis of temporary differences arising between the tax bases of said assets or liabilities and their carrying amount as presented in the consolidated financial statements. In addition, deferred tax assets and liability are not recognized for the following temporary differences. •Theinitialrecognitionofgoodwill •Theinitialrecognitionofassetsorliabilitiesinrelationtotransactions(excludingbusinesscombinations)thataffectneitheraccounting
profit or loss nor taxable income (tax loss carryforwards) •Taxabletemporarydifferencesarisingfrominvestmentsinsubsidiariesoraffiliateswherethetimingofthereversalofthetemporarydif-
ference is controlled by the Group and it is probable that the temporary difference will not reverse in the foreseeable future The carrying amount of deferred tax assets is reviewed annually. Such amount is reduced proportionately with the utilization of deferred tax assets, which may be partial or full depending on the sufficiency of taxable income. An unrecognized deferred tax asset is reviewed every fis-cal year and is recognized to the extent that it has become probable that future taxable profit will be available to allow the deferred tax asset to be recovered. Deferred tax assets and liabilities are measured using the statutory tax rates and tax laws that will be enforced or substantially enforced by the end of the accounting period and applied to the period in which deferred tax assets are realized or deferred tax liabilities are settled. Deferred tax assets and liabilities are offset if the Company and its subsidiaries have a legally enforceable right to offset a current tax asset against a current tax liability and if the same taxation authority levies income taxes either on the same taxable entity or on different taxable entities that intend to settle current tax assets and liabilities on a net basis.
(18) Dividends PaidDividends paid to owners of the parent comprise year-end and interim dividends, each of which requires approval of a general meeting of shareholders or the Board of Directors. These dividends are recognized as liabilities for the period in which such approval was furnished.

48 Sumitomo Rubber Industries Annual Report 2016
(19) Profit per ShareBasic profit per share is calculated by dividing profit attributable to owners of the parent by the weighted-average number of outstanding common shares adjusted by number of treasury shares.
(20) Segment InformationAn operating segment is the basic source of business activities that generate revenues and incur expenses, including through transactions with other operating segments. Discrete financial information is available for each of these segments and reviewed regularly by the Board of Directors, which the Group has positioned as the highest body in charge of management decision making. As such, the Board of Directors is responsible for making decisions about the allocation of resources and assessing performance of each operating segment. 4. Important Accounting Estimates and JudgmentIn preparation of consolidated financial statements of the Group, management is required to establish judgments, estimates and assump-tions that have an effect on the application of accounting policies, as well as the reported amounts of assets, liabilities, revenues and expens-es. Actual operating results may differ from these estimates. The estimates and the underlying assumptions are reviewed on an ongoing basis. The effects of revisions to the accounting estimates are recognized in the fiscal period where such estimates are revised and the future fiscal periods. Of the items subject to the estimates and judgments, the following have a significant impact on the amounts stated in the consolidated financial statements for the fiscal year under review and subsequent fiscal years: •Impairmentofintangibleassets(Note11.“GoodwillandOtherIntangibleAssets”) •Accountingtreatmentandvaluationofprovisions(Note16.“Provisions”) •Measurementofdefinedbenefitobligation(Note17.“EmployeeBenefits”) •Recoverabilityofdeferredtaxassets(Note18.“IncomeTaxes”) •Measurementoffairvalueoffinancialinstruments(Note19.“FinancialInstruments”)
5. Accounting Standards and Guidelines Not Yet Applied The Group has yet to adopt the following accounting standards and guidelines, which have been newly released or revised as of the date on which the accompanying consolidated financial statements were approved. These standards are not subject to earlier adoption. As an assessment of the possible impact from adoption of these standards is ongoing, an estimate of their impact on the Group’s consoli-dated financial statements cannot yet be provided.
IFRS Mandatory adoption dateTo be adopted by the Group
for the fiscal year ending:Description of new or revised standards
IFRS 15Revenue from contracts with customers
Jan. 1, 2018 Dec. 31. 2018Accounting treatment and disclosure of the recognition of revenues
IFRS 16 Leases Jan. 1, 2019 Dec. 31. 2019 Accounting treatment and disclosure of leases
6. Segment Information (1) Overview of the Reportable SegmentsThe reportable segments of the Sumitomo Rubber Group are the units for which separate financial information is available and periodically reviewed by the Board of Directors, the body in charge of the highest decision making, for the purposes of deciding the allocation of man-agement resources and evaluating business performance. The Group has three divisions based on operations in Tires, Sports, and Industrial and Other Products. Each division formulates compre-hensive strategies for both domestic and overseas markets and develops business activities. Therefore, the Company identifies “Tires,” “Sports” and “Industrial and other Products” as reportable segments. The main products, service and content of operations of these report-able segments are described below.
Reportable segments Main products, services and content of operations
TiresTires and tubes (for automobiles, construction machinery, industrial vehicles, racing and rally cars, motorcycles, etc.)Automotive business (instant mobility systems, tire deflation warning systems, etc.)
Sports
Sports goods (golf clubs, golf balls and other golf-related goods, as well as tennis-related goods, etc.)Operation of golf tournamentsManagement of golf and tennis schools Fitness club operations, etc.
Industrial and Other Products
Highly functional rubber products (vibration-control dampers, precision rubber parts for office machines, medical rubber parts, etc.)Daily life products (rubber gloves for food preparation and work, portable ramps for wheelchairs, etc.)Infrastructure (marine fenders, various flooring materials for factories and sports facilities, etc.)
(2) Reportable Segment Sales, Profit or Loss and Other Material ItemsAccounting treatment methods adopted by reportable segments are the same as those described in Note 3. “Significant Accounting Policies.” Intersegment sales and transfers are stated at wholesale prices based on current market values.

49Sumitomo Rubber Industries Annual Report 2016
Figures for reportable segment profit or loss are based on business profit. Information on reportable segments for the previous fiscal year and the fiscal year is as follows.
(i) For the fiscal year ended December 31, 2015 (From January 1, 2015 to December 31, 2015
Millions of yen
Reportable segments
TotalAdjustments
(Note 2)
Consolidated financial
statementsTires SportsIndustrial and
Other products
Sales to external customers ¥682,220 ¥77,778 ¥38,485 ¥798,483 ¥ — ¥798,483
Intersegment sales and transfers 10 314 35 359 (359) —
Total ¥682,230 ¥78,092 ¥38,520 ¥798,842 ¥(359) ¥798,483
Segment income (Note 1) 74,021 2,634 2,110 78,765 88 78,853
Other income and expenses 10,320
Operating profit 89,173
Other important items
Depreciation and amortization 47,180 2,768 1,471 51,419 — 51,419
Impairment loss 345 0 — 345 — 345
Capital expenditures 63,144 2,454 1,680 67,278 — 67,278
Notes: 1. Segment income (business profit) is calculated by deducting the total of cost of sales and selling, general and administrative expenses from sales revenue. 2. Adjustments for segment income include the elimination of intersegment transactions.
(ii) January 1 to December 31, 2016
Millions of yen
Reportable segments
TotalAdjustments
(Note 2)
Consolidated financial
statementsTires SportsIndustrial and
Other products
Sales to external customers ¥648,445 ¥72,772 ¥35,479 ¥756,696 ¥ — ¥756,696
Intersegment sales and transfers 56 293 639 988 (988) —
Total ¥648,501 ¥73,065 ¥36,118 ¥757,684 ¥(988) ¥756,696
Segment income (Note 1) 67,924 4,303 2,673 74,900 16 74,916
Other income and expenses (1,632)
Operating profit 73,284
Other important items
Depreciation and amortization 47,311 2,492 1,445 51,248 — 51,248
Impairment loss 393 — 2 395 — 395
Capital expenditures 52,068 2,268 2,087 56,423 — 56,423
Notes: 1. Segment income (business profit) is calculated by deducting the total of cost of sales and selling, general and administrative expenses from sales revenue. 2. Adjustments for segment income include the elimination of intersegment transactions.
(3) Products and Services InformationRevenue by products and services are not presented since the segmentation of products and services is the same as that for reportable segments.
(4) Geographic Information The regional breakdown of sales to external customers and non-current assets by country and region are as follows.
(i) Sales to External Customers
Millions of yen
Jan. 1 to Dec. 31, 2015 Jan. 1 to Dec. 31, 2016
Japan ¥328,017 ¥307,290
North America 126,798 132,848
Europe 56,954 55,088
Asia 174,123 157,261
Other 112,591 104,209
Total ¥798,483 ¥756,696
Note: Breakdown is based on product destination.

50 Sumitomo Rubber Industries Annual Report 2016
(ii) Non-Current Assets
Millions of yen
Date of transition to IFRS As of Jan. 1, 2015 As of Dec. 31, 2015 As of Dec. 31, 2016
Japan ¥157,324 ¥158,135 ¥160,737
North America 3,365 34,992 35,240
Europe 931 9,055 9,117
Asia 176,049 160,140 138,864
Other 51,657 50,694 61,284
Total ¥389,326 ¥413,016 ¥405,242
Note: Breakdown is based on the location of assets. The above figures exclude investments accounted for using equity method and other financial assets, as well as net defined benefit assets and deferred tax assets.
(5) Information on Major CustomersThe Group had no transaction with a single external customer amounting to 10% or more of total external revenue.
7. Cash and Cash EquivalentsThe breakdown of cash and cash equivalents is as follows.
Millions of yen
Date of transition to IFRS As of Jan. 1, 2015 As of Dec. 31, 2015 As of Dec. 31, 2016
Cash and deposits ¥54,546 ¥53,604 ¥66,539
Time deposits with a maturity of over three months (893) (48) (47)
Total ¥53,653 ¥53,556 ¥66,492
Note: As of the date of transition to IFRS, the value of cash and cash equivalents presented in the consolidated statement of financial position and consolidated statement of cash flows is identical. The same applies to the value as of the previous fiscal year and the value as of the current fiscal year, respectively.
8. Trade and Other ReceivablesThe breakdown of trade and other receivables is as follows.
Millions of yen
Date of transition to IFRS As of Jan. 1, 2015 As of Dec. 31, 2015 As of Dec. 31, 2016
Trade notes ¥ 44,344 ¥ 43,109 ¥ 41,661
Accounts receivable 164,385 145,929 138,151
Accrued accounts receivable 5,666 2,982 5,428
Allowance for doubtful accounts (2,000) (2,080) (2,385)
Total ¥212,395 ¥189,940 ¥182,855
9. InventoriesThe breakdown of inventories is as follows.
Millions of yen
Date of transition to IFRS As of Jan. 1, 2015 As of Dec. 31, 2015 As of Dec. 31, 2016
Finished products ¥ 88,992 ¥ 91,821 ¥ 88,981
Work-in-progress 6,240 6,936 7,049
Raw materials and supplies 45,069 45,750 42,963
Total ¥140,301 ¥144,507 ¥138,993
Note: The write-down of inventories recognized as expenses totaled 292 million yen and 93 million yen as of the previous and current fiscal year, respectively.

51Sumitomo Rubber Industries Annual Report 2016
10. Property, Plant and Equipment(1) Acquisition Cost, Changes in Accumulated Depreciation, Accumulated Impairment Loss and Carrying AmountThe acquisition cost of property, plant and equipment, changes in accumulated depreciation and accumulated impairment loss on such assets and their carrying amount are as follows.
(i) Acquisition Cost
Millions of yen
LandBuildings and
structures
Machinery, equipment
and vehiclesTools, furniture
and fixturesConstruction
in progress Total
Balance as of January 1, 2015 ¥40,711 ¥213,214 ¥527,946 ¥105,842 ¥46,170 ¥933,883
Individual acquisitions — 1,575 3,016 2,238 52,898 59,727
Transfer from construction in progress — 9,378 38,090 10,519 (57,987) —
Acquisition through business combination 606 9,879 13,238 40 1,224 24,987
Disposal (40) (588) (8,468) (7,129) (197) (16,422)
Decrease through sales of subsidiaries (8) (48) (93) (3,143) — (3,292)
Foreign currency translation differences (315) (7,581) (20,773) (2,934) (6,374) (37,977)
Other — 416 (9,534) 13,016 (155) 3,743
Balance as of December 31, 2015 ¥40,954 ¥226,245 ¥543,422 ¥118,449 ¥35,579 ¥964,649
Individual acquisitions 459 659 1,123 2,022 46,638 50,901
Transfer from construction in progress — 8,118 27,250 9,787 (45,155) —
Disposal (309) (1,070) (7,905) (5,282) (54) (14,620)
Foreign Currency translation differences (208) (2,872) (8,854) (1,600) (2,061) (15,595)
Other 663 (488) (215) 233 (1,560) (1,367)
Balance as of December 31, 2016 ¥41,559 ¥230,592 ¥554,821 ¥123,609 ¥33,387 ¥983,968
(ii) Accumulated Depreciation and Accumulated Impairment Loss
Millions of yen
LandBuildings and
structures
Machinery, equipment
and vehiclesTools, furniture
and fixturesConstruction
in progress Total
Balance as of January 1, 2015 ¥(3,957) ¥(109,398) ¥(379,127) ¥(78,967) ¥— ¥(571,449)
Depreciation — (7,033) (28,420) (11,072) — (46,525)
Impairment loss (322) (23) — — — (345)
Disposal 8 484 7,721 6,887 — 15,100
Decrease through sales of subsidiaries — 35 78 2,402 — 2,515
Foreign currency translation differences 26 1,416 8,235 1,570 — 11,247
Other (45) (577) 3,610 (7,050) — (4,062)
Balance as of December 31, 2015 ¥(4,290) ¥(115,096) ¥(387,903) ¥(86,230) ¥— ¥(593,519)
Depreciation — (7,099) (28,150) (10,985) — (46,234)
Impairment loss (295) (74) (21) (0) — (390)
Disposal 172 831 7,121 5,026 — 13,150
Foreign Currency translation differences 97 762 4,394 956 — 6,209
Other (89) 34 278 (114) — 109
Balance as of December 31, 2016 ¥(4,405) ¥(120,642) ¥(404,281) ¥(91,347) ¥— ¥(620,675)
(iii) Carrying Amount
Millions of yen
LandBuildings and
structures
Machinery, equipment and
vehiclesTools furniture
and fixturesConstruction
in progress Total
Balance as of January 1, 2015 ¥36,754 ¥103,816 ¥148,819 ¥26,875 ¥46,170 ¥362,434
Balance as of December 31, 2015 36,664 111,149 155,519 32,219 35,579 371,130
Balance as of December 31, 2016 ¥37,154 ¥109,950 ¥150,540 ¥32,262 ¥33,387 ¥363,293
Notes: 1. No material borrowings are included in acquisition cost of property, plant and equipment as of January 1, 2015, December 31, 2015, or December 31, 2016. 2. Depreciation of property, plant and equipment is included in “cost of sales” and “selling, general and administrative expenses” presented in the consolidated
statement of income. 3. Impairment loss on property, plant and equipment is included in “other expenses” presented in the consolidated statement of income.

52 Sumitomo Rubber Industries Annual Report 2016
(2) Lease Assets under Finance LeasesThe carrying amounts of lease assets that have been held under finance leases and included in property, plant and equipment are as follows.
Millions of yen
Date of transition to IFRS As of Jan. 1, 2015 As of Dec. 31, 2015 As of Dec. 31, 2016
Buildings and structures ¥ 794 ¥ 915 ¥ 657
Machinery, equipment and vehicles 3,423 2,994 2,437
Tools, furniture and fixtures 1,758 2,097 1,855
Total ¥5,975 ¥6,006 ¥4,949
11. Goodwill and Other Intangible Assets(1) Acquisition Cost, Changes in Accumulated Amortization, Accumulated Impairment Loss and Carrying AmountThe acquisition cost of goodwill and other intangible assets, changes in accumulated amortization and accumulated impairment loss on such assets and their carrying amount for the years ended December 31, 2015 and 2016 are as follows.
(i) Acquisition Cost
Millions of yen
GoodwillCustomer-
related assetsTrademark
rights Software Others Total
Balance as of January 1, 2015 ¥10,371 ¥ — ¥2,521 ¥25,365 ¥2,887 ¥41,144
Individual acquisitions — — 404 4,632 315 5,351
Acquisition through business combination 10,645 5,681 — 403 — 16,729
Disposal — — (420) (5,238) (138) (5,796)
Currency translation differences (917) 24 (281) (350) (27) (1,551)
Other — — — 233 (246) (13)
Balance as of December 31, 2015 ¥20,099 ¥5,705 ¥2,224 ¥25,045 ¥2,791 ¥55,864
Individual acquisitions — — 14 5,150 388 5,552
Disposal — — (10) (3,035) (212) (3,257)
Currency translation differences (272) (233) 77 (236) (8) (672)
Other — — — 941 (376) 565
Balance as of December 31, 2016 ¥19,827 ¥5,472 ¥2,305 ¥27,865 ¥2,583 ¥58,052
(ii) Accumulated Amortization and Accumulated Impairment Loss
Millions of yen
GoodwillCustomer-
related assetsTrademark
rights Software Others Total
Balance as of January 1, 2015 ¥(4,476) ¥ — ¥(983) ¥(12,901) ¥(1,557) ¥(19,917)
Amortization — (250) (36) (4,264) (344) (4,894)
Impairment loss — — — — (0) (0)
Disposal — — 420 5,007 73 5,500
Currency translation differences — 6 0 206 25 237
Other — — — (374) — (374)
Balance as of December 31, 2015 ¥(4,476) ¥(244) ¥(599) ¥(12,326) ¥(1,803) ¥(19,448)
Amortization — (435) (30) (4,451) (98) (5,014)
Impairment loss — — — — (5) (5)
Disposal — — 9 3,032 149 3,190
Currency translation differences — (13) (0) 210 27 224
Other — — — (186) (17) (203)
Balance as of December 31, 2016 ¥(4,476) ¥(692) ¥(620) ¥(13,721) ¥(1,747) ¥(21,256)

53Sumitomo Rubber Industries Annual Report 2016
(iii) Carrying Amount
Millions of yen
GoodwillCustomer-
related assetsTrademark
rights Software Others Total
Balance as of January 1, 2015 ¥ 5,895 ¥ — ¥1,538 ¥12,464 ¥1,330 ¥21,227
Balance as of December 31, 2015 15,623 5,461 1,625 12,719 988 36,416
Balance as of December 31, 2016 15,351 4,780 1,685 14,144 836 36,796
Notes: 1. No borrowings are included in acquisition cost. 2. Amortization of intangible assets is included in “cost of sales” and “selling, general and administrative expenses” presented in the consolidated statement
of income. 3. Impairment loss on intangible assets is included in “other expenses” presented in the consolidated statement of income. 4. Research and development costs recognized as expenses for the fiscal years ended December 31, 2015 and 2016, totaled 23,372 million yen and 24,257 million
yen, respectively.
(2) Lease Assets under Finance LeasesThe carrying amount of lease assets that have been held under finance lease and included in intangible assets is as follows.
Millions of yen
Date of transition to IFRS As of Jan. 1, 2015 As of Dec. 31, 2015 As of Dec. 31, 2016
Software ¥686 ¥846 ¥883
(3) Impairment Test of Goodwill and Intangible Assets with Indefinite Useful LivesThe carrying amount of goodwill and intangible assets with indefinite useful lives allocated to each cash-generating unit is as follows.
Millions of yen
Date of transition to IFRS As of Jan. 1, 2015 As of Dec. 31, 2015 As of Dec. 31, 2016
Goodwill
Intangible assets with indefinite
useful lives Goodwill
Intangible assets with indefinite
useful lives Goodwill
Intangible assets with indefinite
useful lives
Tires ¥2,984 ¥1,733 ¥ 8,299 ¥1,498 ¥ 8,293 ¥1,576
Sports 2,911 — 2,911 — 2,911 —
Industrial and Other Products — — 4,413 — 4,147 —
Total ¥5,895 ¥1,733 ¥15,623 ¥1,498 ¥15,351 ¥1,576
The recoverable amount used in the impairment test of goodwill and intangible assets with indefinite useful lives is calculated based on value in use. Value in use is the present value of future cash flows calculated under the business plan for a period of up to 5 years, a man-agement-approved formula, with the discount rate (8% to 18%) set at the pre-tax weighted average cost of capital (WACC) for each cash-generating unit. The terminal value has been estimated on the basis of the long-term average growth rate of the markets where cash-generating units are based. As of December 31, 2015 and 2016, impairment loss on goodwill and intangible assets with indefinite useful lives was not recognized.
12. Leases(1) Finance Lease ObligationsThe total and present value of minimum future lease payments under finance lease contracts are as follows.
Millions of yen
Minimum lease payments Present value of minimum lease payments
Date of transition to
IFRS As of Jan. 1, 2015
As of Dec. 31, 2015
As of Dec. 31, 2016
Date of transition to
IFRS As of Jan. 1, 2015
As of Dec. 31, 2015
As of Dec. 31, 2016
Due within 1 year ¥2,104 ¥2,055 ¥1,932 ¥2,058 ¥2,018 ¥1,900
Between 1 and 5 years 3,876 3,949 3,177 3,752 3,838 3,077
More than 5 years 1,101 1,101 805 973 997 722
Total ¥7,081 ¥7,105 ¥5,914 ¥6,783 ¥6,853 ¥5,699
Future financing expenses (298) (252) (215)
Total present value of minimum lease payments ¥6,783 ¥6,853 ¥5,699

54 Sumitomo Rubber Industries Annual Report 2016
(2) Operating Lease ObligationsHaving signed operating lease contracts, the Group utilizes such leased properties as buildings, structures, machinery, equipment and vehicles. Minimum lease payments under non-cancelable operating leases stated as expenses in the consolidated statement of income as of December 31, 2015 and 2016 are 2,208 million yen and 2,486 million yen, respectively. Total minimum future lease payments under non-cancelable operating leases are as follows.
Millions of yen
Date of transition to IFRS As of Jan. 1, 2015 As of Dec. 31, 2015 As of Dec. 31, 2016
Due within 1 year ¥1,813 ¥ 2,307 ¥ 2,344
Between 1 and 5 years 4,794 6,236 5,620
More than 5 years 2,680 5,121 3,837
Total ¥9,287 ¥13,664 ¥11,801
13. Investments Accounted for Using Equity Method (1) Summary of Consolidated Financial Statements Prepared by Significant Affiliates The Company sold all of its shares in the formerly important Group affiliate Goodyear Dunlop Tires Europe B.V. on October 1, 2015 in con-junction with the dissolution of an alliance agreement with The Goodyear Tire & Rubber Company and associated joint ventures. Accordingly, Goodyear Dunlop Tires Europe has been excluded from the scope of equity-method affiliates. The summary of consolidated financial statements for the fiscal year ended December 31, 2015, reflecting items stated in the consolidated statement of income prepared by Goodyear Dunlop Tires Europe for the first nine months from January 1 to September 30, 2015, is as follows.
Millions of yen
Date of transition to IFRS As of Jan. 1, 2015 As of Dec. 31, 2015 As of Dec. 31, 2016
Current assets ¥240,136 ¥— ¥—
Non-current assets 267,621 — —
Current liabilities 169,734 — —
Non-current liabilities 168,530 — —
Equity attributable to:
Owners of parent 169,493 — —
Non-controlling interests — — —
Millions of yen
Jan. 1 to Dec. 31, 2015 Jan. 1 to Dec. 31, 2016
Sales revenue ¥425,366 ¥—
Profit 15,002 —
Other comprehensive income (after taxes) (9,779) —
Total comprehensive income ¥ 5,223 ¥—
In the fiscal years ended December 31, 2015 and 2016, the Group received no dividends from the aforementioned former affiliate. In addition, adjustments for equity attributable to owners of the parent stated in the summary of consolidated financial statements as well as the carrying amount of such equity are as follows.
Millions of yen
Date of transition to IFRS As of Jan. 1, 2015 As of Dec. 31, 2015 As of Dec. 31, 2016
Equity attributable to owners of parent ¥169,493 ¥— ¥—
Equity holding (%) 25.00 — —
Equity attributable to the Company 42,373 — —
Goodwill and consolidation adjustments (9,961) — —
Carrying amount of equity 32,412 — —

55Sumitomo Rubber Industries Annual Report 2016
(2) Information on Total Investments in Insignificant Affiliates Excluding those stated in (1) above, the amount of total investments (equity held by the Company) in insignificant affiliates accounted for using equity method are as follows.
Millions of yen
Date of transition to IFRS As of Jan. 1, 2015 As of Dec. 31, 2015 As of Dec. 31, 2016
Carrying amount ¥15,330 ¥ 4,045 ¥4,071
Millions of yen
Jan. 1 to Dec. 31, 2015 Jan. 1 to Dec. 31, 2016
Profit ¥ 1,736 ¥57
Other comprehensive income (3,279) —
Total comprehensive income ¥(1,543) ¥57
14. Trade and Other Payables The breakdown of trade and other payables is as follows.
Millions of yen
Date of transition to IFRS As of Jan. 1, 2015 As of Dec. 31, 2015 As of Dec. 31, 2016
Notes payable—trade ¥ 3,665 ¥ 3,535 ¥ 4,131
Accounts payable—trade 71,519 68,708 63,888
Accounts payable—other 53,614 47,520 52,217
Total ¥128,798 ¥119,763 ¥120,236
15. Bonds and Loans payableThe breakdown of bonds and loans payable is as follows.
Millions of yen
Date of transition to
IFRS As of Jan. 1, 2015
As of Dec. 31, 2015
As of Dec. 31, 2016
Average interest rate
(%) Maturity
Current liabilities
Short-term loans payable ¥ 84,487 ¥ 78,015 ¥ 52,870 1.68 —
Bonds payable (maturities of 1 year or less) — 9,995 4,998 — —
Long-term debt (maturities of 1 year or less) 28,812 37,163 19,188 2.06 —
Subtotal 113,299 125,173 77,056 — —
Non-current liabilities
Bonds payable (maturities of over1 year) 64,804 54,851 49,889 — 2018–2024
Long-term debt (maturity of over 1 year) 113,553 76,026 71,667 0.99 2018–2024
Subtotal 178,357 130,877 121,556 — —
Total ¥291,656 ¥256,050 ¥198,612 — —
Notes: 1. Average interest rates are stated at the weighted average interest rates as of December 31, 2016, for the balance of loans outstanding.

56 Sumitomo Rubber Industries Annual Report 2016
2. Summary of issuance conditions for bonds payable is as follows.
Millions of yen
Company name Series Issuance
Date of transition to
IFRS As of Jan. 1, 2015
As of Dec. 31, 2015
As of Dec. 31, 2016
Interest rate (%) Collateral Maturity
Sumitomo Rubber Industries, Ltd.
16th series of unsecured bonds
Jun. 28, 2007¥ 4,992 ¥ 4,995 ¥ 4,998 2.19
None Jun. 28, 2017
Sumitomo Rubber Industries, Ltd.
18th series of unsecured bonds
Jun. 19, 20089,979 9,985 9,992 2.17
None Jun. 19, 2018
Sumitomo Rubber Industries, Ltd.
20th series of unsecured bonds
Jun. 26, 20099,974 9,979 9,986 2.07
None Jun. 26, 2019
Sumitomo Rubber Industries, Ltd.
21st series of unsecured bonds
Jun. 28, 20119,986 9,995 — 0.58
None Jun. 28, 2016
Sumitomo Rubber Industries, Ltd.
22nd series of unsecured bonds
Jun. 28, 20119,963 9,969 9,975 1.38
None Jun. 28, 2021
Sumitomo Rubber Industries, Ltd.
23rd series of unsecured bonds
Jun. 25, 20149,958 9,966 9,974 0.34
None Jun. 25, 2020
Sumitomo Rubber Industries, Ltd.
24th series of unsecured bonds
Jun. 25, 20149,952 9,957 9,962 0.76
None Jun. 25, 2024
Total ¥64,804 ¥64,846 ¥54,887 ¥ —
Bonds payable with maturities of 1 year or less — 9,995 4,998 —
Bonds payable with maturities of over 1 year 64,804 54,851 49,889 —
16. Provisions(1) Breakdown of ProvisionsThe breakdown of provisions is as follows.
Millions of yen
Date of transition to IFRS As of Jan. 1, 2015 As of Dec. 31, 2015 As of Dec. 31, 2016
Current liabilities
Provision for loss on voluntary recall of products ¥ 181 ¥ 131 ¥ 370
Provision for sales returns 4,179 3,619 5,000
Asset retirement obligation 35 — —
Other 1,789 1,410 1,980
Total ¥6,184 ¥5,160 ¥7,350
Non-current liabilities
Asset retirement obligation 1,035 1,113 1,172
Other 4 101 25
Total ¥1,039 ¥1,214 ¥1,197

57Sumitomo Rubber Industries Annual Report 2016
(2) Changes in Provisions
Millions of yen
Jan. 1 to Dec. 31, 2016
Provision for loss on
voluntary recall of products
Provision for sales returns
Asset retirement obligation Others Total
Beginning balance ¥131 ¥3,619 ¥1,113 ¥1,511 ¥6,374
Increase during the year 710 4,670 62 1,757 7,199
Decrease resulting from settlement (471) (3,387) (17) (435) (4,310)
Decrease due to reversal — (22) — (530) (552)
Increase due to passage of time — — 12 0 12
Exchange differences on translation of foreign operations — 2 0 (92) (90)
Other — 118 2 (206) (86)
Ending balance ¥370 ¥5,000 ¥1,172 ¥2,005 ¥8,547
Note: Descriptions of each item are presented in Note 3. “Significant Accounting Policies” (13) “Provisions.”
17. Employee Benefits(1) Outline of Retirement Benefit PlansThe Company and its subsidiaries have a corporate pension plan and a retirement lump-sum plan in place as defined benefit plans. In addi-tion, the Company and some of its subsidiaries maintain a defined contribution plan. Of those plans, the corporate pension plan is a defined benefit plan designed to share the burden of risk among domestic the Company and its domestic subsidiaries under the Company’s control. The amount of defined benefit costs borne by each company enrolling in the plan is determined based on the assessment of that company’s service costs for individual employees during a fiscal year. Net interest expenses are also borne by each company enrolling in the plan; based on the assessment of retirement benefit obligation for individual employees, each company is allocated a portion of the value of total plan assets, subject to discount rates. Some consolidated subsidiaries maintain a defined benefit contribution plan. And the Company has established a retirement benefit trust for defined benefit plans. Moreover some consolidated subsidiaries pay additional retirement benefits to retiring employees.
(2) Defined Benefit Plans (i) The value of defined benefit plans presented in the consolidated statement of financial position is as follows.
Millions of yen
Date of transition to IFRS As of Jan. 1, 2015 As of Dec. 31, 2015 As of Dec. 31, 2016
Present value of defined benefit obligation ¥64,776 ¥126,956 ¥126,857
Fair value of plan assets (68,992) (128,302) (125,304)
Total ¥ (4,216) ¥ (1,346) ¥ 1,553
Value of assets and liabilities presented in consolidated statement of financial position
Net defined benefit liabilities 18,140 22,821 22,188
Net defined benefit assets 22,356 24,167 20,635
(ii) The following amount is recognized as expenses presented in the consolidated statement of income.
Millions of yen
Jan. 1 to Dec. 31, 2015 Jan. 1 to Dec. 31, 2016
Service costs for the year ¥3,288 ¥3,324
Net interest expense 162 382
Total ¥3,450 ¥3,706
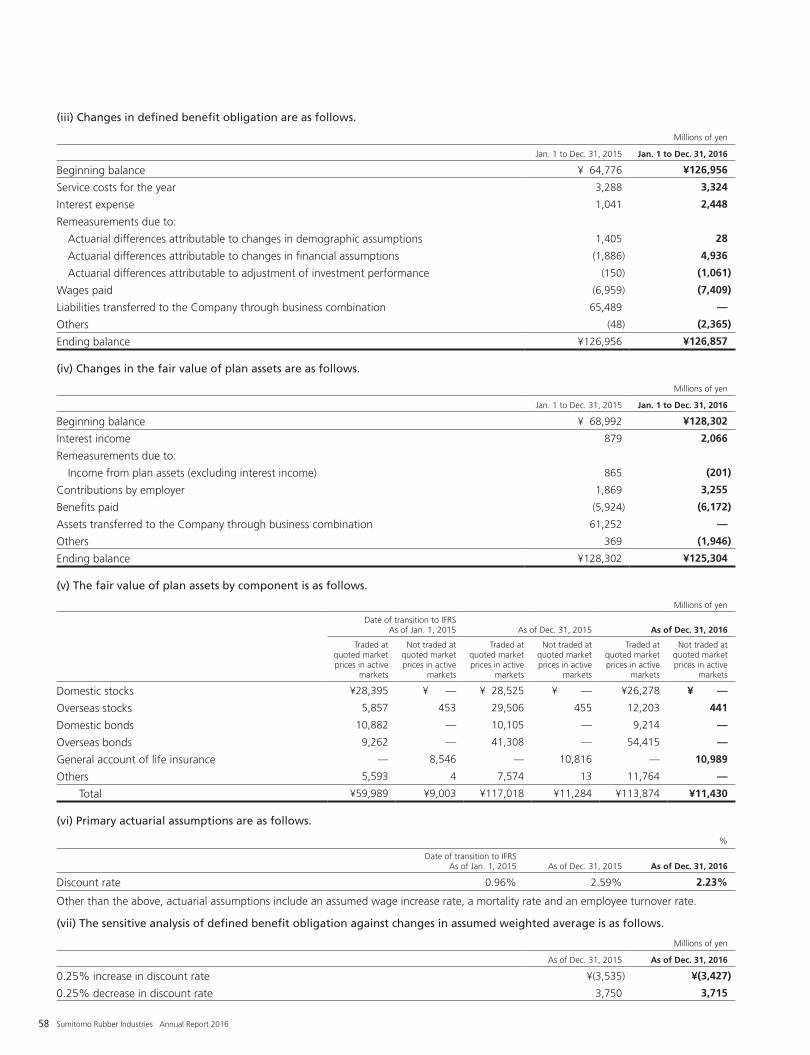
58 Sumitomo Rubber Industries Annual Report 2016
(iii) Changes in defined benefit obligation are as follows.
Millions of yen
Jan. 1 to Dec. 31, 2015 Jan. 1 to Dec. 31, 2016
Beginning balance ¥ 64,776 ¥126,956
Service costs for the year 3,288 3,324
Interest expense 1,041 2,448
Remeasurements due to:
Actuarial differences attributable to changes in demographic assumptions 1,405 28
Actuarial differences attributable to changes in financial assumptions (1,886) 4,936
Actuarial differences attributable to adjustment of investment performance (150) (1,061)
Wages paid (6,959) (7,409)
Liabilities transferred to the Company through business combination 65,489 —
Others (48) (2,365)
Ending balance ¥126,956 ¥126,857
(iv) Changes in the fair value of plan assets are as follows.
Millions of yen
Jan. 1 to Dec. 31, 2015 Jan. 1 to Dec. 31, 2016
Beginning balance ¥ 68,992 ¥128,302
Interest income 879 2,066
Remeasurements due to:
Income from plan assets (excluding interest income) 865 (201)
Contributions by employer 1,869 3,255
Benefits paid (5,924) (6,172)
Assets transferred to the Company through business combination 61,252 —
Others 369 (1,946)
Ending balance ¥128,302 ¥125,304
(v) The fair value of plan assets by component is as follows.
Millions of yen
Date of transition to IFRS As of Jan. 1, 2015 As of Dec. 31, 2015 As of Dec. 31, 2016
Traded at quoted market prices in active
markets
Not traded at quoted market prices in active
markets
Traded at quoted market prices in active
markets
Not traded at quoted market prices in active
markets
Traded at quoted market prices in active
markets
Not traded at quoted market prices in active
markets
Domestic stocks ¥28,395 ¥ — ¥ 28,525 ¥ — ¥26,278 ¥ —
Overseas stocks 5,857 453 29,506 455 12,203 441
Domestic bonds 10,882 — 10,105 — 9,214 —
Overseas bonds 9,262 — 41,308 — 54,415 —
General account of life insurance — 8,546 — 10,816 — 10,989
Others 5,593 4 7,574 13 11,764 —
Total ¥59,989 ¥9,003 ¥117,018 ¥11,284 ¥113,874 ¥11,430
(vi) Primary actuarial assumptions are as follows.
%
Date of transition to IFRS As of Jan. 1, 2015 As of Dec. 31, 2015 As of Dec. 31, 2016
Discount rate 0.96% 2.59% 2.23%
Other than the above, actuarial assumptions include an assumed wage increase rate, a mortality rate and an employee turnover rate.
(vii) The sensitive analysis of defined benefit obligation against changes in assumed weighted average is as follows.
Millions of yen
As of Dec. 31, 2015 As of Dec. 31, 2016
0.25% increase in discount rate ¥(3,535) ¥(3,427)
0.25% decrease in discount rate 3,750 3,715

59Sumitomo Rubber Industries Annual Report 2016
The abovementioned sensitive analysis was performed by changing one assumption, with all other assumptions remaining fixed. In actual circumstances, however, multiple interrelated assumptions may change simultaneously. In calculating the sensitivity of the defined benefit obligation to changes in significant actuarial assumptions, the Group applies the same method as the method it uses to calculate defined benefit liabilities recognized in the statement of financial position: measuring the present value of defined benefit obligation as of the clos-ing date of reporting period using the projected unit credit method.
(viii) Impact of defined benefit plan on future cash flows i. The Group adopted a policy of satisfying legal requirements pertaining to funds as well as rules for securing funds that affect contribu-
tions in the future, thereby ensuring its responsiveness to structural risk associated with benefit liabilities. ii. Estimated contributions in the fiscal year ending December 31, 2017 totaled 2,883 million yen. iii. The weighted-average duration of defined benefit obligation is 12.7 years and 12.1 years, respectively, for the fiscal years ended
December 31, 2015 and 2016.
(3) Defined Contribution PlanCosts recognized in relation with defined contribution plan are as follows.
Millions of yen
Jan. 1 to Dec. 31, 2015 Jan. 1 to Dec. 31, 2016
Retirement benefit costs ¥739 ¥1,460
The above figure includes expenses recognized in relation to public pension systems.
(4) Other Expenses in Relation to Employee BenefitsExpenses associated with employee benefits other than retirement benefits include the following item.
Millions of yen
Jan. 1 to Dec. 31, 2015 Jan. 1 to Dec. 31, 2016
Employee benefit costs ¥141,298 ¥141,020
18. Income Taxes(1) Deferred TaxesThe breakdown of deferred tax assets and liabilities is as follows.
Millions of yen
Date of transition to
IFRS As of Jan. 1, 2015
Recognized through profit or loss (Note)
Recognized through other
comprehensive income
Acquisitions through business
combinations OtherAs of
Dec. 31, 2015
Deferred tax assets
Tax loss carryforwards ¥ 1,786 ¥ 1,223 ¥ — ¥ — ¥ — ¥ 3,009
Inventories 4,904 171 — — — 5,075
Property, plant and equipment 4,029 (748) — — — 3,281
Intangible assets 269 (171) — — — 98
Net defined benefit liability 7,442 (2,111) (137) — — 5,194
Accrued expenses and provisions 4,582 (1,432) — — — 3,150
Other 9,208 1,566 28 — 220 11,022
Total deferred tax assets ¥ 32,220 ¥(1,502) ¥(109) ¥ — ¥220 ¥ 30,829
Deferred tax liabilities
Financial assets measured at fair value through other comprehensive income (7,860) — 850 — — (7,010)
Property, plant and equipment (2,008) 217 — — — (1,791)
Inventories (328) 44 — — — (284)
Intangible assets (2,145) (344) — (281) — (2,770)
Undistributed profit of overseas subsidiaries (4,914) (1,140) — — — (6,054)
Net defined benefit assets (6,415) 2,894 (143) — — (3,664)
Other (5,120) (1,010) 69 (222) 17 (6,266)
Total deferred tax liabilities ¥(28,790) ¥ 661 ¥ 776 ¥(503) ¥ 17 ¥(27,839)
Net deferred tax assets ¥ 3,430 ¥ (841) ¥ 667 ¥(503) ¥237 ¥ 2,990
Note: Exchange differences are included in amounts recognized through profit or loss.

60 Sumitomo Rubber Industries Annual Report 2016
Millions of yen
As of Dec. 31, 2015
Recognized through profit or loss (Note)
Recognized through other
comprehensive income
Acquisitions through business
combinations OtherAs of
Dec. 31. 2016
Deferred tax assets
Tax loss carryforwards ¥ 3,009 ¥(1,473) ¥— ¥— ¥ — ¥ 1,536
Inventories 5,075 1,501 — — — 6,576
Property, plant and equipment 3,281 504 — — — 3,785
Intangible assets 98 7 — — — 105
Net defined benefit liability 5,194 (749) (1,150) — — 3,295
Accrued expenses and provisions 3,150 1,483 — — — 4,633
Other 11,022 (4,553) (198) — (48) 6,223
Total deferred tax assets ¥ 30,829 ¥(3,280) ¥(1,348) ¥— ¥(48) ¥ 26,153
Deferred tax liabilities
Financial assets measured at fair value through other comprehensive income (7,010) 2,548 515 — — (3,947)
Property, plant and equipment (1,791) (185) — — — (1,976)
Inventories (284) (135) — — — (419)
Intangible assets (2,770) 1,086 — — — (1,684)
Undistributed profit of overseas subsidiaries (6,054) (4,430) — — — (10,484)
Net defined benefit assets (3,664) (2,714) 3,783 — — (2,595)
Other (6,266) 2,978 (34) — 8 (3,314)
Total deferred tax liabilities ¥(27,839) ¥(852) ¥ 4,264 ¥— ¥ 8 ¥(24,419)
Net deferred tax assets ¥ 2,990 ¥(4,132) ¥ 2,916 ¥— ¥(40) ¥ 1,734
Note: Exchange differences are included in amounts recognized through profit or loss.
The Group evaluates the recoverability of deferred tax assets on an annual basis. The recognition of such assets takes into account significant uncertainties with regard to the recoverability of deferred tax assets held by the Group. Deductible temporary differences and tax loss carryforwards for which deferred tax assets are not recognized were as follows.
Millions of yen
Date of transition to IFRS As of Jan. 1, 2015 As of Dec. 31, 2015 As of Dec. 31, 2016
Tax loss carryforwards (Note) ¥ 9,417 ¥12,474 ¥14,882
Deductible temporary differences 56,423 18,345 17,080
Total ¥65,840 ¥30,819 ¥31,962
Note: The expiration of tax loss carryforwards for which deferred tax assets were not recognized was as follows.
Millions of yen
Date of transition to IFRS As of Jan. 1, 2015 As of Dec. 31, 2015 As of Dec. 31, 2016
1st year ¥ — ¥ — ¥ —
2nd year — 7 69
3rd year 238 85 542
4th year 104 675 1,834
5th year onwards 9,075 11,707 12,437
Total ¥9,417 ¥12,474 ¥14,882
No deferred tax liability is recognized in respect to these differences if the Company is in a position to control the timing of the reversal of the temporary differences and it is probable that such differences will not reverse in the foreseeable future. The aggregate amounts of temporary differences associated with investments in subsidiaries and associates for which deferred tax liability were not recognized were 99,075 million yen, 110,623 million yen and 53,365 million yen as of January 1, 2015, December 31, 2015 and December 31, 2016, respectively.

61Sumitomo Rubber Industries Annual Report 2016
(2) Income Tax ExpensesThe breakdown of income tax expenses is as follows.
Millions of yen
Jan. 1 to Dec. 31, 2015 Jan. 1 to Dec. 31, 2016
Current tax expenses ¥15,470 ¥24,689
Deferred tax expenses (383) 3,133
Total ¥15,087 ¥27,822
Current tax expenses include the benefits arising from previously unused tax loss, tax credits and temporary differences of prior periods.
Primary factors contributing to differences between the applicable tax rate and the average effective tax rate are as follows.
%
Jan. 1 to Dec. 31, 2015 Jan. 1 to Dec. 31, 2016
Applicable tax rate 35.4% 33.0%
Adjustments
Undistributed benefit of consolidated subsidiaries 1.2% 6.8%
Foreign withholding tax 0.1% 2.8%
Dividend income (0.1)% 1.7%
Income taxes for past fiscal years — 1.6%
Non-deductible expenses for tax purposes 0.3% 1.0%
Effect arising from the change in tax rate 0.5% 0.9%
Changes in unrecognized deferred tax assets (0.2)% 0.5%
Gains on sales of shares of affiliates 1.9% —
Loss on impairment of shares of affiliates (13.8)% —
Differences in tax rates applied to consolidated subsidiaries (3.9)% (6.3)%
Tax credits for research and development costs (0.0)% (2.6)%
Tax exemption for overseas subsidiaries (1.7)% (0.7)%
Share of (profit) loss of entities accounted for using equity method (2.2)% (0.0)%
Other (0.5)% 1.0%
Average effective tax rate 17.0% 39.7%
Note: Loss on impairment of shares of affiliates in the fiscal year ended December 31,2015 was caused by the realization of the tax burden of the past fiscal year’s impair-ment of a Europe joint venture in association with the dissolution of the alliance with the Goodyear Tire & Rubber Company.
On March 29, 2016, amendments to the Japanese tax regulations, “Act for Partial Revision of the Income Tax Act etc.,” (Act No. 15 of 2016) and “Act for Partial Revision of the Local Tax Act etc.” (Act No. 13 of 2016) were enacted into law by the Diet. As a result of these amendments, the statutory effective tax rate for years beginning April 1, 2016 or later was revised downward. More specifically, the statuto-ry effective tax rate for calculating deferred tax assets and liabilities was decreased from the conventional 32.2% to 30.8% for temporary differences expected to be reversed in the fiscal years beginning January 1, 2017 and 2018, and to 30.6% for the temporary difference expected to be eliminated in fiscal years beginning in January 1, 2019 and later.
In conjunction with this, deferred tax expenses increased by 440 million yen.
19. Financial Instruments (1) Capital Management Aiming to secure the soundness and efficiency of its business operations and realize sustainable growth, the Group has positioned the estab-lishment and maintenance of stable financial position as its basic capital risk management policy. Guided by this policy, the Group utilizes cash flows from operating activities, such as funds provided by the development and sale of competitive products, to execute investments for business expansion, provide shareholder returns through the payment of dividends, secure loans and repay debt.

62 Sumitomo Rubber Industries Annual Report 2016
(2) Financial Risk ManagementThe Group’s business activities can be affected by changes in the operating environment and financial markets. Therefore, financial instru-ments held or underwritten by the Group in the course of its business activities may be exposed to specific risks. These risks include 1) credit risk; 2) liquidity risk; and 3) market risk (foreign exchange risk, stock price risk and interest rate risk).
(i) Credit Risk The Group is exposed to the risk of being unable to recover financial assets that are held by a partner if that partner defaults on debt
(hereinafter “credit risk”). In line with its in-house rules on credit management, marketing departments at each business division monitor the status of their key business partners on a regular basis. To ensure the soundness of operating receivables, these departments assesses the ability of each counterpart to fulfill their payments on time. To mitigate risk, the Company has a system in place to promptly detect whether the financial position of a counterpart deteriorates.
Derivative financial instruments provided by financial institutions are utilized to mitigate operational risk. As the Group executes finan-cial instrument transactions only through highly-rated financial institutions, the Group considers the credit risk associated with such transactions to be insignificant in the fiscal year under review.
Operating receivables are attributable to a large number of customers across vast regions. The Group identified no specific customer that accounted for significant credit risk exposure. Accordingly, the excessive concentration of credit risk has not been detected.
Regarding trade and other receivables, the Group conducts exhaustive analysis of the credit status of its customers that includes exam-ining their historical default rates as well as credit reports issued by external institutions. The Group estimates expected credit loss related to financial counterparties for 12 months or the full duration, records impairment loss on trade and other receivables, and sets aside an allowance for doubtful accounts.
The maximum credit risk exposure attributable to financial assets held by the Group, excluding the valuation of guarantees and collateral acquired, is the carrying amount of such assets presented in the consolidated financial statements after impairment.
i. Credit Risk Exposure Maturity analysis of trade and other receivables is as follows.
Date of transition to IFRS (as of January 1, 2015)
Millions of yen
Financial assets whose allowance for doubtful
accounts is measured at the same amount as 12-month expected
credit losses
Financial assets whose allowance for doubtful accounts is measured at the same amount as lifetime expected
credit losses
Total
Financial assets whose credit risk has significantly
increased since initial recognition
Financial assets whose allowance for doubtful
accounts has always been measured at the same
amount as lifetime expected credit losses
Before maturity ¥5,622 ¥— ¥190,603 ¥196,225
Due within 30 days — — 13,019 13,019
Due after 30 days but within 60 days — — 2,895 2,895
Due after 60 days but within 90 days — — 434 434
More than 90 days — — 1,822 1,822
Total ¥5,622 ¥— ¥208,773 ¥214,395
As of December 31, 2015
Millions of yen
Financial assets whose allowance for doubtful
accounts is measured at the same amount as 12-month expected
credit losses
Financial assets whose allowance for doubtful accounts is measured at the same amount as lifetime expected
credit losses
Total
Financial assets whose credit risk has significantly
increased since initial recognition
Financial assets whose allowance for doubtful
accounts has always been measured at the same
amount as lifetime expected credit losses
Before maturity ¥2,456 ¥— ¥178,566 ¥181,022
Due within 30 days — — 6,927 6,927
Due after 30 days but within 60 days — — 2,872 2,872
Due after 60 days but within 90 days — — 176 176
More than 90 days — — 1,023 1,023
Total ¥2,456 ¥— ¥189,564 ¥192,020

63Sumitomo Rubber Industries Annual Report 2016
As of December 31, 2016
Millions of yen
Financial assets whose allowance for doubtful
accounts is measured at the same amount as 12-month expected
credit losses
Financial assets whose allowance for doubtful accounts is measured at the same amount as lifetime expected
credit losses
Total
Financial assets whose credit risk has significantly
increased since initial recognition
Financial assets whose allowance for doubtful
accounts has always been measured at the same
amount as lifetime expected credit losses
Before maturity ¥4,163 ¥— ¥162,667 ¥166,830
Due within 30 days — — 7,270 7,270
Due after 30 days but within 60 days — — 3,949 3,949
Due after 60 days but within 90 days — — 1,120 1,120
More than 90 days — — 6,071 6,071
Total ¥4,163 ¥— ¥181,077 ¥185,240
ii. Analysis of Changes in Allowance for Doubtful Accounts Changes in allowance for doubtful accounts in relation to trade and other receivables are as follows.
January 1 to December 31, 2015
Millions of yen
12-month expected credit losses
Lifetime expected credit losses
Total
Financial assets whose credit risk has significantly
increased since initial recognition
Financial assets whose allowance for doubtful
accounts has always been measured at the same
amount as lifetime expected credit losses
Beginning balance ¥— ¥— ¥(2,000) ¥(2,000)
Increase — — (1,065) (1,065)
Decrease resulting from settlement — — 185 185
Decrease due to reversal — — 686 686
Other — — 114 114
Ending balance ¥— ¥— ¥(2,080) ¥(2,080)
January 1 to December 31, 2016
Millions of yen
12-month expected credit losses
Lifetime expected credit losses
Total
Financial assets whose credit risk has significantly
increased since initial recognition
Financial assets whose allowance for doubtful
accounts has always been measured at the same
amount as lifetime expected credit losses
Beginning balance ¥— ¥— ¥(2,080) ¥(2,080)
Increase — — (1,042) (1,042)
Decrease resulting from settlement — — 616 616
Decrease due to reversal — — 125 125
Other — — (4) (4)
Ending balance ¥— ¥— ¥(2,385) ¥(2,385)
(ii) Liquidity Risk The Group uses short-term borrowings mainly to raise operating funds while utilizing long-term debt and corporate bonds for such purpos-
es as funding capital expenditure. Along with trade notes and accounts payables, these liabilities can be difficult to repay, thus exposing the Group to liquidity risk. To counter such risk, the Group maintains and updates appropriate fundraising plans based on the projections of the amounts necessary to settle these liabilities. The Group also manages such risk by, for example, maintaining liquidity on hand.
The maturity analysis of corporate bonds, borrowings, lease obligations and derivative liabilities is as follows.
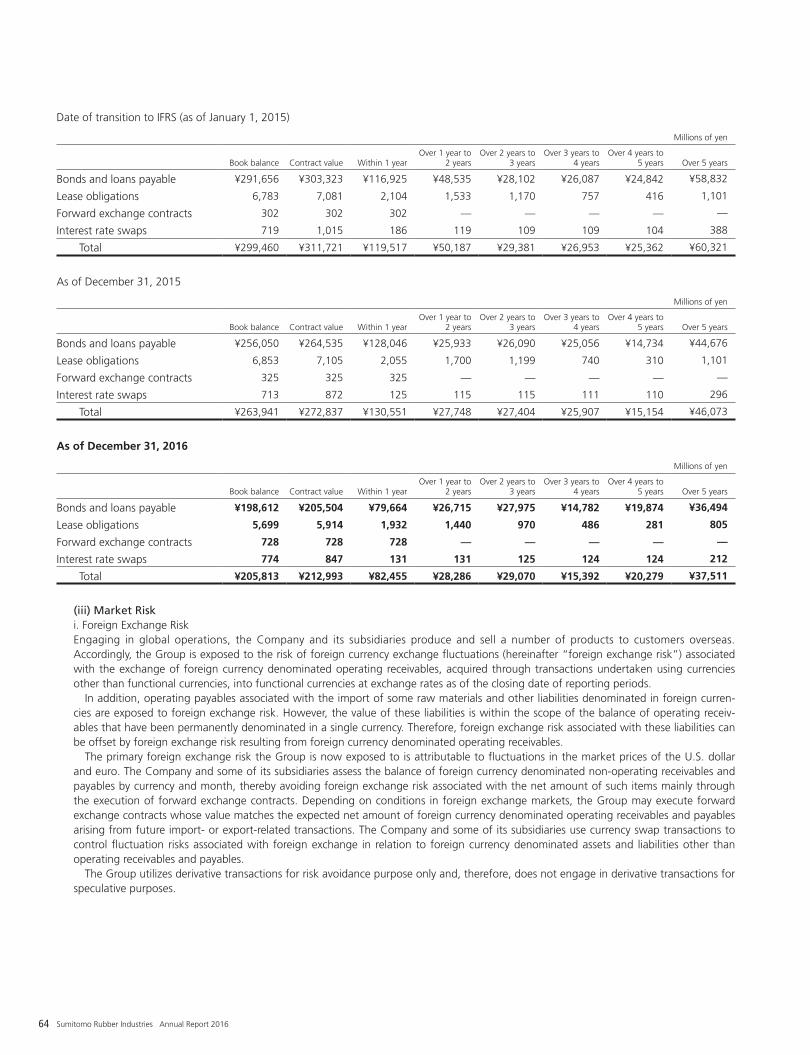
64 Sumitomo Rubber Industries Annual Report 2016
Date of transition to IFRS (as of January 1, 2015)
Millions of yen
Book balance Contract value Within 1 year
Over 1 year to 2 years
Over 2 years to 3 years
Over 3 years to 4 years
Over 4 years to 5 years Over 5 years
Bonds and loans payable ¥291,656 ¥303,323 ¥116,925 ¥48,535 ¥28,102 ¥26,087 ¥24,842 ¥58,832
Lease obligations 6,783 7,081 2,104 1,533 1,170 757 416 1,101
Forward exchange contracts 302 302 302 — — — — —
Interest rate swaps 719 1,015 186 119 109 109 104 388
Total ¥299,460 ¥311,721 ¥119,517 ¥50,187 ¥29,381 ¥26,953 ¥25,362 ¥60,321
As of December 31, 2015
Millions of yen
Book balance Contract value Within 1 year
Over 1 year to 2 years
Over 2 years to 3 years
Over 3 years to 4 years
Over 4 years to 5 years Over 5 years
Bonds and loans payable ¥256,050 ¥264,535 ¥128,046 ¥25,933 ¥26,090 ¥25,056 ¥14,734 ¥44,676
Lease obligations 6,853 7,105 2,055 1,700 1,199 740 310 1,101
Forward exchange contracts 325 325 325 — — — — —
Interest rate swaps 713 872 125 115 115 111 110 296
Total ¥263,941 ¥272,837 ¥130,551 ¥27,748 ¥27,404 ¥25,907 ¥15,154 ¥46,073
As of December 31, 2016
Millions of yen
Book balance Contract value Within 1 year
Over 1 year to 2 years
Over 2 years to 3 years
Over 3 years to 4 years
Over 4 years to 5 years Over 5 years
Bonds and loans payable ¥198,612 ¥205,504 ¥79,664 ¥26,715 ¥27,975 ¥14,782 ¥19,874 ¥36,494
Lease obligations 5,699 5,914 1,932 1,440 970 486 281 805
Forward exchange contracts 728 728 728 — — — — —
Interest rate swaps 774 847 131 131 125 124 124 212
Total ¥205,813 ¥212,993 ¥82,455 ¥28,286 ¥29,070 ¥15,392 ¥20,279 ¥37,511
(iii) Market Risk i. Foreign Exchange Risk Engaging in global operations, the Company and its subsidiaries produce and sell a number of products to customers overseas.
Accordingly, the Group is exposed to the risk of foreign currency exchange fluctuations (hereinafter “foreign exchange risk”) associated with the exchange of foreign currency denominated operating receivables, acquired through transactions undertaken using currencies other than functional currencies, into functional currencies at exchange rates as of the closing date of reporting periods.
In addition, operating payables associated with the import of some raw materials and other liabilities denominated in foreign curren-cies are exposed to foreign exchange risk. However, the value of these liabilities is within the scope of the balance of operating receiv-ables that have been permanently denominated in a single currency. Therefore, foreign exchange risk associated with these liabilities can be offset by foreign exchange risk resulting from foreign currency denominated operating receivables.
The primary foreign exchange risk the Group is now exposed to is attributable to fluctuations in the market prices of the U.S. dollar and euro. The Company and some of its subsidiaries assess the balance of foreign currency denominated non-operating receivables and payables by currency and month, thereby avoiding foreign exchange risk associated with the net amount of such items mainly through the execution of forward exchange contracts. Depending on conditions in foreign exchange markets, the Group may execute forward exchange contracts whose value matches the expected net amount of foreign currency denominated operating receivables and payables arising from future import- or export-related transactions. The Company and some of its subsidiaries use currency swap transactions to control fluctuation risks associated with foreign exchange in relation to foreign currency denominated assets and liabilities other than operating receivables and payables.
The Group utilizes derivative transactions for risk avoidance purpose only and, therefore, does not engage in derivative transactions for speculative purposes.
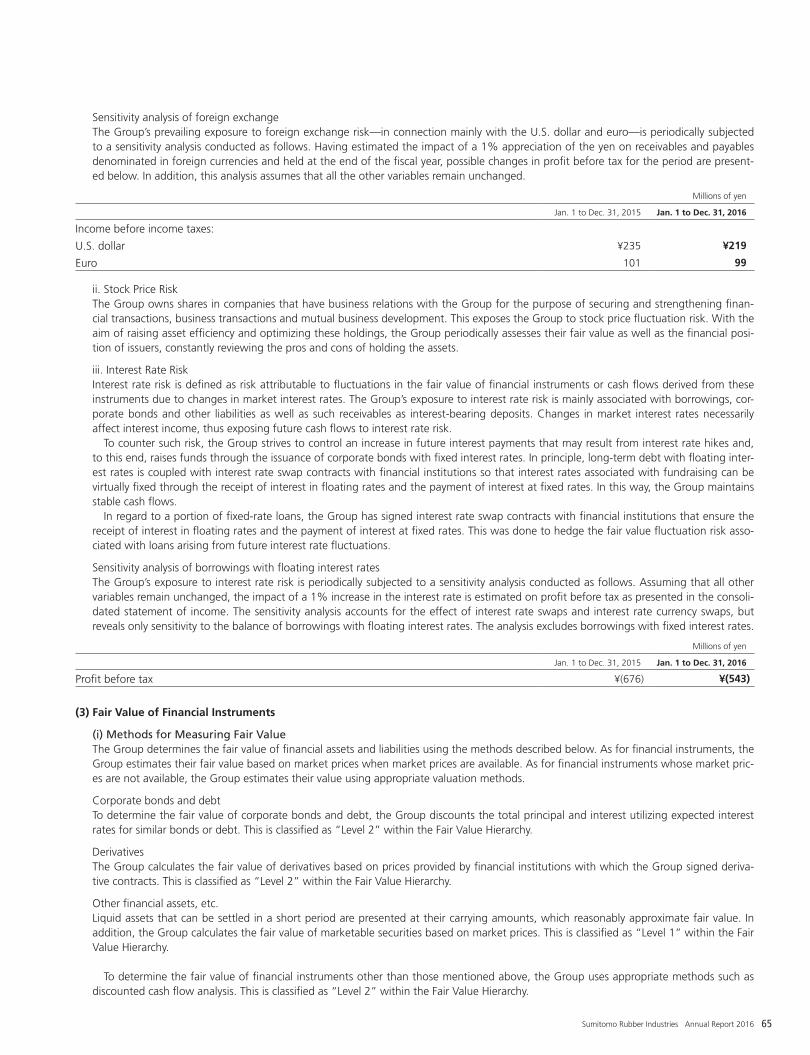
65Sumitomo Rubber Industries Annual Report 2016
Sensitivity analysis of foreign exchange The Group’s prevailing exposure to foreign exchange risk—in connection mainly with the U.S. dollar and euro—is periodically subjected
to a sensitivity analysis conducted as follows. Having estimated the impact of a 1% appreciation of the yen on receivables and payables denominated in foreign currencies and held at the end of the fiscal year, possible changes in profit before tax for the period are present-ed below. In addition, this analysis assumes that all the other variables remain unchanged.
Millions of yen
Jan. 1 to Dec. 31, 2015 Jan. 1 to Dec. 31, 2016
Income before income taxes:
U.S. dollar ¥235 ¥219
Euro 101 99
ii. Stock Price Risk The Group owns shares in companies that have business relations with the Group for the purpose of securing and strengthening finan-
cial transactions, business transactions and mutual business development. This exposes the Group to stock price fluctuation risk. With the aim of raising asset efficiency and optimizing these holdings, the Group periodically assesses their fair value as well as the financial posi-tion of issuers, constantly reviewing the pros and cons of holding the assets.
iii. Interest Rate Risk Interest rate risk is defined as risk attributable to fluctuations in the fair value of financial instruments or cash flows derived from these
instruments due to changes in market interest rates. The Group’s exposure to interest rate risk is mainly associated with borrowings, cor-porate bonds and other liabilities as well as such receivables as interest-bearing deposits. Changes in market interest rates necessarily affect interest income, thus exposing future cash flows to interest rate risk.
To counter such risk, the Group strives to control an increase in future interest payments that may result from interest rate hikes and, to this end, raises funds through the issuance of corporate bonds with fixed interest rates. In principle, long-term debt with floating inter-est rates is coupled with interest rate swap contracts with financial institutions so that interest rates associated with fundraising can be virtually fixed through the receipt of interest in floating rates and the payment of interest at fixed rates. In this way, the Group maintains stable cash flows.
In regard to a portion of fixed-rate loans, the Group has signed interest rate swap contracts with financial institutions that ensure the receipt of interest in floating rates and the payment of interest at fixed rates. This was done to hedge the fair value fluctuation risk asso-ciated with loans arising from future interest rate fluctuations.
Sensitivity analysis of borrowings with floating interest rates The Group’s exposure to interest rate risk is periodically subjected to a sensitivity analysis conducted as follows. Assuming that all other
variables remain unchanged, the impact of a 1% increase in the interest rate is estimated on profit before tax as presented in the consoli-dated statement of income. The sensitivity analysis accounts for the effect of interest rate swaps and interest rate currency swaps, but reveals only sensitivity to the balance of borrowings with floating interest rates. The analysis excludes borrowings with fixed interest rates.
Millions of yen
Jan. 1 to Dec. 31, 2015 Jan. 1 to Dec. 31, 2016
Profit before tax ¥(676) ¥(543)
(3) Fair Value of Financial Instruments
(i) Methods for Measuring Fair Value The Group determines the fair value of financial assets and liabilities using the methods described below. As for financial instruments, the
Group estimates their fair value based on market prices when market prices are available. As for financial instruments whose market pric-es are not available, the Group estimates their value using appropriate valuation methods.
Corporate bonds and debt To determine the fair value of corporate bonds and debt, the Group discounts the total principal and interest utilizing expected interest
rates for similar bonds or debt. This is classified as “Level 2” within the Fair Value Hierarchy.
Derivatives The Group calculates the fair value of derivatives based on prices provided by financial institutions with which the Group signed deriva-
tive contracts. This is classified as “Level 2” within the Fair Value Hierarchy.
Other financial assets, etc. Liquid assets that can be settled in a short period are presented at their carrying amounts, which reasonably approximate fair value. In
addition, the Group calculates the fair value of marketable securities based on market prices. This is classified as “Level 1” within the Fair Value Hierarchy.
To determine the fair value of financial instruments other than those mentioned above, the Group uses appropriate methods such as discounted cash flow analysis. This is classified as “Level 2” within the Fair Value Hierarchy.

66 Sumitomo Rubber Industries Annual Report 2016
For details on the Fair Value Hierarchy, please see (iii) Fair Value Hierarchy.
(ii) Carrying Amount and Fair Value of Financial Instruments The carrying amount and fair value of financial instruments are as follows.
Millions of yen
Date of transition to IFRS (as of Jan. 1, 2015) As of Dec. 31, 2015 As of Dec. 31, 2016
Carrying amount Fair value
Carrying amount Fair value
Carrying amount Fair value
Financial assets measured at fair value through profit or loss
Derivatives to which hedging is not applied ¥ 9,058 ¥ 9,058 ¥ 8,639 ¥ 8,639 ¥ 3,503 ¥ 3,503
Loans 1,056 1,056 1,054 1,054 1,051 1,051
Financial assets measured at fair value through other comprehensive income
Derivatives to which hedging is applied 1,117 1,117 333 333 1,492 1,492
Equity equivalents 33,899 33,899 33,467 33,467 22,403 22,403
Financial assets measured at amortized cost
Cash and cash equivalents 53,653 53,653 53,556 53,556 66,492 66,492
Trade and other receivables 212,395 212,395 189,940 189,940 182,855 182,855
Other financial assets 12,935 12,935 18,720 18,720 16,611 16,611
Financial liabilities measured at fair value through profit or loss
Derivatives to which hedging is applied 15 15 13 13 10 10
Derivatives to which hedging is not applied 210 210 202 202 466 466
Financial liabilities measured at fair value through other comprehensive income
Derivatives to which hedging is applied 796 796 823 823 1,026 1,026
Financial liabilities measured at amortized cost
Trade and other payables 128,798 128,798 119,763 119,763 120,236 120,236
Bonds and debts 291,656 293,999 256,050 258,207 198,612 200,438
Lease obligations 6,783 7,244 6,853 7,146 5,699 5,867
Financial Assets Measured at Fair Value through Other Comprehensive IncomeThe Group designates its long-term stockholdings aimed at securing a greater earnings base through the maintenance and expansion of transactions with investees, as financial assets measured at fair value through other comprehensive income.
In addition, the breakdown of equity equivalents measured at fair value through other comprehensive income that have been disposed of during each fiscal year, is as follows.
Millions of yen
As of December 31, 2015 As of December 31, 2016
Fair value at the time of sale
Accumulated gains (losses) Dividend income
Fair value at the time of sale
Accumulated gains (losses) Dividend income
¥78 ¥74 ¥52 ¥10,062 ¥8,066 ¥26
In addition, accumulated gains transferred from other components of equity to retained earnings totaled 74 million yen and 8,066 million yen as of December 31, 2015 and 2016, respectively.
(iii) Fair Value Hierarchy The following analysis of fair value measurements is applied periodically to financial assets and liabilities recognized in the consolidated
statement of financial position.
The inputs used to measure fair value are categorized into three different levels of the fair value hierarchy, defined as follows.
Level 1: Fair value measured directly at quoted prices in active markets Level 2: Fair value calculated, either directly or indirectly, by using observable prices other than Level 1 Level 3: Fair value calculated using valuation methods based on unobservable indicators

67Sumitomo Rubber Industries Annual Report 2016
Date of transition to IFRS (as of January 1, 2015)
Millions of yen
Level 1 Level 2 Level 3 Total
Assets
Financial assets measured at fair value through profit or loss
Derivatives to which hedging is not applied ¥ — ¥ 9,058 ¥ — ¥ 9,058
Loans
Financial assets measured at fair value through other comprehensive income — 1,056 — 1,056
Derivatives to which hedging is applied — 1,117 — 1,117
Equity equivalents 31,980 — 1,919 33,899
Total assets ¥31,980 ¥11,231 ¥1,919 ¥45,130
Liabilities
Financial liabilities measured at fair value through profit or loss
Derivatives to which hedging is applied — 15 — 15
Derivatives to which hedging is not applied — 210 — 210
Financial liabilities measured at fair value through other comprehensive income
Derivatives to which hedging is applied — 796 — 796
Total liabilities ¥ — ¥ 1,021 ¥ — ¥ 1,021
As of December 31, 2015
Millions of yen
Level 1 Level 2 Level 3 Total
Assets
Financial assets measured at fair value through profit or loss
Derivatives to which hedging is not applied ¥ — ¥ 8,639 ¥ — ¥ 8,639
Loans — 1,054 — 1,054
Financial assets measured at fair value through other comprehensive income
Derivatives to which hedging is applied — 333 — 333
Equity equivalents 31,596 — 1,871 33,467
Total assets ¥31,596 ¥10,026 ¥1,871 ¥43,493
Liabilities
Financial liabilities measured at fair value through profit or loss
Derivatives to which hedging is applied — 13 — 13
Derivatives to which hedging is not applied — 202 — 202
Financial liabilities measured at fair value through other comprehensive income
Derivatives to which hedging is applied — 823 — 823
Total liabilities ¥ — ¥ 1,038 ¥ — ¥ 1,038

68 Sumitomo Rubber Industries Annual Report 2016
As of December 31, 2016
Millions of yen
Level 1 Level 2 Level 3 Total
Assets
Financial assets measured at fair value through profit or loss
Derivatives to which hedging is not applied ¥ — ¥3,503 — ¥ 3,503
Loans — 1,051 — 1,051
Financial assets measured at fair value through other comprehensive income
Derivatives to which hedging is applied — 1,492 — 1,492
Equity equivalents 20,574 — 1,829 22,403
Total assets ¥20,574 ¥6,046 ¥1,829 ¥28,449
Liabilities
Financial liabilities measured at fair value through profit or loss
Derivatives to which hedging is applied — 10 — 10
Derivatives to which hedging is not applied — 466 — 466
Financial liabilities measured at fair value through other comprehensive income
Derivatives to which hedging is applied — 1,026 — 1,026
Total liabilities ¥ — ¥1,502 ¥ — ¥ 1,502
No financial instruments have been transferred between Levels as of January 1, 2015, December 31, 2015 and December 31, 2016.
(4) Derivatives The Group designates such derivatives as forward exchange contracts and interest rate swaps as hedges against foreign exchange risk and interest rate risk. When a derivative transaction is initiated, the Group documents the relationship between hedging instruments and hedged items as well as its risk management goals and strategies for various hedging transactions, with the aim of evaluating whether its hedge relationship meets hedge accounting requirements. Moreover, since the inception of hedging, the performance of derivatives used for hedge transac-tions to offset changes in the fair value of or cash flows from hedged items, are constantly evaluated and documented to determine wheth-er they meet all the applicable hedging efficacy requirements. The evaluation of hedge effectiveness is undertaken at the earlier of the closing date of each fiscal year or whenever a significant change in circumstances may affect hedge effectiveness requirements.
(i) Derivatives to Which Hedging Is Applied As of January 1, 2015, December 31, 2015 and December 31, 2016, derivatives designated as hedging instruments are as follows.
As of January 1, 2015 (date of transition to IFRS)
Millions of yen
Notional amount of hedging instruments
Carrying amount of hedging instruments Hedging instruments included in the consolidated statement of
financial position as:Assets Liabilities
Cash flow hedges
Foreign exchange risk
Forward exchange contracts ¥20,802 ¥762 ¥ 92Other financial assets/
Other financial liabilities
Foreign exchange and interest rate risks
Interest rate and currency swaps 2,411 355 — Other financial assets
Interest rate risk
Interest rate swaps 29,770 0 704Other financial assets/
Other financial liabilities
Fair value hedge
Interest rate risk
Interest rate swaps 1,041 — 15 Other financial liabilities

69Sumitomo Rubber Industries Annual Report 2016
As of December 31, 2015
Millions of yen
Notional amount of hedging instruments
Carrying amount of hedging instruments Hedging instruments included in the consolidated statement of
financial position as:Assets Liabilities
Cash flow hedges
Foreign exchange risk
Forward exchange contracts ¥22,353 ¥ 2 ¥123Other financial assets/
Other financial liabilities
Foreign exchange and interest rate risks
Interest rate and currency swaps 2,412 331 — Other financial assets
Interest rate risk
Interest rate swaps 21,530 — 700 Other financial liabilities
Fair value hedge
Interest rate risk
Interest rate swaps 1,041 — 13 Other financial liabilities
As of December 31, 2016
Millions of yen
Notional amount of hedging instruments
Carrying amount of hedging instruments Hedging instruments included in the consolidated statement of
financial position as:Assets Liabilities
Cash flow hedges
Foreign exchange risk
Forward exchange contracts ¥20,981 ¥852 ¥258Other financial assets/
Other financial liabilities
Foreign exchange and interest rate risks
Interest rate and currency swaps 11,011 640 — Other financial assets
Interest rate risk
Interest rate swaps 17,000 — 768 Other financial liabilities
Fair value hedge
Interest rate risk
Interest rate swaps 1,041 — 10 Other financial liabilities

70 Sumitomo Rubber Industries Annual Report 2016
(ii) Derivatives to Which Hedging Is Not Applied As of January 1, 2015, December 31, 2015 and December 31, 2016, derivatives that have not been designated as hedging instruments
are as follows.
Millions of yen
Date of transition to IFRS (as of Jan. 1, 2015) As of Dec. 31, 2015 As of Dec. 31, 2016
Contract value (notional amount) Fair value
Contract value (notional amount) Fair value
Contract value (notional amount) Fair value
Forward exchange contracts
Sold
USD ¥ 1,173 ¥ (68) ¥ 2,161 ¥ (2) ¥10,626 ¥ (74)
GBP 277 (2) 141 4 316 (15)
AUD 1,239 (6) 1,180 (12) 1,178 (33)
Euro 3,632 (79) 3,162 44 4,577 (209)
RUB 726 105 949 79 140 (18)
TRY 1,346 (9) 453 (18) 132 0
ZAR 151 (0) 655 43 810 (77)
CHF — — 1,458 10 1,713 3
THB 215 (4) — — — —
CNY — — 297 6 — —
JPY 186 (1) 159 (1) 40 0
Bought
USD 6,848 192 3,546 (16) 2,265 140
Euro 4 0 — — 4 0
THB — — 83 0 52 6
CNY — — 13,771 (127) 12,570 20
JPY — — — — 50 1
Currency swaps
USD receipts/THB payments 8,487 350 4,609 673 1,421 177
USD receipts/JPY payments 27,037 7,609 27,050 7,515 15,645 3,116
AUD receipts/JPY payments 3,432 761 — — — —
USD receipts/ZAR payments — — 984 239 — —
Total ¥54,753 ¥8,848 ¥60,658 ¥8,437 ¥51,539 ¥3,037
20. Capital Stock and Other Equity Items(1) Capital Stock—Amortized and Issued
Authorized (Shares)
Issued (Shares)
Capital stock (Millions of yen)
Capital surplus (Millions of yen)
Date of transition to IFRS as of Jan. 1, 2015 800,000,000 263,043,057 ¥42,658 ¥37,789
Changes during the year — — — 127
As of Dec. 31, 2015 800,000,000 263,043,057 ¥42,658 ¥37,916
Changes during the year — — — 21
As of Dec. 31, 2016 800,000,000 263,043,057 ¥42,658 ¥37,937
Note: All shares issued by the Company carry no par value and contain no restrictions on shareholder rights. Purchasers paid full price for such shares.
(2) Treasury Stock
Treasury stock (Shares) Value (Millions of yen)
Date of transition to IFRS as of Jan. 1, 2015 720,365 ¥559
Changes during the year 4,148 8
As of Dec. 31, 2015 724,513 ¥567
Changes during the year 1,655 3
As of Dec. 31, 2016 726,168 ¥570
Note: Changes during the year are attributable to meeting requests for the purchase or transfer of shareholdings of less than one unit.

71Sumitomo Rubber Industries Annual Report 2016
(3) Capital Stock and Capital SurplusIn accordance with Japan’s Corporation Law, stock companies are obliged to set aside at least 50% of proceeds from or contributions associ-ated with the issuance of shares as capital stock, with the residual amount being allocated to additional paid-in capital as part of capital sur-plus. Said law also allows companies to include additional paid-in capital in capital stock upon obtaining the approval of their general meeting of shareholders.
(4) Retained EarningsIn accordance with the Corporation Law, stock companies are obliged to set aside 10% of any appropriation to shareholders from retained earnings as additional paid-in capital or legal reserve, until the reserve reaches 25% of stated capital. The legal reserve can be appropriated to eliminate a deficit. The reversal of such reserve requires a resolution of the General Meeting of Shareholders. In accordance with the Corporation Law, distributable surplus is calculated based on retained earnings as presented in the Company’s stat-utory financial statements prepared in accordance with Japanese GAAP. In addition, the Company distributes its retained earnings in compliance with restrictions imposed by said law on determining the amounts available for distribution.
(5) Other Components of Equity (i) Remeasurements of Defined Benefit PlansA reassessment of the defined benefit obligation that identifies the differences between actuarial assumptions at the beginning of the fiscal year and actual returns, in addition to an assessment of gain on plan assets at fair value (excluding interest income)
(ii) Net Gain or Loss on Financial Assets Measured at Fair Value through Other Comprehensive IncomeDifferences between the fair value and the acquisition prices of financial assets, whose value is measured at fair value through other compre-hensive income, included in other components of equity until derecognition
(iii) Currency translation differences of foreign operationsTranslation differences attributable to the consolidation of the results of foreign operations whose financial statements are prepared using foreign currencies
(iv) Cash Flow HedgesChanges in gain or loss on the valuation of derivatives designated as eligible hedging instruments recorded in the statement of comprehen-sive income before the date on which hedge accounting was closed
21. Other Comprehensive IncomeBreakdown of other comprehensive income that has been recognized in each fiscal year, adjustments associated with reclassification to prof-it or loss and tax effects for each component (including non-controlling interests) are as follows.
January 1 to December 31, 2015
Millions of yen
Amount arising
during the yearReclassification
adjustments Before taxes Tax effects After taxes
Items that will not be reclassified subsequently to profit or loss:
Financial assets measured at fair value through other comprehensive income ¥ (373) ¥ — ¥ (373) ¥850 ¥ 477
Remeasurements of defined benefit plans 1,496 — 1,496 (280) 1,216
Share of other comprehensive income of associates accounted for using equity method (2,803) — (2,803) — (2,803)
Items that may be reclassified subsequently to profit or loss:
Cash flow hedges (316) 173 (143) 30 (113)
Exchange differences on translation of foreign operations (33,624) — (33,624) 67 (33,557)
Share of other comprehensive income of associates accounted for using equity method (2,447) 2,446 (1) — (1)
Other comprehensive income (38,067) 2,619 (35,448) 667 (34,781)

72 Sumitomo Rubber Industries Annual Report 2016
January 1 to December 31, 2016
Millions of yen
Amount arising
during the yearReclassification
adjustments Before taxes Tax effects After taxes
Items that will not be reclassified subsequently to profit or loss:
Financial assets measured at fair value through other comprehensive income ¥ (599) ¥ — ¥ (599) ¥ 515 ¥ (84)
Remeasurements of defined benefit plans (4,104) — (4,104) 2,633 (1,471)
Share of other comprehensive income of associates accounted for using equity method — — — — —
Items that may be reclassified subsequently to profit or loss:
Cash flow hedges 430 47 477 (165) 312
Exchange differences on translation of foreign operations (19,219) 70 (19,149) (67) (19,216)
Share of other comprehensive income of associates accounted for using equity method — — — — —
Other comprehensive income (23,492) 117 (23,375) 2,916 (20,459)
22. Selling, General and Administrative Expenses The breakdown of selling, general and administrative expenses is as follows.
Millions of yen
Jan. 1 to Dec. 31, 2015 Jan. 1 to Dec. 31, 2016
Advertising and sales expansion costs ¥ 33,489 ¥ 29,968
Transportation, storage and packaging costs 37,683 35,681
Personnel costs 59,650 58,366
Others 60,415 58,115
Total ¥191,237 ¥182,130
23. Other Income and ExpensesThe breakdown of other income and expenses is as follows. (1) Other Income
Millions of yen
Jan. 1 to Dec. 31, 2015 Jan. 1 to Dec. 31, 2016
Government Grants ¥ 1,720 ¥1,275
Gain and losses on transfer of business in association with dissolution of joint ventures (Note) 9,636 —
Others 2,131 2,655
Total ¥13,487 ¥3,930
Note: On October 1, 2015, the Company completed the dissolution of the alliance agreement and joint ventures with The Goodyear Tire & Rubber Company. Reflecting this, proceeds from business transfer due to the dissolution of joint ventures have been recorded in the fiscal year ended December 31, 2015. The breakdown of such proceeds is as follows.
(Millions of yen)
Gain on sales of shares of subsidiaries and associates ¥9,067
Gain on step acquisitions 676
Other (107)
Total ¥9,636
(2) Other Expenses
Millions of yen
Jan. 1 to Dec. 31, 2015 Jan. 1 to Dec. 31, 2016
Loss on sales and retirement of non-current assets ¥ 875 ¥ 833
Others 2,292 4,729
Total ¥3,167 ¥5,562

73Sumitomo Rubber Industries Annual Report 2016
24. Financial Income and ExpensesThe breakdown of financial income and costs is as follows.
(1) Financial Income
Millions of yen
Jan. 1 to Dec. 31, 2015 Jan. 1 to Dec. 31, 2016
Interest income
Financial assets measured at amortized cost ¥1,486 ¥1,754
Dividend income
Financial assets measured at fair value through other comprehensive income 874 659
Foreign exchange gains — 740
Gains on valuation of derivatives 244 —
Others — 15
Total ¥2,604 ¥3,168
(2) Financial Expenses
Millions of yen
Jan. 1 to Dec. 31, 2015 Jan. 1 to Dec. 31, 2016
Interest expense
Financial liabilities measured at amortized cost ¥3,834 ¥3,105
Other 642 607
Foreign exchange losses 3,963 —
Losses on valuation of derivatives — 2,704
Total ¥8,439 ¥6,416
25. Earnings per Share(1) Basic Profit per ShareBasic profit per share is as follows.
Jan. 1 to Dec. 31, 2015 Jan. 1 to Dec. 31, 2016
Basic profit per share (yen) ¥274.38 ¥157.69
(2) Calculating Basic Profit per Share The basis for the calculation of basic profit per share is as follows.
Jan. 1 to Dec. 31, 2015 Jan. 1 to Dec. 31, 2016
Profit for the period attributable to owners of parent (millions of yen) ¥71,976 ¥41,364
Weighted average number of common shares outstanding during the period (thousands of shares) 262,320 262,318
Diluted profit per share is not presented because there were no potentially dilutive shares.

74 Sumitomo Rubber Industries Annual Report 2016
26. DividendsInterim and year-end dividends paid to common shareholders are as follows.
January 1 to December 31, 2015(1) Dividends Paid
Resolution date Type of stockTotal dividends paid
(Millions of yen) ResourceDividends per share
(Yen) Record date Effective from:
Mar. 26, 2015 (GMOS)* Common stock 7,870 Retained earnings 30.00 Dec. 31, 2014 Mar. 27, 2015
Aug. 5, 2015 (BOD)** Common stock 6,558 Retained earnings 25.00 Jun. 30, 2015 Sep. 4, 2015
(2) Dividends That Have Become Effective from the Fiscal Year Subsequent to Their Record Date
Resolution date Type of stockTotal dividends paid
(Millions of yen) ResourceDividends per share
(Yen) Record date Effective from:
Mar. 30, 2016 (GMOS)* Common stock 7,870 Retained earnings 30.00 Dec. 31, 2015 Mar. 31, 2016
January 1 to December 31, 2016(1) Dividends paid
Resolution date Type of stockTotal dividends paid
(Millions of yen) ResourceDividends per share
(Yen) Record date Effective from:
Mar. 30, 2016 (GMOS)* Common stock 7,870 Retained earnings 30.00 Dec. 31, 2015 Mar. 31, 2016
Aug. 8, 2016 (BOD)** Common stock 7,870 Retained earnings 30.00 Jun. 30, 2016 Sep. 7, 2016
(2) Dividends That Have Become Effective from the Fiscal Year Subsequent to Their Record Date
Resolution date Type of stockTotal dividends paid
(Millions of yen) ResourceDividends per share
(Yen) Record date Effective from:
Mar. 29, 2017 (GMOS)* Common stock 6,558 Retained earnings 25.00 Dec. 31, 2016 Mar. 30, 2017
* General Meeting of Shareholders** Board of Directors
27. Business Combinations
January 1 to December 31, 2015
Business Combination by means of Acquisition Business combination of Lonstroff Holding AG and its wholly owned subsidiary(1) Overview of Business Combination (i) Name and business of acquired company Name of acquired company: Lonstroff Holdings AG and its wholly owned subsidiary Main business: Manufacture and sale of medical packaging material, medical rubber material, industrial rubber and others
(ii) Purpose of business combination Securing the Company’s own regional bases for the manufacture and sale of medical rubber material in Europe and enhancing the
Group’s global operations mainly in Europe.
(iii) Date of business combination January 30, 2015
(iv) Legal form of business combination Acquisition of shares in exchange for cash payment
(v) Name of acquired company after business combination No change
(vi) Ratio of voting rights acquired Voting right ratio before acquisition: 0% Voting right ratio after acquisition: 100%
(vii) Consideration for acquisition The Company acquired 100% of the voting rights of the parent company through the acquisition of shares in exchange for cash payment.

75Sumitomo Rubber Industries Annual Report 2016
(2) Acquisition Price and Breakdown of the Fair Value of Assets Acquired and Liabilities Assumed on the Acquisition Date
Millions of yen
Acquisition price (Note 1) ¥5,394
Fair value of assets acquired and liabilities assumed
Cash and cash equivalents 72
Trade and other receivables 779
Inventories 317
Property, plant and equipment 2,177
Intangible assets 1,487
Other assets 631
Liabilities (4,696)
Goodwill (Note 2) 4,627
Total ¥5,394
Notes: 1. There was no contingent consideration. 2. Goodwill reflects the expected profitability from future business activities in excess of fair value.
The Company recorded 185 million yen acquisition cost associated with this business combination has been included in selling, general and administrative expenses.
(3) Impact of Business Combination on Cash Flows
Millions of yen
Payment of acquisition cost ¥(5,394)
Cash and cash equivalents 72
Purchase of shares of subsidiaries ¥(5,322)
(4) Business Performance since the Business CombinationOmitted because the impact of the business combination on the consolidated statement of income and consolidated statement of compre-hensive income for the fiscal year ended December 31, 2015 was insignificant.
Business combination of Goodyear Dunlop Tires North America, Ltd.(1) Overview of Business Combination (i) Name of acquiring company/ Name and business of acquired company Name of acquiring company: SRI America, Inc. (a wholly owned consolidated subsidiary of the Company) Name of acquired company: Goodyear Dunlop Tires North America, Ltd. Main business: Manufacture and sale of tires in North America
(ii) Purpose of business combination Enhancing competitiveness by promoting Dunlop-brand original equipment tires for vehicles and motorcycles manufactured by Japanese
automakers in North America and by securing the Group’s regional production, research and development and other bases.
(iii) Date of business combination October 1, 2015
(iv) Legal form of business combination Acquisition of shares in exchange for cash payment
(v) Name of acquired company after business combination Goodyear Dunlop Tires North America, Ltd. (The name was subsequently changed to Sumitomo Rubber USA, LLC on April 1, 2016)
(vi) Ratio of voting rights acquired Voting right ratio before acquisition: 30% (equity interest ratio: 25%) Voting right ratio after acquisition: 100% (equity interest ratio: 100%)
(vii) Consideration for acquisition The Group acquired 100% of the voting rights through the acquisition of shares in exchange for cash payment.
(viii) Other matters concerning the summary of transactions SRI America, Inc. additionally acquired 75% of the shares of Goodyear Dunlop Tires North America, Ltd. The remaining 25% of the lat-
ter’s shares are held by SRI USA, Inc., one of the Company’s consolidated subsidiaries. Consequently, the Group’s ratio of voting rights in Goodyear Dunlop Tires North America, Ltd. is 100%.

76 Sumitomo Rubber Industries Annual Report 2016
(2) Acquisition Price and Breakdown of the Fair Value of Assets Acquired and Liabilities Assumed on the Acquisition Date
Millions of yen
Fair value of shares held before business combination ¥11,699
Fair value of shares additionally acquired at business combination 14,979
Acquisition price (Note 1) 26,678
Fair value of assets acquired and liabilities assumed
Cash and cash equivalents 2,838
Trade and other receivables 9,514
Inventories 5,488
Property, plant and equipment 22,810
Intangible assets 4,224
Other assets 6,786
Liabilities (30,454)
Goodwill (Note 2) 5,472
Total ¥26,678
Notes: 1. There was no contingent consideration. 2. Goodwill reflects the expected profitability from future business activities in excess of fair value.
With the fair-value based remeasurement of equity held by the Company prior to business combination, gains attributable to successive share purchases in the acquired company totaling 676 million yen were recognized. This amount has been included in “Gain and losses on transfer of business in association with dissolution of joint ventures” as part of “Other income.”
(3) Impact of Business Combination on Cash Flows
Millions of yen
Payment of acquisition cost ¥(14,979)
Cash and cash equivalents 2,838
Spending due to business transfer ¥(12,141)
(4) Business Performance since the Business CombinationOmitted because the impact of the business combination on the consolidated statement of income and consolidated statement of compre-hensive income for the fiscal year ended December 31, 2015 was insignificant.
Acquisition of Non-Controlling InterestsOn October 1, 2015, the Company acquired an additional 25% of the shares of Dunlop Goodyear Tires Ltd. in conjunction with the dissolu-tion of the alliance agreement and joint ventures with The Goodyear Tire & Rubber Company. As a result, the Company’s voting rights ratio in Dunlop Goodyear Tires Ltd. increased to 100%. The abovementioned purchases resulted in a ¥127 million difference between the ¥1,679 million cost of the additional share purchases and the ¥1,806 million reduction in the carrying amount of non-controlling interests due to such purchases. This amount was treated as cap-ital surplus.
January 1 to December 31, 2016Omitted due to the absence of significant events.
Pro Forma Information (Not Audited)If the aforementioned business combination had been executed at the beginning of the fiscal year on January 1, 2015, the increase attribut-able to the combination on sales revenue and profit attributable to owners of parent would have totaled at ¥848.5 billion and ¥77 billion, respectively. This is based on the sales revenue and profit recognized at the acquired company during the period immediately preceding the date of acquisition. As the impact of said business combination on the consolidated financial statements for the fiscal year ended December 31, 2016 was insignificant, pro forma information is omitted. This pro forma information is based on the sales revenue and profit recognized at the acquired company during the period immediately preceding the date of acquisition.

77Sumitomo Rubber Industries Annual Report 2016
28. Main Subsidiaries (1) Information on Main SubsidiariesThe Group’s main subsidiaries are as follows.
Name LocationMain
businesses
Date of transition to IFRS As of Jan. 1, 2015 As of Dec. 31, 2015 As of Dec. 31, 2016
Voting right ratio (%)
Equity interest ratio (%)
Voting right ratio (%)
Equity interest ratio (%)
Voting right ratio (%)
Equity interest ratio (%)
DUNLOP TYRE HOKKAIDO Co. Ltd. Japan Tires 100.0 100.0 100.0 100.0 100.0 100.0
DUNLOP MOTORCYCLE CORPORATION Japan Tires 100.0 100.0 100.0 100.0 100.0 100.0
Dunlop Goodyear Tires Ltd. Japan Tires 70.0 75.0 100.0 100.0 — —
Goodyear Japan Ltd. Japan Tires 70.0 75.0 — — — —
Dunlop Retread Service Co., Ltd. Japan Tires 100.0 100.0 100.0 100.0 100.0 100.0
Dunlop Sports Co. Ltd. Japan Sports 60.4 60.4 60.4 60.4 60.4 60.4
Dunlop Sports Marketing Co. Ltd. Japan Sports 100.0(100.0) 60.4 100.0
(100.0) 60.4 100.0(100.0) 60.4
Dunlop Golf Club Corp. Japan Sports 100.0(100.0) 60.4 100.0
(100.0) 60.4 100.0(100.0) 60.4
Sumigomu Sangyou Ltd. Japan Industrial products 100.0 100.0 100.0 100.0 100.0 100.0
Dunlop Home Products, Ltd Japan Industrial products 100.0 100.0 100.0 100.0 100.0 100.0
Sumigomu Takasago Integrate, Ltd Japan Industrial products 66.7 66.7 66.7 66.7 66.7 66.7
P.T. Sumi Rubber Indonesia Indonesia Tires and sports 72.5 72.5 72.5 72.5 72.5 72.5
Sumitomo Rubber (Changshu) Co., Ltd. China Tires 100.0
(100.0) 100.0 100.0(100.0) 100.0 100.0
(100.0) 100.0
Sumitomo Rubber (Hunan) Co., Ltd. China Tires 100.0(100.0) 100.0 100.0
(100.0) 100.0 100.0(100.0) 100.0
Sumitomo Rubber (China) Co., Ltd. China Tires 100.0 100.0 100.0 100.0 100.0 100.0
Sumitomo Rubber (Thailand) Co., Ltd. Thailand Tires 100.0 100.0 100.0 100.0 100.0 100.0
Sumitomo Rubber do Brasil Ltda. Brazil Tires 100.0 100.0 100.0 100.0 100.0 100.0
Sumitomo Rubber South Africa (Pty) Limited
South Africa Tires 100.0 100.0 100.0 100.0 100.0 100.0
Sumitomo Rubber AKO Lastik Sanayi ve Ticaret A. . Turkey Tires 80.0 80.0 80.0 80.0 80.0 80.0
Sumitomo Rubber USA, LLC U.S.A. Tires 30.0(30.0) 25.0 100.0
(100.0)100.0(100.0)
100.0(100.0)
100.0(100.0)
Sumitomo Rubber North America, Inc. U.S.A. Tires 100.0 100.0 100.0 100.0 100.0 100.0
Falken Tyre Europe GmbH Germany Tires 100.0 100.0 100.0 100.0 100.0 100.0
Sumitomo Rubber Middle East FZE U.A.E. Tires 100.0 100.0 100.0 100.0 100.0 100.0
Sumitomo Rubber Australia Pty Ltd. Australia Tires 100.0 100.0 75.0 75.0 75.0 75.0
Srixon Sports Europe Ltd. U.K. Sports 100.0(100.0) 60.4 100.0
(100.0) 60.4 100.0(100.0) 60.4
Cleveland Golf Canada Corp. Canada Sports 100.0(100.0) 60.4 100.0
(100.0) 60.4 100.0(100.0) 60.4
Roger Cleveland Golf Company, Inc. U.S.A. Sports 100.0(100.0) 60.4 100.0
(100.0) 60.4 100.0(100.0) 60.4
Srixon Sports Manufacturing (Thailand) Co., Ltd. Thailand Sports 65.0
(65.0) 39.2 65.0(65.0) 39.2 65.0
(65.0) 39.2
Dunlop Sports Korea Co., Ltd. South Korea Sports 50.0
(50.0) 30.2 50.0(50.0) 30.2 50.0
(50.0) 30.2
Hong Kong Sumirubber, Ltd. Hong Kong Industrial products 100.0 100.0 100.0 100.0 100.0 100.0
Sumirubber Malaysia Sdn. Bhd. Malaysia Industrial products 100.0 100.0 100.0 100.0 100.0 100.0
Zhongshan Sumirubber Precision Rubber Ltd. China Industrial
products 100.0 100.0 100.0 100.0 100.0 100.0
Sumirubber Vietnam, Ltd. Vietnam Industrial products 100.0 100.0 100.0 100.0 100.0 100.0
Lonstroff AG Switzerland Industrial products — — 100.0
(100.0) 100.0 100.0(100.0) 100.0
Notes: 1. Voting right ratio in parentheses signifies the percentage of indirect holdings. 2. Dunlop Goodyear Tires Ltd. was merged by the Company by an absorption-type merger on January 1, 2016.

78 Sumitomo Rubber Industries Annual Report 2016
(2) Changes in Equity in Main Consolidated Subsidiaries Due to the Loss of Control In the fiscal year ended December 31, 2015, the Company sold all of its shares in Goodyear Japan Ltd., a former consolidated subsidiary, in conjunction with the dissolution of the alliance agreement and joint ventures with The Goodyear Tire & Rubber Company. As a result, the Company recognized 356 million yen in proceeds attributable to changes in equity due to the loss of control in consolidated subsidiaries. This amount has been included in “Proceeds from business transfer due to the dissolution of joint ventures” as part of “Other income.” In the fiscal year ended December 31, 2016, no significant profit or loss has been recognized in relation to changes in equity due to changes in control at consolidated subsidiaries.
29. Related Parties(1) Related Party Transactions
January 1 to December 31, 2015Omitted. No significant transaction was undertaken, excepting transactions that were offset in the consolidated financial statements.
January 1 to December 31, 2016Omitted. No significant transaction was undertaken, excepting transactions that were offset in the consolidated financial statements.
(2) Remuneration of Key Managerial Personnel
Millions of yen
Jan. 1 to Dec. 31, 2015 Jan. 1 to Dec. 31, 2016
Basic remuneration ¥471 ¥451
Bonuses 123 115
Total ¥594 ¥566
30. Subsequent EventsBusiness Combination through Acquisition Based on a resolution passed at a Board of Directors meeting held on December 27, 2016, the Company decided to make Micheldever Group Ltd. a wholly owned subsidiary by purchasing all of its shares from private equity fund Graphite Capital Management LLP. Having signed a share transfer agreement dated January 5, 2017 with this fund, the Company acquired such shares on February 10, 2017.
(1) Overview of Business Combination (i) Name of principal company acquired and business Name of principal company acquired: Micheldever Group Ltd. and its subsidiaries Main business: Distribution and retail of tires for automobiles, motorcycles and agricultural machinery as well as other automotive equip-
ment
(ii) Purpose of business combination As part of initiatives aimed at actively expanding the Group’s production capacity and sales network in Europe, this acquisition is intend-
ed to enhance the Falken brand in the UK market.
(iii) Date of business combination February 10, 2017
(iv) Legal form of business combination Acquisition of shares in exchange for cash payment
(v) Name of principal company acquired upon business combination No change
(vi) Ratio of voting rights acquired Voting right ratio before acquisition: 0% Voting right ratio after acquisition: 100%
(vii) Consideration for acquisition The Company acquired 100% of the voting rights through the acquisition of shares in exchange for cash payment.
(2) Acquisition Price as of the Date of the Business Combination Faire value of acquisition price: 22,424 million yen There was no contingent consideration. The fair value of acquisition price includes the price paid to sellers of such shares as well as the cost of repaying the debt of the acquired compa-
ny to its former parent company. In addition, the fair value of goodwill, acquired assets and transferred liabilities has not yet been determined.

79Sumitomo Rubber Industries Annual Report 2016
Significant Business AcquisitionAt the Board of Directors’ meeting held on December 27, 2016, the Company resolved to establish Dunlop International Co. Ltd. jointly with the Company’s sports business subsidiary Dunlop Sports Co. Ltd., and enter into an agreement with Sports Direct International plc, under which the Company will acquire the trademark rights of the DUNLOP brand overseas and the sporting goods and licensing businesses of the DUNLOP brand. The agreement was concluded as of the same date. Necessary approval procedures were subsequently undertaken, and the acquisition of the businesses was completed on April 3, 2017.
(1) Overview of the business acquisition (i) Purpose of business acquisition After the completion of this transaction, the Group, in its tire business, will become the owner and licensor of DUNLOP trademark rights
globally (except in Europe, North America, India and Australia, etc.). As for the sports and industrial products businesses, the acquisition will enable the Group to produce and sell DUNLOP branded products globally. In this transaction, the Group will also acquire Sports Direct International plc’s sporting goods manufacturing and sales business of DUNLOP brand products as well as its licensing business with respect to the trademark rights of the DUNLOP brand.
Dunlop International Co. Ltd. will operate and manage the acquired sporting goods and licensing businesses while the Sumitomo Rubber Group as a whole continues working to create, implement and promote strategies to enhance the global value of the DUNLOP brand and improve the overall profitability of our entire group, including existing businesses.
(ii) Name of the counterparty Sports Direct International plc
(iii) Details of the acquired business Trademark rights of the DUNLOP brand and sporting goods and licensing businesses of the DUNLOP brand
(iv) Date of acquisition April 3, 2017 For the above purpose, a subsidiary was newly established. Its outline is as follows: Name: Dunlop International Co. Ltd. Address: 3-6-9 Wakinohama-cho, Chuo-ku, Kobe, Hyogo Capital: ¥3,000 million Establishment: February 1, 2017 Capital contribution ratio: The Company 66.7%; Dunlop Sports Co. Ltd. 33.3%
(2) Consideration for acquisition as of the acquisition date Fair value of acquisition price ¥16,388 million Acquisition price is calculated provisionally and to be determined after adjusting changes in working capital, etc., based on the agree-
ment. The fair value of acquisition price includes the price paid to sellers as well as the repayment amount of liabilities the acquired company
had incurred from those companies. As the initial accounting process for said acquisition has not been completed, detailed information on the accounting treatment for
business combinations has not been herein disclosed.
31. First-Time Adoption of IFRS(1) Transition to reporting in accordance with IFRS Commencing with the fiscal year under review, the Group discloses consolidated financial statements that have been prepared in confor-
mity with IFRS. The significant accounting policies stated in Note 3. “Significant Accounting Policies” have been applied in the creation of the consolidat-
ed financial statements for the fiscal year under review (from January 1 to December 31, 2016) and the previous fiscal year (from January 1 to December 31, 2015) and the consolidated statement of financial position released on the date of the transition to IFRS (January 1, 2015).
In principle, IFRS 1 calls for the retroactive application of IFRS. However, exemptions can be voluntarily selected for some matters. The Group exercised the following exemptions in its transition from Japanese GAAP (JGAAP) to IFRS.
(i) Business Combinations IFRS 3 can be applied both retroactively and to future combinations. The Group has chosen not to retroactively apply IFRS 3 to business
combinations carried out prior to the transition date. Business combinations carried out prior to the transition date have therefore not been restated.
(ii) Exchange Differences on Translation of Foreign Operations Under IFRS 1, the balance of all exchange differences due to the translation of the results of foreign operations can be treated as zero on
the date of the transition, or the exchange differences can be retroactively recalculated to the date of a subsidiary or affiliate being founded or acquired. The Group has opted to treat all exchange differences on translating foreign operations as zero.

80 Sumitomo Rubber Industries Annual Report 2016
(iii) Recognition of Financial Instruments Specified Prior to the Transition Date Under IFRS 1, financial instruments can be specified according to IFRS 9 Financial Instruments based on the facts and circumstances exist-
ing on the transition date. The Group specified its financial instruments held based on the circumstances on the transition date.
The Group made necessary adjustments to the consolidated financial statements prepared in conformity with JGAAP when preparing consolidated financial statements for the previous fiscal year and consolidated financial statements on the transition date to IFRS in conformity with IFRS. The impact of the transition from JGAAP to IFRS is as stated below in “(2) Adjustments to Equity on the Transition Date (January 1, 2015)” and on the following pages.
In the adjustments table, “Reclassification” includes items that do not affect retained earnings or comprehensive income and “Differences in Recognition and Measurement” includes items that affect retained earnings and comprehensive income.
(2) Adjustments to Equity on the Transition Date (January 1, 2015)
Millions of yen
JGAAP Line Item JGAAP Reclassification
Difference in recognition and
measurement IFRS Note IFRS Line Item
Assets Assets
Current assets: Current assets:
Cash and time deposits ¥ 54,476 ¥ (893) ¥ 70 ¥ 53,653 Cash and cash equivalents
Notes and accounts receivable 210,027 3,642 (1,274) 212,395 A, G Trade and other receivables
Allowance for doubtful accounts (2,020) 2,020 — —
— 3,954 (35) 3,919 B Other financial assets
Inventories 142,043 — (1,742) 140,301 H Inventories
Deferred tax assets 11,950 (11,950) — — C
Other 23,820 (8,722) 1,808 16,906 A, B Other current assets
Total current assets 440,296 (11,949) (1,173) 427,174 Total current assets
Non-current assets: Non-current assets:
Property, plant and equipment 359,955 — 2,479 362,434 Property, plant and equipment
Intangible non-current assets (goodwill) 10,465 — (4,570) 5,895 I Goodwill
Intangible non-current assets (other) 20,185 — (4,853) 15,332 Other intangible assets
— 48,106 (364) 47,742D Investments accounted for
using equity method
— 53,525 621 54,146 B Other financial assets
Investments in securities 81,430 (81,430) — — B, D
Long-term loans 1,280 (1,280) — — B
Retirement benefit plan assets 30,133 — (7,777) 22,356 K Retirement benefit plan assets
Deferred tax assets 6,686 11,950 (4,950) 13,686 C, J Deferred tax assets
Other 24,082 (19,847) 1,430 5,665 B, H Other non-current assets
Allowance for doubtful accounts (925) 925 — —
Total non-current assets 533,291 11,949 (17,984) 527,256 Total non-current assets
Total assets ¥973,587 ¥ — ¥(19,157) ¥954,430 Total assets

81Sumitomo Rubber Industries Annual Report 2016
Millions of yen
JGAAP Line Item JGAAP Reclassification
Difference in recognition and
measurement IFRS Note IFRS Line Item
Liabilities Liabilities and equity
Liabilities:
Current liabilities: Current liabilities
Short-term borrowings ¥ 82,008 ¥ 29,812 ¥ 1,479 ¥113,299 E, G Bonds and loans payable
Current portion of long-term debt 28,812 (28,812) — — E
Commercial paper 1,000 (1,000) — — E
Notes and accounts payable 74,990 55,268 (1,460) 128,798 A Trade and other payables
— 1,936 479 2,415 B Other financial liabilities
Lease obligations 1,644 (1,644) — — B
Accrued accounts payable 57,132 (57,132) — — A
Accrued income taxes 12,714 — — 12,714 Income tax payable
— 4,204 1,980 6,184 F Provisions
Accrued bonuses 4,564 (4,564) — — F
Accrued bonuses for directors and corporate auditors 162 (162) — — F
Provision for sales returns 2,106 (2,106) — — F
Provision for sales rebate 555 (555) — — F
Provision for loss on voluntary recall of products 181 (181) — — F
Other 26,437 4,920 (1,050) 30,307 B, C, F, L Other current liabilities
Total current liabilities 292,305 (16) 1,428 293,717 Total current liabilities
Current liabilities directly r elated to assets held for sale
Long-term liabilities: Non-current liabilities:
Corporate bonds 65,000 113,184 173 178,357 E Bonds and loans payable
Long-term debt 113,184 (113,184) — — E
— 4,099 1,290 5,389 B Other financial liabilities
Accrued pension and retirement benefits 17,018 — 1,122 18,140 K Net defined benefit liability
— 927 112 1,039 F Provisions
Provision for retirement benefits for directors and corporate auditors 115 (115) — — F
Deferred tax liabilities 21,981 15 (11,740) 10,256 C, J Deferred tax liabilities
Lease obligations (long-term) 4,099 (4,099) — — B
Other 12,925 (811) 5,326 17,440 F, K, L Other non-current liabilities
Total long-term liabilities 234,322 16 (3,717) 230,621 Total non-current liabilities
Total liabilities 526,627 — (2,289) 524,338 Total liabilities
Net assets Equity
Common stock 42,658 — — 42,658 Capital stock
Capital surplus 38,661 — (872) 37,789 Capital surplus
Retained earnings 265,997 — 38,153 304,150 N Retained earnings
Treasury stock (559) — — (559) Treasury stock
Total accumulated other comprehensive income 66,617 — (51,996) 14,621 K, M
Other components of equity
413,374 — (14,715) 398,659 Total equity attributable to
owners of parent
Minority interests 33,586 — (2,153) 31,433 Non-controlling interests
Total net assets 446,960 — (16,868) 430,092 Total equity
Total liabilities and net assets ¥973,587 ¥ — ¥(19,157) ¥954,430 Total liabilities and equity

82 Sumitomo Rubber Industries Annual Report 2016
(3) Adjustments to Equity as of December 31, 2015
Millions of yen
JGAAP Line Item JGAAP Reclassification
Difference in recognition and
measurement IFRS Note IFRS Line Item
Assets Assets
Current assets: Current assets:
Cash and time deposits ¥ 53,569 ¥ (48) ¥ 35 ¥ 53,556 Cash and cash equivalents
Notes and accounts receivable 189,888 909 (857) 189,940 A, G Trade and other receivables
Allowance for doubtful accounts (2,070) 2,070 — —
— 5,455 15 5,470 B Other financial assets
Inventories 147,180 — (2,673) 144,507 H Inventories
Deferred tax assets 10,122 (10,122) — — C
Other 34,719 (8,386) 1,555 27,888 A, B Other current assets
Total current assets 433,408 (10,122) (1,925) 421,361 Total current assets
Non-current assets: Non-current assets:
Property, plant and equipment 367,930 — 3,200 371,130 Property, plant and equipment
Intangible non-current assets (goodwill) 18,251 — (2,628) 15,623 I Goodwill
Intangible non-current assets (other) 21,366 — (573) 20,793 Other intangible assets
— 4,049 (4) 4,045D
Investments accounted for using equity method
— 56,168 575 56,743 B Other financial assets
Investments in securities 36,976 (36,976) — — B, D
Long-term loans 8,063 (8,063) — — B
Net defined benefit assets 24,167 — — 24,167 K Net defined benefit assets
Deferred tax assets 6,516 10,122 (3,538) 13,100 C, J Deferred tax assets
Other 20,337 (16,038) 1,171 5,470 B, H Other non-current assets
Allowance for doubtful accounts (860) 860 — —
Total non-current assets 502,746 10,122 (1,797) 511,071 Total non-current assets
Total assets 936,154 ¥ — ¥(3,722) ¥932,432 Total assets

83Sumitomo Rubber Industries Annual Report 2016
Millions of yen
JGAAP Line Item JGAAP Reclassification
Difference in recognition and
measurement IFRS Note IFRS Line Item
Liabilities and equity
Liabilities Liabilities
Current liabilities: Current liabilities:
Short-term borrowings ¥ 64,586 ¥ 59,163 ¥ 1,424 ¥125,173 E, G Bonds and loans payable
Current portion of long-term debt 37,163 (37,163) — — E
Current portion of corporate bonds 10,000 (10,000) — — E
Commercial paper 12,000 (12,000) — — E
Notes and accounts payable 73,684 47,958 (1,879) 119,763 A Trade and other payables
— 2,078 274 2,352 B Other financial liabilities
Lease obligations (short-term) 1,768 (1,768) — — B
Accrued accounts payable 49,437 (49,437) — — A
Accrued income taxes 3,517 — — 3,517 Income tax payable
— 3,746 1,414 5,160 F Provisions
Accrued bonuses 3,974 (3,974) — — F
Accrued bonuses for directors and corporate auditors 123 (123) — — F
Provision for sales returns 2,062 (2,062) — — F
Provision for sales rebate 549 (549) — — F
Provision for loss on voluntary recall of products 131 (131) — — F
Other 25,176 4,243 (230) 29,189 B, C, F, L Other current liabilities
Total current liabilities 284,170 (19) 1,003 285,154 Total current liabilities
Long-term liabilities: Non-current liabilities:
Corporate bonds 55,000 75,657 220 130,877 E Bonds and loans payable
Long-term debt 75,657 (75,657) — — E
— 4,458 1,081 5,539 B Other financial liabilities
Accrued pension and retirement benefits 22,817 — 4 22,821 K
Net defined benefit liability
— 1,096 118 1,214 F Provisions
Provision for retirement benefits for directors and corporate auditors 109 (109) — — F
Deferred tax liabilities 19,636 19 (9,545) 10,110 C, J Deferred tax liabilities
Lease obligations (long-term) 4,458 (4,458) — — B
Other 20,539 (987) 5,328 24,880 F, K, L Other non-current liabilities
Total long-term liabilities 198,216 19 (2,794) 195,441 Total non-current liabilities
Total liabilities 482,386 — (1,791) 480,595 Total liabilities
Net Assets Equity
Common stock 42,658 — — 42,658 Capital stock
Capital surplus 38,661 — (745) 37,916 Capital surplus
Retained earnings 301,712 — 58,431 360,143 N Retained earnings
Treasury stock (567) — — (567) Treasury stock
Total accumulated other comprehensive income 41,393 — (59,256) (17,863) K. M Other components of equity
423,857 — (1,570) 422,287Total equity attributable to owners of parent
Minority interests 29,911 — (361) 29,550 Non-controlling interests
Total net assets 453,768 — (1,931) 451,837 Total equity
Total liabilities and net assets ¥936,154 ¥ — ¥ (3,722) ¥932,432 Total liabilities and equity

84 Sumitomo Rubber Industries Annual Report 2016
(4) Notes Related to Equity AdjustmentsA summary of the primary adjustments follows.
(i) Reclassification of Line Items A. Reclassification of Accrued Accounts Receivable and Payable “Accrued accounts receivable,” which were included in “Other” of current assets under JGAAP, are now stated as “Trade and other
receivables” under IFRS. “Accrued accounts payable,” which were listed separately under JGAAP, are now partially reclassified to “Trade and other payables” under IFRS.
B. Reclassification of Other Financial Assets and Liabilities “Short-term loans” and “Derivatives,” which were included in “Other” of current assets under JGAAP, are now stated as “Other finan-
cial assets” (current) under IFRS. In addition, derivative assets included in “Other” of total investments and other assets under JGAAP, as well as “Long-term loans,” which were listed separately thereunder, are now stated as “Other financial assets” (non-current) under IFRS. “Investments in securities,” which were listed separately under JGAAP, is now partially included in the same item under IFRS.
“Lease obligations,” which were listed separately as current liabilities and long-term liabilities under JGAAP, are now stated as “Other financial liabilities” (current) and “Other financial liabilities” (non-current) respectively under IFRS. In addition, derivative liabilities, which were included in “Other” of current liabilities under JGAAP, are now stated as “Other financial liabilities” (current) under IFRS.
C. Reclassification of Deferred Tax Assets and Liabilities “Deferred tax assets,” which were listed separately under JGAAP, are now stated as a non-current line item under IFRS. In addition,
deferred tax liabilities, which were included under “Other” of current liabilities under JGAAP, are now stated as a non-current line item under IFRS.
D. Reclassification of Investments Accounted For Using Equity Method “Investments accounted for using equity method,” which were included in “Investments in securities” under JGAAP, are now listed sepa-
rately.
E. Reclassification of Corporate Bonds, Commercial Paper, and Borrowings “Short-term borrowings,” “Current portion of long-term debt,” “Current portion of corporate bonds,” and “Commercial paper,” which
were all stated separately as current liabilities under JGAAP, are now stated as “Bonds and loans payable” (current) under IFRS. In addi-tion, “Corporate bonds” and “Long-term debt,” which were listed separately as long-term liabilities under JGAAP, are now stated as “Bonds and loans payable” (non-current) under IFRS.
F. Reclassification of Provisions “Accrued bonuses” and “Accrued bonuses for directors and corporate auditors,” which were listed separately as current liabilities under
JGAAP, are now stated as “Other current liabilities” under IFRS. “Provision for sales returns,” “Provision for sales rebate” and “Provision for loss on voluntary recall of products,” which were all listed separately as current liabilities under JGAAP, and asset retirement obliga-tion that was included in “Other” of current liabilities under JGAAP, are now stated as “Provisions” (current) under IFRS. “Provision for retirement benefits for directors and corporate auditors,” which was listed separately as long-term liabilities under JGAAP, is now stated as “Other non-current liabilities” under IFRS. In addition, asset retirement obligation which was included in “Other” of long-term liabili-ties under JGAAP is now stated as “Provisions” (non-current) under IFRS.
(ii) Notes Related to Differences in Recognition and Measurement G. Derecognition of Trade Notes Discounted Under JGAAP, trade notes cease to be recognized as financial assets at the time they are discounted. However, IFRS discontinues recogni-
tion at the time the recourse obligation is eliminated. Therefore, net discounted trade notes are now stated under “Trade and other receivables” and “Bonds and loans payable” (current).
H. Reclassification of Supplies and Long-Term Prepaid Expenses Assets for advertisements and sales promotion, which were included in inventories and “Other” under investments and other assets
under JGAAP, have been reclassified as retained earnings because they do not meet the definition of assets under IFRS.
I. Adjustments to the Carrying Amounts of Goodwill Under JGAAP, goodwill is amortized on a straight-line basis over a period of 20 years or less. For each asset unit that includes goodwill,
comparisons of the carrying amount and non-discounted cash flows are undertaken whenever signs of impairment are detected. Impairment loss is thus recognized for only those assets whose non-discounted cash flows fall short of their carrying amounts and to the extent recoverable based on discounted cash flows.
Under IFRS, however, goodwill is not amortized and is subject to annual impairment testing regardless of whether or not signs of impairment are detected. For each cash-generating unit that carries goodwill, comparisons are undertaken of the carrying amount and recoverable amounts based on discounted cash flows. Subsequently, impairment loss is recognized based on the extent recoverable utiliz-ing discounted cash flows.
Also, under JGAAP, the Group determines whether or not impairment loss should be recognized by using a larger asset grouping to encompass goodwill, and using one or more asset groups related to operations where such goodwill exists. On the other hand, under IFRS the Group allocates goodwill to individual cash-generating units or cash-generating unit groups, which were defined to monitor goodwill for the purpose of internal management and represent the minimum organizational unit that is expected to bring benefits by creating synergies attributable to business combination. Such allocation is undertaken from the date of acquisition.

85Sumitomo Rubber Industries Annual Report 2016
In line with its business plan as of the date of transition to IFRS, the Group tested each cash-generating unit/group for impairment. As a result, recoverable amounts based on discounted cash flows fell short of the carrying amounts of such cash-generating units/groups that carry goodwill. Based on this, the Group has recognized a 4,511 million yen impairment loss on goodwill associated with Roger Cleveland Golf Company, Inc., as of the date of transition to IFRS. This impairment loss is recognized in the Sports segment.
In addition, the recoverable amount is calculated based on value in use. Value in use is the present value of future cash flows calculat-ed under the business plan for a period of up to 5 years, a management-approved formula that incorporates average market growth rates, past experience and external input, with the discount rate set at the pre-tax weighted average cost of capital (WACC) for each cash-generating unit. The average market growth rate is determined by referring to the inflation rate of the market where a cash gener-ating unit operates and by taking future uncertainties into account. At the time of impairment loss recognition, value in use was deter-mined using the aforementioned grouping of cash generating units. Value in use amounted to 1,511 million yen, based on a discount rate of 14.6% and growth rate of 0%.
In reference to Paragraph 32 of “Practical Guidelines on Accounting Standards for Capital Consolidation Procedures in Preparing Consolidated Financial Statements” (Accounting Practice Committee Statement No.7, published by The Japanese Institute of Certified Public Accountants (JICPA); final revision: November 28, 2014), a 3,948 million yen temporary amortization of goodwill associated with Roger Cleveland Golf Company, Inc. , was posted as extraordinary loss in the JGAAP-based consolidated financial statements for the fis-cal year ended December 31, 2015.
J. Adjustments to Deferred Tax Assets Under JGAAP, deferred tax assets were recognized based on company classification, as defined by the JICPA Audit Committee Report No.
66 entitled, “Audit Treatment of Judgments Regarding the Recoverability of Deferred Tax Assets.” Under IFRS, however, deferred tax assets resulting from unused tax losses and deductible temporary differences are recognized when a manager determines that they are likely be used to offset expected taxable income.
In addition, under JGAAP tax effects associated with the elimination of unrealized gains were calculated using the statutory effective tax rate applied to the company being acquired. Under IFRS, such calculation is performed using the statutory effective tax rate applied to the acquiring company.
K. Adjustments to Employee Benefits Unused paid vacation and special vacation and incentives that are given after a certain number of years of employment, which were not
required to be accounted for under JGAAP, are now recorded as liabilities under IFRS. Furthermore, under JGAAP, prior service costs and actuarial gains and losses are recognized as other comprehensive income in the fis-
cal year they are incurred and are amortized on a straight-line basis over a fixed number of years that falls within the average remaining service period of employees, commencing with the fiscal year they are incurred. Under IFRS, however, remeasurements of defined benefit plan, which include actuarial differences, are recognized as other comprehensive income in the fiscal year they are incurred and then immediately reclassified as retained earnings. All past service costs are treated as profit or loss as they are incurred.
Under JGAAP, the Group had changed methods for the determination of the retirement benefit obligation and current service costs and the discount rate from the fiscal year ended March 31, 2015. More specifically, the Group changed the method of attributing expected benefit to periods to a benefit formula basis. Moreover, the Group had decided to apply a single weighted-average rate that reflects the projected payment period of retirement benefits and the projected payment amount for the period to determine the discount rate. Under IFRS, the Group will continue to use the same methods to determine the remaining retirement benefit obligation and current service costs as of and after the date of transition to IFRS.
L. Adjustments to Government Subsidies Under JGAAP, all government subsidies were recognized as profit at the time of receipt. Under IFRS, however, these subsidies are subject to
deferred accounting treatment. More specifically, the Group recognizes these subsidies on a straight-line basis over the useful lives of assets to which such subsidies are applied, with liabilities being recognized in “Other current liabilities” and “Other non-current liabilities.”
M. Reclassification of Cumulative Exchange Differences on Translating Foreign Operations On this first-time adoption of IFRS, the Group opted for exemptions defined by IFRS 1 and reclassified all cumulative exchange differenc-
es as retained earnings on the transition date.

86 Sumitomo Rubber Industries Annual Report 2016
N. Adjustments for Retained Earnings
Millions of yen
Date of transition to IFRS As of Jan. 1, 2015
FY 2015As of Dec. 31, 2015
Reclassification of supplies and long-term prepaid expenses ¥ (3,326) ¥ (3,085)
Adjustments to government subsidies (3,157) (3,097)
Adjustments to carrying amounts of goodwill (2,811) 955
Adjustments to deferred tax assets 308 3,098
Adjustments to employee benefits (16,978) (13,628)
Reclassification of cumulative currency translation differences of foreign operations 62,618 62,618
Proceeds from business transfer due to the dissolution of joint ventures (Note) — 9,477
Other 1,499 2,093
Total adjustments for retained earnings ¥38,153 ¥58,431
Note: The increase in “Proceeds from business transfer due to the dissolution of joint ventures,” which had been listed as extraordinary income under JGAAP, is attribut-able to the reclassification to retained earnings of cumulative currency translation differences of foreign operations and remeasurements of defined benefit plan. Under IFRS, this item is included in “Other income.”
(5) Adjustments to Profits (Losses) and Comprehensive Income in the Year Ended December 31, 2015
Millions of yen
JGAAP Line Item JGAAP Reclassification
Difference in recognition and
measurement IFRS Note IFRS Line Item
Sales revenue ¥848,663 ¥ — ¥(50,180) ¥798,483 C Sales revenue
Cost of sales (523,217) — (5,176) (528,393) C, D, F Cost of sales
Gross profits Gross profit
325,446 — (55,356) 270,090
Selling, general and administrative expenses (248,379) 8 57,134 (191,237)
C, D, E, F
Selling, general and administrative expenses
— 3,929 9,558 13,487 A, G Other income
— (7,211) 4,044 (3,167) A Other expenses
Operating income 77,067 (3,274) 15,380 89,173 Operating profit
Other income 12,120 (12,120) — — A
Other expenses (10,293) 10,293 — — A
Extraordinary income 232 (232) — — A
Extraordinary loss (5,197) 5,197 — — A
— 2,861 (257) 2,604 A Financial income
— (8,287) (152) (8,439) A Financial expenses
— 5,562 51 5,613 A Equity in earnings of affiliates
Income before income taxes and minority interests
Profit before tax
73,929 — 15,022 88,951
Corporate taxes, resident taxes, and business taxes (15,617) (2,184) 2,714 (15,087) B, H Income tax expenses
Corporate tax adjustments (2,184) 2,184 — — B
Income before minority interests 56,128 — 17,736 73,864 Profit
Other comprehensive income Other comprehensive income
Items that will not be reclassified to profit or loss
Net unrealized gains and losses on available-for-sale securities
423 — 54 477
Financial assets measured at fair value through other com-prehensive income
Cumulative remeasurements of defined benefit plan 626 — 590 1,216 F
Remeasurements of defined benefit plan

87Sumitomo Rubber Industries Annual Report 2016
Millions of yen
JGAAP Line Item JGAAP Reclassification
Difference in recognition and
measurement IFRS Note IFRS Line Item
— — (2,803) (2,803)
Share of other comprehensive income of associates accounted for using the equity method
Items that may be reclassified subsequently to profit or loss
Deferred gains and losses on hedges (588) — 475 (113) Cash flow hedges
Currency translation adjustments(33,674) — 117 (33,557)
Currency translation differences of foreign operations
Share of other comprehensive income of affiliates under the equity method
6,756 — (6,757) (1)
Share of other comprehensive income of associates accounted for using the equity method
Total other comprehensive income(26,457) — (8,324) (34,781)
Other comprehensive income, net of tax
Total other comprehensive income ¥ 29,671 ¥ — ¥ 9,412 ¥ 39,083 Comprehensive income
(6) Notes Related to Adjustments to Profits (Losses) and Comprehensive IncomeThe main adjustments to profit (loss) and comprehensive income follow.
(i) Reclassification of Line Items A. Adjustments to Line Items Items that were stated as “Other income,” “Other expenses,” “Extraordinary income,” and “Extraordinary loss” under JGAAP are now
stated under IFRS as “Financial income” and “Financial expenses” for profit or loss related to finance and as “Other income,” “Other expenses,” and “Equity in earnings of affiliates” for all other items.
B. Income Tax Expenses “Corporate taxes, resident taxes and business taxes” as well as “Income tax adjustments,” which were listed separately under JGAAP, are
now stated as “Income tax expenses” under IFRS.
(ii) Notes Related to Differences in Recognition and Measurement C. Adjustments to Sales Revenue A portion of rebates and other items that was stated as selling, general and administrative expenses under JGAAP is now deducted from
sales revenue under IFRS. In addition, under JGAAP losses attributable to sales returns have been directly deducted from gross sales reve-nue based on estimated losses on product returns by referring to the past record of such returns. Under IFRS, however, the estimated losses on returns and sales costs of corresponding products are presented as deductions from “Sales revenue” and “Sales costs,” respectively.
D. Scope of Inventory Costs Under JGAAP, transportation and distribution costs, including those for product delivery to customers, were amortized as incurred. Under
IFRS, all transportation and distribution expenses incurred in bringing such inventories to their present location and state, are included in inventory costs.
E. Adjustments Related to the Amortization of Goodwill Under JGAAP, the period of amortization for goodwill is based on an estimate of the appropriate number of years. Under IFRS, Under
IFRS, goodwill is not amortized. Furthermore, the amortization of goodwill that was recognized as extraordinary loss in the previous fiscal year under JGAAP has
already been recognized as of the date of the transition to IFRS.
F. Accounting Method for Retirement Benefits Under JGAAP, actuarial differences and past service costs were recognized as other comprehensive income when they were incurred.
These items were amortized on a straight-line basis over a fixed number of years that was within the average remaining service period of employees. Under IFRS, remeasurements of defined benefit plan, including actuarial differences, are recognized as other comprehensive income when they are incurred and immediately reclassified as retained earnings. All past service costs are immediately treated as profit or loss when they are incurred.
G. Adjustments to Proceeds from Business Transfer Due to the Dissolution of Joint Ventures “Proceeds from business transfer due to the dissolution of joint ventures,” which have been listed as extraordinary income under JGAAP,
increased due to the reclassification to retained earnings of cumulative currency translation differences of foreign operations and remea-surements of defined benefit plan (stated as part of other comprehensive income). Under IFRS, this item is included in “Other income.”

88 Sumitomo Rubber Industries Annual Report 2016
H. Income Tax Expenses Under JGAAP, tax effects associated with the elimination of unrealized gains were calculated using the statutory effective tax rate applied to the
company being acquired. Under IFRS, such calculation is performed using the statutory effective tax rate applied to the acquiring company.
(7) Material Adjustments to the Consolidated Statement of Cash Flows for the Year Ended December 31, 2015There are no material differences in the consolidated statement of cash flows disclosed in conformity with JGAAP and the consolidated statement of cash flows disclosed in conformity with IFRS for the year ended December 31, 2015.
(2) Other
Quarterly Information for the Fiscal Year under Review
Cumulative Period Q1 Q2 Q3 Current fiscal year
Sales revenue (millions of yen) ¥182,656 ¥373,566 ¥560,453 ¥804,964
Quarterly income before tax adjustment (millions of yen) 20,149 36,728 48,734 79,356
Quarterly income attributable to owners of parent (millions of yen) 16,751 28,107 37,656 49,937
Quarterly income per share (yen) ¥63. 86 ¥107.15 ¥143.55 ¥190.37
Accounting Period Q1 Q2 Q3 Current fiscal year
Quarterly income per share (yen) ¥63.86 ¥43.29 ¥36.40 ¥46.82
Notes: 1. Quarterly information for the current fiscal year is prepared in conformity with JGAAP. 2. No audits or reviews were conducted by an auditing firm for the current fiscal year or for the fourth quarter.

89Sumitomo Rubber Industries Annual Report 2016
Independent Auditors’ Report

90 Sumitomo Rubber Industries Annual Report 2016
JAPAN
OFFICES
Head Offi ce3-6-9, Wakinohama-cho,Chuo-ku, Kobe,Hyogo 651-0072, JapanTel: (078) 265-3000Fax: (078) 265-3111
Tokyo Head Offi ce3-3-3, Toyosu, Koto-ku,Tokyo 135-6005, JapanTel: (03) 5546-0111Fax: (03) 5546-0140
OTHER FACTORIES AND TEST COURSESShirakawa FactoryNagoya FactoryIzumiotsu FactoryMiyazaki FactoryKakogawa FactoryTyre Technical CenterOkayama Tire Proving GroundNayoro Tire Proving GroundAsahikawa Tire Proving GroundCentral Training CenterShirakawa Training Center
MAJOR GROUP COMPANIES
DUNLOP TYRE HOKKAIDO Co. Ltd.Sapporo, Hokkaido
DUNLOP TYRE TOHOKU Co. Ltd.Sendai, Miyagi
DUNLOP TYRE KANTO Co. Ltd.Saitama, Saitama
DUNLOP TYRE CHUO Co. Ltd.Minato-ku, Tokyo
DUNLOP TYRE CHUBU Co. Ltd.Nagoya, Aichi
DUNLOP TYRE HOKURIKU Co. Ltd.Kanazawa, Ishikawa
DUNLOP TYRE KINKI Co. Ltd.Osaka, Osaka
DUNLOP TYRE CHUGOKU Co. Ltd.Hiroshima, Hiroshima
DUNLOP TYRE SHIKOKU Co. Ltd.Takamatsu, Kagawa
DUNLOP TYRE KYUSYU Co. Ltd.Fukuoka, Fukuoka
DUNLOP MOTORCYCLE CORPORATION Taito-ku, Tokyo
Dunlop Retread Service Co., Ltd.Ono, Hyogo
SRI Logistics Ltd.Kobe, Hyogo
Nakata Engineering Co., Ltd.Kobe, Hyogo
Dunlop Sports Co. Ltd.Kobe, Hyogo
Dunlop Golf Club Corp.Miyakonojyo, Miyazaki
Dunlop Sports Marketing Co. Ltd.Minato-ku, Tokyo
Dunlop Sports EnterprisesAshiya, Hyogo
Dunlop Sports Wellness Co. Ltd.Chiba-shi, Chiba
Dunlop Golf School Co. Ltd.Osaka, Osaka
Dunlop Tennis School Co. Ltd.Minato-ku, Tokyo
Sumigomu Sangyou Ltd.Osaka, Osaka
Dunlop Home Products, LtdOsaka, Osaka
Sumigomu Takasago Integrate, Ltd.Kobe, Hyogo
OVERSEAS
OFFICES AND TEST COURSES
1 Brussels Offi ceDiegem, Belgium
2 U.S. Tire Test CourseAlabama, U.S.A.
MAJOR GROUP COMPANIES
3 Sumitomo Rubber (China) Co., Ltd.Jiangsu Province, China
4 Sumitomo Rubber (Changshu) Co., Ltd.Jiangsu Province, China
5 Sumitomo Rubber (Hunan) Co., Ltd.Hunan Province, China
6 Sumitomo Rubber (Thailand) Co., Ltd.Rayong, Thailand
7 P.T. Sumi Rubber IndonesiaJakarta, Indonesia
8 Sumitomo Rubber USA, LLCNew York, U.S.A.
9 Sumitomo Rubber do Brasil Ltda.Parana State, Brazil
10 Sumitomo Rubber AKO Lastik Sanayi ve Ticaret A.Ş.Cankiri Province, Turkey
11 Sumitomo Rubber South Africa (Pty) LimitedKwaZulu-Natal, South Africa
12 Kou Chu Rubber Co., Ltd.Taipei, Taiwan
13 Falken Tyre India Private LimitedHaryana, India
14 Dunlop Tire (Thailand) Co., Ltd.Bangkok, Thailand
15 Sumitomo Rubber Asia (Tyre) PTE. Ltd.Singapore, Singapore
16 Sumitomo Rubber Australia Pty. Ltd.Sydney, Australia
17 Sumitomo Rubber North America, Inc.California, U.S.A.
18 Sumitomo Rubber Latin America LimitadaSantiago, Chile
19 Dunlop Tire CIS LLCMoscow, Russia
20 Falken Tyre Europe GmbHOffenbach, Germany
21 Sumitomo Rubber Middle East FZEDubai, UAE
22 Sumirubber Thai Eastern Corporation Co., Ltd.Udon Thani, Thailand
23 SRI USA, Inc.Delaware, U.S.A.
24 Sumitomo Rubber Europe GmbHHanau, Germany
25 Srixon Sports Manufacturing (Thailand) Co., Ltd.Prachinburi, Thailand
26 Roger Cleveland Golf Company, Inc.California, U.S.A.
27 Dunlop Sports Korea Co., Ltd.Seoul, South Korea
28 Srixon Sports Asia Sdn. Bhd.Selangor Darul Ehsan, Malaysia
29 Srixon Sports Europe Ltd.Hampshire, UK
30 Zhongshan Sumirubber Precision Rubber Ltd.Guangdong Province, China
31 Sumirubber Vietnam, Ltd.Haiphong, Vietnam
32 Sumirubber Malaysia Sdn. Bhd.Kedah, Malaysia
33 Lonstroff AGAargau, Switzerland
34 Hong Kong Sumirubber, Ltd.Hong Kong, China
25
33
21
32
17
9
16 18
2
823
3031
19
10
11
13
15
7
146
45
3
1 20
28
2627
34
22
29 24
12
Offices and Test Courses Factories and Production Subsidiaries
Sales Subsidiaries Major Affiliates
Global Network (As of May 2017)

91Sumitomo Rubber Industries Annual Report 2016
0
500
1,000
1,500
2,000
2,500
I II III IV I II III IV I I II III IV III III IV
2013 20172014 2015 2016
(Yen)
Stock price
Investor Information (As of December 31, 2016)
paid-in Capital
¥42,658,014 thousand
number of Shares of Common Stock
Authorized: 800,000,000
Issued: 263,043,057
number of Shareholders
21,325
Major Shareholders
Sumitomo Electric Industries, Ltd. ............................. 28.76%
JP MORGAN CHASE BANK 385632 ............................. 3.76%
Japan Trustee Services Bank, Ltd. (Trust Account) ........ 2.85%
The Master Trust Bank of Japan, Ltd. (Trust Account) ... 2.73%
Sumitomo Mitsui Banking Corporation ....................... 1.99%
Sumitomo Corporation ............................................... 1.83%
National Mutual Insurance Federation of
Agricultural Cooperatives .......................................... 1.55%
THE BANK OF NEW YORK MELLON 140044 ................ 1.45%
CBNY-ORBIS SICAV ..................................................... 1.37%
Japan Trustee Services Bank, Ltd. (Trust9) .................... 1.26%
Note: The percentage of shares in the above list was calculated using the total number of shares of common stock, excluding 726,168 shares of treasury stock.
Stock Exchange Listing
Tokyo
Ticker Symbol
5110
Transfer agent and Special
account Management
Institution
Sumitomo Mitsui Trust Bank,
Limited
1-4-1, Marunouchi,
Chiyoda-ku, Tokyo, Japan
Independent auditors
KPMG AZSA LLC
3-6-5, Kawaramachi,
Chuo-ku, Osaka, Japan

Public Relations Department3-6-9, Wakinohama-cho, Chuo-ku, Kobe, Hyogo 651-0072, JapanTEL: (078) 265-3004 FAX: (078) 265-3113
http://www.srigroup.co.jp/english/ PRINTED IN JAPAN
Annual Report
2016
SU
MIT
OM
O R
UB
BE
R IN
DU
ST
RIE
S A
NN
UA
L R
EP
OR
T 2
01
6

Consolidated Financial Statements
U.S. dollar amounts are converted solely for convenience at the rate of \116 per US$1.00,
the approximate exchange rate prevailing at December 31,2016.
Consolidated Statement of Financial PositionSumitomo Rubber Industries, Ltd. and its Consolodated Subsidaries
Thousands of U.S. dollars
Assets
Current assets
Cash and cash equivalents 462,526 461,690 573,207
Trade and other receivables 1,830,991 1,637,414 1,576,336
Other financial assets 33,784 47,155 32,940
Inventories 1,209,491 1,245,750 1,198,216
Other current assets 145,743 240,414 175,844
Total current assets 3,682,535 3,632,423 3,556,543
Non-current assets
Property, plant and equipment 3,124,431 3,199,397 3,131,836
Goodwill 50,819 134,681 132,336
Intangible assets 132,172 179,250 184,871
Investments accounted for using equity method 411,569 34,871 35,095
Other financial assets 466,776 489,164 355,509
Net defined benefit asset 192,724 208,336 177,888
Deferred tax assets 117,983 112,931 119,724
Other non-current assets 48,836 47,154 44,422
Total non-current assets 4,545,310 4,405,784 4,181,681
Total assets 8,227,845 8,038,207 7,738,224
Thousands of U.S. dollars
Liabilities and equity
Liabilities
Current liabilities
Bonds and loans payable 976,716 1,079,078 664,276
Trade and other payables 1,110,328 1,032,440 1,036,517
Other financial liabilities 20,819 20,276 22,621
Income tax payable 109,603 30,319 85,862
Provisions 53,310 44,483 63,362
Other current liabilities 261,267 251,628 299,802
Total current liabilities 2,532,043 2,458,224 2,172,440
Non-current liabilities
Bonds and loans payable 1,537,560 1,128,250 1,047,897
Other financial liabilities 46,457 47,750 39,457
Net defined benefit liability 156,379 196,733 191,276
Provisions 8,957 10,466 10,319
Deferred tax liabilities 88,414 87,155 104,776
Other non-current liabilities 150,345 214,482 210,499
Total non-current liabilities 1,988,112 1,684,836 1,604,224
Total liabilities 4,520,155 4,143,060 3,776,664
Equity
Capital stock 367,741 367,741 367,741
Capital surplus 325,767 326,862 327,043
Retained earnings 2,621,983 3,104,681 3,361,810
Treasury stock (4,819) (4,888) (4,914)
Other components of equity 126,044 (153,991) (350,680)
Total equity attributable to owners of parent 3,436,716 3,640,405 3,701,000
Non-controlling interest 270,974 254,742 260,560
Total equity 3,707,690 3,895,147 3,961,560
Total liabilities and equity 8,227,845 8,038,207 7,738,224
Date of transition
to IFRS
As of Dec. 31,
2015
Date of transition
to IFRS
As of Dec 31, 2015
As of Dec. 31,
2015
As of Dec. 31,
2016
As of Dec. 31,
2015
As of Dec. 31,
2016

Consolidated Statement of IncomeSumitomo Rubber Industries, Ltd. and its Consolodated Subsidaries
Thousands of U.S. dollars
Jan.1 to Dec. 31, 2015 Jan.1 to Dec. 31, 2016
Sales revenue 6,883,474 6,523,241
Cost of sales (4,555,112) (4,307,327)
Gross profit 2,328,362 2,215,914
Selling, general and administrative expenses (1,648,595) (1,570,086)
Other income 116,268 33,879
Other expenses (27,302) (47,948)
Operating profit 768,733 631,759
Financial income 22,448 27,310
Financial expenses (72,750) (55,310)
Share of (Profit) loss of entities accounted for using equity method 48,388 491
Profit before tax 766,819 604,250
Income tax expenses (130,060) (239,845)
Profit for the year 636,759 364,405
Profit attributable to:
Owners of the parent company 620,483 356,586
Non-controlling interests 16,276 7,819
Profit for the year 636,759 364,405
Earning per share
Basic earning per share (U.S. dollars) 2.365 1.359
Consolidated Statement of Comprehensive IncomeSumitomo Rubber Industries, Ltd. and its Consolodated Subsidaries
Thousands of U.S. dollars
Jan.1 to Dec. 31, 2015 Jan.1 to Dec. 31, 2016
Profit for the year 636,759 364,405
Other comprehensive income
Items that will not be reclassified to profit or loss
Financial assets measured at fair value through other comprehensive income 4,112 (724)
Remeasurements of defined benefit plan 10,483 (12,681)
Share of other comprehensive income of associates accounted for
using the equity method(24,164) -
Items that may be reclassified subsequently to profit or loss
Cash flow hedges (974) 2,690
Currency translation differences of foreign operations (289,285) (165,656)
Share of other comprehensive income of associates accounted for
using the equity method(9) -
Other comprehensive income, net of tax (299,837) (176,371)
Total comprehensive income for the year 336,922 188,034
Total comprehensive income fot the year attribute to:
Owners of parent company 331,414 195,422
Non-controlling interests 5,508 (7,388)
Total comprehensive income fot the year 336,922 188,034

Consolidated Statement of Changes in EquitySumitomo Rubber Industries, Ltd. and its Consolodated Subsidaries
January 1 to December 31, 2015 Thousands of U.S. dollars
Currency translation
differences of
foreign operations Cash flow hedge
Balance as of January 1, 2015 367,741 325,767 2,621,983 (4,819) - 362
Profit for the year 620,483
Other comprehensive income (278,154) (974)
Total comprehensive income - - 620,483 - (278,154) (974)
Purchase of treasury stock (69)
Disposal of treasury stock 0 0
Dividends (124,380)
Changes in ownership interests in subsidiaries
without a loss of control1,095
Changes in scope of consolidation
Transfer to retained earnings (13,405)
Other increase and decrease (4,373)
Total transactions with owners - 1,095 (137,785) (69) - (4,373)
Balance as of December 31, 2015 367,741 326,862 3,104,681 (4,888) (278,154) (4,985)
Thousands of U.S. dollars
Financial assets
measured at fair
value through other
comprehensive
income
Remeasurements
of defined
benefit plan Total
Balance as of January 1, 2015 125,682 - 126,044 3,436,716 270,974 3,707,690
Profit for the year - 620,483 16,276 636,759
Other comprehensive income 3,897 (13,836) (289,067) (289,067) (10,769) (299,836)
Total comprehensive income 3,897 (13,836) (289,067) 331,416 5,507 336,923
Purchase of treasury stock - (69) (69)
Disposal of treasury stock - 0 0
Dividends - (124,380) (29,180) (153,560)
Changes in ownership interests in subsidiaries
without a loss of control- 1,095 16,465 17,560
Changes in scope of consolidation - - (9,024) (9,024)
Transfer to retained earnings (431) 13,836 13,405 - -
Other increase and decrease (4,373) (4,373) (4,373)
Total transactions with owners (431) 13,836 9,032 (127,727) (21,739) (149,466)
Balance as of December 31, 2015 129,148 - (153,991) 3,640,405 254,742 3,895,147
January 1 to December 31, 2016 Thousands of U.S. dollars
Currency translation
differences of
foreign operations Cash flow hedge
Balance as of January 1, 2016 367,741 326,862 3,104,681 (4,888) (278,154) (4,985)
Profit for the year 356,586
Other comprehensive income (149,924) 2,692
Total comprehensive income - - 356,586 - (149,924) 2,692
Purchase of treasury stock (26)
Disposal of treasury stock 0 0
Dividends (135,680)
Changes in ownership interests in subsidiaries
without a loss of control181
Changes in scope of consolidation
Transfer to retained earnings 36,223
Other increase and decrease 698
Total transactions with owners - 181 (99,457) (26) - 698
Balance as of December 31, 2016 367,741 327,043 3,361,810 (4,914) (428,078) (1,595)
Thousands of U.S. dollars
Financial assets
measured at fair
value through other
comprehensive
income
Remeasurements
of defined
benefit plan Total
Balance as of January 1, 2016 129,148 - (153,991) 3,640,405 254,742 3,895,147
Profit for the year 356,586 7,819 364,405
Other comprehensive income (716) (13,216) (161,164) (161,164) (15,207) (176,371)
Total comprehensive income (716) (13,216) (161,164) 195,422 (7,388) 188,034
Purchase of treasury stock - (26) (26)
Disposal of treasury stock - 0 0
Dividends - (135,680) (11,329) (147,009)
Changes in ownership interests in subsidiaries
without a loss of control- 181 22,190 22,371
Changes in scope of consolidation - - 2,345 2,345
Transfer to retained earnings (49,439) 13,216 (36,223) - -
Other increase and decrease 698 698 698
Total transactions with owners (49,439) 13,216 (35,525) (134,827) 13,206 (121,621)
Balance as of December 31, 2016 78,993 - (350,680) 3,701,000 260,560 3,961,560
Capital stock Capital surplus Retained earnings
Capital stock Capital surplus Retained earnings
Other components of equity
Equity attributable to owners of the parent company
Treasury stock
Other components of equity
Equity attributable to owners of the parent company
Non-controlling
interests TotalTotal
Equity attributable to owners of the parent company
Treasury stock
Other components of equity
Equity attributable to owners of the parent company
Non-controlling
interests Total
Other components of equity
Total

Consolidated Statement of Cash FlowsSumitomo Rubber Industries, Ltd. and its Consolodated Subsidaries
Thousands of U.S. dollars
Jan.1 to Dec. 31, 2015 Jan.1 to Dec. 31, 2016
Cash flows from operating activities
Profit before tax 766,819 604,250
Depreciation and amortization 443,267 441,793
Impairment loss 2,974 3,405
Interest and dividends income (20,345) (20,802)
Interest expenses 38,586 32,000
Share of (profit) loss of entities accounted for using equity method (48,388) (491)
Loss (gain) on sales and retirement of non-current assets 7,543 5,793
Loss (gain) on sales of shares of subsidiaries and associates (78,164) -
Decrease (increase) in inventories (73,957) 32,776
Decrease (increase) in trade and other receivables 166,164 38,948
Increase (decrease) in trade and other payables (116,034) (10,259)
Other, net (43,395) 67,414
Subtotal 1,045,070 1,194,827
Interest received 12,828 15,078
Dividend income received 7,534 5,681
Interest expenses paid (36,983) (29,707)
Income taxes paid (279,621) (80,793)
Net cash provided by (used in) operating activities 748,828 1,105,086
Cash flows from investing activities
Purchase of property, plant and equipment (497,466) (415,707)
Proceeds from sales of property, plants and equipment 8,345 3,793
Purchase of intangible assets (36,483) (44,569)
Purchase of investment securities (1,310) (767)
Proceeds from sales of investment securities 698 89,250
Proceeds from purchase of shares of subsidiaries resulting in change in scope of consolidation - 1,034
Purchase of shares of subsidiaries resulting in change in scope of consolidation (150,543) -
Proceeds from sales of shares of subsidiaries resulting in change in scope of consolidation 24,457 -
Proceeds from sales of shares of associates 391,991 -
Payment for transfer of business (16,466) -
Other, net 12,363 3,656
Net cash provided by (used in) investing activities (264,414) (363,310)
Cash flows from financing activities
Net increase (decrease) in short-term loans payable (53,483) (214,043)
Proceeds from long-term debt and newly issued bonds 8,233 126,491
Repayments of long-term debt and redemption of bonds (252,491) (381,819)
Proceeds from contributions of non-controlling interests 32,043 22,448
Cash dividends paid (124,379) (135,681)
Cash dividends paid to non-controlling interests (29,181) (11,328)
Purchase of shares of non-controlling interests (14,776) (164)
Other, net (20,337) (18,447)
Net cash provided by (used in) financing activities (454,371) (612,543)
Effect of exchange rate change on cash and cash equivalents (30,879) (17,716)
Net increase (decrease) in cash and cash equivalents (836) 111,517
Cash and cash equivalents at the beginning of current period 462,526 461,690
Cash and cash equivalents at the end of current period 461,690 573,207