annual report 2016 - cisionmb.cision.com/public/6758/2201016/a8e70949901b495c.pdf · 2 asetek a/s...
TRANSCRIPT

ANNUAL REPORT 2016(January 1st - December 31st 2016)
CVR-NR. 34 88 05 22

ASETEK A/S – ANNUAL REPORT 20162
SamuelSzteinbaum
JørgenSmidt
Jim McDonnell
André Sloth Eriksen
PeterGross
Chris J.Christopher
Knut Øversjøen
Peter Dam Madsen
Asetek A/S
Assensvej 2
DK-9220 Aalborg East
Denmark
Phone: +45 9645 0047
Fax: +45 9645 0048
Web site: www.asetek.com
email: [email protected]
CVR-number: 3488 0522
ISIN-Number DK0060477263

ASETEK A/S – ANNUAL REPORT 2016 3
Board of Directors
Samuel Szteinbaum, Chairman
Chris J. Christopher
Jim McDonnell
Jørgen Smidt
Knut Øversjøen
Peter Gross
Nomination Committee
Ib Sønderby
Samuel Szteinbaum
Scott Pagel
Audit Committee
Knut Øversjøen
Chris J. Christopher
Compensation Committee
Samuel Szteinbaum
Jim McDonnell
Jørgen Smidt
Executive Management
André Sloth Eriksen, CEO
Peter Dam Madsen, CFO
Auditor
PwC, State Authorized Public Accountants
Nobelparken, Jens Chr. Skous Vej 1,
DK-8000 Aarhus C
Phone: +45 8932 0000
CVR-nr. 33 77 12 31
TABLE OF CONTENTS
Shareholder Information
4
Management Report
6
Statement by Management
19
Independent Auditor’s Report
20
Profit & Loss
24
Balance Sheet
25
Cash Flows
26
Equity
27
Notes
28
Annual Report 2016
– Parent Company
52
Notes to the Annual Report
– Parent Company
56
ASETEK A/S – ANNUAL REPORT 2016 3

ASETEK A/S – ANNUAL REPORT 20164
SHAREHOLDER INFORMATION
Asetek’s shares are listed on Oslo Børs. As of December 31, 2016,
a total of 25,421,119 shares are issued, each with a nominal value
of DKK 0.1.
The share is classified in the “Information Technology” sector by
the stock exchange, and the ticker mark is ASETEK.
The total market capitalization value at the end of 2016 was NOK
1,333m (approximately USD 155m) which was an increase of
190% from the market value at the beginning of 2016.
502,424 shares were held by the Company as per December 31,
2016 as treasury shares, primarily to support an employee stock
option program.
Each share provides one vote. The shares are marketable
securities and no restrictions have been set for the shares’
negotiability. The share register is maintained by DNB Bank ASA
– Verdipapirservice, Postboks 1600 Sentrum, 0021 Oslo, Norway.
Ownership
At the end of 2016, Asetek A/S had 754 shareholders, some of
whom are nominee accounts covering several individual investors.
Members of Asetek A/S’s Board of Directors and Executive Board
owned or represented a total of 15.0% of the share capital at the
end of 2016.
According to Asetek’s registrations, the following shareholders
possessed 5% or above of the share capital as per December 31,
2016:
Number of
Shares %
Sunstone Technology Ventures, Fund I, Denmark
3,186,341 12.5%
Investor Relations
Asetek aims to provide a high and consistent level of information
to its shareholders and other interested parties.
It is Asetek’s intention to conduct an active dialogue with
shareholders, analysts, the press and the public as a whole.
Communication with interested parties takes place via the ongoing
publication of notifications, investor presentations and individual
meetings.
The website www.asetek.com is the primary source of information
for interested parties. It is updated continuously with information
about Asetek’s activities and strategy. Shareholders, analysts,
investors, stockbrokers as well as other interested parties who
have questions regarding Asetek are requested to inquire via the
email address [email protected], which is monitored
by the CFO.
Dividends. In October 2016, the Board of Directors announced
a new dividend policy and intends to propose a cash dividend
of NOK 1.00 per share to the Annual General Meeting in 2017.
Asetek policy is to distribute a dividend to its shareholders of
up to 50% of the previous year’s net income (after tax profits).
When proposing the annual dividend level, the Board will take into
consideration the Company’s growth plans, liquidity requirements
and necessary financial flexibility. In addition to the new dividend
policy, Asetek will continue to invest its capital in the development
and marketing of its cooling products.
Reporting Calendar for 2017:
Q1 2017 Report: April 26, 2017
Annual General Meeting: April 25, 2017
Q2 2017 Report: August 16, 2017
Q3 2017 Report: October 26, 2017
1 January 2016
Asetek shares opened the year 2016 at NOK 18.00.
31 December 2016
At the last day of the year the Asetek shares closed
at NOK 53.50, which was an increase of 197% from
the beginning of the year. The Oslo Stock Exchange
(OSE) Benchmark Index advanced 12.1% in 2016.
The OSE Information Technology Index advanced
2.4% in 2016.
SHAREHOLDER INFORMATION

ASETEK A/S – ANNUAL REPORT 2016 5
Stock Exchange Notices Issued in 2016
Issue Date Headline
December 6, 2016 Mandatory Notification of Trade
December 5, 2016 Notification update re: Share Capital
Increase
December 1, 2016 Disclosure of Large Shareholdings
November 28, 2016 Share Capital Increase Upon Exercise of
Warrants
November 18, 2016 Update to Full Year 2016 Revenue
Guidance
November 15, 2016 Financial calendar
November 15, 2016 Asetek Announces Names of Undisclosed
OEM Partner and HPC Customer
November 10, 2016 Asetek included in the Oslo Børs
Benchmark Index
October 28, 2016 Mandatory Notification of Trade; Share
Capital Increase
October 27, 2016 Share Capital Increase Upon Exercise of
Warrants
October 27, 2016 Mandatory Notification of Trade: CEO
Exercises Warrants and Sells Shares
October 27, 2016 Board of Directors Decides to Adopt
Dividend Policy
October 27, 2016 Asetek Q3 2016: Growing Adoption of
Liquid Cooling for Desktop PCs and Data
Centers
October 20, 2016 Invitation to Presentation of Results for
the Third Quarter 2016
September 20, 2016 Investor Presentation
September 16, 2016 Disclosure of large shareholdings
September 15, 2016 Update to Full Year 2016 Revenue
Guidance
September 12, 2016 Mandatory Notification of Trade
September 7, 2016 Mandatory Notification of Trade
August 29, 2016 Mandatory Notification of Trade
August 29, 2016 Mandatory Notification of Trade
Issue Date Headline
August 26, 2016 Asetek Selected by HP to Cool New OMEN
X Desktop Gaming PC
August 17, 2016 Mandatory Notification of Trade
August 17, 2016 Asetek Q2 2016: Good Progress
August 11, 2016 Invitation to Presentation of Results for
the Second Quarter and First Half Year
2016
July 1, 2016 Disclosure of large shareholdings
June 22, 2016 Asetek Continues Market Moment with
Latest Order for RackCDU
April 29, 2016 Issuance of Warrants
April 28, 2016 Disclosure of large shareholdings
April 28, 2016 Asetek Receives Largest Data Center
Order for Single Installation to Date
April 27, 2016 Outcome of Annual General Meeting
April 27, 2016 Asetek Q1 2016: Revenue Growth and
Profitability
April 20, 2016 Invitation to Presentation of Results for
the First Quarter 2016
April 4, 2016 Notice of Annual General Meeting April
27, 2016
February 29, 2016 Mandatory Notification of Trade
February 29, 2016 Asetek Capital Markets Update
February 24, 2016 Asetek Annual Report 2015
February 24, 2016 Asetek Q4 2015: Growth, profitability and
emerging data center business
February 23, 2016 Reminder: Publication of Asetek fourth
quarter results 2015 and capital markets
update event
January 20, 2016 Asetek to Host Capital Markets Update
January 20, 2016 Financial calendar
SHAREHOLDER INFORMATION

ASETEK A/S – ANNUAL REPORT 20166
MANAGEMENT REPORT
The Year 2016 Outlined
• First full year of profitability with revenue of $50.9
million, up 42% from 2015
• Desktop revenue expands to $45.8 million, up 34% from
2015
• Data center revenue expands to $5.2 million, up 178%
from 2015
• Gross margin increases to 38.8% from 34.5% in 2015
• The year 2016 was a year of unprecedented growth and major
accomplishments for Asetek.
• Revenue in 2016 totaled $50.9 million, a record level for the
Company and growth of 42% over 2015 ($36.0 million).
• Desktop revenue in 2016 expanded to $45.8 million, a 34%
increase from 2015 ($34.1 million), fueled by significant
growth in shipments to the Do-it-Yourself (DIY) and Gaming/
Performance Desktop PC markets.
• Data center revenue grew to $5.2 million in 2016, a 178%
increase from 2015 ($1.9 million), powered by High-
Performance-Computing projects in public and private sector.
• Gross margin increased to 38.8% in 2016 from 34.5% in 2015.
The increase primarily reflects significant growth in shipments
of new high performing products in 2016. The change also
reflects a significant one-time charge incurred in 2015 for a
quality assurance measure.
• Asetek achieved its first full year of profitability, earning pre-tax
income of $5.0 million for the year, compared with pre-tax loss
of $2.1 million in 2015. Adjusted EBITDA was $7.4 million in
2016, compared with $0.4 million in 2015.
• Operating profit (adjusted EBITDA) from the desktop
segment was $15.1 million for the year, an increase from
$7.2 million profit in 2015. Revenue growth in the desktop
market was driven principally by high volume shipments of
DIY products to Asetek’s largest customers, as well as an
increase in shipments in the general Gaming/Performance
Desktop PC market.
• Operating loss (adjusted EBITDA) from the data center
segment was $5.1 million for the year, compared with an
operating loss of $5.9 million in 2015. The data center
spending reflects continued investment in development,
sales and marketing, production resources and equipment/
tools.
• Headquarters expenses of $2.7 million increased from 2015
($1.1 million) mainly caused by a $1.8 million litigation
settlement received in 2015. Excluding the settlement,
headquarters expenses decreased from the prior year ($2.8
million).
• Operational achievements during the year:
• Asetek continued its success as the leading supplier of liquid
cooling solutions for high-end computing, shipping 949,000
sealed loop liquid cooling units in 2016, representing growth
of 31% from 2015.
• In 2016, the data center business built upon its relationships
with two key OEM’s:
– Sales to Fujitsu Technology Solutions GmbH (“Fujitsu”)
totaled $1.6 million under the OEM agreement on multiple
projects, such as the installation of 70 RackCDU at the
Joint Center for Advanced High Performance Computing
(JCAHPC) in conjunction with University of Tokyo and
Tsukuba University. This is Asetek’s largest installation to
date with an OEM partner. Sales to Fujitsu are expected to
continue to grow in 2017.
– Sales to Penguin Computing, Inc. (“Penguin”) totaled $1.2
million through integration of RackCDU products in Penguin
HPC servers, including deliveries on a large deployment for
the U.S. National Nuclear Security Administration. Sales to
Penguin are expected to continue to grow in 2017.
• Asetek’s continued progress on its two-year, $3.5 million project
with the California Energy Commission to install RackCDU liquid
cooling in two large-scale data centers, one of which resides at
Lawrence Livermore National Laboratory. Progress on Asetek’s
three-year, $2.5 million contract with the U.S. Department of
Defense (DoD) continued with installation at a new site.
MANAGEMENT REPORT
Oakforest PACS, University of Tokyo

ASETEK A/S – ANNUAL REPORT 2016 7MANAGEMENT REPORT
The TOP500 Supercomputer and Green500 Supercomputer lists showcased a combined total of 18 Asetek installations. The
TOP500 table shows the 500 most powerful commercially available computer systems known to the tech community. The
Green500 Supercomputer list ranks the top 500 supercomputers in the world by energy efficiency.
The adoption of Asetek Direct-to-Chip (D2C) liquid cooling technology is accelerating across the globe. Original Equipment
Manufacturers (OEMs) like Fujitsu, Format, Penguin and Cray, in particular, have given Asetek global reach with major
installations at world class High-Performance-Computing (HPC) sites.
The 6th most energy-efficient and most powerful computer system in the world is Oakforest-PACS powered by Asetek liquid
cooled Fujitsu PRIMERGY servers. Oakforest-PACS has become the fastest supercomputer in Japan, surpassing the K computer
with a peak performance of 25 petaflops. Installed at the Joint Center for Advanced High-Performance Computing (JCAHPC),
Oakforest-PACS is a collaboration between The University of Tokyo and Tsukuba University.
Ranked the 5th most energy-efficient supercomputer in the world is the QPACE3 installation at the University of Regensburg,
a joint research project between the the University of Wuppertal and the Jülich Supercomputing Center. It is one of the first
Intel Xeon Phi-based HPC clusters in Europe and uses Asetek cooled Fujitsu PRIMERGY servers. The Regensburg installation
is ranked 375 on the TOP500 list.
The need for energy-efficient, effective and fast computational power calls for increased adoption for liquid cooling technologies.
Asetek proudly works with key OEM partners like Format, Penguin and CRAY at respected research centers across the world
to achieve this.
In Poland (Format) and the United States (Penguin), HPC systems cooled by Asetek technology increase compute resources and
scientific collaboration which benefit respected national laboratories, such as the Polish National Centre for Nuclear Research
and Maria Curie-Skodowska University (UMCS), Lawrence Livermore, Los Alamos and Sandia. Asetek cooling technology also
powers the Computational Resource Centre and National Super Computing Centre that is part of the Agency for Science,
Technology and Research (A-STAR) in Singapore.
These recent installations join the list of other HPC sites around the world using Asetek liquid cooling technology such as
Mississippi State University, Kyoto University, University of Tromsø, the National Renewable Energy Laboratory. It is these
installations, in addition to exciting technology innovations, that distances Asetek from the competition.
Read more on www.top500.org and on www.green500.org
PERFORMANCE AND SUSTAINABILITYFEATURED ON TOP500 AND GREEN500
SUPERCOMPUTER LISTS

ASETEK A/S – ANNUAL REPORT 20168 MANAGEMENT REPORT
ASETEK’S BUSINESS
Asetek is a global leader in liquid cooling solutions for data
centers, servers and PCs. Asetek’s server products enable OEMs
to offer cost effective, high performance liquid cooling data center
solutions. Its PC products are targeted at the gaming and high
performance desktop PC segments. With about 4 million liquid
cooling units deployed, Asetek’s patented technology is being
adopted by a growing portfolio of OEMs and channel partners.
Founded in 2000, Asetek is headquartered in Demark and has
operations in California, Texas, China and Taiwan.
FINANCIAL POSITION ANDOPERATING RESULTS FOR 2016
Profit and loss
Total revenue for 2016 was $50.9 million, representing an
increase of 42% from 2015 ($36.0 million). Sealed loop cooling
unit shipments for 2016 totaled 949,000, a 31% increase over
2015 (727,000). Average Selling Prices (ASP) for the year 2016
increased to $48.23, from $46.96 in 2015.
Gross margin increased to 38.8% in 2016 from 34.5% in 2015.
The increase reflects two principal factors: An increase in the sale
of new high performance DIY products; and a one-time charge
in the second quarter 2015 explained by a cost of $0.8 million
incurred when Asetek decided to recall, rework and reship a bulk
of DIY products as a quality assurance measure.
In 2016, operating expenses were $15.1 million, a 2% increase
from 2015 ($14.7 million), reflecting several factors. In 2015, the
Company received $1.8 million associated with a legal settlement
with CoolIT Systems. These payments are presented as other
income in the period the award was granted. Excluding the
settlement amount in 2015, operating expenses have declined
by 9%. Legal costs incurred associated with defense of existing
IP and securing new IP declined to $1.4 million in 2016 ($1.7
million).
Adjusted EBITDA was $7.4 million in 2016, compared with $0.4
million in 2015.
Adjusted EBITDA in 2016 represents operating income of $4.6
million, plus depreciation of $2.5 million and plus share based
compensation of $0.3 million.
Foreign currency transactions in 2016 resulted in a $0.3 million
gain ($0.3 million gain in 2015).
In 2016, income tax benefit associated with net operating loss
carryforwards recorded as deferred tax assets totaled $4.6 million.
In 2015, tax credits for research and development in Denmark
totaled $0.4 million.
Asetek earned $9.2 million total comprehensive income for
2016, compared with total comprehensive loss of $1.5 million in
2015. Comprehensive income included a negative $0.5 million
translation adjustment in 2016 (positive $0.2 million in 2015).
Balance sheet
Asetek’s total assets at the end of 2016 were $41.2 million,
compared with $27.7 million at the end of 2015. The increase
in assets resulted principally from revenue growth which drove
operating income and positive cash flow and additions to defferred
tax assets. Cash and cash equivalents at December 31, 2016 was
$17.6 million, an increase from $13.1 million from 2015. Trade
receivables increased $4.6 million from prior year-end due to the
increase in revenue at the end of the period.
Total liabilities increased by $3.8 million in 2016. Trade payables
increased $3.0 million principally due to higher production volumes
in the fourth quarter 2016 compared with the same period of
2015. Accrued liabilities increased $0.5 million due to increases
in various other costs associated with operations growth. Accrued
compensation and benefits increased $0.1 million due to increased
incentive compensation payable associated with the Company’s
performance in 2016.
Statement of cash flows
Net cash provided by operating activities was $7.8 million in 2016
($1.1 million used in 2015). The operating cash flow was mainly
attributed to the operating income from the increase in revenue.
Included in cash flow from operations in 2015 is $1.8 million in
payments received for settlement of patent litigation, and $0.9
million income tax benefit received.
Cash used by investing activities was $2.9 million, related
principally to additions in capitalized development costs and
expansion of manufacturing capabilities. The figure compares with
$2.4 million used in 2015.
Cash provided by financing activities was $0.2 million, compared
with $12.3 million provided by financing activities in 2015. The
activity in 2015 primarily represents funds raised through the
offerings of common stock, net of financing costs.
Net change in cash and cash equivalents was positive $4.6 million
in 2016, compared with positive $8.9 million in the same period
last year. Not including equity offering transactions, the net
change in cash in 2015 was negative $3.3 million.

ASETEK A/S – ANNUAL REPORT 2016 9
Liquidity and financing
From its inception and until the end of the previous year, Asetek
has incurred losses and negative cash flows from operations.
Positive cash flows and net earnings were generated for the first
time in 2016. Prior to 2013, as a privately held company, Asetek
financed operations principally through the issuance of convertible
preferred shares. In March 2013, through its initial public offering
of common shares on the Oslo Stock Exchange, the Company
raised $21.4 million. In March and April 2015, the Company
raised $12.2 million through the private and public issuance of
shares. As of December 31, 2016, the Company has working
capital of $19.5 million and non-current liabilities of $0.3 million.
While there is no assurance that the Company will generate
sufficient revenue or operating profits in the future, Asetek’s
management estimate that the Company’s capital resources are
sufficient to fund operating activities in the foreseeable future,
based on financial forecasts. To the extent necessary to fund
expansion or other liquidity needs, management will consider
offerings of debt, equity, or a combination thereof, depending on
the cost of capital and the status of financial markets at that time.
Historical financial review
Fiscal Year 2016 2015 2014 2013 2012
Financial highlights: ($000's)
Revenue 50,921 35,982 20,847 20,729 18,681
Gross profit 19,750 12,412 8,710 8,049 6,788
Gross margin % 38.8% 34.5% 41.8% 38.8% 36.3%
EBITDA 7,119 67 (7,739) (5,649) (2,755)
Operating income (loss) 4,669 (2,323) (9,510) (7,679) (4,807)
Finance income (expenses) 322 238 (385) 955 (3,758)
Net income (loss) 9,637 (1,647) (8,757) (6,281) (8,558)
Purchases of property and equipment 1,222 958 172 952 88
Sealed loop units shipped (000's) (unaudited) 949 727 425 426 414
Year-end values ($000's):
Total assets 41,164 27,748 12,814 20,983 8,162
Total equity 28,290 18,646 7,422 14,808 (40,642)
Total liabilities 12,874 9,102 5,392 6,175 48,804
Employees 79 71 68 69 60
Key ratios:
Average selling price per desktop unit ($) 48.2 47.0 45.5 46.8 45.1
Revenue per employee ($000's) 645 507 307 300 311
Days sales outstanding 93 85 52 74 65
Inventory turns per year 21.2 13.2 11.2 11.9 12.6
Key ratio: Formula used for key ratio calculations
Average selling price per desktop unit ($) Total desktop revenue / Total desktop units sold
Revenue per employee ($000’s) Revenue / Employees
Days sales outstanding Trade receivables / Revenue / 365 days
Inventory turns per year Costs of goods sold / (beginning inventory + ending inventory) / 2
MANAGEMENT REPORT

ASETEK A/S – ANNUAL REPORT 201610
A growing E-sport and Virtual Reality fan base across the world has pushed the tech industry to develop even more powerful
CPUs and GPUs. Working with gaming industry-shapers like HP and NZXT, Asetek is a key partner is making gaming processors,
high-quality graphics and extreme computing power mainstream.
The ground-breaking new HP OMEN X Desktop Gaming PC and the new NZXT Kraken Series were proof-points of that in 2016.
The OMEN X Desktop marks HP’s return to ultra-high end gaming systems, boasting enthusiast hardware and thermal
performance. The OMEN X builds on a long history of collaboration between Asetek and HP. From the innovative HP Blackbird
002 to the HP ENVY Phoenix 860, Asetek has worked closely with HP to deliver revolutionary performance and low noise –
through liquid cooling technology.
With the debut of the Kraken X52, and the
upgraded Kraken X42 and X62, everything,
including the pump, radiator and fans have
been designed and engineered to deliver
strong cooling performance.
“We’re excited to work with Asetek on this
next generation of Kraken coolers,” said
Johnny Hou, NZXT’s founder and CEO.
“The advances Asetek has made with
their pump has allowed us to bring
quieter operations with improved
performance.”
E-SPORT AND VIRTUAL REALITY USERS PUSH DEVELOPMENTS IN CPUS AND GPUS
MANAGEMENT REPORT

ASETEK A/S – ANNUAL REPORT 2016 1 1
Datacenter production Denmark
MANAGEMENT REPORT

ASETEK A/S – ANNUAL REPORT 201612
ASETEK POWERS NVIDIA TESLA P100 GPU ACCELERATOR
The latest addition to the NVIDIA Tesla Accelerated
Computing Platform, the Tesla P100 enables a new
class of servers that can deliver the performance of
hundreds of CPU server nodes.
Based on the new NVIDIA Pascal GPU architecture, the
Tesla P100 delivers high performance and efficiency
to power the most computationally demanding
applications.
“The Tesla P100 represents a massive leap forward in
computing performance and efficiency,” said Roy Kim,
Group Product Manager of Accelerated Computing
at NVIDIA. “With Asetek’s liquid cooling solution
optimized for the most demanding high-density Tesla
P100 server designs, OEMs can deliver new levels
of performance to handle the most computationally
intensive HPC workloads.”
“Asetek’s liquid cooling solution for the Tesla P100 lets
HPC and data center OEMs benefit from huge boosts
in server density and dramatic reductions in cooling
costs,” said John Hamill, Asetek Vice President of WW
Sales and Marketing. “We look forward to further
collaboration with Nvidia in the future.”
EXPECTATIONS FOR 2017
Desktop:
The revenue growth within the desktop segment in the past
two years – revenue grew by 240% since 2014 – was driven
by a number of factors, including customers’ desire for a more
immersive gaming experience, which increased demand for new
technologies such as 4K screen resolution and virtual reality
capability. These new technologies in turn require advanced
cooling, as a high performance PC now typically needs two liquid
coolers instead of only one. This significant market growth may
not replicate in 2017. The Company will continue to develop new
products and expects to add new customers within the desktop
segment. The desktop business is therefore expected to grow
modestly in 2017 from a record level in 2016.
Data center:
Asetek’s progress in the HPC market indicates an evolving
acceptance of liquid cooling in the data center market, and high-
power technologies such as Intel’s family of Xeon Phi processors
are supporting this development. Working closely with ecosystem
partners such as Intel, NVIDIA and large OEM’s such as Fujitsu,
has enabled Asetek to connect with a wide array of companies and
institutions exploring liquid cooling solutions. With over 200 million
hours of fault-free pump operation at data center installations, the
adaptability, reliability and cost effectiveness of Asetek’s RackCDU
installations in large-scale deployments is garnering attention
from decision makers across the industry.
Asetek’s strategy in the data center market is to increase end-
user adoption within existing OEM customers, and to add new
OEM customers. The Company plans to achieve this by continuing
to develop and defend its market-leading technology and
leverage the successful performance achieved at its installed
base of universities, enterprises and government entities. Asetek
expects significant revenue growth in the data center segment
in 2017 compared with 2016. Revenue and operating results are
however expected to fluctuate as partnerships with large OEMs
are developed.
Consolidated results:
The financial results for 2016 exceeded Management’s
expectations. In 2017, the Company plans to continue to invest
in the data center business with a focus on long-term growth and
scalability. In the short-term, management expects to generate
positive income on a consolidated basis while the Company
continues to focus on design wins to gain traction with data
center OEM’s, and development of new product releases in the
desktop business. Overall, the Company expects modest revenue
growth for 2017, with minimal growth in spending and continued
investments in the data center business. As such, management
expects that the Company will report profitability for 2017
consistent with the results of the latter part of 2016.
MANAGEMENT REPORT

ASETEK A/S – ANNUAL REPORT 2016 13
A-Star installation, Singapore
MANAGEMENT REPORT

ASETEK A/S – ANNUAL REPORT 201614
Installed at end-user locations as diverse as Singapore and Norway, Asetek pumps have run fault-free for 200 million hours.
“At the end of 2016, we have not had a single server pump failure at any of our data center installations around the world,” said
Mette Nørmølle, Vice President of Engineering. “Our low-pressure architecture is the key to enabling a cost-effective solution
that is relied on by data centers demanding unrivaled performance and maximum uptime.”
At the heart of Asetek liquid cooling is the Direct-to-Chip (D2C) CPU Cooler. The CPU Cooler is a patented integrated pump
and cold plate assembly used to cool server CPUs. Because a single pump has sufficient power to circulate cooling water in a
server node, servers with more than one CPU have multiple pumps, providing built in redundancy.
With over 3.5 million units deployed worldwide in desktop PCs and servers, Asetek’s cooler pumps incorporate features
designed to meet our customers’ strict demands for reliability, performance and uptime. Pumps are mechanically sealed with
the impeller, the only moving part, suspended in lubricating cooling liquid. As a result, high reliability and low cost are both
inherent in the pump design.
Asetek’s reliable data center solutions include RackCDU D2C™ and Server Level Sealed Loop (ServerLSL). RackCDU D2C
provides cooling energy savings greater than 50% and density increases of 2.5x-5x. ServerLSL provides liquid assisted air
cooling for server nodes, replacing less efficient air coolers and enabling the servers to incorporate the highest performing
CPUs and GPUs.
FAULT-FREE PUMP OPERATION
MANAGEMENT REPORT
Penguin Installation

ASETEK A/S – ANNUAL REPORT 2016 15
EVENTS AFTERTHE REPORTING PERIOD
There have been no events since December 31, 2016 which could
significantly affect the evaluation of the Group’s financial position
and revenue.
RISK EXPOSURE AND MANAGEMENT
Asetek’s potential to realize the Company’s strategic and
operational objectives are subject to a number of commercial
and financial risks. Asetek is continuously working on identifying
risks that can negatively impact the Company’s future growth,
activities, financial position and results. To the largest extent
possible, Asetek tries to accommodate and limit the risks which
the Company can affect through its own actions.
Below, some of the risk factors management considers as being of
special importance to the Group are described in no specific order.
A more thorough elaboration on risk factors can be found in the
Company’s prospectus dated March 23, 2015, available from the
Company’s website: www.asetek.com.
Asetek conducts its business with significant focus on continuous
risk monitoring and management. The overall goal of risk
management is to ensure that the Company is run with a level of
risk, which is in a sensible ratio to the activity level, the nature of
the business, and the Company’s expected earnings and equity.
Significant customer. In 2016, one customer accounted for
53% of total revenue. In the event of a decline or loss of this
significant customer, replacement of this revenue stream would be
difficult for Asetek to achieve in the short term. Asetek is actively
pursuing to diversify its product and technology offering to a
broader customer base in efforts to mitigate this risk.
Competition. The markets in which the Company operates
are competitive, the technological development is rapid, and
the Company may in the future also be exposed to increased
competition from current market players or new entrants.
Currently, the Company’s principal competitor is CoolIT Systems,
Inc.
Insurance. It is the Company’s policy to cover all relevant
risk areas with commercially available insurance products.
This currently includes insurance for product liability, operating
material and inventory as well as compulsory coverage, which
varies from country to country. Management assessments indicate
that the necessary and relevant precautions have been taken to
thoroughly cover insurance issues. Asetek’s insurance policies and
overall coverage approach are reviewed at least annually.
Credit risk. Credit risk is the risk of a counterpart neglecting
to fulfill its contractual obligations and in so doing imposing a
loss on Asetek. The Group’s credit risk originates mainly from
receivables from the sale of products as well as deposits in
financial institutions. Receivables from the sale of products are
split between many customers and geographic areas, though one
customer represented 46% of trade receivables at December 31,
2016. A systematic credit evaluation of all customers is conducted,
and the rating forms the basis for the payment terms offered to
the individual customer. Credit risk is monitored centrally.
Intellectual property defense. Asetek has filed and defended
lawsuits against competitors for patent infringement. While
some of the recent cases have been settled or dismissed, some
may continue, and new cases may be initiated. Such cases may
proceed for an extended period and could potentially lead to an
unfavorable outcome to Asetek. Asetek has historically incurred
significant legal costs associated with litigation and may continue
to do so in the future to the extent management believes it is
necessary to protect intellectual property.
Manufacturing supply. Asetek relies upon suppliers and
partners to supply products and services at competitive prices.
Asetek’s desktop products have been historically assembled by a
single contract manufacturer which may be difficult to substitute
in the short term if the need should arise. Asetek mitigates the
supplier risk with Company-owned supplemental manufacturing
lines which can be utilized if necessary.
Foreign exchange rates. Substantially all of Asetek’s revenue is
billed in USD. However, many customers resell Asetek products to
end users in countries where USD is not the transactional currency.
As a result, there is a risk that fluctuations in currency will affect
the cost of product to the end user and negatively impact market
demand for Asetek products. During 2016, the USD fluctuated
moderately, ending the year 3% stronger against the DKK and
EUR, and 2% weaker against the Japanese yen. Asetek estimates
that about one third of its sold products ultimately are delivered
in Europe or Japan, which are the two geographical areas which
could have the largest potential impact due to USD fluctuation.
Asetek’s raw materials are predominantly purchased from vendors
whose underlying currency is CNY. The USD has strengthened
approximately 7% versus the CNY during 2016, and Asetek
therefore does not expect to pass on a significant portion of its
currency risk to its vendors. While Asetek recognizes that USD
appreciation adds negative sales price pressure, Asetek has
only seen a limited reaction from its markets. Asetek believes
that other factors in the end users’ buying decision play a larger
role than price fluctuation on the liquid cooling component. In
addition, Asetek believes that competing products will be prone to
the same exchange rate scenarios as Asetek.
Asetek strives to match expenses against income and liabilities against
assets. Furthermore, as many expenses and liabilities as feasible are
denominated in USD. Despite this, increased fluctuations in USD vs.
DKK and CNY will have an influence on the financial position. The
Group has not entered into any forward exchange instruments.
MANAGEMENT REPORT
ASETEK A/S – ANNUAL REPORT 201616 MANAGEMENT REPORT
Research and development, product innovation, market
development. The Company’s future success, including the
opportunities to ensure growth, depends on the ability to continue
developing new solutions and products adapted to the latest
technology and the clients’ needs as well as improving existing
solutions and market position. As such, the Company develops new
releases on a regular basis, with emphasis on higher performance,
improved efficiency and noise-reduction. Providing new and
innovative applications for Asetek’s cooling technology is also a
focus, as evidenced by the cooling products released for graphics
processing units (GPUs) and data center solutions during 2016.
Asetek has in recent years increased its focus and investments on
building the market for data center liquid cooling products.
Projects and contracts. It is of significant importance to
Asetek’s overall success that development projects are executed
at high quality and at predetermined timeframes and cost prices.
Risks are attached to the sale, analysis and design, development
and initial manufacturing phases. Asetek has carefully defined the
individual phases and the activities contained therein, with a view
to active risk management and efficient implementation. Through
project reviews and ongoing analyses before, during, and after
initiation, Asetek works to ensure that agreements are adhered to
and that revenue and margins are as planned.
Taxation. The tax situation of the Company is complex. Since
Asetek, in connection with its initial public offering in 2013,
moved its Parent company from the U.S. to Denmark, both U.S.
and Danish tax authorities may claim that the Company is tax
liable to both countries. The tax treaties in place between the
two countries may not fully resolve this potential conflict, which
is increasing in importance as the Company becomes profitable
and potentially desires to pay dividends. The Company is in the
process of clarifying the situation.
Employee relations. Asetek is a knowledge-intensive Company
and in order to continuously offer optimal solutions, develop
innovative products, and ensure satisfactory financial results, it
is necessary to attract and develop the right employees. Asetek
has the goal of being an attractive workplace and achieves this
through various programs including an option incentive program,
and attractive working conditions. The Company seeks to support
a Company culture founded on individual responsibility and
performance as well as team accomplishment.
STATUTORY REPORT ONCORPORATE SOCIALRESPONSIBILITY
Code of conduct. Asetek’s Code of Business Conduct Ethics is
the general ethical guideline for business conduct to ensure that
Asetek on a global level is dedicated to promote ethical business
practices and protect Asetek against corruption and other unethical
business behavior. The business conduct guidelines can be found
at http://asetek.com/investor-relations/corporate-governance/
ethical-guidelines.aspx
Transparency and credibility. Asetek is committed to show
complete openness towards shareholders, customers, employees,
suppliers and other stakeholders. It is essential that their
understanding of the business and products is accurate, updated
and truthful.
Anti-corruption. Asetek will not tolerate corruption, money
laundering, bribery or other illegal or unethical business activity.
The Company’s performance and competitiveness are strengthened
solely through lawful conduct. The group’s anti-corruption position
has been clearly communicated to all employees. Furthermore,
Asetek has implemented an Ethics Website operated by a third
party company. Via the website, all stakeholders can keep
themselves informed about Asetek’s policies as well as report any
concern to the Company’s leadership. During 2016, the existence
of the policies and the reporting mechanisms were reiterated to
the employees. No reports related to alleged infringing activities
have been received during 2016.
Internal environment and knowledge resources. Asetek
recognizes that its employees are its key assets and it is committed
to maintaining a stimulating working environment that offers
opportunity for both personal and professional development. The
Company maintains a team-oriented culture where all employees
have the opportunity to contribute significantly to the success of
the Company. This is also necessary to continue to attract and
retain highly qualified employees within the computer industry.
Asetek welcomes applications for employment from all sectors
of the community and strives to promote equal opportunity
of employment to all. The Group maintains a positive working
environment and sick leave and turnaround is not significant. No
work accidents or injuries occurred in 2016. During 2016, the work
on internal environment focused on enhancing the collaboration
between Asetek’s various global locations and cultures. The work
resulted in improved collaboration regarding launching of new
products.
Equal opportunities. The Board of Directors had previously set
a goal for Asetek to have at least 15% female representation at
board and management level by 2016. At the end of 2016, the
Board of Directors consists of 100% male members and hence
the goal has not been met. During 2016 there were no board
seat changes. When evaluating new potential board members, the
Board of Directors will encourage female candidates, while at the
same time will continue to search for relevant experience specific
to Asetek. The Board of Directors has renewed its goal in this
respect, and will work to achieve 15% female representation at
board level by 2018. At other management levels, there is 18%
female representation at the end of 2016, which is an increase from
the year before (16%). During 2016 the Company has continued
to actively encourage women to apply for open positions as well
as it has continued its communication with educational institutions
which trains both male and female candidates. The work to further
increase the female representation continues into 2017.

ASETEK A/S – ANNUAL REPORT 2016 17MANAGEMENT REPORT
External environment. Asetek Group operations’ effect
on the environment is minimal and is typical for a supplier of
computer components. The principal manufacturing operations
are outsourced to a commercial manufacturer in China, which
is continuously monitored on various factors relating to the
environment and other social responsibilities. The principal
source of strain on the environment from the business is related
to shipment of inventory, which is conducted in accordance with
normal routine commerce. Asetek does not have a policy on
environment and climate change.
Adherence to Human Rights Principles. Asetek supports the
fundamental principles of EICC (Electronic Industry Citizenship
Coalition) on human rights, employees’ rights, child labor, health
and safety, environment and anticorruption. Asetek requires that
its suppliers respect and conform to the same principles. Asetek
periodically reviews via its supplier review and evaluation process
that its suppliers conform to the principles. The principles can be
found at http://www.eicc.info/eicc_code.shtml. The Company’s
work in 2016 focused on documenting suppliers’ scoring results.
Social responsibility program. The Board of Directors adopted
a CSR policy in 2016, which has been made publically available
on the Company’s website, and which has been implemented
throughout the Company. The policy sets out the minimum
standards, which the Board expects the staff to adhere to in
their internal and external dealings with colleagues, customers,
stakeholders and third parties.
CORPORATE GOVERNANCE
The work of the board of directors
Asetek’s management model and organization are adapted
continuously to ensure the Company is equipped to manage
all obligations to shareholders, customers, employees,
authorities and other stakeholders to the utmost. The Board
of Directors is fundamentally in full agreement with Danish
Committee on Corporate Governance recommendations for good
company governance. Asetek endeavors to follow the relevant
recommendations for the Company, which support the business
and ensure value for the Company’s stakeholders. The statutory
report on Corporate Governance, cf. section 107b of the Danish
Financial Statements Act, is available on the Company’s website:
http://www.asetek.com/media/2354/scgs2016.pdf
Dialogue between the Company and its shareholders. The
communication between Asetek and shareholders primarily takes
place at the Company’s annual general meeting and via company
announcements. Asetek shareholders are encouraged to subscribe
to the e-mail service to receive company announcements, interim
management statements, interim reports and annual reports as
well as other news via e-mail.
The general meeting. The general meeting has the final
authority over the Company. The Board of Directors emphasize
that shareholders are given detailed information and an
adequate basis for the decisions to be made by the general
meeting.
The general meeting elects the Board of Directors, which currently
consists of six members. The board members are elected for one
year at a time with the option for re-election.
Amendment of Articles of Association. Unless otherwise
required by the Danish Companies Act, resolutions to amend
the Articles of Association must be approved by at least 2/3 of
the votes cast as well as at least 2/3 of the voting share capital
represented at the General Meeting.
Board responsibilities. The Board of Directors’ main tasks
include participating in developing and adopting the Company’s
strategy, performing the relevant control functions and serving
as an advisory body for the executive management. The Board
reviews and adopts the Company’s plans and budgets. Items of
major strategic or financial importance for the Company are items
processed by the Board. The Board is responsible for hiring the
CEO and defining his or her work instructions as well as setting
of his or her compensation. The Board periodically reviews the
Company’s policies and procedures to ensure that the Group
is managed in accordance with good corporate governance
principles, upholding high ethics.
Financial reporting. The Board of Directors receives regular
financial reports on the Company’s business and financial status.
Notification of meetings and discussion of items. The Board
schedules regular meetings each year. Ordinarily, the Board
meets 4-6 times a year. The meetings are typically conducted at
either the facility in Aalborg, Denmark or in San Jose, California.
Additional meetings may be convened on an ad hoc basis. During
2016, the Board met five times.
All Board members receive regular information about the
Company’s operational and financial progress in advance of the
scheduled Board meetings.
The Board members also regularly receive operations reports and
participate in strategy reviews. The Company’s business plan,
strategy and risks are regularly reviewed and evaluated by the
Board. The Board Members are free to consult the Company’s
senior executives as needed. Ordinarily, the Chairman of the
Board proposes the agenda for each Board meeting. Besides the
Board Members, Board meetings are attended by the Executive
Board. Other participants are summoned as needed. The Board
approves decisions of particular importance to the Company
including the strategies and strategic plans, the approval of
significant investments, and the approval of business acquisitions
and disposals.

ASETEK A/S – ANNUAL REPORT 201618 MANAGEMENT REPORT
Conflicts of interest. In a situation involving a member of the
Board personally, this member will exclude him or herself from the
discussions and voting on the issue.
Use of Committees. Currently, the Company has a Nomination
Committee, an Audit Committee and a Compensation Committee.
• The Nomination Committee is elected directly by the General
Meeting. The Committee consists of three members and must be
independent from the Board of Directors and the management,
however, it is recommended that the chairman of the Board of
Directors is a member. The tasks include proposing candidates
for the Board of Directors, propose remuneration for the Board
of Directors as well as perform the annual assessment of the
Board of Directors. Members: Ib Sønderby (chairman), Scott
Pagel and Samuel Szteinbaum. The Committee met two times
during 2016.
• The Audit Committee is elected among the members of the
Board of Directors and has responsibilities related to financial
reporting, the independent auditor, internal reporting and risk
management. The Committee consists of two shareholder-
elected Board members. The other Board members are
entitled to attend if they so desire. Members: Knut Øversjøen
(Chairman) and Chris J. Christopher. The Committee met four
times during 2016.
• The Compensation Committee has responsibilities related to
developing proposals for the applicable remuneration policy
and execution of the Management Board. Members: Samuel
Szteinbaum (Chairman), Jim McDonnell and Jørgen Smidt. The
Committee met two times during 2016.
The Board’s self-evaluation. The Board’s composition,
competencies, working methods and interaction are discussed on
an ongoing basis and evaluated formally on an annual basis. In
this connection, the Board also evaluates its efforts in terms of
corporate governance.
The composition of the Board is considered appropriate in terms
of professional experience and relevant special competences to
perform the tasks of the Board of Directors. The Board of Directors
continuously assesses whether the competences and expertise of
members need to be updated. At least half of the members elected
by the general meeting are independent persons, and none of the
Board members participates in the day-to-day operation of the
Company.
A comprehensive list of other management positions held by the
Board members can be found in Note 24.
Risk management. Refer to the Risk Exposure and Management
section of the Management Report as well as Note 3 of the
consolidated financial statements.
The board’s authorization to issue shares
At the general meeting held on August 13, 2013 the Board was
authorized to issue shares with a nominal value of up to DKK
80,000 for the period until August 14, 2018 in connection with
employee warrant programs.
At the Board of Directors meeting on April 23, 2014 warrants
permitting subscription of up to 118,210 shares of a nominal value
of DKK 0.10 and at an exercise price of NOK 40.10 per share
were issued. The exercise price was established as the share price
(“closing price”) for the Company’s share as of the prior day. The
warrants were issued to employees and Board members.
At the Board of Directors meeting on August 12, 2014 warrants
permitting subscription of up to 32,970 shares of a nominal value
of DKK 0.10 and at an exercise price of NOK 33.90 per share
were issued. The exercise price was established as the share price
(“closing price”) for the Company’s share as of the prior day. The
warrants were issued to employees and Board members.
At the general meeting held on April 30, 2015, the Board was
authorized to issue new shares under the warrant program up to
a nominal value of DKK 200,000 through April 30, 2020.
At the Board Meeting on August 11, 2015, warrants permitting
subscription of up to 700,000 shares of a nominal value of DKK
0.10 and at an exercise price of NOK 10.50 per share were issued.
The exercise price was established as the share price (“closing
price”) for the Company’s share as of August 12, 2015. The
warrants were issued to employees and Board members.
At the Board Meeting on April 29, 2016, warrants permitting
subscription of up to 600,000 shares of a nominal value of DKK
0.10 and at an exercise price of NOK 19.50 per share were issued.
The exercise price was established as the share price (“closing
price”) for the Company’s share as of April 28, 2016. The warrants
were issued to employees and Board members.
In addition to the above, the Board is authorized to buy and sell
Company shares to treasury.
Remuneration of the board of directors
Board members representing their Company’s ownership interests
are not compensated for their services. Independent board
members received a combination of cash compensation and long
termed stock option based incentives during 2016. Please see
Note 24 for further details.
Remuneration of the executive staff
The Remuneration Committee recommends to the Board, and
the Board sets, the terms of employment of the members of the
Management Board. Each year, the Remuneration Committee
undertakes a review of salary and other remuneration to the CEO
as well as for other members of the Management Board.
A summary of the agreements between the Company and its
management board members pertaining to termination can be
found in Note 6.
The option program and the allocation of options to the employees
and Board members are decided upon by the Board of Directors.

ASETEK A/S – ANNUAL REPORT 2016 19STATEMENT BY MANAGEMENT
STATEMENT BY MANAGEMENT
The Executive Board and the Board of Directors have today
considered and adopted the Annual Report of Asetek A/S for the
financial year January 1 to December 31, 2016. The annual report
is prepared in accordance with International Financial Reporting
Standards as adopted by the EU and additional Danish disclosure
requirements for listed companies.
In our opinion, the Consolidated Financial Statements and Financial
Statements give a true and fair view of the financial position at
December 31, 2016 of the Group and the Parent company and of
the results of the Group and Parent company operations and cash
flows for 2016.
In our opinion, Management’s Report includes a true and fair
account of the development in the operations and financial
circumstances of the Group and the Parent company as well
as a description of the most significant risks and elements of
uncertainty facing the Group and the Parent company.
We recommend that the Annual Report be adopted at the Annual
General Meeting.
Aalborg, Denmark
February 27, 2017
Executive Board
André Sloth Eriksen
Chief Executive Officer
Peter Dam Madsen
Chief Financial Officer
Board of Directors
Samuel Szteinbaum, Chairman Chris J. Christopher
Jim McDonnell Jørgen Smidt
Peter Gross Knut Øversjøen

ASETEK A/S – ANNUAL REPORT 201620 INDEPENDENT AUDITOR’S REPORT
INDEPENDENT AUDITOR’S REPORT
To the Shareholders of Asetek A/S
Our opinion
In our opinion, the Consolidated Financial Statements and the
Parent Company Financial Statements give a true and fair view
of the Group’s and the Parent Company’s financial position at 31
December 2016 and of the results of the Group’s and the Parent
Company’s operations and cash flows for the financial year 1
January to 31 December 2016 in accordance with International
Financial Reporting Standards as adopted by the EU and further
requirements in the Danish Financial Statements Act.
What we have audited
• the statement of comprehensive income for the financial year 1
January to 31 December 2016;
• the balance sheet at December 31 2016;
• the statement of changes in equity for the financial year 1
January to 31 December 2016;
• the cash flow statement for the financial year 1 January to 31
December 2016; and
• the notes to the financial statements, including summary of
significant accounting policies for the Group as well as for
the Parent Company. Collectively referred to as the “financial
statements”.
Basis for Opinion
We conducted our audit in accordance with International Standards
on Auditing (ISAs) and the additional requirements applicable
in Denmark. Our responsibilities under those standards and
requirements are further described in the Auditor’s Responsibilities
for the Audit of the Financial Statements section of our report.
We believe that the audit evidence we have obtained is sufficient
and appropriate to provide a basis for our opinion.
Independence
We are independent of the Group in accordance with International
Ethics Standards Board for Accountants’ Code of Ethics
for Professional Accountants (IESBA Code) and the ethical
requirements that are relevant to our audit of the financial
statements in Denmark. We have also fulfilled our other ethical
responsibilities in accordance with the IESBA Code.
Key Audit Matters
Key audit matters are those matters that, in our professional
judgment, were of most significance in our audit of the financial
statements for 2016. These matters were addressed in the context
of our audit of the financial statements as a whole, and in forming
our opinion thereon, and we do not provide a separate opinion on
these matters.

ASETEK A/S – ANNUAL REPORT 2016 21INDEPENDENT AUDITOR’S REPORT
Key Audit Matter How our audit addressed the Key Audit Matter
Capitalization of development costs
As explained on page 16, Asetek A/S continuously develops new
solutions and products adapted to the latest technology and
the clients’ needs as well as improving existing solutions and
market position. As described in note 14 USD 1,871K of internal
development costs have been capitalized within Intangible Assets.
We focused on this area due to the size of the internal costs
capitalized, and the fact that there is judgement involved in
assessing whether the criteria set out in the accounting standards
for capitalization of such costs have been met, particularly:
• The technical feasibility of the project; and
• The likelihood of the project delivering sufficient future economic
benefits.
In the light of the development of new solutions and products
adapted to the latest technology, we also focussed on whether
the carrying value of existing capitalised solutions and products
was impaired.
We obtained a breakdown, by value, of all individual development
projects capitalized in the period and reconciled this to the
amounts recorded in the general ledger, identifying no significant
reconciling differences.
We tested the largest capitalized development projects in 2016
totalling to USD 708K, together with a sample of smaller projects
from the remaining population, as follows:
• We obtained business cases from management including
description of the development project, feasibility analysis,
budgeted costs and budgeted revenue. This also included
descriptions on how the specific requirements of the relevant
accounting standards and other guidance, most notably IAS 38
were met.
• We discussed the assumptions for budgets and compared
historical budgets with realized amounts to challenge
management’s explanations. We found that the explanations
supports our understanding of developments in the business
and supported management’s assessment that the costs met
the relevant capitalization criteria.
• We obtained explanations from management of why the projects
are impaired or not. We challenged both management and the
project manager as to whether the development of new solutions
and products superseded or impaired any of the existing assets
on the balance sheet. We noted that, as disclosed in note 14 an
impairment charge of USD 186K was recorded in this regard,
but did not identify any further indicators of impairment. We
also applied our own understanding of both new and existing
projects that is no longer in use or its life was shortened by any
development activity. We found no such items.
To determine whether costs were directly attributable to projects,
we obtained listings of hours worked on individual projects and
compared a sample of the individual hours recorded with the
capitalized hours. We also checked the hours charged equated
to the value of costs capitalized, by applying the approved salary
rates per employee to the timesheet hours, without significant
exception. We reconciled specifications of the basis used for
capitalized overheads and discussed the appropriateness of
included costs in respect of relevant accounting rules and
guidance.
Furthermore, we compared a sample of the direct costs capitalized
with external vendor invoices, without significant exception.

ASETEK A/S – ANNUAL REPORT 201622 INDEPENDENT AUDITOR’S REPORT
Key Audit Matter How our audit addressed the Key Audit Matter
Valuation of deferred tax assets
As explained in note 11, Asetek A/S has recognized USD 4,874k
as deferred tax assets. The deferred tax assets primarily relates
to tax losses from previous years. The tax losses can be carried
forward against future taxable income. The tax losses relates to
losses realized in Denmark and the U.S.
We focused on this area due to the size of the deferred tax
asset and the size of the total tax losses. Furthermore, there is
judgement involved in assessing whether the criteria set out in
the accounting standards (IAS 12) for recognising deferred tax
assets have been met, particularly:
• The probability that future taxable profit will be available,
against which the unused tax losses can be utilised.
Furthermore, the group has not recognized deferred tax assets
in previous years as the group has not realised or expected to
realise sufficient taxable profits against which the unused tax
losses could be utilized. Because of the realised taxable profits
for 2016 and the expectations for the future years, management
has recognised a deferred tax asset of USD 4,874k. Therefore,
judgments and the group’s ability to recognise future taxable
profits has been more significant in 2016 than previous.
We obtained the management’s valuation of the deferred tax
assets and reconciled this to the amounts recorded in the financial
statements, identifying no significant reconciling differences.
We challenged and applied professional skepticism to the
judgments and estimates made by management in relation to the
deferred tax assets through the following audit procedures:
• We received the Group’s budgets and forecasts for the period
2017-2019. We tested and challenged the assumptions made
by management by comparing to realized figures and realized
growth for 2015-2016
• We compared the budgets with the deferred tax asset recognised
and challenged management on their plan for utilising the tax
losses
• We utilised relevant country tax specialists in order to ensure
compliance to pending tax rules
Statement on Management’s Review
Management is responsible for Management’s Review.
Our opinion on the financial statements does not cover
Management’s Review, and we do not express any form of
assurance conclusion thereon.
In connection with our audit of the financial statements, our
responsibility is to read Management’s Review and, in doing so,
consider whether Management’s Review is materially inconsistent
with the financial statements or our knowledge obtained in the
audit, or otherwise appears to be materially misstated.
Moreover, we considered whether Management’s Review includes
the disclosures required by the Danish Financial Statements Act.
Based on the work we have performed, in our view, Management’s
Review is in accordance with the Consolidated Financial
Statements and the Parent Company Financial Statements and
has been prepared in accordance with the requirements of the
Danish Financial Statements Act. We did not identify any material
misstatement in Management’s Review.
Responsibilities for the Financial Statements and the Audit
Management’s Responsibility for the Financial Statements
Management is responsible for the preparation of Consolidated
Financial Statements and Parent Company Financial Statements
that give a true and fair view in accordance with International
Financial Reporting Standards as adopted by the EU and further
requirements in the Danish Financial Statements Act, and for such
internal control as Management determines is necessary to enable
the preparation of financial statements that are free from material
misstatement, whether due to fraud or error.
In preparing the financial statements, Management is responsible
for assessing the Group’s and the Parent Company’s ability to
continue as a going concern, disclosing, as applicable, matters
related to going concern and using the going concern basis of
accounting unless Management either intends to liquidate the
Group or the Parent Company or to cease operations, or has no
realistic alternative but to do so.
Auditor’s Responsibilities for the Audit of the Financial Statements
Our objectives are to obtain reasonable assurance about whether
the financial statements as a whole are free from material
misstatement, whether due to fraud or error, and to issue an
auditor’s report that includes our opinion. Reasonable assurance
is a high level of assurance, but is not a guarantee that an audit
conducted in accordance with ISAs and the additional requirements
applicable in Denmark will always detect a material misstatement
when it exists. Misstatements can arise from fraud or error and
are considered material if, individually or in the aggregate, they
could reasonably be expected to influence the economic decisions
of users taken on the basis of these financial statements.
As part of an audit in accordance with ISAs and the additional
requirements applicable in Denmark, we exercise professional
judgment and maintain professional skepticism throughout the
audit. We also:
• Identify and assess the risks of material misstatement of the
financial statements, whether due to fraud or error, design and
perform audit procedures responsive to those risks, and obtain
audit evidence that is sufficient and appropriate to provide
a basis for our opinion. The risk of not detecting a material
misstatement resulting from fraud is higher than for one
resulting from error, as fraud may involve collusion, forgery,

ASETEK A/S – ANNUAL REPORT 2016 23INDEPENDENT AUDITOR’S REPORT
Henrik Trangeled Kristensen
State Authorised Public Accountant
Aarhus, February 27, 2017
PricewaterhouseCoopers
Statsautoriseret Revisionspartnerselskab
CVR-nr. 33 77 12 31
intentional omissions, misrepresentations, or the override of
internal control.
• Obtain an understanding of internal control relevant to the audit
in order to design audit procedures that are appropriate in the
circumstances, but not for the purpose of expressing an opinion
on the effectiveness of the Group’s and the Parent Company’s
internal control.
• Evaluate the appropriateness of accounting policies used
and the reasonableness of accounting estimates and related
disclosures made by Management.
• Conclude on the appropriateness of Management’s use of the
going concern basis of accounting and based on the audit
evidence obtained, whether a material uncertainty exists
related to events or conditions that may cast significant doubt
on the Group’s and the Parent Company’s ability to continue
as a going concern. If we conclude that a material uncertainty
exists, we are required to draw attention in our auditor’s
report to the related disclosures in the financial statements
or, if such disclosures are inadequate, to modify our opinion.
Our conclusions are based on the audit evidence obtained up
to the date of our auditor’s report. However, future events or
conditions may cause the Group or the Parent Company to
cease to continue as a going concern.
• Evaluate the overall presentation, structure and content of the
financial statements, including the disclosures, and whether the
financial statements represent the underlying transactions and
events in a manner that achieves fair presentation.
• Obtain sufficient appropriate audit evidence regarding the
financial information of the entities or business activities within
the Group to express an opinion on the consolidated financial
statements. We are responsible for the direction, supervision
and performance of the group audit. We remain solely
responsible for our audit opinion.
We communicate with those charged with governance regarding,
among other matters, the planned scope and timing of the audit
and significant audit findings, including any significant deficiencies
in internal control that we identify during our audit.
We also provide those charged with governance with a statement
that we have complied with relevant ethical requirements regarding
independence, and to communicate with them all relationships
and other matters that may reasonably be thought to bear on our
independence, and where applicable, related safeguards.
From the matters communicated with those charged with
governance, we determine those matters that were of most
significance in the audit of the financial statements of the current
period and are therefore the key audit matters. We describe these
matters in our auditor’s report unless law or regulation precludes
public disclosure about the matter or when, in extremely rare
circumstances, we determine that a matter should not be
communicated in our report because the adverse consequences
of doing so would reasonably be expected to outweigh the public
interest benefits of such communication.
Henrik Berring Rasmussen
State Authorised Public Accountant

ASETEK A/S – ANNUAL REPORT 201624
PROFIT & LOSS
Asetek A/S
Consolidated Statement of Comprehensive Income
For the years ended December 31, 2016 and 2015
USD 000's Note 2016 2015
Revenue 4 50,921 35,982
Cost of sales 8 (31,171) (23,570)
Gross profit 19,750 12,412
Research and development (3,428) (3,938)
Selling, general and administrative (11,653) (12,641)
Other income - 1,844
Total operating expenses 8 (15,081) (14,735)
Operating income 4,669 (2,323)
Foreign exchange gain 9 330 305
Finance income 9 48 1
Finance costs 9 (56) (68)
Total financial income 322 238
Income before tax 4,991 (2,085)
Income tax (expense) benefit 10, 11 4,646 438
Income for the year 9,637 (1,647)
Other comprehensive income items that may be reclassified
to profit or loss in subsequent periods:
Foreign currency translation adjustments (455) 181
Total comprehensive income 9,182 (1,466)
Income per share: (in USD)
Basic 12 0.39 (0.07)
Diluted 12 0.38 (0.07)
All operations are continuing.
The Notes on the following pages are an integral part of these consolidated financial statements.
PROFIT & LOSS

ASETEK A/S – ANNUAL REPORT 2016 25
BALANCE SHEET
Asetek A/S
Consolidated Balance Sheet
As of December 31, 2016 and 2015
USD 000's Note 2016 2015
ASSETS
Non-current assets
Intangible assets 14 1,871 1,852
Property and equipment 15 1,684 1,188
Deferred income tax assets 11 4,874 -
Other assets 642 496
Total non-current assets 9,071 3,536
Current assets
Inventory 17 1,158 1,786
Trade receivables and other 16 13,325 9,366
Cash and cash equivalents 17,610 13,060
Total current assets 32,093 24,212
Total assets 41,164 27,748
EQUITY AND LIABILITIES
Equity
Share capital 18 417 416
Share premium - 76,665
Retained earnings 28,130 (58,633)
Translation and other reserves (257) 198
Total equity 28,290 18,646
Non-current liabilities
Long-term debt 19 264 259
Total non-current liabilities 264 259
Current liabilities
Short-term debt 19 524 375
Accrued liabilities 1,305 789
Accrued compensation and employee benefits 1,413 1,272
Trade payables 9,368 6,407
Total current liabilities 12,610 8,843
Total liabilities 12,874 9,102
Total equity and liabilities 41,164 27,748
The Notes on the following pages are an integral part of these consolidated financial statements.
BALANCE SHEET

ASETEK A/S – ANNUAL REPORT 201626
CASH FLOWS
Asetek A/S
Consolidated Cash Flow Statement
For the years ended December 31, 2016 and 2015
USD 000's Note 2016 2015
Cash flows from operating activities
Income (loss) for the year 9,637 (1,647)
Depreciation and amortization 14, 15 2,450 2,390
Finance costs 9 8 67
Income tax expense (income) 10, 11 (4,646) (438)
Impairment of intangible assets 28 -
Cash receipt (payment) for income tax (40) 934
Share based payments expense 7 328 321
Changes in trade receivables, inventories, other assets (3,895) (6,937)
Changes in trade payables and accrued liabilities 3,936 4,243
Net cash used in operating activities 7,806 (1,067)
Cash flows from investing activities
Additions to intangible assets 14 (1,835) (1,489)
Purchase of property and equipment 15 (1,077) (882)
Net cash used in investing activities (2,912) (2,371)
Cash flows from financing activities
Funds drawn against line of credit 142 90
Proceeds from issuance of share capital 18 133 13,148
Cash paid for fees related to financing 18 - (832)
Principal and interest payments on finance leases (100) (76)
Net cash provided by financing activities 175 12,330
Effect of exchange rate changes on cash and cash equivalents (519) (2)
Net changes in cash and cash equivalents 4,550 8,890
Cash and cash equivalents at beginning of period 13,060 4,170
Cash and cash equivalents at end of period 17,610 13,060
Supplemental disclosure - non-cash transactions
Equipment acquired under finance leases $ 140 $ 76
The Notes on the following pages are an integral part of these consolidated financial statements
CASH FLOWS

ASETEK A/S – ANNUAL REPORT 2016 27
EQUITY
Asetek A/S
Consolidated Statement of Changes in Equity
For the years ended December 31, 2016 and 2015
(USD 000's)Share
capitalShare
premiumTranslation
reservesOther
reservesAccumulated
deficit Total
Equity at December 31, 2014 264 64,451 26 (12) (57,307) 7,422
Total comprehensive income for 2015
Loss for the year - - - - (1,647) (1,647)
Foreign currency translation adjustments - - 181 - - 181
Total comprehensive loss for 2015 - - 181 - (1,647) (1,466)
Transactions with owners in 2015
Shares issued 152 12,993 - 3 - 13,148
Less: issuance costs - (779) - - - (779)
Share based payment expense - - - - 321 321
Transactions with owners in 2015 152 12,214 - 3 321 12,690
Equity at December 31, 2015 416 76,665 207 (9) (58,633) 18,646
Total comprehensive income for 2016
Income for the year - - - - 9,637 9,637
Foreign currency translation adjustments - - (455) - - (455)
Total comprehensive income for 2016 - - (455) - 9,637 9,182
Transactions with owners in 2016
Shares issued 1 133 - - - 134
Transfer - (76,798) - - 76,798 -
Share based payment expense - - - - 328 328
Transactions with owners in 2016 1 (76,665) - - 77,126 462
Equity at December 31, 2016 417 - (248) (9) 28,130 28,290
The Notes on the following pages are an integral part of these consolidated financial statements
EQUITY

ASETEK A/S – ANNUAL REPORT 201628
NOTES
1. GENERAL INFORMATION
Asetek A/S (‘the Company’), and its subsidiaries (together,
‘Asetek Group’, ‘the Group’ or ‘Asetek’) designs, develops and
markets liquid cooling solutions used in personal computers,
servers and data centers. The Group’s core products utilize liquid
cooling technology to provide improved performance, acoustics
and energy efficiency. The Company is based in Aalborg, Denmark
with offices in USA, China and Taiwan. The Company’s shares
trade on the Oslo Stock Exchange under the symbol ‘ASETEK’.
2. SUMMARY OF SIGNIFICANT ACCOUNTING POLICIES
The principal accounting policies applied in the preparation of
these consolidated financial statements are set out below. These
policies have been consistently applied to all the years presented,
unless otherwise stated.
2.1. Basis of preparation
The consolidated financial statements have been prepared on
a historical cost convention, in accordance with International
Financial Reporting Standards (IFRS) as adopted by the
European Union (EU) and the supplementary Danish information
requirements for class D publicly listed companies. The amendment
to Danish Statements ÅRL § 97a has been early adopted. Certain
prior period amounts have been reclassified to conform to current
period presentation.
2.2. Consolidation
The consolidated financial statements comprise the Company and
its consolidated subsidiaries. Subsidiaries are all entities (including
structured entities) over which the Group has control. The Group
controls an entity when the Group is exposed to, or has rights to,
variable returns from its involvement with the entity and has the
ability to affect those returns through its power over the entity.
Subsidiaries are fully consolidated from the date on which control
is transferred to the Group. They are deconsolidated from the
date that control ceases. Intercompany transactions, balances,
income and expenses on transactions between Group companies
are eliminated. Profits and losses resulting from the intercompany
transactions that are recognized in assets are also eliminated.
Accounting policies of subsidiaries are consistent with the policies
adopted by the Group.
The Group uses the acquisition method of accounting to account
for business combinations. The consideration transferred for
the acquisition of a subsidiary is the fair values of the assets
transferred, the liabilities incurred and the equity interests issued
by the Group. The consideration transferred includes the fair value
of any asset or liability resulting from a contingent consideration
arrangement. Acquisition-related costs are expensed as incurred.
Identifiable assets acquired and liabilities and contingent liabilities
assumed in a business combination are measured initially at
their fair values at the acquisition date. The Group recognizes
any non-controlling interest in the acquiree on an acquisition-
by-acquisition basis either at fair value or at the non-controlling
interest’s proportionate share of the acquiree’s net assets. The
excess of the consideration transferred, the amount of any non-
controlling interest in the acquiree and the acquisition-date fair
value of any previous equity interest in the acquiree over the
fair value of the identifiable net assets acquired is recorded as
goodwill. If the total of consideration transferred, non-controlling
interest recognized and previously held interest measured is less
than the fair value of the net assets of the subsidiary acquired
in the case of a bargain purchase, the difference is recognized
directly in the income statement.
2.3. Foreign currency
Items included in the financial statements of each of the Group’s
entities are measured using the currency of the primary economic
environment in which the entity operates (‘the functional
currency’). The functional currency of the Company’s operations
in the United States of America, Denmark and China are the U.S.
dollar, Danish kroner, and Chinese Yuan Renminbi, respectively.
The consolidated financial statements are presented in U.S.
dollars, which is the Group’s presentation currency.
Foreign currency transactions are translated into the functional
currency using the exchange rates prevailing at the dates of the
transactions. Foreign exchange gains and losses resulting from
the settlement of such transactions and from the translation
at year-end exchange rates of monetary assets and liabilities
denominated in foreign currencies are recognized as operating
expense in the income statement in foreign exchange (loss)/gain.
Group companies that have a functional currency different from
the presentation currency are translated into the presentation
currency as follows:
• Assets and liabilities for each balance sheet presented are
translated at the closing rate at the date of that balance sheet;
• Income and expenses for each income statement are translated
at average exchange rates;
• All resulting exchange differences are recognized in other
comprehensive income
2.4. Property and equipment
Property and equipment are stated at historical cost less
accumulated depreciation. Subsequent costs are included in the
asset’s carrying amount or recognized as a separate asset, as
appropriate, only when it is probable that future economic benefits
associated with the item will flow to the Group and the cost of
the item can be measured reliably. The carrying amount of any
replaced part is derecognized. All other repairs and maintenance
NOTES

ASETEK A/S – ANNUAL REPORT 2016 29
are charged to the income statement during the financial period
in which they are incurred.
Depreciation is provided over the estimated useful lives of the
depreciable assets, generally three to five years, using the
straight-line method. The assets’ useful lives and residual values
are reviewed, and adjusted if appropriate, at the end of each
reporting period. Gains and losses on disposals are determined
by comparing the proceeds with the carrying amount and are
recognized as other income or expense in the consolidated income
statement. Property and equipment is grouped as follows:
Group Estimated Useful Life
Leasehold improvements Lesser of 5 years or lease term
Plant and machinery 5 years
Tools, equipment, fixtures 3 to 5 years
2.5. Research and development
Research costs are expensed as incurred. Costs directly
attributable to the design and testing of new or improved products
to be held for sale by the Group are recognized as intangible
assets within development projects when all of the following
criteria are met:
• It is technically feasible to complete the product so that it will
be available for sale;
• management intends to complete the product and use or sell it;
• there is an ability to use or sell the product;
• it can be demonstrated how the product will generate probable
future economic benefits;
• adequate technical, financial and other resources to complete
the development and to use or sell the product are available;
and
• the expenditure attributable to the product during its
development can be reliably measured.
Directly attributable costs that are capitalized as part of the
product include the employee costs associated with development.
Other development expenditures that do not meet these criteria
are recognized as expense when incurred. Development costs
previously recognized as expense are not recognized as an
asset in a subsequent period. Development costs recognized as
assets are amortized on a straight-line basis over their estimated
useful lives, which generally range between three and forty-eight
months. Amortization expense related to capitalized development
costs is included in research and development expense.
2.6. Impairment of non-financial assets
Assets that are subject to amortization are reviewed for impairment
annually, and whenever events or changes in circumstances
indicate that the carrying amount may not be recoverable. An
impairment loss is recognized for the amount by which the asset’s
carrying amount exceeds its recoverable amount. The recoverable
amount is the higher of 1) an asset’s fair value less costs to sell
or 2) its value in use. For the purposes of assessing impairment,
assets are grouped at the lowest levels for which there are
separately identifiable cash flows (cash-generating units). Non-
financial assets other than goodwill that previously suffered an
impairment are reviewed for possible reversal of the impairment
at each reporting date.
2.7. Financial assets
Recognition and Measurement. The Group determines the
classification of its financial assets at initial recognition. Financial
assets within the scope of IAS 39 are classified as follows:
• ‘Financial assets at fair value through profit or loss’ are financial
assets held for trading, and are classified as current if they are
expected to be settled within twelve months.
• ‘Loans and receivables’ are non-derivative financial assets with
fixed or determinable payments that are not quoted in an active
market. They are classified as current assets except when they
have maturities of twelve months or more from the balance
sheet date.
• ‘Available-for-sale financial assets’ are all others that are
designated in this category or not classified in the other
categories.
For all years presented, the Group’s financial assets include only
‘loans and receivables’.
Impairment of financial assets. For financial assets carried at
amortized cost, the Group assesses at the end of each reporting
period whether there is objective evidence that a financial asset or
group of financial assets is impaired. A financial asset or a group
of financial assets is impaired and impairment losses are incurred
only if there is objective evidence of impairment as a result of
one or more events that occurred after the initial recognition of
the asset (a ‘loss event’) and that loss event (or events) has an
impact on the estimated future cash flows of the financial asset or
group of financial assets that can be reliably estimated. Evidence
of impairment may include indications that the debtors or a group
of debtors is experiencing significant financial difficulty, default
or delinquency in interest or principal payments, the probability
that they will enter bankruptcy or other financial reorganization,
and where observable data indicate that there is a measurable
decrease in the estimated future cash flows, such as changes in
arrears or economic conditions that correlate with defaults.
For loans and receivables category, the amount of the loss is
measured as the difference between the asset’s carrying amount
and the present value of estimated future cash flows (excluding
future credit losses that have not been incurred) discounted at the
financial asset’s original effective interest rate. The carrying amount
of the asset is reduced and the amount of the loss is recognized in
the consolidated income statement. As of December 31, 2016, the
Company has not incurred any impairment losses on financial assets.
NOTES

ASETEK A/S – ANNUAL REPORT 201630
2.8. Financial liabilities
Recognition and measurement. Financial liabilities within the
scope of IAS 39 are classified as financial liabilities at fair value
through profit or loss, or other liabilities. The Group determines
the classification of its financial liabilities at initial recognition.
Financial liabilities are recognized initially at fair value less, in the
case of other liabilities, directly attributable transaction costs. The
measurement of financial liabilities depends on their classification
as follows:
• ‘Financial liabilities at fair value through profit or loss’ are
liabilities entered into that do not meet the hedge accounting
criteria as defined by IAS 39. Gains or losses on liabilities held
for trading are recognized in profit and loss.
• ‘Other liabilities’ – After initial recognition, interest bearing debt
is subsequently measured at amortized cost using the effective
interest rate method. Gains and losses are recognized in the
income statement when the liabilities are derecognized as well
as through the amortization process. The calculation takes into
account any premium or discount on acquisition and includes
transaction costs and fees that are an integral part of the
effective interest rate.
Offsetting of financial instruments. Financial assets and
financial liabilities are offset and the net amount reported in the
consolidated balance sheet if, and only if, there is a currently
enforceable legal right to offset the recognized amounts and there
is an intention to settle on a net basis, or to realize the assets and
settle the liabilities simultaneously.
2.9. Inventories
Inventories are stated at the lower of actual cost or net realizable
value. Cost is determined using the first-in, first-out (FIFO)
method. Net realizable value is the estimated selling price in the
ordinary course of business less estimated costs necessary to
make the sale. Adjustments to reduce the cost of inventory to its
net realizable value, if required, are made for estimated excess,
obsolescence, or impaired balances.
2.10. Trade receivables
Trade receivables are amounts due from customers for product
sold in the ordinary course of business. Trade receivables are
recognized initially at fair value and subsequently measured
at amortized cost using the effective interest method, less any
provision for impairment. If collection is expected in one year or
less, trade receivables are classified as current assets.
2.11. Cash and cash equivalents
Cash and cash equivalents includes cash on hand, deposits with
banks, overdrafts and other short-term highly liquid investments
with original maturities of three months or less.
2.12. Share capital
Ordinary shares are classified as equity. Incremental costs directly
attributable to the issue of new ordinary shares or options are
shown in equity as a deduction, net of tax, from the proceeds.
2.13 Share-based payments
The Company issues options (or warrants) that allow management
and key personnel to acquire shares in the Company. Through
equity-settled, share-based compensation plans, the Company
receives services from employees as consideration for the granting
of equity options to purchase shares in the Company at a fixed
exercise price. The fair value of the employee services received in
exchange for the grant of the options is recognized as an expense.
The total amount to be expensed is determined by reference to
the fair value of the options granted, excluding the impact of
any non-market service and performance vesting conditions.
The grant date fair value of options granted is recognized as an
employee expense with a corresponding increase in equity, over
the period that the employees become unconditionally entitled to
the options (vesting period). The fair value of the options granted
is measured using the Black-Scholes model, taking into account
the terms and conditions as set forth in the share option program.
Measurement inputs include share price on measurement date,
exercise price of the instrument, expected volatility, weighted
average expected life of the instruments (based on historical
experience and general option holder behavior), expected
dividends, and the risk-free interest rate. Service and non-market
performance conditions attached to the transactions are not taken
into account in determining fair value. At each reporting date, the
Company revises its estimates of the number of options that are
expected to vest based on the non-market vesting conditions. The
impact of the revision to original estimates, if any, is recognized
in the Statement of Comprehensive Income, with a corresponding
adjustment to equity.
2.14. Current and deferred income tax
The tax expense for the period comprises current and deferred
tax. Tax is recognized in the income statement, except to the
extent that it relates to items recognized in other comprehensive
income or directly in equity. In this case, the tax is also recognized
in other comprehensive income or directly in equity, respectively.
The current income tax expense is calculated on the basis of the
tax laws enacted or substantively enacted at the balance sheet
date in the countries where the Company and its subsidiaries
operate and generate taxable income. Management periodically
evaluates positions taken in tax returns with respect to situations
in which applicable tax regulation is subject to interpretation.
Management establishes provisions where appropriate on the
basis of amounts expected to be paid to the tax authorities.
Deferred income tax is recognized, using the liability method, on
temporary differences arising between the tax bases of assets and
liabilities and their carrying amounts in the consolidated financial
statements. However, deferred tax liabilities are not recognized if
they arise from the initial recognition of goodwill; deferred income
tax is not accounted for if it arises from initial recognition of an
asset or liability in a transaction other than a business combination
that at the time of the transaction affects neither accounting nor
taxable profit or loss. Deferred income tax is determined using tax
rates (and laws) that have been enacted or substantively enacted
by the balance sheet date and are expected to apply when the
NOTES

ASETEK A/S – ANNUAL REPORT 2016 31
related deferred income tax asset is realized or the deferred
income tax liability is settled.
Deferred income tax assets are recognized only to the extent that
it is probable that future taxable profit will be available against
which the temporary differences can be utilized.
Deferred income tax assets and liabilities are offset when there
is a legally enforceable right to offset current tax assets against
current tax liabilities and when the deferred income tax assets
and liabilities relate to income taxes levied by the same taxation
authority on either the same taxable entity or different taxable
entities where there is an intention to settle the balances on a
net basis.
2.15. Revenue recognition and other income
Revenue represents sale of the Group’s products to customers
which are principally resellers and original equipment
manufacturers. Revenue is measured at the fair value of the
consideration received or receivable, and represents amounts
receivable for goods supplied, stated net of discounts, sales tax,
returns and after eliminating sales within the Group.
The Group recognizes revenue when shipment or delivery has
occurred, the amount of revenue can be reliably measured, and
it is probable that future economic benefits will flow to the entity.
Customer purchase orders and/or contracts are used as evidence
of an arrangement. Delivery occurs when products are shipped
to the specified location and the risks of obsolescence and loss
have been transferred to the customer. For certain customers
with vendor-managed inventory, delivery does not occur until
product is acquired by the customer from the vendor-managed
inventory location. The Company assesses collectability based
primarily on the creditworthiness of the customer as determined
by credit checks and customer payment history. Customers do not
generally have a right of return.
The Company enters into contracts with the United States
government and California state government to deliver
products and services under time and materials and costs-plus
arrangements. Revenue under such contracts is recorded as costs
are incurred and includes estimated earned fees in proportion
that costs incurred-to-date bear to total estimated costs. The
Company also periodically receives funding from government
agencies and other customers to assist with the development and
testing of specific technologies. Such awards are recognized over
the period that the costs are incurred and are recorded as an
offset to research and development expense.
Income received as a result of patent litigation settlement is
recorded as other income as an offset to operating expense in the
period the award is granted.
2.16. Leases
Leases in which more than an insignificant portion of the risks
and rewards of ownership are retained by the lessor are classified
as operating leases. Payments made under operating leases are
charged to the income statement on a straight line basis over the
period of the lease.
The Group leases certain property and equipment. Leases of
property and equipment where the Group has substantially all the
risks and rewards of ownership are classified as finance leases and
the asset is accounted for as if it has been purchased outright.
The amount initially recognized as an asset is the lower of the
fair value of the leased property and the present value of the
minimum lease payments over the term of the lease.
Finance lease payments are allocated between the liability and
finance charges. The corresponding rental obligations, net of
finance charges, are included in other long-term payables.
Amounts due within one year are classified as current liabilities.
The interest element of the finance cost is charged to the
statement of comprehensive income over the lease period to
produce a constant periodic rate of interest on the remaining
balance of the liability for each period. The equipment acquired
under finance leases is depreciated over the shorter of the useful
life of the asset and the lease term.
2.17. Provisions
A provision is recognized when the Company has a present
legal or constructive obligation as a result of past events, it is
probable that an outflow of resources will be required to settle
the obligation, and the amount has been reliably estimated. If
the impact of time value is significant, the provision is calculated
by discounting anticipated future cash flow using a discount rate
before tax that reflects the market’s pricing of the present value
of money and, if relevant, risks specifically associated with the
obligation. Provisions are reviewed at each balance sheet date
and adjusted to reflect the current best estimate.
2.18. Contingent liabilities
Contingent liabilities are not recognized in the financial
statements. Significant contingent liabilities are disclosed, with
the exception of contingent liabilities where the probability of the
liability occurring is remote.
2.19. Segment reporting
Business segmentation. The Group is reporting on two distinct
segments: Desktop and Data center. The two segments are
identified by their specific sets of products and specific sets of
customers. The splitting of operating expenses between segments
is based on the Company’s best judgment, and done by using the
Company’s employee/project time tracking system and project
codes from the accounting system. Operating expenses that
are not divisible by nature (rent, telecommunication expenses,
etc.) have been split according to actual time spent on the two
businesses, and the Company’s best estimate for attribution.
Costs incurred for intellectual property defense and headquarters
administration have been classified separately as headquarters
costs and excluded from segment operating expenses as
indicated. The CEO is the Group’s chief operating decision-maker.
NOTES

ASETEK A/S – ANNUAL REPORT 201632
The CEO assesses the performance of each segment principally
on measures of revenue, gross margins, and adjusted EBITDA.
Geographical segmentation. Each of the Group’s offices in its
three principal geographies fulfills a particular function that serves
the Asetek Group as a whole. The majority of costs incurred in
each of the geographies are generally incurred for the benefit of
the entire Group and not to generate revenue in the respective
geography. As a result, the financial results of the Group are not
divided between multiple geographical segments for key operating
decision-making. Revenue and assets by geography is measured
and reported in Note 4, Geographical information.
2.20. Cash flow statement
The cash flow statement is prepared using the indirect method.
2.21. Critical accounting estimates and assumptions
The preparation of financial statements in conformity with IFRS
requires management to make estimates and assumptions
that affect the amounts reported in the financial statements
and accompanying notes. Actual results could differ from those
estimates. Areas where significant judgment has been applied
are:
• Valuation of deferred tax assets: deferred income tax assets are
recognized to the extent that the realization of the tax benefit
to offset future tax liabilities is considered to be probable.
Through 2015, the Group had not recognized deferred income
tax assets due to historical losses and uncertainty of future
profits. In the 2015 tax filings, the Group utilized $1.0 million of
net operating loss carryforwards to reduce U.S. taxable income.
In 2016, as a result of current earnings and future earnings
estimates, the Company recorded deferred tax assets for the
estimated amount of net operating losses that will be utilized
to offset future taxable income. In future periods, management
will continue to assess the probability of realization of the
assets’ value and adjust the valuation in accordance with IAS
12.
• Capitalization of development costs: the Group’s business
includes a significant element of research and development
activity. Under IAS 38, there is a requirement to capitalize
and amortize development spend to match costs to expected
benefits from projects deemed to be commercially viable. The
application of this policy involves the ongoing consideration
by management of the forecasted economic benefit from such
projects compared to the level of capitalized costs, together
with the selection of amortization periods appropriate to the
life of the associated revenue from the product. If customer
demand for products or the useful lives of products vary from
management estimates, impairment charges on intangibles
could increase.
2.22. Defined contribution plan
In 2008, the Company established a defined contribution savings
plan (the “Plan”) in the U.S. that meets the requirements under
Section 401(k) of the U.S. Internal Revenue Code. This Plan
covers substantially all U.S. employees who meet the minimum
age and service requirements and allows participants to defer a
portion of their annual compensation on a pre-tax basis. Company
contributions to the Plan may be made at the discretion of the
board of directors. Through December 31, 2016, there have been
no contributions made to the Plan by the Company.
2.23. Changes in accounting policy and disclosures
Applied new standards and amendments included in
Annual Report for 2016. Certain new standards, amendments
to standards, and annual improvements to standards and
interpretations are effective for annual periods beginning after
January 1, 2016, and have been applied in preparing these
consolidated financial statements. None of these have a significant
effect on the consolidated financial statements of the Group.
New standards and amendments not applied in the Annual
Report for 2016. A number of new standards and amendments
to standards and interpretations are effective for annual periods
beginning after January 1, 2016, and have not been applied
in preparing these consolidated financial statements. None of
these is expected to have a significant effect on the consolidated
financial statements of the Group:
NOTES
EU Endorsed as of December 31, 2016
Standard Content Effective Date
IFRS 15: Revenue from
Contracts with Customers
The IASB has issued a new standard for the recognition of revenue. IFRS 15 is based
on the principle that revenue is recognised when control of a good or service transfers
to a customer – so the notion of control replaces the existing notion of risks and
rewards. The principle is applied to each individual performance obligation identified
in the contract. This standard may potentially affect the timing of revenue recognition,
recognition of variable consideration, allocation of revenue from multi-element
arrangements, recognition of revenue from license rights, up-front fees, and additional
disclosure requirements. This standard is not expected to have a significant effect on the
consolidated financial statements of the Asetek Group.
1-Jan-18

ASETEK A/S – ANNUAL REPORT 2016 33NOTES
IFRS 9: Financial
Instruments - on the
measurement and
classification of financial
assets and liabilities
The standard replaces IAS 39, Financial instrument, recognition and measurement. The
number of classification categories for financial assets is reduced to three: amortised
cost, fair value through profit or loss (FVPL) and fair value through other comprehensive
income (FVOCI). Entities taking the fair value option are required under IFRS 9 to
present the share of the fair value change for the period which is attributable to changes
in the entity’s own credit risk in other comprehensive income. Further, the impairment
model for financial assets is changed to a model based on expected credit losses under
which changes to the credit risk imply changes to the provision for bad debts. The hedge
accounting rules are relaxed so as to be aligned with the entity’s risk management
practices. This standard is not expected to have a significant effect on the consolidated
financial statements of the Asetek Group.
1-Jan-18
Not endorsed by EU as of December 31, 2016
Standard Content Effective Date
IFRS 14: Regulatory
deferral accounts
New common standard on regulatory assets (surplus/deficit) for first-time adopters of
IFRS. The EU has, however, positively decided that this standard should not be applicable
within the EU.
1-Jan-16
IFRS 16: Leases New standard on the accounting treatment of operating leases. In the future, leases
are to be recognized in the balance sheet with a lease asset and a corresponding lease
liability. Asetek expects to implement the standard when it comes into effect. Asetek is
examining the effect of the standard which cannot yet be determined.
1-Jan-19
IAS 12: Income Taxes Amendments clarifying the requirements for recognising deferred tax assets on unrealised
losses on securities adjusted to fair value through other comprehensive income.
1-Jan-17
IAS 7: Statement of Cash
Flows
Additional disclosures on reconciliation of financial liabilities required. Interest-bearing
debt to be reconciled from beginning to end of period.
1-Jan-17
IFRS 15: Revenue from
Contracts with Customers
Clarifications concerning the identification of performance obligations, principal versus
agent considerations and license considerations.
1-Jan-18
IFRS 2: Share based
payment
Changes to vesting conditions for cash-settled share-based payment schemes and the
accounting treatment of modifications to a cash-based scheme.
1-Jan-18
IFRIC 22: Foreign
Currency Transactions and
Advance Consideration
The exchange rate at the date of transaction of the advance consideration is to be
applied. In case of multiple advance payments, a date of transaction is to be determined
for each payment.
1-Jan-17
IAS 40: Investment
Property
Amendments clarify the use of the provisions of IAS 40, Investment Property, on
transfers to and from investment property.
1-Jan-18
Annual improvements:
IFRS 1, First time
adoption
Minor amendment deletes short-term exemptions for first-time adopters of IFRS related
to transitional provisions in specific standards because they have now served their
intended
1-Jan-17
Annual improvements:
IFRS 12, Disclosure of
interest in other entities
A purfewpo dsies. closure requirements under IFRS 12 also applicable to interests
classified as held for sale, held for distribution or as discontinued operations under IFRS
5. Assets classified as held for sale are exempt from other disclosure requirements under
IFRS 12.
1-Jan-17
Annual improvements:
IAS 28, Investments in
Associates
The option to measure at fair value through profit or loss an investment in an associate
or a joint venture held by an entity that is a venture capital organization is available for
each investment in an associate or joint venture on an investment-by-investment basis.
1-Jan-18

ASETEK A/S – ANNUAL REPORT 201634
The Group’s activities expose it to a variety of risks: liquidity
risk, market risk (including foreign exchange risk and interest
rate risk) and credit risk. The primary responsibility for Asetek’s
risk management and internal controls in relation to the financial
reporting process rests with executive management. Asetek’s
internal control procedures are integrated in the accounting
and reporting systems and include procedures with respect to
review, authorization, approval and reconciliation. Management
is in charge of ongoing efficient risk management, including the
identification of material risks, the development of systems for
risk management, and that significant risks are routinely reported
to the board of directors.
Liquidity risk. The Group incurred losses from operations and
negative cash flows from operations from inception through 2015;
positive cash flows and net earnings were generated for the first
time in 2016. The Group secured liquidity through its initial public
offering of common shares in 2013 and subsequent equity offerings
in 2015. Previously the Group issued convertible preferred shares,
convertible debt and notes payable to shareholders, and secured
bank lines of credit and trade receivables financing. The Group’s
corporate finance team monitors risk of a shortage of funds
through regular updates and analysis of cash flow projections and
maturities of financial assets and liabilities. The finance teams
also review liquidity, balance sheet ratios (such as days’ sales
outstanding, inventory turns) and other metrics on a regular basis
to ensure compliance both on a short- and long-term basis.
In October 2016, the Board of Directors announced a new dividend
policy and intends to propose a cash dividend of NOK1.00 per
share to the Annual General Meeting in 2017. When proposing
the annual dividend level, the Board takes into consideration the
Company’s growth plans, liquidity requirements and necessary
financial flexibility. In addition to the new dividend policy, Asetek
will continue to invest its capital in the development and marketing
of its cooling products.
The following are contractual maturities of financial liabilities,
including estimated interest payments on an undiscounted basis.
As of December 31, 2016
(USD 000's) On Demand Less than 3
months3 to 12 months
1 to 5 years Total
Line of credit (414) - - - (414)
Finance leases - (27) (83) (264) (374)
Lease deposit - - (82) - (82)
Trade payables and accrued liabilities - (11,343) (661) - (12,004)
(414) (11,370) (826) (264) (12,874)
As of December 31, 2015
(USD 000's) On Demand Less than 3
months3 to 12 months
1 to 5 years Total
Line of credit (288) - - - (288)
Finance leases - (22) (65) (259) (346)
Lease deposit - - (84) - (84)
Trade payables and accrued liabilities - (7,993) (391) - (8,384)
(288) (8,015) (540) (259) (9,102)
Debt Maturities
3. RISK MANAGEMENT AND DEBT
NOTES

ASETEK A/S – ANNUAL REPORT 2016 35
Market risk factors. The Group’s current principal financial
liabilities consist of short-term debt on revolving lines of credit.
The Group’s financial assets mainly comprise trade receivables,
cash and deposits. The Group’s operations are exposed to market
risks, principally foreign exchange risk and interest rate risk.
(a) Foreign exchange risk. With few exceptions, the Group’s
inventory purchase and sale transactions are denominated in
U.S. dollars. The Group operates internationally and is exposed
to foreign exchange risk arising from currency exposures,
principally with respect to the Danish kroner. Foreign exchange
risk arises from operating results and net assets associated
with Denmark-based operations where the Danish krone is the
functional currency. Transactions that are denominated in Danish
kroner result in foreign exchange gains (losses) in the U.S. dollar-
based financial statements, and translation of the Denmark entity
balance sheet accounts from Danish kroner to U.S. dollars affect
the equity balances of the Group. The Company’s Denmark entity
has a revolving line of credit available totaling 3.5 million Danish
kroner ($0.5 million) as of December 31, 2016. The Group does
not enter into derivatives or other hedging transactions to manage
foreign exchange risk. Management mitigates this exposure
through timely settlement of intercompany operating liabilities.
The ending exchange rate at December 31, 2016 was 7.05 Danish
kroner to one U.S. dollar (6.83 to the U.S. dollar at December
31, 2015). The effect of a 10% strengthening (weakening) of
the Danish kroner against the U.S. dollar for the reporting period
would have resulted in an increase (decrease) in post-tax income
for fiscal year 2016 of $823,000 and comparable increase in 2015
of the post-tax loss of $210,000.
(b) Interest rate risk. As of December 31, 2016, Asetek had the
following debt outstanding that is subject to interest rate risk:
• Line of credit with Sydbank – 3.5 million Danish kroner
revolving line of credit available to Asetek A/S. Total line in
USD is approximately $0.5 million, $414 thousand of which was
outstanding at December 31, 2016. The line carries interest
at the Danish CIBOR 3 rate plus 4.5 percentage points, which
in total was 2.75% at December 31, 2016. Based on the line’s
revolving, short-term nature, interest rate risk is not significant.
Capital and debt management. Because the Company is in
the relatively early stages of developing its data center market,
its primary focus has been to support its product development
initiatives, maintain liquidity through use of financing alternatives,
and maximize shareholder value. The Group manages its capital
and debt structure with consideration of economic conditions. In
March 2013, the Company completed an initial public offering on
the Oslo Stock Exchange, raising net $21.4 million, to support its
market strategies and liquidity needs. In March 2015, the Company
raised $11.6 million of net proceeds through private placement of
10 million new common shares, at a price of NOK 10.00 per share.
In April 2015, the Company issued 480 thousand new shares in
a public offering at NOK 10.00 per share, receiving proceeds of
$0.6 million. With regard to future capital needs, the Company will
continue to consider both equity and debt financing strategies.
Credit risk factors. Credit risk refers to the risk that a
counterparty will default on its contractual obligations resulting
in financial loss to the Group. The Group is exposed to credit
risk primarily through trade receivables and cash deposits.
Management mitigates credit risk through standard review of
customer credit-worthiness and maintaining its liquid assets
primarily with reputable banks, principally Wells Fargo Bank in
the U.S. and Sydbank in Denmark. The carrying amount of the
financial assets represents the maximum credit exposure. Trade
receivables that are deemed uncollectible are charged to expense
with an offsetting allowance recorded against the trade receivable.
Historically, bad debt expense has not been significant. Certain
customers in the Desktop segment have accounted for a significant
portion of the Company’s revenues in the years presented, as
follows. In 2016 and 2015, one customer accounted for 53%
and 60% of revenue, respectively. At December 31, 2016 and
2015, one customer represented 46% and 62% of outstanding
trade receivables, respectively. The reserve for uncollectible trade
accounts was $37,000 at December 31, 2016 and $19,000 at
December 31, 2015. The aged trade receivables and bad debt
reserve balances for all years presented are provided in Note 16.
The maximum exposure to credit risk at the reporting dates was:
(USD 000’s) 2016 2015
Cash and cash equivalents 17,610 13,060
Trade receivables and other 13,325 9,366
Other assets 642 496
Maximum credit exposure 31,577 22,922
NOTES

ASETEK A/S – ANNUAL REPORT 201636
The Group operates internationally in several geographical areas
mainly in Asia, Europe and the Americas.
The following table presents the Group’s revenue and assets in
each of the principal geographical areas:
(USD 000’s) 2016
Revenue Current assets
Non-current assets
Asia 42,620 11,254 15
Americas 7,087 2,686 2,223
Europe 1,214 18,153 6,833
Total 50,921 32,093 9,071
(USD 000’s) 2015
Revenue Current assets
Non-current assets
Asia 30,377 7,699 9
Americas 4,216 2,412 835
Europe 1,389 14,101 2,692
Total 35,982 24,212 3,536
Revenue in Denmark (country of domicile) was $0.1 million in
2016 ($0.2 million in 2015). Non-current assets in Denmark were
$6.8 million in 2016 ($2.7 million in 2015). Revenue in Hong
Kong, Taiwan and USA represented 55%, 18% and 13% of total
revenue in 2016, respectively (62%, 18% and 10%, respectively,
in 2015).
For the purpose of the above presentation, the information
pertaining to revenue and current assets is calculated based on
the location of the customers, whereas information pertaining to
non-current assets is based on the physical location of the assets.
The information pertaining to current assets is calculated as a
summation of assets such as trade receivables and finished goods
inventories reasonably attributable to the specific geographical
area.
4. GEOGRAPHICAL INFORMATION
NOTES

ASETEK A/S – ANNUAL REPORT 2016 37
Condensed income statement- years ended December 31,
2016 2015
(USD 000's) Desktop Datacenter Not allo-cable to
divisions
Total Desktop Datacenter Not allo-cable to
divisions
Total
Revenue 45,752 5,169 - 50,921 34,121 1,861 - 35,982
Cost of goods sold 27,482 3,689 - 31,171 22,486 1,084 - 23,570
Gross profit 18,270 1,480 - 19,750 11,635 777 - 12,412
Operating costs 3,128 6,559 2,616 12,303 4,405 6,667 2,796 13,868
Litigation settlement received - - - - - - (1,844) (1,844)
Adjusted EBITDA 15,142 (5,079) (2,616) 7,447 7,230 (5,890) (952) 388
Depreciation in operating expense 806 1,644 - 2,450 1,005 1,385 - 2,390
Share based compensation 77 137 114 328 81 127 113 321
Financial income (expenses) - - 322 322 - - 238 238
Income (loss) before tax 14,259 (6,860) (2,408) 4,991 6,144 (7,402) (827) (2,085)
Condensed balance sheet - as of December 31,
Total investment 5,546 2,542 20,202 28,290 4,255 2,429 11,963 18,646
Total assets 14,709 3,436 23,020 41,164 10,615 3,136 13,997 27,748
Total liabilities 9,162 894 2,818 12,874 6,360 708 2,034 9,102
Changes in intangible assets- years ended December 31,
Opening balance, intangible assets
665 1,187 - 1,852 936 1,398 - 2,334
Gross additions 736 1,099 - 1,835 548 941 - 1,489
Amortization and other (499) (1,317) - (1,816) (819) (1,152) - (1,971)
Ending balance, intangible assets
902 969 - 1,871 665 1,187 - 1,852
The Company reports on two segments, Desktop and Data center.
The Desktop and Data center segments are identified by their
specific sets of products and specific sets of customers. The CEO
is the Group’s chief operating decision-maker. The CEO assesses
the performance of each segment principally on measures of
revenue, gross margins, and adjusted EBITDA. The following
tables represent the results by operating segment in 2016 and
2015. Income and expense items below adjusted EBITDA, to
arrive at income (loss) before tax, are provided as supplemental
disclosures.
5. SEGMENT INFORMATION
NOTES

ASETEK A/S – ANNUAL REPORT 201638
6. SALARY COSTS AND REMUNERATIONS
7. SHARE BASED PAYMENT
(USD 000's) 2016 2015
Salaries 6,891 6,766
Retirement fund contributions 61 55
Social cost 321 114
Share based payment 328 321
Other expenses 167 207
Total personnel expenses before
capitalization
7,768 7,463
Capitalized as development cost (1,227) (1,163)
Total personnel expenses in
statement of income
6,541 6,300
Average number of employees 79 71
The staff costs are specified as follows:
(USD 000's) 2016 2016
Research and development 2,235 1,936
Selling, general and administrative 5,533 5,527
Total personnel expenses before
capitalization
7,768 7,463
Compensation to the Board of Directors and Officers in 2016
(USD 000’s) Remuneration Options Total
Board of Directors 75 48 123
Officers 967 114 1,081
1,042 162 1,204
Compensation to the Board of Directors and Officers in 2015
(USD 000’s) Remuneration Options Total
Board of Directors 50 32 82
Officers 1,079 123 1,202
1,129 155 1,284
The figures listed include incentive based compensation for
management and staff. Incentive based compensation is based
on a combination of quarterly cash based rewards and periodic
grants of options (or warrants) to buy the Company’s common
shares. The above remuneration for Officers include $22,000 and
$22,000 in pension payments in 2016 and 2015, respectively. The
bonus plan for the CEO is approved by the Board of Directors
at the beginning of the year and the bonus payments for the
CEO and the upper management are reviewed by the Board of
Directors on an annual basis. All bonus plans are structured to
include an absolute dollar cap.
The Company’s CEO has an agreement of six months’ severance
pay in case of termination or termination in connection with change
of control. The Company’s CFO has an agreement of six months’
severance pay in case of termination. Except for the Company’s
CEO and CFO, no member of the administrative, management
or supervisory bodies has contracts with the Company or any
of its subsidiaries providing for benefits upon termination of
employment.
As of December 31, 2016, The Company’s CEO, André Eriksen, held
or was in control of 300,000 common shares of the Company and
14,688 options exercisable at $0.96 per share, 86,933 warrants
exercisable at $1.30 (NOK10.50) per share, 101,799 warrants
exercisable at $2.40 (NOK19.50) per share, 96,167 warrants
exercisable at $6.11 (NOK36.50) per share and 24,750 warrants
exercisable at $6.70 (NOK40.10) per share. The Company’s CFO,
Peter Dam Madsen, held 72,741 common shares of the Company
and 14,221 options exercisable at $0.96 or $0.94 per share,
50,875 warrants exercisable at $1.30 (NOK10.50) per share,
49,837 warrants exercisable at $2.40 (NOK19.50) per share,
37,800 warrants exercisable at $6.11 (NOK36.50) per share, and
10,313 warrants exercisable at $6.70 (NOK40.10) per share.
Asetek’s Equity Incentive Plan (‘the Plan’) is a share option program
where the employees and other parties that deliver services to
the Group have been granted share options (or warrants). The
options, if vested and executed, will be settled in common shares
of the Company.
The options are granted at the time of employment and, at the
discretion of the Board of Directors, under other circumstances.
The options are granted with exercise prices equaling the fair
market value of the underlying security. The exercise prices of
option grants are determined based on the closing market price
of the shares on the day of the grant. Share based compensation
expense was $328,000 and $321,000 for the years ended
December 31, 2016 and 2015, respectively.
The Plan was adopted by the Board of Directors in 2008 and has
the following purpose:
• To attract and retain the best available personnel for positions
of substantial responsibility;
• to provide additional incentive to employees, directors and
consultants, and
• to promote the success of the Company’s business.
As of December 31, 2016 there is a total of 3,813,166 common
shares authorized under the Plan.
NOTES

ASETEK A/S – ANNUAL REPORT 2016 39
Of the options and warrants outstanding at December 31, 2016,
125,771 have an exercise price of $0.94 per share, 143,513 have
an exercise price of $0.96 per share, 562,749 have an exercise
price of $1.30 (NOK10.50) per share, 585,364 have an exercise
price of $2.40 (NOK19.50) per share, 26,626 have an exercise
price of $5.50 (NOK33.90) per share, 457,647 have an exercise
price of $6.11 (NOK36.50) per share, and 95,550 have an exercise
price of $6.70 (NOK40.10) per share. The weighted average
remaining contractual term is 4.74 years. The Company calculated
the fair value of each option award on the date of grant using
the Black-Scholes option pricing model. The warrants granted in
2016 have an estimated total value of $328,000. The warrants
granted in 2015 have an estimated total value of $241,000. The
following weighted average assumptions were used for the period
indicated. weighted average remaining contractual term is 4.74
years. The Company calculated the fair value of each option award
on the date of grant using the Black-Scholes option pricing model.
The warrants granted in 2016 have an estimated total value of
$328,000. The warrants granted in 2015 have an estimated total
value of $241,000. The following weighted average assumptions
were used for the period indicated.
Valuation assumptions 2016 2015
Risk-free interest rate 1.04%-1.12% 1.18% - 1.42%
Dividend yield 0.0% 0.0%
Expected life of options (years) 3.58-4.07 3.75-4.6
Expected volatility 32% 31%-53%
All options are intended to be exercisable at a price per share not
less than the per share fair market value of the common shares
underlying those options on the date of grant.
Date of authorization Number of options
March 2013 1,048,187
August 2013 764,979
April 2015 2,000,000
Total number of warrents authorized 3,813,166
In April 2016, 600,000 warrants were granted with exercise
prices of $2.40 (NOK19.50) per share. In August, 2015, 700,000
warrants were granted with exercise prices of $1.30 (NOK10.50)
per share. In August, 2014, 32,970 warrants were granted with
exercise prices of $5.50 (NOK33.90) per share. In April 2014,
118,210 warrants were granted with exercise prices of $6.70
(NOK40.10) per share. Movements in the number of share options
outstanding and their related weighted average exercise price are
as follows:
Weighted Average Exercise
Weighted Average Exercise
Activity for exercise prices of $0.94 to $2.40 2016 Price 2015 Price
Outstanding on January 1 997,933 1.20 486,073 0.95
Options/warrants granted 600,000 2.40 700,000 1.30
Options/warrants exercised (95,879) 1.35 (181,399) 0.95
Options/warrants forfeited (84,657) 1.28 (6,741) 0.96
Outstanding on December 31 1,417,397 1.69 997,933 1.20
Exercisable on December 31 602,829 1.37 368,648 1.02
The weighted average market price per share on the date of exercise for the above shares was $4.84 in 2016 and $1.48 in 2015.
Weighted Average Exercise
Weighted Average Exercise
Activity for exercise prices of $5.50 to $6.70 2016 Price 2015 Price
Outstanding on January 1 645,525 6.18 764,979 6.18
Options/warrants forfeited (65,702) 5.59 (119,454) 6.19
Outstanding on December 31 579,823 6.18 645,525 6.18
Exercisable on December 31 495,795 6.18 418,277 6.18
NOTES

ASETEK A/S – ANNUAL REPORT 201640
8. EXPENSES BY NATURE
(USD 000's) 2016 2015
Inventories recognized as cost of sales (Note 17) 31,171 23,570
Personnel expenses (Note 6) 7,768 7,463
Depreciation and amortization 2,450 2,390
Legal, patent, consultants and auditor 3,188 4,413
Litigation settlement received - (1,844)
Facilities and infrastructure 1,397 1,387
Other expenses 2,113 2,415
Total operating expenses before capitalization 48,087 39,794
Less: capitalized costs for development projects (Note 14) (1,835) (1,489)
Total expenses 46,252 38,305
9. FINANCE COSTS AND INCOME
(USD 000's) 2016 2015
Foreign exchange gain 330 305
Interest cost on line of credit (3) (6)
Interest cost on finance leases (15) (14)
Interest income 48 1
Other banking and finance fees (38) (48)
Total finance income 322 238
Depreciation and amortization expense by classification on the income statement is as follows:
(USD 000's) 2016 2015
Depreciation and amortization included in:
Research and development 1,241 1,388
Selling, general and administrative 1,209 1,002
Total 2,450 2,390
NOTES

ASETEK A/S – ANNUAL REPORT 2016 41
10. INCOME TAXES
Tax on profit/loss for the year is specified as follows:
(USD 000’s) 2016 2015
Current income tax (228) 438
Deferred income tax 4,874 -
Tax benefit 4,646 438
The tax benefit for 2016 represents deferred tax assets
recognized associated with net operating loss carryforwards.
See Note 11. The 2015 tax benefit represents principally credits
realized in Denmark associated with investment in research and
development. The tax benefit on the group’s loss before tax differs
from the theoretical amount that would arise using the weighted
average tax rate applicable to profits of the consolidated entities
as follows:
11. DEFERRED INCOME TAX
(USD 000’s) 2016 2015
Income (loss) before tax 4,991 (2,085)
Tax calculated at domestic rates
applicable to profits/losses in
respective countries
(1,281) 422
Tax effects of:
Expenses not deductible for tax
purposes(18) (152)
Benefit of tax losses recognized 5,948 -
Temporary differences between book
and tax (3) 168
Tax benefit 4,646 438
(USD 000’s) 2016 2015
Potential tax assets from prior year
losses11,480 13,907
Tax assets not considered probable to
realize before expiration(6,606) (13,907)
Deferred income tax asset 4,874 -
At December 31, 2016, potential income tax assets totaled $11.5
million (2015: $13.9 million) in respect of losses amounting to
$56.6 million that should be applied to different tax rates. The
losses can be carried forward against future taxable income.
In 2016, the Group recorded deferred tax assets totaling $4.9
million, which represents the net tax benefit that the Company
considers probable to be realized through the year 2019, based on
Company budget for 2017, and estimates for 2018 and 2019. It is
not possible to establish reasonably accurate budgets for periods
beyond 2019. Prior to 2016, the Group did not recognize deferred
income tax assets due to uncertainty of realizability.
In accordance with IAS 12, the Company recognizes deferred tax
assets arising from unused tax losses or tax credits only to the
extent that the entity has sufficient taxable temporary differences
or there is convincing other evidence that sufficient taxable profit
will be available against which the unused tax losses or unused
tax credits can be utilized by the Company. The estimated tax
benefit is calculated considering recent historical levels of income,
expectations and risks associated with estimates of future taxable
income. The calculation utilizes the statutory tax rates that are
expected to apply to taxable income for the years in which the
asset is expected to be realized.
Losses of the U.S. parent company and U.S. subsidiary will
begin to expire in 2028 for carryforward purposes. Losses of the
Denmark subsidiary do not expire. Expiration of the carryforward
of losses is summarized as follows:
(USD 000’s) Tax effected loss
Expire in years 2028 to 2034 1,461
Do not expire 3,413
Total 4,874
NOTES

ASETEK A/S – ANNUAL REPORT 201642
12. EARNINGS PER SHARE
13. FINANCIAL INSTRUMENTS CATEGORY AND FAIR VALUE ESTIMATION
The Company uses the following valuation methods for fair value
estimation of its financial instruments:
• Quoted prices (unadjusted) in active markets (Level 1).
• Inputs other than quoted prices included within level 1 that are
observable for the asset or liability, either directly (as prices) or
indirectly (derived from prices) (Level 2).
• Inputs for the asset or liability that are not based on observable
market data (unobservable inputs) (Level 3).
All of the Company’s financial assets as of December 31, 2016 are
classified as ‘loans and receivables’ having fixed or determinable
payments that are not quoted in an active market (Level 3). As of
December 31, 2016, all of the Company’s financial liabilities are
carried at amortized cost.
The Company believes that book value approximates fair value for
all financial instruments as of December 31, 2016. The values of
the Group’s assets and liabilities are as follows:
As of December 31, 2016
(USD 000’s) Loans and receivables
Assets as per balance sheet:
Trade receivables and other 13,325
Cash and cash equivalents 17,610
30,935
Basic earnings per share is calculated by dividing the profit or loss
attributable to equity holders of the Company by the weighted
average number of common shares outstanding during the period.
Diluted earnings per share is calculated by adjusting the number
of common shares outstanding used in the Basic calculation for
the effect of dilutive equity instruments, which include options,
warrants and debt or preferred shares that are convertible to
common shares, to the extent their inclusion in the calculation
would be dilutive.
2016 2015
Income attributable to equity holders of the Company (USD 000’s) 9,637 (1,647)
Weighted average number of common shares outstanding (000’s) 24,851 22,332
Basic earnings per share $ 0.39 $ (0.07)
Weighted average number of common
shares outstanding (000’s) 24,851 22,332
Instruments with potentially dilutive
effect: Warrants and options (000’s) 752 -
Weighted average number of common
shares outstanding, diluted (000’s) 25,603 22,332
Diluted earnings per share $ 0.38 $ (0.07)
Potential dilutive instruments are not included in the calculation
of diluted loss per share for 2015 because the effect of including
them would be anti-dilutive and reduce the loss per share.
As of December 31, 2016
(USD 000's) Liabilities at fair value through profit and loss
Other financial liabilities at amortized cost
Total
Liabilities as per balance sheet:
Long-term debt - 264 264
Short-term debt - 524 524
Trade payables and accrued liabilities - 12,086 12,086
- 12,874 12,874
NOTES

ASETEK A/S – ANNUAL REPORT 2016 43
As of December 31, 2015
(USD 000’s) Loans and receivables
Assets as per balance sheet:
Trade receivables and other 9,366
Cash and cash equivalents 13,060
22,426
As of December 31, 2015
(USD 000's) Liabilities at fair value through profit and loss
Other financial liabilities at amortized cost
Total
Liabilities as per balance sheet:
Long-term debt - 259 259
Short-term debt - 375 375
Trade payables and accrued liabilities - 8,468 8,468
- 9,102 9,102
14. INTANGIBLE ASSETS
The Group routinely incurs costs directly attributable to the design
and testing of new or improved products to be held for sale. These
costs are capitalized as intangible assets and amortized over the
estimated useful lives of the products, typically three to forty-
eight months. The following table presents a summary of these
development projects.
Impairment tests are performed annually on developed assets.
Impairment tests are also performed on completed assets
whenever there are indications of a need for write-offs and for
assets still in development regardless of whether there have
been indications for write downs. If the value of expected future
free cash flow of the specific development project is lower than
the carrying value, the asset is written down to the lower value.
The booked value includes capitalized salary expenses and other
net assets for the cash flow producing project. Expected future
free cash flow is based on budgets and anticipations prepared
by management. The main parameters are the development in
revenue, EBIT and working capital.
(USD 000's) 2016 2015
Cost:
Balance at January 1 6,340 4,866
Additions 1,835 1,489
Deletions - completion of useful life (1,231) -
Impairment loss (186) (15)
Balance at December 31 6,758 6,340
Accumulated amortization and impairment losses:
Balance at January 1 (4,488) (2,532)
Amortization for the year (1,784) (1,970)
Amortization associated with deletions 1,227 3
Amortization associated with impairment losses 158 11
Balance at December 31 (4,887) (4,488)
Carrying amount 1,871 1,852
NOTES

ASETEK A/S – ANNUAL REPORT 201644
15. PROPERTY AND EQUIPMENT
At December 31, 2016, property and equipment includes leased
equipment at a gross value of approximately $656,000 which had
accumulated amortization of $476,000. (2015: gross value of
$527,000 and accumulated amortization of $333,000).
The following table presents a summary of property and equiptment activity.
(USD 000's)Leasehold
improvements MachineryOther fixtures, fittings,
tools, equipment Total
Cost:
Balance at January 1, 2015 277 1,761 435 2,473
Additions 42 565 351 958
Disposals - (64) (36) (100)
Exchange rate difference (19) (136) (41) (196)
Balance at December 31, 2015 300 2,126 709 3,135
Balance at January 1, 2016 300 2,126 709 3,135
Additions 70 820 332 1,222
Disposals - (64) (15) (79)
Exchange rate difference (10) (83) (34) (127)
Balance at December 31, 2016 360 2,799 992 4,151
Acccumulated depreciations
Balance at January 1, 2015 (113) (1,311) (319) (1,743)
Disposals - 64 36 100
Depreciations for the year (44) (303) (73) (420)
Exchange rate differences 5 85 26 116
Balance at December 31, 2015 (152) (1,465) (330) (1,947)
Balance at January 1, 2016 (152) (1,465) (330) (1,947)
Disposals - 64 15 79
Depreciations for the year (53) (444) (169) (666)
Exchange rate differences 5 47 16 68
Balance at December 31, 2016 (200) (1,798) (468) (2,466)
Carrying amount at December 31, 2015 148 661 379 1,188
Carrying amount at December 31, 2016 160 1,001 524 1,685
NOTES

ASETEK A/S – ANNUAL REPORT 2016 45
16. TRADE RECEIVABLES AND OTHER
The trade receivables of Asetek Danmark A/S carry a general lien
of 6 million Danish krone ($0.9 million), representing collateral on
Sydbank’s engagement with the Company. The carrying amount
of trade receivables is approximately equal to fair value due to
the short term to maturity. Regarding credit risks, refer to Note 3.
A summary of the activity in the provision for uncollectible
accounts is as follows:
(USD 000’s) 2016 2015
Balance at January 1 (19) (48)
Additions (37) (19)
Reversals 19 48
Balance at December 31 (37) (19)
Other receivables. Other receivables include $0.4 million of
income tax benefit receivable as of December 31, 2015. Refer to
Note 10.
Trade receivables are non-interest bearing and are generally on payment terms of Net 30 days
(USD 000's) 2016 2015
Gross trade receivables 12,986 8,408
Provision for uncollectible accounts (37) (19)
Net trade receivables 12,949 8,389
Other receivables and assets 376 977
Total trade receivables and other 13,325 9,366
The aging of trade receivables as of the reporting date is as follows
(USD 000's) Total 0 to 30 days 31 to 60 days 61 to 90 days Over 90 days
December 31, 2016 12,986 6,596 5,721 271 398
December 31, 2015 8,408 4,753 3,266 249 140
NOTES

ASETEK A/S – ANNUAL REPORT 201646
17. INVENTORIES
(USD 000's) 2016 2015
Raw materials 705 542
Finished goods 571 1,349
Total gross inventories 1,276 1,891
Less: provision for inventory reserves (118) (105)
Total net inventories 1,158 1,786
(USD 000's) 2016 2015
Inventories recognized as cost of sales during the period (31,171) (23,570)
Write-down of inventories to net realizable value (118) (105)
A summary of activity in the provision for inventory reserves is as follows
(USD 000's) 2016 2015
Balance at January 1 (105) (78)
Additions (118) (105)
Write-offs 105 78
Balance at December 31 (118) (105)
18. SHARE CAPITAL
In March 2015, the Company raised $12.4 million in gross
proceeds through a private placement of 10 million new common
shares, each with a par value of DKK 0.10, at a price of NOK
10.00 per share. In April 2015, the Company raised $0.6 million
in gross proceeds through the public issuance of an additional 480
thousand new shares, each with a par value of DKK 0.10, at a
price of NOK 10.00 per share.
The Company has reserved 1,150 thousand shares (4.5% of total
shares, nominal value DKK 115 thousand) for future exercises of
options. In 2016, a total of 96 thousand options (0.4% of total
shares, nominal value DKK 10 thousand) were exercised resulting
in $0.1 million funds received by the Company. In 2015, a total
of 181 thousand options (0.7% of total shares, nominal value
DKK 18 thousand) were exercised resulting in $0.2 million funds
received by the Company.
As of December 31, 2016, there are 24,919 thousand common
shares outstanding with a nominal value of 0.10 DKK per share
and 502 thousand shares (2.0% of total shares, nominal value
DKK 50 thousand) held in treasury. Included in equity is a reserve
for treasury shares of approximately $9,000 at December 31,
2016.
A dividend in respect of the year ended December 31, 2016 of
NOK 1.00 per share, for a total payout of $2.9 million, is to be
proposed at the annual general meeting on April 25, 2017. These
financial statements do not reflect this dividend payable.
NOTES

ASETEK A/S – ANNUAL REPORT 2016 47
The following table summarizes common share activity in the years presented
(000's) 2016 2015
Common shares outstanding - January 1 24,823 14,165
Offerings of new shares - 10,480
Treasury shares purchased - (3)
Options and warrants exercised 96 181
Common shares outstanding - December 31 24,919 24,823
Refer to ‘Shareholder information’ in this report for information on the composition of Asetek shareholders
19. NET DEBT
Asetek A/S Danmark line of credit. In September 2012, the
Company entered into a revolving line of credit agreement with
Sydbank. The line is collateralized by the trade receivables of
Asetek Danmark A/S and is payable on demand. At December 31,
2016, the total line was 3.5 million Danish kroner, which equates
to $496 thousand at December 31, 2016. Interest on the line is
payable monthly at the Danish CIBOR 3 rate plus 4.5 percentage
points, which in total was 2.75% at December 31, 2016. As of
December 31, 2016, the Company had 2.92 million Danish kroner
($414 thousand) outstanding on the line. (1.97 million Danish
kroner outstanding at December 31, 2015).
The following is a summary of the Company’s outstanding and net debt:
(USD 000's) 2016 2015
Line of credit (414) (288)
Finance leases - due within one year (110) (87)
Sublease deposit (82) (84)
Debt included in current liabilities (606) (459)
Finance leases - due after one year (264) (259)
Total debt (870) (718)
Less: cash and equivalents 17,610 13,060
Net debt 16,740 12,342
NOTES

ASETEK A/S – ANNUAL REPORT 201648
21. TRANSACTIONS WITH RELATED PARTIES
22. SUBSIDIARIES
The Company’s chairman is a member of the board of directors of
a reseller of Company products. During the years ended December
31, 2016 and 2015, the Company had sales of inventory to the
reseller of $26.9 million and $21.7 million, which represented
53% and 60% of total revenues, respectively. As of December 31,
2016 and 2015, the Company had outstanding trade receivables
from the reseller of $6.0 million and $5.2 million, respectively.
The Company’s CEO serves as Chairman of the Board for a vendor
that supplies information technology services to the Company. In
2016, the Company purchased services totaling approximately
$0.3 million ($0.3 million in 2015) from this vendor. At December
31, 2016 and 2015, the Company had outstanding payables to
this vendor of $17,000 and $5,000, respectively.
20. LEASES
Operating leases. The Company leases some of its facilities under
noncancelable operating leases. Total expense from operating
leases was $546,000 in 2016 ($538,000 in 2015). The Company’s
office space in Aalborg, Denmark is under lease through August
2020 or later. The Company subleases a portion of this facility
to another tenant and under the sublease agreement received
payments totaling $0.3 million for rent and expenses during
the year ended December 31, 2016 ($0.2 million in 2015). The
Company’s office in San Jose, California is under lease through
December 2018. Future minimum operating lease payments are
as follows as of the balance sheet date:
(USD 000’s) 2016 2015
Minimum operating lease payments due:
In the following year 523 483
In the second year 522 483
In the third year 345 488
In the fourth year 201 352
In the fifth year and thereafter - 205
1,591 2,011
Finance leases. The Company has finance leases outstanding
for manufacturing, engineering and test equipment and the
leases generally have terms of 60 months. There are no lease
commitments beyond five years. Future minimum lease payments
under finance leases are as follows as of the respective balance
sheet date:
(USD 000’s) 2016 2015
Minimum finance lease payments as of December 31
400 346
Less: Amount representing interest
(26) (14)
Total obligations under finance leases
374 332
Obligations under finance leases due within one year
110 87
Obligations under finance leases due after one year
264 259
374 346
The following entities are included in the consolidated accounts:
Company Domicile Stake Voting Share Activity
Asetek A/S Denmark 100% 100% Trading
Asetek Holdings, Inc. USA 100% 100% Inactive
Asetek USA, Inc. USA 100% 100% Trading
Asetek Danmark A/S Denmark 100% 100% Trading
Xiamen Asetek Computer Industry Co., Ltd. China 100% 100% Trading
Asetek International ApS Denmark 100% 100% Trading
Asetek International ApS - Branch Office Taiwan 100% 100% Trading
NOTES
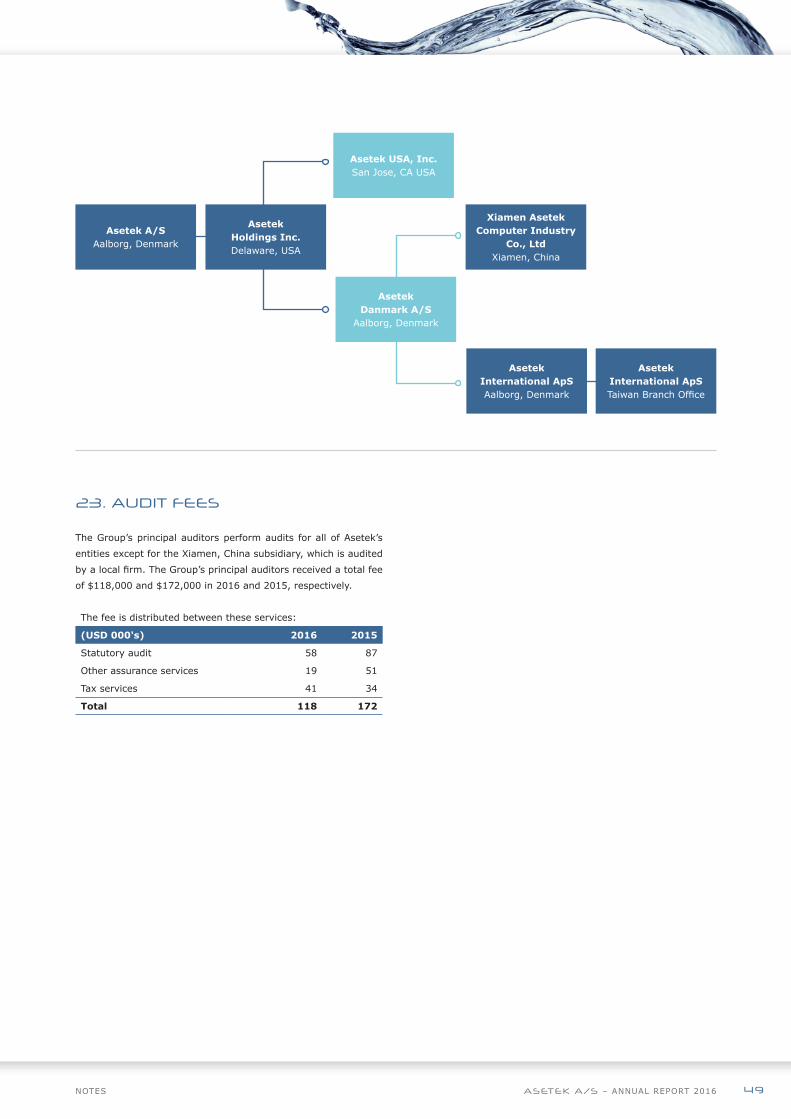
ASETEK A/S – ANNUAL REPORT 2016 49
Asetek Danmark A/S
Aalborg, Denmark
Asetek USA, Inc.San Jose, CA USA
Xiamen Asetek Computer Industry
Co., LtdXiamen, China
Asetek International ApSAalborg, Denmark
Asetek International ApSTaiwan Branch Office
Asetek A/SAalborg, Denmark
Asetek Holdings Inc.Delaware, USA
23. AUDIT FEES
The Group’s principal auditors perform audits for all of Asetek’s
entities except for the Xiamen, China subsidiary, which is audited
by a local firm. The Group’s principal auditors received a total fee
of $118,000 and $172,000 in 2016 and 2015, respectively.
The fee is distributed between these services:
(USD 000's) 2016 2015
Statutory audit 58 87
Other assurance services 19 51
Tax services 41 34
Total 118 172
NOTES

ASETEK A/S – ANNUAL REPORT 201650
24. BOARD OF DIRECTORS
The members of the Board of Directors have reported, that they had the below listed other director positions as of the date of this filing.
For the year 2016, the board members have been compensated as listed below.
Name Current directorships and position Share compensation from Asetek in 2016 and current holdings
Samuel Szteinbaum Corsair Components, Inc. – Board memberThe Wonder Years Inc. – Chairman and CEOThe Wash Stop, Inc. – President
14,757 warrants to buy shares at a price of $2.40 (NOK19.50). The warrants are vesting over 12 months and are exercisable for 7 years. Also holds 152,254 shares, and 12,822 warrants at $6.11/share and 11,000 warrants at $6.70/share from grants in prior years. $15,000 in cash compensation.
Chris J. Christopher Rocky Mountain Innosphere – Board memberCloudRegen – Board member
14,757 warrants to buy shares at a price of $2.40 (NOK19.50). The warrants are vesting over 12 months and are exercisable for 7 years. Also holds 55,840 shares and 17,760 options at $0.96/share, 12,822 warrants at $6.11/share, 15,654 warrants at $1.30/share and 11,000 warrants at $6.70/share from prior year grants. $15,000 in cash compensation.
Jim McDonnell None 14,757 warrants to buy shares at a price of $2.40 (NOK19.50). The warrants are vesting over 12 months and are exercisable for 7 years. Also holds 16,400 shares, 6,408 warrants at $5.50/share and 15,654 warrants at $1.30/share from prior year grants. $15,000 in cash compensation.
Peter Gross Glumac, Inc. TBC – Board memberI3 Solutions, Inc. – Board memberVirtual Power Systems, Inc. – Board member
14,757 warrants to buy shares at a price of $2.40 (NOK19.50). The warrants are vesting over 12 months and are exercisable for 7 years. Also holds 350 shares, 6,408 warrants at $5.50/share and 15,654 warrants at $1.30/share from prior year grants. $15,000 in cash compensation.
Knut Øversjøen Nordic Energy AS – ChairmanKov Invest Holding, Chairman and CEOSpond AS – Board memberScandec Systems, Chairman & CEOFalcon Industrial Partners, AS – ChairmanGuardian Corporate AS – Board member Aega ASA – Chairman Aega ASA – Chairman Relacom AB – Board MemberRelacom Finland - Chairman
14,757 warrants to buy shares at a price of $2.40 (NOK19.50). The warrants are vesting over 12 months and are exercisable for 7 years. Also holds 24,468 shares and 12,822 warrants at $6.11/share, 11,000 warrants at $6.70/share and 15,654 warrants at $1.30/share from prior year grants. $15,000 in cash compensation.
Jørgen Smidt Flatfrog AB – Board member Microtask OY – Board member FreeSpee – Board member
Holds 16,600 shares.
NOTES

ASETEK A/S – ANNUAL REPORT 2016 51
25. POST BALANCE SHEET EVENTS
26. CONTINGENT LIABILITIES
The Company has evaluated the period after December 31,
2016 up through the date of the Statement by Management
and determined that there were no transactions that required
recognition or disclosure in the Company’s financial statements.
Joint taxation. The Danish group enterprises are jointly and
severally liable for tax on group income subject to joint taxation,
as well as for Danish withholding taxes by way of dividend
tax, royalty tax, tax on unearned income and any subsequent
adjustments to these.
Legal proceedings. In the ordinary course of conducting our
business, the Company is involved in various intellectual property
proceedings, including those in which it is a plaintiff that are
complex in nature and have outcomes that are difficult to predict.
Asetek records accruals for such contingencies to the extent that
it is probable that a liability will be incurred and the amount of
the related loss can be reasonably estimated. The Company’s
assessment of each matter may change based on future
unexpected events. An unexpected adverse judgment in any
pending litigation could cause a material impact on the Group’s
business operations, intellectual property, results of operations
or financial position. There are no material updates to matters
previously reported on the Asetek 2015 Annual Report, except:
In December 2014, the U.S. District Court unanimously ruled
in favor of Asetek on all claims in a patent infringement lawsuit
against CMI USA, Inc. (“CMI”). The jury awarded Asetek damages
of $0.4 million, representing a 14.5% royalty on CMI’s infringing
sales since 2012. In September 2015, the court refused additional
demands from CMI, issued a permanent injunction barring CMI
from selling infringing products in the U.S., and awarded an
enhanced royalty rate (25.4%) beginning in 2015, because CMI
continued to sell infringing products after the verdict. In October
2015, CMI filed an appeal with the Federal Circuit U.S. Court of
Appeals. In December 2016, the Federal Circuit U.S. Court of
Appeals affirmed the U.S. District Court’s decision on infringement,
invalidity and damages in favor of Asetek, but remanded the issue
of injunction back to the District Court for further review. CMI has
filed an appeal to challenge the Federal Circuit Court’s ruling and
Asetek has filed its response.
In April 2016, Asetek initiated patent infringement proceedings
against Cooler Master before the District Court The Hague in the
Netherlands. The proceedings pertain to European Patent EP 1
923 771 owned by Asetek. A decision in first instance is expected
in mid-2017.
On September 30, 2014, Asia Vital Components Co., Ltd. filed
suit against Asetek Danmark A/S in the Eastern District of
Virginia, requesting a declaratory judgment of non-infringement
and invalidity of Asetek’s U.S. Patents 8,240,362 and 8,245,764.
Asetek disputes these allegations. On April 17, 2015, the district
court granted Asetek’s motion to dismiss the case for lack of
subject matter jurisdiction. AVC appealed to the Court of Appeals
for the Federal Circuit, which reversed the district court’s decision
on September 28, 2016. Asetek then filed a renewed motion to
transfer the case to the Northern District of California. The district
court in Virginia granted the motion to transfer on December 13,
2016. This case is in its earliest stages.
Other significant commitments of the Company are referenced
within the respective Notes to these consolidated financial
statements.
NOTES
ASETEK A/S – ANNUAL REPORT 201652
ANNUAL REPORT 2016 - PARENT COMPANY
For year ended December 31, 2016
CVR-nr. 33 77 12 31
ANNUAL REPORT 2016 – PARENT COMPANY
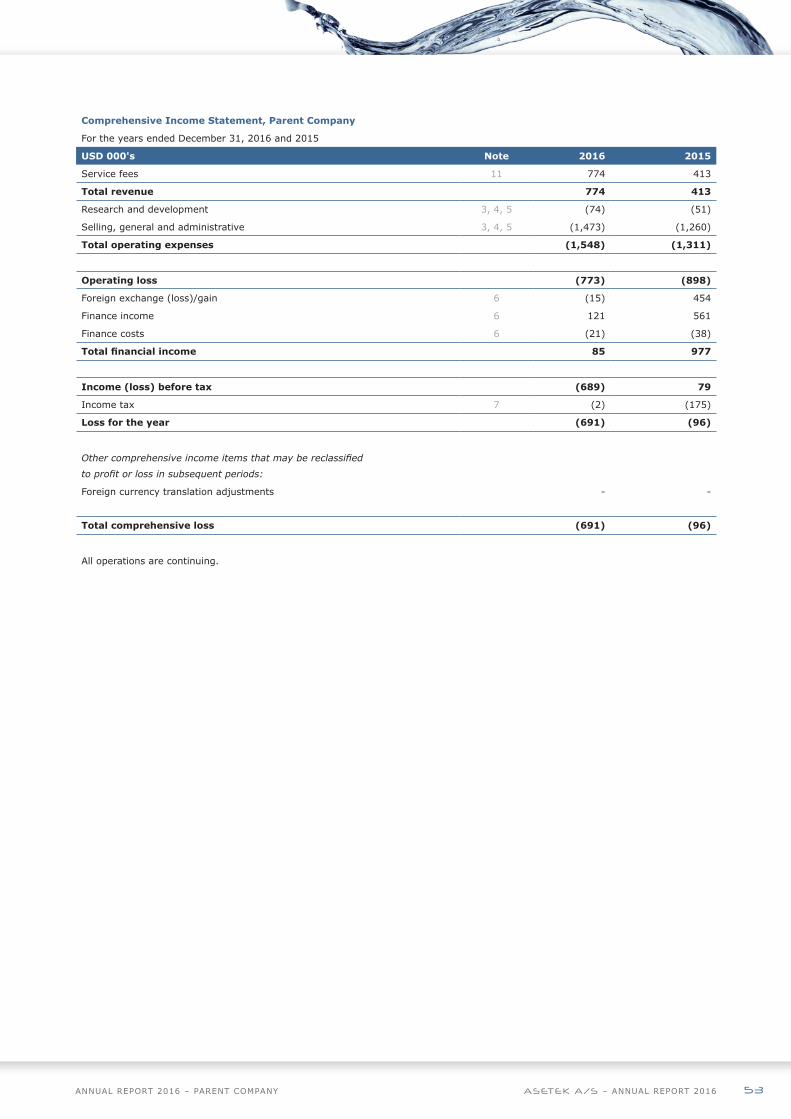
ASETEK A/S – ANNUAL REPORT 2016 53
Comprehensive Income Statement, Parent Company
For the years ended December 31, 2016 and 2015
USD 000's Note 2016 2015
Service fees 11 774 413
Total revenue 774 413
Research and development 3, 4, 5 (74) (51)
Selling, general and administrative 3, 4, 5 (1,473) (1,260)
Total operating expenses (1,548) (1,311)
Operating loss (773) (898)
Foreign exchange (loss)/gain 6 (15) 454
Finance income 6 121 561
Finance costs 6 (21) (38)
Total financial income 85 977
Income (loss) before tax (689) 79
Income tax 7 (2) (175)
Loss for the year (691) (96)
Other comprehensive income items that may be reclassified
to profit or loss in subsequent periods:
Foreign currency translation adjustments - -
Total comprehensive loss (691) (96)
All operations are continuing.
ANNUAL REPORT 2016 – PARENT COMPANY

ASETEK A/S – ANNUAL REPORT 201654
USD 000's Note 2016 2015
ASSETS
Non-current assets
Investments in subsidiaries 8 20,100 20,100
Receivables from subsidiaries 9 117 3,462
Total non-current assets 20,217 23,562
Current assets
Other assets 10 43
Cash and cash equivalents 13,719 10,570
Total current assets 13,729 10,613
Total assets 33,945 34,175
EQUITY AND LIABILITIES
Equity
Share capital 10 417 416
Share premium - 33,753
Retained earnings 33,075 (448)
Translation and other reserves (9) (9)
Total equity 33,483 33,712
Current liabilities
Accrued liabilities 462 463
Total current liabilities 462 463
Total liabilities 462 463
Total equity and liabilities 33,945 34,175
ANNUAL REPORT 2016 – PARENT COMPANY
Balance Sheet, Parent Company
As of December 31, 2016 and 2015

ASETEK A/S – ANNUAL REPORT 2016 55
Statement of Cash Flows, Parent Company
For the years ended December 31, 2016 and 2015
USD 000's Note 2016 2015
Cash flows from operating activities
Loss for the year (691) (96)
Share based payments expense 4 328 314
Changes in other current assets 33 107
Changes in trade payables and accrued liabilities (1) 421
Net cash provided by (used in) operating activities (331) 746
Cash flows from investing activities
Investment in subsidiaries 8 - (18,600)
Net receipts from subsidiaries 9 3,343 12,608
Net cash provided by (used in) investing activities 3,343 (5,992)
Cash flows from financing activities
Proceeds from issuance of share capital 10 134 13,148
Cash paid for fees related to stock offering 10 - (832)
Net cash provided by financing activities 134 12,316
Net changes in cash and cash equivalents 3,146 7,070
Cash and cash equivalents at beginning of period 10,570 3,500
Cash and cash equivalents at end of period 13,719 10,570
Statement of Changes in Equity, Parent Company
(USD 000's) Share capital
Share premium
Translation reserves
Other reserves
Accumulated deficit
Total
Equity at December 31, 2014 264 21,539 - (12) (666) 21,125
Total comprehensive income for 2015
Loss for the year - - - - (96) (96)
Total comprehensive loss for 2015 - - - - (96) (96)
Transactions with owners in 2015
Shares issued 152 12,993 - 3 - 13,148
Less: issuance cost - (779) - - -
Share based payment expense - - - - 314 314
Transactions with owners in 2015 152 12,214 - 3 314 12,683
Equity at December 31, 2015 416 33,753 - (9) (448) 33,712
Total comprehensive income for 2016
Loss for the year - - - - (691) (691)
Total comprehensive loss for 2016 - - - - (691) (691)
Transactions with owners in 2016
Shares issued 1 133 - - - 134
Transfer - (33,886) - - 33,886 -
Share based payment expense - - - - 328 328
Transactions with owners in 2016 1 (33,753) - - 34,214 462
Equity at December 31, 2016 417 - - (9) 33,075 33,483
ANNUAL REPORT 2016 – PARENT COMPANY
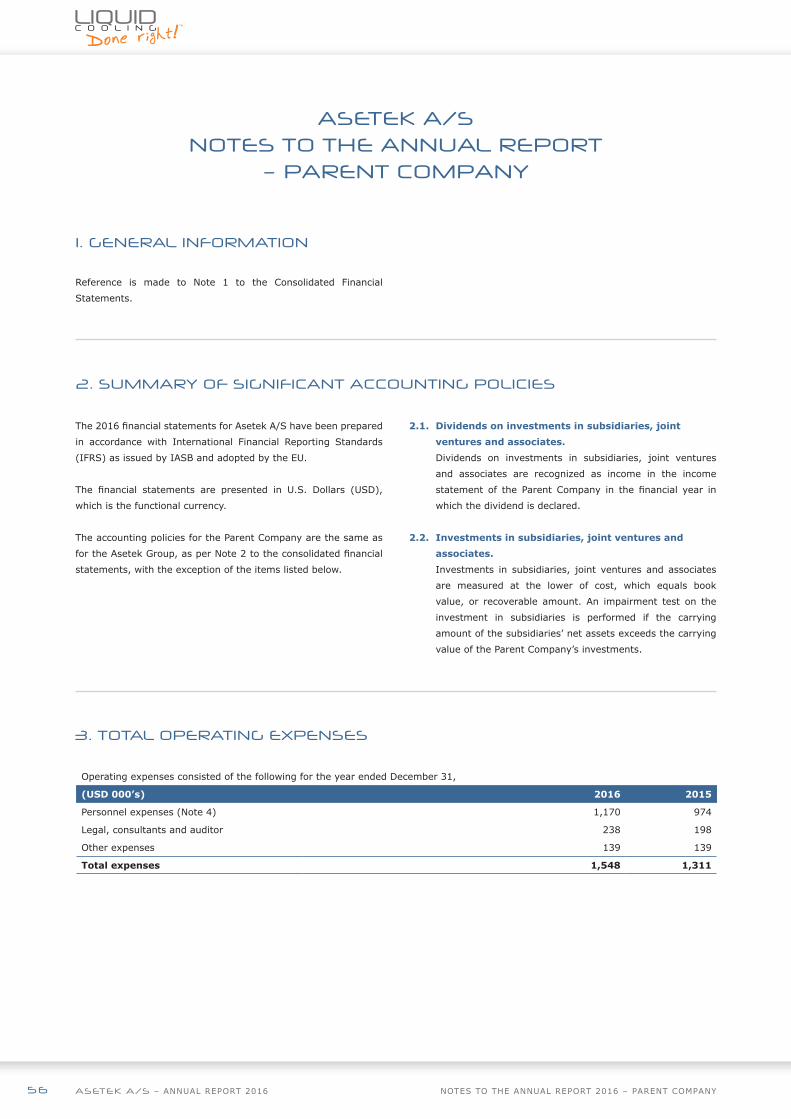
ASETEK A/S – ANNUAL REPORT 201656
ASETEK A/S NOTES TO THE ANNUAL REPORT
– PARENT COMPANY
1. GENERAL INFORMATION
2. SUMMARY OF SIGNIFICANT ACCOUNTING POLICIES
3. TOTAL OPERATING EXPENSES
Reference is made to Note 1 to the Consolidated Financial
Statements.
The 2016 financial statements for Asetek A/S have been prepared
in accordance with International Financial Reporting Standards
(IFRS) as issued by IASB and adopted by the EU.
The financial statements are presented in U.S. Dollars (USD),
which is the functional currency.
The accounting policies for the Parent Company are the same as
for the Asetek Group, as per Note 2 to the consolidated financial
statements, with the exception of the items listed below.
2.1. Dividends on investments in subsidiaries, joint
ventures and associates.
Dividends on investments in subsidiaries, joint ventures
and associates are recognized as income in the income
statement of the Parent Company in the financial year in
which the dividend is declared.
2.2. Investments in subsidiaries, joint ventures and
associates.
Investments in subsidiaries, joint ventures and associates
are measured at the lower of cost, which equals book
value, or recoverable amount. An impairment test on the
investment in subsidiaries is performed if the carrying
amount of the subsidiaries’ net assets exceeds the carrying
value of the Parent Company’s investments.
Operating expenses consisted of the following for the year ended December 31,
(USD 000’s) 2016 2015
Personnel expenses (Note 4) 1,170 974
Legal, consultants and auditor 238 198
Other expenses 139 139
Total expenses 1,548 1,311
NOTES TO THE ANNUAL REPORT 2016 – PARENT COMPANY

ASETEK A/S – ANNUAL REPORT 2016 57
5. AUDIT FEES
(USD 000’s) 2016 2015
Statutory audit 18 29
Other assurance services 25 48
Tax services 33 34
Total 76 111
6. FINANCIAL INCOME AND COST
(USD 000’s) 2016 2015
Foreign currency exchange (loss) gain (15) 454
Interest income on loans to subsidiaries 83 561
Interest from bank accounts 38 -
Total finance income 121 561
Interest cost on loans from subsidiaries 20 37
Other finance expense 1 1
Total finance cost 21 38
NOTES TO THE ANNUAL REPORT 2016 – PARENT COMPANY
4. PERSONNEL EXPENSES
Total personnel costs for the year ended December 31,
(USD 000’s) 2016 2015
Salaries, pension and other 842 660
Share based payment 328 314
Total personnel expenses 1,170 974
Total personnel costs are specified as follows:
(USD 000’s) 2016 2015
Research and development 74 51
Selling, general and administrative 1,096 923
Total personnel expenses 1,170 974
The figures listed above include a portion of the executive management’s
cash compensation based on an estimate of the actual resources
allocated to the management of the parent company. Also, the figures
include incentive based compensation in the form of share options and
warrants granted to employees in the Asetek Group.
Remuneration of the Group Board of Directors is specified in Note 6 to
the Consolidated Financial Statements.
The Company’s share based incentive pay program is described in Note
7 of the Consolidated Financial Statements.

ASETEK A/S – ANNUAL REPORT 201658
7. INCOME TAX
Reference is made to Notes 10 and 11 to the Consolidated Financial
Statements.
8. INVESTMENT IN SUBSIDIARIES
9. RECEIVABLES FROM SUBSIDIARIES
Asetek A/S acquired 100% of Asetek Holdings, Inc. through the
exchange of shares in February 2013. At the time of acquisition,
Asetek Holdings, Inc. had negative net equity, resulting in the
(USD 000's) Investment in Asetek Holdings, Inc,
Balance at December 31, 2014 1,500
Additions 18,600
Balance at December 31, 2015 20,100
Additions -
Balance at December 31, 2016 20,100
Carrying amount at December 31, 2014 1,500
Carrying amount at December 31, 2015 20,100
Carrying amount at December 31, 2016 20,100
As of december 31,
(USD 000's) 2016 2015
Asetek Danmark A/S 931 3,156
Asetek USA, Inc. (945) 216
Asetek Xiamen 56 21
Asetek Holdings, Inc. 75 69
Net receivables from subsidiaries 117 3,462
% 2016 2015
Average effective interest rate 5.31% 5.31%
The fair value of receivables corresponds in all material respects to the carrying amount
initial investment to be valued at zero. Asetek Holdings, Inc.
represents Asetek A/S’s only direct investment in subsidiaries.
NOTES TO THE ANNUAL REPORT 2016 - PARENT COMPANY

ASETEK A/S – ANNUAL REPORT 2016 59
10. EQUITY
11. TRANSACTIONS WITH RELATED PARTIES
12. EVENTS AFTER THE REPORTING PERIOD
13. CONTINGENT LIABILITIES
Reference is made to Note 18 to the Consolidated Financial Statements.
A dividend in respect of the year ended December 31, 2016 of NOK1.00 per share, for a total payout of $2.9 million, is to be proposed at
the annual general meeting on April 25, 2017. These financial statements do not reflect this dividend payable.
Asetek A/S charges its subsidiaries a management service fee. Reference is made to Note 21 to the Consolidated Financial Statements.
Reference is made to Note 25 to the Consolidated Financial Statements.
The Danish group enterprises are jointly and severally liable for tax on group income subject to joint taxation, as well as for Danish
withholding taxes by way of dividend tax, royalty tax, tax on unearned income and any subsequent adjustments to these. Asetek A/S
has executed a guarantee to its Group’s principal bank, Sydbank, for all outstanding matters with its wholly owned subsidiary, Asetek
Danmark A/S.
Reference is made to Note 26 to the Consolidated Financial Statements.
NOTES TO THE ANNUAL REPORT 2016 - PARENT COMPANY

ASETEK A/S – ANNUAL REPORT 201660