annual report 2016 - oci nv nv ar16_ double_finalf.pdf · our products we produce nitrogen...
TRANSCRIPT

ANNUAL REPORT 2016

Our Products we produce nitrogen fertilizers, methanol, melamine and other natural gas based products from six facilities in the USA, Netherlands, Egypt and Algeria, and have two US greenfields coming on-stream in 2017.
See page 21
Our Commitment to Shareholders our commitment to create outstanding value to shareholders is absolute.
See page 07
8.4mtpa
47%
8.4MTPA total production capacity in 2016
47% return to shareholders since 1999
PERFORMANCE REVIEW04 2016 performance05 Company overview06 Letter to Shareholders07 Operational excellence08 Our global reach10 Market review12 Year In review14 Financial performance
OPERATIONAL STRENGTHS21 Design capacities22 OCI Nitrogen24 OCI Partners26 Iowa Fertilizer Company28 Natgasoline 29 BioMCN30 Sorfert Algérie31 Egyptian Fertilizers Company (EFC)32 Egypt Basic Industries Corporation (EBIC)33 OCI Fertilizer Trading (OFT) and OCI
Fertilizer Trade & Supply (OFTS)
SUSTAINABILITY REVIEW36 A local employer 37 Investing in our people38 Supporting our communities42 Operational excellence in HSE43 2016 safety performance44 Environmental excellence
CORPORATE GOVERNANCE48 Board of Directors profile50 Chairman’s letter52 Overview54 Board report58 Risk management & compliance65 Remuneration report70 Declarations
FINANCIAL STATEMENTS72 Consolidated financial statements77 Notes to the consolidated financial
statements134 Parent Company financial statements138 Notes to the Parent Company
financial statements
OTHER INFORMATION153 Proposed appropriation of net profit / (loss) 154 Independent Auditor’s report 158 Shareholder information159 Key subsidiaries
Our Business we are a global producer and distributor of natural gas based fertilizers and industrial chemicals based in the Netherlands. See page 04
+18%
Our People we believe our employees are fundamental to our success and are committed to investing in their development.
See page 37
Our Global Reach we serve agricultural and industrial customers around the world through both our own production and third party traded products.
See page 08
Our Communities we are proud to be a trusted corporate citizen dedicated to growing our business responsibly and minimizing our carbon footprint wherever possible
See page 4360Served customers in 60 countries in 2016
18% total sales volume growth in 2016
2,8712,871 employees in 2016
7%7% reduction in total GHG emissions in 2016

PERFORMANCE REVIEW
02 OCI N.V. Annual Report 2016 OCI N.V. Annual Report 2016 03

$ Million 2016 2015
Revenue 1,906.5 2,186.1
Adjusted EBITDA 466.5 736.2
Net income attributable to shareholders (continuing operations) 167.9 (246.1)
Net income attributable to shareholders (including discontinued operations) 167.9 384.7
Earnings per share (continuing operations) ($/share) 0.802 (1.177)
Total assets 7,260.3 7,764.5
Total equity 1,778.0 1,749.8
Gross interest-bearing debt 4,586.0 4,902.8
Net debt 4,249.0 4,349.6
Capital expenditures 735.9 1,131.4
2016 PERFORMANCE
STREAMLINING OUR BUSINESSES• Completed a group-wide cost savings
programme that identified $ 100 million of cost savings through optimizing operational costs
• Revamped our group-wide commercial strategy for international sales along product lines with direct reporting to the CEO
• Launched offer to acquire all publically held common units of OCI Partners
• Refinanced all outstanding debt with near-term maturities
GREENFIELD INITIATIVES ON TRACK TO BOOST CURRENT PRODUCTION CAPACITY BY 50%• IFCo precommissioning and
commissioning activities underway
• Natgasoline 78.1% complete as at 28 February 2017, expected to start production in the second half of 2017
COMPANY OVERVIEW
We aspire to be a leader in our industries providing clean, environmentally sound solutions to our customers. We aim to create a safe and encouraging workplace for our employees, and are committed to delivering exceptional value to our shareholders.
OUR STRATEGY
Promoting excellence in every aspect through our expertise, efficiency, attention to detail and passion.
Creating exceptional value based on the depth of our financial resources, our local knowledge and our technical expertise.
Ensuring our employees enjoy a safe and encouraging workplace through a strong focus on health and safety in every aspect of our operations.
Investing in our people and operations to match global standards and maintaining a commitment to develop our host communities.
OUR CORE STRENGTHS
Our people – their expertise, hunger for knowledge and passion to excel. Above all, their loyalty and commitment to OCI N.V.
Our resources – capital resources that enable us to respond faster than our competitors.
Our experience – a tradition of excellence and achievement.
Our entrepreneurial attitude – a strong appetite for investment and diversification to grow our business and create outstanding returns to shareholders.
NATGASOLINE STRATEGIC PARTNERSHIP Entered into a 50% partnership with Consolidated Energy Limited/G2X for Natgasoline, creating an international leader in the global methanol space benefiting from the combined expertise of both groups
Performance review / Operational strengths / Sustainability review / Corporate governance / Financial statements / Other information Performance review / Operational strengths / Sustainability review / Corporate governance / Financial statements / Other information
04 OCI N.V. Annual Report 2016 OCI N.V. Annual Report 2016 05

LETTER TO SHAREHOLDERS
Nassef Sawiris Chief Executive Officer
Dear Shareholders,
As the nitrogen fertilizer industry struggled through its cyclical trough across all benchmarks in 2016, OCI’s resilience and agility has resulted in a stronger company in 2017. We used 2016 to focus on optimizing three key areas of our operations: our production sites, our commercial activities, and our debt.
We achieved our goals and entered 2017 with a 27% ramp up in production volumes during 2016, an improved balance sheet following the repayment of all near-term debt, and streamlined our operations resulting in a leaner, more efficient company.
We finished construction of Iowa Fertilizer Company (IFCo) at the end of 2016. The facility is now in final stage of start-up phase with the first product expected imminently. IFCo will greatly enhance our global competitive position and establish OCI as a logistical hub in the US Midwest Corn Belt, one of the most attractive markets globally for nitrogen fertilizers. IFCo complements our operations in Europe, where OCI Nitrogen enjoys a market leading position in the premium nitrates market, and in North Africa, where our plants are amongst the lowest cost producers globally and benefit from freight time and cost advantage over Yuzhny producers to Europe and the Americas.
Natgasoline is making good progress and we expect to start commissioning in the fourth quarter of 2017. In April 2016, we announced our partnership with Consolidated Energy limited/G2X who acquired a 50% stake in the facility. By partnering with a global leader in methanol, we have firmly cemented Natgasoline as an international leader in the global methanol space. The project offers significant strategic value and will
benefit from the combined expertise of both groups. Once Natgasoline is complete, our methanol portfolio comprising OCI Beaumont, BioMCN and Natgasoline, will be one of the world’s largest and most efficient in the industry, with a leading position on the global cost curve.
Once all of our production sites are fully operational, we expect our total annual nitrogen fertilizer and industrial chemical sellable production capacity to exceed 12.5 million metric tons, a 50% increase over 2016.
With these start-ups, we are becoming a global top five player in our respective fields.We are proud that every asset in our portfolio meets the three key conditions for success: each asset is a world-class plant maintained to excellent standards, has access to competitively priced feedstock, and is strategically located with strong logistics and distribution reach.
We also believe industry fundamentals are improving. Our underlying markets, both nitrogen fertilizers and methanol, have turned significantly more positive, following robust price increases during the fourth quarter of 2016 and into 2017. Healthy demand growth, limited new supply expected in the medium term, and expected supply reductions in key export locations should lend support to prices across our product portfolio in the foreseeable future. As one of the lowest-cost producers globally, with assets that are capable of superior cash conversion and the step-up in production capacity, we believe OCI is one of the best-placed companies to benefit from improvements in underlying markets.
I am proud of the resilience we’ve shown as a company comprised of nearly 3,000 talented and hard-working employees. We are all invigorated to pursue the breadth of opportunities available to OCI in 2017.
“OUR COMMITMENT TO CREATING VALUE FOR OUR SHAREHOLDERS
IS ABSOLUTE”
OPERATIONAL EXCELLENCE
14%
PRODUCTION EFFICIENCY
Improvement in groupwide operatonal efficiencies in 2016 by
35%
SAFETY FIRST
Improvement in groupwide Total Recordable Injury Rates in 2016 by
35%
CAPITAL EXPENDITURES
Redcution in groupwide capex in 2016 by
Performance review / Operational strengths / Sustainability review / Corporate governance / Financial statements / Other information Performance review / Operational strengths / Sustainability review / Corporate governance / Financial statements / Other information
06 OCI N.V. Annual Report 2016 OCI N.V. Annual Report 2016 07

OUR GLOBAL REACH
OUR PRODUCTS REACH CUSTOMERS IN MORE THAN 60 COUNTRIES AROUND THE WORLD
LOCATIONS
Production assets
Warehousing capacity
Distribution / JVs
Performance review / Operational strengths / Sustainability review / Corporate governance / Financial statements / Other information Performance review / Operational strengths / Sustainability review / Corporate governance / Financial statements / Other information
08 OCI N.V. Annual Report 2016 OCI N.V. Annual Report 2016 09

MARKET REVIEW
Market Performance 2016
The nitrogen fertilizer and methanol markets reached their respective cyclical troughs in 2016, with prices for all of our products apart from melamine declining for much of the year.
However, prices started to recover significantly towards the end of 2016. Nitrogen fertilizer prices increased by 31% and US methanol contract prices by 36% on average in the final quarter of the year and this trend continued into 2017.
Nitrogen Fertilizers
Ammonia
Ammonia markets were depressed throughout most of 2016, as a result of new capacities coming on stream and sluggish demand, reaching a multi-year low in November. Towards the end of that month, selling prices started to firm significantly, supported by widespread supply shortages at key export locations in Eastern Europe, the Middle East and Trinidad, improved demand from key ammonia importers and a rebound in prices of some downstream products, including caprolactam and urea.
Urea
Urea prices were impacted during 2016 by an increase in global supply, relatively low demand in the beginning of the year, lower cash costs for marginal producers and the expectation of further supply additions coming on stream towards the end of the year. Urea prices reached unsustainably low levels in the third quarter of 2016, below break-even costs of many producers, mostly in China.
However, prices started to recover in the final months of the year, largely due to a significant drop in exports from China, which operate at the high end of the global urea cash cost curve. Urea exports from China decreased by about 35%, from 13.8 million tons in 2015 to 8.9 million tons in 2016. In China, government measures to improve loss-making coal markets and the desire to reduce air pollution resulted in a sharp increase in coal prices during the fourth quarter, which combined with higher transportation costs, increased the cash cost of Chinese exporters and lowered urea operating rates. As a result of the lower exports from China and increased global demand, urea supply became tighter than expected and prices have rebounded since the fourth quarter.
Nitrates
European nitrate markets followed urea price developments, and were impacted by relatively high stocks during the summer period, as well as adverse agricultural conditions for farmers, with grain prices remaining depressed. The low prices and lower nitrate premium reached during the summer provided fewer incentives for both importers, and for potential substitution by other products. As a result, prices started to rapidly increase towards the end of the year, in line with urea price developments.
Industrial Chemicals
Methanol
Methanol prices reached historic lows at the beginning of 2016, primarily due to capacity additions from the start-up of Methanex’s Geismar II and Fairway LLC (a Celanese and Mitsui joint venture) in the fourth quarter of 2015, at a time when demand was seasonally low. Spot prices were below the typical benchmark discount to contract prices as these new plants started up with shorter than expected ramp-up periods. Imports into the US remained at normal levels, thus creating an excess supply in the US Gulf Coast basin.
However, the methanol market re-adjusted as 2016 progressed, with prices increasing continuously throughout the rest of the year, driven by healthy global demand growth coupled with a recovery in crude markets and higher Chinese coal prices, the main feedstock for domestic producers. Methanol prices are currently underpinned by general supply tightness globally coupled with strong demand. Recently, plant outages around the world have tightened global inventories.
Global demand was robust in 2016 and is expected to remain healthy with traditional chemical derivatives growing at or near GDP levels and Chinese MTO continuing to drive demand growth.
Melamine
Melamine is a white powder made from urea and is mainly used to make amino-formaldehyde resins for the creation of safe, hard, durable glossy surfaces, resistant to heat, chemicals and moisture. Products include surface laminates, laminate flooring, wood-based panels, coating resins, moulding compounds, flame retardants, paper and textile resins and superplasticizers for concrete.
Driven by accelerating economic growth, global melamine demand continued to grow in 2016. Throughout the year melamine markets remained robust and selling prices improved compared to 2015. Especially towards the end of the year the supply & demand balance tightened, resulting in globally increasing sales prices for melamine.
UREA AMMONIUM NITRATE PRICES FRANCE, FOT ($/TON)
0
50
100
150
200
250
Q1
164
231
157
208
136
191
149
181
Q2 Q3 Q4
MELAMINE PRICES EUROPE CONTRACT (EUR/TON)
0
300
600
900
1200
1500
Q1
1,390 1,340 1,390 1,348 1,390 1,350 1,390 1,360
Q2 Q3 Q4
CALCIUM AMMONIUM NITRATE PRICES GERMANY, CIF (EUR/TON)
0
50
100
150
200
250
300
Q1
227
267
173
249
151
233
172
233
Q2 Q3 Q4
AMMONIA PRICES NORTH WEST EUROPE, FOB ($/TON)
0
100
200
300
400
500
600
Q1
354
506
357
481
285
476
263
453
Q2 Q3 Q4
METHANOL PRICES US GULF CONTRACT, FOB ($/TON)
0
100
200
300
400
500
Q1
249
426
247
431
267
402
326350
Q2 Q3 Q4
GRANULAR UREA PRICES EGYPT, FOB ($/TON)
0
50
100
150
200
250
300
350
Q1
231
336
206
295
193
280
235270
Q2 Q3 Q4
2016 2015
Performance review / Operational strengths / Sustainability review / Corporate governance / Financial statements / Other information Performance review / Operational strengths / Sustainability review / Corporate governance / Financial statements / Other information
10 OCI N.V. Annual Report 2016 OCI N.V. Annual Report 2016 11

During 2016, we achieved an 18% increase in total volume sold as a result of improved operations in North Africa, as well as a strong increase in methanol volumes as a result of high utilisation rates at OCI Beaumont and the first-time full year inclusion of BioMCN.
000 metric tons 2016 2015 % change
Granular urea
OCI product sold 1,916.5 1,383.0 38.6%Third party traded 115.3 65.6 75.8%Total granular urea 2,031.8 1,448.6 40.3%
Ammonia
OCI product sold 1,441.5 1,340.8 7.5%Third party traded 220.4 280.1 -21.3%Total ammonia 1,661.9 1,620.9 2.5%
Calcium ammonium nitrate (CAN)OCI product sold 1,028.8 995.8 3.3%Total CAN 1,028.8 995.8 3.3%
Urea ammonium nitrate (UAN)
OCI product sold 425.8 346.3 23.0%Third party traded 78.3 52.3 49.6%Total UAN 504.1 398.6 26.4%
Ammonium sulphate
Third party traded 1,613.2 1,669.4 -3.4%Total AS 1,613.2 1,669.4 -3.4%
Total fertilizers
OCI product sold 4,812.5 4,065.9 18.4%Third party traded 2,027.2 2,067.4 -1.9%Total fertilizers 6,839.7 6,133.3 11.5%
Industrial chemicals
Melamine 149.0 142.0 5.0%Methanol 1,180.8 644.8 83.1%Total industrial chemicals 1,329.9 786.8 69.0%
Total
OCI product sold 6,142.4 4,852.7 26.6%Third party traded 2,027.2 2,067.4 -1.9%Total product volumes 8,169.6 6,920.1 18.1%
Preparing for the Market Recovery
Fertilizer and methanol prices reached what we believed were unsustainably low levels in 2016, reaching trough levels of their respective cycles. As a result of soft global markets and the ongoing construction of our two greenfield plants in the United States, our focus during the year was to identify structural and operational efficiencies at each of our businesses in order to be best positioned to capitalize on an anticipated price recovery.
We completed a group-wide cost savings programme in the third quarter of 2016 that identified $ 100 million of cost savings. $ 65 million of the identified cash savings will be fully reflected on a run-rate basis in our 2017 results. A further $ 35 million of identified run-rate cash savings will be implemented by mid-2018. The programme focused on optimizing operational costs, including logistics, plant efficiencies, procurement, IT, general SG&A, and utilities management.
We also focused on improving production efficiencies at our plants through planned turnarounds, refocused our commercial operations, and refinanced all outstanding debt with near-term maturities.
With the start-up of Iowa Fertilizer Company, Natgasoline already fully funded and no plans to initiate new projects over the next 18 to 24 months, there are no further financing requirements for growth capex. Accordingly, we are confident that our improved debt profile, in conjunction with the step-up in our production capacity, an improved price environment, our diversified product portfolio, and our efficient existing operations will result in our ability to channel operational cash flows to deleveraging our balance sheet and improving our investment grade matrix.
Finally, we started witnessing significant price improvements in the fourth quarter and into 2017. US methanol average contract price and average nitrogen fertilizers prices, respectively.
Operational Excellence
OCI Nitrogen returned to stable operations in the first quarter following the rehabilitation of the CAN lines damaged by a fire at the end of the third quarter of 2015, in time for the spring application season. Production stability resumed in the second quarter following start-up and remained steady for the rest of the year. Despite a planned ammonia line turnaround, utilization rates were strong and the year’s overall production targets were met.
OCI Beaumont achieved utilization rates above nameplate capacity during the year, following a full debottlenecking and maintenance turnaround last year. The plant’s production capacity increased by 25% for both lines as a result of the
debottlenecking, which also allowed OCI Beaumont to reduce energy consumption and produce greener ammonia and methanol through the implementation of state-of-the-art Best Available Control Technology (BACT), a pollution control standard mandated by the United States Clean Air Act.
BioMCN underwent its largest turnaround since inception. BioMCN performed full maintenance during the turnaround, which took place in the summer to coincide with the seasonal decline in demand for methanol. Following the turnaround, the plant has been running smoothly, with production consistently above name-plate capacity. Production in October hit a record 103.3% capacity efficiency, a fitting way to celebrate BioMCN’s ten-year anniversary that month.
Sorfert successfully completed the first turnarounds of its urea and captive ammonia lines in September. The turnaround was timed to take place in the summer to coincide with the seasonal decline in demand for urea. OCI N.V.’s world-class Corporate Technology Team also collaborated with Sorfert’s technical team to identify additional areas for improvement at the plant that can be implemented in the near term.
EFC and EBIC continued to benefit from improved natural gas supply in Egypt during the year as a result of the Egyptian government’s commitment to maintaining natural gas supply through liquefied natural gas (LNG) imports. EFC’s utilization rate averaged 75% during the year, a significant improvement on the year before. The Egyptian government continues to use EBIC’s jetty for LNG imports, thereby limiting the plant’s ability to export product. Nevertheless, EBIC produced steadily during the year and is expected to return to high utilization rates once construction of a dedicated jetty for import of LNG is complete in 2017. In addition to our Egyptian facilities achieving improved production during the year, we have also benefitting from the devaluation of the Egyptian Pound (EGP) in the fourth quarter due to the denomination of a sizeable portion of these assets’ fixed and variable costs in EGP.
Focus on Commercial Operations — Global Distribution Reach
Our centralized distribution capabilities allow us to act as a ‘one-stop-shop’ for customers around the world. Our vast distribution network stretches across the Americas, Europe, Africa and parts of Asia, cultivated both organically through our trading units and through strategic investments and partnerships in distribution companies to support our global presence.
Our comprehensive logistics and distribution capabilities include approximately 1 million tons of warehousing capacity around the world, access to strategic ports and waterways at each of our plants, and vast fleets of owned and leased rail tank cars, vessels, trucks, and distribution pipelines.
As part of the operational improvement programme, we also revamped our commercial strategy for international sales to create more focus along product lines and global product managers now directly report to the CEO.
WE COMPLETED SEVERAL INITIATIVES TO REDUCE OPERATING COSTS AND
STREAMLINE PRODUCTION DURING 2016
Financial Management
We refinanced or repaid more than $ 1.7 billion in debt instruments during 2016 and settled all due short-term obligations. We therefore have no significant debt maturing until September 2018, and have funded all of our growth projects.
50% Increase in Total Production Capacity
With the expected start-up of our greenfield plants in the United States in 2017, our total annual nitrogen fertilizer and industrial chemical production capacity will exceed 12.5 million metric tons, a 50% increase over 2016.
Iowa Fertilizer Company (IFCo), our greenfield nitrogen fertilizer plant, is located in Wever County, Iowa, the largest corn-producing state in the United States. The plant achieved major milestones in December when process gas and air were introduced into front end of ammonia plant. The plant is in the commissioning and final start-up phase, with first product expected imminently. As the first greenfield world-scale natural gas-based fertilizer plant built in the United States in nearly 30 years, IFCo will be a key player in the effort to reduce the United States’ dependence on imported fertilizers by providing a stable, domestic supply of fertilizer using industry-leading technology and environmentally sustainable processes.
In April, we partnered with Consolidated Energy Limited (CEL)/G2X for 50% of Natgasoline, our 1.75 million metric ton per year merchant methanol production complex in Beaumont, Texas. Our partner is a global leader in methanol and will contribute key management personnel and technical leadership to the project.
Natgasoline will be one of the largest merchant methanol producers in the world once complete and is the only methanol greenfield project under construction in the United States. As at 28 February 2017, the plant was 78.1% complete.
Delivering Exceptional Value
We believe industry fundamentals are improving, with healthy demand growth coupled with limited new supply expected to lend support to prices across our product portfolio in the foreseeable future. OCI is well-positioned to benefit from improvements in underlying markets. The streamlining of our businesses during this year’s industry trough has resulted in a leaner, more efficient company. We are one of the lowest-cost producers globally, strategically located near some of the largest end markets for fertilizers in Europe and the US Midwest, and will become a leading global methanol player. We have created a global home for our new capacity coming on-stream through our third party trading activities. Our diversified and flexible product portfolio, agile production facilities, and strong commercial strategy will allow us to maximise returns and deliver exceptional value to our customers, partners, employees, and shareholders.
8.17mtSold in 2016
50%Increase in total production capacity in 2017
YEAR IN REVIEW
Performance review / Operational strengths / Sustainability review / Corporate governance / Financial statements / Other information Performance review / Operational strengths / Sustainability review / Corporate governance / Financial statements / Other information
OCI N.V. Annual Report 2016 1312 OCI N.V. Annual Report 2016

FINANCIAL PERFORMANCE
Segments
In 2016, reportable segments are: OCI Partners, IFCo, OCI Nitrogen and Trading, and North Africa.
Consolidated Revenue
OCI N.V.’s 2016 revenue from continuing operations reached $ 1,906.5 million, a 12.8% decrease from $ 2,186.1 million in 2015, due to a decline in selling prices of most products in 2016 compared to 2015 and despite a robust increase in product volumes sold.
Total volume sold in 2016 increased by 18.1%. Own produced nitrogen fertilizer and methanol volumes increased by 26.6% to 6.1 million metric tons in 2016 compared to 4.9 million metric tons in 2015. Lower margin third party traded volumes decreased by 1.9% to 2.0 million metric tons in 2016 compared to 2.1 million metric tons in 2015.
All segments and products contributed to this growth.
In North Africa, volumes improved significantly as a result of strong performance of the urea operations in Egypt and despite a planned shutdown at Sorfert in Algeria from the end of July to the beginning of September 2016. Egyptian Fertilizers Company’s (EFC) utilization rate was c.75% in 2016 and reached more than 100% in both January and February 2017. Utilization rates at Egypt Basic Industries (EBIC), our ammonia operations in Egypt, remained low. The Egyptian government continues to use EBIC’s jetty for LNG imports, thereby limiting the plant’s ability to export product. Nevertheless, EBIC is expected to return to high utilization rates once construction of a dedicated jetty for import of LNG is complete in 2017.
At OCI Nitrogen, calcium ammonium nitrate (CAN) and own-produced urea ammonium nitrate (UAN) volumes improved by 3.3% and 23.0% respectively. On 30 September 2015, OCI Nitrogen was required to stop production due to a fire incident in the basement of the CAN lines. The CAN lines restarted production in February / early March 2016, affecting volumes in both the fourth quarter of 2015 and the first quarter of 2016.
Methanol volumes improved 83.1% as a result of high capacity utilization at OCI Beaumont in the United States and the first-time inclusion of BioMCN in The Netherlands. OCI Beaumont achieved utilization rates of 90% and 100% in 2016 for the methanol and ammonia facilities respectively. Following a comprehensive turnaround of the BioMCN facility in June / July 2016, the facility has been operating at high utilization rates. BioMCN volumes were not included in the 2015 reported methanol volumes, as the plant produced methanol for a fixed fee for a third party. These toll manufacturing agreements were in place until the end of 2015.
Average selling prices for all products, except melamine, declined in 2016. Compared to 2015, benchmark ammonia prices witnessed the steepest decline, almost 40%, whereas urea, nitrate and methanol prices were on average between 25% and 30% lower. Benchmark melamine prices increased by 3% in 2016 compared to 2015. However, the nitrogen and methanol markets reached their respective cyclical troughs during 2016. Prices started to recover significantly towards the end of 2016 and all products increased in the fourth quarter of 2016 compared to the third, except for ammonia prices, which reached a low in the fourth quarter.
EBITDA
Adjusted EBITDA reached $ 466.5 million in 2016, a 36.6% decrease from $ 736.2 million in 2015, mainly due to lower selling prices and the shutdown in Algeria.
Lower selling prices were partly offset by the increase in volumes and a drop in spot natural gas feedstock prices. In the United States, Henry Hub spot gas prices declined from an average of approximately $ 2.6 / MMBtu in 2015 to $ 2.5 / MMBtu in 2016, approaching ten-year lows of around $ 1.5 / MMBtu at the beginning of 2016. European TTF spot gas prices declined on average from around €19.8 / MWh in 2015 (~$ 6.4 / MMBtu) to €14.0 / MWh in 2016 (~$ 4.5 / MMBtu) and reached a record low of around €10.6 /MWh (or c.$ 3.5 / MMBtu) in August 2016.
One-off items
One-off items in 2016 are mainly related to the termination of the combination agreement, the agreement with Consolidated Energy Ltd (CEL) for an investment in a 50% stake in Natgasoline in participation with OCI and our development projects in the United States. The most important items at the EBITDA level are:
• In May 2016, OCI received a termination fee of $ 150.0 million as a result of the termination of the combination agreement as originally announced in August 2015.
• Transaction costs of $ 24.8 million include legal, accounting and advisory fees.
• In May 2016, 50% of the shares held in Natgasoline, which was formerly controlled 100% by OCI, were sold to CEL. Subsequently, the interest in Natgasoline was deconsolidated resulting in a transaction gain of $ 107.9 million.
• Expenses related to the capacity expansion projects in the United States amounted to $ 75.2 million in 2016.
Financial Highlights1
$ millions unless otherwise stated 2016 2015
Revenue 1,906.5 2,186.1
Cost of Sales (1,685.4) (1,654.1)
Gross Profit 221.1 532.0
Gross Profit Margin 11.6% 24.3%
Adjusted EBITDA2 466.5 736.2
EBITDA Margin 24.5% 33.7%
Adjusted Operating profit before one-off items2 149.3 434.6
One-off items at EBITDA level 155.2 (69.4)
Goodwill impairment - (422.9)
Operating profit/(loss) – reported 304.5 (57.7)
Adjusted net Income from continuing operations attributable to shareholders2 22.1 179.6
Net Income from continuing operations attributable to shareholders 167.9 (246.1)
Net Income Margin 8.8% (11.3%)
Result from discontinued operations attributable to shareholders - 630.8
Net income after discontinued operations attributable to shareholders 167.9 384.7
Earnings/(loss) per share for continuing operations ($)
Basic earnings per share 0.802 (1.177)
Diluted earnings per share 0.802 (1.177)
Total assets 7,260.3 7,764.5
Total equity 1,778.0 1,749.8
Gross interest-bearing debt 4,586.0 4,902.8
Net debt3 4,249.0 4,349.6
Capital expenditure 735.9 1,131.4 1 As a result of the demerger of the Engineering & Construction
business in March 2015, only the Fertilizer & Chemicals financials are reported as continuing operations. The demerged Engineering & Construction business has been classified as Discontinued Operations.
2 OCI N.V. uses a few Alternative Performance Measures (‘APM’) to provide a better understanding of the underlying developments of the performance of the business. The APMs are not defined in IFRS and should be used as supplementary information in conjunction with the most directly comparable IFRS measures. A detailed reconciliation between APM and IFRS is included in one of the next paragraphs.
3 Excluding reserved bank balances of $ 55.2 million as at 31 December 2016 and $ 243.2 million as at 31 December 2015.
One-off items impact on EBITDA
$ millions 2016 2015One-off item
in P&L
Operating profit as reported 304.5 (57.7)
Depreciation and amortization 317.2 301.6
Impairment of goodwill - 422.9
EBITDA 621.7 666.8
Adjustments for: Termination fee (150.0) - Other income
Transaction costs 24.8 16.4 Other expenses
Result on sale of 50% and deconsolidation of Natgasoline (107.9) - Other income
Expenses related to expansion projects 75.2 62.1
SG&A expenses
Egypt idled expenses - 27.4 Various
Gain on sale of Gavilon (2.8) (10.1) Other income
Release of provisions - (46.3) Other income
Loss on natural gas price derivative 2.5 6.7 Other expenses
Other adjustments 3.0 13.2 Various
Total adjustment at EBITDA level (155.2) 69.4
Adjusted EBITDA 466.5 736.2
Performance review / Operational strengths / Sustainability review / Corporate governance / Financial statements / Other information Performance review / Operational strengths / Sustainability review / Corporate governance / Financial statements / Other information
OCI N.V. Annual Report 2016 1514 OCI N.V. Annual Report 2016

One-off items impact on net income from continuing operations attributable to shareholders
$ millions 2016 2015One-off item
in P&L
Reported net income from continued operations attributable to shareholders
167.9 (246.1)
Adjustments for: One-off items in EBITDA (155.2) 69.4
Goodwill impairment - 422.9 Other expenses
Forex gain on intercompany loans (48.7) (8.2) Finance income
EBIC tax release - (82.9)
Income tax (adjusted for
minorities)
Egypt idled expenses, net 11.3 24.5Net profit after tax
Tax one-off items 43.5 - Income tax
Other 3.3 - Various
Total one-off items (145.8) 425.7
Adjusted net income 22.1 179.6
Income tax
Income tax expense amounted to $ 48.7 million in 2016 compared to a positive of $ 93.7 million in 2015. In 2015, the tax charge was positive, mainly due to a release of $ 138.2 million of (deferred) tax liabilities for EBIC. The deferred tax was released following a court verdict reinstating EBIC’s tax free status. Even though the verdict was appealed by The General Authority for Investment in Egypt, management believes that it is likely that the appeal verdict will be in OCI’s favour.
Net income attributable to shareholders and earnings per share (EPS)
Net income from continuing operations (after non-controlling interest) was $ 167.9 million in 2016, compared to a loss of $ 246.1 million in 2015. Total one-off items had a positive impact of $ 145.8 million on net income in 2016. Adjusted net income excluding one-off items decreased from $ 179.6 million in 2015 to $ 22.1 million in 2016.
Following the demerger of the Engineering & Construction business, all demerged entities have been treated as discontinued operations. In 2015, net profit from discontinued operations amounted to $ 630.8 million.
Basic and diluted EPS for continuing operations stood at $ 0.802 per share compared to a loss of $ 1.177 per share during 2015.
Dividends
OCI has a flexible dividend policy designed to balance the availability of funds for dividend distribution with pursuing growth opportunities that generate attractive returns. Over the past few years, OCI has pursued two large greenfield projects in the US, which required high capital expenditure. Accordingly, the Board of Directors has not announced a dividend for FY 2016.
Number of employees
During the financial year ended 31 December 2016, the average number of staff employed in the Group converted into full-time equivalents amounted to 2,871 employees (2015: 2,972 employees).
Cash flowCondensed Consolidated Statement of Cash Flows for the years ended 31 December
$ millions 2016 2015
Cash and cash equivalents at 1 January 787.0 1,115.2
Cash flows from operating activities (continuing operations) 322.6 710.4
Cash flow (used in) investing activities (continuing operations) (229.9) (1,132.6)
Cash flows (used in) / from financing activities (continuing operations) (378.4) 503.8
Net cash flows from / (used in) continuing operations (285.7) 81.6
Net cash flows (used in) / from discontinued operations - (85.0)
Currency translation adjustments (109.8) (40.9)
Less cash and cash equivalents as at 7 March (demerger date)
- (283.9)
Cash and cash equivalents at 31 December 391.5 787.0
Cash Flows from Operating Activities
Cash inflows from operating activities in 2016 totaled $ 322.6 million, compared to $ 710.4 million in 2015. Excluding a payment of $ 49.5 million by OCI to the Egyptian Tax Authority (ETA) in 2016 and a refund of $ 266.2 million from the ETA to OCI in 2015, cash inflows from operations amounted to $ 372.1 million and $ 444.2 million in 2016 and 2015 respectively. In 2016, cash flow from operating activities include several one-off items discussed above, with the most important being the termination fee of $ 150 million received from CF Industries in May 2016, offset by related transaction costs of $ 24.8 million. Excluding those items, the decline was largely due to the lower operating result in 2016 compared to 2015.
Cash Flows from Investing Activities
Cash used in investing activities (continuing operations) reached $ 229.9 million in 2016, significantly lower than $ 1,132.6 million in 2015, as a result of lower capital expenditure and the repayment of $ 511.0 million shareholder’s loan by Natgasoline. Total capital expenditures decreased from $ 1,131.4 million in 2015 to $ 735.9 million in 2016, principally used for the construction of the Iowa Fertilizer Company and Natgasoline LLC (until the deconsolidation as of 4 May 2016).
Cash Flows from Financing Activities
Cash outflows from financing continuing activities in 2016 totaled $ 378.4 million, principally as a result of repayments of short term loans and refinancing of debt at OCI Nitrogen and a Revolving Credit Facility at the Holding Company. Financing activities are discussed in more detail below.
FINANCIAL PERFORMANCE CONTINUED
Gross profit and cost of sales
Cost of sales increased 1.9% to $ 1,685.5 million in 2016 from $ 1,654.1 million in 2015.
Cost of sales as a percentage of revenue increased to 88.4% in 2016 from 75.7% in 2015. The gross profit margin decreased from 24.3% in 2015 to 11.6% in 2016, resulting in a decrease in gross profit of 58.4% to $ 221.1 million.
Selling, General and Administrative Expenses
Selling, General and Administrative expenses (SG&A) expenses decreased to $ 224.1 million in 2016 (11.8% of revenue) from $ 270.3 million in 2015 (12.4% of revenue). SG&A expenses include costs incurred by the expansion projects and other one-off costs. Excluding one-off costs, SG&A as a percentage of revenue decreased from 8.9% in 2015 to 7.8% in 2016.
Operating Profit
Depreciation and amortization expenses are a significant component of the cost of operations. In 2016, depreciation and amortization expenses stood at $ 317.2 million, at the same level as in 2015.
Operating profit from continuing operations amounted to $ 304.5 million in 2016 compared to a loss of $ 57.7 million in 2015. Excluding one-off items, operating profit amounted to $ 149.3 million in 2016 compared to $ 434.6 million in 2015.
Net financing cost
Net finance costs consist of interest income, gain or loss on foreign exchange, and interest expense on interest-bearing liabilities.
Net finance costs amounted to $ 80.3 million in 2016 compared to $ 146.0 million in 2015, the drop largely explained by higher net foreign exchange gains ($ 136.2 million in 2016 compared to $ 22.1 million in 2015). The increase in foreign exchange gains and losses from 2015 to 2016 are due to the weakening of the Euro, Algerian Dinar and the Egyptian Pound (EGP) against the US Dollar.
Net interest expense, excluding foreign exchange gains or losses, amounted to $ 220.5 million in 2016 compared to $ 168.1 million in 2015. The increase was due to higher net interest at OCI Beaumont, higher refinancing fees, as well as a higher net debt level in the first half of 2016 compared to the same period in 2015.
Performance review / Operational strengths / Sustainability review / Corporate governance / Financial statements / Other information Performance review / Operational strengths / Sustainability review / Corporate governance / Financial statements / Other information
OCI N.V. Annual Report 2016 1716 OCI N.V. Annual Report 2016

Outlook
With the start-up of Iowa Fertilizer Company and Natgasoline, expected higher capacity utilization rates in Egypt and the benefit of a lower exchange rate there, OCI expects a significant step-up in operational cash flow in 2017 and again in 2018, further boosted by an improved price environment. OCI is studying the potential to restart the second methanol production line at BioMCN, which is currently mothballed. The likely capital expenditure for this will be spread over the period 2018 - 2020. Other than that, OCI has no further financing requirements for growth capex and expects capital expenditure to drop from on average in excess of $ 1.0 billion over the past few years to a maintenance level of $ 150 - 200 million on an annual basis. Accordingly, OCI expects a path of rapid deleveraging, towards achieving an investment grade rating by 2018.
Net Debt as at 31 December
$ millions 2016 2015
Long-term interest-bearing debt 4,322.2 3,336.7
Short-term interest-bearing debt 263.8 1,566.1
Gross interest-bearing debt 4,586.0 4,902.8
Cash and cash equivalents1 337.0 553.2
Net debt 4,249.0 4,349.6
1 Excluding reserved bank balances of $ 55.2 million as at 31 December 2016 and $ 243.2 million as at 31 December 2015.
FINANCIAL PERFORMANCE CONTINUED
Condensed Consolidated Statement of Financial Position as at 31 December
$ millions 2016 2015
Total non-current assets 6,462.8 6,539.5
Total current assets 797.5 1,225.0
Total Assets 7,260.3 7,764.5
Shareholders’ Equity 1,432.7 1,260.3
Non-controlling interest 345.3 489.5
Total Equity 1,778.0 1,749.8
Total non-current liabilities 4,546.7 3,598.3
Total current liabilities (continuing operations) 935.6 2,416.4
Total Liabilities 5,482.3 6,014.7
OCI N.V.’s debt profile is detailed in the table below:
Consolidated Debt Breakdown as at 31 December 2016
$ millions Description Companies Gross debt Cash1 Net debt
Majority Owned Subsidiaries
• Debt at entities where OCI’s stake is less than 100%• Debt is non-recourse to OCI N.V., although fully
consolidated on the group’s balance sheet
• Sorfert• EBIC• OCI Beaumont
1,095.1 116.8 978.3
Fully Owned Subsidiaries
• 100% owned operating companies’ debt is organized against operating company cash flow and is non-recourse to HoldCo
• Corporate support is available from OCI N.V. with Board approvals
• OCI Nitrogen• EFC• OFT
981.5 106.1 875.4
Project Finance Debt • Project finance debt which can remain with companies after completion of construction
• All project finance debt is ring-fenced and non-recourse to OCI N.V.
• Debt is raised through banks or capital markets• Long tenures financed by operating cash flow
• IFCo 1,180.9 3.8 1,177.1
Holding Company Debt
• Full responsibility of OCI N.V.• Supported by investment asset values and dividends
received from subsidiaries
• OCI N.V.• Other
1,328.5 110.3 1,218.2
Total 4,586.0 337.0 4,249.0
1 Excluding reserved bank balances of $ 55.2 million.
Balance Sheet and Net Debt
In 2016, OCI has taken a number of actions to strengthen the Company’s financial position and ensure a healthy debt profile. Significant progress towards this goal was achieved by repaying or refinancing all short-term maturities, and monetizing shareholder’s loans to Natgasoline. As a result, OCI does not have any significant debt maturing until September 2018.
In May 2016, CEL, owned by the Proman Group, acquired 50% of Natgasoline by means of a capital increase of $ 630.0 million and committed to an additional $ 50.0 million to cover any required contingencies. In April 2016, Natgasoline successfully issued a fully underwritten $ 250 million bond, partly used to redeem the shareholder loan from OCI N.V. to Natgasoline, and in August 2016, Natgasoline obtained external financing to repay the remaining balance of the shareholder loan. A total amount of $ 511.0 million was collected by OCI N.V. from Natgasoline.
Proceeds from borrowing amounted to c.$ 1.5 billion. OCI entered into new credit facility agreements, in addition to refinancing and upsizing existing facilities at the Holding Company level and OCI Nitrogen.
Total borrowings of of c. $ 1.7 billion were repaid during 2016, settling all due short-term obligations. The Company also repaid $ 398.2 million bridge loans outstanding as of year end 2015. OCI Beaumont reduced third party term loans by $ 200 million through an intercompany loan from OCI N.V. See also note 18 in the Consolidated Financial Statements.
Total gross debt outstanding was down 6.5% from $ 4,902.8 million as at 31 December 2015 to $ 4,586 million as at 31 December 2016, whereas short term debt decreased from $ 1,566.1 million as of 31 December 2015 to $ 263.8 million as of 31 December 2016, the result of the refinancing and repayments as mentioned above.
Cash & cash equivalents decreased from $ 553.2 million as at 31 December 2015 to $ 337.0 million as at 31 December 2016 (excluding the funds reserved for donation of $ 55.2 million as of 31 December 2016 and $ 243.2 million as of 31 December 2015). The decline resulted from the devaluation of the Egyptian Pound against the US Dollar, as well as a payment of $ 49.5 million by OCI to the Egyptian Tax Authority in October 2016.
OCI N.V.’s net debt of $ 4,249.0 million as at 31 December 2016 is a 2.3% decrease over $ 4,349.6 million as at 31 December 2015. Net debt declined at the holding company level and at most operating companies except OCI Nitrogen (due to upsizing of debt facilities in August 2016) and Sorfert. Net debt at Sorfert increased as it paid out $ 195 million in dividends to its two shareholders in September 2016 ($ 125 million to Sonatrach and $ 70 million, or $ 63 million net of dividend withholding taxes, to OCI). Devaluation of the Egyptian Pound resulted in lower net debt in US Dollar terms at EFC. As of 31 December 2016, debt denominated in Egyptian Pounds amounted to EGP 1.015 billion ($ 56.7 million).
Performance review / Operational strengths / Sustainability review / Corporate governance / Financial statements / Other information Performance review / Operational strengths / Sustainability review / Corporate governance / Financial statements / Other information
OCI N.V. Annual Report 2016 1918 OCI N.V. Annual Report 2016

OPERATIONAL STRENGTHS
Design Capacities1
Ammonia
Plant Country Ownership Gross Net2 Urea UAN3 CAN
Total Fertilizer for sale Methanol Melamine4 DEF
Total Fertilizer & Chemicals
for sale
Egyptian Fertilizers Company5 Egypt 100% 800 - 1,550 - - 1,550 - - - 1,550
Egypt Basic Industries Corp. Egypt 60% 730 730 - - - 730 - - - 730
OCI Nitrogen Netherlands 100% 1,150 350 - 350 1,450 2,150 - 200 - 2,350
Sorfert Algérie Algeria 51% 1,600 800 1,260 - - 2,060 - - - 2,060
OCI Beaumont USA 80% 331 331 - - - 331 913 - - 1,244
BioMCN6 Netherlands 100% - - - - - - 440 440
2016 run-rate design capacity 4,611 2,211 2,810 350 1,450 6,821 1,353 200 - 8,374
Iowa Fertilizer Company USA 100% 875 195 420 1,505 - 2,120 - - 315 2,435
Natgasoline USA 50% - - - - - - 1,750 - - 1,750
Full design capacity 5,486 2,406 3,230 1,855 1,450 8,941 3,103 200 315 12,559
1 All tonnage is in thousand metric tons per year (ktpa) and refers to total design capacity, IFCo and Natgasoline volumes are estimates. Design capacities at OCI Nitrogen and IFCo cannot all be achieved at the same time. Capacities are not adjusted for OCI’s ownership stake in considered plant
2 Net ammonia is remaining capacity after downstream products are produced3 OCI Nitrogen maximum UAN capacity cannot be achieved when producing maximum CAN capacity4 Split as 150 ktpa in Geleen and 50 ktpa in China (Chinese capacity does not account for 49% stake and exclusive right to offtake 90%)5 Also has a 325 thousand metric ton per year (ktpa) UAN blending unit to capitalize on seasonal UAN price premiums over urea
(swing capacity replaces urea capacity when in production)
6 Does not include mothballed methanol line of 430 ktpa
Our competitive strengths lie in our high quality production facilities, our global low cost producer advantage, our diversified product portfolio, and our strategic locations with access to strong distribution and logistics capabilities.
20 OCI N.V. Annual Report 2016 OCI N.V. Annual Report 2016 21

OCI NITROGEN
OCI Nitrogen is Europe’s second largest integrated nitrates fertilizer producer and the world’s largest melamine producer. It is capable of producing over 2 million metric tons of sellable fertilizer and chemicals products annually through nine interconnected plants located on a fully integrated production site in Geleen, the Netherlands. OCI Nitrogen’s melamine production capacity in Geleen is complemented by a 49% stake in a melamine production facility in China.
World-Class Production ComplexAll of OCI Nitrogen’s plants utilize efficient technology from proven global technology providers coupled with proprietary nitric acid and melamine proven technology.
Since our acquisition of the OCI Nitrogen assets from Royal DSM B.V. in 2010, we have fully revamped the facilities through a five-year capital expenditure program launched to upgrade the complex to its current state. As a result of this maintenance and replacement program, OCI Nitrogen is a world-class production complex consistently performing at excellent utilization, reliability and efficiency and emissions rates. OCI Nitrogen consistently ranks amongst the top plants globally in terms of energy efficiency.
The capital investment program also added nearly 500 thousand metric tons of production capacity through various improvement and debottlenecking initiatives of OCI Nitrogen’s CAN, UAN and melamine plants.
Diversified Product Portfolio As Europe’s second largest integrated nitrates producer and the world’s largest melamine producer, OCI Nitrogen benefits from excellent brand recognition with owned trade names including Nutramon®, Exacote®, and Melafine®. Its diversified product portfolio, which includes ammonia, CAN, UAN and melamine, is fully flexible, allowing us to maximize production of certain swing products depending on global supply and demand.
Strategic Location with Strong Distribution and LogisticsOCI Nitrogen has developed a comprehensive and highly efficient distribution and logistics network through pipeline, road, rail and shipping, with access to both Stein harbor and Rotterdam port.
The majority of OCI Nitrogen’s product is distributed out of Stein harbor through dedicated CAN and AS barge loaders and a direct pipeline connection to the plant’s ammonia and UAN lines. Access to Stein harbour allows OCI Nitrogen to streamline its import/export activities and ensures supply security in the event of unplanned downtime. As one of the largest inland ports in the Netherlands, Stein harbor provides links to the seaports of Rotterdam, Terneuzen, Antwerp and Ghent as well as efficient river connections to Belgium, France, Netherlands and Germany.
OCI Nitrogen’s distribution infrastructure also includes OCI Terminal Europoort (OTE), an ammonia terminal at Rotterdam port. OTE consists of two ammonia tanks of 15 thousand metric ton capacity each, protected by a surrounding concrete wall. OTE is capable of receiving up to 0.55 million metric tons per year (mtpa) of ammonia and delivering up to 0.45 mtpa. Access to Rotterdam port through OTE also allows our wholly owned distribution arm, OCI Fertilizer Trade and Supply (OFTS), to trade third party ammonia around the world.
OCI Nitrogen is also able to distribute ammonia by rail. Our leased rail tank car (RTC) fleet in Geleen consists of approximately 250 RTCs, and is the largest ammonia RTC fleet in Europe. Fertilizers and melamine are also trucked across Europe, supported by access to warehousing capacity around Europe of nearly 650 thousand metric tons.
Nat G
asoline
2016 SALES BY REGION
Europe 90%
Other 7%
Americas 3%
MILLION TONS 1.45
CALCIUM AMMONIUM NITRATEANNUAL CAPACITY
MILLION TONS 1.15
ANHYDROUS AMMONIAANNUAL GROSS CAPACITY
THOUSAND TONS 350
UREA AMMONIUM NITRATEANNUAL CAPACITY
THOUSAND TONS 200
MELAMINEANNUAL CAPACITY
www.ocinitrogen.com
OWNERSHIP 100%
Performance review / Operational strengths / Sustainability review / Corporate governance / Financial statements / Other information Performance review / Operational strengths / Sustainability review / Corporate governance / Financial statements / Other information
22 OCI N.V. Annual Report 2016 OCI N.V. Annual Report 2016 23

OCI PARTNERS LP (OCI BEAUMONT)
OCI Partners LP is a master limited partnership that owns and operates OCI Beaumont, an integrated methanol and ammonia production facility that is strategically located on the Texas Gulf Coast near Beaumont. The Partnership is headquartered in Nederland, Texas. OCI Partners LP is listed on the NYSE in New York under the symbol “OCIP” and we own 80%.
World-Class Production ComplexSince acquiring OCI Beaumont in 2011, we have fully rehabilitated the facility and debottlenecked both lines, achieving a 25% increase in ammonia and methanol production capacity. Our investments in the facility have also resulted in reduced energy consumption, and greener ammonia and methanol production through the implementation of state-of-the-art Best Available Control Technology (BACT), a pollution control standard mandated by the United States Clean Air Act.
The integrated methanol-ammonia facility uses Lurgi GmbH’s Low Pressure Methanol technology and Haldor Topsøe technology. It is one of the world’s largest merchant methanol producers.
Strategic Location on Gulf Coast OCI Beaumont is strategically located on the Texas Gulf Coast, which provides advantageous access and connectivity to established infrastructure and transportation facilities, including pipeline connections to adjacent customers and port access with dedicated methanol and ammonia export barge docks. OCI Beaumont has connections to one major interstate and three major intrastate natural gas pipelines that provide access to significantly more natural gas supply than the facility requires and flexibility in sourcing natural gas feedstock. OCI Beaumont also has a state-of-the-art ammonia and methanol truck loading facility on-site, providing flexibility to reach customers effectively. The facility also includes two ammonia tanks with a total capacity of 33 thousand metric tons and two methanol storage tanks with a total capacity of 42 thousand metric tons.
THOUSAND TONS 913
METHANOLANNUAL CAPACITY
www.ocipartnerslp.com
EBIC
2016 SALES BY REGION
USA 100%
THOUSAND TONS 331
ANHYDROUS AMMONIAANNUAL CAPACITY
OWNERSHIP 80%
Performance review / Operational strengths / Sustainability review / Corporate governance / Financial statements / Other information Performance review / Operational strengths / Sustainability review / Corporate governance / Financial statements / Other information
24 OCI N.V. Annual Report 2016 OCI N.V. Annual Report 2016 25

IOWA FERTILIZER COMPANY (IFCO)
Iowa Fertilizer Company (IFCo) is a wholly owned greenfield nitrogen fertilizer complex currently under construction in Wever County, Iowa. Once operational, the plant will produce north of 1.5 million metric tons of nitrogen fertilizers and diesel exhaust fluid per year.
IFCo was first envisioned in November 2011 as part of the Company’s strategic expansion into the United States and is the first greenfield, world-scale natural gas-based fertilizer plant built in the United States in nearly 30 years. Peak construction activity created over 3,000 jobs and the plant has created approximately 200 permanent jobs.
World-Class Production ComplexIFCo is one of the largest nitrogen fertilizer plants in the United States based on design capacity and will utilize proven state-of-the-art production process technologies from world leaders. IFCo has licensed its ammonia production technology from Kellogg Brown & Root (KBR), a leading supplier of ammonia technology; its urea production technology from Stamicarbon B.V. (Stamicarbon), the world’s largest licensor of urea production technology; and urea granulation, UAN and nitric acid technologies from ThyssenKrupp Uhde. By using premium technology suppliers, IFCo will benefit from greater reliability, efficiency and flexibility in the production of nitrogen products.
Diversified Product Portfolio IFCo’s diversified nitrogen fertilizer product portfolio includes design capacities of up to 1.5 million metric tons of UAN, 875 thousand metric tons of ammonia, and 420 thousand metric tons of granular urea, in addition to 315 thousand metric tons of diesel exhaust fluid, a fuel additive used to lower harmful nitrogen oxide emissions and improve fuel economy. The facility’s design provides significant flexibility in determining the relative production amounts of its various nitrogen products and therefore allows IFCo to maximize production of swing products in response to changes in market dynamics and to maximize netback prices.
Strategic Location with Strong Distribution and Logistics IFCo is strategically located in southeastern Iowa, adjacent to the Iowa-Illinois border and in the center of the Midwest Corn Belt, which is generally understood within the nitrogen fertilizer products industry to include the states of Illinois, Indiana, Iowa, Missouri, Nebraska and Ohio. The Midwest Corn Belt is the largest market in the United States for direct application nitrogen fertilizer products. The United States is the largest corn producer in the world, with Iowa and Illinois being the top two corn producing states. IFCo’s core market for nitrogen fertilizer is considered to be the states of Iowa, Illinois, Indiana and Missouri.
IFCo’s proximity to its core markets allows us to optimize logistics infrastructure with nearby access to truck, rail and potentially barge transportation. With the goal of optimizing logistics infrastructure, IFCo currently leases 350 railcars for use in product delivery. IFCo’s on-site storage capacity includes 100 thousand metric tons of ammonia, 40 thousand metric tons of urea, and 120 thousand metric tons of UAN. IFCo’s physical location in the center of the Midwest Corn Belt provides a strategic location and transportation cost advantage compared to other producers who must ship their products over greater distances to our core market. The combination of IFCo’s transportation options, proximity to customers and on-site storage capacity allows for advantageous flexibility to reach customers effectively. In addition to truck and rail access, IFCo is located within four miles of the Mississippi River and can expand its distribution network to include barge through the construction of barge facilities.
MILLION TONS 1.5
UREA AMMONIUM NITRATEEXPECTED ANNUAL CAPACITY
MILLION TONS 0.9
ANHYDROUS AMMONIAEXPECTED ANNUAL GROSS CAPACITY
THOUSAND TONS 420
GRANULAR UREA EXPECTED ANNUAL CAPACITY
THOUSAND TONS 315
DIESEL EXHAUST FLUIDEXPECTED ANNUAL CAPACITY
www.iowafertilizer.com
OWNERSHIP 100%
Performance review / Operational strengths / Sustainability review / Corporate governance / Financial statements / Other information Performance review / Operational strengths / Sustainability review / Corporate governance / Financial statements / Other information
26 OCI N.V. Annual Report 2016 OCI N.V. Annual Report 2016 27

NATGASOLINE LLC
Natgasoline LLC is a greenfield world-scale methanol production complex currently under construction in Beaumont, Texas. OCI and its partner, Consolidated Energy Limited (CEL)/G2X, each own 50% stakes. The plant is expected to have a capacity of up to approximately 1.75 million metric tons per year, and is expected to commission in 2017. At peak construction, Natgasoline LLC created approximately 2,000 construction jobs and will create approximately 108 permanent jobs.
World-Class Production ComplexNatgasoline will be one of the world’s largest methanol production facilities based on nameplate capacity. The project will use proven state-of-the-art Lurgi MegaMethanol® technology and will incorporate ‘Best Available Environmental Control Technology (BACT). Located on the same industrial site as OCI Beaumont, Natgasoline has access to industrial gases, workshops and laboratories and will capitalize on technical support and synergies with OCI Beaumont. Natgasoline will also leverage OCI Beaumont’s engineers’ and operators’ operational know-how given their extensive experience in running, maintaining, rehabilitating and debottlenecking a methanol plant. Our partner is a global leader in methanol and will contribute key management personnel and will provide technical leadership in the startup, operations and maintenance of the facility.
Once Natgasoline is on-stream, it will leverage the partners’ significant methanol sales and marketing experience as leading methanol players as well as their existing relationships both in the domestic market and around the world.
Strategic Location with Strong Distribution and Logistics Natgasoline is strategically located on the Texas Gulf Coast with access to excellent distribution and logistics infrastructure. The plant is located near six existing natural gas pipelines, and is expected to receive natural gas from two pipelines owned by Golden Triangle (GTS) that run through the project site. Accordingly, the facility has several options to receive gas given GTS’s connection to six existing pipelines.
Natgasoline has entered into a 15-year Terminal Services Agreement with Phillips 66 Gulf Coast Properties LLC and a Pipeline Transportation Services Agreement with Phillips 66 Pipeline LLC for the required outbound logistics. Under the P66 agreements, Phillips 66 will construct, operate and own three new methanol storage tanks with capacity of 50 thousand metric tons each at their Beaumont methanol terminal. Phillips 66 will also construct approximately seven miles of pipeline from Natagsoline to the terminal, which will be equipped for the loading of methanol onto both deep-sea marine vessels and barges. Natgasoline has also leased two deep-sea methanol tankers.
www.biomcn.euBIOMCN
MILLION TONS 0.44
METHANOLANNUAL CAPACITY
BioMCN is one of Europe’s largest methanol producers and is the first company in the world to produce and sell industrial quantities of high quality bio-methanol, a second generation biofuel. Established in 1974, BioMCN owns two methanol plants: M1 and M2. M1 is capable of producing 440 thousand metric tonsper year, and is Europe’s fourth largest plant. M2 is a mothballed plant capable of producing 430 thousand metric tons per year.
Bio-methanol PioneerBioMCN produces two types of methanol: bio-methanol and regular (also known as grey) methanol. Bio-methanol is produced from bio-gas sourced from waste digestion plants through the national gas grid by purchasing bio-gas certificates to label methanol as bio-methanol. BioMCN is a leader in bio-methanol innovations by continuously developing innovative processes and new feedstock.
Strategic Location with Strong Distribution and LogisticsBioMCN is located at the Chemical Park Delfzijl, The Netherlands. The plant site is connected to the national natural gas grid operated by GTS B.V. The GTS grid is connected to the integrated North West European network, supplied by a number of players including GasTerra, Statoil and Gazprom. The plant has easy logistical access to major European end markets via road, rail, barge and sea freight, allowing it to efficiently reach customers across Western Europe.
OWNERSHIP 100%
MILLION TONS 1.75
METHANOLANNUAL CAPACITY
OWNERSHIP 50%
Performance review / Operational strengths / Sustainability review / Corporate governance / Financial statements / Other information Performance review / Operational strengths / Sustainability review / Corporate governance / Financial statements / Other information
28 OCI N.V. Annual Report 2016 OCI N.V. Annual Report 2016 29

SORFERT ALGÉRIE
Sorfert Algérie is a 51%-owned joint venture between OCI N.V. and Algeria’s state-owned oil and gas authority, Sonatrach.
World-Class Production ComplexSorfert is one of the largest integrated nitrogen fertilizer producers in North Africa, capable of producing 1.26 million metric tons of granular urea and 1.6 million metric tons of gross anhydrous ammonia per year. The ammonia capacity is split between two lines, one dedicated to urea production and the other producing merchant capacity. OCI constructed the plant in partnership with Uhde, which supplied the state-of-the-art proven process technology.
Strategic Location with Strong Distribution and Logistics The plant is strategically located in the Arzew industrial complex in northwest Algeria 35 kilometers east of Oran, near three Algerian ports. Sorfert enjoys access to two export jetties at Arzew Port and Bethioua Port with a direct ammonia pipeline to the port, and exclusive access to urea export logistics. Sorfert’s access to flexible infrastructure that allows for exports around the world at favorable freight time and cost, coupled with its competitive production costs, maximizes its ability to reach its customers effectively at competitive prices.
Sorfert’s storage capacity includes a 100 thousand metric ton urea warehouse on-site, and a 15 thousand metric ton ammonia tank on-site, and two ammonia tanks at Bethioua port of 30 thousand metric tons each.
As a local Algerian company, Sorfert provided significant employment opportunities during its construction and continues to do so as an operational plant.
MILLION TONS 1.60
ANHYDROUS AMMONIAANNUAL GROSS CAPACITY
EGYPTIAN FERTILIZERS COMPANY (EFC)
Egyptian Fertilizers Company (EFC) is the largest private sector granular urea producer in Egypt.
World-Class Production ComplexThe plant is capable of producing 1.55 million metric tons per year through two identical production lines. The production lines were constructed by OCI in 2000 and 2006 in collaboration with Uhde, which supplied the state-of-the-art proven process technology. The facility also includes a 325 thousand metric ton per year urea ammonium nitrate blending unit, which was added on-site in 2010. EFC was fully acquired in 2008.
Strategic Location with Strong Distribution and LogisticsEFC is located at the port of Ain Al Sokhna, Egypt’s deepest port, approximately 55 kilometers south of the Suez Canal at the heart of the global East-West trade route. This gives EFC a freight cost advantage over other Middle Eastern and Asian urea producers as exports from EFC do not pass through the Suez Canal. EFC is also located across the street from Egypt Basic Industries Corporation (EBIC) on the grounds of Suez Industrial Development Company’s (SIDC) industrial park in Ain Sokhna, allowing both facilities to benefit from significant synergies.
The plants benefit from several tie-ins for raw materials and utilities, including water, nitrogen, waste water and CO2. The plants also share workshop facilities and spare parts. Additional tie-in initiatives are assessed and implemented wherever possible. This generates savings in capital expenditure, and allows each plant to depend on the other for backup if required.
MILLION TONS 1.26
GRANULAR UREAANNUAL CAPACITY
Sorfert
2016 SALES BY REGION
Europe 75%
North America 9%
North Africa 7%
OWNERSHIP 51%
South America 4%
Asia 5%
MILLION TONS 1.55
GRANULAR UREAANNUAL CAPACITY
EFC
2016 SALES BY REGION
Europe 51%
North America 11%
OWNERSHIP 100%
South America 7%
Asia 11%
Africa 20%
Performance review / Operational strengths / Sustainability review / Corporate governance / Financial statements / Other information Performance review / Operational strengths / Sustainability review / Corporate governance / Financial statements / Other information
30 OCI N.V. Annual Report 2016 OCI N.V. Annual Report 2016 31

EGYPT BASIC INDUSTRIES CORPORATION (EBIC)
Egypt Basic Industries Corporation (EBIC) is a state-of-the-art 0.73 million metric ton per year ammonia plant.
World-Class Production ComplexEBIC was constructed by OCI and uses KBR’s latest and commercially proven KBR Advanced Ammonia Process (KAAP) technology. The plant was established in in partnership with KBR, the Egyptian General Petroleum Corporation (EGPC), and a number of private investors. OCI completed construction of the plant in 2009 and increased its stake to 60% from 30% by buying out several minority investors.
Strategic Location with Strong Distribution and Logistics Located at Sokhna Port, EBIC’s geographic location and logistics infrastructure provide a unique advantage as a cost effective exporter able to ship volumes both east and west of the Suez Canal.
EBIC owns two 40 thousand metric ton refrigerated ammonia storage tanks next to the loading jetty at Sokhna Port. EBIC also owns and operates a dedicated 1,200 metric ton per hour loading arm. The plant and port facilities are connected through an eight kilometer pipeline that continuously transports EBIC’s ammonia to both storage tanks located on the jetty, which is able to accommodate vessels with maximum draft of 17 meters.
EBIC is also located across the street from Egyptian Fertilizers Company (EFC) on the grounds of Suez Industrial Development Company’s (SIDC) industrial park in Ain Sokhna, allowing both facilities to benefit from significant synergies.
OCI FERTILIZER TRADING (OFT) AND OCI FERTILIZER TRADE & SUPPLY (OFTS)
MILLION TONS 1.75
AS DISTRIBUTIONANNUAL CAPACITY
Through our strategically located trading and distribution operations, we are able to directly reach our customers through a wide-reaching network developed across Europe and the Americas.
Our trading operations are optimally organized by product and split between two entities: OCI Fertilizer Trading (OFT) and OCI Fertilizer Trade & Supply (OFTS). Located in Dubai, UAE, OFT focuses on trading granular urea and AS. Located in Geleen, the Netherlands, OFTS focuses on ammonia and UAN. We additionally trade various nitrogen fertilizer products and AS in Brazil through FITCO, a 50/50 joint venture with Fertipar, Brazil’s largest fertilizer compounder and distributor.
Global Distribution ReachWe benefit from strategic access to ports in Europe, North Africa, and the Gulf Coast. OCI Terminal Europoort, our wholly owned ammonia terminal, is located at the port of Rotterdam in the Netherlands; OCI Beaumont has access to jetties on the Gulf Coast; EFC and EBIC are located directly at Sokhna Port on the Red Sea in Egypt, and Sorfert has direct access to two ports in Algeria on the Mediterranean.
With branches in Europe, North Africa, the Americas and the Middle East and sales in over 60 countries, our global presence with centralized management allows us to mitigate the effects of regional demand seasonality and maximize freight advantages across locations and product mix.
EBIC
2016 SALES BY REGION
North Africa 100%
OWNERSHIP 60%MILLION TONS
0.73ANHYDROUS AMMONIAANNUAL CAPACITY
OFT & OFTS
2016 SALES BY REGION
Europe 48%
North America 6%
South America 37%
Other 9%
Performance review / Operational strengths / Sustainability review / Corporate governance / Financial statements / Other information Performance review / Operational strengths / Sustainability review / Corporate governance / Financial statements / Other information
32 OCI N.V. Annual Report 2016 OCI N.V. Annual Report 2016 33
SUSTAINABILITYREVIEW
WE SEEK TO CREATE A SUSTAINABLE ENVIRONMENT IN WHICH WE CAN CREATE VALUE FOR OUR COMMUNITIES, OUR CUSTOMERS, OUR EMPLOYEES AND OUR SHAREHOLDERS.
34 OCI N.V. Annual Report 2016 OCI N.V. Annual Report 2016 35

SUSTAINABILITY REVIEW
A LOCAL EMPLOYERWe are proud to have cultivated a strong community-focused identity as a local employer with approximately 2,900 employees around the world. We have a commitment to maximize the use of local resources whenever possible by drawing local people into our company and developing their skills, and by choosing local partners where possible to supply materials and other services.
Our greenfield projects in the United States have created more than 5,000 construction jobs in Iowa and Texas. Iowa Fertilizer Company (IFCo) utilized more than 3,000 construction workers and created more than 700 ancillary jobs that helped revitalize the economy of the surrounding region. IFCo expects that the number of permanent employees will exceed 200 and have a lasting positive impact on the region. Natgasoline will create more than 2,000 jobs during its construction phase and approximately 80 permanent positions.
We have a strong history of local job creation at each of our communities. At Sorfert, we created more than 7,000 construction jobs and more than 740 permanent jobs with more than 90% held by Algerians. In Egypt, local employment is consistently 99% and in the Netherlands it exceeds 94%.
INVESTING IN OUR PEOPLEOur people are fundamental to the success of our business. We invest heavily in our employees and are committed to continuing to invest in the best people and the best technologies.
COMPREHENSIVE DEVELOPMENT PROGRAMS AT OCI NITROGEN
OCI Nitrogen has developed a comprehensive training and talent management program that aims to invest in all employees’ professional development.
Novice programAll fresh graduates from university starting at OCI Nitrogen participate in our Novice program. The objectives of this program are professional and personal development and a strong start in OCI Nitrogen for our potential future managers and directors.
Talent management programThe talent management program identifies and invests in employees in any field and any level with management potential. The objective of the program is to offer talented employees with managerial education, exposure and experience to facilitate and accelerate growth to the next level.
Leadership programFocusing on senior managers in OCI Nitrogen, the leadership development program helps promote OCI Nitrogen’s mission statement and strategy throughout the company.
Sustainable employabilityTo enable and stimulate sustainable employability, OCI Nitrogen organizes workshops and training related to mental and physical fitness for the job, taking into account current and future roles. OCI Nitrogen also facilitates regular vitality (medical and lifestyle) checkups and encourages sport initiatives of employees.
Work force by Region
2016 WORKFORCE BY REGION
Europe 21%
MENA 66%
North America 12%
RoW 1%
2016 WORKFORCE BY FUNCTION
Technical 79%
Sales, Marketing and Distribution 5%
Other 16%
A LOCAL EMPLOYER IN ALL OF OUR COMMUNITIES
95%local employment rate
ENCOURAGING LOCAL ECONOMIES
6,000Jobs created in Iowa and Texas
Our products are sold across Europe, the Americas, Asia and Africa. Our fertilizers optimize yields, strengthen crops and accelerate growth both at a global scale and in our local communities. Our industrial chemicals are used in many industries to produce sustainable and environmentally sound manufacturing and energy solutions.
Performance review / Operational strengths / Sustainability review / Corporate governance / Financial statements / Other information Performance review / Operational strengths / Sustainability review / Corporate governance / Financial statements / Other information
OCI N.V. Annual Report 2016 3736 OCI N.V. Annual Report 2016

SUPPORTING OUR COMMUNITIESIn addition to creating local jobs, we support the economic and social well-being of our communities through strong local community engagement programs and partnerships. In addition to company donations, our employees personally invest their time in our local communities by participating in fundraisers and volunteering at events.
OCI LionsOCI Nitrogen has been the main sponsor of the OCI LIONS handball club since the 2011-2012 season. The men’s teams play in the BENE-League and the Dutch premiere league. The OCI LIONS won the Dutch national championships in 2015 and 2016, and aim to take their success beyond the Netherlands in the Europa Cup and the BENE-League. OCI Nitrogen’s sponsorship will help them achieve their ambitions.
The OCI LIONS offer OCI Nitrogen significant visibility in its local community. It helps increase name recognition and promotes OCI Nitrogen as an employer. The handball matches also offer good networking possibilities with authorities and local entrepreneurs.
OCI Nitrogen supports several local causes and events in the South Limburg region, including a festival for promising artists called MP Feesten, the Limburg Landscape Foundation, sporting events and fundraisers.
Toon Hermans HuisOCI Nitrogen supports a local charity called the Toon Hermans Huis, a home where cancer patients receive support and participate in activities. Several OCI Nitrogen employees raised funding for the home and for cancer research by participating in the Alpe d’HuZes, an initiative where participants run, hike or cycle the mount Alpe d’Huez in France to raise funding for cancer research.
Kennedy-MarsOCI Nitrogen is one of the main sponsors of the Kennedy-Mars in Sittard. Kennedy-Mars is an annual 80 kilometer hike that attracts over 2,500 participants with versions held across the Netherlands. The Sittard hike is the oldest Kennedy-Mars event and was established in 1963.
The hike fits well with OCI Nitrogen’s Vitality campaign, through which the plant encourages its employees to adopt a healthy lifestyle. In addition to sponsoring the event, several OCI Nitrogen employees participated in the hike.
Riverfest Fort MadisonIFCo supported the Riverfest festival, which returned to the Fort Madison community after a 15-year absence. The donation helped create four days of family-friendly events and live musical entertainment.
IFCo continued to support its community through its philanthropic plan organized around the three main pillars of local economic development, agriculture, and STEM educational endeavors. These charitable donations helped enhance IFCo’s reputation as a key community partner in southeast Iowa and the region as a whole.
Tri-State RodeoIFCo once again sponsored the Tri-State Rodeo, one of the largest events in southeast Iowa that typically attracts more than 30,000 attendees. The donation helped the event organizers plan the program and increase brand awareness for the plant.
4 Paws for Ability and Jeff Deacon BenefitIFCo helped a Fort Madison High School student with generalized epilepsy receive a service dog to assist with her condition. Donations were given directly to the student’s family to help with the cost of the dog and to the organization in honor of the student.
SUSTAINABILITY REVIEW CONTINUED
2016 “Outstanding Business of the Year” Iowa Venture AwardOn December 1, 2016, the Iowa Area Development Group named IFCo as its 2016 Outstanding Business of the Year Venture Award, recognizing IFCo for having a positive impact on the economy in southeast Iowa.
Performance review / Operational strengths / Sustainability review / Corporate governance / Financial statements / Other information Performance review / Operational strengths / Sustainability review / Corporate governance / Financial statements / Other information
OCI N.V. Annual Report 2016 3938 OCI N.V. Annual Report 2016

Christmas Toy DrivesNatgasoline participated in Christmas toys and clothes drives for The Franklin House North, a substance abuse treatment center for women and children, and for Court Appointed Special Advocates for foster children in Southeast Texas.
Natgasoline has supported several community organizations, including the Humane Society, Southeast Texas Food Bank, Beaumont Independent School District, Franchise Elite Baseball Organization, the Texas Energy Museum, and has participated in several toy, clothes and food drives for various causes.
Leading The Fight Against Hunger in Southeast TexasOne in every four children lives in poverty and about 15% of the elderly in Southeast Texas live in poverty. OCI Beaumont is a strong supporter of the South East Texas Food Bank, which works to eliminate hunger and inadequate nutrition in Southeast Texas by providing meals to approximately 12,000 households per month.
Over the last three years, OCI Beaumont has provided approximately 150,000 meals to the needy through the South East Texas Food Bank, and our employees have invested their time and resources to volunteer at food drives and personally deliver essential foodstuffs.
We are proud of OCI Beaumont’s continued commitment to improving standards of living in Jefferson County and neighboring communities.
Tour de GrovesOCI Beaumont was an elite sponsor for the Tour de Groves, a 20-mile and 33-mile bike rides organized by Coastal Caregivers. Their goal is to raise awareness to the needs of seniors in the community, raise money through that awareness and donate it to those organizations that can utilize it for the needs of senior citizens. Coastal Caregivers provides in-home care to senior citizens in all of Southeast Texas.
OCI Beaumont has continued to support its community, focusing on organizations that strive to provide food, help seniors and families, and encourage healthy living. These organizations include Shepherd’s Inn and Cavalry House, community centers, the Gulf Coast Health Center, the Harbour Foundation, and blood drives. In addition to its regular support, OCI Beaumont also made a donation to the Deweyville Independent School District following serious damage caused by record Sabine River flooding. The donation was used to repair the school building and replace textbooks and other educational matters lost in the flooding.
SUPPORTING OUR COMMUNITIES ENCOURAGING EDUCATION Throughout our history, we have invested company resources in educational programs that improve the communities in which we operate. We believe that the key to encouraging tangible improvements our communities is a high-quality, well-rounded education that promotes critical thinking and entrepreneurship.
Accordingly, all of our plants have endowed time and resources into the entire education value chain, from donating school supplies to needy children and rewarding high achievers to funding university scholarships and providing on-site training opportunities.
OCI Nitrogen, OCI Beaumont, Natgasoline and IFCo have worked hard to encourage students to pursue their educations in fields of science, technology, engineering and mathematics (STEM).
OCI Nitrogen maintains several initiatives each year that aim to attract bright minds to STEM programs. OCI Nitrogen actively welcomes students and trainees on-site to get vital hands-on experience that will serve their education in chemistry and engineering. OCI Nitrogen has facilitated 21 traineeships in 2016, 14 at vocational level within manufacturing and 7 at higher vocational level, all in close collaboration with local educational institutions.
OCI Nitrogen also invites the freshmen of the operator class of one of our local institutions for a visit to our plants each year. On 30 August 2016, OCI Nitrogen welcomed 50 students.
In October, OCI Nitrogen organized a “case tour” together with other companies on site. 40 technical master’s students were invited to meet the different companies on site and perform a case study.
OCI NITROGEN
Chemelot2DiscoverChemelot2Discover is an educational program that aims to introduce elementary school students to the world of chemistry and to the companies on the Chemelot site in order to trigger their motivation for technical and chemical education. In 2016 over 1,300 students participated in this program.Launched in 2014 by the seven companies situated at the Chemelot industrial site, the program has welcomed nearly 4,000 students to date.
Jet-NetOCI Nitrogen participates in Jet-Net, a nationwide initiative that lets high school students aged 12-18 see for themselves how challenging, interesting and relevant STEM is in the workplace and for society.
Limburg Process Technology & Maintenance FoundationOCI Nitrogen participates in a joint initiative of companies in the field of Technology and Chemistry (PML) in affiliation with the Limberg Process Technology & Maintenance Foundation. PML organizes different activities for vocational and higher vocational students to introduce them to the position and career opportunities for process operator and maintenance technician. 525 students participated in the “process engineering week” in January 2016 consisting of a site tour and various practical activities and experiments.
OCI BEAUMONT
OCI Beaumont has encouraged students at all scholastic levels, from supporting educational events at elementary schools to funding several engineering and other college scholarships. As encouragement to STEM programs, OCI Beaumont provided support to two middle school robotics tournaments.
IFCO
Southeast Iowa STEM Festival IFCo organized and coordinated an exhibit at the third annual Southeast Iowa STEM Festival in West Burlington. The program involved the development of a series of educational activities, including PH testing, electricity generation, pipefitting, and testing tools aimed at increasing students’ knowledge about fertilizer and the role Iowa Fertilizer plays in the region. Among the 1,000 young people (K-12) who attended the event, most if not all stopped at the Iowa Fertilizer booth.
In addition to supporting the Southeast Iowa STEM Festival, IFCo has made several donations to various educational institutions including the Iowa College Foundation, Ft. Madison High School, and four local southeast Iowa libraries located in Keokuk, Fort Madison, Mount Pleasant and Burlington.
SUSTAINABILITY REVIEW CONTINUED
Performance review / Operational strengths / Sustainability review / Corporate governance / Financial statements / Other information Performance review / Operational strengths / Sustainability review / Corporate governance / Financial statements / Other information
OCI N.V. Annual Report 2016 4140 OCI N.V. Annual Report 2016

WE BELIEVE THAT THE HEALTH AND SAFETY OF OUR EMPLOYEES
IS ESSENTIAL TO THE SUCCESSFUL CONDUCT AND FUTURE GROWTH OF
OUR BUSINESS AND ARE IN THE BEST INTEREST OF OUR SHAREHOLDERS
OPERATIONAL EXCELLENCE IN HSEWe are committed to meeting or exceeding international product stewardship and health, safety, quality and environment standards. We train all employees to implement the best sustainable practices. We believe that the health and safety of our employees is essential to the successful conduct and future growth of our business and are in the best interest of our shareholders.
We are committed to being an environmental steward by implementing the best technology available to minimize our environmental footprint and promote sustainable business best practices.
Product Stewardship
Product stewardship ensures that fertilizers and their raw materials, additives and intermediate products are processed and manufactured, handled, stored, distributed and used in a way which safeguards health, occupational and public safety, the environment, and ensures security.
We comply with international standards as members of the International Fertilizer Association, Fertilizers Europe (formerly EFMA), The Fertilizer Institute (TFI), and the International Methanol Producers & Consumers Association (IMPCA), among others.
Certifications
EFC, EBIC, BioMCN, OCI Beaumont and OCI Nitrogen are ISO 9001 certified. OCI Beaumont, BioMCN, EBIC and EFC also hold ISO 14001. The Egyptian plants also hold OHSAS 18001 certifications, certifying each plant’s commitment to excellence in product quality and management controls and procedures as per global standards. OCI Nitrogen also has a Product Stewardship certificate from Fertilizers Europe. BioMCN also holds an International Sustainability and Carbon Certification and NTA8080 (Biomass Sustainability Certification).
Health & Safety First
We are committed to providing a safe and healthy workplace for all employees by implementing the highest international safety standards to avoid any potential risks to people, communities, assets or the environment. This commitment is underscored by several safety development initiatives undertaken at our plants, with several achievements during the year aiming to standardize health and safety monitoring, prevention and reporting across our plants.
Occupational health is part of our overall HSE management to ensure that everyone working with OCI N.V. remains healthy at all times. A Fitness for Duty Process is set up to ensure all employees are able to safely perform essential physical and mental requirements of the job without creating risk to themselves, others or the environment. A Health Risk Assessment Process is in place to estimate the nature and probability of adverse health effects to people by identifying the adverse health effects that can be caused by any exposure to any hazardous agent or the work environment.
2016 SAFETY PERFORMANCE We achieved excellent safety results across our sites during the year, both compared to our internal targets and compared to the International Fertilizer Association’s industry averages reported for the year.
We held our third global OCI Process Safety conference, where various safety and risk assessment topics were discussed by our process safety experts from across our sites. The main topics in 2016 were “Sharing Practices and Defining Standards”, and six new process safety standards were reviewed. The new standards will be implemented in 2017.
In order to encourage information sharing across sites, we also have regular conference calls to share experiences, and have implemented a safety alert system across our sites, where incidents are discussed immediately after occurring to ensure effective communication of lessons learned.
2016 focused on further developing process safety awareness at all sites, and an OCI process safety awareness training program was developed. The training program is based on industry best practices and the first training was organized at EBIC and EFC, which was well received.
2016 Objectives achieved ongoing
People and Systems
Set and monitor site-specific and company-wide HSE KPI’s
Execute a 3-day Process Safety Training for every site
Introduction of management of change (MOC), learning (LMS) and action tracking software modules
Development of an incidents reporting, classification and investigation software module
Holding an internal process safety seminar
Complete corporate HSE and Manufacturing audits as per 2016 plan
Health and Safety
Aim for no lost time injuries and a maximum LTIR of 0.15 (own employees and contractors)
Aim for no injuries and a maximum TRIR of 0.55 (own employees and contractors)
Strong HSE support for IFCo, including projects safety reviews, process hazardous analysis, facility siting, pre-start-up safety reviews (PSSR) and ready to operate (RTO) program
Introduce reporting and sharing of potential major incidents
Develop new required process safety standards with all sites
Environment
Aim for no major environmental incidents
Full compliance with local environmental regulations
Development and implementation of an environmental reporting and monitoring software module
Full compliance with global chemical control obligations
0.0
0.1
0.2
0.3
0.4
0.5
0.85
0.13
1.57 0.41
0.15
0.0
0.3
0.6
0.9
1.2
1.5
0.85
0.36
1.571.31
0.55
0.0
0.1
0.2
0.3
0.4
0.5
0.85
0.13
1.57 0.41
0.15
0.0
0.3
0.6
0.9
1.2
1.5
0.85
0.29
1.571.31
0.55
2016 LOST TIME INJURY RATE (LTIR)
2016 TOTAL RECORDABLE INJURY RATE (TRIR)
OCI own employees actual
OCI target 2015 IFA average
SUSTAINABILITY REVIEW CONTINUED
WE ACHIEVED EXCELLENT SAFETY RESULTS ACROSS OUR SITES DURING THE YEAR, BOTH COMPARED TO OUR INTERNAL TARGETS AND COMPARED TO THE INTERNATIONAL FERTILIZER
ASSOCIATION’S INDUSTRY AVERAGES REPORTED FOR THE YEAR.
Performance review / Operational strengths / Sustainability review / Corporate governance / Financial statements / Other information Performance review / Operational strengths / Sustainability review / Corporate governance / Financial statements / Other information
OCI N.V. Annual Report 2016 4342 OCI N.V. Annual Report 2016

HEALTH & SAFETY FIRST ENVIRONMENTAL EXCELLENCE
We are committed to being an environmental steward by implementing the best technology available where applicable to minimize our environmental footprint and promote sustainable business best practices. At a group-wide level, we have developed a comprehensive environmental reporting system that tracks a range of air emissions and energy consumption. Our plants’ efficiencies and our environmental footprint have improved year-on-year as a result of our continuous investment in our plants. Our natural gas consumption efficiency has improved by 1.7% year-on-year, and our total GHG emissions per ton declined by 7% in 2016 as compared to 2015, despite a 16% increase in total production year-on-year.
As a testament to EFC’s commitment to producing urea at the lowest possible impact on the environment, EFC is the only plant in Egypt that has implemented a novel solution to the large quantity of water produced as a by-product of the urea manufacturing process. In 2010, the plant invested $ 1.2 million for the construction of two irrigation ponds capable of holding up to 10,000 cubic meters of water. The water is used to irrigate 50 acres of forestry near the plant in an environmentally friendly manner. EFC was impacted by the natural gas supply disruptions throughout 2014 and 2015, which resulted in reduced emissions efficiency during the year.
At EBIC, the plant supplies EFC with the excess CO2 produced in the manufacture of ammonia. Through this shared pipeline, EFC is able to produce additional urea. In addition, both plants have been tuned to share some utilities, primarily electricity and waste water. This not only generates savings in capital expenditure, but also allows each plant to depend on the other for backup in case of a malfunction, making our operations at both plants even more reliable.
OCI Nitrogen’s plants all operate at excellent energy efficiency
OCI BEAUMONT
OCI Beaumont Achieves VPP Star RatingOCI Beaumont’s safety record is considered best in class when compared to national averages within its industry classification. As a direct result of OCI Beaumont’s commitment to safety, OCI Beaumont were approved by OSHA in March 2016 as a VPP Star Site. OCI Beaumont is part of an elite group of organizations that provide exemplary occupational safety and health protection and serve as models for others.
OCI NITROGEN
Vitality CheckDuring 2016, OCI Nitrogen organized a voluntary vitality check for all staff. The check is performed by the occupational health service centre and aims to increase the awareness on health and potential risks and encourage employees to improve their health and lifestyle. Nearly 80% of all staff participated and every participant received individual feedback and improvement programs. The findings from the vitality check will be evaluated and used as input to improve OCI Nitrogen’s sustainable employability policy.
Behavioural SafetyDuring 2016, OCI Nitrogen had all plant employees participate in a behavioural safety program called “Alert”. The program is part of OCI Nitrogen’s commitment to continuously improve its safety performance. Risk thinking, communication, personal leadership and teamwork were identified as crucial competences for safety behaviour. OCI Nitrogen incorporated these competences in job requirements and performance management in order to be able to monitor and improve the individual safety performance of all staff.
rates, with energy consumption and CO2 emissions at levels close to the chemical and physical minimum. In addition, OCI Nitrogen’s award winning “COOL!” indirect cooling technology has allowed OCI Nitrogen to reduce its annual fine particle emissions from 174 metric tons to zero, the first nitrogen fertilizer plant in the world to achieve this. COOL! has also allowed OCI Nitrogen to reduce the cooling unit’s energy consumption by 75% while increasing production by 20%. The innovative cooling system was awarded the Dutch Chemical Industry Association’s (VNCI) Responsible Care prize in 2013, and placed in the top three for the European Business Awards for the Environment’s (EBAE) ‘sustainable process’ prize in 2014. The European Business Awards for the Environment are awarded to eco-innovation companies that successfully combine innovation, competitiveness and outstanding environmental performance.
At OCI Terminal Europoort, our ammonia terminal in Rotterdam, we implemented a program to minimize fugitive ammonia emissions during the year. This has resulted in an 84% reduction in 2016.
In the United States, OCI Beaumont installed a Selective Catalytic Reduction (SCR) Unit, which has significantly reduced in NOx emissions, achieving a 92% reduction in emissions per ton in 2016 as compared to 2014. OCI Beaumont is implementing Best Available Control Technology (BACT), a pollution control standard mandated by the United States Clean Air Act, to further reduce our environmental impact. Both IFCo and Natgasoline are equipped with the best available emissions technology. Risk assessments prior to operations will ensure a smooth environmental management system.
OCI NITROGEN
Investing for Our FutureOCI Nitrogen invested in a catalyst replacement at its nitric acid plant during the year in order to reduce nitrous oxide emissions. This investment has resulted in a 75% decrease in emissions in 2016, bringing the combined nitric acid plants’ emissions levels to below half the industry average.
SUSTAINABILITY REVIEW CONTINUED
WE ARE COMMITTED TO MINIMIZING OUR ENVIRONMENTAL FOOTPRINT BY INVESTING IN THE BEST TECHNOLOGY WHEREVER
POSSIBLE
0
200
400
600
800
1000
988919
2015 2016
0
5
10
15
20
25
20.53 20.18
2015 2016
TOTAL GREENHOUSE GAS EMISSIONSKG OF GHG / METRIC TON PRODUCED
2015 2016
0
200
400
600
800
1000
988919
2015 2016
0
5
10
15
20
25
20.53 20.18
2015 2016
TOTAL NATURAL GAS CONSUMPTIONGJ OF GAS CONSUMED / METRIC TON PRODUCED
Performance review / Operational strengths / Sustainability review / Corporate governance / Financial statements / Other information Performance review / Operational strengths / Sustainability review / Corporate governance / Financial statements / Other information
OCI N.V. Annual Report 2016 4544 OCI N.V. Annual Report 2016

CORPORATEGOVERNANCE
46 OCI N.V. Annual Report 2016 OCI N.V. Annual Report 2016 47

8 Greg Heckman B Non-Executive Director
Nationality American
Age 54
Appointed June 2015
Current term of office expires 2019
Ordinary shares owned 40,000
Current external appointments • Director, Waitt Brands
Previous relevant experience • President and CEO of The Gavilon
Group
• Various positions at ConAgra Foods
• Managing Director Management Consulting Resources
OCI N.V. (‘the Company’ or ‘OCI’) has a one-tier Board of Directors (the Board), which is responsible for the management, general affairs, strategy, and long-term success of the business as a whole. The Board comprises a majority of Non-Executive Directors and a minority of Executive Directors whose responsibility is collective, taking into account their respective roles as Non-Executive Directors and Executive Directors.
1 2 3
4 5 6
7
BOARD OF DIRECTORS’ PROFILE
9
1 Michael Bennett B, C, D Chairman
Nationality American Age 63Appointed January 2013 Reappointed Chairman June 2015Current term of office expires 2019
Ordinary shares owned 8,500
Current external appointments • Director, Alliant Energy Corporation
• Director, SandRidge Energy
• Director, Morningside College
Previous relevant experience • CEO and Director, Terra Industries Inc.
• Chairman and President, Terra Nitrogen Company L.P.
• Chairman, The Fertilizer Institute and The Methanol Institute in the United States
2 Nassef Sawiris Chief Executive Officer
Nationality Egyptian Age 56Appointed CEO January 2013Reappointed CEO June 2016Current term of office expires 2017
Ordinary shares owned 62,520,716
Current external appointments • Non-Executive Director:
- LafargeHolcim Ltd - Adidas AG
Previous relevant experience • Chairman and CEO, Orascom
Construction Industries S.A.E.
• Non-Executive Director, BESIX Group
• Non-Executive Director, Orascom Construction Ltd
3 Salman Butt Chief Financial Officer
Nationality Pakistani Age 57Appointed CFO January 2013Reappointed CFO June 2016 Current term of office expires 2017
Ordinary shares owned 181,027
Current external appointments • Non-Executive Director,
Orascom Construction Ltd.
Previous relevant experience • Head of Investment Banking, Samba
Financial Group in Saudi Arabia
• Various positions at Citibank in Pakistan, Hong Kong, United Kingdom, Egypt and Saudi Arabia
4 Jan Ter Wisch A, B, C Vice-Chairman
Nationality Dutch Age 64Appointed January 2013Reappointed June 2015Current term of office expires 2019
Ordinary shares owned 10,000
Current external appointments • Chairman, Stichting De Westberg
• Director, Stichting Administratiekantoor Grass
• Chairman of Investment Committee, 5square MKB Fund III Coöperatieve U.A
Previous relevant experience • Partner - Deloitte - Loeff Claeys Verbeke - Allen & Overy
• Member European Tax Board, Deloitte
• Board Member, Loeff Claeys Verbeke
• Chairman of Global Tax Board, Allen & Overy
5 Sipko Schat A, D Senior Independent Director
Nationality Dutch
Age 56
Appointed December 2013
Current term of office expires 2017
Ordinary shares owned 5,000
Current external appointments • Member of the Supervisory Board
- Rothschild & Co. - Trafigura Group Pte Ltd - Vion N.V. (Chairman)
Previous relevant experience Member of the Executive Board, Rabobank Group
7 Jérôme Guiraud A, C Non-Executive Director
Nationality French Age 56Appointed June 2014Current term of office expires 2018
Ordinary shares owned 120,190
Current external appointments • CEO and Director, NNS Capital Ltd
• Member of the Board and Audit Committee, LafargeHolcim Ltd
• Non-Executive Director and Chairman, Orascom Construction Ltd
• CEO and Director, NNS Luxembourg
• Non-Executive Director BESIX Group
• Director - NNS Holding Sàrl - OS Luxembourg
Previous relevant experience • 30 years of professional experience
in banking and financial markets
• 15 years as a director in listed and non-listed companies
9 Anja Montijn-Groenewoud B, C Non-Executive Director
Nationality Dutch
Age 54
Appointed June 2016
Current term of office expires 2017
Ordinary shares owned None
Current external appointments • Member Supervisory Board, Fugro N.V.
Previous relevant experience • Various national and international
leadership positions at Accenture, ao managing director Resources practice in France and Benelux, Country Managing Director Accenture the Netherlands, Global Managing Director Management Consulting Resources
8
6 Robert Jan van de Kraats A, D Non-Executive Director
Nationality Dutch
Age 56
Appointed June 2014
Current term of office expires 2018
Ordinary shares owned 3,725
Current external appointments • CFO and Vice-Chairman of the Executive
Board, Randstad Holding N.V.
• Member of the Supervisory Board of Schiphol Group
• Member Dutch monitoring Commission Corporate Governance code
Previous relevant experience • Qualified Chartered Accountant
• Various finance and operational executive and non-executive positions in the technology, financial services and credit insurance sectors
Committees: (A) Audit (B) Health, Safety and Environment (C) Nomination and Governance (D) Remuneration
48 OCI N.V. Annual Report 2016 OCI N.V. Annual Report 2016 49
Performance review / Operational strengths / Sustainability review / Corporate governance / Financial statements / Other information Performance review / Operational strengths / Sustainability review / Corporate governance / Financial statements / Other information

OVERVIEW
ChairmanOCI has a Non-Executive Chairman and a Chief Executive Officer (CEO). There is a clear division of responsibilities between their roles. The Chairman is primarily responsible for the functioning of the Board and its Committees.
The Chairman sets the Board’s agenda and promotes effective relationships and open communication between the Executive and Non-Executive Directors. With the Corporate Secretary, the Chairman will take the lead in providing an induction program for new Directors that is tailored to the respective Director.
Senior Independent DirectorThe Senior Independent Director acts as a trusted intermediary for the individual Directors.
Executive DirectorsOCI’s Executive Directors are the CEO and the Chief Financial Officer (CFO).
Chief Executive OfficerThe CEO has the authority to determine which duties regarding the strategic and operational management will be carried out under his responsibility. The Board has delegated the operational management of the business to the CEO, who can take day-to-day decisions within the boundary conditions as being defined in the Articles of Association and By-laws, without the need to revert to the Board for approval. Matters reserved for the Board include structure, risk management & internal control systems, corporate governance, dividend proposals to the General Meeting of Shareholders, approval of overall strategy, approval of significant transactions, financial reporting and compliance. The CEO is responsible to the Board and is able to delegate his authorities and powers.
Corporate SecretaryThe Corporate Secretary advises the Board on matters relating to the governance of OCI and its subsidiaries and compliance with Board procedures.
Appointment of DirectorsThe General Meeting of Shareholders can appoint, suspend or dismiss a Director by an absolute majority of the votes cast upon a proposal of the Board. In addition, the General Meeting of Shareholders is able to nominate Directors. To do so they must put a resolution to the General Meeting of Shareholders in line with the requirements as described in the Articles of Association. As announced in the shareholders meeting in June 2016, Directors are appointed for a one-year term and are eligible for reappointment. In line with the amended Dutch Corporate Governance Code, as per 2017 Directors may not serve for more than eight years with the option to extend twice for a period of two years in case of extraordinary circumstances.
The Non-Executive Directors are selected individually for their broad and relevant experience and international profile as well as for their independence. Diversity in terms of age, background and gender are taken into account. The Board profile for Non-Executive Directors (which can be found on OCI N.V.’s website) provides guiding principles for the composition of the Board.
OCI is committed to the principles of good corporate governance. The Board believes that good corporate governance practices align the interests of all stakeholders by having structures in place that ensure the business is managed with integrity and efficiency, thereby maximizing the profitability and long-term value of the Company. The Board is committed to continuously monitoring and strengthening the Company’s corporate governance.
OCI is a public limited liability company under Dutch law, with its official seat in Amsterdam, the Netherlands. The authorized capital of the Company amounts to EUR 12 million. The authorized capital is divided into 600 million shares, with a nominal value of EUR 0.02 each.
All shares are registered shares. No share certificates are issued. OCI’s shares are listed and quoted in Euros on NYSE Euronext’s Amsterdam market. The Company reports its financial statements in US Dollars.
This section contains an overview of the corporate governance structure and how it was applied in 2016. It includes the information required by the Dutch Corporate Governance Code. Additional information on our corporate governance can be found on the corporate website www.oci.nl/corporate-governance.
Corporate Governance Structure
The Board of DirectorsOCI has a one-tier Board, which in 2016 comprised two Executive Directors, and after the appointment of Anja Montijn in June 2016, seven Non-Executive Directors.
The Board has ultimate responsibility for the management, general affairs, direction, performance and success of the business as a whole. The responsibility of the Directors is collective, taking into account the respective roles of the Executive and Non-Executive Directors.
The Board is responsible for monitoring and assessing its own performance.
Non-Executive DirectorsThe role of the Non-Executive Directors is essentially supervisory in nature. Their primary responsibilities are:• Determining and amending strategy;• Determining and amending operational and strategic
objectives;• Determining OCI’s financial structure including key financial
metrics;• Supervising financial reporting;• Overseeing corporate social responsibility;• Assessing the performance of the business;• Assessing material risks and controls;• Supervising the Internal Control function;• Supervising financial and internal audit functions;• Remuneration and succession planning;• Selection and nomination for appointment of Executives; and• Governance and Compliance.
50 OCI N.V. Annual Report 2016 OCI N.V. Annual Report 2016 51
Performance review / Operational strengths / Sustainability review / Corporate governance / Financial statements / Other information Performance review / Operational strengths / Sustainability review / Corporate governance / Financial statements / Other information
The Board welcomed Ms. Anja Montijn, whose nomination was approved at the General Meeting of Shareholders in June 2016. Ms. Montijn is a welcome addition to the Board, and we continue to look for ways to further diversify our composition.
For the year ended 31 December 2016, the Board reports the following:• The Board has reviewed and discussed the audited
financial statements for the year 2016.• The Board discussed with the external auditor the
outcome of their performed audits in accordance with International Standards on Auditing.
• The Board has received written confirmation of the external auditor’s independence.
• Based on the review and discussions referred to above, the Board has approved that the audited consolidated and Parent Company financial statements be included in the 2016 Annual Report.
The Board of Directors recommends that the General Meeting of Shareholders adopts the 2016 financial statements included in this Annual Report.
OCI’s employees continue to be the backbone of the Company, working diligently and conscientiously during the trough of the nitrogen fertilizer cycle to maximize OCI’s returns. The Board would like to thank every employee for their commitment to OCI and its shareholders, and looks forward to a promising 2017.
CHAIRMAN’S LETTER
WE APPROVED AND MONITORED SEVERAL SIGNIFICANT IMPROVEMENTS AT OCI
INCLUDING THE IMPLEMENTATION OF A GROUP-WIDE COST SAVINGS PROGRAM.
Michael Bennett Chairman
Dear Shareholders,
During the year, the Board of Directors approved and monitored several significant improvements at OCI including the implementation of a group-wide cost savings program, the strengthening of our balance sheet through refinancing or repayment of all short-term debt maturities, the partnership with Consolidated Energy Limited (CEL) and the offer to acquire OCI Partners LP’s minorities. As a result of our focus on achieving strategic improvements across the group in 2016, we believe OCI is financially and structurally stronger and well-positioned to benefit from the anticipated price recoveries across its sectors.
We also continued to oversee the implementation of several initiatives launched in 2015 that have improved OCI’s corporate governance and risk management including the establishment of a Compliance Charter and the implementation of a revised Code of Conduct and Whistleblower Policy. These activities have resulted in enhanced risk monitoring and compliance reporting, clearer rules and standards to which we hold our employees and partners, and a safe channel to report any concerns through.

Organizational structureThe below simplified corporate structure illustrates the current governance of OCI. The day-to-day operational structure is supervised by the Executive Directors. Each subsidiary is led by a General Manager and a Finance Director who report to the Executive Directors.
For 2016, the Board set the strategic mandate for the Company by setting the financial and non-financial targets. The Executive Directors supervised the achievement of these goals through regular reporting from each subsidiary’s management team and reported progress to the Non-Executive Directors.
Audit Committee
Health, Safety and Environment Committee
Nomination and Governance Committee
Remuneration Committee
General meeting of Shareholders
Board of Directors
Fertilizer Industrial Chemicals
OCI Nitrogen (100%)
Iowa Fertilizer Co. (100%)
Sorfert (51%)
EFC (100%)
EBIC (60%)
Trading subsidiaries (100%)
Natgasoline (50%) OCI Partners (OCI Beaumont) (80%)
Fertilizer & Chemicals
This does not represent a legal structure and is for illustrative purposes only.
BioMCN (100%)
OVERVIEW CONTINUED
External AuditorThe General Meeting of Shareholders appoints the external auditor. The Audit Committee recommends to the Board the external auditor to be proposed for (re)appointment by the General Meeting of Shareholders. In addition, the Audit Committee evaluates the functioning of the external auditor. On 28 June 2016, the General Meeting appointed KPMG Accountants N.V. as external auditor for OCI for the financial year 2016.
Decree Article 10 EU Takeover DirectiveOCI has an authorized capital of EUR 12 million divided into 600 million shares, each with a nominal value of EUR 0.02. One vote can be cast for each share. OCI’s issued share capital amounts to $ 5.6 million made up of 210,306,101 ordinary shares of EUR 0.02 each.
According to the Dutch Financial Supervision Act, any person or legal entity who, directly or indirectly, acquires or disposes of an interest in the Company’s capital or voting rights must immediately give written notice to the Netherlands Authority for the Financial Markets (AFM) if the acquisition or disposal of the percentage of the outstanding capital interest or voting rights exceeds or falls below certain thresholds (3%, 5%, 10%, 15%, 20%, 25%, 30%, 40%, 50%, 60%, 75% and 95%).
OCI N.V. is aware, on the basis of the information in the registers of the Netherlands Authority for the Financial Markets (AFM), that the following shareholders possessed an interest of more than 3% on 31 December 2016:
ShareholderTotal Shareholding (Real) Voting Rights Date of report
Nassef Sawiris 62,520,716 62,520,716 10 June 2016
Onsi Sawiris 36,045,159 36,045,159 31 July 2013
Samih Sawiris 15,527,516 15,527,516 19 February 2013
Southeastern Asset Management, Inc.
21,429,386 21,429,386 15 June 2016
W. H. Gates III 12,725,704 12,725,704 31 July 2013
IGCF General Partner Limited
12,532,310 12,532,310 30 January 2013
Davis Selected Advisors 8,754,054 8,754,054 31 July 2013
Total 169,534,845 175,809,091 The above information is extracted from the AFM notifications and registers website as at 31 December 2016 http://www.afm.nl/en/professionals/registers/alle-huidige-registers.aspx?type={1331D46F-3FB6-4A36-B903-9584972675AF}
As at 31 December 2016, 45.75% of the total shares outstanding were free-float. For details on the number of outstanding shares, see note 15 of the Consolidated Financial Statements. For details on capital structure, listings, share performance and dividend policy see ‘Shareholder Information’.
Shareholders’ rightsOCI’s shareholders exercise their rights through the Annual General Meeting of Shareholders in the Netherlands each year, no later than six months after the end of the Company’s financial year. Additional Extraordinary General Shareholders meetings may be convened at any time by the Board of Directors or by one or more shareholders representing more than 10% of the issued share capital.
A notice convening a General Meeting of Shareholders shall be issued on behalf of the Board by no later than the 42nd day prior to the day of the meeting. Parties who have the right to vote and attend the meeting and who are registered as such in a designated (sub)register on the 28th day prior to the day of the meeting (“registratiedatum”) will be entitled to attend the meeting and vote, irrespective of the identity of the entitled party with respect to those shares at the time of the meeting.
Votes representing shares can be cast at the General Meeting of Shareholders either personally or by proxy. No restrictions are imposed on these proxies, which can be granted electronically or in writing to the Company, or to independent third parties. OCI’s shareholders may cast one vote for each share, be it in the form of ordinary shares or American Depository Receipts. All resolutions adopted by the General Meeting of Shareholders are passed by an absolute majority of the votes cast, unless the law or the Articles of Association prescribe a larger majority. The Shareholders possess the rights conferred by the Articles of Association and By-laws.
Information pertaining to the structure of, admission to, and Shareholders’ voting rights at the General Meeting of Shareholders can be found on the corporate website.
Important matters that require the approval of the Annual General Meeting of Shareholders are:
• Adoption of the financial statements;• Declaration of dividends;• Significant changes to the Company’s corporate governance;• Executive’s Remuneration policy;• Remuneration of the Non-Executive Directors;• Discharge from liability of the Board of Directors;• Appointment of the external auditor;• Appointment, suspension or dismissal of the members of
Board of Directors;• Issuance of shares or rights to shares, restriction or exclusion
of pre-emptive rights of Shareholders and repurchase or cancellation of shares;
• Amendments to the Articles of Association; and• Approval of significant transactions.
The Company’s Articles of Association detail the proposals that the Board may submit to the meeting, and the procedure according to which Shareholders may submit matters for consideration by the meeting. Within three months of the meeting, the draft minutes of the meeting are made available for three months for comments. The final minutes are published on the corporate website.
52 OCI N.V. Annual Report 2016 OCI N.V. Annual Report 2016 53
Performance review / Operational strengths / Sustainability review / Corporate governance / Financial statements / Other information Performance review / Operational strengths / Sustainability review / Corporate governance / Financial statements / Other information

The Company confirms that it has no anti-takeover instruments, in the sense of measures that are primarily intended to block future hostile public offers for its shares. Although the members of the Sawiris family have not entered into any formal shareholders agreement, they have historically coordinated their voting on the OCI shares and should therefore be regarded as parties acting in concert (“personen die in onderling overleg handelen”) as defined in section 1:1 of the Dutch Financial Supervision Act. Their collective voting rights of 54.25% as at 31 December 2016 act as an implicit anti-takeover element.
Composition and independenceThe composition of the Board strives to arm the Company with leadership that is diverse in skills, experience, and background, thereby maximizing the Board’s ability to independently and critically act without emphasis on particular interests. The Board maintains independence by ensuring the majority of Non-Executive Directors including the Chairman are independent. The Board’s composition, independence, competencies, and qualifications are detailed in the Board Profile adopted on 13 May 2013. The Board Profile is assessed on an annual basis and available on the corporate website.
Continuing its effort in diversifying its composition, in February 2016, the Board announced the nomination of Anja Montijn, who was appointed to the Board as a Non-Executive Director at the Annual General Meeting held on 28 June 2016. This is an important step in the gender diversity of the Board.
Assessment and evaluation of the BoardEvery year, the Board evaluates its performance based on a questionnaire that is completed by the Directors. The evaluation is performed every three years with the aid of an external consultant as was the case in 2015. The 2016 evaluation is survey-based. Subsequently the Board received a report which addressed the following areas of Board performance:
• The composition of the Board was addressed, and respondents identified changes to consider in the Board profile in the context of OCI’s strategic goals.
• The Board’s understanding of the company’s key stakeholders and markets was reviewed.
• The management and focus of the Board meetings was considered, as was the quality of information provided to the Board and the management presentations at meetings.
• The support afforded to the Board by the Company Secretary was assessed.
• The Board’s oversight of OCI’s strategy and risk management was reviewed, and respondents identified the top strategic issues facing the organisation over the next 3 - 5 years.
• The adequacy of succession plans for senior management positions was considered, as was the structure of the company at senior levels. The level of interaction with top management in various settings was also assessed.
• The performance of each of the Committees was reviewed, as was the performance of the Chairman and that of individual Directors.
As a result of the analysis, among other things the Board agreed that it should continue to devote attention to succession planning for senior management and operational aspects of OCI’s performance.
Board rotation scheduleThe Board adopted its rotation schedule on 13 May 2013 and updated it on 28 June 2016 to reflect the changes to the Board’s composition as described previously. Directors shall retire periodically in accordance with the Rotation Plan, outlined in the table below, in order to avoid, as far as possible, a situation in which many Directors retire at the same time. Each Non-Executive Director is in principle appointed for a maximum term of four years. Directors are appointed for a one-year term and are eligible for reappointment. In anticipation of the revised Dutch Governance Code a Non-Executive Director may not serve for more than eight years with the option to extend twice with a period of two years. There is no maximum term for Executive Directors. The CEO and CFO were reappointed in the 2016 AGM for one year.
NameDate of first appointment Reappointment
Final retirement Max. 2x4 yrs
Nassef Sawiris 16 January 2013 2017 None
Salman Butt 25 January 2013 2017 None
Michael Bennett 25 January 2013 2019 2021
Jan Ter Wisch 25 January 2013 2019 2021
Sipko Schat 9 December 2013 2017 2021
Jérôme Guiraud 26 June 2014 2018 2022
Robert Jan van de Kraats 26 June 2014 2018 2022
Greg Heckman 10 June 2015 2019 2023
Anja Montijn 28 June 2016 2017 2024
InductionAn Induction Program for the Board was set up in 2014. It provides an excellent governance tool to familiarize new Directors with key people, the business and the internal governance and risk framework. Upon nomination, Non-Executive Directors receive a comprehensive Directors’ Information Pack and are briefed on their responsibilities and the business with a tailored Induction Program. In 2016 Anja Montijn followed the Induction Program and met all key staff, was provided an introduction on the Company’s governance and risk framework and visited several plants.
The Chairman ensures that ongoing training is provided for Directors by way of presentations and updates. Throughout the year all or a part of the members of the Board visit one or more of OCI N.V.’s businesses, operations and other parts of the Company to gain greater familiarity with senior Management and to develop deeper knowledge of local operations, opportunities and challenges and the business in general. In 2016 the Board was trained on the New Market Abuse Directive and completed several individual trainings varying from anticipating outside influences to deep dives in big data, digitalization, cyber risks, and various other trainings on the role of Non-Executives and regulators.
Board MeetingsThe Board held 12 meetings in 2016. The matters on which the Board focused during the year comprised:
• Performance of the business;• Refinancing activities at both the OCI N.V. level and at
OCI Beaumont, EFC, and OCI Nitrogen;• Intended CF Transaction including the termination;• Strategic options;• Cost saving program;• The gas supply situation at EBIC and EFC;• Convening of AGM on 28 June 2016;• Further implementation on topics including internal audit,
internal controls, risk and legal & compliance;• Organizational design and HR strategy;• Discussion of the audit approach and risk assessment for the
year 2016 with the external auditor and approval the Charter of the Internal Audit function;
• Discussion on IFCo completion and Natgasoline, including financing;
• Entry into a joint venture at Natgasoline with CEL;• Sorfert dividend;• Settlement Agreement between IFCo and Orascom
Engineering & Construction Ltd;• Litigation and claims;• Exchange offer on remaining units of OCI Partners LP (OCIP);
and• Approval of key financing, operational, investment activities
and other business developments as described below.
Given that 2015 and 2016 were both transformational years, the Board discussed strategy regularly resulting in:
• Target to achieve investment grade;• Continue assessing the consolidation in the market; and• Focus on operational efficiency and cost-saving.
At the beginning of the year, the Board discussed entering into a joint venture with CEL to jointly develop Natgasoline. CEL acquired 50% of Natgasoline through a $ 630 million injection into the project and a $ 50 million additional commitment following the execution of a binding Participation Agreement in March 2016. CEL is a global leader in methanol and will lead the effort in the marketing and distribution of Natgasoline’s product. CEL’s parent company will also contribute key management personnel and will provide technical leadership in the startup, operations and maintenance of the facility.
Given the Board’s and senior management’s belief that price levels during 2016 were unsustainably low across our product portfolio, the Board focused on strengthening OCI’s financial position. This was achieved through the refinancing of OCI Nitrogen, the issuance of a tax exempt bond and monetization of shareholder loans at Natgasoline, the refinancing of OCI’s revolver, and the successful extraction of dividends from Sorfert. Other areas of focus included shareholder value, regulatory requirements, cost saving program and organizational improvements.
The following table shows the attendance of Directors at Board meetings in 2016. If Directors are unable to attend they have the opportunity to discuss any agenda item with the Chairman.
Board AttendanceDate of appointment during the year
Number of meetings held
Number of meetings attended
Nassef Sawiris 16 January 2013 12 11**
Salman Butt 25 January 2013 12 12
Michael Bennett 25 January 2013 12 12
Jan Ter Wisch 25 January 2013 12 12
Sipko Schat 9 December 2013 12 11
Jérôme Guiraud 26 June 2014 12 12
RJ van de Kraats 26 June 2014 12 10
Greg Heckman 10 June 2015 12 12
Anja Montijn* 28 June 2016 3 2
* The number of meetings held are pro-rated to the term of the individual’s board membership during the year.
** Mr. Sawiris was excused from one meeting because of potential conflict of interest
Board CommitteesThe Board maintains four committees: the Audit Committee, the Nomination and Governance Committee, the Remuneration Committee and the Health, Safety and Environment Committee. All Committees are governed by Terms of Reference. In 2016, the Committee meetings were conducted in line with those Terms of Reference. All committees are made up of Non Executive members who meet the independence and experience requirements to the extent required under applicable securities laws, stock exchange regulations and By-Laws. The Committees reported on a regular basis to the Board. The duties of each committee can be found in the Terms of Reference on the corporate website. The full reports of each committee are set out below.
Annual General Meeting On 28 June 2016 the Annual General Meeting was held, which comprised the following resolutions:
• Adopt the Annual Accounts and appropriation of the profits to the reserves for the 2015 financial year;
• Discharge the Executive and Non-Executive Directors from liability;
• Reappointment of Mr. Sawiris and Mr. Butt as Executive Directors;
• Appointment of Ms. Montijn as Non-Executive Director;• Reduction of issued share capital and amendments of OCI
N.V.’s Articles of Association;• Extension of the designation of the Board as the authorised
body to issue shares in the share capital of the Company;• Extension of the designation of the Board as the authorised
body to restrict or exclude pre-emptive rights upon the issuance of shares;
• Authorisation of the Board to repurchase shares in the share capital of the Company; and
• Appointment of KPMG as auditor charged with the auditing of the Annual Accounts for the 2016 financial year.
All resolutions were adopted and the minutes of the Annual General Meeting are published on the corporate website.
54 OCI N.V. Annual Report 2016 OCI N.V. Annual Report 2016 55
Performance review / Operational strengths / Sustainability review / Corporate governance / Financial statements / Other information Performance review / Operational strengths / Sustainability review / Corporate governance / Financial statements / Other information
BOARD REPORT

Compliance with the Dutch Corporate Governance CodeThe Board subscribes the Dutch Code’s principles and best practice provisions. In accordance with the Corporate Governance Code’s ‘apply or explain’ principle, OCI has outlined below departures from the Dutch Code to ensure full transparency.
• Provision IV.3.1: The General Meetings of Shareholders are not webcast for cost efficiency reasons.
• Provision II.1.8: For the first five months of the year, the CEO also held the position of Non-Executive Chairman of the Board of Directors of Orascom Construction Limited (OCL), which was spun-off from OCI in March 2015. Given his extensive experience in managing OCL’s activities prior to it being spun-off from OCI, Mr. Sawiris’s guidance as Chairman was essential to providing OCL with a strong start during its first year as an independent company. Mr. Sawiris resigned from the OCL Board in May 2016 to comply with provision II.1.8. He also resigned as a Non-Executive Director from the Board of BESIX, a subsidiary of Orascom Construction Limited. The CEO is also a Non-Executive Board member of Adidas AG and LafargeHolcim Ltd. Therefore, as of May 2016 OCI complies with provision II.1.8.
The Board confirms that throughout the year, the Company has complied with the Dutch Code, and any departures from the Dutch Code are explained in accordance with the Dutch Code’s “comply or explain” principle. Any substantial changes to the Corporate Governance structure undertaken by the Board will be presented to the General Meeting of Shareholders.
New Dutch Corporate Governance CodeA new Dutch Corporate Governance Code (the “New Code”) was published by the Corporate Governance Code Monitoring Committee in December 2016. The principle changes compared to the 2008 Corporate Governance Code are as follows:
1 A greater focus on long-term value;2 Reinforcement of risk management;3 A shift of focus in effective management and supervision;4 Introduction of culture as an explicit part of corporate
governance;5 Improvement and simplification of the remuneration provisions
in the code;6 Shareholders and general meeting; and7 Quality requirements for “comply or explain” statements.
The New Code will apply as of the 2017 financial year. The Board recommends complying with the New Code and discussing it at the 2018 AGM. OCI’s current corporate governance is already broadly in compliance with the changes in the New Code. The following changes are already in place at OCI:
• The Audit Committee / Board approves the appointment / dismissal of the senior internal auditor;
• The Audit Committee approves the Internal Audit work plan;• The Audit Committee provides information to the external
auditor;• The Board and the Audit Committee appoint, dismiss and
review the performance of the external auditor;• As of the 2017 AGM, OCI complies with changes to term limits
for current directors;
BOARD REPORT CONTINUED
• Additional positions are notified prior to accepting and are discussed once a year; and
• Compliance with best practices regarding misconduct and irregularities.
The Audit Committee ReportThe Audit Committee consists of four Non-Executive members who are mandated with monitoring and supervising activities related to the Company’s financial, internal audit, compliance and tax performance. Robert Jan van de Kraats is the financial expert ex article III.3.2 of the Dutch Corporate Governance Code.
Six Audit Committee meetings were held in 2016. On 25 April 2016, the 2015 full year financial results and statements were discussed. In accordance with its Charter, the Audit Committee reviewed the annual report including the 2015 financial statements and non-financial information, the annual report including non-financial information prior to its publication. The Audit Committee also reviewed and advised on:
• Financing strategy;• Financial implications and aspects of the proposed transaction
with CF Industries; • Risk management including IT risks and minimum
requirements; • The effectiveness of internal controls and risk management
relating to strategic, financial, operational and compliance matters;
• Change in risk management towards a risk based approach;• In-control statement and underlying in-control situation;• Trading updates and press releases;• The Corporate governance framework in place;• The Compliance function and program that was implemented
in 2015 and is continued in 2016;• Related Party Transactions; • Tax review and policy;• Going concern analysis in the context of the Company’s
expertise in financing;• Set up and functioning of the internal audit function resulting in
the appointment of a new Director Internal Audit; and• An assessment of the functioning of the external auditor, its
appointment, including scope, risk analysis and materiality
Financial Reporting and External AuditorThe Company’s external auditor is KPMG Accountants N.V. The external auditor attended all Audit Committee meetings in 2016. The Board prepared and approved an Independence policy for the external auditor on 9 April 2015 which was applied as of 1 May 2015. The Chairman met with the internal and external auditor in advance of every Audit Committee meeting in order to secure all relevant issues to be sufficiently addressed. The Audit Committee met with the external auditor in absence of Management twice during the year.
The Nomination and Governance Committee ReportThe Nomination and Governance Committee consists of four Non-Executive members. Three meetings were held in 2016. The Nomination and Governance Committee:
• Assessed the size and composition of the Board on the basis of the Board evaluation;
• Successfully identified and nominated a female board member;• Assessed the individual functioning of Directors; • Discussed succession and emergency planning both for
Executives and Senior Staff;• Discussed ancillary positions held by Directors and the
acceptance thereof including Jérôme Guiraud’s position as Non-Executive Chairman of Orascom Construction as per May 2016;
• Evaluated the status of the corporate governance framework and the compliance with both the current Dutch Corporate Governance Code as well as the new one; and
• Evaluated related party transactions and potential conflicts of interest.
The Remuneration Committee ReportThe Remuneration Committee consists of three Independent Non-Executive members. Five meetings were held this year. The Remuneration Committee discussed and prepared for decision making on the following topics:
• Evaluation of the 2016 targets;• 2016 short-term and long-term incentives; • 2017 target setting; and• Performance share plan administration.
Furthermore, the Remuneration Committee:
• Assessed market trends with the support of external advisors;• Assessed alignment between Executive Management
Remuneration and the rest of management; • Aligned internal practices with those trends; and• Optimized the administration of the share option plans..
More information on the remuneration policy and the 2016 remuneration of the Board can be found in the Remuneration Report on page 65.
The Health, Safety and Environment Committee ReportThe Health, Safety and Environment (HSE) Committee consists of four Independent Non-Executive members. Four meetings were held in 2016 including a site visit to BioMCN. The HSE Committee:
• Set HSE targets for 2017;• Assessed the 2016 HSE targets and advised the
Remuneration Committee that no discount applied for the 2016 Executive STI;
• Assessed the fires at OCI Nitrogen and the implementation of the lessons learned;
• Discussed a reporting system on incidents to the HSE Committee;
• Discussed the organizational design of the HSE department; and
• Made a site visit to BioMCN and the terminal in Rotterdam.
More information on HSE can be found in the HSE section in this report on pages 42.
Potential Conflicts of interestThe Board members are bound by the Company’s Code of Conduct. Potential or actual conflicts of interest are governed by the Company’s Articles of Association and By-Laws. A Director shall immediately report any conflict of interest or potential conflict of interest that is of material significance and may not take part in any discussion or decision-making that involves a subject or transaction in relation to which he has a potential conflict of interest with the Company. In 2016, the Company complied with best practice provisions II.3.2 to II.3.4.
Given the position of the CEO (until May 2016) and the CFO as Non-Executive directors on the Board of Orascom Construction, in case a potential conflict of interest arises between the Company and Orascom Construction, the CEO will not participate in the discussions and decision-making that involves a transaction between Orascom Construction and the Company given his continuing position as major shareholder in Orascom Construction. In addition, the CFO will not participate in the decision-making process in Orascom Construction in respect of such transaction.
A $ 200 million settlement agreement with Orascom E&C USA Inc, a subsidiary of OCL, was reached in April 2016 in relation to the construction costs for IFCo. The Board discussed and approved that settlement agreement and the disbursement of the amount. The CEO excused himself from participation and decision making.
In May 2016, Jérôme Guiraud’s was appointed (Non-Executive) Chairman of Orascom Construction. In line with the Corporate Governance Code, Jérôme Guiraud did not participate in the discussion and decision making where there could be a potential conflict of interest.
In 2016, the principal shareholders provided OCI with a shareholder loan and a letter of credit, which are detailed in note 6.2 in the financial statements. The Board discussed and approved these facilities, including the main terms thereof. The CEO and Mr. Guiraud in his capacity of CEO of NNS Capital Ltd. excused themselves from participation and decision making.
For a complete overview of related party transactions, reference is made to the ‘Related Party Transactions’ disclosed in the Financial Statements.
IndemnificationsThe Company grants an indemnity to all of its Directors to the extent permitted by law. These indemnity amounts are uncapped in relation to losses and liabilities which Directors may incur to third parties in the course of acting as a Director of the Company, or in any office where such duties are performed at the request of the Board, or as a result of their appointment as Directors
56 OCI N.V. Annual Report 2016 OCI N.V. Annual Report 2016 57
Performance review / Operational strengths / Sustainability review / Corporate governance / Financial statements / Other information Performance review / Operational strengths / Sustainability review / Corporate governance / Financial statements / Other information

Risk Mitigating Actions
Strategic
Economic and political conditions in the markets in which we operate
OCI N.V. does business in both developed and emerging markets, which means that we are exposed to some countries where there is a risk of political or socioeconomic instability. Accordingly, developments in any of the countries in which we operate can create an uncertain environment for investment and business activity and may adversely impact our business.
We mitigate the impact of any single market by diversifying our presence with operating facilities in both emerging and developed markets. We actively monitor economic, political and legal developments and maintain positive relationships with various governmental bodies in the countries in which we operate as part of our effort to be a ‘local’ player in each of our markets.
Tax verdict appeal
In October 2012, the Egyptian Tax Authority (ETA) raised a tax evasion claim against our Egyptian subsidiary, Orascom Construction Industries S.A.E. (OCI S.A.E.). The tax dispute related to the sale of OCI S.A.E.’s cement assets to Lafarge SA in 2007. Although the management and advisors of OCI S.A.E. believed that the aforementioned transaction was exempted of tax, management entered into a settlement to resolve the tax dispute whereby approximately $ 1 billion would be paid over a five-year period. The agreement was followed by payment of a first installment amounting to approximately $ 360 million in 2013.
In November 2014, the Egyptian Tax Authority’s (ETA) Independent Appeals Committee, the responsible body overseeing the tax dispute between OCI N.V.’s subsidiary, OCI S.A.E., and the ETA, ruled in favor of the Company. As a result of the positive ruling, the balance of the tax liability was released through the 2014 income statement. The Board also unanimously approved the transfer of the rights to amounts paid to the ETA to the Tahya Misr (“Long Live Egypt”) Fund. Cash donations do not require entering into an agreement under Egyptian law.
On 11 December 2014, OCI S.A.E. received a notification that the ETA lodged an appeal. The appeals process is currently ongoing.
As this dispute does not relate to either OCI N.V. or OCL exclusively, any liabilities and any recoveries are shared under the Tax Claim Agreement on a 50% basis between OCI N.V. and OCL (excluding the EGP 1.9 billion to be paid to Tahya Misr social fund in Egypt).
The appeal is a legal formality and proceedings usually take several years before the court issues its judgment. The Company believes the likelihood of a judgment issued in favour of the ETA is weak.
Please also refer to note 28 of the financial statements.
Risk of adverse sovereign actionWe do business in locations where we are exposed to a greater than average risk of adverse sovereign action, including overt or effective expropriation or nationalization of property, the renegotiation of contract terms, the implementation of export controls on commodities regarded by them as strategic, the placement on foreign ownership restrictions, or changes in tax structures or free zone designations.
We work closely with the governments in the countries in which we do business to maintain positive working relationships. Although there is no guarantee that the government of a location in which we operate will not adopt adverse policies going forward, we have worked to minimize this risk through water-tight contracts for our assets and government agreements. Our legal team also works diligently to monitor and review our practices and any changes in laws or regulations in the countries in which we operate to provide reasonable assurances that we remain in line with all relevant laws. Management has also drafted contingency plans for various unforeseen events and adverse scenarios.
Category Description Risk Appetite
Strategic Risks that may impede our ability to achieve strategic objectives that we believe are critical to our performance and growth. These are risks that are considered strategic matters for the Board and Executive Directors, and may impact the company as a whole.
As a leading player in our markets, we are able to take certain calculated strategic risks that create opportunities to maximize our ability to deliver outstanding value to our shareholders. Our ability to adapt our risk management to meet the requirements of our global positioning and diversified exposure to emerging and developed markets is key to maintaining our success.
Operational Risks that may impede our ability to achieve operational objectives and performance. These are risks that are typically directly managed and monitored by the local management teams of each operating company and supervised by our Executive Directors.
We aim to minimize operational risks while maximizing our ability to capitalize on our leadership positions in our markets. We strive to maximize operational efficiency while fostering a safe and entrepreneurial environment for our employees and the environment in general.
Financial Risks related to financial, accounting, and reporting controls and processes that may impede our ability to meet financial commitments, obligations, and daily operating needs.
We implement a financial strategy to maintain an efficient balance sheet whilst securing good access to financing. Our key policies are described throughout the annual report.
Regulatory Risks related to changes in laws and regulations, including HSE, tax, and financial reporting, and other legislation that may require changes in the way we do business.
We strive to comply with applicable laws and regulations everywhere we do business. All employees are bound by our Code of Conduct, which we are continuously embedding throughout the Company. It is in the values of the Company and its employees to act with honesty, integrity and fairness to foster a business climate that maintains such standards.
IntroductionOur businesses inherently involve risks. Our management is cognizant of these risks and takes a measured mitigation approach to maximize our ability to successfully pursue sustained growth. Our Board and management foster a transparent company-wide approach to risk management and internal controls as outlined in our corporate governance section, which allows our businesses to operate effectively. We are working diligently to further enhance our Risk Management within the Company.
Our risk appetite is flexible to account for our diversified market presence and product portfolio, and is tailored to four main categories:
Performance review / Operational strengths / Sustainability review / Corporate governance / Financial statements / Other information Performance review / Operational strengths / Sustainability review / Corporate governance / Financial statements / Other information Strategic review / Operational review / Corporate governance / Financial statements
58 OCI N.V. Annual Report 2016 OCI N.V. Annual Report 2016 59
RISK MANAGEMENT & COMPLIANCE

Risk Mitigating Actions
Operational
Commodity pricing and over-supply risk
A change in market dynamics in our fertilizer and industrial chemicals production portfolio, such as over-supply, may result in lower product prices, which would adversely impact our margins.
We have a diversified production portfolio comprising two distinct sectors: nitrogen fertilizers and industrial chemicals. These sectors have inherently different industrial dynamics, including different supply/demand drivers, seasonal cycles, customers, competitors, and other factors that may affect prices. This mitigates the risk of potential downturns in any of our products or sectors. We are also geographically diversified in emerging and developed markets to reduce market-related risks.
Risks associated with our partnerships We participate in partnerships including Natgasoline, Sorfert Algérie and Egypt Basic Industries Corporation. Our investments in partnerships involve risks that are different from the risks involved in owning facilities and operations independently.
The Shareholders Agreements for our partnerships include clauses that protect OCI N.V.’s economic and operating interests as much as reasonably possible.
We maintain close working relationships with our partners and monitor the operating and financial results of the partnerships in which we hold minority stakes or do not have management control. In our larger partnerships, such as Natgasoline, EBIC and Sorfert, we retain management control and/or seats on each partnership’s Board of Directors.
In addition, we have a policy of constantly reviewing all businesses to determine whether they continue to be core businesses worth retaining on a long term basis. This is particularly applicable to businesses in which we do not have control. If a business becomes non-core or has reached a certain level of maturity, we actively pursue monetizing the business through divestment.
Human capitalOur ability to employ, develop, and retain talented employees is essential to maintain our high quality operations and management.
We have been able to attract, motivate and retain knowledgeable and experienced employees due to our reputation and market position, our in-house training programs, our Employee Incentive Plans (as described in note 21 of the financial statements), as well as our strategic partnerships with industry leaders, which offer employees exposure to high profile projects and advanced technologies.
Financial
Ability to raise debt or meet financing requirements
Our ability to complete strategic acquisitions and greenfields or refinancing existing debt is contingent on our access to new funding.
Although we strive to ensure that adequate levels of working capital and liquidity are maintained, unfavorable financial market conditions may adversely affect our financing costs, hinder our ability to achieve additional financing, hinder our ability to refinancing existing debt, and/or postpone new projects. This could therefore have an adverse effect on business prospects, earnings and/or our financial position.
We strive to maintain a strong financial position and creditworthiness with our creditors. We closely monitor our cash position and credit lines to ensure our financial flexibility. We have also diversified our funding sources to avoid dependence on a single market, and have staggered our debt maturity profile to reduce repayment burdens. OCI has excellent in-house financing expertise and a proven track record in both refinancing debt and accessing new funding.
Risk Mitigating Actions
Strategic
Global economic conditions
Economic changes may result in business interruption, inflation, deflation or decreased demand for our products. Our success will depend in part on our ability to manage continued global economic uncertainty, especially in our markets.
We aim to maintain a strong financial position that would cushion us from any global economic or cyclical downturns. As a fertilizer producer, we have balanced our natural gas costs through our long-term natural gas supply contracts, a natural gas hedge in the United States, and spot purchasing. This mix provides us with competitive feedstock prices, allowing us to withstand a decline in global economic conditions.
Ability to execute large greenfield projects on time
OCI N.V. is developing two large-scale greenfield production facilities in the United States: Iowa Fertilizer Company (IFCo) and, jointly with our JV partner, Natgasoline.
Our ability to achieve our growth targets is in part dependent on our ability to complete these projects on time and in line with our expected cost of construction and development.
Each greenfield project is being executed by OCL, which has more than 20 years’ experience in the construction of large-scale, complex industrial projects. In addition, the completion of both projects is subject to close monitoring by OCI’s senior management.
For more information, please refer to note 32 of the financial statements.
Operational
Cost of productionOur cost of production is primarily dependent on the availability and cost of natural gas, the primary feedstock in manufacturing our products. Our production facilities can be adversely impacted by supply interruptions, as seen in Egypt, where our plants have experienced volatility since 2012 due to the government prioritizing the supply of natural gas to the electricity sector to reduce power blackouts in the country.
Our costs are also subject to fluctuations in the cost of labour, other raw materials, and foreign exchange rates.
Our success is dependent, in part, on our continued ability to manage cost fluctuations through pricing actions and cost savings. We have hedged our global exposure to natural gas price fluctuations through a mix of long-term contracts in Egypt, the United States and Algeria, and spot prices in the United States and The Netherlands.
We continuously identify, implement, and sustain cost improvement plans, including our outsourcing projects and those related to general overhead and workforce rationalization.
With regard to supply issues in Egypt, the Egyptian government has taken several steps to address the country’s gas supply issues. These efforts have resulted in an improved supply of natural gas as from the fourth quarter of 2015.
Business continuity and competition riskWe rely on continued demand for and distribution of our products at favorable prices. Our continued success is dependent on the quality and pricing of our products, and on our continued positive reputation.
This means we must be able to obtain and manage our resources at competitive costs. Our success is also dependent on effective marketing programs in the competitive environments in which we operate.
To address these challenges, we have policies in place to respond to competitive factors and maintain mutually beneficial relationships with our key customers, in order to effectively compete and achieve our business plans.
We have global sales, marketing, distribution and logistics teams that work diligently to expand our sales channels, develop new and repeat customer relationships, negotiate favorable contracts, and create market contacts by attending various industry and trade conferences.
Our production and manufacturing teams also work diligently to ensure our plants operate efficiently to produce high quality products that meet or exceed international standards. Our products and processes are certified by global quality control institutions.
RISK MANAGEMENT & COMPLIANCE CONTINUED
60 OCI N.V. Annual Report 2016 OCI N.V. Annual Report 2016 61
Performance review / Operational strengths / Sustainability review / Corporate governance / Financial statements / Other information Performance review / Operational strengths / Sustainability review / Corporate governance / Financial statements / Other information

Risk management approachThe risk management framework was developed to align with the Dutch Corporate Governance Code and is devised to provide reasonable assurances that the risks we face are properly evaluated and mitigated, and that management is provided with information necessary to make informed decisions in a timely manner. OCI’s risk profile has improved significantly due to the demerger of construction business. Our risk management framework was updated in 2016 in line with our effort to evaluate our approach towards risk management and ensure we maintain full visibility on existing and emerging risks.
The key elements of OCI’s internal risk management, compliance and control systems in 2016 are described below.
Internal Financial Reporting & AuditsSubsidiaries are required to provide management with weekly updates, with a detailed monthly review of performance, financials and operating issues held for each subsidiary to the Executive Directors.
A detailed budget for each subsidiary is prepared and presented to management in the fourth quarter of each preceding year, and includes a one year forecast. The subsidiary budgets are updated monthly to account for actuals, and the forecasts are updated three times a year. These budgets and forecasts are consolidated into an OCI N.V. budget and forecast, which is used by management as a tool to evaluate the Company’s investment strategy, performance indicators, and operations.
Periodic internal audits are conducted to review any specific issues at the subsidiary level, and management is consulted on performance developments and gaps and remediation plans.
The Board of Directors is given a full financial and operational update by the Executive Directors at each Board meeting.
The Group Controller provides guidance on internal and financial controls that must exist for each process and monitors the implementation of these controls in collaboration with the Internal Audit and Risk department.
Strategic and Operational Risk ManagementOur group risk profile is updated every year and agreed with the Executive Board. The Internal Audit & Risk department maintains a central repository for the monitoring of mitigating actions and trends in relation to each risk, and aides the Board in maintaining objectivity in its risk assessments.
In addition, each subsidiary reports on the top risks it faces at its monthly review with the Executive Directors, either in writing or verbally, including the nature of each risk, the likelihood of it materializing, and the financial and operational impact it may have on the subsidiary. Management monitors these risks and provides guidance where necessary.
Operational, health, safety, environmental, quality systems are in place at each subsidiary. All our subsidiaries have been awarded relevant certifications, including ISO and REACH, among others. In addition, insurance policies have been taken out for operating entities to provide full coverage.
Risk Mitigating Actions
Financial
Currency fluctuations
A substantial portion of the company’s consolidated revenue, operating expenses and long-term debt is denominated in foreign currencies. Significant changes in the exchanges rates of operational currencies, which include the US Dollar, the Euro, the Egyptian Pound, and the Algerian Dinar, can have a material effect on the reported and actual financial performance of the company.
We hedge our foreign exchange cash flow risk on a consolidated basis by matching our foreign currency-denominated liabilities with continuing sources of foreign currencies.
Regulatory
Regulatory conditions in the markets in which we operate
Changes in laws, regulations and the related interpretations may alter the environment in which we do business. This includes changes in environmental, competition and product-related laws, as well as changes in accounting standards and taxation requirements. In addition, this includes regions where corrupt behavior exists that could impair our ability to do business in the future or result in significant fines or penalties. Our ability to manage regulatory, tax and legal matters and to resolve pending matters within current estimates may impact our results.
Management of Operating Companies and several corporate departments actively monitor regulatory developments in order to comply with the laws and regulations of the countries in which we operate.
Additionally, our management actively provide comments and feedback regarding proposed or draft rules when given the opportunity, specifically when the said draft rules are open for public comments.
Ability to maintain our health, safety and environment (HSE) standards
HSE is a vital aspect at OCI N.V. We have a deep commitment to maintaining our strong HSE track record. Despite the nature of our businesses, we aim to prevent every accident through stringent HSE rules, standards and training programs.
We implement strict HSE training and operating discipline at every plant in order to minimize HSE risks, and closely monitor our plants through regular audits. Our safety and emissions records meet or exceed international standards, underscoring our commitment to providing our employees with a safe, secure and environmentally conscious workplace.
In addition, the HSE Committee supervises our HSE activities, as described in the HSE Committee report.
RISK MANAGEMENT & COMPLIANCE CONTINUED
Ambition,Strategy, Scope,
Tone-at-the-Top
Compliance principles
Compliance organizations
Compliance universe
Compliance monitoring
Compliance reporting
Incident management
Compliance risk
identification &
assesment
Third party interaction & control
Breach of CoC
Competition & antitrust
Corruption & anti bribery
Insider trading & market abuse
Whistle-blower
Compliance ManagementOCI strives to conduct all business activities responsibly, transparently, and with integrity and respect towards all stakeholders. In support of that we have a Code of Conduct and a Compliance Program.
The effectiveness of the Code of Conduct is monitored through our Compliance Program and hence ensures all employees are aware of and committed to our Code of Conduct. In conjunction with OCI’s Whistleblowing Policy the Code of Conduct provides a safe and confidential procedure to raise any concerns and breaches.
In 2016 the Compliance Program was further formalized by the drafting of the Compliance Charter, a document that sets amongst others compliance scope, roles and responsibilities.
OCI is subject to local, regional and international laws and regulations in countries where we conduct business. We are monitoring and adapting to significant and rapid changes in legal and compliance areas to ensure that the Code of Conduct and the Compliance Program, including internal policies and guidelines remain suited for purpose and are properly applied.
62 OCI N.V. Annual Report 2016 OCI N.V. Annual Report 2016 63
Performance review / Operational strengths / Sustainability review / Corporate governance / Financial statements / Other information Performance review / Operational strengths / Sustainability review / Corporate governance / Financial statements / Other information
Code of ConductThe Code of Conduct serves as a reference document for all our employees and affiliates. In 2016 the Code of Conduct was amended. The new Code of Conduct is an integrated version of the former two codes (Code of Business Principles and Conduct and Code of Ethics). Moreover, the new topics and policy statements have been added, covering a clear and absolute prohibition of Bribery; Third Party Due Diligence; Privacy and Data Protection; instructions on accurate record keeping and reporting; possibility to report concerns or issues via the independent outside Trusted Persons Network (www.oci.trustedpersonsnetwork.com) and a statement of disciplinary measures in case of non- compliance with the Code of Conduct.
Whistleblowing policy and incident reporting channelsOne of the means of keeping our promise to our employees and affiliates of creating a positive workplace environment where there is mutual trust and respect towards and amongst employees, with a shared sense of responsibility for fostering our reputation and success, is to provide the possibility to safely report concerns.
Employees are encouraged to promote ethical behavior and should encourage other employees to talk to supervisors or managers when in doubt about the best course of action in a particular situation. Within OCI, employees on all levels are encouraged to report, in good faith, any suspected misbehavior or malpractice to their immediate or next higher level manager, including possible violations of laws, rules and regulations. We have facilitated this by establishing an independent anonymous reporting hotline.
In 2016, we amended our Whistleblower Policy in order to comply with Dutch legislation with regards to the House for Whistleblowers (Huis voor Klokkenluiders).
Compliance GovernanceThe Group Compliance Officer, in close collaboration with the Board of Directors, provides an adequate compliance framework, consisting of the Compliance Program and all its compliance activities. In 2016, an Integrity Committee comprised of the CFO and the Group Compliance Officer was established. The Integrity Committee handles incidents of a severe nature. Management of Operating Companies and of staff departments are responsible and accountable for raising compliance awareness within their respective businesses and departments.
During the year, several compliance initiatives were implemented, both by the OCI compliance community as a whole and by Operating Companies individually. These initiatives included webinars and the establishment of an e-learning program. Through the quarterly reporting structure, the Local Compliance Officer ensures that alleged breaches of our Code of Conduct or any other compliance incident is not only reported to Operating Companies management for appropriate action, but also to corporate leadership.
In 2016 the Integrity Committee met once to discuss and handle a potential material compliance breach.
Insider TradingMembers of the Board of Directors and senior management of Operating Companies are made aware of their obligations under the OCI N.V. Insider Trading Policy.
In 2016 the Group Compliance Officer set the annual agenda for closed trading periods and kept the list of permanent and incidental insiders. In order to ensure compliance with the new Market Abuse Directive, Board awareness sessions were held, the Insider Trading Policy was amended and Procedures on Market Sounding were adopted. Senior Management was also made aware of the Market Abuse Directive requirements.
Privacy and Data ProtectionIn 2016, a company-wide project was initiated to ensure compliance with current Privacy and Data Protection laws and to prepare for the implementation of the General Data Protection Regulation of the EU, which will enter into effect May 2018.
Non-Financial Letter of Representation (NF LoR)At the end of the year, the CEO and CFO of each Operating Company sign the NF LoR to confirm compliance with the Code of Conduct and other corporate non-financial requirements. The outcome is reviewed by the Group Compliance Officer and the Internal Audit Director and the results are reported to the Board of Directors and the Audit Committee. Reported outstanding actions are followed up on by the Internal Audit department and monitored in quarterly reviews. The outcome of the NF LoR process, in combination with the internal control self-assessments, the HSE report, the Compliance Program, the Risk assessments and the performed internal audits, establishes the basis for the In Control Statement of the Board of Directors in this Report.
RISK MANAGEMENT & COMPLIANCE CONTINUED
This report provides an overview of the remuneration of the Board and explains how the remuneration policy was applied in 2016.
IntroductionThe Remuneration Committee (“the Committee”) oversees the remuneration policy, plans and practices of OCI N.V. and recommends changes when appropriate. The Committee is comprised solely of Independent Non-Executive Directors from the OCI N.V. Board of Directors.
The 2016 Remuneration Report is comprised of two sections:
1. Details of the current Executive and Non-Executive Board remuneration policy that was approved by the 2015 Annual General Meeting of shareholders (votes cast in favour: 99.69%)
2. Details of actual remuneration paid to the Executive and Non-Executive Directors in 2016
Part 1: Current Remuneration Policy
Remuneration policy: objective and scopeThe objective of OCI N.V.’s remuneration policy is to attract, motivate and retain the qualified individuals needed in order to achieve its strategic and operational objectives. The policy is designed in the context of international competitive market trends, the relevant provisions of statutory requirements, corporate governance best practices, the societal context around remuneration and the interests of OCI N.V.’s shareholders and other stakeholders. The policy is simple and transparent, promotes the interests of the Company in the medium and long term, and encourages a “pay for performance” culture.
Term of Employment and severance arrangementsThe Executive Directors referred to in this Remuneration Report are the Chief Executive Officer (CEO) and Chief Financial Officer (CFO).The details of their appointment terms are provided below:
Name TitleDate of appointment Notice period
Nassef SawirisChief Executive Officer (CEO)
16 January 2013 3 months
Salman ButtChief Financial Officer (CFO)
25 January 2013 3 months
If the Company terminates a service agreement with an Executive Director other than due to an urgent cause or serious culpability, the Executive Director is entitled to a severance payment of an amount equal to 100% of base salary.
Peer groupsThe Remuneration Committee consults multiple points of data when setting the remuneration policy, as well as the structure and quantum of remuneration. To ensure the competitiveness of OCI N.V.’s remuneration levels, benchmark remuneration data from a peer group of international companies similar in size and scope to OCI is used for decision making. In addition, the Committee also refers to remuneration levels at Dutch listed companies of a similar size to OCI.
In 2015 the international peer group was reviewed following the spin off of the Engineering & Construction group. As disclosed in the 2015 Remuneration Report, the peer group is as follows:
International labour market peer group
Celanese
CF Industries
K + S
Koppers Holdings
Methanex
Mosaic
Olin
Potash Corp
Tessenderlo Chemie
Wacker Chemie
Westlake Chemical
The peer group used for the assessment of Total Shareholder Return (described in the LTI section below) is different to the one detailed above as it is used for a different purpose. The Total Shareholder Return peer group is intended to reflect the market in which OCI competes for investment rather than for executive talent.
Elements of remunerationThe remuneration policy consists of five main elements:
• Base salaries: fixed cash compensation set in line with individual performance and contribution to Company goals with reference to external market data;
• Short-term incentives (annual bonus): performance-based annual bonus to encourage and reward the achievement of annual financial performance measures and other specified corporate objectives;
• Matching rights over OCI N.V. shares where Executive Directors elect to defer part of their bonus into OCI N.V. shares for at least three years;
• Long-term incentives: share-based compensation focusing on enterprise value creation and retention; and
• Other benefits: simple benefit plans focusing on key needs.
Base salariesThe current base salaries reflect the size and international scope of the Executive Director roles and the calibre and experience of the individuals. The base salaries include a fixed cash allowance (amounting to 25% of the total base salary) which is designed to compensate the Executive Directors for their personal provision of key benefits such as pension, car, and life and disability insurance.
Performance review / Operational strengths / Sustainability review / Corporate governance / Financial statements / Other information Performance review / Operational strengths / Sustainability review / Corporate governance / Financial statements / Other information Strategic review / Operational review / Corporate governance / Financial statements
64 OCI N.V. Annual Report 2016 OCI N.V. Annual Report 2016 65
REMUNERATION REPORT

Short term incentivesThe annual bonus is a key element of a “pay for performance” culture and is linked to pre-determined, measurable targets set and assessed by the Committee. Short-term incentives provide context for Management decisions, ensure focus on primary corporate financial, operational or strategic goals, and reward decisions that drive short-term results and support long-term strategy. For the CEO, the STI is capped at 150% of base salary. On-target performance will result in a pay-out of 75% of base salary and threshold performance 30% of salary. For the CFO, the STI is capped at 120% of base salary, on-target performance will result in a pay-out of 60% of base salary and threshold performance 24% of salary.
At the beginning of each year, the Remuneration Committee establishes the performance measures and targets based on OCI’s business priorities for the year. Specific targets will not be disclosed as they are commercially sensitive. At the end of the year the Committee will review performance against the targets and approve STI awards based on the performance achieved. The strategic measures will be determined and assessed by the Committee based on key priorities for the year.
For 2016, performance targets were a mix of corporate financial (60%) and operational, strategic and personal (40%) objectives. The key financial measure was Group EBITDA.
Payment of the STI to the CEO and CFO will be at least 50% in cash (net of taxes) with the option to invest up to 50% (net of taxes) in the shares of the Company for a period of three years. Any deferral of STI into shares will result in the award of matching share rights on a 1:1 basis to incentivise Executive Directors to increase their long-term interest in the Company. Matching rights will be based on the post-tax value of the amount elected for deferral. Aligned to international best practice, the matching rights will be adjusted to reflect any dividends paid during the vesting period. Vesting of the matching rights at the end of the holding period will normally be conditional upon the incumbent still being employed by OCI N.V. After vesting, shares arising from the matching rights (net of tax) will be held for a further two years in line with the Dutch Corporate Governance Code.
Other executives and senior managers will also be invited to participate in a similar deferred bonus and matching plan.
Payments under the STI may be reduced by up to 20% in the event that health, safety and environment (“HSE”) performance is judged unsatisfactory by the Remuneration Committee, taking account of feedback from the HSE Committee. For 2016 the key measures were the Lost Time Incident Rate (LTR) and Total Recordable Incident Rate (TRIR).
Long term incentivesThe Performance Share Plan aims to:
• Incentivise the creation of shareholder value in excess of that achieved by comparator organisations;
• Align the interests of executives with those of shareholders;• Comply with the Dutch Corporate Governance Code
Best Practice; and• Increase retention of key executives.
Executive Directors will be granted performance share awards which will vest after three years only if pre-specified performance targets are met. Vested shares for Executive Directors (net of tax) will then be held for a further two years after vesting in line with the requirements of the Dutch Corporate Governance Code.
The number of performance shares will be calculated based on the face value method which calculates the number of shares granted based on the share price at date of grant and a fixed percentage of base salary. The maximum award size for all Executive Directors is 100% of total salary.
Share awards under the plan are made annually, subject to complying with any closed periods. In future years it is intended to make awards on 7 February each year as a consistent course of action.
Performance targets are based on relative Total Shareholder Return (TSR) against a peer group of companies that reflect the market in which OCI N.V. competes for investment.
As detailed in the 2015 Remuneration Report, the TSR peer group was reviewed by the Remuneration Committee with the assistance of Mercer, following the demerger of the Engineering & Construction group. The resulting TSR peer group, which is focused on fertilizer and chemicals companies, is as follows:
TSR peer group
Agrium Methanex
Air Products [2014 cycle only] Mosaic
Akzo Nobel Potash Corp
Celanese Royal DSM
CF Industries Solvay
Intrepid Potash Westlake Chemical
Lanxess Yara International
The design of the plan ensures that no pay-out will be made for below-threshold performance. Threshold vesting will begin with performance at the 40th percentile of the peer group. At threshold performance (40th percentile) 25% of the award will vest, for target performance (67th percentile) 100% of the award will vest and at maximum performance (90th percentile) vesting will be equivalent to 150% of the original award. Straight line interpolation will occur between these points.
TSR calculations will be externally verified. Appropriate adjustments will be made to deal with mergers and acquisitions, demergers, rights issues and other material changes.
REMUNERATION REPORT CONTINUED
Other benefitsAs mentioned, the base salaries provided to the Executive Directors include a fixed cash allowance, which is 25% of the total, in lieu of pension, car and other key benefits. No material pension benefits in excess of statutory requirements are offered and the Executive Directors are not eligible for a car benefit. The Remuneration Committee believes that this is a transparent approach.
The Executive Directors receive medical insurance, use of a mobile phone, and reimbursement of business expenses. They also benefit from directors’ and officers’ liability insurance coverage. In addition, the CEO is able to expense the use of a private aircraft for business travel.
Loans and guaranteesNo personal loans or guarantees, including mortgage loans, are offered to members of the Board.
Claw backA “claw-back” clause is included in the terms of employment of the Executive Directors, applicable in the situation that the financial or other information on which the pay-out of variable remuneration was based is determined to be incorrect. This will be applied if needed with the discretion of the Non-Executive Directors after recommendation by the Remuneration Committee.
Non-Executive DirectorsThe remuneration of the Non-Executive Directors consists of fixed fee payments for Board membership and for service on the committees. The fees are not linked to the financial results of the Company. Non-Executive Directors do not receive any performance or equity-related compensation and do not accrue any pension rights with the Company. Non-Executive Directors benefit from directors’ and officers’ liability insurance coverage, and are not entitled to any benefits upon the termination of their appointment.
Part 2: Actual Remuneration
Executive DirectorsThe details of the individual remuneration of the Executive and Non-Executive Directors and its costs to the Company are presented in the table below:
2016 Base salary Annual bonus2
Share-based compensation3
Total remuneration
N. Sawiris 2,000,000 3,269,430 (25,557) 5,243,873
S. Butt 1,680,000 806,400 594,562 3,080,962
Total 3,680,000 4,075,830 569,005 8,324,835
2015 Base salary Annual bonusShare-based
compensation1
Total remuneration
N. Sawiris 2,000,000 900,000 511,935 3,411,935
S. Butt 1,680,000 604,800 190,061 2,474,861
Total 3,680,000 1,504,800 701,996 5,886,796
1 In 2015 the option plans and bonus matching plan 2014 were modified from equity-settled share-based payment plants to cash-settled plans, as a result of the demerger of the Engineering & Construction business. The cash-settled plans were remeasured from the grant date fair value to the fair value as at 31 December 2015 which resulted in a net gain recognized in the statement of profit or loss of 2015 relating to share-based compensation for the board member Nassef Sawiris of $ 1.6 million, and a total expense recognized in for the board member Salman Butt of $ 0.2 million. The amount disclosed in the overview of remuneration relates only to the expenses recorded for the board members for the 2015 share-based payment expenses excluding the remeasurement effect of previous years.
2 Following the announcement of the proposed merger with CF Industries, some employee option holders were unable to exercise options granted in 2011 prior to their expiry at the end of their term due to insider-trading regulations. Following the termination of the CF Industries merger, the Committee agreed to settle these employees’ options on 31 August 2016 in cash as if they had been able to exercise their awards at the normal time. The CEO was treated in the same way as other employees and his 200,000 options were settled for an amount of $ 2,336,000. The liability recognized for these options as at 31 December 2015 of $ 267,000 was released in the statement of profit or loss.
³ The share-based compensation for Nassef Sawiris exists of $ 756,014 share-based compensation expenses for plans in 2016 and a release in the statement of profit or loss of $ 781,571 for the liability recognized as at 31 December 2015 for option plans 2012 due to the remeasurement to fair value at 31 December 2016 as this was a cash-settled plan.
66 OCI N.V. Annual Report 2016 OCI N.V. Annual Report 2016 67
Performance review / Operational strengths / Sustainability review / Corporate governance / Financial statements / Other information Performance review / Operational strengths / Sustainability review / Corporate governance / Financial statements / Other information

REMUNERATION REPORT CONTINUED
Base salaryThe base salary of the Chief Executive Officer was $ 2,000,000 which remained unchanged from 2015. The base salary of the Chief Financial Officer was $ 1,680,000 and remained unchanged from 2015. For the avoidance of doubt, the Executive Directors do not receive housing allowances or other expatriate-style benefits. The base salaries of the Executive Directors include their fees for their positions on the OCI N.V. Board of Directors. As mentioned previously, the Executive Director base salaries disclosed above include a fixed cash allowance of 25% of the total base salary in lieu of pension, car and other key benefits.
No changes to salaries for the Executive Directors are proposed for 2017.
Short term incentives 2016For 2016, performance targets were a mix of corporate financial (60%) and operational, strategic and personal (40%) objectives. The key financial measure was Group EBITDA.
In making a decision about the appropriate short term incentive award for 2016, the Committee took the following factors and achievements into account:
• The 2016 EBITDA threshold target was not achieved• Key strategic objectives for the CEO and CFO were achieved.
The payment was calculated at 40% of the maximum bonus for both the CEO and CFO which equates to 150% of salary for the CEO and 120% of salary for the CFO. In both cases the payment is below target. The HSE Committee judged the HSE performance as satisfactory, so no reduction on that basis was applied.
Long term incentives 2016
OptionsAs at 31 December 2016, the Executive Directors held 200,000 stock options (2015: 400,000).
Name
Outstandingas at 31 December 2016
Exercise Price in EUR
Value at remeasurment date in USD
Vesting date
Value at vesting dateUSD1
Nassef Sawiris
200,000 25.45 - 02-01-2016 -
1 Value of the shares at exercise date minus the exercise price to be paid.
Performance sharesAs mentioned in last year’s remuneration report, OCI N.V. was in an extended closed period for the majority of 2015 and 2016, therefore LTI awards were unable to be granted at the usual time to Executive Directors. These 2015 and 2016 awards were subsequently made as soon as was practicable, on 6 September 2016, with terms as if they were granted on 1 July 2015 and 1 July 2016, respectively.
As at 31 December 2016, the Executive Directors had been granted 499,091 conditional performance shares.
NameAward cycle
Out-standing year-end 2015
Granted Conditional in 2016
Outstanding year-end 2016
Value at grant date in USD1
Vesting date
End of lock-up period
N. Sawiris
2014 62,612 - 62,612 553,809 01-07-2017
01-07-2019
N. Sawiris
2015 - 68,081 68,081 408,688 01-07-2018
01-07-2020
N. Sawiris
2016 - 141,913 141,913 1,549,458 01-07-2019
01-07-2021
S. Butt 2014 50,090 - 50,090 443,050 01-07-2017
01-07-2019
S. Butt 2015 - 57,188 57,188 343,298 01-07-2018
01-07-2020
S. Butt 2016 - 119,207 119,207 1,301,546 01-07-2019
01-07-2021
1 Fair value calculated at grant date.
Bonus matching rightsNassef Sawiris and Salman Butt elected to defer 50% and 47.6% of their 2013 bonuses, respectively, and both elected to defer 50% of their 2015 bonuses. As OCI N.V. was in an extended closed period for the majority of 2015 and 2016, matching rights for these awards were unable to be granted at the usual time to Executive Directors. These 2013 and 2015 deferred shares were purchased and matching awards were subsequently made as soon as was practicable, on 23 May 2016, and will vest on 23 May 2019.
As at 31 December 2016, the Executive Directors had been granted 51,310 matching rights to bonus shares.
NameBonus cycle
Out-standing year-end 2015
Granted Conditional in 2016
Outstanding year-end 2016
Value at remeasure-ment date in USD1
Vesting date
End of lock-up period
N. Sawiris
2013 9,116 - 9,116 182,830 17-11-2017
17-11-2019
S. Butt 2013 7,293 - 7,293 146,268 17-11-2017
17-11-2019
1 These grants were modified into cash-settled awards due to the demerger of the construction business and value was remeasured at 31 December 2016.
NameBonus cycle
Out-standing year-end 2015
Granted Conditional in 2016
Outstanding year-end 2016
Value at grant date in USD
Vesting date
End of lock-up period
N. Sawiris
2015 - 20,874 20,874 286,203 23-05-2019
23-05-2021
S. Butt 2015 - 14,027 14,027 192,324 23-05-2019
23-05-2021
Remuneration scenariosThe Remuneration Committee conducts pay scenario analysis modelling on an annual basis which investigates pay-out quantum for Executive Directors under different performance scenarios. This modelling is undertaken in order to ensure that the remuneration policy links directly with the performance of OCI N.V. and therefore, is in the interests of shareholders. If specific short term and long term threshold performance targets are not hit, then pay in that year for Executive Directors will not include any variable element.
Non-Executive DirectorsThe Non-Executive Director fee rates for 2016 were as follows. There is no intention to change the fee rates in 2017.
$ Main Board Audit Remuneration Nomination HSE
Chairman 260,000 25,000 10,000 10,000 10,000
Member 130,000 20,000 7,500 7,500 7,500
Non-Executive Directors are reimbursed for all reasonable costs of travel, accommodation and representation in the performance of their duties. The Chairman received an additional fixed fee of $ 150,000 for service on the board of OCI Partners, a publicly-traded subsidiary of the Company in the United States, as well as an additional fee of $ 219,911 for his closer supervision of our North American commercial and manufacturing activities, which required considerable time and attention during a seven month period. This special role expired on 31 December 2016.
On behalf of the Remuneration CommitteeSipko Schat, Chairman
68 OCI N.V. Annual Report 2016 OCI N.V. Annual Report 2016 69
Performance review / Operational strengths / Sustainability review / Corporate governance / Financial statements / Other information Performance review / Operational strengths / Sustainability review / Corporate governance / Financial statements / Other information

70 OCI N.V. Annual Report 2016 OCI N.V. Annual Report 2016 71
Performance review / Operational strengths / Sustainability review / Corporate governance / Financial statements / Other information Performance review / Operational strengths / Sustainability review / Corporate governance / Financial statements / Other information
IntroductionThis 2016 Annual Report dated 24 March 2017 (the Annual Report) comprises regulated information within the meaning of sections 1:1 and 5:25c of the Dutch Financial Supervision Act (“wet op het financieel toezicht”).
For the consolidated and the parent Company’s 2016 financial statements “jaarrekening” within the meaning of section 2:361 of the Dutch Civil Code, reference is made to the financial statements. The Members of the Board of Directors have signed the 2016 financial statements pursuant to their obligation under section 2:101, paragraph 2 of the Dutch Civil Code.
The following sections of the Annual Report together constitute the Management Report (“jaarverslag”) within the meaning of section 2:391 Civil Code: the Operational Review, the Corporate Governance Section, the Financial Statements and the Additional Information. For other information “overige gegevens” within the meaning of section 2:392 of the Dutch Civil Code, reference is made to the financial statements and to the section Shareholders information.
Corporate governance statementAs referred to in article 2a of the Decree laying down additional requirements for annual reports ‘Vaststellingsbesluit nadere voorschriften inhoud jaarverslag’ effective 1 January 2010 (the ‘Decree’), OCI N.V. is required to make a statement on corporate governance.
The information required to be included in this corporate governance statement as described in articles 3, 3a and 3b of the Decree can be found in the following sections of this Annual Report and Accounts:
• The information concerning compliance with the Dutch Code, as required by article 3 of the Decree, can be found in the section Compliance with the ‘Dutch Corporate Governance Code’;
• The information concerning OCI N.V.’s Risk Management and control frameworks relating to the financial reporting process, as required by article 3a(a) of the Decree, can be found in the section ‘Risk Management’;
• The information regarding the functioning of OCI N.V.’s General Meeting of Shareholders, and the authority and rights of OCI N.V.’s shareholders and holders of depositary receipts, as required by article 3a(b) of the Decree, can be found within the relevant sections under ‘Corporate Governance’;
• The information regarding the composition and functioning of OCI N.V.’s Board and its Committees, as required by article 3a(c) of the Decree, can be found within the relevant sections under ‘Corporate Governance’; and
• The information concerning the inclusion of the information required by the decree Article 10 European Takeover Directive, as required by article 3b of the Decree, can be found in the section ‘Decree Article 10 EU Takeover Directive’.
The Dutch Corporate Governance Code was last amended on 8 December 2016 and is available at www.commissiecorporategovernance.nl.
In control statementThe Board believes that, to the best of its knowledge and in accordance with best practice provisions of section II.1.4 and II.1.5 of the 2008 Dutch Corporate Governance Code, OCI N.V. is in control of its business processes. The Board confirms that internal controls over financial reporting provide a reasonable level of assurance, that the financial reporting does not contain any material inaccuracies, and confirms that these controls functioned properly during the year 2016.
The Board of Directors has reasonable assurance that OCI N.V.’s financial reporting for the financial year 2016 does not contain any material misstatements.
Directors’ statement pursuant to article 5:25c of the Dutch Financial Supervision Act ((wet op het financieel toezicht)In accordance with Article 5:25c of the Dutch Financial Supervision Act (wet op het financieel toezicht), OCI N.V.’s Board declares that to the best of its knowledge, (i) the 2016 financial statements provide a true and fair view of the assets, liabilities, financial position and results of the Company and its subsidiaries included in the consolidated statements in accordance with International Financial Reporting Standards as adopted by the European Union (IFRS-EU); and (ii) the annual report provides a true and fair view of the situation as at December 31, 2016, and of the Company’s state of affairs for the financial year 2016, as well as the principal risks faced by OCI N.V. (iii) the Management report includes a description of the principal risks and uncertainties that the Company faces.
Amsterdam, the Netherlands, 24 March 2017
The OCI N.V. Board of DirectorsMichael Bennett, Chairman Nassef Sawiris Salman Butt Jan Ter Wisch Sipko Schat Jérôme Guiraud Greg Heckman Robert Jan van de Kraats Anja Montijn
DECLARATIONS
72 Consolidated Statement of Financial Position
73 Consolidated Statement of Profit or Loss and Other Comprehensive Income
74 Consolidated Statement of Changes in Equity
75 Consolidated Statement of Cash Flows
77 Notes to the Consolidated Financial Statements
CONSOLIDATED FINANCIALSTATEMENTS

72 OCI N.V. Annual Report 2016 OCI N.V. Annual Report 2016 73
Performance review / Operational strengths / Sustainability review / Corporate governance / Financial statements / Other information Performance review / Operational strengths / Sustainability review / Corporate governance / Financial statements / Other information
$ millions Note 2016 2015
AssetsNon-current assets
Property, plant and equipment (7) 5,231.0 5,913.9Goodwill and other intangible assets (8) 489.5 499.6Trade and other receivables (9) 41.1 44.9Equity accounted investees (10) 653.3 33.4Available-for-sale financial assets (11) 42.9 41.2Deferred tax assets (12) 5.0 6.5
Total non-current assets 6,462.8 6,539.5
Current assetsInventories (13) 141.0 140.6Trade and other receivables (9) 259.0 276.5Available-for-sale financial assets (11) 4.1 9.3Income tax receivables (12) 1.2 2.2Cash and cash equivalents (14) 392.2 796.4
Total current assets 797.5 1,225.0
Total assets 7,260.3 7,764.5
EquityShare capital (15) 5.6 4,704.9Share premium (15) 6,316.3 1,610.7Reserves (16) (112.3) (87.6)Retained earnings (4,776.9) (4,967.7)
Equity attributable to owners of the Company 1,432.7 1,260.3Non-controlling interest (17) 345.3 489.5
Total equity 1,778.0 1,749.8
Liabilities
Non-current liabilitiesLoans and borrowings (18) 4,322.2 3,336.7Trade and other payables (19) 5.6 24.9Provisions (20) 9.8 12.0Deferred tax liabilities (12) 209.1 224.7
Total non-current liabilities 4,546.7 3,598.3
Current liabilitiesLoans and borrowings (18) 263.8 1,566.1Trade and other payables (19) 480.1 568.3Provisions (20) 110.7 243.4Income tax payables (12) 81.0 38.6
Total current liabilities 935.6 2,416.4
Total liabilities 5,482.3 6,014.7
Total equity and liabilities 7,260.3 7,764.5
The notes on pages 77 to 132 are an integral part of these consolidated financial statements.
CONSOLIDATED STATEMENT OF FINANCIAL POSITION AS AT 31 DECEMBER
$ millions Note 2016 2015
Revenue (26) 1,906.5 2,186.1Cost of sales (21) (1,685.4) (1,654.1)Gross profit 221.1 532.0
Other income (22) 352.7 116.9Selling, general and administrative expenses (21) (224.1) (270.3)Other expenses1 (23) (45.2) (436.3)Operating profit / (loss) 304.5 (57.7)
Finance income (24) 352.2 128.0Finance cost (24) (432.5) (274.0)Net finance cost (24) (80.3) (146.0)Income from equity accounted investees (net of tax) (10) (0.9) 1.3Profit / (loss) before income tax 223.3 (202.4)Income tax (12) (48.7) 93.7Net profit / (loss) from continued operations 174.6 (108.7)
Net profit from discontinued operations (net of tax) (27) - 630.8
Total net profit 174.6 522.1
Other comprehensive income:Items that are or may be reclassified to profit or lossNet change in fair value of available-for-sale financial assets (16) 0.7 0.3Release of cash flow hedges due to demerger (27) - 12.8Currency translation differences (16) (35.5) (68.8)Release of currency translation differences due to demerger (27) - 108.8Other comprehensive income from equity accounted investees - (0.6)Other comprehensive income, net of tax (34.8) 52.5Total comprehensive income 139.8 574.6
Profit attributable to:Owners of the Company 167.9 384.7Non-controlling interest 6.7 137.4Net profit 174.6 522.1
Total comprehensive income attributable to:Owners of the Company 140.9 423.5Non-controlling interest (1.1) 151.1Total comprehensive income 139.8 574.6
Earnings per share from total operations (in USD)Basic earnings per share (25) 0.802 1.839Diluted earnings per share (25) 0.802 1.817
Earnings / (loss) per share from continuing operations (in USD)Basic earnings / (loss) per share (25) 0.802 (1.177)Diluted earnings / (loss) earnings per share (25) 0.802 (1.177)
1 The 2015 amount includes impairment of goodwill for USD 422.9 million. Reference is made to note 8.
The notes on pages 77 to 132 are an integral part of these consolidated financial statements.
CONSOLIDATED STATEMENT OF PROFIT OR LOSS AND OTHER COMPREHENSIVE INCOMEFOR THE YEARS ENDED 31 DECEMBER

74 OCI N.V. Annual Report 2016 OCI N.V. Annual Report 2016 75
Performance review / Operational strengths / Sustainability review / Corporate governance / Financial statements / Other information Performance review / Operational strengths / Sustainability review / Corporate governance / Financial statements / Other information
$ millions Note
Sharecapital
(15)
Sharepremium
(15)Reserves
(16)Retainedearnings
Equityattributable
to owners of the Company
Non-controlling
interest(17)
Totalequity
Balance at 1 January 2015 273.3 1,447.6 196.5 201.5 2,118.9 418.9 2,537.8
Net profit - - - 384.7 384.7 137.4 522.1Other comprehensive income - - 38.8 - 38.8 13.7 52.5
Total comprehensive income - - 38.8 384.7 423.5 151.1 574.6
Dividends (15) - - - - - (13.0) (13.0)Increase in nominal value of shares (15) 4,426.9 - - (4,426.9) - - -Conversion of retained earnings into share capital (15) 1,400.0 - - (1,400.0) - - -Dividend in kind demerger activities (15) (1,400.0) - - - (1,400.0) - (1,400.0)Capital contribution OCI Partners LP (15) - - - (10.8) (10.8) 10.8 -Demerger reclassification effect on non-controlling interest (27) - - - - - (78.3) (78.3)Treasury shares sold (16) - - 3.5 - 3.5 - 3.5Treasury shares acquired (16) - - (19.5) - (19.5) - (19.5)Exchange of treasury shares (16) - - 5.5 - 5.5 - 5.5Capital increase (16) 4.7 163.1 - (6.7) 161.1 - 161.1Reclassification from reserve (16) - - (312.4) 312.4 - - -Modification of share-based payments to cash alternatives (21c) - - - (23.7) (23.7) - (23.7)Share-based payments (21) - - - 1.8 1.8 - 1.8
Balance at 31 December 2015 4,704.9 1,610.7 (87.6) (4,967.7) 1,260.3 489.5 1,749.8
Net profit - - - 167.9 167.9 6.7 174.6Other comprehensive income (16) - - (27.0) - (27.0) (7.8) (34.8)
Total comprehensive income - - (27.0) 167.9 140.9 (1.1) 139.8
Decrease in nominal value of shares (15) (4,703.5) 4,703.5 - - - - -Dividend to non-controlling interest (15) - - - - - (129.3) (129.3)Impact difference in profit sharing non-controlling interest (16) - - - - - 7.0 7.0Capital contributions to non-controlling interest (15) - - - (12.5) (12.5) 12.5 -Treasury shares sold (16) - - 2.3 - 2.3 - 2.3Capital increase (15) 4.2 2.1 - - 6.3 - 6.3Reclassification non-controlling interest (15) - - - 33.3 33.3 (33.3) -Share-based payments (21) - - - 2.1 2.1 - 2.1
Balance at 31 December 2016 5.6 6,316.3 (112.3) (4,776.9) 1,432.7 345.3 1,778.0
The notes on pages 77 to 132 are an integral part of these consolidated financial statements.
CONSOLIDATED STATEMENT OF CHANGES IN EQUITY
$ millions Note 2016 2015
Net profit 174.6 522.1
Adjustments for:Net (profit) from discontinued operations (27) - (630.8)Depreciation and amortization (7),(8) 317.2 301.6Impairment of goodwill (8) - 422.9Interest income (24) (21.7) (12.8)Interest expense (24) 242.2 180.9Net foreign exchange (gain) and others (24) (140.2) (22.1)Share in income of equity-accounted investees (10) 0.9 (1.3)Impairment available-for-sale financial assets (23) 3.0 3.5Result on sale of investment (22) (2.8) (10.1)Result on sale of 50% and deconsolidation of Natgasoline (22) (107.9) -Share-based payment transactions (21) 2.1 1.8Impact difference in profit-sharing non-controlling interest (15) 7.0 -Income tax expense (12) 48.7 (93.7)
Changes in:Inventories (13) (20.8) 37.9Trade and other receivables (9) 75.5 88.6Trade and other payables1 (19) 34.1 (35.7)Provisions (20) 3.2 (41.7)
Cash flows:Interest paid (24) (250.2) (274.3)
Interest received (24) 22.2 9.1Income taxes paid (12) (15.0) (1.7)(Payment) / refund of tax dispute liability1 (28) (49.5) 266.2Cash flow from operating activities (continuing operations) 322.6 710.4
Proceeds from sale of property, plant and equipment (7) - 3.1Investments in property, plant and equipment (7) (735.9) (1,131.4)Proceeds from sale of available-for-sale financial assets (11) 0.4 -Proceeds from sale of investment (22) - 5.1Dividends from equity-accounted investees (10) 6.7 7.1Cash flow effect from loss of control Natgasoline (10) (12.1) -Repayment of shareholder’s loan by Natgasoline (6.2) 511.0 -Acquisition of subsidiary net of cash acquired (31) - (16.5)Cash flow (used in) investing activities (continuing operations) (229.9) (1,132.6)
CONSOLIDATED STATEMENT OF CASH FLOWSFOR THE YEARS ENDED 31 DECEMBER

76 OCI N.V. Annual Report 2016 OCI N.V. Annual Report 2016 77
Performance review / Operational strengths / Sustainability review / Corporate governance / Financial statements / Other information Performance review / Operational strengths / Sustainability review / Corporate governance / Financial statements / Other information
$ millions Note 2016 2015
Proceeds from share issuance (15) - 161.1Proceeds from sale of treasury shares (16) 2.3 3.5Purchase of treasury shares (16) - (19.5)Proceeds from borrowings (18) 1,474.3 760.7Repayment of borrowings (18) (1,712.5) (389.0)Debt modification costs on existing loans (18) (13.2) -Dividends paid to non-controlling interest (17) (129.3) (13.0)Cash flows (used in) / from financing activities (continuing operations) (378.4) 503.8
Net cash flows (used in) / from continuing operations (285.7) 81.6
Cash flows (used in) operating activities - (123.3)
Cash flows (used in) investing activities - (20.0)Cash flows from financing activities - 58.3Net cash flows (used in) discontinued operations (27) - (85.0)
Net (decrease) in cash and cash equivalents (285.7) (3.4)Cash and cash equivalents at 1 January 787.0 1,115.2Effect of exchange rate fluctuations on cash held (109.8) (40.9)Less cash and cash equivalents as at 7 March (demerger date) - (283.9)Cash and cash equivalents at 31 December 391.5 787.0
Presentation in the statement of financial positionCash and cash equivalents (14) 392.2 796.4Bank overdraft (18) (0.7) (9.4)Cash and cash equivalents at 31 December 391.5 787.0
1 The 2015 figures have been adjusted to correct the foreign exchange effect on the tax refund received by OCI S.A.E.
The notes on pages 77 to 132 are an integral part of these consolidated financial statements.
CONSOLIDATED STATEMENT OF CASH FLOWSFOR THE YEARS ENDED 31 DECEMBER (CONTINUED)
NOTES TO THE CONSOLIDATED FINANCIAL STATEMENTS FOR THE YEARS ENDED 31 DECEMBER
1. General
OCI (‘OCI’ or ‘the Company’) was established on 2 January 2013 as a public limited liability company incorporated under Dutch law, with its head office located at Honthorststraat 19, Amsterdam, the Netherlands. OCI is registered in the Dutch commercial register under No. 56821166 dated 2 January 2013. The consolidated financial statements comprise the financial statements of the Company, its subsidiaries (together referred to as the ‘Group’) and the Group’s interests in associates and joint ventures.
The Group is primarily involved in the production of nitrogen based fertilizers and industrial chemicals. The Engineering & Construction business was demerged on 7 March 2015.
2. Basis of preparation
2.1 General
The consolidated financial statements have been prepared in accordance with International Financial Reporting Standards as endorsed by the European Union (IFRS-EU).
The consolidated financial statements have been prepared on the historical cost basis, except when otherwise indicated.
The financial year of the Group commences on 1 January and ends on 31 December.
The consolidated financial statements are presented in US dollars (‘USD’), which is the Group’s presentation currency. The Euro (‘EUR’) is the functional currency of OCI N.V. All values are rounded to the nearest tenth of million (in millions of USD), except when stated otherwise.
These financial statements have been authorised for issue by the Company’s Board of Directors on 24 March 2017. These financial statements are subject to adoption of the Annual General Meeting of Shareholders on 8 June 2017.
2.2 Completed demerger of the Engineering & Construction Business in 2015
OCI N.V. demerged the Company’s Engineering & Construction business in March 2015 (‘the Demerger’). The ultimate parent company holding the demerged Engineering & Construction activities and that became listed on the Cairo and Dubai stock exchanges directly after the demerger is Orascom Construction Limited (’OCL’). The demerger was completed on 7 March 2015. Consequently, the assets and liabilities held for demerger have been derecognized as per this date. Reference is made to note 27 ‘Assets classified for demerger / discontinued operations‘. The effect of this demerger is presented as ‘discontinued operations’ in the comparative information in the consolidated statement of profit or loss and other comprehensive income and the consolidated statement of cash flows in accordance with IFRS 5.
Ongoing relationship between OCI N.V. and Orascom Construction LimitedAfter the Demerger, OCI N.V. and OCL each operate as separately listed companies. There are no cross-directorships, other than Jerome Guiraud who is non-executive director of OCI N.V. and chairman of OCL, and Salman Butt, who is Chief Financial Officer of OCI N.V. and non-executive director of OCL. The senior management teams of OCI N.V. and OCL are different.
Construction contracts
OCL and OCI N.V. are party to continuing commercial arrangements, for the construction of OCI’s two greenfield plants in the USA. Reference is made to note 32.
Shared services agreementOn 5 February 2015, OCI N.V. and OCL entered into a 18 month shared services agreement whereby each of the party supplied certain transitional services to the other. These services included: the provision by OCI N.V. to OCL of accounting and consolidation, and any general corporate support services as required and the provision by OCL to OCI N.V. of accounting, treasury, information technology, administration, corporate human resources, and office space services. The agreement has expired, but parties expect to make use of some of the above mentioned support services on an ad-hoc basis. The consideration payable for the services will be on a cost-plus basis.
Conditional sale agreementOrascom Construction Industries S.A.E (‘OCI S.A.E.’) was the former parent company of the OCI Group, which was replaced by OCI N.V. in 2013 and was delisted from the Egyptian Stock Exchange in 2016. OCI S.A.E. acts as the sub holding of several Fertilizer & Chemical entities in the group but also contains Engineering & Construction activities. As part of the demerger of the Engineering & Construction business to OCL it was also decided to legally split the activities of OCI S.A.E. into two separate legal entities. One legal entity holding the Fertilizer & Chemical entities and one legal entity holding the Engineering & Constructions business (mainly ongoing construction projects and several joint operations and joint ventures). The legal split (demerger) of OCI S.A.E. has not taken place yet.
In order to have the Engineering & Construction businesses derecognized from the OCI N.V. consolidated financial statements, a conditional sale agreement was entered into between the OCI Group and the OCL Group. The agreement is for the conditional sale of the Engineering & Construction business of OCI S.A.E. into a separate legal entity, which will be called ‘Construction Egypt’. The conditional sale agreement effectively transfers control over the Engineering & Construction business from the OCI Group to the OCL Group, by passing the economic benefits and liabilities of the legal entity ‘Construction Egypt’, including the underlying relevant construction projects (together with the right to any dividends) from the OCI Group to the OCL Group with effect from the date of the conditional sale agreement as if the legal entity ‘Construction Egypt’ already existed since 30 September 2014.
The OCI Group committed to appoint management personnel in the construction operations nominated by OCL. OCL also received the right to vote on the board of directors of OCI S.A.E. in matters related to the construction business. This transfer of economic benefits, liabilities and rights will remain in force until the transfer of the ‘Construction Egypt’ shares has been legally formalised. Any new awarded projects will be sought through a wholly-owned subsidiary of OCL.

78 OCI N.V. Annual Report 2016 OCI N.V. Annual Report 2016 79
Performance review / Operational strengths / Sustainability review / Corporate governance / Financial statements / Other information Performance review / Operational strengths / Sustainability review / Corporate governance / Financial statements / Other information
2.2 Completed demerger of the Engineering & Construction in 2015 (continued)
Tax indemnity agreement
On 6 February 2015, OCL and OCI S.A.E. entered into a tax indemnity agreement. The agreement sets out each party’s obligations in respect of the tax claim lodged by the tax authorities in Egypt relating to the sale of the OCI S.A.E.’s cement business to Lafarge SA in 2007 (further reference is made to note 28). The parties have agreed to equally split any liability incurred by OCI S.A.E. in relation to the Tax Claim (including the costs of dealing with the Tax Claim). In addition, to the extent that any recoveries are made in relation to the tax claim, including interest received on the funds, these will be shared between the parties on a 50%/50% basis (excluding the amount of EGP 1.9 billion (refund received in March 2015) for which it was announced that the rights will be transferred to Tahya Misr social fund in Egypt).
3. Summary of significant accounting policies
The Group has applied the accounting policies set out in note 3 consistently over both periods presented in these consolidated financial statements. No new accounting standards, amendments and revisions became applicable during 2016 that significantly impacted the consolidated financial statements. Reference is made to note 4.1.
3.1 Consolidation
The consolidated financial statements include the financial statements of OCI N.V., its subsidiaries and the Group’s interests in associates and joint ventures.
SubsidiariesSubsidiaries are all companies to which OCI N.V. is exposed or has rights to variable returns from its involvement with the investee and has the ability to affect those returns through its control over the investee, generally accompanying a shareholding of more than half of the shares issued and related voting power. Subsidiaries are fully consolidated from the date that control commences until the date that control ceases. When the Group ceases to have control over a subsidiary, it derecognizes the assets and liabilities of the subsidiary, and any related non-controlling interest and other components of equity. Any investment retained in the former subsidiary is recognized at fair value. The fair value shall be regarded as the fair value on initial recognition of a financial asset or, when appropriate, the cost on initial recognition of an investment in an associate or joint venture. Any resulting gain or loss is recognized in profit or loss including related cumulative translation adjustments accumulated in other comprehensive income. If it becomes an associate or joint venture, the interest retained is subsequently measured in accordance with the equity method. The principal subsidiaries are listed in note 36.
Transactions eliminated in the consolidated financial statementsIntra-group balances and transactions, and any unrealized income and expenses arising from intra-group transactions, are eliminated in preparing the consolidated financial statements. Unrealized gains arising from transactions with equity-accounted investees are eliminated against the investment to the extent of the Group’s interest in the investees. Unrealized losses are eliminated in the same way as unrealized gains, but only to the extent that there is no evidence of impairment.
Non-controlling interestNon-controlling interest is presented as a separate component in equity. ‘Profit or loss’ and ‘Total comprehensive income’ attributable to the non-controlling interest are presented as a separate line items in the statement of profit or loss and other comprehensive income. Non-controlling interest is measured at its proportionate share of the acquiree’s identifiable net assets at the balance sheet date. Changes in Group’s ownership interest in a subsidiary that do not result in a loss of control are accounted for as equity transactions.
3.2 Equity-accounted investees
AssociatesAssociates are those companies in which the Group exercises significant influence, but does not have control over the financial and operating policies, and are presumed to exist when the Group holds 20% to 50% of the shareholding and related voting rights of the other entity. Associates are accounted for under the equity method. The Group’s share of profit or loss of an associate is recognized in profit or loss from the date when significant influence begins up to the date when that influence ceases. Investments in associates with negative shareholder’s equity are impaired and a provision for its losses is recognized only if the Group has a legal or constructive obligation to cover the losses. Equity changes in investees accounted for under the equity method that do not result from profit or loss are recognized in other comprehensive income. Unrealized gains on transactions between the Group and its associates are eliminated to the extent of the Group’s interest in associates. Unrealized losses are also eliminated unless the transaction provides evidence of an impairment of the asset transferred. Unrealized gains on transactions between two associates are not eliminated.
Joint venturesInvestments in joint arrangements are classified as either joint ventures or joint operations depending on the contractual rights and obligations of each investor. Those joint arrangements that are assessed as joint ventures are accounted for using the equity method. Joint operations are accounted for using the line by line accounting.
Joint ventures are accounted for under the equity method. Under the equity method of accounting, interests in joint ventures are initially recognized at cost and adjusted subsequently for the Group’s share in the post-acquisition profit or losses and movements in comprehensive income. When the Group’s share of losses in a joint venture equals or exceeds its interest in the joint venture (which includes any long term interest that, in substance, forms part of the Group’s net investment in joint ventures), the Group does not recognize further losses, unless it has incurred obligations or made payments on behalf of the joint venture.
3.3 Discontinued operations / assets held for demerger or sale
A discontinued operation is a component of the Group’s business which:
• has operations and cash flows that can be clearly distinguished from the rest of the Group;
• represents a separate major line of business or geographical area of operations;
• is part of a single coordinated plan to dispose of a separate major line of business or geographical area of operations.
Classification as a discontinued operation occurs upon disposal or when the operation meets the criteria to be classified as held for sale or demerger. When an operation is classified as a discontinued operation, the comparative information in the statement of comprehensive income and the consolidated statement of cash flows are reclassified as if the operation had been discontinued from the start of the comparative period. In the statement of financial position, the comparative numbers are not reclassified.
3.4 Business combinations
Business combinations are accounted for using the acquisition method. The cost of an acquisition is measured as the aggregate of the consideration transferred measured at acquisition date fair value and the amount of any non-controlling interest in the acquiree. For each business combination, the Group elects whether to measure the non-controlling interest in the acquiree at fair value or at the proportionate share of the acquiree’s identifiable net assets. Acquisition-related costs are expensed as incurred and included in administrative expenses.
When the Group acquires a business, it assesses the financial assets and liabilities assumed for appropriate classification and designation in accordance with the contractual terms, economic circumstances and pertinent conditions as at the acquisition date. This includes the separation of embedded derivatives in host contracts by the acquiree.
If the business combination is achieved in stages, the previously held equity interest is remeasured at its acquisition date fair value and any resulting gain or loss is recognized in profit or loss. Any contingent consideration to be transferred by the acquirer will be recognized at fair value at the acquisition date. Contingent consideration classified as an asset or liability that is a financial instrument and within the scope of IAS 39 ‘Financial Instruments: Recognition and Measurement’, is measured at fair value with changes in fair value recognized either in profit or loss or as a change to other comprehensive income. If the contingent consideration is not within the scope of IAS 39, it is measured in accordance with the appropriate IFRS. Contingent consideration classified as equity is not remeasured and subsequent settlement is accounted for within equity.
3.5 Foreign currency
Foreign currency transactionsThe financial statements of subsidiaries and joint operations are prepared in the currencies which are determined based on the primary economic environment in which they operate (‘the functional currency’). Transactions in currencies other than the functional currency are recorded at the rates of exchange prevailing on the transaction dates. At each balance sheet date, monetary items denominated in foreign currencies are revalued into the entity’s functional currency at the then prevailing closing-rates. Exchange differences arising on the settlement and translation of monetary items are included in profit or loss for the period except when deferred to other comprehensive income for available-for-sale equity instruments and the effective part of qualifying cash flow hedges.
Foreign currency translationUpon consolidation, the assets and liabilities of subsidiaries with a functional currency other than the US dollars are translated into US dollars using the exchange rates prevailing at the balance sheet date. Income and expense items are translated using exchange rates prevailing at the date of the transactions. Investments in joint ventures and associates with a functional currency other than the US dollars are translated into US dollars using exchange rates prevailing on the balance sheet date. Exchange rate differences arising during consolidation and on the translation of investments in subsidiaries, joint arrangements and associates are included in other comprehensive income, as ‘Currency translation differences’. When a foreign operation is (partly) disposed of or sold, (the proportionate share of) the related currency translation differences that were recorded in other comprehensive income are recycled to profit or loss as part of the gain or loss on disposal or sale. Goodwill and fair value adjustments arising on the acquisition of a foreign subsidiary are considered as assets and liabilities denominated in the functional currency of the foreign subsidiary.
NOTES TO THE CONSOLIDATED FINANCIAL STATEMENTS CONTINUED

80 OCI N.V. Annual Report 2016 OCI N.V. Annual Report 2016 81
Performance review / Operational strengths / Sustainability review / Corporate governance / Financial statements / Other information Performance review / Operational strengths / Sustainability review / Corporate governance / Financial statements / Other information
3.6 Financial instruments
The group classifies its financial instruments in the following three categories:
• financial instruments at fair value through profit or loss;
• loans, receivables and payables at amortized cost;
• available-for-sale financial assets.
The classification depends on the nature and purpose for which the financial instruments were acquired. Management determines the classification of its financial instruments at initial recognition. Financial instruments are classified as current unless the remaining term of the financial instruments or the remaining term of the facility, under which the financial instruments are drawn, is 12 months or more.
Regular way purchases and sales of financial instruments are recognized on trade-date, the date on which the group commits to purchase or sell the instrument. Financial assets are derecognized when the rights to receive cash flows from the financial assets have expired or have been transferred and the group has transferred substantially all the risks and rewards of ownership. The Group derecognizes a financial liability when its contractual obligations are discharged, cancelled or expired. Any remaining interest in such derecognized financial instrument that is retained by the Group is recognized as a separate asset or liability. Financial assets and financial liabilities are offset and presented net in the statement of financial position when the Group has a legal right to offset the amounts and intends either to settle them on a net basis or to realize the asset and settle the liability simultaneously. All financial instruments are initially measured at fair value, except for equity instrument not traded in an active market and for which the fair value cannot be reliably determined. These equity instruments are measured at cost.
For the group’s policy on impairments and fair value determinations, please refer to notes 3.12 and 5.
Financial instruments at fair value through profit or loss A financial instrument is classified at fair value through profit or loss if it is acquired principally for the purpose of selling in the short term (held-for-trading) or if it is designated at fair value through profit or loss. This category also includes derivatives not designated in a hedge relationship. Transaction costs of financial instruments carried at fair value through profit or loss are expensed in profit or loss when incurred.
Financial instruments at fair value through profit or loss are subsequently carried at fair value. Gains or losses arising from changes in the fair value are recognized in profit or loss within finance income or finance expenses. Interest income from financial assets at fair value through profit or loss is included in the net gain / loss.
Loans, receivables and payables at amortized cost Loans, receivables and payables are initially recognized at fair value plus any directly attributable transaction costs. Subsequent to initial recognition, loans and receivables are measured at amortized cost, using the effective interest method, less any impairment losses. Interest on payables, is recognized using the effective interest method in the income statement.
Available-for-sale financial assetsAvailable-for-sale financial assets includes investments that have been designated as available-for-sale and financial assets that are not classified into any of the other financial instruments categories. Investments are designated as available-for-sale financial assets if they do not have fixed maturities and fixed or determinable payments, and management intends to hold them for the medium to long term.
Transaction costs directly attributable to the transaction are included in the initial fair value upon recognition of all financial instruments not at fair value through profit or loss. Dividend income from equity instruments is recognized in profit or loss as ‘finance income’ when the Group’s right to receive payment is established. Interest on available-for-sale debt securities is recognized using the effective interest method in the income statement. Available-for-sale financial assets are subsequently carried at fair value, except for equity instruments for which there is no active market and the fair value cannot be reliably determined. These equity instruments are measured at cost, less impairments. Gains or losses arising from changes in the fair value are recognized in other comprehensive income, net of taxes.
Derivative financial instruments and cash flow hedge accounting
Derivatives are initially recognized at fair value on the date a derivative contract is entered into and are subsequently re-measured to their fair value at the end of each reporting period. The accounting for subsequent changes in fair value depends on whether the derivative is designated as a hedging instrument, and if so, the nature of the item being hedged. Attributable transaction costs are recognized in profit or loss as incurred.
The group designates certain derivatives as cash flow hedges, where it is designated for hedging a particular risk associated with the cash flows of recognized assets and liabilities and highly probable forecast transactions.
At the inception of the hedging transaction, the Group formally documents the relationship between the hedging instrument and hedged item; the risk management objectives; the strategy in undertaking the hedge transaction and the methods that will be used to assess the effectiveness of the hedging relationship.
The Group makes an assessment, at both hedge inception and on an ongoing basis, of whether the hedging instruments have been and will continue to be highly effective in offsetting the changes in the fair value or cash flows of the related hedged items. Certain derivative instruments do not qualify for hedge accounting, for example commodity swaps used by the Group.
A cash flow hedge is a hedge of the exposure to variability in cash flows that is attributable to a particular risk associated with all or a component of a recognized asset or liability or a highly probable forecast transaction, and that could affect profit or loss.
3.6 Financial instruments (continued)
The effective portion of changes in the fair value of derivatives that are designated and qualify as cash flow hedges is recognized in other comprehensive income, net of related tax, and accumulated in the hedging reserve in equity. Any gain or loss relating to the ineffective portion is recognized immediately in profit or loss within other income or other expense.
Amounts accumulated in equity are reclassified to profit or loss in the periods when the hedged item affects profit or loss (for instance when the forecast sale that is hedged takes place).
However, when the forecast transaction that is hedged results in the recognition of a non-financial asset (for example, inventory or fixed assets), the gains and losses previously deferred in equity are reclassified from equity and included in the initial measurement of the cost of the asset. The deferred amounts are ultimately recognized in profit or loss as cost of goods sold in the case of inventory, or as depreciation or impairment in the case of fixed assets.
If the hedging instrument no longer meets the criteria for hedge accounting, expires or is sold, terminated or exercised, hedge accounting is discontinued. The cumulative gain or loss on the hedging instrument that has been recognized in other comprehensive income from the period when the hedge was effective shall remain in equity until the forecast transaction occurs. If the forecast transaction is no longer expected to occur, the balance in equity is reclassified to profit or loss immediately.
Embedded derivatives Embedded derivatives are separated from the host contract and accounted for separately if the economic characteristics and risks of the host contract and the embedded derivative are not clearly and closely related, a separate instrument with the same terms as the embedded derivative would meet the definition of a derivative, and the combined instrument is not measured at fair value through profit or loss. Changes in the fair value of separated embedded derivatives are recognized immediately in profit or loss.
Compound financial instruments Compound financial instruments are bifurcated and the components are presented separately as financial liabilities, financial assets or equity instruments.
The liability component of compound financial instruments is initially recognized at the fair value of a similar liability that does not have an equity conversion option. The equity component is initially recognized at the difference between the fair value of the compound financial instrument as a whole and the fair value of the liability component. Any directly attributable transaction costs are allocated to the liability and equity components in proportion to their initial carrying amounts.
Subsequent to initial recognition, the liability component of a compound financial instrument is measured at amortized cost using the effective
interest method. The equity component of a compound financial instrument is not re-measured.
Interest related to the financial liability is recognized in profit or loss. On conversion at maturity, the financial liability is reclassified to equity and no gain or loss is recognized.
3.7 Cash and cash equivalents
Cash and cash equivalents comprise cash balances and call deposits with original maturities of three months or less from the acquisition date (original maturity) that are subject to an insignificant risk of changes in their fair value and are used by the Group in the management of its short-term commitments. Restricted cash comprises cash balances where specific restrictions exist on the Company’s ability to use this cash. Restricted cash includes cash deposited as collateral for letters of credit issued by the Company. Restricted funds include bank balances reserved by the lending institution for installments of loan payments to be made in the near future.
3.8 Share capital
Ordinary shares are classified as equity. Share premium is the excess amount received over the par value of the shares. Incremental costs directly attributable to the issue of new shares are recognized in equity as a deduction, net of tax, from the proceeds. When ordinary shares are repurchased, the amount of the consideration paid, which includes directly attributable costs, net of tax effects, is recognized as a deduction from ‘Reserves’. Repurchased shares are classified as treasury shares and are presented in ‘Reserves’. When treasury shares are sold or reissued subsequently, the amount received is recognized as an increase in ‘Reserves’, and the resulting surplus or deficit on the transaction is presented in share premium.
NOTES TO THE CONSOLIDATED FINANCIAL STATEMENTS CONTINUED

82 OCI N.V. Annual Report 2016 OCI N.V. Annual Report 2016 83
Performance review / Operational strengths / Sustainability review / Corporate governance / Financial statements / Other information Performance review / Operational strengths / Sustainability review / Corporate governance / Financial statements / Other information
3.9 Property, plant and equipment
Items of property, plant and equipment are measured at cost less accumulated depreciation and any impairment. Cost includes expenditure that is directly attributable to the acquisition of the asset. The cost of self-constructed assets includes cost of material, direct labour, other directly attributable cost incurred to bring the asset ready to its intended use, cost of asset retirement obligations and any capitalized borrowing cost.
Purchased software that is integral to the functionality of the related equipment is capitalized as part of that equipment. When parts of property, plant and equipment have different useful lives, they are accounted for as separate items (major components) of property, plant and equipment. Any gain or loss on disposal of an item of property, plant and equipment (calculated as the difference between the net proceeds from disposal and the carrying amount of the item) is recognized in profit or loss. Subsequent expenditures are capitalized only when it is probable that the future economic benefits associated with the expenditure will flow to the Group. Ongoing repairs and maintenance costs are expensed as incurred. Spare parts of property, plant and equipment are recognized under property, plant and equipment if the average turn-over exceeds 12 months or more, otherwise they are recognized within inventories.
Finance leases Leased assets in which the Group bears substantially all the risks and rewards incidental to ownership are classified as finance leases and recognized under property, plant and equipment. Upon initial recognition, the leased asset is measured at the lower of its fair value and the present value of minimum lease payments. Minimum lease payments made under finance leases are apportioned between the interest expenses and the reduction of the outstanding liability. The interest expenses are recognized as other financing cost over the lease term. The finance cost is allocated to each period during the lease term so as to produce a constant periodic rate of interest on the remaining balance of the liability.
Property, plant and equipment under construction Expenditures incurred for purchasing and constructing property, plant and equipment are initially recorded as ‘under construction’ until the asset is completed and becomes ready for use. Upon the completion of the assets, the recognized costs are reclassified from ‘under construction’ to its final category of property, plant and equipment. Assets under construction are not depreciated and measured at cost less any impairment losses.
Depreciation Items of property, plant and equipment are depreciated on a straight line basis through profit or loss over the estimated useful lives of each component, taking into account any residual values. Finance lease assets are depreciated over the shorter of the lease term and their useful lives. If it is reasonably certain that the Group will obtain ownership by the end of the lease term, the finance lease assets are depreciated over their useful lives. Land is not depreciated. Items of property, plant and equipment are depreciated from the date that they are installed and are ready for use, or in respect of internally constructed assets, from the date that the asset is completed and ready for use.
The estimated useful lives for items of property, plant and equipment are as follows: Years
Buildings 10 - 50Plant and equipment 5 - 25Fixtures and fittings 3 - 10
Depreciation methods, useful lives and residual values are reviewed at each reporting date and adjusted if necessary by the Group.
Borrowing costs Borrowing costs attributable to the acquisition, construction or production of assets that necessarily take a substantial period of time to get ready for their intended use or sale, are recognized as part of the cost of those assets. All other borrowing costs are recognized as ‘Finance cost’ in the period in which they are incurred.
3.10 Goodwill and other intangible assets
GoodwillGoodwill represents the excess of purchase price and related costs over the value assigned to the Groups’ share of identifiable assets acquired and liabilities assumed of businesses acquired that were directly attributable to the legal entities comprising the Group. If the fair value of the net assets acquired is in excess of the aggregate consideration transferred, the gain is recognized in profit or loss.
Goodwill on acquisition of entities that qualify as subsidiaries is presented under ‘Goodwill and intangible assets’. Goodwill on acquisitions of entities that qualify as associates or joint ventures is included in ‘Equity-accounted investees’. Goodwill on acquisition of subsidiaries is allocated to cash-generating units for the purpose of impairment testing. The allocation is made to those cash-generating units or group of units that are expected to benefit from the business combination through which the goodwill arose, based on past experience.
Goodwill is initially measured at cost. After initial recognition, goodwill is measured at cost less any impairment losses. Goodwill is tested annually for impairment; an impairment loss is recognized for the amount by which the cash-generating unit’s carrying amount exceeds its recoverable amount. The recoverable amount of the cash-generating unit is determined by the higher of its fair value less cost to sell and its value in use. Impairment losses on goodwill are not reversed. Gains or losses on the disposal of an entity include the carrying amount of goodwill related to the entity sold. All other expenditures on internally generated goodwill and other intangible assets is recognized in profit or loss as incurred.
3.10 Goodwill and other intangible assets (continued)
Other intangible assetsOther intangible assets with a finite useful life (licenses, customer relations, brand names and other rights that are acquired separately or through business combinations) are amortized on a straight-line basis in profit or loss over their estimated useful lives taking into account any residual value and impairment losses, from the date that they are available for use.
The estimated useful lives of intangible assets are as follows: Years
Licenses and trade names 3 - 10Purchased rights and other 4 - 10
Amortization methods, useful lives and residual values are reviewed at each reporting date and adjusted if necessary.
3.11 Inventories
Inventories are measured at the lower of cost and net realizable value. The cost of inventories of raw materials, spare parts and supplies are based on the weighted average principle or the first-in-first-out method, and includes expenditure incurred in acquiring the inventories and bringing them to their existing location and condition. In case of manufactured inventories and work in progress, cost includes an appropriate share of production overheads based on normal operating capacity. Net realizable value is the estimated selling price in the ordinary course of business, less the estimated costs of completion and selling expenses.
3.12 Impairment of assets
Non-derivative financial assetsThe Group assesses at each balance sheet date whether there is objective evidence that a non-derivative financial asset or a group of non-derivative financial assets is impaired. A non-derivative financial asset is considered to be impaired if the counterparty does not meet the agreed payment terms or when evidence exists that the counterpart will not be able to do so. The Group considers evidence of impairment for these assets at both an individual asset and a collective level. All individually significant assets are individually assessed for impairment. Those found not to be impaired are then collectively assessed for any impairment that has been incurred but not yet individually identified. Assets that are not individually significant are collectively assessed for impairment. Collective assessment is carried out by grouping together assets with similar risk characteristics. In assessing collective impairment, the Group uses historical information on the timing of recoveries and the amount of loss incurred, and makes an adjustment if current economic and credit conditions are such that the actual losses are likely to be greater or lesser than suggested by historical trends. An impairment loss is recognized for the amount by which the carrying amount of a non-derivative financial asset exceeds its estimated discounted future cash flows using the original interest rate. Impaired non-derivative financial assets are tested periodically to determine whether the estimated future cash flows have increased and the impairment has to be reversed. Reversal of impairments is only permitted if in a subsequent period after an impairment loss has been recognized, the amount of the impairment loss decreases and the decrease can be related objectively to an event after the impairment loss was recognized. In the case of a financial asset classified as available-for-sale, a significant or prolonged decline in the fair value of the available-for-sale financial asset below its acquisition cost is considered as an indicator that the available-for-sale financial asset is impaired. If any such evidence exists for an available-for-sale financial asset, the cumulative loss – measured as the difference between the acquisition cost and the current fair value, less any impairment loss on that financial asset previously recognized in profit or loss – is removed from other comprehensive income and recognized in profit or loss. Impairment losses recognized in profit or loss on equity instruments classified as available-for-sale are not reversed through profit or loss.
Derivative financial assetsDerivative financial assets are measured at fair value and the Group investigates whether the counterparty’s creditworthiness gives rise to an impairment. When determining the fair value, credit value and debit value adjustments are taken into account.
Non-financial assetsNon-financial assets that have an indefinite useful life, for example goodwill, are not subject to amortization but are tested annually for impairment or more frequently when indicators arise. Assets with a finite useful life are subject to depreciation or amortization and are reviewed at each reporting date to determine whether there is an indication of impairment. If any such indication exists, then the assets’ recoverable amount is estimated. An impairment loss is recognized for the amount by which the assets’ carrying amount exceeds its recoverable amount. The recoverable amount is the higher of an asset’s fair value less costs of disposal and its value in use. The value in use is the present value of the future cash flows expected to be derived from an asset or cash-generating unit by continued use. For the purposes of assessing impairment, assets are grouped based on the lowest level for which there are separately identifiable cash flows (cash-generating units). Impairment losses are recognized in profit or loss. They are allocated first to reduce the carrying amount of any goodwill allocated to the CGU, and then to reduce the carrying amounts of the other assets in the CGU on a pro-rata basis. Non-financial assets, which are impaired, are tested periodically to determine whether the recoverable amount has increased and the impairment has to be (partially) reversed. Impairment losses on goodwill are not reversed. For other assets, an impairment loss is reversed only to the extent that the asset’s carrying amount does not exceed the carrying amount that would have been determined, net of depreciation or amortization, if no impairment loss had been recognized. Reversal of impairments is only permitted if in a subsequent period after an impairment loss has been recognized, the amount of the impairment loss decreases and the decrease can be related objectively to an event after the impairment loss was recognized.
NOTES TO THE CONSOLIDATED FINANCIAL STATEMENTS CONTINUED
84 OCI N.V. Annual Report 2016 OCI N.V. Annual Report 2016 85
Performance review / Operational strengths / Sustainability review / Corporate governance / Financial statements / Other information Performance review / Operational strengths / Sustainability review / Corporate governance / Financial statements / Other information
3.13 Provisions
Provisions are recognized when a present legal or constructive obligation as a result of a past event exists, and it is probable that an outflow of economic benefits is required to settle the obligation. If the outflow is probable, but cannot be determined reliably, the obligation is disclosed. The non-current part of provisions is determined by discounting the expected future cash flows at a pre-tax rate that reflects current market assessments of the time value of money and the risks specific to the liability. The unwinding of the discount is recognized as finance cost.
Asset retirement obligations The Group recognizes a provision if the Group has an obligation to restore a leased asset in its original condition at the end of its lease term and in case of legal requirements with respect to clean-up of contamination of land, and the estimate can be made reliable.
Claims and contingenciesThe Group is subject to legal and regulatory proceedings in various jurisdictions. Such proceedings may result in criminal or civil sanctions, penalties or disgorgements against the Company. If it is probable that an obligation to the Group exists, which will result in an outflow of resources and the amount of the outflow can be reliably estimated, a provision is recognized.
Donation provisionThe donation provision is recognized as a constructive obligation, the amount is undiscounted as the Group does not know the exact settlement date
3.14 Revenue recognition
Revenues comprise the fair value of the considerations received or receivable from the sale of goods and services to third parties in the ordinary course of the Group’s activities, excluding the taxes levied and taking into account any discounts granted. OCI recognizes revenue when the amount of revenue can be reliably measured, it is probable that future economic benefits will flow to OCI and specific criteria have been met as described below.
Revenue on goods sold is recognized, in addition to abovementioned criteria, when persuasive evidence exists, usually in the form of an executed sales agreement, that the significant risks and rewards of ownership of the goods have transferred to the customer, the associated costs and possible return of goods can be estimated reliably and there is no continuing management involvement with the goods. If it is probable that discounts will be granted and the amount can be measured reliably, then the discount is recognized as a reduction of revenue as the sales are recognized. The timing of the transfer of risks and rewards varies depending on the individual terms of the sales agreement, whereby usually the transfer occurs when the product is received at the customer’s warehouse or the products leave the Company’s warehouse; however, for some international shipments transfer occurs on loading the goods onto the relevant carrier at the port. Generally, for such products, the customer has no right of return.
3.15 Government grants
An unconditional government grant related to an asset is recognized in profit or loss as ‘Other income’ when the grant becomes receivable. When the grant relates to an asset, it is recognized as income in equal amounts over the expected useful life of the related asset. Grants that compensate the Group for expenses incurred are recognized in profit or loss as ‘Other income’ on a systematic basis in the periods in which the expenses are recognized. Other government grants are recognized initially as deferred income at fair value when there is reasonable assurance that they will be received and the Group will comply with the conditions associated with the grant, and are then recognized in profit or loss as ‘Other income’ on a systematic basis over the useful life of the asset.
3.16 Operating leases
Leases in which a significant portion of the risks and rewards incidental to ownership are retained by the lessor are classified as operating leases. Payments made by OCI under operating leases (net of any incentives received from the lessor) are charged to the consolidated statement of profit or loss and other comprehensive income on a ‘straight-line’ basis over the period of the lease.
3.17 Finance income and cost
Finance income comprises:
• interest income on funds invested (including available-for-sale financial assets);
• gains on the disposal of available-for-sale financial assets;
• dividend income;
• fair value gains on financial assets at fair value through profit or loss;
• gains on hedging instruments related to foreign currency and interest rate derivatives that are recognized in profit or loss and reclassifications of amounts previously recognized in other comprehensive income; and
• interest income is recognized as it accrues in profit or loss, using the effective interest method.
Dividend income is recognized in profit or loss on the date that the Group’s right to receive payment is established, which in the case of quoted securities is normally the ex-dividend date.
Finance cost comprise:
• interest expense on borrowings;
• unwinding of the discount on provisions and contingent consideration;
• losses on disposal of available-for-sale financial assets;
• fair value losses on financial assets at fair value through profit or loss;
• loss on hedging instruments related to foreign currency and interest rate derivatives that are recognized in profit or loss and reclassifications of amounts previously recognized in other comprehensive income; and
• impairment losses recognized on financial assets (other than trade receivables).
Borrowing costs that are not directly attributable to the acquisition, construction or production of a qualifying asset are recognized in profit or loss and expensed as incurred. Foreign currency gains and losses are recognized on a net basis as either finance income or finance cost depending on whether foreign currency movements are in a net gain or net loss position.
3.18 Employee benefits
Defined contribution planCertain Group subsidiaries provide ‘pension plans’, ‘end of service remuneration plans’ and ‘long-term service benefits’. These pension plans qualify as defined contribution plans. Obligations for contributions to defined contribution plans are expensed as the related service is provided. Prepaid contributions are recognized as an asset to the extent that a cash refund or a reduction in future payments is available.
Short-term employee benefitsShort-term employee benefits are expensed as the related service is provided. A liability is recognized for the amount expected to be paid if the Group has a present legal or constructive obligation to pay this amount as a result of past service provided by the employee and the obligation can be estimated reliably.
Long-term employee benefitsThe Group long-term employee benefits are recognized if the Group has a present legal or constructive obligation to pay this amount as a result of past service provided by the employee and the obligation can be estimated reliably to determine its present value. The discount rate is the yield at the balance sheet date on triple-A (‘AAA’) credit rated bonds that have maturity dates approximating to the terms of the Group’s obligations. Re-measurements are recognized in profit or loss in the period in which they arise.
Termination benefits Employee termination benefits are payable when employment is terminated before the normal retirement date, or whenever an employee accepts voluntary redundancy in exchange for these benefits. OCI recognizes termination benefits when OCI is demonstrably committed to either terminating the employment of current employees according to a detailed formal plan without possibility of withdrawal, or when OCI is providing termination benefits as a result of an offer made to encourage voluntary redundancy. Benefits falling due more than 12 months after balance sheet date are discounted to present value.
Share-based paymentsEmployees (including senior executives) of the Group receive remuneration in the form of share-based payments, whereby employees render services as consideration for equity instruments.
The grant date fair value of equity-settled share-based payment awards granted to employees is recognized as an employee expense, with a corresponding increase in equity, over the period (the vesting period) that the employees render service and becomes unconditionally entitled to the awards. The amount recognized as an expense is adjusted to reflect the number of awards for which the related service and non-market performance conditions are expected to be met, such that the amount ultimately recognized as an expense is based on the number of awards that meet the related service and non-market performance conditions at the vesting date.
For cash-settled share-based compensation plans and share-based compensation plans with cash alternatives the liability is remeasured at each balance sheet date during the vesting period and for share option plans also during the exercise period.
NOTES TO THE CONSOLIDATED FINANCIAL STATEMENTS CONTINUED

86 OCI N.V. Annual Report 2016 OCI N.V. Annual Report 2016 87
Performance review / Operational strengths / Sustainability review / Corporate governance / Financial statements / Other information Performance review / Operational strengths / Sustainability review / Corporate governance / Financial statements / Other information
3.19 Income tax
Current taxCurrent tax is the expected tax payable or receivable on the taxable income or loss for the year, using tax rates enacted or substantively enacted at the reporting date, and any adjustment to tax payable or receivable in respect of previous years. Current tax payable also includes any tax liability arising from the declaration of dividends. Current income tax receivable and payable are offset when there is a legally enforceable right to offset and when the current income tax relates to the same fiscal authority.
Deferred taxDeferred income tax liabilities are recognized for all taxable temporary differences arising between the tax bases of assets and liabilities and their carrying amounts in the consolidated financial statements (‘liability’ method). Deferred income tax assets are recognized for all deductible temporary differences, unused carry forward losses and unused carry forward tax credits, to the extent that it is probable that future taxable profit will be available against which the deferred income tax assets can be utilized.
Deferred income tax is not recognized if it arises from initial recognition of an asset or liability in a transaction that is not a business combination and at the time of the transaction affects neither accounting nor taxable profit or loss. Also, no deferred income tax is recognized regarding the initial recognition of goodwill and regarding investments in subsidiaries, associates and joint arrangements to the extent that the Group is able to control the timing of the reversal of the temporary differences and it is probable that they will not reverse in the foreseeable future.
Deferred income tax is measured at the tax rates that are expected to apply to the period when the asset is realized or the liability is settled, based on tax rates (and tax laws) that have been enacted or substantively enacted at the balance sheet date. Deferred income tax assets and liabilities are offset when there is a legally enforceable right to offset current tax assets against current tax liabilities and when the deferred income tax relates to the same fiscal authority.
3.20 Segment reporting
An operating segment is a component of an entity that engages in business activities for which it may earn revenues and incur expenses (including revenues and expenses relating to transactions with other components of the same entity), whose operating results are regularly reviewed by the entity’s Chief Operating Decision Maker (‘CODM’) to make decisions about resource allocation to the segment and to assess its performance and for which discrete financial information is available. The Group determines and presents operating segments on the basis of information that internally is provided to the CODM during the period. Operating segments are grouped into reporting segments based on similar long-term financial performance and similar economic characteristics.
3.21 Consolidated statement of cash flows
The consolidated statement of cash flows has been prepared using the ‘indirect’ method. Cash flows in foreign currencies have been translated applying average exchange rates. Currency translation differences are shown separately in the consolidated statement of cash flows. Cash flows from investing activities consist mostly of investments and divestments in property, plant and equipment, intangible assets, and acquisitions insofar as these are paid for in cash. Acquisitions or disposals of subsidiaries are presented as acquisition of subsidiary, net of cash. Cash flows relating to capitalized borrowing cost are presented as cash flows from operating activities. Cash flows from discontinued operations / assets held for demerger are presented separately from the cash flows from continuing operations.
3.22 Earnings per share
Earnings per ordinary share are calculated by dividing the profit or loss (net) attributable to holders of ordinary shares by the weighted average number of ordinary shares outstanding during the year. In making this calculation the (ordinary) treasury shares are deducted from the number of ordinary shares outstanding. The calculation of the diluted earnings per share is based on the weighted average number of ordinary shares outstanding plus the potential increase as a result of the conversion of convertible bonds and the settlement of share-based compensation plans (share option plans). Anti-dilutive effects are not included in the calculation. With regard to the convertible notes it is assumed that these are converted in full. An adjustment is made to profit or loss (net) to eliminate interest charges, whilst allowing for effect of taxation. Regarding equity-settled share option plans it is assumed that all outstanding plans will vest. The potential increase arising from share option plans is based on a calculation of the value of the options outstanding. This is the number of options multiplied by the exercise price, divided by the average share price during the financial year. This potential increase is only applied if the option has intrinsic value.
4. New accounting standards and policies
On a regular basis, the IASB issues new accounting standards, amendments and revisions to existing standards and interpretations. These new accounting standards, amendments and revisions to existing standards and interpretations are subject to endorsement by the European Union.
4.1 Standards, amendments, revisions and interpretations that became applicable to OCI during 2016:
Accounting pronouncements, which became effective for 2016, had no material impact on the Group’s consolidated financial statements.
4.2 Standards, amendments, revisions and interpretations not yet effective to OCI:
IFRS standards and interpretations thereof not yet in force which may apply to the future Group’s consolidated financial statements are being assessed for their potential impact. The most important upcoming changes are:
IFRS 9 ‘Financial Instruments’ The standard issued on 19 November 2013 is effective for reporting periods beginning on or after 1 January 2018. IFRS 9 addresses the classification and measurement of financial assets, impairment and hedge accounting phases of the IASB’s project to replace IAS 39 ‘Financial Instruments: Recognition and Measurement’. IFRS 9 enhances the ability of investors and other users of financial information to understand the accounting of financial assets and reduces complexity. The new standard is expected to have minor impact on certain financial instruments of the Group. Currently the Group has identified that the cost exemption available-for-sale financial asset will no longer be applicable, the whole category of Available-for-sale financial assets will be reclassified into one of the new categories under IFRS 9 and that the measurement of embedded derivatives against fair value will change. Currently for the latter the host contract is accounted for at cost, under IFRS 9 the host contract including the embedded derivative will be measured at fair value in total.
IFRS 15 ‘Revenue from Contracts with Customers’ The standard issued on 28 May 2014 is effective for reporting periods beginning on or after 1 January 2018. IFRS 15 specifies how and when an IFRS reporter will recognize revenue as well as requiring such entities to provide users of financial statements with more informative, relevant disclosures. The standard provides a single, principles based five-step model to be applied to all contracts with customers.
IFRS 15 will be implemented for the first time by OCI Group as of 1 January 2018 (the date of initial application), using the modified retrospective application approach. The Group does not expect a significant impact from the application of this standard on its consolidated financial statements. Contracts with customers of the group generally provide for the sale of products, which generally results in revenue recognition upon delivery.
IFRS 16 ‘Leases’IFRS 16 issued on 13 January 2016 is effective for reporting periods beginning on or after 1 January 2019, with earlier application permitted. IFRS 16 sets out the principles for the recognition, measurement, presentation and disclosure of leases for both parties to a contract, i.e. the customer (‘lessee’) and the supplier (‘lessor’). IFRS 16 introduces a single lessee accounting model. Applying that model, a lessee (like the Group) is required to recognize: (a) assets and liabilities for all leases with a term of more than 12 months, unless the underlying asset is of low value; and (b) depreciation of lease assets separately from interest on lease liabilities in the statement of profit or loss. The Group has not yet assessed their current operating lease commitments in detail. Nevertheless it is expected that a part of the operating lease commitments that are now disclosed in note 30 of the consolidated financial statements (total future minimal lease payments amount to USD 83.8 million at year-end 2016) will need to be recognized under Property, plant and equipment, with a corresponding increase of current and non-current loans. The Group will further assess the impact of this new IFRS standard in 2017.
5. Critical accounting judgment, estimates and assumptions
The preparation of the financial statements in compliance with IFRS requires management to make judgments, estimates and assumptions that affect amounts reported in the consolidated financial statements. The estimates and assumptions are based on experience and various other factors that are believed to be reasonable under the circumstances and are used to judge the carrying values of assets and liabilities that are not readily apparent from other sources. The estimates and underlying assumptions are reviewed on an ongoing basis. Revisions to accounting estimates are recognized in the period in which the estimate is revised or in the revision period and future periods, if the changed estimates affect both current and future periods. The most critical accounting policies involving a higher degree of judgment and complexity in applying principles of valuation and for which changes in the assumptions and estimates could result in significantly different results than those recorded in the financial statements are the following:
Goodwill and other intangible assetsIntangible assets with finite useful lives are carried at cost less cumulative amortization and any impairment. Amortization is calculated using the ‘straight-line’ method based on the estimated useful lives. Management makes estimates regarding the useful lives and residual values and assumes that amortization takes place on a ‘straight-line’ basis. The assets’ useful lives are reviewed, and adjusted if appropriate, at each balance sheet date. For intangible assets with finite useful lives, OCI assesses annually or more frequently whether indicators exist that suggest the intangible asset might be impaired by comparing the recoverable amounts with their carrying amounts. In determining the recoverable amounts of intangible assets, OCI makes estimates and assumptions about future cash flows based on the value in use. In doing so, OCI also makes assumptions and estimates regarding the discount rates in order to calculate the net present value of the future cash flows.
OCI tests at least annually whether goodwill is impaired by comparing the recoverable amounts of cash-generating units with their carrying amounts. The recoverable amount is the higher of the fair value less cost of disposal and the value in use. In determining the recoverable amount, OCI makes estimates and assumptions concerning future revenues, future costs, future working capital, future investments, Weighted Average Cost of Capital (‘WACC’) and future inflation rates.
Property, plant and equipment Depreciation is calculated using the ‘straight-line’ method based on the estimated useful lives, taking into account any residual values. Management makes estimates regarding the useful lives and residual values and assumes that depreciation takes place on a ‘straight-line’ basis. The assets’ residual values and useful lives are reviewed, and adjusted if appropriate, at each balance sheet date. OCI assesses annually, or more frequently, whether indicators exist that suggest that an item of property, plant and equipment might be impaired by comparing the recoverable amounts with their carrying amounts. In determining the recoverable amounts of property, plant and equipment, OCI makes estimates and assumptions about future cash flows based on the value in use. The discount rate to be used in order to calculate the net present value of the future cash flows in the impairment analysis is based on the WACC.
NOTES TO THE CONSOLIDATED FINANCIAL STATEMENTS CONTINUED

88 OCI N.V. Annual Report 2016 OCI N.V. Annual Report 2016 89
Performance review / Operational strengths / Sustainability review / Corporate governance / Financial statements / Other information Performance review / Operational strengths / Sustainability review / Corporate governance / Financial statements / Other information
5. Critical accounting judgment, estimates and assumptions (continued)
Financial instruments The fair value of financial instruments traded in active markets (financial instruments in the fair value hierarchy level 1) is based on quoted market prices at the balance sheet date. The fair value of financial instruments not traded in an active market with observable market prices (financial instruments in the fair value hierarchy level 2) is determined using generally accepted valuation techniques. These valuation techniques include estimates and assumptions about forward rates, discount rates based on a single interest rate, or on a yield-curve based on market conditions existing at the balance sheet date. The fair value of borrowings and interest rate swaps is calculated based on the present value of the estimated future cash flows based on the yield-curve applicable at the balance sheet date. If the financial instrument contains a floating interest rate, the future expected interest rates are determined based on forward rates. The fair value of forward foreign exchange contracts is determined using quoted forward exchange rates at the balance sheet date. The net carrying amount of trade receivables and trade payables is assumed to approximate the fair value due to the short term nature. The fair value of financial instruments with no observable market prices (financial instruments in the fair value hierarchy level 3) is based on assumptions that market participants would use when pricing these asset or liability, including assumptions about risk. Assumptions about risk include the risk inherent in a particular valuation technique used to measure fair value (such as a pricing model) and the risk inherent in the inputs to the valuation technique, including a risk adjustment when there is significant measurement uncertainty.
The fair value of non-current financial liabilities is estimated by discounting the future cash flows using original effective yield-curves. Unlisted equity securities in the available-for-sale category (financial instruments in the fair value hierarchy level 3) are measured at cost less impairments. A significant and prolonged decline in the fair value of the available-for-sale financial asset below its acquisition cost is considered as an indicator that the available-for-sale financial asset is impaired. If any such evidence exists for an available-for-sale financial asset, the cumulative losses previously recognized in other comprehensive income is recognized in the income statement – measured as the difference between the acquisition cost and the current fair value, less any impairment loss on that financial asset previously recognized in the income statement – is removed from other comprehensive income and recognized in the income statement.
Impairment financial instruments (including trade receivables)Objective evidence may exist in circumstances in which a counterparty has been placed in bankruptcy, or has failed on the repayments of principal and interest. In other circumstances OCI uses judgment in order to determine whether a financial assets may be impaired. OCI uses judgment in order to determine whether an impairment can be reversed, an assumption in doing so might be an improvement in the debtor’s credit rating or receipt of payments due. For listed equity securities in the available-for-sale financial assets category, the Group uses the assumption that if the market value declined by more than 25 percent and more than 6 months, the asset is assumed to be impaired. For unlisted equity securities in the available-for-sale financial assets category, an impairment test is performed if objective evidence becomes available to the Group that the asset might be impaired. For debt-securities, an impairment trigger exist when the counterpart fails to meet its contractual payment obligations or there is evidence that the counterpart has encountered financial difficulties. The impairment is determined based on the carrying amount and the recoverable amount. The recoverable amount is determined as the present value of estimated future cash flows using the original effective interest rate.
Inventories In determining the net realizable value of inventories, OCI estimates the selling prices in the ordinary course of business, cost of completion and cost to sell. In doing so, OCI makes estimates and assumptions based on current market prices, historical usage of various product categories versus current inventory levels and specific identified obsolescence risks (e.g. end of life of specific goods and spare parts and the impact of new environmental legislation).
Provisions Recognition of provisions include significant estimates, assumptions and judgments. IFRS requires only those provisions to be recognized if there is an expected outflow of resources in the near future and if the cost of these outflows can be estimated reliably. Accordingly, management exercises considerable judgment in determining whether there is a present obligation as a result of a past event at the end of the reporting period, whether it is probable that such a proceeding will result in an outflow of resources and whether the amount of the obligation can be reliably estimated. These judgments are subject to change as new information becomes available. The required amount of a provision may change in the future due to new developments in the particular matter. Revisions to estimates may significantly impact future profit or loss. Upon resolution, the Group may incur charges in excess of the recorded provisions for such matters.
Provisions for asset retirement obligations, represent estimated costs of decommissioning. Due to the long time frame over which future cash outflows are expected to occur including the respective interest accretion require assumptions. Amongst others, the estimated cash outflows could alter significantly if, and when, political developments affect future laws and regulation with respect to asset retirements.
With respect to legal cases, the Group has to estimate the outcome of the legal cases. Regulatory and legal proceedings as well as government investigations often involve complex legal issues and are subject to substantial uncertainties. The Company periodically reviews the status of these proceedings with both the internal and external legal counsels.
Income taxes OCI is subject to income taxes in several jurisdictions. Estimates are required in determining the group-wide provision for income taxes. There are some transactions and calculations for which the ultimate tax position is uncertain during the ordinary course of business. The Group recognizes provisions for anticipated tax audit issues based on estimates of whether additional taxes will be due. Where the final tax outcome of these matters is different from amounts that were initially recorded, such differences will impact the current income tax and deferred tax provisions in the period in which such determination is made. OCI recognizes deferred tax assets to the extent that it is probable that future taxable profits will be available for the deferred tax asset to be recovered. This is based on estimates of taxable future income by jurisdiction in which OCI operates and the period over which deferred tax assets are expected to be recoverable. In the event that actual results or new estimates differ from previous estimates and depending on the possible tax strategies that may be implemented, changes to the recognition of deferred tax assets could be required, which could impact the financial position and profit or loss.
5. Critical accounting judgment, estimates and assumptions (continued)
Asset held sale for sale / demerger, discontinued operationsOCI used judgment in determining what a disposal group or a discontinued operation is and when it qualifies for reclassification according to IFRS 5 (management commitment, ready for sale / demerger, highly probable, completion within one year). In determining what is a disposal group or a discontinued operation, OCI judges whether the cash flows of the disposal group or a discontinued operation can be distinguished from the rest of the group, what determines a major line of operation and whether a single coordinated plan to dispose exists and at what date it was formally approved.
Liquidity riskAs part of the preparation of the financial statements, the Company has assessed its liquidity risk and going concern. Liquidity risk is the risk that the Group may encounter difficulty in meeting the obligations associated with its financial liabilities that are settled by delivering cash or another financial asset. The Company has made a number of assumptions in assessing its ability to meet its covenant requirements and satisfy obligations as they become due. Determining these assumptions requires significant judgment about future results and cash flows. Key assumptions include product pricing, gas pricing, utilization rates, IFCo commissioning, and the ability to arrange financing and obtain waivers for potential covenant breaches.
6. Financial risk and capital management
OverviewThe Group has exposure to credit, liquidity and market risks from financial instruments. These risks arise from exposures that occur in the normal course of business and are managed on a consolidated company basis. This note presents information about the Group’s exposure to each of the above risks, the Group’s objectives, policies and processes for measuring and managing these risks, additionally it also includes the Group’s management of capital.
Risk management frameworkThe Board has oversight responsibility on the establishment and monitoring of the Group’s risk management framework. Senior (local) management is responsible for the effective operation of the internal risk management and control systems. The Audit & Risk department is responsible for the facilitation and supervision of the Risk Management function, compliance with OCI Internal Control Framework and supports the Board in the exercise of their aforementioned risk management duties.
The Group’s risk management policies and practices are established to identify and analyze the risks faced by the Group, to set appropriate risk limits and controls and to monitor risks and adherence to limits. Risk management policies and systems are reviewed regularly to reflect changes in market conditions and the Group’s business activities. The Group, through its training and management standards and procedures, aims to develop a disciplined and constructive control environment in which all employees understand their roles and responsibilities.
The Audit Committee oversees how management monitors compliance with the Group’s risk management policies and procedures, and reviews the adequacy of the risk management framework in relation to the risks faced by the Group. The Audit Committee is assisted in its oversight role by the Internal Audit Department. The Audit and Risk Department undertakes both regular and ad hoc reviews of risk management controls and procedures, the results of which are reported to the Audit Committee.
6.1 Credit risk
Credit risk is the risk of financial loss to the Group if a customer or counterparty to a financial instrument fails to meet its contractual obligations, and arises principally from the Group’s receivables from customers and investments in debt securities. The Company mitigates the exposure to credit risk on outstanding cash balances by placing funds at multiple financial institutions with a sufficient credit rating.The Group’s exposure to customer credit risk is monitored and mitigated by performing credit checks before selling any goods. No collateral is received. The Group establishes an allowance, if needed, for impairment that represents its estimate of incurred losses in respect of trade and other receivables. The main components of this allowance are a specific loss component that relates to individually significant exposures, and a collective loss component established for groups of similar assets in respect of losses that have been incurred but not yet identified. During the years ended 31 December 2016 and 2015, no allowance related to credit risk has been recognized, as management’s assessment did not result in any significant credit risk.
As of September 2016, OCI Nitrogen entered into a factoring agreement to sell certain trade receivables up to an amount of USD 52.6 million (EUR 50.0 million). Reference is made to note 9.
With respect to transactions with financial institutions, the Group sets a minimum credit rating for the counterparties. The maximum exposure to credit risk is the carrying amount of financial instruments, for an overview reference is made to the tables financial instruments by category. There is no significant concentration of credit risk in Trade and other receivables, Available-for-sale financial assets or Cash and cash equivalents.
The major exposure to credit risk at the reporting date is as follows:
$ millions Note 2016 2015
Trade and other receivables (9) 300.1 321.4
Available-for-sale financial assets (11) 47.0 50.5Cash and cash equivalents (14) 392.2 796.4Total 739.3 1,168.3
NOTES TO THE CONSOLIDATED FINANCIAL STATEMENTS CONTINUED

90 OCI N.V. Annual Report 2016 OCI N.V. Annual Report 2016 91
Performance review / Operational strengths / Sustainability review / Corporate governance / Financial statements / Other information Performance review / Operational strengths / Sustainability review / Corporate governance / Financial statements / Other information
6.1 Credit risk (continued)
The major exposure to credit risk for trade and other receivables by geographic region is as follows:
$ millions 2016 2015
Middle East and Africa 77.8 49.6Asia and Oceania 2.0 5.0Europe and Americas 220.3 266.8Total 300.1 321.4
6.2 Liquidity risk
Liquidity risk is the risk that the Group will encounter difficulty in meeting the obligations associated with its financial liabilities that are settled by delivering cash or another financial asset.
The following are the contractual maturities of financial liabilities, including estimated interest payments and exclude the impact of netting agreements:
At 31 December 2016$ millions Note
Carryingamount
Contractualcash flow
Less than 1 year
Between 1 and 5 years
More than5 years
Financial liabilitiesCash outflows:Loans and borrowings (18) 4,586.0 5,750.7 495.0 4,103.2 1,152.5Trade and other payables (19) 471.1 471.1 465.5 5.6 -Letters of guarantee (28) - 0.2 - - 0.2Derivatives (19) 14.6 85.9 85.9 - -
Cash inflows:Derivatives (9) (2.5) (72.8) (72.8) - -Total 5,069.2 6,235.1 973.6 4,108.8 1,152.7
At 31 December 2015$ millions Note
Carryingamount
Contractualcash flow
Less than 1 year
Between 1 and 5 years
More than5 years
Financial liabilitiesCash outflows:Loans and borrowings (18) 4,902.8 5,971.2 1,815.9 2,802.0 1,353.3Trade and other payables (19) 566.7 566.7 556.8 9.9 -Letters of guarantee (28) - 0.2 - - 0.2Derivatives (19) 26.5 61.2 46.2 15.0 -
Cash inflows:Derivatives (9) (0.1) (31.2) (31.2) - -Total 5,495.9 6,568.1 2,387.7 2,826.9 1,353.5
The interest on floating rate loans and borrowings is based on forward interest rates at period-end. This interest rate may change as the market interest rate changes. Callable loan amounts are classified as ‘Less than one year’. The future obligations will be managed by the future incoming cash from operations, currently available non-restricted cash and cash equivalents of USD 383.0 million and unused amounts on credit facility agreements (reference is made to note 18).
The Group’s approach to managing liquidity is to ensure, as far as possible, that it will always have sufficient liquidity to meet its liabilities when due, under both normal and stressed conditions, without incurring unacceptable losses or risking damage to the Group’s reputation. This is also safeguarded by using multiple financial institutions in order to mitigate any concentration of liquidity risk.
The Company’s financing strategy is to secure finance as much as possible on an operating company level. Excess cash flows of the group are used to fund investment projects that cannot be funded in full by the operating companies itself. OCI N.V. acts as the financing company thus limiting the number of cross relationships within the Company and maximizing flexibility to divest operating companies. The liquidity risk is monitored internally at Group level. On an ongoing basis the Group prepares liquidity forecasts to verify whether the Group is able to meet its future debt obligations. The Company has also carefully evaluated the funding of its Business Plan for the next 12 months, taking into account the previously mentioned measures and has applied sensitivities to the forecasted level of liquidity headroom available. Key assumptions include product pricing, gas pricing, utilization rates and IFCo commissioning. Management has applied these assumptions to the forecasts, which would leave sufficient liquidity headroom.
6.2 Liquidity risk (continued)
In 2016 a number of actions were taken to safeguard and strengthen the Company’s financial position. These included, other than covenant waivers, the sale of 50% of Firewater LLC, the holding company of Natgasoline LLC, to the Proman Group and a fully underwritten bond issuance (reference is made to note 18 for additional information on the covenant waivers and the bond issuance and note 10 regarding the 50% sale of Firewater LLC). Other actions which have been taken place during 2016 include:
• On 22 January 2016, OCI N.V. entered into a credit facility agreement with Nile Holding for USD 300.0 million and an amended agreement on 28 July 2016 for an additional USD 17.0 million.
• In April 2016, JP Morgan issued an irrevocable standby letter of credit for USD 150.0 million at the request of NNS Holding to OCI N.V. The commitments of this letter of credit can be used to cover both any funding requirement to complete the construction at IFCo for USD 100 million and an amount of USD 50 million for Natgasoline. As per 31 December 2016 commitments relating to the stand by letter of credit were outstanding in the amount of USD 82.6 million for IFCo and USD 50.0 million for Natgasoline.
• In August 2016, OCI received the final payments of the outstanding shareholder loans to Natgasoline as of the date control was lost, 4 May 2016, in the total amount of USD 511.0 million. From these proceeds the Company made the final repayments of the USD 398.2 million bridge loans outstanding as per year end 2015.
• In August 2016, OCI Nitrogen refinanced its outstanding debt of USD 315.5 million (EUR 300.0 million), by entering into two term loans of USD 525.8 million (EUR 500.0 million) and a revolving credit facility of USD 52.6 million (EUR 50.0 million) maturing in July 2021.
• In November 2016, OCI NV refinanced and upsized a USD 550.0 million revolving credit facility expiring in July 2017 with a new USD 660.0 million term loan and revolving credit facility maturing in July 2020.
• In November 2016, OCI Partners repaid USD 200.0 million of outstanding term loans and the covenants were reset.
• In November 2016, IFCo successfully completed a consent solicitation and exchange offer for USD 147.0 million of 2019 term bonds with new bonds maturing in 2026 and 2027. Under the exchange offer, the original December 2016, June 2017 and December 2017 principal repayments will be extended to ensure that debt maturities match production plans and cash flows following the start-up of the plant.
• In November 2016, EFC agreed with its lenders to waive all debt covenants until maturity of its facilities in 2019.
• In November 2016, OCI N.V. entered into a credit facility agreement with NNS Luxembourg, which is a related party, for an amount of USD 140.0 million. The loan matures on 31 January 2021 and carries an interest rate of Libor plus a margin of 9.0%. As per 31 December 2016, no amounts have been drawn from this facility.
• In February 2017, EBIC obtained approval from the sole lender to refinance the outstanding term loan in the amount of USD 49.6 million
with a 4-year amortizing loan, with semi-annual installments of USD 6.3 million and a final maturity date in December 2020.
As a result of the above mentioned refinancing actions, the Group does not have any significant debt maturing until the third quarter of 2018. The convertible bond with a principal amount outstanding of USD 356.5 million matures in that period. Reference is made to note 18 for more details on the above-mentioned actions.
6.3 Market risk
Market risk is the risk of changes in market prices, such as foreign exchange rates, interest rates, commodity prices and equity prices that will affect the Group’s income or the value of its holdings of financial instruments. The objective of market risk management is to manage and control market risk exposures within acceptable parameters, while optimizing the return.
The Group is exposed to foreign currency risk arising in separate ways:
Foreign exchange translation risk Due to the Group’s international presence, the Group is exposed to foreign exchange fluctuations as these affect the translation of the Group’s business entities presented in foreign currencies that are different from the U.S. dollar (which is the Group’s functional currency). The currencies concerned are mainly the Euro, the Egyptian pound and the Algerian dinar. Foreign exchange translation exposure is considered a part of doing business on an international level; this risk is not hedged.
Foreign exchange transaction riskThe Group entities predominantly execute their activities in their respective functional currencies. The Group is however exposed to foreign exchange transaction risk to the extent that there is a mismatch between the currencies in which sales, purchases, investments and borrowings are denominated and the respective functional currencies of the Group entities. The Group monitors the exposure to foreign currency risk arising from operating activities and enters selectively into foreign exchange contracts to hedge foreign currency exposures. The nominal amount of the foreign currency derivatives outstanding as per 31 December 2016 was USD 70.3 million (2015: USD 31.2 million). The functional currencies of the Group entities are primarily the U.S. dollar, the Algerian dinar, the Egyptian pound and the Euro.
As of 31 December 2016, if the US dollar had weakened / strengthened by 9.0 percent against the Euro, 28.0 percent against the Egyptian pound and 4.0 percent against the Algerian dinar with all other variables held constant, the translation of foreign currency receivables, payables and loans and borrowings would have resulted in a decrease / increase of USD 72.0 million, a decrease / increase of USD 14.3 million and a decrease / increase of USD 1.5 million of the profit of the year, respectively.
NOTES TO THE CONSOLIDATED FINANCIAL STATEMENTS CONTINUED

92 OCI N.V. Annual Report 2016 OCI N.V. Annual Report 2016 93
Performance review / Operational strengths / Sustainability review / Corporate governance / Financial statements / Other information Performance review / Operational strengths / Sustainability review / Corporate governance / Financial statements / Other information
The summary of balances of the Group’s exposure to foreign exchange transaction, where the main exposure currencies are different from the functional currencies is as follows (amounts after intercompany elimination):
At 31 December 2016$ millions USD EUR EGP
Trade and other receivables 27.8 4.2 58.9Trade and other payables (12.9) (14.1) (1.4)Loans and borrowings (342.8) - (55.8)Provisions - - (104.7)Cash and cash equivalents 180.5 2.1 54.1
At 31 December 2015$ millions USD EUR EGP
Trade and other receivables 18.3 4.4 2.3Trade and other payables (7.6) (14.9) (0.6)Loans and borrowings (398.2) - (129.4)Provisions - - (243.2)Cash and cash equivalents 216.3 5.5 259.8
The Algerian dinar is not included in the above table of foreign exchange transaction exposure, since there are no entities in the Group, which have monetary items denominated in Algerian dinar, except for Sorfert, which has the Algerian dinar as its functional currency.
Significant ratesThe following significant exchange rates applied during the year:
Average 2016
Average 2015
Closing 2016
Closing 2015
Euro 1.1073 1.1089 1.0517 1.0845Egyptian pound 0.1049 0.1296 0.0550 0.1275Algerian dinar 0.0091 0.0100 0.0090 0.0093
The following tables demonstrate the sensitivity to a reasonably possible change in EUR, EGP and DZD exchange rates, with all other variables held constant. The Group’s exposure to foreign currency changes for all other currencies is not material.
31 December 2016$ millions
Change in FX rate
Effect on profit before tax
Effect on equity
EUR - USD 9 percent (72.0) -
(9) percent 72.0 -
EGP - USD 28 percent (14.3) -
(28) percent 14.3 -
DZD - USD 4 percent (1.5) -
(4) percent 1.5 -
31 December 2015 $ millions
Change in FX rate
Effect on profit before tax
Effect on equity
EUR - USD 12 percent 94.9 -
(12) percent (94.9) -
EGP - USD 3 percent (3.3) -
(3) percent 3.3 -
DZD - USD 6 percent (9.2) -
(6) percent 9.2 -
The figures in the above overview are determined on the volatility of last year for the respective currencies. A significant part of the Group’s exposure to foreign currency transaction risk relates to intercompany balances in foreign currencies.
6.3 Market risk (continued)
Interest rate riskThe Group‘s cash flow interest rate risks arise from the exposure to variability in future cash flows of floating rate financial instruments and refinancing fixed rate borrowings. The Group reviews its exposure in light of global interest rate environment. The Group has not entered into any interest rate derivative.
The Group analyses its interest rate exposure on a dynamic basis. The Group calculates the impact on profit or loss of a defined interest rate shift. The same interest rate shift is used for all currencies. The following table demonstrates the sensitivity to a reasonably possible change in interest rates on that portion of borrowings affected. With all other variables held constant, the Group’s profit before tax is affected through the impact on floating rate borrowings plus refinancing of fixed rate borrowings, as follows:
$ millions In basis points 2016 2015
Effect on profit before tax for the coming year +100 bps (22.6) (23.1)- 100 bps 20.6 22.4
The assumed movement in basis points for the interest rate sensitivity analysis is based on the currently observable market data, showing a lower volatility compared to prior years. The interest rate sensitivity calculation is based on the interest bearing liabilities excluding the restricted funds of IFCo, reference is made to note 14.
Commodity price riskThe Group is exposed to natural gas price commodity risk as natural gas is one of the primary raw materials used in the fertilizer and chemicals production process, for those entities that buy natural gas at spot prices. The Group enters into gas hedges in order to hedge future gas price levels over a certain period of time (reference is made to note 19). This commodity hedging policy is only applied in those regions in which natural gas commodity hedging is possible. The Group did not apply hedge accounting on these instruments.
Management monitors the gas and selling prices on a daily basis using external market data provided by several data vendors. These data vendors provide historical and forecast market data. The market data is used by management to analyze the potential profit margin per product in order to make operational decisions.
Although the IFCo plant is still under construction, IFCo has entered into a swaption (option to swap) to mitigate the potential impact of the increase in natural gas prices for a portion of the expected usage. The Group does not apply hedge accounting, therefore all fair value changes related to this financial instrument are recognized in profit or loss. The derivative entitles IFCo to an option to buy a quantity of 95,887,500 MMBtu representing 50% of expected consumption against a strike price of USD 6.0/MMBtu for years 2015-2018 and USD 6.5/MMBtu for years 2019-2022. As of 31 December 2016 and 2015, the fair value of the derivative amounted to almost nil and USD 0.3 million, respectively. The discounted value of the outstanding installments related to the gas price derivative amounting to USD 14.0 million and USD 26.8 million, respectively, have been netted with the fair value of the derivative. The discount rate used was 9.2% for both 2016 and 2015.
For the entities that are impacted by changes in natural gas prices, an increase or decrease in the average natural gas prices by USD 1 per MMBtu would impact the total annual cost of sales by USD 93.3 million and USD 89.9 million based on the capacity levels as of 31 December 2016 and 2015, respectively.
Categories of financial instruments
31 December 2016$ millions Note
Loans and receivables / payables at
amortized costDerivatives at fair value
Available-for-sale financial asset at
fair value
Available-for-sale financial asset at
amortized cost
AssetsTrade and other receivables (9) 297.6 2.5 - -
Available-for-sale financial assets (11) - - 25.9 21.1Cash and cash equivalents (14) 392.2 - - -Total 689.8 2.5 25.9 21.1
LiabilitiesLoans and borrowings (18) 4,586.0 - - -Trade and other payables (19) 471.1 14.6 - - Total 5,057.1 14.6 - -
NOTES TO THE CONSOLIDATED FINANCIAL STATEMENTS CONTINUED
94 OCI N.V. Annual Report 2016 OCI N.V. Annual Report 2016 95
Performance review / Operational strengths / Sustainability review / Corporate governance / Financial statements / Other information Performance review / Operational strengths / Sustainability review / Corporate governance / Financial statements / Other information
6.3 Market risk (continued)
31 December 2015 $ millions Note
Loans and receivables / payables at
amortized costDerivatives at fair value
Available-for-sale financial asset at
fair value
Available-for-sale financial asset at at amortized cost
AssetsTrade and other receivables (9) 321.3 0.1 - -
Available-for-sale financial assets (11) - - 28.9 21.6Cash and cash equivalents (14) 796.4 - - -Total 1,117.7 0.1 28.9 21.6
LiabilitiesLoans and borrowings (18) 4,902.8 - - -Trade and other payables (19) 566.7 26.5 - - Total 5,469.5 26.5 - -
The Group has limited financial instruments carried at fair value. For those carried at fair value, the fair value is calculated within hierarchy category level 2, with the exception of financial assets in the available-for-sale category. An amount of USD 4.1 million (2015: USD 9.3 million) was recognized as level 1, an amount of USD 21.8 million (2015: USD 19.6 million) was recognized as level 2 and an amount of USD 21.1 million (2015: USD 21.6 million) was recognized as amortized cost as no reliable fair value information is available, reference is made to note 11. In 2016 and 2015, there were no transfers between the fair value hierarchy categories. The fair value of loans and borrowings and receivables are disclosed in notes 18 and 9.
6.4 Capital management
The Board’s policy is to maintain a strong capital base so as to maintain investor, creditor and market confidence and to sustain future development of the business. Capital consists of ordinary shares, retained earnings and non-controlling interest of the Group. The Board of Directors monitors the return on capital as well as the level of dividends to ordinary shareholders. The Group is required by external financial institutions to maintain certain capital requirements compared to its debt. Reference is made to note 18 for a description of financial covenants.
The Group’s net debt to equity ratio at the reporting date was as follows:
$ millions Note 2016 2015
Loans and borrowings (18) 4,586.0 4,902.8
Less: cash and cash equivalents (14) 392.2 796.4
Net debt 4,193.8 4,106.4Total equity 1,778.0 1,749.8Net debt to equity ratio at 2.36 2.35
7. Property, plant and equipment
$ millionsLand and buildings
Plant and equipment
Fixtures and fittings
Under construction Total
Cost 234.5 4,140.3 17.2 1,773.8 6,165.8Accumulated depreciation (29.1) (853.4) (10.9) - (893.4)At 1 January 2015 205.4 3,286.9 6.3 1,773.8 5,272.4
Movements in the carrying amount:Additions 3.7 37.2 2.0 1,237.4 1,280.3Release asset retirement obligation - (9.4) - - (9.4)Disposals (0.5) (2.6) - - (3.1)Acquisition of subsidiary 0.1 17.9 0.2 0.6 18.8Depreciation (9.1) (279.4) (2.0) - (290.5)Transfers 10.0 420.1 0.2 (430.3) - Effect of movement in exchange rates (21.6) (325.6) (0.8) (6.6) (354.6)At 31 December 2015 188.0 3,145.1 5.9 2,574.9 5,913.9
Cost 227.0 4,497.9 19.4 2,574.9 7,319.2Accumulated depreciation (39.0) (1,352.8) (13.5) - (1,405.3)At 31 December 2015 188.0 3,145.1 5.9 2,574.9 5,913.9
Movements in the carrying amount:Additions 1.4 24.1 1.0 861.9 888.4Disposals - (0.6) (0.9) - (1.5)Disposal of subsidiary (26.9) - - (1,201.4) (1,228.3)Reclassification - 20.4 - - 20.4
Depreciation (8.5) (295.1) (4.4) - (308.0)Transfers 0.3 96.0 2.7 (99.0) - Effect of movement in exchange rates (2.9) (49.7) 0.7 (2.0) (53.9)At 31 December 2016 151.4 2,940.2 5.0 2,134.4 5,231.0
Cost 198.2 4,562.3 19.7 2,134.4 6,914.6Accumulated depreciation (46.8) (1,622.1) (14.7) - (1,683.6)At 31 December 2016 151.4 2,940.2 5.0 2,134.4 5,231.0
As at 31 December 2016, the Group had land with a carrying amount of USD 35.3 million (2015: USD 62.2 million).
Additions to assets under construction in 2016 are mainly related to the construction of Iowa Fertilizer Company (‘IFCo’) in Iowa (full year) and to Natgasoline in Texas (for the period up to 4 May 2016).
The difference between the additions in the above schedule and the investments in property, plant and equipment mentioned in the consolidated statement of cash flows is mainly caused by capital expenditure creditors not yet paid and capitalized borrowing costs, which are presented as part of interest expenses under cash flows from operating activities in the consolidated statement of cash flows.
Included in the additions of USD 861.9 million to assets under construction is a USD 200.0 million charge related to a settlement and acceleration agreement that was entered into by OCI N.V. and Orascom E&C USA Inc. (“OEC”). The settlement and acceleration agreement addresses outstanding claims between IFCo and OEC. The necessary consents were received in November 2016. An amount of USD 170.0 million was paid in 2016 and the remaining amount of USD 30.0 million is accrued under ‘Trade and other payables’. Reference is made to note 32 for further discussion of the settlement and acceleration agreement. The disposal of subsidiary relates to the sale of 50% of Natgasoline, whereby control was transferred to the buyer and consequently 100% of the assets and liabilities of Natgasoline were derecognized by the group. OCI N.V. retained significant influence and Natgasoline is accounted for as an associate since 4 May 2016. The reclassification relates to spare parts from Inventory for items that meet the definition of Property Plant and Equipment. The effect of movement in exchange rates in 2016 mainly relates to the Sorfert plant (Algeria) and OCI Nitrogen B.V., which have different functional currencies (Algerian dinar and Euro respectively), than the Group’s presentation currency. The Algerian dinar decreased by 3,2% and the Euro decreased by 3,0% against the US dollar in 2016. Additions to assets under construction in 2015 also mainly relate to the construction of IFCo and Natgasoline. Included in the 2015 additions of USD 1,237.4 million to assets under construction is a USD 150.0 million indemnification payment made by OCI N.V. to OEC, for liabilities in connection with the construction contract for IFCo’s fertilizer and chemicals greenfield plant. Reference is made to note 32 for further discussion of these construction contracts. USD 430.3 million of transfer of assets under construction in 2015 is mostly related to the completion of the debottlenecking project of OCI Partners. The capitalized borrowing costs during the year ended 31 December 2016 amounted to USD 75.8 million and relates to IFCo for USD 69.2 million and to Natgasoline for USD 6.6 million. The capitalized borrowing costs during the year ended 31 December 2015 amounted to USD 82.0 million and related to IFCo for USD 65.4 million, to OCI Partners for USD 8.6 million and to Natgasoline for USD 8.0 million. The capitalized borrowing costs for both periods were substantially paid.
For capital commitments reference is made to note 29.
NOTES TO THE CONSOLIDATED FINANCIAL STATEMENTS CONTINUED

96 OCI N.V. Annual Report 2016 OCI N.V. Annual Report 2016 97
Performance review / Operational strengths / Sustainability review / Corporate governance / Financial statements / Other information Performance review / Operational strengths / Sustainability review / Corporate governance / Financial statements / Other information
8. Goodwill and other intangible assets
$ millions GoodwillLicenses and
trademarksPurchase rights
and other Total
Cost 1,808.6 85.6 35.2 1,929.4Accumulated amortization and impairment (900.0) (75.6) (20.9) (996.5)At 1 January 2015 908.6 10.0 14.3 932.9
Movements in the carrying amount:Amortization - (3.9) (7.2) (11.1)Impairment loss (422.9) - - (422.9)Acquisition of subsidiary - - 4.5 4.5Effect of movement in exchange rates (2.4) (1.0) (0.4) (3.8)At 31 December 2015 483.3 5.1 11.2 499.6
Cost 1,811.9 71.6 36.8 1,920.3Accumulated amortization and impairment (1,328.6) (66.5) (25.6) (1,420.7)At 31 December 2015 483.3 5.1 11.2 499.6
Movements in the carrying amount:Amortization - (1.2) (8.0) (9.2)Effect of movement in exchange rates (0.7) (0.1) (0.1) (0.9)At 31 December 2016 482.6 3.8 3.1 489.5
Cost 1,805.5 69.5 4.4 1,879.4Accumulated amortization and impairment (1,322.9) (65.7) (1.3) (1,389.9)At 31 December 2016 482.6 3.8 3.1 489.5
GoodwillGoodwill has been allocated to the cash generating units as follows:
Cash generating units $ millions Reporting segment 2016 2015
EFC North Africa 440.0 440.0OCI Partners OCI Partners 23.0 23.0OCI Nitrogen OCI Nitrogen / Trading 19.6 20.3Total 482.6 483.3
Licenses and trademarksThe licenses and trademarks mainly relate to the customer relationships, trademarks and technology assets of OCI Nitrogen B.V. These intangible assets were identified during the acquisition of OCI Nitrogen B.V. in 2010. The useful life of the customer relationships, trademarks and technology assets are respectively 5 to 10 years, 3 years and 5 years.
8. Goodwill and other intangible assets (continued)
Purchase rights and otherThe balance per year-end relates to the acquisition of BioMCN B.V. in 2015. At 31 December 2015 the balance included USD 6.7 million related to the Ammonium Sulphate supply agreement between Fertiva GmbH and OFT. This agreement was fully amortized and expired on 31 December 2016.
Goodwill impairment testing The determination of the recoverable amounts for the cash generating units requires significant judgments and estimates, including projections of future cash flows from the businesses. The recoverable amounts have been estimated based on value in use.
The tests were carried out by discounting future cash flows to be generated from the continuing use of the cash-generating units to which the goodwill applies and on the assumption of an indefinite life. Key assumptions used in the calculation of recoverable amounts are the discount rate, the terminal value growth rate, selling price outlook per product, natural gas availability and the number of expected operating days per plant. Selling prices assumptions are based on a published independent price outlook prepared by global fertilizer experts. The other assumptions used are based on past experience and external sources, but that are unpredictable and inherently uncertain.
The impairment tests are based on specific estimates for the US dollar cash flow projections for the years 2017 to 2023 (this period captures the cyclical nature of the industry). For the subsequent years the residual values were calculated on the basis of the average EBITDA margin of the projection period and whereby a perpetual growth rate of 1.5% was taken into account.
The estimated pre-tax cash flows are discounted to their present value using the following pre-tax discount rates:
Percentage
2016 2015
EFC OCI Partners OCI Nitrogen EFC OCI Partners OCI Nitrogen
Pre-tax discount rate 13.6 % 10.5 % 11.4 % 15.0 % 10.9 % 11.7 %Perpetual growth rate 1.5 % 1.5 % 1.5 % 1.5 % 1.5 % 1.5 %
Result of the impairment test For all cash generating units the recoverable values significantly exceed the carrying amounts, except for EFC. In 2016 the headroom of EFC is close to nil. In 2015 an impairment was taken on EFC.
Sensitivity analysisWhen performing the annual impairment test, we performed sensitivity analyses for the EFC CGU. The effect on the recoverable amount of modifications in the assumed discount rate, the perpetual growth rate and the selling prices can be summarized as follows:
$ millions In basis points 2016 2015
Change in post-tax discount rate + 100 bps (89) (91)- 100 bps 108 110
Change in assumed perpetual growth rate + 100 bps 62 57- 100 bps (51) (47)
Change in selling prices + 500 bps 133 n.c- 500 bps (133) n.c
NOTES TO THE CONSOLIDATED FINANCIAL STATEMENTS CONTINUED
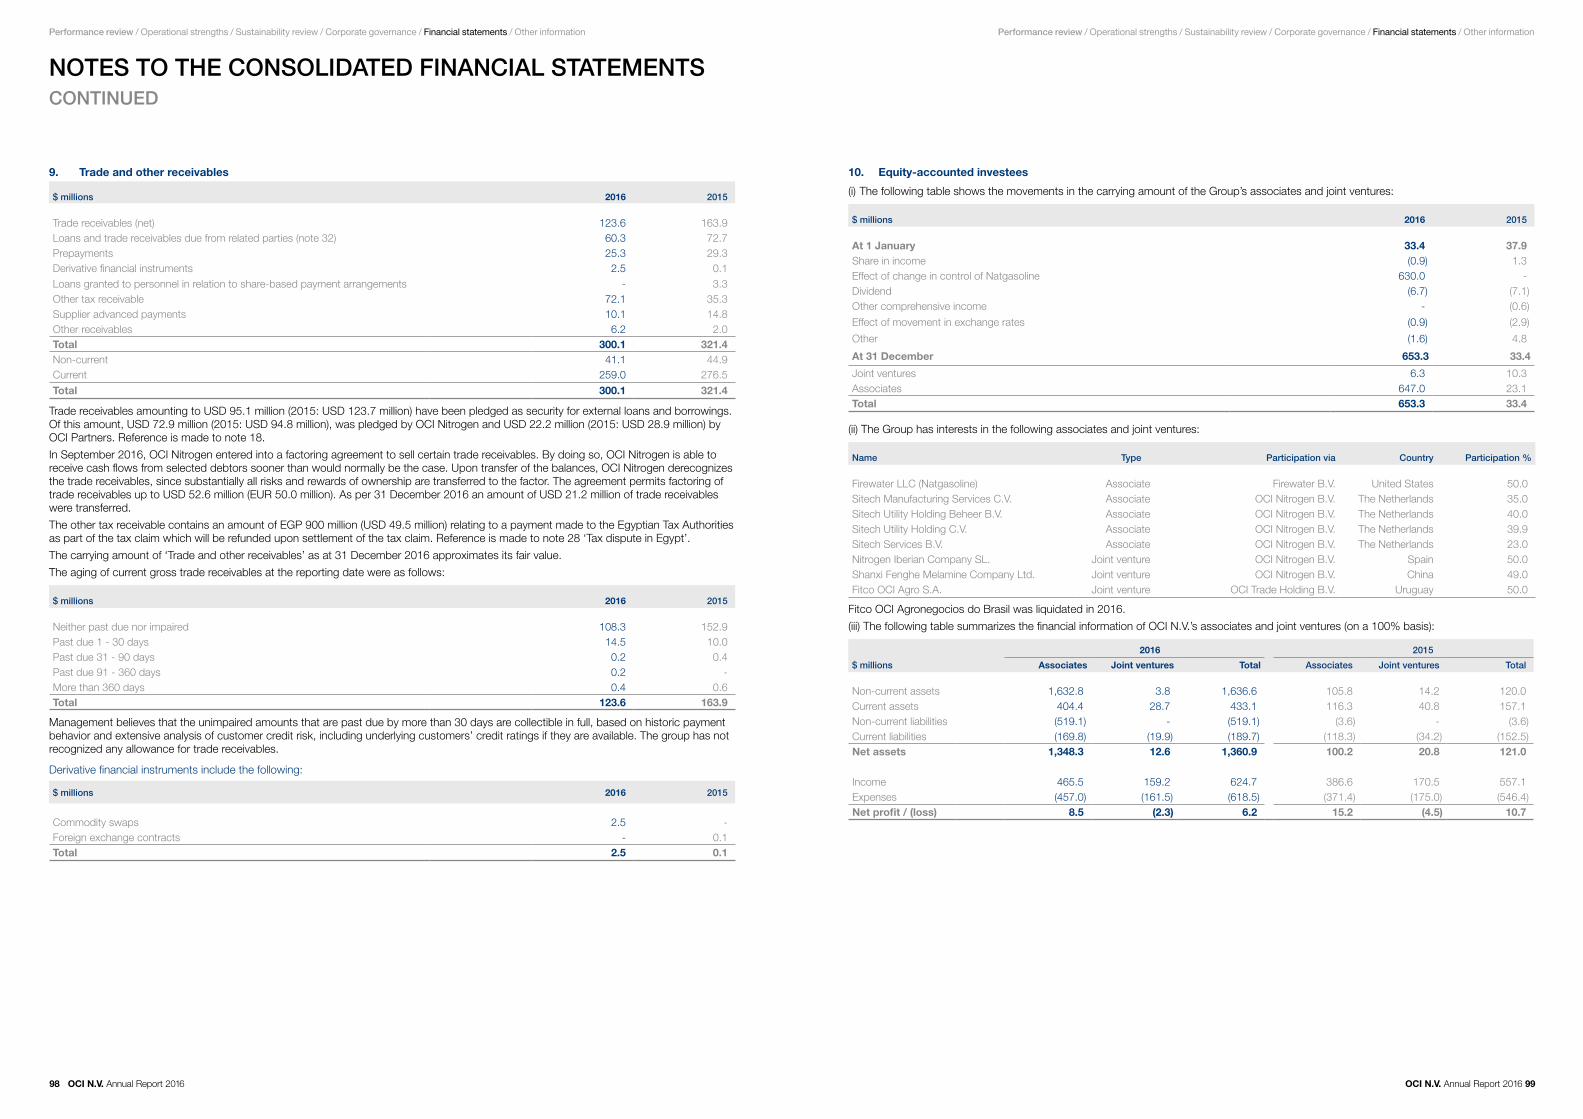
98 OCI N.V. Annual Report 2016 OCI N.V. Annual Report 2016 99
Performance review / Operational strengths / Sustainability review / Corporate governance / Financial statements / Other information Performance review / Operational strengths / Sustainability review / Corporate governance / Financial statements / Other information
9. Trade and other receivables
$ millions 2016 2015
Trade receivables (net) 123.6 163.9Loans and trade receivables due from related parties (note 32) 60.3 72.7Prepayments 25.3 29.3Derivative financial instruments 2.5 0.1Loans granted to personnel in relation to share-based payment arrangements - 3.3Other tax receivable 72.1 35.3Supplier advanced payments 10.1 14.8Other receivables 6.2 2.0Total 300.1 321.4Non-current 41.1 44.9Current 259.0 276.5
Total 300.1 321.4
Trade receivables amounting to USD 95.1 million (2015: USD 123.7 million) have been pledged as security for external loans and borrowings. Of this amount, USD 72.9 million (2015: USD 94.8 million), was pledged by OCI Nitrogen and USD 22.2 million (2015: USD 28.9 million) by OCI Partners. Reference is made to note 18.
In September 2016, OCI Nitrogen entered into a factoring agreement to sell certain trade receivables. By doing so, OCI Nitrogen is able to receive cash flows from selected debtors sooner than would normally be the case. Upon transfer of the balances, OCI Nitrogen derecognizes the trade receivables, since substantially all risks and rewards of ownership are transferred to the factor. The agreement permits factoring of trade receivables up to USD 52.6 million (EUR 50.0 million). As per 31 December 2016 an amount of USD 21.2 million of trade receivables were transferred.
The other tax receivable contains an amount of EGP 900 million (USD 49.5 million) relating to a payment made to the Egyptian Tax Authorities as part of the tax claim which will be refunded upon settlement of the tax claim. Reference is made to note 28 ‘Tax dispute in Egypt’.
The carrying amount of ‘Trade and other receivables’ as at 31 December 2016 approximates its fair value.
The aging of current gross trade receivables at the reporting date were as follows:
$ millions 2016 2015
Neither past due nor impaired 108.3 152.9Past due 1 - 30 days 14.5 10.0Past due 31 - 90 days 0.2 0.4Past due 91 - 360 days 0.2 -More than 360 days 0.4 0.6Total 123.6 163.9
Management believes that the unimpaired amounts that are past due by more than 30 days are collectible in full, based on historic payment behavior and extensive analysis of customer credit risk, including underlying customers’ credit ratings if they are available. The group has not recognized any allowance for trade receivables.
Derivative financial instruments include the following:
$ millions 2016 2015
Commodity swaps 2.5 -Foreign exchange contracts - 0.1Total 2.5 0.1
10. Equity-accounted investees
(i) The following table shows the movements in the carrying amount of the Group’s associates and joint ventures:
$ millions 2016 2015
At 1 January 33.4 37.9Share in income (0.9) 1.3Effect of change in control of Natgasoline 630.0 -Dividend (6.7) (7.1)Other comprehensive income - (0.6)
Effect of movement in exchange rates (0.9) (2.9)
Other (1.6) 4.8
At 31 December 653.3 33.4
Joint ventures 6.3 10.3Associates 647.0 23.1Total 653.3 33.4
(ii) The Group has interests in the following associates and joint ventures:
Name Type Participation via Country Participation %
Firewater LLC (Natgasoline) Associate Firewater B.V. United States 50.0Sitech Manufacturing Services C.V. Associate OCI Nitrogen B.V. The Netherlands 35.0Sitech Utility Holding Beheer B.V. Associate OCI Nitrogen B.V. The Netherlands 40.0Sitech Utility Holding C.V. Associate OCI Nitrogen B.V. The Netherlands 39.9Sitech Services B.V. Associate OCI Nitrogen B.V. The Netherlands 23.0Nitrogen Iberian Company SL. Joint venture OCI Nitrogen B.V. Spain 50.0Shanxi Fenghe Melamine Company Ltd. Joint venture OCI Nitrogen B.V. China 49.0Fitco OCI Agro S.A. Joint venture OCI Trade Holding B.V. Uruguay 50.0
Fitco OCI Agronegocios do Brasil was liquidated in 2016.
(iii) The following table summarizes the financial information of OCI N.V.’s associates and joint ventures (on a 100% basis):
$ millions
2016 2015
Associates Joint ventures Total Associates Joint ventures Total
Non-current assets 1,632.8 3.8 1,636.6 105.8 14.2 120.0Current assets 404.4 28.7 433.1 116.3 40.8 157.1Non-current liabilities (519.1) - (519.1) (3.6) - (3.6)Current liabilities (169.8) (19.9) (189.7) (118.3) (34.2) (152.5)Net assets 1,348.3 12.6 1,360.9 100.2 20.8 121.0
Income 465.5 159.2 624.7 386.6 170.5 557.1Expenses (457.0) (161.5) (618.5) (371.4) (175.0) (546.4)Net profit / (loss) 8.5 (2.3) 6.2 15.2 (4.5) 10.7
NOTES TO THE CONSOLIDATED FINANCIAL STATEMENTS CONTINUED

100 OCI N.V. Annual Report 2016 OCI N.V. Annual Report 2016 101
Performance review / Operational strengths / Sustainability review / Corporate governance / Financial statements / Other information Performance review / Operational strengths / Sustainability review / Corporate governance / Financial statements / Other information
10. Equity-accounted investees (continued)
Joint VenturesThe following chart summarizes the financial information of joint ventures (on a 100% basis):
Fitco OCI Agro S.A.Nitrogen Iberia Company SL.
Shanxi Fenghe Melamine Co. Ltd.
$ millions 2016 2015 2016 2015 2016 2015
Non-current assets - - 0.3 - 3.51 14.2Current assets (excluding cash and cash equivalents) 11.2 18.4 2.6 4.8 5.9 4.5Cash and cash equivalents 5.9 7.5 0.2 0.1 3.1 5.4Non-current liabilities - - - - - -Current liabilities (10.9) (17.6) (2.5) (4.6) (6.6) (12.0)Net assets 6.2 8.3 0.6 0.3 5.9 12.1Group’s share of net assets 3.1 4.2 0.3 0.2 2.9 5.9
Revenues 123.1 123.1 3.2 15.8 32.9 31.6Impairment - - - - (10.7) -Interest income - - - - - -Interest expense (0.2) (0.2) - - (0.5) -Profit / (loss) before taxes 3.1 3.1 - (1.1) (5.6) (8.8)Tax expense - - 0.3 - (0.1) 2.3Net profit / (loss) 3.1 3.1 0.3 (1.1) (5.7) (6.5)Other comprehensive income - - - - 0.2 0.6Total comprehensive income 3.1 3.1 0.3 (1.1) (5.7) (6.5)Group’s share in total comprehensive income 1.6 1.6 0.2 (0.6) (2.9) (3.2)Dividends 5.3 4.3 - 1.1 - -
1 Includes impairment of USD 10.7 million.
Associates
Consolidated Energy AG’s Investment in Firewater LLC (the holding company of Natgasoline LLC)In May 2016, Consolidated Energy AG (‘CEL‘) acquired 50% and management control of Natgasoline, the greenfield methanol project in Texas USA, by means of capital increase in Firewater LLC, the holding company of Natgasoline. CEL, which is owned by the Proman Group (‘Proman’) and its long-term partner Helm AG (‘Helm’) raised the equity of Firewater LLC by USD 630.0 million (partly upfront and partly as construction progresses) and committed to an additional USD 50.0 million to cover any required contingencies. The initial investment of USD 350.0 million was made via G2X Energy, Inc. (a subsidiary of CEL) on 4 May 2016. As of this date CEL gained control over Natgasoline and OCI recognized Natgasoline (which was a fully consolidated subsidiary) as an associate. As of 31 December 2016, CEL paid USD 419.7 million out of the USD 630.0 million agreed capital raise, and the remaining amount of USD 210.3 million is recognized as a receivable in Firewater LLC.
Below table summarizes the fair values of Firewater LLC ’s balance sheet at the transaction date:
$ millions 4 May 2016
Non-current assets 1,336.2Current assets (excluding cash and cash equivalents) 633.7Cash and cash equivalents 12.1
Non-current liabilities (511.0)
Current liabilities (211.0)Net assets 1,260.0Group’s share of net assets 630.0
For the result on the Firewater LLC transaction reference is made to note 22.
10. Equity-accounted investees (continued)
The following chart summarizes the financial information of significant associates (on a 100% basis):
Firewater LLC
(Natgasoline) Sitech Services B.V.Sitech Manufacturing
Services B.V.
$ millions 2016 2016 2015 2016 2015
Non-current assets 1,527.5 100.5 101.8 4.8 4.0Current assets (excluding cash and cash equivalents) 245.3 26.1 40.3 74.6 75.8Cash and cash equivalants 32.4 24.5 - 1.0
Non-current liabilities (507.0) (12.0) (3.6) - -Current liabilities (44.7) (44.5) (38.5) (80.4) (79.8)
Net assets 1,253.5 94.6 100.0 - -Group’s share of net assets 626.7 21.8 23.0 - -
Revenues - 165.8 109.4 299.5 276.9Depreciation (0.1) (11.8) (10.7) (0.6) -Interest income 0.1 - 0.1 - -Profit / (loss) before taxes (6.5) 19.9 20.1 - -Tax expense - 5.0 (5.0) - -Profit / (loss) after taxes (6.5) 14.9 15.1 - -Other comprehensive income - - - - -Total comprehensive income (6.5) 14.9 15.1 - -Group’s share in total comprehensive income (3.2) 3.4 3.5 - -Dividends - 17.4 19.3 - -
The associates include Firewater LLC, the holding company of Natgasoline LLC, which is a green field plant in Texas USA and the Sitech entities, which are used to operate the ‘Chemelot’ site in Geleen the Netherlands, for OCI Nitrogen B.V. The Chemelot site is used by several other companies.
At 31 December 2016, Natgasoline has material capital commitments of USD 255.9 million.
11. Available-for-sale financial assets
$ millions 2016 2015
Infrastructure and Growth Capital Fund LP (Egypt) 21.8 19.6Notore Chemical Industries (Mauritius) 21.1 21.6Orascom Construction Limited (Dubai) 2.8 3.7Abu Qir Fertilizer and Chemical Industries Co (Egypt) 1.3 5.6Total 47.0 50.5Non-current 42.9 41.2Current 4.1 9.3Total 47.0 50.5
The Group holds an investment in the Infrastructure and Growth Capital Fund LP. The fund is managed by the Abraaj Group.
The investment in Notore Chemical Industries (Mauritius) represents a 13.07 percent shareholding. The investment in Notore is measured at cost, as no reliable fair value information is available.
OCI N.V. holds shares in Orascom Construction Limited, which is a related party.
The Group has 233,976 shares (2015: 308,976) in Abu Qir Fertilizer and Chemical Industries Co (Bloomberg ticker: ABUK:EY). In 2016, 75,000 shares of this investment were sold for an amount of USD 0.4 million and an impairment of USD 3.0 million was recognized.
NOTES TO THE CONSOLIDATED FINANCIAL STATEMENTS CONTINUED

102 OCI N.V. Annual Report 2016 OCI N.V. Annual Report 2016 103
Performance review / Operational strengths / Sustainability review / Corporate governance / Financial statements / Other information Performance review / Operational strengths / Sustainability review / Corporate governance / Financial statements / Other information
12. Income taxes
12.1 Income tax in the statement of profit or loss
$ millions 2016 2015
Current tax (61.4) 22.7Deferred tax 12.7 71.0Total income tax in profit or loss (48.7) 93.7
The amount in 2015 excludes the income tax on discontinued operations of USD (4.4) million, which is included in profit or loss from discontinued operations, net of tax (reference is made to note 27).
12.2 Reconciliation of effective tax rate
OCI’s operations are subject to income taxes in various foreign jurisdictions. The statutory income tax rates vary from 0.0% to 42.8%, which results in a difference between the weighted average statutory income tax rate and the Netherlands’ statutory income tax rate of 25.0%.
Reconciliation of the statutory income tax rate in the Netherlands with the effective tax rate can be summarized as follows:
$ millions 2016 % 2015 %
Profit / (loss) before income tax 223.3 (202.4)Enacted income tax rate in the Netherlands 25% 25%Tax calculated at enacted tax rate (55.8) 25.0 50.6 (25.0)Effect of tax rates in foreign jurisdictions 43.5 (19.5) 15.8 (7.8)Unrecognized tax assets (61.2) 27.4 (74.8) 37.0 Non-deductible goodwill impairment - - (95.2) 47.1 Non-taxable income on sale of Gavilon - - 1.0 (0.5) Expenses non-deductible (18.2) 8.2 (33.1) 16.4 Tax credits 2.1 (0.9) 12.5 (6.2)Uncertain tax positions - - 136.6 (67.5)Income not subject to tax 43.3 (19.4) 73.3 (36.2)Change in tax rates - - 9.1 (4.5)Dividend withholding tax not recoverable (2.1) 0.9 - -Other (0.3) 0.1 (2.1) 1.0 Total income tax in profit or loss (48.7) 21.8 93.7 (46.3)
The effective tax rate is 21.8% (2015: (46.3)%), mainly due to (i) unrecognized tax assets for an amount of USD (61.2) million mainly relating to IFCo (start-up cost), OCI USA Inc. and OCI S.A.E., (ii) income not subject to tax for an amount of USD 43.3 million and (iii) expenses non-deductible for an amount of USD (18.2) million.
12.3 Deferred income tax assets and liabilities
Changes in deferred tax asset and liabilities (net):
$ millions 2016 2015
At 1 January (218.2) (293.3)Income statement 12.7 71.0Effect of movement in exchange rates 1.4 4.1At 31 December (204.1) (218.2)
12.3 Deferred income tax assets and liabilities (continued)
Recognized deferred tax assets and liabilities:
Assets Liabilities Net
$ millions 2016 2015 2016 2015 2016 2015
Intangible assets 6.9 - (57.3) (51.3) (50.4) (51.3)Property, plant and equipment - - (122.8) (138.5) (122.8) (138.5)Inventory 0.9 - (2.9) (4.1) (2.0) (4.1)Investment in partnership - - (90.3) (73.0) (90.3) (73.0)Trade and other receivables - 0.6 (19.7) - (19.7) 0.6Loans and borrowings 34.7 15.2 (22.5) (5.3) 12.2 9.9Trade and other payables 1.8 - (0.5) (0.2) 1.3 (0.2)Provisions - - (7.2) (9.2) (7.2) (9.2)Uncertain tax positions - - (1.6) - (1.6) -Provision for withholding tax - - (1.6) - (1.6) -
Operating losses carry forward 78.0 47.6 - - 78.0 47.6Total 122.3 63.4 (326.4) (281.6) (204.1) (218.2)
Netting of fiscal positions (117.3) (56.9) 117.3 56.9 - - Amounts recognized in the balance sheet 5.0 6.5 (209.1) (224.7) (204.1) (218.2)
Deferred tax liabilities relating to intangible assets mainly consits of goodwill of EFC and reverses over a period of 10 years.
Deferred tax liabilities recognized in relation to property, plant and equipment will be realized over the depreciation period of the related asset, and mainly relate to EFC (USD 105.5 million) and OCI Nitrogen (USD 16.7 million). Furthermore, the deferred tax liability ‘investment in partnership’ (USD 90.3 million) relates to OCI Partners. This deferred tax liability does not have a fixed reversal period. This partnership is a Delaware limited partnership and is a non-taxable entity. Each unit-holder in OCI Partners is required to take into account its own share of items of income, gain or loss of the partnership in computing its income tax obligation.
Deferred tax assets relate to temporary differences, tax credits and tax losses carry forward. Temporary differences (mainly start-up costs that have been capitalized for tax purposes) amount to USD 116.5 million and have partly been off set with deferred tax liabilities (USD 39.3 million) and have partly been provided for (USD 72.2 million). In addition the Company has tax losses carry forward totaling USD 154.1 million, for which a valuation allowance has been recorded amounting to USD 76.1 million. The greater part of these tax losses carry forward relates to the US operations and will begin to expire as of 2033 if not utilized before.
Expiration scheme of gross carry forward tax losses is as follows:
$ millions 0 > 1 year 1 > 5 years 5 > 10 years 10 > 15 years 15 > 20 years Unlimited Total
Operating losses carry forward 4.6 15.9 18.6 - 83.3 31.7 154.1
12.4 Income tax receivables and payables
Changes in income tax receivables and payables:
$ millions 2016 2015
At 1 January (36.4) 213.9Income statement (61.4) 22.7Payments / (refunds) 15.0 (268.0)Effect of movement in exchange rates 3.0 (5.0)At 31 December (79.8) (36.4)Income tax receivable 1.2 2.2Income tax payables (81.0) (38.6)Total (79.8) (36.4)
In March 2015, OCI S.A.E. received a cheque for approximately EGP 1,904 million (approximately USD 266.2 million) from the Egyptian Tax Authorities, which refunded the amounts paid in excess from the first installment paid in 2013. Reference is made to note 28 (‘Tax dispute in Egypt’). The payments in 2016 mainly relate for USD 6.8 million to withholding tax on the dividend received by OCI S.A.E. from Sorfert and to a payment made by OCI N.V. of USD 4.4 million on behalf of the Dutch fiscal unity.
NOTES TO THE CONSOLIDATED FINANCIAL STATEMENTS CONTINUED

104 OCI N.V. Annual Report 2016 OCI N.V. Annual Report 2016 105
Performance review / Operational strengths / Sustainability review / Corporate governance / Financial statements / Other information Performance review / Operational strengths / Sustainability review / Corporate governance / Financial statements / Other information
13. Inventories
$ millions 2016 2015
Finished goods 86.4 53.8Raw materials and consumables 21.3 20.0Spare parts, fuels and others 33.3 66.8Total 141.0 140.6
During 2016, the total write-downs amount to USD 10.2 million (2015: USD 11.0 million) of which USD 9.9 million relates to spare parts. During 2016 there were no reversals of write downs (2015: nil). Inventory amounting to USD 43.2 million (2015: USD 52.0 million) has been pledged as security for external loans, consisting of USD 35.1 million to OCI Nitrogen B.V. (2015: USD 46.0 million) and USD 8.1 million to OCI Partners (2015: USD 6.0 million). Reference is made to note 18. An amount of USD 20.4 million was reclassified from inventory spare parts to Property, plant and equipment in 2016.
14. Cash and cash equivalents
$ millions 2016 2015
Cash on hand 0.1 0.2Bank balances 382.9 646.6Restricted funds 2.1 146.2Restricted cash 7.1 3.4Total 392.2 796.4
Bank balancesUSD 55.2 million of the bank balances are being held in order to settle the constructive obligation towards the Tahya Misr Fund, reference is made to note 20.
Restricted fundsIn May 2013, IFCo issued “Series 2013” bonds pursuant to a Bond Financing Agreement with the Iowa Finance Authority to finance the construction of its plant. A portion of the cash proceeds from the bonds were invested under an investment agreement with Natixis Funding Corporation and Bayern LB New York, and are restricted due to the requisition procedures in the agreement. As of 31 December 2016 and 2015, the invested amounts that are included as restricted funds had a carrying amount of USD 1.1 million and USD 64.9 million, respectively.
In addition, IFCo entered into a Collateral Agency and Account Agreement, dated as of 1 May 2013, with UMB Bank, N.A., which establishes certain accounts to be held by UMB Bank, N.A. for the deposit of funds related to the Series 2013 bonds. In 2016 no restricted funds for bond service requirements in accordance with the Bond Financing Agreement and the Collateral Agency and Account Agreement is held (2015: USD 80.3 million). The first installment of the bonds was due and paid on 1 June 2016.
The remaining restricted funds of USD 1.0 million as of 31 December 2016 (2015: USD 1.0 million) are held for debt service requirements related to IFCo’s USD 59.7 million credit agreement entered into May 2015.
Restricted cashRestricted amounts are held as collateral against letters of credit and letters of guarantees issued.
15. Equity attributable to owners of the Company
The movements in the number of shares can be summarized as follows:
2016 2015
Number of shares at 1 January 210,113,854 205,911,570Number of issued shares in restructuring - -Number of issued shares 192,247 4,202,284On issue at 31 December - fully paid 210,306,101 210,113,854Par value per share (in EUR) 0.02 20.00At 31 December (in millions of USD) 5.6 4,704.9
Movements in equity attributable to owners of the Company in 2016:• In the Annual General Meeting of shareholders (“AGM”) held on 28 June 2016, it was proposed to decrease the issued share capital of OCI
N.V. by EUR 19.98 in order to result in a nominal value of EUR 0.02 for each ordinary share. The proposal was accepted and was effected after a two-month period. The amount of the capital reduction of USD 4,703.5 million is added to the share premium reserve of the Company.
• Total dividends paid to non-controlling interest amounted to USD 129.3 million, of which USD 6.7 million related to OCI Partners and USD 122.6 million to Sorfert.
• Impact difference in profit sharing non-controlling interest. In the partnership agreement for Sorfert between OCI and the partner, a profit sharing agreement was entered into, in which it was agreed that as a compensation for lower natural gas prices, the other investor will receive a relatively higher part of dividends. As a result of this agreement the non-controlling interest increased by USD 7.0 million during 2016.
• OCI waived an amount of USD 25.5 million from the dues from Sorfert related to the technical and management services that OCI provided to Sorfert. This waiver was booked as a capital contribution in Sorfert. The non-controlling interest attributable to this contribution is USD 12.5 million. A corresponding amount has been deducted from ‘equity attributable to owners of the Company’.
• In January 2016, 192,247 shares in Orascom Construction Industries S.A.E. (minority shareholders of OCI S.A.E.) were swapped for OCI N.V. shares. This transaction resulted in an issuance of new shares for an amount of USD 4.2 million and an increase of share premium by USD 2.1 million.
• Reclassification an amount of USD 33.3 million relates to the update of non-controlling interest positions.
• An amount of USD 2.1 million related to share-based compensation was recognized in retained earnings.
Movements in equity attributable to owners of the Company in 2015:• On 8 January 2015, 4,202,284 new shares were issued for a total amount of USD 167.8 million (excluding related transaction cost of
USD 6.7 million).
• On 11 August 2015, after conversion of reserves into capital, the issued capital of OCI N.V. increased with an amount of USD 4,426.9 million (EUR 3,992.2 million) by means of an increase of the nominal value of each ordinary share from EUR 1.0 to EUR 20.0.
• In order to facilitate the demerger of the Engineering & Construction business, OCI N.V. converted USD 1,400.0 million of reserves into capital, representing the fair value of the shares of OCL. The capital increase of USD 1,400.0 million was distributed as a capital in kind reduction to OCI N.V.’s shareholders on 7 March 2015.
• As part of the demerger transaction of the Engineering & Construction business, OCI N.V. exchanged treasury shares with Orascom Construction Ltd. shares on a 2:1 basis. This resulted in a decrease of the amount of treasury shares held for USD 5.5 million and an increase in available-for-sale financial assets by an amount of USD 3.7 million. Reference is made to note 16.
• An amount of USD 78.3 million represents the non-controlling interest derecognized as a result of the demerger of the Engineering & Construction business.
• On 17 April 2015, OCI Partners received a capital contribution of USD 60.0 million in cash from OCI N.V.’s subsidiary OCIP Holding LLC to partially fund capital expenditures and other costs and expenses incurred in connection with the debottlenecking project, and in exchange OCI Partners issued 3,502,218 common units to OCIP Holding. Non-controlling interest attributable to these additional partnership common units was USD 10.8 million. A corresponding amount has been deducted from ‘Equity attributable to owners of the Company’.
• Under the terms of the demerger, OCI N.V.’s shareholders received one Orascom Construction Ltd. share for every two OCI N.V. shares owned. As a result of these developments, all outstanding options and matching rights held by awardees related to OCI N.V. shares have been replaced with new options and matching rights related to both OCI N.V. and Orascom Construction Ltd. shares. The new options and matching rights are cash settled (were equity settled). Due to this modification of the share-based compensation plans from equity settled to cash settled the other reserves decreased for a total amount of USD 23.7 million.
• OCI Partners paid a distribution in amount of USD 13.0 million to the non-controlling unit holders. OCIP Holding LLC received a distribution in amount of USD 50.2 million, which was eliminated in the consolidation as OCI owns 80% of the shares of OCIP Holding LLC.
• An amount of USD 1.8 million related to share-based compensation and increase the other reserves.
NOTES TO THE CONSOLIDATED FINANCIAL STATEMENTS CONTINUED

106 OCI N.V. Annual Report 2016 OCI N.V. Annual Report 2016 107
Performance review / Operational strengths / Sustainability review / Corporate governance / Financial statements / Other information Performance review / Operational strengths / Sustainability review / Corporate governance / Financial statements / Other information
16. Reserves
$ millionsHedge
reserveAvailable-
for-sale Currency
translationOther
reserveConvertible
note1Treasury
sharesEmployees
stock option Total
At 1 January 2015 (12.8) (3.1) (113.8) 224.7 31.4 (28.8) 98.9 196.5
Realization due to demerger 12.8 - 108.8 - - - - 121.6Currency translation differences - - (83.1) - - - - (83.1)Available-for-sale financial assets - 0.3 - - - - - 0.3
Other comprehensive income 12.8 0.3 25.7 - - - - 38.8
Exchange of treasury shares - - - - - 5.5 - 5.5Treasury shares acquired - - - - - (19.5) - (19.5)Treasury shares sold - - - - - 3.5 - 3.5
Reclassification to retained earnings - 11.2 - (224.7) - - (98.9) (312.4)
At 31 December 2015 - 8.4 (88.1) - 31.4 (39.3) - (87.6)
Reclassification - 2.1 (2.1) - - - - -Currency translation differences - - (27.7) - - - - (27.7)Available-for-sale financial assets - 0.7 - - - - - 0.7
Other comprehensive income - 2.8 (29.8) - - - - (27.0)Treasury shares sold - - - - - 2.3 - 2.3
At 31 December 2016 - 11.2 (117.9) - 31.4 (37.0) - (112.3)
1 Relates to equity component convertible Euro-notes, net of taxes (reference is made to note 18).
OCI N.V. is a company incorporated under Dutch law. In accordance with the Dutch Civil Code, legal reserves have to be established in certain circumstances. The hedging reserve, the available-for-sale reserve, the currency translation reserve and other legal reserves are legal reserves that limit distributions to shareholders to the extent that these reserves individually have a credit balance. ‘Other reserves’ include amongst other the reserve for non-distributed income of minority share holdings.
Treasury sharesDuring the financial year ended 31 December 2016 the Company sold 172,648 of its own shares and acquired 1,243 shares.
2016 2015
Number of shares 1,018,544 1,189,949
Carrying value of treasury shares (In millions of USD) 37.0 39.3Average carrying value per share (USD) 36.33 33.03
NOTES TO THE CONSOLIDATED FINANCIAL STATEMENTS CONTINUED
17. Non-controlling interest
2016$ millions
OCI Partners
LP
Egyptian BasicIndustries
Corporation
SorfertAlgeria
Spa Other Total
Non-controlling interest percentage 20.12% 40.00% 49.01% - -
Non-current assets 123.5 152.0 595.0 3.0 873.5Current assets 8.6 18.6 70.6 9.1 106.9Non-current liabilities (93.6) - (357.6) (1.1) (452.3)Current liabilities (9.2) (58.6) (114.8) (0.2) (182.8)Net assets 29.3 112.0 193.2 10.8 345.3
Revenues 52.0 18.1 162.9 0.2 233.2Profit (10.0) (7.5) 24.2 - 6.7Other comprehensive income - - (7.8) - (7.8)Total comprehensive income (10.0) (7.5) 16.4 - (1.1)
Dividend cash flows (6.7) - (122.6) - (129.3)
2015$ millions
OCI Partners
LP
Egyptian BasicIndustries
Corporation
SorfertAlgeria
Spa Other Total
Non-controlling interest percentage 20.12% 40.00% 49.01% - -
Non-current assets 136.0 163.8 659.6 34.4 993.8Current assets 11.6 20.8 127.9 9.2 169.5Non-current liabilities (85.0) (20.5) (411.9) (1.2) (518.6)Current liabilities (14.9) (44.2) (95.9) (0.2) (155.2)Net assets 47.7 119.9 279.7 42.2 489.5
Revenues 60.1 4.8 188.3 0.1 253.3Profit 10.5 29.0 97.9 - 137.4Other comprehensive income - - 13.7 - 13.7Total comprehensive income 10.5 29.0 111.6 - 151.1
Dividend cash flows (13.0) - - - (13.0)

108 OCI N.V. Annual Report 2016 OCI N.V. Annual Report 2016 109
Performance review / Operational strengths / Sustainability review / Corporate governance / Financial statements / Other information Performance review / Operational strengths / Sustainability review / Corporate governance / Financial statements / Other information
NOTES TO THE CONSOLIDATED FINANCIAL STATEMENTS CONTINUED
18. Loans and borrowings
Information about the Group’s exposure to interest rate, foreign currency and liquidity risk is disclosed in the financial risk and capital management paragraph in note 6.
Borrowing Company Type of loan Principal amount
(in millions) Interest rate Date of maturity Carrying amount1
(in millions) Long term portion
(in millions) Short term portion
(in millions) Fair value
(in millions) Collateral / Guarantee given (if applicable)
Sorfert Algeria SPA SecuredUSD 1,230.0
(DZD 114,440.0)Algerian bank interest rate plus rate of 1.95% per annum June 2026 815.4 729.5 85.9 815.4
Debt service reserve account, ban for any disposal or decrease of the Company share and assets.
Iowa Fertilizer Company (IFCo) Secured
USD 242.8USD 365.7USD 429.0USD 147.2
Fixed: 5.00%Fixed: 5.50%Fixed: 5.25%
Fixed 5.875%
December 2019December 2022December 2025December 2027
1,135.5 1,135.5 - 1,131.2Certain bank accounts, personal property
of IFCo, all funds, including equity contributions of USD 762.0 million by OCI N.V
Iowa Fertilizer Company (IFCo) Secured USD 59.7 2019: USD LIBOR + 3.0% December 2019 45.4 32.1 13.3 45.4Certain bank accounts, personal property of
IFCo and all funds.
EFC SecuredUSD 930.0USD 56.7
(EGP 1,015.0)
LIBOR + 5.00% marginCBE Mid Corridor + 2.90% margin for EGP denominated borrowings October 2019 463.4 404.2 59.2 463.4
Pledge EFC shares 99.9% owned by ‘Orascom Fertilizer plant maintenance’. Power of Attorney
for perfection of commercial and real estate mortgages. OCI N.V. will pay for shortfalls.
OCI Nitrogen B.V. SecuredUSD 525.8
(EUR 500.0)EURIBOR + a variable margin based on leverage ratio ranging 3.50%-4.50% August 2021 517.4 466.6 50.8 517.4
Pledge of OCI Fertilizers B.V. shares in OCI Nitrogen, Pledge of moveable assets, trade receivables and
company accounts, property mortgage.
OCI N.V.Unsecured convertible
bond
USD 356.5(EUR 339.0)
Fixed at 3.875% September 2018 344.3 344.3 - 347.4
OCI N.V. SecuredUSD 651.4
(EUR 619.4)EURIBOR + 3.75% July 2020 641.4 641.4 - 641.4
Pledge of shares in OCI Chem 2 B.V., which indirectly holds 50% share in Natgasoline
OCI N.V. Subordinated USD 342.8 LIBOR + margin increasing over time ranging 7.50% - 9.75% January 2021 342.8 342.8 - 342.8
OCI Fertilizer Trading Ltd. and OFTS Secured LIBOR + 2.50% Renewed annually 0.7 - 0.7 0.7 .
OCI Partners LP Secured USD 450.0 USD LIBOR + 6.75% margin, with USD LIBOR Floor of 1.0% August 2019 230.1 225.8 4.3 230.1Secured by liens on OCI Partners LP’s assets
as well as assets of future consolidated entities
Egypt Basic Industries Corporation (EBIC) Unsecured USD 100.0 LIBOR + 3.25% December 2017 49.6 - 49.6 49.6
Total 31 December 2016 4,586.0 4,322.2 263.8 4,584.8
Sorfert Algeria SPA SecuredUSD 1,064.3
(DZD 114,440.0)Algerian bank interest rate plus rate of 1.95% per annum June 2026 929.1 840.4 88.7 929.1
Debt service reserve account, ban for any disposal or decrease of the Company share and assets.
Iowa Fertilizer Company (IFCo) SecuredUSD 390.0USD 365.7USD 429.0
Fixed: 5.00%Fixed: 5.50%Fixed: 5.25%
December 2019December 2022December 2025
1,174.0 1,097.2 76.8 1,253.2Certain bank accounts, personal property of IFCo,
all funds, including equity contributions of USD 762.0 million by OCI N.V
Iowa Fertilizer Company (IFCo) Secured USD 59.7 2019: USD LIBOR + 3.0% December 2019 58.4 45.1 13.3 58.4Certain bank accounts, personal property
of IFCo and all funds.
EFC SecuredUSD 930.0USD 129.4
(EGP 1,015.0)
LIBOR + 5.00% marginCBE Mid Corridor + 2.90% margin for EGP denominated borrowings October 2019 596.5 537.4 59.1 596.5
Pledge EFC shares 99.9% owned by ‘Orascom Fertilizer plant maintenance’. Power of Attorney
for perfection of commercial and real estate mortgages. OCI N.V. will pay for shortfalls.
OCI Nitrogen B.V. SecuredUSD 569.4
(EUR 525.0)LIBOR /EURIBOR + a variable margin based on leverage ratio ranging 2.00%-
3.25%October 2016 350.2 - 350.2 350.2
Pledge of OCI Fertilizer International shares in OCI Nitrogen, Pledge of moveable assets, trade
receivables and company accounts, property mortgage.
OCI N.V.Unsecured convertible
bond
USD 367.6(EUR 339.0)
Fixed at 3.875% September 2018 346.6 346.6 - 416.5
OCI N.V. Secured USD 550.0 EURIBOR + 2.75% July 2017 528.6 - 528.6 528.6 OCI Fertilizers B.V.
OCI N.V. Secured USD 200.0 LIBOR + 2.25% September 2016 198.8 - 198.8 198.8
OCI N.V. Secured USD 200.0 LIBOR + 2.50% September 2016 199.4 - 199.4 199.4
OCI Fertilizer Trading Ltd. and OFTS Secured LIBOR + 2.50% Renewed annually 1.3 - 1.3 1.3OCI Fertilizers B.V. as guarantor and pledge
over commodities and bank accounts.
OCI Fertilizer Trading Ltd. and OFTS Secured LIBOR + 1.50% Renewed annually 8.1 - 8.1 8.1OCI N.V. as guarantor and pledge over
commodities and bank accounts.
OCI Partners LP Secured USD 450.0 USD LIBOR + 5.50% margin, with USD LIBOR Floor of 1% August 2019 425.3 420.8 4.5 425.3Secured by liens on OCI Partners LP’s assets as well as
assets of future consolidated entities
OCI Partners LP Secured USD 40.0 USD LIBOR + 2.75% March 2016 24.9 - 24.9 24.9Secured by liens on OCI Partners LP’s assets as well as
assets of future consolidated entities
Egypt Basic Industries Corporation (EBIC) Unsecured USD 100.0 LIBOR + 3.25% December 2017 61.6 49.2 12.4 61.6
Total 31 December 2015 4,902.8 3,336.7 1,566.1 5,051.9
1 As at 31 December 2016 the carrying amount of loans and borrowings excluded interest of USD 44.4 million (2015: USD 45.2 million)

110 OCI N.V. Annual Report 2016 OCI N.V. Annual Report 2016 111
Performance review / Operational strengths / Sustainability review / Corporate governance / Financial statements / Other information Performance review / Operational strengths / Sustainability review / Corporate governance / Financial statements / Other information
18. Loans and borrowings (continued)
Covenants Certain loan agreements include covenants. The covenant calculations are prepared based on the individual borrowing Company’s financial statements at each period of twelve months ending on the last day of each financial quarter.
The definitions for calculating the covenants can be summarized as follows:
• Debt Service Coverage Ratio: Income Available (revenue earned less operating expenses) to Debt Service (net finance charges including the capital element of finance leases) or gross profit less change in working capital to interest and principal payments.
• Debt to Equity Ratio: Gross Debt (current and long term debt obligations) to total Equity (the sole capital of the borrower).
• Cash Flow Coverage Ratio: the Excess Cash Flow available to pay current debt obligations (Debt Service). Excess Cash Flow is adjusted EBITDA further adjusted by net working capital as well as cash paid and received during the relevant period that has not already been taken into account in establishing adjusted EBITDA.
• Net Leverage Ratio: the Group’s Net Debt (meaning the aggregate amount of all obligations of the Group, excluding intergroup loans and cash and cash equivalents, but including finance leases) to adjusted EBITDA.
• Interest Coverage Ratio: EBITDA, EBIT or Distribution Receipts (cash received by the borrower by way of dividends or repayments of loans) to Finance Charges (meaning finance payments in respect of borrowings including the interest element of finance leases).
• Maximum Capital Expenditure: the aggregate capital expenditure of the Group (any expenditure or obligation that creates a future benefit to the Group, excluding those related to business acquisitions and including the capital element of a finance lease) should not exceed the required threshold.
• Minimum Tangible Net Worth: the Group’s Consolidated Equity minus the capitalized intangible assets and intercompany receivables of the Guarantor should exceed a required threshold.
In the event the Company would not comply with the covenant requirements, the loans would become immediately due. Below is a summary of compliance with the main covenants per borrowing Company:
• OCI N.V. borrowings include compliance with the following financial ratios: Debt Service Coverage Ratio, Net Leverage Ratio and Maximum Capital Expenditures. As of 31 December 2016, all covenants were met.
• EFC borrowings include compliance with the following financial ratios: Cash Flow Coverage Ratio, Net Leverage Ratio and Capital expenditures should not exceed the budget. As of 31 December 2016, the Net Leverage Ratio was in breach; however, a waiver was obtained before year-end. The waiver that was obtained also waives any future covenant breaches for the remaining term of the borrowings.
• EBIC borrowings include compliance with the following financial ratios: Net Leverage Ratio, Cash Flow Coverage Ratio and Minimum Tangible Net Worth. As of 31 December 2016, the Net Leverage Ratio and Cash Flow Coverage Ratio were in breach however, a waiver was obtained before year-end.
• OCI Nitrogen borrowings include compliance with the following financial ratios: Interest Coverage Ratio, and Net Leverage Ratio. All ratios were met as of 31 December 2016.
• OCI Partners borrowings include compliance with the following financial ratios: Interest Coverage Ratio and Net Leverage Ratio. A loan amendment was obtained in November 2016, which improves the financial covenants. As of 31 December 2016, all newly amended financial ratios were met.
• Sorfert borrowings include compliance with the following financial ratios: Debt Service Coverage Ratio and Debt to Equity Ratio. All original ratios were met as of 31 December 2016.
• IFCo and OCI Fertilizer Trading Ltd. borrowings do not have financial covenants that require compliance as of 31 December 2016.
Refer to note 6.2 for additional discussion of the Company’s liquidity risk. The aforementioned external borrowings include change in control clauses that enable the lenders to call the financing provided.
Fair value measurement loans & borrowings Except for the IFCo bonds, the convertible bond and the loan of Sorfert the fair value of all other loans and facilities is calculated within hierarchy category level 2. The bonds of IFCo and the convertible bond are measured following hierarchy category 1, while the loan of Sorfert is measured following hierarchy category 3. For the latter no observable market data is available.
NOTES TO THE CONSOLIDATED FINANCIAL STATEMENTS CONTINUED
18. Loans and borrowings (continued)
New and amended financing arrangements in 2016
NatgasolineIn connection with CEL’s investment in Natgasoline (reference is made to note 10), OCI and CEL announced on 21 April 2016 that Citi and Morgan Stanley have priced and fully underwritten approximately USD 250.0 million of tax-exempt Mission Economic Development Corporation Senior Revenue Lien Bonds (Natgasoline Project), Series 2016. The funds were received by Natgasoline beginning of May 2016.USD 192.1 million of the proceeds were used to partly redeem the shareholder loan received from OCI N.V. In August 2016 Natgasoline obtained external financing to repay the remaining outstanding balance of the shareholder loan issued by OCI N.V. A total amount of USD 511.0 million was collected by OCI N.V.
OCI N.V.On 22 January 2016, OCI N.V. entered into a credit facility agreement, which has a payment in kind loan structure with regard to interest, with Nile Holding for USD 300.0 million and an amended agreement on 28 July 2016 for an additional USD 17.0 million. The credit facility agreement is subordinated to the credit facility drawn for USD 651.4 million described below. The facility was fully drawn, and was used for capital expenditures and other corporate expenses. The loan matures on 31 January 2021 and carries an interest rate of LIBOR plus a margin between 7.50% to 9.75%. Transaction costs were incurred and accrued in the amount of USD 3.0 million.
In May 2016, the Company repaid an amount of USD 190.0 million on the USD 398.2 million bridge facilities outstanding per year end 2015, from proceeds received following the USD 250.0 million Natgasoline bond issuance and CEL’s investment in Natgasoline. The remaining outstanding balance of the bridge facilities has been repaid in August 2016.
On 28 November 2016, OCI N.V. refinanced its outstanding revolver facility of USD 550.0 million, by entering into a new credit facility dated 17 November 2016, which comprises a USD 290.0 million (denominated in an equivalent Euro amount) term facility loan and a USD 370.0 million revolving credit facility. The credit facility was drawn for an amount of USD 651.4 million. Net proceeds were USD 640.6 million after taking into account transaction costs in the amount of USD 10.8 million. The term facility loan will be redeemed in four semi-annual installments, starting in January 2019 and ending in July 2020. At inception of the new credit facility the interest rate is set at LIBOR plus a margin of 4.25% for the US dollar denominated loans and EURIBOR plus a margin of 3.75% for the Euro denominated loans. As per year-end 2016 the credit facility was fully drawn in Euros. The new credit facility replaces the previous one, which would originally mature in July 2017.
In November 2016, OCI N.V. entered into a credit facility agreement, which has a payment in kind loan structure with regard to interest, with NNS Luxembourg (a related party), for an amount of USD 140.0 million. The credit facility agreement is subordinated to the credit facility drawn for USD 651.4 million described above. The loan matures on 31 January 2021 and carries an interest rate of Libor plus a margin of 9.0%. As per year end 31 December 2016, no amounts have been drawn from this facility.
OCI Nitrogen B.V.On 18 August 2016, OCI Nitrogen B.V. refinanced its outstanding debt of USD 315.5 million (EUR 300.0 million), by entering into a new credit facility, which comprises an amortizing USD 262.9 million (EUR 250.0 million) term loan facility A (“TLA”), a USD 262.9 million (EUR 250.0 million) term loan facility B (“TLB”) and a USD 52.6 million (EUR 50.0 million) revolving credit facility. Net proceeds were USD 516.7 million after taking into account transaction costs in the amount of USD 9.1 million. The TLA will be redeemed over 5 years and the TLB will be repaid on the maturity date in 2021. The weighted average opening margin is 4.23% over EURIBOR. The new credit facility replaces the previous one, which would originally mature in October 2016.
OCI PartnersOn 17 March 2016, OCI Partners extended the maturity of the revolving credit facility to 31 March 2017 and amended the covenants from the lenders for its outstanding term loans and revolving credit facility for the three month periods ending 30 June 2016, 30 September 2016, 31 December 2016 and 31 March 2017.
On 30 November 2016, OCI Partners further amended the outstanding term loans and agreed to prepay USD 200.0 million. The amendment improves the financial covenants. Debt modification costs were incurred for an amount of USD 2.2 million.
IFCoOn 28 November 2016, IFCo announced the successful completion of consent solicitation and exchange offer for the USD 1,174.0 million outstanding bonds as per year end 2015. The exchange offer involved the tendering of USD 147.0 million of aggregate principal amounts of Series 2013 Bonds maturing in December 2019 through an issuance of new Series 2016 bonds maturing in December 2026 and December 2027. The new Series 2016 Bonds were priced at 5.875% and are interest only until 2026. The amendments and exchange offer will give IFCo more flexibility going forward and will reduce its third party debt obligations over the next 18 months by USD 142.0 million, providing significantly improved liquidity profile as the facility begins operations. As part of the consent process, IFCo also received various other consents, including the removal of a change of control default clause, certain waivers to enter into a settlement and acceleration agreement with its EPC contractor, Orascom E&C, and allowing for an increase in permissible working capital credit facility from USD 30.0 million to USD 50.0 million. Debt modification costs were incurred for an amount of USD 11.0 million.
OFT and OFTSOn 20 August 2016 OCI Fertilizer Trading (“OFT”) and OCI Fertilizer Trade & Supply (“OFTS”) amended their facility agreements, which are reported as bank overdrafts, by removing the financial covenants and releasing the guarantor.

112 OCI N.V. Annual Report 2016 OCI N.V. Annual Report 2016 113
Performance review / Operational strengths / Sustainability review / Corporate governance / Financial statements / Other information Performance review / Operational strengths / Sustainability review / Corporate governance / Financial statements / Other information
18. Loans and borrowings (continued)
Proceeds from borrowingsProceeds from borrowings in 2016 totaled an amount of USD 1,474.3 million, which consisted of the net proceeds of the new financing arrangements mentioned above.
New and amended financing arrangements in 2015
OCI Chemicals B.V.In July 2015, OCI Chemicals B.V. entered into a bridge facility agreement for a total amount of USD 150.0 million. The maximum amount drawn was USD 145.0 million and was repaid in full including interest in September 2015. The facility carried interest of USD LIBOR plus a margin of 4.50% per annum.
IFCoIn May 2015, IFCo entered into a new credit agreement with several lenders for a total amount of USD 59.7 million. Net proceeds were USD 58.2 million after taking into account transaction costs in the amount of USD 1.5 million. The credit agreement bears interest of LIBOR plus a margin of 3.0%. The credit agreement matures in December 2019.
OCI PartnersIn March 2015, OCI Partners borrowed USD 40.0 million under the Revolving Credit Facility agreement with several lenders. Net proceeds were USD 39.9 million after taking into account transaction costs in the amount of USD 0.1 million. The Revolving Credit Facility bears interest at OCI Partners’ option at either LIBOR plus a margin of 2.75% or a base rate plus a margin of 1.75%. OCI Partners pays a commitment fee of 1.10% per annum on the unused portion of the Revolving Credit Facility. The facility has a one-year term that may be extended for an additional one-year period subject to the consent of the lenders.
OCI Partners had term loans outstanding as of 31 December 2014 of USD 384.0 million. On 2 July 2015 OCI Partners entered into an incremental term loan commitment in the principal amount of USD 50.0 million with the same terms and provisions as the existing term loans. Net proceeds were USD 49.1 million after taking into account transaction costs in the amount of USD 0.9 million.
On 16 October 2015, OCI Partners amended the covenants and received a waiver from the lender for its outstanding term loans and revolving credit facility which have new carrying amounts of USD 425.3 million and USD 24.9 million, respectively, as of 31 December 2015.
OCI Fertilizer Trading and OCI Fertilizer Trade and SupplyOn 26 July 2015, OCI Fertilizer Trading signed an uncommitted trade finance facility for USD 75.0 million. The facility carries an interest rate of LIBOR + 1.50% margin. As of 31 December 2015, the outstanding debt balance was USD 8.1 million.
OCI N.V.In September 2015, OCI N.V. entered into a term facility agreement with a principal amount of USD 200.0 million. Net proceeds were USD 198.5 million after taking into account transaction cost in the amount of USD 1.5 million. The term facility agreement carries an interest rate of LIBOR + 2.25%.
In September 2015, OCI N.V. entered into another term facility agreement with a principal amount of USD 200.0 million. Net proceeds were USD 199.0 million after taking into account transaction cost in the amount of USD 1.0 million. The term facility agreement carries an interest rate of LIBOR + 2.50%.
Proceeds from borrowingsProceeds from borrowings in 2015 totaled an amount of USD 760.7 million, which consisted of the net proceeds of the new and amended financing arrangements mentioned above, except for the trade finance facility entered into by OCI Fertilizer Trading which is presented under bank overdraft and an increase of USD 71.0 million in the USD 550.0 million credit facility agreement entered into by OCI N.V., which is currently fully drawn in Euro’s.
Undrawn bank facilitiesAs of 31 December 2016, the Group had not drawn external bank facilities in the amount of USD 175.5 million. This relates to external bank
facilities of OFT and OCI Fertilizer Trade & Supply B.V. of USD 74.3 million, OCI Partners of USD 40.0 million, OCI Nitrogen of USD 52.6 million and OCI N.V. of USD 8.6 million.
NOTES TO THE CONSOLIDATED FINANCIAL STATEMENTS CONTINUED
18. Loans and borrowings (continued)
Convertible note termsIn September, 2013, OCI N.V. issued convertible Euro notes with proceeds of USD 466.5 million. The notes have a 5 year maturity date and a coupon rate of 3.875 percent per annum, payable semi-annually in arrears. The issued convertible notes qualify as compound financial instruments, since each note contains both an equity and liability component. These notes contain an equity component which entitles the holder to convert into shares at a conversion fixed price of EUR 34.45 per share and so contain a liability component for the issuer’s obligation to pay interest and potentially, to redeem the note in cash. In March 2015, post the Demerger of the Engineering & Construction business, the conversion price was adjusted to EUR 28.4690. The conversion price was calculated based on the 5-day weighted average price (WAP) of OCI N.V. prior to the Demerger and the 5-day WAP of Orascom Limited post the Demerger.
Transaction costs that are directly attributable for the issuance of the shares and convertible notes totaled USD 11.7 million. This includes fees and commissions paid to advisers, brokers, dealers and lawyers. These costs are allocated to the liability and equity component on a pro rata basis. The transaction costs related to the liability component will be recognized in accordance with the effective interest rate method over the term of the convertible bond and will be recognized under finance expenses in the statement of profit or loss.
19. Trade and other payables
$ millions 2016 2015
Trade payables 156.0 138.6Trade payable due to related party (note 32) 78.9 192.3Other payables 60.7 56.3Share-based payment liabilities 2.4 11.8Accrued expenses 109.7 97.5Accrued interest 44.4 45.2Deferred income - 12.4Other tax payable 19.0 12.6
Derivative financial instruments 14.6 26.5
Total 485.7 593.2Non-current 5.6 24.9Current 480.1 568.3Total 485.7 593.2
Information about the Group’s exposure to currency and liquidity risk is included in note 6. The carrying amount of ‘Trade and other payables’ approximates its fair value. Reference is made to note 22 with regards to deferred income.
Derivative financial instruments include the following:
$ millions 2016 2015
Foreign exchange contract 0.6 -Gas price derivatives at fair value - (0.3)Discounted value of outstanding installments on gas price derivative 14.0 26.8Total 14.6 26.5
All derivatives included in trade and other payables are classified in the fair value hierarchy level 2.
Gas price derivativeAlthough the IFCo plant is still under construction, IFCo entered into a swaption (option to swap) to mitigate the potential impact of the increase in natural gas prices for a portion of the expected usage. The Group does not apply hedge accounting, therefore all fair value changes related to this financial instrument are recognized in profit or loss. The derivative entitles IFCo to an option to buy a quantity of 95,887,500 MMBtu representing 50% of expected consumption against a strike price of USD 6.0/MMBtu for years 2015-2018 and USD 6.5/MMBtu for years 2019-2022. As of 31 December 2016 and 31 December 2015, the fair value of the derivative amounted to almost nil and USD 0.3 million, respectively. The discounted value of the outstanding installments related to the gas price derivative amounting to USD 14.0 million and USD 26.8 million, respectively, have been netted with the fair value of the derivative. The discount rate used was 9.2% for both 2016 and 2015.

114 OCI N.V. Annual Report 2016 OCI N.V. Annual Report 2016 115
Performance review / Operational strengths / Sustainability review / Corporate governance / Financial statements / Other information Performance review / Operational strengths / Sustainability review / Corporate governance / Financial statements / Other information
20. Provisions
$ millions
Claimsand other
provisionsDonation provision Total
At 1 January 2016 12.2 243.2 255.4
Provision made during the year 6.2 - 6.2Provision used during the year (0.6) - (0.6)Provision reversed during the year (2.4) - (2.4)Effect of movement in exchange rates 0.4 (138.5) (138.1)At 31 December 2016 15.8 104.7 120.5Non-current 9.8 - 9.8Current 6.0 104.7 110.7Total 15.8 104.7 120.5
Claims and other provisionsThe Group is involved in various litigations and arbitrations. In cases where it is probable that the outcome of the proceedings will be unfavorable, and the financial outcome can be measured reliably, a provision has been recognized. Reference is made to note 28 for detailed information with respect to major ongoing litigations and claims for which no provision has been recognized. Other provisions also include a take-or-pay provision on the gas contract of Sorfert.
Donation provisionOn 13 November 2014, the Company announced that it had decided to transfer the rights to the amounts receivable from the first installment already paid to the tax authorities in 2013 of EGP 2,500 million (approximately USD 360.0 million) to the Tahya Misr (‘Long Live Egypt’) social fund (see note 28). No formal agreement has been drafted with the Tahya Misr social fund yet and no payments have been made to the fund. The transfer of rights has been approved by OCI N.V.’s Board of Directors on 12 November 2014.
Following the guidance under IAS 37 (constructive obligations) the Company has presented the transfer of rights to the Tahya Misr Fund as a donation provision.
In March 2015, the Company received a cheque for EGP 1,904 million (approximately USD 266.2 million). At year end 2015 the carrying amount in US dollars had reduced to 243.2 million, due to the revaluation of the EGP. During 2016 the balance was further reduced by the devaluation of the EGP to a value of USD 104.7 million at year end.
21. Development of cost of sales and selling, general and administrative expenses
a. Expenses by nature
$ millions 2016 2015
Raw materials and consumables and finished goods 1,172.2 1,162.9Employee benefit expenses (b) 237.6 226.3Depreciation, amortization 317.2 301.6Provisions - 3.2Consultancy expenses 16.7 20.6Other 165.8 209.8Total 1,909.5 1,924.4Cost of sales 1,685.4 1,654.1Selling, general and administrative expenses 224.1 270.3Total 1,909.5 1,924.4
NOTES TO THE CONSOLIDATED FINANCIAL STATEMENTS CONTINUED
21. Development of cost of sales and selling, general and administrative expenses (continued)
b. Employee benefit expenses
$ millions 2016 2015
Wages and salaries 180.4 163.6Social securities 7.3 6.3Employee profit sharing 38.1 36.1Pension cost 9.1 9.3Share-based compensation expense (c) 2.1 1.8Release remeasurement employee liability share-based payments (9.5) (2.7)Other employee expenses 10.1 11.9Total 237.6 226.3
During the financial year ended 31 December 2016, the number of key executives was 2 (2015: 2 key executives), which represents the Executive Board members; Nassef Sawiris (CEO), and Salman Butt (CFO). During the financial year ended 31 December 2016, the average number of staff employed in the Group converted into full-time equivalents amounted to 2,871 employees (2015: 2,972 employees).
c. Share-based compensation arrangements OCI N.V. currently has four share-based compensation plans which are intended to (i) attract and retain the best available personnel for positions of substantial responsibility, (ii) provide additional incentive to management and employees, (iii) promote the success of the Company’s business, and (iv) align the economic interests of key personnel directly with those of shareholders. Under the first two plans, stock options have been granted to management and employees. The other plans are comprised of share incentive plans.
Share option plansAs a result of the reverse takeover and group restructuring that took place during 2013, OCI N.V. acquired the assets and liabilities of the OCI S.A.E. Stock Incentive Plan (the first plan). Under the terms of the OCI S.A.E. incentive plan, in the event of a change of control of OCI S.A.E., each outstanding option or right shall be assumed or an equivalent option, or right substituted by the successor company or a subsidiary of the successor company. In the event that the successor company refuses to assume or substitute for the option or right, all outstanding options or rights shall fully vest and become immediately exercisable. OCI N.V. elected that holders of options or rights under the OCI S.A.E. incentive plan exchange each of their existing options or rights for an option or right in respect of shares of OCI N.V. on the same terms and conditions as the existing options or rights. The options under the OCI S.A.E. plan were generally granted at the fair market value on the date of grant, vested after four years (cliff vesting) and expired after five years. On 28 August 2013, following the commencement of OCI N.V. ‘s share trading in Euros, the options under the OCI S.A.E. plan were replaced by the Company’s options and accounted for as a modification of the original grant of options. Furthermore, under existing authority, 1,529,598 shares were repurchased from employees to facilitate the administration of the OCI S.A.E. plan during the year.
Employees hold 2,780,675 vested options which are exercisable as at 31 December 2016 for which payment of the purchase price could be made with a promissory note.
On 20 December 2013, the non-executive board members of OCI N.V. adopted an additional Employees Incentive Plan (the second plan). The second plan authorized the issuance of up to 1 million shares to employees and excludes the executive directors. The exercise price of the options granted to employees is equal to the fair market value of the shares on the date of grant. The options granted under this plan generally vest after three years (cliff vesting) and expire after seven years.
The Company modified the plans as at 7 March 2015 due to the demerger of the Construction business. Under the terms of the demerger, OCI N.V. shareholders received one Orascom Construction share for every two OCI N.V. shares owned. As a result of these developments, all outstanding options and matching rights held by awardees related to OCI N.V. shares have been replaced with new options and matching rights. The new option right will give the awardee a right to a cash payment equal to the increase in value of one OCI NV share plus ½ Orascom Construction share less the original exercise price. The new options and matching rights are cash-settled plans. The exercise price of the options and all other terms and conditions remained the same. Of the 2,780,675 option rights outstanding as at 31 December 2016, 1,734,375 are option rights are held by former employees which are now employed by Orascom Construction after the demerger. The vesting date of these rights did not change but since OCI N.V. no longer receives services for these option rights the expenses of USD 0.1 million have been recognized as at 31 December 2016 instead of recognition over the remaining vesting period.
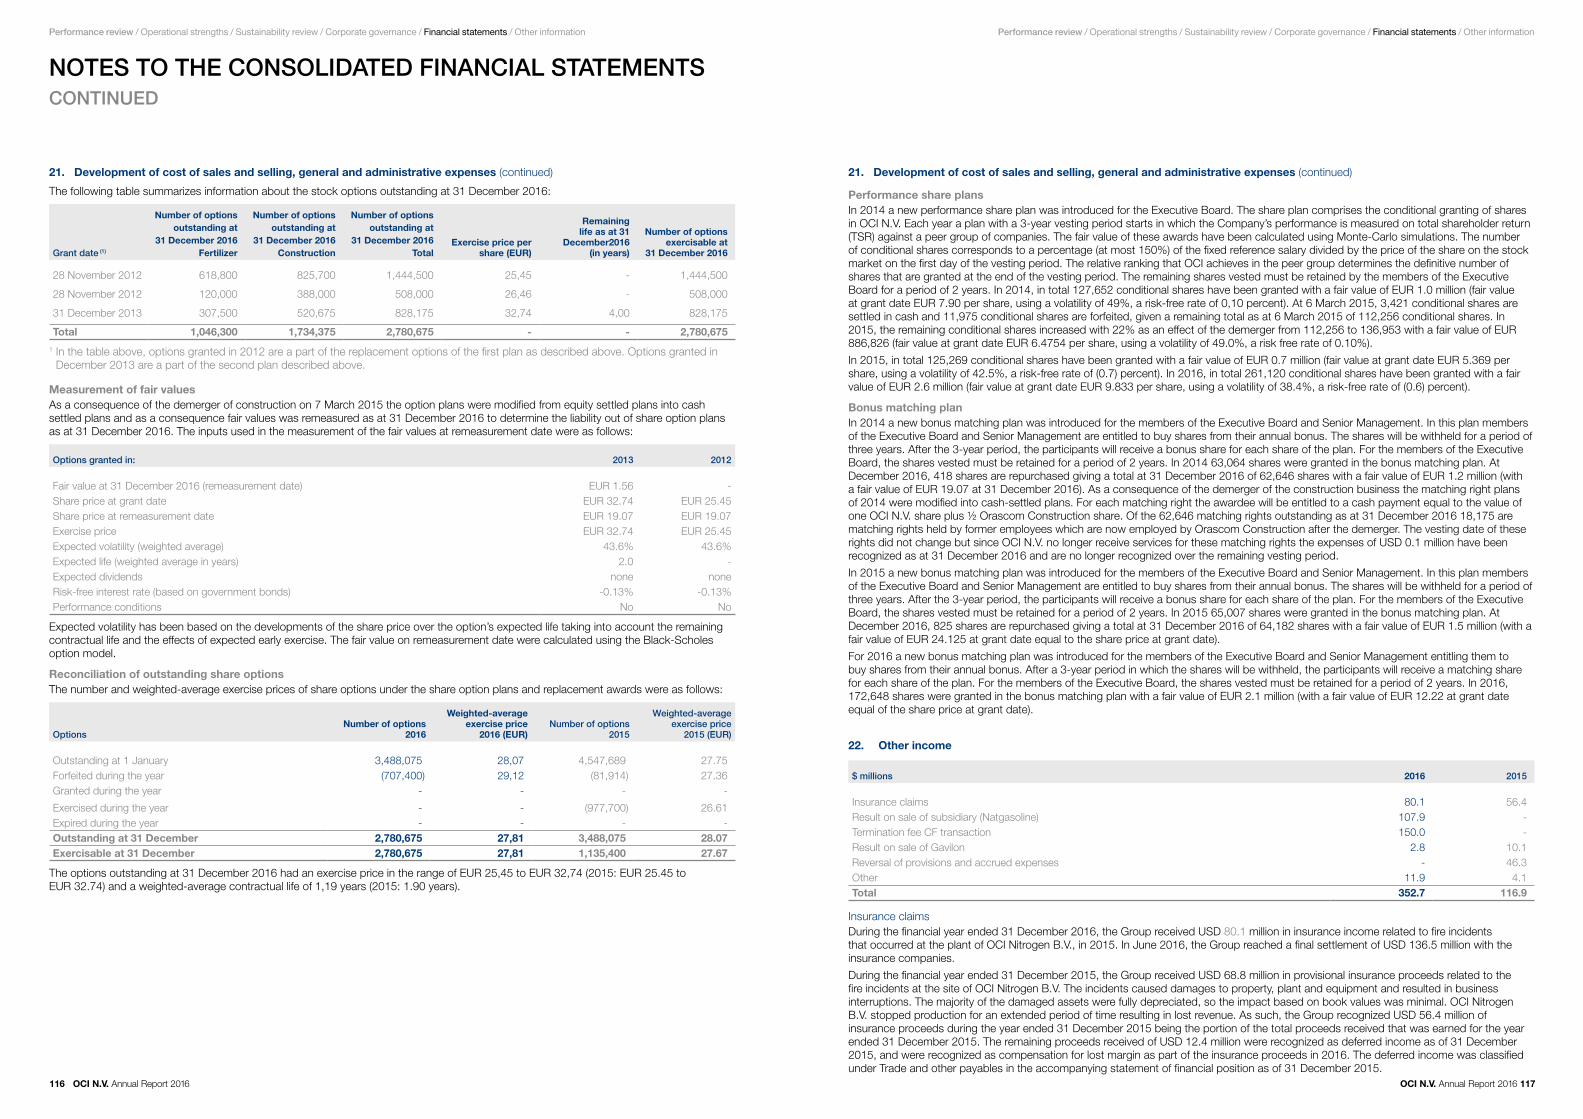
116 OCI N.V. Annual Report 2016 OCI N.V. Annual Report 2016 117
Performance review / Operational strengths / Sustainability review / Corporate governance / Financial statements / Other information Performance review / Operational strengths / Sustainability review / Corporate governance / Financial statements / Other information
21. Development of cost of sales and selling, general and administrative expenses (continued)
The following table summarizes information about the stock options outstanding at 31 December 2016:
Grant date (1)
Number of options outstanding at
31 December 2016 Fertilizer
Number of options outstanding at
31 December 2016 Construction
Number of options outstanding at
31 December 2016 Total
Exercise price per share (EUR)
Remaining life as at 31
December2016(in years)
Number of options exercisable at
31 December 2016
28 November 2012 618,800 825,700 1,444,500 25,45 - 1,444,500
28 November 2012 120,000 388,000 508,000 26,46 - 508,000
31 December 2013 307,500 520,675 828,175 32,74 4,00 828,175
Total 1,046,300 1,734,375 2,780,675 - - 2,780,675
1 In the table above, options granted in 2012 are a part of the replacement options of the first plan as described above. Options granted in December 2013 are a part of the second plan described above.
Measurement of fair valuesAs a consequence of the demerger of construction on 7 March 2015 the option plans were modified from equity settled plans into cash settled plans and as a consequence fair values was remeasured as at 31 December 2016 to determine the liability out of share option plans as at 31 December 2016. The inputs used in the measurement of the fair values at remeasurement date were as follows:
Options granted in: 2013 2012
Fair value at 31 December 2016 (remeasurement date) EUR 1.56 -Share price at grant date EUR 32.74 EUR 25.45Share price at remeasurement date EUR 19.07 EUR 19.07Exercise price EUR 32.74 EUR 25.45Expected volatility (weighted average) 43.6% 43.6%Expected life (weighted average in years) 2.0 -Expected dividends none noneRisk-free interest rate (based on government bonds) -0.13% -0.13%Performance conditions No No
Expected volatility has been based on the developments of the share price over the option’s expected life taking into account the remaining contractual life and the effects of expected early exercise. The fair value on remeasurement date were calculated using the Black-Scholes option model.
Reconciliation of outstanding share optionsThe number and weighted-average exercise prices of share options under the share option plans and replacement awards were as follows:
OptionsNumber of options
2016
Weighted-average exercise price
2016 (EUR)Number of options
2015
Weighted-average exercise price
2015 (EUR)
Outstanding at 1 January 3,488,075 28,07 4,547,689 27.75Forfeited during the year (707,400) 29,12 (81,914) 27.36Granted during the year - - - -
Exercised during the year - - (977,700) 26.61Expired during the year - - - -Outstanding at 31 December 2,780,675 27,81 3,488,075 28.07Exercisable at 31 December 2,780,675 27,81 1,135,400 27.67
The options outstanding at 31 December 2016 had an exercise price in the range of EUR 25,45 to EUR 32,74 (2015: EUR 25.45 to EUR 32.74) and a weighted-average contractual life of 1,19 years (2015: 1.90 years).
NOTES TO THE CONSOLIDATED FINANCIAL STATEMENTS CONTINUED
21. Development of cost of sales and selling, general and administrative expenses (continued)
Performance share plansIn 2014 a new performance share plan was introduced for the Executive Board. The share plan comprises the conditional granting of shares in OCI N.V. Each year a plan with a 3-year vesting period starts in which the Company’s performance is measured on total shareholder return (TSR) against a peer group of companies. The fair value of these awards have been calculated using Monte-Carlo simulations. The number of conditional shares corresponds to a percentage (at most 150%) of the fixed reference salary divided by the price of the share on the stock market on the first day of the vesting period. The relative ranking that OCI achieves in the peer group determines the definitive number of shares that are granted at the end of the vesting period. The remaining shares vested must be retained by the members of the Executive Board for a period of 2 years. In 2014, in total 127,652 conditional shares have been granted with a fair value of EUR 1.0 million (fair value at grant date EUR 7.90 per share, using a volatility of 49%, a risk-free rate of 0,10 percent). At 6 March 2015, 3,421 conditional shares are settled in cash and 11,975 conditional shares are forfeited, given a remaining total as at 6 March 2015 of 112,256 conditional shares. In 2015, the remaining conditional shares increased with 22% as an effect of the demerger from 112,256 to 136,953 with a fair value of EUR 886,826 (fair value at grant date EUR 6.4754 per share, using a volatility of 49.0%, a risk free rate of 0.10%).
In 2015, in total 125,269 conditional shares have been granted with a fair value of EUR 0.7 million (fair value at grant date EUR 5.369 per share, using a volatility of 42.5%, a risk-free rate of (0.7) percent). In 2016, in total 261,120 conditional shares have been granted with a fair value of EUR 2.6 million (fair value at grant date EUR 9.833 per share, using a volatility of 38.4%, a risk-free rate of (0.6) percent).
Bonus matching planIn 2014 a new bonus matching plan was introduced for the members of the Executive Board and Senior Management. In this plan members of the Executive Board and Senior Management are entitled to buy shares from their annual bonus. The shares will be withheld for a period of three years. After the 3-year period, the participants will receive a bonus share for each share of the plan. For the members of the Executive Board, the shares vested must be retained for a period of 2 years. In 2014 63,064 shares were granted in the bonus matching plan. At December 2016, 418 shares are repurchased giving a total at 31 December 2016 of 62,646 shares with a fair value of EUR 1.2 million (with a fair value of EUR 19.07 at 31 December 2016). As a consequence of the demerger of the construction business the matching right plans of 2014 were modified into cash-settled plans. For each matching right the awardee will be entitled to a cash payment equal to the value of one OCI N.V. share plus ½ Orascom Construction share. Of the 62,646 matching rights outstanding as at 31 December 2016 18,175 are matching rights held by former employees which are now employed by Orascom Construction after the demerger. The vesting date of these rights did not change but since OCI N.V. no longer receive services for these matching rights the expenses of USD 0.1 million have been recognized as at 31 December 2016 and are no longer recognized over the remaining vesting period.
In 2015 a new bonus matching plan was introduced for the members of the Executive Board and Senior Management. In this plan members of the Executive Board and Senior Management are entitled to buy shares from their annual bonus. The shares will be withheld for a period of three years. After the 3-year period, the participants will receive a bonus share for each share of the plan. For the members of the Executive Board, the shares vested must be retained for a period of 2 years. In 2015 65,007 shares were granted in the bonus matching plan. At December 2016, 825 shares are repurchased giving a total at 31 December 2016 of 64,182 shares with a fair value of EUR 1.5 million (with a fair value of EUR 24.125 at grant date equal to the share price at grant date).
For 2016 a new bonus matching plan was introduced for the members of the Executive Board and Senior Management entitling them to buy shares from their annual bonus. After a 3-year period in which the shares will be withheld, the participants will receive a matching share for each share of the plan. For the members of the Executive Board, the shares vested must be retained for a period of 2 years. In 2016, 172,648 shares were granted in the bonus matching plan with a fair value of EUR 2.1 million (with a fair value of EUR 12.22 at grant date equal of the share price at grant date).
22. Other income
$ millions 2016 2015
Insurance claims 80.1 56.4Result on sale of subsidiary (Natgasoline) 107.9 -Termination fee CF transaction 150.0 -Result on sale of Gavilon 2.8 10.1Reversal of provisions and accrued expenses - 46.3Other 11.9 4.1Total 352.7 116.9
Insurance claimsDuring the financial year ended 31 December 2016, the Group received USD 80.1 million in insurance income related to fire incidents that occurred at the plant of OCI Nitrogen B.V., in 2015. In June 2016, the Group reached a final settlement of USD 136.5 million with the insurance companies.
During the financial year ended 31 December 2015, the Group received USD 68.8 million in provisional insurance proceeds related to the fire incidents at the site of OCI Nitrogen B.V. The incidents caused damages to property, plant and equipment and resulted in business interruptions. The majority of the damaged assets were fully depreciated, so the impact based on book values was minimal. OCI Nitrogen B.V. stopped production for an extended period of time resulting in lost revenue. As such, the Group recognized USD 56.4 million of insurance proceeds during the year ended 31 December 2015 being the portion of the total proceeds received that was earned for the year ended 31 December 2015. The remaining proceeds received of USD 12.4 million were recognized as deferred income as of 31 December 2015, and were recognized as compensation for lost margin as part of the insurance proceeds in 2016. The deferred income was classified under Trade and other payables in the accompanying statement of financial position as of 31 December 2015.

118 OCI N.V. Annual Report 2016 OCI N.V. Annual Report 2016 119
Performance review / Operational strengths / Sustainability review / Corporate governance / Financial statements / Other information Performance review / Operational strengths / Sustainability review / Corporate governance / Financial statements / Other information
22. Other income (continued)
Result on sale of 50% and deconsolidation of Firewater LLC (Natgasoline)In May 2016, a controlling interest of 50% of the shares held in Firewater LLC (holding company of Natgasoline) were sold to CEL (reference is made to note 10). Subsequently, the investment in Firewater LLC was deconsolidated and the resulting gain of USD 107.9 million recognized, which was determined as follows:
$ millions
Fair value of retained investment in Firewater LLC (Natgasoline) 630.0Carrying amount of Firewater’s net assets (522.1)Resulting gain 107.9
Termination fee as per combination agreement with CFOn 6 August 2015, CF Industries (“CF”) and OCI announced plans to combine OCI’s European, North American and Global distribution business (together referred to as the ‘ENA Business‘) with CF’s global assets to form ‘New CF‘. The 4 April 2016 US Treasury announcement materially reduced the structural synergies of the combination. After unsuccessfully exploring alternative transactions and structures, CF and OCI announced the termination of the combination agreement on 23 May 2016. OCI received a termination fee of USD 150.0 million on 25 May 2016 from CF as contemplated in the combination agreement, which is recognized under other income.
Result on sale of Gavilon in 2015 and 2016The USD 2.8 million of ‘Result on sale of Gavilon’ in 2016 (2015: USD 10.1 million) relates to the partial release of the escrow account created during the sales transaction of Gavilon in 2013. The amount of USD 2.8 million was collected in the beginning of January 2017 and recorded on ‘Trade and other receivables’ as at 31 December 2016. During 2013, OCI Fertilizer Holding Limited (‘OCI FH’) sold its full ownership in Gavilon Group for a total consideration of USD 666.7 million, resulting into a gain of USD 262.1 million. As at 31 December 2016, an amount of USD 2.0 million (2015: USD 9.8 million) was still held by the buyer in the escrow account, which was created to cover any post-closing indemnity under the Sale and Purchase Agreement. It is uncertain when and how much of the remaining amount of USD 2.0 million will be received. No receivable has been recognized for this amount.
Reversal of provisions and accrued expenses in 2015
The reversal of provisions and accrued expenses of USD 46.3 million related to USD 34.4 million to the reversal of claims and other contingencies (reference is made to note 20) and for USD 11.9 million of reversals of accrued expenses for OCI S.A.E. relating to court cases of which the probability has changed in favor of OCI S.A.E.
23. Other expenses
$ millions 2016 2015
Impairment of goodwill - 422.9
CF transaction related expense 24.8 -Repair costs 13.8 -Impairment available-for-sale financial assets 3.0 3.5Loss on gas price derivative by IFCo 2.5 6.7Other 1.1 3.2Total 45.2 436.3
Other expenses in 2016 consist mainly of repair costs of USD 13.8 million incurred by OCI Nitrogen B.V. as a result of the fire at the factory in 2015 and an expense of USD 24.8 million related to the CF transaction. The impairment available-for-sale financial assets relates to the investment in Abu Qir, reference is made to note 11. For further information on the gas price derivative, reference is made to note 19. For further information on the impairment of goodwill in 2015, reference is made to note 8.
NOTES TO THE CONSOLIDATED FINANCIAL STATEMENTS CONTINUED
24. Net finance cost
$ millions 2016 2015
Interest income on loans and receivables 21.7 12.8Fair value gain on derivative 4.9 -Foreign exchange gain 325.6 115.2Finance income 352.2 128.0Interest expense on financial liabilities measured at amortized cost (242.2) (180.9)Fair value loss on derivative (0.9) -Foreign exchange loss (189.4) (93.1)Finance cost (432.5) (274.0)Net finance cost recognized in profit or loss (80.3) (146.0)
The increase in foreign exchange gains and losses from 2015 to 2016 mainly related to the revaluation of intercompany balances in foreign currencies, for which the statement of profit or loss impact is not eliminated in the consolidated financial statements. Foreign exchange gain and losses in both 2016 and 2015, include the foreign currency result from the donation provision and the tax refunds received USD 138.5 million (2015: USD 23.0 million). Also included in the Foreign exchange gain above is a total of USD 52.8 million caused by USD denominated intercompany loans in OCI N.V. whose functional currency is Euro and USD 70.2 million foreign exchange gain on the revaluation of the EGP 1,015 million loan outstanding in EFC. The increase in finance cost compared to prior year mainly relates to the refinancings performed in 2016.
25. Earnings per share
25.1 Earnings per share from total operations
2016 2015
i. BasicNet profit / (loss) attributable to shareholders 167.9 384.7
Weighted average number of ordinary share (Basic) 209,231,092 209,164,389
Basic earnings per ordinary share 0.802 1.839
ii. DilutedNet profit / (loss) attributable to holders of ordinary shareholders 167.9 384.7Interest expense on convertible notes anti-dilutive 17.4Net profit / (loss) attributable to holders of ordinary shareholders based on full conversion 167.9 402.1Weighted average number of ordinary shares (Basic) 209,231,092 209,164,389Adjustment for assumed conversion of convertible notes anti-dilutive 11,907,689Adjustment for assumed equity - settled share-based compensation - 172,395Weighted average number of ordinary shares outstanding on the basis of full conversion 209,231,092 221,244,473Diluted earnings per ordinary share 0.802 1.817
(i) Weighted average number of ordinary shares calculation
shares 2016 2015
Issued ordinary shares at 1 January 210,113,854 205,911,570
Effect of treasury shares held (1,074,484) (926,439)
Effect of shares issued during the year 191,722 4,179,258
Weighted average number of ordinary shares outstanding as per 31 December 209,231,092 209,164,389
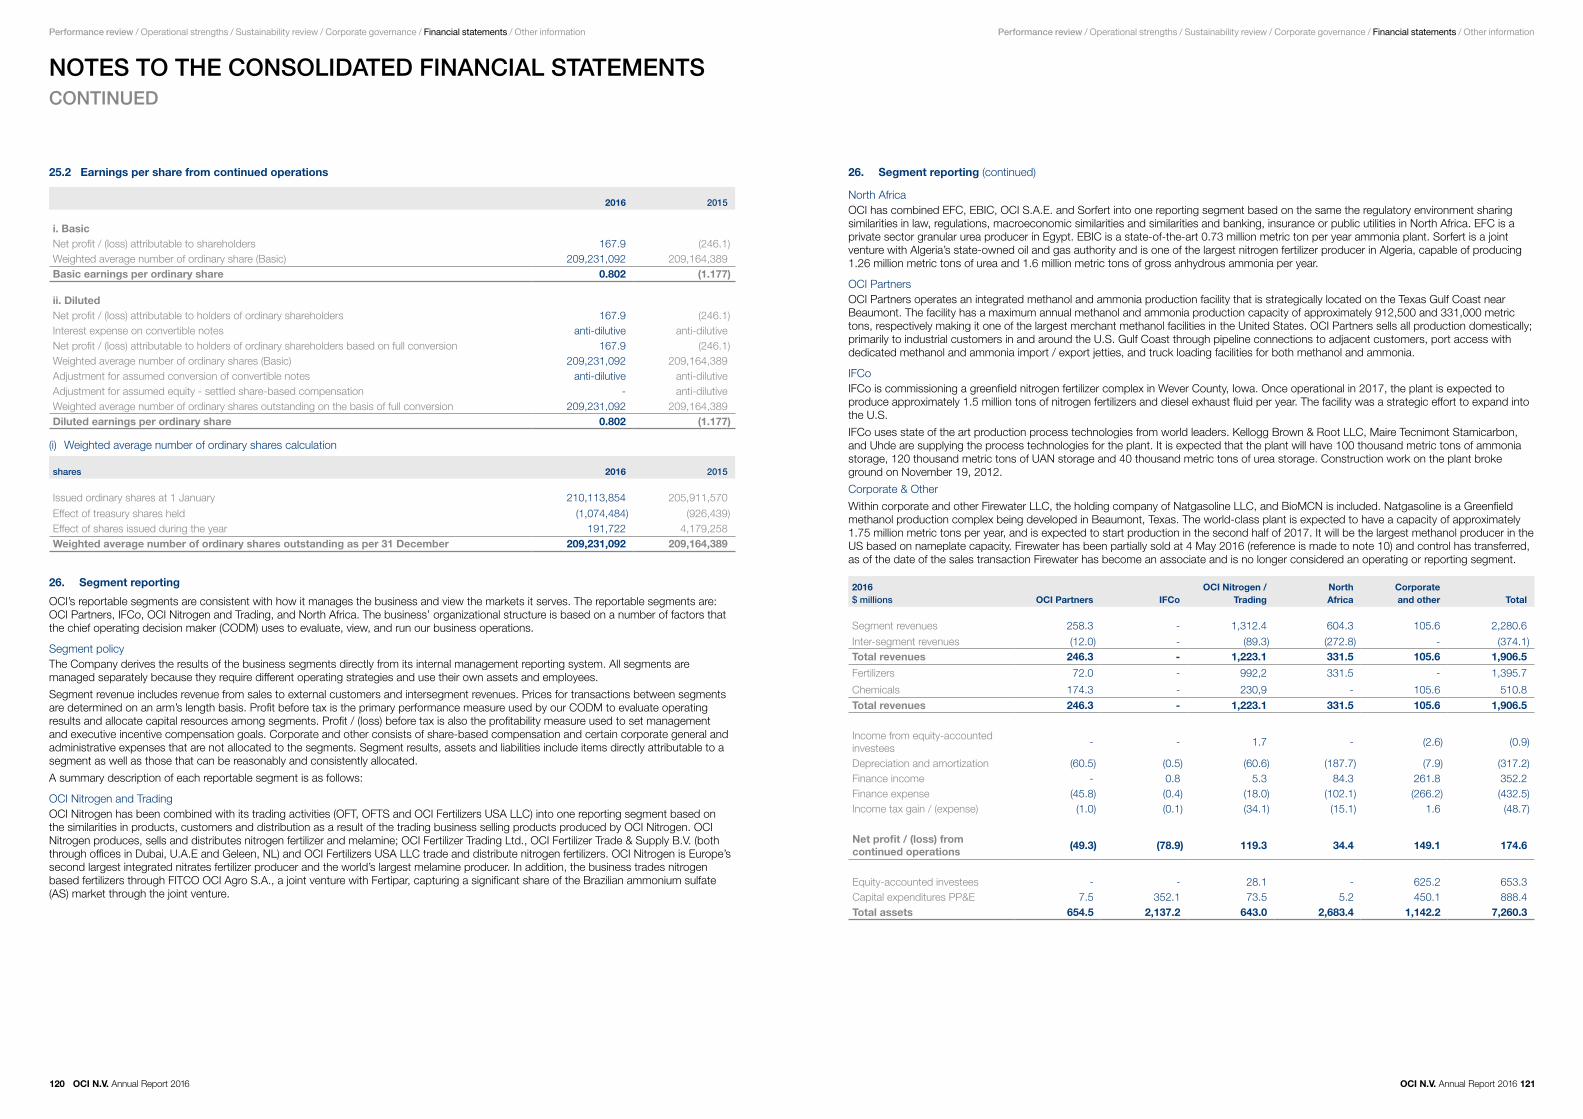
120 OCI N.V. Annual Report 2016 OCI N.V. Annual Report 2016 121
Performance review / Operational strengths / Sustainability review / Corporate governance / Financial statements / Other information Performance review / Operational strengths / Sustainability review / Corporate governance / Financial statements / Other information
25.2 Earnings per share from continued operations
2016 2015
i. BasicNet profit / (loss) attributable to shareholders 167.9 (246.1)Weighted average number of ordinary share (Basic) 209,231,092 209,164,389Basic earnings per ordinary share 0.802 (1.177)
ii. DilutedNet profit / (loss) attributable to holders of ordinary shareholders 167.9 (246.1)Interest expense on convertible notes anti-dilutive anti-dilutiveNet profit / (loss) attributable to holders of ordinary shareholders based on full conversion 167.9 (246.1)Weighted average number of ordinary shares (Basic) 209,231,092 209,164,389Adjustment for assumed conversion of convertible notes anti-dilutive anti-dilutiveAdjustment for assumed equity - settled share-based compensation - anti-dilutiveWeighted average number of ordinary shares outstanding on the basis of full conversion 209,231,092 209,164,389Diluted earnings per ordinary share 0.802 (1.177)
(i) Weighted average number of ordinary shares calculation
shares 2016 2015
Issued ordinary shares at 1 January 210,113,854 205,911,570
Effect of treasury shares held (1,074,484) (926,439)Effect of shares issued during the year 191,722 4,179,258Weighted average number of ordinary shares outstanding as per 31 December 209,231,092 209,164,389
26. Segment reporting
OCI’s reportable segments are consistent with how it manages the business and view the markets it serves. The reportable segments are: OCI Partners, IFCo, OCI Nitrogen and Trading, and North Africa. The business’ organizational structure is based on a number of factors that the chief operating decision maker (CODM) uses to evaluate, view, and run our business operations.
Segment policyThe Company derives the results of the business segments directly from its internal management reporting system. All segments are managed separately because they require different operating strategies and use their own assets and employees.
Segment revenue includes revenue from sales to external customers and intersegment revenues. Prices for transactions between segments are determined on an arm’s length basis. Profit before tax is the primary performance measure used by our CODM to evaluate operating results and allocate capital resources among segments. Profit / (loss) before tax is also the profitability measure used to set management and executive incentive compensation goals. Corporate and other consists of share-based compensation and certain corporate general and administrative expenses that are not allocated to the segments. Segment results, assets and liabilities include items directly attributable to a segment as well as those that can be reasonably and consistently allocated.
A summary description of each reportable segment is as follows:
OCI Nitrogen and TradingOCI Nitrogen has been combined with its trading activities (OFT, OFTS and OCI Fertilizers USA LLC) into one reporting segment based on the similarities in products, customers and distribution as a result of the trading business selling products produced by OCI Nitrogen. OCI Nitrogen produces, sells and distributes nitrogen fertilizer and melamine; OCI Fertilizer Trading Ltd., OCI Fertilizer Trade & Supply B.V. (both through offices in Dubai, U.A.E and Geleen, NL) and OCI Fertilizers USA LLC trade and distribute nitrogen fertilizers. OCI Nitrogen is Europe’s second largest integrated nitrates fertilizer producer and the world’s largest melamine producer. In addition, the business trades nitrogen based fertilizers through FITCO OCI Agro S.A., a joint venture with Fertipar, capturing a significant share of the Brazilian ammonium sulfate (AS) market through the joint venture.
NOTES TO THE CONSOLIDATED FINANCIAL STATEMENTS CONTINUED
26. Segment reporting (continued)
North AfricaOCI has combined EFC, EBIC, OCI S.A.E. and Sorfert into one reporting segment based on the same the regulatory environment sharing similarities in law, regulations, macroeconomic similarities and similarities and banking, insurance or public utilities in North Africa. EFC is a private sector granular urea producer in Egypt. EBIC is a state-of-the-art 0.73 million metric ton per year ammonia plant. Sorfert is a joint venture with Algeria’s state-owned oil and gas authority and is one of the largest nitrogen fertilizer producer in Algeria, capable of producing 1.26 million metric tons of urea and 1.6 million metric tons of gross anhydrous ammonia per year.
OCI Partners OCI Partners operates an integrated methanol and ammonia production facility that is strategically located on the Texas Gulf Coast near Beaumont. The facility has a maximum annual methanol and ammonia production capacity of approximately 912,500 and 331,000 metric tons, respectively making it one of the largest merchant methanol facilities in the United States. OCI Partners sells all production domestically; primarily to industrial customers in and around the U.S. Gulf Coast through pipeline connections to adjacent customers, port access with dedicated methanol and ammonia import / export jetties, and truck loading facilities for both methanol and ammonia.
IFCoIFCo is commissioning a greenfield nitrogen fertilizer complex in Wever County, Iowa. Once operational in 2017, the plant is expected to produce approximately 1.5 million tons of nitrogen fertilizers and diesel exhaust fluid per year. The facility was a strategic effort to expand into the U.S.
IFCo uses state of the art production process technologies from world leaders. Kellogg Brown & Root LLC, Maire Tecnimont Stamicarbon, and Uhde are supplying the process technologies for the plant. It is expected that the plant will have 100 thousand metric tons of ammonia storage, 120 thousand metric tons of UAN storage and 40 thousand metric tons of urea storage. Construction work on the plant broke ground on November 19, 2012.
Corporate & Other
Within corporate and other Firewater LLC, the holding company of Natgasoline LLC, and BioMCN is included. Natgasoline is a Greenfield methanol production complex being developed in Beaumont, Texas. The world-class plant is expected to have a capacity of approximately 1.75 million metric tons per year, and is expected to start production in the second half of 2017. It will be the largest methanol producer in the US based on nameplate capacity. Firewater has been partially sold at 4 May 2016 (reference is made to note 10) and control has transferred, as of the date of the sales transaction Firewater has become an associate and is no longer considered an operating or reporting segment.
2016$ millions OCI Partners IFCo
OCI Nitrogen / Trading
North Africa
Corporate and other Total
Segment revenues 258.3 - 1,312.4 604.3 105.6 2,280.6
Inter-segment revenues (12.0) - (89.3) (272.8) - (374.1)Total revenues 246.3 - 1,223.1 331.5 105.6 1,906.5
Fertilizers 72.0 - 992,2 331.5 - 1,395.7
Chemicals 174.3 - 230,9 - 105.6 510.8Total revenues 246.3 - 1,223.1 331.5 105.6 1,906.5
Income from equity-accounted investees
- - 1.7 - (2.6) (0.9)
Depreciation and amortization (60.5) (0.5) (60.6) (187.7) (7.9) (317.2)Finance income - 0.8 5.3 84.3 261.8 352.2Finance expense (45.8) (0.4) (18.0) (102.1) (266.2) (432.5)Income tax gain / (expense) (1.0) (0.1) (34.1) (15.1) 1.6 (48.7) Net profit / (loss) from continued operations (49.3) (78.9) 119.3 34.4 149.1 174.6
Equity-accounted investees - - 28.1 - 625.2 653.3Capital expenditures PP&E 7.5 352.1 73.5 5.2 450.1 888.4Total assets 654.5 2,137.2 643.0 2,683.4 1,142.2 7,260.3
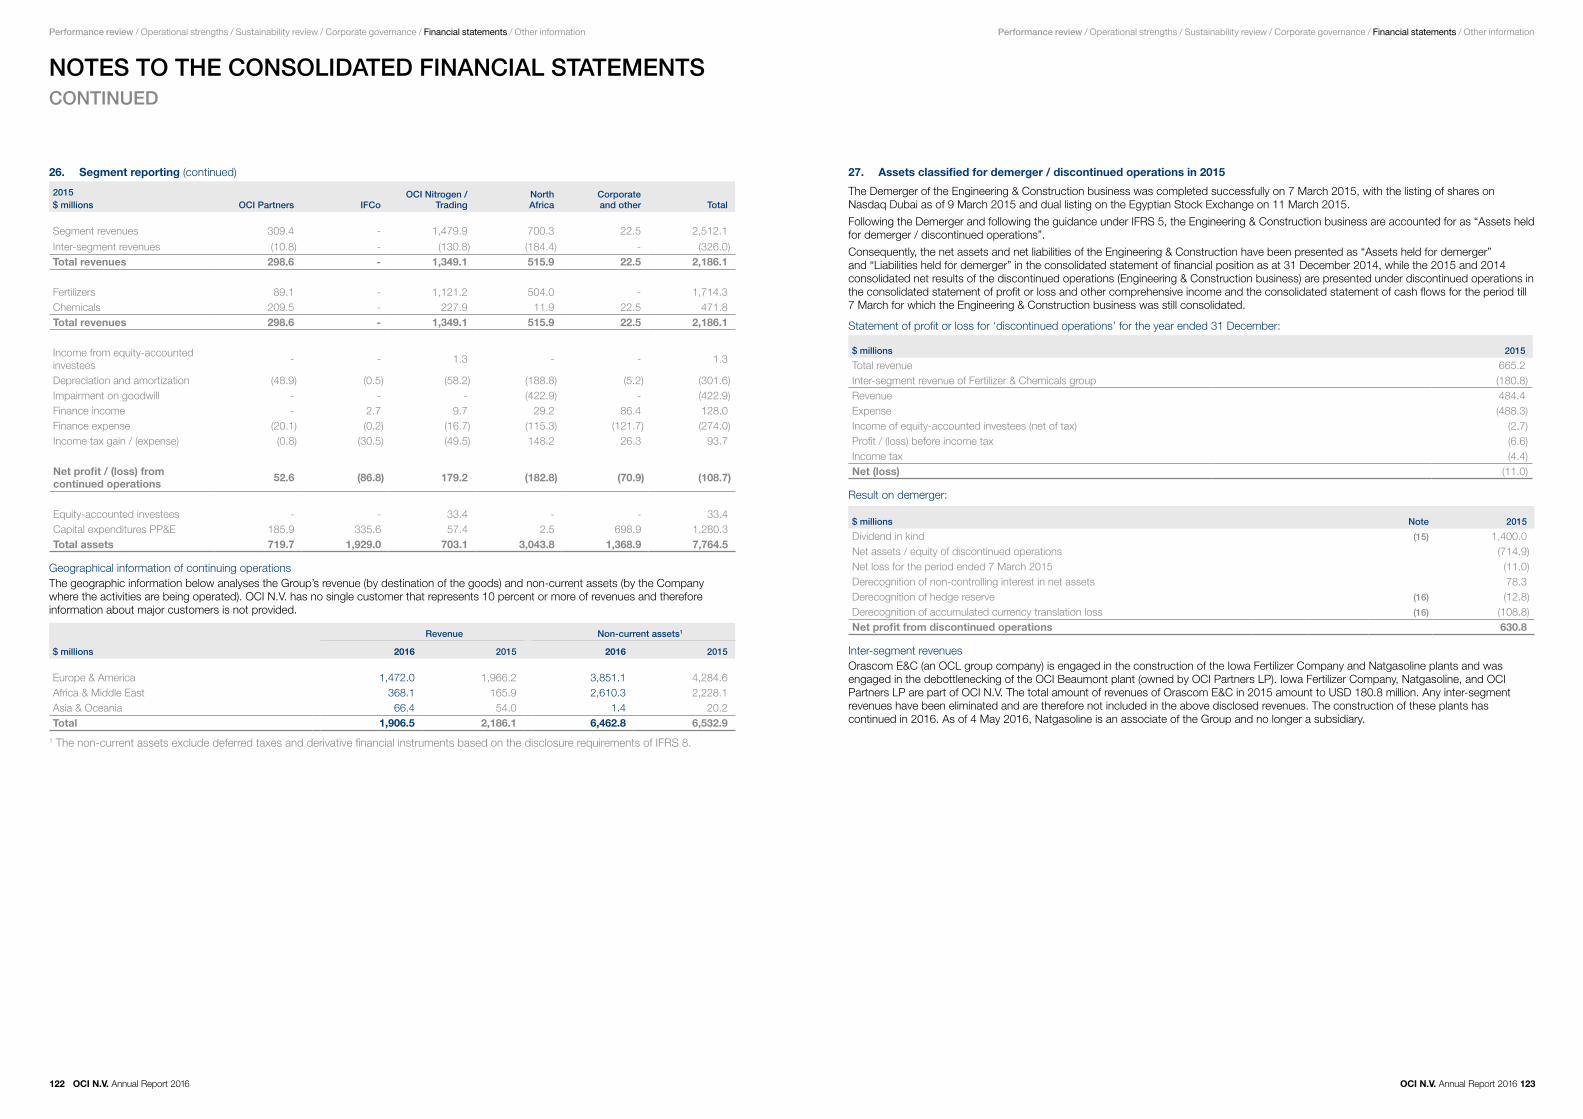
122 OCI N.V. Annual Report 2016 OCI N.V. Annual Report 2016 123
Performance review / Operational strengths / Sustainability review / Corporate governance / Financial statements / Other information Performance review / Operational strengths / Sustainability review / Corporate governance / Financial statements / Other information
NOTES TO THE CONSOLIDATED FINANCIAL STATEMENTS CONTINUED
26. Segment reporting (continued)
2015$ millions OCI Partners IFCo
OCI Nitrogen /Trading
North Africa
Corporate and other Total
Segment revenues 309.4 - 1,479.9 700.3 22.5 2,512.1
Inter-segment revenues (10.8) - (130.8) (184.4) - (326.0)Total revenues 298.6 - 1,349.1 515.9 22.5 2,186.1
Fertilizers 89.1 - 1,121.2 504.0 - 1,714.3Chemicals 209.5 - 227.9 11.9 22.5 471.8Total revenues 298.6 - 1,349.1 515.9 22.5 2,186.1
Income from equity-accounted investees
- - 1.3 - - 1.3
Depreciation and amortization (48.9) (0.5) (58.2) (188.8) (5.2) (301.6)Impairment on goodwill - - - (422.9) - (422.9)Finance income - 2.7 9.7 29.2 86.4 128.0Finance expense (20.1) (0.2) (16.7) (115.3) (121.7) (274.0)Income tax gain / (expense) (0.8) (30.5) (49.5) 148.2 26.3 93.7 Net profit / (loss) from continued operations 52.6 (86.8) 179.2 (182.8) (70.9) (108.7)
Equity-accounted investees - - 33.4 - - 33.4Capital expenditures PP&E 185.9 335.6 57.4 2.5 698.9 1,280.3Total assets 719.7 1,929.0 703.1 3,043.8 1,368.9 7,764.5
Geographical information of continuing operationsThe geographic information below analyses the Group’s revenue (by destination of the goods) and non-current assets (by the Company where the activities are being operated). OCI N.V. has no single customer that represents 10 percent or more of revenues and therefore information about major customers is not provided.
Revenue Non-current assets1
$ millions 2016 2015 2016 2015
Europe & America 1,472.0 1,966.2 3,851.1 4,284.6Africa & Middle East 368.1 165.9 2,610.3 2,228.1Asia & Oceania 66.4 54.0 1.4 20.2Total 1,906.5 2,186.1 6,462.8 6,532.9
1 The non-current assets exclude deferred taxes and derivative financial instruments based on the disclosure requirements of IFRS 8.
27. Assets classified for demerger / discontinued operations in 2015
The Demerger of the Engineering & Construction business was completed successfully on 7 March 2015, with the listing of shares on Nasdaq Dubai as of 9 March 2015 and dual listing on the Egyptian Stock Exchange on 11 March 2015.
Following the Demerger and following the guidance under IFRS 5, the Engineering & Construction business are accounted for as “Assets held for demerger / discontinued operations”.
Consequently, the net assets and net liabilities of the Engineering & Construction have been presented as “Assets held for demerger” and “Liabilities held for demerger” in the consolidated statement of financial position as at 31 December 2014, while the 2015 and 2014 consolidated net results of the discontinued operations (Engineering & Construction business) are presented under discontinued operations in the consolidated statement of profit or loss and other comprehensive income and the consolidated statement of cash flows for the period till 7 March for which the Engineering & Construction business was still consolidated.
Statement of profit or loss for ‘discontinued operations’ for the year ended 31 December:
$ millions 2015
Total revenue 665.2 Inter-segment revenue of Fertilizer & Chemicals group (180.8)Revenue 484.4Expense (488.3)Income of equity-accounted investees (net of tax) (2.7)Profit / (loss) before income tax (6.6)Income tax (4.4)Net (loss) (11.0)
Result on demerger:
$ millions Note 2015
Dividend in kind (15) 1,400.0 Net assets / equity of discontinued operations (714.9)Net loss for the period ended 7 March 2015 (11.0)Derecognition of non-controlling interest in net assets 78.3 Derecognition of hedge reserve (16) (12.8)Derecognition of accumulated currency translation loss (16) (108.8)Net profit from discontinued operations 630.8
Inter-segment revenuesOrascom E&C (an OCL group company) is engaged in the construction of the Iowa Fertilizer Company and Natgasoline plants and was engaged in the debottlenecking of the OCI Beaumont plant (owned by OCI Partners LP). Iowa Fertilizer Company, Natgasoline, and OCI Partners LP are part of OCI N.V. The total amount of revenues of Orascom E&C in 2015 amount to USD 180.8 million. Any inter-segment revenues have been eliminated and are therefore not included in the above disclosed revenues. The construction of these plants has continued in 2016. As of 4 May 2016, Natgasoline is an associate of the Group and no longer a subsidiary.

124 OCI N.V. Annual Report 2016 OCI N.V. Annual Report 2016 125
Performance review / Operational strengths / Sustainability review / Corporate governance / Financial statements / Other information Performance review / Operational strengths / Sustainability review / Corporate governance / Financial statements / Other information
NOTES TO THE CONSOLIDATED FINANCIAL STATEMENTS CONTINUED
28. Contingencies
Contingent liabilities
Letters of guarantee / letters of creditLetters of guarantee issued by banks in favor of others as at 31 December 2016 amounted to USD 0.2 million (2015: USD 0.2 million). Outstanding letters of credit as at 31 December 2016 (uncovered portion) amounted to nil (2015: nil).
Litigations and claimsIn the normal course of business, the Group entities and joint ventures are involved in some arbitration or court cases as defendants or claimants. These litigations are carefully monitored by the entities’ management and legal counsels, and are regularly assessed with due consideration for possible insurance coverage and recourse rights on third parties. OCI does not expect these proceedings to result in liabilities that have a material effect on the Company’s financial position. In cases where it is probable that the outcome of the proceedings will be unfavorable, and the financial outcome can be measured reliably, a provision has been recognized in the financial statements which is disclosed in note 20 ‘Provisions’. It should be understood that, in light of possible future developments, such as (a) potential additional lawsuits, (b) possible future settlements, and (c) rulings or judgments in pending lawsuits, certain cases may result in additional liabilities and related costs. At this point in time, OCI cannot estimate any additional amount of loss or range of loss in excess of the recorded amounts with sufficient certainty to allow such amount or range of amounts to be meaningful. Moreover, if and to the extent that the contingent liabilities materialize, they are typically paid over a number of years and the timing of such payments cannot be predicted with confidence. While the outcome of said cases, claims and disputes cannot be predicted with certainty, we believe, based upon legal advice and information received, that the final outcome will not materially affect our consolidated financial position but could be material to our results of operations or cash flows in any one accounting period.
EBIC tax exemption arbitrationIn 1997, Egypt Basic Industries Corp. (EBIC), a subsidiary of the OCI group, was established as a free zone company under the then prevailing investments laws. In 2008, the tax exemption for activities related to fertilizers, iron and steel, oil production and liquidation and transmission of natural gas in free zones has been canceled, and those activities became subject to taxes for the year 2008 onwards.
On 20 April 2013, the Administrative Court ruled in favor of EBIC and ordered for the revocation of the disputed Decision, and reinstating EBIC to its previous status as a free zone entity in Egypt. On 1 June 2013, the General Authority for Investment and Free Zones (GAFI) filed an appeal to stop the execution of the ruling. The appeal has been lodged, however, it has not been reviewed by the court nor has a hearing been scheduled (‘first appeal’).
GAFI filed a motion to remain the execution of the verdict before the Administrative Court as an interim measure while the appeal is ongoing (‘second appeal’).
On the hearing on 21 March 2015 the Administrative Court rejected the motion of GAFI (‘second appeal’) and ruled in favor of EBIC and has imposed a symbolic penalty of GAFI. The hearing on the 21 March 2015 did not suspend the first appeal of GAFI. This was a separate claim filed by GAFI to the Administrative Court to freeze the court decision of the first degree court till the appeal is decided on. No tax filings have been done by the Company since the filing for the year 2011.
In June 2015 the Administrative Court forwarded the 1st appeal to the State Delegated Authority (SDA) for a technical opinion on the appeal. The SDA Report (technical opinion) concluded to accept the appeal in form and dismiss it in subject. Based on a legal assessment of the case and this technical opinion, management concluded that it is more likely than not that it will win the appeal. Consequently, OCI concluded based on guidance in IAS 37 and IAS 12 to release the (deferred) tax liabilities totaling USD 138.2 million at 31 December 2015. No significant developments occurred during 2016.
28. Contingencies (continued)
Tax dispute in EgyptIn April 2013, OCI S.A.E. and the Egyptian Tax Authorities (“ETA”) reached agreement on the accusation of tax evasion following the sale of Orascom Building Materials Holding S.A.E. to Lafarge in 2007. Although the management of OCI S.A.E. and their advisors believed that the aforementioned transaction was exempted of tax, management entered into an agreement to resolve the tax dispute. A modified tax filing was made and cheques were issued to the ETA for EGP 7,100 million (approximately USD 1.0 billion). The agreement was followed by payment of a first installment amounting to approximately EGP 2,500 million (approximately USD 360.0 million) in 2013. On 18 February 2014, the Egyptian general prosecutor exonerated OCI S.A.E. from tax evasion. Following this court ruling, OCI S.A.E. started proceedings to have the tax settlement and cheques reversed. As the outcome of this litigation was uncertain at 31 December 2013, management concluded that the full liability, amounting to EGP 4,600 million (approximately USD 674.0 million) including interest, had to be accrued. On 4 November 2014, the Egyptian Tax Authorities’ Independent Appeals Committee ruled in favor of the Company. Despite the fact that the Egyptian Prosecutor started an appeal on 30 November 2014, the Company’s management, supported by its legal experts concluded that the tax liability of USD 674.0 million should be released. The release has been accounted for in the 2014 Consolidated Statement of Profit or Loss and Comprehensive Income, the 2014 profit or loss is accounted for under the lines Income taxes (USD 557.4 million) and Finance income and expenses (USD 21.7 million) and includes foreign currency translation gains amounting to USD 9.5 million. In March 2015, the Company received a cheque for EGP 1,904 million (approximately USD 266.2 million) from the ETA, which refunded the amounts paid in excess from the first installment paid in 2013. This amount has been recognized as a receivable in the 2014 Consolidated Statement of Financial Position and a gain on the Income tax line in the Statement of Profit or Loss and Comprehensive Income. On 13 November 2014 the Company announced that it had decided to transfer the rights to the amounts receivable to the Tahya Misr social fund, reference is made to note 20 ‘Donation provision’. In October 2016, OCI made a payment of EGP 900.0 million (USD 49.5 million) to the ETA in order to honor a cheque that was submitted by the Company to the ETA back in April 2013 when the EGP 7,100 million settlement was reached. Even though the Independent Appeal Committee ruled in favor of OCI on 4 November 2014, the Company had to pay the EGP 900 million. The Company submitted a reimbursement claim to the ETA in order to reimburse the EGP 900.0 million paid. On 28 January 2017 the Court of Appeals Circuit 2 has concluded that it has no jurisdiction over this case and referred it to another circuit (Circuit 19). The new circuit has yet to set a date for the first hearing. As per the date of these financial statements the appeal is still ongoing and a final ruling has not yet been issued. OCI management believes that the likelihood of a judgment issued in favor of the Tax Authority is unlikely. With reference to note 2.2. “Tax indemnity agreement” it should be noted that OCI N.V. and OCL have entered into a tax indemnity agreement.
Liens on assets of IFCoOn 19 February, 2016, IFCo was named in a claim submitted by construction subcontractors of OEC in the amount of USD 53.6 million. Any payments that need to be made on successful claims will be for the account of OEC. Management believes that the claim is without merit and plan to vigorously defend against this claim. Liens have been placed on the manufacturing plant in the amount of USD 89.0 million. USD 72.0 million of the liens relate to on-going disputes of OEC with MEI & MEI subcontractors. The EPC (Engineering, Procurement and Construction)agreement requires OEC to have all liens removed from the property for Provisional Acceptance to occur.
Asset retirement obligationsSorfert has a contractual asset retirement obligation in connection with the lease of its land. During 2015, this asset retirement obligation has been released from provision (reference is made to note 20) and is being disclosed as a contingent liability because it is not possible to determine a reliable estimate in both timing and value of this obligation. OCI Nitrogen B.V. entered into agreements with DSM and associated company Sitech for respectively the lease of the sites (land) on which it operates its plant and site services/usage. These agreements have an indefinite term and include an asset dismantling obligation and the obligation to clean up environmental pollution occurred after zero measurement. These obligations have not been accounted for, since the Company has no concrete plans to end its business activities in the forseeable future as such the financial impact is assessed as not material by the Company management.
29. Capital commitments
$ millions 2016 2015
Iowa Fertilizer Company (IFCo) 21.9 43.9Natgasoline LLC1 - 678.0OCI Partners 0.4 -BioMCN 0.7 -OCI Nitrogen B.V. 6.1 10.9Total 29.1 732.8
1 As a result of the 50% sale and deconsolidation of Natgasoline as of 4 May 2016, Natgasoline is recognized as an associate. The capital commitments of Natgasoline are, therefore, no longer presented as of 2016.
In addition to the above mentioned capital commitments, OCI Nitrogen B.V. has a fronting agreement with an external party. The agreement entails that OCI Nitrogen B.V. will take over a loan granted by this external party to Utility Support Group B.V., which is a related party, for an amount of USD 22.1 million before 31 March 2017.

126 OCI N.V. Annual Report 2016 OCI N.V. Annual Report 2016 127
Performance review / Operational strengths / Sustainability review / Corporate governance / Financial statements / Other information Performance review / Operational strengths / Sustainability review / Corporate governance / Financial statements / Other information
NOTES TO THE CONSOLIDATED FINANCIAL STATEMENTS CONTINUED
30. Operating lease commitments
The Group leases a number of office space, warehouses, computers, machinery and cars under operating leases. The leases typically run for a period of 10 years, with an option to renew the lease after that date. Lease payments are renegotiated every five years to reflect market rentals. Some leases provide for additional rent payments that are based on changes in local price indices.
(i) Future minimum lease payments
$ millions 2016 2015
Less than one year 20.2 15.7Between one and five years 34.6 25.1More than five years 29.0 26.0Total 83.8 66.8
(ii) Amount recognized in profit or loss
$ millions 2016 2015
Lease expense 19.0 16.4Total 19.0 16.4
Operating lease expense is recognized in either ‘Cost of sales‘ or in ‘Selling, general and administrative expenses’ depending on the nature of the underlying asset.
31. Business combinations
No business combinations took place in 2016.
On 6 December 2016, OCI N.V. announced it submitted a proposal to the board of directors of OCI Partners LP to acquire all publicly held common units of OCI Partners in exchange for OCI N.V. shares. OCI currently owns 79.88% of issued and outstanding common units of OCI Partners. OCI is proposing an exchange ratio of 0.5200 OCI N.V. shares for each publicly-held unit of OCI Partners. The proposed transaction is subject to approval of a definitive agreement by the board of directors of OCI N.V., the board of directors of the general partner of OCI Partners and a committee to be established by the OCIP Board, and would be subject to customary closing conditions.
On 12 June 2015 OCI acquired 100% of the shares of BioMCN, a methanol producer and pioneer in bio-methanol production based in Delfzijl, The Netherlands. The acquisition adds 440 ktpa methanol design production capacity to OCI N.V.’s current methanol capacity at OCI Beaumont to reach a total of 1.35 million metric tons per annum (excluding BioMCN’s mothballed facility with capacity of 430 ktpa). The acquisition creates a foothold for OCI in the European methanol market. The amount of revenues and profit in 2015 (as of the date of acquisition) amounted to USD 22.5 million and USD 1.6 million, respectively.
The final purchase price allocation is presented below. No goodwill or gain from a bargain purchase was recognized.
$ millions Final purchase price allocation
Property, plant and equipment 18.8Intangible assets 4.5Deferred tax (3.3)Current assets 1.8
Non-current liabilities (2.1)
Current liabilities (3.2)Net assets acquired / purchase price (net of cash) 16.5
32. Related party transactions
Transactions with related parties – Normal course of businessTransactions with related parties occur when a relationship exists between the Company, its participating interest and their directors and key management personnel. In the normal course of business, the Company buys and sells goods and services from and to various related parties (including associates) within the Group. The CEO is able to expense the use of a private aircraft for business travel.
Moreover, OCI used to own construction operations until 7 March 2015 when the Engineering & Construction business was divested into a separate legal entity incorporated under the name Orascom Construction Limited (“OCL”) in the United Arab Emirates. The Sawiris Family, the majority shareholders of OCI, also owns the majority of the outstanding shares of OCL, which qualifies OCL and its subsidiaries to be classified as related parties. The Group has significant ongoing construction contracts with OCL Group. The transactions with the following entities of the OCL Group are presented in the financial statements as related party transactions:
• Orascom Construction Limited (“OCL”)
• OCI Construction Holding Cyprus
• OCI Construction Cyprus
• Orascom E&C (“OEC”)
• Contrack International Inc.
• The Weitz Group LLC (“Weitz”)
• OC Egypt
Next to this, the group engages in transactions with its associates and joint ventures of the group:
• Firewater LLC
• Natgasoline LLC
• Fitco OCI Agro S.A.
• Shanxi Fenghe Melamine Company Ltd.
• Nitrogen Iberian Company SL
• Sitech Manufacturing Services C.V.
• Sitech Utility Holding Beheer B.V
• Sitech Utility Holding C.V.
• Sitech Services B.V.
• Fitco OCI Agronegocios do Brazil (liquidated in 2016)
The Utility Support Group B.V. is a subsidiary of Sitech Services B.V.
Other related party transactions of the group:
The group also engages in transactions with NNS Holding Sarl.

128 OCI N.V. Annual Report 2016 OCI N.V. Annual Report 2016 129
Performance review / Operational strengths / Sustainability review / Corporate governance / Financial statements / Other information Performance review / Operational strengths / Sustainability review / Corporate governance / Financial statements / Other information
NOTES TO THE CONSOLIDATED FINANCIAL STATEMENTS CONTINUED
32. Related party transactions (continued)
The following is a list of significant related party transactions and outstanding amounts as at 31 December 2016:
Related party Relation
Revenue transactions
during the year
AR outstanding at year end
Purchases transactions
during the year
AP outstanding at year end
Loans receivables
Loans payables
Interest income
Interest expense
OC Egypt OCL group company - - - 11.8 - - - -
Contract International
OCL group company - 2.9 0.2 0.1 - - - -
Orascom E&C OCL group company - 2.9 506.2 31.1 - - - -
OCI Construction Cyprus
OCL group company - - - 0.7 - - - -
OCI Construction Holding Cyprus
OCL group company - - - 0.8 - - - -
Weitz OCL group company - 8.7 - - - - - -
Orascom Construction Limited
OCL group company - 3.4 - - - - - -
Natgasoline LLC Related via an associate
- 0.4 - 0.1 - - 9.2 -
Fitco Agro S.A. Joint venture 117.6 10.9 - - - - - -
Sitech Manufacturing Services C.V.
Associate - - 134.6 31.3 - - - -
Utility Support Group B.V.
Related via an associate
14.9 1.2 60.4 1.2 26.8 - 1.0 -
Sitech Services B.V.
Associate - 0.1 6.2 0.9 - - - -
OCI Nitrogen Iberian Company
Joint venture 3.6 1.4 - - - - - -
NNS Holding Sarl Related via shareholder
- - - 0.3 - - - -
Shanxi Fenghe Melamine Co Ltd.
Joint venture 0.2 - 25.2 0.6 1.6 - 0.1 -
Total 136.3 31.9 732.8 78.9 28.4 - 10.3 -
32. Related party transactions (continued)
The following is a list of significant related party transactions and outstanding amounts as at 31 December 2015:
Related party Relation
Revenue transactions
during the year
AR outstanding at year end
Purchases transactions
during the year
AP outstanding at year end
Loans receivables
Loans payables
Interest income
Interest expense
OC Egypt OCL group company - - - 7.8 - - - -
Contract International OCL group company - 3.0 - 0.6 - - - -
Orascom E&C OCL group company - 3.3 949.2 142.6 - - - -
OCI Construction Cyprus OCL group company - - - - - - - -
OCI Construction Holding Cyprus OCL group company - - - 1.7 - - - -
Weitz OCL group company - 9.2 - - - - - -
Orascom Construction Limited OCL group company - 3.2 - - - - - -
Fitco Agro S.A. Joint venture 117.4 16.1 - - - - - -
Sitech Manufacturing Services C.V. Associate - - 117.1 35.9 - - - -
Utility Support Group B.V. Related via associate 17.8 1.8 89.8 2.7 27.6 - 0.4 -
Sitech Services B.V. Associate - - 6.5 1.0 - - - -
OCI Nitrogen Iberian Company Joint venture 3.9 4.1 - - - - - -
Shanxi Fenghe Melamine Co Ltd. Joint venture - 0.6 23.1 - 3.8 - - -Total 139.1 41.3 1,185.7 192.3 31.4 - 0.4 -
In addition to the related party transactions in the table above, the Company incurs certain operating expenses for immaterial amounts in relation to services provided by related parties.
Construction contractsOn 7 March 2015, OCL was demerged from the Group. The Sawiris family is a majority shareholder in both OCI and OCL. This commercial relationship will remain on-going for the construction of the IFCo and Natgasoline projects and the already completed debottlenecking project of OCI Beaumont LLC.
OEC, a wholly owned subsidiary of OCL is:
• A party to an Engineering, Procurement and Construction (EPC) contract for IFCo’s 1.5 million metric ton per year fertilizer and industrial chemicals greenfield plant under construction in Iowa, USA. Under the terms of the EPC contract, the contractor is required to furnish a complete nitrogen fertilizer facility that is engineered, procured and constructed on a lump-sum fixed-price basis of USD 1,216.0 million, plus limited increases, including costs related to breaches, extraordinary subsurface conditions, certain hazardous substances, change orders, changes in law, certain work outside the boundaries of the property, specified reimbursable work and off-site and on-site training (“Contract Price”). The Contract Price is divided among certain categories of work and then further divided among specified milestones. OEC has subcontracted with Tecnimont, KBR and Uhde for state-of-the-art engineering and technology procurement. The project is funded by a combination of cash and a non-recourse project finance tax-exempt municipal bond issuance. In addition, OCI N.V. paid USD 150.0 million to OEC in July 2015 pursuant to an indemnity for certain liabilities under or in connection with the contracts within the Group. This amount was allocated to IFCo and recognized in property, plant and equipment in the second half of 2015.
OCI N.V. and OEC, the EPC contractor of Iowa Fertilizer Company LLC (“IFCo”), entered into a settlement and acceleration agreement in 2016. The agreement addresses outstanding claims between IFCo and OEC, and provides for additional consideration of up to USD 200.0 million to accelerate commercial operations where possible. The terms and conditions of this agreement have been mutually agreed by OCI N.V. and OEC, and the necessary consents were received in November 2016.
Of the consideration of USD 200.0 million, OCI N.V. paid USD 170.0 million to OEC during 2016. This amount was allocated to IFCo and recognized in property, plant and equipment in 2016. The remaining amount to be paid of USD 30.0 million is accrued under ‘Trade and other payables’.

130 OCI N.V. Annual Report 2016 OCI N.V. Annual Report 2016 131
Performance review / Operational strengths / Sustainability review / Corporate governance / Financial statements / Other information Performance review / Operational strengths / Sustainability review / Corporate governance / Financial statements / Other information
32. Related party transactions (continued)
• A party to an EPC contract for Natgasoline’s 1.75 million metric ton per year methanol plant under construction in Texas, USA. Under the terms of the EPC contract, the contractor is required to furnish a complete methanol facility that is engineered, procured and constructed on a lump-sum fixed-price basis of USD 1,396.0 million plus limited increases, including costs related to breaches, extraordinary subsurface conditions, change orders, changes in law, work outside the boundaries of the property and necessary for the operation of the Facility, specified reimbursable work and off-site and on-site training and delays caused by other contractors, engineers or other person engaged to work on the plant (“Contract Price”). The Contract Price is divided among certain categories of work and then further divided among specified milestones. OEC has subcontracted with ALPC to engineer and procure the plant incorporating state-of-the-art production process technology from Lurgi MegaMethanol® technology supplied by Air Liquide’s engineering & construction division, Air Liquide Global E&C Solutions. The plant is expected to begin production in the second half of 2017. The project will be funded by a combination of cash and debt.
• I n June 2013, OCI Beaumont LLC entered into a procurement and construction contract with OEC pursuant to which OEC undertook the debottlenecking of OCI Beaumont LLC’s methanol and ammonia production units (the “Construction Contract”). Upon execution of the Construction Contract, a technical service agreement that was previously entered into by OCI Beaumont LLC and OCL company, an affiliate of OCI, providing for the management and construction services relating to the debottlenecking project was subsumed within the Construction Contract. Under the terms of the Construction Contract, OEC was paid on a cost-reimbursable basis, plus a fixed fee equal to 9.0% of the costs of the project, excluding any discounts. The contract allocated customary responsibilities to OCI Beaumont LLC and OEC. The agreement did not provide for the imposition of liquidated or consequential damages.
Due to the related party nature of above transactions, the terms and conditions may not necessarily be the same as transactions negotiated between third parties. Management believes that the terms and conditions of all transactions with our related parties are generally no less favorable to either party than those that could have been negotiated with unaffiliated parties with respect to similar services.
33. Remuneration of the Board of Directors (Key management personnel)
During 2016, we considered the members of the Board of Directors (Executive and Non-executive) to be the key management personnel as defined in IAS 24 ‘Related parties’. The key management personnel have not entered into any related party transactions. No other benefits or remuneration were provided to or have been entered into with above mentioned key management personnel except as disclosed below.
Remuneration of the DirectorsDuring the financial year ended 31 December 2016, the total remuneration costs relating to the Executive Directors amounted to USD 8.3 million (2015: USD 5.9 million) consisting of the elements in the table below:
2016 Age Base salary Annual bonus2
Share-basedcompensation3
Total remuneration
N. Sawiris 55 2,000,000 3,269,430 (25,557) 5,243,873S. Butt 57 1,680,000 806,400 594,562 3,080,962Total 3,680,000 4,075,830 569,005 8,324,835
2015 Age Base salary Annual bonusShare-based
compensation1Total
remuneration
N. Sawiris 54 2,000,000 900,000 511,935 3,411,935S. Butt 56 1,680,000 604,800 190,061 2,474,861Total 3,680,000 1,504,800 701,996 5,886,796
1 In 2015 the option plans and bonus matching plan 2014 were modified from equity settled share based payment plans to cash settled plans, as a result of the demerger of the Engineering & Construction business. The cash settled plans were remeasured from the grant date fair value to the fair value as at 31 December 2015 which resulted in a net gain recognized in the statement of profit or loss of 2015 relating to share based compensation for the board member Nassef Sawiris of USD 1.6 million, and a total expense recognized for the Board member Salman Butt of USD 0.2 million. The amount disclosed in the overview of remuneration relates only to the expenses recorded for the board members for the 2015 share-based payment expenses excluding the remeasurement effect of previous years.
2 Following the announcement of the proposed merger with CF industries some employee option holders were unable to exercise options granted in 2011 prior to their expiry at the end of their term due to insider-trading regulations. Following the termination of the CF Industries merger the Committee agreed to settle these employees’ options on 31 August 2016 in cash as if they had been able to exercise their awards at the normal time. The CEO was treated in the same way as other employees and his 200,000 options were settled for an amount of USD 2,336,000. The liability recognized for these options as at 31 December 2015 of USD 267,000 was released in the statement of profit or loss.
3 The share based compensation for Nassef Sawiris exists of USD 756,014 share based compensation expenses recognized for plans in 2016 and a release in the statement of profit or loss of USD 781,571 for the liability recognized as at 31 December 2015 for option plans 2012 due to the remeasurement to fair value at 31 December 2016 as this was a cash settled plan.
NOTES TO THE CONSOLIDATED FINANCIAL STATEMENTS CONTINUED
33. Remuneration of the Board of Directors (Key management personnel) (continued)
As at 31 December 2016, the Executive Directors held 200,000 stock options (2015: 400,000) at a weighted average exercise price of EUR 25,45.
Outstandingyear end 2015 Granted Exercised Expired
Outstanding year end 2016 Exercise price Expiration
N. Sawiris 200,000 - - (200,000) - EUR 26.43 31-03-2016N. Sawiris 200,000 - - - 200,000 EUR 25.45 02-01-2017Total 400,000 - - (200,000) 200,000 - -
At 31 December 2016, the Executive Directors held 499,091 conditional performance shares (2015: 112,702).
Outstandingyear end 2015
Grantedconditional
Outstanding year end 2016 Vesting date
N. Sawiris 62,612 - 62,612 01-07-2017- 68,081 68,081 01-07-2018- 141,913 141,913 01-07-2019
N. Sawiris total 62,612 209,994 272,606 -
S. Butt
50,090 50,090 01-07-2017- 57,188 57,188 01-07-2018
119,207 119,207 01-07-2019S. Butt total 50,090 176,395 226,485 -Total 112,702 386,389 499,091 -
As at 31 December 2016, the Executive Directors held 51,310 bonus matching shares (2015: 16,409)
Outstandingyear end 2015 Granted
Outstanding year end 2016 Vesting date
N. Sawiris 9,116 - 9,116 17-11-2017- 20,874 20,874 23-05-2019
N Sawiris total 9,116 20,874 29,990 -
S. Butt 7,293 - 7,293 17-11-2017- 14,027 14,027 23-05-2019
S. Butt total 7,293 14,027 21,320 -
Total 16,409 34,901 51,310 -
In 2016, the total remuneration costs relating to the Non-Executive Directors amounted to USD 1,292,500 (2015: USD 1,276,293) consisting of the elements in the table below:
2016 Annual fixed feeAudit committee
membershipAdditional
fee
Nominationgovernancecommittee
Remunerationcommittee
Healthsafety
environmentcommittee Total
M. Bennett1 260,000 - 369,111 7,500 7,500 9,375 653,486J.A. Ter Wisch 130,000 20,000 - 10,000 - 7,500 167,500S. N. Schat 130,000 20,000 - - 10,000 - 160,000A. Montijn2 65,000 - - 3,750 - 3,750 72,500R.J. van de Kraats 130,000 25,000 - - 7,500 - 162,500G.A. Heckman 130,000 - - - - 8,125 138,125J. Guiraud 130,000 20,000 - 7,500 - - 157,500Total 975,000 85,000 369,111 28,750 25,000 28,750 1,511,611
1 Of the additional fee for Mr. Bennett, USD 150,000 relates to his services on the Board of OCI Partners, a publicly traded subsidiary of the Group in the United States, and USD 219,911 relates to his closer supervision of the start-up of IFCo.
2 Mrs. A. Montijn joined the Board of Directors as of 28 June 2016.

132 OCI N.V. Annual Report 2016 OCI N.V. Annual Report 2016 133
Performance review / Operational strengths / Sustainability review / Corporate governance / Financial statements / Other information Performance review / Operational strengths / Sustainability review / Corporate governance / Financial statements / Other information
33. Remuneration of the Board of Directors (Key management personnel) (continued)
2015 Annual fixed feeAudit committee
membershipAdditional
fee
Nominationgovernancecommittee
Remunerationcommittee
Healthsafety
environmentcommittee Total
M. Bennett1 260,000 - 150,000 7,500 7,500 7,500 432,500J.A. Ter Wisch 130,000 20,000 - 10,000 - 7,500 167,500A. Naqvi2 16,027 2,466 - 925 - - 19,418S. N. Schat 130,000 20,000 - - 10,000 - 160,000K. van der Graaf3 65,000 - - 3,750 - 5,000 73,750R.J. van de Kraats 130,000 25,000 - - 7,500 - 162,500G.A. Heckman4 97,500 - - - - 5,625 103,125J. Guiraud 130,000 20,000 - 7,500 - - 157,500Total 958,527 87,466 150,000 29,675 25,000 25,625 1,276,293
1 The additional fee for Mr. Bennett is for service on the Board of the publicly traded company OCI Partners in the US. 2 Mr. Naqvi left the Board of Directors on 15 February 2015. 3 Mr. van de Graaf left the Board of Directors on 10 June 2015.4 Mr. Heckman joined the Board of Directors as of 10 June 2015.
34 Subsequent events
In February 2017, EBIC obtained approval from the sole lender to refinance the outstanding term loan in the amount of USD 49.6 million with a 4-year amortizing loan, with semi-annual installments of USD 6.3 million and a final maturity date in December 2020.
35. External auditors’ fee
The service fees recognized in the financial statements 2016 for the service of KPMG amounted to USD 5.1 million (2015: USD 6.2 million). The amounts per service category are shown in the following table:
Total service feeof which KPMG Accountants N.V.
(the Netherlands)
$ millions 2016 2015 2016 2015
Audit of Group Financial Statements 4.5 4.1 2.2 1.8Other assurance services 0.5 2.0 0.5 1.7Total assurance services 5.0 6.1 2.7 3.5
Tax services - 0.1 - -Sundry services 0.1 - - -Total 5.1 6.2 2.7 3.5
36. List of principal subsidiaries as per 31 December 2016
Companies Country Percentage of
interestConsolidation
method
Sorfert Algérie Spa Algeria 50.99 FullOCI S.A.E. Egypt 99.96% FullOCi Fertilizer Trade and Supply Egypt 100.00 FullOCI Fertilizer Trading Limited Cyprus 100.00 FullEgypt Basic Industries Corporation Egypt 60.00 FullEgyptian Fertilizers Company Egypt 99.90 FullOCI Nitrogen B.V. The Netherlands 100.00 FullIowa Fertilizer Company LLC USA 100.00 FullOCI Partners LP USA 79.88 FullBioMCN The Netherlands 100.0 Full
A full list of affiliated companies will be available for public inspection at the Commercial Registry in conformity with the provisions of Article 2:379 and 2:414 of the Dutch Civil Code.
NOTES TO THE CONSOLIDATED FINANCIAL STATEMENTS CONTINUED
134 Parent Company Statement of Financial Position
135 Parent Company Statement of Profit or Loss and Other Comprehensive Income
136 Parent Company Statement of Changes in Equity
137 Parent Company Statement of Cash Flows
138 Notes to the Parent Company Consolidated Financial Statements
PARENT COMPANY FINANCIALSTATEMENTS

134 OCI N.V. Annual Report 2016 OCI N.V. Annual Report 2016 135
Performance review / Operational strengths / Sustainability review / Corporate governance / Financial statements / Other information Performance review / Operational strengths / Sustainability review / Corporate governance / Financial statements / Other information
PARENT COMPANY STATEMENT OF FINANCIAL POSITIONAS AT 31 DECEMBER
$ millions Note 2016 2015
AssetsNon-current assetsProperty, plant and equipment 0.9 1.1Investment in subsidiaries (43) 5,583.6 6,403.4Other receivables (44) 648.1 -Total non-current assets 6,232.6 6,404.5
Current assetsOther receivables (44) 1,150.0 487.6Available-for-sale financial assets (45) 2.8 3.7Cash and cash equivalents (46) 89.6 19.2Total current assets 1,242.4 510.5Total assets 7,475.0 6,915.0
EquityShare capital (48),(15) 5.6 4,704.9Share premium (15) 6,316.3 1,610.7Currency translation reserve (1,972.4) (1,801.9)
Other reserves (107.8) (112.2)
Retained earnings 816.7 534.7Equity attributable to owners of the Company 5,058.4 4,936.2
Liabilities
Non-current liabilitiesLoans and borrowings (49) 1,771.7 346.6Deferred tax liabilities (56) 16.4 4.5Total non-current liabilities 1,788.1 351.1
Current liabilitiesLoans and borrowings (49) 500.1 1,537.6Trade and other payables (50) 52.5 49.5Income tax payables 75.9 40.6Total current liabilities 628.5 1,627.7Total liabilities 2,416.6 1,978.8Total equity and liabilities 7,475.0 6,915.0
The notes on pages 138 to 151 are an integral part of these Parent Company financial statements.
PARENT COMPANY STATEMENT OF PROFIT OR LOSS AND OTHER COMPREHENSIVE INCOME FOR THE YEAR ENDED 31 DECEMBER
$ millions Note 2016 2015
Revenue from dividend income (51) 508.3 28.4Other income (53) 153.2 15.9General and administrative expenses (52) (20.3) (37.6)Other expenses1 (54) (351.4) (1076.5)Operating profit / (loss) 289.8 (1,069.8)
Finance income2 (55) 200.7 45.4Finance cost2 (55) (167.9) (108.6)Net finance income / (cost) (55) 32.8 (63.2)Profit / (loss) before income tax 322.6 (1,133.0)Income tax (56) (40.6) 14.7Net profit / (loss) from continuing operations 282.0 (1,118.3)
Net profit from discontinued operations (net of tax) (47) - 243.0
Total net profit / (loss) 282.0 (875.3)
Other comprehensive income:Items that are or may be reclassified to profit or loss
Currency translation differences (170.5) (825.5)Other comprehensive income, net of tax (170.5) (825.5)Total comprehensive income 111.5 (1,700.8)
1 Other expenses include impairment of investment in subsidiaries of USD 326.6 million (2015: 1,073.0 million). Reference is made to note 43.2 The 2015 figures have been adjusted to present the foreign exchange results on a gross basis.
The notes on pages 138 to 151 are an integral part of these Parent Company financial statements.

136 OCI N.V. Annual Report 2016 OCI N.V. Annual Report 2016 137
Performance review / Operational strengths / Sustainability review / Corporate governance / Financial statements / Other information Performance review / Operational strengths / Sustainability review / Corporate governance / Financial statements / Other information
PARENT COMPANY STATEMENT OF CHANGES IN EQUITY
$ millions Note
Sharecapital
(15)
Sharepremium
(15)Revaluation
reserveCurrency
translation1Other
reservesRetainedearnings
Equityattributable
to ownersof the
Company
Balance at 1 January 2015 273.3 1,447.6 6,825.0 (976.4) (79.8) 418.6 7,908.3
Net (loss) - - - - - (875.3) (875.3)Other comprehensive income - - - (825.5) - - (825.5)
Total comprehensive income - - - (825.5) - (875.3) (1,700.8)
Capital increase (15) 4.7 163.1 - - - (6.7) 161.1Conversion of revaluation reserve into share capital (15) 1,400.0 - (1,400.0) - - - -Dividend in kind of demerged activities (15) (1,400.0) - - - - - (1,400.0)Increase nominal amount of shares (15) 4,426.9 - (4,426.9) - - - -Treasury shares sold (16) - - - - 3.5 - 3.5Treasury shares acquired (16) - - - - (19.5) - (19.5)Exchange of treasury shares (16) - - - - 5.5 - 5.5Modification of share-based payments to cash alternatives (21c) - - - - (23.7) - (23.7)Share-based compensation (21c) - - - - 1.8 - 1.8Reclassification due to impairment - - (998.1) - - 998.1 -
Balance at 31 December 2015 4,704.9 1,610.7 - (1,801.9) (112.2) 534.7 4,936.2
Net profit - - - - - 282.0 282.0Other comprehensive income - - - (170.5) - - (170.5)Total comprehensive income - - - (170.5) - 282.0 111.5
Capital increase (15) 4.2 2.1 - - - - 6.3Decrease nominal amount of shares (15) (4,703.5) 4,703.5 - - - - -Treasury shares sold (16) - - - - 2.3 - 2.3Share-based payments (21c) - - - - 2.1 - 2.1Balance at 31 December 2016 5.6 6,316.3 - (1,972.4) (107.8) 816.7 5,058.4
1 Legal reserve under Dutch Law.
The notes on pages 138 to 151 are an integral part of these Parent Company financial statements.
PARENT COMPANY STATEMENT OF CASH FLOWSFOR THE YEAR ENDED 31 DECEMBER
$ millions Note 2016 2015
Net profit / (loss) 282.0 (875.3)
Adjustments for:Net (profit) from discontinued operations (47) - (243.0)Depreciation (52) 0.2 0.2Interest income (55) (87.7) (9.2)Interest expense (55) 118.8 55.7Net foreign exchange (gain) (55) (63.9) 16.7Dividend income from subsidiaries (51) (485.2) -Impairment on subsidiaries (43) 326.6 1,073.0Impairment available-for-sale financial assets (54) - 3.5Share-based compensation (21c) 2.1 1.8Income tax expense (56) 40.6 (14.7)
Changes in:Other receivables (44) (342.9) (692.9)Trade and other payables (50) 7.6 (23.8)
Cash flows:Interest paid (55) (43.8) (34.0)Interest received (55) 11.4 2.3Income taxes paid (56) (4.4) -Cash flow (used in) operating activities (continuing operations) (238.6) (739.7)
Investments in property, plant and equipment - (0.4)Capital contributions in subsidiaries (43) - (457.7)Cash flow from / (used in) investing activities (continuing operations) - (458.1)
Proceeds from share issuance (15) - 161.1Proceeds from sale of treasury shares (16) 2.3 3.5Purchase of treasury shares (16) - (19.5)Proceeds from borrowings (18),(49) 957.6 468.5Proceeds from borrowings from subsidiaries (49) 524.4 599.2Repayment of borrowings (49) (937.5) -Repayment of borrowings from subsidiaries (49) (233.0) -Cash flow from financing activities (continuing operations) 313.8 1,212.8
Net cash flows from continuing operations 75.2 15.0
Cash flows from operating activities - -Net cash flows from discontinued operations (47) - -
Net increase in cash and cash equivalents 75.2 15.0Cash and cash equivalents at 1 January 19.2 16.5Effect of exchange rate fluctuations on cash held (4.8) (12.3)Cash and cash equivalents at 31 December 89.6 19.2
The notes on pages 138 to 151 are an integral part of these Parent Company financial statements.

138 OCI N.V. Annual Report 2016 OCI N.V. Annual Report 2016 139
Performance review / Operational strengths / Sustainability review / Corporate governance / Financial statements / Other information Performance review / Operational strengths / Sustainability review / Corporate governance / Financial statements / Other information
NOTES TO THE PARENT COMPANY FINANCIAL STATEMENTS
37. General
OCI N.V. (‘The Company’) was established on 2 January 2013 as a public limited liability company incorporated under Dutch law, with its head office located at Honthorststraat 19, Amsterdam, the Netherlands. OCI N.V. is registered in the Dutch commercial register under No. 56821166 dated 2 January 2013. OCI N.V. is a holding company.
38. Basis of preparation
The Parent Company financial statements have been prepared in accordance with International Financial Reporting Standards as endorsed by the European Union (IFRS-EU).
The Parent Company financial statements have been prepared on the historical cost basis, except when otherwise indicated.
The financial year of OCI N.V. commences on 1 January and ends on 31 December.
The Parent Company financial statements are presented in US dollars (‘USD’), which is the Company’s presentation currency. The euro (‘EUR’) is the functional currency of OCI N.V. All values are rounded to the nearest tenth million (in millions of USD), except when stated otherwise.
The Parent Company financial statements have been authorized for issue by the Company’s Board of Directors on 24 March 2017. The financial statements are subject to adoption of the Annual General Meeting of Shareholders on 8 June 2017.
39. Accounting principles applied
In the Parent Company financial statements, the same accounting policies have been applied as set out in the notes of the consolidated financial statements, except for the measurement of the subsidiaries as presented under ‘Investments in subsidiaries’ in the Parent Company financial statements. These policies have been consistently applied to all years presented.
40. Summary of significant accounting policies
Investments in subsidiaries
These policies have been consistently applied to all years presented.
In the Parent Company financial statements, investments in subsidiaries are recorded at cost less impairment. In the Parent Company statement of profit or loss and other comprehensive income, dividend received from investments in subsidiaries is recorded as dividend income.
Due to this application, the parent equity and net result are not equal to the consolidated equity and net result. A reconciliation for total equity attributable to owners of the company and total comprehensive income is presented in note 48 to the Parent Company financial statements.
During 2016, no new standards became applicable to OCI N.V. that significantly impacted these Parent Company financial statements. For an overview of new standards not yet applicable to OCI N.V., reference is made to note 4 of the consolidated financial statements.
Dividend distributionDividend distribution to the Company’s shareholders is recognized as a liability in the Parent Company financial statements, in the period in which the dividends are approved by the Company’s shareholders.
Dividend IncomeDividend income from the Company’s subsidiaries is recognized when the right to receive payment is established.
40. Summary of significant accounting policies (continued)
Discontinued operations / assets held for demerger or saleA discontinued operation is a component of the Group’s business which:
• has operations and cash flows that can be clearly distinguished from the rest of the Group;
• represents a separate major line of business or geographical area of operations;
• is part of a single coordinated plan to dispose of a separate major line of business or geographical area of operations.
Classification as a discontinued operation occurs upon disposal or when the operation meets the criteria to be classified as held for sale or demerger. When an operation is classified as a discontinued operation, the comparative information in the statement of comprehensive income and the consolidated statement of cash flows are reclassified as if the operation had been discontinued from the start of the comparative period. In the statement of financial position, the comparative numbers are not reclassified.
TaxationThe Company is tax resident in the Netherlands.
The tax expense for the year comprises current and deferred tax. Tax is recognized in the statement of profit or loss, except to the extent that it relates to items recognized directly in other comprehensive income. The amount of income tax included in the statement of profit or loss is determined in accordance with the rules established by the tax authorities in the Netherlands, based on which income taxes are payable or recoverable.
Deferred tax assets and / or liabilities, arising from temporary differences between the carrying amounts of assets and liabilities and the tax base of assets and liabilities, are calculated using the enacted or substantively enacted tax rates expected to apply when they are realized or settled. Deferred tax assets are recognized if it is probable that they will be realized.
41. Use of estimates and judgments
The preparation of the Parent Company financial statements requires management to exercise judgment and make estimates and assumptions that affect the application of the Company’s accounting policies and the reported amounts of assets, liabilities, income and expenses. Actual results could differ from these estimates.
Estimates and underlying assumptions are reviewed on an ongoing basis. Revisions to accounting estimates are recognized in the period in which the estimates are revised and in any future periods affected.
The areas involving a higher degree of judgment or complexity, or areas where assumptions and estimates are significant to the Parent Company financial statements are the impairment of the investments in subsidiaries.
Impairment of investments in subsidiariesAt each balance sheet date, the Company reviews whether there is an indication that its investments in subsidiaries might be impaired.
An indication for impairment of the investments in subsidiaries may include, respectively, management’s downward adjustment of the strategic plan. Further indications for impairments of its investments may include other areas where observable data indicates that there is a measurable decrease in the estimated future cash flows. These determinations require significant judgment. In making this judgment, management evaluates, among other factors, the financial performance of and business outlook for its investments, including factors such as industry and sector performance, changes in technology and operational and financing cash flow.
If any indication for impairment exists, the recoverable amount of the investments is estimated in order to determine the extent, if any, of the impairment loss. An investment is impaired if the recoverable amount is lower than the carrying value. The recoverable amount is defined as the higher of an investment’s fair value less costs to sell and its value in use.
The investments’ fair value less costs to sell represents the best estimate of the amount OCI N.V. would receive if it sold its investments. The fair value of each investment has been estimated on the basis of the present value of future cash flows, taking into account costs to sell.
The determination of the investment’s value in use is based on calculations using pre-tax cash flow projections based on financial budgets approved by management covering a five-year period. Cash flows beyond the five-year period are extrapolated using estimated growth rates.
If the recoverable amount of an investment is estimated to be less than its carrying amount, the carrying amount of the investment is reduced to its recoverable amount. Any impairment loss is recognized immediately in the statement of profit or loss.
Impairment losses recognized in prior periods shall be reversed only if there has been a change in the estimates or external market information used to determine the investment’s recoverable amount since the last impairment loss was recognized. The recoverable amount shall not exceed the carrying amount that would have been determined had no impairment loss been recognized in prior years.
42. Financial risk management
Unless stated otherwise in this disclosure note, reference is made to note 6 ‘Financial risk and capital management‘ in the notes to the consolidated financial statements.

140 OCI N.V. Annual Report 2016 OCI N.V. Annual Report 2016 141
Performance review / Operational strengths / Sustainability review / Corporate governance / Financial statements / Other information Performance review / Operational strengths / Sustainability review / Corporate governance / Financial statements / Other information
42.1 Credit risk
The major exposure to credit risk at the reporting date was as follows:
$ millions Note 2016 2015
Other receivables (44) 1,798.1 487.6
Available-for-sale financial assets (45) 2.8 3.7Cash and cash equivalents (46) 89.6 19.2Total 1,890.5 510.5
The major exposure to credit risk for other receivables by geographic region was as follows:
$ millions 2016 2015
Middle East and Africa 388.9 11.8Europe and United States 1,409.2 475.8Total 1,798.1 487.6
42.2 Liquidity risk
The following are the contractual maturities of financial liabilities, including estimated interest payments and exclude the impact of netting agreements:
At 31 December 2016$ millions Note
Carryingamount
Contractualcash flow
Less than 1 year
Between 1 and 5 years
More than5 years
Financial liabilitiesLoans and borrowings (49) 1,328.5 1,597.9 38.6 1,559.3 -Loans and borrowings from subsidiaries1 (49) 943.3 1,061.4 500.1 561.3 -
Trade and other payables (50) 52.5 52.5 52.5 - -Letters of guarantee (28) - 0.2 - - 0.2Total 2,324.3 2,712.0 591.2 2,120.6 0.2
At 31 December 2015$ millions Note
Carryingamount
Contractualcash flow
Less than 1 year
Between 1 and 5 years
More than5 years
Financial liabilitiesLoans and borrowings (49) 1,273.4 1,380.4 975.5 404.9 -Loans and borrowings from subsidiaries2 (49) 610.8 610.8 610.8 - -
Trade and other payables (50) 49.5 49.5 49.5 - -Letters of guarantee (28) - 0.2 - - 0.2Total 1,933.7 2,040.9 1,635.8 404.9 0.2
1 The contractual cash flows do not include interest cash flows for the loan received from OCI Overseas Holding Ltd., since the loan is repayable on demand.
2 The contractual cash flows do not include interest cash flows, since the loans and borrowings from subsidiaries are repayable on demand.
As part of the preparation of the financial statements, the Company has assessed its liquidity risk and going concern. Liquidity risk is the risk that the Company may encounter difficulty in meeting the obligations associated with its financial liabilities that are settled by delivering cash or another financial asset. The Company has made a number of assumptions in assessing its ability to meet its covenant requirements and satisfy obligations as they become due. Determining these assumptions requires significant judgment about future results and cash flows. Key assumptions include product pricing, gas pricing, utilization rates, IFCo commissioning, and the ability to arrange financing and obtain waivers for anticipated covenant breaches. Refer to note 6.2 and note 18 of the notes to the consolidated financial statements for the Company’s analyses of liquidity risk and debt covenants, respectively. Furthermore, the Company’s financial liabilities include loans and borrowings from subsidiaries. Although these loans and borrowings from subsidiaries are sometimes classified as short term due the contractual terms, the repayment date of these loans and borrowings can be controlled and determined by OCI N.V and may be extended beyond one year.
NOTES TO THE PARENT COMPANY FINANCIAL STATEMENTS CONTINUED
42.3 Market risk
Foreign exchange riskAs of 31 December 2016, if the US dollar had weakened / strengthened by 9.0 percent against the Euro with all other variables held constant, the translation of foreign currency receivables, payables and loans and borrowings would have resulted in a decrease / increase of USD 99.0 million of the profit of the year.
The summary of quantitative data about the Company’s exposure to foreign exchange transaction exposure based on risk management policy for the main currencies was as follows:
At 31 December 2016$ millions USD
Other receivables 1,774.2Trade and other payables (16.5)Loans and borrowings (842.9)Cash and cash equivalents 86.0
At 31 December 2015$ millions USD
Other receivables 532.7Trade and other payables (17.1)Loans and borrowings (825.2)Cash and cash equivalents 7.6
The following tables demonstrate the sensitivity to a reasonably possible change in EUR-USD exchange rates, with all other variables held constant. The impact on the Company’s general and administrative expenses is due to changes in the fair value of monetary assets and liabilities, including inter-company positions. The Company’s exposure to foreign currency changes for all other currencies is not material.
2016 $ millions
Change in FX rate
Effect on profit before tax
Effect on equity
EUR - USD 9 percent (99.0) -
(9) percent 99.0 -
2015$ millions
Change in FX rate
Effect on profit before tax
Effect on equity
EUR - USD 12 percent 41.2 -
(12) percent (41.2) -

142 OCI N.V. Annual Report 2016 OCI N.V. Annual Report 2016 143
Performance review / Operational strengths / Sustainability review / Corporate governance / Financial statements / Other information Performance review / Operational strengths / Sustainability review / Corporate governance / Financial statements / Other information
NOTES TO THE PARENT COMPANY FINANCIAL STATEMENTS CONTINUED
42.3 Market risk (continued)
Interest rate riskThe following table demonstrates the sensitivity to a reasonably possible change in interest rates on that portion of borrowings affected. With all other variables held constant, the Company’s profit before tax is affected through the impact on floating rate borrowings plus refinancing of fixed rate borrowings, as follows:
$ millions In basis points 2016 2015
Effect on profit before tax for the coming year +100 bps (5.5) (8.6)- 100 bps 5.5 8.6
Categories of financial instruments
2016 $ millions Note
Loans andreceivables /payables at
amortized cost
Available-for-salefinancial asset
at fair value
AssetsOther receivables (44) 1,798.1 -Available-for-sale financial assets (45) - 2.8Cash and cash equivalents (46) 89.6 -Total 1,887.7 2.8
LiabilitiesLoans and borrowings from third parties (49) 1,328.5 -Loans and borrowings from subsidiaries (49) 943.3Trade and other payables (50) 52.5 - Total 2,324.3 -
2015 $ millions Note
Loans andreceivables /payables at
amortized cost
Available-for-salefinancial asset
at fair value
Assets
Other receivables (44) 487.6 -Available-for-sale financial assets (45) - 3.7Cash and cash equivalents (46) 19.2 -Total 506.8 3.7
LiabilitiesLoans and borrowings from third parties (49) 1,273.4 -Loans and borrowings from subsidiaries (49) 610.8Trade and other payables (50) 49.5 - Total 1,933.7 -
The only financial instruments carried at fair value by the Company are available-for-sale financial assets which are recognized in level 1 of the fair value hierarchy.
43. Investment in subsidiaries
$ millions 2016 2015
Balance at 1 January 6,403.4 7,323.6
Impairment subsidiaries (326.6) (1,073.0)Capital distribution (317.6) 1,026.8Exchange rate differences (175.6) (874.0)
Balance at 31 December 5,583.6 6,403.4
Capital contributions and additionsIn 2016, the following additions/extractions to the capital of the subsidiaries in the amount of USD (317.6) million have been made:
• Reversal of the capital contribution in OCI Overseas Ltd. done in 2015 for an amount of USD (346.9) million;
• Capital contribution in the capital of OCI Chemicals B.V. of USD 17.0 million in kind by settling loans and other receivables;
• Net asset transfer shares OCI S.A.E. of USD 6.0 million;
• Contribution in the capital of Natgasoline of USD 6.3 million by waiving the interest receivable.
In 2015, the following additions to the capital of the subsidiaries in the amount of USD 1,026.8 million have been made:
• Capital contribution in the capital of OCI Fertilizers B.V. of USD 74.7 million in cash;
• Capital contribution in the capital of OCI Chemicals B.V. of USD 442.6 million of which USD 233.0 million was paid in cash and USD 209.6 million was paid in kind by settling trade and other receivables;
• Capital contribution in the capital of Iowa Fertilizer Company of USD 150.0 million in cash;
• Net asset transfer shares OCI S.A.E. of USD 1.8 million;
• Capital contribution in OCI Overseas Ltd. was made in kind for an amount of USD 357.7 million by settling trade and other receivables.
Impairment LossAn impairment trigger was identified in OCI N.V.’s investments due to a further decrease in commodity selling prices in 2016. An impairment loss is recognized if the carrying amount of an asset exceeds its estimated recoverable amount.
In accordance with IAS 36, the Group has performed an impairment test on the investments. The determination of the recoverable amounts requires significant judgments and estimates, including projections of future cash flows from the businesses. The recoverable values have been estimated based on value in use. The tests were carried out by discounting future cash flows to be generated from the continuing use of the operating entities to which the investments relate and on the assumption of an indefinite life. Key assumptions used in the calculation of recoverable amounts are the discount rate, the terminal value growth rate, selling price outlook per product, natural gas availability and the number of expected operating days per plant. Selling price assumptions are based on a published independent price outlook prepared by global fertilizer experts. The other assumptions used are based on past experience and external sources, but that are unpredictable and inherently uncertain.
The 2015 and 2016 impairment tests are based on specific estimates for the USD cash flow projections for the subsequent seven years (this period captures the cyclical nature of the industry). The residual value was calculated on the basis of the last year of the projection period and whereby a perpetual growth rate of 1.5% was taken into account. In determining the pre-tax discount rate, first the post-tax average cost of capital was calculated for the underlying entities. The estimated pre-tax cash flows are discounted to their present value using a pre-tax discount rate in the range of 10.4% to14.1% and 10.9% to 12.9% in 2016 and 2015.
The recoverable value of OCI Fertilizers B.V. significantly exceeded the carrying amount as at 31 December 2016, hence no impairment.
The carrying amount of OCI Chemicals B.V. exceeded the recoverable value of USD 1,702.9 million by USD 326.6 million as at 31 December 2016, for which an impairment charge was recognized in the Parent Company statement of Profit or Loss and Other Comprehensive Income. In 2015, an impairment charge was recognized for OCI Chemicals B.V. for an amount of USD 1,073 million. OCI Mena B.V. was transferred to OCI Fertilizer B.V. in 2015.
For OCI Chemicals B.V. the sensitivity analysis for 2016 is shown below based on nil headroom (after impairment).
$ millions Basis points 2016
Change in post-tax discount rate + 100 bps (278.0)Change in post-tax discount rate - 100 bps 363.0Change in assumed perpetual growth rate + 100 bps 238.0Change in assumed perpetual growth rate - 100 bps (182.0)Change in selling prices + 500 bps 319.0Change in selling prices - 500 bps (319.0)

144 OCI N.V. Annual Report 2016 OCI N.V. Annual Report 2016 145
Performance review / Operational strengths / Sustainability review / Corporate governance / Financial statements / Other information Performance review / Operational strengths / Sustainability review / Corporate governance / Financial statements / Other information
NOTES TO THE PARENT COMPANY FINANCIAL STATEMENTS CONTINUED
43. Investment in subsidiaries (continued)
List of subsidiaries
NameCountry of
incorporation Ownership %
OCI Fertilizers B.V. The Netherlands 100.0OCI Chemicals B.V. The Netherlands 100.0OCI UK Ltd United Kingdom 100.0
OCI Fertilizers B.V. and OCI Chemicals B.V. are holding companies that have operating companies as subsidiaries.
44. Other receivables
$ millions 2016 2015
Receivables from subsidiaries 1,784.9 474.0Receivables from related parties 12.1 12.2
Other receivables 1.1 1.4
Total 1,798.1 487.6
Non-current 648.1 -
Current 1,150.0 487.6
At 31 December 1,798.1 487.6
The non-current receivables have a maturity exceeding one year. The carrying amount of receivables approximates their fair value.
Specification of loans and other receivables from subsidiaries:
$ millions Type Interest rate2016
Long term2016
Short term2015
Long term2015
Short term
Firewater B.V. Unsecured Fixed at 8.0% 318.5 - - -Iowa Intermediate Ferilizer Holding Corp. Subordinated Fixed 10.0% 329.6 - - -OCI Fertilizers B.V. Unsecured LIBOR + 3.25% - 374.8 - 372.2OCI MENA B.V. Unsecured LIBOR + 1.40% - 16.5 - 16.2OCI USA Inc. Unsecured LIBOR + 3.25% - 14.1 - -OCI S.A.E. Unsecured LIBOR + 3.25% - 671.1 - -Natgasoline Unsecured LIBOR + 8.50% - - - 56.6Other receivables subsidiaries - - - 60.3 - 29.0Total 648.1 1,136.8 - 474.0
45. Available-for-sale financial assets
$ millions 2016 2015
Orascom Construction Limited (Dubai) 2.8 3.7Total 2.8 3.7
OCI N.V. holds an amount of USD 2.8 million (2015: USD 3.7 million) worth of shares in Orascom Construction Limited, which is a related party.
46. Cash and cash equivalents
$ millions 2016 2015
Bank balances 89.6 19.2Total 89.6 19.2
The bank balances are freely available for usage and are not restricted.
47. Assets held for demerger / discontinued operations
Reference is made to note 27 of the consolidated financial statements. The assets held for demerger / discontinued operations include the subsidiaries transferred to OCL on 7 March 2015.
Construction entities (discontinued operations)
$ millionsCountryof domicile
Ownership percentage
Cementech BVI 100.00Orascom Construction Industries Algeria Spa Algeria 99.90BESIX Group SA Belgium 50.00OCI Construction Limited Cyprus 100.00Orascom Construction Egypt 100.00Orascom Road Construction Egypt 99.98Orasqualia for the Development of the Wastewater Treatment Plant Egypt 50.00National Steel Fabrication Egypt 99.90Alico Egypt Egypt 50.00Suez Industrial Development Company Egypt 60.50Orascom Saudi Company Kingdom of Saudi Arabia 60.00Contrack International Inc. USA 100.00Orascom E&C USA Inc. USA 100.00The Weitz Group LLC USA 100.00
$ millions 2016 2015
Balance at 1 January - 1,176.6
Asset held for sale - transfer from financial assets - -Contribution in kind - 107.1Exchange rate differences - (126.7)Dividend in kind of demerged activities - (1,400.0)Demerger result - 243.0Balance at 31 December - -
The dividend in kind of demerged activities relates to the demerger of the Engineering & Construction business. As a result of the demerger, the Parent Company realized a gain of USD 243.0 million.

146 OCI N.V. Annual Report 2016 OCI N.V. Annual Report 2016 147
Performance review / Operational strengths / Sustainability review / Corporate governance / Financial statements / Other information Performance review / Operational strengths / Sustainability review / Corporate governance / Financial statements / Other information
NOTES TO THE PARENT COMPANY FINANCIAL STATEMENTS CONTINUED
48. Reconciliation of consolidated income and equity attributable to shareholders to Parent Company income and equity attributable to owners
$ millions2016
Equity2016
Profit / (loss)2015
Equity2015
Profit / (loss)
Consolidated equity attributable to owners of the company 1,432.7 140.9 1,260.3 423.5Revaluation of subsidiaries 7,592.0 - 7,592.0 -Difference gain on demerger (387.8) - (387.8) (387.8)Results from subsidiaries 656.7 440.7 216.0 200.8Other comprehensive income (2,071.1) (143.5) (1,927.6) (864.3)Other direct equity movements 2.5 - 23.3 -Impairment subsidiaries (2,166.6) (326.6) (1,840.0) (1,073.0)Parent Company equity attributable to owners 5,058.4 111.5 4,936.2 (1,700.8)
The differences between total shareholders’ equity and total comprehensive income according to the IFRS-EU consolidated financial statements and the Parent Company financial statements in general relate to the accounting of investments at cost (fair value as deemed cost upon adoption of IFRS-EU) in the Parent Company financial statements and subsequent impairments.
The reconciling items for equity and income are further detailed below.
Reconciling item – Revaluation of subsidiaries The revaluation of subsidiaries of USD 7,592.0 million relates to the step up in fair value at the date of transition to IFRS, 1 January 2014.
Reconciling item – Gain on demerger
In the 2015 Parent Company financial statements, the demerger gain of USD 243.0 million is lower compared to the demerger gain as reported in the consolidated financial statements of USD 630.8 million as the investment is stated at cost.
Reconciling item – Results from subsidiaries The 2015 results from investments are USD 200.8 million higher in the Parent Company financial statements as dividend income for 2015 is USD 28.4 million, whereas the result of the subsidiaries in the consolidated financial statements was USD (172.4) million.
The 2016 results from investments are USD 440.7 million higher in the Parent Company financial statements as dividend income for 2016 is USD 508.3 million, whereas the result of the subsidiaries in the consolidated financial statements was USD 67.6 million.
Reconciling item – Other comprehensive incomeThe reconciliation item ‘Other comprehensive income’ represents hedge and currency translation differences which are recognized in the consolidated financial statements but not in the Parent Company financial statements as the investments are stated at cost.
The 2015 difference in income of USD 864.3 million comprises USD 851.2 million of currency translation differences and USD 13.1 million of gains on cash flow hedges and available-for-sale financial assets, which do not occur in the Parent Company financial statements.
The 2016 difference in income of USD 143.5 million comprises USD 144.0 million of currency translation differences and USD 0.5 million of gains on cash flow hedges and available-for-sale financial assets, which do not occur in the Parent Company financial statements.
Reconciling item – Other direct equity movementsOther direct equity movements represent capital contributions in the minority shareholding of Sorfert, OCIP Holding, Mepco and EFC, which are not included in the Parent Company financial statements.
Reconciling item – Impairment subsidiaries For details of impairment of the investments in OCI Mena B.V. and OCI Chemicals B.V. recognized in the 2015 and 2016 Parent Company financial statements, reference is made to note 43.
49. Loans and borrowings
$ millions 2016 2015
Convertible note 344.3 346.6Revolving credit facility - 528.6Term loan and revolving credit facility 641.4 -Term facility agreement - 198.8Term facility agreement - 199.4
Nile Holding 342.8 -
Sub-total third party 1,328.5 1,273.4
OCI Overseas Holding Ltd. 500.1 408.2OCI Nitrogen B.V. 443.2 183.8OCI S.A.E. - 18.8Sub-total subsidiaries 943.3 610.8
Total 2,271.8 1,884.2
Non-current 1,771.7 346.6
Current 500.1 1,537.6
At 31 December 2,271.8 1,884.2
Reference is made to note 18 ‘Loans and borrowings’ of the consolidated financial statements for detailed information on third party loans.
Net proceeds and repayments from borrowings third partyProceeds from borrowings in 2016 for the Company totaled an amount of USD 957.6 million. Total repayments in cash amounted to USD 937.5 million, of which USD 400.0 million related to repayments of the bridge facilities and USD 537.5 million related to the repayment of the revolver credit facility. Reference is made to note 18 of the consolidated financial statements.
Net proceeds and repayments in cash from borrowings from subsidiariesProceeds from borrowings from subsidiaries include proceeds of USD 4.3 million in cash and USD 87.6 million in kind settlements from OCI Overseas Holding Ltd. and USD 520.1 million in cash from OCI Nitrogen B.V. Repayments were done on borrowings from OCI Nitrogen B.V. of USD 233.0 million in cash and USD 27.7 million in kind settlements.
The maturity dates of loans and borrowings from third party are as follows:
$ millions 2016 2015
2016 - 398.22017 - 528.62018 687.1 346.6
2019 - -
2020 641.4 -
Total 1,328.5 1,273.4
Specification of loans and borrowings from subsidiaries:
$ millions Type Interest %2016
Long term2016
Short term2015
Long term2015
Short term
OCI Overseas Holding Ltd. Unsecured LIBOR + 3.25 - 500.1 - 408.2
OCI Nitrogen B.V. UnsecuredEURIBOR + 4.50 443.2 - - 183.8
OCI S.A.E. Unsecured LIBOR + 3.25 - - - 18.8Total 443.2 500.1 - 610.8

148 OCI N.V. Annual Report 2016 OCI N.V. Annual Report 2016 149
Performance review / Operational strengths / Sustainability review / Corporate governance / Financial statements / Other information Performance review / Operational strengths / Sustainability review / Corporate governance / Financial statements / Other information
NOTES TO THE PARENT COMPANY FINANCIAL STATEMENTS CONTINUED
50. Trade and other payables
$ millions 2016 2015
Payables due to subsidiaries 26.5 13.5
Payables due to related parties 1.1 0.8
Share-based compensation 2.4 11.8Other current liabilities 22.5 23.4Total 52.5 49.5
51. Revenue from dividend income
In 2016, OCI Chemicals B.V. distributed an amount of USD 23.1 million in cash and USD 373.5 million in kind to OCI N.V., by settling trade and other receivables. OCI Fertilizers B.V distributed an amount of USD 111.7 million in kind to OCI N.V., by settling loans and borrowings.
In 2015, OCI Chemicals B.V. distributed an amount of USD 28.4 million in cash to OCI N.V.
52. Development of general and administrative expenses
a. Expenses by nature
$ millions 2016 2015
Employee benefit expenses (b) 4.3 3.4Depreciation 0.2 0.2Consultancy expenses 10.1 25.3Other 5.7 8.7Total 20.3 37.6
The expenses by nature comprise ‘general and administrative expenses’.
b. Employee benefit expenses
$ millions 2016 2015
Wages and salaries 3.9 4.0Social securities 0.1 0.2Employee profit sharing 9.6 2.1Pension cost 0.2 0.3
Share-based compensation expense 2.1 1.8
Release remeasurement employee liability share-based payments (9.5) (2.7)Other employee expenses (2.1) (2.3)Total 4.3 3.4
For specifications on share-based payments, reference is made to note 21c of the notes to the consolidated financial statements.
53. Other income
$ millions 2016 2015
Holding recharges 3.2 15.9
Termination fee CF 150.0 -Total 153.2 15.9
The Company recharges certain expenses ‘holding recharges’ for rendered headquarter services to its subsidiaries. These recharges include but are not limited to, general corporate expenses related to finance, legal, information technology, human resources, internal audit, investor relations, treasury services and employee benefits and incentives. The Company received a termination fee of USD 150.0 million on 25 may 2016 from CF industries as contemplated in the combination agreement.
54. Other expenses
$ millions 2016 2015
Impairment of investments in subsidiaries 326.6 1,073.0
Impairment available-for-sale financial assets - 3.5
Consultancy costs related to the CF transaction 24.8 -
Total 351.4 1,076.5
For further information on the impairment of investments in subsidiaries reference is made to note 43. The impairment of the available-for-sale financial assets in 2015 related to the OCL shares held by OCI N.V.
55. Net finance cost
$ millions 2016 2015
Interest income on loans and receivables third party 0.4 0.7Interest income on loans and receivables related parties 10.9 -Interest income on loans and receivables subsidiaries 76.4 8.5Foreign exchange gain 113.0 36.2Finance income 200.7 45.4Interest expense on financial liabilities measured at amortized cost third party (87.6) (48.8)
Interest expense on financial liabilities measured at amortized cost subsidiaries (31.2) (6.9)Foreign exchange loss (49.1) (52.9)Finance cost (167.9) (108.6)Net finance income / (cost) recognized in profit or loss 32.8 (63.2)
56. Income tax
$ millions 2016 2015
Current tax (27.9) 20.7Deferred tax (12.7) (6.0)Total income tax in profit or loss (40.6) 14.7

150 OCI N.V. Annual Report 2016 OCI N.V. Annual Report 2016 151
Performance review / Operational strengths / Sustainability review / Corporate governance / Financial statements / Other information Performance review / Operational strengths / Sustainability review / Corporate governance / Financial statements / Other information
NOTES TO THE PARENT COMPANY FINANCIAL STATEMENTS CONTINUED
56.1 Income tax expense
Reconciliation of the statutory income tax rate in the Netherlands with the effective tax rate can be summarized as follows:
$ millions 2016 % 2015 %
Profit / (loss) before income tax 322.6 (1,133.0)Enacted income tax rate in the Netherlands 25% 25% Tax calculated at statutory tax rate (80.7) 25.0 283.3 (25.0)Expenses non-deductible (11.8) 3.7 (16.0) 1.4Income not subject to tax1 129.0 (40.0) 13.0 (1.1)Impairment subsidiaries2 (81.7) 25.3 (268.3) 23.7Other3 4.6 (1.4) 2.7 (0.2)Total income tax in profit or loss (40.6) 12.6 14.7 (1.3)
1 Income not subject to tax mainly relates to dividend income.2 The impairment of subsidiaries is not subject to income tax.3 Related to prior year adjustments
56.2 Deferred income tax assets and liabilities
Changes in deferred tax assets and liabilities
$ millions 2016 2015
At 1 January (4.5) 1.6(Loss) from continuing operations (12.7) (6.0)Effect of movement in exchange rates 0.8 (0.1)At 31 December (16.4) (4.5)
Recognized deferred tax assets and liabilities
Assets Liabilities Net
$ millions 2016 2015 2016 2015 2016 2015
Intangible assets 6.9 - - - 6.9 -Trade and other receivables - 0.6 (19.7) - (19.7) 0.6Loans and borrowings - - (3.6) (5.5) (3.6) (5.5)Trade and other payables 0.4 - - 0.4Total 6.9 1.0 (23.3) (5.5) (16.4) (4.5)Netting of fiscal position (6.9) (1.0) 6.9 1.0 - -Amounts recognized in the balance sheet - - (16.4) (4.5) (16.4) (4.5)
The deferred tax asset at 31 December 2016 in the amount of USD 6.9 million is to be settled in 2018. Of the deferred tax liabilities at 31 December 2016, an amount of USD 9.2 million is to be settled within 12 months and an amount of USD 14.1 million after 12 months.
57. Related party balances
For an overview of the related parties, reference is made to note 32 of the consolidated financial statements. The company (itself) has the following current account related party balances:
$ millions note 2016 2015
Orascom Construction Limited (‘OCL’) 3.2 3.2Orascom E&C 3.0 3.0Weitz 3.0 3.0Contrack USA 2.9 3.0OCI Construction Cyprus (0.8) (0.8)Natgasoline (0.1) -NNS Capital (0.2) -Total (11.0) 11.4Receivables from related parties (44) 12.1 12.2Payables due to related parties (50) (1.1) (0.8)Total (11.0) 11.4
The current accounts consist of management fees, transferred cost and other.
58. Contingencies
GuaranteesOCI N.V. has provided financial guarantees to certain subsidiaries including EFC related to its International Finance Corporation (‘IFC’) bank loan. For OCI Fertilizer Trading Ltd. and OCI Fertilizer Trade and Supply B.V. a comfort letter was provided by OCI N.V.
59. Employees
The total number of employees in 2016 was 25 (2015: 25 employees).
60. Fiscal unity
OCI N.V. forms a fiscal unity with several Dutch entities for corporation tax purposes. In accordance with the standard conditions, a company and its subsidiaries that form the fiscal unity are jointly and severally liable for taxation payable by the fiscal unity. The following entities are included in the fiscal unity headed by OCI N.V.:
• OCI N.V.
• OCI Nitrogen B.V.
• OCI Personnel B.V.
• OCI Terminal Europoort B.V.
• OCI Fertilizers B.V.
• OCI China Holding B.V.
Amsterdam, the Netherlands, 24 March 2017
The OCI N.V. Board of DirectorsMichael Bennett, Chairman
Nassef Sawiris
Salman Butt
Jan Ter Wisch
Sipko Schat
Jérôme Guiraud
Robert Jan van de Kraats
Greg Heckman
Anja Montijn
152 OCI N.V. Annual Report 2016 OCI N.V. Annual Report 2016 153
Performance review / Operational strengths / Sustainability review / Corporate governance / Financial statements / Other information Performance review / Operational strengths / Sustainability review / Corporate governance / Financial statements / Other information
Appropriation of net profit / (loss)
$ millions 2016 2015
Added to retained earnings 282.0 (875.3)
Total net profit / (loss) attributable to shareholders 282.0 (875.3)
Upon adoption of this proposed Net profit / (loss) appropriation, the dividend for the 2016 financial year will be nil. This proposed Net profit / (loss) appropriation is in conformity with article 26 of the Company’s Articles of Association.
Extract from the Articles of Association relating to Net Profit / (Loss) appropriationArticle 26. ‘Profits and Distributions’.
26.1 The Board may decide that the profits realized during a financial year will fully or partially be appropriated to increase and/or from reserves.
26.2 The profits remaining after application of Article 26.1 shall be put at the disposal of the General Meeting. The Board shall make a proposal for that purpose. A proposal to pay a dividend shall be dealt with as a separate agenda item at the General Meeting of Shareholders.
26.3 Distributions from the Company’s distributable reserves are made pursuant to a resolution of the General Meeting at the proposal of the Board.
26.4 Provided it appears from an interim statement of assets signed by the Board that the requirement mentioned in Article 26.8 concerning the position of the Company’s assets has been fulfilled, the Board may make one or more interim distributions to the holders of Shares.
26.5 The Board may decide that a distribution on Shares shall not take place as a cash payment but as a payment in Shares, or decide that holders of Shares shall have the option to receive a distribution as a cash payment and/or as a payment in Shares, out of the profit and/or at the expense of reserves, provided that the Board is designated by the General Meeting pursuant to Articles 6.2. The Board shall determine the conditions applicable to the aforementioned choices.
26.6 The Company’s policy on reserves and dividends shall be determined and can be amended by the Board. The adoption and thereafter each amendment of the policy on reserves and dividends shall be discussed and accounted for at the General Meeting of Shareholders under a separate agenda item.
26.7 The Company may further have a policy with respect to profit participation for employees which policy will be established by the Board.
26.8 Distributions may be made only insofar as the Company’s equity exceeds the amount of the paid in and called up part of the issued capital, increased by the reserves which must be kept by virtue of the law or these Articles of Association.
PROPOSED APPROPRIATION OF NET PROFIT/(LOSS)
153 Proposed Appropriation of Net Profit/(Loss)
154 Independent Auditor’s Report
157 Shareholder Information
159 Key Subsidiaries
OTHER INFORMATION

154 OCI N.V. Annual Report 2016 OCI N.V. Annual Report 2016 155
Performance review / Operational strengths / Sustainability review / Corporate governance / Financial statements / Other information Performance review / Operational strengths / Sustainability review / Corporate governance / Financial statements / Other information
To: the General Meeting of Shareholders and the Board of Directors of OCI N.V.
Report on the accompanying financial statements 2016
Our opinionIn our opinion, the accompanying financial statements give a true and fair view of the financial position of OCI N.V. (also referred to as “the Company”) as at 31 December 2016, and of its result and its cash flows for 2016 in accordance with International Financial Reporting Standards as adopted by the European Union (EU-IFRS) and with Part 9 of Book 2 of the Netherlands Civil Code.
What we have auditedWe have audited the financial statements 2016 of OCI N.V., based in Amsterdam. The financial statements include the consolidated financial statements and the parent company financial statements.
The financial statements comprise:
1 the consolidated and parent company statement of financial position as at 31 December 2016;
2 the following consolidated and parent company statements for 2016: the statements of profit or loss and other comprehensive income, changes in equity and cash flows; and
3 the notes comprising a summary of the significant accounting policies and other explanatory information.
Basis for our opinionWe conducted our audit in accordance with Dutch law, including the Dutch Standards on Auditing. Our responsibilities under those standards are further described in the ‘Our responsibilities for the audit of the financial statements’ section of our report.
We are independent of OCI N.V. in accordance with the Verordening inzake de onafhankelijkheid van accountants bij assurance-opdrachten (ViO, Code of Ethics for Professional Accountants, a regulation with respect to independence) and other relevant independence regulations in the Netherlands. Furthermore, we have complied with the Verordening gedrags- en beroepsregels accountants (VGBA, Dutch Code of Ethics).
We believe that the audit evidence we have obtained is sufficient and appropriate to provide a basis for our opinion.
Audit approach
Summary
MaterialityFor the consolidated financial statements as a whole we determined, based on our professional judgment, the materiality at USD 12 million (2015: USD 15 million). The materiality is determined with reference to consolidated revenues (2015: profit before tax from continuing operations, before exceptional items) of which it represents approximately 0.6%. We consider consolidated revenues as the most appropriate benchmark considering the nature of the business and the fact that profit before tax from continuing operations, before exceptional items, has been very volatile over the years. In addition, the appropriateness of the materiality was assessed by comparing the materiality to total assets (0.2%). We have also taken into account misstatements and/or possible misstatements that in our opinion are material for qualitative reasons for the users of the consolidated financial statements.
For the parent company financial statements we considered total assets as a more appropriate benchmark in determining materiality given the nature of the activities of the Company on company level only (asset based). Based on our professional judgment we have determined the materiality at USD 55 million, being approximately 0.7% of total assets (2015: USD 60 million).
INDEPENDENT AUDITOR’S REPORT
• Liquidity risk
• Valuation of goodwill
• Demerger E&C
• IFRS 1 – company financial statements
• Coverage of 91% of revenue
• Coverage of 98% of total assets
• Materiality consolidated financial statements of USD 12 million
• Materiality Parent Company financial statements of USD 55 million
• Valuation of goodwill Sale of 50% stake in Natgasoline
• Valuation of subsidiaries in parent company financial statements
• Coverage of 92% of revenue
• Coverage of 98% of total assets
Also for the parent company financial statements we have taken into account misstatements and/or possible misstatements that in our opinion are material for qualitative reasons for the users of the parent company financial statements.
We agreed with the Board of Directors that misstatements in excess of USD 0.6 million, which are identified during the audit, would be reported to them, as well as smaller misstatements that in our view must be reported on qualitative grounds.
Scope of the group auditOCI N.V. is head of a group of components. The financial information of this group is included in the financial statements of OCI N.V.
We selected 10 components from 5 countries for a full scope audit. This resulted in a coverage of approximately 92% of revenue and approximately 98% of total assets. The remaining revenues and assets result from a number of components, of which none individually represented more than 6% of total revenue or 1% of total assets. For these remaining components, we performed amongst others review or specified audit procedures to validate our assessment that there were no significant risks of material misstatement within these components.
We have:
• performed audit procedures ourselves at group level in respect of areas such as the annual goodwill impairment tests, disposals (Natgasoline), valuation of subsidiaries (parent company financial statements) and the liquidity risk;
• performed audit procedures ourselves at component OCI Nitrogen B.V.;
• used the work of local KPMG and non-KPMG auditors when auditing components in other foreign countries;
• performed review procedures or specified audit procedures at other components where no local auditor was involved.
The group audit team has set component materiality levels, which ranged from USD 2 million to USD 7 million, based on the mix of size and risk profile of the components within the group.
The group audit team provided detailed instructions to all component auditors part of the group audit, covering the significant audit areas, including the relevant risks of material misstatement identified by us, and set out the information required to be reported back to the group audit team. The group audit team visited component auditors and performed file reviews for components in Egypt, Algeria and the United States of America. Telephone conferences were held with all the component auditors that were part of the group audit. During these visits and telephone conferences, the planning, audit approach, findings and observations reported to the group audit team were reviewed and discussed. Any further work deemed necessary was subsequently performed by the component auditors and reviewed by us.
By performing the procedures mentioned above at both group and component level, together with additional procedures at component level, we have been able to obtain sufficient and appropriate audit evidence about the group’s financial information to provide an opinion about the financial statements.
Our key audit mattersKey audit matters are those matters that, in our professional judgment, were of most significance in our audit of the financial statements. We have communicated the key audit matters to the Board of Directors. The key audit matters are not a comprehensive reflection of all matters discussed.
These matters were addressed in the context of our audit of the financial statements as a whole and in forming our opinion thereon, and we do not provide a separate opinion on these matters.
Valuation of goodwill
DescriptionOCI N.V. carries a significant amount of goodwill on the statement of financial position of which approximately 91% relates to its subsidiary Egyptian Fertilizer Company (“EFC”). Under EU-IFRS, the Company is required to test the amount of goodwill for impairment at least annually and in case of indications of impairment. The impairment tests were significant to our audit due to the complexity of the assessment process and judgments and assumptions involved which are affected by expected future market and economic developments, including the availability of sufficient gas supplies in Egypt. The assumptions applied by the Company may have a material effect on the result of the impairment test calculations. The Company has disclosed the impairment test method including the main underlying assumptions, the results of the tests, as well as the impact of the sensitivity analyses in disclosure note 8 to the consolidated financial statements.
Our response In our audit we evaluated the cash flow projections included in the annual goodwill impairment tests based on our knowledge and experience of the Company and the sector it operates. Furthermore, we critically assessed and tested the assumptions, methodologies, the weighted average cost of capital and other data used. We included in our team valuation specialists to assist us with these procedures. We specifically focused on the sensitivity in the available headroom for the cash generating units, especially for EFC, evaluating whether a reasonably possible change in assumptions could cause the carrying amount to exceed their recoverable amount and assessed the historical accuracy of management’s estimates. We also assessed the adequacy of the disclosure notes in the consolidated financial statements.
Our observationBased on our procedures performed we consider management’s key assumptions to be within a reasonable range and appropriately disclosed in the disclosure notes in the consolidated financial statements.

156 OCI N.V. Annual Report 2016 OCI N.V. Annual Report 2016 157
Performance review / Operational strengths / Sustainability review / Corporate governance / Financial statements / Other information Performance review / Operational strengths / Sustainability review / Corporate governance / Financial statements / Other information
Sale of 50% stake in Natgasoline
DescriptionIn April 2016, the Company and Consolidated Energy AG entered into an agreement for an investment in a 50% stake in Natgasoline by Consolidated Energy AG. OCI N.V. previously owned 100% of the shares in Natgasoline. Consolidated Energy AG, which is owned by the Proman Group, and its long-term partner Helm AG, will inject USD 630 million in equity, partly upfront and partly as construction of the plant of Natgasoline progresses. As per 4 May 2016, Consolidated Energy AG gained control over Natgasoline and OCI N.V. no longer recognised the investment in Natgasoline as a subsidiary but as an associate. The transaction resulted in a transaction gain of USD 107.9 million.
Our responseWe assessed the appropriateness of the “loss of control” criteria (deconsolidation) by obtaining and evaluating all relevant legal agreements. We recalculated the result of sale of Natgasoline by verifying the transaction with source documentation including the historical book value and the Company’s fair value calculations. Furthermore, we critically assessed the key assumptions, methodologies and other data used in the fair value calculation of Natgasoline, for example by comparing the outcome of various valuation techniques in assessing fair value. We also assessed the adequacy of the disclosure notes 10 and 22 in the consolidated financial statements. We included in our team (valuation) specialists to assist us with these procedures.
Our observation
We observed that the deconsolidation of Natgasoline is appropriately reflected in the 2016 consolidated financial statements.
Valuation subsidiaries in Parent Company financial statements
DescriptionAs disclosed in note 40 and 43 to the parent company financial statements, the Company values its subsidiaries at cost. Under EU-IFRS, the Company is required to test the carrying amount of subsidiaries in case of indications of impairment. Based on an analysis of indications of impairment in 2016, impairment tests have been performed by the Company’s management. The impairment tests were significant to our audit due to the complexity of the process to determine fair value and judgments and assumptions involved which are affected by expected future market and economic developments. The assumptions applied by the Company may have a material effect on the subsidiaries’ valuation. The Company has disclosed the valuation method including the main underlying assumptions in disclosure note 43 to the company financial statements.
Our response In our audit we evaluated the cash flow projections of the subsidiaries that were part of the valuation assessment. Furthermore, we critically assessed and tested the assumptions, methodologies, the weighted average cost of capital and other data used, for example by comparing them to external and historical data, such as external market growth expectations, utilization rates and by analysing sensitivities in OCI N.V.’s valuation model. We included in our team valuation specialists to assist us with these procedures. In relation to the 31 December 2016 impairment tests with respect to the valuation of the subsidiaries, we specifically focused on the sensitivity in the available headroom for these subsidiaries, evaluating whether a reasonably possible change in assumptions could cause the carrying amount to exceed its recoverable amount and assessed the historical accuracy of management’s estimates. In case of recorded impairment losses, we tested the impairment calculations. We also assessed the adequacy of the disclosure note in the company financial statements.
Our observationBased on our procedures performed we consider management’s key assumptions and the valuation of the subsidiaries to be within a reasonable range and appropriately disclosed in the disclosure note in the parent company financial statements.
Report on other information included in the annual report
In addition to the financial statements and our auditor’s report thereon, the annual report contains other information that consists of:
the Board of Directors’ report, which contains the chapters performance review, operational strengths, sustainable review and corporate governance;
other information pursuant to Part 9 of Book 2 of the Netherlands Civil Code.
Based on the below procedures performed, we conclude that the other information:
• is consistent with the financial statements and does not contain material misstatements;
• contains the information as required by Part 9 of Book 2 of the Netherlands Civil Code.
We have read the other information. Based on our knowledge and understanding obtained through our audit of the financial statements or otherwise, we have considered whether the other information contains material misstatements.
By performing these procedures, we comply with the requirements of Part 9 of Book 2 of the Netherlands Civil Code and the Dutch Standard 720. The scope of the procedures performed is substantially less than the scope of those performed in our audit of the financial statements.
Management is responsible for the preparation of the other information, including the Board of Directors’ report in accordance with Part 9 of Book 2 of the Netherlands Civil Code and other Information pursuant to Part 9 of Book 2 of the Netherlands Civil Code
Report on other legal and regulatory requirements
EngagementOur first appointment as auditor of OCI N.V. was in 2013. On 28 June 2016, we were re-appointed by the General Meeting of Shareholders as auditor of OCI N.V. for 2016.
Description of the responsibilities for the financial statements
Responsibilities of the Board of Directors for the financial statementsThe Board of Directors is responsible for the preparation and fair presentation of the financial statements in accordance with EU-IFRS and with Part 9 of Book 2 of the Netherlands Civil Code. Furthermore, the Board of Directors is responsible for such internal control as the Board of Directors determines is necessary to enable the preparation of the financial statements that are free from material misstatement, whether due to errors or fraud.
As part of the preparation of the financial statements, the Board of Directors is responsible for assessing the company’s ability to continue as a going concern. Based on the financial reporting framework mentioned, the Board of Directors should prepare the financial statements using the going concern basis of accounting unless the Board of Directors either intends to liquidate the company or to cease operations, or has no realistic alternative but to do so. The Board of Directors should disclose events and circumstances that may cast significant doubt on the company’s ability to continue as a going concern in the financial statements.
Our responsibilities for the audit of financial statementsOur objective is to plan and perform the audit to obtain sufficient and appropriate audit evidence for our opinion. Our audit has been performed with a high, but not absolute, level of assurance, which means we may not have detected all material errors and fraud during the audit.
Misstatements can arise from fraud or error and are considered material if, individually or in aggregate, they could reasonably be expected to influence the economic decisions of users taken on the basis of these financial statements. The materiality affects the nature, timing and extent of our audit procedures and the evaluation of the effect of identified misstatements on our opinion.
For a further description of our responsibilities in respect of an audit of financial statements we refer to the website of the professional body for accountants in the Netherlands (NBA)
https://www.nba.nl/Documents/Tools%20Vaktechniek/Standaardpassages/Standaardpassage_nieuwe_controletekst_oob_variant_%20Engels.docx
Amstelveen, 24 March 2017
KPMG Accountants N.V.
M. Meester RA
INDEPENDENT AUDITOR’S REPORT CONTINUED

158 OCI N.V. Annual Report 2016 OCI N.V. Annual Report 2016 159
Performance review / Operational strengths / Sustainability review / Corporate governance / Financial statements / Other information Performance review / Operational strengths / Sustainability review / Corporate governance / Financial statements / Other information
Share ListingOCI N.V.’s shares have been listed on the Euronext in Amsterdam as of 25 January 2013.
Number of outstanding ordinary shares as at 31 December 2016
210,306,101
Highest share price (EUR/share) 21.43
Average share price (EUR/share) 14.71
Lowest share price (EUR/share) 11.21
Share price at 31 December 2016 (EUR/share) 16.58
Market capitalization at 31 December 2016 (EUR billion) 3.49
Share capitalAll of the Company’s issued shares are ordinary shares with authorized par value of 0.02 Euros. The number of paid-up ordinary shares outstanding is disclosed in note 15 of the financial statements.
Dividend PolicyOCI has a flexible dividend policy designed to balance the availability of funds for dividend distribution with pursuing growth opportunities that generate attractive returns. Over the past few years, OCI has pursued two large greenfield projects in the US, which required high capital expenditure. Accordingly, the Board of Directors has not announced a dividend for FY 2016.
Investor RelationsOCI N.V. places great importance on maintaining active dialogue with existing and potential shareholders, banks, and analysts. OCI N.V. is committed to providing relevant, high-quality and timely information to all stakeholders, and to giving current and potential shareholders, analysts and financial press broader insight into the Company and the industries in which we operate. To this end, OCI N.V. strives to ensure that relevant information is provided equally and simultaneously to all interested parties.
As per the Company’s by-laws, OCI N.V. observes a ‘black-out’ period during which analysts’ meetings and presentations to and/or direct discussions with current or potential shareholders do not take place shortly before the publication of the regular financial information.
Investor Relations contact
Hans Zayed Investor Relations Director E-mail: [email protected]
Tel: (+31) 06 18 25 13 67
Corporate contactErika Wakid E-mail: [email protected]
Corporate website: www.oci.nl
SHAREHOLDER INFORMATION
OCI NITROGEN (100%)Nitrates and melamine manufacturer, the Netherlands
IOWA FERTILIZER COMPANY (100%)Nitrates and diesel exhaust fluid manufacturer, USA
OCI PARTNERS LP (80%)Owner and operator of OCI Beaumont, ammonia and methanol manufacturer, USA
NATGASOLINE (50%)Methanol manufacturer, USA
BioMCN (100%)Methanol manufacturer, Netherlands
SORFERT ALGÉRIE (51%)Ammonia and granular urea manufacturer, Algeria
EGYPTIAN FERTILIZERS COMPANY (100%)Granular urea manufacturer, Egypt
EGYPT BASIC INDUSTRIES CORPORATION (60%)Ammonia manufacturer, Egypt
OCI FERTILIZER TRADING (100%)Fertilizer trading and distribution, UAE
OCI FERTILIZER TRADE & SUPPLY (100%)Fertilizer trading and distribution, Netherlands
Contact UsThis annual report is available online at www.oci.nl
OCI N.V.Honthorststraat 19 1071 DC Amsterdam The Netherlands
T: (+31) 20 723 45 00
OCI N.V. stock symbols: OCI / OCI.NA / OCI.AS / OCINY
KEY SUBSIDIARIES AND ASSOCIATES