annual report 2016 - oman cablesannual report 2016 3 sales we are pleased to report the 2016 sales...
TRANSCRIPT
ANNUAL REPORT
2016OCI cover print.indd 1 02/03/2017 12:10 PM

HIS MAJESTY SULTAN QABOOS BIN SAID
OUR VISIONWe at Oman Cables Industry ensure that through our product offering, we remain the leader in our industry in quality and performance, exceeding the expectations of our customers and stakeholders.
OUR MISSIONWe continuously strive for excellence in all aspects of our business through the integration of sustainable business development and innovation, enhancing shareholder value and outstanding customer service.
VALUES ANDPRINCIPLES• Build sustainable growth through innovation
• Transparency in all our actions
• Promoting an environment of open
communication for all
• Integrity driven by accountability• Continued integration of world class quality
management
• Safety is not compromised
• Responsible corporate citizenship in compliance
with environmental norms

CONTENTS
Board of Directors 1
Report of the Board of Directors 2
Management Discussion and Analysis 7
Auditors Report to the Shareholder on Corporate Governance Report 11
Corporate Governance Report 12
Report of the Auditors 22 - 27
Consolidated Statement of Financial Position 28
Consolidated statement of profit or loss 29
Consolidated statement of profit or loss and other comprehensive income 30
Consolidated Statement of Changes in Equity 31 - 32
Consolidated Statement of Cash Flows 33
Notes to the Consolidated Financial Statements 34 - 74

ANNUAL REPORT 2016 1
Fabio Ignazio RomeoChairman
Mohamed Al LawatiDirector
Mahmut Tayfun AnikDirector
Lara HansenVice Chairman
Christian Raskin Director
Michele BindaDirector
Hamed Al WaheibiDirector
BOARD OF DIRECTORS

ANNUAL REPORT 20162
To our valued shareholders
It gives me great pleasure to welcome you all on behalf of my colleagues and the Board of Directors of Oman Cables Industry to the 28th Annual General Meeting (AGM) of the company.
We are meeting here today at the Annual General Meeting today where the Board of Directors explains to the shareholders the achievements of the company for the year 2016. We hope to be able to sustain the successes achieved by the company over the years and the current year under review.
Board of Directors
The following are the Board of Directors of the company:
1. Mr. Fabio Ignazio Romeo
2. Mrs. Lara Caroline Mahmoud-Hansen
3. Mr. Mohamed Al Lawati
4. Mr. Hamad Mohammad Al Wahaibi
5. Mr. Christian Raskin
6. Mr. Mahmut Tayfun Anik
7. Mr. Michele Binda
The Board and its committees, conducted various meetings and directed the company operations.
Operational Review
In spite of the current market conditions Oman Cables have been able to maintain the volume. The Copper prices, the most important raw material in cables, were ranging lower during the year by 15% compared to 2015. This has affected the sales value.
The Company, due to its geographically spread markets and its diversified composition of the customer base, could maintain the volumes.
Important expansion of the facilities have been completed during the year and there was a continued focus on customer service and operational efficiencies.
Oman Cables Industry is actively looking for areas to collaborate for mutual benefit with its majority shareholder, being in the same business.
REPORT OFTHE BOARDOF DIRECTORS
ANNUAL REPORT 2016 3
Sales
We are pleased to report the 2016 sales revenues of RO 200.3 million for the parent company as compared to RO 231.5 million in 2015. The sales of the Group were RO 228.6 million compared to RO 283.5 million in 2015.
The sales value decrease in 2016 is largely attributable to the 15% decline of the copper rate in comparison to 2015. The volumes sold by the parent company in 2016 were equal to 2015. The effect of the oil price levels is having an impact on the business sectors and the pressure on the sales value was felt in all markets and across the different segments. Several electrical utilities in and outside of Oman delayed the payments.
Profitability
The net profit of the parent company for the year 2016 was RO 15.4 million as compared to RO 18.2 million in 2015, a decrease of 15.2%
The net profit of the Group was RO 15.3 million compared to RO 18.5 million in 2015 a decrease of 17.6%.
The decrease in profitability is due to the severe competition faced by the parent and subsidiary. In response to market pressure the company and subsidiary kept a tight control on overhead costs.
Oman Aluminum Processing Industries LLC
Oman Cables Industry’s subsidiary company, Oman Aluminum Processing Industries LLC (OAPIL) in Sohar, is a joint venture between Oman Cables with 51% share and Takamul Investment Company of Oman Oil with 49% share.
OAPIL is operating in the Aluminum business that is experiencing fierce competition and price pressure. The company continues to focus on the reduction of costs of production and control of the overheads. The management strategies applied are showing an increase in the production efficiencies. During the year 2016, OAPIL has achieved lower sales and profits compared to 2015. The OAPIL financial results are consolidated with Oman Cables, the parent company, and are reported as Group results.
The Aluminum market worldwide is in turmoil and OAPIL had a challenging year. The Sales Revenues dropped strongly and the profitability was under severe pressure leading to a large drop in the Net Profit.
The year ahead is expected to continue to be challenging and no improvement of the overall market circumstances is expected.
Human Resources
Human Resources plays an important strategic role in the continuous development of Oman Cables and employees are our business partners in this success. Ensuring our employees are equipped with the necessary technical & behavioural skills associated with their roles are always the main drive for excellence. Providing educational assistance for our resources to continue or complete their study has played a vital role in creating stability within the Omani workforce and increasing their qualification levels.

ANNUAL REPORT 20164
The management of Oman Cables are always striving for a better performance and better healthy sustainable working environment, and in line with that, in 2016 it extensively refurbished the existing canteen facilities and extended the free meal scheme to a larger number of employees and facilitated attractively priced food for all employees. This initiative was well received.
At Oman Cables we believe in “one company and one team” and this is in our values and we are proud of it. This has created an unparalleled value, continuous growth and sustainable performance that always achieve and exceed targets.
Health Safety & Environment
Oman Cables is continuously striving to improve the Safety Awareness among it shop floor employees. Various actions are initiated so that all employees have been introduced to the Safety Awareness Programme. The lost time injury frequency rate (LTI) in the company is being actively monitored. The focus is on to have a safe working place with proper safety and health regulations.
As an encouragement to promote the awareness of safety and increase the safety at work and at home, fire extinguishers were distributed to all employees for their homes with Arabic and English manual leaflets illustrating how to use the fire extinguisher together with information on fire prevention.
Corporate Governance
The company has been following the high standards in the Corporate Governance since its inception. The Board has constituted three committees i.e. Audit Committee, Strategic Management Committee and the Nomination and Remuneration Committee. Based on the importance of the strategy area the board realigns the strategy of the company in the “Strategic Management Committee”. The “Nomination and Remuneration Committee” is established in the first quarter of 2015 and assists and advises the Board on matters relating to the Chief Executive Officer and the top line management staff as well as on other essential matters relating to the Board of Directors.
The company has internal systems and manuals to assist the management in the day-to-day operations. These systems and manuals are reviewed and updated and are in line with statutory requirements while meeting the organizations goals that gives transparency to all transactions. These systems and manuals are in-line with Capital Market Authority regulations as a public listed company on the Muscat Securities Market.
Oman Cables shares the information with all stakeholders and public in general through regular publication of its quarterly and annual results in printed media, on the MSM website and on the company’s website.
Company has aligned its Corporate Governance with the latest Guidelines issued by Capital Market Authority of Oman.
Corporate Social Responsibility
Oman Cables believes that giving back to the community is extremely important. The company has grown manifolds, so has our commitment to the society. The Oman Cables CSR program provides assistance to the various organizations that are dedicated to improve the quality of life for the less privileged in the society.
Oman Cables contributed in 2016, to different sectors of the community and society related to the cultural and social development and education sector in Oman. Youth sports and cultural events arising from its belief in the youth as the future for Oman have been able to take place with the help of the Corporate Social Responsibility program of the company.

ANNUAL REPORT 2016 5
The company intends to be in the forefront in this field with different CSR activities, movements and experiences around the world by applying an plan and policy to reflect the depth in partnership between the company and the community and exercise it in line with the needs of the community and society to help securing and providing what is the best for the community and society. The company will keep on working on its CSR activities to reach and cover different sectors of corporate social responsibility in the community and society.
Future Outlook
The countries in which the company’s products are being marketed, have been facing a slowdown in the respective economies due to low and uncertain oil prices and other factors. The company is gearing up to face the challenge in various ways. While maintaining the focus on existing markets the company is fine tuning its operations to deliver exceptional value to its customers
The management continuous to focus on the dynamic and competitive market for cables. The continued emphasis on operational excellence is an important factor to the continuous success of the company. The company has a strong management and a strong operational performance and will continue to strive on a strategy framework that focuses on the creation of long term value to all the stakeholders while ensuring sustainability in the operations.
The company has demonstrated another year of a satisfactory performance and a continued focus on operational excellence. Oman Cables invested further in the manufacturing capabilities, in marketing and in human resources to continue to deal with the market dynamics. Today Oman Cables is positioned favorably locally, regionally in the GCC and MENA region and in selected international markets.
Dividend:
The Board of Directors, during the board meeting held on 25 January 2017, reviewed the company’s annual accounts. Considering the guidelines issued by the Capital Market Authority, the liquidity requirements for the operational needs and the uninterrupted record of declaration of dividend, the Board members propose distributing a cash dividend to the Oman Cables Industry shareholders.
Taking into account the financial performance for the Board recommends to distribute dividend on paid-up capital, ie RO 0.085 baiza for each share with face value of RO 0.100 baiza, to the shareholders registered as on the date of Annual General Meeting.
The Board of Directors also recommends to the shareholders at the Annual General Meeting to approve the total Director’s remuneration of RO 200,000 (including meeting attendance fees) to be paid to the Board of Directors, in recognition and appreciation of their efforts towards their responsibilities and for their continuous inputs, guidance and support to the management.
Cooperation with Prysmian, Italy
The company has entered into discussions /MOU with Prysmian of Milan, Italy for the implementation of a SAP ERP system in the company, subject to the relevant approvals from the shareholders.
ANNUAL REPORT 20166
Enhancing Company Stake of 40% in Associated Cables Private Limited, India.
Keeping in view the long term plans of the company, the company has successfully negotiated buying of remaining 60% stake from the other shareholders of ACPL- Viz Draka UK group Limited and Prysmian Treasury BV. The relevant regulatory approvals and the companies shareholder approval is being sought for this.
Conclusion
We acknowledge with thanks to our local and global customers, business associates, the finance community, local communities and all other stakeholders for their continued support to Oman Cables. Our special thanks go to all our employees and to the management for their consistent hard work and wholehearted commitment in delivering the objectives and in taking the company to greater heights. Oman Cables has trustworthy employees who are the reason for our success and it emphasizes the importance of all our people in the company.
Oman Cables acknowledges the great support extended by the Government of His Majesty Sultan Qaboos Bin Said, the Authorities in the Ministry of Commerce & Industry as well as all other Ministries and Government departments.
We wish the best for our beloved Oman to develop even more under the wise leadership of His Majesty Sultan Qaboos Bin Said by granting His Majesty with good health and longevity.
Mr. Fabio Romeo Chairman Oman Cables Industry (SAOG)
Date: 25 January 2017
ANNUAL REPORT 2016 7
Industry Structure and Development
Oman Cables Industry (SAOG) develops, manufactures and markets a totally integrated variety of electrical cables and conductors for diverse applications, including medium voltage power cables, low voltage power and control cables, instrumentation cables, pilot cables, overhead power transmission line conductors and building wires.
The company offers cables with special features suitable for different types of application, environmental conditions or as per customer requirement. The manufacturing facilities are situated within the largest industrial complex in Muscat. Equivalent facilities are available in Sohar where the aluminum manufacturing facility is based.
Achieving economies of scale combined with operational excellence is an important dynamic for success within the very competitive cable business environment. Copper conductor is the most dominant metal used in power cables however there is a trend towards aluminum cables in some market sectors. Oman Cables is carefully monitoring the partial substitution of copper with aluminum and is capable of processing both materials.
Oman Cables is a well-known internationally accredited power cable manufacturer and operates predominantly within the GCC region with an extensive distribution and office network throughout the region. Offices are based in Oman, the United Arab Emirates, Qatar and Saudi Arabia. Oman Cables is serving customers in the Utility, Construction, Oil, Gas and Petrochemical Industries, Mining, Transportation and Industrial manufacturing sector.
The company has positioned itself as a recognized power cable manufacturer following international standards and accreditations to ensure that the highest quality products are delivered to its customers on time. Through constantly researching the demands and trends within the different market sectors the company provides a specialized service for each customers need.
During December 2015, the Prysmian Group, thru its wholly owned subsidiary, enhanced its stake from 34.78% to 51.17%. This stake increase by the Prysmian Group, which is the world’s number one cable company as a leading provider of energy and telecom systems, has endorsed Oman Cables as a cable company with good potential. Through the year the company has been working together in different fields with the purpose to improve the Oman Cables product portfolio by introducing products and services and by expanding the customer base.
Opportunities and Threats
The GCC region where the company is predominantly operating still continues to be a growth area for the cable products. In the medium term the oil related economic growth and demographics of the region will spur projects in the residential, commercial, infrastructure, oil and gas, power, and Industrial sectors. This will generate the demand for the company’s cable products.
MANAGEMENT DISCUSSIONS AND ANALYSIS REPORT
ANNUAL REPORT 20168
Oman Cables and the Prysmian Group, now has an opportunity to mutually tap into each other strengths and to have a successful commercial approach regionally and globally.
The effect of the cyclical downtrend in oil price levels is having a lingering impact on the business sectors. The uptick in the economic activity will take some time in spite of the recent stabilization of oil prices. Countries and businesses are adapting and realigning their budgets in line with their capital spend to the current levels of the main income revenue e.g. oil and gas. We observed that the market in general is affected by cancellations and projects are put on hold due to governmental budget deficits. This affects contractors which have to cancel orders and reduce their workforce. The delay of payments is felt in many markets. These effects
are strongly influencing the business within the GCC where payment terms, risk and negotiations took on a new approach.
The demand for cables in the region continue to attract many regional and international cable manufacturers creating a very competitive environment.
Oman Cables has plans and strategies in place to counter this thru market development and product diversification. The capabilities and positioning can be leveraged swiftly to seize the growth opportunities that may emerge for large projects or for an increase in the demand for power cables within its markets.
Segment Performance
The approach of Oman Cables of operating in diverse markets with a varied product range and targeting a wide spectrum of consumers has served well for the company.
Oman Cables has performed well across all geographical segments and product categories in 2016. The company has developed a sustainable customer base within the various market sectors thru a combination of branch offices and associations spanning all markets. The company has managed to obtain and sustain a good market share at all main utilities within the region. Oman Cables have invested in the latest technology for manufacturing and testing. Oman Cables is firmly established with International EPC companies doing business within the MENA region. Projects have been executed successfully with adhering to stringent quality and delivery parameters.
The subsidiary company in Sohar, supplying aluminum products, has this year reduced its contribution to the Oman Cables results. The aluminum operation will continue to integrate with Oman Cables’ strategic outlook.
Outlook
In the short run, the lower oil prices, the volatile copper price and the geo-political situation is effecting the overall economic situation in the markets where Oman Cables operates. However there are indications that this situation may reverse slowly. The various measures being taken by the authorities to face this situation will start giving results and stabilize the economy.
Oman Cables expects to maintain its presence in the market and is well equipped to face the challenges based on operational excellence executed by a customer focused performance, efficient resource

ANNUAL REPORT 2016 9
utilization, managing the cost structure, perform a market driven expansion, and sound financial discipline. The outlook for Oman Aluminum Industries LLC (OAPIL) is challenging and the aluminum market is facing a critical phase.
Risk and Concerns
Oman Cables main markets were heavily influenced by the declining oil price. This may impact capital spend on major projects in the current year affecting the local economies and GDP. This may have a cascading effect on the demand for power cables. This coupled with the established capacity in the region may result in pressure on pricing.
The domestic market may remain active based on the government‘s spend as indicated in the State Budget for 2017. Oman Cables Industry will remain vigilant and ensure that supplying a superior product with competitive pricing is maintained.
Oman Cables Industry works carefully to monitor the developments in the potential countries for future business. The company strives to find the balance between the business opportunities and the potential risks involved and cautiously builds market confidence
Internal Control Systems and their adequacy
The company has sound internal control systems and operating procedures in place. The operations are audited by a professional internal audit team, external statutory financial auditors and ISO auditors. Oman Cables is routinely audited in depth by multinational corporations as a part of their stringent pre-qualification processes and product approvals.
These audits include the compliance of the operational activities and Health, Safety and Environmental (HSE) aspects. Oman Cables Industry is driven by Corporate Governance through its strict ethical policies and emphasis on customer satisfaction.
Expansion
During 2016, the company invested in programmes which resulted in the increase of the efficiency for the manufacturing of specific wires and cables. This includes the introduction of the latest technological systems and upgrades of machinery.
Sales and Profitability
The operational performance of the Group for the last 5 years is as below:
2012 2013 2014 2015 2016
Sales (RO’ 000) 257,160 306,058 303,146 283,470 228,639
Profit after Tax (RO’ 000) 11,908 16,886 17,718 18,507 15,254
Equity (RO’ 000) 61,745 72,461 83,498 92,738 102,000
Dividend (%) 70% 88% 90% 90% 85%*
*recommended by the Board of Directors
ANNUAL REPORT 201610
Conclusion
Though 2016, has been a challenging year, Oman cables have responded with satisfactory results in terms of volumes and working capital management, in spite of difficult market circumstances. This was possible through the well planned and long term marketing efforts, utilization of production capacity and overall emphasis on operational excellence.
Oman Cables has shown consistent growth in performance. This is possible due to its excellent relationship and support of the prestigious customer base, other stakeholders and dedicated employees.
The Executive Management with the guidance of the Board of Directors is confident that the company is on a sound footing and will strive to improve its market position and stakeholder’s value.
Mr. Gert Hoefman
Chief Executive Officer
Oman Cables Industry (SAOG)
Date: 25 January 2017
ANNUAL REPORT 201612
Company’s philosophy on Code of Corporate Governance
Oman Cables Industry SAOG (OCI) is committed to adhere to the highest standards of Corporate Governance. OCI believes that the process of Corporate Governance enables it to control and direct the operations making it more efficient. Implementation of the Code of Corporate Governance protects all stakeholders of the company.
OCI’s Corporate Governance Structure is based on the Code of Corporate Governance issued by Capital Market Authority (CMA).
The Directors and management of OCI adapts the following main pillars:
• Transparency regarding sharing of information with stakeholders
• Accountability towards stakeholders
• Fairness in dealing with all Stakeholders
• Responsibility to perform the duties with honesty and integrity
• Acting with prudence, care & diligence
• Placing the Company & community interests ahead of personal Interests
The Company’s has applied the above principles through a combination of measures like:
• Instituting Internal Regulations and Operating Procedures - through the Human Resource Manual, Operations Manual for Finance, Sales and Marketing, Procurement and Supply Chain, documented Quality Management System and other policies
• Monitoring adherence to the Internal Regulations and Operating procedures through frequent internal checks, conducting Internal and external Audit, carrying out regular Quality System, allowing customers to conduct quality and compliance
• Regular management reviews and structured written reports by Management to the Board.
• Periodical communication with shareholders
• Adherence to the process of nomination and election of Directors laid down by CMA, thus ensuring that the Board is constituted of skilled Directors to oversee the company operations
• Ensuring the compliance with relevant laws and regulations.
The Company has set up Audit Committee Charter, Internal Audit Charter, Disclosure and Insider Trading Policy, Strategic Management Committee Charter all duly approved by the Board and which and are all based on the regulations of the CMA.
CORPORATEGOVERNANCE REPORT
ANNUAL REPORT 2016 13
CORPORATEGOVERNANCE REPORT
Board of Directors
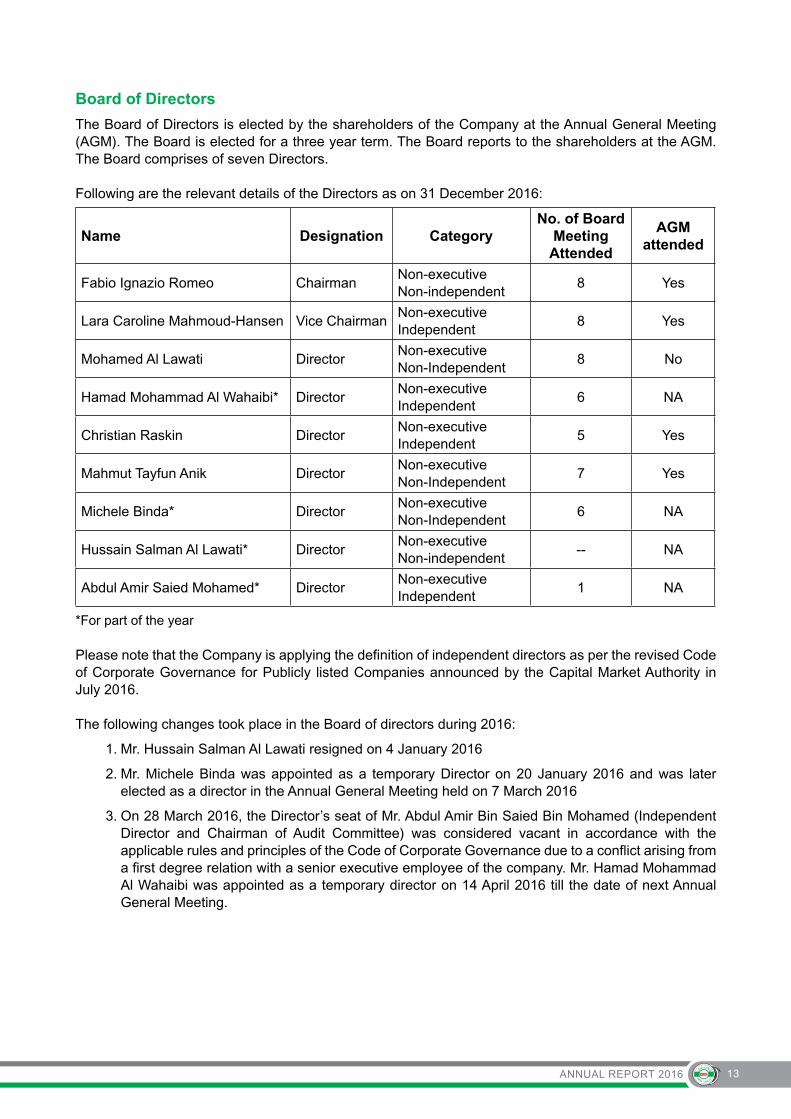
The Board of Directors is elected by the shareholders of the Company at the Annual General Meeting (AGM). The Board is elected for a three year term. The Board reports to the shareholders at the AGM. The Board comprises of seven Directors.
Following are the relevant details of the Directors as on 31 December 2016:
Name Designation Category No. of Board
Meeting Attended
AGM attended
Fabio Ignazio Romeo ChairmanNon-executive Non-independent
8 Yes
Lara Caroline Mahmoud-Hansen Vice ChairmanNon-executive Independent
8 Yes
Mohamed Al Lawati DirectorNon-executiveNon-Independent
8 No
Hamad Mohammad Al Wahaibi* DirectorNon-executive Independent
6 NA
Christian Raskin DirectorNon-executive Independent
5 Yes
Mahmut Tayfun Anik DirectorNon-executiveNon-Independent
7 Yes
Michele Binda* DirectorNon-executiveNon-Independent
6 NA
Hussain Salman Al Lawati* DirectorNon-executive Non-independent
-- NA
Abdul Amir Saied Mohamed* DirectorNon-executive Independent
1 NA
*For part of the year
Please note that the Company is applying the definition of independent directors as per the revised Code of Corporate Governance for Publicly listed Companies announced by the Capital Market Authority in July 2016.
The following changes took place in the Board of directors during 2016:
1. Mr. Hussain Salman Al Lawati resigned on 4 January 2016
2. Mr. Michele Binda was appointed as a temporary Director on 20 January 2016 and was later elected as a director in the Annual General Meeting held on 7 March 2016
3. On 28 March 2016, the Director’s seat of Mr. Abdul Amir Bin Saied Bin Mohamed (Independent Director and Chairman of Audit Committee) was considered vacant in accordance with the applicable rules and principles of the Code of Corporate Governance due to a conflict arising from a first degree relation with a senior executive employee of the company. Mr. Hamad Mohammad Al Wahaibi was appointed as a temporary director on 14 April 2016 till the date of next Annual General Meeting.

ANNUAL REPORT 201614
The Board of Directors also hold the following positions in other Companies / Organisations:
Name of Director Designation in other Companies
Name of Company
Fabio Ignazio Romeo
Chairman
Chief Strategy Officer
Director
Director
Director
Director
Member of the Comite de Controle
Director
Director
Director
Representative of Draka Holding B.V.
Director
Vice President
Director
Member of the Supervisory Board
Prysmian Group
Centro Elettrotecnico Sperimentale Italiano Giacinto Motta S.p.A.
Prysmian (China) Investment Co. Ltd
Prysmian Angel Tianjin Cable Co. Ltd.
Prysmian Tianjin Cable Co. Ltd.
Prysmian Cables et Systemes France S.A.S.
Prysmian Power Cables and Systems Canada
Prysmian S.p.A.
Draka Cableteq Asia Pacific Holding Pte. Ltd.
Turk Prysmian Kablo ve Sistemleri A.S
Prysmian Cables and Systems Ltd.
Elkat Ltd.
Prysmian Baosheng Cable Co. Ltd.
Prysmian Netherlands Holding B.V.
Lara Caroline Mahmoud-Hansen, Vice Chairman
General Manager Feed & Agricultural Suppliers Services Co. LLC
Mohamed Al Lawati
Director
Chief Executive Officer Al-Saleh Group
Hamad Mohammad Al Wahaibi*
Director
Investment Manager
Director
Director
Director
Ministry of Defense Pension Fund
Galfar Engineering and Contracting
Voltamp Energy
National Bank of Oman
Christian Raskin
Director
Director EVS Belgium
Mahmut Tayfun Anik
Director
Director - Joint Venture Management
Director
Prysmian SpA
Ravin Cables Ltd (India)
Michele Binda
Director
Executive Senior Legal Counsel
Prysmian SpA
Mr. Fabio Ignazio Romeo – Chairman is the Senior Vice President Business Energy of Prysmian since July 2011. He did his graduation in Electronic Engineering from Milan’s Polytechnic University in 1979, then obtained an M.S. and a Ph.D. in Electrical Engineering and Computer Sciences at the University of California in Berkeley. He began his career at Tema (ENI Group) as control expert for chemical plants, in 1982 he moved to Honeywell as a technical advisor to the Group’s CEO. In 1989 he joined Magneti Marelli as Innovation Manager of the Electronics division, later becoming Director of the Electronics Systems division. In 2001 he moved to Pirelli Group, where he held the position of Director in charge of the Pirelli Tyre division’s Truck business unit. In 2002 Dr. Romeo moved to the Energy Cable Sector where he has been appointed Utility Director, Sales and Marketing Director position he held until the current assignment.

ANNUAL REPORT 2016 15
Mrs. Lara Caroline Mahmoud-Hansen – Vice Chairman and Independent Director has a Bachelor of Arts from the University of Wisconsin and Juris Doctor from Rutgers University, New Jersey. She has practiced Oman corporate and commercial law for 15 years, specialising in corporate governance. Mrs Hansen was the principal external legal advisor to Oman Cables Industry SAOG from 1998 to 2011. She is currently an owner and the general manager of Feed & Agricultural Suppliers Services Co LLC.
Mr. Mohamed Al Lawati - Director, holds a Bachelor degree in Mechanical Engineering from University of Manchester, UK. He has 5 years engineering experience in Petroleum Development Oman (PDO). He has also held various positions in Oman Cables Industry SAOG for 5 years, latest as General Manager – Sales & Marketing and General Manager - Corporate Projects. Currently he is the CEO of Al-Saleh Group.
Mr. Hamad Mohammad Al Wahaibi - Independent Director, appointed by the Board of Directors as a temporary independent director till the coming general meeting of shareholders in 2017.Holds a Bachelor degree in trade and commerce and an MBA in financeInvestment Manager at Ministry of Defense Pension FundDirector in Galfar Engineering and Constracting, Voltamp Energy and National Bank of OmanChartered Financial Analyst (CFA) CharterholderChartered Alternative Investment Analyst (CAIA) Charterholder He has 16 years’ experience in areas of investment, assets management and business development.
Mr. Christian Raskin – Independent Director, holds a Masters in Economics from the Catholic University of Leuven in Belgium and a Degree in Accountancy from St Mary institute in Liège. He was the co-founder of Zetus Industries for 9 years, later as Managing Director of Draka Holding until 2009. He was also the chairman of Europacable and Member of the board of ICF. He serves on the board of three private companies outside Oman.
Mr. Mahmut Tayfun Anik – Director, holds a BA degree in Business Administration from Bogazici University in Turkey. He has over 30 years of experience at various positions in the Prysmian Group.
Mr. Michele Binda – Independent Director, Executive senior legal counsel at Prysmian SpA with extensive national and international experience in dealing with corporate and commercial legal affairs developed by working more than 10 years as an in-house business lawyer. Specialized in contract drafting and negotiations, special projects (merger & acquisition, joint venture’s establishment and management, EPC contracts, etc.) judicial and arbitral litigation management, corporate and intellectual property laws and compliance. He has extensive knowledge and experience on competition laws.
Mr. Hussain Salman Al Lawati – Director, (resigned from the Board of Directors of OCI on 4 January 2016), is the co-founder of Oman Cables in 1984. He has a rich Business experience of 52 years in the electrical and lighting Industry including 32 years in Oman Cables Industry where he held the position of the Vice Chairman and Managing Director from pre establishment stage in 1983 till 2012 and continued the Managing Director position till 25 July 2013. He has established a few electrical trading enterprises in Oman and UAE. He has developed the first Aluminum rod industry in Oman known as OAPIL, at Sohar (Oman Aluminum Processing Industries LLC) he was driving force and the Chairman of the company till early August 2013, further he is primer partner and Chairman of Bin Salman Group companies, the company is in electrical and lighting trading Business, besides property development and industrial investment.
On his social involvement, he was the first Chairman of the Omani Australian Business council till 2013 at the Oman Chamber of Commerce. He was holding a board member position in the Oman Chamber of Commerce from 1995 till 2003. He was the chairman for the Industrial Committee of the Oman Chamber Of Commerce for the period of eight years as well he was Member industrial Development at the Ministry

ANNUAL REPORT 201616
of Commerce and Industry from 1996 till 2003 and is continuing his contribution as an expertise member. He is also Chairman of Investment Group Development at the Public Authority for Investment Promotion and Export of the Government of Oman. He is also a member of the Omani Dutch Business council and a member of the Omani Tunisian Friendship Association. He was selected as finalist in 2012 for the prestigious Entrepreneur of the Year Award for the year 2011 conducted by Ernst & Young of Oman on 17 March 2012. He was also selected for coveted Global Omani of the Year 2012 award organized by AIWA.
Mr. Abdul Amir Saied Mohamed, (Director till 28 March 2016), holds a Masters in Business Administration from the Oxford Brookes University, UK. He has also been a Member of the Association of Accounting Technicians since 1979. He worked for ten years as Deputy Chief Executive Officer at the State General Reserve Fund. He is a Director of Sembcorp Power and Water Co Salalah SAOG, Oman Fisheries Co. SAOG and Muscat Finance SAOG. He held Directorship of various public limited companies in the past, in and outside the Sultanate of Oman.
Company Management
The names, designations, description of responsibilities in Oman Cables and brief profile of the Company Management personnel is as follows:
Gert Hoefman is the Chief Executive Officer of the Company as of January 2013. He has over 25 years of experience in the cable business and worked with Prysmian at various executive manage-ment positions.
Manoj M. Vaidya, General Manager - Corporate Finance has experience of 34 years, of which 29 years at executive management levels. Responsible for Finance and Risk Management functions.
Louis Dupreez, General Manager - Sales and Marketing has experience of 37 years in industry, of which 27 years at executive management levels. Responsible for Sales, Marketing and Customer Service.
Ahmed Farooqui, General Manager - Procurement and Supply Chain has experience of 34 years in industry, of which 22 years at executive levels.
Mohammed Hashim Al-Shahab, General Manager - Human Resources, Administration & Security has experience of 16 years, of which 7 years at executive levels.
Muhanned Al-Lawati, General Manager - Production has experience of 9 years, of which 5 years at executive levels.
Sajid Ali, General Manager - Information Technology has experience of 26 years, of which 18 years at executive levels.
Antony Douglas Falconer, General Manager - Cable Engineering and Development, has experience of 30 years, of which 21 years at executive levels.
Board Meetings held during the year:
During the year 2016 the company held eight Board Meetings on the following dates:20 January 2016, 14 April 2016, 20 April 2016, 14 July 2016, 18 October 2016, 19 October 2016, 22 November 2016 and 13 December 2016.
In the meetings held on 14 April 2016 and 22 November 2016, a few Board members attended via video conferencing.
The meetings were coordinated by the Board secretary who was appointed as required by the applicable rules and regulations. The meetings were conducted with an agenda and proceedings were minuted. Management reports were reviewed during the meeting. All related issues were also discussed regarding the operations of the company.

ANNUAL REPORT 2016 17
Committees of the Board of Directors:
During the year, there were three committees of the Board which provided able support to the Board for carrying out its responsibilities. The Three committees and their main responsibilities are as follows:
Audit Committee
In line with the regulations issued by the Capital Market Authorities, the company has formed an Audit Committee. The Audit Committee approves the audit plan for the year, reviews the report of Auditors, issues guidance to management and oversees that operating management is adhering to company policies.
The Audit Committee comprised of four Non-executive members including three Independent Directors:
Name DesignationNo. of meetings
attended
Hamad Mohammad Al Wahaibi* Chairman 3
Lara Caroline Mahmoud-Hansen Member 4
Christian Raskin Member 3
Mohamed Al Lawati Member 4
Abdul Amir Saied Mohamed* Chairman 1
*For part of the year
During the year 2016, Audit Committee met and conducted four meetings on the following dates, 18 January 2016, 19 April 2016, 13 July 2016 and 17 October 2016.
The Committee has reviewed the internal audit reports, enterprise risk management report, draft whistleblowing policy, related party transactions, and new ERP system during the period. The Committee issued necessary guidance to the executive management. The Audit Committee reviewed the quarterly accounts before the same was put up to the Board of Directors for approval.
Strategic Management Committee
The Board has constituted “Strategic Management Committee” to develop and oversight the company’s strategic plan and to maintain a cooperative, interactive strategic planning process with management, including the identification and setting of strategic goals and expectations.
The following are the members of the Strategic Management Committee
Name DesignationNo. of meetings
attended
Christian Raskin Chairman 3
Fabio Ignazio Romeo Member 4
Mohamed Al Lawati* Member 3
Gert Hoefman Member 4
Manoj M. Vaidya Member 4
*For part of the year
During the year 2016, Strategic Management Committee conducted four meetings on the following dates, 18 January 2016, 19 April 2016, 13 July 2016 and 18 October 2016.
ANNUAL REPORT 201618
The Committee reviewed market studies on different market segments and new markets as presented by the management. The Committee discussed strategic plans for the company.
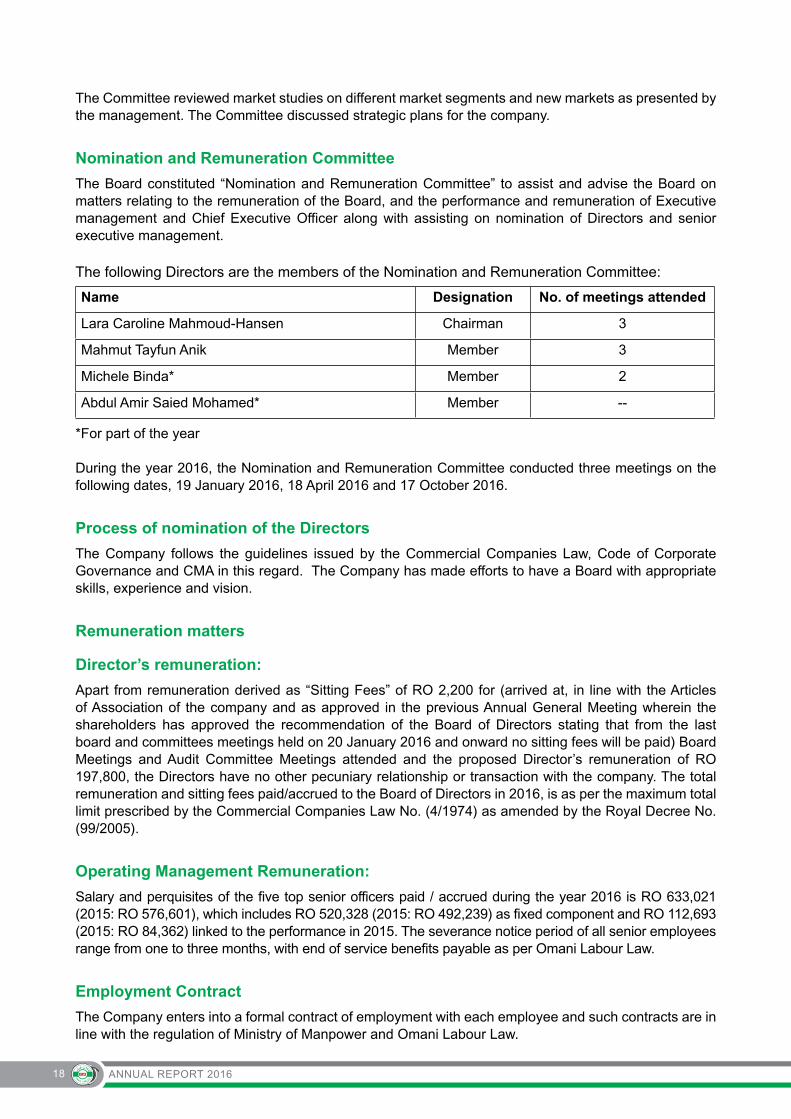
Nomination and Remuneration Committee
The Board constituted “Nomination and Remuneration Committee” to assist and advise the Board on matters relating to the remuneration of the Board, and the performance and remuneration of Executive management and Chief Executive Officer along with assisting on nomination of Directors and senior executive management.
The following Directors are the members of the Nomination and Remuneration Committee:
Name Designation No. of meetings attended
Lara Caroline Mahmoud-Hansen Chairman 3
Mahmut Tayfun Anik Member 3
Michele Binda* Member 2
Abdul Amir Saied Mohamed* Member --
*For part of the year
During the year 2016, the Nomination and Remuneration Committee conducted three meetings on the following dates, 19 January 2016, 18 April 2016 and 17 October 2016.
Process of nomination of the Directors
The Company follows the guidelines issued by the Commercial Companies Law, Code of Corporate Governance and CMA in this regard. The Company has made efforts to have a Board with appropriate skills, experience and vision.
Remuneration matters
Director’s remuneration:
Apart from remuneration derived as “Sitting Fees” of RO 2,200 for (arrived at, in line with the Articles of Association of the company and as approved in the previous Annual General Meeting wherein the shareholders has approved the recommendation of the Board of Directors stating that from the last board and committees meetings held on 20 January 2016 and onward no sitting fees will be paid) Board Meetings and Audit Committee Meetings attended and the proposed Director’s remuneration of RO 197,800, the Directors have no other pecuniary relationship or transaction with the company. The total remuneration and sitting fees paid/accrued to the Board of Directors in 2016, is as per the maximum total limit prescribed by the Commercial Companies Law No. (4/1974) as amended by the Royal Decree No. (99/2005).
Operating Management Remuneration:
Salary and perquisites of the five top senior officers paid / accrued during the year 2016 is RO 633,021 (2015: RO 576,601), which includes RO 520,328 (2015: RO 492,239) as fixed component and RO 112,693 (2015: RO 84,362) linked to the performance in 2015. The severance notice period of all senior employees range from one to three months, with end of service benefits payable as per Omani Labour Law.
Employment Contract
The Company enters into a formal contract of employment with each employee and such contracts are in line with the regulation of Ministry of Manpower and Omani Labour Law.

ANNUAL REPORT 2016 19
Details of non-compliance by the Company
There are no penalties imposed by Capital Market Authority or any other statutory authority; on the company regarding any matter, during the last three years.
Means of Communication with Share Holders and Investors
As required by Capital Market Authority, the Company publishes its quarterly, half yearly, three quarterly and yearly financial results in two local newspapers. The financial results are also uploaded on the website of Muscat Securities Market and on the company’s website www.omancables.com. Further the Company also includes a statement in each of these reports that shareholders can obtain further details, if required, from the company registered office and such details are made available to any shareholder who requests for it. Besides this the company, at the end of each year, sends to all the shareholders, financiers and others who are associated with the Company, the Annual Financial Statements by post.
The company has appropriate disclosure policy and adequate procedures are in place to ensure implementation and monitoring of compliance of the policy
In regard to the Annual audited accounts, after the Annual General Meeting’s approval, such financial statements are published in two local newspapers and submitted to Capital Market Authorities. This information is also posted on the Company’s website. All relevant major events impacting the company are conveyed to the Capital Market Authority.
The Annual Report contains a separate Management Discussion and Analysis report.
Market price data
During the period 2016 the share price of RO 0.100 face value moved in the range of high of RO 1.850 to a low of RO 1.450. The share price as on 29 December 2016 was RO 1.575.
2.050
1.800
1.550
1.300
1.050
0.800
8,000
7,000
6,000
5,000
4,000
IND
EX
RO
OCI SHARE PRICE V/S MSM 30 INDEX - 2016
Jan Feb Mar Apr May June July Aug Sep Oct Nov Dec
1.450 1.475 1.450 1.550 1.750 1.760 1.800 1.780 1.650 1.500 1.495 1.480
1.760 1.585 1.545 1.780 1.850 1.830 1.820 1.810 1.800 1.680 1.505 1.600
5,179 5,395 5,467 5,943 5,811 5,777 5,844 5,735 5,726 5,481 5,488 5,783
Low
High
Index
ANNUAL REPORT 201620
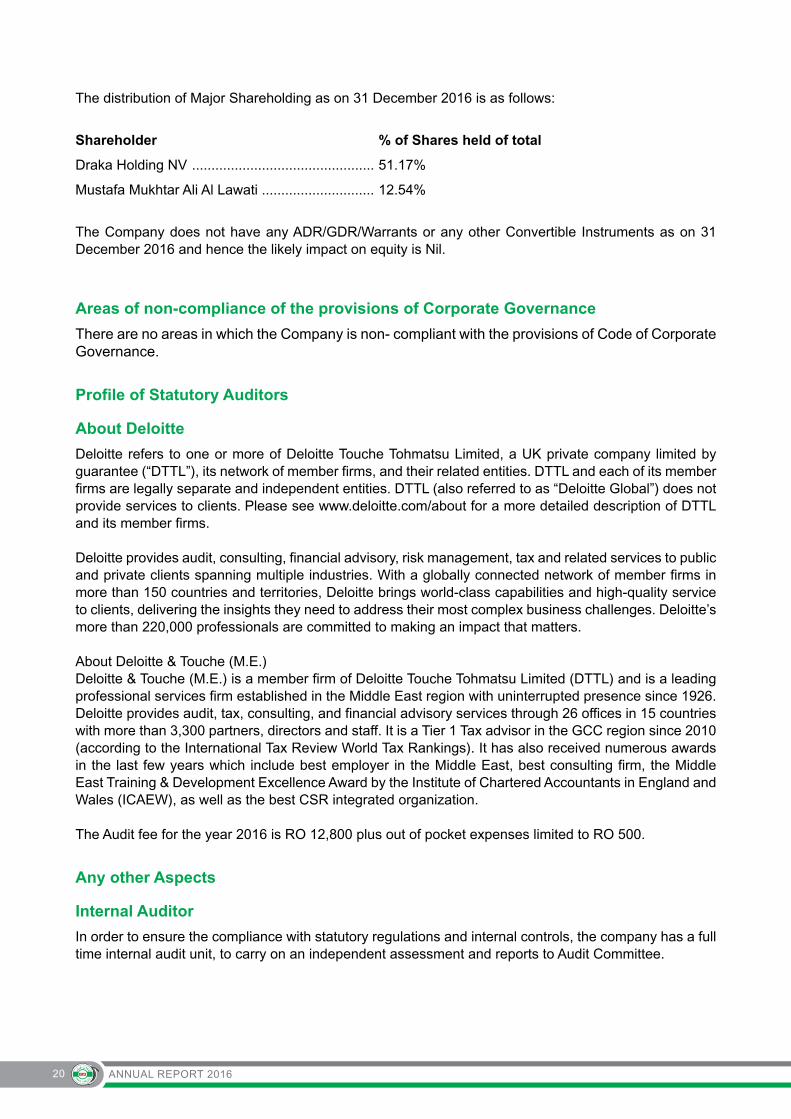
The distribution of Major Shareholding as on 31 December 2016 is as follows:
Shareholder % of Shares held of total
Draka Holding NV ............................................... 51.17%
Mustafa Mukhtar Ali Al Lawati ............................. 12.54%
The Company does not have any ADR/GDR/Warrants or any other Convertible Instruments as on 31 December 2016 and hence the likely impact on equity is Nil.
Areas of non-compliance of the provisions of Corporate Governance
There are no areas in which the Company is non- compliant with the provisions of Code of Corporate Governance.
Profile of Statutory Auditors
About Deloitte
Deloitte refers to one or more of Deloitte Touche Tohmatsu Limited, a UK private company limited by guarantee (“DTTL”), its network of member firms, and their related entities. DTTL and each of its member firms are legally separate and independent entities. DTTL (also referred to as “Deloitte Global”) does not provide services to clients. Please see www.deloitte.com/about for a more detailed description of DTTL and its member firms.
Deloitte provides audit, consulting, financial advisory, risk management, tax and related services to public and private clients spanning multiple industries. With a globally connected network of member firms in more than 150 countries and territories, Deloitte brings world-class capabilities and high-quality service to clients, delivering the insights they need to address their most complex business challenges. Deloitte’s more than 220,000 professionals are committed to making an impact that matters. About Deloitte & Touche (M.E.)Deloitte & Touche (M.E.) is a member firm of Deloitte Touche Tohmatsu Limited (DTTL) and is a leading professional services firm established in the Middle East region with uninterrupted presence since 1926.Deloitte provides audit, tax, consulting, and financial advisory services through 26 offices in 15 countries with more than 3,300 partners, directors and staff. It is a Tier 1 Tax advisor in the GCC region since 2010 (according to the International Tax Review World Tax Rankings). It has also received numerous awards in the last few years which include best employer in the Middle East, best consulting firm, the Middle East Training & Development Excellence Award by the Institute of Chartered Accountants in England and Wales (ICAEW), as well as the best CSR integrated organization.
The Audit fee for the year 2016 is RO 12,800 plus out of pocket expenses limited to RO 500.
Any other Aspects
Internal Auditor
In order to ensure the compliance with statutory regulations and internal controls, the company has a full time internal audit unit, to carry on an independent assessment and reports to Audit Committee.
ANNUAL REPORT 2016 21
Board of Directors Acknowledge that:
The company has all its systems and procedures formally documented and in place. The company has “Internal Regulations” separately compiled as per regulatory requirements. The Board of Directors have reviewed this manual and approved it. The “Internal Regulations” has all the necessary and prescribed procedures. The Board has reviewed these regulations. The Board of Directors ensures that the financial statements have been prepared in accordance with International Financial Reporting Standards (IFRS) issued by the International Accounting Standards Board (IASB), interpretations issued by the International Financial Reporting Interpretations Committee (IFRIC) and the requirements of the Commercial Companies Law of the Sultanate of Oman 1974 (as amended) and the rules for disclosure requirements prescribed by the Capital Market Authority.
There are no material events affecting the continuation of the Company and its ability to continue its operations during the next financial year.
Mr. Fabio Romeo Mr. Gert Hoefman
Chairman Chief Executive OfficerOman Cables Industry (SAOG) Oman Cables Industry (SAOG)
(Arabic version prevails over the English)


ANNUAL REPORT 201628
Consolidated statement of financial position at 31 December 2016Group Parent
Company Group Parent Company
2016 2016 2015 2015
Notes RO RO RO RO
ASSETS
Non-current assets
Property, plant and equipment 5 37,591,311 24,720,997 38,782,905 25,431,153
Investment in a subsidiary 6 - 2,226,660 - 2,226,660
Investment in an associate 7 567,690 567,690 553,063 553,063
Available-for-sale investments 8 230,017 230,017 119,067 119,067
Held-to-maturity investments 9 1,000,000 1,000,000 - -
Total non-current assets 39,389,018 28,745,364 39,455,035 28,329,943
Current assets
Held-to-maturity investments 9 - - 1,251,204 1,251,204
Inventories 10 28,683,750 25,271,518 37,809,072 34,266,331
Trade and other receivables 11 65,346,287 59,953,916 72,146,321 64,510,379
Due from related parties 33 174,858 174,140 396,898 396,898
Cash and bank balances 12 6,601,232 6,231,852 2,485,416 2,193,260
Total current assets 100,806,127 91,631,426 114,088,911 102,618,072
Total assets 140,195,145 120,376,790 153,543,946 130,948,015
EQUITY AND LIABILITIES
Capital and reserves
Share capital 13 8,970,000 8,970,000 8,970,000 8,970,000
Share premium 14 977,500 977,500 977,500 977,500
Legal reserve 15 4,445,333 2,990,000 4,445,333 2,990,000
General reserve 16 10,992,357 10,992,357 9,452,910 9,452,910
Retained earnings 70,200,489 68,396,603 64,559,196 62,614,579
Cumulative changes in fair values 18 1,132,075 1,132,053 (1,204,133) (1,331,125)
Equity attributable to equity holdersof the parent 96,717,754 93,458,513 87,200,806 83,673,864
Non-controlling interests 5,281,777 - 5,537,252 -
Total equity 101,999,531 93,458,513 92,738,058 83,673,864
Non-current liabilities
Term loan 19 - - 1,625,116 -
Deferred tax liability 20 1,089,271 711,645 1,107,160 710,338
Employee’s end of service benefits 21 1,435,596 1,316,441 1,558,729 1,456,252
Total non-current liabilities 2,524,867 2,028,086 4,291,005 2,166,590
Current liabilities
Trade and other payables 22 22,259,161 18,597,754 19,042,528 12,958,847
Due to related parties 33 - 813,373 197,126 848,797
Bank borrowings 23 9,619,910 3,500,000 33,138,118 29,096,668
Current maturities of term loans 19 1,625,116 - 1,625,120 -
Taxation 20 2,166,560 1,979,064 2,511,991 2,203,249
Total current liabilities 35,670,747 24,890,191 56,514,883 45,107,561
Total liabilities 38,195,614 26,918,277 60,805,888 47,274,151
Total equity and liabilities 140,195,145 120,376,790 153,543,946 130,948,015
Net assets per share 31 1.078 1.042 0.972 0.933
The consolidated financial statements were authorized for issue in accordance with a resolution of the directors on 25 January 2017.
______________________________________ _____________________________________ Chairman Chief Executive Officer
The accompanying notes form an integral part of these consolidated financial statements
ANNUAL REPORT 2016 29
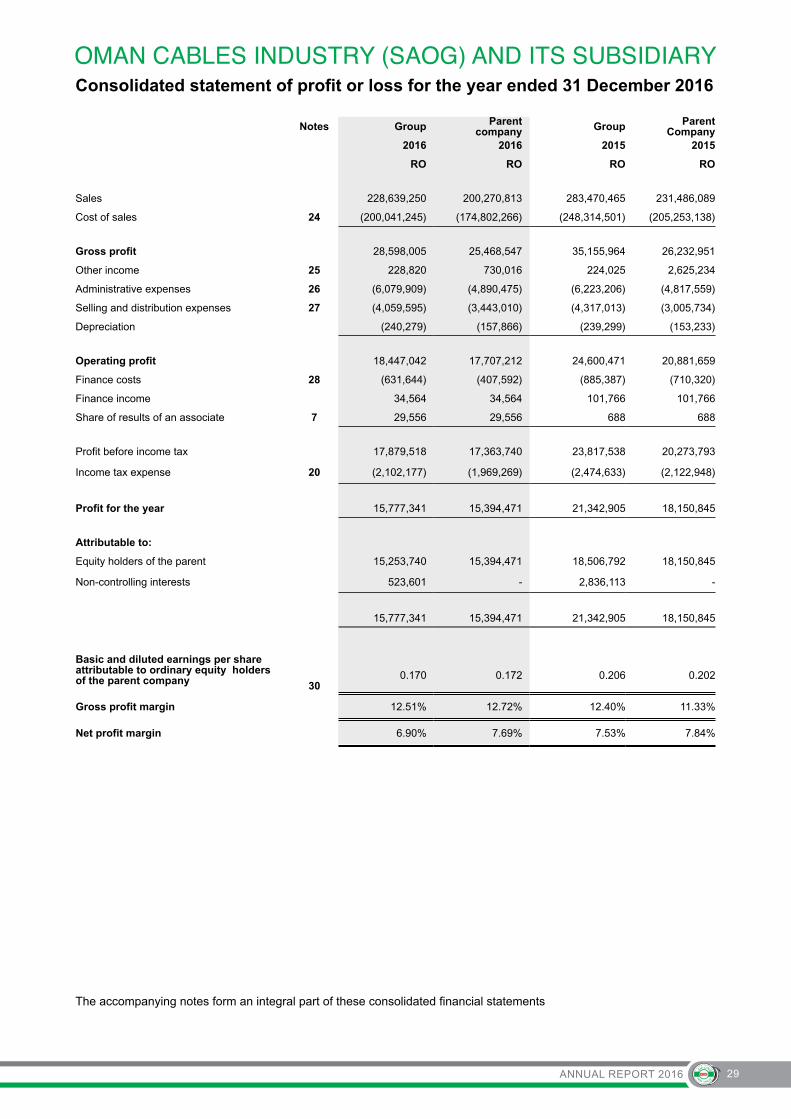
Consolidated statement of profit or loss for the year ended 31 December 2016
Notes Group Parentcompany Group Parent
Company2016 2016 2015 2015
RO RO RO RO
Sales 228,639,250 200,270,813 283,470,465 231,486,089
Cost of sales 24 (200,041,245) (174,802,266) (248,314,501) (205,253,138)
Gross profit 28,598,005 25,468,547 35,155,964 26,232,951
Other income 25 228,820 730,016 224,025 2,625,234
Administrative expenses 26 (6,079,909) (4,890,475) (6,223,206) (4,817,559)
Selling and distribution expenses 27 (4,059,595) (3,443,010) (4,317,013) (3,005,734)
Depreciation (240,279) (157,866) (239,299) (153,233)
Operating profit 18,447,042 17,707,212 24,600,471 20,881,659
Finance costs 28 (631,644) (407,592) (885,387) (710,320)
Finance income 34,564 34,564 101,766 101,766
Share of results of an associate 7 29,556 29,556 688 688
Profit before income tax 17,879,518 17,363,740 23,817,538 20,273,793
Income tax expense 20 (2,102,177) (1,969,269) (2,474,633) (2,122,948)
Profit for the year 15,777,341 15,394,471 21,342,905 18,150,845
Attributable to:
Equity holders of the parent 15,253,740 15,394,471 18,506,792 18,150,845
Non-controlling interests 523,601 - 2,836,113 -
15,777,341 15,394,471 21,342,905 18,150,845
Basic and diluted earnings per share attributable to ordinary equity holders of the parent company 30
0.170 0.172
0.206 0.202
Gross profit margin 12.51% 12.72% 12.40% 11.33%
Net profit margin 6.90% 7.69% 7.53% 7.84%
The accompanying notes form an integral part of these consolidated financial statements

ANNUAL REPORT 201630
Consolidated statement of profit or loss and other comprehensive income for the year ended 31 December 2016
Notes Group Parent Company
Group Parent Company
2016 2016 2015 2015
RO RO RO RO
Profit for the year 15,777,341 15,394,471 21,342,905 18,150,845
Other comprehensive (expense) / income
Items that may be reclassified subsequently to profit or loss:
Net movement in hedging commodity future contracts 2,229,146 2,478,107 (1,503,292 ) (880,364 )
Net movement in available-for-sale investments- - (3,547) (3,547)
Exchange difference on foreign currency translation of associate
7 (14,929) (14,929) (23,784) (23,784)
Other comprehensive income / (expense) for the year
2,214,217 2,463,178(1,530,623 ) (907,695 )
Total comprehensive income for the year 17,991,558 17,857,64919,812,282 17,243,150
Attributable to:
Equity holders of the parent 17,589,948 17,857,649 17,281,404 17,243,150
Non-controlling interests 401,610 - 2,530,878 -
17,991,558 17,857,649 19,812,282 17,243,150
The accompanying notes form an integral part of these consolidated financial statements

ANNUAL REPORT 2016 31
Co
nso
lidat
ed s
tate
men
t o
f ch
ang
es in
eq
uit
y fo
r th
e ye
ar e
nd
ed 3
1 D
ecem
ber
201
6
Att
rib
uta
ble
to
th
e eq
uit
y h
old
ers
of
the
Par
ent
Co
mp
any
Gro
up
Sh
are
cap
ital
Sh
are
pre
miu
mL
egal
re
serv
eG
ener
al
rese
rve
Ret
ain
ed
earn
ing
s
Cu
mu
lati
ve
chan
ges
in
fair
val
ues
Tota
l
No
n-
con
tro
llin
g
inte
rest
sTo
tal
RO
RO
RO
RO
RO
RO
RO
RO
RO
Bal
ance
at 1
Jan
uary
201
58,
970,
000
977,
500
4,00
9,76
47,
637,
825
56,3
76,0
5821
,255
77,9
92,4
025,
505,
374
83,4
97,7
76
Pro
fit fo
r th
e ye
ar-
--
-18
,506
,792
-18
,506
,792
2,83
6,11
321
,342
,905
Oth
er c
ompr
ehen
sive
exp
ense
--
--
-(1
,225
,388
)(1
,225
,388
)(3
05,2
35)
(1,5
30,6
23)
Tota
l com
preh
ensi
ve in
com
e-
--
-18
,506
,792
(1,2
25,3
88)
17,2
81,4
042,
530,
878
19,8
12,2
82
Div
iden
d fo
r th
e ye
ar 2
014
(not
e 17
)-
--
- (
8,07
3,00
0)-
(8,
073,
000)
(2,
499,
000)
(10
,572
,000
)
Tra
nsfe
r to
leg
al a
nd g
ener
al
rese
rve
-
-43
5,56
91,
815,
085
(2,2
50,6
54)
--
--
Bal
ance
at 1
Jan
uary
201
68,
970,
000
977,
500
4,44
5,33
39,
452,
910
64,5
59,1
96(1
,204
,133
)87
,200
,806
5,53
7,25
292
,738
,058
Pro
fit fo
r th
e ye
ar-
--
-15
,253
,740
-15
,253
,740
523,
601
15,7
77,3
41
Oth
er c
ompr
ehen
sive
inco
me
--
--
-2,
336,
208
2,3
36,2
08(1
21,9
91)
2,21
4,21
7
Tota
l com
preh
ensi
ve in
com
e-
--
-15
,253
,740
2,33
6,20
817
,589
,948
401,
610
17,9
91,5
58
Div
iden
d fo
r th
e ye
ar 2
015
(not
e 17
)-
--
-(8
,073
,000
)-
(8,0
73,0
00)
(657
,085
)(8
,730
,085
)
Tra
nsfe
r to
leg
al a
nd g
ener
al
rese
rve
-
--
1,53
9,44
7(1
,539
,447
)-
--
-
Bal
ance
at
31 D
ecem
ber
201
68,
970,
000
977,
500
4,44
5,33
310
,992
,357
70,2
00,4
891,
132,
075
96,7
17,7
545,
281,
777
101,
999,
531
The
acc
ompa
nyin
g no
tes
form
an
inte
gral
par
t of t
hese
con
solid
ated
fina
ncia
l sta
tem
ents
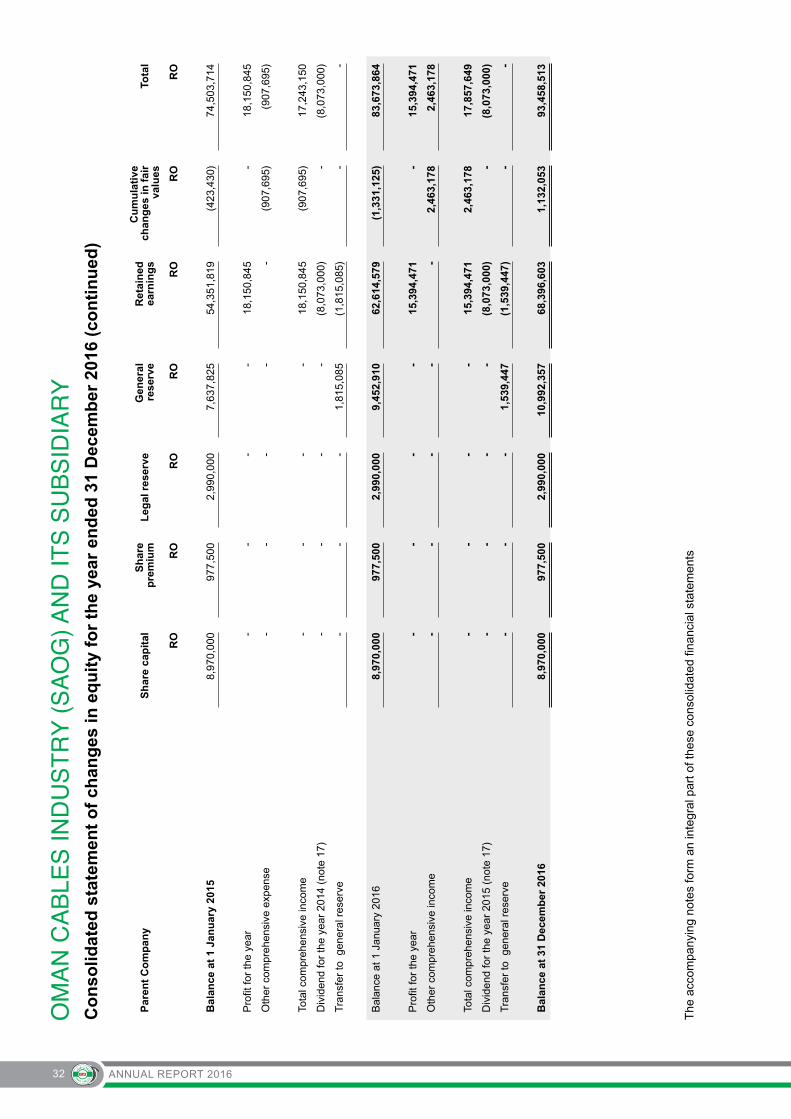
ANNUAL REPORT 201632
Co
nso
lidat
ed s
tate
men
t o
f ch
ang
es in
eq
uit
y fo
r th
e ye
ar e
nd
ed 3
1 D
ecem
ber
201
6 (c
on
tin
ued
)
Par
ent
Co
mp
any
Sh
are
cap
ital
Sh
are
pre
miu
mL
egal
res
erve
Gen
eral
re
serv
eR
etai
ned
ea
rnin
gs
Cu
mu
lati
ve
chan
ges
in f
air
valu
esTo
tal
RO
RO
RO
RO
RO
RO
RO
Bal
ance
at
1 Ja
nu
ary
2015
8,97
0,00
097
7,50
02,
990,
000
7,63
7,82
554
,351
,819
(423
,430
)74
,503
,714
Pro
fit fo
r th
e ye
ar-
--
-18
,150
,845
-18
,150
,845
Oth
er c
ompr
ehen
sive
exp
ense
--
--
-(9
07,6
95)
(907
,695
)
Tota
l com
preh
ensi
ve in
com
e-
--
-18
,150
,845
(907
,695
)17
,243
,150
Div
iden
d fo
r th
e ye
ar 2
014
(not
e 17
)-
--
-(8
,073
,000
)-
(8,0
73,0
00)
Tra
nsfe
r to
gen
eral
res
erve
-
--
1,81
5,08
5(1
,815
,085
)-
-
Bal
ance
at 1
Jan
uary
201
68,
970,
000
977,
500
2,99
0,00
09,
452,
910
62,6
14,5
79(1
,331
,125
)83
,673
,864
Pro
fit fo
r th
e ye
ar-
--
-15
,394
,471
-15
,394
,471
Oth
er c
ompr
ehen
sive
inco
me
--
--
-2,
463,
178
2,46
3,17
8
Tota
l com
preh
ensi
ve in
com
e-
--
-15
,394
,471
2,46
3,17
817
,857
,649
Div
iden
d fo
r th
e ye
ar 2
015
(not
e 17
)-
--
-(8
,073
,000
)-
(8,0
73,0
00)
Tra
nsfe
r to
gen
eral
res
erve
-
--
1,53
9,44
7(1
,539
,447
)-
-
Bal
ance
at
31 D
ecem
ber
201
68,
970,
000
977,
500
2,99
0,00
010
,992
,357
68,3
96,6
031,
132,
053
93,4
58,5
13
The
acc
ompa
nyin
g no
tes
form
an
inte
gral
par
t of t
hese
con
solid
ated
fina
ncia
l sta
tem
ents
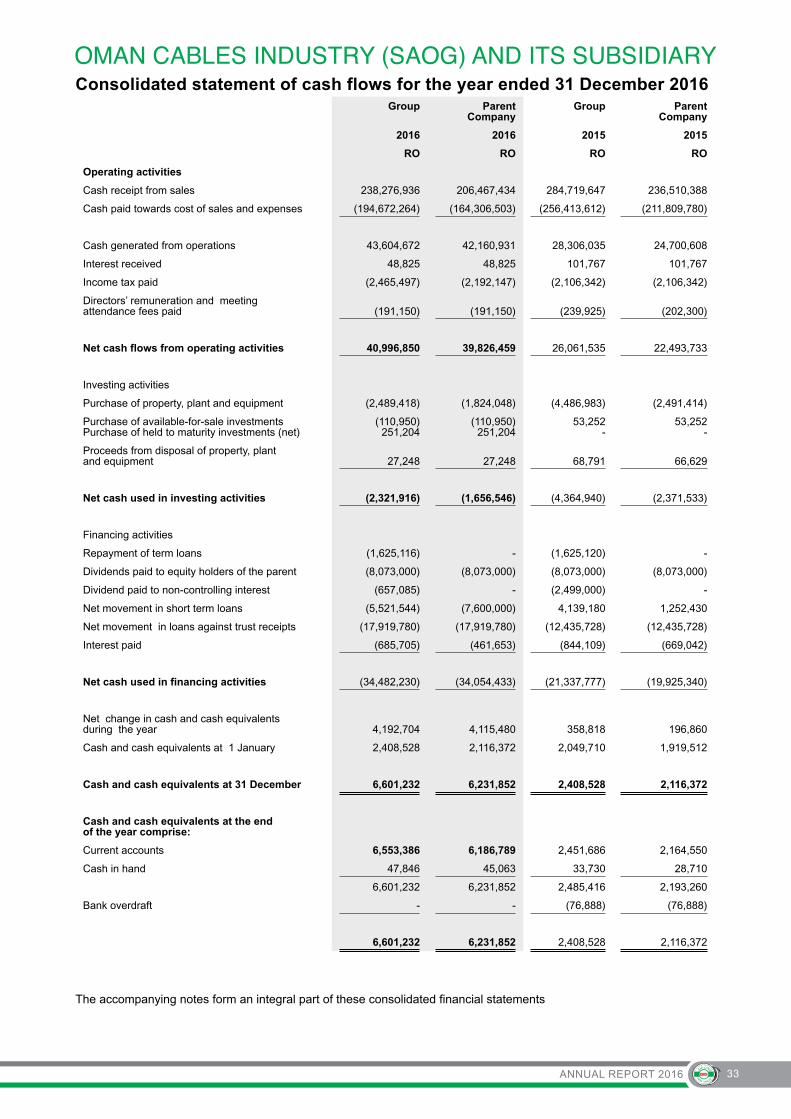
ANNUAL REPORT 2016 33
Consolidated statement of cash flows for the year ended 31 December 2016Group Parent
CompanyGroup Parent
Company
2016 2016 2015 2015
RO RO RO RO
Operating activities
Cash receipt from sales 238,276,936 206,467,434 284,719,647 236,510,388
Cash paid towards cost of sales and expenses (194,672,264) (164,306,503) (256,413,612) (211,809,780)
Cash generated from operations 43,604,672 42,160,931 28,306,035 24,700,608
Interest received 48,825 48,825 101,767 101,767
Income tax paid (2,465,497) (2,192,147) (2,106,342) (2,106,342)
Directors’ remuneration and meeting attendance fees paid (191,150) (191,150) (239,925) (202,300)
Net cash flows from operating activities 40,996,850 39,826,459 26,061,535 22,493,733
Investing activities
Purchase of property, plant and equipment (2,489,418) (1,824,048) (4,486,983) (2,491,414)
Purchase of available-for-sale investmentsPurchase of held to maturity investments (net)
(110,950)251,204
(110,950)251,204
53,252-
53,252-
Proceeds from disposal of property, plant and equipment 27,248 27,248 68,791 66,629
Net cash used in investing activities (2,321,916) (1,656,546) (4,364,940) (2,371,533)
Financing activities
Repayment of term loans (1,625,116) - (1,625,120) -
Dividends paid to equity holders of the parent (8,073,000) (8,073,000) (8,073,000) (8,073,000)
Dividend paid to non-controlling interest (657,085) - (2,499,000) -
Net movement in short term loans (5,521,544) (7,600,000) 4,139,180 1,252,430
Net movement in loans against trust receipts (17,919,780) (17,919,780) (12,435,728) (12,435,728)
Interest paid (685,705) (461,653) (844,109) (669,042)
Net cash used in financing activities (34,482,230) (34,054,433) (21,337,777) (19,925,340)
Net change in cash and cash equivalents during the year 4,192,704 4,115,480 358,818 196,860
Cash and cash equivalents at 1 January 2,408,528 2,116,372 2,049,710 1,919,512
Cash and cash equivalents at 31 December 6,601,232 6,231,852 2,408,528 2,116,372
Cash and cash equivalents at the end of the year comprise:
Current accounts 6,553,386 6,186,789 2,451,686 2,164,550
Cash in hand 47,846 45,063 33,730 28,710
6,601,232 6,231,852 2,485,416 2,193,260
Bank overdraft - - (76,888) (76,888)
6,601,232 6,231,852 2,408,528 2,116,372
The accompanying notes form an integral part of these consolidated financial statements
ANNUAL REPORT 201634
Notes to the consolidated financial statements at 31 December 2016
1. Legal status and principal activities
Oman Cables Industry SAOG (“the Company” or “the Parent Company”) is registered in the Sultanate of Oman as a public joint stock company. The company’s principal activity is the manufacture and sale of electrical cables and conductors.
The Company holds 51% shareholding in Oman Aluminium Processing Industries LLC (“the subsidiary”) which was incorporated in the Sultanate of Oman in the year 2008 and commenced its operations from July 2010.
2. Adoption of new and revised International Financial Reporting Standards (IFRS)
2.1 New and revised IFRSs applied with no material effect on the financial statements
The following new and revised IFRSs, which became effective for annual periods beginning on or after 1 January 2016, have been adopted in these financial statements. The application of these revised IFRSs has not had any material impact on the amounts reported for the current and prior years but may affect the accounting for future transactions or arrangements.
• IFRS 14 Regulatory Deferral Accounts
• Amendments to IAS 1 Presentation of Financial Statements relating to Disclosure initiative
• Amendments to IFRS 11 Joint arrangements relating to accounting for acquisitions of interests in joint operations
• Amendments to IAS 16 Property, Plant and Equipment and IAS 38 Intangible Assets relating to clarification of acceptable methods of depreciation and amortisation
• Amendments to IAS 27 Separate Financial Statements relating to accounting investments in subsidiaries, joint ventures and associates to be optionally accounted for using the equity method in separate financial statements
• Amendments to IFRS 10 Consolidated Financial Statements, IFRS 12 Disclosure of Interests in Other Entities and IAS 28 Investment in Associates and Joint Ventures relating to applying the consolidation exception for investment entities
• Annual Improvements to IFRSs 2012 – 2014 Cycle covering amendments to IFRS 5, IFRS 7, IAS 19 and IAS 34

ANNUAL REPORT 2016 35
Notes to the consolidated financial statements at 31 December 2016 (continued)
2.2 New and revised IFRS in issue but not yet effective
The Company has not yet applied the following new and revised IFRSs that have been issued but are not yet effective:
New and revised IFRSs Effective for annual periods beginning on or after
Annual Improvements to IFRS Standards 2014 – 2016 Cycle amending IFRS 1, IFRS 12 and IAS 28
The amendments to IFRS 1 and IAS 28 are effective for annual periods beginning on or after 1 January 2018, the amendment to IFRS 12 for annual periods beginning on or after 1 January 2017
Amendments to IAS 12 Income Taxes relating to the recognition of deferred tax assets for unrealised losses
1 January 2017
Amendments to IAS 7 Statement of Cash Flows to provide disclosures that enable users of financial statements to evaluate changes in liabilities arising from financing activities.
1 January 2017
IFRIC 22 Foreign Currency Transactions and Advance ConsiderationThe interpretation addresses foreign currency transactions or parts of transactions where:
• there is consideration that is denominated or priced in a foreign currency;
• the entity recognises a prepayment asset or a deferred income liability in respect of that consideration, in advance of the recognition of the related asset, expense or income; and
• the prepayment asset or deferred income liability is non-monetary.
1 January 2018
Amendments to IFRS 2 Share Based Payment regarding classification and measurement of share based payment transactions
1 January 2018
Amendments to IFRS 4 Insurance Contracts: Relating to the different effective dates of IFRS 9 and the forthcoming new insurance contracts standard.
1 January 2018
Amendments to IAS 40 Investment Property: Amends paragraph 57 to state that an entity shall transfer a property to, or from, investment property when, and only when, there is evidence of a change in use. A change of use occurs if property meets, or ceases to meet, the definition of investment property. A change in management’s intentions for the use of a property by itself does not constitute evidence of a change in use.
1 January 2018

ANNUAL REPORT 201636
Notes to the consolidated financial statements at 31 December 2016 (continued)
2.2 New and revised IFRS in issue but not yet effective (continued)
Amendments to IFRS 7 Financial Instruments: Disclosures relating to disclosures about the initial application of IFRS 9
When IFRS 9 is first applied
IFRS 7 Financial Instruments: Disclosures relating to the additional hedge accounting disclosures (and consequential amendments) resulting from the introduction of the hedge accounting chapter in IFRS 9
When IFRS 9 is first applied
IFRS 9 Financial Instruments (revised versions in 2009, 2010, 2013 and 2014)
IFRS 9 issued in November 2009 introduced new requirements for the classification and measurement of financial assets. IFRS 9 was subsequently amended in October 2010 to include requirements for the classification and measurement of financial liabilities and for derecognition, and in November 2013 to include the new requirements for general hedge accounting. Another revised version of IFRS 9 was issued in July 2014 mainly to include a) impairment requirements for financial assets and b) limited amendments to the classification and measurement requirements by introducing a ‘fair value through other comprehensive income’ (FVTOCI) measurement category for certain simple debt instruments.
A finalised version of IFRS 9 which contains accounting requirements for financial instruments, replacing IAS 39 Financial Instruments: Recognition and Measurement. The standard contains requirements in the following areas:
• Classification and measurement: Financial assets are classified by reference to the business model within which they are held and their contractual cash flow characteristics. The 2014 version of IFRS 9 introduces a ‘fair value through other comprehensive income’ category for certain debt instruments. Financial liabilities are classified in a similar manner to under IAS 39, however there are differences in the requirements applying to the measurement of an entity’s own credit risk.
• Impairment: The 2014 version of IFRS 9 introduces an ‘expected credit loss’ model for the measurement of the impairment of financial assets, so it is no longer necessary for a credit event to have occurred before a credit loss is recognised
• Hedge accounting: Introduces a new hedge accounting model that is designed to be more closely aligned with how entities undertake risk management activities when hedging financial and non-financial risk exposures.
• Derecognition: The requirements for the derecognition of financial assets and liabilities are carried forward from IAS 39.
1 January 2018

ANNUAL REPORT 2016 37
Notes to the consolidated financial statements at 31 December 2016 (continued)
2.2 New and revised IFRS in issue but not yet effective (continued)
IFRS 15 Revenue from Contracts with Customers
In May 2014, IFRS 15 was issued which established a single comprehensive model for entities to use in accounting for revenue arising from contracts with customers. IFRS 15 will supersede the current revenue recognition guidance including IAS 18 Revenue, IAS 11 Construction Contracts and the related interpretations when it becomes effective.
The core principle of IFRS 15 is that an entity should recognize revenue to depict the transfer of promised goods or services to customers in an amount that reflects the consideration to which the entity expects to be entitled in exchange for those goods or services. Specifically, the standard introduces a 5-step approach to revenue recognition:
• Step 1: Identify the contract(s) with a customer.
• Step 2: Identify the performance obligations in the contract.
• Step 3: Determine the transaction price.
• Step 4: Allocate the transaction price to the performance obligations in the contract.
• Step 5: Recognise revenue when (or as) the entity satisfies a performance obligation.
Under IFRS 15, an entity recognises when (or as) a performance obligation is satisfied, i.e. when ‘control’ of the goods or services underlying the particular performance obligation is transferred to the customer. Far more prescriptive guidance has been added in IFRS 15 to deal with specific scenarios. Furthermore, extensive disclosures are required by IFRS 15.
1 January 2018
Amendments to IFRS 15 Revenue from Contracts with Customers to clarify three aspects of the standard (identifying performance obligations, principal versus agent considerations, and licensing) and to provide some transition relief for modified contracts and completed contracts.
1 January 2018
IFRS 16 Leases
IFRS 16 specifies how an IFRS reporter will recognise, measure, present and disclose leases. The standard provides a single lessee accounting model, requiring lessees to recognise assets and liabilities for all leases unless the lease term is 12 months or less or the underlying asset has a low value. Lessors continue to classify leases as operating or finance, with IFRS 16’s approach to lessor accounting substantially unchanged from its predecessor, IAS 17.
1 January 2019
Amendments to IFRS 10 Consolidated Financial Statements and IAS 28 Investments in Associates and Joint Ventures (2011) relating to the treatment of the sale or contribution of assets from an investor to its associate or joint venture.
Effective date deferred indefinitely

ANNUAL REPORT 201638
Notes to the consolidated financial statements at 31 December 2016 (continued)
2. Adoption of new and revised International Financial Reporting Standards (IFRS) (continued)
The Directors anticipate that these new standards, interpretations and amendments will be adopted in the Company’s financial statements as and when they are applicable and adoption of these new standards, interpretations and amendments, except for IFRS 9, IFRS 15 and IFRS 16, may have no material impact on the financial statements of the Company in the period of initial application.
The Directors anticipate that IFRS 15 and IFRS 9 will be adopted in the Company’s financial statements for the annual period beginning 1 January 2018 and that IFRS 16 will be adopted in the Company’s financial statements for the annual period beginning 1 January 2019. The application of IFRS 15 and IFRS 9 may have significant impact on amounts reported and disclosures made in the Company’s financial statements in respect of revenue from contracts with customers and the Company’s financial assets and financial liabilities and the application of IFRS 16 may have significant impact on amounts reported and disclosures made in the Company’s financial statements in respect of its leases.
However, it is not practicable to provide a reasonable estimate of effects of the application of these standards until the Company performs a detailed review.
3. Summary of significant accounting policies
Statement of compliance
The consolidated financial statements have been prepared in accordance with International Financial Reporting Standards (“IFRS”) as promulgated by the International Accounting Standards Board (IASB) and the interpretations issued by the International Financial Reporting Interpretations Committee (IFRIC) of the IASB. The consolidated financial statements comply with the relevant disclosure requirements of the Commercial Companies Law of 1974, as amended and the disclosure requirements issued by the Capital Market Authority.
Basis of preparation
These consolidated financial statements have been prepared on the historical cost basis except for derivative financial instruments and available-for-sale financial assets that have been measured at fair value.
Basis of consolidation
The consolidated financial statements comprise those of Oman Cables Industry SAOG and it’s subsidiary as at 31 December each year. Subsidiaries are all entities (including special purpose entities) over which the Group exercises control. Control is achieved when the Company:
• has power over the investee;
• is exposed, or has rights, to variable returns from its involvement with the investee; and
• has the ability to use its power to affect its returns.
The Company reassesses whether or not it controls an investee if facts and circumstances indicate that there are changes to one or more of the three elements of control listed above.
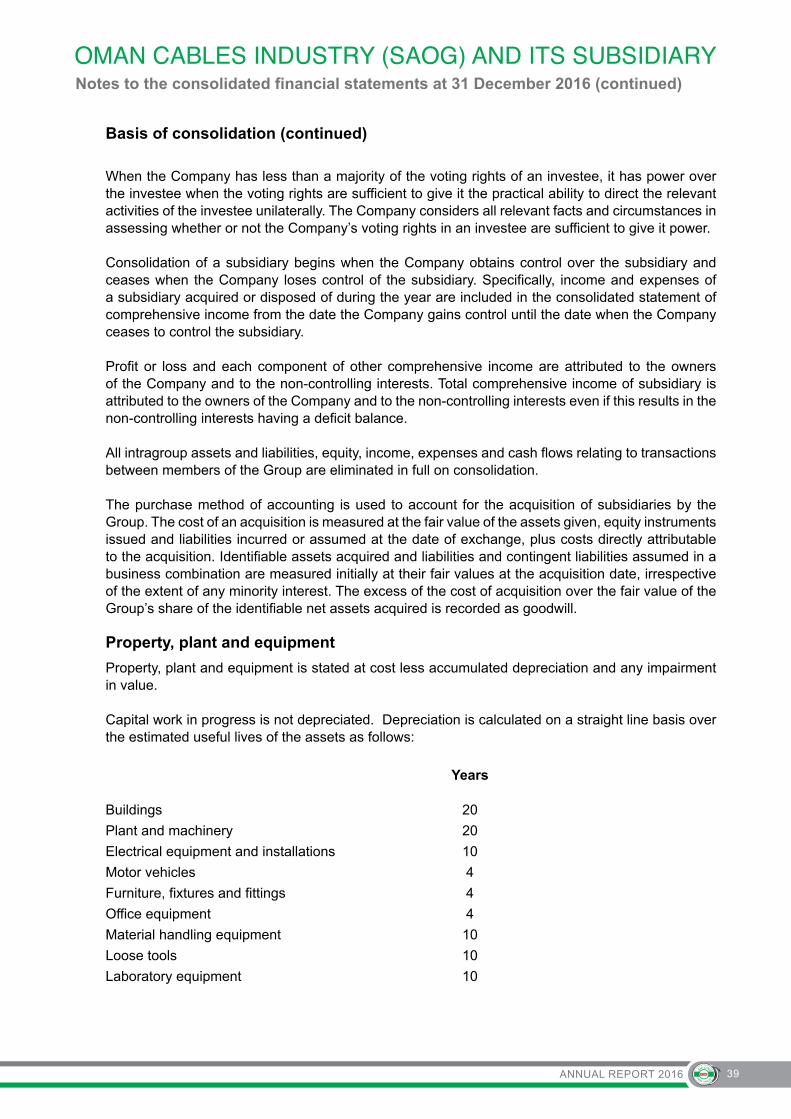
ANNUAL REPORT 2016 39
Notes to the consolidated financial statements at 31 December 2016 (continued)
Basis of consolidation (continued)
When the Company has less than a majority of the voting rights of an investee, it has power over the investee when the voting rights are sufficient to give it the practical ability to direct the relevant activities of the investee unilaterally. The Company considers all relevant facts and circumstances in assessing whether or not the Company’s voting rights in an investee are sufficient to give it power.
Consolidation of a subsidiary begins when the Company obtains control over the subsidiary and ceases when the Company loses control of the subsidiary. Specifically, income and expenses of a subsidiary acquired or disposed of during the year are included in the consolidated statement of comprehensive income from the date the Company gains control until the date when the Company ceases to control the subsidiary.
Profit or loss and each component of other comprehensive income are attributed to the owners of the Company and to the non-controlling interests. Total comprehensive income of subsidiary is attributed to the owners of the Company and to the non-controlling interests even if this results in the non-controlling interests having a deficit balance.
All intragroup assets and liabilities, equity, income, expenses and cash flows relating to transactions between members of the Group are eliminated in full on consolidation.
The purchase method of accounting is used to account for the acquisition of subsidiaries by the Group. The cost of an acquisition is measured at the fair value of the assets given, equity instruments issued and liabilities incurred or assumed at the date of exchange, plus costs directly attributable to the acquisition. Identifiable assets acquired and liabilities and contingent liabilities assumed in a business combination are measured initially at their fair values at the acquisition date, irrespective of the extent of any minority interest. The excess of the cost of acquisition over the fair value of the Group’s share of the identifiable net assets acquired is recorded as goodwill.
Property, plant and equipment
Property, plant and equipment is stated at cost less accumulated depreciation and any impairment in value.
Capital work in progress is not depreciated. Depreciation is calculated on a straight line basis over the estimated useful lives of the assets as follows:
Years
Buildings 20
Plant and machinery 20
Electrical equipment and installations 10
Motor vehicles 4
Furniture, fixtures and fittings 4
Office equipment 4
Material handling equipment 10
Loose tools 10
Laboratory equipment 10
ANNUAL REPORT 201640
Notes to the consolidated financial statements at 31 December 2016 (continued)
Property, plant and equipment (continued)
The carrying values of property, plant and equipment are reviewed for impairment when events or changes in circumstances indicate the carrying value may not be recoverable. If any such indication exists and where the carrying values exceed the estimated recoverable amount, the assets are written down to their recoverable amount, being the higher of their fair value less costs to sell and their value in use.
Expenditure incurred to replace a component of an item of property, plant and equipment that is accounted for separately is capitalised and the carrying amount of the component that is replaced is written off. Other subsequent expenditure is capitalised only when it increases future economic benefits of the related item of property, plant and equipment. All other expenditure is recognised in the statement of profit or loss as the expense is incurred.
An item of property, plant and equipment is derecognised upon disposal or when no future economic benefits are expected from its use or disposal. Any gain or loss arising on de-recognition of the asset (calculated as the difference between the net disposal proceeds and the carrying amount of the asset) is included in the statement of profit or loss in the year the asset is derecognised.
The asset’s residual values, useful lives and methods of depreciation are reviewed, and adjusted if appropriate, at each financial year end.
Derivative financial instruments and hedge accounting
The Group uses derivative financial instruments such as forward currency contracts and forward commodity contracts to hedge its foreign currency risks and commodity price risks, respectively. At the inception of the hedge relationship, the entity documents the relationship between the hedging instrument and the hedged item, along with its risk management objectives and its strategy for undertaking various hedge transactions.
Cash flow HedgesThe derivative financial instruments, which qualify for hedge accounting and meet the criteria for cash flow hedge are initially recognized at cost and are subsequently stated at fair market value. The effective portion of the gain or loss on the hedging instrument is recognized directly as other comprehensive income in the cumulative changes in fair value reserve, while any ineffective position is recognized immediately in the statement of profit or loss. Subsequently the gains or losses recognized as other comprehensive income are transferred to the cost of inventories in the statement of profit or loss. Hedge accounting is discontinued when the Group revokes the hedging relationship, when the hedging instrument expires or is sold, terminated, or exercised, or when it no longer qualifies for hedge accounting. Any gain or loss recognised in other comprehensive income and accumulated in equity at that time remains in equity.
Investment in a subsidiary
A subsidiary is a company in which the Group owns more than one half of the voting power or otherwise exercises control. The financial statements of the subsidiary are included in the consolidated financial statements. In the parent company’s separate financial statements, the investment in the subsidiary is carried at cost less any impairment.

ANNUAL REPORT 2016 41
Notes to the consolidated financial statements at 31 December 2016 (continued)
Investment in an associate
An associate is an entity over which the Group has significant influence. Significant influence is the power to participate in the financial and operating policy decisions of the investee but is not control or joint control over those policies.
The Group’s investment in its associates is accounted for under the equity method of accounting from the date on which the investee becomes an associate. Under the equity method, the investment in the associate is carried in the statement of financial position at cost plus post- acquisition changes in the Group’s share of net assets of the associate. Goodwill relating to an associate is included in the carrying amount of the investment. After application of the equity method, the Group determines whether it is necessary to recognise any additional impairment loss with respect to the Group’s net investment in the associate. The statement of profit or loss reflects the share of the results of operations of the associate. Where there has been a change recognised directly in the equity of the associate, the Group recognises its share of any changes and discloses this, when applicable, in the statement of changes in equity. Profits and losses resulting from transactions between the Group and the associate are eliminated to the extent of the interest in the associate.
The associates’ accounting policies conform to those used by the Group for like transactions and events in similar circumstances.
Financial instruments
Financial assets
Initial recognition and measurementFinancial assets are classified at fair value through profit or loss, loans and receivables, held-to-maturity investments, available-for-sale financial assets, or as derivatives designated as hedging instruments in an effective hedge, as appropriate. The Group determines the classification of its financial assets at initial recognition. All financial assets are recognised initially at fair value plus, in the case of investments not at fair value through profit or loss, directly attributable transaction costs.
Subsequent measurementThe subsequent measurement of financial assets depends on their classification as follows:
Financial assets at fair value through profit or loss, has two sub categories namely financial assets held for trading and those designated at fair value through profit or loss at inception. Investments typically bought with the intention to sell in the near future are classified as held for trading. For investments designated as at fair value through profit or loss, the following criteria must be met:
• the designation eliminates or significantly reduces the inconsistent treatment that would otherwise arise from measuring the assets or liabilities or recognizing gains or losses on them on a different basis; or
• the assets and liabilities are part of a Group of financial assets, financial liabilities or both which are managed and their performance evaluated on a fair value basis, in accordance with a documented risk management or investment strategy; or
• the financial instrument contains an embedded derivative, unless the embedded derivative does not significantly modify the cash flows or it is clear, with little or no analysis, that it would not be separately recorded.

ANNUAL REPORT 201642
Notes to the consolidated financial statements at 31 December 2016 (continued)
Financial assets (continued)
These investments are initially recorded at fair value. Subsequent to initial recognition, these investments are re-measured at fair value. Fair value adjustments and realized gain and loss are recognized in the statement of profit or loss.
Available-for-sale investmentsAfter initial recognition, investments which are classified “available-for-sale” are normally re-measured at fair value, unless fair value cannot be reliably determined in which case they are measured at cost less impairment. Fair value changes, are reported as a separate component of equity until the investment is derecognised or the investment is determined to be impaired. On de-recognition or impairment the cumulative gain or loss previously reported as “cumulative changes in fair value” within equity, is included in the statement of profit or loss for the period.
Held-to-maturity investmentsNon-derivative financial assets with fixed or determinable payments and fixed maturities are classified as held-to-maturity when the Group has the positive intention and ability to hold it to maturity. After initial measurement held-to-maturity investments are measured at amortised cost using the effective interest rate method (EIR), less impairment. Amortised cost is calculated by taking into account any discount or premium on acquisition and fee or costs that are an integral part of the EIR. The EIR amortisation is included in finance income in the statement of profit or loss. The losses arising from impairment are recognised in the statement of profit or loss in finance costs.
De-recognition of financial instruments
Financial assets A financial asset (or, where applicable a part of a financial asset or part of a group of similar financial assets) is de-recognized when:
• the rights to receive cash flows from the asset have expired or
• the Group has transferred its rights to receive cash flows from the asset or has assumed an obligation to pay the received cash flows in full without material delay to a third party under a ‘pass-through’ arrangement and either (a) the Group has transferred substantially all the risks and rewards of the asset, or (b) the Group has neither transferred nor retained substantially all the risks and rewards of the asset, but has transferred control of the asset.
When the Group has transferred its rights to receive cash flows from an asset or has entered into a pass through arrangement, and has neither transferred nor retained substantially all the risks and rewards of the asset nor transferred control of the asset, a new asset is recognized to the extent of the Group’s continuing involvement in the asset.
Continuing involvement that takes the form of a guarantee over the transferred asset, is measured at the lower of the original carrying amount of the asset and the maximum amount of consideration that the Group could be required to repay.
When continuing involvement takes the form of a written and/or purchased option (including a cash settled option or similar provision) on the transferred asset, the extent of the Group’s continuing involvement is the amount of the transferred asset that the Group may repurchase, except that in the case of a written put option (including a cash settled option or similar provision) on an asset measured at fair value, the extent of the Group’s continuing involvement is limited to the lower of the fair value of the transferred asset and the option exercise price.
ANNUAL REPORT 2016 43
Notes to the consolidated financial statements at 31 December 2016 (continued)
De-recognition of financial instruments (continued)
Financial liabilitiesA financial liability is derecognised when the obligation under the liability is discharged or cancelled or expires.
When an existing financial liability is replaced by another from the same lender on substantially different terms, or the terms of an existing liability are substantially modified, such an exchange or modification is treated as a de-recognition of the original liability and the recognition of a new liability, and the difference in the respective carrying amounts is recognised in the statement of profit or loss.
Inventories
Inventories are stated at the lower of cost and net realisable value. Net realisable value is the estimated selling price in the ordinary course of business, less the estimated costs of completion and selling expenses. The cost of inventories is based on the weighted average principle and includes expenditure incurred in acquiring the inventories and bringing them to their existing location and condition. In the case of finished goods and work in progress, cost includes an appropriate share of overheads based on normal operating capacity.
The liability for goods in transit is recorded when significant risks and rewards of ownership of the goods are transferred to the Group.
Trade and other receivables
Trade and other receivables are stated at original invoice amount less an allowance for any uncollectible amounts. An estimate for doubtful debts is made when collection of the full amount is no longer probable. Bad debts are written off as incurred.
Cash and cash equivalents
For the purpose of the Cash Flows Statement, cash and cash equivalents consists of cash and bank balances, net of outstanding bank overdrafts, and bank deposits with original maturities of three months or less.
Impairment and un-collectability of financial assets
An assessment is made at each reporting date to determine whether there is objective evidence that a specific financial asset may be impaired. If such evidence exists, any impairment loss is recognised in the statement of profit or loss. Impairment is determined as follows:
(a) For assets carried at fair value, impairment is the difference between cost and fair value;
(b) For assets carried at cost, impairment is the difference between cost and the present value of future cash flows discounted at the current market rate of return for a similar financial asset.
(c) For assets carried at amortised cost, impairment is the difference between carrying amount and the present value of future cash flows discounted at the original effective interest rate.
ANNUAL REPORT 201644
Notes to the consolidated financial statements at 31 December 2016 (continued)
Impairment of non-financial assets
The Group assesses at each reporting date whether there is an indication that an asset may be impaired. If any such indication exists, or when annual impairment testing for an asset is required, the Group makes an estimate of the asset’s recoverable amount. An asset’s recoverable amount is the higher of an asset’s or cash-generating unit’s fair value less costs to sell and its value in use and is determined for an individual asset, unless the asset does not generate cash inflows that are largely independent of those from other assets or Groups of assets. Where the carrying amount of an asset exceeds its recoverable amount, the asset is considered impaired and is written down to its recoverable amount. In assessing value in use, the estimated future cash flows are discounted to their present value using a pre-tax discount rate that reflects current market assessments of the time value of money and the risks specific to the asset. In determining fair value less costs to sell, an appropriate valuation model is used. These calculations are corroborated by valuation multiples or other available fair value indicators.
An assessment is made at each reporting date as to whether there is any indication that previously recognised impairment losses may no longer exist or may have decreased. If such an indication exists, the Group makes an estimate of the recoverable amount. A previously recognised impairment loss is reversed only if there has been a change in the estimates used to determine the asset’s recoverable amount since the last impairment loss was recognised. If that is the case the carrying amount of the asset is increased to its recoverable amount. That increased amount cannot exceed the carrying amount that would have been determined, net of depreciation, had no impairment loss been recognised for the asset in prior years. Such a reversal is recognised in the statement of profit or loss.
The following criteria are also applied in assessing impairment of specific assets:
AssociatesAfter application of the equity method, the Group determines whether it is necessary to recognise an additional impairment loss of the Group’s investment in its associates. The Group determines at each reporting date whether there is any objective evidence that the investment in associate is impaired. If this is the case the Group calculates the amount of impairment as being the difference between the fair value of the associate and the acquisition cost and recognises the amount in the statement of profit or loss.
Dividend on ordinary shares
Dividends on ordinary shares are recognised as a liability and deducted from equity when they are approved by the Company’s shareholders.
Employee benefits
Payment is made to the Omani Government Social Security scheme under Royal Decree 72/91 for Omani employees.
The Group provides end of service benefits to its expatriate employees. The entitlement to these benefits is based upon the employees’ final salary and length of service, subject to the completion of a minimum service period. The expected costs of these benefits are accrued over the period of employment.
ANNUAL REPORT 2016 45
Notes to the consolidated financial statements at 31 December 2016 (continued)
ProvisionsProvisions are recognised when the Group has an obligation (legal or constructive) arising from a past event, and the costs to settle the obligation are both probable and able to be reliably estimated. If the effect of the time value of money is material, provisions are discounted using a current pre tax rate that reflects, where appropriate, the risks specific to the liability. Where discounting is used, the increase in the provision due to the passage of time is recognised as a finance cost.
BorrowingsAll loans and borrowings are initially recognised at the fair value of the consideration received less directly attributable transaction costs. After initial recognition, interest-bearing loans and borrowings are subsequently measured at amortised cost using the effective interest method. Gains and losses are recognised in profit or loss when the liabilities are derecognised as well as through the amortisation process. Interest on loans is accounted on accrual basis.
Accounts payable and accrualsLiabilities are recognised for amounts to be paid in the future for goods or services received, whether billed by the supplier or not.
Revenue recognitionRevenue is recognised to the extent that it is probable that the economic benefits will flow to the Group and the revenue can be reliably measured. Revenue is measured at the fair value of the consideration received, excluding discounts, rebates, and sales taxes or duty. The Group assesses its revenue arrangements against specific criteria in order to determine if it is acting as principal or agent. The Group has concluded that it is acting as a principal in all of its revenue arrangements. The following specific recognition criteria must also be met before revenue is recognised:
SalesRevenue from the sale of goods net of sales commission and trade discount is recognised in the statement of profit or loss when the significant risks and rewards of ownership have been transferred to the buyer. Revenue is not recognised if there are significant uncertainties regarding recovery of the consideration due, associated costs or the possible return of goods.
InterestInterest revenue is recognised as the interest accrues using the effective interest rate method, under which the rate used exactly discounts the estimated future cash receipts through the expected life of the financial asset to the net carrying amount of the financial asset.
DividendDividend revenue is recognised when the right to receive the dividend is established.
LeasesThe determination of whether an arrangement is, or contains a lease is based on the substance of the arrangement at inception date, whether fulfilment of the arrangement is dependent on the use of a specific asset or assets or the arrangement conveys a right to use the asset.
For arrangements entered into prior to 1 January 2005, the date of inception is deemed to be 1 January 2005 in accordance with the transitional requirements of IFRIC 4.
Operating lease payments are recognised as an expense in the statement of profit or loss on a straight line basis over the lease term.
ANNUAL REPORT 201646
Notes to the consolidated financial statements at 31 December 2016 (continued)
Borrowing costs
Borrowing costs directly attributable to the acquisition, construction or production of a qualifying asset that necessarily takes a substantial period of time to get ready for its intended use or sale are capitalised as part of the cost of the respective assets. All other borrowing costs are expensed in the period they occur. Borrowing costs consist of interest and other costs that an entity incurs in connection with the borrowing of funds.
Foreign currency translation
The consolidated financial statements are presented in Rial Omani, which is the parent Company’s and the subsidiary’s functional currency. Each entity in the Group determines its own functional currency and items included in the financial statements of each entity are measured using that functional currency. Transactions in foreign currencies are initially recorded in the functional currency rate ruling at the date of the transaction. Monetary assets and liabilities denominated in foreign currencies are retranslated at the functional currency rate of exchange ruling at the reporting date. All differences are taken to the statement of profit or loss. Non-monetary items that are measured in terms of historical cost in a foreign currency are translated using the exchange rates as at the dates of the initial transactions. Non-monetary items measured at fair value in a foreign currency are translated using the exchange rates at the date when the fair value was determined.
Translation of foreign operationsExchange differences arising on equity accounting of foreign associates are taken directly to the foreign currency translation reserve. Foreign currency translation reserve is recognized in equity under cumulative changes in fair value. On disposal of the foreign associate, such exchange differences are recognised in the statement of profit or loss as part of the profit or loss on sale. A write down of the carrying amount of a foreign operation does not constitute a disposal.
Income tax
Taxation is provided for based on relevant tax laws of the respective countries in which the Group operates.
Current tax is the expected tax payable on the taxable income for the year, using tax rates enacted or substantially enacted at the reporting date, and any adjustment to tax payable in respect of previous years.
Deferred tax is provided, using the liability method, on all temporary differences at the reporting date between the tax bases of assets and liabilities and their carrying amounts.
Deferred tax assets and liabilities are measured at the tax rates that are expected to apply to the period when the asset is realised or the liability is settled, based on laws that have been enacted at the reporting date.
Deferred tax assets are recognised for all deductible temporary differences and carry-forward of unused tax assets and unused tax losses to the extent that it is probable that taxable profit will be available against which the deductible temporary differences and the carry-forward of unused tax assets and unused tax losses can be utilised.

ANNUAL REPORT 2016 47
Notes to the consolidated financial statements at 31 December 2016 (continued)
Income tax (continued)
The carrying amount of deferred tax assets are reviewed at each reporting date and reduced to the extent that it is no longer probable that sufficient taxable profit will be available to allow all or part of the deferred income tax asset to be utilised.
Income tax relating to items recognised directly in equity is recognised in equity and not in the statement of profit or loss.
Directors’ remuneration
The Parent Company follows the Commercial Companies Law 1974 (as amended), and other relevant directives issued by CMA, in regard to determination of the amount to be paid as Directors’ remuneration. Directors’ remuneration is charged to the statement of profit or loss in the year to which they relate.
4. Critical accounting judgments and key sources of estimation uncertainty
The preparation of the financial statements, as per IFRS, requires management to make estimates and assumptions that affect the reported amount of assets and liabilities at the reporting date and the resultant provisions and changes in fair value for the period. Such estimates are necessarily based on assumptions about several factors involving varying, and possibly significant, degrees of judgment and uncertainty and actual results may differ from management’s estimates resulting in future changes in estimated assets and liabilities.
Classification of investmentsManagement decides on acquisition of an investment whether it should be classified as held for trading, carried at fair value through profit or loss, or available-for-sale or held-to-maturity investments.
Fair valuesFor investments and derivate financial instruments traded in organised financial markets, fair value is determined by reference to quoted market bid prices.
For unquoted equity investments, fair value is determined by reference to the market value of a similar investment or is based on expected discounted cash flows. Fair value cannot be reliably measured for certain unquoted foreign investments. Such investments are measured at cost.
The fair value of interest-bearing items is estimated based on discounted cash flows using interest rates for items with similar terms and risk characteristics.
Key sources of estimation uncertainty
The following are the key assumptions concerning the future, and other key sources of estimation uncertainty at the reporting date, that have a significant risk of causing a material adjustment to the carrying amounts of assets and liabilities within the next financial year.
ANNUAL REPORT 201648
Notes to the consolidated financial statements at 31 December 2016 (continued)
Key sources of estimation uncertainty (continued)
Impairment of accounts receivableAn estimate of the collectible amount of trade accounts receivable is made when collection of the full amount is no longer probable. For individually significant amounts, this estimation is performed on an individual basis. Amounts which are not individually significant, but which are past due, are assessed collectively and a provision applied according to the length of time past due.
At the reporting date, Group trade receivables were RO 65,592,233 (2015: RO 72,675,972), and the provision for doubtful debts was RO 1,950,000 (2015: RO 1,850,000). Any difference between the amounts actually collected in future periods and the amounts expected will be recognised in the statement of profit or loss.
Impairment of inventoriesInventories are held at the lower of cost and net realisable value. When inventories become old or obsolete, an estimate is made of their net realisable value. For individually significant amounts this estimation is performed on an individual basis. Amounts which are not individually significant, but which are old or obsolete, are assessed collectively and a provision applied according to the inventory type and the degree of ageing or obsolescence, based on anticipated selling prices.
At the reporting date, gross inventories were RO 30,281,478 (2015: RO 39,475,542) and the provisions for slow moving and obsolete inventories of RO 1,642,000 (2015: RO 1,666,470) respectively. Any difference between the amounts actually realised in future periods and the amounts expected will be recognised in the statement of profit or loss.
Useful lives of property, plant and equipmentThe Group’s management determines the estimated useful lives of its property, plant and equipment for calculating depreciation. This estimate is determined after considering the expected usage of the asset or physical wear and tear. Management reviews the residual value and useful lives annually and future depreciation charge would be adjusted where the management believes the useful lives differ from previous estimates.
Impairment of equity investmentsThe Group treats available-for-sale equity investments as impaired when there has been a significant or prolonged decline in the fair value below its cost or where other objective evidence of impairment exists. The determination of what is ‘significant’ or ‘prolonged’ requires judgment, which is critically evaluated by the Group on a case to case basis.
TaxesUncertainties exist with respect to the interpretation of tax regulations and the amount and timing of future taxable income. Given the wide range of business relationships and nature of existing contractual agreements, differences arising between the actual results and the assumptions made, or future changes to such assumptions, could necessitate future adjustments to tax income and expense already recorded. The Group establishes provisions, based on reasonable estimates, for possible consequences of finalisation of tax assessments of respective Group companies. The amount of such provisions is based on various factors, such as experience of previous tax assessments and differing interpretations of tax regulations by the taxable entity and the responsible tax authority.
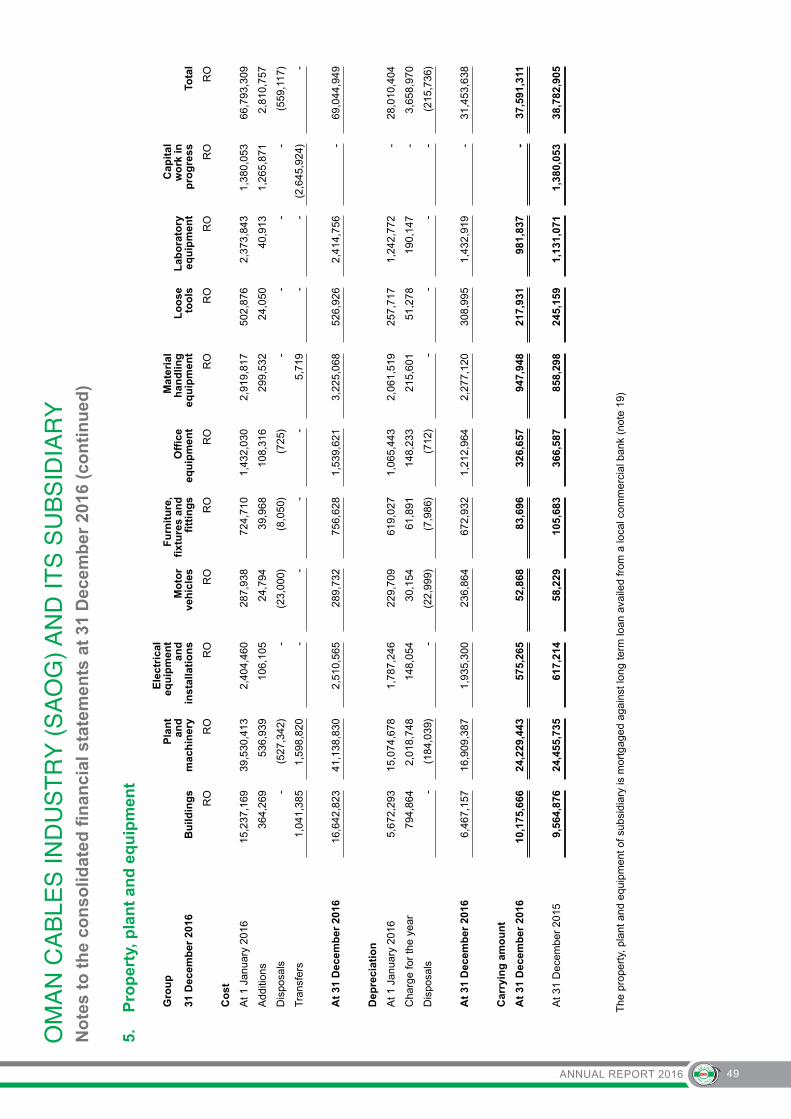
ANNUAL REPORT 2016 49
5.
Pro
per
ty, p
lan
t an
d e
qu
ipm
ent
Gro
up
31 D
ecem
ber
201
6B
uild
ing
s
Pla
nt
and
m
ach
iner
y
Ele
ctri
cal
equ
ipm
ent
and
in
stal
lati
on
s M
oto
r ve
hic
les
Fu
rnit
ure
, fi
xtu
res
and
fi
ttin
gs
Off
ice
equ
ipm
ent
Mat
eria
l h
and
ling
equ
ipm
ent
Lo
ose
to
ols
L
abo
rato
ry
equ
ipm
ent
Cap
ital
w
ork
in
pro
gre
ss
Tota
l
RO
RO
RO
RO
RO
RO
RO
RO
RO
RO
RO
Co
st
At 1
Jan
uary
201
615
,237
,169
39,5
30,4
132,
404,
460
287,
938
724,
710
1,43
2,03
02,
919,
817
502,
876
2,37
3,84
31,
380,
053
66,7
93,3
09
Add
ition
s36
4,26
953
6,93
910
6,10
524
,794
39,9
6810
8,31
629
9,53
224
,050
40,9
131,
265,
871
2,81
0,75
7
Dis
posa
ls-
(527
,342
)-
(23,
000)
(8,0
50)
(725
)-
--
-(5
59,1
17)
Tra
nsfe
rs1,
041,
385
1,59
8,82
0-
--
-5,
719
--
(2,6
45,9
24)
-
At
31 D
ecem
ber
201
616
,642
,823
41,1
38,8
302,
510,
565
289,
732
756,
628
1,53
9,62
13,
225,
068
526,
926
2,41
4,75
6-
69,0
44,9
49
Dep
reci
atio
n
At 1
Jan
uary
201
65,
672,
293
15,0
74,6
781,
787,
246
229,
709
619,
027
1,06
5,44
32,
061,
519
257,
717
1,24
2,77
2-
28,0
10,4
04
Cha
rge
for
the
year
794,
864
2,01
8,74
814
8,05
430
,154
61,8
9114
8,23
321
5,60
151
,278
190,
147
-3,
658,
970
Dis
posa
ls-
(184
,039
)-
(22,
999)
(7,9
86)
(712
)-
--
-(2
15,7
36)
At
31 D
ecem
ber
201
66,
467,
157
16,9
09,3
871,
935,
300
236,
864
672,
932
1,21
2,96
42,
277,
120
308,
995
1,43
2,91
9-
31,4
53,6
38
Car
ryin
g a
mo
un
t
At
31 D
ecem
ber
201
610
,175
,666
24,2
29,4
4357
5,26
552
,868
83,6
9632
6,65
794
7,94
821
7,93
198
1,83
7-
37,5
91,3
11
At 3
1 D
ecem
ber
2015
9,56
4,87
624
,455
,735
617,
214
58,2
2910
5,68
336
6,58
785
8,29
824
5,15
91,
131,
071
1,38
0,05
338
,782
,905
The
pro
pert
y, p
lant
and
equ
ipm
ent o
f sub
sidi
ary
is m
ortg
aged
aga
inst
long
term
loan
ava
iled
from
a lo
cal c
omm
erci
al b
ank
(not
e 19
)
No
tes
to t
he
con
solid
ated
fin
anci
al s
tate
men
ts a
t 31
Dec
emb
er 2
016
(co
nti
nu
ed)

ANNUAL REPORT 201650
5.
Pro
per
ty, p
lan
t an
d e
qu
ipm
ent
(co
nti
nu
ed)
Gro
up
31 D
ecem
ber
201
5B
uild
ing
s
Pla
nt
and
m
ach
iner
y
Ele
ctri
cal
equ
ipm
ent
and
in
stal
lati
on
s M
oto
r ve
hic
les
Fu
rnit
ure
, fi
xtu
res
and
fi
ttin
gs
Off
ice
equ
ipm
ent
Mat
eria
l h
and
ling
equ
ipm
ent
Lo
ose
to
ols
L
abo
rato
ry
equ
ipm
ent
Cap
ital
w
ork
in
pro
gre
ss
Tota
l
RO
RO
RO
RO
RO
RO
RO
RO
RO
RO
RO
Cos
t
At 1
Jan
uary
201
514
,467
,172
38,4
84,2
762,
394,
960
282,
293
692,
855
1,23
4,16
42,
752,
740
398,
772
2,33
5,32
313
0,67
263
,173
,227
Add
ition
s78
4,23
21,
014,
132
9,50
014
,395
50,8
0397
,755
265,
469
104,
104
101,
228
2,04
5,36
54,
486,
983
Dis
posa
ls(1
4,23
5)(6
33,3
07)
-(8
,750
)(1
8,94
8)(3
0,56
1)(9
8,39
2)-
(62,
708)
-(8
66,9
01)
Tra
nsfe
rs-
665,
312
--
-13
0,67
2-
--
(795
,984
)-
At 3
1 D
ecem
ber
2015
15,2
37,1
6939
,530
,413
2,40
4,46
028
7,93
872
4,71
01,
432,
030
2,91
9,81
750
2,87
62,
373,
843
1,38
0,05
366
,793
,309
Dep
reci
atio
n
At 1
Jan
uary
201
54,
909,
262
13,6
12,9
961,
606,
187
206,
513
565,
269
958,
420
1,96
9,98
818
9,54
31,
099,
529
-25
,117
,707
Cha
rge
for
the
year
773,
187
1,98
2,12
218
1,05
931
,946
70,5
2613
6,88
318
9,91
868
,174
205,
949
-3,
639,
764
Dis
posa
ls(1
0,15
6)(5
20,4
40)
-(8
,750
)(1
6,76
8)(2
9,86
0)(9
8,38
7)-
(62,
706)
-(7
47,0
67)
At 3
1 D
ecem
ber
2015
5,67
2,29
315
,074
,678
1,78
7,24
622
9,70
961
9,02
71,
065,
443
2,06
1,51
925
7,71
71,
242,
772
-28
,010
,404
Car
ryin
g am
ount
At 3
1 D
ecem
ber
2015
9,56
4,87
624
,455
,735
617,
214
58,2
2910
5,68
336
6,58
785
8,29
824
5,15
91,
131,
071
1,38
0,05
338
,782
,905
At 3
1 D
ecem
ber
2014
9,55
7,91
024
,871
,280
788,
773
75,7
8012
7,58
627
5,74
478
2,75
220
9,22
91,
235,
794
130,
672
38,0
55,5
20
No
tes
to t
he
con
solid
ated
fin
anci
al s
tate
men
ts a
t 31
Dec
emb
er 2
016
(co
nti
nu
ed)
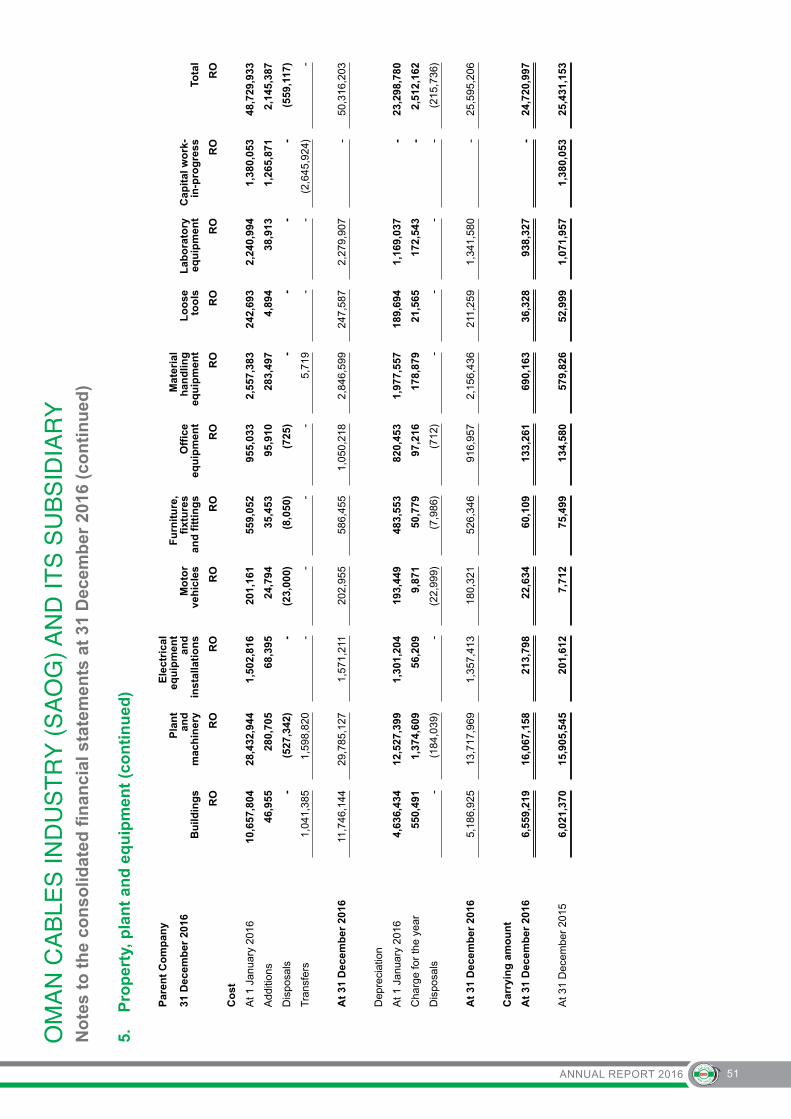
ANNUAL REPORT 2016 51
5.
Pro
per
ty, p
lan
t an
d e
qu
ipm
ent
(co
nti
nu
ed)
Par
ent
Co
mp
any
31 D
ecem
ber
201
6B
uild
ing
s
Pla
nt
and
m
ach
iner
y
Ele
ctri
cal
equ
ipm
ent
and
in
stal
lati
on
s M
oto
r ve
hic
les
Fu
rnit
ure
, fi
xtu
res
and
fit
tin
gs
Off
ice
equ
ipm
ent
Mat
eria
l h
and
ling
eq
uip
men
t L
oo
se
too
ls
Lab
ora
tory
eq
uip
men
t C
apit
al w
ork
-in
-pro
gre
ss
Tota
l
RO
RO
RO
RO
RO
RO
RO
RO
RO
RO
RO
Co
st
At 1
Jan
uary
201
610
,657
,804
28,4
32,9
441,
502,
816
201,
161
559,
052
955,
033
2,55
7,38
324
2,69
32,
240,
994
1,38
0,05
348
,729
,933
Add
ition
s46
,955
280,
705
68,3
9524
,794
35,4
5395
,910
283,
497
4,89
438
,913
1,26
5,87
12,
145,
387
Dis
posa
ls-
(527
,342
)-
(23,
000)
(8,0
50)
(725
)-
--
-(5
59,1
17)
Tra
nsfe
rs1,
041,
385
1,59
8,82
0-
--
-5,
719
--
(2,6
45,9
24)
-
At
31 D
ecem
ber
201
611
,746
,144
29,7
85,1
271,
571,
211
202,
955
586,
455
1,05
0,21
82,
846,
599
247,
587
2,27
9,90
7-
50,3
16,2
03
Dep
reci
atio
n
At 1
Jan
uary
201
64,
636,
434
12,5
27,3
991,
301,
204
193,
449
483,
553
820,
453
1,97
7,55
718
9,69
41,
169,
037
-23
,298
,780
Cha
rge
for
the
year
550,
491
1,37
4,60
956
,209
9,87
150
,779
97,2
1617
8,87
921
,565
172,
543
-2,
512,
162
Dis
posa
ls-
(184
,039
)-
(22,
999)
(7,9
86)
(712
)-
--
-(2
15,7
36)
At
31 D
ecem
ber
201
65,
186,
925
13,7
17,9
691,
357,
413
180,
321
526,
346
916,
957
2,15
6,43
621
1,25
91,
341,
580
-25
,595
,206
Car
ryin
g a
mo
un
t
At
31 D
ecem
ber
201
66,
559,
219
16,0
67,1
5821
3,79
822
,634
60,1
0913
3,26
169
0,16
336
,328
938,
327
-24
,720
,997
At 3
1 D
ecem
ber
2015
6,02
1,37
015
,905
,545
201,
612
7,71
275
,499
134,
580
579,
826
52,9
991,
071,
957
1,38
0,05
325
,431
,153
No
tes
to t
he
con
solid
ated
fin
anci
al s
tate
men
ts a
t 31
Dec
emb
er 2
016
(co
nti
nu
ed)
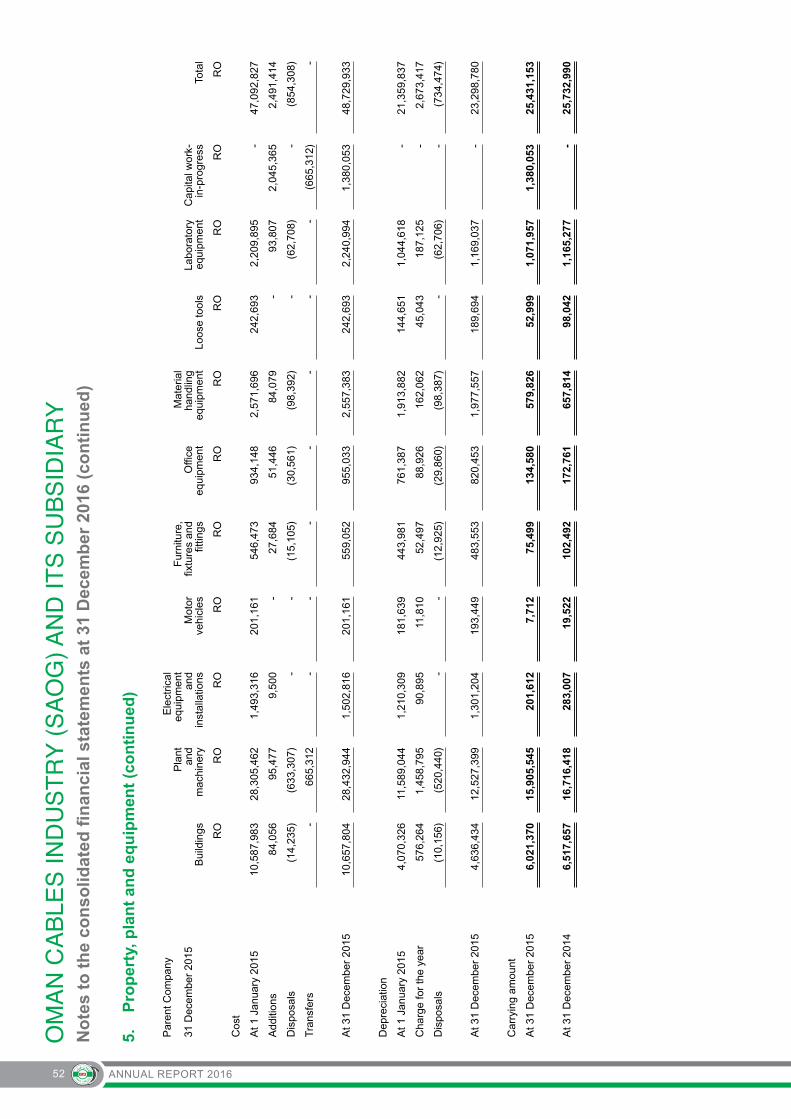
ANNUAL REPORT 201652
5.
Pro
per
ty, p
lan
t an
d e
qu
ipm
ent
(co
nti
nu
ed)
Par
ent C
ompa
ny
31 D
ecem
ber
2015
Bui
ldin
gs
Pla
nt
and
mac
hine
ry
Ele
ctric
al
equi
pmen
t an
d in
stal
latio
ns
Mot
or
vehi
cles
Fur
nitu
re,
fixtu
res
and
fittin
gs
Offi
ce
equi
pmen
t
Mat
eria
l ha
ndlin
g eq
uipm
ent
Loos
e to
ols
Labo
rato
ry
equi
pmen
t C
apita
l wor
k-in
-pro
gres
s To
tal
RO
RO
RO
RO
RO
RO
RO
RO
RO
RO
RO
Cos
t
At 1
Jan
uary
201
510
,587
,983
28,3
05,4
621,
493,
316
201,
161
546,
473
934,
148
2,57
1,69
624
2,69
32,
209,
895
-47
,092
,827
Add
ition
s84
,056
95,4
779,
500
-27
,684
51,4
4684
,079
-93
,807
2,04
5,36
52,
491,
414
Dis
posa
ls(1
4,23
5)(6
33,3
07)
--
(15,
105)
(30,
561)
(98,
392)
-(6
2,70
8)-
(854
,308
)
Tra
nsfe
rs-
665,
312
--
--
--
-(6
65,3
12)
-
At 3
1 D
ecem
ber
2015
10,6
57,8
0428
,432
,944
1,50
2,81
620
1,16
155
9,05
295
5,03
32,
557,
383
242,
693
2,24
0,99
41,
380,
053
48,7
29,9
33
Dep
reci
atio
n
At 1
Jan
uary
201
54,
070,
326
11,5
89,0
441,
210,
309
181,
639
443,
981
761,
387
1,91
3,88
214
4,65
11,
044,
618
-21
,359
,837
Cha
rge
for
the
year
576,
264
1,45
8,79
590
,895
11,8
1052
,497
88,9
2616
2,06
245
,043
187,
125
-2,
673,
417
Dis
posa
ls(1
0,15
6)(5
20,4
40)
--
(12,
925)
(29,
860)
(98,
387)
-(6
2,70
6)-
(734
,474
)
At 3
1 D
ecem
ber
2015
4,63
6,43
412
,527
,399
1,30
1,20
419
3,44
948
3,55
382
0,45
31,
977,
557
189,
694
1,16
9,03
7-
23,2
98,7
80
Car
ryin
g am
ount
At 3
1 D
ecem
ber
2015
6,02
1,37
015
,905
,545
201,
612
7,71
275
,499
134,
580
579,
826
52,9
991,
071,
957
1,38
0,05
325
,431
,153
At 3
1 D
ecem
ber
2014
6,51
7,65
716
,716
,418
283,
007
19,5
2210
2,49
217
2,76
165
7,81
498
,042
1,16
5,27
7-
25,7
32,9
90
No
tes
to t
he
con
solid
ated
fin
anci
al s
tate
men
ts a
t 31
Dec
emb
er 2
016
(co
nti
nu
ed)

ANNUAL REPORT 2016 53
Notes to the consolidated financial statements at 31 December 2016 (continued)
6. Investment in a subsidiary
%Holding Activity
Year of incorporation
2016Parent
Company
2015Parent
Company
Oman Aluminium Processing Industries LLC (OAPIL) (Incorporated in Oman)
51% Manufacture of aluminium rods and overhead
conductors
2008 2,226,660 2,226,660
The Parent Company has 51% shareholding in Oman Aluminum Processing Industries LLC (OAPIL). The Subsidiary commenced its commercial operations from July 2010.
The statement of profit or loss of the Group has been made after consolidating the OAPIL accounts and the 49% share of profit of RO 523,601 (2015: RO 2,836,113) has been shown as non-controlling interests in consolidated statement of profit or loss.
The following further notes apply:
1. Investment in OAPIL has been set off against the capital and reserves of the subsidiary in the consolidated financial statements.
2. The Board of Directors of the Parent Company believes that no impairment has arisen in the investment in OAPIL.
7. Investment in an associate
2016Group and Parent Company
2015Group and Parent Company
Name of the associate% Holding Carrying
valueCost %
HoldingCarrying
valueCost
RO RO RO RO
Associated Cables Private Limited, India (ACPL) 40% 567,690 - 40% 553,063 -
The associate company registered in India, is in the business of manufacturing and selling of electrical power cables, control cables and instrumentation cables.
During the year 2006, the Parent Company had acquired 35% stake and in 2009 an additional 5% stake in the associate at consideration of Nil. This acquisition was in accordance with the terms of the commercial understanding agreement with Draka Holding NV, the associate company’s major shareholder.
The carrying value of the investment in an associate is as follows:2016 2015
Group Parent Company Group Parent
Company
RO RO RO RO
At 1 January 553,063 553,063 576,159 576,159
Share of profit / fair value changes of associate 29,556 29,556 688 688
Effect of foreign currency translation (14,929) (14,929) (23,784) (23,784)
At 31 December 567,690 567,690 553,063 553,063

ANNUAL REPORT 201654
Notes to the consolidated financial statements at 31 December 2016 (continued)
7. Investment in an associate (continued)
The share of results is based on the unaudited financial statements of the associate as at 31 December 2016. The associate company prepares audited financial statements at 31 March each year.
The summarised financial position of the associate as at reporting date is as follows:
2016 2015
RO RO
Associate’s statement of financial position:
Current assets 1,354,612 1,366,578
Non-current assets 374,106 383,060
Current liabilities (275,108) (328,202)
Non-current liabilities (34,388) (38,773)
Net assets 1,419,222 1,382,663
Associate’s revenue and profit:
Revenue 2,626,245 2,717,205
Profit 73,890 1,721
Carrying amount of investment 567,690 553,063
8. Available-for-sale investments
2016 2015
Group and Parent Company Group and Parent Company
Market value Cost Market value Cost
RO RO RO RO
Unquoted investments (refer note (a) below) 230,017 230,017 119,067 119,067
Marketable securities listed on the Muscat Securities Market - 510 - 510
230,017 230,527 119,067 119,577
(a) During the year, the Company invested RO 110,950 (2015: refund of RO 49,375) in units of Oman Fixed Income Fund.
(b) Movements in cumulative changes in fair values arising from available-for-sale investments are as follows:
2016 2015
Group and Parent company
RO RO
Net realised loss reclassified to the statement of profit or loss on disposals - (92)
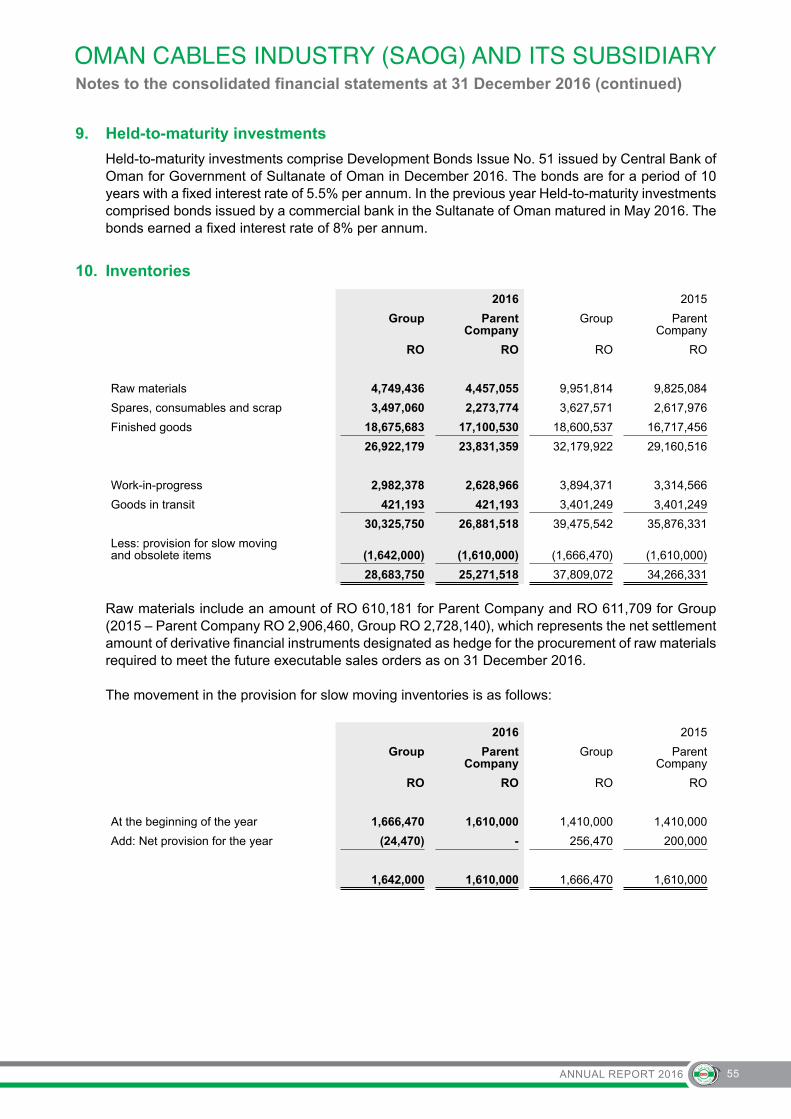
ANNUAL REPORT 2016 55
Notes to the consolidated financial statements at 31 December 2016 (continued)
9. Held-to-maturity investments
Held-to-maturity investments comprise Development Bonds Issue No. 51 issued by Central Bank of Oman for Government of Sultanate of Oman in December 2016. The bonds are for a period of 10 years with a fixed interest rate of 5.5% per annum. In the previous year Held-to-maturity investments comprised bonds issued by a commercial bank in the Sultanate of Oman matured in May 2016. The bonds earned a fixed interest rate of 8% per annum.
10. Inventories
2016 2015
Group Parent Company
Group Parent Company
RO RO RO RO
Raw materials 4,749,436 4,457,055 9,951,814 9,825,084
Spares, consumables and scrap 3,497,060 2,273,774 3,627,571 2,617,976
Finished goods 18,675,683 17,100,530 18,600,537 16,717,456
26,922,179 23,831,359 32,179,922 29,160,516
Work-in-progress 2,982,378 2,628,966 3,894,371 3,314,566
Goods in transit 421,193 421,193 3,401,249 3,401,249
30,325,750 26,881,518 39,475,542 35,876,331
Less: provision for slow moving and obsolete items (1,642,000) (1,610,000) (1,666,470) (1,610,000)
28,683,750 25,271,518 37,809,072 34,266,331
Raw materials include an amount of RO 610,181 for Parent Company and RO 611,709 for Group (2015 – Parent Company RO 2,906,460, Group RO 2,728,140), which represents the net settlement amount of derivative financial instruments designated as hedge for the procurement of raw materials required to meet the future executable sales orders as on 31 December 2016.
The movement in the provision for slow moving inventories is as follows:
2016 2015
Group Parent Company
Group Parent Company
RO RO RO RO
At the beginning of the year 1,666,470 1,610,000 1,410,000 1,410,000
Add: Net provision for the year (24,470) - 256,470 200,000
1,642,000 1,610,000 1,666,470 1,610,000

ANNUAL REPORT 201656
Notes to the consolidated financial statements at 31 December 2016 (continued)
11. Trade and other receivables
2016 2015
Group Parent Company
Group ParentCompany
RO RO RO RO
Trade receivables 65,592,233 60,258,531 72,675,972 65,499,216
Less: allowance for credit losses (1,950,000) (1,900,000) (1,850,000) (1,800,000)
63,642,233 58,358,531 70,825,972 63,699,216
Advances 217,815 186,272 745,237 667,827
Derivatives designated and effective as hedging instrumentscarried at fair value (Note 18) 1,227,763 1,227,722 249,002 -
Other receivables and prepayments 258,476 181,391 326,110 143,336
65,346,287 59,953,916 72,146,321 64,510,379
Movements in the allowance for impairment of receivables were as follows:2016 2015
Group Parent Company
Group Parent Company
RO RO RO RO
At the beginning of the year 1,850,000 1,800,000 1,400,000 1,400,000
Add: charge for the year 100,000 100,000 450,000 400,000
1,950,000 1,900,000 1,850,000 1,800,000
The Company offers credit to its customers, after which trade receivables are considered to be past due. At the reporting date, gross trade receivables amounting to RO 1,900,000 for Parent Company and RO 1,950,000 for Group (2015- Parent Company RO 1,800,000 and Group RO 1,850,000) were assessed as impaired by the management, for which allowance for credit losses has been established.
Group Past due but not impaired
Total Impaired
Neither past due
nor impairedLess than 3 months
3 to 6 months
6 to 12 months
More than 1 year
RO RO RO RO RO RO RO
2016 65,592,233 1,950,000 49,020,562 10,559,281 380,728 2,077,082 1,604,580
2015 72,675,972 1,850,000 59,841,330 7,368,211 2,440,984 1,175,447 -
Parent
2016 60,258,531 1,900,000 44,261,395 10,264,472 227,689 2,000,395 1,604,580
2015 65,499,126 1,800,000 52,898,755 7,184,030 2,440,984 1,175,447 -
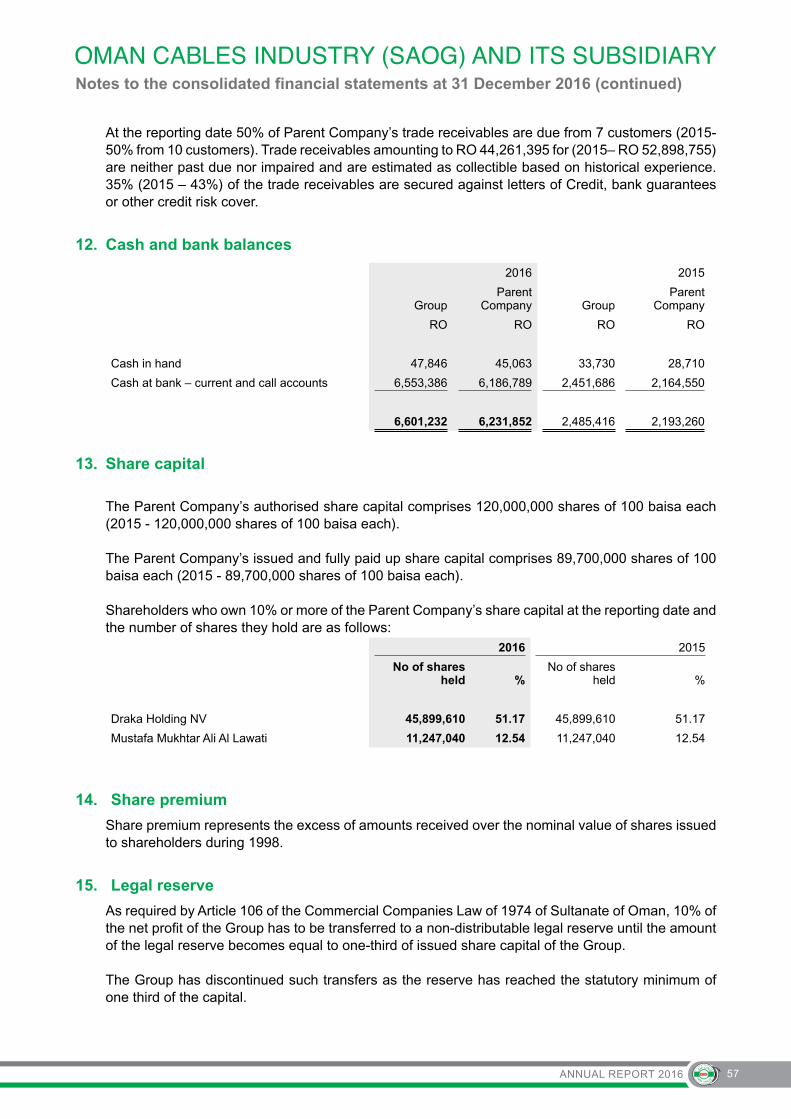
ANNUAL REPORT 2016 57
Notes to the consolidated financial statements at 31 December 2016 (continued)
At the reporting date 50% of Parent Company’s trade receivables are due from 7 customers (2015- 50% from 10 customers). Trade receivables amounting to RO 44,261,395 for (2015– RO 52,898,755) are neither past due nor impaired and are estimated as collectible based on historical experience. 35% (2015 – 43%) of the trade receivables are secured against letters of Credit, bank guarantees or other credit risk cover.
12. Cash and bank balances
2016 2015
GroupParent
Company GroupParent
Company
RO RO RO RO
Cash in hand 47,846 45,063 33,730 28,710
Cash at bank – current and call accounts 6,553,386 6,186,789 2,451,686 2,164,550
6,601,232 6,231,852 2,485,416 2,193,260
13. Share capital
The Parent Company’s authorised share capital comprises 120,000,000 shares of 100 baisa each (2015 - 120,000,000 shares of 100 baisa each).
The Parent Company’s issued and fully paid up share capital comprises 89,700,000 shares of 100 baisa each (2015 - 89,700,000 shares of 100 baisa each).
Shareholders who own 10% or more of the Parent Company’s share capital at the reporting date and the number of shares they hold are as follows:
2016 2015
No of shares held %
No of shares held %
Draka Holding NV 45,899,610 51.17 45,899,610 51.17
Mustafa Mukhtar Ali Al Lawati 11,247,040 12.54 11,247,040 12.54
14. Share premium
Share premium represents the excess of amounts received over the nominal value of shares issued to shareholders during 1998.
15. Legal reserve
As required by Article 106 of the Commercial Companies Law of 1974 of Sultanate of Oman, 10% of the net profit of the Group has to be transferred to a non-distributable legal reserve until the amount of the legal reserve becomes equal to one-third of issued share capital of the Group.
The Group has discontinued such transfers as the reserve has reached the statutory minimum of one third of the capital.

ANNUAL REPORT 201658
Notes to the consolidated financial statements at 31 December 2016 (continued)
16. General reserve
This reserve represents a distributable reserve initially created at 31 December 2001, to address any impact of unforeseen events in view of the Parent Company’s growing operations. 10 % (2015 - 10%) of the net profit of the Parent Company has been transferred to this reserve during the year. The transfer is subject to the approval of the shareholders at the forthcoming Annual General Meeting.
17. Dividend per share
During the year, dividends of 90 baisa (2015: 90 baisa) per share totalling RO 8,073,000 (2015: RO 8,073,000) relating to the year 2015 were declared and paid.
The Board of Directors have recommended a dividend of 85 baisa (2015: 90 baisa) per share for the year 2016 amounting to RO 7,624,500 (2015: RO 8,073,000), subject to the approval of the shareholders at the forthcoming Annual General Meeting.
18. Cumulative changes in fair values
The following summarises the cumulative changes in fair values as of reporting date:2016 2015
GroupParent
Company GroupParent
Company
RO RO RO RO
Unrealised gain relating to:
Hedging commodity and currency forward / future contracts (Net) maturing within 12 months 1,227,744 1,227,722 (1,123,393) (1,250,385)
Fair value of investments available-for-sale (510) (510) (510) (510)
Others (95,159) (95,159) (80,230) (80,230)
1,132,075 1,132,053 (1,204,133) (1,331,125)
Any positive or negative fair value adjustments of commodity future contracts designated as cash flow hedges will be included in the subsequent period on the maturity of the contracts, as cost of inventories and ultimately as cost of sales in the statement of profit or loss.
The cumulative change in fair value relating to the unrealised gain / loss in commodity future contracts of RO 1,227,763 (2015 – RO (1,001,383)) is mainly on account of differences between the original values of the future commodity contracts entered into by the Group in the normal course of business and the market value of these contracts as at the reporting date attributable to equity holders of the parent company. RO 19 (2015 – RO (122,011)) attributable to non-controlling interest is disclosed separately in statement of changes in equity as a component of non-controlling interests.
The cumulative change in fair value relating to the unrealised gain / loss in commodity future contracts of RO 1,227,722 (2015 - RO (1,250,385)) is mainly on account of differences between the original values of the future commodity contracts entered into by the Parent Company in the normal course of business and the market value of these contracts as at the reporting date.
The reported fair value changes on account of commodity future contracts mentioned above, does not have an impact on the year 2016 profitability, as it relates to the cost of purchase in the year 2017.
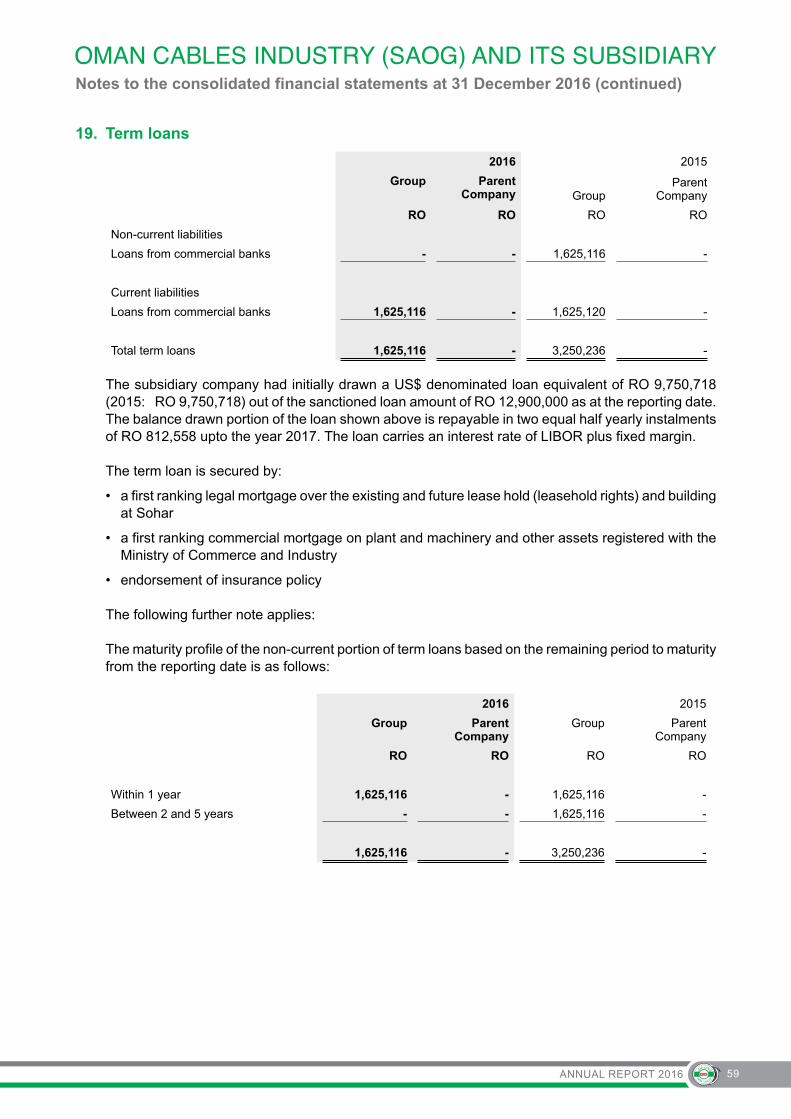
ANNUAL REPORT 2016 59
Notes to the consolidated financial statements at 31 December 2016 (continued)
19. Term loans
2016 2015
Group Parent Company Group
ParentCompany
RO RO RO RO
Non-current liabilities
Loans from commercial banks - - 1,625,116 -
Current liabilities
Loans from commercial banks 1,625,116 - 1,625,120 -
Total term loans 1,625,116 - 3,250,236 -
The subsidiary company had initially drawn a US$ denominated loan equivalent of RO 9,750,718 (2015: RO 9,750,718) out of the sanctioned loan amount of RO 12,900,000 as at the reporting date. The balance drawn portion of the loan shown above is repayable in two equal half yearly instalments of RO 812,558 upto the year 2017. The loan carries an interest rate of LIBOR plus fixed margin.
The term loan is secured by:
• a first ranking legal mortgage over the existing and future lease hold (leasehold rights) and building at Sohar
• a first ranking commercial mortgage on plant and machinery and other assets registered with the Ministry of Commerce and Industry
• endorsement of insurance policy
The following further note applies:
The maturity profile of the non-current portion of term loans based on the remaining period to maturity from the reporting date is as follows:
2016 2015
Group Parent Company
Group ParentCompany
RO RO RO RO
Within 1 year 1,625,116 - 1,625,116 -
Between 2 and 5 years - - 1,625,116 -
1,625,116 - 3,250,236 -
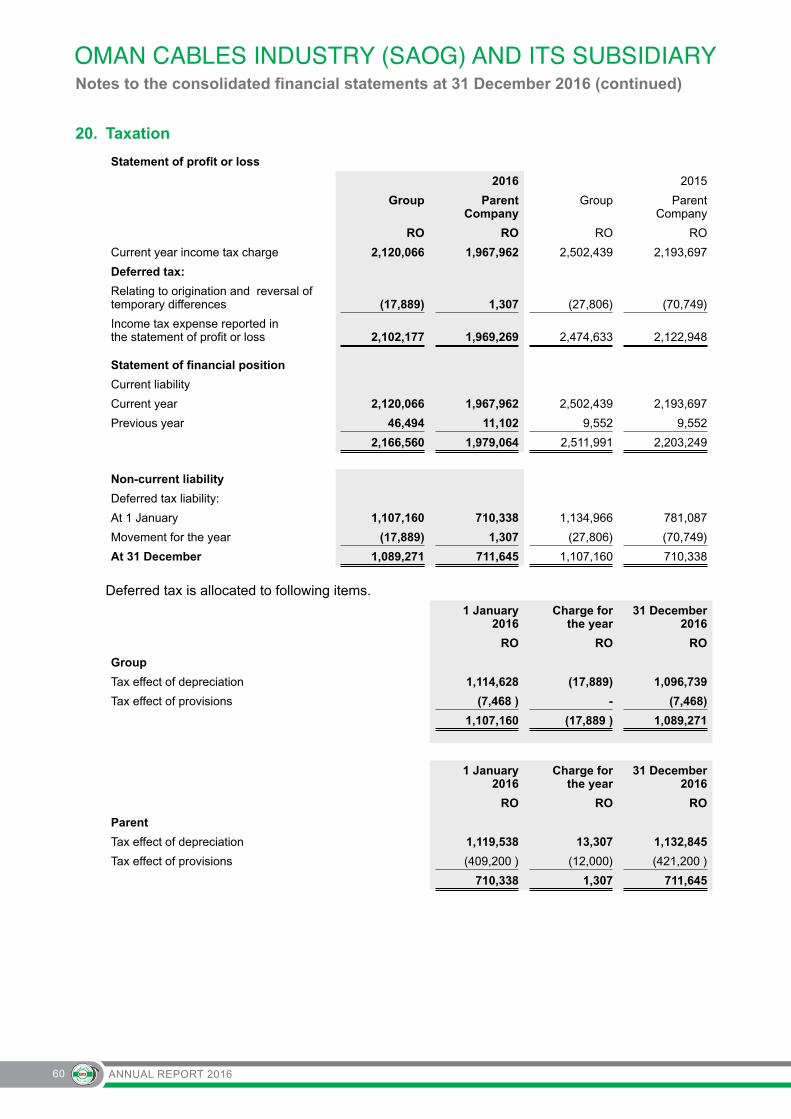
ANNUAL REPORT 201660
Notes to the consolidated financial statements at 31 December 2016 (continued)
20. Taxation
Statement of profit or loss
2016 2015
Group Parent Company
Group ParentCompany
RO RO RO RO
Current year income tax charge 2,120,066 1,967,962 2,502,439 2,193,697
Deferred tax:
Relating to origination and reversal of temporary differences (17,889) 1,307 (27,806) (70,749)
Income tax expense reported inthe statement of profit or loss 2,102,177 1,969,269 2,474,633 2,122,948
Statement of financial position
Current liability
Current year 2,120,066 1,967,962 2,502,439 2,193,697
Previous year 46,494 11,102 9,552 9,552
2,166,560 1,979,064 2,511,991 2,203,249
Non-current liability
Deferred tax liability:
At 1 January 1,107,160 710,338 1,134,966 781,087
Movement for the year (17,889) 1,307 (27,806) (70,749)
At 31 December 1,089,271 711,645 1,107,160 710,338
Deferred tax is allocated to following items.1 January
2016Charge for
the year31 December
2016
RO RO RO
Group
Tax effect of depreciation 1,114,628 (17,889) 1,096,739
Tax effect of provisions (7,468 ) - (7,468)
1,107,160 (17,889 ) 1,089,271
1 January2016
Charge for the year
31 December2016
RO RO RO
Parent
Tax effect of depreciation 1,119,538 13,307 1,132,845
Tax effect of provisions (409,200 ) (12,000) (421,200 )
710,338 1,307 711,645
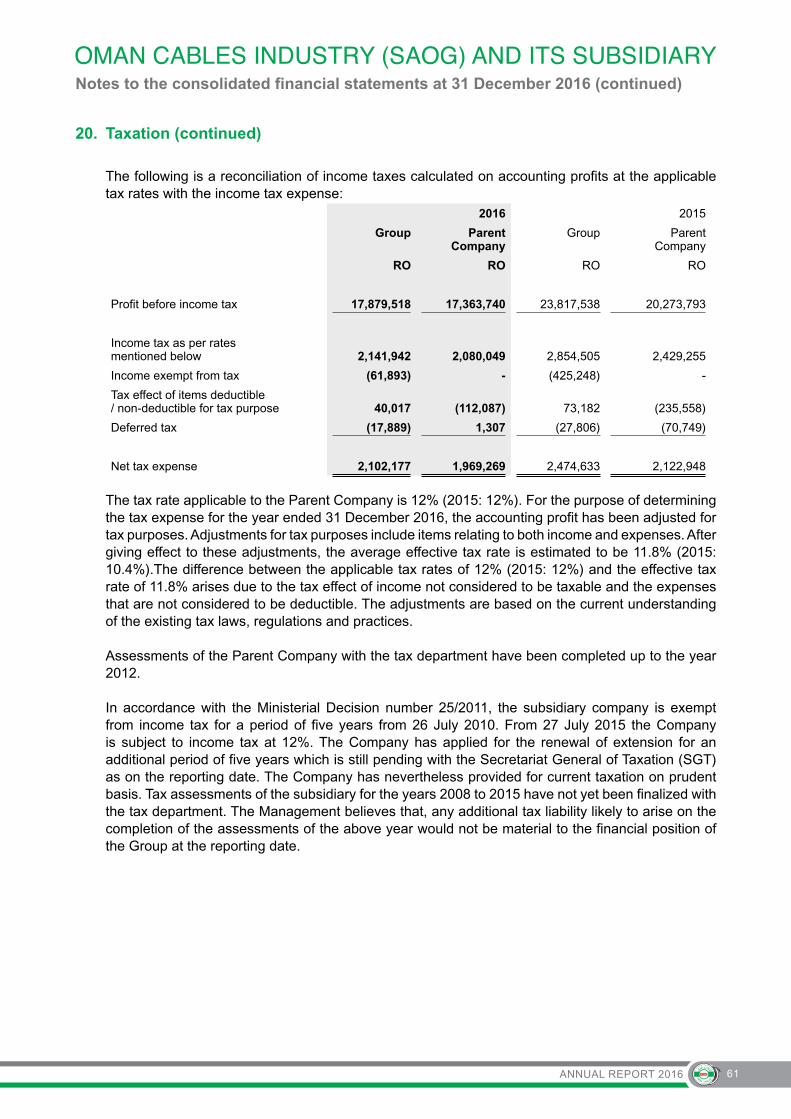
ANNUAL REPORT 2016 61
Notes to the consolidated financial statements at 31 December 2016 (continued)
20. Taxation (continued)
The following is a reconciliation of income taxes calculated on accounting profits at the applicable tax rates with the income tax expense:
2016 2015
Group Parent Company
Group Parent Company
RO RO RO RO
Profit before income tax 17,879,518 17,363,740 23,817,538 20,273,793
Income tax as per ratesmentioned below 2,141,942 2,080,049 2,854,505 2,429,255
Income exempt from tax (61,893) - (425,248) -
Tax effect of items deductible/ non-deductible for tax purpose 40,017 (112,087) 73,182 (235,558)
Deferred tax (17,889) 1,307 (27,806) (70,749)
Net tax expense 2,102,177 1,969,269 2,474,633 2,122,948
The tax rate applicable to the Parent Company is 12% (2015: 12%). For the purpose of determining the tax expense for the year ended 31 December 2016, the accounting profit has been adjusted for tax purposes. Adjustments for tax purposes include items relating to both income and expenses. After giving effect to these adjustments, the average effective tax rate is estimated to be 11.8% (2015: 10.4%).The difference between the applicable tax rates of 12% (2015: 12%) and the effective tax rate of 11.8% arises due to the tax effect of income not considered to be taxable and the expenses that are not considered to be deductible. The adjustments are based on the current understanding of the existing tax laws, regulations and practices.
Assessments of the Parent Company with the tax department have been completed up to the year 2012.
In accordance with the Ministerial Decision number 25/2011, the subsidiary company is exempt from income tax for a period of five years from 26 July 2010. From 27 July 2015 the Company is subject to income tax at 12%. The Company has applied for the renewal of extension for an additional period of five years which is still pending with the Secretariat General of Taxation (SGT) as on the reporting date. The Company has nevertheless provided for current taxation on prudent basis. Tax assessments of the subsidiary for the years 2008 to 2015 have not yet been finalized with the tax department. The Management believes that, any additional tax liability likely to arise on the completion of the assessments of the above year would not be material to the financial position of the Group at the reporting date.

ANNUAL REPORT 201662
Notes to the consolidated financial statements at 31 December 2016 (continued)
21. End of service benefits
Movement in the liability towards end of service benefits recognised in the statement of financial position is as follows:
2016 2015
GroupParent
Company GroupParent
Company
RO RO RO RO
At 1 January 1,558,729 1,456,252 1,428,290 1,355,291
Accrued during the year 226,512 193,812 218,994 183,376
Employees’ end of service benefits paid (349,645) (333,623) (88,555) (82,415)
At 31 December 1,435,596 1,316,441 1,558,729 1,456,252
22. Trade and other payables
Trade payables 16,823,658 14,067,909 12,547,172 7,841,712
Other payables 517,289 266,355 601,149 348,437
Derivatives designated and effective as hedging instruments carried at fair value (Note 18)
- - 1,250,385 1,250,385
Accruals 4,918,214 4,263,490 4,643,822 3,518,313
22,259,161 18,597,754 19,042,528 12,958,847
23. Bank borrowings
Overdrafts - - 76,888 76,888
Loans against trust receipts - - 17,919,780 17,919,780
Short term loans 9,619,910 3,500,000 15,141,450 11,100,000
9,619,910 3,500,000 33,138,118 29,096,668
The Parent Company avails short-term loans from commercial banks for a period ranging up to 180 days (2015 – 180 days). Bank borrowings carry interest at commercial rates.

ANNUAL REPORT 2016 63
Notes to the consolidated financial statements at 31 December 2016 (continued)
24. Cost of sales
2016 2015
Group Parent Company
Group Parent Company
RO RO RO RO
Cost of materials consumed 186,390,318 164,199,054 233,982,881 194,940,331
Employee costs 5,606,344 4,965,921 5,548,628 4,621,996
Depreciation 3,418,691 2,354,296 3,400,465 2,520,184
Stores, consumables,repairs and maintenance 2,319,601 1,473,996 2,769,413 1,291,248
Electricity and water 1,206,521 825,203 1,285,999 881,253
Provision for slow movinginventories (note 10) (24,470) - 256,470 200,000
Land lease rent 130,821 85,821 130,821 85,821
Loss on sale of property, plant and equipment - - 53,206 53,206
Other direct costs993,419 897,975 886,618 659,099
200,041,245 174,802,266 248,314,501 205,253,138
25. Other income
Insurance claim 28,530 21,355 13,074 13,074
Gain on sale of property, plant and equipment 5,207 5,207 2,162 -
Dividend from subsidiary - 683,904 - 2,601,000
Miscellaneous income 195,083 19,550 208,789 11,160
228,820 730,016 224,025 2,625,234
26. Administrative expenses
Employee costs 3,957,197 3,094,614 4,168,402 3,327,808
Insurance 223,002 159,619 150,959 150,959
Allowance for credit losses 100,000 100,000 450,000 400,000
Directors’ remuneration 197,800 197,800 188,950 188,950
Directors’ meeting attendance fees 2,200 2,200 82,871 11,050
Legal and professional charges 307,119 211,613 286,519 83,286
Repairs and maintenance 153,525 141,901 141,405 120,550
Communication 92,855 53,442 106,833 61,796
Travelling 68,468 26,444 79,090 44,676
Printing and stationery 47,193 46,316 53,874 47,248
Contributions to local organizations 100,000 100,000 100,000 100,000
Vehicle running and Maintenance 48,545 23,646 50,032 17,971
Service charges 6,000 6,000 6,000 6,000
Employee claim settlement 557,190 557,190 - -
Other sundry expenses 218,815 169,690 358,271 257,265
6,079,909 4,890,475 6,223,206 4,817,559
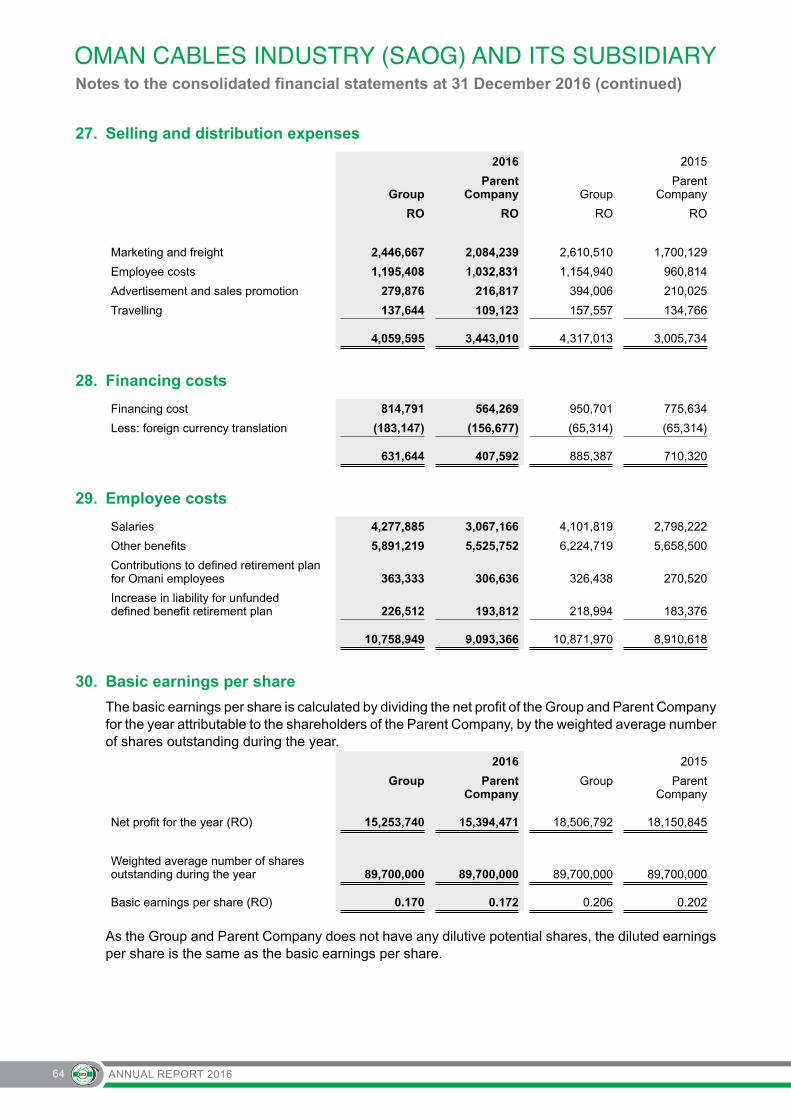
ANNUAL REPORT 201664
Notes to the consolidated financial statements at 31 December 2016 (continued)
27. Selling and distribution expenses
2016 2015
GroupParent
Company GroupParent
Company
RO RO RO RO
Marketing and freight 2,446,667 2,084,239 2,610,510 1,700,129
Employee costs 1,195,408 1,032,831 1,154,940 960,814
Advertisement and sales promotion 279,876 216,817 394,006 210,025
Travelling 137,644 109,123 157,557 134,766
4,059,595 3,443,010 4,317,013 3,005,734
28. Financing costs
Financing cost 814,791 564,269 950,701 775,634
Less: foreign currency translation (183,147) (156,677) (65,314) (65,314)
631,644 407,592 885,387 710,320
29. Employee costs
Salaries 4,277,885 3,067,166 4,101,819 2,798,222
Other benefits 5,891,219 5,525,752 6,224,719 5,658,500
Contributions to defined retirement plan for Omani employees 363,333 306,636 326,438 270,520
Increase in liability for unfunded defined benefit retirement plan 226,512 193,812 218,994 183,376
10,758,949 9,093,366 10,871,970 8,910,618
30. Basic earnings per share
The basic earnings per share is calculated by dividing the net profit of the Group and Parent Company for the year attributable to the shareholders of the Parent Company, by the weighted average number of shares outstanding during the year.
2016 2015
Group Parent Company
Group Parent Company
Net profit for the year (RO) 15,253,740 15,394,471 18,506,792 18,150,845
Weighted average number of shares outstanding during the year 89,700,000 89,700,000 89,700,000 89,700,000
Basic earnings per share (RO) 0.170 0.172 0.206 0.202
As the Group and Parent Company does not have any dilutive potential shares, the diluted earnings per share is the same as the basic earnings per share.
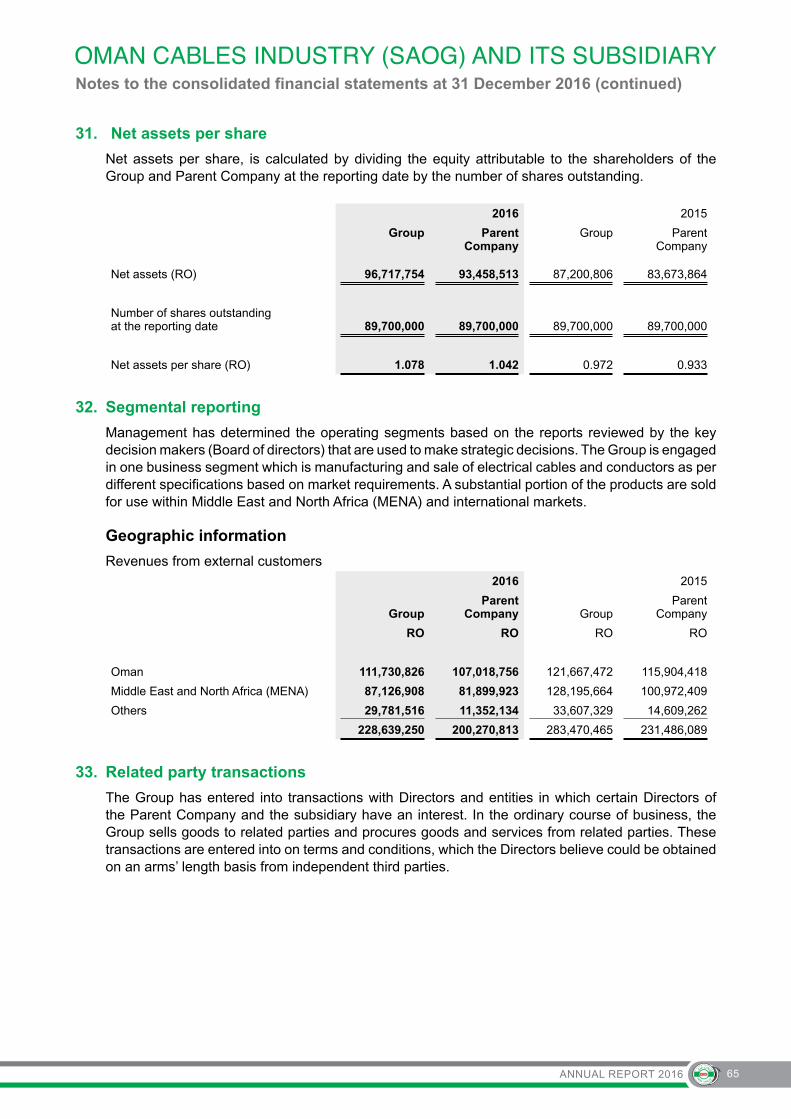
ANNUAL REPORT 2016 65
Notes to the consolidated financial statements at 31 December 2016 (continued)
31. Net assets per share
Net assets per share, is calculated by dividing the equity attributable to the shareholders of the Group and Parent Company at the reporting date by the number of shares outstanding.
2016 2015
Group Parent Company
Group Parent Company
Net assets (RO) 96,717,754 93,458,513 87,200,806 83,673,864
Number of shares outstanding at the reporting date 89,700,000 89,700,000 89,700,000 89,700,000
Net assets per share (RO) 1.078 1.042 0.972 0.933
32. Segmental reporting
Management has determined the operating segments based on the reports reviewed by the key decision makers (Board of directors) that are used to make strategic decisions. The Group is engaged in one business segment which is manufacturing and sale of electrical cables and conductors as per different specifications based on market requirements. A substantial portion of the products are sold for use within Middle East and North Africa (MENA) and international markets.
Geographic information
Revenues from external customers2016 2015
GroupParent
Company GroupParent
Company
RO RO RO RO
Oman 111,730,826 107,018,756 121,667,472 115,904,418
Middle East and North Africa (MENA) 87,126,908 81,899,923 128,195,664 100,972,409
Others 29,781,516 11,352,134 33,607,329 14,609,262
228,639,250 200,270,813 283,470,465 231,486,089
33. Related party transactions
The Group has entered into transactions with Directors and entities in which certain Directors of the Parent Company and the subsidiary have an interest. In the ordinary course of business, the Group sells goods to related parties and procures goods and services from related parties. These transactions are entered into on terms and conditions, which the Directors believe could be obtained on an arms’ length basis from independent third parties.
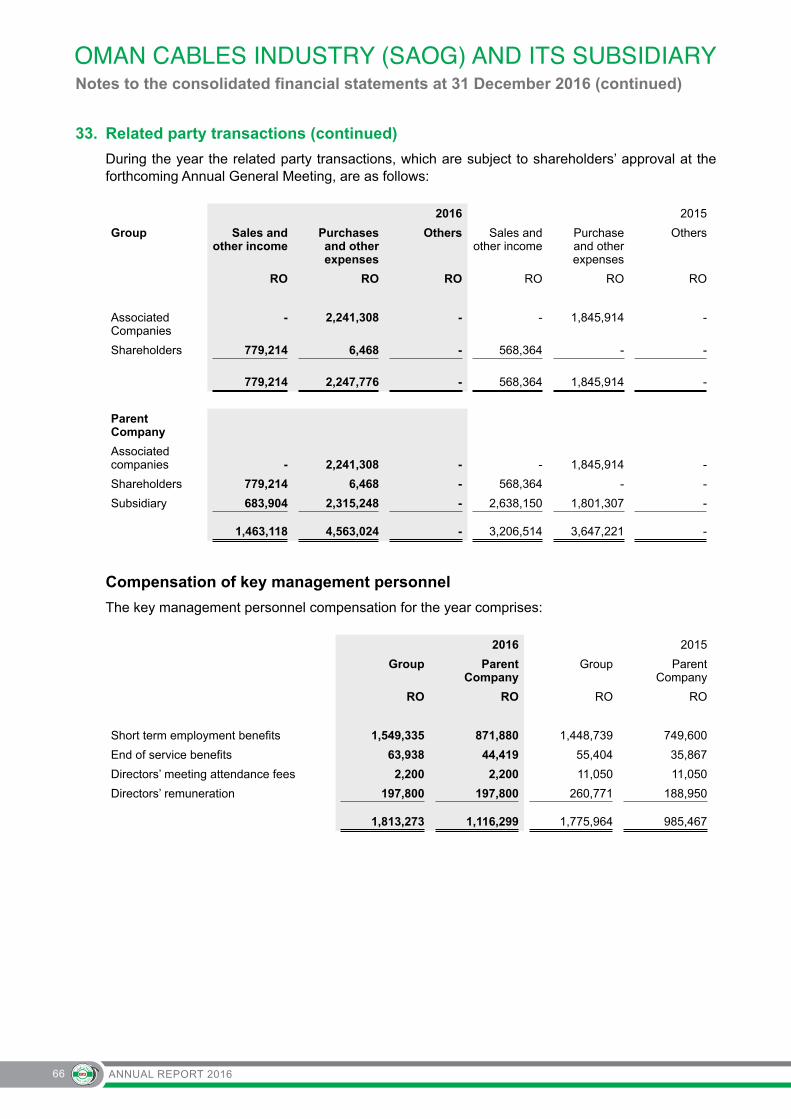
ANNUAL REPORT 201666
Notes to the consolidated financial statements at 31 December 2016 (continued)
33. Related party transactions (continued)
During the year the related party transactions, which are subject to shareholders’ approval at the forthcoming Annual General Meeting, are as follows:
2016 2015
Group Sales and other income
Purchases and other expenses
Others Sales and other income
Purchase and other expenses
Others
RO RO RO RO RO RO
Associated Companies
- 2,241,308 - - 1,845,914 -
Shareholders 779,214 6,468 - 568,364 - -
779,214 2,247,776 - 568,364 1,845,914 -
Parent Company
Associatedcompanies - 2,241,308 - - 1,845,914 -
Shareholders 779,214 6,468 - 568,364 - -
Subsidiary 683,904 2,315,248 - 2,638,150 1,801,307 -
1,463,118 4,563,024 - 3,206,514 3,647,221 -
Compensation of key management personnel
The key management personnel compensation for the year comprises:
2016 2015
Group Parent Company
Group Parent Company
RO RO RO RO
Short term employment benefits 1,549,335 871,880 1,448,739 749,600
End of service benefits 63,938 44,419 55,404 35,867
Directors’ meeting attendance fees 2,200 2,200 11,050 11,050
Directors’ remuneration 197,800 197,800 260,771 188,950
1,813,273 1,116,299 1,775,964 985,467
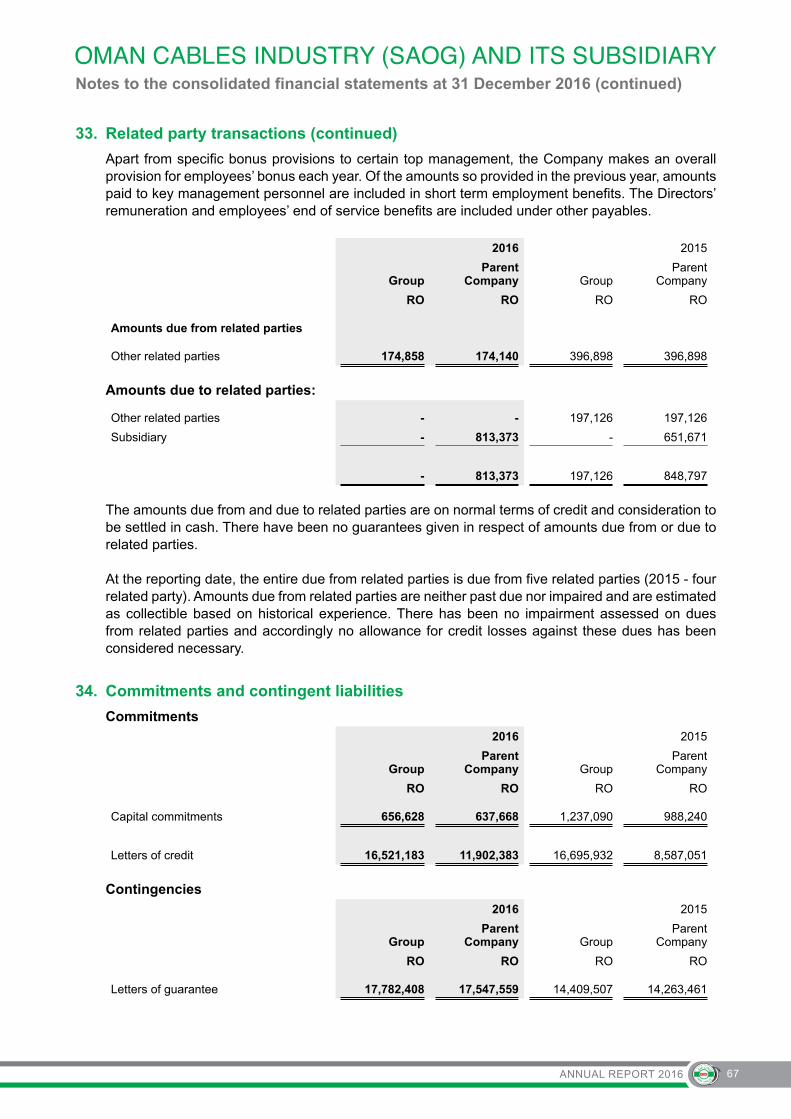
ANNUAL REPORT 2016 67
Notes to the consolidated financial statements at 31 December 2016 (continued)
33. Related party transactions (continued)
Apart from specific bonus provisions to certain top management, the Company makes an overall provision for employees’ bonus each year. Of the amounts so provided in the previous year, amounts paid to key management personnel are included in short term employment benefits. The Directors’ remuneration and employees’ end of service benefits are included under other payables.
2016 2015
GroupParent
Company GroupParent
Company
RO RO RO RO
Amounts due from related parties
Other related parties 174,858 174,140 396,898 396,898
Amounts due to related parties:
Other related parties - - 197,126 197,126
Subsidiary - 813,373 - 651,671
- 813,373 197,126 848,797
The amounts due from and due to related parties are on normal terms of credit and consideration to be settled in cash. There have been no guarantees given in respect of amounts due from or due to related parties.
At the reporting date, the entire due from related parties is due from five related parties (2015 - four related party). Amounts due from related parties are neither past due nor impaired and are estimated as collectible based on historical experience. There has been no impairment assessed on dues from related parties and accordingly no allowance for credit losses against these dues has been considered necessary.
34. Commitments and contingent liabilities
Commitments2016 2015
GroupParent
Company GroupParent
Company
RO RO RO RO
Capital commitments 656,628 637,668 1,237,090 988,240
Letters of credit 16,521,183 11,902,383 16,695,932 8,587,051
Contingencies2016 2015
GroupParent
Company GroupParent
Company
RO RO RO RO
Letters of guarantee 17,782,408 17,547,559 14,409,507 14,263,461

ANNUAL REPORT 201668
Notes to the consolidated financial statements at 31 December 2016 (continued)
35. Leases
The Parent Company has leased land for factory premises, at Rusayl, from the Public Establishment for Industrial Estates (PEIE), under agreements that expire over periods ranging up to 30 September 2036. Payment of lease rentals to PEIE in respect of the plot that expires on 22 June 2026 commenced on 2 June 2012 as the lease rentals until that date will be set off against certain amounts due to the Parent Company for having developed the land. The subsidiary has entered into a lease agreement on 6 January 2009 in respect of the land used for factory premises, which is valid until 5 January 2034.
At the reporting date future minimum lease commitments under non-cancellable operating leases were as follows:
2016 2015
GroupParent
Company GroupParent
Company
RO RO RO RO
Less than one year 130,825 85,825 130,825 85,825
Between one and five years 676,343 496,343 658,816 478,816
More than five years 1,587,196 1,047,196 1,725,162 1,140,162
2,394,364 1,629,364 2,514,803 1,704,803
36. Financial instruments and related risk management
The Group’s principal financial liabilities other than derivatives, comprise loans and borrowings, trade and other payables. The main purpose of these financial liabilities is to raise finances for the Group’s operations. The Group principal financial assets comprise loans, trade and other receivables, and cash and short-term deposits that arrive directly from its operations. The Group also holds available-for-sale investments, held to maturity investments and enters into derivative transactions.
The Group’s activities expose it to various financial risks, primarily being, credit risk, market risk (including currency risk, interest rate risk, and price risk) and liquidity risk. The Group’s risk management is carried out internally in accordance with the policies approved by the Board of Directors.
Credit risk
Credit risk is the risk of financial loss to the Company if a customer fails to meet its contractual obligations and arises principally from the Company’s receivables.
Credit risk primarily arises from credit exposures to customers, including outstanding receivables and committed transactions. The Group has a credit policy in place and exposure to credit risk is monitored on an ongoing basis. Credit evaluations are performed for all customers requiring credit over a certain amount. The Group seeks to limit its credit risk with respect to banks by only dealing with reputable banks and with respect to customers by setting credit limits for individual customers and monitoring outstanding receivables.
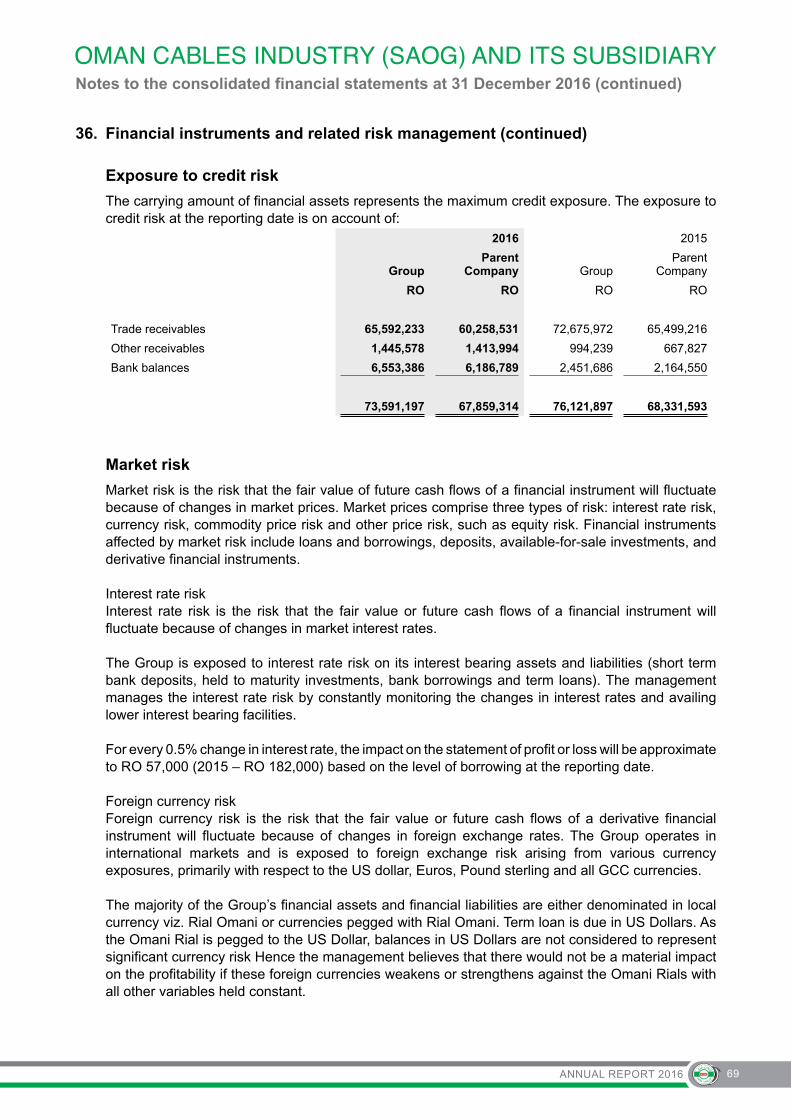
ANNUAL REPORT 2016 69
Notes to the consolidated financial statements at 31 December 2016 (continued)
36. Financial instruments and related risk management (continued)
Exposure to credit risk
The carrying amount of financial assets represents the maximum credit exposure. The exposure to credit risk at the reporting date is on account of:
2016 2015
GroupParent
Company GroupParent
Company
RO RO RO RO
Trade receivables 65,592,233 60,258,531 72,675,972 65,499,216
Other receivables 1,445,578 1,413,994 994,239 667,827
Bank balances 6,553,386 6,186,789 2,451,686 2,164,550
73,591,197 67,859,314 76,121,897 68,331,593
Market risk
Market risk is the risk that the fair value of future cash flows of a financial instrument will fluctuate because of changes in market prices. Market prices comprise three types of risk: interest rate risk, currency risk, commodity price risk and other price risk, such as equity risk. Financial instruments affected by market risk include loans and borrowings, deposits, available-for-sale investments, and derivative financial instruments.
Interest rate riskInterest rate risk is the risk that the fair value or future cash flows of a financial instrument will fluctuate because of changes in market interest rates.
The Group is exposed to interest rate risk on its interest bearing assets and liabilities (short term bank deposits, held to maturity investments, bank borrowings and term loans). The management manages the interest rate risk by constantly monitoring the changes in interest rates and availing lower interest bearing facilities.
For every 0.5% change in interest rate, the impact on the statement of profit or loss will be approximate to RO 57,000 (2015 – RO 182,000) based on the level of borrowing at the reporting date.
Foreign currency riskForeign currency risk is the risk that the fair value or future cash flows of a derivative financial instrument will fluctuate because of changes in foreign exchange rates. The Group operates in international markets and is exposed to foreign exchange risk arising from various currency exposures, primarily with respect to the US dollar, Euros, Pound sterling and all GCC currencies.
The majority of the Group’s financial assets and financial liabilities are either denominated in local currency viz. Rial Omani or currencies pegged with Rial Omani. Term loan is due in US Dollars. As the Omani Rial is pegged to the US Dollar, balances in US Dollars are not considered to represent significant currency risk Hence the management believes that there would not be a material impact on the profitability if these foreign currencies weakens or strengthens against the Omani Rials with all other variables held constant.

ANNUAL REPORT 201670
Notes to the consolidated financial statements at 31 December 2016 (continued)
36. Financial instruments and related risk management (continued)
Commodity price risk
The Group is affected by the volatility of certain commodities. Its operating activities require the ongoing purchase and manufacturing of electric cables and therefore require a continuous supply of Copper, Aluminium, and Lead. Due to the significantly increased volatility of the price of the underlying, the Group’s Board of Directors has developed and enacted a risk management strategy regarding commodity price risk and its mitigation.
To manage metal price fluctuation risk, the management uses futures contracts to hedge any significant risks arising from fluctuations in metal prices. Future contracts have maturities of less than one year after the reporting date. Hence the management believes that there would not be a material impact on the profitability if these commodity prices weakens or strengthens.
Equity price riskThe Group is exposed to price risk related to quoted investments held by the Group and traded in organized financial markets. To manage its price risk arising from investments in equity, the management continuously monitors the market and the key factors that effect stock market movements. The management believes that the impact of price fluctuation on the quoted investments will not be material considering the amount of quoted investments at the reporting date. At the reporting date the Group’s exposure to equity price risk is insignificant.
36. Financial instruments and related risk management
Liquidity risk
The Group maintains sufficient and approved bank credit limits to meet its obligations as they fall due for payment and is therefore not subjected to significant liquidity risk.
The table below summarizes the maturities of the Group and Parent Company’s undiscounted financial liabilities based on contractual payment dates.
Less than 3 months
3 to 6 months
6 months to 1 year
More than1 year Total
Parent Company RO RO RO RO RO
2016
Trade and other payables 16,757,514 364,787 1,475,453 - 18,597,754
Short term loan 1,500,000 2,000,000 - - 3,500,000
Amount due to related parties 487,787 325,586 - - 813,373
18,745,301 2,690,373 1,475,453 - 22,911,127
2015
Trade and other payables 11,561,385 84,114 1,313,348 - 12,958,847
Short term loan 11,100,000 - - - 11,100,000
Overdraft 76,888 - - - 76,888
Loans against trust receipts 1,854,207 16,065,573 - - 17,919,780
Amount due to related parties 473,869 374,928 - - 848,797
25,066,349 16,524,615 1,313,348 - 42,904,312

ANNUAL REPORT 2016 71
Notes to the consolidated financial statements at 31 December 2016 (continued)
36. Financial instruments and related risk management (continued)
Group Less than 3 months
3 to 6 months
6 months to 1 year
More than1 year Total
RO RO RO RO RO
2016
Trade and other payables 19,268,200 1,515,508 1,475,453 - 22,259,161
Term loans - 812,556 812,560 - 1,625,116
Short term loan 7,619,910 2,000,000 - - 9,619,910
26,888,110 4,328,064 2,288,013 - 33,504,187
2015
Trade and other payables 16,602,775 1,126,405 1,313,348 - 19,042,528
Term loans - 812,560 812,560 1,625,116 3,250,236
Short term loan 15,141,450 - - - 15,141,450
Overdraft 76,888 - - - 76,888
Loans against trust receipts 1,854,207 16,065,573 - - 17,919,780
Amount due to related parties 197,126 - - - 197,126
33,872,446 18,004,538 2,125,908 1,625,116 55,628,008

ANNUAL REPORT 201672
37. F
air
valu
es o
f fi
nan
cial
inst
rum
ents
Fai
r va
lues
Fin
anci
al in
stru
men
ts c
ompr
ise
finan
cial
ass
et,
finan
cial
liab
ilitie
s an
d de
rivat
ives
. F
inan
cial
ass
ets
cons
ist
of b
ank
bala
nces
, re
ceiv
able
s an
d av
aila
ble-
for-
sale
inv
estm
ents
. F
inan
cial
lia
bilit
ies
cons
ist
of t
erm
loa
ns a
nd t
rade
and
oth
er p
ayab
les.
Der
ivat
ives
rel
ates
to
forw
ard
curr
ency
and
com
mod
ity
hedg
ing
cont
ract
s. S
et o
ut b
elow
is a
com
paris
on b
y cl
ass
of t
he c
arry
ing
amou
nts
and
fair
valu
e of
the
Gro
up’s
fin
anci
al in
stru
men
ts t
hat
are
carr
ied
in
the
finan
cial
sta
tem
ents
.
Car
ryin
g a
mo
un
tF
air
Val
ue
2016
2015
2016
2015
Gro
up
Par
ent
Co
mp
any
Gro
up
Par
ent
Com
pany
Gro
up
Par
ent
Co
mp
any
Gro
up
Par
ent
Com
pany
RO
RO
RO
RO
RO
RO
RO
RO
Fin
anci
al a
sset
s
Tra
de a
nd o
ther
rec
eiva
bles
65,3
46,2
8759
,953
,916
72,1
46,3
2164
,510
,379
65,3
46,2
8759
,953
,916
72,1
46,3
2164
,510
,379
Ava
ilabl
e fo
r sa
le in
vest
men
ts23
0,01
723
0,01
711
9,06
711
9,06
723
0,01
723
0,01
711
9,06
711
9,06
7
Hel
d to
mat
urity
inve
stm
ents
1,00
0,00
01,
000,
000
1,25
1,20
41,
251,
204
1,00
0,00
01,
000,
000
1,25
1,20
41,
251,
204
Due
from
rel
ated
par
ties
174,
858
174,
140
396,
898
396,
898
174,
858
174,
140
396,
898
396,
898
Cas
h an
d ba
nk b
alan
ces
6,60
1,23
26,
231,
852
2,48
5,41
62,
193,
260
6,60
1,23
26,
231,
852
2,48
5,41
62,
193,
260
73,3
52,3
9467
,589
,925
76,3
98,9
0668
,470
,808
73,3
52,3
9467
,589
,925
76,3
98,9
0668
,470
,808
Fin
anci
al li
abili
ties
Tra
de a
nd o
ther
pay
able
s22
,259
,161
18,5
97,7
5419
,042
,528
12,9
58,8
4722
,259
,161
18,5
97,7
5419
,042
,528
12,9
58,8
47
Due
to r
elat
ed p
artie
s -
813,
373
197,
126
848,
797
-81
3,37
319
7,12
684
8,79
7
Ban
k bo
rrow
ings
9,61
9,91
03,
500,
000
33,1
38,1
1829
,096
,668
9,61
9,91
03,
500,
000
33,1
38,1
1829
,096
,668
Term
loan
s1,
625,
116
-3,
250,
236
-1,
625,
116
-3,
250,
236
-
33,5
04,1
8722
,911
,127
55,6
28,0
0842
,904
,312
33,5
04,1
8722
,911
,127
55,6
28,0
0842
,904
,312
No
tes
to t
he
con
solid
ated
fin
anci
al s
tate
men
ts a
t 31
Dec
emb
er 2
016
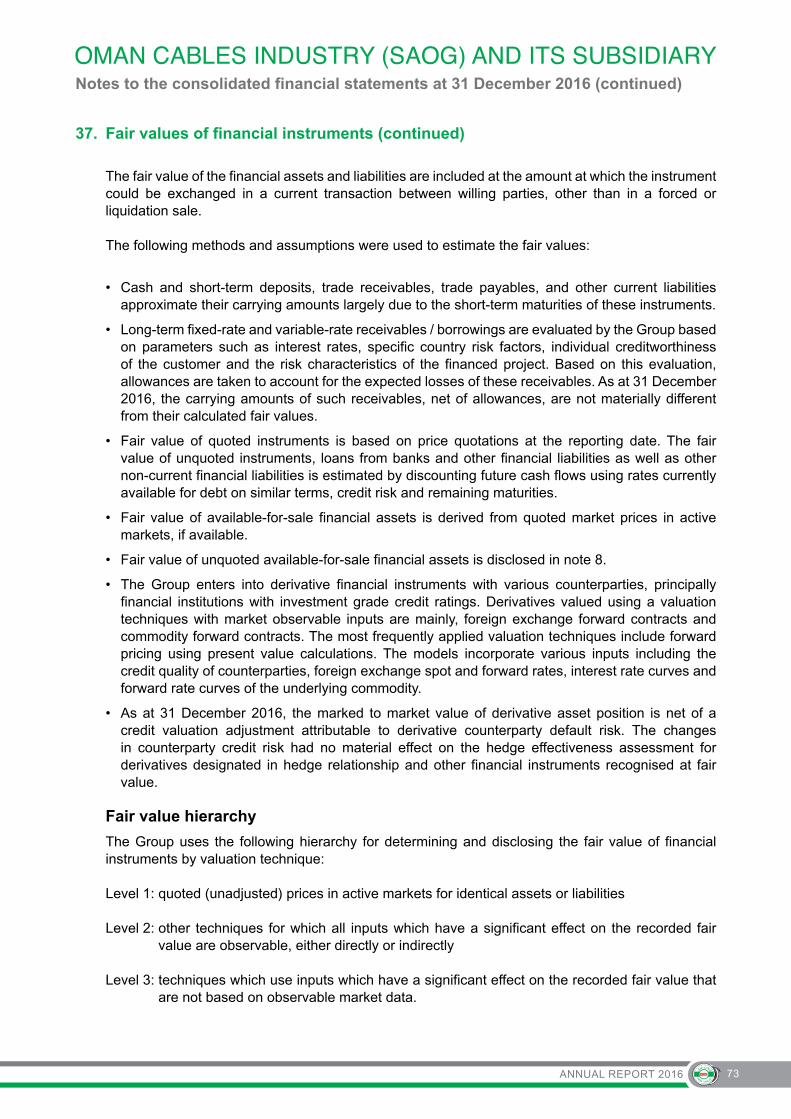
ANNUAL REPORT 2016 73
Notes to the consolidated financial statements at 31 December 2016 (continued)
37. Fair values of financial instruments (continued)
The fair value of the financial assets and liabilities are included at the amount at which the instrument could be exchanged in a current transaction between willing parties, other than in a forced or liquidation sale.
The following methods and assumptions were used to estimate the fair values:
• Cash and short-term deposits, trade receivables, trade payables, and other current liabilities approximate their carrying amounts largely due to the short-term maturities of these instruments.
• Long-term fixed-rate and variable-rate receivables / borrowings are evaluated by the Group based on parameters such as interest rates, specific country risk factors, individual creditworthiness of the customer and the risk characteristics of the financed project. Based on this evaluation, allowances are taken to account for the expected losses of these receivables. As at 31 December 2016, the carrying amounts of such receivables, net of allowances, are not materially different from their calculated fair values.
• Fair value of quoted instruments is based on price quotations at the reporting date. The fair value of unquoted instruments, loans from banks and other financial liabilities as well as other non-current financial liabilities is estimated by discounting future cash flows using rates currently available for debt on similar terms, credit risk and remaining maturities.
• Fair value of available-for-sale financial assets is derived from quoted market prices in active markets, if available.
• Fair value of unquoted available-for-sale financial assets is disclosed in note 8.
• The Group enters into derivative financial instruments with various counterparties, principally financial institutions with investment grade credit ratings. Derivatives valued using a valuation techniques with market observable inputs are mainly, foreign exchange forward contracts and commodity forward contracts. The most frequently applied valuation techniques include forward pricing using present value calculations. The models incorporate various inputs including the credit quality of counterparties, foreign exchange spot and forward rates, interest rate curves and forward rate curves of the underlying commodity.
• As at 31 December 2016, the marked to market value of derivative asset position is net of a credit valuation adjustment attributable to derivative counterparty default risk. The changes in counterparty credit risk had no material effect on the hedge effectiveness assessment for derivatives designated in hedge relationship and other financial instruments recognised at fair value.
Fair value hierarchy
The Group uses the following hierarchy for determining and disclosing the fair value of financial instruments by valuation technique:
Level 1: quoted (unadjusted) prices in active markets for identical assets or liabilities
Level 2: other techniques for which all inputs which have a significant effect on the recorded fair value are observable, either directly or indirectly
Level 3: techniques which use inputs which have a significant effect on the recorded fair value that are not based on observable market data.
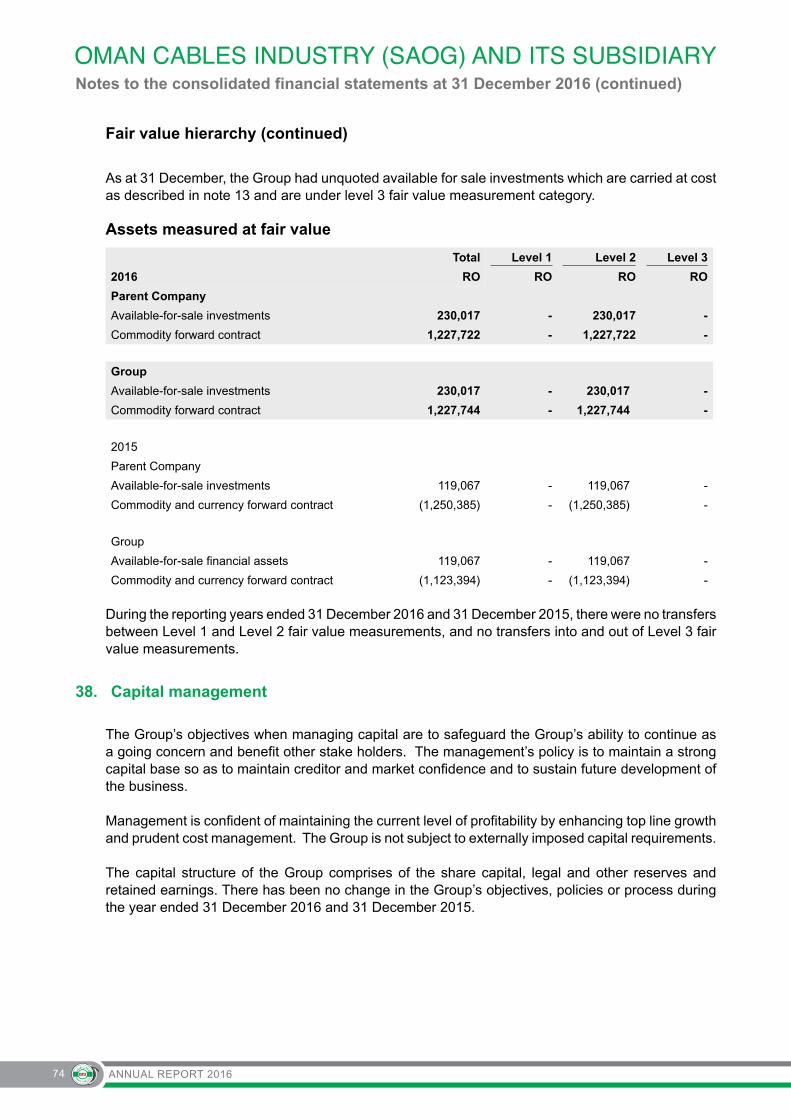
ANNUAL REPORT 201674
Notes to the consolidated financial statements at 31 December 2016 (continued)
Fair value hierarchy (continued)
As at 31 December, the Group had unquoted available for sale investments which are carried at cost as described in note 13 and are under level 3 fair value measurement category.
Assets measured at fair value
Total Level 1 Level 2 Level 3
2016 RO RO RO RO
Parent Company
Available-for-sale investments 230,017 - 230,017 -
Commodity forward contract 1,227,722 - 1,227,722 -
Group
Available-for-sale investments 230,017 - 230,017 -
Commodity forward contract 1,227,744 - 1,227,744 -
2015
Parent Company
Available-for-sale investments 119,067 - 119,067 -
Commodity and currency forward contract (1,250,385) - (1,250,385) -
Group
Available-for-sale financial assets 119,067 - 119,067 -
Commodity and currency forward contract (1,123,394) - (1,123,394) -
During the reporting years ended 31 December 2016 and 31 December 2015, there were no transfers between Level 1 and Level 2 fair value measurements, and no transfers into and out of Level 3 fair value measurements.
38. Capital management
The Group’s objectives when managing capital are to safeguard the Group’s ability to continue as a going concern and benefit other stake holders. The management’s policy is to maintain a strong capital base so as to maintain creditor and market confidence and to sustain future development of the business.
Management is confident of maintaining the current level of profitability by enhancing top line growth and prudent cost management. The Group is not subject to externally imposed capital requirements.
The capital structure of the Group comprises of the share capital, legal and other reserves and retained earnings. There has been no change in the Group’s objectives, policies or process during the year ended 31 December 2016 and 31 December 2015.