annual report 2016 - serabi gold
TRANSCRIPT
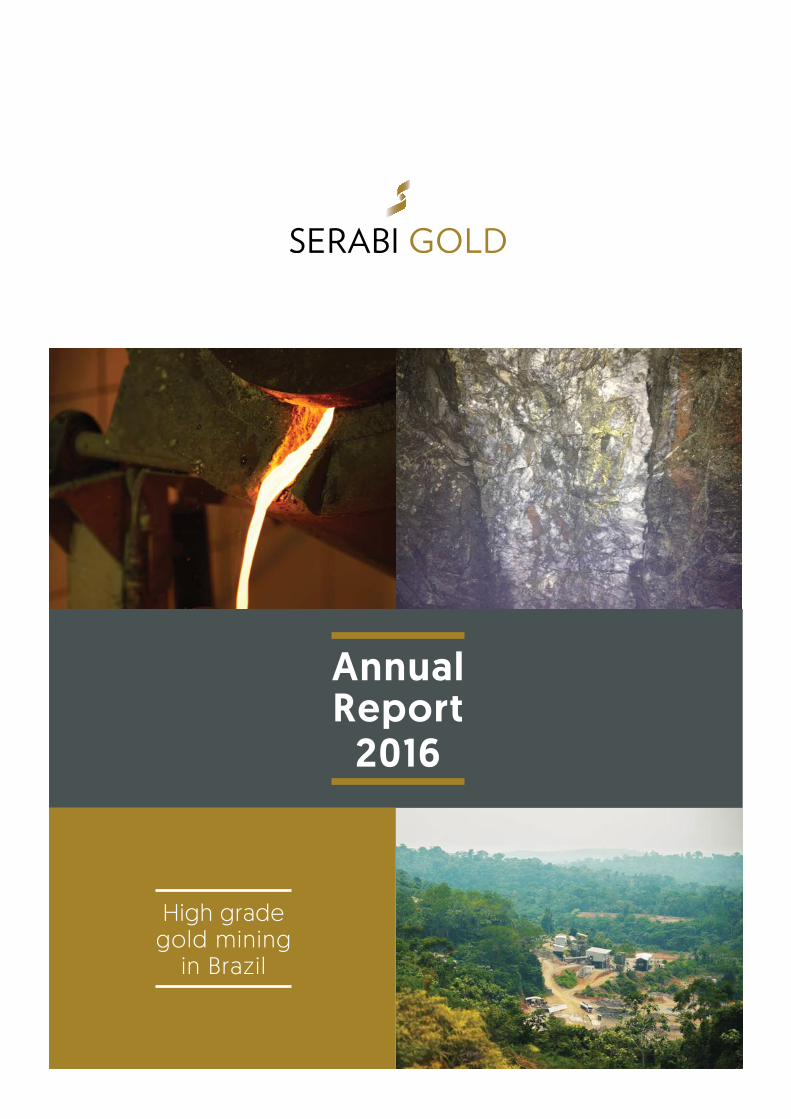
Annual Report
2016
High grade gold mining
in Brazil
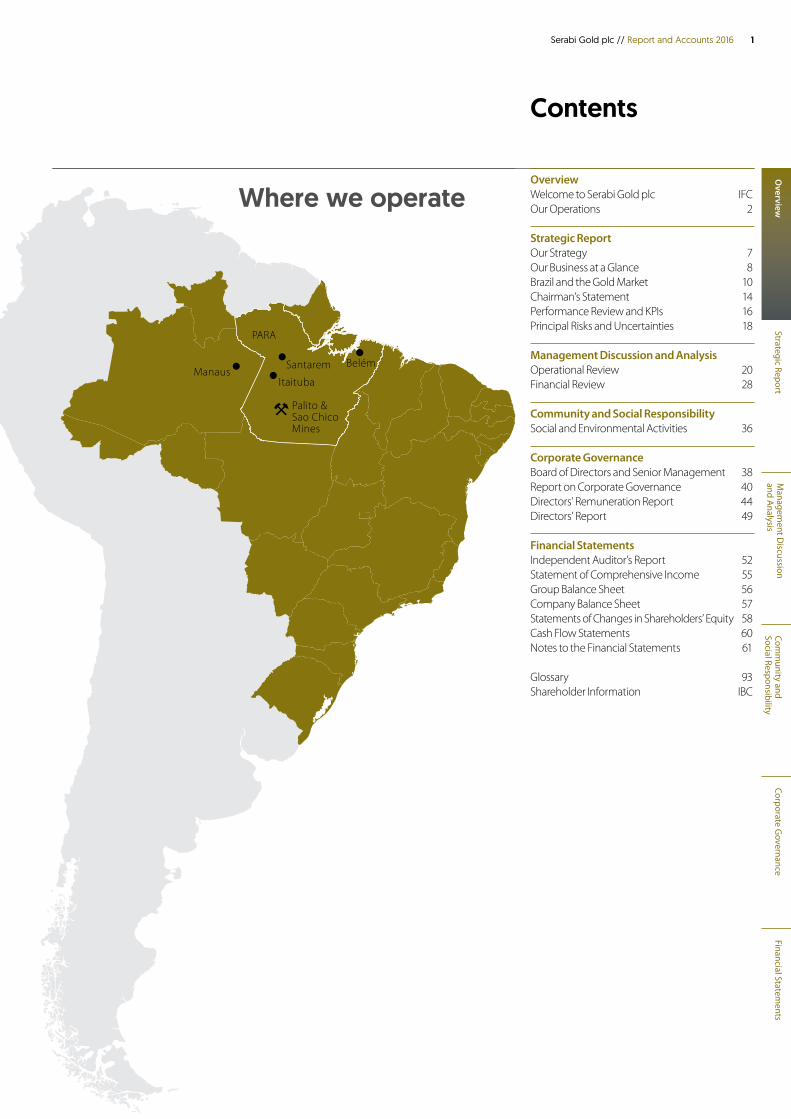
PARA
Santarem
Itaituba
Palito & Sao Chico Mines
BelémManaus
OVERVIEW
Welcome to Serabi Gold plc
Its shares are listed on both the TSX in Canada (ticker “SBI”) and AIM in London (ticker “SRB”).
The Company benefits from a strong operational management team, with extensive experience of South America and Brazil in particular. Having established a solid production base, management is now seeking to grow the company both organically and through acquisitions.
The Tapajos region is an area of significant historic artisanal gold production but systematic exploration has been limited and underlying hard–rock resources identified to date represent less than 25 per cent of the total reported artisanal production, indicative that significant levels of hard-rock resources remain to be discovered. Serabi is the only company operating a hard-rock mine in this 100,000 square kilometre area.
Serabi holds over 40,000 hectares of contiguous exploration tenement located around its current operations, located close to regional infrastructure and Serabi has established a proven formula for further resource growth. Management consider that Serabi is therefore well placed to significantly expand its potential over the next couple of years.
Serabi Gold plc // Report and Accounts 2016
Serabi Gold plc is engaged in the evaluation and development of gold projects in Brazil currently producing 40,000 ounces of gold per annum from its high grade (9 grammes per tonne ("g/t") of gold) underground mining operations located in the Tapajos region of Para state.
2016 Highlights
39,390 ouncesA 21% improvement compared with 2015
US$11.30 million Gross profit from operations
• Record annual full year production of 39,390 ounces of gold, exceeding guidance and representing a 21 per cent improvement compared with 2015.
• Gross profit from operations of US$11.30 million for 2016, which represents an improvement of over 99 per cent compared to the same 12 month period of 2015.
• Post tax profit of US$4.43 million compared with a loss of US$0.048 million for the same 12 month period of 2015.
• Earnings per share of 0.66 cents for 2016.• All-In Sustaining Cost for the year of US$965
per ounce.• Cash Cost for the year of US$770 per ounce.• Cash holdings of US$4.16 million at 31 December
2016.• Total tonnage mined of approximately 159,000
tonnes, a 17 per cent increase compared with the preceding year.
• Total tonnage processed of approximately 159,000 tonnes, representing a 22 per cent improvement compared with 2015.
• Milled ore grades of 8.11 grammes per tonne (“g/t”) of gold.
• New exploration licences at Sao Chico have been acquired immediately to the east and west of the Sao Chico Mine deposit, offering excellent opportunity to expand the deposit, with exploration already underway.
• Ground induced polarisation (“IP”) survey undertaken at Sao Chico has identified some excellent targets within 500 metres of the current operation.
• The Company has three additional gold discoveries within three kilometres of the Palito deposit providing further potential for near term resource and production growth.
PARA
Santarem
Itaituba
Palito & Sao Chico Mines
BelémManaus
Overview
1Serabi Gold plc // Report and Accounts 2016
Strategic ReportM
anagement D
iscussion and A
nalysisCom
munity and
Social ResponsibilityCorporate G
overnanceFinancial Statem
ents
OverviewWelcome to Serabi Gold plc IFCOur Operations 2
Strategic ReportOur Strategy 7Our Business at a Glance 8Brazil and the Gold Market 10Chairman’s Statement 14Performance Review and KPIs 16Principal Risks and Uncertainties 18
Management Discussion and AnalysisOperational Review 20Financial Review 28
Community and Social ResponsibilitySocial and Environmental Activities 36
Corporate GovernanceBoard of Directors and Senior Management 38Report on Corporate Governance 40Directors’ Remuneration Report 44Directors’ Report 49
Financial StatementsIndependent Auditor’s Report 52Statement of Comprehensive Income 55Group Balance Sheet 56Company Balance Sheet 57Statements of Changes in Shareholders’ Equity 58Cash Flow Statements 60Notes to the Financial Statements 61
Glossary 93Shareholder Information IBC
Contents
Where we operate
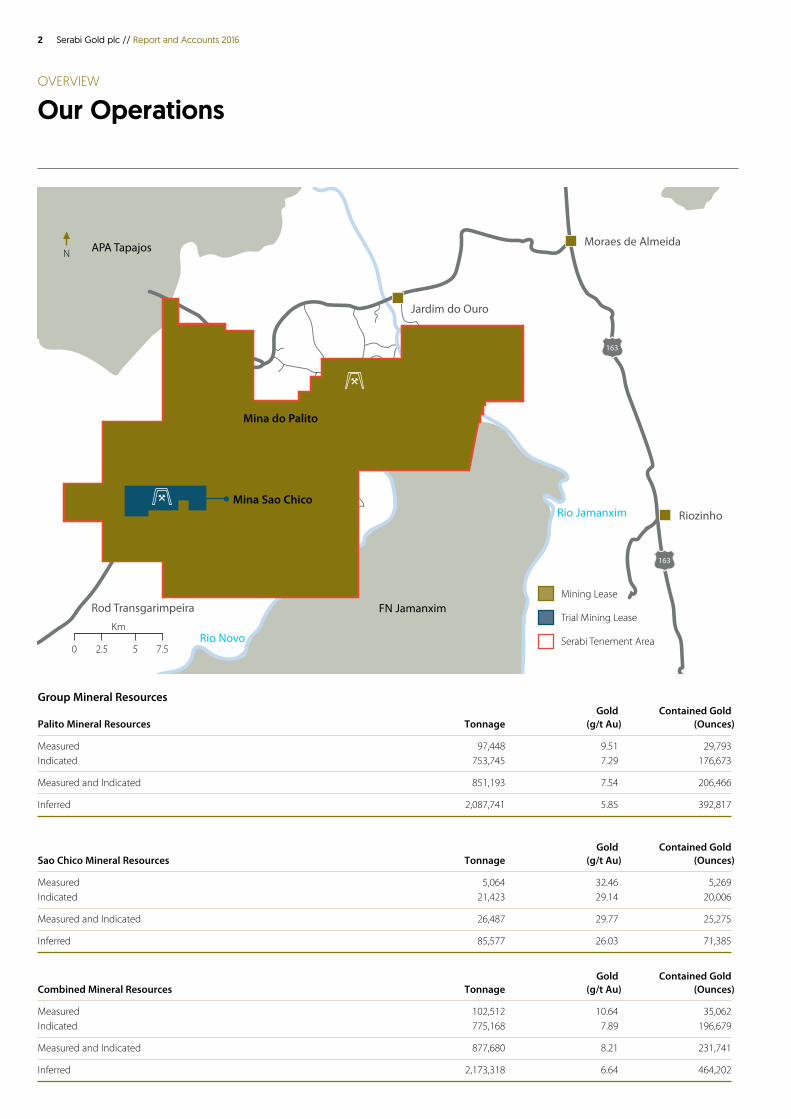
APA Tapajos Moraes de Almeida
Riozinho
Mining Lease
Trial Mining Lease
Serabi Tenement Area
FN JamanximRod Transgarimpeira
Mina Sao Chico
Mina do Palito
Jardim do Ouro
Rio Novo
Rio Jamanxim
163
163
0 2.5 5 7.5
Km
N
2 Serabi Gold plc // Report and Accounts 2016
OVERVIEW
Our Operations
Group Mineral Resources Gold Contained Gold Palito Mineral Resources Tonnage (g/t Au) (Ounces)
Measured 97,448 9.51 29,793Indicated 753,745 7.29 176,673
Measured and Indicated 851,193 7.54 206,466
Inferred 2,087,741 5.85 392,817
Gold Contained Gold Sao Chico Mineral Resources Tonnage (g/t Au) (Ounces)
Measured 5,064 32.46 5,269Indicated 21,423 29.14 20,006
Measured and Indicated 26,487 29.77 25,275
Inferred 85,577 26.03 71,385
Gold Contained Gold Combined Mineral Resources Tonnage (g/t Au) (Ounces)
Measured 102,512 10.64 35,062Indicated 775,168 7.89 196,679
Measured and Indicated 877,680 8.21 231,741
Inferred 2,173,318 6.64 464,202
Overview
Strategic ReportM
anagement D
iscussion and A
nalysisCom
munity and
Social ResponsibilityCorporate G
overnanceFinancial Statem
ents
3Serabi Gold plc // Report and Accounts 2016
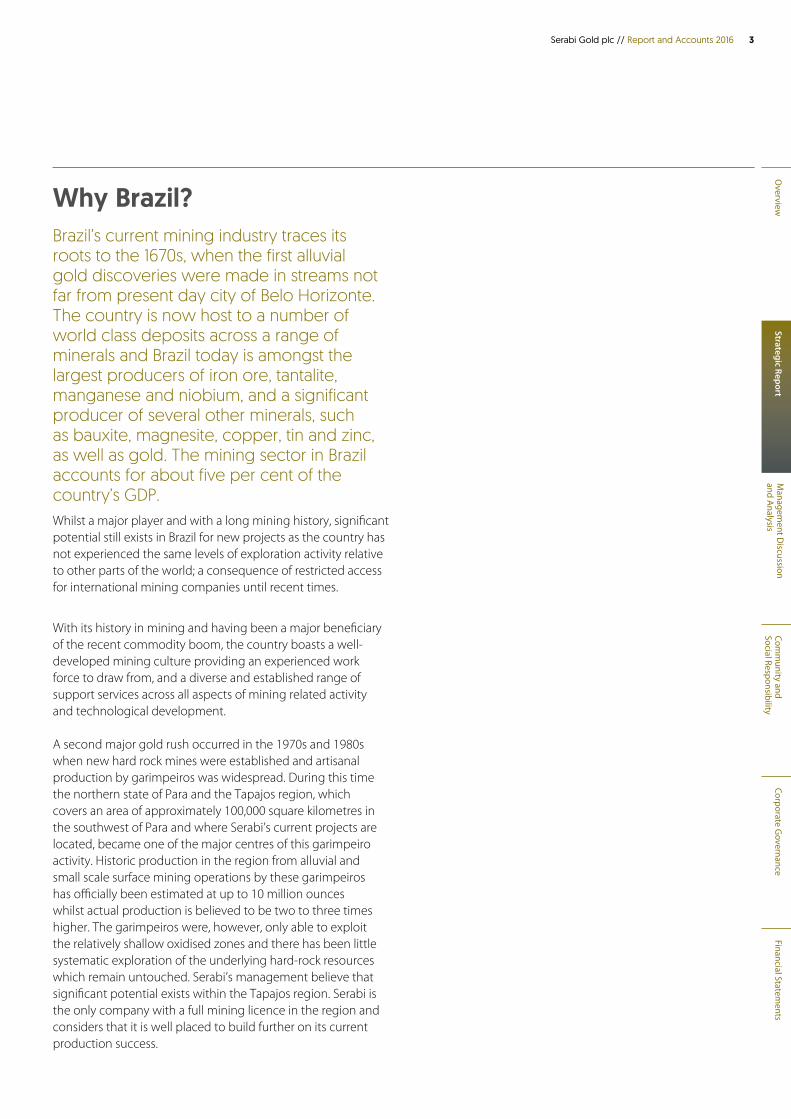
Why Brazil?Brazil’s current mining industry traces its roots to the 1670s, when the first alluvial gold discoveries were made in streams not far from present day city of Belo Horizonte. The country is now host to a number of world class deposits across a range of minerals and Brazil today is amongst the largest producers of iron ore, tantalite, manganese and niobium, and a significant producer of several other minerals, such as bauxite, magnesite, copper, tin and zinc, as well as gold. The mining sector in Brazil accounts for about five per cent of the country’s GDP.Whilst a major player and with a long mining history, significant potential still exists in Brazil for new projects as the country has not experienced the same levels of exploration activity relative to other parts of the world; a consequence of restricted access for international mining companies until recent times.
With its history in mining and having been a major beneficiary of the recent commodity boom, the country boasts a well-developed mining culture providing an experienced work force to draw from, and a diverse and established range of support services across all aspects of mining related activity and technological development.
A second major gold rush occurred in the 1970s and 1980s when new hard rock mines were established and artisanal production by garimpeiros was widespread. During this time the northern state of Para and the Tapajos region, which covers an area of approximately 100,000 square kilometres in the southwest of Para and where Serabi’s current projects are located, became one of the major centres of this garimpeiro activity. Historic production in the region from alluvial and small scale surface mining operations by these garimpeiros has officially been estimated at up to 10 million ounces whilst actual production is believed to be two to three times higher. The garimpeiros were, however, only able to exploit the relatively shallow oxidised zones and there has been little systematic exploration of the underlying hard-rock resources which remain untouched. Serabi’s management believe that significant potential exists within the Tapajos region. Serabi is the only company with a full mining licence in the region and considers that it is well placed to build further on its current production success.

4 Serabi Gold plc // Report and Accounts 2016
40,000 ouncesTarget production per annum
450 tonnes Daily mining rate
9.0g/tPlanned grade
PalitoThe Palito Mine is a narrow-vein underground mining operation and reflects Serabi’s desire to concentrate on high quality projects with low capital costs and early repayment of capital. The Palito Mine is a small-scale, high-grade operation using selective mining techniques with a production target of around 25,000 to 28,000 ounces per annum.
• Fully permitted. • Currently operating at 300 tonnes per day at 8-9 g/t gold.• Mining is undertaken by on-lode development followed by selective
open stoping between 30-40 metre vertically spaced levels. • The mine is dry with excellent ground conditions.• Experienced underground mining labour at site with proven
experience in underground selective mining.• Mains grid-power at site with back up from diesel
powered generators.• Fully functioning camp for ~250 employees, airstrip, assay laboratory,
hospital, and workshops all in place with all year round road access.
Since restarting its operations at the Palito Mine, the Group has declared total gold production recovered from the Palito Mine operations of approximately 74,500 ounces and has mined a total of approximately 330,000 tonnes at an average grade of 9.72 g/t.
OVERVIEW
Our Operations
Mining
Overview
Strategic ReportM
anagement D
iscussion and A
nalysisCom
munity and
Social ResponsibilityCorporate G
overnanceFinancial Statem
ents
5Serabi Gold plc // Report and Accounts 2016
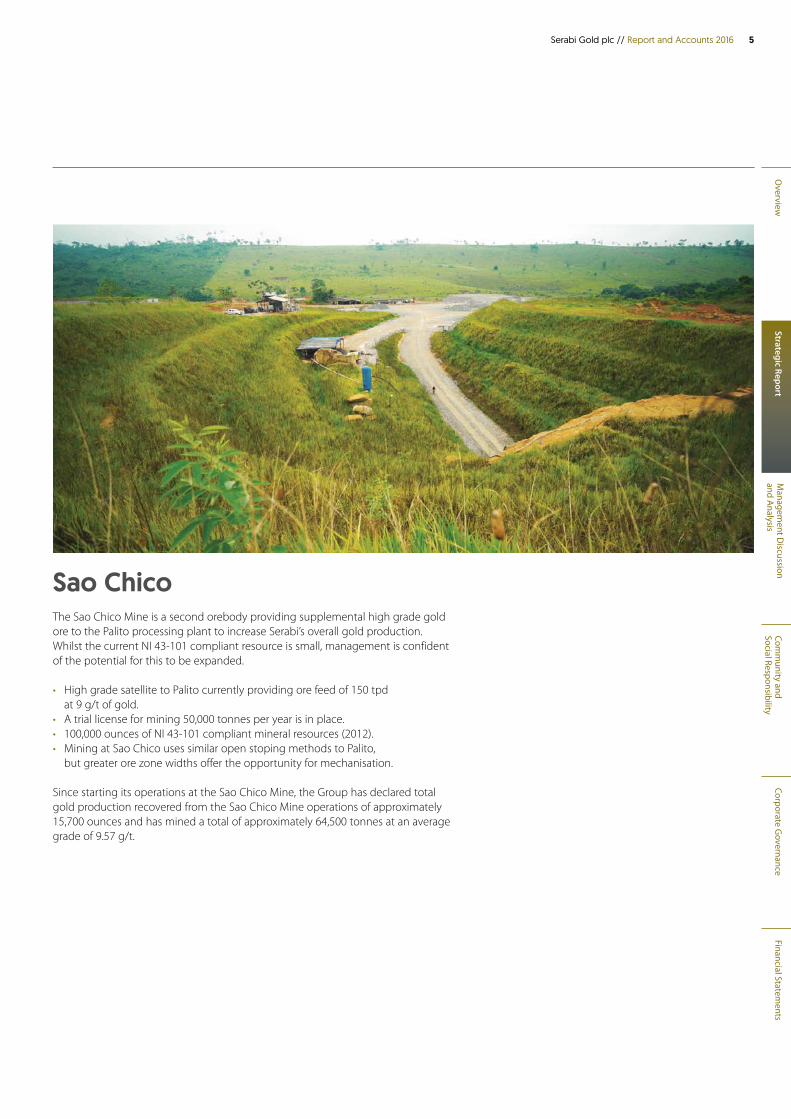
Sao ChicoThe Sao Chico Mine is a second orebody providing supplemental high grade gold ore to the Palito processing plant to increase Serabi’s overall gold production. Whilst the current NI 43-101 compliant resource is small, management is confident of the potential for this to be expanded.
• High grade satellite to Palito currently providing ore feed of 150 tpd at 9 g/t of gold.
• A trial license for mining 50,000 tonnes per year is in place.• 100,000 ounces of NI 43-101 compliant mineral resources (2012).• Mining at Sao Chico uses similar open stoping methods to Palito,
but greater ore zone widths offer the opportunity for mechanisation.
Since starting its operations at the Sao Chico Mine, the Group has declared total gold production recovered from the Sao Chico Mine operations of approximately 15,700 ounces and has mined a total of approximately 64,500 tonnes at an average grade of 9.57 g/t.
6 Serabi Gold plc // Report and Accounts 2016
OVERVIEW
Our Operations
The Gold Recovery ProcessPalito/Sao
Chico Mines
Grinding in ball mill
Gravity concentration
CIP plant
Electrowinning
Inline leach reactor
Copper/Gold concentrate
Tailings Dam
Flotation
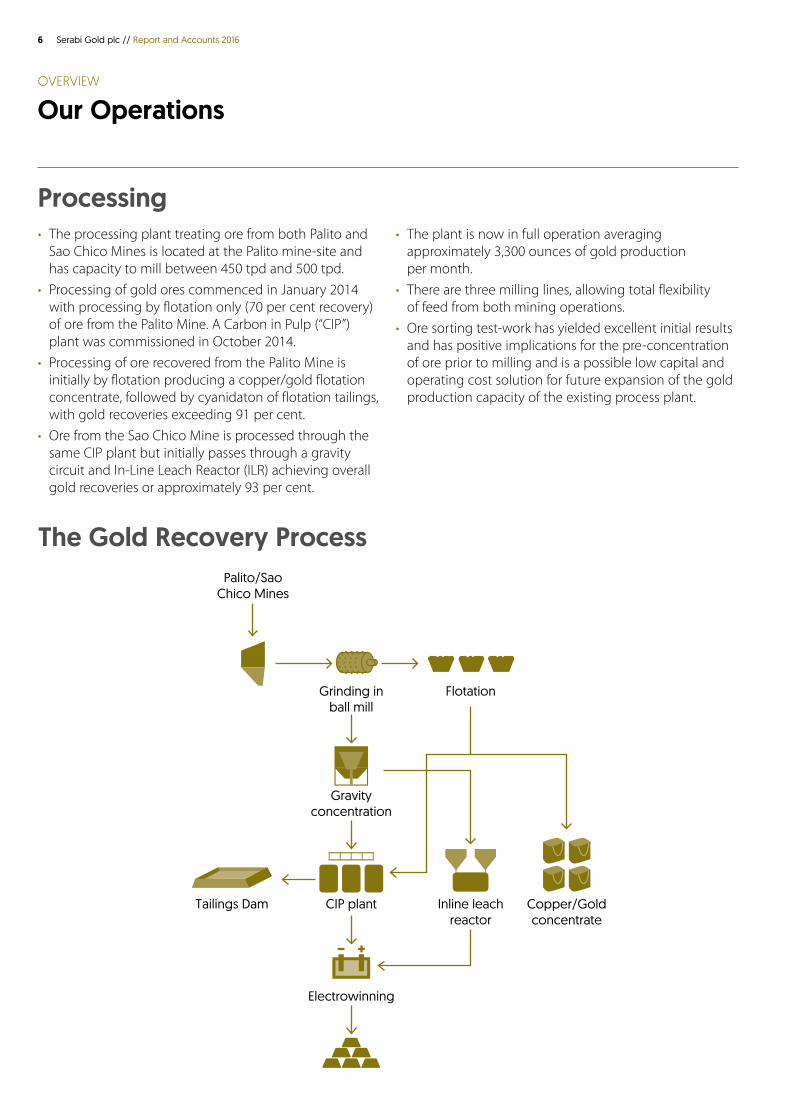
Processing• The processing plant treating ore from both Palito and
Sao Chico Mines is located at the Palito mine-site and has capacity to mill between 450 tpd and 500 tpd.
• Processing of gold ores commenced in January 2014 with processing by flotation only (70 per cent recovery) of ore from the Palito Mine. A Carbon in Pulp (“CIP”) plant was commissioned in October 2014.
• Processing of ore recovered from the Palito Mine is initially by flotation producing a copper/gold flotation concentrate, followed by cyanidaton of flotation tailings, with gold recoveries exceeding 91 per cent.
• Ore from the Sao Chico Mine is processed through the same CIP plant but initially passes through a gravity circuit and In-Line Leach Reactor (ILR) achieving overall gold recoveries or approximately 93 per cent.
• The plant is now in full operation averaging approximately 3,300 ounces of gold production per month.
• There are three milling lines, allowing total flexibility of feed from both mining operations.
• Ore sorting test-work has yielded excellent initial results and has positive implications for the pre-concentration of ore prior to milling and is a possible low capital and operating cost solution for future expansion of the gold production capacity of the existing process plant.
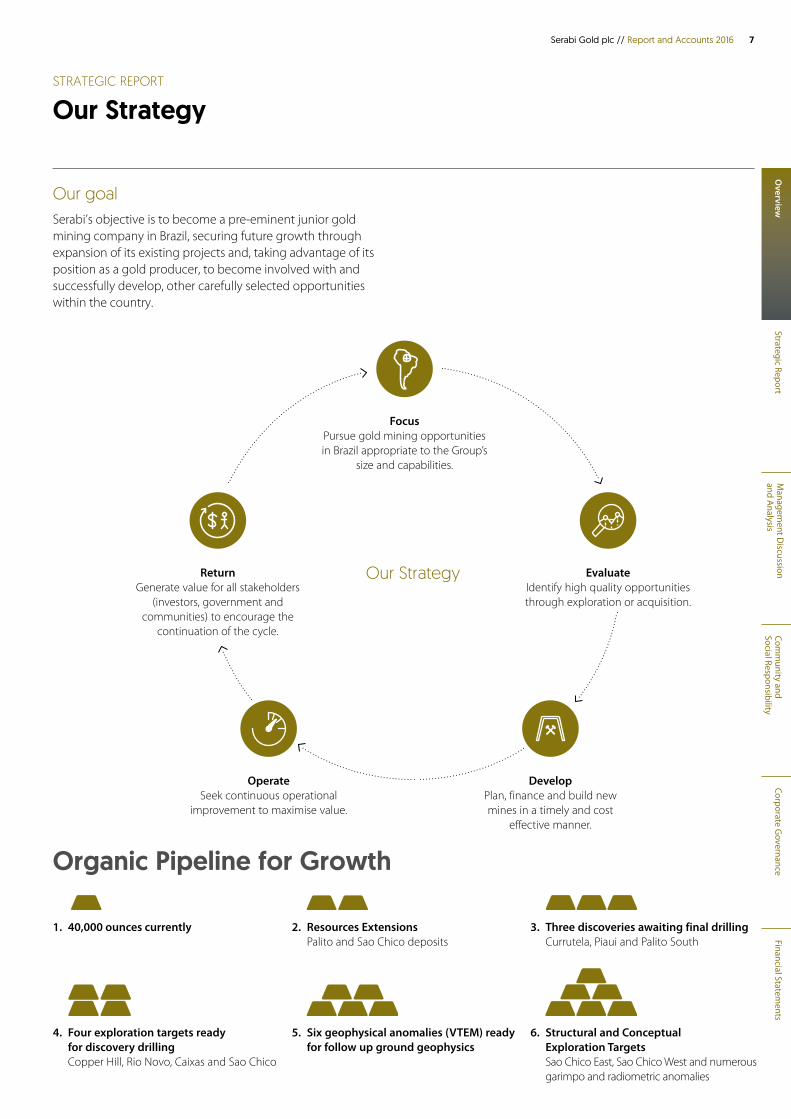
Our goalSerabi’s objective is to become a pre-eminent junior gold mining company in Brazil, securing future growth through expansion of its existing projects and, taking advantage of its position as a gold producer, to become involved with and successfully develop, other carefully selected opportunities within the country.
Overview
7Serabi Gold plc // Report and Accounts 2016
Strategic ReportM
anagement D
iscussion and A
nalysisCom
munity and
Social ResponsibilityCorporate G
overnanceFinancial Statem
ents
STRATEGIC REPORT
Our Strategy
Our Strategy
DevelopPlan, finance and build new mines in a timely and cost
effective manner.
OperateSeek continuous operational
improvement to maximise value.
Return Generate value for all stakeholders
(investors, government and communities) to encourage the
continuation of the cycle.
Evaluate Identify high quality opportunities through exploration or acquisition.
Focus Pursue gold mining opportunities in Brazil appropriate to the Group’s
size and capabilities.
Organic Pipeline for Growth
1. 40,000 ounces currently 2. Resources Extensions Palito and Sao Chico deposits
3. Three discoveries awaiting final drilling Currutela, Piaui and Palito South
4. Four exploration targets ready for discovery drilling Copper Hill, Rio Novo, Caixas and Sao Chico
5. Six geophysical anomalies (VTEM) ready for follow up ground geophysics
6. Structural and Conceptual Exploration Targets Sao Chico East, Sao Chico West and numerous garimpo and radiometric anomalies

8 Serabi Gold plc // Report and Accounts 2016
STRATEGIC REPORT
Our Business at a Glance
What we have donesee pages 20 to 35 to read more =
Our Strategy
Focus Pursue gold mining opportunities in Brazil appropriate to the Group’s size and capabilities.
Management have undertaken a number of site-visits and desk-top reviews of exploration development and production projects throughout the year.
Mine-site geophysics programmes were started in the third quarter of 2016 at Palito and Sao Chico to help plan proposed drilling programmes to be undertaken in 2017.
DevelopPlan, finance and build new mines in a timely and cost effective manner.
Serabi successfully brought the Palito Mine into commercial production for approximately US$18 million, in line with the original estimates in the Preliminary Economic Assessment. The Sao Chico satellite mine was also brought into commercial production with low up-front capital costs.
Technical studies including mine design, engineering and construction were largely undertaken by Serabi’s own staff reducing reliance on third party consultants and ensuring that responsibility for successful commissioning was taken by those who would also operate on a long term basis.
OperateSeek continuous operational improvement to maximise value.
During 2016, the Group made various improvements and increased plant capacity including; • Acquisition and installation of a third ball mill.• Increased leaching capacity through improved screens and flow-rates.• Installed additional flotation cells.• Installed and commissioned an intensive leach reactor to process gravity
concentrate produced from Sao Chico ore.• Introduced mechanised stope mining to the Sao Chico project to improve
ore production rates without affecting dilution.• Commenced underground exploration and mine planning drill programmes.
Return Generate value for all stakeholders (investors, government and communities) to encourage the continuation of the cycle.
During 2016 the Group has settled US$8.5 million of debt whilst at the same time its share price has increased by 50 per cent year on year.
Evaluate Identify high quality opportunities through exploration or acquisition.
Management ranks acquisition opportunities against each other and also its ability to build value from investment in its own exploration tenement. Although several opportunities have been pursued the commercial terms have not been sufficiently accretive and the potential returns lower than management consider could be generated from organic growth opportunities.
Overview
Strategic ReportM
anagement D
iscussion and A
nalysisCom
munity and
Social ResponsibilityCorporate G
overnanceFinancial Statem
ents
9Serabi Gold plc // Report and Accounts 2016
How we measure our performancesee pages 20 to 35 to read more =
What we plan to dosee pages 20 to 35 to read more =
Management continues to maintain its focus on Brazil where it can make use of its existing infrastructure, local knowledge, contact base, and specialist skills, in particular, successfully developing and operating smaller scale mining operations.
A significant focus of management during 2017 will be on trying to develop opportunities within the Group’s existing tenement holding. The Group has four drilled discoveries near to its existing Palito Mine, significant geophysical anomalies near to the Sao Chico Mine where there is also significant potential for further discoveries along strike. In addition within the wider tenement holding are numerous gold occurrences and other exploration opportunities that the Group considers should be pursued as a priority. Nonetheless as other opportunities are identified management will continue to evaluate and assess these based on their merits.
Dependent on exploration success, the Group would be looking to develop new satellite orebodies in close proximity to either or both of the Sao Chico or Palito Mines at the earliest possible opportunity to facilitate production growth. It has already made preliminary plans that would permit the processing of increased ore volumes at low additional cost and with negligible impact on existing operations.
Management continues to review all aspects of operational performance to achieve improvements in total gold production but simultaneously seeking to reduce costs, improve equipment utilisations rates, reduce machinery down-time and achieving better production rates per shift.
The Group will initially use existing cash flow to finance its exploration and development programmes and look to supplement this with appropriate levels of debt and other sources of capital that will be non-dilutive for shareholders. Equity will be used where the Group considers that investments will be accretive to existing shareholders and the nature of the investment does not lend itself to alternative financing structures.
Development of new opportunities or expansion of existing operations are measured against development plans and costings. Performance is judged by considering adherence to time schedules. cost estimates and performance against plan.
Operational performance is judged by considering annual and quarterly results achieved by comparison with forecasts, with a blend of measurements to ensure that efficiency is the key objective, in the use of the Group’s human, equipment and financial resources.
The Board seeks to add value for all of the Group’s stakeholders and recognises that stakeholders may seek returns in varying ways. Returns are evaluated by the ability of the Group to generate cash and sustainable cash flow, to reduce the investment risk for stakeholders and increase, on a sustainable basis, the value of the Group.
The Board reviews all projects that management bring to its attention and only authorise the pursuit of opportunities including organic growth opportunities, that the Board considers have synergies, strong growth and good investment return potential or will in other ways have strong potential to add value for shareholders.
10 Serabi Gold plc // Report and Accounts 2016
STRATEGIC REPORT
Brazil and the Gold Market
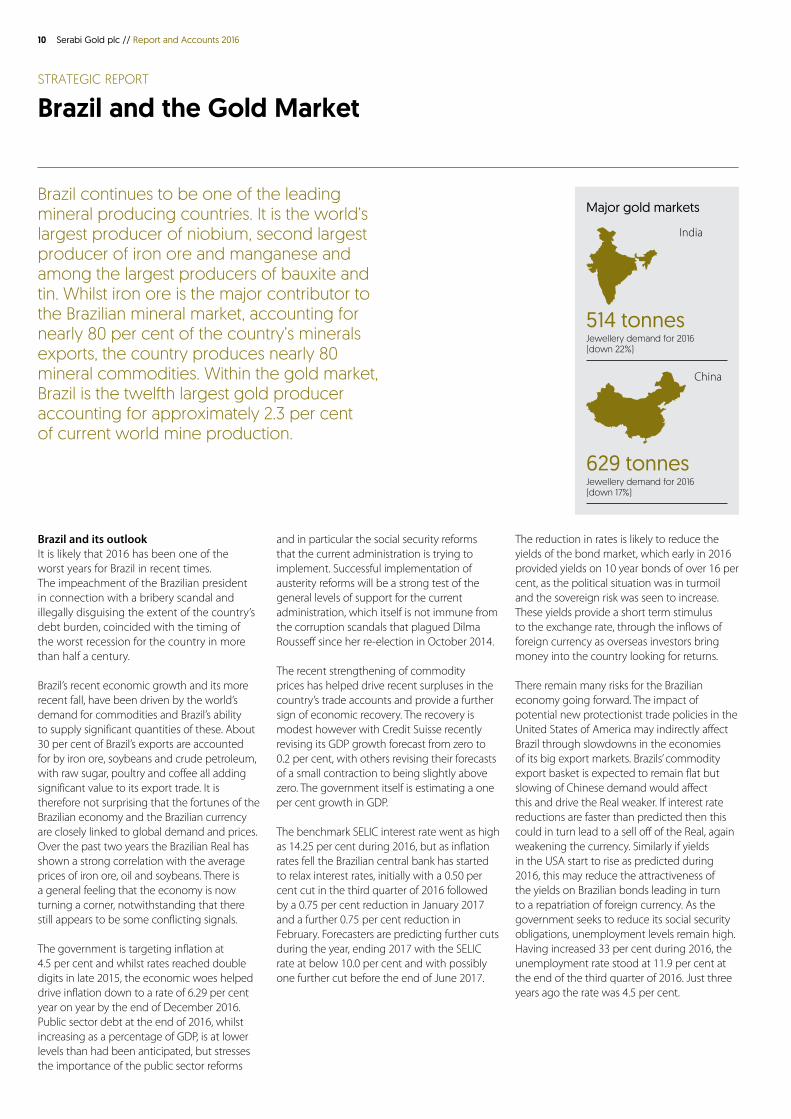
Brazil continues to be one of the leading mineral producing countries. It is the world’s largest producer of niobium, second largest producer of iron ore and manganese and among the largest producers of bauxite and tin. Whilst iron ore is the major contributor to the Brazilian mineral market, accounting for nearly 80 per cent of the country’s minerals exports, the country produces nearly 80 mineral commodities. Within the gold market, Brazil is the twelfth largest gold producer accounting for approximately 2.3 per cent of current world mine production.
Brazil and its outlookIt is likely that 2016 has been one of the worst years for Brazil in recent times. The impeachment of the Brazilian president in connection with a bribery scandal and illegally disguising the extent of the country’s debt burden, coincided with the timing of the worst recession for the country in more than half a century.
Brazil’s recent economic growth and its more recent fall, have been driven by the world’s demand for commodities and Brazil’s ability to supply significant quantities of these. About 30 per cent of Brazil’s exports are accounted for by iron ore, soybeans and crude petroleum, with raw sugar, poultry and coffee all adding significant value to its export trade. It is therefore not surprising that the fortunes of the Brazilian economy and the Brazilian currency are closely linked to global demand and prices. Over the past two years the Brazilian Real has shown a strong correlation with the average prices of iron ore, oil and soybeans. There is a general feeling that the economy is now turning a corner, notwithstanding that there still appears to be some conflicting signals.
The government is targeting inflation at 4.5 per cent and whilst rates reached double digits in late 2015, the economic woes helped drive inflation down to a rate of 6.29 per cent year on year by the end of December 2016. Public sector debt at the end of 2016, whilst increasing as a percentage of GDP, is at lower levels than had been anticipated, but stresses the importance of the public sector reforms
Major gold markets
and in particular the social security reforms that the current administration is trying to implement. Successful implementation of austerity reforms will be a strong test of the general levels of support for the current administration, which itself is not immune from the corruption scandals that plagued Dilma Rousseff since her re-election in October 2014.
The recent strengthening of commodity prices has helped drive recent surpluses in the country’s trade accounts and provide a further sign of economic recovery. The recovery is modest however with Credit Suisse recently revising its GDP growth forecast from zero to 0.2 per cent, with others revising their forecasts of a small contraction to being slightly above zero. The government itself is estimating a one per cent growth in GDP.
The benchmark SELIC interest rate went as high as 14.25 per cent during 2016, but as inflation rates fell the Brazilian central bank has started to relax interest rates, initially with a 0.50 per cent cut in the third quarter of 2016 followed by a 0.75 per cent reduction in January 2017 and a further 0.75 per cent reduction in February. Forecasters are predicting further cuts during the year, ending 2017 with the SELIC rate at below 10.0 per cent and with possibly one further cut before the end of June 2017.
The reduction in rates is likely to reduce the yields of the bond market, which early in 2016 provided yields on 10 year bonds of over 16 per cent, as the political situation was in turmoil and the sovereign risk was seen to increase. These yields provide a short term stimulus to the exchange rate, through the inflows of foreign currency as overseas investors bring money into the country looking for returns.
There remain many risks for the Brazilian economy going forward. The impact of potential new protectionist trade policies in the United States of America may indirectly affect Brazil through slowdowns in the economies of its big export markets. Brazils’ commodity export basket is expected to remain flat but slowing of Chinese demand would affect this and drive the Real weaker. If interest rate reductions are faster than predicted then this could in turn lead to a sell off of the Real, again weakening the currency. Similarly if yields in the USA start to rise as predicted during 2016, this may reduce the attractiveness of the yields on Brazilian bonds leading in turn to a repatriation of foreign currency. As the government seeks to reduce its social security obligations, unemployment levels remain high. Having increased 33 per cent during 2016, the unemployment rate stood at 11.9 per cent at the end of the third quarter of 2016. Just three years ago the rate was 4.5 per cent.
India
China
514 tonnesJewellery demand for 2016 (down 22%)
629 tonnesJewellery demand for 2016 (down 17%)
Overview
Strategic ReportM
anagement D
iscussion and A
nalysisCom
munity and
Social ResponsibilityCorporate G
overnanceFinancial Statem
ents
11Serabi Gold plc // Report and Accounts 2016
The government has stopped public works projects, ranging from oil refineries to subways in Sao Paulo, that were contracted out to a number of the civil construction giants now caught in the corruption net. These work stoppages led to tens of thousands of lay-offs over the last 24 months. Brazilian workers have been paying the price for high-level corruption. However, it is thought unlikely that the Brazilian states will shed public sector jobs in the face of near zero per cent economic growth. The last thing Brazil needs is a higher head count receiving unemployment benefits. Finally the current government is still proving its credentials and markets will want to see evidence that it can continue to push through the necessary fiscal reforms. Within the country the sense is that the public will give this administration the opportunity to complete the current term and judgement will only be passed when elections are due again at the end of 2018.
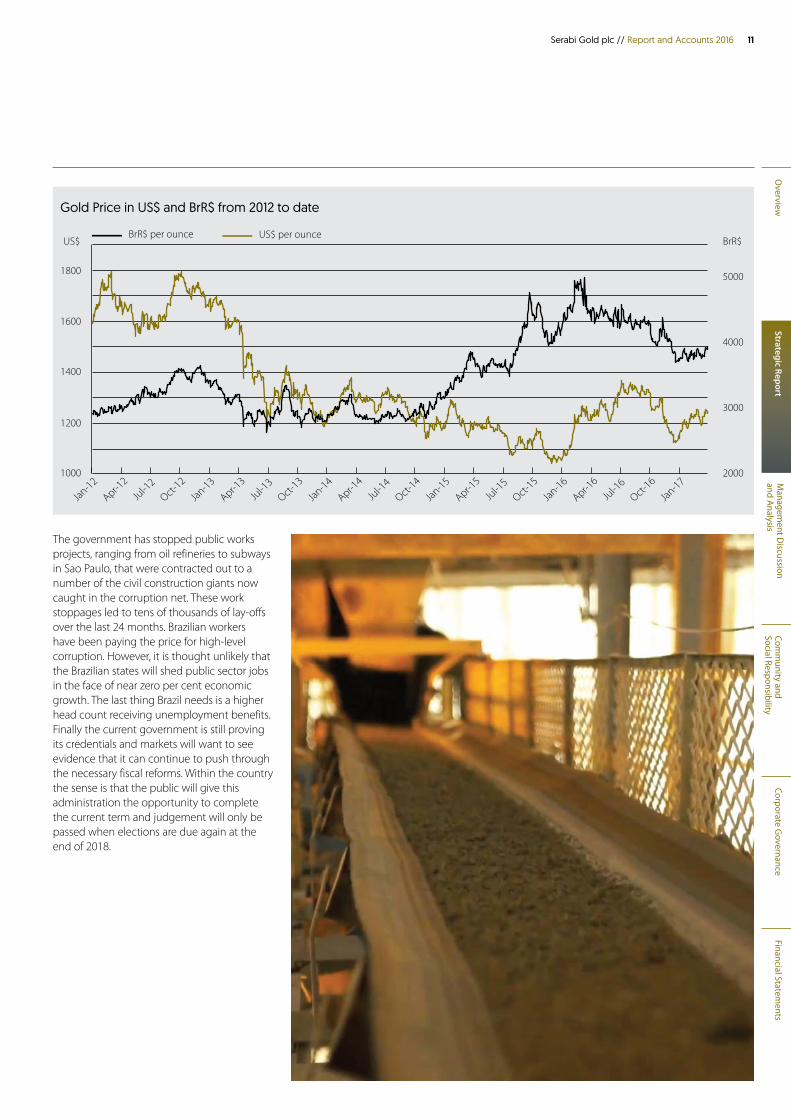
Gold Price in US$ and BrR$ from 2012 to date
1000
1200
1400
1600
1800
2000
3000
4000
5000
BrR$ per ounceBrR$ US$
US$ per ounce
Apr-15
Jan-15
Oct-14
Jan-16
Apr-16
Jul-1
6Oct-1
6
Jan-17
Oct-15
Jul-1
5Ju
l-14
Apr-14
Jan-14
Oct-13
Jul-1
3Apr-1
3
Jan-13
Oct-12
Jul-1
2Apr-1
2
Jan-12
12 Serabi Gold plc // Report and Accounts 2016
The Gold Market and OutlookMirroring the start to 2016, the first few months of 2017 have seen a strengthening of the gold price which having risen 25 per cent by the end of September 2016, gave back some of its gains in the fourth quarter of 2016, following the US presidential election results, the conciliatory acceptance speech from Donald Trump and interest rate rises announced by the FOMC. Overall the gold price ended 2016 having risen eight per cent since the end of 2015.
Notwithstanding the forecast US interest rises for 2017, which would generally be considered a negative influence on the gold price, observers are optimistic on the prospects for the gold price in 2017.
At the heart of this optimism lies uncertainty fuelled by a number of factors. Political uncertainty remains, not least in Europe where elections during the year make the direction of on-going EU policy as well as Brexit and its associated implications, hard to judge. Whilst the US Dollar has strengthened following the presidential elections, there is uncertainty regarding on-going trade relations as well as geopolitical tension being created by some of the statements coming from the new administration.
The prospect of other economies being able to follow the lead of the USA in tightening monetary policy seems unlikely and again looking to Europe, it seems likely that the
Eurozone economies can expect to face continued expansionist monetary policy. This raises the possibility for currency depreciation and both investors and central banks looking to gold to preserve their capital.
Whilst US Dollar interest rates may be set to rise this will be to counter anticipated inflation which will dampen the rate of real interest rate increases and, in doing so, reduces the attraction of fixed income and bonds and support gold’s historic role as an inflationary hedge.
Finally demand from investors and therefore price will be driven by the relative performance of the stock markets. Many markets have started to perform, having been sluggish or contracting in preceding years. In the USA in particular, historic highs have been achieved with the result that valuations are being raised. Any corrections could see an increased movement to gold as part of general portfolio diversification especially if fixed income markets are also weaker.
Physical demand for gold in 2016 (as shown in the table above) was fairly static year on year rising by five per cent with significant demand for ETF’s in the first half of the year driving price improvement, with ETF selling following the US presidential elections paring back the gains at the end of 2016.
STRATEGIC REPORT
The Gold Market and Brazil continued
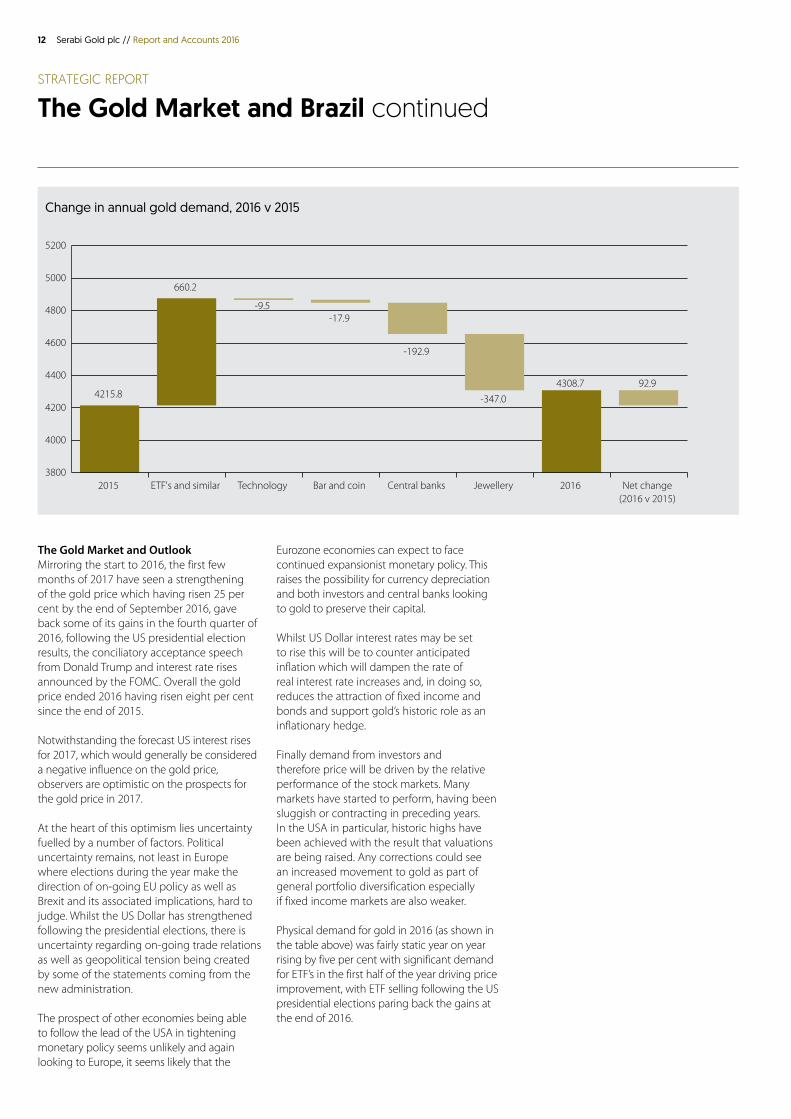
Change in annual gold demand, 2016 v 2015
4215.8 4308.7
660.2
92.9
3800
4000
4200
4400
4600
4800
5000
5200
2015 ETF's and similar Technology Bar and coin Central banks Jewellery 2016 Net change (2016 v 2015)
-9.5 -17.9
-192.9
-347.0
Overview
Strategic ReportM
anagement D
iscussion and A
nalysisCom
munity and
Social ResponsibilityCorporate G
overnanceFinancial Statem
ents
13Serabi Gold plc // Report and Accounts 2016
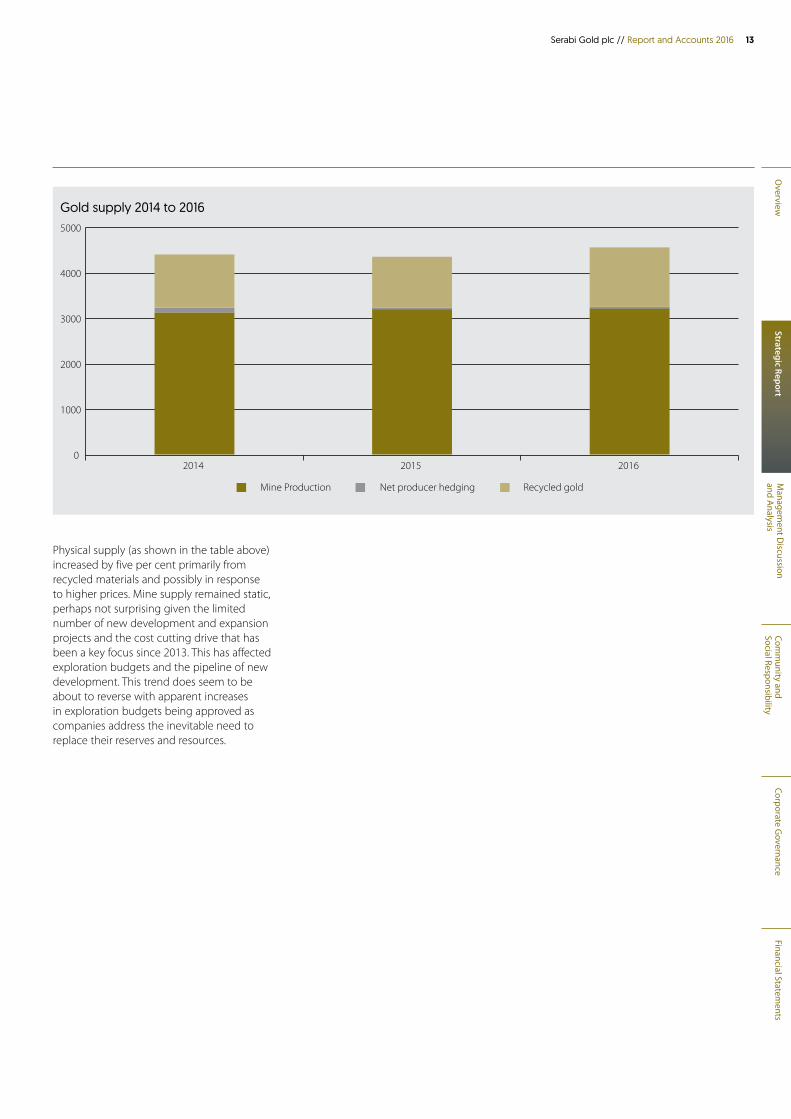
Physical supply (as shown in the table above) increased by five per cent primarily from recycled materials and possibly in response to higher prices. Mine supply remained static, perhaps not surprising given the limited number of new development and expansion projects and the cost cutting drive that has been a key focus since 2013. This has affected exploration budgets and the pipeline of new development. This trend does seem to be about to reverse with apparent increases in exploration budgets being approved as companies address the inevitable need to replace their reserves and resources.
Gold supply 2014 to 2016
0
1000
2000
3000
4000
5000
2014 2015 2016
Mine Production Net producer hedging Recycled gold
14 Serabi Gold plc // Report and Accounts 2016
STRATEGIC REPORT
Chairman's Statement
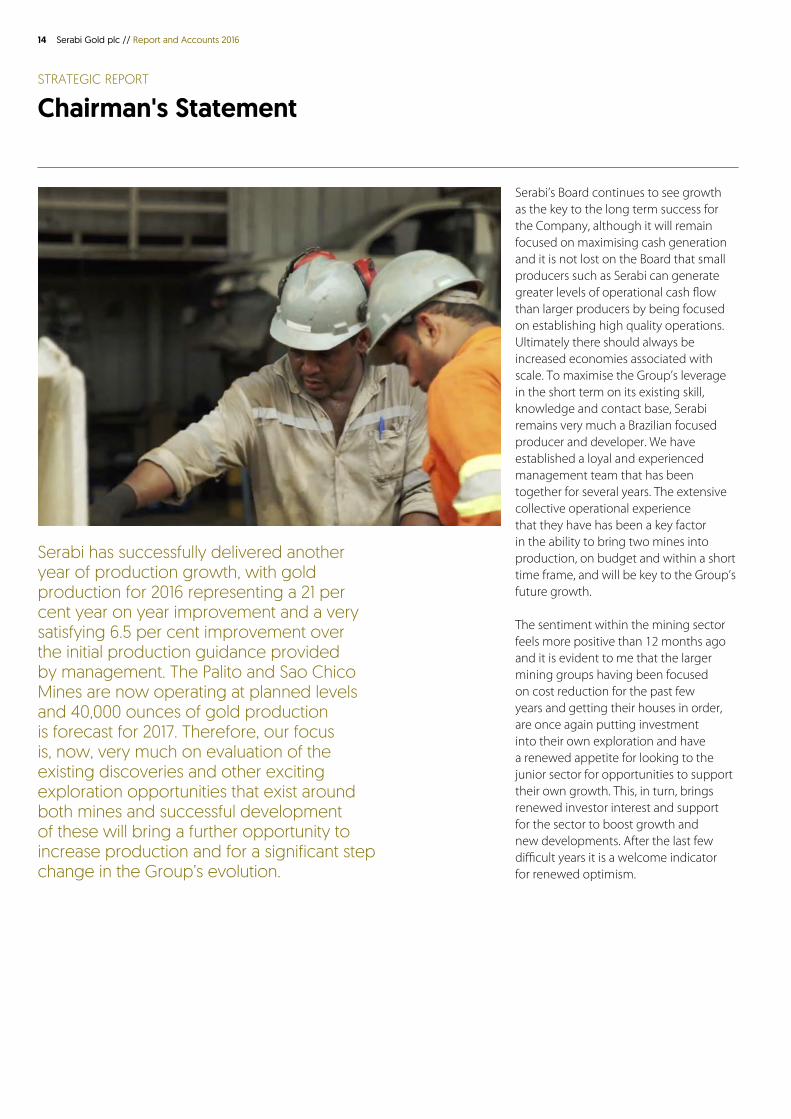
Serabi has successfully delivered another year of production growth, with gold production for 2016 representing a 21 per cent year on year improvement and a very satisfying 6.5 per cent improvement over the initial production guidance provided by management. The Palito and Sao Chico Mines are now operating at planned levels and 40,000 ounces of gold production is forecast for 2017. Therefore, our focus is, now, very much on evaluation of the existing discoveries and other exciting exploration opportunities that exist around both mines and successful development of these will bring a further opportunity to increase production and for a significant step change in the Group’s evolution.
Serabi’s Board continues to see growth as the key to the long term success for the Company, although it will remain focused on maximising cash generation and it is not lost on the Board that small producers such as Serabi can generate greater levels of operational cash flow than larger producers by being focused on establishing high quality operations. Ultimately there should always be increased economies associated with scale. To maximise the Group’s leverage in the short term on its existing skill, knowledge and contact base, Serabi remains very much a Brazilian focused producer and developer. We have established a loyal and experienced management team that has been together for several years. The extensive collective operational experience that they have has been a key factor in the ability to bring two mines into production, on budget and within a short time frame, and will be key to the Group’s future growth.
The sentiment within the mining sector feels more positive than 12 months ago and it is evident to me that the larger mining groups having been focused on cost reduction for the past few years and getting their houses in order, are once again putting investment into their own exploration and have a renewed appetite for looking to the junior sector for opportunities to support their own growth. This, in turn, brings renewed investor interest and support for the sector to boost growth and new developments. After the last few difficult years it is a welcome indicator for renewed optimism.
Overview
Strategic ReportM
anagement D
iscussion and A
nalysisCom
munity and
Social ResponsibilityCorporate G
overnanceFinancial Statem
ents
15Serabi Gold plc // Report and Accounts 2016
However, as the last 12 months have shown, the world is an unpredictable place. Commodity price volatility is not a friend to the resource sector and for good reason can stimulate a cautionary approach. Your Board will therefore be judicious in its own strategy for growth as it seeks to maximise the value that it can achieve from each dollar spent. We will insist that management continue to follow its tested risk reducing formula and systematic approach to exploration activity. We continue to be very excited about the prospects that we have in our own tenements and whilst we insist on a pragmatic and risk reduction approach, we are also aware that we need to build value quickly and make the most of the Group’s current position and strength. This needs to be balanced with the concurrent need to continue to improve the Group’s working capital position and improve its resilience to short term market movements that can negatively impact on cash flow and margin.
We started the first phase of an increased exploration effort during the second half of 2016 with some initial geophysics programmes around the Palito and Sao Chico Mines. The results at Palito from the down the hole electromagnetic (“EM”) programmes have helped us better understand the size and location of existing discoveries and will help us plan the next phase of evaluating these. At Sao Chico the work was suspended because of weather conditions but the initial signs have been very encouraging and continue to support management’s belief that the current Sao Chico Mine is just a small part of a much larger regional feature and structure. In this respect the successful acquisition of the exploration rights, during 2016, over exploration tenements surrounding the current Sao Chico operations was very important. The weather in the early part of the year can limit the efficiency and nature of exploration programmes, but management is actively planning the next stages of work and considering the optimum solutions that will ensure the Group can properly finance these.
Management continue to actively assess other opportunities in Brazil and our track record of moving exploration projects into production makes Serabi an attractive partner for companies with less operational experience. However, it remains difficult to find the blend of project and price that makes an acquisition compelling and, whilst we recognise that Serabi needs to grow and make a step change that will be reflected in its valuation, the Board will only pursue opportunities that will bring strong, long term returns to our existing shareholders.
The next 12 months will continue to bring challenges but also, I am sure, rewards. I am optimistic about the outlook for gold and believe that we have now positioned Serabi to benefit from and grow on the back of it. We have built a strong platform for our longer term growth and will do all that we can to realise this growth quickly and efficiently.
On behalf of the Board of Directors I would like to extend my appreciation to the employees and management of Serabi for a job well done during the past year. Their hard work and determination to succeed means your Company is well positioned to reap the benefits of the higher gold price environment we expect during 2017 and beyond. Finally, thank you to our shareholders, large and small, for your patience during the last few years. I continue to believe the future is extremely bright for Serabi.
T Sean Harvey Chairman 30 March 2017
The successful acquisition of the exploration rights, during 2016, over exploration tenements surrounding the current Sao Chico operations was very important.
I am optimistic about the outlook for gold and believe that we have now positioned Serabi to benefit from and grow on the back of it.
16 Serabi Gold plc // Report and Accounts 2016
STRATEGIC REPORT
Performance Review and KPIs
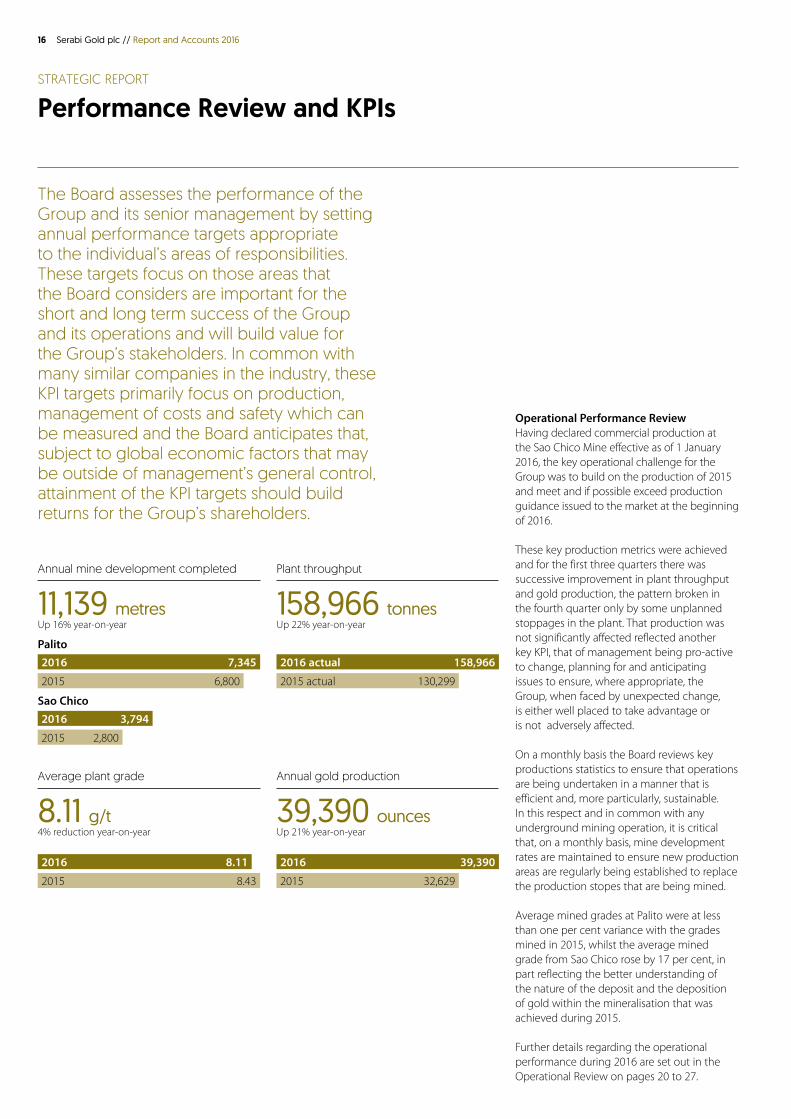
Annual mine development completed
11,139 metresUp 16% year-on-year
Average plant grade
8.11 g/t4% reduction year-on-year
Plant throughput
158,966 tonnesUp 22% year-on-year
Annual gold production
39,390 ouncesUp 21% year-on-year
7,345
8.11
158,966
39,390
3,794
6,800
8.43
130,299
32,629
2,800
2016
2016
2016 actual
2016
2016
Palito
Sao Chico
2015
2015
2015 actual
2015
2015
The Board assesses the performance of the Group and its senior management by setting annual performance targets appropriate to the individual’s areas of responsibilities. These targets focus on those areas that the Board considers are important for the short and long term success of the Group and its operations and will build value for the Group’s stakeholders. In common with many similar companies in the industry, these KPI targets primarily focus on production, management of costs and safety which can be measured and the Board anticipates that, subject to global economic factors that may be outside of management’s general control, attainment of the KPI targets should build returns for the Group’s shareholders.
Operational Performance ReviewHaving declared commercial production at the Sao Chico Mine effective as of 1 January 2016, the key operational challenge for the Group was to build on the production of 2015 and meet and if possible exceed production guidance issued to the market at the beginning of 2016.
These key production metrics were achieved and for the first three quarters there was successive improvement in plant throughput and gold production, the pattern broken in the fourth quarter only by some unplanned stoppages in the plant. That production was not significantly affected reflected another key KPI, that of management being pro-active to change, planning for and anticipating issues to ensure, where appropriate, the Group, when faced by unexpected change, is either well placed to take advantage or is not adversely affected. On a monthly basis the Board reviews key productions statistics to ensure that operations are being undertaken in a manner that is efficient and, more particularly, sustainable. In this respect and in common with any underground mining operation, it is critical that, on a monthly basis, mine development rates are maintained to ensure new production areas are regularly being established to replace the production stopes that are being mined.
Average mined grades at Palito were at less than one per cent variance with the grades mined in 2015, whilst the average mined grade from Sao Chico rose by 17 per cent, in part reflecting the better understanding of the nature of the deposit and the deposition of gold within the mineralisation that was achieved during 2015.
Further details regarding the operational performance during 2016 are set out in the Operational Review on pages 20 to 27.
Overview
Strategic ReportM
anagement D
iscussion and A
nalysisCom
munity and
Social ResponsibilityCorporate G
overnanceFinancial Statem
ents
17Serabi Gold plc // Report and Accounts 2016
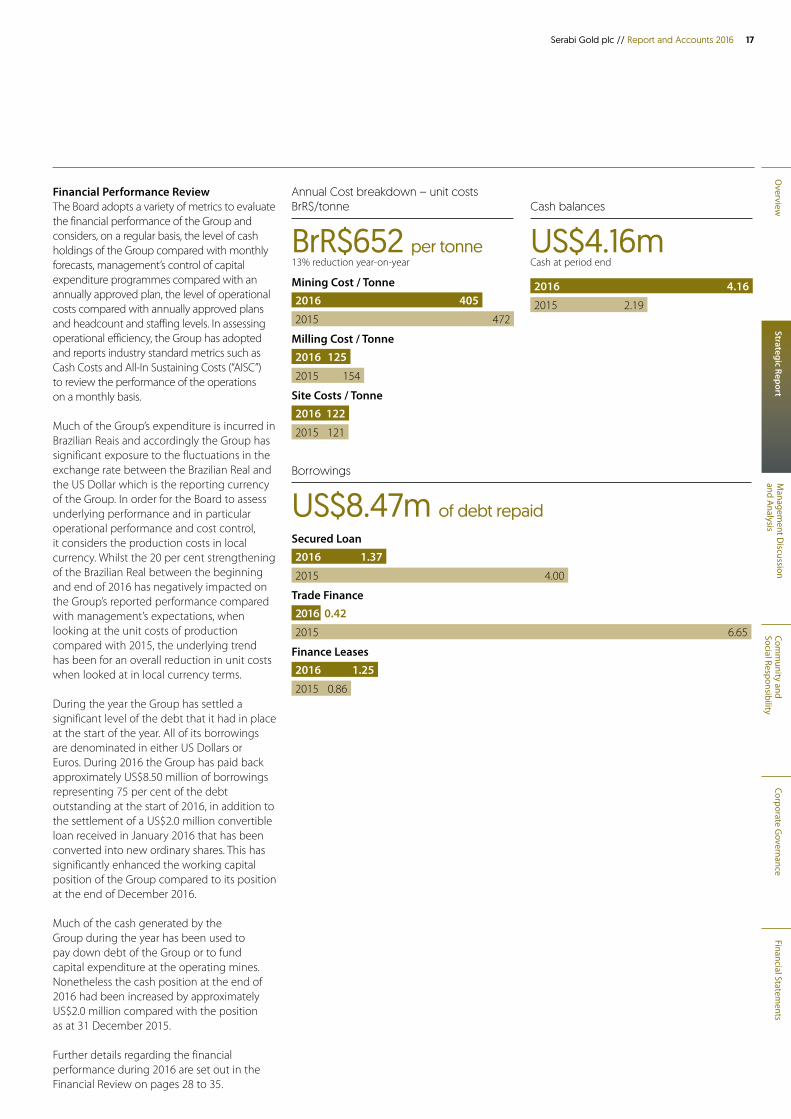
Financial Performance Review The Board adopts a variety of metrics to evaluate the financial performance of the Group and considers, on a regular basis, the level of cash holdings of the Group compared with monthly forecasts, management’s control of capital expenditure programmes compared with an annually approved plan, the level of operational costs compared with annually approved plans and headcount and staffing levels. In assessing operational efficiency, the Group has adopted and reports industry standard metrics such as Cash Costs and All-In Sustaining Costs (“AISC”) to review the performance of the operations on a monthly basis.
Much of the Group’s expenditure is incurred in Brazilian Reais and accordingly the Group has significant exposure to the fluctuations in the exchange rate between the Brazilian Real and the US Dollar which is the reporting currency of the Group. In order for the Board to assess underlying performance and in particular operational performance and cost control, it considers the production costs in local currency. Whilst the 20 per cent strengthening of the Brazilian Real between the beginning and end of 2016 has negatively impacted on the Group’s reported performance compared with management’s expectations, when looking at the unit costs of production compared with 2015, the underlying trend has been for an overall reduction in unit costs when looked at in local currency terms.
During the year the Group has settled a significant level of the debt that it had in place at the start of the year. All of its borrowings are denominated in either US Dollars or Euros. During 2016 the Group has paid back approximately US$8.50 million of borrowings representing 75 per cent of the debt outstanding at the start of 2016, in addition to the settlement of a US$2.0 million convertible loan received in January 2016 that has been converted into new ordinary shares. This has significantly enhanced the working capital position of the Group compared to its position at the end of December 2016.
Much of the cash generated by the Group during the year has been used to pay down debt of the Group or to fund capital expenditure at the operating mines. Nonetheless the cash position at the end of 2016 had been increased by approximately US$2.0 million compared with the position as at 31 December 2015.
Further details regarding the financial performance during 2016 are set out in the Financial Review on pages 28 to 35.
Annual Cost breakdown – unit costs BrR$/tonne
BrR$652 per tonne13% reduction year-on-year
Cash balances
US$4.16mCash at period end
Borrowings
US$8.47m of debt repaid
4054.16
125
122
4722.19
154
121
20162016
2016
2016
Mining Cost / Tonne
Milling Cost / Tonne
Site Costs / Tonne
20152015
2015
2015
1.37
2016
1.25
4.00
6.65
0.86
2016
2016
Secured Loan
Trade Finance
Finance Leases
2015
2015
2015
0.42
18 Serabi Gold plc // Report and Accounts 2016
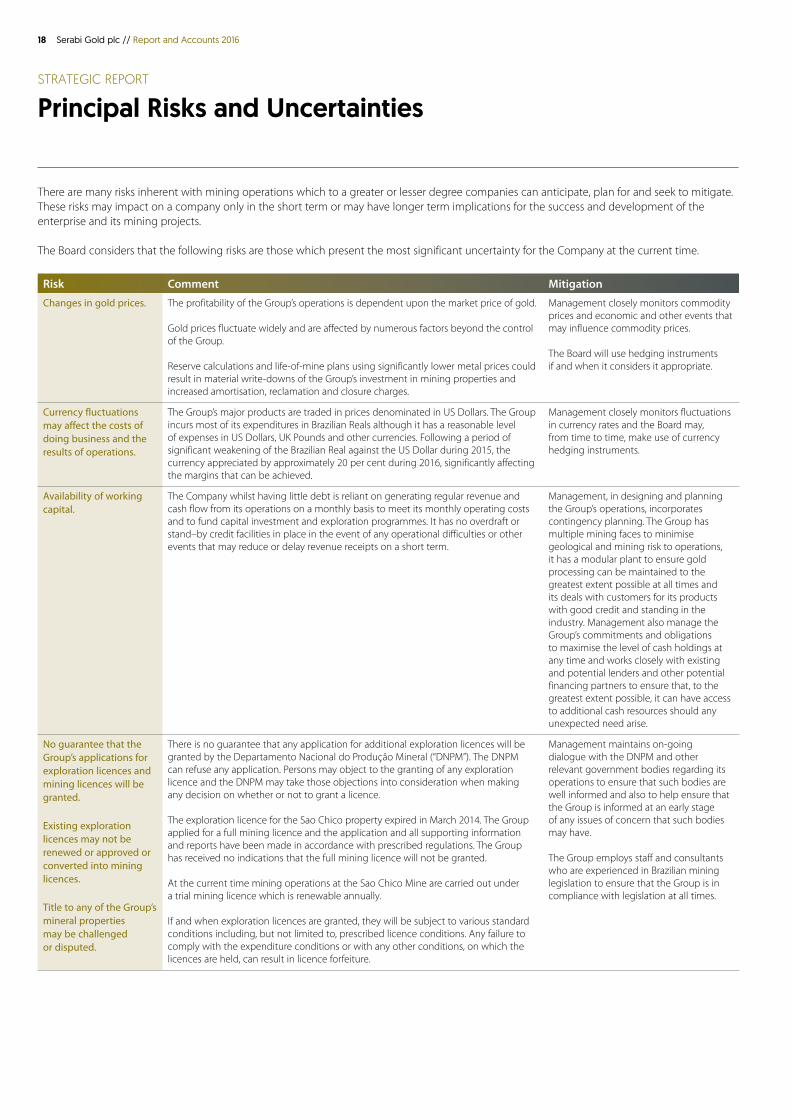
Risk Comment Mitigation
Changes in gold prices. The profitability of the Group’s operations is dependent upon the market price of gold.
Gold prices fluctuate widely and are affected by numerous factors beyond the control of the Group.
Reserve calculations and life-of-mine plans using significantly lower metal prices could result in material write-downs of the Group’s investment in mining properties and increased amortisation, reclamation and closure charges.
Management closely monitors commodity prices and economic and other events that may influence commodity prices.
The Board will use hedging instruments if and when it considers it appropriate.
Currency fluctuations may affect the costs of doing business and the results of operations.
The Group’s major products are traded in prices denominated in US Dollars. The Group incurs most of its expenditures in Brazilian Reals although it has a reasonable level of expenses in US Dollars, UK Pounds and other currencies. Following a period of significant weakening of the Brazilian Real against the US Dollar during 2015, the currency appreciated by approximately 20 per cent during 2016, significantly affecting the margins that can be achieved.
Management closely monitors fluctuations in currency rates and the Board may, from time to time, make use of currency hedging instruments.
Availability of working capital.
The Company whilst having little debt is reliant on generating regular revenue and cash flow from its operations on a monthly basis to meet its monthly operating costs and to fund capital investment and exploration programmes. It has no overdraft or stand–by credit facilities in place in the event of any operational difficulties or other events that may reduce or delay revenue receipts on a short term.
Management, in designing and planning the Group’s operations, incorporates contingency planning. The Group has multiple mining faces to minimise geological and mining risk to operations, it has a modular plant to ensure gold processing can be maintained to the greatest extent possible at all times and its deals with customers for its products with good credit and standing in the industry. Management also manage the Group’s commitments and obligations to maximise the level of cash holdings at any time and works closely with existing and potential lenders and other potential financing partners to ensure that, to the greatest extent possible, it can have access to additional cash resources should any unexpected need arise.
No guarantee that the Group’s applications for exploration licences and mining licences will be granted.
Existing exploration licences may not be renewed or approved or converted into mining licences.
Title to any of the Group’s mineral properties may be challenged or disputed.
There is no guarantee that any application for additional exploration licences will be granted by the Departamento Nacional do Produçăo Mineral (“DNPM”). The DNPM can refuse any application. Persons may object to the granting of any exploration licence and the DNPM may take those objections into consideration when making any decision on whether or not to grant a licence.
The exploration licence for the Sao Chico property expired in March 2014. The Group applied for a full mining licence and the application and all supporting information and reports have been made in accordance with prescribed regulations. The Group has received no indications that the full mining licence will not be granted.
At the current time mining operations at the Sao Chico Mine are carried out under a trial mining licence which is renewable annually.
If and when exploration licences are granted, they will be subject to various standard conditions including, but not limited to, prescribed licence conditions. Any failure to comply with the expenditure conditions or with any other conditions, on which the licences are held, can result in licence forfeiture.
Management maintains on-going dialogue with the DNPM and other relevant government bodies regarding its operations to ensure that such bodies are well informed and also to help ensure that the Group is informed at an early stage of any issues of concern that such bodies may have.
The Group employs staff and consultants who are experienced in Brazilian mining legislation to ensure that the Group is in compliance with legislation at all times.
STRATEGIC REPORT
Principal Risks and Uncertainties
There are many risks inherent with mining operations which to a greater or lesser degree companies can anticipate, plan for and seek to mitigate. These risks may impact on a company only in the short term or may have longer term implications for the success and development of the enterprise and its mining projects.
The Board considers that the following risks are those which present the most significant uncertainty for the Company at the current time.
Overview
Strategic ReportM
anagement D
iscussion and A
nalysisCom
munity and
Social ResponsibilityCorporate G
overnanceFinancial Statem
ents
19Serabi Gold plc // Report and Accounts 2016
Risk Comment Mitigation
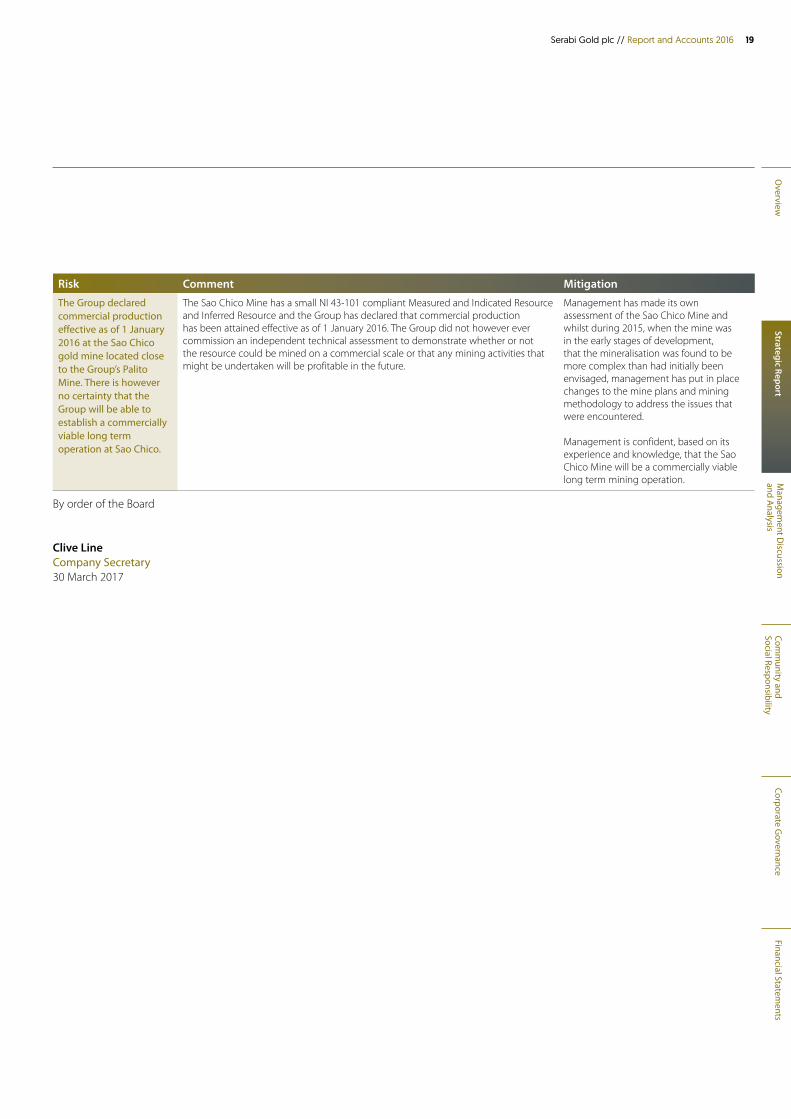
The Group declared commercial production effective as of 1 January 2016 at the Sao Chico gold mine located close to the Group’s Palito Mine. There is however no certainty that the Group will be able to establish a commercially viable long term operation at Sao Chico.
The Sao Chico Mine has a small NI 43-101 compliant Measured and Indicated Resource and Inferred Resource and the Group has declared that commercial production has been attained effective as of 1 January 2016. The Group did not however ever commission an independent technical assessment to demonstrate whether or not the resource could be mined on a commercial scale or that any mining activities that might be undertaken will be profitable in the future.
Management has made its own assessment of the Sao Chico Mine and whilst during 2015, when the mine was in the early stages of development, that the mineralisation was found to be more complex than had initially been envisaged, management has put in place changes to the mine plans and mining methodology to address the issues that were encountered.
Management is confident, based on its experience and knowledge, that the Sao Chico Mine will be a commercially viable long term mining operation.
By order of the Board
Clive LineCompany Secretary30 March 2017
20 Serabi Gold plc // Report and Accounts 2016
MANAGEMENT DISCUSSION AND ANALYSIS
Operational Review
Outlook and StrategyMiningThe Palito Mine is currently operating across four key mining sectors and the current mining plans for the next two years take into account only eight of the 24 veins that comprise the measured indicated and inferred resources of the Palito Mine. Underground drilling at the Palito Mine is helping to identify mineralisation at depth, making the rate and location of future mine development more efficient and also identifying additional smaller parallel vein structures that could be accessed from existing mine development.
Within the Main Zone of the Palito Mine, the principal G3 vein has been developed to a depth of over 250 metres and over a strike length of approximately 1.5 kilometres. Management consider that there is strong potential for the Palito set of veins to continue southwards through to the Currutela discovery. If this were to be the case the overall strike length would extend to approximately four kilometres. The strike width from the Chico da Santa sector to the east to the Senna sector to the west is approximately 500 metres.
Management considers that the likelihood of being able to continuously replenish and increase the resource potential in and around the Palito Mine remains very high, with good potential to establish satellite mining opportunities close by. The Palito South, Currutela and Piaui discoveries are advanced prospects that provide excellent opportunities for identifying additional resources, which could both enhance current production levels as well as extend the mine life.
At Sao Chico the mine development has, to date, focused on the central ore shoot of the Main Vein. The Sao Chico Mine, whilst contributing to the Group’s gold production, was primarily in development during 2015 and the early part of 2016, as the Group sought to ensure that it secured a rolling medium term production plan for up to two years into the future. It was only in the second half of 2016 that the level of stoping activity began to increase, and the long term balance between development mining and stope mining rates only started to be reached at the end of 2016. During 2017 management expects that monthly development and production rates will continue to stabilise. The Group is driving development galleries east and west towards additional ore shoots that have been identified by surface drilling. Management is confident that these ore shoots will provide additional
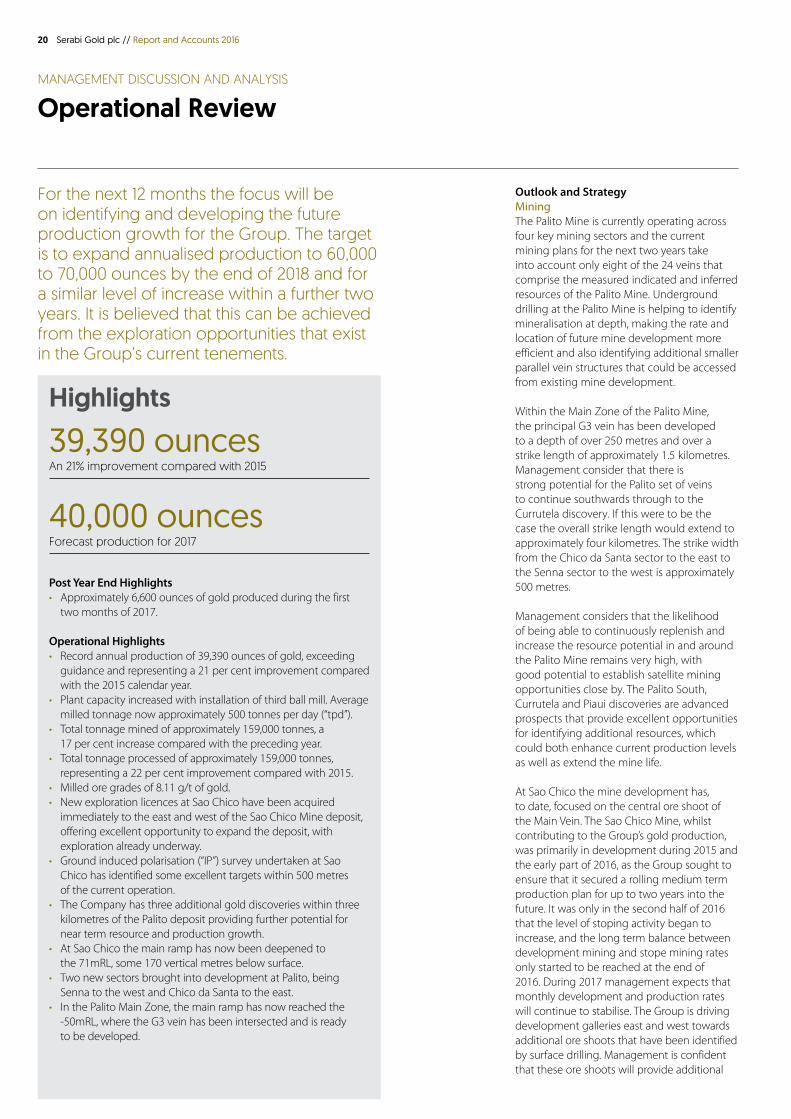
For the next 12 months the focus will be on identifying and developing the future production growth for the Group. The target is to expand annualised production to 60,000 to 70,000 ounces by the end of 2018 and for a similar level of increase within a further two years. It is believed that this can be achieved from the exploration opportunities that exist in the Group’s current tenements.
Highlights
39,390 ouncesAn 21% improvement compared with 2015
40,000 ounces Forecast production for 2017
Post Year End Highlights • Approximately 6,600 ounces of gold produced during the first
two months of 2017.
Operational Highlights • Record annual production of 39,390 ounces of gold, exceeding
guidance and representing a 21 per cent improvement compared with the 2015 calendar year.
• Plant capacity increased with installation of third ball mill. Average milled tonnage now approximately 500 tonnes per day (“tpd”).
• Total tonnage mined of approximately 159,000 tonnes, a 17 per cent increase compared with the preceding year.
• Total tonnage processed of approximately 159,000 tonnes, representing a 22 per cent improvement compared with 2015.
• Milled ore grades of 8.11 g/t of gold.• New exploration licences at Sao Chico have been acquired
immediately to the east and west of the Sao Chico Mine deposit, offering excellent opportunity to expand the deposit, with exploration already underway.
• Ground induced polarisation (“IP”) survey undertaken at Sao Chico has identified some excellent targets within 500 metres of the current operation.
• The Company has three additional gold discoveries within three kilometres of the Palito deposit providing further potential for near term resource and production growth.
• At Sao Chico the main ramp has now been deepened to the 71mRL, some 170 vertical metres below surface.
• Two new sectors brought into development at Palito, being Senna to the west and Chico da Santa to the east.
• In the Palito Main Zone, the main ramp has now reached the -50mRL, where the G3 vein has been intersected and is ready to be developed.
Overview
Strategic ReportM
anagement D
iscussion and A
nalysisCom
munity and
Social ResponsibilityCorporate G
overnanceFinancial Statem
ents
21Serabi Gold plc // Report and Accounts 2016
mineable ore at Sao Chico. Underground drilling is being undertaken at Sao Chico for short term operational and mine planning purposes with a second parallel campaign being undertaken to test the deeper resource potential of the deposit.
Near-term production growthManagement continues to evaluate the Group’s options for expanding its gold production. Mine-site geophysical studies undertaken during the third quarter of 2016 over the Currutela and Piuai discoveries and other areas close to the current Palito Mine have been designed to improve the drill targeting of a planned 2017 surface drilling campaign. Management feel that this drilling campaign could provide sufficient confidence to justify commencement of new mine portals and underground exploration development drives to access and fully evaluate any new discoveries that are considered to be potentially commercially viable. In time these discoveries could become established as new near-mine satellite deposits adding incremental production.
ExplorationThe Group has also commenced mine-site surface geophysics programmes around the Sao Chico deposit. Management considers that the mineralisation at Sao Chico is hosted in a regional shear zone and is now using geophysics to try and identify additional deposits that may lie along a four kilometre strike zone around the current Sao Chico deposit. Again, in time, this exploration work may lead to the identification of additional near-mine satellite mining operations.
All exploration has been on-hold since the end of 2011 when the Group took the strategic decision to focus its immediate efforts on bringing the Palito Mine back into production. Whilst currently the immediate focus of management is to evaluate the near-mine potential within two to three kilometres of its existing operation, on a wider regional basis the Group is developing plans to progress the evaluation of its whole tenement package. The Group has flown approximately 14,650 hectares of airborne VTEM surveys, but has had limited funds and therefore opportunity, to follow up on many of the areas of interest that were highlighted by this initial aerial survey. Conscious that the exploration tenements it holds are only granted for limited terms, the Group is keen to implement, as and when adequate funding is available, a regional exploration programme to highlight the tenement areas that should be prioritised as
having the highest potential. With a number of historic garimpo operations lying within the Group’s tenements, management is confident that, in the fullness of time, it will be able to make further discoveries all of which, in time, could have the potential to be additional satellite operations lying within 15 kilometres of its current Palito or Sao Chico operations and contributing further resource and production growth.
Through this combination of near-mine and regional exploration and evaluation, the Group expects to establish a strong pipeline of development opportunities that will allow the Group to grow its production base at low capital cost, avoid the need for major infrastructure improvements to be in place for new operations to be commercially viable and have low environmental impact.
At this time, no surface drilling or other surface exploration activities are currently planned on any other exploration properties of the Group.
Sao Chico shows strong progress one year after commercial production began
Management considers that the likelihood of being able to continuously replenish and increase the resource potential in and around the Palito Mine remains very high, with good potential to identify further mineable orebodies.
Mining at Sao Chico uses sub-level open stoping with the sub-levels spaced approximately 12 vertical metres apart. This mining method is better suited to the wider mineralised structures of the Sao Chico orebody and the erratic deposition of gold within the alteration zone, improving the economics compared with a more selective method.
Mine development was the principal focus for 2016, to quickly establish mineable blocks for at least the next two years. With five sub-levels having been developed below the current production levels, this objective has been achieved and mine development is comfortably ahead of production.
22 Serabi Gold plc // Report and Accounts 2016
Management has and will continue to evaluate other value adding, cost effective opportunities within Brazil that it considers could increase the resource base and longer term production potential of the Group as well as having the potential to be value enhancing for its shareholders. These opportunities will always be assessed and only considered, if they outrank existing organic growth options.
2017 Production GuidanceThe Group is currently forecasting gold production for 2017 to be approximately 40,000 ounces with All-In Sustaining Cost expected to be between US$950 to US$975 per ounce. The Group’s cost profile is subject to change as a result of exchange rate variations and in particular the exchange rate between the Brazilian Real and the US Dollar.
Operational review for the 2016 calendar yearTotal gold production for the fourth quarter of 2016 was 9,413 ounces making total gold production for the year of 39,390 ounces representing a 21 per cent improvement on the gold production level for the 2015 calendar year which totaled 32,629 ounces (fourth quarter of 2015 : 7,925 ounces).
The Palito Mine has now been in full production for over two years and has achieved a steady state of mine output. The Sao Chico Mine was in development throughout 2015 with no ore production in the first quarter of 2015. Mining rates at the Sao Chico Mine in the fourth quarter of 2015 reached levels that allowed the Group to declare commercial production had been achieved from 1 January 2016. The ore generated from the Sao Chico Mine in the 12 months of 2016 has continued to be derived principally from development operations rather than from stoping, although with a number of development headings now established during the third and fourth quarters of 2016, the Company is increasing the level of stoping activity and increasing the tonnage of ore that is being recovered from stope mining.
Mining operationsPerformance of the combined mining operations of both the Palito and Sao Chico Mines has resulted in approximately 158,900 tonnes of ore being extracted during 2016 which compares with a total of approximately 135,800 tonnes produced in the same 12 month period of 2015, an improvement of 17 per cent. The majority of the 2015 production
was from the Palito Mine, but nonetheless, ore output in 2016 from the Palito Mine was approximately 6,700 tonnes (six per cent) greater than for the same period in 2015. The introduction, at the end of the second quarter of 2016, of increased processing capacity eliminated limitations in the amount of ore that can be processed and allowed the increased levels of ore from the Sao Chico Mine, which supplement the mine production from the Palito Mine, to be accommodated. The mine production for the fourth quarter of 2016 from the Palito Mine of 34,611 tonnes was higher than the corresponding period of 2015 by approximately 7,650 tonnes, representing an improvement of 28 per cent.
Average mined grades achieved for the fourth quarter of 2016 at the Palito Mine were lower than preceding quarters and the corresponding quarter in 2015 as a result of ore being cemented in two stopes. The production shortfall was partially compensated by increased production of development ore albeit at a lower gold grade. Overall the mined grade at Palito averaged 9.62 g/t for the 2016 calendar year, a reduction of four per cent compared with the average grade of 10.05 g/t reported for the 2015 calendar year.
At Sao Chico mined grade for the fourth quarter of 2016 is reported as having been at a gold grade of 14.38 g/t which is 48 per cent higher than the mined grade for the same quarter of 2015. This ore grade is however considered to be a one-off event reflecting particularly high-grade areas that were being mined in the quarter and management consider that normal mined grade of the Sao Chico ore will be between approximately 9.0 to 10.0 g/t over the life of the mine. The average grade of ore mined for the 2016 calendar year was 10.12 g/t an improvement of 17 per cent over the reported average grade of 8.66g/t achieved for the 2015 calendar year. This improvement reflects the fact that during 2015 the Sao Chico Mine was primarily in development and higher grade ore from stoping operations only started to be produced in the second half of 2016.
At the end of the fourth quarter of 2016 combined coarse ore stocks from the Palito and Sao Chico Mines were approximately 21,000 tonnes with an average grade of 4.0 g/t of gold (31 December 2015: approximately 16,000 tonnes with an average grade of 4.7 g/t of gold).
Palito MineMining activities at the Palito Mine are now very much in regime with approximately 112,000 tonnes of ore mined at a grade of 10.05 g/t of gold during 2015 and a further 118,477 tonnes mined at a grade of 9.62 g/t during 2016.
During 2016, the Company focused on opening up new sectors in the mine as well as continuing to develop the existing sectors. Up until 2016, mining operations at Palito had focused on the G1, G2 and G3 vein complex (“the Main Zone”) as well as the Palito West sector. During 2016, the Company continued development of these two sectors but also gave increased priority to developing and accessing previously drilled, but undeveloped sectors in the upper levels, namely Senna and Chico da Santa. Chico da Santa lies to the east of the Main Zone, with the Senna zone located to the west. With four sectors now being developed underground at Palito, during the 2016 calendar year the Group has completed approximately 7,350 metres of horizontal development of which approximately 1,900 metres was completed in the fourth quarter of 2016. This represents an increase of eight per cent by comparison with 2015, reflecting the opening of the new sectors, with a total of 6,800 metres of development completed during 2015, of which 1,960 metres was completed in the final quarter of the year.
In the G1, G2 and G3 vein complex, the main ramp has been deepened further and has now reached the -50 metre relative level (“mRL”) where the G3 vein has been intersected and is ready to be developed and is the lowest production level in the Palito Mine.
The Senna zone was mined during 2008 and 2009 as a small open pit where approximately 25,000 tonnes of oxide ore with a grade of 3.0 g/t gold was extracted. It is now in underground development and to date has been very successful. Mine development on the 250mRL, 237mRL, 225mRL and 210mRL is on-going with the ramp now being taken down to the 180mRL. All ore being mined from the Senna sector is currently from development activity with stoping yet to start. Based on the ore grades recovered from the open pit operation and deeper exploration drill-holes, management is hopeful of the long term potential within the Senna zone which, whilst part of the main Palito Mine complex, has the benefit of an independent access from surface.
MANAGEMENT DISCUSSION AND ANALYSIS
Operational Review continued
Overview
Strategic ReportM
anagement D
iscussion and A
nalysisCom
munity and
Social ResponsibilityCorporate G
overnanceFinancial Statem
ents
23Serabi Gold plc // Report and Accounts 2016
In the Chico da Santa sector, the 114mRL has been developed on the Ipe, Jatoba and Mogno veins. Good grades have been encountered in all three veins, though the veins in the sector tend be slightly narrower than the veins being mined elsewhere in the Palito Mine.
During 2015, the Group continued mine development on G3 towards the Palito South area, primarily on the 114mRL, which has been driven approximately 700 metres further south than any other underground working at Palito. This development has not been advanced significantly in 2016 as it is awaiting underground diamond drilling to test the down-dip continuity of the G3 vein at depth. Management hopes that subject to available cash resources, a drilling programme can be undertaken during 2017 to evaluate this area further.
Opening up new sectors of the Palito Mine has created options and flexibility, an essential part of any underground mining operation. Underground diamond drilling is being used to evaluate numerous known, but underexplored, veins and together with these two new sectors, the Group hopes to open up numerous new mining faces in the upper levels. These have the advantage of being in close proximity to existing mine infrastructure and will not require any new ramp development.
This lateral development also reduces the requirement to continue to deepen the mine at the rates that the Group undertook in 2015. This could be expected to extend the life of the operation with the identification of mining areas that are not currently part of the mining plans and will also increase the amount of ore than can be recovered in each vertical metre of mine development, which can improve margins and reduce costs.
Sao Chico MineAt the Sao Chico Mine, underground development commenced in the fourth quarter of 2014. During 2015 approximately 2,800 metres of development were completed allowing mining on three levels. During January 2015, the ramp development intersected the principal vein, the Main Vein, approximately 30 vertical metres below the portal entrance. The initial sampling confirmed a payable intersection with a true width of 3.6 metres and a gold grade of 42.0 g/t.
Since this time, the Main Vein has continued to be developed and evaluated with a combination of ‘on-lode’ development and underground drilling. The main ramp has now reached the 71mRL, approximately 170 metres below surface and will continue to be deepened during 2017. Development has now been undertaken on seven levels and is active on the 100mRL, 86mRL and the new 71mRL, whilst stoping activity is currently focused on the 186mRL, 170mRL 156mRL and 140mRL.
During 2016, the decision to implement sublevel open stoping as the principal mining method was taken, which resulted in the development of sublevels with 12 metre vertical spacings floor to floor. Each sublevel is advanced three metres at a time and channel sampled. The closer sample spacing that this allows has greatly increased the understanding of the orebody and the increased level of mine development has enabled the Company to define a clear 24 month mine plan.
The Main Vein or ore zone at Sao Chico can vary from one metre to eight metres wide, but most commonly is a 2.5 metre alteration zone, which itself is structurally continuous. However, the gold grades within this alteration zone are quite erratic and are hosted in three steeply plunging pay-shoots. In these pay-shoots, the grades are often truly spectacular, very often being in excess of 100 g/t of gold. Outside the pay-shoots the vein is continuous but with low gold grades and, as a result, it is unavoidable that, as the mine development passes between the pay-shoots, lower grade ore has to be mined. Whilst the alteration zone itself is readily identifiable, the high grade gold zones within this alteration zone are much less so and, as a result, the mining operations require on-lode development at regular vertical intervals, with regular channel sampling and in-fill drilling between these levels to best define the high grade gold mineralisation. This approach allows the Group’s mining personnel to readily identify stoping blocks and optimise mining of the high gold grade zones.
Underground diamond drilling is being used to evaluate numerous known, but underexplored, veins and…the Group hopes to open up numerous new mining faces.
The Main Vein…at Sao Chico…most commonly is a 2.5 metre alteration zone. The grades are often truly spectacular, very often being excess of 100 g/t.
24 Serabi Gold plc // Report and Accounts 2016
The central pay-shoot is the most established of these three high grade shoots, and is some 100 metres long. The Group has, and will continue to focus in the near-term, on developing this part of the Main Vein, and some consistent higher grade development ore is being generated as a result. Access to the other pay-shoots along the strike will not be lost and these will be available for development later in the year.
During the second quarter of 2016, the Company commenced underground exploration drilling of the central pay-shoot targeting its down dip extension. The drilling has intersected the Main Vein in all holes and is confirming the belief that the Sao Chico Main Vein, is a regional shear structure. This bodes well for the continuation and strike extension outside the immediate and current mine limits.
Plant operationsTotal gold production for the 2016 calendar year was 39,390 ounces of gold, generated from the processing of the run of mine (“ROM”) ore from the Palito and Sao Chico Mines, combined with the Palito surface coarse ore and the stockpiled flotation tailings accumulated from the processing of Palito Mine production in 2014.
Gold production for the 12 month period came from the processing of 158,966 tonnes of hard rock ROM ore from the Palito and Sao Chico Mines with an average grade of 8.11g/t of gold (12 months to 31 December 2015: 130,299 tonnes at 8.43 g/t of gold). The total mined ore for the same period was 158,864 tonnes with an average grade of 9.74 g/t of gold (12 months to 31 December 2015: 135,847 tonnes at 9.8g/t of gold). The increase in mined and processed ore reflects the increased levels of ore being produced at Sao Chico compared with the same period in 2015 when ore production was only just beginning. In addition to the ROM ore, an additional 16,716 tonnes of flotation tailings with a grade of 3.23 g/t of gold (12 months to 31 December 2015: approximately 18,000 tonnes) was processed through the cyanidation plant.
The flotation tailings were generated in 2014 as a result of operating the process plant for the first nine months with recovery of gold from flotation only, prior to completion of the CIP circuit which became operational in October 2014.
The Group made the decision before the end of 2015 to acquire a third ball mill and modify the plant to increase nominal daily plant throughput capacity from an average of 400 tpd to at least 500 tpd. Further improvements undertaken within the process plant during 2016 have included the installation of additional flotation capacity and automation, along with new carbon screens within the
CIP tanks to improve inter-tank flow rates. A carbon regeneration kiln was installed, commissioned and became operational during the fourth quarter of 2016. This kiln will regenerate fouled carbon reducing the need to purchase fresh carbon and is also anticipated to enhance gold recoveries.
Since the Group’s operations began, they have been limited by the capacity of its process plant and the Group has not yet been able to run down the surface ore stocks, initially established in 2013 and 2014 when the mine was being re-opened. However, and perhaps more importantly, a third mill provides essential contingency in the processing operations that has never previously existed. Once the surface stocks have been consumed, and with the Group’s current understanding of the mining resources at both Palito and Sao Chico, management currently consider it unlikely that, in the near term, future mine plans can match the increased plant capacity. As a result the operation will have milling capacity in excess of the mining rates and the third ball mill will revert to its primary purpose of providing much needed contingency in the plant. Since the plant commenced operating, the time available for essential routine planned maintenance has been scarce. The third mill means the operation can comfortably accommodate much needed maintenance time, as well as absorbing any unexpected interruptions to operations.
MANAGEMENT DISCUSSION AND ANALYSIS
Operational Review continued

Overview
Strategic ReportM
anagement D
iscussion and A
nalysisCom
munity and
Social ResponsibilityCorporate G
overnanceFinancial Statem
ents
25Serabi Gold plc // Report and Accounts 2016
Summary Production Statistics for the Four Quarters Ending 31 December 2016 (Palito and Sao Chico)
Total Total Quarter 1 Quarter 2 Quarter 3 Quarter 4 2016 2015
Horizontal development – Palito Metres 1,900 1,910 1,607 1,928 7,345 6,800
Horizontal development – Sao Chico Metres 1,025 1,031 1,042 696 3,794 2,800
Horizontal development – Total Metres 2,925 2,941 2,649 2,694 11,209 9,600
Mined ore – Palito Tonnes 26,752 25,198 31,916 34,611 118,477 111,751 Gold grade (g/t) 11.84 10.48 9.52 7.38 9.62 10.05
Mined ore – Sao Chico Tonnes 10,794 8,408 11,217 9,968 40,387 24,096 Gold grade (g/t) 9.00 6.81 9.88 14.38 10.12 8.66
Mined ore – Total Tonnes 37,546 33,606 43,133 44,579 158,864 135,847 Gold grade (g/t) 11.02 9.56 9.61 8.94 9.74 9.8
Milled ore Tonnes 36,615 39,402 42,464 40,485 158,966 130,299 Gold grade (g/t) 8.58 8.17 8.08 7.60 8.11 8.43
Gold produced Ounces 9,771 9,896 10,310 9,413 39,390 32,629
(1) Gold production figures are subject to amendment pending final agreed assays of the gold content of the copper/gold concentrate and gold doré that is delivered to the refineries.(2) Gold production totals for 2016 include treatment of 16,716 tonnes of flotation tails.
Milling rates for ROM ore have increased by 22 per cent from an average of 357 tpd for the 12 months to 31 December 2015 to an average rate of 435 tpd for the 12 month period to 31 December 2016. The introduction of the third ball mill at the end of June 2016 has had a significant effect on throughput rates. The average daily milling rate was 460 tpd for the second six month period of 2016 compared with an average rate of 417 tpd for the first six months of 2016. The increase in processing rates also reflects the improvements in the operational efficiency of the process plant which have been assisted by the introduction of the gravity circuit and ILR for treating Sao Chico ore, reducing the levels of gold that would otherwise have been treated in the CIP circuit. This improved efficiency has also allowed the rate of processing of the flotation tails to be maintained at similar levels to the corresponding period in 2015. This has meant that the effective process rates for the CIP circuit have increased from an average of 406 tpd for the 12 month period to 31 December 2015 to an average rate of 481 tpd for the 12 month period to 31 December 2016.
At 31 December 2016, there were approximately 20,800 tonnes of flotation tails with an average grade of 2.5 g/t of gold (31 December 2015: approximately 37,500 tonnes at 2.5 g/t of gold) waiting to be processed.
Exploration and Licensing MattersThe Group undertook a surface diamond drill programme in March 2015 at the Sao Chico Mine and the completed programme consisted of 42 diamond drill holes totalling 7,204 metres. A further 30 underground diamond drill holes were completed during 2015 totalling an additional 1,459 metres of drilling. The drill programme was a combination of in-fill and step-out drilling and the results from this, in conjunction with the on-lode development mining that took place during the remainder of 2015, greatly enhanced the understanding of the ore body and facilitated mine planning for 2016 and 2017. It built on the results and understanding gained from the 2011 and 2013 drilling campaigns and reported numerous high grade intersections, with some gold grades in excess of 100 g/t, and indications that the grade and resource potential continues at depth. Further details are set out in a news release issued by the Group on 21 October 2015, which is available on the Group’s website www.serabigold.com and has been filed on SEDAR. The understanding of the orebody has also been assisted by paragenetic studies on mine ore samples including detailed petrological descriptions, SEM and QemScan analysis.
...a third mill provides essential contingency in the processing operations that has never previously existed.
The increase in processing rates also reflects the improvements in the operational efficiency of the process plant which have been assisted by the introduction of the gravity circuit and ILR for treating Sao Chico ore, reducing the levels of gold that would otherwise have been treated in the CIP circuit.
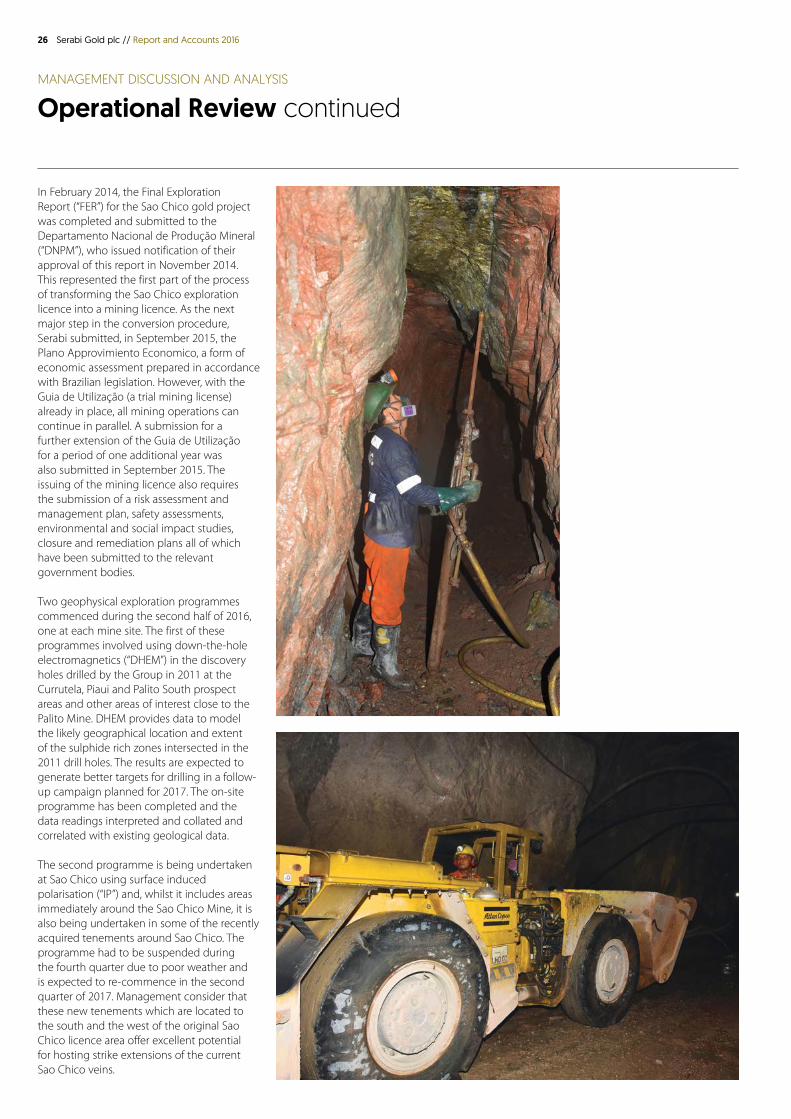
26 Serabi Gold plc // Report and Accounts 2016
MANAGEMENT DISCUSSION AND ANALYSIS
Operational Review continued
In February 2014, the Final Exploration Report (“FER”) for the Sao Chico gold project was completed and submitted to the Departamento Nacional de Produção Mineral (“DNPM”), who issued notification of their approval of this report in November 2014. This represented the first part of the process of transforming the Sao Chico exploration licence into a mining licence. As the next major step in the conversion procedure, Serabi submitted, in September 2015, the Plano Approvimiento Economico, a form of economic assessment prepared in accordance with Brazilian legislation. However, with the Guia de Utilização (a trial mining license) already in place, all mining operations can continue in parallel. A submission for a further extension of the Guia de Utilização for a period of one additional year was also submitted in September 2015. The issuing of the mining licence also requires the submission of a risk assessment and management plan, safety assessments, environmental and social impact studies, closure and remediation plans all of which have been submitted to the relevant government bodies.
Two geophysical exploration programmes commenced during the second half of 2016, one at each mine site. The first of these programmes involved using down-the-hole electromagnetics (“DHEM”) in the discovery holes drilled by the Group in 2011 at the Currutela, Piaui and Palito South prospect areas and other areas of interest close to the Palito Mine. DHEM provides data to model the likely geographical location and extent of the sulphide rich zones intersected in the 2011 drill holes. The results are expected to generate better targets for drilling in a follow-up campaign planned for 2017. The on-site programme has been completed and the data readings interpreted and collated and correlated with existing geological data.
The second programme is being undertaken at Sao Chico using surface induced polarisation (“IP”) and, whilst it includes areas immediately around the Sao Chico Mine, it is also being undertaken in some of the recently acquired tenements around Sao Chico. The programme had to be suspended during the fourth quarter due to poor weather and is expected to re-commence in the second quarter of 2017. Management consider that these new tenements which are located to the south and the west of the original Sao Chico licence area offer excellent potential for hosting strike extensions of the current Sao Chico veins.
Overview
Strategic ReportM
anagement D
iscussion and A
nalysisCom
munity and
Social ResponsibilityCorporate G
overnanceFinancial Statem
ents
27Serabi Gold plc // Report and Accounts 2016
Both geophysical programmes are using well established techniques to identify conductive bodies and sulphide mineralisation as pathfinders to locating gold occurrences which are associated with these features.
Jardim do Ouro Exploration With the addition of the new tenement to the west and south at Sao Chico, the Jardim do Ouro exploration area (“JDO Project”) covers a total area of approximately 42,000 hectares, incorporating the Palito and Sao Chico mining licence areas. The Palito mining licence was granted on 23 October 2007 covering an area of 1,150 hectares, whilst the Sao Chico licence is in the process of being converted into a full mining licence. The remainder of the tenement area comprises exploration licences either granted or in application. The JDO Project is located in the Tapajós Mineral Province in the south east part of the Itaituba Municipality in the west of Pará State in central north Brazil.
The focus of the Group has been on the identification and development of satellite ore deposits located in close proximity to Palito. The Group completed two air-borne electro-magnetic (“VTEM”) surveys in 2008 and 2010 over a total area of 14,650 hectares. From these surveys the Group identified a number of geophysical anomalies which it considers worthy of further investigation. During 2010 and 2011 the Group undertook a 12,000 metre drilling campaign over nine of these anomalies, which resulted in the discovery of the Palito South, Currutela and Piaui prospects.
The Sao Chico Mine is located in the south west corner of the JDO Project area. During 2013 the Group completed a 6,000 metre drilling programme which more than doubled the known 150 metre strike extension of the principal mineralised structure (“the Main Vein”) at Sao Chico and confirmed the presence of a number of parallel mineralised structures. The development mining activities undertaken during 2015 and 2016, in conjunction with the 7,000 metre surface drilling programme, have provided essential data for the further evaluation of the Main Vein and the immediate parallel structures.
It has always been the intention of the Group to use cash flow generated from its production operations to advance its exploration opportunities. As already noted, the Group conducted DHEM in close proximity to the Palito Mine and commenced IP around the Sao Chico during the second half of 2016 with the intention of using the results from these programmes to plan drilling campaigns that can be undertaken during 2017.
Other Exploration Prospects The Group has three other project areas, although activities on each of these projects has been limited in recent periods.
The Sucuba Project is located in the state of Para, and the Group holds two exploration permits covering an area of 10,449 hectares. The Pizon Project, located in the state of Amazonas, represents 4,733 hectares, in one exploration licence and the Modelo Project, also in Amazonas, represents 2,971 hectares in one exploration licence. The Group has not engaged in any exploration activity at any of these projects during the past 12 months and has currently not budgeted for any exploration activity during the next 18 months.
Mike HodgsonChief Executive30 March 2017
28 Serabi Gold plc // Report and Accounts 2016
MANAGEMENT DISCUSSION AND ANALYSIS
Financial Review
12 month period ended 31 December 2016 compared to the 12 month period ended 31 December 2015
The Group has recognised a gross profit for the 12 month period ended 31 December 2016 of US$11,302,587 (2015: US$5,660,281) and an operating profit of US$6,023,906 (2015: US$876,436).
The gross profit of US$11,302,587 for the period ended 31 December 2016 is analysed in the table overleaf.
RevenueSales are only recognised when the risks and rewards of ownership of the goods are transferred to the buyer. During the month of September 2016, the Group entered into a new contract for the sale of its copper/gold concentrate. Under this new contract the sale is recognised when the goods depart from Brazil, whilst under the Group’s previous contract the sale was only recognised when the goods arrived at the purchasers premises.
During the 12 month period ending 31 December 2016 the Group recognised total sales of US$52,593,751 (2015: US$35,086,113). The sales can be separated between sales of copper/gold concentrate of US$26,268,676 (2015: US$25,453,418) and sales of gold bullion of US$26,225,075 (2015: US$9,632,695). Included within the Group’s total concentrate revenue of US$26,268,676 in 2016 is US$636,558 relating to sales recognised and recorded during 2015, but which were not settled until during the first quarter of 2016. Revenue for sales made during the fourth quarter of 2015 were initially estimated using the year end gold price. However as the gold price increased during Q1 2016 the resulted in this increased revenue for the Group of US$636,558 which was reported in the results of the first quarter of 2016.
During 2016 the Group produced 2,039 wet tonnes of copper/gold concentrate, (containing an estimated 17,571 ounces of gold). Revenue has been recognised for sales of 2,240 tonnes, (containing an estimated 19,445 ounces). During the 12 months ended 31 December 2015 the Group produced 2,188 wet tonnes of copper/gold concentrate, (containing an estimated 20,984 ounces of gold). However sales were recognised on 2,200 tonnes sold containing 20,702 ounces. All unsold material is held as inventory.
Growth is seen to be the key to the long term success for the Group, maintaining a focus on maximising cash generation and high quality operations that can generate greater levels of operational cash flow than larger gold producers. With increased economies associated with scale the Group wants to leverage on its existing skill, knowledge and contact base and remains very much a Brazilian focused producer and developer.
Highlights
US$11.3 millionGross operating profit for 2016
US$4.43 million Post tax profit for 2016
US$965 per ounce All-In Sustaining Cost for 2016
Financial Highlights • Gross profit from operations of US$11.30 million for 2016 which
represents an improvement of over 99 per cent compared to the same 12 month period of 2015.
• Post tax profit of US$4.43 million compared with a loss of US$0.048 million for the same 12 month period of 2015.
• All-In Sustaining Cost for the year of US$965 per ounce.• Cash Cost for the year of US$770 per ounce.• Earnings per share of 0.66 cents for 2016.• Cash holdings of US$4.16 million at 31 December 2016
(31 December 2015 : US$2.2 million)• Average gold price of US$1,245 received on gold sales in 2016.• Negligible borrowings with secured debt facilities outstanding
at 31 December of only US$1.37 million.• Borrowings of approximately US$8.50 million settled during
the year.• Unit production costs per tonne reduced by 12.7 per cent
in local currency terms year on year.
Overview
Strategic ReportM
anagement D
iscussion and A
nalysisCom
munity and
Social ResponsibilityCorporate G
overnanceFinancial Statem
ents
29Serabi Gold plc // Report and Accounts 2016
For the year ended 31 December 2016, the Group also recognised revenue for 20,992 ounces of gold bullion earning total revenue of US$26,225,075 (2015: revenue of US$9,632,695 from the sale of 8,284 ounces). However, the 2015 recognised revenue does not include revenue of US$3,337,071 earned from the sale of 2,955 ounces of bullion from ore produced from the Sao Chico Mine. For the year ended 31 December 2015, this income had been treated as capitalised income and set off against capitalised costs of the Sao Chico Mine development as the Sao Chico operation had not attained commercial production until 1 January 2016.
Operating CostsOperating costs for the 12 months ended 31 December 2016 of US$28,962,200 (2015: US$20,053,318) comprise all mining costs at both the Palito and Sao Chico Mines, plant processing costs, as well as all general site costs incurred on both mine sites during the 12 month period to produce the final product sold as shown in the table below. During the same period in the previous year all mining and processing costs associated with the Sao Chico Mine were capitalised as the mine had not reached commercial production. Production activity and operating costs for the full year are broken down in the table below:
Full Year 2016 Full Year 2015 Variance US$ US$ US$
Concentrate sold (Ounces) 17,569 20,702 (3,133)Bullion Sold (Ounces) 20,992 8,284 12,708
Total Ounces 38,561 28,986 9,575
Revenue from Ordinary Activity Gold (in Concentrate) 23,676,825 22,970,460 706,364Copper (in Concentrate) 2,498,933 2,340,609 158,324Silver (in Concentrate) 192,918 142,349 50,569
Total Concentrate Revenue 26,268,676 25,453,418 915,257Gold Bullion 26,225,075 9,632,695 16,592,381
Total Sales 52,593,751 35,086,113 17,507,638
Costs of salesOperational costs (28,962,200) (20,053,318) (8,098,882)Shipping costs (1,889,111) (2,054,896) 165,785Treatment charges (1,085,039) (1,074,428) (10,611)Royalties (970,076) (402,421) (567,655)Amortisation of Mine Property (6,308,840) (4,540,432) (1,768,408)Depreciation of Plant & Equipment (2,075,898) (1,300,337) (775,561)
Total Operating costs (41,291,164) (29,425,832) (11,865,332)
Gross Profit 11,302,587 5,660,281 5,642,306
12 months ended 12 months ended Variance December 2016 December 2015 Variance %
Tonnes Mined 161,086 111,751 49,722 44%Tonnes Milled 158,966 114,131 44,835 39%Ounces Produced 39,390 29,841 9,549 32%
12 months ended 12 months ended December 2016 December 2015 Variance Variance
US$’000 US$’000 US$’000 %
Operating Costs Labour 13,843 10,020 3,823 38%Mining consumables & Maintenance 7,902 5,010 2,892 58%Plant Consumables 4,197 3,080 1,117 36%General Site 3,020 1,943 1,077 55%
28,962 20,053 8,909 44%
Note: All production numbers in the table above relate to operational activity included within the income statement and does not consider 2015 activity which was capitalised. The Sao Chico Mine achieved commercial production on 1 January 2016 therefore all activity and costs associated with the Sao Chico Mine during 2015 were not included in the numbers above, including tonnes mined of 23,658 tonnes milled of 10,307 and production of 3,163 ounces of gold.
As shown in the table above, the Group has extracted 44 per cent more tonnes from the mine in 2016 in comparison to 2015 as well as milling 39 per cent more tonnes which has resulted in the Group producing 32 per cent more gold in the form of both copper concentrate and gold bullion. This increase in activity has resulted in an increase on operating costs year on year of 44 per cent.
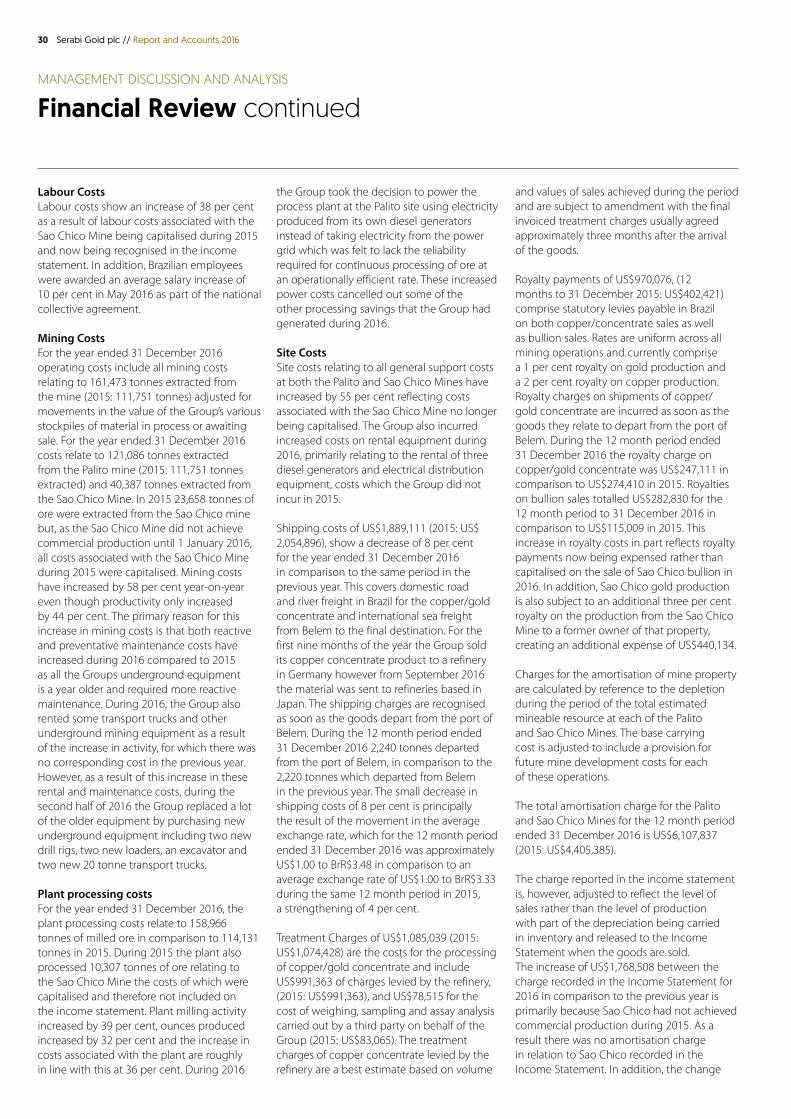
30 Serabi Gold plc // Report and Accounts 2016
Labour CostsLabour costs show an increase of 38 per cent as a result of labour costs associated with the Sao Chico Mine being capitalised during 2015 and now being recognised in the income statement. In addition, Brazilian employees were awarded an average salary increase of 10 per cent in May 2016 as part of the national collective agreement.
Mining CostsFor the year ended 31 December 2016 operating costs include all mining costs relating to 161,473 tonnes extracted from the mine (2015: 111,751 tonnes) adjusted for movements in the value of the Group’s various stockpiles of material in process or awaiting sale. For the year ended 31 December 2016 costs relate to 121,086 tonnes extracted from the Palito mine (2015: 111,751 tonnes extracted) and 40,387 tonnes extracted from the Sao Chico Mine. In 2015 23,658 tonnes of ore were extracted from the Sao Chico mine but, as the Sao Chico Mine did not achieve commercial production until 1 January 2016, all costs associated with the Sao Chico Mine during 2015 were capitalised. Mining costs have increased by 58 per cent year-on-year even though productivity only increased by 44 per cent. The primary reason for this increase in mining costs is that both reactive and preventative maintenance costs have increased during 2016 compared to 2015 as all the Groups underground equipment is a year older and required more reactive maintenance. During 2016, the Group also rented some transport trucks and other underground mining equipment as a result of the increase in activity, for which there was no corresponding cost in the previous year. However, as a result of this increase in these rental and maintenance costs, during the second half of 2016 the Group replaced a lot of the older equipment by purchasing new underground equipment including two new drill rigs, two new loaders, an excavator and two new 20 tonne transport trucks.
Plant processing costsFor the year ended 31 December 2016, the plant processing costs relate to 158,966 tonnes of milled ore in comparison to 114,131 tonnes in 2015. During 2015 the plant also processed 10,307 tonnes of ore relating to the Sao Chico Mine the costs of which were capitalised and therefore not included on the income statement. Plant milling activity increased by 39 per cent, ounces produced increased by 32 per cent and the increase in costs associated with the plant are roughly in line with this at 36 per cent. During 2016
the Group took the decision to power the process plant at the Palito site using electricity produced from its own diesel generators instead of taking electricity from the power grid which was felt to lack the reliability required for continuous processing of ore at an operationally efficient rate. These increased power costs cancelled out some of the other processing savings that the Group had generated during 2016.
Site CostsSite costs relating to all general support costs at both the Palito and Sao Chico Mines have increased by 55 per cent reflecting costs associated with the Sao Chico Mine no longer being capitalised. The Group also incurred increased costs on rental equipment during 2016, primarily relating to the rental of three diesel generators and electrical distribution equipment, costs which the Group did not incur in 2015.
Shipping costs of US$1,889,111 (2015: US$ 2,054,896), show a decrease of 8 per cent for the year ended 31 December 2016 in comparison to the same period in the previous year. This covers domestic road and river freight in Brazil for the copper/gold concentrate and international sea freight from Belem to the final destination. For the first nine months of the year the Group sold its copper concentrate product to a refinery in Germany however from September 2016 the material was sent to refineries based in Japan. The shipping charges are recognised as soon as the goods depart from the port of Belem. During the 12 month period ended 31 December 2016 2,240 tonnes departed from the port of Belem, in comparison to the 2,220 tonnes which departed from Belem in the previous year. The small decrease in shipping costs of 8 per cent is principally the result of the movement in the average exchange rate, which for the 12 month period ended 31 December 2016 was approximately US$1.00 to BrR$3.48 in comparison to an average exchange rate of US$1.00 to BrR$3.33 during the same 12 month period in 2015, a strengthening of 4 per cent.
Treatment Charges of US$1,085,039 (2015: US$1,074,428) are the costs for the processing of copper/gold concentrate and include US$991,363 of charges levied by the refinery, (2015: US$991,363), and US$78,515 for the cost of weighing, sampling and assay analysis carried out by a third party on behalf of the Group (2015: US$83,065). The treatment charges of copper concentrate levied by the refinery are a best estimate based on volume
and values of sales achieved during the period and are subject to amendment with the final invoiced treatment charges usually agreed approximately three months after the arrival of the goods.
Royalty payments of US$970,076, (12 months to 31 December 2015: US$402,421) comprise statutory levies payable in Brazil on both copper/concentrate sales as well as bullion sales. Rates are uniform across all mining operations and currently comprise a 1 per cent royalty on gold production and a 2 per cent royalty on copper production. Royalty charges on shipments of copper/gold concentrate are incurred as soon as the goods they relate to depart from the port of Belem. During the 12 month period ended 31 December 2016 the royalty charge on copper/gold concentrate was US$247,111 in comparison to US$274,410 in 2015. Royalties on bullion sales totalled US$282,830 for the 12 month period to 31 December 2016 in comparison to US$115,009 in 2015. This increase in royalty costs in part reflects royalty payments now being expensed rather than capitalised on the sale of Sao Chico bullion in 2016. In addition, Sao Chico gold production is also subject to an additional three per cent royalty on the production from the Sao Chico Mine to a former owner of that property, creating an additional expense of US$440,134.
Charges for the amortisation of mine property are calculated by reference to the depletion during the period of the total estimated mineable resource at each of the Palito and Sao Chico Mines. The base carrying cost is adjusted to include a provision for future mine development costs for each of these operations.
The total amortisation charge for the Palito and Sao Chico Mines for the 12 month period ended 31 December 2016 is US$6,107,837 (2015: US$4,405,385).
The charge reported in the income statement is, however, adjusted to reflect the level of sales rather than the level of production with part of the depreciation being carried in inventory and released to the Income Statement when the goods are sold. The increase of US$1,768,508 between the charge recorded in the Income Statement for 2016 in comparison to the previous year is primarily because Sao Chico had not achieved commercial production during 2015. As a result there was no amortisation charge in relation to Sao Chico recorded in the Income Statement. In addition, the change
MANAGEMENT DISCUSSION AND ANALYSIS
Financial Review continued
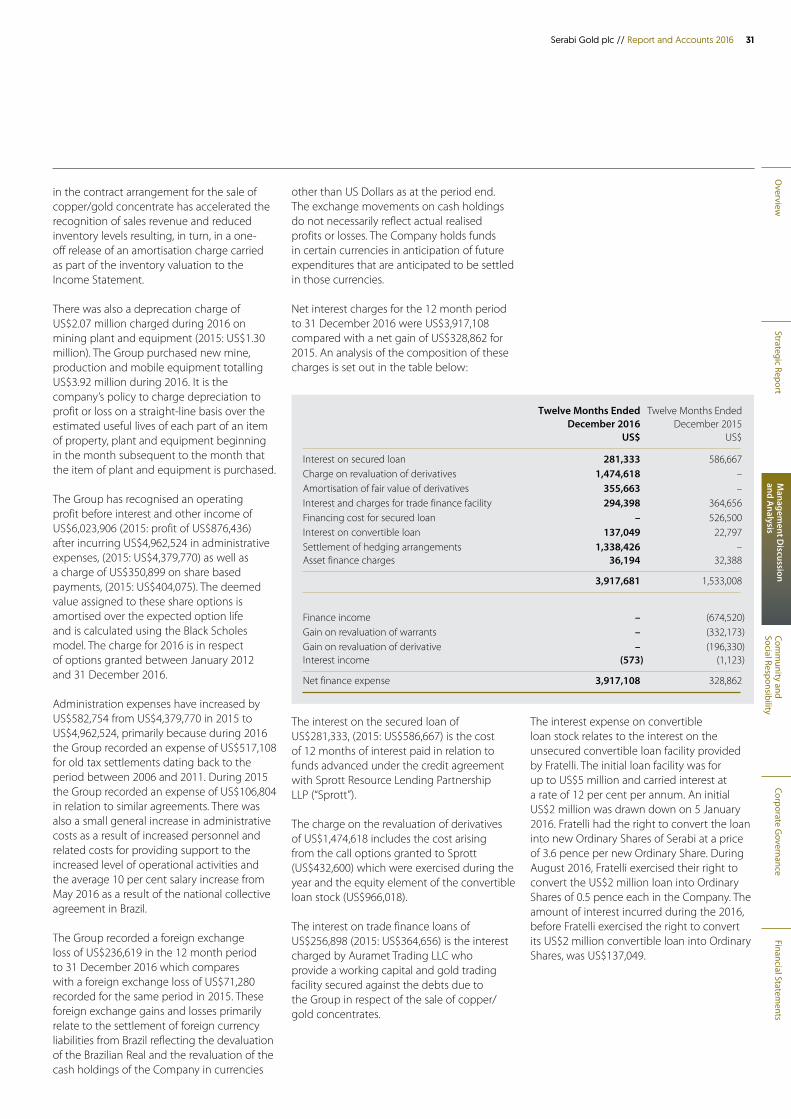
Overview
Strategic ReportM
anagement D
iscussion and A
nalysisCom
munity and
Social ResponsibilityCorporate G
overnanceFinancial Statem
ents
31Serabi Gold plc // Report and Accounts 2016
in the contract arrangement for the sale of copper/gold concentrate has accelerated the recognition of sales revenue and reduced inventory levels resulting, in turn, in a one-off release of an amortisation charge carried as part of the inventory valuation to the Income Statement.
There was also a deprecation charge of US$2.07 million charged during 2016 on mining plant and equipment (2015: US$1.30 million). The Group purchased new mine, production and mobile equipment totalling US$3.92 million during 2016. It is the company’s policy to charge depreciation to profit or loss on a straight-line basis over the estimated useful lives of each part of an item of property, plant and equipment beginning in the month subsequent to the month that the item of plant and equipment is purchased.
The Group has recognised an operating profit before interest and other income of US$6,023,906 (2015: profit of US$876,436) after incurring US$4,962,524 in administrative expenses, (2015: US$4,379,770) as well as a charge of US$350,899 on share based payments, (2015: US$404,075). The deemed value assigned to these share options is amortised over the expected option life and is calculated using the Black Scholes model. The charge for 2016 is in respect of options granted between January 2012 and 31 December 2016.
Administration expenses have increased by US$582,754 from US$4,379,770 in 2015 to US$4,962,524, primarily because during 2016 the Group recorded an expense of US$517,108 for old tax settlements dating back to the period between 2006 and 2011. During 2015 the Group recorded an expense of US$106,804 in relation to similar agreements. There was also a small general increase in administrative costs as a result of increased personnel and related costs for providing support to the increased level of operational activities and the average 10 per cent salary increase from May 2016 as a result of the national collective agreement in Brazil.
The Group recorded a foreign exchange loss of US$236,619 in the 12 month period to 31 December 2016 which compares with a foreign exchange loss of US$71,280 recorded for the same period in 2015. These foreign exchange gains and losses primarily relate to the settlement of foreign currency liabilities from Brazil reflecting the devaluation of the Brazilian Real and the revaluation of the cash holdings of the Company in currencies
other than US Dollars as at the period end. The exchange movements on cash holdings do not necessarily reflect actual realised profits or losses. The Company holds funds in certain currencies in anticipation of future expenditures that are anticipated to be settled in those currencies.
Net interest charges for the 12 month period to 31 December 2016 were US$3,917,108 compared with a net gain of US$328,862 for 2015. An analysis of the composition of these charges is set out in the table below:
Twelve Months Ended Twelve Months Ended December 2016 December 2015 US$ US$
Interest on secured loan 281,333 586,667Charge on revaluation of derivatives 1,474,618 –Amortisation of fair value of derivatives 355,663 –Interest and charges for trade finance facility 294,398 364,656Financing cost for secured loan – 526,500Interest on convertible loan 137,049 22,797Settlement of hedging arrangements 1,338,426 –Asset finance charges 36,194 32,388
3,917,681 1,533,008
Finance income – (674,520)Gain on revaluation of warrants – (332,173)Gain on revaluation of derivative – (196,330)Interest income (573) (1,123)
Net finance expense 3,917,108 328,862
The interest on the secured loan of US$281,333, (2015: US$586,667) is the cost of 12 months of interest paid in relation to funds advanced under the credit agreement with Sprott Resource Lending Partnership LLP (“Sprott”).
The charge on the revaluation of derivatives of US$1,474,618 includes the cost arising from the call options granted to Sprott (US$432,600) which were exercised during the year and the equity element of the convertible loan stock (US$966,018).
The interest on trade finance loans of US$256,898 (2015: US$364,656) is the interest charged by Auramet Trading LLC who provide a working capital and gold trading facility secured against the debts due to the Group in respect of the sale of copper/gold concentrates.
The interest expense on convertible loan stock relates to the interest on the unsecured convertible loan facility provided by Fratelli. The initial loan facility was for up to US$5 million and carried interest at a rate of 12 per cent per annum. An initial US$2 million was drawn down on 5 January 2016. Fratelli had the right to convert the loan into new Ordinary Shares of Serabi at a price of 3.6 pence per new Ordinary Share. During August 2016, Fratelli exercised their right to convert the US$2 million loan into Ordinary Shares of 0.5 pence each in the Company. The amount of interest incurred during the 2016, before Fratelli exercised the right to convert its US$2 million convertible loan into Ordinary Shares, was US$137,049.
32 Serabi Gold plc // Report and Accounts 2016
The finance cost on gold hedging arrangements of US$1,338,426 (12 months to 31 December 2015: income of US$674,520) is actual and estimated variations arising from short term movements in the gold price between the contractual pricing arrangements with the end purchaser of the copper/gold concentrate and the prices fixed when the Group draws down on the trade finance arrangement that it had in place.
Asset finance charges relate to mining equipment acquired under supplier credit terms. The lease terms range from a 12 month period to a twenty four month period and bear interest at a rate between 6.7 per cent and 6.85 per cent per annum. Lease interest charges are reducing as the capital element of the financing is paid down in monthly instalments.
Liquidity and Capital ResourcesNon-Current AssetsOn 31 December 2016, the Group’s net assets amounted to US$63.38 million, which compares to US$46.78 million as reported at 31 December 2015. This increase primarily reflects the effect of the strengthening of the Brazilian Real between 31 December 2015 when the rate was BrR$3.9042 to US$1.00, and 31 December 2016, when the rate was BrR$3.2585 to US$1.00. Whilst the Group has reported a profit after taxation of US$4.43 million, it has also incurred a gain of US$17.40 million on the re-translation of the assets of its Brazilian operations in the 12 month period since 31 December 2015.
Non-current assets totalling US$58.64 million at 31 December 2016 (31 December 2015: US$48.83 million), are primarily comprised of property, plant and equipment, which as at 31 December 2016 totalled US$45.40 million (31 December 2015: US$40.15 million) as well as development and deferred exploration costs with a value of US$10.00 million (31 December 2015: US$8.68 million). The Group has also established a provision for a deferred tax asset of US$3.25 million.
The Group’s Brazilian subsidiary, Serabi Mineracao SA has historic tax losses which can be utilised in future years to reduce the income tax liability that will be assessed on future profits. In both 2015 and 2016, SMSA reported taxable profits and as the Board of Serabi considers that there is reasonable certainty that SMSA will continue to make profits in the future, the Group is recognising a deferred tax asset for the first time in the current year.
The Group’s property, plant and equipment include the value of its mine assets at 31 December 2016 of US$31.79 million (2015: US$21.47 million). During the year, the Group transferred assets with a value of US$9.37 million from assets in construction into mine assets, primarily reflecting the Sao Chico Mine having achieved commercial production from 1 January 2016. Assets in construction valued as at 31 December 2016 were valued at US23.83 million (2015: US$11.23 million). During 2016 the Group also transferred US$558,895 from deferred exploration costs to mine assets. The Group owns land, buildings, plant and equipment with a cost of US$10.78 million (31 December 2015: US7.44 million). During 2016 the Group has acquired additional plant and machinery to the value of US$3.92 million and capitalised expenditure of US$2.37 million for on-going capital development of the Palito and Sao Chico Mines.
The gross value ascribed to both the Palito and Sao Chico properties is now being amortised over the expected recoverable ounces of each mine. An amortisation charge totalling US$6.1 million has been recorded for the 12 month period to 31 December 2016, (2015: US$4.4 million). The increase of US$1.7 million in the amortisation charge for 2016 arises because during the 12 month period ended 31 December 2015 there was no amortisation charge in relation to the Sao Chico Mine. However, following the announcement by the Group that commercial production had been achieved effective from 1 January 2016, an amortisation charge is now being made in respect of the value ascribed to this mine. The net book value of property, plant and equipment has been increased by US$6.61 million as a result of the retranslation of the underlying values from Brazilian Reais to US Dollars.
Deferred exploration costs as at 31 December 2016 totalled US$10.00 million (31 December 2015: US$8.68 million), which relates to capitalised exploration expenditures around the Palito Mine, Sao Chico Mine and the wider Jardim Do Ouro project area. During 2016 the Group incurred costs of US$525,444 on exploration and evaluation expenditure and also transferred US$558,895 from deferred exploration costs to mining property.
The carrying value of deferred exploration costs also increased by US$1.34 million as a result of the variation in the exchange rates since the start of the year.
MANAGEMENT DISCUSSION AND ANALYSIS
Financial Review continued
The Group’s net assets amounted to US$63.38 million compared with US$46.78 million at the end of 2015.
The Group has decreased its trade finance debt by US$6.65 million and repaid US$3.10 million of its secured loan during 2016.
Overview
Strategic ReportM
anagement D
iscussion and A
nalysisCom
munity and
Social ResponsibilityCorporate G
overnanceFinancial Statem
ents
33Serabi Gold plc // Report and Accounts 2016
Working Capital The Group had a working capital position of US$8.88 million at 31 December 2016 compared to US$1.84 million at 31 December 2015, the improvement of US$7.04 million being detailed in the table below:
December 2016 December 2015 Variance US$ US$ US$
Current assets Inventories 8,110,373 6,908,790 1,201,583Trade and other receivables 1,233,049 6,133,284 (4,900,235)Prepayments 3,696,550 2,429,506 1,267,044Cash and cash equivalents 4,160,923 2,191,759 1,969,164
Total current assets 17,200,895 17,663,339 (462,444)
Current liabilities Trade and other payables 4,941,775 4,212,803 728,972Interest-bearing liabilities 2,964,057 11,385,155 (8,421,098)Accruals 415,810 226,197 189,613
Total current liabilities 8,321,642 15,824,155 (7,502,513)
Working capital 8,879,253 1,839,184 7,040,069
Non-current liabilities Trade and other payables 2,211,078 1,857,914 353,164Provisions 1,851,963 1,898,714 (46,751)Interest-bearing liabilities 77,798 128,641 (50,843)
Total non-current liabilities 4,140,839 3,885,269 255,570
InventoryThe levels of inventory held by the Group have increased by US$1.2 million, or 17 per cent, compared with 31 December 2015. However, as all the inventory is calculated in Brazilian Reais and converted into US Dollars the valuation is also subject to exchange rate fluctuations. The total value of the inventory in local currency has decreased by two per cent or BR$0.55 million between 31 December 2015 and 31 December 2016. A breakdown of the Group’s total inventory balance at the end of 2015 and 2016 in both Brazilian Real and US Dollar are set out in the table to the right.
Inventories of consumables (fuel, spare parts, chemicals, explosives etc.) at 31 December 2016 of US$2.38 million have increased by approximately US$1.01 million or 75 per cent in comparison with the same inventory of consumables at 31 December 2015 (US$1.36 million). As all consumable stock is valued in Brazilian Reais, the valuation is also subject to exchange rate fluctuations. The level of inventory in Brazilian Reais increased by BrR$2.44 million or 46 per cent, from BrR$5.31 million to BrR$7.76 million. The Group
2016 2015 2016 2015 BrR$ US$ BrR$ US$
Stockpile of mined ore 9,220,252 2,829,600 5,595,346 1,433,161Finished goods awaiting sale 6,047,269 1,855,844 9,758,771 2,499,557Stockpile of flotation tails 2,309,543 708,775 4,166,727 1,067,242Other material in process 1,092,511 335,280 2,139,018 547,876Finished goods awaiting sale 6,047,269 1,855,844 9,758,771 2,499,557
18,669,574 5,729,500 21,659,862 5,547,836Consumables 7,758,074 2,380,873 5,313,435 1,360,954
Total Inventory 26,427,649 8,110,373 26,973,298 6,908,790
acquires stocks of certain materials including reagents, explosives and other consumables in quantities that are sufficient for up to three to four months’ consumption requirements to minimise freight and other logistics costs and improve pricing. The levels of inventory of consumables have increased between 31 December 2015 and 31 December 2016 as a result of the increased activity with the Sao Chico Mine now fully operational and, with a third ball bill in place, increased production capacity.
Whilst in Brazilian Real terms the value of inventory of goods in progress and finished goods has decreased by 14 per cent from BR$21,659,862 to BR$18,669,574 between 31 December 2015 and 31 December 2016, this decrease has been offset by the effect of the strengthening of the Brazilian Real, so that in US Dollar terms there has been a three per cent increase in value.
34 Serabi Gold plc // Report and Accounts 2016
At 31 December 2016, the Group had a total of 21,429 tonnes of surface stockpile from both the Palito and Sao Chico Mines with a value of US$2.83 million or BR$9.22 million in comparison to 18,482 tonnes at 31 December 2015 with a value of US$1.43 million or BR$5.60 million. The cost per tonne of stockpiled ore increased by 42 per cent in Brazilian Real terms and 71 per cent in US Dollar terms as a result of changes made during the year to the allocation of costs within the mining and plant process cost centres.
At 31 December 2016, the Group had, on hand, an inventory of approximately 162 wet metric tonnes (31 December 2015: 363 tonnes) of copper/gold concentrate, of which 22 tonnes was located at Palito (31 December 2015: 63 tonnes), and the remaining 140 tonnes were on route to the port of Belem (31 December 2015: 160 tonnes). During the month of September 2016, the Group entered into a new contract for the sale of its copper/gold concentrate and the sale is now recognised when the goods depart from Brazil, whilst previously the sale was only recognised when the goods arrived at the purchaser’s premises. As a result, at 31 December 2015 the Group also included as inventory, 160 tonnes of copper/concentrate which had departed from the port of Belem and was being shipped to the refinery in Germany. This reduction in inventory levels is the major reason for the reduced inventory value. Included in the finished goods awaiting sale is bullion on hand for smelting which, at 31 December 2016, was valued at US$0.62 million or BR$1.99 million in comparison to US$0.55 million or BR$2.14 million as at 31 December 2015.
During 2014 the Group had established a stockpile of approximately 54,000 tonnes of material that had passed through the flotation processing circuit but retained a gold grade of approximately 2.5 g/t. At 31 December 2015, there were approximately 37,500 tonnes of flotation stockpile on site with a value of US$1.07 million or BR$4.17 million. During 2016 the Group processed approximately 16,700 tonnes of this stockpile leaving approximately 20,800 tonnes at 31 December 2016 with a value of US$0.71 million or BR$2.31 million.
The valuation attributable to gold locked up within the processing plant has decreased to US$0.34 million as at 31 December 2016 (31 December 2015: US$0.0.54 million).
Trade ReceivablesTrade and other receivables at 31 December 2016 of US$1.23 million have decreased by US$4.90 million from US$6.13 million at 31 December 2015. As at 31 December 2016, the Group was owed US$1.05 million (2015: US$6.00 million) in respect of shipments of concentrate that had been made to the refinery but, in accordance with the contractual payment terms, remained outstanding at that date. During September 2016, the Group changed the customer to whom it sells its copper concentrate. The new customer now pays an advance to the Group of 85 per cent of the value of the copper concentrate a few days after the ship carrying the goods departs from the port of Belem. As part of the old agreement, the end customer did not provide any advance payment for the goods, but would settle all invoices in three instalments after the goods arrived at their location. Therefore, to help manage working capital requirements, the Group used a trade finance agreement whereby a separate third party would provide short term financing to the Group for a small fee. As a result of this change in the invoicing and settlement process the trade receivables balance has decreased by 82 per cent. In parallel this change has eliminated the need for a trade finance facility resulting in a reduction in interest-bearing liabilities as detailed below.
Also included within trade and other receivables are other some trade advances for freight and insurance which has increased by US$42,342 from US$136,692 at 31 December 2015 to US$179,035 at 31 December 2016.
Cash at BankBetween 31 December 2015 and 31 December 2016 cash balances have increased by approximately US$1.97 million. During 2016 the Group converted the US$2.00 million convertible loan received from Fratelli Investments Limited in January 2016 but also generated US$16.15 million from cash flow from operations, as well as spending US$5.90 million on capital and development expenditure.
The Group also repaid US$3.11 million of the Sprott loan, decreased its liability under the short term finance liability by US$6.24 million and settled finance lease arrangements of US$0.76 million.
Current LiabilitiesCurrent liabilities have decreased by US$7.5 million from US$15.82 million at 31 December 2015 to US$8.32 million at 31 December 2016.
Trade CreditorsTrade and other payables amounting to US$4.94 million at 31 December 2016 compare with an amount owed by the Group of US$4.21 million at 31 December 2015, an increase of US$0.73 million. This increase in trade creditors is as a result of increased activity at both the Palito and Sao Chico Mines, but also reflects the 20 per cent appreciation of the Brazilian Real during 2016.
Interest-Bearing liabilitiesThe main reason for this decrease in liabilities arises from the Group changing customers for its copper/gold concentrate during 2016 and as a result no longer requiring a short term trade financing arrangement. At 31 December 2015, the Group owed US$6.65 million in relation to this trade finance provision which was decreased by US$6.24 million to US$0.42 million by 31 December 2016.
The Group also repaid US$3.1 million of the Sprott loan during 2016 reducing the US$4 million balance which was outstanding at 31 December 2015. However, during 2016 Sprott exercised options relating to their loan with a cost of US$0.43 million to the Group of which US$0.15 million was paid by 31 December 2016. The Group also incurred, in January 2016, an extension fee of US$0.2 million which is included in the total balance of US$1.37 million outstanding as at 31 December 2016.
Obligations under finance leases have increased by US$0.45 million from US$0.73 million at 31 December 2015 to US$1.17 million at 31 December 2016. The Group repaid US$0.75 million in finance leases during 2016 but also bought four new items of underground equipment at a total cost of US$1.2 million. The lease terms range from a 22 month period to a 30 month period and bear interest at a rate between 6.7 per cent and 6.85 per cent per annum.
MANAGEMENT DISCUSSION AND ANALYSIS
Financial Review continued
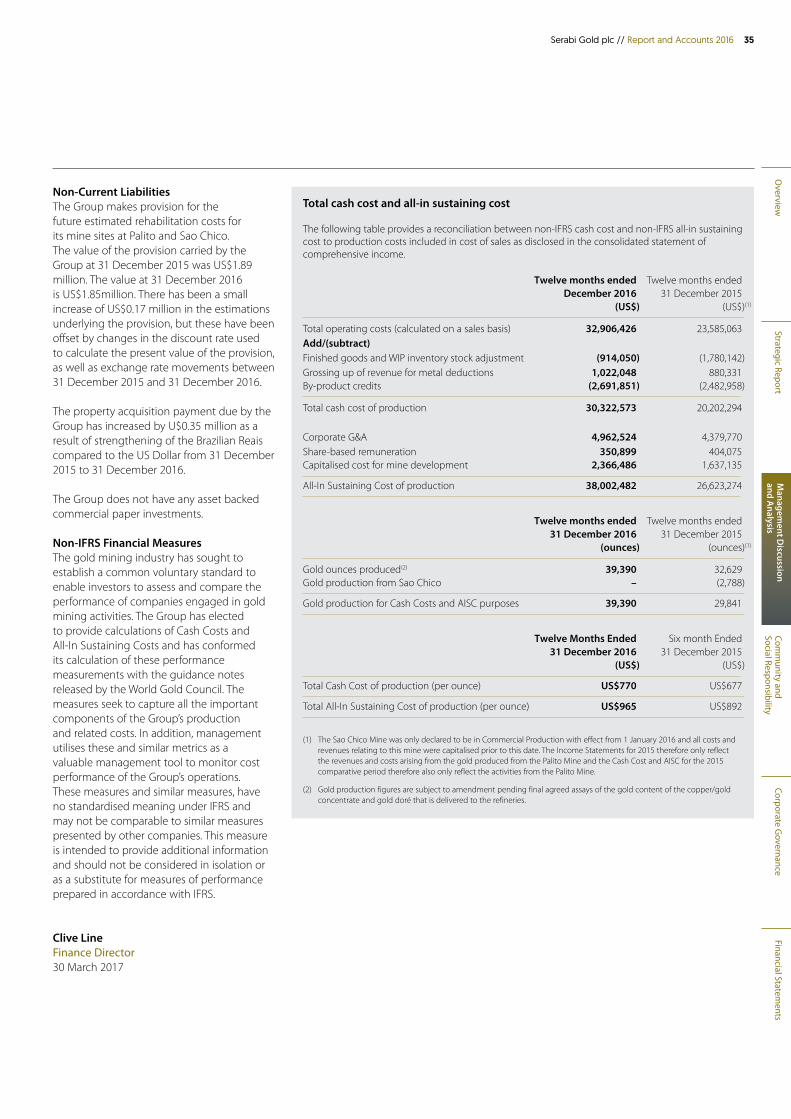
Overview
Strategic ReportM
anagement D
iscussion and A
nalysisCom
munity and
Social ResponsibilityCorporate G
overnanceFinancial Statem
ents
35Serabi Gold plc // Report and Accounts 2016
Non-Current LiabilitiesThe Group makes provision for the future estimated rehabilitation costs for its mine sites at Palito and Sao Chico. The value of the provision carried by the Group at 31 December 2015 was US$1.89 million. The value at 31 December 2016 is US$1.85million. There has been a small increase of US$0.17 million in the estimations underlying the provision, but these have been offset by changes in the discount rate used to calculate the present value of the provision, as well as exchange rate movements between 31 December 2015 and 31 December 2016.
The property acquisition payment due by the Group has increased by U$0.35 million as a result of strengthening of the Brazilian Reais compared to the US Dollar from 31 December 2015 to 31 December 2016.
The Group does not have any asset backed commercial paper investments.
Non-IFRS Financial MeasuresThe gold mining industry has sought to establish a common voluntary standard to enable investors to assess and compare the performance of companies engaged in gold mining activities. The Group has elected to provide calculations of Cash Costs and All-In Sustaining Costs and has conformed its calculation of these performance measurements with the guidance notes released by the World Gold Council. The measures seek to capture all the important components of the Group’s production and related costs. In addition, management utilises these and similar metrics as a valuable management tool to monitor cost performance of the Group’s operations. These measures and similar measures, have no standardised meaning under IFRS and may not be comparable to similar measures presented by other companies. This measure is intended to provide additional information and should not be considered in isolation or as a substitute for measures of performance prepared in accordance with IFRS.
Clive LineFinance Director30 March 2017
Total cash cost and all-in sustaining cost
The following table provides a reconciliation between non-IFRS cash cost and non-IFRS all-in sustaining cost to production costs included in cost of sales as disclosed in the consolidated statement of comprehensive income.
Twelve months ended Twelve months ended December 2016 31 December 2015 (US$) (US$)(1)
Total operating costs (calculated on a sales basis) 32,906,426 23,585,063Add/(subtract) Finished goods and WIP inventory stock adjustment (914,050) (1,780,142)Grossing up of revenue for metal deductions 1,022,048 880,331By-product credits (2,691,851) (2,482,958)
Total cash cost of production 30,322,573 20,202,294
Corporate G&A 4,962,524 4,379,770Share-based remuneration 350,899 404,075Capitalised cost for mine development 2,366,486 1,637,135
All-In Sustaining Cost of production 38,002,482 26,623,274
Twelve months ended Twelve months ended 31 December 2016 31 December 2015 (ounces) (ounces)(1)
Gold ounces produced(2) 39,390 32,629Gold production from Sao Chico – (2,788)
Gold production for Cash Costs and AISC purposes 39,390 29,841
Twelve Months Ended Six month Ended 31 December 2016 31 December 2015 (US$) (US$)
Total Cash Cost of production (per ounce) US$770 US$677
Total All-In Sustaining Cost of production (per ounce) US$965 US$892
(1) The Sao Chico Mine was only declared to be in Commercial Production with effect from 1 January 2016 and all costs and revenues relating to this mine were capitalised prior to this date. The Income Statements for 2015 therefore only reflect the revenues and costs arising from the gold produced from the Palito Mine and the Cash Cost and AISC for the 2015 comparative period therefore also only reflect the activities from the Palito Mine.
(2) Gold production figures are subject to amendment pending final agreed assays of the gold content of the copper/gold concentrate and gold doré that is delivered to the refineries.
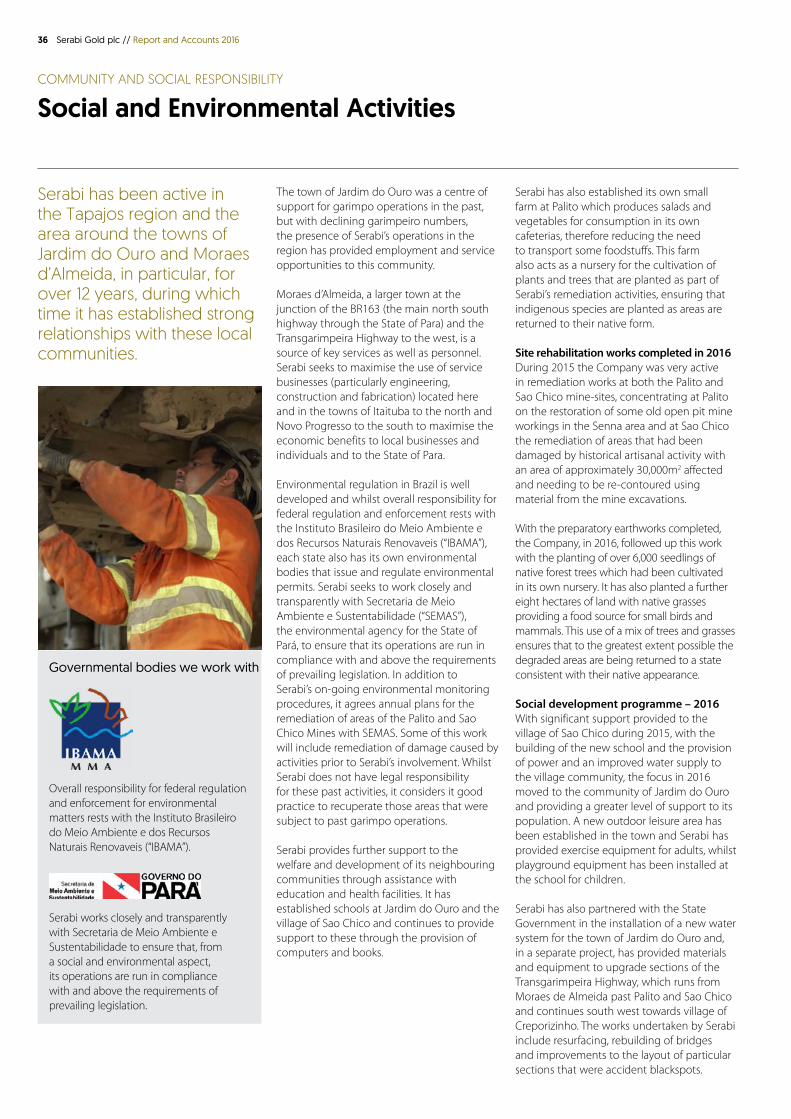
36 Serabi Gold plc // Report and Accounts 2016
COMMUNITY AND SOCIAL RESPONSIBILITY
Social and Environmental Activities
Serabi has also established its own small farm at Palito which produces salads and vegetables for consumption in its own cafeterias, therefore reducing the need to transport some foodstuffs. This farm also acts as a nursery for the cultivation of plants and trees that are planted as part of Serabi’s remediation activities, ensuring that indigenous species are planted as areas are returned to their native form.
Site rehabilitation works completed in 2016During 2015 the Company was very active in remediation works at both the Palito and Sao Chico mine-sites, concentrating at Palito on the restoration of some old open pit mine workings in the Senna area and at Sao Chico the remediation of areas that had been damaged by historical artisanal activity with an area of approximately 30,000m2 affected and needing to be re-contoured using material from the mine excavations.
With the preparatory earthworks completed, the Company, in 2016, followed up this work with the planting of over 6,000 seedlings of native forest trees which had been cultivated in its own nursery. It has also planted a further eight hectares of land with native grasses providing a food source for small birds and mammals. This use of a mix of trees and grasses ensures that to the greatest extent possible the degraded areas are being returned to a state consistent with their native appearance.
Social development programme – 2016With significant support provided to the village of Sao Chico during 2015, with the building of the new school and the provision of power and an improved water supply to the village community, the focus in 2016 moved to the community of Jardim do Ouro and providing a greater level of support to its population. A new outdoor leisure area has been established in the town and Serabi has provided exercise equipment for adults, whilst playground equipment has been installed at the school for children.
Serabi has also partnered with the State Government in the installation of a new water system for the town of Jardim do Ouro and, in a separate project, has provided materials and equipment to upgrade sections of the Transgarimpeira Highway, which runs from Moraes de Almeida past Palito and Sao Chico and continues south west towards village of Creporizinho. The works undertaken by Serabi include resurfacing, rebuilding of bridges and improvements to the layout of particular sections that were accident blackspots.
The town of Jardim do Ouro was a centre of support for garimpo operations in the past, but with declining garimpeiro numbers, the presence of Serabi’s operations in the region has provided employment and service opportunities to this community.
Moraes d’Almeida, a larger town at the junction of the BR163 (the main north south highway through the State of Para) and the Transgarimpeira Highway to the west, is a source of key services as well as personnel. Serabi seeks to maximise the use of service businesses (particularly engineering, construction and fabrication) located here and in the towns of Itaituba to the north and Novo Progresso to the south to maximise the economic benefits to local businesses and individuals and to the State of Para.
Environmental regulation in Brazil is well developed and whilst overall responsibility for federal regulation and enforcement rests with the Instituto Brasileiro do Meio Ambiente e dos Recursos Naturais Renovaveis (“IBAMA”), each state also has its own environmental bodies that issue and regulate environmental permits. Serabi seeks to work closely and transparently with Secretaria de Meio Ambiente e Sustentabilidade (“SEMAS”), the environmental agency for the State of Pará, to ensure that its operations are run in compliance with and above the requirements of prevailing legislation. In addition to Serabi’s on-going environmental monitoring procedures, it agrees annual plans for the remediation of areas of the Palito and Sao Chico Mines with SEMAS. Some of this work will include remediation of damage caused by activities prior to Serabi’s involvement. Whilst Serabi does not have legal responsibility for these past activities, it considers it good practice to recuperate those areas that were subject to past garimpo operations.
Serabi provides further support to the welfare and development of its neighbouring communities through assistance with education and health facilities. It has established schools at Jardim do Ouro and the village of Sao Chico and continues to provide support to these through the provision of computers and books.
Governmental bodies we work with
Overall responsibility for federal regulation and enforcement for environmental matters rests with the Instituto Brasileiro do Meio Ambiente e dos Recursos Naturais Renovaveis (“IBAMA”).
Serabi works closely and transparently with Secretaria de Meio Ambiente e Sustentabilidade to ensure that, from a social and environmental aspect, its operations are run in compliance with and above the requirements of prevailing legislation.
Serabi has been active in the Tapajos region and the area around the towns of Jardim do Ouro and Moraes d’Almeida, in particular, for over 12 years, during which time it has established strong relationships with these local communities.
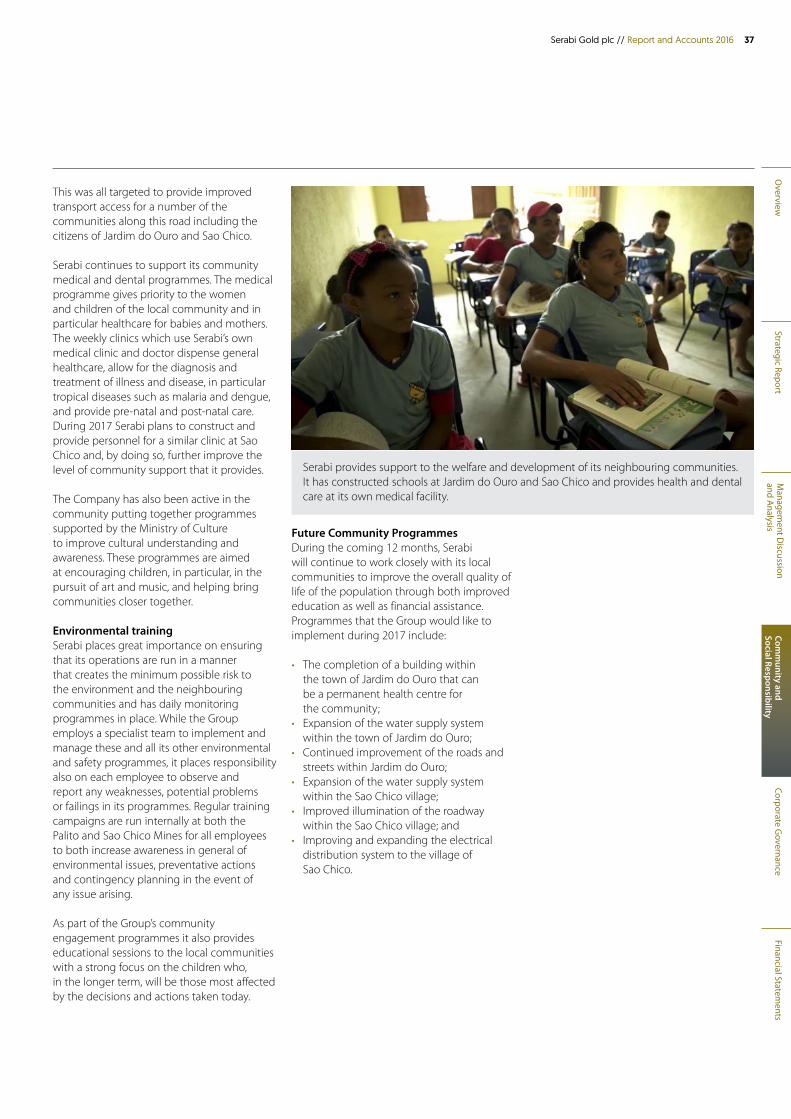
Overview
Strategic ReportM
anagement D
iscussion and A
nalysisCom
munity and
Social ResponsibilityCorporate G
overnanceFinancial Statem
ents
37Serabi Gold plc // Report and Accounts 2016
Serabi provides support to the welfare and development of its neighbouring communities. It has constructed schools at Jardim do Ouro and Sao Chico and provides health and dental care at its own medical facility.
This was all targeted to provide improved transport access for a number of the communities along this road including the citizens of Jardim do Ouro and Sao Chico.
Serabi continues to support its community medical and dental programmes. The medical programme gives priority to the women and children of the local community and in particular healthcare for babies and mothers. The weekly clinics which use Serabi’s own medical clinic and doctor dispense general healthcare, allow for the diagnosis and treatment of illness and disease, in particular tropical diseases such as malaria and dengue, and provide pre-natal and post-natal care. During 2017 Serabi plans to construct and provide personnel for a similar clinic at Sao Chico and, by doing so, further improve the level of community support that it provides.
The Company has also been active in the community putting together programmes supported by the Ministry of Culture to improve cultural understanding and awareness. These programmes are aimed at encouraging children, in particular, in the pursuit of art and music, and helping bring communities closer together.
Environmental trainingSerabi places great importance on ensuring that its operations are run in a manner that creates the minimum possible risk to the environment and the neighbouring communities and has daily monitoring programmes in place. While the Group employs a specialist team to implement and manage these and all its other environmental and safety programmes, it places responsibility also on each employee to observe and report any weaknesses, potential problems or failings in its programmes. Regular training campaigns are run internally at both the Palito and Sao Chico Mines for all employees to both increase awareness in general of environmental issues, preventative actions and contingency planning in the event of any issue arising.
As part of the Group’s community engagement programmes it also provides educational sessions to the local communities with a strong focus on the children who, in the longer term, will be those most affected by the decisions and actions taken today.
Future Community ProgrammesDuring the coming 12 months, Serabi will continue to work closely with its local communities to improve the overall quality of life of the population through both improved education as well as financial assistance. Programmes that the Group would like to implement during 2017 include:
• The completion of a building within the town of Jardim do Ouro that can be a permanent health centre for the community;
• Expansion of the water supply system within the town of Jardim do Ouro;
• Continued improvement of the roads and streets within Jardim do Ouro;
• Expansion of the water supply system within the Sao Chico village;
• Improved illumination of the roadway within the Sao Chico village; and
• Improving and expanding the electrical distribution system to the village of Sao Chico.
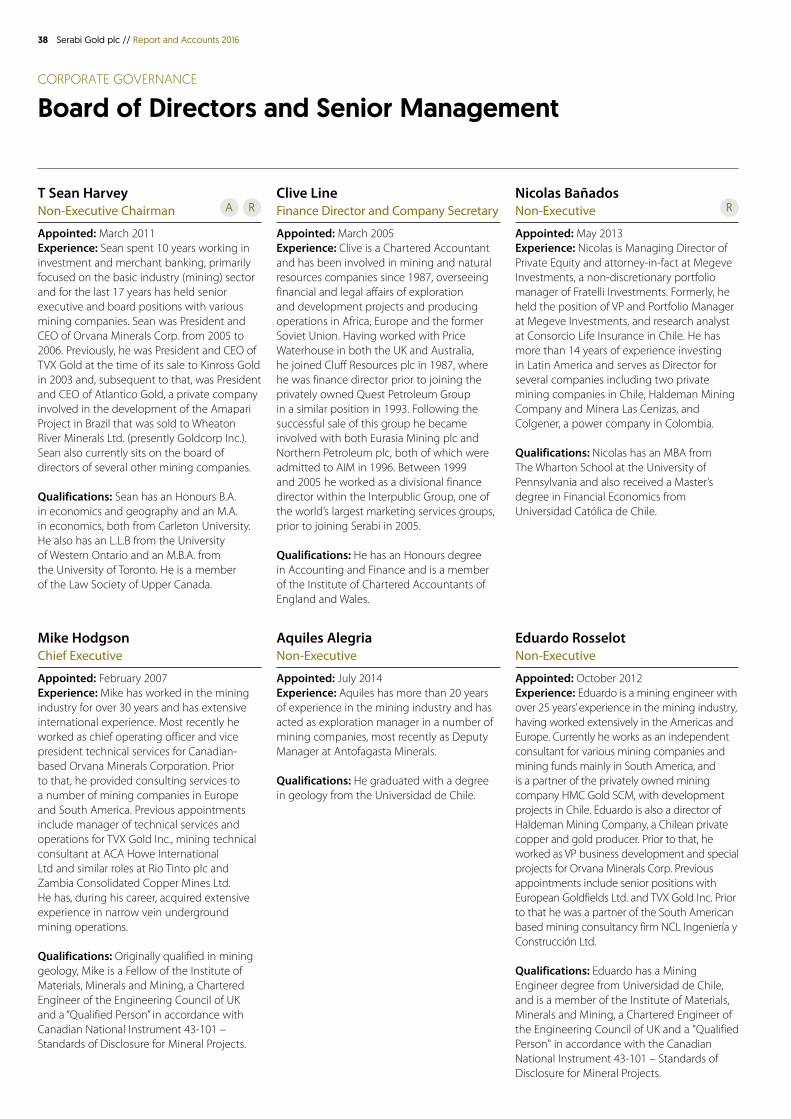
38 Serabi Gold plc // Report and Accounts 2016
CORPORATE GOVERNANCE
Board of Directors and Senior Management
T Sean HarveyNon-Executive Chairman
Appointed: March 2011Experience: Sean spent 10 years working in investment and merchant banking, primarily focused on the basic industry (mining) sector and for the last 17 years has held senior executive and board positions with various mining companies. Sean was President and CEO of Orvana Minerals Corp. from 2005 to 2006. Previously, he was President and CEO of TVX Gold at the time of its sale to Kinross Gold in 2003 and, subsequent to that, was President and CEO of Atlantico Gold, a private company involved in the development of the Amapari Project in Brazil that was sold to Wheaton River Minerals Ltd. (presently Goldcorp Inc.). Sean also currently sits on the board of directors of several other mining companies.
Qualifications: Sean has an Honours B.A. in economics and geography and an M.A. in economics, both from Carleton University. He also has an L.L.B from the University of Western Ontario and an M.B.A. from the University of Toronto. He is a member of the Law Society of Upper Canada.
Clive LineFinance Director and Company Secretary
Appointed: March 2005Experience: Clive is a Chartered Accountant and has been involved in mining and natural resources companies since 1987, overseeing financial and legal affairs of exploration and development projects and producing operations in Africa, Europe and the former Soviet Union. Having worked with Price Waterhouse in both the UK and Australia, he joined Cluff Resources plc in 1987, where he was finance director prior to joining the privately owned Quest Petroleum Group in a similar position in 1993. Following the successful sale of this group he became involved with both Eurasia Mining plc and Northern Petroleum plc, both of which were admitted to AIM in 1996. Between 1999 and 2005 he worked as a divisional finance director within the Interpublic Group, one of the world’s largest marketing services groups, prior to joining Serabi in 2005.
Qualifications: He has an Honours degree in Accounting and Finance and is a member of the Institute of Chartered Accountants of England and Wales.
Nicolas BañadosNon-Executive
Appointed: May 2013Experience: Nicolas is Managing Director of Private Equity and attorney-in-fact at Megeve Investments, a non-discretionary portfolio manager of Fratelli Investments. Formerly, he held the position of VP and Portfolio Manager at Megeve Investments, and research analyst at Consorcio Life Insurance in Chile. He has more than 14 years of experience investing in Latin America and serves as Director for several companies including two private mining companies in Chile, Haldeman Mining Company and Minera Las Cenizas, and Colgener, a power company in Colombia.
Qualifications: Nicolas has an MBA from The Wharton School at the University of Pennsylvania and also received a Master’s degree in Financial Economics from Universidad Católica de Chile.
Mike HodgsonChief Executive
Appointed: February 2007Experience: Mike has worked in the mining industry for over 30 years and has extensive international experience. Most recently he worked as chief operating officer and vice president technical services for Canadian-based Orvana Minerals Corporation. Prior to that, he provided consulting services to a number of mining companies in Europe and South America. Previous appointments include manager of technical services and operations for TVX Gold Inc., mining technical consultant at ACA Howe International Ltd and similar roles at Rio Tinto plc and Zambia Consolidated Copper Mines Ltd. He has, during his career, acquired extensive experience in narrow vein underground mining operations.
Qualifications: Originally qualified in mining geology, Mike is a Fellow of the Institute of Materials, Minerals and Mining, a Chartered Engineer of the Engineering Council of UK and a “Qualified Person” in accordance with Canadian National Instrument 43-101 – Standards of Disclosure for Mineral Projects.
Aquiles AlegriaNon-Executive
Appointed: July 2014Experience: Aquiles has more than 20 years of experience in the mining industry and has acted as exploration manager in a number of mining companies, most recently as Deputy Manager at Antofagasta Minerals.
Qualifications: He graduated with a degree in geology from the Universidad de Chile.
Eduardo RosselotNon-Executive
Appointed: October 2012Experience: Eduardo is a mining engineer with over 25 years’ experience in the mining industry, having worked extensively in the Americas and Europe. Currently he works as an independent consultant for various mining companies and mining funds mainly in South America, and is a partner of the privately owned mining company HMC Gold SCM, with development projects in Chile. Eduardo is also a director of Haldeman Mining Company, a Chilean private copper and gold producer. Prior to that, he worked as VP business development and special projects for Orvana Minerals Corp. Previous appointments include senior positions with European Goldfields Ltd. and TVX Gold Inc. Prior to that he was a partner of the South American based mining consultancy firm NCL Ingeniería y Construcción Ltd.
Qualifications: Eduardo has a Mining Engineer degree from Universidad de Chile, and is a member of the Institute of Materials, Minerals and Mining, a Chartered Engineer of the Engineering Council of UK and a "Qualified Person" in accordance with the Canadian National Instrument 43-101 – Standards of Disclosure for Mineral Projects.
A R R
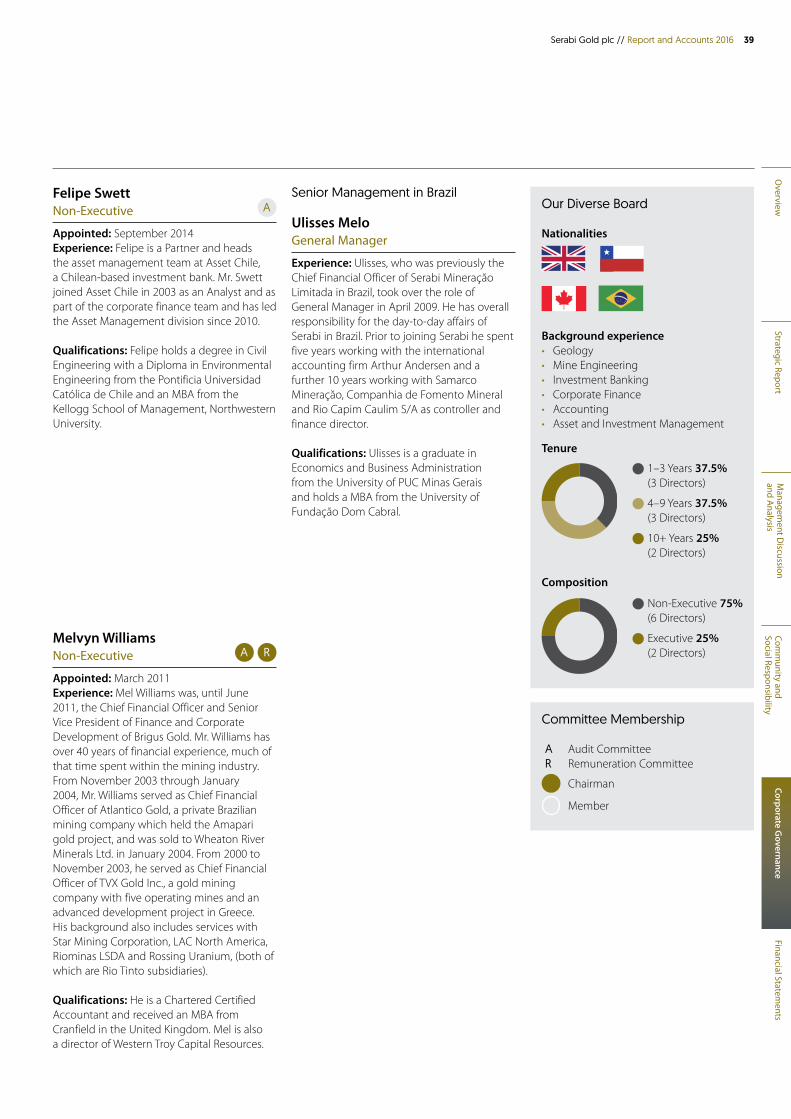
Overview
Strategic ReportM
anagement D
iscussion and A
nalysisCom
munity and
Social ResponsibilityCorporate G
overnanceFinancial Statem
ents
39Serabi Gold plc // Report and Accounts 2016
Felipe SwettNon-Executive
Appointed: September 2014Experience: Felipe is a Partner and heads the asset management team at Asset Chile, a Chilean-based investment bank. Mr. Swett joined Asset Chile in 2003 as an Analyst and as part of the corporate finance team and has led the Asset Management division since 2010.
Qualifications: Felipe holds a degree in Civil Engineering with a Diploma in Environmental Engineering from the Pontificia Universidad Católica de Chile and an MBA from the Kellogg School of Management, Northwestern University.
Senior Management in Brazil
Ulisses MeloGeneral Manager
Experience: Ulisses, who was previously the Chief Financial Officer of Serabi Mineraçăo Limitada in Brazil, took over the role of General Manager in April 2009. He has overall responsibility for the day-to-day affairs of Serabi in Brazil. Prior to joining Serabi he spent five years working with the international accounting firm Arthur Andersen and a further 10 years working with Samarco Mineraçăo, Companhia de Fomento Mineral and Rio Capim Caulim S/A as controller and finance director.
Qualifications: Ulisses is a graduate in Economics and Business Administration from the University of PUC Minas Gerais and holds a MBA from the University of Fundação Dom Cabral.
Melvyn WilliamsNon-Executive
Appointed: March 2011Experience: Mel Williams was, until June 2011, the Chief Financial Officer and Senior Vice President of Finance and Corporate Development of Brigus Gold. Mr. Williams has over 40 years of financial experience, much of that time spent within the mining industry. From November 2003 through January 2004, Mr. Williams served as Chief Financial Officer of Atlantico Gold, a private Brazilian mining company which held the Amapari gold project, and was sold to Wheaton River Minerals Ltd. in January 2004. From 2000 to November 2003, he served as Chief Financial Officer of TVX Gold Inc., a gold mining company with five operating mines and an advanced development project in Greece. His background also includes services with Star Mining Corporation, LAC North America, Riominas LSDA and Rossing Uranium, (both of which are Rio Tinto subsidiaries).
Qualifications: He is a Chartered Certified Accountant and received an MBA from Cranfield in the United Kingdom. Mel is also a director of Western Troy Capital Resources.
Our Diverse Board
Nationalities
Background experience• Geology• Mine Engineering• Investment Banking• Corporate Finance• Accounting• Asset and Investment Management
Committee Membership
A Audit Committee R Remuneration Committee
Chairman
Member
A R
A
1–3 Years 37.5%(3 Directors)
4–9 Years 37.5%(3 Directors)
10+ Years 25%(2 Directors)
Tenure
Composition
Non-Executive 75%(6 Directors)
Executive 25%(2 Directors)
40 Serabi Gold plc // Report and Accounts 2016
CORPORATE GOVERNANCE
Report on Corporate Governance
The Directors give due regard to the principles set out in The UK Corporate Governance Code published in September 2014 by the Financial Reporting Council (the “Code”) and the Quoted Companies Alliance (QCA) published Corporate Governance Guidelines. Under the AIM rules compliance with the Code is voluntary. Although the Board has not formally adopted the Code, throughout the year ended 31 December 2016 it has sought adopt procedures to institute good governance insofar as is practical and appropriate for a group of its size while retaining its primary focus on the success of the business.
Board of DirectorsThe Board of Directors is responsible for the management of the Group on behalf of its shareholders. The objective of the Group is to create long term value for shareholders, and the Board is responsible for delivering that objective by governing the Company and its subsidiaries. The Board is responsible for approving the Group strategy and policies, for safeguarding the assets of the Group, and is the ultimate decision-making body of the Group in all matters except those that are reserved for specific shareholder approval. Matters that are specifically reserved for the Board’s decision include business acquisitions or disposals, authorisation of major capital expenditure and material contractual arrangements, changes to the Group’s capital structure, setting policies for the conduct of business, approval of budgets, remuneration policy of Directors and senior management, and taking on debt and approval of financial statements. Other matters are delegated to the Committees of the Board and Executive Directors, supported by policies for reporting to the Board.
The Board consists of two Executive Directors who hold the key operational positions in the Group and six Non-Executive Directors (including a Non-Executive Chairman), who bring a breadth of experience and knowledge.
The Board, as a matter of practice, meets at least every two to three months and is supplied with appropriate and timely information. Other meetings will be, and are, called by executive management or by any Board member when there is any matter which according to the terms of reference of the Board and the powers delegated to the Executive Directors is required to be discussed with, and considered by, the Board. In 2016, the Board met twelve times. Where appropriate, the Board invites external advisers and/or senior management to attend meetings to discuss matters where their expertise may be beneficial.
The responsibilities of Sean Harvey as Chairman include providing leadership to the Board, ensuring its effectiveness in all aspects of its role and setting its agenda; ensuring that adequate time is available for discussion of all agenda items; ensuring that the Directors receive accurate, timely and clear information; ensuring effective communication with shareholders; promoting a culture of openness and debate by facilitating the effective contribution to the Board of Non-Executive Directors in particular; and ensuring constructive relationships between the Executive and Non-Executive Directors.
The Company provides independent professional and legal advice to all Directors where necessary, to ensure they are able to discharge their duties. In addition, all Board members have access to the services of the Company Secretary, who is responsible for ensuring all Board procedures are complied with.
The articles of association provide that any Director who was not appointed or re-appointed at one of the preceding two annual general meetings retire and stand for re-election. All new Directors appointed since the previous Annual General Meeting need to stand for election at the following Annual General Meeting.
Board Independence Audit Remuneration Position Appointed Status Committee Committee
Sean Harvey Non-Executive Chairman 30 March 2011 Independent Member MemberMelvyn Williams Non-Executive Director 30 March 2011 Independent Chair ChairNicolas Bañados Non-Executive Director 13 May 2013 Not independent(1) – MemberFelipe Swett Non-Executive Director 30 September 2014 Independent Member –Eduardo Rosselot Non-Executive Director 20 October 2012 Not independent(2) – –Aquiles Alegria Non-Executive Director 7 July 2014 Independent – –Michael Hodgson Chief Executive 1 February 2007 Executive – –Clive Line Financial Director 14 March 2005 Executive – –
(1) Mr Bañados is appointed as a representative of Fratelli Investments and holds the position of Managing Director of Private Equity. He is therefore not considered to be fully independent by virtue of his relationship with the Company’s major shareholder. He has never held an executive position with the Group.
(2) Mr Rosselot is appointed as a representative of Fratelli Investments and acts for Fratelli as a consultant on mining matters and investments. He is therefore not considered to be fully independent by virtue of his relationship with the Company’s major shareholder. He has never held an executive position with the Group.
Overview
Strategic ReportM
anagement D
iscussion and A
nalysisCom
munity and
Social ResponsibilityCorporate G
overnanceFinancial Statem
ents
41Serabi Gold plc // Report and Accounts 2016
Board and Committee meetingsThe Board has established an Audit Committee and a Remuneration Committee. A formal technical committee has not been established at this time. Mr Eduardo Rosselot, a mining engineer and Non-Executive Director undertakes visits to the Group’s operations every two to three months and will report to the Board on any issues that he considers require attention that are not already being addressed by management. Mr Aquiles Alegria, a geologist, undertakes annual visits to the Group’s operations and will report to the Board on his findings and is also involved in reviewing proposed exploration programmes and providing expertise, from a geological perspective, for any new projects being considered. The Board has not had reason given the stability of management to establish a Nomination Committee but anticipates that were such a Committee to be established it would be drawn from the members of the Remuneration Committee.
Attendance at the meetings of the Board and sub-committee meetings, by the relevant Board members, is set out below:
Audit Remuneration Board Committee Committee
Sean Harvey 12 4 2Michael Hodgson 12 n/a n/aClive Line 12 n/a n/aAquiles Alegria 10 n/a n/aNicolas Bañados 11 n/a 2Eduardo Rosselot 12 n/a n/aFelipe Swett 11 4 n/aMel Williams 11 3 2
n/a – indicates that a Director was not a member of the committee at any time during the year.
Additionally, the Board has appointed an Executive Committee to oversee and coordinate the day-to-day running of the Group. It is empowered to make decisions over a number of areas without reference to the full Board and specifically to deal with all matters relating to the daily operation of the Group.
The Executive Committee comprises the Chief Executive and the Finance Director. The Executive Committee is responsible for the daily operation of the Group and for making recommendations to the Board regarding short and medium-term budgets, targets and overall objectives and strategies for the Group.
Audit CommitteePurposeThe Audit Committee reviews the principles, policies and practices adopted in the preparation of the financial statements of Serabi Gold plc and its subsidiaries, as well as ensuring any other formal announcements relating to the financial performance of the Group comply with relevant statutory and regulatory requirements.
The Audit Committee is also responsible for assisting the Board in discharging its responsibilities with respect to the integrity of the Group’s financial statements, the effectiveness of the systems of governance, risk management and internal control, and monitoring the effectiveness and independence of the external auditors.
CompositionThe Audit Committee is required to consist of not less than three non-executive Directors. The Audit Committee is chaired by Mel Williams, and also comprises Sean Harvey and Felipe Swett. The UK Corporate Governance Code stipulates that at least one of the members of the Audit Committee must have recent and relevant financial experience. The Company believes that all members have such experience, in particular Mel Williams, who has served for many years as Chief Financial Officer for several international mining companies.
42 Serabi Gold plc // Report and Accounts 2016
CORPORATE GOVERNANCE
Report on Corporate Governance continued
Audit Committee (continued)OperationsThe Audit Committee is required to meet at least four times a year to consider and approve each of the quarterly financial statements and the annual financial statements. In 2016, the Committee met on four occasions. In addition to its members, the Audit Committee also routinely invites the Group’s auditors, the Finance Director, and other Board members to attend its meetings as required.
During 2016, the Audit Committee considered the key areas of risk and judgement relevant to the Group. These included:
• the liquidity and going concern of the Group;• the valuation and impairment of the Group’s assets;• the valuation of stocks of material comprising work in progress;• the policy for capitalisation of development costs and policies for amortisation;• determination of commercial production at the Sao Chico Mine;• determination of the potential recoverability of past tax losses.
In addition to matters raised at the Committee meetings, Serabi’s management submit working papers and notes outlining the key issues, which are be circulated to the Committee for consideration ahead of the meetings.
The Audit Committee also reviews, and discusses plans for, and the conduct of, the Group’s external audit and the findings of the auditors in respect of their work undertaken at the end of each calendar year, prior to approving the financial statements for release.
ResponsibilitiesThe Audit Committee reviews and monitors the integrity of the Group’s financial statements and related press releases, as well as any other formal announcements relating to the Group’s financial performance. As part of this review, it focuses in particular on areas of judgement, appropriateness of policies, going concern matters, and any other areas it identifies as risks (e.g. on the grounds of materiality or uncertainty). Through its involvement in the audit process the Audit Committee considers that it can monitor not only the performance of the Group’s finance teams but also that of the auditors themselves. The Audit Committee also has responsibility for any internal audit function but at this time has determined that in view of the size of the organisation, a separate internal audit team is not required.
Remuneration CommitteePurposeThe Remuneration Committee is responsible for determining and agreeing with the Board the framework for the remuneration of the Chief Executive, all other Executive Directors, the Chairman of the Company (if an Executive Director), the Company Secretary and such other members of the Executive Management as it feels appropriate to consider. Furthermore it is responsible for setting the structure and determining the total individual remuneration packages of each Director including, where appropriate, bonuses, incentive payments and share options with due regard to the interests of the shareholders and the overall performance of the Group and the Company’s overall philosophy and policy with respect to executive compensation.
It also considers recommendations from the Executive Directors in respect of proposals for bonuses, incentive payments and share options to be awarded to senior managers within the Group and makes recommendations on the overall remuneration plans adopted by the Company. The remuneration of the Non-Executive Directors is a matter that is dealt with by the Board as a whole.
The Remuneration Committee has expertise in, among other things, evaluating overall compensation policies, plans and practices, as well as setting compensation for executive officers; overseeing and administering equity compensation plans; and establishing employment, retention and severance arrangements for executive officers.
CompositionThe Remuneration Committee is required to consist of not less than two Non-Executive Directors. Its members, and chairman, are to be determined by the Board. The current membership of the Committee comprises Mel Williams (Chairman), Sean Harvey, and Nicolas Bañados.
OperationsThe Remuneration Committee meets at least twice a year, or more frequently as required. In 2016, the Remuneration Committee met twice. The Committee evaluated and made recommendations to the Board in respect of bonuses for key executives relating to both their individual and the Group’s performance during the preceding year against pre-determined targets. It also established and recommended targets in respect of the 2016 calendar year for executive Directors and senior management and evaluated and made recommendations for the award of share options for senior management and Directors.
Full disclosure of the policies can be found in the Remuneration Report on pages 44 to 48.
Overview
Strategic ReportM
anagement D
iscussion and A
nalysisCom
munity and
Social ResponsibilityCorporate G
overnanceFinancial Statem
ents
43Serabi Gold plc // Report and Accounts 2016
ResponsibilitiesThe Remuneration Committee is responsible for the following matters:
• to review the performance objectives and determine and agree the appropriate levels of remuneration for the Executive Directors, and the senior management of the Group;
• to determine the remuneration of the Chairman of the Board, Non-Executive Directors, as well as Chairmen and members of all Board Committees, subject to the condition that no person shall participate in discussions relating to his or her own remuneration;
• to review the design and management of Group salary structures and incentive schemes, and to ensure proper authorisation for any awards made under such schemes;
• to review the recommendations of the Chief Executive of the Group as to the grant of share awards and other bonuses, and to approve such awards as appropriate; and
• to review and approve the Remuneration Report in the Serabi Gold plc Annual Report.
Service ContractsNo Director has any service contracts, consultancy agreements or other such arrangements with a notice period in excess of one year.
Non-Audit ServicesThe Board regularly reviews the provision of non-audit services from its auditors, at least annually through discussion at Committee meetings. The Board is satisfied that the provision of non-audit services by BDO LLP is compatible with the general standard of independence for auditors and does not give rise to any conflict of interest.
Communications with ShareholdersThe Board is accountable to the Company’s shareholders and as such it is important for the Board to appreciate the aspirations of the shareholders and equally that the shareholders understand how the actions of the Board and short term financial performance relate to the achievement of the Group’s longer term goals.
The Board reports to the shareholders on its stewardship of the Company through the publication of quarterly operational updates and the quarterly and final financial results. News releases are issued throughout the year and the Company maintains a website (www.serabigold.com) on which press releases, corporate presentations and the Report and Financial Statements are available to view. Additionally, this Report and Financial Statements contains extensive information about the Group’s activities. Enquiries from individual shareholders on matters relating to the business of the Company are welcomed. Shareholders and other interested parties can subscribe to receive notification of news updates and other documents from the Company via email. In addition the executive Directors meet with major shareholders to discuss the progress of the Company and provide periodic feedback to the Board following meetings with shareholders.
The Annual General Meeting provides an opportunity for communication with all shareholders and the Board encourages the shareholders to attend and welcomes their participation. The executive Directors attend the Annual General Meeting and are available to answer questions. Details of resolutions to be proposed at the 2017 Annual General Meeting to be held on 15 June 2017 will be sent to all shareholders and will be also be available on the Company’s website in due course.
44 Serabi Gold plc // Report and Accounts 2016
CORPORATE GOVERNANCE
Directors’ Remuneration ReportFor the year ended 31 December 2016
Compensation plays an important role in achieving short and long term business objectives that ultimately drive business success. The Group’s compensation philosophy is to foster entrepreneurship at all levels of the organisation by making long term equity-based incentives, through the granting of stock options, a significant component of executive compensation. This approach is based on the assumption that the performance of the Group’s share price over the long term is an important indicator of long term performance.
The Group’s compensation philosophy and objectives are based on the following fundamental principles:
1. Compensation programs align with shareholder interests – the Group aligns the goals of executives with maximising long term shareholder value;
2. Performance sensitive – compensation for executive officers should be linked to operating and market performance of the Group and fluctuate with the performance; and
3. Offer market competitive compensation to attract and retain talent – the compensation program should provide market competitive pay in terms of value and structure in order to retain existing employees who are performing according to their objectives and to attract new individuals of the highest calibre.
The Group’s principal goal is to create value for its shareholders. The Group’s compensation philosophy is based on the objectives of linking the interests of the executive officers with both the short and long term interests of the Group, of linking executive compensation to the performance of the Group and the individual and of compensating executive officers at a level and in a manner that ensures the Group is capable of attracting, motivating and retaining individuals with exceptional executive skills. The executive compensation program is designed to encourage, compensate and reward employees on the basis of individual and corporate performance, both in the short and the long term. Base salaries are aligned with and judged against corporations of a comparable size and stage of development within the mining industry, thereby enabling the Group to compete for and retain executives critical to the Group’s long term success. Incentive compensation is directly tied to corporate performance. Share ownership opportunities are provided to align the interests of executive officers with the longer term interests of shareholders.
Elements of Executive CompensationThe elements of compensation earned by the executives of the Group for the financial year ended 31 December 2016 consists of a base salary, along with annual discretionary incentive compensation in the form of a performance based bonus, and a longer term incentive in the form of stock options.
This reflects a package consisting of a mix of compensation elements designed to provide executives with an “at risk” component of total compensation that reflects their ability to influence business outcomes and performance, and fixed elements that provide security and enable the Group to attract and retain key employees.
The following table outlines how each element of compensation aligns with the Group’s compensation philosophy. Details regarding the operation of each of the compensation elements are set out below the table.
Element of compensation package Purpose and link to strategy Nature of review
Base salary To recognise the market value of the role, reflecting the individual’s skills, experience, authority and responsibilities, to ensure that the business can attract and retain appropriate individuals for executive and non-executive roles.
The element is reviewed annually. The Group compiles comparator data from published accounts and industry surveys of peer companies to determine the base salary for each of the Executive Directors. The Group has not used remuneration consultants.
Peer group data is also used to assess the level of fees for the Non-Executive Directors.
Overview
Strategic ReportM
anagement D
iscussion and A
nalysisCom
munity and
Social ResponsibilityCorporate G
overnanceFinancial Statem
ents
45Serabi Gold plc // Report and Accounts 2016
Elements of Executive Compensation (continued)
Element of compensation package Purpose and link to strategy Nature of review
Performance related bonus
To incentivise and reward, on an annual basis, the performance of individuals, and of the Group, using a range of financial and non-financial metrics.
Objectives and measurable targets (“KPIs”) are set, prior to the year under review, to align near-term goals with the longer term sustainable future of the Group. The short term incentive component is structured to reward not only increased value for shareholders but also performance with respect to key operational factors and non-financial goals important to long term success. At the end of each year the Committee considers if and to what extent the KPIs have been achieved and in this way establish a transparent and non-discretionary assessment of an individual’s performance and contribution to the Group. Non-Executive Directors do not participate in the bonus scheme.
Share options To reward delivery of sustained long term improvements in shareholder returns by aligning performance directly with an increase in the fundamental measure of the generation of shareholder value.
The Board seeks to award options on an annual basis and the Group’s LTIP scheme is equity settled. Options vest in three annual equal instalments with the initial vesting on the date of the award. Any option which is unexercised after a period of three years from the date of grant expires. Options are also forfeited if a holder leaves the Group before the options vest or are exercised although the Committee may exercise discretionary powers in certain circumstances. Options issued to date have not been subject to attainment of performance criteria prior to vesting or exercise. The Committee has the right to impose such criteria in respect of new awards. Whilst there is no maximum value to which options that may be granted in one year, nor any cap on the level than an individual may hold, the Committee exercise discretion to ensure that annual awards can be made and considers the level and value of existing awards in determining the level of new awards.
Pension provision The provision of pension benefits is a relatively normal constituent of compensation offered by peer companies. The Group will contribute to defined benefit schemes on behalf of its executives as part of the overall remuneration package provided to an employee.
The Group does not operate any pension plans for its Executive Directors except to the minimum extent required under UK law. The level of pension contribution made to an individuals defined contribution scheme will generally be linked to an employee’s base salary, though the Committee may make single lump sum payments to provide an overall completive retirement benefit for an individual.
Other benefits To provide costs effective and competitive remuneration benefits.
The Group provides private medical and life assurance benefits for employees and Executive Directors which may be linked to base salary.
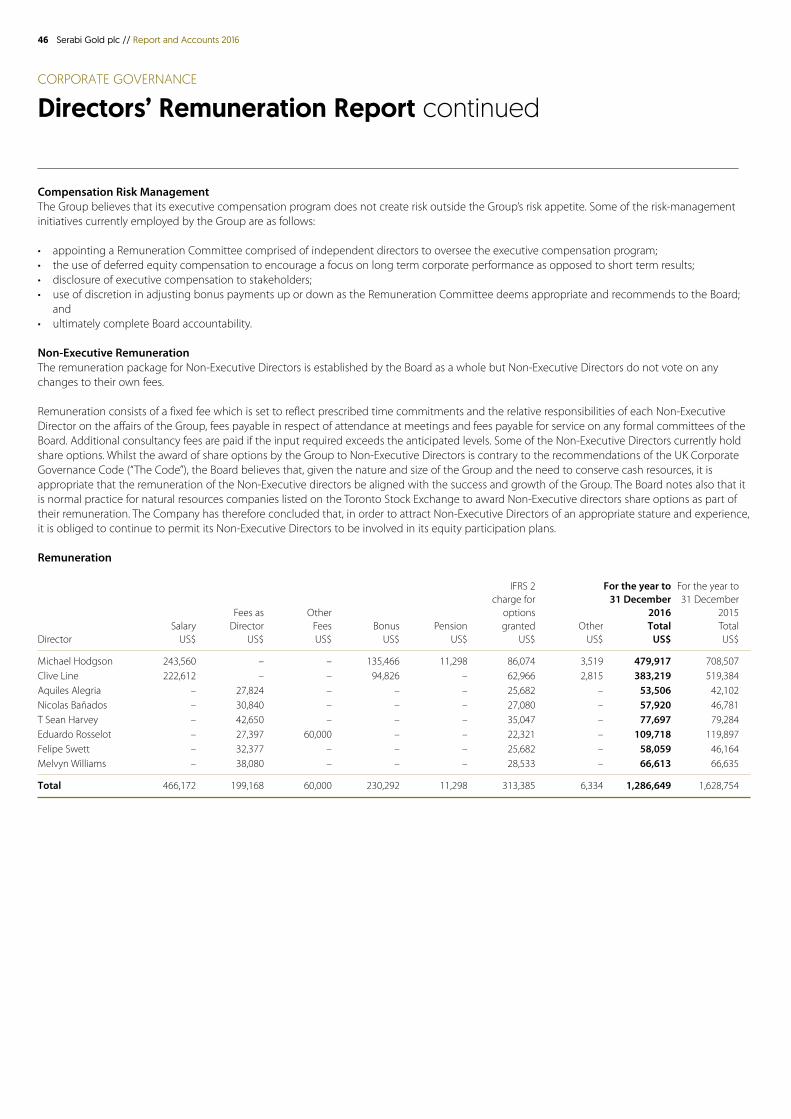
46 Serabi Gold plc // Report and Accounts 2016
CORPORATE GOVERNANCE
Directors’ Remuneration Report continued
Compensation Risk ManagementThe Group believes that its executive compensation program does not create risk outside the Group’s risk appetite. Some of the risk-management initiatives currently employed by the Group are as follows:
• appointing a Remuneration Committee comprised of independent directors to oversee the executive compensation program;• the use of deferred equity compensation to encourage a focus on long term corporate performance as opposed to short term results;• disclosure of executive compensation to stakeholders;• use of discretion in adjusting bonus payments up or down as the Remuneration Committee deems appropriate and recommends to the Board;
and• ultimately complete Board accountability.
Non-Executive RemunerationThe remuneration package for Non-Executive Directors is established by the Board as a whole but Non-Executive Directors do not vote on any changes to their own fees.
Remuneration consists of a fixed fee which is set to reflect prescribed time commitments and the relative responsibilities of each Non-Executive Director on the affairs of the Group, fees payable in respect of attendance at meetings and fees payable for service on any formal committees of the Board. Additional consultancy fees are paid if the input required exceeds the anticipated levels. Some of the Non-Executive Directors currently hold share options. Whilst the award of share options by the Group to Non-Executive Directors is contrary to the recommendations of the UK Corporate Governance Code (“The Code”), the Board believes that, given the nature and size of the Group and the need to conserve cash resources, it is appropriate that the remuneration of the Non-Executive directors be aligned with the success and growth of the Group. The Board notes also that it is normal practice for natural resources companies listed on the Toronto Stock Exchange to award Non-Executive directors share options as part of their remuneration. The Company has therefore concluded that, in order to attract Non-Executive Directors of an appropriate stature and experience, it is obliged to continue to permit its Non-Executive Directors to be involved in its equity participation plans.
Remuneration
IFRS 2 For the year to For the year to charge for 31 December 31 December Fees as Other options 2016 2015 Salary Director Fees Bonus Pension granted Other Total Total Director US$ US$ US$ US$ US$ US$ US$ US$ US$
Michael Hodgson 243,560 – – 135,466 11,298 86,074 3,519 479,917 708,507Clive Line 222,612 – – 94,826 – 62,966 2,815 383,219 519,384Aquiles Alegria – 27,824 – – – 25,682 – 53,506 42,102Nicolas Bañados – 30,840 – – – 27,080 – 57,920 46,781T Sean Harvey – 42,650 – – – 35,047 – 77,697 79,284Eduardo Rosselot – 27,397 60,000 – – 22,321 – 109,718 119,897Felipe Swett – 32,377 – – – 25,682 – 58,059 46,164Melvyn Williams – 38,080 – – – 28,533 – 66,613 66,635
Total 466,172 199,168 60,000 230,292 11,298 313,385 6,334 1,286,649 1,628,754
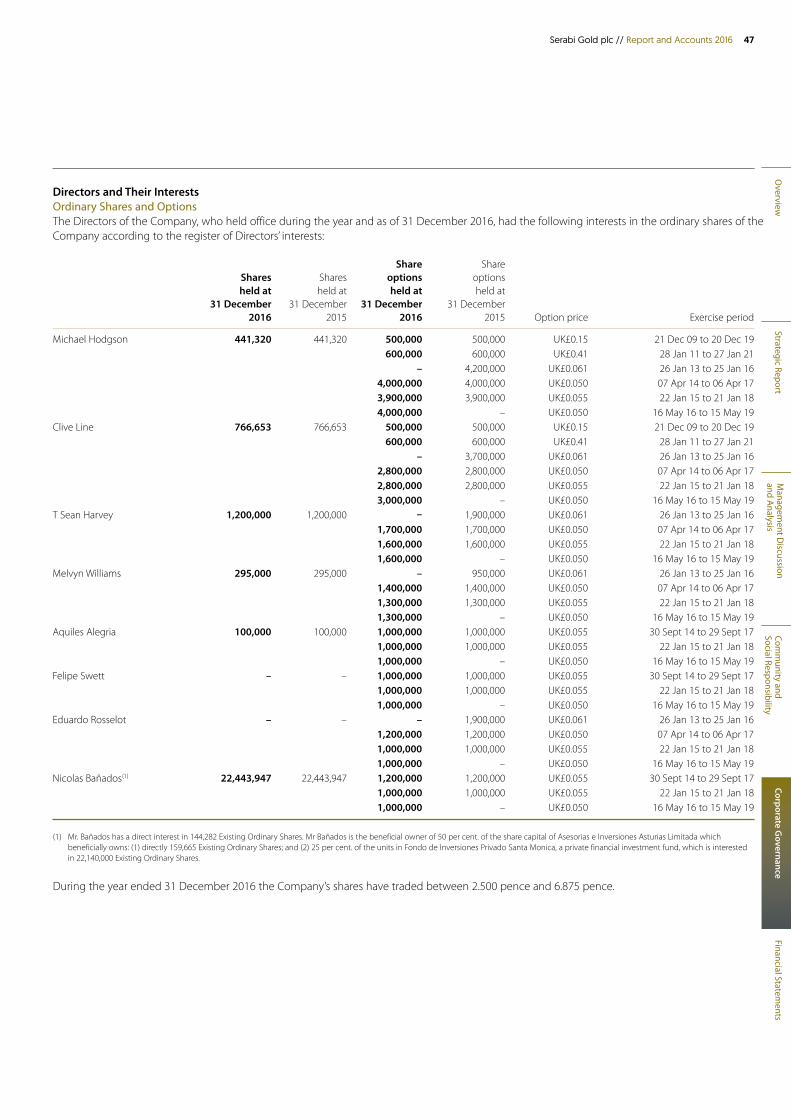
Overview
Strategic ReportM
anagement D
iscussion and A
nalysisCom
munity and
Social ResponsibilityCorporate G
overnanceFinancial Statem
ents
47Serabi Gold plc // Report and Accounts 2016
Directors and Their InterestsOrdinary Shares and OptionsThe Directors of the Company, who held office during the year and as of 31 December 2016, had the following interests in the ordinary shares of the Company according to the register of Directors’ interests:
Share Share Shares Shares options options held at held at held at held at 31 December 31 December 31 December 31 December 2016 2015 2016 2015 Option price Exercise period
Michael Hodgson 441,320 441,320 500,000 500,000 UK£0.15 21 Dec 09 to 20 Dec 19 600,000 600,000 UK£0.41 28 Jan 11 to 27 Jan 21 – 4,200,000 UK£0.061 26 Jan 13 to 25 Jan 16 4,000,000 4,000,000 UK£0.050 07 Apr 14 to 06 Apr 17 3,900,000 3,900,000 UK£0.055 22 Jan 15 to 21 Jan 18 4,000,000 – UK£0.050 16 May 16 to 15 May 19Clive Line 766,653 766,653 500,000 500,000 UK£0.15 21 Dec 09 to 20 Dec 19 600,000 600,000 UK£0.41 28 Jan 11 to 27 Jan 21 – 3,700,000 UK£0.061 26 Jan 13 to 25 Jan 16 2,800,000 2,800,000 UK£0.050 07 Apr 14 to 06 Apr 17 2,800,000 2,800,000 UK£0.055 22 Jan 15 to 21 Jan 18 3,000,000 – UK£0.050 16 May 16 to 15 May 19T Sean Harvey 1,200,000 1,200,000 – 1,900,000 UK£0.061 26 Jan 13 to 25 Jan 16 1,700,000 1,700,000 UK£0.050 07 Apr 14 to 06 Apr 17 1,600,000 1,600,000 UK£0.055 22 Jan 15 to 21 Jan 18 1,600,000 – UK£0.050 16 May 16 to 15 May 19Melvyn Williams 295,000 295,000 – 950,000 UK£0.061 26 Jan 13 to 25 Jan 16 1,400,000 1,400,000 UK£0.050 07 Apr 14 to 06 Apr 17 1,300,000 1,300,000 UK£0.055 22 Jan 15 to 21 Jan 18 1,300,000 – UK£0.050 16 May 16 to 15 May 19Aquiles Alegria 100,000 100,000 1,000,000 1,000,000 UK£0.055 30 Sept 14 to 29 Sept 17 1,000,000 1,000,000 UK£0.055 22 Jan 15 to 21 Jan 18 1,000,000 – UK£0.050 16 May 16 to 15 May 19Felipe Swett – – 1,000,000 1,000,000 UK£0.055 30 Sept 14 to 29 Sept 17 1,000,000 1,000,000 UK£0.055 22 Jan 15 to 21 Jan 18 1,000,000 – UK£0.050 16 May 16 to 15 May 19Eduardo Rosselot – – – 1,900,000 UK£0.061 26 Jan 13 to 25 Jan 16 1,200,000 1,200,000 UK£0.050 07 Apr 14 to 06 Apr 17 1,000,000 1,000,000 UK£0.055 22 Jan 15 to 21 Jan 18 1,000,000 – UK£0.050 16 May 16 to 15 May 19Nicolas Bañados(1) 22,443,947 22,443,947 1,200,000 1,200,000 UK£0.055 30 Sept 14 to 29 Sept 17 1,000,000 1,000,000 UK£0.055 22 Jan 15 to 21 Jan 18 1,000,000 – UK£0.050 16 May 16 to 15 May 19
(1) Mr. Bañados has a direct interest in 144,282 Existing Ordinary Shares. Mr Bañados is the beneficial owner of 50 per cent. of the share capital of Asesorias e Inversiones Asturias Limitada which
beneficially owns: (1) directly 159,665 Existing Ordinary Shares; and (2) 25 per cent. of the units in Fondo de Inversiones Privado Santa Monica, a private financial investment fund, which is interested in 22,140,000 Existing Ordinary Shares.
During the year ended 31 December 2016 the Company’s shares have traded between 2.500 pence and 6.875 pence.
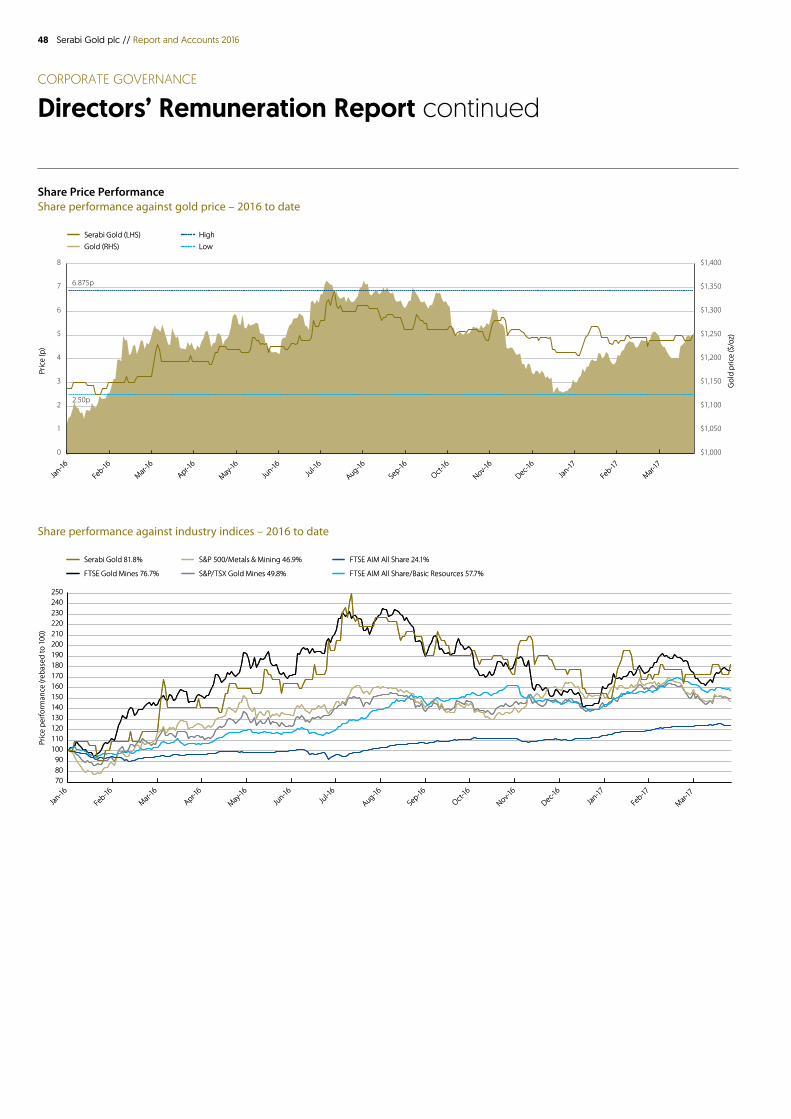
48 Serabi Gold plc // Report and Accounts 2016
Share Price PerformanceShare performance against gold price – 2016 to date
Feb-17
Dec-16
Oct-16
Aug-16
Jun-16
Feb-16
Apr-16
Jan-16
Mar-16
May-16
Jul-1
6
Sep-16
Nov-16Jan-17
Mar-17
Serabi Gold 81.8% FTSE AIM All Share 24.1%
FTSE AIM All Share/Basic Resources 57.7%
S&P 500/Metals & Mining 46.9%
FTSE Gold Mines 76.7% S&P/TSX Gold Mines 49.8%
Pric
e pe
rfor
man
ce (r
ebas
ed to
100
)
Jan-16
Feb-16
Mar-16
Apr-16
May-16
Jun-16
Jul-1
6
Aug-16
Sep-16
Oct-16
Nov-16
Dec-16
Jan-17
Serabi Gold (LHS) High
Gold (RHS) Low
Pric
e (p
)
Gol
d pr
ice
($/o
z)
708090
100110120130140150160170180190200210220230240250
$1,000
$1,050
$1,100
$1,150
$1,200
$1,250
$1,300
$1,350
$1,400
Mar-17
Feb-17Jan-16
Feb-16
Mar-16
Apr-16
May-16
Jun-16
Jul-1
6
Aug-16
Sep-16
Oct-16
Nov-16
Dec-16
Jan-17
Serabi Gold (LHS) High
Gold (RHS) Low
Pric
e (p
)
Gol
d pr
ice
($/o
z)
$1,000
$1,050
$1,100
$1,150
$1,200
$1,250
$1,300
$1,350
$1,400
Mar-17
Feb-17
Feb-17
Dec-16
Oct-16
Aug-16
Jun-16
Feb-16
Apr-16
Jan-16
Mar-16
May-16
Jul-1
6
Sep-16
Nov-16Jan-17
Mar-17
Serabi Gold 81.8% FTSE AIM All Share 24.1%
FTSE AIM All Share/Basic Resources 57.7%
S&P 500/Metals & Mining 46.9%
FTSE Gold Mines 76.7% S&P/TSX Gold Mines 49.8%
Pric
e pe
rfor
man
ce (r
ebas
ed to
100
)
Jan-16
Feb-16
Mar-16
Apr-16
May-16
Jun-16
Jul-1
6
Aug-16
Sep-16
Oct-16
Nov-16
Dec-16
Jan-17
Serabi Gold (LHS) High
6.875p
2.50p
Gold (RHS) Low
Pric
e (p
)
Gol
d pr
ice
($/o
z)
708090
100110120130140150160170180190200210220230240250
Mar-17
Feb-17
0
1
2
3
4
5
6
7
8
Jan-16
Feb-16
Mar-16
Apr-16
May-16
Jun-16
Jul-1
6
Aug-16
Sep-16
Oct-16
Nov-16
Dec-16
Jan-17
Serabi Gold (LHS) High
Gold (RHS) Low
Pric
e (p
)
Gol
d pr
ice
($/o
z)
Mar-17
Feb-17
0
1
2
3
4
5
6
7
8
Share performance against industry indices – 2016 to date
Feb-17
Dec-16
Oct-16
Aug-16
Jun-16
Feb-16
Apr-16
Jan-16
Mar-16
May-16
Jul-1
6
Sep-16
Nov-16Jan-17
Mar-17
Serabi Gold 81.8% FTSE AIM All Share 24.1%
FTSE AIM All Share/Basic Resources 57.7%
S&P 500/Metals & Mining 46.9%
FTSE Gold Mines 76.7% S&P/TSX Gold Mines 49.8%
Pric
e pe
rfor
man
ce (r
ebas
ed to
100
)
Jan-16
Feb-16
Mar-16
Apr-16
May-16
Jun-16
Jul-1
6
Aug-16
Sep-16
Oct-16
Nov-16
Dec-16
Jan-17
Serabi Gold (LHS) High
Gold (RHS) Low
Pric
e (p
)
Gol
d pr
ice
($/o
z)
708090
100110120130140150160170180190200210220230240250
$1,000
$1,050
$1,100
$1,150
$1,200
$1,250
$1,300
$1,350
$1,400
Mar-17
Feb-17Jan-16
Feb-16
Mar-16
Apr-16
May-16
Jun-16
Jul-1
6
Aug-16
Sep-16
Oct-16
Nov-16
Dec-16
Jan-17
Serabi Gold (LHS) High
Gold (RHS) Low
Pric
e (p
)
Gol
d pr
ice
($/o
z)
$1,000
$1,050
$1,100
$1,150
$1,200
$1,250
$1,300
$1,350
$1,400
Mar-17
Feb-17
Feb-17
Dec-16
Oct-16
Aug-16
Jun-16
Feb-16
Apr-16
Jan-16
Mar-16
May-16
Jul-1
6
Sep-16
Nov-16Jan-17
Mar-17
Serabi Gold 81.8% FTSE AIM All Share 24.1%
FTSE AIM All Share/Basic Resources 57.7%
S&P 500/Metals & Mining 46.9%
FTSE Gold Mines 76.7% S&P/TSX Gold Mines 49.8%
Pric
e pe
rfor
man
ce (r
ebas
ed to
100
)
Jan-16
Feb-16
Mar-16
Apr-16
May-16
Jun-16
Jul-1
6
Aug-16
Sep-16
Oct-16
Nov-16
Dec-16
Jan-17
Serabi Gold (LHS) High
6.875p
2.50p
Gold (RHS) Low
Pric
e (p
)
Gol
d pr
ice
($/o
z)
708090
100110120130140150160170180190200210220230240250
Mar-17
Feb-17
0
1
2
3
4
5
6
7
8
Jan-16
Feb-16
Mar-16
Apr-16
May-16
Jun-16
Jul-1
6
Aug-16
Sep-16
Oct-16
Nov-16
Dec-16
Jan-17
Serabi Gold (LHS) High
Gold (RHS) Low
Pric
e (p
)
Gol
d pr
ice
($/o
z)
Mar-17
Feb-17
0
1
2
3
4
5
6
7
8
CORPORATE GOVERNANCE
Directors’ Remuneration Report continued
Overview
Strategic ReportM
anagement D
iscussion and A
nalysisCom
munity and
Social ResponsibilityCorporate G
overnanceFinancial Statem
ents
49Serabi Gold plc // Report and Accounts 2016
CORPORATE GOVERNANCE
Directors’ ReportFor the year ended 31 December 2016
The Directors present their report together with the audited financial statements for the year ended 31 December 2016.
Results and dividendsThe Group profit for the year after taxation amounts to US$4,430,292 (2015: loss of US$48,738). The Directors do not recommend the payment of a dividend.
The results for the year are set out on page 55 in the Statement of Comprehensive Income.
Principal activities and business reviewThe principal activity of the Company is that of a holding and gold sales company and a provider of support and management services to its operating subsidiaries. Together with its subsidiaries (see note 10), it is involved in the development of gold and other metals mining projects in Brazil and the operation of the Palito gold mine in the Tapajos region of Brazil.
A detailed review of activities, future developments and the Group’s projects is included in the Chairman’s Statement, the Management Discussion and Analysis – Operational Review and Financial Review and the Strategic Review.
Substantial shareholdingsAs at 29 March 2017 the Company was aware of the following holdings of 3 per cent or more in the Company’s issued share capital: Number of Name shares held Percentage
Fratelli Investments Limited 386,375,734 55.30%Anker Holding AG 49,485,000 7.08%Drake PIPE Fund 45,979,686 6.58%Eldorado Gold Corporation 34,090,000 4.88%FIP Santa Monica 22,443,947 3.21%
Share capitalDetails of the share capital and movements in share capital during the period are disclosed in note 18 to the financial statements.
During the period the following issues of share options under the Serabi Mining 2011 Share Option Plan were made to Directors and other employees. Date of issue Number issued Price Expiry
16 May 2016 15,650,000 5.00 pence 15 May 2019
Company’s listingsThe Company’s ordinary shares have been traded on AIM since 10 May 2005 and on the TSX since 30 March 2011.
Going concern and availability of finance On 1 February 2016, the Group announced that, with effect from 1 January 2016, the Sao Chico Mine had achieved Commercial Production. The Palito Mine has been in Commercial Production since 1 July 2014.
The Directors anticipate the Group now has access to sufficient funding for its immediate projected needs. The Group expects to have sufficient cash flow from its forecast production to finance its on-going operational requirements, to repay its secured loan facilities and to, at least in part, fund exploration and development activity on its other gold properties. The secured loan facility is repayable by 31 August 2017 and at 31 December 2016, the amount outstanding under this facility was US$1.37 million (2015: US$4.0 million). The Group is currently in negotiations to increase and extend the terms of its loan facilities.
The Directors consider that the Group’s operations are performing at the levels that they anticipate but the Group remains a small scale gold producer with limited cash resources to support any unplanned interruption or reduction in gold production, unforeseen reductions in the gold price or appreciation of the Brazilian currency, all of which could adversely affect the level of free cash flow that the Group can generate on a monthly basis. In the event that the Group is unable to generate sufficient free cash flow to meet its financial obligations as they fall due or to allow it to finance exploration and development activity on its other gold properties, additional sources of finance may be required. Should additional working capital be required the Directors consider that further sources of finance could be secured within the required timescale.
On this basis, the Directors have therefore concluded that it is appropriate to prepare the financial statements on a going concern basis. However, there is no certainty that such additional funds either for working capital or for future development will be forthcoming and these conditions indicate the existence of a material uncertainty which may cast significant doubt over the Group’s ability to continue as a going concern and, therefore, that it may be unable to realise its assets and discharge its liabilities in the normal course of business. The financial statements do not include the adjustments that would result if the Group was unable to continue as a going concern.

50 Serabi Gold plc // Report and Accounts 2016
CORPORATE GOVERNANCE
Directors’ Report continued
Directors’ responsibilitiesThe Directors are responsible for preparing the annual report and the financial statements in accordance with applicable law and regulations.
Company law requires the Directors to prepare financial statements for each financial year. Under that law the Directors have elected to prepare the Group and Company financial statements in accordance with International Financial Reporting Standards (IFRSs) as adopted by the European Union. Under company law the Directors must not approve the financial statements unless they are satisfied that they give a true and fair view of the state of affairs of the Group and Company and of the profit or loss of the Group for that period. The Directors are also required to prepare financial statements in accordance with the rules of the London Stock Exchange for companies trading securities on the Alternative Investment Market and in accordance with the rules of the Toronto Stock Exchange.
In preparing these financial statements, the Directors are required to:
• select suitable accounting policies and then apply them consistently;• make judgements and accounting estimates that are reasonable and prudent;• state whether they have been prepared in accordance with IFRSs as adopted by the European Union, subject to any material departures
disclosed and explained in the financial statements;• prepare the financial statements on the going concern basis unless it is inappropriate to presume that the Company will continue in business.
The Directors are responsible for keeping adequate accounting records that are sufficient to show and explain the Group’s transactions and disclose with reasonable accuracy at any time the financial position of the Group and enable them to ensure that the financial statements comply with the requirements of the Companies Act 2006. They are also responsible for safeguarding the assets of the Group and hence for taking reasonable steps for the prevention and detection of fraud and other irregularities.
Website publicationThe Directors are responsible for ensuring the annual report and the financial statements are made available on a website. Financial statements are published on the Company's website in accordance with legislation in the United Kingdom governing the preparation and dissemination of financial statements, which may vary from legislation in other jurisdictions. The maintenance and integrity of the Company's website is the responsibility of the Directors. The Directors' responsibility also extends to the ongoing integrity of the financial statements contained therein.
Principal risks and uncertaintiesThe principal risks and uncertainties are outlined in the Strategic Report on pages 18 to 19.
Management of financial risksCapital management and financial risk disclosures are provided within notes 20 and 23 of the financial statements.
Corporate governanceThe Directors give due regard to the principles set out in The UK Corporate Governance Code, published in September 2014, by the Financial Reporting Council and comply with those principles that are appropriate given the size and nature of activities of the Group.
Board compositionThe Directors who served during the year are shown on page 47.
The Directors have responsibility for the overall corporate governance of the Group and recognise the need for the highest standards of behaviour and accountability. The Directors are committed to the principles underlying best practice in corporate governance and intend to comply with the principles of The UK Corporate Governance Code published in September 2014 by the Financial Reporting Council and the Quoted Companies Alliance (QCA) published Corporate Governance Guidelines in such respects as they consider appropriate for a company of its size and nature. The Board has a wide range of experience directly relevant to the Group and its activities and its structure ensures that no one individual or group dominates the decision making process.
Further details relating to the Board, independence and meetings undertaken during the year are set out in the Report on Corporate Governance on pages 40 to 43.
CommitteesThe Company has established an Audit Committee, a Remuneration Committee and an Executive Committee. Details of these committees are set out in the Report on Corporate Governance on pages 40 to 43.
EmployeesThe Group has a policy of equal opportunities throughout the organisation, and is proud of its culture of diversity and tolerance. Employees benefit from regular communication both informally and formally with regard to Company issues (external and internal developments, updates, etc.), including regular news updates distributed at the mine site and in the corporate offices. Employees are made aware of the Company’s share ownership policy, both to ensure compliance with listing rules but also to make them aware of the opportunity to participate in the Company’s share performance.
Overview
Strategic ReportM
anagement D
iscussion and A
nalysisCom
munity and
Social ResponsibilityCorporate G
overnanceFinancial Statem
ents
51Serabi Gold plc // Report and Accounts 2016
Share dealingThe Company has adopted a share dealing code for Directors and relevant employees in accordance with the AIM Rules and Market Abuse Regulations and takes proper steps to ensure compliance by the Directors and these employees.
Internal controlsThe Directors acknowledge their responsibility for the Group’s system of internal controls and procedures and for reviewing the effectiveness of these and ensuring that management of its subsidiaries review the internal controls and procedures operating in the subsidiaries. Such controls and procedures are designed to safeguard the Company’s and the Group’s assets and ensure reliability of reporting information, financial and otherwise, for both internal use and external publication. The Group’s management has designed internal controls over financial reporting, in order to provide reasonable assurance regarding the reliability of financial reporting and the preparation of financial statements for external purposes in accordance with IFRS.
Throughout the year the design and operating effectiveness of the Group’s internal controls over financial reporting are reviewed. Based on these evaluations the Board has concluded that the internal controls over financial reporting were effective as at 31 December 2016, using the criteria, having taken account of the size and nature of the Group, put forward by the Financial Reporting Council in their revised guidance for directors on internal controls for UK listed companies (issued 2005).
The Group’s management, including the Chief Executive Officer and the Chief Financial Officer, does not expect that its disclosure controls and internal controls over financial reporting will prevent or detect all errors and fraud. A cost effective system of internal controls, no matter how well conceived or operated, can provide only reasonable, not absolute, assurance that the objectives of the internal controls over financial reporting are achieved.
Key contractsThe Group has contractual arrangements with key suppliers for its operations notably for fuel, power, reagents and equipment spare parts. It also has an existing commitment to sell its production of copper/gold concentrate to a single customer which will be subject to renewal during 2017. However, management considers that alternative suppliers and purchasers could be arranged if necessary and do not therefore consider that the Group is unduly reliant on any single contract or supplier.
The Group is reliant on retaining its exploration and mining licences and its operating licences which are subject to compliance with various federal and state regulations and obligations. The Group considers such compliance a high priority in view of this reliance.
Post balance sheet eventsOn 23 February, the Group extended the term for repayment of its secured loan facility with Sprott to 31 August 2017. With this exception there has been no item, transaction or event of a material or unusual nature likely, in the opinion of the Directors of the Company, to affect significantly the continuing operation of the entity, the results of these operations, or the state of affairs of the entity in future financial periods.
Indemnification of Directors and officersDuring the financial year, the Group paid a premium in respect of a contract insuring the Directors of the Company, the Company Secretary and all executive officers of the Group against liability incurred as such a Director, Company Secretary or executive officer to the extent permitted under legislation.
AuditorThe auditor, BDO LLP has confirmed its willingness to remain as auditor to the Company. A resolution to appoint BDO LLP will be put to the Annual General Meeting.
Disclosure of audit informationAs far as each of the Directors is aware, at the time this report was approved:
(a) There is no relevant available information of which the auditor is unaware; and(b) They have taken all steps that ought to have been taken to make themselves aware of any relevant audit information and to establish that
the auditor is aware of that information.
By order of the Board
Clive LineCompany Secretary30 March 2017
52 Serabi Gold plc // Report and Accounts 2016
INDEPENDENT AUDITOR'S REPORT
To the members of Serabi Gold plc
We have audited the financial statements of Serabi Gold plc for the year ended 31 December 2016 which comprise the consolidated statement of comprehensive income, the consolidated and the Company balance sheets, the consolidated and Company statements of changes in equity, the consolidated and Company statements of cash flows and the related notes. The financial reporting framework that has been applied in their preparation is applicable law and International Financial Reporting Standards (IFRSs) as adopted by the European Union and, as regards the parent company financial statements, as applied in accordance with the provisions of the Companies Act 2006.
This report is made solely to the Company’s members, as a body, in accordance with Chapter 3 of Part 16 of the Companies Act 2006. Our audit work has been undertaken so that we might state to the Company’s members those matters we are required to state to them in an auditor’s report and for no other purpose. To the fullest extent permitted by law, we do not accept or assume responsibility to anyone other than the Company and the Company’s members as a body, for our audit work, for this report, or for the opinions we have formed.
Respective responsibilities of directors and auditorsAs explained more fully in the statement of Directors’ responsibilities, the Directors are responsible for the preparation of the financial statements and for being satisfied that they give a true and fair view. Our responsibility is to audit and express an opinion on the financial statements in accordance with applicable law and International Standards on Auditing (UK and Ireland). Those standards require us to comply with the Financial Reporting Council’s (FRC’s) Ethical Standards for Auditors.
Scope of the audit of the financial statementsA description of the scope of an audit of financial statements is provided on the FRC’s website at www.frc.org.uk/auditscopeukprivate.
Opinion on financial statementsIn our opinion:
• the financial statements give a true and fair view of the state of the Group’s and the parent company’s affairs as at 31 December 2016 and of the Group’s profit for the year then ended;
• the Group financial statements have been properly prepared in accordance with IFRSs as adopted by the European Union;• the parent company financial statements have been properly prepared in accordance with IFRSs as adopted by the European Union
and as applied in accordance with the provisions of the Companies Act 2006; and• the financial statements have been prepared in accordance with the requirements of the Companies Act 2006.
Emphasis of matter – going concernIn forming our opinion, which is not modified, we have considered the adequacy of the disclosures made in Note 1(a) to the financial statements concerning the group’s ability to continue as a going concern.
Whilst the Group expects to have sufficient cash flow from its forecast production to finance its on-going operational requirements, to repay its secured loan facilities and to, at least in part, fund exploration and development activity on its other gold properties, the Group remains a small scale gold producer with limited cash resources. It is therefore susceptible to any unplanned interruption or reduction in gold production, unforeseen reductions in the gold price or appreciation of the Brazilian currency all of which could adversely affect the level of free cash flow that the Group can generate on a monthly basis. In the event that the Group is unable to generate sufficient free cash flow to meet its financial obligations as they fall due or to allow it to finance exploration and development activity on its other gold properties additional sources of finance may be required. The Group is currently in negotiations to increase and extend its loan facilities, but they have not been finalised.
These conditions indicate the existence of a material uncertainty which may cast significant doubt about the Group’s ability to continue as a going concern. The financial statements do not include the adjustments that would result if the Company and the Group were unable to continue as a going concern.
Overview
Strategic ReportM
anagement D
iscussion and A
nalysisCom
munity and
Social ResponsibilityCorporate G
overnanceFinancial Statem
ents
53Serabi Gold plc // Report and Accounts 2016
Opinion on other matters prescribed by the Companies Act 2006In our opinion, based on the work undertaken in the course of the audit:
• the information given in the Strategic Report and Directors’ Report for the financial year for which the financial statements are prepared is consistent with the financial statements; and
• the Strategic Report and Directors’ Report have been prepared in accordance with applicable legal requirements.
Matters on which we are required to report by exceptionIn the light of the knowledge and understanding of the Group and the parent company and its environment obtained in the course of the audit, we have not identified material misstatements in the strategic report or the directors’ report.
We have nothing to report in respect of the following matters where the Companies Act 2006 requires us to report to you if, in our opinion:
• adequate accounting records have not been kept by the parent company, or returns adequate for our audit have not been received from branches not visited by us; or
• the parent company financial statements are not in agreement with the accounting records and returns; or• certain disclosures of Directors’ remuneration specified by law are not made; or• we have not received all the information and explanations we require for our audit.
Stuart Barnsdall (senior statutory auditor)For and on behalf of BDO LLP, statutory auditorLondon, United Kingdom30 March 2017
BDO LLP is a limited liability partnership registered in England and Wales (with registered number OC305127).
54 Serabi Gold plc // Report and Accounts 2016
INDEPENDENT AUDITOR'S REPORT
In Respect of Canadian National Instrument 52-107 (Acceptable Accounting Principles and Auditing Standards)
In accordance with the requirements contained in Canadian National Instrument 52-107 we also report below on whether our audit has been conducted in accordance with International Standards on Auditing (as issued by the International Auditing and Assurance Standards Board) and whether the financial statements have been prepared in accordance with International Financial Reporting Standards (as issued by the International Accounting Standards Board).
To the Shareholders of Serabi Gold plcWe have audited the accompanying financial statements of Serabi Gold plc for the years ended 31 December 2016 and 31 December 2015 which comprise the consolidated statement of comprehensive income, the consolidated and Company balance sheets, the consolidated and Company statements of changes in equity, the consolidated and Company statements of cash flows for the year then ended, and a summary of significant accounting policies and other explanatory information. The financial reporting framework that has been applied in the preparation of the consolidated financial statements is applicable law and International Financial Reporting Standards (IFRSs).
Management's Responsibility for the Consolidated Financial StatementsManagement is responsible for the preparation and fair presentation of these financial statements in accordance with the applicable financial reporting framework, and for such internal control as management determines is necessary to enable the preparation of financial statements that are free from material misstatement, whether due to fraud or error.
Auditor's ResponsibilityOur responsibility is to express an opinion on these financial statements based on our audit. We conducted our audit in accordance with Canadian Generally Accepted Auditing Standards (Canadian GAAS). Those standards require that we comply with ethical requirements and plan and perform the audit to obtain reasonable assurance about whether the consolidated financial statements are free from material misstatement.
An audit involves performing procedures to obtain audit evidence about the amounts and disclosures in the consolidated financial statements. The procedures selected depend on the auditor's judgement, including the assessment of the risks of material misstatement of the financial statements, whether due to fraud or error. In making those risk assessments, the auditor considers internal control relevant to the entity's preparation and fair presentation of the financial statements in order to design audit procedures that are appropriate in the circumstances, but not for the purpose of expressing an opinion on the effectiveness of the entity's internal control. An audit also includes evaluating the appropriateness of accounting policies used and the reasonableness of accounting estimates made by management, as well as evaluating the overall presentation of the financial statements.
We believe that the audit evidence we have obtained is sufficient and appropriate to provide a basis for our audit opinion.
OpinionIn our opinion, the consolidated financial statements present fairly, in all material respects, the financial position of Serabi Gold plc as at 31 December 2016 and 31 December 2015 and its financial performance and its cash flows for the years then ended in accordance with IFRSs.
Emphasis of matter – going concernIn forming our opinion, which is not modified, we have considered the adequacy of the disclosures made in Note 1(a) to the financial statements concerning the group’s ability to continue as a going concern.
Whilst the Group expects to have sufficient cash flow from its forecast production to finance its on-going operational requirements, to repay its secured loan facilities and to, at least in part, fund exploration and development activity on its other gold properties, the Group remains a small scale gold producer with limited cash resources. It is therefore susceptible to any unplanned interruption or reduction in gold production, unforeseen reductions in the gold price or appreciation of the Brazilian currency all of which could adversely affect the level of free cash flow that the Group can generate on a monthly basis. In the event that the Group is unable to generate sufficient free cash flow to meet its financial obligations as they fall due or to allow it to finance exploration and development activity on its other gold properties additional sources of finance may be required. The Group is currently in negotiations to increase and extend its loan facilities, but they have not been finalised.
These conditions indicate the existence of a material uncertainty which may cast significant doubt about the Group’s ability to continue as a going concern. The financial statements do not include the adjustments that would result if the Company and the Group were unable to continue as a going concern.
BDO LLPLondon, United Kingdom30 March 2017
BDO LLP is a limited liability partnership registered in England and Wales (with registered number OC305127).
Overview
Strategic ReportM
anagement D
iscussion and A
nalysisCom
munity and
Social ResponsibilityCorporate G
overnanceFinancial Statem
ents
55Serabi Gold plc // Report and Accounts 2016
FINANCIAL STATEMENTS
Statement of Comprehensive IncomeFor the year ended 31 December 2016
Group
For the For the year ended year ended 31 December 31 December 2016 2015 Notes US$ US$
Continuing operationsRevenue 52,593,751 35,086,113Cost of sales (32,906,426) (23,585,063)Depreciation and amortisation charges (8,384,738) (5,840,769)
Gross profit 11,302,587 5,660,281Administration expenses (4,962,524) (4,379,770)Share-based payments (350,899) (404,075)Gain on disposal of fixed asset 34,742 –
Operating profit 3 6,023,906 876,436Foreign exchange loss (236,619) (71,280)Finance expense 4 (3,917,681) (1,533,008)Income on financial instruments 4 – 1,203,023Finance income 4 573 1,123
Profit before taxation 1,870,179 476,294Income tax benefit/(expense) 5 2,560,113 (525,032)
Profit/(loss) for the period from continuing operations(1) 4,430,292 (48,738) Other comprehensive income (net of tax) Items that may be reclassified subsequently to profit or loss Exchange differences on translating foreign operations 8,618,687 (20,490,243)
Total comprehensive profit/(loss) for the period(1) 13,048,979 (20,538,981)Profit/(loss) per ordinary share (basic) 7 0.66c (0.01c)Profit/(loss) per ordinary share (diluted) 7 0.61c (0.01c)
(1) The Group has no non-controlling interests and all profits are attributable to the equity holders of the parent company.
56 Serabi Gold plc // Report and Accounts 2016
FINANCIAL STATEMENTS
Group Balance SheetAs at 31 December 2016
Group
2016 2015 Notes US$ US$
Non-current assets Development and deferred exploration costs 8 9,990,789 8,679,246Property, plant and equipment 9 45,396,140 40,150,484Deferred taxation 5 3,253,630 –
Total non-current assets 58,640,559 48,829,730
Current assets Inventories 11 8,110,373 6,908,790Trade and other receivables 12 1,233,049 6,133,284Prepayments 13 3,696,550 2,429,506Cash and cash equivalents 14 4,160,923 2,191,759
Total current assets 17,200,895 17,663,339
Current liabilities Trade and other payables 15 4,722,139 4,212,803Interest-bearing liabilities 17 2,964,057 11,385,155Accruals 635,446 226,197
Total current liabilities 8,321,642 15,824,155
Net current assets 8,879,253 1,839,184
Total assets less current liabilities 67,519,812 50,668,914
Non-current liabilities Trade and other payables 15 2,211,078 1,857,914Provisions 16 1,851,963 1,898,714Interest-bearing liabilities 17 77,798 128,641
Total non-current liabilities 4,140,839 3,885,269
Net assets 63,378,973 46,783,645
Equity Share capital 18 5,540,960 5,263,182Share premium reserve 1,722,222 –Option reserve 1,338,652 2,747,415Other reserves 3,051,862 450,262Translation reserve (30,607,848) (39,226,535)Retained surplus 82,333,125 77,549,321
Equity shareholders’ funds attributable to owners of the parent 63,378,973 46,783,645
The financial statements were approved and authorised for issue by the Board of Directors on 29 March 2017 and signed on its behalf by:
Clive LineFinance Director30 March 2017
Company Number 5131528
Overview
Strategic ReportM
anagement D
iscussion and A
nalysisCom
munity and
Social ResponsibilityCorporate G
overnanceFinancial Statem
ents
57Serabi Gold plc // Report and Accounts 2016
FINANCIAL STATEMENTS
Company Balance SheetAs at 31 December 2016
Company
2016 2015 Notes US$ US$
Non-current assets Development and deferred exploration costs 8 1,568,365 2,040,437Property, plant and equipment 9 6,770,252 6,174,311Investments in subsidiaries 10 66,600,872 69,770,204Other receivables 12 7,606,894 13,753,874
Total non-current assets 82,546,383 91,738,826
Current assets Inventories 11 – 1,148,634Trade and other receivables 12 1,075,532 6,030,125Prepayments 13 104,666 101,712Cash and cash equivalents 14 3,612,495 1,781,433
Total current assets 4,792,693 9,061,904
Current liabilities Trade and other payables 15 6,222,345 6,775,354Interest-bearing liabilities 17 1,787,096 10,998,513Accruals 635,446 499,057
Total current liabilities 8,644,887 18,272,924
Net current liabilities (3,852,194) (9,211,020)
Total assets less current liabilities 78,694,189 82,527,806
Total non-current liabilities – –
Net assets 78,694,189 82,527,806
Equity Share capital 18 5,540,960 5,263,182Share premium reserve 1,722,222 –Option reserve 1,338,652 2,747,415Other reserves – 88,801Distributable surplus 70,092,355 74,428,408
Equity shareholders’ funds attributable to owners of the parent 78,694,189 82,527,806
A separate statement of comprehensive income for Serabi Gold plc has not been prepared as permitted by Section 408 of the Companies Act 2006. The loss of the Company during 2016 was US$7,379,966 (2015: US$9,136,678).
The financial statements were approved and authorised for issue by the Board of Directors on 29 March 2017 and signed on its behalf by:
Clive LineFinance Director30 March 2017
Company Number 5131528
58 Serabi Gold plc // Report and Accounts 2016
FINANCIAL STATEMENTS
Statements of Changes in Shareholders’ EquityFor the year ended 31 December 2016
(Accumulated losses)/ Share Share Share option Other Translation retained capital premium reserve reserves reserve surplus Total equity Group US$ US$ US$ US$ US$ US$ US$
Equity shareholders’ funds at 31 December 2014 61,668,212 67,656,848 2,400,080 450,262 (18,736,292) (46,520,559) 66,918,551
Foreign currency adjustments – – – – (20,490,243) – (20,490,243)Loss for year – – – – – (48,738) (48,738)
Total comprehensive loss for the year – – – – (20,490,243) (48,738) (20,538,981)Cancellation of share premium (67,656,848) – – – 67,656,848 –Cancellation of deferred shares (56,405,030) – – – – 56,405,030 –Share options lapsed in period – – (56,740) – – 56,740 –Share option expense – – 404,075 – – – 404,075
Equity shareholders’ funds at 31 December 2015 5,263,182 – 2,747,415 450,262 (39,226,535) 77,549,321 46,783,645
Foreign currency adjustments – – – – 8,618,687 – 8,618,687Profit for year 4,430,292 4,430,292
Total comprehensive income for the year – – – – 8,618,687 4,430,292 13,048,979Transfer to taxation reserve – – – 2,690,401 – (2,690,401) –Shares issued in period 277,778 1,722,222 – – – – 2,000,000Release of fair value provision on convertible loan – – – – – 1,195,450 1,195,450Warrants lapsed – – – (88,801) – 88,801 –Share options lapsed in period – – (1,759,662) – – 1,759,662 –Share option expense 350,899 350,899
Equity shareholders’ funds at 31 December 2016 5,540,960 1,722,222 1,338,652 3,051,862 (30,607,848) 82,333,125 63,378,973
Other reserves comprises a merger reserve of US$361,461 and a taxation reserve of US$2,690,401 (2015: merger reserve of US$361,461 and warrant reserve of US$88,801).
The following is a description of each of the reserve accounts that comprise equity shareholders’ funds
Share capital The share capital comprises the issued ordinary shares of the company at par.Share premium The share premium comprises the excess value recognised from the issue of ordinary shares at par.Share option reserve Cumulative fair value of options charged to the statement of comprehensive income net of transfers to the profit
and loss reserve on exercised and cancelled/lapsed options.Other reserves Other reserves comprises of a merger reserve arising on the acquisition of Kenai Resources Limited, representing
the difference between the nominal value of the shares issued and their fair value, and a warrant reserve being the cumulative fair value of warrants issued associated with equity shares issued. The Group has also established a taxation reserve. The reserve is used to accumulate taxation savings received by the Group as a result of a lower taxation rate being applied in Brazil through its eligibility for a tax incentive programme (“SUDAM”) SUDAM reduces the Group’s effective tax rate from approximately 34 per cent to approximately 15.25 per cent. The regulations of the incentive programme require the Group to accumulate incentives received through tax savings in a taxation reserve.
Translation reserve Cumulative gains and losses on translating the net assets of overseas operations to the presentation currency.Retained surplus Retained surplus/(accumulated losses) comprise the Group’s cumulative accounting profits and losses since inception.
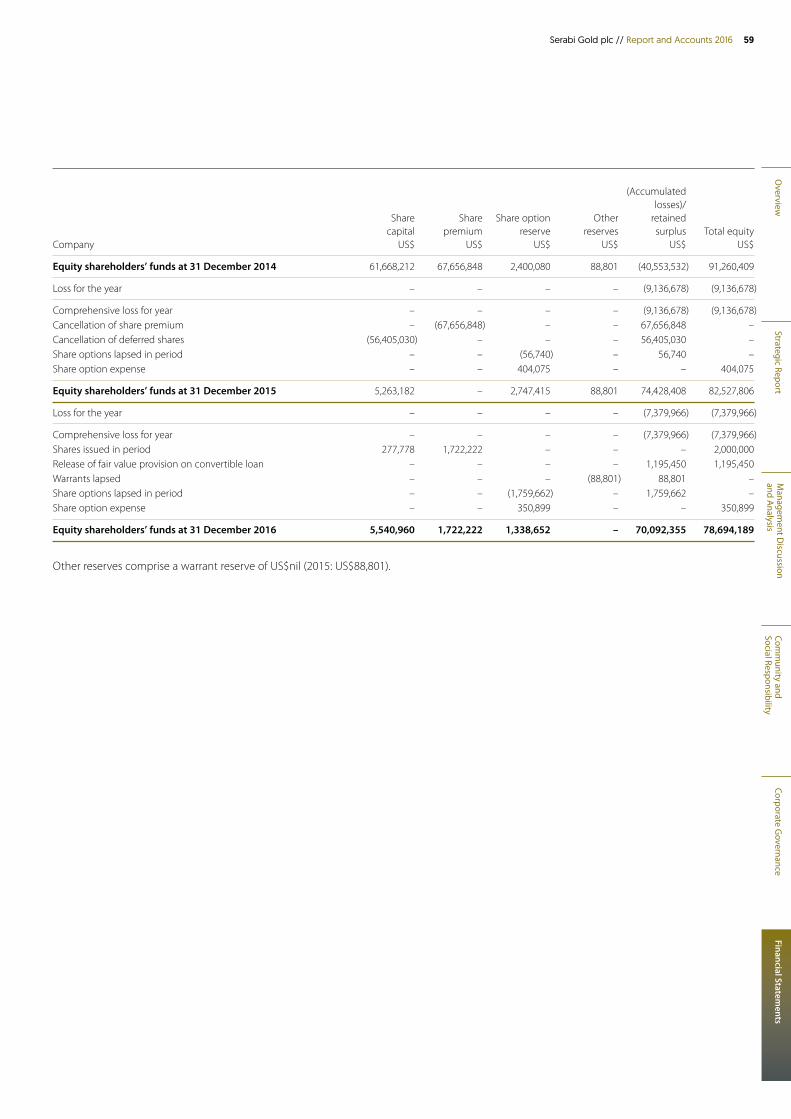
Overview
Strategic ReportM
anagement D
iscussion and A
nalysisCom
munity and
Social ResponsibilityCorporate G
overnanceFinancial Statem
ents
59Serabi Gold plc // Report and Accounts 2016
(Accumulated losses)/ Share Share Share option Other retained capital premium reserve reserves surplus Total equity Company US$ US$ US$ US$ US$ US$
Equity shareholders’ funds at 31 December 2014 61,668,212 67,656,848 2,400,080 88,801 (40,553,532) 91,260,409
Loss for the year – – – – (9,136,678) (9,136,678)
Comprehensive loss for year – – – – (9,136,678) (9,136,678)Cancellation of share premium – (67,656,848) – – 67,656,848 –Cancellation of deferred shares (56,405,030) – – – 56,405,030 –Share options lapsed in period – – (56,740) – 56,740 –Share option expense – – 404,075 – – 404,075
Equity shareholders’ funds at 31 December 2015 5,263,182 – 2,747,415 88,801 74,428,408 82,527,806
Loss for the year – – – – (7,379,966) (7,379,966)
Comprehensive loss for year – – – – (7,379,966) (7,379,966)Shares issued in period 277,778 1,722,222 – – – 2,000,000Release of fair value provision on convertible loan – – – – 1,195,450 1,195,450Warrants lapsed – – – (88,801) 88,801 –Share options lapsed in period – – (1,759,662) – 1,759,662 –Share option expense – – 350,899 – – 350,899
Equity shareholders’ funds at 31 December 2016 5,540,960 1,722,222 1,338,652 – 70,092,355 78,694,189
Other reserves comprise a warrant reserve of US$nil (2015: US$88,801).
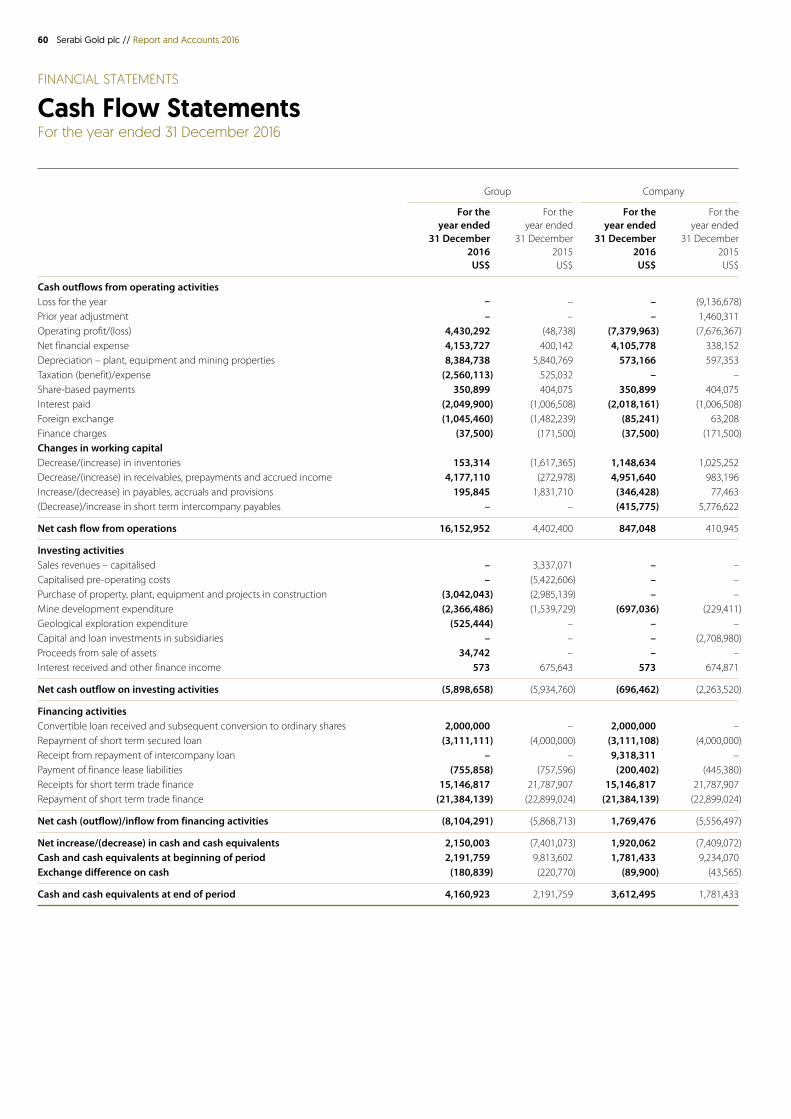
60 Serabi Gold plc // Report and Accounts 2016
FINANCIAL STATEMENTS
Cash Flow StatementsFor the year ended 31 December 2016
Group Company
For the For the For the For the year ended year ended year ended year ended 31 December 31 December 31 December 31 December 2016 2015 2016 2015 US$ US$ US$ US$
Cash outflows from operating activities Loss for the year – – – (9,136,678)Prior year adjustment – – – 1,460,311Operating profit/(loss) 4,430,292 (48,738) (7,379,963) (7,676,367)Net financial expense 4,153,727 400,142 4,105,778 338,152Depreciation – plant, equipment and mining properties 8,384,738 5,840,769 573,166 597,353Taxation (benefit)/expense (2,560,113) 525,032 – –Share-based payments 350,899 404,075 350,899 404,075Interest paid (2,049,900) (1,006,508) (2,018,161) (1,006,508)Foreign exchange (1,045,460) (1,482,239) (85,241) 63,208Finance charges (37,500) (171,500) (37,500) (171,500)Changes in working capital Decrease/(increase) in inventories 153,314 (1,617,365) 1,148,634 1,025,252Decrease/(increase) in receivables, prepayments and accrued income 4,177,110 (272,978) 4,951,640 983,196Increase/(decrease) in payables, accruals and provisions 195,845 1,831,710 (346,428) 77,463(Decrease)/increase in short term intercompany payables – – (415,775) 5,776,622
Net cash flow from operations 16,152,952 4,402,400 847,048 410,945
Investing activities Sales revenues – capitalised – 3,337,071 – –Capitalised pre-operating costs – (5,422,606) – –Purchase of property, plant, equipment and projects in construction (3,042,043) (2,985,139) – –Mine development expenditure (2,366,486) (1,539,729) (697,036) (229,411)Geological exploration expenditure (525,444) – – –Capital and loan investments in subsidiaries – – – (2,708,980)Proceeds from sale of assets 34,742 – – –Interest received and other finance income 573 675,643 573 674,871
Net cash outflow on investing activities (5,898,658) (5,934,760) (696,462) (2,263,520)
Financing activities Convertible loan received and subsequent conversion to ordinary shares 2,000,000 – 2,000,000 –Repayment of short term secured loan (3,111,111) (4,000,000) (3,111,108) (4,000,000)Receipt from repayment of intercompany loan – – 9,318,311 –Payment of finance lease liabilities (755,858) (757,596) (200,402) (445,380)Receipts for short term trade finance 15,146,817 21,787,907 15,146,817 21,787,907Repayment of short term trade finance (21,384,139) (22,899,024) (21,384,139) (22,899,024)
Net cash (outflow)/inflow from financing activities (8,104,291) (5,868,713) 1,769,476 (5,556,497)
Net increase/(decrease) in cash and cash equivalents 2,150,003 (7,401,073) 1,920,062 (7,409,072)Cash and cash equivalents at beginning of period 2,191,759 9,813,602 1,781,433 9,234,070Exchange difference on cash (180,839) (220,770) (89,900) (43,565)
Cash and cash equivalents at end of period 4,160,923 2,191,759 3,612,495 1,781,433
Overview
Strategic ReportM
anagement D
iscussion and A
nalysisCom
munity and
Social ResponsibilityCorporate G
overnanceFinancial Statem
ents
61Serabi Gold plc // Report and Accounts 2016
1 Significant accounting policies(a) Basis of preparationSerabi Gold plc (the “Company”) is a public limited company incorporated and domiciled in England, the shares of which are listed on AIM, part of the London Stock Exchange, and the Toronto Stock Exchange. The public registered office and principal place of business are disclosed in the shareholder information section of the Annual Report.
The principal activities of the Group are described in the Directors’ Report on page 49.
The consolidated financial statements are presented in US Dollars. They are prepared on the historical cost basis or the fair value basis where the fair valuing of relevant assets and liabilities has been applied.
The financial statements have been prepared in accordance with International Financial Reporting Standards (“IFRS”) in force at the reporting date and their interpretations issued by the International Accounting Standards Board (“IASB”) as adopted for use within the European Union and with IFRS and their interpretations issued by the IASB. The parent company financial statements have also been prepared in accordance with those parts of the Companies Act 2006 applicable to companies reporting under IFRS.
Accounting standards issued but not adoptedAt the date of authorisation of these financial statements, the following standards and relevant interpretations, which have not been applied in these financial statements, were in issue but not yet effective (and some of which were pending endorsement by the EU): IAS 12 (amended) Recognition of Deferred Tax Asset for Unrealised LossesIFRS 16 LeasesIAS 7 Disclosure InitiativelFRIC 22 Foreign Currency Transactions and Advance ConsiderationlFRS 9 Financial InstrumentslFRS 15 Revenue from ContractslFRS 2 (amended) Classification and Measurement of Share-based Payment TransactionslFRS 15 Clarification to IFRS 15 Revenue from Contracts with CustomersAnnual improvements to IFRSs: 2014-2016 Cycle
The Group considers that the only standard that may have any impact is IFRS 9. The new standard will replace existing accounting standards. It is applicable to financial assets and liabilities and will introduce changes to existing accounting concerning classification, measurement and impairment (introducing an expected loss method). The Group considers that whilst IFRS 15 and IFRS 16 may impact on the Group the effect will not be significant. The operating leases held by the Company are of low value and revenue contracts usually contain a single performance criteria that is satisfied at a point in time. The Group will adopt the above standards at the time stipulated by that standard. The Group does not at this time anticipate voluntary early adoption of any of the standards.
Going concern and availability of financeOn 1 February 2016, the Group announced that, with effect from 1 January 2016, the Sao Chico Mine had achieved Commercial Production. The Palito Mine has been in Commercial Production since 1 July 2014.
The Directors anticipate the Group now has access to sufficient funding for its immediate projected needs. The Group expects to have sufficient cash flow from its forecast production to finance its on-going operational requirements, to repay its secured loan facilities and to, at least in part, fund exploration and development activity on its other gold properties. The secured loan facility is repayable by 31 August 2017 and at 31 December 2016, the amount outstanding under this facility was US$1.37 million (2015: US$4.0 million). The Group is currently in negotiations to increase and extend the terms of its loan facilities.
The Directors consider that the Group’s operations are performing at the levels that they anticipate but the Group remains a small scale gold producer with limited cash resources to support any unplanned interruption or reduction in gold production, unforeseen reductions in the gold price or appreciation of the Brazilian currency, all of which could adversely affect the level of free cash flow that the Group can generate on a monthly basis. In the event that the Group is unable to generate sufficient free cash flow to meet its financial obligations as they fall due or to allow it to finance exploration and development activity on its other gold properties, additional sources of finance may be required. Should additional working capital be required the Directors consider that further sources of finance could be secured within the required timescale.
On this basis, the Directors have therefore concluded that it is appropriate to prepare the financial statements on a going concern basis. However, there is no certainty that such additional funds either for working capital or for future development will be forthcoming and these conditions indicate the existence of a material uncertainty which may cast significant doubt over the Group’s ability to continue as a going concern and, therefore, that it may be unable to realise its assets and discharge its liabilities in the normal course of business. The financial statements do not include the adjustments that would result if the Group was unable to continue as a going concern.
FINANCIAL STATEMENTS
Notes to the Financial StatementsFor the year ended 31 December 2016
62 Serabi Gold plc // Report and Accounts 2016
1 Significant accounting policies (continued)(b) Basis of consolidation(i) Subsidiaries and acquisitions The consolidated financial statements incorporate the financial statements of the Company and entities controlled by the Company (its subsidiaries) made up to 31 December each year. Control is recognised where an investor is expected, or has rights, to variable returns from its investment with the investee, and has the ability to affect these returns through its power over the investee. On acquisition, the assets, liabilities and contingent liabilities of a subsidiary are measured at their fair value at the date of acquisition. Any excess of the cost of the acquisition over the fair values of the identifiable net assets acquired is recognised as a “fair value” adjustment. If the cost of the acquisition is less than the fair value of net assets of the subsidiary acquired, the difference is recognised directly in profit or loss.
The results of subsidiaries acquired or disposed of during the year are included in the statement of comprehensive income from the effective date of acquisition or up to the effective date of disposal, as appropriate.
In the Company’s balance sheet, investments in subsidiaries includes the investment in Kenai Resources Limited (“Kenai”) for the nominal value of the shares issued as consideration for the acquisition of that company. As permitted by the Companies Act 2006, no premium was recorded on the issue of such shares. On consolidation, the difference between the nominal value of the shares issued and their fair value was credited directly to the merger reserve, which is included within other reserves.
Where necessary, adjustments are made to the financial statements of subsidiaries to bring the accounting policies into line with those used by the Group.
(ii) Transactions eliminated on consolidationIntra-group balances and any unrealised gains and losses or income and expenses arising from intra-group transactions, are eliminated in preparing the consolidated financial statements.
(c) Foreign currenciesThe Group’s presentational currency is US Dollars and has been selected based on the currency of the primary economic environment in which the Group as a whole operates on the basis that the Group’s primary product is generally traded by reference to its pricing in US Dollars. The functional currency of the Company is also considered to be the US Dollar.
Transactions in currencies other than the functional currency of a company are recorded at a rate of exchange approximating to that prevailing at the date of the transaction. At each balance sheet date, monetary assets and liabilities that are denominated in currencies other than the functional currency are translated at the amounts prevailing at the balance sheet date and any gains or losses arising are recognised in the income statement.
On consolidation, the assets and liabilities of the Group’s overseas operations that do not have a US Dollar functional currency, are translated at exchange rates prevailing at the balance sheet date. Income and expense items are translated at the average exchange rate for the period. Exchange differences arising on the net investment in subsidiaries are recognised in other comprehensive income.
The US Dollar/Sterling exchange rate at 31 December 2016 was 1.2275 (2015: 1.4741). The Brazilian Real/US Dollar exchange rate at 31 December 2016 was 3.2585 (2015: 3.9042).
(d) Property, plant and equipment(i) Owned assetsItems of property, plant and equipment are stated at cost less accumulated depreciation (note 1(d) (iv)) and impairment losses (note 1(h)).
Upon demonstration of the feasibility of commercial production, any past deferred exploration, evaluation and development costs related to that operation are reclassified as Assets in Construction. When commercial production commences these expenditures are then subsequently transferred at cost to Mining Properties. They are stated at cost less amortisation charges and any provision for impairment. Amortisation is calculated over the estimated life of the mineable inventory on a unit of production basis. Future forecast capital expenditure is included in the unit of production depreciation calculation.
(ii) Leased assetsAssets held under leases, which result in the Group bearing risk and receiving benefit of ownership (finance leases), are capitalised as property, plant and equipment at the estimated present value of underlying lease payments.
The corresponding finance lease obligation is included within borrowings. The interest element is allocated to accounting periods during the lease term to reflect a constant rate of interest on the remaining balance of the obligation for each accounting period.
FINANCIAL STATEMENTS
Notes to the Financial Statements continued
Overview
Strategic ReportM
anagement D
iscussion and A
nalysisCom
munity and
Social ResponsibilityCorporate G
overnanceFinancial Statem
ents
63Serabi Gold plc // Report and Accounts 2016
1 Significant accounting policies (continued)(d) Property, plant and equipment (continued)(iii) Subsequent costsCosts relating to maintenance and upkeep of the Group’s assets once such assets have been commissioned and entered into commercial operations, will generally be expensed as incurred. In the event, however, that the costs demonstrably result in extending the original estimated life of such asset or enhances its value, then such expenditure is added to the carrying value of that asset and amortised over its remaining estimated useful life.
(iv) DepreciationDepreciation is charged to profit or loss on a straight-line basis over the estimated useful lives of each part of an item of property, plant and equipment. Land is not depreciated. The estimated useful lives are as follows:
Mining assetsProcessing plant three – seven yearsOther plant and assay equipment two – ten yearsHeavy vehicles eight yearsLight vehicles three yearsLand and buildings ten – twenty yearsMining properties unit of production
Other assetsFurniture and fittings five yearsOffice equipment four yearsCommunication installations five yearsComputers three years
The Group reviews the economic lives at the end of each annual reporting period.
The residual value, if not insignificant, is reassessed annually. Gains and losses on disposal are determined by comparing proceeds with carrying values and are included in profit or loss.
(e) Deferred exploration costsAll costs incurred prior to obtaining the legal right to undertake exploration and evaluation activities on a project are written off as incurred. Subsequent to the legal rights being obtained, all costs related to the exploration of mineral properties are capitalised on a project-by-project basis and deferred until either the properties are demonstrated to be commercially viable (see note 1(d)(i)) or until the properties are sold, allowed to lapse or abandoned, at which time any capitalised costs are written off to the income statement. Costs incurred include appropriate technical and administrative overheads but not general overheads. Deferred exploration costs are carried at cost, less any impairment losses recognised.
At such time as commercial feasibility is established and a development decision is reached, the costs associated with that property will be transferred to and re-categorised as Projects in Construction and upon commercial production being achieved, re-categorised as Mining Property.
Property, plant and equipment used in the Group’s exploration activities are separately reported.
(f ) Trade and other receivablesTrade receivables are not interest-bearing and are stated at nominal value at the balance sheet date.
Other receivables are not interest-bearing and are stated at amortised cost at the balance sheet date.
Receivables in respect of sale of gold/copper concentrate are re-valued using the best estimate of the forecast metal prices for the expected date of settlement (see Revenue policy – note 1(p)).
Trade and other receivables are reviewed for impairment on a regular basis.
(g) Cash and cash equivalentsCash and cash equivalents include cash in hand, deposits held at call with banks, other short term highly liquid investments with original maturities of three months or less and bank overdrafts. Bank overdrafts are shown within interest-bearing liabilities in current liabilities on the balance sheet.
64 Serabi Gold plc // Report and Accounts 2016
1 Significant accounting policies (continued)(h) Impairment At each balance sheet date, the Group reviews the carrying amounts of its property, plant and equipment and intangible assets to determine whether there is any indication that those assets have suffered impairment. Prior to carrying out impairment reviews, the significant cash generating units are assessed to determine whether they should be reviewed under the requirements of IFRS 6 – Exploration for and Evaluation of Mineral Resources or IAS 36 – Impairment of Assets. Such determination is by reference to the stage of development of the project and the level of reliability and surety of information used in calculating value in use or fair value less costs to sell. Impairment reviews performed under IFRS 6 are carried out on a project by project basis, with each project representing a potential single cash generating unit. An impairment review is undertaken when indicators of impairment arise; typically when one of the following circumstances applies:
(i) sufficient data exists that render the resource uneconomic and unlikely to be developed(ii) title to the asset is compromised(iii) budgeted or planned expenditure is not expected in the foreseeable future(iv) insufficient discovery of commercially viable resources leading to the discontinuation of activities
Impairment reviews performed under IAS 36 are carried out when there is an indication that the carrying value may be impaired. Such key indicators (though not exhaustive) to the industry include:
(i) a significant deterioration in the spot price of gold(ii) a significant increase in production costs(iii) a significant revision to, and reduction in, the life of mine plan
If any indication of impairment exists, the recoverable amount of the asset is estimated, being the higher of fair value less costs to sell and value in use. In assessing value in use, the estimated future cash flows are discounted to their present value using a pre-tax discount rate that reflects current market assessments of the time value of money and the risks specific to the asset for which the estimates of future cash flows have not been adjusted.
If the recoverable amount of an asset (or cash-generating unit) is estimated to be less than its carrying amount, the carrying amount of the asset (or cash generating unit) is reduced to its recoverable amount. Such impairment losses are recognised in profit or loss for the year.
Where an impairment loss subsequently reverses, the carrying amount of the asset (or cash-generating unit) is increased to the revised estimate of its recoverable amount, but so that the increased carrying amount does not exceed the carrying amount that would have been determined had no impairment loss been recognised for the asset (or cash-generating unit) in prior years. A reversal of an impairment loss is recognised in profit or loss for the year.
(i) Share capital and share premiumThe Company’s ordinary shares are classified as equity.
Called up share capital is recorded at par value of 0.5 pence per ordinary share.
Monies raised from the issue of shares in excess of par value are recorded as share premium. Costs associated with the raising of capital are netted off this amount.
(j) BorrowingsBorrowings are initially recognised at fair value, net of transaction costs incurred. Borrowings are subsequently stated at amortised cost with any difference between the proceeds (net of transaction costs) and the redemption value recognised in profit or loss over the period of the borrowings using the effective interest rate method.
Where the Group secures borrowings which include any rights of conversion into equity, the fair value of such conversion rights is estimated and reported as a financing cost. In the event that the conversion rights are not exercised this financing costs will reversed as a movement in reserves.
Interest on borrowings used specifically to fund the acquisition of non-current assets is capitalised as part of the acquisition cost of the asset otherwise borrowing costs are expensed as incurred. Borrowing costs comprise interest and other costs that the Group incurs in connection with the borrowing of finance.
FINANCIAL STATEMENTS
Notes to the Financial Statements continued
Overview
Strategic ReportM
anagement D
iscussion and A
nalysisCom
munity and
Social ResponsibilityCorporate G
overnanceFinancial Statem
ents
65Serabi Gold plc // Report and Accounts 2016
1 Significant accounting policies (continued)(k) Employee benefits(i) Share-based payment transactions and share optionsThe Group issues share-based payments including share options to certain employees, which are measured at fair value at date of grant. The fair value determined at the grant date is expensed on a graded vesting basis over the vesting period, based on the Group’s estimate of shares that will eventually vest. The Black-Scholes method is used to calculate fair value. The expected life of the instrument used in the model is adjusted, based on management’s best estimate, for the effects of non-transferability, exercise restrictions and behavioural considerations.
The entity measures the fair value of the services received by reference to the fair value of the equity instruments granted, because typically it is not possible to estimate reliably the fair value of the services received. The fair value is measured at the date of grant. Where the equity instruments granted do not vest immediately but after a specified number of years, the fair value is accounted for over the vesting period.
(ii) Pension costsThe Group does not operate any pension plan for its employees although it does make contributions to employee pension plans in accordance with instructions from those employees. The Company has no contractual commitment as to the ability of those funds to provide any minimum level of future benefit to the individual and is contracted only to make the contributions. Company contributions to such schemes are charged against profit as they fall due.
(l) Provisions, contingent liabilities and contingent assetsProvisions are recognised when:
(i) the Group has a present legal or constructive obligation as a result of past events;(ii) it is more likely than not that an outflow of resources will be required to settle the obligation; and(iii) the amount can be reliably estimated.
(m) Restoration, rehabilitation and environmental costsProvision for environmental remediation and decommissioning of the Group’s mining and exploration facilities has been estimated using current prices which are inflated and then discounted for the time value of money. While the provision has been based on the best estimates of future costs and economic life, there is uncertainty regarding the amount and timing of these costs.
(n) Trade and other payablesTrade and other payables that are not interest-bearing are stated at amortised cost. Any interest charges or late payment penalties are recognised only when agreed with the supplying party or it considered probable that they will be levied.
(o) InventoriesInventories are stated at the lower of cost and net realisable value. Materials that are no longer considered as likely to be used by the Group, or their value is unlikely to be readily realised through a sale to a third party, are provided for.
Materials held for consumption within operations are valued based on purchase price or, when manufactured internally, at cost. Costs are allocated on an average basis and include direct material, labour, related transportation costs and an appropriate allocation of overhead costs.
Gold bullion, copper/gold concentrate, run of mine ore and any other production inventories are valued at the lower of cost and net realisable value. Dependent on the current stage of any product inventory in the process cycle, cost will reflect, as appropriate, mining, processing, transport and labour costs, as well as an allocation of mine services overheads required to bring the product to its current state.
Net realisable value is the estimated selling price in the ordinary course of business, after deducting any costs to completion and any applicable marketing, selling, shipping and other distribution expenses.
66 Serabi Gold plc // Report and Accounts 2016
1 Significant accounting policies (continued)(p) RevenueRevenue represents amounts receivable in respect of sales of gold and by-products. Revenue represents only sales for which contracts have been agreed and for which the product has been delivered to the purchaser in the manner set out in the contract. Revenue is stated net of any applicable sales taxes. All revenue is derived from the sales of copper/gold concentrates produced by the Palito Mine and gold bullion produced from both the Palito Mine and the Sao Chico Mine.
Revenue from the sale of goods is recognised when the risks and rewards of ownership have been transferred to the buyer. Revenues are recognised in full using prices ruling at the date of sale with adjustments in respect of final sales prices being recognised in the month that such adjustment is agreed. Fair value adjustments for gold prices in respect of any sale for which final pricing has not been agreed at any balance sheet date is accounted for using the best estimates of forecast prices for the expected date of settlement. Any unsold production and in particular concentrate, is held as inventory and valued at the lower of production cost and net realisable value until sold.
In the case of the sales of copper/gold concentrates, revenue is recognised when in accordance with the terms of the contract the product arrives at the port of delivery. In the case of gold bullion revenue is recognised at the time that gold is delivered to the end purchaser.
No revenue is recognised if there are significant uncertainties regarding recovery of the consideration due.
All sales revenue from incidental production arising during the exploration, evaluation, development and commissioning of a mineral resource prior to commercial production, are taken as a contribution towards previously incurred costs and offset against the related asset accordingly.
Interest income is recognised on a time-proportion basis using the effective interest rate method.
(q) Expenses(i) Operating lease paymentsPayments made under operating leases are recognised in profit or loss on a straight-line basis over the term of the lease.
(ii) Finance lease paymentsLease payments are apportioned between the finance charge and the reduction of the outstanding liability. The finance charge is allocated to each period during the lease term so as to produce a constant periodic rate of interest on the remaining balance of the liability.
(iii) Financing expensesFinancing expenses comprise interest payable on borrowings calculated using the effective interest rate method and interest receivable on funds invested. It also includes charges arising on the unwinding of discount factors relating to the provisions for future charges.
(r) TaxationIncome tax on the profit or loss for the year comprises current and deferred tax. Current tax is the expected tax payable on the taxable income for the year, using tax rates enacted or substantively enacted at the year end and any adjustments in respect of prior years.
Deferred tax is the tax expected to be payable or recoverable on differences between the carrying amounts of assets and liabilities in the financial statements and the corresponding tax bases used in the computation of taxable profit and is accounted for using the balance sheet method. Deferred tax is not recognised for the following temporary differences: the initial recognition of assets or liabilities in a transaction that is not a business combination and that affects neither accounting nor taxable profit, and differences relating to investments in subsidiaries to the extent that it is probable that they will not reverse in the foreseeable future. Deferred tax is measured at the tax rates that are expected to be applied to the temporary differences when they reverse, based on the laws that have been enacted or substantively enacted by the reporting date.
Deferred tax assets are only recognised to the extent that it is probable that future taxable profit will be available against which the asset can be utilised. Deferred tax assets and liabilities are offset if there is a legally enforceable right to offset current tax liabilities and assets and they relate to income taxes levied by the same tax authority on the same taxable entity, or on different tax entities, but they intend to settle current tax liabilities and assets on a net basis or their tax assets and liabilities will be realised simultaneously.
(s) Segmental reportingAn operating segment is a component of the Group engaged in exploration or production activity that is regularly reviewed by the Chief Operating Decision Maker (“CODM”) for the purposes of allocating resources and assessing financial performance. The CODM is considered to be the Board of Directors. The Group has only one primary business activity namely the conduct of gold mining and exploration in Brazil. For management purposes, however, the Group recognises two separate segments, Brazil and UK. Copper/gold concentrate is produced in Brazil and sales routed through the UK, whilst sales of gold bullion are conducted directly from Brazil. The operating segments are reported in a manner consistent with the internal reporting provided to the CODM.
The Group does not report geographic segments by location of customer as its business is the production of gold which is traded as a commodity on a worldwide basis. Sales are ultimately made into the bullion market, where the location of the ultimate customer is unknown.
FINANCIAL STATEMENTS
Notes to the Financial Statements continued
Overview
Strategic ReportM
anagement D
iscussion and A
nalysisCom
munity and
Social ResponsibilityCorporate G
overnanceFinancial Statem
ents
67Serabi Gold plc // Report and Accounts 2016
1 Significant accounting policies (continued)(t) Investments in subsidiariesInvestments in subsidiaries are recognised at cost, less any provision for impairment.
(u) Financial instruments Financial instrumentsFinancial assets and financial liabilities are recognised on the Company’s and Group’s balance sheet when the Company and Group has become a party to the contractual provisions of the instrument and are initially measured at fair value, except for financial assets at fair value through profit or loss, which are initially measured at fair value, excluding transaction costs.
Financial liabilities and equityFinancial liabilities and equity instruments are classified according to the substance of the contractual arrangements entered into. An equity instrument is any contract that evidences a residual interest in the assets of the Group after deducting all of its liabilities. Financial liabilities include bank loans and overdrafts which are recognised initially at fair value less attributable transaction costs. Subsequent to initial recognition, interest-bearing borrowings are stated at amortised cost with any difference between cost and redemption value being recognised in the statement of comprehensive income over the period of the borrowings on an effective interest basis.
Financial assets and liabilities at fair value through profit and lossFinancial assets and liabilities at fair value through profit and loss comprise derivative financial instruments. Subsequent to initial recognition financial assets at fair value through profit and loss are stated at fair value. Movements in fair values are recognised in profit or loss, unless they relate to derivatives designated and effective as hedging instruments, in which event, the timing of the recognition in profit or loss depends on the nature of the hedging relationship.
De-recognition of financial assetsDe-recognition of financial assets occurs when the rights to receive cash flows from the investments expire or are transferred and substantially all of the risks and rewards of ownership have been transferred. An assessment for impairment is undertaken at least annually at each balance sheet date whether or not there is objective evidence that a financial asset or a group of financial assets is impaired.
(v) LeasesFinance leases are recognised as those leases that transfer substantially all the risks and rewards of ownership. Assets held under finance leases are capitalised and the outstanding future lease obligations are shown in liabilities at the fair value of the lease, or if lower at the present value of the lease payments. They are depreciated over the term of the lease or their useful economic lives, whichever is the shorter. The interest element (finance charge) of lease payments is charged to the income statement on a constant basis over the period of the lease.
All other leases are regarded as operating leases and the payments made under them are charged to the income statement in the period on a straight-line basis. The Company does not act as a lessor.
(w) Derivatives Derivatives are valued by reference to available market data. Any change in the value of the derivative is recognised in the statement of comprehensive income in the period in which it occurs.
(x) Critical accounting estimates and judgementsThe preparation of financial statements requires management to make judgements and assumptions about the future in the use of accounting estimates. These are based on management’s best knowledge of the relevant facts and circumstances. However, these judgements and estimates regarding the future are a source of uncertainty and actual results may differ from the amounts included in the financial statements and adjustment will consequently be necessary. Estimates are continually evaluated, based on experience and reasonable expectations of future events.
Accounting estimates are applied in assessing and determining the carrying values of significant assets and liabilities.
The estimates and underlying assumptions are reviewed on an on-going basis. Revisions to accounting estimates are recognised in the period in which the estimate is revised if the revision affects only that period or in the period of the revision and future periods if the revision affects both current and future periods.
The following are the critical judgements that management has made in the process of applying the entity’s accounting policies and that have the most significant effect on the amounts recognised in financial statements.
68 Serabi Gold plc // Report and Accounts 2016
FINANCIAL STATEMENTS
Notes to the Financial Statements continued
1 Significant accounting policies (continued)(x) Critical accounting estimates and judgements (continued)Impairment of mining assets and other property, plant and equipmentDetermining whether mining assets are impaired requires an estimation of the value in use of the cash-generating units (“CGU’s”). The value in use calculation requires the entity to estimate the future cash flows expected to arise from a CGU and a suitable discount rate in order to calculate present value. A CGU is a group of assets that generates cash inflows from continuing use. Given their interdependences and physical proximity, the Palito and Sao Chico Mines are considered to be a single CGU.
As described in note 1(d) (iv), the Group reviews the estimated useful lives of property, plant and equipment at the end of each annual reporting period. Further disclosure is provided in note 19 regarding the key assumptions made in assessing the value in use.
Provisions and contingent liabilitiesThe Group reviews estimates of provisions for potential liabilities at the end of each reporting period where applicable taking into account the circumstances of the potential liability, the availability and confidence of information used to calculate the potential liability and where applicable, past history regarding the actual liability incurred in similar situations.
Mineral resourcesQuantification of mineral resources requires a judgement on the reasonable prospects for eventual economic extraction. These judgements are based on assessments made in accordance with the provisions of Canadian National instrument 43-101. These factors are a source of uncertainty and changes could result in an increase or decrease in mineral resources and changes to the categorisation or mineral resources between Ore Reserves, Measured and Indicated Resources and Inferred Resources. This would, in turn, affect certain amounts in the financial statements such as depreciation and closure provisions, which are calculated on projected life of mine figures, and carrying values of mining property and plant which are tested for impairment by reference to future cash flows based on projected life of mine figures.
Recoverability of deferred exploration expenditureThe recoverability of exploration expenditure capitalised within intangible assets is assessed based on a judgement about the feasibility of the project and estimates of its future cash flows. Future gold prices, operating costs, capital expenditure and production are sources of estimation uncertainty. The Group periodically makes judgements as to whether its deferred exploration expenditure may have been impaired, based on internal and external indicators. Any impairment is based on a variety of estimates and opinions and may include estimates of future cash flows. In particular, the Group recognises that, if it decides, or is compelled due to insufficient funding, to withdraw from exploration activity at a project, then the Company would need to assess whether an impairment is necessary based on the likely sale value of the property.
Inventory valuationValuations of gold in stockpiles and in circuit, require estimations of the amount of gold contained in, and recovery rates from, the various work in progress. These estimations are based on analysis of samples and prior experience. A judgement is also required about when stockpiles will be used and what gold price should be applied in calculating net realisable value; these are both sources of uncertainty.
Utilisation of historic tax losses and recognition of deferred tax assetsThe recognition of deferred tax assets is based upon whether sufficient and suitable taxable profits will be available in the future against which the reversal of temporary differences can be deducted. Recognition of deferred tax assets therefore involves judgement regarding the future financial performance of the particular legal entity or tax group in which the deferred tax asset has been recognised. Where the temporary differences are related to losses, relevant tax law is considered to determine the availability of the losses to offset against the future taxable profits.
The amounts recognised in the consolidated financial statements in are derived from the Group’s best estimation and judgement as set out in note 5.
Restoration, rehabilitation and environmental provisionsSuch provisions require a judgement on likely future obligations, based on assessment of technical, legal and economic factors. The ultimate cost of environmental remediation is uncertain and cost estimates can vary in response to many factors including the timing of expenditure, the discount rate, inflation rate and foreign exchange rate used in calculating the current value of future expenditures and the projected scale of disturbance that is anticipated at the end of the project life.
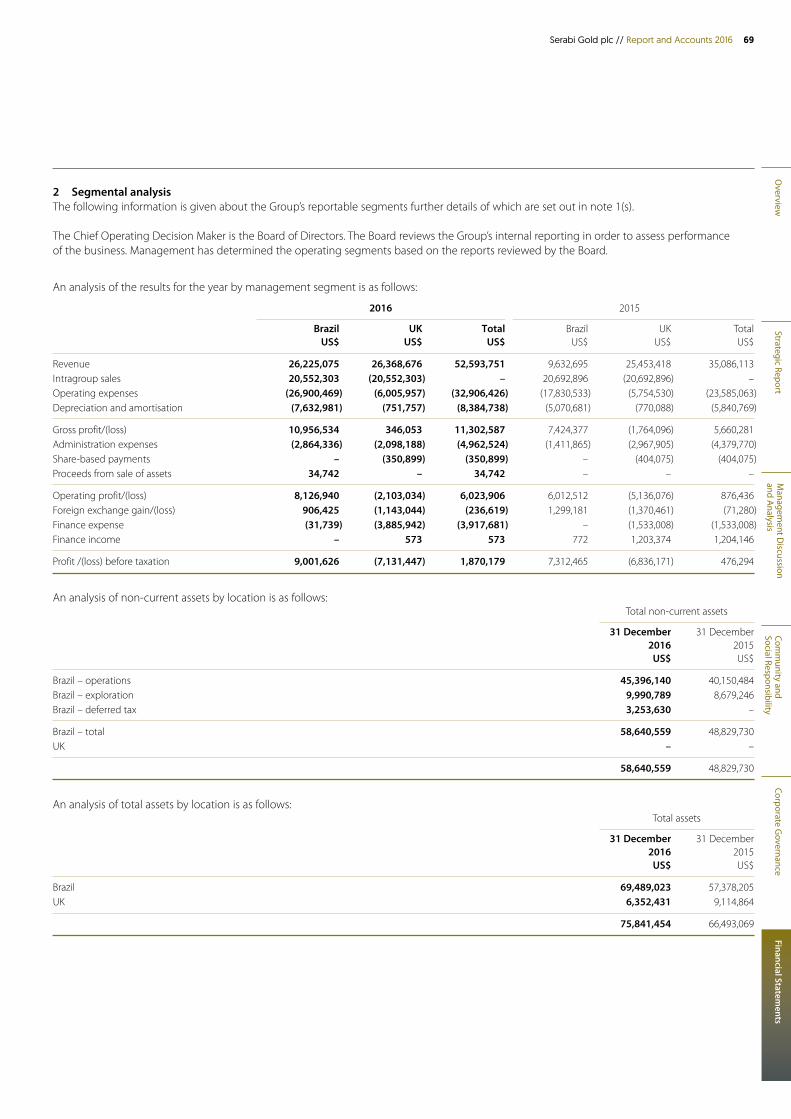
Overview
Strategic ReportM
anagement D
iscussion and A
nalysisCom
munity and
Social ResponsibilityCorporate G
overnanceFinancial Statem
ents
69Serabi Gold plc // Report and Accounts 2016
2 Segmental analysisThe following information is given about the Group’s reportable segments further details of which are set out in note 1(s).
The Chief Operating Decision Maker is the Board of Directors. The Board reviews the Group’s internal reporting in order to assess performance of the business. Management has determined the operating segments based on the reports reviewed by the Board.
An analysis of the results for the year by management segment is as follows:
2016 2015
Brazil UK Total Brazil UK Total US$ US$ US$ US$ US$ US$
Revenue 26,225,075 26,368,676 52,593,751 9,632,695 25,453,418 35,086,113Intragroup sales 20,552,303 (20,552,303) – 20,692,896 (20,692,896) –Operating expenses (26,900,469) (6,005,957) (32,906,426) (17,830,533) (5,754,530) (23,585,063)Depreciation and amortisation (7,632,981) (751,757) (8,384,738) (5,070,681) (770,088) (5,840,769)
Gross profit/(loss) 10,956,534 346,053 11,302,587 7,424,377 (1,764,096) 5,660,281Administration expenses (2,864,336) (2,098,188) (4,962,524) (1,411,865) (2,967,905) (4,379,770)Share-based payments – (350,899) (350,899) – (404,075) (404,075)Proceeds from sale of assets 34,742 – 34,742 – – –
Operating profit/(loss) 8,126,940 (2,103,034) 6,023,906 6,012,512 (5,136,076) 876,436Foreign exchange gain/(loss) 906,425 (1,143,044) (236,619) 1,299,181 (1,370,461) (71,280)Finance expense (31,739) (3,885,942) (3,917,681) – (1,533,008) (1,533,008)Finance income – 573 573 772 1,203,374 1,204,146
Profit /(loss) before taxation 9,001,626 (7,131,447) 1,870,179 7,312,465 (6,836,171) 476,294
An analysis of non-current assets by location is as follows:Total non-current assets
31 December 31 December 2016 2015 US$ US$
Brazil – operations 45,396,140 40,150,484Brazil – exploration 9,990,789 8,679,246Brazil – deferred tax 3,253,630 –
Brazil – total 58,640,559 48,829,730UK – –
58,640,559 48,829,730
An analysis of total assets by location is as follows:Total assets
31 December 31 December 2016 2015 US$ US$
Brazil 69,489,023 57,378,205UK 6,352,431 9,114,864
75,841,454 66,493,069
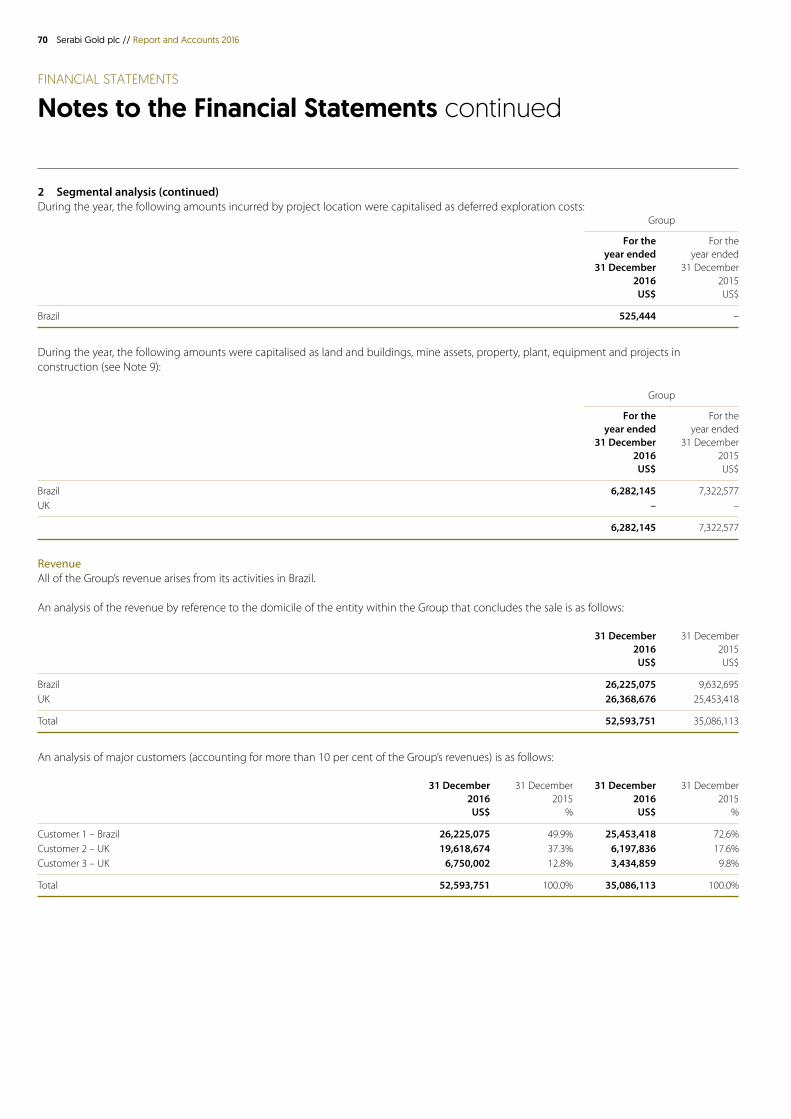
70 Serabi Gold plc // Report and Accounts 2016
FINANCIAL STATEMENTS
Notes to the Financial Statements continued
2 Segmental analysis (continued)During the year, the following amounts incurred by project location were capitalised as deferred exploration costs:
Group
For the For the year ended year ended 31 December 31 December 2016 2015 US$ US$
Brazil 525,444 –
During the year, the following amounts were capitalised as land and buildings, mine assets, property, plant, equipment and projects in construction (see Note 9):
Group
For the For the year ended year ended 31 December 31 December 2016 2015 US$ US$
Brazil 6,282,145 7,322,577UK – –
6,282,145 7,322,577
RevenueAll of the Group’s revenue arises from its activities in Brazil.
An analysis of the revenue by reference to the domicile of the entity within the Group that concludes the sale is as follows:
31 December 31 December 2016 2015 US$ US$
Brazil 26,225,075 9,632,695UK 26,368,676 25,453,418
Total 52,593,751 35,086,113
An analysis of major customers (accounting for more than 10 per cent of the Group’s revenues) is as follows:
31 December 31 December 31 December 31 December 2016 2015 2016 2015 US$ % US$ %
Customer 1 – Brazil 26,225,075 49.9% 25,453,418 72.6%Customer 2 – UK 19,618,674 37.3% 6,197,836 17.6%Customer 3 – UK 6,750,002 12.8% 3,434,859 9.8%
Total 52,593,751 100.0% 35,086,113 100.0%
Overview
Strategic ReportM
anagement D
iscussion and A
nalysisCom
munity and
Social ResponsibilityCorporate G
overnanceFinancial Statem
ents
71Serabi Gold plc // Report and Accounts 2016
3 Operating profita. Group operating profit/(loss) for the year is stated after charging the following:
Group
For the For the year ended year ended 31 December 31 December 2016 2015 US$ US$
Staff costs 11,995,399 8,719,740Depreciation (property, plant and equipment) 2,075,898 298,716Amortisation of the mine asset 6,308,840 4,540,432Operating lease charges 172,497 147,755
b. Auditor’s remunerationGroup
For the For the year ended year ended 31 December 31 December 2016 2015 US$ US$
Fees payable to the Group’s auditor for the audit of the Group’s annual financial statements 108,020 124,445Fees payable to the Group’s auditor and its associates for other services: audit of the Group’s subsidiaries pursuant to legislation 32,926 28,858 tax compliance services 10,358 2,743 audit-related assurance services 3,312 9,994
4 Finance expense and income Group
For the For the year ended year ended 31 December 31 December 2016 2015 US$ US$
Interest on trade financing loan (256,898) (364,656)Finance cost on secured loan facility (672,331) (526,500)Interest payable on secured loan facility (281,333) (586,667)Interest payable on finance leases (36,194) (32,388)Interest payable on convertible loan (137,049) –Fair value provision on convertible loan(1) (1,195,450) –Expense from gold hedging activities (1,338,426) –Other finance-related expenses – (22,797)
Interest payable and expense on financial instruments (3,917,681) (1,533,008)
Release of fair value for call options granted – 196,330Release of fair value for warrants issued(2) – 332,173Income from gold hedging activities – 674,520
Gains on financial instruments – 1,203,023
Finance income on short term deposits 573 1,123
Net finance expense (3,917,108) (328,862)
(1) The fair value provision relates to the implied value of the equity conversion right included as part of the loan terms. The value was estimated at the date of drawdown and updated until the date of exercise to reflect the price of the Group’s ordinary shares and the remaining period during which the conversion rights may be exercised.
(2) The release of fair value for warrants issued in 2015 relates to 100,000,000 warrants to subscribe for new ordinary shares issued by the Company on 3 March 2014. The Company accounted for the issue of these warrants in accordance with IAS32 and recorded a liability of US$1.68 million at the date of issue. As at 31 December 2015 the fair value of these warrants was assessed to be US$nil and the reduction in fair value was recognised through the income statement. The warrants expired on 2 March 2016 with none having been exercised.

72 Serabi Gold plc // Report and Accounts 2016
FINANCIAL STATEMENTS
Notes to the Financial Statements continued
5 Taxation Group
For the For the year ended year ended 31 December 31 December 2016 2015 US$ US$
Current tax UK tax – –Foreign tax 484,960 525,032
Total current tax 484,960 525,032
Deferred tax Initial recognition of deferred tax asset (3,045,073) –
Total deferred tax (3,045,073) –
Income tax (benefit)/expense (2,560,113) 525,032
The tax provision for the current period varies from the standard rate of corporation tax in the UK of 20.00% (2015: 20.25%). The differences are explained as follows:
Group
For the For the year ended year ended 31 December 31 December 2016 2015 US$ US$
Profit/(loss) on ordinary activities before tax 1,870,179 476,294
Tax thereon at UK corporate tax rate of 20.00% (2015: 20.25%) 374,036 96,449Factors affecting the tax charge: expenses not deductible for tax purposes 738,888 159,617 timing differences (not recognised) (474,206) (233,161) income not taxable (341,248) (52,420) lower rate tax overseas (389,908) (370,305) unrecognised tax losses carried forward 577,398 924,852 recognised tax losses carried forward (3,045,073) –
Tax (benefit)/charge (2,560,113) 525,032
Gross deferred tax position US$ US$
Tax losses brought forward 53,413,057 53,527,355Timing differences brought forward (348,248) (1,738,086)Tax losses recognised in the period (19,967,689) –Tax losses not recognised in the period 6,400,226 9,089,550Prior year tax losses used in the period (1,983,222) –Movement in timing differences 863,981 1,389,838Exchange 2,085,696 (9,203,848)
Tax losses carried forward 39,948,068 53,413,057Timing differences carried forward 515,733 (348,248)
40,463,801 53,064,809
Overview
Strategic ReportM
anagement D
iscussion and A
nalysisCom
munity and
Social ResponsibilityCorporate G
overnanceFinancial Statem
ents
73Serabi Gold plc // Report and Accounts 2016
5 Taxation (continued)Group
For the For the year ended year ended 31 December 31 December 2016 2015 Unrecognised deferred tax asset US$ US$
Tax losses 8,443,659 10,059,038Timing differences 78,649 (53,108)
Total unrecognised deferred tax asset 8,522,308 10,005,930 Recognised deferred tax asset US$ US$
Tax losses 3,045,073 –Exchange 208,287 –
Net recognised deferred tax asset 3,253,630 –
The deferred tax asset has been recognised in the financial statements only to the extent that the Group has reasonable certainty as the level and timing of future profits that might be generated and against which this asset may be recovered.
6 Employee informationThe average number of persons, including Executive Directors, employed by the Group during the year was:
Group Company
For the For the For the For the year ended year ended year ended year ended 31 December 31 December 31 December 31 December 2016 2015 2016 2015 Number Number Number Number
Management and corporate administration 19 17 3 3Exploration 10 – – –Mine operations and maintenance 259 139 – –Mine management and administration 14 14 – –Plant and processing 62 57 – –
Total 364 227 3 3
Group Company
For the For the For the For the year ended year ended year ended year ended 31 December 31 December 31 December 31 December 2016 2015 2016 2015 US$ US$ US$ US$
Staff costs Wages and salaries 8,984,427 6,525,020 2,434,263 2,309,425Cost of incentive scheme shares and Director shares vested 350,899 359,652 350,899 359,652Social security costs 2,509,463 1,621,644 101,350 105,855Termination costs 25,212 58,646 – –Pension contributions 125,398 154,779 125,398 154,779
Total 11,995,399 8,719,740 3,011,910 2,929,711
No company within the Group operates a pension plan for the Directors or the employees. For those Executive Directors and employees who have an entitlement to pension provision, the premiums are paid directly to the personal pension plans selected by the individuals. The Company’s obligation is limited to making fixed payments to these individual plans.
Serabi Mineração SA and Gold Aura do Brasil Mineração Ltda contribute via social security payments to the state pension scheme which operates in Brazil and to which all its employees are entitled.
74 Serabi Gold plc // Report and Accounts 2016
FINANCIAL STATEMENTS
Notes to the Financial Statements continued
6 Employee information (continued)Directors’ remunerationThe compensation of the Directors is: For the For the year ended year ended 31 December 31 December 2016 2015 US$ US$
Salary and other benefits 961,966 1,114,323Post-employment benefits 11,298 154,779
Total 973,264 1,269,102
The remuneration of the highest paid Director during the year was US$479,917 (2015: US$608,423). The Company made cash contributions to his money purchase pension scheme of US$11,298 (2015: US$93,643).
During the year ended 31 December 2016, two of the Directors (2015: two) were entitled to accrue retirement benefits under money purchase schemes.
7 Earnings per share For the For the year ended year ended 31 December 31 December 2016 2015
Profit/(loss) attributable to ordinary shareholders (US$) 4,430,292 (48,738)
Weighted average ordinary shares in issue 672,502,757 656,389,204Basic profit/(loss) per share (US cents) 0.659 (0.01)
Diluted ordinary shares in issue 722,412,757(1) 656,389,204Diluted profit /(loss) per share (US cents) 0.613 (0.01)(2)
(1) Assumes exercise of all options and warrants outstanding as of that date.(2) As the effect of dilution is to reduce the loss per share, the diluted loss per share is considered to be the same as the basic loss per share.
Details of share options that could potentially dilute earnings per share in future periods are set out in note 18.
8 Intangible assets Deferred exploration costs Group Company
31 December 31 December 31 December 31 December 2016 2015 2016 2015 US$ US$ US$ US$
Cost Opening balance 8,679,246 11,799,271 2,040,437 2,040,437Exploration and evaluation expenditure 525,444 – – –Transfer to mining property and projects in construction (558,895) – (472,072) –Foreign exchange movements 1,344,994 (3,120,035) – –
Total as at end of period 9,990,789 8,679,236 1,568,365 2,040,437
The value of these assets is dependent on the development of mineral deposits.
Past exploration and evaluation expenditures for a project are transferred to mining property and projects in construction at the commencement of the mine and process plant construction activities for that project.
Overview
Strategic ReportM
anagement D
iscussion and A
nalysisCom
munity and
Social ResponsibilityCorporate G
overnanceFinancial Statem
ents
75Serabi Gold plc // Report and Accounts 2016
9 Tangible assetsProperty, plant and equipment – Group Land and Mining Projects in Plant and buildings property construction equipment – at cost – at cost – at cost – at cost Total 2016 US$ US$ US$ US$ US$
CostBalance at 31 December 2015 2,484,679 28,574,370 11,230,262 12,650,974 54,940,285Additions – 2,366,486 (117,402) 4,033,061 6,282,145Transfers – 9,366,554 (9,366,554) – –Transferred from deferred exploration costs – 558,895 – – 558,895Write-offs – – – (23,490) (23,490)Foreign exchange movements 492,361 5,660,878 1,082,027 2,244,267 9,479,533
At 31 December 2016 2,977,040 46,527,183 2,828,333 18,904,812 71,237,368
Depreciation Balance at 31 December 2015 (1,239,727) (7,099,764) – (6,450,310) (14,789,801)Charge for period (37,751) (6,107,837) – (2,037,080) (8,182,668)Foreign exchange movements (372,257) (1,529,724) – (966,778) (2,868,759)
At 31 December 2016 (1,649,735) (14,737,325) – (9,454,168) (25,841,228)
Net book value at 31 December 2016 1,327,305 31,789,858 2,828,333 9,450,644 45,396,140
Net book value at 31 December 2015 1,244,952 21,474,606 11,230,262 6,200,664 40,150,484
Additions during the period include US$1,127,688 in respect of plant and equipment purchased by finance lease (2015: US$574,789). The net book value of assets acquired under finance leases at 31 December 2016 was US$2,694,735 (2015: US$1,970,312). Depreciation charged on leased assets for the period was US$650,667 (2015:US$487,519).
In 2009 the Company established an impairment provision against the carrying value of the Palito Mine. The Company has undertaken an impairment review at the end of each of 2016 and 2015 and has also determined that Palito and Sao Chico form a single cash generating unit (“the Palito/Sao Chico CGU”) given their close proximity and sharing of common services and processing facilities.
The 2016 impairment review has also indicated that the carrying value ascribed to the Palito/Sao Chico CGU remains below the value in use calculation and therefore the Board has determined that no impairment provision is required. Further details regarding the impairment review undertaken by the Group, are set out in note 19.
Land and Mining Projects in Plant and buildings property construction equipment – at cost – at cost – at cost – at cost Total 2015 US$ US$ US$ US$ US$
Cost Balance at 31 December 2014 3,579,379 38,106,946 13,166,324 12,970,637 67,823,286Additions 58,597 1,769,141 2,025,613 3,469,226 7,322,577Foreign exchange movements (1,153,297) (11,301,717) (3,961,675) (3,788,889) (20,205,578)
At 31 December 2015 2,484,679 28,574,370 11,230,262 12,650,974 54,940,285
Depreciation Balance at 31 December 2014 (2,074,684) (4,525,753) – (7,118,951) (13,719,388)Charge for period (33,604) (4,405,385) – (1,159,504) (5,598,493)Foreign exchange movements 868,561 1,831,374 – 1,828,145 4,528,080
At 31 December 2015 (1,239,727) (7,099,764) – (6,450,310) (14,789,801)
Net book value at 31 December 2015 1,244,952 21,474,606 11,230,262 6,200,664 40,150,484
Net book value at 31 December 2014 1,504,695 33,581,193 13,166,324 5,851,686 54,103,898
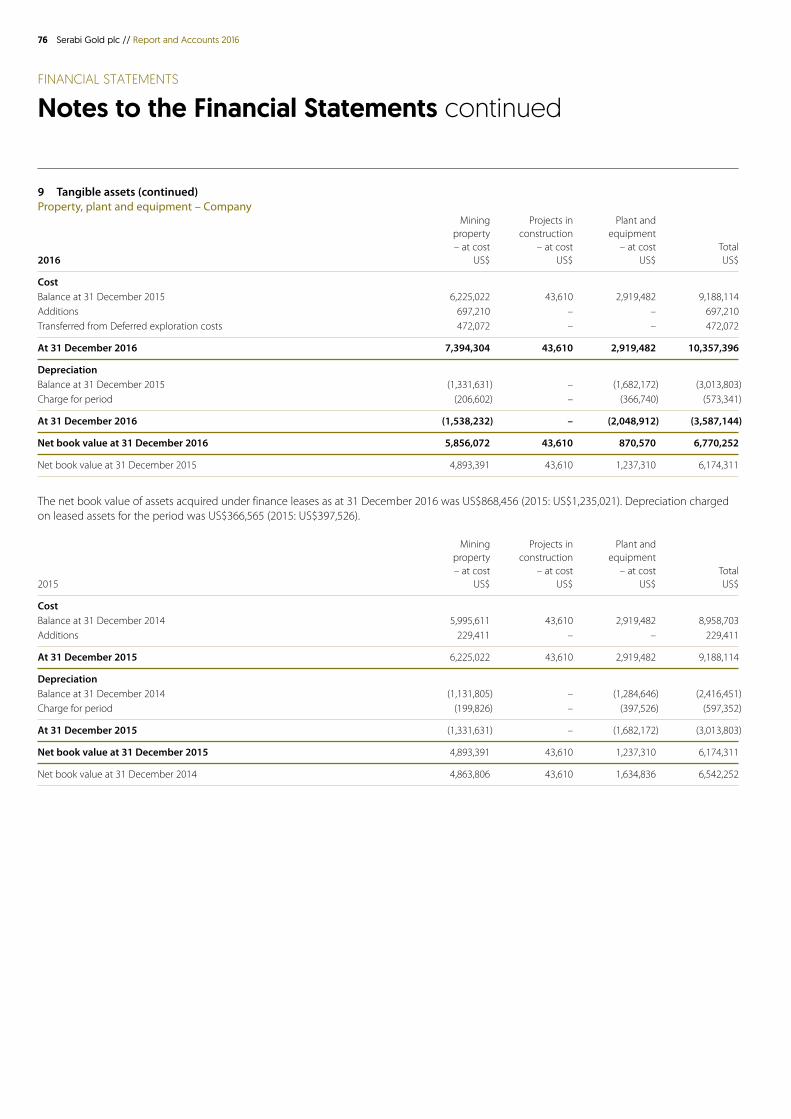
76 Serabi Gold plc // Report and Accounts 2016
FINANCIAL STATEMENTS
Notes to the Financial Statements continued
9 Tangible assets (continued)Property, plant and equipment – Company Mining Projects in Plant and property construction equipment – at cost – at cost – at cost Total 2016 US$ US$ US$ US$
Cost Balance at 31 December 2015 6,225,022 43,610 2,919,482 9,188,114Additions 697,210 – – 697,210Transferred from Deferred exploration costs 472,072 – – 472,072
At 31 December 2016 7,394,304 43,610 2,919,482 10,357,396
Depreciation Balance at 31 December 2015 (1,331,631) – (1,682,172) (3,013,803)Charge for period (206,602) – (366,740) (573,341)
At 31 December 2016 (1,538,232) – (2,048,912) (3,587,144)
Net book value at 31 December 2016 5,856,072 43,610 870,570 6,770,252
Net book value at 31 December 2015 4,893,391 43,610 1,237,310 6,174,311
The net book value of assets acquired under finance leases as at 31 December 2016 was US$868,456 (2015: US$1,235,021). Depreciation charged on leased assets for the period was US$366,565 (2015: US$397,526).
Mining Projects in Plant and property construction equipment – at cost – at cost – at cost Total 2015 US$ US$ US$ US$
Cost Balance at 31 December 2014 5,995,611 43,610 2,919,482 8,958,703Additions 229,411 – – 229,411
At 31 December 2015 6,225,022 43,610 2,919,482 9,188,114
Depreciation Balance at 31 December 2014 (1,131,805) – (1,284,646) (2,416,451)Charge for period (199,826) – (397,526) (597,352)
At 31 December 2015 (1,331,631) – (1,682,172) (3,013,803)
Net book value at 31 December 2015 4,893,391 43,610 1,237,310 6,174,311
Net book value at 31 December 2014 4,863,806 43,610 1,634,836 6,542,252
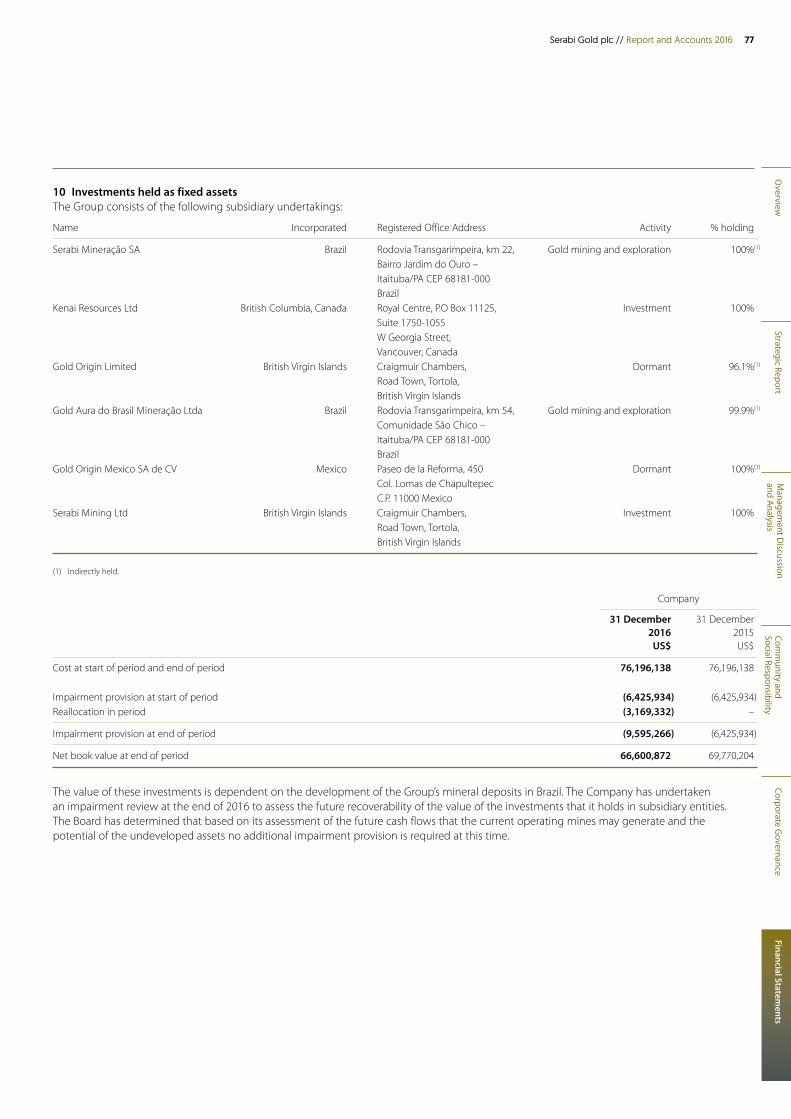
Overview
Strategic ReportM
anagement D
iscussion and A
nalysisCom
munity and
Social ResponsibilityCorporate G
overnanceFinancial Statem
ents
77Serabi Gold plc // Report and Accounts 2016
10 Investments held as fixed assetsThe Group consists of the following subsidiary undertakings:
Name Incorporated Registered Office Address Activity % holding
Serabi Mineraçăo SA Brazil Rodovia Transgarimpeira, km 22, Gold mining and exploration 100%(1)
Bairro Jardim do Ouro – Itaituba/PA CEP 68181-000 Brazil Kenai Resources Ltd British Columbia, Canada Royal Centre, P.O Box 11125, Investment 100% Suite 1750-1055 W Georgia Street, Vancouver, Canada Gold Origin Limited British Virgin Islands Craigmuir Chambers, Dormant 96.1%(1)
Road Town, Tortola, British Virgin Islands Gold Aura do Brasil Mineraçăo Ltda Brazil Rodovia Transgarimpeira, km 54, Gold mining and exploration 99.9%(1)
Comunidade São Chico – Itaituba/PA CEP 68181-000 Brazil Gold Origin Mexico SA de CV Mexico Paseo de la Reforma, 450 Dormant 100%(1)
Col. Lomas de Chapultepec C.P. 11000 Mexico Serabi Mining Ltd British Virgin Islands Craigmuir Chambers, Investment 100% Road Town, Tortola, British Virgin Islands
(1) Indirectly held.
Company
31 December 31 December 2016 2015 US$ US$
Cost at start of period and end of period 76,196,138 76,196,138
Impairment provision at start of period (6,425,934) (6,425,934)Reallocation in period (3,169,332) –
Impairment provision at end of period (9,595,266) (6,425,934)
Net book value at end of period 66,600,872 69,770,204
The value of these investments is dependent on the development of the Group’s mineral deposits in Brazil. The Company has undertaken an impairment review at the end of 2016 to assess the future recoverability of the value of the investments that it holds in subsidiary entities. The Board has determined that based on its assessment of the future cash flows that the current operating mines may generate and the potential of the undeveloped assets no additional impairment provision is required at this time.
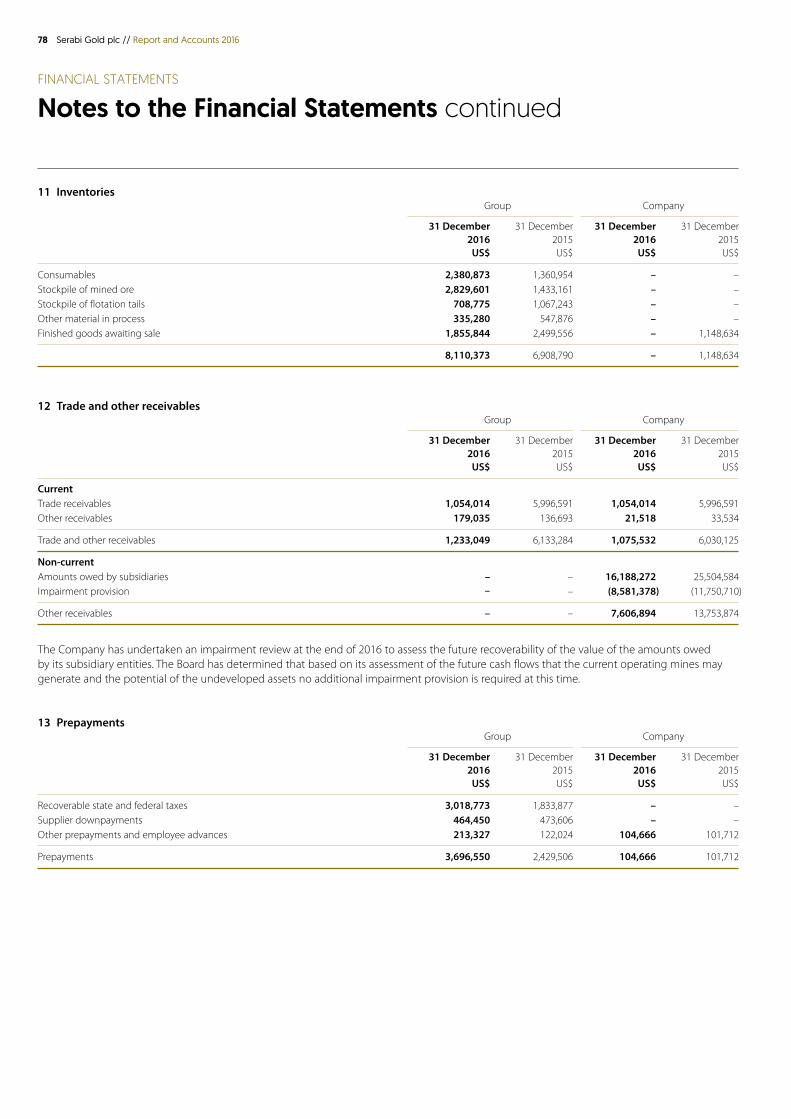
78 Serabi Gold plc // Report and Accounts 2016
FINANCIAL STATEMENTS
Notes to the Financial Statements continued
11 Inventories Group Company
31 December 31 December 31 December 31 December 2016 2015 2016 2015 US$ US$ US$ US$
Consumables 2,380,873 1,360,954 – –Stockpile of mined ore 2,829,601 1,433,161 – –Stockpile of flotation tails 708,775 1,067,243 – –Other material in process 335,280 547,876 – –Finished goods awaiting sale 1,855,844 2,499,556 – 1,148,634
8,110,373 6,908,790 – 1,148,634
12 Trade and other receivables Group Company
31 December 31 December 31 December 31 December 2016 2015 2016 2015 US$ US$ US$ US$
Current Trade receivables 1,054,014 5,996,591 1,054,014 5,996,591Other receivables 179,035 136,693 21,518 33,534
Trade and other receivables 1,233,049 6,133,284 1,075,532 6,030,125
Non-current Amounts owed by subsidiaries – – 16,188,272 25,504,584Impairment provision – – (8,581,378) (11,750,710)
Other receivables – – 7,606,894 13,753,874
The Company has undertaken an impairment review at the end of 2016 to assess the future recoverability of the value of the amounts owed by its subsidiary entities. The Board has determined that based on its assessment of the future cash flows that the current operating mines may generate and the potential of the undeveloped assets no additional impairment provision is required at this time.
13 Prepayments Group Company
31 December 31 December 31 December 31 December 2016 2015 2016 2015 US$ US$ US$ US$
Recoverable state and federal taxes 3,018,773 1,833,877 – –Supplier downpayments 464,450 473,606 – –Other prepayments and employee advances 213,327 122,024 104,666 101,712
Prepayments 3,696,550 2,429,506 104,666 101,712
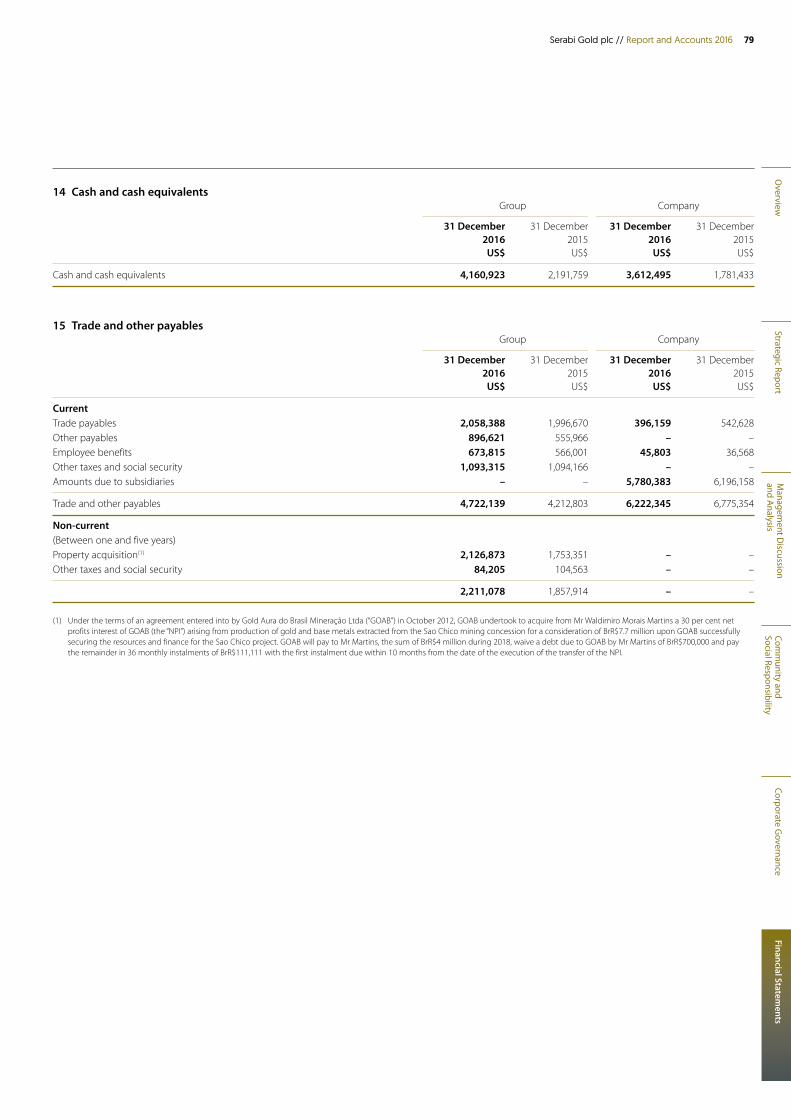
Overview
Strategic ReportM
anagement D
iscussion and A
nalysisCom
munity and
Social ResponsibilityCorporate G
overnanceFinancial Statem
ents
79Serabi Gold plc // Report and Accounts 2016
14 Cash and cash equivalents Group Company
31 December 31 December 31 December 31 December 2016 2015 2016 2015 US$ US$ US$ US$
Cash and cash equivalents 4,160,923 2,191,759 3,612,495 1,781,433
15 Trade and other payables Group Company
31 December 31 December 31 December 31 December 2016 2015 2016 2015 US$ US$ US$ US$
Current Trade payables 2,058,388 1,996,670 396,159 542,628Other payables 896,621 555,966 – –Employee benefits 673,815 566,001 45,803 36,568Other taxes and social security 1,093,315 1,094,166 – –Amounts due to subsidiaries – – 5,780,383 6,196,158
Trade and other payables 4,722,139 4,212,803 6,222,345 6,775,354
Non-current (Between one and five years) Property acquisition(1) 2,126,873 1,753,351 – –Other taxes and social security 84,205 104,563 – –
2,211,078 1,857,914 – –
(1) Under the terms of an agreement entered into by Gold Aura do Brasil Mineração Ltda (“GOAB”) in October 2012, GOAB undertook to acquire from Mr Waldimiro Morais Martins a 30 per cent net profits interest of GOAB (the “NPI”) arising from production of gold and base metals extracted from the Sao Chico mining concession for a consideration of BrR$7.7 million upon GOAB successfully securing the resources and finance for the Sao Chico project. GOAB will pay to Mr Martins, the sum of BrR$4 million during 2018, waive a debt due to GOAB by Mr Martins of BrR$700,000 and pay the remainder in 36 monthly instalments of BrR$111,111 with the first instalment due within 10 months from the date of the execution of the transfer of the NPI.
80 Serabi Gold plc // Report and Accounts 2016
FINANCIAL STATEMENTS
Notes to the Financial Statements continued
16 Non-current provisionsEmployment and claims provision Group Company
31 December 31 December 31 December 31 December 2016 2015 2016 2015 US$ US$ US$ US$
Opening balance 24,160 35,518 – –As a result of exchange variations 4,786 (11,358) – –
Closing balance 28,946 24,160 – –
Environmental rehabilitation provision Group Company
31 December 31 December 31 December 31 December 2016 2015 2016 2015 US$ US$ US$ US$
Opening balance 1,898,714 2,793,950 – –Provided for in year as a result of changes in estimates 170,157 (30,300) – – as a result of exchange variations (245,854) (889,096) – –
(75,697) (919,396) – –
Closing balance 1,823,017 1,874,554 – –
Total non-current provisions 1,851,963 1,898,714 – –
The employment and claims provision covers claims that may be brought by:
(i) Former employees of Serabi Mineraçăo SA and Gold Aura do Brasil Mineraçăo Ltda against these companies. Brazilian labour law entitles a former employee to lodge within two years of leaving the company claims for alleged unpaid remuneration and compensation in the event of dismissal. The Group whilst contesting each claim has made provision in respect of all known claims.
(ii) Third parties against Serabi Mineraçăo SA and Gold Aura do Brasil Mineraçăo Ltda where sums are claimed over and above contracted amounts. Whilst the Group will contest these claims it has made an additional provision as a best estimate of the potential value of any settlement that could arise based on legal opinion.
The environmental rehabilitation provision has been established to cover any asset decommissioning and rehabilitation obligations for the Palito and Sao Chico Mines. Such obligations include the dismantling of infrastructure, removal of residual materials and remediation of disturbed areas. The provision does not allow for any additional obligations expected from future developments. The timing and scope of the rehabilitation is uncertain and is dependent on mine life and quantities extracted from the mine.
Cost estimates are formally reviewed at regular intervals and the provisions are adjusted accordingly.
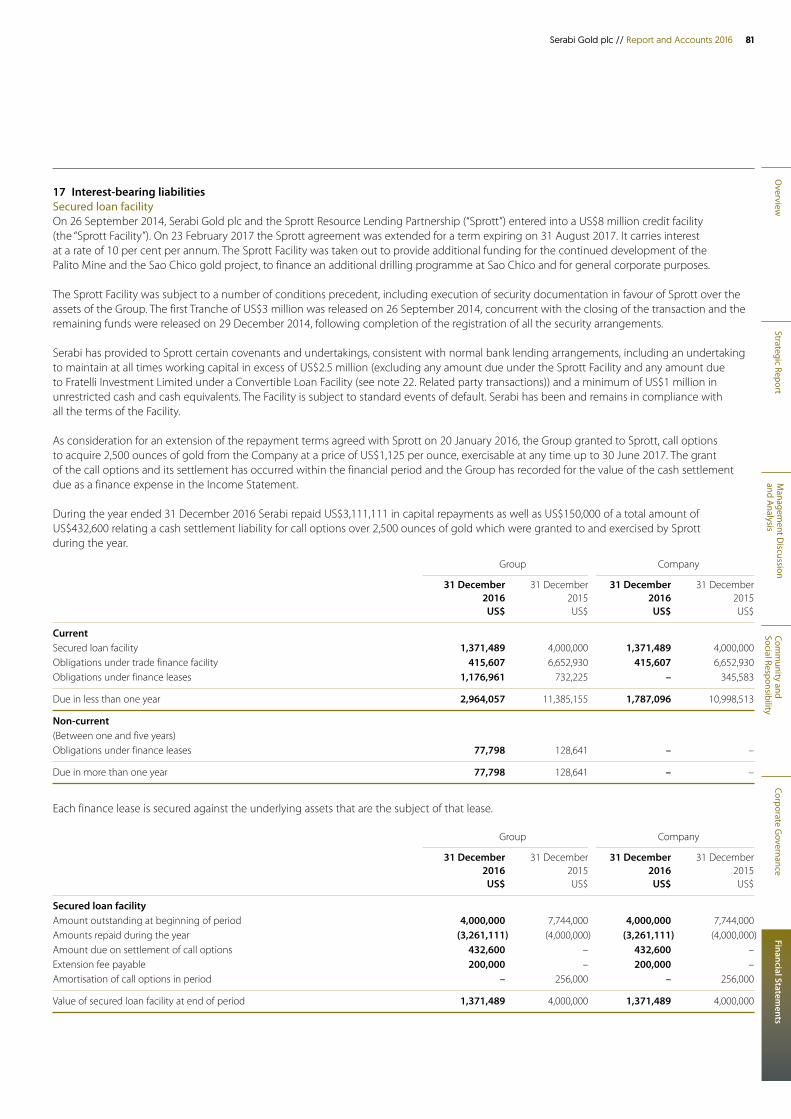
Overview
Strategic ReportM
anagement D
iscussion and A
nalysisCom
munity and
Social ResponsibilityCorporate G
overnanceFinancial Statem
ents
81Serabi Gold plc // Report and Accounts 2016
17 Interest-bearing liabilitiesSecured loan facilityOn 26 September 2014, Serabi Gold plc and the Sprott Resource Lending Partnership (“Sprott”) entered into a US$8 million credit facility (the “Sprott Facility”). On 23 February 2017 the Sprott agreement was extended for a term expiring on 31 August 2017. It carries interest at a rate of 10 per cent per annum. The Sprott Facility was taken out to provide additional funding for the continued development of the Palito Mine and the Sao Chico gold project, to finance an additional drilling programme at Sao Chico and for general corporate purposes.
The Sprott Facility was subject to a number of conditions precedent, including execution of security documentation in favour of Sprott over the assets of the Group. The first Tranche of US$3 million was released on 26 September 2014, concurrent with the closing of the transaction and the remaining funds were released on 29 December 2014, following completion of the registration of all the security arrangements.
Serabi has provided to Sprott certain covenants and undertakings, consistent with normal bank lending arrangements, including an undertaking to maintain at all times working capital in excess of US$2.5 million (excluding any amount due under the Sprott Facility and any amount due to Fratelli Investment Limited under a Convertible Loan Facility (see note 22. Related party transactions)) and a minimum of US$1 million in unrestricted cash and cash equivalents. The Facility is subject to standard events of default. Serabi has been and remains in compliance with all the terms of the Facility.
As consideration for an extension of the repayment terms agreed with Sprott on 20 January 2016, the Group granted to Sprott, call options to acquire 2,500 ounces of gold from the Company at a price of US$1,125 per ounce, exercisable at any time up to 30 June 2017. The grant of the call options and its settlement has occurred within the financial period and the Group has recorded for the value of the cash settlement due as a finance expense in the Income Statement.
During the year ended 31 December 2016 Serabi repaid US$3,111,111 in capital repayments as well as US$150,000 of a total amount of US$432,600 relating a cash settlement liability for call options over 2,500 ounces of gold which were granted to and exercised by Sprott during the year.
Group Company
31 December 31 December 31 December 31 December 2016 2015 2016 2015 US$ US$ US$ US$
CurrentSecured loan facility 1,371,489 4,000,000 1,371,489 4,000,000Obligations under trade finance facility 415,607 6,652,930 415,607 6,652,930Obligations under finance leases 1,176,961 732,225 – 345,583
Due in less than one year 2,964,057 11,385,155 1,787,096 10,998,513
Non-current (Between one and five years) Obligations under finance leases 77,798 128,641 – –
Due in more than one year 77,798 128,641 – –
Each finance lease is secured against the underlying assets that are the subject of that lease.
Group Company
31 December 31 December 31 December 31 December 2016 2015 2016 2015 US$ US$ US$ US$
Secured loan facility Amount outstanding at beginning of period 4,000,000 7,744,000 4,000,000 7,744,000Amounts repaid during the year (3,261,111) (4,000,000) (3,261,111) (4,000,000)Amount due on settlement of call options 432,600 – 432,600 –Extension fee payable 200,000 – 200,000 –Amortisation of call options in period – 256,000 – 256,000
Value of secured loan facility at end of period 1,371,489 4,000,000 1,371,489 4,000,000
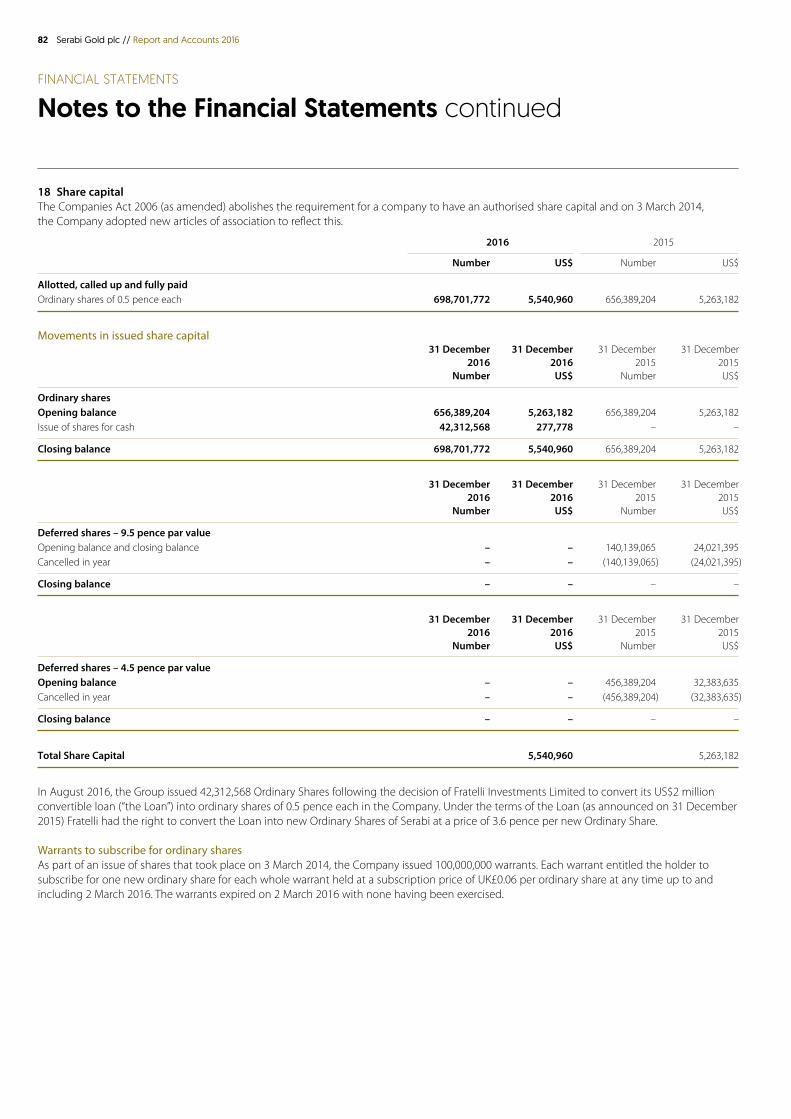
82 Serabi Gold plc // Report and Accounts 2016
FINANCIAL STATEMENTS
Notes to the Financial Statements continued
18 Share capitalThe Companies Act 2006 (as amended) abolishes the requirement for a company to have an authorised share capital and on 3 March 2014, the Company adopted new articles of association to reflect this.
2016 2015
Number US$ Number US$
Allotted, called up and fully paid Ordinary shares of 0.5 pence each 698,701,772 5,540,960 656,389,204 5,263,182
Movements in issued share capital 31 December 31 December 31 December 31 December 2016 2016 2015 2015 Number US$ Number US$
Ordinary shares Opening balance 656,389,204 5,263,182 656,389,204 5,263,182Issue of shares for cash 42,312,568 277,778 – –
Closing balance 698,701,772 5,540,960 656,389,204 5,263,182
31 December 31 December 31 December 31 December 2016 2016 2015 2015 Number US$ Number US$
Deferred shares – 9.5 pence par value Opening balance and closing balance – – 140,139,065 24,021,395Cancelled in year – – (140,139,065) (24,021,395)
Closing balance – – – –
31 December 31 December 31 December 31 December 2016 2016 2015 2015 Number US$ Number US$
Deferred shares – 4.5 pence par value Opening balance – – 456,389,204 32,383,635Cancelled in year – – (456,389,204) (32,383,635)
Closing balance – – – –
Total Share Capital 5,540,960 5,263,182
In August 2016, the Group issued 42,312,568 Ordinary Shares following the decision of Fratelli Investments Limited to convert its US$2 million convertible loan (“the Loan”) into ordinary shares of 0.5 pence each in the Company. Under the terms of the Loan (as announced on 31 December 2015) Fratelli had the right to convert the Loan into new Ordinary Shares of Serabi at a price of 3.6 pence per new Ordinary Share.
Warrants to subscribe for ordinary sharesAs part of an issue of shares that took place on 3 March 2014, the Company issued 100,000,000 warrants. Each warrant entitled the holder to subscribe for one new ordinary share for each whole warrant held at a subscription price of UK£0.06 per ordinary share at any time up to and including 2 March 2016. The warrants expired on 2 March 2016 with none having been exercised.
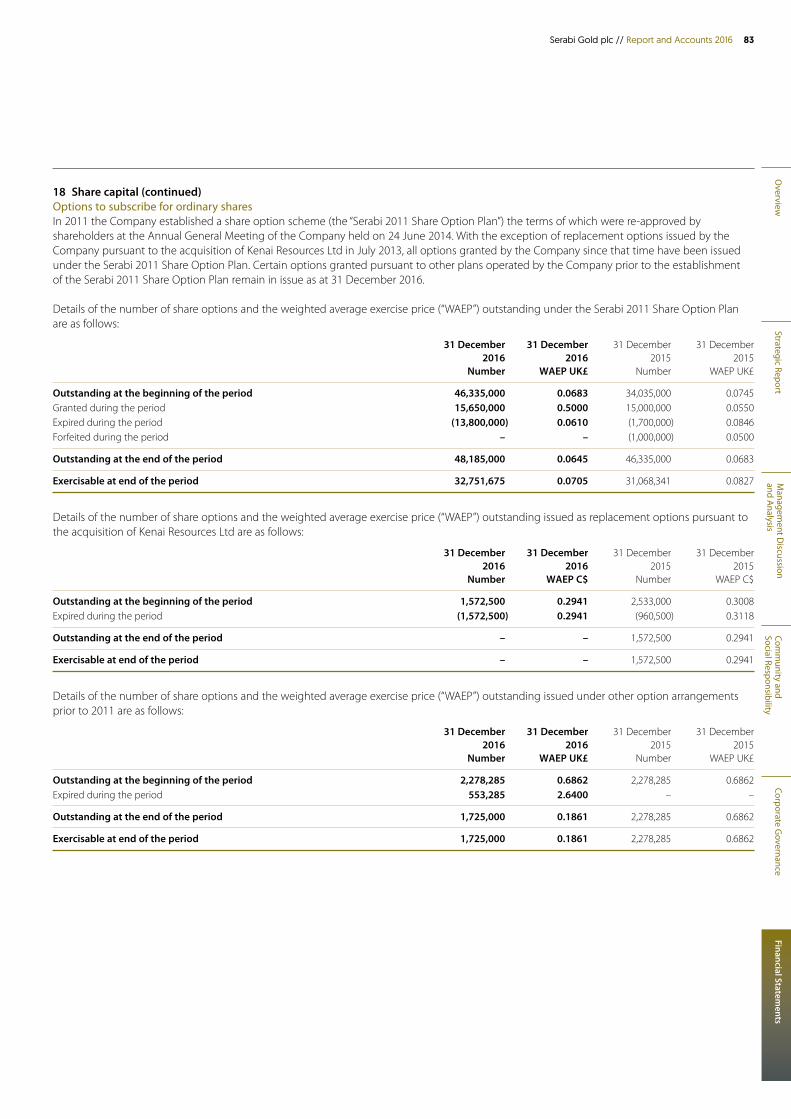
Overview
Strategic ReportM
anagement D
iscussion and A
nalysisCom
munity and
Social ResponsibilityCorporate G
overnanceFinancial Statem
ents
83Serabi Gold plc // Report and Accounts 2016
18 Share capital (continued)Options to subscribe for ordinary sharesIn 2011 the Company established a share option scheme (the “Serabi 2011 Share Option Plan”) the terms of which were re-approved by shareholders at the Annual General Meeting of the Company held on 24 June 2014. With the exception of replacement options issued by the Company pursuant to the acquisition of Kenai Resources Ltd in July 2013, all options granted by the Company since that time have been issued under the Serabi 2011 Share Option Plan. Certain options granted pursuant to other plans operated by the Company prior to the establishment of the Serabi 2011 Share Option Plan remain in issue as at 31 December 2016.
Details of the number of share options and the weighted average exercise price (“WAEP”) outstanding under the Serabi 2011 Share Option Plan are as follows:
31 December 31 December 31 December 31 December 2016 2016 2015 2015 Number WAEP UK£ Number WAEP UK£
Outstanding at the beginning of the period 46,335,000 0.0683 34,035,000 0.0745Granted during the period 15,650,000 0.5000 15,000,000 0.0550Expired during the period (13,800,000) 0.0610 (1,700,000) 0.0846Forfeited during the period – – (1,000,000) 0.0500
Outstanding at the end of the period 48,185,000 0.0645 46,335,000 0.0683
Exercisable at end of the period 32,751,675 0.0705 31,068,341 0.0827
Details of the number of share options and the weighted average exercise price (“WAEP”) outstanding issued as replacement options pursuant to the acquisition of Kenai Resources Ltd are as follows:
31 December 31 December 31 December 31 December 2016 2016 2015 2015 Number WAEP C$ Number WAEP C$
Outstanding at the beginning of the period 1,572,500 0.2941 2,533,000 0.3008Expired during the period (1,572,500) 0.2941 (960,500) 0.3118
Outstanding at the end of the period – – 1,572,500 0.2941
Exercisable at end of the period – – 1,572,500 0.2941
Details of the number of share options and the weighted average exercise price (“WAEP”) outstanding issued under other option arrangements prior to 2011 are as follows:
31 December 31 December 31 December 31 December 2016 2016 2015 2015 Number WAEP UK£ Number WAEP UK£
Outstanding at the beginning of the period 2,278,285 0.6862 2,278,285 0.6862Expired during the period 553,285 2.6400 – –
Outstanding at the end of the period 1,725,000 0.1861 2,278,285 0.6862
Exercisable at end of the period 1,725,000 0.1861 2,278,285 0.6862
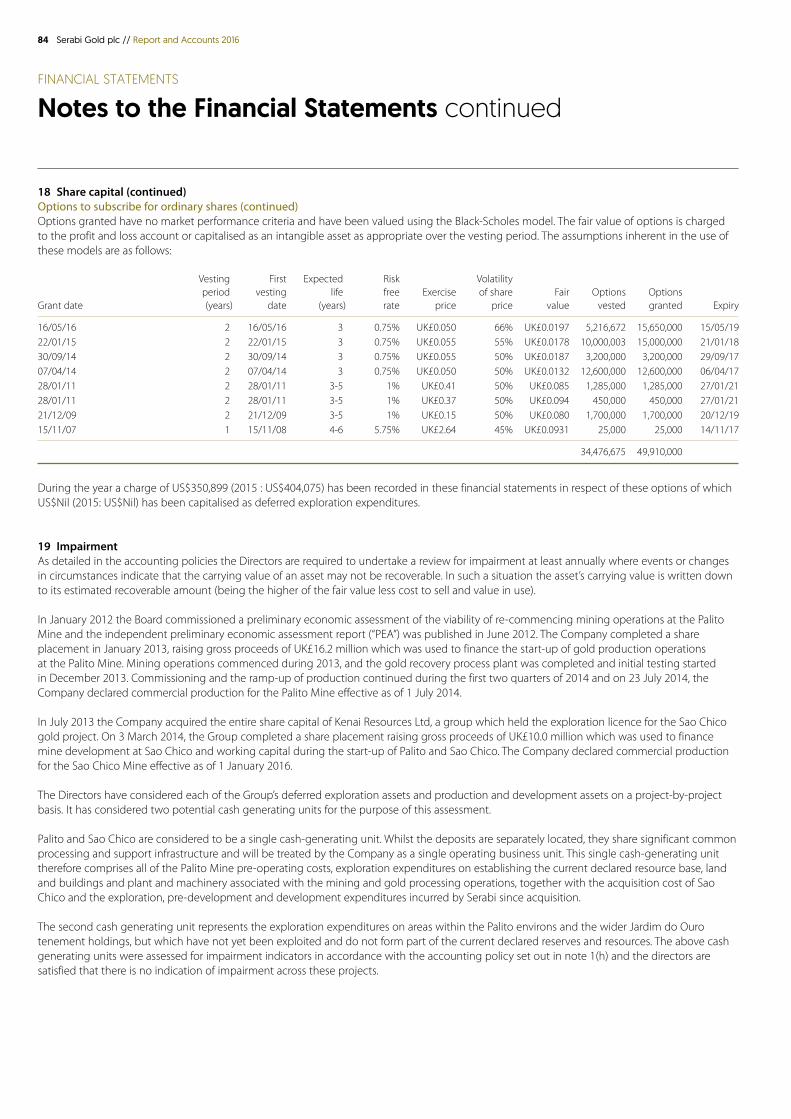
84 Serabi Gold plc // Report and Accounts 2016
FINANCIAL STATEMENTS
Notes to the Financial Statements continued
18 Share capital (continued)Options to subscribe for ordinary shares (continued)Options granted have no market performance criteria and have been valued using the Black-Scholes model. The fair value of options is charged to the profit and loss account or capitalised as an intangible asset as appropriate over the vesting period. The assumptions inherent in the use of these models are as follows:
Vesting First Expected Risk Volatility period vesting life free Exercise of share Fair Options Options Grant date (years) date (years) rate price price value vested granted Expiry
16/05/16 2 16/05/16 3 0.75% UK£0.050 66% UK£0.0197 5,216,672 15,650,000 15/05/1922/01/15 2 22/01/15 3 0.75% UK£0.055 55% UK£0.0178 10,000,003 15,000,000 21/01/1830/09/14 2 30/09/14 3 0.75% UK£0.055 50% UK£0.0187 3,200,000 3,200,000 29/09/1707/04/14 2 07/04/14 3 0.75% UK£0.050 50% UK£0.0132 12,600,000 12,600,000 06/04/1728/01/11 2 28/01/11 3-5 1% UK£0.41 50% UK£0.085 1,285,000 1,285,000 27/01/2128/01/11 2 28/01/11 3-5 1% UK£0.37 50% UK£0.094 450,000 450,000 27/01/2121/12/09 2 21/12/09 3-5 1% UK£0.15 50% UK£0.080 1,700,000 1,700,000 20/12/1915/11/07 1 15/11/08 4-6 5.75% UK£2.64 45% UK£0.0931 25,000 25,000 14/11/17
34,476,675 49,910,000
During the year a charge of US$350,899 (2015 : US$404,075) has been recorded in these financial statements in respect of these options of which US$Nil (2015: US$Nil) has been capitalised as deferred exploration expenditures.
19 ImpairmentAs detailed in the accounting policies the Directors are required to undertake a review for impairment at least annually where events or changes in circumstances indicate that the carrying value of an asset may not be recoverable. In such a situation the asset’s carrying value is written down to its estimated recoverable amount (being the higher of the fair value less cost to sell and value in use).
In January 2012 the Board commissioned a preliminary economic assessment of the viability of re-commencing mining operations at the Palito Mine and the independent preliminary economic assessment report (“PEA”) was published in June 2012. The Company completed a share placement in January 2013, raising gross proceeds of UK£16.2 million which was used to finance the start-up of gold production operations at the Palito Mine. Mining operations commenced during 2013, and the gold recovery process plant was completed and initial testing started in December 2013. Commissioning and the ramp-up of production continued during the first two quarters of 2014 and on 23 July 2014, the Company declared commercial production for the Palito Mine effective as of 1 July 2014.
In July 2013 the Company acquired the entire share capital of Kenai Resources Ltd, a group which held the exploration licence for the Sao Chico gold project. On 3 March 2014, the Group completed a share placement raising gross proceeds of UK£10.0 million which was used to finance mine development at Sao Chico and working capital during the start-up of Palito and Sao Chico. The Company declared commercial production for the Sao Chico Mine effective as of 1 January 2016.
The Directors have considered each of the Group’s deferred exploration assets and production and development assets on a project-by-project basis. It has considered two potential cash generating units for the purpose of this assessment.
Palito and Sao Chico are considered to be a single cash-generating unit. Whilst the deposits are separately located, they share significant common processing and support infrastructure and will be treated by the Company as a single operating business unit. This single cash-generating unit therefore comprises all of the Palito Mine pre-operating costs, exploration expenditures on establishing the current declared resource base, land and buildings and plant and machinery associated with the mining and gold processing operations, together with the acquisition cost of Sao Chico and the exploration, pre-development and development expenditures incurred by Serabi since acquisition.
The second cash generating unit represents the exploration expenditures on areas within the Palito environs and the wider Jardim do Ouro tenement holdings, but which have not yet been exploited and do not form part of the current declared reserves and resources. The above cash generating units were assessed for impairment indicators in accordance with the accounting policy set out in note 1(h) and the directors are satisfied that there is no indication of impairment across these projects.
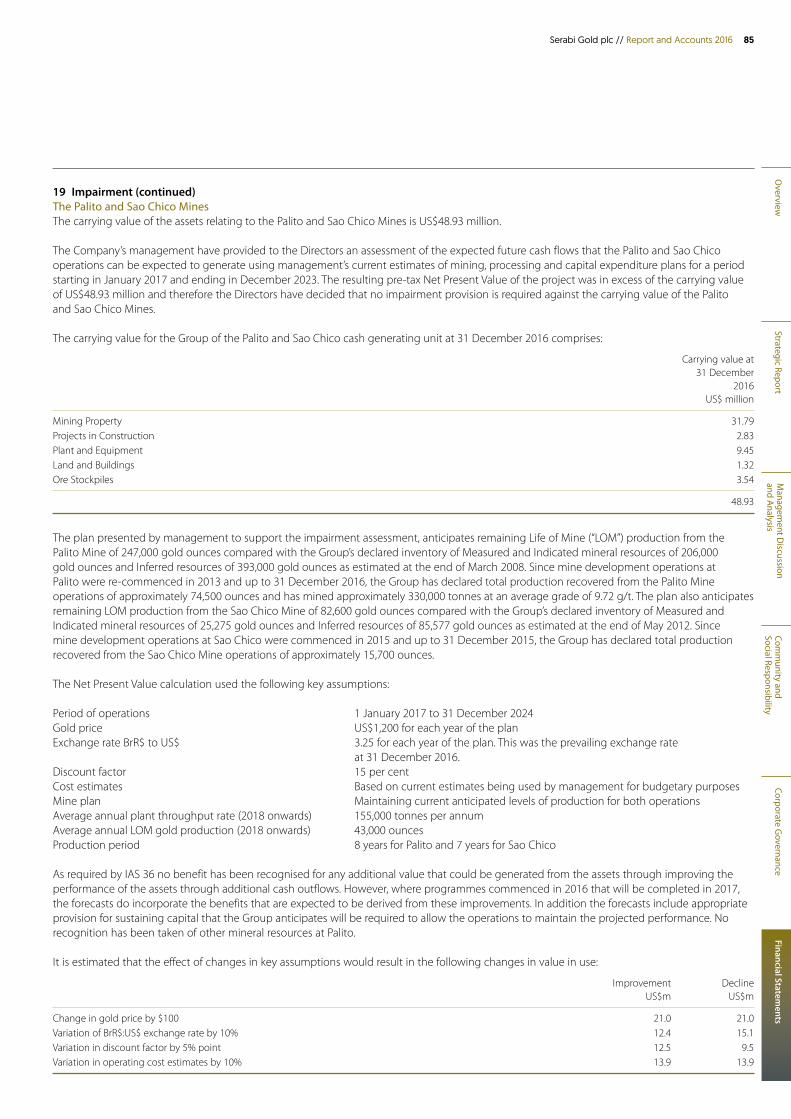
Overview
Strategic ReportM
anagement D
iscussion and A
nalysisCom
munity and
Social ResponsibilityCorporate G
overnanceFinancial Statem
ents
85Serabi Gold plc // Report and Accounts 2016
19 Impairment (continued)The Palito and Sao Chico MinesThe carrying value of the assets relating to the Palito and Sao Chico Mines is US$48.93 million.
The Company’s management have provided to the Directors an assessment of the expected future cash flows that the Palito and Sao Chico operations can be expected to generate using management’s current estimates of mining, processing and capital expenditure plans for a period starting in January 2017 and ending in December 2023. The resulting pre-tax Net Present Value of the project was in excess of the carrying value of US$48.93 million and therefore the Directors have decided that no impairment provision is required against the carrying value of the Palito and Sao Chico Mines.
The carrying value for the Group of the Palito and Sao Chico cash generating unit at 31 December 2016 comprises:
Carrying value at 31 December 2016 US$ million
Mining Property 31.79Projects in Construction 2.83Plant and Equipment 9.45Land and Buildings 1.32Ore Stockpiles 3.54
48.93
The plan presented by management to support the impairment assessment, anticipates remaining Life of Mine (“LOM”) production from the Palito Mine of 247,000 gold ounces compared with the Group’s declared inventory of Measured and Indicated mineral resources of 206,000 gold ounces and Inferred resources of 393,000 gold ounces as estimated at the end of March 2008. Since mine development operations at Palito were re-commenced in 2013 and up to 31 December 2016, the Group has declared total production recovered from the Palito Mine operations of approximately 74,500 ounces and has mined approximately 330,000 tonnes at an average grade of 9.72 g/t. The plan also anticipates remaining LOM production from the Sao Chico Mine of 82,600 gold ounces compared with the Group’s declared inventory of Measured and Indicated mineral resources of 25,275 gold ounces and Inferred resources of 85,577 gold ounces as estimated at the end of May 2012. Since mine development operations at Sao Chico were commenced in 2015 and up to 31 December 2015, the Group has declared total production recovered from the Sao Chico Mine operations of approximately 15,700 ounces.
The Net Present Value calculation used the following key assumptions:
Period of operations 1 January 2017 to 31 December 2024Gold price US$1,200 for each year of the planExchange rate BrR$ to US$ 3.25 for each year of the plan. This was the prevailing exchange rate
at 31 December 2016.Discount factor 15 per centCost estimates Based on current estimates being used by management for budgetary purposesMine plan Maintaining current anticipated levels of production for both operationsAverage annual plant throughput rate (2018 onwards) 155,000 tonnes per annumAverage annual LOM gold production (2018 onwards) 43,000 ouncesProduction period 8 years for Palito and 7 years for Sao Chico
As required by IAS 36 no benefit has been recognised for any additional value that could be generated from the assets through improving the performance of the assets through additional cash outflows. However, where programmes commenced in 2016 that will be completed in 2017, the forecasts do incorporate the benefits that are expected to be derived from these improvements. In addition the forecasts include appropriate provision for sustaining capital that the Group anticipates will be required to allow the operations to maintain the projected performance. No recognition has been taken of other mineral resources at Palito.
It is estimated that the effect of changes in key assumptions would result in the following changes in value in use:
Improvement Decline US$m US$m
Change in gold price by $100 21.0 21.0Variation of BrR$:US$ exchange rate by 10% 12.4 15.1Variation in discount factor by 5% point 12.5 9.5Variation in operating cost estimates by 10% 13.9 13.9

86 Serabi Gold plc // Report and Accounts 2016
FINANCIAL STATEMENTS
Notes to the Financial Statements continued
20 Capital managementThe Group has historically sourced equity capital through share issues on the London Stock Exchange and the Toronto Stock Exchange and the Board had managed the capital structure of the Group and aligned this with the risk profiles of its underlying assets.
On 26 September 2014, the Group entered into the Sprott Facility further details of which are set out in note 17 (Interest-bearing liabilities) and note 25 (Post balance sheet events). As at 31 December 2016, the amount of US$1.37 million (2015: US$4 million) was outstanding in respect of the Sprott Facility.
On 30 December 2015, the Group agreed an unsecured short term working capital convertible loan facility of US$5 million with its major shareholder, Fratelli Investments Limited. The facility was available to be drawn down at any time up to 30 June 2016 and was to provide additional working capital facilities. On 6 January 2016, the Group announced that it had made an initial drawdown of US$2 million against this convertible loan facility. The group made no further drawdowns prior to 30 June 2016 and in August 2016 Fratelli exercised its right to convert the outstanding loan of US$2 million into shares of the Company at a subscription price of UK£0.036. On 15 August 2016, the Company issued 42,312,568 shares of the Company to Fratelli.
The Group’s objectives, when managing its capital are to maintain financial flexibility to achieve its development plans, safeguard its ability to continue to operate as a going concern through management of its costs whilst optimising its access to capital markets by endeavouring to deliver increases in value of the Group for the benefit of shareholders. In establishing its capital requirements the Group will take account of the risks inherent in its plans and proposed activities and prevailing market conditions.
The Group anticipates that, whilst it may seek to raise further finance in the future, it now has access to sufficient funding for its immediate needs. The Palito Mine has been in Commercial Production since 1 July 2014 and the Sao Chico Mine achieved Commercial Production with effect from 1 January 2016. With current market conditions and prices, the Group expects to have sufficient cash flow to finance its on-going operational requirements, repay its secured loan facility and to, at least in part, fund exploration and development activity on its other gold properties. It will seek to raise debt finance where possible to finance further capital development of its projects taking due consideration of the ability of the Group to satisfy the obligations and undertakings that would be imposed in connection with such borrowings.
The Company’s shares are listed on both AIM and the TSX which management consider increases the potential of the Group to raise finance through further issues of shares in the future. Management consider that with cash flow being generated from its operations in the near-term this also enhances the ability of the Group to raise debt finance in the future.
21 Commitments and contingenciesCapital commitmentsThe Group holds certain exploration prospects which require the Group to make certain payments under rental or purchase arrangements allowing the Group to retain the right to access and undertake exploration on these properties. Failure to meet these obligations could result in forfeiture of any affected prospects.
Management estimates that the cost over the next 12 months of fulfilling the current contracted commitments on these exploration properties in which the Group has an interest is US$50,355 (2015: US$45,000).
Operating lease commitmentsThe Group has commitments under non-cancellable operating leases as follows:
Group Company
31 December 31 December 31 December 31 December 2016 2015 2016 2015 US$ US$ US$ US$
Commitments falling due:Within one year 162,903 166,633 93,029 64,955Between one year and five years 161,411 78,278 11,215 72,785
Total 324,314 244,911 104,244 137,740
Overview
Strategic ReportM
anagement D
iscussion and A
nalysisCom
munity and
Social ResponsibilityCorporate G
overnanceFinancial Statem
ents
87Serabi Gold plc // Report and Accounts 2016
21 Commitments and contingencies (continued)ContingenciesEmployment legislation in Brazil allows former employees to bring claims against an employer at any time for a period of two years from the date of cessation of employment and regardless of whether the employee left the company voluntarily or had their contract terminated by the company. The Group considers that it operates in compliance with the law at all times but is aware that claims are made against all companies in Brazil on a regular basis. Whilst not accepting legal liability the Group makes provision or accrues for all known claims further claims may arise at any time.
During 2013, Serabi Mineração SA (“SMSA”) was requested by the Tax Authorities for the State of Para, to provide supporting documentation in respect of certain tax reclaims made by SMSA dating back for six years. SMSA has provided all the requested information and the Group considers all claims made were in accordance with prevailing legislation. The total sum of the tax claims that are subject to this review is BrR$78,000, which at the year-end is equivalent to US$24,000.
22 Related party transactionsDuring the period the Company has made no loans to subsidiaries (2015: US$2,708,980). There were no loans converted into new shares issued by subsidiaries during 2016 (2015: US$Nil).
The Company has loans receivable from subsidiaries totalling US$16,188,272 (2014: US$25,504,584) before any provision for the impairment of these loans (see note 12). The Company received loan repayments from its subsidiary Serabi Mineração SA (“SMSA”) during the year totalling US$9,316,312.
The Company has purchased, during the year from its subsidiary SMSA, 2,080 tonnes of copper/gold concentrate for a consideration of US$20,552,303 (2015: 2,220 tonnes; US$24,569,649).
On 30 December 2015, the Group agreed an unsecured short term working capital convertible loan facility of US$5 million with its major shareholder, Fratelli Investments Limited (“Fratelli”). The facility was available to be drawn down at any time up to 30 June 2016 and was to provide additional working capital facilities. On 6 January 2016, the Group announced that it had made an initial drawdown of US$2 million against this convertible loan facility. The Group made no further drawdowns prior to 30 June 2016 and in August 2016 Fratelli exercised its right to convert the outstanding loan of US$2 million into shares of the Company at a subscription price of UK£0.036. On 15 August 2016, the Company issued 42,312,568 shares of the Company to Fratelli.
Key management remunerationKey management comprises the Executive, Non-Executive Directors and country manager only. Their compensation is:
For the For the year ended year ended 31 December 31 December 2016 2015 US$ US$
Short term employee benefits 1,189,595 1,421,117Post-employment benefits 11,298 154,779Share-based payments 313,384 383,980
Total 1,514,277 1,959,876
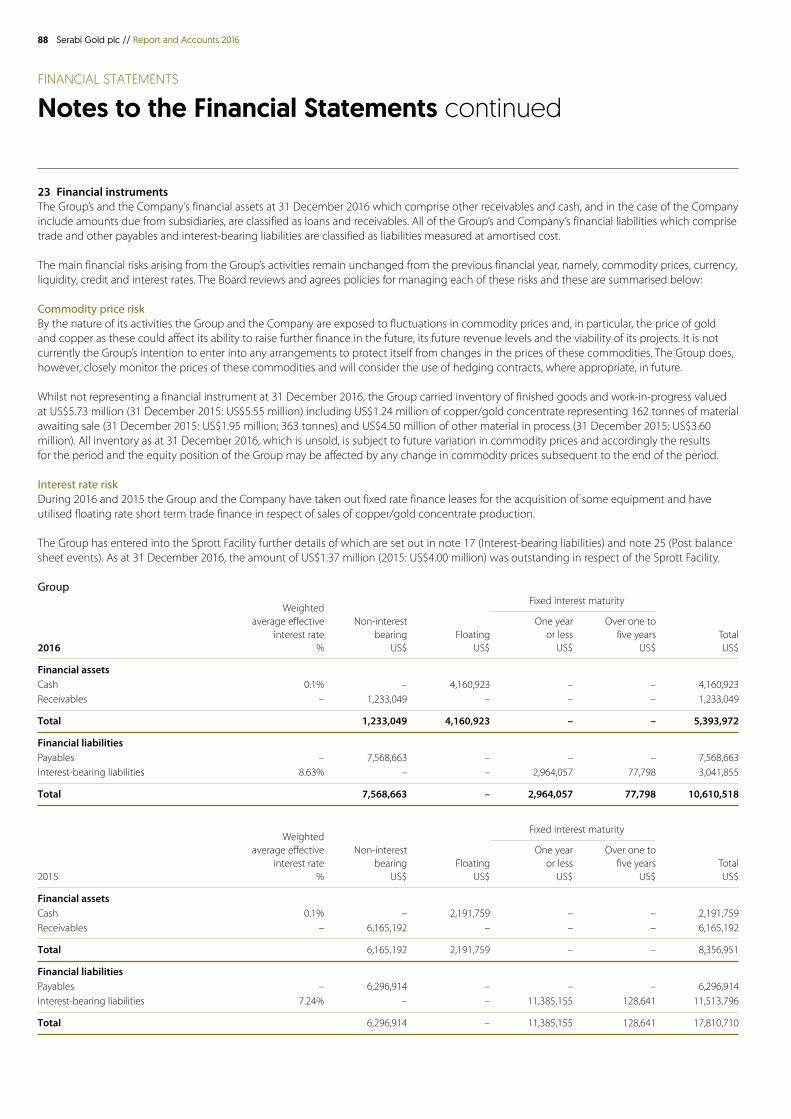
88 Serabi Gold plc // Report and Accounts 2016
FINANCIAL STATEMENTS
Notes to the Financial Statements continued
23 Financial instrumentsThe Group’s and the Company’s financial assets at 31 December 2016 which comprise other receivables and cash, and in the case of the Company include amounts due from subsidiaries, are classified as loans and receivables. All of the Group’s and Company’s financial liabilities which comprise trade and other payables and interest-bearing liabilities are classified as liabilities measured at amortised cost.
The main financial risks arising from the Group’s activities remain unchanged from the previous financial year, namely, commodity prices, currency, liquidity, credit and interest rates. The Board reviews and agrees policies for managing each of these risks and these are summarised below:
Commodity price risk By the nature of its activities the Group and the Company are exposed to fluctuations in commodity prices and, in particular, the price of gold and copper as these could affect its ability to raise further finance in the future, its future revenue levels and the viability of its projects. It is not currently the Group’s intention to enter into any arrangements to protect itself from changes in the prices of these commodities. The Group does, however, closely monitor the prices of these commodities and will consider the use of hedging contracts, where appropriate, in future.
Whilst not representing a financial instrument at 31 December 2016, the Group carried inventory of finished goods and work-in-progress valued at US$5.73 million (31 December 2015: US$5.55 million) including US$1.24 million of copper/gold concentrate representing 162 tonnes of material awaiting sale (31 December 2015: US$1.95 million; 363 tonnes) and US$4.50 million of other material in process (31 December 2015: US$3.60 million). All inventory as at 31 December 2016, which is unsold, is subject to future variation in commodity prices and accordingly the results for the period and the equity position of the Group may be affected by any change in commodity prices subsequent to the end of the period.
Interest rate risk During 2016 and 2015 the Group and the Company have taken out fixed rate finance leases for the acquisition of some equipment and have utilised floating rate short term trade finance in respect of sales of copper/gold concentrate production.
The Group has entered into the Sprott Facility further details of which are set out in note 17 (Interest-bearing liabilities) and note 25 (Post balance sheet events). As at 31 December 2016, the amount of US$1.37 million (2015: US$4.00 million) was outstanding in respect of the Sprott Facility.
Group
Weighted Fixed interest maturity
average effective Non-interest One year Over one to interest rate bearing Floating or less five years Total 2016 % US$ US$ US$ US$ US$
Financial assetsCash 0.1% – 4,160,923 – – 4,160,923Receivables – 1,233,049 – – – 1,233,049
Total 1,233,049 4,160,923 – – 5,393,972
Financial liabilities Payables – 7,568,663 – – – 7,568,663Interest-bearing liabilities 8.63% – – 2,964,057 77,798 3,041,855
Total 7,568,663 – 2,964,057 77,798 10,610,518
Weighted
Fixed interest maturity
average effective Non-interest One year Over one to interest rate bearing Floating or less five years Total 2015 % US$ US$ US$ US$ US$
Financial assets Cash 0.1% – 2,191,759 – – 2,191,759Receivables – 6,165,192 – – – 6,165,192
Total 6,165,192 2,191,759 – – 8,356,951
Financial liabilities Payables – 6,296,914 – – – 6,296,914Interest-bearing liabilities 7.24% – – 11,385,155 128,641 11,513,796
Total 6,296,914 – 11,385,155 128,641 17,810,710
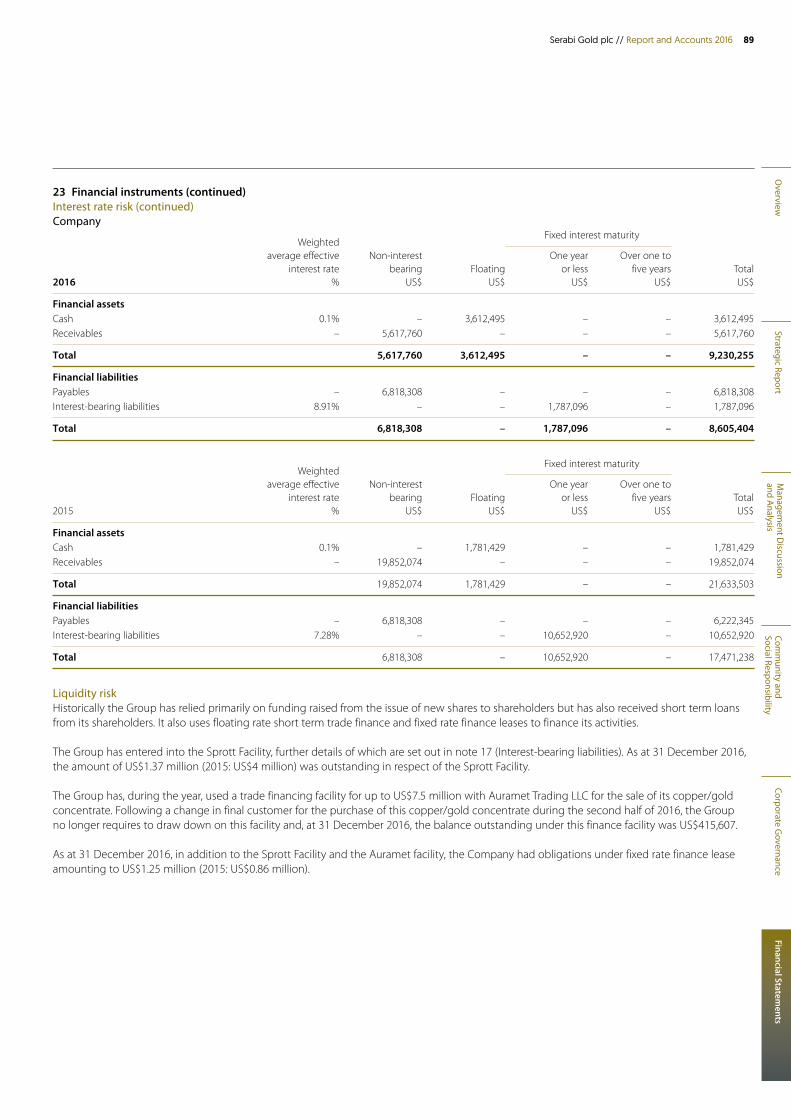
Overview
Strategic ReportM
anagement D
iscussion and A
nalysisCom
munity and
Social ResponsibilityCorporate G
overnanceFinancial Statem
ents
89Serabi Gold plc // Report and Accounts 2016
23 Financial instruments (continued)Interest rate risk (continued)Company
Weighted Fixed interest maturity
average effective Non-interest One year Over one to interest rate bearing Floating or less five years Total 2016 % US$ US$ US$ US$ US$
Financial assets Cash 0.1% – 3,612,495 – – 3,612,495Receivables – 5,617,760 – – – 5,617,760
Total 5,617,760 3,612,495 – – 9,230,255
Financial liabilities Payables – 6,818,308 – – – 6,818,308Interest-bearing liabilities 8.91% – – 1,787,096 – 1,787,096
Total 6,818,308 – 1,787,096 – 8,605,404
Weighted
Fixed interest maturity
average effective Non-interest One year Over one to interest rate bearing Floating or less five years Total 2015 % US$ US$ US$ US$ US$
Financial assets Cash 0.1% – 1,781,429 – – 1,781,429Receivables – 19,852,074 – – – 19,852,074
Total 19,852,074 1,781,429 – – 21,633,503
Financial liabilities Payables – 6,818,308 – – – 6,222,345Interest-bearing liabilities 7.28% – – 10,652,920 – 10,652,920
Total 6,818,308 – 10,652,920 – 17,471,238
Liquidity risk Historically the Group has relied primarily on funding raised from the issue of new shares to shareholders but has also received short term loans from its shareholders. It also uses floating rate short term trade finance and fixed rate finance leases to finance its activities.
The Group has entered into the Sprott Facility, further details of which are set out in note 17 (Interest-bearing liabilities). As at 31 December 2016, the amount of US$1.37 million (2015: US$4 million) was outstanding in respect of the Sprott Facility.
The Group has, during the year, used a trade financing facility for up to US$7.5 million with Auramet Trading LLC for the sale of its copper/gold concentrate. Following a change in final customer for the purchase of this copper/gold concentrate during the second half of 2016, the Group no longer requires to draw down on this facility and, at 31 December 2016, the balance outstanding under this finance facility was US$415,607.
As at 31 December 2016, in addition to the Sprott Facility and the Auramet facility, the Company had obligations under fixed rate finance lease amounting to US$1.25 million (2015: US$0.86 million).
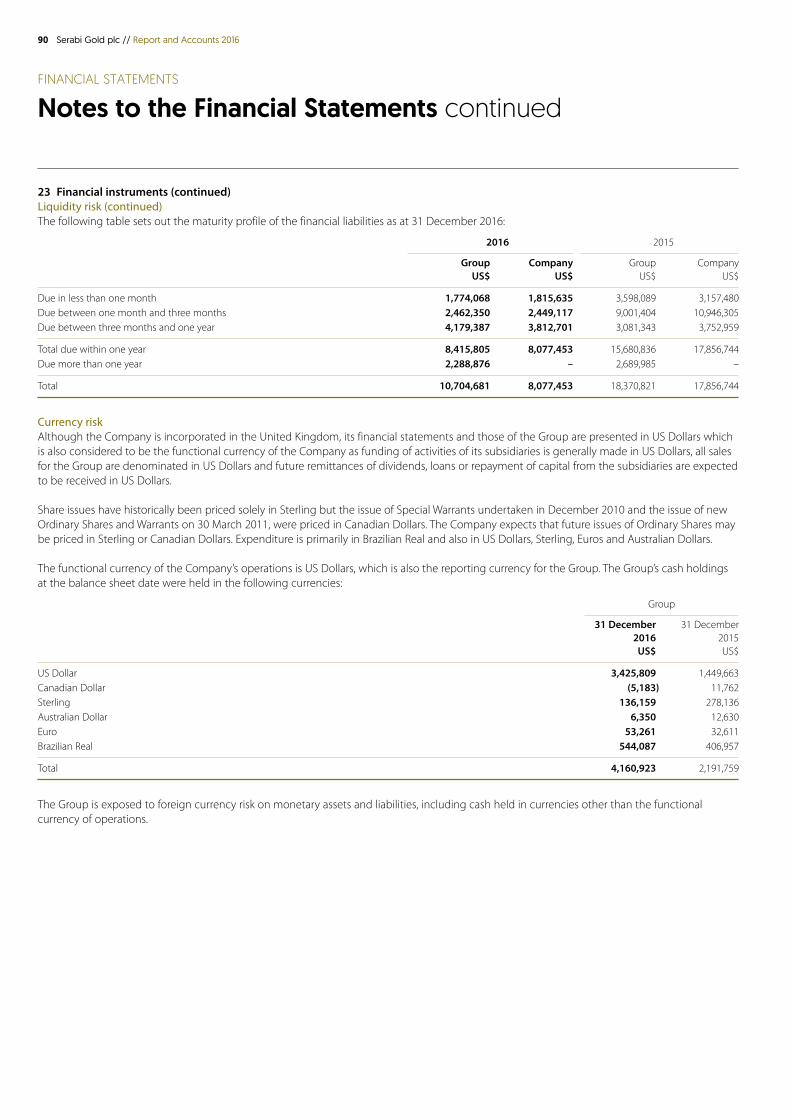
90 Serabi Gold plc // Report and Accounts 2016
FINANCIAL STATEMENTS
Notes to the Financial Statements continued
23 Financial instruments (continued)Liquidity risk (continued)The following table sets out the maturity profile of the financial liabilities as at 31 December 2016:
2016 2015
Group Company Group Company US$ US$ US$ US$
Due in less than one month 1,774,068 1,815,635 3,598,089 3,157,480Due between one month and three months 2,462,350 2,449,117 9,001,404 10,946,305Due between three months and one year 4,179,387 3,812,701 3,081,343 3,752,959
Total due within one year 8,415,805 8,077,453 15,680,836 17,856,744Due more than one year 2,288,876 – 2,689,985 –
Total 10,704,681 8,077,453 18,370,821 17,856,744
Currency risk Although the Company is incorporated in the United Kingdom, its financial statements and those of the Group are presented in US Dollars which is also considered to be the functional currency of the Company as funding of activities of its subsidiaries is generally made in US Dollars, all sales for the Group are denominated in US Dollars and future remittances of dividends, loans or repayment of capital from the subsidiaries are expected to be received in US Dollars.
Share issues have historically been priced solely in Sterling but the issue of Special Warrants undertaken in December 2010 and the issue of new Ordinary Shares and Warrants on 30 March 2011, were priced in Canadian Dollars. The Company expects that future issues of Ordinary Shares may be priced in Sterling or Canadian Dollars. Expenditure is primarily in Brazilian Real and also in US Dollars, Sterling, Euros and Australian Dollars.
The functional currency of the Company’s operations is US Dollars, which is also the reporting currency for the Group. The Group’s cash holdings at the balance sheet date were held in the following currencies:
Group
31 December 31 December 2016 2015 US$ US$
US Dollar 3,425,809 1,449,663Canadian Dollar (5,183) 11,762Sterling 136,159 278,136Australian Dollar 6,350 12,630Euro 53,261 32,611Brazilian Real 544,087 406,957
Total 4,160,923 2,191,759
The Group is exposed to foreign currency risk on monetary assets and liabilities, including cash held in currencies other than the functional currency of operations.
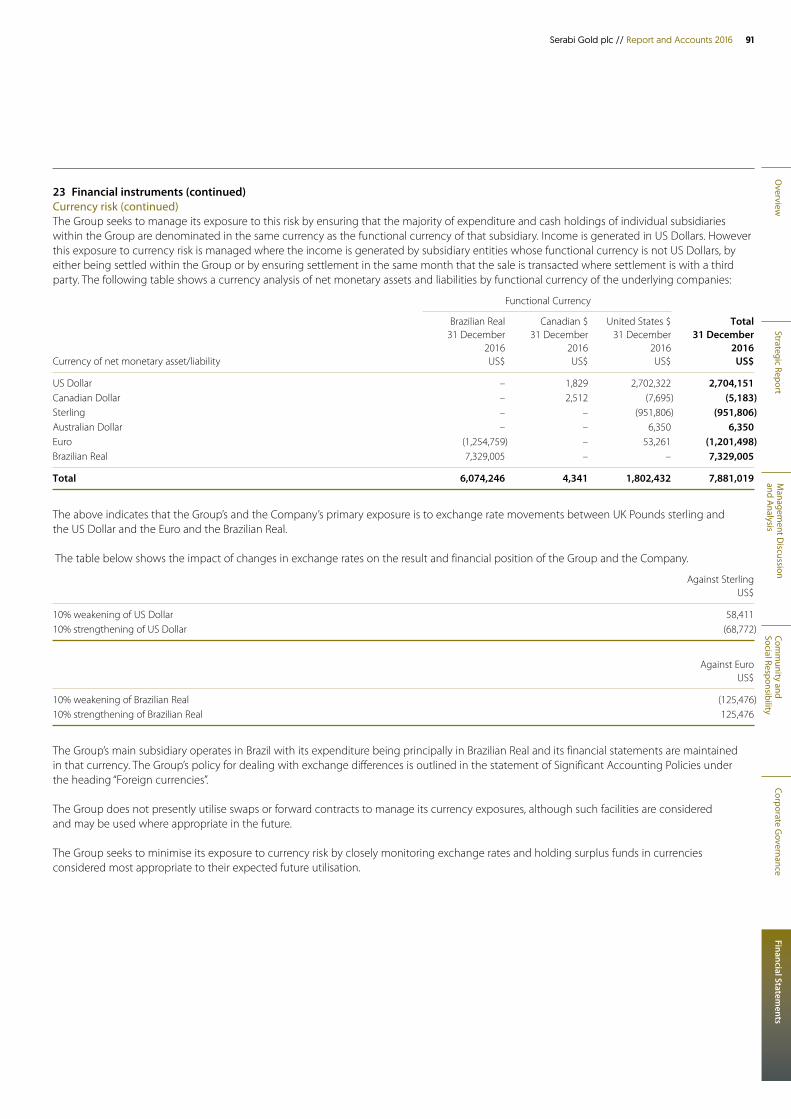
Overview
Strategic ReportM
anagement D
iscussion and A
nalysisCom
munity and
Social ResponsibilityCorporate G
overnanceFinancial Statem
ents
91Serabi Gold plc // Report and Accounts 2016
23 Financial instruments (continued)Currency risk (continued)The Group seeks to manage its exposure to this risk by ensuring that the majority of expenditure and cash holdings of individual subsidiaries within the Group are denominated in the same currency as the functional currency of that subsidiary. Income is generated in US Dollars. However this exposure to currency risk is managed where the income is generated by subsidiary entities whose functional currency is not US Dollars, by either being settled within the Group or by ensuring settlement in the same month that the sale is transacted where settlement is with a third party. The following table shows a currency analysis of net monetary assets and liabilities by functional currency of the underlying companies:
Functional Currency
Brazilian Real Canadian $ United States $ Total 31 December 31 December 31 December 31 December 2016 2016 2016 2016 Currency of net monetary asset/liability US$ US$ US$ US$
US Dollar – 1,829 2,702,322 2,704,151Canadian Dollar – 2,512 (7,695) (5,183)Sterling – – (951,806) (951,806)Australian Dollar – – 6,350 6,350Euro (1,254,759) – 53,261 (1,201,498)Brazilian Real 7,329,005 – – 7,329,005
Total 6,074,246 4,341 1,802,432 7,881,019
The above indicates that the Group’s and the Company’s primary exposure is to exchange rate movements between UK Pounds sterling and the US Dollar and the Euro and the Brazilian Real.
The table below shows the impact of changes in exchange rates on the result and financial position of the Group and the Company.
Against Sterling US$
10% weakening of US Dollar 58,41110% strengthening of US Dollar (68,772)
Against Euro US$
10% weakening of Brazilian Real (125,476)10% strengthening of Brazilian Real 125,476
The Group’s main subsidiary operates in Brazil with its expenditure being principally in Brazilian Real and its financial statements are maintained in that currency. The Group’s policy for dealing with exchange differences is outlined in the statement of Significant Accounting Policies under the heading “Foreign currencies”.
The Group does not presently utilise swaps or forward contracts to manage its currency exposures, although such facilities are considered and may be used where appropriate in the future.
The Group seeks to minimise its exposure to currency risk by closely monitoring exchange rates and holding surplus funds in currencies considered most appropriate to their expected future utilisation.

92 Serabi Gold plc // Report and Accounts 2016
FINANCIAL STATEMENTS
Notes to the Financial Statements continued
23 Financial instruments (continued)Credit risk The Group’s exposure to credit risk is limited to its cash and cash equivalents and trade and other receivables amounting to US$8,647,602 (2015: US$8,325,045). It is the Group’s policy to only deposit surplus cash with financial institutions that hold acceptable credit ratings.
The Group currently sells most of its gold bullion to a single customer. The Group seeks to receive full settlement by bank transfer on delivery of its product to the purchaser to minimise its exposure to any credit risk on that customer.
The Group currently sells most of its copper/gold concentrate production to a single customer, a publicly quoted trading group located in Japan having changed customer in the second half of 2016. Settlement terms are in accordance with industry norms. The customer has a strong reputation within the industry and has a good credit risk history. As at the balance sheet date there were no amounts owed to the Group that were overdue. Whilst the Group has made sales to other parties during the year all amounts due have been settled and therefore there is no credit risk associated with these sales.
The Company’s exposure to credit risk amounted to US$9,125,589 (2015: US$21,565,432). Of this amount US$4,437,562 (2015: US$13,753,874) is due from subsidiary companies, US$3,612,495 represents cash holdings (2015: US$1,781,433) and a significant portion of the remainder represented by trade debtors for the sale of copper/gold concentrate.
24 Ultimate controlling partyFratelli Investments Ltd owns 386,375,734 ordinary shares representing 55.30 per cent of the voting shares in issue and is considered to be the controlling party.
25 Post balance sheet events On 23 February, the Group extended the term for repayment of its secured loan facility with Sprott to 31 August 2017. With this exception there has been no item, transaction or event of a material or unusual nature likely, in the opinion of the Directors of the Company, to affect significantly the continuing operation of the entity, the results of these operations, or the state of affairs of the entity in future financial periods.
Overview
Strategic ReportM
anagement D
iscussion and A
nalysisCom
munity and
Social ResponsibilityCorporate G
overnanceFinancial Statem
ents
93Serabi Gold plc // Report and Accounts 2016
Glossary
“Ag” means silver.
“AISC” means All-In Sustaining Cost – a non IFRS performance measurement established by the World Gold Council.
“Au” means gold.
“assay” in economic geology, means to analyse the proportions of metal in a rock or overburden sample; to test an ore or mineral for composition, purity, weight or other properties of commercial interest.
“CIM” means the Canadian Institute of Mining, Metallurgy and Petroleum.
“CIP” or “Carbon in Pulp” means a process used in gold extraction by addition of cyanide.
“chalcopyrite” is a sulphide of copper and iron.
“Cu” means copper.
“cut-off grade” the lowest grade of mineralised material that qualifies as ore in a given deposit; rock of the lowest assay included in an ore estimate.
“deposit” is a mineralised body which has been physically delineated by sufficient drilling, trenching, and/or underground work, and found to contain a sufficient average grade of metal or metals to warrant further exploration and/or development expenditures; such a deposit does not qualify as a commercially mineable ore body or as containing ore reserves, until final legal, technical, and economic factors have been resolved.
“DNPM” means the Departamento Nacional de Producao Mineral.
“electromagnetics” is a geophysical technique tool measuring the magnetic field generated by subjecting the sub-surface to electrical currents.
“garimpeiro” is a local artisanal miner.
“geochemical” refers to geological information using measurements derived from chemical analysis.
“geophysical” refers to geological information using measurements derived from the use of magnetic and electrical readings.
“geophysical techniques” include the exploration of an area by exploiting differences in physical properties of different rock types. Geophysical methods include seismic, magnetic, gravity, induced polarisation and other techniques; geophysical surveys can be undertaken from the ground or from the air.
“gold equivalent” refers to quantities of materials other than gold stated in units of gold by reference to relative product values at prevailing market prices.
“gossan” is an iron-bearing weathered product that overlies a sulphide deposit.
“grade” is the concentration of mineral within the host rock typically quoted as grams per tonne (g/t), parts per million (ppm) or parts per billion (ppb).
“g/t” means grams per tonne.
“hectare” or a “ha” is a unit of measurement equal to 10,000 square metres.
“indicated mineral resource” is that part of a mineral resource for which quantity, grade or quality, densities, shape and physical characteristics, can be estimated with a level of confidence sufficient to allow the appropriate application of technical and economic parameters, to support mine planning and evaluation of the economic viability of the deposit. The estimate is based on detailed and reliable exploration and testing information gathered through appropriate techniques from locations such as outcrops, trenches, pits, workings and drill holes that are spaced closely enough for geological and grade continuity to be reasonably assumed.
“inferred mineral resource” is that part of a mineral resource for which quantity and grade or quality can be estimated on the basis of geological evidence and limited sampling and reasonably assumed, but not verified, geological and grade continuity. The estimate is based on limited information and sampling gathered through appropriate techniques from locations such as outcrops, trenches, pits, workings and drill holes.
“IP” refers to induced polarisation, a geophysical technique whereby an electric current is induced into the sub-surface and the conductivity of the sub-surface is recorded.
94 Serabi Gold plc // Report and Accounts 2016
“measured mineral resource” is that part of a mineral resource for which quantity, grade or quality, densities, shape, and physical characteristics are so well established that they can be estimated with confidence sufficient to allow the appropriate application of technical and economic parameters, to support production planning and evaluation of the economic viability of the deposit. The estimate is based on detailed and reliable exploration, sampling and testing information gathered through appropriate techniques from locations such as outcrops, trenches, pits, workings and drill holes that are spaced closely enough to confirm both geological and grade continuity.
“mineralisation” the concentration of metals and their chemical compounds within a body of rock.
“mineralised” refers to rock which contains minerals e.g. iron, copper, gold.
“mineral reserve” is the economically mineable part of a measured or indicated mineral resource demonstrated by at least a preliminary feasibility study. This study must include adequate information on mining, processing, metallurgical, economic and other relevant factors that demonstrate, at the time of reporting, that economic extraction can be justified. A mineral reserve includes diluting materials and allowances for losses that may occur when the material is mined.
“mineral resource” is a concentration or occurrence of diamonds, natural solid inorganic material or natural fossilised organic material including base and precious metals, coal, and industrial minerals in or on the Earth’s crust in such form and quantity and of such a grade or quality that it has reasonable prospects for economic extraction. The location, quantity, grade, geological characteristics and continuity of a mineral resource are known, estimated or interpreted from specific geological evidence and knowledge.
“mt” means million tonnes.
“NI 43-101” means Canadian Securities Administrators’ National Instrument 43-101 – Standards of Disclosure for Mineral Projects.
“ore” means a metal or mineral or a combination of these of sufficient value as to quality and quantity to enable it to be mined at a profit.
“oxides” are near surface bed-rock which has been weathered and oxidised by long term exposure to the effects of water and air.
“ppm” means parts per million.
“saprolite” is a weathered or decomposed clay-rich rock.
“sulphide” refers to minerals consisting of a chemical combination of sulphur with a metal.
“tailings” are the residual waste material that it is produced by the processing of mineralised rock.
“tpd” means tonnes per day.
“vein” is a generic term to describe an occurrence of mineralised rock within an area of non-mineralised rock.
“VTEM” refers to versa time domain electromagnetic, a particular variant of time-domain electromagnetic geophysical survey to prospect for conductive bodies below surface.
Glossary continued
Overview
Strategic ReportM
anagement D
iscussion and A
nalysisCom
munity and
Social ResponsibilityCorporate G
overnanceFinancial Statem
ents
Serabi Gold plc // Report and Accounts 2016
Shareholder Information
Serabi Gold plcUK Office2nd Floor 30-32 Ludgate Hill,London EC4M 7DR Tel: +44 (0)20 7246 6830 Fax: +44 (0)20 7246 6831
Serabi Mineração S.A.Av Antonio de Pádua Gomes, no. 737Jardim das Araras, Cidade ItaitubaCEP 8180-120 ParáBrazil
Registered Office66 Lincoln’s Inn FieldsLondon WC2A 3LHEmail: [email protected]: www.serabigold.com
Company Number 5131528
Board of DirectorsSean Harvey – Non-Executive ChairmanMike Hodgson – Chief ExecutiveClive Line – Finance DirectorAquiles Alegria – Non-Executive DirectorNicolas Bañados – Non-Executive DirectorEduardo Rosselot – Non-Executive DirectorFelipe Swett – Non-Executive DirectorMel Williams – Non-Executive Director
Company Secretary Clive Line
Nominated AdviserBeaumont Cornish LimitedBowman House29 Wilson StreetLondon EC2M 2SJ
AuditorBDO LLP55 Baker StreetLondon W1U 7EU
Solicitors – UKFarrer & Co66 Lincoln’s Inn FieldsLondon WC2A 3LH
Legal Counsel – CanadaPeterson McVicar LLP390 Bay Street, Suite 806Toronto, Ontario M5H 2Y2
Brokers – UKPeel Hunt LLPMoor House, 120 London WallLondon EC2Y 5ET
Registrars – UKComputershare Investor Services PLCPO Box 82, The PavilionsBridgwater RoadBristol BS99 7NH
Registrar & Transfer Agent – CanadaComputershare Investor Services Inc100 University Avenue, 8th FloorToronto Ontario M5J 2Y1

Serabi Gold plc
2nd Floor30-32 Ludgate Hill London EC4M 7DR
t +44 (0)20 7246 6830f +44 (0)20 7246 6831e [email protected]
www.serabigold.com