annual report 2018 - fransabank · operating environment, the lebanese financial sector still...
TRANSCRIPT

ANNUAL REPORT2018


We care for the environment The environmentally friendly paper used in this report is from sus-tainable sources and adheres to strict international guidelines for the preservation of the world’s forests and ecosystems.

Consolidated Financial Highlights Statement of the Chairman Corporate Governance • Corporate Governance Framework • Group Chart • Organization Chart - Fransabank SAL • Executive and Management Committees - Fransabank SAL • Management - Fransabank SAL • Local Banking Subsidiaries - Board of Directors and General Managers • Overseas Banking Subsidiaries and Associate - Board of Directors and General Managers
Historical Milestones Management Report • Lebanon’s Economic Performance in 2018 • Consolidated Results of Operations • Main Ratios • Resolutions of Fransabank SAL Ordinary General Assembly • Core Banking Activities - Investment and Private Banking - Corporate Banking - Retail Banking - China Desk • Local Subsidiaries and Associate - BLC Bank SAL - Fransa Invest Bank SAL (FIB) - Lebanese Leasing Company SAL (LLC) - Bancassurance SAL - Société Générale Foncière SAL (Sogefon) • Overseas Subsidiaries, Branches Abroad and Associate - Fransabank (France) SA - Fransabank El Djazaïr SPA - Fransabank OJSC (Belarus) - Fransabank SAL Iraq branches - United Capital Bank (Sudan) • Risk Management • Compliance • Human Resources • Information and Communication Technology • Corporate Social Responsibility • Environmental and Social Management System (ESMS)
Consolidated Financial Statements • Independent Auditors’ Report • Consolidated Statement of Financial Position • Consolidated Statement of Profit or Loss • Consolidated Statement of Profit or Loss and Other Comprehensive Income • Consolidated Statement of Changes in Equity • Consolidated Statement of Cash Flows • Notes to the Consolidated Financial Statements
Group Network • Lebanon - Parent Company, Subsidiaries and Associates • Overseas Subsidiaries and Branches • Overseas Associate • Representative Offices
Contents
2
6
10 16 18 20 21 22 23
26
30 32 43 44 45 45 45 46 46 48 48 48 49 49 49 50 50 50 51 51 51 52 55 57 58 59 63
66 70 72 73 74 76 78
136 140 142 142
FRANSABANK | ANNUAL REPORT 2018 | 0-1

0
30
60
90
120
150
180
210
(in million of USD)Net profit for the financial year
2017201620152014 2018 2017201620152014 2018 2017201620152014 20180
10,000
12,000
14,000
16,000
18,000
20,000
22,000
24,000
0
1,000
2,000
3,000
4,000
5,000
6,000
7,000
166.
98 179.
62 200.
95
179.
33
174.
35
19,9
93.6
6
20,8
54.6
1
22,0
57.0
4
23,6
09.0
6
18,9
42.4
7
5,81
9.06 6,
533.
39
6,48
4.92
6,28
8.59
6,73
9.52
CAGR + 1.09% CAGR + 5.66% CAGR + 3.74%
(in million of USD)Total assets
(in million of USD)Loans & advances to customers (net)
31.12.15
16,306.91
6,288.59
179.62
1,956.34
19,993.66
14.74%
124
3,494
1,507.5
31.12.14
15,346.48
5,819.06
166.98
1,865.74
18,942.47
15.07%
124
3,416
1,507.5
31.12.16
17,007.08
6,533.39
200.95
2,127.06
20,854.61
15.37%
125
3,563
1,507.5
31.12.17
16,595.50 (a)
6,484.92 (a)
179.33
2,151.55
22,057.04
15.40%
124
3,456 (b)
1,507.5
Customers' Creditor Accounts
Loans & Advances to Customers (net)
Net Profit for the Financial Year
Shareholders' Equity
Total Balance Sheet
Capital Adequacy Ratio
Number of Local Branches
Staff Number
Exchange Rate USD/LBP
+6.26%
+8.07%
+7.57%
+4.86%
+5.55%
31.12.18
17,022.85
6,739.52
174.35
2,186.17
23,609.06
16.30%
126
3,381 (b)
1,507.5
In million of USD
+4.29%
+3.89%
+11.88%
+8.73%
+4.31%
-2.42%
-0.74%
-10.76%
+1.15%
+5.77%
prog. 17/16
prog. 16/15
prog. 15/14
Consolidated Financial Highlights
+2.58%
+3.93%
-2.78%
+1.61%
+7.04%
prog. 18/17
(a) The decrease in these figures is due to the deconsolidation at end 2017 of our subsidiaries in Syria and Cyprus
(b) The decrease in the number of employees is due to the deconsolidation of our subsidiaries

0
300
700
900
1,200
1,500
1,800
2,100
2,400
2017201620152014 2018 2017201620152014 2018
2017201620152014 2018
2017201620152014 2018
2017201620152014 2018
0
3,000
6,000
9,000
12,000
15,000
18,000
0
1
2
3
4
5
6
7
8
0
100
200
300
400
16,3
06.9
1
17,0
07.0
8
16,5
95.5
0
2,18
6.17
1,865
.74
1,956
.34
2,12
7.06
2,15
1.55
362.
93
388.
30
396.
04
365.
17
374.
38
39.5
9%
37.9
2%
38.4
2%
39.0
8%
38.5
6%
6.59
7.20
7.107.8
3
6.59
0
5
10
15
20
25
30
35
40
CAGR + 2.63% CAGR + 4.04%
(in million of USD)Customers’ creditor accounts
(in million of USD)Shareholders’ equity
(in million of USD)Net interest income
(in USD)Earnings per common share
Loans & advances to customers tocustomers’ creditor accounts (%)
15,3
46.4
8
17,0
22.8
5
FRANSABANK | ANNUAL REPORT 2018 | 2-3


FRANSABANK | ANNUAL REPORT 2018 | 4-5

2018 was a year of continued progress for Fransabank as we delivered on key strategic objectives and made progress against our plan to achieve profitable and sustainable growth. We follow this path by building responsible and impactful partnerships with our stakeholders, in order to safeguard and transmit wealth to the benefit of the real economy. Within the changing and often challenging operating environment, the Lebanese financial sector still registered sound liquidity and satisfactory deposit growth. Banks have managed to grow their deposit base by an annual growth that is more enough to meet the borrowing needs of the Lebanese economy. At year-end 2018, the banking sector activities registered an increase of 13.25% with total assets amounting to USD 255 billion and customers’ deposits growing by 2.6% while customers’ loans witnessed a slight decrease of 1%. Fransabank Group operated profitably with successful determination to build a stronger and more resilient Bank that is capable of delivering improved returns for our shareholders and added-value to the community. Total assets reached USD 23.61 billion, an increase of 7% from USD 22.06 billion at year-end 2017. Net loans and advances to customers stood at USD 6.74 billion at year-end 2018, up by 4% from year-end 2017. Customers’ deposits amounted to USD 17.02 billion at year-end 2018, an increase of 2.6% from year-end
Adnan Kassar - Chairman Adel Kassar - Deputy Chairman
Statement of the Chairman

FRANSABANK | ANNUAL REPORT 2018 | 6-7
2017. A net profit of USD 174 million in 2018, a slight decrease by 2.8% from USD 179 million in 2017, following a Return on Average Common Equity (ROACE) of 8.53% and Return on Average Assets (ROAA) of 0.83%. In addition, the solvency ratio as per Basle III attained 16.30% by end-December 2018, exceeding the standards required by the Central Bank of Lebanon. At Fransabank, we take a balanced approach towards our regional and international presence, which we have been consolidating, over the years, driven by an active and successful Lebanese Diaspora. As such, we remain close to our corporate clients in foreign markets such as Algeria, Iraq and France, where our subsidiaries and branches are supporting Lebanese companies in their organic growth. Consequently, in 2018, 9% of our net profits were derived from our operations overseas. In Algeria alone, we inaugurated five new branches. Within our strategic relations with China, we joined as a founding member, of the China – Arab Countries Interbank Association founded by the world’s largest development bank, China Development Bank. We have also signed Memorandums of Understanding with the Asian Financial Cooperation Association (AFCA) and with the Lebanese Ministry of Industry to promote cooperation with China. On the other hand, Fransabank OJSC, our subsidiary in Belarus, inaugurated a branch in
“Great Stone” the China-Belarus Industrial Park, the largest overseas industrial park China has invested in. On a different note, our strategic focus on green finance economy lauding Fransabank as a pioneer bank was further confirmed in 2018 by being the first bank in Lebanon and the Levant region to launch green bonds that are exclusively allocated to projects with positive environmental impact. The International Finance Corporation (IFC) and the European Bank for Reconstruction and Development (EBRD) invested respectively USD 45 million and USD 15 million in Fransabank green bonds – series 1, giving a vote of confidence to green finance at Fransabank and in Lebanon. Additionally, Moody’s assessed the operation and has given it an “Excellent” rating. This operation is part of a larger three years green bonds program. This investment from international institutions is a vote of confidence for Lebanon and our Bank in particular. It sends a strong signal with regards to the development of the green market in Lebanon and specifically our role in developing this sector. In adopting our strategic orientations in 2018, we remained focused on performing our core role as a reliable and efficient financial services provider. We always strive to carry out our activities in accordance with clear principles and values – particularly our commitment to operating responsibly and with
integrity in the interests of our stakeholders. We adhere to a strong corporate governance framework and compliance culture; as Fransabank has been unequivocally embracing the banking sector transformation in terms of updated local and international regulations and requirements, as well as in abiding by internationally recognized principles of corporate responsibility. On the human capital side, we continue to shape the Bank’s culture with an emphasis on ethics, training and development, as well as diversity and inclusion. We are harnessing the power of new technologies to better serve our clients as we embrace the potential of digitalization to drive cost efficiencies across our Bank and to support labor-intensive processes. I wish to thank our shareholders for their trust, our clients for their loyalty, and our employees for their dedication and commitment. I am confident that we have a robust base on which to build our future and that we are steadfast in our commitment to build and protect the long-term values of our Bank for the benefit of our communities.
Sincerely,
Adnan Kassar


FRANSABANK | ANNUAL REPORT 2018 | 8-9

Corporate Governance provides the structure through which the objectives of the Bank are set, and the means of attaining them and monitoring performance are defined and determined. Strong Corporate Governance requires having a clear and proper decision-making process that ensures the allocation of responsibility, management of conflicts of interests and an adequate internal control framework. It defines the rights of shareholders in addition to the rights and responsibilities attributed to the directors and managers and spells out the rules and procedures for making decisions on corporate affairs. Fransabank corporate governance framework is set out in the corporate governance code. The code delineates a corporate governance framework in line with the regulatory requirements and international best practices and sets the grounds for other governance policies, charters and codes such as the rights of shareholders’ policy, policy for managing conflicts of interest, disclosure policy, employees’ handbook, etc. All of these are
regularly updated to cope with the evolution of the regulatory framework and to best serve the changing needs of stakeholders. In line with its long standing commitment to sound corporate governance, the Bank launched in 2018 an assessment exercise of its inherent practices seeking to identify areas of advancement to its corporate governance framework. Governance Structure Fransabank governance structure, which aims to provide an efficient framework for the assignment of responsibility and accountability, is designed in a way that facilitates a clearly defined decision-making process. It includes the General Assembly of shareholders; the Board of Directors; the Chairman; the Deputy Chairman; the various committees, control functions; the external auditors; general and senior management and the business and support functions.
ManagementCommittees
ExecutiveCommittee
RemunerationCommittee
CorporateGovernanceCommittee
BoardRisk
Committee
BOARD COMMITTEES
Board of Directors
GENERAL ASSEMBLY (SHAREHOLDERS)
AuditCommittee
Chairman &Deputy Chairman
General Managers
AML/CFTBoard
Committee
GROUP BANKING SUBSIDIARIES, BRANCHES ABROAD AND REPRESENTATIVE OFFICES
BLC GroupFransa Invest
Bank SALFransabank
El Djazaïr SPAFransabank(France) SA
FransabankOJSC
FransabankIraq Branches
Representative OfficeIvory Coast
Corporate Governance &Group Risk Management
GroupInternal Audit
External Audit
GroupCompliance
Inspection
Senior Management
Business &Support Functions
Adnan Kassar Adel Kassar Deutsche Investitions - und Entwicklungsgesellschaft mbH (DEG) (2) Al-Fadl Holdings Limited The Public Institution for Social Security – KuwaitOthers (3)
TOTAL SHAREHOLDING
(1) Percent of total share capital consisting of 21,925,000 Common Shares as at 31.03.2019 (2) DEG is one of Germany’s top development and investment banks. DEG is owned by Kreditanstalt für Wiederaufbau KfW, which, in turn, is owned
by the German Government. (3) Each with less than 2%.
39.81 39.81
5.00 2.70 2.00
10.68
100
PERCENT (1)Main Holders of Common Shares as at March, 2019
FRANSABANK GOVERNANCE STRUCTURE
Corporate Governance Framework
CORPORATE GOVERNANCE
SHAREHOLDERS' GENERAL ASSEMBLY
Fransabank has made the commitment to maintain the highest standards of Corporate Governance and ethics across its Group. The main principles of transparency, accountability, integrity and fairness in the treatment of all stakeholders that the Bank promotes are key to ensure the prosperity of its successful business, to uphold its sustainability, and to create value for the Bank’s stakeholders and the community.

Rights of Shareholders Shareholders enjoy all rights conferred upon them by the Lebanese Code of Commerce, including the right to vote at the General Assembly, the right to receive dividends, the right to transfer their shares and the preferential right to subscribe to capital increases. All common shareholders, including minority shareholders, enjoy the same rights and benefits and have one voting right for each common share (the principle of one share, one vote) without limitation. Shareholders who own registered shares for at least two years are entitled to a double voting right according to Article 117 of the Lebanese Code of Commerce. Board of Directors The Board of Directors is entrusted with the duty of ensuring the proper management of the Bank in the best interest of its shareholders, depositors, and other stakeholders, in accordance with applicable laws and regulations. A charter of the Board of Directors is developed in line with the prevailing Lebanese laws & regulations and international good practices. The charter defines, among other things, the composition, roles and responsibilities and the authority of the Board of Directors. The Board has overall responsibility of the Bank, including adopting and overseeing the implementation of the Bank’s strategic objectives, risk strategy, risk policies, corporate governance and corporate values, as well as ensuring that adequate, effective and independent controls are in place. The Board also exercises adequate oversight over the Group entities and ensures that each entity of the Group adopts corporate governance policies and mechanisms appropriate to its structure, business and risks. The Board of Directors is composed of twelve members elected by the General Assembly of Shareholders for a renewable mandate of three years. The ‘Board Members Succession Plan’ clearly defines the criteria and conditions for the nomination and selection of Board members. Shareholders have the power, through the General Assembly, to remove Directors ad nutum, at any time and without cause, even before the expiration of their tenor. The Board consists of a mix of executive, non-executive and independent members. The majority of its members qualify as non-executive. This composition aims to safeguard the governance and effectiveness of the Board of Directors and to ensure the objective of adding value to all shareholders, investors, clients and community in the short, medium and long terms.
During 2018, the Board of Directors has met four times. Also, the Board carries out an annual collective evaluation with the aim to eventually come out with areas of improvements related to Board structure & committees, meetings & procedures, as well as the Board role and responsibilities.
FRANSABANK | ANNUAL REPORT 2018 | 10-11
25%
17%58%
Executive
Non-Executive
IndependentNon-Executive
BOARD COMPOSITION
MIX OF SKILLS OF NON-EXECUTIVE BOARD MEMBERS
Law / Politics
Consultancy
BusinessAdministration
Banking /Financial Services

CORPORATE GOVERNANCE
Biographies of Board Members
H.E. Mr. Adnan Kassar is the Chairman & CEO of Fransabank Group and member of the Board of Directors of BLC Bank SAL and Fransabank (France) SA. He is also the Chairman of the Supervisory Board of Fransabank OJSC in Belarus. He and his brother Adel acquired Fransabank in 1980. Mr. Kassar served as Minister of Economy and Trade in Lebanon from 2004 to 2005 and Minister of State in Lebanon from 2009 to 2011. He was the first Arab businessman elected Chairman of the International Chamber of Commerce (ICC) and headed the World Business Organization from 1999 to 2000. He is also former President of the Lebanese Federation of Chambers of Commerce, Industry and Agriculture in Lebanon and headed this Federation for over thirty years (from 1972 to 2002).
He is the Honorary President of the Lebanese Economic Organizations and Honorary Chairman of the Arab Union of Chambers which groups millions of companies and associations from the 22 member Arab countries. He is the Honorary Chairman of the Silk Road Chamber of International Commerce (SRCIC) elected in 2016. Mr. Kassar has received global awards and high distinguished decorations from many Heads of States and International Organizations including the Oslo Business for Peace Award in 2014 and the “China Arab Outstanding Contribution” Award from China’s President Xi in 2016. He holds a law degree from Saint Joseph University, Beirut and an Honorary Doctorate from the Lebanese American University. www.adnankassar.com
H.E. MR. ADNAN KASSAR Executive Director | Chairman of the Board of Directors
Born in 1930 - Lebanon
Born in 1932 - Lebanon
Born in 1937 - France
MR. ADEL KASSAR Executive Director | Deputy Chairman of the Board of Directors
MR. ANTOINE JEANCOURT GALIGNANI Non-Executive Director | Chair of the Audit Committee and the Corporate Governance Committee
Mr. Adel Kassar is the Deputy Chairman and Chief Executive Officer of Fransabank Group. He is the Chairman of the Board of Directors of Fransabank (France) SA. He is also the Chairman of the Board of Directors and General Manager of Bancassurance SAL and Lebanese Leasing Company SAL. He is member of the Board of Directors of BLC Bank SAL and member of the Supervisory Board of Fransabank OJSC in
Belarus. He and his brother Adnan acquired Fransabank in 1980. He is a former Chairman of the Association of Banks in Lebanon and is the Honorary Consul General of the Republic of Hungary in Lebanon. He holds a degree in Lebanese and French law from Saint Joseph University, Beirut, affiliated to the Faculty of Law of Lyon, France.
Mr. Antoine Jeancourt Galignani started his career at the French Ministry of Finance and later joined Chase Manhattan Bank in New York and Crédit Agricole. He was appointed as Managing Director, then Chairman of Bank Indosuez. He was also member of the Board of Directors of Banque Saudi Fransi, in Saudi Arabia and the Chairman and CEO of AGF, which was later acquired by Allianz Group and the Chairman of the
holding company of SNA. He also served in numerous Boards such as TOTAL, Bouygues and Société Générale and he chaired the Board of the Institute of International Finance in Washington from 1991 to 1994. Mr. Galignani was until the 1st of December 2012 the Chairman of the Board of Eurodisney France. He holds a master degree in economics and political sciences from ENA, France.

FRANSABANK | ANNUAL REPORT 2018 | 12-13
Born in 1947 - Germany MR. BERND TÜMMERS Non-Executive Director | Member of the Board Risk Committee
MRS. MAGDA RIZK Non-Executive Director | Chair of the AML/CFT Board Committee
H. E. MR. NEHMÉ TOHMÉ Non-Executive Director
H.E. MR. WALID DAOUK , ESQ. Non-Executive Director | Member of the Audit Committee, the Corporate Governance Committee,
the AML/CFT Board Committee and the Remuneration Committee
Mr. Bernd Tūmmers began his career working in various roles for large manufacturing, engineering and construction companies in Germany and the US, before settling in for a longer stint at Ford Europe, where he prepared investment decisions for its European subsidiaries. In 1980, he made the move to his long-term employer Deutsche Investitions- und Entwicklungs-gesellschaft mbH (DEG), Cologne - member of the KFW Banking Group. Starting as an Investment Manager executing transaction in South Asia, he then progressed to Head of Department in charge of DEG’s overall activities in both South and East Asia; before accepting a role as Senior Vice President, as which Mr. Tūmmers was responsible for DEG’s investments in approximately
500 companies worldwide with an investment volume of approximately USD 6 billion for over a decade. After an internal restructuring of the company, Mr. Tümmers transitioned to a senior VP role in charge of structured finance globally, where he oversaw the execution of on average 100 transactions annually worth circa USD 1.2 billion. After his retirement in 2012, he founded a consulting firm and became a partner of AdminiStraight GmbH, a company advising German companies in different fields. Throughout his career, he has served as a director on numerous boards across multiple industries on behalf of DEG in Asia, Africa and Eastern Europe. He holds an MBA from University of Cologne, Germany.
Mrs. Magda Rizk is the owner and manager of Rizk Real Estate and Agricultural Properties. She chaired the Remuneration Committee and was member of the Risk Management Committee at Fransabank SAL until December 2016. She was also a member of the
Audit Committee at Fransabank SAL from 2008 to 2012. She is a specialized lawyer in property law and a member of the Beirut Bar Association. She holds a degree in Lebanese and French law from Saint Joseph University, Beirut.
The Public Institution for Social Security is a public institution which has an independent budget and is under the supervision of the Minister of Finance. The Institution has a Board of Directors, chaired by the Minister of Finance and a General Manager who is responsible for executing the policy as drawn-up by the Board of Directors. The Public Institution for Social Security is represented by Mr. Mohammad Al-Qassar in the Board of Directors.
Mr. Nehmé Tohmé is a Lebanese businessman, civil engineer by profession and politician who served as Minister in the Lebanese Government from 2005 until 2008 and as a member of parliament from 2000 until present day. Mr. Tohmé is also the Chairman of Almabani General Contractors a Saudi Based Construction company. Throughout his career, Mr. Tohmé has diversified his investment portfolio into
banking, real estate development, hotel resorts and bio agriculture. He sits on a number of boards in which he is an active shareholder. In 2002, Mr. Tohmé founded the “Nehmé & Thérèse Tohmé Foundation”, a private foundation dedicated to the family’s philanthropic endeavours in tackling extreme poverty, healthcare and education. He holds a BS in civil engineering from the American University of Beirut.
H.E. Mr. Walid Daouk, Esq is a specialized lawyer in commercial law, civil corporate and property law. He started his career in 1981, as an associate in Takla & Trad law firm becoming thereafter a partner. In 2005, he occupied the position of Vice Chairman at the International Affairs Commission at the Beirut Bar Association, and in 2008, he became a member of the Arbitration Commission. In 2011, he was appointed Minister of Information and Minister of Justice per interim. After the termination of his appointment in 2014, he resumed his practice as lawyer, legal consultant and managing partner in above mentioned firm. He is a lawyer and legal advisor for multinational and Lebanese companies performing business in
various fields. Also, he is a board member of many corporations in Lebanon and abroad including Fransabank SAL, Fransabank (France) SA, Fransabank El Djazaïr SPA, BLC Bank SAL, Semiramis SAL, Beirut Waterfront Development SAL, Tourism and Hotel Development Company SAL. He was a member of the Board of Directors of the Council for Development and Reconstruction of Lebanon (CDR) 2001-2004. He is the Commissioner of the Lebanese Government at the Beirut Stock Exchange since 1994. He holds a degree in Lebanese and French law from Saint Joseph University, Beirut and had prepared a degree in business management at the Beirut University College.
THE PUBLIC INSTITUTION FOR SOCIAL SECURITY – KUWAIT Non-Executive Director
Born in 1957 - Lebanon
Born in 1939- Lebanon
Born in 1958- Lebanon

Born in 1939 - Lebanon
Born in 1964 - Lebanon
Born in 1947 - France
Born in 1941 - Lebanon
CORPORATE GOVERNANCE
Mr. Rafic Charafeddine is a businessman, and has participations in various companies. He deals in construction projects and real estate investments.
MR. RAFIC CHARAFEDDINE Non-Executive Director | Chair of the Remuneration Committee
MR. NADIM KASSAR Executive Director
MR. HENRI GUILLEMIN Non-Executive Director | Chair of the Board Risk Committee
Mr. Nadim Kassar is the General Manager of Fransabank SAL. He is also Chairman and General Manager of BLC Bank SAL, founder and Board member of Fransa Invest Bank SAL (FIB), Founder and Chairman of Fransabank El Djazaïr SPA. In 2019, Mr. Kassar was elected as Vice-Chairman for the Association of Banks in Lebanon (ABL), where he was Board member since 2001. In addition, he has been lately nominated Co-Chairman of Mastercard Middle East and Africa Advisory Board of Directors, while he occupied since 2005 the position of Board member for Mastercard Incorporated Asia, Pacific, Middle East & Africa,
APMEA Regional Board of Directors. Mr. Kassar is also a Board member of the following institutions: Lebanese International Finance Executives (LIFE), NetCommerce, Interbank Payment Network (IPN) SAL, Credit Card Management (CCM) and Founder & Board member of the American Lebanese Chamber of Commerce (ALCC). He is also the Deputy Chairman of Société Financière du Liban SAL and the General Manager of A.A. Kassar SAL. He holds a bachelor’s degree in business administration from the American University of Beirut.
Mr. Henri Guillemin started his career at Crédit Lyonnais. He then joined Indosuez Bank in 1978 and was appointed at different management positions in Singapore, Saudi Arabia (Jeddah and Riyadh), Bahrain and Paris. He became Managing Director of Banque Saudi Fransi in Riyadh in 1993 for four years and then was promoted Director for the Middle East and Africa
region for Crédit Agricole Indosuez, based in Paris. Mr. Guillemin was the Managing Director of Crédit Agricole Egypt SAE, Cairo between 2007 and 2011. He holds a degree in economic sciences from Sorbonne University, Paris, as well as a degree in political studies, and an MBA degree from INSEAD Fontainebleau.
DR. WALID NAJA (Mandate till 30 May 2019) Non-Executive Director | Member of the Board Risk Committee, the Audit Committee,
the Corporate Governance Committee and the Remuneration Committee
Dr. Walid Naja is former Chairman of the Banking Control Commission - Central Bank of Lebanon. He previously served as economic counsellor at the Lebanese Embassy in Washington D.C., and General Manager of the Federation of Chambers of Commerce,
Industry and Agriculture in Lebanon. He holds graduate degrees in economics and international relations from the American University of Beirut and Yale University, USA.
Born in 1963 - LebanonMR. MOHAMED ALI BEYHUM (Mandate starting 30 May 2019) Non-Executive Director | Member of the Board Risk Committee, the Audit Committee, the AML/CFT Board Committee,
the Corporate Governance Committee and the Remuneration Committee
Mr. Mohamed Ali Beyhum started his banking career at Irving Trust in New York and spent 5 years with The Bank of New York, NY. He was then appointed Vice President and Senior Representative of The Bank of New York in their regional office in Beirut. In 2005, he joined Bankmed Group and was responsible for the strategic expansion and business development in the MENA region and the overall restructuring of the organization. In 2010, he was appointed as Executive
General Manager at Bankmed Group and served on the boards of various banking group entities until 2018. In the 2nd quarter of 2019, he was elected as the Chairman of Valpre Capital. Mr. Beyhum holds a master’s degree in industrial management from Columbia University, New York and a bachelor of engineering in mechanical engineering from the American University of Beirut.

FRANSABANK | ANNUAL REPORT 2018 | 14-15
In carrying out its oversight responsibilities, the Board is supported by the Corporate Governance Committee, Board Risk Committee, Audit Committee, the Remuneration Committee and Anti-Money Laundering / Combating the Financing of Terrorism (AML/CFT) Board Committee. These committees are chaired by independent non-executive members. Each of the Board committees has its own charter that defines each committee’s scope of work, membership structure and composition, meetings as well as its roles and responsibilities. The charters are regularly updated to ensure compliance with local and international standards. The Corporate Governance Committee, Risk Committee, Audit Committee and AML/CFT Board Committee meet at least quarterly and when necessary. The Remuneration Committee is set to meet at least semi-annually. Corporate Governance Committee The responsibility of the Corporate Governance Committee is to provide oversight of all material corporate governance issues affecting the Bank and its subsidiaries and to ensure that Fransabank corporate governance practices are in line with the regulatory requirements and international best practices. Risk Committee The Board Risk Committee’s responsibilities are to assist the Board of Directors in fulfilling its risk-related duties and to oversee the proper implementation of the risk management principles. In discharging its responsibilities, the committee monitors the Bank’s risk profile vis-à-vis its risk appetite through the reports submitted by the Group Chief Risk Officer to the Board Risk Committee prior to presenting them to the Board of Directors. The committee is also responsible for recommending to the Board of Directors the Bank’s risk policies including the risk appetite and risk tolerance. Audit Committee The Audit Committee assits the Board of Directors in its oversight responsibilities regarding the: • Evaluation of the internal control regulations and procedures • Assessment of the qualifications and independence of the
external auditors • Supervision of the internal audit’s activities • Integrity of the financial statements • Review of the Bank’s disclosure standards. Remuneration Committee The responsibility of the Remuneration Committee is to ensure that the Bank has comprehensive remuneration policies and procedures. The committee defines the remuneration system and submits it to the Board of Directors for approval. It also controls the proper implementation of the remuneration policy and reviews periodically (at least annually) the basic rules and principles of the Bank’s remuneration policy in order to ensure that the set objectives are attained. AML/CFT Board Committee The AML/CFT Board Committee supports the Board of Directors in exercising its supervisory mission and role, in the context of
fighting money laundering and financing of terrorism, in understanding the relevant risks, and in helping the Board take appropriate decisions in this regard. The committee reviews and approves the AML/CFT Policy & Procedures and the proper incentive required for its full implementation. It also examines the suspicious cases and transactions and takes appropriate decisions thereupon. Management Senior management undertakes and manages the Bank’s activities under the direction and oversight of the Board. Members of senior management are responsible and are held accountable for overseeing the day-to-day management of the Bank. The Chairman of the Board may suggest to the Board the appointment of one or more General Managers and Deputy General Managers, who shall act for account and under the full responsibility of the Chairman. Specialized management committees are established, whose members include senior staff, having the responsibility to set strategies and take decisions as necessary for the development of the Bank’s activities and to ensure a proper management of any potential conflict of interest. Conflicts of Interest Fransabank has a policy for managing conflicts of interest that sets the ‘tone at the top’ in terms of the principles to abide by to prevent and manage any cases of conflicts of interest. A conflict of interest is a situation where different parties have interests that conflict with each other. Such conflicts may arise between: (i) the interests of customers on the one hand and the interests
of the Bank or its related parties or its employees on the other,
(ii) the interests of a customer on the one hand and the interest of another customer on the other.
The Bank will always strive to have in place (i) preventive measures to avoid operations that would create material conflicts of interest as well as (ii) an effective organizational and administrative framework, covering all hierarchical levels, for dealing with conflicts of interest. Control Functions The internal control system is a set of rules and controls governing the Bank’s organisational and operational structure. It is based on interrelated components, among which, the adoption of a clear and documented organizational structure, the assessment of risks, the adoption of systems for risk assessment & monitoring, and a continuous monitoring process through reporting any identified weakness or any violation to the existing policies and procedures. It is designed to ensure process integrity, compliance and effectiveness as well as provide reasonable assurance that financial and management information is reliable, timely and complete. The Bank recognizes the importance of implementing a solid and sound structure for control functions, namely the risk management, compliance, internal audit and inspection functions, which shall ensure that the Bank’s activities are performed in accordance with the prevailing laws and regulations as well as with the Bank’s policies and procedures.
Board Committees
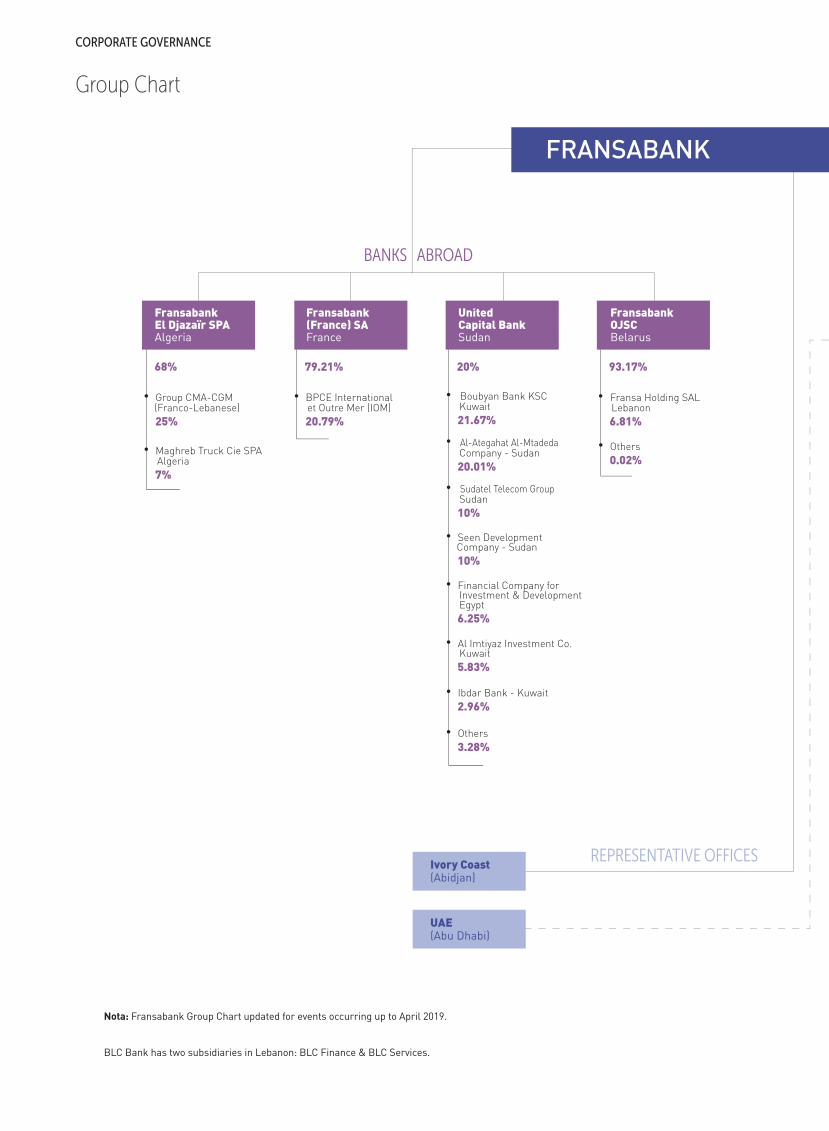
68%
• Group CMA-CGM (Franco-Lebanese)
25%
• Maghreb Truck Cie SPA Algeria
7%
79.21%
• BPCE International et Outre Mer (IOM)
20.79%
20%
• Boubyan Bank KSC Kuwait
21.67%
• Seen Development Company - Sudan
10%
• Al-Ategahat Al-Mtadeda Company - Sudan
20.01%
• Sudatel Telecom Group Sudan
10%
• Financial Company for Investment & Development Egypt
6.25%
• Al Imtiyaz Investment Co. Kuwait
5.83%
• Others
0.02%
• Ibdar Bank - Kuwait
2.96%
• Others
3.28%
93.17%
• Fransa Holding SAL Lebanon
6.81%
Nota: Fransabank Group Chart updated for events occurring up to April 2019.
BLC Bank has two subsidiaries in Lebanon: BLC Finance & BLC Services.
Fransabank(France) SAFrance
UnitedCapital BankSudan
FransabankOJSCBelarus
FransabankEl Djazaïr SPA Algeria
FRANSABANK
BANKS ABROAD
REPRESENTATIVE OFFICESIvory Coast(Abidjan)
UAE(Abu Dhabi)
Group Chart
CORPORATE GOVERNANCE

81.88% 100%
• Others
11.87%
37.067%
75 branches in Lebanon and 2 branches in Iraq
50 branches in Lebanon
6.25%BLC BankSAL
SAL
FransaInvest BankSAL
Bank of Beirut andthe Arab CountriesSAL
BANKS IN LEBANON
COMPANIES IN LEBANON
50%
• Banque Libano-Française SAL
40%
• BLC Bank SAL
10%
99.99% 99.88% 99.70% 99.70% 96.70%
Lebanese LeasingCompany SAL
Fransabank Insurance Services Co SAL
SogefonSAL
ExpressSARL
Switch & ElectronicServices SAL
BancassuranceSAL
FRANSABANK | ANNUAL REPORT 2018 | 16-17
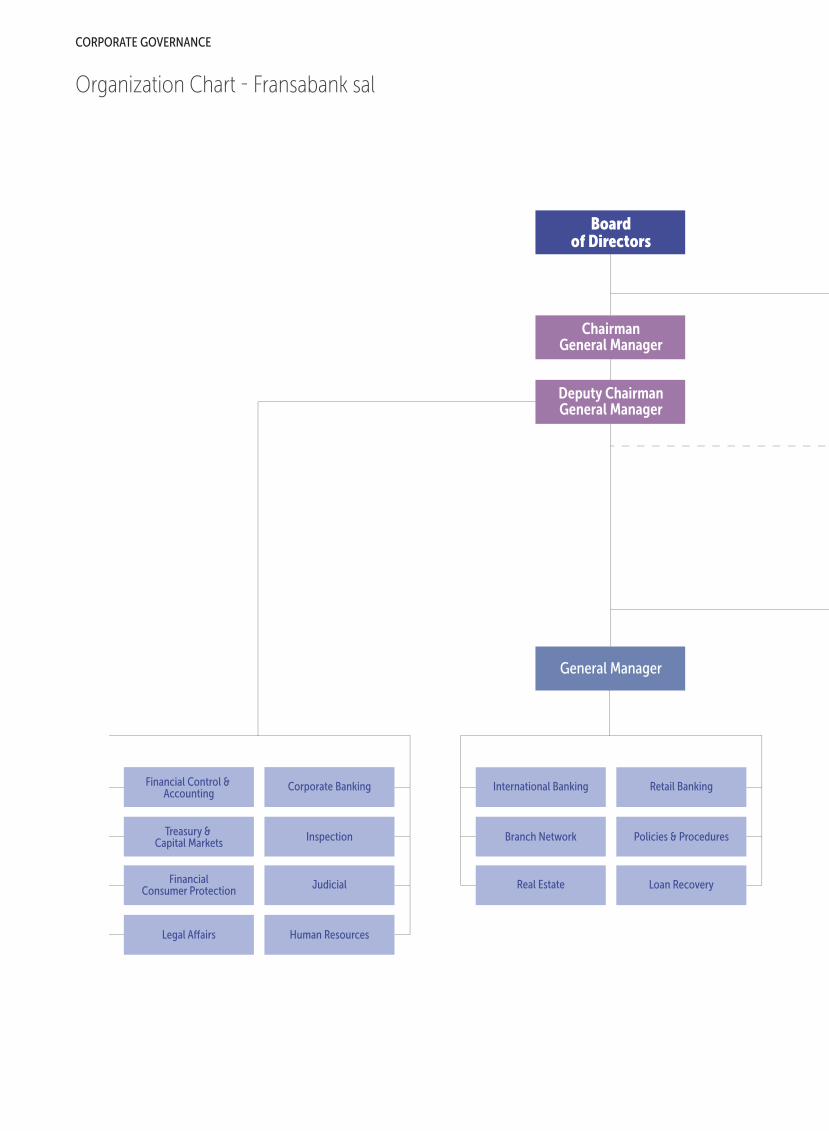
Boardof Directors
ChairmanGeneral Manager
General Manager
Financial Control & Accounting
Corporate Banking
Treasury & Capital Markets
Inspection
FinancialConsumer Protection
Legal Affairs
Judicial
Human Resources
International Banking Retail Banking
Branch Network Policies & Procedures
Real Estate Loan Recovery
Deputy ChairmanGeneral Manager
Organization Chart - Fransabank sal
CORPORATE GOVERNANCE

FRANSABANK | ANNUAL REPORT 2018 | 18-19
RiskManagement
InternalAudit Compliance
Central OperationsMarketing & Corporate
Communication
Credit Appraisal Administration
Credit Information
Credit Reporting & Documentation
Engineering & Logistics
ICT & Projects
Security & Business Continuity Organization
General Manager

H.E. Mr. Adnan Kassar Chairman General Manager
& or
Mr. Adel Kassar Deputy Chairman General Manager
Mr. Nadim Kassar General Manager
H.E. Mr. Mansour Bteish* General Manager
Mr. Nabil Kassar General Manager
H.E. Mr. Walid Daouk, Esq.
Mr. Nabih Saddy Group Chief Financial Officer
Mr. Nabil Tannous Head of Treasury & Capital Markets
Miss Mona Khoury Group Chief Risk Officer (Non-voting Member)
Clientele Risks Committees
Asset/Liability Committee
Overseas Expansion Committee
ICT Committee
Information Security Committee
Compliance Committee
Human Resources Committee
Marketing & Corporate Communication Committee
Commercial Product Committee
Purchasing Committee
MANAGEMENT COMMITTEES
EXECUTIVE COMMITTEE
Executive and Management Committees – Fransabank SAL
CORPORATE GOVERNANCE
*till end of February 2019, as he was appointed Minister of Economy and Trade

FRANSABANK | ANNUAL REPORT 2018 | 20-21
Management – Fransabank SAL
Mr. Nadim Kassar General Manager H.E. Mr. Mansour Bteish General Manager (till end of February 2019) Mr. Nabil Kassar General Manager Dr. Mohamad Daher Deputy General Manager, Head of Corporate Banking Mr. Philippe El Hajj Deputy General Manager, Head of Retail Banking Miss Mona Khoury Deputy General Manager, Group Chief Risk Officer Mr. Nabih Saddy Deputy General Manager, Group Chief Financial Officer Mr. Nabil Tannous Deputy General Manager, Head of Treasury & Capital Markets Mr. Wajdi Abi Chacra Secretary General
Mr. Georges Andraos Head of International Banking Mr. Zouheir Chouraiki Group Chief Internal Auditor Mr. Fouad Khalifeh Group Chief Compliance Officer Mr. Pierre Posbic Head of Organization Mr. Antoine Asmar Business Development Consultant, Corporate Banking Mr. Roland Tabib Chief Information Officer Mr. Zakaria El Khatib Head of Inspection Mr. Fouad Helou Head of Central Operations Mrs. Dania Kassar Head of Marketing & Corporate Communication Mr. Antoine Younes Head of Credit Appraisal Mr. Antoine Zarifeh Head of Branch Network Mr. Khalil Assaf Head of Special Credits Mrs. Gretta Boustany Head of Trade Finance Mrs. Lama Dick Head of Local & Overseas Credit Cards Mrs. Lama Ghoutaymi Head of Loan Recovery Miss Rania Jamal Head of Human Resources Miss Hoda Kadi Head of Policies & Procedures Mrs. Magida Kasbani Head of Administration Mr. Adel Moubarak Head of Security & Business Continuity Mr. Roger Abboud Head of Credit Information Mrs. Dalal Halabi Head of Credit Reporting & Documentation Mr. Nagi Makhlouf Head of Engineering & Logistics Me. Joumana Oueidat Head of Judicial Mrs. Sawsan Rawda Head of Financial Consumer Protection Mrs. Najwa Sandid Regional Manager, Beirut I Mr. Antoine Nehmeh Regional Manager, Beirut II Mr. Raed Hajj Regional Manager, Beirut III Mr. Francis Abi Nakhoul Regional Manager, Mount Lebanon, Group A Mr. Marwan Youssef Regional Manager, Mount Lebanon, Group B Mr. Amine Abou Mhaya Regional Manager, Bekaa Mr. Nazih Chaarani Regional Manager, North Mr. Mahmoud Salameh Regional Manager, South Mr. Mohamed Achi El Saadi Area Manager, Beirut I
H.E. Mr. Adnan Kassar Chairman General Manager
Mr. Adel Kassar Deputy Chairman General Manager
GENERAL MANAGEMENT
MANAGEMENT
LOCAL NETWORK MANAGEMENT

Local Banking Subsidiaries Board of Directors and General Managers
CORPORATE GOVERNANCE
LEBANON
BLC Bank SAL
Board of Directors
Mr. Nadim Kassar Chairman General Manager
Mr. Nabil Kassar Deputy Chairman
H.E. Mr. Adnan Kassar Member
Mr. Adel Kassar Member
H.E. Mr. Walid Daouk, Esq. Member
H.E. Mr. Mansour Bteish Member
H.E. Mr. Nazem El Khoury Member
Mr. Henri De Courtivron Member
H.E. Mr. Ziyad Baroud, Esq. Member
Mr. Sarkis Yoghourtdjian Member
General Manager & CEO Mr. Bassam Farid Hassan
Fransa Invest Bank SAL
Board of Directors
Mr. Nabil Kassar Chairman General Manager
Fransabank SAL Member
Mr. Nadim Kassar Member
H.E. Mr. Walid Daouk, Esq. Member
H.E. Mr. Mansour Bteish Member
Mr. Mohammed Mou'minah Member
Mr. Michel Saroufim Member
Mr. Henri Guillemin Member
Mr. Ghantous Gemayel Member General Manager Mr. Michel Saroufim
BLC Finance SAL
Board of Directors
H.E. Mr. Mansour Bteish Chairman General Manager
Fransabank SAL Member
BLC Bank SAL Member
BLC Services SAL
Board of Directors
H.E. Mr. Nazem El Khoury Chairman General Manager
BLC Bank SAL Member
H.E. Mr. Walid Daouk, Esq. Member
Mr. Khaled Salman Member

FRANSABANK | ANNUAL REPORT 2018 | 22-23
Overseas Banking Subsidiaries & Associate Board of Directors and General Managers
BELARUS
Fransabank OJSC
Supervisory Board
H.E. Mr. Adnan Kassar Chairman, representing Fransabank SAL
Mr. Adel Kassar Deputy Chairman, representing Fransa Holding
Mr. Ghantous Gemayel Member, Independent Director
Mr. Franz Josef Flosbach Member, Independent Director
Mr. Georges Andraos Member General Manager Mr. Alexander Ignatov
FRANCE ALGERIA
Fransabank (France) SA
Board of Directors
Mr. Adel Kassar Chairman
BPCE IOM, Vice Chairman represented by Mr. Jean-Pierre Levayer
Fransabank SAL, Member represented by Mr. Nabil Kassar
H.E. Mr. Adnan Kassar Member
H.E. Mr. Mansour Bteish Member
H.E. Mr. Walid Daouk, Esq. Member
Mr. Yvan de La Porte du Theil Member
Mrs. Patricia Lantz Member
Mr. Henri de Courtivron Member General Manager Mr. Andre Tyan
SUDAN
United Capital Bank
Board of Directors
Mr. Tarig Hamza Zain El Abdein Chairman representing Sudatel Company, Sudan H.E. Mr. Mansour Qaiser Bteish Vice Chairman Mr. Abdulsalam Alsaleh Member representing Boubyan Bank, Kuwait Mr. Tarig Sir-Elkhatim Mohamed Member representing Seen Development Company, Sudan Mr. Mohamed Farah Idris Member representing Al-Ategahat Al-Mtadeda Company, Sudan Mrs. Amira Al Alami Member representing Financial Company for Investment and Development - Egypt
Mr. Al Sherif Ahmad Badur Member Independent Director
Prof. Ahmed Majzoub Ahmed Member Independent Director
Mr. Yousif Ahmed El-Tinay Member & General Manager Mr. Elamin Mohamed Ahmed Secretary of the Board General Manager Mr. Yousif Ahmed El-Tinay
Fransabank El Djazaïr SPA
Board of Directors
Mr. Nadim Kassar Chairman
Fransabank SAL, Member represented by Mr. Nabil Kassar
CMA CGM SA, Member represented by Mr. Raja Sarkis
Merit Corporation SAL, Member represented by Mr. Raja Sarkis
H.E. Mr. Walid Daouk, Esq. Member
H.E. Mr. Mansour Bteish Member General Manager Mr. Mohammed Tifour


FRANSABANK | ANNUAL REPORT 2018 | 24-25

Fransabank was first established in Beirut as a full branch of one of the major French banks then, Crédit Foncier d’Algérie et de Tunisie (C.F.A.T.). Fransabank is registered n° 1 on the list of banks operating in Lebanon.
Société Centrale de Banque in Beirut was acquired by Banque Française pour le Moyen-Orient SAL (B.F.M.O.), a Lebanese company whose shares were predominantly owned by Banque Indosuez Group.
C.F.A.T. changed its name to Société Centrale de Banque.
Banque Indosuez was also the major shareholder of Banque Sabbag SAL. Banque Indosuez merged these two banks under the name of Banque Sabbag et Française pour le Moyen-Orient SAL.
The Bank’s denomination was changed to Fransabank SAL. Fransabank concluded a cooperation agreement with Crédit Agricole SA – France. It led at first to the joint creation in Paris of Fransabank (France) SA, and to the participation of Crédit Agricole SA - France in the shareholding of Fransabank SAL. In line with its global strategy, Crédit Agricole SA exited from Fransabank (France) SA in 2007 and from Fransabank SAL shareholding in 2012.
Fransa Invest Bank SAL (FIB), the investment banking subsidiary of Fransabank started its operations.
Fransabank acquired 37.067% in BBAC SAL.
Fransabank acquired all the shares of Banque de la Békaa SAL, which was sold as an empty shell in 2007.
Fransabank is the first and only Lebanese Bank to enter the Algerian market with the opening of its subsidiary Fransabank El Djazaïr SPA. Fransabank launched its operations in Sudan through an associate bank, United Capital Bank.
Fransabank acquired BLC Bank SAL along with its two subsidiaries, BLC Services SAL and BLC Finance SAL. Fransabank concurrently purchased 34% of the share capital of Fransabank (France) SA held by Crédit Agricole SA and sold 40% of the share capital of Fransabank (France) SA to Financière Océor, a subsidiary of Groupe Caisse d’Epargne (France) - currently BPCE. At present, Fransabank share in Fransabank (France) SA is 79.21%
Fransabank acquired United Bank of Saudi & Lebanon SAL.
Banque Indosuez sold its shares in Banque Sabbag et Française pour le Moyen-Orient SAL to a financial group headed by Messrs. Adnan & Adel Kassar.
1921
2001 2002 2003 2005 2006 2007
1963 1971 1978 1980 1984
Historical Milestones

FRANSABANK | ANNUAL REPORT 2018 | 26-27
Fransabank acquired Banque Tohmé SAL.
A private placement of shares took place, pursuant to which 5% of the Bank’s shares were sold to Lebanese, Arab and foreign investors. The Public Institution for Social Security – Kuwait, acquired 2% of the Bank’s share capital.
Fransabank concluded an agreement with Deutsche Investitions - und Entwicklungs-gesellschaft mbH (DEG), which led to the acquisition by DEG of 5% of the Bank’s share capital. Fransabank established the Lebanese Leasing Company SAL.
Fransabank acquired Universal Bank SAL.
BLC Bank SAL opened its representative office in Abu Dhabi.
Fransabank inaugurated its two branches in Baghdad and in Erbil- Kurdistan, Iraq. Fransabank acquired and merged Ahli International Bank SAL.
Fransabank established a representative office in Abidjan - Ivory Coast.
Fransabank acquired Fransabank OJSC - Belarus, formerly known as Golden Taler Bank.
Fransabank acquired the assets & liabilities of Chase Manhattan Bank’s branches in Beirut.
Fransabank launched Green Bonds exclusively dedicated to finance green energy projects. Fransabank joined as a founding member of the China – Arab Countries Interbank Association.
Fransabank established its insurance arm through its associated Company, Bancassurance SAL.
2008 2012 2014 2015 2018
1985 1993 1995 1997 1998 1999


FRANSABANK | ANNUAL REPORT 2018 | 28-29

While 2018 reported a setback in Lebanon’s national economic growth, it was still non-recessionary as no net contraction in the national real economy was registered. Thus, economic growth reached 0.25% for 2018 as per the International Monetary Fund (IMF) estimates, relative to 0.6% growth in 2017 and 1.6% in 2016 as per the Central Administration of Statistics figures. In fact, the economy experienced a mix of improvement in some sectors in 2018, and regression in some other sectors. It registered an improvement in the activity of air transport, tourism, banking and export sectors; which was accompanied by expanding monetary conditions. Whereas, the activity of real-estate, construction, and maritime transport regressed. Concerning the activity of Beirut Rafic Hariri International Airport, which is an indicator of air transport and tourism, the total number of passengers increased by 7.4% from 2017 to reach 8.8 million passengers in 2018. The hotel occupancy rate, an indicator of hotel activity and tourism as well, was almost unchanged registering 65.1% in 2018 compared to 63.7% in 2017. This rate reflects a decent hotel activity primarily due to the improvement in touristic activity in the past two years. The total number of tourists visiting Lebanon expanded by 5.8% on annual basis to reach nearly 1.96 million tourists in 2018. Tourist spending increased by 6.5% in 2018 relative to an increase of 5.5% in 2017. On a different note, the amount of industrial and agricultural exports had also a positive contribution to the economy; registering a 7.1% increase as compared to 2017 to reach USD 3 billion at the end of 2018. On the other hand, the construction permits, an indicator of future construction activity and future supply in the real-estate sector, regressed by 23.1% from 2017 to reach 9.1 million square meters in 2018. Cement deliveries followed with a decline of 5.3% on annual basis to reach nearly 4.5 million tons in 2018. Likewise, the number of real-estate transactions decreased by 17.4% from 2017 to reach 60,714 transactions in 2018; and the value of real-estate transactions dropped by 18.3% to reach USD 8.1 billion during the same period.
These figures reflect a relatively shrinking real-estate sector throughout 2018. As regards to the Port of Beirut activity, an indicator of maritime transport and trade, the number of ships decreased by 1.9% from 2017 to reach 1,872 ships in 2018. The number of containers also shrank by 2.6% to reach 874,246 containers; and the quantity of goods decreased by 7.5% to reach 7,985 thousand tons during the same period. The revenues of the port regressed by 3.5% from 2017 to reach nearly USD 231.5 million in 2018. The total value of cleared checks, mirroring private investment and consumption spending, decreased by 2.5% in 2018 relative to 2017, recording USD 66.5 billion in 2018. Also, returned checks increased from USD 1.43 billion in 2017 to USD 1.62 billion in 2018, thus registering an annual growth of 13.6%. The amount of Kafalat loans, an indicator of the activity of SMEs and start-ups as well as private investment spending, decreased by 39.6% from 2017 to reach USD 40.1 million in 2018. Meanwhile, the banking sector has maintained its growth in 2018, but the Beirut Stock Exchange (BSE) experienced a receding activity. The banking activity, as reflected by the consolidated balance sheet of commercial and MLT banks in Lebanon, has improved during 2018, recording USD 254.8 billion, as of end 2018, an increase of 13.3% from the end of 2017. The customers’ deposits grew by 2.6% from end-2017 to reach USD 179.5 billion at the end of 2018. On the other hand, loans to customers decreased by a moderate 1% to reach USD 60.7 billion during the same period. The aggregate loans-to-deposits ratio was 33.8% at end-2018, relative to 35.1% at end-2017. This reflects the relatively slow lending opportunities in the economy under current conditions. The dollarization rate of deposits registered 68.9% in 2018 relative to 67% in 2017; and the dollarization rate of credit reached 66.2% relative to 65% a year earlier. The capitalization of the commercial banking sector increased by 5.3% from the end of 2017 to reach USD 21.8 billion at end-2018. .
BANKING SECTOR INDICATORS (COMMERCIAL AND MLT BANKS)
Total assets Total customers' deposists Total loans to customers Bank’s capital base
225 174.9
61.3 20.7
+ 13.3% + 2.6%
- 1% + 5.3%
254.8 179.5
60.7 21.8
In billion of USD 2017 Variation
The activity of the Beirut Stock Exchange (BSE), which mirrors the activity of the capital market, regressed in 2018 relative to 2017. The total trading volume of BSE expanded by 3.6% on annual basis to reach 90.11 million shares in 2018. The aggregate turnover decreased by 16.7% to reach USD 635 million. Market capitalization also dropped by 15.7% on annual basis, from
USD 11.5 billion at end of 2017 to USD 9.7 billion at end of 2018. Its ratio to GDP reached 21.5% in 2017 and 17.2% in 2018, reflecting a narrow capital market in Lebanon. Market capitalization continues to be dominated by banking stocks, followed by real-estate stocks, and industrial stocks.
BEIRUT STOCK EXCHANGE INDICATORS
Market capitalization (USD, billion) Total trading volume (Shares, million) Aggregate turnover (USD, million)
11.5 86.99 762.1
- 15.7% + 3.6%
- 16.7%
9.7 90.11
635
2017 Variation
Sources: Central Bank of Lebanon and Association of Banks in Lebanon
Sources: BSE and Central Bank of Lebanon
Lebanon’s Economic Performance in 2018
MANAGEMENT REPORT
2018
2018

FRANSABANK | ANNUAL REPORT 2018 | 30-31
PUBLIC FINANCE INDICATORS
Public revenues Public expenditures Fiscal deficit Deficit / Expenditures (%) Gross public debt Net public debt Gross public debt / Nominal GDP (%)
11.6 15.4
3.8 24.7 79.5 69.1 149
- + 15.6% + 63.2%
- + 7%
+ 9.5% -
11.6 17.8
6.2 34.8 85.1 75.7
151.2
In billion of USD 2017 Variation
Sources: Ministry of Finance and Central Bank of Lebanon
MONETARY SITUATION INDICATORS
Central Bank of Lebanon’s assets in FX Central Bank of Lebanon’s gold reserves Financial sector deposits Inflation rate - CPI (%) BTA-Fransabank Retail Index (4th quarter)
42 12 97
4.5 49.64
- 5.5% - 1.6%
+ 22.7% - -
39.7 11.8
119.1 6.1
49.68
In billion of USD 2017 Variation
Sources: Central Bank of Lebanon, Association of Banks in Lebanon, Beirut Traders Association, and Central Administration of Statistics
FOREIGN TRADE SECTOR INDICATORS
Exports Imports Trade deficit Capital + Financial + Services inflows Balance of payments
2.8 19.6 16.8 16.6 - 0.2
+ 3.8% + 2%
+ 1.7% - 26.4%
-
3 20 17
12.2 - 4.8
In billion of USD 2017 Variation
Sources: Higher Customs Council and Central Bank of Lebanon
The fiscal figures for 2018 reveal that the public deficit, which mirrors internal deficit in the economy, surged by 63.2% from the corresponding period last year to reach USD 6.2 billion. The public finances for 2018 reveal a stagnation in public revenues, and a growth in public spending by 15.6% during the same period. As a result of these fiscal conditions on the revenues-spending front, the deficit-to-spending ratio reached 34.8% in 2018 against 24.7% for the same period of 2017. The total primary surplus which was USD 1,442 million for 2017 turned into a deficit of USD 624 million for the corresponding period of 2018.
As a result of these developments on the fiscal front, public indebtedness continued its growth during 2018, with an increase of 7% in gross debt figures from the end of 2017 to reach USD 85.1 billion at the end of 2018. Excluding the public sector’s deposits at the Central Bank and commercial banks from the gross debt figures, the net public debt increased by 9.5% on annual basis to reach USD 75.7 billion at end-2018. When deflated by GDP, the public deficit is estimated to reach nearly 11% in 2018. On the other hand, the gross debt-to-GDP ratio surged upwards over the past five years to reach 151.2% in 2018. These ratios are very high by international standards and clearly reflect the deep fiscal imbalances in Lebanon.
Inflation remained moderate during 2018 due to the moderate growth rate. It reached 6.1% in 2018 relative to 4.5% in 2017, against a deflation rate of 0.8% in 2016. The moderate inflation recorded in 2018, was translated into moderate growth in money supply M3, which grew by nearly 2.2% in 2018. As for
the Beirut Traders Association-Fransabank Retail Index, it stood at 49.68 for the fourth quarter of the year 2018, compared to the level of 48.17 for the third quarter of 2018, and 49.64 for the fourth quarter of the year 2017; displaying a slight improvement.
The trade deficit widened by 1.7% on annual basis to reach USD 17 billion in 2018, thus reflecting a radical and continued foreign deficit which represents nearly 30% of GDP in 2018, relative to 31.5% in 2017. This surge in the trade deficit was the result of an annual increase in exports by 3.8% to reach USD 3 billion in 2018, and an increase in imports by 2% to reach USD 20 billion during the same period. The year 2018 experienced continued capital inflows reaching nearly USD 12.2 billion relative to a level of USD 16.6 billion in 2017, a decrease of 26.4% on annual basis. These lower capital
inflows were induced by a continued regional turmoil and political tension in Lebanon. These capital inflows recorded in 2018 represent nearly 21.8% of GDP in 2018 relative to 31.1% in 2017. Hence, they contributed to the economic growth achieved in 2018. The balance of payments realized a deficit in 2018, recording a level of USD 4.8 billion relative to a lower deficit of USD 0.2 billion in 2017. In this sense, the balance of payments deficit represented nearly 8.6% of GDP in 2018, while its deficit in 2017 was nearly 0.3% of GDP.
2018
2018
2018

AVERAGE VOLUME OF INTEREST-EARNING ASSETS
Investment securities Banks and financial institutions (including assets under leverage arrangement with BDL) Loans and advances to customers TOTAL
10,507,121,508 9,087,012,742 9,137,355,897
28,731,490,147
9,649,013,140 11,193,535,900
9,526,309,356
30,368,858,396
In thousands of LBP 2017
1. Net Income In 2018, Fransabank SAL net income, amounted to LBP 173.97 billion (USD 115.41 million) compared to LBP 177.80 billion (USD 117.94 million) in 2017, a decrease of 2.15%. This has translated into a Return on Average Assets of 0.72% and a Return on Average Common Equity of 7.84%.
In 2018, the Group’s net income amounted to LBP 262.83 billion (USD 174.35 million) compared to LBP 270.34 billion (USD 179.33 million) in 2017, a decrease of 2.78%. This has translated into a Return on Average Assets of 0.83% excluding the assets held for sale as well as the assets under leverage arrangements with BDL, and a Return on Average Common Equity of 8.53%.
BREAKDOWN OF INTEREST RECEIVED
In 2018, the Group’s monthly average interest-earning assets reached LBP 30,368.86 billion (USD 20,145.18 million) compared to LBP 28,731.49 billion (USD 19,059.03 million) in 2017 (+ 5.70%). This growth is due to the following: - increase in banks and financial institutions (+ LBP 2,106.53 billion
or c/v USD 1,397.36 million),
- increase in loans and advances to customers (+ LBP 388.95 billion or c/v USD 258.02 million),
- decrease in investment securities (- LBP 858.11 billion or c/v USD 569.23 million).
OVERVIEW 2018 was relatively a challenging year for Lebanese banks; nevertheless, the confidence in the banking system was shaken coupled with sound liquidity at hand. Similarly, Fransabank’s results of operations echoed the sector’s resilience achieving an organic growth and solid performance.
From loans and advances to customers From investment securities From loans to banks and placements with banks From investments at FVTPL TOTAL Tax on interest
TOTAL NET AFTER TAX ON INTEREST
644,588,257 683,039,102 366,432,501
23,594,131 1,717,653,991
(2,578,423)
1,715,075,568
668,335,786 700,982,458 623,141,437
12,550,003 2,005,009,684
(73,185,734)
1,931,823,950
In thousands of LBP 2017
1.1 Net Interest Income In 2018, the Group’s net interest income amounted to LBP 547.12 billion (USD 362.93 million) compared to LBP 564.38 billion (USD 374.38 million) in 2017, a decrease of 3.06%. If we consider that banks were still exempted from the tax on Interest and it was still deductible from the tax on profits, the Group’s net interest income will amount to LBP 620.30 billion (USD 411.48 million) compared to LBP 566.96 billion (USD 376.09 million) in 2017, an increase of 9.41%.
In 2018, the Group’s interest received amounted to LBP 1,931.82 billion (USD 1,281.48 million) compared to LBP 1,715.08 billion (USD 1,137.70 million) in 2017, an increase of 12.64%. Interest received before tax on interest from loans and advances to customers, investment securities, loans to banks & placements with banks and investments at Fair Value Through Profit or Loss (FVTPL), represents 33.33%, 34.96%, 31.08% and 0.63% respectively of total 2018 interest income, compared to 37.53%, 39.77%, 21.33% and 1.37% respectively in 2017.
Consolidated Results of Operations
MANAGEMENT REPORT
2018
2018

In 2018, the Group’s interest paid amounted to LBP 1,384.71 billion (USD 918.54 million) compared to LBP 1,150.69 billion (USD 763.31 million) in 2017 (+ 20.34%). In 2018, the largest single component of interest paid belongs to customers’ deposits, which represents 96% of the total compared to 96.82% in 2017. This
increase in interest paid is due to the increase in the average creditor interest rates on customers’ deposits in line with the market condition prevailing at present and in common with all other Lebanese banks.
In 2018, the Group’s monthly average interest-bearing liabilities reached LBP 28,818.80 billion (USD 19,116.95 million) compared to LBP 26,611.77 billion (USD 17,652.91 million) in 2017 (+ 8.29%). This growth is largely attributed to an increase in BDL, banks
and financial institution of 79.81%, i.e. LBP 1,439.35 billion (USD 954.79 million) and to an increase in customers’ creditor accounts at amortized cost of 2.76%, i.e. LBP 679.46 billion (USD 450.72 million).
BREAKDOWN OF INTEREST PAID
On deposits and borrowings from banks On deposits from customers and related parties at amortized cost On deposits from customers designated at FVTPL On subordinated loans On cash contribution to Share Capital TOTAL
(33,888,990) (1,106,570,288)
(7,470,421) (1,734,338) (1,026,823)
(1,150,690,860)
(53,182,962) (1,322,379,195)
(6,868,190) (1,247,864) (1,026,834)
(1,384,705,045)
In thousands of LBP 2017
AVERAGE VOLUME OF INTEREST-BEARING LIABILITIES
BDL, banks and financial institutions (including leverage arrangement with BDL) Liabilities designated at FVTPL Customers’ creditor accounts at amortized cost Bonds issued Subordinated loans Cash contribution to Share Capital TOTAL
1,803,392,427 134,353,140
24,633,832,508 -
23,073,935 17,113,885
26,611,765,895
3,242,738,437 166,644,783
25,313,289,381 62,815,321 16,200,827 17,113,885
28,818,802,634
In thousands of LBP 2018 2017
1.2 Net Fee and Commission Income In 2018, the Group’s net fee and commission income reached LBP 95.55 billion (USD 63.38 million) compared to LBP 106.73 billion (USD 70.80 million) in 2017, a decrease of 10.47%. Fees and commissions received in 2018 reached LBP 117.84 billion (USD 78.17 mill ion) compared to LBP 126.68 bi l l ion (USD 84.03 million) in 2017, a decrease of 6.98%. Fees and commissions received in 2018 comprise mainly fees on customers’ transactions and commissions on documentary LCs and on LGs, which represented 63.70% and 26.20% respectively compared to 70.07% and 29.05% in 2017.
Fees and commissions paid in 2018 reached LBP 22.29 billion (USD 14.79 mil l ion) compared to LBP 19.95 bi l l ion (USD 13.23 million) in 2017, an increase of 11.73%. Fees and commissions paid comprise fees on customers’ transactions and commissions on transactions with banks and financial institutions, which represent 83.15% and 16.85% respectively compared to 79.94% and 20.06% in 2017.
FRANSABANK | ANNUAL REPORT 2018 | 32-33
2018

1.3 Other Net Gain/(Loss) on Investments at FVTPL In 2018, the Group’s other net gain on investments at FVTPL reached LBP 30.26 billion (USD 20.08 million) compared to LBP 7.59 billion (USD 5.03 million) in 2017, an increase of 298.80%. This increase results mainly from the net change in fair value of investments at FVTPL.
The net gain on investments at FVTPL in 2018 includes, dividends received on investments at FVTPL, change in fair value and gain on sale of investments at FVTPL, which represented 1.42%, 101.84% and - 3.26% compared to 35%, 22.13% and 42.87%, in 2017 respectively.
1.4 Foreign Exchange Gain In 2018, foreign exchange gain amounted to LBP 16.93 billion (USD 11.23 million) compared to LBP 16.47 billion (USD 10.93 million) in 2017, an increase of 2.81%. 1.5 Other Operating Income In 2018, other operating income amounted to LBP 36.12 billion (USD 23.96 million) compared to LBP 37.99 bill ion (USD 25.20 million) in 2017, a decrease of 4.92%. This decrease is mainly due to the decrease in gain resulting from the sale of assets acquired in settlement of loans, properties & equipment and intangible assets.
Other operating income comprises dividends received on investment securities, share in profit of associates, gain on sale of assets acquired in settlement of loans, on sale of properties & equipment and intangible assets, appropriation from regulatory deferred liabilities, losses from deconsolidation of a subsidiary and other income, which represented 23.38%, 53.24%, 5.20%, 0.46%, nil and 17.72% in 2018 compared to 12.23%, 49.06%, 23.98%, 46.99%, - 41.96% and 9.70% in 2017 respectively.
BREAKDOWN OF NET FEE AND COMMISSION INCOME
Fee and commission received Commissions on documentary LCs and on LGs Service fees on customers’ transactions Commissions on transactions with banks and financial institutions Asset management fees Fee and commission paid Commissions on transactions with banks Other commissions paid (including those on customers’ transactions) NET FEE AND COMMISSION INCOME
126,676,330 36,797,005 88,764,559
770,918 343,848
(19,947,117) (4,001,532)
(15,945,585)
106,729,213
117,838,473 30,868,600 75,068,422 11,521,327
380,124 (22,287,901)
(3,756,270) (18,531,631)
95,550,572
2018In thousands of LBP 2017
BREAKDOWN OF OTHER NET GAIN/(LOSS) ON INVESTMENTS AT FVTPL
Dividends received on investments at FVTPL Change in fair value of investments at FVTPL (net) Gain on sale of investments at FVTPL (net)
OTHER NET GAIN/(LOSS) ON INVESTMENTS AT FVTPL
2,656,101 1,679,352 3,253,137
7,588,590
430,386 30,820,925
(988,174)
30,263,137
2018In thousands of LBP 2017
MANAGEMENT REPORT
BREAKDOWN OF OTHER OPERATING INCOME
Dividends income on investment securities Share in profit of associates Gain resulting from the sale of assets acquired in settlement of loans, properties & equipment and intangible assets Appropriation from regulatory deferred liabilities Losses from deconsolidation of Fransabank Syria Other OTHER OPERATING INCOME
4,643,918 18,637,661
9,109,959
17,851,479 (15,940,262)
3,685,563
37,988,318
8,445,516 19,232,095
1,875,971
165,833 -
6,401,722
36,121,137
2018In thousands of LBP 2017

On cash and deposits with Central Banks On deposits with and loans to banks and financial institutions On loans and advances to customers On investment securities On customer acceptance liability On financial guarantee and other commitments On other assets Direct write-offs - Loans TOTAL
2,359,158 -
(7,321,723) - - - -
(15,205)
(4,977,770)
(1,666,478) (31,336,924)
(3,814,303) 11,406,066
331,586 8,218,217
39,281 (19,822)
(16,842,377)
2018In thousands of LBP 2017
BREAKDOWN OF GENERAL EXPENSES
Staff costs Administrative expenses Depreciation and amortization of assets TOTAL
(243,390,203) (112,456,892)
(29,713,496)
(385,560,591)
(253,907,027) (115,446,561)
(29,702,446)
(399,056,034)
2018In thousands of LBP 2017
In 2018, the Group’s net allowances for Expected Credit Losses (ECL) amounted to LBP 16.84 billion (USD 11.17 million) compared to LBP 4.98 billion (USD 3.30 million) in 2017, which may be described as follows: - Allowances for ECL on cash and deposits with Central Banks for
LBP 1.67 billion (USD 1.10 million), compared to a write-back for LBP 2.36 billion (USD 1.57 million) in 2017.
- Allowances for ECL on deposits with and loans to banks and financial institutions for LBP 31.34 billion (USD 20.79 million), compared to nil in 2017.
- Allowances for ECL on loans and advances to customers for LBP 3.81 billion (USD 2.53 million), against LBP 7.32 billion (USD 4.86 million) in 2017.
- Write-back of allowances for ECL on investment securities for LBP 11.41 billion (USD 7.57 million), against nil in 2017.
- Write-back of allowances for ECL on customer acceptance liability for LBP 0.33 billion (USD 0.22 million), against nil in 2017.
- Write-back of allowances for ECL on financial guarantee and other commitments for LBP 8.22 billion (USD 5.45 million), against nil in 2017.
- Write-back of allowances for ECL on other assets for LBP 39.28 million (USD 26.06 thousand), against nil in 2017.
- Direct write-offs for LBP 19.82 million (USD 13.15 thousand), against LBP 15.21 million (USD 10.09 thousand) in 2017.
1.7 General Expenses In 2018, the Group’s general expenses comprising staff costs, administrative expenses, depreciation and amortization of assets, reached LBP 399.06 billion (USD 264.71 million) compared to LBP 385.56 billion (USD 255.76 million) in 2017, an increase of 3.50%. This increase is due to the following: - salaries and related charges amounted to LBP 253.91 billion
(USD 168.43 million) in 2018, compared to LBP 243.39 billion (USD 161.45 million) in 2017, an increase of 4.32%,
- administrative expenses amounted to LBP 115.45 billion (USD 76.58 million) in 2018, compared to LBP 112.46 billion (USD 74.60 million) in 2017, an increase of 2.66%,
- depreciation and amortization of assets amounted to LBP 29.70 billion (USD 19.70 million) in 2018, compared to LBP 29.71 billion (USD 19.71 million) in 2017, a decrease of 0.04%.
1.6 Net Allowances for Expected Credit Losses
FRANSABANK | ANNUAL REPORT 2018 | 34-35
1.8 Income Tax and Deferred Tax The Group’s income tax for the financial year 2018 amounted to LBP 29.43 billion (USD 19.52 million), compared to LBP 55.83 billion (USD 37.04 million) for the financial year 2017, a decrease of 47.28%. Deferred tax on associates and
subsidiaries’ profits for the financial year 2018 amounted to LBP 10.61 billion (USD 7.04 million), compared to LBP 13.12 billion (USD 8.70 million) for the financial year 2017, a decrease of 19.11%.
BREAKDOWN OF NET ALLOWANCE FOR EXPECTED CREDIT LOSSES (ECL)

Leverage arrangements with BDL Soft loans from Banque du Liban Long-term borrowings Banks and financial institutions Customers’ creditor accounts at FVTPL Customers’ creditor accounts at amortized cost Subordinated loans Shareholders’ equity TOTAL
BREAKDOWN OF FUNDING SOURCES AS AT 31 DECEMBER
2.77% 0.85% 4.02% 0.85% 0.44%
80.51% 0.06%
10.50%
100%
855,418,125 261,776,891
1,242,829,524 264,140,929 135,500,053
24,882,215,698 19,124,748
3,243,464,308
30,904,470,276
%Amount
2,238,085,922 261,961,339
1,354,687,775 309,042,968 110,462,963
25,551,478,737 12,749,832
3,295,653,934
33,134,123,470
6.75% 0.79% 4.09% 0.93% 0.33%
77.12% 0.04% 9.95%
100%
Amount %
2018In thousands of LBP 2017
Lebanese Pounds U.S. Dollars Euros Other foreign currencies TOTAL
FUNDING SOURCES BY CURRENCY AS AT 31 DECEMBER
45.80% 47.21%
4.90% 2.09%
100%
14,154,008,561 14,589,379,041
1,513,196,341 647,886,333
30,904,470,276
%Amount
15,243,565,062 15,626,068,585
1,520,781,651 743,708,172
33,134,123,470
46.01% 47.16%
4.59% 2.24%
100%
Amount %
2018In thousands of LBP 2017
2.1 Funding Sources As at 31 December 2018, the Group’s funding sources amounted to LBP 33,134.12 billion (USD 21,979.52 million) compared to LBP 30,904.47 billion (USD 20,500.48 million) as at 31 December 2017, an increase of 7.21%. Similar to all other banks in Lebanon, the principal source of funding is customers’ creditor accounts, which represented as at 31 December 2018, 77.45% of total funding sources as compared to 80.95% as at 31 December 2017. Other funding
sources include, in addition to the shareholders’ equity, which includes preference shares, long-term credit lines provided by international banks and financial Institutions, deposits of banks and financial institutions, subordinated loans and soft loans granted by Banque du Liban for the Bank’s mergers and acquisitions according to the pertinent Lebanese Law of mergers and acquisitions as well as the Leverage arrangements with BDL recently introduced.
2. Total Balance Sheet As at 31 December 2018, the Group’s Total Balance Sheet amounted to LBP 35,590.67 billion (USD 23,609.06 million) compared to LBP 33,251 billion (USD 22,057.05 million) as at year-end 2017, an increase of 7.04%. As at 31 December 2018, the Group ranked 5th
within the Lebanese banking sector in terms of Total Balance Sheet compared to 4th rank as at 31 December 2017. Market share reached 8.64% as at 31 December 2018 compared to 9.12% as at 31 December 2017.
MANAGEMENT REPORT

As at 31 December 2018, 55.68% of the Bank’s major funding sources were denominated in foreign currencies, as compared to 54.27% as at 31 December 2017.
Short-term funding (less than 1 year) Medium-term funding (between 1 & 5 years) Long-term funding (more than 5 years) TOTAL
FUNDING SOURCES BY MATURITY AS AT 31 DECEMBER
82.35% 3.45%
14.20%
100%
25,448,670,504 1,067,329,537 4,388,470,235
30,904,470,276
%Amount
24,549,434,635 2,741,614,036 5,843,074,799
33,134,123,470
74.09% 8.27%
17.64%
100%
Amount %
2018In thousands of LBP 2017
Customers’ Creditor Accounts As at 31 December 2018, the Group’s customers’ creditor accounts at FVTPL and at amortized cost amounted to LBP 25,661.94 billion (USD 17,022.85 million) compared to LBP 25,017.72 billion (USD 16,595.50 million) as at 31 December 2017, an increase of 2.58%. The increase of LBP 644.23 billion (USD 427.35 million) in deposits was mainly due to the increase in (i) Demand and sight saving accounts of LBP 707.37 billion (USD 469.23 million), in (ii) Margins and collateral accounts of LBP 825.53 billion (USD 547.61 million), the decrease in (iii) Term deposits accounts of LBP 620.84 billion (USD 411.83 million), in (iv) Related
parties accounts at amortized cost and at FVTPL of LBP 288.68 billion (USD 191.50 million) and in (v) Time saving accounts of LBP 10.13 billion (USD 6.72 million), and in (vi) Escrow account of LBP 14.94 billion (USD 9.91 million). As at 31 December 2018, customers’ creditor accounts represent 72.10% of the Group’s Total Balance Sheet as compared to 75.24% as at 31 December 2017. As at 31 December 2018, the Group is ranked 5th within the Lebanese banking sector in terms of customers’ creditor accounts compared to 4th as at 31 December 2017, with a market share of 9.12% against 9.20% as at 31 December 2017.
BREAKDOWN OF CUSTOMERS' CREDITOR ACCOUNTS BY TYPE AS AT 31 DECEMBER
Customers’ Liabilities at Fair Value Through Profit or Loss (FVTPL) Customers’ liabilities at Fair Value Through Profit or Loss Related parties’ liabilities at Fair Value Through Profit or Loss Accrued interest Customers’ Creditor Accounts at Amortized Cost Demand and sight saving accounts Time saving accounts Term deposits Blocked accounts Margins and collateral accounts Escrow accounts Related parties accounts Accrued interest TOTAL CUSTOMERS’ CREDITOR ACCOUNTS AT FVTPL & AT AMORTIZED COST Lebanese Pounds Foreign currencies
135,500,053 131,856,007
2,735,789 908,257
24,882,215,698 2,318,829,429
13,812,203,883 5,126,364,918
75,197,751 1,652,586,808
14,944,039 1,731,144,305
150,944,565
25,017,715,751
39.21% 60.79%
110,462,963 107,125,462
2,557,612 779,889
25,551,478,737 3,026,194,937
13,802,071,810 4,505,528,405
101,896,963 2,478,116,296
- 1,442,465,083
195,205,243
25,661,941,700
35.77% 64.23%
2018In thousands of LBP 2017
FRANSABANK | ANNUAL REPORT 2018 | 36-37

BREAKDOWN OF CUSTOMERS’ CREDITOR ACCOUNTS BY AMOUNT AS AT 31 DECEMBER 2018
Amount % % Cum.
1,159,281,574 905,796,268
1,331,082,501 2,124,879,271 2,747,524,945 2,524,750,572 5,690,103,845
16,483,418,976
7.03% 5.49% 8.08%
12.89% 16.67% 15.32% 34.52%
7.03% 12.52% 20.60% 33.49% 50.16% 65.48%
100%
Amount % % Cum.
1,503,470,791 1,011,338,088 1,374,698,455 1,774,868,864 1,616,403,861 1,051,027,051
846,715,614
9,178,522,724
16.38% 11.02% 14.98% 19.34% 17.61% 11.45%
9.22%
16.38% 27.40% 42.38% 61.72% 79.33% 90.78%
100%
A < 50 million 50 million ≤ A < 100 million 100 million ≤ A < 200 million 200 million ≤ A < 500 million 500 million ≤ A < 1.5 billion 1.5 billion ≤ A < 5 billion A ≥ 5 billion TOTAL Number of accounts Average per account
100% 100%
FCsLBP
2,662,752,365 1,917,134,356 2,705,780,956 3,899,748,135 4,363,928,806 3,575,777,623 6,536,819,459
25,661,941,700
10.38% 7.47%
10.54% 15.20% 17.01% 13.93% 25.47%
10.38% 17.85% 28.39% 43.59% 60.60% 74.53%
100%
Amount % % Cum.TOTALIn thousands of LBP
100%
302,737 30,318
282,670 58,313
585,407 43,836
Shareholders’ Equity Shareholders’ equity as at 31 December 2018 amounted to LBP 3,295.65 billion (USD 2,186.17 million), compared to LBP 3,243.46 billion (USD 2,151.55 million) as at 31 December 2017, an increase of 1.61%. This increase is mainly due to the incorporation of 2018 net profits and to the redemption of Series C of preference shares for USD 35 million by one of the bank’s subsidiaries.
2.2 Uses of Funds The Bank uses its funds to comply with Central Banks regulatory reserve requirements, cash, short-term placements and liquid financial instruments with international banks and financial
institutions, loans and advances to customers and investment securities.
Cash on hand Central Banks including compulsory/regulatory deposits Banks and financial institutions Investment securities Loans and advances to customers Assets under leverage arrangements with BDL TOTAL
BREAKDOWN OF USES OF FUNDS AS AT 31 DECEMBER
0.70% 26.50%
4.14% 33.86% 32.00%
2.80%
100%
214,929,568 8,094,606,927 1,264,074,651
10,345,262,168 9,776,012,029
855,418,125
30,550,303,468
%Amount
227,647,712 8,949,815,215 1,524,404,230 9,346,131,507
10,159,824,897 2,238,085,922
32,445,909,483
0.70% 27.58%
4.70% 28.81% 31.31%
6.90%
100%
Amount %
2018In thousands of LBP 2017
Lebanese Pounds U.S. Dollars Euros Other foreign currencies TOTAL
USES OF FUNDS BY CURRENCY AS AT 31 DECEMBER
46.21% 46.57%
4.39% 2.83%
100%
14,117,578,455 14,227,128,232
1,339,950,116 865,646,665
30,550,303,468
%Amount
14,387,154,500 15,830,435,345
1,373,511,145 854,808,493
32,445,909,483
44.34% 48.79%
4.23% 2.64%
100%
Amount %
2018In thousands of LBP 2017
MANAGEMENT REPORT

2018In thousands of LBP 2017
As at 31 December 2018, the Group’s uses of funds amounted to LBP 32,445.91 billion (USD 21,522.99 million) compared to LBP 30,550.30 billion (USD 20,265.54 million) as at 31 December 2017, an increase of 6.20%.
Cash, Central Banks, Banks and Financial Institutions As at 31 December 2018, cash, Central Banks and banks and financial institutions portfolio amounted to LBP 12,473.82 billion (USD 8,274.51 million) and constituted 35.05% of total assets
compared to LBP 10,268.47 billion (USD 6,811.59 million) and 30.88% of total assets as at 31 December 2017. This represents a year-on-year increase of 21.48%.
Investment Securities As at 31 December 2018, the Group’s investment securities portfolio (including assets under leverage arrangements with BDL), which consists of both fixed and variable rates income securities, amounted to LBP 9,812.27 billion (USD 6,508.97 million),
compared to LBP 10,505.82 billion (USD 6,969.03 million) as at 31 December 2017, a decrease of 6.60%. Investment securities constituted 27.57% of Total Assets as at 31 December 2018 compared to 31.60% as at 31 December 2017.
Cash on hand Central Banks including compulsory/regulatory deposits Compulsory deposits with Central Banks Regulatory placements with Central Banks Current accounts with Central Banks Free placements with Central Banks Assets under leverage arrangements with BDL Blocked deposits with Central Banks Regulatory allowance for country risk Allowance for ECL Accrued interest Banks and financial institutions Current accounts with banks & FIs Term placements with banks & FIs Blocked margins with banks & FIs Purchased checks for collection Loans to banks & FIs Regulatory allowance for country risk Allowance for ECL Accrued interest TOTAL
BREAKDOWN OF CASH, CENTRAL BANKS, BANKS AND FINANCIAL INSTITUTIONS AS AT 31 DECEMBER
2.09% 85.60%
6.30% 16.62%
4.38% 50.33%
6.77% 0.43%
- 0.06% -
0.83% 12.31%
3.25% 7.58% 0.03% 0.07% 1.36%
- -
0.02%
100%
214,929,568 8,789,466,808
647,034,226 1,706,141,266
449,315,628 5,168,758,262
694,859,881 44,520,984 (6,685,842)
- 85,522,403
1,264,074,651 333,406,979 778,666,854
3,292,003 7,711,179
139,384,491 (7,313) (2,789)
1,623,247
10,268,471,027
%Amount
227,647,712 10,721,764,215
618,432,788 2,311,906,236
430,855,176 5,483,964,266 1,771,949,000
40,824,506 -
(45,837,720) 109,669,963
1,524,404,230 467,299,221
1,011,608,558 4,859,804 3,344,188
69,749,882 -
(38,136,886) 5,679,463
12,473,816,157
1.83% 85.95%
4.96% 18.53%
3.45% 43.96% 14.21%
0.33% -
- 0.37% 0.88%
12.22% 3.74% 8.11% 0.04% 0.03% 0.56%
- - 0.31%
0.05%
100%
Amount %
FRANSABANK | ANNUAL REPORT 2018 | 38-39

Securities measured at FVTPL Amortized cost securities Securities measured at fair value through other comprehensive income Assets under leverage arrangements with BDL TOTAL
BREAKDOWN OF INVESTMENT SECURITIES PORTFOLIO BY CLASSIFICATION AS AT 31 DECEMBER
3.08% 91.80%
3.59% 1.53%
100%
323,599,788 9,644,198,175
377,464,205 160,558,244
10,505,820,412
%Amount
228,826,166 8,205,038,079
912,267,262 466,136,922
9,812,268,429
2.33% 83.62%
9.30% 4.75%
100%
Amount %
2018In thousands of LBP 2017
Equities, funds and preference shares Lebanese Treasury bills Lebanese Government bonds Foreign Eurobonds and Government bonds Bonds issued by banks Certificates of deposit issued by BDL Corporate bonds Asset-backed securities Lebanese Treasury bills under leverage arrangements with BDL Term placements with BDL Subordinated bonds
Allowance for ECL Accrued interest TOTAL
Lebanese Pounds Foreign currencies
BREAKDOWN OF INVESTMENT SECURITIES PORTFOLIO BY TYPE AS AT 31 DECEMBER
4.27% 26.49% 28.98%
0.14% 1.66%
34.69% 0.50% 0.22% 1.53%
- 0.02%
- 1.50%
100%
448,220,322 2,783,546,984 3,044,911,375
14,875,333 174,847,139
3,644,402,953 52,762,500 22,877,250
160,558,244 -
1,507,500
- 157,310,812
10,505,820,412
58.08% 41.92%
%Amount
470,275,994 2,041,542,495 2,590,870,144
45,998,424 142,129,102
3,684,329,213 123,663,114
18,201,794 466,136,922 121,754,991
-
(61,256,207) 168,622,443
9,812,268,429
59.72% 40.28%
4.79% 20.80% 26.40%
0.47% 1.45%
37.55% 1.26% 0.19% 4.75% 1.24%
-
- 0.62% 1.72%
100%
Amount %
2018In thousands of LBP 2017
Loans and Advances to Customers As at 31 December 2018, the Group’s loans and advances to customers, net of allowances for ECL and interest in suspense, amounted to LBP 10,159.82 billion (USD 6,739.52 million) compared to LBP 9,776.01 billion (USD 6,484.92 million) as at 31 December 2017, an increase of 3.93%.
As at 31 December 2018, the Group maintained its 3rd ranking within the Lebanese banking sector in terms of net loans and advances to customers, with a market share of 9.69% as at 31 December 2018 compared to 9.45% as at 31 December 2017.
MANAGEMENT REPORT

BREAKDOWN OF LOANS AND ADVANCES TO CUSTOMERS BY TYPE AS AT 31 DECEMBER
Gross Performing Loans Stages 1 & 2 Retail customers Consumer loans Mortgage loans Educational loans Car loans Others Small and Medium Enterprises Corporates Accrued interest Gross Impaired Loans Stage 3 (including interest in suspense) Substandard Doubtful & bad Allowance for ECL/credit losses Allowance for ECL on stage 1 & 2 loans Allowance for collectively assessed stage 1 & 2 loans Allowance for ECL - substandard Allowance for ECL - doubtful & bad Allowance for credit losses - Substandard Allowance for credit losses - doubtful & bad Interest in Suspense On substandard loans On doubtful and bad loans NET LOANS AND ADVANCES TO CUSTOMERS STAGES 1, 2 & 3 Lebanese Pounds Foreign currencies
9,306,040,274 3,174,300,239
856,183,258 1,971,153,322
45,433,558 223,508,280
78,021,821 1,837,335,960 4,262,047,811
32,356,264 1,630,930,359
275,707,001 1,355,223,358 (241,422,039)
- (4,555,911)
- -
(3,049,670) (233,816,458) (919,536,565)
(58,846,791) (860,689,774)
9,776,012,029
30.64% 69.36%
9,718,151,496 3,129,697,326
878,338,409 1,910,886,671
43,581,260 190,298,406 106,592,580
1,275,012,790 5,278,454,778
34,986,602 1,666,387,525
399,176,775 1,267,210,750 (469,688,617) (100,725,869)
- (21,653,213)
(347,309,535) - -
(755,025,507) (75,802,065)
(679,223,442)
10,159,824,897
28.29% 71.71%
2018In thousands of LBP 2017
As at 31 December 2018: • The Group’s doubtful and bad debts, net of allowances
for ECL and interest in suspense, amounted to LBP 240.68 billion (USD 159.65 million) compared to LBP 260.72 billion (USD 172.95 million) as at 31 December 2017.
• The Group’s allowances for ECL and interest in suspense
for doubtful and bad debts amounted to LBP 1,026.53 billion (USD 680.95 million) against LBP 1,094.51 billion (USD 726.04 million) as at 31 December 2017. This, places
the coverage ratio in 2018 at 81.01% compared to 80.76% in 2017.
• The Group’s substandard debts, net of allowances for ECL
and interest in suspense, amounted to LBP 301.72 billion ( U S D 2 0 0 . 1 5 m i l l i o n ) compared to LBP 213.81 billion (USD 141.83 million) as at 31 December 2017.
FRANSABANK | ANNUAL REPORT 2018 | 40-41
ASSET QUALITY RATIOS AS AT 31 DECEMBER
Net doubtful and bad debts to Net loans and advances to customers Net doubtful and bad debts to Shareholders’ equity Net substandard debts to Net loans and advances to customers Allowance for ECL and interest in suspense to Doubtful and bad debts Allowance for ECL and interest in suspense to Substandard debts
2.67% 8.04% 2.19%
80.76% 22.45%
2.37% 7.30% 2.97%
81.01% 24.41%
2017 2018

BREAKDOWN OF GROSS LOANS AND ADVANCES TO CUSTOMERS BY AMOUNT AS AT 31 DECEMBER 2018
Amount % % Cum.
582,798,288 219,678,188 322,238,863 697,238,869
1,081,946,706 1,584,688,429 3,482,606,329
7,971,195,672
7.31% 2.76% 4.04% 8.75%
13.57% 19.88% 43.69%
7.31% 10.07% 14.11% 22.86% 36.43% 56.31%
100%
Amount % % Cum.
720,511,437 288,457,118 836,328,788 597,863,046 219,999,499 141,094,714 609,088,747
3,413,343,349
21.11% 8.45%
24.50% 17.52%
6.45% 4.13%
17.84%
21.11% 29.56% 54.06% 71.58% 78.03% 82.16%
100%
A < 50 million 50 million ≤ A < 100 million 100 million ≤ A < 200 million 200 million ≤ A < 500 million 500 million ≤ A < 1.5 billion 1.5 billion ≤ A < 5 billion A ≥ 5 billion TOTAL 100% 100%
FCsLBP
1,303,309,725 508,135,306
1,158,567,651 1,295,101,915 1,301,946,205 1,725,783,143 4,091,695,076
11,384,539,021
11.45% 4.46%
10.18% 11.37% 11.44% 15.16% 35.94%
11.45% 15.91% 26.09% 37.46% 48.90% 64.06%
100%
Amount % % Cum.In thousands of LBP
100%
3. Capital Adequacy Ratio The Board of Directors has decided to include 2018 and 2017 net profits in the calculation of the respective Equity Ratios. This decision has been taken in anticipation of the 2017 and 2018 General Assembly meetings ratification and subject to the deduction of the related estimated dividends distribution. To note that the 2018 and 2017 Ordinary General Assemblies which were held respectively on 30.05.2019 and 30.05.2018 approved the Board a/m decisions. Accordingly, the Group’s total capital adequacy ratio as at 31 December 2018 is 16.30% (2018 profit included), as compared to 15.40% (2017 profit included) as at 31 December 2017.
The capital adequacy ratio is calculated according to Central Bank of Lebanon guidelines, which are in line with the recommendations of the Committee on Banking Regulations and Supervisory Practices of the Bank for International Settlements (the Basel III Accord). On a stand-alone basis, Fransabank’s capital adequacy ratio as at 31 December 2018, stood at 17.29% (2018 profit included), as compared to 16.58% (2017 profit included) as at 31 December 2017. The statutory minimum total capital adequacy ratio requested by Central Bank of Lebanon is 15% as at end December 2018 which was raised from 14.5% as at end December 2017.
BREAKDOWN OF LOANS AND ADVANCES TO CUSTOMERS BY ECONOMIC SECTOR
39%
3%
16%
12%
2%
28% Trade & Services
Industry
Construction
Agriculture
Retail
Miscellaneous
31.12.17
Trade & Services
Industry
Construction
Agriculture
Retail
Miscellaneous
38%
2%
15%12%
2%
31%
31.12.18
TOTAL
MANAGEMENT REPORT

2017
A. PROFITABILITY
ROAA (Return on Average Assets) ROACE (Return on Average Common Equity) Total interest paid to Total interest received Net interest income to Average assets Net commissions to Net financial revenues (before allowance to credit losses) Operating expenses to Net financial revenues (before allowance to credit losses) (Cost-to-income ratio) Non-interest income to Net financial revenues (before allowance to credit losses) Operating expenses to Average customers’ creditor accounts EPS in USD (Earnings per common share in US Dollar) DPS in USD (Dividend per common share in US Dollar)* Dividend payout ratio (Dividends on common and preferred shares / Net profits)* B. LIQUIDITY
Average net customers’ loans to Average customers’ creditor accounts Average customers’ creditor accounts to Average total deposits Foreign currency customers’ loans to Foreign currency customers’ creditor accounts C. CAPITAL ADEQUACY
Shareholders’ equity to Total assets Shareholders’ equity to Loans and acceptances Capital Adequacy Ratio (as per Basel III) Common Tier I Ratio Tier I Ratio Total Capital Ratio D. ASSET QUALITY RATIOS
Doubtful debts (net) to Total customers’ loans (net) Doubtful debts (net) to Shareholders’ equity Allowance to credit losses for doubtful debts to Doubtful debts Substandard accounts (net) to Total customers’ loans (net) Unrealized interest & allowance to credit losses for Substandard accounts to Substandard accounts Total allowance to credit losses and unrealized interest to Total gross customers’ loans (*) On an unconsolidated basis.
0.84% 9.47%
67.09% 1.74%
14.56%
52.59% 23.02%
1.52% 7.10 2.19
55.78%
38.74% 98.93% 44.59%
10.46% 31.77%
10.42% 14.11% 15.40%
2.67% 8.04%
80.76% 2.19%
22.45% 10.61%
0.83% 8.53%
71.68% 1.73%
13.16%
54.97% 24.63%
1.57% 6.59 1.33
45.07%
39.34% 98.88% 44.20%
10.28% 29.75%
10.73% 14.42% 16.30%
2.37% 7.30%
81.01% 2.97%
24.41% 10.76%
Main ratios
2018
FRANSABANK | ANNUAL REPORT 2018 | 42-43

The Ordinary General Assembly of Fransabank SAL held on 30 May 2019:
• Approved the accounts and the Balance Sheet of Fransabank SAL as at end December 2018 • Acquitted Fransabank SAL Board of Directors for their management of the business activities of the fiscal year 2018
• Decided to allocate out of Fransabank SAL net profit (LBP 173,974,503 thousand) as follows:
- 10% to legal reserve (LBP 17,397,450 thousand),
- LBP 24,043,424 thousand to general reserves,
- LBP 7,538,932 thousand to reserve for assets acquired in settlement of bad loans,
- LBP 43,850,000 thousand (LBP 2,000/share) as dividend distribution on common shares, LBP 7,631,719 thousand on
preferred shares - Series C, LBP 8,328,938 thousand on preferred shares - Series D, LBP 10,684,406 thousand on
preferred shares - Series E, and LBP 7,914,375 thousand on preferred shares - Series F representing 25.20%, 4.39%,
4.79%, 6.14% and 4.55% respectively of the Bank’s 2018 net profits,
- LBP 46,585,259 thousand, i.e. the remaining balance, to free reserves.
RESOLUTIONS OF FRANSABANK SAL ORDINARY GENERAL ASSEMBLY
MANAGEMENT REPORT

Investment and Private Banking Fransa Invest Bank (FIB), the investment arm of Fransabank provides its customers with a panoply of financial advisory, investment and financing solutions ranging from medium to long-term deposit/lending to highly structured and specialized products. During the year 2018, FIB achieved the following: • Private Banking/Asset Management FIB successfully structured and marketed two retail investment products in 2018. - The first retail product was a structured deposit that
was issued in March 2018, raising USD 39.34 million. It pays fixed coupons of 5.25% p.a. over a 5-year term, in addition to a participation at maturity in the performance of a diversified basket of international stocks.
- The second retail product was structured for Bancassurance SAL, in collaboration with Fransabank. It paid a guaranteed coupon of 5.20% p.a. and also had a life insurance component. The product successfully closed on October of 2018, surpassing its target size and raising USD 8.16 million.
FIB also increased its brokerage client base and revenue, evidenced by an increase of 16% in total net commissions in 2018. The strong activity in stock trading (+44% in net commission) has largely offset the decline in derivatives trading (-32%), following the increase in required margins on derivatives mandated by the regulator. In addition, FIB continued to manage its own fund, the Fransa Invest Beehive Fund, which is a global balanced fund that provides exposure to fixed income and equities. • Advisory Services/Equity & Debt Financing FIB managed investment banking and corporate finance assets – proprietary and group owned – of USD 120 million in 2018, these included: - medium to long term project finance and corporate loans
and notes of approximately USD 50 million; - participations in securitizations in excess of USD 35 million; - commitments for local and foreign direct equity funds of
USD 27 million; - direct equity investments in excess of USD 7 million. FIB has been diligently exercising hands on supervision and monitoring through representations on boards and active participations in general assemblies. In this regard, FIB contributed to the amelioration of corporate governance, reporting standards, and exit opportunities. On the other hand and in terms of financing, the strategy was to optimize the portfolio in terms of diversification, maturities, exposure to currency risk, and spreads. In this regard, FIB recommended and successfully negotiated the terms of a USD 30 million placement in a new securitization fund with a moderate expected average life and at better yields. FIB has also been optimizing its efforts to promote resilient industries such as healthcare. In addition, FIB has successfully secured regulatory approval for a USD 14 million private placement in Lebanon. It has been advising, and at arm’s length, both the sponsor and the potential investors on the optimal corporate structure, minority interest protection, reserved matters, and exit options at the most
favorable returns. FIB’s contribution was also in advising the sponsor on balanced local versus foreign financing resources and respective terms. • Research FIB and Fransabank collaborated with the High Council for Privatization and PPP, to produce a guide on the implementation of Public Private Partnerships (PPP). The document, released in June 2018, was widely cited in the media and used by the public and private sectors. The guide helps companies better understand how they can propose, bid for, and undertake to design, build, operate, manage, or invest in a PPP project in Lebanon. It also details 18 potential projects, which are parts of the Capital Investment Program. Corporate Banking Fransabank sustained its leading position in the Lebanese corporate banking field, by catering to the financial needs of medium and large corporate businesses and offering a wide range of industry-specific products and services. In this context, Fransabank played a prominent role in supporting the financing of the major sectors of the economy and in particular the green economy by focusing on key projects such as: winds farms, PV farms, energy efficiency financing, natural resources projects, infrastructure development, as well as electricity, water and oil & gas … In fact, Fransabank Sustainable Energy Finance (SEF) has become a strategic core business in the Bank’s corporate lending activities coupled with the adoption of an Environmental and Social Management System (ESMS) in all SEF lending files. In order to further strengthen the involvement in the green economy, the Bank launched Green Bonds with leading international finance institutions exclusively dedicated to finance green energy projects. Fransabank long-dated dealings with international financing institution have been a major competitive advantage in the local market, especially in times of uncertainty and economic downturns, as they have helped the Bank secure custom-made and flexible conditions for capable clients that otherwise would not have been able to meet their financial duties. Consequently, further agreements were concluded in 2018, as such: - Signed with the European Bank for Reconstruction and
Development (EBRD) a trade finance line supporting the expansion of international and intra-regional trade in Lebanon by providing guarantees and cash advances for the import, export, and local distribution of imported goods (mainly in the medical, energy, electricity, and food production sectors). This agreement provides clients with international trade financing at lower interest rates through correspondent banks.
- Signed with PROPARCO a credit line to support Lebanese
companies (large corporations as well as SMEs) facing exceptional difficulties in meeting their financial commitments. This credit line strengthens the Group’s status vis-à-vis its corporate and SME clients, and thus reinforcing their loyalty.
CORE BANKING ACTIVITIES
FRANSABANK | ANNUAL REPORT 2018 | 44-45

- Accordingly, Fransabank will keep on dealing with current and new International financial institutions as EIB, ATFP, … in order to offer distinguished and competitive corporate products and services.
Moreover, the Bank has been expanding into new markets, driven by a very active Lebanese Diaspora. As such, Fransabank keeps up with its corporate clients in foreign markets such as Africa, Algeria, Iraq, and France, where its subsidiaries and/or branches are supporting Lebanese companies in developing their businesses. Retail Banking Fransabank's retail banking activities sustained its growth pace; while new agreements with international partners were consolidated; offering customers further financial access. Thus, Fransabank signed two credit lines with the European International Bank (EIB) and the International Finance Corporation (IFC), targeting micro, small and medium sized enterprises financing. In parallel, and with a concrete vision of sustainable financial inclusion, essentially in remote areas, Fransabank, in cooperation with Vitas – one of the largest microfinance institutions in Lebanon, re- asserted its financial support to micro credits clients and rewarded 10 micro entrepreneurs (divided equally between men and women); which were selected according to selected KPIs as for performance, sustainability, growth and return on investment. Moreover on the lending side and despite the decline in demand for housing loans among the Lebanese, and the limited quota to all subsidized housing loans, Fransabank took the initiative and launched a housing loan spring campaign whereby approved applicants benefited from up to 100% pay back for the registration fees. In 2018, Fransabank introduced two new Mastercard credit cards targeting individual retail customers: the first Biometric Credit Card in Lebanon and the region as well as the Titanium Contactless Credit Card with the “Tap & Go” technology, In addition the Bank launched the 3DS Secure Code on the entire credit cards portfolio for an advanced security. Rewarding its loyal clientele, the Bank launched several promotions and acquisition campaigns throughout the year. Customers were rewarded with cashbacks, valuable gifts and special discounts at selected merchants. Within Fransabank’s commitment to green finance and fighting climate change and in addition to the eco-friendly products and services already launched during the past years, the Bank has prepared the necessary logistics to finance sustainable PV Panels for households and individuals during the year 2019. While, shifting to virtual banking is a complex journey, supporting more high-tech channels available around the clock, including mobile apps adapted to main mobile devices as well as the Apple Watch, have become a top priority. Consequently, for a superior customer experience, Fransabank upgraded its mobile app by adding new features, installed smart ATMs with cash and check deposit, and upgraded its CRM experience for
a better customer engagement experience. Fransabank is committed to encouraging greater financial inclusiveness by adapting its services to the shifting clients’ banking wants and requirements. On the local network aspect, Fransabank inaugurated, in 2018, a new branch in Rahbe – Akkar, in addition to installing off-premises ATMs at selected locations for greater accessibility. With a Group network of 126 branches spread from Rahbe in the North of Lebanon to Naqoura in the South, Fransabank Group enjoys one of the widest geographic expansion of local branches, and the largest in number of local branches. Then again, it is worth noting that several branches will be relocated to new premises or be fully renovated with the same innovative concept applied to all new branches, reflecting a contemporary experience at the Bank. Furthermore, a new e-branch is anticipated to be inaugurated within 2019 to further meet customers’ expectations by taking advantage of digital innovations and by providing clients with more bespoke services and experiences that would be in line with these days’ changing lifestyles. Above and beyond, Fransabank has been adopting several notions that lead to open communication with clients as per the Central Bank of Lebanon Circular No. 134 related to the “Know your Rights & Duties”. In fact, customers have full access to information regarding the terms, conditions, details of available products and services, and can request further explanations to have a clear and complete awareness about different risk levels of any financial product. Fransabank is keen on being approachable by clients willing to contact the Bank or file a complaint. China Desk Fransabank’s China Desk main objective is to promote and facilitate Lebanese and Chinese business exchanges, and aims to make Fransabank Group the preferred partner to Chinese banks and companies in its markets, as well as local and foreign ones dealing with China. Based on the relations built with Chinese companies in the various markets where Fransabank operates, and further to the different missions conducted by China Desk to the Bank’s overseas subsidiaries, business influx from several Chinese banks and companies has witnessed a real growth. China Desk team further developed its activities from banking cooperation to attracting Chinese investment to Lebanon. In this context, Fransabank achieved the following: • Organized two major events in Beirut namely “Lebanon
Investment in Infrastructure Conference” and “the First China-Arab Banking and Business Forum”. Both conferences aimed at promoting the investment opportunities in infrastructure in Lebanon, during which a special session was hosted targeting Chinese investors. Side meetings were arranged for the Chinese companies with relevant Lebanese government entities to get more information about the projects and have them registered for bidding.
MANAGEMENT REPORT

• Joined as a founding member of the China – Arab Countries
Interbank Association, announced by Chinese President XI Jinping and led by China Development Bank, the world’s leading development bank.
• Signed a MOU with the Asian Financial Cooperation Association
(AFCA) and with the Lebanese Ministry of Industry for China related projects and businesses.
• Welcomed the high-level official visit by Chinese State
Leader Chen, Vice President of the Chinese People's Political Consultative Conference, and his 20-member delegation at Fransabank headquarters, confirming to him that China can benefit from Lebanon.
• Participated in the first China International Import Expo
(CIIE), which took place in Shanghai-China, being the sole Lebanese entity officially registered at the Expo. China Desk team was also coordinating with China Council for the Promotion of International Trade (CCPIT) for the establishment of their representative office in Lebanon, estimated to be launched by mid-2019.
• Launched several important publications on PPP projects
in Lebanon, under the Capital Investment Program of the Lebanese Government and on the Investment Climate in the country to International and Chinese Investors.
Fransabank OJSC opened its branch in the China-Belarus Industrial Park, the biggest overseas industrial park China has invested in.
FRANSABANK | ANNUAL REPORT 2018 | 46-47

BLC Bank SAL Despite the continuous political disorder and the inadequate macroeconomic conditions, BLC Bank was able to achieve reasonable stability at the level of profitability and on the balance sheet level while minimizing its concentration risk and deposits' volatility. With regards to profits, net profits closed at USD 41 million, 12% below the 2017 results due to the large impact of the new tax law. As for net commissions, they increased by 2% compared to December 2017. On the balance sheet side, during 2018, BLC Bank maintained its customers’ deposits base at USD 3.9 billion, unchanged compared to 2017. Concentration risk was minimized though as customers’ deposits, below USD 1 million (considered the stable and sustainable deposit base), increased by 2.3% on a yearly basis. On the other hand, loans to customers slightly increased by 0.4%, despite a decrease in the market by 1% compared to 2017, noting that SME loans increased by 1%. Total consolidated assets increased by 0.5%, to reach USD 5.89 billion as at end-December 2018. Furthermore, BLC Bank’s net spread reached 1.8% in 2018, standing among the best in the sector. As far as liquidity is concerned and same as other Lebanese banks, liquidity was affected following the political crisis; yet, BLC Bank recovered back and its liquidity ratio reached 17.8% as at 31 December 2018, which is above the 10% required by the regulator. BLC Bank’s Capital Adequacy Ratio reached 19.25% compared to a regulatory requirement of 15% as at end-December 2018 reflecting the solidity of its capital structure and a clear growth potential. In an unsteady financial landscape, with consumer behaviors and expectations challenging the banking sector, BLC Bank sustained its customer centric strategy, offering thus a broad array of financial and non-financial services. As such, the Bank pursued its commitment to supporting small and medium size enterprises and women while both the retail and the corporate levels witnessed a stable activity through its personal, car and business loans. On the non-financial services level, the Bank’s strategy included the implementation of roadshows across Lebanese regions and conferences. On the other hand, Business Power Sessions took place on a monthly basis, covering a wide scope of topics. In parallel, BLC Bank pursued getting international recognition for its pioneering experience in empowering SMEs and Women, which became global best practices for the international community and encouraged other Lebanese institutions to
follow its path. As such, Chairman General Manager Mr. Nadim Kassar attended the CEO roundtable during the UNGC Leaders Summit held at the UN Headquarters in New York, representing the only financial institution in the MENA region. Moreover, BLC Bank pursued its volunteer mentorship programs for bank members of the Global Banking Alliance for Women, highlighting its role as an international reference for best practice and an advocate for the economic empowerment of women. This remarkable commitment was translated through the GBA Women’s Market Champion 2018 Data Award delivered to BLC Bank, for having reported extraordinarily high-quality sex-disaggregated data to GBA at the GBA Summit held in Jordan. The Bank received as well recognition for being innovative receiving a trophy from Oracle for being the first to implement the SuperCluster M8 in Lebanon, being the world’s fastest engineered system while having the most advanced security features. BLC Bank celebrated once again entrepreneurs’ achievements through the Brilliant Lebanese Awards. BLC Bank placed entrepreneurs (both male and female) in the limelight by conducting the seventh edition of the Brilliant Lebanese Awards. The Business of the Year, Women Entrepreneur of the Year and People Choice Award were announced in a TV event broadcasted live delivering on its promise to honor and promote successful Lebanese entrepreneurs. Moreover, the Tech Innovation of the Year Award was added due to the important role this sector plays in the knowledge economy. Fransa Invest Bank SAL (FIB) A wholly owned investment and private banking subsidiary of Fransabank, Fransa Invest Bank is one of the leading investment and private banking institutions in Lebanon. It provides full-fledged investment banking services, aiming at meeting the needs of a diversified client base including high-net-worth individuals, financial institutions, corporations, and governments, through a full range of dedicated professional financial services. FIB is also keen to keep abreast with all events and changing conditions in key financial markets along with their potential impact on the development of national, regional and international economies. The Bank’s strategic advice to clients is delivered via this know-how, so as to support them to meet their investment and financial objectives. The Bank fosters its long-term success and sustainable growth through its core principles in terms of superior client service, teamwork, excellence, and accountability. FIB’s activities include: • Financial Advisory – mergers and acquisitions, equity capital
markets, private investments, corporate equity/debt advisory, re-organization and balance sheet re-structuring;
Local Subsidiaries and Associate
MANAGEMENT REPORT

• Equity and Debt Financing – feasibility studies, legal and financial due diligence, corporate and project financing, syndicated financing, debt/equity structuring, equity placements, and debt settlement arrangement;
• Private Banking and Asset Management – offers clients a
complete range of tailor made advice, investment products and services;
• Capital Markets Services - available through a very well
equipped and staffed trading room, which provides full brokerage services to carry out transactions in equities, fixed income, currencies, commodities, futures and options, with access to local, regional and international markets;
• Research - FIB provides in-house research and analysis on
financial markets, as well as economic and country analysis, supported by international banks and asset managers upon the request of clients.
Lebanese Leasing Company SAL (LLC) The year 2018 was another profitable year for the Lebanese Leasing Company, the leasing arm of Fransabank, which persisted to actively market its services despite the difficult local and regional environments. In terms of energy efficiency leasing business, LLC sustained its growth and consequently witnessed an increase of 13% in terms of new business. LLC kept on strengthening its structure and developing new products, aiming at creating new revenue streams and diversifying its portfolio in terms of products and risk. While maintaining the classical lines of business, LLC will endeavor to operate in generating non-interest income, which is a plan set for the coming three years. Reinforcing the existing products and launching new products in the market will allow LLC to enhance its profitability and subsequently contribute to the development and wealth of Fransabank Group. Bancassurance SAL Bancassurance sustained its rank as first bank insurer and second life insurer amongst 34 life insurance companies in Lebanon. Its professionalism and know-how are key elements in its persisting success in the Lebanese market. In fact, Bancassurance offers fully developed insurance & financial services for individuals and groups, thus meeting every specific requirement. Its goal is to focus on improving people’s quality of life through financial security by providing products and services which satisfy the consumers’ daily needs as well as long-term ones.
Bancassurance grew its performance in 2018, whereby it reached a turnover of USD 83.4 million and increased its net profit by 5.5%, attaining USD 20.6 million. The global spectrum is made of pure life insurance products, financial saving products, and investment products. It includes: - Term and accidental life insurance products for protection; - Savings and life insurance plans for retirement, education,
and housing; - Investment and life insurance plans with access to the
international financial markets; - Borrower life insurance products for all types of loans. Société Générale Foncière SAL (SOGEFON) Sogefon, the real estate arm of Fransabank registered an acceptable profit margin during 2018, despite the challenging market conditions and the real estate sector stagnation. This result was made possible due to the dedication of Sogefon team and their deploying efforts to ensure the best interest of Fransabank Group.
FRANSABANK | ANNUAL REPORT 2018 | 48-49

During 2018, the global economy has strengthened driven by an accelerated growth in developed countries and a recovery from recession in developing and transition economies. The sturdy indicators of global economic output and global business helped increase consumer confidence and boost investment activities. The improved business sentiment allowed Fransabank Group to capitalize on the growth prospects in the countries of presence to further consolidate its position as a leader in these markets. In this context, the Bank’s foreign entities pursued active business development strategies taking into account the individual characteristics of each country, with a focus on geographical expansion in Algeria and Belarus to ensure a wider reach; on synergies and close partnerships between Fransabank (France) and its representative office in Abidjan, to accompany the growth of Lebanese businesses overseas; on infrastructure and digitalization overhaul in Sudan, in addition to ongoing development of new products and services within the whole network to create long-term values for its overseas customers. Teamwork, inter-group synergies and effective processes were the main drivers for the sustained growth of the Group’s network. This led to a growth by 5.81% in the total assets of overseas entities, while profits generated by the network accounted for 9% of consolidated net profit. Besides, Fransabank received JP Morgan Chase Bank’s 2018 Elite Quality Recognition Award for U.S. Dollar Clearing MT103 at a rate of 99.52%, which indicates the high quality of payment transactions processed by the Bank, attaining one of the highest percentage among banks. This award reflects the Bank’s commitment to international rigorous standards in transaction execution, precision and accuracy.
Fransabank (France) SA Fransabank (France) continued to further strengthen its market position by providing a comprehensive range of products and services to better cater for the needs of its diversified client base spread across Europe, the Middle East and Africa. Fransabank (France) corporate culture oriented towards customer satisfaction, empowering its human capital and based on ethical values, are its key success factors. Leveraging on the expertise of its shareholder, BPCE Group, in the French banking sector and backed by its parent company Fransabank SAL in Lebanon, Fransabank (France) managed to become the reference partner for customers seeking to develop their business, acquire real estate or willing to place and secure part of their savings in France at competitive rates. The Bank has adopted an active lending approach while sustaining a healthy coverage ratio. Customers’ loans increased by 14% to reach EUR 378.71 million at year-end 2018. The Bank made it a top priority to attract new deposits from existing and new retail and corporate clients. Consequently, customers’ deposits increased by 27% to reach EUR 188.71 million; while 2018 net profit, after provisions and taxes, amounted to EUR 3.04 million with total assets reaching EUR 429.55 million. Fransabank El Djazaïr SPA The Algerian government carried out several economic reforms during 2018, however the key challenges for the economy remain mitigating the impact of the volatility of crude oil and gas prices and diversifying sources of growth to overcome the high fiscal and external deficits. Higher oil prices and the Algerian government's expansionary fiscal policy allowed export revenues to recover in 2018 easing the pressure on fiscal reserves and prompting a slight decrease of fiscal deficit. This trend is expected to continue in 2019 with a gradual recovery of the economy. The year 2018 has marked a promising start for Fransabank El Djazaïr 2020 development plan with the aim of confirming its position as a major player in the Algerian banking sector, based on the following two core pillars: . The expansion of the local branch network across Algerian
wilayas to reach 30 branches by end of 2020 for a broader reach of customers, and
. The development of a complete range of products and services offering solutions to better serve the needs of its clients and help them achieve their goals.
The Bank’s business activity developed vigorously sustained by a gradually recovering economy. Total assets stood at c/v USD 530.15 million as at year-end 2018, up 31% compared to year-end 2017. Customers’ deposits increased by 35% to reach c/v USD 366.16 million and customers’ loans by 62% to reach c/v USD 355.35 million. Net profit reached c/v USD 10.70 million in 2018 compared to c/v USD 8.11 million in 2017, registering an increase of 36%.
Overseas Subsidiaries, Branches Abroad and Associate
MANAGEMENT REPORT

Fransabank OJSC (Belarus) The cyclical economic recovery continued in Belarus during 2018, driven by strong domestic demand and increased exports. The rise of real wages led to an increase in household consumption, which grew by 10.2% year-on-year in the second quarter of 2018 while GDP grew by 2.4% in 2017 and is projected to grow by 4% in 2018 and by 3.1% in 2019. The National Bank of the Republic of Belarus continued its monetary policies targeting the containment of inflation, which slowed to 6% in 2017, and further to 5.6% by September 2018. The stabilization of inflation led to the decrease of benchmark interest rates (refinancing rate) from 17% p.a. at the beginning of 2017 to 10% p.a., improving loan supply conditions and stimulating the Bank’s lending. The positive business environment allowed Fransabank OJSC to adopt a more active strategy, increasing its loan portfolio by 60% year-on-year from BYN 47.7 million at end of 2017 to BYN 75.9 million at end of 2018. Moreover, with the development of the Chinese-Belarusian ties in recent years, Fransabank OJSC, supported by the parent company, is positioning itself at the center of servicing Chinese companies operating in Belarus, through its newly established branch in the China-Belarus industrial park “Great Stone” in Minsk, China’s largest overseas industrial park. Earlier in March 2018, Fransabank OJSC organized together with the Chinese Chamber of Commerce in Belarus, and the Chinese Embassy in Belarus, a seminar under theme “Partnerships on Belt & Road Initiative”, attracting more than 50 major Chinese companies. During 2019, Fransabank OJSC will further develop its active lending strategy to positively contribute to the growth of the Belarusian economy. Fransabank SAL Iraq Branches The Iraqi economy started a gradual recovery in 2018 following years of deep economic strains. However, challenges remain due to political and social instability and the dependence on oil prices. The improving oil market will allow the Iraqi government to substantially increase spending and finance reconstruction. Public investment is set to increase by 32% focusing on key sectors such as energy and security. Post-conflict recovery will remain the main drive for non-oil growth with reconstruction needs estimated at USD 88 billion. However, reconstruction efforts may be delayed due to political uncertainty. In this context, Fransabank Iraq has adopted a conservative growth and lending strategy while concentrating on building a solid infrastructure and constantly completing its range of products and services in order to better cater for the needs of its customers.
Fransabank Iraq is strengthening its commercial team, gradually readjusting sales mechanisms to match the market needs as well as consolidating the support functions with the aim of improving the productivity and competitiveness of the Bank. As the economic recovery is expected to noticeably pick up in 2019, Fransabank Iraq will progressively adopt an active lending approach consistent with the ongoing improvement in the Iraqi business environment. United Capital Bank (Sudan) Following the lift of the US economic sanctions in October 2017 and the reforms undertaken by the government, which were urged by the IMF to allow progress towards debt relief, the Sudanese economy was expected to move gradually towards recovery. However, 2018 ended with full-fledged protests across Sudanese cities amid deteriorating living conditions, high inflation and acute currency devaluation. Our associate bank in Sudan, United Capital Bank (UCB) was able to overcome the difficult economic situation through a focused strategy based on financing large corporate and strategic projects as well as arranging and managing syndicated financing. Furthermore, UCB initiated during 2018 its five years strategic plan aiming at positioning the Bank as an innovator in the Sudanese banking sector, through the modernization of its infrastructure and the digitization of banking services. UCB also targeted a vertical expansion through opening banking offices within the premises of universities and large corporates to attract current and investment deposits. This was reflected in the Bank’s financial performance registering a net profit of c/v USD 19.9 million in 2018 and maintaining a healthy loan portfolio, which reached c/v USD 46.3 million at end of 2018. Total assets increased by 40% year-on-year reaching c/v USD 124 million at end of 2018.
FRANSABANK | ANNUAL REPORT 2018 | 50-51

Risk Management
Risk Management Framework Risk Governance Fransabank highly values its reputation as a responsible and ethical operator in the financial industry. Against this backcloth, the Board of Directors acknowledges that one of its primary objectives is to explicitly enforce the collective oversight and risk governance responsibilities. Thus, the Bank has set risk management as a strategic priority, pursuing a continued improvement of its risk organization and risk governance practices, based on a three lines of defense model to identify, assess and mitigate risks. The Bank targets to build effective and intelligent risk management processes, infusing at all hierarchical levels a risk management philosophy that seeks calculated risk-taking as a means for value creation. This will enable sound strategy decisions and conducting business activities on a risk-informed basis. The Board of Directors and the general management have also committed to invest in human resources and information technology systems to upgrade the Bank’s risk information capabilities, providing the platform for data collection, aggregation, analysis and communication. Risk Culture Risk culture is the Bank’s system of ethics, values & behavior related to risk awareness, risk taking, risk management and
controls: from the beliefs of the Board of Directors to the attitudes of employees. Fransabank recognizes that the Board of Directors and senior management are the starting point for setting the Bank’s core values and expectations for promoting a sound risk culture. The Board of Directors and senior management promote through behaviors, actions and words, a risk culture that expects integrity and a sound approach to risk management and that will proactively address any identified areas of weakness and concern. A critical point in implementing a sound risk culture at Fransabank is for all employees to act with integrity and report any observed non-compliance. Reporting of risk events or potential risks should be a valued characteristic and be done in an environment where there is no fear of reprisal or prejudicial judgment. The Bank should ensure that there are appropriate, ‘safe’ mechanisms to promote this principle. Employees at all levels have to understand the core values of the Bank and that they will be held accountable for their actions. Risk Appetite Fransabank expresses its risk appetite statement in quantitative and qualitative terms, focusing on major risk areas, among which: capital management, funding management, credit risk, specific asset liability management risks and operational risk. The risk appetite statement is incorporated in the Bank’s annual budget process to ensure that plans are within the risk appetite parameters.
Risk Management Focus Over the past few years, efforts have been exerted to achieve a more advanced risk management model. In that context, focus was also directed on rolling out the risk management processes at all Group entities in order to ensure proactive risk governance and management both at the individual and Group levels.
With a strong involvement of senior management, the risk management function at the parent company, supervised by the Board Risk Committee, continued in 2018 to upscale its efforts towards achieving a more advanced risk management model. Among other things, it worked on: . Cultivating a bank-wide awareness of risks, promoting
RISK GOVERNANCE
RISK MANAGEMENT FRAMEWORK
RISK CULTURE
Board of Directors & Board Risk Committee✓ Risk Appetite✓ Risk Oversight
Senior Management & Management Committees✓ Implement business strategies within the Board Risk Appetite
Business Lines ✓ 1st Line of Defense
Risk Management & Compliance ✓ 2nd Line of Defense
Internal Audit ✓ 3rd Line of Defense
Board of Directors & Senior Management are the starting point for setting and promoting a sound risk culture through behaviors, actions & words Integrity & a sound approach to risk management
Safe mechanisms to report risk events or potential risks ‘Whistle blowing channels’
Employees at all levels will be held accountable for their actions
• What risks to engage with?
• What risks to avoid?
• Risk Appetite Statement
✓ Quantitative✓ Qualitative
MANAGEMENT REPORT

interactions between the different hierarchical levels at the Bank for an integrated risk management approach
. Linking the risk appetite to the decision-making process, endeavoring to incorporate therein sufficiently severe macro-economic factors in the stress test criteria
. Ensuring that policies and procedures are updated and implemented consistently across all risk categories, business lines and legal entities. The policies & procedures would emphasize the qualitative, as well as, the quantitative factors with a focus on standardizing the risk management framework across the Group
. Improving the comprehensiveness and quality of risk data and risk reporting to provide for more in-depth and dynamic discussions and hence a sound basis for management decisions.
The Operating Environment in 2018 In 2018, Lebanon faced politico-economic challenges that tested the resilience of the Lebanese banking sector. The sluggish economic situation and delay in government formation exerted pressure on the Lebanese banking sector that witnessed a decline in customers' deposits growth combined to a conversion from the national currency to the US Dollar. Interest rates on deposits were heightened exacerbated as well by the rising global interest rates. The lending activity in the Lebanese banking sector witnessed a negative growth contracting by 1%, impacted by the continuing downturn in the economy and the resulting counter measures taken by Banque du Liban (BDL) mainly revising its subsidized lending programs and setting a 25% limit on loans to deposits in LBP. In 2018, Banque du Liban has continued to conduct a series of financial operations that incentivized banks to park their liquid foreign assets at the BDL. These transactions provided banks with higher returns on their placements with the Central Bank, in turn supporting their offering higher interest rates on customers' deposits. Capital Management Capital Adequacy Ratios Banque du Liban minima Capital Adequacy Ratios were gradually increased as of 2015 to reach 10%, 13% and 15% respectively by end 2018 at the level of Common Equity Tier 1 (CET 1), Tier 1 and Total Capital Ratios. The minimum requirement as of 2018 for CET 1 includes a capital conservation buffer of 4.5% and a systemic risk buffer of 2.5%. As at 31.12.2018, the Group Capital Ratios stood at 10.73%, 14.42% and 16.3% respectively. Fransabank Group CET 1 Capital as at end 2018 amounts to USD 1,258 million compared to USD 1,230 million as at end 2017, representing 66% of the Total Regulatory Capital. With the introduction of the International Financial Reporting Standard 9 (IFRS9) applicable as of 1st January 2018, the Bank has taken advantage to constitute Expected Credit Losses’ (ECLs) provisions out of General Reserves. In addition, total regulatory capital, which stands at USD 1,912 million at
year-end 2018, reflects the incorporation of stage 1 ECLs in Tier 2 Capital. As at 31.12.2018, the Group’s Risk Weighted Assets (RWA) amounted USD 11,731 million, constituted up to 92% of Credit Risk. Market Risk share decreased from 2% to 1% as a result of the new classification of financial assets under IFRS9, introducing the new category ‘Fair Value through Other Comprehensive Income’ for fixed income securities. As of the beginning of 2019, the share ownership of Fransabank in its subsidiary BLC Bank SAL passed to 98% up from 75%, therefrom reducing the minority interest share in the Group’s consolidated equity and eventually impacting the capital ratios. The Bank’s risk appetite would target to gradually reinstate the total capital ratio at 16% minimum. Internal Capital Adequacy Assessment Process Fransabank carries out its annual Internal Capital Adequacy Assessment Process (ICAAP) exercise on a consolidated and on a standalone basis. Under the ICAAP, banks assess the amounts and types of capital considered adequate to cover all material risks. The ICAAP exercise takes into account concentration risk per borrower and per sector, as well as the sensitivity to interest rate increases on the balance sheet. In addition, a capital charge is set based on the assessment of the quality of risk governance and processes. The ICAAP incorporates the 3-year budget for the assessment of future needs and further assesses the impact of multiple extreme but plausible stress test scenarios on the Bank’s financial position. The ICAAP is discussed with executive management and submitted to the Board Risk Committee and to the Board of Directors and has become an integral part in the capital planning and budgeting. Leverage Ratio Fransabank monitors the Leverage Ratio, which is another supplementary non-risk based measurement, introduced by Basel III framework, calculated as capital to total on and off-balance sheet exposure. Banque du Liban has not yet set a minimum requirement for the Leverage Ratio. Recovery Plan In 2018, the Bank has prepared its first recovery plan, identifying the main financial indicators related to Capital Adequacy, Profitability, Asset Quality and Liquidity and setting the appropriate thresholds under normal, stressed and recovery situations that aim to trigger the implementation of the recovery plan. In addition, the Bank has applied stress-testing scenarios and identified the recovery options that will allow the Bank, eventually, to gradually restore its financial position. The recovery plan was updated in early 2019 and therefrom on yearly basis.
FRANSABANK | ANNUAL REPORT 2018 | 52-53

Risk Profile Key Elements The Group’s risk profile reflects a conservative approach, translating the Bank’s strategic objectives, business plan and risk appetite. Fransabank manages the risks arising from its activity through detailed processes that emphasize the importance of integrity, maintaining high quality staff and public accountability. Credit Risk Credit risk is defined as the risk of losses in earnings or capital from the potential that a bank’s borrower or counterparty will fail to meet its obligations in accordance with agreed terms. Fransabank adopts prudent credit standards in designing its credit policies and procedures. The Bank customers’ credit risk revolves around traditional lending activities to the different market segments namely Corporate, SME and Retail. These would include loans and contingent liabilities, where losses might occur due to the failure of borrowers or counterparties to meet their contractual obligations. Credit requests are processed through a uniform credit proposal that assesses the client’s quantitative and qualitative information using the internal risk rating system, where applicable. These are therefrom subject to an independent credit risk assessment. Internal ratings are becoming part of the decision making process as to ultimately yield a Risk Based Pricing. Credit files are submitted for approval to specialized committees and eventually to the Board of Directors. The Bank’s credit processes are supplemented by regular portfolio reviews focused on countries, regions or specific industries to ensure portfolio diversification. The Bank manages the levels of credit risk undertaken by placing limits on the amount of risk accepted in relation to one borrower or group of related borrowers. Country limits are also established and reviewed on regular basis. In 2018, the challenging politico-economic environment prevailing in Lebanon continued to weigh on the customers’ lending activity, in terms of assets growth and quality, in the same way for the local banking sector. Asset quality ratios remained however within the projected levels, being mitigated to a large extent by comfortable tangible securities, reflecting the Bank’s traditionally prudent and conservative approach. The credit risk exposure on banks contracted by Fransabank consists mainly of short-term money market deposits placed with prime international banks and only in investment grade rated countries. These placements are considered as highly liquid assets and are thus aimed to form part of the Bank’s liquidity cushion. Exposures on banks and financial institutions are undertaken within credit lines and are capped by country ceilings. Fransabank and similar to its peer banks, tolerates a substantial exposure on the Lebanese sovereign as part of its investment of surplus funds and given the comparative return potential. The level of exposure is contained within pre-approved limits set in the asset liability risk management policy.
With the introduction of IFRS9 as of 1st January 2018, the Bank moved from the incurred loss model to the Expected Credit Loss model (ECL), whereby provisions are booked on all types of credit risk, since inception. Liquidity Risk Liquidity risk is defined as the inability of a bank i) to meet its obligations in due time and ii) to fund increases in assets without incurring unacceptable losses. The fundamental role of banks in the maturity transformation of short-term deposits into long-term loans makes banks vulnerable to liquidity risk on an institution-specific and market-wide level will negatively impact the banks’ profitability in case the bank is obliged to resort to capital markets for funding under unfavorable circumstances. The Bank’s funding strategy is to ensure a solid funding base mainly relying on customers’ retail deposits. Fransabank’s liquidity risk management policy sets several methods and measures to manage liquidity risk over the short and longer term. The Bank recognizes that a critical element to resilience to liquidity risk is the availability of an adequate cushion of unencumbered and highly liquid assets. Thus and among other things, the Bank has set a floor to the level of money market deposits denominated in foreign currencies it places for less than 30 days with prime international banks measured to its customers’ deposits denominated in foreign currencies. These money market deposits are also dispersed on a number of banks to further ensure the needed diversification. Fransabank follows and tracks the evolution of financial markets and assesses their inherent volatility so to detect early warning indicators that serve as warning signals for probable liquidity shortages of both specific and systematic nature. In case of any warning signals, the Bank will decide on the appropriate corrective measures or eventually trigger the contingency funding plan in order to facilitate and coordinate the decision making process during a liquidity crisis. Market Risk Market risk is defined as the risk of losses arising from adverse movements in market prices in on and off-balance-sheet positions, encompassing interest rate sensitive instruments and equities in the trading book, as well as foreign exchange (FX) positions and commodity positions in the banking book. Fransabank has a low appetite to market risk and limits are set accordingly in the Bank’s market risk management policy. In what concerns securities trading, the Bank holds a small portfolio consisting mainly of Lebanese sovereign securities; the Bank also carries FX risk that essentially arises from the translation effect of the positions the Bank holds as equity investments in some of its banking subsidiaries and that cannot be hedged against. Interest Rate Risk in the Banking Book (IRRBB) IRRBB emerges from the negative re-pricing gap between rate sensitive assets and rate sensitive liabilities. The resulting
MANAGEMENT REPORT

mismatch between long-term assets and short-term liabilities is inherent in banking activities. Excessive IRRBB can pose significant threat to a bank’s current capital base and/or future earnings if not managed appropriately. At Fransabank, the IRRBB is monitored through two measurement approaches in order to control the impact of interest rates changes on the Bank’s balance sheet over both the short-term as well as the long-term and to confine them within the preset limits. The earnings at risk methodology is adopted for a short-term horizon of 1 year and calculates the potential decrease in the said year’s projected net interest income, resulting from hypothetical increases in interest rates. The economic value of equity approach calculates the impact of a hypothetical interest rate change on the bank’s balance sheet cash flows. Operational Risk Operational risk is the risk of losses from internal failures relating to processing, systems and people as well as losses relating to external factors such as disasters or changes in laws and regulations. The ultimate responsibility of risk oversight lies with the Board of Directors. The Board of Directors delegates specific oversight of risk management activities in the Bank to the Board Risk Committee, which oversees operational risk arising from business and support functions through regular reporting on the operational risk profile. Senior management ensures a proper segregation of duties and separation of functions through an effective internal control framework referring to the three lines of defense approach. The business lines own the risk and act as a first control level. Risk management designs, implements and maintains the operational risk management framework and, together with the compliance function, act as the second line of defense and internal audit as the third. Fransabank implements sound and reliable set of management processes to identify, assess, control, and monitor operational risks, as part of the overall strengthening and continuous improvement of the controls within the Bank. The Bank has developed an operational loss incident reporting tool and expanded the collection of operational loss incidents. In addition, risk and control self-assessments are periodically conducted by the business and support units in order to evaluate the effectiveness of the internal control system and to eventually recommend corrective actions. By its nature, operational risk is difficult to eliminate entirely. Fransabank aims to keep it at a minimum by ensuring that business units and staff identify and manage the risks inherent in the products, activities, processes and systems for which they are accountable. To support this, Fransabank believes that a strong risk culture is essential; hence, investing in ongoing training and development at all staff levels to increase knowledge and promote risk management practices.
Compliance
Fransabank relies on compliance risk management as a main pillar for its activities. Compliance focuses on identifying and managing all possible non-compliance risks and aims at encouraging, monitoring and controlling the observation of rules and regulations, laws, internal policies - including the compliance principles outlined in Fransabank’s Code of Conduct – as well as established good business standards and practices which are relevant to the integrity and hence to the reputation of Fransabank. Integrity and ethics are the foundation for managing compliance risks, and therefore, the driving force behind everything Fransabank enterprises. Managing integrity risk is accordingly placed within the scope of the compliance function and is the basis for a sound compliance environment. The compliance function of Fransabank supports the entity in integrating and improving the compliance arrangements in all levels and structures of the Bank. The compliance activity therefore has the following objectives: • Identify, assess, control, monitor, test and report on the
compliance risks faced by Fransabank; • Assist, support and advise the Board of Directors, top and
senior management of Fransabank, in fulfilling their responsibilities to manage compliance risks;
• Implement a compliance culture among staff and enhancing
compliance awareness throughout the organization; • Implement the compliance program in a fashion that is in
line with the regulatory environment and expectations; • Enforce compliance policies and procedures which implement
applicable laws and regulations and adopt industry standards and best practices;
• Implement a Group-wide risk assessment review; • Advise any staff member of Fransabank with respect to their
personal responsibility to manage compliance risks; As to the scope of compliance, it depends on the nature, size and location of business activities. It generally includes: - Legal compliance including: Compliance with Rules &
Regulations, Global Reporting (FATCA Law, Common Reporting Standard and GDPR), and local and international sanctions and restrictive measures (UN, US, EU and other sanctions requirements).
- Anti-Money Laundering and Combating the Financing of
Terrorism including: customer acceptance – Know Your Customer / Customer Due Diligence, transaction monitoring, risk-based classification and monitoring of customers, and investigation and reporting.
- Capital Markets Compliance including treatment of confidential
information, management of conflicts of interest, prevention of insider trading and market manipulation, new product approval, and fair treatment of customers.
FRANSABANK | ANNUAL REPORT 2018 | 54-55

Governing Principles AML/CFT Fransabank Group’s AML/CFT (Anti-Money Laundering / Combatting the Financing of Terrorism) policy primarily aims at setting, within the Group, the essential standards for fighting money laundering operations and terrorism financing. Should the applicable AML/CFT laws and regulations of any country or jurisdiction require higher standards, Fransabank Group’s overseas subsidiaries and associate banks must conform to these standards. However, in case the relevant subsidiary or associate bank comes across any applicable law that is inconsistent with the Group’s policy, it must first refer to the Group’s compliance department to resolve the conflict. The AML/CFT Policy also encompasses the following objectives: • Promoting a Know Your Customer (KYC) standard as the
main principle for Fransabank Group business ethics and practices:
- Prior to any transaction of any type, Fransabank Group’s
entities gather and document the relevant customer identification data, along with the background information, as well as the purpose and the intended nature of the business.
- Fransabank Group’s entities retain and document any additional customer information relevant to the assessment of the money laundering risk, by adopting a risk-based approach which triggers the proper enhanced due diligence for the relevant customers.
• Enforcing the following additional due diligence measures
while establishing and maintaining correspondent relations: - Gathering sufficient documentary evidence on a respondent
institution to avoid any relationships with “shell banks”; - Enquiring about the good reputation of a respondent
institution from public sources of information, including whether it has been subject to a money laundering or terrorist financing investigation or other regulatory action;
- Verifying periodically that the respondent institution is implementing sufficient and effective procedures to fight money laundering and terrorist financing.
• Monitoring and reporting suspicious transactions/activity: - Fransabank Group’s entities apply due diligence measures
whenever they detect any unusual or suspicious transaction or activity, taking into account the legal framework of the concerned institution.
- All suspicious transactions or activities complying with the laws and regulations of the corresponding jurisdiction are reported.
- The Group’s compliance department is notified of all suspicious transactions or activities when doubts arise.
• Developing an effective internal control structure where no
activity with a customer is carried out without obtaining in advance all the required information relating to the customer.
• Consolidating, within the Group, the AML/CFT efforts deployed by Fransabank entities.
• Conducting self-evaluation processes on the compliance
with the AML/CFT policy and measures. Consequently, the adoption of the AML/CFT policy is crucial to ascertain that all Fransabank Group’s entities, whatever their geographic location, fully comply with the enacted AML legislation. Thus, the Group is committed to overseeing its AML/CFT strategies, objectives and guidelines on an ongoing basis, and also to supporting an effective AML/CFT Policy within the Group’s business. Compliance Fransabank Group’s compliance governing principles are as follows: • Integrity, ethics and reputation are vital assets to maintain
the healthy growth of business. • Management is the owner of compliance to foster the adequate
enterprise-wide culture. • The compliance function is independent from business lines,
yet is a shared responsibility of all employees. • A transparent and constructive relationship between
Fransabank Group and its regulators, partners and other stakeholders is maintained.
• Effective monitoring of compliance risks is implemented. • Timely, accurate and systematic compliance reporting is
provided. • An anti-bribery and corruption policy is enforced, in line with
International requirements and best practices. • A conflict of interest management policy is introduced to be
in harmony with international requirements. • The compliance function will continue to develop by improving
its governance, its measurement methods, its policies and procedures, and adopting the industry’s best practice in line with local and global developments.
The Group compliance team is headed by the Group Chief Compliance Officer who coordinates “overall compliance” within Fransabank Group. He is the internal supervisor and responsible for ensuring that Fransabank Group operates within the defined compliance framework. The Group Chief Compliance Officer is supported by a number of designated officers and controlling bodies within Fransabank’s Group organization structures.
MANAGEMENT REPORT

At Fransabank, we believe that a strong and supportive culture, diverse and engaged employees, along with a shared commitment to living the Bank’s core values are essential to define the long-term and sustainable business success. It is the expertise and dedication of 1,752 employees which enable the Bank to create a shared value strategy with its customers. Core values are at the basis of Fransabank’s diverse culture, training and development programs, and continuous efforts to maintain a healthy working environment. Importantly, diversity is a key focus for the workforce, and embracing it is a central growth enabler for a successful business. Thus, in terms of gender balance; 47% of Fransabank’s employees are females, with 55% holding senior management positions and 53% holding middle management positions. The annual turnover rate reached 2.23%. It is the lowest for the past five years, and is a very satisfactory rate as compared to the overall local sector; echoing Fransabank’s employees’ loyalty. Understanding the importance of supporting the education journey of its employees, whether to achieve higher degrees or develop new expertise to enhance their job knowledge, Fransabank provides its workforce with efficient and customized financial support. Educational loans are offered at zero interest rate to employees wishing to pursue their professional certification or graduate studies in any field related to banking, and linked to their career path. During 2018, six employees pursued the continuous education program. In fact, enhancing the professional competence of personnel is one of Fransabank’s priorities, as it fosters a positive working environment and improves employees’ output. In 2018, the training seminars totaled 102,623 hours of training, an average of 58.5 hours per staff compared to 39.1 hours of training per staff in 2017. Training programs were split into 13,415 hours of external training (13%) and 14,334 hours of internal seminars (14%) and 74,874 hours of orientation programs (73%). The 2018 training sessions were related to the Common Reporting Standards (CRS), FATCA, Anti-Money Laundering and Combating the Financing of Terrorism (AML/CFT), which covered 1,006 employees from various departments and branches for over 3,289 hours of training. In parallel, other training topics were held covering various topics ranging from banking and financial techniques, management and behavioral skills, to marketing and selling skills and information technology. In addition to offering internal and external training, the Employee Development Program works on improving employees’ ability to handle multiple functions through the Polyvalence Enhancement program, preparing potential employees to occupy higher positions through the Potentials Development program, selecting employees based on personal attributes, educational background, banking skills and knowledge, to be enrolled in a Fast Track program through the Talent Management program, as well as initiating them into future organizational requirements, or key positions through the Succession Planning.
Furthermore, 98 employees successfully passed the Lebanese Financial Regulations exam. Thus, the total coverage ratio of Fransabank employees certified as per the Central Bank of Lebanon Circular No 103 requisite was 62.5%. Within its inclusive culture, Fransabank is keen on attracting, hiring and retaining young professionals and graduates. Therefore, the Bank makes sure to annually be present at main universities’ job fairs, offering career guidance for university students who wish to acquire further knowledge or know-how on the financial and banking sector. As a result, interested candidates are granted internship opportunities. In 2018, the Summer Internship Program welcomed 202 students. Each student was offered a customized training of 240 hours providing him/her with a practical banking experience. In fact, these internships programs help the Bank identify future talent and potential candidates. Accordingly, at the end of the summer program, a list of candidates was selected to go through the hiring process, once they graduate. The decision was based upon those who outshined in performance and behavior and showed eagerness to learn and assist. Consequently, five candidates were selected and hired in 2018. Remuneration Policy The objective of the remuneration policy is to attract talented staff by offering competitive compensation within the market. Accordingly, the compensation system and policy applies to all employees across the Bank and aims to reinforce effective performance management. Thus, the Performance Appraisal Review (PAR) system assists managers in their annual evaluation, basing performance assessment on clear standards of delivery and behavior. It starts with employees aligning their duties and objectives to business and team goals. Behavioural expectations are set in the context of the Bank’s values. Fransabank’s remuneration system consists of salary payment, allowances and other benefits and employees are eligible to receive for an annual bonus as an outcome of their evaluation. The system includes fixed remunerations (salary increments) and variable remunerations (bonuses and promotions).
Human Resources
FRANSABANK | ANNUAL REPORT 2018 | 56-57

Information and Communication Technology
In the world of Information and Communication Technology (ICT), the only constant thing is change and transformation. In view of that, Fransabank is continuously enhancing its ICT infrastructure, services and building new partnerships during the past years with strategic partners to onboard the digital waves of new Fintech disruptions and grab the opportunity to offer better customer convenience, loyalty and inclusion. The Bank embraces the potential of digitalization to drive cost efficiencies across the organization and to support labor-intensive processes. The transformation journey will put the client at the center of the Bank’s strategic vision. Moreover, digital signatures technology recently approved by the Lebanese Parliament will provide an opportunity for the Bank to kick-off several initiatives that would facilitate online enrollment, loan approvals as well as numerous other advanced services. A- Partnership with the Leading International Software Providers In 2018, a major partnership with Oracle Financial Services was established to pave the way for several technology-driven projects in the below areas: • Anti-Money Laundering (AML) A project was launched to replace the traditional AML platform with a leading Tier-1 application using proactive scenario based detection techniques and Artificial Intelligence. • Profitability, funds transfer pricing, and assets & liability management Another project is to meet the ever growing business needs using Oracle technology that will allow the Bank to get more accurate figures and have advanced financial controls using international best practices in profitability, funds transfer, pricing and assets and liabilities management; this is coupled with advanced dashboards, business intelligence reports, simulations, and stress test results. • Financial consolidation Another initiative with Oracle is to implement financial consolidation, planning, and budgeting solutions applications. A hybrid model will be put in place where consolidation is managed on premise, while budgeting and planning are managed on the cloud to benefit from the high agility and to adapt to the changing business environment and resource usage. • Human resources A strategic project is to shift the current Human Resources system to a globalized HR and talent management system, aligned with international best practices.
B- Omni-Channel and Digital Transformation Providing round the clock services through various channels including support for major mobile devices and handheld accessories (like the Apple Watch) is a top priority for the Bank. In that perspective – for a superior customer experience – Fransabank introduced several initiatives to answer the ever-growing needs through: - an advanced internet banking for corporate customers, - a new mobile app for retail customers, - smart ATMs with cash and check deposit, and - an upgraded CRM experience for the best customer engagement
experience. C- Infrastructure, Monitoring and Security • Software defined datacenter In 2018, Fransabank has completed the initiative started a year earlier regarding the conversion of its datacenter into a software-defined datacenter, which helps lower cost as well as deliver auto-scaling of services at a much faster rate. Equipped with powerful virtualization capabilities and orchestration tools, the Bank is already seeing it come to fruition when less hardware is bought, fewer licenses needed, and reduced cooling is required; which adds considerable savings on all levels. • Information security log management A Security Information Event Management (SIEM) solution was deployed to detect malicious attacks and anomalous behavior on the network. This complies with industry standards and regulations that mandate log trail collection and management. • Swift upgrade An exhaustive list of security requirements mandated by Swift Alliance were implemented including, but not limited to, multi-factor authentication, file integrity, next generation firewalls, data leakage prevention, and privilege management. • Improving service availability and stability A new network operations center was established to provide round-the-clock services. This includes dedicated monitoring, root-cause analysis, and level one remediation. This ensures service availability across all platforms, notably with the ever-changing technology and more-demanding community through the available delivery channels outside normal working hours.
MANAGEMENT REPORT

Corporate Social Responsibility
In this regard, the Bank is keen on updating its open dialogues with internal and external stakeholders, on a yearly basis, directing them each and every time on different aspects and through different communication means. In 2018, the Bank assumed three surveys targeting selected internal stakeholders (employees) and external stakeholders (clients and youth). One of the main objectives of these surveys was to depict the material topics of high importance to them and determine which issues are still the most relevant. While the 2018 exercise revealed relatively similar issues and priorities as in previous years, the wording of some indicators was edited to reflect well-defined and more precise topics. Moreover, Fransabank’s commitment to the United Nations Global Compact 10 principles and the 17 Sustainable Development Goals (SDGs) was sustained with further advancement of six specific SDGs: Goal 4 - Quality Education, Goal 5 - Gender Equality, Goal 8 - Decent Work and Economic Growth, Goal 9 - Industry, Innovation and Infrastructure, Goal 11 - Sustainable Cities and Communities, and Goal 13 - Climate Action. A broader description of Fransabank’s contribution to the six chosen SDGs, with their corresponding targets, is reported in the comprehensive CSR report. Besides, Fransabank has been an active affiliate of various sustainability initiatives such as being member in the steering committee of the Global Compact Network Lebanon (GCNL) and is a signatory to Lebanon Climate Act (LCA) initiative. In brief, Fransabank’s 2018 CSR Report covered the Bank’ accomplishments in terms of: 1. Responsibility in Banking Fransabank is a responsible financial partner committed to best-in-class governance practices, transparent policies and regulations, as well as accountable mechanisms and standards. It focuses on Corporate Governance as a tool for incorporating social, environmental and ethical practices into the business decision making process, thus benefiting all related stakeholders in a balanced way. The Bank is keen on ensuring compliance across all business activities by preventing financial crimes and eliminating all forms of corruption. Therefore, Fransabank collaborates with all regulatory authorities on potential and actual money laundering cases and has put in place written policies, procedures and internal controls designed to comply with local and applicable international rules and regulations. Common Reporting Standards (CRS), fraud prevention, anti-money
laundering and terrorist financing, professional secrecy, conflicts of interest and ethics, anti-bribery and corruption, and sanctions requirements as well as customer protection and satisfaction were all topics discussed during the compliance training sessions targeted to the Bank’s employees. As for the labor force, it is the reflection of the Bank’s corporate culture. Employees’ role is crucial in replicating the integrity and accountability of Fransabank. Therefore, the entire workforce strive to abide by the highest ethical standards through a well-developed and easily accessible Corporate Code of Conduct and Professional Ethics. Human rights are, as well, an integral part of our core values, which is in accordance with the Universal Declaration of Human Rights, the Lebanese Labor Law, and the Collective Labor Agreement. Fransabank’s internal and fundamental guidelines, including the corporate Code of Conduct and Professional Ethics, policies and procedures as well as the Employee Handbook, reflect the Bank’s conviction in advocating human rights within the workplace, and in its dealings with clients and suppliers. With the emerging cyber-attacks and threats, Fransabank has worked on enhancing its security standards protecting the business integrity and customers’ information confidentiality. Knowing that with the quick advancement of the hacking techniques, reactive actions based on detective and corrective security measures are not sufficient anymore, proactive measures to detect any attempt to penetrate in the internal environment have been adopted in order to stop the hacker before the damage is done. In this perspective, Fransabank initiated the implementation of a Security Operation Center (SOC) by acquiring and implementing a Security Information and Event Management (SIEM) solution, being the corner stone toward building a SOC. 2. Responsibility for the Economy Fransabank offers tailored financial services that span from commercial, retail, small and medium sized, to environmentally conscious products, all offered within a responsible approach making sure that clients’ needs are well understood and, in turn, banking products are suited to their wants and financial capacity. They constitute priority business lines which are well aligned with the targets of SDG 8 - Decent Work and Economic Growth and SDG 9 - Industry, Innovation and Infrastructure. When discussing financial inclusion, Fransabank provides solutions to satisfy diverse segments from micro businesses to Small and Medium Enterprises (SMEs) and start-ups. By
FRANSABANK | ANNUAL REPORT 2018 | 58-59
Fransabank’s Corporate Social Responsibility (CSR) is driven by an ambition to create value for all stakeholders, use its expertise to drive sustainable progress and make a positive impact in the societies it serves. Thus, the Bank’s CSR approach is directed towards the integration of the following five main pillars within its core business activities:
Corporate Governance Managing the business risks, while still providing an ethical business environment and protecting customers’ information.
Economic Development Supporting financial inclusion and investments with a positive socio- economic impact.
Environment Adopting and funding the transition to a low-carbon economy as well as spreading awareness to the general public.
Human Capital Upholding diversity and inclusion within workplace, supporting career development, and stimulating staff engagement.
Social Commitment Building financial confidence in the next generations, as well as endorsing cultural and social initiatives.

acting as a financial catalyst, the Bank contributes to economic growth especially in rural or remote areas. As such, through its partnership with Vitas – one of the largest microfinance institutions in Lebanon, Fransabank has gained the trust of its marginalized customers supporting their microenterprises, while also offering the necessary assistance. At the end of 2018, over 23,758 micro entrepreneurs benefited from more than USD 49.1 million assets used for the financing of microcredits. However, the challenge remains in persuading clients of the benefits of saving as much as borrowing. Interestingly, a considerable portion of microcredits portfolio consists of women and young entrepreneurs. Defining young entrepreneurs as clients whose age is between 18 and 30 years, Fransabank youth portfolio totaled 1,322 beneficiaries with a total portfolio value of USD 2.31 million in 2018. As for the female microcredits beneficiaries, constituting 41% of the total portfolio, they have reached 1,676 women entrepreneurs with a total portfolio value of USD 2.78 million in 2018. Annually, youth clients’ increased by 19% and their total loans value by 33.5%; women beneficiaries’ number increased by 10.3% and the total loans value by 25%. Moreover, in 2018, following a KPI assessment of the micro entrepreneurs’ portfolio, Fransabank financially rewarded its top 10 performing clients; standing, once again, by the minority-owned businesses. Contributing to more than half of the population’s employment, SMEs are a great part of the Bank’s lending portfolio. At end of 2018, the total financial support for SMEs and Mid-caps reached USD 615.45 million for 9,232 approved SME loans; noting that Lebanon is witnessing a precarious economic situation. In view of that, Fransabank was the first bank to receive from the European Bank for Reconstruction and Development (EBRD) a USD 50 million trade finance line to help expand international trade in Lebanon. Another USD 18 million credit line was extended by PROPARCO to Fransabank Group, with the main purpose of backing SMEs and Mid-caps companies that are currently operating their business in a difficult local economic context, and to which the Bank is committed to provide the necessary support so they can overcome more confidently their challenges. In parallel, Fransabank stands by the Central Bank of Lebanon Circular No. 331 by supporting Lebanese start-ups in their ride to success and allocating equity funds to accelerate creative Lebanese entrepreneurs in their business growth. Simultaneously, Fransabank’s responsibility goes beyond securing loans and funds. It also provides strategic insights and guidance to customers by organizing seminars and sector- based information meetings in order to raise customers’ awareness, know-how and strengthen their loyalty to the Bank. Ensuring the fair and proper treatment of customers while delivering responsible advisory services are requirements and standards that are embedded in the Bank policies and practices. Employees must act in the best interest of clients and propose the products and assistance deemed suitable for
their request. Communication, irrespective of the channel and the customer, should be open, straight and explicit. As part of Fransabank’s accountability to its clients, the Bank also relies on a complaints mechanism to enable customers to raise their concerns; which in turn helps employees handle and resolve complaints via a dedicated financial consumer protection department. 3. Responsibility for the Environment Fransabank has been stressing on the importance of long-term finance to deal with climate change while adopting, internally as well, sustainable practices. Throughout the past years, Fransabank has been the leading commercial bank in Lebanon in financing energy efficiency and renewable energy projects through its Sustainable Energy Finance Initiative (SEF) with more than 175 projects financed amounting to USD 120 million; giving rise to a separate business line within the Bank. In order to attain its objective and centralize actions, a comprehensive Environmental and Social Management System (ESMS) was adopted to support the implementation of sustainability strategy through the identification and management of the Environment and Social (E&S) risks related to clients' activities and operations. Several Memorandums of Understanding were signed with various parties for extensive cooperation to fight climate change, create general awareness and finance energy projects; these include: • A group of petrol stations (2015) • A prominent university (2016) • A Chamber of Commerce, Industry and Agriculture (2016) • Green School Certification Program (2016) • The Association of Lebanese Industrialists (2017) • The Ministry of Industry (2018) • Lebanon Water Project funded by the USAID (2018) The latter, resulted from the adoption, in 2018, of the Lebanese Water Stewardship, in coordination with Lebanon Water Project, a USAID funded program. It aims to create awareness on the importance of water, water savings, development of water treatment projects, etc. Accordingly, Fransabank would work on integrating water management criteria in its credit assessments. In April 2018, a distinguished achievement was realized by being the first bank in Lebanon and the Levant region to launch Green Bonds, which are exclusively allocated to projects with positive environmental impact. International finance institutions such as the IFC and EBRD invested respectively USD 45 million and USD 15 million in Fransabank Green Bonds – series 1, giving a vote of confidence to Green Finance at Fransabank and in Lebanon. As a front-runner act being, Moody’s assessed the operation and has given it an “Excellent” rating (the highest rating possible on this type of transaction).
MANAGEMENT REPORT

This operation is part of a larger three years USD 150 million green bond program. This investment from prime international financial institution is a vote of confidence for Lebanon and Fransabank in particular. In fact, as a pioneer in introducing Green Bonds in the region, Fransabank received the 2019 Green Bond Pioneer Award from the Climate Bonds Initiative, in partnership with the London Stock Exchange Group. Consequently to this well-recognized Sustainable Energy Finance strategy, Fransabank was selected by the Global Compact Network Lebanon as the national Goal Leader of SDG 13 – Climate Action; thus, working on mainstreaming the SDG 13 in the private sector in Lebanon, focusing on raising awareness about climate change and transforming it into national policies while strengthening the ability of the country to deal with the results of climate change through mitigation and adaptation measures. Internally, the Bank constantly strive to improve its environmental management setup in order to reduce its environmental footprint, by opting for green technologies and mostly reinforcing a responsible culture among the staff. Consequently, the yearly average of CO2 emissions, after the implementation of the latest infrastructure projects, reached 2,870 tons of CO2 per year, while the total annual CO2 yearly reduction averaged 684 tons of CO2. In 2018, emissions from heating, paper and plastics all saw declines. The reduction in paper consumption across the Bank continued, as quantities recycled decreased by 60% in 2018, with only 76 tons of papers recycled. This decline is partly, the result of an ongoing digitalization of documents and constant focus on minimizing paper consumption. Furthermore, Fransabank’s e-banking services reached 64,301 users at the end of 2018, compared to 57,455 at the end of 2017. The replacement of individual printers by a shared printing across the Bank was finalized; pushing employees to rethink their printing habits and facilitating the shift to a double-sided printing practice. Likewise, plastic waste was decreased since water dispensers and refill bottles are progressively replacing the use of plastic water bottles. This change in habit results from a wider national awareness regarding plastic waste consumption. Accordingly, 1.4 tons of recyclable plastics were collected and sent for recycling in 2018; a decrease of 12% as compared to 2017. All of that comes together with the International Finance Corporation (IFC) comprehensive green audit, conducted on the Headquarters, from which a series of green refurbishments were derived and prepared to be executed. Thus, energy efficiency solutions were studied by the internal engineering team resulting in the implementation of appropriate solutions, while some other energy efficiency upgrade projects are still in the pipeline. In effect, following the Headquarters greenhouse gas emissions 2017 reporting to the Ministry of Environment, the Bank received a certificate of acknowledgement for its reporting as well as its leadership in climate change awareness.
4. Responsibility as an Employer Fransabank aspires to be the preferred workplace for dedicated persons who are driven by delivering remarkable working experiences. Acting on the principle of making the best use out of its diverse human capital, the Bank is keen to observe equal employment opportunity in its recruitment, career development (or promotion), and compensation policies and practices. Whether gender, age, background, thinking, or seniority, Fransabank takes diversity into consideration as much as education and experience. Focusing initially on gender equality, women employees represented 47% of the total workforce, with 45% of new recruits being also females out of 84 new hires. Yet, the true concern is the inclusion of women in the decision-making, by considering their shrewdness and gratifying their competences. Accordingly, women represent 55% of senior managers (namely head of division/department, regional manager/deputy/area, branch manager & deputy branch manager), and occupy 53% of middle management positions (being operational/commercial controller, deputy head of department/head & deputy head of section/unit). Another major aspect of diversity and inclusion is age distribution. Aiming to serve all society’s age group, Fransabank is always committed to accommodate its human capital to secure an approach, which customers would relate to. As such, our young employees have an added value when it comes to dealing with millennial clients’ as they would be more familiar with their needs and expectations. Similarly, older customers attach more importance to their long-term relationship with our loyal employees. Thus, the Bank’s workforce average age is 38.3 years, younger by 1.8% from the average age of 2017. As for the turnover rate, it has registered 2.23% in 2018; pointing out the ability of the Bank to retain talents. In fact, it is the lowest rate for the past five years, and is a very satisfactory one as compared to the overall local sector. To achieve further diversity, Fransabank also invests in its existing and acquired talents, ensuring professional development opportunities through trainings, internal mobility and merit-based career growth. Therefore, Training & Development (T&D) programs are based on personalized modules and employees current or forthcoming responsibilities. In 2018, the training sessions totaled 102,623 hours of training, an average of 58.5 hours per staff compared to 39.1 hours of training per staff in 2017.
FRANSABANK | ANNUAL REPORT 2018 | 60-61

5. Responsibility towards the Communities A key part of Fransabank’s strategy is providing seed money to support community groups and projects in their capacity building and help them reach the resources that facilitate social development and welfare. In 2018, Fransabank has invested more than USD 855,000 to more than 80 organizations working for the common good of a range of educational, cultural and social initiatives. Over the years, Fransabank’s contributions to educational initiatives have increased mainly due its increased commitment to advancing financial education and literacy, such as raising awareness of young people on financial inclusion, budgeting and saving skills, financial planning, financial management, and e-payment to prepare the youth generation with regard to the world of banking and finance. In fact, its strategic financial literacy approach contributed directly to the advancement of some of the targets of SDG 4 – Quality Education. In view of that, Fransabank organized an educational day with an integrated training program for 250 school students as part of the Global Money Week initiative. Students were involved in interactive discussions with the Bank’s management and staffs, who presented key banking facts and figures, CSR definition, strategic scope, and initiatives, as well as products and services targeting the youth. Discussions were closed with a one-question survey requesting students’ new idea/projects to better serve the community. The 2018 batch of students were also introduced to a financial literacy cards game, Fransabank Big Bank Challenge, combining interactive entertainment and learning. Not to forget the Bank’s employees who were trained as youth ambassadors to teach the game rules and accordingly play with the students; giving them further insights about the banking world. In addition, Fransabank, in collaboration with INJAZ, held the “I Camp Business Challenge” also as part of the GMW 2018 program. Vivid discussions and exercises took place to enhance the students’ financial knowledge, marketing strategy and teamwork skills in a thriving and knowledge-based economy. In view of that, students were dispatched into groups, which were assisted by Fransabank employees proficient in corporate banking. Thus, seven employees voluntarily shared their knowledge and expertise creating a hub of excellence for new start-ups and innovative ideas. Fransabank has also worked, collaboratively, with the Lebanese American University (LAU), to introduce the Practical Banking course as a one credit course offered to all LAU students regardless of their major. The objective of the course is to explain to students the basics of banking. Other financial education initiatives were wrapped up with the Institute of Finance Basil Fuleihan, and the General Secretariat of Catholic Schools.
Significantly, Fransabank’s educational loans, introduced back in 2009, reached a total of 1,669 grants for an outstanding amount of around the c/v of USD 20.01 million as end of 2018; helping all qualified students pursue their education either in Lebanon or abroad at very competitive rates and flexible repayment periods. On the other hand, Fransabank has always been an art advocate, with the belief that everyone should have access to art and music. Through its partnerships with cultural institutions, the Bank aims to bring together people from all backgrounds, opening doors and minds for social change. Fransabank is also committed to bringing together social contribution, philanthropy and donation to create lasting change for the better of communities across Lebanon. Fransabank’s efforts focus on providing nonprofit organizations with the necessary support to serve the most vulnerable populations and come up with new models to help low-income citizens, children, seniors, and people with special needs improve their living standards.
Corporate Social Responsibility Reporting This is a summary of the Bank's Corporate Social Responsibility (CSR) progress in 2018. A comprehensive report is published separately. It covers a wider range of topics with an all-embracing content about Fransabank CSR strategy, initiatives, facts, figures and case studies. The CSR report 2018 has been prepared in accordance with the GRI Standards: Core option, highlighting its pledge to the UN Global Compact, as well as reporting on its contribution to the six selected SDGs and their corresponding targets. For additional information: https://bit.ly/2GaewBg
MANAGEMENT REPORT

Environmental and Social Management System (ESMS)
As part of Climate Finance Initiative initiated in 2013, sustainability features are gradually being integrated into the core business lines. An Environmental and Social Management System (ESMS) was, therefore, developed to become an important tool supporting the implementation of sustainability strategy through the identification and management of Environmental and Social (E&S) risks related to clients’ activities and operations. In view of that, An Environmental & Social Due Diligence (ESDD) is conducted to evaluate the compliance of clients’ operations with international environmental best practices and applicable local laws. Based on the assessment of E&S practices in place (waste management, efficiency of resources, labor working conditions, pollution prevention, community health safety, conservation of biodiversity…), the Bank does establish a corrective action plan for its clients, when needed. This will urge clients to identify practices hindering environmental and social sustainability, and take action towards reforming these practices, embracing clean production and sound environmental management, for the sake of improvement of environmental stewardship across the country. Additionally, Fransabank abides by IFC and EBRD Exclusion lists whereby Fransabank commits to substantially reduce or stop the exposure to excluded sectors and activities. In 2018, Fransabank assigned an ESMS officer, dedicated to the implementation of ESMS principles to the Bank’s entire portfolio; making sure all clients are environmentally and socially compliant. The next phase will be to have ESMS embedded within the Bank's core lending procedures, with the aim of having ESMS as a pillar factor in the lending process and an essential determinant of credit eligibility. Thus Fransabank is again proving its commitment towards becoming an all-inclusive sustainable bank by taking, thenceforward, the pledge to only finance environmentally and socially viable projects.
FRANSABANK | ANNUAL REPORT 2018 | 62-63


FRANSABANK | ANNUAL REPORT 2018 | 64-65

TO THE SHAREHOLDERS FRANSABANK SAL BEIRUT, LEBANON
Opinion We have audited the accompanying consolidated financial statements of Fransabank SAL, (the “Bank”) and its subsidiaries (collectively the “Group”) which comprise the consolidated statement of financial position as at December 31, 2018, and the consolidated statement of profit or loss and other comprehensive income, consolidated statement of changes in equity and the consolidated statement of cash flows for the year then ended, and Notes to the consolidated financial statements, including a summary of significant accounting policies.
In our opinion, the accompanying consolidated financial statements present fairly, in all material respects, the consolidated financial position of the Group as of December 31, 2018, its consolidated financial performance and its consolidated cash flows for the year then ended in accordance with International Financial Reporting Standards (IFRSs).
Basis for Opinion We conducted our audit in accordance with International Standards on Auditing (ISAs). Our responsibilities under those standards are further described in the Auditors’ Responsibilities for the Audit of the Financial Statements section of our report. We are independent of the Group in accordance with the International Ethics Standards Board for Accountants’ Code of Ethics for Professional Accountants (IESBA Code) together with
the Code of Ethics of the Lebanese Association of Certified Public Accountants that are relevant to our audit of the consolidated financial statements, and we have fulfilled our other ethical responsibilities in accordance with these requirements. We believe that the audit evidence we have obtained is sufficient and appropriate to provide a basis for our opinion.
Key Audit Matters Key audit matters are those matters that, in our professional judgment, were of most significance in our audit of the consolidated financial statements of the current period. These matters were addressed in the context of our audit of the
consolidated financial statements as a whole, and in forming our opinion thereon, and we do not provide a separate opinion on these matters.
Independent auditors’ report
CONSOLIDATED FINANCIAL STATEMENTS

FRANSABANK | ANNUAL REPORT 2018 | 66-67
Impairment of financial assets The Group adopted IFRS 9 Financial Instruments (as revised in July 2014) including impairment requirements on its mandatory effective date of implementation on January 1, 2018, which resulted in changes in accounting policies and adjustments to amounts previously recognised in the consolidated financial statements. As permitted by transitional provisions of IFRS 9, the Group elected not to restate the comparative figures and recorded an adjustment in the amount of LBP 400 billion to the opening retained earnings and reserves in the consolidated statement of changes in equity as at January 1, 2018. The changes required to processes, systems and controls to comply with IFRS 9 were significant, as the standard requires a fundamental change to the way and when credit losses are recognised and how these are measured by changing the impairment model from an Incurred Loss model to an Expected Credit Loss (ECL) model. Accordingly the following were identified: - Judgements, assumptions and estimates, which include
adopting a ‘default’ definition and methodologies for developing Probabilities of Defaults (PDs) at origination, lifetime-PDs, Loss Given Default (LGD), Exposure At Default (EAD), and macroeconomic models with a number of scenarios and probabilities for each scenario and other post-model adjustments.
- Inadequate data and lack of uniformity in the data used makes
it difficult to develop models, which are sufficient to IFRS 9 impairment requirements.
- Inappropriate segmentation of portfolios is used to develop
risk parameters. - The number and range of forward-looking scenarios are not
representative of an appropriate range of possible outcomes. - Significant increases (or reductions) in credit risk are not
completely or accurately identified on a timely basis. - Assumptions incorporated in the ECL model are not updated
on a timely basis. The Notes 2, 3(D), 4 and 46 to the financial statements include disclosures on the Group’s judgments, assumptions, estimates and methodologies adopted as well as information about impairment of the Group’s financial assets.
We updated our understanding of the Group’s adoption of IFRS 9 and identified the internal controls including entity level controls adopted, processes and systems under the new accounting standard. In addition, our work performed included the below procedures: - Evaluate the appropriateness of key technical decisions,
judgments and accounting policy elections made by the Group to ensure compliance with IFRS 9 impairment requirements.
- Evaluate the reasonableness of management’s key
judgements and estimates made in the ECL calculation, including but not limited to the selection of methods, models, assumptions and data sources.
- Evaluate the appropriateness and testing the mathematical
accuracy of the ECL model applied. - Test the controls related to the credit impairment process and
verified the integrity of data used as input to the models. - Evaluate post model adjustments and management overlays
in order to assess the reasonableness of these adjustments. - Assessment on whether significant increase in credit risk
(SICR) indicators are present for the financial assets portfolio based on IFRS 9 and the possible implications on the ECL staging and expected provisioning.

Goodwill impairment The Group annually carries out an impairment assessment of goodwill using the market transaction approach. The risk is that the book value of the goodwill exceeds its recoverable amount, and therefore the goodwill is impaired and should be written down in value. This is due to the limited and/or relevance of data that may be available.
We assessed the reasonableness of the impairment testing carried out by management especially in determining the fair value of each separate cash generating unit defined and compared key input such as the multiplier used in recent acquisition transactions.
Other Information Management is responsible for the other information included in the Annual Report. The other information does not include the consolidated financial statements and our auditor’s report thereon. The Annual Report is expected to be made available to us after the date of this auditor’s report. Our opinion on the consolidated financial statements does not cover the other information and we do not express any form of assurance conclusion thereon.
In connection with our audit of the consolidated financial statements, our responsibility is to read the other information when it becomes available and, in doing so, consider whether the other information is materially inconsistent with the consolidated financial statements or our knowledge obtained in the audit, or otherwise appears to be materially misstated.
Responsibilities of Management and those Charged with Governance for the Consolidated Financial Statements
Management is responsible for the preparation and fair presentation of the consolidated financial statements in accordance with IFRSs, and for such internal control as management determines is necessary to enable the preparation of the consolidated financial statements that are free from material misstatement, whether due to fraud or error. In preparing the consolidated financial statements, management is responsible for assessing the Group’s ability to continue as a
going concern, disclosing, as applicable, matters related to going concern and using the going concern basis of accounting unless management either intends to liquidate the Group or to cease operations, or has no realistic alternative but to do so. Those charged with governance are responsible for overseeing the Group’s financial reporting process.
Independent auditors’ report
CONSOLIDATED FINANCIAL STATEMENTS

FRANSABANK | ANNUAL REPORT 2018 | 68-69
DFK Fiduciaire du Moyen-Orient Deloitte & Touche
Auditors’ Responsibilities for the Audit of the Consolidated Financial Statements
Beirut, Lebanon May 15, 2019
Our objectives are to obtain reasonable assurance about whether the consolidated financial statements as a whole are free from material misstatement, whether due to fraud or error, and to issue an auditor’s report that includes our opinion. Reasonable assurance is a high level of assurance, but is not a guarantee that an audit conducted in accordance with ISAs, within the framework of local banking laws, will always detect a material misstatement when it exists. Misstatements can arise from fraud or error and are considered material if, individually or in the aggregate, they could reasonably be expected to influence the economic decisions of users taken on the basis of these consolidated financial statements. As part of an audit in accordance with ISAs, we exercise professional judgment and maintain professional skepticism throughout the audit. We also: • Identify and assess the risks of material misstatement of the
consolidated financial statements, whether due to fraud or error, design and perform audit procedures responsive to those risks, and obtain audit evidence that is sufficient and appropriate to provide a basis for our opinion. The risk of not detecting a material misstatement resulting from fraud is higher than for one resulting from error, as fraud may involve collusion, forgery, intentional omissions, misrepresentations, or the override of internal control.
• Obtain an understanding of internal control relevant to the
audit in order to design audit procedures that are appropriate in the circumstances, but not for the purpose of expressing an opinion on the effectiveness of the Group’s internal control.
• Evaluate the appropriateness of accounting policies used and
the reasonableness of accounting estimates and related disclosures made by management.
• Conclude on the appropriateness of management’s use of the
going concern basis of accounting and, based on the audit evidence obtained, whether a material uncertainty exists related to events or conditions that may cast significant doubt on the Group’s ability to continue as a going concern. If we conclude that a material uncertainty exists, we are required to draw attention in our auditor’s report to the related disclosures in the financial statements or, if such disclosures are inadequate, to modify our opinion. Our conclusions are based on the audit evidence obtained up to the date of our auditor’s report. However, future events or conditions may cause the Group to cease to continue as a going concern.
• Evaluate the overall presentation, structure and content of the consolidated financial statements, including the disclosures, and whether the consolidated financial statements represent the underlying transactions and events in a manner that achieves fair presentation.
• Obtain sufficient appropriate audit evidence regarding the
financial information of the entities or business activities within the Group to express an opinion on the consolidated financial statements. We are responsible for the direction, supervision and performance of the audit. We remain solely responsible for our audit opinion.
We communicate with those charged with governance regarding, among other matters, the planned scope and timing of the audit and significant audit findings, including any significant deficiencies in internal control that we identify during our audit. We also provide those charged with governance with a statement that we have complied with relevant ethical requirements regarding independence, and to communicate with them all relationships and other matters that may reasonably be thought to bear on our independence, and where applicable, related safeguards. From the matters communicated with those charged with governance, we determine those matters that were of most significance in the audit of the consolidated financial statements of the current period and are therefore the key audit matters. We describe these matters in our auditor’s report unless law or regulation precludes public disclosure about the matter or when, in extremely rare circumstances, we determine that a matter should not be communicated in our report because the adverse consequences of doing so would reasonably be expected to outweigh the public interest benefits of such communication.

ASSETS
Cash and deposits with Central Banks 5 9,177,462,927 8,309,536,495 Deposits with banks and financial institutions 6 1,487,294,924 1,123,611,712 Loans to banks 7 37,109,306 140,462,939 Loans and advances to customers 9 10,159,824,897 9,776,012,029 Investment securities 10 9,346,131,507 10,345,262,168 Customers' liability under acceptances 11 916,875,239 434,478,352 Investments in associates 12 82,037,600 79,301,461 Assets acquired in satisfaction of loans 13 226,952,238 211,571,360 Assets under leverage arrangements with the Central Bank of Lebanon 15 2,238,085,922 855,418,125 Property and equipment 14 445,329,021 404,279,660 Intangible assets 14 17,810,575 12,161,157 Goodwill 16 48,903,653 48,903,653 Other assets 17 109,503,453 129,729,037 34,293,321,262 31,870,728,148 Assets classified as held for sale 8 1,297,343,966 1,380,267,902 TOTAL ASSETS 35,590,665,228 33,250,996,050 FINANCIAL INSTRUMENTS WITH OFF-BALANCE SHEET RISKS Documentary and commercial letters of credit 40 424,315,892 306,952,246 Guarantees and standby letters of credit 40 888,359,231 943,342,301 Forward contracts 40 146,684,384 843,756,842
Notes 2018LBP’000 2017
Consolidated statement of financial position as at December 31,
CONSOLIDATED FINANCIAL STATEMENTS

FRANSABANK | ANNUAL REPORT 2018 | 70-71
Notes
LIABILITIES
EQUITY
Leverage arrangements with the Central Bank of Lebanon 15 2,238,085,922 855,418,125 Deposits and borrowings from banks 18 309,042,968 264,140,929 Liabilities designated at fair value through profit or loss 19 110,462,963 135,500,053 Deposits from customers and related parties 20 25,551,478,737 24,882,215,698 Customers' acceptance liability 11 918,197,271 434,478,352 Other borrowings 21 1,616,649,114 1,504,606,415 Subordinated loan 22 12,749,832 19,124,748 Other liabilities 23 303,635,663 615,961,401 Provisions 24 61,950,553 47,044,261 31,122,253,023 28,758,489,982 Liabilities directly associated with assets classified as held for sale 8 1,172,758,271 1,249,041,760 TOTAL LIABILITIES 32,295,011,294 30,007,531,742
Issued capital - Ordinary shares 25 438,500,000 438,500,000 Issued capital - Preferred shares 27 34,000,000 34,000,000 Share premium - Preferred shares 27 478,550,000 478,550,000 Shareholders’ cash contribution to capital 26 17,113,885 17,113,885 Non-distributable reserves 28 530,828,640 564,191,745 Cumulative change in fair value of financial assets 29 185,612,118 175,962,132 Retained earnings 952,225,112 864,944,123 Profit for the year 31 243,027,727 251,191,771 Equity attributable to the owners of the Bank 2,879,857,482 2,824,453,656 Non-controlling interests 30 415,796,452 419,010,652 TOTAL EQUITY 3,295,653,934 3,243,464,308 TOTAL LIABILITIES AND EQUITY 35,590,665,228 33,250,996,050
2018LBP’000 2017
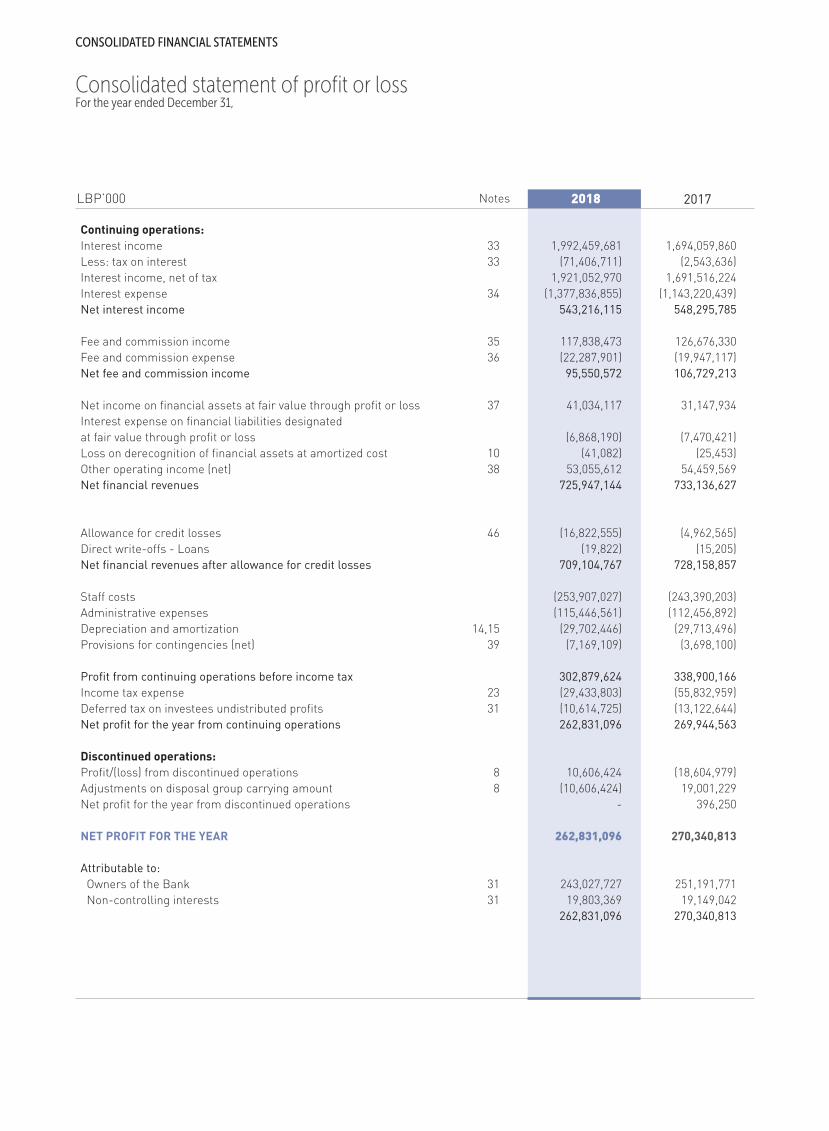
Continuing operations: Interest income 33 1,992,459,681 1,694,059,860 Less: tax on interest 33 (71,406,711) (2,543,636) Interest income, net of tax 1,921,052,970 1,691,516,224 Interest expense 34 (1,377,836,855) (1,143,220,439) Net interest income 543,216,115 548,295,785 Fee and commission income 35 117,838,473 126,676,330 Fee and commission expense 36 (22,287,901) (19,947,117) Net fee and commission income 95,550,572 106,729,213 Net income on financial assets at fair value through profit or loss 37 41,034,117 31,147,934 Interest expense on financial liabilities designated at fair value through profit or loss (6,868,190) (7,470,421) Loss on derecognition of financial assets at amortized cost 10 (41,082) (25,453) Other operating income (net) 38 53,055,612 54,459,569 Net financial revenues 725,947,144 733,136,627 Allowance for credit losses 46 (16,822,555) (4,962,565) Direct write-offs - Loans (19,822) (15,205) Net financial revenues after allowance for credit losses 709,104,767 728,158,857 Staff costs (253,907,027) (243,390,203) Administrative expenses (115,446,561) (112,456,892) Depreciation and amortization 14,15 (29,702,446) (29,713,496) Provisions for contingencies (net) 39 (7,169,109) (3,698,100) Profit from continuing operations before income tax 302,879,624 338,900,166 Income tax expense 23 (29,433,803) (55,832,959) Deferred tax on investees undistributed profits 31 (10,614,725) (13,122,644) Net profit for the year from continuing operations 262,831,096 269,944,563 Discontinued operations: Profit/(loss) from discontinued operations 8 10,606,424 (18,604,979) Adjustments on disposal group carrying amount 8 (10,606,424) 19,001,229 Net profit for the year from discontinued operations - 396,250 NET PROFIT FOR THE YEAR 262,831,096 270,340,813 Attributable to: Owners of the Bank 31 243,027,727 251,191,771 Non-controlling interests 31 19,803,369 19,149,042 262,831,096 270,340,813
Notes 2018LBP’000
2017
Consolidated statement of profit or loss For the year ended December 31,
CONSOLIDATED FINANCIAL STATEMENTS

FRANSABANK | ANNUAL REPORT 2018 | 72-73
Consolidated statement of profit or loss and other comprehensive income For the year ended December 31,
2018LBP’000
Profit for the year 262,831,096 270,340,813 Other comprehensive income: Items that will not be reclassified subsequently to profit or loss Change in fair value of equity securities at FVTOCI 10 20,662,123 30,882,423 Change in property revaluation (211,584) 38,589 Share in other comprehensive income of associates 12 5,680,676 4,433 Deferred tax (4,774,774) (17,732,741) 21,356,441 13,192,704 Items that may be reclassified subsequently to profit or loss Change in fair value of debt securities at FVTOCI (9,245,874) - Currency translation adjustment (22,207,697) (8,485,992) Effect of deconsolidation of a subsidiary 43 - 15,940,262 Deferred tax 1,957,932 - (29,495,639) 7,454,270 Total other comprehensive income (loss) (8,139,198) 20,646,974 TOTAL COMPREHENSIVE INCOME FOR THE YEAR 254,691,898 290,987,787 Attributable to: Owners of the Bank 236,776,089 272,494,333 Non-controlling interests 17,915,809 18,493,454 254,691,898 290,987,787
Notes
2017

Consolidated statement of changes in equity For the year ended December 31,
Equity Attributable to
LBP’000 Preference
Shares
Capital Ordinary
Shares
Shareholders’ Cash
Contribution to Capital
Non- Distributable
Reserves
Share Premium on
Preference Shares
BALANCE AS AT JANUARY 1, 2017 430,000,000 35,000,000 492,625,000 17,113,885 436,516,545 Dividends paid (Note 32) - - - - - Issuance of preference shares - 7,500,000 105,562,500 - - Redemption of preference shares - (8,500,000) (119,637,500) - - Capital increase and reconstruction 8,500,000 - - - - Transfer to retained earnings upon liquidation of a subsidiary - - - - (395,092) Effect of increase of capital in subsidiary - - - - (398,830) Deferred liabilities - - - - - Other movement - - - - 44,954 Allocation of 2016 profit - - - - 79,850,355 Redemption of preference shares by a subsidiary - - - - - Reallocation between reserves and retained earnings - - - - (5,974,485) Board of Directors’ remuneration in subsidiaries - - - - - Transfer to other liabilities - - - - - Effect of deconsolidation of Fransabank Syria (Note 43) - - - - (17,176,506) Total comprehensive income for the year 2017 - - - - 7,671,438 BALANCE AS AT DECEMBER 31, 2017 438,500,000 34,000,000 478,550,000 17,113,885 500,138,379 Effect of adoption of IFRS 9 (Note 2.1.1) - - - - (252,836,423) Appropriation from regulatory deferred liabilities (Note 23) - - - - 218,754,440 Dividends paid (Note 32) - - - - - Transfer to retained earnings upon liquidation of a subsidiary - - - - - Allocation of 2017 profit - - - - 79,832,842 Issuance of preferred shares by a subsidiary - - - - - Redemption of preferred shares by a subsidiary - - - - - Dilution of non-controlling interests share - - - - - Effect of change in deferred taxes - - - - - Other movement - - - - - Total comprehensive income for the year 2018 - - - - (15,060,598) BALANCE AS AT DECEMBER 31, 2018 438,500,000 34,000,000 478,550,000 17,113,885 530,828,640
CONSOLIDATED FINANCIAL STATEMENTS

FRANSABANK | ANNUAL REPORT 2018 | 74-75
the Owners of the Bank
Total Equity
Cumulative Change in
Fair Value of Financial Assets Total
Profit for the Year
Retained Earnings
Special Reserve and
General Reserve on Performing Loans
Non- Controlling
Interests
32,234,969 811,566,473 280,074,244 162,436,153 2,697,567,269 508,981,738 3,206,549,007
- - (114,524,064) - (114,524,064) (5,886,516) (120,410,580) - - - - 113,062,500 - 113,062,500 - (4,484,801) - - (132,622,301) - (132,622,301) - (8,500,000) - - - - -
- 495,804 - (100,712) - - - - 1,592,856 - - 1,194,026 10,421 1,204,447 - (4,023,576) - - (4,023,576) (2,845,112) (6,868,688) - 600,754 - - 645,708 974,004 1,619,712 31,818,397 53,881,428 (165,550,180) - - - - - - - - - (82,912,500) (82,912,500) - 5,974,485 - - - - - - (67,233) - - (67,233) - (67,233) - - - - - (11,346) (11,346) - 7,903,500 - - (9,273,006) (17,793,491) (27,066,497) - 4,433 251,191,771 13,626,691 272,494,333 18,493,454 290,987,787
64,053,366 864,944,123 251,191,771 175,962,132 2,824,453,656 419,010,652 3,243,464,308 (64,053,366) (58,432,518) - 841,026 (374,481,281) (25,991,066) (400,472,347)
- 77,373,578 - - 296,128,018 26,025,564 322,153,582 - - (107,546,890) - (107,546,890) (5,734,448) (113,281,338)
- (781,173) - - (781,173) (2,949,107) (3,730,280) - 63,812,039 (143,644,881) - - - - - - - - - 39,724,132 39,724,132 - - - - - (52,762,500) (52,762,500) - 1,568,436 - - 1,568,436 (1,568,436) - - 4,150,304 - - 4,150,304 - 4,150,304 - (409,677) - - (409,677) 2,125,852 1,716,175 - - 243,027,727 8,808,960 236,776,089 17,915,809 254,691,898
- 952,225,112 243,027,727 185,612,118 2,879,857,482 415,796,452 3,295,653,934

2018LBP’000 2017
Cash flows from operating activities Profit for the year before tax 302,879,624 339,296,417 Adjustments for: Unrealized gain on financial assets at fair value through profit or loss 37 (30,820,925) (1,679,352) Share in profits of associates 38 (19,232,095) (18,637,661) Depreciation and amortization 14,15 29,702,446 29,713,496 Allowance for expected credit losses 6, 46 16,822,555 5,848,342 Loans written-off 19,822 - Appropriation from regulatory deferred liabilities 23 (165,833) (17,851,479) Net effect of assets held-for sale 8 - (131,226,142) Gain on disposal of property and equipment 38 (741,984) (777,973) Gain on disposal of assets acquired in satisfaction of loans 38 (1,133,987) (8,331,986) Provisions 24 12,213,579 5,950,494 Interest expense 1,384,705,045 1,150,690,860 Interest income (1,931,823,950) (1,715,075,568) Dividend income 37,38 (8,875,902) (7,300,019) (246,451,605) (369,380,571) Net increase in placements with banks (52,486,228) (966,774,512) Net decrease/(increase) in loans to banks 7 69,631,819 (82,681,048) Net (increase)/decrease in loans and advances to customers 9 (667,972,276) 96,335,928 Net decrease in investment securities 10 981,119,992 896,017,519 Net decrease in other assets 17 23,640,808 10,312,435 Net increase in deposits and borrowings from banks 18 52,935,251 82,249,103 Net decrease in customers’ deposits at FVTPL (24,908,722) (2,363,995) Net increase/(decrease) in customers’ deposits at amortized cost 20 625,002,361 (440,642,635) Net decrease in other liabilities 23 (19,509,371) (65,747,538) Proceeds from disposal of foreclosed assets 2,146,323 17,169,895 Settlement of provisions 24 (4,766,822) (6,684,339) 738,381,530 (832,189,758) Interest paid (1,334,353,210) (1,149,286,735) Interest received 1,889,678,205 1,729,058,723 Dividends received 18,875,419 14,889,680 Income tax paid (32,390,216) (54,897,624) Net cash generated by/(used in) operating activities 1,280,191,728 (292,425,714)
Notes
Consolidated statement of cash flows For the year ended December 31,
CONSOLIDATED FINANCIAL STATEMENTS

FRANSABANK | ANNUAL REPORT 2018 | 76-77
2018LBP’000 2017
Cash flows from investing activities Proceeds from disposal of tangible and intangible assets 2,642,655 5,406,447 Acquisition of tangible and intangible assets 14 (82,799,909) (34,177,639) Net cash used in investing activities (80,157,254) (28,771,192) Cash flows from financing activities Issuance of preference shares 27 - 113,062,500 Redemption of preference shares - (132,622,301) Issuance of preferred shares by a subsidiary 39,724,132 - Redemption of preferred shares by a subsidiary (52,762,500) (82,912,500) Decrease in subordinated loan (6,004,545) (6,374,916) Net increase in other borrowings 21 97,419,591 230,984,268 Subscription of capital by non-controlling interests - 1,204,447 Dividends paid 32 (113,281,338) (120,410,580) Net cash (used in)/generated by financing activities (34,904,660) 2,930,918 Net increase/(decrease) in cash and cash equivalents 1,165,129,814 (318,265,988) Unrealized currency translation adjustment 29,856,410 12,497,850 Cash and cash equivalents beginning of year 3,141,944,012 3,447,712,150 CASH AND CASH EQUIVALENTS END OF YEAR 41 4,336,930,236 3,141,944,012
Notes

1. General Information Fransabank SAL (the “Bank”) is a Lebanese joint-stock company incorporated in 1921 registered in the Trade Register under Number 25699 and in the Central Bank of Lebanon list of banks under number 1. The consolidated financial statements of the Bank comprise the financial statements of the Bank and those of its subsidiaries collectively (the “Group”). The Group is primarily involved in investment, corporate and retail banking. The Bank’s registered address is Fransabank Center, Hamra, P.O. Box 11-0393 Beirut, Lebanon. No ultimate direct or indirect company controls the Group. The Group is controlled by individual shareholders of the Kassar family members. The consolidated subsidiaries consist of the following as at December 31: Effective December 31, 2017, the financial statements of Fransabank Syria were deconsolidated from the consolidated financial statements of the Group due to the exit of the Bank’s management from the Board of Directors of Fransabank Syria and the loss of control over this subsidiary. Accordingly, the investment in Fransabank Syria was classified as “Investment securities at fair value through other comprehensive income”. (Refer to Note 43 for more details). During 2017, BLC Bank SAL merged the financials of its subsidiary BLC Invest SAL within its own financials by virtue of acquisition of assets, liabilities and activities. The merger agreement between BLC Bank SAL and its subsidiary was approved by the regulator on April 12, 2017.
During 2017, a term sheet was signed between the BLC Bank SAL major shareholders, namely Fransabank SAL and Sehnaoui Group, whereby the subsidiary’s investment in USB Bank PLC will be sold to Sehnaoui Group who in turn will exit their investment at BLC Bank SAL subject to certain terms and conditions including securing the regulators’ approval in Cyprus and Lebanon. In its meeting held on August 16, 2018, the Board of Directors resolved to sell its investment in USB Bank PLC to AstroBank Limited, a Cyprus registered Bank, which is owned by a group of investors including Sehnaoui Group. The sale transaction is still pending the necessary approvals from the regulatory authorities and the completion of other formalities. In conjunction with the sale, subsequent to the financial position date, BLC Bank SAL bought-back 10% of its own shares that were owned by Sehnaoui Holding in an aggregate amount of USD 43 million and EUR 6.5 million. Based on the above, IFRS 5 “Non-current assets held for sale and discontinued operations” has been applied for the Cypriot entity in the preparation of the 2018 and 2017 year end consolidated financial statements (Note 8). In parallel, subsequent to the financial position date, the Bank increased its ownership interest in BLC Bank SAL by 13.3%. Financial information of subsidiaries that have material non-controlling interests is provided under Note 30. The Group has ownership interest in the following associates: Information on the Group’s associates is provided under Note 12. Information on other related party relationships is provided under Note 41.
2. Application of New and Revised International Financial Reporting Standards (IFRS) 2.1 New and Amended IFRS Standards that Are Effective for the Current Year The following new and revised IFRSs and amendments to IFRSs and Interpretations, which became effective for annual periods beginning on or after January 1, 2018, have been adopted in these consolidated financial statements. 2.1.1 IFRS 9 Financial Instruments In the current year, the Group has applied IFRS 9 Financial Instruments (as revised in July 2014) and the related consequential amendments to other IFRS Standards that are mandatorily effective for an accounting period that begins on or after January 1, 2018. Transition provisions of IFRS 9 allow
Notes to the Consolidated Financial Statements For the year ended December 31, 2018
CONSOLIDATED FINANCIAL STATEMENTS
Country of Incorporation
Ownership Interest Business
Activity2017 %
2018 %
• Fransa Invest Bank SAL Lebanon 99.99 99.99 Specialized Bank • Fransabank (France) SA France 79.21 79.21 Banking • Lebanese Leasing Lebanon 87.49 87.49 Financial Company SAL Institution • Switch and Electronics Lebanon 99.70 99.70 Financial Services SAL Services • Sogefon SAL Lebanon 99.88 99.88 Real Estate Company • Fransabank Insurance Lebanon 99.70 99.70 Insurance Services Co. SAL • Fransabank El Djazaïr SPA Algeria 67.99 67.99 Banking • BLC Bank SAL & its Lebanon 74.83 74.83 Banking Subsidiaries (BLC Services SAL & BLC Finance SAL) • Express SARL Lebanon 98.35 98.35 Restaurant • Fransabank OJSC Belarus 93.17 91.55 Banking • The Kuwaiti Lebanese Company for Real Estate Lebanon 100 100 Real Estate Services SAL Company • F&B Holding SAL Lebanon 100 - Holding
INVESTEE
Country of Incorporation
Interests Held Business Activity2017
%2018
%
Bancassurance SAL Lebanon 60 60 Life Insurance United Capital Bank PLC Republic 20 20 Islamic of Sudan Banking International Payment Lebanon 20.30 20.30 Payment Network SAL Network
INVESTEE

Stage 2: Lifetime ECL Stage 2 includes financial assets that have had a significant increase in credit risk (SICR) since initial recognition but that do not have objective evidence of impairment. For these assets, lifetime ECL are recognised, but interest is still calculated on the gross carrying amount of the asset. Lifetime ECL are the expected credit losses that result from all possible default events over the expected life of the financial instrument. Stage 3: Lifetime ECL Stage 3 includes financial assets that have objective evidence of impairment at the reporting date. For these assets, lifetime ECL are recognised. The impact of the adoption of IFRS 9 impairment model on the Group’s financial assets and their carrying values and equity is disclosed in section (d) below. c. Hedge accounting IFRS 9 incorporates new hedge accounting rules that align hedge accounting with risk management practices. IFRS 9 does not cover guidance on macro hedge accounting as IASB is working on it as a separate project. IFRS 9 includes an accounting policy choice to defer the adoption of IFRS 9 hedge accounting and to continue with IAS 39 hedge accounting. The Group, however, has elected to adopt the new hedge accounting provisions of IFRS 9. The existing hedging relationships continue to qualify and be effective under the IFRS 9 hedge accounting provisions and did not have any transition impact on the Group’s financial statements. d. Transition Changes in accounting policies resulting from the adoption of IFRS 9 have been applied retrospectively, except as described below: - As permitted by the transitional provisions of IFRS 9, the
Group elected not to restate comparative figures. Differences in the carrying amounts of financial assets and financial liabilities resulting from the adoption of IFRS 9 are recognised in retained earnings as at January 1, 2018. Accordingly, the information presented for 2017 does not reflect the requirements of IFRS 9 and therefore is not comparable to the information presented for 2018 under IFRS 9.
- The following assessments have been made on the basis of the facts and circumstances that existed at the date of initial application.
• The determination of the business model within which
a financial asset is held. • The designation of certain investments in equity instru-
ments not held for trading as at FVOCI. • If a debt security had low credit risk at the date of ini-
tial application of IFRS 9, then the Group has assumed that credit risk on the asset had not increased significantly since its initial recognition.
an entity not to restate comparatives. Additionally, the Group adopted consequential amendments to IFRS 7 Financial Instruments: Disclosures that were applied to the disclosures about 2018 and to the comparative period. IFRS 9 introduced new requirements for: a. Classification and measurement of financial assets The Group early adopted IFRS 9 (2009) and IFRS 9 (2010) with respect to classification and measurement requirements of its financial assets and financial liabilities. On January 1, 2018 the Group adopted IFRS 9 (July 2014) and therefore reassessed the classification and measurement of its financial assets and financial liabilities that have not been derecognised as at January 1, 2018 and has not applied the requirements to instruments that have already been derecognised as at January 1, 2018. All recognised financial assets that are within the scope of IFRS 9 are required to be measured subsequently at amortised cost or fair value on the basis of the entity’s business model for managing the financial assets and the contractual cash flow characteristics of the financial assets. Refer to Note 3. Debt instruments that are measured subsequently at amortised cost or at FVTOCI are subject to impairment. See (b) below. The impact on the classification of financial assets and their carrying amounts is disclosed under section (d) below. b. Impairment of financial assets In relation to the impairment of financial assets, IFRS 9 requires an expected credit loss model as opposed to an incurred credit loss model under IAS 39. The expected credit loss model requires the Group to account for expected credit losses and changes in those expected credit losses at each reporting date to reflect changes in credit risk since initial recognition of the financial assets. In other words, it is no longer necessary for a credit event to have occurred before credit losses are recognised. The new impairment model applies to all financial assets measured at amortised cost (including debts instruments measured at FVTOCI). It also applies to certain loan commitments and financial guarantee contracts but not to equity investments. The Group applies three-stage approach to measuring expected credit losses (ECL) on financial assets carried at amortised cost and debt instruments classified as FVOCI. Assets migrate through the following three stages based on the change in credit quality since initial recognition. Stage 1: 12 months ECL Stage 1 includes financial assets that did not experience a significant increase in credit risk since the initial recognition or that have low credit risk. For these assets, ECL are recognised on the gross carrying amount of the asset based on the expected credit losses that result from default events that are possible within 12 months after the reporting date. Interest is computed on the gross carrying amount of the asset.
FRANSABANK | ANNUAL REPORT 2018 | 78-79

2.1.2 IFRS 15 Revenue from contracts with customers In the current year, the Group has applied IFRS 15 Revenue from Contracts with Customers (as amended in April 2016) which is effective for an annual period that begins on or after January 1, 2018. IFRS 15 introduced a 5-step approach to revenue recognition. The impact of IFRS 15 is not material on the consolidated financial statements of the Group. 2.1.3 Other IFRSs and amendments In the current year, the Group has applied a number of amendments to IFRS Standards and Interpretations issued by the International Accounting Standards Board (IASB) that are effective for an annual period that begins on or after January 1, 2018. Their adoption has not had any material impact on the disclosures or on the amounts reported in these consolidated financial statements. • Annual Improvements to IFRS Standards 2014 – 2016 Cycle
amending IFRS 1 and IAS 28. • Amendments to IFRS 2 Share Based Payment regarding
classification and measurement of share based payment transactions.
• Amendments to IAS 28 Investments in Associates and Joint
Ventures: The amendments clarify that the option for a venture capital organization and other similar entities to measure investments in associates and joint ventures at FVTPL is available separately for each associate or joint venture, and that election should be made at initial recognition.
• In respect of the option for an entity that is not an Investment
Entity (IE) to retain the fair value measurement applied by its associates and joint ventures that are IEs when applying the equity method, the amendments make a similar clarification that this choice is available for each IE associate or IE joint venture.
• Amendments to IAS 40 Investment Property: Amends paragraph 57 to state that an entity shall transfer a property to, or from, investment property when, and only when, there is evidence of a change in use. A change of use occurs if property meets, or ceases to meet, the definition of investment property. A change in management’s intentions for the use of a property by itself does not constitute evidence of a change in use.
• IFRIC 22 Foreign Currency Transactions and Advance
Consideration: The interpretation addresses foreign currency transactions or parts of transactions where:
- there is consideration that is denominated or priced in a foreign currency;
- the entity recognizes a prepayment asset or a deferred income liability in respect of that consideration, in advance of the recognition of the related asset, expense or income; and
- the prepayment asset or deferred income liability is non-monetary.
Other than the above, there are no other significant IFRSs and amendments that were effective for the first time for the financial year beginning on or after January 1, 2018.
2.2 New and Revised IFRS in Issue but not yet Effective and not Early Adopted At the date of authorisation of these consolidated financial statements, the Group has not applied the following new and revised IFRS Standards that have been issued but are not yet effective: • Annual improvements to IFRS Standards 2015–2017 Cycle
amending IFRS 3, IFRS 11, IAS 12 and IAS 23. Effective for annual periods beginning on or after January 1, 2019.
• Amendments to IFRS 9 Financial Instruments: Relating to prepayment features with negative compensation. This amends the existing requirements in IFRS 9 regarding
FINANCIAL ASSETS
Cash and deposits with Central Banks Amortized cost 8,309,536,495 - (37,485,406) Amortized cost 8,272,051,089 Deposits with banks and financial institutions Amortized cost 1,123,611,712 - (2,748,087) Amortized cost 1,120,863,625 Loans to banks Amortized cost 140,462,939 - (4,551,502) Amortized cost 135,911,437 Loans and advances to customers Amortized cost 9,776,012,029 - (264,053,757) Amortized cost 9,511,958,272 Financial assets at amortized cost Amortized cost 9,644,198,175 (472,733,375) (69,973,057) Amortized cost 9,101,491,743 Financial assets at FVTOCI FVTOCI 377,464,205 508,314,464 (2,700,150) FVTOCI 883,078,519 Financial assets at FVTPL FVTPL 323,599,788 (34,457,173) - FVTPL 289,142,615 Customers' liability under acceptances Amortized cost 434,478,352 - (1,653,618) Amortized cost 432,824,734 Other assets Amortized cost 129,729,037 - (711,567) Amortized cost 129,017,470 30,259,092,732 1,123,916 (383,877,144) 29,876,339,504
FINANCIAL LIABILITIES
Allowance for off-balance sheet commitments - (17,719,119) (17,719,119) Net impact on equity 1,123,916 (401,596,263) (400,472,347)
Category Amount Reclassification
Premeasurement ECL
Classification under IFRS 9 (2010) December 31, 2017
Category Amount
Classification under IFRS 9 (2014) January 1, 2018
LBP’000
Notes to the Consolidated Financial Statements For the year ended December 31, 2018
CONSOLIDATED FINANCIAL STATEMENTS
Impact of change in classification and measurement Except for the financial statement captions listed in the below table, there have been no changes in the carrying amounts of assets and liabilities on application of IFRS 9 (2014) as at January 1, 2018.
The increase in impairment allowances when measured in accordance with IFRS 9 expected credit losses model compared to IAS 39 incurred loss model amounts to LBP 400 billion on January 1, 2018.

3. Basis of Preparation Statement of Compliance The consolidated financial statements have been prepared in accordance with International Financial Reporting Standards (IFRSs) as issued by the International Accounting Standards Board (IASB). Basis of Measurement The consolidated financial statements have been prepared on the historical cost basis except for certain financial instruments measured at fair value as explained in the accounting policies below. Assets and liabilities are grouped according to their nature and presented in the consolidated statement of financial position in an approximate order that reflects their relative liquidity. Summary of Significant Accounting Policies Following is a summary of the most significant accounting policies applied in the preparation of these consolidated financial statements: A. Basis of Consolidation: The consolidated financial statements of Fransabank SAL incorporate the financial statements of the Bank and enterprises controlled by the Bank (its subsidiaries) as at the reporting date. Control is achieved when the Group is exposed, or has rights, to variable returns from its involvement with the investee and has the ability to affect those returns through its power over the investee. Specifically, the Group controls an in-vestee if and only if the Group has: • Power over the investee (i.e. existing rights that give it the
current ability to direct the relevant activities of the investee);
• Exposure, or rights, to variable returns from its involvement with the investee, and
• The ability to use its power over the investee to affect its returns.
When the Bank has less than a majority of the voting or similar rights of an investee, the Bank considers all relevant facts and circumstances in assessing whether it has power over an investee, including: • The contractual arrangement with the other vote holders of
the investee; • Rights arising from other contractual arrangements; • The Bank’s voting rights and potential voting rights. The Bank re-assesses whether or not it controls an investee if facts and circumstances indicate that there are changes to one or more of the three elements of control. Consolidation of a subsidiary begins when the Bank obtains control over the subsidiary and ceases when the Bank loses control of the subsidiary. Income and expenses of a subsidiary acquired or disposed of during the year are included in the consolidated statement of comprehensive income from the date the Bank gains control until the date the Bank ceases to control the subsidiary.
termination rights in order to allow measurement at amortized cost (or, depending on the business model, at fair value through other comprehensive income) even in the case of negative compensation payments.Effective for annual periods beginning on or after January 1, 2019.
• IFRS 16 Leases. IFRS 16 specifies how an IFRS reporter will recognize, measure, present and disclose leases. The standard provides a single lessee accounting model, requiring lessees to recognize assets and liabilities for all leases unless the lease term is 12 months or less or the underlying asset has a low value. Lessors continue to classify leases as operating or finance, with IFRS 16’s approach to lessor accounting substantially unchanged from its predecessor, IAS 17. Effective for annual periods beginning on or after January 1, 2019.
• Amendments to IAS 28 Investment in Associates and Joint Ventures: Relating to long-term interests in associates and joint ventures. These amendments clarify that an entity applies IFRS 9 Financial Instruments to long-term interests in an associate or joint venture that form part of the net investment in the associate or joint venture but to which the equity method is not applied.Effective for annual periods beginning on or after January 1, 2019.
• IFRIC 23 Uncertainty over Income Tax Treatments. The interpretation addresses the determination of taxable profit (tax loss), tax bases, unused tax losses, unused tax credits and tax rates, when there is uncertainty over income tax treatments under IAS 12. It specifically considers:
- Whether tax treatments should be considered collectively; - Assumptions for taxation authorities' examinations; - The determination of taxable profit (tax loss), tax bases,
unused tax losses, unused tax credits and tax rates; and - The effect of changes in facts and circumstances. Effective for annual periods beginning on or after January 1, 2019. • Amendment to IFRS 3 Business Combinations relating to
definition of a business . Effective for annual periods beginning on or after January 1, 2020.
• Amendments to IAS 1 and IAS 8 relating to definition of material. Effective for annual periods beginning on or after January 1, 2020.
• IFRS 17 Insurance Contracts. IFRS 17 requires insurance liabilities to be measured at a current fulfillment value and
provides a more uniform measurement and presentation approach for all insurance contracts. These requirements are designed to achieve the goal of a consistent, principle-based accounting for insurance contracts. IFRS 17 supersedes IFRS 4 Insurance Contracts as of 1 January 2021. Effective for annual periods beginning on or after January 1, 2021.
• Amendments to IFRS 10 Consolidated Financial Statements
and IAS 28 Investments in Associates and Joint Ventures (2011): Relating to the treatment of the sale or contribution of assets from and investor to its associate or joint venture. Effective date deferred indefinitely. Adoption is still permitted.
The directors anticipate that these new standards, interpretations, and amendments will be adopted in the Group’s consolidated financial statements as and when they are applicable and adoption of these new standards, interpretations and amendment, except for IFRS 16 may have no material impact on the consolidated financial statements of the Group in the period of initial application. Management is still in the process of assessing the impact of IFRS 16 and therefore an estimate of any impact on the consolidated financial statements as of January 1, 2019 cannot be reasonably determined at present.
FRANSABANK | ANNUAL REPORT 2018 | 80-81

Total comprehensive income of subsidiaries is attributed to the owners of the Bank and to the non-controlling interests even if this results in the non-controlling interests having a deficit balance. Adjustments are made to the financial statements of the subsidiaries to bring their accounting policies into line with those used by the Bank. All intra-group transactions, balances, income and expenses (except for foreign currency transaction gains or loss) are eliminated on consolidation. Unrealized losses are eliminated in the same way as unrealized gains, but only to the extent that there is no evidence of impairment. Changes in the Bank's ownership interests in subsidiaries that do not result in the Bank losing control over the subsidiaries are accounted for as equity transactions. The carrying amounts of the Bank's interests and the non-controlling interests are adjusted to reflect the changes in their relative interests in the subsidiaries. Any difference between the amount by which the non-controlling interests are adjusted and the fair value of the consideration paid or received is recognized directly in equity and attributed to owners of the Bank. Upon the loss of control, the Group derecognizes the assets and liabilities of the subsidiary, any non-controlling interests and the other components of equity related to the subsidiary. Any surplus or deficit arising on the loss of control is recognized in profit or loss. If the Group retains any interest in the previous subsidiary, then such interest is measured at fair value at the date that control is lost. B. Business Combinations: Acquisitions of businesses are accounted for using the acquisition method. The consideration transferred in a business combination is measured at fair value, which is calculated as the sum of the acquisition date fair values of the assets transferred by the Group, liabilities incurred by the Group to the former owners of the acquiree and the equity interests issued by the Group in exchange for control of the acquiree. Acquisition related costs are expensed as incurred in profit or loss. The consideration transferred does not include amounts related to the settlement of pre-existing relationships. Such amounts are generally recognized in profit or loss. Goodwill is measured as the excess of the sum of the consideration transferred, the amount of any non-controlling interests in the acquiree, and the fair value of the acquirer's previously held equity interest in the acquiree (if any) over the net of the acquisition date amounts of the identifiable assets acquired and the liabilities assumed. When the excess is negative, a bargain purchase gain is recognized immediately in profit or loss. Where applicable, adjustments are made to provisional values of recognized assets and liabilities related to facts and circumstances that existed at the acquisition date. These are adjusted to the provisional goodwill amount. All other adjustments including above adjustments made after one year are recognized in profit and loss except to correct an error in accordance with IAS 8. Non-controlling interests that present ownership interests and entitle their holders to a proportionate share of the entity's net assets in the event of liquidation may be initially measured either
at fair value or at the non-controlling interests' proportionate share of the recognized amounts of the acquiree's identifiable net assets. The choice of measurement basis is made on a transaction-by-transaction basis. Non-controlling interests in business acquisitions transacted so far by the Group were initially measured at the non-controlling interests’ proportionate share of net assets acquired. Any contingent consideration payable is recognized at fair value at the acquisition date. If the contingent consideration is classified as equity, it is not remeasured and settlement is accounted for within equity. Otherwise, subsequent changes to the fair value of the contingent consideration are recognized in profit or loss. C. Foreign Currencies: The consolidated financial statements are presented in Lebanese Pound (LBP), which is the reporting currency of the Group. The primary currency of the economic environment in which the Group operates (functional currency) is the U.S. Dollar. The Lebanese Pound rate has been constant to the U.S. Dollar since many years. In preparing the financial statements of each individual group entity, transactions in currencies other than the entity's reporting currency (foreign currencies) are recognized at the rates of exchange prevailing at the dates of the transactions. At the end of each reporting period, monetary items denominated in foreign currencies are retranslated at the rates prevailing at that date. Non-monetary items carried at fair value that are denominated in foreign currencies are retranslated at the rates prevailing at the date when the fair value was determined. Non-monetary items that are measured in terms of historical cost in a foreign currency are not retranslated. Exchange differences on monetary items are recognized in profit or loss in the period in which they arise except for exchange differences on transactions entered into in order to hedge certain foreign currency risks, and except for exchange differences on monetary items receivable from or payable to a foreign operation for which settlement is neither planned nor likely to occur in the foreseeable future, which are recognized in other comprehensive income, and presented in the translation reserve in equity. These are recognized in profit or loss on disposal of the net investment. For the purposes of presenting consolidated financial statements, the assets and liabilities of the Group's foreign operations are translated into Lebanese Pound using exchange rates prevailing at the end of each reporting period. Income and expense items are translated at the average exchange rates for the period when this is a reasonable approximation. Exchange differences arising are recognized in other comprehensive income and accumulated in equity (attributed to non-controlling interests as appropriate). Such exchange differences are recognized in profit or loss in the period in which the foreign operation is disposed of. D. Financial Instruments: Financial assets and financial liabilities are recognised in the Group’s statement of financial position when the Group becomes a party to the contractual provisions of the instrument. Recognised financial assets and financial liabilities are initially measured at fair value. Transaction costs that are directly attributable to the acquisition or issue of financial assets and
Notes to the Consolidated Financial Statements For the year ended December 31, 2018
CONSOLIDATED FINANCIAL STATEMENTS

cash flows that are SPPI, are subsequently measured at FVTOCI;
• All other debt instruments (e.g. debt instruments managed on a fair value basis, or held for sale) and equity investments are subsequently measured at FVTPL.
However, the Group may make the following irrevocable election / designation at initial recognition of a financial asset on an asset-by-asset basis: • The Group may irrevocably elect to present subsequent
changes in fair value of an equity investment that is neither held for trading nor contingent consideration recognised by an acquirer in a business combination to which IFRS 3 applies, in OCI; and
• The Group may irrevocably designate a debt instrument that
meets the amortised cost or FVTOCI criteria as measured at FVTPL if doing so eliminates or significantly reduces an accounting mismatch (referred to as the fair value option).
Debt instruments at amortised cost or at FVTOCI For an asset to be classified and measured at amortised cost or at FVTOCI, its contractual terms should give rise to cash flows that are solely payments of principal and interest on the principal outstanding (SPPI). An assessment of business models for managing financial assets is fundamental to the classification of a financial asset. The Group determines the business models at a level that reflects how groups of financial assets are managed together to achieve a particular business objective. The Group’s business model does not depend on management’s intentions for an individual instrument; therefore, the business model assessment is performed at a higher level of aggregation rather than on an instrument-by-instrument basis. When a debt instrument measured at FVTOCI is derecognised, the cumulative gain/loss previously recognised in OCI is reclassified from equity to profit or loss. In contrast, for an equity investment designated as measured at FVTOCI, the cumulative gain/loss previously recognised in OCI is not subsequently reclassified to profit or loss but transferred within equity. The Group reassess its business models each reporting period to determine whether the business models have changed since the preceding period. Debt instruments that are subsequently measured at amortised cost or at FVTOCI are subject to impairment. In the current and prior reporting period, the Group has applied the fair value option and so has designated debt instruments that meet the amortised cost or FVTOCI criteria as measured at FVTPL. Financial assets at FVTPL Financial assets at FVTPL are: • assets with contractual cash flows that are not SPPI; or/and • assets that are held in a business model other than held to
collect contractual cash flows or held to collect and sell; or • assets designated at FVTPL using the fair value option. These assets are measured at fair value, with any gains/losses arising on remeasurement recognised in profit or loss. Fair value is determined in the manner described below.
financial liabilities (other than financial assets and financial liabilities at FVTPL) are added to or deducted from the fair value of the financial assets or financial liabilities, as appropriate, on initial recognition. Transaction costs directly attributable to the acquisition of financial assets or financial liabilities at FVTPL are recognised immediately in profit or loss. If the transaction price differs from fair value at initial recognition, the Group will account for such difference as follows: • If fair value is evidenced by a quoted price in an active market
for an identical asset or liability or based on a valuation technique that uses only data from observable markets, then the difference is recognised in profit or loss on initial recognition (i.e. day 1 profit or loss)
• In all other cases, the fair value will be adjusted to bring it
in line with the transaction price (i.e. day 1 profit or loss will be deferred by including it in the initial carrying amount of the asset or liability).
Central Bank of Lebanon Circular No. 143 dated November 7, 2017 prohibits recognition of day one profits on designated non-conventional transactions concluded between the Central Bank of Lebanon and banks and whose purpose is to secure yield adjustment to maturity on certain designated financial assets as part of the Central Bank’s monetary policy. The Group recognized the designated financial assets at amortized cost. These non-conventional transactions with the Central Bank of Lebanon consist of non-transferable non-negotiable agreements. After initial recognition, the deferred gain or loss will be released to profit or loss on a rational basis, only to the extent that it arises from a change in a factor (including time) that market participants would take into account when pricing the asset or liability. E. Financial Assets: All financial assets are recognised and derecognised on a trade date where the purchase or sale of a financial asset is under contract whose terms require delivery of the financial asset within the timeframe established by the market concerned, and initially measured at fair value, plus transaction costs, except for those financial assets classified as at FVTPL. Transaction costs directly attributable to the acquisition of financial assets classified as at FVTPL are recognised immediately in profit or loss. All recognised financial assets that are within the scope of IFRS 9 are required to be subsequently measured at amortised cost or fair value on the basis of the entity’s business model for managing the financial assets and the contractual cash flow characteristics of the financial assets. Specifically: • Debt instruments that are held within a business model
whose objective is to collect the contractual cash flows, and that have contractual cash flows that are solely payments of principal and interest on the principal amount outstanding (SPPI), are subsequently measured at amortised cost;
• Debt instruments that are held within a business model whose objective is both to collect the contractual cash flows and to sell the debt instruments, and that have contractual
FRANSABANK | ANNUAL REPORT 2018 | 82-83

Reclassifications If the business model under which the Group holds financial assets changes, the financial assets affected are reclassified. The classification and measurement requirements related to the new category apply prospectively from the first day of the first reporting period following the change in business model that results in reclassifying the Group’s financial assets. Impairment Policy applicable up to December 31, 2017: Financial assets that are measured at amortized cost are assessed for impairment at the end of each reporting period. Financial assets are considered to be impaired when there is objective evidence that, as a result of one or more events that occurred after the initial recognition of the financial assets, the estimated future cash flows of the asset have been affected. Objective evidence of impairment could include: • significant financial difficulty of the issuer or counterparty; or • breach of contract, such as a default or delinquency in
interest or principal payments; or • it is becoming probable that the borrower will enter
bankruptcy or financial re-organization; or • the disappearance of an active market for that financial asset
because of financial difficulties; or • significant or prolonged decline in fair value beyond one
business cycle that occurred after the initial recognition of the financial asset or group of financial assets which impacted the estimated future cash flows of the investment.
For certain categories of financial asset, such as loans and advances, assets that are assessed not to be impaired individually are, in addition, assessed for impairment on a collective basis. This provision is estimated based on various factors including credit ratings allocated to a borrower or group of borrowers, the current economic conditions, the experience the Group has had in dealing with a borrower or group of borrowers and available historical default information, as well as observable changes in national or local economic conditions that correlate with default on loans and advances. The amount of the impairment loss recognized is the difference between the asset’s carrying amount and the present value of estimated future cash flows reflecting the amount of collateral and guarantee, discounted at the financial asset’s original effective interest rate. If, in a subsequent period, the amount of the impairment loss decreases and the decrease can be related objectively to an event occurring after the impairment was recognized, the previously recognized impairment loss is reversed through profit or loss to the extent that the carrying amount of the investment at the date the impairment is reversed does not exceed what the amortized cost would have been had the impairment not been recognized. Policy applicable effective January 1, 2018: The Group recognises loss allowances for ECLs on the following financial instruments that are not measured at FVTPL: • deposits at banks; • loans and advances to banks; • loans and advances to customers;
• customers' liability under acceptances; • debt investment securities; • loan commitments issued; and • financial guarantee contracts issued. No impairment loss is recognised on equity investments. With the exception of Purchased or Originated Credit Impaired (POCI) financial assets (which are considered separately below), ECLs are required to be measured through a loss allowance at an amount equal to: • 12-month ECL, i.e. lifetime ECL that result from those
default events on the financial instrument that are possible within 12 months after the reporting date, (referred to as Stage 1); or
• full lifetime ECL, i.e. lifetime ECL that result from all possible default events over the life of the financial instrument, (referred to as Stage 2 and Stage 3).
A loss allowance for full lifetime ECL is required for a financial instrument if the credit risk on that financial instrument has increased significantly since initial recognition. For all other financial instruments, ECLs are measured at an amount equal to the 12-month ECL. ECLs are a probability-weighted estimate of the present value of credit losses. These are measured as the present value of the difference between the cash flows due to the Group under the contract and the cash flows that the Group expects to receive arising from the weighting of multiple future economic scenarios, discounted at the asset’s EIR. • for undrawn loan commitments, the ECL is the difference
between the present value of the difference between the contractual cash flows that are due to the Group if the holder of the commitment draws down the loan and the cash flows that the Group expects to receive if the loan is drawn down; and
• for financial guarantee contracts, the ECL is the difference
between the expected payments to reimburse the holder of the guaranteed debt instrument less any amounts that the Group expects to receive from the holder, the debtor or any other party.
The Group measures ECL on an individual basis, or on a collective basis for portfolios of loans that share similar economic risk characteristics. The measurement of the loss allowance is based on the present value of the asset’s expected cash flows using the asset’s original EIR, regardless of whether it is measured on an individual basis or a collective basis. Credit-impaired financial assets A financial asset is ‘credit-impaired’ when one or more events that have a detrimental impact on the estimated future cash flows of the financial asset have occurred. Credit-impaired financial assets are referred to as Stage 3 assets. Evidence of credit-impairment includes observable data about the following events: • significant financial difficulty of the borrower or issuer; • a breach of contract such as a default or past due event; • the lender of the borrower, for economic or contractual
reasons relating to the borrower’s financial difficulty, having granted to the borrower a concession that the lender would
Notes to the Consolidated Financial Statements For the year ended December 31, 2018
CONSOLIDATED FINANCIAL STATEMENTS

recognition. If there has been a significant increase in credit risk the Group will measure the loss allowance based on lifetime rather than 12-month ECL. In assessing whether the credit risk on a financial instrument has increased significantly since initial recognition, the Group compares the risk of a default occurring on the financial instrument at the reporting date based on the remaining maturity of the instrument with the risk of a default occurring that was anticipated for the remaining maturity at the current reporting date when the financial instrument was first recognised. In making this assessment, the Group considers both quantitative and qualitative information that is reasonable and supportable, including historical experience and forward-looking information that is available without undue cost or effort, based on the Group’s historical experience and expert credit assessment including forward-looking information. Modification and derecognition of financial assets A modification of a financial asset occurs when the contractual terms governing the cash flows of a financial asset are renegotiated or otherwise modified between initial recognition and maturity of the financial asset. A modification affects the amount and/or timing of the contractual cash flows either immediately or at a future date. In addition, the introduction or adjustment of existing covenants of an existing loan would constitute a modification even if these new or adjusted covenants do not yet affect the cash flows immediately but may affect the cash flows depending on whether the covenant is or is not met (e.g. a change to the increase in the interest rate that arises when covenants are breached). When a financial asset is modified the Group assesses whether this modification results in derecognition. In accordance with the Group’s policy a modification results in derecognition when it gives rise to substantially different terms. The Group derecognises a financial asset only when the contractual rights to the asset’s cash flows expire (including expiry arising from a modification with substantially different terms), or when the financial asset and substantially all the risks and rewards of ownership of the asset are transferred to another entity. If the Group neither transfers nor retains substantially all the risks and rewards of ownership and continues to control the transferred asset, the Group recognises its retained interest in the asset and an associated liability for amounts it may have to pay. If the Group retains substantially all the risks and rewards of ownership of a transferred financial asset, the Group continues to recognise the financial asset and also recognises a collateralised borrowing for the proceeds received. On derecognition of a financial asset in its entirety, the difference between the asset’s carrying amount and the sum of the consideration received and receivable and the cumulative gain/loss that had been recognised in OCI and accumulated in equity is recognised in profit or loss, with the exception of equity investment designated as measured at FVTOCI, where the cumulative gain/loss previously recognised in OCI is not subsequently reclassified to profit or loss. On derecognition of a financial asset other than in its entirety (e.g. when the Group retains an option to repurchase part of a transferred asset), the Group allocates the previous carrying amount of the financial asset between the part it continues to recognise under continuing involvement, and the part it no
not otherwise consider; • the disappearance of an active market for a security because
of financial difficulties; or • the purchase of a financial asset at a deep discount that
reflects the incurred credit losses. It may not be possible to identify a single discrete event—instead; the combined effect of several events may have caused financial assets to become credit-impaired. The Group assesses whether debt instruments that are financial assets measured at amortised cost or FVTOCI are credit-impaired at each reporting date. To assess if sovereign and corporate debt instruments are credit impaired, the Group considers factors such as bond yields, credit ratings and the ability of the borrower to raise funding. Purchased or originated credit-impaired (POCI) financial assets POCI financial assets are treated differently because the asset is credit-impaired at initial recognition. For these assets, the Group recognises all changes in lifetime ECL since initial recognition as a loss allowance with any changes recognised in profit or loss. A favorable change for such assets creates an impairment gain. Definition of default Critical to the determination of ECL is the definition of default. The definition of default is used in measuring the amount of ECL and in the determination of whether the loss allowance is based on 12-month or lifetime ECL, as default is a component of the Probability of Default (PD) which affects both the measurement of ECLs and the identification of a significant increase in credit risk. The Group considers the following as constituting an event of default: • the borrower is past due more than 90 days on any material
credit obligation to the Group; or • the borrower is unlikely to pay its credit obligations to the
Group in full. The definition of default is appropriately tailored to reflect different characteristics of different types of assets. Overdrafts are considered as being past due once the customer has breached an advised limit or has been advised of a limit smaller than the current amount outstanding. When assessing if the borrower is unlikely to pay its credit obligation, the Group takes into account both qualitative and quantitative indicators. The information assessed depends on the type of the asset, for example in corporate lending a qualitative indicator used is the breach of covenants, which is not relevant for retail lending. Quantitative indicators, such as overdue status and non-payment on another obligation of the same counterparty are key inputs in this analysis. The Group uses a variety of sources of information to assess default, which are either developed internally or obtained from external sources. Significant increase in credit risk The Group monitors all financial assets, issued loan commitments and financial guarantee contracts that are subject to the impairment requirements to assess whether there has been a significant increase in credit risk since initial
FRANSABANK | ANNUAL REPORT 2018 | 84-85

longer recognises on the basis of the relative fair values of those parts on the date of the transfer. The difference between the carrying amount allocated to the part that is no longer recognised and the sum of the consideration received for the part no longer recognised and any cumulative gain/loss allocated to it that had been recognised in OCI is recognised in profit or loss. A cumulative gain/loss that had been recognised in OCI is allocated between the part that continues to be recognised and the part that is no longer recognized based on the relative fair values of those parts. This does not apply for equity investments designated as measured at FVTOCI, as the cumulative gain/loss previously recognised in OCI is not subsequently reclassified to profit or loss. Write-off Loans and debt securities are written-off when the Group has no reasonable expectations of recovering the financial asset (either in its entirety or in a portion of it). This is the case when the Group determines that the borrower does not have assets or sources of income that could generate sufficient cash flows to repay the amounts subject to the write-off. A write-off constitutes a derecognition event. The Group may apply enforcement activities to financial assets written off. Recoveries resulting from the Group’s enforcement activities will result in impairment gains. Presentation of allowance for ECL in the statement of financial position Loss allowances for ECL are presented in the statement of financial position as follows: • for financial assets measured at amortised cost: as a deduction
from the gross carrying amount of the assets; • for debt instruments measured at FVTOCI: no loss allowance
is recognised in the statement of financial position as the carrying amount is at fair value. However, the loss allowance is included as part of the revaluation amount in the investments revaluation reserve;
• for loan commitments and financial guarantee contracts: as
a provision; and • where a financial instrument includes both a drawn and an
undrawn component, and the Group cannot identify the ECL on the loan commitment component separately from those on the drawn component: the Group presents a combined loss allowance for both components. The combined amount is presented as a deduction from the gross carrying amount of the drawn component. Any excess of the loss allowance over the gross amount of the drawn component is presented as a provision.
F. Financial Liabilities and Equity: Debt and equity instruments that are issued are classified either as financial liabilities or as equity in accordance with the substance of the contractual arrangement. A financial liability is a contractual obligation to deliver cash or another financial asset or to exchange financial assets or financial liabilities with another entity under conditions that are potentially unfavorable to the Group or a contract that will or may be settled in the Group’s own equity instruments and is a non-derivative contract for which the Group is or may be obliged to deliver a variable number of its own equity instruments,
or a derivative contract over own equity that will or may be settled other than by the exchange of a fixed amount of cash (or another financial asset) for a fixed number of the Group’s own equity instruments. Equity instruments An equity instrument is any contract that evidences a residual interest in the assets of an entity after deducting all of its liabilities. Equity instruments issued by the Group are recognised at the proceeds received, net of direct issue costs. Repurchase of the Group’s own equity instruments is recognised and deducted directly in equity. No gain/loss is recognised in profit or loss on the purchase, sale, issue or cancellation of the Group’s own equity instruments. Financial liabilities Financial liabilities are classified as either financial liabilities ‘at FVTPL’ or ‘other financial liabilities’. Financial liabilities at FVTPL Financial liabilities are classified as at FVTPL when the financial liability is (i) held for trading, or (ii) it is designated as at FVTPL. A financial liability is classified as held for trading if: • it has been incurred principally for the purpose of repurchasing
it in the near term; or • on initial recognition it is part of a portfolio of identified
financial instruments that the Group manages together and has a recent actual pattern of short-term profit-taking; or
• it is a derivative that is not designated and effective as a hedging instrument.
A financial liability other than a financial liability held for trading or contingent consideration that may be paid by an acquirer as part of a business combination may be designated as at FVTPL upon initial recognition if: • such designation eliminates or significantly reduces a
measurement or recognition inconsistency that would otherwise arise; or
• the financial liability forms part of a group of financial assets or financial liabilities or both, which is managed and its performance is evaluated on a fair value basis, in accordance with the Group’s documented risk management or investment strategy, and information about the grouping is provided internally on that basis; or
• it forms part of a contract containing one or more embedded derivatives, and IFRS 9 permits the entire hybrid (combined) contract to be designated as at FVTPL.
Financial liabilities at FVTPL are stated at fair value, with any gains/losses arising on remeasurement recognised in profit or loss to the extent that they are not part of a designated hedging relationship. The net gain/loss recognised in profit or loss incorporates any interest paid on the financial liability and is included in the ‘net income from other financial instruments at FVTPL’ line item in the profit or loss account. However, for non-derivative financial liabilities that are designated as at FVTPL, the amount of change in the fair value of the financial liability that is attributable to changes in the credit risk of that liability is recognised in OCI, unless the recognition of the effects of changes in the liability’s credit risk in OCI would create or enlarge an accounting mismatch in profit or loss. The remaining amount of change in the fair value
Notes to the Consolidated Financial Statements For the year ended December 31, 2018
CONSOLIDATED FINANCIAL STATEMENTS
H. Derivative Financial Instruments: Derivatives, such as foreign exchange forward contracts, interest rate swaps, cross currency interest rate swaps and credit default swaps, are initially recognised at fair value at the date a derivative contract is entered into and are subsequently remeasured to their fair value at each statement of financial position date. The resulting gain/loss is recognised in profit or loss immediately unless the derivative is designated and effective as a hedging instrument, in which event the timing of the recognition in profit or loss depends on the nature of the hedge relationship. The Group designates certain derivatives as either hedges of the fair value of recognised assets or liabilities or firm commitments (fair value hedges), hedges of highly probable forecast transactions or hedges of foreign currency risk of firm commitments (cash flow hedges), or hedges of net investments in foreign operations (net investment hedges). A derivative with a positive fair value is recognised as a financial asset whereas a derivative with a negative fair value is recognised as a financial liability. Embedded derivatives Derivatives embedded in financial liabilities or other non-financial asset host contracts are treated as separate derivatives when their risks and characteristics are not closely related to those of the host contracts and the host contracts are not measured at FVTPL. I. Financial Guarantee Contracts: A financial guarantee contract is a contract that requires the issuer to make specified payments to reimburse the holder for a loss it incurs because a specified debtor fails to make payments when due in accordance with the terms of a debt instrument. Financial guarantee contracts issued by the Group are initially measured at their fair values and, if not designated as at FVTPL and not arising from a transfer of a financial asset, are subsequently measured at the higher of: • the amount of the loss allowance determined in accordance
with IFRS 9; and • the amount initially recognised less, where appropriate,
cumulative amount of income recognised in accordance with the Group’s revenue recognition policies.
Financial guarantee contracts not designated at FVTPL are presented as provisions on the statement of financial position and the remeasurement is presented in other revenue. The Group has not designated any financial guarantee contracts as at FVTPL. J. Hedge Accounting: The Group designates certain derivatives as hedging instruments in respect of foreign currency risk and interest rate risk in fair value hedges, cash flow hedges, or hedges of net investments in foreign operations as appropriate. Hedges of foreign exchange risk on firm commitments are accounted for as cash flow hedges. The Group does not apply fair value hedge accounting of portfolio hedges of interest rate risk. In addition, the Group does not use the exemption to continue
of liability is recognised in profit or loss. Changes in fair value attributable to a financial liability’s credit risk that are recognised in OCI are not subsequently reclassified to profit or loss; instead, they are transferred to retained earnings upon derecognition of the financial liability. For issued loan, commitments and financial guarantee contracts that are designated as at FVTPL all gains and losses are recognised in profit or loss. In making the determination of whether recognizing changes in the liability’s credit risk in OCI will create or enlarge an accounting mismatch in profit or loss, the Group assesses whether it expects that the effects of changes in the liability’s credit risk will be offset in profit or loss by a change in the fair value of another financial instrument measured at FVTPL. This determination is made at initial recognition. Fair value is determined as described below. Other financial liabilities Other financial liabilities, including deposits and borrowings, are initially measured at fair value, net of transaction costs. Other financial liabilities are subsequently measured at amortised cost using the effective interest method. The effective interest method is a method of calculating the amortised cost of a financial liability and of allocating interest expense over the relevant period. The EIR is the rate that exactly discounts estimated future cash payments through the expected life of the financial liability, or, where appropriate, a shorter period, to the net carrying amount on initial recognition. For details on EIR see the “net interest income section” above. Derecognition of financial liabilities The Group derecognises financial liabilities when, and only when, the Group’s obligations are discharged, cancelled or have expired. The difference between the carrying amount of the financial liability derecognised and the consideration paid and payable is recognised in profit or loss. When the Group exchanges with the existing lender one debt instrument into another one with substantially different terms, such exchange is accounted for as an extinguishment of the original financial liability and the recognition of a new financial liability. Similarly, the Group accounts for substantial modification of terms of an existing liability or part of it as an extinguishment of the original financial liability and the recognition of a new liability. It is assumed that the terms are substantially different if the discounted present value of the cash flows under the new terms, including any fees paid net of any fees received and discounted using the original effective rate is at least 10 per cent different from the discounted present value of the remaining cash flows of the original financial liability. G. Offsetting: Financial assets and liabilities are set-off and the net amount is presented in the statement of financial position when, and only when, the Group has a legal right to set-off the amounts or intends either to settle on a net basis or to realize the asset and settle the liability simultaneously.
FRANSABANK | ANNUAL REPORT 2018 | 86-87

using IAS 39 hedge accounting rules, i.e. the Group applies IFRS 9 hedge accounting rules in full. At the inception of the hedge relationship, the Group documents the relationship between the hedging instrument and the hedged item, along with its risk management objectives and its strategy for undertaking various hedge transactions. Policy applicable up to December 31, 2017: Furthermore, at the inception of the hedge and on an ongoing basis, the Group documents whether the hedging instrument that is used in a hedging relationship is highly effective in offsetting changes in fair values or cash flows of the hedged item. At each hedge effectiveness assessment date, a hedge relationship must be expected to be highly effective on a prospective basis and demonstrate that it was effective (retrospective effectiveness) for the designated period in order to qualify for hedge accounting. A formal assessment is undertaken to ensure the hedging instrument is expected to be highly effective in offsetting the designated risk in the hedged item, both at inception and at each quarter end on an ongoing basis. A hedge is expected to be highly effective if the changes in fair value or cash flows attributable to the hedged risk during the period for which the hedge is designated are expected to offset in a range of 80% to 125% and are expected to achieve such offset in future periods. Hedge ineffectiveness is recognized in the statement of profit or loss in “Net results on financial instruments at fair value through profit or loss”. For situations where that hedged item is a forecast transaction, the Group also assesses whether the transaction is highly probable and presents an exposure to variations in cash flows that could ultimately affect the statement of profit or loss. Policy applicable effective January 1, 2018: Furthermore, at the inception of the hedge and on an ongoing basis, the Group documents whether the hedging instrument is effective in offsetting changes in fair values or cash flows of the hedged item attributable to the hedged risk, which is when the hedging relationships meet all of the following hedge effectiveness requirements: • there is an economic relationship between the hedged item
and the hedging instrument; • the effect of credit risk does not dominate the value changes
that result from that economic relationship; and • the hedge ratio of the hedging relationship is the same as
that resulting from the quantity of the hedged item that the Group actually hedges and the quantity of the hedging instrument that the Group actually uses to hedge that quantity of hedged item.
The Group rebalances a hedging relationship in order to comply with the hedge ratio requirements when necessary. In such cases, discontinuation may apply to only part of the hedging relationship. For example, the hedge ratio might be adjusted in such a way that some of the volume of the hedged item is no longer part of a hedging relationship; hence, hedge accounting is discontinued only for the volume of the hedged item that is no longer part of the hedging relationship.
If a hedging relationship ceases to meet the hedge effectiveness requirement relating to the hedge ratio but the risk management objective for that designated hedging relationship remains the same, the Group adjusts the hedge ratio of the hedging relationship (i.e. rebalances the hedge) so that it meets the qualifying criteria again. In some hedge relationships, the Group designates only the intrinsic value of options. In this case, the fair value change of the time value component of the option contract is deferred in OCI, over the term of the hedge, to the extent that it relates to the hedged item and is reclassified from equity to profit or loss when the hedged item does not result in the recognition of a non-financial item. The Group’s risk management policy does not include hedges of items that result in the recognition of non-financial items, because the Group’s risk exposures relate to financial items only. The hedged items designated by the Group are time-period related hedged items, which means that the amount of the original time value of the option that relates to the hedged item is amortised from equity to profit or loss on a rational basis (e.g. straight-line) over the term of the hedging relationship. In some hedge relationships, the Group excludes from the designation the forward element of forward contracts or the currency basis spread of cross currency hedging instruments. In this case a similar treatment is applied to the one applied for the time value of options. The treatment for the forward element of a forward and the currency basis element is optional and the option is applied on a hedge-by-hedge basis, unlike the treatment for the time value of the options, which is mandatory. For hedge relationships with forwards or foreign currency derivatives such as cross currency interest rate swaps, where the forward element or the currency basis spread is excluded from the designation the Group generally recognises the excluded element in OCI. Fair value hedges The fair value change on qualifying hedging instruments is recognised in profit or loss except when the hedging instrument hedges an equity instrument designated at FVTOCI in which case it is recognised in OCI. The carrying amount of a hedged item not already measured at fair value is adjusted for the fair value change attributable to the hedged risk with a corresponding entry in profit or loss. For debt instruments measured at FVTOCI, the carrying amount is not adjusted as it is already at fair value, but the part of the fair value gain or loss on the hedged item associated with the hedged risk is recognised in profit or loss instead of OCI. When the hedged item is an equity instrument designated at FVTOCI, the hedging gain/loss remains in OCI to match that of the hedging instrument. Where hedging gains/losses are recognised in profit or loss, they are recognised in the same line as the hedged item. The Group discontinues hedge accounting only when the hedging relationship (or a part thereof) ceases to meet the qualifying criteria (after rebalancing, if applicable). This includes instances when the hedging instrument expires or is sold, terminated or exercised. The discontinuation is accounted for prospectively. The fair value adjustment to the carrying amount of hedged items for which the EIR method is used (i.e. debt instruments measured at amortised cost or at FVTOCI)
Notes to the Consolidated Financial Statements For the year ended December 31, 2018
CONSOLIDATED FINANCIAL STATEMENTS

arising from the hedged risk is amortised to profit or loss commencing no later than the date when hedge accounting is discontinued. Cash flow hedges The effective portion of changes in the fair value of derivatives and other qualifying hedging instruments that are designated and qualify as cash flow hedges is recognised in the cash flow hedging reserve, a separate component of OCI, limited to the cumulative change in fair value of the hedged item from inception of the hedge less any amounts recycled to profit or loss. Amounts previously recognised in OCI and accumulated in equity are reclassified to profit or loss in the periods when the hedged item affects profit or loss, in the same line as the recognised hedged item. If the Group no longer expects the transaction to occur that amount is immediately reclassified to profit or loss. The Group discontinues hedge accounting only when the hedging relationship (or a part thereof) ceases to meet the qualifying criteria (after rebalancing, if applicable). This includes instances when the hedging instrument expires or is sold, terminated or exercised, or where the occurrence of the designated hedged forecast transaction is no longer considered to be highly probable. The discontinuation is accounted for prospectively. Any gain/loss recognised in OCI and accumulated in equity at that time remains in equity and is recognised when the forecast transaction is ultimately recognised in profit or loss. When a forecast transaction is no longer expected to occur, the gain/loss accumulated in equity is reclassified and recognised immediately in profit or loss. Hedges of net investments in foreign operations Hedges of net investments in foreign operations are accounted for similarly to cash flow hedges. Any gain/loss on the hedging instrument relating to the effective portion of the hedge is recognised in OCI and accumulated in the foreign currency translation reserve. Gains and losses on the hedging instrument relating to the effective portion of the hedge accumulated in the foreign currency translation reserve are reclassified to profit or loss in the same way as exchange differences relating to the foreign operation. K. Investments in Associates: An associate is an entity over which the Group has significant influence. Significant influence is the power to participate in the financial and operating policy decisions of the investee, but is not control or joint control over those policies. The considerations made in determining significant influence are similar to those necessary to determine control over subsidiaries. The results and assets and liabilities of associates, except where the Group has control over the associates’ financial and operating policies, are incorporated in the consolidated financial statements using the equity method of accounting, except when the investment is classified as held for sale, in which case it is accounted for under IFRS 5 Non-current Assets Held-for-Sale and Discontinued Operations. Under the equity method, an investment in an associate is initially recognized in the consolidated statement of financial position at cost and
adjusted thereafter to recognize the Group’s share of the profit or loss and other comprehensive income of the associate. When the Group's share of losses of an associate exceeds the Group's interest in that associate, the Group discontinues recognizing its share of further losses. Additional losses are recognized only to the extent that the Group has incurred legal or constructive obligations or made payments on behalf of the associate. Any excess of the cost of acquisition over the Group's share of the net fair value of the identifiable assets, liabilities and contingent liabilities of an associate recognized at the date of acquisition is recognized as goodwill. The goodwill is included within the carrying amount of the investment. Any excess of the Group's share of the net fair value of the identifiable assets, liabilities and contingent liabilities over the cost of acquisition, after reassessment, is recognized immediately in profit or loss. The entire carrying amount of the investment (including goodwill) is tested for impairment in accordance with IAS 36 Impairment of Assets as a single asset by comparing its recoverable amount (higher of value in use and fair value less costs to sell) with its carrying amount. Any impairment loss recognized forms part of the carrying amount of the investment. Any reversal of that impairment loss is recognized in accordance with IAS 36 to the extent that the recoverable amount of the investment subsequently increases. The Group discontinues the use of the equity method from the date when the investment ceases to be an associate or when the investment is classified as held for sale. When the Group retains an interest in the former associate or joint venture and the retained interest is a financial asset, the Group measures the retained interest at fair value at that date and the fair value is regarded as its fair value on initial recognition. The difference between the carrying amount of the associate at the date the equity method was discontinued, and the fair value of any retained interest and any proceeds from disposing of a part interest in the associate is included in the determination of the gain or loss on disposal of the associate. In addition, the Group accounts for all amounts previously recognized in other comprehensive income in relation to that associate on the same basis as would be required if that associate had directly disposed of the related assets or liabilities. Therefore, if a gain or loss previously recognized in other comprehensive income by that associate would be reclassified to profit or loss on the disposal of the related assets or liabilities, the Group reclassifies the gain or loss from equity to profit or loss (as a reclassification adjustment) when the equity method is discontinued. When the Group reduces its ownership interest in an associate but the Group continues to use the equity method, the Group reclassifies to profit or loss the proportion of the gain or loss that had previously been recognized in other comprehensive income relating to that reduction in ownership interest if that gain or loss would be reclassified to profit or loss on the disposal of the related assets or liabilities. When a Group entity transacts with an associate of the Group, profits and losses resulting from the transactions with the associate are recognized in the Group’s consolidated financial statements only to the extent of interests in the associate that are not related to the Group. The financial statements of the associates are prepared for the same reporting period of the Group.
FRANSABANK | ANNUAL REPORT 2018 | 88-89

L. Property and Equipment: Property and equipment are stated at historical cost, less accumulated depreciation and any impairment loss. Depreciation of property and equipment, other than land and advance payments on capital expenditures is calculated using the straight-line method over the estimated useful lives of the related assets using the following annual rates: Buildings 2% - 5% Office improvements and installations 6% - 20% Furniture, equipment and machines 8% - 20% Computer equipment 20% - 33% Vehicles 10% - 20%
The estimated useful lives and depreciation method are reviewed at each year-end, with the effect of any changes in estimate accounted for on a prospective basis. The gain or loss arising on the disposal or retirement of an item of property and equipment is determined as the difference between the sales proceeds and the carrying amount of the asset and is recognized in profit or loss. M. Intangible Assets (other than Goodwill): Intangible assets other than goodwill are amortized on a straight-line basis at the rate of 20%. Intangible assets are subject to impairment testing. Subsequent expenditure on intangible assets is capitalized only when it increases the future economic benefits embodied in the specific asset to which it relates. All other expenditure is expensed when incurred. N. Assets Acquired in Satisfaction of Loans: Real estate properties acquired through the enforcement of collateral over loans and advances are stated at cost less any accumulated impairment losses. The acquisition of such assets is regulated by the local banking authorities who require the liquidation of these assets within 2 years from acquisition. In case of default of liquidation, the regulatory authorities require an appropriation of a special reserve from the yearly profits reflected in equity. Upon sale of repossessed assets, any gain or loss realized is recognized in the statement of profit or loss under “Other operating income” or “Other operating expenses”. Gains resulting from the sale of repossessed assets are transferred to reserves to be used for capital increase starting in the following financial year. For assets which were not disposed of within the specified period of two years, an amount computed as percentage of their gross carrying value is transferred to “Reverses for assets acquired in satisfaction of loans” in the following financial year. O. Impairment of Tangible and Intangible Assets (other than Goodwill): At the end of each reporting period, the Group reviews the carrying amounts of its tangible and intangible assets to determine whether there is any indication that those assets have suffered an impairment loss. If any such indication exists,
the recoverable amount of the asset is estimated in order to determine the extent of the impairment loss (if any). Recoverable amount is defined as the higher of: • Fair value that reflects market conditions at the statement
of financial position date, less cost to sell, if any. To determine fair value the Group adopts the market comparability approach using as indicators the current prices for similar assets in the same location and condition.
• Value in use: the present value of estimated future cash flows expected to arise from the continuing use of the asset and from its disposal at the end of its useful life, only applicable to assets with cash generation units.
If the recoverable amount of an asset is estimated to be less than its carrying amount, the carrying amount of the asset is reduced to its recoverable amount. An impairment loss is recognized immediately in profit or loss, unless the relevant asset is carried at a revalued amount, in which case the impairment loss is treated as a revaluation decrease. Where an impairment loss subsequently reverses, the carrying amount of the asset (cash-generating unit) is increased to the revised estimate of its recoverable amount, but so that the in-creased carrying amount does not exceed the carrying amount that would have been determined had no impairment loss been recognized for the asset (cash-generating unit) in prior years. A reversal of an impairment loss is recognized immedi-ately in profit or loss, unless the relevant asset is carried at a revalued amount, in which case the reversal of the impairment loss is treated as a revaluation increase. P. Non-Current Assets Held for Sale: Non-current assets and disposal groups are classified as held for sale if their carrying amount will be recovered principally through a sale transaction rather than through continuing use. This condition is regarded as met only when the asset (or disposal group) is available for immediate sale in its present condition subject only to terms that are usual and customary for sales of such asset (or disposal group) and its sale is highly probable. Management must be committed to the sale, which should be expected to qualify for recognition as a completed sale within one year from the date of classification. When the Group is committed to a sale plan involving loss of control of a subsidiary, all of the assets and liabilities of that subsidiary are classified as held for sale when the criteria described above are met, regardless of whether the Group will retain a non-controlling interest in its former subsidiary after the sale. Non-current assets (and disposal groups) classified as held for sale are measured at the lower of their carrying amount and fair value less costs to sell. Q. Investment Properties: Investment properties are measured initially at cost, including transaction costs. Subsequent to initial recognition, investment properties are measured at fair value, as at the balance sheet date. Gain or losses arising from changes in the fair values of investment properties are included in the statement of profit or loss. Valuations are carried out by independent qualified valuers on the basis of current market values.
Notes to the Consolidated Financial Statements For the year ended December 31, 2018
CONSOLIDATED FINANCIAL STATEMENTS

The Group’s Cypriot entity acquires in its normal course of business properties in satisfaction of debts. These properties are directly held by the Group or by special purpose entities for the sole purpose of managing these properties. To reflect the substance of transactions, these are classified as investment properties and are consolidated without the entities being explicitly disclosed as subsidiaries. Transfers are made to or from investment property only when there is a change in use. For a transfer from investment property to stock of property, the property’s deemed cost for subsequent accounting is its fair value at the date of change in use. The fair value of the Group’s owned properties and of properties acquired in satisfaction of loans is the estimated market value as determined by real estate appraisers on the basis of market compatibility by comparing with similar transactions in the same geographical area and on the basis of the expected value of a current sale between a willing buyer and a willing seller, that is, other than in a forced or liquidation sale after adjustment for an illiquidity factor and market constraints. The impairment loss is charged to the statement of profit or loss. R. Provision for Employees’ End-of-Service Indemnity/Staff Retirement Benefits: The provision for employees’ termination indemnities is based on the liability that would arise if the employment of all the employees’ were voluntary terminated at the reporting date. This provision is calculated in accordance with the directives of the Lebanese Social Security Fund and Labor laws based on the number of years of service multiplied by the monthly average of the last 12 months’ remunerations and less contributions paid to the Lebanese Social Security National Fund. S. Provisions: Provisions are recognized when the Group has a present obligation as a result of a past event, and it is probable that the Group will be required to settle that obligation. Provision is measured at the best estimate of the consideration required to settle the obligation at the statement of financial position date. Where a provision is measured using the cash flows estimated to settle the present obligation, its carrying amount is the present value of those cash flows determined by discounting the expected future cash flows at a pre-tax rate that reflects current market assessments of the time value of money and, where appropriate, the risks specific to the liability. When some or all of the economic benefits required to settle a provision are expected to be recovered from a third party, the receivable is recognized as an asset if it is virtually certain that reimbursement will be received and the amount of the receivable can be measured reliably. T. Net Interest Income: Interest income and expense for all financial instruments except for those classified as held for trading or those measured or designated as at FVTPL are recognised in ‘Net interest income’ as ‘Interest income’ and ‘Interest expense’ in the profit or loss account using the effective interest method. Interest on financial instruments measured as at FVTPL is
included within the fair value movement during the period, see ‘Net (loss)/income from financial assets at fair value through profit or loss’. The effective interest rate (EIR) is the rate that exactly discounts estimated future cash flows of the financial instrument through the expected life of the financial instrument or, where appropriate, a shorter period, to the net carrying amount of the financial asset or financial liability. The future cash flows are estimated taking into account all the contractual terms of the instrument. The calculation of the EIR includes all fees paid or received between parties to the contract that are incremental and directly attributable to the specific lending arrangement, transaction costs, and all other premiums or discounts. For financial assets at FVTPL, transaction costs are recognised in profit or loss at initial recognition. The interest income/interest expense is calculated by applying the EIR to the gross carrying amount of non-credit impaired financial assets (i.e. at the amortised cost of the financial asset before adjusting for any expected credit loss allowance), or to the amortised cost of financial liabilities. For credit-impaired financial assets, the interest income is calculated by applying the EIR to the amortised cost of the credit-impaired financial assets (i.e. the gross carrying amount less the allowance for expected credit losses (ECLs)). For financial assets purchased or originated credit-impaired (POCI) the EIR reflects the ECLs in determining the future cash flows expected to be received from the financial asset. U. Net Fee and Commission Income: Fee and commission income and expense that are integral to the effective interest rate on a financial asset or liability (e.g. commissions and fees earned on loans) are included under interest income and expense. Other fee and commission income are recognized as the related services are performed. V. Income from Financial Assets at Fair Value Through Profit or Loss: Net income from financial instruments at FVTPL includes all gains and losses from changes in the fair value of financial assets and financial liabilities at FVTPL and related interest income, expense and dividends. W. Dividend Income: Dividend income is recognized when the right to receive payment is established. Dividends on equity instruments designated as at fair value through other comprehensive income are recognized in profit or loss, unless the dividend clearly represents a recovery of part of the investment, in which case it is presented in other comprehensive income. X. Income Tax: Income tax expense represents the sum of the tax currently payable and deferred tax. Income tax is recognized in the statement of profit or loss except to the extent that it relates to items recognized directly in other comprehensive income, in which case it is recognized in other comprehensive income.
FRANSABANK | ANNUAL REPORT 2018 | 90-91

The tax currently payable is based on taxable profit for the year. Taxable profit differs from profit as reported in the statement of profit or loss because of the items that are never taxable or deductible. The Group’s liability for current tax is calculated using tax rates that have been enacted or substantively enacted by the end of the reporting period. Up to October 26, 2017, part of the debt securities invested by the Group is subject to withheld tax by the issuer. This tax is deducted at year-end from the corporate tax liability not eligible for deferred tax benefit, and therefore, accounted for as prepayment on corporate income tax and reflected as a part of income tax provision. During 2017, Lebanese tax amendments and new taxes and duties were issued as per Law No. 64 dated October 26, 2017. These amendments include, but are not limited to, an increase in the Lebanese corporate income tax from 15% to 17% to be applied effective on October 27, 2017 onwards. In addition, the above-mentioned withheld tax by the issuer is not allowed anymore to be deducted from the annual corporate income tax amount and is considered as a deductible expense for calculating the corporate taxable income. Deferred tax is recognized on differences between the carrying amounts of assets and liabilities in the statement of financial position and the corresponding tax base used in the computation of taxable profit. Deferred tax liabilities are generally recognized for all taxable temporary differences and deferred tax assets are recognized to the extent that it is probable that taxable profits will be available against which deductible temporary differences can be utilized. Y. Fiduciary Accounts: Fiduciary assets held or invested on behalf of individuals and others are held on a non-discretionary basis and related risks and rewards belong to the account holders. Accordingly, these deposits are reflected as off-balance sheet accounts. Z. Operating Lease Agreements: Lease agreements which do not transfer substantially all the risks and benefits incidental to ownership of the leased items are classified as operating leases. Operating lease payments are recorded in the statement of profit or loss on a straight line basis over the lease term. AA. Cash and Cash Equivalents: Cash and cash equivalents comprise balances with maturities of a period of three months including cash and balances with the Central Banks and deposits with banks and financial institutions. AB. Dividends on Ordinary Shares: Dividends on ordinary shares are recognized as a liability and deducted from equity when they are approved by the General Assembly of the Group’s shareholders. Interim dividends are deducted from equity when they are declared and no longer at the discretion of the Group. Dividends for the year that are approved after the reporting date are disclosed as an event after the reporting date.
AC. Deferred Restricted Contributions Restricted contributions derived from special and non-conventional deals arrangement with the regulator are deferred until designated conditions for recognition are met. At the time income is received, it is deferred under “regulatory deferred liability” and applied to the designated purpose according to the regulator’s requirements. 4. Critical Accounting Judgments and Key Sources of Estimation Uncertainty In the application of the Group’s accounting policies, which are described in Note 3, the directors are required to make judgments, estimates and assumptions about the carrying amounts of revenues, expenses, assets and liabilities and the accompanying disclosures, and the disclosure of contingent liabilities that are not readily apparent from other sources. The estimates and associated assumptions are based on historical experience and other factors that are considered relevant. Actual results may differ from these estimates. The estimates and underlying assumptions are reviewed on an ongoing basis. Revisions to accounting estimates are recognized in the period in which the estimate is revised if the revision affects only that period or in the period of the revision and future periods if the revision affects both current and future periods. A. Critical Accounting Judgments in Applying the Group’s Accounting Policies: In the process of applying the Group’s accounting policies, management has made the following judgments, apart from those involving estimations, which have the most significant effect in the amounts recognized in the financial statements. Going concern The Group’s management has made an assessment of the Group’s ability to continue as a going concern and is satisfied that the Group has the resources to continue in business for the foreseeable future. Furthermore, management is not aware of any material uncertainties that may cast significant doubt upon the Group’s ability to continue as a going concern. Therefore, the financial statements continue to be prepared on the going concern basis. Business model assessment Classification and measurement of financial assets depends on the results of the SPPI and the business model test (Refer to the financial assets sections of Note 3). The Group determines the business model at a level that reflects how groups of financial assets are managed together to achieve a particular business objective. This assessment includes judgement reflecting all relevant evidence including how the performance of the assets is evaluated and their performance measured the risks that affect the performance of the assets and how these are managed. The Group monitors financial assets measured at amortized cost or fair value through other comprehensive income that are derecognized prior to their maturity to understand the reason for their disposal and whether the reasons are consistent with the objective of the
Notes to the Consolidated Financial Statements For the year ended December 31, 2018
CONSOLIDATED FINANCIAL STATEMENTS

business for which the asset was held. Monitoring is part of the Group’s continuous assessment of whether the business model for which the remaining financial assets are held continues to be appropriate and if it is not appropriate whether there has been a change in business model and so a prospective change to the classification of those assets. Significant increase of credit risk As explained in Note 3, ECL are measured as an allowance equal to 12-month ECL for stage 1 assets, or lifetime ECL assets for stage 2 or stage 3 assets. An asset moves to stage 2 when its credit risk has increased significantly since initial recognition. IFRS 9 does not define what constitutes a significant increase in credit risk. In assessing whether the credit risk of an asset has significantly increased, the Group takes into account qualitative and quantitative reasonable and supportable forward looking information. Establishing groups of assets with similar credit risk characteristics When ECLs are measured on a collective basis, the financial instruments are grouped based on shared risk characteristics. The Group monitors the appropriateness of the credit risk characteristics on an ongoing basis to assess whether they continue to be similar. This is required in order to ensure that should credit risk characteristics change there is appropriate re-segmentation of the assets. This may result in new portfolios being created or assets moving to an existing portfolio that better reflects the similar credit risk characteristics of that group of assets. Re-segmentation of portfolios and movement between portfolios is more common when there is a significant increase in credit risk (or when that significant increase reverses) and so assets move from 12-month to lifetime ECLs, or vice versa, but it can also occur within portfolios that continue to be measured on the same basis of 12-month or lifetime ECLs but the amount of ECL changes because the credit risk of the portfolios differ. Models and assumptions used The Group uses various models and assumptions in estimating ECL. Judgement is applied in identifying the most appropriate model for each type of asset, as well as for determining the assumptions used in these models, including assumptions that relate to key drivers of credit risk. See Note 3 and Note 46 for more details on ECL. B. Key Sources of Estimation Uncertainty: The following are the key assumptions concerning the future, and other key sources of estimation uncertainty at the reporting date, that have a significant risk of causing a material adjustment to the carrying amounts of assets and liabilities within the next financial year. The Group based their assumptions and estimates on parameters available when the financial statements were prepared. Existing circumstances and assumptions about future developments, however, may change due to market changes or circumstances arising beyond the control of the Group. Such changes are reflected in the assumptions when they occur. Allowances for credit losses (applicable up to December 31, 2017) Specific impairment for credit losses is determined by assessing each case individually. This method applies to classified loans
and advances and the factors taken into consideration when estimating the allowance for credit losses include the counterparty’s credit limit, the counterparty’s ability to generate cash flows sufficient to settle his advances and the value of collateral and potential repossession. Loans and advances that have been assessed individually and found not to be impaired and all individually insignificant loans and advances are then assessed collectively, in groups of assets with similar risk characteristics, to determine whether provision should be made due to incurred loss events for which there is objective evidence but whose effects are not yet evident. The collective assessment takes account of data from the loan portfolio (such as credit quality, levels of arrears, credit utilization, loan to collateral ratios, etc.), concentrations of risks, economic data and the performance of different individual groups. Establishing the number and relative weightings of forward-looking scenarios for each type of product/market and determining the forward-looking information relevant to each scenario When measuring ECL the Group uses reasonable and supportable forward-looking information, which is based on assumptions for the future movement of different economic drivers and how these drivers will affect each other. Probability of default PD constitutes a key input in measuring ECL. PD is an estimate of the likelihood of default over a given time horizon, the calculation of which includes historical data, assumptions and expectations of future conditions. Loss given default LGD is an estimate of the loss arising on default. It is based on the difference between the contractual cash flows due and those that the lender would expect to receive, taking into account cash flows from collateral and integral credit enhancements. Determining fair values The determination of fair value for financial assets for which there is no observable market price requires the use of valuation techniques as described in Note 42. For financial instruments that are traded infrequently and have little price transparency, fair value is less objective, and requires varying degrees of judgment depending on liquidity, concentration, uncertainty of market factors, pricing assumptions and other risks affecting the specific instrument. Unobservable inputs are used to measure fair value to the extent that observable inputs are not available, thereby allowing for situations in which there is little, if any, market activity for the asset or liability at the measurement date. However, the fair value measurement objective should remain the same; that is, an exit price from the perspective of market participants. Unobservable inputs are developed based on the best information available in the circumstances, which may include the reporting entity's own data.
FRANSABANK | ANNUAL REPORT 2018 | 92-93

Notes to the Consolidated Financial Statements For the year ended December 31, 2018
CONSOLIDATED FINANCIAL STATEMENTS
5. Cash and Deposits with Central Banks
Cash on hand 227,647,712 - 214,929,568 - Current accounts with Central Bank of Lebanon 819,679,219 612,346,929 739,351,376 601,019,182 Current accounts with other Central Banks 229,608,745 6,085,859 356,998,478 46,015,044 Term placements with Central Bank of Lebanon 7,795,870,502 2,311,906,236 6,874,899,528 1,706,141,266 Blocked accounts with Central Bank of Lebanon under Intermediate Circular 313 40,824,506 - 44,520,984 - Accrued interest receivable 109,669,963 - 85,522,403 - Allowance for expected credit losses (Note 46) (45,837,720) - - - Regulatory allowance for country risk - - (6,685,842) - TOTAL 9,177,462,927 2,930,339,024 8,309,536,495 2,353,175,492
of which Compulsory/ Regulatory
Deposits
Balance
of which Compulsory/ Regulatory
Deposits
Balance
December 31, 2018LBP’000 December 31, 2017
Compulsory deposits under current accounts with Central Bank of Lebanon are in Lebanese Pounds and non-interest earning. These deposits are computed on the basis of 25% and 15% of the average weekly sight and term customers’ deposits in Lebanese Pounds subject to certain exemptions, in accordance with the local banking regulations. These deposits are not available for use in the Group’s day-to-day operations. Regulatory deposits under term placements with Central Bank of Lebanon are in foreign currencies and made in accordance with local banking regulations, which require banks to maintain interest-earning placements in foreign currency to the extent of 15% of customers’ deposits in foreign currencies, certificates of deposit and borrowings acquired from non-resident financial institutions.
Blocked accounts with the Central Bank of Lebanon under Intermediary Circular No. 313 represent transitory deposits to be granted to the Bank’s customers, pursuant to certain conditions, rules and mechanism following Central Bank of Lebanon Basic Decision No. 6116 of March 7, 1996 and its amendments against facilities granted from the Central Bank of Lebanon (Note 21). During 2017, the Group was exempted from compulsory reserves in foreign currency, for half a year, up to USD 200 million to offset the remaining outstanding deferred assets against future cash flows (Note 17). During 2018, the Group recovered the remaining regulatory allowance for country risk related to the deposits held with the Central Bank of Iraq-Kurdistan in the aggregate amount of LBP 6.68 billion (LBP 2.36 billion during 2017).
Checks in course of collection Current accounts with banks and financial institutions Current margin accounts with banks and financial institutions Term placements with banks and financial institutions Term placements with related banks and financial institutions Blocked margins with banks and financial institutions Accrued interest receivable Allowance for expected credit losses (Note 46) Regulatory allowance for country risk
TOTAL
7,711,179 333,391,301
15,678 773,189,216
5,477,638 3,292,003
542,010 -
(7,313)
1,123,611,712
2018LBP’000 2017
3,344,188 467,299,221
- 1,001,186,001
10,422,557 4,859,804 4,848,870
(4,665,717) -
1,487,294,924
6. Deposits with Banks and Financial Institutions

FRANSABANK | ANNUAL REPORT 2018 | 94-95
LBP’000 2017
2017
Loans to banks are reflected at amortized cost and consist of the following:
Performing: Loans to banks 38,176,883 89,794,850 Discounted acceptances on letters of credit - 49,589,641 Accrued interest receivable 830,593 1,081,237 Allowance for expected credit losses (Note 46) (1,898,170) (2,789) 37,109,306 140,462,939 Credit impaired: Loan to a bank 31,572,999 - Allowance for expected credit losses (Note 46) (31,572,999) - - - TOTAL 37,109,306 140,462,939
7. Loans to Banks
2018
LBP’000 2017
8. Discontinued Operations
After signing a term sheet during 2017, as disclosed under Note 1, the associated assets and liabilities of USB Bank PLC were consequently classified as held for sale as follows:
The major classes of assets and liabilities comprising the discontinued operations after the allocation of adjustments at the financial position date are as follows:
LBP’000
Assets classified as held for sale Liabilities directly associated with assets classified as held for sale
1,297,343,966 1,172,758,271
1,380,267,902 1,249,041,760
Cash and Central Bank 349,945,680 319,064,067 Deposits with banks and financial institutions 31,257,384 55,396,674 Investment securities at amortized cost 5,265,192 - Investment securities at fair value through profit or loss 187,468,507 256,595,744 Loans and advances to customers 535,505,836 572,545,744 Stock of property 103,458,337 107,290,829 Investment properties 22,094,380 21,663,240 Property and equipment 20,965,211 21,733,444 Intangible assets 1,287,286 1,541,742 Other assets 4,204,050 5,435,189 Deferred assets adjustments to reach fair value less cost to sell 35,892,103 19,001,229 TOTAL ASSETS 1,297,343,966 1,380,267,902 Deposits from banks - 2,492,959 Customers’ accounts 1,143,614,288 1,226,523,935 Other liabilities 28,136,242 19,976,063 Provisions 1,007,741 48,803 TOTAL LIABILITIES 1,172,758,271 1,249,041,760
The result of the discontinued operations of USB Bank PLC included in the statement of profit or loss is set out below.
The comparative profit and cash flows from discontinued operations has been re-presented in conformity with IFRS 5.
2018
2018

LBP’000 2017
Profit for the year from discontinued operations Net interest income 31,516,713 35,302,624 Net fee and commission income 3,740,331 3,171,433 (Loss)/income from securities at fair value through profit or loss (1,710,142) 12,534,476 Allowance for credit losses (net) (10,629,504) (33,898,883) Other expense (net) (33,523,822) (35,714,629) Loss for the year from discontinued operations (10,606,424) (18,604,979) Adjustments on disposal group carrying amount 10,606,424 19,001,229 TOTAL - 396,250
LBP’000 2017
Cash flows from discontinued operations Net cash inflows from operating activities - 223,797,291 Net cash outflows from investing activities - (8,287,547) Net cash inflows - 215,509,744
2018
2018
Notes to the Consolidated Financial Statements For the year ended December 31, 2018
CONSOLIDATED FINANCIAL STATEMENTS
In its meeting held on August 16, 2018, the Board of Directors resolved to sell its investment in USB Bank PLC (classified as an entity held for sale) to AstroBank Limited. The sale transaction is completed during January 2019. In conjunction
with the sale, subsequent to year-end, BLC Bank SAL bought-back 10% of its common shares that were owned by Sehnaoui Holding, in an aggregate amount of USD 43 million and EUR 6.5 million.
The carrying value of loans and advances to customers is net of interest in suspense amounting to LBP 755 billion as at December 31, 2018 (LBP 920 billion as at December 31, 2017). The carrying value of loans and advances to customers include accidentally temporary debtors with carrying value amounting
to LBP 90.1 billion as of December 31, 2018 (LBP 85.6 billion in 2017). The carrying value of loans and advances to customers include loans to related parties in the aggregate of LBP 32 billion as of December 31, 2018 (LBP 32 billion in 2017).
9. Loans and Advances to Customers
December 31, 2018LBP’000 December 31, 2017
Performing Loans - stages 1 & 2 Retail customers 3,129,697,326 (17,929,280) 3,111,768,046 3,174,300,239 - 3,174,300,239 Corporates 5,278,454,778 (50,954,992) 5,227,499,786 4,262,047,811 - 4,262,047,811 Small and medium enterprises 1,275,012,790 (31,841,597) 1,243,171,193 1,837,335,960 - 1,837,335,960 Accrued interest receivable 34,986,602 - 34,986,602 32,356,264 - 32,356,264 Allowance for collectively assessed loans - - - - (4,555,911) (4,555,911) 9,718,151,496 (100,725,869) 9,617,425,627 9,306,040,274 (4,555,911) 9,301,484,363 Credit Impaired Loans - Stage 3 Substandard 323,374,710 (21,653,213) 301,721,497 216,860,210 (3,049,670) 213,810,540 Doubtful 543,522,744 (303,237,777) 240,284,967 415,898,088 (155,257,326) 260,640,762 Bad 44,464,564 (44,071,758) 392,806 78,635,496 (78,559,132) 76,364 911,362,018 (368,962,748) 542,399,270 711,393,794 (236,866,128) 474,527,666 TOTAL 10,629,513,514 (469,688,617) 10,159,824,897 10,017,434,068 (241,422,039) 9,776,012,029
Gross Amount Net of Interest in Suspense
Allowance for Expected Credit Losses Carrying Amount Gross Amount Net of
Interest in SuspenseAllowance for Credit Losses Carrying Amount

FRANSABANK | ANNUAL REPORT 2018 | 96-97
10. Investment Securities
Equity and preferred shares 22,769,331 52,724 447,453,939 470,275,994 Lebanese Treasury bills 20,548,354 1,808,185,043 212,809,098 2,041,542,495 Lebanese Government bonds 21,797,302 2,338,745,809 230,327,033 2,590,870,144 Certificates of deposit issued by the Central Bank of Lebanon - 3,670,267,549 14,061,664 3,684,329,213 Foreign Eurobonds 39,623,424 6,375,000 - 45,998,424 Corporate bonds 199,856 118,589,953 4,873,305 123,663,114 Bonds issued by banks - 142,129,102 - 142,129,102 Asset-backed securities - 18,201,794 - 18,201,794 Term placements with BDL 121,754,991 - - 121,754,991 226,693,258 8,102,546,974 909,525,039 9,238,765,271 Allowance for expected credit losses (Note 46) - (56,752,837) (4,503,370) (61,256,207) Accrued interest receivable 2,132,908 159,243,942 7,245,593 168,622,443 TOTAL 228,826,166 8,205,038,079 912,267,262 9,346,131,507
Equities and preference shares 38,779,601 21,852,720 377,464,205 438,096,526 Lebanese Treasury bills 46,423,467 2,737,123,517 - 2,783,546,984 Lebanese Government bonds 63,927,266 2,980,984,109 - 3,044,911,375 Foreign Government bonds - 14,875,333 - 14,875,333 Foreign bonds issued by banks 39,924,436 134,922,703 - 174,847,139 Subordinated bonds - 1,507,500 - 1,507,500 Certificates of deposit issued by Central Bank of Lebanon 120,249,766 3,524,153,187 - 3,644,402,953 Corporate bonds - 52,762,500 - 52,762,500 Asset-backed securities - 22,877,250 - 22,877,250 Mutual fund 10,123,796 - - 10,123,796 319,428,332 9,491,058,819 377,464,205 10,187,951,356 Accrued interest receivable 4,171,456 153,139,356 - 157,310,812 TOTAL 323,599,788 9,644,198,175 377,464,205 10,345,262,168
Investment securities are allocated as follows:
Fair Value Through Profit or Loss Amortized Cost
Fair Value Through Other Comprehensive
Income Total
December 31, 2018LBP’000
Fair Value Through Profit or Loss Amortized Cost
Fair Value Through Other Comprehensive
Income Total
LBP’000 December 31, 2017
Effective January 1, 2018 and as a result of the adoption of IFRS 9 (2014), the Group reclassified certain financial instruments between the different categories as permitted by the transition requirements as disclosed under Note 2.
Investment securities given as collateral as of December 31, 2018 and 2017 are disclosed under Note 45.

10.1 Investments at Fair Value through Other Comprehensive Income
Equity and preferred shares 211,729,582 447,453,939 235,724,357 Lebanese Treasury bills 211,076,598 212,809,098 1,732,500 Lebanese Government bonds 241,779,420 230,327,033 (11,452,387) Certificates of deposit issued by the Central Bank of Lebanon 14,376,490 14,061,664 (314,826) Corporate bonds 4,873,305 4,873,305 - 683,835,395 909,525,039 225,689,644 Less: Deferred taxes (40,077,526) TOTAL 185,612,118
Amortized Cost Fair Value Cumulative Change in Fair Value
December 31, 2018LBP’000
Equity and preferred shares 162,720,975 377,464,205 214,743,230 162,720,975 377,464,205 214,743,230 Less: Deferred taxes (38,781,098) TOTAL 175,962,132
Amortized Cost Fair Value Cumulative Change in Fair Value
LBP’000 December 31, 2017
On December 31, 2017, the Bank deconsolidated the accounts of Fransabank Syria as a result from the loss of control over the said subsidiary and the investment was classified as
investment at fair value through other comprehensive income at the carrying value of LBP 51.9 billion.
Acceptances represent documentary credits, which the Group has committed to settle on behalf of its customers against commitments by those customers (acceptances). These acceptances are presented net of their related expected loss
allowance amounting to LBP 1.3 billion (Note 46) as at December 31, 2018. The commitments resulting from these acceptances are stated as a liability in the statement of financial position for the same amount.
Even though, the Group’s interest in Bancassurance SAL is 60%, the management determined that it does not control this entity on the basis that according to the shareholders’
agreement, the relevant activities of Bancassurance are directed on the basis of 75% votes of the Board of Directors which does not give the Bank power over the investee.
11. Customers’ Liability under Acceptances
12. Investments in Associates
Investments in associates, which are not listed, are as follows:
Bancassurance SAL United Capital Bank International Payment Network SAL TOTAL
61,995,311 15,782,254
1,523,896
79,301,461
Interest Held %
60.00 20.00 20.30
60.00 20.00 20.30
Lebanon Republic of Sudan
Lebanon
66,022,769 14,369,186
1,645,645
82,037,600
Country of Incorporation 2018 2017 2018LBP’000 2017
Notes to the Consolidated Financial Statements For the year ended December 31, 2018
CONSOLIDATED FINANCIAL STATEMENTS
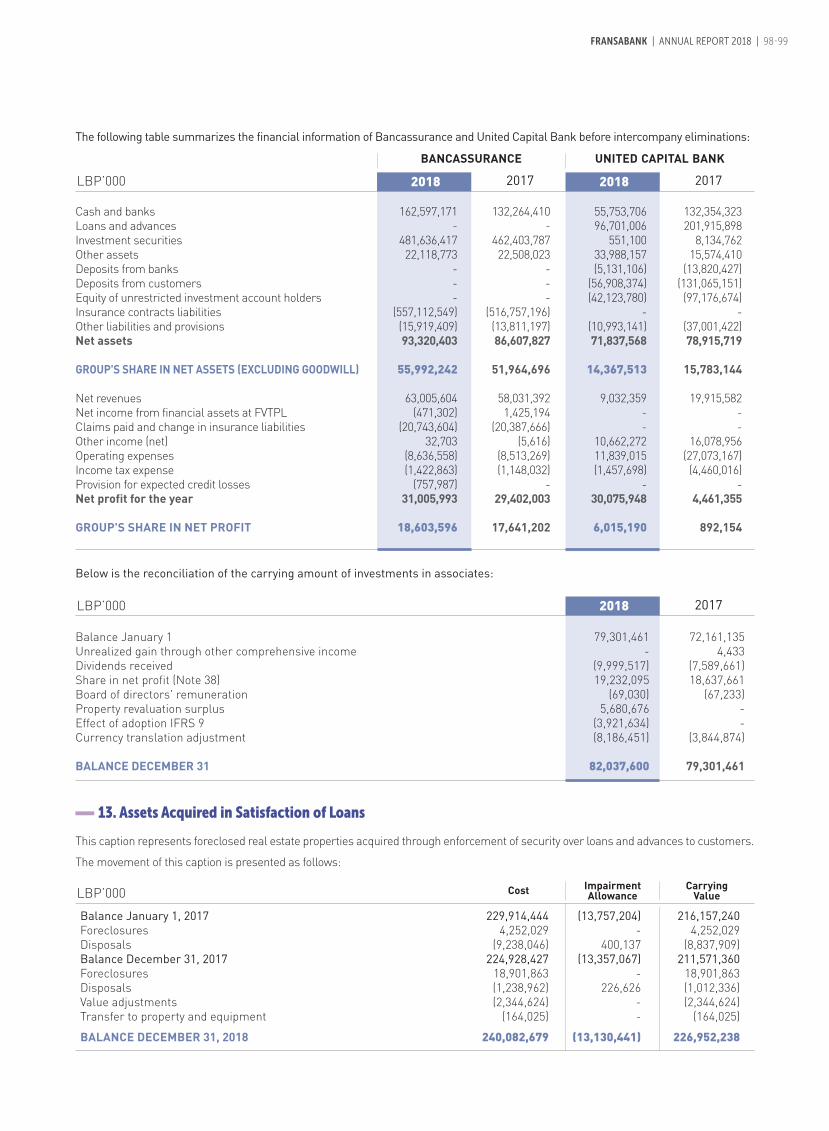
2018LBP’000 2017 2018 2017
The following table summarizes the financial information of Bancassurance and United Capital Bank before intercompany eliminations:
BANCASSURANCE UNITED CAPITAL BANK
Cash and banks 162,597,171 132,264,410 55,753,706 132,354,323 Loans and advances - - 96,701,006 201,915,898 Investment securities 481,636,417 462,403,787 551,100 8,134,762 Other assets 22,118,773 22,508,023 33,988,157 15,574,410 Deposits from banks - - (5,131,106) (13,820,427) Deposits from customers - - (56,908,374) (131,065,151) Equity of unrestricted investment account holders - - (42,123,780) (97,176,674) Insurance contracts liabilities (557,112,549) (516,757,196) - - Other liabilities and provisions (15,919,409) (13,811,197) (10,993,141) (37,001,422) Net assets 93,320,403 86,607,827 71,837,568 78,915,719 GROUP'S SHARE IN NET ASSETS (EXCLUDING GOODWILL) 55,992,242 51,964,696 14,367,513 15,783,144 Net revenues 63,005,604 58,031,392 9,032,359 19,915,582 Net income from financial assets at FVTPL (471,302) 1,425,194 - - Claims paid and change in insurance liabilities (20,743,604) (20,387,666) - - Other income (net) 32,703 (5,616) 10,662,272 16,078,956 Operating expenses (8,636,558) (8,513,269) 11,839,015 (27,073,167) Income tax expense (1,422,863) (1,148,032) (1,457,698) (4,460,016) Provision for expected credit losses (757,987) - - - Net profit for the year 31,005,993 29,402,003 30,075,948 4,461,355 GROUP'S SHARE IN NET PROFIT 18,603,596 17,641,202 6,015,190 892,154
FRANSABANK | ANNUAL REPORT 2018 | 98-99
2018LBP’000 2017
Balance January 1 79,301,461 72,161,135 Unrealized gain through other comprehensive income - 4,433 Dividends received (9,999,517) (7,589,661) Share in net profit (Note 38) 19,232,095 18,637,661 Board of directors' remuneration (69,030) (67,233) Property revaluation surplus 5,680,676 - Effect of adoption IFRS 9 (3,921,634) - Currency translation adjustment (8,186,451) (3,844,874) BALANCE DECEMBER 31 82,037,600 79,301,461
Below is the reconciliation of the carrying amount of investments in associates:
13. Assets Acquired in Satisfaction of Loans
This caption represents foreclosed real estate properties acquired through enforcement of security over loans and advances to customers.
The movement of this caption is presented as follows:
LBP’000
Balance January 1, 2017 229,914,444 (13,757,204) 216,157,240 Foreclosures 4,252,029 - 4,252,029 Disposals (9,238,046) 400,137 (8,837,909) Balance December 31, 2017 224,928,427 (13,357,067) 211,571,360 Foreclosures 18,901,863 - 18,901,863 Disposals (1,238,962) 226,626 (1,012,336) Value adjustments (2,344,624) - (2,344,624) Transfer to property and equipment (164,025) - (164,025) BALANCE DECEMBER 31, 2018 240,082,679 (13,130,441) 226,952,238
Impairment AllowanceCost Carrying
Value

According to the Lebanese banking regulations, the acquisition of assets in settlement of loans requires the approval of the banking regulatory authorities and these are classified as “Assets acquired in satisfaction of loans” and should be liquidated within 2 years. In case of default of liquidation, a regulatory reserve should be appropriated from the yearly net profits over
a period of 5 or 20 years as applicable. These assets are carried at cost less impairment allowance. Gain on disposals amounted to LBP 1.13 billion (LBP 8.3 billion in 2017) recorded under other income in the statement of profit or loss (Note 38).
Notes to the Consolidated Financial Statements For the year ended December 31, 2018
CONSOLIDATED FINANCIAL STATEMENTS
14. Tangible and Intangible Assets
Balance as at December 31,
2018
Cost/Revaluation: Owned properties 338,479,256 11,811,334 (1,142,685) - - - (3,933,589) 345,214,316 Furniture, equipment and computer 114,555,822 49,528,539 (5,295,385) 189,506 - - 11,498,250 170,476,732 Vehicles 6,102,025 1,104,928 (587,169) - - - 10,651 6,630,435 Office improvements and installations 120,319,154 17,613,248 (1,570,270) 2,564,114 - - 797,732 139,723,978 Advance payments 62,323,237 (5,661,553) - (2,852,714) - - (14,280,040) 39,528,930 641,779,494 74,396,496 (8,595,509) (99,094) - - (5,906,996) 701,574,391 Accumulated Depreciation (234,061,409) (25,771,291) 6,762,262 - - - 263,493 (252,806,945) Provision for Impairment (3,438,425) - - - - - - (3,438,425) Carrying Value 404,279,660 445,329,021
LBP’000
Balance as at December 31,
2017
Cost/Revaluation: Owned properties 346,720,483 9,264,783 (3,297,011) - (6,917,334) (5,901,484) (1,390,181) 338,479,256 Furniture, equipment and computer 121,071,606 6,713,286 (4,562,047) - (1,043,432) (7,679,339) 55,748 114,555,822 Vehicles 6,119,175 964,875 (702,062) - (9,175) (260,515) (10,273) 6,102,025 Office improvements and installations 118,449,316 10,956,188 (1,986,243) - (718,774) (6,280,679) (100,654) 120,319,154 Building under finance lease 6,807,776 - - - - (6,807,776) - - Advance payments 43,477,850 19,738,238 - (323,929) (1,092,612) - 523,690 62,323,237 642,646,206 47,637,370 (10,547,363) (323,929) (9,781,327) (26,929,793) (921,670) 641,779,494 Accumulated Depreciation (227,167,402) (26,201,613) 6,612,310 - 1,262,096 11,369,974 63,226 (234,061,409) Provision for Impairment (2,808,460) - (629,965) - - - - (3,438,425) Carrying Value 412,670,344 404,279,660
Balance at January 1,
2017
Additions and Transfers from
Advance Payments
Retirements TransferEffect of Assets
Held-for Sale Adjustments
Effect of Deconsolidation of Fransabank
SyriaLBP’000
Balance at January 1,
2018
Additions and Transfers from
Advance Payments
Retirements TransfersEffect of Assets
Held-for Sale Adjustments
Effect of Deconsolidation of Fransabank
Syria
Advance payments as at December 31, 2017 include an amount of LBP 13 billion paid on account for the acquisition of two plots in Achrafieh to be used for the purpose of expanding the head office of a subsidiary bank.
14.1 Property and Equipment
Currency Translation Adjustment and other
Movements
Currency Translation Adjustment and other
Movements

FRANSABANK | ANNUAL REPORT 2018 | 100-101
Balance as at December 31,
2018
Cost: Purchase software 30,815,356 6,473,744 (5,515,429) - - - 1,268,819 33,042,490 Licenses 1,198,007 - - - - - 60,606 1,258,613 Goodwill - - - - - - - - Key money 196,017 5,179 (29,592) - - - (131,819) 39,785 32,209,380 6,478,923 (5,545,021) - - - 1,197,606 34,340,888 Accumulated Depreciation: Purchase software (22,417,084) (3,925,980) 5,448,005 - - - (138,193) (21,033,252) Licenses (391,955) - - - - - 391,955 - Goodwill - - - - - - - - Key money (196,017) (5,179) 29,592 - - - 146,476 (25,128) (23,005,056) (3,931,159) 5,477,597 - - - 400,238 (21,058,380) Advance payments 2,956,833 1,924,490 - - - - (353,256) 4,528,067 CARRYING VALUE 12,161,157 17,810,575
Effect of Deconsolidation of Fransabank
Syria
Effect of Assets
Held-for Sale Adjustments
Currency Translation Adjustment and other
Movements
Transfer from Property and
Equipment
Additions and Transfers from
Advance Payments
RetirementsBalance at January 1,
2018
Cost: Purchase software 47,152,103 4,567,893 (4,535,484) 323,929 (863,706) (16,277,558) 448,179 30,815,356 Licenses 938,199 343,960 (79,012) - - - (5,140) 1,198,007 Key money 196,017 - - - - - - 196,017 48,286,319 4,911,853 (4,614,496) 323,929 (863,706) (16,277,558) 443,039 32,209,380 Accumulated Depreciation: Purchase software (38,934,529) (3,288,394) 4,472,568 - 120,295 15,287,474 (74,498) (22,417,084) Licenses (286,418) (188,314) 78,472 - - - 4,305 (391,955) Key money (160,842) (35,175) - - - - - (196,017) (39,381,789) (3,511,883) 4,551,040 - 120,295 15,287,474 (70,193) (23,005,056) Advance payments 4,422,339 (1,449,172) - - (17,862) - 1,528 2,956,833 CARRYING VALUE 13,326,869 12,161,157
Effect of Deconsolidation of Fransabank
Syria
Effect of Assets
Held-for Sale Adjustments
Currency Translation Adjustment and other
Movements
Transfer from Property and
Equipment
Additions and Transfers from
Advance Payments
RetirementsBalance at January 1,
2017
LBP’000
Balance as at December 31,
2017LBP’000
14.2 Intangible Assets
2018LBP’000 2017
15. Assets under Leverage Arrangements with the Central Bank of Lebanon
Term placements with the Central Bank of Lebanon 1,771,949,000 694,859,881 Lebanese Treasury bills 466,136,922 160,558,244 TOTAL 2,238,085,922 855,418,125

2018LBP’000 2017
16. Goodwill
Goodwill is derived from acquisition of control of subsidiaries as follows:
Goodwill Allocated to BLC Bank The recoverable amount is determined based on fair value less cost of disposal, which is determined to be higher than the asset’s carrying value using the market comparability approach of similar transaction.
Goodwill from Merger of Ahli International Bank SAL On July 31, 2014, the Group acquired “Ahli International Bank SAL“ for a consideration of USD 103 million and then it was fully merged within the Group’s accounts. This transaction resulted in a goodwill for the amount of LBP 4.09 billion.
Fransabank OJSC - Belarus 720,704 720,704 BLC Bank SAL 44,095,440 44,095,440 Ahli International Bank SAL (merger) 4,087,509 4,087,509 TOTAL 48,903,653 48,903,653
Notes to the Consolidated Financial Statements For the year ended December 31, 2018
CONSOLIDATED FINANCIAL STATEMENTS
As at December 31, 2018, assets under leverage arrangements with BDL consists of term placements with the Central Bank of Lebanon and Lebanese Treasury bills in LBP earning coupon rates ranging between 6.7% per annum and 10.5% per annum and having maturities ranging between 2022 and 2033 (2017: coupon rates ranging between 6.7% per annum and 10.5% per annum and having maturities ranging between 2018 and 2027) originated from and are pledged against the
corresponding leverage arrangements with the Central Bank of Lebanon for the same amounts in LBP, bearing interest at the rate of 2% per annum and carrying same maturities, purpose of which is to provide yield adjustment on certain transactions related to either fresh deposits in foreign currency or sale of foreign currency against LBP placed in term deposits at the Central Bank of Lebanon.
2018LBP’000 2017
Term placements with the Central Bank of Lebanon 1,653,199,875 685,083,375 Term placement with the Central Bank of Lebanon in LBP originated from sale of foreign currency 13,268,000 - Term placement with Central Bank of Lebanon in LBP originated from the swap of certificates of deposit in foreign currency 19,682,000 - Lebanese Government bonds 112,583,364 - TOTAL 1,798,733,239 685,083,375
The leverage and related pledged assets mechanism resulted in a yield enhancement on the following financial assets:

FRANSABANK | ANNUAL REPORT 2018 | 102-103
2018 2017LBP’000
2018LBP’000 2017
17. Other Assets
Deferred assets on business acquisition (a) 15,521,543 21,481,875 Deferred assets against future cash flows (b) - 7,821,948 Derivative assets held for risk management (c) 2,553,079 4,893,995 Deferred tax asset 3,308,798 185,645 Regulatory blocked deposit (d) 7,313,454 6,758,423 Assets in process of acquisition in settlement of loans (e) 1,011,272 1,011,272 Advance on investment in subsidiary - 1,356,750 Deferred charges 1,780,792 907,240 Prepayments 28,777,272 21,127,524 Foreign exchange operations 36,324 385,035 Accrued income 1,734,826 1,434,937 Doubtful claims by banks 1,283,840 1,323,120 Provision on doubtful claims by banks (1,283,840) (1,323,120) Sundry accounts receivable 49,162,571 66,095,519 Allowance for credit losses (Note 46) (1,696,478) (3,731,126) TOTAL 109,503,453 129,729,037
(a) Deferred assets on business acquisition represent what was compensated by the Central Bank of Lebanon in the form of future cash flows and benefits originated from the soft loans granted to the Group on acquisition of Al Ahli International Bank SAL (refer to Note 21 f). The Group is amortizing these deferred assets against the reduction of future economic benefits derived from the soft loans and thus the carrying value of these deferred assets corresponds to the present value of future cash flows expected to be derived from the soft loans. The amortization charge for the year 2018 was LBP 5.96 billion (LBP 7.16 billion during 2017) and is treated as a yield adjustment to the interest income on the pledged Lebanese Treasury bills acquired from the soft loan proceeds.
(b) Net outstanding deferred assets against future cash flows correspond to the Bank’s Cypriot subsidiary’s carried over losses incurred since the crisis in Cyprus occurred up to December 31, 2015. These deferred assets are offset against future economic benefits derived from the low yield funding amounting to LBP 300 million provided by the Central Bank of Lebanon, which was redeemed and replaced by exemption from compulsory reserves up to USD 200 million during 2016. Proceeds of the loan and the compulsory reserves are invested in fixed income securities. The return on these debt securities is appropriated to deferred assets.
The movement of deferred assets against future cash flows during the years 2018 and 2017 was as follows:
Net carrying value as at January 1 7,521,948 26,935,864 Write down during the year (7,521,948) (15,773,541) Write-off against regulatory deferred liability (Note 23) - (3,340,375) NET CARRYING VALUE AS AT DECEMBER 31, - 7,821,948
(c) The derivative assets held for risk management consist of the following:Fair Value as at December 31,
2017LBP’000 Over-The-Counter (OTC) structured derivative 4,893,995
Fair Value as at December 31,
2018
2,553,079
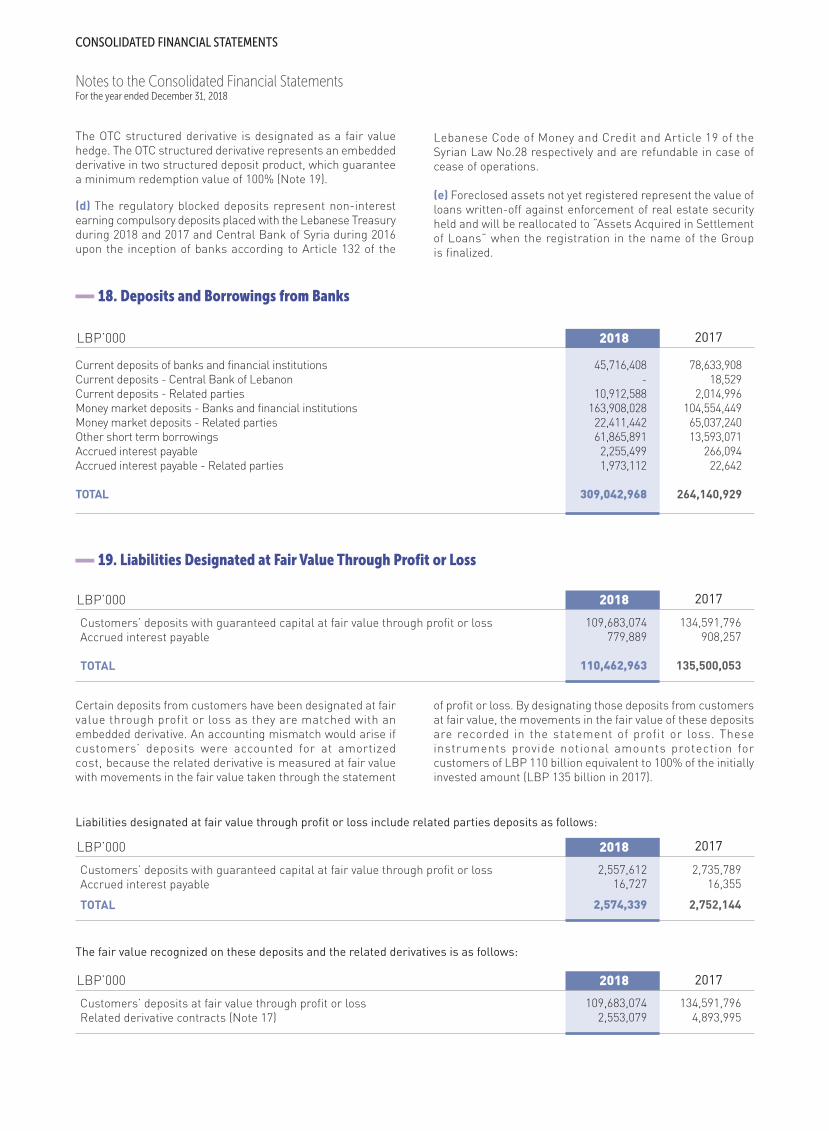
2018LBP’000 2017
(d) The regulatory blocked deposits represent non-interest earning compulsory deposits placed with the Lebanese Treasury during 2018 and 2017 and Central Bank of Syria during 2016 upon the inception of banks according to Article 132 of the
Lebanese Code of Money and Credit and Article 19 of the Syrian Law No.28 respectively and are refundable in case of cease of operations. (e) Foreclosed assets not yet registered represent the value of loans written-off against enforcement of real estate security held and will be reallocated to “Assets Acquired in Settlement of Loans” when the registration in the name of the Group is finalized.
18. Deposits and Borrowings from Banks
19. Liabilities Designated at Fair Value Through Profit or Loss
Current deposits of banks and financial institutions 45,716,408 78,633,908 Current deposits - Central Bank of Lebanon - 18,529 Current deposits - Related parties 10,912,588 2,014,996 Money market deposits - Banks and financial institutions 163,908,028 104,554,449 Money market deposits - Related parties 22,411,442 65,037,240 Other short term borrowings 61,865,891 13,593,071 Accrued interest payable 2,255,499 266,094 Accrued interest payable - Related parties 1,973,112 22,642 TOTAL 309,042,968 264,140,929
LBP’000
Customers’ deposits with guaranteed capital at fair value through profit or loss Accrued interest payable TOTAL
134,591,796 908,257
135,500,053
2018
109,683,074 779,889
110,462,963
Certain deposits from customers have been designated at fair value through profit or loss as they are matched with an embedded derivative. An accounting mismatch would arise if customers’ deposits were accounted for at amortized cost, because the related derivative is measured at fair value with movements in the fair value taken through the statement
of profit or loss. By designating those deposits from customers at fair value, the movements in the fair value of these deposits are recorded in the statement of profit or loss. These instruments provide notional amounts protection for customers of LBP 110 billion equivalent to 100% of the initially invested amount (LBP 135 billion in 2017).
2017
The OTC structured derivative is designated as a fair value hedge. The OTC structured derivative represents an embedded derivative in two structured deposit product, which guarantee a minimum redemption value of 100% (Note 19).
Notes to the Consolidated Financial Statements For the year ended December 31, 2018
CONSOLIDATED FINANCIAL STATEMENTS
LBP’000
Customers’ deposits with guaranteed capital at fair value through profit or loss Accrued interest payable TOTAL
2,735,789 16,355
2,752,144
2018
2,557,612 16,727
2,574,339
2017
Liabilities designated at fair value through profit or loss include related parties deposits as follows:
LBP’000
Customers’ deposits at fair value through profit or loss Related derivative contracts (Note 17)
134,591,796 4,893,995
2018
109,683,074 2,553,079
2017
The fair value recognized on these deposits and the related derivatives is as follows:

Deposits from customers at amortized cost include coded deposit accounts totaling LBP 471 billion (LBP 401 billion in 2017). These accounts are subject to the provisions of Article 3 of the Lebanese Banking Secrecy Law dated September 3, 1956, which provides that the Bank’s management, in the normal course of business, cannot reveal the identities of
these depositors to third parties, including its independent public accountants. Deposits from customers include fiduciary deposits received from resident and non-resident banks for a total amount of LBP 418 billion (LBP 385 billion respectively in 2017).
FRANSABANK | ANNUAL REPORT 2018 | 104-105
2018LBP’000 2017
2018LBP’000 2017
20. Deposits from Customers and Related Parties
Deposits from customers: - Current/demand deposits 3,036,627,137 2,328,551,553 - Term deposits 19,722,865,475 20,625,854,923 - Collateral against loans and advances 2,021,247,974 1,405,775,912 Margins and other collateral: - Margins for irrevocable import letters of credit 251,245,522 150,635,643 - Margins on letters of guarantee 73,642,833 74,495,369 - Other margins 146,115,197 53,370,678 - Blocked accounts 104,529,356 77,643,016 - Escrow accounts (a) - 14,944,039 Accrued interest payable 195,205,243 150,944,565 TOTAL 25,551,478,737 24,882,215,698
Current assets 10,432,200 9,722,124 Term deposits 1,415,265,260 1,687,286,122 Collateral against loans and advances 14,108,181 31,594,194 Margins 27,049 96,600 Blocked accounts 2,632,393 2,445,265 Accrued interest payable 38,181,279 28,761,331 TOTAL 1,480,646,362 1,759,905,636
Deposits from customers include deposits from related parties detailed as follows:
(a) During 2017, a subsidiary bank offered 400,000 preferred shares, at an issue price of USD 100 per share with a nominal value of LBP 1,000 that were issued during 2018. As at
December 31, 2017, LBP 15 billion were subscribed by customers and booked under escrow account.
2018LBP’000 2017
21. Other Borrowings
Borrowings from European Investment Bank (a) 108,675,233 84,445,919 Borrowing from Agence Française de Développement (b) 27,135,000 - Borrowings from International Finance Corporation (c) 47,046,892 55,108,387 Borrowing from Arab Trade Financing Program (d) 16,750,265 29,389,049 Borrowings from Central Bank of Lebanon (e) 1,003,995,741 989,220,886 Soft loans from Central Bank of Lebanon (f) 261,391,256 261,413,868 Borrowing from the German Investment and Development Company - DEG (related party) (g) - 1,507,500 Borrowing from Green for Growth Fund - GGF (h) 7,537,500 1,507,500 Borrowings from SANAD 30,150,000 22,612,500 Borrowings from Citibank – Ireland - 8,868,268 Borrowings from Standard Chartered – UAE - 48,460,102 Reconstruction and Development International Bank 1,100,475 - Green bonds (i) 90,450,000 - Other borrowings 17,714,295 - 1,611,946,657 1,502,533,979 Accrued interest payable 4,702,457 2,072,436 TOTAL 1,616,649,114 1,504,606,415

(a) Borrowings from European Investment Bank: Borrowings from the European Investment Bank represent term borrowings to finance loans extended to customers. These borrowings are divided into 2 types: a 12 years line of credit for EUR 30 million for touristic loans and a 10 years line of credit for EUR 30 million for industrial loans. These borrowings will be settled in several installments maturing between 2019 and 2026. (b) Borrowing from Agence Française de Développement: The borrowing from Agence Française de Développement represents a 7 years line of credit for a limit of EUR 18 million (LBP 27 billion) that will enable the Group to support Lebanese SMEs and corporate in difficulty. This borrowing matures in 2025. (c) Borrowings from International Finance Corporation: During 2014, the Group obtained a borrowing from International Finance Corporation representing a 7 years line of credit for a limit of USD 3 million (LBP 5 billion). This borrowing is payable through fixed semi-annual installments starting June 2016. During 2015, another borrowing in the amount of USD 10 million was granted to the Group to be used to finance eligible
sustainable energy finance projects. This borrowing is to be settled semiannually starting June 2016. This borrowing matures in 2024. During 2016, 2 new borrowings in the amount of USD 20 million and USD 7 million were granted to the Group. These borrowings are to be settled semiannually starting June 2018 and January 2018 respectively. These borrowings mature in 2026 and 2023 respectively. (d) Borrowing from Arab Trade Financing Program: The borrowing from Arab Trade Financing Program represents a revolving line of credit for USD 11 million (LBP 17 billion) granted in 2000 to support inter-Arab Trade exchanges. This borrowing matures in 2019. (e) Borrowings from Central Bank of Lebanon: Borrowings from the Central Bank of Lebanon represent facilities following Central Bank of Lebanon Basic Decision No. 6116 of March 7, 1996 and its amendments by which the Bank benefited from credit facilities granted against loans that the Bank has granted, on its own responsibility, to its customers, pursuant to certain conditions, rules and mechanism. Part of these facilities is collateralized by Lebanese Treasury bills (Note 45).
Notes to the Consolidated Financial Statements For the year ended December 31, 2018
CONSOLIDATED FINANCIAL STATEMENTS
2018LBP’000
2017
(f) Soft Loans from Central Bank of Lebanon:
This caption represents soft loans granted by the Central Bank of Lebanon as detailed below:
Soft loan against merger with Ahli International Bank SAL Soft loan against providing liquidity to cover 60% of the replacement value of buildings and equipment pertaining to Bank's clients who were directly damaged from the July 2006 Lebanon war Soft loan against subsidized loan granted by the group CARRYING VALUE
Maturity DateDate Granted
243,589,400
17,734,000 90,468
261,413,868
December 21, 2020
March 21, 2019 December 30, 2021
December 26, 2014
March 29, 2012 December 30, 2015
Soft loans are secured by pledged Lebanese Treasury bills (Note 45).
243,589,400
17,734,000 67,856
261,391,256
(g) Borrowing from The German Investment and Development Company – DEG (related party): The borrowing from The German Investment and Development Company – DEG represents a loan for a limit of USD 6 million (LBP 9 billion), payable through 12 semi-annual payments of USD 500,000 each starting June 2013. (h) Borrowing from Green for Growth Fund - GGF: The borrowing from Green for Growth Fund – GGF represents a 7 years line of credit for a limit USD 5 million (LBP 7.54 billion)
obtained on December 15, 2017. This borrowing is payable through 11 semi-annual payments of USD 454,545 each starting December 2019. Up until December 31, 2017, only USD 1 million was utilized and settled fully during 2018. (i) Green Bonds: During 2018, the Group issued green bonds in the amount of USD 60 million for a period of 7 years. These bonds are subject to a fixed annual interest rate of 6.788% and mature in 2025.
2018LBP’000 2017
22. Subordinated Loan
19,124,748Loan from Proparco (7.61%) 12,749,839

FRANSABANK | ANNUAL REPORT 2018 | 106-107
2018LBP’000 2017
23. Other Liabilities
Current tax liability (a) 16,804,615 32,390,216 Deferred tax liability on items recognized in other comprehensive income (Note 29) 40,077,526 36,214,407 Deferred tax liability on undistributed profits of subsidiaries and associates of the Bank 15,031,546 59,095,812 Other deferred income tax liability 2,581,820 3,351,098 Withholding and other taxes payable 30,944,610 13,515,357 Due to the Social Security National Fund 3,143,535 2,617,143 Checks and incoming payment orders in course of settlement 20,590,987 26,244,902 Blocked capital subscriptions for companies under incorporation 414,764 - Accrued expenses 52,182,279 51,243,105 Accrued interest payable - Subordinated loan 1,247,864 1,618,235 Financial guarantee contracts issued 654,419 1,946,331 Payable to non-controlling interests of a subsidiary under liquidation 11,349 11,349 Regulatory deferred liability (b) - 326,510,510 Sundry accounts payable 119,950,349 61,202,936 TOTAL 303,635,663 615,961,401
This caption represents a loan according to a contract signed between the Bank and “Proparco” on January 19, 2010 for an amount of USD 21,144,000 and is to be settled over a period of 10 years including a 6-year grace period. The Group started to
accrue interest effective June 30, 2010 and this interest is payable on July 15 of each year starting year 2011. Repayment of principal started on July 15, 2016.
2018LBP’000 2017
(a) Below is the reconciliation of income tax expense:
Profit before tax from continuing operations 302,879,624 338,900,166 Income tax on enacted applicable rates 54,887,014 59,473,099 Effect of non-deductible expense and non taxable income (25,453,211) (3,640,140) Income tax expense 29,433,803 55,832,959 Less: tax paid in advance and deferred tax (12,629,188) (23,442,743) CURRENT TAX PAYABLE 16,804,615 32,390,216
(b) In accordance with the Central Bank of Lebanon Intermediary Circular number 446 dated December 30, 2016, banks should record the surplus derived from sale of Treasury bills and certificates of deposit in Lebanese Pound against investment in medium and long term Lebanese Government bonds and certificates of deposit in foreign currency issued by the Central Bank of Lebanon under deferred liability which is regulated in nature, and shall be appropriated, among other things, after deducting the relevant tax liability, to collective provision for credit risks associated with the loan book at a minimum of 2% of the weighted credit, and that in anticipation of implementation of IFRS 9 for Impairment, as and when quantified effective on January 1, 2018. By virtue of this Circular, 70% of the remaining residual surplus once recognized over time shall be treated as non-distributable income designated and restricted only for appropriation to capital increase.
During the year 2016, as a result of several transactions derived from the special and non-conventional deals arrangement with the Central Bank of Lebanon, the Group received a surplus of LBP 440 billion of which an amount of LBP 22 billion was recognized in the statement of profit or loss. The remaining surplus of LBP 356 billion, net of tax in the amount of LBP 62.7 billion, was credited to “Regulatory deferred liability” under other liabilities and deferred as restricted contribution in anticipation of expected loss provisions that will be deemed to be necessary along with the application of IFRS 9 in accordance with the Central Bank of Lebanon requirements as indicated above. During 2017, tax payable on regulatory deferred liability was settled.

2018
LBP’000
This account was constitued as follows:
Total surplus Recognized contribution Deferred regulatory liability Tax on deferred regulatory liability Deferred regulatory liability – net of tax
440,416,318 (22,154,654) 418,261,664 (62,739,249)
355,522,415
LBP’000
The movement of this account during 2018 and 2017 was as follows:
Balance, January 1 326,510,510 355,522,415 Write-off against deferred assets - (3,340,375) Write-off against goodwill - (6,580,859) Appropriated to retained earnings (322,153,582) - Transfer to collective provision and other movement 8 (1,239,192) Transfer to provision for contingencies (Note 24) (4,191,103) - Appropriation to other income (Note 38) (165,833) (17,851,479) BALANCE, DECEMBER 31 - 326,510,510
2018LBP’000 2017
2017
2018LBP’000 2017
2018LBP’000 2017
24. Provisions
Provisions consist of the following:
The movement of provision for staff termination indemnities is as follows:
Provision for staff termination indemnities 36,006,788 35,011,326 Provision for contingencies 14,721,657 11,249,790 Provision for expected credit loss on off-balance sheet commitments (Note 46) 9,457,562 - Provision for loss on foreign currency position 1,424,690 475,549 Provision for off-balance sheet risk 240,000 307,596 Other provision 99,856 - TOTAL 61,950,553 47,044,261
Balance January 1 35,011,326 33,660,174 Additions 5,044,471 3,037,009 Settlements (4,049,009) (1,685,857) BALANCE, DECEMBER 31 36,006,788 35,011,326
The movement of the provision for contingencies was as follows:
Balance January 1 11,249,790 12,747,041 Additions (Note 39) 7,169,108 3,694,084 Settlements (717,813) (5,004,028) Transfer from deferred liabilities (Note 23) 4,191,103 - Transfer to allowance for off-balance sheet risk (9,195,750) - Effect of exchange rates changes (289,375) (187,307) Reclassification from other liabilities 2,314,594 - BALANCE, DECEMBER 31 14,721,657 11,249,790
During 2017, the Bank transferred an amount of LBP 17.8 billion to other income to cover the impairment derived from the investment in Fransabank Syria up till December 31, 2017.
Notes to the Consolidated Financial Statements For the year ended December 31, 2018
CONSOLIDATED FINANCIAL STATEMENTS

25. Share Capital
At December 31, 2018 and 2017, the authorized ordinary share capital of the Bank was LBP 438.5 billion consisting of 21,925,000 fully paid shares of LBP 20,000 each. During 2017, the Bank increased the nominal value of these shares upon transferring from reserves restricted following a decision by the general assembly to reconstitute the capital, which decreased by an amount of LBP 8.5 billion as a result of the redemption of all series “B” preference shares (Note 27).
Up to 2018 and 2017 year-end, the Bank has established a fixed exchange position in the amount of USD 172,179,882 authorized by Central Bank of Lebanon to hedge its equity against exchange fluctuations within the limit of 60% of equity denominated in Lebanese Pounds.
Subsequent to the date of the statement of financial position, the Bank, amongst 10 other banks in the country, is defendant in a civil action brought on January 1, 2019 under the Anti-Terrorism Act (“ATA”), at United States District Court, Eastern District of New York, by a group of plaintiffs claiming to have suffered losses by reason of acts of international
terrorism occurring between 2004 and 2011. The Bank’s management states that the Bank has not been involved in any wrong doing and has appointed lawyers to defend its case. Management is of the opinion that the risk derived from the outcome of the lawsuit is relatively low and will not result in an adverse impact on the Bank’s financial statements.
26. Shareholders’ Cash Contribution to Capital
The shareholders’ cash contribution to capital is for a total amount of LBP 17.1 billion (USD 11,352,494) as at December 31, 2018 and 2017 and it is subject to a yearly interest of 6% payable from unrestricted profits after securing the approval of Central Bank of Lebanon.
This sort of financial instrument is accounted for in foreign currency and therefore allows hedging against national currency exchange fluctuation.
27. Preference Shares
On September 30, 2010, the Bank issued 425,000 non-cumulative convertible redeemable Series “B” preferred shares with nominal value of LBP 20,000 each at an issue price of USD 200 per share. During 2017, the Bank redeemed the preferred shares at a price equal to 103% of the issue price (USD 207 per share) as per the offering circular for a total additional amount of LBP 4.48 billion from the original price. The difference was recorded against retained earnings (Note 25). The Bank distributed USD 13.5 per preference share series “B” during 2017. On December 21, 2012, the Bank issued 375,000 non-cumulative redeemable Series “C” preferred shares with nominal value of LBP 20,000 each at an issue price of USD 200 per share. These shares may be redeemed within 60 days of the ordinary general assembly of shareholders held to approve the accounts of the Bank for the year 2017 and within 60 days following the date of each subsequent ordinary general assembly of shareholders held to approve the annual accounts of the Bank for the immediate preceding fiscal year. The Bank distributed USD 13.5 per preferred share Series “C” during 2018 and 2017. On December 15, 2014, the Bank issued 425,000 non-cumulative redeemable series “D” preferred shares with nominal value of LBP 20,000 each at an issue price of USD 200 per share. These shares may be redeemed within 90 days of the ordinary general assembly of shareholders held to approve the accounts of the
Bank for the year 2019 and within 90 days following the date of each subsequent ordinary general assembly of shareholders held to approve the annual accounts of the Bank for the immediate preceding fiscal year. The Bank distributed USD 13 per preferred share Series “D” during 2018 and 2017. On December 2015, the Bank issued 525,000 non-cumulative redeemable series “E” preferred shares with nominal value of LBP 20,000 each at an issue price of USD 200 per share. These shares may be redeemed within 90 days of the ordinary general assembly of shareholders held to approve the accounts of the Bank for the year 2020 and within 90 days following the date of each subsequent ordinary general assembly of shareholders held to approve the annual accounts of the Bank for the immediate preceding fiscal year. The Bank distributed USD 13.5 per preferred share Series “E” during 2018 and 2017. On December 2017, the Bank issued 375,000 non-cumulative redeemable series “F” preferred shares with nominal value of LBP 20,000 each at an issue price of USD 200 per share. These shares may be redeemed within 90 days of the ordinary general assembly of shareholders held to approve the accounts of the Bank for the year 2022 and within 90 days following the date of each subsequent ordinary general assembly of shareholders held to approve the annual accounts of the Bank for the immediate preceding fiscal year.
FRANSABANK | ANNUAL REPORT 2018 | 108-109

(a) The legal reserve is constituted in conformity with the requirements of the Lebanese Money and Credit Code on the basis of 10% of net profit. This reserve is not available for distribution. (b) The reserve for general banking risks is constituted according to local banking regulations, from net profit, on the basis of a minimum of 2 per mil and a maximum of 3 per mil of the total risk weighted assets, off-financial position risk and global exchange position as defined for the computation of the solvency ratio at year-end. The cumulative reserve should not be less than 1.25% at the end of the 10th year (2007) and 2% at the end of the 20th year (2017). This reserve is constituted in Lebanese Pound and in foreign currencies in proportion to the composition of the Group’s total risk weighted assets and off-financial position items. This reserve is not available for distribution. (c) The special reserve is made based on regulatory requirements, in connection with the uncovered portion of the doubtful debts outstanding as at June 30, 2003. (d) In compliance with the basic circular no. 81 issued by the Central Bank of Lebanon, the Bank is required to transfer from
net profit to general reserve for performing loans the equivalent of: • 0.5% of retail loans that are less than 30 days past due (subject
to deductions of some guarantees received) to general reserve for the year 2014 in addition to a percentage of 0.5% yearly over a six year period starting 2015.
• 0.25% of performing corporate loans to general reserve as of end of 2014. This reserve should increase to 0.5% as of end of 2015, 1% as of end of 2016 and 1.5% as of end of 2017. The Bank is exempted from this general reserve if the balance of collective provision is not less than 0.25% of the performing corporate loans portfolio as of end of 2014, 0.5% as of end of 2015, 1% as of end of 2016 and 1.5% as of end of 2017.
In accordance with BDL Basic Circular No. 143 issued in November 2017, banks are no longer required by the end of the year 2017 to set up reserves for general banking risks and other reserves for credit risks. Banks are required to appropriate the excess after implementation of IFRS 9 on January 1, 2018, to a non-distributable general reserve.
29. Cumulative Change in Fair Value of Financial Assets
This caption represents the cumulative change in fair value of investment securities at fair value through other comprehensive income. It consists of the following:
Cumulative unrealized gain on investments at fair value through other comprehensive income (Note 10) 227,194,346 213,743,230 Less: Deferred tax liability (Note 23) (40,077,526) (36,214,407) Net 187,116,820 177,528,823 Adjustment to retained earnings - (134,588) Share of non-controlling interests (Notes 10, 30) (1,504,702) (1,432,103) SHARE OF OWNERS OF THE BANK 185,612,118 175,962,132
2018LBP’000 2017
30. Non-Controlling InterestsNon-controlling interests represent the minority share in the subsidiaries’ equities as follows:
Capital 115,513,745 149,399,584 Change in fair value of investment securities through other comprehensive income (Note 29) 1,504,702 1,432,103 Preferred shares 152,786,633 165,825,001 Reserves and retained earnings 126,188,003 83,204,922 Profit for the year 19,803,369 19,149,042 TOTAL 415,796,452 419,010,652
2018LBP’000 2017
Notes to the Consolidated Financial Statements For the year ended December 31, 2018
CONSOLIDATED FINANCIAL STATEMENTS
2018LBP’000 2017
28. Non-Distributable Reserves
Non-distributable reserves consist of the following:
Legal reserve (a) 234,308,143 210,421,489 Reserve for general banking risks (b) - 308,883,675 Non-distributable general reserves 307,888,051 - Reserve for assets acquired in satisfaction of loans 107,499,289 96,758,660 Owned buildings revaluation reserve 51,384,665 45,448,453 Foreign currency translation reserve (170,251,508) (161,373,898) Special reserve (c) - 10,216,872 General reserve for performing loans (d) - 53,836,494 TOTAL 530,828,640 564,191,745

The following table summarizes financial information of subsidiaries that have material Non-Controlling Interests (NCI) before intra-group eliminations:
NCI percentage 25.17% 32.00% Cash and banks 1,970,608,961 144,691,377 Loans and advances 2,422,662,239 535,692,399 Assets classified as held for sale 1,297,343,966 - Investment securities 2,743,413,011 13,359,393 Foreclosed assets and investment properties 83,861,346 - Other assets 285,360,113 105,461,281 Deposits from banks (149,157,009) (968,005) Liabilities directly associated with assets classified as held for sale (1,172,758,271) - Deposits from customers (5,891,381,129) (551,989,104) Borrowings and subordinated bonds (578,467,894) (12,751,416) Other liabilities and provisions (131,186,038) (50,103,545) NET ASSETS 880,299,295 183,392,380 Carrying amount of NCI 221,571,333 58,685,562 Net financial revenues 171,287,210 42,502,255 Net allowance for impairment of loans 7,058,101 - Other income (net) 597,111 3,589,665 Operating expenses (109,853,326) (22,737,318) Income tax expense (7,277,359) (7,001,035) Other Comprehensive Income (OCI) (1,047,980) (4,780,738) TOTAL COMPREHENSIVE INCOME 60,763,757 11,572,829 Profit allocated to NCI 15,294,237 5,233,141 OCI allocated to NCI (263,777) (1,529,836)
NCI percentage 25.17% 32.00% Cash and banks 1,530,376,396 216,000,341 Loans and advances 2,416,372,032 340,966,532 Assets classified as held for sale 1,380,267,902 - Investment securities 3,263,319,053 6,932,690 Foreclosed assets and investment properties 82,496,874 - Other assets 113,270,663 65,524,694 Deposits from banks (67,494,144) (191,384) Liabilities directly associated with assets classified as held for sale (1,249,041,760) - Deposits from customers (5,908,204,095) (419,768,237) Borrowings and subordinated bonds (511,348,740) - Other liabilities and provisions (206,104,122) (31,405,904) NET ASSETS 843,910,059 178,058,732 Carrying amount of NCI 212,412,162 56,978,794 Net financial revenues 187,568,882 35,980,072 Net allowance for impairment of loans (3,015,745) (622,041) Other income (net) 6,076,850 - Operating expenses (106,340,780) (17,801,534) Income tax expense (14,601,275) (4,902,799) Discontinued operations 396,250 - Other Comprehensive Income (OCI) (1,941,135) (6,757,347) TOTAL COMPREHENSIVE INCOME 68,143,047 5,896,351 Profit allocated to NCI 17,697,258 4,049,182 OCI allocated to NCI (438,419) (2,183,225)
BLC Bank and its Direct Subsidiaries
Fransabank El Djazaïr SPA
December 31, 2018LBP’000
BLC Bank and its Direct Subsidiaries
Fransabank El Djazaïr SPA
December 31, 2017LBP’000
FRANSABANK | ANNUAL REPORT 2018 | 110-111

Owners of the Bank
Non-Controlling Interests Total
31. Profit for the Year
The consolidated profit is allocated as follows between the Bank and its subsidiaries (after intra-group eliminations):
TotalOwners
of the BankNon-Controlling
Interests
Profit of the Bank 180,281,054 - 180,281,054 Profit/(Loss) of subsidiaries: - Fransa Invest Bank SAL 11,719,609 - 11,719,609 - Fransabank France SA 3,879,440 1,018,224 4,897,664 - Lebanese Leasing Company SAL 1,542,330 220,333 1,762,663 - Switch and Electronics Services SAL 310,011 - 310,011 - Sogefon SAL (142,174) - (142,174) - Fransabank El Djazaïr SPA 8,604,512 4,049,182 12,653,694 - Fransabank Insurance Services SAL 3,110,760 - 3,110,760 - BLC Bank SAL and Subsidiaries 52,386,924 17,697,258 70,084,182 - Express SARL 19,050 - 19,050 - Fransabank Syria (1,911,218) (1,521,902) (3,433,120) - Fransabank OJSC 2,158,182 199,199 2,357,381 - Kuwaiti Lebanese Company for Real Estate Services SAL (157,317) - (157,317) Deferred tax on profit from associates and subsidiaries (10,609,392) (2,513,252) (13,122,644) TOTAL 251,191,771 19,149,042 270,340,813
Profit of the Bank 175,108,422 - 175,108,422 Profit/(loss) of subsidiaries: - Fransa Invest Bank SAL 7,886,610 - 7,886,610 - Fransabank France SA 4,284,853 1,124,633 5,409,486 - Lebanese Leasing Company SAL 1,493,468 213,351 1,706,819 - Switch and Electronics Services SAL 268,291 - 268,291 - Sogefon SAL 174,272 - 174,272 - Fransabank El Djazaïr SPA 11,120,426 5,233,141 16,353,567 - Fransabank Insurance Services SAL 3,177,528 - 3,177,528 - BLC Bank SAL and Subsidiaries 46,206,412 15,605,325 61,811,737 - Express SARL (13,302) - (13,302) - Fransabank OJSC 1,504,690 110,304 1,614,994 - F&B Invest Holding (52,603) - (52,603) Deferred tax on profit from associates and subsidiaries (8,131,340) (2,483,385) (10,614,725) TOTAL 243,027,727 19,803,369 262,831,096
Year Ended December 31, 2017
Year Ended December 31, 2018LBP’000
LBP’000
2018LBP’000 2017
32. Dividends Paid
The following dividends were declared and paid by the Group:
LBP 3,300 per ordinary share paid by the Bank from 2017net income (LBP 3,200 paid from 2016 net income) Dividends paid to preference shares Dividends paid by subsidiaries to non-controlling interests
68,800,000
35,294,343 16,316,237
72,352,500
26,818,528 14,110,310
Notes to the Consolidated Financial Statements For the year ended December 31, 2018
CONSOLIDATED FINANCIAL STATEMENTS
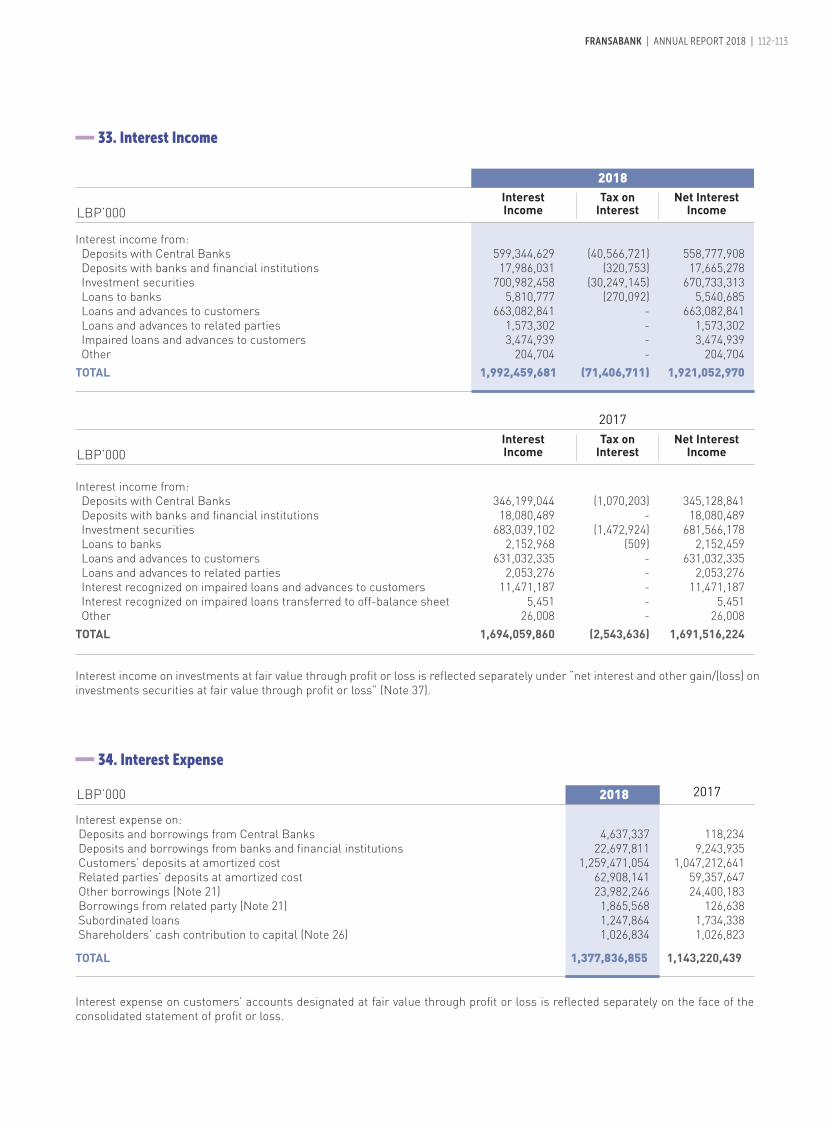
LBP’000
2018LBP’000 2017
2017
33. Interest Income
34. Interest Expense
Interest income from: Deposits with Central Banks 599,344,629 (40,566,721) 558,777,908 Deposits with banks and financial institutions 17,986,031 (320,753) 17,665,278 Investment securities 700,982,458 (30,249,145) 670,733,313 Loans to banks 5,810,777 (270,092) 5,540,685 Loans and advances to customers 663,082,841 - 663,082,841 Loans and advances to related parties 1,573,302 - 1,573,302 Impaired loans and advances to customers 3,474,939 - 3,474,939 Other 204,704 - 204,704 TOTAL 1,992,459,681 (71,406,711) 1,921,052,970
Interest income on investments at fair value through profit or loss is reflected separately under “net interest and other gain/(loss) on investments securities at fair value through profit or loss” (Note 37).
Interest expense on: Deposits and borrowings from Central Banks 4,637,337 118,234 Deposits and borrowings from banks and financial institutions 22,697,811 9,243,935 Customers’ deposits at amortized cost 1,259,471,054 1,047,212,641 Related parties’ deposits at amortized cost 62,908,141 59,357,647 Other borrowings (Note 21) 23,982,246 24,400,183 Borrowings from related party (Note 21) 1,865,568 126,638 Subordinated loans 1,247,864 1,734,338 Shareholders’ cash contribution to capital (Note 26) 1,026,834 1,026,823 TOTAL 1,377,836,855 1,143,220,439
Interest expense on customers’ accounts designated at fair value through profit or loss is reflected separately on the face of the consolidated statement of profit or loss.
Interest Income
Tax on Interest
Net Interest Income
2018
FRANSABANK | ANNUAL REPORT 2018 | 112-113
LBP’000
Interest income from: Deposits with Central Banks 346,199,044 (1,070,203) 345,128,841 Deposits with banks and financial institutions 18,080,489 - 18,080,489 Investment securities 683,039,102 (1,472,924) 681,566,178 Loans to banks 2,152,968 (509) 2,152,459 Loans and advances to customers 631,032,335 - 631,032,335 Loans and advances to related parties 2,053,276 - 2,053,276 Interest recognized on impaired loans and advances to customers 11,471,187 - 11,471,187 Interest recognized on impaired loans transferred to off-balance sheet 5,451 - 5,451 Other 26,008 - 26,008 TOTAL 1,694,059,860 (2,543,636) 1,691,516,224
Interest Income
Tax on Interest
Net Interest Income

2018LBP’000 2017
2018LBP’000 2017
2018LBP’000 2017
36. Fee and Commission Expense
37. Net Income on Financial Assets at Fair Value through Profit or Loss
38. Other Operating Income (Net)
Commission on transactions with banks and financial institutions Sundry TOTAL
4,001,532 15,945,585
19,947,117
Fee and commission expenses include fee and commission to related parties with immaterial amounts.
3,756,270 18,531,631
22,287,901
Dividends income on investment securities 8,445,516 4,643,918 Share in profits of associates (Note 12) 19,232,095 18,637,661 Foreign exchange gain 16,934,475 16,471,251 Appropriation from regulatory deferred liabilities (Note 22) 165,833 17,851,479 Losses resulting from deconsolidation of Fransabank Syria (Note 43) - (15,940,262) Gain on disposal of assets acquired in satisfaction of loans (Note 13) 1,133,987 8,331,986 Gain on disposal of property and equipment 741,984 777,973 Other operating income – Net 6,401,722 3,685,563 TOTAL 53,055,612 54,459,569
Interest income 10,770,980 23,559,344 Dividends income 430,386 2,656,101 Net unrealized gain 30,820,925 1,679,352 Net realized (loss)/gain (988,174) 3,253,137 TOTAL 41,034,117 31,147,934
Notes to the Consolidated Financial Statements For the year ended December 31, 2018
CONSOLIDATED FINANCIAL STATEMENTS
2018LBP’000 2017
35. Fee and Commission Income
Commission on documentary credits 17,296,780 17,009,174 Commission on letters of guarantee 13,571,820 19,787,831 Service fees on customers’ transactions 75,068,422 88,764,559 Commission on transactions with banks 11,521,327 770,918 Asset management fees 380,124 343,848 TOTAL 117,838,473 126,676,330
Fee and commission income include fee and commission from related parties with immaterial amounts.

2018LBP’000 2017
39. Provisions (Net)
40. Financial Instruments with Off-Balance Sheet Risks
41. Balances/Transactions with Related Parties
Provision for contingencies (Note 24) 7,169,109 3,694,084 Other provisions - 4,016 TOTAL 7,169,109 3,698,100
The guarantees and standby letters of credit and the documentary and commercial letters of credit represent financial instruments with contractual amounts representing credit risk. The guarantees and standby letters of credit represent irrevocable assurances that the Group will make payments in the event that a customer cannot meet its obligations to third parties and are not different from loans and advances on the statement of financial position. However, documentary and commercial letters of credit, which represent written undertakings by the Group on behalf of a customer authorizing a third party to draw drafts on the Group
up to a stipulated amount under specific terms and conditions, are collateralized by the underlying shipments documents of goods to which they relate and, therefore, have significantly less risks. Forward exchange contracts outstanding as of December 31, 2018 and 2017 represent positions held for customers' accounts. The Group entered into such instrument to serve the needs of customers, and these contracts are fully hedged by the Group.
In the ordinary course of its activities, the Group carries on transactions with related parties including shareholders, directors, subsidiaries and associates. Also, the Group conducts sale and purchase transactions of investment securities with subsidiary banks and these transactions are made at net book value of the financial instruments. Balances and transactions with related parties disclosed in Notes 6, 9, 12, 18, 19, 20, 21, 33, 34, 35 and 36.
Some loans and advances are covered by real estate mortgage and by pledged deposits of the respective borrowers. The remunerations to executive management amounted to LBP 41 billion during 2018 (LBP 40.1 billion during 2017). This includes accrued remuneration payable to the Bank’s Chairman and Vice Chairman calculated on the basis of 8% of profit before tax.
FRANSABANK | ANNUAL REPORT 2018 | 114-115
2018LBP’000 2017
42. Cash and Cash Equivalents
Cash 227,647,712 214,929,568 Current accounts with Central Banks 471,152,414 492,900,411 Time deposits with Central Banks (maturities of 3 months or less) 2,248,174,600 1,314,336,334 Checks in course of collection 3,344,189 7,711,179 Current accounts with banks and financial institutions 492,180,739 333,399,666 Time deposits with banks and financial institutions (maturities of 3 months or less) 894,430,582 778,666,854 TOTAL 4,336,930,236 3,141,944,012
Cash and cash equivalents for the purpose of the statement of cash flows statement consist of the following:

The following non-cash transactions were excluded from the statement of cash flows: (a) Positive change in fair value of investment securities at fair
value through other comprehensive income of LBP 11 billion and related deferred tax liability of LBP 2.8 billion during 2018 (LBP 31 billion and related deferred tax liability of LBP 17 billion during 2017).
(b) Foreclosed assets in settlement of loans in the amount of LBP 18.9 billion during 2018 (LBP 4.2 billion during 2017).
(c) Assets and liabilities removed due to deconsolidation of a subsidiary during 2017.
(d) Transfer from property and equipment to intangible assets in the amount of LBP 99 million during 2018 (LBP 324 million during 2017).
(e) Transfer of LBP 11.1 billion from other liabilities to collective provision in the amount of LBP 1.2 billion and to write-off deferred assets and goodwill in the amount of LBP 9.9 billion during 2017.
(f) Transfer of LBP 9.2 billion from provision liability to expected credit loss allowance.
(g) The appropriation of regulatory deferred liability in the amount of LBP 322 billion during 2018 to retained earnings and reserves.
43. Deconsolidation of a Subsidiary
Since the outbreak of the civil war in Syria in March 2011, persisting negative macroeconomic conditions and strict limitations on banking activities were preventing the Group from managing Syrian operations and implementing decisions at operational and financial levels. Consequently, Fransabank Board of Directors decided to completely review the relationship with Fransabank Syria, which is 55.67% owned by the Group. Members of the Board, who represented the Group, have submitted their resignation from the Board of Directors of Fransabank Syria, hence, conditions for exercising control as set in IFRS 10 are no longer met, and accordingly the Group has deconsolidated the subsidiary’s account effective December 31, 2017.
The deconsolidation of Fransabank Syria, resulted in the recognition of losses of LBP 15.94 billion deriving mainly from the currency translation into Lebanese Pounds of the financial statements of Fransabank Syria, previously recognized under foreign currency translation reserve in equity and recycled to the statement of profit or loss upon deconsolidation. The Group has determined the fair value of its investment retained in the former subsidiary at LBP 51.9 billion that was classified as an investment at fair value through other comprehensive income as of December 31, 2017 and 2018. The Group will reassess its position in case there are significant future changes in the circumstances calling for deconsolidation.
Notes to the Consolidated Financial Statements For the year ended December 31, 2018
CONSOLIDATED FINANCIAL STATEMENTS

FRANSABANK | ANNUAL REPORT 2018 | 116-117
ASSETS: Cash and banks 9,092,128,220 104,298,746 215,000,341 21,720,900 - 9,433,148,207 Loans to banks 140,103,727 - - 359,212 - 140,462,939 Assets classified as held for sale - - - - 1,380,267,902 1,380,267,902 Loans and advances to customers 8,802,735,455 596,266,801 340,966,532 36,043,241 - 9,776,012,029 Investments securities 10,324,635,463 40,674 6,932,690 13,653,341 - 10,345,262,168 Customers' liability under acceptances 403,606,590 1,523,197 29,348,565 - - 434,478,352 Assets under leverage arrangements with BDL 855,418,125 - - - - 855,418,125 Investments in associates 79,301,461 - - - - 79,301,461 Goodwill 48,903,653 - - - - 48,903,653 Other assets 670,973,387 5,905,631 65,524,694 15,337,502 - 757,741,214 TOTAL ASSETS 30,417,806,081 708,035,049 657,772,822 87,114,196 1,380,267,902 33,250,996,050 LIABILITIES: Deposits and borrowings from banks 170,674,770 92,086,415 110,982 1,268,762 - 264,140,929 Liabilities directly associated with assets classified as held for sale - - - - 1,249,041,760 1,249,041,760 Customers' accounts at FVTPL 135,500,053 - - - - 135,500,053 Customers' accounts at amortized cost 24,138,687,007 285,560,348 419,768,237 38,200,106 - 24,882,215,698 Customers' acceptance liability 403,606,590 1,523,197 29,348,565 - - 434,478,352 Other borrowings 1,504,606,415 - - - - 1,504,606,415 Leverage arrangements with BDL 855,418,125 - - - - 855,418,125 Subordinated loan 19,124,748 - - - - 19,124,748 Other liabilities and provisions 626,537,605 4,546,258 31,405,904 515,895 - 663,005,662 TOTAL LIABILITIES 27,854,155,313 383,716,218 480,633,688 39,984,763 1,249,041,760 30,007,531,742
Lebanon France Algeria Belarus Cyprus Total
December 31, 2017LBP’000
44. Distribution by Geographical Location
Below is the distribution of assets and liabilities and statement of profit or loss by geographical location of various Group entities: 44.1 Distribution of Assets and Liabilities by Geographical Location
ASSETS: Cash and banks 10,419,707,940 82,436,468 144,691,377 17,922,066 - 10,664,757,851 Loans to banks 35,651,922 - - 1,457,384 - 37,109,306 Assets classified as held for sale - - - - 1,297,343,966 1,297,343,966 Loans and advances to customers 8,917,972,992 653,167,369 535,692,399 52,992,137 - 10,159,824,897 Investments securities 9,317,466,404 52,724 13,359,393 15,252,986 - 9,346,131,507 Customers' liability under acceptances 903,527,965 13,347,274 - - - 916,875,239 Investments in associates 82,037,600 - - - - 82,037,600 Assets under leverage arrangements with BDL 2,238,085,922 - - - - 2,238,085,922 Goodwill 48,903,653 - - - - 48,903,653 Other assets 675,771,272 5,205,086 105,461,281 13,157,648 - 799,595,287 TOTAL ASSETS 32,639,125,670 754,208,921 799,204,450 100,782,221 1,297,343,966 35,590,665,228 LIABILITIES: Deposits and borrowings from banks 225,638,680 64,213,387 968,005 18,222,896 - 309,042,968 Liabilities directly associated with assets classified as held for sale - - - - 1,172,758,271 1,172,758,271 Customers' accounts at FVTPL 110,462,963 - - - - 110,462,963 Customers' accounts at amortized cost 24,623,854,001 326,673,640 551,989,104 48,961,992 - 25,551,478,737 Customers' acceptance liability 904,849,997 13,347,274 - - - 918,197,271 Other borrowings 1,603,253,460 - 12,751,417 644,237 - 1,616,649,114 Leverage arrangements with BDL 2,238,085,922 - - - - 2,238,085,922 Subordinated loan 12,749,832 - - - - 12,749,832 Other liabilities and provisions 309,105,120 5,712,374 50,103,545 665,177 - 365,586,216 TOTAL LIABILITIES 30,027,999,975 409,946,675 615,812,071 68,494,302 1,172,758,271 32,295,011,294
FranceLebanon Algeria Belarus Cyprus Total
December 31, 2018LBP’000

44.2 Distribution of Statement of Profit or Loss by Geographical Location
Net interest income 495,740,708 13,175,111 30,064,914 4,235,382 543,216,115 Net fee and commission income 78,911,249 2,766,761 12,437,342 1,435,221 95,550,573 Net income from investments at FVTPL 41,034,117 - - - 41,034,117 Interest expense on liabilities designated at FVTPL (6,868,190) - - - (6,868,190) Other operating income 51,101,253 (927,410) 312,565 2,528,121 53,014,529 Allowance for expected credit losses (14,957,113) (2,221,135) - 335,871 (16,842,377) Other expenses (369,286,937) (6,386,332) (22,737,318) (7,814,557) (406,225,144) Income tax expense (19,410,085) (2,713,444) (7,001,035) (309,238) (29,433,802) Deferred tax on investees undistributed profits (7,478,776) (540,948) (2,453,035) (141,966) (10,614,725) TOTAL 248,786,226 3,152,603 10,623,433 268,834 262,831,096
Lebanon France Algeria Belarus Total
Year Ended December 31, 2018LBP’000
Net interest income 496,025,574 5,589,822 15,796,134 24,399,556 6,484,699 - 548,295,785 Net fee and commission income 89,528,090 1,491,541 2,935,512 11,221,161 1,552,909 - 106,729,213 Net income on investments at FVTPL 31,147,934 - - - - - 31,147,934 Interest expense on liabilities designated at FVTPL (7,470,421) - - - - - ( 7,470,421) Other operating income 32,088,366 464,918 809,920 359,354 2,860,079 - 36,582,637 Allowance for credit losses (5,607,406) (442,933) (1,178,897) (622,041) 514,349 - (7,336,928) Regulatory allowance for country risk - Deposits with Central Banks 2,359,158 - - - - - 2,359,158 Recognized contribution 17,851,479 - - - - - 17,851,479 Other expense (346,263,656) (10,357,903) (7,331,561) (17,801,534) (7,504,037) - (389,258,691) Income tax expense (47,211,823) (753,877) (2,513,901) (4,902,799) (450,559) - (55,832,959) Net income from discontinued operations - - - - - 396,250 396,250 Deferred tax on investees undistributed profits (13,122,644) - - - - - (13,122,644) TOTAL 249,324,651 (4,008,432) 8,517,207 12,653,697 3,457,440 396,250 270,340,813
Lebanon Syria France Algeria Belarus Cyprus Total
Year Ended December 31, 2017LBP’000
Notes to the Consolidated Financial Statements For the year ended December 31, 2018
CONSOLIDATED FINANCIAL STATEMENTS

FRANSABANK | ANNUAL REPORT 2018 | 118-119
45. Collateral Given
Financial assets given as collateral are as follows at December 31:
Corresponding FacilitiesRedemption Value of Pledged Assets Nature of Facility Amount of Facility Maturity Date
Treasury bills at amortized cost 17,734,000 Soft Loan from BDL 17,734,000 March 2019 Certificates of deposit issued by BDL 6,292,235 Facilities from BDL 25,721,246 June 09, 2029 Lebanese Treasury bills 338,512,320 Facilities from BDL 397,171,215 Revolving Lebanese Treasury bills at amortized cost 243,589,400 Soft Loan from BDL 243,589,400 December 2020 Lebanese Treasury bills at amortized cost 25,874,560 Borrowings 581,171,136 Over 5 years Certificates of deposit at amortized cost 2,149,375 Other borrowings 5,904,237 Over 5 years TOTAL 634,151,890 1,271,291,234
December 31, 2018LBP’000
Corresponding FacilitiesRedemption Value of Pledged Assets Nature of Facility Amount of Facility Maturity Date
Treasury bills at amortized cost 17,734,000 Soft Loan 17,734,000 March 2019 Treasury bills at amortized cost 243,589,400 Soft Loan 243,589,400 December 2020 Lebanese Government bonds at amortized cost 301,500,000 Exemption of 301,500,000 July 2018 regulatory reserve Treasury bills at amortized cost 338,512,320 Facilities 396,163,236 Over 5 years Treasury bills at amortized cost 25,768,020 Facilities 593,057,650 Over 5 years TOTAL 927,103,740 1,552,044,286
December 31, 2017LBP’000
46. Risk Management of Financial Instruments
Risk Management Framework The main risks arising from the Group’s financial instruments are: A. Credit risk. B. Liquidity risk. C. Interest rate risk. D. Foreign currency risk. The Board of Directors has overall responsibility for the establishment and oversight of the Group’s risk management framework. The Board has established various committees to develop and monitor the Group’s risk management policies in their specified areas. The Bank’s risk management policies are established to identify and analyze the risks faced by the Bank, to set appropriate risk limits and controls, and to monitor risks and adherence to limits. Risk management policies and systems are reviewed regularly to reflect changes in market conditions, products and services offered. The Group, through its management standards and procedures, aims to develop a disciplined control environment, in which employees understand their roles and obligations.
A. Credit Risk Credit risk is the risk of loss that arises when a client or counterparty defaults on its loans or contractual obligations. Financial assets exposing the Group to credit risk would essentially include loans and advances to customers as well as related commitments to loans, money market deposits placed with Banks, and investments in debt securities. The Group considers all elements of credit risk exposure such as counterparty default risk, geographical risk and sector risk for risk management purposes. Credit risk management The Group’s credit risk management revolves around the following: • Identifying, assessing and measuring credit risk from
an individual instrument to a portfolio level. • Creating credit policies to protect the Group against the
identified risks including the requirements to obtain collateral from borrowers, to perform robust ongoing credit assessment of borrowers and to continually monitor exposures against internal risk limits.

Notes to the Consolidated Financial Statements For the year ended December 31, 2018
CONSOLIDATED FINANCIAL STATEMENTS
• Ensuring that the Group has appropriate credit risk practices, including an effective system of internal control, to consistently determine adequate allowances in accordance with the Group’s stated policies and procedures, IFRS and relevant supervisory guidance.
• Establishing a robust control framework regarding the authorization structure for the approval and renewal of credit facilities.
• Limiting concentrations of exposure by type of asset, counterparties, industry, credit rating, geographic location etc.
• Developing and maintaining the Group’s risk grading to categorize exposures according to the degree of risk of default. Risk grades are subject to regular reviews.
• Developing and maintaining the Group’s processes for measuring ECL including monitoring of credit risk, incorporation of forward-looking information and the method used to measure ECL.
• Ensuring that the Group has policies and procedures in place to appropriately maintain and validate models used to assess and measure ECL.
• Establishing a sound credit risk accounting assessment and measurement process that provides it with a strong basis for common systems, tools and data to assess credit risk and to account for ECL. Providing advice, guidance and specialist skills to business units to promote best practice throughout the Group in the management of credit risk.
The internal audit function performs regular audits making sure that the established controls and procedures are adequately designed and implemented.
Internal rating and regulatory classification In order to better manage credit risk, the Group has tasked its credit management committees to maintain the Group’s credit risk grading to categorize exposures according to their degree of risk of default. The credit rating information is based on a range of data that is thought to be predictive of the risk of default and applies experienced credit judgment. The nature of the exposure and type of borrower are taken into account in the analysis. Credit risk grades are defined using qualitative and quantitative factors that are indicative of risk of default. Each exposure is allocated to a credit risk grade at initial recognition based on the available information about the counterparty. The credit risk grades are designed and calibrated to reflect the probability of default as credit risk deteriorates. As the credit risk increases the probability of default between grades changes. The Group’s credit risk grading framework comprises nine categories, 6 performing categories each comprising 3 notches, in total 18 grades, in addition to 3 non-performing categories 8, 9, 10. A “low credit risk” would essentially imply that the borrower has a strong capacity to meet its contractual cash flow obligations in the near term. The Group has defined its Commercial Low Credit Risk Portfolio to include commercial borrowers that carry, within the investment grade category, the ratings 2 (strong) and 3 (good) mapped to the regulatory classification of “1”; loans fully cash covered are also categorized as “low credit risk” regardless of rating or classification.
1. “Regular” includes borrowers demonstrating good to excellent financial condition, risk factors, and capacity to repay. These loans demonstrate regular and timely payment of dues, adequacy of cash flows, timely presentation of financial statements, and sufficient collateral/guarantee when required. 2. “Follow-up” represents a lack of documentation related to a borrower’s activity, an inconsistency between facilities’ type and related conditions. 3. “Follow-up and Regularization” includes credit worthy borrowers requiring close monitoring without being impaired. These loans might be showing weaknesses; insufficient
or inadequate cash flows; highly leveraged; deterioration in economic sector or country where the facility is used; loan rescheduling more than once since initiation; or excess utilization above limit. 4. “Substandard loans” include borrowers with incapacity to repay from identified cash flows. Also included under this category are those with recurrent late payments and financial difficulties. 5. “Doubtful loans” where full repayment is questioned even after liquidation of collateral. It also includes loans stagnating for over 6 months and debtors who are unable to repay restructured loans. Finally,
Internal ratings are mapped to the regulatory classifications and the IFRS9 stages 1, 2 and 3 as shown in the table below.
The regulatory classification comprises six main categories detailed as follows:
Regulatory ClassificationIFRS 9 Stages
Internal Rating
Stage 1
1
2+, 2, 2- Low Credit Risk - Normal 3+, 3, 3-
2 4+, 4, 4- Follow-Up 5+, 5, 5-
Stage 2 3
6+, 6, 6- Follow-Up & Settlement 7+, 7, 7-
Stage 3 4, 5, 6 8, 9, 10 Objective Evidence of Impairment at the Reporting Date

FRANSABANK | ANNUAL REPORT 2018 | 120-121
6. “Bad loans” with no or little expected inflows from business or assets. This category also includes borrowers with significant delays and deemed insolvent. The retail and housing loan portfolio’s regulatory classification and IFRS9 stages are applied based on the days past due brackets. The Group’s internal rating scale for the financial sector and sovereigns is established based on the external rating agencies’ scales. Monitoring of credit risk The Group monitors all financial assets that are subject to impairment requirements to assess whether there has been a significant increase in credit risk since initial recognition. If there has been a significant increase in credit risk, the Group measures the loss allowance based on lifetime rather than 12-month ECL. All exposures are monitored, and the credit risk grade is updated to reflect current information. The monitoring procedures followed are general and tailored to the type of exposure. The Group collects performance and default information about its credit risk exposures analyzed by jurisdiction or region and by type of product, economic sector, borrower and by credit risk grading. The information used is both internal and external depending on the portfolio assessed. The following data are typically used to monitor the Group’s exposures: • Payment record, including payment ratios and ageing analysis; • Extent of utilization of granted limit; • Forbearances (both requested and granted); • Changes in business, financial and economic conditions; • Credit rating information supplied by external rating agencies. Irrespective of the outcome of the above assessment, the Group presumes that the credit risk on a financial asset has increased significantly since initial recognition when contrac-tual payments are more than 30 days past due unless the Group has reasonable and supportable information that demonstrates otherwise. Measurement of ECL The key inputs used for measuring ECL are: • Probability of Default (PD); • Loss Given Default (LGD); • Exposure At Default (EAD). These figures are generally derived from internally developed statistical models and other historical data, and they are adjusted to reflect probability-weighted forward-looking information. PD is an estimate of the likelihood of default over a given time horizon. It is estimated as at a point in time. The calculation is based on statistical rating models and assessed using rating tools tailored to the various categories of counterparties and exposures. These statistical models are based on market data (where available) as well as internal data comprising both quantitative and qualitative factors. PDs are estimated considering the contractual maturities of exposures. The estimation is
based on current conditions adjusted to take into account estimates of future conditions that will impact PD. LGD is an estimate of the loss arising on default. It is based on the difference between the contractual cash flows due and those that the Group would expect to receive, taking into account cash flows from any collateral. The LGD models for secured assets consider forecasts of future collateral valuation taking into account sale discounts, time to realization of collateral, cross-collateralization and seniority of claim, cost of realization of collateral and cure rates (i.e. exit from non-performing status). LGD models for unsecured assets consider time of recovery, recovery rates and seniority of claims. The calculation is on a discounted cash flow basis, where the cash flows are discounted by the original EIR of the loan. EAD is an estimate of the exposure at a future default date, taking into account expected changes in the exposure after the reporting date, including repayments of principal and interest, and expected drawdowns on committed facilities. The Group’s approach takes into account the maximum expected balance after applying credit conversion factors on indirect facilities (off-balance sheet items). The Group measures ECL considering the risk of default over the maximum contractual period over which the Group is exposed to credit risk. However, for financial instruments such as credit cards, revolving credit facilities and overdraft facilities that include both a loan and an undrawn commitment component, the Group’s contractual ability to demand repayment and cancel the undrawn commitment does not limit the Group’s exposure to credit losses to the contractual notice period. These financial instruments do not have a fixed term or repayment structure and have a short contractual cancellation period. The Group does not enforce in the normal day-to-day management the contractual right to cancel these financial instruments. This is because these financial instruments are managed on a collective basis and are canceled only when the Group becomes aware of an increase in credit risk at the facility level. For such financial instruments, the Group measures ECL over the period that it is exposed to credit risk, and ECL would not be mitigated by credit risk management actions. Incorporation of forward-looking information The Group uses forward-looking information that is available without undue cost or effort in its assessment of significant increase in credit risk as well as in its measurement of ECL. The factors taken into account in this process include macro-economic data such as GDP growth, unemployment, benchmark interest rates and house prices published by governmental bodies and monetary authorities. The Group employs experts who use external and internal information to generate a ‘base case’ scenario of future forecast of relevant economic variables along with a representative range of other possible forecast scenarios. The Group applies probabilities to the forecast scenarios iden-tified. The base case scenario is the single most-likely out-come. The Group uses a statistical analysis of historical data to estimate relationships between macro-economic variables and credit risk/default rates.

Credit Quality: Loans’ classifications are assessed and updated regularly. The distribution of loans and advances to customers by classification is disclosed under Note 9.
1. Maximum Exposure to Credit Risk The following corresponds to the maximum credit risk exposure net of the expected credit loss allowances:
The movement of allowance for expected credit losses during 2018 is summarized as follows:
Most of customers’ exposures represent credit facilities granted to corporations, which do not have external credit rating.
Notes to the Consolidated Financial Statements For the year ended December 31, 2018
CONSOLIDATED FINANCIAL STATEMENTS
LBP’000
Cash and deposits with Central Banks 9,223,300,647 (45,837,720) 9,177,462,927 Deposits with banks and financial institutions 1,491,960,641 (4,665,717) 1,487,294,924 Loans to banks 70,580,476 (33,471,169) 37,109,307 Loans and advances to customers 10,629,513,514 (469,688,617) 10,159,824,897 Investment securities 9,407,387,713 (61,256,206) 9,346,131,507 Customers' liability under acceptances 918,197,271 (1,322,032) 916,875,239 31,740,940,262 (616,241,461) 31,124,698,801
OFF-BALANCE SHEET COMMITMENTS 2,180,399,854 (9,457,562) 2,170,942,292
Carrying Amount ECL
Net Carrying Amount
December 31, 2018
Closing Balance December 31,
2018
Cash and deposits with Central Banks 6,685,842 37,485,406 - 44,171,248 1,666,478 - - (6) 45,837,720 Deposits with and loans to banks and financial institutions 10,102 7,299,589 - 7,309,691 31,336,924 - - (509,729) 38,136,886 Loans and advances to customers 241,422,039 264,053,757 9,195,000 514,670,796 3,814,303 (42,195,640) (5,695,663) (905,179) 469,688,617 Investment securities 26,554 72,673,207 - 72,699,761 (11,406,066) - - (37,489) 61,256,206 Customer acceptance liability - 1,653,618 - 1,653,618 (331,586) - - - 1,322,032 Financial guarantees and other commitments - 17,719,119 - 17,719,119 (8,218,217) - - (43,340) 9,457,562 Other assets 5,054,246 711,567 - 5,765,813 (39,281) (2,746,214) - - 2,980,318 TOTAL 253,198,783 401,596,263 9,195,000 663,990,046 16,822,555 (44,941,854) (5,695,663) (1,495,743) 628,679,341
LBP’000
Adjusted Opening Balance
January 1, 2018
Opening Balance
January 1, 2018
Net Loss Allowance
for the Year
Transfer from other Liabilities
First Time Adoption
Impact
Transfer to Off-Balance
Sheet
Write-offs and Other Movement
Effect of Exchange Rate
Changes
LBP’000 2017
Balance January 1 408,699,100 Net additions 8,295,682 Effect of assets held for sale adjustments (138,598,943) Effect of deconsolidation of Fransabank Syria (18,152,837) Write-offs (22,349,502) Transfer to off-balance sheet (1,925) Transfer from regulatory deferred liability 1,239,192 Effect of exchange rates changes 2,291,272 TOTAL 241,422,039
The movement of allowance for impairment of loans and advances during 2017 was as follows:

FRANSABANK | ANNUAL REPORT 2018 | 122-123
The below is a summary of the financial assets, commitments and their respective expected credit loss allowance by stage:
Cash and deposits with Central Banks 9,162,874,074 60,426,578 - 9,223,300,652 (42,661,559) (3,176,166) - (45,837,725) 9,177,462,927 Deposits with banks and financial institutions 1,481,729,321 10,231,320 - 1,491,960,641 (3,303,564) (1,362,153) - (4,665,717) 1,487,294,924 Loans to banks 37,162,430 1,845,047 31,572,999 70,580,476 (1,300,560) (597,610) (31,572,999) (33,471,169) 37,109,307 Loans and advances to customers 8,826,144,680 892,006,814 911,362,020 10,629,513,514 (54,148,525) (46,577,344) (368,962,748) (469,688,617) 10,159,824,897 Investments securities 9,407,387,713 - - 9,407,387,713 (61,256,206) - - (61,256,206) 9,346,131,507 Customers' liability under acceptances 913,866,529 4,330,741 - 918,197,270 (1,110,506) (211,525) - (1,322,031) 916,875,239 Other assets 111,199,928 - 1,283,840 112,483,768 (1,696,478) - (1,283,840) (2,980,318) 109,503,450 29,940,364,675 968,840,500 944,218,859 31,853,424,034 (165,477,398) (51,924,798) (401,819,798) (619,221,783) 31,234,202,251 OFF-BALANCE SHEET COMMITMENTS 2,146,673,183 33,726,671 - 2,180,399,854 (7,596,237) (1,861,325) - (9,457,562) 2,170,942,292
LBP’000 Stage 1 Stage 2 Stage 3 Total
Carrying Value
Stage 1 Stage 2 Stage 3 Total Exposure
Allowance for Expected Credit Losses
2018LBP’000
Loans classified under stages 1 and 2 include the following past due but not impaired balances:
Less than 30 days 29,944,030 Between 30-60 days 9,695,208 Between 60-90 days 8,324,276 Between 90-180 days 33,782,420 Beyond 180 days 70,638,264
TOTAL 152,384,198
Limiting of credit risk The Group manages the levels of credit risk undertaken by placing limits on the amount of risk accepted in relation to one borrower, and/or groups of related borrowers. Such risk is monitored on a revolving basis and subject to an annual or more frequent review, when considered necessary.
Exposures to any one borrower including banks are further restricted by sub-limits covering on and off-financial position exposures. Country limit are also set by the Bank. Actual exposures against limits are monitored on a regular basis.
Concentration of Credit Risk by Geographical Location (Major Financial Assets)
FINANCIAL ASSETS: Cash and Central Banks 8,931,018,786 60,426,577 - 186,017,564 - - 9,177,462,927 Deposits with banks and financial institutions 38,367,304 17,999,976 220,666,026 924,338,334 80,861,769 205,061,515 1,487,294,924 Assets under leverage arrangements with BDL 2,238,085,922 - - - - - 2,238,085,922 Loans to banks and financial institutions 33,806,875 - - 1,457,385 - 1,845,046 37,109,306 Loans and advances to customers 8,380,157,038 139,952,050 16,098,589 1,261,145,862 315,097,126 47,374,232 10,159,824,897 Investment securities 9,109,710,267 58,689,062 21,345,542 156,386,636 - - 9,346,131,507 TOTAL 28,731,146,192 277,067,665 258,110,157 2,529,345,781 395,958,895 254,280,793 32,445,909,483 FINANCIAL LIABILITIES: Deposits and borrowings from banks 152,460,019 45,442,402 - 111,140,547 - - 309,042,968 Customers' accounts at FVTPL 110,462,963 - - - - - 110,462,963 Customers' accounts at amortized cost 23,494,274,686 668,948,993 76,736,972 1,256,463,861 - 55,054,225 25,551,478,737 Leverage arrangements with BDL 2,238,085,922 - - - - - 2,238,085,922 Other borrowings 1,610,728,186 4,518,362 - 1,402,566 - - 1,616,649,114 Subordinated loan 12,749,832 - - - - - 12,749,832 TOTAL 27,618,761,608 718,909,757 76,736,972 1,369,006,974 - 55,054,225 29,838,469,536
Lebanon Middle East & Africa North America Europe Gulf Other Total
2018LBP’000
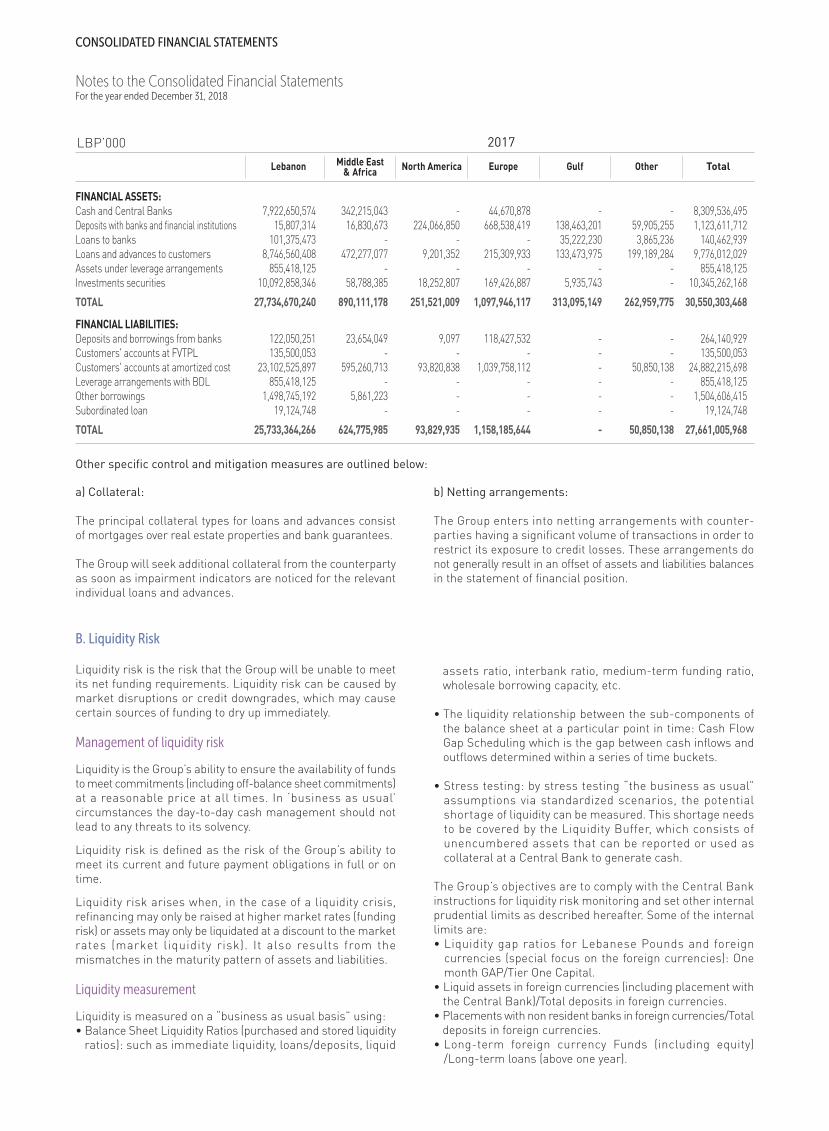
Other specific control and mitigation measures are outlined below:
a) Collateral: The principal collateral types for loans and advances consist of mortgages over real estate properties and bank guarantees. The Group will seek additional collateral from the counterparty as soon as impairment indicators are noticed for the relevant individual loans and advances.
b) Netting arrangements: The Group enters into netting arrangements with counter-parties having a significant volume of transactions in order to restrict its exposure to credit losses. These arrangements do not generally result in an offset of assets and liabilities balances in the statement of financial position.
FINANCIAL ASSETS: Cash and Central Banks 7,922,650,574 342,215,043 - 44,670,878 - - 8,309,536,495 Deposits with banks and financial institutions 15,807,314 16,830,673 224,066,850 668,538,419 138,463,201 59,905,255 1,123,611,712 Loans to banks 101,375,473 - - - 35,222,230 3,865,236 140,462,939 Loans and advances to customers 8,746,560,408 472,277,077 9,201,352 215,309,933 133,473,975 199,189,284 9,776,012,029 Assets under leverage arrangements 855,418,125 - - - - - 855,418,125 Investments securities 10,092,858,346 58,788,385 18,252,807 169,426,887 5,935,743 - 10,345,262,168 TOTAL 27,734,670,240 890,111,178 251,521,009 1,097,946,117 313,095,149 262,959,775 30,550,303,468 FINANCIAL LIABILITIES: Deposits and borrowings from banks 122,050,251 23,654,049 9,097 118,427,532 - - 264,140,929 Customers' accounts at FVTPL 135,500,053 - - - - - 135,500,053 Customers' accounts at amortized cost 23,102,525,897 595,260,713 93,820,838 1,039,758,112 - 50,850,138 24,882,215,698 Leverage arrangements with BDL 855,418,125 - - - - - 855,418,125 Other borrowings 1,498,745,192 5,861,223 - - - - 1,504,606,415 Subordinated loan 19,124,748 - - - - - 19,124,748 TOTAL 25,733,364,266 624,775,985 93,829,935 1,158,185,644 - 50,850,138 27,661,005,968
Lebanon Middle East & Africa North America Europe Gulf Other Total
2017LBP’000
B. Liquidity Risk Liquidity risk is the risk that the Group will be unable to meet its net funding requirements. Liquidity risk can be caused by market disruptions or credit downgrades, which may cause certain sources of funding to dry up immediately. Management of liquidity risk Liquidity is the Group’s ability to ensure the availability of funds to meet commitments (including off-balance sheet commitments) at a reasonable price at all times. In ‘business as usual’ circumstances the day-to-day cash management should not lead to any threats to its solvency. Liquidity risk is defined as the risk of the Group’s ability to meet its current and future payment obligations in full or on time. Liquidity risk arises when, in the case of a liquidity crisis, refinancing may only be raised at higher market rates (funding risk) or assets may only be liquidated at a discount to the market rates (market liquidity risk). It also results from the mismatches in the maturity pattern of assets and liabilities. Liquidity measurement Liquidity is measured on a “business as usual basis” using: • Balance Sheet Liquidity Ratios (purchased and stored liquidity
ratios): such as immediate liquidity, loans/deposits, liquid
assets ratio, interbank ratio, medium-term funding ratio, wholesale borrowing capacity, etc.
• The liquidity relationship between the sub-components of
the balance sheet at a particular point in time: Cash Flow Gap Scheduling which is the gap between cash inflows and outflows determined within a series of time buckets.
• Stress testing: by stress testing “the business as usual”
assumptions via standardized scenarios, the potential shortage of liquidity can be measured. This shortage needs to be covered by the Liquidity Buffer, which consists of unencumbered assets that can be reported or used as collateral at a Central Bank to generate cash.
The Group’s objectives are to comply with the Central Bank instructions for liquidity risk monitoring and set other internal prudential limits as described hereafter. Some of the internal limits are: • Liquidity gap ratios for Lebanese Pounds and foreign
currencies (special focus on the foreign currencies): One month GAP/Tier One Capital.
• Liquid assets in foreign currencies (including placement with the Central Bank)/Total deposits in foreign currencies.
• Placements with non resident banks in foreign currencies/Total deposits in foreign currencies.
• Long-term foreign currency Funds (including equity) /Long-term loans (above one year).
Notes to the Consolidated Financial Statements For the year ended December 31, 2018
CONSOLIDATED FINANCIAL STATEMENTS

C. Interest Rate Risk a) Interest Rate Risk Interest rate risk arises when there is a mismatch between positions, which are subject to interest rate adjustment within a specified period. The Bank’s lending, funding and investment activities give rise to interest rate risk. The immediate impact of variation in interest rate is on Bank’s net interest income, while a long-term impact is on Bank’s net worth since the economic value of Bank’s assets, liabilities and off-balance sheet exposures are affected. b) Interest Rate Risk Measurement Major concern is to be given to interest rates movements both in the local and international markets whenever hedging against rates rise should be undertaken as part of the Group’s strategy. Interest rate risk is the risk that changes in interest rates will affect the Group’s income or the value of its holdings group of financial instruments. The objective of interest rate risk
management is to manage and control interest rate risk exposure within acceptable parameters while optimizing the return on risk. Interest rate risk originating from banking activities arises partially from the employment of non-interest bearing liabilities such as shareholders’ funds and customer current accounts, but also from the gaps that arise from the normal course of business. The policy of the Group is to price all placements/exposures at floating rates or at fixed rates for fixed periods on appropriate rollover dates that allow for matching in the market.
FRANSABANK | ANNUAL REPORT 2018 | 124-125
The table below shows the allocation of financial liabilities based on the earliest possible contractual maturity (undiscounted values). The expected maturities vary significantly from the contractual maturities, namely with regard to customers’ deposits:
FINANCIAL LIABILITIES: Deposits from banks and financial institutions 4,809,973 280,429,291 12,060,000 11,743,704 309,042,968 Liabilities designated at fair value through profit or loss 10,424,635 1,073,066 98,965,262 - 110,462,963 Customers' deposits at amortized cost 19,805,298,979 4,140,915,954 1,600,942,103 4,321,701 25,551,478,737 Borrowings 30,240,651 67,221,213 510,721,755 1,008,465,495 1,616,649,114 Leverage arrangements with BDL - - - 2,238,085,922 2,238,085,922 Subordinated loan - 6,374,916 6,374,916 - 12,749,832 TOTAL FINANCIAL LIABILITIES 19,850,774,238 4,496,014,440 2,229,064,036 3,262,616,822 29,838,469,536
Up to 3 Months
3 Months to 1 Year
1 to 5 Years Total
Over 5 Years
December 31, 2018LBP’000
FINANCIAL LIABILITIES: Deposits and borrowings from banks 131,371,760 132,769,169 - - 264,140,929 Leverage arrangements with BDL - - - 855,418,125 855,418,125 Liabilities designated at fair value through profit or loss - 908,257 134,591,796 - 135,500,053 Customers' accounts at amortized cost 21,180,900,761 3,535,426,401 165,888,536 - 24,882,215,698 Other borrowings 62,991,194 118,903,105 354,611,873 968,100,243 1,504,606,415 Subordinated loan - 6,374,916 12,749,832 - 19,124,748 TOTAL FINANCIAL LIABILITIES 21,375,263,715 3,794,381,848 667,842,037 1,823,518,368 27,661,005,968
Up to 3 Months
3 months to 1 Year
1 to 5 Years Total
Over 5 Years
December 31, 2017LBP’000
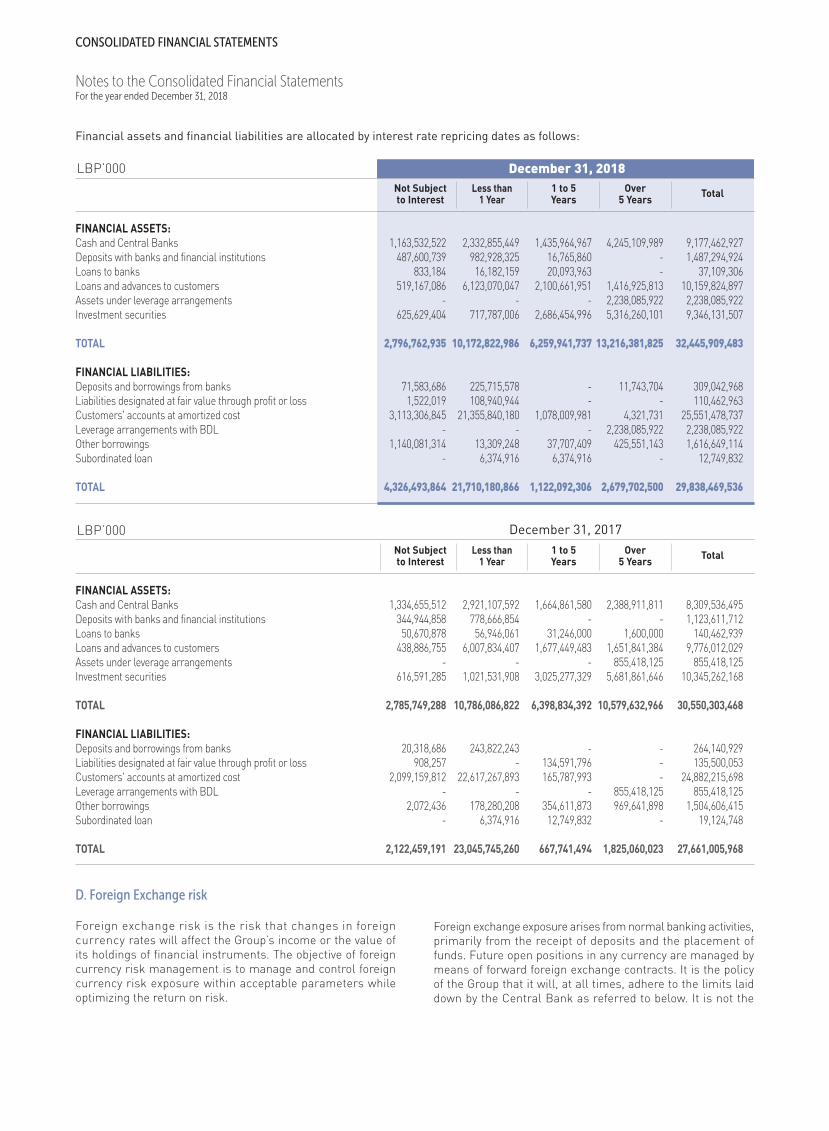
Notes to the Consolidated Financial Statements For the year ended December 31, 2018
CONSOLIDATED FINANCIAL STATEMENTS
Financial assets and financial liabilities are allocated by interest rate repricing dates as follows:
FINANCIAL ASSETS: Cash and Central Banks 1,163,532,522 2,332,855,449 1,435,964,967 4,245,109,989 9,177,462,927 Deposits with banks and financial institutions 487,600,739 982,928,325 16,765,860 - 1,487,294,924 Loans to banks 833,184 16,182,159 20,093,963 - 37,109,306 Loans and advances to customers 519,167,086 6,123,070,047 2,100,661,951 1,416,925,813 10,159,824,897 Assets under leverage arrangements - - - 2,238,085,922 2,238,085,922 Investment securities 625,629,404 717,787,006 2,686,454,996 5,316,260,101 9,346,131,507 TOTAL 2,796,762,935 10,172,822,986 6,259,941,737 13,216,381,825 32,445,909,483 FINANCIAL LIABILITIES: Deposits and borrowings from banks 71,583,686 225,715,578 - 11,743,704 309,042,968 Liabilities designated at fair value through profit or loss 1,522,019 108,940,944 - - 110,462,963 Customers' accounts at amortized cost 3,113,306,845 21,355,840,180 1,078,009,981 4,321,731 25,551,478,737 Leverage arrangements with BDL - - - 2,238,085,922 2,238,085,922 Other borrowings 1,140,081,314 13,309,248 37,707,409 425,551,143 1,616,649,114 Subordinated loan - 6,374,916 6,374,916 - 12,749,832 TOTAL 4,326,493,864 21,710,180,866 1,122,092,306 2,679,702,500 29,838,469,536
Not Subject to Interest
Less than 1 Year
1 to 5 Years
Over 5 Years Total
December 31, 2018LBP’000
FINANCIAL ASSETS: Cash and Central Banks 1,334,655,512 2,921,107,592 1,664,861,580 2,388,911,811 8,309,536,495 Deposits with banks and financial institutions 344,944,858 778,666,854 - - 1,123,611,712 Loans to banks 50,670,878 56,946,061 31,246,000 1,600,000 140,462,939 Loans and advances to customers 438,886,755 6,007,834,407 1,677,449,483 1,651,841,384 9,776,012,029 Assets under leverage arrangements - - - 855,418,125 855,418,125 Investment securities 616,591,285 1,021,531,908 3,025,277,329 5,681,861,646 10,345,262,168 TOTAL 2,785,749,288 10,786,086,822 6,398,834,392 10,579,632,966 30,550,303,468 FINANCIAL LIABILITIES: Deposits and borrowings from banks 20,318,686 243,822,243 - - 264,140,929 Liabilities designated at fair value through profit or loss 908,257 - 134,591,796 - 135,500,053 Customers' accounts at amortized cost 2,099,159,812 22,617,267,893 165,787,993 - 24,882,215,698 Leverage arrangements with BDL - - - 855,418,125 855,418,125 Other borrowings 2,072,436 178,280,208 354,611,873 969,641,898 1,504,606,415 Subordinated loan - 6,374,916 12,749,832 - 19,124,748 TOTAL 2,122,459,191 23,045,745,260 667,741,494 1,825,060,023 27,661,005,968
Not Subject to Interest
Less than 1 Year
1 to 5 Years
Over 5 Years Total
December 31, 2017LBP’000
D. Foreign Exchange risk Foreign exchange risk is the risk that changes in foreign currency rates will affect the Group’s income or the value of its holdings of financial instruments. The objective of foreign currency risk management is to manage and control foreign currency risk exposure within acceptable parameters while optimizing the return on risk.
Foreign exchange exposure arises from normal banking activities, primarily from the receipt of deposits and the placement of funds. Future open positions in any currency are managed by means of forward foreign exchange contracts. It is the policy of the Group that it will, at all times, adhere to the limits laid down by the Central Bank as referred to below. It is not the
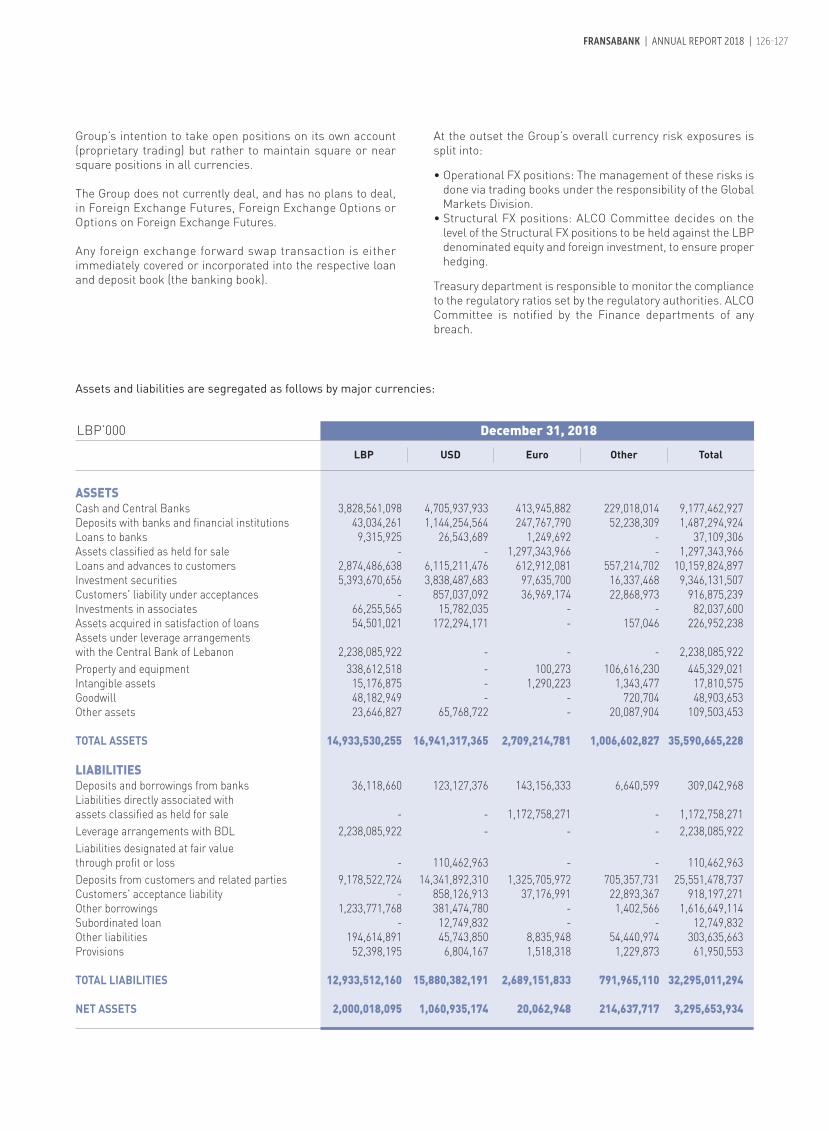
FRANSABANK | ANNUAL REPORT 2018 | 126-127
Group’s intention to take open positions on its own account (proprietary trading) but rather to maintain square or near square positions in all currencies. The Group does not currently deal, and has no plans to deal, in Foreign Exchange Futures, Foreign Exchange Options or Options on Foreign Exchange Futures. Any foreign exchange forward swap transaction is either immediately covered or incorporated into the respective loan and deposit book (the banking book).
At the outset the Group’s overall currency risk exposures is split into: • Operational FX positions: The management of these risks is
done via trading books under the responsibility of the Global Markets Division.
• Structural FX positions: ALCO Committee decides on the level of the Structural FX positions to be held against the LBP denominated equity and foreign investment, to ensure proper hedging.
Treasury department is responsible to monitor the compliance to the regulatory ratios set by the regulatory authorities. ALCO Committee is notified by the Finance departments of any breach.
December 31, 2018LBP’000
Assets and liabilities are segregated as follows by major currencies:
LBP USD Euro Other Total
ASSETS Cash and Central Banks 3,828,561,098 4,705,937,933 413,945,882 229,018,014 9,177,462,927 Deposits with banks and financial institutions 43,034,261 1,144,254,564 247,767,790 52,238,309 1,487,294,924 Loans to banks 9,315,925 26,543,689 1,249,692 - 37,109,306 Assets classified as held for sale - - 1,297,343,966 - 1,297,343,966 Loans and advances to customers 2,874,486,638 6,115,211,476 612,912,081 557,214,702 10,159,824,897 Investment securities 5,393,670,656 3,838,487,683 97,635,700 16,337,468 9,346,131,507 Customers' liability under acceptances - 857,037,092 36,969,174 22,868,973 916,875,239 Investments in associates 66,255,565 15,782,035 - - 82,037,600 Assets acquired in satisfaction of loans 54,501,021 172,294,171 - 157,046 226,952,238 Assets under leverage arrangements with the Central Bank of Lebanon 2,238,085,922 - - - 2,238,085,922 Property and equipment 338,612,518 - 100,273 106,616,230 445,329,021 Intangible assets 15,176,875 - 1,290,223 1,343,477 17,810,575 Goodwill 48,182,949 - - 720,704 48,903,653 Other assets 23,646,827 65,768,722 - 20,087,904 109,503,453 TOTAL ASSETS 14,933,530,255 16,941,317,365 2,709,214,781 1,006,602,827 35,590,665,228 LIABILITIES Deposits and borrowings from banks 36,118,660 123,127,376 143,156,333 6,640,599 309,042,968 Liabilities directly associated with assets classified as held for sale - - 1,172,758,271 - 1,172,758,271 Leverage arrangements with BDL 2,238,085,922 - - - 2,238,085,922 Liabilities designated at fair value through profit or loss - 110,462,963 - - 110,462,963 Deposits from customers and related parties 9,178,522,724 14,341,892,310 1,325,705,972 705,357,731 25,551,478,737 Customers' acceptance liability - 858,126,913 37,176,991 22,893,367 918,197,271 Other borrowings 1,233,771,768 381,474,780 - 1,402,566 1,616,649,114 Subordinated loan - 12,749,832 - - 12,749,832 Other liabilities 194,614,891 45,743,850 8,835,948 54,440,974 303,635,663 Provisions 52,398,195 6,804,167 1,518,318 1,229,873 61,950,553 TOTAL LIABILITIES 12,933,512,160 15,880,382,191 2,689,151,833 791,965,110 32,295,011,294 NET ASSETS 2,000,018,095 1,060,935,174 20,062,948 214,637,717 3,295,653,934

December 31, 2017LBP’000
LBP USD Euro Other Total
ASSETS Cash and Central Banks 4,274,287,489 3,342,614,924 401,488,439 291,145,643 8,309,536,495 Deposits with banks and financial institutions 6,137,396 837,789,598 135,227,221 144,457,497 1,123,611,712 Loans to banks 45,125,685 46,584,658 4,077,446 44,675,150 140,462,939 Assets classified as held for sale - - 1,380,267,902 - 1,380,267,902 Loans and advances to customers 2,994,965,834 5,807,508,224 595,578,424 377,959,547 9,776,012,029 Investment securities 5,941,643,926 4,192,630,828 203,578,586 7,408,828 10,345,262,168 Customers' liability under acceptances 170,213 372,012,677 58,090,366 4,205,096 434,478,352 Investments in associates 62,392,799 16,908,662 - - 79,301,461 Assets acquired in satisfaction of loans 57,182,624 154,388,736 - - 211,571,360 Assets under leverage arrangements with the Central Bank of Lebanon 855,418,125 - - - 855,418,125 Property and equipment 332,498,835 (1,049,974) 76,286 72,754,513 404,279,660 Intangible assets 9,411,279 - 941,400 1,808,478 12,161,157 Goodwill 48,903,653 - - - 48,903,653 Other assets 72,828,832 43,881,429 4,235,490 8,783,286 129,729,037 TOTAL ASSETS 14,700,966,690 14,813,269,762 2,783,561,560 953,198,038 33,250,996,050 LIABILITIES Deposits and borrowings from banks 13,366,239 116,947,092 126,268,994 7,558,604 264,140,929 Liabilities directly associated with assets classified as held for sale - - 1,249,041,760 - 1,249,041,760 Leverage arrangements with BDL 855,418,125 - - - 855,418,125 Liabilities designated at fair value through profit or loss - 135,500,053 - - 135,500,053 Deposits from customers and related parties 9,808,724,381 13,131,031,540 1,336,483,182 605,976,595 24,882,215,698 Customers' acceptance liability 170,213 372,012,677 58,090,366 4,205,096 434,478,352 Other borrowings 1,251,412,513 253,193,902 - - 1,504,606,415 Subordinated loan - 19,124,748 - - 19,124,748 Other liabilities 528,712,762 57,536,438 5,880,456 23,831,745 615,961,401 Provisions 39,449,524 1,031,113 - 6,563,624 47,044,261 TOTAL LIABILITIES 12,497,253,757 14,086,377,563 2,775,764,758 648,135,664 30,007,531,742 NET ASSETS 2,203,712,933 726,892,199 7,796,802 305,062,374 3,243,464,308
Notes to the Consolidated Financial Statements For the year ended December 31, 2018
CONSOLIDATED FINANCIAL STATEMENTS

FRANSABANK | ANNUAL REPORT 2018 | 128-129
47. Fair Value of Financial Assets and Liabilities
Fair value is the price that would be received to sell an asset or paid to transfer a liability in an orderly transaction between market participants at the measurement date. The fair value measurement is based on the presumption that the transaction to sell the asset or transfer the liability takes place either: • In the principal market for the asset or liability; or •.In the absence of a principal market, in the most advantageous
market for the asset or liability. The principal or the most advantageous market must be accessible by the Bank. The fair value of an asset or a liability is measured using the assumptions that market participants would use when pricing the asset or liability, assuming that market participants act in their economic best interest. A fair value measurement of a non-financial asset takes into account a market participant's ability to generate economic benefits by using the asset in its highest and best use or by selling it to another market participant that would use the asset in its highest and best use. The Group uses valuation techniques that are appropriate in the circumstances and for which sufficient data are available to measure fair value, maximizing the use of relevant observable inputs and minimizing the use of unobservable inputs. All assets and liabilities for which fair value is measured or disclosed in the consolidated financial statements are categorized within the fair value hierarchy, described as follows, based on the lowest level input that is significant to the fair measurement as a whole:
• Level 1 – Quoted (unadjusted) market prices in active markets for identical assets or liabilities.
• Level 2 – Valuation techniques for which the lowest level input that is significant to the fair value measurement is directly or indirectly observable.
• Level 3 – Valuation techniques for which the lowest level input that is significant to the fair value measurement is unobservable.
For assets and liabilities that are recognized in the consolidated financial statements on a recurring basis, the Group determines whether transfers have occurred between levels in the hierarchy by re-assessing categorization (based on the lowest level input that is significant to the fair value measurement as a whole) at the end of each reporting period. For the purpose of fair value disclosures, the Group has determined classes of assets and liabilities on the basis of the nature, characteristics and risks of the asset or liability and the level of the fair value hierarchy as explained above. The Directors consider that the carrying amounts of customers’ acceptance liability, other assets, acceptances payable, certificates of deposit issued, and other liabilities approximate their fair values due to the short-term maturities of these instruments.

Carrying Amount Level 1
FAIR VALUE
Level 2 Level 3 TOTAL
Financial Assets Measured at Fair Value: Investments at fair value through profit or loss: Equities and preference shares 22,769,331 3,169,606 6,600,341 12,999,384 22,769,331 Lebanese Treasury bills 20,548,354 - 20,548,354 - 20,548,354 Lebanese Government bonds 21,797,302 21,797,302 - - 21,797,302 Foreign Eurobonds issued by banks 39,623,424 39,623,424 - - 39,623,424 Corporate bonds 199,856 - 199,856 - 199,856 Term placements with Central Bank of Lebanon 121,754,991 - 121,754,991 - 121,754,991 Investments at fair value through other comprehensive income: Quoted equities 447,453,939 42,626,819 - 404,827,120 447,453,939 Lebanese Treasury bills 212,360,658 - 212,360,658 - 212,360,658 Lebanese Government bonds 230,775,474 45,785,369 184,990,105 - 230,775,474 Certificates of deposit issued by the Central Bank of Lebanon 14,061,664 - 14,061,664 - 14,061,664 Corporate bonds 4,873,305 4,873,305 - - 4,873,305 TOTAL 1,136,218,298 157,875,825 560,515,969 417,826,504 1,136,218,298 Financial Assets Measured At Amortized Cost: Term placements with Central Bank of Lebanon 7,795,870,502 - 7,547,704,835 - 7,547,704,835 Placement with banks 1,011,608,558 - 1,011,608,558 - 1,011,608,558 Preferred shares 52,724 - 52,724 - 52,724 Lebanese Treasury bills 1,808,185,043 - 1,778,615,807 - 1,778,615,807 Lebanese Government bonds 2,338,745,809 1,960,534,315 - - 1,960,534,315 Foreign Government bonds 12,750,000 - 12,750,000 - 12,750,000 Certificates of deposit issued by the Central Bank of Lebanon 3,670,267,549 230,281,523 3,109,385,736 - 3,339,667,259 Corporate bonds 254,344,055 - 221,115,070 54,175,254 275,290,324 Asset-backed securities 18,201,794 - 17,655,398 - 17,655,398 TOTAL 16,910,026,034 2,190,815,838 13,698,888,128 54,175,254 15,943,879,220 Financial Liabilities Measured at Fair Value: Financial liabilities measured at fair value through profit or loss 112,200,624 - 112,200,624 - 112,200,624 Financial Liabilities Not Measured at Fair Value: Subordinated loan 12,749,832 - 12,749,832 - 12,749,832
December 31, 2018LBP’000
Notes to the Consolidated Financial Statements For the year ended December 31, 2018
CONSOLIDATED FINANCIAL STATEMENTS
The following table shows the carrying amounts and fair values of financial assets and liabilities recognized in the financial statements, including their levels in the fair value hierarchy. It does not include financial assets and financial liabilities, which are not measured at fair value and where the directors consider that the carrying amounts of these financial assets and liabilities are reasonable approximations of their fair value:
Note
10 10 10 10 10 10
10 10 10 10 10
5 6
10 10 10 10 10 10 10
19
22

Note Carrying Amount Level 1
FAIR VALUE
Level 2 Level 3 TOTAL
Financial Assets Measured at Fair Value: Investments at fair value through profit or loss: Equities and preference shares 10 38,779,601 27,647,548 - 11,132,053 38,779,601 Lebanese Treasury bills 10 47,294,897 - 47,294,897 - 47,294,897 Lebanese Government bonds 10 64,869,092 - 64,869,092 - 64,869,092 Foreign Eurobonds issued by banks 10 40,125,926 - 40,125,926 - 40,125,926 Certificates of deposit issued by Central Bank of Lebanon 10 122,406,476 - 122,406,476 - 122,406,476 Mutual fund 10 10,123,796 - 10,123,796 - 10,123,796 Investments at fair value through other comprehensive income: Quoted equities 10 18,685,323 18,685,323 - - 18,685,323 Unquoted equity 10 269,264,087 - - 269,264,087 269,264,087 Other unquoted equities 10 89,514,795 - - 89,514,795 89,514,795 TOTAL 701,063,993 46,332,871 284,820,187 369,910,935 701,063,993 Financial Assets Not Measured at Fair Value: Term placement with Central Bank of Lebanon 5 7,250,270,833 - 7,401,900,223 - 7,401,900,223 Loans and advances to banks 7 140,462,939 - 131,688,593 - 131,688,593 Investments at amortized cost: Preference shares 10 21,852,720 2,065,275 19,787,445 - 21,852,720 Lebanese Treasury bills 10 2,945,064,278 - 2,887,254,983 - 2,887,254,983 Lebanese Government bonds 10 3,016,729,765 - 2,871,828,408 - 2,871,828,408 Foreign Government bonds 10 15,088,560 - 15,088,560 - 15,088,560 Foreign Eurobonds issued by banks 10 135,091,953 - 135,237,842 - 135,237,842 Subordinated Eurobonds 10 1,604,734 - 1,604,734 - 1,604,734 Certificates of deposit issued by Central Bank of Lebanon 10 3,592,868,684 - 3,510,898,840 - 3,510,898,840 Corporate bonds 10 53,256,415 - 53,225,067 - 53,225,067 Asset-backed securities 10 23,199,310 - 22,552,127 - 22,552,127 TOTAL 17,195,490,191 2,065,275 17,051,066,822 - 17,053,132,097 Financial Liabilities Measured at Fair Value: Liabilities designated at fair value through profit or loss 19 135,500,053 135,500,053 - - 135,500,053 Financial Liabilities Not Measured at Fair Value: Subordinated loan 21 19,124,748 - 20,803,692 - 20,803,692
December 31, 2017LBP’000
FRANSABANK | ANNUAL REPORT 2018 | 130-131

There have been no transfers between Level 1, Level 2 and Level 3 during the period. The directors consider that the carrying amounts of cash, compulsory and other short term deposits with Central Bank,
deposits from banks and accounts payable approximate their fair values due to the short-term maturities of these instruments. For customers’ accounts, this is largely due to their short term contractual maturities.
Valuation Techniques, Significant Unobservable Inputs, and Sensitivity of the Input to the Fair Value The following table gives information about how the fair values of financial instruments included in the consolidated financial statements, are determined (Level 2 and Level 3 fair values) and significant unobservable inputs used:
Financial Instruments Date of Valuation Valuation Technique and Key Inputs Significant Unobservable Inputs
Lebanese Treasury bills 31-Dec-18/17 DCF at a discount rate determined based on the yield curve applicable to N/A Lebanese Treasury bills, adjusted for illiquidity Certificates of deposits in LBP 31-Dec-18/17 DCF at a discount rate determined based on the yield curve applicable to N/A issued by Central Bank Lebanese Treasury bills, adjusted for illiquidity
Certificates of deposits in foreign 31-Dec-18/17 DCF at discount rates based on observable yield curves at the N/A currencies issued by Central Bank measurement date
Lebanese Government bonds 31-Dec-18/17 DCF at discount rates determined based on the yield on USA Treasury bills N/A and the Credit Default Swap applicable to Lebanon subject to illiquidity factor
Term deposits with 31-Dec-18/17 DCF at discount rates based on observable yield curves at the N/A Central Bank of Lebanon measurement date
Loans and advances to customers 31-Dec-18/17 DCF at discount rates based on average rate of return of the receivables N/A bearing fixed interest rate for more than one year
Foreign Government bonds 31-Dec-18/17 Quoted prices for similar assets in active markets N/A
Unquoted equity at FVTOCI 31-Dec-18/17 Income approach (DCF)
Other unquoted equities at FVTOCI 31-Dec-18/17 N/A N/A Other borrowings 31-Dec-18/17 DCF at discount rates based on average rate of return of the payables N/A bearing fixed interest rate for more than one year
Subordinated loan 31-Dec-18/17 DCF at discount rates based on average rate of return of the payables N/A bearing fixed interest rate for more than one year
Yearly growth rate 1%; discount rate 12%;
growth rate at perpetuity 2%
Notes to the Consolidated Financial Statements For the year ended December 31, 2018
CONSOLIDATED FINANCIAL STATEMENTS

48. Capital Management
The Group manages its capital to comply with the capital adequacy requirements set by the Central Bank of Lebanon, the Group’s lead regulator. The Group’s foreign entities are also required to respect particular ratios according to the competent authorities of supervisions. The Group’s capital is split as follows: Common Tier I Capital: Comprises share capital after deduction of Treasury shares, certain reserves from appropriation of profits, retained earnings. Goodwill is deducted from Tier I Capital.
Tier I Capital: Comprises Common Tier I capital, shareholders’ cash contribution to capital and preference shares. Tier II Capital: Comprises qualifying subordinated liabilities, collective impairment allowance and cumulative change in fair value for investment at fair value through other comprehensive income.
The consolidated financial statements were approved by the Bank’s Board of Directors in its meeting held on April 24, 2019.
The Group has complied with the imposed capital requirements throughout the period.
Tier I capital Of which: Common Tier I Tier II capital Total regulatory capital Credit risk Market risk Operational risk RISK-WEIGHTED ASSETS OF CREDIT, MARKET AND OPERATIONAL RISKS Capital adequacy ratio: COMMON TIER I TIER I TOTAL CAPITAL (TIER I AND II)
2,509,969,000 1,853,791,000
228,808,000 2,738,777,000
16,091,297,000
307,990,000 1,383,852,000
17,783,139,000
10.42% 14.11% 15.40%
2,549,896,000 1,896,853,000
332,060,000 2,881,956,000
16,203,014,000
127,709,000 1,354,444,000
17,685,167,000
10.73% 14.42% 16.30%
2018LBP’000 2017
49. Approval of the Financial Statements
FRANSABANK | ANNUAL REPORT 2018 | 132-133


FRANSABANK | ANNUAL REPORT 2018 | 134-135

Bancassurance SAL
International Payment Network SAL
Parent CompanyFransabank SAL 75 branches
• 21 branches in Beirut
• 26 branches in Mount Lebanon
• 11 branches in Northern Lebanon
• 7 branches in Bekaa Region
• 10 branches in Southern Lebanon
Subsidiaries
Associated Companies
BLC Bank SAL (with BLC Services & BLC Finance) 50 branches
• 12 branches in Beirut
• 17 branches in Mount Lebanon
• 6 branches in Northern Lebanon
• 3 branches in Bekaa Region
• 4 branches in Southern Lebanon
• 8 branches non-operational
Fransa Invest Bank SAL (FIB)
Société Générale Foncière SAL (Sogefon)
Lebanese Leasing Company SAL (LLC)
Fransabank Insurance Services Company SAL
Switch & Electronic Services SAL
Société Express SARL
Subdivided as follows:
• 75 Fransabank branches
• 50 BLC Bank branches
• 1 branch for Fransa Invest Bank
126 BRANCHES
Lebanon Parent Company, Subsidiaries and Associates
GROUP NETWORK

FRANSABANK | ANNUAL REPORT 2018 | 136-137
Fransabank SAL
Headquarters
Fransabank Center, Hamra Str., P.O.Box 11-0393 Riad El Solh Beirut 1107 2803 Lebanon Tel (961) 1 340180/8 - (961) 1 745761/4 - (961) 3 650700 Fax (961) 1 354572 Cable FRANSBANK Swift FSAB LB BX Email [email protected] Website www.fransabank.com Call Center (961) 1 734000 - 1552 Forex Tel (961) 1 343706 - (961) 1 344216 Reuters FRBK Retail@Fransabank Fransabank Center, Hamra Str., Ground Floor Tel (961) 1 340180/8 - Fax (961) 1 740281
Beirut
Adlieh Sequoia Center (facing Palais de Justice), Sami El Solh Avenue, Beirut Tel (961) 1 427219 - (961) 1 427203 | Fax (961) 1 426536 Ain El Mreisseh Nawrass Bldg., Opposite Ain El Mreisseh Mosque Tel (961) 1 373240/1/2 | Fax (961) 1 373243 Ashrafieh (Rmeil) Akra Bldg., St. Louis Str., Rmeil Tel (961) 1 571844/499 | Fax (961) 1 446804 Ashrafieh (Sassine) Notre Dame Center, Sassine Square Tel (961) 1 203466/7 | Fax (961) 1 200651 Ashrafieh (Sodeco) Dakota Bldg., Sodeco Tel (961) 1 423573/4/5 | Fax (961) 1 423577 Bab Idriss Fransabank Bldg., (Ex. Ahli International Bank Bldg.), Omar Daouk Str., Bab Idriss, Beirut Central District Tel (961) 1 970951 | Fax (961) 1 970952 Badaro Khatoun Bldg., Badaro Str. Tel (961) 1 387024 - (961) 1 386900/1 | Fax (961) 1 390409 Bliss Bliss 697 Bldg., facing the police station, Bliss Str. Tel (961) 1 370434 – (961) 1 371 434 | Fax (961) 1 360434 Foch Focheville Bldg., Foch Str. Beirut Central District Tel (961) 1 998230/240 | Fax (961) 1 998230 Hamra Fransabank Center, Hamra Str., 1st Floor Tel (961) 1 340180/1/8 - (961) 1 750679 | Fax (961) 1 341413
Hamra (Sadat) Itani Bldg., Sadat Str. Tel (961) 1 743135/6 | Fax (961) 1 743138 Jnah Assaf Bldg., Adnan El Hakim Str. Tel (961) 1 857972/3/4 | Fax (961) 1 857972 Mar Elias Metco Center, Moussaitbeh, Mar Elias Str. Tel (961) 1 818529/30 - (961) 1 817770 | Fax (961) 1 300617 Moussaitbeh Al Lou’loua Bldg., Selim Salam Str. Tel (961) 1 308791/2/3 - (961) 70 677651 | Fax (961) 1 305189 Ras El Nabeh La Cité Bldg., Bechara El Khoury Str. Tel: (961) 1 663118/119 | Fax (961) 1 663117 Saifi Andraos Bldg., El-Arz Str. Tel (961) 1 442418 - (961) 3 650703 - (961) 1 585899 | Fax (961) 1 442417 Starco Starco Center, Bloc C, Omar Daouk Str. Tel (961) 1 367346/8 | Fax (961) 1 367350 Tabaris Saifi 311 Bldg., Fouad Chehab Avenue Tel (961) 1 203422 - (961) 1 328600 | Fax (961) 1 201141 Tarik Jdide Kassar Bldg., Loubos Str. Tel (961) 1 702930/1 - (961) 3 650705 | Fax (961) 1 309090 Verdun Verdun 730 Center, Rachid Karame Str., 1st Floor Tel (961) 1 788690/1/2/3/4 - (961) 3 650709 | Fax (961) 1 788691 Verdun (Mazraa) Diamond Tower, Rachid Karame Str., 1st Floor Tel (961) 1 797079 | Fax (961) 1 797082 Mount Lebanon
Aley Said Chehayeb Bldg. (DANA), Main Road Tel (961) 5 557042/3/4 | Fax (961) 5 557046 Antelias Order Antonin Maronite Bldg., Catholicossat Armenien Str. Tel (961) 4 417240/1 | Fax (961) 4 412990 Baakline Hafez Bou Ajram, Al Marj, Main Road Tel (961) 5 303005 - (961) 5 301267 | Fax (961) 5 303006 Bauchrieh Bakhos & Aoun Bldg., Square One Center Tel (961) 1 897490/1/2 | Fax (961) 1 898786 Bikfaya Adel Dagher Bldg., Bikfaya Square Tel (961) 4 986901/2 - (961) 70 910700 | Fax (961) 4 986903

Bourj El Brajneh Ahmad Nabbouh Bldg., Ain El Sekkeh, Dr. Hosni Jalloul Str. Tel (961) 1 453200/1 - (961) 3 740410 | Fax (961) 1 453203 Bourj Hammoud Harboyan Center, Near St. Vartan Church, Bourj Hammoud entrance, 2nd Floor Tel (961) 1 258101/2/3 | Fax (961) 1 264446 Chehim Wehbe Center, Main Road Tel (961) 7 241916/7 | Fax (961) 7 241921 Chiyah Tayyar Bldg., facing Moawad junctions, Ghobeiri Blvd., Chiyah Next to the Ministry of Labor Tel (961) 1 279671/3 - (961) 3 740412 | Fax (961) 1 279680 Choueifat Mahmoud El Kheshen Bldg., Haret Al Oumara, Saida Main Road Tel (961) 5 431152 - (961) 5 431178 | Fax (961) 5 431183 Dora Kassardjian Bldg., Dora Highway, 1st Floor Tel (961) 1 899121 | Fax (961) 1 894721 Elyssar (Mazraat Yachouh) Fransabank Bldg., Mazraat Yachouh, Bikfaya Main Road Tel (961) 4 914803/4/7 | Fax (961) 4 914805 Furn El Chebbak Saadeh Center, Facing Planete Abraj, Beirut/Damascus Str. Tel (961) 1 293025/6 | Fax (961) 1 293027 Galerie Semaan Hadath, Galerie Semaan Bldg. & Str. Tel (961) 5 957657 - (961) 5 954630 | Fax (961) 5 954632 Hadath Bechara Beik Karam Str., Al Saha, Near Al Saydeh Church, Main Road Tel (961) 5 463975/7 | Fax (961) 5 463980 Hazmieh Unigroup Bldg., Sayyad Square Tel (961) 5 459602 - (961) 5 450350 | Fax (961) 5 457312 Jal El Dib Le Baron Center, Jal El Dib Highway, 1st Floor Tel (961) 1 889884/5 | Fax (961) 1 902959 Jbeil Byblos Sun Bldg., Jbeil Roundabout Tel (961) 9 945108 - (961) 3 650719 | Fax (961) 9 540968 Jdeideh Barbar Bou-Jawdeh Bldg. & Str., 1st Floor Tel (961) 1 881680 | Fax (961) 1 883891 Jounieh Saint Paul Center, P.T.T. Str. Tel (961) 9 830190/1 | Fax (961) 9 830192 Kaslik Damaa Center, Zouk Highway Tel (961) 9 210769 | Fax (961) 9 210773 Mansourieh Maalouf Center, Opposite P.T.T., Main Road Tel (961) 4 409840/1 | Fax (961) 4 409840
Mreijeh Chahine Bldg., Hadi Nasrallah Blv. Tel (961) 1 469014/5/6 | Fax (961) 1 469006 Sarba Antoine & Youssef Kallas Bldg., Sarba Highway Tel (961) 9 640293 - (961) 9 640060 | Fax (961) 9 640543 Sin El Fil Kibinian & Kazangian Bldg., Delta Center, Horch Tabet Tel (961) 1 510571/2/3 - (961) 3 650708 | Fax (961) 1 481680 Zouk Zouk Mosbeh, Jeita Main Road Tel (961) 9 217271/2/3 | Fax (961) 9 219696
North Chekka Ragheb Center, Main Road Tel (961) 6 540642/3 | Fax (961) 6 545035 Dahr El Ain Michel Frangieh Bldg., Main Road Dahr El Ain, Koura Tel (961) 78 809580/680 | Fax (961) 6 418860/1 Halba Marwan Ibrahim Bldg., Main Road Tel (961) 6 693330/1/2 | Fax (961) 6 692001 Meryata Ayoush Bldg., Ardeh Str. Tel (961) 6 255560/1/2 | Fax (961) 6 255564 Rahbe Rahbe Main Road, Facing Harb Station, Akkar Tel: (961) 6 840207/8 | Fax: (961) 6 840204 Tripoli (Abou Samra) Sayadi Bldg., Saadoun Square Tel (961) 6 424617/9 | Fax (961) 6 424611 Tripoli (Al Mina) Hassan & Hassane Abbas Bldg., Bawabet Al Mina Str. Tel (961) 6 611524 - (961) 6 611249/50 | Fax (961) 6 611250 Tripoli (Gemmayzat) Fattal Bldg., Gemmayzat Str. Tel (961) 6 430012/3 | Fax (961) 6 625735 Tripoli (Maarad) Ordre des Ingénieurs Bldg. , « Damm et Farez » District Tel (961) 78 809780 | Fax (961) 6 411514 Tripoli (Tell) Gaston Habib Bldg., Kayal Square Tel (961) 6 442815 - (961) 6 441881/2 | Fax (961) 6 441881/2 Zgharta El-Kareh & Zakhia Center, Road 1, Zgharta El-Abbeh Tel (961) 6 667951/2/3 - (961) 70 676255 | Fax (961) 6 667956
GROUP NETWORK

Bekaa Baalbeck Mohammad Said El Lakiss Bldg., Ras Al-Ayn, Main Road Tel (961) 8 378800/1/2 - (961) 8 371800/1 | Fax (961) 8 370379 Bednayel Ali Fouad Sleiman Bldg., Main Road Tel (961) 8 911124/5 | Fax (961) 8 911124 Chtaura Haddad Bldg., Main Road Tel (961) 8 541988 - (961) 8 542498 | Fax (961) 8 543843 Laboue Near Laboue Square, Main Road Tel (961) 8 230801/2/3 | Fax (961) 8 230805 Riyak Hosch Hala, Main Road Tel (961) 8 900333/444/555 | Fax (961) 8 900107 Zahle (Barbara) Ghossain Bldg., St. Barbe Str. Tel (961) 8 811060 - (961) 8 803715 | Fax (961) 8 822335 Zahle (Warde) Warde Center, Main Road Tel (961) 8 803566 - (961) 8 821411 | Fax (961) 8 810187
South Bint Jbeil Fransabank Bldg., Saf El-Hawa, Main Road Tel (961) 7 450701/2/3 - (961) 3 239092 | Fax (961) 7 450701 Ghazieh Khalifeh Center, Ghazieh, Main Road Tel (961) 7 224430/60 | Fax (961) 7 224480 Hlalyeh Bdeir Bldg., Chammah Str., New Majdelyoun Highway Tel (961) 71 255585 - (961) 71 255570 | Fax (961) 71 255585 Jezzine St. Therese Center, Jezzine Highway Tel (961) 7 780941 - (961) 7 780052 | Fax (961) 7 780941 Marjeyoun Farid Hamra Bldg., Main Road Tel (961) 7 830139/140 - (961) 3 334923 | Fax (961) 7 830139 Nabatieh Kodeih Center, Sabbah Str. Tel (961) 7 760258 - (961) 7 764264 | Fax (961) 7 761750 Nakoura Hamzeh Bldg., Near UNIFIL, Main Road, 1st Floor Tel (961) 7 460235/6/7 - (961) 3 067702 | Fax (961) 7 460236 Saida Fransabank Bldg., Riad El Solh Str. Tel (961) 7 722180/1 - (961) 3 650701 | Fax (961) 7 721194 Tyr Abou Saleh Bldg., Senegal Str., Tyr Main Entrance, 1st Floor Tel (961) 7 345253 - (961) 7 345315 | Fax (961) 7 345308 Tyr (Abbassieh) Mix Center, Jal El Bahr El Bass, Main Road Tel (961) 7 740388 - (961) 7 740486 | Fax (961) 7 740084
OFF-PREMISES ATM’s
Beirut • Adlieh, General Security • American University of Beirut • Basta, Main cross road of Saleh Bin Yehya • Beirut Central District, UFA Insurance • Verdun, ABC Mall Mount Lebanon • Aley, Obeid Supermarket Kabrechmoun • Aoukar, US Embassy • Bauchrieh, Chaer Center • Bourj Hammoud, Total Medawar • Faraya, Total Gas Station • Hazmieh, City Center Beirut • Hazmieh, The Backyard • Jbeil, Cordahi Center • Jounieh, Caliprix Supermarket • Yarzeh, Ministry of Defense North • Dahr El Ain, Hoz Mall • Ehden, Sérail Hotel • Kalamoun, Miramar Hotel • Ordre des Avocats de Tripoli et du Liban Nord Bekaa • Zahle, Tell Chiha Hospital South • Nabatieh, Toul • Nakoura, United Nations Center • Rmeich, Choufani Center • Tyr, Electricité du Liban
FRANSABANK | ANNUAL REPORT 2018 | 138-139

LEBANON – SUBSIDIARIES & ASSOCIATES
BLC Bank SAL BLC Bank Bldg., Adlieh Square P.O.Box 11-1126 Beirut, Lebanon Tel (961) 1 387000
(961) 1 429000 Fax (961) 1 616984 Email [email protected] Website www.blcbank.com Fransa Invest Bank SAL (FIB) Fransabank Center, Hamra Str., 1st Floor P.O.Box 11-0393 Riad El Solh Beirut
1107 2803, Lebanon Tel (961) 1 745978/9 Fax (961) 1 351030 Email [email protected] Website www.fibleb.com Lebanese Leasing Company SAL (LLC) Fransabank Center, Hamra Str., 2nd Floor P.O.Box 11-0144 Beirut, Lebanon Tel (961) 1 738610/1/2/3
(961) 1 750310/1 Fax (961) 1 738614 Email [email protected] Bancassurance SAL Semiramis Bldg., Weygand Str., Bab ldriss, 4th Floor (opposite to Beirut Souks) P.O.Box 11-6729 Beirut, Lebanon Tel / Fax (961) 1 960 100 Email [email protected] Website www.ebancassurance.com Société Générale Foncière SAL (Sogefon) Fransabank Center, Hamra Str., 6th Floor P.O.Box 11-0393 Riad El Solh Beirut
1107 2803, Lebanon Tel (961) 1 749418 Fax (961) 1 340180 - Ext. 1816
Fransabank (France) SA Headquarters & Main Branch 104, Champs-Elysées Avenue, 75008 Paris, France Tel (33) 1 53 76 84 00 Fax (33) 1 45 63 57 00 Swift FRAF FR PP Email [email protected] Website www.fransabank.fr Fransabank El Djazaïr SPA Headquarters & Main Branch 45B, Lot Petite Provence, Sidi Yahia, Hydra, 16405, Algiers, Algeria Tel (213) 21 48 12 96 / 21 48 27 48 - Headquarters Tel (213) 21 48 00 29 / 21 48 02 12 - Main Branch Fax (213) 21 60 66 06 Swift FSBK DZ AL Email [email protected] Website www.fransabank.dz New Headquarters & New Main Branch (under construction) Résidence des Pins, Bloc A, Commune de Chéraga, Algiers, Algeria Baba Hassen Ilot n. 211, section 03, n. 01 & 02, Baba Hassen, Algiers, Algeria Tel (213) 23 35 32 02 / 23 35 32 03/ 23 35 32 06 / 23 35 30 15 Fax (213) 23 35 30 98 Bab Ezzouar Tour CMA CGM Zone des affaires, Bab Ezzouar, Algiers, Algeria Tel (213) 23 92 49 94/ 23 92 49 95/ 23 92 49 96/ 23 92 50 02 Fax (213) 23 92 50 03 Kouba Rue Garidi G4 Groupement de propriété 101, Lot 49 commune de Kouba, Algiers, Algeria Tel (213) 23 70 63 35 / 23 70 63 47 / 23 70 63 69 Fax (213) 23 70 63 70 Annaba 07, Avenue de l’ALN commune d’Annaba, Annaba, Algeria Tel (213) 38 43 32 72 / 38 43 32 76 / 38 43 32 77 Fax (213) 38 43 32 89 Batna Rue des Frères Guellil, lot N°9, commune de Batna, Batna, Algeria Tel (213) 33 85 10 68 / 33 85 31 80 / 33 85 63 74 Fax (213) 33 80 57 07
FRANCE
ALGERIA
Overseas Subsidiaries & Branches
GROUP NETWORK

Bejaia Route des Aures, Lot n° 43, Section N. 74, Bejaia, Algeria Tel (213) 34 18 72 66/67/68/78 Fax (213) 34 18 72 69 Blida Avenue Mokhtar Kertli, Lotissement Les Palmiers N. 01, Blida, Algeria Tel (213) 25 22 47 61/69/71, (213) 25 22 48 04 / 42 60 Fax (213) 25 22 48 29 Constantine Cité Ali Besbes, Lot G no.23, Sidi Mabrouk, Constantine, Algeria Tel (213) 31 62 93 66 / 31 62 96 28 Fax (213) 31 63 06 40 Oran Cité Dar El Beida, Cooperative El-Zouhour, N.12, Oran, Algeria Tel (213) 41 46 09 06 / 41 46 07 02 Fax (213) 41 46 07 05 Setif Nouvelle zone urbaine secteur A, lotissement 06 N.65 (Boulevard des Entrepreneurs), Sétif, Algeria Tel (213) 36 51 41 57, (213) 36 51 35 98, (213) 36 51 41 35 Fax (213) 36 51 44 14
BELARUS
Fransabank OJSC Minsk Headquarters & Main Branch 95A, Nezavisimosti Avenue, 220012 Minsk, Republic of Belarus Tel (375) 17 389 36 36 Fax (375) 17 389 36 37 Swift GTBN BY 22 Email [email protected] Website www.fransabank.by Branch 1 4 Kalvariyskaya Str., 220004 Minsk, Republic of Belarus Tel (375) 17 389 37 57 Fax (375) 17 210 07 15 Branch 2 9 Dombrovskaya Str., 220140, Minsk, Republic of Belarus Tel (375) 17 389 37 47 Fax (375) 17 313 29 08 Branch 3 7 Zhinovicha Str., 220055, Minsk, Republic of Belarus Tel (375) 17 389 37 77, (375) 29 344 82 07
Brest Branch 1 16 Masherova Ave, 224030 Brest, Republic of Belarus Tel /Fax (375) 16 250 88 35 Branch 2 46 Sovetskaya Str., 224005 Brest, Republic of Belarus Tel/Fax (375) 16 220 99 51 Gomel 5A Krasnoarmeyskaya Str., 246017 Gomel, Republic of Belarus Tel/Fax (375) 23 275 03 40 Grodno 10, Dominikanskaya Str., 230023 Grodno, Republic of Belarus Tel (375) 15 277 35 30 Fax (375) 15 277 04 06 Lida 12, Knyaza Gedimina Blvd., 231281 Lida, Republic of Belarus Tel (375) 15 452 88 58 Fax (375) 15 460 61 37
IRAQ
Fransabank SAL, Iraq Branches Baghdad Headquarters & Branch Dr. Salman Faek Str., Al Wahad District 902/14, Bldg. no 48 Karrada, Baghdad, Iraq Tel (964) 771 822 9163 / (964) 781 452 6312
(964) 781 452 6321 / (964) 772 917 8437 Email [email protected]
[email protected] Erbil Headquarters & Branch 100 m. Str., Facing Cristal Hotel, Erbil, Kurdistan Region, Iraq Tel (964) 750 760 9118 / (964) 771 822 9164 (964) 770 780 7037 / (964) 780 300 7007 Email [email protected]
[email protected] [email protected]
FRANSABANK | ANNUAL REPORT 2018 | 140-141

SUDAN
United Capital Bank Headquarters & Main Branch Plot 411, Square 65, Mamoun Beheiry Str., South the Green Square P.O.Box 8210 Al Amarat, Khartoum, Sudan Tel (249) 183 24 77 00 - Headquarters Fax (249) 183 23 50 00 - Headquarters (249) 183 24 84 90 - Main Branch Swift CBSK SD KH Email [email protected] Website www.bankalmal.net Khartoum North Branch Plot 130, Square 8, Industry Str., Khartoum North (Bahri) P.O.Box 1173 Khartoum, Sudan Tel (249) 185 32 44 80 Fax (249) 185 32 40 01 Omdurman Branch Plot 6, Square 4/5, Alarda North, South Hilal Stadium, Omdurman P.O.Box 1500 Khartoum, Sudan Tel (249) 183 73 19 99 Fax (249) 183 73 19 98
Ivory Coast (Abidjan) Fransabank SAL Acacias Bldg., Clozel Str. - Plateau, Abidjan, Ivory Coast Tel (225) 57 07 42 75 / (961) 3 23 58 03 Fax (225) 20 24 26 82 Email [email protected] UAE (Abu Dhabi) BLC Bank SAL Khalidiya Park Bldg., 1st Floor, Khalidiya Str. P.O. Box 6204, Abu Dhabi, UAE Tel (971) 2 65 05 777 Fax (971) 2 65 05 778 Email [email protected] Website www.blcbank.com
Representative OfficesOverseas Associate
GROUP NETWORK

