annual report 2020 - tatua
TRANSCRIPT
ANNUAL REPORT 2020
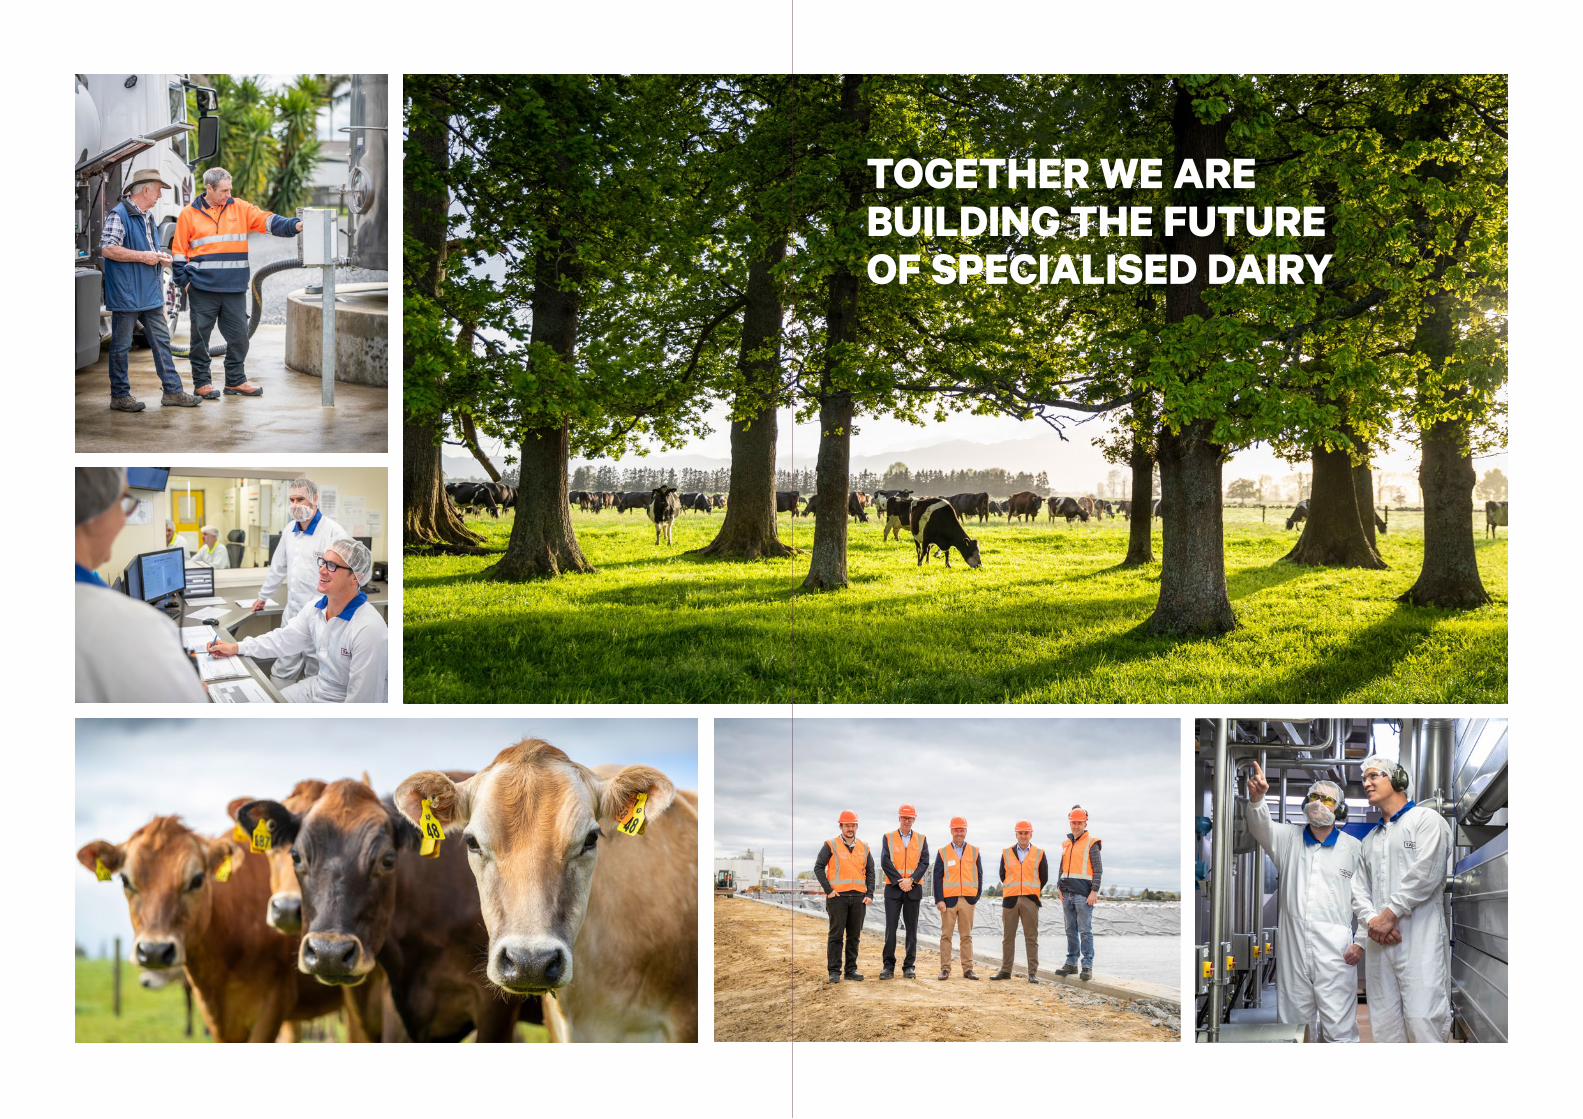
TOGETHER WE ARE BUILDING THE FUTURE OF SPECIALISED DAIRY

CONTENTS
Year in Review
Financial Statements
An Exceptional Year – 2020 Key Highlights 01
Report from the Chairman and Chief Executive Officer 03
Tatua Together 07
From NZ to the World 09
Building the Future of Specialised Dairy 11
Investing for a Better Future 13
Key Financial Performance Summary 16
Statutory Information 19
Balance Sheet 23
Statement of Comprehensive Income 24
Statement of Changes in Equity 25
Statement of Cash Flows 26
Notes to the Financial Statements 27
Audit Report 52
Statistics 55
Directory 56
2020Tatua Annual ReportOUR YEAR IN REVIEW
01 Tatua Annual Report 2020
TOTAL UNDERLYING REVENUE
TOTAL UNDERLYING REVENUE
TOTAL EARNINGS PER KG MILKSOLIDS
CASH PAYOUT TO SHAREHOLDERS PER KG MILKSOLIDS
GEARING RATIO
$9.96 $8.70
02Year in Review
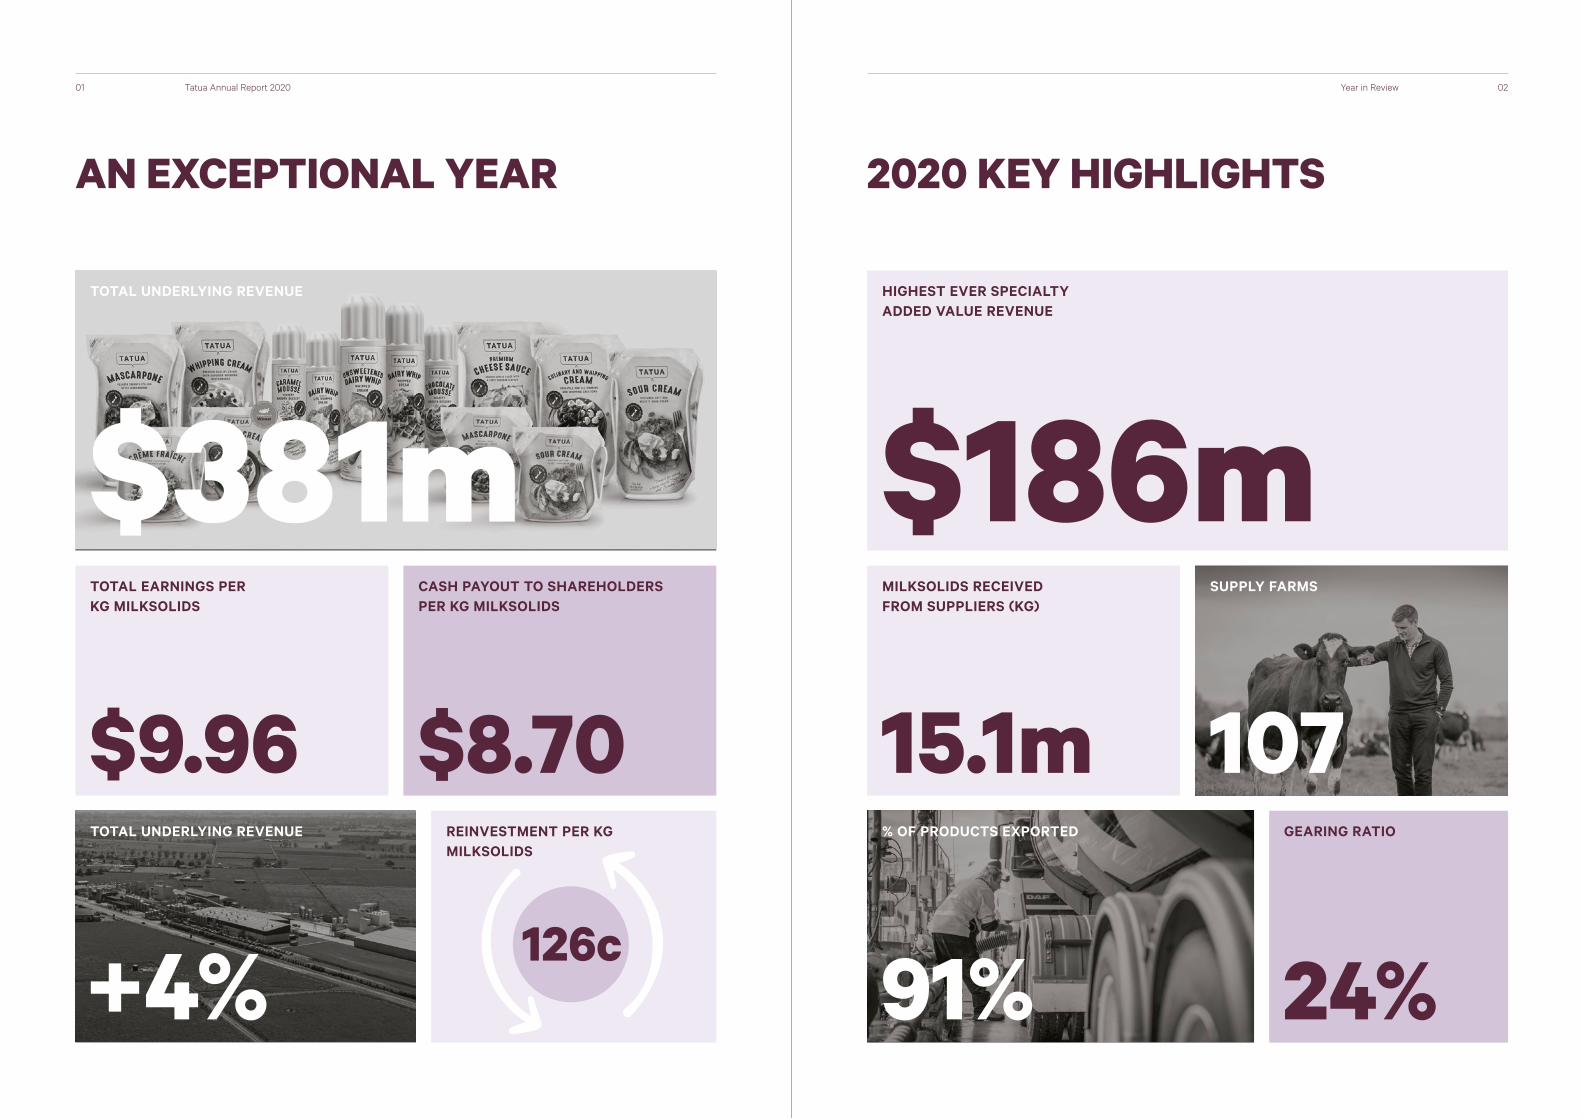
HIGHEST EVER SPECIALTY ADDED VALUE REVENUE
$186m
+4%
MILKSOLIDS RECEIVED FROM SUPPLIERS (KG)
SUPPLY FARMS
% OF PRODUCTS EXPORTED
91%
15.1m
126c24%
$381m
AN EXCEPTIONAL YEAR 2020 KEY HIGHLIGHTS
REINVESTMENT PER KG MILKSOLIDS
107
03
REPORT FROM THE CHAIRMAN AND CHIEF EXECUTIVE OFFICER
04Tatua Annual Report 2020 Year in Review
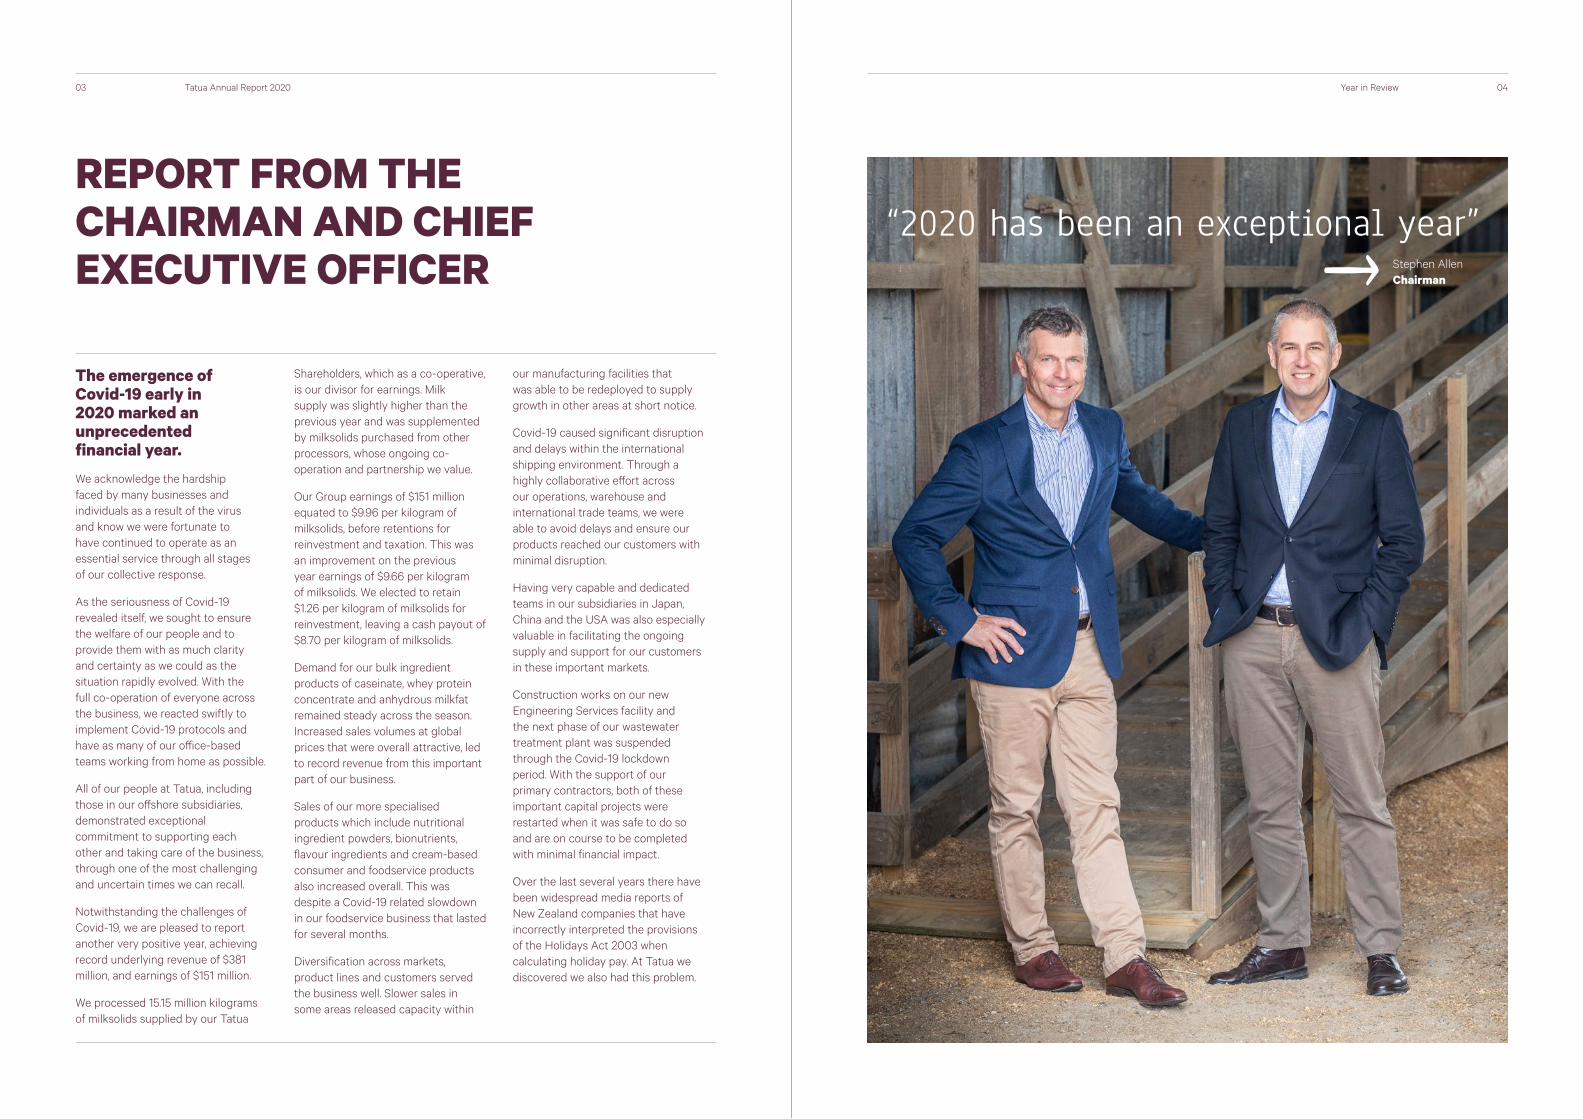
The emergence of Covid-19 early in 2020 marked an unprecedented financial year.
We acknowledge the hardship faced by many businesses and individuals as a result of the virus and know we were fortunate to have continued to operate as an essential service through all stages of our collective response.
As the seriousness of Covid-19 revealed itself, we sought to ensure the welfare of our people and to provide them with as much clarity and certainty as we could as the situation rapidly evolved. With the full co-operation of everyone across the business, we reacted swiftly to implement Covid-19 protocols and have as many of our office-based teams working from home as possible.
All of our people at Tatua, including those in our offshore subsidiaries, demonstrated exceptional commitment to supporting each other and taking care of the business, through one of the most challenging and uncertain times we can recall.
Notwithstanding the challenges of Covid-19, we are pleased to report another very positive year, achieving record underlying revenue of $381 million, and earnings of $151 million.
We processed 15.15 million kilograms of milksolids supplied by our Tatua
Shareholders, which as a co-operative, is our divisor for earnings. Milk supply was slightly higher than the previous year and was supplemented by milksolids purchased from other processors, whose ongoing co-operation and partnership we value.
Our Group earnings of $151 million equated to $9.96 per kilogram of milksolids, before retentions for reinvestment and taxation. This was an improvement on the previous year earnings of $9.66 per kilogram of milksolids. We elected to retain $1.26 per kilogram of milksolids for reinvestment, leaving a cash payout of $8.70 per kilogram of milksolids.
Demand for our bulk ingredient products of caseinate, whey protein concentrate and anhydrous milkfat remained steady across the season. Increased sales volumes at global prices that were overall attractive, led to record revenue from this important part of our business.
Sales of our more specialised products which include nutritional ingredient powders, bionutrients, flavour ingredients and cream-based consumer and foodservice products also increased overall. This was despite a Covid-19 related slowdown in our foodservice business that lasted for several months.
Diversification across markets, product lines and customers served the business well. Slower sales in some areas released capacity within
our manufacturing facilities that was able to be redeployed to supply growth in other areas at short notice.
Covid-19 caused significant disruption and delays within the international shipping environment. Through a highly collaborative effort across our operations, warehouse and international trade teams, we were able to avoid delays and ensure our products reached our customers with minimal disruption.
Having very capable and dedicated teams in our subsidiaries in Japan, China and the USA was also especially valuable in facilitating the ongoing supply and support for our customers in these important markets.
Construction works on our new Engineering Services facility and the next phase of our wastewater treatment plant was suspended through the Covid-19 lockdown period. With the support of our primary contractors, both of these important capital projects were restarted when it was safe to do so and are on course to be completed with minimal financial impact.
Over the last several years there have been widespread media reports of New Zealand companies that have incorrectly interpreted the provisions of the Holidays Act 2003 when calculating holiday pay. At Tatua we discovered we also had this problem.
“2020 has been an exceptional year”Stephen AllenChairman

In June, following an extensive review of our historical payroll system, we notified over 400 of our past and present employees in order to make remedial payments of $1.6 million, including interest and superannuation contributions, covering a thirteen-year period. Only a small number of payments remain outstanding for past employees we have so far been unable to contact.
Through our 106-year history there have been many changes in the way our supply farms operate, and we have no doubt they will continue to evolve as we play our part in further reducing dairy’s environmental footprint. Together with other primary sector organisations, we have been actively engaged in the development of national and regional environmental policies to help ensure that environmental benefits can be achieved in a pragmatic and economically sustainable manner.
With the full co-operation of our Shareholders, our Tatua 360 Responsible Farming Programme continues to develop and to provide the framework for supporting and progressing on-farm sustainability, including capturing evolving environmental policy requirements. All waterways on Tatua farms are fenced. After just two years, over 40% of our Shareholders farms have farm environmental plans in place.
An updated and expanded animal care programme for our farmers was introduced during the year. This is delivered by local veterinarians and aims to help our farmers identify and implement actions to enhance animal care outcomes.
Tatua 360 also focuses on actions to enhance the profile of dairying as a safe and rewarding career. To support this goal, we are engaging with our farmers to help ensure they fully understand their opportunities and responsibilities relating to employment practices and health and safety systems on farm.
While acknowledging there is still more to do, we are confident the framework provided by Tatua 360 is making a positive contribution to our farmer’s individual businesses and the dairy industry more broadly.
Unfortunately, due to Covid-19, we were unable to deliver our annual programme of site visits for schools and universities, or the annual social events for our people on site that support collaboration and connectedness across the business. We look forward to being able to resume these valuable community and social interactions over the year ahead.
Outlook
We will continue with our programme to improve environmental outcomes, especially in the area of wastewater management, where we have invested more than $20 million over the last four years. In addition to our environmental priorities, our capital investment programme will include ongoing investment in our facilities and systems as well as capacity for further growth of our specialist products.
With the ongoing threat of the Covid-19 global pandemic and the uncertainty around its long-term impact, we will remain cautious
in our outlook. This is despite the successful year that we have had and the positive demand signals we continue to experience through all of our markets.
Acknowledgements
Firstly, we thank all of our people at Tatua who have demonstrated enormous commitment and resilience through a very challenging and uncertain year. Your willingness and ability to adapt to the many changes we made at short notice, while doing everything to support each other and keep the business moving, has been a highlight.
Thank you to our Shareholders. Your continued trust and support of the co-operative and our people as we navigated through the challenges of Covid-19 has been widely appreciated.
We would also like to thank the diverse range of organisations who have partnered with us over the last twelve months through all aspects of our business and in so many ways.
Finally, a very sincere thank you to all of our customers, in all of our markets, for your continuing support. We remain a customer led organisation and look forward to continuing to strengthen the relationships that are the foundation of our business.
Our sincerest thanks to you all.
Welcome to Julie Langley
Julie Langley joined the Board of Directors in November 2019, following Dr. Kevin Old’s retirement. Julie is a fourth generation Tatua farmer, becoming a shareholder in 2015.
Julie has had a career in advertising, including sales and marketing of Tatua consumer products. She also operates a dairy farming business with her husband through 50/50 sharemilking and farm ownership. Julie holds a Bachelor of Communication Studies from the University of Waikato.
Stephen AllenChairman
Brendhan GreaneyChief Executive Officer
05 Tatua Annual Report 2020 Year in Review
Essential Service Contribution
Our Tatua farmer suppliers were proud to have been able to support New Zealand’s economy through the Covid-19 lockdown as an essential service, while operating within social distancing protocols.
To have been widely acknowledged as being part of New Zealand’s economic backbone, as well as playing a valuable role in the country’s economic recovery, has been inspiring and motivating for farmers.
The whole New Zealand primary sector, including dairy, sheep and beef, horticulture and fisheries, has proven to be resilient, and can rightfully feel proud of the contribution it continues to make.
06

07 08
TATUA TOGETHER
Tatua Annual Report 2020 Year in Review
“Tatua looked after its employees very well. Open communication was the key. I felt safe and secure working for Tatua during lockdown.”
— Tatua Employee, Covid-19 Employee Survey Results
— Sarah Stevenson
“We are determined to live our mission of ‘farming for the future’ ensuring we care for the safety of our team and act as guardians of the land for future generations of our family”.
Over 100 years of dairy innovation and co-operative spirit is at the heart of everything we do.
Our 107 shareholder farms and 380 employees in New Zealand, Japan, China and USA are committed to building the future of specialised dairy.
Covid-19 ChallengesTogether our team showed incredible co-operation and resilience during the Covid-19 disruptions. Thanks to all our people, shareholder farmers, customers and business partners throughout our supply chain who helped us achieve this season’s success.
Clifton StrengthsTatua implemented Clifton Strengths assessments as an employee development tool this season. Clifton Strengths identifies a person’s natural talents and capabilities.
180 employees across New Zealand, China, Japan and the USA have now completed their Clifton Strengths assessments.
Award Winners – Stevenson Farming Limited – Tatua SuppliersSarah and Aidan Stevenson, NZ Share Farmer of the Year and Waikato Regional Share Farmer of the Year Winners 2020. Sarah and Aidan have been 50/50 sharemilkers on Sue Williams’ Tatua farm since 2013.
They also won the following merit awards at the NZ Dairy Industry Awards 2020 – DairyNZ Human Resources Award, Honda Farm Safety, Health and Biosecurity Award, Ravensdown Pasture Performance Award, Westpac Business Performance Award and DeLaval Interview Award.
Congratulations Sarah and Aidan on achieving a high standard of farming excellence.
Farming Excellence
10
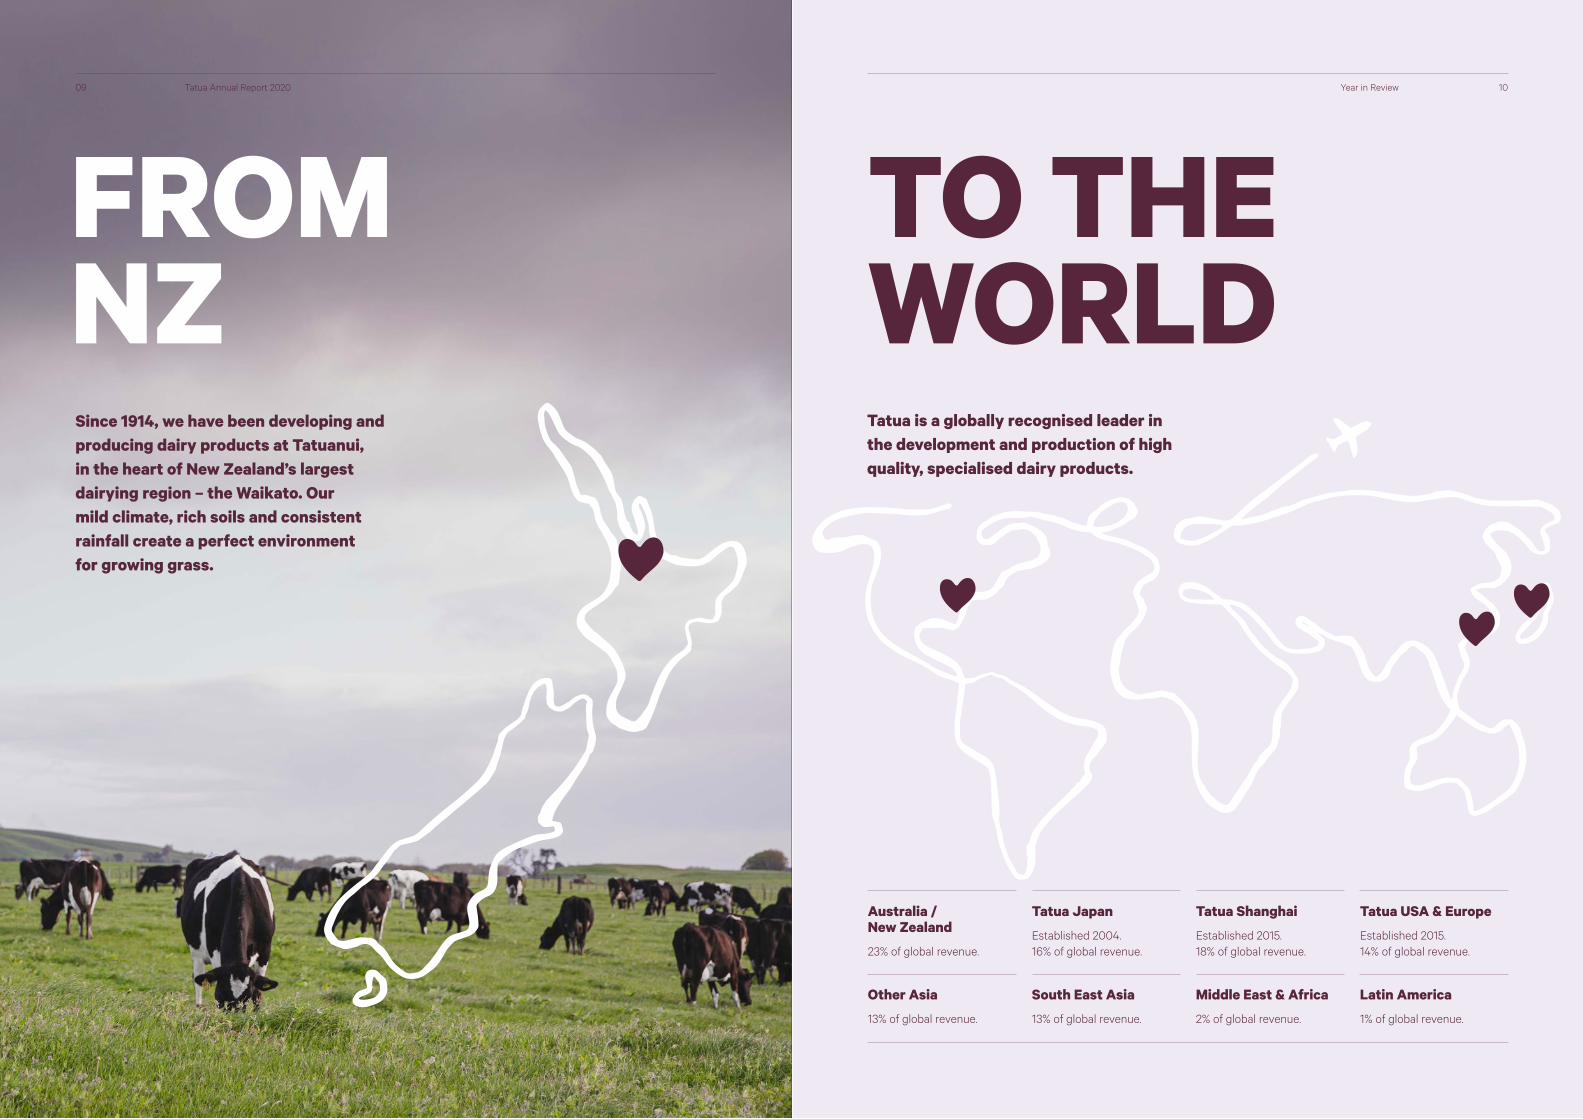
Since 1914, we have been developing and producing dairy products at Tatuanui, in the heart of New Zealand’s largest dairying region – the Waikato. Our mild climate, rich soils and consistent rainfall create a perfect environment for growing grass.
Australia / New Zealand
23% of global revenue.
Tatua Japan
Established 2004. 16% of global revenue.
Tatua Shanghai
Established 2015. 18% of global revenue.
Tatua USA & Europe
Established 2015. 14% of global revenue.
Other Asia
13% of global revenue.
South East Asia
13% of global revenue.
Middle East & Africa
2% of global revenue.
Latin America
1% of global revenue.
09 Tatua Annual Report 2020 Year in Review
Tatua is a globally recognised leader in the development and production of high quality, specialised dairy products.
FROM NZ
TO THE WORLD

1211 Tatua Annual Report 2020 Year in Review
BUILDING THE FUTURE OF SPECIALISED DAIRY
+30%Revenue growth in China
$381m+4%Total underlying revenue
+8%Specialty Cream Products revenue - sold in Ecolean packaging
+20%Dairy Ingredients revenue growth
$186mRecord Specialty Added Value revenue
+26%Dairy Flavours revenue growth
+66%Specialty Proteins revenue growth
+25%Nutritional products revenue growth in Japan
+4%Dairy Whip revenue growth
$67mHighest ever Specialty Nutritionals revenue
14
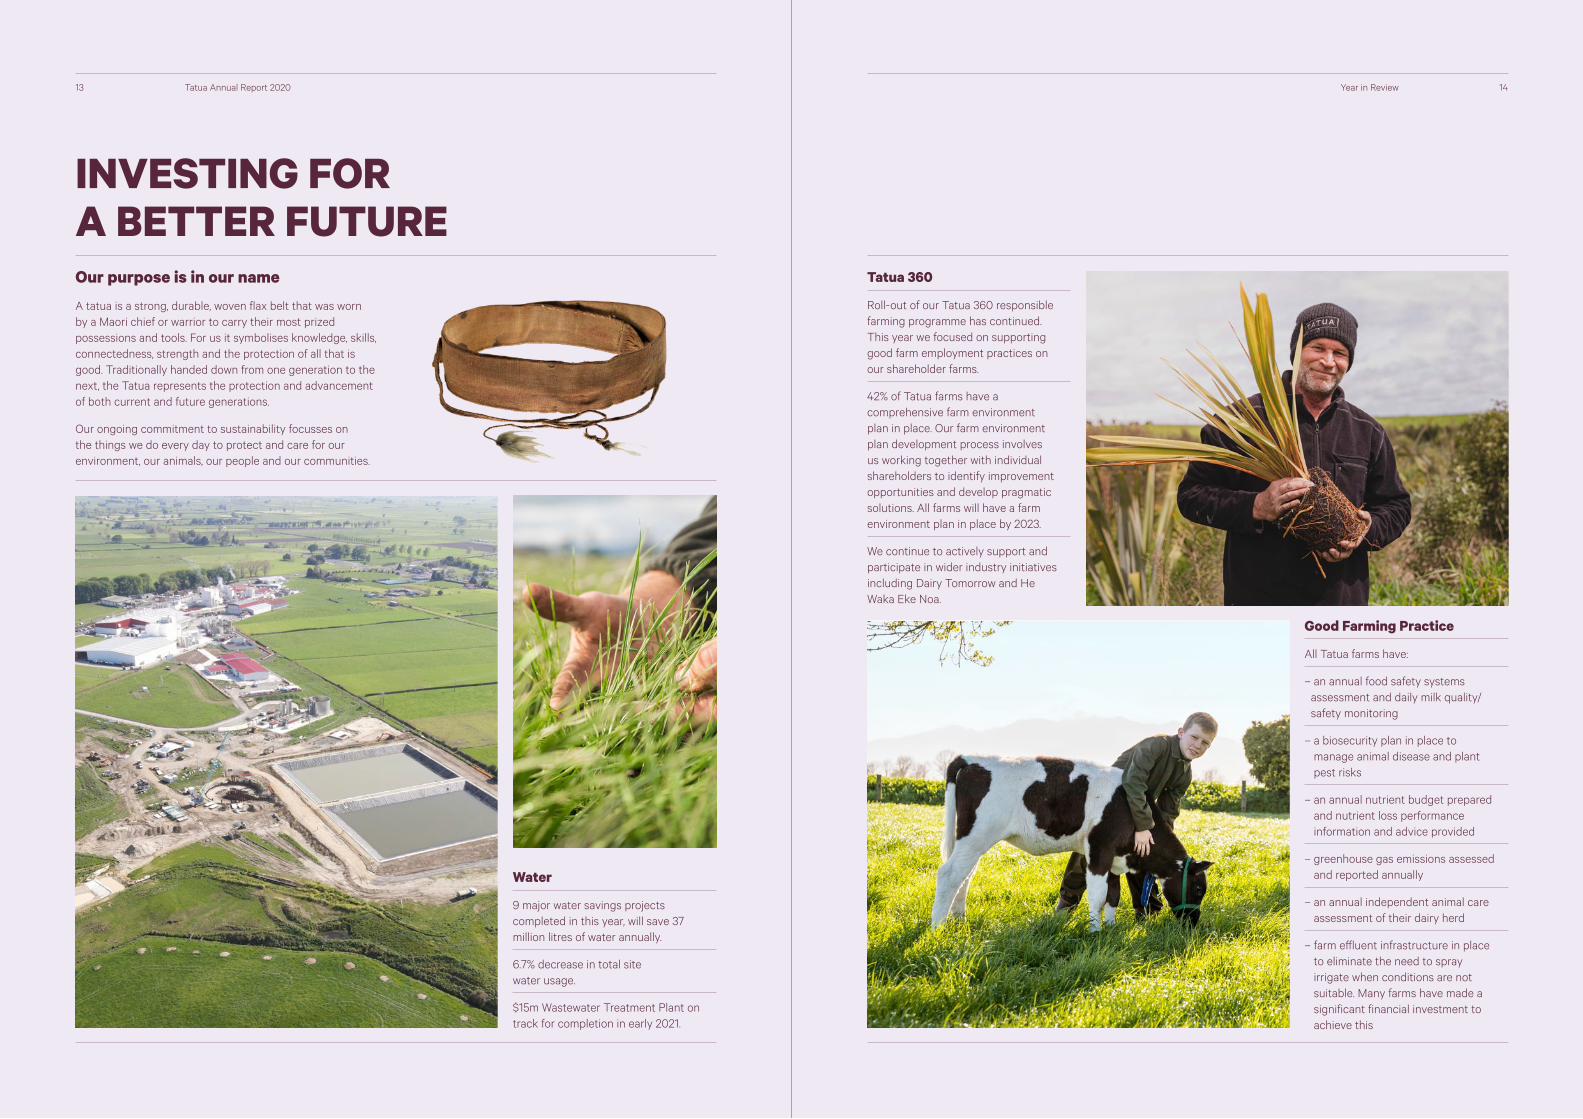
Water
9 major water savings projects completed in this year, will save 37 million litres of water annually.
6.7% decrease in total site water usage.
$15m Wastewater Treatment Plant on track for completion in early 2021.
Tatua 360
Roll-out of our Tatua 360 responsible farming programme has continued. This year we focused on supporting good farm employment practices on our shareholder farms.
42% of Tatua farms have a comprehensive farm environment plan in place. Our farm environment plan development process involves us working together with individual shareholders to identify improvement opportunities and develop pragmatic solutions. All farms will have a farm environment plan in place by 2023.
We continue to actively support and participate in wider industry initiatives including Dairy Tomorrow and He Waka Eke Noa.
Good Farming Practice
All Tatua farms have:
– an annual food safety systems assessment and daily milk quality/safety monitoring
– a biosecurity plan in place to manage animal disease and plant pest risks
– an annual nutrient budget prepared and nutrient loss performance information and advice provided
– greenhouse gas emissions assessed and reported annually
– an annual independent animal care assessment of their dairy herd
– farm effluent infrastructure in place to eliminate the need to spray irrigate when conditions are not suitable. Many farms have made a significant financial investment to achieve this
13 Tatua Annual Report 2020 Year in Review
INVESTING FOR A BETTER FUTUREOur purpose is in our name
A tatua is a strong, durable, woven flax belt that was worn by a Maori chief or warrior to carry their most prized possessions and tools. For us it symbolises knowledge, skills, connectedness, strength and the protection of all that is good. Traditionally handed down from one generation to the next, the Tatua represents the protection and advancement of both current and future generations.
Our ongoing commitment to sustainability focusses on the things we do every day to protect and care for our environment, our animals, our people and our communities.
16Financial Statements
KEY FINANCIAL PERFORMANCE SUMMARY
17
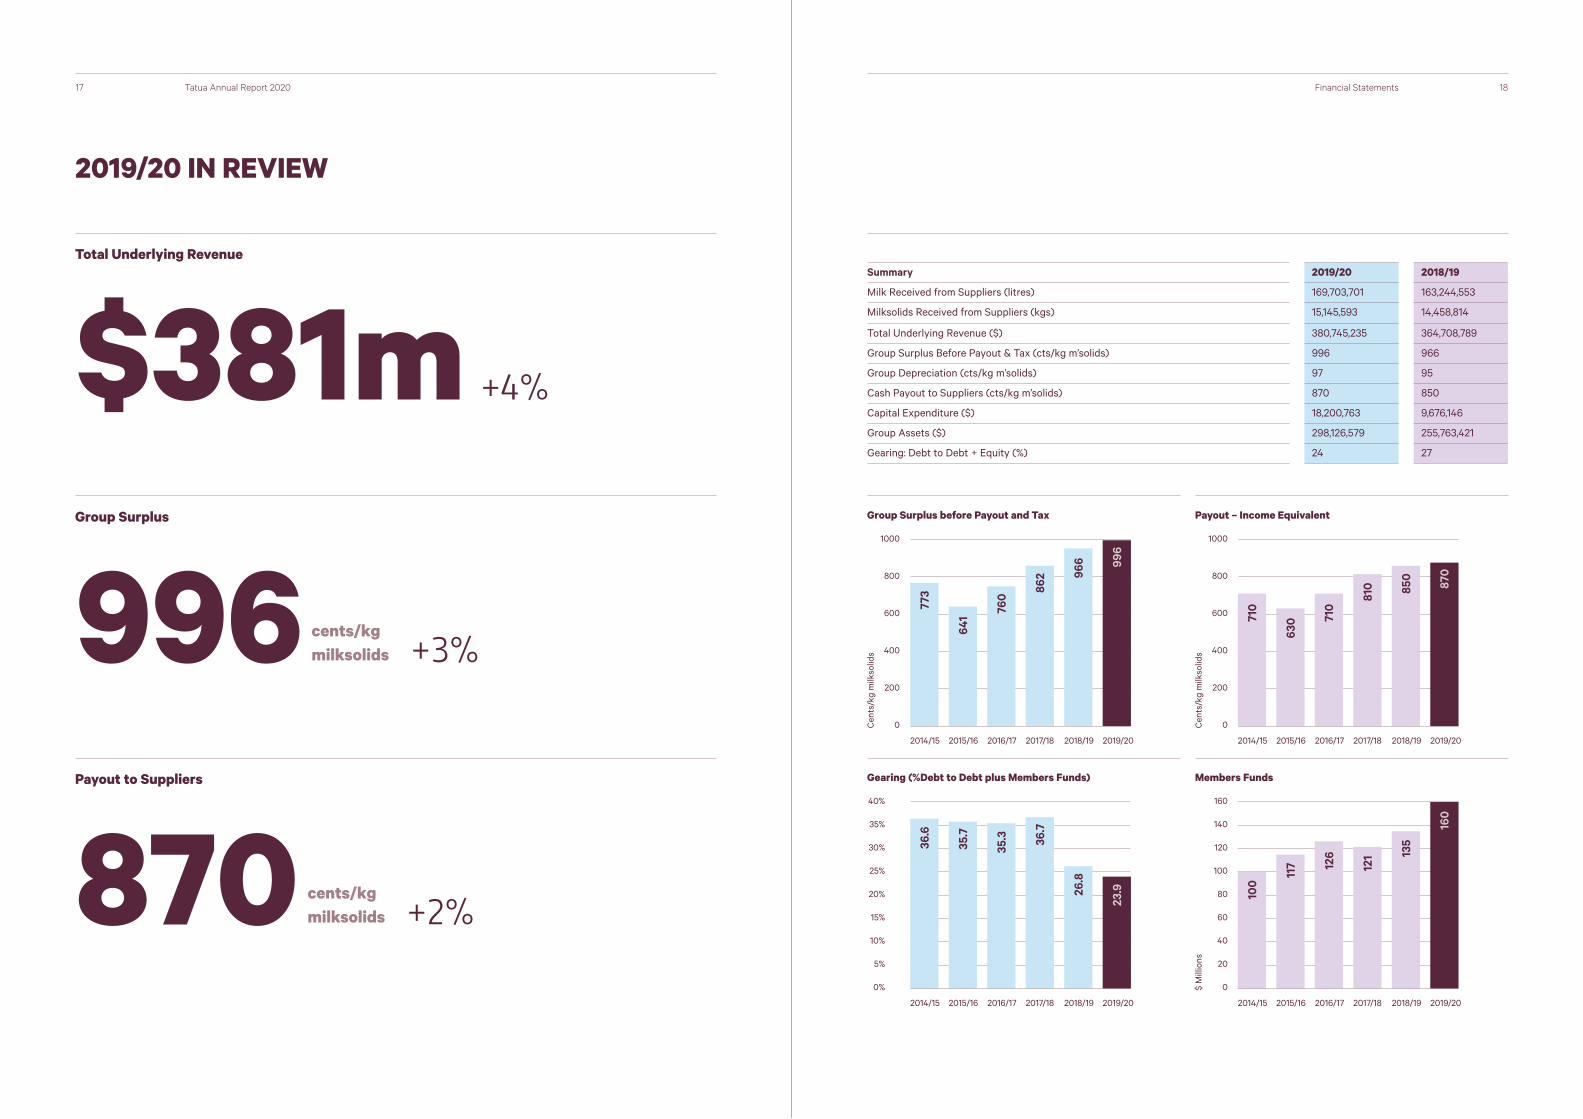
Total Underlying Revenue
Group Surplus
Payout to Suppliers
$381m
996
870
cents/kg milksolids
cents/kg milksolids
Group Surplus before Payout and Tax
Gearing (%Debt to Debt plus Members Funds)
Payout – Income Equivalent
Members Funds
Summary 2019/20 2018/19
Milk Received from Suppliers (litres) 169,703,701 163,244,553
Milksolids Received from Suppliers (kgs) 15,145,593 14,458,814
Total Underlying Revenue ($) 380,745,235 364,708,789
Group Surplus Before Payout & Tax (cts/kg m’solids) 996 966
Group Depreciation (cts/kg m’solids) 97 95
Cash Payout to Suppliers (cts/kg m’solids) 870 850
Capital Expenditure ($) 18,200,763 9,676,146
Group Assets ($) 298,126,579 255,763,421
Gearing: Debt to Debt + Equity (%) 24 27
18
1000
800
600
400
200
0
40%
35%
30%
25%
20%
15%
10%
5%
0%
1000
800
600
400
200
0
160
140
120
100
80
60
40
20
0
Cen
ts/k
g m
ilkso
lids
Cen
ts/k
g m
ilkso
lids
$ M
illio
ns
2014/15
2014/15
2014/15
2014/15
2015/16
2015/16
2015/16
2015/16
2016/17
2016/17
2016/17
2016/17
2017/18
2017/18
2017/18
2017/18
2018/19
2018/19
2018/19
2018/19
2019/20
2019/20
2019/20
2019/20
996
23.9
870
160
966
26.8
850
135
760
35.3
862
36.7
810
121
641
35.7
630
117
773
36.6
710
100
710
126
Tatua Annual Report 2020
2019/20 IN REVIEW
+4%
+2%
+3%
Financial Statements
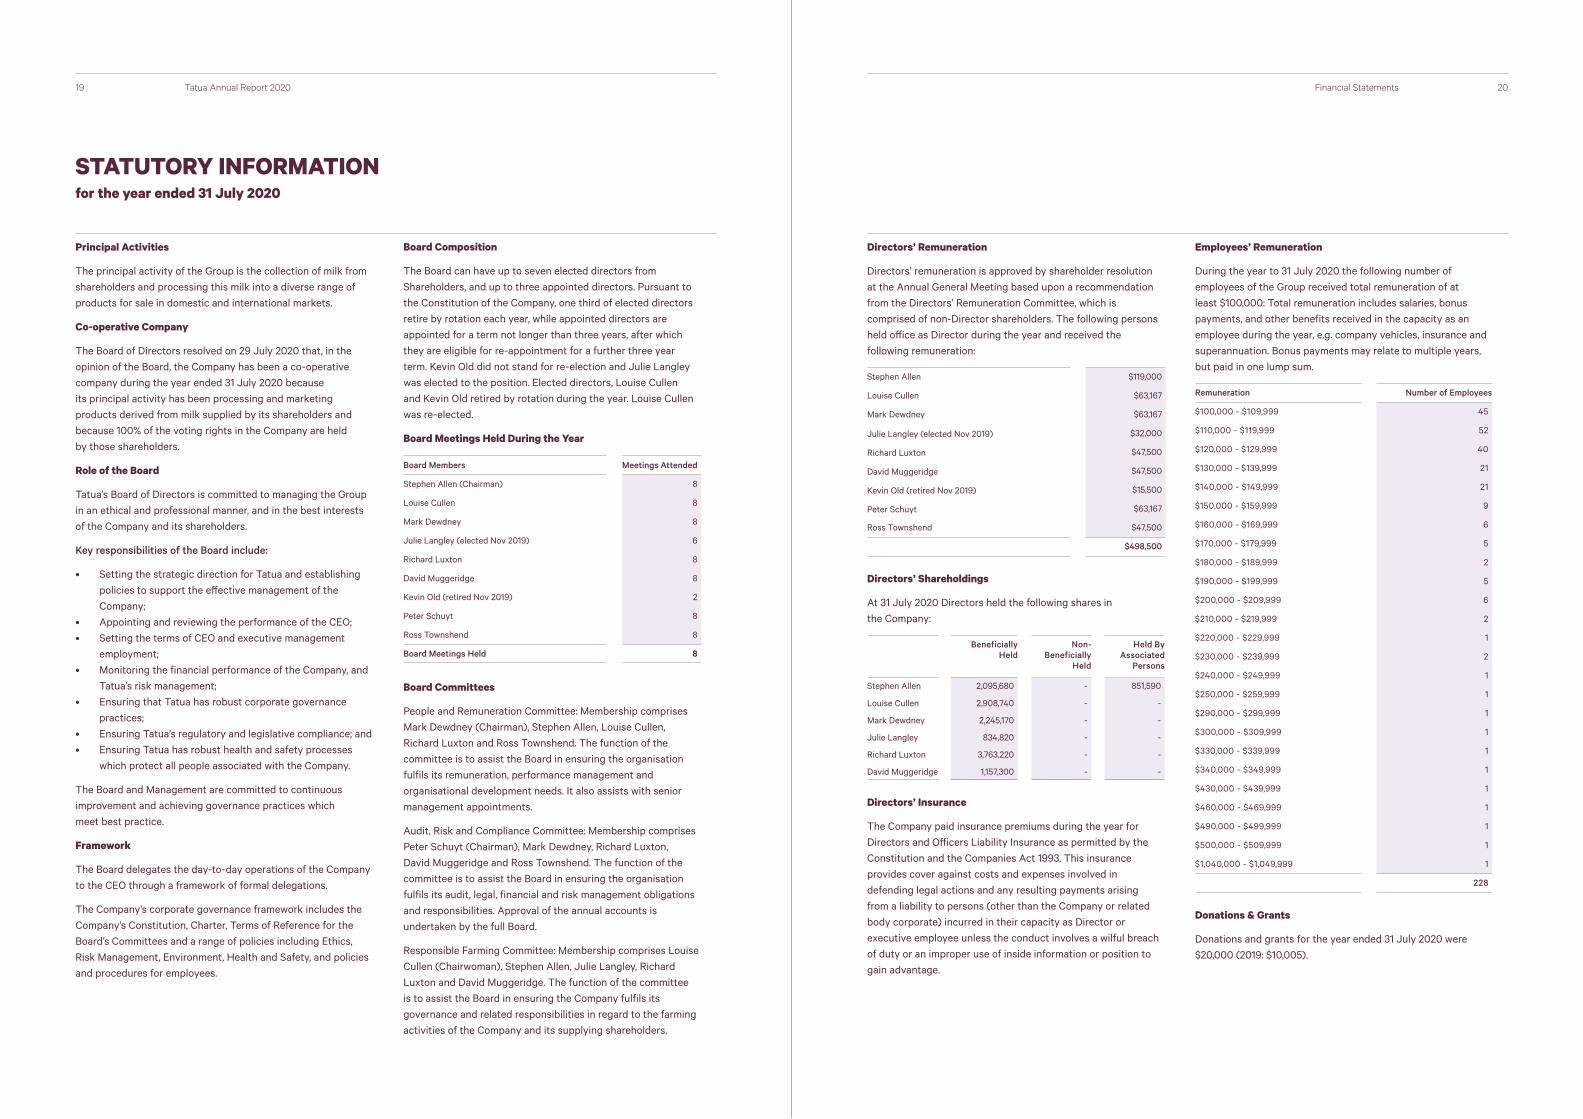
Principal Activities
The principal activity of the Group is the collection of milk from shareholders and processing this milk into a diverse range of products for sale in domestic and international markets.
Co-operative Company
The Board of Directors resolved on 29 July 2020 that, in the opinion of the Board, the Company has been a co-operative company during the year ended 31 July 2020 because its principal activity has been processing and marketing products derived from milk supplied by its shareholders and because 100% of the voting rights in the Company are held by those shareholders.
Role of the Board
Tatua’s Board of Directors is committed to managing the Group in an ethical and professional manner, and in the best interests of the Company and its shareholders.
Key responsibilities of the Board include:
• Setting the strategic direction for Tatua and establishing policies to support the effective management of the Company;
• Appointing and reviewing the performance of the CEO;• Setting the terms of CEO and executive management
employment;• Monitoring the financial performance of the Company, and
Tatua’s risk management;• Ensuring that Tatua has robust corporate governance
practices; • Ensuring Tatua’s regulatory and legislative compliance; and• Ensuring Tatua has robust health and safety processes
which protect all people associated with the Company.
The Board and Management are committed to continuous improvement and achieving governance practices which meet best practice.
Framework
The Board delegates the day-to-day operations of the Company to the CEO through a framework of formal delegations.
The Company’s corporate governance framework includes the Company’s Constitution, Charter, Terms of Reference for the Board’s Committees and a range of policies including Ethics, Risk Management, Environment, Health and Safety, and policies and procedures for employees.
Board Composition
The Board can have up to seven elected directors from Shareholders, and up to three appointed directors. Pursuant to the Constitution of the Company, one third of elected directors retire by rotation each year, while appointed directors are appointed for a term not longer than three years, after which they are eligible for re-appointment for a further three year term. Kevin Old did not stand for re-election and Julie Langley was elected to the position. Elected directors, Louise Cullen and Kevin Old retired by rotation during the year. Louise Cullen was re-elected.
Board Meetings Held During the Year
Board Members Meetings Attended
Stephen Allen (Chairman) 8
Louise Cullen 8
Mark Dewdney 8
Julie Langley (elected Nov 2019) 6
Richard Luxton 8
David Muggeridge 8
Kevin Old (retired Nov 2019) 2
Peter Schuyt 8
Ross Townshend 8
Board Meetings Held 8
Board Committees
People and Remuneration Committee: Membership comprises Mark Dewdney (Chairman), Stephen Allen, Louise Cullen, Richard Luxton and Ross Townshend. The function of the committee is to assist the Board in ensuring the organisation fulfils its remuneration, performance management and organisational development needs. It also assists with senior management appointments.
Audit, Risk and Compliance Committee: Membership comprises Peter Schuyt (Chairman), Mark Dewdney, Richard Luxton, David Muggeridge and Ross Townshend. The function of the committee is to assist the Board in ensuring the organisation fulfils its audit, legal, financial and risk management obligations and responsibilities. Approval of the annual accounts is undertaken by the full Board.
Responsible Farming Committee: Membership comprises Louise Cullen (Chairwoman), Stephen Allen, Julie Langley, Richard Luxton and David Muggeridge. The function of the committee is to assist the Board in ensuring the Company fulfils its governance and related responsibilities in regard to the farming activities of the Company and its supplying shareholders.
STATUTORY INFORMATION
19
Directors’ Remuneration
Directors’ remuneration is approved by shareholder resolution at the Annual General Meeting based upon a recommendation from the Directors’ Remuneration Committee, which is comprised of non-Director shareholders. The following persons held office as Director during the year and received the following remuneration:
Stephen Allen $119,000
Louise Cullen $63,167
Mark Dewdney $63,167
Julie Langley (elected Nov 2019) $32,000
Richard Luxton $47,500
David Muggeridge $47,500
Kevin Old (retired Nov 2019) $15,500
Peter Schuyt $63,167
Ross Townshend $47,500
$498,500
Directors’ Shareholdings
At 31 July 2020 Directors held the following shares in the Company:
Beneficially Held
Non-Beneficially
Held
Held By Associated
Persons
Stephen Allen 2,095,680 - 851,590
Louise Cullen 2,908,740 - -
Mark Dewdney 2,245,170 - -
Julie Langley 834,820 - -
Richard Luxton 3,763,220 - -
David Muggeridge 1,157,300 - -
Directors’ Insurance
The Company paid insurance premiums during the year for Directors and Officers Liability Insurance as permitted by the Constitution and the Companies Act 1993. This insurance provides cover against costs and expenses involved in defending legal actions and any resulting payments arising from a liability to persons (other than the Company or related body corporate) incurred in their capacity as Director or executive employee unless the conduct involves a wilful breach of duty or an improper use of inside information or position to gain advantage.
Employees’ Remuneration
During the year to 31 July 2020 the following number of employees of the Group received total remuneration of at least $100,000: Total remuneration includes salaries, bonus payments, and other benefits received in the capacity as an employee during the year, e.g. company vehicles, insurance and superannuation. Bonus payments may relate to multiple years, but paid in one lump sum.
Remuneration Number of Employees
$100,000 - $109,999 45
$110,000 - $119,999 52
$120,000 - $129,999 40
$130,000 - $139,999 21
$140,000 - $149,999 21
$150,000 - $159,999 9
$160,000 - $169,999 6
$170,000 - $179,999 5
$180,000 - $189,999 2
$190,000 - $199,999 5
$200,000 - $209,999 6
$210,000 - $219,999 2
$220,000 - $229,999 1
$230,000 - $239,999 2
$240,000 - $249,999 1
$250,000 - $259,999 1
$290,000 - $299,999 1
$300,000 - $309,999 1
$330,000 - $339,999 1
$340,000 - $349,999 1
$430,000 - $439,999 1
$460,000 - $469,999 1
$490,000 - $499,999 1
$500,000 - $509,999 1
$1,040,000 - $1,049,999 1
228
Donations & Grants
Donations and grants for the year ended 31 July 2020 were $20,000 (2019: $10,005).
20Tatua Annual Report 2020
for the year ended 31 July 2020
Financial Statements
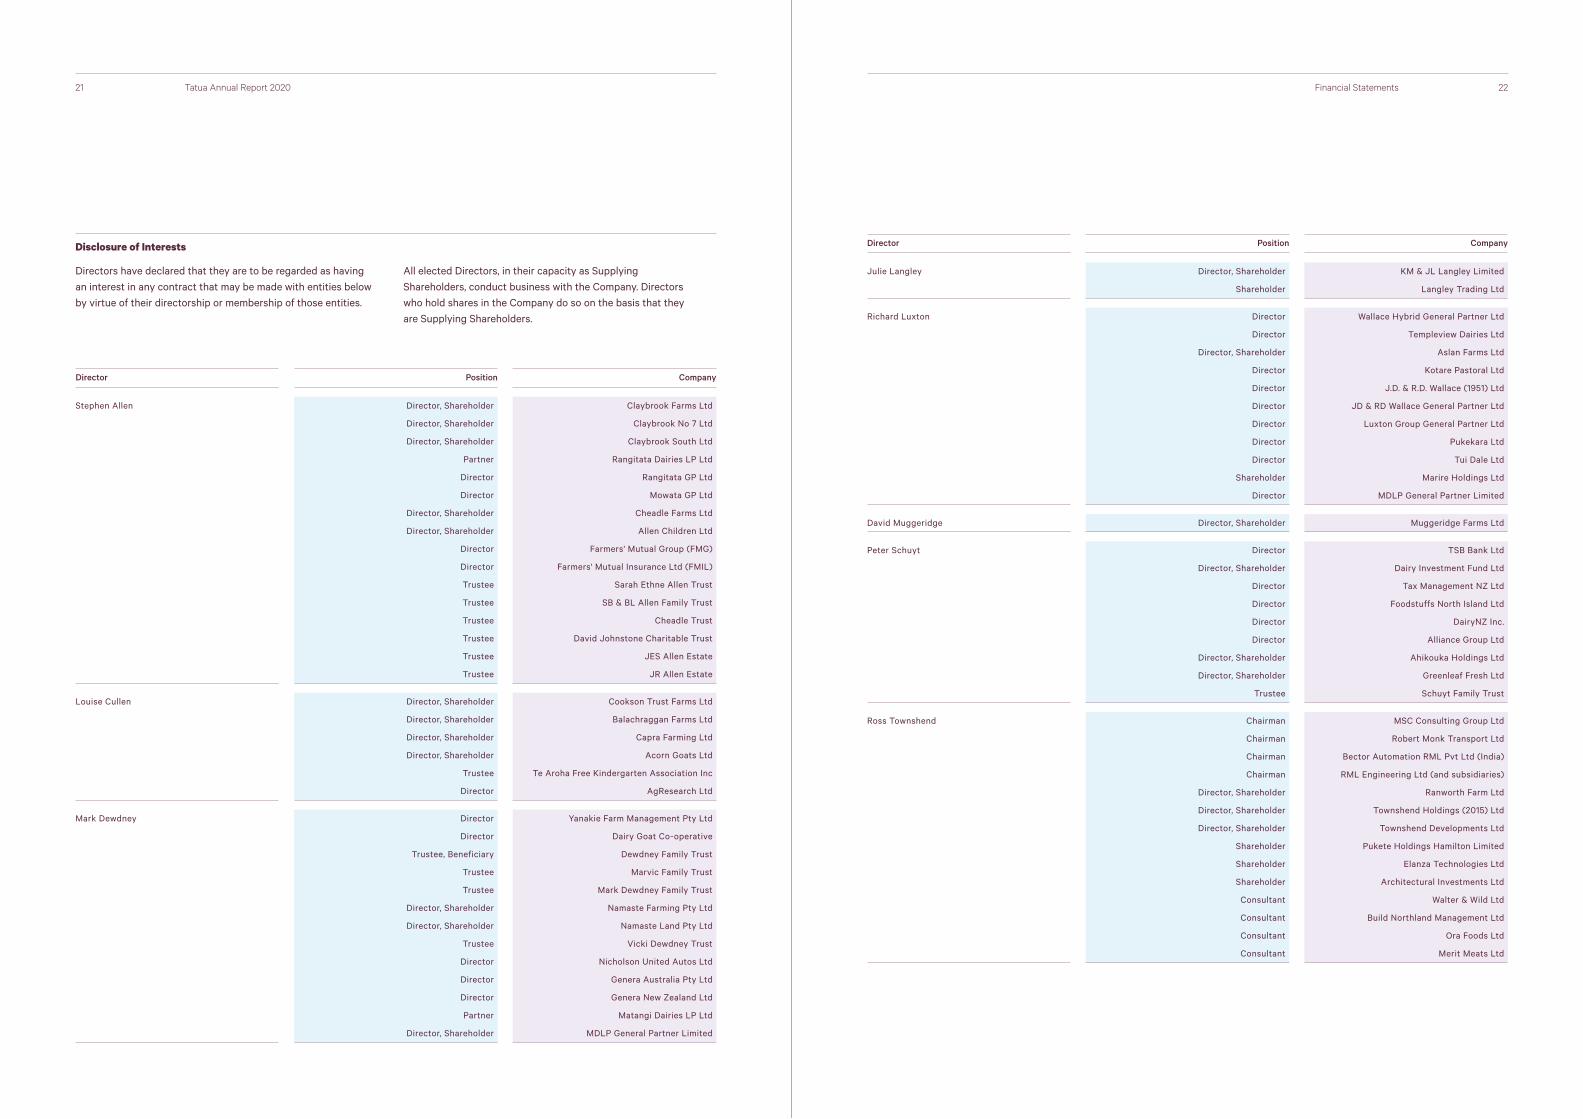
Disclosure of Interests
Directors have declared that they are to be regarded as having an interest in any contract that may be made with entities below by virtue of their directorship or membership of those entities.
All elected Directors, in their capacity as Supplying Shareholders, conduct business with the Company. Directors who hold shares in the Company do so on the basis that they are Supplying Shareholders.
21 22Tatua Annual Report 2020
Director Position Company
Stephen Allen Director, Shareholder Claybrook Farms Ltd
Director, Shareholder Claybrook No 7 Ltd
Director, Shareholder Claybrook South Ltd
Partner Rangitata Dairies LP Ltd
Director Rangitata GP Ltd
Director Mowata GP Ltd
Director, Shareholder Cheadle Farms Ltd
Director, Shareholder Allen Children Ltd
Director Farmers' Mutual Group (FMG)
Director Farmers' Mutual Insurance Ltd (FMIL)
Trustee Sarah Ethne Allen Trust
Trustee SB & BL Allen Family Trust
Trustee Cheadle Trust
Trustee David Johnstone Charitable Trust
Trustee JES Allen Estate
Trustee JR Allen Estate
Louise Cullen Director, Shareholder Cookson Trust Farms Ltd
Director, Shareholder Balachraggan Farms Ltd
Director, Shareholder Capra Farming Ltd
Director, Shareholder Acorn Goats Ltd
Trustee Te Aroha Free Kindergarten Association Inc
Director AgResearch Ltd
Mark Dewdney Director Yanakie Farm Management Pty Ltd
Director Dairy Goat Co-operative
Trustee, Beneficiary Dewdney Family Trust
Trustee Marvic Family Trust
Trustee Mark Dewdney Family Trust
Director, Shareholder Namaste Farming Pty Ltd
Director, Shareholder Namaste Land Pty Ltd
Trustee Vicki Dewdney Trust
Director Nicholson United Autos Ltd
Director Genera Australia Pty Ltd
Director Genera New Zealand Ltd
Partner Matangi Dairies LP Ltd
Director, Shareholder MDLP General Partner Limited
Director Position Company
Julie Langley Director, Shareholder KM & JL Langley Limited
Shareholder Langley Trading Ltd
Richard Luxton Director Wallace Hybrid General Partner Ltd
Director Templeview Dairies Ltd
Director, Shareholder Aslan Farms Ltd
Director Kotare Pastoral Ltd
Director J.D. & R.D. Wallace (1951) Ltd
Director JD & RD Wallace General Partner Ltd
Director Luxton Group General Partner Ltd
Director Pukekara Ltd
Director Tui Dale Ltd
Shareholder Marire Holdings Ltd
Director MDLP General Partner Limited
David Muggeridge Director, Shareholder Muggeridge Farms Ltd
Peter Schuyt Director TSB Bank Ltd
Director, Shareholder Dairy Investment Fund Ltd
Director Tax Management NZ Ltd
Director Foodstuffs North Island Ltd
Director DairyNZ Inc.
Director Alliance Group Ltd
Director, Shareholder Ahikouka Holdings Ltd
Director, Shareholder Greenleaf Fresh Ltd
Trustee Schuyt Family Trust
Ross Townshend Chairman MSC Consulting Group Ltd
Chairman Robert Monk Transport Ltd
Chairman Bector Automation RML Pvt Ltd (India)
Chairman RML Engineering Ltd (and subsidiaries)
Director, Shareholder Ranworth Farm Ltd
Director, Shareholder Townshend Holdings (2015) Ltd
Director, Shareholder Townshend Developments Ltd
Shareholder Pukete Holdings Hamilton Limited
Shareholder Elanza Technologies Ltd
Shareholder Architectural Investments Ltd
Consultant Walter & Wild Ltd
Consultant Build Northland Management Ltd
Consultant Ora Foods Ltd
Consultant Merit Meats Ltd
Financial Statements
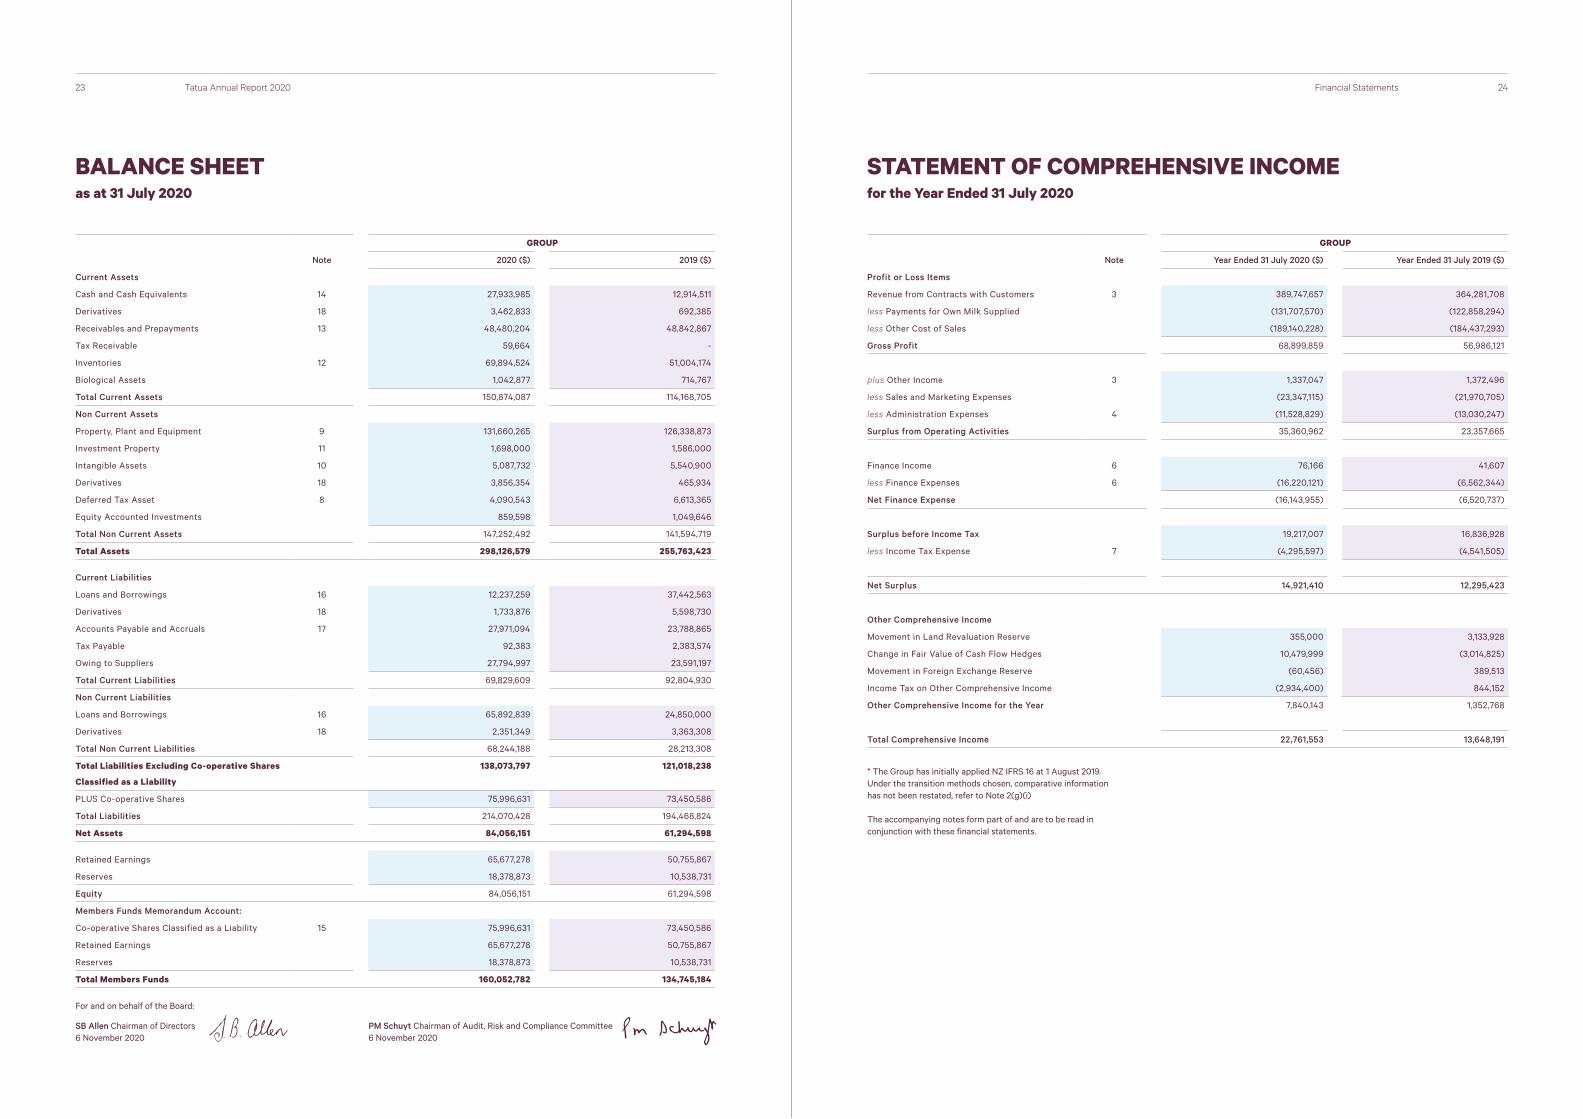
BALANCE SHEET STATEMENT OF COMPREHENSIVE INCOME
23 24Tatua Annual Report 2020
for the Year Ended 31 July 2020
GROUP
Note 2020 ($) 2019 ($)
Current Assets
Cash and Cash Equivalents 14 27,933,985 12,914,511
Derivatives 18 3,462,833 692,385
Receivables and Prepayments 13 48,480,204 48,842,867
Tax Receivable 59,664 -
Inventories 12 69,894,524 51,004,174
Biological Assets 1,042,877 714,767
Total Current Assets 150,874,087 114,168,705
Non Current Assets
Property, Plant and Equipment 9 131,660,265 126,338,873
Investment Property 11 1,698,000 1,586,000
Intangible Assets 10 5,087,732 5,540,900
Derivatives 18 3,856,354 465,934
Deferred Tax Asset 8 4,090,543 6,613,365
Equity Accounted Investments 859,598 1,049,646
Total Non Current Assets 147,252,492 141,594,719
Total Assets 298,126,579 255,763,423
Current Liabilities
Loans and Borrowings 16 12,237,259 37,442,563
Derivatives 18 1,733,876 5,598,730
Accounts Payable and Accruals 17 27,971,094 23,788,865
Tax Payable 92,383 2,383,574
Owing to Suppliers 27,794,997 23,591,197
Total Current Liabilities 69,829,609 92,804,930
Non Current Liabilities
Loans and Borrowings 16 65,892,839 24,850,000
Derivatives 18 2,351,349 3,363,308
Total Non Current Liabilities 68,244,188 28,213,308
Total Liabilities Excluding Co-operative Shares
Classified as a Liability
138,073,797 121,018,238
PLUS Co-operative Shares 75,996,631 73,450,586
Total Liabilities 214,070,428 194,468,824
Net Assets 84,056,151 61,294,598
Retained Earnings 65,677,278 50,755,867
Reserves 18,378,873 10,538,731
Equity 84,056,151 61,294,598
Members Funds Memorandum Account:
Co-operative Shares Classified as a Liability 15 75,996,631 73,450,586
Retained Earnings 65,677,278 50,755,867
Reserves 18,378,873 10,538,731
Total Members Funds 160,052,782 134,745,184
GROUP
Note Year Ended 31 July 2020 ($) Year Ended 31 July 2019 ($)
Profit or Loss Items
Revenue from Contracts with Customers 3 389,747,657 364,281,708
less Payments for Own Milk Supplied (131,707,570) (122,858,294)
less Other Cost of Sales (189,140,228) (184,437,293)
Gross Profit 68,899,859 56,986,121
plus Other Income 3 1,337,047 1,372,496
less Sales and Marketing Expenses (23,347,115) (21,970,705)
less Administration Expenses 4 (11,528,829) (13,030,247)
Surplus from Operating Activities 35,360,962 23,357,665
Finance Income 6 76,166 41,607
less Finance Expenses 6 (16,220,121) (6,562,344)
Net Finance Expense (16,143,955) (6,520,737)
Surplus before Income Tax 19,217,007 16,836,928
less Income Tax Expense 7 (4,295,597) (4,541,505)
Net Surplus 14,921,410 12,295,423
Other Comprehensive Income
Movement in Land Revaluation Reserve 355,000 3,133,928
Change in Fair Value of Cash Flow Hedges 10,479,999 (3,014,825)
Movement in Foreign Exchange Reserve (60,456) 389,513
Income Tax on Other Comprehensive Income (2,934,400) 844,152
Other Comprehensive Income for the Year 7,840,143 1,352,768
Total Comprehensive Income 22,761,553 13,648,191
* The Group has initially applied NZ IFRS 16 at 1 August 2019. Under the transition methods chosen, comparative information has not been restated, refer to Note 2(g)(i) The accompanying notes form part of and are to be read in conjunction with these financial statements.
For and on behalf of the Board:
SB Allen Chairman of Directors 6 November 2020
PM Schuyt Chairman of Audit, Risk and Compliance Committee 6 November 2020
Financial Statements
as at 31 July 2020
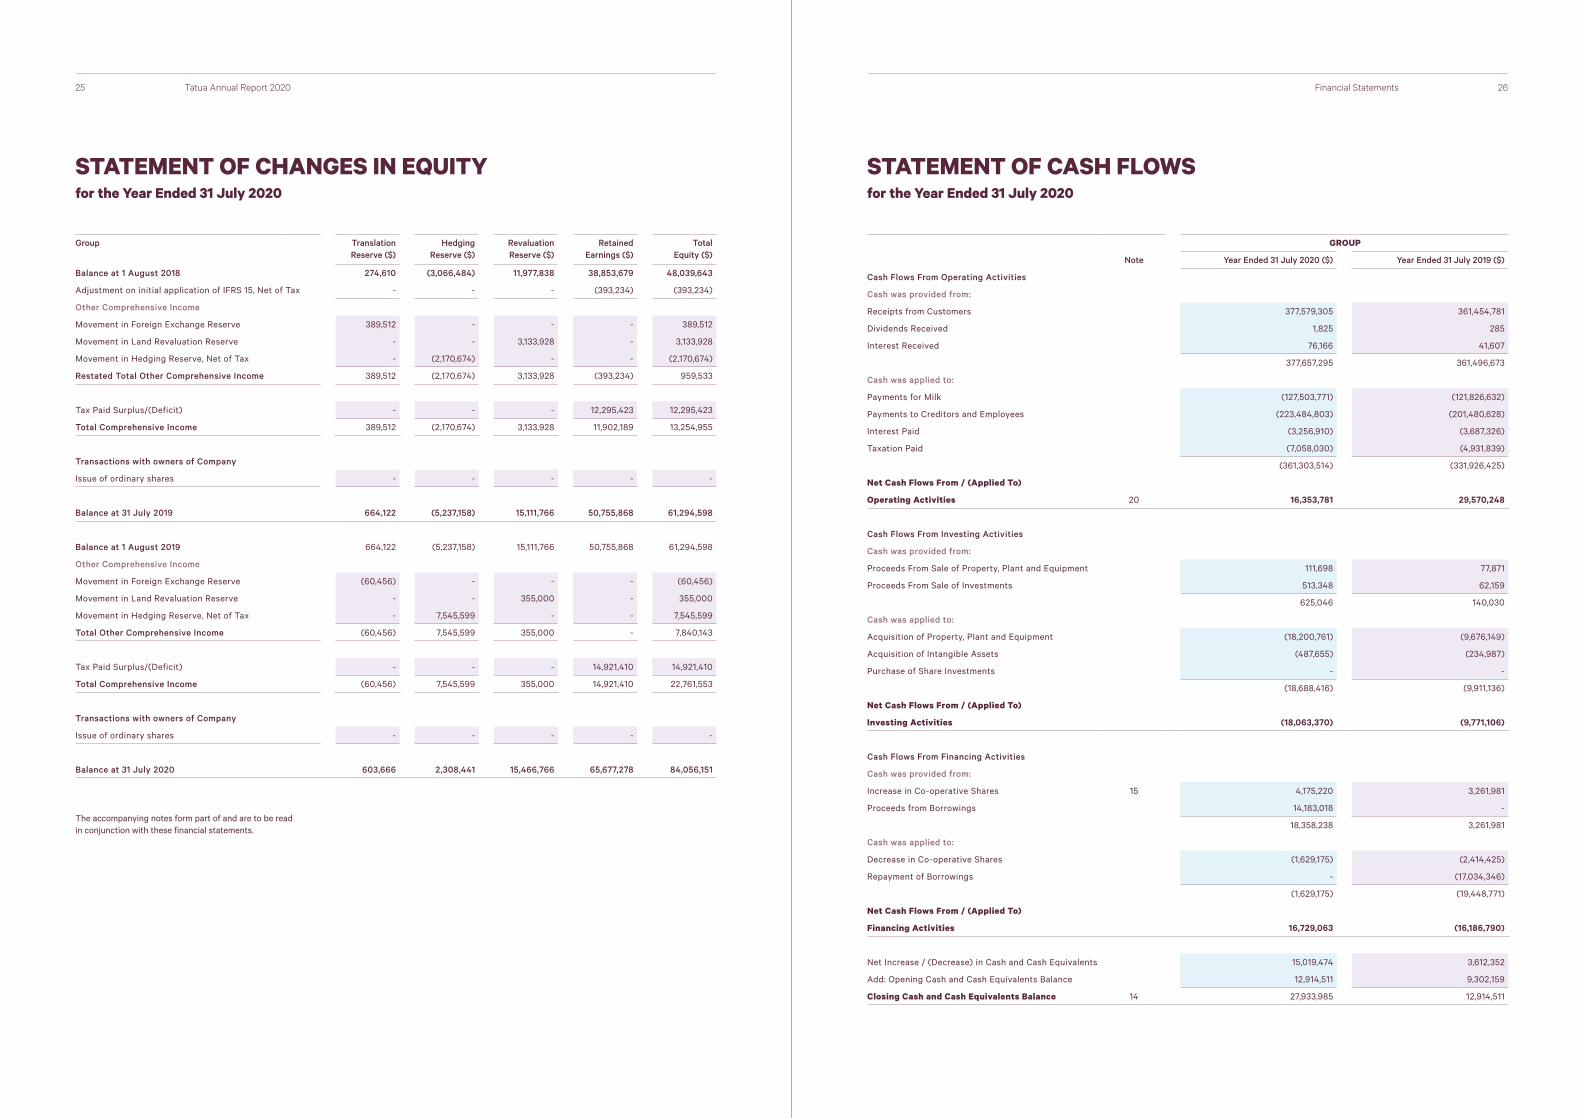
STATEMENT OF CHANGES IN EQUITY STATEMENT OF CASH FLOWS
25 26Tatua Annual Report 2020
for the Year Ended 31 July 2020 for the Year Ended 31 July 2020
Group Translation Reserve ($)
Hedging Reserve ($)
Revaluation Reserve ($)
Retained Earnings ($)
Total Equity ($)
Balance at 1 August 2018 274,610 (3,066,484) 11,977,838 38,853,679 48,039,643
Adjustment on initial application of IFRS 15, Net of Tax - - - (393,234) (393,234)
Other Comprehensive Income
Movement in Foreign Exchange Reserve 389,512 - - - 389,512
Movement in Land Revaluation Reserve - - 3,133,928 - 3,133,928
Movement in Hedging Reserve, Net of Tax - (2,170,674) - - (2,170,674)
Restated Total Other Comprehensive Income 389,512 (2,170,674) 3,133,928 (393,234) 959,533
Tax Paid Surplus/(Deficit) - - - 12,295,423 12,295,423
Total Comprehensive Income 389,512 (2,170,674) 3,133,928 11,902,189 13,254,955
Transactions with owners of Company
Issue of ordinary shares - - - - -
Balance at 31 July 2019 664,122 (5,237,158) 15,111,766 50,755,868 61,294,598
Balance at 1 August 2019 664,122 (5,237,158) 15,111,766 50,755,868 61,294,598
Other Comprehensive Income
Movement in Foreign Exchange Reserve (60,456) - - - (60,456)
Movement in Land Revaluation Reserve - - 355,000 - 355,000
Movement in Hedging Reserve, Net of Tax - 7,545,599 - - 7,545,599
Total Other Comprehensive Income (60,456) 7,545,599 355,000 - 7,840,143
Tax Paid Surplus/(Deficit) - - - 14,921,410 14,921,410
Total Comprehensive Income (60,456) 7,545,599 355,000 14,921,410 22,761,553
Transactions with owners of Company
Issue of ordinary shares - - - - -
Balance at 31 July 2020 603,666 2,308,441 15,466,766 65,677,278 84,056,151
The accompanying notes form part of and are to be read in conjunction with these financial statements.
GROUP
Note Year Ended 31 July 2020 ($) Year Ended 31 July 2019 ($)
Cash Flows From Operating Activities
Cash was provided from:
Receipts from Customers 377,579,305 361,454,781
Dividends Received 1,825 285
Interest Received 76,166 41,607
377,657,295 361,496,673
Cash was applied to:
Payments for Milk (127,503,771) (121,826,632)
Payments to Creditors and Employees (223,484,803) (201,480,628)
Interest Paid (3,256,910) (3,687,326)
Taxation Paid (7,058,030) (4,931,839)
(361,303,514) (331,926,425)
Net Cash Flows From / (Applied To)
Operating Activities 20 16,353,781 29,570,248
Cash Flows From Investing Activities
Cash was provided from:
Proceeds From Sale of Property, Plant and Equipment 111,698 77,871
Proceeds From Sale of Investments 513,348 62,159
625,046 140,030
Cash was applied to:
Acquisition of Property, Plant and Equipment (18,200,761) (9,676,149)
Acquisition of Intangible Assets (487,655) (234,987)
Purchase of Share Investments - -
(18,688,416) (9,911,136)
Net Cash Flows From / (Applied To)
Investing Activities (18,063,370) (9,771,106)
Cash Flows From Financing Activities
Cash was provided from:
Increase in Co-operative Shares 15 4,175,220 3,261,981
Proceeds from Borrowings 14,183,018 -
18,358,238 3,261,981
Cash was applied to:
Decrease in Co-operative Shares (1,629,175) (2,414,425)
Repayment of Borrowings - (17,034,346)
(1,629,175) (19,448,771)
Net Cash Flows From / (Applied To)
Financing Activities 16,729,063 (16,186,790)
Net Increase / (Decrease) in Cash and Cash Equivalents 15,019,474 3,612,352
Add: Opening Cash and Cash Equivalents Balance 12,914,511 9,302,159
Closing Cash and Cash Equivalents Balance 14 27,933,985 12,914,511
Financial Statements

NOTES TO THE FINANCIAL STATEMENTS
27 28Tatua Annual Report 2020
1— Reporting Entity
2— Basis of Preparation
3— Operating Revenue & Other Income
4— Administration Expenses
5— Personnel Expenses
6— Finance Income & Expense
7— Income Tax Expense
8— Deferred Tax Assets & Liabilities
9— Property, Plant & Equipment
10— Intangible Assets
11— Investment Property
12— Inventories
13— Receivables & Prepayments
14— Cash & Cash Equivalents
15— Members Funds
16— Loans & Borrowings
17— Accounts Payable & Accruals
18— Derivatives
19— Financial Risk Management
20— Reconciliation of Cash Flows from Operating Activities
21— Related Party Transactions
22— Group Entities
23— Subsequent Events
1—REPORTING ENTITY
The Tatua Co-operative Dairy Company Limited (the parent company) is a co-operative company domiciled and incorporated in New Zealand, and registered under the Co-operative Companies Act 1996 and the Companies Act 1993. At 31 July 2020 the Group consists of The Tatua Co-operative Dairy Company Ltd and its subsidiaries Tatua Japan Co. Ltd, Tatua Dairy Products (Shanghai) Co., Ltd and Tatua USA Ltd.
Tatua is an FMC reporting entity in terms of the Financial Markets Conduct Act. The Group is a producer and marketer of dairy products with sales to both domestic and export markets. These financial statements are for the year ended 31 July 2020.
2—BASIS OF PREPARATION
The financial statements have been prepared on a going concern basis.
(a) Statement of Compliance and Basis of Preparation
The financial statements have been prepared in accordance with Generally Accepted Accounting Practice in New Zealand (NZ GAAP). They comply with New Zealand equivalents to International Financial Reporting Standards (NZ IFRS) and other applicable Financial Reporting Standards, as appropriate for profit oriented entities. These financial statements also comply with International Financial Reporting Standards (IFRS).
These accounting policies have been applied consistently to all periods presented in these financial statements except as noted in Note 2(g)(i).
These financial statements were approved by the Board of Directors on 6 November 2020, and have been prepared in accordance with the New Zealand Companies Act 1993 and the Financial Reporting Act 2013.
(b) Basis of Measurement
The financial statements are prepared on the historical cost basis except for the following:
— Land is measured at fair value. Refer to Note 9. — Biological assets are measured at fair value less point-of-
sale costs. — Investment property is measured at fair value. Refer to
Note 11. — Derivative financial instruments are measured at fair value.
Refer to Note 18. — The carrying value of financial instruments measured at
amortised cost equals their fair values.
(c) Functional and Presentation Currency
The financial statements are presented in New Zealand dollars (NZD), which is the Company’s functional currency. Monetary assets and liabilities denominated in foreign currencies at the reporting dates are retranslated to the functional currency
at the exchange rate at that date. All financial information presented has been rounded to the nearest dollar.
(d) Use of Estimates and Judgement
The preparation of financial statements requires management to make judgements, estimates and assumptions that affect the application of accounting policies and the reported amounts of assets, liabilities, income, and expenses. Actual results may differ from these estimates.
Estimates and underlying assumptions are reviewed on an ongoing basis. Revisions to accounting estimates are recognised in the period in which the estimate is revised and in any future periods affected. In particular, information about significant areas of estimation, uncertainty and critical judgements in applying accounting policies that have the most significant effect on the amount recognised in the financial statements are described in the following notes:
Note 12. – Milk cost included in inventory
(e) Goods and Services Tax
The financial statements have been prepared on a GST exclusive basis, except for Accounts Receivable and Accounts Payable which are stated inclusive of GST.
(f) Impact of COVID-19
In preparing these financial statements, the directors have considered the potential impacts of COVID-19 on future revenues, asset values and other areas, and believe any impacts are appropriately recognized.
(g) New Standards and Interpretations
(i) New and amended standards adopted by the Group
Financial Statements
30
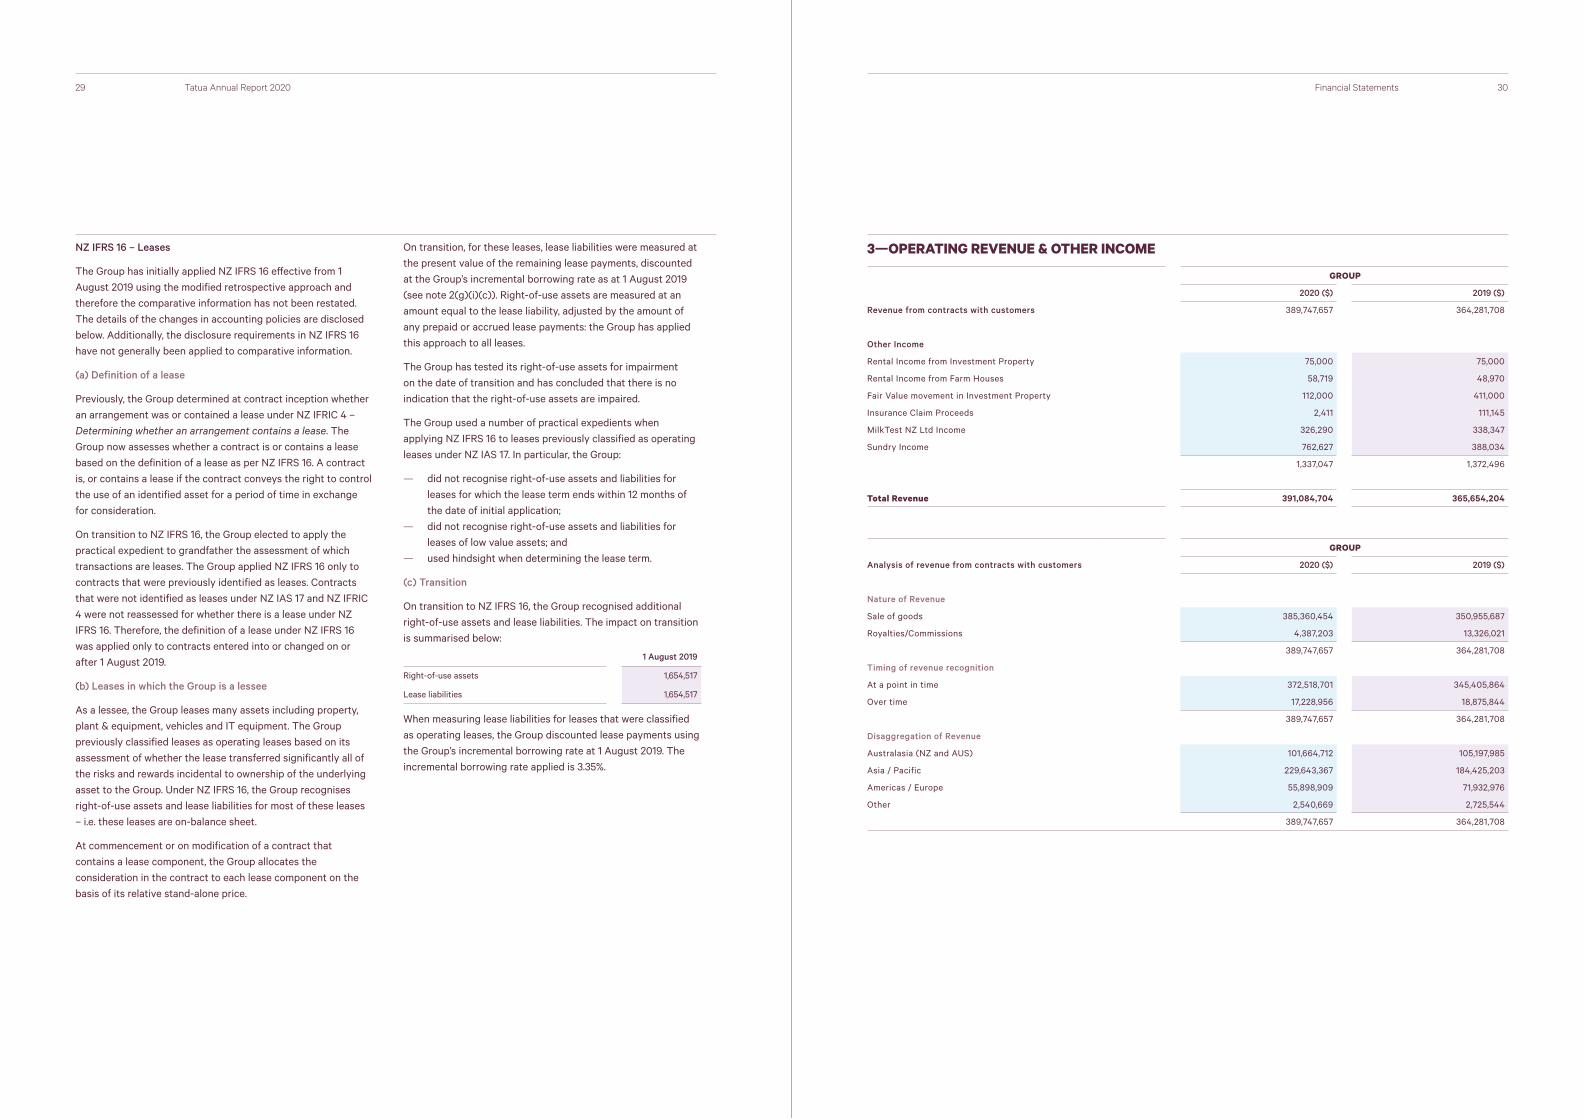
3—OPERATING REVENUE & OTHER INCOME
GROUP
2020 ($) 2019 ($)
Revenue from contracts with customers 389,747,657 364,281,708
Other Income
Rental Income from Investment Property 75,000 75,000
Rental Income from Farm Houses 58,719 48,970
Fair Value movement in Investment Property 112,000 411,000
Insurance Claim Proceeds 2,411 111,145
MilkTest NZ Ltd Income 326,290 338,347
Sundry Income 762,627 388,034
1,337,047 1,372,496
Total Revenue 391,084,704 365,654,204
GROUP
Analysis of revenue from contracts with customers 2020 ($) 2019 ($)
Nature of Revenue
Sale of goods 385,360,454 350,955,687
Royalties/Commissions 4,387,203 13,326,021
389,747,657 364,281,708
Timing of revenue recognition
At a point in time 372,518,701 345,405,864
Over time 17,228,956 18,875,844
389,747,657 364,281,708
Disaggregation of Revenue
Australasia (NZ and AUS) 101,664,712 105,197,985
Asia / Pacific 229,643,367 184,425,203
Americas / Europe 55,898,909 71,932,976
Other 2,540,669 2,725,544
389,747,657 364,281,708
NZ IFRS 16 – Leases
The Group has initially applied NZ IFRS 16 effective from 1 August 2019 using the modified retrospective approach and therefore the comparative information has not been restated. The details of the changes in accounting policies are disclosed below. Additionally, the disclosure requirements in NZ IFRS 16 have not generally been applied to comparative information.
(a) Definition of a lease
Previously, the Group determined at contract inception whether an arrangement was or contained a lease under NZ IFRIC 4 – Determining whether an arrangement contains a lease. The Group now assesses whether a contract is or contains a lease based on the definition of a lease as per NZ IFRS 16. A contract is, or contains a lease if the contract conveys the right to control the use of an identified asset for a period of time in exchange for consideration.
On transition to NZ IFRS 16, the Group elected to apply the practical expedient to grandfather the assessment of which transactions are leases. The Group applied NZ IFRS 16 only to contracts that were previously identified as leases. Contracts that were not identified as leases under NZ IAS 17 and NZ IFRIC 4 were not reassessed for whether there is a lease under NZ IFRS 16. Therefore, the definition of a lease under NZ IFRS 16 was applied only to contracts entered into or changed on or after 1 August 2019.
(b) Leases in which the Group is a lessee
As a lessee, the Group leases many assets including property, plant & equipment, vehicles and IT equipment. The Group previously classified leases as operating leases based on its assessment of whether the lease transferred significantly all of the risks and rewards incidental to ownership of the underlying asset to the Group. Under NZ IFRS 16, the Group recognises right-of-use assets and lease liabilities for most of these leases – i.e. these leases are on-balance sheet.
At commencement or on modification of a contract that contains a lease component, the Group allocates the consideration in the contract to each lease component on the basis of its relative stand-alone price.
On transition, for these leases, lease liabilities were measured at the present value of the remaining lease payments, discounted at the Group’s incremental borrowing rate as at 1 August 2019 (see note 2(g)(i)(c)). Right-of-use assets are measured at an amount equal to the lease liability, adjusted by the amount of any prepaid or accrued lease payments: the Group has applied this approach to all leases.
The Group has tested its right-of-use assets for impairment on the date of transition and has concluded that there is no indication that the right-of-use assets are impaired.
The Group used a number of practical expedients when applying NZ IFRS 16 to leases previously classified as operating leases under NZ IAS 17. In particular, the Group:
— did not recognise right-of-use assets and liabilities for leases for which the lease term ends within 12 months of the date of initial application;
— did not recognise right-of-use assets and liabilities for leases of low value assets; and
— used hindsight when determining the lease term.
(c) Transition
On transition to NZ IFRS 16, the Group recognised additional right-of-use assets and lease liabilities. The impact on transition is summarised below:
1 August 2019
Right-of-use assets 1,654,517
Lease liabilities 1,654,517
When measuring lease liabilities for leases that were classified as operating leases, the Group discounted lease payments using the Group’s incremental borrowing rate at 1 August 2019. The incremental borrowing rate applied is 3.35%.
29 Tatua Annual Report 2020 Financial Statements
32
Policy
(a) Revenue from contracts with customers
Revenue from the sale of goods is measured based on the consideration specified in a contract with customers, net of returns and allowances, trade discounts and volume rebates.
Revenue recognised at a point in time
The Group has assessed that its contracts include two performance obligations, being the supply of goods and the arrangement of and payment for shipping on behalf of the customer. The amount of revenue recorded excludes the amount attributable to shipping costs on behalf of the customer as that is an agency arrangement.
Revenue is recognised when the performance obligation, being the supply of goods, has been satisfied and control has passed to the customer. Transfer of control varies depending on the individual terms of the contract of sale but for the majority of the Group’s export sales, revenue is recognised at the point in time when the goods have been loaded onto a ship at the port of departure. In respect of the majority of domestic sales within New Zealand, control is considered to be transferred to the customer when the goods have dispatched the Tatua warehouse.
Revenue recognised over time
Revenue relating to contract manufacturing is recognised over time. Under these contracts the product is made to a customer’s specifications using customer’s intellectual property, and if the contract is terminated by the customer then the Group is entitled to reimbursement of the costs incurred to date, including a reasonable margin.
(b) Other Income
Sundry income is measured at the fair value of consideration received or receivable.
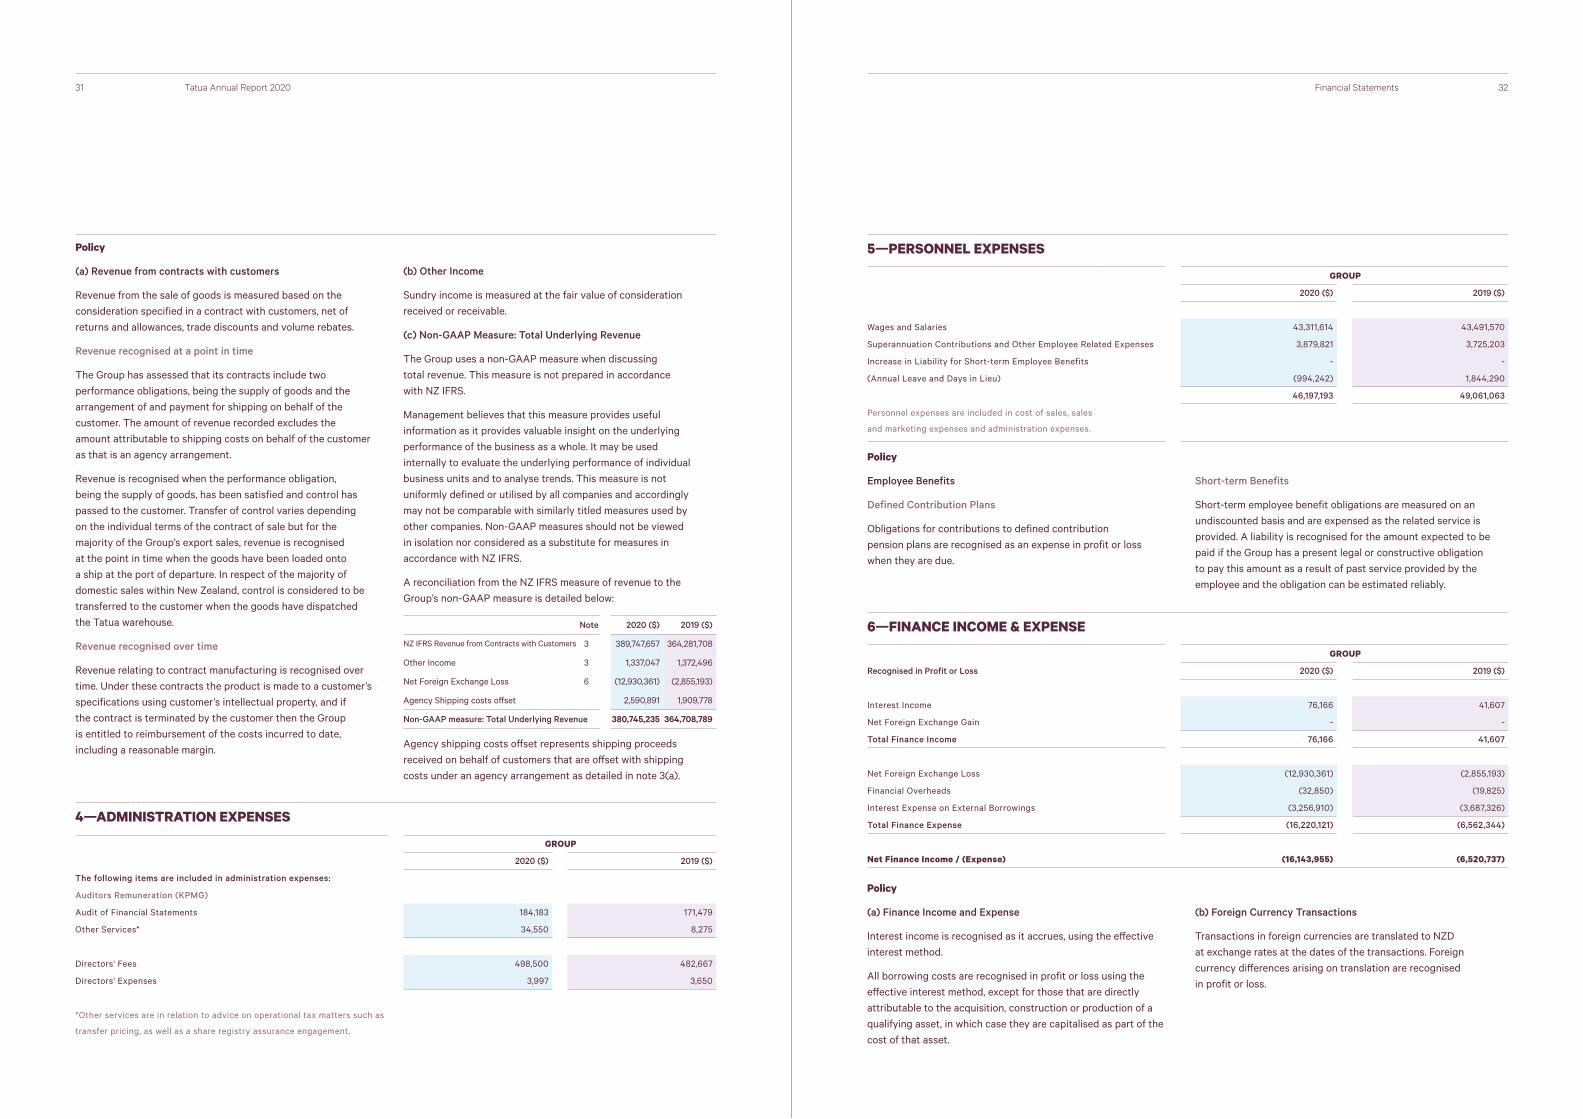
(c) Non-GAAP Measure: Total Underlying Revenue
The Group uses a non-GAAP measure when discussing total revenue. This measure is not prepared in accordance with NZ IFRS.
Management believes that this measure provides useful information as it provides valuable insight on the underlying performance of the business as a whole. It may be used internally to evaluate the underlying performance of individual business units and to analyse trends. This measure is not uniformly defined or utilised by all companies and accordingly may not be comparable with similarly titled measures used by other companies. Non-GAAP measures should not be viewed in isolation nor considered as a substitute for measures in accordance with NZ IFRS.
A reconciliation from the NZ IFRS measure of revenue to the Group’s non-GAAP measure is detailed below:
Note 2020 ($) 2019 ($)
NZ IFRS Revenue from Contracts with Customers 3 389,747,657 364,281,708
Other Income 3 1,337,047 1,372,496
Net Foreign Exchange Loss 6 (12,930,361) (2,855,193)
Agency Shipping costs offset 2,590,891 1,909,778
Non-GAAP measure: Total Underlying Revenue 380,745,235 364,708,789
Agency shipping costs offset represents shipping proceeds received on behalf of customers that are offset with shipping costs under an agency arrangement as detailed in note 3(a).
5—PERSONNEL EXPENSES
GROUP
2020 ($) 2019 ($)
Wages and Salaries 43,311,614 43,491,570
Superannuation Contributions and Other Employee Related Expenses 3,879,821 3,725,203
Increase in Liability for Short-term Employee Benefits - -
(Annual Leave and Days in Lieu) (994,242) 1,844,290
46,197,193 49,061,063
Personnel expenses are included in cost of sales, sales
and marketing expenses and administration expenses.
Policy
Employee Benefits
Defined Contribution Plans
Obligations for contributions to defined contribution pension plans are recognised as an expense in profit or loss when they are due.
Short-term Benefits
Short-term employee benefit obligations are measured on an undiscounted basis and are expensed as the related service is provided. A liability is recognised for the amount expected to be paid if the Group has a present legal or constructive obligation to pay this amount as a result of past service provided by the employee and the obligation can be estimated reliably.
31 Tatua Annual Report 2020 Financial Statements
6—FINANCE INCOME & EXPENSE
GROUP
Recognised in Profit or Loss 2020 ($) 2019 ($)
Interest Income 76,166 41,607
Net Foreign Exchange Gain - -
Total Finance Income 76,166 41,607
Net Foreign Exchange Loss (12,930,361) (2,855,193)
Financial Overheads (32,850) (19,825)
Interest Expense on External Borrowings (3,256,910) (3,687,326)
Total Finance Expense (16,220,121) (6,562,344)
Net Finance Income / (Expense) (16,143,955) (6,520,737)
Policy
(a) Finance Income and Expense
Interest income is recognised as it accrues, using the effective interest method.
All borrowing costs are recognised in profit or loss using the effective interest method, except for those that are directly attributable to the acquisition, construction or production of a qualifying asset, in which case they are capitalised as part of the cost of that asset.
(b) Foreign Currency Transactions
Transactions in foreign currencies are translated to NZD at exchange rates at the dates of the transactions. Foreign currency differences arising on translation are recognised in profit or loss.
4—ADMINISTRATION EXPENSES
GROUP
2020 ($) 2019 ($)
The following items are included in administration expenses:
Auditors Remuneration (KPMG)
Audit of Financial Statements 184,183 171,479
Other Services* 34,550 8,275
Directors' Fees 498,500 482,667
Directors' Expenses 3,997 3,650
*Other services are in relation to advice on operational tax matters such as
transfer pricing, as well as a share registry assurance engagement.

34
GROUP
Reconciliation of Effective Tax Rate 2020 (%) 2020 ($) 2019 (%) 2019 ($)
Profit for the Period - 14,921,410 - 12,295,423
Total Income Tax Expense - 4,295,597 - 4,541,505
Profit Excluding Income Tax - 19,217,007 - 16,836,928
Income Tax Using the Group’s Domestic Tax Rate 28.0 5,380,762 28.0 4,714,339
Impact of Tax Rate in Foreign Countries (0.5) (97,103) (0.1) (10,609)
Tax Exempt Income (0.2) (30,619) (0.7) (116,511)
Non-deductible Expenses 0.2 39,772 (0.3) (50,503)
Legislative change of Depreciation on Buildings (5.2) (1,002,452) 0.0 -
Tax Credits on Dividend Income (0.0) (511) (0.0) (80)
Recognition of Previously Unrecognised Tax Losses 0.0 - 0.0 -
Under/(Over) Provided in Prior Periods 0.0 5,748 0.0 4,869
22.4 4,295,597 27.0 4,541,505
GROUP
Income Tax Recognised Directly in Other Comprehensive Income 2020 ($) 2019 ($)
Derivatives (2,934,400) 844,152
Total Income Tax Recognised Directly in Other Comprehensive Income (2,934,400) 844,152
GROUP
Imputation Credits 2020 ($) 2019 ($)
Imputation Credits Available for use in Subsequent Reporting Periods 34,669,221 27,369,425
7—INCOME TAX EXPENSE
GROUP
Income Tax Recognised in Profit or Loss 2020 ($) 2019 ($)
Current Tax Expense
Current Period 4,666,375 5,653,195
Adjustment for Prior Periods 40,799 (134,265)
4,707,174 5,518,930
Deferred Tax Expense
Origination and Reversal of Temporary Differences (376,526) (1,116,559)
Adjustment for Prior Periods (35,051) 139,134
(411,577) (977,425)
Total Income Tax Expense 4,295,597 4,541,505
33 Tatua Annual Report 2020
Policy
Income tax expense comprises current and deferred tax. Income tax expense is recognised in profit or loss except to the extent that it relates to items recognised directly in equity or in other comprehensive income, in which case it is recognised in equity or in other comprehensive income.
Current tax is the expected tax payable on the taxable income for the year, using tax rates enacted or substantially enacted at the reporting date, and any adjustment to tax payable in respect of previous years.
Financial Statements
8—DEFERRED TAX ASSETS & LIABILITIES
Reconciliation of Effective Tax Rate Assets Liabilities Net
2020 ($) 2019 ($) 2020 ($) 2019 ($) 2020 ($) 2019 ($)
Deferred tax assets and liabilities
are attributable to the following:
Property, Plant and Equipment 2,039,222 1,165,030 - - 2,039,222 1,165,030
Investment Property - - (83,558) (81,014) (83,558) (81,014)
Derivatives - 2,036,673 (897,727) - (897,727) 2,036,673
Biological Assets - - - - - -
Inventory 1,371,646 1,602,526 - - 1,371,646 1,602,526
Provisions and Accruals 1,660,960 1,890,150 - - 1,660,960 1,890,150
Other items - - - - -
Tax Assets /(Liabilities) 5,071,828 6,694,379 (981,285) (81,014) 4,090,543 6,613,365
Movement in Temporary Differences
During The Year
Balance Recognised in
Recognised in
Recognised in
Balance Recognised in
Recognised in
Balance
1 August 2018
($)
Opening Retaining Earnings
($)
Profit or Loss
($)
Other Com-prehensive
Income ($)
31 July 2019
($)
Profit or Loss
($)
Other Com-prehensive
Income ($)
31 July 2020
($)
Deferred tax assets and liabilities
are attributable to the following:
Property, Plant and Equipment 1,351,007 - (185,977) - 1,165,030 874,192 2,039,222
Investment Property (81,014) - - - (81,014) (2,544) (83,558)
Derivatives 1,018,641 - 173,880 844,152 2,036,673 (2,934,400) (897,727)
Biological Assets - - - - - -
Inventory 1,119,482 137,843 345,201 - 1,602,526 (230,880) 1,371,646
Provisions and Accruals 1,245,830 - 644,320 - 1,890,150 (229,190) 1,660,960
Other items - - - - - -
Tax Loss Carry-forwards - - - - - -
Tax Assets /(Liabilities) 4,653,946 137,843 977,425 844,152 6,613,365 411,579 (2,934,400) 4,090,543
Policy
Deferred tax is recognised in respect of temporary differences between the carrying amounts of assets and liabilities for financial reporting purposes and the amounts used for taxation purposes.
A deferred tax asset is recognised to the extent that it is probable that future taxable profits will be available against
which temporary differences can be utilised based on the ability of the Company to record taxable profits through retentions or through the reclassification of payout. Deferred tax assets are reviewed at each reporting date and are reduced to the extent that it is no longer probable that the related tax benefit will be realised.
36
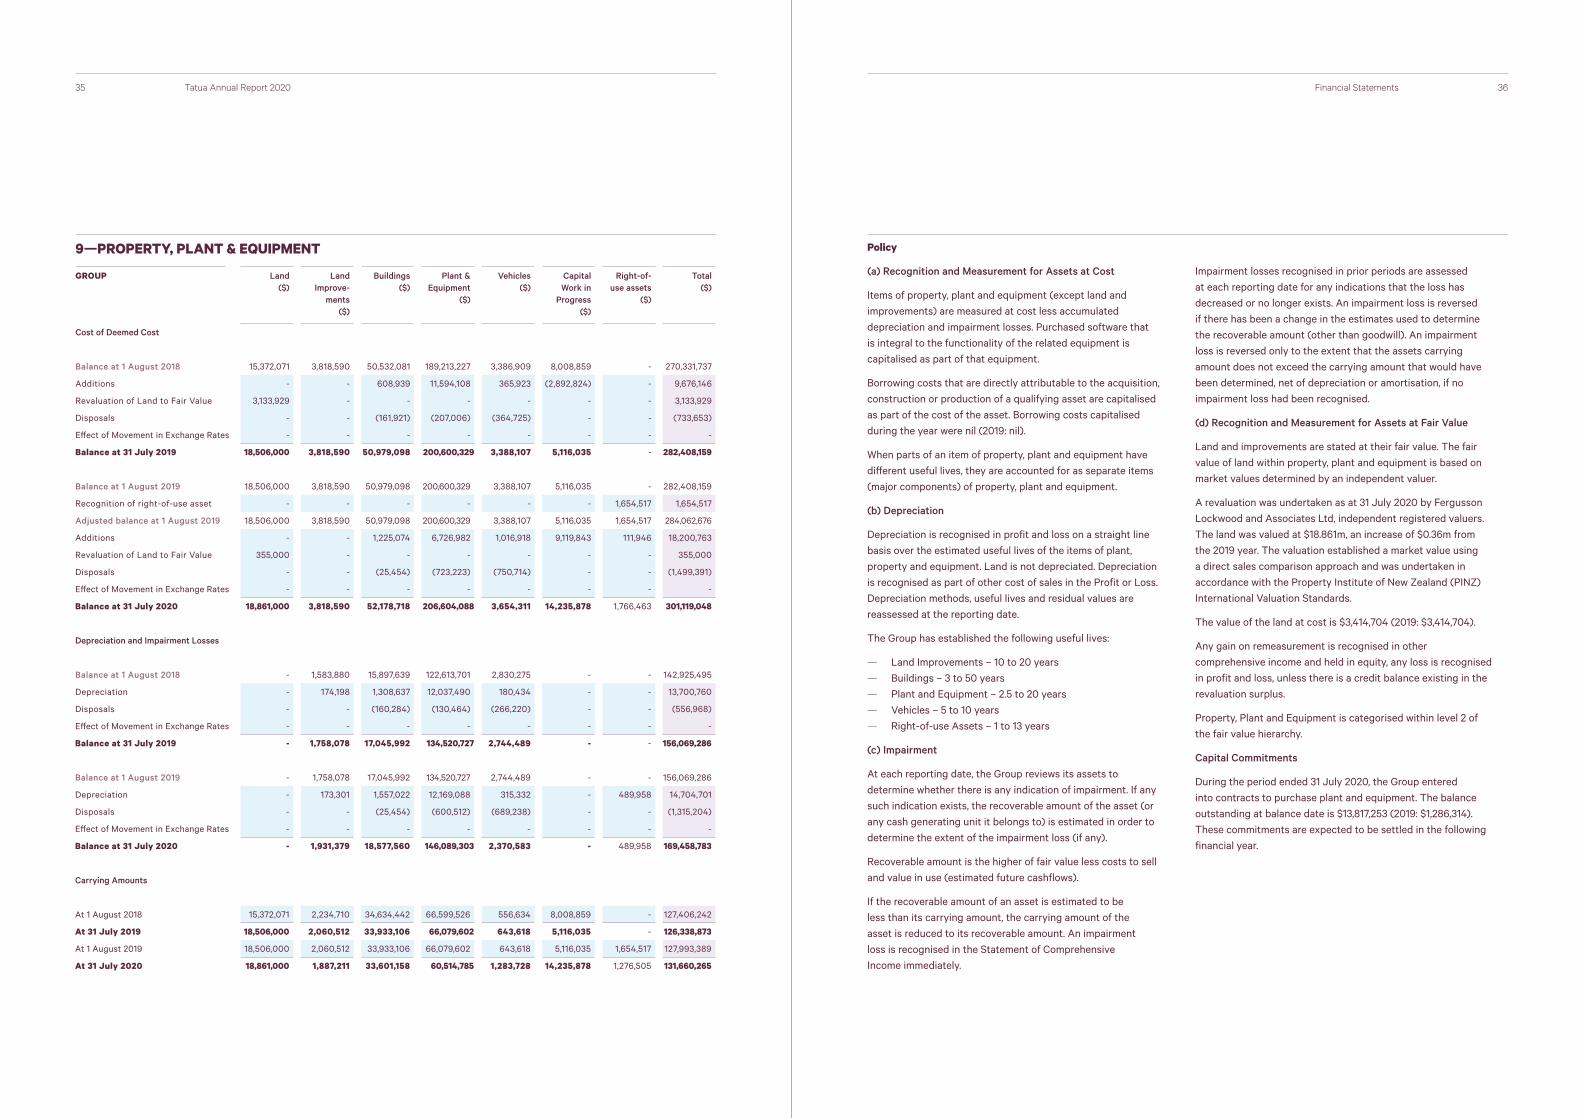
9—PROPERTY, PLANT & EQUIPMENT
GROUP Land($)
Land Improve-
ments($)
Buildings($)
Plant & Equipment
($)
Vehicles ($)
Capital Work in
Progress($)
Right-of-use assets
($)
Total ($)
Cost of Deemed Cost
Balance at 1 August 2018 15,372,071 3,818,590 50,532,081 189,213,227 3,386,909 8,008,859 - 270,331,737
Additions - - 608,939 11,594,108 365,923 (2,892,824) - 9,676,146
Revaluation of Land to Fair Value 3,133,929 - - - - - - 3,133,929
Disposals - - (161,921) (207,006) (364,725) - - (733,653)
Effect of Movement in Exchange Rates - - - - - - - -
Balance at 31 July 2019 18,506,000 3,818,590 50,979,098 200,600,329 3,388,107 5,116,035 - 282,408,159
Balance at 1 August 2019 18,506,000 3,818,590 50,979,098 200,600,329 3,388,107 5,116,035 - 282,408,159
Recognition of right-of-use asset - - - - - - 1,654,517 1,654,517
Adjusted balance at 1 August 2019 18,506,000 3,818,590 50,979,098 200,600,329 3,388,107 5,116,035 1,654,517 284,062,676
Additions - - 1,225,074 6,726,982 1,016,918 9,119,843 111,946 18,200,763
Revaluation of Land to Fair Value 355,000 - - - - - - 355,000
Disposals - - (25,454) (723,223) (750,714) - - (1,499,391)
Effect of Movement in Exchange Rates - - - - - - - -
Balance at 31 July 2020 18,861,000 3,818,590 52,178,718 206,604,088 3,654,311 14,235,878 1,766,463 301,119,048
Depreciation and Impairment Losses
Balance at 1 August 2018 - 1,583,880 15,897,639 122,613,701 2,830,275 - - 142,925,495
Depreciation - 174,198 1,308,637 12,037,490 180,434 - - 13,700,760
Disposals - - (160,284) (130,464) (266,220) - - (556,968)
Effect of Movement in Exchange Rates - - - - - - - -
Balance at 31 July 2019 - 1,758,078 17,045,992 134,520,727 2,744,489 - - 156,069,286
Balance at 1 August 2019 - 1,758,078 17,045,992 134,520,727 2,744,489 - - 156,069,286
Depreciation - 173,301 1,557,022 12,169,088 315,332 - 489,958 14,704,701
Disposals - - (25,454) (600,512) (689,238) - - (1,315,204)
Effect of Movement in Exchange Rates - - - - - - - -
Balance at 31 July 2020 - 1,931,379 18,577,560 146,089,303 2,370,583 - 489,958 169,458,783
Carrying Amounts
At 1 August 2018 15,372,071 2,234,710 34,634,442 66,599,526 556,634 8,008,859 - 127,406,242
At 31 July 2019 18,506,000 2,060,512 33,933,106 66,079,602 643,618 5,116,035 - 126,338,873
At 1 August 2019 18,506,000 2,060,512 33,933,106 66,079,602 643,618 5,116,035 1,654,517 127,993,389
At 31 July 2020 18,861,000 1,887,211 33,601,158 60,514,785 1,283,728 14,235,878 1,276,505 131,660,265
35 Tatua Annual Report 2020 Financial Statements
Policy
(a) Recognition and Measurement for Assets at Cost
Items of property, plant and equipment (except land and improvements) are measured at cost less accumulated depreciation and impairment losses. Purchased software that is integral to the functionality of the related equipment is capitalised as part of that equipment.
Borrowing costs that are directly attributable to the acquisition, construction or production of a qualifying asset are capitalised as part of the cost of the asset. Borrowing costs capitalised during the year were nil (2019: nil).
When parts of an item of property, plant and equipment have different useful lives, they are accounted for as separate items (major components) of property, plant and equipment.
(b) Depreciation
Depreciation is recognised in profit and loss on a straight line basis over the estimated useful lives of the items of plant, property and equipment. Land is not depreciated. Depreciation is recognised as part of other cost of sales in the Profit or Loss. Depreciation methods, useful lives and residual values are reassessed at the reporting date.
The Group has established the following useful lives:
— Land Improvements – 10 to 20 years — Buildings – 3 to 50 years — Plant and Equipment – 2.5 to 20 years — Vehicles – 5 to 10 years — Right-of-use Assets – 1 to 13 years
(c) Impairment
At each reporting date, the Group reviews its assets to determine whether there is any indication of impairment. If any such indication exists, the recoverable amount of the asset (or any cash generating unit it belongs to) is estimated in order to determine the extent of the impairment loss (if any).
Recoverable amount is the higher of fair value less costs to sell and value in use (estimated future cashflows).
If the recoverable amount of an asset is estimated to be less than its carrying amount, the carrying amount of the asset is reduced to its recoverable amount. An impairment loss is recognised in the Statement of Comprehensive Income immediately.
Impairment losses recognised in prior periods are assessed at each reporting date for any indications that the loss has decreased or no longer exists. An impairment loss is reversed if there has been a change in the estimates used to determine the recoverable amount (other than goodwill). An impairment loss is reversed only to the extent that the assets carrying amount does not exceed the carrying amount that would have been determined, net of depreciation or amortisation, if no impairment loss had been recognised.
(d) Recognition and Measurement for Assets at Fair Value
Land and improvements are stated at their fair value. The fair value of land within property, plant and equipment is based on market values determined by an independent valuer.
A revaluation was undertaken as at 31 July 2020 by Fergusson Lockwood and Associates Ltd, independent registered valuers. The land was valued at $18.861m, an increase of $0.36m from the 2019 year. The valuation established a market value using a direct sales comparison approach and was undertaken in accordance with the Property Institute of New Zealand (PINZ) International Valuation Standards.
The value of the land at cost is $3,414,704 (2019: $3,414,704).
Any gain on remeasurement is recognised in other comprehensive income and held in equity, any loss is recognised in profit and loss, unless there is a credit balance existing in the revaluation surplus.
Property, Plant and Equipment is categorised within level 2 of the fair value hierarchy.
Capital Commitments
During the period ended 31 July 2020, the Group entered into contracts to purchase plant and equipment. The balance outstanding at balance date is $13,817,253 (2019: $1,286,314). These commitments are expected to be settled in the following financial year.
38
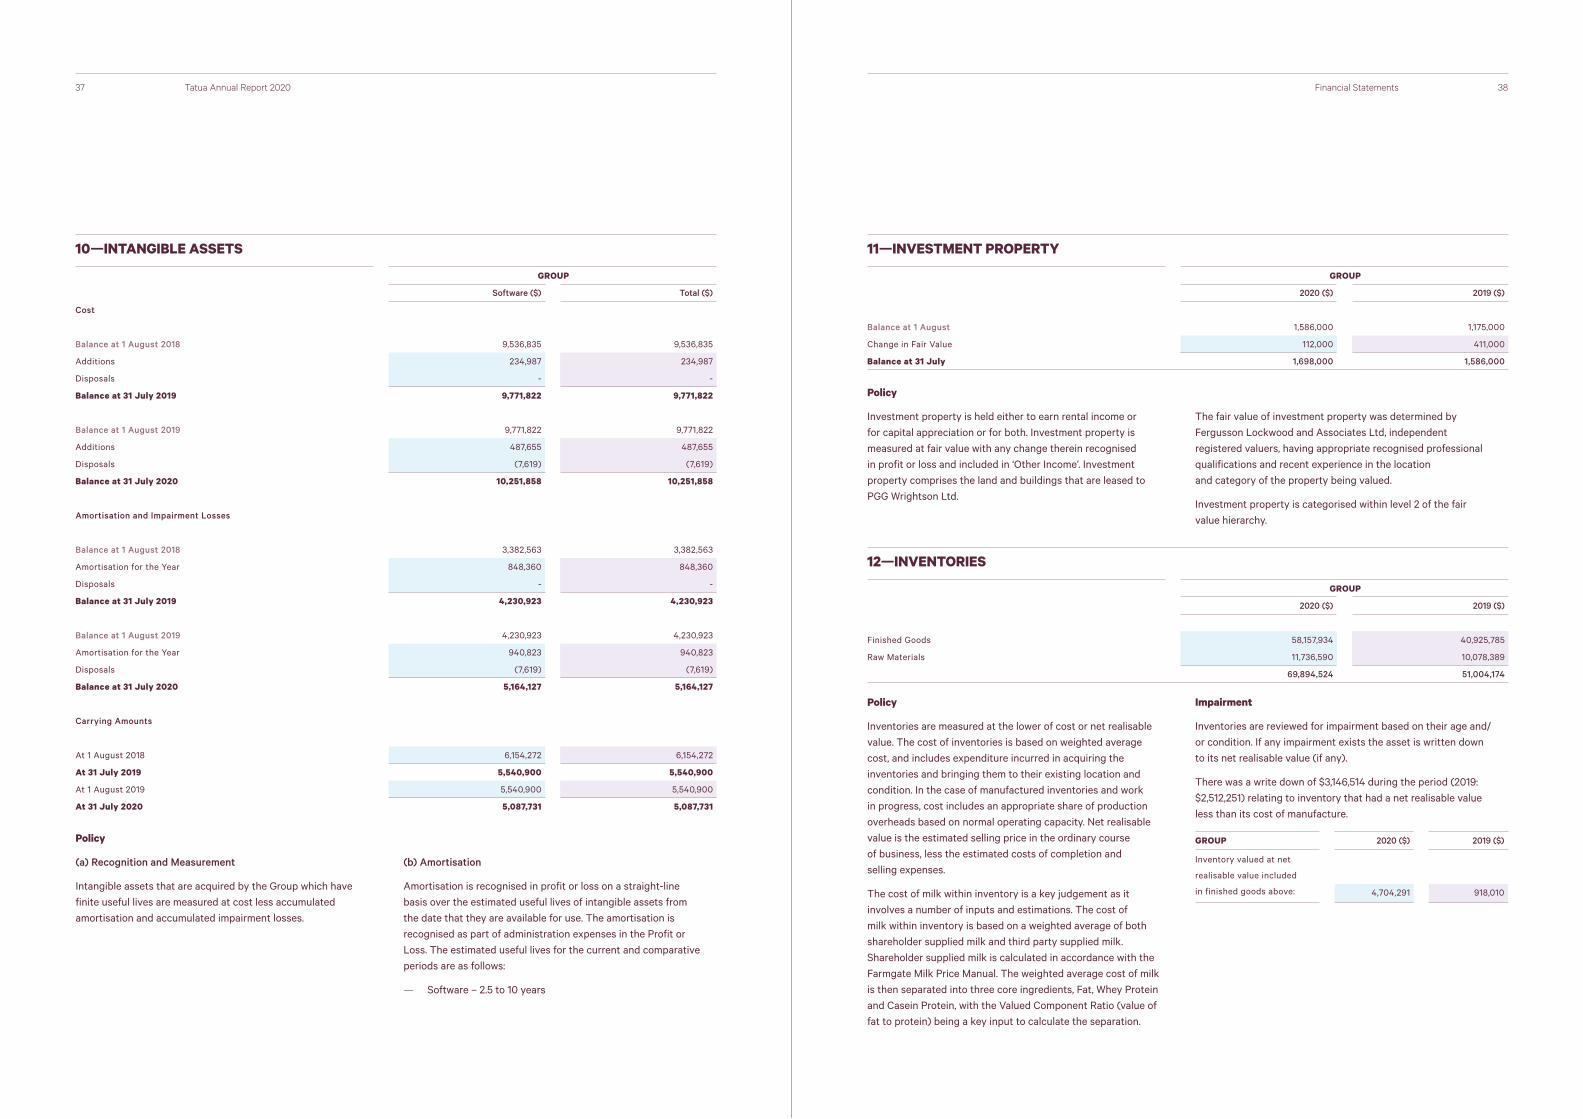
10—INTANGIBLE ASSETS
GROUP
Software ($) Total ($)
Cost
Balance at 1 August 2018 9,536,835 9,536,835
Additions 234,987 234,987
Disposals - -
Balance at 31 July 2019 9,771,822 9,771,822
Balance at 1 August 2019 9,771,822 9,771,822
Additions 487,655 487,655
Disposals (7,619) (7,619)
Balance at 31 July 2020 10,251,858 10,251,858
Amortisation and Impairment Losses
Balance at 1 August 2018 3,382,563 3,382,563
Amortisation for the Year 848,360 848,360
Disposals - -
Balance at 31 July 2019 4,230,923 4,230,923
Balance at 1 August 2019 4,230,923 4,230,923
Amortisation for the Year 940,823 940,823
Disposals (7,619) (7,619)
Balance at 31 July 2020 5,164,127 5,164,127
Carrying Amounts
At 1 August 2018 6,154,272 6,154,272
At 31 July 2019 5,540,900 5,540,900
At 1 August 2019 5,540,900 5,540,900
At 31 July 2020 5,087,731 5,087,731
37 Tatua Annual Report 2020
Policy
(a) Recognition and Measurement
Intangible assets that are acquired by the Group which have finite useful lives are measured at cost less accumulated amortisation and accumulated impairment losses.
(b) Amortisation
Amortisation is recognised in profit or loss on a straight-line basis over the estimated useful lives of intangible assets from the date that they are available for use. The amortisation is recognised as part of administration expenses in the Profit or Loss. The estimated useful lives for the current and comparative periods are as follows:
— Software – 2.5 to 10 years
Financial Statements
11—INVESTMENT PROPERTY
GROUP
2020 ($) 2019 ($)
Balance at 1 August 1,586,000 1,175,000
Change in Fair Value 112,000 411,000
Balance at 31 July 1,698,000 1,586,000
12—INVENTORIES
GROUP
2020 ($) 2019 ($)
Finished Goods 58,157,934 40,925,785
Raw Materials 11,736,590 10,078,389
69,894,524 51,004,174
Policy
Investment property is held either to earn rental income or for capital appreciation or for both. Investment property is measured at fair value with any change therein recognised in profit or loss and included in ‘Other Income’. Investment property comprises the land and buildings that are leased to PGG Wrightson Ltd.
The fair value of investment property was determined by Fergusson Lockwood and Associates Ltd, independent registered valuers, having appropriate recognised professional qualifications and recent experience in the location and category of the property being valued.
Investment property is categorised within level 2 of the fair value hierarchy.
Policy
Inventories are measured at the lower of cost or net realisable value. The cost of inventories is based on weighted average cost, and includes expenditure incurred in acquiring the inventories and bringing them to their existing location and condition. In the case of manufactured inventories and work in progress, cost includes an appropriate share of production overheads based on normal operating capacity. Net realisable value is the estimated selling price in the ordinary course of business, less the estimated costs of completion and selling expenses.
The cost of milk within inventory is a key judgement as it involves a number of inputs and estimations. The cost of milk within inventory is based on a weighted average of both shareholder supplied milk and third party supplied milk. Shareholder supplied milk is calculated in accordance with the Farmgate Milk Price Manual. The weighted average cost of milk is then separated into three core ingredients, Fat, Whey Protein and Casein Protein, with the Valued Component Ratio (value of fat to protein) being a key input to calculate the separation.
Impairment
Inventories are reviewed for impairment based on their age and/or condition. If any impairment exists the asset is written down to its net realisable value (if any).
There was a write down of $3,146,514 during the period (2019: $2,512,251) relating to inventory that had a net realisable value less than its cost of manufacture.
GROUP 2020 ($) 2019 ($)
Inventory valued at net
realisable value included
in finished goods above: 4,704,291 918,010
40
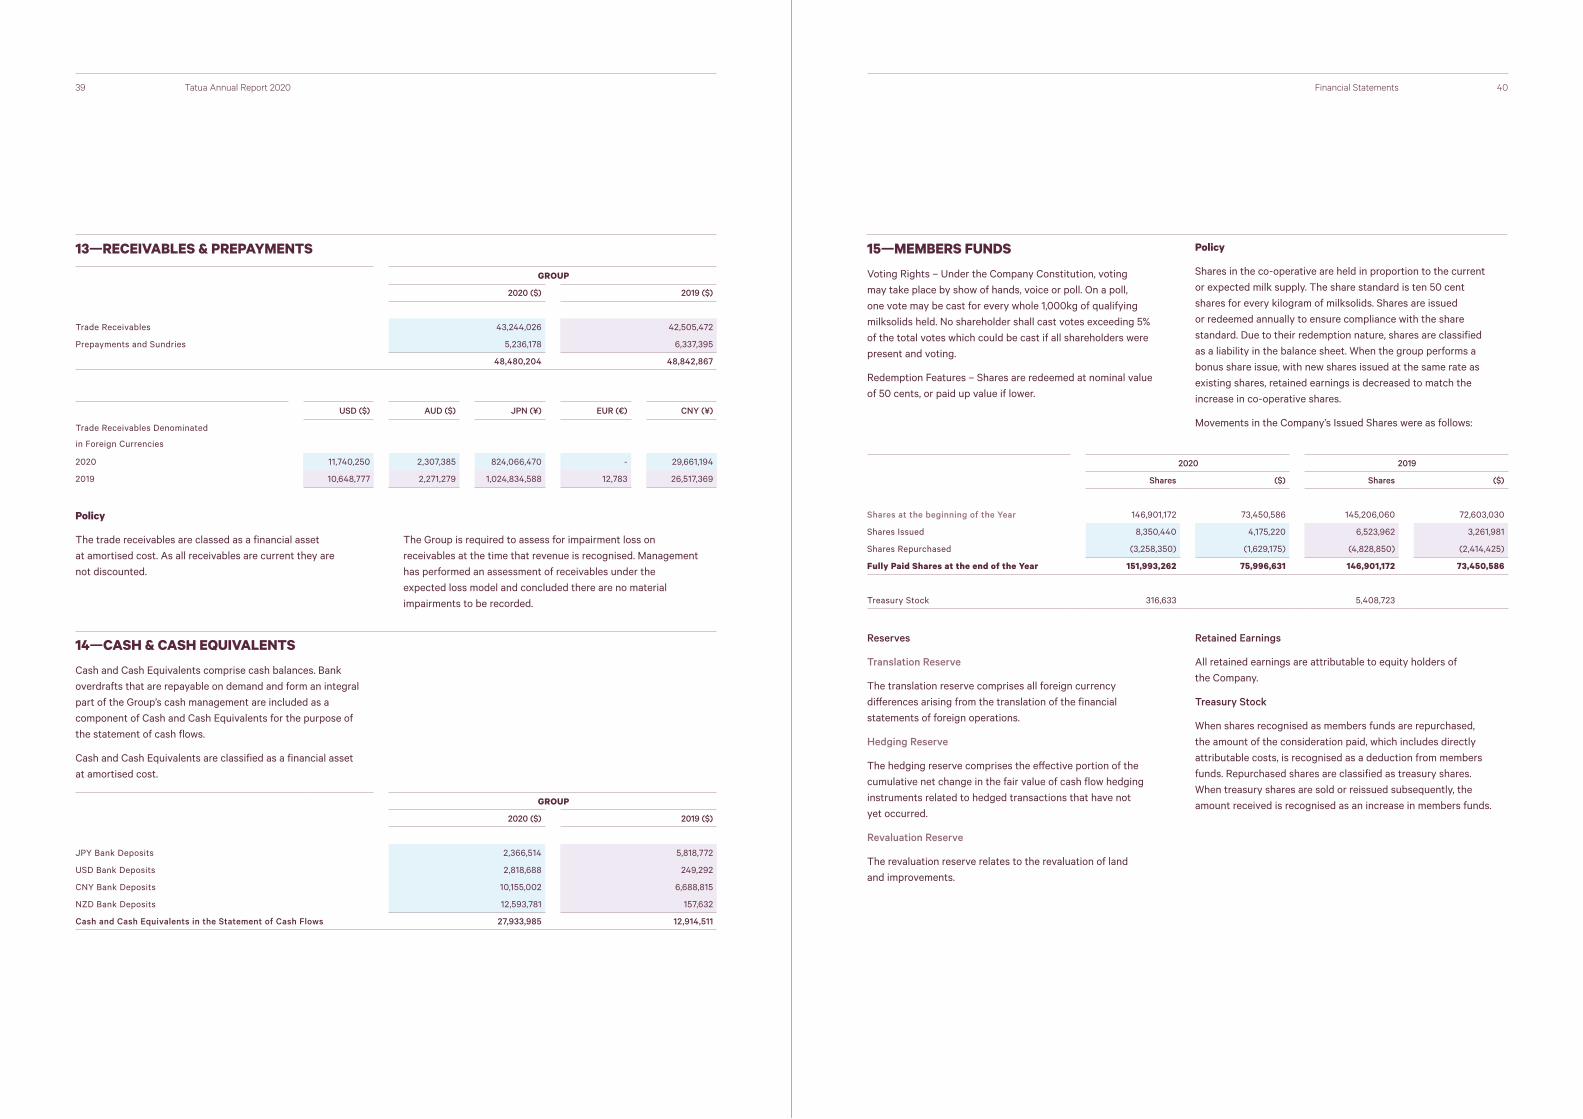
13—RECEIVABLES & PREPAYMENTS
GROUP
2020 ($) 2019 ($)
Trade Receivables 43,244,026 42,505,472
Prepayments and Sundries 5,236,178 6,337,395
48,480,204 48,842,867
USD ($) AUD ($) JPN (¥) EUR (€) CNY (¥)
Trade Receivables Denominated
in Foreign Currencies
2020 11,740,250 2,307,385 824,066,470 - 29,661,194
2019 10,648,777 2,271,279 1,024,834,588 12,783 26,517,369
GROUP
2020 ($) 2019 ($)
JPY Bank Deposits 2,366,514 5,818,772
USD Bank Deposits 2,818,688 249,292
CNY Bank Deposits 10,155,002 6,688,815
NZD Bank Deposits 12,593,781 157,632
Cash and Cash Equivalents in the Statement of Cash Flows 27,933,985 12,914,511
39 Tatua Annual Report 2020
Policy
The trade receivables are classed as a financial asset at amortised cost. As all receivables are current they are not discounted.
The Group is required to assess for impairment loss on receivables at the time that revenue is recognised. Management has performed an assessment of receivables under the expected loss model and concluded there are no material impairments to be recorded.
14—CASH & CASH EQUIVALENTS
Cash and Cash Equivalents comprise cash balances. Bank overdrafts that are repayable on demand and form an integral part of the Group’s cash management are included as a component of Cash and Cash Equivalents for the purpose of the statement of cash flows.
Cash and Cash Equivalents are classified as a financial asset at amortised cost.
Financial Statements
15—MEMBERS FUNDS
Voting Rights – Under the Company Constitution, voting may take place by show of hands, voice or poll. On a poll, one vote may be cast for every whole 1,000kg of qualifying milksolids held. No shareholder shall cast votes exceeding 5% of the total votes which could be cast if all shareholders were present and voting.
Redemption Features – Shares are redeemed at nominal value of 50 cents, or paid up value if lower.
Policy
Shares in the co-operative are held in proportion to the current or expected milk supply. The share standard is ten 50 cent shares for every kilogram of milksolids. Shares are issued or redeemed annually to ensure compliance with the share standard. Due to their redemption nature, shares are classified as a liability in the balance sheet. When the group performs a bonus share issue, with new shares issued at the same rate as existing shares, retained earnings is decreased to match the increase in co-operative shares.
Movements in the Company’s Issued Shares were as follows:
Reserves
Translation Reserve
The translation reserve comprises all foreign currency differences arising from the translation of the financial statements of foreign operations.
Hedging Reserve
The hedging reserve comprises the effective portion of the cumulative net change in the fair value of cash flow hedging instruments related to hedged transactions that have not yet occurred.
Revaluation Reserve
The revaluation reserve relates to the revaluation of land and improvements.
Retained Earnings
All retained earnings are attributable to equity holders of the Company.
Treasury Stock
When shares recognised as members funds are repurchased, the amount of the consideration paid, which includes directly attributable costs, is recognised as a deduction from members funds. Repurchased shares are classified as treasury shares. When treasury shares are sold or reissued subsequently, the amount received is recognised as an increase in members funds.
2020 2019
Shares ($) Shares ($)
Shares at the beginning of the Year 146,901,172 73,450,586 145,206,060 72,603,030
Shares Issued 8,350,440 4,175,220 6,523,962 3,261,981
Shares Repurchased (3,258,350) (1,629,175) (4,828,850) (2,414,425)
Fully Paid Shares at the end of the Year 151,993,262 75,996,631 146,901,172 73,450,586
Treasury Stock 316,633 5,408,723

42
16—LOANS & BORROWINGS
Interest-bearing borrowings are classified as financial liabilities and are measured at amortised cost using the effective interest rate.
41 Tatua Annual Report 2020
2020 ($) 2019 ($)
Current
JPY Bank Loans 7,306,590 9,881,698
USD Bank Loans 4,512,636 7,560,865
NZD Bank Loans - 20,000,000
Lease Liabilities 418,033 -
12,237,259 37,442,563
Non Current
JPY Bank Loans - -
NZD Bank Loans 65,000,000 24,850,000
Lease Liabilities 892,839 -
65,892,839 24,850,000
Total 78,130,098 62,292,563
2020 Currency Nominal Interest Rate Year of Maturity Face Value Carrying Amount (NZD)
Current JPY 0.83% 2021 ¥510,000,000 $7,306,590
USD 1.30% 2021 $3,000,000 $4,512,636
NZD 3.35% - 4.15% 2021 $418,033 $418,033
Non Current NZD 1.43% 2022 $30,000,000 $30,000,000
NZD 1.48% 2023 $35,000,000 $35,000,000
NZD 3.35% - 4.15% 2022 - 2033 $892,839 $892,839
2019 Currency Nominal Interest Rate Year of Maturity Face Value Carrying Amount (NZD)
Current JPY 1.32% 2020 ¥710,000,000 $9,881,698
USD 3.45% 2020 $5,000,000 $7,560,865
NZD 2.70% 2020 $20,000,000 $20,000,000
Non Current NZD 3.45% 2021 $350,000 $350,000
NZD 2.88% 2022 $24,500,000 $24,500,000
Financial Statements
The Group’s bank loans are secured by registered first mortgages, preferred security interest in all present and after acquired property, and an interlocking guarantee from companies within the Group. The Group’s borrowings are subject to various covenants such as minimum equity, interest cover ratio and gearing ratio and the Group was in compliance with the various covenants.
The Group has committed (but undrawn) facilities with expiry dates through to 2023 of NZD $35.0 million, JPY ¥540 million and USD $4 million (2019: NZD $55.2 million, JPY ¥1,050 million and USD $2 million). The JPY and USD loans are held by the respective subsidiaries.
17—ACCOUNTS PAYABLE & ACCRUALS
GROUP
2020 ($) 2019 ($)
Trade Payables 10,262,639 8,142,162
Employee Entitlements 7,441,755 8,435,997
Income in Advance - -
Accruals 10,266,700 7,210,706
27,971,094 23,788,865
Policy
Trade payables and accruals
Trade payables are recognised at fair value and measured at cost and classed as other financial liabilities.
Employee entitlements
Employee benefits which remain unused at balance date, and amounts expected to be paid under short-term cash bonus plans are accrued for.
4443 Tatua Annual Report 2020
GROUP
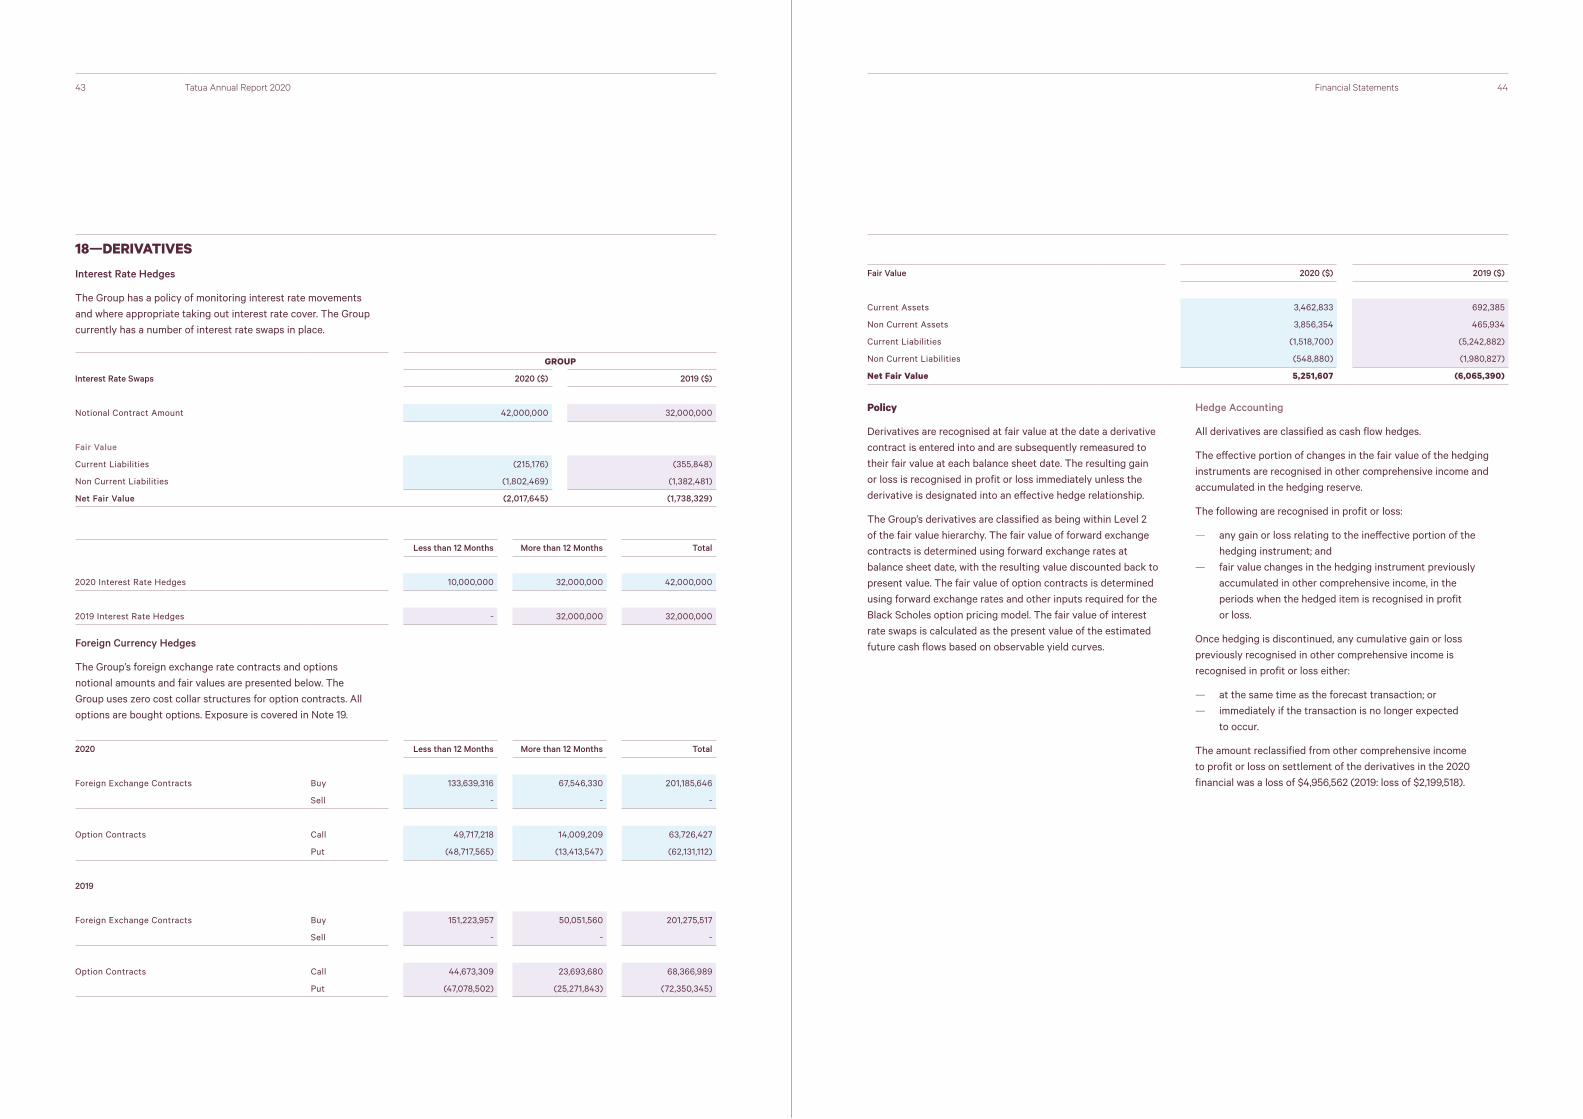
Interest Rate Swaps 2020 ($) 2019 ($)
Notional Contract Amount 42,000,000 32,000,000
Fair Value
Current Liabilities (215,176) (355,848)
Non Current Liabilities (1,802,469) (1,382,481)
Net Fair Value (2,017,645) (1,738,329)
Less than 12 Months More than 12 Months Total
2020 Interest Rate Hedges 10,000,000 32,000,000 42,000,000
2019 Interest Rate Hedges - 32,000,000 32,000,000
2020 Less than 12 Months More than 12 Months Total
Foreign Exchange Contracts Buy 133,639,316 67,546,330 201,185,646
Sell - - -
Option Contracts Call 49,717,218 14,009,209 63,726,427
Put (48,717,565) (13,413,547) (62,131,112)
2019
Foreign Exchange Contracts Buy 151,223,957 50,051,560 201,275,517
Sell - - -
Option Contracts Call 44,673,309 23,693,680 68,366,989
Put (47,078,502) (25,271,843) (72,350,345)
18—DERIVATIVES
Interest Rate Hedges
The Group has a policy of monitoring interest rate movements and where appropriate taking out interest rate cover. The Group currently has a number of interest rate swaps in place.
Foreign Currency Hedges
The Group’s foreign exchange rate contracts and options notional amounts and fair values are presented below. The Group uses zero cost collar structures for option contracts. All options are bought options. Exposure is covered in Note 19.
Financial Statements
Fair Value 2020 ($) 2019 ($)
Current Assets 3,462,833 692,385
Non Current Assets 3,856,354 465,934
Current Liabilities (1,518,700) (5,242,882)
Non Current Liabilities (548,880) (1,980,827)
Net Fair Value 5,251,607 (6,065,390)
Policy
Derivatives are recognised at fair value at the date a derivative contract is entered into and are subsequently remeasured to their fair value at each balance sheet date. The resulting gain or loss is recognised in profit or loss immediately unless the derivative is designated into an effective hedge relationship.
The Group’s derivatives are classified as being within Level 2 of the fair value hierarchy. The fair value of forward exchange contracts is determined using forward exchange rates at balance sheet date, with the resulting value discounted back to present value. The fair value of option contracts is determined using forward exchange rates and other inputs required for the Black Scholes option pricing model. The fair value of interest rate swaps is calculated as the present value of the estimated future cash flows based on observable yield curves.
Hedge Accounting
All derivatives are classified as cash flow hedges.
The effective portion of changes in the fair value of the hedging instruments are recognised in other comprehensive income and accumulated in the hedging reserve.
The following are recognised in profit or loss:
— any gain or loss relating to the ineffective portion of the hedging instrument; and
— fair value changes in the hedging instrument previously accumulated in other comprehensive income, in the periods when the hedged item is recognised in profit or loss.
Once hedging is discontinued, any cumulative gain or loss previously recognised in other comprehensive income is recognised in profit or loss either:
— at the same time as the forecast transaction; or — immediately if the transaction is no longer expected
to occur.
The amount reclassified from other comprehensive income to profit or loss on settlement of the derivatives in the 2020 financial was a loss of $4,956,562 (2019: loss of $2,199,518).
46
Carrying Amount
2020 ($) 2019 ($)
Australasia (NZ and AUS) 6,754,513 7,408,941
Asia / Pacific 30,971,626 25,223,319
Americas / Europe 4,616,361 9,872,602
Other 901,526 610
43,244,026 42,505,472
45 Tatua Annual Report 2020
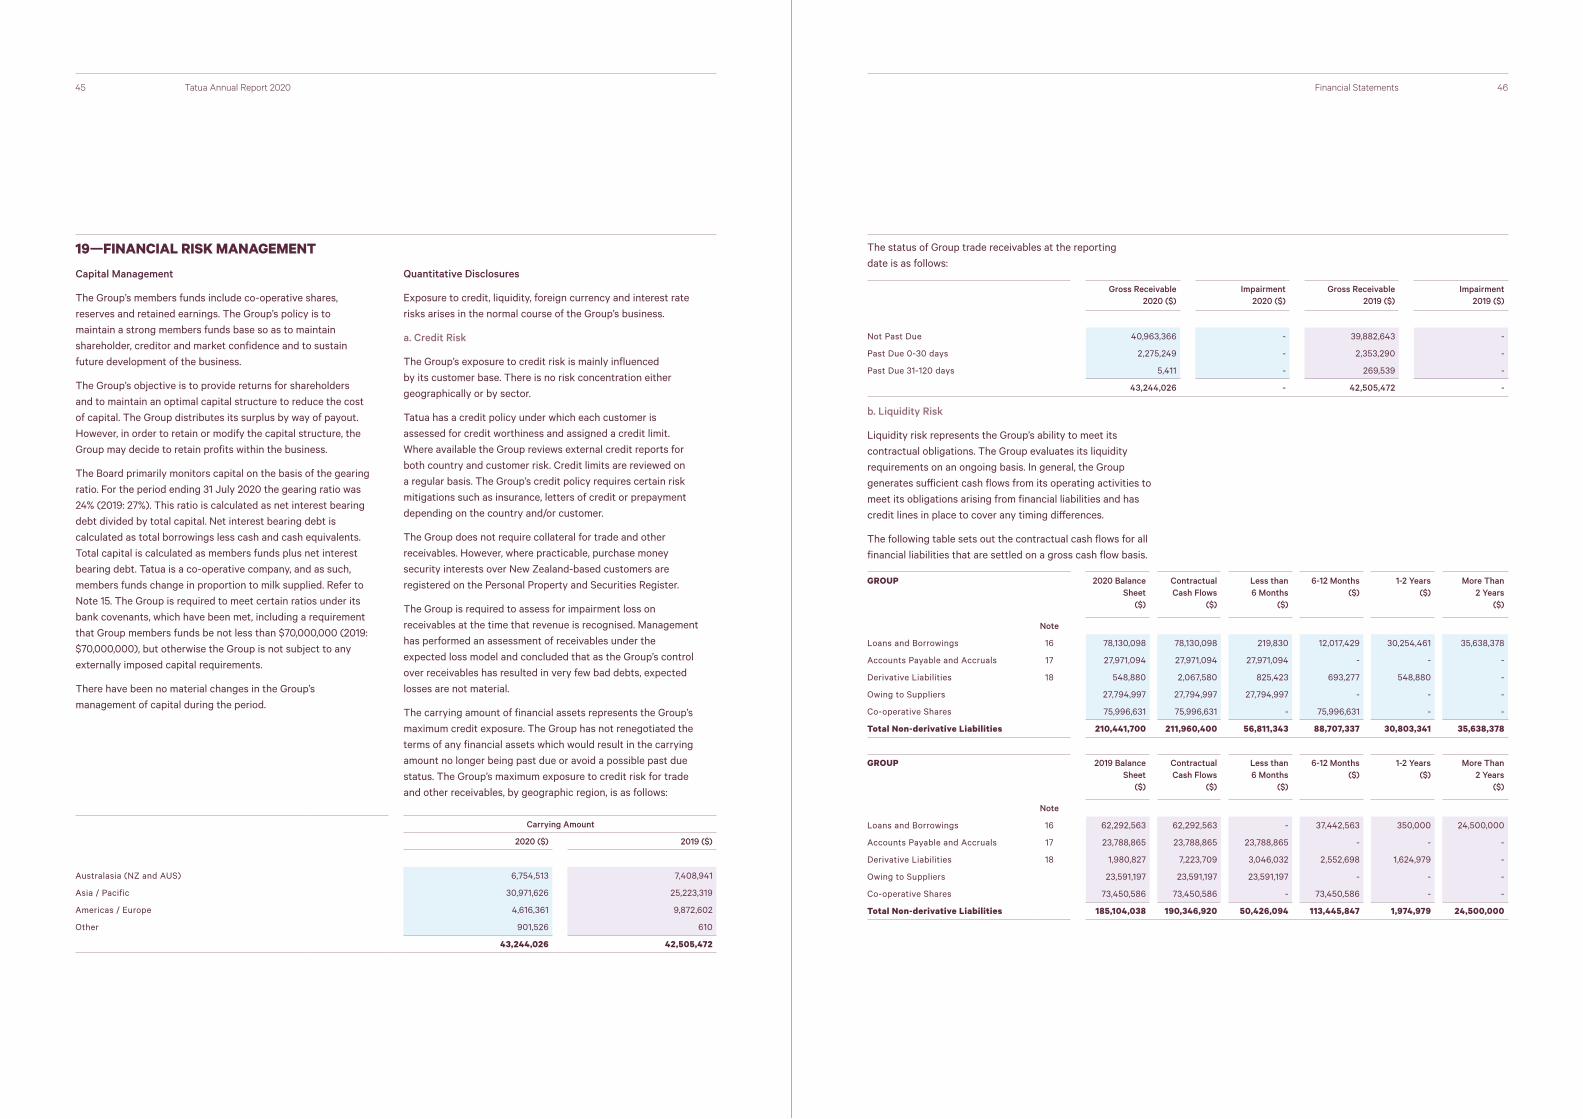
19—FINANCIAL RISK MANAGEMENT
Capital Management
The Group’s members funds include co-operative shares, reserves and retained earnings. The Group’s policy is to maintain a strong members funds base so as to maintain shareholder, creditor and market confidence and to sustain future development of the business.
The Group’s objective is to provide returns for shareholders and to maintain an optimal capital structure to reduce the cost of capital. The Group distributes its surplus by way of payout. However, in order to retain or modify the capital structure, the Group may decide to retain profits within the business.
The Board primarily monitors capital on the basis of the gearing ratio. For the period ending 31 July 2020 the gearing ratio was 24% (2019: 27%). This ratio is calculated as net interest bearing debt divided by total capital. Net interest bearing debt is calculated as total borrowings less cash and cash equivalents. Total capital is calculated as members funds plus net interest bearing debt. Tatua is a co-operative company, and as such, members funds change in proportion to milk supplied. Refer to Note 15. The Group is required to meet certain ratios under its bank covenants, which have been met, including a requirement that Group members funds be not less than $70,000,000 (2019: $70,000,000), but otherwise the Group is not subject to any externally imposed capital requirements.
There have been no material changes in the Group’s management of capital during the period.
Quantitative Disclosures
Exposure to credit, liquidity, foreign currency and interest rate risks arises in the normal course of the Group’s business.
a. Credit Risk
The Group’s exposure to credit risk is mainly influenced by its customer base. There is no risk concentration either geographically or by sector.
Tatua has a credit policy under which each customer is assessed for credit worthiness and assigned a credit limit. Where available the Group reviews external credit reports for both country and customer risk. Credit limits are reviewed on a regular basis. The Group’s credit policy requires certain risk mitigations such as insurance, letters of credit or prepayment depending on the country and/or customer.
The Group does not require collateral for trade and other receivables. However, where practicable, purchase money security interests over New Zealand-based customers are registered on the Personal Property and Securities Register.
The Group is required to assess for impairment loss on receivables at the time that revenue is recognised. Management has performed an assessment of receivables under the expected loss model and concluded that as the Group’s control over receivables has resulted in very few bad debts, expected losses are not material.
The carrying amount of financial assets represents the Group’s maximum credit exposure. The Group has not renegotiated the terms of any financial assets which would result in the carrying amount no longer being past due or avoid a possible past due status. The Group’s maximum exposure to credit risk for trade and other receivables, by geographic region, is as follows:
Financial Statements
The status of Group trade receivables at the reporting date is as follows:
Gross Receivable 2020 ($)
Impairment 2020 ($)
Gross Receivable 2019 ($)
Impairment 2019 ($)
Not Past Due 40,963,366 - 39,882,643 -
Past Due 0-30 days 2,275,249 - 2,353,290 -
Past Due 31-120 days 5,411 - 269,539 -
43,244,026 - 42,505,472 -
b. Liquidity Risk
Liquidity risk represents the Group’s ability to meet its contractual obligations. The Group evaluates its liquidity requirements on an ongoing basis. In general, the Group generates sufficient cash flows from its operating activities to meet its obligations arising from financial liabilities and has credit lines in place to cover any timing differences.
The following table sets out the contractual cash flows for all financial liabilities that are settled on a gross cash flow basis.
GROUP 2020 Balance Sheet
($)
Contractual Cash Flows
($)
Less than 6 Months
($)
6-12 Months ($)
1-2 Years($)
More Than 2 Years
($)
Note
Loans and Borrowings 16 78,130,098 78,130,098 219,830 12,017,429 30,254,461 35,638,378
Accounts Payable and Accruals 17 27,971,094 27,971,094 27,971,094 - - -
Derivative Liabilities 18 548,880 2,067,580 825,423 693,277 548,880 -
Owing to Suppliers 27,794,997 27,794,997 27,794,997 - - -
Co-operative Shares 75,996,631 75,996,631 - 75,996,631 - -
Total Non-derivative Liabilities 210,441,700 211,960,400 56,811,343 88,707,337 30,803,341 35,638,378
GROUP 2019 Balance Sheet
($)
Contractual Cash Flows
($)
Less than 6 Months
($)
6-12 Months ($)
1-2 Years($)
More Than 2 Years
($)
Note
Loans and Borrowings 16 62,292,563 62,292,563 - 37,442,563 350,000 24,500,000
Accounts Payable and Accruals 17 23,788,865 23,788,865 23,788,865 - - -
Derivative Liabilities 18 1,980,827 7,223,709 3,046,032 2,552,698 1,624,979 -
Owing to Suppliers 23,591,197 23,591,197 23,591,197 - - -
Co-operative Shares 73,450,586 73,450,586 - 73,450,586 - -
Total Non-derivative Liabilities 185,104,038 190,346,920 50,426,094 113,445,847 1,974,979 24,500,000

4847 Tatua Annual Report 2020
c. Foreign Currency Exchange Risk
The Group is exposed to foreign currency risk predominantly on sales that are denominated in a currency other than the Group’s functional currency. The New Zealand dollar is the presentation currency of the Group. The currencies in which transactions are primarily denominated are United States dollars, Japanese yen and Australian dollars.
The Group has a policy of maintaining a level of foreign currency hedging that allows for a degree of certainty in its future cash flows and to help protect it against sudden increases in the value of the New Zealand dollar against the United States dollar, Japanese yen and Australian dollar.
The Group uses forward exchange contracts and currency options to hedge its foreign currency exposure. All of the forward exchange contracts and options have maturities of less than two years at balance date.
The Group classifies its forward exchange and option contracts, which are hedging forecast transactions, as cash flow hedges.
The Group’s exposure to foreign currency risk for the next 12 months can be summarised as follows:
The Group also has foreign currency loans in foreign currency operations to minimise the translation risk in those locations.
d. Interest Rate Risk – Repricing Analysis
Interest rate risk is the risk that the value of the Group’s assets and liabilities will fluctuate due to changes in market interest rates. The Group is exposed to interest rate risk primarily through its cash balances and advances, bank overdraft and borrowings. Interest rate swaps have been entered into to achieve an appropriate mix of fixed and floating rate exposure within the Group’s policy.
The Group’s exposure to interest rate risk can be summarised as follows:
2020 USD ($) AUD ($) CNY (¥) JPY (¥ - 000’s)
Net Cash Flow Exposure Before Hedging 81,252,141 22,305,968 266,338,112 3,808,867
less Foreign Exchange Contracts and Options (59,500,000) (14,000,000) (164,000,000) (2,950,000)
Net Unhedged Exposure 21,752,141 8,305,968 102,338,112 858,867
2019 USD ($) AUD ($) CNY (¥) JPY (¥ - 000’s)
Net Cash Flow Exposure Before Hedging 79,670,495 19,541,962 288,605,176 4,984,829
less Foreign Exchange Contracts and Options (68,500,000) (11,000,000) (167,000,000) (3,600,000)
Net Unhedged Exposure 11,170,495 8,541,962 121,605,176 1,384,829
Financial Statements
2020 NZD ($) USD ($) AUD ($) CNY (¥) JPY (¥)
Cash and Cash Equivalents 12,369,695 1,885,144 58,399 47,153,075 174,559,366
Loans and Borrowings (65,000,000) (3,000,000) - - (510,000,000)
Interest Rate Swaps 42,000,000 - - - -
Net Unhedged Exposure (10,630,305) (1,114,856) 58,399 47,153,075 (335,440,634)
2019 NZD ($) USD ($) AUD ($) CNY (¥) JPY (¥)
Cash and Cash Equivalents 82,131 173,310 18,240 30,484,543 420,553,356
Loans and Borrowings (44,850,000) (5,000,000) - - (710,000,000)
Interest Rate Swaps 32,000,000 - - - -
Net Unhedged Exposure (12,767,869) (4,826,690) 18,240 30,484,543 (289,446,644)
e. Sensitivity Analysis
In managing interest rate and currency risks the Group aims to reduce the impact of short-term fluctuations on the Group’s earnings. Over the longer-term, however, permanent changes in foreign exchange and interest rates will have an impact on profit.
Interest Rates: At 31 July it is estimated that a general increase of one percentage point in NZ interest rates would decrease Group profit before income tax by approximately $407,380 (2019: $427,224). Interest rate swaps have been included in this calculation.
Foreign Exchange Rates: The Group has a foreign exchange policy to mitigate the risk associated with the fluctuations in the value of the New Zealand Dollar. At 31 July it is estimated that a general increase of one cent in the NZD/USD exchange rate would increase the Group’s profit by $153,209 (2019: decrease profit by $869,430). Foreign exchange hedging has been included in this calculation.
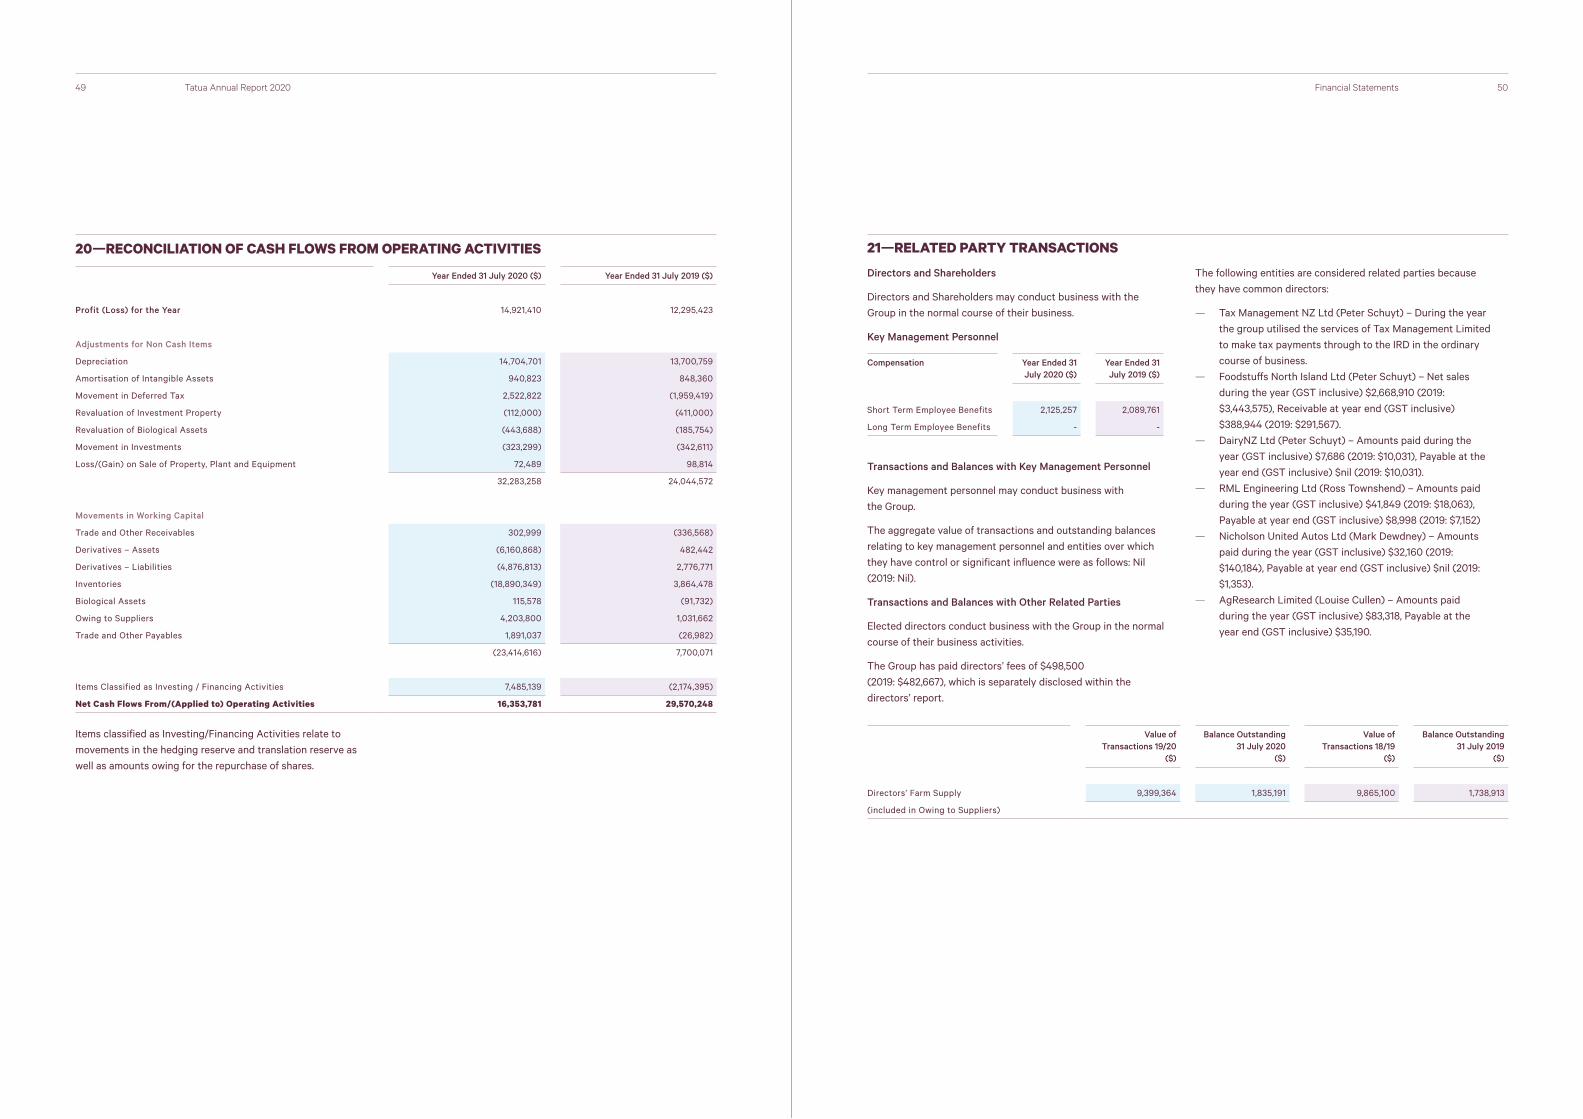
5049 Tatua Annual Report 2020
Items classified as Investing/Financing Activities relate to movements in the hedging reserve and translation reserve as well as amounts owing for the repurchase of shares.
20—RECONCILIATION OF CASH FLOWS FROM OPERATING ACTIVITIES
Year Ended 31 July 2020 ($) Year Ended 31 July 2019 ($)
Profit (Loss) for the Year 14,921,410 12,295,423
Adjustments for Non Cash Items
Depreciation 14,704,701 13,700,759
Amortisation of Intangible Assets 940,823 848,360
Movement in Deferred Tax 2,522,822 (1,959,419)
Revaluation of Investment Property (112,000) (411,000)
Revaluation of Biological Assets (443,688) (185,754)
Movement in Investments (323,299) (342,611)
Loss/(Gain) on Sale of Property, Plant and Equipment 72,489 98,814
32,283,258 24,044,572
Movements in Working Capital
Trade and Other Receivables 302,999 (336,568)
Derivatives – Assets (6,160,868) 482,442
Derivatives – Liabilities (4,876,813) 2,776,771
Inventories (18,890,349) 3,864,478
Biological Assets 115,578 (91,732)
Owing to Suppliers 4,203,800 1,031,662
Trade and Other Payables 1,891,037 (26,982)
(23,414,616) 7,700,071
Items Classified as Investing / Financing Activities 7,485,139 (2,174,395)
Net Cash Flows From/(Applied to) Operating Activities 16,353,781 29,570,248
Financial Statements
21—RELATED PARTY TRANSACTIONS
Directors and Shareholders
Directors and Shareholders may conduct business with the Group in the normal course of their business.
Key Management Personnel
Compensation Year Ended 31 July 2020 ($)
Year Ended 31 July 2019 ($)
Short Term Employee Benefits 2,125,257 2,089,761
Long Term Employee Benefits - -
Transactions and Balances with Key Management Personnel
Key management personnel may conduct business with the Group.
The aggregate value of transactions and outstanding balances relating to key management personnel and entities over which they have control or significant influence were as follows: Nil (2019: Nil).
Transactions and Balances with Other Related Parties
Elected directors conduct business with the Group in the normal course of their business activities.
The Group has paid directors’ fees of $498,500 (2019: $482,667), which is separately disclosed within the directors’ report.
The following entities are considered related parties because they have common directors:
— Tax Management NZ Ltd (Peter Schuyt) – During the year the group utilised the services of Tax Management Limited to make tax payments through to the IRD in the ordinary course of business.
— Foodstuffs North Island Ltd (Peter Schuyt) – Net sales during the year (GST inclusive) $2,668,910 (2019: $3,443,575), Receivable at year end (GST inclusive) $388,944 (2019: $291,567).
— DairyNZ Ltd (Peter Schuyt) – Amounts paid during the year (GST inclusive) $7,686 (2019: $10,031), Payable at the year end (GST inclusive) $nil (2019: $10,031).
— RML Engineering Ltd (Ross Townshend) – Amounts paid during the year (GST inclusive) $41,849 (2019: $18,063), Payable at year end (GST inclusive) $8,998 (2019: $7,152)
— Nicholson United Autos Ltd (Mark Dewdney) – Amounts paid during the year (GST inclusive) $32,160 (2019: $140,184), Payable at year end (GST inclusive) $nil (2019: $1,353).
— AgResearch Limited (Louise Cullen) – Amounts paid during the year (GST inclusive) $83,318, Payable at the year end (GST inclusive) $35,190.
Value of Transactions 19/20
($)
Balance Outstanding 31 July 2020
($)
Value of Transactions 18/19
($)
Balance Outstanding 31 July 2019
($)
Directors’ Farm Supply 9,399,364 1,835,191 9,865,100 1,738,913
(included in Owing to Suppliers)
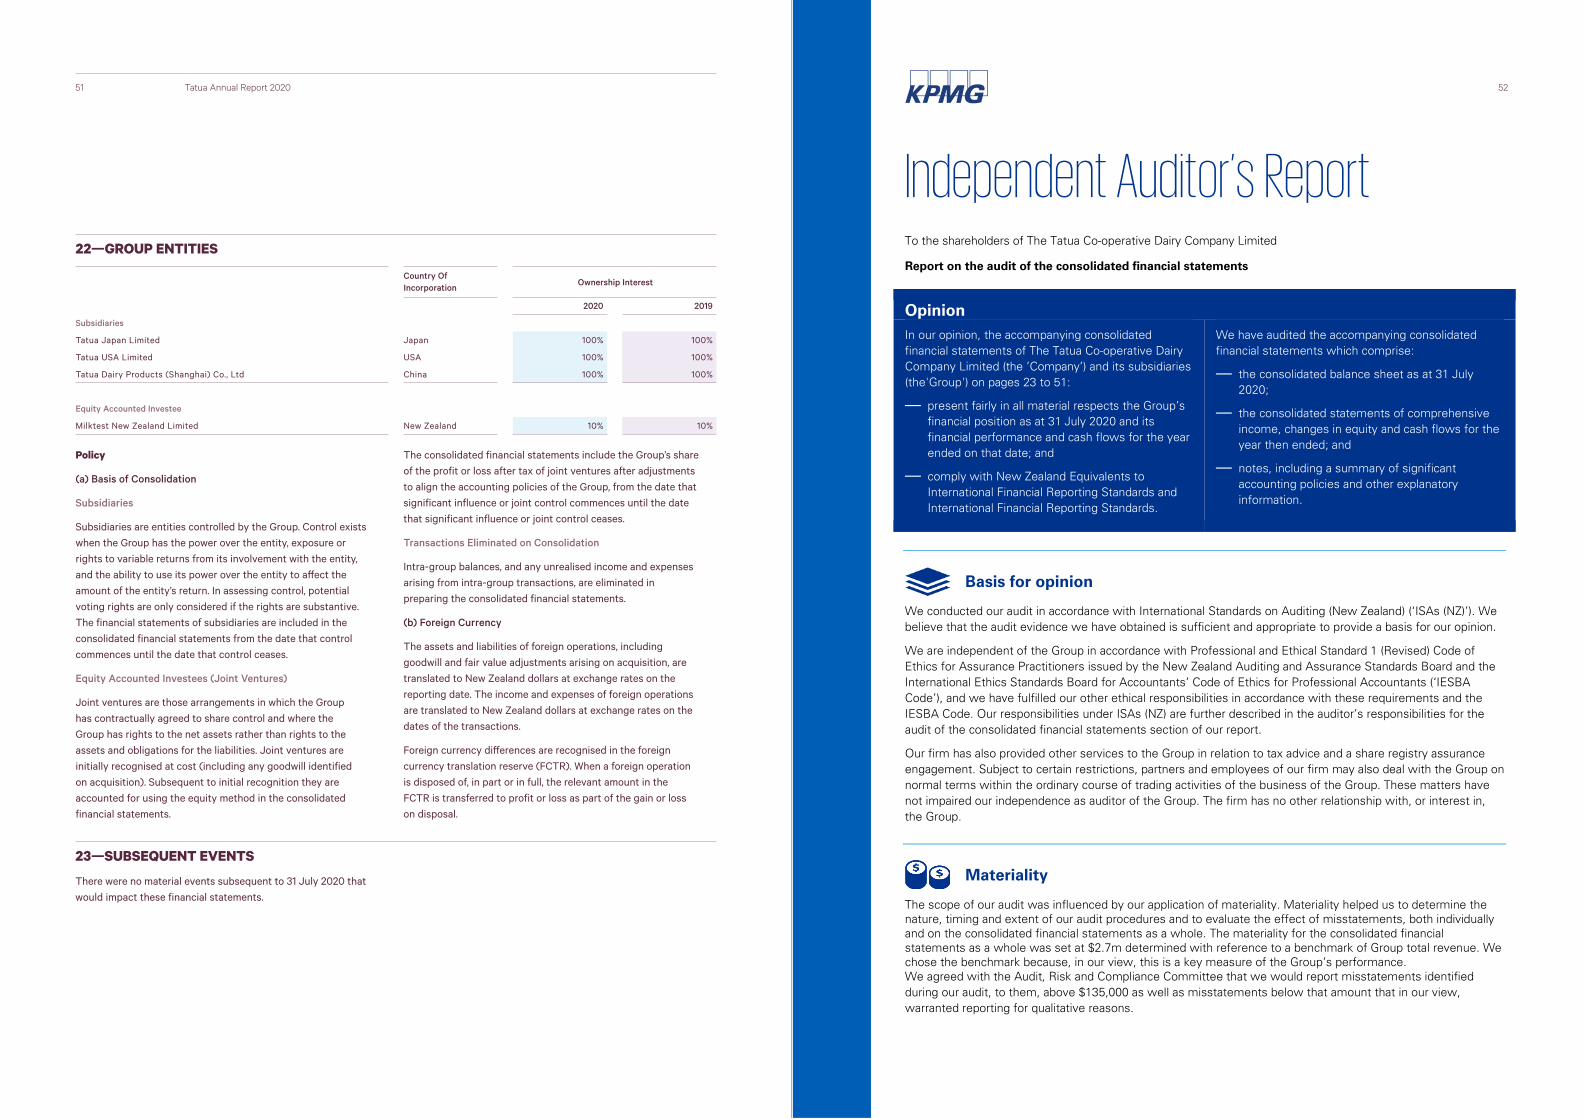
5251 Tatua Annual Report 2020
Policy
(a) Basis of Consolidation
Subsidiaries
Subsidiaries are entities controlled by the Group. Control exists when the Group has the power over the entity, exposure or rights to variable returns from its involvement with the entity, and the ability to use its power over the entity to affect the amount of the entity’s return. In assessing control, potential voting rights are only considered if the rights are substantive. The financial statements of subsidiaries are included in the consolidated financial statements from the date that control commences until the date that control ceases.
Equity Accounted Investees (Joint Ventures)
Joint ventures are those arrangements in which the Group has contractually agreed to share control and where the Group has rights to the net assets rather than rights to the assets and obligations for the liabilities. Joint ventures are initially recognised at cost (including any goodwill identified on acquisition). Subsequent to initial recognition they are accounted for using the equity method in the consolidated financial statements.
The consolidated financial statements include the Group’s share of the profit or loss after tax of joint ventures after adjustments to align the accounting policies of the Group, from the date that significant influence or joint control commences until the date that significant influence or joint control ceases.
Transactions Eliminated on Consolidation
Intra-group balances, and any unrealised income and expenses arising from intra-group transactions, are eliminated in preparing the consolidated financial statements.
(b) Foreign Currency
The assets and liabilities of foreign operations, including goodwill and fair value adjustments arising on acquisition, are translated to New Zealand dollars at exchange rates on the reporting date. The income and expenses of foreign operations are translated to New Zealand dollars at exchange rates on the dates of the transactions.
Foreign currency differences are recognised in the foreign currency translation reserve (FCTR). When a foreign operation is disposed of, in part or in full, the relevant amount in the FCTR is transferred to profit or loss as part of the gain or loss on disposal.
23—SUBSEQUENT EVENTS
There were no material events subsequent to 31 July 2020 that would impact these financial statements.
22—GROUP ENTITIES
Country Of Incorporation Ownership Interest
2020 2019
Subsidiaries
Tatua Japan Limited Japan 100% 100%
Tatua USA Limited USA 100% 100%
Tatua Dairy Products (Shanghai) Co., Ltd China 100% 100%
Equity Accounted Investee
Milktest New Zealand Limited New Zealand 10% 10%
52
Independent Auditor’s Report To the shareholders of The Tatua Co-operative Dairy Company Limited
Report on the audit of the consolidated financial statements
Opinion In our opinion, the accompanying consolidated financial statements of The Tatua Co-operative Dairy Company Limited (the ’Company’) and its subsidiaries (the'Group') on pages 23 to 51:
— present fairly in all material respects the Group’sfinancial position as at 31 July 2020 and its financial performance and cash flows for the year ended on that date; and
— comply with New Zealand Equivalents toInternational Financial Reporting Standards and International Financial Reporting Standards.
We have audited the accompanying consolidated financial statements which comprise:
— the consolidated balance sheet as at 31 July2020;
— the consolidated statements of comprehensiveincome, changes in equity and cash flows for the year then ended; and
— notes, including a summary of significantaccounting policies and other explanatory information.
Basis for opinion
We conducted our audit in accordance with International Standards on Auditing (New Zealand) (‘ISAs (NZ)’). We believe that the audit evidence we have obtained is sufficient and appropriate to provide a basis for our opinion.
We are independent of the Group in accordance with Professional and Ethical Standard 1 (Revised) Code of Ethics for Assurance Practitioners issued by the New Zealand Auditing and Assurance Standards Board and the International Ethics Standards Board for Accountants’ Code of Ethics for Professional Accountants (‘IESBA Code’), and we have fulfilled our other ethical responsibilities in accordance with these requirements and the IESBA Code. Our responsibilities under ISAs (NZ) are further described in the auditor’s responsibilities for the audit of the consolidated financial statements section of our report.
Our firm has also provided other services to the Group in relation to tax advice and a share registry assurance engagement. Subject to certain restrictions, partners and employees of our firm may also deal with the Group on normal terms within the ordinary course of trading activities of the business of the Group. These matters have not impaired our independence as auditor of the Group. The firm has no other relationship with, or interest in, the Group.
Materiality
The scope of our audit was influenced by our application of materiality. Materiality helped us to determine the nature, timing and extent of our audit procedures and to evaluate the effect of misstatements, both individually and on the consolidated financial statements as a whole. The materiality for the consolidated financial statements as a whole was set at $2.7m determined with reference to a benchmark of Group total revenue. We chose the benchmark because, in our view, this is a key measure of the Group’s performance. We agreed with the Audit, Risk and Compliance Committee that we would report misstatements identified during our audit, to them, above $135,000 as well as misstatements below that amount that in our view, warranted reporting for qualitative reasons.
54
53
Key audit matters
Key audit matters are those matters that, in our professional judgement, were of most significance in our audit of the consolidated financial statements in the current period. We summarise below those matters and our key audit procedures to address those matters in order that the shareholders as a body may better understand the process by which we arrived at our audit opinion. Our procedures were undertaken in the context of and solely for the purpose of our statutory audit opinion on the consolidated financial statements as a whole and we do not express discrete opinions on separate elements of the consolidated financial statements.
The key audit matter How the matter was addressed in our audit
Inventory – Milk Cost
Refer to Note 12 of the financial statements.
The Group has inventory of $70 million (2019: $51 million) which represents 23% of total assets.
A significant portion of the cost of finished goods inventory is represented by an estimated cost for milk solids supplied by co-operative shareholders and actual cost for milk produced by other suppliers.
The Group has determined that the estimated cost of the milk solids supplied from co-operative shareholders is best represented by the Farmgate Milk Price calculated in accordance with the Farmgate Milk Price Manual.
A model is prepared to calculate the weighted average cost of milk solids supplied from both co-operative shareholders and other suppliers. The weighted average cost of milk solids supplied is then split into the individual cost for three core product ingredients (Fat, Whey protein and Casein protein). The model incorporates a number of significant inputs, including the Farmgate Milk Price, purchased milk cost from other suppliers, and a valued component ratio of fat to protein.
The judgment required to consider these variabilities and uncertainties are the reason we have considered this a key audit matter.
Our audit procedures included, among others, challenge of management’s significant input assumptions in the model.
We considered the appropriateness of management’s use of the Farmgate Milk Price as the best estimate of the cost of milk solids supplied from the co-operative shareholders.
We compared the Farmgate Milk Price used to the latest publicised rate for the 2019/20 season.
We compared a sample of purchased wholemilk and cream (quality and value) from other parties to their respective invoices.
We compared the valued component ratio of fat to protein in the model to the ratio that was physically paid to farmers based on their fat and protein supply split during the 2019/20 season.
We checked that the split of protein into its casein and whey components was calculated correctly. We checked that the mechanics of the model were calculating correctly and were consistent with the prior year.
We did not identify material exceptions from the procedures performed and found the judgements and assumptions to be balanced and consistent.
Other information
The Directors, on behalf of the Group, are responsible for the other information included in the entity’s Annual Report. Other information includes the 2020 Key Highlights, Report from the Chairman & Chief Executive Officer, Tatua Together, From NZ to the World, Building the Future of Specialised Dairy, Investing for a Better Future, Key Financial Performance Summary, Statutory Information, Statistics and Directory. Our opinion on the consolidated financial statements does not cover any other information and we do not express any form of assurance conclusion thereon.
In connection with our audit of the consolidated financial statements our responsibility is to read the other information and, in doing so, consider whether the other information is materially inconsistent with the consolidated financial statements or our knowledge obtained in the audit or otherwise appears materially misstated. If, based on the work we have performed, we conclude that there is a material misstatement of this other information, we are required to report that fact. We have nothing to report in this regard.
54
Use of this independent auditor’s report
This independent auditor’s report is made solely to the shareholders as a body. Our audit work has been undertaken so that we might state to the shareholders those matters we are required to state to them in the independent auditor’s report and for no other purpose. To the fullest extent permitted by law, we do not accept or assume responsibility to anyone other than the shareholders as a body for our audit work, this independent auditor’s report, or any of the opinions we have formed.
Responsibilities of the Directors for the consolidated financial
statements The Directors, on behalf of the Company, are responsible for:
— the preparation and fair presentation of the consolidated financial statements in accordance with generallyaccepted accounting practice in New Zealand (being New Zealand Equivalents to International Financial Reporting Standards);
— implementing necessary internal control to enable the preparation of a consolidated set of financialstatements that is fairly presented and free from material misstatement, whether due to fraud or error; and
— assessing the ability to continue as a going concern. This includes disclosing, as applicable, matters relatedto going concern and using the going concern basis of accounting unless they either intend to liquidate or to cease operations, or have no realistic alternative but to do so.
Auditor’s responsibilities for the audit of the consolidated financial
statements Our objective is:
— to obtain reasonable assurance about whether the consolidated financial statements as a whole are freefrom material misstatement, whether due to fraud or error; and
— to issue an independent auditor’s report that includes our opinion.
Reasonable assurance is a high level of assurance, but is not a guarantee that an audit conducted in accordance with ISAs NZ will always detect a material misstatement when it exists.
Misstatements can arise from fraud or error. They are considered material if, individually or in the aggregate, they could reasonably be expected to influence the economic decisions of users taken on the basis of these consolidated financial statements.
A further description of our responsibilities for the audit of these consolidated financial statements is located at the External Reporting Board (XRB) website at:
http://www.xrb.govt.nz/standards-for-assurance-practitioners/auditors-responsibilities/audit-report-1/
This description forms part of our independent auditor’s report.
The engagement partner on the audit resulting in this independent auditor's report is Murray Dunn.
For and on behalf of
Hamilton
6th November 2020
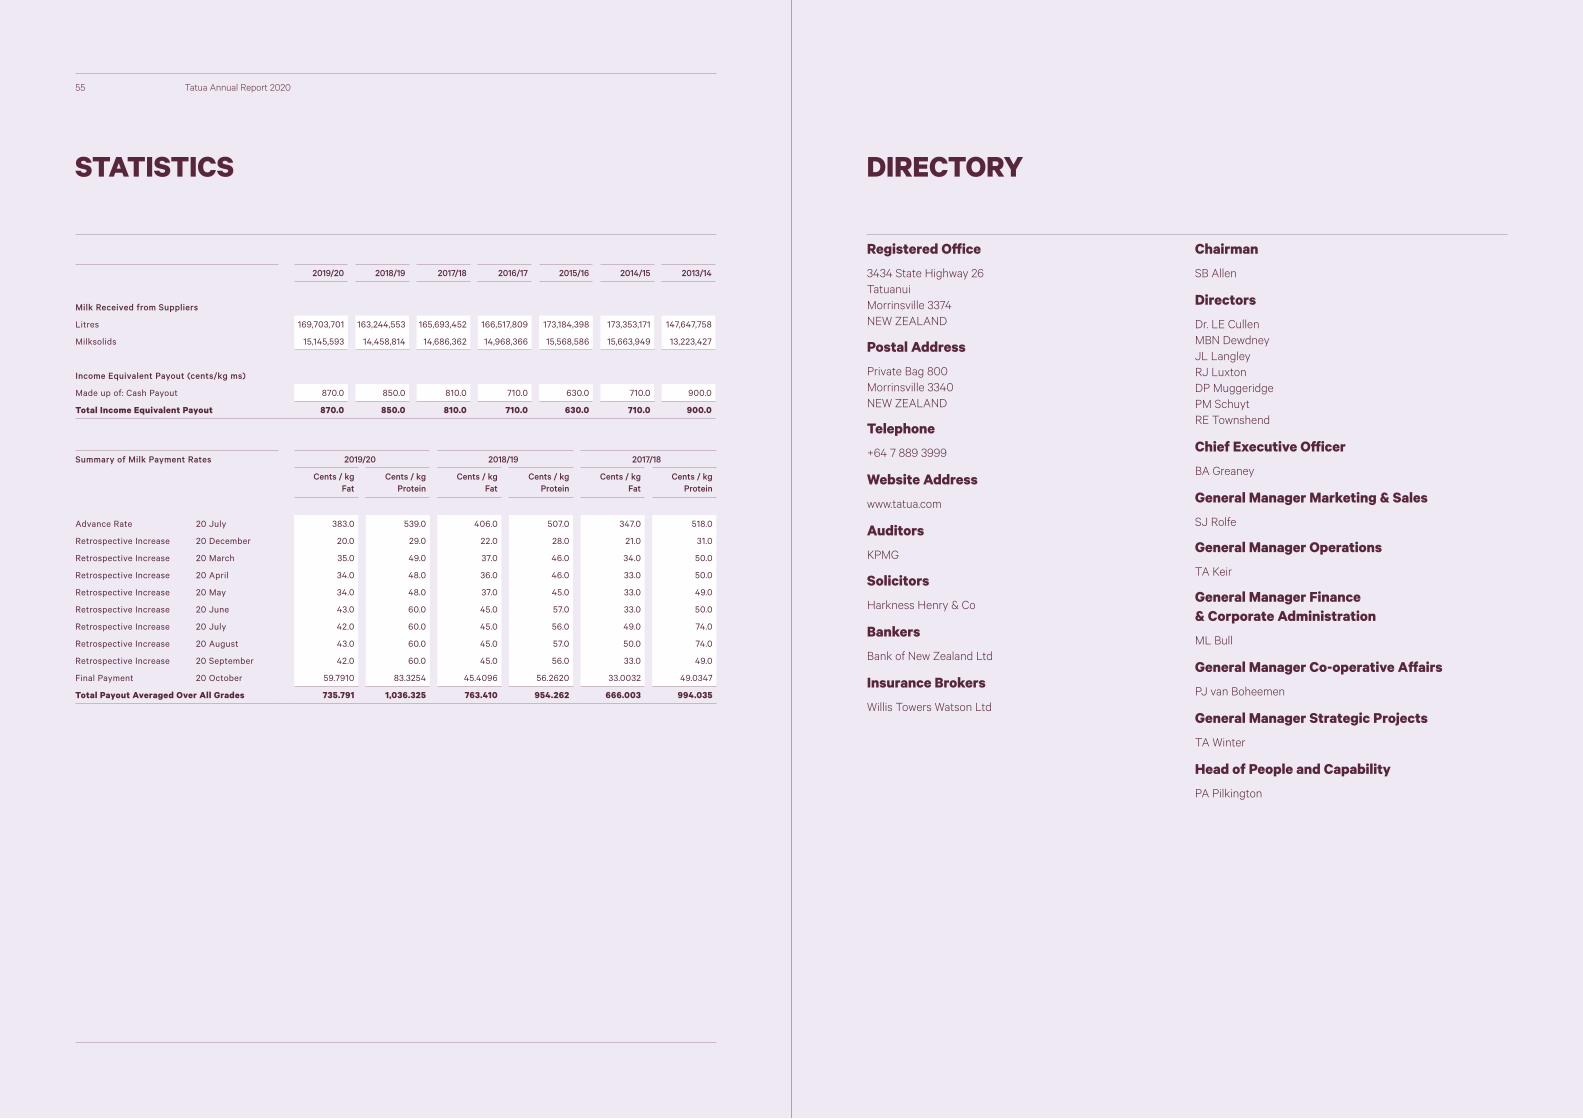
5655 Tatua Annual Report 2020
STATISTICS
2019/20 2018/19 2017/18 2016/17 2015/16 2014/15 2013/14
Milk Received from Suppliers
Litres 169,703,701 163,244,553 165,693,452 166,517,809 173,184,398 173,353,171 147,647,758
Milksolids 15,145,593 14,458,814 14,686,362 14,968,366 15,568,586 15,663,949 13,223,427
Income Equivalent Payout (cents/kg ms)
Made up of: Cash Payout 870.0 850.0 810.0 710.0 630.0 710.0 900.0
Total Income Equivalent Payout 870.0 850.0 810.0 710.0 630.0 710.0 900.0
Summary of Milk Payment Rates 2019/20 2018/19 2017/18
Cents / kg Fat
Cents / kg Protein
Cents / kg Fat
Cents / kg Protein
Cents / kg Fat
Cents / kg Protein
Advance Rate 20 July 383.0 539.0 406.0 507.0 347.0 518.0
Retrospective Increase 20 December 20.0 29.0 22.0 28.0 21.0 31.0
Retrospective Increase 20 March 35.0 49.0 37.0 46.0 34.0 50.0
Retrospective Increase 20 April 34.0 48.0 36.0 46.0 33.0 50.0
Retrospective Increase 20 May 34.0 48.0 37.0 45.0 33.0 49.0
Retrospective Increase 20 June 43.0 60.0 45.0 57.0 33.0 50.0
Retrospective Increase 20 July 42.0 60.0 45.0 56.0 49.0 74.0
Retrospective Increase 20 August 43.0 60.0 45.0 57.0 50.0 74.0
Retrospective Increase 20 September 42.0 60.0 45.0 56.0 33.0 49.0
Final Payment 20 October 59.7910 83.3254 45.4096 56.2620 33.0032 49.0347
Total Payout Averaged Over All Grades 735.791 1,036.325 763.410 954.262 666.003 994.035
Financial Statements
DIRECTORY
Registered Office
3434 State Highway 26 Tatuanui Morrinsville 3374 NEW ZEALAND
Postal Address
Private Bag 800 Morrinsville 3340 NEW ZEALAND
Telephone
+64 7 889 3999
Website Address
www.tatua.com
Auditors KPMG
Solicitors
Harkness Henry & Co
Bankers
Bank of New Zealand Ltd
Insurance Brokers
Willis Towers Watson Ltd
Chairman
SB Allen
Directors Dr. LE Cullen MBN Dewdney JL Langley RJ Luxton DP Muggeridge PM Schuyt RE Townshend
Chief Executive Officer
BA Greaney
General Manager Marketing & Sales
SJ Rolfe
General Manager Operations
TA Keir
General Manager Finance & Corporate Administration
ML Bull
General Manager Co-operative Affairs
PJ van Boheemen
General Manager Strategic Projects
TA Winter
Head of People and Capability
PA Pilkington

tatua.com