annual report - brainmass.comannual+report_final.pdf · annual report 10 igt | it’s a whole new...
TRANSCRIPT
Annual Report 10IGT | It’s a whole new game.

A letter to our shareholders.
In fiscal year 2010, we set out with a
clear plan to improve our balance sheet,
deliver game-changing new products
and experiences, scale and grow our
international business, and increase our
profitability. We have delivered on every
aspect of that plan, positioned IGT for
robust growth, and I’m confident that we
are poised to make the coming quarters,
and fiscal years, even better.
Notable financial achievements for 2010
include growing our international revenues
by 21 percent, and increasing our adjusted
operating margins by 200 basis points
to 25 percent1 – the best in the industry.
We also generated nearly $2 billion in
revenues, delivered more than $770 million
of adjusted EBITDA2, and reduced our debt
obligations by over $400 million.
I am proud of our 2010 financial results and
excited about the progress we have made
in thoroughly executing our plan.
1

2
At IGT, our international business is a distinct competitive advantage as we continually look to diversify our revenue model. This past year we made it a priority to allocate capital and resources to our growing business outside the United States. On that front, we sold 24,600 units internationally – more than double our nearest competitor – and we are well-positioned to capitalize on expanding international markets, now and into the future. In the last three years, our international revenues (excluding discontinued operations in Japan) have grown from 20 percent of total revenues to 28 percent this year.
In 2010, IGT employees were committed to contributing extra effort to make our business more profitable and were relentless in continuing to challenge the status quo. As an IGT shareholder myself, I applaud our team for taking the changes of the past few years in stride and turning them into significant opportunities. Everyone is pitching in at every level of the Company, in what is a formidable force-multiplier for IGT.
As we look to the future, we continue to break new ground and lead the industry into new markets with new technologies. Our recent game and systems developments position IGT well. We have prioritized customer feedback and utilized extensive research to create the products our customers want and need to enhance their businesses. At this year’s Global Gaming Expo tradeshow, we launched some of the most exciting games IGT has ever introduced, such as The Dark Knight™, Ghostbusters™, Wheel of Fortune® Triple Extreme Spin™, The Hangover™, Puppy Stampede™, Reel Edge™, and Texas Hold’em Heads Up Poker™. As our portfolio of system products continues to gain momentum, it offers increased potential to enhance our new product performance and generate more non-box revenue.
Our management team is fully immersed in the business and our global workforce has a clear understanding of our future strategy. We have completed our long-term planning, we are executing to plan, and we are on track to accomplish our goals. We have distilled our
priorities to their essentials and identified our core objectives for 2011:
First, we will continue reducing our reliance on the North American replacement cycle by concentrating on global revenue sources and allocating assets where the highest yielding opportunities exist. We expect to see marked improvement in the health of our gaming operations business. In addition, we are seeing increased adoption of our improved systems products, and bigger returns on our library of intellectual property.
Second, we plan to increase our global footprint through jurisdictional expansion and sales growth. We will maintain our sense of priority regarding returns on our international invested capital.
Third, we will continue to find ways to drive our improving profitability and margins even higher. We carefully consider every dollar we spend, and we continuously look for ways to efficiently manage our cost structure and minimize expenses. Our research and development budget is allocated with great care, with a disciplined focus on generating returns for our shareholders.
Finally, we plan to accelerate our growth and increase our presence in the online and mobile gaming marketplace, a segment we’ve actively participated in for more than a decade. We recently completed the formation of a division of IGT dedicated to increasing our leadership in interactive gaming. As online, mobile and land-based gaming experiences converge globally, we plan to be a leader in this emerging business and to work with our customers as they thrive in an increasingly digital world.
Fiscal 2011 is going to be an exciting year for IGT. Much of the planning and groundwork has been done. We believe our shareholders will begin to see and share in the rewards.
At IGT … it IS a whole new game.
Patti S. Hart PRESIDENT AND CEO
IGT AnnuAl RepoRT 2010 IT’s A whole new GAme

3
3
Board of Directors
Philip G. SatreChairman of the Board of IGT
Retired Chairman and CEO, Harrah’s Entertainment Inc.
Paget L. AlvesPresident of Business Markets Group (BMG)
Sprint Nextel Corporation
Janice ChaffinGroup President, Consumer Business Unit
Symantec Corporation
Greg CreedPresident and Chief Concept Officer
Taco Bell© Corporation
Robert A. MathewsonPresident of RGC Inc.
Thomas J. MatthewsFormer Chairman and Chief Executive Officer of IGT
Robert J. MillerPrincipal of Robert J. Miller Consulting
David E. RobersonSenior Vice President in the Enterprise Server,
Storage and Networking DivisionHewlett-Packard
Vincent L. SaduskyPresident and Chief Executive Officer
LIN TV Corporation
4
Key Executives & Officers
Patti S. Hart President and Chief Executive Officer
Patrick W. Cavanaugh Executive Vice President, Chief Financial Officer and Treasurer
Robert C. Melendres Chief Legal Officer and Corporate Secretary
Christopher J. Satchell Chief Technology Officer and Executive Vice President of Research and Development
Eric P. Tom Chief Operating Officer
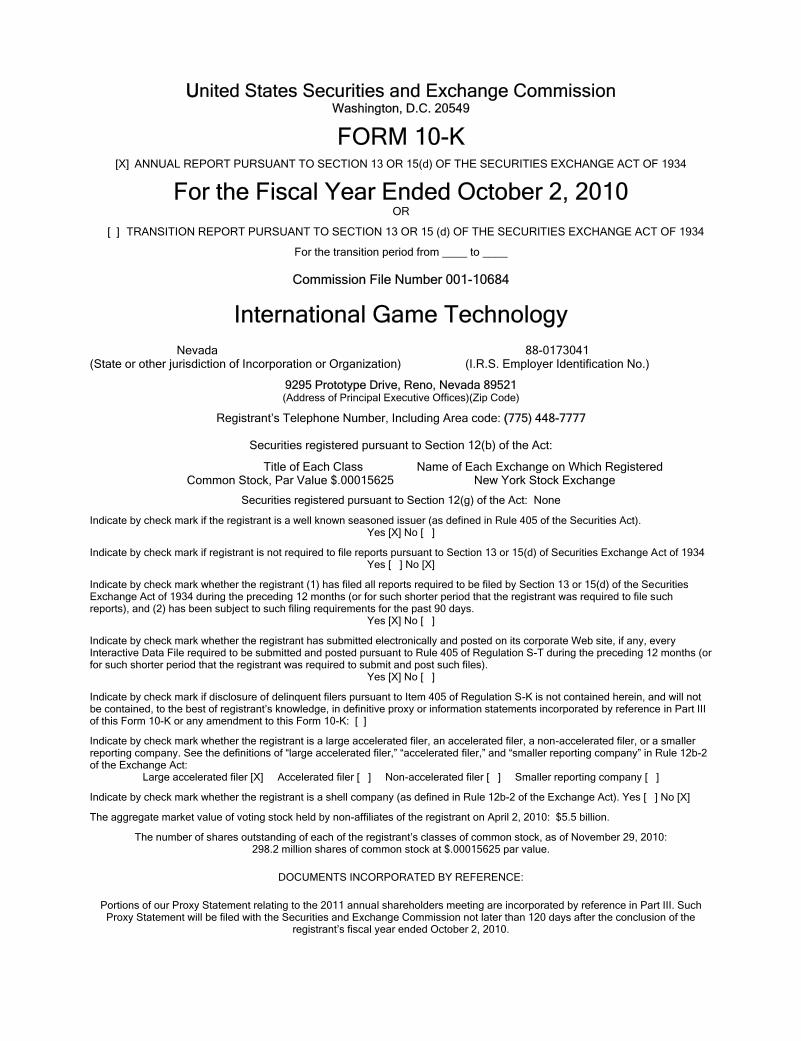
UUnited States Securities and Exchange Commission Washington, D.C. 20549
FORM 10-K
[X] ANNUAL REPORT PURSUANT TO SECTION 13 OR 15(d) OF THE SECURITIES EXCHANGE ACT OF 1934
For the Fiscal Year Ended October 2, 2010 OR
[ ] TRANSITION REPORT PURSUANT TO SECTION 13 OR 15 (d) OF THE SECURITIES EXCHANGE ACT OF 1934
For the transition period from ____ to ____
Commission File Number 001-10684
International Game Technology
Nevada 88-0173041 (State or other jurisdiction of Incorporation or Organization) (I.R.S. Employer Identification No.)
9295 Prototype Drive, Reno, Nevada 89521 (Address of Principal Executive Offices)(Zip Code)
Registrant’s Telephone Number, Including Area code: ((775) 448-7777
Securities registered pursuant to Section 12(b) of the Act:
Title of Each Class Name of Each Exchange on Which Registered Common Stock, Par Value $.00015625 New York Stock Exchange
Securities registered pursuant to Section 12(g) of the Act: None
Indicate by check mark if the registrant is a well known seasoned issuer (as defined in Rule 405 of the Securities Act). Yes [X] No [ ]
Indicate by check mark if registrant is not required to file reports pursuant to Section 13 or 15(d) of Securities Exchange Act of 1934 Yes [ ] No [X]
Indicate by check mark whether the registrant (1) has filed all reports required to be filed by Section 13 or 15(d) of the Securities Exchange Act of 1934 during the preceding 12 months (or for such shorter period that the registrant was required to file such reports), and (2) has been subject to such filing requirements for the past 90 days.
Yes [X] No [ ]
Indicate by check mark whether the registrant has submitted electronically and posted on its corporate Web site, if any, every Interactive Data File required to be submitted and posted pursuant to Rule 405 of Regulation S-T during the preceding 12 months (or for such shorter period that the registrant was required to submit and post such files).
Yes [X] No [ ]
Indicate by check mark if disclosure of delinquent filers pursuant to Item 405 of Regulation S-K is not contained herein, and will not be contained, to the best of registrant’s knowledge, in definitive proxy or information statements incorporated by reference in Part III of this Form 10-K or any amendment to this Form 10-K: [ ]
Indicate by check mark whether the registrant is a large accelerated filer, an accelerated filer, a non-accelerated filer, or a smaller reporting company. See the definitions of “large accelerated filer,” “accelerated filer,” and “smaller reporting company” in Rule 12b-2 of the Exchange Act:
Large accelerated filer [X] Accelerated filer [ ] Non-accelerated filer [ ] Smaller reporting company [ ]
Indicate by check mark whether the registrant is a shell company (as defined in Rule 12b-2 of the Exchange Act). Yes [ ] No [X]
The aggregate market value of voting stock held by non-affiliates of the registrant on April 2, 2010: $5.5 billion.
The number of shares outstanding of each of the registrant’s classes of common stock, as of November 29, 2010: 298.2 million shares of common stock at $.00015625 par value.
DOCUMENTS INCORPORATED BY REFERENCE:
Portions of our Proxy Statement relating to the 2011 annual shareholders meeting are incorporated by reference in Part III. Such Proxy Statement will be filed with the Securities and Exchange Commission not later than 120 days after the conclusion of the
registrant’s fiscal year ended October 2, 2010.

2
TABLE OF CONTENTS
GLOSSARY OF TERMS AND ABBREVIATIONS (as used in this document) ................................................... 3
PART I Item 1. Business .......................................................................................................................................... 5
Item 1A. Risk Factors ................................................................................................................................... 13
Item 1B. Unresolved Staff Comments ......................................................................................................... 20
Item 2. Properties ..................................................................................................................................... 20
Item 3. Legal Proceedings ........................................................................................................................ 20
Item 4. (Removed and Reserved) ............................................................................................................. 20 PART II
Item 5. Market for Registrant’s Common Equity, Related Stockholder Matters, and Issuer Purchases of Equity Securities ............................................................................................................................ 21
Item 6. Selected Financial Data ................................................................................................................ 23
Item 7. Management’s Discussion and Analysis of Financial Condition and Results of Operations ............ 24
Item 7A. Quantitative and Qualitative Disclosures about Market Risk .......................................................... 45
Item 8. Financial Statements and Supplementary Data ............................................................................. 47 REPORTS OF INDEPENDENT REGISTERED PUBLIC ACCOUNTING FIRM ......................................................................... 47
CONSOLIDATED INCOME STATEMENTS ................................................................................................................................ 49 CONSOLIDATED BALANCE SHEETS ....................................................................................................................................... 50 CONSOLIDATED STATEMENTS OF CASH FLOWS ................................................................................................................ 51 CONSOLIDATED STATEMENTS OF TOTAL EQUITY AND COMPREHENSIVE INCOME ...................................................... 53 NOTES TO CONSOLIDATED FINANCIAL STATEMENTS ........................................................................................................ 54
Item 9. Changes in and Disagreements with Accountants on Accounting and Financial Disclosure ........... 95
Item 9A. Controls and Procedures ................................................................................................................ 95
Item 9B. Other Information ........................................................................................................................... 96 PART III
Item 10. Directors, Executive Officers and Corporate Governance .............................................................. 96
Item 11. Executive Compensation ............................................................................................................... 96
Item 12. Security Ownership of Certain Beneficial Owners, Management, Related Stockholder Matters ..... 96
Item 13. Certain Relationships and Related Transactions, and Director Independence ............................... 96
Item 14. Principal Accountant Fees and Services ........................................................................................ 96
PART IV Item 15. Exhibits and Financial Statement Schedules ..................................................................................... 96
3
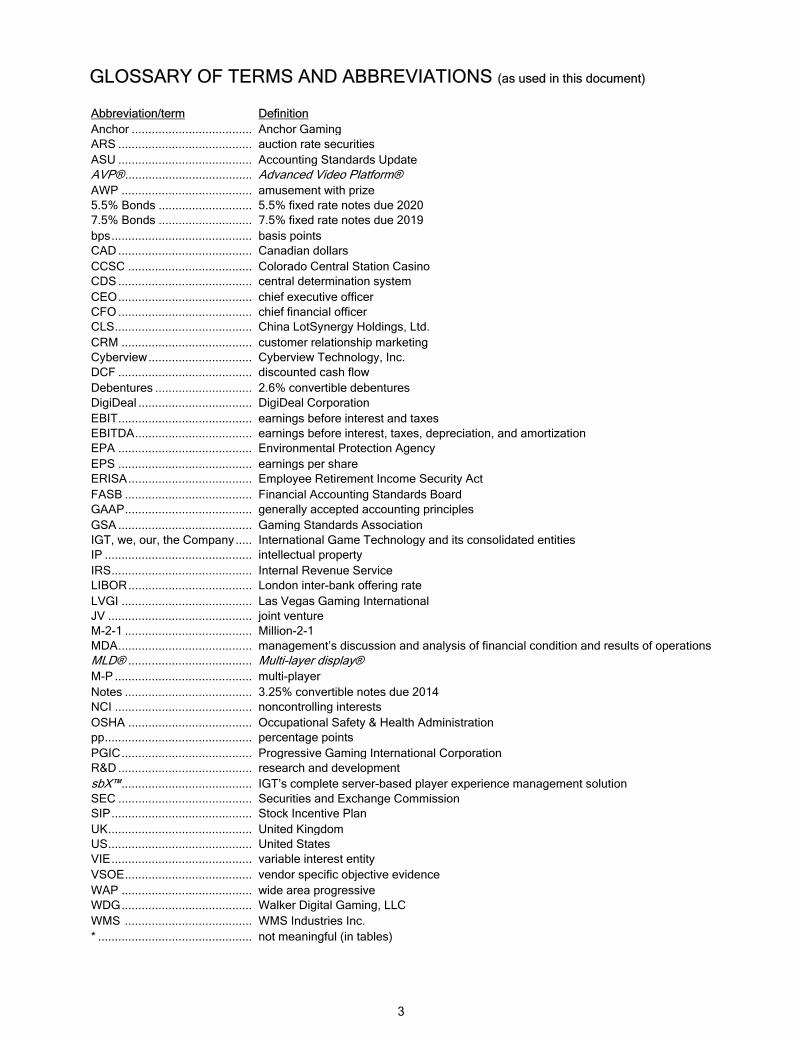
GLOSSARY OF TERMS AND ABBREVIATIONS (as used in this document)
Abbreviation/term Definition Anchor .................................... Anchor Gaming ARS ........................................ auction rate securities ASU ........................................ Accounting Standards Update AVP® ...................................... Advanced Video Platform® AWP ....................................... amusement with prize 5.5% Bonds ............................ 5.5% fixed rate notes due 2020 7.5% Bonds ............................ 7.5% fixed rate notes due 2019 bps .......................................... basis points CAD ........................................ Canadian dollars CCSC ..................................... Colorado Central Station Casino CDS ........................................ central determination system CEO ........................................ chief executive officer CFO ........................................ chief financial officer CLS ......................................... China LotSynergy Holdings, Ltd. CRM ....................................... customer relationship marketing Cyberview ............................... Cyberview Technology, Inc. DCF ........................................ discounted cash flow Debentures ............................. 2.6% convertible debentures DigiDeal .................................. DigiDeal Corporation EBIT ........................................ earnings before interest and taxes EBITDA ................................... earnings before interest, taxes, depreciation, and amortization EPA ........................................ Environmental Protection Agency EPS ........................................ earnings per share ERISA ..................................... Employee Retirement Income Security Act FASB ...................................... Financial Accounting Standards Board GAAP ...................................... generally accepted accounting principles GSA ........................................ Gaming Standards Association IGT, we, our, the Company ..... International Game Technology and its consolidated entities IP ............................................ intellectual property IRS .......................................... Internal Revenue Service LIBOR ..................................... London inter-bank offering rate LVGI ....................................... Las Vegas Gaming International JV ........................................... joint venture M-2-1 ...................................... Million-2-1 MDA ........................................ management’s discussion and analysis of financial condition and results of operations MLD® ..................................... Multi-layer display® M-P ......................................... multi-player Notes ...................................... 3.25% convertible notes due 2014 NCI ......................................... noncontrolling interests OSHA ..................................... Occupational Safety & Health Administration pp ............................................ percentage points PGIC ....................................... Progressive Gaming International Corporation R&D ........................................ research and development sbX™ ....................................... IGT’s complete server-based player experience management solution SEC ........................................ Securities and Exchange Commission SIP .......................................... Stock Incentive Plan UK ........................................... United Kingdom US ........................................... United States VIE .......................................... variable interest entity VSOE ...................................... vendor specific objective evidence WAP ....................................... wide area progressive WDG ....................................... Walker Digital Gaming, LLC WMS ...................................... WMS Industries Inc. * .............................................. not meaningful (in tables)

4
FORWARD LOOKING STATEMENTS
This report contains statements that do not relate to historical or current facts, but are “forward looking” statements within the meaning of the Private Securities Litigation Reform Act of 1995. These statements relate to analyses and other information based on forecasts of future results and estimates of amounts not yet determinable. These statements may also relate to future events or trends, our future prospects and proposed new products, services, developments, or business strategies, among other things. These statements can generally (although not always) be identified by their use of terms and phrases such as anticipate, appear, believe, could, would, estimate, expect, indicate, intend, may, plan, predict, project, pursue, will, continue, and other similar terms and phrases, as well as the use of the future tense.
Examples of forward looking statements in this report include, but are not limited to, the following categories of expectations about:
� our ability to successfully introduce new products and their impact on replacement demand
� the timing, features, benefits, and expected continued or future success of new product introductions and ongoing product and marketing initiatives
� our leadership position in the gaming industry
� the advantages offered to customers by our anticipated products and product features
� gaming growth, expansion, and new market opportunities
� fluctuations in future gross margins and tax rates
� increasing product sales or machine placements
� legislative or regulatory developments and related market opportunities
� available capital resources to fund future operating requirements, capital expenditures, payment obligations, and share repurchases
� expectations related to the timing and cost associated with restructuring efforts and deconsolidations
� losses from off-balance sheet arrangements
� financial returns to shareholders related to management of our costs
� the impact of recently adopted accounting pronouncements
� the outcome and expense of litigation
� anticipated increased revenue yields and operating margin if general economic conditions improve
Actual results could differ materially from those expressed or implied in our forward looking statements. Our future financial condition and results of operations, as well as any forward looking statements, are subject to change and to inherent known and unknown risks and uncertainties. See Part 1, Item 1A, Risk Factors, in this report for a discussion of these and other risks and uncertainties. You should not assume at any point in the future that the forward looking statements in this report are still valid. We do not intend, and undertake no obligation, to update our forward looking statements to reflect future events or circumstances.

5
PART I
Item 1. Business
International Game Technology is a global gaming company specializing in the design, manufacture, and marketing of electronic gaming equipment and systems. IGT maintains a wide array of entertainment-inspired gaming product lines and targets gaming markets in all legal jurisdictions worldwide.
International Game Technology was incorporated in Nevada in December 1980 to acquire the gaming licensee and operating entity, IGT, and to facilitate our initial public offering. Principally serving the US gaming markets when founded, we expanded into jurisdictions outside the US in 1986. Unless the context indicates otherwise, International Game Technology, IGT, we, our, or the Company refers to International Game Technology and its consolidated entities. Italicized text in this document with an attached superscript trademark or copyright notation indicates trademarks of IGT or its licensors. Information about IGT trademarks and copyrights is available on our website at www.IGT.com.
Our fiscal year is reported on a 52/53-week period that ends on the Saturday nearest to September 30. For simplicity, this report presents all fiscal years using the calendar month end as outlined in the table below.
Fiscal Year WeeksActual Presented as
2010 October 2, 2010 September 30, 2010 522009 October 3, 2009 September 30, 2009 532008 September 27, 2008 September 30, 2008 522007 September 29, 2007 September 30, 2007 522006 September 30, 2006 September 30, 2006 52
Ended
BUSINESS SEGMENTS
We derive our revenues from the distribution of electronic gaming equipment, systems, services and licensing. Operating results reviewed by our chief operating decision maker encompass all revenue sources within each geographical customer region. We currently view our business in two operating segments as stated below, each incorporating all types of revenues. Unless otherwise noted, prior year amounts throughout this report have been adjusted for Japan and DigiDeal operations discontinued during fiscal 2010, as further described in Note 7 of our Consolidated Financial Statements.
� North America consists of our operations in the US and Canada, comprising 72% of consolidated revenues from continuing operations in fiscal 2010, 78% in 2009, and 76% in 2008.
� International consists of our operations in all other jurisdictions worldwide, comprising 28% of consolidated revenues from continuing operations in fiscal 2010, 22% in 2009, and 24% in 2008.
We measure segment profit on the basis of operating income. Certain income and expenses related to company-wide initiatives are managed at the corporate level and not allocated to an operating segment. Other segment and financial information contained in BUSINESS SEGMENT RESULTS of our MDA and Note 21 of our Consolidated Financial Statements is incorporated here by this reference.
REVENUE STREAMS
We have two revenue streams within each business segment -- gaming operations and product sales.
Gaming Operations
Comprising 55% of consolidated revenues in fiscal 2010, 56% in 2009, and 53% in 2008, gaming operations generates recurring revenues by providing our customers with proprietary gaming equipment, systems and services. Our gaming operations pricing arrangements are largely variable where casinos pay service fees to IGT based on a percentage of amounts wagered or net win. Variable fee units comprised 82% of our gaming operations installed base at September 30, 2010. Fixed fee pricing arrangements are typically based on a daily

6
or monthly fee. A portion of WAP fees paid to IGT is used for the funding and administration of progressive jackpots. The cost of funding progressive jackpots is subject to interest rate volatility as further described in Note 1 of our Consolidated Financial Statements and the MDA—CRITICAL ACCOUNTING ESTIMATES.
Gaming operations revenues are affected by variations in the number and type of machines in service, levels of player wagers, and pricing arrangement terms. Levels of play are dependent on game popularity, casino seasonality trends, economic conditions, and other player preferences. Seasonal trends generally show higher play levels in the spring and summer months and lower in the fall and winter months. We monitor the productive life cycles of our gaming operations machines and systematically replace units experiencing declining play levels with newer games.
The IGT installed base of gaming devices includes both variable fee and fixed fee machines, which are recorded on our balance sheet as part of our property, plant and equipment. Casino-owned units are machines sold that also provide a recurring royalty fee. Gaming operations revenues are generated from the units reflected in the table below, as well as service fees for internet gaming, systems access, game content, and other gaming equipment rentals and leasing.
September 30, 2010 2009 2008IGT owned units - variable fee 47,000 52,000 44,800 IGT owned units - fixed fee 10,000 9,300 15,700
IGT installed base 57,000 61,300 60,500
Casino-owned units 17,900 18,200 17,600
Total Gaming Operations Units 74,900 79,500 78,100
Product Sales
Comprising 45% of consolidated revenues in 2010, 44% in 2009, and 47% in 2008, product sales includes gaming equipment, systems, services, licensing, and component parts. Non-machine sales are comprised of gaming systems, licensing fees, parts, conversions, and miscellaneous royalty fees and services.
Product Sales Composit ion 2010 2009 2008Video & spinning reel machines 59% 59% 62%AWP machines 4% 4% 4%
Total machine sales 63% 63% 66%
Gaming systems 21% 21% 18%Parts & conversions 13% 14% 14%Other fees & services 3% 2% 2%
Total non-machine sales 37% 37% 34%
Fiscal Years
STRATEGIC BUSINESS ARRANGEMENTS
We complement our internal resources through strategic alliances, investments, and business acquisitions that:
� diversify our geographic reach
� expand our product lines and customer base
� leverage our technological and manufacturing infrastructure to increase our rates of return
Our most recent acquisitions and affiliate investments are discussed in Notes 3 and 7 of our Consolidated Financial Statements.
During fiscal 2010, we continued to evaluate and assess whether certain investments fit into our core business strategy. A discussion of the resulting recognition of material losses or impairment and discontinued operations during the current periods is contained in the OVERVIEW and CONSOLIDATED RESULTS of our MDA and Notes 2 and 7 of our Consolidated Financial Statements.

7
PRODUCTS
We provide a broad range of electronic gaming equipment and systems, as well as licensing, services, and component parts that may be sold or placed under recurring revenue arrangements.
Gaming Equipment
We offer our customers a wide variety of video and physical reel slot machines that may be tailored to meet specific needs. Customers can choose from an extensive library of games combined with several new machine cabinet models designed to maximize functionality, flexibility, and player comfort. Additionally, IGT’s AVP® machines are designed to support server-based gaming networks. Machine configurations vary by jurisdiction and may include:
� Stand-alone casino-style slot machines that determine the game play outcome at the machine, known as Class III in tribal jurisdictions
� WAP jackpot systems with linked machines across several casinos
� CDS machines connected to a central server that determines the game outcome, encompassing VLT’s (video lottery terminals) used primarily in government-sponsored applications and electronic or video bingo machines, known as Class II in tribal jurisdictions
We also offer multi-player community-style configurations with a common display, especially useful in jurisdictions where live table games are not allowed. Our electronic table games include live dealer hosted configurations with virtual chips/electronic credits, as well as a fully virtual platform that can be approved as a slot game, providing table-like gaming for slot only or limited table jurisdictions.
Our international gaming machines also include AWP games, which generally incorporate lower payouts with features that allow players to exercise an element of skill and strategy.
Systems
IGT systems products include applications for casino management, CRM, server-based games and player management. Our casino management solutions include integrated modules for machine accounting, patron management, cage and table accounting, ticket-in/ticket-out, bonusing (jackpots and promotions), and table game automation. Our CRM solution features integrated marketing and business intelligence modules that provide analytical, predictive, and management tools for maximizing casino operational effectiveness. Our server-based solutions enable game delivery to slot machines, computers, mobile phones, tablets and other networked devices, as well as providing casino operators with opportunities to increase profits by enhancing the players’ experience, connecting with players interactively, and creating operational efficiencies.
PRODUCT DEVELOPMENT
The focus of our product development is to enhance the player experience through interactive networked gaming, information technology, innovative game design, and customer relationship services, thereby maximizing the potential for casino operator profitability. The foundation of our product development is built on the creation and delivery of high quality game content through interoperable systems and client casino platforms. Our product innovation reflects the combination of customer research, design experience and engineering excellence.
Since 1986 with the introduction of microprocessor based S+ slots and Megabucks® , the world’s first WAP slot machine, IGT’s most significant product innovations have also included:
� Multi-denomination play
� Wheel of Fortune® ,the most popular game theme to date
� EZ Pay® ticket-in / ticket-out
� Internet gaming through WagerWorks™
� sbX® complete player experience management solution
� MLD® 3-D multi-layer display
8
We support our product development efforts through a considerable emphasis and investment in the R&D of future technology, which we believe enables IGT to maintain a leadership position in the industry. We dedicate more than 1,600 employees worldwide to product development covering multiple engineering disciplines, including hardware, electrical, systems and software. We also specialize in creative development such as game design, game math, cutting edge graphics and audio development. Our investment in R&D from continuing operations totaled $200.1 million in fiscal 2010, $204.1 million in 2009, and $216.5 million in 2008.
Our primary development facilities are located in Nevada (Reno and Las Vegas), California (San Francisco) and China (Beijing). Additionally, IGT global design centers provide local community presence, customized products, and regional production where beneficial or required.
During fiscal 2010, we initiated the use of our next-generation of game development tools aimed to increase velocity of production, reduce cost, improve quality and enhance new game innovation. We also continued our process improvements, enabling added efficiency by reducing the number of hardware and software platforms. Additionally, we increased our use of proven third-party technologies to improve the yield of our development investments and concentrate increased resources on differentiated engineering.
Games
We combine elements of math, play mechanics, sound, art, and technological advancements with our library of entertainment licenses and patented IP to provide gaming products with a high degree of player appeal. During fiscal 2010, we continued expanding our game libraries with rich content, compelling brands and engaging bonuses to address changing player preferences and other market trends.
Our games are created primarily by employee designers, engineers, and artists, augmented by third-party content creators. We develop video-reel and poker games, as well as enhancements for our classic spinning-reel games, such as multi-line, and multi-coin configurations. We build on our traditional game development with unique customization for video lottery, CDS, Class II, and international markets. We also continually upgrade and optimize our proprietary flagship themes, such as Wheel of Fortune® and Megabucks®, with game refreshers and innovative features to enhance play.
In today’s gaming markets we face highly capable and aggressive competitors, demanding gaming patrons, and increasing game complexity. Today’s market requires constant innovation and increased velocity in providing quality game content across all platforms, particularly in video slots, at attractive pricing for our customers. During fiscal 2010, we sharpened our R&D efforts toward content development with a more effective use of our game design resources and IP portfolio. We used real-time patron level market information obtained through our consumer research group for the development and deployment of game content with a “customer first” focus.
Fiscal 2010 highlights
� IGT released enhanced MLD® spinning-reel games featuring curved reels that shake, wobble, and bounce. MLD® technology is used to create virtual spinning reels that mimic the look, feel, and sound of mechanical reels.
� MLD® technology advancements were incorporated into Double Jeweled 7s™ and Blackbeard’s Double Doubloons™ games, as well as the Triple Red Hot 7s™ MLD® tournament game. MLD® tournament games provide the flexibility to toggle instantly between tournament and regular play at the touch of a button.
� We continued to refresh legacy game libraries with the release of many new themes for the S2000® spinning-reel and 80960 video-reel games.
� We launched Siberian Storm™, Three Kings™, and Figaro™ with innovative features such as Connected Lines™, Split Symbols®, and Progressive Free Games™.
� We released our first in-demand “configurable cost-to-cover” feature, which allows for low or high denomination play configuration options, offered on 25% of new video themes.
� Sex and the City™ with a MultiPLAY interface was introduced in gaming operations. We released the big-screen Center Stage Series, delivering cinema-style entertainment to players, as well as game and hardware flexibility to operators.
� We continued to innovate with our flagship brand, Wheel of Fortune®, by offering new experiences, including Wheel of Fortune® Secret Spins™, featuring our exclusive tilting Reel Wheel, and Wheel of Fortune® Reel MultiPLAY, which gives players the chance at four consecutive wheel spins.
9
� Other gaming operations releases in fiscal 2010 included The Amazing Race™, Top Dollar® Reel MultiPLAY, Megabucks® Multi-Level Progressives, Crystal Fortunes™, House of 9 Dragons™, Bombs Away™, and Star Wars™ Droid™ Hunt.
� We developed upcoming Center Stage releases, such as American Idol®, Wheel of Fortune® Triple Spin™, Wheel of Fortune® Experience 2™, and The Dark Knight™.
� M-P Series® Triple Towers® Horse Racing was introduced, where much like a live racetrack, players can place bets for Win, Place, Show, Exacta, or Quinella with horse history and handicap information displayed on a large-format LCD screen.
� New video poker games developed included Ultimate X Poker™, with exciting multipliers for current and next-game hands, and Super Star Poker®, designed specifically to bring versatility and entertainment to areas with limited floor space.
Systems
Gaming continues to become increasingly systems-centric, as operators have come to expect network functionality to manage game performance and adapt to player preferences. As we develop and integrate our gaming systems products, we recognize that networks have the power to dramatically change the delivery of game content and significantly enhance the player experience.
IGT systems infrastructure and Service Window applications are available in enterprise, floor-wide, or bank-level implementations, scalable and versatile to meet the diverse needs of our customer base. Our ongoing systems development continues to focus on network solutions designed to provide operators with tools for more effective casino floor management and new ways to engage and interact with players.
During fiscal 2010, we successfully installed the first floor-wide version of our sbX® Experience Management system at the Las Vegas ARIA Resort and Casino at City Center. This installation included a one-of-a-kind combination of IGT’s server-based network applications, including the Service Window, sbX® Floor Manager and Media Manager, and IGT Advantage® casino management, powering 970 IGT machines and 100 WMS machines. Worldwide expansion of sbX® continued, with several floor-wide and Tier-One package installations completed throughout the US and Europe.
The IGT Global Technology and Interoperability Center continued to facilitate testing by third-party manufacturers and strategic partners of GSA protocol product interface integration, compatibility, and performance throughout fiscal 2010. The center actively tests the interaction of our GSA compliant sbX® system with other vendor systems, while we continue to engineer new applications and demonstrate the security, efficiency, and innovative casino player marketing features this technology can provide. This collaborative approach ensures that rigorous testing is conducted in a true-to-life environment with full-scale systems.
As operators continuously look for more ways to increase player loyalty and convenience while optimizing current investments, we continue to develop cost-effective server-based applications to deliver a variety of new marketing, loyalty, and casino management tools. During fiscal 2010, we installed the first Taxable Accrual application, which enables players to process taxable jackpots through the intuitive Service Window interface. Our proven bonusing applications Xtra Credit®, Point Play®, and Lucky Coin® were also adapted for the Service Window.
Platforms
Platforms are a combination of hardware and software used to deliver games to players. We support several platforms in order to maximize our game distribution reach. Our platform development is focused on empowering game development teams with the best environment for creativity and innovation, while targeting global markets with the best balance of cost and features. Our goal is to supply quality gaming content through traditional and new interactive channels worldwide.
During fiscal 2010, we initiated a new strategy to unify the land and interactive gaming realms through further development of our remote gaming platform to support increased innovation and an expansion of addressable markets. Accordingly, we now deliver games to computers, mobile phones, tablets and other networked devices through multiple partners in international markets. We also introduced new features that make it easier for partners to integrate and monetize IGT games.

10
During fiscal 2010, we standardized our machine cabinets, increasing the efficiency of operations and capital deployment. Our AVP ® DynamiX™ platform was launched, containing our most configurable and future ready set of features yet, such as Multi-Layer Display (MLD ®), surround sound capability, dynamic buttons, Service Window and GSA open standards compliance. We believe this combination of features allows for the richest, most engaging games for the player while providing maximum systems flexibility for the casino operator.
Transition to AVP® as our standard development and delivery platform on a worldwide basis continued during fiscal 2010. In addition to North and South America, we now use AVP® in Australia and the UK. With the majority of development concentrated on AVP®, we also maintain support for a variety of legacy platforms.
Intellectual Property
Our IP portfolio of patents, trademarks, copyrights, and other licensed rights are significant to our business. We currently own nearly 5,000 patents and patent applications, and hold more than 3,100 filed and registered trademarks worldwide. Our capitalized patents have a weighted average remaining useful life of 6 years. Additionally, our material brand licensing arrangements have various expiration dates through 2018, frequently with options to extend.
We seek to protect our investment in R&D and the distinct features of our products by perfecting and maintaining our IP rights. We obtain patent protection covering many of our products and have a significant number of U.S. and foreign patent applications pending. Our portfolio is widely diversified with patents related to a variety of gaming products, including game designs, bonus and secondary game features, device components, and online or mobile functionality.
We market most of our products under trademarks and copyrights that provide product recognition and promote widespread acceptance. We seek protection for our copyrights and trademarks in the US and various foreign countries, where applicable. We use IP assets not just from a defensive standpoint, but also offensively to protect our innovation, and we license our IP under reasonable terms to promote standardization in the gaming industry. IP litigation is described in Note 16 of our Consolidated Financial Statements and related risk factors are described in Part1, Item 1A.
SALES AND MARKETING REGIONS
We market our products and services in legalized gaming jurisdictions around the world. We have a substantial market share in the US and growing international operations. We promote our products through a worldwide network of sales associates. We use third-party distributors and agents in certain markets under arrangements that generally specify no minimum purchase and require specified performance standards be maintained. We also offer equipment contract financing for qualified customers and development financing loans to select customers for new or expanding gaming facilities.
Our overall marketing strategy places the “Customer First.” At September 30, 2010, we had 65 offices across six continents to respond to customer needs. In addition, we maintain a Global Support Center staffed by experienced consultants for technical issue resolutions. We provide access to product information and 24-hour customer service through our website and a variety of customer training to ensure their success in using our products to their full potential.
North America
The gaming industry in the US and Canada continues to grow, albeit at a slower pace in the last few years due to the economic downturn. We estimate the installed base of legal gaming devices in North America increased slightly from 943,000 in fiscal 2009 to over 947,000 machines in fiscal 2010.
The growth of legalized gaming is largely driven by new jurisdictions considering gaming tax revenues as a means to address budget shortfalls. Sales or placements of gaming machines are also affected by new openings or expansion of existing gaming properties and the machine replacement cycle, as well as economic conditions. Legislative action and voter referendums during fiscal 2010 provided new opportunities for gaming growth in Illinois, Ohio, Kansas, Maryland, Pennsylvania, and Florida. We are closely monitoring ongoing gaming actions in Kentucky, Massachusetts, New Hampshire, North Carolina, Texas, and Canada.
11
Changes in existing gaming regulation or new interpretations of existing gaming laws may hinder or prevent us from continuing to operate in certain jurisdictions. See further discussion surrounding regulatory challenges in Alabama in MDA-CONSOLIDATED RESULTS and MDA-BUSINESS SEGMENT RESULTS.
International
Our international strategy capitalizes on our North America experience, while customizing products for unique local preferences and regulatory requirements. During fiscal 2010, our international gaming markets were organized into the following customer regions:
� Europe, the Middle East, and Africa (EMEA)
� Mexico and South/Central America (LatAm)
� Asia, Australia, New Zealand, the Pacific (AsiaPac)
� the UK
During fiscal 2010, we discontinued our operations in Japan due to ongoing difficult market conditions and changes in our core business strategy. See Note 7 of our Consolidated Financial Statements for additional information about discontinued operations.
As “harm minimization” measures for gaming machines continues to negatively affect Australia and New Zealand markets, we anticipate new growth opportunities in the Philippines, Macau, and Italy. We are also closely monitoring ongoing gaming actions in Brazil and Greece for possible future expansion into these countries.
OPERATIONAL OVERVIEW
Manufacturing and Suppliers
In addition to our main production facility in Nevada, we manufacture in the UK and through third-party manufacturers in China. We also have reconditioning and re-manufacturing processes in our Las Vegas facility for gaming operations fixed assets. Our manufacturing operations primarily involve the configuration and assembly of electronic components, cables, harnesses, video monitors, and prefabricated parts purchased from outside sources. We also operate facilities for silkscreen manufacturing and digital design.
We use a variety of raw materials to manufacture our gaming devices including metals, wood, plastics, glass, electronic components, and LCD screens. We have a broad base of material suppliers and utilize multi-sourcing practices to ensure component availability. We believe the availability of materials used to manufacture our products is adequate and we are not substantially dependent on any single supplier.
We currently devote more than 800,000 square feet in our Reno facility and more than 270,000 square feet in our Las Vegas facility to product development, manufacturing, warehousing, shipping, and receiving. Maintaining our commitment to quality, we recertified our ISO 9001.2008 Quality Management System certification at all of our manufacturing facilities during fiscal 2010. In addition, we added our Advantage and sbX systems to our certification in fiscal 2010. ISO standards represent an international consensus with respect to the design, manufacture, and use of practices intended to ensure ongoing customer satisfaction with consistent delivery of products and services.
We generally carry a significant amount of inventory related to the breadth of our product lines. We reasonably expect to fill our order backlog within the next fiscal year. Backlog totaled approximately $239.9 million at October 31, 2010 and $331.2 million at October 31, 2009.
Regulatory Compliance
IGT is dedicated to regulatory compliance worldwide in order to ensure that our products meet requirements in each gaming jurisdiction and that we obtain the necessary approvals and licenses. We conduct business in most jurisdictions where gaming is legal and hold licenses where required.

12
Employees
As of September 30, 2010, we employed 4,900 individuals worldwide, 3,900 in our North America segment and 1,000 in our International segment. In light of the economic downturn and reduced demand for our products and services, we have been conducting an ongoing comprehensive strategic review of our costs and organizational structure to maximize efficiency and align expenses with the current and long-term business outlook. As a result of restructuring efforts during fiscal 2009 and 2010, our global workforce was reduced by approximately 16% through a combination of voluntary and involuntary separation arrangements. For discussion of related restructuring costs, see Note 2 of our Consolidated Financial Statements and MDA—CONSOLIDATED RESULTS.
COMPETITION AND PRODUCT DEMAND
IGT has been met with increasingly aggressive competition. The market for gaming devices and systems is constantly evolving and technological advances increasingly employ personal computers, mobile communication, and other digital media devices. Our competitors range from small, localized companies to large, multi-national corporations in every jurisdiction in which we conduct business. Our most significant competitors include Aristocrat Leisure Limited, Bally Technologies, Inc., and WMS Industries, Inc.
We believe replacement sales are driven by customer strategies to upgrade casino floors with newer games and technologies that combine higher yields with cost savings, convenience, and other benefits. Emerging technologies that improve operators’ profitability, such as delivery platforms with increased capabilities, game features that increase player appeal, or application modules which increase operator efficiencies, can accelerate the replacement cycle.
New or expanding casinos generate new product demand and stimulate replacement demand at neighboring properties compelled to upgrade their gaming floors to remain competitive. New jurisdictions establishing legalized gaming also create product demand and continue to grow the overall installed base of gaming devices.
We endeavor to create gaming products with superior functionality and features, using innovative architecture and technologies, resulting in a high degree of customer acceptance and player preference. We also strive to maintain an edge in our quality of support and efficient product implementation. The breadth of our gaming products and diversity of our innovative game library contribute to our competitive advantage.
We believe IGT also has competitive advantages resulting from broad alliances and a long history with customers, the financial strength to aggressively invest in R&D, and an extensive collection of intellectual properties. Our historically high levels of customer service and support, extensive and well-established infrastructure of sales and manufacturing, worldwide name recognition, and geographic diversity are competitive assets. We believe our reputation for consistently delivering and supporting quality products will encourage operators to select our products and enable us to maintain a substantial market position. Risk factors related to competition are discussed in Part 1, Item 1A.
AVAILABLE INFORMATION
IGT’s principal corporate executive offices are located at: 9295 Prototype Drive Reno, Nevada 89521 (775) 448-7777
All reporting information filed with or furnished to the SEC is available free of charge through the Investor Relations link on our website at www.IGT.com as soon as reasonably practicable after we electronically file or furnish such information to the SEC. Our corporate governance guidelines and charters for our Audit, Compensation, and Nominating and Corporate Governance Committees are also available on our website. This information will be mailed in print form free of charge to any shareholder upon request.

13
GOVERNMENT GAMING REGULATION
We operate in most legal casino gaming jurisdictions worldwide, as well as in several legalized lottery and online jurisdictions. The manufacture and distribution of gaming equipment, systems, and services, as well as the operation of casinos, is subject to regulation by a variety of local and federal agencies, with the majority of oversight provided by individual state gaming control boards.
While the regulatory requirements vary from jurisdiction to jurisdiction, most require: � licenses and/or permits � findings of suitability for the company, as well as individual officers, directors, major shareholders, and
key employees � documentation of qualification, including evidence of financial stability � specific approvals for gaming equipment manufacturers and distributors
Our operating entities and key personnel have obtained or applied for all required government licenses, permits, registrations, findings of suitability, and approvals necessary to manufacture and distribute gaming products in all jurisdictions where we do business. Although many regulations at each level are similar or overlapping, we must satisfy all conditions individually for each jurisdiction.
Laws of the various gaming regulatory agencies serve to protect the public and ensure that gaming related activity is conducted honestly, competitively, and free of corruption. Regulatory oversight additionally ensures that the local authorities receive the appropriate amount of gaming tax revenues. As such, our financial systems and reporting functions must demonstrate high levels of detail and integrity.
Certain regulators not only govern the activities within their jurisdiction, but also oversee activities that occur in other jurisdictions to ensure that we comply with local standards on a worldwide basis. As a Nevada licensee, state regulatory authorities require us to maintain Nevada standards for all operations worldwide. Violations of laws in one jurisdiction could result in disciplinary action in other jurisdictions. A more detailed description of the regulations to which we are subject is provided in Exhibit 99 of this Annual Report on Form 10-K, incorporated herein by reference.
The nature of the industry and our worldwide operations make this process very time consuming and require extensive resources. We employ additional community staff members and legal resources familiar with local customs in certain jurisdictions to assist in keeping us compliant with applicable regulations worldwide. Through this process, we seek to assure both regulators and investors that all our operations maintain the highest levels of integrity and avoid any appearance of impropriety. We have never been denied a gaming related license, nor have our licenses ever been suspended or revoked.
Risk factors related to gaming regulation are included in Part 1, Item 1A.
Item 1A. Risk Factors
Our business is vulnerable to changing economic conditions and to other factors that adversely affect the casino industry, which have negatively impacted and could continue to negatively impact the play levels of our participation games, our product sales, and our ability to collect outstanding receivables from our customers.
Demand for our products and services depends largely upon favorable conditions in the casino industry, which is highly sensitive to casino patrons’ disposable incomes and gaming activities. Discretionary spending on entertainment activities could further decline for reasons beyond our control, such as continued negative economic conditions, natural disasters, acts of war or terrorism, transportation disruptions or health issues. Any prolonged or significant decrease in consumer spending on entertainment activities could result in reduced play levels on our participation games, causing our cash flows and revenues from a large share of our recurring revenue products to decline. Unfavorable economic conditions have also resulted in a tightening in the credit markets, decreased liquidity in many financial markets, and significant volatility in the credit and equity markets.
A decline in the relative health of the gaming industry and the difficulty or inability of our customers to obtain adequate levels of capital to finance their ongoing operations reduces their resources available to purchase our products and services, which adversely affects our revenues. If we experience a significant unexpected
14
decrease in demand for our products, we could also be required to increase our inventory obsolescence charges.
Furthermore, the extended economic downturn has impacted and could continue to impact the ability of our customers to make timely payments to us. We have, and may continue, to incur additional provisions for bad debt related to credit concerns on certain receivables.
Our ability to operate in our existing markets or expand into new jurisdictions could be adversely affected by changing regulations, new interpretations of existing laws, and difficulties or delays in obtaining or maintaining needed licenses or approvals.
We operate only in jurisdictions where gaming is legal. The gaming industry is subject to extensive governmental regulation by US federal, state and local governments, as well as tribal officials or organizations and foreign governments. While the regulatory requirements vary by jurisdiction, most require:
� licenses and/or permits
� findings of suitability
� documentation of qualifications, including evidence of financial stability
� other required approvals for companies who manufacture or distribute gaming equipment and services
� individual suitability of officers, directors, major shareholders and key employees
Any license, permit, approval or finding of suitability may be revoked, suspended or conditioned at any time. We may not be able to obtain or maintain all necessary registrations, licenses, permits or approvals, or could experience delays related to the licensing process which could adversely affect our operations and our ability to maintain key employees.
To expand into new jurisdictions, we may need to be licensed, obtain approvals of our products and/or seek licensure of our officers, directors, major stockholders, key employees or business partners. If we fail to seek, do not receive or receive a revocation of a license in a particular jurisdiction for our games and gaming machines, hardware or software, we cannot sell or place on a participation or leased basis our products in that jurisdiction. Any delays in obtaining or difficulty in maintaining regulatory approvals needed for expansion within existing markets or into new jurisdictions can negatively affect our opportunities for growth.
Further, changes in existing gaming regulations or new interpretations of existing gaming laws may hinder or prevent us from continuing to operate in those jurisdictions where we currently do business, which would harm our operating results. In particular, the enactment of unfavorable legislation or government efforts affecting or directed at manufacturers or gaming operators, such as referendums to increase gaming taxes or requirements to use local distributors, would likely have a negative impact on our operations.
Slow growth in the establishment of new gaming jurisdictions or the number of new casinos, declines in the rate of replacement of existing gaming machines and ownership changes and consolidation in the casino industry could limit or reduce our future profits.
Demand for our products is driven substantially by the establishment of new gaming jurisdictions, the addition of new casinos or expansion of existing casinos within existing gaming jurisdictions and the replacement of existing gaming machines. The establishment or expansion of gaming in any jurisdiction typically requires a public referendum or other legislative action. As a result, gaming continues to be the subject of public debate, and there are numerous active organizations that oppose gaming. Opposition to gaming could result in restrictions on or even prohibitions of gaming operations or the expansion of operations in any jurisdiction.
In addition, the construction of new casinos or expansion of existing casinos fluctuates with demand, general economic conditions and the availability of financing. The rate of gaming growth in North America has diminished and machine replacements are at historically low levels. Slow growth in the establishment of new gaming jurisdictions or delays in the opening of new or expanded casinos and continued declines in, or low levels of demand for, machine replacements could reduce the demand for our products and our future profits. Because a substantial portion of our sales come from repeat customers, our business could be affected if one or more of our customers is sold to or merges with another entity that utilizes more of the products and services of one of our competitors or that reduces spending on our products or causes downward pricing pressures. Such consolidations could lead to order cancellations, a slowing in the rate of gaming machine replacements,

15
or require our current customers to switch to our competitors’ products, any of which could negatively impact our results of operations.
Demand for our products and the level of play of our products could be adversely affected by changes in player and operator preferences.
As a supplier of gaming machines, we must offer themes and products that appeal to gaming operators and players. There is constant pressure to develop and market new game content and technologically innovative products. Our revenues are dependent on the earning power and life span of our games. We therefore face continuous pressure to design and deploy new and successful game themes to maintain our revenue and remain competitive. If we are unable to anticipate or react timely to any significant changes in player preferences, such as a negative change in the trend of acceptance of our newest systems innovations or jackpot fatigue (declining play levels on smaller jackpots), the demand for our gaming products and the level of play of our gaming products could decline. Further, our products could suffer a loss of floor space to table games or other more technologically advanced games or operators may reduce revenue sharing arrangements, each of which would harm our sales and financial results. In addition, general changes in consumer behavior, such as reduced travel activity or redirection of entertainment dollars to other venues, could result in reduced demand and reduced play levels for our gaming products.
The gaming industry is intensely competitive. We face competition from a growing number of companies and, if we are unable to compete effectively, our business could be negatively impacted.
Competition among manufacturers of electronic gaming equipment and systems products is intense. Competition in our industry is primarily based on the amount of profit our products generate for our customers, together with cost savings, convenience, and other benefits. Additionally, we compete on the basis of price and financing terms made available to customers, the appeal of game content and features to the end player, and the features and functionality of our hardware and software products. Our competitors range from small, localized companies to large, multi-national corporations, several of which have substantial resources.
Competition in the gaming industry is intense due to the increasing number of providers, combined with the limited number of casino operators and jurisdictions in which they operate. This combination of a growing number of providers and a limited number of casino operators has resulted in an increased focus on price to value. To compete effectively, providers must offer innovative products, with increasing features and functionality benefiting the operators along with game content appealing to the end player, at prices that are attractive to operators.
Obtaining space and favorable placement on casino gaming floors is also a competitive factor in our industry. In addition, the level of competition among equipment providers has increased significantly due to consolidation among casino operators and cutbacks in capital spending by casino operators resulting from the economic downturn and decreased player spend.
Our success in the competitive gaming industry depends in large part on our ability to develop and manage frequent introductions of innovative products.
The gaming industry is characterized by dynamic customer demand and technological advances. As a result, we must continually introduce and successfully market new themes and technologies in order to remain competitive and effectively stimulate customer demand.
There is no assurance that our investments in research and development will lead to successful new technologies or timely new products. We invest heavily in product development in various disciplines from hardware, software, and firmware engineering to game design, video, multimedia, graphics, and sound. Because our newer products are generally more technologically sophisticated than those we have produced in the past, we must continually refine our production capabilities to meet the needs of our product innovation. If we cannot efficiently adapt our manufacturing infrastructure to meet the needs of our product innovations, or if we are unable to make upgrades in our production capacity in a timely manner, our business could be negatively impacted.
Our customers will accept a new product only if it is likely to increase operator profits more than competitors’ products. The amount of operator profits primarily depends on consumer play levels, which are influenced by player demand for our product. There is no certainty that our new products will attain this market acceptance or
16
that our competitors will not more effectively anticipate or respond to changing customer preferences. In addition, any delays by us in introducing new products on schedule could negatively impact our operating results by providing an opportunity for our competitors to introduce new products and gain market share ahead of us. For example, our business and results could be adversely affected if we experience delays or problems in our continued deployment of sbX™ gaming management systems, or if we do not gain market acceptance for these or other systems that are currently under development.
New products require regulatory approval and may be subject to complex and dynamic revenue recognition standards, which could materially affect our financial results.
As we introduce new products and transactions become increasingly complex, additional analysis and judgment is required to account for and recognize revenues in accordance with generally accepted accounting principles. Transactions may include multiple element arrangements and/or software components and applicable accounting principles or regulatory product approval delays could further change the timing of revenue recognition and could adversely affect our financial results for any given period. Fluctuations may occur in our deferred revenues and reflect our continued shift toward more multiple element contracts that include systems and software.
A decline in and/or sustained low interest rates causes an increase in our jackpot expense which could limit or reduce our future profits.
Changes in prime and/or treasury and agency interest rates during a given period cause fluctuations in jackpot expense largely due to the revaluation of future winner liabilities. When rates increase, jackpot liabilities are reduced as it costs less to fund the liability. However, when interest rates decline or remain low the value of the liability (and related jackpot expense) increases because the cost to fund the liability increases. Our results may continue to be negatively impacted by continuing low interest rates or further declines in interest rates, resulting in increased jackpot expense and a reduction of our investment income, which could limit or reduce our future profits.
We may be unable to protect our IP.
A significant portion of our revenues is generated from products using certain IP rights and our operating results would be negatively impacted if we are unsuccessful in protecting these rights from infringement. In addition, some of our most popular games and features are based on trademarks, patents and other IP licensed from third parties. Our future success may depend upon our ability to obtain, retain and/or expand licenses for popular IP rights with reasonable terms in a competitive market. In the event that we cannot renew and/or expand existing licenses, we may be required to discontinue or limit our use of the games or gaming machines that use the licensed technology or bear the licensed marks.
Our success may depend in part on our ability to obtain trademark protection for the names or symbols under which we market our products and to obtain copyright protection and patent protection of our proprietary technologies, intellectual property and other game innovations. We may not be able to build and maintain goodwill in our trademarks or obtain trademark or patent protection, and there can be no assurance that any trademark, copyright or issued patent will provide competitive advantages for us or that our intellectual properties will not be successfully challenged or circumvented by competitors.
We also rely on trade secrets and proprietary know-how to protect certain proprietary knowledge and have entered into confidentiality agreements with our employees and independent contractors regarding our trade secrets and proprietary information. However, there can be no guarantees that our employees and consultants will not breach these agreements, and if these agreements are breached it is unlikely that the remedies available to us will be sufficient to compensate us for the damages suffered. Additionally, despite various confidentiality agreements and other trade secret protections, our trade secrets and proprietary know-how could become known to, or independently developed by, competitors.
We may be subject to claims of IP infringement or invalidity and adverse outcomes of litigation could unfavorably affect our operating results.
Competitors and others may infringe on our intellectual property rights, or may allege that we have infringed on theirs. Monitoring infringement and misappropriation of intellectual property can be difficult and expensive, and we may not be able to detect infringement or misappropriation of our proprietary rights. We may also incur
17
significant litigation expenses protecting our intellectual property or defending our use of intellectual property, reducing our ability to bring new products to market in the future. These expenses could have an adverse effect on our future cash flows and results of operations. Our assessment of current IP litigation could change in light of the discovery of facts not presently known to us or determinations by judges, juries or others that do not agree with our evaluation of the possible liability or outcome of such litigation. If we are found to infringe on the rights of others we could be required to discontinue offering certain products or systems, to pay damages, or purchase a license to use the intellectual property in question from its owner. Litigation can also distract management from the day-to-day operations of the business. There can be no assurances that certain of our products, including those with currently pending patent applications, will not be determined to have infringed upon an existing third party patent.
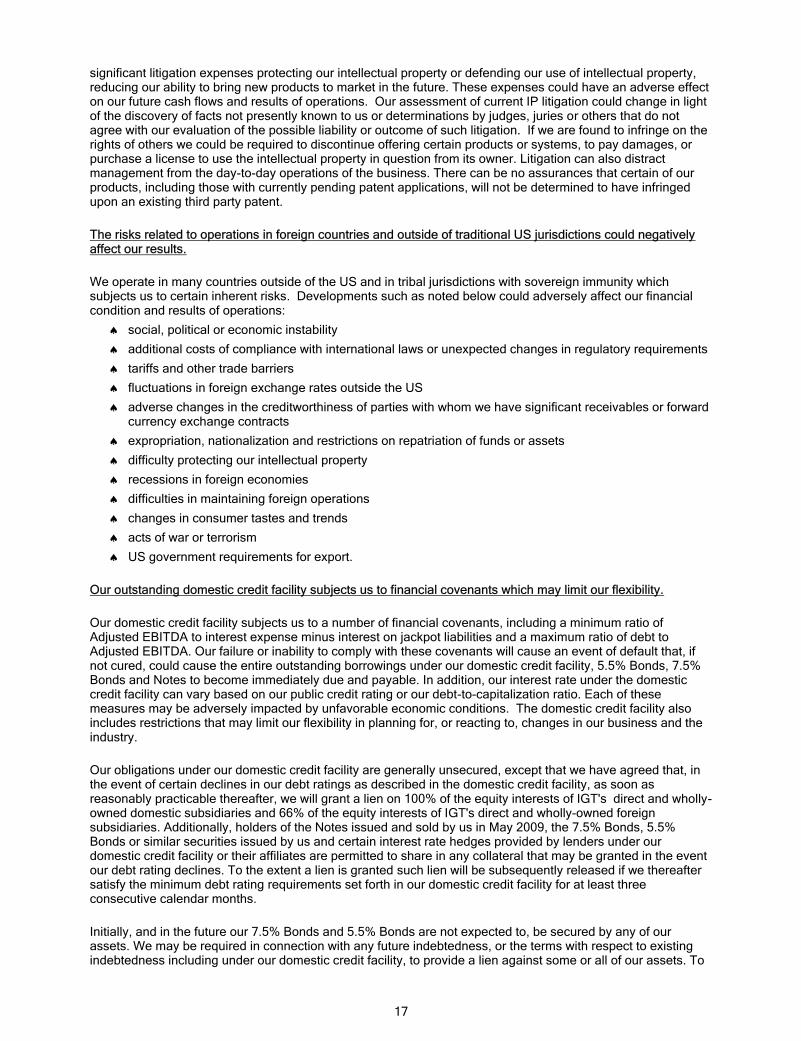
The risks related to operations in foreign countries and outside of traditional US jurisdictions could negatively affect our results.
We operate in many countries outside of the US and in tribal jurisdictions with sovereign immunity which subjects us to certain inherent risks. Developments such as noted below could adversely affect our financial condition and results of operations:
� social, political or economic instability
� additional costs of compliance with international laws or unexpected changes in regulatory requirements
� tariffs and other trade barriers
� fluctuations in foreign exchange rates outside the US
� adverse changes in the creditworthiness of parties with whom we have significant receivables or forward currency exchange contracts
� expropriation, nationalization and restrictions on repatriation of funds or assets
� difficulty protecting our intellectual property
� recessions in foreign economies
� difficulties in maintaining foreign operations
� changes in consumer tastes and trends
� acts of war or terrorism
� US government requirements for export.
Our outstanding domestic credit facility subjects us to financial covenants which may limit our flexibility.
Our domestic credit facility subjects us to a number of financial covenants, including a minimum ratio of Adjusted EBITDA to interest expense minus interest on jackpot liabilities and a maximum ratio of debt to Adjusted EBITDA. Our failure or inability to comply with these covenants will cause an event of default that, if not cured, could cause the entire outstanding borrowings under our domestic credit facility, 5.5% Bonds, 7.5% Bonds and Notes to become immediately due and payable. In addition, our interest rate under the domestic credit facility can vary based on our public credit rating or our debt-to-capitalization ratio. Each of these measures may be adversely impacted by unfavorable economic conditions. The domestic credit facility also includes restrictions that may limit our flexibility in planning for, or reacting to, changes in our business and the industry.
Our obligations under our domestic credit facility are generally unsecured, except that we have agreed that, in the event of certain declines in our debt ratings as described in the domestic credit facility, as soon as reasonably practicable thereafter, we will grant a lien on 100% of the equity interests of IGT's direct and wholly-owned domestic subsidiaries and 66% of the equity interests of IGT's direct and wholly-owned foreign subsidiaries. Additionally, holders of the Notes issued and sold by us in May 2009, the 7.5% Bonds, 5.5% Bonds or similar securities issued by us and certain interest rate hedges provided by lenders under our domestic credit facility or their affiliates are permitted to share in any collateral that may be granted in the event our debt rating declines. To the extent a lien is granted such lien will be subsequently released if we thereafter satisfy the minimum debt rating requirements set forth in our domestic credit facility for at least three consecutive calendar months.
Initially, and in the future our 7.5% Bonds and 5.5% Bonds are not expected to, be secured by any of our assets. We may be required in connection with any future indebtedness, or the terms with respect to existing indebtedness including under our domestic credit facility, to provide a lien against some or all of our assets. To

18
the extent that a lien on our assets is not also granted on an equal and ratable basis with our domestic credit facility in favor of the 7.5% Bonds and 5.5% Bonds, then if we become insolvent or are liquidated, or in the event that our existing indebtedness becomes secured, as described above, and payment of such secured indebtedness is accelerated, the holders of the secured indebtedness will be entitled to exercise the remedies available to them under applicable law, including the ability to foreclose on and sell the assets securing such indebtedness in order to satisfy such indebtedness. In any such case, any remaining assets may be insufficient to repay the notes and our other unsecured indebtedness.
Our outstanding Notes subject us to additional risks.
Our Notes issued in May 2009 contain a net settlement feature, which entitles holders to receive cash up to $1,000 per Note and shares for any excess conversion value as determined by the respective governing indentures. Consequently, if a significant number of Notes are converted or redeemed, we would be required to make significant cash payments to the holders who convert or redeem the Notes.
In connection with the offering of the Notes, we entered into additional separate transactions for note hedges and warrant transactions. In connection with these transactions, the hedge counterparties and/or their respective affiliates may enter into various derivative transactions with respect to our common stock and may enter into or unwind various derivative transactions and/or purchase or sell our common stock in secondary market transactions prior to maturity of the Notes. These activities could have the effect of increasing or preventing a decline in, or having a negative effect on, the value of our common stock and could have the effect of increasing or preventing a decline in the value of our common stock during any conversion reference period related to a conversion of the Notes. The warrant transactions could separately have a dilutive effect from the issuance of our common stock pursuant to the warrants.
Our gaming machines and online operations may experience losses due to technical problems or fraudulent activities.
Our success depends on our ability to avoid, detect, replicate and correct software and hardware anomalies and fraudulent manipulation of our gaming machines. We incorporate security features into the design of our gaming machines and other systems, including those responsible for our online operations, which are designed to prevent us and our patrons from being defrauded. We also monitor our software and hardware to avoid, detect and correct any technical errors. However, there can be no guarantee that our security features or technical efforts will continue to be effective in the future. If our security systems fail to prevent fraud or if we experience any significant technical difficulties, our operating results could be adversely affected. Additionally, if third parties breach our security systems and defraud our patrons, or if our hardware or software experiences any technical anomalies, the public may lose confidence in our gaming machines and operations or we could become subject to legal claims by our customers or to investigation by gaming authorities.
Our gaming machines have experienced anomalies and fraudulent manipulation in the past. Games and gaming machines may be replaced by casinos and other gaming machine operators if they do not perform according to expectations, or may be shut down by regulators. The occurrence of anomalies in, or fraudulent manipulation of, our gaming machines may give rise to claims for lost revenues and related litigation by our customers and may subject us to investigation or other action by gaming regulatory authorities including suspension or revocation of our gaming licenses, or disciplinary action.
Business combinations and investments in intellectual properties or affiliates present risk, and we may not be able to realize the financial and strategic goals that were contemplated at the time of the transaction, which could materially affect our financial results.
We have invested in strategic business combinations and acquisitions of important technologies and IP that we believe will expand our geographic reach, product lines, and/or customer base. We may encounter difficulties in the assimilation of acquired operations, technologies and/or products, or an acquisition may prove to be less valuable than the price we paid. We also may encounter difficulties applying our internal controls to an acquired business. Any of these events or circumstances may have an adverse effect on our business by requiring us to, among other things, record substantial impairment charges on goodwill and other intangible assets, resulting in a negative impact on our operating results.
Moreover, as we continue the process of evaluating our business in conjunction with an assessment of our long-term strategic goals, we will also further evaluate past and potential investments to determine if and how

19
they will fit into our organizational structure going forward. If an event or change occurs in affiliate relationships or agreements associated with business combinations, we may be required to reassess cash flows, recoverability, useful lives, and fair value measurements, which may result in material impairment charges.
Failure to attract, retain and motivate key employees may adversely affect our ability to compete.
Our success depends largely on recruiting and retaining talented employees. The market for qualified executives and highly skilled, technical workers is intensely competitive. The loss of key employees or an inability to hire a sufficient number of technical staff could limit our ability to develop successful products and cause delays in getting new products to market.
Investments and development financing loans could adversely impact liquidity or cause us to incur loan losses or record a charge to earnings if our investments become impaired.
We invest in and/or provide financing for expansion or construction of gaming locations and other business purposes, including locations abroad. Such investment and financing activities subject us to increased credit risk in certain regions, which could be exacerbated by current unfavorable economic conditions or other political or economic instability in those regions. We monitor our investments and financing activities to assess impairment on a quarterly basis.
We have in the past and may in the future incur losses on these types of investments and loans. Our results of operations, liquidity or financial position may be negatively impacted if we are unable to collect on loans or derive benefit from our investments.
Current environmental laws and regulations, or those enacted in the future, could result in additional liabilities and costs.
The manufacturing of our products may require the use of materials that are subject to a variety of environmental, health and safety laws and regulations (such as climate change legislation). Compliance with these laws could increase our costs and impact the availability of components required to manufacture our products. Violation of these laws may subject us to significant fines, penalties or disposal costs, which could negatively impact our results of operations, financial position or cash flows.

20
Item 1B. Unresolved Staff Comments
None
Item 2. Properties
Our properties consist primarily of facilities worldwide used for manufacturing, engineering, sales, corporate administration, customer service and technical support. We own our corporate headquarters in Reno, Nevada, which serves as our primary manufacturing, engineering and warehousing facility. We also own a Las Vegas, Nevada campus, which serves as our primary sales and service facility. Additional sales and service facilities worldwide are occupied under leases that expire at various times through 2020.
Square Footage Of Facilities At September 30, 2010
Owned Leased(in thousands)
No rth Ame rica (US and Canada) 1,856 419
Inte rna tio na lEurope, the Middle East and Africa 149 98 Mexico and South/Central America - 78 Asia, Australia, New Zealand, the Pacific 15 193
Approxim ate Square Footage
We expect our current properties will be adequate for our near-term business needs and that the productive capacity of our facilities is substantially utilized. In fiscal 2010, we discontinued operations and terminated all facility lease agreements in Japan. See Note 7 of our Consolidated Financial Statements for more information regarding discontinued operations.
Item 3. Legal Proceedings
IGT has been named in and has brought lawsuits in the normal course of business. We do not expect the outcome of these suits to have a material adverse effect on our results of operations, financial position, or cash flows. A description of certain of these matters is contained in Note 16 of our Consolidated Financial Statements and is incorporated herein by this reference.
Item 4. (Removed and Reserved)

21
PART II
Item 5. Market for Registrant’s Common Equity, Related Stockholder Matters and Issuer Purchases of Equity Securities
Our common stock is listed and traded on the New York Stock Exchange under the symbol “IGT.”
QuartersFirst Second Third Fourth
Fiscal 2010Stock price - high 22.42$ 21.94$ 21.86$ 16.90$ Stock price - low 17.53 16.18 15.21 13.65 Dividends declared 0.06 0.06 0.06 0.06
Fiscal 2009Stock price - high 18.18$ 14.24$ 18.15$ 23.30$ Stock price - low 7.03 6.81 10.01 13.58 Dividends declared 0.15 0.06 0.06 0.06
We are currently restricted from declaring or making cash dividends in excess of certain amounts by the terms of our domestic credit facility as described in MDA-LIQUIDITY AND CAPITAL RESOURCES-CREDIT FACILITIES AND INDEBTEDNESS and Note 13 of our Consolidated Financial Statements.
As of November 29, 2010, there were approximately 2,900 record holders of IGT’s common stock and the closing price was $15.54.
IGT transfer agent and registrar
Wells Fargo Shareowner Services 161 North Concord Exchange South St. Paul, MN 55075-1139 (800) 468-9716 www.wellsfargo.com/contactshareownerservices
Performance Graph
The following graph reflects the cumulative total return (change in stock price plus reinvested dividends) of a $100 investment in our common stock for five fiscal years ended September 30, 2010 in comparison to the Standard and Poor’s 500 Composite Index and two customized peer groups.
The old peer group consists of Bally Technologies, Inc., Progressive Gaming International Corporation, Scientific Games Corp., Shuffle Master, Inc., and WMS Industries, Inc. The new peer group excludes Progressive Gaming International Corporation, which declared bankruptcy and is not considered a comparable peer. The comparisons are not intended to be indicative of future performance of our common stock.
The following graph is not “soliciting material,” is not deemed filed with the SEC and is not to be incorporated by reference in any filing by us under the Securities Act of 1933, as amended (the Securities Act), or the Exchange Act, whether made before or after the date hereof and irrespective of any general incorporation language in any such filing. The stock price performance included in this graph is not necessarily indicative of future stock price performance.

22
$0
$20
$40
$60
$80
$100
$120
$140
$160
$180
2005 2006 2007 2008 2009 2010
COMPARISON OF 5 YEAR CUMULATIVE TOTAL RETURN
International Game Technology S&P 500Old Peer Group New Peer Group
2005 2006 2007 2008 2009 2010
International Game Technology $100.00 $156.16 $164.23 $71.75 $79.57 $57.90S&P 500 100.00 110.79 129.01 100.66 93.70 103.22Old Peer Group 100.00 102.70 129.83 91.32 97.19 84.64New Peer Group 100.00 109.17 141.57 101.78 108.48 94.48
Share Repurchases
The purpose of our 1990 common stock repurchase authorization, as amended, is to return value to our shareholders and reduce the number of shares outstanding. We use open market or privately negotiated transactions, as well as Rule 10b5-1 trading plans, depending on market conditions and other factors. The authorization does not specify an expiration date.
Our share repurchases for the quarter ended September 30, 2010 summarized below consist only of shares of common stock tendered by employees to satisfy tax withholding obligations arising from restricted stock or units vested under our stock incentive plan. The shares were repurchased for their fair market value on the vesting date and were not part of a publicly announced program to purchase our common stock.
Periods
Total Number of Shares Purchased
Average Price Paid Per Share
Total Number of Shares Purchased as
part of a Publicly Announced Plan
(millions)
July 4 - July 31, 2010 3,595 15.68$ - 7.7
August 1 - August 28, 2010 2,380 15.71 - 7.7
August 29 - October 2, 2010 2,003 14.80 - 7.7
Total 7,978 15.47$ -
Maximum Number of Shares Still Available for Purchase Under
the Plan
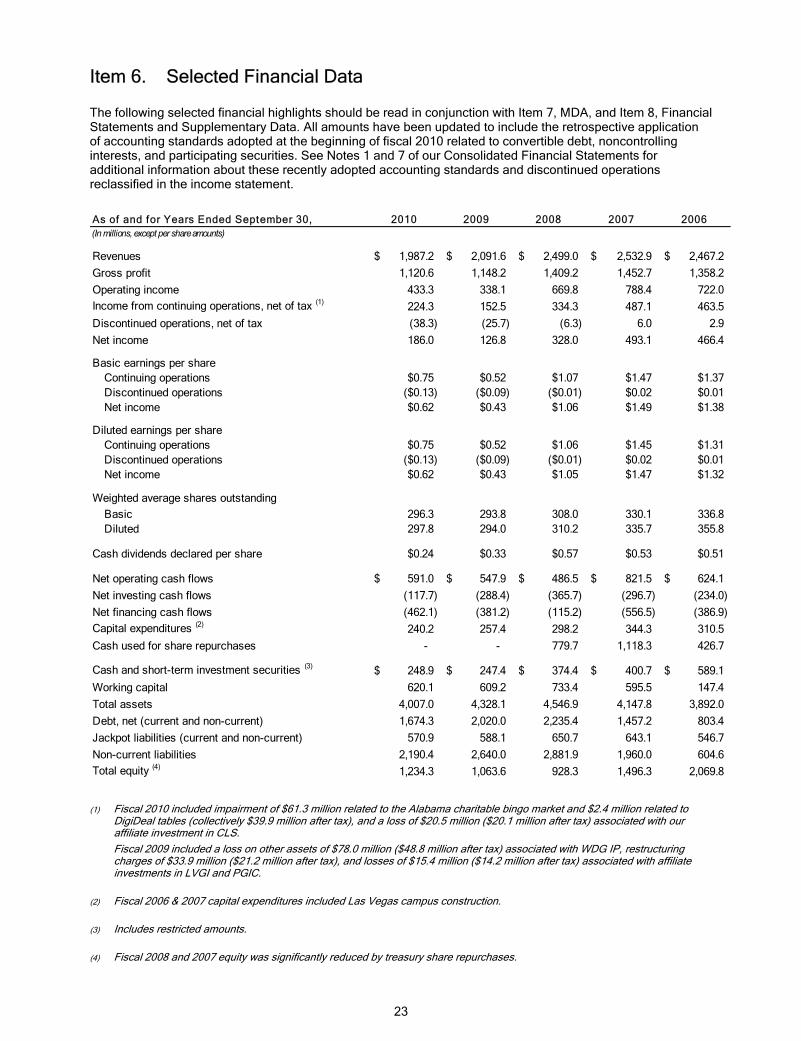
23
Item 6. Selected Financial Data
The following selected financial highlights should be read in conjunction with Item 7, MDA, and Item 8, Financial Statements and Supplementary Data. All amounts have been updated to include the retrospective application of accounting standards adopted at the beginning of fiscal 2010 related to convertible debt, noncontrolling interests, and participating securities. See Notes 1 and 7 of our Consolidated Financial Statements for additional information about these recently adopted accounting standards and discontinued operations reclassified in the income statement.
As of and for Years Ended September 30, 2010 2009 2008 2007 2006(In millions, except per share amounts)
Revenues 1,987.2$ 2,091.6$ 2,499.0$ 2,532.9$ 2,467.2$ Gross profit 1,120.6 1,148.2 1,409.2 1,452.7 1,358.2 Operating income 433.3 338.1 669.8 788.4 722.0 Income from continuing operations, net of tax (1) 224.3 152.5 334.3 487.1 463.5 Discontinued operations, net of tax (38.3) (25.7) (6.3) 6.0 2.9 Net income 186.0 126.8 328.0 493.1 466.4
Basic earnings per shareContinuing operations $0.75 $0.52 $1.07 $1.47 $1.37Discontinued operations ($0.13) ($0.09) ($0.01) $0.02 $0.01Net income $0.62 $0.43 $1.06 $1.49 $1.38
Diluted earnings per shareContinuing operations $0.75 $0.52 $1.06 $1.45 $1.31Discontinued operations ($0.13) ($0.09) ($0.01) $0.02 $0.01Net income $0.62 $0.43 $1.05 $1.47 $1.32
Weighted average shares outstandingBasic 296.3 293.8 308.0 330.1 336.8 Diluted 297.8 294.0 310.2 335.7 355.8
Cash dividends declared per share $0.24 $0.33 $0.57 $0.53 $0.51
Net operating cash flows 591.0$ 547.9$ 486.5$ 821.5$ 624.1$ Net investing cash flows (117.7) (288.4) (365.7) (296.7) (234.0) Net financing cash flows (462.1) (381.2) (115.2) (556.5) (386.9) Capital expenditures (2) 240.2 257.4 298.2 344.3 310.5 Cash used for share repurchases - - 779.7 1,118.3 426.7
Cash and short-term investment securities (3) 248.9$ 247.4$ 374.4$ 400.7$ 589.1$ Working capital 620.1 609.2 733.4 595.5 147.4 Total assets 4,007.0 4,328.1 4,546.9 4,147.8 3,892.0 Debt, net (current and non-current) 1,674.3 2,020.0 2,235.4 1,457.2 803.4 Jackpot liabilities (current and non-current) 570.9 588.1 650.7 643.1 546.7 Non-current liabilities 2,190.4 2,640.0 2,881.9 1,960.0 604.6 Total equity (4) 1,234.3 1,063.6 928.3 1,496.3 2,069.8
(1) Fiscal 2010 included impairment of $61.3 million related to the Alabama charitable bingo market and $2.4 million related to DigiDeal tables (collectively $39.9 million after tax), and a loss of $20.5 million ($20.1 million after tax) associated with our affiliate investment in CLS. Fiscal 2009 included a loss on other assets of $78.0 million ($48.8 million after tax) associated with WDG IP, restructuring charges of $33.9 million ($21.2 million after tax), and losses of $15.4 million ($14.2 million after tax) associated with affiliate investments in LVGI and PGIC.
(2) Fiscal 2006 & 2007 capital expenditures included Las Vegas campus construction.
(3) Includes restricted amounts.
(4) Fiscal 2008 and 2007 equity was significantly reduced by treasury share repurchases.

24
Item 7. Management’s Discussion and Analysis of Financial Condition and Results of Operations
The following MDA is intended to enhance the reader’s understanding of our operations and current business environment. MDA is provided as a supplement to, and should be read in conjunction with, our Item 1, Business, and Item 8, Financial Statements and Supplementary Data.
Unless the context indicates otherwise, International Game Technology, IGT, we, our, or the Company refers to International Game Technology and its consolidated entities. Italicized text in this document with an attached superscript trademark or copyright notation indicates trademarks of IGT or its licensors. All comparisons herein refer to the fiscal year ended September 30, 2010 as compared with fiscal 2009, unless otherwise noted. As used in this report, “current” refers to the fiscal year ended September 30, 2010.
OVERVIEW
International Game Technology is a global company specializing in the design, manufacture, and marketing of electronic gaming equipment and systems products. We are a leading supplier of gaming products in substantially all legal jurisdictions worldwide and provide a diverse offering of quality products and services at competitive prices, designed to increase the potential for gaming operator profits by enhancing the player’s experience.
We manage our operations in two geographic segments, North America and International, with certain unallocated company-wide income and expenses managed at the corporate level. See BUSINESS SEGMENT RESULTS below and Note 21 of our Consolidated Financial Statements for additional segment information.
Demand for our gaming products and services has been negatively affected by global macroeconomic factors, as well as intense competition among suppliers. While our customers’ capital spending remains conservative due to continued economic uncertainty, we continue to focus our efforts on making IGT financially stronger and operationally more efficient. During fiscal 2010:
� We refinanced $300.0 million of debt to improve our borrowing flexibility by extending maturities. We issued 5.5% bonds due 2020 under our shelf registration statement and reduced the size of our domestic credit facility. We also reduced our outstanding debt obligations by $412.3 million.
� We managed our cost structure and fiscal 2010 operating expense decreased 15% from the prior year. Our operating margin improved to 22% from 16% in the prior year, largely due to the realization of operational efficiencies from our restructuring efforts.
� We addressed the need for increased efficiency among our global research and development resources by unifying and standardizing platforms and processes, increasing focus with a streamlined portfolio of products, and increasing engineering efforts on sbX™ applications and content. In the first quarter of fiscal 2010, we installed the industry’s first large-scale GSA compliant server-based open platform. As of September 30, 2010, we had completed 19 sbX™ installations, with an additional five in-process, and numerous others in various stages of contract negotiation. We believe the open network approach is driving our customers and outside content developers to create applications for sbX™ that will differentiate the next-generation slot floor.
� We continued to develop and deliver our latest product innovations. Gaming operations yields (revenue per unit per day) improved compared to the prior year in North America and International segments, but declined slightly overall due to the higher contribution from lower priced non-WAP units. Our new Sex and the City™ participation placements (non-WAP), with approximately 1,600 units deployed at September 30, 2010, performed well throughout fiscal 2010. We released over 100 new for-sale game titles in North America, with approximately 30% of new games for our legacy 80960 platform enabling customers to refresh their floors during these tough economic times. We sold 5,300 Dynamix™ promotional packages bundling one AVP® slot machine with two free 80960 platform conversions. This promotion allowed our customers to refresh three machines concurrently and enabled IGT to preserve floor space.
� We continued to build and strengthen our senior management team, with the appointments of our chief operating officer, vice president of core products, chief marketing officer, and executive vice president of interactive new media, and centralized the leadership of research and development under our chief technology officer. Additionally, an experienced media executive was appointed to our Board of Directors.

25
We believe new market opportunities will arise when the economy improves and new jurisdictions consider gaming tax revenues as a means to address budget shortfalls. We are closely monitoring ongoing gaming actions in Maryland, Illinois, Massachusetts, Italy, Brazil, and Greece. We may also be negatively impacted by changes in existing gaming regulations or new interpretations of existing gaming laws that may hinder or prevent us from continuing to operate in jurisdictions where we currently do business. See further discussion surrounding regulatory challenges in Alabama in CONSOLIDATED RESULTS and BUSINESS SEGMENT RESULTS later in this MDA.
As part of our ongoing evaluation of long-term strategic goals, it is necessary to assess if and how existing investments will fit into our core business strategy. The resulting recognition of material losses or impairment and discontinued operations during the periods of this analysis is further discussed under CONSOLIDATED RESULTS and BUSINESS SEGMENT RESULTS later in this MDA.
During fiscal 2010, we discontinued our operations in Japan and divested our majority interest in Digideal. All prior year income statements and earnings related information reflect the reclassification of these operations to discontinued operations. See Note 7 of our Consolidated Financial Statements for additional information related to these discontinued operations.
RECENTLY ISSUED ACCOUNTING STANDARDS
Other recently issued accounting standards that may impact our financial statements, as well as those noted below in this MDA, are discussed further in Note 1 of our Consolidated Financial Statements.
Revenue Recognition For Software-enabled Products and Multi-element Arrangements
In October 2009, the FASB issued ASUs about revenue recognition for certain software-enabled products and multi-element arrangements. Under these ASUs, tangible products, containing both software and nonsoftware components that function together to deliver a tangible product’s essential functionality, are no longer subject to software revenue accounting. These ASUs also established a more economically aligned model for allocating revenues among deliverables in a multi-element arrangement, based on relative selling prices.
We elected to early adopt these ASUs prospectively for new or materially modified arrangements entered into on or after the beginning of fiscal 2010. See our revenue recognition accounting policies in Note 1 of our Consolidated Financial Statements for additional information about our application of these ASUs.
Convertible Debt Instruments
At the beginning of fiscal 2010, we adopted an ASU issued in May 2008 requiring the separation of liability (debt) and equity (conversion option) components for convertible debt instruments that may settle in cash upon conversion to reflect an effective nonconvertible borrowing rate when the debt was issued. We estimated the fair value of our convertible debt using similar debt instruments at issuance that did not have a conversion feature and allocated the residual fair value to an equity component that represents the estimated fair value of the conversion feature at issuance.
The adoption of this ASU reduced diluted EPS $0.06 in fiscal 2010, $0.08 in fiscal 2009, and $0.05 in fiscal 2008 related to additional noncash interest discussed below under MDA-CONSOLIDATED RESULTS—Other Income (Expense). Additionally, the adoption of this ASU decreased long-term debt, deferred tax assets and deferred offering costs, and increased paid-in-capital in shareholders’ equity. See Note 1 and Note 13 of our Consolidated Financial Statements for a comprehensive list of adjustments related to the retrospective application of this ASU and additional information about our convertible debt.
CRITICAL ACCOUNTING ESTIMATES
Our consolidated financial statements were prepared in conformity with US GAAP. Accordingly, we are required to make estimates incorporating judgments and assumptions we believe are reasonable based on our historical experience, contract terms, trends in our company and the industry as a whole, as well as information available from other outside sources. Our estimates affect amounts recorded in the financial statements and actual results may differ from initial estimates.

26
We consider the following accounting estimates to be the most critical to fully understand and evaluate our reported financial results. They require us to make subjective or complex judgments about matters that are inherently uncertain or variable. The following accounting estimates are considered the most sensitive to changes from external factors.
Revenue Recognition
We receive revenues from the distribution of electronic gaming equipment and network systems, as well as licensing and services. Revenues are recognized when all of the following have been satisfied:
� persuasive evidence of an arrangement exists
� the price to the customer is fixed and determinable
� delivery has occurred and any acceptance terms have been fulfilled
� collection is reasonably assured
Determining whether these requirements have been met may require us to make assumptions and exercise judgment that could significantly impact the timing and amount of revenue reported each period. In addition, we may enter into arrangements which include multiple elements or deliverables, such as gaming devices bundled with software systems and services. In such cases additional judgments and estimates are necessary to ensure the appropriate amounts of revenue are recorded in a given period. These judgments relate primarily to the allocation of revenues based on VSOE or management’s best estimate of each element’s selling price, and may affect the amounts and timing of revenue recorded. If we are unable to establish VSOE for undelivered software and software-related elements, we may be required to defer software revenues in certain arrangements.
The application of our revenue recognition policies and changes in our assumptions or judgments affect the timing and amounts of our revenues and costs. Deferred revenue decreased to $90.2 million at September 30, 2010 from $122.0 million at September 30, 2009, primarily related to the completion of obligations under multiple element contracts. Complex systems and/or multiple element contracts may take several months to complete and deferred revenue may increase as our products evolve toward a more software systems-centric environment. Additionally, see discussion above under RECENTLY ISSUED ACCOUNTING STANDARDS—Revenue Recognition for Software-enabled Products and Multi-element Arrangements for information about how our revenue accounting changed in fiscal 2010.
Goodwill, Other Intangible Assets, Royalties, and Affiliate Investments
Impairment testing for goodwill, other intangibles, affiliate investments and royalties requires judgment, including the identification of reporting units, allocation of related goodwill, assignment of corporate shared assets and liabilities to reporting units, estimated cash flows, and determinations of fair value. While we believe our estimates of future revenues and cash flows are reasonable, different assumptions could materially affect the assessment of useful lives, recoverability and fair value. If actual cash flows fall below initial forecasts, we may need to record additional amortization and/or impairment charges.
Goodwill
We measure and test goodwill for impairment at least annually, or more often if there are indicators of impairment. The fair value of the reporting unit is first compared to its carrying amount including goodwill. If the fair value of the reporting unit is greater than its carrying amount, goodwill is not considered impaired. In the event that the fair value of the reporting unit is less than its carrying value, the amount of the impairment loss will be measured by comparing the implied fair value of goodwill to its carrying amount. If the carrying amount of goodwill exceeds its implied fair value, an impairment loss is recognized equal to that excess.
Our two reporting units, North America and International, were determined on the basis of customer regions and in accordance with accounting guidance on reporting units. Components below our North America and International business segments were evaluated to have similar economic characteristics and therefore aggregated. In determining the fair value of our reporting units, we apply the income approach using the DCF method. We then compare the implied valuation multiples (such as enterprise value to revenue, EBITDA and EBIT) of comparable gaming companies under the market approach to validate the reasonableness of our DCF results.

27
Our DCF analysis is based on the present value of two components: the sum of our five-year projected cash flows and a terminal value assuming a long-term growth rate. The cash flow estimates are prepared based on our business plans for each reporting unit, considering historical results and anticipated future performance based on our expectations regarding product introductions and market opportunities. The discount rates used to determine the present value of future cash flows were derived from the weighted average cost of capital of a group of comparable companies with consideration for the size and specific risks of each IGT reporting unit. The discount rate used for each reporting unit was 12% for our fiscal 2010 test and ranged from 12% to 13% for our 2009 test.
Our goodwill totaled $1.2 billion at September 30, 2010 and 2009. Our fiscal 2010 annual goodwill impairment test indicated the fair value of each reporting unit was significantly in excess of its carrying value. Inherent in such fair value determinations are significant judgments and estimates, including assumptions about our future revenues, profitability, cash flows, and long-term growth rates, as well as our operational plans and interpretation of current economic indicators and market valuations.
Changes in our assumptions used from the fiscal 2009 test to the fiscal 2010 test included updated five-year forecasts with reduced and delayed growth and lower discount rates. The fair value for North America reporting unit decreased 29% from fiscal 2009, and increased 27% for International. The excess of fair value over carrying value at the 2010 testing date was $1.8 billion for each reporting unit.
If our assumptions do not prove correct or economic conditions affecting future operations change, our goodwill could become impaired and result in a material adverse effect on our results of operations and financial position. To illustrate the sensitivity of the fair value calculations on our goodwill impairment test, we modified our 2010 test assumptions to create a hypothetical 50% decrease to the fair values of each reporting unit. The resulting hypothetical excess of fair value over carrying value would be approximately $0.6 billion for each reporting unit, and we would therefore have no impairment.
Other Intangibles
Our portfolio of other intangibles substantially consists of finite-lived patents, contracts, trademarks, developed technology, reacquired rights and customer relationships. We regularly monitor events or changes in circumstances that indicate the carrying value of these intangibles may not be recoverable or require a revision to the estimated remaining useful life. Our other intangibles totaled $202.1 million at September 30, 2010 and $259.2 million at September 30, 2009.
If an event or change occurs, we estimate cash flows directly associated with the use of the intangible to test recoverability and remaining useful lives based on the forecasted utilization of the asset and expected product revenues. In developing estimated cash flows, we incorporate assumptions regarding changes in legal factors, related industry climate, regulatory actions, contractual factors, operational performance and the company’s strategic business plans, as well as the effects of obsolescence, demand, competition, and other market conditions. When the carrying amount exceeds the undiscounted cash flows expected to result from the use and eventual disposition of a finite-lived intangible asset or asset group, we then compare the carrying amount to its current fair value. We estimate the fair value using prices for similar assets, if available, or more typically using a DCF model. We recognize an impairment loss if the carrying amount is not recoverable and exceeds its fair value.
Royalties
We also regularly evaluate the estimated future benefit of prepaid and deferred royalties to determine amounts unlikely to be realized from forecasted sales or placements of our games. The carrying value of our prepaid and deferred royalties totaled $63.0 million at September 30, 2010 and $101.5 million at September 30, 2009.
Affiliate investments
Our affiliate investments consist of strategic alliances with other gaming technology companies. We regularly monitor events or changes in circumstances that indicate the carrying value of these affiliate investments may be impaired. Future adverse changes in market conditions or operating results related to these affiliates could impair our ability to recover part or all of an investment, causing us to record impairment or other losses.
28
In September 2010, we modified our relationship with CLS in conjunction with changes to our strategy in China. As part of the modification, we reduced the outstanding note receivable, accelerated payments due IGT, eliminated restrictions on IGT’s exclusivity and ability to sell CLS shares, and recorded a loss of $20.5 million. In fiscal 2009, we recorded losses of $78.0 million related to restructuring our relationship and strategy pertaining to the use of WDG IP rights and $13.3 million related to adverse changes in LVGI’s financial capacity and changes in our business strategy.
See Note 3 of our Consolidated Financial Statements for additional information about our affiliate investments.
Jackpot Liabilities and Expenses
A portion of our gaming operations recurring revenue arrangements incorporates IGT paid WAP jackpots for which we recognize corresponding jackpot liabilities and expense. Changes in our estimated amounts for WAP jackpot liabilities and associated jackpot expense are attributable to regular analysis and evaluation of the following factors:
� variations in slot play (frequency of WAP jackpots and patterns of coin-in driving WAP jackpot growth)
� volume (number of WAP units in service and levels of coin-in per unit)
� interest rate movements
� the size of base WAP jackpots (startup amount) at initial setup or after a WAP win
Interest rates applicable to jackpot funding vary by jurisdiction and are impacted by market forces, as well as winner elections to receive a lump sum payment in lieu of periodic annual payments. Current and noncurrent portions of jackpot liabilities, as well as jackpot expense, may also be impacted by changes in our estimates and assumptions regarding the expected number of future winners who may elect a lump sum payout.
Changes in prime and/or treasury and agency interest rates during a given period cause fluctuations in our jackpot expense largely due to the revaluation of future winner liabilities. The value of the liability (and related jackpot expense) increases when rates decline because it increases the cost to fund the liability. Conversely, when rates increase, jackpot liabilities are reduced as it costs less to fund the liability. Our results may be materially affected by significant changes in interest rates.
Our jackpot liabilities decreased to $570.9 million at September 30, 2010 compared to $588.1 million at September 30, 2009. Consolidated jackpot expense totaled $112.1 million for fiscal 2010, $129.3 million for fiscal 2009, and $160.0 million in fiscal 2008. The decline in jackpot expense for fiscal 2010 resulted from decreased WAP units in our installed base and favorable interest rate movements, partially offset by improved variations in slot play.
BUSINESS SEGMENT RESULTS, later in this MDA, provides additional details regarding the fluctuation in jackpot expense. Note 1 of our Consolidated Financial Statements summarizes our accounting policies related to jackpot liabilities and expense.
Inventory and Gaming Operations Equipment
The determination of obsolete or excess inventory requires us to estimate the future demand for our products within specific time horizons, generally one year or less. If we experience a significant unexpected decrease in demand for our products or a higher occurrence of inventory obsolescence because of changes in technology or customer requirements, we would recognize additional obsolescence charges. Inventory management remains an area of focus as we balance the need to maintain strategic inventory levels to ensure competitive lead times versus the risk of inventory obsolescence because of rapidly changing technology and customer requirements. The decrease in inventories to $97.6 million at September 30, 2010 from $157.8 million at September 30, 2009, was primarily related to lower product demand and cost containment efforts.
We are also required to estimate salvage values and useful lives for our gaming operations equipment. Trends in market demand and technological obsolescence may require us to record additional asset charges which would negatively impact gross profit.

29
Income Taxes
We conduct business globally and are subject to income taxes in US federal, state, local, and foreign jurisdictions. Determination of the appropriate amount and classification of income taxes depends on several factors, including estimates of the timing and probability of realization of deferred income taxes, reserves for uncertain tax positions, and income tax payment timing.
We record deferred tax assets and liabilities based on temporary differences between the financial reporting and tax bases of assets and liabilities, applying enacted tax rates expected to be in effect for the year in which the differences are expected to reverse. The ability to realize the deferred tax assets is evaluated through the forecasting of taxable income in each jurisdiction, using historical and projected future operating results, the reversal of existing temporary differences, and the availability of tax planning strategies. Net deferred tax assets totaled $221.1 million at September 30, 2010 and $255.0 million at September 30, 2009.
Valuation allowances are recorded to reduce deferred tax assets when it is more likely than not that a tax benefit will not be realized. Changes in tax laws, enacted tax rates, geographic mix, or estimated annual taxable income could change our valuation of deferred tax assets and liabilities, which in turn impacts our tax provision. We carefully monitor many factors, including the impact of current economic conditions, in our valuation of deferred tax assets. During fiscal 2010, we recorded additional valuation allowances of $25.5 million, primarily related to foreign deferred tax assets and capital losses. At September 30, 2010, our total valuation allowance of $62.6 million, related to investment write-downs, capital losses, net operating losses, and foreign deferred assets not expected to be fully realized because we cannot conclude that it is more likely than not that we will earn income of the specific character required to utilize these assets before they expire.
In the ordinary course of business, there are many transactions and calculations for which the ultimate tax determination is uncertain. We are required to recognize uncertain tax positions taken or expected to be taken in a tax return, when it is “more likely than not” to be sustained upon examination. This assessment further presumes that tax authorities evaluate the technical merits of transactions individually with full knowledge of all facts and circumstances surrounding the issue. The amount recognized in the financial statements is the largest benefit that we believe is more than 50% likely of being realized upon settlement. Changes in facts or information as well as the expiration of statutes of limitations and/or settlements with tax jurisdictions may result in material adjustments to these estimates in the future.
Our income tax provision will be impacted to the extent the final outcome of these tax positions differs from the amount recorded. At September 30, 2010, our unrecognized tax benefits totaled $83.8 million, of which $65.6 million would impact the effective tax rate if recognized. At September 30, 2009, our unrecognized tax benefits totaled $91.5 million, of which $70.2 million would impact the effective tax rate if recognized.
Our tax provision for fiscal 2010 was reduced by settlements with tax authorities, partially offset by increases in valuation allowances and uncertain tax positions. See Notes 1 and 17 of our Consolidated Financial Statements for additional information about our income taxes.

30
CONSOLIDATED RESULTS – A Year Over Year Comparative Analysis
2010 2009 2008 10 vs 09 09 v s 08(In millions except units & EPS)
Revenues 1,987.2$ 2,091.6$ 2,499.0$ (104.4)$ -5% (407.4)$ -16%Gaming operations 1,101.0 1,167.0 1,328.4 (66.0) -6% (161.4) -12%Product sales 886.2 924.6 1,170.6 (38.4) -4% (246.0) -21%
Machines 556.9 578.9 779.6 (22.0) -4% (200.7) -26%Non-machine 329.3 345.7 391.0 (16.4) -5% (45.3) -12%
Gross profit 1,120.6$ 1,148.2$ 1,409.2$ (27.6)$ -2% (261.0)$ -19%Gaming operations 662.8 678.6 773.1 (15.8) -2% (94.5) -12%Product sales 457.8 469.6 636.1 (11.8) -3% (166.5) -26%
Gross margin 56% 55% 56% 1 pp 2% (1) pp -2%Gaming operations 60% 58% 58% 2 pp 3% - pp - Product sales 52% 51% 54% 1 pp 2% (3) pp -6%
UnitsGaming operations installed base 57,000 61,300 60,500 (4,300) -7% 800 1%
Fixed 10,000 9,300 15,700 700 8% (6,400) -41%Variable 47,000 52,000 44,800 (5,000) -10% 7,200 16%
Product sales shipped (1) 41,200 52,400 68,300 (11,200) -21% (15,900) -23%New 13,400 22,500 30,600 (9,100) -40% (8,100) -26%Replacement 27,800 29,900 37,700 (2,100) -7% (7,800) -21%
Product sales recognized (2) 43,200 49,700 66,200 (6,500) -13% (16,500) -25%
Operating inc ome 433.3$ 338.1$ 669.8$ 95.2$ 28% (331.7)$ -50%
Operating margin 22% 16% 27% 6 pp 38% (11) pp -41%
Income from c ontinuing operations 224.3$ 152.5$ 334.3$ 71.8$ 47% (181.8)$ -54%
Loss from discontinued operations (38.3) (25.7) (6.3) (12.6) * (19.4) *
Net income 186.0 126.8 328.0 59.2 47% (201.2) -61%
Diluted EPS
Continuing operations $0.75 $0.52 $1.06 $0.23 44% ($0.54) -51%
Discontinued operations ($0.13) ($0.09) ($0.01) ($0.04) * ($0.08) *
Net income $0.62 $0.43 $1.05 $0.19 44% ($0.62) -59%
(1) includes units where revenues were deferred to future periods(2) correlates with revenues recognized during the period
Favorable (Unfavorable)
Fiscal 2010 Compared With Fiscal 2009
Significant items affecting comparability included:
� impairment charges of $63.7 million ($39.9 million after tax) in fiscal 2010, including $61.3 million related to the Alabama charitable bingo market and $2.4 million related primarily to remaining DigiDeal tables held by IGT, and loss on other assets of $78.0 million ($48.8 million after tax) in fiscal 2009, related to WDG IP as further discussed below under “Operating Expenses”
� restructuring charges of $4.7 million ($2.9 million after tax) in fiscal 2010 and $33.9 million ($21.2 million after tax) in fiscal 2009, as further discussed below under “Operating Expenses”
� investment losses of $20.5 million ($20.1 million after tax) in fiscal 2010 and $15.4 million ($14.2 million after tax) in fiscal 2009, as further discussed below under “Other Income (Expense)”
� certain favorable discrete tax items of $36.7 million in fiscal 2010 related to settlements with tax authorities for fiscal years 2002 through 2005, partially offset by other changes in uncertain tax liabilities, and $17.1 million in fiscal 2009, including settlements with tax authorities for fiscal years 2000 and 2001
31
Increased operating income was largely the result of cost saving initiatives. Revenue declines in both gaming operations and product sales were primarily attributable to fewer new casino openings, additional competitive pressure and lower casino capital spending in an uncertain economy. North America revenue declines were partially offset by International revenue increases. Changes in foreign exchange rates increased revenues by approximately $28.7 million in fiscal 2010.
Operating income improvements were also due to lower restructuring and impairment and loss on other assets in fiscal 2010. Restructuring charges included in operating expenses related to the reorganization of certain US facilities in fiscal 2010 and to our global workforce reduction in fiscal 2009. Additionally, fiscal 2009 included an extra week due to our 52/53-week accounting year, primarily increasing gaming operations revenues and gross profit, as well as operating expenses.
The early adoption of revenue recognition ASUs for certain software-enable products and multi-element arrangements at the beginning of fiscal 2010 resulted in the recognition of $46.4 million of revenues in fiscal 2010 that would have been recognized in later periods under the prior accounting guidance. See additional discussion about these ASUs under RECENTLY ISSUED ACCOUNTING STANDARDS above in this MDA.
Loss from Discontinued Operations
During fiscal 2010, we closed of our operations in Japan due to difficult market conditions and changes in our core business strategy. In September 2010, we also divested our equity interest in DigiDeal and ceased to manufacture and distribute DigiDeal products. Results from Japan and DigiDeal were reclassified to discontinued operations for all periods presented. See Note 7 of our Consolidated Financial Statements for additional information about discontinued operations.
Alabama
The legality of electronic charitable bingo in Alabama was challenged during fiscal 2010 and continues to be discussed. Legislation that would have allowed Alabama voters to decide on the addition of a state constitutional amendment authorizing electronic bingo failed to pass the legislative session concluded in April 2010. As of September 30, 2010, three locations in Alabama where IGT placed electronic bingo machines, VictoryLand, Country Crossing, and Greenetrack, have closed their charitable bingo operations. On October 4, 2010, the Department of Justice executed grand jury indictments for eleven individuals who are charged with conspiracy to bribe Alabama legislators for their support of proposed legislation to legalize charitable bingo in Alabama.
Individuals associated with VictoryLand and Country Crossing were among those charged in the grand jury indictments. In November 2010, the Governor-elect of Alabama indicated that he will consider allowing legal charitable bingo operations to re-open, although the likelihood and timing of any such decision is currently unknown.
Consolidated Gaming Operations
Gaming operations revenues and gross profit decreased primarily due to a lower installed base, largely from the closure of certain charitable bingo facilities in Alabama, and the continued shift toward lower price-point machines. Additionally, the extra week in fiscal 2009 contributed approximately $22.4 million in consolidated gaming operations revenues and approximately $11.5 million in gross profit. Growth in our International installed base partially offset declines in North America. Decreased average revenues per unit reflect our continued shift toward lower price-point non-WAP machines.
Gross margins improved due to reduced costs, primarily depreciation, royalties, and jackpot expense. Jackpot expense decreased $17.2 million overall, $17.5 million due to fewer WAP units and $3.8 million due to favorable interest rate effect, partially offset by variations in slot play. See MDA—CRITICAL ACCOUNTING ESTIMATES—Jackpot Liabilities and Expenses for additional information about factors affecting jackpot expense.
32
Consolidated Product Sales
Product sales revenues and gross profit decreased primarily due to decreased units in North America from fewer new openings, partially offset by increased International units and favorable changes in foreign exchange rates. Gross margin improvement was primarily attributable to reduced material costs and obsolescence.
Deferred revenue decreased $31.8 million during fiscal 2010 to $90.2 million at September 30, 2010, primarily related to the completion of obligations under multi-element contracts. During fiscal 2010, we shipped 3,700 units for which revenues were deferred and recognized revenues for 5,700 units previously shipped, for a net decrease of 2,000 units in deferred revenue.
Fiscal 2009 Compared With Fiscal 2008
Consolidated net income declined in fiscal 2009 primarily due to reduced volumes, largely attributable to the impact of the extended economic downturn on casino play levels and capital spending, as well as increased competition. Comparability was also significantly affected by:
� fiscal 2009 non-cash loss of $78.0 million ($48.8 million after tax) associated with our WDG IP transaction
� fiscal 2009 workforce restructuring costs of $33.9 million ($21.2 million after tax)
� fiscal 2008 write-downs of investments in unconsolidated affiliates totaling $28.6 million
Increased interest expense related to debt refinancing, additional bad debt provisions, and unfavorable changes in foreign exchange rates further burdened fiscal 2009 earnings. Unfavorable changes in foreign exchange rates accounted for approximately $76.0 million of the decrease in fiscal 2009 revenues.
Although fiscal 2009 included an extra week due to our 52/53-week accounting year, the benefit to gaming operations was more than offset by increased operating expenses.
Consolidated Gaming Operations
Revenues and gross profit from gaming operations declined primarily due to lower play levels and continued shifts in our installed base mix toward lower-yielding non-WAP machines. Non-WAP units generally provide lower revenues and gross profit because they carry a lower pricing structure and generate lower average play levels. At the same time, non-WAP units provide higher gross margin because there is no associated jackpot expense. Growth in our International installed base partially offset declines in North America, reflecting strength in our geographic diversity.
Jackpot expense decreased $35.0 million in fiscal 2009 primarily due to fewer WAP units and decreased play levels, partially offset by unfavorable interest rate changes. Interest rate movement increased jackpot expense by $2.2 million in fiscal 2009 compared to the prior year.
The extra week during fiscal 2009 contributed approximately $22.4 million in gaming operations revenues and $11.5 million in gross profit.
Consolidated Product Sales
Revenues and gross profit for product sales declined from the prior year primarily due to lower unit volume across most markets, largely attributed to fewer new openings and weakness in replacement demand. International markets were further impacted by unfavorable changes in foreign exchange rates. Gross margin was negatively impacted by reduced volume, as well as higher systems upgrade costs and fewer new systems installations. Consolidated product sales margins fluctuate depending on the geographic mix and types of products sold.
Deferred revenue increased $59.9 million during fiscal 2009 to $122.0 million at September 30, 2009, primarily as a result of multi-element contracts with systems software and machines bundled together. During fiscal 2009, we shipped 5,000 units for which revenues were deferred and recognized revenues for 2,300 units previously shipped, for a net growth of 2,700 units in our deferred revenue balance.

33
Operating Expenses
2010 2009 2008 10 vs 09 09 vs 08(In millions)Selling, general and administrative 343.8$ 414.8$ 445.9$ 71.0$ 17% 31.1$ 7%
Research and development 200.1 204.1 216.5 4.0 2% 12.4 6%
Depreciation and amortization 75.0 79.3 75.4 4.3 5% (3.9) -5%
Restructuring 4.7 33.9 1.6 29.2 86% (32.3) *
Impairment and loss on other assets 63.7 78.0 - 14.3 18% (78.0) -
Total operating expenses 687.3$ 810.1$ 739.4$ 122.8$ 15% (70.7)$ -10%Percent of revenues 35% 39% 30%
Favorable (Unfavorable)
Fiscal 2010 Compared With Fiscal 2009
The decrease in operating expenses in fiscal 2010 was primarily due to reduced restructuring and impairment and loss on other assets, expense reduction efforts and lower bad debt. Bad debt provisions decreased $30.0 million, excluding the Alabama impairment discussed below, as fiscal 2009 included higher customer reserves resulting from the economic downturn. Additionally, fiscal 2009 included an extra week, which added approximately $12.6 million to operating expenses and the impact of foreign currency exchange increased operating expenses by approximately $6.0 million during fiscal 2010 compared to fiscal 2009.
With the Alabama regulatory challenges described above, we recognized $61.3 million of impairment charges in fiscal 2010, including allowances for notes and accounts receivable of $54.7 million and gaming operations equipment impairment of $6.6 million. The remaining net carrying amount of our related assets at September 30, 2010 totaled $33.0 million.
Fiscal 2010 restructuring charges related primarily to the reorganization of certain US facilities and for fiscal 2009 related primarily to global workforce reductions. See Note 2 of our Consolidated Financial Statements for additional information about our restructuring charges.
Fiscal 2009 Compared With Fiscal 2008
The increase in operating expenses in fiscal 2009 was primarily due to the loss on other assets associated with our WDG IP and restructuring charges, partially offset by cost reduction efforts. Decreases in staffing costs, professional fees, advertising, supplies, and travel were partially offset by higher bad debt provisions, up $25.1 million during fiscal 2009 due to certain specific customer credit concerns amidst the economic downturn. Additionally, the extra week of operations added $12.6 million and the impact of foreign currency exchange reduced operating expenses by approximately $24.2 million during fiscal 2009 compared to fiscal 2008. See Note 3 of our Consolidated Financial Statements for additional information about WDG IP.
Our fiscal 2009 cost rationalization efforts were executed through workforce reduction and other non-wage cost controls. We reduced our global workforce by approximately 16% during fiscal 2009 from September 30, 2008 levels, through a combination of voluntary and involuntary separation arrangements. Restructuring charges included cash severance and one-time termination costs, reduced by stock compensation forfeitures.

34
Other Income (Expense)
2010 2009 2008 10 vs 09 09 vs 08(In millions)
Interest Income 61.2$ 61.8$ 67.4$ (0.6)$ -1% (5.6)$ -8%WAP investments 24.9 27.9 32.2 (3.0) -11% (4.3) -13%Receivables and investments 36.3 33.9 35.2 2.4 7% (1.3) -4%
Interest Expense (161.7) (159.2) (123.3) (2.5) -2% (35.9) -29%WAP jackpot liabilities (24.6) (27.4) (28.6) 2.8 10% 1.2 4%Borrowings (107.4) (101.9) (71.5) (5.5) -5% (30.4) -43%Convertible debt equity discount (29.7) (29.9) (23.2) 0.2 1% (6.7) -29%
Other (19.8) (21.4) (36.3) 1.6 7% 14.9 41%
Total other income (expense) (120.3)$ (118.8)$ (92.2)$ (1.5)$ -1% (26.6)$ -29%
Favorable (Unfavorable)
Retrospective Application
All prior years presented include the retrospective application of accounting guidance adopted at the beginning of fiscal 2010 requiring the separation of liability and equity components of our convertible debt to reflect an effective nonconvertible borrowing rate at issuance. Additional amortization related to convertible debt equity discount required under this guidance increased interest expense $29.7 million for fiscal 2010, $29.9 million for fiscal 2009, and $23.2 million in fiscal 2008, and reduced Debenture repurchase gains $5.2 million in fiscal 2009. See Note 1 and Note 13 of our Consolidated Financial Statements for additional information about the impact of this accounting guidance.
Fiscal 2010 Compared With Fiscal 2009
The unfavorable variance in total other income (expense) was primarily due to increased interest expense resulting from higher borrowing costs. WAP interest income and expense relates to previous jackpot winner liabilities and accretes at approximately the same rate. WAP interest income also includes earnings on restricted cash and investments held for future winners.
“Other” expense included affiliate investment losses primarily related to changes in our core business strategy of $20.5 million on our CLS notes receivable in fiscal 2010 and $15.4 million on LVGI and PGIC in fiscal 2009. See Note 3 of our Consolidated Financial Statements for additional information about affiliate investments.
Fiscal 2009 Compared With Fiscal 2008
The unfavorable variance in fiscal 2009 compared with fiscal 2008 in total other income (expense) was primarily due to higher interest expense, partially offset by reduced investment write-downs. Higher interest costs were primarily due to higher rates on refinancing completed in June 2009 and included non-recurring refinancing charges of $4.4 million. The extra week in fiscal 2009 also contributed to higher interest expense.
Fiscal 2009 included affiliate investment write-downs of $13.3 million for LVGI and $2.1 million for PGIC compared to $21.4 million for CLS and $7.2 million for PGIC in fiscal 2008, driven by the economic downturn and changes in our core business strategy.
Income Tax Provision
2010 2009 2008 10 vs 09 09 vs 08(In millions)
Income tax provision 88.7$ 66.8$ 243.3$ (21.9)$ 176.5$ Effect ive tax rate 28.3% 30.5% 42.1% 2.2 pp 11.6 pp
Favorable (Unfavorable)
Our effective tax rate on income from continuing operations for fiscal 2010 benefited from settlements with tax authorities of $50.9 million as the IRS closed its examination of our tax returns for fiscal 2002 through 2005. In
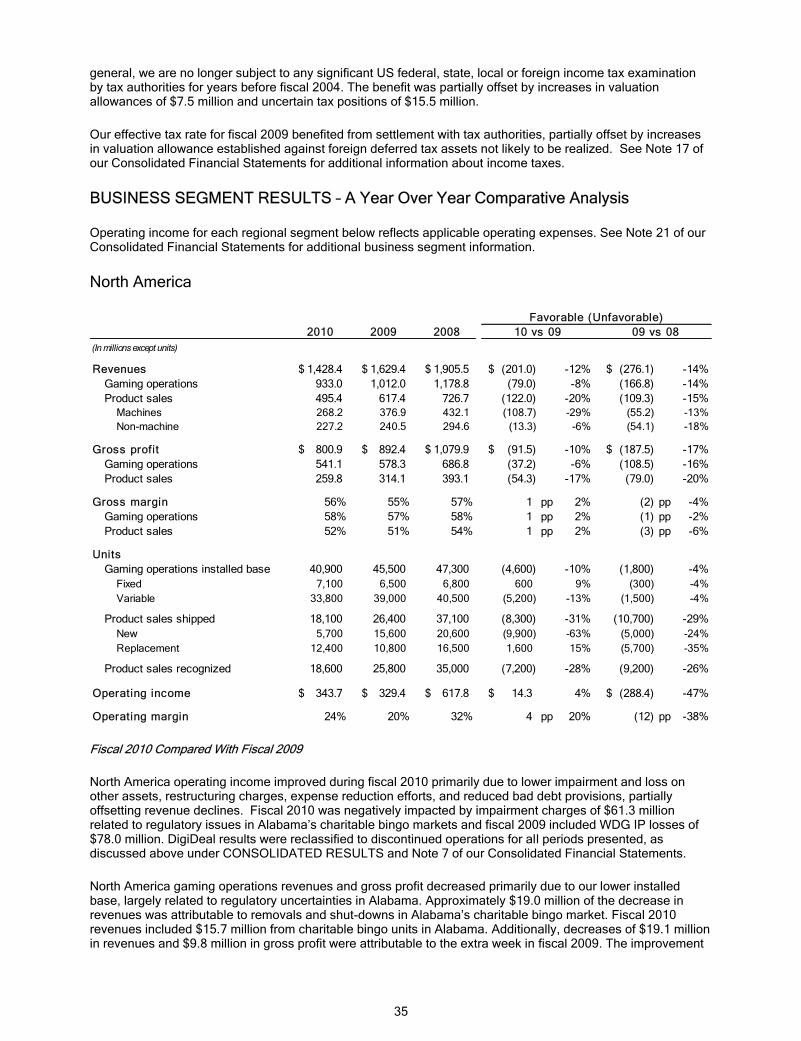
35
general, we are no longer subject to any significant US federal, state, local or foreign income tax examination by tax authorities for years before fiscal 2004. The benefit was partially offset by increases in valuation allowances of $7.5 million and uncertain tax positions of $15.5 million.
Our effective tax rate for fiscal 2009 benefited from settlement with tax authorities, partially offset by increases in valuation allowance established against foreign deferred tax assets not likely to be realized. See Note 17 of our Consolidated Financial Statements for additional information about income taxes.
BUSINESS SEGMENT RESULTS – A Year Over Year Comparative Analysis
Operating income for each regional segment below reflects applicable operating expenses. See Note 21 of our Consolidated Financial Statements for additional business segment information.
North America
2010 2009 2008 10 vs 09 09 vs 08(In millions except units)
Revenues 1,428.4$ 1,629.4$ 1,905.5$ (201.0)$ -12% (276.1)$ -14%Gaming operations 933.0 1,012.0 1,178.8 (79.0) -8% (166.8) -14%Product sales 495.4 617.4 726.7 (122.0) -20% (109.3) -15%
Machines 268.2 376.9 432.1 (108.7) -29% (55.2) -13%Non-machine 227.2 240.5 294.6 (13.3) -6% (54.1) -18%
Gross profit 800.9$ 892.4$ 1,079.9$ (91.5)$ -10% (187.5)$ -17%Gaming operations 541.1 578.3 686.8 (37.2) -6% (108.5) -16%Product sales 259.8 314.1 393.1 (54.3) -17% (79.0) -20%
Gross margin 56% 55% 57% 1 pp 2% (2) pp -4%Gaming operations 58% 57% 58% 1 pp 2% (1) pp -2%Product sales 52% 51% 54% 1 pp 2% (3) pp -6%
UnitsGaming operations installed base 40,900 45,500 47,300 (4,600) -10% (1,800) -4%
Fixed 7,100 6,500 6,800 600 9% (300) -4%Variable 33,800 39,000 40,500 (5,200) -13% (1,500) -4%
Product sales shipped 18,100 26,400 37,100 (8,300) -31% (10,700) -29%New 5,700 15,600 20,600 (9,900) -63% (5,000) -24%Replacement 12,400 10,800 16,500 1,600 15% (5,700) -35%
Product sales recognized 18,600 25,800 35,000 (7,200) -28% (9,200) -26%
Operating income 343.7$ 329.4$ 617.8$ 14.3$ 4% (288.4)$ -47%
Operating margin 24% 20% 32% 4 pp 20% (12) pp -38%
Favorable (Unfavorable)
Fiscal 2010 Compared With Fiscal 2009
North America operating income improved during fiscal 2010 primarily due to lower impairment and loss on other assets, restructuring charges, expense reduction efforts, and reduced bad debt provisions, partially offsetting revenue declines. Fiscal 2010 was negatively impacted by impairment charges of $61.3 million related to regulatory issues in Alabama’s charitable bingo markets and fiscal 2009 included WDG IP losses of $78.0 million. DigiDeal results were reclassified to discontinued operations for all periods presented, as discussed above under CONSOLIDATED RESULTS and Note 7 of our Consolidated Financial Statements.
North America gaming operations revenues and gross profit decreased primarily due to our lower installed base, largely related to regulatory uncertainties in Alabama. Approximately $19.0 million of the decrease in revenues was attributable to removals and shut-downs in Alabama’s charitable bingo market. Fiscal 2010 revenues included $15.7 million from charitable bingo units in Alabama. Additionally, decreases of $19.1 million in revenues and $9.8 million in gross profit were attributable to the extra week in fiscal 2009. The improvement

36
in gaming operations margin was attributable to lower costs, most significantly depreciation, royalties, and jackpot expense.
North America product sales revenues and gross profit decreases were primarily attributable to fewer new/expansion units and lower systems sales. Gross margin improvement was primarily due to reduced material costs and obsolescence.
Fiscal 2009 Compared With Fiscal 2008
Reduced operating results for North America in fiscal 2009 were a result of suppressed demand from our customers and their patrons, partially offset by decreased expenses achieved through cost savings efforts. Fiscal 2009 operating results were also negatively impacted by the $78.0 million loss on our WDG IP transaction, restructuring charges, and increased bad debt provisions related to increased customer credit risk associated with the economic downturn.
North America gaming operations revenues and gross profit declined in fiscal 2009 compared with fiscal 2008 due to lower play levels and a lower installed base increasingly comprised of fewer WAP units. Depressed casino play levels had a significant adverse affect on gaming operations as approximately 86% of our installed base was comprised of variable fee units where pricing is based on a percentage of play. Lower play levels also drove fiscal 2009 gross profit and margin decline, partially offset by lower depreciation, service labor, and gaming taxes. The extra week of North America operations in fiscal 2009 contributed approximately $19.1 million in revenues and $9.8 million in gross profit.
Fiscal 2009 product sales revenues and gross profit in North America decreased on lower unit volume and fewer non-machine sales, partially offset by a favorable mix of higher priced MLD models. Gross margin declined in fiscal 2009 primarily due to reduced volume, as well as higher systems upgrade costs and fewer new systems installations. Low replacement demand continued to adversely affect product sales.
International
2010 2009 2008 10 vs 09 09 vs 08(In millions except units)
Revenues 558.8$ 462.2$ 593.5$ 96.6$ 21% (131.3)$ -22%Gaming operations 168.0 155.0 149.6 13.0 8% 5.4 4%Product sales 390.8 307.2 443.9 83.6 27% (136.7) -31%
Machines 288.7 202.0 347.5 86.7 43% (145.5) -42%Non-machine 102.1 105.2 96.4 (3.1) -3% 8.8 9%
Gross profit 319.7$ 255.8$ 329.3$ 63.9$ 25% (73.5)$ -22%Gaming operations 121.7 100.3 86.3 21.4 21% 14.0 16%Product sales 198.0 155.5 243.0 42.5 27% (87.5) -36%
Gross margin 57% 55% 55% 2 pp 4% - pp - Gaming operations 72% 65% 58% 7 pp 11% 7 pp 12%Product sales 51% 51% 55% - pp - (4) pp -7%
UnitsGaming operations installed base 16,100 15,800 13,200 300 2% 2,600 20%
Fixed 2,900 2,800 8,900 100 4% (6,100) -69%Variable 13,200 13,000 4,300 200 2% 8,700 202%
Product sales shipped 23,100 26,000 31,200 (2,900) -11% (5,200) -17%New 7,700 6,900 10,000 800 12% (3,100) -31%Replacement 15,400 19,100 21,200 (3,700) -19% (2,100) -10%
Product sales recognized 24,600 23,900 31,200 700 3% (7,300) -23%
Operating income 181.8$ 114.1$ 164.5$ 67.7$ 59% (50.4)$ -31%
Operating margin 33% 25% 28% 8 pp 32% (3) pp -11%
Favorable (Unfavorable)
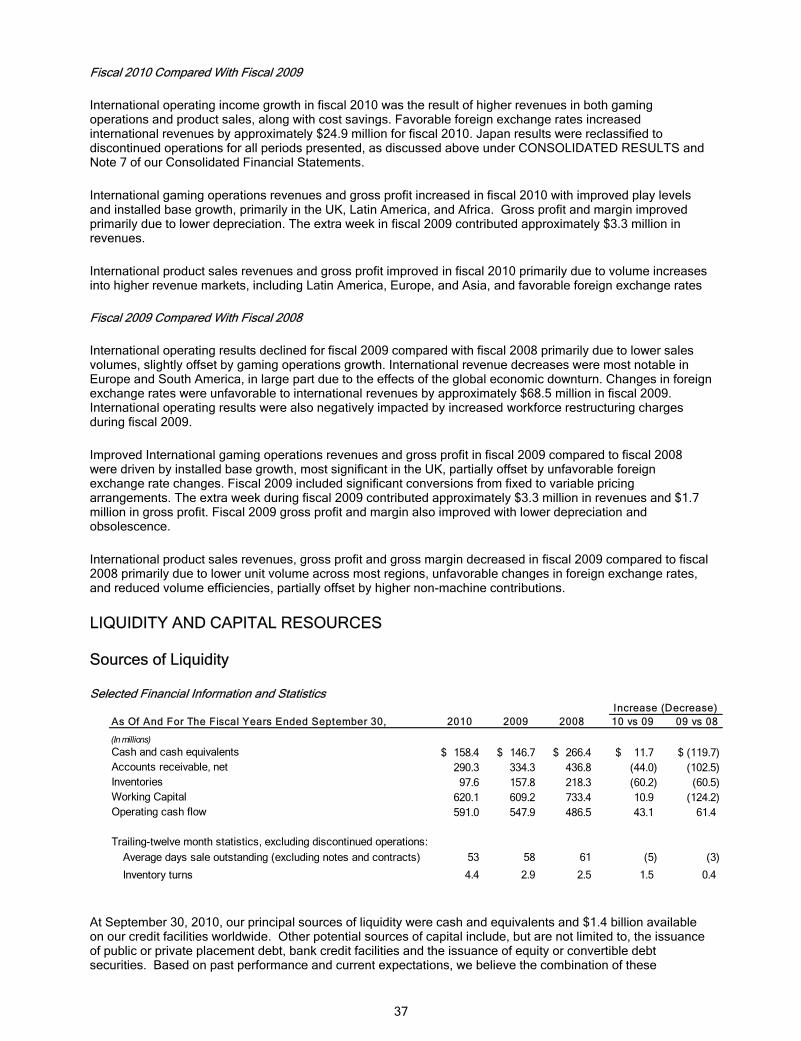
37
Fiscal 2010 Compared With Fiscal 2009
International operating income growth in fiscal 2010 was the result of higher revenues in both gaming operations and product sales, along with cost savings. Favorable foreign exchange rates increased international revenues by approximately $24.9 million for fiscal 2010. Japan results were reclassified to discontinued operations for all periods presented, as discussed above under CONSOLIDATED RESULTS and Note 7 of our Consolidated Financial Statements.
International gaming operations revenues and gross profit increased in fiscal 2010 with improved play levels and installed base growth, primarily in the UK, Latin America, and Africa. Gross profit and margin improved primarily due to lower depreciation. The extra week in fiscal 2009 contributed approximately $3.3 million in revenues.
International product sales revenues and gross profit improved in fiscal 2010 primarily due to volume increases into higher revenue markets, including Latin America, Europe, and Asia, and favorable foreign exchange rates
Fiscal 2009 Compared With Fiscal 2008
International operating results declined for fiscal 2009 compared with fiscal 2008 primarily due to lower sales volumes, slightly offset by gaming operations growth. International revenue decreases were most notable in Europe and South America, in large part due to the effects of the global economic downturn. Changes in foreign exchange rates were unfavorable to international revenues by approximately $68.5 million in fiscal 2009. International operating results were also negatively impacted by increased workforce restructuring charges during fiscal 2009.
Improved International gaming operations revenues and gross profit in fiscal 2009 compared to fiscal 2008 were driven by installed base growth, most significant in the UK, partially offset by unfavorable foreign exchange rate changes. Fiscal 2009 included significant conversions from fixed to variable pricing arrangements. The extra week during fiscal 2009 contributed approximately $3.3 million in revenues and $1.7 million in gross profit. Fiscal 2009 gross profit and margin also improved with lower depreciation and obsolescence.
International product sales revenues, gross profit and gross margin decreased in fiscal 2009 compared to fiscal 2008 primarily due to lower unit volume across most regions, unfavorable changes in foreign exchange rates, and reduced volume efficiencies, partially offset by higher non-machine contributions.
LIQUIDITY AND CAPITAL RESOURCES
Sources of Liquidity
Selected Financial Information and Statistics Increase (Decrease)
As Of And For The Fiscal Years Ended September 30, 2010 2009 2008 10 vs 09 09 vs 08
(In millions)Cash and cash equivalents 158.4$ 146.7$ 266.4$ 11.7$ (119.7)$ Accounts receivable, net 290.3 334.3 436.8 (44.0) (102.5) Inventories 97.6 157.8 218.3 (60.2) (60.5) Working Capital 620.1 609.2 733.4 10.9 (124.2) Operating cash flow 591.0 547.9 486.5 43.1 61.4
Trailing-twelve month statistics, excluding discontinued operations:Average days sale outstanding (excluding notes and contracts) 53 58 61 (5) (3)
Inventory turns 4.4 2.9 2.5 1.5 0.4
At September 30, 2010, our principal sources of liquidity were cash and equivalents and $1.4 billion available on our credit facilities worldwide. Other potential sources of capital include, but are not limited to, the issuance of public or private placement debt, bank credit facilities and the issuance of equity or convertible debt securities. Based on past performance and current expectations, we believe the combination of these

38
resources will satisfy our needs for working capital, jackpot liabilities, capital expenditures, debt service, and other liquidity requirements associated with our existing operations for the foreseeable future. Restricted cash and investments, as well as jackpot annuity investments, are used only for funding jackpot winner payments.
Cash and equivalents increased during the fiscal year ended September 30, 2010, primarily due to cash generated from operations of $591.0 million and net investment proceeds of $119.5 million, partially offset by capital expenditures of $240.2 million and net debt payments of $415.3 million. The remaining decrease was comprised mostly of dividends paid of $71.3 million, partially offset by net proceeds from employee stock plans of $24.5 million, and net cash inflows from other investing activities of $3.0 million.
Cost Savings Initiatives
In light of the economic downturn and reduced demand, we have been conducting a comprehensive strategic review of our costs and organizational structure to maximize efficiency and align expenses with the current and long-term business outlook. Beginning in early fiscal 2009, our cost savings initiatives included organizational restructurings at our corporate and subsidiary operations, reductions in employee headcount, third-party professional fees, employee incentives and benefits, and capital spending, as well as rationalization of all other expenses. Increased restructuring expenses were offset by savings from cost reduction initiatives.
Cash Flows Summary - A Three Year Comparative
Years Ended September 30, 2010 2009 2008 10 vs 09 09 vs 08
(In millions)Operations 591.0$ 547.9$ 486.5$ 43.1$ 61.4$ Investing (117.7) (288.4) (365.7) 170.7 77.3 Financing (462.1) (381.2) (115.2) (80.9) (266.0) Effects of exchange rates 0.5 2.0 (0.5) (1.5) 2.5
Net Change 11.7$ (119.7)$ 5.1$ 131.4$ (124.8)$
Favorable (Unfavorable)
Operating Cash Flows
Fiscal 2010 provided higher operating cash flows than the prior year, primarily due to net changes in operating assets and liabilities. Less cash used for other assets and jackpot liabilities and more cash provided from receivables were partially offset by more cash used for accounts payable and accrued liabilities, income taxes, and inventories. Cash flows related to jackpot liabilities fluctuate based on the timing of jackpots and winner payments, volume of play, and market variations in applicable interest rates.
Fiscal 2009 provided higher operating cash flows compared to the prior year, primarily due to additional prepayments to secure long-term licensing rights in the prior year and net changes in operating assets and liabilities. Additional cash provided from inventories and receivables was partially offset by increased cash used for jackpot liabilities and taxes.
Investing Cash Flows
We used less cash for investing during fiscal 2010 compared to the prior year, primarily due to decreased net development financing, increased net proceeds from investments, decreased capital expenditures, and decreased acquisitions, partially offset by increased cash used for jackpot funding and less proceeds from assets sold. The decrease in cash used for investing during fiscal 2009 compared to 2008 was primarily due to reduced jackpot funding, business acquisitions and affiliate investments, and capital expenditures, partially offset by increased net development financing.
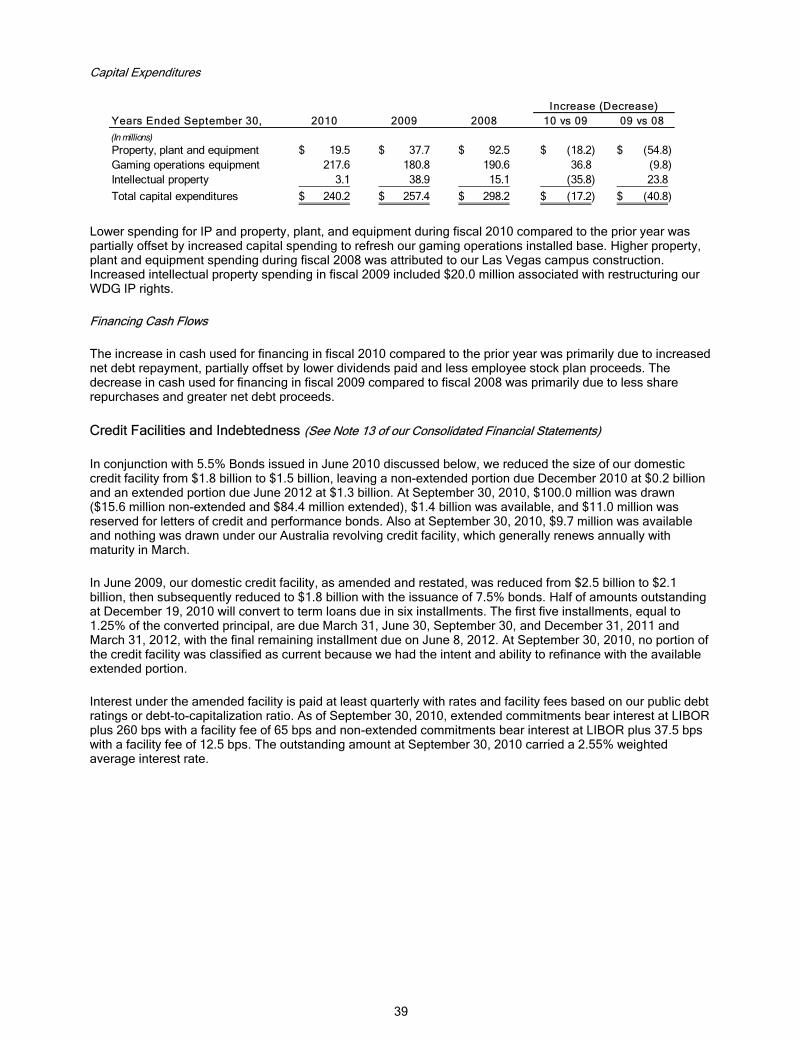
39
Capital Expenditures
Years Ended September 30, 2010 2009 2008 10 vs 09 09 vs 08(In millions)Property, plant and equipment 19.5$ 37.7$ 92.5$ (18.2)$ (54.8)$ Gaming operations equipment 217.6 180.8 190.6 36.8 (9.8) Intellectual property 3.1 38.9 15.1 (35.8) 23.8 Total capital expenditures 240.2$ 257.4$ 298.2$ (17.2)$ (40.8)$
Increase (Decrease)
Lower spending for IP and property, plant, and equipment during fiscal 2010 compared to the prior year was partially offset by increased capital spending to refresh our gaming operations installed base. Higher property, plant and equipment spending during fiscal 2008 was attributed to our Las Vegas campus construction. Increased intellectual property spending in fiscal 2009 included $20.0 million associated with restructuring our WDG IP rights.
Financing Cash Flows
The increase in cash used for financing in fiscal 2010 compared to the prior year was primarily due to increased net debt repayment, partially offset by lower dividends paid and less employee stock plan proceeds. The decrease in cash used for financing in fiscal 2009 compared to fiscal 2008 was primarily due to less share repurchases and greater net debt proceeds.
Credit Facilities and Indebtedness (See Note 13 of our Consolidated Financial Statements)
In conjunction with 5.5% Bonds issued in June 2010 discussed below, we reduced the size of our domestic credit facility from $1.8 billion to $1.5 billion, leaving a non-extended portion due December 2010 at $0.2 billion and an extended portion due June 2012 at $1.3 billion. At September 30, 2010, $100.0 million was drawn ($15.6 million non-extended and $84.4 million extended), $1.4 billion was available, and $11.0 million was reserved for letters of credit and performance bonds. Also at September 30, 2010, $9.7 million was available and nothing was drawn under our Australia revolving credit facility, which generally renews annually with maturity in March.
In June 2009, our domestic credit facility, as amended and restated, was reduced from $2.5 billion to $2.1 billion, then subsequently reduced to $1.8 billion with the issuance of 7.5% bonds. Half of amounts outstanding at December 19, 2010 will convert to term loans due in six installments. The first five installments, equal to 1.25% of the converted principal, are due March 31, June 30, September 30, and December 31, 2011 and March 31, 2012, with the final remaining installment due on June 8, 2012. At September 30, 2010, no portion of the credit facility was classified as current because we had the intent and ability to refinance with the available extended portion.
Interest under the amended facility is paid at least quarterly with rates and facility fees based on our public debt ratings or debt-to-capitalization ratio. As of September 30, 2010, extended commitments bear interest at LIBOR plus 260 bps with a facility fee of 65 bps and non-extended commitments bear interest at LIBOR plus 37.5 bps with a facility fee of 12.5 bps. The outstanding amount at September 30, 2010 carried a 2.55% weighted average interest rate.

40
The domestic credit facility includes the following financial and restrictive covenants (all terms as defined per the amended facility):
� a minimum ratio of adjusted EBITDA to interest expense (interest coverage ratio or ICR)
� a maximum ratio of Total Debt to adjusted EBITDA (total leverage ratio or TLR)
� certain restrictions on our ability to: � incur or guaranty additional debt, or enter into swap agreements � incur liens � merge with or acquire other companies, liquidate or dissolve � sell, transfer, lease or dispose of substantially all assets � change the nature of our business � declare or make cash dividends or distributions or pay cash for the purchase, redemption,
retirement, defeasance, acquisition, cancellation or termination of our capital stock or equity interests or any return of capital to shareholders, provided that we may, as long as no continuing default has occurred, pay dividends of up to the lesser of $0.06 per common share per fiscal quarter or $25 million in any fiscal quarter.
We were in compliance with all debt covenants at September 30, 2010, with our ICR at 8.8 (minimum allowed 3.0) and TLR at 2.3 (maximum allowed 3.5, reducing to 3.25 on April 1, 2011). Our ability to comply with these financial covenants may be adversely impacted by an extended economic downturn.
2.6% Convertible Debentures Redeemed
Debentures of $701.2 million aggregate principal were tendered under the holders’ put option and accepted by IGT for payment on December 15, 2009. The tender was funded with borrowings under our domestic credit facility. As a result of our call notice on December 21, 2009, we completed final redemption of the remaining $5.8 million aggregate outstanding principal on February 4, 2010 using cash on hand.
5.5% Bonds Issued
On June 8, 2010, we issued $300.0 million aggregate principal amount of 5.5% Bonds due 2020 under our March 2009 shelf registration statement and June 3, 2010 prospectus supplement pursuant to an underwriting agreement dated June 3, 2010. We received net proceeds of $295.7 million after a discount of $1.3 million and deferred offering costs of approximately $3.0 million, both of which will be amortized to interest expense over the bond term. Interest is payable semiannually on June 15 and December 15, beginning December 15, 2010. Net proceeds from the 5.5% Bonds were used to reduce outstanding amounts under our domestic credit facility.
The 5.5% Bonds are general unsecured obligations of IGT, ranking equal with all existing and future unsecured and unsubordinated obligations. The 5.5% Bonds rank junior to all existing and future liabilities, including trade payables, of our subsidiaries. The 5.5% Bonds mature on June 15, 2020, unless IGT redeems them earlier by paying the holders 100% of the principal amount plus a make-whole redemption premium as described further in the indenture.
Our 5.5% Bonds contain restrictive covenants similar to those described above with our domestic credit facility. The 5.5% Bonds also specify a number of events of default (some of which are subject to applicable grace or cure periods), including the failure to make timely principal and interest payments or satisfy the covenants. Upon the occurrence of an event of default under the 5.5% Bonds, the outstanding amounts may become immediately due and payable.
In conjunction with the 5.5% Bonds issued in June 2010, we executed $300.0 million notional value of interest rate swaps that terminate on June 15, 2020, which effectively exchange 5.5% fixed interest payments for variable rate interest payments based on the six-month LIBOR plus 186 bps set in arrears on June 13 and December 13 of each year. Net amounts receivable or payable under the swaps settle semiannually on June 15 and December 15. See Note 19 of our Consolidated Financial Statements for additional information related to derivative values.
41
7.5% Bonds
On June 15, 2009, we issued $500.0 million aggregate principal amount of 7.5% Bonds due 2019, under our March 2009 shelf registration statement and June 11, 2009 prospectus supplement, to certain underwriters pursuant to an underwriting agreement dated June 10, 2009. We received net proceeds of $493.3 million after a discount of $2.7 million and deferred offering costs of approximately $4.0 million, both of which will be amortized to interest expense over the 7.5% Bond term. Interest is payable semiannually on June 15 and December 15, beginning December 15, 2009. We used the net proceeds from the 7.5% Bonds to fund the redemption of a portion of our Debentures put to us in December 2009.
The 7.5% Bonds are general unsecured obligations of IGT, ranking equal with all existing and future unsecured and unsubordinated obligations. The 7.5% Bonds rank junior to all existing and future liabilities, including trade payables, of our subsidiaries. The 7.5% Bonds mature on June 15, 2019, unless IGT redeems them earlier by paying the holders 100% of the principal amount plus a make-whole redemption premium as described further in the indenture.
Our 7.5% Bonds contain restrictive covenants similar to those described above with our domestic credit facility. The 7.5% Bonds also specify a number of events of default (some of which are subject to applicable grace or cure periods), including the failure to make timely principal and interest payments or satisfy the covenants. Upon the occurrence of an event of default under the 5.5% Bonds, the outstanding amounts may become immediately due and payable.
In conjunction with our 7.5% Bonds issued in June 2009, we executed $250.0 million notional value of interest rate swaps that terminate on June 15, 2019, which effectively exchange 7.5% fixed interest payments for variable rate interest payments based on one-month LIBOR plus 342 bps reset on the 15th of each month. Net amounts receivable or payable under the swaps settle semiannually on June 15 and December 15. See Note 19 of our Consolidated Financial Statements for additional information related to derivative values.
3.25% Convertible Notes
On May 11, 2009, we issued $850.0 million aggregate principal amount of Notes, in a private placement for net proceeds of $822.5 million, after deferred offering costs of approximately $27.5 million, which will be amortized to interest expense over the Note term. We will pay interest at 3.25% on the Notes, semiannually on May 1 and November 1, beginning November 1, 2009. Proceeds from the Notes (net of amounts used for the separate note hedge transactions and funds provided by the separate warrant transactions described below) were used to reduce outstanding borrowings under our revolving domestic credit facility.
The Notes are general unsecured obligations of IGT, ranking equal with all existing and future unsecured and unsubordinated obligations. The Notes rank junior to all existing and future subsidiary liabilities, including trade payables. The Notes mature on May 1, 2014, unless repurchased earlier by IGT or converted. The Notes are not redeemable at IGT's option before maturity, except in certain circumstances relating to applicable gaming authority regulations. The terms of the Notes may, in certain circumstances, require us to grant a lien on equity interests if certain downgrades by rating agencies occur.
Each $1,000 Note is initially convertible into 50.0808 shares of IGT Common Stock, representing a conversion price of $19.97 per share. Upon conversion, a holder will receive cash up to the aggregate principal amount of each Note and shares of our common stock for any conversion value in excess of the principal amount as determined per the indenture. The conversion rate is adjustable upon the occurrence of certain events as defined in the indenture.
The Notes are convertible under any of the following circumstances:
� during any fiscal quarter ending after September 30, 2009 (and only during such fiscal quarter), if the closing price of our common stock for at least 20 trading days in the last 30 trading day period of the immediately preceding fiscal quarter is more than 130% of the conversion price on the last trading day of the preceding fiscal quarter
� if specified corporate transactions occur as described further in the indenture
� at any time on or after February 1, 2014 until the close of business on the second scheduled trading day immediately preceding May 1, 2014
42
Holders who convert their Notes in connection with a make-whole adjustment event, as defined in the indenture, may be entitled to a premium increase in the conversion rate. Upon the occurrence of a fundamental change, as defined in the indenture, such as certain mergers and acquisitions of our common stock or liquidation, holders have the option to require IGT to repurchase their Notes at a purchase price equal to 100% of the principal, plus accrued and unpaid interest.
Note Hedges and Warrant Transactions
Concurrent with the issuance of our Notes, we purchased separate note hedges and sold warrants, which effectively serve to reduce the potential future dilution associated with Note conversions and increase the initial Note conversion price to $30.14 per share. The call option in the note hedges has a strike price equal to the conversion price of the Notes, and the warrants have a higher strike price of $30.14 per share that serves to cap the amount of dilution protection provided. The warrants together with the note hedges create a capped call position on the shares underlying the Notes.
If our share price is above $19.97 upon conversion of the Notes, the note hedges will automatically neutralize the impact to share dilution, because IGT will receive shares under the note hedges exercised equal to the shares IGT must deliver to the Note holders. If our share price is above $30.14, upon exercise of the warrants IGT will deliver shares to the counterparties in an amount equal to the excess of our share price over $30.14. A 10% increase in our share price above $30.14 would result in the issuance of 3.9 million incremental shares upon exercise of the warrants. As our share price continues to increase, additional dilution would occur at a declining rate.
Prior to conversion or exercise, the Notes and warrants could have a dilutive effect on our earnings per share to the extent the price of our common stock during a given measurement period exceeds the respective exercise prices of those instruments. The note hedges are excluded from the calculation of diluted earnings per share as their impact is anti-dilutive. The market price condition for convertibility of our Notes was not met and there were no related note hedges or warrants exercised at September 30, 2010.
The note hedges and warrants were separate transactions apart from the Notes, and Note holders have no rights with respect to these separate transactions. The note hedges and warrants are considered indexed to IGT stock, require net-share settlement, and met all criteria for equity classification at inception and at September 30, 2010. Accordingly, the note hedges cost of $177.3 million, net of deferred taxes of $65.5 million, and $66.8 million received for the warrants were recorded as adjustments to shareholders’ equity. Subsequent changes in fair value will not be recognized so long as the note hedges and warrants continue to meet the criteria for equity classification.
Note Hedges
We paid an aggregate amount of $177.3 million to certain initial Note holders or their affiliates (note hedge counterparties/dealers) for note hedges with terms substantially similar to the embedded conversion options in the Notes. The note hedges cover, subject to anti-dilution and certain other customary adjustments substantially similar to those in the Notes, approximately 42.6 million shares of our common stock at a strike price of $19.97, which corresponds to the initial conversion price of the Notes.
The note hedges exercise automatically upon Note conversions and require the counterparty to deliver shares to IGT equal to the shares required to be delivered by IGT to the Note holder for the excess conversion value. The note hedges expire upon the earlier of the last day the Notes remain outstanding or the second scheduled trading day immediately preceding the maturity of the Notes on May 1, 2014.
Warrants
IGT received an aggregate amount of $66.8 million from the note hedge counterparties/dealers for the sale of rights to receive approximately 42.6 million shares of common stock underlying the Notes, subject to anti-dilution and certain other customary adjustments, at a strike price of $30.14 per share. Subject to certain adjustments, a maximum of 72.6 million shares may be delivered under the warrants.
The warrants are automatically exercised on their specified expiration dates that occur over a period of time ending in November 2014. If the volume weighted average share price of our common stock, as defined in the warrants (VWAP), exceeds the strike price of the warrants, IGT will deliver to the counterparties shares equal to

43
the spread between the VWAP on the date of exercise or expiration and the strike price. If the VWAP is less than the strike price, neither party is obligated to deliver anything to the other.
Shelf Registration
In March 2009, we filed a shelf registration statement with the SEC which allows us to issue debt securities, in one or more series, from time to time in amounts, at prices and on terms determined at the time of offering. The 5.5% Bonds and 7.5% Bonds were issued under this registration statement.
Share Repurchases
We last repurchased 25.5 million IGT common shares on the open market for an aggregate cost of $779.7 million during fiscal 2008. We have no current plans to repurchase additional shares and our amended credit facility restricts us from repurchasing shares except within certain specified parameters.
Financial Condition
Inc reaseSeptember 30, 2010 2009 (Decrease)(In millions)
Assets 4,007.0$ 4,328.1$ (321.1)$ Liabilities 2,772.7 3,264.5 (491.8) Total Equity 1,234.3 1,063.6 170.7
Changes During The Fiscal Year Ended September 30, 2010
Total assets decreased largely related to impairment and restructuring discussed above, as well as lower sales volume and management of our working capital. Receivables decreased $92.2 million, inventory decreased $60.2 million, jackpot investments decreased $38.2 million, and the remaining decrease is primarily due to the reduction of other assets and deferred costs and intangibles.
Liabilities decreased primarily due to reductions of $345.7 million in net debt, $52.3 million related to unrecognized tax benefit liabilities, $31.8 million in deferred revenues and $17.2 million in jackpot liabilities, as well as generally lower accrued liabilities. Shareholders’ equity increased primarily due to earnings.
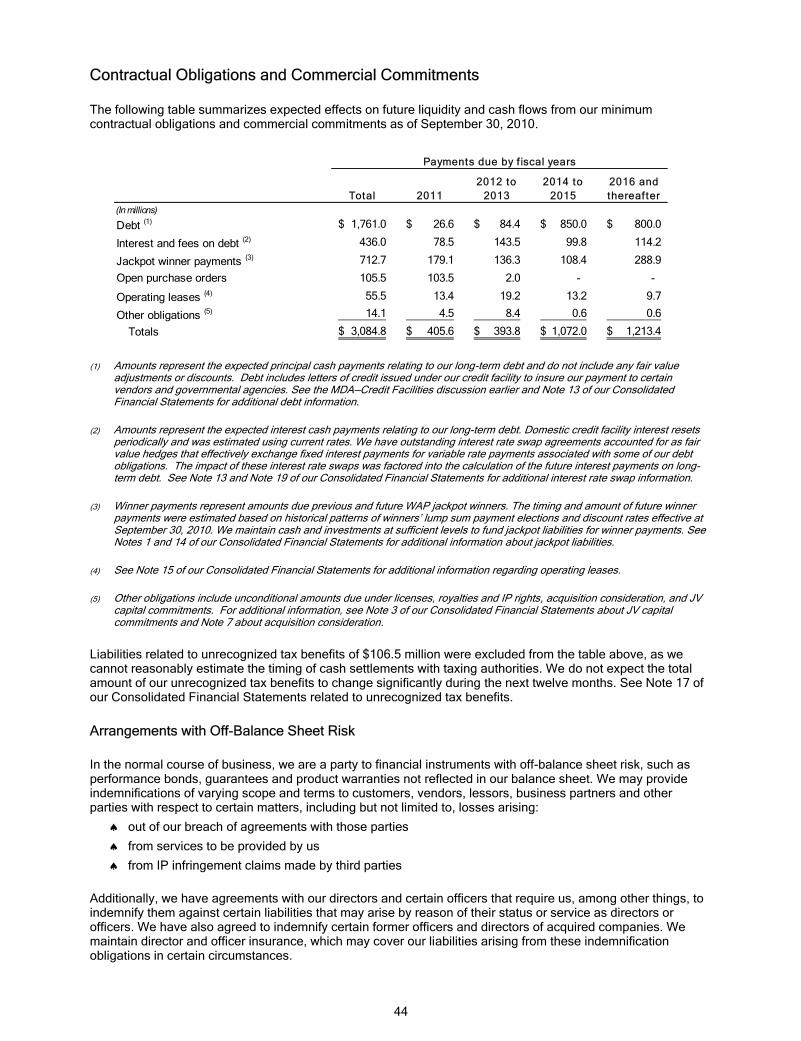
44
Contractual Obligations and Commercial Commitments
The following table summarizes expected effects on future liquidity and cash flows from our minimum contractual obligations and commercial commitments as of September 30, 2010.
Total 20112012 to
20132014 to
20152016 and thereafter
(In millions)
Debt (1) 1,761.0$ 26.6$ 84.4$ 850.0$ 800.0$
Interest and fees on debt (2) 436.0 78.5 143.5 99.8 114.2
Jackpot winner payments (3) 712.7 179.1 136.3 108.4 288.9
Open purchase orders 105.5 103.5 2.0 - -
Operating leases (4) 55.5 13.4 19.2 13.2 9.7
Other obligations (5) 14.1 4.5 8.4 0.6 0.6
Totals 3,084.8$ 405.6$ 393.8$ 1,072.0$ 1,213.4$
Payments due by f iscal years
(1) Amounts represent the expected principal cash payments relating to our long-term debt and do not include any fair value adjustments or discounts. Debt includes letters of credit issued under our credit facility to insure our payment to certain vendors and governmental agencies. See the MDA—Credit Facilities discussion earlier and Note 13 of our Consolidated Financial Statements for additional debt information.
(2) Amounts represent the expected interest cash payments relating to our long-term debt. Domestic credit facility interest resets periodically and was estimated using current rates. We have outstanding interest rate swap agreements accounted for as fair value hedges that effectively exchange fixed interest payments for variable rate payments associated with some of our debt obligations. The impact of these interest rate swaps was factored into the calculation of the future interest payments on long-term debt. See Note 13 and Note 19 of our Consolidated Financial Statements for additional interest rate swap information.
(3) Winner payments represent amounts due previous and future WAP jackpot winners. The timing and amount of future winner payments were estimated based on historical patterns of winners’ lump sum payment elections and discount rates effective at September 30, 2010. We maintain cash and investments at sufficient levels to fund jackpot liabilities for winner payments. See Notes 1 and 14 of our Consolidated Financial Statements for additional information about jackpot liabilities.
(4) See Note 15 of our Consolidated Financial Statements for additional information regarding operating leases.
(5) Other obligations include unconditional amounts due under licenses, royalties and IP rights, acquisition consideration, and JV capital commitments. For additional information, see Note 3 of our Consolidated Financial Statements about JV capital commitments and Note 7 about acquisition consideration.
Liabilities related to unrecognized tax benefits of $106.5 million were excluded from the table above, as we cannot reasonably estimate the timing of cash settlements with taxing authorities. We do not expect the total amount of our unrecognized tax benefits to change significantly during the next twelve months. See Note 17 of our Consolidated Financial Statements related to unrecognized tax benefits.
Arrangements with Off-Balance Sheet Risk
In the normal course of business, we are a party to financial instruments with off-balance sheet risk, such as performance bonds, guarantees and product warranties not reflected in our balance sheet. We may provide indemnifications of varying scope and terms to customers, vendors, lessors, business partners and other parties with respect to certain matters, including but not limited to, losses arising:
� out of our breach of agreements with those parties
� from services to be provided by us
� from IP infringement claims made by third parties
Additionally, we have agreements with our directors and certain officers that require us, among other things, to indemnify them against certain liabilities that may arise by reason of their status or service as directors or officers. We have also agreed to indemnify certain former officers and directors of acquired companies. We maintain director and officer insurance, which may cover our liabilities arising from these indemnification obligations in certain circumstances.

45
It is not possible to determine the maximum potential obligations under these indemnification undertakings due to the unique facts and circumstances involved in each particular agreement. Such indemnification undertakings may not be subject to maximum loss clauses. Historically, we have not incurred material costs related to indemnification obligations.
We do not expect any material losses to result from these arrangements and do not rely on off-balance sheet financing arrangements to fund our operations. See also Note 16 of our Consolidated Financial Statements.
Item 7A. Quantitative and Qualitative Disclosures about Market Risk
We use derivative financial instruments to manage certain foreign currency exchange and interest rate risk. The primary business objective of our hedging program, as defined in our corporate risk management policy, is to minimize the impact to our financial results from currency transaction remeasurement and other specified economic exposures. We enter into derivative financial instruments with high-credit quality counterparties and diversify our positions among such counterparties to reduce our exposure to credit losses. We are not party to leveraged derivatives and do not hold or issue financial instruments for speculative purposes.
Foreign Currency Risk
We routinely use forward exchange contracts to minimize our market risk exposure related to our monetary assets and liabilities denominated in nonfunctional foreign currencies. The primary business objective of our economic hedging program is to minimize the impact to earnings from changes in foreign exchange rates. These hedging instruments are subject to fluctuations in value that are generally offset by the value of the underlying exposures being hedged. Counterparties to our agreements are major commercial banks.
We also hedge significant investments denominated in foreign currency with forward exchange contracts to protect the US dollar value of our investment. In addition, from time to time, we may enter into forward exchange contracts to establish with certainty the US dollar amount of future firm commitments denominated in a foreign currency.
Hedging
The notional amount of forward contracts hedging our net foreign currency exposure related to our monetary assets and liabilities denominated in nonfunctional currency totaled $41.7 million at September 30, 2010 and $74.8 million at September 30, 2009. Changes in foreign exchange rates upon which these foreign exchange contracts are based result in exchange gains and losses. Generally, contract gain or loss should be offset by gain or loss on the underlying monetary exposures.
Translation
As currency rates change, translation of our foreign currency functional operations into US dollars affects year-over-year equity comparability. We do not generally hedge translation risk because cash flows from our international operations are typically reinvested locally. Currency exchange rates with the most significant impact to our translation include the British pound, Australian dollar, Euro, South African rand, and Canadian dollar. Disregarding that rates can move in opposite directions resulting in offsetting gains and losses, we estimate a 10% change in exchange rates overall would have impacted our reported equity by approximately $25.0 million at September 30, 2010 and $24.7 million at September 30, 2009.
Interest Rate Risk
Costs to fund jackpot liabilities
Fluctuations in prime, treasury and agency rates due to changes in market and other economic conditions directly impact our cost to fund jackpots and corresponding gaming operations gross profit. If interest rates decline, jackpot cost increases and gross profit decreases. We estimate a hypothetical decline of 100 bps in applicable interest rates would have reduced our gross profit by approximately $16.0 million in fiscal 2010 and $14.5 million in 2009. We do not manage this exposure with derivative financial instruments.

46
Domestic Credit Facility
Fluctuations in LIBOR directly impact interest costs related to our domestic credit facility. We estimate a hypothetical increase of 100 bps in LIBOR would have increased our interest expense for fiscal 2010 by approximately $4.8 million and $11.2 million in fiscal 2009. We do not manage this exposure with derivative financial instruments. See Note 13 of our Consolidated Financial Statements for additional information about our domestic credit facility.
Convertible Debt
The fair value of our convertible debt is affected by changes in the price of IGT stock and changes in interest rates. The fair value of convertible instruments generally increases and decreases directionally with like movements in stock price and increases with stock price volatility. The fair value of fixed rate instruments increase as interest rates fall and decreases as interest rates rise. As we do not record our debt at fair value, changes in interest or stock price have no material effect on our financial position, cash flows or results of operations.
The face value and fair value of our convertible Notes (liability and equity components) totaled $0.9 billion at September 30, 2010. Face value at September 30, 2009 totaled $0.9 billion with a fair value of $1.1 billion. See Note 13 of our Consolidated Financial Statements for additional information about our Debentures and Notes.
Bonds and Related Swaps
We use interest rate swap derivatives to diversify our debt portfolio between fixed and variable rate instruments. The amount and term of each swap is matched with all or a portion of outstanding principal and remaining term of a specific obligation. Our swaps exchange fixed rates for variable rates without an exchange of the notional amount upon which they are based.
At September 30, 2010, the carrying value of our 5.5% Bonds including the interest rate swap bond adjustment totaled $317.0 million. The fair value of the 5.5% Bonds was $321.4 million, and the fair value of related interest rate swap assets totaled $19.6 million. The swaps effectively converted the 5.5% fixed rate interest to variable rate based on the six-month LIBOR, reducing the effective rate on the 5.5% Bonds hedged for the year ended September 30, 2010. Because we simultaneously reduced our outstanding borrowings and total commitment on our domestic credit facility, which also carried LIBOR rate risk, our overall interest rate risk is substantially unchanged. See Note 13 and Note 19 of our Consolidated Financial Statements for additional information about the 5.5% Bonds and related swaps.
At September 30, 2010, the carrying value of our 7.5% Bonds including the interest rate swap bond adjustment totaled $531.4 million. The fair value of the 7.5% Bonds was $586.2 million, and the fair value of related interest rate swap assets totaled $32.5 million. At September 30, 2009, the carrying value of our 7.5% Bonds including the interest rate swap adjustment totaled $512.5 million. The fair value of the 7.5% Bonds was $553.3 million, and the fair value of related interest rate swap assets totaled $14.8 million. The swaps effectively converted the 7.5% fixed rate interest to variable rate based on the one-month LIBOR, reducing the effective rate on the 7.5% Bonds hedged for the years ended September 30, 2010 and September 30, 2009. See Note 13 and Note 19 of our Consolidated Financial Statements for additional information about the 7.5% Bonds and related swaps.
Investments in CLS
The value of our CLS investments is affected by changes in the Hong Kong dollar exchange rate and the trading price of CLS stock. The carrying value and fair value of our equity investment in CLS stock was $12.7 million at September 30, 2010 versus $15.7 million at September 30, 2009.
Our CLS convertible note investment is subject to interest rate risk and CLS stock price volatility. The CLS note carrying value and fair value was $21.3 million at September 30, 2010, including the bifurcated derivative, and $78.4 million at September 30, 2009. See Note 3 of our Consolidated Financial Statements for additional information about our CLS investment.

47
Item 8. Financial Statements and Supplementary Data
REPORT OF INDEPENDENT REGISTERED PUBLIC ACCOUNTING FIRM
To the Board of Directors and Stockholders of International Game Technology: In our opinion, the accompanying consolidated balance sheet as of September 30, 2010 and the related consolidated statements of income, of cash flows and total equity and comprehensive income present fairly, in all material respects, the financial position of International Game Technology and its subsidiaries at September 30, 2010, and the results of their operations and their cash flows for the fiscal year then ended in conformity with accounting principles generally accepted in the United States of America. Also in our opinion, the Company maintained, in all material respects, effective internal control over financial reporting as of September 30, 2010 based on criteria established in Internal Control - Integrated Framework issued by the Committee of Sponsoring Organizations of the Treadway Commission (COSO). The Company's management is responsible for these financial statements, for maintaining effective internal control over financial reporting and for its assessment of the effectiveness of internal control over financial reporting, included in Management's Report on Internal Control over Financial Reporting appearing under item 9A. Our responsibility is to express opinions on these financial statements and on the Company's internal control over financial reporting based on our integrated audit. We conducted our audit in accordance with the standards of the Public Company Accounting Oversight Board (United States). Those standards require that we plan and perform the audit to obtain reasonable assurance about whether the financial statements are free of material misstatement and whether effective internal control over financial reporting was maintained in all material respects. Our audit of the financial statements included examining, on a test basis, evidence supporting the amounts and disclosures in the financial statements, assessing the accounting principles used and significant estimates made by management, and evaluating the overall financial statement presentation. Our audit of internal control over financial reporting included obtaining an understanding of internal control over financial reporting, assessing the risk that a material weakness exists, and testing and evaluating the design and operating effectiveness of internal control based on the assessed risk. Our audit also included performing such other procedures as we considered necessary in the circumstances. We believe that our audit provides a reasonable basis for our opinions. As discussed in Note 1 to the consolidated financial statements, the Company changed the manner in which it accounts for certain convertible debt instruments and the manner in which it recognizes revenue for multiple element arrangements in 2010. A company’s internal control over financial reporting is a process designed to provide reasonable assurance regarding the reliability of financial reporting and the preparation of financial statements for external purposes in accordance with generally accepted accounting principles. A company’s internal control over financial reporting includes those policies and procedures that (i) pertain to the maintenance of records that, in reasonable detail, accurately and fairly reflect the transactions and dispositions of the assets of the company; (ii) provide reasonable assurance that transactions are recorded as necessary to permit preparation of financial statements in accordance with generally accepted accounting principles, and that receipts and expenditures of the company are being made only in accordance with authorizations of management and directors of the company; and (iii) provide reasonable assurance regarding prevention or timely detection of unauthorized acquisition, use, or disposition of the company’s assets that could have a material effect on the financial statements. Because of its inherent limitations, internal control over financial reporting may not prevent or detect misstatements. Also, projections of any evaluation of effectiveness to future periods are subject to the risk that controls may become inadequate because of changes in conditions, or that the degree of compliance with the policies or procedures may deteriorate. /s/ PricewaterhouseCoopers LLP Las Vegas, Nevada
December 1, 2010
48
REPORT OF INDEPENDENT REGISTERED PUBLIC ACCOUNTING FIRM
Stockholders and Board of Directors International Game Technology Reno, Nevada: We have audited the accompanying consolidated balance sheet of International Game Technology and subsidiaries (the “Company”) as of September 30, 2009, and the related consolidated statements of income, stockholders’ equity and comprehensive income, and cash flows for the years ended September 30, 2009 and 2008. The Company’s management is responsible for these financial statements. Our responsibility is to express an opinion on these financial statements based on our audits. We conducted our audits in accordance with the standards of the Public Company Accounting Oversight Board (United States). Those standards require that we plan and perform the audit to obtain reasonable assurance about whether the financial statements are free of material misstatement. An audit includes examining, on a test basis, evidence supporting the amounts and disclosures in the financial statements. An audit also includes assessing the accounting principles used and significant estimates made by management, as well as evaluating the overall financial statement presentation. We believe that our audits provide a reasonable basis for our opinions. In our opinion, the consolidated financial statements referred to above present fairly, in all material respects, the financial position of the Company as of September 30, 2009, and the results of their operations and their cash flows for the years ended September 30, 2009 and 2008, in conformity with accounting principles generally accepted in the United States of America. As discussed in Note 17 to the financial statements, the Company adopted accounting guidance relating to accounting for uncertainty in income taxes during the first quarter of fiscal 2008. As discussed in Note 1 to the consolidated financial statements, the Company adopted guidance requiring retrospective application relating to convertible debt instruments, noncontrolling interests, and participating securities in share-based payment transactions during the first quarter of fiscal 2010. As discussed in Note 2 and Note 7 to the consolidated financial statements, the accompanying 2009 and 2008 financial statements have been retrospectively adjusted for discontinued operations. /s/ DDELOITTE & TOUCHE LLP Costa Mesa, California December 1, 2009 (May 21, 2010 as to the effect of the October 1, 2009 adoption of the new accounting standards requiring retrospective application to convertible debt instruments, noncontrolling interests, and participating securities in share-based payment transactions as described in Note 1, and December 1, 2010 as to the effect of the discontinued operations described in Note 2 and Note 7)
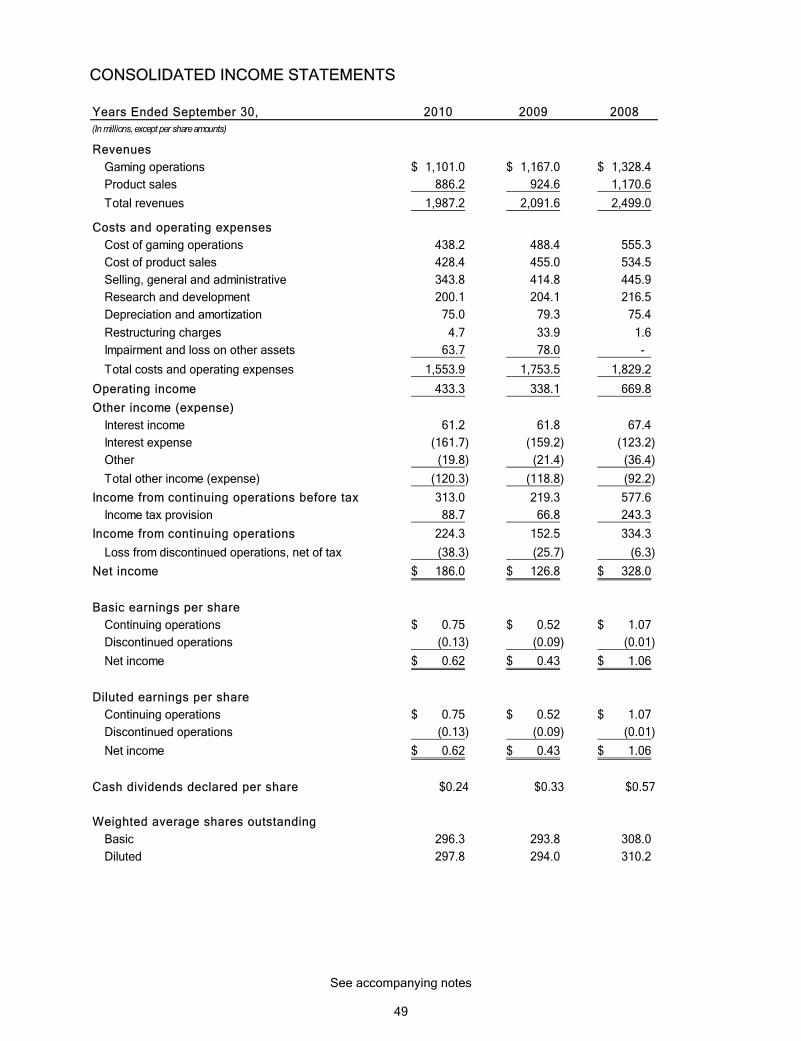
See accompanying notes
49
CONSOLIDATED INCOME STATEMENTS
Years Ended September 30, 2010 2009 2008(In millions, except per share amounts)
RevenuesGaming operations 1,101.0$ 1,167.0$ 1,328.4$ Product sales 886.2 924.6 1,170.6 Total revenues 1,987.2 2,091.6 2,499.0
Costs and operating expensesCost of gaming operations 438.2 488.4 555.3 Cost of product sales 428.4 455.0 534.5 Selling, general and administrative 343.8 414.8 445.9 Research and development 200.1 204.1 216.5 Depreciation and amortization 75.0 79.3 75.4 Restructuring charges 4.7 33.9 1.6 Impairment and loss on other assets 63.7 78.0 -
Total costs and operating expenses 1,553.9 1,753.5 1,829.2
Operating income 433.3 338.1 669.8 Other income (expense)
Interest income 61.2 61.8 67.4 Interest expense (161.7) (159.2) (123.2) Other (19.8) (21.4) (36.4) Total other income (expense) (120.3) (118.8) (92.2)
Income from continuing operations before tax 313.0 219.3 577.6 Income tax provision 88.7 66.8 243.3
Income from continuing operations 224.3 152.5 334.3 Loss from discontinued operations, net of tax (38.3) (25.7) (6.3)
Net income 186.0$ 126.8$ 328.0$
Basic earnings per shareContinuing operations 0.75$ 0.52$ 1.07$ Discontinued operations (0.13) (0.09) (0.01) Net income 0.62$ 0.43$ 1.06$
Diluted earnings per shareContinuing operations 0.75$ 0.52$ 1.07$ Discontinued operations (0.13) (0.09) (0.01) Net income 0.62$ 0.43$ 1.06$
Cash dividends declared per share $0.24 $0.33 $0.57
Weighted average shares outstandingBasic 296.3 293.8 308.0 Diluted 297.8 294.0 310.2
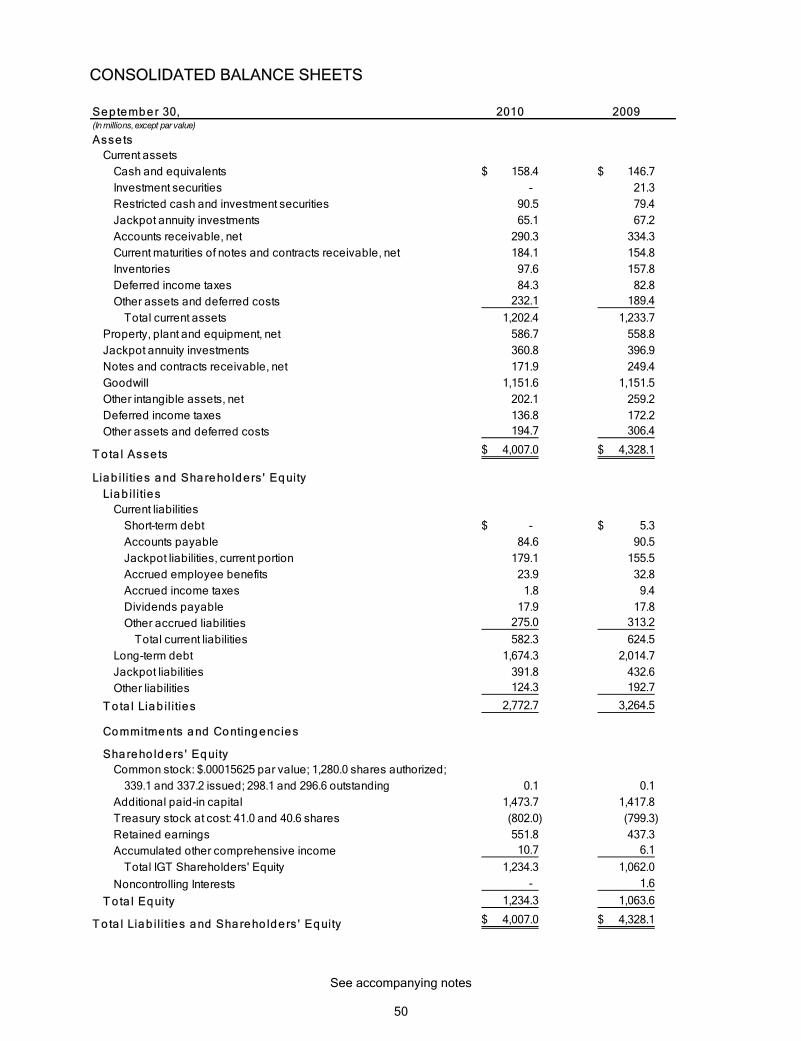
See accompanying notes
50
CONSOLIDATED BALANCE SHEETS
Se p te mb e r 30, 2010 2009(In millions, except par value)
Asse tsCurrent assets
Cash and equivalents 158.4$ 146.7$ Investment securities - 21.3 Restricted cash and investment securities 90.5 79.4 Jackpot annuity investments 65.1 67.2 Accounts receivable, net 290.3 334.3 Current maturities of notes and contracts receivable, net 184.1 154.8 Inventories 97.6 157.8 Deferred income taxes 84.3 82.8 Other assets and deferred costs 232.1 189.4
Total current assets 1,202.4 1,233.7 Property, plant and equipment, net 586.7 558.8 Jackpot annuity investments 360.8 396.9 Notes and contracts receivable, net 171.9 249.4 Goodwill 1,151.6 1,151.5 Other intangible assets, net 202.1 259.2 Deferred income taxes 136.8 172.2 Other assets and deferred costs 194.7 306.4
T o ta l Asse ts 4,007.0$ 4,328.1$
Lia b il itie s a nd Sha re ho ld e rs ' Eq uityLia b il itie s
Current liabilitiesShort-term debt -$ 5.3$ Accounts payable 84.6 90.5 Jackpot liabilities, current portion 179.1 155.5 Accrued employee benefits 23.9 32.8 Accrued income taxes 1.8 9.4 Dividends payable 17.9 17.8 Other accrued liabilities 275.0 313.2
Total current liabilities 582.3 624.5 Long-term debt 1,674.3 2,014.7 Jackpot liabilities 391.8 432.6 Other liabilities 124.3 192.7
T o ta l Lia b il itie s 2,772.7 3,264.5
Co mmitme nts a nd Co nting e nc ie s
Sha re ho ld e rs ' Eq uityCommon stock: $.00015625 par value; 1,280.0 shares authorized;
339.1 and 337.2 issued; 298.1 and 296.6 outstanding 0.1 0.1 Additional paid-in capital 1,473.7 1,417.8 Treasury stock at cost: 41.0 and 40.6 shares (802.0) (799.3) Retained earnings 551.8 437.3 Accumulated other comprehensive income 10.7 6.1
Total IGT Shareholders' Equity 1,234.3 1,062.0 Noncontrolling Interests - 1.6
T o ta l Eq uity 1,234.3 1,063.6
T o ta l Lia b il itie s a nd Sha re ho ld e rs ' Eq uity 4,007.0$ 4,328.1$
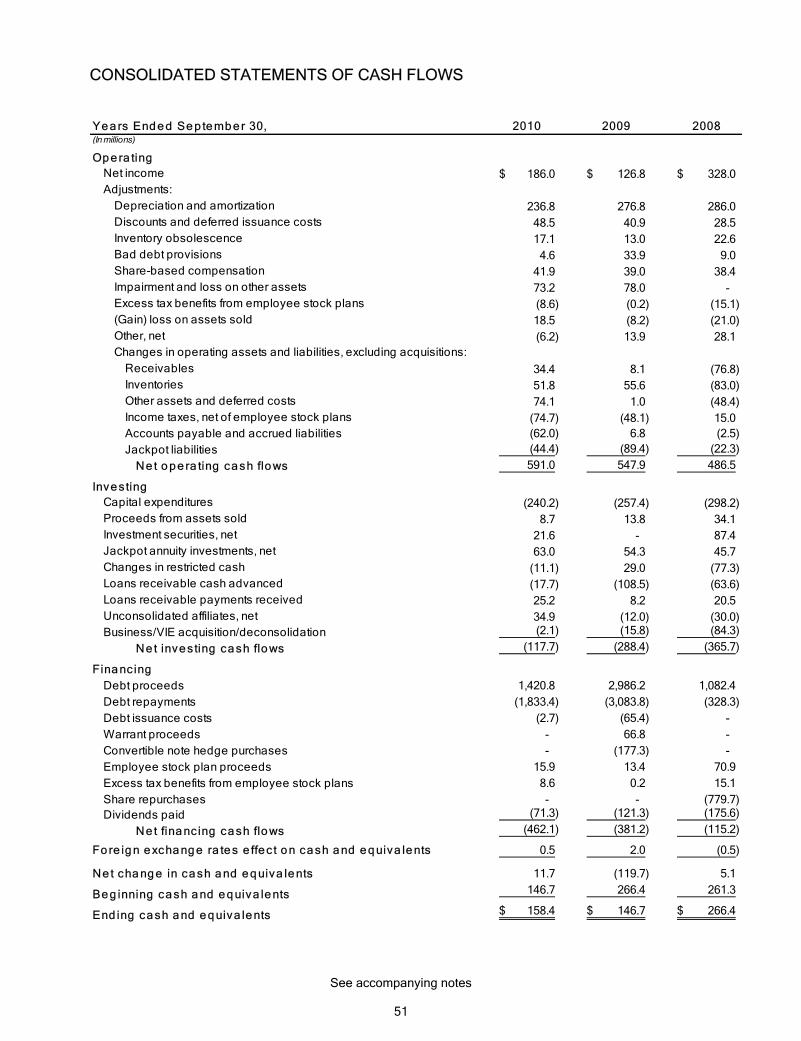
See accompanying notes
51
CONSOLIDATED STATEMENTS OF CASH FLOWS
Ye a rs End e d Se p te mb e r 30, 2010 2009 2008(In millions)
Op e ra ting Net income 186.0$ 126.8$ 328.0$ Adjustments:
Depreciation and amortization 236.8 276.8 286.0 Discounts and deferred issuance costs 48.5 40.9 28.5 Inventory obsolescence 17.1 13.0 22.6 Bad debt provisions 4.6 33.9 9.0 Share-based compensation 41.9 39.0 38.4 Impairment and loss on other assets 73.2 78.0 - Excess tax benefits from employee stock plans (8.6) (0.2) (15.1) (Gain) loss on assets sold 18.5 (8.2) (21.0) Other, net (6.2) 13.9 28.1 Changes in operating assets and liabilities, excluding acquisitions:
Receivables 34.4 8.1 (76.8) Inventories 51.8 55.6 (83.0) Other assets and deferred costs 74.1 1.0 (48.4) Income taxes, net of employee stock plans (74.7) (48.1) 15.0 Accounts payable and accrued liabilities (62.0) 6.8 (2.5) Jackpot liabilities (44.4) (89.4) (22.3)
Ne t o p e ra ting ca sh flo ws 591.0 547.9 486.5
Inve sting Capital expenditures (240.2) (257.4) (298.2) Proceeds from assets sold 8.7 13.8 34.1 Investment securities, net 21.6 - 87.4 Jackpot annuity investments, net 63.0 54.3 45.7 Changes in restricted cash (11.1) 29.0 (77.3) Loans receivable cash advanced (17.7) (108.5) (63.6) Loans receivable payments received 25.2 8.2 20.5 Unconsolidated affiliates, net 34.9 (12.0) (30.0) Business/VIE acquisition/deconsolidation (2.1) (15.8) (84.3)
Ne t inve sting ca sh flo ws (117.7) (288.4) (365.7)
Fina nc ingDebt proceeds 1,420.8 2,986.2 1,082.4 Debt repayments (1,833.4) (3,083.8) (328.3) Debt issuance costs (2.7) (65.4) - Warrant proceeds - 66.8 - Convertible note hedge purchases - (177.3) - Employee stock plan proceeds 15.9 13.4 70.9 Excess tax benefits from employee stock plans 8.6 0.2 15.1 Share repurchases - - (779.7) Dividends paid (71.3) (121.3) (175.6)
Ne t fina nc ing ca sh flo ws (462.1) (381.2) (115.2)
Fo re ig n e xcha ng e ra te s e ffe c t o n ca sh a nd e q uiva le nts 0.5 2.0 (0.5)
Ne t cha ng e in ca sh a nd e q uiva le nts 11.7 (119.7) 5.1
Be g inning ca sh a nd e q uiva le nts 146.7 266.4 261.3
End ing ca sh a nd e q uiva le nts 158.4$ 146.7$ 266.4$
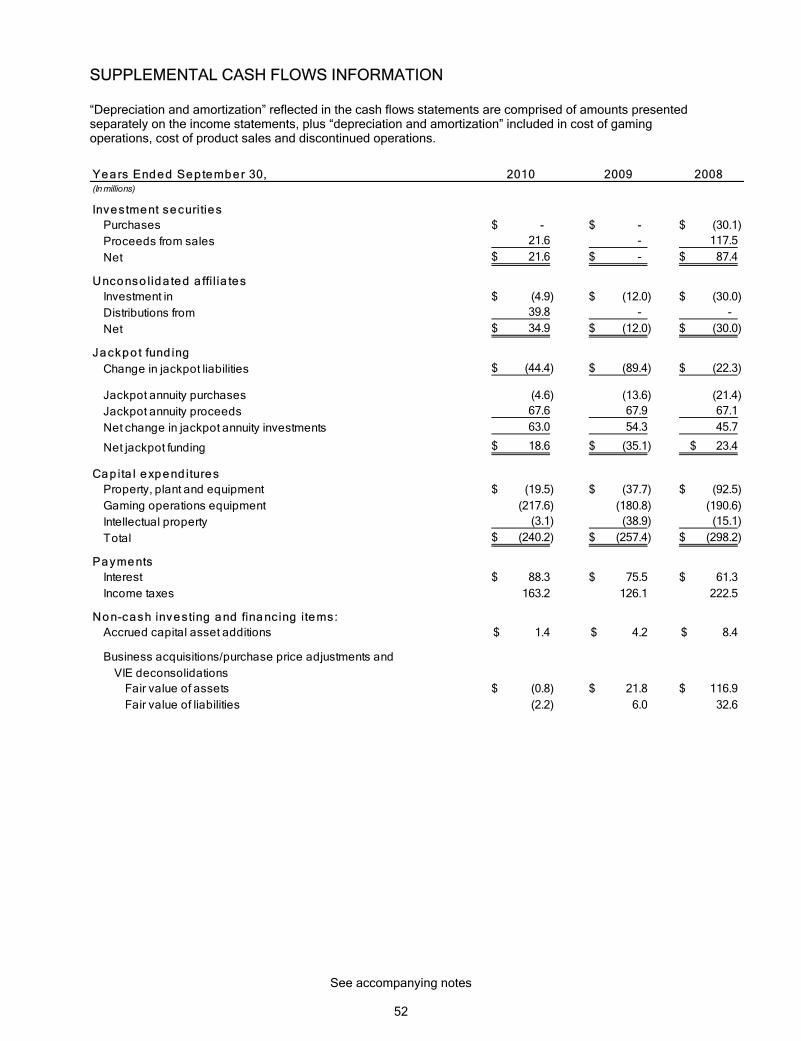
See accompanying notes
52
SUPPLEMENTAL CASH FLOWS INFORMATION
“Depreciation and amortization” reflected in the cash flows statements are comprised of amounts presented separately on the income statements, plus “depreciation and amortization” included in cost of gaming operations, cost of product sales and discontinued operations.
Yea rs Ended Sep tember 30, 2010 2009 2008(In millions)
Investment securitiesPurchases -$ -$ (30.1)$ Proceeds from sales 21.6 - 117.5 Net 21.6$ -$ 87.4$
Unconso lida ted a ffi l ia tesInvestment in (4.9)$ (12.0)$ (30.0)$ Distributions from 39.8 - - Net 34.9$ (12.0)$ (30.0)$
Jackpo t fund ing
Change in jackpot liabilities (44.4)$ (89.4)$ (22.3)$
Jackpot annuity purchases (4.6) (13.6) (21.4) Jackpot annuity proceeds 67.6 67.9 67.1 Net change in jackpot annuity investments 63.0 54.3 45.7
Net jackpot funding 18.6$ (35.1)$ 23.4$
Cap ita l expend ituresProperty, plant and equipment (19.5)$ (37.7)$ (92.5)$ Gaming operations equipment (217.6) (180.8) (190.6) Intellectual property (3.1) (38.9) (15.1) Total (240.2)$ (257.4)$ (298.2)$
Payments
Interest 88.3$ 75.5$ 61.3$ Income taxes 163.2 126.1 222.5
Non-cash investing and financ ing items:
Accrued capital asset additions 1.4$ 4.2$ 8.4$
Business acquisitions/purchase price adjustments and VIE deconsolidations
Fair value of assets (0.8)$ 21.8$ 116.9$ Fair value of liabilities (2.2) 6.0 32.6

See accompanying notes
53
CONSOLIDATED STATEMENTS OF TOTAL EQUITY AND COMPREHENSIVE INCOME
Ye a rs End e d Se p te mb e r 30, 2010 2009 2008(In millions)
Co mmo n s to ck Shares issued:
Beginning shares 337.2 334.9 731.4 Employee stock plans 1.9 2.3 3.5 Treasury share retirement - - (400.0)
Ending shares 339.1 337.2 334.9
Ending balance 0.1$ 0.1$ 0.1$
Ad d itio na l p a id -in ca p ita l
Beginning balance 1,417.8$ 1,316.0$ 2,094.3$ Employee stock plan shares issued 14.3 8.4 88.6 Share-based compensation 41.6 39.0 38.7 Issuance of convertible debt - 99.7 - Purchase of note hedges - (177.3) - Tax benefit on note hedges - 65.2 - Proceeds from sale of warrants - 66.8 - Treasury share retirement - - (905.6)
Ending balance 1,473.7$ 1,417.8$ 1,316.0$
T re a sury s to ck
Beginning balance (799.3)$ (798.5)$ (3,722.1)$ Treasury shares acquired - - (779.7) RSA forfeitures (2.7) (0.8) (1.0) Treasury share retirement - - 3,704.3
Ending balance (802.0)$ (799.3)$ (798.5)$
Re ta ine d e a rning s
Beginning balance 437.3$ 406.7$ 3,086.1$ Dividends declared (71.5) (96.2) (174.2) Net income 186.0 126.8 328.0 Adoption of new standards for uncertain tax positions - - (34.5) Treasury share retirement - - (2,798.7)
Ending balance 551.8$ 437.3$ 406.7$
Accumula te d o the r co mp re he ns ive inco me (lo ss) Beginning balance 6.1$ 1.9$ 26.0$
Other comprehensive income (loss) 4.6 4.2 (24.1) Ending balance 10.7$ 6.1$ 1.9$
Unrealized gains (losses) on securities 0.5$ 4.2$ (3.3)$ Foreign currency translation 10.2 1.9 5.2
Co mp re he ns ive inco me (lo ss)
Net income 186.0$ 126.8$ 328.0$ Other comprehensive income (loss):
Unrealized holding gain (loss) (3.7) 8.1 (10.2) Income tax (provision) benefit - (0.6) 3.0
Foreign currency translation 8.3 (3.3) (16.9) Total comprehensive income 190.6$ 131.0$ 303.9$
No nco ntro ll ing inte re stBeginning balance 1.6$ 2.1$ 11.9$
Change in ownership (0.5) - (9.3) Net income (loss) (1.1) (0.5) (0.5)
Ending balance -$ 1.6$ 2.1$
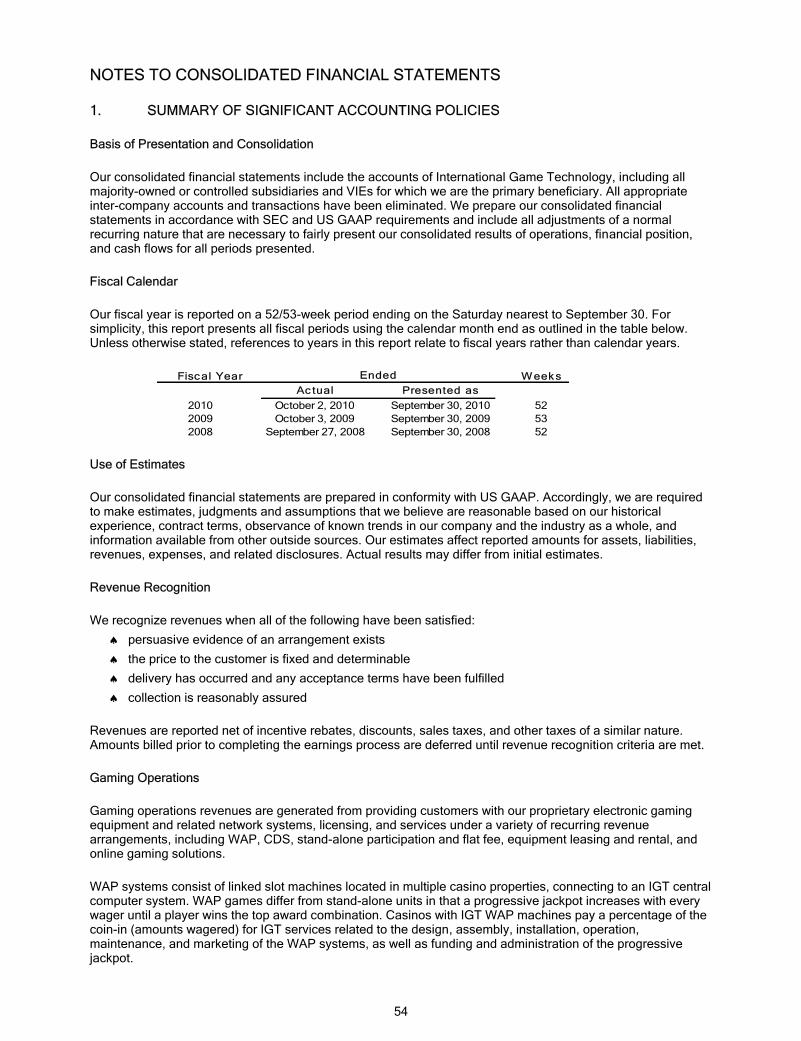
54
NOTES TO CONSOLIDATED FINANCIAL STATEMENTS
1. SUMMARY OF SIGNIFICANT ACCOUNTING POLICIES
Basis of Presentation and Consolidation
Our consolidated financial statements include the accounts of International Game Technology, including all majority-owned or controlled subsidiaries and VIEs for which we are the primary beneficiary. All appropriate inter-company accounts and transactions have been eliminated. We prepare our consolidated financial statements in accordance with SEC and US GAAP requirements and include all adjustments of a normal recurring nature that are necessary to fairly present our consolidated results of operations, financial position, and cash flows for all periods presented.
Fiscal Calendar
Our fiscal year is reported on a 52/53-week period ending on the Saturday nearest to September 30. For simplicity, this report presents all fiscal periods using the calendar month end as outlined in the table below. Unless otherwise stated, references to years in this report relate to fiscal years rather than calendar years.
Fiscal Year W eeksAc tual Presented as
2010 October 2, 2010 September 30, 2010 522009 October 3, 2009 September 30, 2009 532008 September 27, 2008 September 30, 2008 52
Ended
Use of Estimates
Our consolidated financial statements are prepared in conformity with US GAAP. Accordingly, we are required to make estimates, judgments and assumptions that we believe are reasonable based on our historical experience, contract terms, observance of known trends in our company and the industry as a whole, and information available from other outside sources. Our estimates affect reported amounts for assets, liabilities, revenues, expenses, and related disclosures. Actual results may differ from initial estimates.
Revenue Recognition
We recognize revenues when all of the following have been satisfied:
� persuasive evidence of an arrangement exists
� the price to the customer is fixed and determinable
� delivery has occurred and any acceptance terms have been fulfilled
� collection is reasonably assured
Revenues are reported net of incentive rebates, discounts, sales taxes, and other taxes of a similar nature. Amounts billed prior to completing the earnings process are deferred until revenue recognition criteria are met.
Gaming Operations
Gaming operations revenues are generated from providing customers with our proprietary electronic gaming equipment and related network systems, licensing, and services under a variety of recurring revenue arrangements, including WAP, CDS, stand-alone participation and flat fee, equipment leasing and rental, and online gaming solutions.
WAP systems consist of linked slot machines located in multiple casino properties, connecting to an IGT central computer system. WAP games differ from stand-alone units in that a progressive jackpot increases with every wager until a player wins the top award combination. Casinos with IGT WAP machines pay a percentage of the coin-in (amounts wagered) for IGT services related to the design, assembly, installation, operation, maintenance, and marketing of the WAP systems, as well as funding and administration of the progressive jackpot.

55
Revenues from CDS, stand-alone and other equipment leasing or rentals are recognized based on a percentage of the net win or on a fixed daily/monthly fee or rental basis. Online gaming solutions encompass online casino gaming software and content licensing, as well as back office operational support services. All online gaming solutions are provided under revenue sharing arrangements based on a percentage of net win.
Product Sales
Our product sales revenues are generated from the sale of electronic gaming equipment and network systems, as well as licensing, services, and component parts. Time-based licensing and maintenance fees are typically recognized ratably over the term of the agreement. Our credit sales terms are predominately 90 days or less. We also grant extended payment terms under contracts of sale secured by the related equipment sold, and these contracts are typically paid within their terms.
Our gaming machines and certain other tangible products, containing both software and nonsoftware components that function together to deliver the product’s essential functionality, were previously subject to software revenue recognition rules. Under ASUs adopted for new and materially modified arrangements entered into after the beginning of our first quarter of fiscal 2010 (discussed below under Recently Issued Accounting Standards – Adopted), our gaming machines and certain other tangible products no longer fall under the scope of software revenue recognition rules and are generally recognized upon delivery and customer acceptance.
Multi-element Arrangements
The majority of our multiple element contracts are for some combination of machines, network systems, license fees, maintenance, training, and other services. Revenues for individual deliverables are recognized when the recognition criteria for that element has been met. We elected to early adopt ASUs for revenue recognition related to certain software-enabled products and multi-element arrangements on a prospective basis for new or materially modified arrangements entered into after the beginning of fiscal 2010.
Most of our products and services qualify as separate units of accounting, and the ASUs did not change this premise. The terms of performance, cancellation, termination, or refunds in our multiple element contracts are similar to those for individual stand-alone deliverables. Under the ASUs, arrangement consideration is allocated among multiple deliverables based on relative selling prices. In order of preference, relative selling prices are estimated based on VSOE, third-party evidence, or management’s best estimate, and the residual method is not allowed for nonsoftware elements.
VSOE is determined by the net price charged for each deliverable when it is sold separately. VSOE for maintenance agreements is determined based on actual renewals sold. Third-party evidence is generally not available for our products. When VSOE is not available, generally for new or highly customized offerings, the estimated selling price is the amount we would sell the product or service for individually. Management’s best estimate is made based on our standard pricing and discounting practices, which consider multiple factors, such as market conditions, competitive landscape, internal costs, and profit objectives.
Under the ASUs, revenues for machines and other software-enabled equipment in certain bundled arrangements are no longer deferred because VSOE is not available for an undelivered element. Generally, revenues allocated to nonsoftware elements will be recognized upon delivery and customer acceptance, and only revenues allocated to software elements could require deferral and recognition over a lease or license term.
Prior to the beginning of fiscal 2010, if we were unable to establish VSOE for any undelivered element, revenue was generally deferred until all elements were delivered or until VSOE could be determined. If we did not have VSOE for a delivered element, VSOE for the undelivered elements was deferred, and the residual amount constituted the revenues recognized for the delivered elements. Additionally, when machines were sold in combination with a leased system on which the machines depend for essential functionality, machine revenues were recognized ratably over the system lease contract term.
Deferred Revenue
Deferred revenue consists of amounts received or billed after products are delivered or services are rendered, but prior to meeting all of the requirements for revenue recognition. Complex systems and/or multi-element
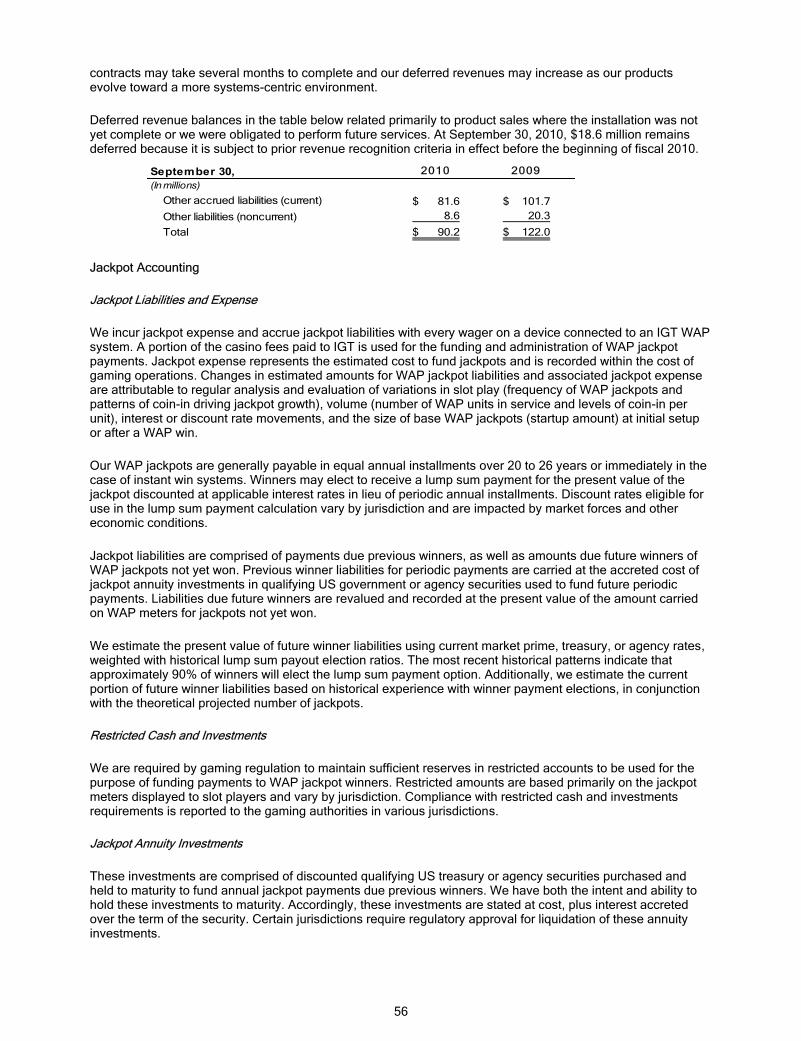
56
contracts may take several months to complete and our deferred revenues may increase as our products evolve toward a more systems-centric environment.
Deferred revenue balances in the table below related primarily to product sales where the installation was not yet complete or we were obligated to perform future services. At September 30, 2010, $18.6 million remains deferred because it is subject to prior revenue recognition criteria in effect before the beginning of fiscal 2010.
September 30, 2010 2009(In millions)
Other accrued liabilities (current) 81.6$ 101.7$ Other liabilities (noncurrent) 8.6 20.3
Total 90.2$ 122.0$
Jackpot Accounting
Jackpot Liabilities and Expense
We incur jackpot expense and accrue jackpot liabilities with every wager on a device connected to an IGT WAP system. A portion of the casino fees paid to IGT is used for the funding and administration of WAP jackpot payments. Jackpot expense represents the estimated cost to fund jackpots and is recorded within the cost of gaming operations. Changes in estimated amounts for WAP jackpot liabilities and associated jackpot expense are attributable to regular analysis and evaluation of variations in slot play (frequency of WAP jackpots and patterns of coin-in driving jackpot growth), volume (number of WAP units in service and levels of coin-in per unit), interest or discount rate movements, and the size of base WAP jackpots (startup amount) at initial setup or after a WAP win.
Our WAP jackpots are generally payable in equal annual installments over 20 to 26 years or immediately in the case of instant win systems. Winners may elect to receive a lump sum payment for the present value of the jackpot discounted at applicable interest rates in lieu of periodic annual installments. Discount rates eligible for use in the lump sum payment calculation vary by jurisdiction and are impacted by market forces and other economic conditions.
Jackpot liabilities are comprised of payments due previous winners, as well as amounts due future winners of WAP jackpots not yet won. Previous winner liabilities for periodic payments are carried at the accreted cost of jackpot annuity investments in qualifying US government or agency securities used to fund future periodic payments. Liabilities due future winners are revalued and recorded at the present value of the amount carried on WAP meters for jackpots not yet won.
We estimate the present value of future winner liabilities using current market prime, treasury, or agency rates, weighted with historical lump sum payout election ratios. The most recent historical patterns indicate that approximately 90% of winners will elect the lump sum payment option. Additionally, we estimate the current portion of future winner liabilities based on historical experience with winner payment elections, in conjunction with the theoretical projected number of jackpots.
Restricted Cash and Investments
We are required by gaming regulation to maintain sufficient reserves in restricted accounts to be used for the purpose of funding payments to WAP jackpot winners. Restricted amounts are based primarily on the jackpot meters displayed to slot players and vary by jurisdiction. Compliance with restricted cash and investments requirements is reported to the gaming authorities in various jurisdictions.
Jackpot Annuity Investments
These investments are comprised of discounted qualifying US treasury or agency securities purchased and held to maturity to fund annual jackpot payments due previous winners. We have both the intent and ability to hold these investments to maturity. Accordingly, these investments are stated at cost, plus interest accreted over the term of the security. Certain jurisdictions require regulatory approval for liquidation of these annuity investments.

57
WAP Systems Interest
Interest income accretion on jackpot annuity investments is offset by interest expense accretion on previous winner liabilities. WAP interest income and expense, included in other income (expense), accrete at approximately the same rate and vary depending on the amount of jackpots won and the number of winners electing periodic payments. WAP systems annuity interest accretion totaled $24.8 million in 2010, $27.5 million in fiscal 2009, and $28.6 million in 2008
We also hold a significant amount of cash and short-term investments related to our WAP operations on which we earn interest income.
Share-based Compensation
Share-based compensation is measured at fair value on the grant date reduced for estimated forfeitures. We use historical data and projections to estimate expected employee behaviors related to option exercise and forfeitures. We expense share-based compensation over the applicable vesting period using the straight-line method for service-based awards and the accelerated method for performance-based awards. Compensation for share-based awards granted prior to the beginning of fiscal 2006 was recognized under the accelerated method. See Note 6.
The fair value of restricted share awards is based on the market price of IGT stock on the grant date. We estimate the fair value of each stock option award on the grant date using the Black-Scholes valuation model. Option valuation models require the input of highly subjective assumptions, and changes in assumptions used can materially affect the fair value estimate. Expected volatility and dividends are based on implied and historical IGT stock factors. Expected term represents the estimated weighted average time between grant and employee exercise. Risk free rate is based on US Treasury rates appropriate for the expected term.
Advertising Costs
Advertising costs are expensed as incurred. Amounts included in continuing operations totaled $12.4 million in 2010, $15.6 million in fiscal 2009, and $21.9 million in 2008.
Research and Development
Our products reach technological feasibility shortly before the products are released and therefore R&D costs are generally expensed as incurred. Employee related costs associated with product development are included in R&D costs. Certain R&D performed for specific customers is charged to cost of product sales when the related sale is recorded.
Income Taxes
We record deferred tax assets and liabilities based on temporary differences between the financial reporting and tax bases of assets and liabilities, applying enacted tax rates expected to be in effect for the year in which the differences are expected to reverse. We reduce deferred tax assets by a valuation allowance when it is more likely than not that some or all of the deferred tax assets will not be realized.
Our provision for income taxes includes interest, penalties and reserves for uncertain tax positions. We are required to recognize uncertain tax positions taken or expected to be taken in a tax return, when they are “more likely than not” to be sustained upon examination. A recognized tax position is recorded in the financial statements at the largest amount of benefit that has a greater than 50% likelihood of being realized upon settlement. See Note 17.
Earnings Per Share
We compute EPS using the weighted average number of common and potential shares outstanding.
Our financial statements presented in this report have been adjusted for the retrospective application of new accounting guidance adopted at the beginning of fiscal 2010 for determining whether instruments granted in share-based payment transactions are participating securities that should be included in the computation of

58
EPS using the two-class method. Certain restricted stock granted under our employee SIP is considered a participating security because it carries non-forfeitable rights to dividends. Net income available to these participating securities was not significant and this adoption did not have a material impact on EPS. See Recently Adopted Accounting Standards below and Note 18.
Cash and Equivalents
Cash and equivalents consist primarily of deposits held at major banks and other marketable securities with original maturities of 90 days or less. Our cash equivalents are in US Treasury-backed money market funds.
Investment Securities
Available-for-sale securities are reported at fair value, with unrealized gains and losses recorded in accumulated other comprehensive income (loss). Trading securities are reported at fair value, with unrealized gains or losses recognized in other income (expense). See Notes 8 and 20.
Receivables
Equipment Financing Contracts
We grant extended payment terms to qualifying customers under contracts of sale. These contracts are generally for terms of one to five years, secured by the related equipment sold, with interest recognized at prevailing rates.
Facility Notes
We provide development financing loans to select customers for new or expanding gaming facilities, generally under terms of one to seven years with interest recognized at prevailing rates. Certain agreements may also include provisions for the facility to reserve a percentage of its floor space for the placement of IGT proprietary games, which may be reduced if the machines do not meet certain performance standards.
Allowance for Doubtful Accounts
We maintain an allowance for doubtful accounts related to trade, contracts, and notes receivable where collection has been deemed a high risk. We analyze historical customer collection trends, concentrations of credit risk, customer creditworthiness, and changes in payment terms, as well as current economic trends when evaluating the adequacy of our allowance for doubtful accounts. Contracts and notes with specific reserves are also evaluated for potential placement on non-accrual status.
Inventories
Inventories are stated at the lower of cost (approximate cost determined on the first-in, first-out method) or market value. We regularly assess inventory quantities for excess and obsolescence primarily based on forecasted product demand.
Property, Plant and Equipment
We depreciate property, plant and equipment down to salvage value using the straight-line method. Maintenance and repairs are expensed as incurred and improvements are capitalized. Depreciation and asset charges related to gaming operations equipment are recorded to cost of gaming operations. Proceeds from gaming operations equipment sold are reflected in investing cash flows.
Goodwill and Other Intangible Assets
We amortize our finite-lived intangible assets to reflect the pattern in which the economic benefits of the assets will be consumed based on projected usage and revenues over one to 18 years. When the pattern of economic benefit is undeterminable, we amortize using the straight-line method. We consider certain factors when

59
assigning useful lives such as legal, regulatory, and contractual provisions, as well as the effects of obsolescence, demand, competition, and other economic factors.
We measure and test goodwill and other intangible assets not subject to amortization for impairment at least annually or more often if there are indicators of impairment. We regularly evaluate our portfolio of finite-lived intangibles to determine if changes in circumstances indicate the carrying values may not be recoverable or a change in remaining useful life is needed. Indicators that could trigger an impairment review include detrimental changes in legal and regulatory factors, market conditions, or operational performance. Impairment is measured as the difference between the carrying amount and the fair value of the assets and recognized as a component of operating income.
Other Assets
Other assets are comprised of deferred licensing rights and other expenses, investments in unconsolidated affiliates, uncertain tax positions, and refundable deposits.
Deferred Licensing Rights
We pay royalty and license fees for the use of third-party trade names, celebrity likenesses, content, and other IP rights. Licensing rights and deferred fees are classified as current or non-current assets based on the estimated period of expected consumption related to forecasted distribution schedules. Amortization is generally based on the actual pattern of consumption. If a pattern cannot be reliably determined, we use the straight-line method over the contract life. We also contract with certain parties for IP rights where future payments are contingent upon revenues generated.
Prepaid fees deemed unrealizable after the related product is released for distribution are charged to cost of product sales or gaming operations. Prepaid fees deemed unlikely to be realized before the related product is released are charged to R&D.
Investments in Unconsolidated Affiliates
We apply the equity method of accounting for investments in unconsolidated affiliates when we exercise significant influence, but do not control the financial and operating decisions. Equity earnings of our unconsolidated affiliates are included in operating income because they are integral to our business operations. Equity method losses were not material to our financial statements and presented as a component of SG&A.
Strategic investments in unconsolidated affiliates are presented apart from investment securities held for a return, in non-current other assets, or in current other assets if we intend to sell in less than 12 months. In certain circumstances, equity investments in unconsolidated affiliates may be recorded under the cost method. All other investments in unconsolidated affiliates not accounted for under the equity or cost methods are recorded as available-for-sale securities at fair value. Unrealized holding gains or losses are recorded in other comprehensive income, except those hedged with designated fair value foreign currency derivatives are recognized in other income (expense). See Note 3.
Derivatives
We use derivative financial instruments to manage certain foreign currency exchange and interest rate risk. We enter into derivative financial instruments with high credit quality counterparties and diversify our positions among such counterparties to reduce our exposure to credit losses.
We recognize derivative financial instruments as fair value assets or liabilities. Accounting for changes in the fair value of derivatives depends on the intended use and resulting designation. We are not party to leveraged derivatives and do not hold or issue financial instruments for speculative purposes. We record derivative financial instruments on a net basis with counterparties for which a master netting arrangement has been executed. Unless otherwise noted, derivative gains or losses, including any ineffectiveness, are recognized in other income (expense). See Note 19.

60
Foreign Currency Hedging
We routinely use derivative financial instruments to minimize our market risk exposure related to our monetary assets and liabilities denominated in nonfunctional foreign currencies. The primary business objective of our hedging program is to minimize the impact to earnings from changes in foreign exchange rates. These hedging instruments are subject to fluctuations in value that are generally offset by the value of the underlying exposures being hedged. Counterparties to our agreements are major commercial banks. These forward exchange contracts are not designated hedges.
We hedge significant investments denominated in foreign currency with forward exchange contracts to protect the US dollar value of our investment. These forward exchange contracts are designated fair value hedges. These derivative gains or losses are recorded together with the offsetting gains or losses on the change in the investment’s fair value attributable to foreign currency rates. Time value is excluded from effectiveness testing.
Interest Rate Management
We use interest rate swap derivatives to diversify our debt portfolio between fixed and variable rate instruments. The amount and term of each swap is matched with all or a portion of outstanding principal and remaining term of a specific obligation. Our swaps exchange fixed rates for variable rates without an exchange of the notional amount upon which they are based.
These swaps are designated fair value hedges because they protect us against fair value changes related to interest rates on a portion of our fixed rate borrowings. These derivative gains or losses are recorded together with the offsetting change in the fair value of the hedge-designated portion of fixed rate debt. Amounts receivable or payable under the swaps are net settled and recorded as a net receivable or payable with corresponding adjustments to interest expense.
Other Liabilities
Other liabilities are primarily comprised of uncertain tax positions, deferred revenue, customer deposits, accrued expenses, and deferred compensation.
Foreign Currency Translation and Remeasurement
For international subsidiaries that are non-US currency functional, we translate assets and liabilities at exchange rates in effect at the balance sheet date, and income and expense accounts at the average exchange rates during the year. Resulting currency translation adjustments are recorded directly to accumulated other comprehensive income.
Remeasurement gains and losses resulting from transactions in non-functional currency are recorded in other income (expense).
Fair Value Measurements
At the beginning of fiscal 2009, we adopted accounting guidance which redefined fair value, established a framework for measuring fair value, and permitted the election of fair value measurement for certain designated financial assets and liabilities with unrealized gains and losses recognized in earnings. We adopted this new fair value definition and framework for non-financial assets and liabilities at the beginning of fiscal 2010.
Fair value is defined as the price that would be received to sell an asset or paid to transfer a liability (exit price), in the principal or most advantageous market, in an orderly transaction between market participants, on the measurement date. Assets and liabilities carried at fair value are classified and disclosed in one of the following three categories:
� Level 1 - Quoted market prices in active markets for identical instruments
� Level 2 - Quoted market prices for similar instruments, using observable market based inputs or unobservable inputs corroborated by market data
� Level 3 - Unobservable inputs using our own assumptions when observable inputs are unavailable
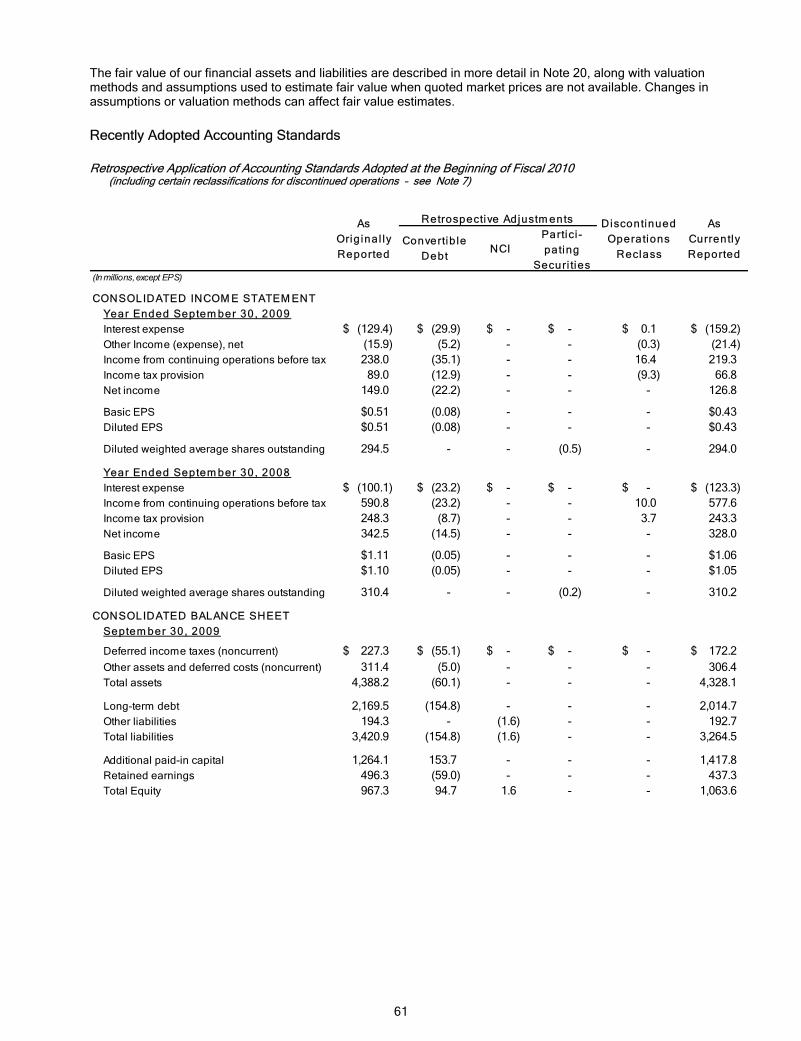
61
The fair value of our financial assets and liabilities are described in more detail in Note 20, along with valuation methods and assumptions used to estimate fair value when quoted market prices are not available. Changes in assumptions or valuation methods can affect fair value estimates.
Recently Adopted Accounting Standards
Retrospective Application of Accounting Standards Adopted at the Beginning of Fiscal 2010 (including certain reclassifications for discontinued operations – see Note 7)
(In millions, except EPS)
CONSOLIDATED INCOM E STATEM ENTYear Ended Septem ber 30, 2009Interest expense (129.4)$ (29.9)$ -$ -$ 0.1$ (159.2)$ Other Income (expense), net (15.9) (5.2) - - (0.3) (21.4) Income from continuing operations before tax 238.0 (35.1) - - 16.4 219.3 Income tax provision 89.0 (12.9) - - (9.3) 66.8 Net income 149.0 (22.2) - - - 126.8
Basic EPS $0.51 (0.08) - - - $0.43Diluted EPS $0.51 (0.08) - - - $0.43
Diluted weighted average shares outstanding 294.5 - - (0.5) - 294.0
Year Ended Septem ber 30, 2008Interest expense (100.1)$ (23.2)$ -$ -$ -$ (123.3)$ Income from continuing operations before tax 590.8 (23.2) - - 10.0 577.6 Income tax provision 248.3 (8.7) - - 3.7 243.3 Net income 342.5 (14.5) - - - 328.0
Basic EPS $1.11 (0.05) - - - $1.06Diluted EPS $1.10 (0.05) - - - $1.05
Diluted weighted average shares outstanding 310.4 - - (0.2) - 310.2
CONSOLIDATED BALANCE SHEETSeptem ber 30, 2009
Deferred income taxes (noncurrent) 227.3$ (55.1)$ -$ -$ -$ 172.2$ Other assets and deferred costs (noncurrent) 311.4 (5.0) - - - 306.4 Total assets 4,388.2 (60.1) - - - 4,328.1
Long-term debt 2,169.5 (154.8) - - - 2,014.7 Other liabilities 194.3 - (1.6) - - 192.7 Total liabilities 3,420.9 (154.8) (1.6) - - 3,264.5
Additional paid-in capital 1,264.1 153.7 - - - 1,417.8 Retained earnings 496.3 (59.0) - - - 437.3 Total Equity 967.3 94.7 1.6 - - 1,063.6
As Orig inal ly Reported
Retrospective Adjustm ents Discontinued Operations
Reclass
As Currently Reported
Convertib le Debt
NCIPartici -pating
Securi ties
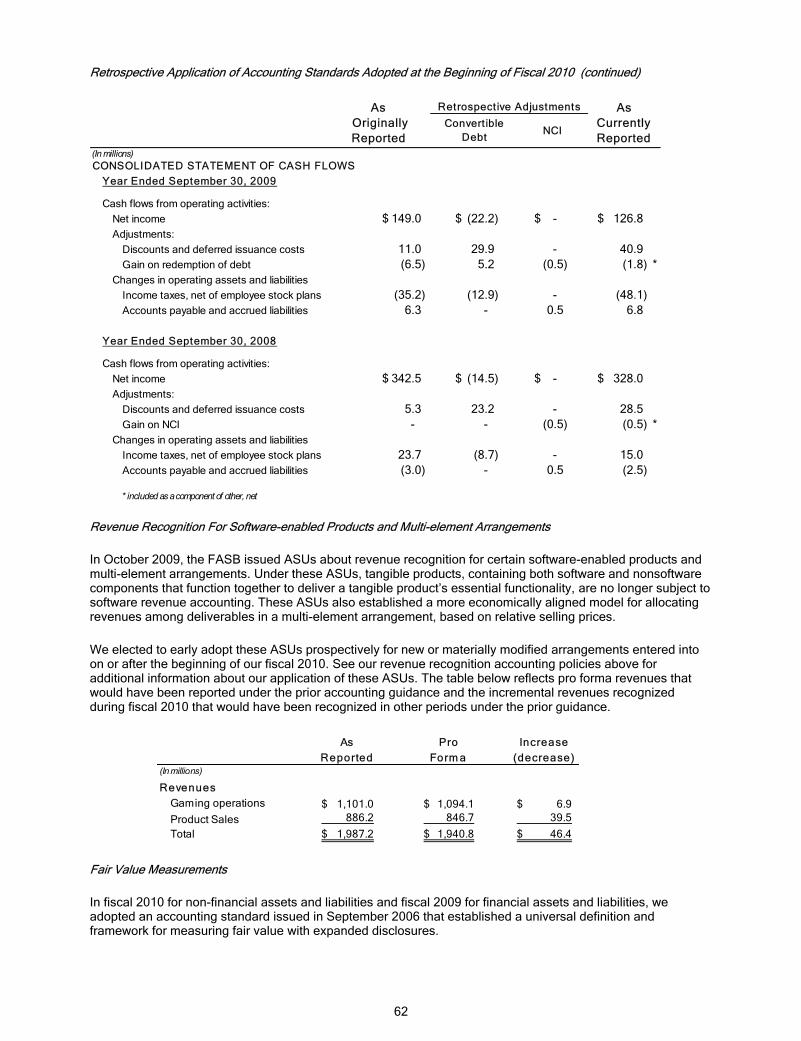
62
Retrospective Application of Accounting Standards Adopted at the Beginning of Fiscal 2010 (continued)
(In millions)CONSOLIDATED STATEMENT OF CASH FLOWS
Year Ended September 30, 2009
Cash flows from operating activities:Net income 149.0$ (22.2)$ -$ 126.8$ Adjustments:
Discounts and deferred issuance costs 11.0 29.9 - 40.9 Gain on redemption of debt (6.5) 5.2 (0.5) (1.8) *
Changes in operating assets and liabilitiesIncome taxes, net of employee stock plans (35.2) (12.9) - (48.1) Accounts payable and accrued liabilities 6.3 - 0.5 6.8
Year Ended September 30, 2008
Cash flows from operating activities:Net income 342.5$ (14.5)$ -$ 328.0$ Adjustments:
Discounts and deferred issuance costs 5.3 23.2 - 28.5 Gain on NCI - - (0.5) (0.5) *
Changes in operating assets and liabilitiesIncome taxes, net of employee stock plans 23.7 (8.7) - 15.0 Accounts payable and accrued liabilities (3.0) - 0.5 (2.5)
* included as a component of other, net
As Originally Reported
As Currently Reported
Convert ible Debt
NCI
Retrospect ive Adjustments
Revenue Recognition For Software-enabled Products and Multi-element Arrangements
In October 2009, the FASB issued ASUs about revenue recognition for certain software-enabled products and multi-element arrangements. Under these ASUs, tangible products, containing both software and nonsoftware components that function together to deliver a tangible product’s essential functionality, are no longer subject to software revenue accounting. These ASUs also established a more economically aligned model for allocating revenues among deliverables in a multi-element arrangement, based on relative selling prices.
We elected to early adopt these ASUs prospectively for new or materially modified arrangements entered into on or after the beginning of our fiscal 2010. See our revenue recognition accounting policies above for additional information about our application of these ASUs. The table below reflects pro forma revenues that would have been reported under the prior accounting guidance and the incremental revenues recognized during fiscal 2010 that would have been recognized in other periods under the prior guidance.
AsReported
ProForm a
(In millions)
RevenuesGaming operations 1,101.0$ 1,094.1$ 6.9$ Product Sales 886.2 846.7 39.5 Total 1,987.2$ 1,940.8$ 46.4$
Increase (decrease)
Fair Value Measurements
In fiscal 2010 for non-financial assets and liabilities and fiscal 2009 for financial assets and liabilities, we adopted an accounting standard issued in September 2006 that established a universal definition and framework for measuring fair value with expanded disclosures.

63
In the second quarter of fiscal 2010, we adopted an ASU issued in January 2010 requiring additional disclosures related to assets and liabilities carried at fair value to identify significant transfers between Level 1 and Level 2, techniques and inputs used, and any significant changes to techniques and inputs (see Note 20).
The adoption of these accounting standards did not have a material impact on our results of operations, financial position or cash flows.
Participating Securities in Share-Based Payment Transactions
At the beginning of fiscal 2010, we adopted an ASU issued in June 2008 for determining whether instruments granted in share-based payment transactions are participating securities that should be included in the computation of EPS using the two-class method (see Note 18.) Certain restricted stock granted under our employee SIP (see Note 6) is considered a participating security because it carries non-forfeitable rights to dividends. This adoption did not have a material impact on our financial statements and the effect of the required retrospective application is summarized in the table at the top of this section.
Business Combinations and Noncontrolling Interests (NCI)
At the beginning of fiscal 2010, we adopted accounting standards issued in December 2007 revising the method of accounting for a number of aspects for business combination and NCI (i.e. minority interests), such that more assets and liabilities will be measured at fair value as of the acquisition date. Certain contingent consideration liabilities will require remeasurement at fair value in each subsequent reporting period. NCI will initially be measured at fair value and classified as a separate component of equity.
Acquisition related costs, such as fees for attorneys, accountants, and investment bankers, will be expensed as incurred and no longer be capitalized as part of the business purchase price. For all acquisitions, regardless of the consummation date, deferred tax assets and uncertain tax position adjustments occurring after the measurement period will be recorded as a component of income tax expense, rather than adjusted through goodwill. For business combinations and asset purchases, the impact of this guidance on our results of operations or financial position will vary depending on the specifics of each transaction.
This adoption did not have a material impact on our consolidated financial position, results of operations or cash flows. Income attributable to NCI has been presented as a component of other income (expense) as it was not significant to our consolidated operating results. The required retrospective reclassification of NCI from other liabilities to a separate component of equity is summarized in the table at the top of this section.
Convertible Debt Instruments
At the beginning of fiscal 2010, we adopted an ASU issued in May 2008 requiring the separation of liability (debt) and equity (conversion option) components for convertible debt instruments that may settle in cash upon conversion to reflect an effective nonconvertible borrowing rate when the debt was issued. We estimated the fair value of our convertible debt (see Note 13) using similar debt instruments at issuance that did not have a conversion feature and allocated the residual fair value to an equity component that represents the estimated fair value of the conversion feature at issuance.
This ASU was retrospectively applied for all outstanding convertible debt and the adjustments are summarized in the table at the top of this section. The adjustment to long-term debt represents the unamortized balance of the revised discount. Additionally, this adoption resulted in a decrease to long-term debt, deferred tax assets and deferred offering costs and an increase to shareholders’ equity.
Recently Issued Accounting Standards--Not Yet Adopted
Consolidation of Variable Interest Entities
In June 2009, the FASB issued an ASU which will require us to reassess our primary beneficiary position for all VIE arrangements based on qualitative factors on an on-going basis. This ASU is effective beginning with our first quarter of fiscal 2011 and must be adopted through a cumulative-effect adjustment (with a retrospective option). We do not expect the adoption of this ASU to have a material impact on our results of operations, financial position, or cash flows.

64
Fair Value Measurement Disclosures
In January 2010, the FASB issued an ASU which will require supplemental disclosures related to purchases, sales, issuances, and settlements within the Level 3 reconciliation. This ASU is effective with our first quarter of fiscal 2012 and is not expected to have a material impact on our financial statements.
Accruals for Casino Jackpot Liabilities
In April 2010, the FASB issued an ASU clarifying that jackpot liabilities should not be accrued before they are won if the payout can be avoided, specifically addressing base jackpot liabilities. The ASU will be applied prospectively with a cumulative-effect adjustment in retained earnings at the beginning of our first quarter of fiscal 2012. We continue to evaluate the extent to which this guidance will impact our results of operations, financial position, or cash flows.
Credit Quality of Financing Receivables and the Allowance for Credit Losses
In July 2010, the FASB issued an ASU to address concerns about the sufficiency, transparency, and robustness of credit risk disclosures for financing receivables and the related allowance for credit losses. This ASU is effective for our first quarter of fiscal 2011. Additional disclosures will require information at disaggregated levels, designed to enable a better understanding of:
� the nature of credit risk inherent in our portfolio of financing receivables
� how credit risk is analyzed to determine the allowance for credit losses
� changes in and reasons for changes in the allowance for credit losses
The adoption of this ASU is not expected to have a material impact on our results of operations, financial position, or cash flow.

65
2. IMPAIRMENT AND RESTRUCTURING
Impairment
Years Ended Septem ber 30, 2010 2009(In millions)
Impairment - Alabama 61.3$ -$ Impairment - DigiDeal 2.4 - Loss on other assets - Walker Digital (see Note 3) - 78.0
Impairment and loss on other assets 63.7$ 78.0$
Alabama
The legality of electronic charitable bingo in Alabama was challenged during fiscal 2010 and continues to be discussed. Legislation that would have allowed Alabama voters to decide on the addition of a state constitutional amendment authorizing electronic bingo failed to pass the legislative session concluded in April 2010. As of September 30, 2010, three locations in Alabama where IGT placed electronic bingo machines have closed their charitable bingo operations. On October 4, 2010, the US Department of Justice executed grand jury indictments for eleven individuals who are charged with conspiracy to bribe Alabama legislators for their support of proposed legislation to legalize charitable bingo in Alabama.
Individuals associated with VictoryLand and Country Crossing were among those charged in the grand jury indictments. In November 2010, the Governor-elect of Alabama indicated that he will consider allowing legal charitable bingo operations to re-open, although the likelihood and timing of any such decision is currently unknown.
With the deterioration of the legal and political climate, we determined the recoverability of our assets in this market is impaired. During fiscal 2010, we recognized $61.3 million of impairment related to our investments in Alabama, including note allowances of $51.9 million, accounts receivable allowances of $2.8 million, and gaming operations equipment impairment of $6.6 million. The fair values were determined using DCF models, risk-based market discount rates, and associated property collateral.
The net carrying amount of our investment in Alabama charitable bingo properties totaled $33.0 million at September 30, 2010 and primarily related to development financing. Revenues and interest income related to these assets were recorded on a cash basis subsequent to the first quarter of fiscal 2010 as collectability was not reasonably assured.
Digideal
In September 2010, we divested our ownership interest in DigiDeal and ceased manufacturing and distribution of DigiDeal products. As a result, we recognized $2.4 million of impairment related primarily to the remaining DigiDeal products held by IGT operations outside of the Digideal entity that was discontinued. These assets did not meet the criteria for presentation as a part of the DigiDeal discontinued operation (See Note 7).

66
Restructuring
In response to reduced demand, we continue to restructure our organization to maximize efficiency and align expenses with the current and long-term business outlook. During fiscal 2009, we reduced our global workforce by approximately 16% from September 30, 2008 levels through a combination of voluntary and involuntary separation arrangements.
In fiscal 2010, our operations in Japan were closed and our controlling interest in DigiDeal was divested, both of which were reclassified to discontinued operations for all periods presented (see Note 7). We also began the process of closing and consolidating certain North America facilities during fiscal 2010. We expect to record additional restructuring charges, primarily related to severance and benefits, in continuing operations of $1.9 million in the first six months of fiscal 2011.
Restructuring Charges and Liability As Of And For The Years Ended September 30, 2010
(In millions)
Fiscal 2010North America 2.2$ 1.0$ 0.5$ 33.7$ -$ 0.3$ 00.3$ 4.0$ International 0.4 - - 00.4 - 0.2 00.2 0.6 Corporate 0.1 - - 00.1 - - -- 0.1
Continuing operations 2.7 1.0 0.5 44.2 - 0.5 00.5 4.7 Discontinued operations 3.2 1.5 5.0 99.7 9.6 - 99.6 19.3
Consolidated 5.9 2.5 5.5 113.9 9.6 0.5 110.1 24.0
Fiscal 2009North America 28.0$ -$ -$ 228.0$ -$ (2.6)$ ((2.6)$ 25.4$ International 2.6 2.2 0.8 55.6 - (0.1) ((0.1) 5.5 Corporate 3.4 - 0.3 33.7 - (0.7) ((0.7) 3.0
Continuing operations 34.0 2.2 1.1 337.3 - (3.4) ((3.4) 33.9 Discontinued operations 1.0 - 0.1 11.1 - - -- 1.1
Consolidated 35.0 2.2 1.2 338.4 - (3.4) ((3.4) 35.0
L i fe-to-dateNorth America 30.2$ 1.0$ 0.5$ 331.7$ -$ (2.3)$ ((2.3)$ 29.4$ International 3.0 2.2 0.8 66.0 - 0.1 00.1 6.1 Corporate 3.5 - 0.3 33.8 - (0.7) ((0.7) 3.1
Continuing operations 36.7 3.2 1.6 441.5 - (2.9) ((2.9) 38.6 Discontinued operations 4.2 1.5 5.1 110.8 9.6 - 99.6 20.4
Consolidated 40.9$ 4.7$ 6.7$ 552.3 9.6$ (2.9)$ 66.7$ 59.0$
Deferred severance 00.6 Cash payments ((46.1)
Rem ain ing accrued l iab i l i ty 6.8$ (expected to be paid by March 31, 2011)
TOTAL NONCASH CHARGES
TOTALALL
CHARGES
Severanceand
Benefits
LeaseTermination
Other Fees
TOTALCASH
CHARGES
Abandoned Assets
Share-based Compensation (Forfeitures)
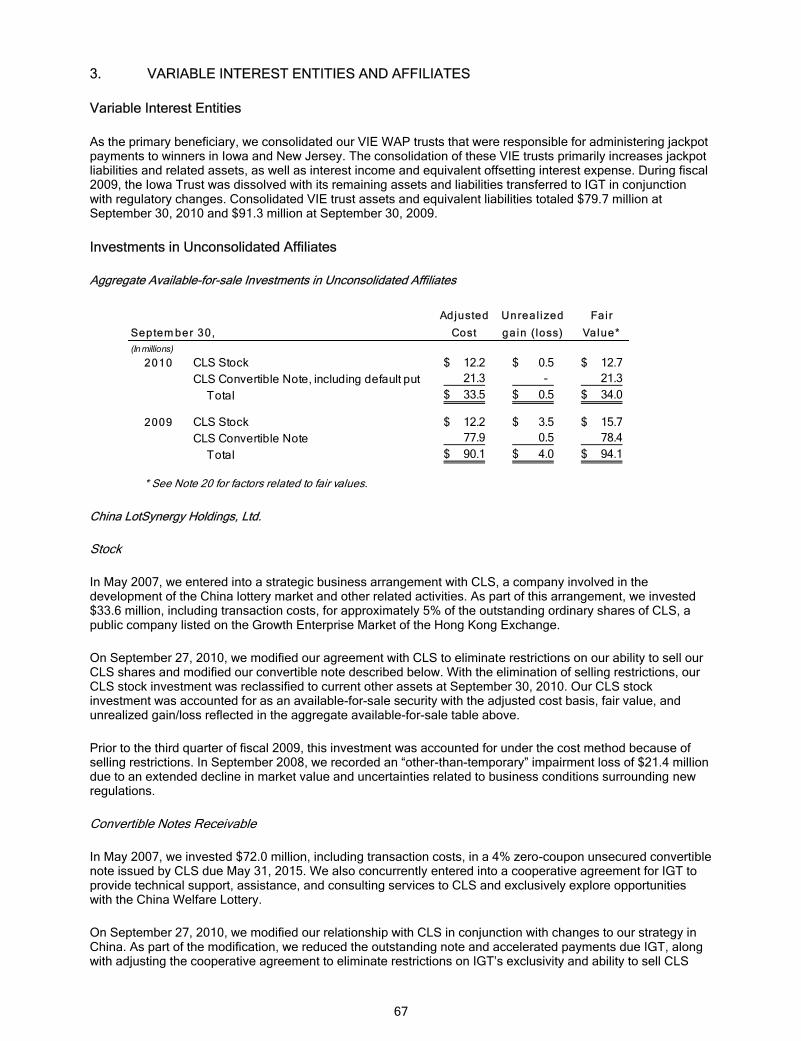
67
3. VARIABLE INTEREST ENTITIES AND AFFILIATES
Variable Interest Entities
As the primary beneficiary, we consolidated our VIE WAP trusts that were responsible for administering jackpot payments to winners in Iowa and New Jersey. The consolidation of these VIE trusts primarily increases jackpot liabilities and related assets, as well as interest income and equivalent offsetting interest expense. During fiscal 2009, the Iowa Trust was dissolved with its remaining assets and liabilities transferred to IGT in conjunction with regulatory changes. Consolidated VIE trust assets and equivalent liabilities totaled $79.7 million at September 30, 2010 and $91.3 million at September 30, 2009.
Investments in Unconsolidated Affiliates
Aggregate Available-for-sale Investments in Unconsolidated Affiliates
Adjusted Unreal ized Fair
Septem ber 30, Cost gain (loss) Value*(In millions)
2010 CLS Stock 12.2$ 0.5$ 12.7$ CLS Convertible Note, including default put 21.3 - 21.3
Total 33.5$ 0.5$ 34.0$
2009 CLS Stock 12.2$ 3.5$ 15.7$ CLS Convertible Note 77.9 0.5 78.4
Total 90.1$ 4.0$ 94.1$
* See Note 20 for factors related to fair values.
China LotSynergy Holdings, Ltd.
Stock
In May 2007, we entered into a strategic business arrangement with CLS, a company involved in the development of the China lottery market and other related activities. As part of this arrangement, we invested $33.6 million, including transaction costs, for approximately 5% of the outstanding ordinary shares of CLS, a public company listed on the Growth Enterprise Market of the Hong Kong Exchange.
On September 27, 2010, we modified our agreement with CLS to eliminate restrictions on our ability to sell our CLS shares and modified our convertible note described below. With the elimination of selling restrictions, our CLS stock investment was reclassified to current other assets at September 30, 2010. Our CLS stock investment was accounted for as an available-for-sale security with the adjusted cost basis, fair value, and unrealized gain/loss reflected in the aggregate available-for-sale table above.
Prior to the third quarter of fiscal 2009, this investment was accounted for under the cost method because of selling restrictions. In September 2008, we recorded an “other-than-temporary” impairment loss of $21.4 million due to an extended decline in market value and uncertainties related to business conditions surrounding new regulations.
Convertible Notes Receivable
In May 2007, we invested $72.0 million, including transaction costs, in a 4% zero-coupon unsecured convertible note issued by CLS due May 31, 2015. We also concurrently entered into a cooperative agreement for IGT to provide technical support, assistance, and consulting services to CLS and exclusively explore opportunities with the China Welfare Lottery.
On September 27, 2010, we modified our relationship with CLS in conjunction with changes to our strategy in China. As part of the modification, we reduced the outstanding note and accelerated payments due IGT, along with adjusting the cooperative agreement to eliminate restrictions on IGT’s exclusivity and ability to sell CLS

68
shares. The original note was redeemed for an immediate cash payment of $39.8 million and a new non-interest bearing convertible note of HK$166.3 million ($21.4 million) due in two installments of HK$95.0 million ($12.2 million) due on September 27, 2011 and HK$71.3 million ($9.2 million) due on May 12, 2012. When redeemed, the original note had an accreted value of $80.7 million and we recognized a loss of $20.5 million.
The new note is partially or wholly convertible in increments of HK$10.0 million at an initial conversion price of HK$0.96 per CLS share. This conversion option did not initially qualify as a freestanding derivative to be accounted for separately from the note and will be reevaluated each quarter. If CLS fails to make a payment according to the new installment schedule, CLS will be required to pay the fully accreted value of the original 2007 note. This default put was accounted for separately as a noncurrent freestanding derivative.
Both notes were accounted for as available-for-sale securities with the adjusted cost basis, fair value, and unrealized gain/loss reflected in the aggregate available-for-sale table above. The new note was initially recorded net of discount at a total fair value of $21.3 million, of which $10.9 million was current and $10.4 million was non-current, including the embedded conversion option and default put derivatives. A discount of $2.9 million was recorded for the imputed market interest rate of 11.55%, which will be amortized to interest income over the 20-month life.
See Note 19 and 20 for additional information about CLS derivatives and fair value assumptions.
Joint Ventures
IGT and CLS formed two 50/50 JVs: IGT Synergy Holding Ltd. in September 2007 to explore China Welfare Lottery opportunities and Asiatic Group Ltd. in September 2009 for bingo and electronic lottery games. In conjunction with the new note executed on September 27, 2010, IGT and CLS agreed to terminate the Asiatic Group.
Under the equity method, we recorded JV losses of $0.5 million in fiscal 2010, $0.3 million in 2009, and $0.1 million in 2008. Asiatic Group losses exceeded our initial investment at September 30, 2010 and will be accounted for under the cost method prospectively. As of September 30, 2010, $7.1 million remains accrued for our unconditional capital commitment to IGT Synergy.
Las Vegas Gaming International
There was no change in the status of our investment in LVGI during the year ended September 30, 2010.
In October 2008, we entered into a strategic business arrangement with LVGI, an innovator in gaming software applications and hardware, whereby LVGI agreed to create applications for IGT’s server-based gaming systems, and IGT agreed to purchase certain shares in LVGI. We advanced $1.5 million in July 2008 and paid $10.3 million in October 2008 to LVGI for a total investment of $11.8 million to receive 4.7 million shares of LVGI convertible perpetual cumulative preferred stock and warrants to purchase an additional 1.5 million common shares. In February 2009, we advanced $1.5 million with LVGI as a refundable deposit against a second potential investment.
As LVGI is not a publicly traded company and the preferred stock did not meet all the characteristics of in-substance common stock, this investment was accounted for under the cost method. The warrants were not accounted for separately as they did not qualify as freestanding derivatives. In August 2009, LVGI publicly stated that it lacked the funding to satisfy its current obligations or sustain expected working capital requirements for its current fiscal year and further, was unable to make cash flow forecasts based on reasonably objective assumptions. As a result of significant adverse changes in the expected financial performance of LVGI, together with an evaluation of our long-term gaming systems strategy, we determined our investment was fully impaired at September 30, 2009 and recorded $13.3 million of other-than-temporary impairment.
Progressive Gaming International Corp.
The fair value of our investment in PGIC's senior subordinated convertible notes, including accrued interest, totaled $6.3 million in January 2009 when it was attributed to consideration paid for certain PGIC assets acquired (See Note 7).

69
In August 2008, we invested $15.0 million in a Note and Warrant Purchase Agreement with PGIC, a casino management systems provider focused on smaller casinos. The initial investment was allocated to three components of the agreement based on their respective fair values: convertible notes of $6.6 million accounted for as available-for-sale securities, with embedded derivatives of $7.5 million and stock warrants of $0.9 million accounted for separately.
We recorded a loss of $0.9 million on the notes investment during fiscal 2009. The embedded derivatives and warrants had a combined fair value of zero at September 30, 2009, after recording losses of $1.2 million during fiscal 2009 and $7.2 million in 2008.
Walker Digital Gaming, LLC
In February 2006, IGT paid $56.0 million for a 10% equity interest in WDG, formerly known as Casino IP Holdings, LLC, a VIE formed with our involvement to hold, develop, and license WDG IP identified for gambling use. In January 2008, we invested $14.0 million in WDG for an additional 2% equity interest and committed to fund a $60.0 million royalty advance in annual $15.0 million installments. This relationship was designed to facilitate development, introduction, and integration of WDG gaming application concepts into IGT product lines.
We determined IGT was not the primary beneficiary of the WDG VIE because IGT did not provide more than half of the total equity or financial support and accounted for this investment under the equity method. There were no other terms of the arrangement, explicit or implicit, that could have required IGT to provide additional financial support. We recognized losses from this unconsolidated affiliate, largely comprised of intangible asset amortization, of $5.2 million in fiscal 2009, $5.8 million in fiscal 2008, and $5.3 million in fiscal 2007.
In August 2009, we paid $20.0 million to WDG in connection with an agreement to extinguish the royalty commitment, eliminate future IGT royalty obligations, relinquish our WDG equity ownership, and restructure IP rights and ownership. This new agreement superseded and terminated all other previous IP license agreements between WDG and IGT. We paid an additional $5.0 million in October 2009 upon the finalization of certain third-party IP license arrangements. This new agreement triggered a VIE reconsideration event and we determined that IGT no longer holds any variable interest in WDG.
As a result of this exchange and related evaluation of the future business outlook pertaining to the use of these IP rights, in the fourth quarter of fiscal 2009 we recorded a loss of $78.0 million. The equity investment, deferred royalties and related accrued commitment were eliminated and we recorded patent additions in intangible assets of $24.8 million of patents ($20.0 million in cash and $4.8 million of other assets). See Note 12.
4. INVENTORIES
Septem ber 30, 2010 2009(In millions)
Raw materials 54.5$ 74.9$
Work-in-process 3.9 6.7
Finished goods 39.2 76.2
Total 97.6$ 157.8$

70
5. PROPERTY, PLANT AND EQUIPMENT
Septem ber 30, 2010 2009 Useful l ives(In millions) (years)
Land 62.7$ 62.7$ Buildings 230.9 230.0 40Leasehold improvements 14.6 14.5 1-10Machinery, furniture and equipment 286.0 300.2 3-10Gaming operations equipment 804.9 832.4 1-5Total 1,399.1 1,439.8
Less accumulated depreciation (812.4) (881.0)
Property, plant and equipment, net 586.7$ 558.8$
6. EMPLOYEE BENEFIT PLANS
401(k) Plan and Cash Incentives
IGT maintains a salary deferral 401(k) plan that allows eligible employees to contribute up to 40% of their base pay up to the IRS prescribed limit. IGT matches 100% of employee contributions, up to $750 per year, which vest immediately. IGT may also contribute a discretionary amount of profits to eligible employees, which vest over a six-year period. Cash bonuses are paid annually to eligible management employees and cash sharing is distributed to non-management employees semi-annually. Benefits recorded for these plans totaled $24.3 million in fiscal 2010, $38.8 million in 2009, and $75.1 million in 2008.
Additionally, IGT implemented a non-qualified deferred compensation plan in September 1999, which provides an unfunded incentive compensation arrangement for eligible management and highly compensated employees. Participants may elect to defer up to 50% of their annual earnings with a minimum deferral of $2,000. Distributions can be paid out as short-term payments or at retirement. Retirement benefits can be paid out as a lump sum or in annual installments over a term of up to 15 years.
Share-based Compensation
The amount, frequency, and terms of share-based awards may vary based on competitive practices, operating results, and government regulations. New shares of IGT common stock are issued upon option exercises or restricted share grants and vesting of restricted share units. Our current practice is generally to grant restricted share awards in the form of units without dividends. Forfeitures are typically due to employee terminations. Unrecognized costs related to share-based awards outstanding at September 30, 2010 totaled $65.7 million and are expected to be recognized over a weighted average period of 1.8 years.
Stock Incentive Plan (SIP)
Under the IGT SIP, eligible employees and non-employee directors may be granted non-qualified and incentive stock options, restricted shares or stock appreciation rights. SIP grants may vest based on time of service or performance. Stock options are generally granted at an exercise price equal to the market price on the date of grant, with a 10-year contractual term. SIP grants generally vest over 3-5 years in ratable annual increments. At September 30, 2010, 17.5 million shares were available for grant under the IGT SIP and restricted shares granted count as four shares against this allowance.
Stock Options Exchanged
On November 4, 2009, IGT granted 2.7 million employee stock options with an exercise price of $18.60 per share in exchange for the 5.3 million underwater employee stock options surrendered in a shareholder approved exchange offer that expired on November 3, 2009. The newly granted options have a six-year contractual term and will vest ratably over two years. The exchange ratio was calculated based on the fair values of the options surrendered and issued under a value-for-value exchange and incremental compensation

71
expense recognized was not material. In connection with the exchange, we recorded $1.4 million of deferred tax benefits.
Employee Stock Purchase Plans
Under the IGT Qualified Employee Stock Purchase Plan, eligible employees are granted an option with a 12-month term to purchase a limited number of shares, exercisable the last day in February each year. Eligible employees may participate in this plan through payroll deductions up to certain limits. The option price is equal to 85% of the market price of our stock on the grant date or exercise date, whichever is less. Approximately 1.2 million shares were issued in February 2010 under this plan. Based on enrollment through September 30, 2010, we expect to issue approximately 0.5 million shares in February 2011 under this plan. At September 30, 2010, 0.7 million shares were available for future grants.
Additionally, eligible UK employees may enroll annually in the Barcrest Savings Related Share Option Scheme established in January 1999. Employees must elect to vest over three, five, or seven years and the option price is equal to 80% of the market price of our stock on the grant date. No shares were issued during fiscal 2010 under this plan and approximately 388,000 shares were available for grant at September 30, 2010. Based on enrollment through September 30, 2010, we expect to issue approximately 214,000 shares under this plan over the next seven years.
SIP Activity As Of And For The Year Ended September 30, 2010
W eighted AverageRemaining Aggregate
Exerc ise Contrac tual IntrinsicShares Price Term Value
(thousands) (per share) (years) (millions)
Outstanding at beginning of fiscal year 18,022 26.88$
Granted 4,098 18.88
Exercised (656) 12.03
Forfeited (1,032) 18.59
Expired (936) 33.23
Stock options exchange:
Granted 2,653 18.60
Cancelled (5,306) 36.35
Outstanding at end of period 16,843 21.38$ 6.0 14.5$
Vested and expected to vest 16,632 21.44$ 6.0 14.2$
Exercisable at end of period 7,101 26.51$ 3.8 3.5$
Options
Grant AggregateDate Intrinsic
Restric ted Shares/ Units Shares Fair Value Value(thousands) (per share) (millions)
Outstanding at beginning of fiscal year 2,000 22.60$
Granted 1,426 18.20
Vested (718) 24.73
Forfeited (340) 25.96
Outstanding at end of period 2,368 18.88$ 1.4 33.9$
Expected to vest 2,309 18.92$ 1.4 33.0$
(years)
W eighted AverageRemaining
VestingPeriod

72
Option Valuation Assumptions
Years Ended September 30, 2010 2009 2008
Expected volatility 0.52 0.60 0.31 Expected dividends 1.28% 4.84% 1.32%Expected term (in years) 4.4 4.4 4.4 Risk free rate 1.62% 1.83% 2.61%
Reported Share-based Compensation
Years Ended Septem ber 30, 2010 2009 2008(In millions)
Pre-tax 41.9$ 39.2$ 38.4$ Tax benefit (13.1) (11.9) (11.6)
After-tax 28.8$ 27.3$ 26.8$
Other Share-based Compensation Information
Years Ended Septem ber 30, 2010 2009 2008(In millions, except per share amounts)
Weighted average grant date fair value per share:Options granted $7.34 $3.71 $8.72Restricted shares granted $18.20 $10.71 $35.56
Total intrinsic value of options exercised 4.5$ 1.9$ 57.3$ Total fair value of restricted shares vested 14.3 5.7 16.5 Tax benefit realized for tax return deductions 8.1 2.7 26.2
7. BUSINESS ACQUISITIONS AND DISCONTINUED OPERATIONS
Acquisitions
Pro forma information is not provided, as these acquisitions were not material to our consolidated financial statements.
Fiscal 2009
In January 2009, we acquired certain operating assets of PGIC for purchase consideration of $23.6 million, comprised of $17.3 million cash and $6.3 million of fair value from our note investment with accrued interest (See Note 3). This purchase provided additional market opportunities using the PGIC technology to augment our systems products. The purchase price was allocated to identifiable intangible assets of $15.3 million, and tangible net assets of $7.5 million, including cash of $1.8 million and in-process R&D immediately charged to expense of $0.8 million.
Fiscal 2008
In July 2008, we paid approximately $88.6 million for substantially all of the assets of Cyberview, a group of companies, that develop, produce, and implement innovative, integrated gaming systems solutions. This purchase enabled access to licensed betting office and video lottery markets in Europe and enhanced our server-based initiatives and IP.
In June 2008, we completed the acquisition of M-2-1, a mobile gaming company based in Manchester, UK for $10.3 million. This business combination provided additional access to new IP, markets, and distribution channels for IGT game content. At September 30, 2010, certain financial targets had been met and we expect to pay approximately $0.5 million in contingent earn-out consideration during fiscal 2011.

73
Collectively for Cyberview and M-2-1, the total purchase consideration of $98.9 million was allocated to identifiable intangible assets of $38.7 million, goodwill of $42.2 million ($6.4 million not deductible for tax purposes), and tangible net assets of $18.0 million, including cash of $17.3 million.
Discontinued Operations
Japan
During fiscal 2010, we closed our international operations in Japan due to ongoing difficult market conditions and changes in our core business strategy. Japan’s results were reclassified to discontinued operations for all periods presented. A legal action related to an outstanding third party contractual dispute is still pending.
DigiDeal
In September 2010, we divested our equity interest in DigiDeal and ceased to manufacture and distribute DigiDeal products. DigiDeal’s results were reclassified to discontinued operations for all periods presented and included $6.7 million of intellectual property impairment primarily related to unrecoverable patents recognized in the second quarter of fiscal 2010, with fair value determined using a relief of royalty method.
Summary of Results in Discontinued Operations
Years Ended Septem ber 30, 2010 2009 2008(In millions)Revenues 9.8$ 22.4$ 29.6$ Restructuring charges (see Note 2) 19.3 1.1 -
Loss before tax (35.5)$ (16.4)$ (10.0)$ Income tax benefit (provision) - (9.3) 3.7 Loss on divestiture (2.8) - -
D isco ntinue d o p e ra tio ns, ne t o f ta x (38.3)$ (25.7)$ (6.3)$
Summary of Assets and Liabilities of Discontinued Operations
Assets of discontinued operations were presented as a component of current other assets and deferred costs, and liabilities of discontinued operations were presented as a component of other accrued liabilities only at September 30, 2010 below.
Septem ber 30, 2010 2009(In millions)
Asse tsCurrent assets
Cash and equivalents -$ 4.7$ Accounts receivable, net 0.1 2.0 Inventories - 2.8 Other assets and deferred costs 0.1 7.6
Total current assets 0.2 17.1 Property, plant and equipment, net - 5.4 Other intangible assets, net - 7.8 Other assets and deferred costs 0.1 1.3
T o ta l a sse ts o f d isco ntinue d o p e ra tio ns 0.3$ 31.6$
Lia b ilitie sCurrent liabilities
Short-term debt -$ 6.0$ Accounts payable 0.3 0.7 Accrued employee benefits - 1.0 Other accrued liabilities 5.2 7.4
T o ta l l ia b il itie s o f d isco ntinue d o p e ra tio ns 5.5$ 15.1$
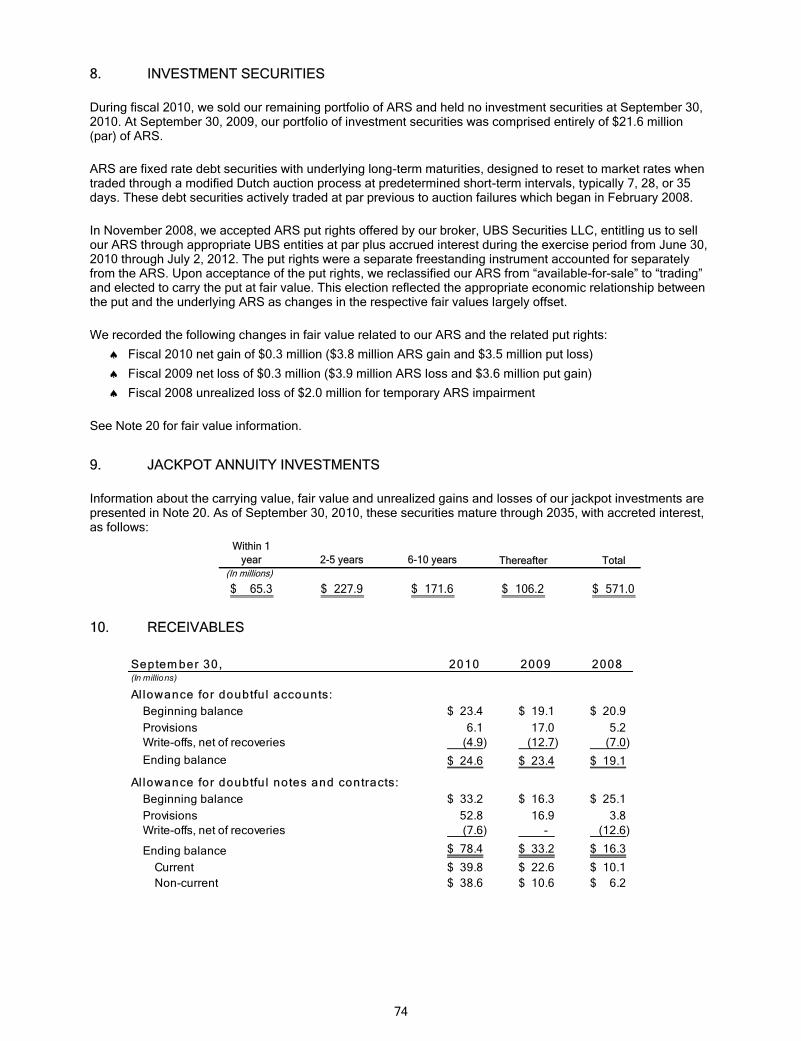
74
8. INVESTMENT SECURITIES
During fiscal 2010, we sold our remaining portfolio of ARS and held no investment securities at September 30, 2010. At September 30, 2009, our portfolio of investment securities was comprised entirely of $21.6 million (par) of ARS.
ARS are fixed rate debt securities with underlying long-term maturities, designed to reset to market rates when traded through a modified Dutch auction process at predetermined short-term intervals, typically 7, 28, or 35 days. These debt securities actively traded at par previous to auction failures which began in February 2008.
In November 2008, we accepted ARS put rights offered by our broker, UBS Securities LLC, entitling us to sell our ARS through appropriate UBS entities at par plus accrued interest during the exercise period from June 30, 2010 through July 2, 2012. The put rights were a separate freestanding instrument accounted for separately from the ARS. Upon acceptance of the put rights, we reclassified our ARS from “available-for-sale” to “trading” and elected to carry the put at fair value. This election reflected the appropriate economic relationship between the put and the underlying ARS as changes in the respective fair values largely offset.
We recorded the following changes in fair value related to our ARS and the related put rights:
� Fiscal 2010 net gain of $0.3 million ($3.8 million ARS gain and $3.5 million put loss)
� Fiscal 2009 net loss of $0.3 million ($3.9 million ARS loss and $3.6 million put gain)
� Fiscal 2008 unrealized loss of $2.0 million for temporary ARS impairment
See Note 20 for fair value information.
9. JACKPOT ANNUITY INVESTMENTS
Information about the carrying value, fair value and unrealized gains and losses of our jackpot investments are presented in Note 20. As of September 30, 2010, these securities mature through 2035, with accreted interest, as follows:
Within 1 year 2-5 years 6-10 years Thereafter Total
(In millions)
65.3$ 227.9$ 171.6$ 106.2$ 571.0$
10. RECEIVABLES
Septem ber 30, 2010 2009 2008(In millions)
Allowance for doubtfu l accounts:Beginning balance 23.4$ 19.1$ 20.9$ Provisions 6.1 17.0 5.2 Write-offs, net of recoveries (4.9) (12.7) (7.0) Ending balance 24.6$ 23.4$ 19.1$
Al lowance for doubtfu l notes and contracts:Beginning balance 33.2$ 16.3$ 25.1$ Provisions 52.8 16.9 3.8 Write-offs, net of recoveries (7.6) - (12.6)
Ending balance 78.4$ 33.2$ 16.3$
Current 39.8$ 22.6$ 10.1$ Non-current 38.6$ 10.6$ 6.2$
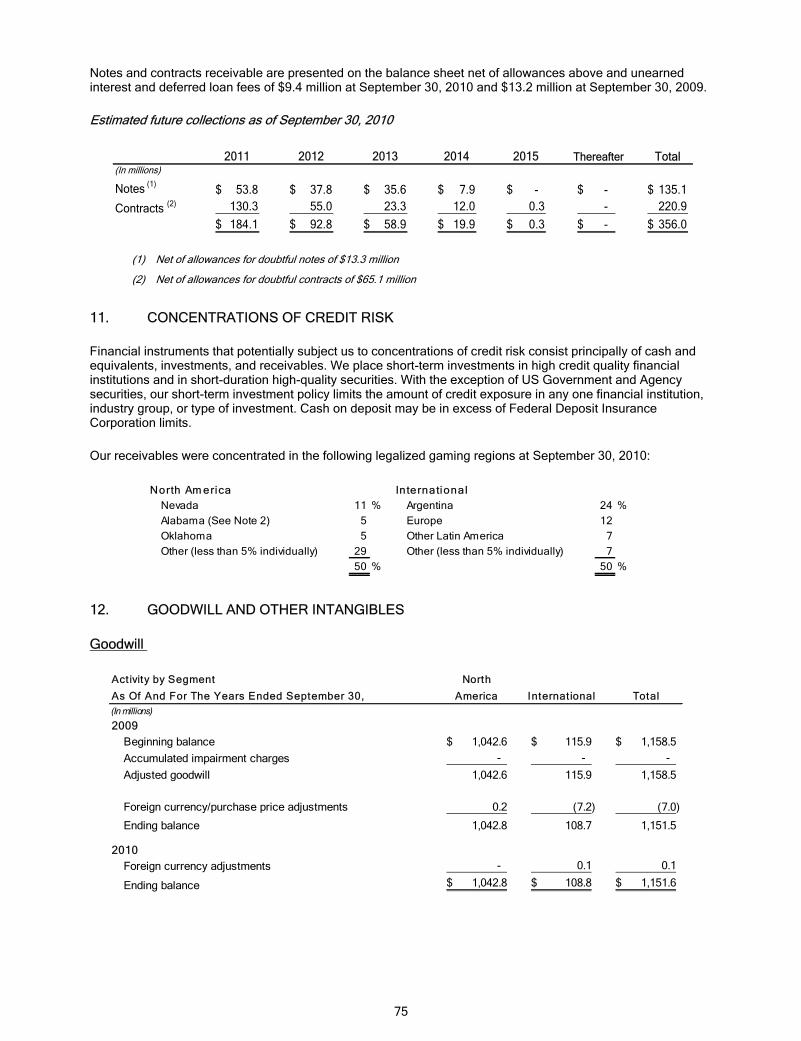
75
Notes and contracts receivable are presented on the balance sheet net of allowances above and unearned interest and deferred loan fees of $9.4 million at September 30, 2010 and $13.2 million at September 30, 2009.
Estimated future collections as of September 30, 2010
2011 2012 2013 2014 2015 Total(In millions)
Notes (1) 53.8$ 37.8$ 35.6$ 7.9$ -$ -$ 135.1$ Contracts (2) 130.3 55.0 23.3 12.0 0.3 - 220.9
184.1$ 92.8$ 58.9$ 19.9$ 0.3$ -$ 356.0$
Thereafter
(1) Net of allowances for doubtful notes of $13.3 million
(2) Net of allowances for doubtful contracts of $65.1 million
11. CONCENTRATIONS OF CREDIT RISK
Financial instruments that potentially subject us to concentrations of credit risk consist principally of cash and equivalents, investments, and receivables. We place short-term investments in high credit quality financial institutions and in short-duration high-quality securities. With the exception of US Government and Agency securities, our short-term investment policy limits the amount of credit exposure in any one financial institution, industry group, or type of investment. Cash on deposit may be in excess of Federal Deposit Insurance Corporation limits.
Our receivables were concentrated in the following legalized gaming regions at September 30, 2010:
North Am erica InternationalNevada 11 % Argentina 24 %Alabama (See Note 2) 5 Europe 12Oklahoma 5 Other Latin America 7Other (less than 5% individually) 29 Other (less than 5% individually) 7
50 % 50 %
12. GOODWILL AND OTHER INTANGIBLES
Goodwill
Act ivity by Segment North
As Of And For The Years Ended September 30, America Internat ional Total(In millions)2009
Beginning balance 1,042.6$ 115.9$ 1,158.5$ Accumulated impairment charges - - -
Adjusted goodwill 1,042.6 115.9 1,158.5
Foreign currency/purchase price adjustments 0.2 (7.2) (7.0)
Ending balance 1,042.8 108.7 1,151.5
2010Foreign currency adjustments - 0.1 0.1
Ending balance 1,042.8$ 108.8$ 1,151.6$

76
Other Intangibles
During the fiscal year ended September 30, 2010, we capitalized $1.7 million of patent legal costs with a weighted average life of 6 years. We also recorded $6.7 million of impairment during fiscal 2010 primarily related to unrecoverable DigiDeal patents, included in discontinued operations (See Note 7).
Cost Net Cost Net(In millions)
Patents 387.3$ 238.8$ 148.5$ 396.3$ 205.7$ 190.6$ Developed technology 75.9 46.7 29.2 76.7 37.3 39.4 Contracts 26.2 17.9 8.3 26.4 15.7 10.7 Reacquired rights 13.4 1.0 12.4 13.4 0.1 13.3 Customer relationships 8.8 5.7 3.1 8.8 4.8 4.0 Trademarks 3.5 2.9 0.6 3.6 2.4 1.2
Total 515.1$ 313.0$ 202.1$ 525.2$ 266.0$ 259.2$
Septem ber 30, 2010 Septem ber 30, 2009Accum ulated Accum ulatedAm ortization Am ortization
Aggregate amortization expense totaled $51.0 million in fiscal 2010, $51.2 million in fiscal 2009 and $45.1 million in fiscal 2008.
2011 2012 2013 2014 2015 (In millions)
Estimated annual amortization $43.5 $38.4 $35.0 $30.9 $22.0
13. CREDIT FACILITIES AND INDEBTEDNESS
2010 2009(In millions)
Domestic credit facility 100.0$ 100.0$ Foreign credit facilities - 5.3 3.25% Convertible Notes 850.0 850.0 7.5% Bonds 500.0 500.0 5.5% Bonds 300.0 - 2.6% Debentures - 707.0
Total principal 1,750.0 2,162.3 3.25% Convertible Notes discount (124.1) (152.1) 7.5% Bonds discount (2.5) (2.6) 5.5% Bonds discount (1.2) - Debentures discount - (2.7) 7.5% Swap fair value adjustment (see Note 19) 33.9 15.1 5.5% Swap fair value adjustment (see Note 19) 18.2 -
Total outstanding debt, net 1,674.3$ 2,020.0$
Outstanding debt at September 30,
The table below reflects our expected future principal payments as of September 30, 2010.
2011 2012 2013 2014 2015 Thereafter Total
(in millions)Principal payments 15.6$ 84.4$ -$ 850.0$ -$ 800.0$ 1,750.0$
IGT was in compliance with all applicable debt covenants at September 30, 2010. Embedded features of all debt agreements were evaluated and were nominal or did not require bifurcation at September 30, 2010.

77
At the beginning of fiscal 2010, we adopted accounting standards requiring the separation of liability (debt) and equity (conversion option) components of our convertible debt instruments to reflect an effective nonconvertible borrowing rate at issuance. See Note 1 for amounts retrospectively recast in conjunction with this recently adopted accounting standard.
Domestic Credit Facility
In conjunction with 5.5% Bonds issued in June 2010, we reduced the size of our domestic credit facility from $1.8 billion to $1.5 billion, leaving a non-extended portion due December 19, 2010 at $0.2 billion and an extended portion due June 8, 2012 at $1.3 billion. At September 30, 2010, $100.0 million was drawn ($84.4 million extended and $15.6 million non-extended), $1.4 billion was available, and $11.0 million was reserved for letters of credit and performance bonds.
Half of amounts outstanding at December 19, 2010 will convert to term loans due in six installments. The first five installments, equal to 1.25% of the converted principal, are due March 31, June 30, September 30, and December 31, 2011 and March 31, 2012, with the final remaining installment due on June 8, 2012. At September 30, 2010, no portion of the credit facility was classified as current because we had the intent and ability to refinance with the available extended portion.
Interest under the amended facility is paid at least quarterly with rates and facility fees based on our public debt ratings or debt to capitalization ratio. As of September 30, 2010, extended commitments bear interest at LIBOR plus 260 bps with a facility fee of 65 bps and non-extended commitments bear interest at LIBOR plus 37.5 bps with a facility fee of 12.5 bps. The outstanding amount at September 30, 2010 carried a 2.55% weighted average interest rate.
In June 2009, the credit facility, as amended and restated, was reduced from $2.5 billion to $2.1 billion, then subsequently reduced to $1.8 billion with the issuance of 7.5% bonds. In connection with the amended credit facility, IGT recorded non-recurring charges of $4.4 million for associated breakage fees related to early repayments and deferred offering costs related to the commitment reduction as additional interest expense in fiscal 2009. Capitalized debt issuance costs of approximately $35.4 million ($16.7 million at September 30, 2010) are amortizing to interest expense over the amended facility term.
Obligations under the amended facility are generally unsecured, except that in the event of certain declines in our debt ratings (as described in the amended facility), we will grant a lien on 100% and 66% of the equity interests of our direct and wholly-owned domestic and foreign subsidiaries, respectively, pursuant to the terms of a Pledge and Security Agreement. The Notes, Bonds or similar securities issued by IGT and certain interest rate hedges provided by lenders or their affiliates under the amended facility are permitted to share in any collateral granted. Any lien granted will be released if we satisfy the minimum debt rating requirements (as described in the amended facility) for at least three consecutive calendar months.
The amended facility includes the following covenants (all terms as defined per the amended facility):
� a minimum ratio of adjusted EBITDA to interest expense (interest coverage ratio)
� a maximum ratio of Total Debt to adjusted EBITDA (total leverage ratio)
� certain restrictions on our ability to: � incur or guaranty additional debt, or enter into swap agreements � incur liens � merge with or acquire other companies, liquidate or dissolve � sell, transfer, lease or dispose of substantially all assets � change the nature of our business � declare or make cash dividends or distributions or pay cash for the purchase, redemption,
retirement, defeasance, acquisition, cancellation or termination of our capital stock or equity interests or any return of capital to shareholders, provided that we may, as long as no continuing default has occurred, pay dividends of up to the lesser of $0.06 per common share per fiscal quarter or $25.0 million in any fiscal quarter.
The amended facility specifies a number of events of default (some of which are subject to applicable grace or cure periods), including failure to make timely principal and interest payments or satisfy the covenants. Upon

78
the occurrence of an event of default under the credit facility, the lenders may cease making loans, terminate the commitments, and declare all amounts outstanding to be immediately due and payable.
Foreign Credit Facilities
At September 30, 2010, $9.7 million was available and nothing was drawn under our revolving credit facility in Australia, which generally renews annually with maturity in March and is guaranteed by the parent company, International Game Technology. With operations discontinued in Japan during fiscal 2010, related credit facilities were cancelled (See Note 7).
3.25% Convertible Notes
On May 11, 2009, we issued $850.0 million aggregate principal amount of Notes, in a private placement for net proceeds of $822.5 million, after deferred offering costs of approximately $27.5 million, which will be amortized to interest expense over the Note term. We pay interest at 3.25% on the Notes, semiannually on May 1 and November 1, beginning November 1, 2009. Proceeds from the Notes (net of amounts used for the separate note hedge transactions and funds provided by the separate warrant transactions described below) were used to reduce outstanding borrowings under our revolving domestic credit facility.
The Notes are general unsecured obligations of IGT, ranking equal with all existing and future unsecured and unsubordinated obligations. The Notes rank junior to all existing and future subsidiary liabilities, including trade payables. The Notes mature on May 1, 2014, unless repurchased earlier by IGT or converted. The Notes are not redeemable at IGT's option before maturity, except in certain circumstances relating to applicable gaming authority regulations. The terms of the Notes may, in certain circumstances, require us to grant a lien on equity interests if certain downgrades by rating agencies occur.
Each $1,000 Note is initially convertible into 50.0808 shares of IGT Common Stock, representing a conversion price of $19.97 per share. Upon conversion, a holder will receive cash up to the aggregate principal amount of each Note and shares of our common stock for any conversion value in excess of the principal amount as determined per the indenture. The conversion rate is adjustable upon the occurrence of certain events as defined in the indenture.
The Notes are convertible under any of the following circumstances:
� during any fiscal quarter ending after September 30, 2009 (and only during such fiscal quarter), if the closing price of our common stock for at least 20 trading days in the last 30 trading day period of the immediately preceding fiscal quarter is more than 130% of the conversion price on the last trading day of the preceding fiscal quarter
� if specified corporate transactions occur as described further in the indenture
� at any time on or after February 1, 2014 until the close of business on the second scheduled trading day immediately preceding May 1, 2014
Holders who convert their Notes in connection with a make-whole adjustment event, as defined in the indenture, may be entitled to a premium increase in the conversion rate. Upon the occurrence of a fundamental change, as defined in the indenture, such as certain mergers and acquisitions of our common stock or liquidation, holders have the option to require IGT to repurchase their Notes at a purchase price equal to 100% of the principal, plus accrued and unpaid interest.
As recast, the equity component of the Notes totaled $99.7 million and the effective interest rate was 8.7% on the debt component. The remaining discount amortization period was 3.6 years at September 30, 2010. The table below reflects contractual interest expense and discount amortization in interest expense, as recast for the prior year periods.
Years Ended Septem ber 30, 2010 2009(In millions)
Contractual interest expense 27.5$ 10.9$ Discount amortization 28.0 11.0

79
Note Hedges and Warrant Transactions
Concurrent with the issuance of our Notes, we purchased separate note hedges and sold warrants, which effectively serve to reduce the potential future dilution associated with Note conversions and increase the initial Note conversion price to $30.14 per share. The call option in the note hedges has a strike price equal to the conversion price of the Notes, and the warrants have a higher strike price of $30.14 per share that serves to cap the amount of dilution protection provided. The warrants together with the note hedges create a capped call position on the shares underlying the Notes.
If our share price is above $19.97 upon conversion of the Notes, the note hedges will automatically neutralize the impact to share dilution, because IGT will receive shares under the note hedges exercised equal to the shares IGT must deliver to the Note holders. If our share price is above $30.14, upon exercise of the warrants IGT will deliver shares to the counterparties in an amount equal to the excess of our share price over $30.14. A 10% increase in our share price above $30.14 would result in the issuance of 3.9 million incremental shares upon exercise of the warrants. As our share price continues to increase, additional dilution would occur at a declining rate.
Prior to conversion or exercise, the Notes and warrants could have a dilutive effect on our earnings per share to the extent the price of our common stock during a given measurement period exceeds the respective exercise prices of those instruments. The note hedges are excluded from the calculation of diluted earnings per share as their impact is anti-dilutive. The market price condition for convertibility of our Notes was not met and there were no related note hedges or warrants exercised at September 30, 2010.
The note hedges and warrants were separate transactions apart from the Notes, and Note holders have no rights with respect to these separate transactions. The note hedges and warrants are considered indexed to IGT stock, require net-share settlement, and met all criteria for equity classification at inception and at September 30, 2010. Accordingly, the note hedges cost of $177.3 million, net of deferred taxes of $65.5 million, and $66.8 million received for the warrants were recorded as adjustments to shareholders’ equity. Subsequent changes in fair value will not be recognized as long as the note hedges and warrants continue to meet the criteria for equity classification.
Note Hedges
We paid an aggregate amount of $177.3 million to certain initial Note holders or their affiliates (note hedge counterparties/dealers) for note hedges with terms substantially similar to the embedded conversion options in the Notes. The note hedges cover, subject to anti-dilution and certain other customary adjustments substantially similar to those in the Notes, approximately 42.6 million shares of our common stock at a strike price of $19.97, which corresponds to the initial conversion price of the Notes.
The note hedges exercise automatically upon Note conversions and require the counterparty to deliver shares to IGT equal to the shares required to be delivered by IGT to the Note holder for the excess conversion value. The note hedges expire upon the earlier of the last day the Notes remain outstanding or the second scheduled trading day immediately preceding the maturity of the Notes on May 1, 2014.
Warrants
IGT received an aggregate amount of $66.8 million from the note hedge counterparties/dealers for the sale of rights to receive approximately 42.6 million shares of common stock underlying the Notes, subject to anti-dilution and certain other customary adjustments, at a strike price of $30.14 per share. Subject to certain adjustments, a maximum of 72.6 million shares may be delivered under the warrants.
The warrants are automatically exercised on their specified expiration dates that occur over a period of time ending in November 2014. If the volume weighted average share price of our common stock, as defined in the warrants (VWAP), exceeds the strike price of the warrants, IGT will deliver to the counterparties shares equal to the spread between the VWAP on the date of exercise or expiration and the strike price. If the VWAP is less than the strike price, neither party is obligated to deliver anything to the other.
80
7.5% Bonds
On June 15, 2009, we issued $500.0 million aggregate principal amount of 7.5% Bonds due 2019, under our March 2009 shelf registration statement and June 11, 2009 prospectus supplement, to certain underwriters pursuant to an underwriting agreement dated June 10, 2009. We received net proceeds of $493.3 million after a discount of $2.7 million and deferred offering costs of approximately $4.0 million, both of which will be amortized to interest expense over the 7.5% Bond term. Interest is payable semiannually on June 15 and December 15, beginning December 15, 2009. We used the net proceeds from the 7.5% Bonds to fund the redemption of a portion of our Debentures put to us in December 2009.
The 7.5% Bonds are general unsecured obligations of IGT, ranking equal with all existing and future unsecured and unsubordinated obligations. The 7.5% Bonds rank junior to all existing and future liabilities, including trade payables, of our subsidiaries. The 7.5% Bonds mature on June 15, 2019, unless IGT redeems them earlier by paying the holders 100% of the principal amount plus a make-whole redemption premium as described further in the indenture.
The 7.5% Bonds contain covenants which may, in certain circumstances:
� restrict our ability to incur additional debt
� limit our ability to enter into sale and leaseback transactions
� restrict our ability to sell, transfer, lease or dispose of substantially all assets
� require us to grant a lien on equity interests if certain downgrades by rating agencies occur
The 7.5% Bonds specify a number of events of default (some of which are subject to applicable grace or cure periods), including the failure to make timely principal and interest payments or satisfy the covenants. Upon the occurrence of an event of default under the 7.5% Bonds, the outstanding amounts may become immediately due and payable.
Interest rate swaps executed in conjunction with our 7.5% Bonds due 2019 are described in Note 19.
5.5% Bonds
On June 8, 2010, we issued $300.0 million aggregate principal amount of 5.5% Bonds due 2020, under our March 2009 shelf registration statement and June 3, 2010 prospectus supplement pursuant to an underwriting agreement dated June 3, 2010. We received net proceeds of $295.7 million after a discount of $1.3 million and deferred offering costs of approximately $3.0 million, both of which will be amortized to interest expense over the 5.5% Bond term. Interest is payable semiannually on June 15 and December 15, beginning December 15, 2010. Net proceeds from the 5.5% Bonds were used to reduce outstanding amounts under our domestic credit facility.
The 5.5% Bonds are general unsecured obligations of IGT, ranking equal with all existing and future unsecured and unsubordinated obligations. The 5.5% Bonds rank junior to all existing and future liabilities, including trade payables, of our subsidiaries. The 5.5% Bonds mature on June 15, 2020, unless IGT redeems them earlier by paying the holders 100% of the principal amount plus a make-whole redemption premium.
The 5.5% Bonds contain covenants which may, in certain circumstances:
� restrict our ability to incur additional debt
� limit our ability to enter into sale and leaseback transactions
� restrict our ability to sell, transfer, lease or dispose of substantially all assets
� require us to grant a lien on equity interests if certain downgrades by rating agencies occur
The 5.5% Bonds specify a number of events of default (some of which are subject to applicable grace or cure periods), including the failure to make timely principal and interest payments or satisfy the covenants. Upon the occurrence of an event of default under the 5.5% Bonds, the outstanding amounts may become immediately due and payable.
Interest rate swaps executed in conjunction with our 5.5% Bonds due 2020 are described in Note 19.
81
Shelf Registration
In March 2009, we filed a shelf registration statement with the SEC which allows us to issue debt securities, in one or more series, from time to time in amounts, at prices and on terms determined at the time of offering. The 5.5% Bonds and 7.5% Bonds were issued under this registration statement.
2.6% Convertible Debentures
On December 15, 2009, Debentures of $701.2 million aggregate principal were tendered under the holders’ put option and accepted by IGT for payment. On February 4, 2010, IGT completed final redemption of the remaining $5.8 million aggregate outstanding principal of Debentures.
As recast, the equity component of the Debentures totaled $43.7 million and the effective interest rate was 6.2% on the debt component. The table below reflects contractual interest expense, discount amortization in interest expense, and repurchase gain (loss) included in other income (expense), as recast for the prior year periods.
Years Ended Septem ber 30, 2010 2009 2008(In millions)
Contractual interest expense 3.8$ 20.1$ 23.4$ Discount amortization 2.7 19.9 23.6
Gain (loss) on repurchases - 1.3 -
14. JACKPOT LIABILITIES
September 30, 2010 2009(In millions)
Payments due previous winners 575.2$ 636.6$ Payments due future winners 137.5 118.0 Unamortized discounts (141.8) (166.5)
Total jackpot liabilities 570.9$ 588.1$
Future jackpot payments due 2011 2012 2013 2014 2015 Thereafter Total (In millions)
Previous winners 69.2$ 62.9$ 59.2$ 54.7$ 50.8$ 278.4$ 575.2$ Future winners 109.9 13.5 0.7 2.2 0.7 10.5 137.5
See Note 20 for fair value information.
15. OPERATING LEASE COMMITMENTS
We lease certain of our facilities and equipment under various agreements with expiration dates through January 2016. Certain facility leases provide that we pay certain other operating expenses applicable to the leased property, including utilities, maintenance, property taxes, and liability and property damage insurance. For leased properties no longer in use, we have accrued lease payments net of anticipated sublease receipts. Rent and lease expense in continuing operations totaled $11.9 million for fiscal 2010 and 2009, and $14.7 million for fiscal 2008.
Future minimum payments due under non-cancelable operating leases at September 30, 2010
2011 2012 2013 2014 2015 Thereafter Total (In millions)
Operating leases $13.4 $11.2 $8.0 $6.7 $6.5 $9.7 $55.5

82
16. CONTINGENCIES
Litigation
IGT has been named in and has brought lawsuits in the normal course of business. We do not expect the outcome of these suits, including the lawsuits described below, to have a material adverse effect on our future results of operations, financial position, or cash flows.
Bally
2004 Federal District Court of Nevada
On December 7, 2004, IGT filed a complaint in US District Court for the District of Nevada, alleging that defendants Alliance Gaming Corp., Bally Gaming Int'l, Inc., and Bally Gaming, Inc. infringed six US patents held by IGT: US Patent Nos. 6,827,646; 5,848,932; 5,788,573; 5,722,891; 6,712,698; and 6,722,985. On January 21, 2005, defendants filed an answer denying the allegations in the complaint and raising various affirmative defenses to IGT's asserted claims. Defendants also asserted fourteen counterclaims against IGT, including counterclaims for a declaratory judgment of non-infringement, invalidity, and unenforceability of the asserted patents, and for antitrust violations and intentional interference with prospective business advantage. IGT has successfully moved for partial summary judgment on defendants’ counterclaims for intentional interference with prospective business advantage and defendants’ antitrust allegations related to the gaming machine market. IGT denies the remaining allegations. On May 9, 2007, the Court issued an order construing disputed terms of the asserted patent claims. On October 16, 2008, the Court issued summary judgment rulings finding certain of IGT’s patents, including patents that IGT believes cover bonus wheel gaming machines, invalid as obvious. The rulings also found that Bally was not infringing certain patents asserted by IGT. Bally’s antitrust and unfair competition counterclaims remain pending. On November 7, 2008, the Court issued an order staying the proceedings and certifying the summary judgment and claim construction rulings for immediate appeal. On December 1, 2008, IGT appealed the rulings to the US Court of Appeals for the Federal Circuit. On January 8, 2009, Bally moved to dismiss the appeal on jurisdictional grounds. On February 2, 2009, the Federal Circuit denied the Bally motion without prejudice to the parties raising jurisdictional issues in their merits briefs. On October 22, 2009, the Federal Circuit affirmed the District Court’s summary judgment rulings. On December 7, 2009, Bally filed a motion to lift the stay and schedule a trial on the remaining issues. A hearing on the motion was held on February 1, 2010, at which the Court indicated that it would revisit earlier motions for summary judgment on the issues not addressed on appeal, including IGT’s motions for summary judgment on Bally’s antitrust and unfair competition counterclaims. On November 29, 2010, the Court granted summary judgment in favor of IGT on all antitrust and unfair competition counterclaims by Bally and dismissed all other remaining claims.
2006 Federal District Court of Delaware
On April 28, 2006, IGT filed a complaint in US District Court for the District of Delaware, alleging that defendants Bally Technologies, Inc., Bally Gaming Int'l, Inc., and Bally Gaming, Inc. infringed nine US patents held by IGT: US Patent Nos. RE 38,812; RE 37,885; 6,832,958; 6,319,125; 6,244,958; 6,431,983; 6,607,441; 6,565,434; and 6,620,046. The complaint alleges that the “BALLY POWER BONUSING™” technology infringes one or more of the claims of the asserted IGT patents. The lawsuit seeks monetary damages and an injunction. On June 30, 2006, defendants filed an answer denying the allegations in the complaint and raising various affirmative defenses to IGT’s asserted claims. Defendants also asserted twelve counterclaims against IGT, including counterclaims for a declaratory judgment of non-infringement, invalidity, and unenforceability of the asserted patents, antitrust violations, unfair competition, and intentional interference with prospective business advantage. IGT denies these allegations. Pursuant to stipulation of the parties, all claims and counterclaims except those relating to US Patent Nos. RE 37,885 ("the '885 patent"), RE 38,812 ("the '812 patent"), and 6,431,983 have been dismissed. All proceedings relating to Bally’s antitrust, unfair competition, and intentional interference counterclaims have been stayed. On April 28, 2009, the court issued a summary judgment ruling finding the '885 and '812 patents valid. The court also ruled that Bally's "Power Rewards" and "ACSC Power Winners" products infringe certain claims of the '885 and '812 patents. The court granted Bally's motion for summary judgment that Bally's "SDS Power Winners" does not infringe the '885 patent and "Power Bank" and "Power Promotions" do not infringe the '983 patent. The court denied Bally's motion for summary judgment that the '983 patent is invalid. The parties have agreed that Bally's counterclaim for a declaratory judgment on invalidity of the '983 patent will be dismissed without prejudice. IGT’s motion for a permanent injunction against Bally’s infringing products was denied. On April 28, 2010, the court entered an order dismissing without prejudice Bally’s remaining counterclaims (antitrust, unfair competition and intentional interference with

83
business relationships) and entered final judgment in favor of IGT and against the Bally defendants. An appeal from the liability judgment is proceeding. A trial to determine the amount of damages incurred by IGT, and related matters, as a result of Bally's infringement has not yet been scheduled.
Aristocrat
2006 Northern Federal District Court of California
On June 12, 2006, Aristocrat Technologies Australia PTY Ltd. and Aristocrat Technologies, Inc. filed a patent infringement lawsuit against IGT. Aristocrat alleged that IGT willfully infringed US Patent No. 7,056,215, which issued on June 6, 2006. On December 15, 2006, Aristocrat filed an amended complaint, adding allegations that IGT willfully infringed US Patent No. 7,108,603, which issued on September 19, 2006. The IGT products named in the original and amended complaints were the Fort Knox® mystery progressive slot machines. On June 13, 2007, the US District Court for the Northern District of California entered an order granting summary judgment in favor of IGT declaring both patents invalid. The US Court of Appeals for the Federal Circuit reversed this decision on September 22, 2008. IGT’s request for a rehearing was denied on November 17, 2008. This case has recommenced in the District Court. On May 13, 2010, the District Court entered an Order granting IGT’s motion for summary judgment of non-infringement. Aristocrat is appealing this judgment. Proceedings on IGT’s claim that Aristocrat committed inequitable conduct in reviving a related patent application are continuing in the District Court. A trial is set on this issue for April 4, 2011.
2010 Central Federal District Court of California
On November 15, 2010, IGT filed a complaint in the US District Court for the Central District of California against Aristocrat Leisure Limited of Australia and its US affiliate Aristocrat Technologies, Inc. (collectively “Aristocrat”) seeking a preliminary and permanent injunction and damages for the infringement of US Patent No. 6,620,047 (the “’047 patent”) and US Patent No. RE 39,370 (the “’370 patent”) in violation of 35 U.S.C. § 271. We assert that Aristocrat infringes on the ‘047 and the ‘370 patents in connection with the sale and distribution of gaming devices, including the Viridian WS slot machine, without authorization or license from IGT.
Brochu v. Loto Quebec
Loto Quebec commenced an action in warranty against VLC, Inc., a wholly-owned subsidiary of IGT, and another manufacturer of video lottery machines in October 2003, in the Superior Court of the Province of Quebec, District of Quebec, seeking indemnification for any damages that may be awarded against Loto Quebec in a class action suit, also filed in the Superior Court of the Province of Quebec. The class action claim against Loto Quebec, to which neither IGT nor any of its affiliates are parties, was filed by Jean Brochu on behalf of himself and a class of other persons who allegedly developed pathological behaviors through the play of video lottery machines made available by Loto Quebec in taverns and other public locations. In this action, the plaintiff seeks to recover on behalf of the class damages of approximately CAD$578.7 million, representing CAD$4,863 per class member, and CAD$119.0 million in punitive damages. Loto Quebec filed its Plea in Defense in the main action in February 2006. On August 1, 2008, Loto Quebec filed a discontinuance of the action in warranty against VLC. Notwithstanding the discontinuance, Loto Quebec may still pursue the claims it asserted, or could have asserted, in the action in warranty through arbitration against VLC. Settlement of the class action was approved by the Superior Court on March 23, 2010. In a letter, dated May 5, 2010, Loto Quebec’s counsel referred to the settlement of the class action and the settlement agreement between Loto Quebec and VLC under which Loto Quebec discontinued its warranty action against VLC but reserved a right to pursue claims via arbitration (the “Settlement Agreement”) and advised VLC that Loto Quebec does not intend to proceed against VLC, Inc. under the terms of the Settlement Agreement.
Piercey v Atlantic Lotteries
In May 2010, Atlantic Lotteries commenced an action against International Game Technology, VLC, Inc. and IGT-Canada, wholly-owned subsidiaries of International Game Technology, and other manufacturers of video lottery machines in the Supreme Court of New Foundland and Labrador seeking indemnification for any damages that may be awarded against Atlantic Lotteries in a class action suit also filed in the Supreme Court of New Foundland and Labrador. A motion to certify the putative class is pending.

84
Shareholder Actions
Securities Class Action
On July 30, 2009, International Brotherhood of Electrical Workers Local 697 filed a putative securities fraud class action in the US District Court for the District of Nevada, alleging causes of action under Sections 10(b) and 20(a) of the Securities Exchange Act against IGT and certain of its officers, one of whom is a director. The complaint alleges that between November 1, 2007 and October 30, 2008, the defendants inflated IGT's stock price through a series of materially false and misleading statements or omissions regarding IGT's business, operations, and prospects. The Court has appointed a lead plaintiff. The plaintiffs filed an amended complaint on April 26, 2010 and the defendants moved to dismiss that complaint on June 17, 2010.
Derivative Actions
Between August 20, 2009 and September 17, 2009, the Company was nominally sued in a series of derivative lawsuits filed in the US District Court for the District of Nevada, captioned Fosbre v. Matthews et al., Case No. 3:09-cv-00467; Calamore v. Matthews et al., Case No. 3:09-cv-00489-ECR-VPC; Israni v. Bittman, et al., Case No. 3:09-cv-00536; and Aronson v. Matthews et al., Case No. 3:09-cv-00542-RCJ-VPC. Plaintiffs purportedly brought their respective actions on behalf of the Company. The complaints assert claims against various current and former officers and directors of the Company, for breaches of fiduciary duties, unjust enrichment, abuse of control, gross mismanagement, waste of corporate assets, and contribution and indemnification. The complaints seek an unspecified amount of damages and allege similar facts as the securities class action lawsuit. The complaints additionally allege that certain individual defendants engaged in insider trading and that the director defendants improperly handled Thomas J. Matthews’ resignation as Chief Executive Officer of the Company. The actions were consolidated and subsequently a consolidated derivative complaint was filed in December 2009. Defendants have moved to dismiss that complaint. On July 6, 2010, the Court granted the defendants’ motion to dismiss, with leave to amend. The plaintiff in Israni v. Bittman, et al. has appealed the order of dismissal.
On September 30, 2009, the Company was nominally sued in a derivative lawsuit filed in the Second Judicial District Court of the State of Nevada, County of Washoe. Plaintiff purportedly filed the action on behalf of the Company. The lawsuit, captioned Kurz et al. v. Hart et al., Case No. cv-0-9-02982, asserts claims against various current and former officers and directors for breach of fiduciary duties and unjust enrichment. The complaint generally makes the same allegations as the federal derivative complaints and seeks an unspecified amount of damages. The parties have stipulated to dismiss this action.
In a letter dated October 7, 2009 to the Company’s Board of Directors, a shareholder made factual allegations similar to those set forth in the above derivative and securities class actions and demanded that the Board investigate, address and remedy the harm allegedly inflicted on IGT. In particular, the letter alleges that certain officers and directors grossly mismanaged the Company by overspending in the area of R&D of server-based game technology despite a looming recession to which the Company was particularly vulnerable; by making or allowing false and misleading statements regarding the Company’s growth prospects and earnings guidance; and by wasting corporate assets by causing the Company to repurchase Company stock at inflated prices. The letter asserts that this alleged conduct resulted in breaches of fiduciary duties and violations of Section 10(b) of the Exchange Act and SEC Rule 10b-5. On July 9, 2010, the Company was nominally sued in a derivative lawsuit filed in the US District Court for the District of Nevada, captioned Sprando v. Hart, et al., Case No. 3:10-cv-00415-RCJ-VPC and asserting claims as set forth above.
ERISA Actions
On October 2, 2009, two putative class action lawsuits were filed on behalf of participants in the Company’s employee pension plans, naming as defendants the Company, the IGT Profit Sharing Plan Committee, and several current and former officers and directors. The complaints (which seek unspecified damages) allege breaches of fiduciary duty under the Employee Retirement Income Security Act, 29 U.S.C §§ 1109 and 1132. The complaints allege similar facts as the securities class action lawsuit. The complaints further allege that the defendants breached fiduciary duties to Plan Participants by failing to disclose material facts to Plan Participants, failing to exercise their fiduciary duties solely in the interest of the Participants, failing to properly manage Plan assets, failing to diversify Plan assets, and permitting Participants to elect to invest in Company stock. The actions, filed in the US District Court for the District of Nevada, are captioned Carr et al. v. International Game Technology et al., Case No. 3:09-cv-00584, and Jordan et al. v. International Game

85
Technology et al., Case No. 3:09-cv-00585. In October 2009, plaintiffs moved for consolidation of the two actions which motion was granted. On April 9, 2010, defendants moved to dismiss the consolidated complaint.
Environmental Matters
CCSC, a casino operation sold by IGT in April 2003, is located in an area that has been designated by the EPA as an active Superfund site because of contamination from historic mining activity in the area. In order for Anchor Coin, an entity IGT acquired in December 2001, to develop the CCSC site, it voluntarily entered into an administrative order of consent with the EPA to conduct soil removal and analysis (a requirement imposed on similarly situated property developers within the region) in conjunction with re-routing mine drainage. The work and obligations contemplated by the agreement were completed by Anchor in June 1998, and the EPA subsequently issued a termination of the order.
The EPA, together with other property developers excluding CCSC, continues remediation activities at the site. While we believe our remediation obligations are complete, it is possible that additional contamination may be identified and we could be obligated to participate in remediation efforts. Under accounting guidance for environmental remediation liabilities, we determined the incurrence of additional remediation costs is neither probable nor reasonably estimable and no liability has been recorded.
OSHA / Wrongful Termination Matter
On July 8, 2004, two former employees filed a complaint with the US Department of Labor, OSHA alleging retaliatory termination in violation of the Sarbanes-Oxley Act of 2002. The former employees allege that they were terminated in retaliation for questioning whether Anchor and its executives failed to properly disclose information allegedly affecting the value of Anchor's patents in connection with IGT's acquisition of Anchor in December 2001. The former employees also allege that the acquired patents were overvalued on the financial statements of IGT. Outside counsel, retained by an independent committee of our Board of Directors, reviewed the allegations and found them to be entirely without merit.
On November 10, 2004, the employees withdrew their complaint filed with OSHA and filed a notice of intent to file a complaint in federal court. On December 1, 2004, a complaint was filed under seal in the US District Court for the District of Nevada, based on the same facts set forth above regarding their OSHA complaint. IGT filed a motion for summary judgment as to all claims in plaintiffs’ complaint. On June 14, 2007, the US District Court for the District of Nevada entered an order granting summary judgment in favor of IGT as to plaintiffs’ Sarbanes-Oxley whistle-blower claims and dismissed their state law claims without prejudice. Plaintiffs’ motion for reconsideration of the District Court’s decision was denied. Plaintiffs appealed to the US Court of Appeals for the Ninth Circuit. Oral argument was heard on March 12, 2009, and on August 3, 2009, the Ninth Circuit reversed the District Court’s decision. IGT’s motion for summary judgment on plaintiffs’ state law claims was argued on October 22, 2009 and granted in IGT’s favor on December 8, 2009. On April 13, 2010, the District Court granted IGT’s motion to strike the plaintiffs’ jury demand and granted IGT’s motion to retax costs and fees. It denied plaintiffs’ motion for certification and/or reconsideration. Trial was scheduled to begin on June 1, 2010, but was rescheduled to begin on January 24, 2011.
In conjunction with the Anchor acquisition purchase price allocation as of December 31, 2001, IGT used the relief of royalty valuation methodology to estimate the fair value of the patents at $164.4 million. The carrying value of the patents at September 30, 2010 totaled $40.6 million.
Arrangements with Off-Balance Sheet Risks
In the normal course of business, we are party to financial instruments with off-balance sheet risk, such as performance bonds not reflected in our balance sheet. We do not expect any material losses to result from these arrangements and are not dependent on off-balance sheet financing arrangements to fund our operations.
Performance Bonds
Performance bonds outstanding related to certain gaming operations equipment totaled $7.0 million at September 30, 2010. We are liable to reimburse the bond issuer in the event of exercise due to nonperformance.

86
Letters of Credit
Outstanding letters of credit issued under our domestic line of credit to ensure payment to certain vendors and governmental agencies totaled $4.0 million at September 30, 2010.
IGT Licensor Arrangements
Our sales agreements that include software and IP licensing arrangements may require IGT to indemnify the third-party licensee against liability and damages (including legal defense costs) arising from any claims of patent, copyright, trademark infringement, or trade secret misappropriation. Should such a claim occur, we could be required to make payments to the licensee for any liabilities or damages incurred. Historically, we have not incurred any significant settlement costs due to infringement claims. As we consider the likelihood of incurring future costs to be remote, no liability has been recorded.
Product Warranties
The majority of our products are generally covered by a warranty for periods ranging from 90 days to one year. We estimate accrued warranty costs in the table below based on historical trends in product failure rates and expected costs to provide warranty services.
Years ended September 30, 2010 2009 2008(In millions)
Balance at beginning of year 7.9$ 8.4$ 8.7$
Reduction for payments made (3.1) (7.5) (10.2)
Accrual for new warranties issued 8.3 9.8 11.1 Adjustments for pre-existing warranties (3.8) (2.8) (1.2)
Balance at end of period 9.3$ 7.9$ 8.4$
Self-Insurance
We are self-insured for various levels of workers’ compensation, directors’ and officers’ liability, and electronic errors and omissions liability, as well as employee medical, dental, prescription drug, and disability coverage. We purchase stop loss coverage to protect against unexpected claims. Accrued insurance claims and reserves include estimated settlements for known claims, and actuarial estimates for claims incurred but not reported.
State and Federal Taxes
We are subject to sales, use, income, gaming and other tax audits and administrative proceedings in various US federal, state, local, and foreign jurisdictions. While we believe we have properly reported our tax liabilities in each jurisdiction, we can give no assurance that taxing authorities will not propose adjustments that increase our tax liabilities.
87
17. INCOME TAXES
Income Tax Provision
Distribution of income before tax
Years ended September 30, 2010 2009 2008 (In millions)
US 224.9$ 157.3$ 484.9$ Non – US 88.1 62.0 92.7
Total income from continuing operations before tax 313.0$ 219.3$ 577.6$
Reconciliation of statutory federal rate to effective rate for continuing operations
Years ended September 30, 2010 2009 2008
Federal statutory tax 35.0% 35.0% 35.0%State income tax, net 0.7% 1.4% 2.0%Foreign subsidiaries tax, net -0.4% 0.6% -0.1%Domestic production activities -1.4% -2.5% -1.2%Change in income tax contingencies -10.4% -3.5% 0.0%Changes in valuation allowance 2.4% 0.9% 1.7%Other, net 2.4% -1.4% 4.7%
Effective rate 28.3% 30.5% 42.1%
Components of income tax provision
Years ended September 30, 2010 2009 2008 (In millions)
Federal 16.2$ 51.5$ 206.4$ State 8.1 9.6 16.1 Foreign 22.4 23.2 33.7 Total current 46.7 84.3 256.2
Federal 41.2 (10.3) (8.9) State (4.3) (4.7) 1.2 Foreign 5.1 (2.5) (5.2)
Total deferred 42.0 (17.5) (12.9)
Total income tax provision from continuing operations 88.7$ 66.8$ 243.3$
Income Taxes Receivable
Presented as a component of current other assets and deferred costs, income taxes receivable is comprised of prepaid US taxes on intercompany sales, as well as tax overpayments in various US and foreign jurisdictions. Income taxes receivable increased to $104.6 million at September 30, 2010 from $53.1 million at September 30, 2009, primarily due to a favorable US tax law change enacted near the end of fiscal 2010.

88
Deferred Income Taxes
Significant Components of Deferred Income Taxes
September 30, 2010 2009
(In millions)
Deferred Tax AssetsReserves 90.7$ 70.5$ Jackpot payment timing difference 128.8 142.3 Share-based compensation 27.6 22.9 Net operating loss carry forwards 33.5 32.5 State income taxes, net 18.8 14.9 Foreign 20.1 27.5 Property, plant and equipment 2.3 10.0 Goodwill and intangibles 31.3 34.7 Capital loss carryover 19.9 1.0 Other 14.6 29.5
Total deferred income tax assets 387.6 385.8 Valuation allowance (62.6) (37.1)
Total deferred income tax assets, net 325.0 348.7
Deferred Tax LiabilitiesInterest expense on convertible debt (35.6) (22.4) Foreign (2.6) (3.8) Intangibles (51.4) (61.7) Other (14.3) (5.8)
Total deferred income tax liabilities (103.9) (93.7)
Net deferred income tax assets 221.1$ 255.0$
Net operating loss carry forwards at September 30, 2010 of $13.9 million for the US and $77.3 million for foreign countries expire in tax years 2012 through 2020. Capital loss carryover at September 30, 2010 of $57.3 million expires in tax years 2012 through 2015.
Our valuation allowance is based on our assessment that it is more likely than not that certain deferred tax assets will not be realized in the foreseeable future. The valuation allowance increased by $25.5 million in fiscal 2010, primarily due to foreign operating losses and capital losses not expected to be fully realized, of which $7.5 million was reflected in continuing operations.
At September 30, 2010, we had not provided for US deferred income taxes or foreign withholding taxes on $179.7 million in unrecognized temporary differences related to the basis of our investments in foreign subsidiaries expected to be permanently reinvested in operations outside the US. Determination of the amount of any unrecognized deferred income tax liability on these undistributed earnings is not practicable.
Unrecognized Tax Benefits
Under the accounting guidance for uncertain tax positions, we are required to recognize uncertain tax positions taken or expected to be taken, when they are “more likely than not” to be sustained upon examination. This assessment further presumes that tax authorities evaluate the technical merits of transactions individually with full knowledge of all facts and circumstances surrounding the issue. The adoption of this guidance, as of the beginning of fiscal 2008, increased our unrecognized tax benefits and related interest and penalties $107.0 million, increased deferred tax assets $55.4 million, increased other non-current assets $17.1 million and decreased retained earnings $34.5 million.

89
Aggregate changes in the balance of unrecognized tax benefits
Years ended September 30, 2010 2009 2008(In millions)Balance at beginning of year 91.5$ 106.2$ 109.3$ Increases related to prior year tax positions 23.6 4.4 8.9 Decreases related to prior year tax positions (1.6) (27.6) (0.1) Increases related to current year tax positions 11.6 13.8 5.0 Decreases related to current year tax positions (5.8) (1.9) (16.9) Reductions for settlements with taxing authorities (35.5) (3.4) -
Balance at year end 83.8$ 91.5$ 106.2$
The amount of unrecognized tax benefits which would impact our effective tax rate totaled $65.6 million at September 30, 2010 and $70.2 million at September 30, 2009. During 2010, the IRS closed its examination of our tax returns for fiscal 2002 through 2005. In connection with the settlement of our fiscal 2002 through 2005 examinations, we paid the IRS approximately $12.4 million, including interest of $4.3 million. In general, we are no longer subject to any significant US federal, state, local or foreign income tax examination by tax authorities for years before fiscal 2004. Our unrecognized tax benefits decreased $7.7 million during fiscal 2010, primarily due to the IRS settlement, partially offset by current year additions. We do not believe our total unrecognized tax benefits will change significantly during the next twelve months.
Interest and penalties related to unrecognized tax benefits are included in our income tax provision. During fiscal 2010, we recognized a $15.1 million benefit primarily for the reversal of interest and penalties related to settlements with tax authorities, partially offset by current year additions. In fiscal 2009, we recognized $2.9 million benefit for the reversal of interest and penalties related to settlements with tax authorities and an accounting method change. Accrued interest and penalties related to uncertain tax positions totaled $22.7 million at September 30, 2010 and $46.5 million at September 30, 2009.
18. EARNINGS PER SHARE
Years Ended Se p temb er 30, 2010 2009 2008(In millions, except per share amounts)
Income from continuing operations available to common shares (1) 224.3$ 152.5$ 334.3$
Basic weighted average shares outstanding 296.3 293.8 308.0
Dilutive effect of non-participating share-based awards 1.5 0.2 2.2
Diluted weighted average common shares outstanding 297.8 294.0 310.2
Basic earnings per share from continuing operations 0.75$ 0.52$ 1.07$ Diluted earnings per share from continuing operations 0.75$ 0.52$ 1.06$
Weighted average shares excluded from diluted EPS because the effect would be anti-dilutive:
Share-based awards 12.3 15.9 5.7 Debentures - 11.4 14.6 Notes 42.6 - - Note hedges (42.6) - - Warrants 42.6 - - -
(1) Income from continuing operations available to participating securities was not significant Our Notes and warrants were excluded from diluted shares outstanding for the year ended September 30, 2010, because the conversion price and exercise price exceeded the average market price of our common stock. The convertible notes will result in additional EPS dilution when our stock price exceeds the note conversion price of $19.97 per share and further dilution when the stock price exceeds the warrant strike price of $30.14 per share. The treasury stock method used to calculate diluted weighted average shares outstanding excludes potential reduction in shares related to the purchased note hedges because it is anti-dilutive. See Note 13.

90
19. FINANCIAL DERIVATIVES
Foreign Currency Hedging
We hedge our net foreign currency exposure related to monetary assets and liabilities denominated in nonfunctional currency. The notional amount of foreign currency contracts hedging this exposure totaled $26.7 million at September 30, 2010 and $24.9 million at September 30, 2009.
In May 2007, we executed five-year forward contracts designated as a fair value hedge to protect a portion of the US dollar value of our Hong Kong dollar investment in the CLS convertible note (See Note 3). In conjunction with the early redemption of our CLS investment negotiated in September 2010, we executed additional contracts which effectively reduced the cumulative amount of forward contracts. The notional amount of foreign currency contracts hedging this exposure totaled $15.0 million at September 30, 2010 and $49.9 million at September 30, 2009. There was no ineffectiveness for the fiscal years 2010, 2009, and 2008. The component of gain/loss excluded from our assessment of hedge effectiveness was not material.
Interest Rate Management
In conjunction with our 7.5% Bonds issued in June 2009, we executed $250.0 million notional value of interest rate swaps that terminate on June 15, 2019. These swaps effectively exchange 7.5% fixed interest payments for variable rate interest payments at one-month LIBOR plus 342 bps reset on the 15th of each month. Net amounts receivable or payable under the swaps settle semiannually on June 15 and December 15. The interest rate swaps are designated fair value hedges against changes in the fair value of a portion of our 7.5% Bonds. Our assessment determined that the interest rate swaps are highly effective.
In conjunction with our 5.5% Bonds issued in June 2010, we executed $300.0 million notional value of interest rate swaps that terminate on June 15, 2020. These swaps effectively exchange 5.5% fixed interest payments for variable rate interest payments based on the six-month LIBOR plus 186 bps set in arrears on June 13 and December 13 of each year. Net amounts receivable or payable under the swaps will be settled semiannually on June 15 and December 15. The interest rate swaps are designated fair value hedges against changes in the fair value of a portion of our 5.5% Bonds. Our assessment determined that the interest rate swaps are highly effective.
Presentation of Derivative Amounts
Balance Sheet Location and Fair Value at September 30, 2009(In millions)
Non-designated HedgesForeign currency contracts: Other assets and deferred costs (current) -$ 0.2$ Foreign currency contracts: Other liabilities (current) 2.2 0.8
Designated HedgesForeign currency contracts: Other liabilities (noncurrent) -$ 0.1$
Interest rate swaps: Other assets (noncurrent) 52.1 14.8
Interest rate swaps: Long-term debt 52.1 15.1
2010
Income Statement Location and Gain (loss) For Fiscal Years 2010 2009(In millions)
Non-designated HedgesForeign currency contracts: Other income (expense) (1.5)$ (0.9)$
Designated HedgesForeign currency contracts: Other income (expense) 0.2$ 0.3$
Interest rate swap - ineffectiveness: Other income (expense) 0.4 (0.3)
Interest rate swap - effectiveness: Interest expense 12.4 2.9
91
20. FAIR VALUE MEASUREMENTS
Financial Assets (Liabilities) Carried at Fair Value
Fair Value Level 1 Level 2 Level 3
(In millions)Septem ber 30, 2010
Money market funds 137.5$ 137.5$ -$ -$ Investments in unconsolidated affiliates 34.0 12.7 - 21.3 Derivative assets 52.1 - 52.1 - Derivative liabilities (54.3) - (54.3) -
Septem ber 30, 2009Money market funds 82.6$ 82.6$ -$ -$ Investments in unconsolidated affiliates 94.1 15.7 - 78.4 Investments in ARS and put rights 21.3 - - 21.3 Derivative assets 15.0 - 15.0 - Derivative liabilities (16.0) - (16.0) -
Reconciliation of Items Carried at Fair Value Using Significant Unobservable Inputs (Level 3)
(In millions)Beginning balance 78.4$ 21.3$ 80.4$ 19.6$ Total gain (loss):
Included in other income (expense) - other (19.5) 0.3 (1.7) (0.3) Included in other comprehensive income (0.7) - 2.8 2.0
Purchases, issuances, accretion, settlements (36.9) (21.6) (3.1) -
Ending balance 21.3$ -$ 78.4$ 21.3$
Net change in unrealized gain (loss) includedin earnings related to instruments still held (19.5)$ -$ -$ (0.3)$
2010 2009
Investmentsin
UnconsolidatedAffiliates
Investmentsin
ARS and Put Rights
Investmentsin
UnconsolidatedAffiliates
Investmentsin
ARS and Put Rights
Valuation Techniques and Balance Sheet Presentation
Investments in unconsolidated affiliates carried at fair value are estimated using quoted market prices when available or DCF models incorporating market participant assumptions, including credit quality and market interest rates and/or a Black-Scholes formula or an integrated lattice model with assumptions for stock price volatility and default recovery rates. These investments are presented as a component of other assets. See Note 3.
Investments in ARS were valued using DCF, with certain assumptions related to lack of liquidity and observable market transactions. Related put rights were valued based on the difference between the ARS par and fair value, discounted for the broker’s non-performance risk and the time remaining until the exercise period. The ARS and related put rights were presented in short-term investment securities. See Note 8.
Derivative assets and liabilities are valued using quoted forward pricing from bank counterparties and LIBOR credit default swap rates for non-performance risk, and approximate the net settlement amount if the contracts were settled at the reporting date. These are presented primarily as components of other assets, other liabilities, and notes payable. See Note 19.
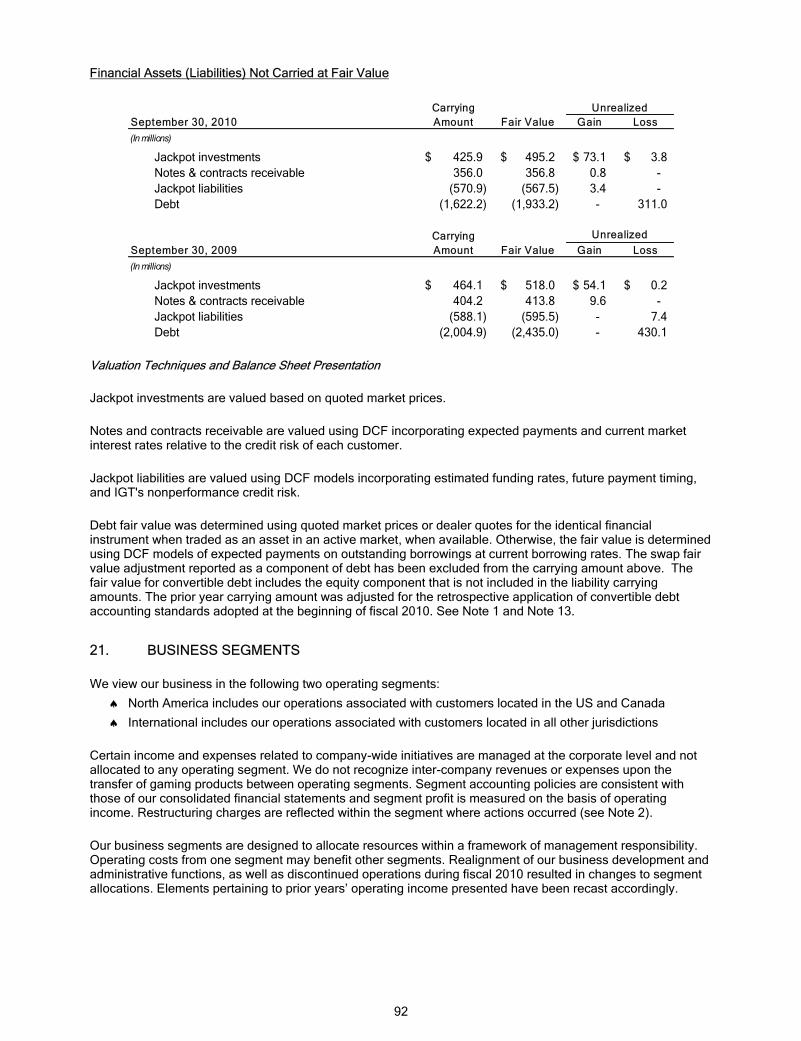
92
Financial Assets (Liabilities) Not Carried at Fair Value
CarryingSeptember 30, 2010 Amount Fair Value Gain Loss(In millions)
Jackpot investments 425.9$ 495.2$ 73.1$ 3.8$ Notes & contracts receivable 356.0 356.8 0.8 - Jackpot liabilities (570.9) (567.5) 3.4 - Debt (1,622.2) (1,933.2) - 311.0
CarryingSeptember 30, 2009 Amount Fair Value Gain Loss(In millions)
Jackpot investments 464.1$ 518.0$ 54.1$ 0.2$ Notes & contracts receivable 404.2 413.8 9.6 - Jackpot liabilities (588.1) (595.5) - 7.4 Debt (2,004.9) (2,435.0) - 430.1
Unrealized
Unrealized
Valuation Techniques and Balance Sheet Presentation
Jackpot investments are valued based on quoted market prices.
Notes and contracts receivable are valued using DCF incorporating expected payments and current market interest rates relative to the credit risk of each customer.
Jackpot liabilities are valued using DCF models incorporating estimated funding rates, future payment timing, and IGT's nonperformance credit risk.
Debt fair value was determined using quoted market prices or dealer quotes for the identical financial instrument when traded as an asset in an active market, when available. Otherwise, the fair value is determined using DCF models of expected payments on outstanding borrowings at current borrowing rates. The swap fair value adjustment reported as a component of debt has been excluded from the carrying amount above. The fair value for convertible debt includes the equity component that is not included in the liability carrying amounts. The prior year carrying amount was adjusted for the retrospective application of convertible debt accounting standards adopted at the beginning of fiscal 2010. See Note 1 and Note 13.
21. BUSINESS SEGMENTS
We view our business in the following two operating segments:
� North America includes our operations associated with customers located in the US and Canada
� International includes our operations associated with customers located in all other jurisdictions
Certain income and expenses related to company-wide initiatives are managed at the corporate level and not allocated to any operating segment. We do not recognize inter-company revenues or expenses upon the transfer of gaming products between operating segments. Segment accounting policies are consistent with those of our consolidated financial statements and segment profit is measured on the basis of operating income. Restructuring charges are reflected within the segment where actions occurred (see Note 2).
Our business segments are designed to allocate resources within a framework of management responsibility. Operating costs from one segment may benefit other segments. Realignment of our business development and administrative functions, as well as discontinued operations during fiscal 2010 resulted in changes to segment allocations. Elements pertaining to prior years’ operating income presented have been recast accordingly.
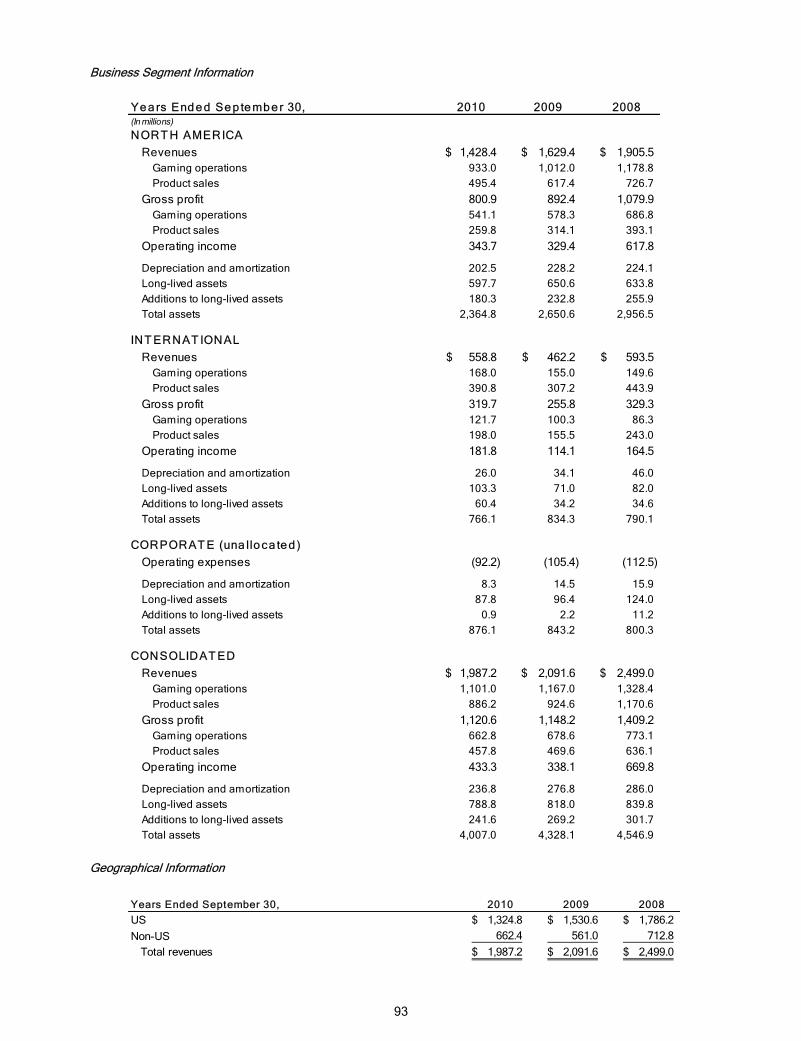
93
Business Segment Information
Ye a rs End e d Se p te mb e r 30, 2010 2009 2008(In millions)NORT H AMERICA
Revenues 1,428.4$ 1,629.4$ 1,905.5$ Gaming operations 933.0 1,012.0 1,178.8 Product sales 495.4 617.4 726.7
Gross profit 800.9 892.4 1,079.9 Gaming operations 541.1 578.3 686.8 Product sales 259.8 314.1 393.1
Operating income 343.7 329.4 617.8
Depreciation and amortization 202.5 228.2 224.1 Long-lived assets 597.7 650.6 633.8 Additions to long-lived assets 180.3 232.8 255.9 Total assets 2,364.8 2,650.6 2,956.5
INT ERNAT IONALRevenues 558.8$ 462.2$ 593.5$
Gaming operations 168.0 155.0 149.6 Product sales 390.8 307.2 443.9
Gross profit 319.7 255.8 329.3 Gaming operations 121.7 100.3 86.3 Product sales 198.0 155.5 243.0
Operating income 181.8 114.1 164.5
Depreciation and amortization 26.0 34.1 46.0 Long-lived assets 103.3 71.0 82.0 Additions to long-lived assets 60.4 34.2 34.6 Total assets 766.1 834.3 790.1
CORPORAT E (una llo ca te d )Operating expenses (92.2) (105.4) (112.5)
Depreciation and amortization 8.3 14.5 15.9 Long-lived assets 87.8 96.4 124.0 Additions to long-lived assets 0.9 2.2 11.2 Total assets 876.1 843.2 800.3
CONSOLIDAT EDRevenues 1,987.2$ 2,091.6$ 2,499.0$
Gaming operations 1,101.0 1,167.0 1,328.4 Product sales 886.2 924.6 1,170.6
Gross profit 1,120.6 1,148.2 1,409.2 Gaming operations 662.8 678.6 773.1 Product sales 457.8 469.6 636.1
Operating income 433.3 338.1 669.8
Depreciation and amortization 236.8 276.8 286.0 Long-lived assets 788.8 818.0 839.8 Additions to long-lived assets 241.6 269.2 301.7 Total assets 4,007.0 4,328.1 4,546.9
Geographical Information
Years Ended September 30, 2010 2009 2008US 1,324.8$ 1,530.6$ 1,786.2$ Non-US 662.4 561.0 712.8
Total revenues 1,987.2$ 2,091.6$ 2,499.0$

94
22. QUARTERLY FINANCIAL DATA (Unaudited)
Operations discontinued during fiscal 2010 related to the closure of Japan and divestiture of our controlling interest in Digideal have been reclassified to discontinued operations for all periods presented (See Note 7).
September 30, First Second Third Fourth(In millions, except per share amounts)2010Total revenues 515.1$ 486.8$ 489.3$ 496.0$ Gross profit 295.8 271.9 276.1 276.8 Operating income 143.7 64.3 122.7 102.6 Income from continuing operations 75.4 25.7 97.4 25.8 Net income 73.3 0.7 92.1 19.9 Diluted EPS 0.25 - 0.31 0.07
2009Total revenues 595.1$ 467.4$ 516.8$ 512.3$ Gross profit 304.6 257.9 295.5 290.2 Operating income 103.3 73.7 128.1 33.0 Income from continuing operations 63.4 36.2 63.0 (10.1) Net income 61.2 33.6 60.6 (28.6) Diluted EPS 0.21 0.11 0.20 (0.10)
95
Item 9. Changes in and Disagreements with Accountants on Accounting and Financial Disclosure
None
Item 9A. Controls and Procedures
Evaluation of Disclosure Controls and Procedures
We maintain disclosure controls and procedures designed to provide reasonable assurance that information required to be disclosed in our reports filed under the Securities Exchange Act of 1934 is recorded, processed, summarized, and reported within the time periods specified by the SEC’s rules and forms, and that such information is accumulated and communicated to our management, including our CEO and CFO, as appropriate, to allow for timely decisions regarding required disclosure. We recognize that any controls and procedures, no matter how well designed and operated, can only provide reasonable assurance of achieving desired control objectives. Judgment is required when designing and evaluating the cost-benefit relationship of potential controls and procedures.
As of the end of the period covered by this report, with the supervision and participation of management, including our CEO and CFO, we evaluated the effectiveness of the design and operation of our disclosure controls and procedures. Based on this evaluation, our CEO and CFO have concluded that, as of the end of such period, our disclosure controls and procedures were effective at the reasonable assurance level.
Internal Control over Financial Reporting
Management’s Report on Internal Control Over Financial Reporting
Internal control over financial reporting refers to the process designed by, or under the supervision of, our CEO and CFO, and effected by our board of directors, management and other personnel, to provide reasonable assurance regarding the reliability of financial reporting and the preparation of financial statements for external purposes in accordance with generally accepted accounting principles. Internal control over financial reporting includes those policies and procedures that:
(i) pertain to the maintenance of records that in reasonable detail accurately and fairly reflect the transactions and dispositions of our assets;
(ii) provide reasonable assurance that the transactions are recorded as necessary to permit preparation of financial statements in accordance with generally accepted accounting principles, and that our receipts and expenditures are being made only in accordance with authorizations of our management and our directors; and
(iii) provide reasonable assurance regarding prevention or timely detection of unauthorized acquisition, use or disposition of our assets that could have a material effect on the financial statements.
Management is responsible for establishing and maintaining adequate internal control over our financial reporting. We have evaluated the effectiveness of our internal control over financial reporting as of September 30, 2010. This evaluation was performed using the Internal Control - Integrated Framework developed by the Committee of Sponsoring Organizations of the Treadway Commission (COSO). Based on this evaluation, management has concluded that, as of such date, our internal control over financial reporting was effective. The effectiveness of the company's internal control over financial reporting as of September 30, 2010 has been audited by PricewaterhouseCoopers LLP, an independent registered public accounting firm, as stated in their report which appears in Part II, Item 8 of this report.
Changes in Internal Control Over Financial Reporting
As a part of our normal operations, we update our internal controls as necessary to accommodate any modifications to our business processes or accounting procedures. No change occurred during the most recent
96
fiscal quarter that materially affected, or is reasonably likely to materially affect, our internal control over financial reporting.
Item 9B. Other Information
None
PART III
The information required by Items 10, 11, 12, 13, and 14, except as provided below, is incorporated by reference from the Proxy Statement to be filed with the SEC within 120 days of the end of the fiscal year covered by this report.
Item 10. Directors, Executive Officers and Corporate Governance
We have adopted the “Code of Ethics for Principal Executive Officer and Senior Financial Officers of International Game Technology” (Finance Code of Ethics), a code of ethics that applies to our Principal Executive Officer, Principal Financial Officer, Principal Accounting Officer or Controller, or any persons performing similar functions (together, the “Covered Officers”). The Finance Code of Ethics is publicly available on our website. If we make any substantive amendments to the Finance Code of Ethics or grant any waiver, including any implicit waiver, from a provision of the code to any of the Covered Officers, we will disclose the nature of such amendment or waiver on our website.
Item 11. Executive Compensation
Item 12. Security Ownership of Certain Beneficial Owners and Management and Related Stockholder Matters
Item 13. Certain Relationships and Related Transactions, and Director Independence
Item 14. Principal Accountant Fees and Services
PART IV
Item 15. Exhibits and Financial Statement Schedules
(a)(1) Consolidated Financial Statements are included under Part II, Item 8.
(a)(2) Consolidated Financial Statement Schedules are either not required or included under Part II, Item 8.
Parent Company Financial Statements - Financial Statements of the Registrant only are omitted under Rule 3-05 as modified by ASR 302.
(a)(3) Exhibits:
3.1 Articles of Incorporation of International Game Technology, as amended (incorporated by reference to Exhibit 3.1 to Registrant’s Report on Form 10-K for the year ended September 30, 2006)
3.2 Fourth Restated Code of Bylaws of International Game Technology, dated December 10, 2007 (incorporated by reference to Exhibit 3.2 to Registrant’s Report on Form 10-Q for the quarter ended December 31, 2007)
4.1 Indenture, dated as of December 20, 2006, between IGT and Wells Fargo Bank, National Association, as Trustee, relating to the 2.60% Convertible Debentures due December 15, 2036 (incorporated by reference to Exhibit 4.1 to Registrant’s Report on Form 8-K filed December 20, 2006)
97
4.2 Form of 2.60% Convertible Debenture due December 15, 2036 (incorporated by reference to Exhibit 4.2 to Registrant’s Report on Form 8-K filed December 20, 2006)
4.3 Indenture, dated May 11, 2009, between IGT and Wells Fargo Bank, National Association, as Trustee, related to the 3.25% Convertible Notes due 2014 (incorporated by reference to Exhibit 4.1 to Registrant’s Report on Form 8-K filed May 11, 2009)
4.4 Form of 3.25% Convertible Note due 2014 (incorporated by reference to Exhibit 4.2 to Registrant’s Report on Form 8-K filed May 11, 2009)
4.5 Indenture, dated June 15, 2009, between IGT and Wells Fargo Bank, National Association, as Trustee, related to the 7.5% Notes due 2019 (incorporated by reference to Exhibit 4.1 to Registrant’s Report on Form 8-K filed June 15, 2009)
4.6 First Supplemental Indenture, dated June 15, 2009, between IGT and Wells Fargo Bank, National Association, as Trustee, related to the 7.5% Notes due 2019 (incorporated by reference to Exhibit 4.2 to Registrant’s Report on Form 8-K filed June 15, 2009)
4.7 Form of 7.5% Notes due 2019 (incorporated by reference to Exhibit 4.3 to Registrant’s Report on Form 8-K filed June 15, 2009)
4.8 Second Supplemental Indenture, dated June 8, 2010, between IGT and Wells Fargo Bank, National Association, as Trustee, related to the 5.500% Notes due 2020 (incorporated by reference to Exhibit 4.2 to Registrants’ Report on Form 8-K filed June 8, 2010)
4.9 Form of 5.500% Notes due 2020 (incorporated by reference to Exhibit 4.3 to Registrant’s Report on Form 8-K filed June 8, 2010)
10.1* Form of officers and directors indemnification agreement
10.2* Barcrest Savings Related Share Option Scheme (incorporated by reference to Registration Statement No. 333-94349, on Form S-8 filed by Registrant on January 10, 2000)
10.3* Amendment to IGT Deferred Compensation Plan (Applicable to Post-2004 Deferrals) dated December 15, 2008 (incorporated by reference to Exhibit 10.2 to Registrant’s Report on Form 10-Q for the quarter ended December 31, 2008)
10.4* International Game Technology 2002 Stock Incentive Plan, as amended June 7, 2010 (incorporated by reference to Exhibit 10.4 to Registrant’s Report on Form 10-Q for the quarter ended June 30, 2010)
10.5* Amendments to IGT Profit Sharing Plan dated July 14, 2003 and November 15, 2005 (incorporated by reference to Exhibit 10.8 to Registrant’s Report on Form 10-K for the year ended September 30, 2006)
10.6* Amendment 2006-I to IGT Profit Sharing Plan effective as of January 1, 2006 (incorporated by reference to Exhibit 10.8 to Registrant’s Report on Form 10-K for the year ended September 30, 2007)
10.7* IGT 2002 Stock Incentive Plan Agreement Forms: Director Stock Option Agreement; Incentive Stock Option Agreement; Nonqualified Stock Option Agreement; Restricted Stock Award Agreement; UK Stock Option Sub-Plan (“the UK Sub-Plan”) Option Agreement (incorporated by reference to Exhibit 10.15 to Registrant’s Report on Form 10-K for the year ended September 30, 2006)
10.8* IGT 2002 Stock Incentive Plan Agreement Forms: Director Restricted Stock Award Agreement (incorporated by reference to Exhibit 10.14 to Registrant’s Report on Form 10-K for the year ended September 30, 2008)
10.9* International Game Technology Employee Stock Purchase Plan, amended and restated effective as of June 7, 2010 (incorporated by reference to Exhibit 10.5 to Registrant’s Report on Form 10-Q for the quarter ended June 30, 2010)
10.10* Summary of IGT Management Bonus Plan (incorporated by reference to Exhibit 10.20 to Registrant’s Report on Form 10-K for the year ended September 30, 2004)
10.11* Amended and Restated Employment Agreement, dated March 20, 2009, between International Game Technology and Thomas J. Matthews (incorporated by reference to Exhibit 10.2 to Registrant's Report on Form 8-K filed March 25, 2009)
10.12* Restricted Stock Award Agreement with Thomas J. Matthews, Chief Executive Officer, President, and Chief Operating Officer dated September 29, 2006 (incorporated by reference to Exhibit 10.2 to Registrant’s Report on Form 8-K filed October 4, 2006)
10.13* Performance Share Award Agreement with Thomas J. Matthews, Chief Executive Officer, President, and Chief Operating Officer dated September 29, 2006 (incorporated by reference to Exhibit 10.3 to Registrant’s Report on Form 8-K filed October 4, 2006)
98
10.14* Amended and Restated Employment Agreement, dated December 1, 2009, between International Game Technology and Thomas J. Matthews (incorporated by reference to Exhibit 10.1 to Registrant’s Report on Form 8-K filed December 7, 2009)
10.15* Severance and General Release Agreement with Stephen W. Morro dated January 8, 2009 (incorporated by reference to Exhibit 10.3 to Registrant’s Report on Form 10-Q for the quarter ended December 31, 2008)
10.16* Employment Agreement, dated March 20, 2009, between International Game Technology and Patti S. Hart (incorporated by reference to Exhibit 10.1 to Registrant’s Report on Form 8-K filed March 25, 2009)
10.17* Executive Transition Agreement, dated to be effective October 23, 2009, between International Game Technology and Patrick W. Cavanaugh (incorporated by reference to Exhibit 10.1 to Registrant’s Report on Form 8-K filed December 23, 2009)
10.18* Executive Transition Agreement, dated to be effective October 23, 2009, between International Game Technology and David D. Johnson (incorporated by reference to Exhibit 10.2 to Registrants’ Report on Form 8-K filed December 23, 2009)
10.19* Executive Transition Agreement, dated as of October 23, 2009, between International Game Technology and Anthony Ciorciari (incorporated by reference to Exhibit 10.3 to Registrants’ Report on Form 8-K filed June 11. 2010)
10.20* Employment Agreement, dated November 30, 1993, between International Game Technology and Paulus Karskens (incorporated by reference to Exhibit 10.6 to Registrant’s Report on Form 10-Q filed February 11, 2010)
10.21* Executive Transition Agreement dated as of June 9, 2010, between IGT-Europe, B.V. and Paulus Karskens (incorporated by reference to Exhibit 10.1 to Registrants’ Report on Form 8-K filed June 11, 2010)
10.22* First Amendment to Executive Transition Agreement, dated to be effective as of October 1, 2010, between International Game Technology and Anthony Ciorciari (incorporated by reference to Exhibit 10.2 to Registrants’ Report on Form 8-K filed on June 11, 2010)
10.23 Purchase Agreement dated as of December 14, 2006, between IGT and the Initial Purchasers, relating to the 2.6% Convertible Debentures due December 15, 2036 (incorporated by reference to Exhibit 10.1 to Registrant’s Report on Form 8-K filed December 20, 2006)
10.24 Purchase agreement dated as of May 5, 2009, between IGT and Goldman, Sachs & Co., as representative for the initial purchasers of the 3.25% Convertible Notes due May 1, 2014 (incorporated by reference to Exhibit 10.1 of Registrant’s Report on Form 8-K filed May 11, 2009)
10.25 Convertible Bond Hedge Transaction, dated May 5, 2009, between IGT and Goldman, Sachs & Co., relating to the 3.25% Convertible Notes due May 1, 2014 (incorporated by reference to Exhibit 10.2 to Registrant’s Report on Form 10-Q for the quarter ended June 30, 2009)
10.26 Convertible Bond Hedge Transaction, dated May 5, 2009, between IGT and Morgan Stanley & Co., Incorporated as Agent for Morgan Stanley & Co. International plc, relating to the 3.25% Convertible Notes due May 1, 2014 (incorporated by reference to Exhibit 10.3 to Registrant’s Report on Form 10-Q for the quarter ended June 30, 2009)
10.27 Convertible Bond Hedge Transaction, dated May 5, 2009, between IGT and Deutsche Bank AG, London Branch, relating to the 3.25% Convertible Notes due May 1, 2014 (incorporated by reference to Exhibit 10.4 to Registrant’s Report on Form 10-Q for the quarter ended June 30, 2009)
10.28 Convertible Bond Hedge Transaction, dated May 5, 2009, between IGT and BNP Paribas, relating to the 3.25% Convertible Notes due May 1, 2014 (incorporated by reference to Exhibit 10.5 to Registrant’s Report on Form 10-Q for the quarter ended June 30, 2009)
10.29 Convertible Bond Hedge Transaction, dated May 5, 2009, between IGT and Bank of America, N.A., relating to the 3.25% Convertible Notes due May 1, 2014 (incorporated by reference to Exhibit 10.6 to Registrant’s Report on Form 10-Q for the quarter ended June 30, 2009)
10.30 Convertible Bond Hedge Transaction, dated May 5, 2009, between IGT and The Royal Bank of Scotland plc, relating to the 3.25% Convertible Notes due May 1, 2014 (incorporated by reference to Exhibit 10.7 to Registrant’s Report on Form 10-Q for the quarter ended June 30, 2009)
10.31 Issuer Warrant Transaction, dated May 5, 2009, between IGT and Goldman, Sachs & Co., relating to the 3.25% Convertible Notes due May 1, 2014 (incorporated by reference to Exhibit 10.27 to Registrant’s Report on Form 10-K for the year ended September 30, 2009)
99
10.32 Issuer Warrant Transaction, dated May 5, 2009, between IGT and Morgan Stanley & Co. Incorporated as Agent for Morgan Stanley & Co. International plc, relating to the 3.25% Convertible Notes due May 1, 2014 (incorporated by reference to Exhibit 10.28 to Registrant’s Report on Form 10-K for the year ended September 30, 2009)
10.33 Issuer Warrant Transaction, dated May 5, 2009, between IGT and Deutsche Bank AG, London Branch, relating to the 3.25% Convertible Notes due May 1, 2014 (incorporated by reference to Exhibit 10.29 to Registrant’s Report on Form 10-K for the year ended September 30, 2009)
10.34 Issuer Warrant Transaction, dated May 5, 2009, between IGT and BNP Paribas, relating to the 3.25% Convertible Notes due May 1, 2014 (incorporated by reference to Exhibit 10.30 to Registrant’s Report on Form 10-K for the year ended September 30, 2009)
10.35 Issuer Warrant Transaction, dated May 5, 2009, between IGT and Bank of America, N.A., relating to the 3.25% Convertible Notes due May 1, 2014 (incorporated by reference to Exhibit 10.31 to Registrant’s Report on Form 10-K for the year ended September 30, 2009)
10.36 Issuer Warrant Transaction, dated May 5, 2009, between IGT and The Royal Bank of Scotland plc, relating to the 3.25% Convertible Notes due May 1, 2014 (incorporated by reference to Exhibit 10.32 to Registrant’s Report on Form 10-K for the year ended September 30, 2009)
10.37 Second Amended and Restated Credit Agreement, dated as of June 8, 2009, with Wells Fargo Bank, N.A. as Administrative Agent, Bank of America, N.A., as Syndication Agent, The Royal Bank of Scotland PLC, the Bank of Tokyo-Mitsubishi UFJ, Ltd./Union Bank of California, N.A., and Mizuho Corporate Bank, Ltd., as Co-Documentation Agents, and Banc of America Securities LLC, Wells Fargo Bank, N.A. and RBS Securities, Inc., as Joint Lead Arrangers and Joint Book Managers, and a syndicate of other lenders (incorporated by reference to Exhibit 10.7 to Registrant’s Report on Form 10-Q filed February 11, 2010)
21 Subsidiaries
23.1 Consent of PricewaterhouseCoopers LLP, Independent Registered Public Accounting Firm
23.2 Consent of Deloitte & Touche LLP, Independent Registered Public Accounting Firm
24 Power of Attorney (see next page)
31.1 Certification of Chief Executive Officer pursuant to Rule 13a – 14(a) of the Exchange Act, as adopted pursuant to section 302 of the Sarbanes-Oxley Act of 2002
31.2 Certification of Chief Financial Officer pursuant to Rule 13a – 14(a) of the Exchange Act, as adopted pursuant to section 302 of the Sarbanes-Oxley Act of 2002
32.1 Certification of Chief Executive Officer pursuant to Rule 13a – 14(b) of the Exchange Act and section 18 U.S.C. Section 1350, as adopted pursuant to section 906 of the Sarbanes-Oxley Act of 2002
32.2 Certification of Chief Financial Officer pursuant to Rule 13a – 14(b) of the Exchange Act and section 18 U.S.C. Section 1350, as adopted pursuant to section 906 of the Sarbanes-Oxley Act of 2002
99 Government Gaming Regulation
101.INS** XBRL Instance
101.SCH** XBRL Taxonomy Extension Schema
101.CAL** XBRL Taxonomy Extension Calculation
101.DEF** XBRL Taxonomy Extension Definition
101.LAB** XBRL Taxonomy Extension Labels
101.PRE** XBRL Taxonomy Extension Presentation
** XBRL information is furnished and not filed or a part of a registration statement or prospectus for purposes of sections 11 or 12 of the Securities and Exchange Act of 1933, as amended, is deemed not filed for purposes of section 18 of the Securities and Exchange Act of 1934, as amended, and otherwise is not subject to liability under these sections.
* Management contract or compensatory plan or arrangement

Signatures
Pursuant to the requirements of Section 13 or 15(d) of the Securities Exchange Act of 1934, as amended, the registrant has caused this Annual Report on Form 10-K to be signed on its behalf by the undersigned, thereunto duly authorized.
Date: December 1, 2010
INTERNATIONAL GAME TECHNOLOGY
By: /s/ Patrick W. Cavanaugh Patrick W. Cavanaugh Executive Vice President, Chief Financial Officer, and Treasurer

Power of Attorney
Pursuant to the requirements of the Securities Exchange Act of 1934, as amended, this report has been signed below by the following persons on behalf of the registrant and in the capacities and on the dates indicated. Each person whose signature appears below hereby authorizes Patti Hart and Patrick Cavanaugh, or either of them, as attorneys-in-fact to sign on their behalf, individually, and in each capacity stated below, and to file all amendments and/or supplements to this Annual Report on Form 10-K.
Signature Title Date /s/ Patti S. Hart Chief Executive Officer and President Patti S. Hart (Principal Executive Officer) December 1, 2010 /s/ Patrick W. Cavanaugh Chief Financial Officer, Executive Vice Patrick W. Cavanaugh President and Treasurer December 1, 2010 (Principal Financial and Accounting Officer) /s/ Philip G. Satre Philip G. Satre Chairman of the Board of Directors December 1, 2010 /s/ Paget L. Alves Paget L. Alves Director December 1, 2010 /s/ Janice Chaffin Janice Chaffin Director December 1, 2010 /s/ Greg Creed Greg Creed Director December 1, 2010 /s/ Robert A. Mathewson Robert A. Mathewson Director December 1, 2010 /s/ Thomas J. Matthews Thomas J. Matthews Director December 1, 2010 /s/ Robert Miller Robert Miller Director December 1, 2010 /s/ David E. Roberson David E. Roberson Director December 1, 2010 /s/ Vincent L. Sadusky Vincent L. Sadusky Director December 1, 2010

Exhibit 31.1
CERTIFICATION PURSUANT TO RULE 13a–14(a) OF THE EXCHANGE ACT As Adopted Pursuant To Section 302 of the Sarbanes-Oxley Act of 2002
I, Patti S. Hart, certify that:
1. I have reviewed this report on Form 10-K of International Game Technology;
2. Based on my knowledge, this report does not contain any untrue statement of a material fact or omit to state a material fact necessary to make the statements made, in light of the circumstances under which such statements were made, not misleading with respect to the period covered by this report;
3. Based on my knowledge, the financial statements, and other financial information included in this report, fairly present in all material respects the financial condition, results of operations and cash flows of the registrant as of, and for, the periods presented in this report;
4. The registrant's other certifying officer and I are responsible for establishing and maintaining disclosure controls and procedures (as defined in Exchange Act Rules 13a-15(e) and 15d-15(e)) and internal control over financial reporting (as defined in Exchange Act Rules 13a-15(f) and 15d-15(f)) for the registrant and have:
a. designed such disclosure controls and procedures, or caused such disclosure controls and procedures to be designed under our supervision, to ensure that material information relating to the registrant, including its consolidated subsidiaries, is made known to us by others within those entities, particularly during the period in which this report is being prepared;
b. designed such internal control over financial reporting, or caused such internal control over financial reporting to be designed under our supervision, to provide reasonable assurance regarding the reliability of financial reporting and the preparation of financial statements for external purposes in accordance with generally accepted accounting principles;
c. evaluated the effectiveness of the registrant’s disclosure controls and procedures and presented in this report our conclusions about the effectiveness of the disclosure controls and procedures, as of the end of the period covered by this report based on such evaluation; and
d. disclosed in this report any change in the registrant’s internal control over financial reporting that occurred during the registrant’s most recent fiscal quarter (the registrant’s fourth fiscal quarter in the case of an annual report) that has materially affected, or is reasonably likely to materially affect, the registrant’s internal control over financial reporting.
5. The registrant's other certifying officer and I have disclosed, based on our most recent evaluation of internal control over financial reporting, to the registrant's auditors and the audit committee of the registrant's board of directors (or persons performing the equivalent functions):
a. all significant deficiencies and material weaknesses in the design or operation of internal control over financial reporting which are reasonably likely to adversely affect the registrant's ability to record, process, summarize and report financial information; and
b. any fraud, whether or not material, that involves management or other employees who have a significant role in the registrant's internal control over financial reporting.
Date: December 1, 2010
/s/ Patti S. Hart Patti S. Hart Chief Executive Officer
Exhibit 31.2
CERTIFICATION PURSUANT TO RULE 13a–14(a) OF THE EXCHANGE ACT As Adopted Pursuant To Section 302 of the Sarbanes-Oxley Act of 2002
I, Patrick W. Cavanaugh, certify that:
1. I have reviewed this report on Form 10-K of International Game Technology;
2. Based on my knowledge, this report does not contain any untrue statement of a material fact or omit to state a material fact necessary to make the statements made, in light of the circumstances under which such statements were made, not misleading with respect to the period covered by this report;
3. Based on my knowledge, the financial statements, and other financial information included in this report, fairly present in all material respects the financial condition, results of operations and cash flows of the registrant as of, and for, the periods presented in this report;
4. The registrant's other certifying officer and I are responsible for establishing and maintaining disclosure controls and procedures (as defined in Exchange Act Rules 13a-15(e) and 15d-15(e)) and internal control over financial reporting (as defined in Exchange Act Rules 13a-15(f) and 15d-15(f)) for the registrant and have:
a. designed such disclosure controls and procedures, or caused such disclosure controls and procedures to be designed under our supervision, to ensure that material information relating to the registrant, including its consolidated subsidiaries, is made known to us by others within those entities, particularly during the period in which this report is being prepared;
b. designed such internal control over financial reporting, or caused such internal control over financial reporting to be designed under our supervision, to provide reasonable assurance regarding the reliability of financial reporting and the preparation of financial statements for external purposes in accordance with generally accepted accounting principles;
c. evaluated the effectiveness of the registrant’s disclosure controls and procedures and presented in this report our conclusions about the effectiveness of the disclosure controls and procedures, as of the end of the period covered by this report based on such evaluation; and
d. disclosed in this report any change in the registrant’s internal control over financial reporting that occurred during the registrant’s most recent fiscal quarter (the registrant’s fourth fiscal quarter in the case of an annual report) that has materially affected, or is reasonably likely to materially affect, the registrant’s internal control over financial reporting.
5. The registrant's other certifying officer and I have disclosed, based on our most recent evaluation of internal control over financial reporting, to the registrant's auditors and the audit committee of the registrant's board of directors (or persons performing the equivalent functions):
a. all significant deficiencies and material weaknesses in the design or operation of internal control over financial reporting which are reasonably likely to adversely affect the registrant's ability to record, process, summarize and report financial information; and
b. any fraud, whether or not material, that involves management or other employees who have a significant role in the registrant's internal control over financial reporting.
Date: December 1, 2010
/s/ Patrick W. Cavanaugh Patrick W. Cavanaugh Chief Financial Officer

Exhibit 32.1
CERTIFICATION PURSUANT TO 18 U.S.C. SECTION 1350 As Adopted Pursuant to Section 906 of the Sarbanes-Oxley Act of 2002
In connection with the Annual Report of International Game Technology (Company) on Form 10-K for the period ended October 2, 2010 as filed with the Securities and Exchange Commission on the date hereof (Report), I, Patti S. Hart, Chief Executive Officer of the Company, certify, pursuant to 18 U.S.C. section 1350, as adopted pursuant to section 906 of the Sarbanes-Oxley Act of 2002, that to my knowledge:
(i) the Report fully complies with the requirements of Section 13(a) and 15(d), as applicable, of the Securities Exchange Act of 1934, as amended, and
(ii) the information contained in the Report fairly presents, in all material respects, the financial condition and results of operations of the Company.
Date: December 1, 2010
/s/ Patti S. Hart Patti S. Hart Chief Executive Officer
Exhibit 32.2
CERTIFICATION PURSUANT TO 18 U.S.C. SECTION 1350 As Adopted Pursuant to Section 906 of the Sarbanes-Oxley Act of 2002
In connection with the Annual Report of International Game Technology (Company) on Form 10-K for the period ended October 2, 2010 as filed with the Securities and Exchange Commission on the date hereof (Report), I, Patrick W. Cavanaugh, Chief Financial Officer of the Company, certify, pursuant to 18 U.S.C. section 1350, as adopted pursuant to section 906 of the Sarbanes-Oxley Act of 2002, that to my knowledge:
(i) the Report fully complies with the requirements of Section 13(a) and 15(d), as applicable, of the Securities Exchange Act of 1934, as amended, and
(ii) the information contained in the Report fairly presents, in all material respects, the financial condition and results of operations of the Company.
Date: December 1, 2010
/s/ Patrick W. Cavanaugh Patrick W. Cavanaugh Chief Financial Officer

This page intentionally left blank.

© 2011 IGT. All rights reserved.
American Idol® 19 TV Ltd & FremantleMedia North America, Inc. Licensed by FremantleMedia Enterprises.
BATMAN and all related characters and elements are trademarks of and © DC Comics.(s10)
Ghostbusters: TM & © 2011 Columbia Pictures Industries Inc. All Rights Reserved.
THE HANGOVER and all related characters and elements are trademarks of and © Warner Bros. Entertainment Inc.(s11)
Sex and the City: Official HBO Licensed Product. All Rights Reserved. Series Title, Video Clips and Photographs © Home Box Office, Inc. All Rights Reserved. HBO and related trademarks are the property of Home Box Office, Inc.
“Star Wars” © 2011 Lucasfilm Ltd. & ™ All Rights Reserved. Used Under Authorization.
1Adjusted operating margin (25% for fiscal 2010; 23% for fiscal 2009) is a non-GAAP financial measure defined as adjusted operating income ($506.0 million for fiscal 2010; $486.1 million for fiscal 2009) as a percentage of total revenues ($1,987.2 million for fiscal 2010; $2,091.6 million for fiscal 2009). Adjusted operating income is a non-GAAP financial measure defined as operating income ($433.3 million for fiscal 2010; $338.1 million for fiscal 2009) adjusted to exclude impairment and loss on other assets ($63.7 million for fiscal 2010; $78.0 million for fiscal 2009), restructuring charges ($4.7 million for fiscal 2010; $33.9 for fiscal 2009), debt refinancing charges ($0 for fiscal 2010; $1.8 million for fiscal 2009) and bad debt provision ($4.3 million for fiscal 2010; $34.3 million for fiscal 2009).
2Adjusted EBITDA for fiscal 2010 ($777.4 million) is a non-GAAP financial measure defined as income from continuing operations ($224.3 million) before interest and other expense, net ($120.3 million), income tax provision ($88.7 million), depreciation and amortization ($234.3 million), share-based compensation excluding restructuring adjustment ($41.4 million), restructuring charges ($4.7 million), and impairment and loss on other assets ($63.7 million).
PureDepth®, MLD®, Multi-Layer Display™, and Actual Depth® are trademarks and registered trademarks of PureDepth, Inc. All other trademarks and registered trademarks are the property of their respective owners, without intent to infringe. www.puredepth.com.
Texas Hold’em Heads Up Poker™ is a trademark of G2 Games Design, LLC.
TM Amazing Race Productions, Inc. © 2011 Amazing Race Productions Inc. and ABC Studios Inc. All Rights Reserved
“Wheel of Fortune” is a registered trademark of Califon Productions, Inc. “Wheel of Fortune” ©2011 Califon Productions, Inc. All Rights Reserved.
All other trademarks are owned and/or registered by IGT and/or its licensors in the U.S. and/or other countries.
Printed on recycled PaPer.