annual report - bpdb.gov.bd report 2016-17 (3).… · reform and restructure, ... easy bill pay,...
TRANSCRIPT
Annual Report2016 - 2017
Bangladesh Power Development Board
Annual Report2016 - 2017
Bangladesh Power Development Board
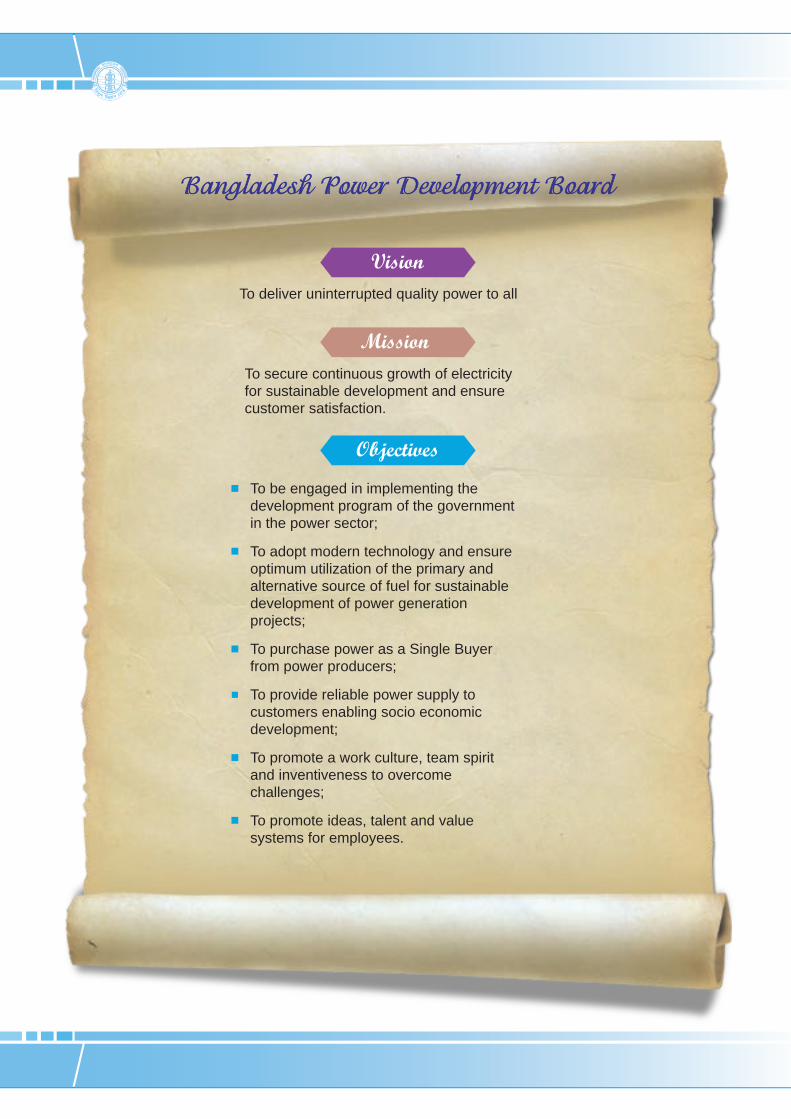
To deliver uninterrupted quality power to all
To secure continuous growth of electricityfor sustainable development and ensurecustomer satisfaction.
To be engaged in implementing thedevelopment program of the governmentin the power sector;
To adopt modern technology and ensureoptimum utilization of the primary andalternative source of fuel for sustainabledevelopment of power generationprojects;
To purchase power as a Single Buyerfrom power producers;
To provide reliable power supply tocustomers enabling socio economicdevelopment;
To promote a work culture, team spiritand inventiveness to overcomechallenges;
To promote ideas, talent and valuesystems for employees.
Bangladesh Power Development Board
Vision
Mission
Objectives
This is a matter of joy that Bangladesh Power Development Board (BPDB), the mother organisation of power sector of the country is going to bring out the Annual Report for the financial year 2016-2017.
Bangladesh Power Development Board has been playing a pivotal role in the socio economic development of the country since independence, but it got a momentum after 2009 when new ideas and initiatives introduced in power sector to cope with the sharp rise in development activities of the country.
At present, 83% of the total population has come under the electricity coverage and per capita generation has increased to 433 kWh. The government has already set a target to become a middle income country by 2021 and develop country by 2041. Power sector especially BPDB has to play a significant role in achieving government's all goals because targeted socio economic development will not be possible without uninterrupted and reliable power supply.
BPDB has been functioning as a single buyer in the power market of Bangladesh. BPDB is engaged in purchasing electricity from IPPs, SIPPs, Rental Plants, APSCL, EGCB & NWZPGCL and selling energy to distribution companies. BPDB is now also working for exploring and researching alternative fuel for power generation.
It is to be mentioned that in the fiscal year 2016-17 power sector witnessed a mentionable progress in power generation. 1586 MW new capacity has been added raising the total generation capacity to 13,555 MW. This new capacity addition includes installation of 588 MW by BPDB through IPPs, 278 MW by NWPGCL and 720 MW by APSCL. During the said year the highest power generation was 9479 MW which was 4.90% higher and total energy generation was 57,276 GWh which was 9.74% higher than previous year. In the said year load shedding also came down at a tolerable level despite increasing demand of power. This is a clear indication of gradual improvement.
In FY 2016-17 bulk electricity sales to the distribution utilities were 10.31% higher than the previous year. Total revenue collection also increased to 2,74,355 MTk from 2,22,382 MTk which was 23.37% higher than the previous year. In the said year distribution system loss of BPDB's four zones came down to 9.27% from11.01% of previous year.
We have been working hard over the years to improve the overall performance of BPDB and deliver quality and uninterrupted power to valued consumers and it will continue more vigorously in future.
I hope this annual report would provide a true picture of BPDB as well as power sector.
From the deskof
Chairman
Khaled MahmoodChairman
Bangladesh Power Development Board
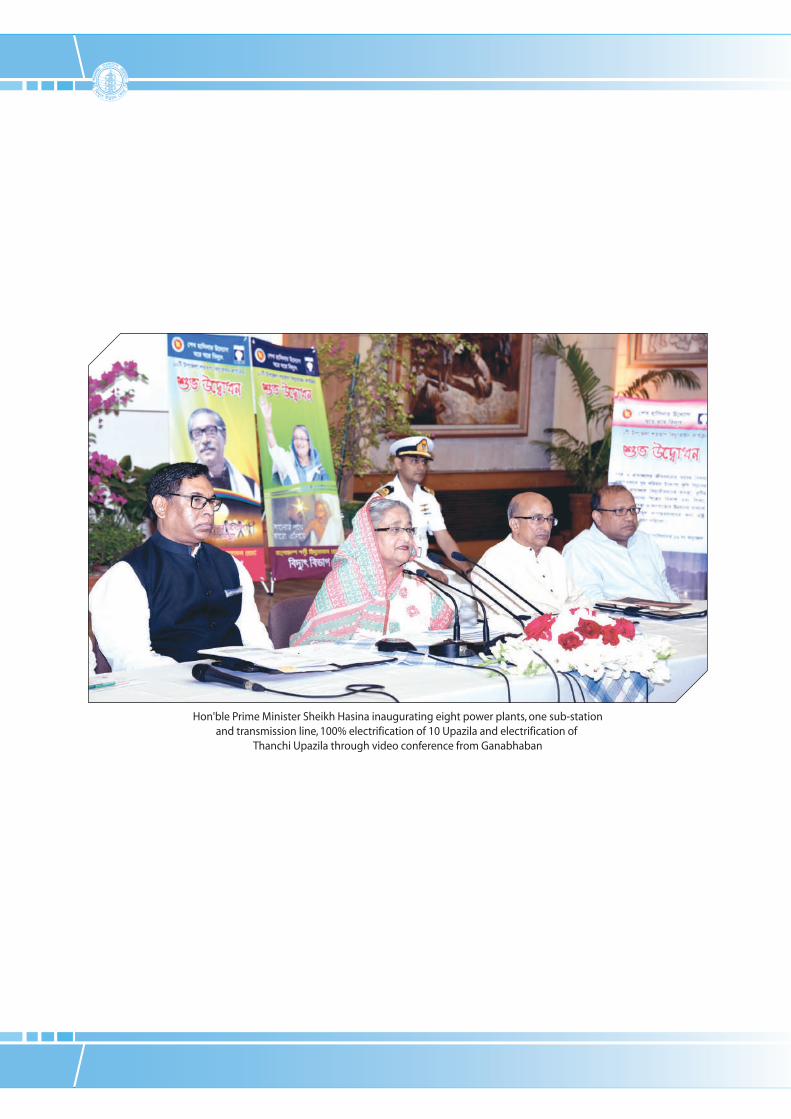
Hon'ble Prime Minister Sheikh Hasina inaugurating eight power plants, one sub-stationand transmission line, 100% electrification of 10 Upazila and electrification of
Thanchi Upazila through video conference from Ganabhaban
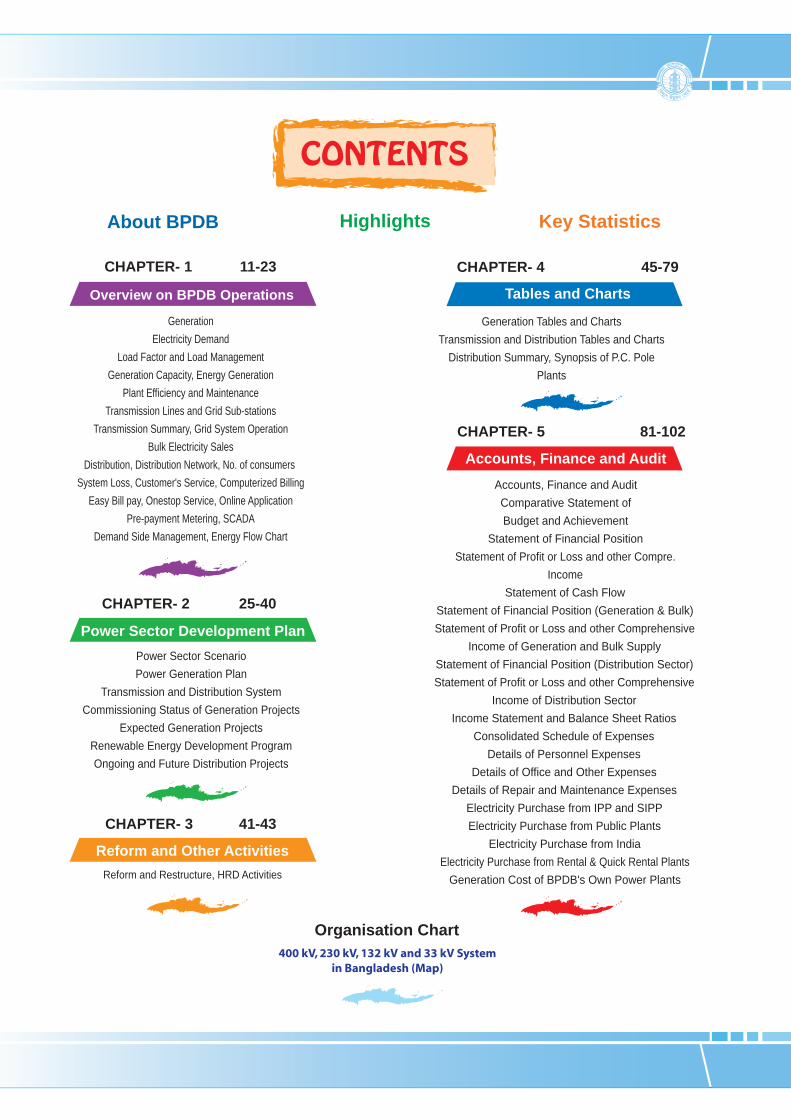
About BPDB Highlights Key Statistics
CONTENTS
CHAPTER- 4 45-79
Generation Tables and ChartsTransmission and Distribution Tables and Charts
Distribution Summary, Synopsis of P.C. Pole Plants
CHAPTER- 2 25-40
Power Sector ScenarioPower Generation Plan
Transmission and Distribution SystemCommissioning Status of Generation Projects
Expected Generation ProjectsRenewable Energy Development ProgramOngoing and Future Distribution Projects
41-43
400 kV, 230 kV, 132 kV and 33 kV Systemin Bangladesh (Map)
CHAPTER- 3
Reform and Restructure, HRD Activities
Organisation Chart
CHAPTER- 1 11-23
GenerationElectricity Demand
Load Factor and Load ManagementGeneration Capacity, Energy Generation
Plant Efficiency and MaintenanceTransmission Lines and Grid Sub-stations
Transmission Summary, Grid System OperationBulk Electricity Sales
Distribution, Distribution Network, No. of consumers System Loss, Customer's Service, Computerized Billing
Easy Bill pay, Onestop Service, Online ApplicationPre-payment Metering, SCADA
Demand Side Management, Energy Flow Chart
CHAPTER- 5 81-102
Accounts, Finance and AuditComparative Statement of Budget and Achievement
Statement of Financial PositionStatement of Profit or Loss and other Compre.
IncomeStatement of Cash Flow
Statement of Financial Position (Generation & Bulk)Statement of Profit or Loss and other Comprehensive
Income of Generation and Bulk SupplyStatement of Financial Position (Distribution Sector)Statement of Profit or Loss and other Comprehensive
Income of Distribution SectorIncome Statement and Balance Sheet Ratios
Consolidated Schedule of ExpensesDetails of Personnel Expenses
Details of Office and Other ExpensesDetails of Repair and Maintenance Expenses
Electricity Purchase from IPP and SIPPElectricity Purchase from Public Plants
Electricity Purchase from IndiaElectricity Purchase from Rental & Quick Rental Plants
Generation Cost of BPDB's Own Power Plants
Overview on BPDB Operations
Power Sector Development Plan
Reform and Other Activities
Tables and Charts
Accounts, Finance and Audit
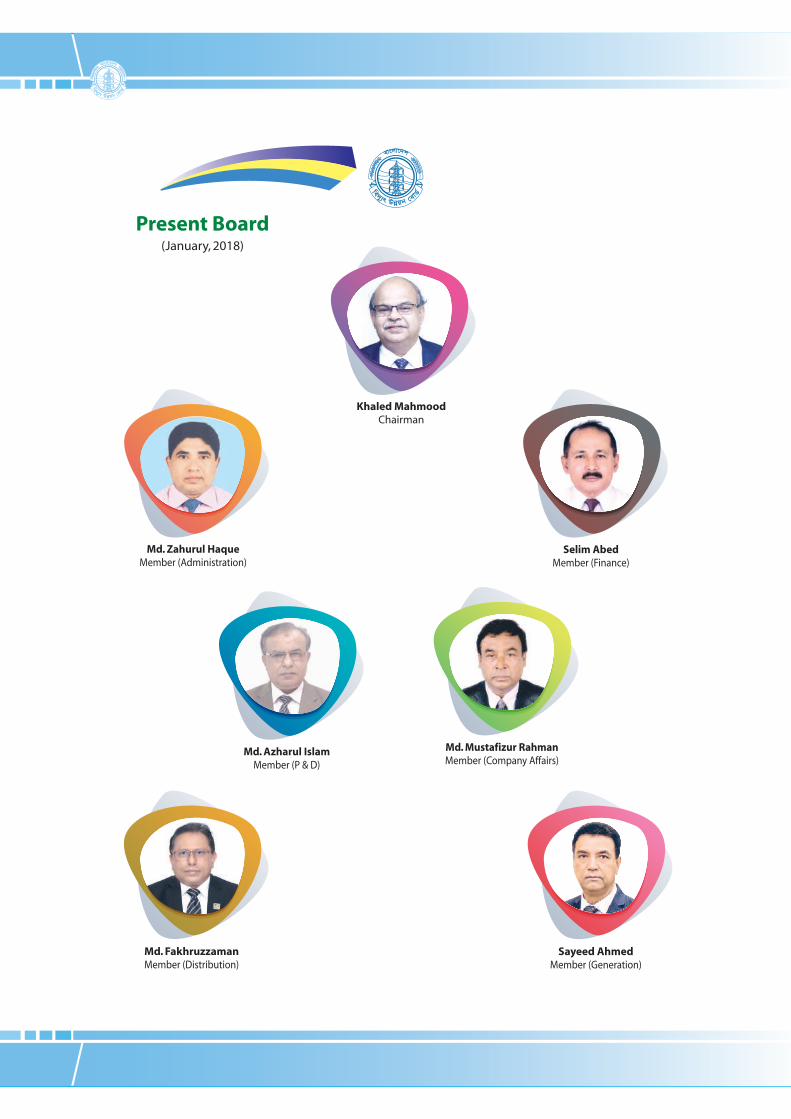
(January, 2018)
Present Board
Khaled MahmoodChairman
Md. Zahurul HaqueMember (Administration)
Selim AbedMember (Finance)
Md. Mustafizur RahmanMember (Company Affairs)
Md. FakhruzzamanMember (Distribution)
Sayeed AhmedMember (Generation)
Md. Azharul IslamMember (P & D)
Bangladesh Power Development Board (BPDB) is a
statutory body created in May 1, 1972 by Presidential
Order No. 59 after bifurcation of erstwhile Bangladesh
Water and Power Development Authority. BPDB had
started its operation with generation capacity of only
180 MW. In its 45 years' service, the installed capacity of
the country increased to 13,555 MW at the end of the
FY 2016-2017.
As part of reform and restructuring, transmission was
vertically separated as a subsidiary of BPDB and
distribution was horizontally separated to create new
distribution entities in capital city (DPDC & DESCO) and
rural areas (REB). Further, a number of generation and
urban distribution companies were created as a
subsidiary of BPDB. The subsidiaries of BPDB are:
BPDB prepared generation expansion plan to add
about 17,752 MW from 2017 to 2021 to achieve
generation capacity 24,000 MW by 2021 with the aim
to provide quality and reliable electricity to the all
people across the country for desired economic growth
and social development. BPDB also prepared
distribution expansion plan to keep pace with the
growing demand.
During the Financial Year under report (2016-17)
Chairman and Members of the Board:
BPDB is under the Power Division of the Ministry of
Power, Energy and Mineral Resources, Government of
Bangladesh. Key responsibilities of the Board are:
Ashugongj Power Station Company Ltd. (APSCL)
Electricity Generation Company of Banglades Ltd.
(EGCB)
North West Power Generation Company Ltd.
(NWPGCL)
Power Grid Company of Bangladesh (PGCB)
West Zone Power Distribution Company Ltd.
(WZPDCL)
Northern Electricity Supply company Ltd. (NESCO)
Generation of electricity from its own Power Plants.
Power purchase from Public & Private Generation
companies as a single buyer.
Bulk sales of electricity to Utilities as a single buyer.
Retail sales of electricity within its Four
Distribution Zones.
Preparation of Generation and Distribution
Expansion Plan.
Implementation of Generation & Distribution
Projects as approved by the Government.
Mr. Sk. Md. Alauddin
Mr. Md. Shamsul Hassan Miah (Upto 16.08.16)
Mr. Khaled Mahmood (From 17.08.16)
Mr. Lokman Hossain Miah (Upto 27.11.16)
Mr. Md. Zahurul Haque (From 27.11.16 to 26.12.16)
Mr. Md. Nur-Ur-Rahman (From 27.12.16 to 16.02.17)
Mr. Md. Zahurul Haque (From 16.02.17)
Mr. Md. Azizul Islam (Upto 28.08.16)
Mr. Md. Zahurul Haque (From 29.08.16 to 06.03.17)
Mr. Pronob Kumar Ghosh (From 06.03.17)
Mr. Khaled Mahmood (Upto 16.08.16)
Mr. Minhazuddin Ahmed (From 17.08.16 to 06.09.16)
Mr. Md. Anwarul Islam (From 07.09.16 to 29.12.16)
Mr. Sk. Md. Alauddin (From 29.12.16 to 12.01.17)
Mr. Abul Baser Khan (From 12.01.17)
Mr. Minhazuddin Ahmed (Upto 29.12.16)
Mr. Abul Baser Khan (From 29.12.16 to 12.01.17)
Mr. Md. Mahfuzur Rahman (From 12.01.17 to 16.02.17)
Mr. Abul Baser Khan (From 16.02.17 to 14.03.17)
Mr. Md. Mustafizur Rahman (From 14.03.17)
Member (Company Affairs)
Member (Planing & Development)
Member (Distribution)
Member (Generation)
Member (Finance)
Member (Administration)
Chairman
Mr. Abul Baser Khan (From 12.01.16 to 12.01.17)
Mr. Md. Azharul Islam (From 12.01.17)
About BPDB
Annual 2016-17Report07
Power sector witnessed significant progress in power
generation in the fiscal year 2016-17. During this fiscal year
1586 MW new capacity added from the newly installed power
plants which raised the total generation capacity to 13,555 MW and
annual increment of generation capacity was 9.62%. Out of this new
capacity addition, BPDB installed 588 MW (including contracted capacity of
IPPs) and the remaining 278 MW was installed by NWPGCL, 720 MW was installed
by APSCL. The highest peak generation was 9,479 MW and the total energy
generated 57,276 GWh which was 4.90% and 9.74% higher than the previous year
respectively. Despite increasing electricity demand, average load shedding came down
at a tolerable limit.
Due to gas shortage and inadequate new generation addition in the few years back,
demand of electricity outpaced generation capacity caused persistent load shedding. In
order to mitigate the demand-supply gap, an aggressive plan is prepared by the Government
for new generation addition. As part of the plan, 34 power generation projects of capacity
12,061 MW are now under construction. The plan envisages around 17,752 MW new
generation addition by 2021.
Gas based power generation increased to 6.23% from previous year. Power generation from
liquid fuel increased by 17.11%
In this fiscal year, BPDB sold bulk energy of 53,916 GWh to the distribution utilities including
BPDB zones as single buyer which was 10.27% higher than the previous year. Retail sales of
BPDB's Four distribution zones was 10,002 MkWh, which was 7.56% lower than the
previous year due To handed over of Rajshahi and Rangpur zone to NESCO. Distribution
system loss of BPDB's Four zones came down to 9.27% from 11.01% of previous year.
Collection/Import (C/I) ratio increased to 89.94% from 85.34%. Per capita generation
and consumption (Grid) increased to 351 kWh & 308 kWh from 324 kWh & 281 kWh
respectively of previous year.
The net operating loss in the FY 2016-17 increased to 44.35 Billion Taka
from 38.74 Billion Taka of previous year. The net loss increased from
the previous year mainly due to increased liquid fuel generation
together with substantial fuel price hike in phases over
the period.
HIGHLIGHTS
Annual 2016-17Report08

Year2015-16
Year2016-17
4,508
1,508
622
77
718
149
3,232
1,890
251
600
13,555
9,479
12,644
26,597
24,094
4,656
55,347
1,929
57,276
5.24
70,591
2.76
44.25
66.65
53,937
273,351
274,355
101,433
2.72
5.70
11,024
10,002
65,791
65,218
13,999
99.13
89.94
9.27
12.74
2,526,682
163
351
308
44,349
4,320
904
622
77
440
149
2,974
2,028
251
600
12,365
9,036
11,405
22,585
23,786
3,822
50,193
1,999
52,193
5.10
60,652
3.10
48.07
63.41
48,895
245,744
222,382
105,609
2.73
5.55
12,159
10,820
69,379
66,531
18,696
95.90
85.34
11.01
13.10
3,457,263
161
324
281
38,738
4.35
66.81
0.00
0.00
63.18
0.00
8.68
-6.80
0.00
0.00
9.62
4.90
10.86
17.76
1.30
21.81
10.27
-3.51
9.74
2.75
16.39
-10.97
-7.95
5.11
10.31
11.23
23.37
-3.95
-0.37
2.70
-9.33
-7.56
-5.17
-1.97
-25.13
3.37
5.39
-15.80
-6.56
-26.92
1.24
8.45
9.74
14.48
1
2
3
4
5
6
7
8
9
10
11
12
13
14
15
16
17
18
Note : Maximum Demand is shown as per power system master plan 2010.
% Changeover the
previous year
Installed Capacity of Power Plants as of June (MW): a) Public Sector
i) BPDB
ii) APSCL
iii) EGCB
iv) RPCL
v) NWPGCL
vi) BPDB-RPCL JV
b) Private Sector :
i) IPP/SIPP
ii) Rental
c) REB (for PBS's only)
d) Energy Import
e) System Total Installed Capacity (MW)Maximum Peak Generation (MW)
Maximum Peak Demand (MW)
Net Energy generation (GWh):
a) i) Public Sectors
ii) Private Sectors (IPP, SIPP and Rental)
iii) Energy Import
iv) Total Generation (In account of Single Buyer)b) REB (for PBS's only)
c) System Total Generation (GWh)Per Unit Generation Cost in Public & Private (Tk/Kwh)
a) Fuel Cost for Thermal Plants in Public Sector (MTk)
b) Per Unit fuel Cost for thermal Plants (Tk/KWh)
Annual Plant Factor of Public Sector's Power Plants (%)
System load factor (%)
BPDB's Commercial Activities as Single Buyer :
a) Bulk Sales Unit to Utilities (GWh)
b) Bulk Billing Amount (MTk)
c) Bulk Collection Amount (MTk)
d) Accounts Receivables to Utilities (MTk)
Transmission Loss (%)
Ave. Bulk Electricity Supply cost Taka/kWh
BPDB's Commercial Activities with in Distribution Zones :
a) Energy Imports for Retail Sale (MKWh)
b) Retail Sales Unit (MKWh)
c) Retail Billing Amount (MTk)
d) Retail Collection Amount (MTk)
e) Accounts Receivables to Retail Consumers (MTk)
f ) Collection/Bill Ratio (%)
g) Collection/Import Ratio (%)
h) Distribution System loss (%)
Transmission and Distribution (T & D) system Loss (%)
Total Number of consumers of BPDB (Nos.)
Total Population in the Country (Million)
Per capita generation (kWh)
Per capita Consumption (kWh)
Net profit/(loss) (MTk)
S.N. Particulars
KEY STATISTICS
Annual 2016-17Report09
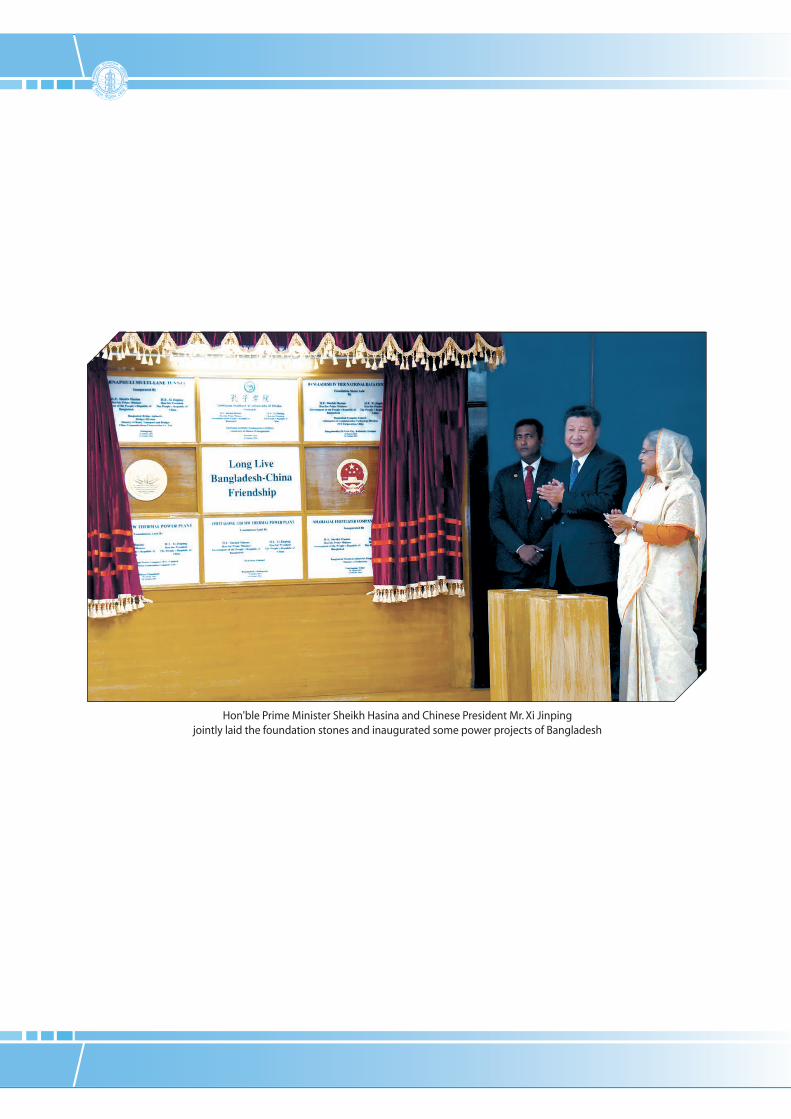
Hon'ble Prime Minister Sheikh Hasina and Chinese President Mr. Xi Jinpingjointly laid the foundation stones and inaugurated some power projects of Bangladesh
Chapter 1
Overview onBPDB Operation
Demand of electricity is increasing rapidly due to
enhanced economic activities in the country with
sustained GDP growth. At present, growth of demand is
about 10% which is expected to be more in coming
years. The maximum demand in this fiscal year was
12,644 MW (as per PSMP-2010).
off-peak hour by introducing some mechanism is termed
as load management. From the view point of load
management, (i) two-part tariff is introduced for 3-phase
consumers (LT & HT) where peak hour price is much
higher than the off-peak hour that motivates consumers
to avoid or use less in the peak hour; (ii) Market &
Shopping malls are kept close after 8.00 PM; (iii) holiday
staggering is implemented to keep industries, markets &
shopping malls close on area basis holiday marked day;
(iv) consumers are encouraged to use energy efficient
bulb, electric appliances, pumps, etc; (v) consumers are
encouraged to keep their air-conditioner's temperature
at 25 degree and so on. These measures also minimize
load-shedding across the country.
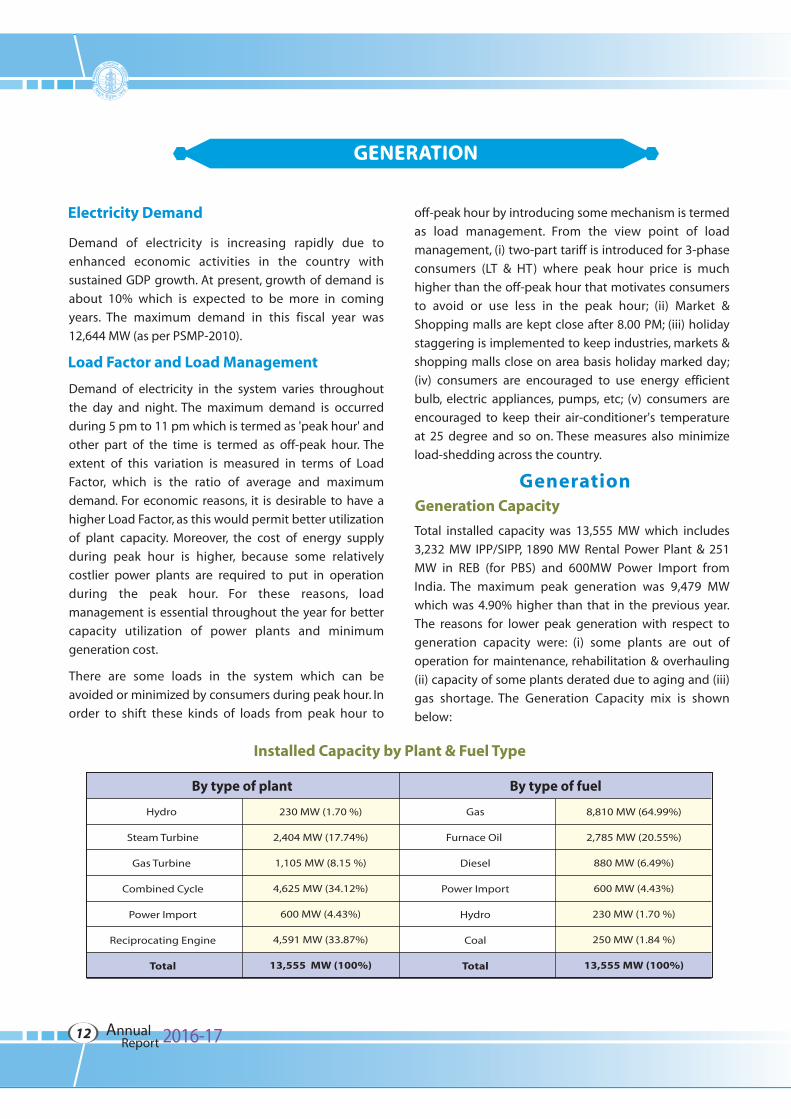
Total installed capacity was 13,555 MW which includes
3,232 MW IPP/SIPP, 1890 MW Rental Power Plant & 251
MW in REB (for PBS) and 600MW Power Import from
India. The maximum peak generation was 9,479 MW
which was 4.90% higher than that in the previous year.
The reasons for lower peak generation with respect to
generation capacity were: (i) some plants are out of
operation for maintenance, rehabilitation & overhauling
(ii) capacity of some plants derated due to aging and (iii)
gas shortage. The Generation Capacity mix is shown
below:
Demand of electricity in the system varies throughout
the day and night. The maximum demand is occurred
during 5 pm to 11 pm which is termed as 'peak hour' and
other part of the time is termed as off-peak hour. The
extent of this variation is measured in terms of Load
Factor, which is the ratio of average and maximum
demand. For economic reasons, it is desirable to have a
higher Load Factor, as this would permit better utilization
of plant capacity. Moreover, the cost of energy supply
during peak hour is higher, because some relatively
costlier power plants are required to put in operation
during the peak hour. For these reasons, load
management is essential throughout the year for better
capacity utilization of power plants and minimum
generation cost.
There are some loads in the system which can be
avoided or minimized by consumers during peak hour. In
order to shift these kinds of loads from peak hour to
Electricity Demand
Load Factor and Load Management
Generation Capacity
Installed Capacity by Plant & Fuel Type
Generation
By type of plant By type of fuel
Hydro
Steam Turbine
Gas Turbine
Combined Cycle
Power Import
Reciprocating Engine
Total
Gas
Furnace Oil
Diesel
Power Import
Hydro
Coal
Total
230 MW (1.70 %)
2,404 MW (17.74%)
1,105 MW (8.15 %)
4,625 MW (34.12%)
600 MW (4.43%)
4,591 MW (33.87%)
13,555 MW (100%)
8,810 MW (64.99%)
2,785 MW (20.55%)
880 MW (6.49%)
600 MW (4.43%)
230 MW (1.70 %)
250 MW (1.84 %)
13,555 MW (100%)
Annual 2016-17Report12
Total net energy generation in FY 2017 was 57,276 GWh, which was about 9.74% higher than previous year's net generation
of 52,193 GWh. Net energy generation in the public sector was 26,597 GWh and 26,023 GWh in the private sector (including
REB). Another 4,656 GWh was imported from India through the interconnection in Bheramara and Tripura.
Total net energy generated in public and private sector power plants by type of fuel are as follows:
Energy Generation
The overall thermal efficiency (Net) of the public sector power plants in FY 2017 was 34.58%, higher than previous year's of 33.15 % efficiency.
Below the list of major power plants were under maintenance in the year under review:
Plant Efficiency and Maintenance
Maintenance of Power Plants In FY 2016-17
Sl.No.
Name of Power Station
Duration of Maintenance
Starting Date
PresentCapacity
(MW)
Type of Maintenance
(HGPI/MI/OH) CompletionDate
Hydro
Natural Gas
Furnace Oil
Diesel
Coal
Power Import
Total
982 GWh (1.72%)
38,052 GWh (66.43%)
9,950 GWh (17.37%)
2,627 GWh (4.58%)
1009 GWh (1.76%)
4,656 GWh (8.13%)
57,276 GWh (100%)
Ghorashal ST Unit -5
Fenchugonj Unit-2 GT-4
Bhola CCPP GT1
Bhola CCPP GT2
Haripur GT
Tongi GT
01-10-2016
25-04-2017
22-12-2016
07-05-2017
28-10-2016
05-09-2016
Continue
25-05-2017
11-01-2017
21-05-2017
06-11-2016
30-11-2016
190
30
63
63
30
105
OH
HGPI
CI
CI
CI
Major Inspection
1.
2.
3.
4.
5.
6.
Signing of contract between BPDB andConsortium of LLC Inter RAO & IED holding Russia for overhauling work of Siddhirganj 210 MW power plant
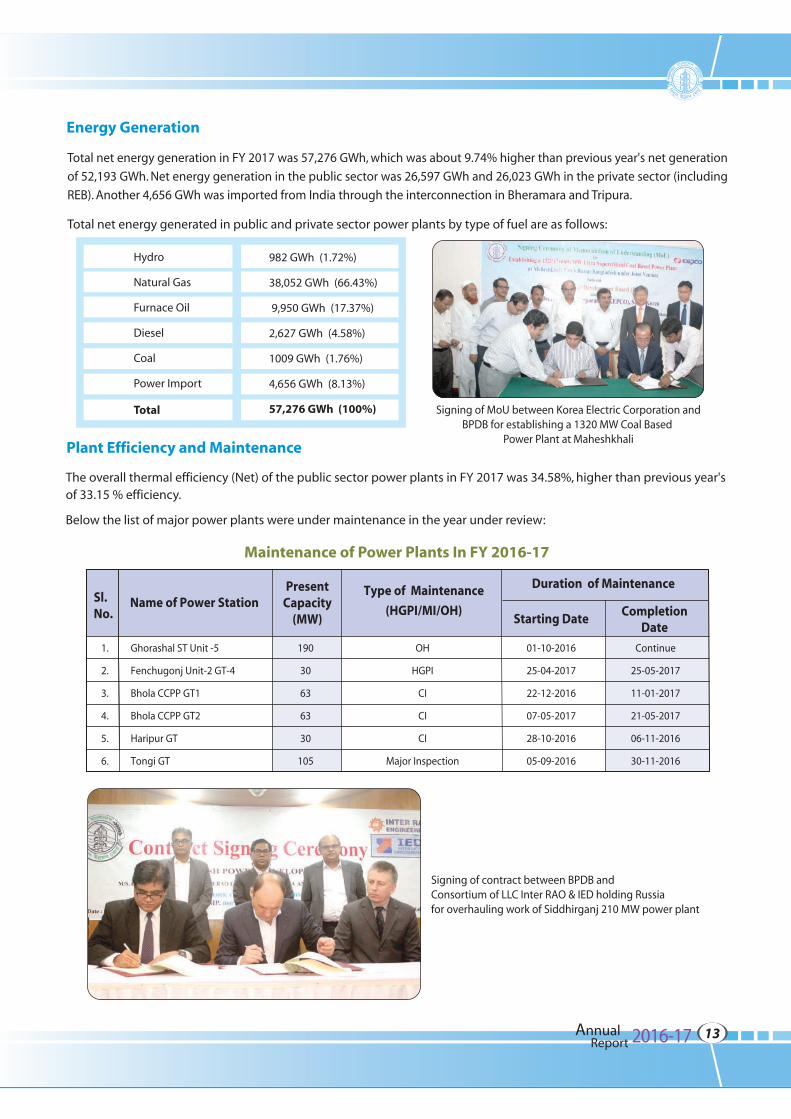
Signing of MoU between Korea Electric Corporation andBPDB for establishing a 1320 MW Coal Based
Power Plant at Maheshkhali
Annual 2016-17Report13
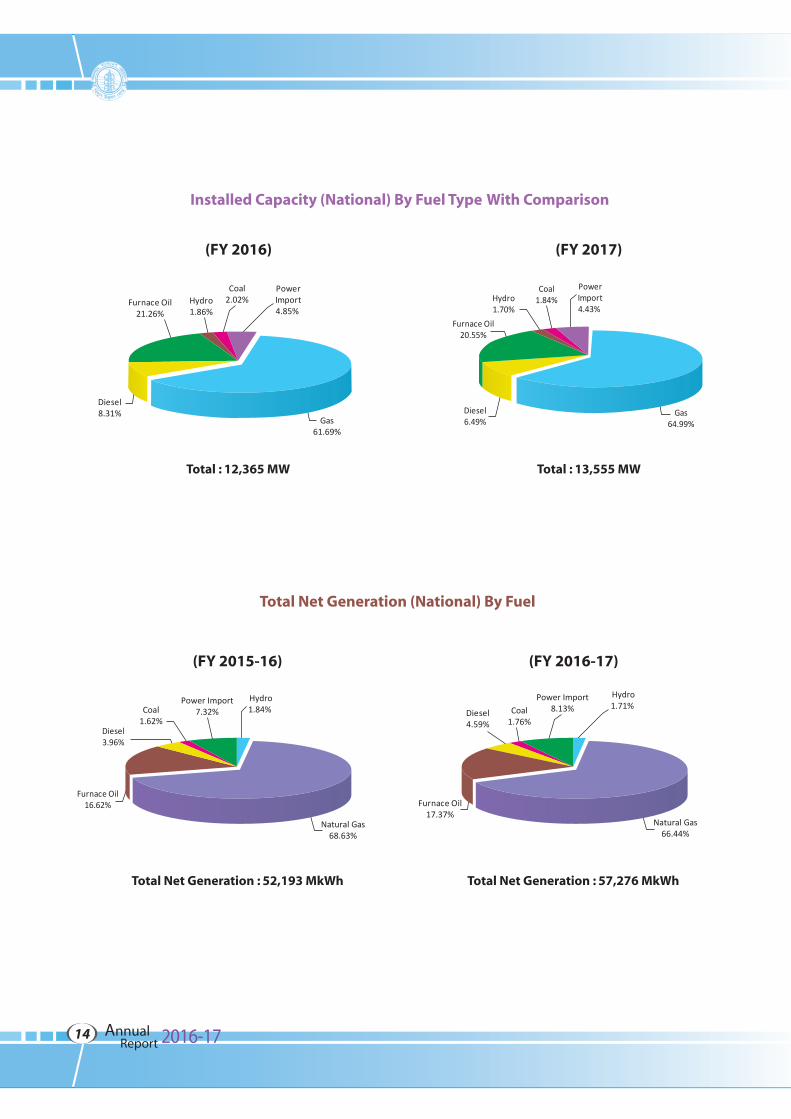
Installed Capacity (National) By Fuel Type With Comparison
(FY 2016) (FY 2017)
Total Net Generation (National) By Fuel
Total : 13,555 MW
Gas64.99%
Diesel6.49%
Furnace Oil20.55%
Hydro1.70%
Coal1.84%
PowerImport4.43%
Total : 12,365 MW
PowerImport4.85%
Gas61.69%
Diesel8.31%
Furnace Oil21.26%
Hydro1.86%
Coal2.02%
(FY 2016-17)
Total Net Generation : 57,276 MkWh
Hydro1.71%
Natural Gas66.44%
Furnace Oil17.37%
Diesel4.59%
Coal1.76%
Power Import8.13%
(FY 2015-16)
Total Net Generation : 52,193 MkWh
Natural Gas68.63%
Furnace Oil16.62%
Diesel3.96%
Coal1.62%
Power Import7.32%
Hydro1.84%
Annual 2016-17Report14
Transmission Line
Grid Sub-stations
During fiscal year 2016-17, very significant transmission components have been added to the system because of the completion of different project works. Ttransmission line length (ckt. km) has enlarged by 5.49% than that of previous year. The line details are as below:
Total length of 400KV transmission line increased to 559.76 circuit km from the previous year of 221circuit km and 230 kV transmission line increased to 3325 circuit km from the previous year of 3,185 circuit km. The total length of 132 kV transmission line increased to 6551 circuit km from the previous year of 6,487 circuit km.
During fiscal year 2016-17, very significant transmission components have been added to the system because of the completion of different project works. The transformer capacity at the end of year 2016-17 has enlarged by 5.50% at difference voltage level. The substations capacity details are as below:
S.N.
1.
2.
3.
4.
5.
Kaliakoir 400/230 kV substation
Kaliakoir 400/132 kV substation
Bheramara 230/132 kV substation (NWPGCL)
Kodda 132/33 kV substation
Rooppur 132/11 kV substation
1x520 MVA
2 x 325 MVA
2x300 MVA
4x50/75 MVA
1x25/41 MVA
Substation Name Capacity
S.N. Transmission Line Conductor Name & Size Length (Circuit km.)
339.06
127.83
12
17.12
47
Total 543.01 ckt.km
1.
2.
3.
4.
5.
Bibiyana-Kaliakoir 400kV double circuit transmission line
LILO of Aminbazar-Tongi 230kV double circuit transmission line at Kaliakoir
Bheramara Power Plant- Bheramara HVDC 230kV double circuit transmission line (NWPGCL)
LILO of Kabirpur-Tangail 132kV double circuit transmission line at Kaliakoir
Khulna (S)- Satkhira 132kV line second circuit stringing
Twin Finch1113 MCM
Twin AAAC37/4.176 mm.
Twin AAAC37/4.176 mm.
Grosbeak636 MCM
AAAC804 MCM
New Sub-stations
Annual 2016-17Report15
Augmentation of Existing Sub-station Capacity
Transmission Summary
01
02
03
560
3325
6551
10,436
2.72 %
400 kV Transmission Line
230 kV Transmission Line
132 kV Transmission Line
Total Transmission Line
Transmission Loss (%)
1.
2.
3.
4.
5.
No of Substation Capacity (MVA)Sub-station Type
Total
1
1
1
24
117
144
625
1560
650
11485
14298
28,618
400 kV HVDC Sub-Station (MVA)
400/230 kV Sub-Station Capacity (MVA)
400/132 kV Sub-Station Capacity (MVA)
230/132 kV Sub-Station Capacity (MVA)
132/33 kV Sub-Station Capacity (MVA)
Bibiyana 400/230 kV Substation
Sikalbaha 230/132 kV Substation
Amnura 132/33 kV Substation
Bogra 132/33 kV Substation
Chowmuhani 132/33 kV Substation
Cox's Bazar 132/33 kV Substation
Dhanmondi 132/33 kV Substation (DPDC)
Fenchuganj 132/33 kV Substation
Jessore 132/33 kV Substation
Jhenaidah 132/33 kV Substation
Joypurhat 132/33 kV Substation
Kabirpur 132/33 kV Substation
Kamrangirchar 132/33 kV Substation (DPDC)
Khulshi 132/33 kV Substation
Madaripur 132/33 kV Substation
Mymensingh 132/33 kV Substation
Narsingdi 132/33 kV Substation
Natore 132/33 kV Substation
Niyamatpur 132/33 kV Substation
Purbasadipur 132/33 kV Substation
Shahjibazar 132/33 kV Substation
Sitalakhya 132/33 kV Substation (DPDC)
Tangail 132/33 kV Substation
1
2
3
4
5
6
7
8
9
10
11
12
13
14
15
16
17
18
19
20
21
22
23
520 MVA
300 MVA
50 MVA
158 MVA
45 MVA
75 MVA
75 MVA
20 MVA
80 MVA
79 MVA
82 MVA
37 MVA
75 MVA
80 MVA
34 MVA
90 MVA
75 MVA
40 MVA
41 MVA
55 MVA
75 MVA
75 MVA
75 MVA
Substation Name CapacityS.N.
S.N. Circuit kmTransmission Line Type
S. N.
Annual 2016-17Report16
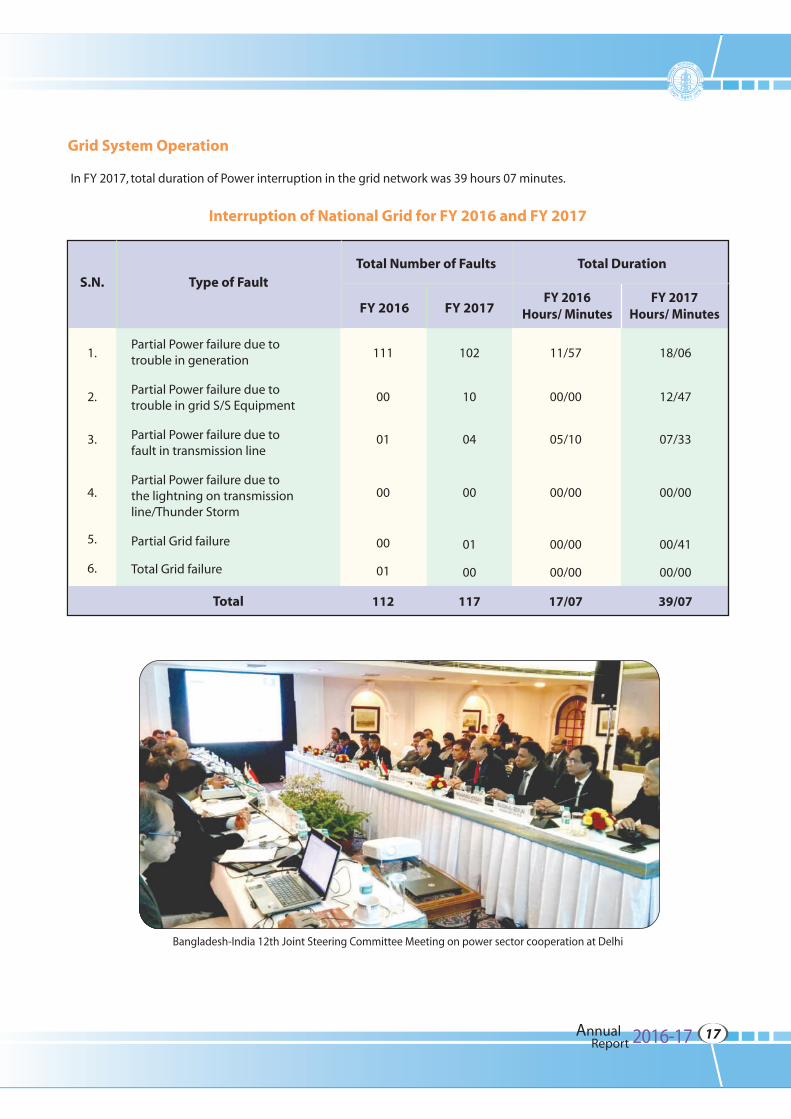
In FY 2017, total duration of Power interruption in the grid network was 39 hours 07 minutes.
Grid System Operation
Interruption of National Grid for FY 2016 and FY 2017
S.N. Type of FaultTotal Number of Faults
FY 2017FY 2017
Hours/ Minutes
Total Duration
1.
2.
3.
4.
5.
6.
Partial Power failure due totrouble in generation
Partial Power failure due totrouble in grid S/S Equipment
Partial Power failure due tofault in transmission line
Partial Power failure due tothe lightning on transmissionline/Thunder Storm
Partial Grid failure
Total Grid failure
111
00
01
00
00
01
112
102
10
04
00
01
00
117
11/57
00/00
05/10
00/00
00/00
00/00
17/07
18/06
12/47
07/33
00/00
00/41
00/00
39/07Total
FY 2016FY 2016
Hours/ Minutes
Bangladesh-India 12th Joint Steering Committee Meeting on power sector cooperation at Delhi
Annual 2016-17Report17
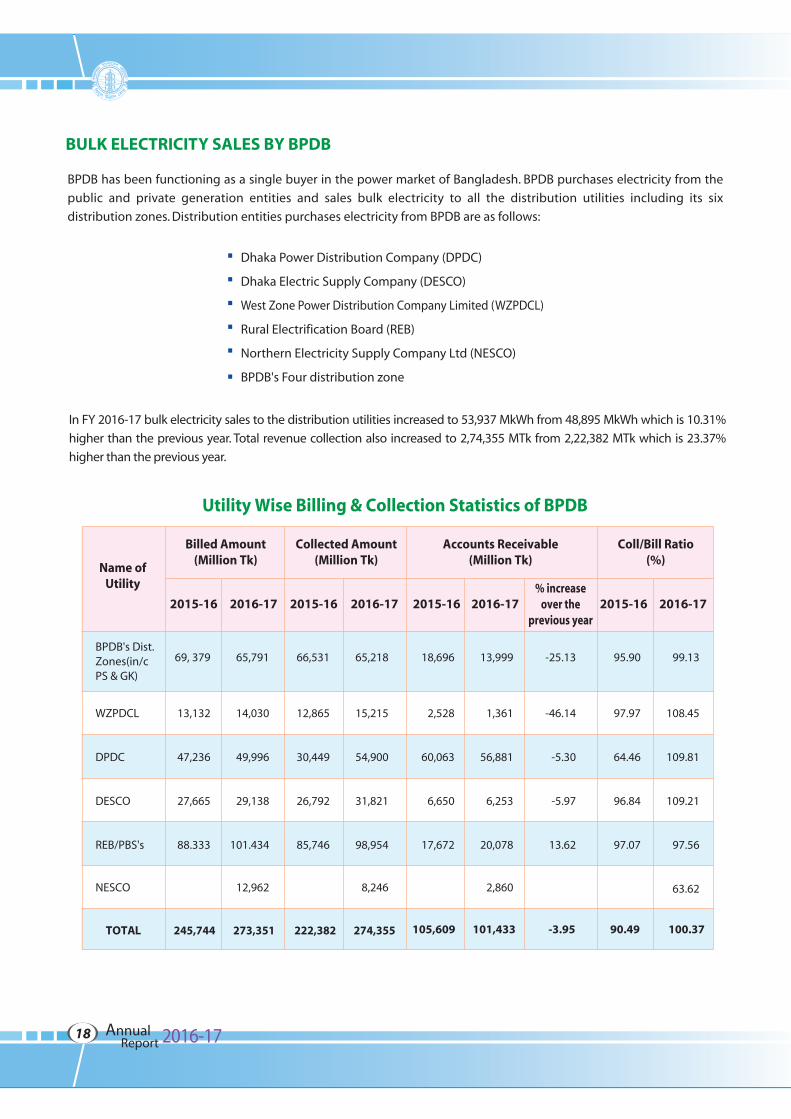
BULK ELECTRICITY SALES BY BPDB
BPDB has been functioning as a single buyer in the power market of Bangladesh. BPDB purchases electricity from the
public and private generation entities and sales bulk electricity to all the distribution utilities including its six
distribution zones. Distribution entities purchases electricity from BPDB are as follows:
In FY 2016-17 bulk electricity sales to the distribution utilities increased to 53,937 MkWh from 48,895 MkWh which is 10.31%
higher than the previous year. Total revenue collection also increased to 2,74,355 MTk from 2,22,382 MTk which is 23.37%
higher than the previous year.
Dhaka Power Distribution Company (DPDC)
Dhaka Electric Supply Company (DESCO)
West Zone Power Distribution Company Limited (WZPDCL)
Rural Electrification Board (REB)
Northern Electricity Supply Company Ltd (NESCO)
BPDB's Four distribution zone
TOTAL 273,351 274,355 101,433 -3.95 100.37
2016-17 2016-17 2016-17 2016-17
69, 379
13,132
47,236
27,665
88.333
65,791
14,030
49,996
29,138
101.434
12,962
BPDB's Dist.Zones(in/cPS & GK)
WZPDCL
DPDC
DESCO
REB/PBS's
NESCO
66,531
12,865
30,449
26,792
85,746
65,218
15,215
54,900
31,821
98,954
8,246
18,696
2,528
60,063
6,650
17,672
-25.13
-46.14
-5.30
-5.97
13.62
13,999
1,361
56,881
6,253
20,078
2,860
95.90
97.97
64.46
96.84
97.07
99.13
108.45
109.81
109.21
97.56
63.62
2015-16
222,382
2015-16
245,744 105,609
2015-16
90.49
2015-16% increase
over theprevious year
Accounts Receivable(Million Tk)
Collected Amount(Million Tk)
Billed Amount(Million Tk)
Coll/Bill Ratio(%)
Name ofUtility
Utility Wise Billing & Collection Statistics of BPDB
Annual 2016-17Report18
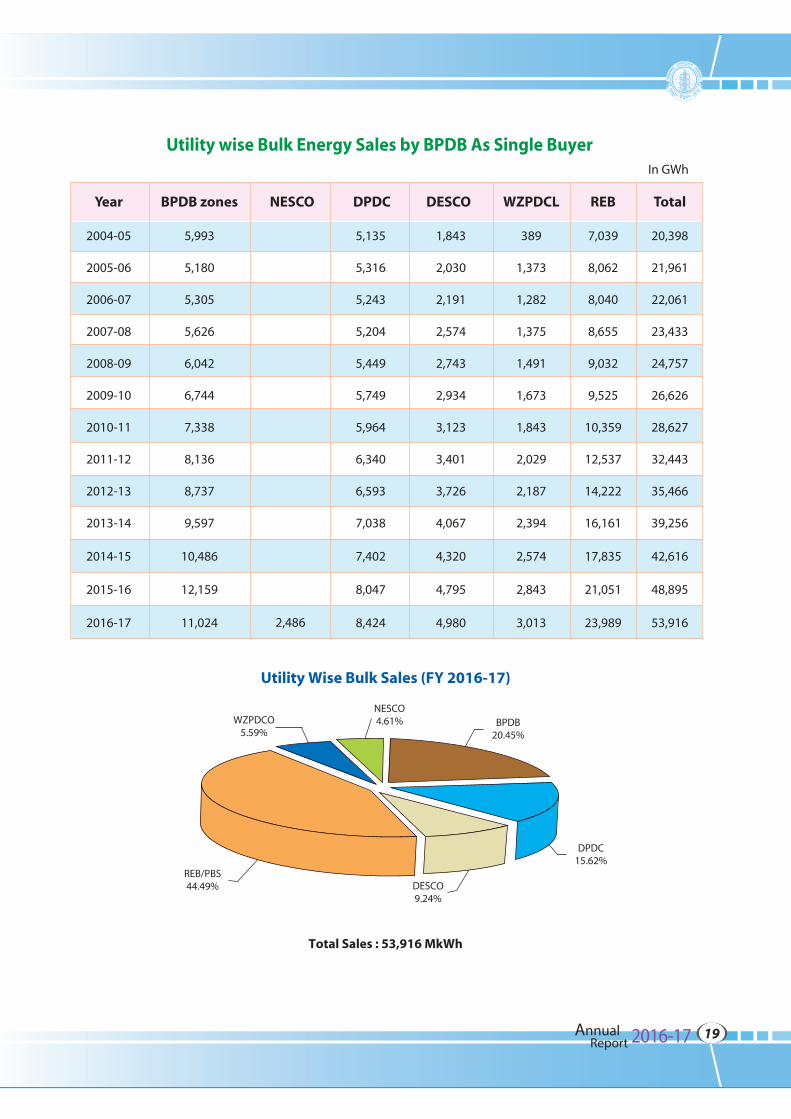
Utility Wise Bulk Sales (FY 2016-17)
2004-05
2005-06
2006-07
2007-08
2008-09
2009-10
2010-11
2011-12
2012-13
2013-14
2014-15
2015-16
2016-17
Year BPDB zones DPDC DESCO WZPDCL
Utility wise Bulk Energy Sales by BPDB As Single BuyerIn GWh
REB Total
5,993
5,180
5,305
5,626
6,042
6,744
7,338
8,136
8,737
9,597
10,486
12,159
11,024
5,135
5,316
5,243
5,204
5,449
5,749
5,964
6,340
6,593
7,038
7,402
8,047
8,424
NESCO
1,843
2,030
2,191
2,574
2,743
2,934
3,123
3,401
3,726
4,067
4,320
4,795
4,980
389
1,373
1,282
1,375
1,491
1,673
1,843
2,029
2,187
2,394
2,574
2,843
3,013
7,039
8,062
8,040
8,655
9,032
9,525
10,359
12,537
14,222
16,161
17,835
21,051
23,989
20,398
21,961
22,061
23,433
24,757
26,626
28,627
32,443
35,466
39,256
42,616
48,895
53,916
Total Sales : 53,916 MkWh
BPDB20.45%
DPDC15.62%
DESCO9.24%
REB/PBS44.49%
WZPDCO5.59%
NESCO4.61%
2,486
Annual 2016-17Report19
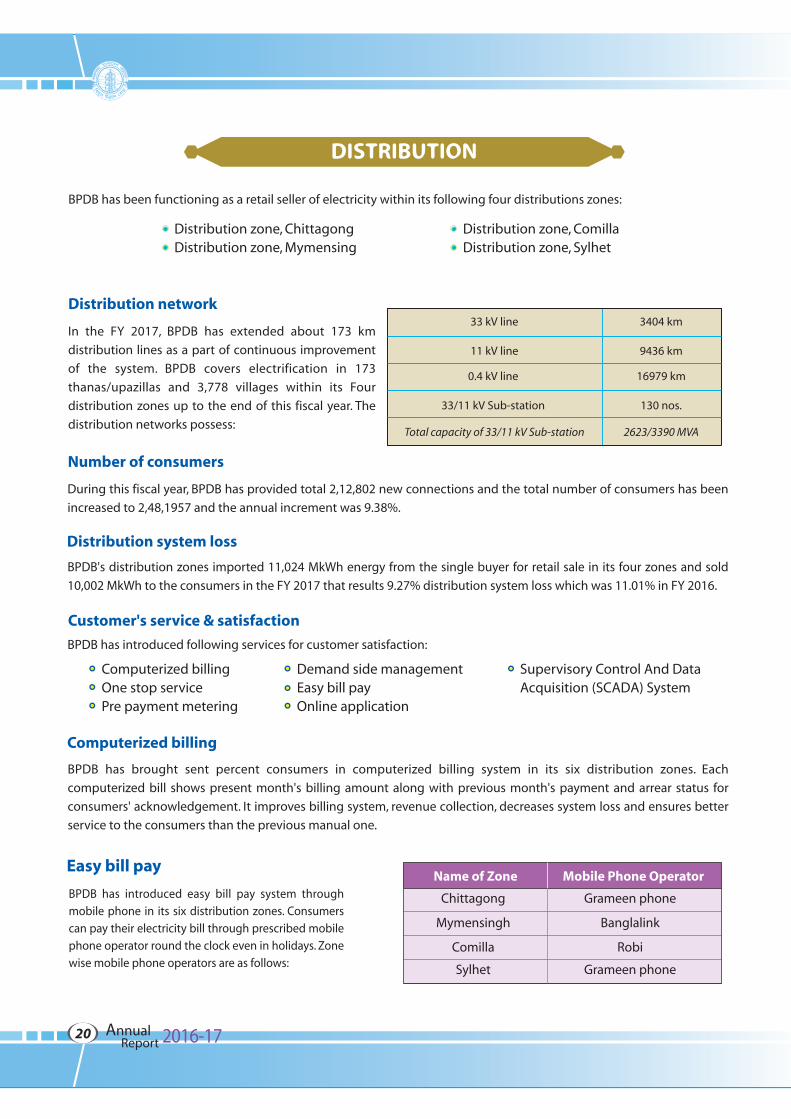
Distribution network
BPDB has been functioning as a retail seller of electricity within its following four distributions zones:
In the FY 2017, BPDB has extended about 173 km
distribution lines as a part of continuous improvement
of the system. BPDB covers electrification in 173
thanas/upazillas and 3,778 villages within its Four
distribution zones up to the end of this fiscal year. The
distribution networks possess:
Distribution zone, ChittagongDistribution zone, Mymensing
Distribution zone, ComillaDistribution zone, Sylhet
33 kV line
11 kV line
0.4 kV line
33/11 kV Sub-station
Total capacity of 33/11 kV Sub-station
3404 km
9436 km
16979 km
130 nos.
2623/3390 MVA
Number of consumers
Distribution system loss
Customer's service & satisfaction
Computerized billing
During this fiscal year, BPDB has provided total 2,12,802 new connections and the total number of consumers has been
increased to 2,48,1957 and the annual increment was 9.38%.
BPDB's distribution zones imported 11,024 MkWh energy from the single buyer for retail sale in its four zones and sold
10,002 MkWh to the consumers in the FY 2017 that results 9.27% distribution system loss which was 11.01% in FY 2016.
BPDB has brought sent percent consumers in computerized billing system in its six distribution zones. Each
computerized bill shows present month's billing amount along with previous month's payment and arrear status for
consumers' acknowledgement. It improves billing system, revenue collection, decreases system loss and ensures better
service to the consumers than the previous manual one.
BPDB has introduced following services for customer satisfaction:
Computerized billing One stop service Pre payment metering
Supervisory Control And Data Acquisition (SCADA) System
Easy bill pay
BPDB has introduced easy bill pay system through
mobile phone in its six distribution zones. Consumers
can pay their electricity bill through prescribed mobile
phone operator round the clock even in holidays. Zone
wise mobile phone operators are as follows:
Demand side managementEasy bill pay Online application
Chittagong
Mymensingh
Comilla
Sylhet
Grameen phone
Banglalink
Robi
Grameen phone
Name of Zone Mobile Phone Operator
Annual 2016-17Report20
One stop service
Online application
Pre-payment metering
SCADA
BPDB has introduced one stop service in each S&D division/ESU in order to provide hassle free
service for its consumers. Every S&D division/ESU has one designated desk for one stop
service. Any consumer can lodge his complain on that desk and the officer-in-charge is
empowered to do all necessary things in order to address the complain.
BPDB has introduced on line application facilities for new connection on test basis in
distribution zone, Chittagong. Any applicant can apply round the clock for new connection of
his house, shop, industry, etc. from the website of distribution zone, BPDB, Chittagong. BPDB
also has a plan to develop similar facilities in its other distribution zones depending on the
responsiveness of consumers of Chittagong zonal area.
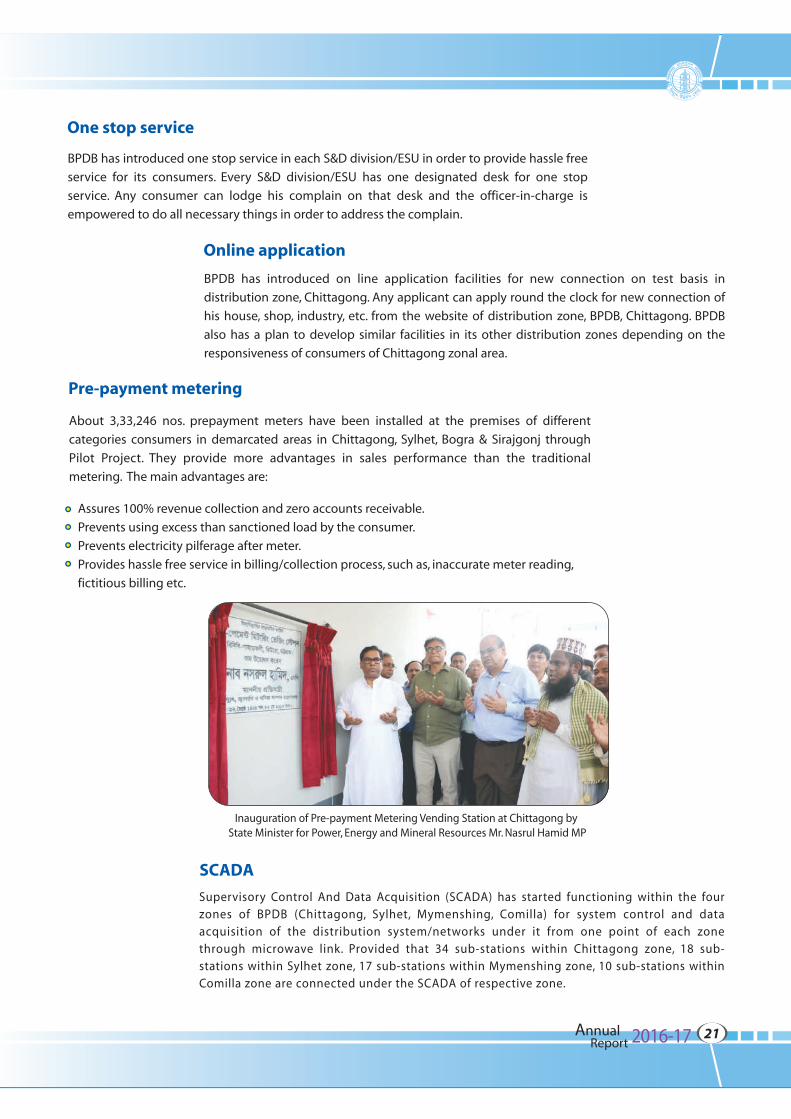
About 3,33,246 nos. prepayment meters have been installed at the premises of different
categories consumers in demarcated areas in Chittagong, Sylhet, Bogra & Sirajgonj through
Pilot Project. They provide more advantages in sales performance than the traditional
metering. The main advantages are:
Supervisory Control And Data Acquisition (SCADA) has started functioning within the four zones of BPDB (Chittagong, Sylhet, Mymenshing, Comilla) for system control and data acquisition of the distribution system/networks under it from one point of each zone through microwave link. Provided that 34 sub-stations within Chittagong zone, 18 sub-stations within Sylhet zone, 17 sub-stations within Mymenshing zone, 10 sub-stations within Comilla zone are connected under the SCADA of respective zone.
Assures 100% revenue collection and zero accounts receivable.
Prevents using excess than sanctioned load by the consumer.
Prevents electricity pilferage after meter.
Provides hassle free service in billing/collection process, such as, inaccurate meter reading,
fictitious billing etc.
Inauguration of Pre-payment Metering Vending Station at Chittagong by State Minister for Power, Energy and Mineral Resources Mr. Nasrul Hamid MP
Annual 2016-17Report21
Demand side managementDemand-side management (DSM) means modifying energy use to maximize energy efficiency. DSM tries to get maximum benefit out of existing energy generation. DSM involves changing energy use habits of consumers and encouraging them for using energy efficient appliances, equipment etc. at
their premises.
To keep load shedding at a minimum level, BPDB has taken a number of steps for demand side management,
which are as follows:
To shift irrigation load from peak hour to off peak hour, BPDB has started campaign through electronic and print media. In the last few years, it is estimated that about 500 MW irrigation load was shifted from peak
hour to off peak hour.
BPDB has taken motivational programs to enhance awareness of the consumers during peak hours. Consumers are being urged through electronic and print media to be rational and economical in electricity use during peak hour by switching off unnecessary loads like extra lighting, ironing, pumps, air conditioners, welding machines etc.
As part of demand side management program, BPDB has taken steps to use CFL in BPDB's offices and also trying to motivate consumers to use Energy efficient lamps.
Industries operating in two shifts are being requested not to operate during peak hours.
Holiday staggering for industries has been implemented, which contributes about 200 MW load
shifting.
Load Management Committee has been formed in every distribution zone/circle/division to monitor
the proper load distribution during irrigation.
As part of DSM, BPDB is monitoring shop/market closure time at 8 p.m. It is estimated that this measure contributes about 400 MW load shifting from peak hour, there by reduces load shedding.
BPDB also has a plan to set up one SCADA in Dhaka to monitor/controll all SCADA of BPDB centrally. Key functionsof SCADA are:
Supervising/Monitoring the networks under it continuously on its computer monitors round the clock and controls the power supply of the networks from the supervisors desk as and when necessary in a systematic manner as directed by the authority
concerned.
Preparing and reporting daily and monthly power supply, demand, load shedding, line shut-down, etc. of each circuit of the networks under it to authorities concerned for system planning.
Preparing power supply, demand, load shedding, line shut-down, etc. report for any specified span of time as wanted by the authorities concerned for system
planning.
Data acquisition and recording of power flow/supply status through each circuit of the entire networks on hourly basis round the clock for reporting to authorities concerned and analyzing demand, power factor & other necessary elements of each circuit for system management within the SCADA in an smart manner.
Load management matching with the power generation as per instructions of NLDC or authority concerned in order to keep the overall system
healthy.
Appraising all important information regarding
system to the authorities concerned as and when
required.
Annual 2016-17Report22
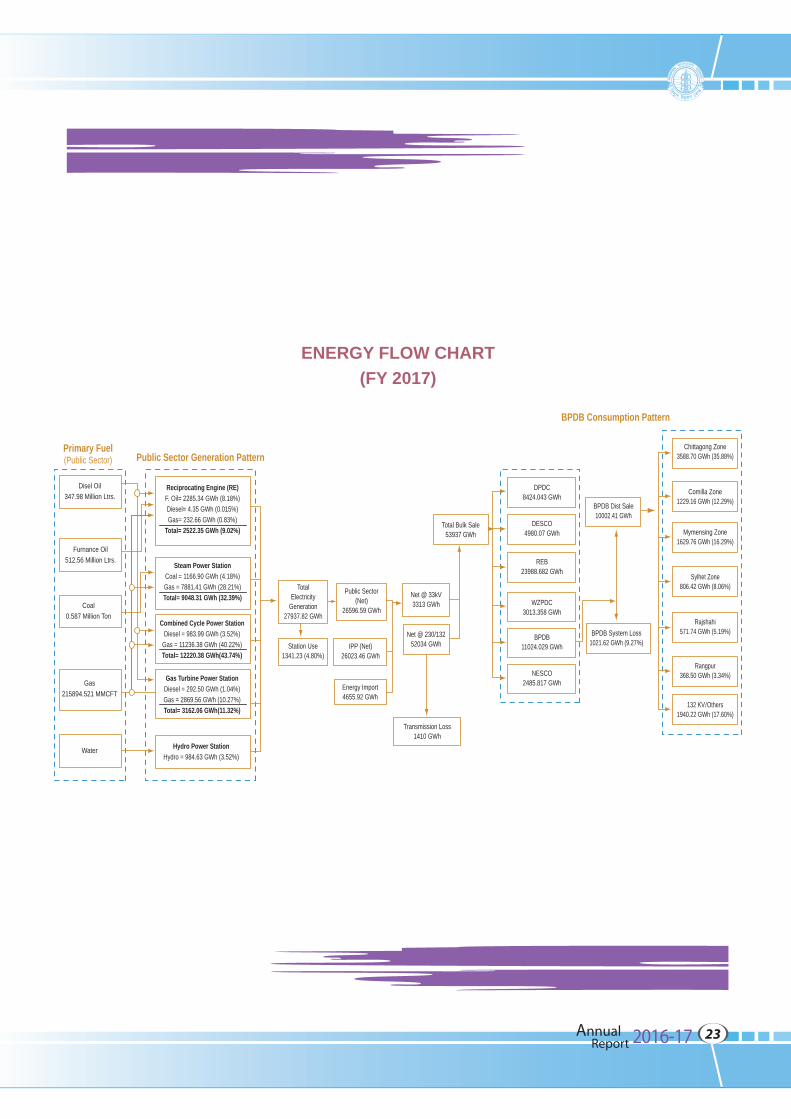
Disel Oil347.98 Million Ltrs.
Furnance Oil512.56 Million Ltrs.
Coal0.587 Million Ton
Gas215894.521 MMCFT
Water
Reciprocating Engine (RE)F. Oil= 2285.34 GWh (8.18%)Diesel= 4.35 GWh (0.015%)Gas= 232.66 GWh (0.83%)
Total= 2522.35 GWh (9.02%)
Steam Power StationCoal = 1166.90 GWh (4.18%)Gas = 7881.41 GWh (28.21%)Total= 9048.31 GWh (32.39%)
TotalElectricity
Generation27937.82 GWh
Public Sector(Net)
26596.59 GWh
Net @ 33kV3313 GWh
Total Bulk Sale53937 GWh
DPDC8424.043 GWh
DESCO4980.07 GWh
WZPDC3013.358 GWh
BPDB11024.029 GWh
NESCO2485.817 GWh
BPDB Dist Sale10002.41 GWh
Chittagong Zone3588.70 GWh (35.88%)
Comilla Zone1229.16 GWh (12.29%)
Mymensing Zone1629.76 GWh (16.29%)
Sylhet Zone806.42 GWh (8.06%)
Rajshahi571.74 GWh (5.19%)
Rangpur368.50 GWh (3.34%)
132 KV/Others1940.22 GWh (17.60%)
BPDB System Loss1021.62 GWh (9.27%)
REB23988.682 GWh
Net @ 230/13252034 GWh
Transmission Loss1410 GWh
IPP (Net)26023.46 GWh
Energy Import4655.92 GWh
Station Use1341.23 (4.80%)
Gas Turbine Power StationDiesel = 292.50 GWh (1.04%)Gas = 2869.56 GWh (10.27%)Total= 3162.06 GWh(11.32%)
Combined Cycle Power StationDiesel = 983.99 GWh (3.52%)
Gas = 11236.38 GWh (40.22%)Total= 12220.38 GWh(43.74%)
Hydro Power StationHydro = 984.63 GWh (3.52%)
Primary Fuel(Public Sector) Public Sector Generation Pattern
BPDB Consumption Pattern
ENERGY FLOW CHART(FY 2017)
Annual 2016-17Report23

Inauguration of Power and Energy Week-2016 by Hon'ble Prime Minister Sheikh Hasina
Chapter 2
Power SectorDevelopment Plan
Power Sector Scenario
Electricity plays the most basic role in the economic growth through
sustainable structure as well as poverty eradication and security of any
country. Reliable electricity supply is a vital issue for the world today. Future
economic growth crucially depends on the long-term availability of electricity,
which are affordable, available and environmentally friendly. Security, climate change,
and public health are closely interrelated with electricity. In line with this aspect,
Bangladesh Government designed a extensive power generation plan to create sustainable
growth of power sector and for overall development of the country economy.
Present installed generation capacity in public, private & import sector is 13,555MW. Out of this,
public sector possesses 7,582 MW (56%) & import 600MW (4%). Electricity demand is increasing
whereas the available generation also increases against with demand. In the public sector, a number
of generation units have become very old and has been operating at a reduced capacity. Moreover,
most of the existing power plants are gas based. Due to shortage of gas supply, some power plants are
unable to reach their usual generation capability. Up to date, maximum generation achieved is 9,479
MW on June 7, 2017. At present, 80% of the total population has access to electricity and per capita
generation has increased to 433 kWh (including captive). Now Bangladesh has shown implausible
achievement in power sector. The target of the government has been implemented successfully and
has even been able to achieve the higher level of growth economic growth.
Long Term Power Generation Plan
A long-term plan of electricity generation against the demand up to 2030 has been incorporated
in the PSMP 2010. Under the plan, generation capacity requirement in 2021 will be 24,000 MW
against the demand of 20,000 MW and in 2030 generation capacity will be 39,000 MW against
the demand of 33,000 MW. Around 50 % power will be generated from the domestic and
imported coal and 23 % will be generated from Gas /LNG out of the total generation
capacity 39,000 MW in 2030.
The PSMP is updated after each and every 5 years due to change of planning
perspective. As per planning perspective, PSMP- 2016 has been compiled including
the strategy of diversifying primary fuel supply. The plan period of this study is
2016-2041. This master plan has been published soon after the approval of
the government. The plan will be implemented to reach the middle
income and develop country.
Power Sector of Bangladesh
Annual 2016-17Report26
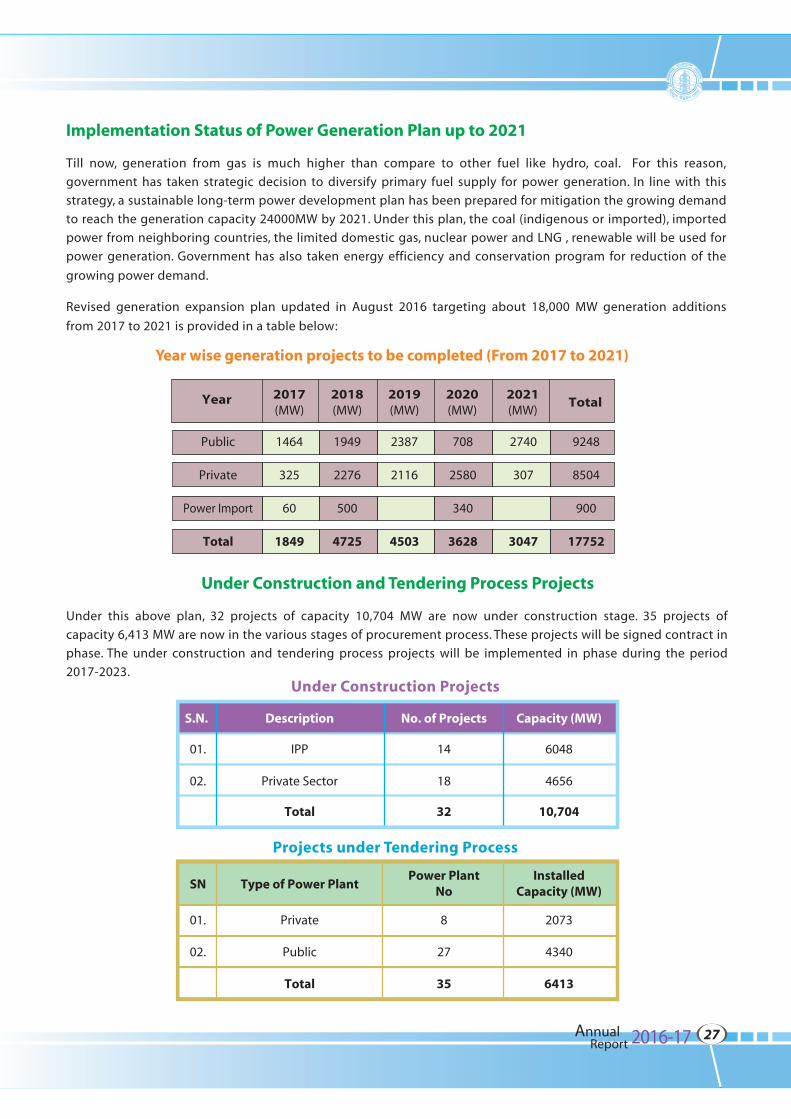
Implementation Status of Power Generation Plan up to 2021
Under Construction and Tendering Process Projects
Under this above plan, 32 projects of capacity 10,704 MW are now under construction stage. 35 projects of
capacity 6,413 MW are now in the various stages of procurement process. These projects will be signed contract in
phase. The under construction and tendering process projects will be implemented in phase during the period
2017-2023.
Year wise generation projects to be completed (From 2017 to 2021)
Year 2017(MW)
2018(MW)
2019(MW)
2020(MW)
2021(MW)
Total
Public
Private
Power Import
Total
1464
325
60
1849
1949
2276
500
4725
2387
2116
4503
708
2580
340
3628
2740
307
3047
9248
8504
900
17752
Under Construction Projects
Description No. of Projects Capacity (MW)
01.
02.
IPP
Private Sector
Total
14
18
32
6048
4656
10,704
Projects under Tendering Process
S.N.
Till now, generation from gas is much higher than compare to other fuel like hydro, coal. For this reason,
government has taken strategic decision to diversify primary fuel supply for power generation. In line with this
strategy, a sustainable long-term power development plan has been prepared for mitigation the growing demand
to reach the generation capacity 24000MW by 2021. Under this plan, the coal (indigenous or imported), imported
power from neighboring countries, the limited domestic gas, nuclear power and LNG , renewable will be used for
power generation. Government has also taken energy efficiency and conservation program for reduction of the
growing power demand.
Revised generation expansion plan updated in August 2016 targeting about 18,000 MW generation additions
from 2017 to 2021 is provided in a table below:
Type of Power PlantSNPower Plant
NoInstalled
Capacity (MW)
01.
02.
Private
Public
Total
8
27
35
2073
4340
6413
Annual 2016-17Report27
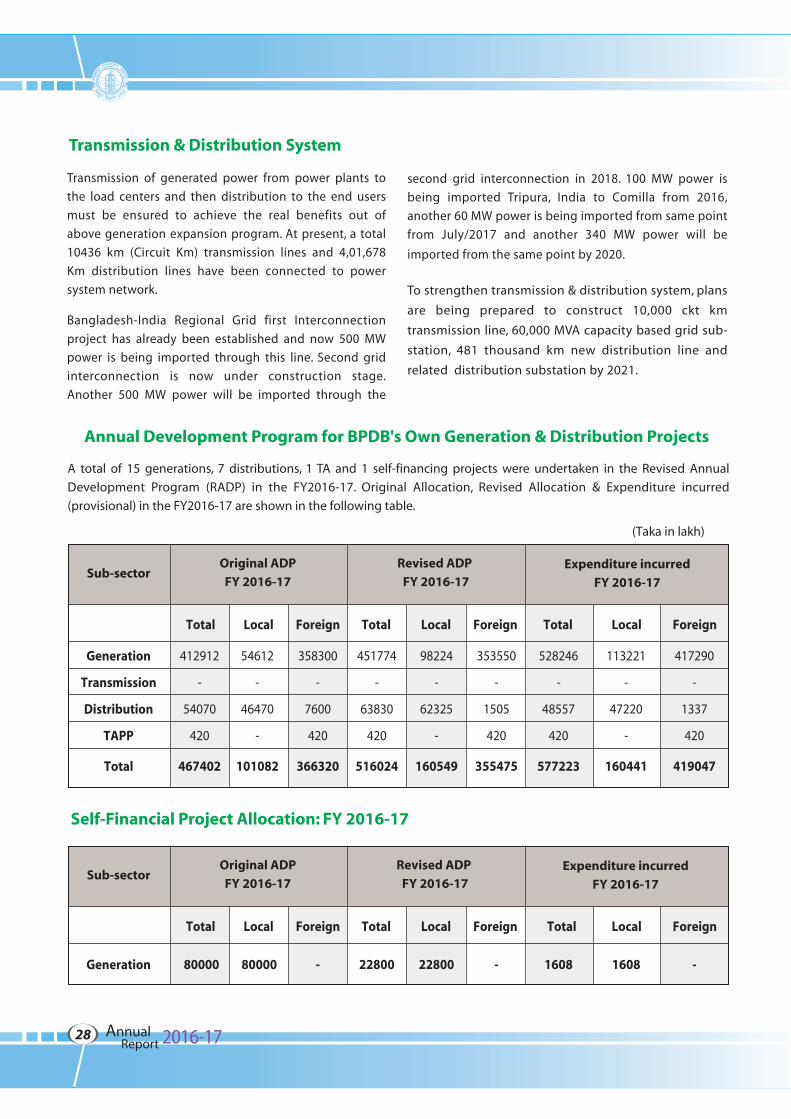
Transmission & Distribution System
Annual Development Program for BPDB's Own Generation & Distribution Projects
A total of 15 generations, 7 distributions, 1 TA and 1 self-financing projects were undertaken in the Revised Annual
Development Program (RADP) in the FY2016-17. Original Allocation, Revised Allocation & Expenditure incurred
(provisional) in the FY2016-17 are shown in the following table.
Sub-sector
Generation
Transmission
Distribution
TAPP
Total
Original ADP
FY 2016-17
Revised ADP
FY 2016-17
(Taka in lakh)
Expenditure incurred
FY 2016-17
412912
-
54070
420
467402
54612
-
46470
-
101082
358300
-
7600
420
366320
451774
-
63830
420
516024
98224
-
62325
-
160549
353550
-
1505
420
355475
528246
-
48557
420
577223
113221
-
47220
-
160441
417290
-
1337
420
419047
Local ForeignTotal Local ForeignTotal Local ForeignTotal
Sub-sector
Generation
Original ADP
FY 2016-17
Revised ADP
FY 2016-17Expenditure incurred
FY 2016-17
80000 80000 - 22800 22800 - 1608 1608 -
Local ForeignTotal Local ForeignTotal Local ForeignTotal
Self-Financial Project Allocation: FY 2016-17
Transmission of generated power from power plants to
the load centers and then distribution to the end users
must be ensured to achieve the real benefits out of
above generation expansion program. At present, a total
10436 km (Circuit Km) transmission lines and 4,01,678
Km distribution lines have been connected to power
system network.
Bangladesh-India Regional Grid first Interconnection
project has already been established and now 500 MW
power is being imported through this line. Second grid
interconnection is now under construction stage.
Another 500 MW power will be imported through the
second grid interconnection in 2018. 100 MW power is
being imported Tripura, India to Comilla from 2016,
another 60 MW power is being imported from same point
from July/2017 and another 340 MW power will be
imported from the same point by 2020.
To strengthen transmission & distribution system, plans
are being prepared to construct 10,000 ckt km
transmission line, 60,000 MVA capacity based grid sub-
station, 481 thousand km new distribution line and
related distribution substation by 2021.
Annual 2016-17Report28

Year wise commissioning status of generation projects
Projects commissioned in 2010
Projects commissioned in 2011
Public Sector
Sub Total 800
Sl.No. Name of the Power Plant
Capacity(MW)
Type ofFuel
Ownership CommissioningDate
1.
2.
3.
4.
5.
6.
7.
8.
9.
10.
Ashugonj 50 MW Power Plant
Baghabari 50 MW Peaking PP
Fenchuganj 90 MW CC
Bera 70 MW Peaking PP
Titas, Doudkandi 50 MW Peaking PP
Siddirganj 2x120 MW Peaking PP
Faridpur 50 MW Peaking PP
Gopanlgonj 100 MW Peaking PP
Sangu, Dohazari 100 MW Peaking PP
Hathazari 100 MW Peaking PP
APSCL
BPDB
BPDB
BPDB
BPDB
EGCB
BPDB
BPDB
BPDB
BPDB
Gas
HFO
Gas
HFO
HFO
Gas
HFO
HFO
HFO
HFO
30.04.2011
29.08.2011
26.10.2011
28.10. 2011
29.10. 2011
December, 2011
November, 2011
29.09.2011
30.12.2011
23.12.2011
53
52
104
71
52
105
54
109
102
98
Sl.No. Name of the Power Plant
Public Sector
Private Sector
Sub Total
Sub Total
Total
Capacity(MW)
Type ofFuel
OwnershipCommissioning
Date
Sikalbaha 150 MW
Siddirganj 2x120 MW GT
150
105
255
BPDB
EGCB
18.08.2010
14.10.2011
Rental (BPDB)
Rental (BPDB)
Rental (BPDB)
Rental (BPDB)
Rental (BPDB)
Rental (BPDB)
Rental (BPDB)
06.05.2010
07.04.2010
02.08.2010
10.08.201028.08.2010
10.08.2010
24.11.2010
31.12.2010
HFO
Gas
HFO
Diesel
Diesel
Diesel
Diesel
520
775
55
55
50
145
55
50
110
1.2.
3.4.5.
6.
7.
8.
9.
Shikalbaha 55 MW Rental Power Plant
Ashugonj Rental Power Plant
Thakurgaon, 3 Years Rental
Khulna, Sponsor: Aggreko
Pagla, Narayaganj, Sponsor: DPAPGL
Bheramara 3 Years Rental
GhorashalSponsor: Aggreko
Annual 2016-17Report29
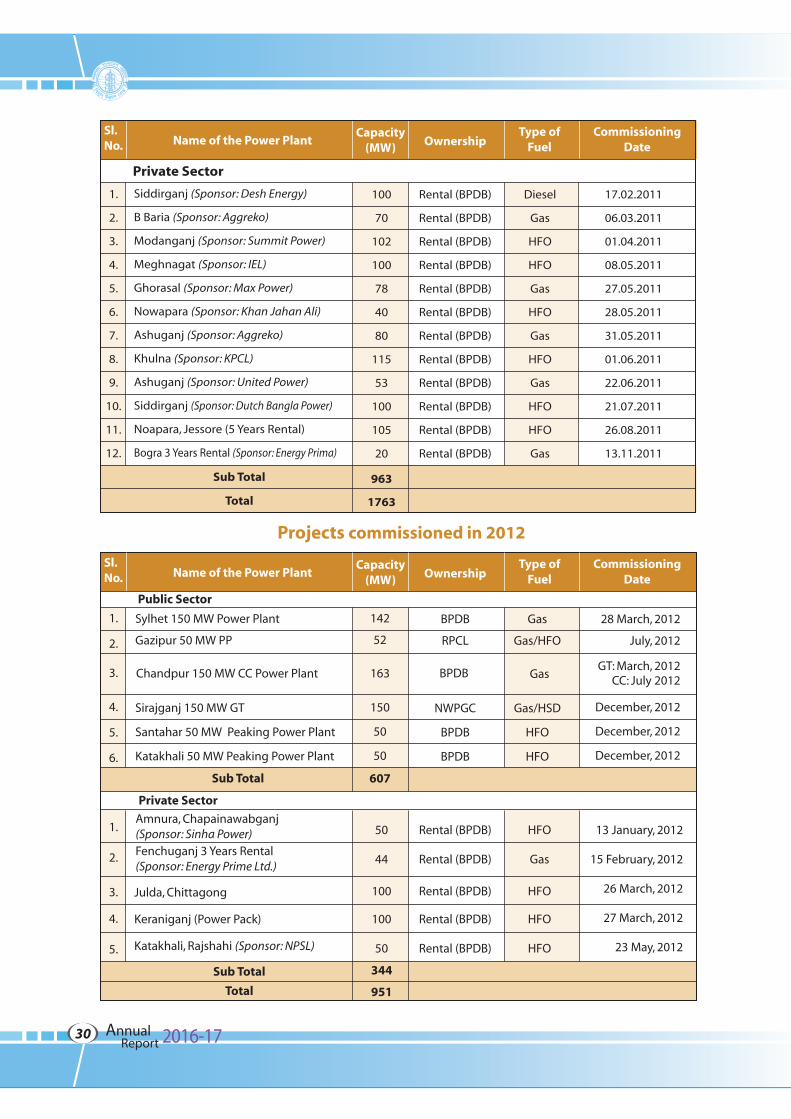
Projects commissioned in 2012
Public Sector
Private Sector
Sub Total
Sub Total
Total
Sl.No. Name of the Power Plant
Capacity(MW)
Type ofFuelOwnership
CommissioningDate
344
951
1.
2.
3.
4.
5.
6.
1.
2.
3.
4.
5.
Julda, Chittagong
Keraniganj (Power Pack)
Katakhali, Rajshahi (Sponsor: NPSL)
50
44
100
100
50
Rental (BPDB)
Rental (BPDB)
Rental (BPDB)
Rental (BPDB)
Rental (BPDB)
HFO
Gas
HFO
HFO
HFO
13 January, 2012
15 February, 2012
26 March, 2012
27 March, 2012
23 May, 2012
Sylhet 150 MW Power Plant
Gazipur 50 MW PP
Sirajganj 150 MW GT
Santahar 50 MW Peaking Power Plant
Katakhali 50 MW Peaking Power Plant
BPDB
RPCL
NWPGC
BPDB
BPDB
Gas
Gas/HFO
Gas/HSD
HFO
HFO
28 March, 2012
July, 2012
GT: March, 2012CC: July 2012
December, 2012
December, 2012
December, 2012
142
52
150
50
50
607
Amnura, Chapainawabganj(Sponsor: Sinha Power)Fenchuganj 3 Years Rental (Sponsor: Energy Prime Ltd.)
163 BPDB GasChandpur 150 MW CC Power Plant
Private Sector
Sub Total
Total
963
1763
1.
2.
3.
4.
5.
6.
7.
8.
9.
10.
11.
12.
Siddirganj (Sponsor: Desh Energy)
B Baria (Sponsor: Aggreko)
Modanganj (Sponsor: Summit Power)
Meghnagat (Sponsor: IEL)
Ghorasal (Sponsor: Max Power)
Nowapara (Sponsor: Khan Jahan Ali)
Ashuganj (Sponsor: Aggreko)
Khulna (Sponsor: KPCL)
Ashuganj (Sponsor: United Power)
Siddirganj (Sponsor: Dutch Bangla Power)
Noapara, Jessore (5 Years Rental)
Bogra 3 Years Rental (Sponsor: Energy Prima)
100
70
102
100
78
40
80
115
53
100
105
20
Rental (BPDB)
Rental (BPDB)
Rental (BPDB)
Rental (BPDB)
Rental (BPDB)
Rental (BPDB)
Rental (BPDB)
Rental (BPDB)
Rental (BPDB)
Rental (BPDB)
Rental (BPDB)
Rental (BPDB)
17.02.2011
06.03.2011
01.04.2011
08.05.2011
27.05.2011
28.05.2011
31.05.2011
01.06.2011
22.06.2011
21.07.2011
26.08.2011
13.11.2011
Diesel
Gas
HFO
HFO
Gas
HFO
Gas
HFO
Gas
HFO
HFO
Gas
Sl.No. Name of the Power Plant
Capacity(MW)
Type ofFuelOwnership
CommissioningDate
Annual 2016-17Report30
Projects commissioned in 2014
Projects commissioned in 2013
Sl.No. Name of the Power Plant
Capacity(MW)
Type ofFuelOwnership
CommissioningDate
Public Sector
Private Sector
Sub Total
Sub Total
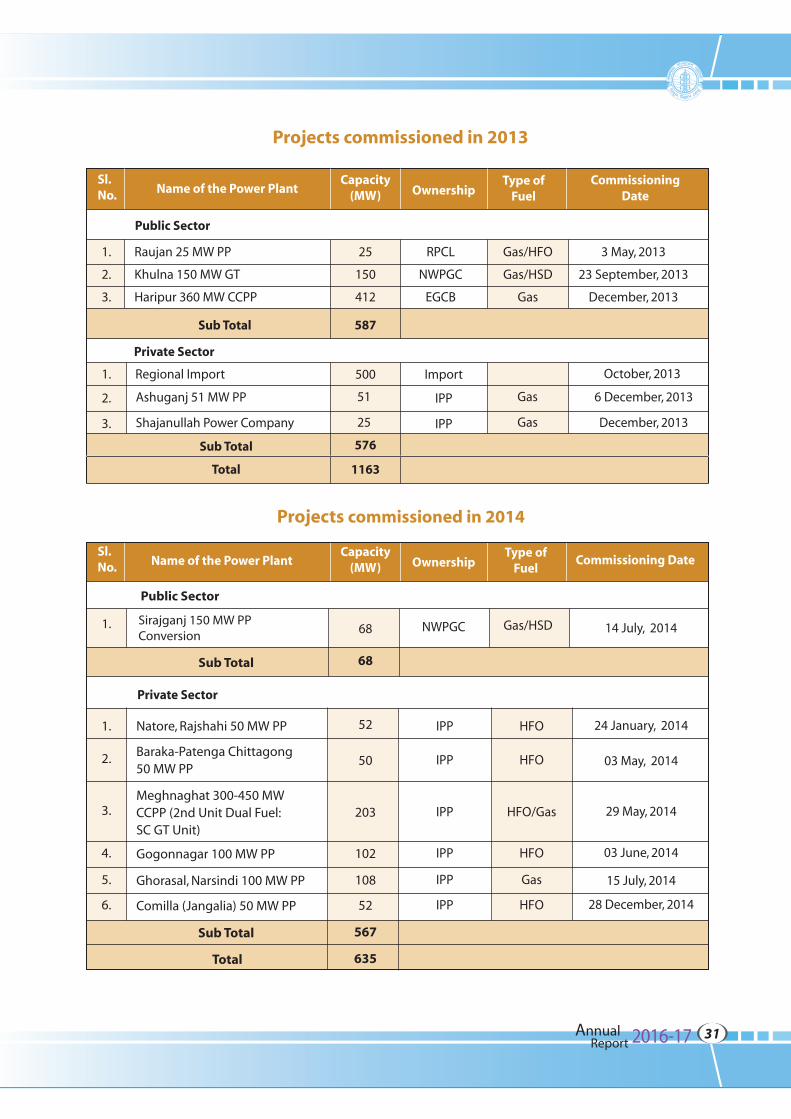
Total 1163
1.
2.
3.
Raujan 25 MW PP
Khulna 150 MW GT
Haripur 360 MW CCPP
25
150
412
587
RPCL
NWPGC
EGCB
Gas/HFO
Gas/HSD
Gas
3 May, 2013
23 September, 2013
December, 2013
Regional Import1.
2.
500 Import October, 2013
Ashuganj 51 MW PP 51 IPP Gas 6 December, 2013
3. Shajanullah Power Company 25 IPP Gas December, 2013
576
Sl.No. Name of the Power Plant
Capacity(MW)
Type ofFuelOwnership Commissioning Date
Private Sector
1.
Public Sector
Sub Total
Sirajganj 150 MW PPConversion 68
68
NWPGC Gas/HSD 14 July, 2014
Natore, Rajshahi 50 MW PP 52
50
203
102
108
52
567
635
IPP
IPP
IPP
IPP
IPP
IPP
HFO
HFO/Gas
HFO
Gas
HFO
HFO1.
2.
3.
4.
5.
6.
Baraka-Patenga Chittagong 50 MW PP
Meghnaghat 300-450 MWCCPP (2nd Unit Dual Fuel:SC GT Unit)
Gogonnagar 100 MW PP
Ghorasal, Narsindi 100 MW PP
Comilla (Jangalia) 50 MW PP
24 January, 2014
03 May, 2014
29 May, 2014
03 June, 2014
15 July, 2014
28 December, 2014
Sub Total
Total
Annual 2016-17Report31
Projects commissioned in 2015
Private Sector
Sl.No.
Name of the Power PlantCapacity
(MW)Type of
FuelOwnership
ExpectedCommissioning Date
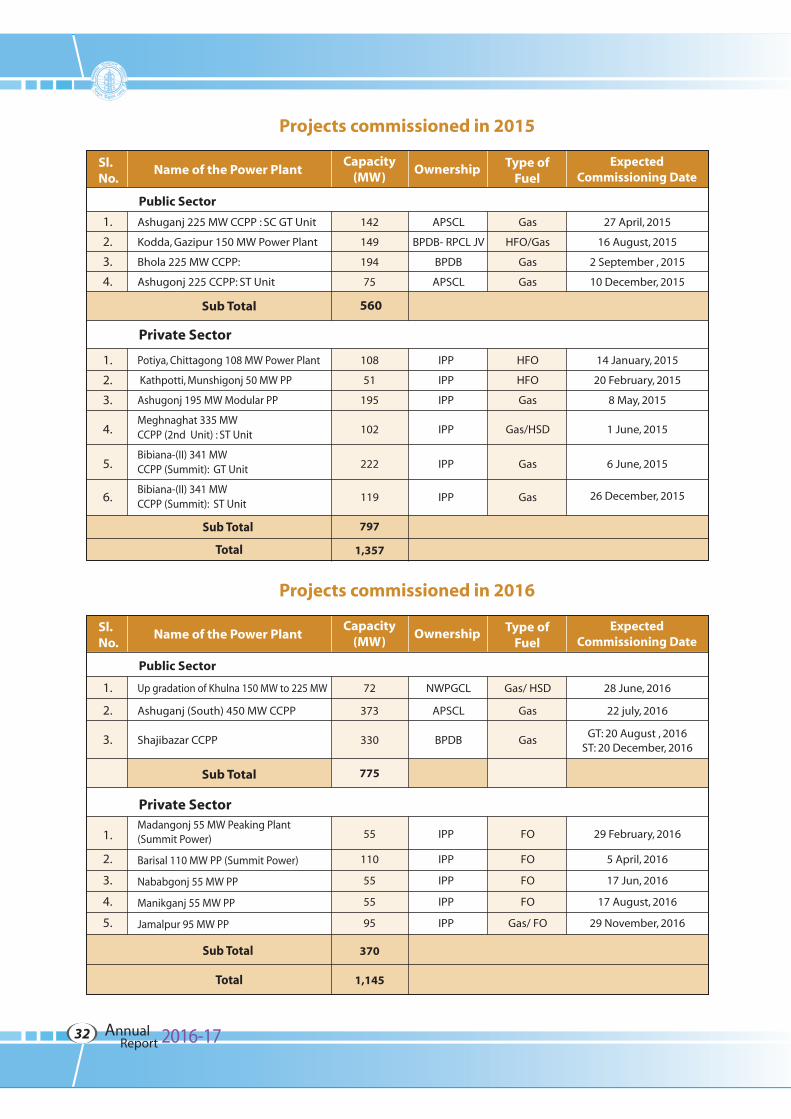
1.
2.
3.
4.
142
149
194
75
560
APSCL
BPDB- RPCL JV
BPDB
APSCL
Gas
HFO/Gas
Gas
Gas
27 April, 2015
16 August, 2015
2 September , 2015
10 December, 2015
Ashuganj 225 MW CCPP : SC GT Unit
Kodda, Gazipur 150 MW Power Plant
Bhola 225 MW CCPP:
Ashugonj 225 CCPP: ST Unit
Public Sector
1.
2.
3.
4.
5.
6.
IPP
IPP
IPP
IPP
IPP
IPP
HFO
HFO
Gas
Gas/HSD
Gas
Gas
14 January, 2015
20 February, 2015
8 May, 2015
1 June, 2015
6 June, 2015
26 December, 2015
Potiya, Chittagong 108 MW Power Plant
Kathpotti, Munshigonj 50 MW PP
Ashugonj 195 MW Modular PP
Meghnaghat 335 MWCCPP (2nd Unit) : ST Unit
Bibiana-(II) 341 MWCCPP (Summit): GT Unit
Bibiana-(II) 341 MWCCPP (Summit): ST Unit
108
51
195
102
222
119
797
1,357
Sub Total
Total
Sub Total
Projects commissioned in 2016
Private Sector
Sl.No.
Name of the Power PlantCapacity
(MW)Type of
FuelOwnership
ExpectedCommissioning Date
1.
2.
3.
72
373
330
775
NWPGCL
APSCL
BPDB
Gas/ HSD
Gas
Gas
28 June, 2016
22 july, 2016
GT: 20 August , 2016ST: 20 December, 2016
Up gradation of Khulna 150 MW to 225 MW
Ashuganj (South) 450 MW CCPP
Shajibazar CCPP
Public Sector
1.
2.
3.
4.
5.
IPP
IPP
IPP
IPP
IPP
FO
FO
FO
FO
Gas/ FO
29 February, 2016
5 April, 2016
17 Jun, 2016
17 August, 2016
29 November, 2016
Madangonj 55 MW Peaking Plant(Summit Power)
Barisal 110 MW PP (Summit Power)
Nababgonj 55 MW PP
Manikganj 55 MW PP
Jamalpur 95 MW PP
55
110
55
55
95
370
1,145
Sub Total
Total
Sub Total
Annual 2016-17Report32
Private Sector
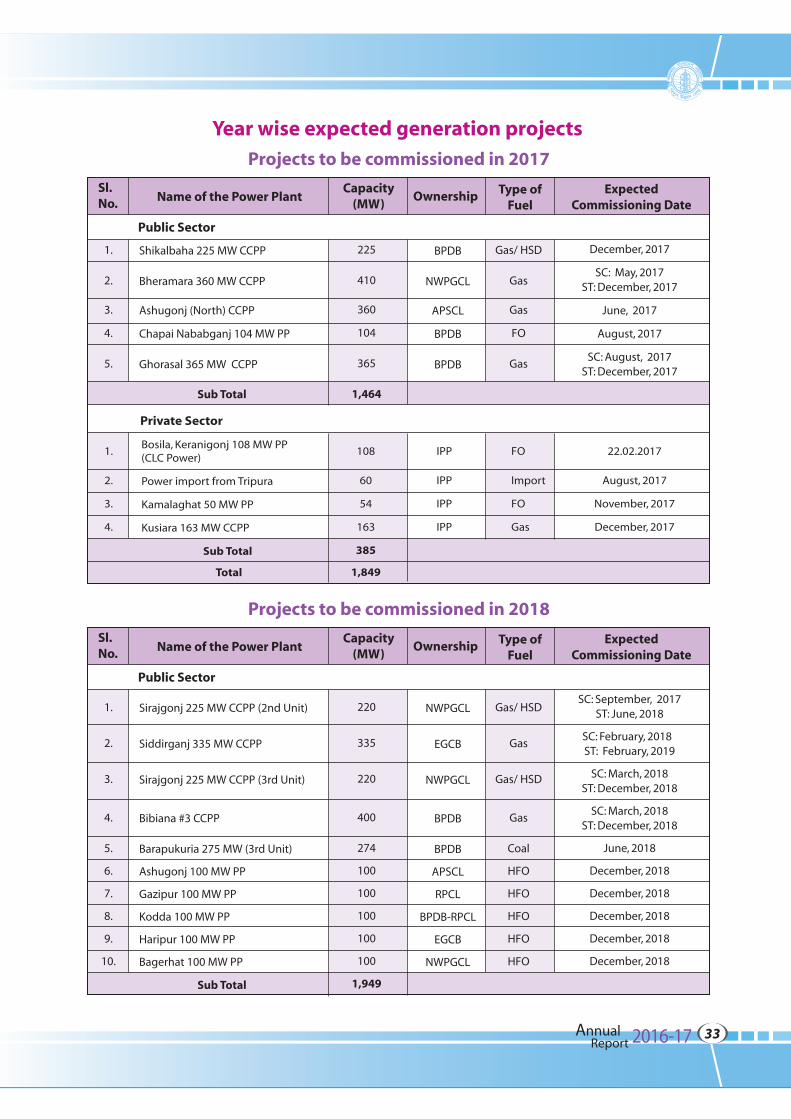
1.
2.
3.
4.
Bosila, Keranigonj 108 MW PP(CLC Power)
Power import from Tripura
Kamalaghat 50 MW PP
Kusiara 163 MW CCPP
108
60
54
163
385
1,849
IPP
IPP
IPP
IPP
FO
Import
FO
Gas
22.02.2017
August, 2017
November, 2017
December, 2017
Sub Total
Total
Year wise expected generation projects
Projects to be commissioned in 2017
Sl.No. Name of the Power Plant
Capacity(MW)
Type ofFuel
Ownership ExpectedCommissioning Date
Public Sector
1.
2.
3.
4.
5.
225
410
360
104
365
1,464
BPDB
NWPGCL
APSCL
BPDB
BPDB
Gas/ HSD
Gas
Gas
FO
Gas
December, 2017
SC: May, 2017ST: December, 2017
June, 2017
August, 2017
SC: August, 2017ST: December, 2017
Shikalbaha 225 MW CCPP
Bheramara 360 MW CCPP
Ashugonj (North) CCPP
Chapai Nababganj 104 MW PP
Ghorasal 365 MW CCPP
Sub Total
Projects to be commissioned in 2018
Sl.No. Name of the Power Plant
Capacity(MW)
Type ofFuel
Ownership ExpectedCommissioning Date
Public Sector
1.
2.
3.
4.
5.
6.
7.
8.
9.
10.
220
335
220
400
274
100
100
100
100
100
1,949
NWPGCL
EGCB
NWPGCL
BPDB
BPDB
APSCL
RPCL
BPDB-RPCL
EGCB
NWPGCL
Gas/ HSD
Gas
Gas/ HSD
Gas
Coal
HFO
HFO
HFO
HFO
HFO
SC: September, 2017ST: June, 2018
SC: February, 2018 ST: February, 2019
SC: March, 2018ST: December, 2018
SC: March, 2018ST: December, 2018
June, 2018
December, 2018
December, 2018
December, 2018
December, 2018
December, 2018
Sirajgonj 225 MW CCPP (2nd Unit)
Siddirganj 335 MW CCPP
Sirajgonj 225 MW CCPP (3rd Unit)
Bibiana #3 CCPP
Barapukuria 275 MW (3rd Unit)
Ashugonj 100 MW PP
Gazipur 100 MW PP
Kodda 100 MW PP
Haripur 100 MW PP
Bagerhat 100 MW PP
Sub Total
Annual 2016-17Report33
Annual 2016-17Report34
Sub Total
Total
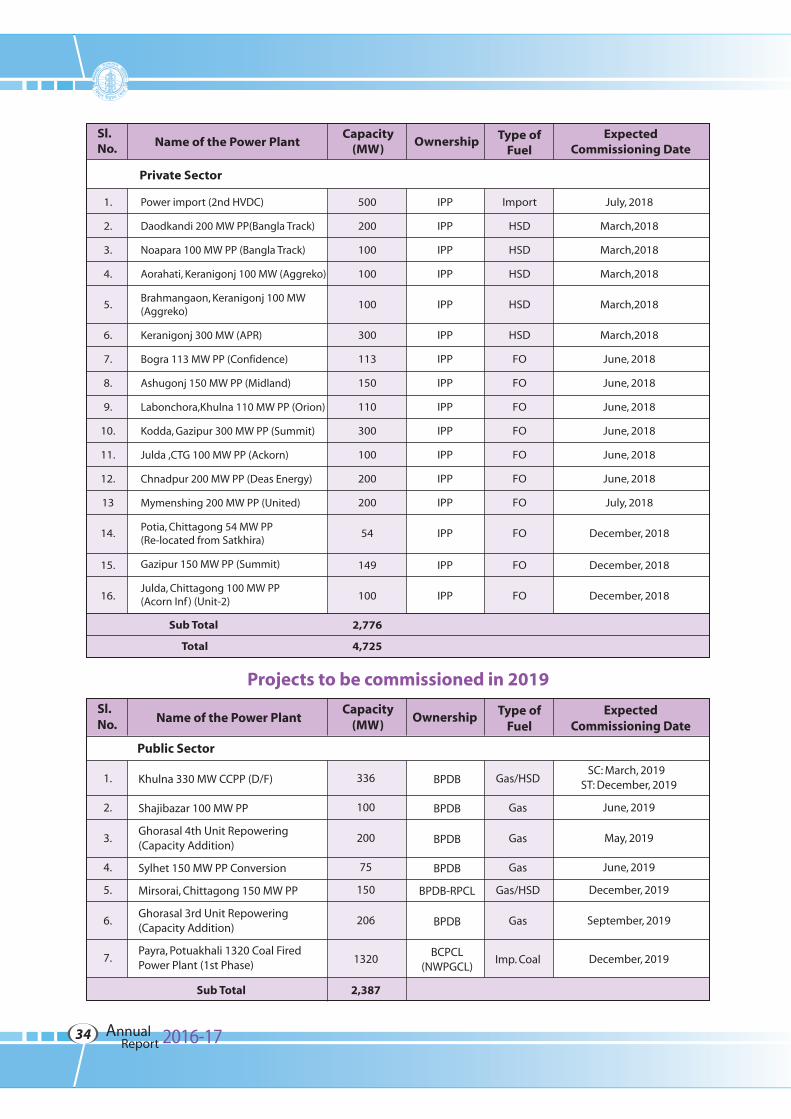
Private Sector
1.
2.
3.
4.
5.
6.
7.
8.
9.
10.
11.
12.
13
14.
15.
16.
500
200
100
100
100
300
113
150
110
300
100
200
200
54
149
100
2,776
4,725
IPP
IPP
IPP
IPP
IPP
IPP
IPP
IPP
IPP
IPP
IPP
IPP
IPP
IPP
IPP
IPP
Import
HSD
HSD
HSD
HSD
HSD
FO
FO
FO
FO
FO
FO
FO
FO
FO
FO
July, 2018
March,2018
March,2018
March,2018
March,2018
March,2018
June, 2018
June, 2018
June, 2018
June, 2018
June, 2018
June, 2018
July, 2018
December, 2018
December, 2018
December, 2018
Power import (2nd HVDC)
Daodkandi 200 MW PP(Bangla Track)
Noapara 100 MW PP (Bangla Track)
Aorahati, Keranigonj 100 MW (Aggreko)
Brahmangaon, Keranigonj 100 MW(Aggreko)
Keranigonj 300 MW (APR)
Bogra 113 MW PP (Confidence)
Ashugonj 150 MW PP (Midland)
Labonchora,Khulna 110 MW PP (Orion)
Kodda, Gazipur 300 MW PP (Summit)
Julda ,CTG 100 MW PP (Ackorn)
Chnadpur 200 MW PP (Deas Energy)
Mymenshing 200 MW PP (United)
Potia, Chittagong 54 MW PP(Re-located from Satkhira)
Gazipur 150 MW PP (Summit)
Julda, Chittagong 100 MW PP(Acorn Inf ) (Unit-2)
Sl.No. Name of the Power Plant
Capacity(MW)
Type ofFuel
OwnershipExpected
Commissioning Date
Projects to be commissioned in 2019
Sl.No. Name of the Power Plant
Capacity(MW)
Type ofFuel
Ownership ExpectedCommissioning Date
Public Sector
1.
2.
3.
4.
5.
6.
7.
336
100
200
75
150
206
1320
2,387
BPDB
BPDB
BPDB
BPDB
BPDB-RPCL
BPDB
BCPCL(NWPGCL)
Gas/HSD
Gas
Gas
Gas
Gas/HSD
Gas
Imp. Coal
SC: March, 2019 ST: December, 2019
June, 2019
May, 2019
June, 2019
December, 2019
September, 2019
December, 2019
Khulna 330 MW CCPP (D/F)
Shajibazar 100 MW PP
Ghorasal 4th Unit Repowering(Capacity Addition)
Sylhet 150 MW PP Conversion
Mirsorai, Chittagong 150 MW PP
Ghorasal 3rd Unit Repowering(Capacity Addition)
Payra, Potuakhali 1320 Coal FiredPower Plant (1st Phase)
Sub Total
Private Sector
LNG based 750 MW CCPP (Reliance)
Meghnaghat 500 MW CCPP (Summit)
Import from Tripura (2nd Phase)
Chittagong 612 MW Coal Fired PowerProject (S.Alam Group)-1
Chittagong 612 MW Coal Fired PowerProject (S.Alam Group)-2
Fenchugonj 50 MW Power Plant
Gabtoli 108 MW PP
1
2
3
4
5
6
7
718
583
340
612
612
55
108
2,920
3,628
IPP
IPP
IPP
IPP
IPP
IPP/NRB
IPP
LNG
LNG
Import
Imp. Coal
Imp. Coal
Gas
FO
June, 2020
December, 2020
December, 2020
December, 2020
June, 2020
June, 2020
December, 2020
Sub Total
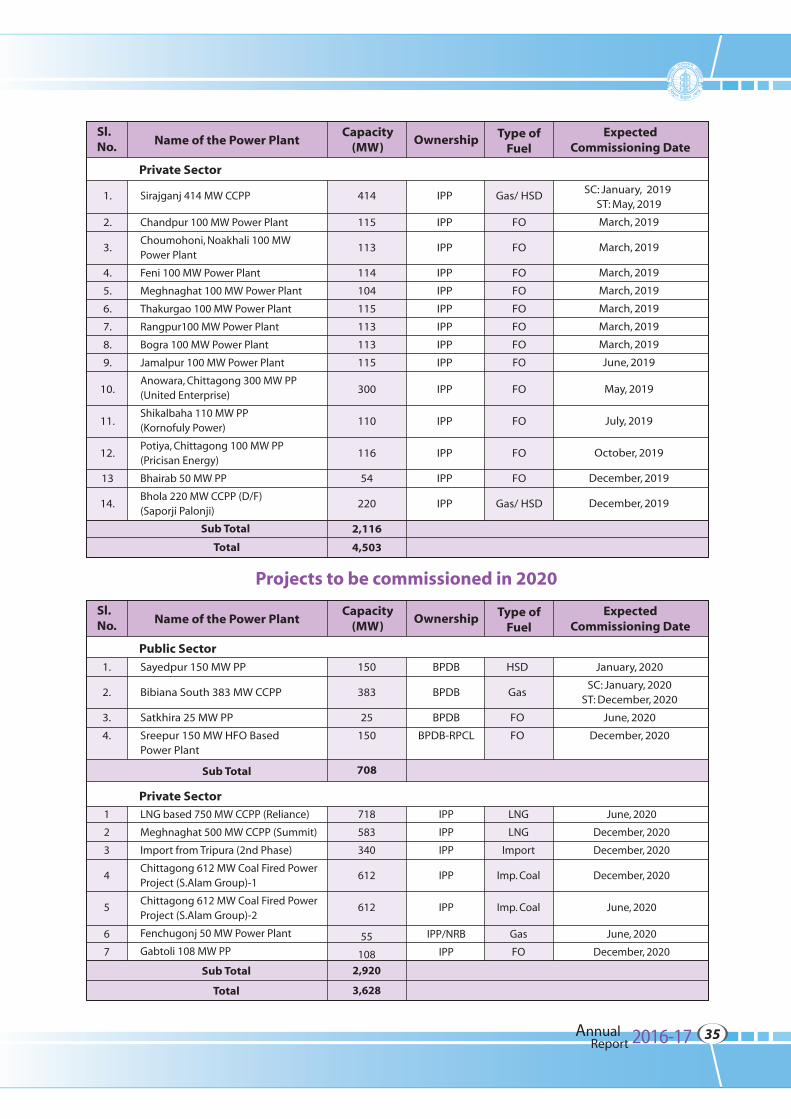
Total
Projects to be commissioned in 2020
Public Sector
Sayedpur 150 MW PP
Bibiana South 383 MW CCPP
Satkhira 25 MW PP
Sreepur 150 MW HFO BasedPower Plant
1.
2.
3.
4.
150
383
25
150
708
HSD
Gas
FO
FO
January, 2020
SC: January, 2020ST: December, 2020
June, 2020
December, 2020
BPDB
BPDB
BPDB
BPDB-RPCL
Sub Total
Sl.No. Name of the Power Plant
Capacity(MW)
Type ofFuel
OwnershipExpected
Commissioning Date
Sub Total
Total
Private Sector
1.
2.
3.
4.
5.
6.
7.
8.
9.
10.
11.
12.
13
14.
414
115
113
114
104
115
113
113
115
300
110
116
54
220
2,116
4,503
IPP
IPP
IPP
IPP
IPP
IPP
IPP
IPP
IPP
IPP
IPP
IPP
IPP
IPP
Gas/ HSD
FO
FO
FO
FO
FO
FO
FO
FO
FO
FO
FO
FO
Gas/ HSD
SC: January, 2019 ST: May, 2019
March, 2019
March, 2019
March, 2019
March, 2019
March, 2019
March, 2019
March, 2019
June, 2019
May, 2019
July, 2019
October, 2019
December, 2019
December, 2019
Sirajganj 414 MW CCPP
Chandpur 100 MW Power Plant
Choumohoni, Noakhali 100 MWPower Plant
Feni 100 MW Power Plant
Meghnaghat 100 MW Power Plant
Thakurgao 100 MW Power Plant
Rangpur100 MW Power Plant
Bogra 100 MW Power Plant
Jamalpur 100 MW Power Plant
Anowara, Chittagong 300 MW PP(United Enterprise)
Shikalbaha 110 MW PP(Kornofuly Power)
Potiya, Chittagong 100 MW PP(Pricisan Energy)
Bhairab 50 MW PP
Bhola 220 MW CCPP (D/F)(Saporji Palonji)
Sl.No. Name of the Power Plant
Capacity(MW)
Type ofFuel
OwnershipExpected
Commissioning Date
Annual 2016-17Report35
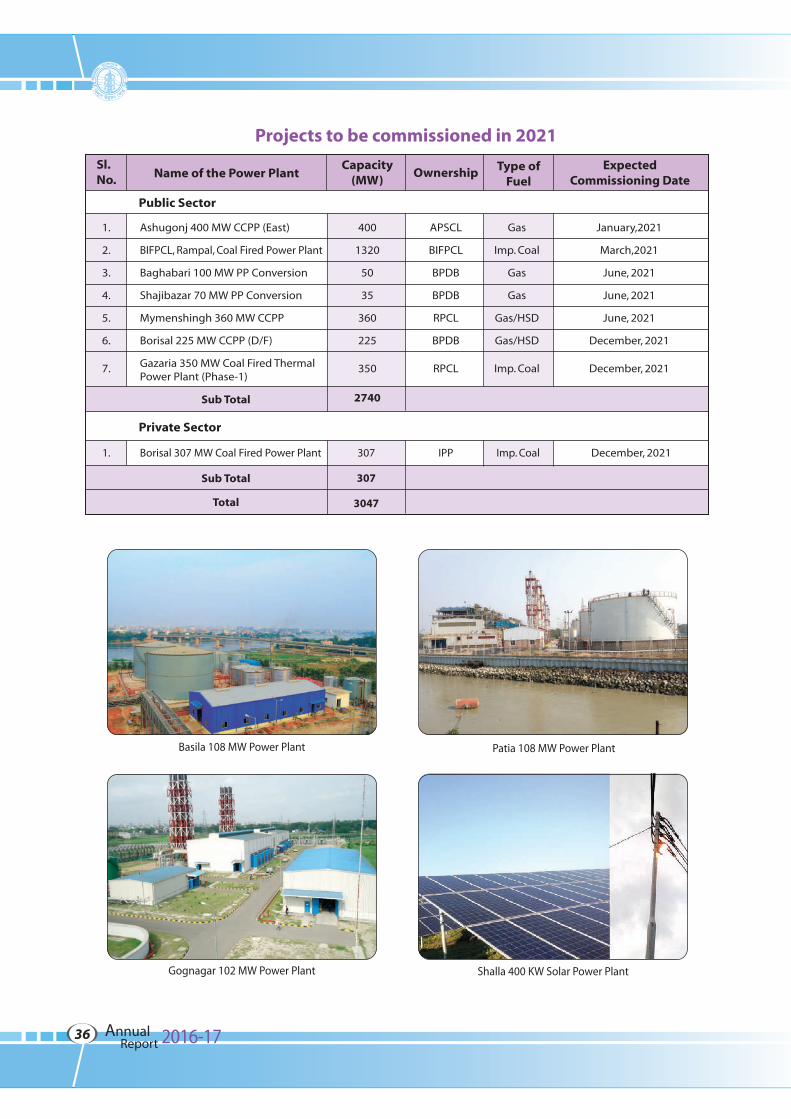
Projects to be commissioned in 2021
Public Sector
Ashugonj 400 MW CCPP (East)
BIFPCL, Rampal, Coal Fired Power Plant
Baghabari 100 MW PP Conversion
Shajibazar 70 MW PP Conversion
Mymenshingh 360 MW CCPP
Borisal 225 MW CCPP (D/F)
Gazaria 350 MW Coal Fired ThermalPower Plant (Phase-1)
1.
2.
3.
4.
5.
6.
7.
400
1320
50
35
360
225
350
2740
Gas
Imp. Coal
Gas
Gas
Gas/HSD
Gas/HSD
Imp. Coal
January,2021
March,2021
June, 2021
June, 2021
June, 2021
December, 2021
December, 2021
APSCL
BIFPCL
BPDB
BPDB
RPCL
BPDB
RPCL
Private Sector
Borisal 307 MW Coal Fired Power Plant1. 307
307
3047
IPP Imp. Coal December, 2021
Sub Total
Sub Total
Total
Sl.No. Name of the Power Plant
Capacity(MW)
Type ofFuel
OwnershipExpected
Commissioning Date
Basila 108 MW Power Plant Patia 108 MW Power Plant
Gognagar 102 MW Power Plant Shalla 400 KW Solar Power Plant
Annual 2016-17Report36
Implemented PV Projects/PV Systems (Mini-Grid)
650 kWp (400 kW ac load) solar mini grid power project in Sulla upazila of Sunamgonj district named "Renewable Energy
Based Power Generation Pilot Project in Remote Haor Area" under Bangladesh Climate Change Trust Fund (BCCTF).
Implemented Solar Power Projects
Dte. of RER&D has completed the work named "Conversion of
the 37.50 kWp Solar System Installed on the Rooftop of
Biddyut Bhaban into Grid Tied Solar System".
Dte. of RER&D has completed the work named "Conversion of
the 32.75 kWp Solar System Installed on the Rooftop of
WAPDA Bhaban into Grid Tied Solar System".
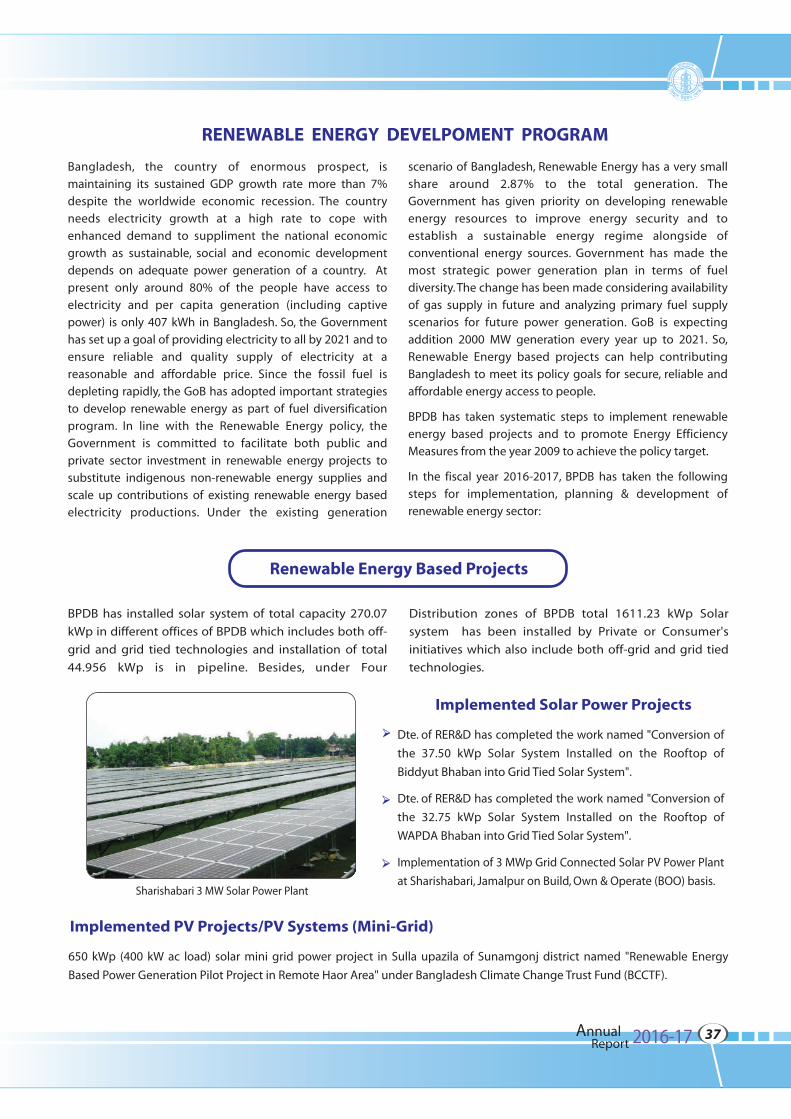
Implementation of 3 MWp Grid Connected Solar PV Power Plant
at Sharishabari, Jamalpur on Build, Own & Operate (BOO) basis.
RENEWABLE ENERGY DEVELPOMENT PROGRAM
Bangladesh, the country of enormous prospect, is
maintaining its sustained GDP growth rate more than 7%
despite the worldwide economic recession. The country
needs electricity growth at a high rate to cope with
enhanced demand to suppliment the national economic
growth as sustainable, social and economic development
depends on adequate power generation of a country. At
present only around 80% of the people have access to
electricity and per capita generation (including captive
power) is only 407 kWh in Bangladesh. So, the Government
has set up a goal of providing electricity to all by 2021 and to
ensure reliable and quality supply of electricity at a
reasonable and affordable price. Since the fossil fuel is
depleting rapidly, the GoB has adopted important strategies
to develop renewable energy as part of fuel diversification
program. In line with the Renewable Energy policy, the
Government is committed to facilitate both public and
private sector investment in renewable energy projects to
substitute indigenous non-renewable energy supplies and
scale up contributions of existing renewable energy based
electricity productions. Under the existing generation
scenario of Bangladesh, Renewable Energy has a very small
share around 2.87% to the total generation. The
Government has given priority on developing renewable
energy resources to improve energy security and to
establish a sustainable energy regime alongside of
conventional energy sources. Government has made the
most strategic power generation plan in terms of fuel
diversity. The change has been made considering availability
of gas supply in future and analyzing primary fuel supply
scenarios for future power generation. GoB is expecting
addition 2000 MW generation every year up to 2021. So,
Renewable Energy based projects can help contributing
Bangladesh to meet its policy goals for secure, reliable and
affordable energy access to people.
BPDB has taken systematic steps to implement renewable
energy based projects and to promote Energy Efficiency
Measures from the year 2009 to achieve the policy target.
In the fiscal year 2016-2017, BPDB has taken the following
steps for implementation, planning & development of
renewable energy sector:
BPDB has installed solar system of total capacity 270.07
kWp in different offices of BPDB which includes both off-
grid and grid tied technologies and installation of total
44.956 kWp is in pipeline. Besides, under Four
Distribution zones of BPDB total 1611.23 kWp Solar
system has been installed by Private or Consumer's
initiatives which also include both off-grid and grid tied
technologies.
Ø
Ø
Ø
Renewable Energy Based Projects
Sharishabari 3 MW Solar Power Plant
Annual 2016-17Report37
Ongoing PV Projects/PV Systems (Grid-Tied)
BPDB's Own Project
7.4 MWp Grid Connected Solar PV Power Plant at Kaptai Hydro Power Station compound under BPDB in Rangamati.
Construction of Rangunia 60 MWp Solar Photovoltaic Grid Connected Power Plant.
Construction of Gangachora 55 MWp Solar Photovoltaic Grid Connected Power Plant.
Installation of a 100 MWp Solar PhotoVoltaic (PV) based Grid-Connected Power Generation Plant at Sonagazi upazilla of Feni district.
Ø
Ø
Ø
Ø
IPP Project200MW (AC) Solar Park on BOO basis at Teknaf, Cox's Bazar by Sun Edsion Energy Holding (Singapore) Pte Ltd.
20MW+10% Grid -Tied Solar Power Project by Joules Power Limited.
"32 MW (AC) Solar Park at Dharmapasha, Sunamganj" by EDISUN-Power Point & Haor Bangla-Korea Green Energy Ltd.
"50 MW (AC) Solar Park at Sutiakhali, Mymensing District, Bangladesh" by HETAT-DITROLI-IFDC SOLAR.
"30MW Grid Tied Solar PV Power Project" at Gangachara, Rangpur by Intraco-Julio Power Consortium.
"5MW Grid Tied Solar PV Power Project" at Gwinghat, Sylhet by Sun Solar Power Plant Ltd.
"200 MW Grid Tied Solar PV Power Project" at Sundarganj, Gaibandha by Beximco Power Company Ltd, Dhaka, Bangladesh.
"5MW Grid Tied Solar PV Power Project" at Patgram, Lalmonirhat by Green Housing & Energy Ltd.
"30MW Grid Tied Solar PV Power Project" at Shekhgach, Tetulia, Panchagarh by a Consortium of Beximco Power Co. Ltd, Bangladesh & Jiangsu Zhongtian Technology Co. Ltd., China.
"100MW Grid Tied Solar PV Power Project" at Teesta Barrage, Lalmonirhat by a Consortium of Zhejiang Dun An New energy Co. Ltd., China National Machinary Import & Export Corporation, Solar Tech Power Ltd. & Amity solar Ltd.
"8MW Grid Tied Solar PV Power Project" at Majhipara, Tetulia, Panchaghar by Parasol Energy Ltd.
"100MW Grid Tied Solar PV Power Project" at Bora Durgapur, Mongla, Bagerhat by a Consortium of Energon Technologies FZE and China Sunergy Co. Ltd. (ESUN).
"50MW Grid Tied Solar PV Power Project" at Porabari, Tangail by a Consortium of Hanwha 63 City Co. Limited, South Korea, BJ Power Company Limited, South Korea and Solar City Bangladesh Limited, Bangladesh.
"Grid Tied Rooftop Solar PV System Installation on Government Building" on BOO Basis at Jamalpur District Town, Bangladesh.
Ø
Ø
Ø
Ø
Ø
Ø
Ø
Ø
Ø
Ø
Ø
Ø
Ø
Ø
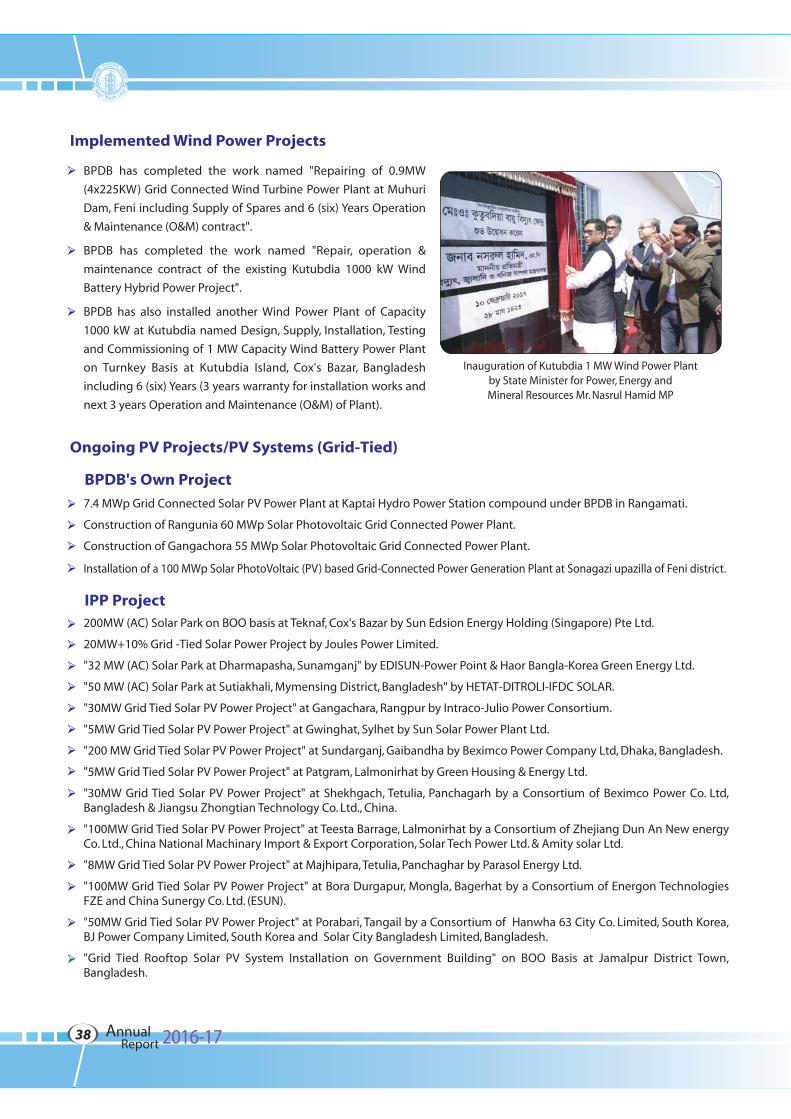
Implemented Wind Power Projects
BPDB has completed the work named "Repairing of 0.9MW
(4x225KW) Grid Connected Wind Turbine Power Plant at Muhuri
Dam, Feni including Supply of Spares and 6 (six) Years Operation
& Maintenance (O&M) contract".
BPDB has completed the work named "Repair, operation &
maintenance contract of the existing Kutubdia 1000 kW Wind
Battery Hybrid Power Project".
BPDB has also installed another Wind Power Plant of Capacity
1000 kW at Kutubdia named Design, Supply, Installation, Testing
and Commissioning of 1 MW Capacity Wind Battery Power Plant
on Turnkey Basis at Kutubdia Island, Cox's Bazar, Bangladesh
including 6 (six) Years (3 years warranty for installation works and
next 3 years Operation and Maintenance (O&M) of Plant).
Ø
Ø
Ø
Inauguration of Kutubdia 1 MW Wind Power Plantby State Minister for Power, Energy andMineral Resources Mr. Nasrul Hamid MP
Annual 2016-17Report38
Ongoing Wind Power Projects
BPDB's Own ProjectProcurement of Design, Supply, Installation, Testing and Commissioning of 2MW Capacity Wind Power Plant on Turnkey
Basis at the bank of the river Jamuna adjacent to the existing Sirajganj 150 MW Power Plant Sirajganj, Bangladesh Including
6 Years (1.5 Years Warranty for Installation Works and next 4.5 Years O&M of Plant with Associated Evacuation Line.
Ø
IPP Project
"60 MW Grid Tied Wind Power Project" at Cox's Bazar by US-DK Green Energy (BD) Ltd.
"100 MW Grid Tied Wind Power Project" at Anwara, Chittagong by a Consortium of PIA Group LLC, Spain and Bangladesh
Alternative Energy Systems Ltd.
Ø
Ø
Ongoing Solid Waste to Energy based Power Projects
Design, Supply, Construction, Testing & Commissioning of Municipal Solid Waste to 1 ± 10% MW Energy Conversion Pilot
Project at Keraniganj on Turnkey Basis.
Ø
Implemented Solar Charging StationsBPDB has implemented two solar charging stations at Sylhet and Chittagong, each having capacity of 20 kW.Ø
Ongoing Other Projects
Solar Street Lighting Programme in 8 City Corporations (SSLPCC).
For lighting and fan load, installation of several off grid and grid tied solar rooftop systems at BPDB's office buildings and in
consumer premises are also in progress.
Ø
Ø
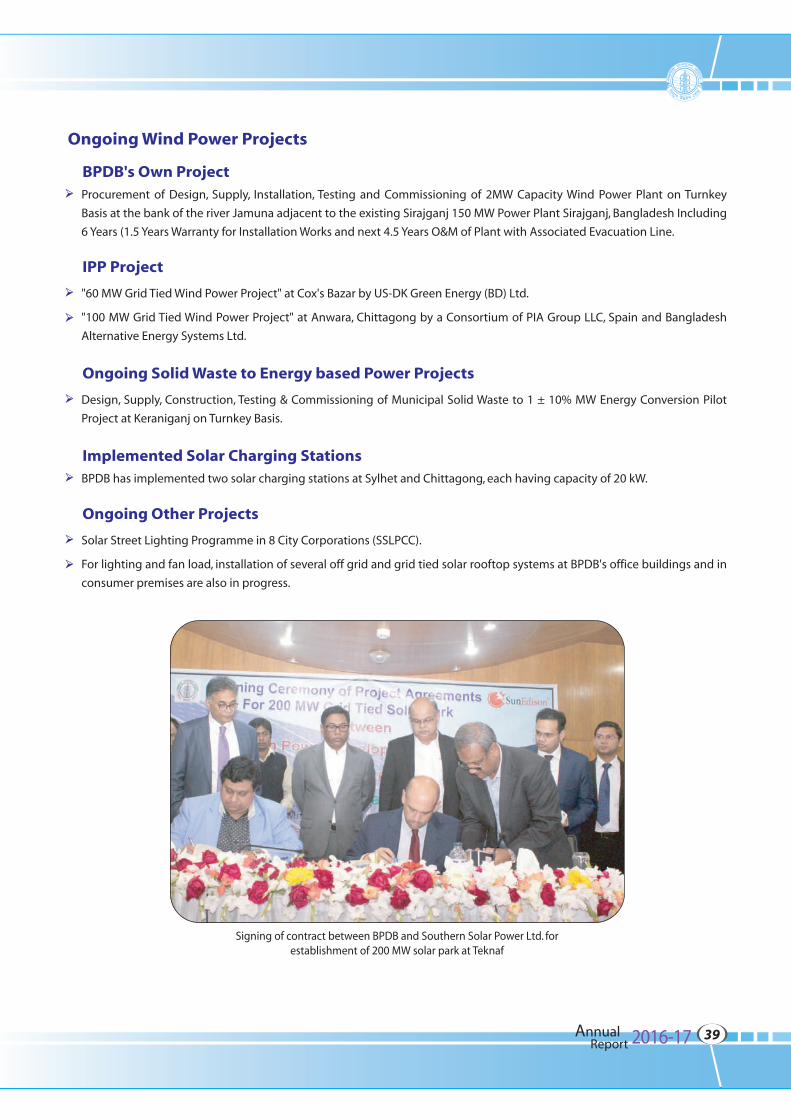
Signing of contract between BPDB and Southern Solar Power Ltd. forestablishment of 200 MW solar park at Teknaf
Annual 2016-17Report39
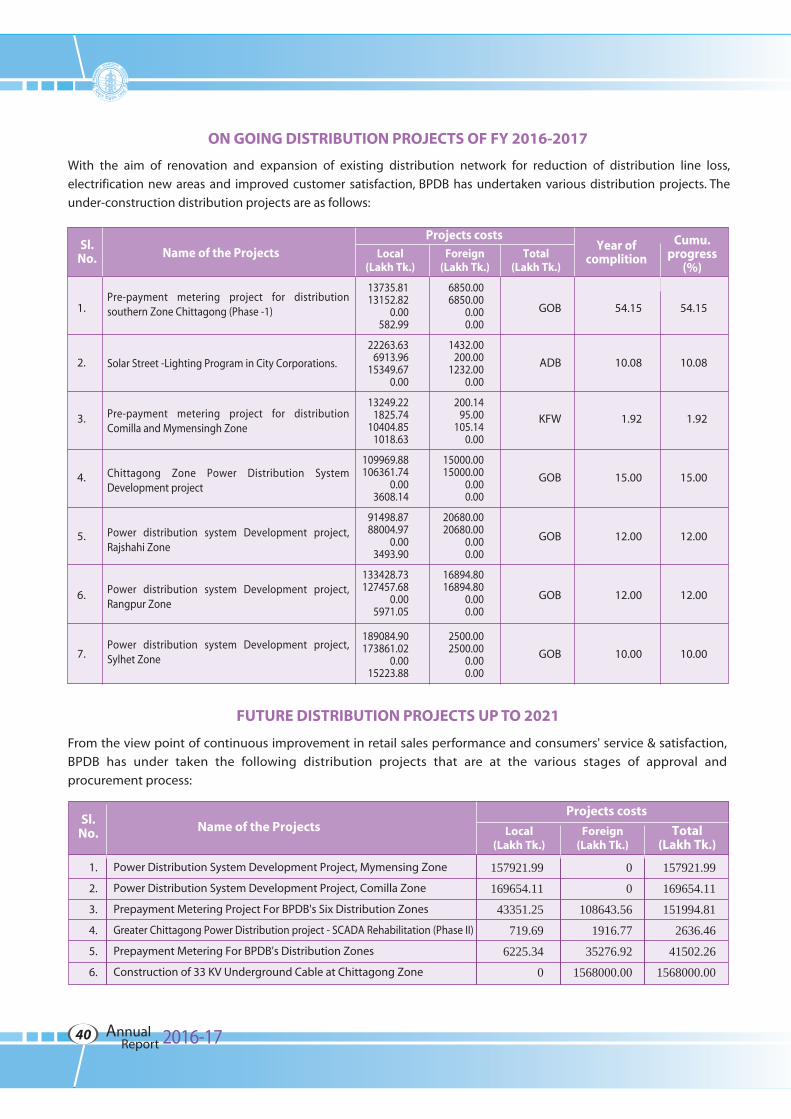
FUTURE DISTRIBUTION PROJECTS UP TO 2021
From the view point of continuous improvement in retail sales performance and consumers' service & satisfaction,
BPDB has under taken the following distribution projects that are at the various stages of approval and
procurement process:
Sl.No. Name of the Projects
Projects costs
Local(Lakh Tk.)
Foreign(Lakh Tk.)
Total(Lakh Tk.)
1.
2.
3.
4.
5.
6.
157921.99
169654.11
43351.25
719.69
6225.34
0
0
0
108643.56
1916.77
35276.92
1568000.00
157921.99
169654.11
151994.81
2636.46
41502.26
1568000.00
Power Distribution System Development Project, Mymensing Zone
Power Distribution System Development Project, Comilla Zone
Prepayment Metering Project For BPDB's Six Distribution Zones
Greater Chittagong Power Distribution project - SCADA Rehabilitation (Phase II)
Prepayment Metering For BPDB's Distribution Zones
Construction of 33 KV Underground Cable at Chittagong Zone
Sl.No. Name of the Projects
Projects costsYear of
complition
Cumu.progress
(%)Local
(Lakh Tk.)Foreign
(Lakh Tk.)Total
(Lakh Tk.)
1.
2.
3.
4.
5.
6.
7.
13735.8113152.82
0.00582.99
22263.636913.96
15349.670.00
13249.221825.74
10404.851018.63
109969.88106361.74
0.003608.14
91498.8788004.97
0.003493.90
133428.73127457.68
0.005971.05
189084.90173861.02
0.0015223.88
6850.006850.00
0.000.00
1432.00200.00
1232.000.00
200.1495.00
105.140.00
15000.0015000.00
0.000.00
20680.0020680.00
0.000.00
16894.8016894.80
0.000.00
2500.002500.00
0.000.00
GOB
ADB
KFW
GOB
GOB
GOB
GOB
54.15
10.08
1.92
15.00
12.00
12.00
10.00
54.15
10.08
1.92
15.00
12.00
12.00
10.00
Pre-payment metering project for distribution southern Zone Chittagong (Phase -1)
Solar Street -Lighting Program in City Corporations.
Pre-payment metering project for distribution Comilla and Mymensingh Zone
Chittagong Zone Power Distribution System Development project
Power distribution system Development project, Rajshahi Zone
Power distribution system Development project, Rangpur Zone
Power distribution system Development project, Sylhet Zone
ON GOING DISTRIBUTION PROJECTS OF FY 2016-2017
With the aim of renovation and expansion of existing distribution network for reduction of distribution line loss,
electrification new areas and improved customer satisfaction, BPDB has undertaken various distribution projects. The
under-construction distribution projects are as follows:
Annual 2016-17Report40

Chapter 3
Reforms & OtherActivities
Government has given top priority in power sector development and has made commitment to provide access to electricity to all citizens across the country by 2021.In order to achieve this goal Government has undertaken a number of reform measures, some of them have already been implemented. Till-to-date the implementation status is as follows:
The Electricity Directorate was established in 1948 in order to plan and improve power supply situation of the country. Considering the increasing demand of electricity and its importance in agriculture & industry "Water & Power Development Authority" (WAPDA) was created in 1959. Later the "WAPDA" was divided into two parts namely "Bangladesh Power Development Board" & "Bangladesh Water Development Board" by the Presidential Order 59 (PO-59) of 31st May 1972. As a result, Bangladesh Power Development Board was entrusted with the responsibilities of Operation, Maintenance, and Development of Generation, Transmission & Distribution facilities
of electricity throughout the country.
By the ordinance (Ordinance No-LI of 1977) Rural Electrification Board (REB) was established for the development of electricity in the rural areas for the effective benefit of rural people on October, 1977.
Under the reform program Dhaka Electric Supply Authority (DESA) was created for the proper management & electrification in Dhaka city and its adjoining areas in 1990.
DESCO has started functioning from 1996 after taking over part of the distribution network of DESA.
DESA was reformed again as Dhaka Power Distribution Company (DPDC) in July, 2008.
Under the Companies Act 1994, Power Grid Company (PGCB) was created in 1996 to look after the transmission system.
Ashuganj Power Station has been converted into Ashuganj Power Station Company Ltd. (APSCL) in 1996, as a subsidiary company of BPDB.
Northern Electricity Supply Company Ltd. (NESCO) was created in 2016 to look after the distribution system of Rajshahi and Rangpur zone. NESCO is a distribution subsidiary of BPDB.
Electricity Generation Company of Bangladesh (EGCB) has been formed as a Generation Company since 2004. EGCB has implemented 2x10⁵ MW Peaking Power Plant at Shiddirgonj and 412 MW CCPP Power Plant at Haripur.
EGCB has also started construction process of another 335 MW CCPP at Shiddirgonj.
West Zone Power Distribution Company Ltd. (WZPDCL) was created in 2002 to look after the distribution system of Barisal and Khulna Zone. WZPDCL is a distribution subsidiary of BPDB.
Electricity Generation Company of Bangladesh (EGCB) has been formed as a Generation Company since 2004. EGCB has implemented 2x10⁵ MW Peaking Power Plant at Shiddirgonj and 412 MW CCPP Power Plant at Haripur. EGCB has also started construction process of another 335 MW CCPP at Shiddirgonj.
North West Power Generation Company (NWPGCL) was created in 2008. NWPGCL has implemented 210 MW Combined Cycle Power Plant at Sirajganj, 230 MW Combined cycle Power Plant at Khulna. NWPGCL has also started construction process of 412 MW CCPP at Bheramara, Sirajganj 225 MW CCPP project (2nd unit), Sirajganj CCPP project (3rd unit), Payra 1200-1320 MW Thermal plant project (1st Phase) under BCPCL.
BPDB is in the process of indentifying Strategic Business Unit (SBU) for its generation and distribution sectors as a new reform initiative. Functional and financial performance of the SBUs will be operated like components of a corporate body and will be evaluated separately under the legal frame work of existing BPDB structure.
Functional, financial and human resource sharing is much easier and highly effective under one legal binding in a bigorganization rather than small corporate power entities.
Reform and Restructure
Annual 2016-17Report42
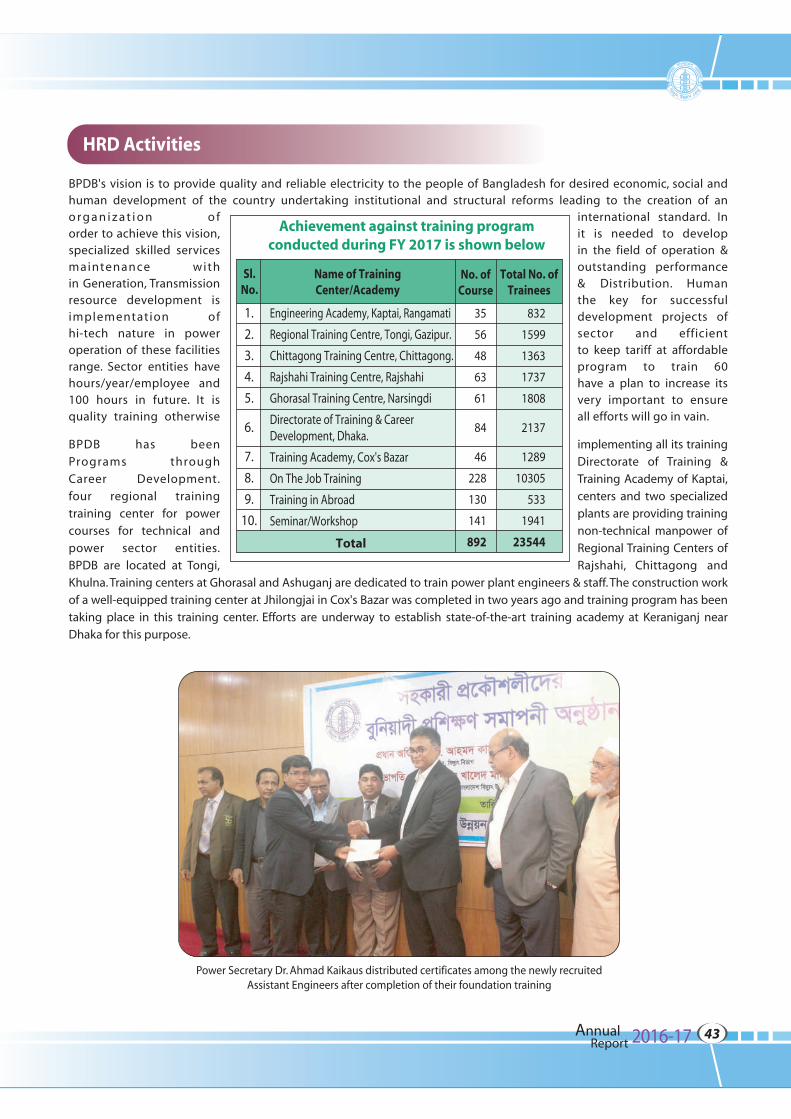
BPDB's vision is to provide quality and reliable electricity to the people of Bangladesh for desired economic, social and human development of the country undertaking institutional and structural reforms leading to the creation of an o r g a n i z a t i o n o f international standard. In order to achieve this vision, it is needed to develop specialized skilled services in the field of operation & maintenance with outstanding performance in Generation, Transmission & Distribution. Human resource development is the key for successful implementation of development projects of hi-tech nature in power sector and efficient operation of these facilities to keep tariff at affordable range. Sector entities have program to train 60 hours/year/employee and have a plan to increase its 100 hours in future. It is very important to ensure quality training otherwise all efforts will go in vain.
BPDB has been implementing all its training
Programs through Directorate of Training &
Career Development. Training Academy of Kaptai,
four regional training centers and two specialized
training center for power plants are providing training
courses for technical and non-technical manpower of
power sector entities. Regional Training Centers of
BPDB are located at Tongi, Rajshahi, Chittagong and
Khulna. Training centers at Ghorasal and Ashuganj are dedicated to train power plant engineers & staff. The construction work
of a well-equipped training center at Jhilongjai in Cox's Bazar was completed in two years ago and training program has been
taking place in this training center. Efforts are underway to establish state-of-the-art training academy at Keraniganj near
Dhaka for this purpose.
Achievement against training programconducted during FY 2017 is shown below
1.
2.
3.
4.
5.
6.
7.
8.
9.
10.
Engineering Academy, Kaptai, Rangamati
Regional Training Centre, Tongi, Gazipur.
Chittagong Training Centre, Chittagong.
Rajshahi Training Centre, Rajshahi
Ghorasal Training Centre, Narsingdi
Directorate of Training & CareerDevelopment, Dhaka.
Training Academy, Cox's Bazar
On The Job Training
Training in Abroad
Seminar/Workshop
35
56
48
63
61
84
46
228
130
141
892
832
1599
1363
1737
1808
2137
1289
10305
533
1941
23544
Sl.No.
Name of TrainingCenter/Academy
No. ofCourse
Total No. ofTrainees
Total
HRD Activities
Power Secretary Dr. Ahmad Kaikaus distributed certificates among the newly recruitedAssistant Engineers after completion of their foundation training
Annual 2016-17Report43
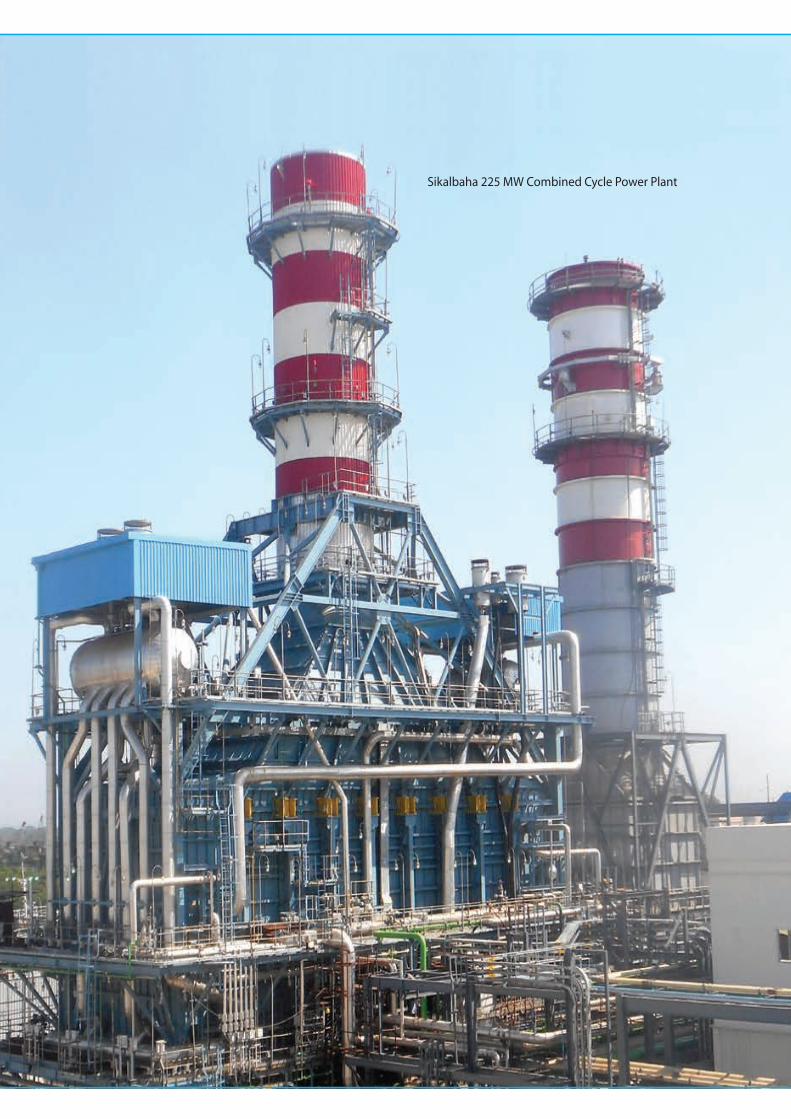
Sikalbaha 225 MW Combined Cycle Power Plant

Chapter 4
Tables and Charts
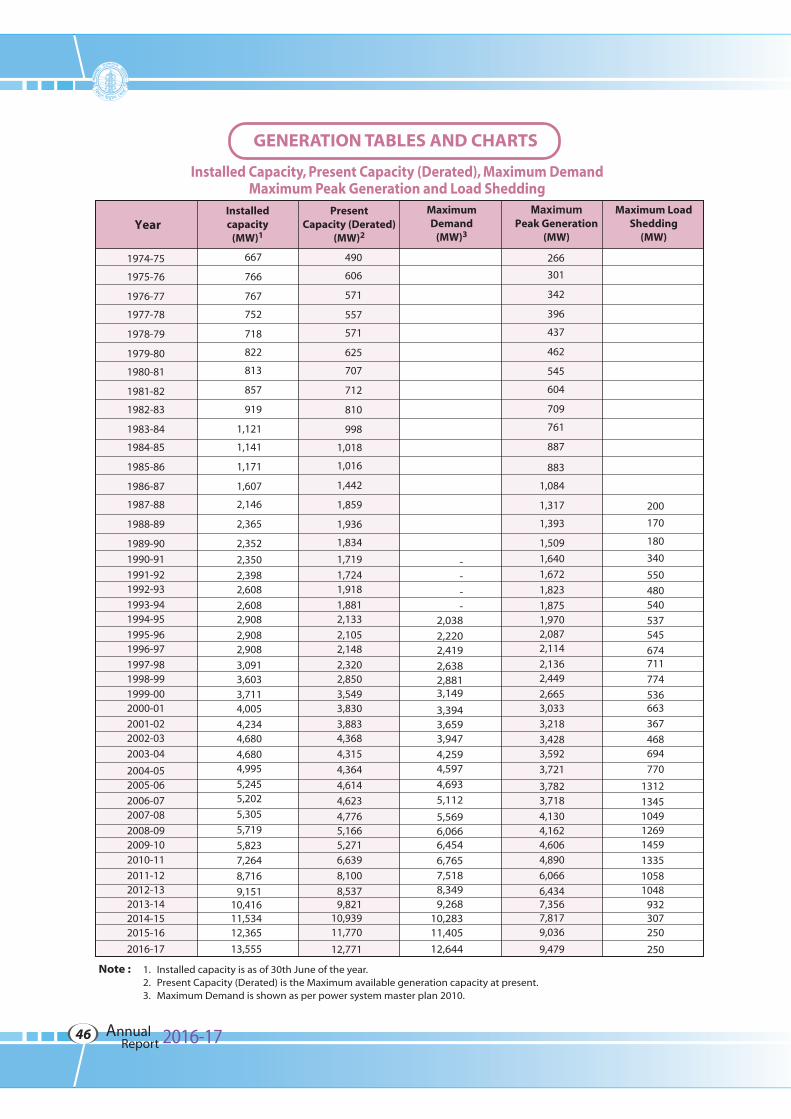
Installed Capacity, Present Capacity (Derated), Maximum DemandMaximum Peak Generation and Load Shedding
490
606
571
557
571
625
707
712
810
998
1,018
1,016
1,442
1,859
1,936
1,834
1,719
1,724 1,918
1,881 2,133
2,105 2,148
2,320 2,850 3,549 3,830
3,883 4,368
4,315
4,364
4,614
4,623
4,776 5,166 5,271 6,639
8,100
8,537 9,821
10,93911,770
12,771
266
301
342
396
437
462
545
604
709
761
887
883
1,084
1,317
1,393
1,509
1,640
1,672
1,823
1,8751,970 2,087 2,114
2,136 2,449
2,665 3,033
3,218
3,428 3,592
3,721
3,782 3,718
4,130 4,162 4,606 4,890
6,066
6,434 7,356 7,8179,036
9,479
- -
- -
2,038
2,220 2,419
2,638 2,881 3,149
3,394 3,659 3,947
4,259 4,597
4,693
5,112
5,569 6,066 6,454
6,765 7,518 8,349 9,268
10,28311,405
12,644
1974-75
1975-76
1976-77
1977-78
1978-79
1979-80
1980-81
1981-82
1982-83
1983-84
1984-85
1985-86
1986-87
1987-88
1988-89
1989-90
1990-91
1991-921992-93
1993-941994-95
1995-961996-97
1997-981998-991999-002000-01
2001-022002-03
2003-04
2004-052005-06
2006-072007-08
2008-092009-102010-11
2011-122012-132013-142014-152015-16
2016-17
667
766
767
752
718
822
813
857
919
1,121
1,141
1,171
1,607
2,146
2,365
2,352
2,350
2,398 2,608
2,608 2,908
2,908 2,908
3,091 3,603 3,711 4,005
4,234 4,680
4,680 4,995
5,245 5,202
5,305
5,719
5,823 7,264
8,716
9,151 10,416 11,53412,365
13,555
200
170
180
340
550
480540
537545
674711
774
536663
367
468694
770
1312
1345104912691459
1335
10581048
932307250
250
1.2.3.
Note : Installed capacity is as of 30th June of the year.Present Capacity (Derated) is the Maximum available generation capacity at present.Maximum Demand is shown as per power system master plan 2010.
GENERATION TABLES AND CHARTS
Annual 2016-17Report46
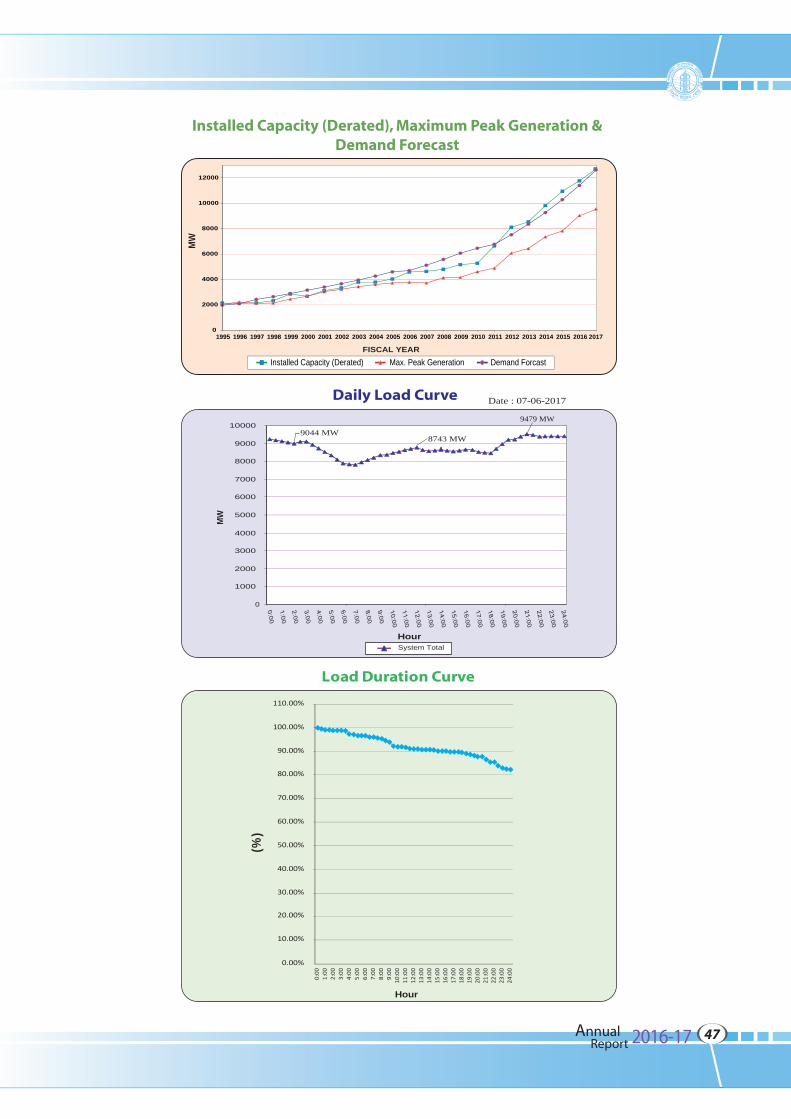
0
2000
4000
6000
8000
10000
12000
1995 1996 1997 1998 1999 2000 2001 2002 2003 2004 2005 2006 2007 2008 2009 2010 2011 2012 2013 2014 2015 2016 2017
MW
FISCAL YEARInstalled Capacity (Derated) Max. Peak Generation Demand Forcast
Date : 07-06-2017
MW
HourSystem Total
Daily Load Curve
Installed Capacity (Derated), Maximum Peak Generation &Demand Forecast
Load Duration Curve
9044 MW8743 MW
9479 MW
0
1000
2000
3000
4000
5000
6000
7000
8000
9000
10000
110.00%
90.00%
100.00%
80.00%
70.00%
60.00%
50.00%
40.00%
30.00%
20.00%
10.00%
0.00%
0:00
1:00
2:00
3:00
4:00
5:00
6:00
7:00
8:00
9:00
10:0
011
:00
12:0
013
:00
14:0
015
:00
16:0
017
:00
18:0
019
:00
20:0
021
:00
22:0
023
:00
24:0
0
(%)
Hour
Annual 2016-17Report47
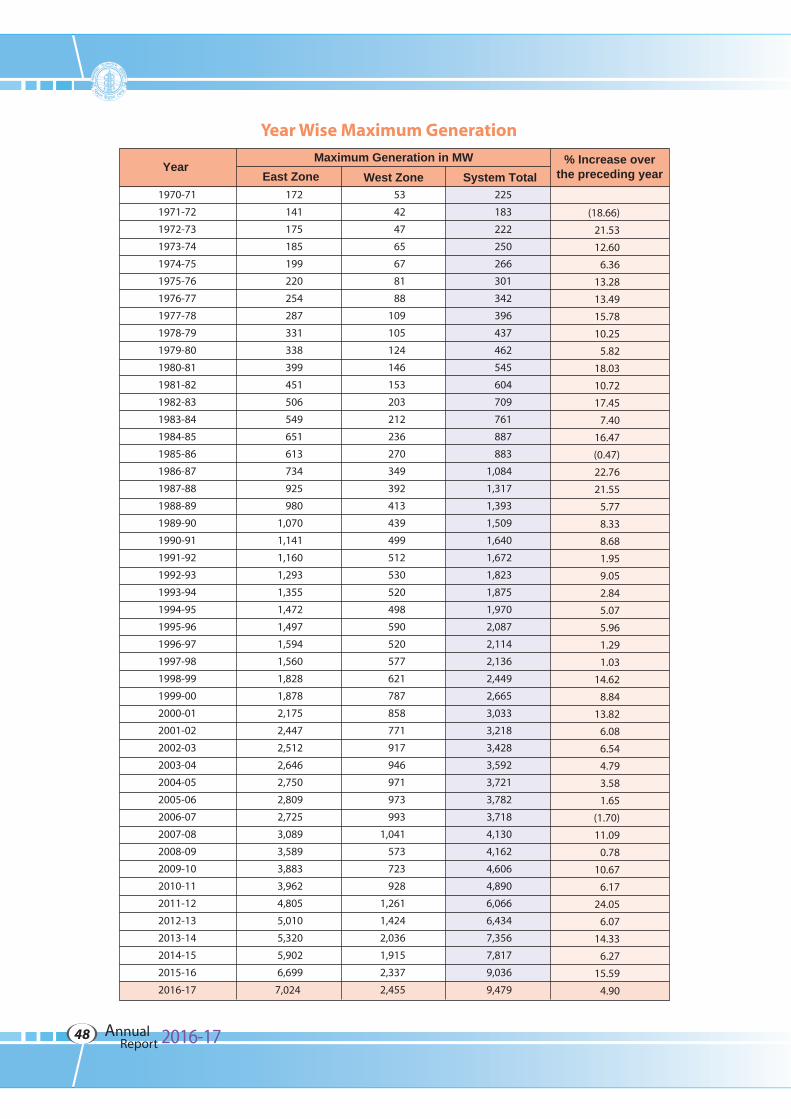
1970-71
1971-72
1972-73
1973-74
1974-75
1975-76
1976-77
1977-78
1978-79
1979-80
1980-81
1981-82
1982-83
1983-84
1984-85
1985-86
1986-87
1987-88
1988-89
1989-90
1990-91
1991-92
1992-93
1993-94
1994-95
1995-96
1996-97
1997-98
1998-99
1999-00
2000-01
2001-02
2002-03
2003-04
2004-05
2005-06
2006-07
2007-08
2008-09
2009-10
2010-11
2011-12
2012-13
2013-14
2014-15
2015-16
2016-17
172
141
175
185
199
220
254
287
331
338
399
451
506
549
651
613
734
925
980
1,070
1,141
1,160
1,293
1,355
1,472
1,497
1,594
1,560
1,828
1,878
2,175
2,447
2,512
2,646
2,750
2,809
2,725
3,089
3,589
3,883
3,962
4,805
5,010
5,320
5,902
6,699
7,024
53
42
47
65
67
81
88
109
105
124
146
153
203
212
236
270
349
392
413
439
499
512
530
520
498
590
520
577
621
787
858
771
917
946
971
973
993
1,041
573
723
928
1,261
1,424
2,036
1,915
2,337
2,455
225
183
222
250
266
301
342
396
437
462
545
604
709
761
887
883
1,084
1,317
1,393
1,509
1,640
1,672
1,823
1,875
1,970
2,087
2,114
2,136
2,449
2,665
3,033
3,218
3,428
3,592
3,721
3,782
3,718
4,130
4,162
4,606
4,890
6,066
6,434
7,356
7,817
9,036
9,479
(18.66)
21.53
12.60
6.36
13.28
13.49
15.78
10.25
5.82
18.03
10.72
17.45
7.40
16.47
(0.47)
22.76
21.55
5.77
8.33
8.68
1.95
9.05
2.84
5.07
5.96
1.29
1.03
14.62
8.84
13.82
6.08
6.54
4.79
3.58
1.65
(1.70)
11.09
0.78
10.67
6.17
24.05
6.07
14.33
6.27
15.59
4.90
Year Wise Maximum Generation
YearEast Zone West Zone
Maximum Generation in MW % Increase overthe preceding yearSystem Total
Annual 2016-17Report48
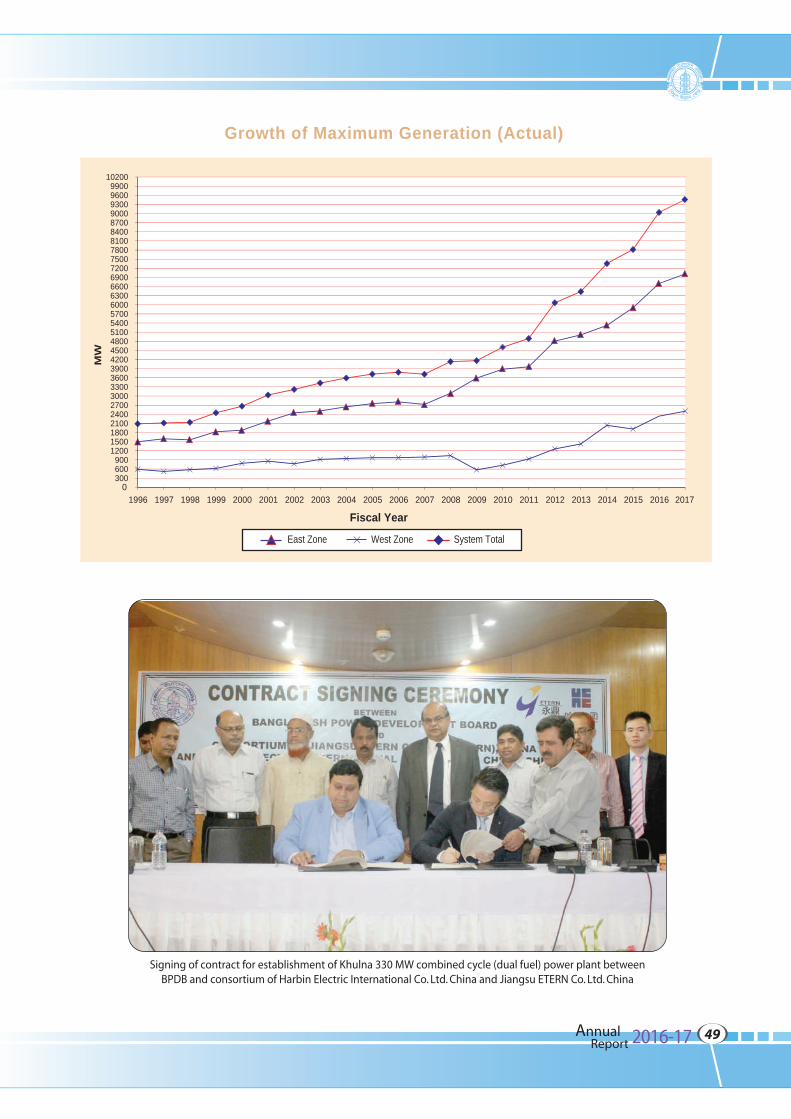
Growth of Maximum Generation (Actual)
0 300 600 900
1200 1500 1800 2100 2400 2700 3000 3300 3600 3900 4200 4500 4800 5100 5400 5700 6000 6300 6600 6900 7200 7500 7800 8100 8400 8700 9000 9300 9600 9900
10200
1996 1997 1998 1999 2000 2001 2002 2003 2004 2005 2006 2007 2008 2009 2010 2011 2012 2013 2014 2015 2016 2017
Fiscal Year
MW
East Zone West Zone System Total
Signing of contract for establishment of Khulna 330 MW combined cycle (dual fuel) power plant betweenBPDB and consortium of Harbin Electric International Co. Ltd. China and Jiangsu ETERN Co. Ltd. China
Annual 2016-17Report49
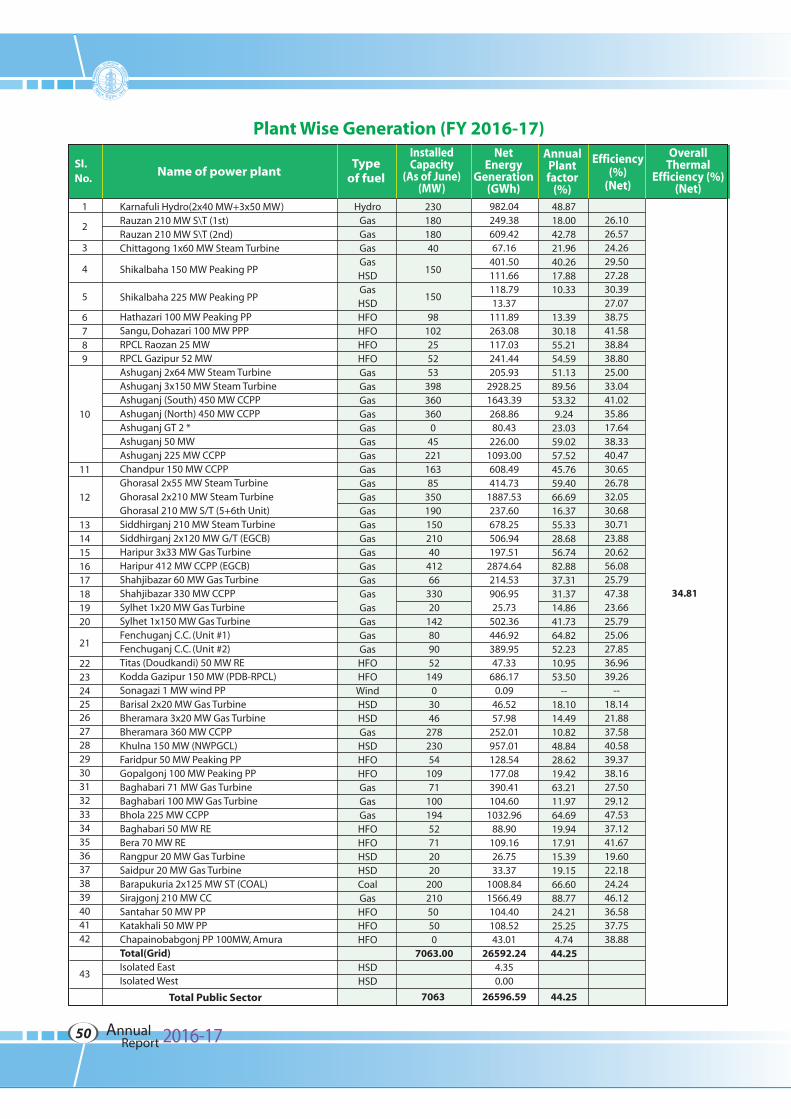
Plant Wise Generation (FY 2016-17)
Sl.No.
Name of power plantType
of fuel
InstalledCapacity
(As of June)(MW)
NetEnergy
Generation(GWh)
AnnualPlantfactor
(%)
Efficiency(%)
(Net)
OverallThermal
Efficiency (%)(Net)
982.04249.38609.4267.16
401.50111.66118.7913.37
111.89263.08117.03241.44205.93
2928.251643.39268.8680.43
226.001093.00608.49414.73
1887.53237.60678.25506.94197.51
2874.64214.53906.9525.73
502.36446.92389.9547.33
686.170.09
46.5257.98
252.01957.01128.54177.08390.41104.60
1032.9688.90
109.1626.7533.37
1008.841566.49104.40108.5243.01
26592.244.350.00
26596.59
1
2
3
4
5
6789
10
11
12
1314151617181920
21
222324252627282930313233343536373839404142
43
Total Public Sector
HydroGasGasGasGasHSDGasHSDHFOHFOHFOHFOGasGasGasGasGasGasGasGasGasGasGasGasGasGasGasGasGasGasGasGasGasHFOHFOWindHSDHSDGasHSDHFOHFOGasGasGasHFOHFOHSDHSDCoalGasHFOHFOHFO
HSDHSD
230 180 180 40
150
150
98 102 25 52 53
398 360 360
0 45
221 163 85
350 190 15021040
41266
33020
142809052
1490
3046
27823054
10971
10019452712020
20021050 500
7063.00
7063
48.8718.0042.7821.9640.2617.8810.33
13.3930.1855.2154.5951.1389.5653.329.24
23.0359.0257.5245.7659.4066.6916.3755.3328.6856.7482.8837.3131.3714.8641.7364.8252.2310.9553.50
--18.1014.4910.8248.8428.6219.4263.2111.9764.6919.9417.9115.3919.1566.6088.7724.2125.254.74
44.25
44.25
26.1026.5724.2629.5027.2830.3927.0738.7541.5838.8438.8025.0033.0441.0235.8617.6438.3340.4730.6526.7832.0530.6830.7123.8820.6256.0825.7947.3823.6625.7925.0627.8536.9639.26
--18.1421.8837.5840.5839.3738.1627.5029.1247.5337.1241.6719.6022.1824.2446.1236.5837.7538.88
Karnafuli Hydro(2x40 MW+3x50 MW)Rauzan 210 MW S\T (1st)Rauzan 210 MW S\T (2nd)Chittagong 1x60 MW Steam Turbine
Shikalbaha 150 MW Peaking PP
Shikalbaha 225 MW Peaking PP
Hathazari 100 MW Peaking PPSangu, Dohazari 100 MW PPPRPCL Raozan 25 MWRPCL Gazipur 52 MWAshuganj 2x64 MW Steam TurbineAshuganj 3x150 MW Steam TurbineAshuganj (South) 450 MW CCPPAshuganj (North) 450 MW CCPPAshuganj GT 2 *Ashuganj 50 MWAshuganj 225 MW CCPPChandpur 150 MW CCPPGhorasal 2x55 MW Steam TurbineGhorasal 2x210 MW Steam TurbineGhorasal 210 MW S/T (5+6th Unit)Siddhirganj 210 MW Steam TurbineSiddhirganj 2x120 MW G/T (EGCB)Haripur 3x33 MW Gas TurbineHaripur 412 MW CCPP (EGCB)Shahjibazar 60 MW Gas TurbineShahjibazar 330 MW CCPPSylhet 1x20 MW Gas Turbine Sylhet 1x150 MW Gas Turbine Fenchuganj C.C. (Unit #1) Fenchuganj C.C. (Unit #2) Titas (Doudkandi) 50 MW REKodda Gazipur 150 MW (PDB-RPCL)Sonagazi 1 MW wind PPBarisal 2x20 MW Gas TurbineBheramara 3x20 MW Gas TurbineBheramara 360 MW CCPPKhulna 150 MW (NWPGCL)Faridpur 50 MW Peaking PPGopalgonj 100 MW Peaking PPBaghabari 71 MW Gas TurbineBaghabari 100 MW Gas TurbineBhola 225 MW CCPPBaghabari 50 MW REBera 70 MW RERangpur 20 MW Gas TurbineSaidpur 20 MW Gas TurbineBarapukuria 2x125 MW ST (COAL)Sirajgonj 210 MW CCSantahar 50 MW PPKatakhali 50 MW PPChapainobabgonj PP 100MW, AmuraTotal(Grid)Isolated EastIsolated West
34.81
Annual 2016-17Report50

123456789
10111213141516171819202122
123456789
10111213141516171819202122232425262728293031323334353637
KPCL (Khulna,BMPP)NEPC (Haripur, BMPP)RPCL 210 MW(Mymensingh)CDC, Haripur CDC, Meghnaghat Ashuganj 51 MW (Midland)Natore, Rajshahi 50 MW PP (RajLanka)Meghnagat power Co. (summit)Gogonnogor 102 MW PPBaraka-Potengga 50 MW PPGhorashal 108 MW (Regent Power)Potiya, Chittagong 108 MW (ECPV)Comilla 52 MW (Lakdhanvi Bangla)Katpotti,Munshigonj 50 MW (Sinha peoples)Ashuganj modular 195 MW (United Power)Nawabganj 55 MW (Dhaka Southern)Doreen Northern Power LimitedMadangonj 55 MW IPP (5 Yrs Summit)Summit Barisal (110 MW)CLC 108 MW Bosila KeraniganjJamalpur 95 MW Power Plant Ltd. Powerpac MutiaraBibiyana 2 (Summith) 341 MWSub-Total IPPRENTAL & SIPP Bogra Rental (GBB) ( 15 Years)Kumargoan (Energy Prima)( 3 Years)Sahzibazar RPP (Shahjibazar Power) (15 Years)Sahzibazar RPP (Energyprima) ( 3 Years)Tangail SIPP (Doreen) (22 MW) (BPDB)Feni SIPP (22 MW) (BPDB)Kumargao 10 MW(Desh Energy) (15 Years)BarabkunduBhola RPP (34.5 MW)Jangalia , Comilla (33 MW)Fenchugonj 51 MW Rental ( Barakatullah) (15 Yrs)Shikalbaha 55 MW Rental (3 Years)MalanchaShahjahanullah Power Gen Co. Ltd.Ashugonj 55 MW (Precision Energy) 3 Years RentalThakurgaon 50 MW 3 Years RentalFenchugonj 50 MW (Energy Prima)Ghorashal 45 MW RPP (Aggreko)Khulna 55 MW RPP 3 yrs (Aggreko)Ghorashal 100 MW RPP Aggreko)Pagla 50 MW ( DPA)Shiddirgonj 100 MW Q. Rental (Desh Energy) 3 YrsB.Baria 70 MW QRPP (3 Yrs Aggreco)Madangonj 100 MW QRPP (5 Yrs Summit)Khulna 115 MW QRPP (5 Yrs Summit)Ghorashal 78 MW QRPP (3 Yrs Max Power)Noapara 40 MW QRPP (5 Yrs Khan Jahan Ali)Ashugonj 80 MW QRPP (3 Yrs Aggreco)Ashugonj 53 MW Q. Rental PP (3 Years) ( United Power)Meghnagat 100 MW QRPP (5 Yrs) IELShiddirgonj 100 MW QRPP (5Years) Dutch BanglaBogra RPP 3 Yrs (Energy Prima)Amnura 50 MW QRPP (5 Yrs, Sinha Power)Keranigonj 100 MW QRPP(5Yrs) (Power Pac)Julda 100MW QRPP (5Yrs, Acron infra)Katakhali 50 MW QRPPPower ImportSub-Total RENTAL & SIPPSIPP (REB)Total Private Sector (IPP+SIPP+Rental+Import+REB)Public Sector Net GenerationTotal Net Generation(Public+IPP Net+ Import)
110110202360450
5152
305102
50108108
5251
195555555
110108
95341
3125
225086502222102233335151
00
550
444555
10050
10085
100115
7840
053
100100
1050
100100
50600
2482251
58587063
12921
43.00%22.87%61.71%74.93%65.93%51.35%44.19%38.32%47.13%63.13%69.06%51.57%18.23%36.39%56.12%56.45%48.68%52.73%73.77%13.14%32.98%69.00%
90.03%60.73%53.49%32.96%72.44%79.06%63.06%66.07%30.53%67.30%63.09%51.38%
----
48.59%8.55%
70.32%85.48%16.21%75.31%19.11%18.31%58.62%52.86%51.37%64.59%55.53%21.66%39.42%42.16%53.06%72.15%51.23%37.90%69.17%42.56%83.05%
39.0941.0345.1549.0645.1735.5143.5725.5441.2543.0537.2643.0543.5742.9042.5144.4044.4042.5442.5443.2043.5728.88
31.6234.2527.2528.4138.2638.2643.0538.2628.4938.2337.9143.00
----
32.5036.6931.2835.9632.5035.9638.3339.2435.9641.7940.1535.8541.1135.9636.3141.2941.2934.2541.7940.9843.2241.29
414.34220.35
1092.052362.912599.08
229.39201.28
1023.96421.09276.51653.34487.89
83.05162.60958.71271.97234.55254.07710.88124.29274.45
2061.2215117.97
173.50266.00402.95144.38139.61152.37
55.24127.33
88.24194.55281.85229.54176.39
28.18234.12
29.94271.04336.96
78.09659.69
83.71160.39436.45463.06517.53441.30194.57180.23183.03369.32464.82
63.20224.37332.01605.93186.42
4655.9213632
192930679.37
2659757275.97
HFOHFOGasGasGasGasHFOHSDHFOHFOGasHFOHFOHFOGasHFOHFOHFOHFOHFOHFOGas
GasGasGasGasGasGasGasGasGasGasGasHFOGasGasGasHSDGasHSDHSDGASHSDHSDGasHFOHFOGasHFOGasGasHFOHFOGasHFOHFOHFOHFO
Import
IPP
Sl.No.
Name of power plantType
of fuel
InstalledCapacity
(As of June)(MW)
NetEnergy
Generation(GWh)
AnnualPlantfactor
(%)
Efficiency(%)
(Net)
Annual 2016-17Report51

Energy Generation (National)
1970-71
1971-72
1972-73
1973-74
1974-75
1975-76
1976-77
1977-78
1978-79
1979-80
1980-81
1981-82
1982-83
1983-84
1984-85
1985-86
1986-87
1987-88
1988-89
1989-90
1990-91
1991-92
1992-93
1993-94
1994-95
1995-96
1996-97
1997-98
1998-99
1999-00
2000-01
2001-02
2002-03
2003-04
2004-05
2005-06
2006-07
2007-08
2008-09
2009-10
2010-11
2011-12
2012-13
2013-14
2014-15
2015-16
2016-17
725
582
857
982
1022
1116
1224
1444
1603
1745
1,978
2,292
2,846
3,398
3,656
3,488
4,749
5,753
6,534
7,401
8,126
8,500
8,583
9,129
9,885
10,735
10,805
11,789
13,126
13,634
13,717
13,267
11,371
11,303
11,910
13,177
12,964
13,397
13,627
14,735
12,845
13,316
15,078
15,726
16,950
17,542
21,343
204
135
229
283
300
344
394
468
519
609
684
744
587
568
873
1,312
838
789
581
331
144
394
624
655
921
740
1,053
1,093
746
684
1,111
1,183
1,510
2,039
2,157
2,240
2,531
2,758
2,803
2,329
2,680
2,758
3,929
4,943
5,214
6,179
6,594
929
717
1086
1265
1322
1460
1619
1913
2122
2353
2,662
3,036
3,433
3,966
4,528
4,800
5,587
6,541
7,115
7,732
8,270
8,894
9,206
9,784
10,806
11,474
11,858
12,882
13,872
14,318
14,828
14,450
12,881
13,342
14,067
15,417
15,495
16,155
16,431
17,064
15,525
16,074
19,008
20,669
22,163
23,72
27,938
883
681
1031
1202
1256
1387
1538
1817
2016
2236
2529
2885
3261
3768
4302
4560
5308
6214
6759
7345
7857
8450
8746
9295
10266
10901
11,243
12,194
13,060
13,495
14,062
13,674
12,159
12,584
13,223
14,456
14,539
15,167
15,449
16,072
14,673
15,201
17,994
19,645
21,103
22,586
26,597
578
1,244
2,193
3,771
6,299
7,718
8,185
8,522
8,729
9,779
11,084
13,175
16,682
19,917
20,235
22,550
24,733
29,608
30,679
883
681
1,031
1,202
1,256
1,387
1,538
1,817
2,016
2,236
2,529
2,885
3,261
3,768
4,302
4,560
5,308
6,214
6,759
7,345
7,857
8,450
8,746
9,295
10,266
10,901
11,243
12,194
13,638
14,739
16,255
17,445
18,458
20,302
21,408
22,978
23,268
24,946
26,533
29,247
31,355
35,118
38,229
42,195
45,836
52,193
57,276
(22.82)
51.41
16.56
4.48
10.41
10.89
18.18
10.95
10.89
13.11
14.07
13.05
15.54
14.18
6.00
16.39
17.08
8.77
8.67
6.96
7.55
3.51
6.28
10.45
6.18
3.14
8.46
11.84
8.07
10.28
7.32
5.80
9.99
5.45
7.33
1.26
7.21
6.36
10.23
7.21
12.00
8.86
10.37
8.63
13.87
9.74
341.32
519.04
477.41
222.40
797.84
1,179.54
1,550.00
1,956.78
2,314.07
2,213.00
1,919.89
1,980.76
1,954.62
2,215.02
1,924.17
1,997.00
2,186.00
2,482.45
1,979.40
2,249.16
2,170.40
2,135.55
2,146.20
2344.72
1950.25
2462.08
2548.99
3831.43
3574.00
4445.42
4695.49
3138.37
3043.08
2859.60
2398.56
0.24
1.44
20.63
106.43
10.91
0.02
--
--
--
--
--
--
--
--
--
--
--
--
--
--
--
--
--
--
--
--
--
--
--
--
--
--
--
--
YearNet
Generation ofPublic Sector
Total PrivateGenerationInclu. REB
(Net)
TotalGeneration
(Net)
% ChangeOver the
PrecedingYear
Energy Transfer throughEast-West Interconnector
Gross Energy Generation of Public Sector
East Zone West Zone East to West West to EastSystem Total
In GWh
Annual 2016-17Report52
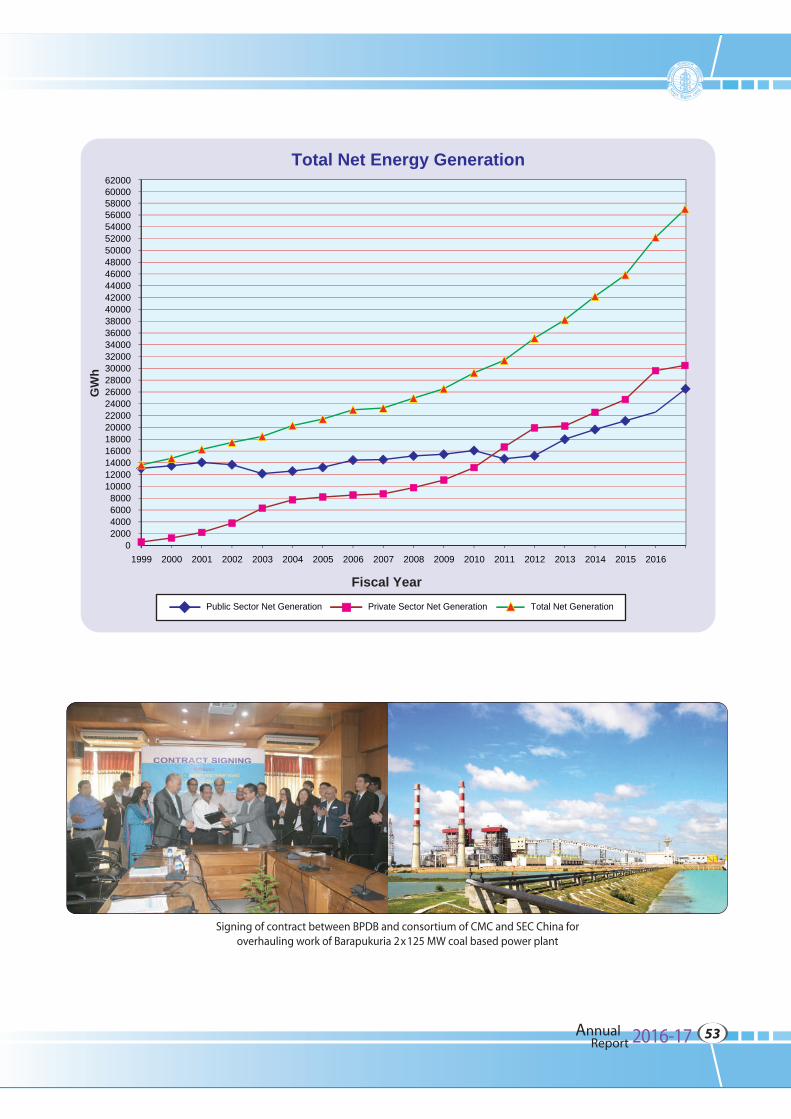
GW
h
Fiscal Year
Total Net Energy Generation
Public Sector Net Generation Private Sector Net Generation Total Net Generation
0 2000 4000 6000 8000
10000 12000 14000 16000 18000 20000 22000 24000 26000 28000 30000 32000 34000 36000 38000 40000 42000 44000 46000 48000 50000 52000 54000 56000 58000 60000 62000
1999 2000 2001 2002 2003 2004 2005 2006 2007 2008 2009 2010 2011 2012 2013 2014 2015 2016
Signing of contract between BPDB and consortium of CMC and SEC China foroverhauling work of Barapukuria 2x125 MW coal based power plant
Annual 2016-17Report53
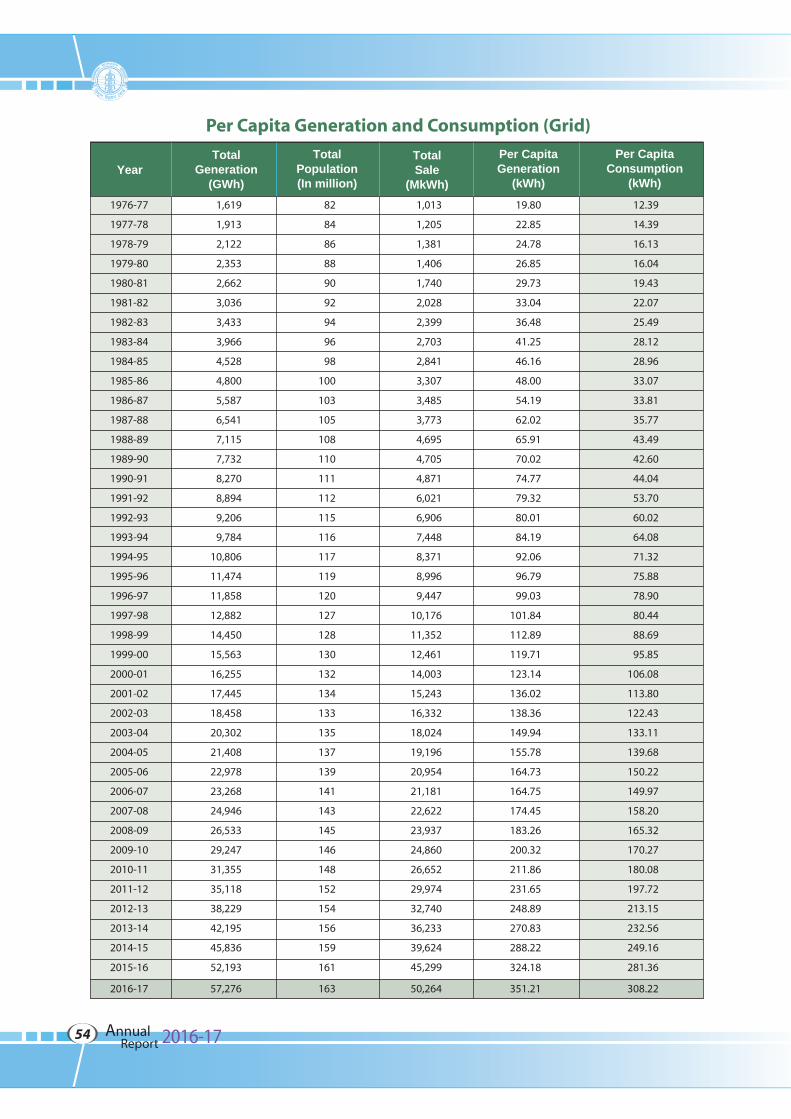
1976-77
1977-78
1978-79
1979-80
1980-81
1981-82
1982-83
1983-84
1984-85
1985-86
1986-87
1987-88
1988-89
1989-90
1990-91
1991-92
1992-93
1993-94
1994-95
1995-96
1996-97
1997-98
1998-99
1999-00
2000-01
2001-02
2002-03
2003-04
2004-05
2005-06
2006-07
2007-08
2008-09
2009-10
2010-11
2011-12
2012-13
2013-14
2014-15
2015-16
2016-17
1,619
1,913
2,122
2,353
2,662
3,036
3,433
3,966
4,528
4,800
5,587
6,541
7,115
7,732
8,270
8,894
9,206
9,784
10,806
11,474
11,858
12,882
14,450
15,563
16,255
17,445
18,458
20,302
21,408
22,978
23,268
24,946
26,533
29,247
31,355
35,118
38,229
42,195
45,836
52,193
57,276
82
84
86
88
90
92
94
96
98
100
103
105
108
110
111
112
115
116
117
119
120
127
128
130
132
134
133
135
137
139
141
143
145
146
148
152
154
156
159
161
163
1,013
1,205
1,381
1,406
1,740
2,028
2,399
2,703
2,841
3,307
3,485
3,773
4,695
4,705
4,871
6,021
6,906
7,448
8,371
8,996
9,447
10,176
11,352
12,461
14,003
15,243
16,332
18,024
19,196
20,954
21,181
22,622
23,937
24,860
26,652
29,974
32,740
36,233
39,624
45,299
50,264
19.80
22.85
24.78
26.85
29.73
33.04
36.48
41.25
46.16
48.00
54.19
62.02
65.91
70.02
74.77
79.32
80.01
84.19
92.06
96.79
99.03
101.84
112.89
119.71
123.14
136.02
138.36
149.94
155.78
164.73
164.75
174.45
183.26
200.32
211.86
231.65
248.89
270.83
288.22
324.18
351.21
12.39
14.39
16.13
16.04
19.43
22.07
25.49
28.12
28.96
33.07
33.81
35.77
43.49
42.60
44.04
53.70
60.02
64.08
71.32
75.88
78.90
80.44
88.69
95.85
106.08
113.80
122.43
133.11
139.68
150.22
149.97
158.20
165.32
170.27
180.08
197.72
213.15
232.56
249.16
281.36
308.22
Per Capita Generation and Consumption (Grid)
YearTotal
Generation(GWh)
TotalPopulation(In million)
TotalSale
(MkWh)
Per CapitaGeneration
(kWh)
Per CapitaConsumption
(kWh)
Annual 2016-17Report54
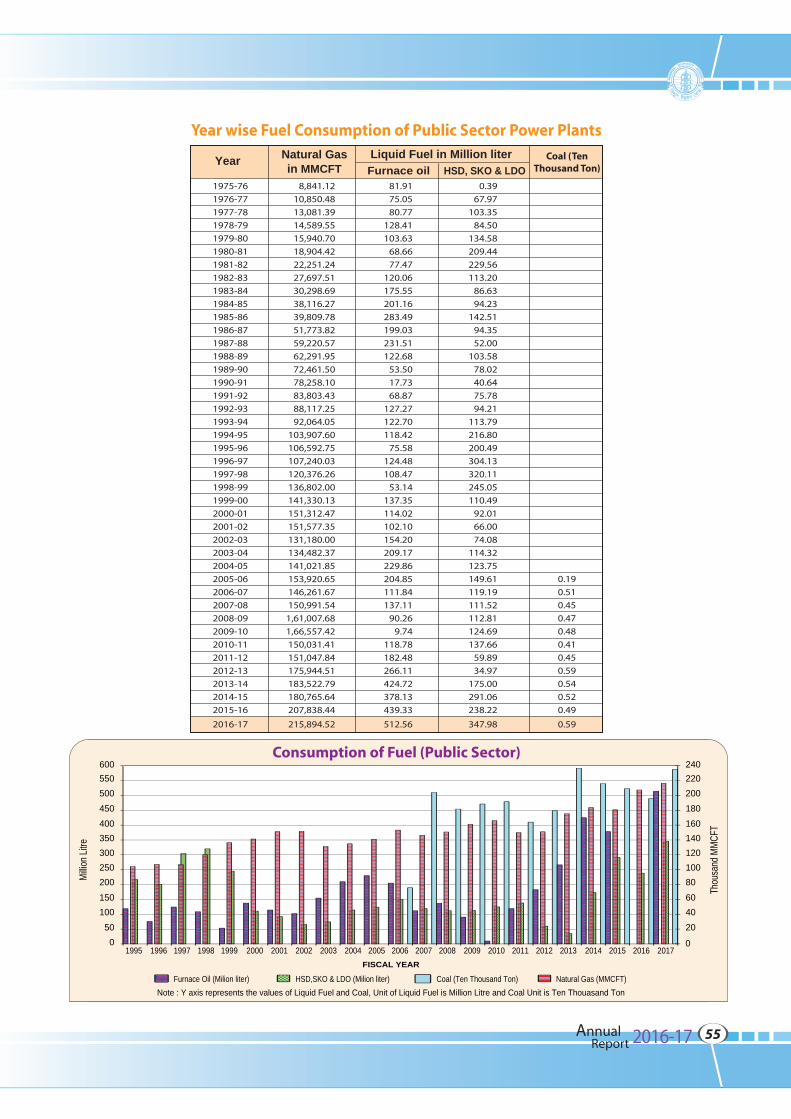
1975-76
1976-77
1977-78
1978-79
1979-80
1980-81
1981-82
1982-83
1983-84
1984-85
1985-86
1986-87
1987-88
1988-89
1989-90
1990-91
1991-92
1992-93
1993-94
1994-95
1995-96
1996-97
1997-98
1998-99
1999-00
2000-01
2001-02
2002-03
2003-04
2004-05
2005-06
2006-07
2007-08
2008-09
2009-10
2010-11
2011-12
2012-13
2013-14
2014-15
2015-16
2016-17
8,841.12
10,850.48
13,081.39
14,589.55
15,940.70
18,904.42
22,251.24
27,697.51
30,298.69
38,116.27
39,809.78
51,773.82
59,220.57
62,291.95
72,461.50
78,258.10
83,803.43
88,117.25
92,064.05
103,907.60
106,592.75
107,240.03
120,376.26
136,802.00
141,330.13
151,312.47
151,577.35
131,180.00
134,482.37
141,021.85
153,920.65
146,261.67
150,991.54
1,61,007.68
1,66,557.42
150,031.41
151,047.84
175,944.51
183,522.79
180,765.64
207,838.44
215,894.52
81.91
75.05
80.77
128.41
103.63
68.66
77.47
120.06
175.55
201.16
283.49
199.03
231.51
122.68
53.50
17.73
68.87
127.27
122.70
118.42
75.58
124.48
108.47
53.14
137.35
114.02
102.10
154.20
209.17
229.86
204.85
111.84
137.11
90.26
9.74
118.78
182.48
266.11
424.72
378.13
439.33
512.56
0.39
67.97
103.35
84.50
134.58
209.44
229.56
113.20
86.63
94.23
142.51
94.35
52.00
103.58
78.02
40.64
75.78
94.21
113.79
216.80
200.49
304.13
320.11
245.05
110.49
92.01
66.00
74.08
114.32
123.75
149.61
119.19
111.52
112.81
124.69
137.66
59.89
34.97
175.00
291.06
238.22
347.98
0.19
0.51
0.45
0.47
0.48
0.41
0.45
0.59
0.54
0.52
0.49
0.59
Year wise Fuel Consumption of Public Sector Power Plants
Coal (TenThousand Ton)
Year Natural Gasin MMCFT Furnace oil
Liquid Fuel in Million literHSD, SKO & LDO
Note : Y axis represents the values of Liquid Fuel and Coal, Unit of Liquid Fuel is Million Litre and Coal Unit is Ten Thouasand Ton
Consumption of Fuel (Public Sector)
HSD,SKO & LDO (Milion liter)Furnace Oil (Milion liter) Coal (Ten Thousand Ton) Natural Gas (MMCFT)
600550500450400350300250200150100
500
Thou
sand
MMC
FT
Millio
n Litre
24022020018016014012010080604020
01995 1996 1997 1998 1999 2000 2001 2002 2003 2004 2005
FISCAL YEAR2006 2007 2008 2009 2010 2011 2012 2013 2014 2015 2016 2017
Annual 2016-17Report55
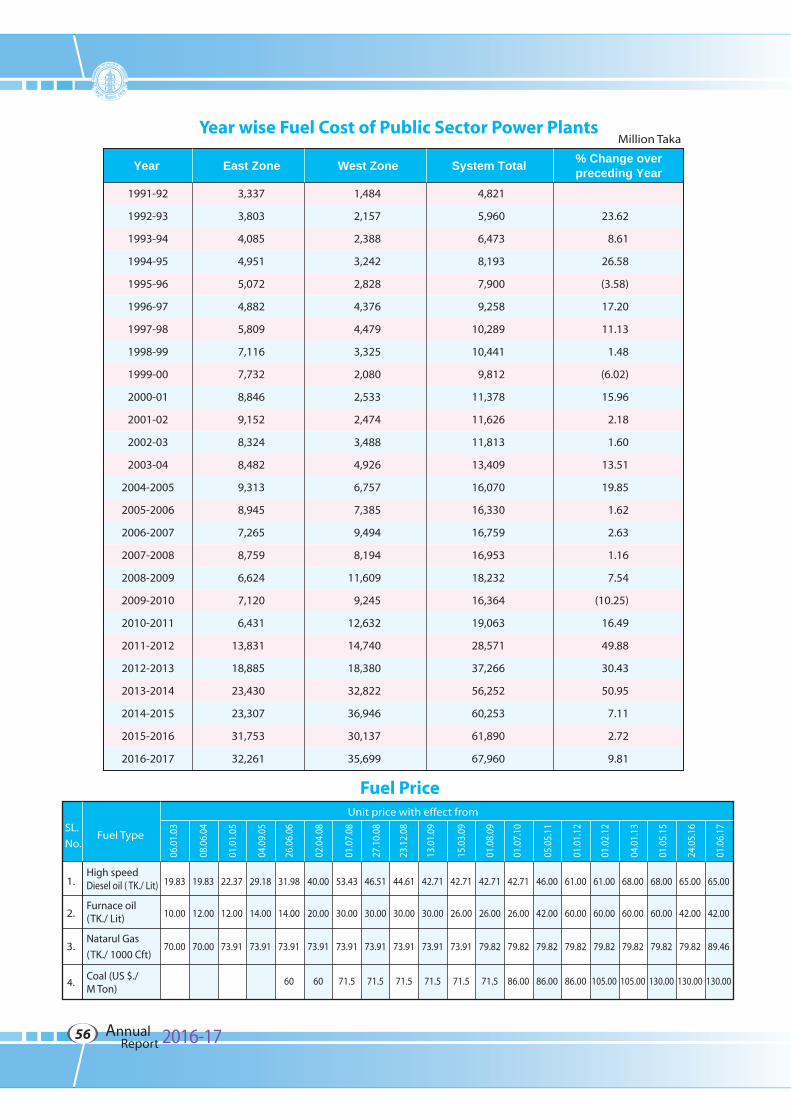
Year wise Fuel Cost of Public Sector Power PlantsMillion Taka
1991-92
1992-93
1993-94
1994-95
1995-96
1996-97
1997-98
1998-99
1999-00
2000-01
2001-02
2002-03
2003-04
2004-2005
2005-2006
2006-2007
2007-2008
2008-2009
2009-2010
2010-2011
2011-2012
2012-2013
2013-2014
2014-2015
2015-2016
2016-2017
3,337
3,803
4,085
4,951
5,072
4,882
5,809
7,116
7,732
8,846
9,152
8,324
8,482
9,313
8,945
7,265
8,759
6,624
7,120
6,431
13,831
18,885
23,430
23,307
31,753
32,261
1,484
2,157
2,388
3,242
2,828
4,376
4,479
3,325
2,080
2,533
2,474
3,488
4,926
6,757
7,385
9,494
8,194
11,609
9,245
12,632
14,740
18,380
32,822
36,946
30,137
35,699
4,821
5,960
6,473
8,193
7,900
9,258
10,289
10,441
9,812
11,378
11,626
11,813
13,409
16,070
16,330
16,759
16,953
18,232
16,364
19,063
28,571
37,266
56,252
60,253
61,890
67,960
23.62
8.61
26.58
(3.58)
17.20
11.13
1.48
(6.02)
15.96
2.18
1.60
13.51
19.85
1.62
2.63
1.16
7.54
(10.25)
16.49
49.88
30.43
50.95
7.11
2.72
9.81
Fuel Price
SL.
No.Fuel Type
Unit price with effect from
06.0
1.03
08.0
6.04
01.0
1.05
04.0
9.05
26.0
6.06
02.0
4.08
01.0
7.08
27.1
0.08
23.1
2.08
13.0
1.09
15.0
3.09
01.0
8.09
01.0
7.10
05.0
5.11
01.0
1.12
01.0
2.12
04.0
1.13
01.0
5.15
24.0
5.16
High speedDiesel oil ( TK./ Lit)
Furnace oil(TK./ Lit)
Natarul Gas
(TK./ 1000 Cft)
Coal (US $./M Ton)
1.
2.
3.
4.
19.83
10.00
70.00
19.83
12.00
70.00
22.37
12.00
73.91
29.18
14.00
73.91
31.98
14.00
73.91
60
40.00
20.00
73.91
60
53.43
30.00
73.91
71.5
46.51
30.00
73.91
71.5
44.61
30.00
73.91
71.5
42.71
30.00
73.91
71.5
42.71
26.00
73.91
71.5
42.71
26.00
79.82
71.5
42.71
26.00
79.82
86.00
46.00
42.00
79.82
86.00
61.00
60.00
79.82
86.00
61.00
60.00
79.82
105.00
68.00
60.00
79.82
105.00
68.00
60.00
79.82
130.00
65.00
42.00
79.82
130.00
01.0
6.17
65.00
42.00
89.46
130.00
Year East Zone West Zone System Total % Change overpreceding Year
Annual 2016-17Report56
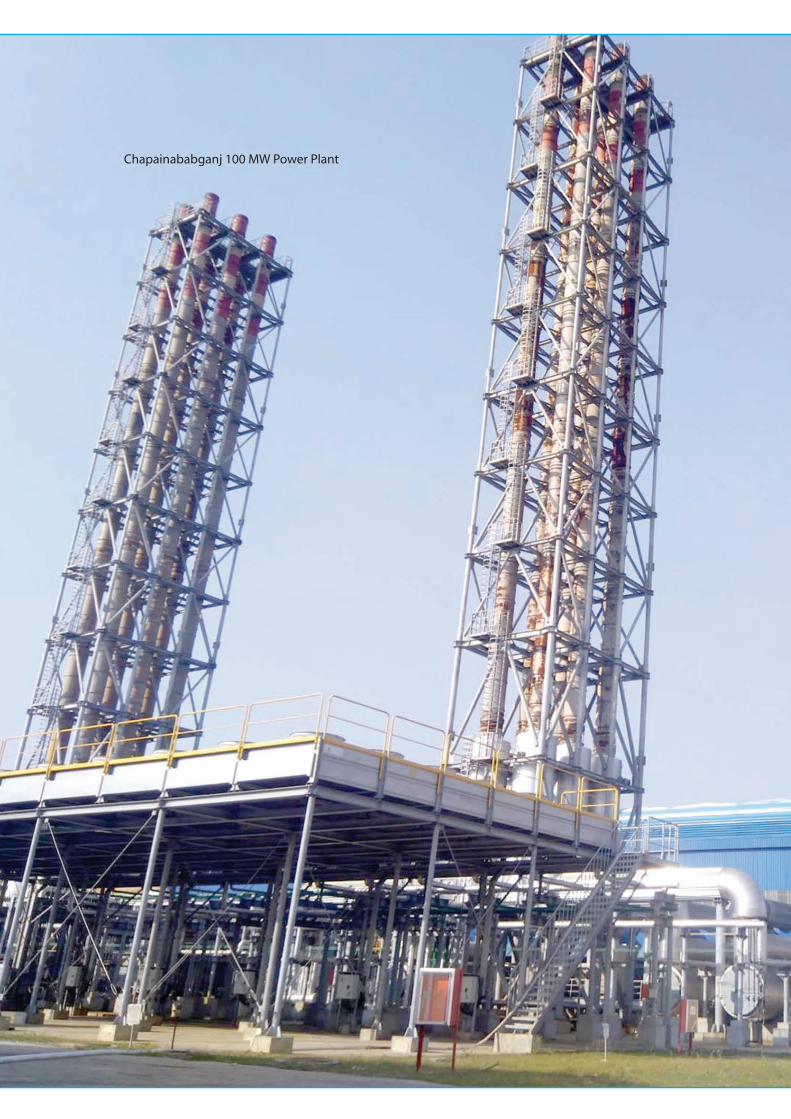
Chapainababganj 100 MW Power Plant
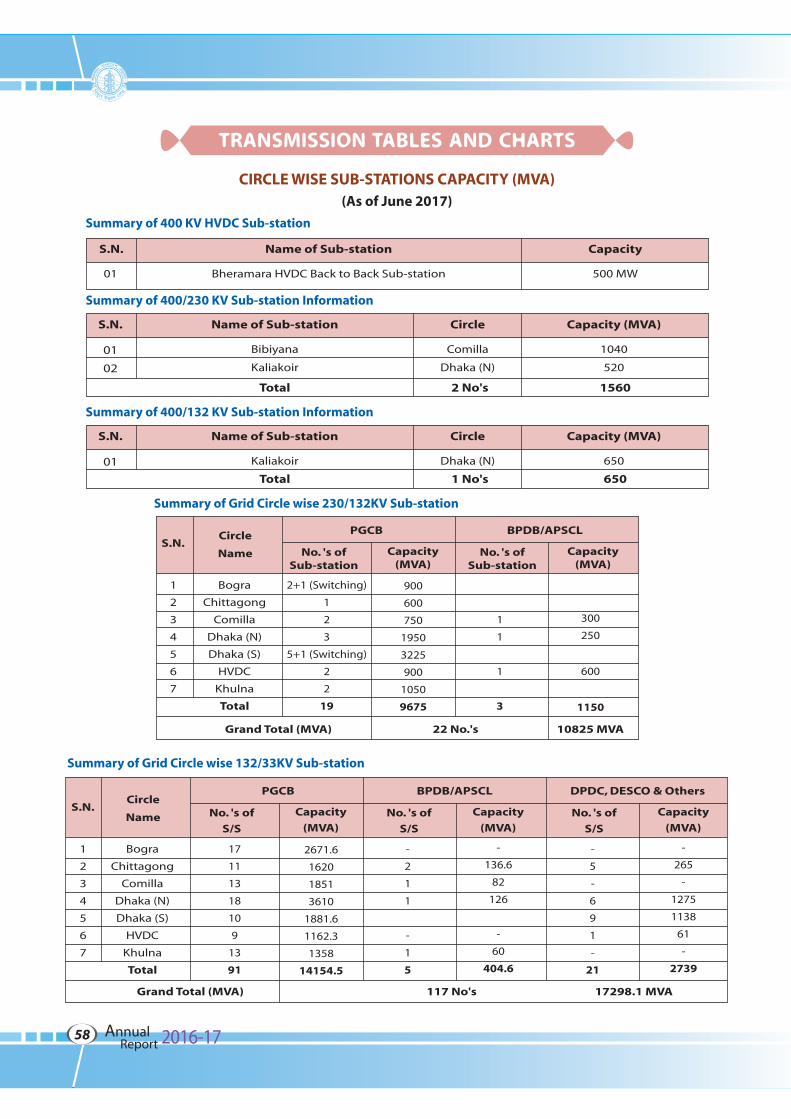
CIRCLE WISE SUB-STATIONS CAPACITY (MVA)
Summary of 400/230 KV Sub-station Information
Summary of Grid Circle wise 230/132KV Sub-station
(As of June 2017)
Summary of 400 KV HVDC Sub-station
Summary of Grid Circle wise 132/33KV Sub-station
Name of Sub-stationS.N.
Bheramara HVDC Back to Back Sub-station01
Capacity
500 MW
Name of Sub-stationS.N.
01 Bibiyana
Capacity (MVA)
1040
Circle
Comilla
02 Kaliakoir
Total 2 No's 1560
520Dhaka (N)
Summary of 400/132 KV Sub-station Information
Name of Sub-stationS.N.
01 Kaliakoir
Capacity (MVA)
650
Circle
Dhaka (N)
Total 1 No's 650
Circle
NameS.N.
PGCB BPDB/APSCL
No. 's ofSub-station
Capacity(MVA)
No. 's ofSub-station
Capacity(MVA)
Bogra
Chittagong
Comilla
Dhaka (N)
Dhaka (S)
HVDC
Khulna
Total
1
2
3
4
5
6
7
2+1 (Switching)
1
2
3
5+1 (Switching)
2
2
19
900
600
750
1950
3225
900
1050
9675
1
1
1
3
300
250
600
1150
Grand Total (MVA) 10825 MVA22 No.'s
Circle
NameS.N.
PGCB BPDB/APSCL
No. 's of
S/S
Capacity
(MVA)No. 's of
S/S
Capacity
(MVA)
Bogra
Chittagong
Comilla
Dhaka (N)
Dhaka (S)
HVDC
Khulna
Total
1
2
3
4
5
6
7
17
11
13
18
10
9
13
91
2671.6
1620
1851
3610
1881.6
1162.3
1358
14154.5
-
2
1
1
-
1
5
-
136.6
82
126
-
60
404.6
Grand Total (MVA) 117 No's 17298.1 MVA
DPDC, DESCO & Others
No. 's of
S/S
Capacity
(MVA)
-
5
-
6
9
1
-
21
-
265
-
1275
1138
61
-
2739
Annual 2016-17Report58
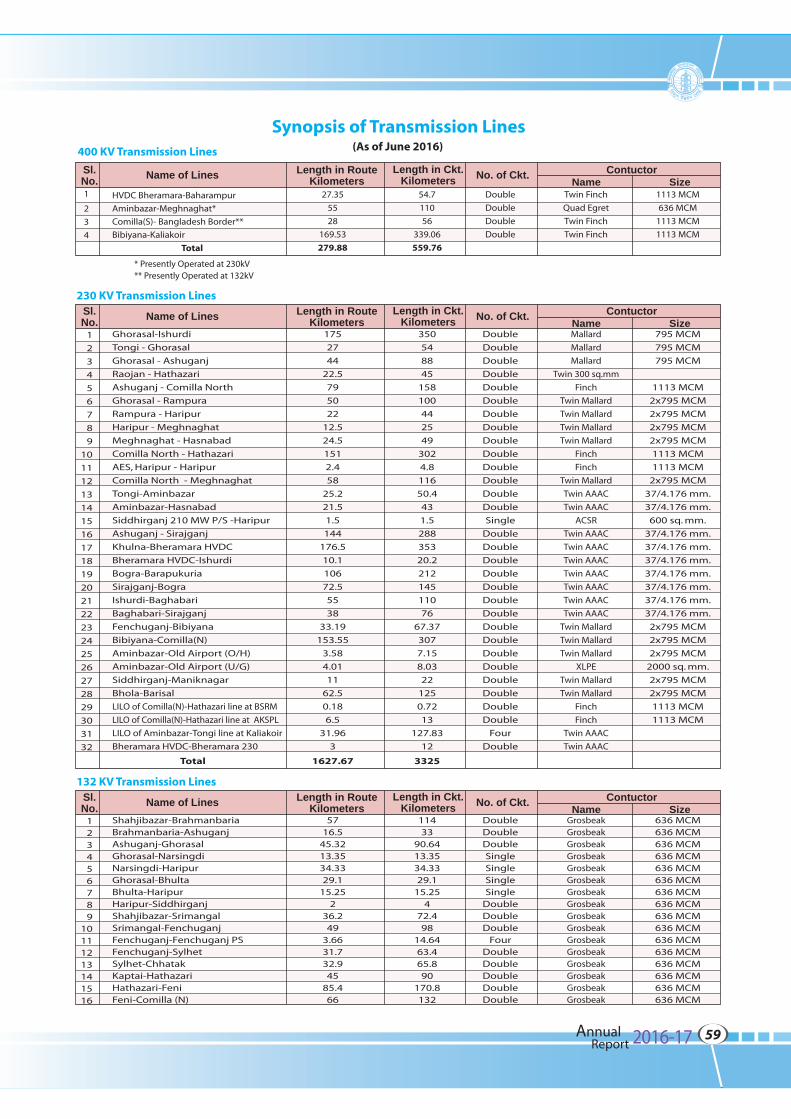
Synopsis of Transmission Lines(As of June 2016)400 KV Transmission Lines
1
2
3
4
HVDC Bheramara-Baharampur
Aminbazar-Meghnaghat*
Comilla(S)- Bangladesh Border**
Bibiyana-Kaliakoir
Total
27.35
55
28
169.53
279.88
54.7
110
56
339.06
559.76
Double
Double
Double
Double
Twin Finch
Quad Egret
Twin Finch
Twin Finch
1113 MCM
636 MCM
1113 MCM
1113 MCM
* Presently Operated at 230kV** Presently Operated at 132kV
230 KV Transmission Lines
1
2
3
4
5
6
7
8
9
10
11
12
13
14
15
16
17
18
19
20
21
22
23
24
25
26
27
28
29
30
31
32
Ghorasal-Ishurdi
Tongi - Ghorasal
Ghorasal - Ashuganj
Raojan - Hathazari
Ashuganj - Comilla North
Ghorasal - Rampura
Rampura - Haripur
Haripur - Meghnaghat
Meghnaghat - Hasnabad
Comilla North - Hathazari
AES, Haripur - Haripur
Comilla North - Meghnaghat
Tongi-Aminbazar
Aminbazar-Hasnabad
Siddhirganj 210 MW P/S -Haripur
Ashuganj - Sirajganj
Khulna-Bheramara HVDC
Bheramara HVDC-Ishurdi
Bogra-Barapukuria
Sirajganj-Bogra
Ishurdi-Baghabari
Baghabari-Sirajganj
Fenchuganj-Bibiyana
Bibiyana-Comilla(N)
Aminbazar-Old Airport (O/H)
Aminbazar-Old Airport (U/G)
Siddhirganj-Maniknagar
Bhola-Barisal
LILO of Comilla(N)-Hathazari line at BSRM
LILO of Comilla(N)-Hathazari line at AKSPL
LILO of Aminbazar-Tongi line at Kaliakoir
Bheramara HVDC-Bheramara 230
Total
175
27
44
22.5
79
50
22
12.5
24.5
151
2.4
58
25.2
21.5
1.5
144
176.5
10.1
106
72.5
55
38
33.19
153.55
3.58
4.01
11
62.5
0.18
6.5
31.96
3
1627.67
350
54
88
45
158
100
44
25
49
302
4.8
116
50.4
43
1.5
288
353
20.2
212
145
110
76
67.37
307
7.15
8.03
22
125
0.72
13
127.83
12
3325
Double
Double
Double
Double
Double
Double
Double
Double
Double
Double
Double
Double
Double
Double
Single
Double
Double
Double
Double
Double
Double
Double
Double
Double
Double
Double
Double
Double
Double
Double
Four
Double
Mallard
Mallard
Mallard
Twin 300 sq.mm
Finch
Twin Mallard
Twin Mallard
Twin Mallard
Twin Mallard
Finch
Finch
Twin Mallard
Twin AAAC
Twin AAAC
ACSR
Twin AAAC
Twin AAAC
Twin AAAC
Twin AAAC
Twin AAAC
Twin AAAC
Twin AAAC
Twin Mallard
Twin Mallard
Twin Mallard
XLPE
Twin Mallard
Twin Mallard
Finch
Finch
Twin AAAC
Twin AAAC
795 MCM
795 MCM
795 MCM
1113 MCM
2x795 MCM
2x795 MCM
2x795 MCM
2x795 MCM
1113 MCM
1113 MCM
2x795 MCM
37/4.176 mm.
37/4.176 mm.
600 sq. mm.
37/4.176 mm.
37/4.176 mm.
37/4.176 mm.
37/4.176 mm.
37/4.176 mm.
37/4.176 mm.
37/4.176 mm.
2x795 MCM
2x795 MCM
2x795 MCM
2000 sq. mm.
2x795 MCM
2x795 MCM
1113 MCM
1113 MCM
Sl.No. Name of Lines Length in Route
KilometersLength in Ckt.
Kilometers No. of Ckt. ContuctorSizeName
Sl.No. Name of Lines Length in Route
KilometersLength in Ckt.
Kilometers No. of Ckt. ContuctorSizeName
132 KV Transmission Lines
123456789
10111213141516
Shahjibazar-BrahmanbariaBrahmanbaria-AshuganjAshuganj-GhorasalGhorasal-NarsingdiNarsingdi-HaripurGhorasal-BhultaBhulta-HaripurHaripur-SiddhirganjShahjibazar-SrimangalSrimangal-FenchuganjFenchuganj-Fenchuganj PSFenchuganj-SylhetSylhet-ChhatakKaptai-HathazariHathazari-FeniFeni-Comilla (N)
5716.5
45.3213.3534.3329.1
15.252
36.249
3.6631.732.945
85.466
11433
90.6413.3534.3329.1
15.254
72.498
14.6463.465.890
170.8132
DoubleDoubleDoubleSingleSingleSingleSingle
DoubleDoubleDouble
FourDoubleDoubleDoubleDoubleDouble
GrosbeakGrosbeakGrosbeakGrosbeakGrosbeakGrosbeakGrosbeakGrosbeakGrosbeakGrosbeakGrosbeakGrosbeakGrosbeakGrosbeakGrosbeakGrosbeak
636 MCM636 MCM636 MCM636 MCM636 MCM636 MCM636 MCM636 MCM636 MCM636 MCM636 MCM636 MCM636 MCM636 MCM636 MCM636 MCM
Sl.No. Name of Lines Length in Route
KilometersLength in Ckt.
Kilometers No. of Ckt. ContuctorSizeName
Annual 2016-17Report59
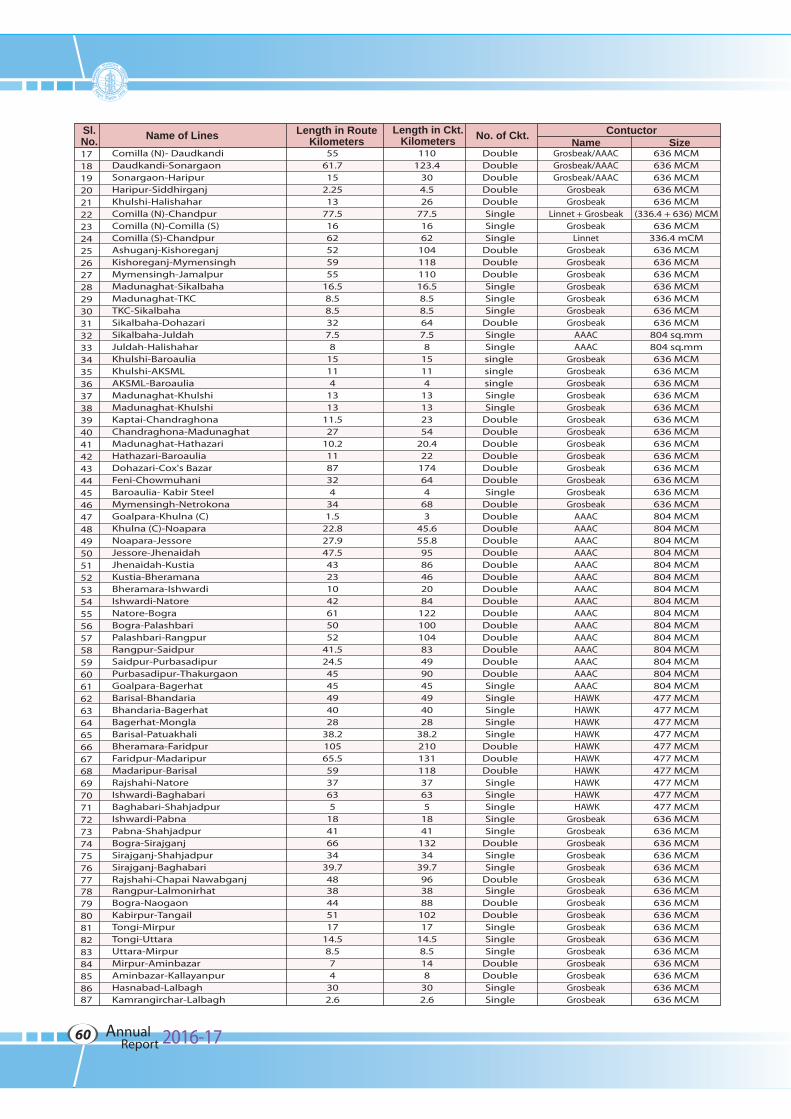
1718192021222324252627282930313233343536373839404142434445464748495051525354555657585960616263646566676869707172737475767778798081828384858687
Comilla (N)- DaudkandiDaudkandi-SonargaonSonargaon-HaripurHaripur-SiddhirganjKhulshi-HalishaharComilla (N)-ChandpurComilla (N)-Comilla (S)Comilla (S)-ChandpurAshuganj-KishoreganjKishoreganj-MymensinghMymensingh-JamalpurMadunaghat-SikalbahaMadunaghat-TKCTKC-SikalbahaSikalbaha-DohazariSikalbaha-JuldahJuldah-HalishaharKhulshi-BaroauliaKhulshi-AKSMLAKSML-BaroauliaMadunaghat-KhulshiMadunaghat-KhulshiKaptai-ChandraghonaChandraghona-MadunaghatMadunaghat-HathazariHathazari-BaroauliaDohazari-Cox's BazarFeni-ChowmuhaniBaroaulia- Kabir SteelMymensingh-NetrokonaGoalpara-Khulna (C)Khulna (C)-NoaparaNoapara-JessoreJessore-JhenaidahJhenaidah-KustiaKustia-BheramanaBheramara-IshwardiIshwardi-NatoreNatore-BograBogra-PalashbariPalashbari-RangpurRangpur-SaidpurSaidpur-PurbasadipurPurbasadipur-ThakurgaonGoalpara-BagerhatBarisal-BhandariaBhandaria-BagerhatBagerhat-MonglaBarisal-PatuakhaliBheramara-FaridpurFaridpur-MadaripurMadaripur-BarisalRajshahi-NatoreIshwardi-BaghabariBaghabari-ShahjadpurIshwardi-PabnaPabna-ShahjadpurBogra-SirajganjSirajganj-ShahjadpurSirajganj-BaghabariRajshahi-Chapai NawabganjRangpur-LalmonirhatBogra-NaogaonKabirpur-TangailTongi-MirpurTongi-UttaraUttara-MirpurMirpur-AminbazarAminbazar-KallayanpurHasnabad-LalbaghKamrangirchar-Lalbagh
5561.715
2.2513
77.51662525955
16.58.58.5327.58
15114
1313
11.527
10.21187324
341.5
22.827.947.543231042615052
41.524.54545494028
38.210565.55937635
18416634
39.74838445117
14.58.574
302.6
110123.4
304.526
77.51662
10411811016.58.58.5647.58
15114
13132354
20.422
174644
683
45.655.89586462084
12210010483499045494028
38.221013111837635
1841
13234
39.7963888
10217
14.58.5148
302.6
DoubleDoubleDoubleDoubleDoubleSingleSingleSingle
DoubleDoubleDoubleSingleSingleSingle
DoubleSingleSinglesingle single single SingleSingle
DoubleDoubleDoubleDoubleDoubleDoubleSingle
DoubleDoubleDoubleDoubleDoubleDoubleDoubleDoubleDoubleDoubleDoubleDoubleDoubleDoubleDoubleSingleSingleSingleSingleSingle
DoubleDoubleDoubleSingleSingleSingleSingleSingle
DoubleSingleSingle
DoubleSingle
DoubleDoubleSingleSingleSingle
DoubleDoubleSingleSingle
Grosbeak/AAACGrosbeak/AAACGrosbeak/AAAC
GrosbeakGrosbeak
Linnet + GrosbeakGrosbeak
LinnetGrosbeakGrosbeakGrosbeakGrosbeakGrosbeakGrosbeakGrosbeak
AAACAAAC
GrosbeakGrosbeakGrosbeakGrosbeakGrosbeakGrosbeakGrosbeakGrosbeakGrosbeakGrosbeakGrosbeakGrosbeakGrosbeak
AAACAAACAAACAAACAAACAAACAAACAAACAAACAAACAAACAAACAAACAAACAAAC HAWK HAWK HAWK HAWK HAWK HAWK HAWK HAWK HAWK HAWK
GrosbeakGrosbeakGrosbeakGrosbeakGrosbeakGrosbeakGrosbeakGrosbeakGrosbeakGrosbeakGrosbeakGrosbeakGrosbeakGrosbeakGrosbeakGrosbeak
636 MCM636 MCM636 MCM636 MCM636 MCM
(336.4 + 636) MCM636 MCM
336.4 mCM636 MCM636 MCM636 MCM636 MCM636 MCM636 MCM636 MCM
804 sq.mm804 sq.mm636 MCM636 MCM636 MCM636 MCM636 MCM636 MCM636 MCM636 MCM636 MCM636 MCM636 MCM636 MCM636 MCM804 MCM804 MCM804 MCM804 MCM804 MCM804 MCM804 MCM804 MCM804 MCM804 MCM804 MCM804 MCM804 MCM804 MCM804 MCM477 MCM477 MCM477 MCM477 MCM477 MCM477 MCM477 MCM477 MCM477 MCM477 MCM636 MCM636 MCM636 MCM636 MCM636 MCM636 MCM636 MCM636 MCM636 MCM636 MCM636 MCM636 MCM636 MCM636 MCM636 MCM636 MCM
Sl.No. Name of Lines Length in Route
KilometersLength in Ckt.
Kilometers No. of Ckt. ContuctorSizeName
Annual 2016-17Report60
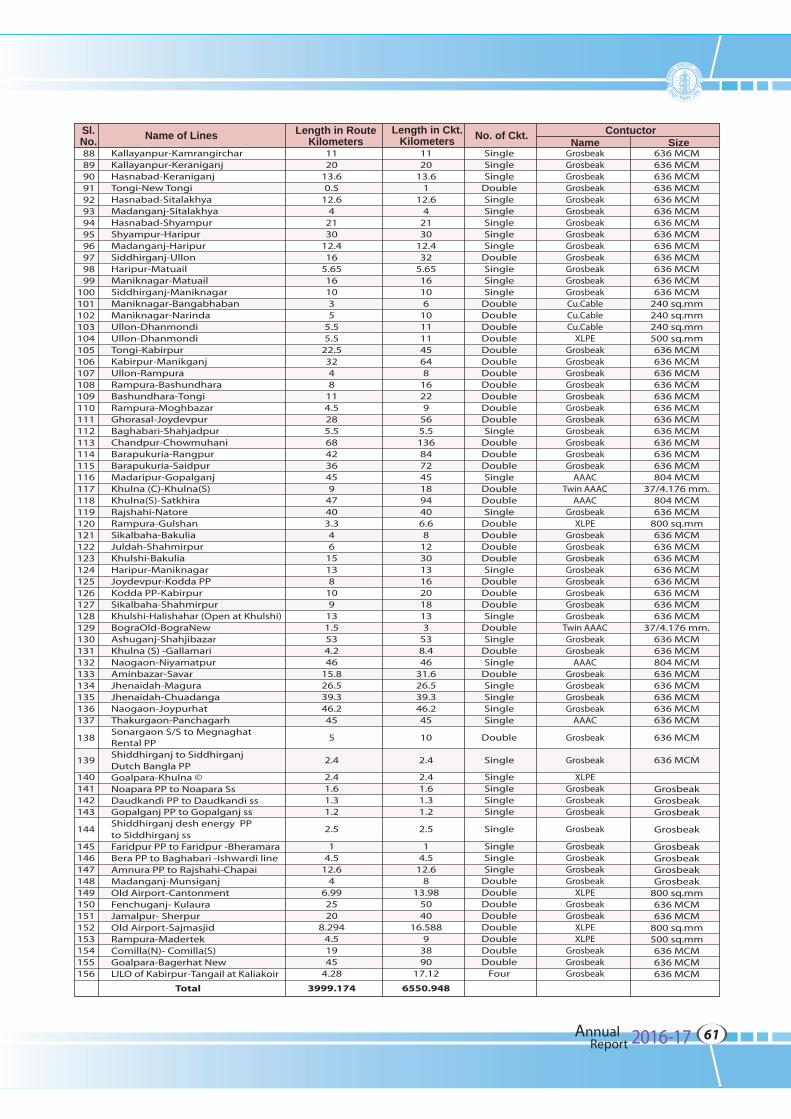
888990919293949596979899
100101102103104105106107108109110111112113114115116117118119120121122123124125126127128129130131132133134135136137
138
139
140141142143
144
145146147148149150151152153154155156
Kallayanpur-KamrangircharKallayanpur-KeraniganjHasnabad-KeraniganjTongi-New TongiHasnabad-SitalakhyaMadanganj-SitalakhyaHasnabad-ShyampurShyampur-HaripurMadanganj-HaripurSiddhirganj-UllonHaripur-MatuailManiknagar-MatuailSiddhirganj-ManiknagarManiknagar-BangabhabanManiknagar-NarindaUllon-DhanmondiUllon-DhanmondiTongi-KabirpurKabirpur-ManikganjUllon-RampuraRampura-BashundharaBashundhara-TongiRampura-MoghbazarGhorasal-JoydevpurBaghabari-ShahjadpurChandpur-ChowmuhaniBarapukuria-RangpurBarapukuria-SaidpurMadaripur-GopalganjKhulna (C)-Khulna(S)Khulna(S)-SatkhiraRajshahi-NatoreRampura-GulshanSikalbaha-BakuliaJuldah-ShahmirpurKhulshi-BakuliaHaripur-ManiknagarJoydevpur-Kodda PPKodda PP-KabirpurSikalbaha-ShahmirpurKhulshi-Halishahar (Open at Khulshi)BograOld-BograNewAshuganj-ShahjibazarKhulna (S) -GallamariNaogaon-NiyamatpurAminbazar-SavarJhenaidah-MaguraJhenaidah-ChuadangaNaogaon-JoypurhatThakurgaon-PanchagarhSonargaon S/S to MegnaghatRental PPShiddhirganj to SiddhirganjDutch Bangla PPGoalpara-Khulna ©Noapara PP to Noapara SsDaudkandi PP to Daudkandi ssGopalganj PP to Gopalganj ssShiddhirganj desh energy PP to Siddhirganj ssFaridpur PP to Faridpur -BheramaraBera PP to Baghabari -Ishwardi lineAmnura PP to Rajshahi-ChapaiMadanganj-MunsiganjOld Airport-CantonmentFenchuganj- KulauraJamalpur- SherpurOld Airport-SajmasjidRampura-MadertekComilla(N)- Comilla(S)Goalpara-Bagerhat NewLILO of Kabirpur-Tangail at Kaliakoir
1120
13.60.5
12.64
2130
12.416
5.65161035
5.55.5
22.53248
114.5285.5684236459
47403.346
15138
109
131.5534.246
15.826.539.346.245
5
2.4
2.41.61.31.2
2.5
14.5
12.64
6.992520
8.2944.51945
4.28
3999.174
1120
13.61
12.64
2130
12.432
5.6516106
10111145648
16229
565.51368472451894406.68
123013162018133
538.446
31.626.539.346.245
10
2.4
2.41.61.31.2
2.5
14.5
12.68
13.985040
16.5889
3890
17.12
6550.948
SingleSingleSingle
DoubleSingleSingleSingleSingleSingle
DoubleSingleSingleSingle
DoubleDoubleDoubleDoubleDoubleDoubleDoubleDoubleDoubleDoubleDoubleSingle
DoubleDoubleDoubleSingle
DoubleDoubleSingle
DoubleDoubleDoubleDoubleSingle
DoubleDoubleDoubleSingle
DoubleSingle
DoubleSingle
DoubleSingleSingleSingleSingle
Double
Single
SingleSingleSingleSingle
Single
SingleSingleSingle
DoubleDoubleDoubleDoubleDoubleDoubleDoubleDouble
Four
GrosbeakGrosbeakGrosbeakGrosbeakGrosbeakGrosbeakGrosbeakGrosbeakGrosbeakGrosbeakGrosbeakGrosbeakGrosbeakCu.CableCu.CableCu.Cable
XLPEGrosbeakGrosbeakGrosbeakGrosbeakGrosbeakGrosbeakGrosbeakGrosbeakGrosbeakGrosbeakGrosbeak
AAACTwin AAAC
AAACGrosbeak
XLPEGrosbeakGrosbeakGrosbeakGrosbeakGrosbeakGrosbeakGrosbeakGrosbeak
Twin AAACGrosbeakGrosbeak
AAACGrosbeakGrosbeakGrosbeakGrosbeak
AAAC
Grosbeak
Grosbeak
XLPEGrosbeakGrosbeakGrosbeak
Grosbeak
GrosbeakGrosbeakGrosbeakGrosbeak
XLPEGrosbeakGrosbeak
XLPEXLPE
GrosbeakGrosbeakGrosbeak
636 MCM636 MCM636 MCM636 MCM636 MCM636 MCM636 MCM636 MCM636 MCM636 MCM636 MCM636 MCM636 MCM
240 sq.mm240 sq.mm240 sq.mm500 sq.mm636 MCM636 MCM636 MCM636 MCM636 MCM636 MCM636 MCM636 MCM636 MCM636 MCM636 MCM804 MCM
37/4.176 mm.804 MCM636 MCM
800 sq.mm636 MCM636 MCM636 MCM636 MCM636 MCM636 MCM636 MCM636 MCM
37/4.176 mm.636 MCM636 MCM804 MCM636 MCM636 MCM636 MCM636 MCM636 MCM
636 MCM
636 MCM
GrosbeakGrosbeakGrosbeak
Grosbeak
GrosbeakGrosbeakGrosbeakGrosbeak
800 sq.mm636 MCM636 MCM
800 sq.mm500 sq.mm636 MCM636 MCM636 MCM
Sl.No. Name of Lines Length in Route
KilometersLength in Ckt.
Kilometers No. of Ckt. ContuctorSizeName
Total
Annual 2016-17Report61
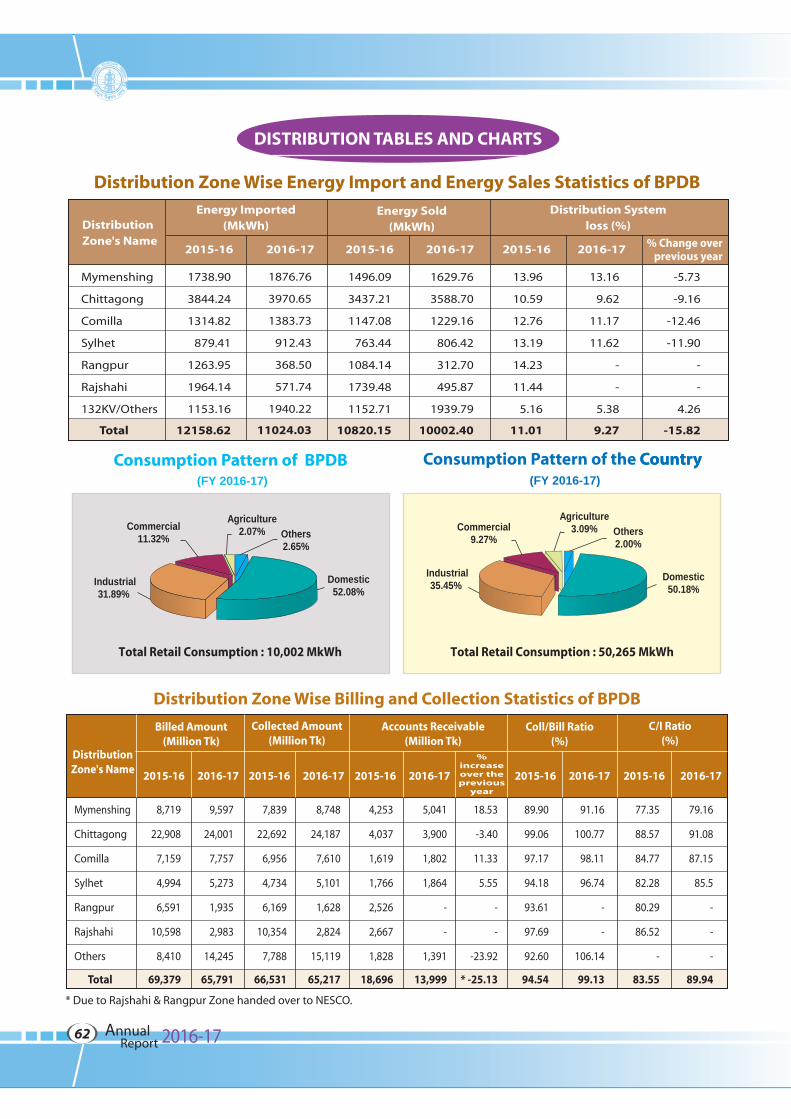
2015-16
DistributionZone's Name
Billed Amount(Million Tk)
Collected Amount(Million Tk)
Accounts Receivable(Million Tk)
Coll/Bill Ratio(%)
C/I Ratio(%)
2016-17 2015-16 2016-17 2015-16 2016-17
%increaseover theprevious
year
2015-16 2016-17 2015-16 2016-17
Mymenshing
Chittagong
Comilla
Sylhet
Rangpur
Rajshahi
Others
Total
8,719
22,908
7,159
4,994
6,591
10,598
8,410
69,379
9,597
24,001
7,757
5,273
1,935
2,983
14,245
65,791
7,839
22,692
6,956
4,734
6,169
10,354
7,788
66,531
8,748
24,187
7,610
5,101
1,628
2,824
15,119
65,217
4,253
4,037
1,619
1,766
2,526
2,667
1,828
18,696
5,041
3,900
1,802
1,864
-
-
1,391
13,999
18.53
-3.40
11.33
5.55
-
-
-23.92
* -25.13
89.90
99.06
97.17
94.18
93.61
97.69
92.60
94.54
91.16
100.77
98.11
96.74
-
-
106.14
99.13
77.35
88.57
84.77
82.28
80.29
86.52
-
83.55
79.16
91.08
87.15
85.5
-
-
-
89.94
Distribution Zone Wise Energy Import and Energy Sales Statistics of BPDB
Distribution Zone Wise Billing and Collection Statistics of BPDB
2015-16 2016-17 2015-16 2016-17 2015-16 2016-17
Mymenshing
Chittagong
Comilla
Sylhet
Rangpur
Rajshahi
132KV/Others
Total
1738.90
3844.24
1314.82
879.41
1263.95
1964.14
1153.16
12158.62
1876.76
3970.65
1383.73
912.43
368.50
571.74
1940.22
11024.03
1496.09
3437.21
1147.08
763.44
1084.14
1739.48
1152.71
10820.15
1629.76
3588.70
1229.16
806.42
312.70
495.87
1939.79
10002.40
13.96
10.59
12.76
13.19
14.23
11.44
5.16
11.01
13.16
9.62
11.17
11.62
-
-
5.38
9.27
-5.73
-9.16
-12.46
-11.90
-
-
4.26
-15.82
% Change overprevious year
(FY 2016-17)(FY 2016-17)Consumption Pattern of the CountryConsumption Pattern of the CountryConsumption Pattern of BPDB
DistributionZone's Name
Energy Imported(MkWh)
Energy Sold(MkWh)
Distribution Systemloss (%)
Total Retail Consumption : 50,265 MkWh
Others2.00%
Domestic50.18%
Industrial35.45%
Commercial9.27%
Agriculture3.09%Others
2.65%
Domestic52.08%
Industrial31.89%
Commercial11.32%
Agriculture2.07%
Total Retail Consumption : 10,002 MkWh
DISTRIBUTION TABLES AND CHARTS
* Due to Rajshahi & Rangpur Zone handed over to NESCO.
Annual 2016-17Report62

1995-1996
1996-1997
1997-1998
1998-1999
1999-2000
2000-2001
2000-2002
2002-2003
2003-2004
2004-2005
2005-2006
2006-2007
2007-2008
2008-2009
2009-2010
2010-2011
2011-2012
2012-2013
2013-2014
2014-2015
2015-2016
2016-17
16,791
16,015
17,199
16,235
22,450
27,017
31,373
36,066
39,608
39,177
44,284
52,799
54,060
58,922
66,776
74,303
102,242
151,711
174,740
193,013
222,382
274,355
7.05
-4.62
7.39
-5.61
38.28
20.34
16.12
14.96
9.82
-1.09
13.03
19.23
2.39
8.99
13.33
11.27
37.60
48.38
15.18
10.46
15.22
23.37
1991-92
1992-93
1993-94
1994-95
1995-96
1996-97
1997-98
1998-99
1999-00
2000-01
2001-02
2002-03
2003-04
2004-05
2005-06
2006-07
2007-08
2008-09
2009-10
2010-11
2011-12
2012-13
2013-14
2014-15
2015-16
2016-17
35.79
31.24
30.72
29.94
29.09
28.28
29.82
30.56
27.73
26.11
24.5
22.35
21.33
20
19.06
16.58
14.43
13.57
13.10
13.06
12.15
11.95
11.89
11.17
11.01
9.27
Distribution System Loss (BPDB)Revenue Collection (Bulk)
Year Million Taka% Change overprevious year
YearDistribution
System loss In %
Net Revenue Collection Distribution System Loss
loss
in %
YearYear
0
5
10
15
20
25
30
2000
-01
2001
-02
2002
-03
2003
-04
2004
-05
2005
-06
2006
-07
2007
-08
2008
-09
2009
-10
2010
-11
2011
-12
2012
-13
2013
-14
2014
-15
2015
-16
2016
-17
300,000
200,000
150,000
100,000
50,000
0
2000-2001
2001-2002
2002-2003
2003-2004
2004-2005
2005-2006
2006-2007
2007-2008
2008-2009
2009-2010
2010-2011
2011-2012
2012-2013
2013-2014
2014-2015
2016-2017
2015-2016
Tk (M
illio
n)
250,000
Annual 2016-17Report63
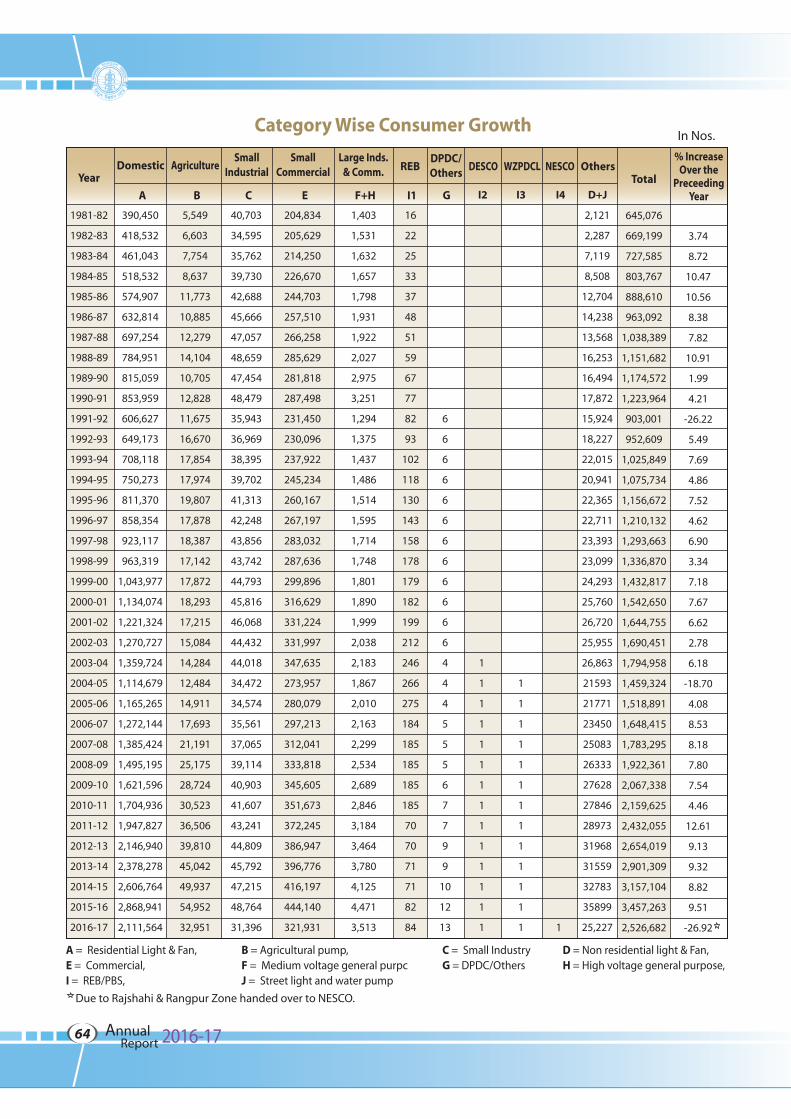
A = Residential Light & Fan,E = Commercial,I = REB/PBS,
Due to Rajshahi & Rangpur Zone handed over to NESCO.
B = Agricultural pump,F = Medium voltage general purpcJ = Street light and water pump
C = Small IndustryG = DPDC/Others
D = Non residential light & Fan,H = High voltage general purpose,
Category Wise Consumer Growth
1981-82
1982-83
1983-84
1984-85
1985-86
1986-87
1987-88
1988-89
1989-90
1990-91
1991-92
1992-93
1993-94
1994-95
1995-96
1996-97
1997-98
1998-99
1999-00
2000-01
2001-02
2002-03
2003-04
2004-05
2005-06
2006-07
2007-08
2008-09
2009-10
2010-11
2011-12
2012-13
2013-14
2014-15
2015-16
2016-17
390,450
418,532
461,043
518,532
574,907
632,814
697,254
784,951
815,059
853,959
606,627
649,173
708,118
750,273
811,370
858,354
923,117
963,319
1,043,977
1,134,074
1,221,324
1,270,727
1,359,724
1,114,679
1,165,265
1,272,144
1,385,424
1,495,195
1,621,596
1,704,936
1,947,827
2,146,940
2,378,278
2,606,764
2,868,941
2,111,564
5,549
6,603
7,754
8,637
11,773
10,885
12,279
14,104
10,705
12,828
11,675
16,670
17,854
17,974
19,807
17,878
18,387
17,142
17,872
18,293
17,215
15,084
14,284
12,484
14,911
17,693
21,191
25,175
28,724
30,523
36,506
39,810
45,042
49,937
54,952
32,951
40,703
34,595
35,762
39,730
42,688
45,666
47,057
48,659
47,454
48,479
35,943
36,969
38,395
39,702
41,313
42,248
43,856
43,742
44,793
45,816
46,068
44,432
44,018
34,472
34,574
35,561
37,065
39,114
40,903
41,607
43,241
44,809
45,792
47,215
48,764
31,396
204,834
205,629
214,250
226,670
244,703
257,510
266,258
285,629
281,818
287,498
231,450
230,096
237,922
245,234
260,167
267,197
283,032
287,636
299,896
316,629
331,224
331,997
347,635
273,957
280,079
297,213
312,041
333,818
345,605
351,673
372,245
386,947
396,776
416,197
444,140
321,931
1,403
1,531
1,632
1,657
1,798
1,931
1,922
2,027
2,975
3,251
1,294
1,375
1,437
1,486
1,514
1,595
1,714
1,748
1,801
1,890
1,999
2,038
2,183
1,867
2,010
2,163
2,299
2,534
2,689
2,846
3,184
3,464
3,780
4,125
4,471
3,513
16
22
25
33
37
48
51
59
67
77
82
93
102
118
130
143
158
178
179
182
199
212
246
266
275
184
185
185
185
185
70
70
71
71
82
84
6
6
6
6
6
6
6
6
6
6
6
6
4
4
4
5
5
5
6
7
7
9
9
10
12
13
1
1
1
1
1
1
1
1
1
1
1
1
1
1
1
1
1
1
1
1
1
1
1
1
1
1
1
2,121
2,287
7,119
8,508
12,704
14,238
13,568
16,253
16,494
17,872
15,924
18,227
22,015
20,941
22,365
22,711
23,393
23,099
24,293
25,760
26,720
25,955
26,863
21593
21771
23450
25083
26333
27628
27846
28973
31968
31559
32783
35899
25,227
645,076
669,199
727,585
803,767
888,610
963,092
1,038,389
1,151,682
1,174,572
1,223,964
903,001
952,609
1,025,849
1,075,734
1,156,672
1,210,132
1,293,663
1,336,870
1,432,817
1,542,650
1,644,755
1,690,451
1,794,958
1,459,324
1,518,891
1,648,415
1,783,295
1,922,361
2,067,338
2,159,625
2,432,055
2,654,019
2,901,309
3,157,104
3,457,263
2,526,682
3.74
8.72
10.47
10.56
8.38
7.82
10.91
1.99
4.21
-26.22
5.49
7.69
4.86
7.52
4.62
6.90
3.34
7.18
7.67
6.62
2.78
6.18
-18.70
4.08
8.53
8.18
7.80
7.54
4.46
12.61
9.13
9.32
8.82
9.51
-26.92
I2 I3
YearDomestic
A
SmallIndustrial
C
SmallCommercial
E
Large Inds.& Comm.
F+H
REB DESCO
1
WZPDCL
D+J
OthersTotal
% IncreaseOver the
PreceedingYearI1
DPDC/Others
G
Agriculture
B I4
NESCO
Annual 2016-17Report64
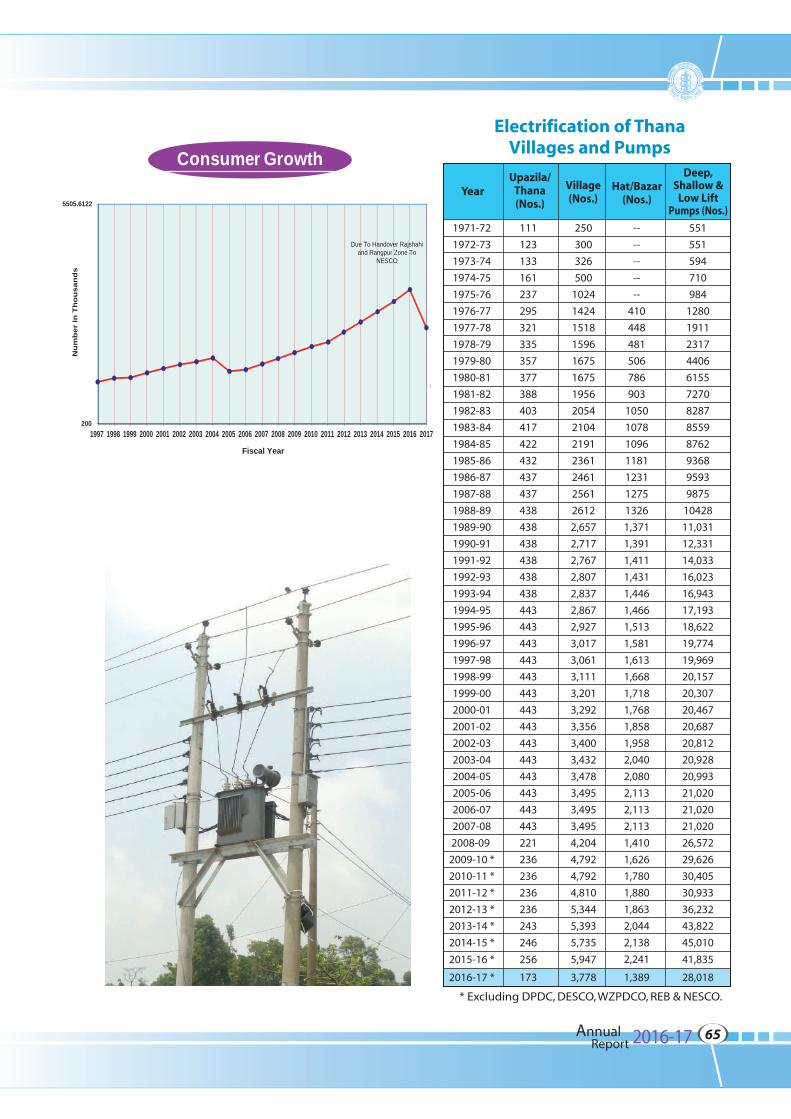
1971-72
1972-73
1973-74
1974-75
1975-76
1976-77
1977-78
1978-79
1979-80
1980-81
1981-82
1982-83
1983-84
1984-85
1985-86
1986-87
1987-88
1988-89
1989-90
1990-91
1991-92
1992-93
1993-94
1994-95
1995-96
1996-97
1997-98
1998-99
1999-00
2000-01
2001-02
2002-03
2003-04
2004-05
2005-06
2006-07
2007-08
2008-09
2009-10 *
2010-11 *
2011-12 *
2012-13 *
2013-14 *
2014-15 *
2015-16 *
2016-17 *
111
123
133
161
237
295
321
335
357
377
388
403
417
422
432
437
437
438
438
438
438
438
438
443
443
443
443
443
443
443
443
443
443
443
443
443
443
221
236
236
236
236
243
246
256
173
250
300
326
500
1024
1424
1518
1596
1675
1675
1956
2054
2104
2191
2361
2461
2561
2612
2,657
2,717
2,767
2,807
2,837
2,867
2,927
3,017
3,061
3,111
3,201
3,292
3,356
3,400
3,432
3,478
3,495
3,495
3,495
4,204
4,792
4,792
4,810
5,344
5,393
5,735
5,947
3,778
--
--
--
--
--
410
448
481
506
786
903
1050
1078
1096
1181
1231
1275
1326
1,371
1,391
1,411
1,431
1,446
1,466
1,513
1,581
1,613
1,668
1,718
1,768
1,858
1,958
2,040
2,080
2,113
2,113
2,113
1,410
1,626
1,780
1,880
1,863
2,044
2,138
2,241
1,389
551
551
594
710
984
1280
1911
2317
4406
6155
7270
8287
8559
8762
9368
9593
9875
10428
11,031
12,331
14,033
16,023
16,943
17,193
18,622
19,774
19,969
20,157
20,307
20,467
20,687
20,812
20,928
20,993
21,020
21,020
21,020
26,572
29,626
30,405
30,933
36,232
43,822
45,010
41,835
28,018
* Excluding DPDC, DESCO, WZPDCO, REB & NESCO.
YearUpazila/
Thana(Nos.)
Village(Nos.)
Hat/Bazar(Nos.)
Deep,Shallow &
Low LiftPumps (Nos.)
Electrification of ThanaVillages and Pumps
200
5505.6122
Due To Handover Rajshahiand Rangpur Zone To
NESCO
1997 1998 1999 2000 2001 2002 2003 2004 2005 2006 2007 2008 2009 2010 2011 2012 2013 2014 2015 2016 2017
Nu
mb
er In
Th
ou
san
ds
Fiscal Year
Consumer Growth
Annual 2016-17Report65
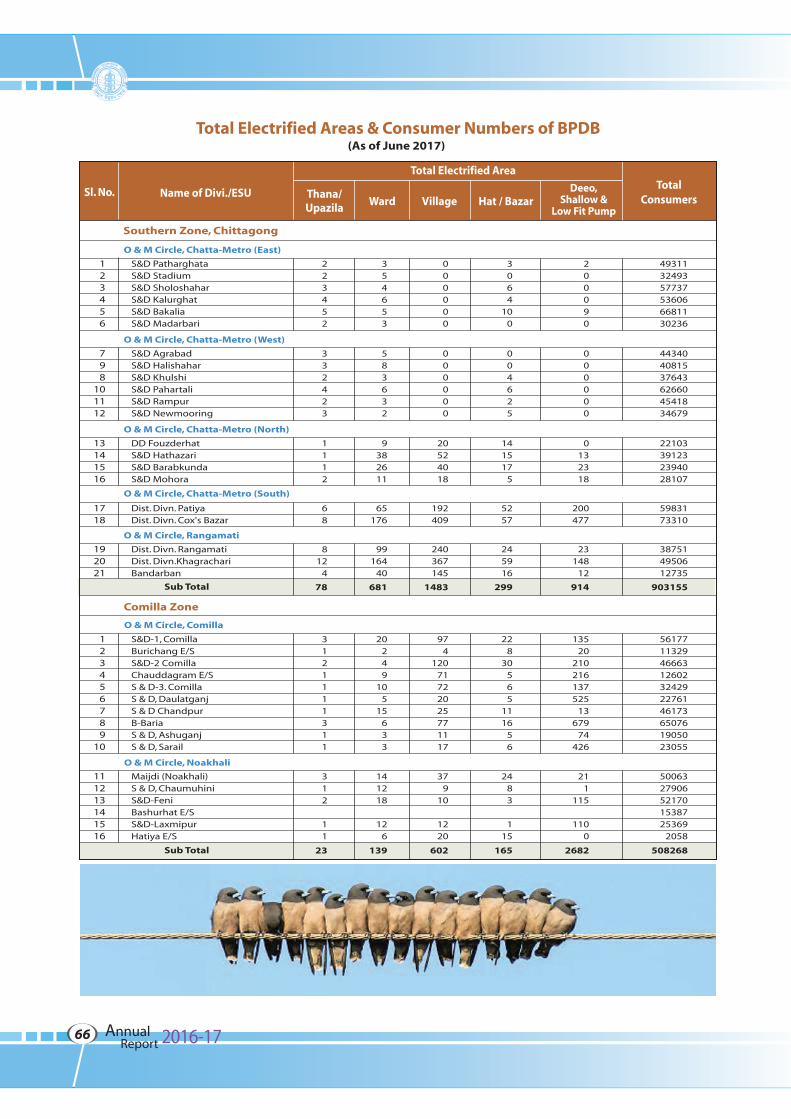
223452
354653
000000
3064
100
200090
493113249357737536066681130236
123456
(As of June 2017)
O & M Circle, Chatta-Metro (East)
Sub Total
Comilla Zone
Southern Zone, Chittagong
O & M Circle, Comilla
S&D PatharghataS&D StadiumS&D SholoshaharS&D KalurghatS&D BakaliaS&D Madarbari
3121111311
20249
105
15633
974
12071722025771117
228
30565
1116
56
13520
210216137525
13679
74426
56177113294666312602324292276146173650761905023055
123456789
10
S&D-1, ComillaBurichang E/SS&D-2 ComillaChauddagram E/SS & D-3. ComillaS & D, DaulatganjS & D ChandpurB-BariaS & D, AshuganjS & D, Sarail
O & M Circle, Noakhali
312
11
23
141218
126
139
379
10
1220
602
2483
115
165
211
115
1100
2682
5006327906521701538725369
2058
508268
111213141516
Maijdi (Noakhali)S & D, ChaumuhiniS&D-FeniBashurhat E/SS&D-LaxmipurHatiya E/S
332423
583632
000000
004625
000000
443404081537643626604541834679
798
101112
O & M Circle, Chatta-Metro (West)
S&D AgrabadS&D HalishaharS&D KhulshiS&D PahartaliS&D RampurS&D Newmooring
1112
9382611
20524018
141517
5
0132318
22103391232394028107
13141516
O & M Circle, Chatta-Metro (North)
DD FouzderhatS&D HathazariS&D BarabkundaS&D Mohora
812
4
78
99164
40
681
240367145
1483
245916
299
23148
12
914
387514950612735
903155
192021
O & M Circle, Rangamati
Dist. Divn. RangamatiDist. Divn.KhagrachariBandarban
Sub Total
68
65176
192409
5257
200477
5983173310
1718
O & M Circle, Chatta-Metro (South)
Dist. Divn. PatiyaDist. Divn. Cox's Bazar
Total Electrified Areas & Consumer Numbers of BPDB
Sl. No. Name of Divi./ESU
Total Electrified Area
Thana/Upazila
Ward Village Hat / BazarDeeo,
Shallow &Low Fit Pump
TotalConsumers
Annual 2016-17Report66
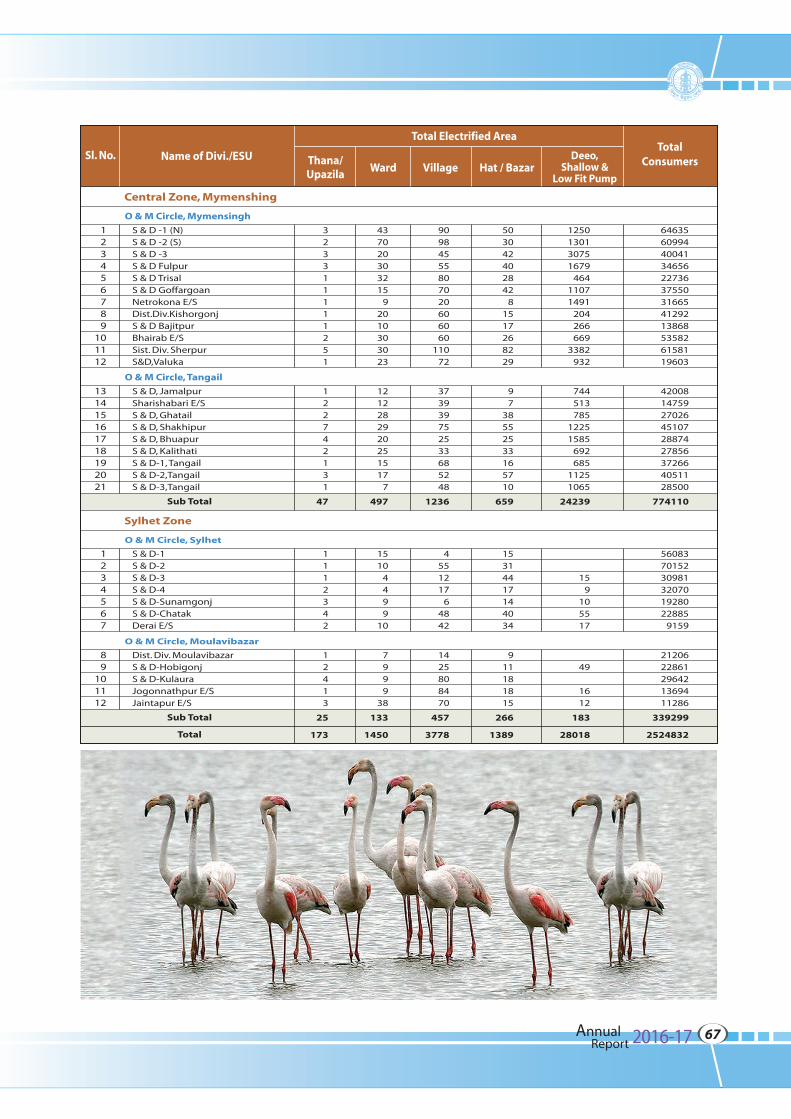
O & M Circle, Mymensingh
Central Zone, Mymenshing
Sylhet Zone
Sl. No. Name of Divi./ESU
Total Electrified Area
Thana/Upazila
Ward Village Hat / BazarDeeo,
Shallow &Low Fit Pump
TotalConsumers
323311111251
437020303215
92010303023
90984555807020606060
11072
503042402842
81517268229
1250130130751679
46411071491
204266669
3382932
646356099440041346562273637550316654129213868535826158119603
123456789
101112
S & D -1 (N)S & D -2 (S)S & D -3S & D FulpurS & D TrisalS & D GoffargoanNetrokona E/SDist.Div.KishorgonjS & D BajitpurBhairab E/SSist. Div. SherpurS&D,Valuka
O & M Circle, Sylhet
1112342
1510
4499
10
4551217
64842
15314417144034
159
105517
560837015230981320701928022885
9159
1234567
S & D-1S & D-2S & D-3S & D-4S & D-SunamgonjS & D-ChatakDerai E/S
O & M Circle, Tangail
122742131
47
1212282920251517
7
497
373939752533685248
1236
97
38552533165710
659
744513785
12251585
692685
11251065
24239
420081475927026451072887427856372664051128500
774110
131415161718192021
S & D, Jamalpur Sharishabari E/SS & D, Ghatail S & D, ShakhipurS & D, BhuapurS & D, KalithatiS & D-1, TangailS & D-2,TangailS & D-3,Tangail
Sub Total
O & M Circle, Moulavibazar
12413
25
173
7999
38
133
1450
1425808470
457
3778
911181815
266
1389
49
1612
183
28018
2120622861296421369411286
339299
2524832
89
101112
Dist. Div. MoulavibazarS & D-HobigonjS & D-KulauraJogonnathpur E/SJaintapur E/S
Sub Total
Total
Annual 2016-17Report67
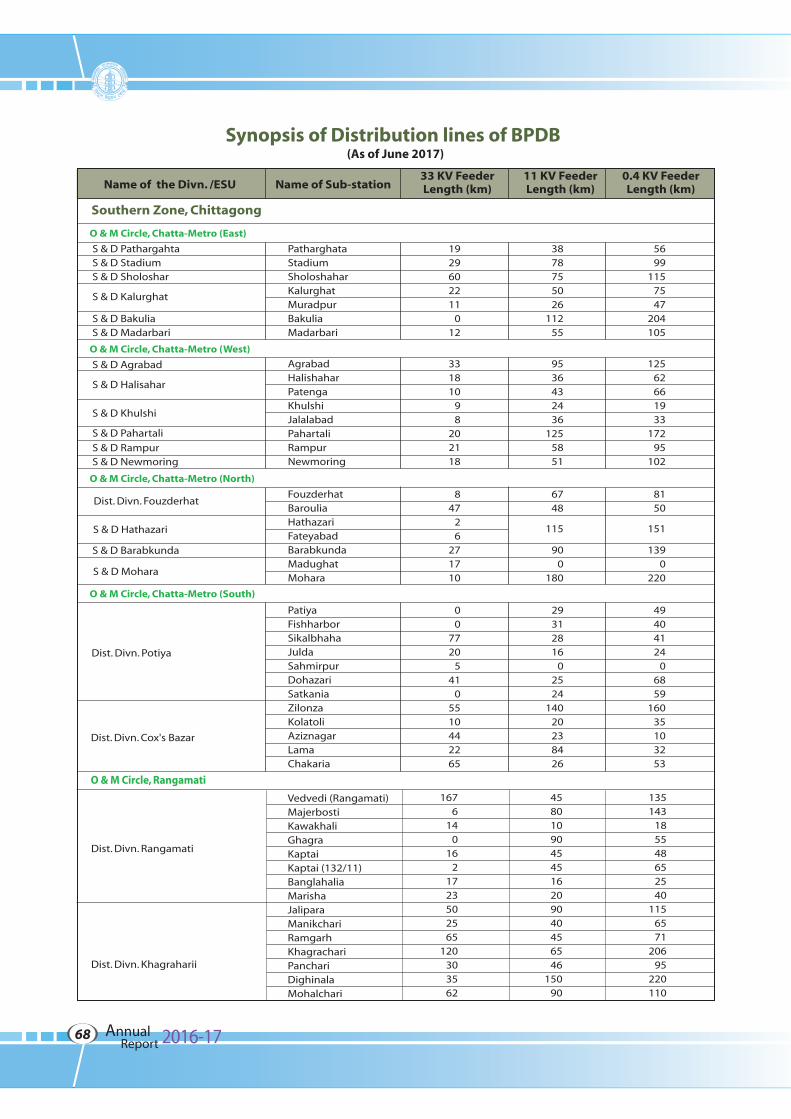
Synopsis of Distribution lines of BPDB(As of June 2017)
Southern Zone, Chittagong
O & M Circle, Chatta-Metro (East)
O & M Circle, Chatta-Metro (West)
O & M Circle, Chatta-Metro (North)
O & M Circle, Chatta-Metro (South)
S & D PathargahtaS & D StadiumS & D Sholoshar
S & D Kalurghat
S & D BakuliaS & D Madarbari
PatharghataStadiumSholoshaharKalurghatMuradpurBakuliaMadarbari
S & D Agrabad
S & D Halisahar
S & D Khulshi
S & D Pahartali
S & D RampurS & D Newmoring
S & D Barabkunda
Dist. Divn. Fouzderhat
S & D Hathazari
S & D Mohara
Dist. Divn. Potiya
Dist. Divn. Cox's Bazar
1929602211
012
3878755026
11255
5699
1157547
204105
O & M Circle, Rangamati
1676
140
162
1723502565
120303562
45801090454516209040456546
15090
135143
185548652540
1156571
20695
220110
Vedvedi (Rangamati)MajerbostiKawakhaliGhagraKaptaiKaptai (132/11)Banglahalia Marisha JaliparaManikchariRamgarhKhagrachariPanchariDighinalaMohalchari
Dist. Divn. Rangamati
Dist. Divn. Khagraharii
Name of Sub-station33 KV FeederLength (km)
11 KV FeederLength (km)
0.4 KV FeederLength (km)Name of the Divn. /ESU
AgrabadHalishaharPatengaKhulshiJalalabadPahartaliRampurNewmoring
331810
98
202118
9536432436
1255851
12562661933
17295
102
FouzderhatBarouliaHathazariFateyabadBarabkundaMadughatMohara
847
26
271710
6748
115
900
180
8150
151
1390
220
PatiyaFishharborSikalbhahaJuldaSahmirpurDohazariSatkaniaZilonzaKolatoliAziznagarLamaChakaria
00
7720
541
05510442265
29312816
02524
14020238426
49404124
06859
16035103253
Annual 2016-17Report68
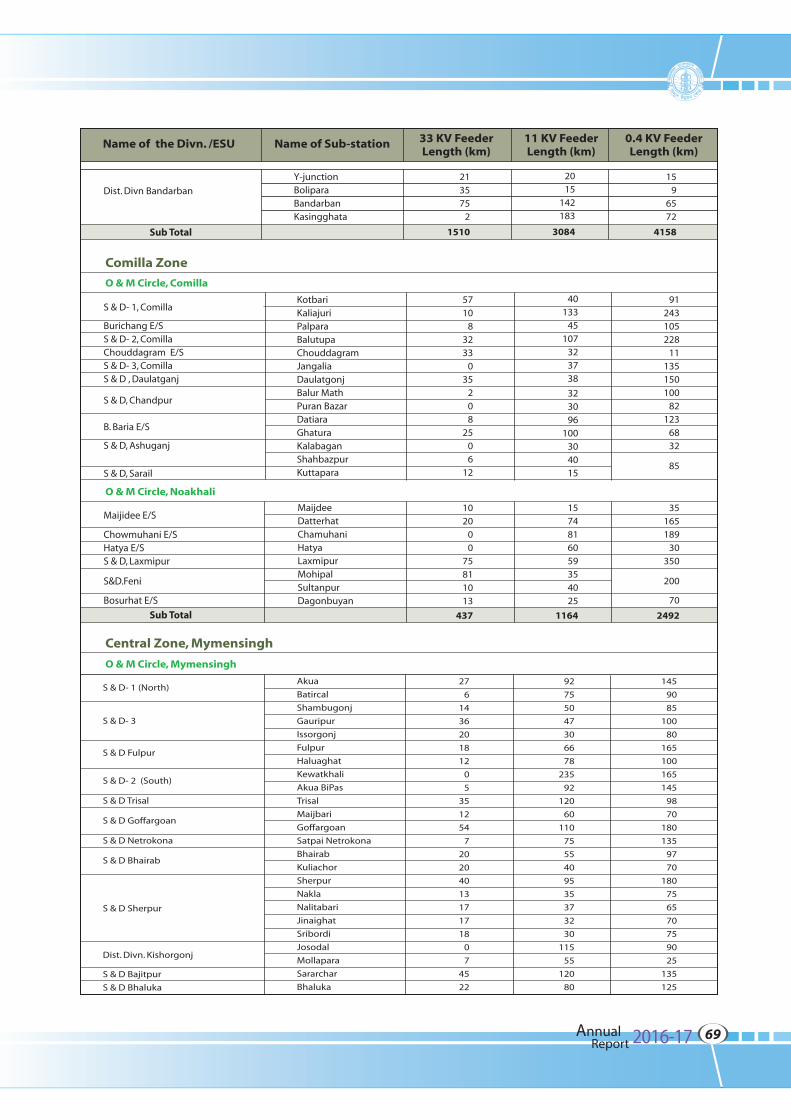
Annual 2016-17Report69
213575
2
1510
Dist. Divn Bandarban
2015
142183
3084
159
6572
4158
Y-junctionBoliparaBandarbanKasingghata
Sub Total
Sub Total
5710
83233
035
208
2506
12
S & D- 1, Comilla
Burichang E/SS & D- 2, ComillaChouddagram E/SS & D- 3, ComillaS & D , Daulatganj
S & D, Chandpur
B. Baria E/S
S & D, Ashuganj
S & D, Sarail
40133
45107
323738
323096
100304015
91243105228
11135150100
82123
6832
85
KotbariKaliajuriPalparaBalutupaChouddagramJangaliaDaulatgonjBalur MathPuran BazarDatiaraGhaturaKalabaganShahbazpurKuttapara
Maijidee E/S
Chowmuhani E/SHatya E/SS & D, Laxmipur
S&D.Feni
Bosurhat E/S
MaijdeeDatterhatChamuhaniHatyaLaxmipurMohipalSultanpurDagonbuyan
1020
00
75811013
437
1574816059354025
1164
35165189
30350
200
70
2492
S & D- 1 (North)
S & D- 3
S & D Fulpur
S & D- 2 (South)
S & D Trisal
S & D Goffargoan
S & D Netrokona
S & D Bhairab
S & D Sherpur
Dist. Divn. Kishorgonj
S & D Bajitpur
S & D Bhaluka
27
6
14
36
20
18
12
0
5
35
12
54
7
20
20
40
13
17
17
18
0
7
45
22
92
75
50
47
30
66
78
235
92
120
60
110
75
55
40
95
35
37
32
30
115
55
120
80
145
90
85
100
80
165
100
165
145
98
70
180
135
97
70
180
75
65
70
75
90
25
135
125
Akua
Batircal
Shambugonj
Gauripur
Issorgonj
Fulpur
Haluaghat
Kewatkhali
Akua BiPas
Trisal
Maijbari
Goffargoan
Satpai Netrokona
Bhairab
Kuliachor
Sherpur
Nakla
Nalitabari
Jinaighat
Sribordi
Josodal
Mollapara
Sararchar
Bhaluka
Comilla Zone
O & M Circle, Comilla
Central Zone, Mymensingh
O & M Circle, Mymensingh
O & M Circle, Noakhali
Name of Sub-station 33 KV FeederLength (km)
11 KV FeederLength (km)
0.4 KV FeederLength (km)
Name of the Divn. /ESU
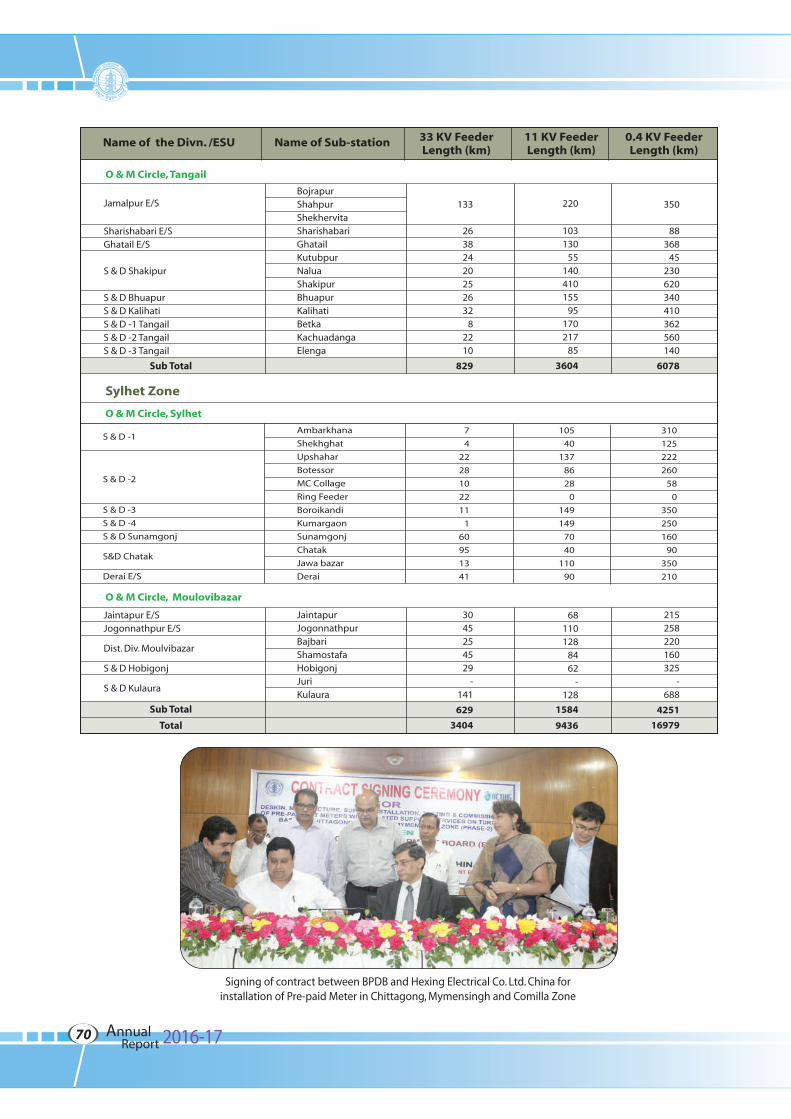
Sub Total
133
26382420252632
82210
829
Jamalpur E/S
Sharishabari E/SGhatail E/S
S & D Shakipur
S & D BhuapurS & D KalihatiS & D -1 TangailS & D -2 TangailS & D -3 Tangail
220
103130
55140410155
95170217
85
3604
350
88368
45230620340410362560140
6078
BojrapurShahpurShekhervitaSharishabariGhatailKutubpurNaluaShakipurBhuapurKalihatiBetkaKachuadangaElenga
S & D -1
S & D -2
S & D -3
S & D -4
S & D Sunamgonj
S&D Chatak
Derai E/S
7
4
22
28
10
22
11
1
60
95
13
41
105
40
137
86
28
0
149
149
70
40
110
90
310
125
222
260
58
0
350
250
160
90
350
210
Ambarkhana
Shekhghat
Upshahar
Botessor
MC Collage
Ring Feeder
Boroikandi
Kumargaon
Sunamgonj
Chatak
Jawa bazar
Derai
O & M Circle, Tangail
Sub Total
Total
3045254529
-141
629
3404
Jaintapur E/SJogonnathpur E/S
Dist. Div. Moulvibazar
S & D Hobigonj
S & D Kulaura
68110128
8462
-128
1584
9436
215258220160325
-688
4251
16979
JaintapurJogonnathpurBajbariShamostafaHobigonjJuriKulaura
O & M Circle, Moulovibazar
O & M Circle, Sylhet
Name of Sub-station 33 KV FeederLength (km)
11 KV FeederLength (km)
0.4 KV FeederLength (km)
Name of the Divn. /ESU
Sylhet Zone
Signing of contract between BPDB and Hexing Electrical Co. Ltd. China forinstallation of Pre-paid Meter in Chittagong, Mymensingh and Comilla Zone
Annual 2016-17Report70

(As of June 2017)33/11 KV Sub-stations of BPDB
SOUTHERN ZONE, CHITTAGONG
O & M Circle, Chatta-Metro (East)
S & D PatharghataS & D Stadium
S & D Sholoshar
S & D Kalurghat
S & D BakaliaS & D Madarbari
2x16/203x16/201x16/20
2x161x16/20
1x162x16/202x16/202x16/20
3550
40
35
343529
12
3
4
56
Patharghata Stadium
Sholoshar
Kalurghat
Muradpur Bakalia
Madarbari
O & M Circle, Chatta-Metro (West)
S & D Agrabad
S & D Halisahar
S & D Khulshi
S & D Pahartali
S & D Newmooring S & D Rampur
2x16/201x20/26.66
2x16/202x16/202x16/202x16/20
1x20/26.662x16/202x16/202x16/20
50
24153032
39
2835
7
8
9
10
1112
Agrabad
Halisahar Patenga Khulshi
Jalalabad
Pahartali
Newmooring Rampur
O & M Circle, Chatta-Metro (North)
Dis. Div. Fouzderhat
S & D, Hathazari
S & D Barabkunda
S & D Mohara
2 x 16/202 x 16/201 x 16/20
1 x 10/13.332 x 10/13.33
2 x 16/202 x 16/20
1 x 5
2530
12
92422
3
13
14
15
16
Baroulia Fouzderhat
Hathazari
FateybadBarabkunda
MoharaRangunia Sub Station
O & M Circle, Chatta-Metro (South)
Dist. Divn. Patiya
Dist. Divn. Cox’s Bazar
2x10/122x10
2x16/201x16/201x16/202x5/6.672x16/201x10/131x5/6.5
2x10/13.331x5/6.5
915
710
64.5328.5
2142.8
17
18
PatiyaFishharbor
JuldaShikalbahaDohazariSatkaniaZilonza Chakaria
AziznagarKolatoli
Lama
O & M Circle, Rangamati
Dist. Divn. Rangamati
1x5/6.671x5/6.681x5/6.692x5/6.67
1x102x3
1x6.651x200.5
1.51.51.54.55.51.32.56.5
2
19
KawkhaliBangalhalia
MarishaVedvedi (Rangamati)
MajerbostiKaptaiGhagra
Kaptai (132/11)Chandraghona (33/11)
Name of the 33/11KVSub-Station
MaximumDemand (MW)
Sl.No. Name of the Division Capacity (MVA)
Annual 2016-17Report71
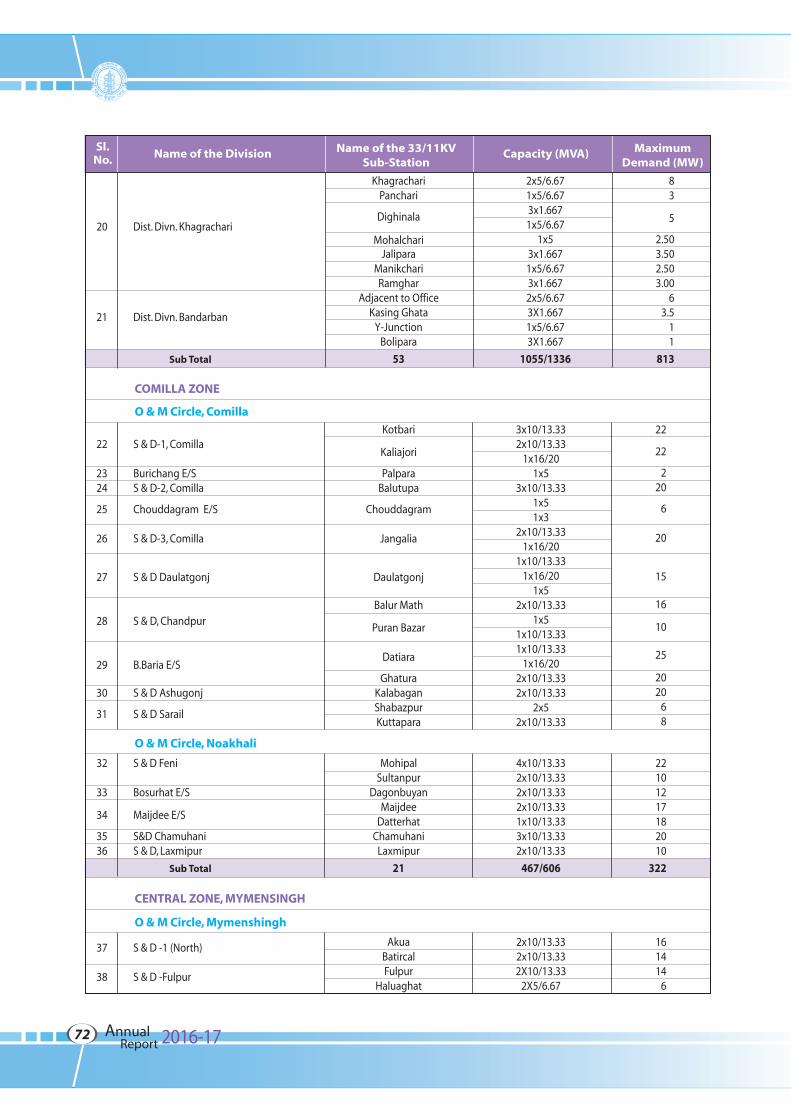
COMILLA ZONE
O & M Circle, Comilla
2x5/6.671x5/6.673x1.6671x5/6.67
1x53x1.6671x5/6.673x1.6672x5/6.673X1.6671x5/6.673X1.667
1055/1336
83
5
2.503.502.503.00
63.5
11
813
20
21
Dist. Divn. Khagrachari
Dist. Divn. Bandarban
KhagrachariPanchari
Dighinala
MohalchariJalipara
ManikchariRamghar
Adjacent to OfficeKasing Ghata
Y-JunctionBolipara
53
CENTRAL ZONE, MYMENSINGH
O & M Circle, Mymenshingh
Sub Total
Sub Total
3x10/13.332x10/13.33
1x16/201x5
3x10/13.331x51x3
2x10/13.331x16/20
1x10/13.331x16/20
1x52x10/13.33
1x51x10/13.331x10/13.33
1x16/202x10/13.332x10/13.33
2x52x10/13.33
22
22
220
6
20
15
16
10
25
2020
68
22
2324
25
26
27
28
29
30
31
S & D-1, Comilla
Burichang E/SS & D-2, Comilla
Chouddagram E/S
S & D-3, Comilla
S & D Daulatgonj
S & D, Chandpur
B.Baria E/S
S & D Ashugonj
S & D Sarail
Kotbari
Kaliajori
PalparaBalutupa
Chouddagram
Jangalia
Daulatgonj
Balur Math
Puran Bazar
Datiara
GhaturaKalabaganShabazpurKuttapara
22101217182010
322
O & M Circle, Noakhali
4x10/13.332x10/13.332x10/13.332x10/13.331x10/13.333x10/13.332x10/13.33
467/606
32
33
34
3536
S & D Feni
Bosurhat E/S
Maijdee E/S
S&D ChamuhaniS & D, Laxmipur
MohipalSultanpur
DagonbuyanMaijdee
DatterhatChamuhani
Laxmipur
21
161414
6
2x10/13.332x10/13.332X10/13.33
2X5/6.67
37
38
S & D -1 (North)
S & D -Fulpur
AkuaBatircalFulpur
Haluaghat
Name of the 33/11KVSub-Station
MaximumDemand (MW)
Sl.No. Name of the Division Capacity (MVA)
Annual 2016-17Report72
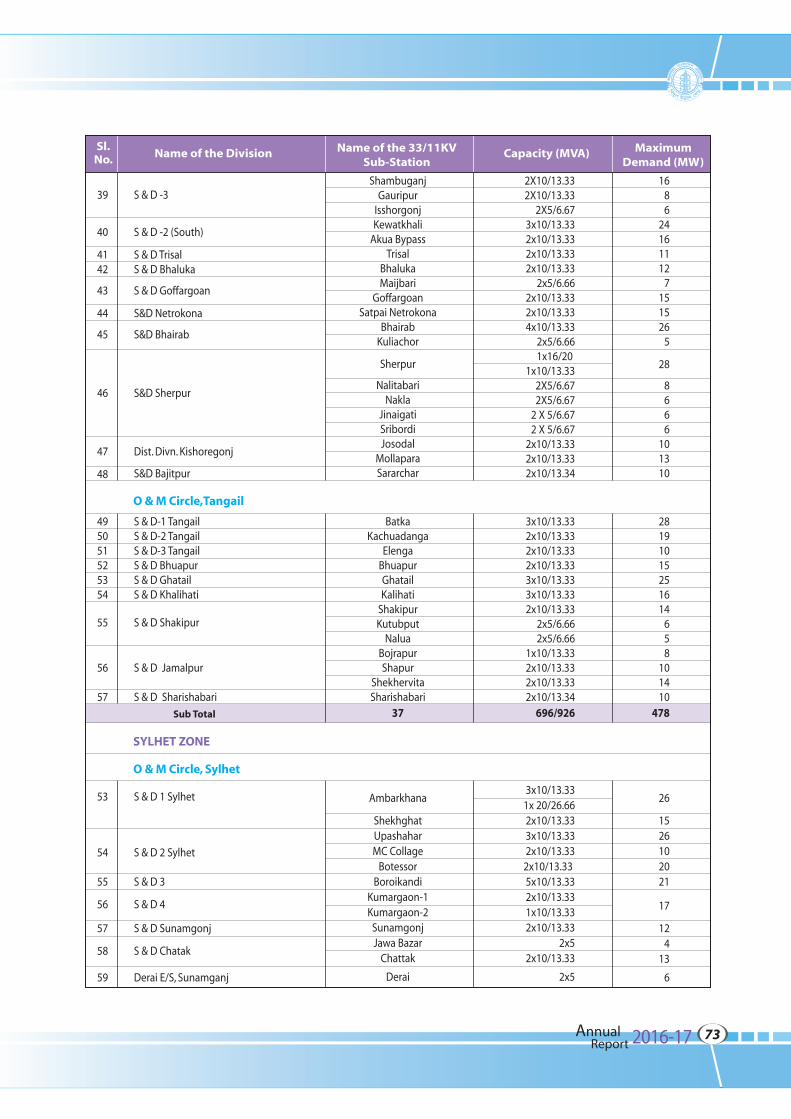
2X10/13.332X10/13.33
2X5/6.673x10/13.332x10/13.332x10/13.332x10/13.33
2x5/6.662x10/13.332x10/13.334x10/13.33
2x5/6.661x16/20
1x10/13.332X5/6.672X5/6.67
2 X 5/6.672 X 5/6.67
2x10/13.332x10/13.332x10/13.34
1686
24161112
7151526
5
28
8666
101310
39
40
4142
43
44
45
46
47
48
S & D -3
S & D -2 (South)
S & D TrisalS & D Bhaluka
S & D Goffargoan
S&D Netrokona
S&D Bhairab
S&D Sherpur
Dist. Divn. Kishoregonj
S&D Bajitpur
ShambuganjGauripur
IsshorgonjKewatkhali
Akua BypassTrisal
BhalukaMaijbari
GoffargoanSatpai Netrokona
BhairabKuliachor
Sherpur
NalitabariNakla
JinaigatiSribordiJosodal
MollaparaSararchar
SYLHET ZONE
O & M Circle, Sylhet
Sub Total
28191015251614
658
101410
478
O & M Circle,Tangail
3x10/13.332x10/13.332x10/13.332x10/13.333x10/13.333x10/13.332x10/13.33
2x5/6.662x5/6.66
1x10/13.332x10/13.332x10/13.332x10/13.34
696/926
495051525354
55
56
57
S & D-1 TangailS & D-2 TangailS & D-3 TangailS & D BhuapurS & D Ghatail S & D Khalihati
S & D Shakipur
S & D Jamalpur
S & D Sharishabari
BatkaKachuadanga
ElengaBhuapurGhatailKalihati
ShakipurKutubput
NaluaBojrapurShapur
ShekhervitaSharishabari
37
26
1526102021
17
124
13
6
3x10/13.331x 20/26.662x10/13.333x10/13.332x10/13.33
2x10/13.33 5x10/13.332x10/13.331x10/13.332x10/13.33
2x52x10/13.33
2x5
53
54
55
56
57
58
59
S & D 1 Sylhet
S & D 2 Sylhet
S & D 3
S & D 4
S & D Sunamgonj
S & D Chatak
Derai E/S, Sunamganj
Ambarkhana
ShekhghatUpashaharMC Collage
BotessorBoroikandi
Kumargaon-1Kumargaon-2
SunamgonjJawa Bazar
Chattak
Derai
Name of the 33/11KVSub-Station
MaximumDemand (MW)
Sl.No. Name of the Division Capacity (MVA)
Annual 2016-17Report73
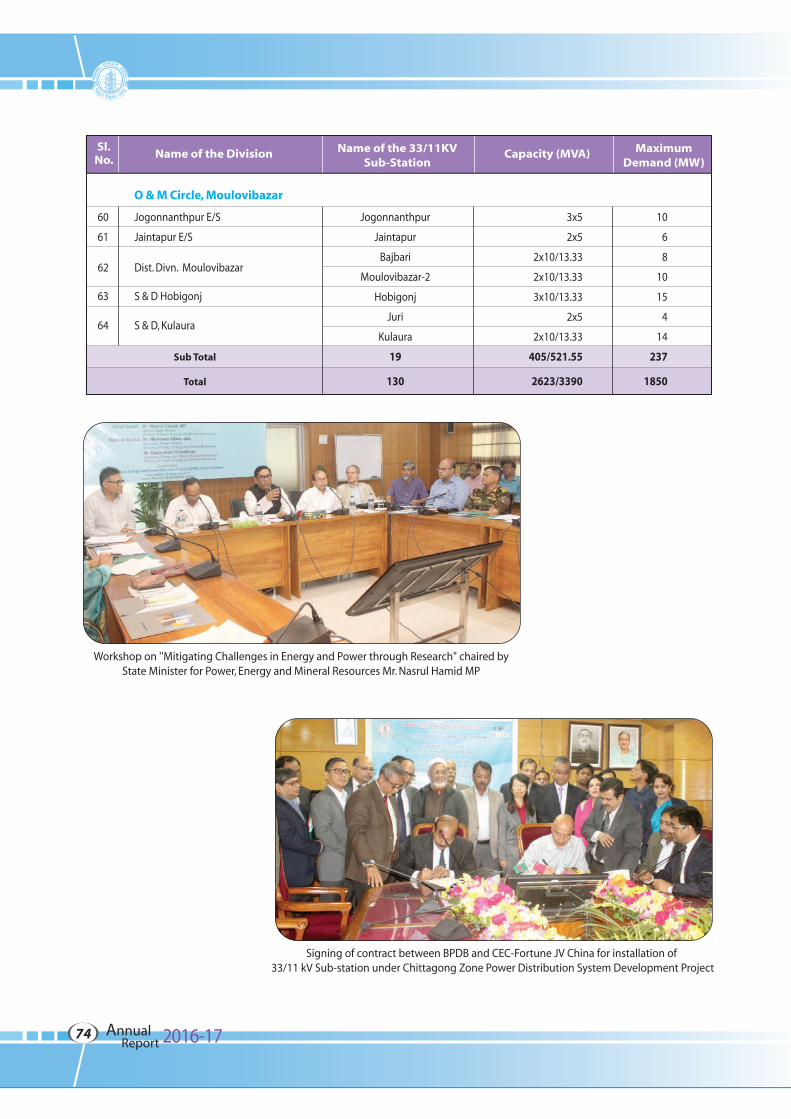
O & M Circle, Moulovibazar
3x5
2x5
2x10/13.33
2x10/13.33
3x10/13.33
2x5
2x10/13.33
405/521.55
2623/3390
10
6
8
10
15
4
14
237
1850
60
61
62
63
64
Jogonnanthpur E/S
Jaintapur E/S
Dist. Divn. Moulovibazar
S & D Hobigonj
S & D, Kulaura
Jogonnanthpur
Jaintapur
Bajbari
Moulovibazar-2
Hobigonj
Juri
Kulaura
19
130
Sub Total
Total
Name of the 33/11KVSub-Station
MaximumDemand (MW)
Sl.No. Name of the Division Capacity (MVA)
Signing of contract between BPDB and CEC-Fortune JV China for installation of 33/11 kV Sub-station under Chittagong Zone Power Distribution System Development Project
Workshop on ''Mitigating Challenges in Energy and Power through Research" chaired byState Minister for Power, Energy and Mineral Resources Mr. Nasrul Hamid MP
Annual 2016-17Report74
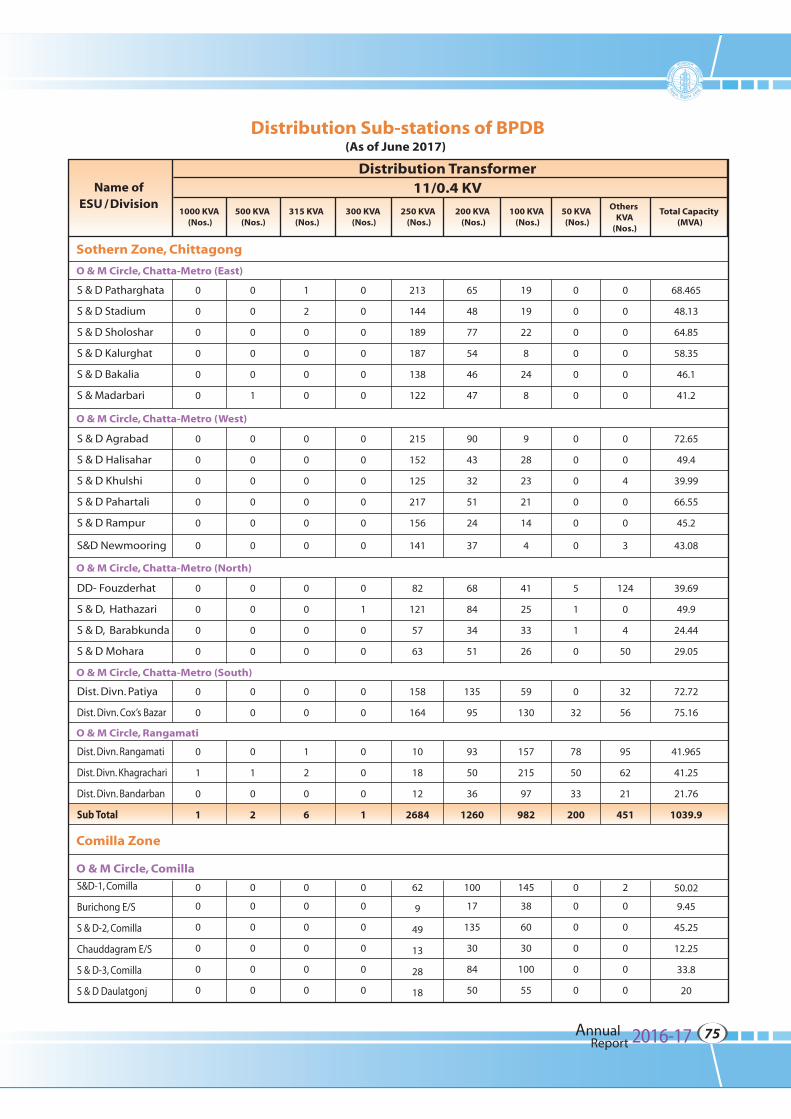
(As of June 2017)Distribution Sub-stations of BPDB
11/0.4 KVDistribution Transformer
1000 KVA (Nos.)
500 KVA (Nos.)
315 KVA (Nos.)
300 KVA (Nos.)
250 KVA (Nos.)
200 KVA (Nos.)
100 KVA (Nos.)
50 KVA (Nos.)
Total Capacity (MVA)
Others KVA
(Nos.)
Name ofESU / Division
Sothern Zone, Chittagong
O & M Circle, Chatta-Metro (East)
S & D Patharghata
S & D Stadium
S & D Sholoshar
S & D Kalurghat
S & D Bakalia
S & Madarbari
0
0
0
0
0
0
0
0
0
0
0
0
213
144
189
187
138
122
65
48
77
54
46
47
19
19
22
8
24
8
0
0
0
0
0
0
0
0
0
0
0
0
68.465
48.13
64.85
58.35
46.1
41.2
0
0
0
0
0
1
1
2
0
0
0
0
O & M Circle, Chatta-Metro (West)
S & D Agrabad
S & D Halisahar
S & D Khulshi
S & D Pahartali
S & D Rampur
S&D Newmooring
0
0
0
0
0
0
0
0
0
0
0
0
215
152
125
217
156
141
90
43
32
51
24
37
9
28
23
21
14
4
0
0
0
0
0
0
0
0
4
0
0
3
72.65
49.4
39.99
66.55
45.2
43.08
0
0
0
0
0
0
0
0
0
0
0
0
O & M Circle, Chatta-Metro (North)
DD- Fouzderhat
S & D, Hathazari
S & D, Barabkunda
S & D Mohara
0
0
0
0
0
1
0
0
82
121
57
63
68
84
34
51
41
25
33
26
5
1
1
0
124
0
4
50
39.69
49.9
24.44
29.05
0
0
0
0
0
0
0
0
O & M Circle, Chatta-Metro (South)
Dist. Divn. Patiya
Dist. Divn. Cox’s Bazar
0
0
0
0
158
164
135
95
59
130
0
32
32
56
72.72
75.16
0
0
0
0
O & M Circle, Rangamati
Dist. Divn. Rangamati
Dist. Divn. Khagrachari
Dist. Divn. Bandarban
Sub Total
0
1
0
1
0
0
0
1
10
18
12
2684
93
50
36
1260
157
215
97
982
78
50
33
200
95
62
21
451
41.965
41.25
21.76
1039.9
0
1
0
2
1
2
0
6
Comilla Zone
O & M Circle, Comilla
S&D-1, Comilla
Burichong E/S
S & D-2, Comilla
Chauddagram E/S
S & D-3, Comilla
S & D Daulatgonj
0
0
0
0
0
0
0
0
0
0
0
0
62
9
49
13
28
18
100
17
135
30
84
50
145
38
60
30
100
55
0
0
0
0
0
0
2
0
0
0
0
0
50.02
9.45
45.25
12.25
33.8
20
0
0
0
0
0
0
0
0
0
0
0
0
Annual 2016-17Report75
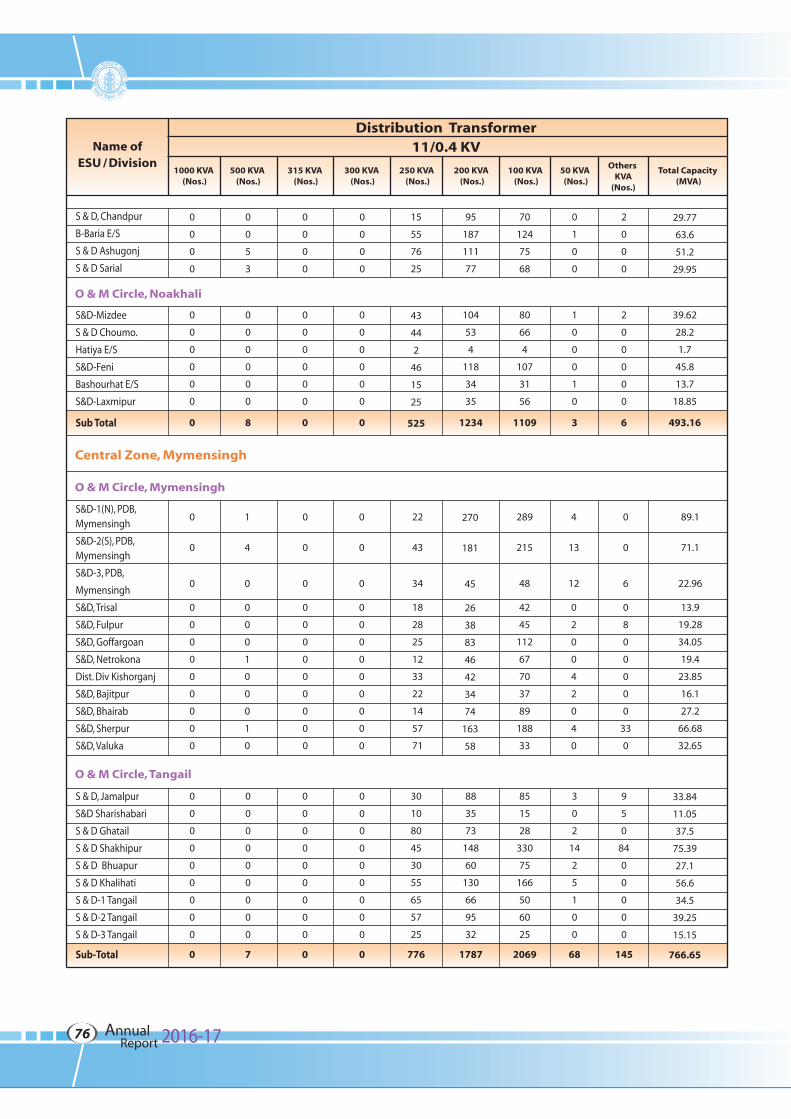
11/0.4 KVDistribution Transformer
1000 KVA (Nos.)
500 KVA (Nos.)
315 KVA (Nos.)
300 KVA (Nos.)
250 KVA (Nos.)
200 KVA (Nos.)
100 KVA (Nos.)
50 KVA (Nos.)
Total Capacity (MVA)
Others KVA
(Nos.)
Name ofESU / Division
Central Zone, Mymensingh
O & M Circle, Mymensingh
O & M Circle, Noakhali
S & D, Chandpur
B-Baria E/S
S & D Ashugonj
S & D Sarial
0
0
0
0
15
55
76
25
95
187
111
77
70
124
75
68
0
1
0
0
2
0
0
0
29.77
63.6
51.2
29.95
0
0
5
3
0
0
0
0
0
0
0
0
S&D-Mizdee
S & D Choumo.
Hatiya E/S
S&D-Feni
Bashourhat E/S
S&D-Laxmipur
Sub Total
0
0
0
0
0
0
0
0
0
0
0
0
0
0
43
44
2
46
15
25
525
104
53
4
118
34
35
1234
80
66
4
107
31
56
1109
1
0
0
0
1
0
3
2
0
0
0
0
0
6
39.62
28.2
1.7
45.8
13.7
18.85
493.16
0
0
0
0
0
0
8
0
0
0
0
0
0
0
O & M Circle, Tangail
S & D, Jamalpur
S&D Sharishabari
S & D Ghatail
S & D Shakhipur
S & D Bhuapur
S & D Khalihati
S & D-1 Tangail
S & D-2 Tangail
S & D-3 Tangail
Sub-Total
0
0
0
0
0
0
0
0
0
0
0
0
0
0
0
0
0
0
0
0
30
10
80
45
30
55
65
57
25
776
88
35
73
148
60
130
66
95
32
1787
85
15
28
330
75
166
50
60
25
2069
3
0
2
14
2
5
1
0
0
68
9
5
0
84
0
0
0
0
0
145
33.84
11.05
37.5
75.39
27.1
56.6
34.5
39.25
15.15
766.65
0
0
0
0
0
0
0
0
0
7
0
0
0
0
0
0
0
0
0
0
S&D-1(N), PDB,Mymensingh
S&D-2(S), PDB,Mymensingh
S&D-3, PDB,
Mymensingh
S&D, Trisal
S&D, Fulpur
S&D, Goffargoan
S&D, Netrokona
Dist. Div Kishorganj
S&D, Bajitpur
S&D, Bhairab
S&D, Sherpur
S&D, Valuka
0
0
0
0
0
0
0
0
0
0
0
0
1
4
0
0
0
0
1
0
0
0
1
0
0
0
0
0
0
0
0
0
0
0
0
0
0
0
0
0
0
0
0
0
0
0
0
0
22
43
34
18
28
25
12
33
22
14
57
71
270
181
45
26
38
83
46
42
34
74
163
58
289
215
48
42
45
112
67
70
37
89
188
33
4
13
12
0
2
0
0
4
2
0
4
0
0
0
6
0
8
0
0
0
0
0
33
0
89.1
71.1
22.96
13.9
19.28
34.05
19.4
23.85
16.1
27.2
66.68
32.65
Annual 2016-17Report76
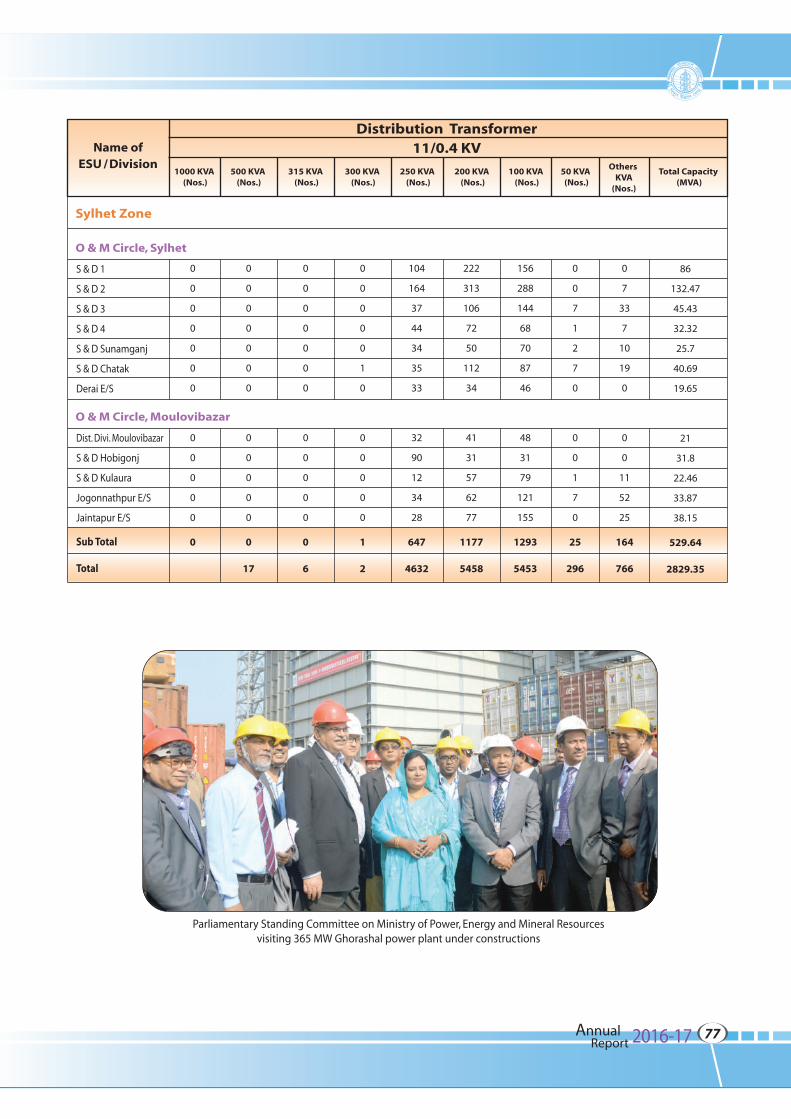
Annual 2016-17Report77
11/0.4 KVDistribution Transformer
1000 KVA (Nos.)
500 KVA (Nos.)
315 KVA (Nos.)
300 KVA (Nos.)
250 KVA (Nos.)
200 KVA (Nos.)
100 KVA (Nos.)
50 KVA (Nos.)
Total Capacity (MVA)
Others KVA
(Nos.)
Name ofESU / Division
Sylhet Zone
O & M Circle, Sylhet
S & D 1
S & D 2
S & D 3
S & D 4
S & D Sunamganj
S & D Chatak
Derai E/S
0
0
0
0
0
0
0
0
0
0
0
0
1
0
104
164
37
44
34
35
33
222
313
106
72
50
112
34
156
288
144
68
70
87
46
0
0
7
1
2
7
0
0
7
33
7
10
19
0
86
132.47
45.43
32.32
25.7
40.69
19.65
0
0
0
0
0
0
0
0
0
0
0
0
0
0
O & M Circle, Moulovibazar
Dist. Divi. Moulovibazar
S & D Hobigonj
S & D Kulaura
Jogonnathpur E/S
Jaintapur E/S
Sub Total
Total
0
0
0
0
0
0
0
0
0
0
0
1
2
32
90
12
34
28
647
4632
41
31
57
62
77
1177
5458
48
31
79
121
155
1293
5453
0
0
1
7
0
25
296
0
0
11
52
25
164
766
21
31.8
22.46
33.87
38.15
529.64
2829.35
0
0
0
0
0
0
17
0
0
0
0
0
0
6
Parliamentary Standing Committee on Ministry of Power, Energy and Mineral Resourcesvisiting 365 MW Ghorashal power plant under constructions
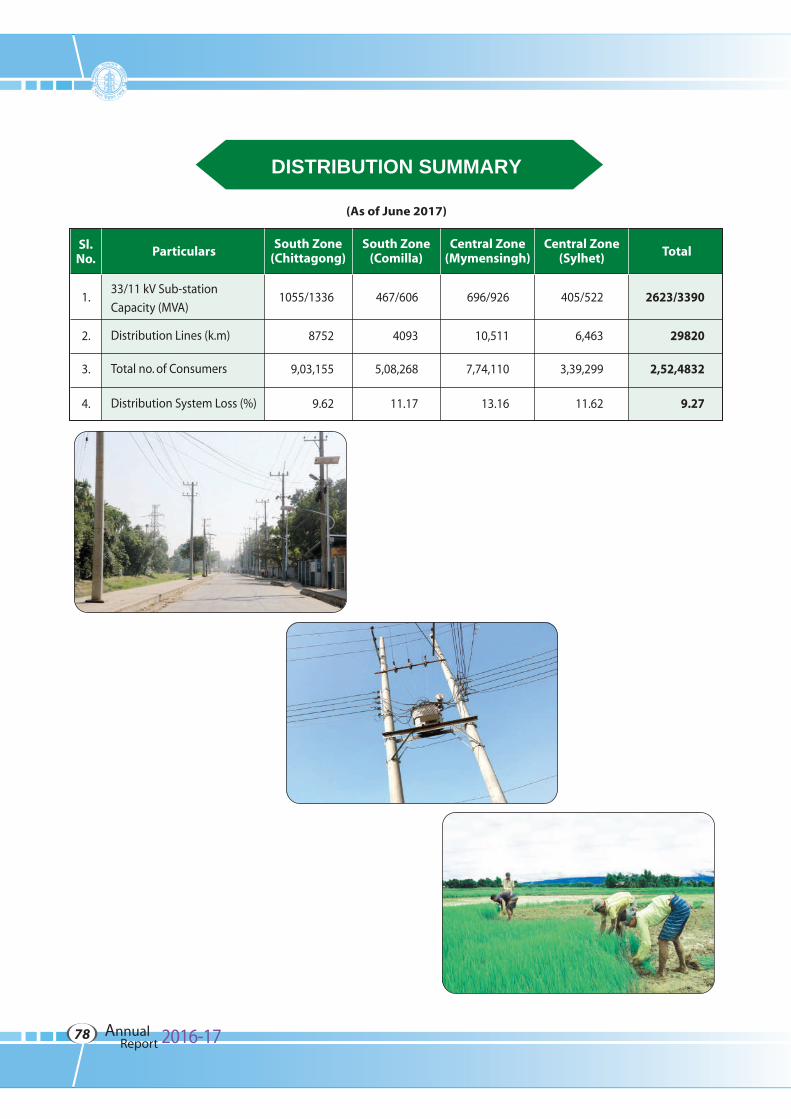
1.
2.
3.
4.
1055/1336
8752
9,03,155
9.62
33/11 kV Sub-station
Capacity (MVA)
Distribution Lines (k.m)
Total no. of Consumers
Distribution System Loss (%)
(As of June 2017)
Particulars TotalSl.No.
South Zone(Chittagong)
467/606
4093
5,08,268
11.17
South Zone(Comilla)
696/926
10,511
7,74,110
13.16
Central Zone(Mymensingh)
405/522
6,463
3,39,299
11.62
Central Zone(Sylhet)
2623/3390
29820
2,52,4832
9.27
DISTRIBUTION SUMMARY
Annual 2016-17Report78
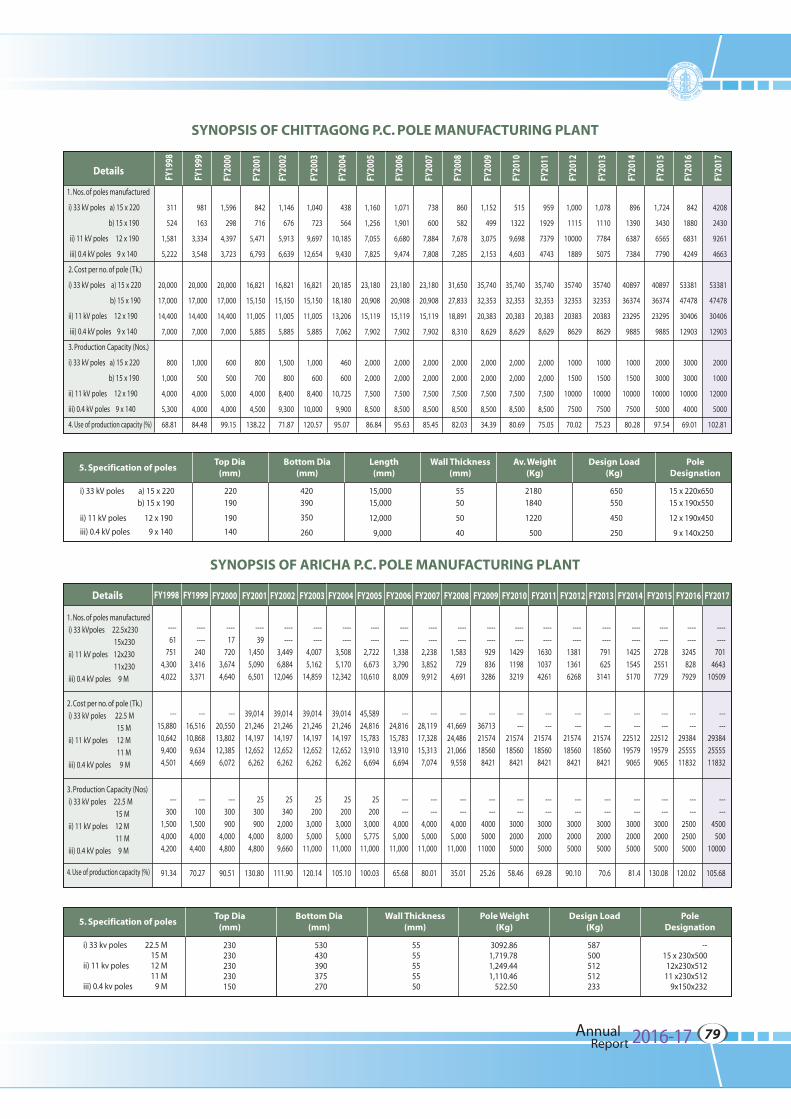
DetailsFY
1998
FY19
99
FY20
00
FY20
01
FY20
02
FY20
03
FY20
04
FY20
05
FY20
06
FY20
07
FY20
08
FY20
09
FY20
10
FY20
11
FY20
12
FY20
13
FY20
14
FY20
15
1. Nos. of poles manufactured
i) 33 kV poles a) 15 x 220
b) 15 x 190
ii) 11 kV poles 12 x 190
iii) 0.4 kV poles 9 x 140
2. Cost per no. of pole (Tk.)
i) 33 kV poles a) 15 x 220
b) 15 x 190
ii) 11 kV poles 12 x 190
iii) 0.4 kV poles 9 x 140
3. Production Capacity (Nos.)
i) 33 kV poles a) 15 x 220
b) 15 x 190
ii) 11 kV poles 12 x 190
iii) 0.4 kV poles 9 x 140
4. Use of production capacity (%)
311
524
1,581
5,222
20,000
17,000
14,400
7,000
800
1,000
4,000
5,300
68.81
981
163
3,334
3,548
20,000
17,000
14,400
7,000
1,000
500
4,000
4,000
84.48
1,596
298
4,397
3,723
20,000
17,000
14,400
7,000
600
500
5,000
4,000
99.15
842
716
5,471
6,793
16,821
15,150
11,005
5,885
800
700
4,000
4,500
138.22
1,146
676
5,913
6,639
16,821
15,150
11,005
5,885
1,500
800
8,400
9,300
71.87
1,040
723
9,697
12,654
16,821
15,150
11,005
5,885
1,000
600
8,400
10,000
120.57
438
564
10,185
9,430
20,185
18,180
13,206
7,062
460
600
10,725
9,900
95.07
1,160
1,256
7,055
7,825
23,180
20,908
15,119
7,902
2,000
2,000
7,500
8,500
86.84
1,071
1,901
6,680
9,474
23,180
20,908
15,119
7,902
2,000
2,000
7,500
8,500
95.63
738
600
7,884
7,808
23,180
20,908
15,119
7,902
2,000
2,000
7,500
8,500
85.45
860
582
7,678
7,285
31,650
27,833
18,891
8,310
2,000
2,000
7,500
8,500
82.03
1,152
499
3,075
2,153
35,740
32,353
20,383
8,629
2,000
2,000
7,500
8,500
34.39
515
1322
9,698
4,603
35,740
32,353
20,383
8,629
2,000
2,000
7,500
8,500
80.69
959
1929
7379
4743
35,740
32,353
20,383
8,629
2,000
2,000
7,500
8,500
75.05
1,000
1115
10000
1889
35740
32353
20383
8629
1000
1500
10000
7500
70.02
1,078
1110
7784
5075
35740
32353
20383
8629
1000
1500
10000
7500
75.23
896
1390
6387
7384
40897
36374
23295
9885
1000
1500
10000
7500
80.28
1,724
3430
6565
7790
40897
36374
23295
9885
2000
3000
10000
5000
97.54
FY20
16
842
1880
6831
4249
53381
47478
30406
12903
3000
3000
10000
4000
69.01
FY20
17
4208
2430
9261
4663
53381
47478
30406
12903
2000
1000
12000
5000
102.81
i) 33 kV poles a) 15 x 220 b) 15 x 190 ii) 11 kV poles 12 x 190 iii) 0.4 kV poles 9 x 140
220190
190
140
420 390
350
260
15,000 15,000
12,000
9,000
55 50
50
40
2180 1840
1220
500
650 550
450
250
15 x 220x650 15 x 190x550
12 x 190x450
9 x 140x250
Details FY1998 FY1999 FY2000 FY2001 FY2002 FY2003 FY2004 FY2005 FY2006 FY2007 FY2008 FY2009 FY2010 FY2011 FY2012 FY2013 FY2014
1. Nos. of poles manufactured
i) 33 kVpoles 22.5x230
15x230
ii) 11 kV poles 12x230
11x230
iii) 0.4 kV poles 9 M
2. Cost per no. of pole (Tk.)
i) 33 kV poles 22.5 M
15 M
ii) 11 kV poles 12 M
11 M
iii) 0.4 kV poles 9 M
3. Production Capacity (Nos)
i) 33 kV poles 22.5 M
15 M
ii) 11 kV poles 12 M
11 M
iii) 0.4 kV poles 9 M
4. Use of production capacity (%)
----
61
751
4,300
4,022
---
15,880
10,642
9,400
4,501
---
300
1,500
4,000
4,200
91.34
----
----
240
3,416
3,371
---
16,516
10,868
9,634
4,669
---
100
1,500
4,000
4,400
70.27
----
17
720
3,674
4,640
---
20,550
13,802
12,385
6,072
---
300
900
4,000
4,800
90.51
----
39
1,450
5,090
6,501
39,014
21,246
14,197
12,652
6,262
25
300
900
4,000
4,800
130.80
----
----
3,449
6,884
12,046
39,014
21,246
14,197
12,652
6,262
25
340
2,000
8,000
9,660
111.90
----
----
4,007
5,162
14,859
39,014
21,246
14,197
12,652
6,262
25
200
3,000
5,000
11,000
120.14
----
----
3,508
5,170
12,342
39,014
21,246
14,197
12,652
6,262
25
200
3,000
5,000
11,000
105.10
----
----
2,722
6,673
10,610
45,589
24,816
15,783
13,910
6,694
25
200
3,000
5,775
11,000
100.03
----
----
1,338
3,790
8,009
---
24,816
15,783
13,910
6,694
---
---
4,000
5,000
11,000
65.68
----
----
2,238
3,852
9,912
---
28,119
17,328
15,313
7,074
---
---
4,000
5,000
11,000
80.01
----
----
1,583
729
4,691
---
41,669
24,486
21,066
9,558
---
---
4,000
5,000
11,000
35.01
----
----
929
836
3286
---
36713
21574
18560
8421
---
---
4000
5000
11000
25.26
----
----
1429
1198
3219
---
---
21574
18560
8421
---
---
3000
2000
5000
58.46
----
----
1630
1037
4261
---
---
21574
18560
8421
---
---
3000
2000
5000
69.28
----
----
1381
1361
6268
---
---
21574
18560
8421
---
---
3000
2000
5000
90.10
----
----
791
625
3141
---
---
21574
18560
8421
---
---
3000
2000
5000
70.6
----
----
1425
1545
5170
---
---
22512
19579
9065
---
---
3000
2000
5000
81.4
FY2015
----
----
2728
2551
7729
---
---
22512
19579
9065
---
---
3000
2000
5000
130.08
FY2017
----
----
3245
828
7929
---
---
29384
25555
11832
---
---
2500
2500
5000
120.02
----
----
701
4643
10509
---
---
29384
25555
11832
---
---
4500
500
10000
105.68
i) 33 kv poles 22.5 M 15 Mii) 11 kv poles 12 M 11 Miii) 0.4 kv poles 9 M
230230230230150
530 430 390 375 270
55 55 55 55 50
3092.86 1,719.78 1,249.44 1,110.46
522.50
587500512512233
-- 15 x 230x500
12x230x512 11 x230x512
9x150x232
FY2016
SYNOPSIS OF CHITTAGONG P.C. POLE MANUFACTURING PLANT
SYNOPSIS OF ARICHA P.C. POLE MANUFACTURING PLANT
5. Specification of polesTop Dia
(mm)Bottom Dia
(mm)Length(mm)
Wall Thickness(mm)
Av. Weight(Kg)
Design Load(Kg)
PoleDesignation
5. Specification of polesTop Dia
(mm)Bottom Dia
(mm)Wall Thickness
(mm)Pole Weight
(Kg)Design Load
(Kg)Pole
Designation
Annual 2016-17Report79
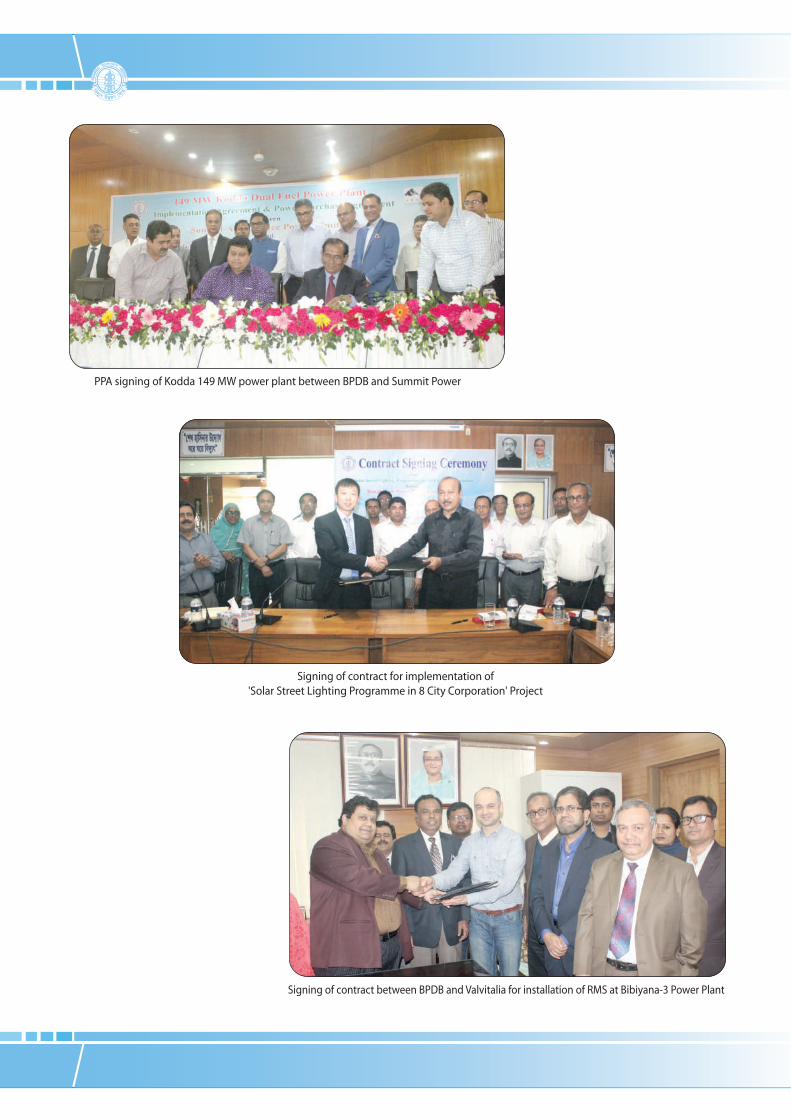
Signing of contract between BPDB and Valvitalia for installation of RMS at Bibiyana-3 Power Plant
Signing of contract for implementation of'Solar Street Lighting Programme in 8 City Corporation' Project
PPA signing of Kodda 149 MW power plant between BPDB and Summit Power
Chapter 5
Accounts, Financeand Audit
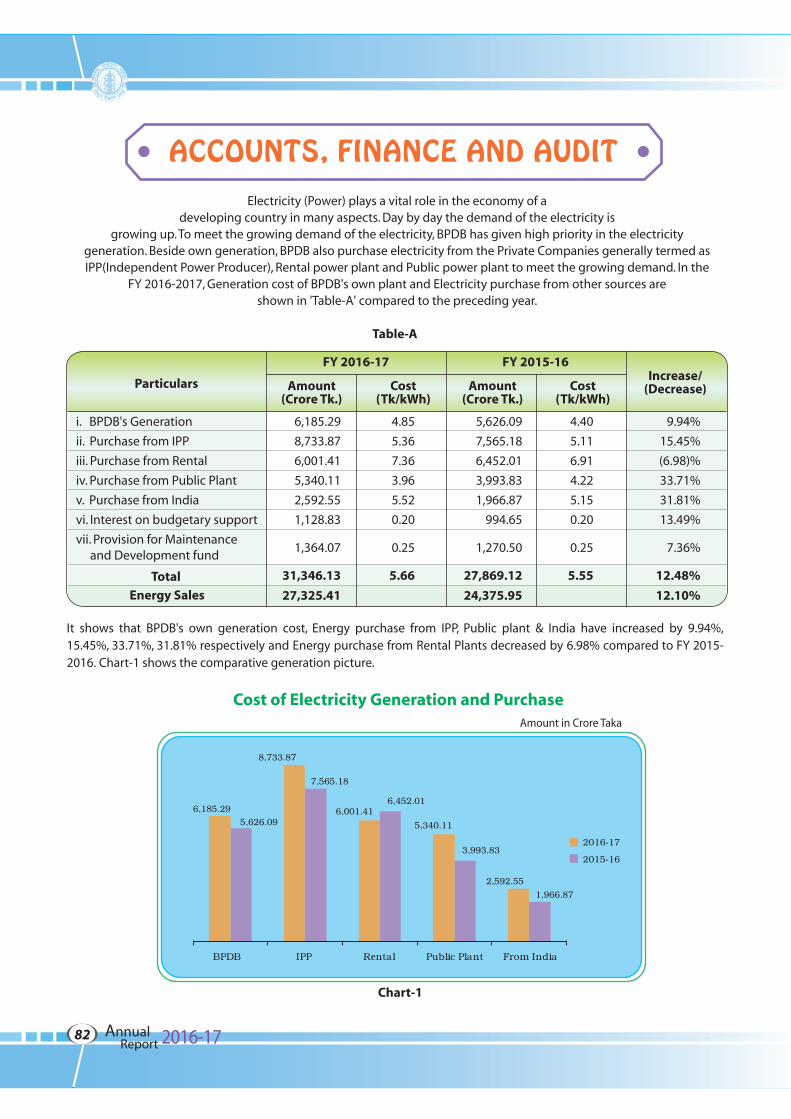
FY 2015-16FY 2016-17
Table-A
Cost of Electricity Generation and Purchase
Particulars
i. BPDB's Generation
ii. Purchase from IPP
iii. Purchase from Rental
iv. Purchase from Public Plant
v. Purchase from India
vi. Interest on budgetary support
vii. Provision for Maintenance and Development fund
Total
Energy Sales
6,185.29
8,733.87
6,001.41
5,340.11
2,592.55
1,128.83
1,364.07
31,346.13
27,325.41
4.85
5.36
7.36
3.96
5.52
0.20
0.25
5.66
5,626.09
7,565.18
6,452.01
3,993.83
1,966.87
994.65
1,270.50
27,869.12
24,375.95
4.40
5.11
6.91
4.22
5.15
0.20
0.25
5.55
9.94%
15.45%
(6.98)%
33.71%
31.81%
13.49%
7.36%
12.48%
12.10%
Amount(Crore Tk.)
Cost(Tk/kWh)
Cost(Tk/kWh)
Increase/(Decrease)Amount
(Crore Tk.)
Amount in Crore Taka
Electricity (Power) plays a vital role in the economy of a developing country in many aspects. Day by day the demand of the electricity is
growing up. To meet the growing demand of the electricity, BPDB has given high priority in the electricity generation. Beside own generation, BPDB also purchase electricity from the Private Companies generally termed as IPP(Independent Power Producer), Rental power plant and Public power plant to meet the growing demand. In the
FY 2016-2017, Generation cost of BPDB's own plant and Electricity purchase from other sources are shown in 'Table-A' compared to the preceding year.
It shows that BPDB's own generation cost, Energy purchase from IPP, Public plant & India have increased by 9.94%, 15.45%, 33.71%, 31.81% respectively and Energy purchase from Rental Plants decreased by 6.98% compared to FY 2015-2016. Chart-1 shows the comparative generation picture.
Chart-1
6,185.29
8,733.87
6,001.415,340.11
2,592.55
5,626.09
7,565.18
6,452.01
3,993.83
1,966.87
BPDB IPP Rental Public Plant From India
2016-17
2015-16
Annual 2016-17Report82
ACCOUNTS, FINANCE AND AUDIT
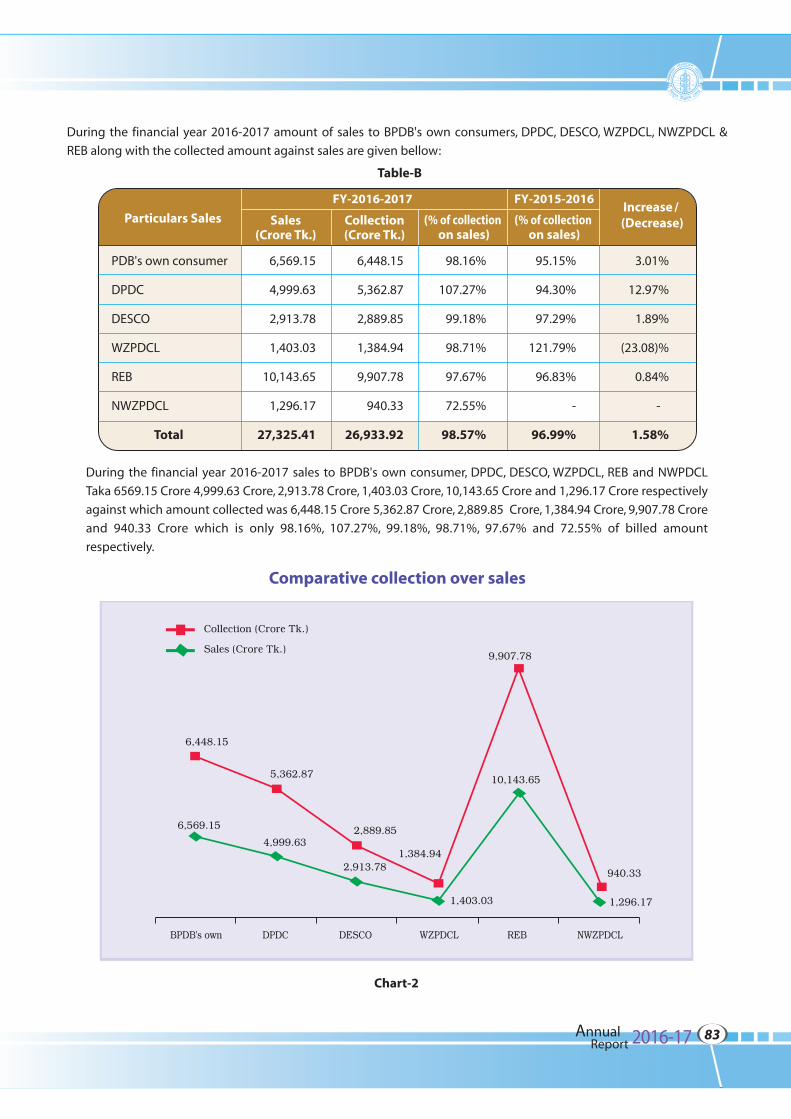
During the financial year 2016-2017 sales to BPDB's own consumer, DPDC, DESCO, WZPDCL, REB and NWPDCL
Taka 6569.15 Crore 4,999.63 Crore, 2,913.78 Crore, 1,403.03 Crore, 10,143.65 Crore and 1,296.17 Crore respectively
against which amount collected was 6,448.15 Crore 5,362.87 Crore, 2,889.85 Crore, 1,384.94 Crore, 9,907.78 Crore
and 940.33 Crore which is only 98.16%, 107.27%, 99.18%, 98.71%, 97.67% and 72.55% of billed amount
respectively.
Comparative collection over sales
During the financial year 2016-2017 amount of sales to BPDB's own consumers, DPDC, DESCO, WZPDCL, NWZPDCL &
REB along with the collected amount against sales are given bellow:
Particulars Sales
Table-B
Sales(Crore Tk.)
Collection(Crore Tk.)
(% of collection on sales)
(% of collection on sales)
Increase / (Decrease)
Chart-2
FY-2016-2017 FY-2015-2016
6,448.15
5,362.87
6,569.15
4,999.63
2,913.78
1,403.03
2,889.85
10,143.65
1,384.94
9,907.78
940.33
1,296.17
Collection (Crore Tk.)
Sales (Crore Tk.)
PDB's own consumer
DPDC
DESCO
WZPDCL
REB
NWZPDCL
Total
6,569.15
4,999.63
2,913.78
1,403.03
10,143.65
1,296.17
27,325.41
6,448.15
5,362.87
2,889.85
1,384.94
9,907.78
940.33
26,933.92
98.16%
107.27%
99.18%
98.71%
97.67%
72.55%
98.57%
95.15%
94.30%
97.29%
121.79%
96.83%
-
96.99%
3.01%
12.97%
1.89%
(23.08)%
0.84%
-
1.58%
BPDB's own DPDC DESCO WZPDCL REB NWZPDCL
Annual 2016-17Report83
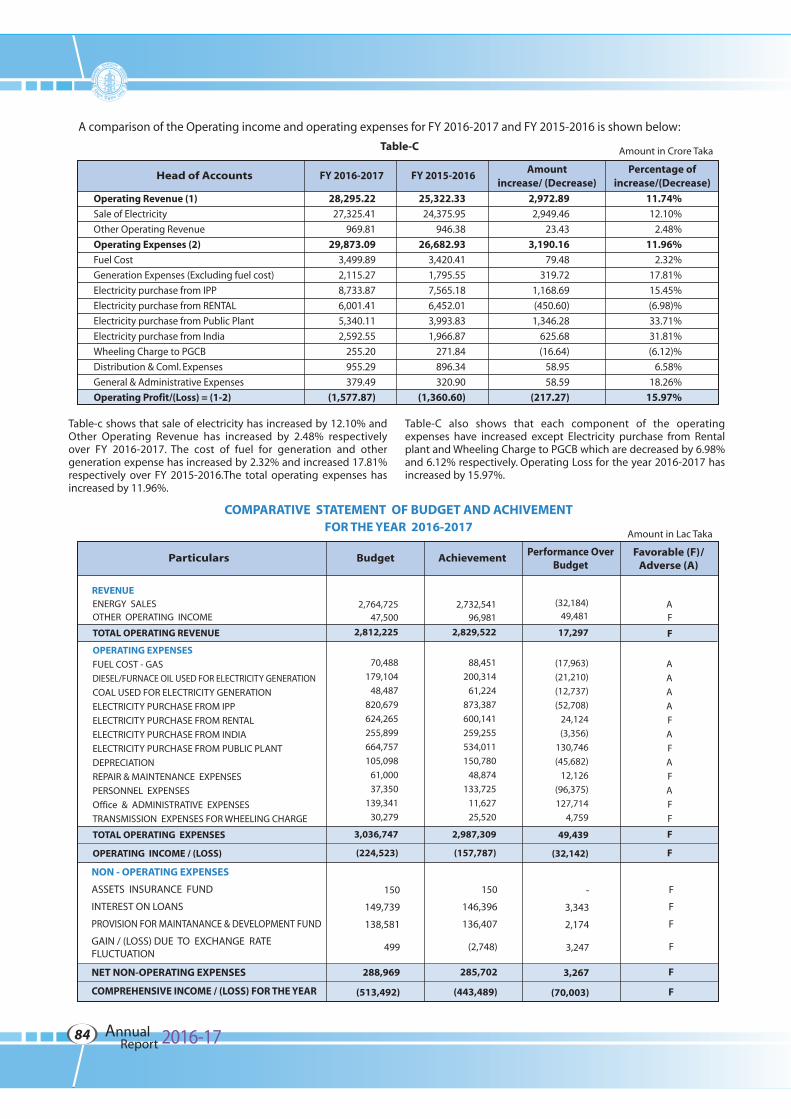
A comparison of the Operating income and operating expenses for FY 2016-2017 and FY 2015-2016 is shown below:
Head of Accounts FY 2016-2017 FY 2015-2016Amount
increase/ (Decrease)Percentage of
increase/(Decrease)
Operating Revenue (1)
Sale of Electricity
Other Operating Revenue
Operating Expenses (2)
Fuel Cost
Generation Expenses (Excluding fuel cost)
Electricity purchase from IPP
Electricity purchase from RENTAL
Electricity purchase from Public Plant
Electricity purchase from India
Wheeling Charge to PGCB
Distribution & Coml. Expenses
General & Administrative Expenses
Operating Profit/(Loss) = (1-2)
28,295.22
27,325.41
969.81
29,873.09
3,499.89
2,115.27
8,733.87
6,001.41
5,340.11
2,592.55
255.20
955.29
379.49
(1,577.87)
25,322.33
24,375.95
946.38
26,682.93
3,420.41
1,795.55
7,565.18
6,452.01
3,993.83
1,966.87
271.84
896.34
320.90
(1,360.60)
2,972.89
2,949.46
23.43
3,190.16
79.48
319.72
1,168.69
(450.60)
1,346.28
625.68
(16.64)
58.95
58.59
(217.27)
11.74%
12.10%
2.48%
11.96%
2.32%
17.81%
15.45%
(6.98)%
33.71%
31.81%
(6.12)%
6.58%
18.26%
15.97%
COMPARATIVE STATEMENT OF BUDGET AND ACHIVEMENTFOR THE YEAR 2016-2017
Table-C
150
146,396
136,407
(2,748)
285,702
(443,489)
-
3,343
2,174
3,247
3,267
(70,003)
Amount in Lac Taka
Amount in Crore Taka
Particulars Budget AchievementPerformance Over
BudgetFavorable (F)/
Adverse (A)
ENERGY SALES OTHER OPERATING INCOME
TOTAL OPERATING REVENUE
OPERATING EXPENSES
FUEL COST - GAS
DIESEL/FURNACE OIL USED FOR ELECTRICITY GENERATION
COAL USED FOR ELECTRICITY GENERATION
ELECTRICITY PURCHASE FROM IPP
ELECTRICITY PURCHASE FROM RENTAL
ELECTRICITY PURCHASE FROM INDIA
ELECTRICITY PURCHASE FROM PUBLIC PLANT
DEPRECIATION
REPAIR & MAINTENANCE EXPENSES
PERSONNEL EXPENSES
Office & ADMINISTRATIVE EXPENSES
TRANSMISSION EXPENSES FOR WHEELING CHARGE
TOTAL OPERATING EXPENSES
OPERATING INCOME / (LOSS)
2,764,72547,500
2,812,225
70,488
179,104
48,487
820,679
624,265
255,899
664,757
105,098
61,000
37,350
139,341
30,279
3,036,747
(224,523)
2,732,54196,981
2,829,522
88,451
200,314
61,224
873,387
600,141
259,255
534,011
150,780
48,874
133,725
11,627
25,520
2,987,309
(157,787)
(32,184)49,481
17,297
(17,963)
(21,210)
(12,737)
(52,708)
24,124
(3,356)
130,746
(45,682)
12,126
(96,375)
127,714
4,759
49,439
(32,142)
AF
F
A
A
A
A
F
A
F
A
F
A
F
F
F
F
REVENUE
150
149,739
138,581
499
288,969
(513,492)
F
F
F
F
F
F
NON - OPERATING EXPENSES
ASSETS INSURANCE FUND
INTEREST ON LOANS
PROVISION FOR MAINTANANCE & DEVELOPMENT FUND
GAIN / (LOSS) DUE TO EXCHANGE RATEFLUCTUATION
NET NON-OPERATING EXPENSES
COMPREHENSIVE INCOME / (LOSS) FOR THE YEAR
Table-c shows that sale of electricity has increased by 12.10% and Other Operating Revenue has increased by 2.48% respectively over FY 2016-2017. The cost of fuel for generation and other generation expense has increased by 2.32% and increased 17.81% respectively over FY 2015-2016.The total operating expenses has increased by 11.96%.
Table-C also shows that each component of the operating expenses have increased except Electricity purchase from Rental plant and Wheeling Charge to PGCB which are decreased by 6.98% and 6.12% respectively. Operating Loss for the year 2016-2017 has increased by 15.97%.
Annual 2016-17Report84
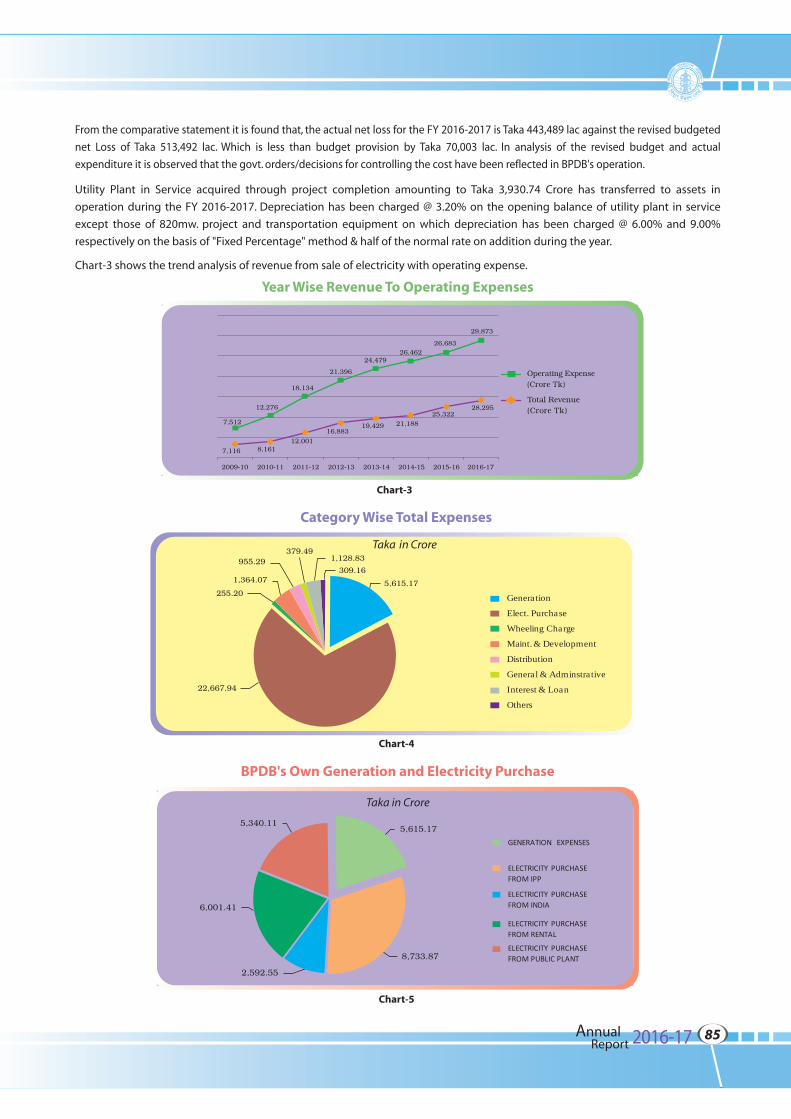
From the comparative statement it is found that, the actual net loss for the FY 2016-2017 is Taka 443,489 lac against the revised budgeted
net Loss of Taka 513,492 lac. Which is less than budget provision by Taka 70,003 lac. In analysis of the revised budget and actual
expenditure it is observed that the govt. orders/decisions for controlling the cost have been reflected in BPDB's operation.
Utility Plant in Service acquired through project completion amounting to Taka 3,930.74 Crore has transferred to assets in
operation during the FY 2016-2017. Depreciation has been charged @ 3.20% on the opening balance of utility plant in service
except those of 820mw. project and transportation equipment on which depreciation has been charged @ 6.00% and 9.00%
respectively on the basis of "Fixed Percentage" method & half of the normal rate on addition during the year.
Chart-3 shows the trend analysis of revenue from sale of electricity with operating expense.
Chart-3
Year Wise Revenue To Operating Expenses
2009-10 2010-11 2011-12 2012-13 2013-14 2014-15 2015-16 2016-17
Operating Expense(Crore Tk)
Total Revenue (Crore Tk)
7,512
12,276
18,134
21,396
24,47926,462
26,683
29,873
7,116 8,16112,001
16,88319,429 21,188
25,32228,295
Chart-4
Category Wise Total Expenses
BPDB's Own Generation and Electricity Purchase
Chart-5
255.20
22,667.94
1,364.07
955.29 379.49
1,128.83
309.16
Taka in Crore
5,615.17
Generation
Elect. Purchase
Wheeling Charge
Maint. & Development
Distribution
General & Adminstrative
Interest & Loan
Others
5,615.17
8,733.87
2,592.55
6,001.41
5,340.11
GENERATION EXPENSES
ELECTRICITY PURCHASE FROM IPP
ELECTRICITY PURCHASE FROM INDIA
ELECTRICITY PURCHASE FROM RENTAL
ELECTRICITY PURCHASE FROM PUBLIC PLANT
Taka in Crore
Annual 2016-17Report85
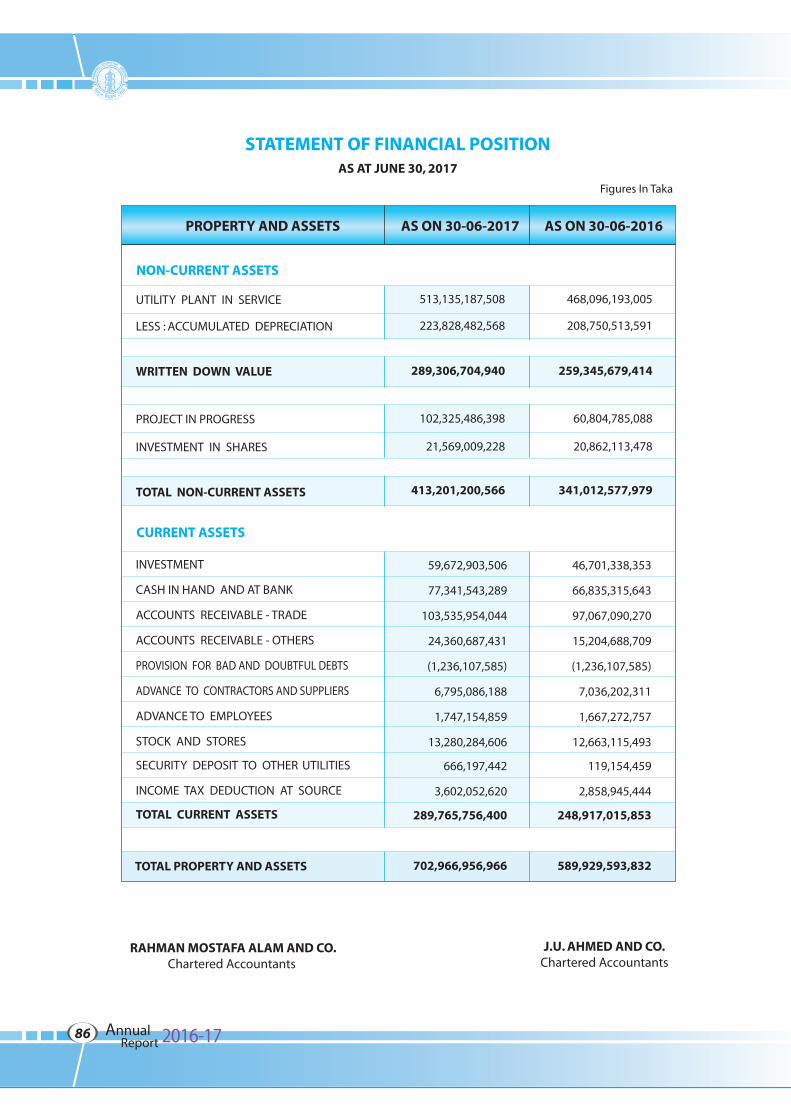
J.U. AHMED AND CO.Chartered Accountants
RAHMAN MOSTAFA ALAM AND CO.Chartered Accountants
UTILITY PLANT IN SERVICE
LESS : ACCUMULATED DEPRECIATION
WRITTEN DOWN VALUE
PROJECT IN PROGRESS
INVESTMENT IN SHARES
TOTAL NON-CURRENT ASSETS
INVESTMENT
CASH IN HAND AND AT BANK
ACCOUNTS RECEIVABLE - TRADE
ACCOUNTS RECEIVABLE - OTHERS
PROVISION FOR BAD AND DOUBTFUL DEBTS
ADVANCE TO CONTRACTORS AND SUPPLIERS
ADVANCE TO EMPLOYEES
STOCK AND STORES
SECURITY DEPOSIT TO OTHER UTILITIES
INCOME TAX DEDUCTION AT SOURCE
TOTAL CURRENT ASSETS
46,701,338,353
66,835,315,643
97,067,090,270
15,204,688,709
(1,236,107,585)
7,036,202,311
1,667,272,757
12,663,115,493
119,154,459
2,858,945,444
248,917,015,853
589,929,593,832
513,135,187,508
223,828,482,568
289,306,704,940
102,325,486,398
21,569,009,228
413,201,200,566
468,096,193,005
208,750,513,591
259,345,679,414
60,804,785,088
20,862,113,478
341,012,577,979
NON-CURRENT ASSETS
CURRENT ASSETS
TOTAL PROPERTY AND ASSETS
59,672,903,506
77,341,543,289
103,535,954,044
24,360,687,431
(1,236,107,585)
6,795,086,188
1,747,154,859
13,280,284,606
666,197,442
3,602,052,620
289,765,756,400
702,966,956,966
AS ON 30-06-2017PROPERTY AND ASSETS AS ON 30-06-2016
Figures In Taka
STATEMENT OF FINANCIAL POSITIONAS AT JUNE 30, 2017
Annual 2016-17Report86
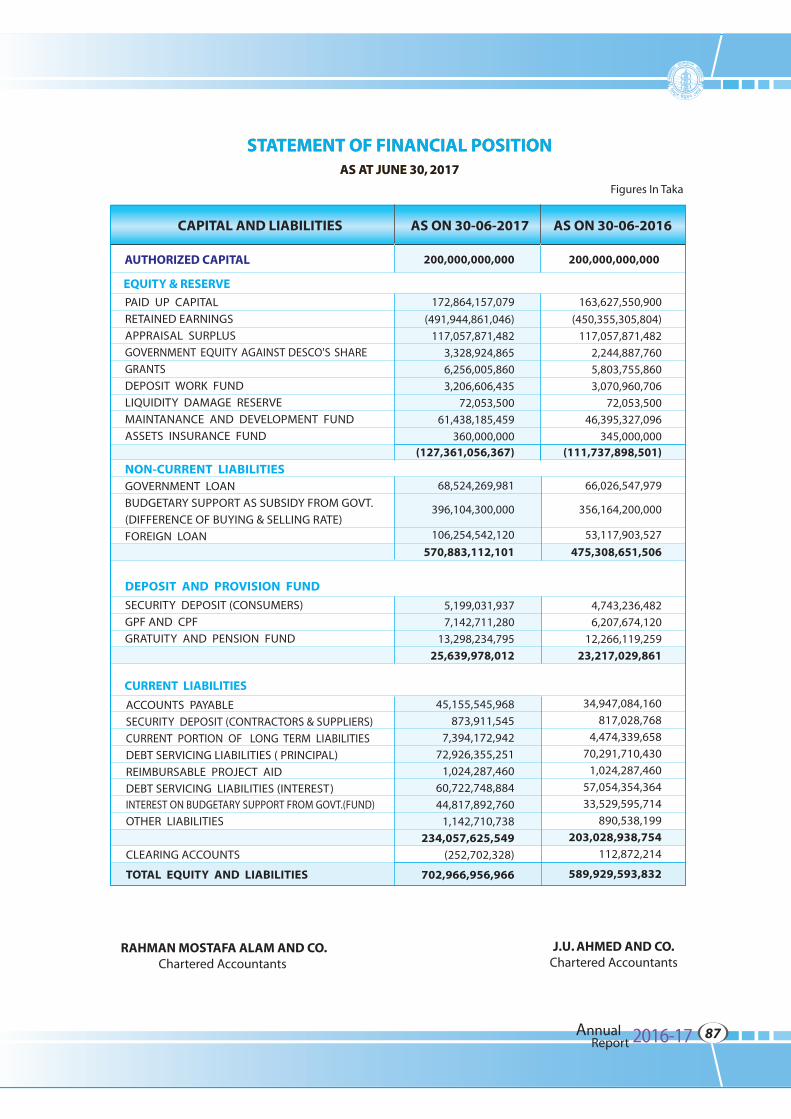
EQUITY & RESERVE
AS ON 30-06-2017CAPITAL AND LIABILITIES AS ON 30-06-2016
PAID UP CAPITAL
RETAINED EARNINGS
APPRAISAL SURPLUS
GOVERNMENT EQUITY AGAINST DESCO'S SHARE
GRANTS
DEPOSIT WORK FUND
LIQUIDITY DAMAGE RESERVE
MAINTANANCE AND DEVELOPMENT FUND
ASSETS INSURANCE FUND
NON-CURRENT LIABILITIESGOVERNMENT LOAN
BUDGETARY SUPPORT AS SUBSIDY FROM GOVT.
(DIFFERENCE OF BUYING & SELLING RATE)
FOREIGN LOAN
DEPOSIT AND PROVISION FUND
SECURITY DEPOSIT (CONSUMERS)
GPF AND CPF
GRATUITY AND PENSION FUND
ACCOUNTS PAYABLE
SECURITY DEPOSIT (CONTRACTORS & SUPPLIERS)
CURRENT PORTION OF LONG TERM LIABILITIES
DEBT SERVICING LIABILITIES ( PRINCIPAL)
REIMBURSABLE PROJECT AID
DEBT SERVICING LIABILITIES (INTEREST)INTEREST ON BUDGETARY SUPPORT FROM GOVT.(FUND)
OTHER LIABILITIES
CLEARING ACCOUNTS
TOTAL EQUITY AND LIABILITIES
45,155,545,968
873,911,545
7,394,172,942
72,926,355,251
1,024,287,460
60,722,748,884
44,817,892,760
1,142,710,738
234,057,625,549
(252,702,328)
702,966,956,966
34,947,084,160
817,028,768
4,474,339,658
70,291,710,430
1,024,287,460
57,054,354,364
33,529,595,714
890,538,199
203,028,938,754
112,872,214
589,929,593,832
CURRENT LIABILITIES
172,864,157,079
(491,944,861,046)
117,057,871,482
3,328,924,865
6,256,005,860
3,206,606,435
72,053,500
61,438,185,459
360,000,000(127,361,056,367)
68,524,269,981
396,104,300,000
106,254,542,120
570,883,112,101
5,199,031,937
7,142,711,280
13,298,234,795
25,639,978,012
163,627,550,900
(450,355,305,804)
117,057,871,482
2,244,887,760
5,803,755,860
3,070,960,706
72,053,500
46,395,327,096
345,000,000(111,737,898,501)
66,026,547,979
356,164,200,000
53,117,903,527
475,308,651,506
4,743,236,482
6,207,674,120
12,266,119,259
23,217,029,861
AUTHORIZED CAPITAL
STATEMENT OF FINANCIAL POSITIONAS AT JUNE 30, 2017
STATEMENT OF FINANCIAL POSITIONAS AT JUNE 30, 2017
J.U. AHMED AND CO.Chartered Accountants
RAHMAN MOSTAFA ALAM AND CO.Chartered Accountants
Figures In Taka
200,000,000,000 200,000,000,000
Annual 2016-17Report87
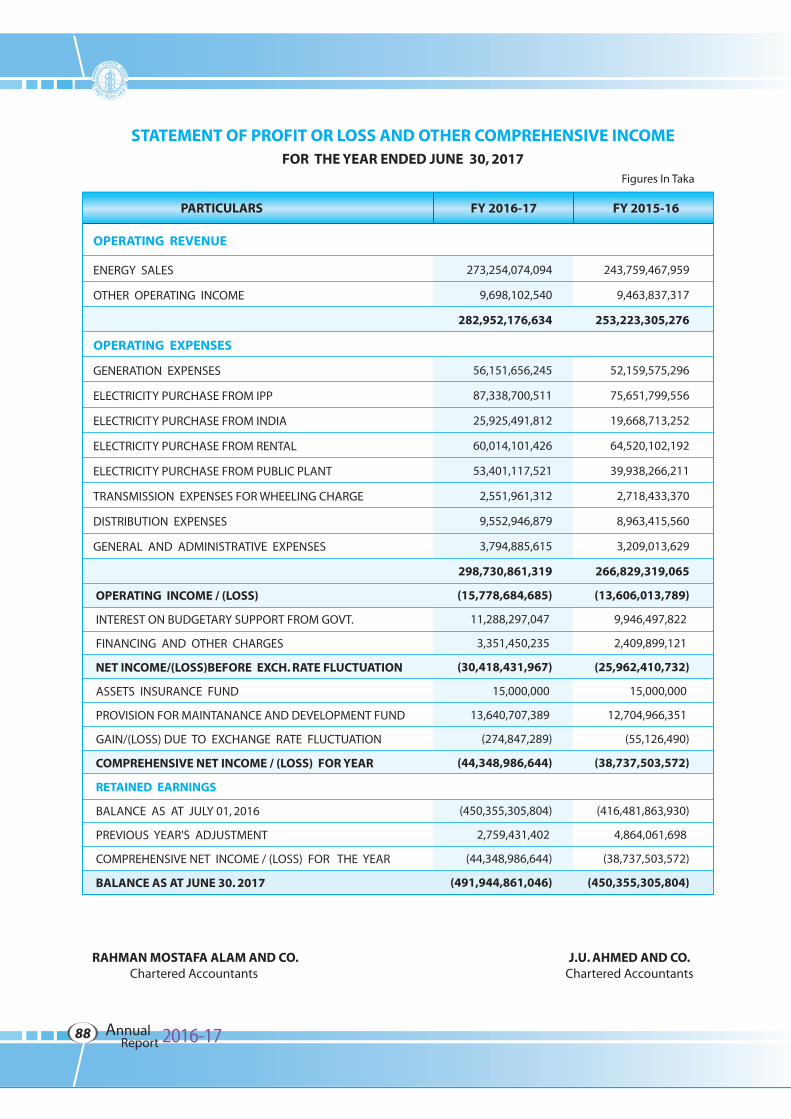
FY 2016-17PARTICULARS FY 2015-16
ENERGY SALES
OTHER OPERATING INCOME
OPERATING EXPENSES
GENERATION EXPENSES
ELECTRICITY PURCHASE FROM IPP
ELECTRICITY PURCHASE FROM INDIA
ELECTRICITY PURCHASE FROM RENTAL
ELECTRICITY PURCHASE FROM PUBLIC PLANT
TRANSMISSION EXPENSES FOR WHEELING CHARGE
DISTRIBUTION EXPENSES
GENERAL AND ADMINISTRATIVE EXPENSES
OPERATING INCOME / (LOSS)
INTEREST ON BUDGETARY SUPPORT FROM GOVT.
FINANCING AND OTHER CHARGES
NET INCOME/(LOSS)BEFORE EXCH. RATE FLUCTUATION
ASSETS INSURANCE FUND
PROVISION FOR MAINTANANCE AND DEVELOPMENT FUND
GAIN/(LOSS) DUE TO EXCHANGE RATE FLUCTUATION
COMPREHENSIVE NET INCOME / (LOSS) FOR YEAR
RETAINED EARNINGS
BALANCE AS AT JULY 01, 2016
PREVIOUS YEAR'S ADJUSTMENT
COMPREHENSIVE NET INCOME / (LOSS) FOR THE YEAR
BALANCE AS AT JUNE 30. 2017
273,254,074,094
9,698,102,540
282,952,176,634
56,151,656,245
87,338,700,511
25,925,491,812
60,014,101,426
53,401,117,521
2,551,961,312
9,552,946,879
3,794,885,615
298,730,861,319
(15,778,684,685)
11,288,297,047
3,351,450,235
(30,418,431,967)
15,000,000
13,640,707,389
(274,847,289)
(44,348,986,644)
(450,355,305,804)
2,759,431,402
(44,348,986,644)
(491,944,861,046)
243,759,467,959
9,463,837,317
253,223,305,276
52,159,575,296
75,651,799,556
19,668,713,252
64,520,102,192
39,938,266,211
2,718,433,370
8,963,415,560
3,209,013,629
266,829,319,065
(13,606,013,789)
9,946,497,822
2,409,899,121
(25,962,410,732)
15,000,000
12,704,966,351
(55,126,490)
(38,737,503,572)
(416,481,863,930)
4,864,061,698
(38,737,503,572)
(450,355,305,804)
RAHMAN MOSTAFA ALAM AND CO.Chartered Accountants
J.U. AHMED AND CO.Chartered Accountants
STATEMENT OF PROFIT OR LOSS AND OTHER COMPREHENSIVE INCOMEFOR THE YEAR ENDED JUNE 30, 2017
OPERATING REVENUE
Figures In Taka
Annual 2016-17Report88
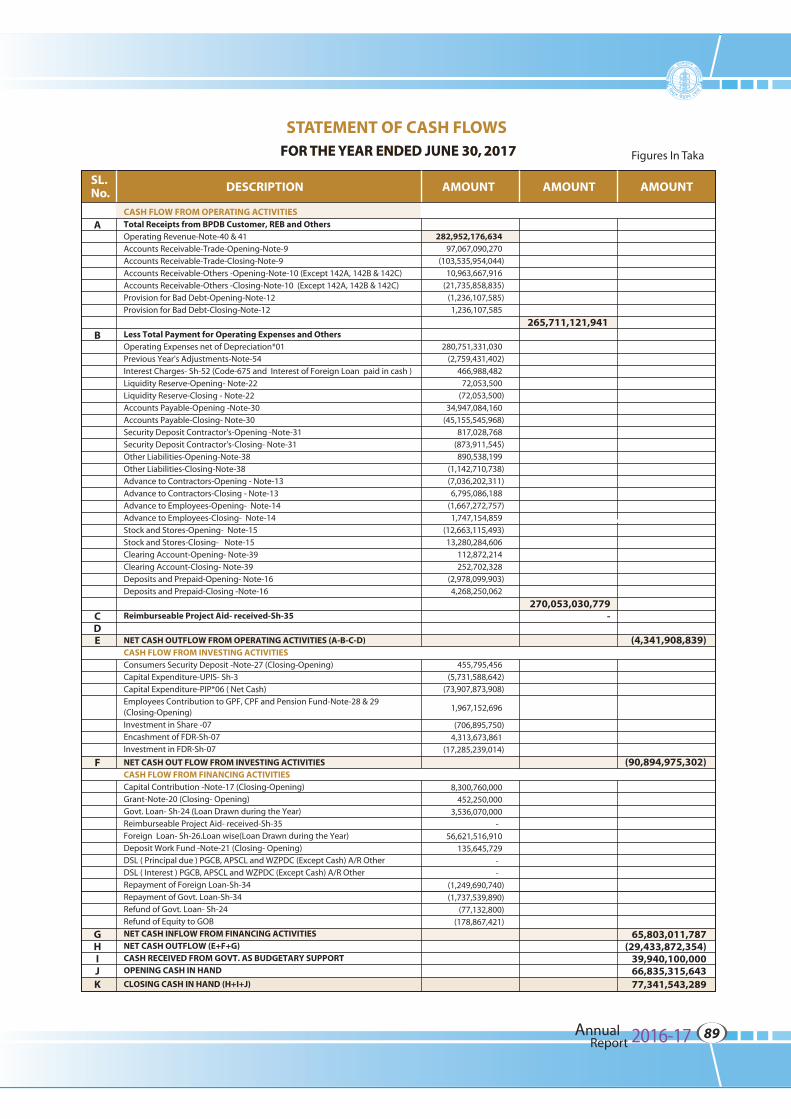
SL.No. DESCRIPTION AMOUNT AMOUNT AMOUNT
A
B
CDE
F
GHIJK
Total Receipts from BPDB Customer, REB and OthersOperating Revenue-Note-40 & 41
Accounts Receivable-Trade-Opening-Note-9
Accounts Receivable-Trade-Closing-Note-9
Accounts Receivable-Others -Opening-Note-10 (Except 142A, 142B & 142C)
Accounts Receivable-Others -Closing-Note-10 (Except 142A, 142B & 142C)
Provision for Bad Debt-Opening-Note-12
Provision for Bad Debt-Closing-Note-12
Less Total Payment for Operating Expenses and OthersOperating Expenses net of Depreciation*01
Previous Year's Adjustments-Note-54
Interest Charges- Sh-52 (Code-675 and Interest of Foreign Loan paid in cash )
Liquidity Reserve-Opening- Note-22
Liquidity Reserve-Closing - Note-22
Accounts Payable-Opening -Note-30
Accounts Payable-Closing- Note-30
Security Deposit Contractor's-Opening -Note-31
Security Deposit Contractor's-Closing- Note-31
Other Liabilities-Opening-Note-38
Other Liabilities-Closing-Note-38
Advance to Contractors-Opening - Note-13
Advance to Contractors-Closing - Note-13
Advance to Employees-Opening- Note-14
Advance to Employees-Closing- Note-14
Stock and Stores-Opening- Note-15
Stock and Stores-Closing- Note-15
Clearing Account-Opening- Note-39
Clearing Account-Closing- Note-39
Deposits and Prepaid-Opening- Note-16
Deposits and Prepaid-Closing -Note-16
Reimburseable Project Aid- received-Sh-35
NET CASH OUTFLOW FROM OPERATING ACTIVITIES (A-B-C-D)CASH FLOW FROM INVESTING ACTIVITIESConsumers Security Deposit -Note-27 (Closing-Opening)
Capital Expenditure-UPIS- Sh-3
Capital Expenditure-PIP*06 ( Net Cash)
Employees Contribution to GPF, CPF and Pension Fund-Note-28 & 29(Closing-Opening)
Investment in Share -07
Encashment of FDR-Sh-07
Investment in FDR-Sh-07
NET CASH OUT FLOW FROM INVESTING ACTIVITIESCASH FLOW FROM FINANCING ACTIVITIESCapital Contribution -Note-17 (Closing-Opening)
Grant-Note-20 (Closing- Opening)
Govt. Loan- Sh-24 (Loan Drawn during the Year)
Reimburseable Project Aid- received-Sh-35
Foreign Loan- Sh-26.Loan wise(Loan Drawn during the Year)
Deposit Work Fund -Note-21 (Closing- Opening)
DSL ( Principal due ) PGCB, APSCL and WZPDC (Except Cash) A/R Other
DSL ( Interest ) PGCB, APSCL and WZPDC (Except Cash) A/R Other
Repayment of Foreign Loan-Sh-34
Repayment of Govt. Loan-Sh-34
Refund of Govt. Loan- Sh-24
Refund of Equity to GOB
NET CASH INFLOW FROM FINANCING ACTIVITIESNET CASH OUTFLOW (E+F+G)CASH RECEIVED FROM GOVT. AS BUDGETARY SUPPORTOPENING CASH IN HAND
CLOSING CASH IN HAND (H+I+J)
282,952,176,634
97,067,090,270
(103,535,954,044)
10,963,667,916
(21,735,858,835)
(1,236,107,585)
1,236,107,585
280,751,331,030
(2,759,431,402)
466,988,482
72,053,500
(72,053,500)
34,947,084,160
(45,155,545,968)
817,028,768
(873,911,545)
890,538,199
(1,142,710,738)
(7,036,202,311)
6,795,086,188
(1,667,272,757)
1,747,154,859
(12,663,115,493)
13,280,284,606
112,872,214
252,702,328
(2,978,099,903)
4,268,250,062
455,795,456
(5,731,588,642)
(73,907,873,908)
1,967,152,696
(706,895,750)
4,313,673,861
(17,285,239,014)
8,300,760,000
452,250,000
3,536,070,000
-
56,621,516,910
135,645,729
-
-
(1,249,690,740)
(1,737,539,890)
(77,132,800)
(178,867,421)
265,711,121,941
270,053,030,779-
(4,341,908,839)
(90,894,975,302)
65,803,011,787(29,433,872,354)
39,940,100,00066,835,315,64377,341,543,289
STATEMENT OF CASH FLOWS FOR THE YEAR ENDED JUNE 30, 2017
STATEMENT OF CASH FLOWS FOR THE YEAR ENDED JUNE 30, 2017
CASH FLOW FROM OPERATING ACTIVITIES
Figures In Taka
Annual 2016-17Report89
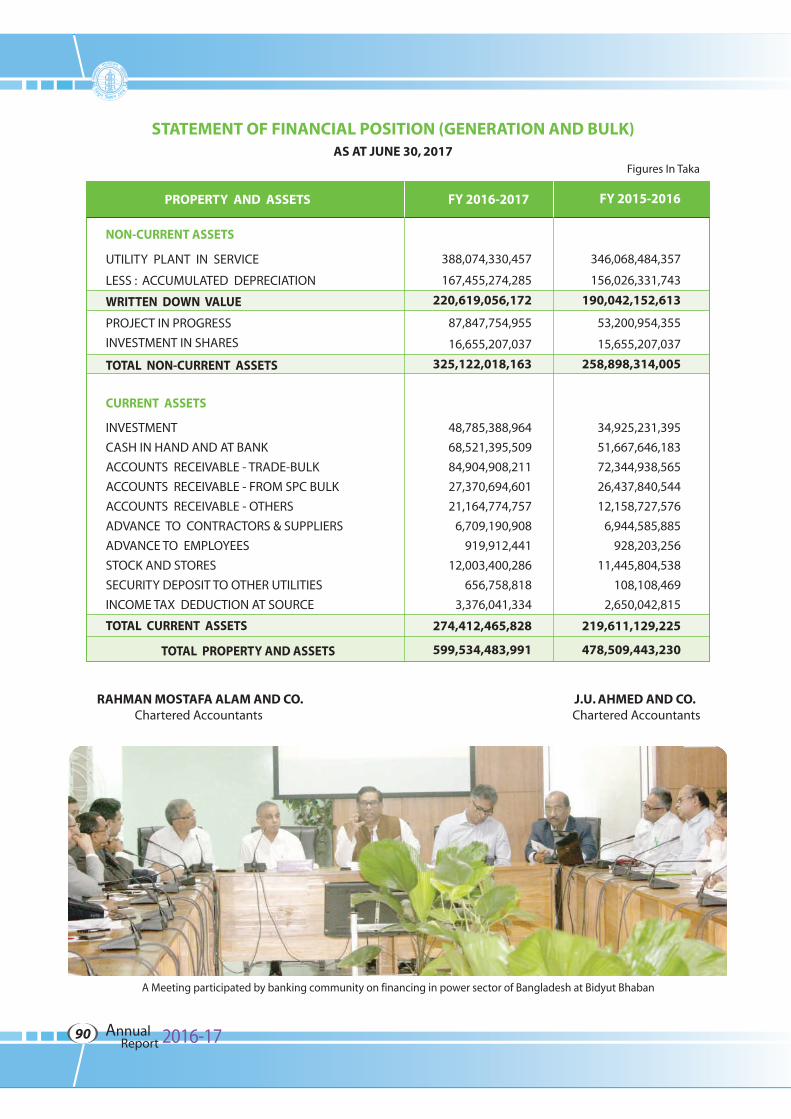
FY 2015-2016FY 2016-2017
.
UTILITY PLANT IN SERVICE
LESS : ACCUMULATED DEPRECIATION
WRITTEN DOWN VALUE
PROJECT IN PROGRESS
INVESTMENT IN SHARES
TOTAL NON-CURRENT ASSETS
CURRENT ASSETS
INVESTMENT
CASH IN HAND AND AT BANK
ACCOUNTS RECEIVABLE - TRADE-BULK
ACCOUNTS RECEIVABLE - FROM SPC BULK
ACCOUNTS RECEIVABLE - OTHERS
ADVANCE TO CONTRACTORS & SUPPLIERS
ADVANCE TO EMPLOYEES
STOCK AND STORES
SECURITY DEPOSIT TO OTHER UTILITIES
INCOME TAX DEDUCTION AT SOURCE
TOTAL CURRENT ASSETS
TOTAL PROPERTY AND ASSETS
346,068,484,357
156,026,331,743
190,042,152,613
53,200,954,355
15,655,207,037
258,898,314,005
34,925,231,395
51,667,646,183
72,344,938,565
26,437,840,544
12,158,727,576
6,944,585,885
928,203,256
11,445,804,538
108,108,469
2,650,042,815
219,611,129,225
478,509,443,230
388,074,330,457
167,455,274,285
220,619,056,172
87,847,754,955
16,655,207,037
325,122,018,163
48,785,388,964
68,521,395,509
84,904,908,211
27,370,694,601
21,164,774,757
6,709,190,908
919,912,441
12,003,400,286
656,758,818
3,376,041,334
274,412,465,828
599,534,483,991
PROPERTY AND ASSETS
RAHMAN MOSTAFA ALAM AND CO.Chartered Accountants
J.U. AHMED AND CO. Chartered Accountants
STATEMENT OF FINANCIAL POSITION (GENERATION AND BULK)AS AT JUNE 30, 2017
CURRENT ASSETS
NON-CURRENT ASSETS
Figures In Taka
Annual 2016-17Report90
A Meeting participated by banking community on financing in power sector of Bangladesh at Bidyut Bhaban
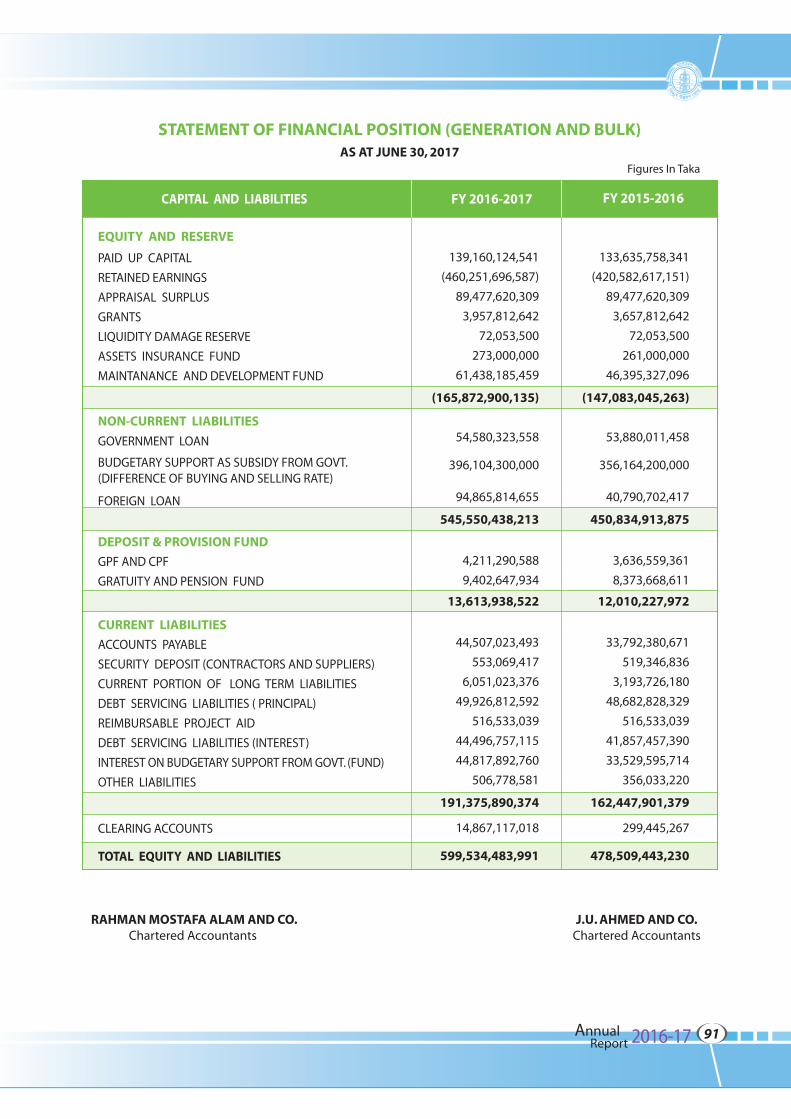
FY 2015-2016FY 2016-2017
.
PAID UP CAPITAL
RETAINED EARNINGS
APPRAISAL SURPLUS
GRANTS
LIQUIDITY DAMAGE RESERVE
ASSETS INSURANCE FUND
MAINTANANCE AND DEVELOPMENT FUND
NON-CURRENT LIABILITIES
GOVERNMENT LOAN
BUDGETARY SUPPORT AS SUBSIDY FROM GOVT.(DIFFERENCE OF BUYING AND SELLING RATE)
FOREIGN LOAN
DEPOSIT & PROVISION FUND
GPF AND CPF
GRATUITY AND PENSION FUND
CURRENT LIABILITIES
ACCOUNTS PAYABLE
SECURITY DEPOSIT (CONTRACTORS AND SUPPLIERS)
CURRENT PORTION OF LONG TERM LIABILITIES
DEBT SERVICING LIABILITIES ( PRINCIPAL)
REIMBURSABLE PROJECT AID
DEBT SERVICING LIABILITIES (INTEREST)
INTEREST ON BUDGETARY SUPPORT FROM GOVT. (FUND)
OTHER LIABILITIES
CLEARING ACCOUNTS
TOTAL EQUITY AND LIABILITIES
139,160,124,541
(460,251,696,587)
89,477,620,309
3,957,812,642
72,053,500
273,000,000
61,438,185,459
(165,872,900,135)
54,580,323,558
396,104,300,000
94,865,814,655
545,550,438,213
4,211,290,588
9,402,647,934
13,613,938,522
44,507,023,493
553,069,417
6,051,023,376
49,926,812,592
516,533,039
44,496,757,115
44,817,892,760
506,778,581
191,375,890,374
14,867,117,018
599,534,483,991
133,635,758,341
(420,582,617,151)
89,477,620,309
3,657,812,642
72,053,500
261,000,000
46,395,327,096
(147,083,045,263)
53,880,011,458
356,164,200,000
40,790,702,417
450,834,913,875
3,636,559,361
8,373,668,611
12,010,227,972
33,792,380,671
519,346,836
3,193,726,180
48,682,828,329
516,533,039
41,857,457,390
33,529,595,714
356,033,220
162,447,901,379
299,445,267
478,509,443,230
CAPITAL AND LIABILITIES
RAHMAN MOSTAFA ALAM AND CO.Chartered Accountants
J.U. AHMED AND CO.Chartered Accountants
STATEMENT OF FINANCIAL POSITION (GENERATION AND BULK)AS AT JUNE 30, 2017
EQUITY AND RESERVE
Figures In Taka
Annual 2016-17Report91
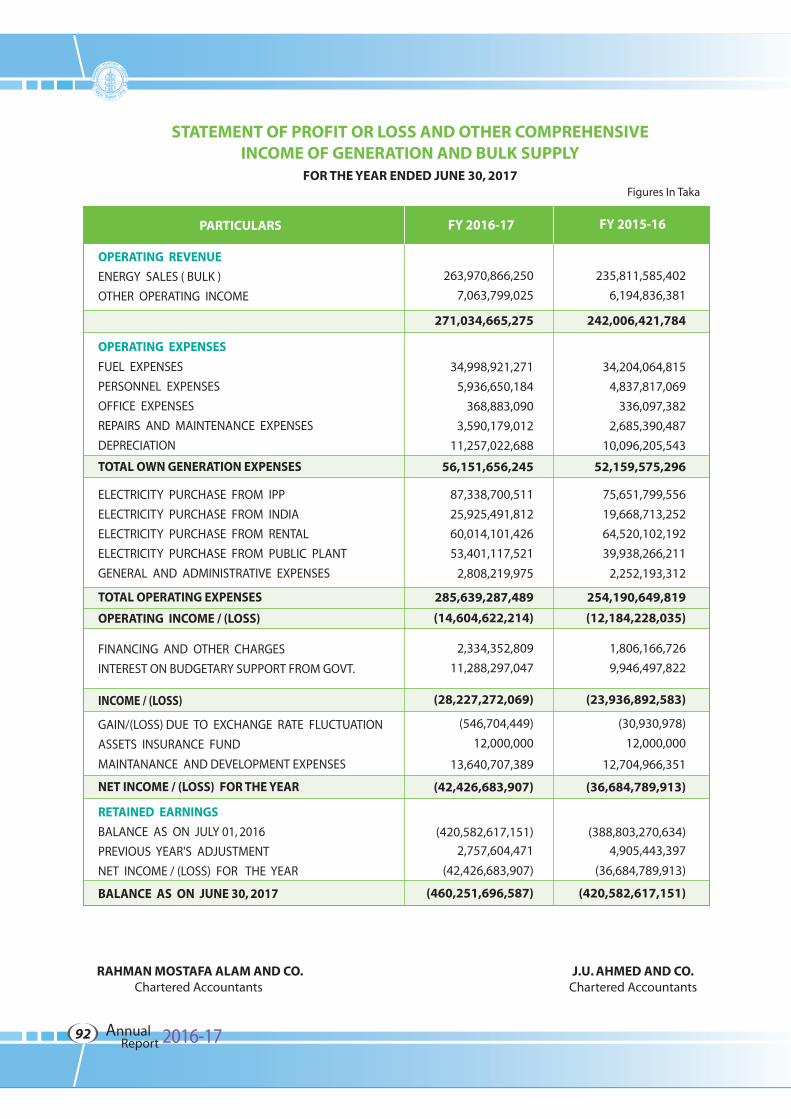
FY 2015-16FY 2016-17
OPERATING REVENUE
ENERGY SALES ( BULK )
OTHER OPERATING INCOME
OPERATING EXPENSES
FUEL EXPENSES
PERSONNEL EXPENSES
OFFICE EXPENSES
REPAIRS AND MAINTENANCE EXPENSES
DEPRECIATION
TOTAL OWN GENERATION EXPENSES
ELECTRICITY PURCHASE FROM IPP
ELECTRICITY PURCHASE FROM INDIA
ELECTRICITY PURCHASE FROM RENTAL
ELECTRICITY PURCHASE FROM PUBLIC PLANT
GENERAL AND ADMINISTRATIVE EXPENSES
TOTAL OPERATING EXPENSES
OPERATING INCOME / (LOSS)
FINANCING AND OTHER CHARGES
INTEREST ON BUDGETARY SUPPORT FROM GOVT.
INCOME / (LOSS)
GAIN/(LOSS) DUE TO EXCHANGE RATE FLUCTUATION
ASSETS INSURANCE FUND
MAINTANANCE AND DEVELOPMENT EXPENSES
NET INCOME / (LOSS) FOR THE YEAR
RETAINED EARNINGS
BALANCE AS ON JULY 01, 2016
PREVIOUS YEAR'S ADJUSTMENT
NET INCOME / (LOSS) FOR THE YEAR
BALANCE AS ON JUNE 30, 2017
263,970,866,250
7,063,799,025
271,034,665,275
34,998,921,271
5,936,650,184
368,883,090
3,590,179,012
11,257,022,688
56,151,656,245
87,338,700,511
25,925,491,812
60,014,101,426
53,401,117,521
2,808,219,975
285,639,287,489
(14,604,622,214)
2,334,352,809
11,288,297,047
(28,227,272,069)
(546,704,449)
12,000,000
13,640,707,389
(42,426,683,907)
(420,582,617,151)
2,757,604,471
(42,426,683,907)
(460,251,696,587)
235,811,585,402
6,194,836,381
242,006,421,784
34,204,064,815
4,837,817,069
336,097,382
2,685,390,487
10,096,205,543
52,159,575,296
75,651,799,556
19,668,713,252
64,520,102,192
39,938,266,211
2,252,193,312
254,190,649,819
(12,184,228,035)
1,806,166,726
9,946,497,822
(23,936,892,583)
(30,930,978)
12,000,000
12,704,966,351
(36,684,789,913)
(388,803,270,634)
4,905,443,397
(36,684,789,913)
(420,582,617,151)
RAHMAN MOSTAFA ALAM AND CO.Chartered Accountants
J.U. AHMED AND CO.Chartered Accountants
STATEMENT OF PROFIT OR LOSS AND OTHER COMPREHENSIVEINCOME OF GENERATION AND BULK SUPPLY
FOR THE YEAR ENDED JUNE 30, 2017Figures In Taka
PARTICULARS
Annual 2016-17Report92

FY 2015-2016FY 2016-2017
NON-CURRENT ASSETS
UTILITY PLANT IN SERVICE
LESS : ACCUMULATED DEPRECIATION
WRITTEN DOWN VALUE
PROJECT IN PROGRESS
INVESTMENT IN SHARES
TOTAL NON-CURRENT ASSETS
CURRENT ASSETS
INVESTMENT
CASH IN HAND AND AT BANK
ACCOUNTS RECEIVABLE - TRADE
ACCOUNTS RECEIVABLE - OTHERS
PROVISION FOR BAD AND DOUBTFUL DEBTS
ADVANCE TO CONTRACTORS AND SUPPLIERS
ADVANCE TO EMPLOYEES
STOCK AND STORES
SECURITY DEPOSIT TO OTHER UTILITIES
INCOME TAX DEDUCTION AT SOURCE
TOTAL CURRENT ASSETS
TOTAL PROPERTY AND ASSETS
125,060,857,052
56,373,208,280
68,687,648,771
14,477,731,446
4,913,802,191
88,079,182,408
10,887,514,546
8,820,147,779
18,631,045,833
3,195,912,675
(1,236,107,585)
85,895,281
827,242,419
1,276,884,320
9,438,625
226,011,286
42,723,985,177
130,803,167,585
122,027,708,649
52,724,181,846
69,303,526,803
7,603,830,735
5,206,906,441
82,114,263,979
11,776,106,962
15,167,669,459
24,722,151,705
3,045,961,134
(1,236,107,585)
91,616,426
739,069,502
1,217,310,955
11,045,991
208,902,628
55,743,727,177
137,857,991,156
RAHMAN MOSTAFA ALAM AND CO.Chartered Accountants
J.U. AHMED AND CO. Chartered Accountants
PROPERTY AND ASSETS
STATEMENT OF FINANCIAL POSITION (DISTRIBUTION SECTOR)
AS AT JUNE 30, 2017Figures In Taka
Annual 2016-17Report93
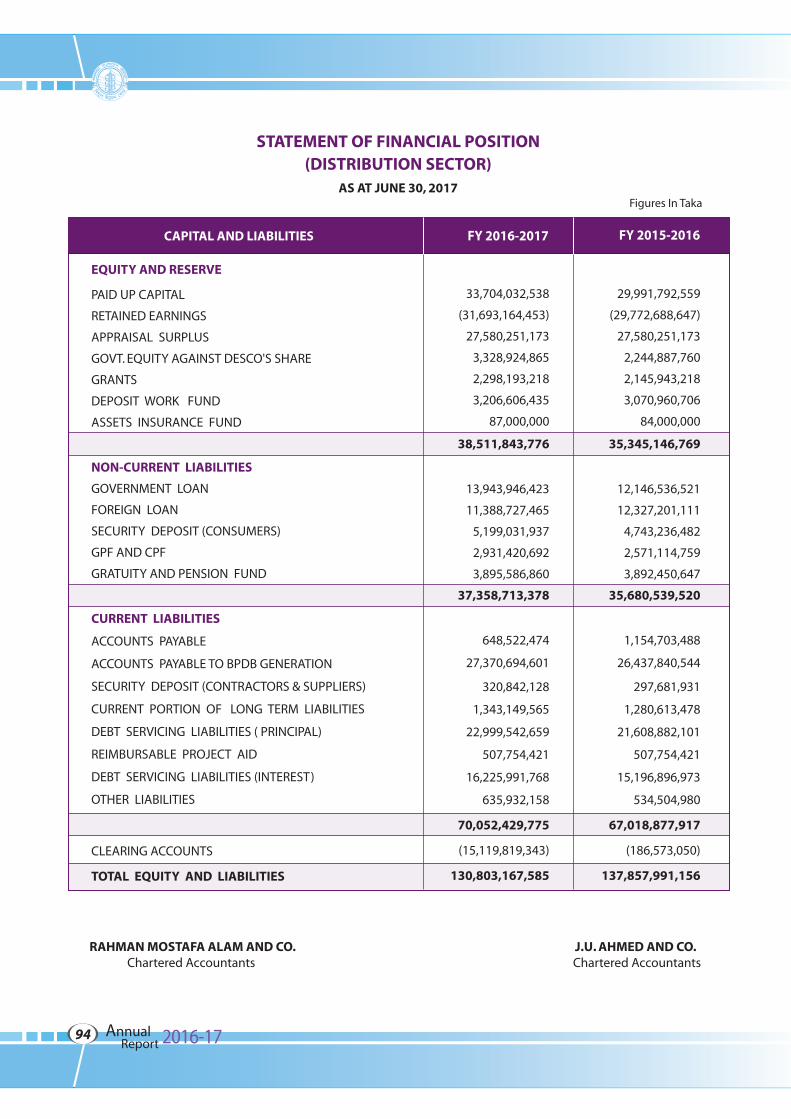
FY 2015-2016FY 2016-2017CAPITAL AND LIABILITIES
.
PAID UP CAPITAL
RETAINED EARNINGS
APPRAISAL SURPLUS
GOVT. EQUITY AGAINST DESCO'S SHARE
GRANTS
DEPOSIT WORK FUND
ASSETS INSURANCE FUND
NON-CURRENT LIABILITIES
GOVERNMENT LOAN
FOREIGN LOAN
SECURITY DEPOSIT (CONSUMERS)
GPF AND CPF
GRATUITY AND PENSION FUND
CURRENT LIABILITIES
ACCOUNTS PAYABLE
ACCOUNTS PAYABLE TO BPDB GENERATION
SECURITY DEPOSIT (CONTRACTORS & SUPPLIERS)
CURRENT PORTION OF LONG TERM LIABILITIES
DEBT SERVICING LIABILITIES ( PRINCIPAL)
REIMBURSABLE PROJECT AID
DEBT SERVICING LIABILITIES (INTEREST)
OTHER LIABILITIES
CLEARING ACCOUNTS
TOTAL EQUITY AND LIABILITIES
33,704,032,538
(31,693,164,453)
27,580,251,173
3,328,924,865
2,298,193,218
3,206,606,435
87,000,000
38,511,843,776
13,943,946,423
11,388,727,465
5,199,031,937
2,931,420,692
3,895,586,860
37,358,713,378
648,522,474
27,370,694,601
320,842,128
1,343,149,565
22,999,542,659
507,754,421
16,225,991,768
635,932,158
70,052,429,775
(15,119,819,343)
130,803,167,585
29,991,792,559
(29,772,688,647)
27,580,251,173
2,244,887,760
2,145,943,218
3,070,960,706
84,000,000
35,345,146,769
12,146,536,521
12,327,201,111
4,743,236,482
2,571,114,759
3,892,450,647
35,680,539,520
1,154,703,488
26,437,840,544
297,681,931
1,280,613,478
21,608,882,101
507,754,421
15,196,896,973
534,504,980
67,018,877,917
(186,573,050)
137,857,991,156
RAHMAN MOSTAFA ALAM AND CO.Chartered Accountants
J.U. AHMED AND CO. Chartered Accountants
STATEMENT OF FINANCIAL POSITION(DISTRIBUTION SECTOR)
AS AT JUNE 30, 2017
EQUITY AND RESERVE
Figures In Taka
Annual 2016-17Report94
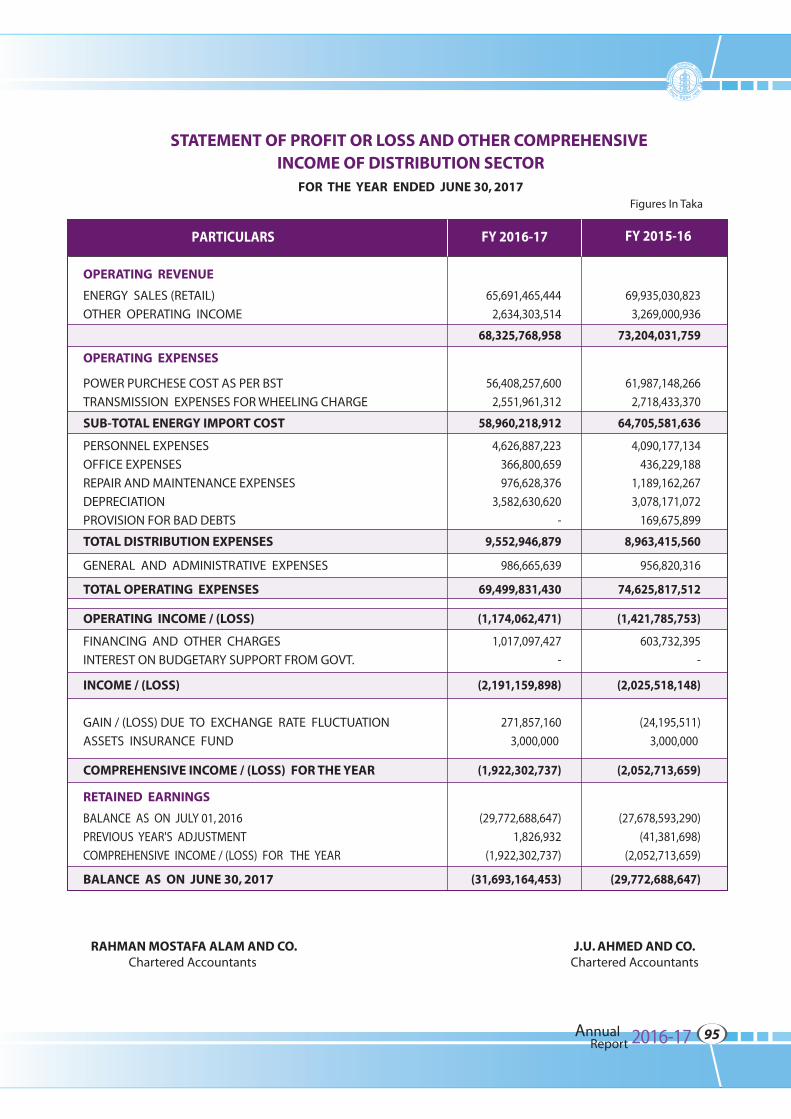
FY 2015-16FY 2016-17
.
ENERGY SALES (RETAIL)
OTHER OPERATING INCOME
OPERATING EXPENSES
POWER PURCHESE COST AS PER BST
TRANSMISSION EXPENSES FOR WHEELING CHARGE
SUB-TOTAL ENERGY IMPORT COST
PERSONNEL EXPENSES
OFFICE EXPENSES
REPAIR AND MAINTENANCE EXPENSES
DEPRECIATION
PROVISION FOR BAD DEBTS
TOTAL DISTRIBUTION EXPENSES
GENERAL AND ADMINISTRATIVE EXPENSES
TOTAL OPERATING EXPENSES
OPERATING INCOME / (LOSS)
FINANCING AND OTHER CHARGES
INTEREST ON BUDGETARY SUPPORT FROM GOVT.
INCOME / (LOSS)
GAIN / (LOSS) DUE TO EXCHANGE RATE FLUCTUATION
ASSETS INSURANCE FUND
COMPREHENSIVE INCOME / (LOSS) FOR THE YEAR
RETAINED EARNINGS
BALANCE AS ON JULY 01, 2016
PREVIOUS YEAR'S ADJUSTMENT
COMPREHENSIVE INCOME / (LOSS) FOR THE YEAR
BALANCE AS ON JUNE 30, 2017
65,691,465,444
2,634,303,514
68,325,768,958
56,408,257,600
2,551,961,312
58,960,218,912
4,626,887,223
366,800,659
976,628,376
3,582,630,620
-
9,552,946,879
986,665,639
69,499,831,430
(1,174,062,471)
1,017,097,427
-
(2,191,159,898)
271,857,160
3,000,000
(1,922,302,737)
(29,772,688,647)
1,826,932
(1,922,302,737)
(31,693,164,453)
69,935,030,823
3,269,000,936
73,204,031,759
61,987,148,266
2,718,433,370
64,705,581,636
4,090,177,134
436,229,188
1,189,162,267
3,078,171,072
169,675,899
8,963,415,560
956,820,316
74,625,817,512
(1,421,785,753)
603,732,395
-
(2,025,518,148)
(24,195,511)
3,000,000
(2,052,713,659)
(27,678,593,290)
(41,381,698)
(2,052,713,659)
(29,772,688,647)
RAHMAN MOSTAFA ALAM AND CO.Chartered Accountants
J.U. AHMED AND CO.Chartered Accountants
STATEMENT OF PROFIT OR LOSS AND OTHER COMPREHENSIVE INCOME OF DISTRIBUTION SECTOR
FOR THE YEAR ENDED JUNE 30, 2017
OPERATING REVENUE
Figures In Taka
Annual 2016-17Report95
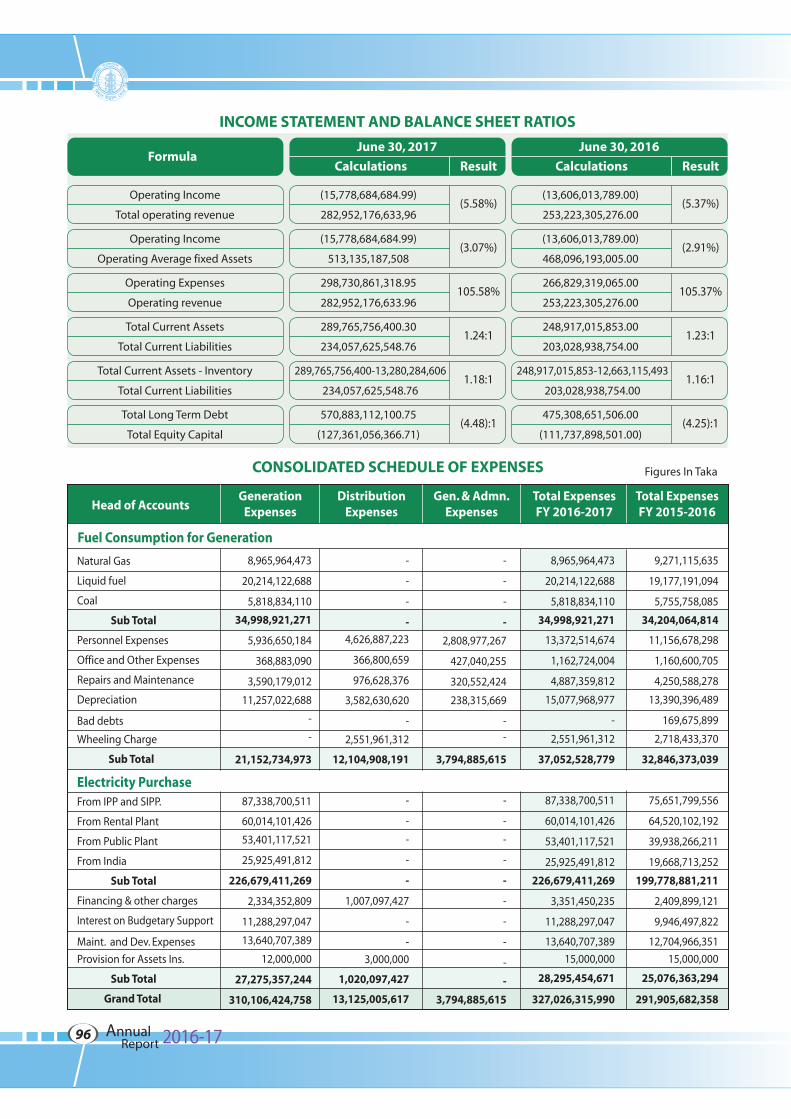
Head of AccountsGeneration
ExpensesDistribution
ExpensesGen. & Admn.
ExpensesTotal ExpensesFY 2016-2017
Total ExpensesFY 2015-2016
Fuel Consumption for Generation
Natural Gas
Liquid fuel
Coal
Sub Total
Personnel Expenses
Office and Other Expenses
Repairs and Maintenance
Depreciation
Bad debts
Wheeling Charge
Sub Total
Electricity PurchaseFrom IPP and SIPP.
From Rental Plant
From Public Plant
From India
Sub Total
Financing & other charges
Interest on Budgetary Support
Maint. and Dev. Expenses
Provision for Assets Ins.
Sub Total
Grand Total
8,965,964,473
20,214,122,688
5,818,834,110
34,998,921,271
5,936,650,184
368,883,090
3,590,179,012
11,257,022,688
-
-
21,152,734,973
87,338,700,511
60,014,101,426
53,401,117,521
25,925,491,812
226,679,411,269
2,334,352,809
11,288,297,047
13,640,707,389
12,000,000
27,275,357,244
310,106,424,758
-
-
-
-
4,626,887,223
366,800,659
976,628,376
3,582,630,620
-
2,551,961,312
12,104,908,191
-
-
-
-
-
1,007,097,427
-
-
3,000,000
1,020,097,427
13,125,005,617
-
-
-
-
2,808,977,267
427,040,255
320,552,424
238,315,669
--
3,794,885,615
-
-
-
-
-
-
-
-
-
-
3,794,885,615
8,965,964,473
20,214,122,688
5,818,834,110
34,998,921,271
13,372,514,674
1,162,724,004
4,887,359,812
15,077,968,977
-
2,551,961,312
37,052,528,779
87,338,700,511
60,014,101,426
53,401,117,521
25,925,491,812
226,679,411,269
3,351,450,235
11,288,297,047
13,640,707,389
15,000,000
28,295,454,671
327,026,315,990
9,271,115,635
19,177,191,094
5,755,758,085
34,204,064,814
11,156,678,298
1,160,600,705
4,250,588,278
13,390,396,489
169,675,899
2,718,433,370
32,846,373,039
75,651,799,556
64,520,102,192
39,938,266,211
19,668,713,252
199,778,881,211
2,409,899,121
9,946,497,822
12,704,966,351
15,000,000
25,076,363,294
291,905,682,358
Figures In Taka
INCOME STATEMENT AND BALANCE SHEET RATIOS
June 30, 2017
Calculations Result
(15,778,684,684.99)
282,952,176,633,96(5.58%)
(15,778,684,684.99)
513,135,187,508(3.07%)
298,730,861,318.95
282,952,176,633.96105.58%
289,765,756,400.30
234,057,625,548.761.24:1
289,765,756,400-13,280,284,606
234,057,625,548.761.18:1
570,883,112,100.75
(127,361,056,366.71)(4.48):1
June 30, 2016
Calculations Result
(13,606,013,789.00)
253,223,305,276.00(5.37%)
(13,606,013,789.00)
468,096,193,005.00(2.91%)
266,829,319,065.00
253,223,305,276.00105.37%
248,917,015,853.00
203,028,938,754.001.23:1
248,917,015,853-12,663,115,493
203,028,938,754.001.16:1
475,308,651,506.00
(111,737,898,501.00)(4.25):1
Operating Income
Total operating revenue
Operating Income
Operating Average fixed Assets
Operating Expenses
Operating revenue
Total Current Assets
Total Current Liabilities
Total Current Assets - Inventory
Total Current Liabilities
Total Long Term Debt
Total Equity Capital
CONSOLIDATED SCHEDULE OF EXPENSES
Formula
Annual 2016-17Report96
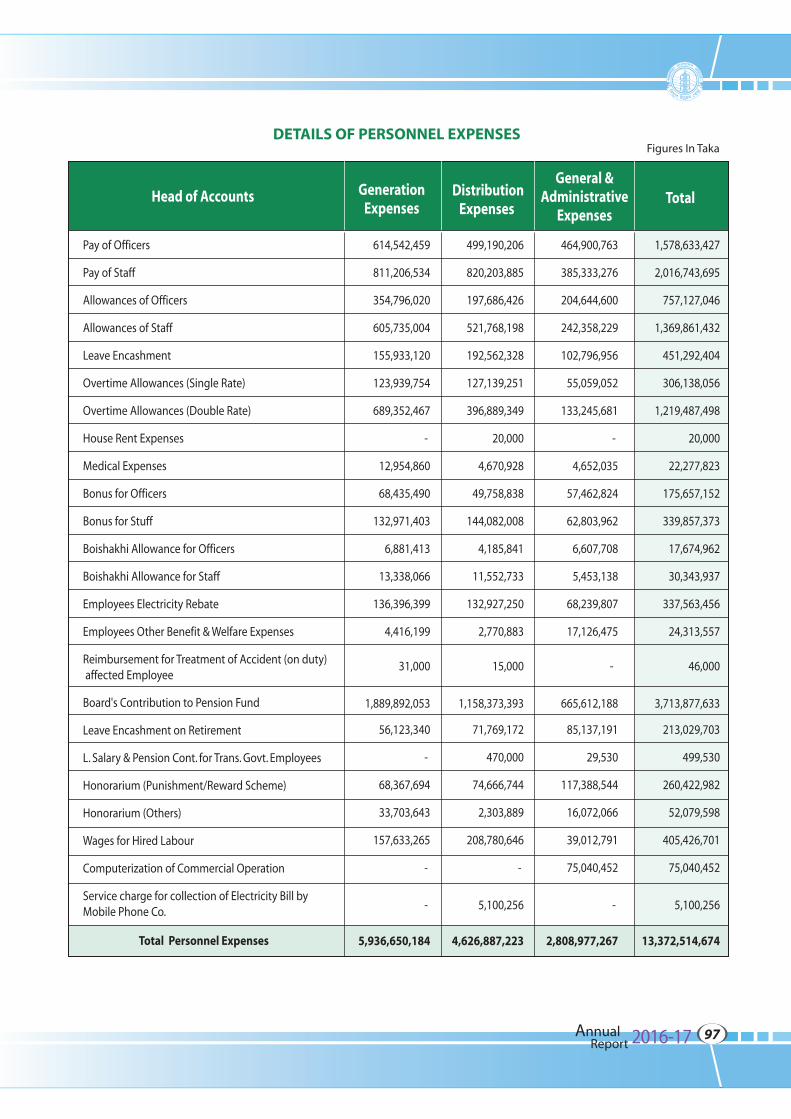
DETAILS OF PERSONNEL EXPENSES
Head of Accounts GenerationExpenses
DistributionExpenses
TotalGeneral &
AdministrativeExpenses
Pay of Officers
Pay of Staff
Allowances of Officers
Allowances of Staff
Leave Encashment
Overtime Allowances (Single Rate)
Overtime Allowances (Double Rate)
House Rent Expenses
Medical Expenses
Bonus for Officers
Bonus for Stuff
Boishakhi Allowance for Officers
Boishakhi Allowance for Staff
Employees Electricity Rebate
Employees Other Benefit & Welfare Expenses
Reimbursement for Treatment of Accident (on duty) affected Employee
Board's Contribution to Pension Fund
Leave Encashment on Retirement
L. Salary & Pension Cont. for Trans. Govt. Employees
Honorarium (Punishment/Reward Scheme)
Honorarium (Others)
Wages for Hired Labour
Computerization of Commercial Operation
Service charge for collection of Electricity Bill by Mobile Phone Co.
Total Personnel Expenses
614,542,459
811,206,534
354,796,020
605,735,004
155,933,120
123,939,754
689,352,467
-
12,954,860
68,435,490
132,971,403
6,881,413
13,338,066
136,396,399
4,416,199
31,000
1,889,892,053
56,123,340
-
68,367,694
33,703,643
157,633,265
-
-
5,936,650,184
499,190,206
820,203,885
197,686,426
521,768,198
192,562,328
127,139,251
396,889,349
20,000
4,670,928
49,758,838
144,082,008
4,185,841
11,552,733
132,927,250
2,770,883
15,000
1,158,373,393
71,769,172
470,000
74,666,744
2,303,889
208,780,646
-
5,100,256
4,626,887,223
464,900,763
385,333,276
204,644,600
242,358,229
102,796,956
55,059,052
133,245,681
-
4,652,035
57,462,824
62,803,962
6,607,708
5,453,138
68,239,807
17,126,475
-
665,612,188
85,137,191
29,530
117,388,544
16,072,066
39,012,791
75,040,452
-
2,808,977,267
1,578,633,427
2,016,743,695
757,127,046
1,369,861,432
451,292,404
306,138,056
1,219,487,498
20,000
22,277,823
175,657,152
339,857,373
17,674,962
30,343,937
337,563,456
24,313,557
46,000
3,713,877,633
213,029,703
499,530
260,422,982
52,079,598
405,426,701
75,040,452
5,100,256
13,372,514,674
Figures In Taka
Annual 2016-17Report97
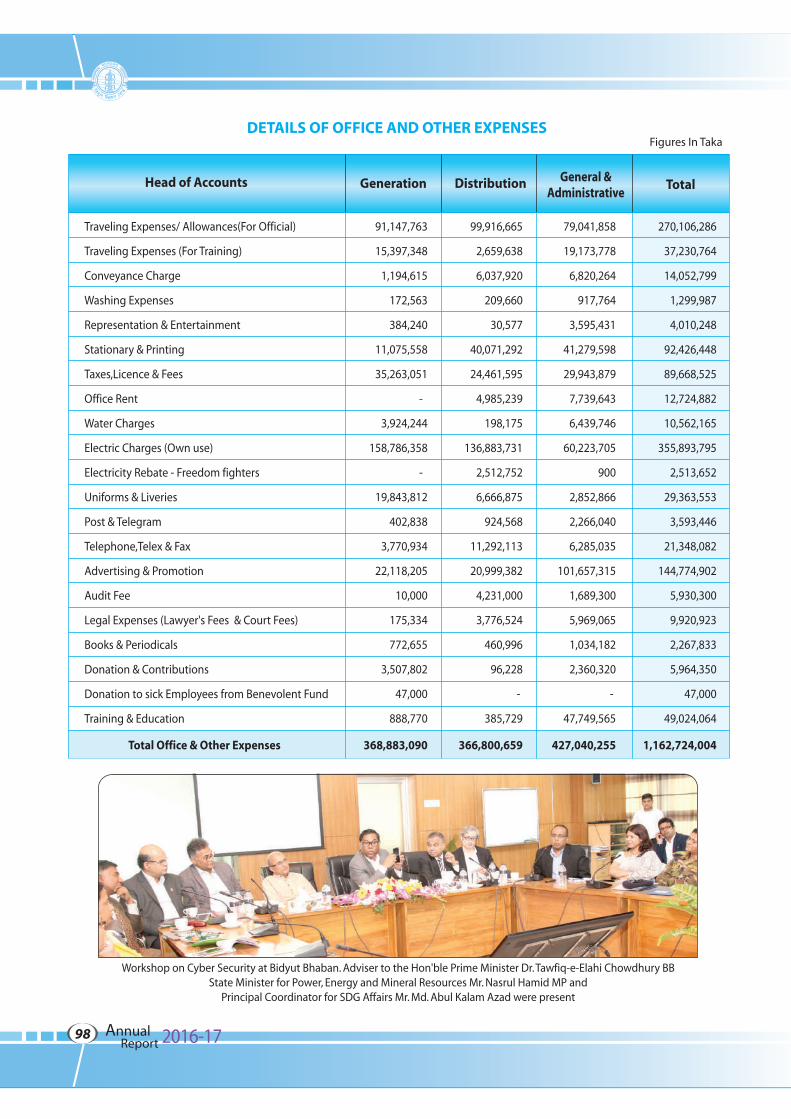
DETAILS OF OFFICE AND OTHER EXPENSESFigures In Taka
Head of Accounts Generation Distribution TotalGeneral &
Administrative
Traveling Expenses/ Allowances(For Official)
Traveling Expenses (For Training)
Conveyance Charge
Washing Expenses
Representation & Entertainment
Stationary & Printing
Taxes,Licence & Fees
Office Rent
Water Charges
Electric Charges (Own use)
Electricity Rebate - Freedom fighters
Uniforms & Liveries
Post & Telegram
Telephone,Telex & Fax
Advertising & Promotion
Audit Fee
Legal Expenses (Lawyer's Fees & Court Fees)
Books & Periodicals
Donation & Contributions
Donation to sick Employees from Benevolent Fund
Training & Education
Total Office & Other Expenses
91,147,763
15,397,348
1,194,615
172,563
384,240
11,075,558
35,263,051
-
3,924,244
158,786,358
-
19,843,812
402,838
3,770,934
22,118,205
10,000
175,334
772,655
3,507,802
47,000
888,770
368,883,090
99,916,665
2,659,638
6,037,920
209,660
30,577
40,071,292
24,461,595
4,985,239
198,175
136,883,731
2,512,752
6,666,875
924,568
11,292,113
20,999,382
4,231,000
3,776,524
460,996
96,228
-
385,729
366,800,659
79,041,858
19,173,778
6,820,264
917,764
3,595,431
41,279,598
29,943,879
7,739,643
6,439,746
60,223,705
900
2,852,866
2,266,040
6,285,035
101,657,315
1,689,300
5,969,065
1,034,182
2,360,320
-
47,749,565
427,040,255
270,106,286
37,230,764
14,052,799
1,299,987
4,010,248
92,426,448
89,668,525
12,724,882
10,562,165
355,893,795
2,513,652
29,363,553
3,593,446
21,348,082
144,774,902
5,930,300
9,920,923
2,267,833
5,964,350
47,000
49,024,064
1,162,724,004
Annual 2016-17Report98
Workshop on Cyber Security at Bidyut Bhaban. Adviser to the Hon'ble Prime Minister Dr. Tawfiq-e-Elahi Chowdhury BBState Minister for Power, Energy and Mineral Resources Mr. Nasrul Hamid MP and
Principal Coordinator for SDG Affairs Mr. Md. Abul Kalam Azad were present
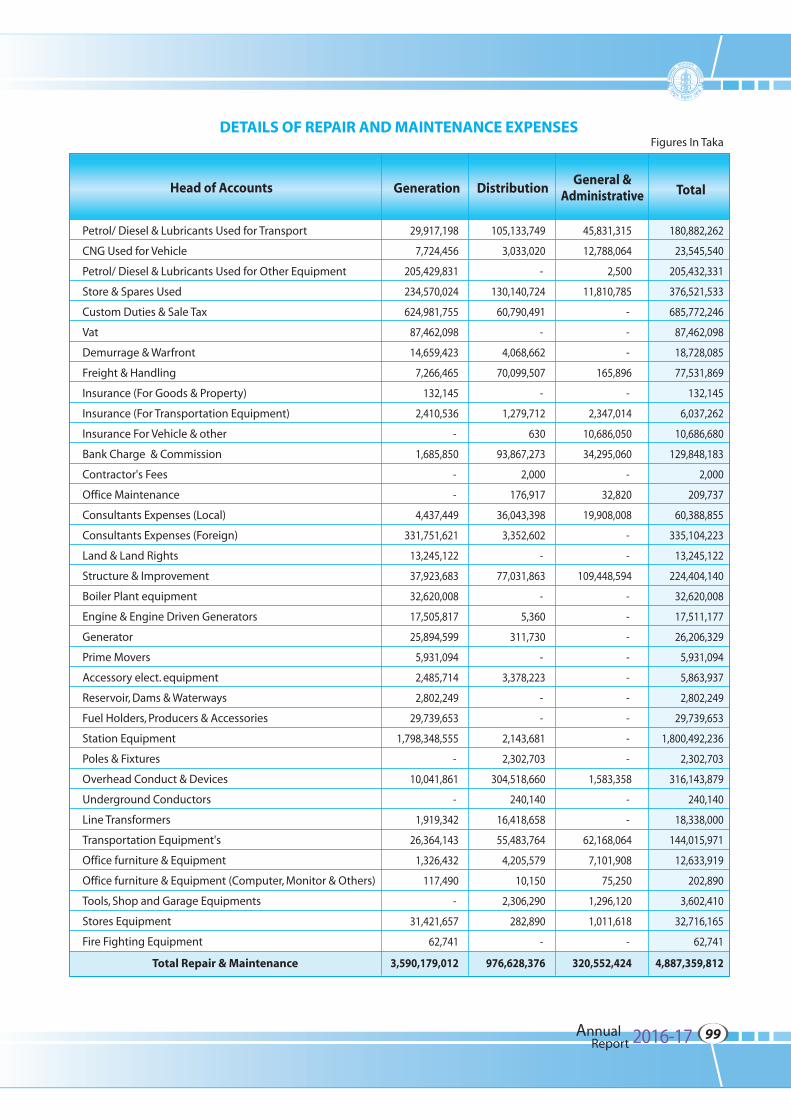
DETAILS OF REPAIR AND MAINTENANCE EXPENSES
Head of Accounts Generation Distribution TotalGeneral &
Administrative
Petrol/ Diesel & Lubricants Used for Transport
CNG Used for Vehicle
Petrol/ Diesel & Lubricants Used for Other Equipment
Store & Spares Used
Custom Duties & Sale Tax
Vat
Demurrage & Warfront
Freight & Handling
Insurance (For Goods & Property)
Insurance (For Transportation Equipment)
Insurance For Vehicle & other
Bank Charge & Commission
Contractor's Fees
Office Maintenance
Consultants Expenses (Local)
Consultants Expenses (Foreign)
Land & Land Rights
Structure & Improvement
Boiler Plant equipment
Engine & Engine Driven Generators
Generator
Prime Movers
Accessory elect. equipment
Reservoir, Dams & Waterways
Fuel Holders, Producers & Accessories
Station Equipment
Poles & Fixtures
Overhead Conduct & Devices
Underground Conductors
Line Transformers
Transportation Equipment's
Office furniture & Equipment
Office furniture & Equipment (Computer, Monitor & Others)
Tools, Shop and Garage Equipments
Stores Equipment
Fire Fighting Equipment
Total Repair & Maintenance
29,917,198
7,724,456
205,429,831
234,570,024
624,981,755
87,462,098
14,659,423
7,266,465
132,145
2,410,536
-
1,685,850
-
-
4,437,449
331,751,621
13,245,122
37,923,683
32,620,008
17,505,817
25,894,599
5,931,094
2,485,714
2,802,249
29,739,653
1,798,348,555
-
10,041,861
-
1,919,342
26,364,143
1,326,432
117,490
-
31,421,657
62,741
3,590,179,012
105,133,749
3,033,020
-
130,140,724
60,790,491
-
4,068,662
70,099,507
-
1,279,712
630
93,867,273
2,000
176,917
36,043,398
3,352,602
-
77,031,863
-
5,360
311,730
-
3,378,223
-
-
2,143,681
2,302,703
304,518,660
240,140
16,418,658
55,483,764
4,205,579
10,150
2,306,290
282,890
-
976,628,376
45,831,315
12,788,064
2,500
11,810,785
-
-
-
165,896
-
2,347,014
10,686,050
34,295,060
-
32,820
19,908,008
-
-
109,448,594
-
-
-
-
-
-
-
-
-
1,583,358
-
-
62,168,064
7,101,908
75,250
1,296,120
1,011,618
-
320,552,424
180,882,262
23,545,540
205,432,331
376,521,533
685,772,246
87,462,098
18,728,085
77,531,869
132,145
6,037,262
10,686,680
129,848,183
2,000
209,737
60,388,855
335,104,223
13,245,122
224,404,140
32,620,008
17,511,177
26,206,329
5,931,094
5,863,937
2,802,249
29,739,653
1,800,492,236
2,302,703
316,143,879
240,140
18,338,000
144,015,971
12,633,919
202,890
3,602,410
32,716,165
62,741
4,887,359,812
Figures In Taka
Annual 2016-17Report99
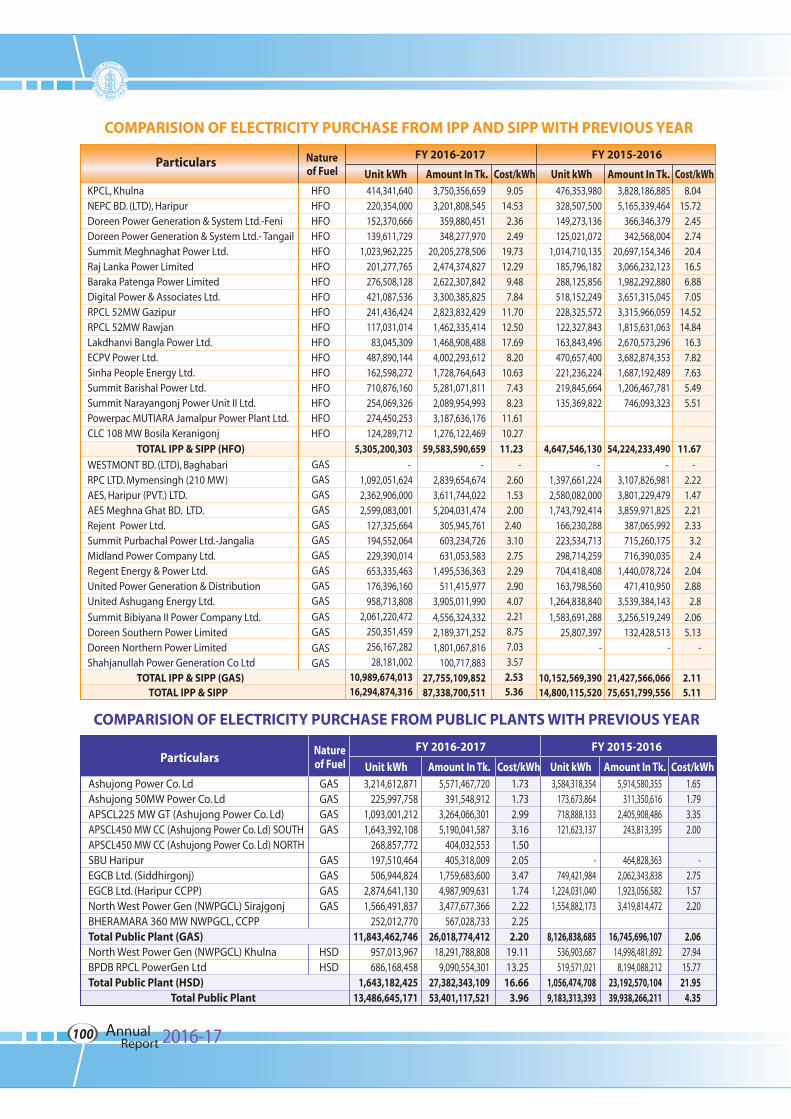
COMPARISION OF ELECTRICITY PURCHASE FROM PUBLIC PLANTS WITH PREVIOUS YEAR
FY 2016-2017
1.651.793.352.00
-2.751.572.20
2.0627.9415.77
21.954.35
3,584,318,354173,673,864718,888,133121,623,137
-749,421,984
1,224,031,0401,554,882,173
8,126,838,685536,903,687519,571,021
1,056,474,7089,183,313,393
5,914,580,355311,350,616
2,405,908,486243,813,395
464,828,3632,062,343,8381,923,056,5823,419,814,472
16,745,696,10714,998,481,892
8,194,088,21223,192,570,10439,938,266,211
ParticularsUnit kWh Amount In Tk. Cost/kWh Unit kWh Amount In Tk. Cost/kWh
FY 2015-2016Natureof Fuel
Ashujong Power Co. LdAshujong 50MW Power Co. LdAPSCL225 MW GT (Ashujong Power Co. Ld)APSCL450 MW CC (Ashujong Power Co. Ld) SOUTHAPSCL450 MW CC (Ashujong Power Co. Ld) NORTHSBU HaripurEGCB Ltd. (Siddhirgonj)EGCB Ltd. (Haripur CCPP)North West Power Gen (NWPGCL) SirajgonjBHERAMARA 360 MW NWPGCL, CCPPTotal Public Plant (GAS)North West Power Gen (NWPGCL) KhulnaBPDB RPCL PowerGen LtdTotal Public Plant (HSD)
Total Public Plant
GASGASGASGAS
GASGASGASGAS
HSDHSD
3,214,612,871 225,997,758
1,093,001,212 1,643,392,108
268,857,772 197,510,464 506,944,824
2,874,641,130 1,566,491,837
252,012,770 11,843,462,746
957,013,967 686,168,458
1,643,182,42513,486,645,171
5,571,467,720 391,548,912
3,264,066,301 5,190,041,587
404,032,553 405,318,009
1,759,683,600 4,987,909,631 3,477,677,366
567,028,733 26,018,774,412
18,291,788,808 9,090,554,301
27,382,343,10953,401,117,521
1.73 1.73 2.99 3.16 1.50 2.05 3.47 1.74 2.22 2.25 2.20
19.11 13.25
16.66 3.96
COMPARISION OF ELECTRICITY PURCHASE FROM IPP AND SIPP WITH PREVIOUS YEAR
ParticularsFY 2016-2017
Unit kWh Amount In Tk. Cost/kWh Unit kWh Amount In Tk. Cost/kWh
FY 2015-2016Natureof Fuel
KPCL, KhulnaNEPC BD. (LTD), HaripurDoreen Power Generation & System Ltd.-FeniDoreen Power Generation & System Ltd.- TangailSummit Meghnaghat Power Ltd.Raj Lanka Power LimitedBaraka Patenga Power LimitedDigital Power & Associates Ltd.RPCL 52MW GazipurRPCL 52MW RawjanLakdhanvi Bangla Power Ltd.ECPV Power Ltd.Sinha People Energy Ltd.Summit Barishal Power Ltd.Summit Narayangonj Power Unit II Ltd.Powerpac MUTIARA Jamalpur Power Plant Ltd. CLC 108 MW Bosila Keranigonj
TOTAL IPP & SIPP (HFO)
WESTMONT BD. (LTD), BaghabariRPC LTD. Mymensingh (210 MW)AES, Haripur (PVT.) LTD.AES Meghna Ghat BD. LTD.Rejent Power Ltd.Summit Purbachal Power Ltd.-JangaliaMidland Power Company Ltd.Regent Energy & Power Ltd.United Power Generation & DistributionUnited Ashugang Energy Ltd.
Summit Bibiyana II Power Company Ltd.Doreen Southern Power LimitedDoreen Northern Power LimitedShahjanullah Power Generation Co Ltd
TOTAL IPP & SIPP (GAS)TOTAL IPP & SIPP
HFOHFOHFOHFOHFOHFOHFOHFOHFOHFOHFOHFOHFOHFOHFOHFOHFO
GASGASGASGASGASGASGASGASGASGAS
GASGAS
GASGAS
414,341,640 220,354,000 152,370,666 139,611,729
1,023,962,225 201,277,765 276,508,128 421,087,536 241,436,424 117,031,014
83,045,309 487,890,144 162,598,272 710,876,160 254,069,326 274,450,253 124,289,712
5,305,200,303
- 1,092,051,624 2,362,906,000 2,599,083,001
127,325,664 194,552,064 229,390,014 653,335,463 176,396,160 958,713,808
2,061,220,472 250,351,459 256,167,282
28,181,00210,989,674,01316,294,874,316
3,750,356,659 3,201,808,545
359,880,451 348,277,970
20,205,278,506 2,474,374,827 2,622,307,842 3,300,385,825 2,823,832,429 1,462,335,414 1,468,908,488 4,002,293,612 1,728,764,643 5,281,071,811 2,089,954,993 3,187,636,176 1,276,122,469
59,583,590,659
- 2,839,654,674 3,611,744,022 5,204,031,474
305,945,761 603,234,726 631,053,583
1,495,536,363 511,415,977
3,905,011,990
4,556,324,332 2,189,371,252 1,801,067,816
100,717,883 27,755,109,85287,338,700,511
9.05 14.53
2.36 2.49
19.73 12.29
9.48 7.84
11.70 12.50 17.69
8.20 10.63
7.43 8.23
11.61 10.27
11.23
- 2.60 1.53 2.00
2.40 3.10 2.75 2.29 2.90 4.07 2.21 8.75 7.03 3.57 2.53 5.36
476,353,980328,507,500149,273,136125,021,072
1,014,710,135185,796,182288,125,856518,152,249228,325,572122,327,843163,843,496470,657,400221,236,224219,845,664135,369,822
4,647,546,130
- 1,397,661,2242,580,082,0001,743,792,414
166,230,288223,534,713298,714,259704,418,408163,798,560
1,264,838,840
1,583,691,28825,807,397
-
10,152,569,39014,800,115,520
3,828,186,8855,165,339,464
366,346,379342,568,004
20,697,154,3463,066,232,1231,982,292,8803,651,315,0453,315,966,0591,815,631,0632,670,573,2963,682,874,3531,687,192,4891,206,467,781
746,093,323
54,224,233,490
- 3,107,826,9813,801,229,4793,859,971,825
387,065,992715,260,175716,390,035
1,440,078,724471,410,950
3,539,384,143
3,256,519,249132,428,513
-
21,427,566,06675,651,799,556
8.0415.72
2.452.7420.416.56.887.05
14.5214.84
16.37.827.635.495.51
11.67
- 2.221.472.212.33
3.22.4
2.042.88
2.8
2.065.13
-
2.115.11
Annual 2016-17Report100
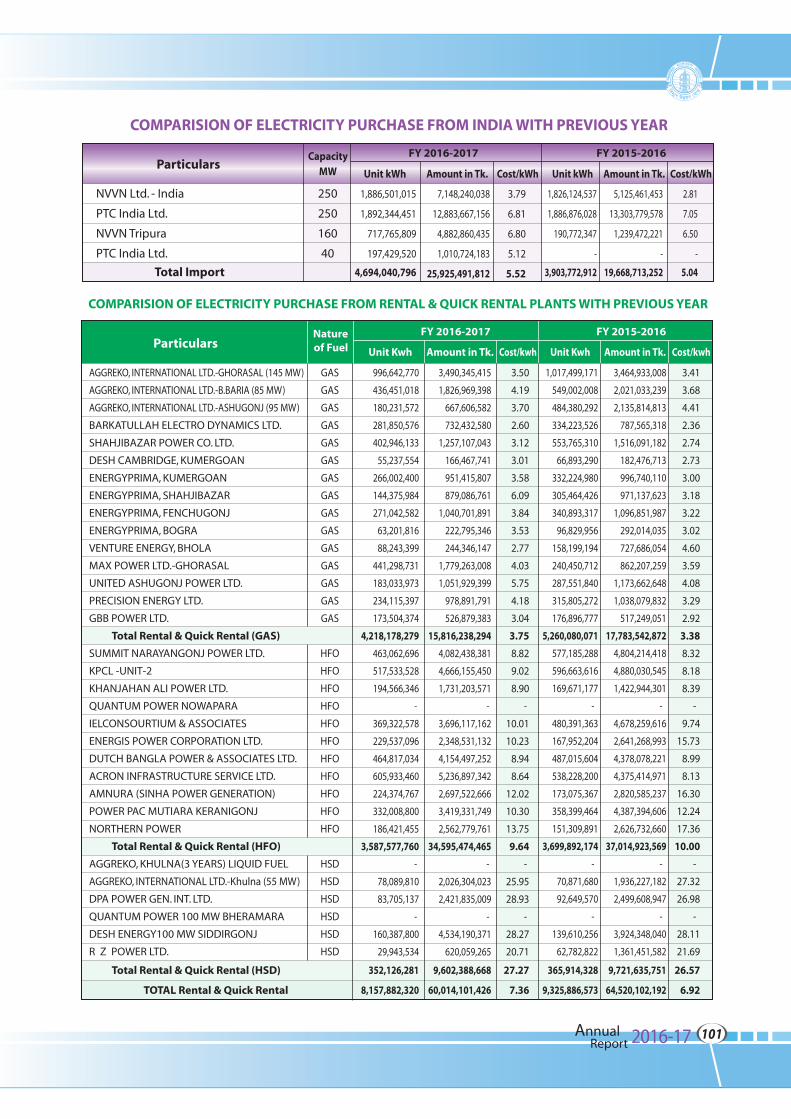
COMPARISION OF ELECTRICITY PURCHASE FROM RENTAL & QUICK RENTAL PLANTS WITH PREVIOUS YEAR
Particulars FY 2016-2017
Unit Kwh Amount in Tk. Cost/kwh Unit Kwh Amount in Tk. Cost/kwh
FY 2015-2016Natureof Fuel
COMPARISION OF ELECTRICITY PURCHASE FROM INDIA WITH PREVIOUS YEAR
FY 2016-2017
1,826,124,537
1,886,876,028
190,772,347
-
3,903,772,912
5,125,461,453
13,303,779,578
1,239,472,221
-
19,668,713,252
ParticularsUnit kWh Amount in Tk. Cost/kWh Unit kWh Amount in Tk. Cost/kWh
FY 2015-2016CapacityMW
NVVN Ltd. - India
PTC India Ltd.
NVVN Tripura
PTC India Ltd.
Total Import
250
250
160
40
1,886,501,015
1,892,344,451
717,765,809
197,429,520
4,694,040,796
7,148,240,038
12,883,667,156
4,882,860,435
1,010,724,183
25,925,491,812
3.79
6.81
6.80
5.12
5.52
2.81
7.05
6.50
-
5.04
AGGREKO, INTERNATIONAL LTD.-GHORASAL (145 MW)
AGGREKO, INTERNATIONAL LTD.-B.BARIA (85 MW)
AGGREKO, INTERNATIONAL LTD.-ASHUGONJ (95 MW)
BARKATULLAH ELECTRO DYNAMICS LTD.
SHAHJIBAZAR POWER CO. LTD.
DESH CAMBRIDGE, KUMERGOAN
ENERGYPRIMA, KUMERGOAN
ENERGYPRIMA, SHAHJIBAZAR
ENERGYPRIMA, FENCHUGONJ
ENERGYPRIMA, BOGRA
VENTURE ENERGY, BHOLA
MAX POWER LTD.-GHORASAL
UNITED ASHUGONJ POWER LTD.
PRECISION ENERGY LTD.
GBB POWER LTD.
Total Rental & Quick Rental (GAS)
SUMMIT NARAYANGONJ POWER LTD.
KPCL -UNIT-2
KHANJAHAN ALI POWER LTD.
QUANTUM POWER NOWAPARA
IELCONSOURTIUM & ASSOCIATES
ENERGIS POWER CORPORATION LTD.
DUTCH BANGLA POWER & ASSOCIATES LTD.
ACRON INFRASTRUCTURE SERVICE LTD.
AMNURA (SINHA POWER GENERATION)
POWER PAC MUTIARA KERANIGONJ
NORTHERN POWER
Total Rental & Quick Rental (HFO)
AGGREKO, KHULNA(3 YEARS) LIQUID FUEL
AGGREKO, INTERNATIONAL LTD.-Khulna (55 MW)
DPA POWER GEN. INT. LTD.
QUANTUM POWER 100 MW BHERAMARA
DESH ENERGY100 MW SIDDIRGONJ
R Z POWER LTD.
Total Rental & Quick Rental (HSD)
TOTAL Rental & Quick Rental
GAS
GAS
GAS
GAS
GAS
GAS
GAS
GAS
GAS
GAS
GAS
GAS
GAS
GAS
GAS
HFO
HFO
HFO
HFO
HFO
HFO
HFO
HFO
HFO
HFO
HFO
HSD
HSD
HSD
HSD
HSD
HSD
996,642,770
436,451,018
180,231,572
281,850,576
402,946,133
55,237,554
266,002,400
144,375,984
271,042,582
63,201,816
88,243,399
441,298,731
183,033,973
234,115,397
173,504,374
4,218,178,279
463,062,696
517,533,528
194,566,346
-
369,322,578
229,537,096
464,817,034
605,933,460
224,374,767
332,008,800
186,421,455
3,587,577,760
-
78,089,810
83,705,137
-
160,387,800
29,943,534
352,126,281
8,157,882,320
1,017,499,171
549,002,008
484,380,292
334,223,526
553,765,310
66,893,290
332,224,980
305,464,426
340,893,317
96,829,956
158,199,194
240,450,712
287,551,840
315,805,272
176,896,777
5,260,080,071
577,185,288
596,663,616
169,671,177
-
480,391,363
167,952,204
487,015,604
538,228,200
173,075,367
358,399,464
151,309,891
3,699,892,174
-
70,871,680
92,649,570
-
139,610,256
62,782,822
365,914,328
9,325,886,573
3,490,345,415
1,826,969,398
667,606,582
732,432,580
1,257,107,043
166,467,741
951,415,807
879,086,761
1,040,701,891
222,795,346
244,346,147
1,779,263,008
1,051,929,399
978,891,791
526,879,383
15,816,238,294
4,082,438,381
4,666,155,450
1,731,203,571
-
3,696,117,162
2,348,531,132
4,154,497,252
5,236,897,342
2,697,522,666
3,419,331,749
2,562,779,761
34,595,474,465
-
2,026,304,023
2,421,835,009
-
4,534,190,371
620,059,265
9,602,388,668
60,014,101,426
3,464,933,008
2,021,033,239
2,135,814,813
787,565,318
1,516,091,182
182,476,713
996,740,110
971,137,623
1,096,851,987
292,014,035
727,686,054
862,207,259
1,173,662,648
1,038,079,832
517,249,051
17,783,542,872
4,804,214,418
4,880,030,545
1,422,944,301
-
4,678,259,616
2,641,268,993
4,378,078,221
4,375,414,971
2,820,585,237
4,387,394,606
2,626,732,660
37,014,923,569
-
1,936,227,182
2,499,608,947
-
3,924,348,040
1,361,451,582
9,721,635,751
64,520,102,192
3.50
4.19
3.70
2.60
3.12
3.01
3.58
6.09
3.84
3.53
2.77
4.03
5.75
4.18
3.04
3.75
8.82
9.02
8.90
-
10.01
10.23
8.94
8.64
12.02
10.30
13.75
9.64
-
25.95
28.93
-
28.27
20.71
27.27
7.36
3.41
3.68
4.41
2.36
2.74
2.73
3.00
3.18
3.22
3.02
4.60
3.59
4.08
3.29
2.92
3.38
8.32
8.18
8.39
-
9.74
15.73
8.99
8.13
16.30
12.24
17.36
10.00
-
27.32
26.98
-
28.11
21.69
26.57
6.92
Annual 2016-17Report101
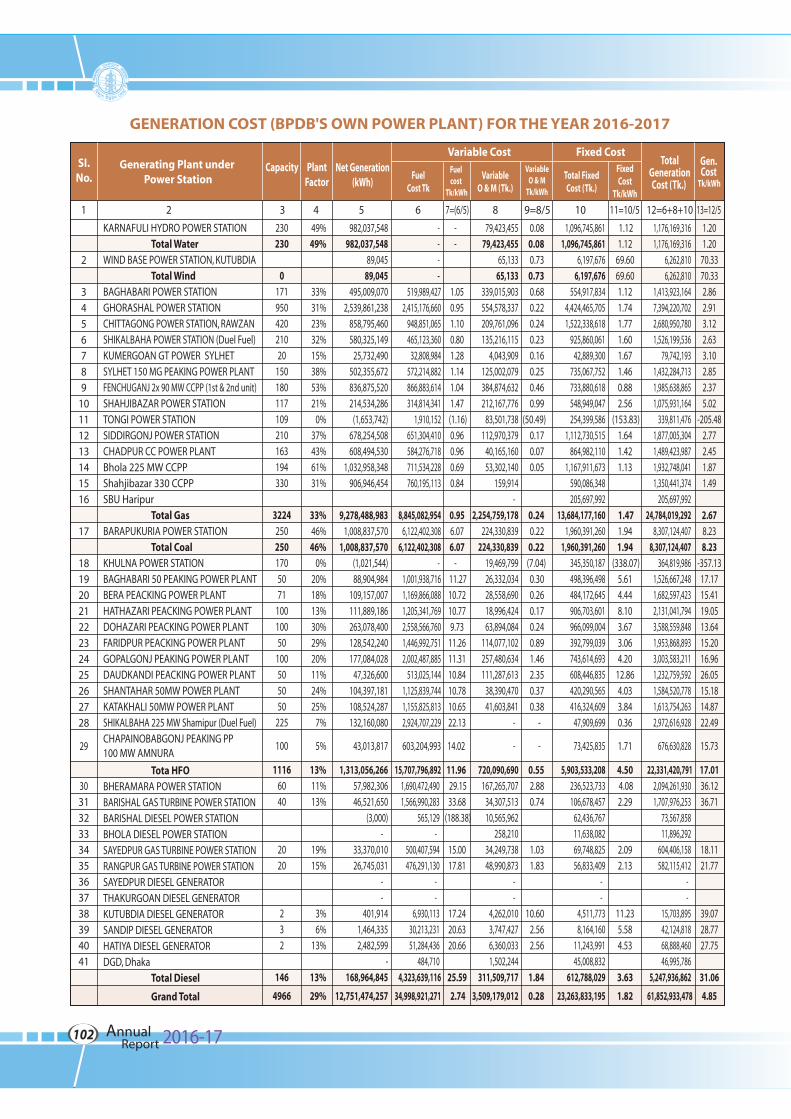
GENERATION COST (BPDB'S OWN POWER PLANT) FOR THE YEAR 2016-2017
SI.No.
Generating Plant under Power Station
Capacity PlantFactor
2
3456789
10111213141516
17
1819202122232425262728
29
303132333435363738394041
21
KARNAFULI HYDRO POWER STATIONTotal Water
WIND BASE POWER STATION, KUTUBDIATotal Wind
BAGHABARI POWER STATIONGHORASHAL POWER STATIONCHITTAGONG POWER STATION, RAWZANSHIKALBAHA POWER STATION (Duel Fuel)KUMERGOAN GT POWER SYLHETSYLHET 150 MG PEAKING POWER PLANTFENCHUGANJ 2x 90 MW CCPP (1st & 2nd unit)SHAHJIBAZAR POWER STATIONTONGI POWER STATIONSIDDIRGONJ POWER STATION CHADPUR CC POWER PLANTBhola 225 MW CCPPShahjibazar 330 CCPPSBU Haripur
Total GasBARAPUKURIA POWER STATION
Total CoalKHULNA POWER STATIONBAGHABARI 50 PEAKING POWER PLANTBERA PEACKING POWER PLANTHATHAZARI PEACKING POWER PLANTDOHAZARI PEACKING POWER PLANTFARIDPUR PEACKING POWER PLANTGOPALGONJ PEAKING POWER PLANTDAUDKANDI PEACKING POWER PLANTSHANTAHAR 50MW POWER PLANTKATAKHALI 50MW POWER PLANTSHIKALBAHA 225 MW Shamipur (Duel Fuel)CHAPAINOBABGONJ PEAKING PP100 MW AMNURA
Tota HFOBHERAMARA POWER STATIONBARISHAL GAS TURBINE POWER STATION BARISHAL DIESEL POWER STATIONBHOLA DIESEL POWER STATION SAYEDPUR GAS TURBINE POWER STATION RANGPUR GAS TURBINE POWER STATION SAYEDPUR DIESEL GENERATOR THAKURGOAN DIESEL GENERATORKUTUBDIA DIESEL GENERATOR SANDIP DIESEL GENERATOR HATIYA DIESEL GENERATORDGD, Dhaka
Total Diesel
Grand Total
230230
017195042021020
150180117109210163194330
32242502501705071
10010050
100505050
225
100
11166040
2020
232
146
4966
43
49%49%
33%31%23%32%15%38%53%21%
0%37%43%61%31%
33%46%46%
0%20%18%13%30%29%20%11%24%25%
7%
5%
13%11%13%
19%15%
3%6%
13%
13%
29%
Variable Cost Fixed CostNet Generation
(kWh)Fuel
Cost TkTotal FixedCost (Tk.)
VariableO & M (Tk.)
TotalGenerationCost (Tk.)
Gen.Cost
Tk/kWh
VariableO & M
Tk/kWh
FixedCost
Tk/kWh
Fuelcost
Tk/kWh
5 6 8 9=8/5 10 11=10/5 12=6+8+107=(6/5) 13=12/5
982,037,548982,037,548
89,04589,045
495,009,0702,539,861,238
858,795,460580,325,149
25,732,490502,355,672836,875,520214,534,286
(1,653,742)678,254,508608,494,530
1,032,958,348906,946,454
9,278,488,9831,008,837,570
1,008,837,570(1,021,544)88,904,984
109,157,007111,889,186263,078,400128,542,240177,084,028
47,326,600104,397,181108,524,287132,160,080
43,013,817
1,313,056,26657,982,30646,521,650
(3,000) -
33,370,01026,745,031
- -
401,9141,464,3352,482,599
-168,964,845
12,751,474,257
- - - -
519,989,427 2,415,176,660
948,851,065 465,123,360
32,808,984 572,214,882 866,883,614 314,814,341
1,910,152 651,304,410 584,276,718 711,534,228 760,195,113
8,845,082,954 6,122,402,308
6,122,402,308 -
1,001,938,716 1,169,866,088 1,205,341,769 2,558,566,760 1,446,992,751 2,002,487,885
513,025,144 1,125,839,744 1,155,825,813 2,924,707,229
603,204,993
15,707,796,892 1,690,472,490 1,566,990,283
565,129 -
500,407,594 476,291,130
- -
6,930,113 30,213,231 51,284,436
484,710 4,323,639,116
34,998,921,271
- -
1.05 0.95 1.10 0.80 1.28 1.14 1.04 1.47 (1.16) 0.96 0.96 0.69 0.84
0.95 6.07 6.07
- 11.27 10.72 10.77 9.73
11.26 11.31 10.84 10.78 10.65 22.13
14.02
11.96 29.15 33.68
(188.38)
15.00 17.81
17.24 20.63 20.66
25.59
2.74
0.08 0.08 0.73 0.73 0.68 0.22 0.24 0.23 0.16 0.25 0.46 0.99
(50.49) 0.17 0.07 0.05
0.24 0.22 0.22 (7.04) 0.30 0.26 0.17 0.24 0.89 1.46 2.35 0.37 0.38
-
-
0.55 2.88 0.74
1.03 1.83
10.60 2.56 2.56
1.84
0.28
1.201.20
70.3370.332.862.913.122.633.102.852.375.02
-205.482.772.451.871.49
2.678.238.23
-357.1317.1715.4119.0513.6415.2016.9626.0515.1814.8722.49
15.73
17.0136.1236.71
18.1121.77
39.0728.7727.75
31.06
4.85
1,096,745,861 1,096,745,861
6,197,676 6,197,676
554,917,834 4,424,465,705 1,522,338,618
925,860,061 42,889,300
735,067,752 733,880,618 548,949,047 254,399,586
1,112,730,515 864,982,110
1,167,911,673 590,086,348 205,697,992
13,684,177,160 1,960,391,260
1,960,391,260 345,350,187 498,396,498 484,172,645 906,703,601 966,099,004 392,799,039 743,614,693 608,446,835 420,290,565 416,324,609
47,909,699
73,425,835
5,903,533,208 236,523,733 106,678,457
62,436,767 11,638,082 69,748,825 56,833,409
- -
4,511,773 8,164,160
11,243,991 45,008,832
612,788,029
23,263,833,195
1,176,169,316 1,176,169,316
6,262,810 6,262,810
1,413,923,164 7,394,220,702 2,680,950,780 1,526,199,536
79,742,193 1,432,284,713 1,985,638,865 1,075,931,164
339,811,476 1,877,005,304 1,489,423,987 1,932,748,041 1,350,441,374
205,697,992 24,784,019,292
8,307,124,407 8,307,124,407
364,819,986 1,526,667,248 1,682,597,423 2,131,041,794 3,588,559,848 1,953,868,893 3,003,583,211 1,232,759,592 1,584,520,778 1,613,754,263 2,972,616,928
676,630,828
22,331,420,791 2,094,261,930 1,707,976,253
73,567,858 11,896,292
604,406,158 582,115,412
- -
15,703,895 42,124,818 68,888,460 46,995,786
5,247,936,862
61,852,933,478
1.12 1.12
69.60 69.60 1.12 1.74 1.77 1.60 1.67 1.46 0.88 2.56
(153.83) 1.64 1.42 1.13
1.47 1.94 1.94
(338.07) 5.61 4.44 8.10 3.67 3.06 4.20
12.86 4.03 3.84 0.36
1.71
4.50 4.08 2.29
2.09 2.13
11.23 5.58 4.53
3.63
1.82
79,423,455 79,423,455
65,133 65,133
339,015,903 554,578,337 209,761,096 135,216,115
4,043,909 125,002,079 384,874,632 212,167,776
83,501,738 112,970,379
40,165,160 53,302,140
159,914 -
2,254,759,178 224,330,839
224,330,839 19,469,799 26,332,034 28,558,690 18,996,424 63,894,084
114,077,102 257,480,634 111,287,613
38,390,470 41,603,841
-
-
720,090,690 167,265,707
34,307,513 10,565,962
258,210 34,249,738 48,990,873
- -
4,262,010 3,747,427 6,360,033 1,502,244
311,509,717
3,509,179,012
Annual 2016-17Report102
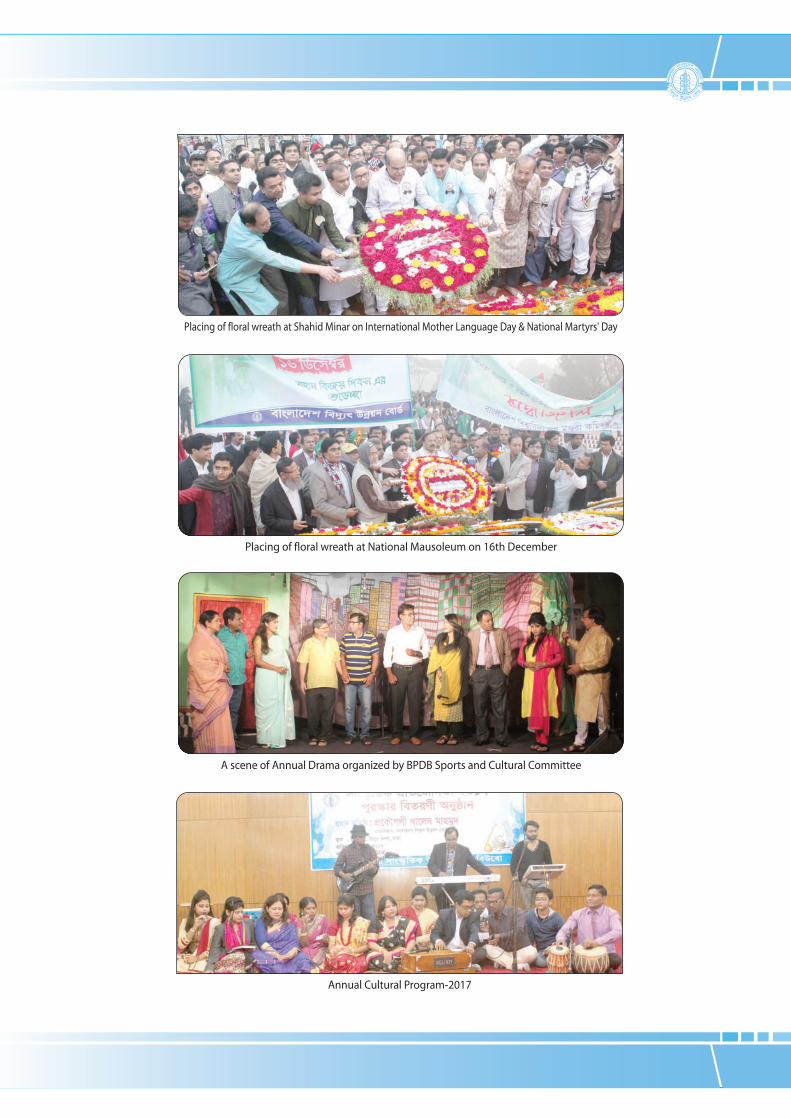
Placing of floral wreath at Shahid Minar on International Mother Language Day & National Martyrs' Day
Placing of floral wreath at National Mausoleum on 16th December
Annual Cultural Program-2017
A scene of Annual Drama organized by BPDB Sports and Cultural Committee
Prepared by the Directorates of System Planning, Programme, Accounts and O & MCompiled and Published by the Directorate of Public Relations, BPDB
Web Site: www.bpdb.gov.bd