annual report fiscal year 2014/15 - aurubis · antamina expansion (pe) los bronces toromocho...
TRANSCRIPT
December 2015 1 1 1
Erwin Faust Executive Board Spokesman
Analyst Conference on December 11, 2015
Annual Report
Fiscal Year 2014/15
December 2015

December 2015
Agenda
2
1. Current situation and market trends
2. Aurubis’ market position
3. Financial data
4. Strategy and outlook

December 2015
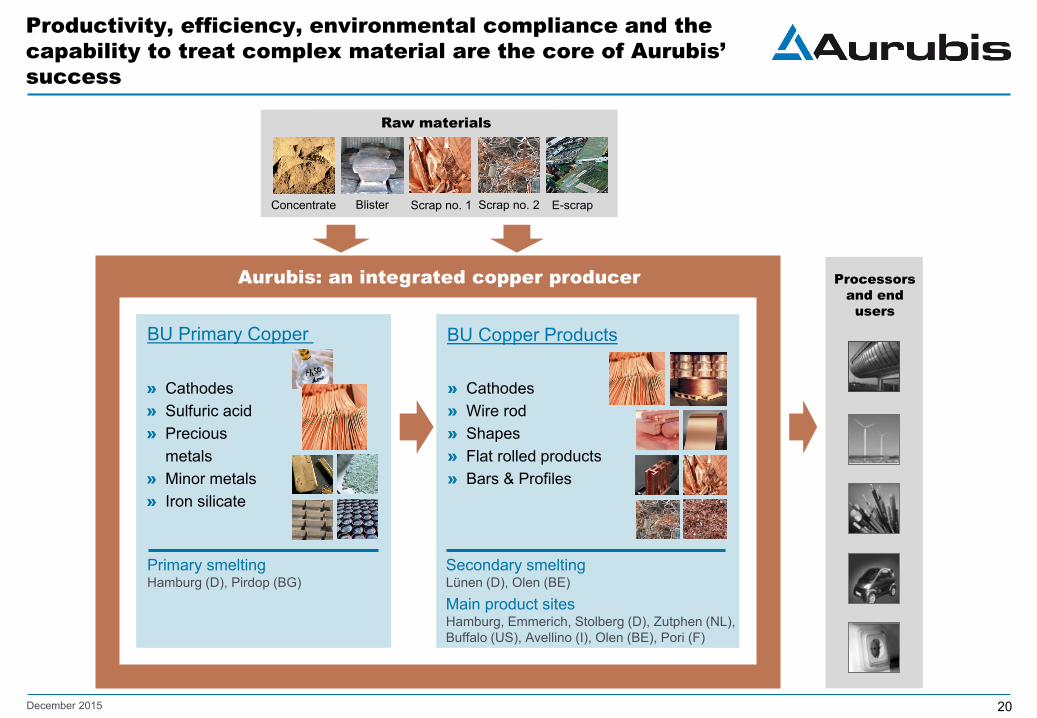
Productivity, efficiency, environmental compliance and the capability to treat complex material are the core of Aurubis’ success
Processors and end users
BU Copper Products
» Cathodes » Wire rod » Shapes » Flat rolled products » Bars & Profiles
BU Primary Copper
» Cathodes » Sulfuric acid » Precious
metals » Minor metals » Iron silicate
Secondary smelting Lünen (D), Olen (BE)
Main product sites Hamburg, Emmerich, Stolberg (D), Zutphen (NL), Buffalo (US), Avellino (I), Olen (BE), Pori (F)
Primary smelting Hamburg (D), Pirdop (BG)
Raw materials
Concentrate Blister Scrap no. 1 E-scrap Scrap no. 2
Aurubis: an integrated copper producer
3

December 2015
Aurubis achieves record earnings in 2014/15
4
12 months FY 2014/15
12 months FY 2013/14
Operating EBT (€ million) 343 137
Net cash flow (€ million) 365 401
ROCE (%) (operating) 18.7 8.5

December 2015
170
173
343
137
Substantial improvement in operating results compared to previous year
5
EBT 2014/15 (in € million, rounded)
FY 14/15
Operating EBT
Adjust- ments
Operating EBT
EBT IFRS
FY 13/14
Main factors influencing the results » Significantly higher treatment and refining charges
for copper concentrates
» A strong increase in sales prices for sulfuric acid
» Substantially increased refining charges for copper scrap
» Higher cathode premiums

December 2015
7.8 9.2 10.1 10.5 10.9 11.3 12.2
11.8 11.5 11.9 12.1 12.4 12.6
12.7
19.6 20.6 22.0 22.7 23.3 23.9
24.9
2013 2014 2015 2016e 2017e 2018e 2020e
Moderate growth expectations for China translate to lower copper demand forecasts
6
Global copper demand (in million t)
» The main drivers of copper demand are the infrastructure sector and consumer goods.
» Central applications include construction, energy production and distribution, electronics, cars and air conditioning.
» Despite slower growth, China is still the important driver of copper demand.
» Development in emerging countries and the use of new technologies will push copper demand outside of China in the future as well.
» Nevertheless, Chinese copper demand growth rates are falling from about 7 % in 2014 to an expected 3 to 4 % in the next few years.
China
Source: Wood Mackenzie 9/2015 + 11/2015

December 2015
Copper price: Downward trend with ongoing volatility
7
2000
3000
4000
5000
6000
7000
8000
9000
10000
0
250
500
750
1000
1250
1500
1750
2000
10/
10
04/
11
10/
11
04/
12
10/
12
04/
13
10/
13
04/
14
10/
14
04/
15
10/
15
in US$/t in 1,000 t Metal exchange inventories LME copper price (settlement)
Copper price and metal exchange inventories
Copper price December 10, 2015:
4,572.0

December 2015
From a euro perspective, the US dollar increase has mitigated the copper price reduction
8
2000
3000
4000
5000
6000
7000
8000
9000
10000
10/
10
04/
11
10/
11
04/
12
10/
12
04/
13
10/
13
04/
14
10/
14
04/
15
10/
15
LME copper price (settlement) – in US$/t
Copper price
LME copper price (settlement) – in €/t

December 2015
The European copper market traditionally exhibits a cathode deficit
9
• Copper demand by region in 2015 (in million t) • Copper surplus/deficit before adjustment (in million t)
Total demand 2015: 22.0 million t Global output 2015: 22.2 million t
2.4
13.8
0.6 0.1 0.2
-0.5
+2.8
+1.1 +0.4
-3.2
Source: Wood Mackenzie 11/2015
3.7 -0.7
0.7 -0.5
0.5 +0.8

December 2015
Additional projects will start up production before 2025
Size of deposits (in million t of copper content)
Copper price (in US$/t – 3-month quotation)
Source: info Mine, company data 10
Existing projects New projects
1000
2000
3000
4000
5000
6000
7000
8000
9000
10000
Collahuasi (CL)
Batu Hijau (ID)
Los Pelambres (CL)
Antamina (PE)
Esperanza (CL)
Los Pelambres Expansion (CL)
Antamina Expansion (PE)
Los Bronces Expansion (CL)
Salobo I (BR)
Toromocho (PE)
Caserones/Regalito (CL)
Oyu Tolgoi (MN)
Mina Ministro
Halees (CL)
Las Bambas
El Teniente (CL)
Quellaveco (PE)
Andina Expansion
(CL)
Chuquicamata underground (CL)
0
10
20
30
40
50
60
70
80
90
1995 2000 2005 2010 2015 2020 2025

December 2015
Chinese smelter capacities are increasing less than previously forecasted
11
Capacities of Chinese copper smelters incl. planned increases (in million t)
Source: Wood Mackenzie 09/2015
5
6
7
8
9
10
2014 2015 2016e 2017e 2018e 2019e
Forecast Jun 15 Forecast Sept 15
» In the short term, 10 leading Chinese copper smelters (including Jiangxi Copper and Tongling) want to reduce their refined copper output by 350,000 t in 2016.
» In the long term, these producers ask for increased approval hurdles for new smelting capacities.

December 2015
Agenda
12
1. Current situation and market trends
2. Aurubis’ market position
3. Financial data
4. Strategy and outlook

December 2015 13
Aurubis is a world leader in the copper value chain
Output FY 2014/15 Position
Concentrate processing 2,294,000 t No. 2 worldwide
Copper recycling 294,000 t No. 1 worldwide
Cathode production 1,138,000 t No. 3 worldwide
Rod production 764,000 t No. 1 worldwide
Shape production 170,000 t No. 1 in Europe
Strip production 216,000 t No. 1 worldwide
Gold production 45 t
Silver production 958 t

December 2015
Agenda
14
1. Current situation and market trends
2. Aurubis’ market position
3. Financial data
4. Strategy and outlook

December 2015
Record consolidated results – operating EBT and ROCE significantly up on previous year
15
FY FY Change
2014/15 2013/14 Absolute Relative
Revenues €m 10,995 11,241 -246 -2 %
Gross profit €m 1,173 937 +236 +25 %
EBITDA €m 500 288 +212 +74 %
EBIT €m 370 167 +203 >100 %
EBT €m 343 137 +206 >100 %
Consolidated net income €m 257 99 +158 >100 %
Net cash flow €m 365 401 -36 - 9 %
Return on capital employed (ROCE) % 18.7 8.5 - -
(operating IFRS)

December 2015
Reconciliation of balance sheet/income statement from IFRS (operating) to IFRS (average cost method)
16
IFRS based on operating
IFRS using average Adjustments
Balance sheet 9/30/2015
Total assets and liabilities 3,733 4,044 311 Assets Fixed assets Deferred tax assets Inventories
1,387
3 1,374
1,440
8 1,627
53
5 253
Equity and liabilities Equity Deferred tax liabilities
1,765
76
1,969
183
204 107
Income statement 10/1/2014 – 9/30/2015
Change in inventories 76 15 (61) Cost of materials (9,964) (10,067) (103) Gross profit 1,173 1,009 (164) Result from investments measured using the equity method
4 1 (3)
Earnings before taxes 343 170 (173) Income taxes (86) (36) 50 Consolidated net income 257 134 (123)
(in € million)

December 2015
Total assets and liabilities higher due to increased cash level, equity ratio improved
17
1,146 1,155
506 433
316 324
1,765 1,550
9/30/15 9/30/14
Assets
(operating IFRS in € million)
Equity and liabilities
3,462 3,733
Fixed assets
Inventories
Receivables, etc.
Cash and cash equivalents
453 187
519 570
1,374 1,298
1,387 1,407
9/30/15 9/30/14
(37%)
(37%)
(14%)
(12%)
(41%)
(37%)
(16%) (5%)
Equity*
Provisions
Borrowings
Other liabilities
* incl. consolidated profit, non-controlling interests
3,462 3,733
(47%)
(8%)
(14%)
(31%)
(45%)
(9%)
(13%)
(33%)

December 2015
Aurubis Group financial ratios reflect very good results of operations
18
9/30/2015 operating
9/30/2014 operating Target
Profitability ROCE*
18.7 %
8.5 %
15 %
Capital structure - Equity ratio (equity / total assets and liabilities) - Fixed asset cover (equity / fixed assets) - Intensity of investments (fixed assets / total assets and liabilities)
47.3 %
127.2 % 37.2 %
44.8 %
110.2 % 40.6 %
> 40 %
> 120 % < 40 %
Debt and interest coverage - Net debt / EBITDA
0.1
0.9
< 3
- EBITDA / net interest expense 18.3 9.2 > 5
Liquidity - Quick ratio (current assets - inventories + finished products + credit lines / current liabilities)
156.3 %
104.5 %
> 100 %
(operating IFRS)
* EBIT rolling last four quarters

December 2015
Change in the Aurubis Group’s organizational structure
» The previous organizational structure was based on three operating Business Units (BUs): Primary Copper, Recycling/Precious Metals and Copper Products
» Aurubis’ activities were reorganized into two operating BUs effective July 1, 2015 » BU Primary Copper includes
» The copper concentrate processing facilities and copper cathode production in Hamburg and Pirdop (Bulgaria)
» The Group’s precious metal division, which is centralized in Hamburg » BU Copper Products includes
» The recycling plant in Lünen and the production site in Olen (Belgium) for an extensive involvement of recycling in customer business
» The production and marketing of copper products » Group-wide functions support the operating BUs
» Newly established Supply Chain Management division: group-wide raw material management and sale of sulfuric acid and other specialty products
19
December 2015
Productivity, efficiency, environmental compliance and the capability to treat complex material are the core of Aurubis’ success
Processors and end users
BU Copper Products
» Cathodes » Wire rod » Shapes » Flat rolled products » Bars & Profiles
BU Primary Copper
» Cathodes » Sulfuric acid » Precious
metals » Minor metals » Iron silicate
Secondary smelting Lünen (D), Olen (BE)
Main product sites Hamburg, Emmerich, Stolberg (D), Zutphen (NL), Buffalo (US), Avellino (I), Olen (BE), Pori (F)
Primary smelting Hamburg (D), Pirdop (BG)
Raw materials
Concentrate Blister Scrap no. 1 E-scrap Scrap no. 2
Aurubis: an integrated copper producer
20

December 2015
Reconciliation of old and new Group structure
Operating EBT (in € million; previous year adjusted)
New structure FY 14/15
FY 13/14
Diff. 14/15 13/14
Primary Copper 256 130 126
Copper Products 130 55 75
Other/cons. (43) (48) 5
Consolidated earnings before taxes
343 137 206
Old structure FY 14/15
FY 13/14
Diff. 14/15 13/14
Primary Copper 281 141 140
Rec./Prec. Metals 55 15 40
Copper Products 50 29 21
Other/cons. (43) (48) 5 Consolidated earnings before taxes
343 137 206
» BU Primary Copper: includes precious metals (previously BU Recycling/Precious Metals)
» BU Copper Products: includes Lünen recycling plant (previously BU Recycling/Precious Metals) and Olen site (previously divided between BU Primary Copper and BU Copper Products)
21

December 2015
Reconciliation of old and new Group structure (Q4)
22
Operating EBT (in € million; previous year adjusted)
New structure Q4 14/15
Q4 13/14
Diff. Q4 14/15 13/14
Primary Copper 54 61 (7)
Copper Products 40 26 14
Other/cons. (12) (25) 13
Consolidated earnings before taxes
82 62 20
Old structure Q4 14/15
Q4 13/14
Diff. Q4 14/15 13/14
Primary Copper 74 75 (1)
Rec./Prec. Metals 8 4 4
Copper Products 12 8 4
Other/cons. (12) (25) 13 Consolidated earnings before taxes
82 62 20
» BU Primary Copper: includes precious metals (previously BU Recycling/Precious Metals)
» BU Copper Products: includes Lünen recycling plant (previously BU Recycling/Precious Metals) and Olen site (previously divided between BU Primary Copper and BU Copper Products)

December 2015
BU Primary Copper: All earnings drivers at a high level in a good market environment
23
Operating results in BU Primary Copper (fiscal year 2014/15)
BU Primary Copper
FY 14/15
FY 13/14
EBIT (in €m) 271.4 150.3
EBT (in €m) 256.2 130.2
ROCE (%) 31.1 16.9
(Quantities in 1,000 t)
Concentrates 2,294 2,221
Copper scrap 103 97
Cathodes 615 595
Sulfuric acid 2,200 2,125
Gold (t) 45 43
Silver (t) 958 1,000
» Significantly higher TC/RCs due to good availability on the concentrate markets with a very good metal gain
» Positive trends on the copper markets led to refining charges that were about 40 % up on the previous year
» Strong increase in sales prices (over 60 % compared to previous year) for sulfuric acid owing to good global demand
» Positive contribution to earnings due to higher cathode premiums
» The concentrate throughputs were only slightly up on the previous year and did not fully meet our expectations
» ROCE improved notably again compared to previous year » Prior-year earnings were strained by the extensive
maintenance and repair shutdown at the Hamburg site and delays during the restart of production

December 2015
BU Copper Products: Positive trend due to considerable increase in refining charges and higher cathode premiums
24
Operating results in BU Copper Products (fiscal year 2014/15)
» The recycling business benefited from a good supply with substantially increased refining charges; refining charges for copper scrap about 40 % above the previous year
» AURUBIS ROD recorded a slight increase compared to the previous year due to good ongoing European demand
» Cathode output was slightly down on the previous year. Higher cathode premiums led in total to positive earnings effects
» Higher contributions to earnings from BL Flat Rolled Products as restructuring continued
» KRS throughput lower than the previous year as a result of scheduled shutdowns
BU Copper Products
FY 14/15
FY 13/14
EBIT (in €m) 137.8 61.4
EBT (in €m) 130.1 55.2
ROCE (%) 12.9 6.0
(Quantities in 1,000 t)
Copper scrap 191 202
KRS throughput 269 301
Cathodes 523 531
Wire rod 764 742
Shapes 170 183
Strip and wire products 216 228

December 2015 25
Stable shareholder structure
Shareholder structure as of Dec 2014
» IPO in 1998 » Aurubis shares are in the Prime
Standard Segment of the Deutsche Börse
» Shares are listed in the MDAX and in the Global Challenges Index (GCX)
~25 %
~40 %
~35 %
Salzgitter AG
Institutional investors
Retail investors

December 2015
5 €
10 €
15 €
20 €
25 €
30 €
35 €
40 €
45 €
50 €
55 €
60 €
65 €
1/04
1/05
1/06
1/07
1/08
1/09
1/10
1/11
1/12
1/13
1/14
1/15
80%
90%
100%
110%
120%
130%
140%
150%
160%
170%
10/1
411
/14
12/1
41/
152/
153/
154/
155/
156/
157/
158/
159/
1510
/15
11/1
512
/15
AurubisDAXMDAX
Development of Aurubis share price
Closing prices of Aurubis shares (Xetra)
200 days average
Comparison of Aurubis shares with indices (September 30, 2014 = 100 %)
Market capitalization December 9, 2015: About € 2.6 billion
26

December 2015
1.20 1.35
1.10 1.00
1.35
10/11 11/12 12/13 13/14 14/15proposal
Executive Board and Supervisory Board propose a dividend payout of € 1.35 in line with the dividend policy
27
Aurubis dividend (in € per share)
51 54
46 51 53
10/11 11/12 12/13 13/14 14/15proposal
Payout ratio (in %)

December 2015
Agenda
28
1. Current situation and market trends
2. Aurubis’ market position
3. Financial data
4. Strategy and outlook

December 2015
Aurubis’ strategic orientation has proven itself and will continue
29
Markets
Solutions for customers &
suppliers
Full synergy potential of value chain
Multi-metal supply and recovery
Internation-alization
Sustainability Core metal copper
Production capability
& innovation
» The core metal, copper, is decisive for success
» Expand multi-metal supply and recovery by increasing production expertise
» Better understand the needs of customers and suppliers and develop new solutions
» Broaden the activities in the value chain – closer internal and external cooperation to achieve this objective
» More investments outside of Germany in order to enhance proximity to supply and sales markets
» Sustainability plays a central role in our activities » Production capability is a strength and driving force
of our success – innovation is the key factor
We will strengthen our leading market position and add more value for our suppliers and customers

December 2015
Main internal projects to enhance profitability
30
Fit for Future Pirdop: » Expanding capacity by about 170,000 t » Optimizing existing facilities Earnings Improvement Project: » Focus on Lünen and Hamburg sites » Improving productivity and processes » Optimizing throughput pix Review of Metallurgical Concepts: » Optimizing existing metallurgical flows for precious metals » Processing more complex input materials
Marketable Slag Product Project: » Reviewing technical possibilities for further reducing copper contents
in the slag » Exploring new sales options for slag

December 2015
Large-scale shutdown in Pirdop scheduled for Q3 2015/16
31
» Primary copper and sulfuric acid production facilities will be renovated in Bulgaria » The last shutdown of this kind in Pirdop was in 2007 » Scheduled shutdown period: about 50 days » Capital expenditure volume: approx. € 44 million » Expected EBT effect: about € 25 million

December 2015
We expect a good fiscal year in 2015/16 again
» Metal prices are currently very volatile and market opinions about future developments diverge considerably
» Continued good availability of copper concentrates should allow for a good volume supply with high TC/RCs
» Restrained market outlook for copper scrap at the moment due to reduced collecting activities resulting from lower metal prices
» Large-scale shutdown at the Pirdop site will cause a € 25 million strain on operating EBT » Sulfuric acid markets are currently under pressure due to a supply surplus and weak
fertilizer markets; ongoing short-term visibility makes a forecast difficult » Aurubis lowered the cathode premium for European customers from US$ 110/t to
US$ 92/t, taking into account expectations of weaker global demand » Current demand level expected to continue in copper product business » Improvement projects initiated in 2015 will partially influence earnings in the coming year,
but significant positive contributions to earnings are expected in future fiscal years
32
We expect both operating EBT and ROCE to be significantly lower in fiscal year 2015/16 compared to the reporting year.

December 2015 33 33 33
Erwin Faust Executive Board Spokesman
Analyst Conference on December 11, 2015
Annual Report
Fiscal Year 2014/15
December 2015

December 2015 34
Dieter Birkholz Senior Specialist +49 40 7883-3969 [email protected]
Angela Seidler Head of Investor Relations +49 40 7883-3178 [email protected]
Elke Brinkmann Senior Specialist +49 40 7883-2379 [email protected]
IR contacts:
Financial calendar
» Interim Report First 3 Months FY 2015/16 February 10, 2016 » Annual General Meeting 2016 February 24, 2016 » Interim Report First 6 Months FY 2015/16 May 10, 2016 » Interim Report First 9 Months FY 2015/16 August 10, 2016 » Annual Report 2015/16 December 14, 2016

December 2015 35
Annex 1: Company profile
» Founded in 1866 as Norddeutsche Affinerie AG in Hamburg » IPO in 1998 » Renamed in 2009 after the acquisition of Cumerio
» Production sites in European countries and North America with about
6,300 employees » Third largest producer of copper cathodes in the world with an annual
output of about 1.1 million t of copper cathodes » No. 1 copper recycler in the world » Largest rod producer in the world » One of the world’s leading copper foil and flat rolled product
manufacturers » Production capacities for approx. 1.3 million t of different copper
products » Global leader in environmental protection
Aurum + Rubrum = the red gold = Aurubis

December 2015
Annex 2: Primary copper production process
36
Copper concentrates
Flash smelter
Off-gas cleaning
Sulfuric acid plant
Anode furnace
Copper scrap
Copper matte (64 % Cu)
Blister copper (98 % Cu)
Converter
Copper (99.5 % Cu)
Anode casting wheel
Anode
Nickel sulfate
Precious metal refining
Anode slime Tankhouse
Cathode

December 2015 37
Annex 3: Aurubis AG’s sources of earnings
TC/RC Treatment and refining charge = Mines’ payments to smelters for processing copper concentrates into cathodes. Smelters’ central profit driver – primarily influenced by concentrate supply and demand
RC Refining charge = Fee for processing copper scrap, blister and recycling materials into cathodes; primarily influenced by the situation on the European scrap markets
Metal prices Price risks fundamentally eliminated at Aurubis by hedging; strong influence on revenues and working capital, also for our customers
Cathode premium Surcharge for high-quality cathodes (Grade A), premium for cathode delivery, paid by the customer; expresses the scarcity in structurally undersupplied markets
Shape surcharge Processing prices for converting cathodes into copper products (wire rod, shapes, flat rolled products, etc.), paid by the customer
Sulfuric acid Sulfuric acid (H2SO4) is a by-product of concentrate processing; 1 t of sulfuric acid is generally produced per t of concentrate treated

December 2015
Annex 4: European cathode premium
110
92
0
20
40
60
80
100
120
140
2000
2001
2002
2003
2004
2005
2006
2007
2008
2009
2010
2011
*201
2
2013
2014
2015
2016
(in US$/t; from June 1, 2012: Aurubis cathode premium )
* from June 1: US$ 86/t 38

December 2015 39
Disclaimer
Forward-looking statements This document contains forward-looking statements that involve risks and uncertainties, including statements about Aurubis’ plans, objectives, expectations and intentions. Readers are cautioned that forward-looking statements include known and unknown risks and are subject to significant business, economic and competitive uncertainties and contingencies, many of which are beyond the control of Aurubis. Should one or more of these risks, uncertainties or contingencies materialize, or should any underlying assumptions prove incorrect, actual results could vary materially from those anticipated, expected, estimated or projected.