annual report - investor.accenture.com/media/files/a/accenture-ir/home/... · their career...
TRANSCRIPT

6strategy | consulting | digital | technology | operations
Annual Report
2 10LEADINGIN THE NEW

FROM OUR CHAIRMAN & CEOPIERRE NANTERME
DELIVERINGIN FISCAL 2016
Here are some highlights:
• We delivered strong new bookings of $35.4 billion, a 7 percent increase in local currency.
• We grew net revenues 10.5 percent in local currency to a record $32.9 billion.
• We delivered diluted earnings per share of $6.45, compared with $4.76 in fiscal 2015. After excluding $1.11 per share in gains on the sale of businesses in fiscal 2016 and a $0.06 per share pension settlement charge in fiscal 2015, adjusted EPS of $5.34 in fiscal 2016 increased 11 percent.
• Our operating margin was 14.6 percent, a 10 basis-point expansion from our adjusted fiscal 2015 operating margin of 14.5 percent, which excludes the 20 basis-point impact of the pension settlement charge.
• We generated free cash flow of $4.1 billion and returned $4.0 billion in cash to shareholders through dividends and share repurchases.
• We announced a 10 percent increase in our semi-annual dividend shortly after fiscal year-end.
Accenture delivered outstanding financial results in fiscal 2016, demonstrating that our growth strategy is resonating with our clients and that we continue to execute very well.
We met or exceeded all of the objectives in our initial business outlook for the year. I am particularly pleased that we delivered double-digit revenue growth in local currency for the second year in a row, gaining significant market share. We also generated strong new bookings and delivered excellent earnings per share and free cash flow—enabling us to return substantial cash to shareholders while making significant investments in our business.

Our durable and balanced performance—across industries, businesses and geographic regions—is particularly impressive in the context of a global economic environment that remains volatile and uncertain. We achieved double-digit revenue growth in local currency for the year in three of our five operating groups and in both North America and Europe, our two largest geographic regions. In the United States—our largest market—we have now delivered double-digit growth in five of the last six years.
Our continued strong financial results, together with our focus on returning cash to shareholders, enabled us to deliver significant shareholder value in fiscal 2016. Accenture shares provided a 24 percent total return (including dividends) for the year ended August 31—11 percentage points above the S&P 500 Index. For the last five fiscal years, our compound annual total return to shareholders has been 19 percent, compared with 15 percent for the S&P 500.
DRIVING DIFFERENTIATIONWe have taken bold strategic actions over the last few years to drive differentiation and make Accenture the leading professional services company in the new digital world. We have aligned Accenture around five distinct businesses, transformed the services we offer and increased our investment in new and high-growth areas.
Our five businesses—Accenture Strategy, Accenture Consulting, Accenture Digital, Accenture Technology and Accenture Operations—all operate at scale and are highly competitive, while also working together synergistically to deliver value for our clients.
Today, the breadth of capabilities we provide—end-to-end—is truly unique in the marketplace. We are highly relevant in the C-suite; we deliver cutting-edge technologies, digital solutions and innovative platforms; and we
operate services on behalf of clients to drive tangible outcomes.
At the same time, we have transformed our services, rotating our business rapidly to what we call “the New”—digital-, cloud- and security-related services—which together accounted for about $13.5 billion or 40 percent of our total revenues in fiscal 2016. That is a substantial increase from approximately 30 percent of revenues just one year ago.
In digital, we bring together our market-leading capabilities in Accenture Interactive, Accenture Analytics and Accenture Mobility:
• Accenture Interactive, which was recognized by Ad Age as the largest and fastest-growing provider of digital marketing services, helps clients ranging from BMW to ENGIE, the global energy company, to transform their digital customer experiences.
• In Accenture Analytics, we are using the Accenture Insights Platform to help clients such as Thames Water in the United Kingdom analyze thousands of sensors and embrace the Internet of Things to transform their decision-making.
• And Accenture Mobility has become one of the world’s leading developers of mobile apps, leveraging the capabilities of our Global Delivery Network to develop more than 2,800 apps releases across iOS, Android and Windows for clients from many different industries.
In cloud, we are focused on building strong platforms for key industries, such as our Accenture Life Sciences Cloud for R&D platform. This truly innovative solution to collect, share and analyze clinical data is now being used by seven top pharmaceutical companies—including Pfizer, Merck, GSK and Lilly—to accelerate drug development and improve patient outcomes.
And in security, our cybersecurity experts are working with many leading companies, providing them with comprehensive next-generation solutions spanning strategy development, risk management, cyber
“ Accenture delivered outstanding financial results in fiscal 2016, demonstrating that our growth strategy is resonating with our clients and that we continue to execute very well.”
2

defense, digital identity, application security and managed security services.
We continue to make substantial investments across our business, particularly in acquisitions. In fiscal 2016, we invested more than $930 million of capital in acquisitions—in addition to about $800 million the prior year—and approximately 70 percent of these investments were in “the New.” Key examples in fiscal 2016 included Cloud Sherpas, a leading cloud advisory and services provider; IMJ Corporation, one of Japan’s largest digital marketing agencies; and several European digital services companies, including MOBGEN in the Netherlands, Tecnilógica in Spain and dgroup in Germany.
We are also investing to enhance our expertise in key industries through acquisitions such as Sagacious Consultants in Health, Beacon Consulting and Formicary in Capital Markets, and Schlumberger Business Consulting and Cimation in Energy.
With our broad range of services and deep industry expertise, Accenture remains the partner of choice for many of the world’s leading companies and largest government agencies on mission-critical transformation programs. We serve more than three-quarters of the FORTUNE Global 500 and 94 of the top 100. We also continue to build strong, long-term relationships with our clients. All of our top 100 clients have been clients for at least five years, and 98 have been clients for 10 years or more.
LEADING WITH INNOVATIONIn today’s fast-changing business environment, where companies need to continually reinvent themselves, we are increasingly leading with innovation to help clients—and Accenture itself—“imagine and invent” the future. Our unique approach, through the Accenture Innovation Architecture, enables us to combine our capabilities across the company to develop and deliver disruptive innovations—and to scale them faster. Our innovation capabilities include:
• Accenture Research identifies and anticipates game-changing business,
market and technology trends through provocative thought leadership. To do this, our researchers leverage techniques such as economic modeling, data science, crowdsourcing, expert networks, online surveys, design thinking and data visualization.
• Accenture Ventures identifies and partners with early-stage companies to capitalize on emerging trends using an open innovation approach. We also selectively invest in growth-stage companies with innovative enterprise technologies that can be a catalyst for our growth. In fiscal 2016, we invested in Digital Asset Holdings, a leading developer of blockchain technology, which is expected to drive significant efficiency gains for financial institutions.
• Accenture Labs incubate and prototype new concepts through applied R&D projects that are expected to have a significant near-term impact on clients’ businesses. We opened two new Labs during the year in Ireland and Israel—focused on artificial intelligence and cybersecurity, respectively—and now have seven Accenture Labs around the world.
• Accenture Studios co-create innovative solutions for clients with speed and agility. We opened several new studios in fiscal 2016, including a Liquid Studio in Silicon Valley —to help clients dramatically accelerate application development— and a Digital Studio for US government clients in Washington, DC.
• Accenture Innovation Centers bring our solutions to scale and demonstrate their impact for clients. Our new Innovation Center in Paris is leveraging our proven ideation methodology, digital technology expertise and deep industry knowledge in an immersive environment to help clients rapidly achieve business results.
• Accenture Delivery Centers industrialize the delivery of our innovations through our unparalleled network of more than 50 delivery centers around the world.
3

A key indicator of our innovation capabilities is our extensive intellectual property portfolio, which today includes more than 5,500 patents and pending patent applications in 44 countries, in addition to our many trade secrets. We have patented innovations in the most disruptive emerging technologies, including artificial intelligence, cybersecurity, drones, virtual agents, Internet of Things, platforms and many more. Our intellectual property is an important asset for Accenture, differentiating our services and driving value in the marketplace.
OUR PEOPLE AND OUR COMMUNITIESOne of Accenture’s highest priorities—as a talent-led organization—is attracting, developing and inspiring the very best people in our industry. Each of our five businesses has a unique talent strategy focused on the highly specialized and differentiated skills needed to serve our clients. In fiscal 2016, we invested $941 million in training and professional development for our people, using digital learning technologies to help deepen skills and drive innovation.
We also pioneered Performance Achievement, our new approach to performance management, which is enabling us to better understand our people’s skills and aspirations, and provide real-time feedback to accelerate their career development. By moving from annual performance reviews to a digitally enabled process featuring ongoing, forward-looking conversations, we are empowering and inspiring our people to succeed professionally as well as personally.
We were very pleased to be recognized once again as one of FORTUNE’s “100 Best Companies to Work For,” as well as one of the “World’s Most Ethical Companies” by the Ethisphere Institute. And we were proud that our work with the United Nations High Commissioner for Refugees to deliver a biometric identity management system earned us a place on FORTUNE’s “Change the World” list of the 50 best companies putting purpose at the center of their business strategies.
We are committed to making a difference in the communities where we work and live—from closing employment gaps, to advancing client sustainability, to accelerating gender equality in the workforce.
Through Skills to Succeed, Accenture and our partners have now equipped more than 1.2 million people around the world with the skills to get a job or build a business since 2010. We are increasingly leveraging technology and digital solutions to scale our impact as we strive to meet our goal of equipping more than 3 million people with workplace or entrepreneurial skills by 2020.
We also remain focused on reducing our environmental impact and have made further progress toward our goal of decreasing our per-employee carbon emissions by more than 50 percent by 2020 from our 2007 baseline. We are using collaborative technologies to connect our people and clients while reducing travel.
Accenture’s commitment to diversity, which starts at the top, makes us stronger smarter and more innovative. We offer an inclusive environment regardless of ethnicity, religion, gender, sexual orientation, age or disability. Our more than 145,000 women make up more than one-third of our global workforce, and we were very pleased to surpass our goal of reaching 40 percent women new hires by 2017.
In closing, I want to thank all Accenture people around the world for their continued hard work and dedication to our clients and our business, which enabled us to deliver another excellent year. We have strong, ongoing momentum in our business and are very well-positioned in the marketplace. With the highly differentiated capabilities we are building, our continued rotation to “the New” and our disciplined management of the business, I am very confident in our ability to continue gaining market share and driving sustainable, profitable growth.
Pierre Nanterme Chairman & CEOOctober 28, 2016
4

We delivered a strong, broad-based financial performance in fiscal 2016, driving superior shareholder value.
Diluted Earnings Per Share
$6.45 After excluding $1.11 in gains on the sale of businesses in fiscal 2016 and a $0.06 pension settlement charge in fiscal 2015, adjusted EPS of $5.34 increased 11 percent from $4.82 in fiscal 2015
Free Cash Flow
$4.1BDefined as operating cash flow of $4.6 billion net of property and equipment additions of $497 million
Net Revenues
$32.9BAn increase of 10.5 percent in local currency and 6 percent in US dollars from fiscal 2015
New Bookings
$35.4BAn increase of 7 percent in local currency and 3 percent in US dollars from fiscal 2015
Operating Margin
14.6%An expansion of 10 basis points from the adjusted 2015 operating margin of 14.5 percent, which excludes a 20 basis-point impact from a pension settlement charge
Cash Returned to Shareholders
$4.0BDefined as cash dividends of $1.4 billion plus share repurchases of $2.6 billion
Twelve months ended August 31, 2016

S&P 500 Stock Index S&P 500 Information Technology Sector IndexAccenture
20122011 2013 2014 2015 2016
$0
$50
$100
$150
$200
$250
$300
Comparison of Cumulative Total ReturnAugust 31, 2011–August 31, 2016Accenture vs. S&P 500 Stock Index and S&P 500 Information Technology Sector Index
The performance graph to the right shows the cumulative total shareholder return on our Class A shares for the period starting on August 31, 2011, and ending on August 31, 2016, which was the end of fiscal 2016. This is compared with the cumulative total returns over the same period of the S&P 500 Stock Index and the S&P 500 Information Technology Sector Index. The graph assumes that, on August 31, 2011, $100 was invested in our Class A shares and $100 was invested in each of the other two indices, with dividends reinvested on the ex-dividend date without payment of any commissions. The performance shown in the graph represents past performance and should not be considered an indication of future performance.
Accenture
S&P 500 Information Technology Sector Index
Index Pricesas of August 31
$100 $126 $133 $178 $182
$100 $118 $141 $162 $193 $241
S&P 500 Stock Index $100 $118 $140 $175 $176 $198
$216
2011 2012 2013 2014 2015 2016
6

STOCK LISTINGAccenture plc Class A ordinary shares are traded on the New York Stock Exchange under the symbol ACN.
AVAILABLE INFORMATIONOur website address is www.accenture.com. We use our website as a channel of distribution for company information. We make available free of charge on the Investor Relations section of our website (investor.accenture.com) our Annual Report on Form 10-K, Quarterly Reports on Form 10-Q, Current Reports on Form 8-K and all amendments to those reports as soon as reasonably practicable after such material is electronically filed with or furnished to the Securities and Exchange Commission (the “SEC”) pursuant to Section 13(a) or 15(d) of the Securities Exchange Act of 1934 (the “Exchange Act”). We also make available through our website other reports filed with or furnished to the SEC under the Exchange Act, including our proxy statements and reports filed by officers and directors under Section 16(a) of the Exchange Act, as well as our Code of Business Ethics. Financial and other material information regarding Accenture is routinely posted on and accessible at investor.accenture.com. We do not intend for information contained in this letter or on our website to be part of the Annual Report on Form 10-K. This letter and our Annual Report on Form 10-K for the fiscal year ended August 31, 2016, together constitute Accenture’s annual report to security holders for purposes of Rule 14a-3(b) of the Exchange Act.
TRADEMARK REFERENCESRights to trademarks referenced herein, other than Accenture trademarks, belong to their respective owners. We disclaim proprietary interest in the marks and names of others.
FORWARD-LOOKING STATEMENTS AND CERTAIN FACTORS THAT MAY AFFECT OUR BUSINESSWe have included in this letter “forward-looking statements” within the meaning of Section 27A of the Securities Act of 1933 and Section 21E of the Exchange Act relating
to our operations, results of operations and other matters that are based on our current expectations, estimates, assumptions and projections. Words such as “will,” “expect,” “believe” and similar expressions are used to identify these forward-looking statements. These statements are not guarantees of future performance and involve risks, uncertainties and assumptions that are difficult to predict. Forward-looking statements are based upon assumptions as to future events that may not prove to be accurate. Actual outcomes and results may differ materially from what is expressed or forecast in these forward-looking statements. Risks, uncertainties and other factors that might cause such differences, some of which could be material, include, but are not limited to, the factors discussed in our Annual Report on Form 10-K and Quarterly Reports on Form 10-Q (available through the Investor Relations section of our website at investor.accenture.com) under the sections entitled “Risk Factors.” Our forward-looking statements speak only as of the date of this letter or as of the date they are made, and we undertake no obligation to update them.
RECONCILIATION OF NON-GAAP MEASURESThis letter contains certain non-GAAP (Generally Accepted Accounting Principles) measures that our management believes provide our shareholders with additional insights into Accenture’s results of operations. The non-GAAP measures in this letter are supplemental in nature. They should not be considered in isolation or as alternatives to net income as indicators of company performance, to cash flows from operating activities as measures of liquidity, or to other financial information prepared in accordance with GAAP. Reconciliations of this non-GAAP financial information to Accenture’s financial statements as prepared under GAAP are included in this letter.
All amounts throughout this letter are stated in US dollars, except where noted.
7

Table of Contents
UNITED STATESSECURITIES AND EXCHANGE COMMISSION
WASHINGTON, D.C. 20549
FORM 10-K(Mark One)
ANNUAL REPORT PURSUANT TO SECTION 13 OR 15(d) OF THE SECURITIES EXCHANGE ACT OF 1934
For the fiscal year ended August 31, 2016 OR
TRANSITION REPORT PURSUANT TO SECTION 13 OR 15(d) OF THE SECURITIES EXCHANGE ACT OF 1934 for the transition period from to
Commission File Number: 001-34448_________________________________
Accenture plc(Exact name of registrant as specified in its charter)
Ireland 98-0627530(State or other jurisdiction of
incorporation or organization)(I.R.S. Employer Identification No.)
1 Grand Canal Square,Grand Canal Harbour,
Dublin 2, Ireland(Address of principal executive offices)
(353) (1) 646-2000(Registrant’s telephone number, including area code)Securities registered pursuant to Section 12(b) of the Act:
Title of each class Name of each exchange on which registeredClass A ordinary shares, par value $0.0000225 per share New York Stock Exchange
Securities registered pursuant to Section 12(g) of the Act:Class X ordinary shares, par value $0.0000225 per share
(Title of Class)Indicate by check mark if the registrant is a well-known seasoned issuer, as defined in Rule 405 of the Securities Act. Yes No Indicate by check mark if the registrant is not required to file reports pursuant to Section 13 or Section 15(d) of the Securities Exchange Act of 1934. Yes No Indicate by check mark whether the registrant (1) has filed all reports required to be filed by Section 13 or 15(d) of the Securities Exchange Act of 1934 during the preceding 12 months (or for such shorter period that the registrant was required to file such reports), and (2) has been subject to such filing requirements for the past 90 days. Yes No Indicate by check mark whether the registrant has submitted electronically and posted on its corporate Web site, if any, every Interactive Data File required to be submitted and posted pursuant to Rule 405 of Regulation S-T (§232.405 of this chapter) during the preceding 12 months (or for such shorter period that the registrant was required to submit and post such files). Yes No Indicate by check mark if disclosure of delinquent filers pursuant to Item 405 of Regulation S-K (§229.405 of this chapter) is not contained herein, and will not be contained, to the best of registrant’s knowledge, in definitive proxy or information statements incorporated by reference in Part III of this Form 10-K or any amendment to this Form 10-K. Indicate by check mark whether the registrant is a large accelerated filer, an accelerated filer, a non-accelerated filer, or a smaller reporting company. See the definitions of “large accelerated filer,” “accelerated filer” and “smaller reporting company” in Rule 12b-2 of the Exchange Act.
Large accelerated filer Accelerated filer Non-accelerated filer Smaller reporting company (Do not check if a smaller reporting company)
Indicate by check mark whether the registrant is a shell company (as defined in Rule 12b-2 of the Act). Yes No The aggregate market value of the common equity of the registrant held by non-affiliates of the registrant on February 29, 2016 was approximately $62,548,022,041 based on the closing price of the registrant’s Class A ordinary shares, par value $0.0000225 per share, reported on the New York Stock Exchange on such date of $100.26 per share and on the par value of the registrant’s Class X ordinary shares, par value $0.0000225 per share.The number of shares of the registrant’s Class A ordinary shares, par value $0.0000225 per share, outstanding as of October 14, 2016 was 655,397,748 (which number includes 35,089,236 issued shares held by the registrant). The number of shares of the registrant’s Class X ordinary shares, par value $0.0000225 per share, outstanding as of October 14, 2016 was 21,875,907.
DOCUMENTS INCORPORATED BY REFERENCEPortions of the definitive proxy statement to be filed with the Securities and Exchange Commission pursuant to Regulation 14A relating to the registrant’s Annual General Meeting of Shareholders, to be held on February 10, 2017, will be incorporated by reference in this Form 10-K in response to Items 10, 11, 12, 13 and 14 of Part III. The definitive proxy statement will be filed with the SEC not later than 120 days after the registrant’s fiscal year ended August 31, 2016.

Table of Contents
TABLE OF CONTENTS
Page
Part IItem 1. BusinessItem 1A. Risk FactorsItem 1B. Unresolved Staff CommentsItem 2. PropertiesItem 3. Legal ProceedingsItem 4. Mine Safety DisclosuresPart IIItem 5. Market for Registrant’s Common Equity, Related Shareholder Matters and Issuer
Purchases of Equity SecuritiesItem 6. Selected Financial DataItem 7. Management’s Discussion and Analysis of Financial Condition and Results of OperationsItem 7A. Quantitative and Qualitative Disclosures about Market RiskItem 8. Financial Statements and Supplementary DataItem 9. Changes in and Disagreements With Accountants on Accounting and Financial DisclosureItem 9A. Controls and ProceduresItem 9B. Other InformationPart IIIItem 10. Directors, Executive Officers and Corporate GovernanceItem 11. Executive CompensationItem 12. Security Ownership of Certain Beneficial Owners and Management and Related
Shareholder MattersItem 13. Certain Relationships and Related Transactions, and Director IndependenceItem 14. Principal Accounting Fees and ServicesPart IVItem 15. Exhibits, Financial Statement SchedulesSignatures
19
22222222
2427284646474747
4848
484949
5053
Table of Contents
1
PART IDisclosure Regarding Forward-Looking Statements
This Annual Report on Form 10-K contains forward-looking statements within the meaning of Section 27A of the Securities Act of 1933 and Section 21E of the Securities Exchange Act of 1934 (the “Exchange Act”) relating to our operations, results of operations and other matters that are based on our current expectations, estimates, assumptions and projections. Words such as “may,” “will,” “should,” “likely,” “anticipates,” “expects,” “intends,” “plans,” “projects,” “believes,” “estimates,” “positioned,” “outlook” and similar expressions are used to identify these forward-looking statements. These statements are not guarantees of future performance and involve risks, uncertainties and assumptions that are difficult to predict. Forward-looking statements are based upon assumptions as to future events that may not prove to be accurate. Actual outcomes and results may differ materially from what is expressed or forecast in these forward-looking statements. Risks, uncertainties and other factors that might cause such differences, some of which could be material, include, but are not limited to, the factors discussed below under the section entitled “Risk Factors.” Our forward-looking statements speak only as of the date of this report or as of the date they are made, and we undertake no obligation to update them.
Available InformationOur website address is www.accenture.com. We use our website as a channel of distribution for company
information. We make available free of charge on the Investor Relations section of our website (http://investor.accenture.com) our Annual Report on Form 10-K, Quarterly Reports on Form 10-Q, Current Reports on Form 8-K and all amendments to those reports as soon as reasonably practicable after such material is electronically filed with or furnished to the Securities and Exchange Commission (the “SEC”) pursuant to Section 13(a) or 15(d) of the Exchange Act. We also make available through our website other reports filed with or furnished to the SEC under the Exchange Act, including our proxy statements and reports filed by officers and directors under Section 16(a) of the Exchange Act, as well as our Code of Business Ethics. Financial and other material information regarding us is routinely posted on and accessible at http://investor.accenture.com. We do not intend for information contained in our website to be part of this Annual Report on Form 10-K.
Any materials we file with the SEC may be read and copied at the SEC’s Public Reference Room at 100 F Street, NE, Washington, DC, 20549. Information on the operation of the Public Reference Room may be obtained by calling the SEC at 1-800-SEC-0330. The SEC maintains an Internet site (http://www.sec.gov) that contains reports, proxy and information statements and other information regarding issuers that file electronically with the SEC.
In this Annual Report on Form 10-K, we use the terms “Accenture,” “we,” the “Company,” “our” and “us” to refer to Accenture plc and its subsidiaries. All references to years, unless otherwise noted, refer to our fiscal year, which ends on August 31.
ITEM 1. BUSINESSOverview
Accenture is one of the world’s leading professional services companies with approximately 384,000 people serving clients in a broad range of industries and in three geographic regions: North America, Europe and Growth Markets (Asia Pacific, Latin America, Africa, the Middle East, Russia and Turkey). Our five operating groups, organized by industry, bring together expertise from across the organization to deliver services and solutions in strategy, consulting, digital, technology including application services, and operations to our clients. Digital-, cloud- and security-related services are increasingly important components of the services we provide. For fiscal 2016, our revenues before reimbursements (“net revenues”) were $32.9 billion.
We operate globally with one common brand and business model, allowing us to provide clients around the world with the same high level of service. Drawing on a combination of industry and functional expertise, technology capabilities and alliances, and our global delivery resources, we seek to provide differentiated services that help our clients measurably improve their business performance and create sustainable value for their customers and stakeholders. Our global delivery model enables us to provide an end-to-end delivery capability by drawing on our global resources to deliver high-quality, cost-effective solutions to our clients.
In fiscal 2016, we continued to implement a strategy focused on industry and technology differentiation, leveraging our global organization to serve clients in locally relevant ways. We continued to make significant investments—in strategic acquisitions, in assets and offerings, in branding and thought leadership, and in attracting and developing talent—to further enhance our differentiation and competitiveness.

Table of Contents
2
Operating Groups Our five operating groups are Accenture’s reporting segments and primary market channel, organized around
13 industry groups that serve clients globally in more than 40 industries. Our industry focus gives us an understanding of industry evolution, business issues and applicable technologies, enabling us to deliver innovative solutions tailored to each client or, as appropriate, more standardized capabilities to multiple clients. The operating groups assemble integrated client engagement teams, which typically consist of industry experts, capability specialists and professionals with local market knowledge. The operating groups have primary responsibility for building and sustaining long-term client relationships; providing management and technology consulting services; working with the other parts of our business to sell and deliver the full range of our services and capabilities; ensuring client satisfaction; and achieving revenue and profitability objectives.
The following table shows the current organization of our five operating groups and their 13 industry groups. We do not allocate total assets by operating group, although our operating groups do manage and control certain assets. For certain historical financial information regarding our operating groups (including certain asset information), as well as financial information by geography (including long-lived asset information), see Note 16 (Segment Reporting) to our Consolidated Financial Statements under Item 8, “Financial Statements and Supplementary Data.”
Operating Groups and Industry GroupsCommunications, Media& Technology Financial Services
Health &Public Service Products Resources
• Communications • Electronics & High Tech • Media & Entertainment
• Banking & Capital Markets
• Insurance
• Health • Public Service
• Consumer Goods, Retail & Travel Services
• Industrial • Life Sciences
• Chemicals & Natural Resources
• Energy • Utilities
Communications, Media & TechnologyOur Communications, Media & Technology operating group serves the communications, electronics, high
technology, media and entertainment industries. Professionals in this operating group help clients accelerate and deliver digital transformation, enhance business results through industry-specific solutions and seize the opportunities made possible by the convergence of communications, computing and content. Examples of our services include helping clients run cost-effective operations, create business model innovations, introduce new products and services, and digitally engage and entertain their customers. Our Communications, Media & Technology operating group comprises the following industry groups:
• Our Communications industry group serves most of the world’s leading wireline, wireless, cable and satellite communications service providers. This group represented approximately 49% of our Communications, Media & Technology operating group’s net revenues in fiscal 2016.
• Our Electronics & High Tech industry group serves the information and communications technology, software, semiconductor, consumer electronics, aerospace and defense, and medical equipment industries. This group represented approximately 37% of our Communications, Media & Technology operating group’s net revenues in fiscal 2016.
• Our Media & Entertainment industry group serves the broadcast, entertainment, print, publishing and Internet/social media industries. This group represented approximately 14% of our Communications, Media & Technology operating group’s net revenues in fiscal 2016.
Financial ServicesOur Financial Services operating group serves the banking, capital markets and insurance industries.
Professionals in this operating group work with clients to address growth, cost and profitability pressures, industry consolidation, regulatory changes and the need to continually adapt to new, digital technologies. We offer services designed to help our clients increase cost efficiency, grow their customer base, manage risk and transform their operations. Our Financial Services operating group comprises the following industry groups:
• Our Banking & Capital Markets industry group serves retail and commercial banks, mortgage lenders, payment providers, investment banks, wealth and asset management firms, broker/dealers, depositories, exchanges, clearing and settlement organizations, and other diversified financial enterprises. This group represented approximately 72% of our Financial Services operating group’s net revenues in fiscal 2016.
• Our Insurance industry group serves property and casualty insurers, life insurers, reinsurance firms and insurance brokers. This group represented approximately 28% of our Financial Services operating group’s net revenues in fiscal 2016.

Table of Contents
3
Health & Public Service Our Health & Public Service operating group serves healthcare payers and providers, as well as government
departments and agencies, public service organizations, educational institutions and non-profit organizations around the world. The group’s research-based insights and offerings, including consulting services and digital solutions, are designed to help clients deliver better social, economic and health outcomes to the people they serve. Our Health & Public Service operating group comprises the following industry groups:
• Our Health industry group works with healthcare providers, such as hospitals, public health systems, policy-making authorities, health insurers (payers), and industry organizations and associations around the world to improve the quality, accessibility and productivity of healthcare. This group represented approximately 39% of our Health & Public Service operating group’s net revenues in fiscal 2016.
• Our Public Service industry group helps governments transform the way they deliver public services and engage with citizens. We work primarily with defense departments and military forces; public safety authorities, such as police forces and border management agencies; justice departments; human services agencies; educational institutions, such as universities; non-profit organizations; and postal, customs, revenue and tax agencies. Our work with clients in the U.S. federal government is delivered through Accenture Federal Services, a U.S. company and a wholly owned subsidiary of Accenture LLP. Our Public Service industry group represented approximately 61% of our Health & Public Service operating group’s net revenues in fiscal 2016. Our work with clients in the U.S. federal government represented approximately 35% of our Health & Public Service operating group’s net revenues in fiscal 2016.
Products Our Products operating group serves a set of increasingly interconnected consumer-relevant industries. Our
offerings are designed to help clients transform their organizations and increase their relevance in the digital world. We help clients enhance their performance in distribution and sales and marketing; in research and development and manufacturing; and in business functions such as finance, human resources, procurement and supply chain while leveraging technology. Our Products operating group comprises the following industry groups:
• Our Consumer Goods, Retail & Travel Services industry group serves food and beverage, household goods, personal care, tobacco, fashion/apparel, agribusiness and consumer health companies; supermarkets, hardline retailers, mass-merchandise discounters, department stores and specialty retailers; as well as airlines and hospitality and travel services companies. This group represented approximately 55% of our Products operating group’s net revenues in fiscal 2016.
• Our Industrial industry group works with automotive manufacturers and suppliers; freight and logistics companies; industrial and electrical equipment, consumer durable and heavy equipment companies; and construction and infrastructure management companies. This group represented approximately 24% of our Products operating group’s net revenues in fiscal 2016.
• Our Life Sciences industry group serves pharmaceutical, medical technology and biotechnology companies. This group represented approximately 21% of our Products operating group’s net revenues in fiscal 2016.
Resources Our Resources operating group serves the chemicals, energy, forest products, metals and mining, utilities and
related industries. We work with clients to develop and execute innovative strategies, improve operations, manage complex change initiatives and integrate digital technologies designed to help them differentiate themselves in the marketplace, gain competitive advantage and manage their large-scale capital investments. Our Resources operating group comprises the following industry groups:
• Our Chemicals & Natural Resources industry group works with a wide range of industry segments, including petrochemicals, specialty chemicals, polymers and plastics, gases and agricultural chemicals, among others, as well as the metals, mining, forest products and building materials industries. This group represented approximately 28% of our Resources operating group’s net revenues in fiscal 2016.
• Our Energy industry group serves a wide range of companies in the oil and gas industry, including upstream, downstream, oil services and new energy companies. This group represented approximately 29% of our Resources operating group’s net revenues in fiscal 2016.
• Our Utilities industry group works with electric, gas and water utilities around the world. This group represented approximately 43% of our Resources operating group’s net revenues in fiscal 2016.
Table of Contents
4
Services and SolutionsOur operating groups bring together expertise from Accenture Strategy, Accenture Consulting, Accenture Digital,
Accenture Technology and Accenture Operations to develop and deliver integrated services and solutions for our clients.
Accenture Strategy Accenture Strategy helps clients achieve specific business outcomes and enhance shareholder value by defining
and executing industry-specific strategies enabled by technology. We bring together our strategy capabilities in business and technology to help senior management teams shape and execute their transformation objectives, focusing on issues related to digital disruption, competitive agility, global operating models and the future workforce. We provide a range of strategy services focused on areas such as digital technologies; enterprise architecture and applications; CFO and enterprise value; IT; security; mergers and acquisitions; operations; advanced customer services; sustainability; and talent and organization.
Accenture ConsultingAccenture Consulting provides industry experts with the insights and management and technology consulting
capabilities to transform the world’s leading companies. Accenture Consulting has primary responsibility for orchestrating expertise from across our entire organization to enable our clients to transform their businesses.
Our consulting capabilities enable our clients to design and implement transformational change programs, either for one or more functions or business units, or across their entire organization. We provide industry-specific consulting services across 13 industry groups, as well as functional and technology consulting services. Our functional and technology consulting services include finance and enterprise performance; supply chain and operations; talent and organization; customers and channels; applications and architecture advisory; and technology advisory. We help our clients with the digital transformation of industries, enhancing our consulting services with digital, cloud, cybersecurity, artificial intelligence and blockchain capabilities.
Accenture DigitalAccenture Digital combines our capabilities in digital marketing, mobility and analytics to help clients provide
better experiences for the customers they serve, create new products and business models, and enhance their digital enterprise capabilities and connections. We provide digital services across three broad areas:
• Accenture Interactive. Our end-to-end marketing solutions help clients deliver seamless multi-channel customer experiences and enhance their marketing performance. Our services span customer experience design, digital marketing, personalization and commerce, as well as digital content production and operations.
• Accenture Mobility. We provide clients with practical innovations in connectivity and the Internet of Things to transform business processes and enable new operating models. Our end-to-end mobility capabilities include collecting and exchanging valuable data through connected devices, mobile applications, embedded software and sensor technology.
• Accenture Analytics. We deliver insight-driven outcomes at scale to help clients improve performance. Our capabilities range from implementing analytics technologies such as big data to advanced mathematical modeling and sophisticated statistical analysis. Our services enhance business performance and productivity outcomes through advanced analytics, artificial intelligence and collaboration capabilities.
Accenture Technology Accenture Technology comprises two primary areas: technology services and technology innovation &
ecosystem.• Technology Services. Technology Services includes our application services spanning systems integration
and application outsourcing and covering the full application lifecycle, from custom systems to all emerging technologies, across every leading technology platform (both traditional and cloud/software-as-a-service-based). It also includes our global delivery capability in Technology and portfolio of products and platforms. We continuously innovate new services and capabilities through early adoption of technologies such as artificial intelligence to enhance productivity and create new growth opportunities.
• Technology Innovation & Ecosystem. We harness innovation through the research and development activities in the Accenture Labs and through emerging technologies. We also manage our technology platforms and our alliance relationships across a broad range of technology providers, including SAP, Oracle, Microsoft,
Table of Contents
5
salesforce.com, Workday, Pegasystems and many others, to enhance the value that we and our clients realize from the technology ecosystem.
Accenture Operations Accenture Operations provides business process services, infrastructure services, security services and cloud
services, including the Accenture Cloud Platform. We operate infrastructure and business processes on behalf of clients, increasingly on an as-a-service basis, to help improve their productivity and performance.
• Business Process Services. We offer services for specific business functions, such as finance and accounting, procurement, marketing, human resources and learning, as well as industry-specific services, such as credit and health services. We provide these services on a global basis and across industry sectors through our Global Delivery Network.
• Infrastructure and Cloud Services. We provide infrastructure and security design, implementation and operation services to help organizations take advantage of innovative technologies and improve the efficiency and effectiveness of their existing technology. Our solutions help clients optimize their IT infrastructures—whether on-premise, in the cloud or a hybrid of the two.
Global Delivery Model A key differentiator is our global delivery model, which allows us to draw on the benefits of using people and
other resources from around the world—including scalable, standardized processes, methods and tools; automation and artificial intelligence; industry expertise and specialized capabilities; cost advantages; foreign language fluency; proximity to clients; and time zone advantages—to deliver high-quality solutions. Emphasizing quality, productivity, reduced risk, speed to market and predictability, our global delivery model supports all parts of our business to provide clients with price-competitive services and solutions.
Our Global Delivery Network continues to be a competitive differentiator for us. As of August 31, 2016, we had approximately 285,000 professionals in our network globally in more than 50 delivery centers around the world, as well as Accenture offices and client locations.
Alliances We have sales and delivery alliances with companies whose capabilities complement our own by, among other
things, enhancing a service offering, delivering a new technology or helping us extend our services to new geographies. By combining our alliance partners’ products and services with our own capabilities and expertise, we create innovative, high-value business solutions for our clients. Most of our alliances are non-exclusive. These alliances can generate significant revenues from services we provide to implement our alliance partners’ products as well as revenue from the resale of their products. We also receive as reimbursement some direct payments, which are not material to our business, from our alliance partners to cover costs we incur for marketing and other assistance.
Research and Innovation We are committed to developing leading-edge ideas. Research and innovation, which is a component of our
overall investment in our business, have been major factors in our success, and we believe they will help us continue to grow in the future. We use our investment in research and development—on which we spent $643 million, $626 million and $640 million in fiscal 2016, 2015 and 2014, respectively—to help create, commercialize and disseminate innovative business strategies and technology solutions. We spend a significant portion of our research and development investment to develop market-ready solutions for our clients.
Our research and innovation program is designed to generate early insights into how knowledge can be harnessed to create innovative business solutions for our clients and to develop business strategies with significant value. Our innovation capabilities include research and thought leadership to identify market and technology trends. We also partner with and invest in growth-stage companies that create innovative enterprise technologies. Our Accenture Labs incubate and prototype new concepts through applied research and development projects. In addition, our studios, innovation centers and delivery centers build, scale and industrialize the delivery of our innovations.
Employees As a talent-led organization, one of our key goals is to have the best talent, with highly specialized skills in each
part of our business, at the right levels in the right locations, to enhance our differentiation and competitiveness. We are deeply committed to the career development of our employees, who receive significant and focused technical, functional, industry, managerial and leadership skill development and training appropriate for their roles and levels within the Company. We provide our people with expert content and opportunities to collaborate in a broad range of
Table of Contents
6
physical and virtual learning environments. We seek to reinforce our employees’ commitments to our clients, culture and values through a comprehensive performance management and compensation system and a career philosophy that provides rewards based on individual and Company performance. With our commitment to inclusion and diversity, we strive to maintain a work environment that reinforces collaboration, motivation and innovation and is consistent with our core values and Code of Business Ethics.
As of August 31, 2016, we employed approximately 384,000 people and had offices and operations in more than 200 cities in 55 countries.
Competition We operate in a highly competitive and rapidly changing global marketplace and compete with a variety of
organizations that offer services and solutions competitive with those we offer. Our competitors include: • large multinational providers, including the services arms of large global technology providers (hardware,
equipment and software), that offer some or all of the services and solutions that we do;• off-shore service providers in lower-cost locations, particularly in India, that offer services globally that are
similar to the services and solutions we offer; • accounting firms that provide consulting and other services and solutions in areas that compete with us; • niche solution or service providers or local competitors that compete with us in a specific geographic market,
industry segment or service area, including digital agencies and emerging start-ups and other companies that can scale rapidly to focus on certain markets and provide new or alternative products, services or delivery models; and
• in-house departments of large corporations that use their own resources, rather than engage an outside firm for the types of services and solutions we provide.
Our revenues are derived primarily from Fortune Global 500 and Fortune 1000 companies, medium-sized companies, governments, government agencies and other enterprises. We believe that the principal competitive factors in the industries in which we compete include:
• skills and capabilities of people; • technical and industry expertise; • innovative service and product offerings; • ability to add business value and improve performance; • reputation and client references; • contractual terms, including competitive pricing; • ability to deliver results reliably and on a timely basis; • scope of services; • service delivery approach; • quality of services and solutions;• availability of appropriate resources; and• global reach and scale, including level of presence in key emerging markets.Our clients typically retain us on a non-exclusive basis.
Intellectual Property We provide value to our clients based in part on a differentiated range of proprietary inventions, methodologies,
software, reusable knowledge capital and other intellectual property. We recognize the increasing value of intellectual property in the marketplace and create, harvest, and protect this intellectual property. We leverage patent, trade secret, copyright and trademark laws as well as contractual arrangements to protect our intellectual property. We have also established policies to respect the intellectual property rights of third parties, such as our clients, partners and others.
As of August 31, 2016, we had over 2,475 patent applications pending worldwide and had been issued over 1,250 U.S. patents and 1,750 non-U.S. patents.
Trademarks appearing in this report are the trademarks or registered trademarks of Accenture Global Services Ltd or third parties, as applicable.

Table of Contents
7
Organizational StructureAccenture plc is an Irish public limited company with no material assets other than ordinary and deferred shares
in its subsidiary, Accenture Holdings plc, an Irish public limited company. Accenture plc owns a majority voting interest in Accenture Holdings plc, and Accenture plc’s only business is to hold these shares. As a result, Accenture plc controls Accenture Holdings plc’s management and operations and consolidates Accenture Holdings plc’s results in its Consolidated Financial Statements. We operate our business through subsidiaries of Accenture Holdings plc. Accenture Holdings plc generally reimburses Accenture plc for its expenses but does not pay Accenture plc any fees.
HistoryPrior to our transition to a corporate structure in fiscal 2001, we operated as a series of related partnerships and
corporations under the control of our partners. In connection with our transition to a corporate structure, our partners generally exchanged all of their interests in these partnerships and corporations for Accenture Ltd Class A common shares or, in the case of partners in certain countries, Class I common shares of Accenture SCA, a Luxembourg partnership limited by shares and direct subsidiary of Accenture Ltd (“Accenture SCA”), or exchangeable shares issued by Accenture Canada Holdings Inc., an indirect subsidiary of Accenture SCA. Generally, partners who received Accenture SCA Class I common shares or Accenture Canada Holdings Inc. exchangeable shares also received a corresponding number of Accenture Ltd Class X common shares, which entitled their holders to vote at Accenture Ltd shareholder meetings but did not carry any economic rights. The combination of the Accenture Ltd Class X common shares and the Accenture SCA Class I common shares or Accenture Canada Holdings Inc. exchangeable shares gave these partners substantially similar economic and governance rights as holders of Accenture Ltd Class A common shares.
On June 10, 2009, Accenture plc was incorporated in Ireland, as a public limited company, in order to effect moving the place of incorporation of our parent holding company from Bermuda to Ireland. This transaction was completed on September 1, 2009, at which time Accenture Ltd, our predecessor holding company, became a wholly owned subsidiary of Accenture plc and Accenture plc became our parent holding company. Accenture Ltd was dissolved on December 29, 2009.
On April 10, 2015, Accenture Holdings plc was incorporated in Ireland, as a public limited company, in order to further consolidate Accenture’s presence in Ireland. On August 26, 2015, Accenture SCA merged with and into Accenture Holdings plc, with Accenture Holdings plc as the surviving entity. This merger was a transaction between entities under common control and had no effect on the Company’s Consolidated Financial Statements.
All references to Accenture Holdings plc included in this report with respect to periods prior to August 26, 2015 reflect the activity and/or balances of Accenture SCA (the predecessor of Accenture Holdings plc). The Consolidated Financial Statements reflect the ownership interests in Accenture Holdings plc and Accenture Canada Holdings Inc. held by certain current and former members of Accenture Leadership as noncontrolling interests. “Accenture Leadership” is comprised of members of our global management committee (the Company’s primary management and leadership team, which consists of approximately 20 of our most senior leaders), senior managing directors and managing directors. The noncontrolling ownership interests percentage was 4% as of August 31, 2016.
Accenture plc Class A and Class X Ordinary SharesEach Class A ordinary share and each Class X ordinary share of Accenture plc entitles its holder to one vote on
all matters submitted to a vote of shareholders of Accenture plc. A Class X ordinary share does not, however, entitle its holder to receive dividends or to receive payments upon a liquidation of Accenture plc. As described above under “—History,” Class X ordinary shares generally provide the holders of Accenture Holdings plc ordinary shares and Accenture Canada Holdings Inc. exchangeable shares with a vote at Accenture plc shareholder meetings that is equivalent to the voting rights held by Accenture plc Class A ordinary shareholders, while their economic rights consist of interests in Accenture Holdings plc ordinary shares or in Accenture Canada Holdings Inc. exchangeable shares.
Under its memorandum and articles of association, Accenture plc may redeem, at its option, any Class X ordinary share for a redemption price equal to the nominal value of the Class X ordinary share, or $0.0000225 per share. Accenture plc, as successor to Accenture Ltd, has separately agreed with the original holders of Accenture Holdings plc ordinary shares and Accenture Canada Holdings Inc. exchangeable shares not to redeem any Class X ordinary share of such holder if the redemption would reduce the number of Class X ordinary shares held by that holder to a number that is less than the number of Accenture Holdings plc ordinary shares or Accenture Canada Holdings Inc. exchangeable shares owned by that holder. Accenture plc will redeem Class X ordinary shares upon the redemption or exchange of Accenture Holdings plc ordinary shares and Accenture Canada Holdings Inc. exchangeable shares so that the aggregate number of Class X ordinary shares outstanding at any time does not exceed the aggregate number

Table of Contents
8
of Accenture Holdings plc ordinary shares and Accenture Canada Holdings Inc. exchangeable shares outstanding. Class X ordinary shares are not transferable without the consent of Accenture plc.
A transfer of Accenture plc Class A ordinary shares effected by transfer of a book-entry interest in The Depository Trust Company will not be subject to Irish stamp duty. Other transfers of Accenture plc Class A ordinary shares may be subject to Irish stamp duty (currently at the rate of 1% of the price paid or the market value of the Class A ordinary shares acquired, if higher) payable by the buyer.
Accenture Holdings plc Ordinary and Deferred Shares
Only Accenture plc, Accenture Holdings plc, Accenture International S.à.r.l. and certain current and former members of Accenture Leadership and their permitted transferees hold Accenture Holdings plc ordinary shares. Each ordinary share entitles its holder to one vote on all matters submitted to the shareholders of Accenture Holdings plc and entitles its holder to dividends and liquidation payments. As of October 14, 2016, Accenture plc holds a voting interest of approximately 96% of the aggregate outstanding Accenture Holdings plc ordinary shares entitled to vote, with the remaining 4% of the voting interest held by certain current and former members of Accenture Leadership and their permitted transferees.
Only Accenture plc beneficially holds Accenture Holdings plc deferred shares. The deferred shares were issued solely to ensure that Accenture Holdings plc satisfies Irish law minimum share capital requirements for public limited companies at all times and carry no voting rights or income rights and have only limited rights on a return of capital equal to the nominal value of those shares.
Holders of ordinary shares of Accenture Holdings plc have the ability, subject to the restrictions on redemption contained in Accenture Holdings plc’s articles of association and the Companies Act 2014 of Ireland (the “Companies Act”) and any contractual restrictions on redemption that may be applicable to a holder, to require that Accenture Holdings plc redeem all or a portion of such holder’s ordinary shares of Accenture Holdings plc. In that case, Accenture Holdings plc is obligated, subject to the availability of distributable reserves, to redeem any such ordinary shares of Accenture Holdings plc. The redemption price per share generally equals the average of the high and low sale prices of a Class A ordinary share of Accenture plc as reported on the New York Stock Exchange on the trading day on which Accenture Holdings plc receives an irrevocable notice of redemption from a holder of ordinary shares of Accenture Holdings plc if received prior to close of trading for that day, or on the following trading day if Accenture Holdings plc receives the irrevocable notice of redemption later than the close of trading on that day. Accenture Holdings plc may, at its option, pay the redemption price in cash or by instructing Accenture plc to deliver Class A ordinary shares on a one-for-one basis, subject to adjustment for dividends and share splits. In order to maintain Accenture plc’s economic interest in Accenture Holdings plc, Accenture plc generally will acquire additional Accenture Holdings plc ordinary shares each time additional Accenture plc Class A ordinary shares are issued.
Except in the case of a redemption of Accenture Holdings plc ordinary shares or a transfer of Accenture Holdings plc ordinary shares to Accenture plc or one of its subsidiaries, Accenture Holdings plc’s articles of association provide that Accenture Holdings plc ordinary shares may be transferred only with the consent of the Board of Directors of Accenture Holdings plc. In addition, all holders of ordinary shares (except Accenture plc) are precluded from having their shares redeemed by Accenture Holdings plc or transferred to Accenture Holdings plc, Accenture plc or a subsidiary of Accenture plc at any time or during any period when Accenture Holdings plc determines, based on the advice of counsel, that there is material non-public information that may affect the average price per share of Accenture plc Class A ordinary shares, if the redemption would be prohibited by applicable law or regulation, or during the period from the announcement of a tender offer by Accenture Holdings plc or its affiliates for Accenture Holdings plc ordinary shares, or any securities convertible into, or exchangeable or exercisable for, ordinary shares, until the expiration of ten business days after the termination of the tender offer (other than to tender the holder’s Accenture Holdings plc ordinary shares in the tender offer).
Accenture Canada Holdings Inc. Exchangeable SharesHolders of Accenture Canada Holdings Inc. exchangeable shares may exchange their shares for Accenture plc
Class A ordinary shares at any time on a one-for-one basis. Accenture may, at its option, satisfy this exchange with cash at a price per share generally equal to the market price of an Accenture plc Class A ordinary share at the time of the exchange. Each exchangeable share of Accenture Canada Holdings Inc. entitles its holder to receive distributions equal to any distributions to which an Accenture plc Class A ordinary share entitles its holder. The exchange of all of the outstanding Accenture Canada Holdings Inc. exchangeable shares for Accenture plc Class A ordinary shares would not have a material impact on the equity ownership position of Accenture or the other shareholders of Accenture Holdings plc.

Table of Contents
9
ITEM 1A. RISK FACTORS In addition to the other information set forth in this report, you should carefully consider the following factors which
could materially adversely affect our business, financial condition, results of operations (including revenues and profitability) and/or stock price. Our business is also subject to general risks and uncertainties that may broadly affect companies, including us. Additional risks and uncertainties not currently known to us or that we currently deem to be immaterial also could materially adversely affect our business, financial condition, results of operations and/or stock price.
Our results of operations could be adversely affected by volatile, negative or uncertain economic conditions and the effects of these conditions on our clients’ businesses and levels of business activity.
Global macroeconomic conditions affect our clients’ businesses and the markets they serve. Volatile, negative or uncertain economic conditions in our significant markets have undermined and could in the future undermine business confidence in our significant markets or in other markets, which are increasingly interdependent, and cause our clients to reduce or defer their spending on new initiatives and technologies, or may result in clients reducing, delaying or eliminating spending under existing contracts with us, which would negatively affect our business. Growth in the markets we serve could be at a slow rate, or could stagnate or contract, in each case, for an extended period of time. Differing economic conditions and patterns of economic growth and contraction in the geographical regions in which we operate and the industries we serve have affected and may in the future affect demand for our services and solutions. A material portion of our revenues and profitability is derived from our clients in North America and Europe. Weak demand in these markets could have a material adverse effect on our results of operations. In addition, because we operate globally and have significant businesses in markets outside of North America and Europe, an economic slowdown in one or more of those other markets could adversely affect our results of operations as well. Ongoing economic volatility and uncertainty and changing demand patterns affect our business in a number of other ways, including making it more difficult to accurately forecast client demand and effectively build our revenue and resource plans, particularly in consulting.
Economic volatility and uncertainty is particularly challenging because it may take some time for the effects and changes in demand patterns resulting from these and other factors to manifest themselves in our business and results of operations. Changing demand patterns from economic volatility and uncertainty could have a significant negative impact on our results of operations.
Our business depends on generating and maintaining ongoing, profitable client demand for our services and solutions, including through the adaptation and expansion of our services and solutions in response to ongoing changes in technology and offerings, and a significant reduction in such demand or an inability to respond to the evolving technological environment could materially affect our results of operations.
Our revenue and profitability depend on the demand for our services and solutions with favorable margins, which could be negatively affected by numerous factors, many of which are beyond our control and unrelated to our work product. As described above, volatile, negative or uncertain global economic conditions and lower growth in the markets we serve have adversely affected and could in the future adversely affect client demand for our services and solutions. Our success depends, in part, on our ability to continue to develop and implement services and solutions that anticipate and respond to rapid and continuing changes in technology and offerings to serve the evolving needs of our clients. Examples of areas of significant change include digital-, cloud- and security-related offerings, which are continually evolving as developments such as artificial intelligence, automation, blockchain, Internet of Things and as-a-service solutions are commercialized. Technological developments such as these may materially affect the cost and use of technology by our clients and, in the case of as-a-service solutions, could affect the nature of how we generate revenue. Some of these technologies, such as cloud-based services, artificial intelligence and automation, and others that may emerge, have reduced and replaced some of our historical services and solutions and may continue to do so in the future. This has caused, and may in the future cause, clients to delay spending under existing contracts and engagements and to delay entering into new contracts while they evaluate new technologies. Such delays can negatively impact our results of operations if the pace and level of spending on new technologies is not sufficient to make up any shortfall.
Developments in the industries we serve, which may be rapid, also could shift demand to new services and solutions. If, as a result of new technologies or changes in the industries we serve, our clients demand new services and solutions, we may be less competitive in these new areas or need to make significant investment to meet that demand. Our growth strategy focuses on responding to these types of developments by driving innovation that will enable us to expand our business into new growth areas. If we do not sufficiently invest in new technology and adapt to industry developments, or evolve and expand our business at sufficient speed and scale, or if we do not make the right strategic investments to respond to these developments and successfully drive innovation, our services and

Table of Contents
10
solutions, our results of operations, and our ability to develop and maintain a competitive advantage and to execute on our growth strategy could be negatively affected.
We operate in a rapidly evolving environment in which there currently are, and we expect will continue to be, new technology entrants. New services or technologies offered by competitors or new entrants may make our offerings less differentiated or less competitive when compared to other alternatives, which may adversely affect our results of operations. In addition, companies in the industries we serve sometimes seek to achieve economies of scale and other synergies by combining with or acquiring other companies. If one of our current clients merges or consolidates with a company that relies on another provider for the services and solutions we offer, we may lose work from that client or lose the opportunity to gain additional work if we are not successful in generating new opportunities from the merger or consolidation. At any given time in a particular industry or geography, one or a small number of clients could contribute a significant portion of our revenues, and any decision by such a client to delay, reduce, or eliminate spending on our services and solutions could have a disproportionate impact on the results of operations in the relevant industry and/or geography.
Many of our consulting contracts are less than 12 months in duration, and these contracts typically permit a client to terminate the agreement with as little as 30 days’ notice. Longer-term, larger and more complex contracts, such as the majority of our outsourcing contracts, generally require a longer notice period for termination and often include an early termination charge to be paid to us, but this charge might not be sufficient to cover our costs or make up for anticipated ongoing revenues and profits lost upon termination of the contract. Many of our contracts allow clients to terminate, delay, reduce or eliminate spending on the services and solutions we provide. Additionally, a client could choose not to retain us for additional stages of a project, try to renegotiate the terms of its contract or cancel or delay additional planned work. When contracts are terminated or not renewed, we lose the anticipated revenues, and it may take significant time to replace the level of revenues lost. Consequently, our results of operations in subsequent periods could be materially lower than expected. The specific business or financial condition of a client, changes in management and changes in a client’s strategy are also all factors that can result in terminations, cancellations or delays.
If we are unable to keep our supply of skills and resources in balance with client demand around the world and attract and retain professionals with strong leadership skills, our business, the utilization rate of our professionals and our results of operations may be materially adversely affected.
Our success is dependent, in large part, on our ability to keep our supply of skills and resources in balance with client demand around the world and our ability to attract and retain personnel with the knowledge and skills to lead our business globally. Experienced personnel in our industry are in high demand, and competition for talent is intense. We must hire, retain and motivate appropriate numbers of talented people with diverse skills in order to serve clients across the globe, respond quickly to rapid and ongoing technology, industry and macroeconomic developments and grow and manage our business. For example, if we are unable to hire or continually train our employees to keep pace with the rapid and continuing changes in technology and the industries we serve or changes in the types of services and solutions clients are demanding, we may not be able to develop and deliver new services and solutions to fulfill client demand. As we expand our services and solutions, we must also hire and retain an increasing number of professionals with different skills and professional expectations than those of the professionals we have historically hired and retained. Additionally, if we are unable to successfully integrate, motivate and retain these professionals, our ability to continue to secure work in those industries and for our services and solutions may suffer.
We are particularly dependent on retaining members of Accenture Leadership and other experienced managers, and if we are unable to do so, our ability to develop new business and effectively manage our current contracts and client relationships could be jeopardized. We depend on identifying, developing and retaining key employees to provide leadership and direction for our businesses. This includes developing talent and leadership capabilities in emerging markets, where the depth of skilled employees is often limited and competition for these resources is intense. Our ability to expand geographically depends, in large part, on our ability to attract, retain and integrate both leaders for the local business and people with the appropriate skills.
Similarly, our profitability depends on our ability to effectively utilize personnel with the right mix of skills and experience to perform services for our clients, including our ability to transition employees to new assignments on a timely basis. If we are unable to effectively deploy our employees globally on a timely basis to fulfill the needs of our clients, our profitability could suffer. If the utilization rate of our professionals is too high, it could have an adverse effect on employee engagement and attrition, the quality of the work performed as well as our ability to staff projects. If our utilization rate is too low, our profitability and the engagement of our employees could suffer. The costs associated with recruiting and training employees are significant. An important element of our global business model is the deployment of our employees around the world, which allows us to move talent as needed. Therefore, if we are not able to deploy the talent we need because of increased regulation of immigration or work visas, including limitations

Table of Contents
11
placed on the number of visas granted, limitations on the type of work performed or location in which the work can be performed, and new or higher minimum salary requirements, it could be more difficult to staff our employees on client engagements and could increase our costs.
Our equity-based incentive compensation plans are designed to reward high-performing personnel for their contributions and provide incentives for them to remain with us. If the anticipated value of such incentives does not materialize because of volatility or lack of positive performance in our stock price, or if our total compensation package is not viewed as being competitive, our ability to attract and retain the personnel we need could be adversely affected. In addition, if we do not obtain the shareholder approval needed to continue granting equity awards under our share plans in the amounts we believe are necessary, our ability to attract and retain personnel could be negatively affected.
There is a risk that at certain points in time, and in certain geographical regions, we will find it difficult to hire and retain a sufficient number of employees with the skills or backgrounds to meet current and/or future demand. In these cases, we might need to redeploy existing personnel or increase our reliance on subcontractors to fill certain labor needs, and if not done effectively, our profitability could be negatively impacted. Additionally, if demand for our services and solutions were to escalate at a high rate, we may need to adjust our compensation practices, which could put upward pressure on our costs and adversely affect our profitability if we are unable to recover these increased costs. At certain times, however, we may also have more personnel than we need in certain skill sets or geographies or at compensation levels that are not aligned with skill sets. In these situations, we have engaged, and may in the future engage, in actions to rebalance our resources, including through reduced levels of new hiring and increased involuntary terminations as a means to keep our supply of skills and resources in balance with client demand. If we are not successful in these initiatives, our results of operations could be adversely affected.
The markets in which we compete are highly competitive, and we might not be able to compete effectively. The markets in which we offer our services and solutions are highly competitive. Our competitors include: • large multinational providers, including the services arms of large global technology providers (hardware,
equipment and software), that offer some or all of the services and solutions that we do;• off-shore service providers in lower-cost locations, particularly in India, that offer services globally that are
similar to the services and solutions we offer; • accounting firms that provide consulting and other services and solutions in areas that compete with us; • niche solution or service providers or local competitors that compete with us in a specific geographic market,
industry segment or service area, including digital agencies and emerging start-ups and other companies that can scale rapidly to focus on certain markets and provide new or alternative products, services or delivery models; and
• in-house departments of large corporations that use their own resources, rather than engage an outside firm for the types of services and solutions we provide.
Some competitors may have greater financial, marketing or other resources than we do and, therefore, may be better able to compete for new work and skilled professionals, may be able to innovate and provide new services and solutions faster than we can or may be able to anticipate the need for services and solutions before we do.
Even if we have potential offerings that address marketplace or client needs, competitors may be more successful at selling similar services they offer, including to companies that are our clients. Some competitors are more established in certain markets, and that may make executing our geographic expansion strategy in these markets more challenging. Additionally, competitors may also offer more aggressive contractual terms, which may affect our ability to win work. Our future performance is largely dependent on our ability to compete successfully in the markets we currently serve, while expanding into additional markets. If we are unable to compete successfully, we could lose market share and clients to competitors, which could materially adversely affect our results of operations.
In addition, we may face greater competition due to consolidation of companies in the technology sector through strategic mergers or acquisitions. Consolidation activity may result in new competitors with greater scale, a broader footprint or offerings that are more attractive than ours. Over time, our access to certain technology products and services may be reduced as a result of this consolidation. Additionally, vertically integrated companies are able to offer as a single provider more integrated services (software and hardware) to clients than we can in some cases and therefore may represent a more attractive alternative to clients. If buyers of services favor using a single provider for an integrated technology stack, such buyers may direct more business to such competitors, and this could materially adversely affect our competitive position and our results of operations.

Table of Contents
12
We could have liability or our reputation could be damaged if we fail to protect client and/or Accenture data from security breaches or cyberattacks.
We are dependent on information technology networks and systems to securely process, transmit and store electronic information and to communicate among our locations around the world and with our clients, alliance partners and vendors. As the breadth and complexity of this infrastructure continues to grow, including as a result of the use of mobile technologies, social media and cloud-based services, the potential risk of security breaches and cyberattacks increases. Such breaches could lead to shutdowns or disruptions of our systems and potential unauthorized disclosure of sensitive or confidential information, including personal data.
In providing services and solutions to clients, we often manage, utilize and store sensitive or confidential client or Accenture data, including personal data, and we expect these activities to increase, including through the use of analytics. Unauthorized disclosure of sensitive or confidential client or Accenture data, whether through systems failure, employee negligence, fraud or misappropriation, could damage our reputation, cause us to lose clients and could result in significant financial exposure. Similarly, unauthorized access to or through our information systems or those we develop for our clients, whether by our employees or third parties, including a cyberattack by computer programmers, hackers, members of organized crime and/or state-sponsored organizations, who may develop and deploy viruses or other malicious software programs or social engineering attacks, could result in negative publicity, significant remediation costs, legal liability, damage to our reputation and government sanctions and could have a material adverse effect on our results of operations. Cybersecurity threats are constantly evolving, thereby increasing the difficulty of detecting and defending against them.
We are subject to numerous laws and regulations designed to protect this information, such as the national laws implementing the European Union Directive on Data Protection (which will be replaced by the European Union General Data Protection Regulation from 2018 onwards), various U.S. federal and state laws governing the protection of health or other personally identifiable information and data privacy and cybersecurity laws in other regions. These laws and regulations are increasing in complexity and number, change frequently and sometimes conflict among the various countries in which we operate. If any person, including any of our employees, negligently disregards or intentionally breaches our established controls with respect to client or Accenture data, or otherwise mismanages or misappropriates that data, we could be subject to significant litigation, monetary damages, regulatory enforcement actions, fines and/or criminal prosecution in one or more jurisdictions. These monetary damages might not be subject to a contractual limit of liability or an exclusion of consequential or indirect damages and could be significant. In addition, our liability insurance, which includes cyber insurance, might not be sufficient in type or amount to cover us against claims related to security breaches, cyberattacks and other related breaches.Our profitability could materially suffer if we are unable to obtain favorable pricing for our services and solutions, if we are unable to remain competitive, if our cost-management strategies are unsuccessful or if we experience delivery inefficiencies.
Our profitability is highly dependent on a variety of factors and could be materially impacted by any of the following:Our results of operations could materially suffer if we are not able to obtain sufficient pricing to meet our profitability
expectations. If we are not able to obtain favorable pricing for our services and solutions, our revenues and profitability could materially suffer. The rates we are able to charge for our services and solutions are affected by a number of factors, including:
• general economic and political conditions; • our clients’ desire to reduce their costs; • the competitive environment in our industry; • our ability to accurately estimate our service delivery costs, upon which our pricing is sometimes determined,
includes our ability to estimate the impact of inflation and foreign exchange on our service delivery costs over long-term contracts; and
• the procurement practices of clients and their use of third-party advisors. Our profitability could suffer if we are not able to remain competitive. The competitive environment in our industry
affects our ability to secure new contracts at our target economics in a number of ways, any of which could have a material negative impact on our results of operations. The less we are able to differentiate our services and solutions and/or clearly convey the value of our services and solutions, the more risk we have in winning new work in sufficient volumes and at our target pricing and overall economics. In addition, the introduction of new services or products by competitors could reduce our ability to obtain favorable pricing and impact our overall economics for the services or solutions we offer. Competitors may be willing, at times, to price contracts lower than us in an effort to enter the market or increase market share.

Table of Contents
13
Our profitability could suffer if our cost-management strategies are unsuccessful, and we may not be able to improve our profitability to the degree we have done in the past. Our ability to improve or maintain our profitability is dependent on our being able to successfully manage our costs. Our cost management strategies include maintaining appropriate alignment between the demand for our services and solutions and our resource capacity. We have also taken actions to reduce certain costs, and these initiatives include, without limitation, re-alignment of portions of our workforce to lower-cost locations and the use of involuntary terminations as a means to keep our supply of skills and resources in balance. These actions and our other cost-management efforts may not be successful, our efficiency may not be enhanced and we may not achieve desired levels of profitability. Because of the significant steps taken in the past to manage costs, it may become increasingly difficult to continue to manage our cost structure to the same degree as in the past. If we are not effective in managing our operating costs in response to changes in demand or pricing, or if we are unable to recover employee compensation increases through improved pricing, automation or the movement of work to lower-cost locations, we may not be able to continue to invest in our business in an amount necessary to achieve our planned rates of growth, we may not be able to reward our people in the manner we believe is necessary to attract or retain personnel at desired levels, and our results of operations could be materially adversely affected.
If we do not accurately anticipate the cost, risk and complexity of performing our work or if third parties upon whom we rely do not meet their commitments, then our contracts could have delivery inefficiencies and be less profitable than expected or unprofitable. Our contract profitability is highly dependent on our forecasts regarding the effort and cost necessary to deliver our services and solutions, which are based on available data and could turn out to be materially inaccurate. If we do not accurately estimate the effort, costs or timing for meeting our contractual commitments and/or completing engagements to a client’s satisfaction, our contracts could yield lower profit margins than planned or be unprofitable. Similarly, if we experience unanticipated delivery difficulties due to our management, the failure of third parties to meet their commitments or for any other reason, our contracts could yield lower profit margins than planned or be unprofitable. In particular, large and complex arrangements often require that we utilize subcontractors or that our services and solutions incorporate or coordinate with the software, systems or infrastructure requirements of other vendors and service providers, including companies with which we have alliances. Our profitability depends on the ability of these subcontractors, vendors and service providers to deliver their products and services in a timely manner and in accordance with the project requirements, as well as on our effective oversight of their performance. In some cases, these subcontractors are small firms, and they might not have the resources or experience to successfully integrate their services or products with large-scale engagements or enterprises. Some of this work involves new technologies, which may not work as intended or may take more effort to implement than initially predicted. In addition, certain client work requires the use of unique and complex structures and alliances, some of which require us to assume responsibility for the performance of third parties whom we do not control. Any of these factors could adversely affect our ability to perform and subject us to additional liabilities, which could have a material adverse effect on our relationships with clients and on our results of operations.
Changes in our level of taxes, as well as audits, investigations and tax proceedings, or changes in tax laws or in their interpretation or enforcement, could have a material adverse effect on our effective tax rate, results of operations, cash flows and financial condition.
We are subject to taxes in numerous jurisdictions. We calculate and provide for taxes in each tax jurisdiction in which we operate. Tax accounting often involves complex matters and requires our judgment to determine our worldwide provision for income taxes and other tax liabilities. We are subject to ongoing audits, investigations and tax proceedings in various jurisdictions. Tax authorities have disagreed, and may in the future disagree, with our judgments, or may take increasingly aggressive positions opposing the judgments we make, including with respect to our intercompany transactions. We regularly assess the likely outcomes of our audits, investigations and tax proceedings to determine the appropriateness of our tax liabilities. However, our judgments might not be sustained as a result of these audits, investigations and tax proceedings, and the amounts ultimately paid could be materially different from the amounts previously recorded. In addition, our effective tax rate in the future could be adversely affected by the expiration of current tax benefits, changes in the mix of earnings in countries with differing statutory tax rates, challenges to our intercompany transactions, changes in the valuation of deferred tax assets and liabilities and changes in tax laws or in their interpretation or enforcement. Tax rates in the jurisdictions in which we operate may change as a result of macroeconomic or other factors outside of our control. In addition, changes in tax laws, treaties or regulations, or their interpretation or enforcement, have become more unpredictable and may become more stringent, which could materially adversely affect our tax position.
The overall tax environment has made it increasingly challenging for multinational corporations to operate with certainty about taxation in many jurisdictions. For example, the European Commission has been conducting investigations, focusing on whether local country tax rulings or tax legislation provide preferential tax treatment that violates European Union state aid rules. In addition, the Organization for Economic Co-operation and Development,

Table of Contents
14
which represents a coalition of member countries, is supporting changes to numerous long-standing tax principles through its base erosion and profit shifting project, which is focused on a number of issues, including the shifting of profits among affiliated entities located in different tax jurisdictions. Furthermore, a number of countries where we do business, including the United States and many countries in the European Union, are considering changes in relevant tax, accounting and other laws, regulations and interpretations, including changes to tax laws applicable to multinational corporations. The increasingly complex global tax environment could have a material adverse effect on our effective tax rate, results of operations, cash flows and financial condition.
Although we expect to be able to rely on the tax treaty between the United States and Ireland, legislative or diplomatic action could be taken, or the treaty may be amended in such a way, that would prevent us from being able to rely on such treaty. Our inability to rely on the treaty would subject us to increased taxation or significant additional expense. In addition, congressional proposals could change the definition of a U.S. person for U.S. federal income tax purposes, which could also subject us to increased taxation. In addition, we could be materially adversely affected by future changes in tax law or policy (or in their interpretation or enforcement) in Ireland or other jurisdictions where we operate, including their treaties with Ireland or the United States. These changes could be exacerbated by economic, budget or other challenges facing Ireland or these other jurisdictions.
Our results of operations could be materially adversely affected by fluctuations in foreign currency exchange rates.
Although we report our results of operations in U.S. dollars, a majority of our net revenues is denominated in currencies other than the U.S. dollar. Unfavorable fluctuations in foreign currency exchange rates have had an adverse effect, and could in the future have a material adverse effect, on our results of operations.
Because our consolidated financial statements are presented in U.S. dollars, we must translate revenues, expenses and income, as well as assets and liabilities, into U.S. dollars at exchange rates in effect during or at the end of each reporting period. Therefore, changes in the value of the U.S. dollar against other currencies will affect our net revenues, operating income and the value of balance-sheet items, including intercompany payables and receivables, originally denominated in other currencies. These changes cause our growth in consolidated earnings stated in U.S. dollars to be higher or lower than our growth in local currency when compared against other periods. Our currency hedging programs, which are designed to partially offset the impact on consolidated earnings related to the changes in value of certain balance sheet items, might not be successful. Additionally, some transactions and balances may be denominated in currencies for which there is no available market to hedge.
As we continue to leverage our global delivery model, more of our expenses are incurred in currencies other than those in which we bill for the related services. An increase in the value of certain currencies, such as the Indian rupee or Philippine peso, against the currencies in which our revenue is recorded could increase costs for delivery of services at off-shore sites by increasing labor and other costs that are denominated in local currency. Our contractual provisions or cost management efforts might not be able to offset their impact, and our currency hedging activities, which are designed to partially offset this impact, might not be successful. This could result in a decrease in the profitability of our contracts that are utilizing delivery center resources. Conversely, a decrease in the value of certain currencies, such as the Indian rupee or Philippine peso, against the currencies in which our revenue is recorded could place us at a competitive disadvantage compared to service providers that benefit to a greater degree from such a decrease and can, as a result, deliver services at a lower cost. In addition, our currency hedging activities are themselves subject to risk. These include risks related to counterparty performance under hedging contracts, risks related to ineffective hedges and risks related to currency fluctuations. We also face risks that extreme economic conditions, political instability, or hostilities or disasters of the type described below could impact or perhaps eliminate the underlying exposures that we are hedging. Such an event could lead to losses being recognized on the currency hedges then in place that are not offset by anticipated changes in the underlying hedge exposure.
Our business could be materially adversely affected if we incur legal liability.We are subject to, and may become a party to, a variety of litigation or other claims and suits that arise from time
to time in the ordinary course of our business. Our business is subject to the risk of litigation involving current and former employees, clients, alliance partners, subcontractors, suppliers, competitors, shareholders, government agencies or others through private actions, class actions, whistleblower claims, administrative proceedings, regulatory actions or other litigation. Regardless of the merits of the claims, the cost to defend current and future litigation may be significant, and such matters can be time-consuming and divert management’s attention and resources. The results of litigation and other legal proceedings are inherently uncertain, and adverse judgments or settlements in some or all of these legal disputes may result in materially adverse monetary damages, penalties or injunctive relief against us. Any claims or litigation, even if fully indemnified or insured, could damage our reputation and make it more difficult to compete effectively or to obtain adequate insurance in the future.
Table of Contents
15
For example, we could be subject to significant legal liability and litigation expense if we fail to meet our contractual obligations, contribute to internal control deficiencies of a client or otherwise breach obligations to third parties, including clients, alliance partners, employees and former employees, and other parties with whom we conduct business, or if our subcontractors breach or dispute the terms of our agreements with them and impede our ability to meet our obligations to our clients. We may enter into agreements with non-standard terms because we perceive an important economic opportunity or because our personnel did not adequately follow our contracting guidelines. In addition, the contracting practices of competitors, along with the demands of increasingly sophisticated clients, may cause contract terms and conditions that are unfavorable to us to become new standards in the marketplace. We may find ourselves committed to providing services or solutions that we are unable to deliver or whose delivery will reduce our profitability or cause us financial loss. If we cannot or do not meet our contractual obligations and if our potential liability is not adequately limited through the terms of our agreements, liability limitations are not enforced or a third party alleges fraud or other wrongdoing to prevent us from relying upon those contractual protections, we might face significant legal liability and litigation expense and our results of operations could be materially adversely affected. In addition, as we expand our services and solutions into new areas, such as taking over the operation of certain portions of our clients’ businesses, which increasingly include the operation of functions and systems that are critical to the core businesses of our clients, we may be exposed to additional operational, regulatory or other risks specific to these new areas, including risks related to data security. A failure of a client’s system based on our services or solutions could also subject us to a claim for significant damages that could materially adversely affect our results of operations.
While we maintain insurance for certain potential liabilities, such insurance does not cover all types and amounts of potential liabilities and is subject to various exclusions as well as caps on amounts recoverable. Even if we believe a claim is covered by insurance, insurers may dispute our entitlement to recovery for a variety of potential reasons, which may affect the timing and, if they prevail, the amount of our recovery.
Our work with government clients exposes us to additional risks inherent in the government contracting environment.
Our clients include national, provincial, state and local governmental entities. Our government work carries various risks inherent in the government contracting process. These risks include, but are not limited to, the following:
• Government entities, particularly in the United States, often reserve the right to audit our contract costs and conduct inquiries and investigations of our business practices and compliance with government contract requirements. U.S. government agencies, including the Defense Contract Audit Agency, routinely audit our contract costs, including allocated indirect costs, for compliance with the Cost Accounting Standards and the Federal Acquisition Regulation. These agencies also conduct reviews and investigations and make inquiries regarding our accounting and other systems in connection with our performance and business practices with respect to our government contracts. Negative findings from existing and future audits, investigations or inquiries could affect our future sales and profitability by preventing us, by operation of law or in practice, from receiving new government contracts for some period of time. In addition, if the U.S. government concludes that certain costs are not reimbursable, have not been properly determined or are based on outdated estimates of our work, then we will not be allowed to bill for such costs, may have to refund money that has already been paid to us or could be required to retroactively and prospectively adjust previously agreed to billing or pricing rates for our work. Negative findings from existing and future audits of our business systems, including our accounting system, may result in the U.S. government preventing us from billing, at least temporarily, a percentage of our costs. As a result of prior negative findings in connection with audits, investigations and inquiries, we have from time to time experienced some of the adverse consequences described above and may in the future experience further adverse consequences, which could materially adversely affect our future results of operations.
• If a government client discovers improper or illegal activities in the course of audits or investigations, we may become subject to various civil and criminal penalties, including those under the civil U.S. False Claims Act, and administrative sanctions, which may include termination of contracts, forfeiture of profits, suspension of payments, fines and suspensions or debarment from doing business with other agencies of that government. The inherent limitations of internal controls may not prevent or detect all improper or illegal activities.
• U.S. government contracting regulations impose strict compliance and disclosure obligations. Disclosure is required if certain company personnel have knowledge of “credible evidence” of a violation of federal criminal laws involving fraud, conflict of interest, bribery or improper gratuity, a violation of the civil U.S. False Claims Act or receipt of a significant overpayment from the government. Failure to make required disclosures could be a basis for suspension and/or debarment from federal government contracting in addition to breach of the specific contract and could also impact contracting beyond the U.S. federal level. Reported matters also could lead to audits or investigations and other civil, criminal or administrative sanctions.

Table of Contents
16
• Government contracts are subject to heightened reputational and contractual risks compared to contracts with commercial clients. For example, government contracts and the proceedings surrounding them are often subject to more extensive scrutiny and publicity. Negative publicity, including an allegation of improper or illegal activity, regardless of its accuracy, may adversely affect our reputation.
• Terms and conditions of government contracts also tend to be more onerous and are often more difficult to negotiate. For example, these contracts often contain high or unlimited liability for breaches and feature less favorable payment terms and sometimes require us to take on liability for the performance of third parties.
• Government entities typically fund projects through appropriated monies. While these projects are often planned and executed as multi-year projects, government entities usually reserve the right to change the scope of or terminate these projects for lack of approved funding and/or at their convenience. Changes in government or political developments, including budget deficits, shortfalls or uncertainties, government spending reductions or other debt constraints could result in our projects being reduced in price or scope or terminated altogether, which also could limit our recovery of incurred costs, reimbursable expenses and profits on work completed prior to the termination. Furthermore, if insufficient funding is appropriated to the government entity to cover termination costs, we may not be able to fully recover our investments.
• Political and economic factors such as pending elections, the outcome of recent elections, changes in leadership among key executive or legislative decision makers, revisions to governmental tax or other policies and reduced tax revenues can affect the number and terms of new government contracts signed or the speed at which new contracts are signed, decrease future levels of spending and authorizations for programs that we bid, shift spending priorities to programs in areas for which we do not provide services and/or lead to changes in enforcement or how compliance with relevant rules or laws is assessed.
• Legislative and executive proposals remain under consideration or could be proposed in the future, which, if enacted, could limit or even prohibit our eligibility to be awarded state or federal government contracts in the United States in the future or could include requirements that would otherwise affect our results of operations. Various U.S. federal and state legislative proposals have been introduced and/or enacted in recent years that deny government contracts to certain U.S. companies that reincorporate or have reincorporated outside the United States. While Accenture was not a U.S. company that reincorporated outside the United States, it is possible that these contract bans and other legislative proposals could be applied in a way that negatively affects Accenture.
The occurrences or conditions described above could affect not only our business with the particular government entities involved, but also our business with other entities of the same or other governmental bodies or with certain commercial clients, and could have a material adverse effect on our business or our results of operations.
We might not be successful at identifying, acquiring, investing in or integrating businesses, entering into joint ventures or divesting businesses.
We expect to continue pursuing strategic and targeted acquisitions, investments and joint ventures to enhance or add to our skills and capabilities or offerings of services and solutions, or to enable us to expand in certain geographic and other markets. Depending on the opportunities available, we may increase the amount of capital invested in such opportunities. We may not successfully identify suitable investment opportunities. We also might not succeed in completing targeted transactions or achieve desired results of operations. Furthermore, we face risks in successfully integrating any businesses we might acquire or create through a joint venture. Ongoing business may be disrupted, and our management’s attention may be diverted by acquisition, investment, transition or integration activities. In addition, we might need to dedicate additional management and other resources, and our organizational structure could make it difficult for us to efficiently integrate acquired businesses into our ongoing operations and assimilate and retain employees of those businesses into our culture and operations. Acquisitions or joint ventures may result in significant costs and expenses, including those related to retention payments, equity compensation, severance pay, early retirement costs, intangible asset amortization and asset impairment charges, assumed litigation and other liabilities, and legal, accounting and financial advisory fees, which could negatively affect our profitability. We may have difficulties as a result of entering into new markets where we have limited or no direct prior experience or where competitors may have stronger market positions.
We might fail to realize the expected benefits or strategic objectives of any acquisition, investment or joint venture we undertake. We might not achieve our expected return on investment or may lose money. We may be adversely impacted by liabilities that we assume from a company we acquire or in which we invest, including from that company’s known and unknown obligations, intellectual property or other assets, terminated employees, current or former clients or other third parties. In addition, we may fail to identify or adequately assess the magnitude of certain liabilities, shortcomings or other circumstances prior to acquiring, investing in or partnering with a company, including potential

Table of Contents
17
exposure to regulatory sanctions or liabilities resulting from an acquisition target’s previous activities. If any of these circumstances occurs, they could result in unexpected legal or regulatory exposure, unfavorable accounting treatment, unexpected increases in taxes or other adverse effects on our business. In addition, we have a lesser degree of control over the business operations of the joint ventures and businesses in which we have made minority investments. This lesser degree of control may expose us to additional reputational, financial, legal, compliance or operational risks. Litigation, indemnification claims and other unforeseen claims and liabilities may arise from the acquisition or operation of acquired businesses. For example, we may face litigation or other claims as a result of certain terms and conditions of the acquisition agreement, such as earnout payments or closing net asset adjustments. Alternatively, shareholder litigation may arise as a result of proposed acquisitions. If we are unable to complete the number and kind of investments for which we plan, or if we are inefficient or unsuccessful at integrating any acquired businesses into our operations, we may not be able to achieve our planned rates of growth or improve our market share, profitability or competitive position in specific markets or services.
We periodically evaluate, and have engaged in, the disposition of assets and businesses. Divestitures could involve difficulties in the separation of operations, services, products and personnel, the diversion of management’s attention, the disruption of our business and the potential loss of key employees. After reaching an agreement with a buyer for the disposition of a business, the transaction may be subject to the satisfaction of pre-closing conditions as well as to obtaining necessary regulatory and government approvals, which, if not satisfied or obtained, may prevent us from completing the transaction. Divestitures may also involve continued financial involvement in the divested assets and businesses, such as indemnities or other financial obligations, in which the performance of the divested assets or businesses could impact our results of operations. Any divestiture we undertake could adversely affect our results of operations.
Our Global Delivery Network is increasingly concentrated in India and the Philippines, which may expose us to operational risks.
Our business model is dependent on our Global Delivery Network, which includes Accenture personnel based at more than 50 delivery centers around the world. While these delivery centers are located throughout the world, we have based large portions of our delivery network in India, where we have the largest number of people in our delivery network located, and the Philippines, where we have the second largest number of people located. Concentrating our Global Delivery Network in these locations presents a number of operational risks, many of which are beyond our control. For example, natural disasters of the type described below, some of which India and the Philippines have experienced and other countries may experience, could impair the ability of our people to safely travel to and work in our facilities and disrupt our ability to perform work through our delivery centers. Additionally, both India and the Philippines have experienced, and other countries may experience, political instability, worker strikes, civil unrest and hostilities with neighboring countries. Military activity or civil hostilities in the future, as well as terrorist activities and other conditions, which are described more fully below, could significantly disrupt our ability to perform work through our delivery centers. Our business continuity and disaster recovery plans may not be effective, particularly if catastrophic events occur. If any of these circumstances occurs, we have a greater risk that the interruptions in communications with our clients and other Accenture locations and personnel, and any down-time in important processes we operate for clients, could result in a material adverse effect on our results of operations and our reputation in the marketplace.
As a result of our geographically diverse operations and our growth strategy to continue geographic expansion, we are more susceptible to certain risks.
We have offices and operations in more than 200 cities in 55 countries around the world. One aspect of our growth strategy is to continue to expand in key markets around the world. Our growth strategy might not be successful. If we are unable to manage the risks of our global operations and geographic expansion strategy, including international hostilities, terrorist activities, natural disasters, security breaches, failure to maintain compliance with our clients’ control requirements and multiple legal and regulatory systems, our results of operations and ability to grow could be materially adversely affected. In addition, emerging markets generally involve greater financial and operational risks, such as those described below, than our more mature markets. Negative or uncertain political climates in countries or geographies where we operate could also adversely affect us.
International hostilities, terrorist activities, natural disasters, pandemics and infrastructure disruptions could prevent us from effectively serving our clients and thus adversely affect our results of operations. Acts of terrorist violence; political unrest; armed regional and international hostilities and international responses to these hostilities; natural disasters, volcanic eruptions, floods and other severe weather conditions; health emergencies or pandemics or the threat of or perceived potential for these events; and other acts of god could have a negative impact on us. These events could adversely affect our clients’ levels of business activity and precipitate sudden and significant changes in regional and global economic conditions and cycles. These events also pose significant risks to our people and to physical facilities and operations around the world, whether the facilities are ours or those of our alliance partners
Table of Contents
18
or clients. By disrupting communications and travel and increasing the difficulty of obtaining and retaining highly skilled and qualified personnel, these events could make it difficult or impossible for us to deliver our services and solutions to our clients. Extended disruptions of electricity, other public utilities or network services at our facilities, as well as system failures at, or security breaches in, our facilities or systems, could also adversely affect our ability to serve our clients. We might be unable to protect our people, facilities and systems against all such occurrences. We generally do not have insurance for losses and interruptions caused by terrorist attacks, conflicts and wars. If these disruptions prevent us from effectively serving our clients, our results of operations could be adversely affected.
We could be subject to strict restrictions on the movement of cash and the exchange of foreign currencies. In some countries, we could be subject to strict restrictions on the movement of cash and the exchange of foreign currencies, which would limit our ability to use this cash across our global operations and expose us to more extreme currency fluctuations. This risk could increase as we continue our geographic expansion in key markets around the world, which include emerging markets that are more likely to impose these restrictions than more established markets.
Our global operations expose us to numerous and sometimes conflicting legal and regulatory requirements, and violation of these regulations could harm our business. We are subject to numerous, and sometimes conflicting, legal regimes on matters as diverse as anticorruption, import/export controls, content requirements, trade restrictions, tariffs, taxation, sanctions, immigration, internal and disclosure control obligations, securities regulation, anti-competition, anti-money-laundering, data privacy and protection, wage-and-hour standards, and employment and labor relations. The global nature of our operations, including emerging markets where legal systems may be less developed or understood by us, and the diverse nature of our operations across a number of regulated industries, further increase the difficulty of compliance. Compliance with diverse legal requirements is costly, time-consuming and requires significant resources. Violations of one or more of these regulations in the conduct of our business could result in significant fines, criminal sanctions against us and/or our employees, prohibitions on doing business and damage to our reputation. Violations of these regulations in connection with the performance of our obligations to our clients also could result in liability for significant monetary damages, fines and/or criminal prosecution, unfavorable publicity and other reputational damage and restrictions on our ability to effectively carry out our contractual obligations and thereby expose us to potential claims from our clients. Due to the varying degrees of development of the legal systems of the countries in which we operate, local laws may not be well developed or provide sufficiently clear guidance and may be insufficient to protect our rights.
In particular, in many parts of the world, including countries in which we operate and/or seek to expand, practices in the local business community might not conform to international business standards and could violate anticorruption laws, or regulations, including the U.S. Foreign Corrupt Practices Act and the UK Bribery Act 2010. Our employees, subcontractors, vendors, agents, alliance or joint venture partners, the companies we acquire and their employees, subcontractors, vendors and agents, and other third parties with which we associate, could take actions that violate policies or procedures designed to promote legal and regulatory compliance or applicable anticorruption laws or regulations. Violations of these laws or regulations by us, our employees or any of these third parties could subject us to criminal or civil enforcement actions (whether or not we participated or knew about the actions leading to the violations), including fines or penalties, disgorgement of profits and suspension or disqualification from work, including U.S. federal contracting, any of which could materially adversely affect our business, including our results of operations and our reputation.
Changes in laws and regulations could also mandate significant and costly changes to the way we implement our services and solutions or could impose additional taxes on our services and solutions. For example, changes in laws and regulations to limit using off-shore resources in connection with our work or to penalize companies that use off-shore resources, which have been proposed from time to time in various jurisdictions, could adversely affect our results of operations. Such changes may result in contracts being terminated or work being transferred on-shore, resulting in greater costs to us. In addition, these changes could have a negative impact on our ability to obtain future work from government clients.
Adverse changes to our relationships with key alliance partners or in the business of our key alliance partners could adversely affect our results of operations.
We have alliances with companies whose capabilities complement our own. A very significant portion of our services and solutions are based on technology or software provided by a few major providers that are our alliance partners. See “Business—Alliances.” The priorities and objectives of our alliance partners may differ from ours. As most of our alliance relationships are non-exclusive, our alliance partners are not prohibited from competing with us or forming closer or preferred arrangements with our competitors. One or more of our key alliance partners may be acquired by a competitor, or key alliance partners might merge with each other, either of which could reduce our access over time to the technology or software provided by those partners. In addition, our alliance partners could experience reduced demand for their technology or software, including, for example, in response to changes in technology, which

Table of Contents
19
could lessen related demand for our services and solutions. If we do not obtain the expected benefits from our alliance relationships for any reason, we may be less competitive, our ability to offer attractive solutions to our clients may be negatively affected, and our results of operations could be adversely affected.
Our services or solutions could infringe upon the intellectual property rights of others or we might lose our ability to utilize the intellectual property of others.
We cannot be sure that our services and solutions, including, for example, our software solutions, or the solutions of others that we offer to our clients, do not infringe on the intellectual property rights of third parties, and these third parties could claim that we or our clients are infringing upon their intellectual property rights. These claims could harm our reputation, cause us to incur substantial costs or prevent us from offering some services or solutions in the future. Any related proceedings could require us to expend significant resources over an extended period of time. In most of our contracts, we agree to indemnify our clients for expenses and liabilities resulting from claimed infringements of the intellectual property rights of third parties. In some instances, the amount of these indemnities could be greater than the revenues we receive from the client. Any claims or litigation in this area could be time-consuming and costly, damage our reputation and/or require us to incur additional costs to obtain the right to continue to offer a service or solution to our clients. If we cannot secure this right at all or on reasonable terms, or we cannot substitute alternative technology, our results of operations could be materially adversely affected. The risk of infringement claims against us may increase as we expand our industry software solutions and continue to develop and license our software to multiple clients. Additionally, in recent years, individuals and firms have purchased intellectual property assets in order to assert claims of infringement against technology providers and customers that use such technology. Any such action naming us or our clients could be costly to defend or lead to an expensive settlement or judgment against us. Moreover, such an action could result in an injunction being ordered against our client or our own services or operations, causing further damages.
In addition, we rely on third-party software in providing some of our services and solutions. If we lose our ability to continue using such software for any reason, including because it is found to infringe the rights of others, we will need to obtain substitute software or seek alternative means of obtaining the technology necessary to continue to provide such services and solutions. Our inability to replace such software, or to replace such software in a timely or cost-effective manner, could materially adversely affect our results of operations.
If we are unable to protect our intellectual property rights from unauthorized use or infringement by third parties, our business could be adversely affected.
Our success depends, in part, upon our ability to protect our proprietary methodologies and other intellectual property. Existing laws of the various countries in which we provide services or solutions offer only limited protection of our intellectual property rights, and the protection in some countries may be very limited. We rely upon a combination of confidentiality policies, nondisclosure and other contractual arrangements, and patent, trade secret, copyright and trademark laws to protect our intellectual property rights. These laws are subject to change at any time and could further limit our ability to protect our intellectual property. There is uncertainty concerning the scope of available intellectual property protection for software and business methods, which are fields in which we rely on intellectual property laws to protect our rights. Our intellectual property rights may not prevent competitors from reverse engineering our proprietary information or independently developing products and services similar to or duplicative of ours. Further, the steps we take in this regard might not be adequate to prevent or deter infringement or other misappropriation of our intellectual property by competitors, former employees or other third parties, and we might not be able to detect unauthorized use of, or take appropriate and timely steps to enforce, our intellectual property rights. Enforcing our rights might also require considerable time, money and oversight, and we may not be successful in enforcing our rights.
Our ability to attract and retain business and employees may depend on our reputation in the marketplace. We believe the Accenture brand name and our reputation are important corporate assets that help distinguish
our services and solutions from those of competitors and also contribute to our efforts to recruit and retain talented employees. However, our corporate reputation is potentially susceptible to material damage by events such as disputes with clients, cybersecurity breaches or service outages, internal control deficiencies, delivery failures, compliance violations, government investigations or legal proceedings. Similarly, our reputation could be damaged by actions or statements of current or former clients, directors, employees, competitors, vendors, alliance partners, our joint ventures or joint venture partners, adversaries in legal proceedings, legislators or government regulators, as well as members of the investment community or the media. There is a risk that negative information about Accenture, even if based on rumor or misunderstanding, could adversely affect our business. Damage to our reputation could be difficult, expensive and time-consuming to repair, could make potential or existing clients reluctant to select us for new engagements, resulting in a loss of business, and could adversely affect our recruitment and retention efforts. Damage

Table of Contents
20
to our reputation could also reduce the value and effectiveness of the Accenture brand name and could reduce investor confidence in us, materially adversely affecting our share price.
If we are unable to manage the organizational challenges associated with our size, we might be unable to achieve our business objectives.
As of August 31, 2016, we had approximately 384,000 employees worldwide. Our size and scale present significant management and organizational challenges. It might become increasingly difficult to maintain effective standards across a large enterprise and effectively institutionalize our knowledge. It might also become more difficult to maintain our culture, effectively manage and monitor our personnel and operations and effectively communicate our core values, policies and procedures, strategies and goals, particularly given our world-wide operations. The size and scope of our operations increase the possibility that we will have employees who engage in unlawful or fraudulent activity, or otherwise expose us to unacceptable business risks, despite our efforts to train them and maintain internal controls to prevent such instances. For example, employee misconduct could involve the improper use of our clients’ sensitive or confidential information or the failure to comply with legislation or regulations regarding the protection of sensitive or confidential information. Furthermore, the inappropriate use of social networking sites by our employees could result in breaches of confidentiality, unauthorized disclosure of non-public company information or damage to our reputation. If we do not continue to develop and implement the right processes and tools to manage our enterprise and instill our culture and core values into all of our employees, our ability to compete successfully and achieve our business objectives could be impaired. In addition, from time to time, we have made, and may continue to make, changes to our operating model, including how we are organized, as the needs and size of our business change, and if we do not successfully implement the changes, our business and results of operation may be negatively impacted.
We make estimates and assumptions in connection with the preparation of our consolidated financial statements, and any changes to those estimates and assumptions could adversely affect our financial results.
Our financial statements have been prepared in accordance with U.S. generally accepted accounting principles. The application of generally accepted accounting principles requires us to make estimates and assumptions about certain items and future events that affect our reported financial condition, and our accompanying disclosure with respect to, among other things, revenue recognition and income taxes. We base our estimates on historical experience, contractual commitments and on various other assumptions that we believe to be reasonable under the circumstances and at the time they are made. These estimates and assumptions involve the use of judgment and are subject to significant uncertainties, some of which are beyond our control. If our estimates, or the assumptions underlying such estimates, are not correct, actual results may differ materially from our estimates, and we may need to, among other things, adjust revenues or accrue additional charges that could adversely affect our results of operations.
Many of our contracts include payments that link some of our fees to the attainment of performance or business targets and/or require us to meet specific service levels. This could increase the variability of our revenues and impact our margins.
Many of our contracts include clauses that tie our compensation to the achievement of agreed-upon performance standards or milestones. If we fail to satisfy these measures, it could significantly reduce or eliminate our fees under the contracts, increase the cost to us of meeting performance standards or milestones, delay expected payments or subject us to potential damage claims under the contract terms. Clients also often have the right to terminate a contract and pursue damage claims under the contract for serious or repeated failure to meet these service commitments. We also have a number of contracts in which a portion of our compensation depends on performance measures such as cost-savings, revenue enhancement, benefits produced, business goals attained and adherence to schedule. These goals can be complex and may depend on our clients’ actual levels of business activity or may be based on assumptions that are later determined not to be achievable or accurate. These provisions could increase the variability in revenues and margins earned on those contracts.
Our results of operations and share price could be adversely affected if we are unable to maintain effective internal controls.
The accuracy of our financial reporting is dependent on the effectiveness of our internal controls. We are required to provide a report from management to our shareholders on our internal control over financial reporting that includes an assessment of the effectiveness of these controls. Internal control over financial reporting has inherent limitations, including human error, the possibility that controls could be circumvented or become inadequate because of changed conditions, and fraud. Because of these inherent limitations, internal control over financial reporting might not prevent or detect all misstatements or fraud. If we cannot maintain and execute adequate internal control over financial reporting or implement required new or improved controls that provide reasonable assurance of the reliability of the financial reporting and preparation of our financial statements for external use, we could suffer harm to our reputation, incur

Table of Contents
21
incremental compliance costs, fail to meet our public reporting requirements on a timely basis, be unable to properly report on our business and our results of operations, or be required to restate our financial statements, and our results of operations, our share price and our ability to obtain new business could be materially adversely affected.
We are incorporated in Ireland and a significant portion of our assets are located outside the United States. As a result, it might not be possible for shareholders to enforce civil liability provisions of the federal or state securities laws of the United States. We may also be subject to criticism and negative publicity related to our incorporation in Ireland.
We are organized under the laws of Ireland, and a significant portion of our assets are located outside the United States. A shareholder who obtains a court judgment based on the civil liability provisions of U.S. federal or state securities laws may be unable to enforce the judgment against us in Ireland or in countries other than the United States where we have assets. In addition, there is some doubt as to whether the courts of Ireland and other countries would recognize or enforce judgments of U.S. courts obtained against us or our directors or officers based on the civil liabilities provisions of the federal or state securities laws of the United States or would hear actions against us or those persons based on those laws. We have been advised that the United States and Ireland do not currently have a treaty providing for the reciprocal recognition and enforcement of judgments in civil and commercial matters. The laws of Ireland do, however, as a general rule, provide that the judgments of the courts of the United States have the same validity in Ireland as if rendered by Irish Courts. Certain important requirements must be satisfied before the Irish Courts will recognize a U.S. judgment. The originating court must have been a court of competent jurisdiction, the judgment must be final and conclusive and the judgment may not be recognized if it was obtained by fraud or its recognition would be contrary to Irish public policy. Any judgment obtained in contravention of the rules of natural justice or that is irreconcilable with an earlier foreign judgment would not be enforced in Ireland. Similarly, judgments might not be enforceable in countries other than the United States where we have assets.
Some companies that conduct substantial business in the United States but which have a parent domiciled in certain other jurisdictions have been criticized as improperly avoiding U.S. taxes or creating an unfair competitive advantage over other U.S. companies. Accenture never conducted business under a U.S. parent company and pays U.S. taxes on all of its U.S. operations. Nonetheless, we could be subject to criticism in connection with our incorporation in Ireland.
Irish law differs from the laws in effect in the United States and might afford less protection to shareholders. Our shareholders could have more difficulty protecting their interests than would shareholders of a corporation
incorporated in a jurisdiction of the United States. As an Irish company, we are governed by the Companies Act. The Companies Act differs in some significant, and possibly material, respects from laws applicable to U.S. corporations and shareholders under various state corporation laws, including the provisions relating to interested directors, mergers and acquisitions, takeovers, shareholder lawsuits and indemnification of directors.
Under Irish law, the duties of directors and officers of a company are generally owed to the company only. Shareholders of Irish companies do not generally have rights to take action against directors or officers of the company under Irish law, and may only do so in limited circumstances. Directors of an Irish company must, in exercising their powers and performing their duties, act with due care and skill, honestly and in good faith with a view to the best interests of the company. Directors have a duty not to put themselves in a position in which their duties to the company and their personal interests might conflict and also are under a duty to disclose any personal interest in any contract or arrangement with the company or any of its subsidiaries. If a director or officer of an Irish company is found to have breached his duties to that company, he could be held personally liable to the company in respect of that breach of duty.
Under Irish law, we must have authority from our shareholders to issue any shares, including shares that are part of the company’s authorized but unissued share capital. In addition, unless otherwise authorized by its shareholders, when an Irish company issues shares for cash to new shareholders, it is required first to offer those shares on the same or more favorable terms to existing shareholders on a pro-rata basis. If we are unable to obtain these authorizations from our shareholders, or are otherwise limited by the terms of our authorizations, our ability to issue shares under our equity compensation plans and, if applicable, to facilitate funding acquisitions or otherwise raise capital could be adversely affected.
We might be unable to access additional capital on favorable terms or at all. If we raise equity capital, it may dilute our shareholders’ ownership interest in us.
We might choose to raise additional funds through public or private debt or equity financings in order to: • take advantage of opportunities, including more rapid expansion;

Table of Contents
22
• acquire other businesses or assets; • repurchase shares from our shareholders; • develop new services and solutions; or • respond to competitive pressures.
Any additional capital raised through the sale of equity could dilute shareholders’ ownership percentage in us. Furthermore, any additional financing we need might not be available on terms favorable to us, or at all.
ITEM 1B. UNRESOLVED STAFF COMMENTSNone.
ITEM 2. PROPERTIESWe have major offices in the world’s leading business centers, including Boston, Chicago, New York, San
Francisco, Dublin, Frankfurt, London, Madrid, Milan, Paris, Rome, Bangalore, Beijing, Manila, Mumbai, Sao Paolo, Shanghai, Singapore, Sydney and Tokyo, among others. In total, we have offices and operations in more than 200 cities in 55 countries around the world. We do not own any material real property. Substantially all of our office space is leased under long-term leases with varying expiration dates. We believe that our facilities are adequate to meet our needs in the near future.
ITEM 3. LEGAL PROCEEDINGSThe information set forth under “Legal Contingencies” in Note 15 (Commitments and Contingencies) to our
Consolidated Financial Statements under Part II, Item 8, “Financial Statements and Supplementary Data,” is incorporated herein by reference.
ITEM 4. MINE SAFETY DISCLOSURESNot applicable.
EXECUTIVE OFFICERS OF THE REGISTRANTOur executive officers and persons chosen to become executive officers as of the date hereof are as follows:
Gianfranco Casati, 57, became our group chief executive—Growth Markets in January 2014. From September 2006 to January 2014, he served as our group chief executive—Products operating group. From April 2002 to September 2006, Mr. Casati was managing director of the Products operating group’s Europe operating unit. He also served as Accenture’s country managing director for Italy and as chairman of our geographic council in its IGEM (Italy, Greece, emerging markets) region, supervising Accenture offices in Italy, Greece and several Eastern European countries. Mr. Casati has been with Accenture for 32 years.
Richard P. Clark, 55, became our chief accounting officer in September 2013 and has served as our corporate controller since September 2010. Prior to that, Mr. Clark served as our senior managing director of investor relations from September 2006 to September 2010. Previously he served as our finance director—Communications, Media & Technology operating group from July 2001 to September 2006 and as our finance director—Resources operating group from 1998 to July 2001. Mr. Clark has been with Accenture for 33 years.
Johan (Jo) G. Deblaere, 54, became our chief operating officer in September 2009 and has also served as our chief executive—Europe since January 2014. From September 2006 to September 2009, Mr. Deblaere served as our chief operating officer—Outsourcing. Prior to that, from September 2005 to September 2006, he led our global network of business process outsourcing delivery centers. From September 2000 to September 2005, he had overall responsibility for work with public-sector clients in Western Europe. Mr. Deblaere has been with Accenture for 31 years.
Chad T. Jerdee, 49, became our general counsel and chief compliance officer in June 2015. From August 2010 to June 2015, Mr. Jerdee served as deputy general counsel—Sales & Delivery. Previously, he served as legal lead for the outsourcing sales legal team as well as for Accenture’s growth platforms. Mr. Jerdee has been with Accenture for 19 years.
Daniel T. London, 52, became our group chief executive—Health & Public Service operating group in June 2014. From 2009 to June 2014, Mr. London was senior managing director for Health & Public Service in North America. Previously, he served as managing director of Accenture’s Finance & Performance Management global service line. Mr. London has been with Accenture for 30 years.
Richard A. Lumb, 55, became our group chief executive—Financial Services operating group in December 2010. From June 2006 to December 2010, Mr. Lumb led our Financial Services operating group in Europe, Africa, the

Table of Contents
23
Middle East and Latin America. He also served as our managing director of business and market development—Financial Services operating group from September 2005 to June 2006. Mr. Lumb has been with Accenture for 31 years.
Pierre Nanterme, 57, became chairman of the Board of Directors in February 2013 and has served as our chief executive officer since January 2011. Mr. Nanterme was our group chief executive—Financial Services operating group from September 2007 to December 2010. Prior to assuming this role, Mr. Nanterme held various leadership roles throughout the Company, including serving as our chief leadership officer from May 2006 through September 2007 and our country managing director for France from November 2005 to September 2007. Mr. Nanterme has been a director since October 2010 and has been with Accenture for 33 years. In addition to serving on Accenture plc’s board of directors, Mr. Nanterme serves on the board of its subsidiary Accenture Holdings plc.
Jean-Marc Ollagnier, 54, became our group chief executive—Resources operating group in March 2011. From September 2006 to March 2011, Mr. Ollagnier led our Resources operating group in Europe, Latin America, the Middle East and Africa. Previously, he served as our global managing director—Financial Services Solutions group and as our geographic unit managing director—Gallia. Mr. Ollagnier has been with Accenture for 30 years.
David P. Rowland, 55, became our chief financial officer in July 2013. From October 2006 to July 2013, he was our senior vice president—Finance. Previously, Mr. Rowland was our managing director—Finance Operations from July 2001 to October 2006. Prior to assuming that role, he served as our finance director—Communications, Media & Technology and as our finance director—Products. Mr. Rowland has been with Accenture for 33 years.
Robert E. Sell, 54, became our group chief executive—Communications, Media & Technology operating group in March 2012. From September 2007 to March 2012, Mr. Sell led our Communications, Media & Technology operating group in North America. Prior to assuming that role, he served in a variety of leadership roles throughout Accenture, serving clients in a number of industries. Mr. Sell has been with Accenture for 32 years.
Ellyn J. Shook, 53, became our chief leadership officer in December 2015 and has also served as our chief human resources officer since March 2014. From 2012 to March 2014, Ms. Shook was our senior managing director—Human Resources and head of Accenture’s Human Resources Centers of Expertise. From 2004 to 2011, she served as the global human resources lead for career management, performance management, total rewards, employee engagement and mergers and acquisitions. Ms. Shook has been with Accenture for 28 years.
Julie Spellman Sweet, 49, became our group chief executive—North America in June 2015. From March 2010 to June 2015, she served as our general counsel, secretary and chief compliance officer. Prior to joining Accenture, Ms. Sweet was, for 10 years, a partner in the Corporate department of the law firm of Cravath, Swaine & Moore LLP, which she joined as an associate in 1992. Ms. Sweet has been with Accenture for 6 years.
Alexander M. van ’t Noordende, 53, became our group chief executive—Products operating group in January 2014. From March 2011 to January 2014, he served as our group chief executive—Management Consulting. Mr. van ’t Noordende was our group chief executive—Resources operating group from September 2006 to March 2011. Prior to assuming that role, he led our Resources operating group in Southern Europe, Africa, the Middle East and Latin America, and served as managing partner of the Resources operating group in France, Belgium and the Netherlands. From 2001 until September 2006, he served as our country managing director for the Netherlands. Mr. van ’t Noordende has been with Accenture for 29 years.

Table of Contents
24
PART II
ITEM 5. MARKET FOR REGISTRANT’S COMMON EQUITY, RELATED SHAREHOLDER MATTERS AND ISSUER PURCHASES OF EQUITY SECURITIES
Price Range of Accenture plc Class A Ordinary SharesAccenture plc Class A ordinary shares are traded on the New York Stock Exchange under the symbol “ACN.”
The New York Stock Exchange is the principal United States market for these shares.
The following table sets forth, on a per share basis for the periods indicated, the high and low sale prices for Accenture plc Class A ordinary shares as reported by the New York Stock Exchange.
Price Range High LowFiscal 2015First Quarter $ 86.49 $ 73.98Second Quarter $ 91.94 $ 81.66Third Quarter $ 97.95 $ 86.40Fourth Quarter $ 105.37 $ 88.43Fiscal 2016First Quarter $ 109.86 $ 91.68Second Quarter $ 109.65 $ 91.40Third Quarter $ 119.72 $ 101.00Fourth Quarter $ 120.78 $ 108.66Fiscal 2017First Quarter (through October 14, 2016) $ 124.96 $ 108.83
The closing sale price of an Accenture plc Class A ordinary share as reported by the New York Stock Exchange consolidated tape as of October 14, 2016 was $118.25. As of October 14, 2016, there were 284 holders of record of Accenture plc Class A ordinary shares.
There is no trading market for Accenture plc Class X ordinary shares. As of October 14, 2016, there were 603holders of record of Accenture plc Class X ordinary shares.
To ensure that members of Accenture Leadership continue to maintain equity ownership levels that we consider meaningful, we require current members of Accenture Leadership to comply with the Accenture Equity Ownership Requirement Policy. This policy requires members of Accenture Leadership to own Accenture equity valued at a multiple (ranging from 1/2 to 6) of their base compensation determined by their position level.
Dividend Policy On November 17, 2014, May 15, 2015, November 13, 2015 and May 13, 2016, Accenture plc paid a semi-annual
cash dividend of $1.02, $1.02, $1.10 and $1.10 per share, respectively, on our Class A ordinary shares, and Accenture Holdings plc paid a semi-annual cash dividend of $1.02, $1.02, $1.10 and $1.10 per share, respectively, on its ordinary shares.
Future dividends on Accenture plc Class A ordinary shares and Accenture Holdings plc ordinary shares, if any, and the timing of declaration of any such dividends, will be at the discretion of the Board of Directors of Accenture plc and will depend on, among other things, our results of operations, cash requirements and surplus, financial condition, contractual restrictions and other factors that the Board of Directors of Accenture plc may deem relevant, as well as our ability to pay dividends in compliance with the Companies Act.
In certain circumstances, as an Irish tax resident company, we may be required to deduct Irish dividend withholding tax (“DWT”) (currently at the rate of 20%) from dividends paid to our shareholders. Shareholders resident in “relevant territories” (including countries that are European Union member states (other than Ireland), the United States and other countries with which Ireland has a tax treaty) may be exempted from Irish DWT. However, shareholders residing in other countries will generally be subject to Irish DWT.
Recent Sales of Unregistered SecuritiesNone.

Table of Contents
25
Purchases and Redemptions of Accenture plc Class A Ordinary Shares and Class X Ordinary SharesThe following table provides information relating to our purchases of Accenture plc Class A ordinary shares and
redemptions of Accenture plc Class X ordinary shares during the fourth quarter of fiscal 2016. For year-to-date information on all share purchases, redemptions and exchanges by the Company and further discussion of our share purchase activity, see “Management’s Discussion and Analysis of Financial Condition and Results of Operations—Liquidity and Capital Resources—Share Purchases and Redemptions.”
Period
Total Number ofShares
Purchased
AveragePrice Paid
per Share (1)
Total Number ofShares Purchased as
Part of PubliclyAnnounced Plans or
Programs (2)
Approximate Dollar Valueof Shares that May Yet Be
Purchased Under the Plans orPrograms (3)
(in millions of U.S. dollars)June 1, 2016 — June 30, 2016
Class A ordinary shares 1,342,918 $ 116.73 1,330,550 $ 5,758Class X ordinary shares 17,448 $ 0.0000225 — —
July 1, 2016 — July 31, 2016Class A ordinary shares 2,334,486 $ 113.95 1,444,155 $ 5,583Class X ordinary shares 64,830 $ 0.0000225 — —
August 1, 2016 — August 31, 2016Class A ordinary shares 1,703,494 $ 113.75 1,667,532 $ 5,387Class X ordinary shares 187,020 $ 0.0000225 — —
TotalClass A ordinary shares (4) 5,380,898 $ 114.58 4,442,237Class X ordinary shares (5) 269,298 $ 0.0000225 —
_______________(1) Average price paid per share reflects the total cash outlay for the period, divided by the number of shares
acquired, including those acquired by purchase or redemption for cash and any acquired by means of employee forfeiture.
(2) Since August 2001, the Board of Directors of Accenture plc has authorized and periodically confirmed a publicly announced open-market share purchase program for acquiring Accenture plc Class A ordinary shares. During the fourth quarter of fiscal 2016, we purchased 4,442,237 Accenture plc Class A ordinary shares under this program for an aggregate price of $510 million. The open-market purchase program does not have an expiration date.
(3) As of August 31, 2016, our aggregate available authorization for share purchases and redemptions was $5,387 million, which management has the discretion to use for either our publicly announced open-market share purchase program or our other share purchase programs. Since August 2001 and as of August 31, 2016, the Board of Directors of Accenture plc has authorized an aggregate of $30,100 million for purchases and redemptions of Accenture plc Class A ordinary shares, Accenture Holdings plc ordinary shares or Accenture Canada Holdings Inc. exchangeable shares.
(4) During the fourth quarter of fiscal 2016, Accenture purchased 938,661 Accenture plc Class A ordinary shares in transactions unrelated to publicly announced share plans or programs. These transactions consisted of acquisitions of Accenture plc Class A ordinary shares primarily via share withholding for payroll tax obligations due from employees and former employees in connection with the delivery of Accenture plc Class A ordinary shares under our various employee equity share plans. These purchases of shares in connection with employee share plans do not affect our aggregate available authorization for our publicly announced open-market share purchase and our other share purchase programs.
(5) Accenture plc Class X ordinary shares are redeemable at their par value of $0.0000225 per share.
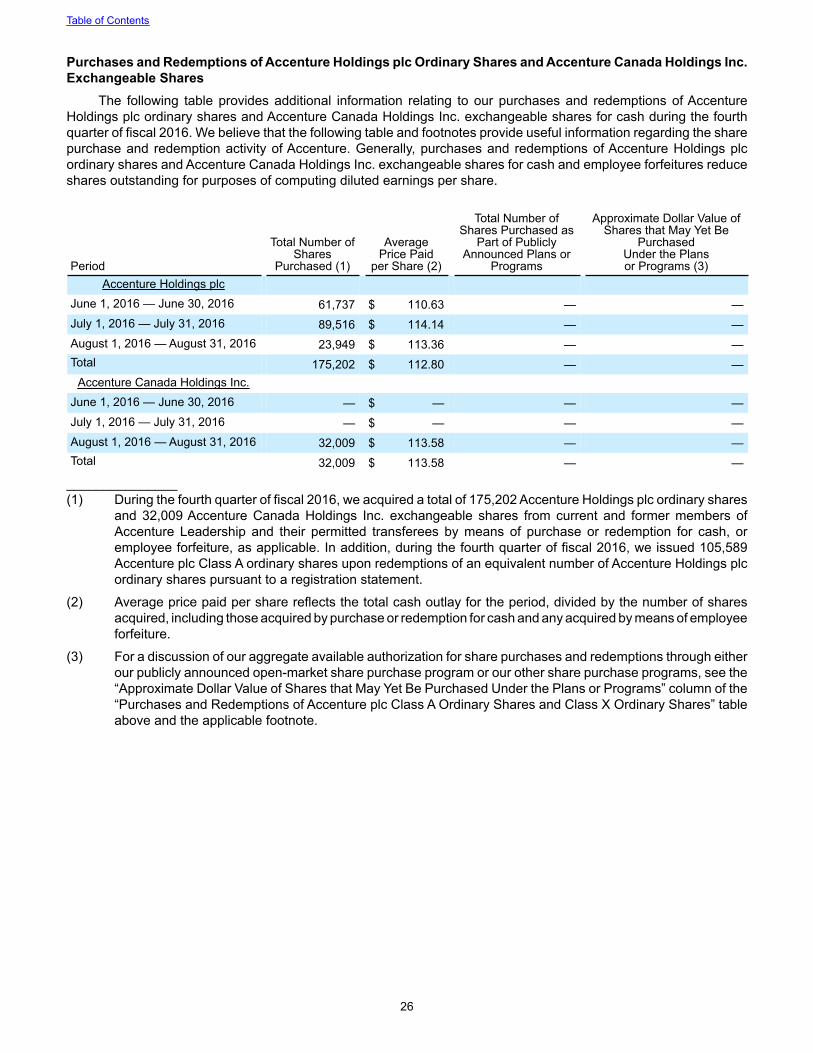
Table of Contents
26
Purchases and Redemptions of Accenture Holdings plc Ordinary Shares and Accenture Canada Holdings Inc. Exchangeable Shares
The following table provides additional information relating to our purchases and redemptions of Accenture Holdings plc ordinary shares and Accenture Canada Holdings Inc. exchangeable shares for cash during the fourth quarter of fiscal 2016. We believe that the following table and footnotes provide useful information regarding the share purchase and redemption activity of Accenture. Generally, purchases and redemptions of Accenture Holdings plc ordinary shares and Accenture Canada Holdings Inc. exchangeable shares for cash and employee forfeitures reduce shares outstanding for purposes of computing diluted earnings per share.
Period
Total Number ofShares
Purchased (1)
AveragePrice Paid
per Share (2)
Total Number ofShares Purchased as
Part of PubliclyAnnounced Plans or
Programs
Approximate Dollar Value ofShares that May Yet Be
PurchasedUnder the Plansor Programs (3)
Accenture Holdings plcJune 1, 2016 — June 30, 2016 61,737 $ 110.63 — —July 1, 2016 — July 31, 2016 89,516 $ 114.14 — —August 1, 2016 — August 31, 2016 23,949 $ 113.36 — —Total 175,202 $ 112.80 — —
Accenture Canada Holdings Inc.June 1, 2016 — June 30, 2016 — $ — — —July 1, 2016 — July 31, 2016 — $ — — —August 1, 2016 — August 31, 2016 32,009 $ 113.58 — —Total 32,009 $ 113.58 — —
_______________ (1) During the fourth quarter of fiscal 2016, we acquired a total of 175,202 Accenture Holdings plc ordinary shares
and 32,009 Accenture Canada Holdings Inc. exchangeable shares from current and former members of Accenture Leadership and their permitted transferees by means of purchase or redemption for cash, or employee forfeiture, as applicable. In addition, during the fourth quarter of fiscal 2016, we issued 105,589Accenture plc Class A ordinary shares upon redemptions of an equivalent number of Accenture Holdings plc ordinary shares pursuant to a registration statement.
(2) Average price paid per share reflects the total cash outlay for the period, divided by the number of shares acquired, including those acquired by purchase or redemption for cash and any acquired by means of employee forfeiture.
(3) For a discussion of our aggregate available authorization for share purchases and redemptions through either our publicly announced open-market share purchase program or our other share purchase programs, see the “Approximate Dollar Value of Shares that May Yet Be Purchased Under the Plans or Programs” column of the “Purchases and Redemptions of Accenture plc Class A Ordinary Shares and Class X Ordinary Shares” table above and the applicable footnote.

Table of Contents
27
ITEM 6. SELECTED FINANCIAL DATAThe data for fiscal 2016, 2015 and 2014 and as of August 31, 2016 and 2015 are derived from the audited
Consolidated Financial Statements and related Notes that are included elsewhere in this report. The data for fiscal 2013 and 2012 and as of August 31, 2014, 2013 and 2012 are derived from the audited Consolidated Financial Statements and related Notes that are not included in this report. The selected financial data should be read in conjunction with “Management’s Discussion and Analysis of Financial Condition and Results of Operations” and our Consolidated Financial Statements and related Notes included elsewhere in this report.
Fiscal 2016 (1) 2015 (2) 2014 2013 (3) 2012 (in millions of U.S. dollars)Income Statement DataRevenues before reimbursements (“Netrevenues”) $ 32,883 $ 31,048 $ 30,002 $ 28,563 $ 27,862Revenues 34,798 32,914 31,875 30,394 29,778Operating income 4,810 4,436 4,301 4,339 3,872Net income 4,350 3,274 3,176 3,555 2,825Net income attributable to Accenture plc 4,112 3,054 2,941 3,282 2,554
_______________ (1) Includes the impact of $849 million pre-tax Gain on sale of businesses recorded during fiscal 2016. See
“Management’s Discussion and Analysis of Financial Condition and Results of Operations—Results of Operations for Fiscal 2016 Compared to Fiscal 2015—Gain on Sale of Businesses.”
(2) Includes the impact of a $64 million, pre-tax, Pension settlement charge recorded during fiscal 2015. See “Management’s Discussion and Analysis of Financial Condition and Results of Operations—Results of Operations for Fiscal 2016 Compared to Fiscal 2015—Pension Settlement Charge.”
(3) Includes the impact of $274 million in reorganization benefits and $243 million in U.S. federal tax benefits recorded during fiscal 2013.
Fiscal
2016 2015 2014 2013 2012Earnings Per Class A Ordinary ShareBasic $ 6.58 $ 4.87 $ 4.64 $ 5.08 $ 3.97Diluted 6.45 4.76 4.52 4.93 3.84Dividends per ordinary share 2.20 2.04 1.86 1.62 1.35
August 31,2016
August 31,2015
August 31,2014
August 31,2013
August 31,2012
(in millions of U.S. dollars)Balance Sheet DataCash and cash equivalents $ 4,906 $ 4,361 $ 4,921 $ 5,632 $ 6,641Total assets 20,609 18,203 17,930 16,867 16,665Long-term debt, net of current portion 24 26 26 26 —Accenture plc shareholders’ equity 7,555 6,134 5,732 4,960 4,146

Table of Contents
28
ITEM 7. MANAGEMENT’S DISCUSSION AND ANALYSIS OF FINANCIAL CONDITION AND RESULTS OF OPERATIONS
The following discussion and analysis should be read in conjunction with our Consolidated Financial Statements and related Notes included elsewhere in this Annual Report on Form 10-K. This discussion and analysis also contains forward-looking statements and should also be read in conjunction with the disclosures and information contained in “Disclosure Regarding Forward-Looking Statements” and “Risk Factors” in this Annual Report on Form 10-K.
We use the terms “Accenture,” “we,” the “Company,” “our” and “us” in this report to refer to Accenture plc and its subsidiaries. All references to years, unless otherwise noted, refer to our fiscal year, which ends on August 31. For example, a reference to “fiscal 2016” means the 12-month period that ended on August 31, 2016. All references to quarters, unless otherwise noted, refer to the quarters of our fiscal year.
We use the term “in local currency” so that certain financial results may be viewed without the impact of foreign currency exchange rate fluctuations, thereby facilitating period-to-period comparisons of business performance. Financial results “in local currency” are calculated by restating current period activity into U.S. dollars using the comparable prior year period’s foreign currency exchange rates. This approach is used for all results where the functional currency is not the U.S. dollar.
Overview Revenues are driven by the ability of our executives to secure new contracts and to deliver services and solutions
that add value relevant to our clients’ current needs and challenges. The level of revenues we achieve is based on our ability to deliver market-leading service offerings and to deploy skilled teams of professionals quickly and on a global basis.
Our results of operations are affected by economic conditions, including macroeconomic conditions and levels of business confidence. There continues to be significant volatility and economic and geopolitical uncertainty in many markets around the world, which may impact our business. We continue to monitor the impact of this volatility and uncertainty and seek to manage our costs in order to respond to changing conditions. There also continues to be significant volatility in foreign currency exchange rates. The majority of our net revenues are denominated in currencies other than the U.S. dollar, including the Euro and the U.K. pound. Unfavorable fluctuations in foreign currency exchange rates have had and could have in the future a material effect on our financial results.
Revenues before reimbursements (“net revenues”) for the fourth quarter of fiscal 2016 increased 8% in U.S. dollars and 9% in local currency compared to the fourth quarter of fiscal 2015. Net revenues for fiscal 2016 increased 6% in U.S. dollars and 10% in local currency compared to fiscal 2015. Demand for our services and solutions continued to be strong, resulting in growth across all areas of our business. During the fourth quarter of fiscal 2016, revenue growth in local currency was significant in Products and strong in Health & Public Service and Financial Services. Communications, Media & Technology revenue growth in local currency was solid, while Resources was flat. Revenue growth in local currency was very strong in consulting and solid in outsourcing during the fourth quarter of fiscal 2016. While the business environment remained competitive, we experienced pricing improvement in several areas of our business in fiscal 2016. We use the term “pricing” to mean the contract profitability or margin on the work that we sell.
In our consulting business, net revenues for the fourth quarter of fiscal 2016 increased 11% in U.S. dollars and 13% in local currency compared to the fourth quarter of fiscal 2015. Net consulting revenues for fiscal 2016 increased 10% in U.S. dollars and 15% in local currency compared to fiscal 2015. Consulting revenue growth in local currency in the fourth quarter of fiscal 2016 was led by very significant growth in Products, as well as strong growth in Financial Services, Health & Public Service and Communications, Media & Technology, while Resources had a slight decline. We continue to experience growing demand for digital-related services and assisting clients with the adoption of new technologies. In addition, clients continued to be focused on initiatives designed to deliver cost savings and operational efficiency, as well as projects to integrate their global operations and grow and transform their businesses. Compared to fiscal 2015, we continued to provide a greater proportion of systems integration consulting through use of lower cost resources in our Global Delivery Network. This trend has resulted in work volume growing faster than revenue in our systems integration business, and we expect this trend to continue.
In our outsourcing business, net revenues for the fourth quarter of fiscal 2016 increased 4% in U.S. dollars and 6% in local currency compared to the fourth quarter of fiscal 2015. Net outsourcing revenues for fiscal 2016 increased 1% in U.S. dollars and 6% in local currency compared to fiscal 2015. Outsourcing revenue growth in local currency in the fourth quarter of fiscal 2016 was driven by very strong growth in Health & Public Service as well as solid growth in Products and Financial Services. We are experiencing growing demand to assist clients with cloud enablement and the operation and maintenance of digital-related services. In addition, clients continue to be focused on transforming

Table of Contents
29
their operations to improve effectiveness and save costs. Compared to fiscal 2015, we continued to provide a greater proportion of application outsourcing through use of lower-cost resources in our Global Delivery Network.
As we are a global company, our revenues are denominated in multiple currencies and may be significantly affected by currency exchange rate fluctuations. If the U.S. dollar strengthens against other currencies, resulting in unfavorable currency translation, our revenues, revenue growth and results of operations in U.S. dollars may be lower. If the U.S. dollar weakens against other currencies, resulting in favorable currency translation, our revenues, revenue growth and results of operations in U.S. dollars may be higher. When compared to the same periods in fiscal 2015, the U.S. dollar strengthened against many currencies during the fourth quarter and fiscal year ended August 31, 2016, resulting in unfavorable currency translation and U.S. dollar revenue growth that was approximately 2% and 5% lower, respectively, than our revenue growth in local currency. Assuming that exchange rates stay within recent ranges for fiscal 2017, we estimate that our full fiscal 2017 revenue growth in U.S. dollars will be approximately equal to our revenue growth in local currency.
The primary categories of operating expenses include Cost of services, Sales and marketing and General and administrative costs. Cost of services is primarily driven by the cost of client-service personnel, which consists mainly of compensation, subcontractor and other personnel costs, and non-payroll costs on outsourcing contracts. Cost of services includes a variety of activities such as: contract delivery; recruiting and training; software development; and integration of acquisitions. Sales and marketing costs are driven primarily by: compensation costs for business development activities; marketing- and advertising-related activities; and certain acquisition-related costs. General and administrative costs primarily include costs for non-client-facing personnel, information systems and office space.
Utilization for the fourth quarter of fiscal 2016 was 92%, up from 91% in the third quarter of fiscal 2016 and 90%in the fourth quarter of fiscal 2015. We continue to hire to meet current and projected future demand. We proactively plan and manage the size and composition of our workforce and take actions as needed to address changes in the anticipated demand for our services and solutions, given that compensation costs are the most significant portion of our operating expenses. Based on current and projected future demand, we have increased our headcount, the majority of which serve our clients, to approximately 384,000 as of August 31, 2016, compared to approximately 358,000 as of August 31, 2015. The year-over-year increase in our headcount reflects an overall increase in demand for our services and solutions, as well as headcount added in connection with acquisitions. Annualized attrition, excluding involuntary terminations, for the fourth quarter of fiscal 2016 was 16%, up from 15% in the third quarter of fiscal 2016and 14% in the fourth quarter of fiscal 2015. We evaluate voluntary attrition, adjust levels of new hiring and use involuntary terminations as means to keep our supply of skills and resources in balance with changes in client demand. In addition, we adjust compensation in certain skill sets and geographies in order to attract and retain appropriate numbers of qualified employees. For the majority of our personnel, compensation increases for fiscal 2016 became effective December 1, 2015. We strive to adjust pricing and/or the mix of resources to reduce the impact of compensation increases on our gross margin. Our ability to grow our revenues and maintain or increase our margin could be adversely affected if we are unable to: keep our supply of skills and resources in balance with changes in the types or amounts of services and solutions clients are demanding; recover increases in compensation; deploy our employees globally on a timely basis; manage attrition; and/or effectively assimilate and utilize new employees.
Gross margin (Net revenues less Cost of services before reimbursable expenses as a percentage of Net revenues) for the fourth quarter of fiscal 2016 was 31.3%, compared with 31.7% for the fourth quarter of fiscal 2015. Gross margin for fiscal 2016 was 31.3%, compared with 31.6% for fiscal 2015. The reduction in gross margin for fiscal 2016 was principally due to higher labor costs and higher costs associated with acquisition activities compared to fiscal 2015.
Sales and marketing and General and administrative costs as a percentage of net revenues were 17.2% for the fourth quarter of fiscal 2016, compared with 17.9% for the fourth quarter of fiscal 2015. Sales and marketing and General and administrative costs as a percentage of net revenues were 16.6% for fiscal 2016, compared with 17.1%for fiscal 2015. We continuously monitor these costs and implement cost-management actions, as appropriate. For fiscal 2016 compared to fiscal 2015, Sales and marketing costs as a percentage of net revenues decreased 40 basis points principally due to improved operational efficiency in our business development activities, and General and administrative costs as a percentage of net revenues decreased 10 basis points.
Operating expenses in fiscal 2015 included a Pension settlement charge of $64 million related to lump sum cash payments made from our U.S. defined benefit pension plan to former employees who elected to receive such payments. For additional information, see Note 10 (Retirement and Profit Sharing Plans) to our Consolidated Financial Statementsunder Item 8, “Financial Statements and Supplementary Data.”
Operating margin (Operating income as a percentage of Net revenues) for the fourth quarter of fiscal 2016 was14.1%, compared with 13.9% for the fourth quarter of fiscal 2015. Operating margin for fiscal 2016 was 14.6%, compared with 14.3% for fiscal 2015. The Pension settlement charge of $64 million recorded in fiscal 2015 decreased operating
Table of Contents
30
margin by 20 basis points for fiscal 2015. Excluding the effect of the Pension settlement charge, operating margin for fiscal 2015 would have been 14.5%.
During fiscal 2016, we recorded a $548 million gain on sale of business and $56 million in taxes related to the divestiture of our Navitaire business, as well as a $301 million gain on sale of business and $48 million in taxes related to the partial divestiture of our Duck Creek business. For additional information, see Note 5 (Business Combinations and Divestitures) to our Consolidated Financial Statements under Item 8, “Financial Statements and Supplementary Data.”
The effective tax rate for fiscal 2016 was 22.4%, compared with 25.8% for fiscal 2015. Absent the $849 millionGain on sale of businesses and related $104 million in taxes recorded during fiscal 2016, our effective tax rate for fiscal 2016 would have been 24.2%. Absent the $64 million Pension settlement charge and related $25 million in taxes recorded during fiscal 2015, our effective tax rate for fiscal 2015 would have been 26.0%.
Diluted earnings per share were $6.45 for fiscal 2016, compared with $4.76 for fiscal 2015. The Gain on sale of businesses, net of taxes, recorded during fiscal 2016 increased Diluted earnings per share by $1.11 in fiscal 2016. The Pension settlement charge, net of taxes, recorded during fiscal 2015 decreased Diluted earnings per share by $0.06 in fiscal 2015. Excluding these impacts, Diluted earnings per share would have been $5.34 and $4.82 for fiscal 2016 and 2015, respectively.
We have presented Operating income, operating margin, effective tax rate and Diluted earnings per share excluding the impacts of the fiscal 2016 Gain on sale of businesses and the fiscal 2015 Pension settlement charge, as we believe doing so facilitates understanding as to both the impacts of these items and our operating performance in comparison to the prior period.
Our Operating income and Diluted earnings per share are affected by currency exchange rate fluctuations on revenues and costs. Most of our costs are incurred in the same currency as the related net revenues. Where practical, we seek to manage foreign currency exposure for costs not incurred in the same currency as the related net revenues, such as the cost of our Global Delivery Network, by using currency protection provisions in our customer contracts and through our hedging programs. We seek to manage our costs, taking into consideration the residual positive and negative effects of changes in foreign exchange rates on those costs. For more information on our hedging programs, see Note 7 (Derivative Financial Instruments) to our Consolidated Financial Statements under Item 8, “Financial Statements and Supplementary Data.”
Bookings and Backlog New bookings for the fourth quarter of fiscal 2016 were $8.99 billion, with consulting bookings of $4.81 billion
and outsourcing bookings of $4.18 billion. New bookings for fiscal 2016 were $35.39 billion, with consulting bookings of $19.16 billion and outsourcing bookings of $16.23 billion.
We provide information regarding our new bookings, which include new contracts, including those acquired through acquisitions, as well as renewals, extensions and changes to existing contracts, because we believe doing so provides useful trend information regarding changes in the volume of our new business over time. New bookings can vary significantly quarter to quarter depending in part on the timing of the signing of a small number of large outsourcing contracts. The types of services and solutions clients are demanding and the pace and level of their spending may impact the conversion of new bookings to revenues. For example, outsourcing bookings, which are typically for multi-year contracts, generally convert to revenue over a longer period of time compared to consulting bookings. Information regarding our new bookings is not comparable to, nor should it be substituted for, an analysis of our revenues over time. New bookings involve estimates and judgments. There are no third-party standards or requirements governing the calculation of bookings. We do not update our new bookings for material subsequent terminations or reductions related to bookings originally recorded in prior fiscal years. New bookings are recorded using then-existing foreign currency exchange rates and are not subsequently adjusted for foreign currency exchange rate fluctuations.
The majority of our contracts are terminable by the client on short notice, and some without notice. Accordingly, we do not believe it is appropriate to characterize bookings attributable to these contracts as backlog. Normally, if a client terminates a project, the client remains obligated to pay for commitments we have made to third parties in connection with the project, services performed and reimbursable expenses incurred by us through the date of termination.

Table of Contents
31
Critical Accounting Policies and Estimates The preparation of our Consolidated Financial Statements in conformity with U.S. generally accepted accounting
principles requires us to make estimates and assumptions that affect the reported amounts of assets and liabilities and disclosure of contingent assets and liabilities at the date of the Consolidated Financial Statements and the reported amounts of revenues and expenses. We continually evaluate our estimates, judgments and assumptions based on available information and experience. Because the use of estimates is inherent in the financial reporting process, actual results could differ from those estimates. Certain of our accounting policies require higher degrees of judgment than others in their application. These include certain aspects of accounting for revenue recognition and income taxes.
Revenue Recognition Our contracts have different terms based on the scope, deliverables and complexity of the engagement, the
terms of which frequently require us to make judgments and estimates in recognizing revenues. We have many types of contracts, including time-and-materials contracts, fixed-price contracts and contracts with features of both of these contract types. In addition, some contracts include incentives related to costs incurred, benefits produced or adherence to schedules that may increase the variability in revenues and margins earned on such contracts. We conduct rigorous reviews prior to signing such contracts to evaluate whether these incentives are reasonably achievable.
We recognize revenues from technology integration consulting contracts using the percentage-of-completion method of accounting, which involves calculating the percentage of services provided during the reporting period compared with the total estimated services to be provided over the duration of the contract. Our contracts for technology integration consulting services generally span six months to two years. Estimated revenues used in applying the percentage-of-completion method include estimated incentives for which achievement of defined goals is deemed probable. This method is followed where reasonably dependable estimates of revenues and costs can be made. Estimates of total contract revenues and costs are continuously monitored during the term of the contract, and recorded revenues and estimated costs are subject to revision as the contract progresses. Such revisions may result in increases or decreases to revenues and income and are reflected in the Consolidated Financial Statements in the periods in which they are first identified. If our estimates indicate that a contract loss will occur, a loss provision is recorded in the period in which the loss first becomes probable and reasonably estimable. Contract losses are determined to be the amount by which the estimated total direct and indirect costs of the contract exceed the estimated total revenues that will be generated by the contract and are included in Cost of services and classified in Other accrued liabilities.
Revenues from contracts for non-technology integration consulting services with fees based on time and materials or cost-plus are recognized as the services are performed and amounts are earned. We consider amounts to be earned once evidence of an arrangement has been obtained, services are delivered, fees are fixed or determinable, and collectibility is reasonably assured. In such contracts, our efforts, measured by time incurred, typically are provided in less than a year and represent the contractual milestones or output measure, which is the contractual earnings pattern. For non-technology integration consulting contracts with fixed fees, we recognize revenues as amounts become billable in accordance with contract terms, provided the billable amounts are not contingent, are consistent with the services delivered and are earned. Contingent or incentive revenues relating to non-technology integration consulting contracts are recognized when the contingency is satisfied and we conclude the amounts are earned.
Outsourcing contracts typically span several years and involve complex delivery, often through multiple workforces in different countries. In a number of these arrangements, we hire client employees and become responsible for certain client obligations. Revenues are recognized on outsourcing contracts as amounts become billable in accordance with contract terms, unless the amounts are billed in advance of performance of services, in which case revenues are recognized when the services are performed and amounts are earned. Revenues from time-and-materials or cost-plus contracts are recognized as the services are performed. In such contracts, our effort, measured by time incurred, represents the contractual milestones or output measure, which is the contractual earnings pattern. Revenues from unit-priced contracts are recognized as transactions are processed based on objective measures of output. Revenues from fixed-price contracts are recognized on a straight-line basis, unless revenues are earned and obligations are fulfilled in a different pattern. Outsourcing contracts can also include incentive payments for benefits delivered to clients. Revenues relating to such incentive payments are recorded when the contingency is satisfied and we conclude the amounts are earned. We continuously review and reassess our estimates of contract profitability. Circumstances that potentially affect profitability over the life of the contract include decreases in volumes of transactions or other inputs/outputs on which we are paid, failure to deliver agreed benefits, variances from planned internal/external costs to deliver our services and other factors affecting revenues and costs.
Costs related to delivering outsourcing services are expensed as incurred, with the exception of certain transition costs related to the set-up of processes, personnel and systems, which are deferred during the transition period and expensed evenly over the period outsourcing services are provided. The deferred costs are specific internal costs or

Table of Contents
32
incremental external costs directly related to transition or set-up activities necessary to enable the outsourced services. Generally, deferred amounts are protected in the event of early termination of the contract and are monitored regularly for impairment. Impairment losses are recorded when projected remaining undiscounted operating cash flows of the related contract are not sufficient to recover the carrying amount of contract assets. Amounts billable to the client for transition or set-up activities are deferred and recognized as revenue evenly over the period outsourcing services are provided. Contract acquisition and origination costs are expensed as incurred.
We enter into contracts that may consist of multiple deliverables. These contracts may include any combination of technology integration consulting services, non-technology integration consulting services or outsourcing services described above. Revenues for contracts with multiple deliverables are allocated based on the lesser of the element’s relative selling price or the amount that is not contingent on future delivery of another deliverable. The selling price of each deliverable is determined by obtaining third party evidence of the selling price for the deliverable and is based on the price charged when largely similar services are sold on a standalone basis by the Company to similarly situated customers. If the amount of non-contingent revenues allocated to a deliverable accounted for under the percentage-of-completion method of accounting is less than the costs to deliver such services, then such costs are deferred and recognized in future periods when the revenues become non-contingent. Revenues are recognized in accordance with our accounting policies for the separate deliverables when the services have value on a stand-alone basis, selling price of the separate deliverables exists and, in arrangements that include a general right of refund relative to the completed deliverable, performance of the in-process deliverable is considered probable and substantially in our control. While determining fair value and identifying separate deliverables require judgment, generally fair value and the separate deliverables are readily identifiable as we also sell those deliverables unaccompanied by other deliverables.
Revenues recognized in excess of billings are recorded as Unbilled services. Billings in excess of revenues recognized are recorded as Deferred revenues until revenue recognition criteria are met. Client prepayments (even if nonrefundable) are deferred and recognized over future periods as services are delivered or performed.
Our consulting revenues are affected by the number of work days in a fiscal quarter, which in turn is affected by the level of vacation days and holidays. Consequently, since our first and third quarters typically have approximately 5-10% more work days than our second and fourth quarters, our consulting revenues are typically higher in our first and third quarters than in our second and fourth quarters.
Net revenues include the margin earned on computer hardware, software and related services resale contracts, as well as revenues from alliance agreements, neither of which is material to us. Reimbursements include billings for travel and other out-of-pocket expenses and third-party costs, such as the cost of hardware, software and related services resales. In addition, Reimbursements include allocations from gross billings to record an amount equivalent to reimbursable costs, where billings do not specifically identify reimbursable expenses. We report revenues net of any revenue-based taxes assessed by governmental authorities that are imposed on and concurrent with specific revenue-producing transactions.
Income Taxes Determining the consolidated provision for income tax expense, income tax liabilities and deferred tax assets
and liabilities involves judgment. Deferred tax assets and liabilities, measured using enacted tax rates, are recognized for the future tax consequences of temporary differences between the tax and financial statement bases of assets and liabilities. As a global company, we calculate and provide for income taxes in each of the tax jurisdictions in which we operate. This involves estimating current tax exposures in each jurisdiction as well as making judgments regarding the recoverability of deferred tax assets. Tax exposures can involve complex issues and may require an extended period to resolve. In assessing the realizability of deferred tax assets, we consider whether it is more likely than not that some portion or all of the deferred tax assets will not be realized and adjust the valuation allowances accordingly. Factors considered in making this determination include the period of expiration of the tax asset, planned use of the tax asset, tax planning strategies and historical and projected taxable income as well as tax liabilities for the tax jurisdiction in which the tax asset is located. Valuation allowances will be subject to change in each future reporting period as a result of changes in one or more of these factors. Changes in the geographic mix or estimated level of annual income before taxes can affect the overall effective tax rate.
We apply an estimated annual effective tax rate to our quarterly operating results to determine the interim provision for income tax expense. In accordance with Financial Accounting Standards Board (“FASB”) guidance on uncertainty in income taxes, a change in judgment that impacts the measurement of a tax position taken in a prior year is recognized as a discrete item in the interim period in which the change occurs. In the event there is a significant unusual or infrequent item recognized in our quarterly operating results, the tax attributable to that item is recorded in the interim period in which it occurs.

Table of Contents
33
No taxes have been provided on undistributed foreign earnings that are planned to be indefinitely reinvested. If future events, including material changes in estimates of cash, working capital and long-term investment requirements, necessitate that these earnings be distributed, an additional provision for taxes may apply, which could materially affect our future effective tax rate. During fiscal 2015, the Company distributed substantially all of the earnings of its U.S. subsidiaries that were previously considered indefinitely reinvested and recorded a tax liability of $247 million for withholding taxes payable on this distribution. We currently do not foresee any event that would require us to distribute any remaining undistributed earnings. For additional information, see Note 9 (Income Taxes) to our Consolidated Financial Statements under Item 8, “Financial Statements and Supplementary Data.”
As a matter of course, we are regularly audited by various taxing authorities, and sometimes these audits result in proposed assessments where the ultimate resolution may result in us owing additional taxes. We establish tax liabilities or reduce tax assets for uncertain tax positions when, despite our belief that our tax return positions are appropriate and supportable under local tax law, we believe we may not succeed in realizing the tax benefit of certain positions if challenged. In evaluating a tax position, we determine whether it is more likely than not that the position will be sustained upon examination, including resolution of any related appeals or litigation processes, based on the technical merits of the position. Our estimate of the ultimate tax liability contains assumptions based on past experiences, judgments about potential actions by taxing jurisdictions as well as judgments about the likely outcome of issues that have been raised by taxing jurisdictions. The tax position is measured at the largest amount of benefit that is greater than 50 percent likely of being realized upon settlement. We evaluate these uncertain tax positions each quarter and adjust the related tax liabilities or assets in light of changing facts and circumstances, such as the progress of a tax audit or the expiration of a statute of limitations. We believe the estimates and assumptions used to support our evaluation of uncertain tax positions are reasonable. However, final determinations of prior-year tax liabilities, either by settlement with tax authorities or expiration of statutes of limitations, could be materially different from estimates reflected in assets and liabilities and historical income tax provisions. The outcome of these final determinations could have a material effect on our income tax provision, net income, or cash flows in the period in which that determination is made. We believe our tax positions comply with applicable tax law and that we have adequately accounted for uncertain tax positions.
Revenues by Segment/Operating Group Our five reportable operating segments are our operating groups, which are Communications, Media &
Technology; Financial Services; Health & Public Service; Products; and Resources. Operating groups are managed on the basis of net revenues because our management believes net revenues are a better indicator of operating group performance than revenues. In addition to reporting net revenues by operating group, we also report net revenues by two types of work: consulting and outsourcing, which represent the services sold by our operating groups. Consulting net revenues, which include management and technology consulting and systems integration, reflect a finite, distinct project or set of projects with a defined outcome and typically a defined set of specific deliverables. Outsourcing net revenues typically reflect ongoing, repeatable services or capabilities provided to transition, run and/or manage operations of client systems or business functions.
From time to time, our operating groups work together to sell and implement certain contracts. The resulting revenues and costs from these contracts may be apportioned among the participating operating groups. Generally, operating expenses for each operating group have similar characteristics and are subject to the same factors, pressures and challenges. However, the economic environment and its effects on the industries served by our operating groups affect revenues and operating expenses within our operating groups to differing degrees. The mix between consulting and outsourcing is not uniform among our operating groups. Local currency fluctuations also tend to affect our operating groups differently, depending on the geographic concentrations and locations of their businesses.
While we provide discussion about our results of operations below, we cannot measure how much of our revenue growth in a particular period is attributable to changes in price or volume. Management does not track standard measures of unit or rate volume. Instead, our measures of volume and price are extremely complex, as each of our services contracts is unique, reflecting a customized mix of specific services that does not fit into standard comparability measurements. Revenue for our services is a function of the nature of each service to be provided, the skills required and the outcome sought, as well as estimated cost, risk, contract terms and other factors.

Table of Contents
34
Results of Operations for Fiscal 2016 Compared to Fiscal 2015 Net revenues (by operating group, geographic region and type of work) and reimbursements were as follows:
Fiscal
PercentIncrease
(Decrease)U.S.
Dollars
PercentIncrease
LocalCurrency
Percent of TotalNet Revenues
for Fiscal 2016 2015 2016 2015 (in millions of U.S. dollars) OPERATING GROUPS
Communications, Media & Technology $ 6,616 $ 6,349 4% 9% 20% 20%Financial Services 7,031 6,635 6 11 21 21Health & Public Service 5,987 5,463 10 12 18 18Products 8,395 7,596 11 15 26 25Resources 4,839 4,989 (3) 3 15 16Other 15 17 n/m n/m — —
TOTAL NET REVENUES 32,883 31,048 6% 10% 100% 100%Reimbursements 1,915 1,866 3TOTAL REVENUES $ 34,798 $ 32,914 6%
GEOGRAPHIC REGIONSNorth America $ 15,653 $ 14,209 10% 11% 48% 46%Europe 11,448 10,930 5 11 35 35Growth Markets 5,781 5,909 (2) 8 17 19
TOTAL NET REVENUES $ 32,883 $ 31,048 6% 10% 100% 100%TYPE OF WORK
Consulting $ 17,868 $ 16,204 10% 15% 54% 52%Outsourcing 15,015 14,844 1 6 46 48
TOTAL NET REVENUES $ 32,883 $ 31,048 6% 10% 100% 100%
_______________ n/m = not meaningful Amounts in table may not total due to rounding.
Our business in the United States represented 46%, 43% and 40% of our consolidated net revenues during fiscal2016, 2015 and 2014, respectively. No other country individually comprised 10% or more of our consolidated net revenues during these periods.
Net Revenues The following net revenues commentary discusses local currency net revenue changes for fiscal 2016 compared
to fiscal 2015:
Operating Groups • Communications, Media & Technology net revenues increased 9% in local currency. Net revenues reflected
strong growth, driven by growth across all industry groups in North America and Growth Markets, as well as Media & Entertainment in Europe.
• Financial Services net revenues increased 11% in local currency. Net revenues reflected very strong growth, driven by growth in both industry groups across all geographic regions, led by Banking & Capital Markets in Europe.
• Health & Public Service net revenues increased 12% in local currency. Net revenues reflected very strong growth, driven by growth in both industry groups across all geographic regions, led by Public Service and Health in North America.
• Products net revenues increased 15% in local currency. Net revenues reflected very strong growth, driven by growth across all industry groups and geographic regions, led by Consumer Goods, Retail & Travel Services, as well as Industrial in Europe and Life Sciences in North America.

Table of Contents
35
• Resources net revenues increased 3% in local currency. Net revenues reflected modest growth, as significant growth in Utilities across all geographic regions was largely offset by declines in Chemicals & Natural Resources in Growth Markets and North America and Energy in Europe and Growth Markets. We have experienced lower or negative revenue growth in Chemicals & Natural Resources and Energy, principally due to economic challenges in these industries, and we expect this trend to continue in the near term.
Geographic Regions • North America net revenues increased 11% in local currency, driven by the United States.
• Europe net revenues increased 11% in local currency, driven by the United Kingdom, Italy, Switzerland, Spain, Germany and France.
• Growth Markets net revenues increased 8% in local currency, led by Japan, as well as China, India, South Africa and Mexico.
Operating Expenses Operating expenses for fiscal 2016 increased $1,509 million, or 5%, over fiscal 2015, and decreased as a
percentage of revenues to 86.2% from 86.5% during this period. Operating expenses before reimbursable expenses for fiscal 2016 increased $1,460 million, or 5%, over fiscal 2015, and decreased as a percentage of net revenues to 85.4% from 85.7% during this period.
Cost of Services Cost of services for fiscal 2016 increased $1,415 million, or 6%, over fiscal 2015, and increased as a percentage
of revenues to 70.5% from 70.2% during this period. Cost of services before reimbursable expenses for fiscal 2016increased $1,367 million, or 6%, over fiscal 2015, and increased as a percentage of net revenues to 68.7% from 68.4%during this period. Gross margin for fiscal 2016 decreased to 31.3% from 31.6% in fiscal 2015. The reduction in gross margin for fiscal 2016 was principally due to higher labor costs and higher costs associated with acquisition activities compared to fiscal 2015.
Sales and Marketing Sales and marketing expense for fiscal 2016 increased $75 million, or 2%, over fiscal 2015, and decreased as
a percentage of net revenues to 10.9% from 11.3% during this period. The decrease as a percentage of net revenues was principally due to improved operational efficiency in our business development activities.
General and Administrative Costs General and administrative costs for fiscal 2016 increased $83 million, or 5%, over fiscal 2015, and decreased
as a percentage of net revenues to 5.7% from 5.8% during this period.
Pension Settlement Charge We recorded a Pension settlement charge of $64 million during fiscal 2015 as a result of lump sum cash payments
made from our U.S. defined benefit pension plan to former employees who elected to receive such payments. For additional information, see Note 10 (Retirement and Profit Sharing Plans) to our Consolidated Financial Statements under Item 8, “Financial Statements and Supplementary Data.”

Table of Contents
36
Operating Income and Operating MarginOperating income for fiscal 2016 increased $375 million, or 8%, over fiscal 2015. During fiscal 2015, we recorded
a Pension settlement charge of $64 million, which decreased operating margin by 20 basis points. Excluding the effect of the fiscal 2015 Pension settlement charge, operating margin for fiscal 2016 increased 10 basis points compared with fiscal 2015.
Operating income and operating margin for each of the operating groups were as follows:
Fiscal 2016 2015
OperatingIncome
OperatingMargin
OperatingIncome
OperatingMargin
(in millions of U.S. dollars)Communications, Media & Technology $ 966 15% $ 871 14%Financial Services 1,128 16 1,079 16Health & Public Service 807 13 701 13Products 1,282 15 1,082 14Resources 628 13 702 14Total $ 4,810 14.6% $ 4,436 14.3%
_______________ Amounts in table may not total due to rounding.
Operating Income and Operating Margin Excluding Fiscal 2015 Pension Settlement Charge (Non-GAAP)
Fiscal2016 2015
Operating Income and Operating Margin as
Reported (GAAP)
Operating Income and Operating Margin Excluding Pension Settlement Charge
(Non-GAAP)
OperatingIncome
OperatingMargin
OperatingIncome(GAAP)
Pension Settlement Charge (1)
Operating Income
(Adjusted)
Operating Margin
(Adjusted)Increase
(Decrease) (in millions of U.S. dollars)
Communications, Media &Technology $ 966 15% $ 871 $ 13 $ 884 14% $ 82Financial Services 1,128 16 1,079 13 1,093 16 35Health & Public Service 807 13 701 12 713 13 94Products 1,282 15 1,082 16 1,098 14 184Resources 628 13 702 11 713 14 (85)Total $ 4,810 14.6% $ 4,436 $ 64 $ 4,500 14.5% $ 310_______________ Amounts in table may not total due to rounding.
(1) Represents Pension settlement charge related to lump sum cash payment from plan assets offered to eligible former employees.
We estimate that the aggregate percentage impact of foreign currency exchange rates on our Operating income during fiscal 2016 was similar to that disclosed for Net revenue. In addition, during fiscal 2016, each operating group experienced higher costs associated with acquisition activity. The commentary below provides insight into other factors affecting operating group performance and operating margin for fiscal 2016 compared with fiscal 2015, exclusive of the Pension settlement charge recorded in fiscal 2015:
• Communications, Media & Technology operating income increased primarily due to higher contract profitability and consulting revenue growth.
• Financial Services operating income increased primarily due to consulting revenue growth.
• Health & Public Service operating income increased due to revenue growth and higher contract profitability.

Table of Contents
37
• Products operating income increased due to very significant consulting revenue growth and lower sales and marketing costs as a percentage of net revenues.
• Resources operating income decreased due to lower outsourcing contract profitability, partially offset by lower sales and marketing costs as a percentage of net revenues.
Other Expense, net Other expense, net primarily consists of foreign currency gains and losses as well as gains and losses associated
with our investments in privately held companies. During fiscal 2016, Other expense, net increased $25 million over fiscal 2015, primarily due to higher net foreign exchange losses, including losses incurred on the devaluation of the Nigerian Naira.
Gain on Sale of Businesses We recorded a gain from the Navitaire divestiture of $548 million and a gain from the Duck Creek partial divestiture
of $301 million during fiscal 2016. For additional information, see Note 5 (Business Combinations and Divestitures) to our Consolidated Financial Statements under Item 8, “Financial Statements and Supplementary Data.”
Provision for Income Taxes The effective tax rate for fiscal 2016 was 22.4%, compared with 25.8% for fiscal 2015. Absent the $849 million
Gain on sale of businesses and related $104 million in taxes recorded during fiscal 2016, the effective tax rate for fiscal 2016 would have been 24.2%. Absent the $64 million Pension settlement charge and related $25 million in taxes recorded during fiscal 2015, the effective tax rate for fiscal 2015 would have been 26.0%. The effective tax rate for fiscal 2016 benefited from a final determination of U.S. Federal taxes for fiscal 2012. The effective tax rate for fiscal 2015 benefited from a final determination of U.S. Federal taxes for fiscal years 2010 and 2011. This was offset by expenses associated with an increase in deferred tax liabilities during fiscal 2015, when we concluded that certain undistributed earnings of our U.S. subsidiaries would no longer be considered indefinitely reinvested. For additional information, see Note 9 (Income Taxes) to our Consolidated Financial Statements under Item 8, “Financial Statements and Supplementary Data.”
Net Income Attributable to Noncontrolling InterestsNet income attributable to noncontrolling interests reflects the income earned or expense incurred attributable to
the equity interest that some current and former members of Accenture Leadership and their permitted transferees have in our Accenture Holdings plc and Accenture Canada Holdings Inc. subsidiaries. See “Business—Organizational Structure.” Net income attributable to Accenture plc represents the income attributable to the shareholders of Accenture plc. Since January 2002, noncontrolling interests has also included immaterial amounts primarily attributable to noncontrolling shareholders in our Avanade Inc. subsidiary.
Net income attributable to noncontrolling interests for fiscal 2016 increased $18 million, or 8%, over fiscal 2015. The increase was due to higher Net income of $1,076 million, primarily driven by the Gain on sale of businesses, partially offset by a reduction in the Accenture Holdings plc ordinary shares and Accenture Canada Holdings Inc. exchangeable shares average noncontrolling ownership interest during fiscal 2016.
Earnings Per ShareDiluted earnings per share were $6.45 for fiscal 2016, compared with $4.76 for fiscal 2015. The $1.69 increase
in our Diluted earnings per share included the impact of the Gain on sale of businesses, net of taxes, which increased Diluted earnings per share for fiscal 2016 by $1.11 and the impact of the Pension settlement charge, net of taxes, which decreased Diluted earnings per share for fiscal 2015 by $0.06. Excluding these impacts, Diluted earnings per share for fiscal 2016 increased $0.52 compared with fiscal 2015, due to increases of $0.34 from higher revenues and operating results, $0.13 from a lower effective tax rate and $0.08 from lower weighted average shares outstanding. These increases were partially offset by a decrease of $0.03 from higher non-operating expense. For information regarding our Earnings per share calculations, see Note 2 (Earnings Per Share) to our Consolidated Financial Statements under Item 8, “Financial Statements and Supplementary Data.”

Table of Contents
38
Results of Operations for Fiscal 2015 Compared to Fiscal 2014 Net revenues (by operating group, geographic region and type of work) and reimbursements were as follows:
Fiscal
PercentIncrease
(Decrease)U.S.
Dollars
PercentIncrease
LocalCurrency
Percent of TotalNet Revenues
for Fiscal 2015 2014 2015 2014 (in millions of U.S. dollars) OPERATING GROUPS
Communications, Media & Technology $ 6,349 $ 5,924 7% 16% 20% 20%Financial Services 6,635 6,511 2 11 21 22Health & Public Service 5,463 5,022 9 12 18 17Products 7,596 7,395 3 10 25 24Resources 4,989 5,135 (3) 5 16 17Other 17 15 n/m n/m — —
TOTAL NET REVENUES 31,048 30,002 3% 11% 100% 100%Reimbursements 1,866 1,872 —TOTAL REVENUES $ 32,914 $ 31,875 3%
GEOGRAPHIC REGIONS (1)North America $ 14,209 $ 12,797 11% 12% 46% 43%Europe 10,930 11,255 (3) 10 35 37Growth Markets 5,909 5,951 (1) 11 19 20
TOTAL NET REVENUES $ 31,048 $ 30,002 3% 11% 100% 100%TYPE OF WORK
Consulting $ 16,204 $ 15,738 3% 11% 52% 52%Outsourcing 14,844 14,265 4 11 48 48
TOTAL NET REVENUES $ 31,048 $ 30,002 3% 11% 100% 100%
_______________ n/m = not meaningfulAmounts in table may not total due to rounding.
(1) Effective September 1, 2014, we revised the reporting of our geographic regions as follows: North America (the United States and Canada); Europe; and Growth Markets (Asia Pacific, Latin America, Africa, the Middle East, Russia and Turkey). Prior period amounts have been reclassified to conform to the current period presentation.
Net RevenuesThe following net revenues commentary discusses local currency net revenue changes for fiscal 2015 compared
to fiscal 2014:
Operating Groups• Communications, Media & Technology net revenues increased 16% in local currency. Outsourcing revenues
reflected significant growth, driven by growth across all industry groups and geographic regions, led by Communications in all geographic regions as well as Media & Entertainment in North America. Consulting revenues reflected significant growth, driven by growth across all industry groups and geographic regions, led by Communications in North America and Growth Markets.
• Financial Services net revenues increased 11% in local currency. Consulting revenues reflected significant growth, driven by growth across both industry groups and all geographic regions, led by Banking & Capital Markets in Europe. Outsourcing revenue growth was driven by Banking & Capital Markets and Insurance in Europe and Banking & Capital Markets in Growth Markets. These outsourcing increases were partially offset by a decline in Banking & Capital Markets in North America.

Table of Contents
39
• Health & Public Service net revenues increased 12% in local currency. Outsourcing revenues reflected very significant growth, led by Health and Public Service in North America. Consulting revenue growth was driven by Health and Public Service in North America.
• Products net revenues increased 10% in local currency. Consulting revenues reflected very strong growth, driven by growth across all industry groups and geographic regions, led by Consumer Goods, Retail & Travel Services and Industrial in Europe. Outsourcing revenues reflected strong growth, driven by all geographic regions and in most industry groups, led by Consumer Goods, Retail & Travel Services. These outsourcing increases were partially offset by a decline in Industrial in Europe.
• Resources net revenues increased 5% in local currency. Outsourcing revenues reflected strong growth, driven by Utilities across all geographic regions, Chemicals & Natural Resources in Growth Markets and Energy in Europe. Consulting revenues reflected slight growth, driven by Utilities across all geographic regions and Chemicals & Natural Resources in Europe. These consulting increases were largely offset by declines in Energy in Europe and North America and Chemicals & Natural Resources in Growth Markets.
Geographic Regions• North America net revenues increased 12% in local currency, driven by the United States.
• Europe net revenues increased 10% in local currency, driven by Germany, the United Kingdom, Spain, the Netherlands, Italy and France.
• Growth Markets net revenues increased 11% in local currency, driven by Japan, Brazil and Australia, partially offset by declines in South Korea and Singapore.
Operating ExpensesOperating expenses for fiscal 2015 increased $904 million, or 3%, over fiscal 2014, and remained flat as a
percentage of revenues at 86.5%, compared with fiscal 2014. Operating expenses before reimbursable expenses for fiscal 2015 increased $910 million, or 4%, over fiscal 2014, and remained flat as a percentage of net revenues at 85.7%, compared with fiscal 2014.
Cost of ServicesCost of services for fiscal 2015 increased $915 million, or 4%, over fiscal 2014, and increased as a percentage
of revenues to 70.2% from 69.6% during this period. Cost of services before reimbursable expenses for fiscal 2015 increased $921 million, or 5%, over fiscal 2014, and increased as a percentage of net revenues to 68.4% from 67.7% during this period. Gross margin for fiscal 2015 decreased to 31.6% from 32.3% in fiscal 2014, principally due to higher labor costs, increased usage of subcontractors and higher non-payroll costs including recruiting and training costs from the addition of a larger number of employees compared to fiscal 2014.
Sales and MarketingSales and marketing expense for fiscal 2015 decreased $78 million, or 2%, from fiscal 2014, and decreased as
a percentage of net revenues to 11.3% from 11.9% during this period. The decrease as a percentage of net revenues was principally due to improved operational efficiency in our business development activities.
General and Administrative CostsGeneral and administrative costs for fiscal 2015 decreased $15 million, or 1%, from fiscal 2014, and decreased
as a percentage of net revenues to 5.8% from 6.1% during this period.
Pension Settlement ChargeWe recorded a Pension settlement charge of $64 million, pre-tax, during fiscal 2015 as a result of lump sum cash
payments made from our U.S. defined benefit pension plan to former employees who elected to receive such payments. For additional information, refer to Note 10 (Retirement and Profit Sharing Plans) to our Consolidated Financial Statements under Item 8, “Financial Statements and Supplementary Data.”

Table of Contents
40
Operating Income and Operating MarginOperating income for fiscal 2015 increased $135 million, or 3%, from fiscal 2014. The Pension settlement charge
of $64 million recorded in fiscal 2015 decreased operating margin by 20 basis points. Excluding the effects of the Pension settlement charge, operating margin for fiscal 2015 increased 20 basis points compared with fiscal 2014.
Operating income and operating margin for each of the operating groups were as follows:
Fiscal 2015 2014
OperatingIncome
OperatingMargin
OperatingIncome
OperatingMargin
(in millions of U.S. dollars)Communications, Media & Technology $ 871 14% $ 770 13%Financial Services 1,079 16 957 15Health & Public Service 701 13 679 14Products 1,082 14 992 13Resources 702 14 902 18Total $ 4,436 14.3% $ 4,301 14.3%
_______________ Amounts in table may not total due to rounding.
Operating Income and Operating Margin Excluding Fiscal 2015 Pension Settlement Charge (Non-GAAP)
Fiscal2015 2014
Operating Income and Operating Margin Excluding Pension Settlement Charge
(Non-GAAP)
Operating Income and Operating Margin as
Reported (GAAP) OperatingIncome(GAAP)
PensionSettlementCharge (1)
OperatingIncome
(Adjusted)
OperatingMargin
(Adjusted)OperatingIncome
OperatingMargin
Increase(Decrease)
(in millions of U.S. dollars)Communications, Media &Technology $ 871 $ 13 $ 884 14% $ 770 13% $ 114Financial Services 1,079 13 1,093 16 957 15 136Health & Public Service 701 12 713 13 679 14 34Products 1,082 16 1,098 14 992 13 106Resources 702 11 713 14 902 18 (190)Total $ 4,436 $ 64 $ 4,500 14.5% $ 4,301 14.3% $ 200_______________ Amounts in table may not total due to rounding.
(1) Represents Pension settlement charge related to lump sum cash payment from plan assets offered to eligible former employees.
We estimate that the aggregate percentage impact of foreign currency exchange rates on our Operating income during fiscal 2015 was similar to that disclosed for Net revenue. In addition, during fiscal 2015, each operating group recorded a portion of the $64 million Pension settlement charge. The commentary below provides insight into other factors affecting operating group performance and operating margin for fiscal 2015, exclusive of the Pension settlement charge, compared with fiscal 2014:
• Communications, Media & Technology operating income increased primarily due to revenue growth and lower sales and marketing costs as a percentage of net revenues.
• Financial Services operating income increased primarily due to consulting revenue growth, lower sales and marketing costs as a percentage of net revenues and higher contract profitability.
• Health & Public Service operating income increased due to outsourcing revenue growth.
• Products operating income increased due to higher contract profitability and consulting revenue growth.

Table of Contents
41
• Resources operating income decreased due to lower contract profitability.
Other Expense, netOther expense, net for fiscal 2015 increased $29 million over fiscal 2014, primarily due to higher net foreign
exchange losses, including losses incurred on the devaluation of the Venezuelan Bolivar Fuerte.
Provision for Income TaxesThe effective tax rate for fiscal 2015 was 25.8%, compared with 26.1% for fiscal 2014. Absent the tax impact of
the $64 million Pension settlement charge recorded during the third quarter of fiscal 2015, the effective tax rate for fiscal 2015 would have been 26.0%. The fiscal 2015 tax rate includes higher benefits related to final determinations of tax liabilities for prior years, including a $170 million benefit related to final settlement of U.S. tax audits for fiscal years 2010 and 2011, and benefits related to changes in the geographic distribution of earnings, offset by an increase in withholding taxes payable on the distribution of U.S. earnings. For additional information, see Note 9 (Income Taxes) to our Consolidated Financial Statements under Item 8, “Financial Statements and Supplementary Data.”
Net Income Attributable to Noncontrolling InterestsNet income attributable to noncontrolling interests reflects the income earned or expense incurred attributable
to the equity interest that some current and former members of Accenture Leadership and their permitted transferees have in our Accenture Holdings plc and Accenture Canada Holdings Inc. subsidiaries. See “Business—Organizational Structure.” Net income attributable to Accenture plc represents the income attributable to the shareholders of Accenture plc. Since January 2002, noncontrolling interests has also included immaterial amounts primarily attributable to noncontrolling shareholders in our Avanade Inc. subsidiary.
Net income attributable to noncontrolling interests for fiscal 2015 decreased $14 million, or 6%, from fiscal 2014. The decrease was due to a reduction in the Accenture Holdings plc ordinary shares and Accenture Canada Holdings Inc. exchangeable shares average noncontrolling ownership interest, partially offset by higher Net income of $98 million for fiscal 2015.
Earnings Per ShareDiluted earnings per share were $4.76 for fiscal 2015, compared with $4.52 for fiscal 2014. The $0.24 increase
in our diluted earnings per share included the impact of the $64 million Pension settlement charge, which decreased diluted earnings per share for fiscal 2015 by $0.06. Excluding the impact of this charge, diluted earnings per share for fiscal 2015 increased $0.30 compared with fiscal 2014, due to increases of $0.22 from higher revenues and operating results, $0.09 from lower weighted average shares outstanding and $0.01 from a lower effective tax rate. These increases were partially offset by a decrease of $0.02 from lower non-operating income. For information regarding our earnings per share calculations, see Note 2 (Earnings Per Share) to our Consolidated Financial Statements under Item 8, “Financial Statements and Supplementary Data.”

Table of Contents
42
Liquidity and Capital Resources Our primary sources of liquidity are cash flows from operations, available cash reserves and debt capacity
available under various credit facilities. In addition, we could raise additional funds through public or private debt or equity financings. We may use our available or additional funds to, among other things:
• facilitate purchases, redemptions and exchanges of shares and pay dividends; • acquire complementary businesses or technologies; • take advantage of opportunities, including more rapid expansion; or • develop new services and solutions.
As of August 31, 2016, Cash and cash equivalents were $4.9 billion, compared with $4.4 billion as of August 31, 2015.
Cash flows from operating, investing and financing activities, as reflected in our Consolidated Cash Flows Statements, are summarized in the following table:
Fiscal
2016 2015 20142016 to 2015
Change (in millions of U.S. dollars)Net cash provided by (used in):
Operating activities $ 4,575 $ 4,092 $ 3,486 $ 483Investing activities (610) (1,170) (1,056) 560Financing activities (3,397) (3,202) (3,165) (195)
Effect of exchange rate changes on cash and cash equivalents (23) (280) 25 257Net increase (decrease) in cash and cash equivalents $ 545 $ (561) $ (711) $ 1,105
_______________ Amounts in table may not total due to rounding.
Operating activities: The year-over-year increase in operating cash flow was primarily driven by revenue growth and higher operating income, as well as higher collections on net client balances (receivables from clients, current and non-current unbilled services and deferred revenues), partially offset by other changes in operating assets and liabilities, including higher spending on certain compensation payments.
Investing activities: Cash used in investing activities decreased $560 million year-over-year, as higher spending on business acquisitions, investments and property and equipment was more than offset by proceeds of $815 millionfrom the Navitaire divestiture and Duck Creek partial divestiture. For additional information, see Note 5 (Business Combinations and Divestitures) to our Consolidated Financial Statements under Item 8, “Financial Statements and Supplementary Data.”
Financing activities: The $195 million increase in cash used in financing activities was primarily due to an increase in the net purchases of shares and an increase in cash dividends paid. For additional information, see Note 13 (Material Transactions Affecting Shareholders’ Equity) to our Consolidated Financial Statements under Item 8, “Financial Statements and Supplementary Data.”
We believe that our available cash balances and the cash flows expected to be generated from operations will be sufficient to satisfy our current and planned working capital and investment needs for the next twelve months. We also believe that our longer-term working capital and other general corporate funding requirements will be satisfied through cash flows from operations and, to the extent necessary, from our borrowing facilities and future financial market activities.
Substantially all of our cash is held in jurisdictions where there are no regulatory restrictions or material tax effects on the free flow of funds. Domestic cash inflows for our Irish parent, principally dividend distributions from lower-tier subsidiaries, have been sufficient to meet our historic cash requirements, and we expect this to continue into the future.

Table of Contents
43
Borrowing Facilities As of August 31, 2016, we had the following borrowing facilities, including the issuance of letters of credit, to
support general working capital purposes:
FacilityAmount
BorrowingsUnder
Facilities (in millions of U.S. dollars)Syndicated loan facility (1) $ 1,000 $ —Separate, uncommitted, unsecured multicurrency revolving credit facilities (2) 516 —Local guaranteed and non-guaranteed lines of credit (3) 165 —Total $ 1,681 $ —
_______________ (1) On December 22, 2015, we replaced our $1.0 billion syndicated loan facility maturing on October 31, 2016
with a $1.0 billion syndicated loan facility maturing on December 22, 2020. This facility provides unsecured, revolving borrowing capacity for general working capital purposes, including the issuance of letters of credit. We continue to be in compliance with relevant covenant terms. The facility is subject to annual commitment fees. As of August 31, 2016 and 2015, we had no borrowings under either the current or the prior loan facility.
(2) We maintain separate, uncommitted and unsecured multicurrency revolving credit facilities. These facilities provide local-currency financing for the majority of our operations. Interest rate terms on the revolving facilities are at market rates prevailing in the relevant local markets. As of August 31, 2016 and 2015, we had no borrowings under these facilities.
(3) We also maintain local guaranteed and non-guaranteed lines of credit for those locations that cannot access our global facilities. As of August 31, 2016 and 2015, we had no borrowings under these various facilities.
Under the borrowing facilities described above, we had an aggregate of $169 million and $167 million of letters of credit outstanding as of August 31, 2016 and 2015, respectively. In addition, we had total outstanding debt of approximately $27 million at both August 31, 2016 and 2015.
Share Purchases and Redemptions The Board of Directors of Accenture plc has authorized funding for our publicly announced open-market share
purchase program for acquiring Accenture plc Class A ordinary shares and for purchases and redemptions of Accenture plc Class A ordinary shares, Accenture Holdings plc ordinary shares and Accenture Canada Holdings Inc. exchangeable shares held by current and former members of Accenture Leadership and their permitted transferees.
Our share purchase activity during fiscal 2016 was as follows:
Accenture plc Class A
Ordinary
Accenture Holdings plc Ordinary and Accenture Canada
Holdings Inc. Exchangeable Shares Amount Shares Amount (in millions of U.S. dollars, except share amounts)Open-market share purchases (1) 19,989,726 $ 2,122 — $ —Other share purchase programs — — 653,222 72Other purchases (2) 3,857,795 411 — —Total 23,847,521 $ 2,533 653,222 $ 72
_______________
(1) We conduct a publicly announced open-market share purchase program for Accenture plc Class A ordinary shares. These shares are held as treasury shares by Accenture plc and may be utilized to provide for select employee benefits, such as equity awards to our employees.
(2) During fiscal 2016, as authorized under our various employee equity share plans, we acquired Accenture plc Class A ordinary shares primarily via share withholding for payroll tax obligations due from employees and former employees in connection with the delivery of Accenture plc Class A ordinary shares under those plans. These purchases of shares in connection with employee share plans do not affect our aggregate available authorization for our publicly announced open-market share purchase and the other share purchase programs.
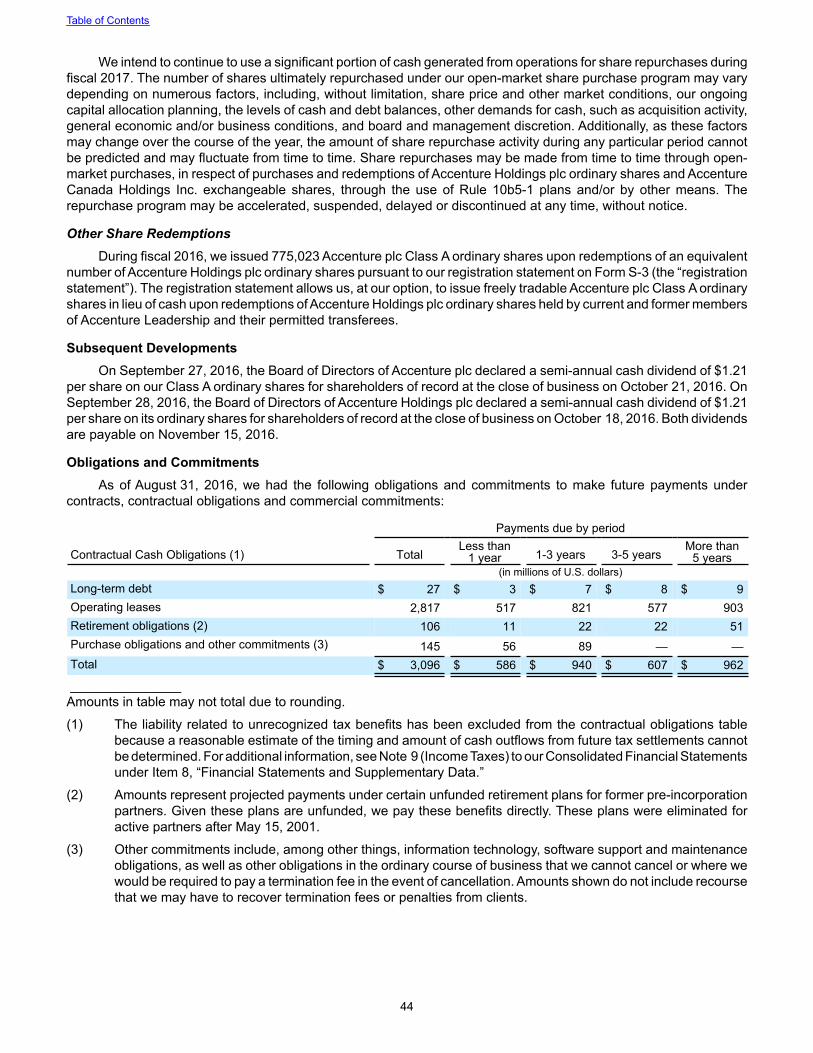
Table of Contents
44
We intend to continue to use a significant portion of cash generated from operations for share repurchases during fiscal 2017. The number of shares ultimately repurchased under our open-market share purchase program may vary depending on numerous factors, including, without limitation, share price and other market conditions, our ongoing capital allocation planning, the levels of cash and debt balances, other demands for cash, such as acquisition activity, general economic and/or business conditions, and board and management discretion. Additionally, as these factors may change over the course of the year, the amount of share repurchase activity during any particular period cannot be predicted and may fluctuate from time to time. Share repurchases may be made from time to time through open-market purchases, in respect of purchases and redemptions of Accenture Holdings plc ordinary shares and Accenture Canada Holdings Inc. exchangeable shares, through the use of Rule 10b5-1 plans and/or by other means. The repurchase program may be accelerated, suspended, delayed or discontinued at any time, without notice.
Other Share Redemptions During fiscal 2016, we issued 775,023 Accenture plc Class A ordinary shares upon redemptions of an equivalent
number of Accenture Holdings plc ordinary shares pursuant to our registration statement on Form S-3 (the “registration statement”). The registration statement allows us, at our option, to issue freely tradable Accenture plc Class A ordinary shares in lieu of cash upon redemptions of Accenture Holdings plc ordinary shares held by current and former members of Accenture Leadership and their permitted transferees.
Subsequent Developments On September 27, 2016, the Board of Directors of Accenture plc declared a semi-annual cash dividend of $1.21
per share on our Class A ordinary shares for shareholders of record at the close of business on October 21, 2016. OnSeptember 28, 2016, the Board of Directors of Accenture Holdings plc declared a semi-annual cash dividend of $1.21per share on its ordinary shares for shareholders of record at the close of business on October 18, 2016. Both dividends are payable on November 15, 2016.
Obligations and Commitments As of August 31, 2016, we had the following obligations and commitments to make future payments under
contracts, contractual obligations and commercial commitments:
Payments due by period
Contractual Cash Obligations (1) TotalLess than
1 year 1-3 years 3-5 yearsMore than
5 years (in millions of U.S. dollars)Long-term debt $ 27 $ 3 $ 7 $ 8 $ 9Operating leases 2,817 517 821 577 903Retirement obligations (2) 106 11 22 22 51Purchase obligations and other commitments (3) 145 56 89 — —Total $ 3,096 $ 586 $ 940 $ 607 $ 962
_______________Amounts in table may not total due to rounding.
(1) The liability related to unrecognized tax benefits has been excluded from the contractual obligations table because a reasonable estimate of the timing and amount of cash outflows from future tax settlements cannot be determined. For additional information, see Note 9 (Income Taxes) to our Consolidated Financial Statements under Item 8, “Financial Statements and Supplementary Data.”
(2) Amounts represent projected payments under certain unfunded retirement plans for former pre-incorporation partners. Given these plans are unfunded, we pay these benefits directly. These plans were eliminated for active partners after May 15, 2001.
(3) Other commitments include, among other things, information technology, software support and maintenance obligations, as well as other obligations in the ordinary course of business that we cannot cancel or where we would be required to pay a termination fee in the event of cancellation. Amounts shown do not include recourse that we may have to recover termination fees or penalties from clients.

Table of Contents
45
Off-Balance Sheet Arrangements
In the normal course of business and in conjunction with some client engagements, we have entered into contractual arrangements through which we may be obligated to indemnify clients with respect to certain matters. To date, we have not been required to make any significant payment under any of these arrangements. For further discussion of these transactions, see Note 15 (Commitments and Contingencies) to our Consolidated Financial Statements under Item 8, “Financial Statements and Supplementary Data.”
Recently Adopted Accounting Pronouncement In August 2016, we early adopted Financial Accounting Standards Board (“FASB”) Accounting Standards Update
(“ASU”) No. 2015-17, Balance Sheet Classification of Deferred Taxes, which amends existing guidance on income taxes to require the classification of all deferred tax assets and liabilities as non-current on the balance sheet. Weadopted this ASU using the retrospective method which required reclassification of current deferred taxes as previously reported on our August 31, 2015 Consolidated Balance Sheets to non-current, resulting in an increase to non-current deferred tax assets of $816 million and a decrease to noncurrent deferred tax liabilities of $22 million.
New Accounting Pronouncements On March 31, 2016, the FASB issued ASU No. 2016-09, Improvements to Employee Share-Based Payment
Accounting, which simplifies the accounting for share-based payment transactions. The new guidance requires excess tax benefits and tax deficiencies to be recorded in the income statement when the awards vest or are settled. In addition, the ASU includes provisions that impact the classification of awards as either equity or liabilities and the classification of excess tax benefits on the cash flow statements. We will early adopt the standard effective September 1, 2016. Following adoption, the primary impact on our Consolidated Financial Statements will be the recognition of excess tax benefits in the provision for income taxes rather than Additional paid-in capital, which will likely result in increased volatility in the reported amounts of income tax expense and net income. We estimate this change will reduce our fiscal 2017 effective tax rate by less than two percentage points. The actual impact of adopting this standard on the effective tax rate will vary depending on our share price during fiscal 2017. Provisions of the new guidance related to changes to classification of excess tax benefits in the cash flow statements are expected to be adopted retrospectively.We are continuing to evaluate the impacts of the adoption of this guidance and our preliminary assessments are subject to change.
On March 15, 2016, the FASB issued ASU No. 2016-07, Simplifying the Transition to the Equity Method of Accounting, which eliminates the requirement to retrospectively apply equity method accounting when an entity increases ownership or influence in a previously held investment. The ASU will be effective for us beginning September 1, 2017, including interim periods in our fiscal year 2018. We do not expect the adoption of this ASU to have a material impact on our Consolidated Financial Statements.
On February 25, 2016, the FASB issued ASU No. 2016-02, Leases, which amends existing guidance to require lessees to recognize assets and liabilities on the balance sheet for the rights and obligations created by long-term leases and to disclose additional quantitative and qualitative information about leasing arrangements. The ASU will be effective for us beginning September 1, 2019, including interim periods in our fiscal year 2020, and allows for a modified retrospective method upon adoption. We are assessing the impact of this ASU on our Consolidated Financial Statements.
On January 5, 2016, the FASB issued ASU No. 2016-01, Recognition and Measurement of Financial Assets and Financial Liabilities, which amends certain aspects of recognition, measurement, presentation and disclosure of financial instruments. The ASU will be effective for us beginning September 1, 2018, including interim periods in our fiscal year 2019. We do not expect the adoption of this ASU to have a material impact on our Consolidated Financial Statements.
On May 28, 2014, the FASB issued ASU No. 2014-09 (Accounting Standard Codification 606), Revenue from Contracts with Customers, which will replace most existing revenue recognition guidance in U.S. GAAP. The core principle of the ASU is that an entity should recognize revenue for the transfer of goods or services equal to the amount that it expects to be entitled to receive for those goods or services. The ASU requires additional disclosure about the nature, amount, timing and uncertainty of revenue and cash flows arising from customer contracts, including significant judgments and changes in judgments. The ASU will be effective for us beginning September 1, 2018, including interim periods in our fiscal year 2019, and allows for both retrospective and modified retrospective methods of adoption. Wewill adopt the guidance on September 1, 2018 and apply the modified retrospective method.We are assessing the impact of this ASU on our Consolidated Financial Statements.

Table of Contents
46
ITEM 7A. QUANTITATIVE AND QUALITATIVE DISCLOSURES ABOUT MARKET RISKAll of our market risk sensitive instruments were entered into for purposes other than trading.
Foreign Currency Risk We are exposed to foreign currency risk in the ordinary course of business. We hedge material cash flow exposures
when feasible using forward contracts. These instruments are subject to fluctuations in foreign currency exchange rates and credit risk. Credit risk is managed through careful selection and ongoing evaluation of the financial institutions utilized as counterparties.
Certain of these hedge positions are undesignated hedges of balance sheet exposures such as intercompany loans and typically have maturities of less than one year. These hedges—primarily U.S. dollar/Indian rupee, U.S. dollar/Euro, U.S. dollar/Japanese yen, U.S. dollar/U.K. pound, U.S. dollar/Brazilian real, U.S. dollar/Swiss franc, U.S. dollar/Philippine peso and U.S. dollar/Norwegian krone—are intended to offset remeasurement of the underlying assets and liabilities. Changes in the fair value of these derivatives are recorded in Other expense, net in the Consolidated Income Statement. Additionally, we have hedge positions that are designated cash flow hedges of certain intercompany charges relating to our Global Delivery Network. These hedges—U.S. dollar/Indian rupee, U.S. dollar/Philippine peso, Euro/Indian rupee, U.K. pound/Indian rupee and Japanese yen/Chinese yuan, which typically have maturities not exceeding three years—are intended to partially offset the impact of foreign currency movements on future costs relating to resources supplied by our Global Delivery Network. For additional information, see Note 7 (Derivative Financial Instruments) to our Consolidated Financial Statements under Item 8, “Financial Statements and Supplementary Data.”
For designated cash flow hedges, gains and losses currently recorded in Accumulated other comprehensive loss will be reclassified into earnings at the time when certain anticipated intercompany charges are accrued as Cost of services. As of August 31, 2016, it was anticipated that approximately $61 million of net gains, net of tax, currently recorded in Accumulated other comprehensive loss will be reclassified into Cost of services within the next 12 months.
We use sensitivity analysis to determine the effects that market foreign currency exchange rate fluctuations may have on the fair value of our hedge portfolio. The sensitivity of the hedge portfolio is computed based on the market value of future cash flows as affected by changes in exchange rates. This sensitivity analysis represents the hypothetical changes in value of the hedge position and does not reflect the offsetting gain or loss on the underlying exposure. A 10% change in the levels of foreign currency exchange rates against the U.S. dollar (or other base currency of the hedge if not a U.S. dollar hedge) with all other variables held constant would have resulted in a change in the fair value of our hedge instruments of approximately $328 million and $305 million as of August 31, 2016 and 2015, respectively.
Interest Rate RiskThe interest rate risk associated with our borrowing and investing activities as of August 31, 2016 is not material
in relation to our consolidated financial position, results of operations or cash flows. While we may do so in the future, we have not used derivative financial instruments to alter the interest rate characteristics of our investment holdings or debt instruments.
Other Market Risk The privately held companies in which we invest are often in a start-up or development stage, which is inherently
risky. The technologies or products these companies have under development are typically in the early stages and may never materialize, which could result in a loss of a substantial part of our investment in these companies. The evaluation of privately held companies is based on information that we request from these companies, which is not subject to the same disclosure regulations as U.S. publicly traded companies, and as such, the basis for these evaluations is subject to the timing and accuracy of the data received from these companies. We have minimal exposure on our long-term investments in privately held companies as these investments were insignificant as of August 31, 2016.
Equity Price RiskThe equity price risk associated with our marketable equity securities that are subject to market price volatility is
not material in relation to our consolidated financial position, results of operations or cash flows.
ITEM 8. FINANCIAL STATEMENTS AND SUPPLEMENTARY DATASee the Index to Consolidated Financial Statements and financial statements commencing on page F-1, which
are incorporated herein by reference.

Table of Contents
47
ITEM 9. CHANGES IN AND DISAGREEMENTS WITH ACCOUNTANTS ON ACCOUNTING AND FINANCIAL DISCLOSURE
None.
ITEM 9A. CONTROLS AND PROCEDURES
Evaluation of Disclosure Controls and ProceduresOur management, with the participation of our principal executive officer and our principal financial officer, has
evaluated the effectiveness of our disclosure controls and procedures (as defined in Rule 13a-15(e) under the Exchange Act) as of the end of the period covered by this report. Any controls and procedures, no matter how well designed and operated, can provide only reasonable assurance of achieving the desired control objectives. Based on that evaluation, the principal executive officer and the principal financial officer of Accenture plc have concluded that, as of the end of the period covered by this report, our disclosure controls and procedures were effective at the reasonable assurance level.
Management’s Annual Report on Internal Control over Financial ReportingOur management is responsible for establishing and maintaining adequate internal control over financial reporting
to provide reasonable assurance regarding the reliability of our financial reporting and the preparation of financial statements for external purposes in accordance with generally accepted accounting principles. Internal control over financial reporting includes those policies and procedures that:
i. pertain to the maintenance of records that in reasonable detail accurately and fairly reflect the transactions and dispositions of our assets;
ii. provide reasonable assurance that the transactions are recorded as necessary to permit preparation of financial statements in accordance with generally accepted accounting principles, and that our receipts and expenditures are being made only in accordance with authorizations of management and our Board of Directors; and
iii. provide reasonable assurance regarding prevention or timely detection of unauthorized acquisition, use or disposition of our assets that could have a material effect on our financial statements.
Due to its inherent limitations, internal control over financial reporting may not prevent or detect misstatements. Also, projections of any evaluation of effectiveness to future periods are subject to the risk that controls may become inadequate due to changes in conditions, or that the degree of compliance with the policies or procedures may deteriorate.
Under the supervision and with the participation of our management, including our principal executive officer and principal financial officer, we conducted an evaluation of the effectiveness of our internal control over financial reporting using the criteria set forth by the Committee of Sponsoring Organizations of the Treadway Commission (COSO) in Internal Control—Integrated Framework (2013). Based on its evaluation, our management concluded that our internal control over financial reporting was effective as of the end of the fiscal year covered by this Annual Report on Form 10-K.
KPMG LLP, an independent registered public accounting firm, has audited the Consolidated Financial Statements included in this Annual Report on Form 10-K and, as part of their audit, has issued its attestation report, included herein, on the effectiveness of our internal control over financial reporting. See “Report of Independent Registered Public Accounting Firm” on page F-2.
Changes in Internal Control over Financial ReportingThere has been no change in our internal control over financial reporting that occurred during the fourth quarter
of fiscal 2016 that has materially affected, or is reasonably likely to materially affect, our internal control over financial reporting.
ITEM 9B. OTHER INFORMATIONNone.

Table of Contents
48
PART III
ITEM 10. DIRECTORS, EXECUTIVE OFFICERS AND CORPORATE GOVERNANCEExcept as described in Part II, Item 5 of our Quarterly Report on Form 10-Q for the quarter ended February 29,
2016, there have been no material changes to the procedures by which security holders may recommend nominees to our Board of Directors from those described in the proxy statement for our Annual General Meeting of Shareholders filed with the SEC on December 11, 2015.
Information about our executive officers is contained in the discussion entitled “Executive Officers of the Registrant” in Part I of this Form 10-K. The remaining information called for by Item 10 will be included in the sections captioned “Re-Appointment of Directors,” “Corporate Governance” and “Beneficial Ownership” included in the definitive proxy statement relating to the 2017 Annual General Meeting of Shareholders of Accenture plc to be held on February 10, 2017 and is incorporated herein by reference. Accenture plc will file such definitive proxy statement with the SEC pursuant to Regulation 14A not later than 120 days after the end of the Company’s 2016 fiscal year covered by this Form 10-K.
ITEM 11. EXECUTIVE COMPENSATIONThe information called for by Item 11 will be included in the sections captioned “Executive Compensation” and
“Director Compensation” included in the definitive proxy statement relating to the 2017 Annual General Meeting of Shareholders of Accenture plc to be held on February 10, 2017 and is incorporated herein by reference. Accenture plc will file such definitive proxy statement with the SEC pursuant to Regulation 14A not later than 120 days after the end of the Company’s 2016 fiscal year covered by this Form 10-K.
ITEM 12. SECURITY OWNERSHIP OF CERTAIN BENEFICIAL OWNERS AND MANAGEMENT AND RELATED SHAREHOLDER MATTERS
Securities Authorized for Issuance under Equity Compensation PlansThe following table sets forth, as of August 31, 2016, certain information related to our compensation plans under
which Accenture plc Class A ordinary shares may be issued.
Plan Category
Number ofShares to beIssued UponExercise ofOutstanding
Options,Warrants
andRights
Weighted-AverageExercisePrice of
OutstandingOptions,Warrants
and Rights
Number ofShares
RemainingAvailable for
FutureIssuance
Under EquityCompensation
Plans(ExcludingSecurities
Reflected in1st Column)
Equity compensation plans approved by shareholders:
2001 Share Incentive Plan 439,242 (1) $ 35.417 —Amended and Restated 2010 Share Incentive Plan 22,478,425 (2) 48.105 23,167,880Amended and Restated 2010 Employee Share Purchase Plan — N/A 47,420,425
Equity compensation plans not approved by shareholders — N/A —Total 22,917,667 70,588,305
_______________(1) Consists of 419,683 restricted share units and 19,559 stock options.(2) Consists of 22,474,674 restricted share units and 3,751 stock options.
The remaining information called for by Item 12 will be included in the section captioned “Beneficial Ownership” included in the definitive proxy statement relating to the 2017 Annual General Meeting of Shareholders of Accenture plc to be held on February 10, 2017 and is incorporated herein by reference. Accenture plc will file such definitive proxy statement with the SEC pursuant to Regulation 14A not later than 120 days after the end of the Company’s 2016 fiscal year covered by this Form 10-K.

Table of Contents
49
ITEM 13. CERTAIN RELATIONSHIPS AND RELATED TRANSACTIONS, AND DIRECTOR INDEPENDENCEThe information called for by Item 13 will be included in the section captioned “Corporate Governance” included
in the definitive proxy statement relating to the 2017 Annual General Meeting of Shareholders of Accenture plc to be held on February 10, 2017 and is incorporated herein by reference. Accenture plc will file such definitive proxy statement with the SEC pursuant to Regulation 14A not later than 120 days after the end of the Company’s 2016 fiscal year covered by this Form 10-K.
ITEM 14. PRINCIPAL ACCOUNTING FEES AND SERVICESThe information called for by Item 14 will be included in the section captioned “Audit” included in the definitive
proxy statement relating to the 2017 Annual General Meeting of Shareholders of Accenture plc to be held on February 10, 2017 and is incorporated herein by reference. Accenture plc will file such definitive proxy statement with the SEC pursuant to Regulation 14A not later than 120 days after the end of the Company’s 2016 fiscal year covered by this Form 10-K.

Table of Contents
50
PART IV
ITEM 15. EXHIBITS, FINANCIAL STATEMENT SCHEDULES(a) List of documents filed as part of this report:
1. Financial Statements as of August 31, 2016 and August 31, 2015 and for the three years ended August 31, 2016—Included in Part II of this Form 10-K:
Consolidated Balance SheetsConsolidated Income StatementsConsolidated Statements of Comprehensive IncomeConsolidated Shareholders’ Equity StatementsConsolidated Cash Flows StatementsNotes to Consolidated Financial Statements
2. Financial Statement Schedules:
None
3. Exhibit Index:
ExhibitNumber Exhibit
3.1 Amended and Restated Memorandum and Articles of Association of Accenture plc (incorporated by reference to Exhibit 3.1 to Accenture plc’s 8-K filed on February 3, 2016)
3.2 Certificate of Incorporation of Accenture plc (incorporated by reference to Exhibit 3.2 to Accenture plc’s 8-K12B filed on September 1, 2009 (the “8-K12B”))
10.1
Form of Voting Agreement, dated as of April 18, 2001, among Accenture Ltd and the covered persons party thereto as amended and restated as of February 3, 2005 (incorporated by reference to Exhibit 9.1 to the Accenture Ltd February 28, 2005 10-Q (File No. 001-16565) (the “February 28, 2005 10-Q”))
10.2 Assumption Agreement of the Amended and Restated Voting Agreement, dated September 1, 2009 (incorporated by reference to Exhibit 10.4 to the 8-K12B)
10.3*
Form of Non-Competition Agreement, dated as of April 18, 2001, among Accenture Ltd and certain employees (incorporated by reference to Exhibit 10.2 to the Accenture Ltd Registration Statement on Form S-1 (File No. 333-59194) filed on April 19, 2001 (the “April 19, 2001 Form S-1”))
10.4 Assumption and General Amendment Agreement between Accenture plc and Accenture Ltd, dated September 1, 2009 (incorporated by reference to Exhibit 10.1 to the 8-K12B)
10.5* 2001 Share Incentive Plan (incorporated by reference to Exhibit 10.3 to the Accenture Ltd Registration Statement on Form S-1/A (File No. 333-59194) filed on July 12, 2001)
10.6* Amended and Restated 2010 Share Incentive Plan (incorporated by reference to Exhibit 10.1 to Accenture plc’s 8-K filed on February 3, 2016)
10.7* Amended and Restated 2010 Employee Share Purchase Plan (incorporated by reference to Exhibit 10.2 to Accenture plc’s 8-K filed on February 3, 2016)
10.8 Memorandum and Articles of Association and Deed Poll of Accenture Holdings plc (incorporated by reference to Exhibit 3.1 to Accenture Holdings plc’s 8-K12G3 filed on August 26, 2015 (the “8-K12G3”)
10.9
Form of Accenture SCA Transfer Rights Agreement, dated as of April 18, 2001, among Accenture SCA and the covered persons party thereto as amended and restated as of February 3, 2005 (incorporated by reference to Exhibit 10.2 to the February 28, 2005 10-Q)
10.10* Form of Non-Competition Agreement, dated as of April 18, 2001, among Accenture SCA and certain employees (incorporated by reference to Exhibit 10.7 to the April 19, 2001 Form S-1)
10.11 Form of Letter Agreement, dated April 18, 2001, between Accenture SCA and certain shareholders of Accenture SCA (incorporated by reference to Exhibit 10.8 to the April 19, 2001 Form S-1)
10.12
Form of Support Agreement, dated as of May 23, 2001, between Accenture Ltd and Accenture Canada Holdings Inc. (incorporated by reference to Exhibit 10.9 to the Accenture Ltd Registration Statement on Form S-1/A (File No. 333-59194) filed on July 2, 2001 (the “July 2, 2001 Form S-1/A”))
10.13 First Supplemental Agreement to Support Agreement among Accenture plc, Accenture Ltd and Accenture Canada Holdings Inc., dated September 1, 2009 (incorporated by reference to Exhibit 10.2 to the 8-K12B)
10.14* Employment Agreement between Accenture SAS and Pierre Nanterme dated as of June 20, 2013 (incorporated by reference to Exhibit 10.2 to the May 31, 2013 10-Q)

Table of Contents
51
10.15* Form of Employment Agreement of executive officers in the United States (incorporated by reference to Exhibit 10.3 to the February 28, 2013 10-Q)
10.16* Form of Employment Agreement of executive officers in the United Kingdom (incorporated by reference to Exhibit 10.16 to the August 31, 2013 10-K)
10.17* Form of Employment Agreement of executive officers in Singapore (incorporated by reference to Exhibit 10.17 to the August 31, 2015 10-K)
10.18 Form of Articles of Association of Accenture Canada Holdings Inc. (incorporated by reference to Exhibit 10.11 to the July 2, 2001 Form S-1/A)
10.19 Articles of Amendment to Articles of Association of Accenture Canada Holdings Inc. (incorporated by reference to Exhibit 10.21 to the August 31, 2013 10-K)
10.20 Form of Exchange Trust Agreement by and between Accenture Ltd and Accenture Canada Holdings Inc. and CIBC Mellon Trust Company, made as of May 23, 2001 (incorporated by reference to Exhibit 10.12 to the July 2, 2001 Form S-1/A)
10.21
First Supplemental Agreement to Exchange Trust Agreement among Accenture plc, Accenture Ltd, Accenture Canada Holdings Inc. and Accenture Inc., dated September 1, 2009 (incorporated by reference to Exhibit 10.3 to the 8-K12B)
10.22* Form of Key Executive Performance-Based Award Restricted Share Unit Agreement pursuant to the Amended and Restated Accenture plc 2010 Share Incentive Plan (incorporated by reference to Exhibit 10.4 to the February 29, 2016 10-Q)
10.23* Form of Key Executive Performance-Based Award Restricted Share Unit Agreement pursuant to Accenture plc 2010 Share Incentive Plan (incorporated by reference to Exhibit 10.2 to the February 28, 2015 10-Q)
10.24*
Form of Amendment to Senior Officer Performance Equity Award Restricted Share Unit Agreement pursuant to Accenture plc 2010 Share Incentive Plan (incorporated by reference to Exhibit 10.3 to the November 30, 2014 10-Q)
10.25* Form of Senior Officer Performance Equity Award Restricted Share Unit Agreement pursuant to Accenture plc 2010 Share Incentive Plan (incorporated by reference to Exhibit 10.3 to the February 28, 2014 10-Q)
10.26*
Form of Senior Officer Performance Equity Award Restricted Share Unit Agreement in France pursuant to Accenture Ltd 2001 Share Incentive Plan (incorporated by reference to Exhibit 10.29 to the August 31, 2012 10-K)
10.27*
Form of Accenture Leadership Performance Equity Award Restricted Share Unit Agreement pursuant to the Amended and Restated Accenture plc Accenture plc 2010 Share Incentive Plan (incorporated by reference to Exhibit 10.5 to the February 29, 2016 10-Q)
10.28* Form of Accenture Leadership Performance Equity Award Restricted Share Unit Agreement pursuant to Accenture plc 2010 Share Incentive Plan (incorporated by reference to Exhibit 10.3 to the February 28, 2015 10-Q)
10.29* Form of Voluntary Equity Investment Program Matching Grant Restricted Share Unit Agreement pursuant to the Amended and Restated Accenture plc 2010 Share Incentive Plan (incorporated by reference to Exhibit 10.6 to the February 29, 2016 10-Q)
10.30* Form of Voluntary Equity Investment Program Matching Grant Restricted Share Unit Agreement pursuant to Accenture plc 2010 Share Incentive Plan (incorporated by reference to Exhibit 10.4 to the February 28, 2015 10-Q)
10.31* Form of Amendment to the Senior Officer Performance Equity Award Restricted Share Unit Agreement, the Accenture Leadership Performance Equity Award Restricted Share Unit Agreement and the Voluntary Equity Investment Program Matching Grant Restricted Share Unit Agreement (filed herewith)
10.32* Form of Restricted Share Unit Agreement for director grants pursuant to the Amended and Restated Accenture plc 2010 Share Incentive Plan (incorporated by reference to Exhibit 10.7 to the February 29, 2016 10-Q)
10.33* Form of Restricted Share Unit Agreement for director grants pursuant to Accenture Ltd 2001 Share Incentive Plan (incorporated by reference to Exhibit 10.1 to the Accenture Ltd February 29, 2008 10-Q)
10.34* Accenture LLP Leadership Separation Benefits Plan (filed herewith)10.35* Description of Global Annual Bonus Plan (incorporated by reference to Exhibit 10.49 to the August 31,
2013 10-K)10.36* Form of Indemnification Agreement, between Accenture International S.à.r.l. and the indemnitee party
thereto (incorporated by reference to Exhibit 10.5 to the 8-K12B)10.37* Form of Indemnification Agreement, between Accenture Holdings plc, Accenture LLP and the indemnitee
party thereto (incorporated by reference to Exhibit 10.1 of the 8-K12G3)21.1 Subsidiaries of the Registrant (filed herewith)

Table of Contents
52
23.1 Consent of KPMG LLP (filed herewith)23.2 Consent of KPMG LLP related to the Accenture plc 2010 Employee Share Purchase Plan (filed herewith)24.1 Power of Attorney (included on the signature page hereto)31.1
Certification of the Chief Executive Officer pursuant to Rule 13a-14(a) or 15d-14(a) of the Securities Exchange Act of 1934, as adopted pursuant to Section 302 of the Sarbanes-Oxley Act of 2002 (filed herewith)
31.2
Certification of the Chief Financial Officer pursuant to Rule 13a-14(a) or 15d-14(a) of the Securities Exchange Act of 1934, as adopted pursuant to Section 302 of the Sarbanes-Oxley Act of 2002 (filed herewith)
32.1 Certification of the Chief Executive Officer pursuant to 18 U.S.C. Section 1350, as adopted pursuant to Section 906 of the Sarbanes-Oxley Act of 2002 (furnished herewith)
32.2 Certification of the Chief Financial Officer pursuant to 18 U.S.C. Section 1350, as adopted pursuant to Section 906 of the Sarbanes-Oxley Act of 2002 (furnished herewith)
99.1 Amended and Restated Accenture plc 2010 Employee Share Purchase Plan Financial Statements (filed herewith)
101
The following financial information from Accenture plc’s Annual Report on Form 10-K for the fiscal year ended August 31, 2016, formatted in XBRL (eXtensible Business Reporting Language): (i) Consolidated Balance Sheets as of August 31, 2016 and August 31, 2015, (ii) Consolidated Income Statements for the years ended August 31, 2016, 2015 and 2014, (iii) Consolidated Statements of Comprehensive Income for the years ended August 31, 2016, 2015 and 2014, (iv) Consolidated Shareholders’ Equity Statement for the years ended August 31, 2016, 2015 and 2014, (v) Consolidated Cash Flows Statements for the years ended August 31, 2016, 2015 and 2014, and (vi) the Notes to Consolidated Financial Statements
(*) Indicates management contract or compensatory plan or arrangement.
The agreements and other documents filed as exhibits to this report are not intended to provide factual information or other disclosure other than with respect to the terms of the agreements or other documents themselves, and you should not rely on them for that purpose. In particular, any representations and warranties made by us in these agreements or other documents were made solely within the specific context of the relevant agreement or document and may not describe the actual state of affairs as of the date they were made or at any other time.

Table of Contents
53
SIGNATURESPursuant to the requirements of Section 13 or 15(d) of the Securities Exchange Act of 1934, the registrant has
duly caused this report to be signed on its behalf on October 28, 2016 by the undersigned, thereunto duly authorized.
ACCENTURE PLC
By: /s/ PIERRE NANTERME
Name: Pierre NantermeTitle: Chief Executive Officer
POWER OF ATTORNEYKNOW ALL PERSONS BY THESE PRESENTS, that each person whose signature appears below hereby
constitutes and appoints Pierre Nanterme, David P. Rowland and Joel Unruch, and each of them, as his or her true and lawful attorneys-in-fact and agents, with power to act with or without the others and with full power of substitution and resubstitution, to do any and all acts and things and to execute any and all instruments which said attorneys and agents and each of them may deem necessary or desirable to enable the registrant to comply with the U.S. Securities Exchange Act of 1934, as amended, and any rules, regulations and requirements of the U.S. Securities and Exchange Commission thereunder in connection with the registrant’s Annual Report on Form 10-K for the fiscal year ended August 31, 2016 (the “Annual Report”), including specifically, but without limiting the generality of the foregoing, power and authority to sign the name of the registrant and the name of the undersigned, individually and in his or her capacity as a director or officer of the registrant, to the Annual Report as filed with the U.S. Securities and Exchange Commission, to any and all amendments thereto, and to any and all instruments or documents filed as part thereof or in connection therewith; and each of the undersigned hereby ratifies and confirms all that said attorneys and agents and each of them shall do or cause to be done by virtue hereof.
Pursuant to the requirements of the Securities Exchange Act of 1934, this report has been signed below on October 28, 2016 by the following persons on behalf of the registrant and in the capacities indicated.
Signature Title
/s/ PIERRE NANTERME Chief Executive Officer, Chairman of the Board and DirectorPierre Nanterme (principal executive officer)
/s/ DAVID P. ROWLAND Chief Financial OfficerDavid P. Rowland (principal financial officer)
/s/ RICHARD P. CLARK Chief Accounting OfficerRichard P. Clark (principal accounting officer)
/s/ JAIME ARDILA DirectorJaime Ardila
/s/ DINA DUBLON DirectorDina Dublon

Table of Contents
54
/s/ CHARLES GIANCARLO DirectorCharles Giancarlo
/s/ WILLIAM L. KIMSEY DirectorWilliam L. Kimsey
/s/ MARJORIE MAGNER DirectorMarjorie Magner
/s/ BLYTHE J. MCGARVIE DirectorBlythe J. McGarvie
/s/ NANCY MCKINSTRY DirectorNancy McKinstry
/s/ GILLES C. PÉLISSON DirectorGilles C. Pélisson
/s/ PAULA A. PRICE DirectorPaula A. Price
/s/ ARUN SARIN DirectorArun Sarin
/s/ WULF VON SCHIMMELMANN DirectorWulf von Schimmelmann
/s/ FRANK K. TANG DirectorFrank K. Tang
Table of Contents
F- 1
ACCENTURE PLCINDEX TO CONSOLIDATED FINANCIAL STATEMENTS
PageReport of Independent Registered Public Accounting Firm F-2Consolidated Financial Statements as of August 31, 2016 and 2015 and for the years ended August 31,2016, 2015 and 2014:
Consolidated Balance Sheets F-3Consolidated Income Statements F-4Consolidated Statements of Comprehensive Income F-5Consolidated Shareholders’ Equity Statements F-6Consolidated Cash Flows Statements F-8
Notes to Consolidated Financial Statements F-9

Table of Contents
F- 2
Report of Independent Registered Public Accounting Firm
The Board of Directors and ShareholdersAccenture plc:
We have audited the accompanying consolidated balance sheets of Accenture plc and its subsidiaries (the Company) as of August 31, 2016 and 2015, and the related consolidated statements of income, comprehensive income, shareholders’ equity, and cash flows for each of the years in the three-year period ended August 31, 2016. We also have audited Accenture plc’s internal control over financial reporting as of August 31, 2016, based on criteria established in Internal Control - Integrated Framework (2013) issued by the Committee of Sponsoring Organizations of the Treadway Commission (COSO). Accenture plc’s management is responsible for these consolidated financial statements, for maintaining effective internal control over financial reporting, and for its assessment of the effectiveness of internal control over financial reporting, included in the accompanying Management’s Annual Report on Internal Control over Financial Reporting (Item 9A). Our responsibility is to express an opinion on these consolidated financial statements and an opinion on the Company’s internal control over financial reporting based on our audits.
We conducted our audits in accordance with the standards of the Public Company Accounting Oversight Board (United States). Those standards require that we plan and perform the audits to obtain reasonable assurance about whether the financial statements are free of material misstatement and whether effective internal control over financial reporting was maintained in all material respects. Our audits of the consolidated financial statements included examining, on a test basis, evidence supporting the amounts and disclosures in the financial statements, assessing the accounting principles used and significant estimates made by management, and evaluating the overall financial statement presentation. Our audit of internal control over financial reporting included obtaining an understanding of internal control over financial reporting, assessing the risk that a material weakness exists, and testing and evaluating the design and operating effectiveness of internal control based on the assessed risk. Our audits also included performing such other procedures as we considered necessary in the circumstances. We believe that our audits provide a reasonable basis for our opinions.
A company’s internal control over financial reporting is a process designed to provide reasonable assurance regarding the reliability of financial reporting and the preparation of financial statements for external purposes in accordance with generally accepted accounting principles. A company’s internal control over financial reporting includes those policies and procedures that (1) pertain to the maintenance of records that, in reasonable detail, accurately and fairly reflect the transactions and dispositions of the assets of the company; (2) provide reasonable assurance that transactions are recorded as necessary to permit preparation of financial statements in accordance with generally accepted accounting principles, and that receipts and expenditures of the company are being made only in accordance with authorizations of management and directors of the company; and (3) provide reasonable assurance regarding prevention or timely detection of unauthorized acquisition, use, or disposition of the company’s assets that could have a material effect on the financial statements.
Because of its inherent limitations, internal control over financial reporting may not prevent or detect misstatements. Also, projections of any evaluation of effectiveness to future periods are subject to the risk that controls may become inadequate because of changes in conditions, or that the degree of compliance with the policies or procedures may deteriorate.
In our opinion, the consolidated financial statements referred to above present fairly, in all material respects, the financial position of Accenture plc and its subsidiaries as of August 31, 2016 and 2015, and the results of their operations and their cash flows for each of the years in the three-year period ended August 31, 2016, in conformity with U.S. generally accepted accounting principles. Also in our opinion, Accenture plc maintained, in all material respects, effective internal control over financial reporting as of August 31, 2016, based on criteria established in Internal Control - Integrated Framework (2013) issued by the Committee of Sponsoring Organizations of the Treadway Commission.
/s/ KPMG LLP
Chicago, IllinoisOctober 28, 2016

Table of Contents
F- 3
ACCENTURE PLCCONSOLIDATED BALANCE SHEETS
August 31, 2016 and 2015 (In thousands of U.S. dollars, except share and per share amounts)
August 31,2016
August 31,2015
ASSETSCURRENT ASSETS:
Cash and cash equivalents $ 4,905,609 $ 4,360,766Short-term investments 2,875 2,448Receivables from clients, net 4,072,180 3,840,920Unbilled services, net 2,150,219 1,884,504Other current assets 845,339 611,436
Total current assets 11,976,222 10,700,074NON-CURRENT ASSETS:
Unbilled services, net 68,145 15,501Investments 198,633 45,027Property and equipment, net 956,542 801,884Goodwill 3,609,437 2,929,833Deferred contract costs 733,219 655,482Deferred income taxes, net 2,077,312 2,089,928Other non-current assets 989,494 964,918
Total non-current assets 8,632,782 7,502,573TOTAL ASSETS $ 20,609,004 $ 18,202,647
LIABILITIES AND SHAREHOLDERS’ EQUITYCURRENT LIABILITIES:
Current portion of long-term debt and bank borrowings $ 2,773 $ 1,848Accounts payable 1,280,821 1,151,464Deferred revenues 2,364,728 2,251,617Accrued payroll and related benefits 4,040,751 3,687,468Accrued consumption taxes 358,359 319,350Income taxes payable 362,963 516,827Other accrued liabilities 468,529 562,432
Total current liabilities 8,878,924 8,491,006NON-CURRENT LIABILITIES:
Long-term debt 24,457 25,587Deferred revenues 754,812 524,455Retirement obligation 1,494,789 1,108,623Deferred income taxes, net 111,020 91,372Income taxes payable 850,709 996,077Other non-current liabilities 304,917 317,956
Total non-current liabilities 3,540,704 3,064,070COMMITMENTS AND CONTINGENCIESSHAREHOLDERS’ EQUITY:
Ordinary shares, par value 1.00 euros per share, 40,000 shares authorized and issued as of August 31, 2016 and August 31, 2015 57 57Class A ordinary shares, par value $0.0000225 per share, 20,000,000,000 shares authorized, 654,202,813 and 804,757,785 shares issued as of August 31, 2016 and August 31, 2015, respectively 15 18Class X ordinary shares, par value $0.0000225 per share, 1,000,000,000 shares authorized, 21,917,155 and 23,335,142 shares issued and outstanding as of August 31, 2016 and August 31, 2015, respectively — 1Restricted share units 1,004,128 1,031,203Additional paid-in capital 2,924,729 4,516,810Treasury shares, at cost: Ordinary, 40,000 shares as of August 31, 2016 and August 31, 2015; Class A ordinary, 33,529,739 and 178,056,462 shares as of August 31, 2016 and August 31, 2015, respectively (2,591,907) (11,472,400)Retained earnings 7,879,960 13,470,008Accumulated other comprehensive loss (1,661,720) (1,411,972)
Total Accenture plc shareholders’ equity 7,555,262 6,133,725Noncontrolling interests 634,114 513,846
Total shareholders’ equity 8,189,376 6,647,571TOTAL LIABILITIES AND SHAREHOLDERS’ EQUITY $ 20,609,004 $ 18,202,647
The accompanying Notes are an integral part of these Consolidated Financial Statements.

Table of Contents
F- 4
ACCENTURE PLCCONSOLIDATED INCOME STATEMENTS
For the Years Ended August 31, 2016, 2015 and 2014 (In thousands of U.S. dollars, except share and per share amounts)
2016 2015 2014REVENUES:
Revenues before reimbursements (“Net revenues”) $ 32,882,723 $ 31,047,931 $ 30,002,394Reimbursements 1,914,938 1,866,493 1,872,284
Revenues 34,797,661 32,914,424 31,874,678OPERATING EXPENSES:
Cost of services:
Cost of services before reimbursable expenses 22,605,296 21,238,692 20,317,928Reimbursable expenses 1,914,938 1,866,493 1,872,284Cost of services 24,520,234 23,105,185 22,190,212
Sales and marketing 3,580,439 3,505,045 3,582,833General and administrative costs 1,886,543 1,803,943 1,819,136Pension settlement charge — 64,382 —Reorganization benefits, net — — (18,015)
Total operating expenses 29,987,216 28,478,555 27,574,166OPERATING INCOME 4,810,445 4,435,869 4,300,512Interest income 30,484 33,991 30,370Interest expense (16,258) (14,578) (17,621)Other expense, net (69,922) (44,752) (15,560)Gain on sale of businesses 848,823 — —INCOME BEFORE INCOME TAXES 5,603,572 4,410,530 4,297,701Provision for income taxes 1,253,969 1,136,741 1,121,743NET INCOME 4,349,603 3,273,789 3,175,958Net income attributable to noncontrolling interests inAccenture Holdings plc and Accenture Canada Holdings Inc. (195,560) (178,925) (187,107)Net income attributable to noncontrolling interests – other (42,151) (41,283) (47,353)NET INCOME ATTRIBUTABLE TO ACCENTURE PLC $ 4,111,892 $ 3,053,581 $ 2,941,498Weighted average Class A ordinary shares:Basic 624,797,820 626,799,586 634,216,250Diluted 667,770,274 678,757,070 692,389,966Earnings per Class A ordinary share:Basic $ 6.58 $ 4.87 $ 4.64Diluted $ 6.45 $ 4.76 $ 4.52Cash dividends per share $ 2.20 $ 2.04 $ 1.86
The accompanying Notes are an integral part of these Consolidated Financial Statements.

Table of Contents
F- 5
ACCENTURE PLCCONSOLIDATED STATEMENTS OF COMPREHENSIVE INCOME
For the Years Ended August 31, 2016, 2015 and 2014 (In thousands of U.S. dollars)
2016 2015 2014NET INCOME $ 4,349,603 $ 3,273,789 $ 3,175,958
OTHER COMPREHENSIVE INCOME (LOSS), NET OF TAX:Foreign currency translation (66,459) (528,908) 89,805
Defined benefit plans (285,885) 7,524 (105,739)
Cash flow hedges 101,299 (17,079) 196,732
Marketable securities 1,297 (1,561) —
OTHER COMPREHENSIVE INCOME (LOSS) ATTRIBUTABLE TO ACCENTURE PLC (249,748) (540,024) 180,798Other comprehensive income (loss) attributable to noncontrolling interests (7,881) 10,160 9,183
COMPREHENSIVE INCOME $ 4,091,974 $ 2,743,925 $ 3,365,939
COMPREHENSIVE INCOME ATTRIBUTABLE TO ACCENTURE PLC $ 3,862,144 $ 2,513,557 $ 3,122,296
Comprehensive income attributable to noncontrolling interests 229,830 230,368 243,643
COMPREHENSIVE INCOME $ 4,091,974 $ 2,743,925 $ 3,365,939
The accompanying Notes are an integral part of these Consolidated Financial Statements.
Table of Contents
F- 6
ACCENTURE PLCCONSOLIDATED SHAREHOLDERS’ EQUITY STATEMENTS
For the Years Ended August 31, 2016, 2015 and 2014(In thousands of U.S. dollars and share amounts)
OrdinaryShares
Class AOrdinaryShares
Class XOrdinaryShares
RestrictedShareUnits
AdditionalPaid-inCapital
Treasury Shares AccumulatedOther
ComprehensiveLoss
TotalAccenture plcShareholders’
EquityNoncontrolling
Interests
TotalShareholders’
Equity $No.
Shares $No.
Shares $No.
Shares $No.
SharesRetainedEarnings
Balance as of August 31, 2013 $ 57 40 $ 17 771,302 $ 1 30,312 $ 875,156 $ 2,393,936 $ (7,326,079) (135,299) $ 10,069,844 $ (1,052,746) $ 4,960,186 $ 467,643 $ 5,427,829
Net income 2,941,498 2,941,498 234,460 3,175,958
Other comprehensive income (loss)
180,798 180,798 9,183 189,981
Income tax benefit on share-based compensation plans
78,421 78,421 78,421
Purchases of Class A ordinary shares
128,395 (2,403,373) (30,629) (2,274,978) (128,395) (2,403,373)
Share-based compensation expense
625,792 45,509 671,301 671,301
Purchases/redemptions of Accenture Holdings plc ordinary shares, Accenture Canada Holdings Inc. exchangeable shares and Class X ordinary shares
(2,255) (147,278) (147,278) (8,783) (156,061)
Issuances of Class A ordinary shares:
Employee share programs 1 14,325 (634,619) 858,012 306,250 7,518 529,644 28,853 558,497
Upon redemption of Accenture Holdings plc ordinary shares 1,242 5,784 5,784 (5,784) —
Dividends 55,257 (1,234,147) (1,178,890) (76,026) (1,254,916)
Other, net (15,387) (19,064) (34,451) 32,151 (2,300)
Balance as of August 31, 2014 $ 57 40 $ 18 786,869 $ 1 28,057 $ 921,586 $ 3,347,392 $ (9,423,202) (158,410) $ 11,758,131 $ (871,948) $ 5,732,035 $ 553,302 $ 6,285,337

Table of Contents
F- 7
ACCENTURE PLCCONSOLIDATED SHAREHOLDERS’ EQUITY STATEMENTS — (continued)
For the Years Ended August 31, 2016, 2015, and 2014 (In thousands of U.S. dollars and share amounts)
OrdinaryShares
Class AOrdinaryShares
Class XOrdinaryShares
RestrictedShareUnits
AdditionalPaid-inCapital
Treasury Shares AccumulatedOther
ComprehensiveLoss
TotalAccenture plcShareholders’
EquityNoncontrolling
Interests
TotalShareholders’
Equity $No.
Shares $No.
Shares $No.
Shares $No.
SharesRetainedEarnings
Net income 3,053,581 3,053,581 220,208 3,273,789
Other comprehensive income(loss)
(540,024) (540,024) 10,160 (529,864)
Income tax benefit on share-based compensation plans
202,868 202,868 202,868
Purchases of Class A ordinaryshares
112,476 (2,273,933) (25,449) (2,161,457) (112,476) (2,273,933)
Share-based compensationexpense
634,195 46,134 680,329 680,329
Purchases/redemptions ofAccenture Holdings plcordinary shares, AccentureCanada Holdings Inc.exchangeable shares andClass X ordinary shares
(4,722) (170,168) (170,168) (8,888) (179,056)
Issuances of Class A ordinaryshares:
Employee share programs 11,649 (575,979) 878,939 224,735 5,763 527,695 26,454 554,149
Upon redemption ofAccenture Holdings plcordinary shares
6,240 29,815 29,815 (29,815) —
Dividends 51,401 (1,328,188) (1,276,787) (76,684) (1,353,471)
Other, net 69,354 (13,516) 55,838 (68,415) (12,577)
Balance as of August 31, 2015 $ 57 40 $ 18 804,758 $ 1 23,335 $ 1,031,203 $ 4,516,810 $ (11,472,400) (178,096) $ 13,470,008 $ (1,411,972) $ 6,133,725 $ 513,846 $ 6,647,571

Table of Contents
F- 8
ACCENTURE PLCCONSOLIDATED SHAREHOLDERS’ EQUITY STATEMENTS — (continued)
For the Years Ended August 31, 2016, 2015, and 2014 (In thousands of U.S. dollars and share amounts)
OrdinaryShares
Class AOrdinaryShares
Class XOrdinaryShares
RestrictedShareUnits
AdditionalPaid-inCapital
Treasury Shares AccumulatedOther
ComprehensiveLoss
TotalAccenture plcShareholders’
EquityNoncontrolling
Interests
TotalShareholders’
Equity $No.
Shares $No.
Shares $No.
Shares $No.
SharesRetainedEarnings
Net income 4,111,892 4,111,892 237,711 4,349,603
Other comprehensive income(loss)
(249,748) (249,748) (7,881) (257,629)
Income tax benefit on share-based compensation plans
112,562 112,562 112,562
Purchases of Class A ordinaryshares
103,760 (2,532,796) (23,848) (2,429,036) (103,760) (2,532,796)
Cancellation of treasury shares (4) (163,016) (2,923,579) 11,199,016 163,016 (8,275,433) — —
Share-based compensationexpense
701,923 56,253 758,176 758,176
Purchases/redemptions ofAccenture Holdings plcordinary shares, AccentureCanada Holdings Inc.exchangeable shares andClass X ordinary shares
(1) (1,418) (68,481) (68,482) (3,711) (72,193)
Issuances of Class A ordinaryshares:
Employee share programs 1 11,686 (785,141) 1,138,304 214,273 5,358 567,437 23,920 591,357
Upon redemption ofAccenture Holdings plcordinary shares
775 3,541 3,541 (3,541) —
Dividends 51,137 (1,423,316) (1,372,179) (65,959) (1,438,138)
Other, net 5,006 (14,441) (3,191) (12,626) 43,489 30,863
Balance as of August 31, 2016 $ 57 40 $ 15 654,203 $ — 21,917 $ 1,004,128 $ 2,924,729 $ (2,591,907) (33,570) $ 7,879,960 $ (1,661,720) $ 7,555,262 $ 634,114 $ 8,189,376
The accompanying Notes are an integral part of these Consolidated Financial Statements.

Table of Contents
F- 9
ACCENTURE PLCCONSOLIDATED CASH FLOWS STATEMENTS
For the Years Ended August 31, 2016, 2015 and 2014 (In thousands of U.S. dollars)
2016 2015 2014CASH FLOWS FROM OPERATING ACTIVITIES:
Net income $ 4,349,603 $ 3,273,789 $ 3,175,958Adjustments to reconcile Net income to Net cash provided by operatingactivities—
Depreciation, amortization and asset impairments 729,052 645,923 620,743Reorganization benefits, net — — (18,015)Share-based compensation expense 758,176 680,329 671,301Gain on sale of businesses (848,823) — —Deferred income taxes, net 65,940 (459,109) (74,092)Other, net (53,706) (237,876) 104,950Change in assets and liabilities, net of acquisitions—
Receivables from clients, net (177,156) (158,990) (464,639)Unbilled services, current and non-current, net (192,912) (268,135) (239,893)Other current and non-current assets (655,876) (400,524) (343,392)Accounts payable 72,626 113,548 72,526Deferred revenues, current and non-current 302,738 182,836 93,927Accrued payroll and related benefits 386,018 586,548 (138,618)Income taxes payable, current and non-current (251,255) 105,037 108,860Other current and non-current liabilities 90,690 28,761 (83,531)
Net cash provided by operating activities 4,575,115 4,092,137 3,486,085CASH FLOWS FROM INVESTING ACTIVITIES:
Proceeds from sales of property and equipment 4,220 5,784 5,526Purchases of property and equipment (496,566) (395,017) (321,870)Purchases of businesses and investments, net of cash acquired (932,542) (791,704) (740,067)Proceeds from the sale of businesses and investments, net of cash transferred 814,538 10,553 —
Net cash used in investing activities (610,350) (1,170,384) (1,056,411)CASH FLOWS FROM FINANCING ACTIVITIES:
Proceeds from issuance of ordinary shares 591,357 554,149 558,497Purchases of shares (2,604,989) (2,452,989) (2,559,434)Proceeds from (repayments of) long-term debt, net (1,059) 701 543Cash dividends paid (1,438,138) (1,353,471) (1,254,916)Excess tax benefits from share-based payment arrangements 92,285 84,026 114,293Other, net (36,389) (34,712) (24,399)
Net cash used in financing activities (3,396,933) (3,202,296) (3,165,416)Effect of exchange rate changes on cash and cash equivalents (22,989) (279,996) 25,162
NET INCREASE (DECREASE) IN CASH AND CASH EQUIVALENTS 544,843 (560,539) (710,580)
CASH AND CASH EQUIVALENTS, beginning of period 4,360,766 4,921,305 5,631,885
CASH AND CASH EQUIVALENTS, end of period $ 4,905,609 $ 4,360,766 $ 4,921,305SUPPLEMENTAL CASH FLOW INFORMATION:
Interest paid $ 16,285 $ 14,810 $ 17,595Income taxes paid $ 1,425,480 $ 1,433,538 $ 962,976
The accompanying Notes are an integral part of these Consolidated Financial Statements.

Table of ContentsACCENTURE PLC
NOTES TO CONSOLIDATED FINANCIAL STATEMENTS(In thousands of U.S. dollars, except share and per share amounts or as otherwise disclosed)
F- 10
1. SUMMARY OF SIGNIFICANT ACCOUNTING POLICIES
Description of Business Accenture plc is one of the world’s leading organizations providing consulting, technology and outsourcing services
and operates globally with one common brand and business model designed to enable it to provide clients around the world with the same high level of service. Drawing on a combination of industry and functional expertise, technology capabilities and alliances, and global delivery resources, Accenture plc seeks to provide differentiated services that help clients measurably improve their business performance and create sustainable value for their customers and stakeholders. Accenture plc’s global delivery model enables it to provide an end-to-end delivery capability by drawing on its global resources to deliver high-quality, cost-effective solutions to clients.
Basis of Presentation The Consolidated Financial Statements include the accounts of Accenture plc, an Irish company, and its controlled
subsidiary companies (collectively, the “Company”). Accenture plc’s only business is to hold ordinary and deferred shares in, and to act as the controlling shareholder of, its subsidiary, Accenture Holdings plc, an Irish public limited company. The Company operates its business through Accenture Holdings plc and subsidiaries of Accenture Holdings plc. Accenture plc controls Accenture Holdings plc’s management and operations and consolidates Accenture Holdings plc’s results in its Consolidated Financial Statements.
On April 10, 2015, Accenture Holdings plc was incorporated in Ireland, as a public limited company, in order to further consolidate Accenture’s presence in Ireland. On August 26, 2015, Accenture SCA merged with and into Accenture Holdings plc, with Accenture Holdings plc as the surviving entity. This merger was a transaction between entities under common control and had no effect on the Company’s Consolidated Financial Statements.
All references to Accenture Holdings plc included in this report with respect to periods prior to August 26, 2015 reflect the activity and/or balances of Accenture SCA (the predecessor of Accenture Holdings plc). The shares ofAccenture Holdings plc and Accenture Canada Holdings Inc. held by persons other than the Company are treated as a noncontrolling interest in the Consolidated Financial Statements. The noncontrolling interest percentages were 4% and 5% as of August 31, 2016 and 2015, respectively.
All references to years, unless otherwise noted, refer to the Company’s fiscal year, which ends on August 31. For example, a reference to “fiscal 2016” means the 12-month period that ended on August 31, 2016. All references to quarters, unless otherwise noted, refer to the quarters of the Company’s fiscal year.
The preparation of the Consolidated Financial Statements in conformity with U.S. generally accepted accounting principles requires management to make estimates and assumptions that affect amounts reported in the Consolidated Financial Statements and accompanying disclosures. Although these estimates are based on management’s best knowledge of current events and actions that the Company may undertake in the future, actual results may be different from those estimates.
Revenue Recognition Revenues from contracts for technology integration consulting services where the Company designs/redesigns,
builds and implements new or enhanced systems applications and related processes for its clients are recognized on the percentage-of-completion method, which involves calculating the percentage of services provided during the reporting period compared to the total estimated services to be provided over the duration of the contract. Contracts for technology integration consulting services generally span six months to two years. Estimated revenues used in applying the percentage-of-completion method include estimated incentives for which achievement of defined goals is deemed probable. This method is followed where reasonably dependable estimates of revenues and costs can be made. Estimates of total contract revenues and costs are continuously monitored during the term of the contract, and recorded revenues and estimated costs are subject to revision as the contract progresses. Such revisions may result in increases or decreases to revenues and income and are reflected in the Consolidated Financial Statements in the periods in which they are first identified. If the Company’s estimates indicate that a contract loss will occur, a loss provision is recorded in the period in which the loss first becomes probable and reasonably estimable. Contract losses are determined to be the amount by which the estimated total direct and indirect costs of the contract exceed the estimated total revenues that will be generated by the contract and are included in Cost of services and classified in Other accrued liabilities.

Table of ContentsACCENTURE PLC
NOTES TO CONSOLIDATED FINANCIAL STATEMENTS — (continued)(In thousands of U.S. dollars, except share and per share amounts or as otherwise disclosed)
F- 11
Revenues from contracts for non-technology integration consulting services with fees based on time and materials or cost-plus are recognized as the services are performed and amounts are earned. The Company considers amounts to be earned once evidence of an arrangement has been obtained, services are delivered, fees are fixed or determinable, and collectibility is reasonably assured. In such contracts, the Company’s efforts, measured by time incurred, typically are provided in less than a year and represent the contractual milestones or output measure, which is the contractual earnings pattern. For non-technology integration consulting contracts with fixed fees, the Company recognizes revenues as amounts become billable in accordance with contract terms, provided the billable amounts are not contingent, are consistent with the services delivered and are earned. Contingent or incentive revenues relating to non-technology integration consulting contracts are recognized when the contingency is satisfied and the Company concludes the amounts are earned.
Outsourcing contracts typically span several years and involve complex delivery, often through multiple workforces in different countries. In a number of these arrangements, the Company hires client employees and becomes responsible for certain client obligations. Revenues are recognized on outsourcing contracts as amounts become billable in accordance with contract terms, unless the amounts are billed in advance of performance of services, in which case revenues are recognized when the services are performed and amounts are earned. Revenues from time-and-materials or cost-plus contracts are recognized as the services are performed. In such contracts, the Company’s effort, measured by time incurred, represents the contractual milestones or output measure, which is the contractual earnings pattern. Revenues from unit-priced contracts are recognized as transactions are processed based on objective measures of output. Revenues from fixed-price contracts are recognized on a straight-line basis, unless revenues are earned and obligations are fulfilled in a different pattern. Outsourcing contracts can also include incentive payments for benefits delivered to clients. Revenues relating to such incentive payments are recorded when the contingency is satisfied and the Company concludes the amounts are earned.
Costs related to delivering outsourcing services are expensed as incurred with the exception of certain transition costs related to the set-up of processes, personnel and systems, which are deferred during the transition period and expensed evenly over the period outsourcing services are provided. The deferred costs are specific internal costs or incremental external costs directly related to transition or set-up activities necessary to enable the outsourced services. Generally, deferred amounts are protected in the event of early termination of the contract and are monitored regularly for impairment. Impairment losses are recorded when projected remaining undiscounted operating cash flows of the related contract are not sufficient to recover the carrying amount of contract assets. Deferred transition costs were $709,444 and $630,420 as of August 31, 2016 and 2015, respectively, and are included in Deferred contract costs. Amounts billable to the client for transition or set-up activities are deferred and recognized as revenue evenly over the period outsourcing services are provided. Deferred transition revenues were $604,674 and $522,968 as of August 31, 2016 and 2015, respectively, and are included in non-current Deferred revenues. Contract acquisition and origination costs are expensed as incurred.
The Company enters into contracts that may consist of multiple deliverables. These contracts may include any combination of technology integration consulting services, non-technology integration consulting services or outsourcing services described above. Revenues for contracts with multiple deliverables are allocated based on the lesser of the element’s relative selling price or the amount that is not contingent on future delivery of another deliverable. The selling price of each deliverable is determined by obtaining third party evidence of the selling price for the deliverable and is based on the price charged when largely similar services are sold on a standalone basis by the Company to similarly situated customers. If the amount of non-contingent revenues allocated to a deliverable accounted for under the percentage-of-completion method of accounting is less than the costs to deliver such services, then such costs are deferred and recognized in future periods when the revenues become non-contingent. Revenues are recognized in accordance with the Company’s accounting policies for the separate deliverables when the services have value on a stand-alone basis, selling price of the separate deliverables exists and, in arrangements that include a general right of refund relative to the completed deliverable, performance of the in-process deliverable is considered probable and substantially in the Company’s control. While determining fair value and identifying separate deliverables require judgment, generally fair value and the separate deliverables are readily identifiable as the Company also sells those deliverables unaccompanied by other deliverables.
Revenues recognized in excess of billings are recorded as Unbilled services. Billings in excess of revenues recognized are recorded as Deferred revenues until revenue recognition criteria are met. Client prepayments (even if nonrefundable) are deferred and recognized over future periods as services are delivered or performed.

Table of ContentsACCENTURE PLC
NOTES TO CONSOLIDATED FINANCIAL STATEMENTS — (continued)(In thousands of U.S. dollars, except share and per share amounts or as otherwise disclosed)
F- 12
Revenues before reimbursements (“net revenues”) include the margin earned on computer hardware, software and related services resale, as well as revenues from alliance agreements. Reimbursements include billings for travel and other out-of-pocket expenses and third-party costs, such as the cost of hardware, software and related services resales. In addition, Reimbursements include allocations from gross billings to record an amount equivalent to reimbursable costs, where billings do not specifically identify reimbursable expenses. The Company reports revenues net of any revenue-based taxes assessed by governmental authorities that are imposed on and concurrent with specific revenue-producing transactions.
Employee Share-Based Compensation Arrangements Share-based compensation expense is recognized over the requisite service period for awards of equity
instruments to employees based on the grant date fair value of those awards expected to ultimately vest. Forfeitures are estimated on the date of grant and revised if actual or expected forfeiture activity differs materially from original estimates.
Income Taxes The Company calculates and provides for income taxes in each of the tax jurisdictions in which it operates.
Deferred tax assets and liabilities, measured using enacted tax rates, are recognized for the future tax consequences of temporary differences between the tax and financial statement bases of assets and liabilities. A valuation allowance reduces the deferred tax assets to the amount that is more likely than not to be realized. The Company establishes liabilities or reduces assets for uncertain tax positions when the Company believes those tax positions are not more likely than not of being sustained if challenged. Each fiscal quarter, the Company evaluates these uncertain tax positions and adjusts the related tax assets and liabilities in light of changing facts and circumstances.
Translation of Non-U.S. Currency Amounts Assets and liabilities of non-U.S. subsidiaries whose functional currency is not the U.S. dollar are translated into
U.S. dollars at fiscal year-end exchange rates. Revenue and expense items are translated at average foreign currency exchange rates prevailing during the fiscal year. Translation adjustments are included in Accumulated other comprehensive loss. Gains and losses arising from intercompany foreign currency transactions that are of a long-term investment nature are reported in the same manner as translation adjustments.
Cash and Cash Equivalents Cash and cash equivalents consist of all cash balances and liquid investments with original maturities of three
months or less, including certificates of deposit and time deposits. Cash and cash equivalents also include restricted cash of $45,478 and $45,935 as of August 31, 2016 and 2015, respectively, which primarily relates to cash held to meet certain insurance requirements. As a result of certain subsidiaries’ cash management systems, checks issued but not presented to the banks for payment may create negative book cash balances. Such negative balances are classified as Current portion of long term debt and bank borrowings.
Client Receivables, Unbilled Services and Allowances The Company records its client receivables and unbilled services at their face amounts less allowances. On a
periodic basis, the Company evaluates its receivables and unbilled services and establishes allowances based on historical experience and other currently available information. As of August 31, 2016 and 2015, total allowances recorded for client receivables and unbilled services were $79,440 and $70,165, respectively. The allowance reflects the Company’s best estimate of collectibility risks on outstanding receivables and unbilled services. In limited circumstances, the Company agrees to extend financing to certain clients. The terms vary by contract, but generally payment for services is contractually linked to the achievement of specified performance milestones.
Table of ContentsACCENTURE PLC
NOTES TO CONSOLIDATED FINANCIAL STATEMENTS — (continued)(In thousands of U.S. dollars, except share and per share amounts or as otherwise disclosed)
F- 13
Concentrations of Credit Risk The Company’s financial instruments, consisting primarily of cash and cash equivalents, foreign currency
exchange rate instruments, client receivables and unbilled services, are exposed to concentrations of credit risk. The Company places its cash and cash equivalents and foreign exchange instruments with highly-rated financial institutions, limits the amount of credit exposure with any one financial institution and conducts ongoing evaluations of the credit worthiness of the financial institutions with which it does business. Client receivables are dispersed across many different industries and countries; therefore, concentrations of credit risk are limited.
Investments All liquid investments with an original maturity greater than three months but less than one year are considered
to be short-term investments. Non-current investments are primarily non-marketable equity securities of privately held companies and are accounted for using either the equity or cost methods of accounting, in accordance with the requirements of Accounting Standards Codification 323, Investments—Equity Method and Joint Ventures. Marketable securities are classified as available-for-sale investments and reported at fair value with changes in unrealized gains and losses recorded as a separate component of Accumulated other comprehensive loss until realized. Interest and amortization of premiums and discounts for debt securities are included in Interest income.
Cost method investments are periodically assessed for other-than-temporary impairment. For investments in privately held companies, if there are no identified events or circumstances that would have a significant adverse effect on the fair value of the investment, the fair value is not estimated. If an investment is deemed to have experienced an other-than-temporary decline below its cost basis, the Company reduces the carrying amount of the investment to its quoted or estimated fair value, as applicable, and establishes a new cost basis for the investment.
Property and Equipment Property and equipment is stated at cost, net of accumulated depreciation. Depreciation of property and equipment
is computed on a straight-line basis over the following estimated useful lives:
Computers, related equipment and software 2 to 7 yearsFurniture and fixtures 5 to 10 yearsLeasehold improvements Lesser of lease term or 15 years
Goodwill Goodwill represents the excess of the purchase price of an acquired entity over the fair value of net assets
acquired. The Company reviews the recoverability of goodwill by reportable operating segment annually, or more frequently when indicators of impairment exist. Based on the results of its annual impairment analysis, the Company determined that no impairment existed as of August 31, 2016 and 2015, as each reportable operating segment’s estimated fair value substantially exceeded its carrying value.
Long-Lived Assets Long-lived assets, including deferred contract costs and identifiable intangible assets, are reviewed for impairment
whenever events or changes in circumstances indicate that the carrying amount of an asset or group of assets may not be recoverable. Recoverability of long-lived assets or groups of assets is assessed based on a comparison of the carrying amount to the estimated future net cash flows. If estimated future undiscounted net cash flows are less than the carrying amount, the asset is considered impaired and a loss is recorded equal to the amount required to reduce the carrying amount to fair value.
Intangible assets with finite lives are generally amortized using the straight-line method over their estimated economic useful lives, ranging from one to fifteen years.

Table of ContentsACCENTURE PLC
NOTES TO CONSOLIDATED FINANCIAL STATEMENTS — (continued)(In thousands of U.S. dollars, except share and per share amounts or as otherwise disclosed)
F- 14
Operating Expenses Selected components of operating expenses were as follows:
Fiscal 2016 2015 2014Training costs $ 940,509 $ 841,440 $ 786,517Research and development costs 643,407 625,541 639,513Advertising costs 80,601 79,899 87,559Provision for (release of) doubtful accounts (1) 15,312 (10,336) (12,867)
_______________ (1) For additional information, see “Client Receivables, Unbilled Services and Allowances”.
Recently Adopted Accounting Pronouncement In August 2016, the Company early adopted Financial Accounting Standards Board (“FASB”) Accounting
Standards Update (“ASU”) No. 2015-17, Balance Sheet Classification of Deferred Taxes, which amends existing guidance on income taxes to require the classification of all deferred tax assets and liabilities as non-current on the balance sheet. The Company adopted this ASU using the retrospective method which required reclassification of current deferred taxes as previously reported on the Company’s August 31, 2015 Consolidated Balance Sheets to non-current, resulting in an increase to non-current deferred tax assets of $815,909 and a decrease to noncurrent deferred tax liabilities of $22,218.
New Accounting Pronouncements On March 31, 2016, the FASB issued ASU No. 2016-09, Improvements to Employee Share-Based Payment
Accounting, which simplifies the accounting for share-based payment transactions. The new guidance requires excess tax benefits and tax deficiencies to be recorded in the income statement when the awards vest or are settled. In addition, the ASU includes provisions that impact the classification of awards as either equity or liabilities and the classification of excess tax benefits on the cash flow statements. The Company will early adopt the standard effective September 1, 2016. Following adoption, the primary impact on the Company’s Consolidated Financial Statements will be the recognition of excess tax benefits in the provision for income taxes rather than Additional paid-in capital, which will likely result in increased volatility in the reported amounts of income tax expense and net income. The Company estimates this change will reduce its fiscal 2017 effective tax rate by less than two percentage points. The actual impact of adopting this standard on the effective tax rate will vary depending on the Company’s share price during fiscal 2017. Provisions of the new guidance related to changes to classification of excess tax benefits in the cash flow statements are expected to be adopted retrospectively. The Company is continuing to evaluate the impacts of the adoption of this guidance and its preliminary assessments are subject to change.
On March 15, 2016, the FASB issued ASU No. 2016-07, Simplifying the Transition to the Equity Method of Accounting, which eliminates the requirement to retrospectively apply equity method accounting when an entity increases ownership or influence in a previously held investment. The ASU will be effective for the Company beginning September 1, 2017, including interim periods in its fiscal year 2018. The Company does not expect the adoption of this ASU to have a material impact on its Consolidated Financial Statements.
On February 25, 2016, the FASB issued ASU No. 2016-02, Leases, which amends existing guidance to require lessees to recognize assets and liabilities on the balance sheet for the rights and obligations created by long-term leases and to disclose additional quantitative and qualitative information about leasing arrangements. The ASU will be effective for the Company beginning September 1, 2019, including interim periods in its fiscal year 2020, and allows for a modified retrospective method upon adoption. The Company is assessing the impact of this ASU on itsConsolidated Financial Statements.
On January 5, 2016, the FASB issued ASU No. 2016-01, Recognition and Measurement of Financial Assets and Financial Liabilities, which amends certain aspects of recognition, measurement, presentation and disclosure of financial instruments. The ASU will be effective for the Company beginning September 1, 2018, including interim periods in its fiscal year 2019. The Company does not expect the adoption of this ASU to have a material impact onits Consolidated Financial Statements.

Table of ContentsACCENTURE PLC
NOTES TO CONSOLIDATED FINANCIAL STATEMENTS — (continued)(In thousands of U.S. dollars, except share and per share amounts or as otherwise disclosed)
F- 15
On May 28, 2014, the FASB issued ASU No. 2014-09 (Accounting Standard Codification 606), Revenue from Contracts with Customers, which will replace most existing revenue recognition guidance in U.S. GAAP. The core principle of the ASU is that an entity should recognize revenue for the transfer of goods or services equal to the amount that it expects to be entitled to receive for those goods or services. The ASU requires additional disclosure about the nature, amount, timing and uncertainty of revenue and cash flows arising from customer contracts, including significant judgments and changes in judgments. The ASU will be effective for the Company beginning September 1, 2018, including interim periods in its fiscal year 2019, and allows for both retrospective and modified retrospective methods of adoption. The Company will adopt the guidance on September 1, 2018 and apply the modified retrospective method.The Company is assessing the impact of this ASU on its Consolidated Financial Statements.
2. EARNINGS PER SHARE
Basic and diluted earnings per share were calculated as follows:
Fiscal 2016 2015 2014Basic Earnings per share
Net income attributable to Accenture plc $ 4,111,892 $ 3,053,581 $ 2,941,498Basic weighted average Class A ordinary shares 624,797,820 626,799,586 634,216,250
Basic earnings per share $ 6.58 $ 4.87 $ 4.64Diluted Earnings per share
Net income attributable to Accenture plc $ 4,111,892 $ 3,053,581 $ 2,941,498Net income attributable to noncontrolling interests in Accenture Holdings plc and Accenture Canada Holdings Inc. (1) 195,560 178,925 187,107Net income for diluted earnings per share calculation $ 4,307,452 $ 3,232,506 $ 3,128,605Basic weighted average Class A ordinary shares 624,797,820 626,799,586 634,216,250Class A ordinary shares issuable upon redemption/exchange of noncontrolling interests (1) 29,712,982 36,693,816 40,333,904Diluted effect of employee compensation related to Class A ordinary shares 13,105,585 15,094,672 17,689,942Diluted effect of share purchase plans related to Class A ordinary shares 153,887 168,996 149,870Diluted weighted average Class A ordinary shares 667,770,274 678,757,070 692,389,966
Diluted earnings per share $ 6.45 $ 4.76 $ 4.52 _______________(1) Diluted earnings per share assumes the redemption of all Accenture Holdings plc ordinary shares owned by
holders of noncontrolling interests and the exchange of all Accenture Canada Holdings Inc. exchangeable shares for Accenture plc Class A ordinary shares, on a one-for-one basis. The income effect does not take into account “Net income attributable to noncontrolling interests—other,” since those shares are not redeemable or exchangeable for Accenture plc Class A ordinary shares.

Table of ContentsACCENTURE PLC
NOTES TO CONSOLIDATED FINANCIAL STATEMENTS — (continued)(In thousands of U.S. dollars, except share and per share amounts or as otherwise disclosed)
F- 16
3. ACCUMULATED OTHER COMPREHENSIVE LOSS The following table summarizes the changes in the accumulated balances for each component of accumulated
other comprehensive loss attributable to Accenture plc:
Fiscal2016 2015 2014
Foreign currency translation Beginning balance $ (853,504) $ (324,596) $ (414,401) Foreign currency translation (67,884) (524,729) 91,170 Income tax benefit 2,120 6,520 2,236 Portion attributable to noncontrolling interests (695) (10,699) (3,601) Foreign currency translation, net of tax (66,459) (528,908) 89,805 Ending balance (919,963) (853,504) (324,596)
Defined benefit plans Beginning balance (523,619) (531,143) (425,404) Actuarial losses (481,331) (77,228) (177,243) Pension settlement — 64,382 — Prior service costs arising during the period 1,561 (79) (468) Reclassifications into net periodic pension and post-retirement expense 26,639 27,538 20,026 Income tax benefit (expense) 153,869 (6,725) 45,459 Portion attributable to noncontrolling interests 13,377 (364) 6,487 Defined benefit plans, net of tax (285,885) 7,524 (105,739) Ending balance (1) (809,504) (523,619) (531,143)
Cash flow hedges Beginning balance (33,288) (16,209) (212,941) Unrealized gains (losses) 180,196 (17,207) 222,100 Reclassification adjustments into Cost of services (23,004) (15,207) 101,026 Income tax (expense) benefit (51,153) 14,508 (114,325) Portion attributable to noncontrolling interests (4,740) 827 (12,069) Cash flow hedges, net of tax 101,299 (17,079) 196,732 Ending balance (2) 68,011 (33,288) (16,209)
Marketable securities Beginning balance (1,561) — — Unrealized gain (loss) 2,231 (2,693) — Income tax (expense) benefit (873) 1,056 — Portion attributable to noncontrolling interests (61) 76 — Marketable securities, net of tax 1,297 (1,561) — Ending balance (264) (1,561) —
Accumulated other comprehensive loss $ (1,661,720) $ (1,411,972) $ (871,948)
_______________(1) As of August 31, 2016, $50,410 of net losses is expected to be reclassified into net periodic pension expense recognized
in Cost of services, Sales and marketing and General and administrative costs in the next twelve months. (2) As of August 31, 2016, $61,135 of net unrealized gains related to derivatives designated as cash flow hedges is expected
to be reclassified into Cost of services in the next twelve months.

Table of ContentsACCENTURE PLC
NOTES TO CONSOLIDATED FINANCIAL STATEMENTS — (continued)(In thousands of U.S. dollars, except share and per share amounts or as otherwise disclosed)
F- 17
4. PROPERTY AND EQUIPMENT The components of Property and equipment, net were as follows:
August 31, 2016 August 31, 2015Buildings and land $ 2,914 $ 2,939Computers, related equipment and software 1,428,134 1,386,226Furniture and fixtures 354,523 310,971Leasehold improvements 900,996 750,716
Property and equipment, gross 2,686,567 2,450,852Total accumulated depreciation (1,730,025) (1,648,968)Property and equipment, net $ 956,542 $ 801,884
5. BUSINESS COMBINATIONS AND DIVESTITURES
Fiscal 2016
Business Combinations On October 20, 2015, the Company acquired Cloud Sherpas (through its holding company, Declarative Holdings,
Inc.), a leader in cloud advisory and technology services, for approximately $409,424, net of cash acquired. This acquisition enhances the Company’s ability to provide clients with cloud strategy and technology consulting, as well as cloud application implementation, integration and management services, and resulted in approximately 1,100employees joining the Company. In connection with this acquisition, the Company recorded goodwill of $385,337, which was allocated to all five reportable operating segments, and intangible assets of $66,522, primarily related to customer-related intangibles. The goodwill is non-deductible for U.S. federal income tax purposes. The intangible assets are being amortized over one to seven years. The pro forma effects of this acquisition on the Company’s operations were not material.
During fiscal 2016, the Company also completed other individually immaterial acquisitions for total consideration of $458,892, net of cash acquired. These acquisitions were completed primarily to expand the Company’s services and solutions offerings. In connection with these acquisitions, the Company recorded goodwill of $382,326, which was allocated among the reportable operating segments, and intangible assets of $109,981, primarily consisting of customer-related and technology intangibles. The goodwill is partially deductible for U.S. federal income tax purposes. The intangible assets are being amortized over one to ten years. The pro forma effects of these acquisitions on the Company’s operations were not material.
Divestiture On January 26, 2016, the Company completed the sale of Navitaire LLC (“Navitaire”), a wholly owned subsidiary
of the Company that provides technology and business solutions to the airline industry, to Amadeus IT Group, S.A. (“Amadeus”). Concurrent with the sale, the Company also entered into several arrangements to provide services to Amadeus, principally infrastructure outsourcing, over the next five years. The Company received a total of $825,644, net of transaction costs and cash divested, of which $214,500 was recorded as deferred revenue attributable to arrangements to provide services to Amadeus. In connection with the sale of Navitaire, the Company recorded a gain of $547,584 (reported in “Gain on sale of businesses” in the Consolidated Income Statements) and recorded related income taxes of $55,759. Approximately 600 Navitaire employees transferred to Amadeus as a part of this sale.
Joint Venture On August 1, 2016, the Company completed the transfer of its Duck Creek business to Apax Partners LLP in
exchange for $196,198, net of transaction costs and cash divested, and a 40% non-controlling interest in the newly formed joint venture, Duck Creek Technologies LLC (“Duck Creek”). Duck Creek’s business is to accelerate the innovation of claims, billing and policy administration software for the insurance industry. In connection with the transaction, which resulted in the recording of the retained non-controlling interest at fair value, the Company recorded a gain of $301,239 (reported in “Gain on sale of businesses” in the Consolidated Income Statements) and related income tax expense of $48,286. The fair value of the Company’s retained interest in Duck Creek was calculated based on the terms of the transfer and other factors related to the valuation of the non-controlling interest. Adjustments related
Table of ContentsACCENTURE PLC
NOTES TO CONSOLIDATED FINANCIAL STATEMENTS — (continued)(In thousands of U.S. dollars, except share and per share amounts or as otherwise disclosed)
F- 18
to the completion of certain post-closing matters may be recorded in subsequent periods. Approximately 1,000employees moved to Duck Creek as a part of this transaction.
Fiscal 2015 Acquisitions On March 25, 2015, the Company acquired Agilex Technologies, Inc., a provider of digital solutions for the U.S.
federal government, for $264,444, net of cash acquired. This acquisition enhanced Accenture’s digital capabilities in analytics, cloud and mobility for federal agencies and resulted in approximately 730 employees joining the Company. In connection with this acquisition, the Company recorded goodwill of $206,123, which was allocated to the Health & Public Service operating segment, and intangible assets of $50,800, primarily consisting of customer-related intangibles. The goodwill is non-deductible for U.S. federal income tax purposes. The intangible assets are being amortized over one to eight years. The pro forma effects of this acquisition on the Company’s operations were not material.
During fiscal 2015, the Company also completed other individually immaterial acquisitions for total consideration of $510,236, net of cash acquired. These acquisitions were completed primarily to expand the Company’s services and solutions offerings. In connection with these acquisitions, the Company recorded goodwill of $427,435, which was allocated among the reportable operating segments, and intangible assets of $120,970, primarily consisting of customer-related and technology intangibles. The goodwill is partially deductible for U.S. federal income tax purposes. The intangible assets are being amortized over one to eleven years. The pro forma effects of these acquisitions on the Company’s operations were not material.
Fiscal 2014 Acquisitions On December 4, 2013, the Company acquired Procurian Inc. (“Procurian”), a provider of procurement business
process solutions, for $386,407, net of cash acquired. This acquisition enhanced Accenture’s capabilities in procurement business process outsourcing across a range of industries and resulted in approximately 780 employees joining Accenture. In connection with this acquisition, the Company recorded goodwill of $305,627, which was allocated to all five reportable operating segments, and intangible assets of $60,514, primarily consisting of customer-related and technology intangibles. The goodwill is substantially non-deductible for U.S. federal income tax purposes. The intangible assets are being amortized over one to twelve years. The pro forma effects of this acquisition on the Company’s operations were not material.
During fiscal 2014, the Company also completed other individually immaterial acquisitions for total consideration of $320,225, net of cash acquired. These acquisitions were completed primarily to expand the Company’s services and solutions offerings. In connection with these acquisitions, the Company recorded goodwill of $256,704, which was allocated among the reportable operating segments, and intangible assets of $80,305, primarily consisting of customer-related and technology intangibles. The goodwill is partially deductible for U.S. federal income tax purposes. The intangible assets are being amortized over one to twelve years. The pro forma effects of these acquisitions on the Company’s operations were not material.
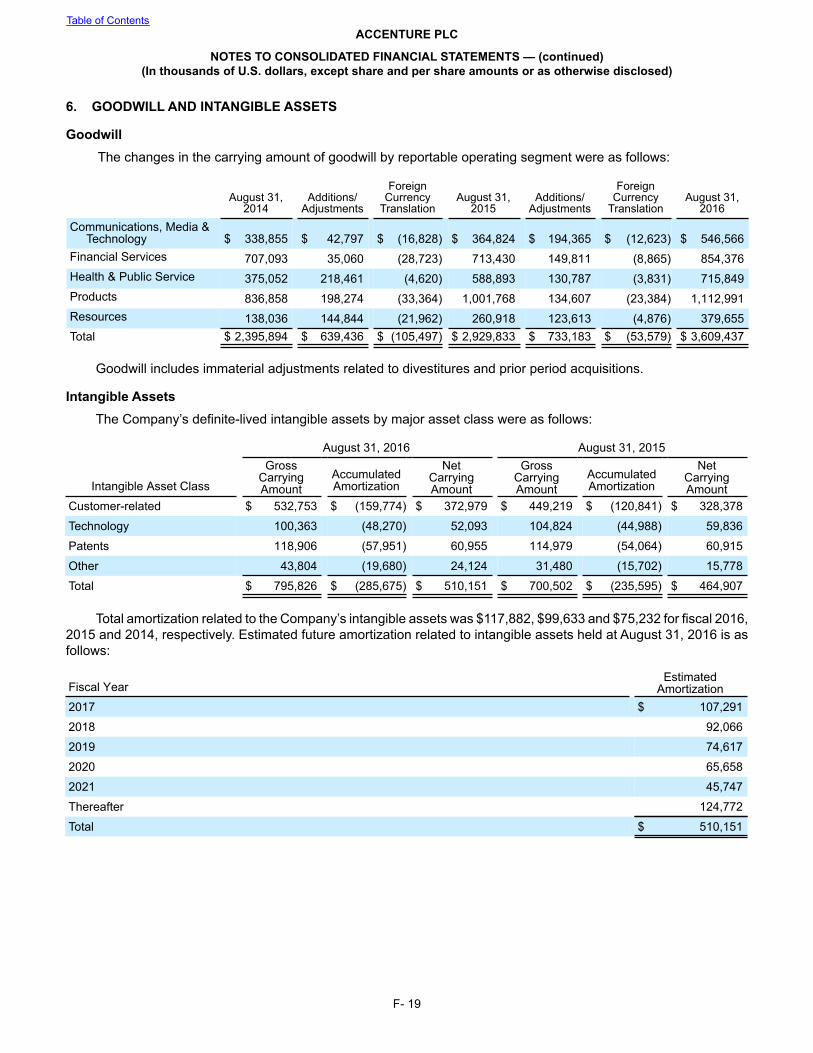
Table of ContentsACCENTURE PLC
NOTES TO CONSOLIDATED FINANCIAL STATEMENTS — (continued)(In thousands of U.S. dollars, except share and per share amounts or as otherwise disclosed)
F- 19
6. GOODWILL AND INTANGIBLE ASSETS
Goodwill The changes in the carrying amount of goodwill by reportable operating segment were as follows:
August 31,2014
Additions/Adjustments
ForeignCurrency
TranslationAugust 31,
2015Additions/
Adjustments
ForeignCurrency
TranslationAugust 31,
2016Communications, Media & Technology $ 338,855 $ 42,797 $ (16,828) $ 364,824 $ 194,365 $ (12,623) $ 546,566Financial Services 707,093 35,060 (28,723) 713,430 149,811 (8,865) 854,376Health & Public Service 375,052 218,461 (4,620) 588,893 130,787 (3,831) 715,849Products 836,858 198,274 (33,364) 1,001,768 134,607 (23,384) 1,112,991Resources 138,036 144,844 (21,962) 260,918 123,613 (4,876) 379,655Total $ 2,395,894 $ 639,436 $ (105,497) $ 2,929,833 $ 733,183 $ (53,579) $ 3,609,437
Goodwill includes immaterial adjustments related to divestitures and prior period acquisitions.
Intangible Assets The Company’s definite-lived intangible assets by major asset class were as follows:
August 31, 2016 August 31, 2015
Intangible Asset Class
GrossCarryingAmount
AccumulatedAmortization
NetCarryingAmount
GrossCarryingAmount
AccumulatedAmortization
NetCarryingAmount
Customer-related $ 532,753 $ (159,774) $ 372,979 $ 449,219 $ (120,841) $ 328,378
Technology 100,363 (48,270) 52,093 104,824 (44,988) 59,836
Patents 118,906 (57,951) 60,955 114,979 (54,064) 60,915
Other 43,804 (19,680) 24,124 31,480 (15,702) 15,778
Total $ 795,826 $ (285,675) $ 510,151 $ 700,502 $ (235,595) $ 464,907
Total amortization related to the Company’s intangible assets was $117,882, $99,633 and $75,232 for fiscal 2016, 2015 and 2014, respectively. Estimated future amortization related to intangible assets held at August 31, 2016 is as follows:
Fiscal YearEstimated
Amortization2017 $ 107,291
2018 92,066
2019 74,617
2020 65,658
2021 45,747
Thereafter 124,772
Total $ 510,151

Table of ContentsACCENTURE PLC
NOTES TO CONSOLIDATED FINANCIAL STATEMENTS — (continued)(In thousands of U.S. dollars, except share and per share amounts or as otherwise disclosed)
F- 20
7. DERIVATIVE FINANCIAL INSTRUMENTS In the normal course of business, the Company uses derivative financial instruments to manage foreign currency
exchange rate risk. Derivative transactions are governed by a uniform set of policies and procedures covering areas such as authorization, counterparty exposure and hedging practices. Positions are monitored using techniques such as market value and sensitivity analyses. The Company does not enter into derivative transactions for trading purposes. The Company classifies cash flows from its derivative programs as cash flows from operating activities in the Consolidated Cash Flows Statements.
Certain derivatives also give rise to credit risks from the possible non-performance by counterparties. Credit risk is generally limited to the fair value of those contracts that are favorable to the Company, and the maximum amount of loss due to credit risk, based on the gross fair value of all of the Company’s derivative financial instruments, was $129,603 as of August 31, 2016.
The Company also utilizes standard counterparty master agreements containing provisions for the netting of certain foreign currency transaction obligations and for set-off of certain obligations in the event of an insolvency of one of the parties to the transaction. These provisions may reduce the Company’s potential overall loss resulting from the insolvency of a counterparty and reduce a counterparty’s potential overall loss resulting from the insolvency of the Company. Additionally, these agreements contain early termination provisions triggered by adverse changes in a counterparty’s credit rating, thereby enabling the Company to accelerate settlement of a transaction prior to its contractual maturity and potentially decrease the Company’s realized loss on an open transaction. Similarly, a decrement in the Company’s credit rating could trigger a counterparty’s early termination rights, thereby enabling a counterparty to accelerate settlement of a transaction prior to its contractual maturity and potentially increase the Company’s realized loss on an open transaction. The aggregate fair value of the Company’s derivative instruments with credit-risk-related contingent features that are in a liability position as of August 31, 2016 was $33,774.
The Company’s derivative financial instruments consist of deliverable and non-deliverable foreign currency forward contracts. Fair values for derivative financial instruments are based on prices computed using third-party valuation models and are classified as Level 2 in accordance with the three-level hierarchy of fair value measurements. All of the significant inputs to the third-party valuation models are observable in active markets. Inputs include current market-based parameters such as forward rates, yield curves and credit default swap pricing. For additional information related to the three-level hierarchy of fair value measurements, see Note 10 (Retirement and Profit Sharing Plans) to these Consolidated Financial Statements.
Cash Flow Hedges Certain of the Company’s subsidiaries are exposed to currency risk through their use of resources supplied by
the Company’s Global Delivery Network. To mitigate this risk, the Company uses foreign currency forward contracts to hedge the foreign exchange risk of the forecasted intercompany expenses denominated in foreign currencies for up to three years in the future. The Company has designated these derivatives as cash flow hedges. As of August 31, 2016 and 2015, the Company held no derivatives that were designated as fair value or net investment hedges.
In order for a derivative to qualify for hedge accounting, the derivative must be formally designated as a fair value, cash flow or net investment hedge by documenting the relationship between the derivative and the hedged item. The documentation includes a description of the hedging instrument, the hedged item, the risk being hedged, the Company’s risk management objective and strategy for undertaking the hedge, the method for assessing the effectiveness of the hedge and the method for measuring hedge ineffectiveness. Additionally, the hedge relationship must be expected to be highly effective at offsetting changes in either the fair value or cash flows of the hedged item at both inception of the hedge and on an ongoing basis. The Company assesses the ongoing effectiveness of its hedges using the Hypothetical Derivative Method, which measures hedge ineffectiveness based on a comparison of the change in fair value of the actual derivative designated as the hedging instrument and the change in fair value of a hypothetical derivative. The hypothetical derivative would have terms that identically match the critical terms of the hedged item. The Company measures and records hedge ineffectiveness at the end of each fiscal quarter.
For a cash flow hedge, the effective portion of the change in estimated fair value of a hedging instrument is recorded in Accumulated other comprehensive loss as a separate component of Shareholders’ Equity and is reclassified into Cost of services in the Consolidated Income Statement during the period in which the hedged transaction is recognized. The amounts related to derivatives designated as cash flow hedges that were reclassified into Cost of services were a net gain of $23,004 and $15,207 during fiscal 2016 and 2015, respectively, and a net loss of $101,026 during fiscal 2014. The ineffective portion of the change in fair value of a cash flow hedge is recognized immediately

Table of ContentsACCENTURE PLC
NOTES TO CONSOLIDATED FINANCIAL STATEMENTS — (continued)(In thousands of U.S. dollars, except share and per share amounts or as otherwise disclosed)
F- 21
in Other expense, net in the Consolidated Income Statement and for fiscal 2016, 2015 and 2014, was not material. In addition, the Company did not discontinue any cash flow hedges during fiscal 2016 and 2015 or 2014.
Other Derivatives The Company also uses foreign currency forward contracts, which have not been designated as hedges, to hedge
balance sheet exposures, such as intercompany loans. These instruments are generally short-term in nature, with typical maturities of less than one year, and are subject to fluctuations in foreign exchange rates. Realized gains or losses and changes in the estimated fair value of these derivatives were a net loss of $84,293 and $257,783 for fiscal 2016 and 2015, respectively, and a net gain of $78,446 for fiscal 2014. Gains and losses on these contracts are recorded in Other expense, net in the Consolidated Income Statement and are offset by gains and losses on the related hedged items.
Fair Value of Derivative Instruments The notional and fair values of all derivative instruments were as follows:
August 31,
2016August 31,
2015Assets
Cash Flow HedgesOther current assets $ 71,955 $ 28,282Other non-current assets 45,683 13,503
Other DerivativesOther current assets 11,965 18,233
Total assets $ 129,603 $ 60,018Liabilities
Cash Flow HedgesOther accrued liabilities $ 10,820 $ 48,683Other non-current liabilities 5,547 48,746
Other DerivativesOther accrued liabilities 17,407 31,862
Total liabilities $ 33,774 $ 129,291Total fair value $ 95,829 $ (69,273)Total notional value $ 7,604,486 $ 6,363,110
The Company utilizes standard counterparty master agreements containing provisions for the netting of certain foreign currency transaction obligations and for the set-off of certain obligations in the event of an insolvency of one of the parties to the transaction. In the Consolidated Balance Sheets, the Company records derivative assets and liabilities at gross fair value. The potential effect of netting derivative assets against liabilities under the counterparty master agreements was as follows:
August 31,
2016August 31,
2015
Net derivative assets $ 114,785 $ 36,661
Net derivative liabilities 18,956 105,934
Total fair value $ 95,829 $ (69,273)

Table of ContentsACCENTURE PLC
NOTES TO CONSOLIDATED FINANCIAL STATEMENTS — (continued)(In thousands of U.S. dollars, except share and per share amounts or as otherwise disclosed)
F- 22
8. BORROWINGS AND INDEBTEDNESS As of August 31, 2016, the Company had the following borrowing facilities, including the issuance of letters of
credit, to support general working capital purposes:
FacilityAmount
BorrowingsUnder
FacilitiesSyndicated loan facility (1) $ 1,000,000 $ —Separate, uncommitted, unsecured multicurrency revolving credit facilities (2) 515,873 —Local guaranteed and non-guaranteed lines of credit (3) 164,692 —Total $ 1,680,565 $ —
_______________ (1) On December 22, 2015, the Company replaced its $1,000,000 syndicated loan facility maturing on October 31,
2016 with a $1,000,000 syndicated loan facility maturing on December 22, 2020. This facility provides unsecured, revolving borrowing capacity for general working capital purposes, including the issuance of letters of credit. Financing is provided under this facility at the prime rate or at the London Interbank Offered Rate plus a spread. This facility requires the Company to: (1) limit liens placed on its assets to (a) liens incurred in the ordinary course of business (subject to certain qualifications) and (b) other liens securing obligations not to exceed 30% of its consolidated assets; and (2) maintain an Adjusted Indebtedness-to-EBITDA ratio not exceeding 1.75 to 1.00. The Company continues to be in compliance with relevant covenant terms. The facility is subject to annual commitment fees. As of August 31, 2016 and 2015, the Company had no borrowings under either the current or the prior loan facility.
(2) The Company maintains separate, uncommitted and unsecured multicurrency revolving credit facilities. These facilities provide local currency financing for the majority of the Company’s operations. Interest rate terms on the revolving facilities are at market rates prevailing in the relevant local markets. As of August 31, 2016 and 2015, the Company had no borrowings under these facilities.
(3) The Company also maintains local guaranteed and non-guaranteed lines of credit for those locations that cannot access the Company’s global facilities. As of August 31, 2016 and 2015, the Company had no borrowings under these various facilities.
Under the borrowing facilities described above, the Company had an aggregate of $168,663 and $166,506 of letters of credit outstanding as of August 31, 2016 and 2015, respectively. In addition, the Company had total outstanding debt of $27,230 and $27,435 as of August 31, 2016 and 2015, respectively.

Table of ContentsACCENTURE PLC
NOTES TO CONSOLIDATED FINANCIAL STATEMENTS — (continued)(In thousands of U.S. dollars, except share and per share amounts or as otherwise disclosed)
F- 23
9. INCOME TAXES
Fiscal 2016 2015 2014Current taxes
U.S. federal $ 314,121 $ 617,488 $ 397,722U.S. state and local 38,255 72,133 46,854Non-U.S. 835,653 906,229 751,259
Total current tax expense 1,188,029 1,595,850 1,195,835Deferred taxes
U.S. federal 8,588 (94,621) 26,941U.S. state and local 1,056 (11,245) 2,911Non-U.S. 56,296 (353,243) (103,944)
Total deferred tax expense (benefit) 65,940 (459,109) (74,092)Total $ 1,253,969 $ 1,136,741 $ 1,121,743
The components of Income before income taxes were as follows:
Fiscal 2016 2015 2014U.S. sources $ 1,047,909 $ 1,321,511 $ 1,119,627Non-U.S. sources 4,555,663 3,089,019 3,178,074Total $ 5,603,572 $ 4,410,530 $ 4,297,701
The reconciliation of the U.S. federal statutory income tax rate to the Company’s effective income tax rate was
as follows:
Fiscal 2016 2015 2014U.S. federal statutory income tax rate 35.0% 35.0% 35.0%U.S. state and local taxes, net 1.1 1.3 1.3Non-U.S. operations taxed at lower rates (12.0) (15.4) (12.1)Final determinations (1) (2.1) (5.1) (1.7)Other net activity in unrecognized tax benefits 2.7 3.2 3.0Change in indefinite reinvestment assertion (0.6) 5.6 —Divestitures (3.4) — —Other, net 1.7 1.2 0.6
Effective income tax rate 22.4% 25.8% 26.1%
_______________ (1) Final determinations include final agreements with tax authorities and expirations of statutes of limitations.
During fiscal 2015, the Company concluded that substantially all of the undistributed earnings of its U.S. subsidiaries would no longer be considered indefinitely reinvested and recorded an estimated tax liability of $247,097for withholding taxes payable on the distribution of these earnings. These earnings were distributed in the form of a U.S. dividend declared and paid on August 26, 2015. The Company intends to indefinitely reinvest any future U.S. earnings. As of August 31, 2016, the Company had not recognized a deferred tax liability on $1,297,932 of undistributed earnings for certain foreign subsidiaries, because these earnings are intended to be indefinitely reinvested. If such earnings were distributed, some countries may impose additional taxes. The unrecognized deferred tax liability (the amount payable if distributed) is approximately $116,000.
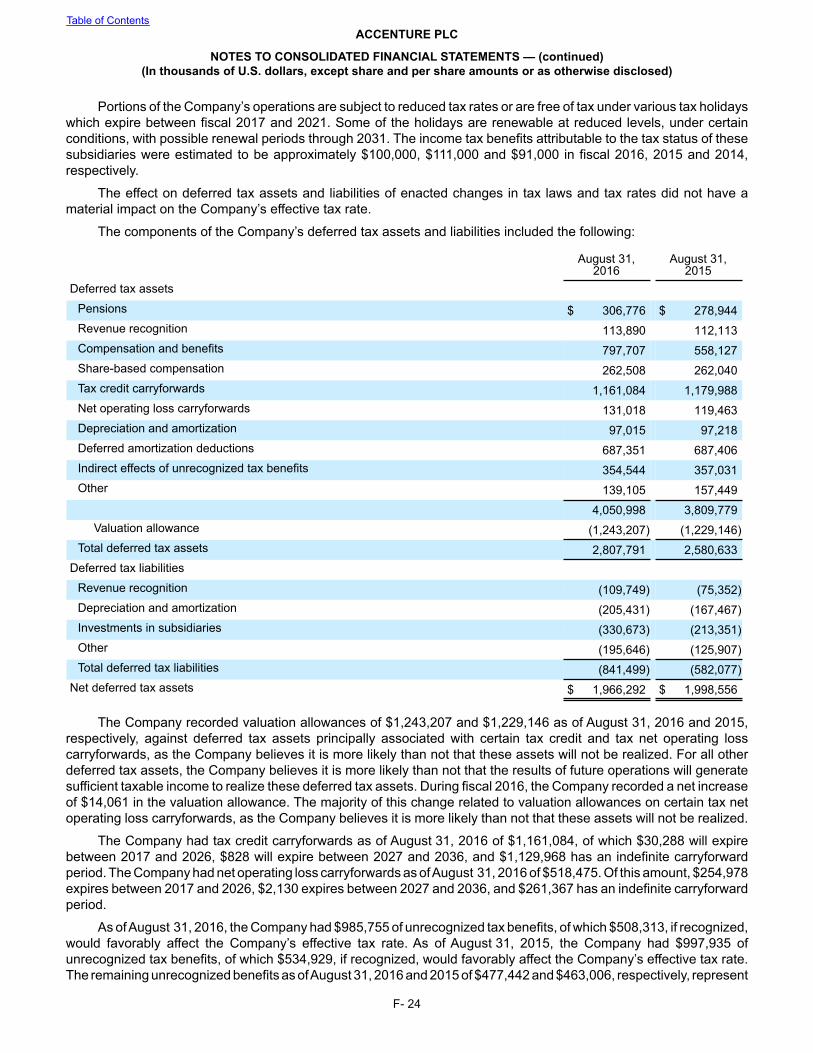
Table of ContentsACCENTURE PLC
NOTES TO CONSOLIDATED FINANCIAL STATEMENTS — (continued)(In thousands of U.S. dollars, except share and per share amounts or as otherwise disclosed)
F- 24
Portions of the Company’s operations are subject to reduced tax rates or are free of tax under various tax holidays which expire between fiscal 2017 and 2021. Some of the holidays are renewable at reduced levels, under certain conditions, with possible renewal periods through 2031. The income tax benefits attributable to the tax status of these subsidiaries were estimated to be approximately $100,000, $111,000 and $91,000 in fiscal 2016, 2015 and 2014, respectively.
The effect on deferred tax assets and liabilities of enacted changes in tax laws and tax rates did not have a material impact on the Company’s effective tax rate.
The components of the Company’s deferred tax assets and liabilities included the following:
August 31,
2016August 31,
2015Deferred tax assets
Pensions $ 306,776 $ 278,944Revenue recognition 113,890 112,113Compensation and benefits 797,707 558,127Share-based compensation 262,508 262,040Tax credit carryforwards 1,161,084 1,179,988Net operating loss carryforwards 131,018 119,463Depreciation and amortization 97,015 97,218Deferred amortization deductions 687,351 687,406Indirect effects of unrecognized tax benefits 354,544 357,031Other 139,105 157,449
4,050,998 3,809,779Valuation allowance (1,243,207) (1,229,146)
Total deferred tax assets 2,807,791 2,580,633Deferred tax liabilities
Revenue recognition (109,749) (75,352)Depreciation and amortization (205,431) (167,467)Investments in subsidiaries (330,673) (213,351)Other (195,646) (125,907)Total deferred tax liabilities (841,499) (582,077)
Net deferred tax assets $ 1,966,292 $ 1,998,556
The Company recorded valuation allowances of $1,243,207 and $1,229,146 as of August 31, 2016 and 2015, respectively, against deferred tax assets principally associated with certain tax credit and tax net operating loss carryforwards, as the Company believes it is more likely than not that these assets will not be realized. For all other deferred tax assets, the Company believes it is more likely than not that the results of future operations will generate sufficient taxable income to realize these deferred tax assets. During fiscal 2016, the Company recorded a net increase of $14,061 in the valuation allowance. The majority of this change related to valuation allowances on certain tax net operating loss carryforwards, as the Company believes it is more likely than not that these assets will not be realized.
The Company had tax credit carryforwards as of August 31, 2016 of $1,161,084, of which $30,288 will expire between 2017 and 2026, $828 will expire between 2027 and 2036, and $1,129,968 has an indefinite carryforward period. The Company had net operating loss carryforwards as of August 31, 2016 of $518,475. Of this amount, $254,978expires between 2017 and 2026, $2,130 expires between 2027 and 2036, and $261,367 has an indefinite carryforward period.
As of August 31, 2016, the Company had $985,755 of unrecognized tax benefits, of which $508,313, if recognized, would favorably affect the Company’s effective tax rate. As of August 31, 2015, the Company had $997,935 of unrecognized tax benefits, of which $534,929, if recognized, would favorably affect the Company’s effective tax rate.The remaining unrecognized benefits as of August 31, 2016 and 2015 of $477,442 and $463,006, respectively, represent

Table of ContentsACCENTURE PLC
NOTES TO CONSOLIDATED FINANCIAL STATEMENTS — (continued)(In thousands of U.S. dollars, except share and per share amounts or as otherwise disclosed)
F- 25
items recorded as adjustments to equity and offsetting tax benefits associated with the correlative effects of potential transfer pricing adjustments, state income taxes and timing adjustments.
A reconciliation of the beginning and ending amounts of unrecognized tax benefits was as follows:
Fiscal 2016 2015Balance, beginning of year $ 997,935 $ 1,333,606
Additions for tax positions related to the current year 163,097 155,637Additions for tax positions related to prior years 126,353 97,694Reductions for tax positions related to prior years (63,782) (470,147)Statute of limitations expirations (208,295) (28,116)Settlements with tax authorities (3,703) (33,743)Foreign currency translation (25,850) (56,996)
Balance, end of year $ 985,755 $ 997,935
The Company recognizes interest and penalties related to unrecognized tax benefits in the Provision for income taxes. During fiscal 2016, 2015 and 2014, the Company recognized expense (benefit) of $8,681, $(17,373) and $16,370in interest and penalties, respectively. Accrued interest and penalties related to unrecognized tax benefits of $109,269($95,057, net of tax benefits) and $101,843 ($84,530, net of tax benefits) were reflected on the Company’s Consolidated Balance Sheets as of August 31, 2016 and 2015, respectively.
The Company is participating in the U.S. Internal Revenue Service (“IRS”) Compliance Assurance Program (“CAP”) beginning with the 2016 fiscal year. As part of CAP, tax years are audited on a contemporaneous basis so that all or most issues are resolved prior to the filing of the tax return. The Company is currently under audit by the IRS for fiscal 2013 and 2014. The Company is also currently under audit in numerous state and non-U.S. tax jurisdictions. Although the outcome of tax audits is always uncertain and could result in significant cash tax payments, the Company does not believe the outcome of these audits will have a material adverse effect on the Company’s consolidated financial position or results of operations. With limited exceptions, the Company is no longer subject to income tax audits by taxing authorities for the years before 2007. The Company believes that it is reasonably possible that its unrecognized tax benefits could decrease by approximately $562,000 or increase by approximately $169,000 in the next 12 months as a result of settlements, lapses of statutes of limitations and other adjustments. The majority of these amounts relate to transfer pricing matters in both U.S. and non-U.S. tax jurisdictions.

Table of ContentsACCENTURE PLC
NOTES TO CONSOLIDATED FINANCIAL STATEMENTS — (continued)(In thousands of U.S. dollars, except share and per share amounts or as otherwise disclosed)
F- 26
10. RETIREMENT AND PROFIT SHARING PLANS
Defined Benefit Pension and Postretirement Plans In the United States and certain other countries, the Company maintains and administers defined benefit
retirement plans and postretirement medical plans for certain current, retired and resigned employees. In addition, the Company’s U.S. defined benefit pension plans include a frozen plan for former pre-incorporation partners, which is unfunded. Benefits under the employee retirement plans are primarily based on years of service and compensation during the years immediately preceding retirement or termination of participation in the plan. The defined benefit pension disclosures include the Company’s U.S. and material non-U.S. defined benefit pension plans.
Assumptions The weighted-average assumptions used to determine the defined benefit pension obligations as of August 31
and the net periodic pension expense were as follows:
Pension Plans Postretirement Plans
August 31,
2016August 31,
2015August 31,
2014
August31,
2016
August31,
2015
August31,
2014
U.S.Plans
Non-U.S.Plans
U.S. Plans
Non-U.S.Plans
U.S. Plans
Non-U.S.Plans
U.S. and Non-U.S. Plans
U.S.andNon-U.S.Plans
U.S.andNon-U.S.Plans
Discount rate for determining projectedbenefit obligation 3.50% 2.40% 4.50% 3.47% 4.25% 3.53% 3.51% 4.46% 4.25%Discount rate for determining net periodicpension expense 4.50% 3.47% 4.25% 3.53% 5.00% 4.18% 4.46% 4.25% 4.96%Long term rate of return on plan assets 4.75% 3.99% 5.50% 4.55% 5.50% 4.79% 4.54% 5.05% 4.87%Rate of increase in future compensationfor determining projected benefitobligation 2.57% 3.47% 3.65% 3.56% 3.65% 3.75% N/A N/A N/ARate of increase in future compensationfor determining net periodic pensionexpense 3.60% 3.56% 3.65% 3.75% 3.60% 3.79% N/A N/A N/A
Beginning in fiscal 2016, the Company changed the method it uses to estimate the service and interest cost components of net periodic pension expense. Historically, the Company selected a discount rate for the U.S. plans by matching the plans’ cash flows to that of the average of two yield curves that provide the equivalent yields on zero-coupon corporate bonds for each maturity. The discount rate assumption for the non-U.S. Plans primarily reflected the market rate for high-quality, fixed-income debt instruments. Beginning in fiscal 2016, the Company utilized a full yield curve approach to estimate these components by applying specific spot rates along the yield curve used in the determination of the benefit obligation to the relevant projected cash flows. The Company made this change to improve the correlation between projected benefit cash flows and the corresponding yield curve spot rates and to provide a more precise measurement of service and interest costs. This change does not affect the measurement of the Company’s total benefit obligations. The Company accounted for this change as a change in estimate and, accordingly, recognized its effect prospectively beginning in fiscal 2016.
The discount rate assumptions are based on the expected duration of the benefit payments for each of the Company’s defined benefit pension and postretirement plans as of the annual measurement date and are subject to change each year.
The expected long-term rate of return on plan assets should, over time, approximate the actual long-term returns on defined benefit pension and postretirement plan assets and is based on historical returns and the future expectations for returns for each asset class, as well as the target asset allocation of the asset portfolio.

Table of ContentsACCENTURE PLC
NOTES TO CONSOLIDATED FINANCIAL STATEMENTS — (continued)(In thousands of U.S. dollars, except share and per share amounts or as otherwise disclosed)
F- 27
Assumed U.S. Health Care Cost Trend
The Company’s U.S. postretirement plan assumed annual rate of increase in the per capita cost of health care benefits is 6.8% for the plan year ending June 30, 2017. The rate is assumed to decrease on a straight-line basis to4.5% for the plan year ending June 30, 2027 and remain at that level thereafter. A one percentage point increase in the assumed health care cost trend rates would increase the benefit obligation by $81,422, while a one percentage point decrease would reduce the benefit obligation by $62,615.
U.S. Defined Benefit Pension Plan Settlement Charge During fiscal 2015, the Company offered a voluntary one-time lump sum payment option to certain eligible former
employees who had vested benefits under the Company’s U.S. pension plan that, if accepted, would settle the Company’s pension obligations to them. This resulted in lump sum payments from plan assets of $279,571 during fiscal 2015. As a result of this settlement and the adoption of the new U.S. mortality tables released by the Society of Actuaries, the Company remeasured the assets and liabilities of the U.S. pension plan, which in aggregate resulted in a net reduction to the projected benefit obligation of $179,938 as well as a non-cash settlement charge of $64,382, pre-tax, during fiscal 2015.
Pension and Postretirement Expense Pension expense for fiscal 2016, 2015 and 2014 was $94,827, $143,968 (including the above noted settlement
charge) and $87,422, respectively. Postretirement expense for fiscal 2016, 2015 and 2014 was not material to the Company’s Consolidated Financial Statements.

Table of ContentsACCENTURE PLC
NOTES TO CONSOLIDATED FINANCIAL STATEMENTS — (continued)(In thousands of U.S. dollars, except share and per share amounts or as otherwise disclosed)
F- 28
Benefit Obligation, Plan Assets and Funded Status The changes in the benefit obligations, plan assets and funded status of the Company’s pension and
postretirement benefit plans for fiscal 2016 and 2015 were as follows:
Pension Plans Postretirement Plans
August 31,
2016August 31,
2015August 31,
2016August 31,
2015
U.S. PlansNon-
U.S. Plans U.S. PlansNon-
U.S. Plans
U.S. andNon-U.S.
Plans
U.S. andNon-U.S.
PlansReconciliation of benefit obligationBenefit obligation, beginning of year $ 1,635,744 $ 1,439,225 $1,909,651 $1,519,007 $ 403,095 $ 375,312
Service cost 7,305 72,502 8,899 67,471 18,565 17,784Interest cost 63,470 43,827 76,969 48,199 15,618 15,602Participant contributions — 9,857 — 6,081 — —Acquisitions/divestitures/transfers — 41,719 — (364) — —Amendments — (1,561) — 79 — —Curtailment — (689) — — 84 —Pension settlement — — (279,571) — — —Special termination benefits — 1,332 — — — —Actuarial (gain) loss 371,294 261,252 (35,478) 14,618 74,213 14,180Benefits paid (47,807) (52,549) (44,726) (39,685) (11,143) (11,186)Exchange rate impact — (56,805) — (176,181) 532 (8,597)
Benefit obligation, end of year $ 2,030,006 $ 1,758,110 $1,635,744 $1,439,225 $ 500,964 $ 403,095Reconciliation of fair value of plan assets
Fair value of plan assets, beginning ofyear $ 1,596,186 $ 982,471 $1,883,789 $1,032,378 $ 24,643 $ 29,484
Actual return on plan assets 242,112 97,638 25,580 39,797 3,856 92Acquisitions/divestitures/transfers — 24,052 — — — —Employer contributions 10,944 71,046 11,114 52,033 9,774 6,253Participant contributions — 9,857 — 6,081 — —Pension settlement — — (279,571) — — —Benefits paid (47,807) (52,549) (44,726) (39,685) (11,143) (11,186)Exchange rate impact — (51,361) — (108,133) — —
Fair value of plan assets, end of year $ 1,801,435 $ 1,081,154 $1,596,186 $ 982,471 $ 27,130 $ 24,643Funded status, end of year $ (228,571) $ (676,956) $ (39,558) $ (456,754) $ (473,834) $ (378,452)Amounts recognized in the ConsolidatedBalance Sheets
Non-current assets $ — $ 59,335 $ 102,686 $ 64,690 $ — $ —Current liabilities (11,091) (16,691) (11,148) (10,287) (1,579) (1,416)Non-current liabilities (217,480) (719,600) (131,096) (511,157) (472,255) (377,036)
Funded status, end of year $ (228,571) $ (676,956) $ (39,558) $ (456,754) $ (473,834) $ (378,452)

Table of ContentsACCENTURE PLC
NOTES TO CONSOLIDATED FINANCIAL STATEMENTS — (continued)(In thousands of U.S. dollars, except share and per share amounts or as otherwise disclosed)
F- 29
Accumulated Other Comprehensive Loss The pre-tax accumulated net loss and prior service (credit) cost recognized in Accumulated other comprehensive
loss as of August 31, 2016 and 2015 was as follows:
Pension Plans Postretirement Plans
August 31,
2016August 31,
2015August 31,
2016August 31,
2015
U.S. PlansNon-U.S.
Plans U.S. PlansNon-U.S.
Plans
U.S. andNon-U.S.
Plans
U.S. andNon-U.S.
PlansNet loss $ 592,873 $ 480,408 $ 397,065 $ 295,098 $ 143,777 $ 75,224Prior service (credit) cost — (6,860) — (7,281) 31,569 35,173Accumulated other comprehensive loss,pre-tax $ 592,873 $ 473,548 $ 397,065 $ 287,817 $ 175,346 $ 110,397
Funded Status for Defined Benefit Plans The accumulated benefit obligation for defined benefit pension plans as of August 31, 2016 and 2015 was as
follows:
August 31,
2016August 31,
2015
U.S. PlansNon-U.S.
Plans U.S. PlansNon-U.S.
PlansAccumulated benefit obligation $ 2,017,437 $ 1,592,598 $ 1,626,972 $ 1,313,946
The following information is provided for defined benefit pension plans and postretirement plans with projected benefit obligations in excess of plan assets and for defined benefit pension plans with accumulated benefit obligations in excess of plan assets as of August 31, 2016 and 2015:
Pension Plans Postretirement Plans
August 31,
2016August 31,
2015August 31,
2016August 31,
2015
U.S. PlansNon-U.S.
Plans U.S. PlansNon-U.S.
Plans
U.S. andNon-U.S.
Plans
U.S. andNon-U.S.
PlansProjected benefit obligation in excess ofplan assetsProjected benefit obligation $2,030,006 $1,400,510 $ 142,244 $ 757,741 $ 500,964 $ 403,095Fair value of plan assets 1,801,435 664,220 — 236,297 27,130 24,643
August 31,
2016August 31,
2015
U.S. PlansNon-U.S.
Plans U.S. PlansNon-U.S.
PlansAccumulated benefit obligation in excess of plan assetsAccumulated benefit obligation $ 2,017,437 $ 1,233,952 $ 142,244 $ 629,524Fair value of plan assets 1,801,435 627,738 — 204,076
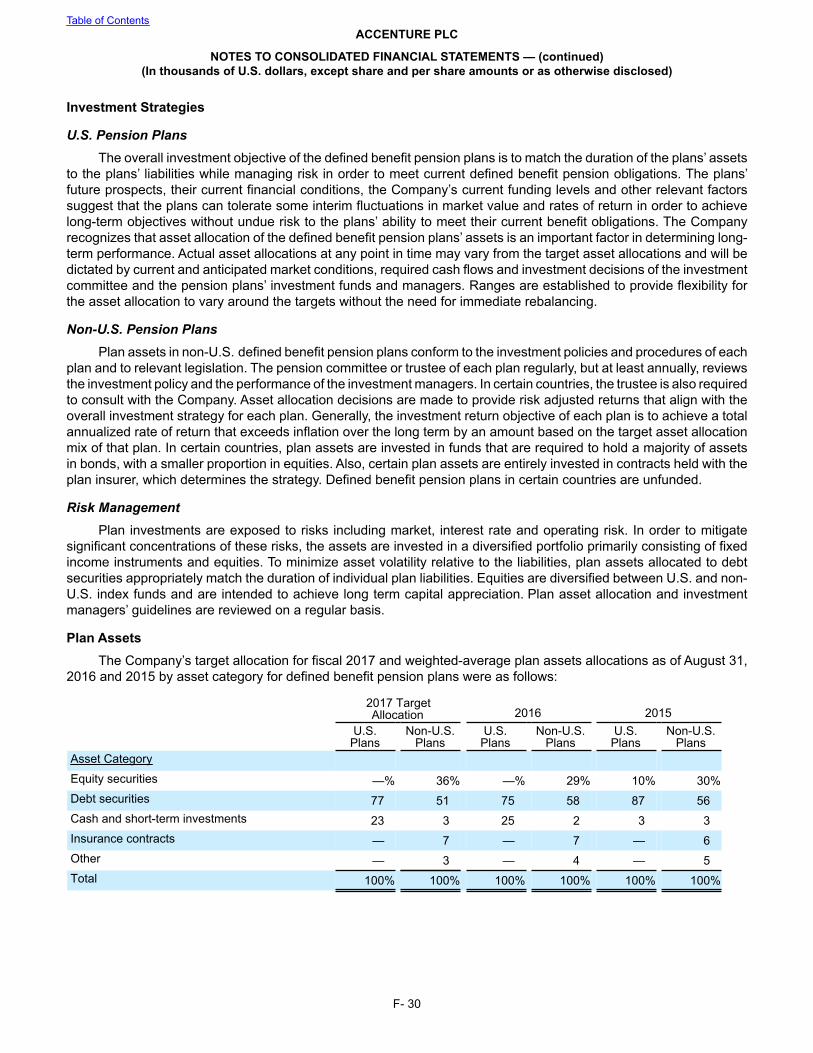
Table of ContentsACCENTURE PLC
NOTES TO CONSOLIDATED FINANCIAL STATEMENTS — (continued)(In thousands of U.S. dollars, except share and per share amounts or as otherwise disclosed)
F- 30
Investment Strategies
U.S. Pension PlansThe overall investment objective of the defined benefit pension plans is to match the duration of the plans’ assets
to the plans’ liabilities while managing risk in order to meet current defined benefit pension obligations. The plans’ future prospects, their current financial conditions, the Company’s current funding levels and other relevant factors suggest that the plans can tolerate some interim fluctuations in market value and rates of return in order to achieve long-term objectives without undue risk to the plans’ ability to meet their current benefit obligations. The Company recognizes that asset allocation of the defined benefit pension plans’ assets is an important factor in determining long-term performance. Actual asset allocations at any point in time may vary from the target asset allocations and will be dictated by current and anticipated market conditions, required cash flows and investment decisions of the investment committee and the pension plans’ investment funds and managers. Ranges are established to provide flexibility for the asset allocation to vary around the targets without the need for immediate rebalancing.
Non-U.S. Pension Plans Plan assets in non-U.S. defined benefit pension plans conform to the investment policies and procedures of each
plan and to relevant legislation. The pension committee or trustee of each plan regularly, but at least annually, reviews the investment policy and the performance of the investment managers. In certain countries, the trustee is also required to consult with the Company. Asset allocation decisions are made to provide risk adjusted returns that align with the overall investment strategy for each plan. Generally, the investment return objective of each plan is to achieve a total annualized rate of return that exceeds inflation over the long term by an amount based on the target asset allocation mix of that plan. In certain countries, plan assets are invested in funds that are required to hold a majority of assets in bonds, with a smaller proportion in equities. Also, certain plan assets are entirely invested in contracts held with the plan insurer, which determines the strategy. Defined benefit pension plans in certain countries are unfunded.
Risk Management Plan investments are exposed to risks including market, interest rate and operating risk. In order to mitigate
significant concentrations of these risks, the assets are invested in a diversified portfolio primarily consisting of fixed income instruments and equities. To minimize asset volatility relative to the liabilities, plan assets allocated to debt securities appropriately match the duration of individual plan liabilities. Equities are diversified between U.S. and non-U.S. index funds and are intended to achieve long term capital appreciation. Plan asset allocation and investment managers’ guidelines are reviewed on a regular basis.
Plan Assets The Company’s target allocation for fiscal 2017 and weighted-average plan assets allocations as of August 31,
2016 and 2015 by asset category for defined benefit pension plans were as follows:
2017 TargetAllocation 2016 2015
U.S.Plans
Non-U.S.Plans
U.S.Plans
Non-U.S.Plans
U.S.Plans
Non-U.S.Plans
Asset Category
Equity securities —% 36% —% 29% 10% 30%Debt securities 77 51 75 58 87 56Cash and short-term investments 23 3 25 2 3 3Insurance contracts — 7 — 7 — 6Other — 3 — 4 — 5Total 100% 100% 100% 100% 100% 100%

Table of ContentsACCENTURE PLC
NOTES TO CONSOLIDATED FINANCIAL STATEMENTS — (continued)(In thousands of U.S. dollars, except share and per share amounts or as otherwise disclosed)
F- 31
Fair Value Measurements Fair value is the price that would be received upon sale of an asset or paid upon transfer of a liability in an orderly
transaction between market participants at the measurement date and in the principal or most advantageous market for that asset or liability. The fair value should be calculated based on assumptions that market participants would use in pricing the asset or liability, not on assumptions specific to the entity.
The three-level hierarchy of fair value measurements is based on whether the inputs to those measurements are observable or unobservable. Observable inputs reflect market data obtained from independent sources, while unobservable inputs reflect the Company’s market assumptions. The fair-value hierarchy requires the use of observable market data when available and consists of the following levels:
• Level 1—Quoted prices for identical instruments in active markets; • Level 2—Quoted prices for similar instruments in active markets; quoted prices for identical or similar
instruments in markets that are not active; and model-derived valuations in which all significant inputs are observable in active markets; and
• Level 3—Valuations derived from valuation techniques in which one or more significant inputs are unobservable.
The fair values of defined benefit pension and postretirement plan assets as of August 31, 2016 were as follows:
U.S. Plans Level 1 Level 2 Level 3 TotalFixed Income
U.S. government, state and local debt securities — 359,583 — 359,583Non-U.S. government debt securities — 38,232 — 38,232U.S. corporate debt securities — 614,136 — 614,136Non-U.S. corporate debt securities — 79,124 — 79,124Mutual fund debt securities 286,360 — — 286,360
Cash and short-term investments — 451,130 — 451,130Total $ 286,360 $ 1,542,205 $ — $ 1,828,565
Non-U.S. Plans Level 1 Level 2 Level 3 TotalEquity
Mutual fund equity securities $ — $ 311,324 $ — $ 311,324Fixed Income
Non-U.S. government debt securities 91,745 — — 91,745Mutual fund debt securities 15,608 524,472 — 540,080
Cash and short-term investments 19,382 4,048 — 23,430Insurance contracts — 72,525 — 72,525Other — 42,050 — 42,050
Total $ 126,735 $ 954,419 $ — $ 1,081,154
There were no transfers between Levels 1 and 2 during fiscal 2016.

Table of ContentsACCENTURE PLC
NOTES TO CONSOLIDATED FINANCIAL STATEMENTS — (continued)(In thousands of U.S. dollars, except share and per share amounts or as otherwise disclosed)
F- 32
Expected Contributions Generally, annual contributions are made at such times and in amounts as required by law and may, from time
to time, exceed minimum funding requirements. The Company estimates it will pay approximately $80,077 in fiscal2017 related to contributions to its U.S. and non-U.S. defined benefit pension plans and benefit payments related to the unfunded frozen plan for former pre-incorporation partners. The Company has not determined whether it will make additional voluntary contributions for its defined benefit pension plans. The Company’s postretirement plan contributions in fiscal 2017 are not expected to be material to the Company’s Consolidated Financial Statements.
Estimated Future Benefit Payments Benefit payments for defined benefit pension plans and postretirement plans, which reflect expected future
service, as appropriate, are expected to be paid as follows:
Pension PlansPostretirement
Plans
U.S. Plans (1)Non-U.S.
PlansU.S. and Non-
U.S. Plans2017 $ 46,881 $ 44,537 $ 10,2592018 49,865 50,094 11,4692019 53,277 55,964 12,5982020 56,950 66,225 13,9422021 61,361 75,166 15,8302022-2026 373,921 416,507 110,756
_______________(1) Excludes the impact of the anticipated U.S. pension plan termination noted below.
U.S. Pension Plan TerminationOn March 18, 2016, Accenture plc’s Board of Directors approved an amendment to terminate the Company’s
U.S. pension plan, effective May 30, 2016, for all active and former employees who are no longer accruing benefits in the pension plan (approximately 16,200 people). The amendment also provides for the creation of a separate defined benefit plan with substantially the same terms for approximately 600 active employees who are currently eligible to accrue benefits. The U.S. pension plan is expected to be settled in 12 to 18 months from the termination effective date, subject to receipt of customary regulatory approvals.
The Company’s ultimate settlement obligation will depend upon both the nature and timing of participant settlements and prevailing market conditions. Upon settlement, the Company expects to recognize additional expense, consisting of unrecognized actuarial losses included in Accumulated other comprehensive loss that totaled approximately $467,000 as of August 31, 2016, adjusted for the difference between the ultimate settlement obligation and the Company’s accrued pension obligation. The Company does not expect the settlement of the U.S. pension plan obligations to have a material impact on its cash position.
Defined Contribution Plans In the United States and certain other countries, the Company maintains and administers defined contribution
plans for certain current, retired and resigned employees. Total expenses recorded for defined contribution plans were$419,932, $397,123 and $331,801 in fiscal 2016, 2015 and 2014, respectively.

Table of ContentsACCENTURE PLC
NOTES TO CONSOLIDATED FINANCIAL STATEMENTS — (continued)(In thousands of U.S. dollars, except share and per share amounts or as otherwise disclosed)
F- 33
11. SHARE-BASED COMPENSATION
Share Incentive Plans The Amended and Restated Accenture plc 2010 Share Incentive Plan, as amended and approved by the
Company’s shareholders in 2016 (the “Amended 2010 SIP”), is administered by the Compensation Committee of the Board of Directors of Accenture and provides for the grant of nonqualified share options, incentive stock options, restricted share units and other share-based awards. A maximum of 83,000,000 Accenture plc Class A ordinary shares are currently authorized for awards under the Amended 2010 SIP. As of August 31, 2016, there were 23,167,880 shares available for future grants. Accenture plc Class A ordinary shares covered by awards that terminate, lapse or are cancelled may again be used to satisfy awards under the Amended 2010 SIP. The Company issues new Accenture plc Class A ordinary shares and shares from treasury for shares delivered under the Amended 2010 SIP.
A summary of information with respect to share-based compensation is as follows:
Fiscal 2016 2015 2014Total share-based compensation expense included in Net income $ 758,176 $ 680,329 $ 671,301Income tax benefit related to share-based compensation included in Net income 236,423 212,019 206,007
Restricted Share Units Under the Amended 2010 SIP, participants may be, and previously under the predecessor 2001 Share Incentive
Plan were, granted restricted share units, each of which represent an unfunded, unsecured right to receive an Accenture plc Class A ordinary share on the date specified in the participant’s award agreement. The fair value of the awards is based on the Company’s stock price on the date of grant. The restricted share units granted under these plans are subject to cliff or graded vesting, generally ranging from two to seven years. For awards with graded vesting, compensation expense is recognized over the vesting term of each separately vesting portion. Compensation expense is recognized on a straight-line basis for awards with cliff vesting. Restricted share unit activity during fiscal 2016 was as follows:
Number of RestrictedShare Units
Weighted AverageGrant-Date Fair Value
Nonvested balance as of August 31, 2015 24,733,581 $ 71.83Granted (1) 9,699,688 105.16Vested (2) (10,987,988) 72.50Forfeited (1,481,576) 77.82
Nonvested balance as of August 31, 2016 21,963,705 $ 85.81
_______________(1) The weighted average grant-date fair value for restricted share units granted for fiscal 2016, 2015 and 2014
was $105.16, $89.63 and $80.61, respectively.
(2) The total grant-date fair value of restricted share units vested for fiscal 2016, 2015 and 2014 was $796,620, $581,936 and $628,999, respectively.
As of August 31, 2016, there was $677,433 of total restricted share unit compensation expense related to nonvested awards not yet recognized, which is expected to be recognized over a weighted average period of 1.3years. As of August 31, 2016, there were 930,652 restricted share units vested but not yet delivered as Accenture plc Class A ordinary shares.
Stock OptionsThere were no stock options granted during fiscal 2016, 2015 or 2014. As of August 31, 2016 we had 23,310
stock options outstanding and exercisable at a weighted average exercise price of $37.46 and a weighted average remaining contractual term of 2.5 years.

Table of ContentsACCENTURE PLC
NOTES TO CONSOLIDATED FINANCIAL STATEMENTS — (continued)(In thousands of U.S. dollars, except share and per share amounts or as otherwise disclosed)
F- 34
Employee Share Purchase Plan
2010 ESPP The Amended and Restated Accenture plc 2010 Employee Share Purchase Plan (the “2010 ESPP”) is a
nonqualified plan that provides eligible employees of Accenture plc and its designated affiliates with an opportunity to purchase Accenture plc Class A ordinary shares through payroll deductions. Under the 2010 ESPP, eligible employees may purchase Accenture plc Class A ordinary shares through the Employee Share Purchase Plan (the “ESPP”) or the Voluntary Equity Investment Program (the “VEIP”). Under the ESPP, eligible employees may elect to contribute 1%to 10% of their eligible compensation during each semi-annual offering period (up to $7.5 per offering period) to purchase Accenture plc Class A ordinary shares at a discount. Under the VEIP, eligible members of Accenture Leadership may elect to contribute up to 30% of their eligible compensation towards the monthly purchase of Accenture plc Class A ordinary shares at fair market value. At the end of the VEIP program year, Accenture Leadership participants who did not withdraw from the program will be granted restricted share units under the Amended 2010 SIP equal to 50% of the number of shares purchased during that year and held by the participant as of the grant date.
A maximum of 90,000,000 Accenture plc Class A ordinary shares may be issued under the 2010 ESPP. As ofAugust 31, 2016, the Company had issued 42,579,575 Accenture plc Class A ordinary shares under the 2010 ESPP.The Company issued 5,850,113, 6,232,031 and 7,067,832 shares to employees in fiscal 2016, 2015 and 2014, respectively, under the 2010 ESPP.
12. SHAREHOLDERS’ EQUITY
Accenture plc
Ordinary Shares The Company has 40,000 authorized ordinary shares, par value €1 per share. Each ordinary share of Accenture
plc entitles its holder to receive payments upon a liquidation of Accenture plc; however a holder of an ordinary share is not entitled to vote on matters submitted to a vote of shareholders of Accenture plc or to receive dividends.
Class A Ordinary Shares An Accenture plc Class A ordinary share entitles its holder to one vote per share, and holders of those shares
do not have cumulative voting rights. Each Class A ordinary share entitles its holder to a pro rata part of any dividend at the times and in the amounts, if any, which Accenture plc’s Board of Directors from time to time determines to declare, subject to any preferred dividend rights attaching to any preferred shares. Each Class A ordinary share is entitled on a winding-up of Accenture plc to be paid a pro rata part of the value of the assets of Accenture plc remaining after payment of its liabilities, subject to any preferred rights on liquidation attaching to any preferred shares.
Class X Ordinary Shares An Accenture plc Class X ordinary share entitles its holder to one vote per share, and holders of those shares
do not have cumulative voting rights. A Class X ordinary share does not entitle its holder to receive dividends, and holders of those shares are not entitled to be paid any amount upon a winding-up of Accenture plc. Most of the Company’s partners who received Accenture SCA Class I common shares or Accenture Canada Holdings Inc. exchangeable shares in connection with the Company’s transition to a corporate structure received a corresponding number of Accenture plc Class X ordinary shares. Accenture plc may redeem, at its option, any Class X ordinary share for a redemption price equal to the par value of the Class X ordinary share. Accenture plc has separately agreed with the original holders of Accenture Holdings plc ordinary shares and Accenture Canada Holdings Inc. exchangeable shares not to redeem any Class X ordinary share of such holder if the redemption would reduce the number of Class X ordinary shares held by that holder to a number that is less than the number of Accenture Holdings plc ordinary shares or Accenture Canada Holdings Inc. exchangeable shares owned by that holder, as the case may be. Accenture plc will redeem Class X ordinary shares upon the redemption or exchange of Accenture Holdings plc ordinary shares and Accenture Canada Holdings Inc. exchangeable shares so that the aggregate number of Class X ordinary shares outstanding at any time does not exceed the aggregate number of Accenture Holdings plc ordinary shares and Accenture Canada Holdings Inc. exchangeable shares outstanding. Class X ordinary shares are not transferable without the consent of Accenture plc.

Table of ContentsACCENTURE PLC
NOTES TO CONSOLIDATED FINANCIAL STATEMENTS — (continued)(In thousands of U.S. dollars, except share and per share amounts or as otherwise disclosed)
F- 35
Equity of Subsidiaries Redeemable or Exchangeable for Accenture plc Class A Ordinary Shares
Accenture Holdings plc Ordinary SharesMembers of Accenture Leadership in certain countries, including the United States, received Accenture SCA
Class I common shares in connection with the Company’s transition to a corporate structure. On August 26, 2015, Accenture SCA merged with and into Accenture Holdings plc, with Accenture Holdings plc as the surviving entity. In connection with this transaction, holders of Accenture SCA Class I common shares (other than Accenture SCA itself) received, on a one-for-one basis, ordinary shares of Accenture Holdings plc. Only Accenture plc, Accenture Holdings plc, Accenture International S.à.r.l. and certain current and former members of Accenture Leadership and their permitted transferees hold Accenture Holdings plc ordinary shares. Each Accenture Holdings plc share entitles its holder to onevote on all matters submitted to a vote of shareholders of Accenture Holdings plc and entitles its holders to dividends and liquidation payments.
Accenture Holdings plc is obligated, at the option of the holder, to redeem any outstanding Accenture Holdings plc ordinary share at a redemption price per share generally equal to its current market value as determined in accordance with Accenture Holdings plc’s memorandum and articles of association. Under Accenture Holdings plc’s memorandum and articles of association, the market value of an ordinary share will be deemed to be equal to (i) the average of the high and low sales prices of an Accenture plc Class A ordinary share as reported on the New York Stock Exchange, net of customary brokerage and similar transaction costs, or (ii) if Accenture sells its Class A ordinary shares on the date that the redemption price is determined (other than in a transaction with any employee or an affiliate or pursuant to a preexisting obligation), the weighted average sales price of an Accenture plc Class A ordinary share on the New York Stock Exchange, net of customary brokerage and similar transaction costs. Accenture Holdings plc may, at its option, pay this redemption price with cash or by causing Accenture plc to deliver Class A ordinary shares on aone-for-one basis. Each holder of Accenture Holdings plc ordinary shares is entitled to a pro rata part of any dividend and to the value of any remaining assets of Accenture Holdings plc after payment of its liabilities upon dissolution.
Accenture Canada Holdings Inc. Exchangeable Shares Partners resident in Canada and New Zealand received Accenture Canada Holdings Inc. exchangeable shares
in connection with the Company’s transition to a corporate structure. Holders of Accenture Canada Holdings Inc. exchangeable shares may exchange their shares for Accenture plc Class A ordinary shares at any time on a one-for-one basis. The Company may, at its option, satisfy this exchange with cash at a price per share generally equal to the market price of an Accenture plc Class A ordinary share at the time of the exchange. Each exchangeable share of Accenture Canada Holdings Inc. entitles its holder to receive distributions equal to any distributions to which an Accenture plc Class A ordinary share entitles its holder.

Table of ContentsACCENTURE PLC
NOTES TO CONSOLIDATED FINANCIAL STATEMENTS — (continued)(In thousands of U.S. dollars, except share and per share amounts or as otherwise disclosed)
F- 36
13. MATERIAL TRANSACTIONS AFFECTING SHAREHOLDERS’ EQUITY
Share Purchases and Redemptions The Board of Directors of Accenture plc has authorized funding for the Company’s publicly announced open-
market share purchase program for acquiring Accenture plc Class A ordinary shares and for purchases and redemptions of Accenture plc Class A ordinary shares, Accenture Holdings plc ordinary shares and Accenture Canada Holdings Inc. exchangeable shares held by current and former members of Accenture Leadership and their permitted transferees. As of August 31, 2016, the Company’s aggregate available authorization was $5,386,517 for its publicly announced open-market share purchase and these other share purchase programs.
The Company’s share purchase activity during fiscal 2016 was as follows:
Accenture plc Class A
Ordinary Shares
Accenture Holdings plcOrdinary Shares and Accenture Canada
Holdings Inc. Exchangeable Shares Shares Amount Shares Amount Open-market share purchases (1) 19,989,726 $ 2,122,066 — $ —Other share purchase programs — — 653,222 72,193Other purchases (2) 3,857,795 410,730 — —Total 23,847,521 $ 2,532,796 653,222 $ 72,193
_______________
(1) The Company conducts a publicly announced open-market share purchase program for Accenture plc Class A ordinary shares. These shares are held as treasury shares by Accenture plc and may be utilized to provide for select employee benefits, such as equity awards to the Company’s employees.
(2) During fiscal 2016, as authorized under the Company’s various employee equity share plans, the Company acquired Accenture plc Class A ordinary shares primarily via share withholding for payroll tax obligations due from employees and former employees in connection with the delivery of Accenture plc Class A ordinary shares under those plans. These purchases of shares in connection with employee share plans do not affect the Company’s aggregate available authorization for the Company’s publicly announced open-market share purchase and the other share purchase programs.
Other Share Redemptions During fiscal 2016, the Company issued 775,023 Accenture plc Class A ordinary shares upon redemptions of an
equivalent number of Accenture Holdings plc ordinary shares pursuant to its registration statement on Form S-3 (the “registration statement”). The registration statement allows the Company, at its option, to issue freely tradable Accenture plc Class A ordinary shares in lieu of cash upon redemptions of Accenture Holdings plc ordinary shares held by current and former members of Accenture Leadership and their permitted transferees.
Cancellation of Treasury SharesDuring fiscal 2016, the Company received authorization from the Board of Directors of Accenture plc to cancel
163,015,507 Accenture plc Class A ordinary shares that were held as treasury shares and had an aggregate cost of $11,199,016. The effect of the cancellation of these treasury shares was recognized in Class A ordinary shares and Additional paid-in capital with the residual recorded in Retained earnings. There was no effect on total shareholders’ equity as a result of this cancellation.

Table of ContentsACCENTURE PLC
NOTES TO CONSOLIDATED FINANCIAL STATEMENTS — (continued)(In thousands of U.S. dollars, except share and per share amounts or as otherwise disclosed)
F- 37
Dividends The Company’s dividend activity during fiscal 2016 was as follows:
Dividend Per
Share
Accenture plc Class AOrdinary Shares
Accenture Holdings plc OrdinaryShares and Accenture Canada
Holdings Inc. Exchangeable Shares Total CashOutlayDividend Payment Date Record Date Cash Outlay Record Date Cash Outlay
November 13, 2015 $ 1.10 October 16, 2015 $ 687,285 October 13, 2015 $ 33,391 $ 720,676May 13, 2016 1.10 April 15, 2016 684,894 April 12, 2016 32,568 717,462
Total Dividends $ 1,372,179 $ 65,959 $1,438,138
The payment of the cash dividends also resulted in the issuance of an immaterial number of additional restricted share units to holders of restricted share units.
Subsequent Event On September 27, 2016, the Board of Directors of Accenture plc declared a semi-annual cash dividend of $1.21
per share on its Class A ordinary shares for shareholders of record at the close of business on October 21, 2016. On September 28, 2016, the Board of Directors of Accenture Holdings plc declared a semi-annual cash dividend of $1.21per share on its ordinary shares for shareholders of record at the close of business on October 18, 2016. Both dividends are payable on November 15, 2016. The payment of the cash dividends will result in the issuance of an immaterial number of additional restricted share units to holders of restricted share units.
14. LEASE COMMITMENTS The Company has operating leases, principally for office space, with various renewal options. Substantially all
operating leases are non-cancelable or cancelable only by the payment of penalties. Rental expense in agreements with rent holidays and scheduled rent increases is recorded on a straight-line basis over the lease term. Rental expense, including operating costs and taxes, and sublease income from third parties during fiscal 2016, 2015 and 2014 was as follows:
Fiscal 2016 2015 2014Rental expense $ 578,149 $ 547,206 $ 539,711Sublease income from third parties (26,403) (27,293) (29,482)
Future minimum rental commitments under non-cancelable operating leases as of August 31, 2016 were as
follows:
OperatingLease
Payments
OperatingSubleaseIncome
2017 $ 516,622 $ (16,147)2018 445,853 (15,410)2019 375,393 (13,996)2020 318,828 (12,324)2021 257,949 (11,074)Thereafter 902,659 (50,350)
$ 2,817,304 $ (119,301)

Table of ContentsACCENTURE PLC
NOTES TO CONSOLIDATED FINANCIAL STATEMENTS — (continued)(In thousands of U.S. dollars, except share and per share amounts or as otherwise disclosed)
F- 38
15. COMMITMENTS AND CONTINGENCIES
Commitments The Company has the right to purchase or may also be required to purchase substantially all of the remaining
outstanding shares of its Avanade Inc. subsidiary (“Avanade”) not owned by the Company at fair value if certain events occur. Certain holders of Avanade common stock and options to purchase the stock have put rights that, under certain circumstances and conditions, would require Avanade to redeem shares of its stock at fair value. As of August 31, 2016 and 2015, the Company has reflected the fair value of $54,221 and $79,023, respectively, related to Avanade’s redeemable common stock and the intrinsic value of the options on redeemable common stock in Other accrued liabilities in the Consolidated Balance Sheets.
Indemnifications and Guarantees In the normal course of business and in conjunction with certain client engagements, the Company has entered
into contractual arrangements through which it may be obligated to indemnify clients with respect to certain matters. These arrangements with clients can include provisions whereby the Company has joint and several liability in relation to the performance of certain contractual obligations along with third parties also providing services and products for a specific project. In addition, the Company’s consulting arrangements may include warranty provisions that the Company’s solutions will substantially operate in accordance with the applicable system requirements. Indemnification provisions are also included in arrangements under which the Company agrees to hold the indemnified party harmless with respect to third-party claims related to such matters as title to assets sold or licensed or certain intellectual property rights.
Typically, the Company has contractual recourse against third parties for certain payments made by the Company in connection with arrangements where third-party nonperformance has given rise to the client’s claim. Payments by the Company under any of the arrangements described above are generally conditioned on the client making a claim, which may be disputed by the Company typically under dispute resolution procedures specified in the particular arrangement. The limitations of liability under these arrangements may be expressly limited or may not be expressly specified in terms of time and/or amount.
As of August 31, 2016 and 2015, the Company’s aggregate potential liability to its clients for expressly limited guarantees involving the performance of third parties was approximately $749,000 and $655,000, respectively, of which all but approximately $113,000 and $43,000, respectively, may be recovered from the other third parties if the Company is obligated to make payments to the indemnified parties as a consequence of a performance default by the other third parties. For arrangements with unspecified limitations, the Company cannot reasonably estimate the aggregate maximum potential liability, as it is inherently difficult to predict the maximum potential amount of such payments, due to the conditional nature and unique facts of each particular arrangement.
To date, the Company has not been required to make any significant payment under any of the arrangements described above. The Company has assessed the current status of performance/payment risk related to arrangements with limited guarantees, warranty obligations, unspecified limitations and/or indemnification provisions and believes that any potential payments would be immaterial to the Consolidated Financial Statements, as a whole.
Legal Contingencies As of August 31, 2016, the Company or its present personnel had been named as a defendant in various litigation
matters. The Company and/or its personnel also from time to time are involved in investigations by various regulatory or legal authorities concerning matters arising in the course of its business around the world. Based on the present status of these matters, management believes the range of reasonably possible losses in addition to amounts accrued, net of insurance recoveries, will not have a material effect on the Company’s results of operations or financial condition.

Table of ContentsACCENTURE PLC
NOTES TO CONSOLIDATED FINANCIAL STATEMENTS — (continued)(In thousands of U.S. dollars, except share and per share amounts or as otherwise disclosed)
F- 39
16. SEGMENT REPORTING Operating segments are components of an enterprise where separate financial information is available that is
evaluated regularly by the chief operating decision maker, or decision-making group, in deciding how to allocate resources and in assessing performance.
The Company’s chief operating decision maker is its Chief Executive Officer. The Company’s operating segments are managed separately because each operating segment represents a strategic business unit providing consulting and outsourcing services to clients in different industries.
The Company’s reportable operating segments are the five operating groups, which are Communications, Media & Technology, Financial Services, Health & Public Service, Products and Resources. Information regarding the Company’s reportable operating segments is as follows:
Fiscal
2016
Communications, Media &
TechnologyFinancialServices
Health &Public
Service Products Resources Other Total
Net revenues $ 6,615,717 $ 7,031,053 $ 5,986,878 $ 8,395,038 $ 4,838,963 $ 15,074 $ 32,882,723Depreciation and amortization (1) 141,356 139,518 134,788 206,806 106,584 — 729,052Operating income 965,574 1,127,750 807,012 1,282,461 627,648 — 4,810,445Net assets as of August 31 (2) 923,764 123,827 892,569 1,281,551 820,273 (137,761) 3,904,223
2015
Net revenues $ 6,349,372 $ 6,634,771 $ 5,462,550 $ 7,596,051 $ 4,988,627 $ 16,560 $ 31,047,931Depreciation and amortization (1) 152,329 128,413 115,010 168,731 81,440 — 645,923Operating income 871,388 1,079,397 700,960 1,082,351 701,773 — 4,435,869Net assets as of August 31 (2) 798,623 186,739 812,278 1,158,953 723,113 (59,371) 3,620,335
2014 Net revenues $ 5,923,821 $ 6,511,228 $ 5,021,692 $ 7,394,980 $ 5,135,309 $ 15,364 $ 30,002,394Depreciation and amortization (1) 136,029 139,759 101,345 169,704 73,906 — 620,743Operating income 770,166 957,347 678,663 991,844 902,492 — 4,300,512Net assets as of August 31 (2) 926,952 128,179 791,084 974,546 735,048 (127,396) 3,428,413
_______________
(1) Amounts include depreciation on property and equipment and amortization of intangible assets controlled by each operating segment, as well as an allocation for amounts they do not directly control.
(2) The Company does not allocate total assets by operating segment. Operating segment assets directly attributed to an operating segment and provided to the chief operating decision maker include Receivables from clients, current and non-current Unbilled services, Deferred contract costs and current and non-current Deferred revenues.
The accounting policies of the operating segments are the same as those described in Note 1 (Summary of Significant Accounting Policies) to these Consolidated Financial Statements.

Table of ContentsACCENTURE PLC
NOTES TO CONSOLIDATED FINANCIAL STATEMENTS — (continued)(In thousands of U.S. dollars, except share and per share amounts or as otherwise disclosed)
F- 40
Revenues are attributed to geographic regions and countries based on where client services are supervised. Information regarding geographic regions and countries is as follows:
Fiscal North America Europe Growth Markets Total2016
Net revenues $ 15,653,290 $ 11,448,361 $ 5,781,072 $ 32,882,723Reimbursements 970,248 635,362 309,328 1,914,938
Revenues 16,623,538 12,083,723 6,090,400 34,797,661Property and equipment, net as of August 31 244,351 220,500 491,691 956,542
2015Net revenues $ 14,209,387 $ 10,929,572 $ 5,908,972 $ 31,047,931Reimbursements 891,443 628,342 346,708 1,866,493
Revenues 15,100,830 11,557,914 6,255,680 32,914,424Property and equipment, net as of August 31 230,359 179,925 391,600 801,884
2014 (1)Net revenues $ 12,796,846 $ 11,254,953 $ 5,950,595 $ 30,002,394Reimbursements 882,481 624,219 365,584 1,872,284
Revenues 13,679,327 11,879,172 6,316,179 31,874,678Property and equipment, net as of August 31 240,886 190,450 362,108 793,444
_______________(1) Effective September 1, 2014, we revised the reporting of the Company’s geographic regions as follows: North
America (the United States and Canada); Europe; and Growth Markets (Asia Pacific, Latin America, Africa, the Middle East, Russia and Turkey). Fiscal 2014 amounts have been reclassified to conform to the current period presentation.
The Company’s business in the United States represented 46%, 43% and 40% of its consolidated net revenues during fiscal 2016, 2015 and 2014, respectively. No other country individually comprised 10% or more of the Company’s consolidated net revenues during these periods. Business in Ireland, the Company’s country of domicile, represented approximately 1% of its consolidated net revenues during each of fiscal 2016, 2015 and 2014.
The Company conducts business in Ireland and in the following countries that hold 10% or more of its total consolidated Property and equipment, net:
August 31,
2016August 31,
2015August 31,
2014United States 25% 28% 29%India 25 26 22Ireland 4 2 2
Revenues by type of work were as follows:
Fiscal 2016 2015 2014Consulting $ 17,867,891 $ 16,203,915 $ 15,737,661Outsourcing 15,014,832 14,844,016 14,264,733
Net revenues 32,882,723 31,047,931 30,002,394Reimbursements 1,914,938 1,866,493 1,872,284
Revenues $ 34,797,661 $ 32,914,424 $ 31,874,678

Table of ContentsACCENTURE PLC
NOTES TO CONSOLIDATED FINANCIAL STATEMENTS — (continued)(In thousands of U.S. dollars, except share and per share amounts or as otherwise disclosed)
F- 41
17. QUARTERLY DATA (unaudited)
Fiscal 2016First
QuarterSecondQuarter
ThirdQuarter
FourthQuarter Annual
Net revenues $ 8,013,163 $ 7,945,565 $ 8,434,757 $ 8,489,238 $ 32,882,723Reimbursements 452,821 451,488 534,287 476,342 1,914,938
Revenues 8,465,984 8,397,053 8,969,044 8,965,580 34,797,661Cost of services before reimbursable expenses 5,450,644 5,575,749 5,745,205 5,833,698 22,605,296Reimbursable expenses 452,821 451,488 534,287 476,342 1,914,938
Cost of services 5,903,465 6,027,237 6,279,492 6,310,040 24,520,234Operating income 1,221,260 1,088,044 1,305,943 1,195,198 4,810,445Net income 868,681 1,399,858 950,283 1,130,781 4,349,603Net income attributable to Accenture plc 818,899 1,326,520 897,247 1,069,226 4,111,892Weighted average Class A ordinary shares:
—Basic 626,463,124 626,523,793 623,725,913 622,555,642 624,797,820—Diluted 671,300,744 668,125,087 666,403,323 665,365,231 667,770,274
Earnings per Class A ordinary share:
—Basic $ 1.31 $ 2.12 $ 1.44 $ 1.72 $ 6.58—Diluted 1.28 2.08 1.41 1.68 6.45
Ordinary share price per share:
—High $ 109.86 $ 109.65 $ 119.72 $ 120.78 $ 120.78—Low 91.68 91.40 101.00 108.66 91.40
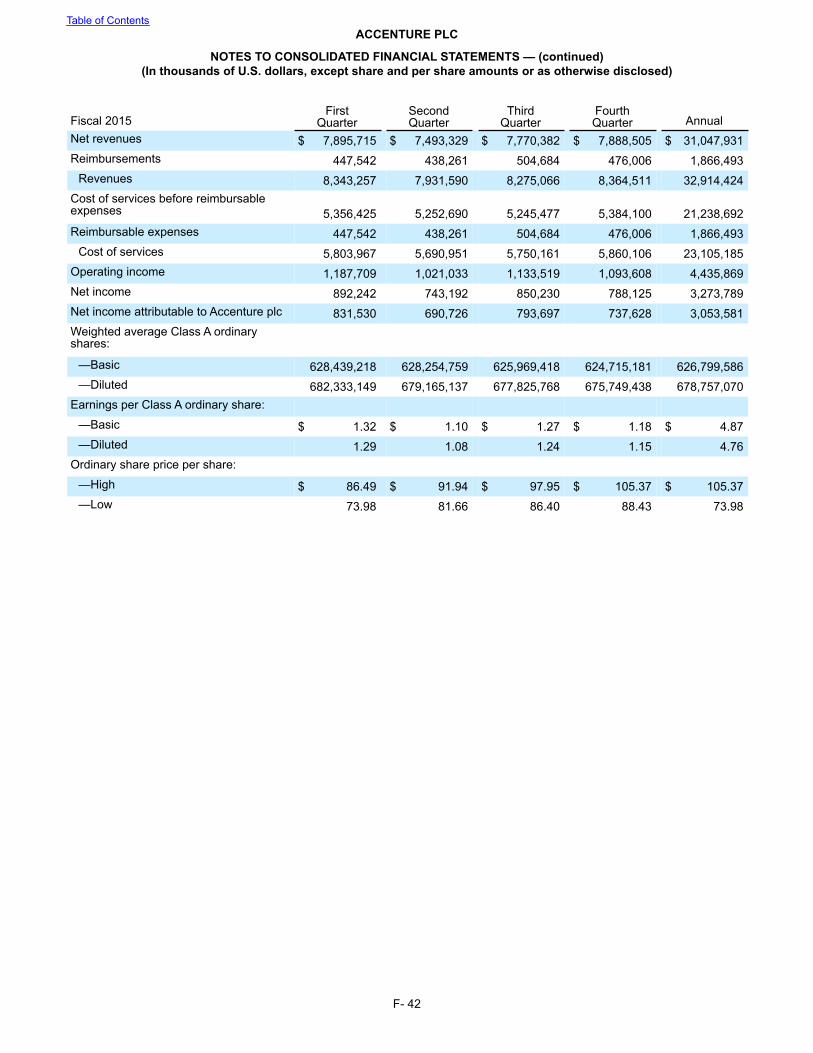
Table of ContentsACCENTURE PLC
NOTES TO CONSOLIDATED FINANCIAL STATEMENTS — (continued)(In thousands of U.S. dollars, except share and per share amounts or as otherwise disclosed)
F- 42
Fiscal 2015First
QuarterSecondQuarter
ThirdQuarter
FourthQuarter Annual
Net revenues $ 7,895,715 $ 7,493,329 $ 7,770,382 $ 7,888,505 $ 31,047,931Reimbursements 447,542 438,261 504,684 476,006 1,866,493
Revenues 8,343,257 7,931,590 8,275,066 8,364,511 32,914,424Cost of services before reimbursable expenses 5,356,425 5,252,690 5,245,477 5,384,100 21,238,692Reimbursable expenses 447,542 438,261 504,684 476,006 1,866,493
Cost of services 5,803,967 5,690,951 5,750,161 5,860,106 23,105,185Operating income 1,187,709 1,021,033 1,133,519 1,093,608 4,435,869Net income 892,242 743,192 850,230 788,125 3,273,789Net income attributable to Accenture plc 831,530 690,726 793,697 737,628 3,053,581Weighted average Class A ordinary shares:
—Basic 628,439,218 628,254,759 625,969,418 624,715,181 626,799,586—Diluted 682,333,149 679,165,137 677,825,768 675,749,438 678,757,070
Earnings per Class A ordinary share:
—Basic $ 1.32 $ 1.10 $ 1.27 $ 1.18 $ 4.87—Diluted 1.29 1.08 1.24 1.15 4.76
Ordinary share price per share:
—High $ 86.49 $ 91.94 $ 97.95 $ 105.37 $ 105.37—Low 73.98 81.66 86.40 88.43 73.98