annual report open edge networking 2020
TRANSCRIPT
Annual report 2020
Open edge networking

DisclaimerThis printed Annual Report 2020 is dated February 23, 2021 and takes into account the correction of errors identified during the printing process. The disclosure of the relevant parts from this Annual Report together with other documents to be disclosed to the Federal Gazette will take place until end of March 2021. To the extent that these documents are subject to the reporting obligation pursuant to Section 328 (1) sentence 4 of the German Commercial Code (HGB) in the European Single Electronic Format (ESEF) in accordance with Article 3 of Delegated Regulation (EU) 2019/8152, no changes have been taken into account after February 18, 2021. We would like to point out that the officially disclosed documents represent the authoritative version.
ContentsADVA OVERVIEW 5Welcome 6
Profile 6Mission 62020 key performance indicators 6ADVAntages 7Worldwide presence 82020 business highlights 10
Management board 13Members and their backgrounds 13Letter to shareholders 16
Supervisory board 20Members 20Report of the supervisory board 20
ADVA stock 22Stock information 23Shareholder structure 23Price development 2020 comparison 23Investor relations review 24Financial analyst coverage 24
Business overview 25Technology 25Market, target customers and growth drivers 26Products 29Regions, sales and marketing 31DevOps 32Quality management 34IT strategy 35Compliance and sustainability 36
COMBINED MANAGEMENT REPORT 39Basis of preparation 40Forward-looking statements 40Strategy and control design 40General economic and market conditions 40Business development and Operational performance of the group 42Net assets and financial position of the group 46Performance of ADVA Optical Networking SE 50Events after the balance sheet date 52Disclosures under takeover law in accordance with Section § 289a (1) HGB and Section § 315a (1) HGB 52Remuneration of the management and the supervisory board 54Employees 56Risk and opportunity report 57Outlook 68Declaration on corporate governance 70
IFRS CONSOLIDATED FINANCIAL STATEMENTS 73Consolidated statement of financial position as of December 31, 2020 74Consolidated income statement for the period January 1 to December 31, 2020 76Consolidated statement of comprehensive income 77Consolidated cash flow statement 78Consolidated statement of changes in stockholders’ equity 80Notes to the consolidated financial statements 82Notes to the consolidated statement of financial position 97Notes to the consolidated income statement 116Other disclosures 121Declaration of compliance with the German Corporate Governance Code 139Affirmative declaration of the legal representatives 139“Independent auditor’s report 140
ADDITIONAL INFORMATION 147Quarterly overview 2019 – 2020 148Multi-year overview 2010 – 2020 150Glossary 154Corporate information 159Financial calendar 2021 159


ADVA overview

The ADVA FSP 3000 TeraFlex™ unlocks the full potential of our network. Now we can meet rapidly rising data demand.“Sergey Petukhin, Head of connectivity infrastructure, Serverius
Welcome
PROFILEADVA is a company founded on innovation and driven to help our customers succeed.
Our technology is the foundation of a shared digital future and empowers networks across the globe. We’re continually developing breakthrough hardware and software that leads the networking industry and creates new business opportunities.
It’s these open connectivity solutions that enable our customers to deliver the cloud and mobile services that are vital to today’s society and for imagining new tomorrows.
Together, we’re building a truly connected and sustainable future.Glossary: page 154
MISSIONADVA enables open next-generation networks. The group’s mission is to be an innovation leader focused on its customers’ experience by building better networking solutions.
2020 KEY PERFORMANCE INDICATORS (in millions of EUR, except net promoter score)
Net debt(as of December 31)
566.7
514.5
502.0
556.8565.0
2016 2017 2018 2019 2020
23.4
19.5
23.324.8
33.8
2016 2017 2018 2019 2020
-25.5
38.2
26.8
61.1
25.5
2016 2017 2018 2019 2020
6056
52
44
50
2016 2017 2018 2019 2020
Revenues Pro formaoperating income
Net promoter score (%)
Glossary: page 154
ADVA overviewWelcome
6 ADVA – Annual report 2020
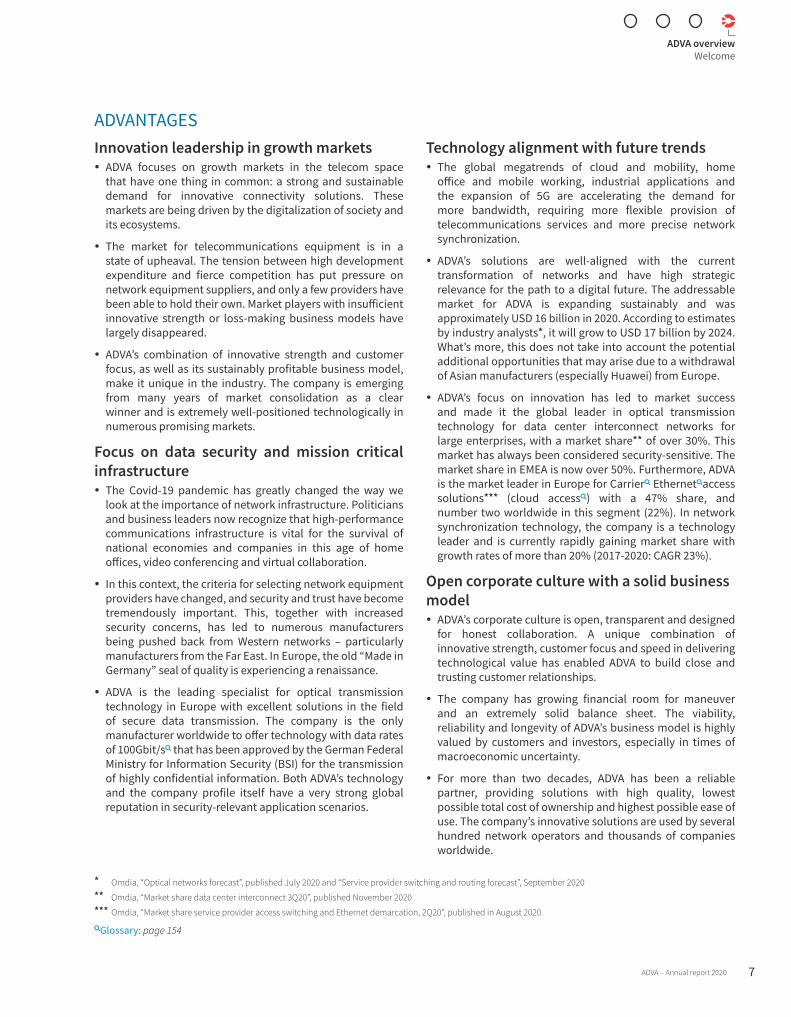
ADVANTAGESInnovation leadership in growth markets
y ADVA focuses on growth markets in the telecom space that have one thing in common: a strong and sustainable demand for innovative connectivity solutions. These markets are being driven by the digitalization of society and its ecosystems.
y The market for telecommunications equipment is in a state of upheaval. The tension between high development expenditure and fierce competition has put pressure on network equipment suppliers, and only a few providers have been able to hold their own. Market players with insufficient innovative strength or loss-making business models have largely disappeared.
y ADVA’s combination of innovative strength and customer focus, as well as its sustainably profitable business model, make it unique in the industry. The company is emerging from many years of market consolidation as a clear winner and is extremely well-positioned technologically in numerous promising markets.
Focus on data security and mission critical infrastructure
y The Covid-19 pandemic has greatly changed the way we look at the importance of network infrastructure. Politicians and business leaders now recognize that high-performance communications infrastructure is vital for the survival of national economies and companies in this age of home offices, video conferencing and virtual collaboration.
y In this context, the criteria for selecting network equipment providers have changed, and security and trust have become tremendously important. This, together with increased security concerns, has led to numerous manufacturers being pushed back from Western networks – particularly manufacturers from the Far East. In Europe, the old “Made in Germany” seal of quality is experiencing a renaissance.
y ADVA is the leading specialist for optical transmission technology in Europe with excellent solutions in the field of secure data transmission. The company is the only manufacturer worldwide to offer technology with data rates of 100Gbit/s that has been approved by the German Federal Ministry for Information Security (BSI) for the transmission of highly confidential information. Both ADVA’s technology and the company profile itself have a very strong global reputation in security-relevant application scenarios.
Technology alignment with future trends y The global megatrends of cloud and mobility, home
office and mobile working, industrial applications and the expansion of 5G are accelerating the demand for more bandwidth, requiring more flexible provision of telecommunications services and more precise network synchronization.
y ADVA’s solutions are well-aligned with the current transformation of networks and have high strategic relevance for the path to a digital future. The addressable market for ADVA is expanding sustainably and was approximately USD 16 billion in 2020. According to estimates by industry analysts*, it will grow to USD 17 billion by 2024. What’s more, this does not take into account the potential additional opportunities that may arise due to a withdrawal of Asian manufacturers (especially Huawei) from Europe.
y ADVA’s focus on innovation has led to market success and made it the global leader in optical transmission technology for data center interconnect networks for large enterprises, with a market share** of over 30%. This market has always been considered security-sensitive. The market share in EMEA is now over 50%. Furthermore, ADVA is the market leader in Europe for Carrier Ethernetaccess solutions*** (cloud access) with a 47% share, and number two worldwide in this segment (22%). In network synchronization technology, the company is a technology leader and is currently rapidly gaining market share with growth rates of more than 20% (2017-2020: CAGR 23%).
Open corporate culture with a solid business model
y ADVA’s corporate culture is open, transparent and designed for honest collaboration. A unique combination of innovative strength, customer focus and speed in delivering technological value has enabled ADVA to build close and trusting customer relationships.
y The company has growing financial room for maneuver and an extremely solid balance sheet. The viability, reliability and longevity of ADVA’s business model is highly valued by customers and investors, especially in times of macroeconomic uncertainty.
y For more than two decades, ADVA has been a reliable partner, providing solutions with high quality, lowest possible total cost of ownership and highest possible ease of use. The company’s innovative solutions are used by several hundred network operators and thousands of companies worldwide.
* Omdia, “Optical networks forecast”, published July 2020 and “Service provider switching and routing forecast”, September 2020** Omdia, “Market share data center interconnect 3Q20”, published November 2020*** Omdia, “Market share service provider access switching and Ethernet demarcation, 2Q20”, published in August 2020
Glossary: page 154
ADVA – Annual report 2020
ADVA overviewWelcome
7
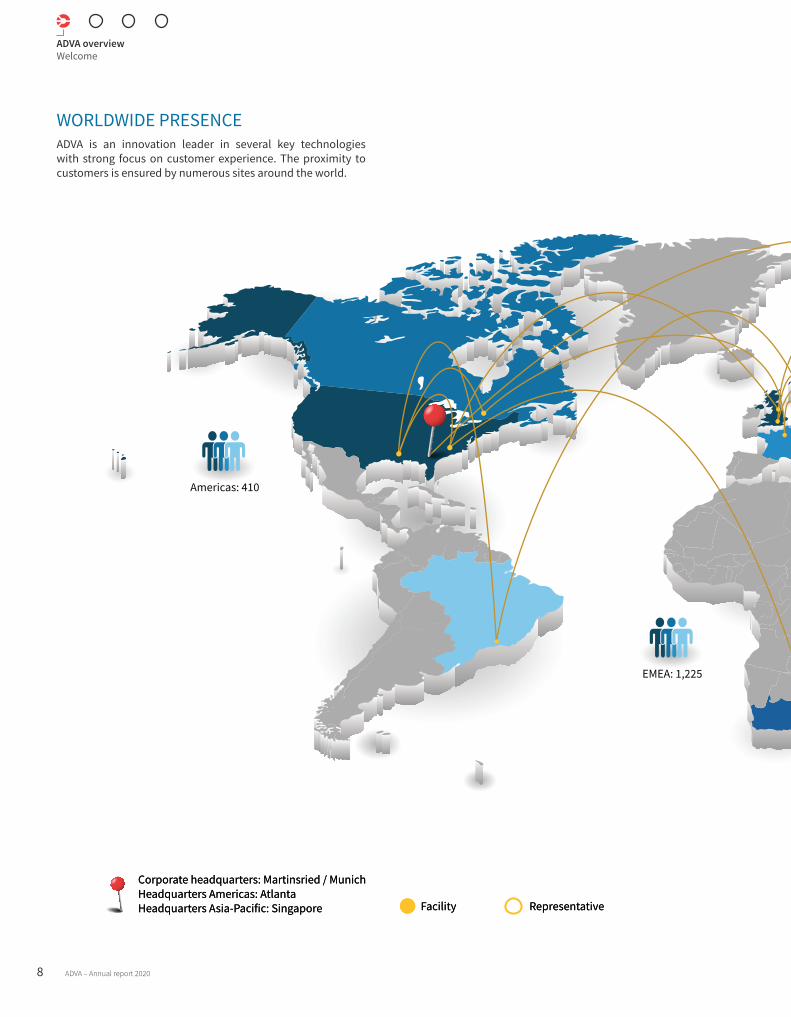
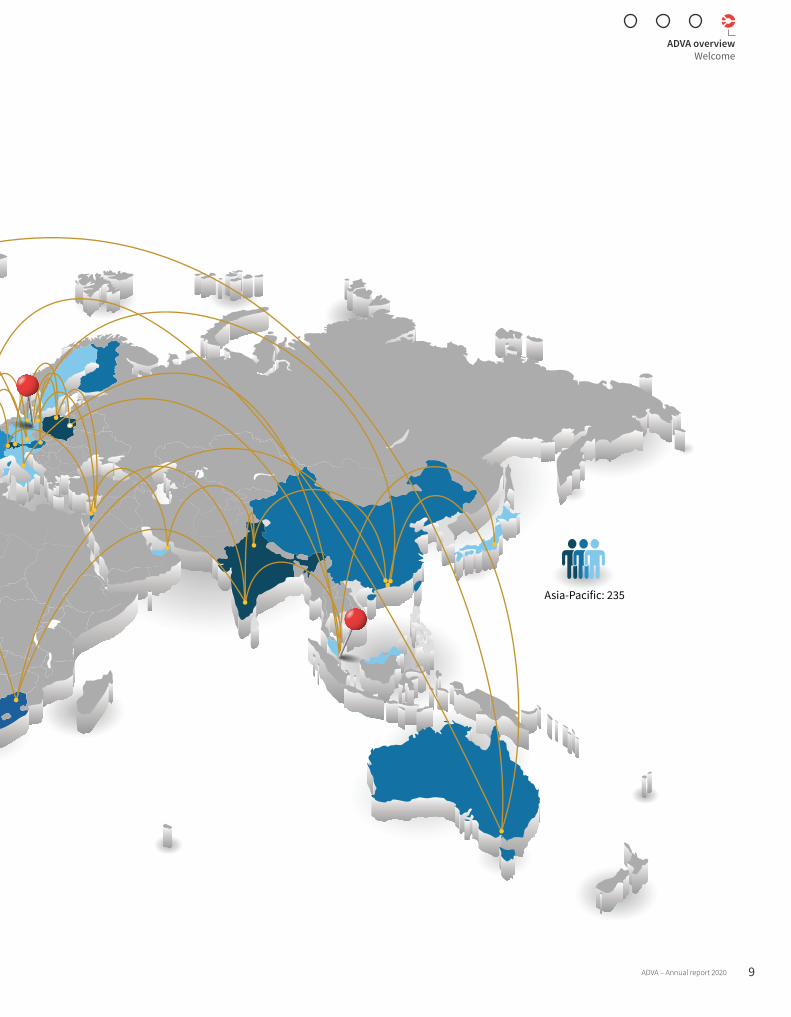
WORLDWIDE PRESENCEADVA is an innovation leader in several key technologies with strong focus on customer experience. The proximity to customers is ensured by numerous sites around the world.
Corporate headquarters: Martinsried / MunichHeadquarters Americas: AtlantaHeadquarters Asia-Pacific: Singapore RepresentativeFacility
Corporate headquarters: Martinsried / MunichHeadquarters Americas: AtlantaHeadquarters Asia-Pacific: Singapore RepresentativeFacility
Americas: 410
EMEA: 1,225
Asia-Pacific: 235
ADVA overviewWelcome
8 ADVA – Annual report 2020
WORLDWIDE PRESENCEADVA is an innovation leader in several key technologies with strong focus on customer experience. The proximity to customers is ensured by numerous sites around the world.
Corporate headquarters: Martinsried / MunichHeadquarters Americas: AtlantaHeadquarters Asia-Pacific: Singapore RepresentativeFacility
Corporate headquarters: Martinsried / MunichHeadquarters Americas: AtlantaHeadquarters Asia-Pacific: Singapore RepresentativeFacility
Americas: 410
EMEA: 1,225
Asia-Pacific: 235
ADVA – Annual report 2020
ADVA overviewWelcome
9
2020 BUSINESS HIGHLIGHTS Due to the Covid-19 pandemic, 2020 was a year full of uncertainties and new challenges. Nevertheless, ADVA stayed on course. The company has achieved numerous customer successes, entered partnerships and brought new, innovative solutions to market. Some of these successes have been published in the form of press releases. The following chapter provides an overview of these announcements.
Customer achievements and awardsIn 2020, ADVA solutions helped global service providers and enterprises across all industries to tackle soaring bandwidth demand and meet the challenges of an increasingly complex network environment. The year saw major customers massively increase the capacity of their existing infrastructure with the ADVA FSP 3000 TeraFlex™. Many others realized the benefits of openness and disaggregation through ADVA technology and multiple mission-critical networks were protected with ConnectGuard™ encryption and enhanced with ADVA’s Oscilloquartz timing technology. Here are a few of the highlights from the last 12 months:
March 19Viettel rolls out nationwide 5G-ready timing solution with
ADVA and NEC
April 7Bank Otkritie first financial company in Russia to harness 32G
FC with ADVA FSP 3000
April 9Serverius deploys ADVA FSP 3000 TeraFlex™ for 1200G
transport
April 30dacoso secures VPN with ADVA ConnectGuard™ Cloud
encryption
May 13WiTCOM deploys ADVA’s NFV hosting platform and 6WIND
vRouter in open public IoT network
May 14Türk Telekom upgrades its synchronization network with
ADVA’s high-performance cesium clocks
June 2Zenlayer uses ADVA FSP 3000 to tackle huge surge in cloud
data demand
June 25Central Bank of Austria leverages ADVA FSP 3000 for secure
high-speed connectivity
Glossary: page 154
July 2Telstra Wholesale deploys ADVA technology in Australian-first
Ethernet service
July 9KCOM extends high-speed connectivity with ADVA’s packet
edge solution
September 1Colocation Australia harnesses ADVA solution to offer low-
cost, long-haul connectivity
September 8LU-CIX increases service reliability and efficiency with ADVA
fiber monitoring solution
September 10Alsard Fiber uses ADVA FSP 3000 for highly resilient
connectivity throughout Iraq
November 5Yandex injects 600G wavelengths into DCI network with ADVA
TeraFlex™
December 2ADVA recognized as an Intel Network Builders Winners’ Circle
Leaders Board partner
December 17StarHub harnesses ADVA’s encryption solution for secure,
high-performance enterprise services
ADVA overviewWelcome
10 ADVA – Annual report 2020

Innovation and corporate events2020 was a significant year for ADVA technology. The company launched the market’s most versatile DCSG operating system and the industry’s most compact 100G edge demarcation solution. Other milestones included the release of ADVA’s turnkey G.metro solution built to tackle access network bottlenecks and its announcement of the industry’s first ePRC optical cesium clock for 5G accuracy and stability. Here are some of the headlines:
January 21ADVA demos Europe’s first 5G rail deployment
February 11ADVA tackles GNSS jamming and spoofing with market’s first
intelligent assurance solution
February 18ADVA unveils industry’s most compact 100G edge demarcation
solution
March 5ADVA launches turnkey G.metro solution to tackle access
network bottlenecks
March 12ADVA unlocks network potential with spectrum as a service
May 7ADVA upgrades timing technology to provide risk-free route
to 5G
May 12ADVA brings post-quantum security to packet networks
May 20ADVA brings next-gen synchronization to power utility
networks
June 4ADVA launches industry’s first ePRC optical cesium clock
solution
September 29ADVA delivers unprecedented precision in timing networks
with optical timing channel solution
Glossary: page 154
October 6ADVA announces general availability of market’s most
versatile DCSG operating system
December 15ADVA launches new generation of edge and access clocks for
5G network timing
ADVA – Annual report 2020
ADVA overviewWelcome
11

Interoperability and alliance partnerships ADVA continued to play a central role in joint innovation projects in 2020, driving interoperability and advancing the open environment. As well as expanding its Ensemble Harmony ecosystem and PEP partner program, the company brought its 5G X-Haul technology to multi-vendor projects like Affordable5G and the O-RAN ALLIANCE. ADVA’s Ensemble edge cloud software was utilized as a uCPE solution by major partners and its ConnectGuard™ encryption technology was at the heart of key projects building quantum-safe communications. Here are some of the relevant announcements:
January 28ADVA to play key role in OPENQKD project pioneering market-
ready quantum-safe communications
April 1ADVA’s carrier-grade NOS for bare-metal switches succeeds
in multi-vendor EANTC testing
May 5FUNET trials ADVA FSP 3000 TeraFlex™ to dramatically expand
network capacity
May 19dacoso protects managed services with ADVA’s virtualized
encryption technology
July 14ADVA teams up with OTN Systems to provide end-to-end
industrial connectivity
October 8ADVA sets ambitious new targets to radically reduce carbon
emissions
October 27ADVA joins O-RAN ALLIANCE to develop open and
disaggregated mobile networks
December 1ADVA joins Affordable5G to build high-performance and cost-
effective mobile networks
December 3ADVA and 6WIND deliver complete uCPE solution with high-
performance routing
December 9ADVA and Advantech simplify remote uCPE rollout with the
launch of a virtual lab
Glossary: page 154
December 14ADVA expands industry’s most comprehensive multi-vendor
NFV program
December 16
Telefónica Germany/O2 uses ADVA technology in country’s first open RAN trial
December 18ADVA announces winners of 2020 partner awards
ADVA overviewWelcome
12 ADVA – Annual report 2020

We love to work with highly innovative people to connect the world and drive change, success and value.
In an increasingly digital environment, our networking technologies enable those who are solving the world’s most critical challenges.“
Management board
MEMBERS AND THEIR BACKGROUNDSADVA is led by an international and highly motivated board of directors. The members of the management board have many years of experience in leading positions and extensive operational expertise in their respective areas of responsibility. With their complementary skills they steer ADVA in a highly competitive environment to ensure profitable growth.
The management team shares a common vision:
ADVA – Annual report 2020
ADVA overviewManagement board
13

Brian Protivachief executive officer (CEO)
Born in 1964 Bachelor of Science in electrical engineering, Stanford University, USA
Brian Protiva co-founded ADVA in 1994. As the CEO, he is responsible for overall strategy, human resources and quality management. Under Brian’s leadership, ADVA advanced to become a global market leader in Ethernet access devices and one of the top players in metro wavelength division multiplexing (WDM) worldwide. To date, ADVA’s innovative networking solutions have been deployed in thousands of enterprises and hundreds of carrier networks around the world. Prior to leading ADVA, Brian was managing director at AMS Technologies (now the EGORA group), which he joined in 1987 and where he focused on co-managing its subsidiaries.Glossary: page 154
Christoph Glingenerchief technology officer (CTO), chief operating officer (COO)
Born in 1968 Ph.D. in electrical engineering, University of Dortmund, Germany
Dr. Christoph Glingener joined ADVA in April 2006, assuming responsibility for all global research and development activities and was appointed CTO in 2007. Since that time, he has also led ADVA’s product management and advanced technology teams. Christoph has focused on streamlining ADVA’s product portfolio, defining the product strategy and building the group’s standing as a global innovator in optical networking. Strategic partnerships and mergers & acquisitions are an integral part of this strategy. Additionally, in January 2015, Christoph took on responsibility for global operations, enabling ADVA to integrate research and development, new product introduction and global operations into a unified development operations team. Christoph’s activities at ADVA build on a long and successful industry career with experience gained in both academic and corporate roles. These include leading positions at Marconi Communications (now Ericsson) and Siemens Communications (now Infinera).
14 ADVA – Annual report 2020
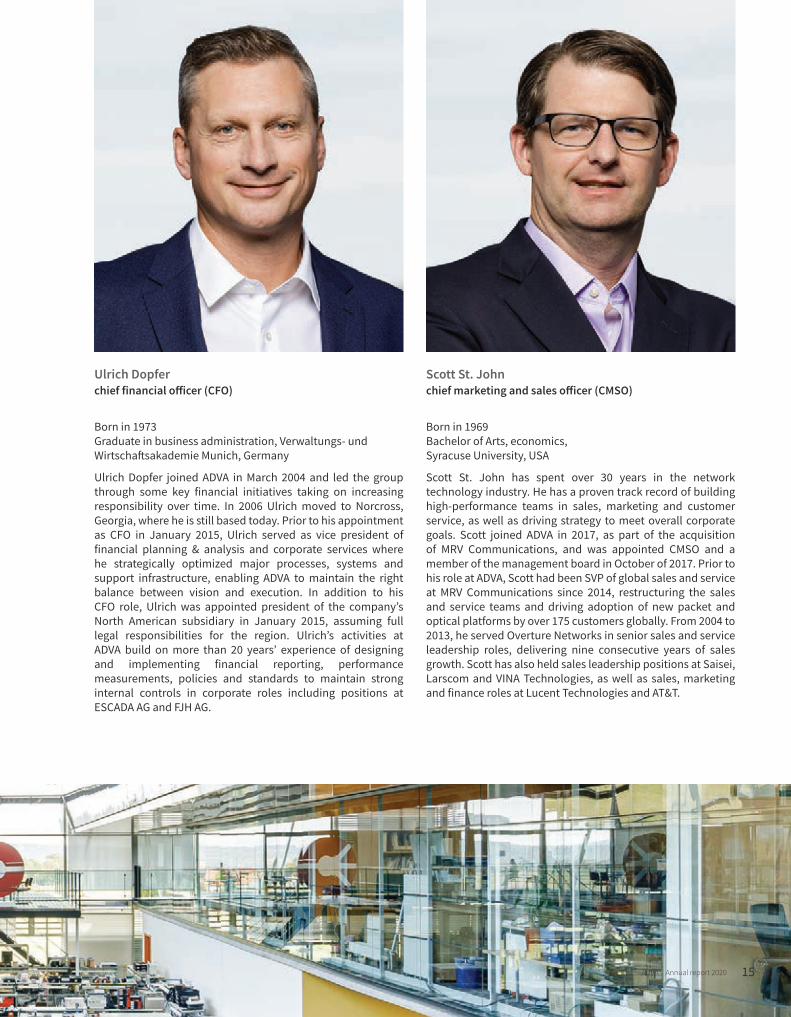
Ulrich Dopferchief financial officer (CFO)
Born in 1973 Graduate in business administration, Verwaltungs- und Wirtschaftsakademie Munich, Germany
Ulrich Dopfer joined ADVA in March 2004 and led the group through some key financial initiatives taking on increasing responsibility over time. In 2006 Ulrich moved to Norcross, Georgia, where he is still based today. Prior to his appointment as CFO in January 2015, Ulrich served as vice president of financial planning & analysis and corporate services where he strategically optimized major processes, systems and support infrastructure, enabling ADVA to maintain the right balance between vision and execution. In addition to his CFO role, Ulrich was appointed president of the company’s North American subsidiary in January 2015, assuming full legal responsibilities for the region. Ulrich’s activities at ADVA build on more than 20 years’ experience of designing and implementing financial reporting, performance measurements, policies and standards to maintain strong internal controls in corporate roles including positions at ESCADA AG and FJH AG.
Scott St. Johnchief marketing and sales officer (CMSO)
Born in 1969 Bachelor of Arts, economics, Syracuse University, USA
Scott St. John has spent over 30 years in the network technology industry. He has a proven track record of building high-performance teams in sales, marketing and customer service, as well as driving strategy to meet overall corporate goals. Scott joined ADVA in 2017, as part of the acquisition of MRV Communications, and was appointed CMSO and a member of the management board in October of 2017. Prior to his role at ADVA, Scott had been SVP of global sales and service at MRV Communications since 2014, restructuring the sales and service teams and driving adoption of new packet and optical platforms by over 175 customers globally. From 2004 to 2013, he served Overture Networks in senior sales and service leadership roles, delivering nine consecutive years of sales growth. Scott has also held sales leadership positions at Saisei, Larscom and VINA Technologies, as well as sales, marketing and finance roles at Lucent Technologies and AT&T.
ADVA – Annual report 2020 15
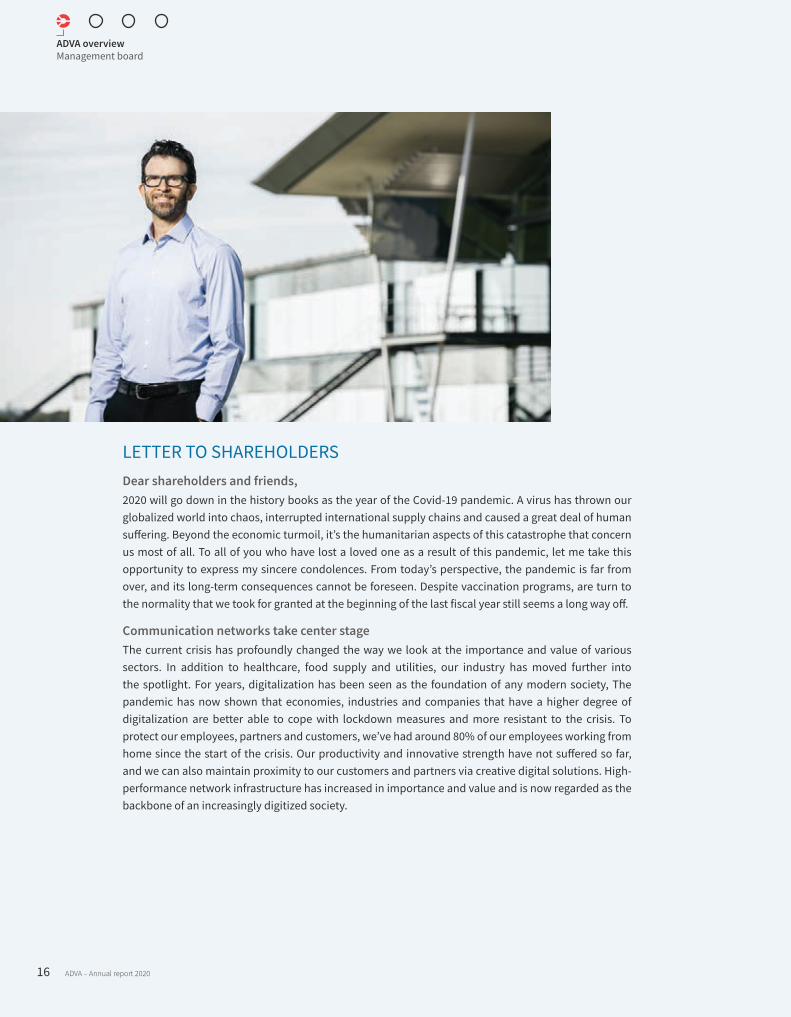
LETTER TO SHAREHOLDERS Dear shareholders and friends,2020 will go down in the history books as the year of the Covid-19 pandemic. A virus has thrown our globalized world into chaos, interrupted international supply chains and caused a great deal of human suffering. Beyond the economic turmoil, it’s the humanitarian aspects of this catastrophe that concern us most of all. To all of you who have lost a loved one as a result of this pandemic, let me take this opportunity to express my sincere condolences. From today’s perspective, the pandemic is far from over, and its long-term consequences cannot be foreseen. Despite vaccination programs, are turn to the normality that we took for granted at the beginning of the last fiscal year still seems a long way off.
Communication networks take center stageThe current crisis has profoundly changed the way we look at the importance and value of various sectors. In addition to healthcare, food supply and utilities, our industry has moved further into the spotlight. For years, digitalization has been seen as the foundation of any modern society, The pandemic has now shown that economies, industries and companies that have a higher degree of digitalization are better able to cope with lockdown measures and more resistant to the crisis. To protect our employees, partners and customers, we’ve had around 80% of our employees working from home since the start of the crisis. Our productivity and innovative strength have not suffered so far, and we can also maintain proximity to our customers and partners via creative digital solutions. High-performance network infrastructure has increased in importance and value and is now regarded as the backbone of an increasingly digitized society.
ADVA overviewManagement board
16 ADVA – Annual report 2020
Data security and deglobalization lead to competitive advantages The realization that communications infrastructure is an invaluable asset for all economies and companies has also prompted a rethink in politics and business. A few years ago, network technology primarily had to provide cost-effective bandwidth. Today, the focus is increasingly on security aspects. In particular, the expansion of 5G and the industrial use cases associated with it have made this more critical, and the use of technology of questionable origin is now viewed very negatively. In many industrialized nations of the western world, the dependence on large Chinese network equipment suppliers, in particular Huawei, is perceived as a serious threat. Following the USA, network operators in Europe with high Huawei exposure are now also working on concepts to free themselves from this dependency. For ADVA, this new dynamic creates additional opportunities. After years of consolidation in the market, our profile as a western network equipment supplier with a European-American corporate culture, strong innovation and a solid business model is being perceived extremely positively. In a network operator environment that increasingly favors local value creation and secure technologies, we can open new doors and gain market share in Europe, the USA and other parts of the world.
Innovative network technology provides the foundation for a digital futureRegardless of the economic difficulties in numerous sectors, the bandwidth requirements of the digitized world continue to rise, and the expansion and transformation of networks is progressing inexorably. Multi-cloud concepts for enterprises, edge computing solutions at network operators, IoT and 5G all require robust and scalable telecommunications infrastructure. They need more optical data transmission, new edge cloud solutions for optimized delivery of communications services, and more precise network synchronization. Our investments in recent years address these exact areas, leaving us extremely well-positioned technologically for widespread network transformation based on openness, virtualization and security. New solutions are being developed all over the world that address the major core issues of our civilization, such as food generation and supply, medical technology, climate protection and the reduction of CO2 emissions. And what all of these future solutions have in common is that they all need the communications technology that we develop.
Stronger growth and cash generation – the next phase of ADVA’s success story Our focus on innovation has involved heavy investment. Over the last few years, we’ve brought several new technologies to market and have started to see the returns. It is now time to write the next chapter in our corporate history – a chapter focused on stronger growth and cash generation. The following three points are the cornerstones of our strategy:
Increased growth in the areas of software and services: In recent years, we’ve been steadily increasing the share of software and services in our revenue to around 20%. In 2020 the contribution grew further to 23%. This growth is positive for customer retention and will further increase our margins. Over the next three years, we will continue to increase the share of software and services so that the total contribution to revenue will exceed 30%. Our Ensemble software solutions have gained a lot of momentum and our newly introduced network operating systems, Ensemble Connector and Ensemble Activator, have particularly high growth potential. In our services portfolio, we are further expanding our competencies including the use of artificial intelligence and launching new offerings in the areas of network security, planning and consulting. Glossary: page 154
ADVA overviewManagement board
ADVA – Annual report 2020 17
New markets with a high degree of differentiation: Our investments in new technologies give us access to new markets in which we can operate in a highly differentiated and therefore highly profitable way and grow at an above-average rate. Revenue contribution of our network synchronization technology area has grown at an annual rate of over 25% over the last years and will continue to increase disproportionately. In addition, we’ve started to commercialize the customer gains of the last 24 months with our Ensemble virtualization solutions. Dell as our new sales partner, is opening new doors into enterprise IT applications in interesting verticals, bringing us new customers. With our technology investments of recent years, we can address new higher-value applications with carriers and ICPs and open up new markets outside these customer groups. The revenue contribution from non-telco customer segments will grow from approximately 30% last year to over 40% in the next three years.
Verticalization: An important aspect in our industry is to maintain control over crucial parts of the value chain. This includes components and subsystems that either ensure additional differentiation on the product side and thus increase competitiveness, or decisively improve the cost basis of our own solutions. We have an excellent network of partners in the field of electro-photonic components and will continue to use the added value of this industry to the advantage of our systems. However, we’ve also launched our own activities in the field of photonic integration. With a key focus on optical transceivers, we launched a family of highly integrated multiplexers and will further expand this product line going forward. These pluggable modules are required in large quantities in our own systems and provide increasing value for neighboring technology areas such as switching, routing and 5G RAN technology. With our activities around photonic integration, we are sustainably improving our cost base and opening up new markets. The revenue contribution from these modules will grow to over 15% in the next years.Glossary: page 154
Positive outlook2020 was one of the most successful years in our company’s history. In addition, our macro environment has evolved positively over the last 12 months. We therefore offer an optimistic outlook:
y The realization has matured in politics and business that communications infrastructure plays an essential role in solving major problems as well as shaping a sustainable future. We are the only remaining expert in optical networks and synchronization systems in Europe. Increasing security concerns around the big Chinese suppliers create new opportunities and differentiation for ADVA, strengthening our market position.
y Technologically our solutions are perfectly aligned with the transformation of networks that is taking place, including a focus on cloud, mobility, 5G, network automation and security. In addition to the high-value performance features of our optical data transmission, our precise network synchronization technology and our programmable cloud access solutions, our service portfolio is also delivering increasing value.
y The three pillars of our growth acceleration strategy based on software and services, expansion into new industries and technology verticalization, in combination with our continued stringent cost management, will deliver increasing returns and higher operating results.
ADVA overviewManagement board
18 ADVA – Annual report 2020

Our global and loyal customer base consisting of hundreds of carriers, ICPs and thousands of large enterprises values our innovative solutions. The knowledge, creativity and commitment our employees make ADVA the innovation leader and trusted partner for operators worldwide. I would like to thank our dedicated employees for their consistent and valuable contributions, especially during these challenging times. The interplay of their diverse knowledge and skills has made ADVA a unique company with bright prospects for the future.
In 2021, we will continue to invest all our energy and creativity in innovative solutions for the benefit of our customers, shareholders and employees.
Stay healthy!
February 23, 2021
Brian Protiva Chief executive officer
Supervisory board
MEMBERSADVA’s supervisory board consists of a diverse and international group of seasoned experts in their respective fields:
Nikos Theodosopoulos – chairman y Chairman since January 9, 2015
y Member since 2014
y Independent member
y Chairman of the compensation and nomination committee
y Member of the audit committee
y Founder and managing member of NT Advisors LLC, Manhasset, New York, USA
Johanna Hey – vice chairwoman y Vice chairwoman since June 4, 2013
y Member since 2011
y Independent member
y Chairwoman of the audit committee
y Professor for tax law, University of Cologne, Cologne, Germany
Michael Aquino – member y Member since June 13, 2018
y Independent member
y Member of the compensation and nomination committee
y Technology strategy consultant, Peachtree City, Georgia, USA
REPORT OF THE SUPERVISORY BOARDIn 2020, the supervisory board once again performed its duties under the law and the company’s articles. It carefully and continuously monitored the management board and supported it in all strategic matters. The supervisory board has been directly involved in the early stages of all important strategic decisions of the company. During a total of five ordinary meetings, in which all members of the supervisory board and the members of the management board regularly participated, the management board consistently, promptly and extensively informed the supervisory board about the business situation of the company and the group. In addition, the supervisory board occasionally consults before or after the regular meetings without the management board being
present. In particular, the supervisory board was informed on matters regarding strategic orientation, market development and prospects for growth, as well as on the development of net assets, financial position and profitability, including budgeting, investments, personnel, compliance, internal audit and risk management. The supervisory board extensively discussed all important business issues on the basis of the management board’s reports. Any deviations of the actual business development from the group’s plans and objectives were thoroughly explained by the management board and reviewed by the supervisory board. The supervisory board gave its approvals to all important decisions, after thorough examination and consultation, where required by law or the company’s articles and acting in the best interest of the company and the group. Furthermore, on urgent matters resolutions were passed outside of meetings during the year. Moreover, especially the chairman and the vice chairwoman of the supervisory board maintained regular contact with individual members of the management board outside of scheduled meetings and were kept up-to-date with respect to current business developments, important transactions and forthcoming decisions. No extraordinary meetings have been held in 2020.
Main management board activities covered and examined by the supervisory boardIn 2020, as in the prior year, the supervisory board focused mainly on the business development and strategic direction of the company and the group, particularly its revenue, earnings and headcount development, and ADVA’s financial situation. In this context, new opportunities for revenue growth and the development of margins were discussed.
The supervisory board closely monitored and supported the activities of the management board, including discussions on corporate governance. It discussed the group’s organization and key business processes with the management board and assured itself of the efficiency of this organization and these processes. The management board submitted to the supervisory board all transactions and decisions requiring approval according to the company’s articles. The supervisory board approved all such transactions and decisions.
CommitteesIn order to perform its tasks efficiently, the supervisory board continued to maintain two committees during 2020, the audit committee and the compensation and nomination committee. Members of the audit committee were Johanna Hey (chairwoman) and Nikos Theodosopoulos, members of the compensation and nomination committee were Nikos Theodosopoulos (chairman) and Michael Aquino.
ADVA overviewSupervisory board
20 ADVA – Annual report 2020
The audit committee held four meetings during the reporting period, in which all members regularly participated. In addition to reviewing the consolidated annual and three quarterly financial statements and group management reports as well as the company’s annual financial statements and management report, the audit committee discussed the financial position and performance of the group, the appointment of the external auditor, the audit scope for 2020, the development of tax positions and risks, internal audit activities, as well as the effectiveness of the internal controls related to financial reporting and of the risk management system.
The compensation and nomination committee sat two times during the past year. The committee’s discussions focused in particular on the remuneration and the contract extensions of the chief officers.
Reports on the work of the supervisory board committees were regularly presented and discussed during the subsequent supervisory board plenary meeting.
Corporate Governance CodeThe supervisory board welcomes the German Corporate Governance Code and supports its objectives. The supervisory board has agreed to comply with most of the recommendations and proposals of the Corporate Governance Code within the ADVA Optical Networking organization. In its meeting on November 10, 2020, the supervisory board discussed the deviations from the Code and jointly issued the regularly scheduled update on the declaration of compliance in accordance with section 161 of the German Stock Corporation Law (Aktiengesetz, AktG). The declaration is made permanently available to shareholders on the company’s website.
Annual financial statements and management reportsADVA Optical Networking’s consolidated annual financial statements for the year ended December 31, 2020, and ADVA Optical Networking SE’s annual financial statements for the year ended December 31, 2020, as well as the group management report and the management report of ADVA Optical Networking SE for the fiscal year 2020 were audited by the company’s appointed auditor for 2020, PricewaterhouseCoopers GmbH Wirtschaftsprüfungsgesellschaft, Munich, who issued unqualified audit opinions. Pursuant to section 315e of the German Commercial Code (Handelsgesetzbuch, HGB), the consolidated annual financial statements have been prepared according to International Financial Reporting Standards (IFRS) as enacted in the EU. All management letter points issued by the auditor were taken up, discussed with the management board, and their consideration was ensured.
All relevant accounting documents, financial reports and audit reports were submitted to the supervisory board members prior to the meeting of the supervisory board
dealing with the company’s and group’s 2020 financial statements. On February 17 and February 22, 2021, these documents were discussed and examined in detail jointly by the audit committee and the auditor and in consideration of the auditor’s long-form report. The audit committee reported its findings to the entire supervisory board in its meeting on February 23, 2021. Furthermore, the auditor, who was present in both meetings, reported on the material results of the audit, explained net assets, the financial position and the results of operations of the company and the group, and was available to answer additional questions from the members of the supervisory board.
In view and consideration of these audit reports and on the basis of the additional information provided by the auditor, the supervisory board discussed and examined in detail the financial statements and management reports in its meeting on February 23, 2021. It unanimously approved ADVA Optical Networking SE’s annual financial statements and management report, as well as ADVA’s consolidated annual financial statements and group management report. The annual financial statements of ADVA Optical Networking SE for the fiscal year 2020 are thereby adopted.
Changes within the management and supervisory boardsWithin the fiscal year 2020, no personnel changes occurred in either the management or supervisory board.
In its meeting on February 18, 2020, the supervisory board extended the appointments of Brian Protiva, Christoph Glingener, Ulrich Dopfer and Scott St. John as members of the management board until December 31, 2021. In its meeting on February 23, 2021, the supervisory board approved the proposals of the compensation and nomination committee and resolved to extend the terms of appointment of Brian Protiva, Christoph Glingener, Ulrich Dopfer and Scott St. John as members of the management board until December 31, 2022. It was agreed that corresponding contractual provisions would be superimposed with the individual members of the management board in writing.
The supervisory board would like to express its appreciation for the personal dedication, performance and the ongoing commitment of the management board and all employees of the company and the group during 2020.
February 23, 2021
On behalf of the supervisory board:
Nikos Theodosopoulos Chairman of the supervisory board
ADVA – Annual report 2020
ADVA overviewSupervisory board
21
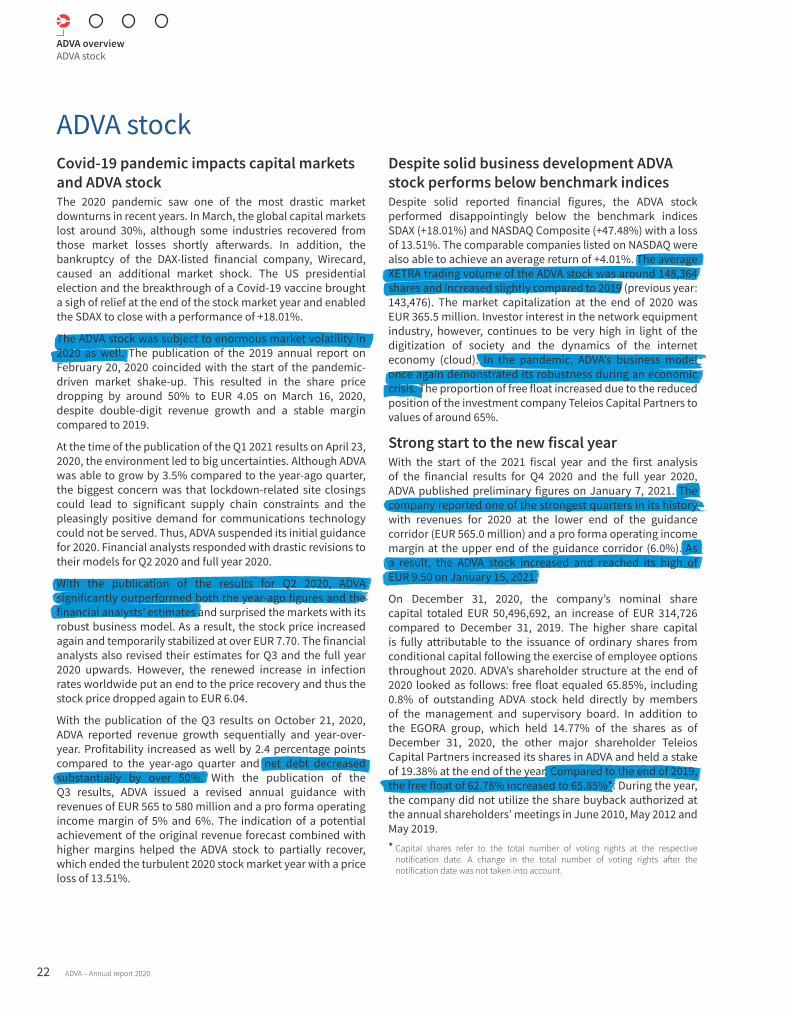
ADVA stockCovid-19 pandemic impacts capital markets and ADVA stock The 2020 pandemic saw one of the most drastic market downturns in recent years. In March, the global capital markets lost around 30%, although some industries recovered from those market losses shortly afterwards. In addition, the bankruptcy of the DAX-listed financial company, Wirecard, caused an additional market shock. The US presidential election and the breakthrough of a Covid-19 vaccine brought a sigh of relief at the end of the stock market year and enabled the SDAX to close with a performance of +18.01%.
The ADVA stock was subject to enormous market volatility in 2020 as well. The publication of the 2019 annual report on February 20, 2020 coincided with the start of the pandemic-driven market shake-up. This resulted in the share price dropping by around 50% to EUR 4.05 on March 16, 2020, despite double-digit revenue growth and a stable margin compared to 2019.
At the time of the publication of the Q1 2021 results on April 23, 2020, the environment led to big uncertainties. Although ADVA was able to grow by 3.5% compared to the year-ago quarter, the biggest concern was that lockdown-related site closings could lead to significant supply chain constraints and the pleasingly positive demand for communications technology could not be served. Thus, ADVA suspended its initial guidance for 2020. Financial analysts responded with drastic revisions to their models for Q2 2020 and full year 2020.
With the publication of the results for Q2 2020, ADVA significantly outperformed both the year-ago figures and the financial analysts’ estimates and surprised the markets with its robust business model. As a result, the stock price increased again and temporarily stabilized at over EUR 7.70. The financial analysts also revised their estimates for Q3 and the full year 2020 upwards. However, the renewed increase in infection rates worldwide put an end to the price recovery and thus the stock price dropped again to EUR 6.04.
With the publication of the Q3 results on October 21, 2020, ADVA reported revenue growth sequentially and year-over-year. Profitability increased as well by 2.4 percentage points compared to the year-ago quarter and net debt decreased substantially by over 50%. With the publication of the Q3 results, ADVA issued a revised annual guidance with revenues of EUR 565 to 580 million and a pro forma operating income margin of 5% and 6%. The indication of a potential achievement of the original revenue forecast combined with higher margins helped the ADVA stock to partially recover, which ended the turbulent 2020 stock market year with a price loss of 13.51%.
Despite solid business development ADVA stock performs below benchmark indicesDespite solid reported financial figures, the ADVA stock performed disappointingly below the benchmark indices SDAX (+18.01%) and NASDAQ Composite (+47.48%) with a loss of 13.51%. The comparable companies listed on NASDAQ were also able to achieve an average return of +4.01%. The average XETRA trading volume of the ADVA stock was around 148,364 shares and increased slightly compared to 2019 (previous year: 143,476). The market capitalization at the end of 2020 was EUR 365.5 million. Investor interest in the network equipment industry, however, continues to be very high in light of the digitization of society and the dynamics of the internet economy (cloud). In the pandemic, ADVA’s business model once again demonstrated its robustness during an economic crisis. The proportion of free float increased due to the reduced position of the investment company Teleios Capital Partners to values of around 65%.
Strong start to the new fiscal yearWith the start of the 2021 fiscal year and the first analysis of the financial results for Q4 2020 and the full year 2020, ADVA published preliminary figures on January 7, 2021. The company reported one of the strongest quarters in its history with revenues for 2020 at the lower end of the guidance corridor (EUR 565.0 million) and a pro forma operating income margin at the upper end of the guidance corridor (6.0%). As a result, the ADVA stock increased and reached its high of EUR 9.50 on January 15, 2021.
On December 31, 2020, the company’s nominal share capital totaled EUR 50,496,692, an increase of EUR 314,726 compared to December 31, 2019. The higher share capital is fully attributable to the issuance of ordinary shares from conditional capital following the exercise of employee options throughout 2020. ADVA’s shareholder structure at the end of 2020 looked as follows: free float equaled 65.85%, including 0.8% of outstanding ADVA stock held directly by members of the management and supervisory board. In addition to the EGORA group, which held 14.77% of the shares as of December 31, 2020, the other major shareholder Teleios Capital Partners increased its shares in ADVA and held a stake of 19.38% at the end of the year. Compared to the end of 2019, the free float of 62.78% increased to 65.85%*. During the year, the company did not utilize the share buyback authorized at the annual shareholders’ meetings in June 2010, May 2012 and May 2019.* Capital shares refer to the total number of voting rights at the respective
notification date. A change in the total number of voting rights after the notification date was not taken into account.
ADVA overviewADVA stock
22 ADVA – Annual report 2020

ADVA’s versatile and compact Oscilloquartz timing devices are easy to install in a wide range of outdoor locations.“Michał Ziółkowski, CTO, Play
STOCK INFORMATIONTrade name ISIN DE0005103006/WKN 510300
Symbol ADV
Exchange Prime Standard Segment Frankfurt Stock Exchange
Sector Technology
Industry Communications Technology
Number of shares outstanding at year-end 2020 50,496,692
2020 high/low price EUR 8.46/EUR 4.05
2020 year-end price EUR 7.04
2019 year-end market capitalization EUR 365.5 million
2018 year-end price EUR 8.14
2019 share price performance -13.5%
* Price information is based on Xetra closing prices.
SHAREHOLDER STRUCTURE
50,181,96650,496,692
65.85%
14.77%
19.38%
2020 year end*
64.76%
14.99%
20.25%
2019 year end
Teleios Capital PartnersFree float EGORA-group
Share outstanding
* Capital shares refer to the total number of voting rights at the respective notification date. A change in the total number of voting rights after the notification date was not taken into account.
PRICE DEVELOPMENT 2020 COMPARISON (in %, indexed)
-60%
-40%
-20%
0%
20%
40%
60%
Jan. Feb. Mar. Apr. May. Jun. Jul. Aug. Sep. Oct. Nov. Dec.
Peer group* SDAX ADVA Optical Networking Nasdaq Composite
* Peer group data are calculated with the arithmetic average of Ciena, Cisco, and Infinera stock prices.
ADVA – Annual report 2020
ADVA overviewADVA stock
23
INVESTOR RELATIONS REVIEWInvestor relations work changed fundamentally in 2020 due to the global pandemic and the associated travel restrictions. The main changes concerned the following points in particular:
y Switch to virtual investor conferences and roadshows
y Switch to virtual annual general meeting
y Increasing complexity in compliance with MAR guidelines due to Covid-19-driven corporate and stock market performance
The digitization of ecosystems is progressing across the globe and requires a rapid and sustainable expansion of network infrastructure. The preparation for the fifth generation of mobile technology (5G), the internet of things (IoT) and the development and use of artificial intelligence (AI) are driving the modernization and expansion of networks. ADVA’s solution portfolio based on open optical transmission technology, network access solutions with virtualization and synchronization technology is exclusively based on technologies that are strategically important for the transformation of networks.
Despite the sustained increase in demand for modern network technology and its economic importance, the network equipment industry continues to face a challenging environment determined by high R&D expenditures, short innovation cycles, competitive pressure and fierce price negotiations. However, due to its importance in maintaining economic processes during the pandemic, the industry is now perceived much more positive and valuable. Additionally, promising market growth potential exists in various segments and geographical regions.
In order to meet investors’ demand for information on current market developments and their impact on ADVA, the company has transformed its investor relations work to new virtual concepts. A total of three (virtual) roadshows (2019: three) were held in London, Paris, Geneve and Zurich, as well as over 150 one-on-one meetings (2019: 210). ADVA presented itself to institutional investors at a total of ten investor conferences (2019: ten), including cross-industry conferences and technology-focused events. These conferences were organized by Berenberg/Goldman Sachs, Cowen, Commerzbank, Deutsche Boerse, Jefferies, Kepler Cheuvreux, Montega AG and Needham.
In addition, with a total of 48 press releases, two ad-hoc publications, three quarterly reports and regular conference calls, the financial community was kept informed about any significant developments within ADVA. Furthermore, throughout the year, the company continued to provide comprehensive and up-to-date information relevant to the financial community on the investor relations pages of its website at www.adva.com, including full transcripts of archived conference calls.
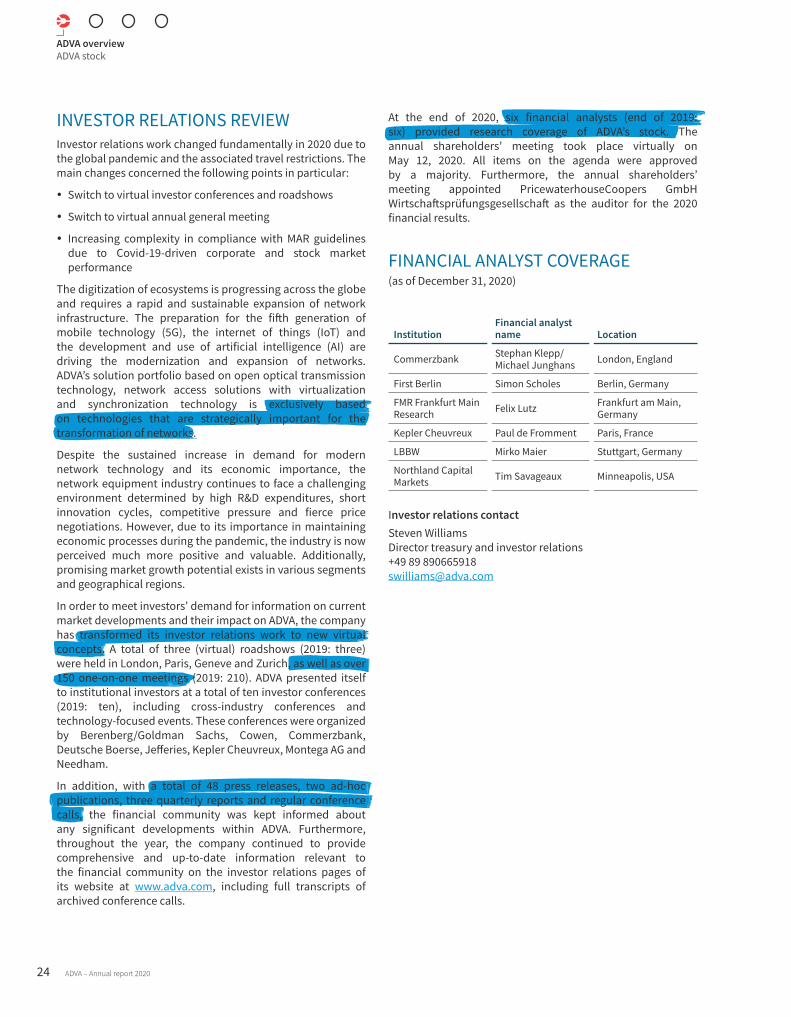
At the end of 2020, six financial analysts (end of 2019: six) provided research coverage of ADVA’s stock. The annual shareholders’ meeting took place virtually on May 12, 2020. All items on the agenda were approved by a majority. Furthermore, the annual shareholders’ meeting appointed PricewaterhouseCoopers GmbH Wirtschaftsprüfungsgesellschaft as the auditor for the 2020 financial results.
FINANCIAL ANALYST COVERAGE(as of December 31, 2020)
Institution Financial analyst name Location
Commerzbank Stephan Klepp/Michael Junghans London, England
First Berlin Simon Scholes Berlin, Germany
FMR Frankfurt Main Research Felix Lutz Frankfurt am Main,
Germany
Kepler Cheuvreux Paul de Fromment Paris, France
LBBW Mirko Maier Stuttgart, Germany
Northland Capital Markets Tim Savageaux Minneapolis, USA
Investor relations contactSteven Williams Director treasury and investor relations +49 89 890665918 [email protected]
ADVA overviewADVA stock
24 ADVA – Annual report 2020

Business overviewADVA develops open networking technology that is the foundation of a shared digital future and empowers networks across the globe.
TECHNOLOGYADVA develops, manufactures and sells networking solutions for a digital future. Its products are based on three core areas of expertise: fiber-optic transmission technology, cloud access technology for rapid creation of innovative services and solutions for precise timing and synchronization of networks. All three technology areas are unified by intelligent software for network management.
Optical networkingFiber is the optimum physical medium to transmit large amounts of data over long distances. The bandwidth-over-distance capabilities of fiber by far exceed those of any other physical medium such as copper or wireless technologies. Therefore, fiber-optic transport is the unchallenged foundation for all high-speed networks. ADVA’s optical transmission solutions are based on wavelength division multiplexing (WDM) technology. With WDM, multiple data streams are transmitted simultaneously over a single optical fiber by assigning each stream to a different wavelength (i.e., color) of laser light. Every wavelength (more than 100 in total) can carry a different application such as voice, video, data or storage traffic. Combining (i.e., multiplexing) these wavelengths at one end of the fiber, transmitting them over distance and then separating (i.e., de-multiplexing) them at the far end multiplies the fiber capacity and makes transmission more efficient. WDM supports all data protocols and transmission speeds and is a natural foundation for all high-capacity networks.
Cloud accessEthernet is the dominant data-link protocol for today’s networks supporting a multitude of communication applications. ADVA provides Ethernet-optimized transmission solutions for fiber-based networks. Carrier Ethernet is often used at the network edge supporting several important applications. Network operators use the technology to backhaul traffic from mobile base stations and to connect their enterprise customers. Over the years, Ethernet has evolved to be the key protocol used to carry applications in high-speed optical networks for data backhaul and the interconnection of routers.Glossary: page 154
The importance of software in networking technology is increasing rapidly. On the one hand, network operation is automated by means of intelligent software, which increases user friendliness and simplifies network control and
maintenance. On the other hand, more and more network functions are virtualized (network function virtualization, NFV). With NFV, the tight coupling between hardware and software in network elements is dissolved, and individual network functions can be developed and provided independently of the underlying hardware.
Packet-based data transmission technology and innovative network operating systems to run on open compute and switching platforms are the foundation for ADVA’s cloud access solutions. The Ensemble software products of the company are leading the way in NFV infrastructure applications.
Network synchronization Reference sources that deliver stable frequency and time-of-day information are crucial to the effective transmission of digital signals. Especially in mobile networks, the availability of highly accurate synchronization and timing information is crucial for best end-user experience. With a complete end-to-end solution portfolio sold under the Oscilloquartz brand, ADVA can offer a smooth evolution across multiple generations of synchronization technologies.
Technologies for a digital future ADVA’s three technology pillars are fundamental to the rapidly advancing digitalization of ecosystems around the world. Optical networking technology with WDM provides the scalable transmission capacity needed to handle bandwidth growth. Cloud access solutions allow the flexible and fast deployment of new communication services, and the synchronization technology ensures maximum performance in the network.
ADVA creates innovative networking solutions from inception through manufacturing and into service. The following paragraphs describe important market dynamics that drive growth for the group’s business.
ADVA – Annual report 2020
ADVA overviewBusiness overview
25
MARKET, TARGET CUSTOMERS AND GROWTH DRIVERSThe rapid digitalization of society and ecosystems is putting a lot of pressure on communication networks worldwide. It is generating an ever-growing demand for more universally available bandwidth, faster provisioning of specialized communication services and high-precision time and frequency synchronization in distributed systems.
ADVA’s technologies are strategically important to the necessary network transformation, and there is an ever-growing number of applications for open optical transmission technology, programmable cloud access solutions and high-performance synchronization technologies.
The following briefly describes the key applications, target groups and growth drivers in ADVA’s addressable market.
Data center interconnect for large enterprisesIn a digitally networked world, enterprises depend more than ever on the integrity of their data and the availability of digital resources. There is a growing need to develop more reliable and efficient IT infrastructures, which not only protect against data loss, but also ensure that all processes run smoothly and at all locations. The loss of mission-critical information is a big threat to enterprises. System failures can result in idle staff, damage to reputation and, ultimately, lower revenues.
Due to the criticality of data and application availability, many large enterprises, research and educational institutions as well as health care providers have gone down the path of operating their own data centers connected via private fiber optic networks. Such private enterprise networks purely serve the business processes of an individual company or organization and offer a high degree of security and control. The network operation is either in the hands of the in-house IT department, or a specialized IT or communication service provider. The private IT infrastructure (private cloud) is often complemented by a partial outsourcing of less critical functions and data in external data centers, operated by a third party (public cloud). The combined use of private and public cloud solutions is called hybrid cloud, the simultaneous use of multiple clouds “multi-cloud.” Cloud-based solutions have been gaining a lot of traction and will continue to spread rapidly in the corporate world.
ADVA has over 25 years of experience in the development and deployment of innovative transmission technology for data center interconnect. Many major companies from the so-called Fortune 500 league rely on ADVA’s transmission technology for their business continuity and disaster recovery applications. ADVA offers a highly innovative product feature set in this market segment. The ADVA FSP 3000 supports native transmission for all data center protocols, guarantees low latency and provides additional security through the company’s ConnectGuard™ encryption technology.
Furthermore, ADVA has built a strong partner landscape supporting the go-to-market process.
Data center interconnect for internet content providersInternet content providers (ICPs) are companies whose principal business is the creation and dissemination of digital content. The ICP community includes, for example, large internet companies such as Apple, Amazon, Facebook, Google, HP, IBM and Microsoft. These companies operate data centers of enormous proportions and are often referred to as a “hyper-scale” or “cloud-scale” operators. ICP data centers contain huge server farms. The main asset of an ICP is its digital content and the associated services.Glossary: page 154
The ICP community is focused on innovation, has much experience in developing software and a pronounced do-it-yourself mentality. ICPs’ main objective is optimizing costs and strengthening the performance of their portfolios. For wide-area connections between their data center sites, they often still resort to leased lines from CSPs. However, there is a trend toward more and more scenarios where ICPs rent dark fiber and equip it with their own transmission technology. Because of their size and purchasing power, ICPs are an interesting target group in the market for optical transmission equipment, promising high growth potential.Glossary: page 154
ADVA, thanks to its extensive experience in the field of data center interconnect for enterprise networks, offers many compelling product features and solutions for DCI applications (see previous section). Furthermore, the company developed a new generation of the FSP 3000 platform specialized for the ICP community. The latest version of the product is optimized for the direct interworking between data center switching and routing technology and the optical transmission link. The use of optical plugs with data rates of 400Gbit/s in combination with the FSP 3000 open line system enables lean and innovative network architecture for data center interconnect. For network applications with terminals ADVA offers the FSP 3000 TeraFlex™. This terminal further enhances fiber utilization and takes key performance parameters such as space and power efficiency to a new level. Thus, the FSP 3000 open line system with its choice of terminals delivers a highly compelling feature set for interconnecting hyperscale data centers for ICPs. ADVA’s highly agile and innovative corporate culture makes the company an attractive partner for the ICP target group.
ADVA overviewBusiness overview
26 ADVA – Annual report 2020
Transforming carrier infrastructure Carriers are companies that are in the business of building and operating large-scale networks that they use to offer communication services to end-users or other CSPs. Besides the demand from businesses and ICPs for data center interconnect capacity, it is primarily the increasing bandwidth demand of private households which is challenging carriers, increasing the pressure to expand their network infrastructure. Drivers of bandwidth growth are mainly mobile devices, the trend to work from home and online schooling, as well as the increasing number of networked devices through the internet of things (IoT). This growth will drive a new set of requirements around network availability, latency and accessibility of computing resources. Carriers have a key role to play in building a suitable network infrastructure and digitizing ecosystems.
In addition to industrial use cases, it is the rapid growth of video-on-demand offerings from so-called “over-the-top” providers like Netflix or Amazon Prime that is creating huge traffic loads in carrier networks. In order to guarantee good signal quality, carriers need to deliver several Mbit/s of bandwidth per household. Building and operating a network that delivers such capacity is no trivial task. Moreover, due to the adoption of higher resolution video standards and 3D technology, bandwidth demand will continue to grow relentlessly for the foreseeable future. It is to be expected that the available bandwidth per household will reach data rates of 1Gbit/s in the near future. This is more than a factor of 20 higher than the bandwidth required for a traditional broadband service today.Glossary: page 154
There are several ways for service providers to deliver broadband connectivity to their customers. Traditional telecommunications companies still leverage digital subscriber line (DSL) technology to increase the capacity of their access lines (i.e., twisted pairs of copper wires), which are typically available to every household. Coaxial cables are a good alternative, typically owned by cable TV companies that are expanding their offerings to become multiple service operators (MSOs). New initiatives for fiber-to-the-home (FTTH) or fiber-to-the-building (FTTB) are rolling out, providing the ultimate bandwidth pipe. Finally, there are wireless technologies in the mix that are gaining momentum. In many developed countries, the roll-out of the new 5G standard is progressing and being promoted aggressively. A complete, nationwide 5G build-out, however, will take several years. All these innovative new access technologies deliver significantly higher bandwidth per end user than legacy technology.Glossary: page 154
For carriers, the challenge is to provide market competitive connectivity to as many customers as possible at the lowest possible cost. That means making good use of existing infrastructure, especially in the access part of the network, and
intelligent investment in new technology to support growth and emerging applications.
ADVA helps carriers to simplify and automate their networks and build a scalable network infrastructure that is future-proof. By deploying the group’s networking solutions, carriers can combine various traffic streams from different access technologies onto a single transport platform. In addition, ADVA offers with the FSP 3000 one of the most scalable platforms on the market, allowing seamless data transport from the customer premises to the core of the network. Thus, carriers can bypass some of the small access nodes, eliminating the expense of operating these locations.
The ability to deliver more bandwidth to more customers from fewer sites located farther back in the network enables operators to streamline their networks while simultaneously improving the end-user experience. Energy-hungry devices, which are needed for data processing, can be concentrated in fewer network locations. This is important for so-called edge computing solutions and leads to a network architecture that is more energy-efficient and easier to operate.
Transforming the network edgeServing residential customers is, in most regions around the world, a highly competitive business with low margins for service providers. The providers are therefore keen to offer telecommunications services to business customers and provide industrial multi-cloud solutions. Serving enterprise customers is typically more lucrative as this clientele has more stringent requirements for quality of service, network performance, network availability and security. The CSP can charge a premium for these quality attributes but needs to back the service offerings with service level agreements. Glossary: page 154
In a digital framework, what companies need above all is high data security and speed. It is secondary whether it is a transfer of data between two company locations, an application for the company’s customers or an application in the cloud. As a result, companies will pay more attention to the location of their data and connections in the future.
Also, for the internet of things (IoT) it is important how and where the three critical functions of data processing, storage and transmission work together. The resulting edge computing solutions generate their added value as much as possible by optimizing two parameters: the amount of data to be processed, and the proximity to the place where the data is collected and needed.
CSPs are in a perfect position to capitalize on the trend towards more localized functions and use their geographic footprint to their competitive advantage by creating tailor-made solutions with low signal latency and high security. Thus, the investment focus for carriers is moving to the network edge.
ADVA – Annual report 2020
ADVA overviewBusiness overview
27
At the network edge, many operators deploy packet-based Carrier Ethernet (CE) technology as a unified, data-optimized transmission solution in their infrastructure. Business customers appreciate the simplicity and efficiency of the CE technology, and already know the Ethernet protocol from their local area networks. For services that address functions in higher network layers, however, network operators often rely on so-called routers and switches. Glossary: page 154
Recently, the adoption of NFV has changed the market at the network edge, and the separation between the two technology segments is disappearing. Through the virtualization of network functions, the creation of new services becomes a software-centric process, and new value-added services in higher network layers can easily be deployed over CE connections. This allows network operators to reduce the complexity of application-specific hardware in their portfolio and to offer new business models through a universal, programmable infrastructure, thus generating additional revenues. Innovative edge cloud solutions are being defined and brought to market.
In addition to connecting business customers, CSPs also use fiber-based CE solutions to backhaul traffic from mobile base stations. The success of smart phones and the associated high-speed mobile services created a bandwidth explosion. Mobile operators are now challenged to provide significantly higher bandwidth via their mobile networks without compromise on geographic coverage. Operators consequently upgrade their mobile networks and the commercial introduction of the new fifth generation (5G) has begun. While the new mobile technologies allow the delivery of more bandwidth over the air interface to the mobile devices, operators also need to solve the backhaul challenge from base stations to their core networks. Higher-speed backhaul today is generally implemented via fiber and optimized for data transmission supporting all the different applications. In order to make the expansion financially viable, close collaboration between wireline operators and mobile network operators with shared infrastructure will be necessary in most markets.
In the context of newer 5G technologies, not only the bandwidth in the networks increases, but also the number of antennas multiplies. This densification of radio heads requires a significant investment in the fiber optic network and 5G antenna technology as well as much more precise time and frequency synchronization throughout the network. The build-out of mobile broadband networks drives the demand for a new generation of fiber-based cloud access solutions that deliver and assure high data throughput and accurate timing information.
In summary, the trend towards enterprise multi-cloud solutions, IoT and corresponding edge computing solutions, as well as the increase in antenna density in 5G mobile networks, are creating new market dynamics and opportunities at the network edge.
ADVA offers a highly competitive solution set in this space. The company’s FSP 150 cloud access portfolio empowers service providers to provide their customers with intelligent solutions quickly and efficiently in all relevant application scenarios. The portfolio allows the creation of programmable edge cloud solutions, provisioning of virtual network functions and the definition of a universal network termination. In combination with ADVA’s Ensemble software solutions, network functions can be reliably hosted and orchestrated. In mobile backhaul applications, the ADVA FSP 150 excels by delivering and assuring precise synchronization information in addition to powerful data plane performance. The network operating system Ensemble Activator on the other hand enable the use of standard low-cost hardware as so called cell site gateways in mobile network infrastructure. Glossary: page 154
ADVA overviewBusiness overview
28 ADVA – Annual report 2020

PRODUCTSADVA’s portfolio strategy is built on a tripod of technologies:
y Open optical transmission technology
y Programmable cloud access solutions
y Precise network synchronization
Open optical transportThe ADVA FSP 3000 is a WDM-based optical networking system designed to maximize the bandwidth and service flexibility of access, metro and core networks. The modular design is highly scalable and enables high levels of network automation.
The platform impresses on the one hand with its high-performance terminals, which bundle data streams and generate transmission rates of up to 600Gbit/s per wavelength. On the other hand, through its open optical line system (OLS), which can be optimized for access, metro and long-haul applications. The combination of the platform’s latest generation terminal and OLS supports transmission capacities of more than 50Tbit/s per fiber. Thanks to the FSP 3000, network operators can reduce the cost of data transmission and optimize their numerous network scenarios. Glossary: page 154
The ADVA FSP 3000 – The open optical transport solution
Programmable cloud access solutions The ADVA FSP 150 product family is a programmable, universal networking solution based on Carrier Ethernet technology for the so-called network edge. At the network edge, carriers worry less about the total amount of data to be transferred, but rather about a radical simplification of the logistical processes. Network operators strive to make delivery and protection of communications services faster and more flexible while implementing scalable and cost-efficient solutions to aggregate data streams.
With the introduction of NFV, more and more network functions will be realized as software applications, independent of application-centric hardware. These software applications can then be deployed centrally in a data center, or alternatively can be installed on a network termination device with integrated server functionality. With the Ensemble software framework, ADVA provides an NFV-optimized infrastructure (NFVi) that enables network operators and IT solution providers to quickly and efficiently generate, deploy and administer value-added services, regardless of the underlying hardware. For the first time, functions from higher network levels can now also be mapped onto the ADVA portfolio. As a result, the addressable application space for the company is once again significantly expanded.
Besides Ensemble Connector, a network operating system that converts generic servers into high-performance network demarcation devices, ADVA also introduced Ensemble Activator. This NOS runs on so called bare metal switches – again, generic hardware – which then can be turned into feature-rich network elements and used for example as cell site gateways in mobile network infrastructure.Glossary: page 154
The ADVA FSP 150 – The programmable cloud access solution
ADVA – Annual report 2020
ADVA overviewBusiness overview
29
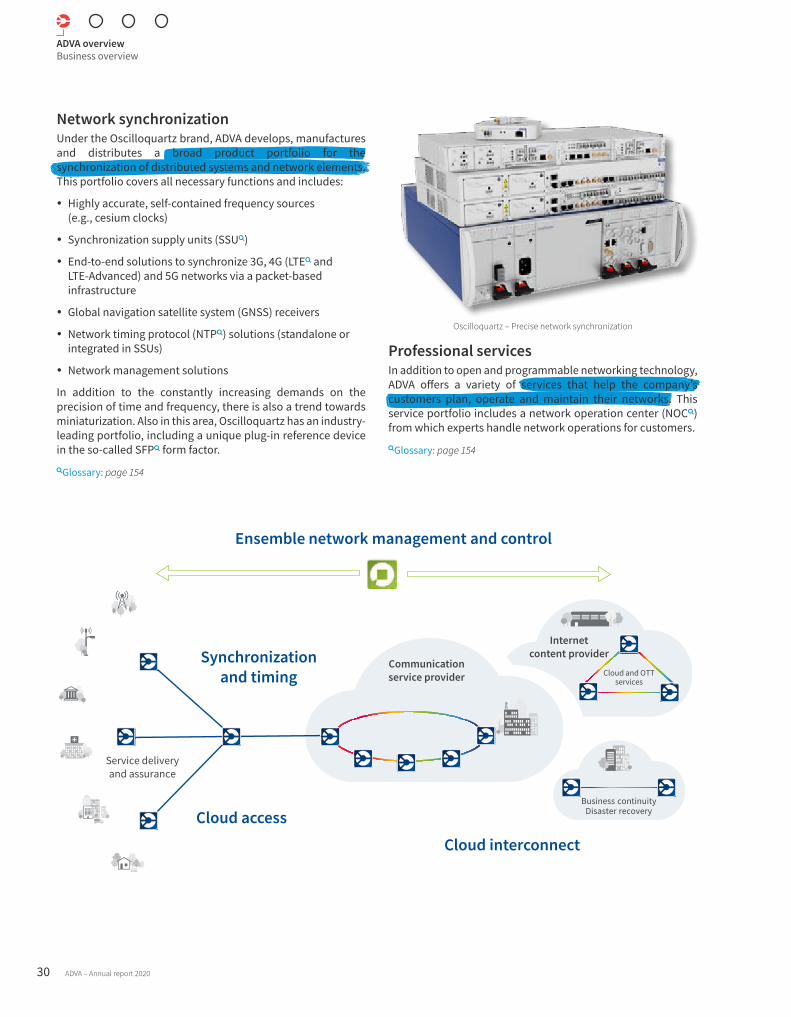
Network synchronizationUnder the Oscilloquartz brand, ADVA develops, manufactures and distributes a broad product portfolio for the synchronization of distributed systems and network elements. This portfolio covers all necessary functions and includes:
y Highly accurate, self-contained frequency sources (e.g., cesium clocks)
y Synchronization supply units (SSU)
y End-to-end solutions to synchronize 3G, 4G (LTE and LTE-Advanced) and 5G networks via a packet-based infrastructure
y Global navigation satellite system (GNSS) receivers
y Network timing protocol (NTP) solutions (standalone or integrated in SSUs)
y Network management solutions
In addition to the constantly increasing demands on the precision of time and frequency, there is also a trend towards miniaturization. Also in this area, Oscilloquartz has an industry-leading portfolio, including a unique plug-in reference device in the so-called SFP form factor.Glossary: page 154
Oscilloquartz – Precise network synchronization
Professional servicesIn addition to open and programmable networking technology, ADVA offers a variety of services that help the company’s customers plan, operate and maintain their networks. This service portfolio includes a network operation center (NOC) from which experts handle network operations for customers.Glossary: page 154
Cloud interconnect
Cloud access
Synchronization and timing
Enterprise
Business continuity Disaster recovery
Internet content provider
Cloud and OTTservices
Ensemble network management and control
Metro / Core Distribution and hosting
Service delivery and assurance
Communicationservice provider
ADVA overviewBusiness overview
30 ADVA – Annual report 2020
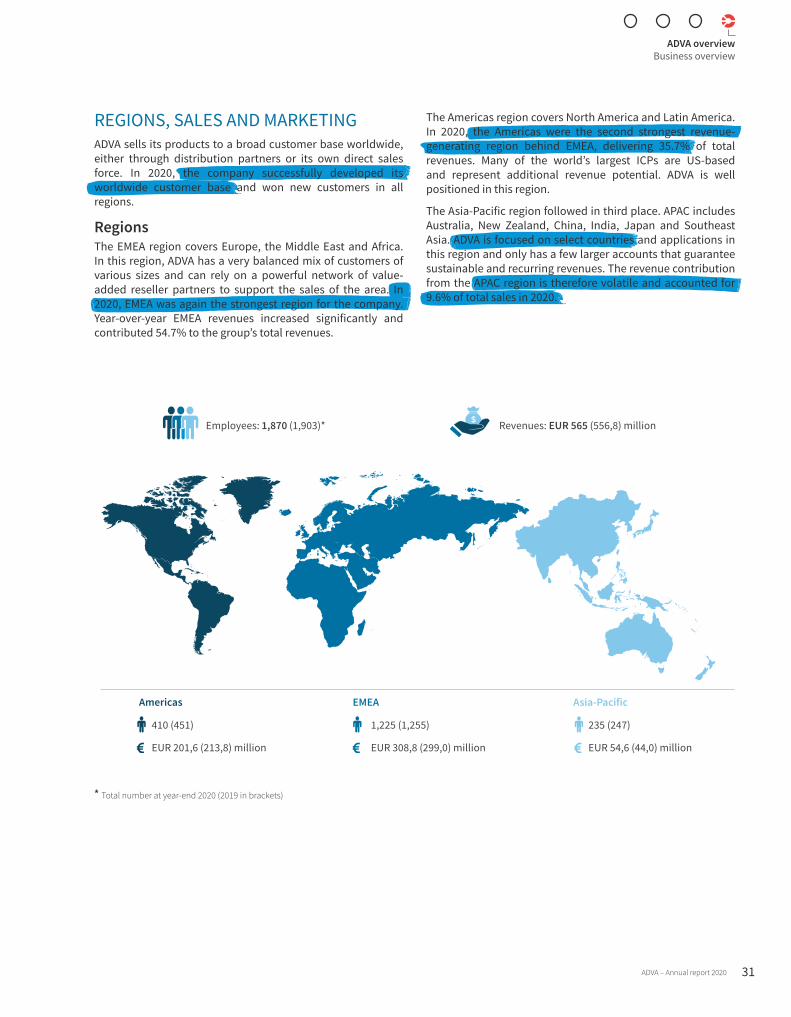
REGIONS, SALES AND MARKETINGADVA sells its products to a broad customer base worldwide, either through distribution partners or its own direct sales force. In 2020, the company successfully developed its worldwide customer base and won new customers in all regions.
RegionsThe EMEA region covers Europe, the Middle East and Africa. In this region, ADVA has a very balanced mix of customers of various sizes and can rely on a powerful network of value-added reseller partners to support the sales of the area. In 2020, EMEA was again the strongest region for the company. Year-over-year EMEA revenues increased significantly and contributed 54.7% to the group’s total revenues.
The Americas region covers North America and Latin America. In 2020, the Americas were the second strongest revenue-generating region behind EMEA, delivering 35.7% of total revenues. Many of the world’s largest ICPs are US-based and represent additional revenue potential. ADVA is well positioned in this region.
The Asia-Pacific region followed in third place. APAC includes Australia, New Zealand, China, India, Japan and Southeast Asia. ADVA is focused on select countries and applications in this region and only has a few larger accounts that guarantee sustainable and recurring revenues. The revenue contribution from the APAC region is therefore volatile and accounted for 9.6% of total sales in 2020.
Revenues: EUR 565 (556,8) millionEmployees: 1,870 (1,903)*
410 (451)
EUR 201,6 (213,8) million
1,225 (1,255)
EUR 308,8 (299,0) million
235 (247)
EUR 54,6 (44,0) million
Americas EMEA Asia-Pacific
* Total number at year-end 2020 (2019 in brackets)
ADVA – Annual report 2020
ADVA overviewBusiness overview
31

SalesADVA continues to employ a well-balanced sales distribution strategy to maximize customer reach around the world:
Direct salesThe group continues to focus on its direct-touch initiative as well as its direct sales force to win new customers. Establishing direct contact with enterprises and carriers enables ADVA to work more closely and better understand customers’ specific requirements, which in turn helps to develop the right products and solutions. A direct sales approach is required in particular to address ICPs and strategically important communication service providers.
Partner sales Sales partners of ADVA include global system integrators such as IBM, Dell and NEC, OEM partners such as Fujitsu Network Communications (FNC) and so-called value-added resellers (VARs). Especially in the case of large enterprise networks and carriers, the company works closely with the sales partners during the planning and consulting phase and is intensively involved in the development of an optimal solution for the customer. Technical support after commissioning is generally performed by the partners. ADVA’s Partner Ecosphere Program (PEP) ensures that sales partners have intensive training courses for their staff, quick and easy access to equipment engineering and high-quality support for projects. Glossary: page 154
MarketingDirect-touch efforts are proactively supported by the marketing team to build the ADVA brand and to expand visibility of the entire product portfolio. Specific marketing activities include regular participation in tradeshows and conferences, tactical online advertising, news coverage and bylined articles in trade publications.
The Covid-19-related travel and contact restrictions significantly disrupted ADVA’s 2020 trade show and conference plans. The company, however, was able to rapidly adjust course and transitioned to virtual event formats, to continue a regular and creative engagement with customers and partners. ADVA supports co-marketing efforts with its partners and delivers regular e-newsletters to customers and partners. The group also maintains a dynamic and active online presence, including an influential, popular blog and social media outreach on multiple platforms.
In addition, ADVA has continued to engage in marketing alliances with various global network solution providers. Of particular importance are the numerous interoperability tests, especially in the field of NFV, which ADVA is conducting with its technology partners in order to demonstrate the seamless interaction of the different systems. In the area of NFV, the company has established a global network of technology partners around its Harmony program to ensure the seamless operation of virtualized network functions.
ADVA’s brand promise can be summarized by three headlines: “Innovation,” “Speed for customers” and “Trusted partner.” The combination of these three elements makes ADVA a unique and differentiated player in the industry.
DEVOPSOrganizational setupADVA takes an advanced approach to development and operations. In order to further optimize product quality, manufacturability and time to market, these traditionally separate areas are tightly integrated with cross-functional teams working closely across the entire system. DevOps and the business lifecycle (BLC) organization form the two main units in the organizational setup.Glossary: page 154
The DevOps team covers products from the cradle to the grave. Its goal is to ensure consistently high quality and to routinely deliver the right product to the customer in the shortest possible time.
The BLC organization is ADVA’s move into next-generation, automated manufacturing, supply chain management, sales and operations planning (S&OP), logistics and reverse logistics.
A third unit, the Advanced Technology Team, continues to identify new areas of innovation. It explores research possibilities and potential avenues for feasibility analysis and proofs of concept.
DevOps As the term suggest, DevOps refers to a combined approach to development and operations. DevOps is a model that has successfully been used in software development firms. ADVA has translated this model into a combined hardware plus software R&D environment. By adopting this model, ADVA is encouraging communication, collaboration and shared goals across cross-functional teams in all business areas. With a set of practices and policies being adopted by the whole team, the aim is to improve quality at all stages of the development lifecycle by enabling fast feedback loops and rapidly changing systems.
ADVA implemented a fully integrated, value-stream oriented DevOps model of organization involving product-line management, R&D and new product introduction – lifecycle engineering and quality management. It also developed a merged approach to system verification testing, network engineering and customer application testing. This setup allows a smooth and efficient integration of new products to existing portfolios.
ADVA overviewBusiness overview
32 ADVA – Annual report 2020
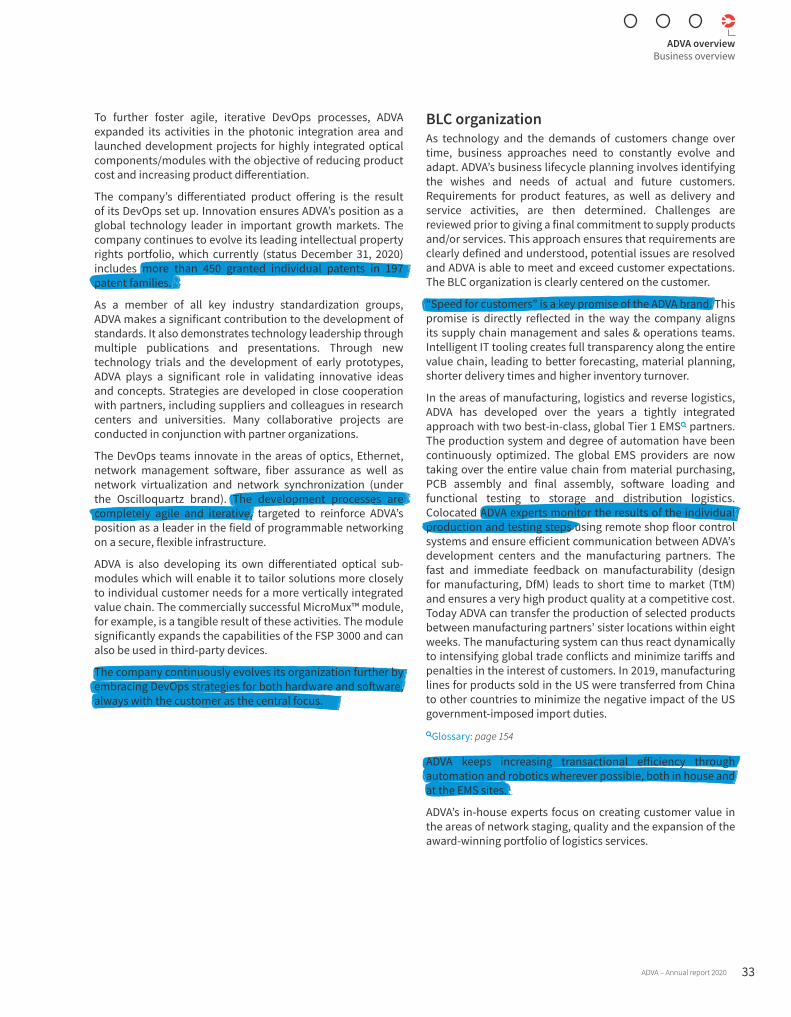
To further foster agile, iterative DevOps processes, ADVA expanded its activities in the photonic integration area and launched development projects for highly integrated optical components/modules with the objective of reducing product cost and increasing product differentiation.
The company’s differentiated product offering is the result of its DevOps set up. Innovation ensures ADVA’s position as a global technology leader in important growth markets. The company continues to evolve its leading intellectual property rights portfolio, which currently (status December 31, 2020) includes more than 450 granted individual patents in 197 patent families.
As a member of all key industry standardization groups, ADVA makes a significant contribution to the development of standards. It also demonstrates technology leadership through multiple publications and presentations. Through new technology trials and the development of early prototypes, ADVA plays a significant role in validating innovative ideas and concepts. Strategies are developed in close cooperation with partners, including suppliers and colleagues in research centers and universities. Many collaborative projects are conducted in conjunction with partner organizations.
The DevOps teams innovate in the areas of optics, Ethernet, network management software, fiber assurance as well as network virtualization and network synchronization (under the Oscilloquartz brand). The development processes are completely agile and iterative, targeted to reinforce ADVA’s position as a leader in the field of programmable networking on a secure, flexible infrastructure.
ADVA is also developing its own differentiated optical sub-modules which will enable it to tailor solutions more closely to individual customer needs for a more vertically integrated value chain. The commercially successful MicroMux™ module, for example, is a tangible result of these activities. The module significantly expands the capabilities of the FSP 3000 and can also be used in third-party devices.
The company continuously evolves its organization further by embracing DevOps strategies for both hardware and software, always with the customer as the central focus.
BLC organization As technology and the demands of customers change over time, business approaches need to constantly evolve and adapt. ADVA’s business lifecycle planning involves identifying the wishes and needs of actual and future customers. Requirements for product features, as well as delivery and service activities, are then determined. Challenges are reviewed prior to giving a final commitment to supply products and/or services. This approach ensures that requirements are clearly defined and understood, potential issues are resolved and ADVA is able to meet and exceed customer expectations. The BLC organization is clearly centered on the customer.
“Speed for customers” is a key promise of the ADVA brand. This promise is directly reflected in the way the company aligns its supply chain management and sales & operations teams. Intelligent IT tooling creates full transparency along the entire value chain, leading to better forecasting, material planning, shorter delivery times and higher inventory turnover.
In the areas of manufacturing, logistics and reverse logistics, ADVA has developed over the years a tightly integrated approach with two best-in-class, global Tier 1 EMS partners. The production system and degree of automation have been continuously optimized. The global EMS providers are now taking over the entire value chain from material purchasing, PCB assembly and final assembly, software loading and functional testing to storage and distribution logistics. Colocated ADVA experts monitor the results of the individual production and testing steps using remote shop floor control systems and ensure efficient communication between ADVA’s development centers and the manufacturing partners. The fast and immediate feedback on manufacturability (design for manufacturing, DfM) leads to short time to market (TtM) and ensures a very high product quality at a competitive cost. Today ADVA can transfer the production of selected products between manufacturing partners’ sister locations within eight weeks. The manufacturing system can thus react dynamically to intensifying global trade conflicts and minimize tariffs and penalties in the interest of customers. In 2019, manufacturing lines for products sold in the US were transferred from China to other countries to minimize the negative impact of the US government-imposed import duties. Glossary: page 154
ADVA keeps increasing transactional efficiency through automation and robotics wherever possible, both in house and at the EMS sites.
ADVA’s in-house experts focus on creating customer value in the areas of network staging, quality and the expansion of the award-winning portfolio of logistics services.
ADVA – Annual report 2020
ADVA overviewBusiness overview
33

This portfolio is founded on a groundbreaking supply chain model with the following key components:
y dispatch of materials directly to installation sites precisely when needed
y refurbishment and recycling of materials returned by customers
y ADVA’s radical approach to collaborating with customers on planning to maximize flexibility
The company’s strategic procurement team has established rigorous processes for supplier onboarding, supplier performance and stringent component cost management. Procurement is closely integrated with the R&D teams to negotiate volume pricing in the product design phase and assure lowest product cost later in the product lifecycle.
It is important to note that requirement planning, supply chain management, forward and reverse logistics and ADVA’s broad range of service offerings are all fully supported by one common and highly integrated business application infrastructure. Its main constituents are enterprise resource planning (ERP), product data management (PDM) and customer relationship management (CRM). This integrated transactional platform is the key to organizational efficiency and is constantly being enhanced by a team of application analysts using agile project management methods. ADVA’s operating principle is to move any acquisition fully onto the company’s process and organizational setup in less than six months. Fast and decisive integration are key to unleashing operational synergies and scale.
QUALITY MANAGEMENTADVA strives to deliver world-class quality in all areas. From research and development, through production and supply chain management, all the way to post-sales technical support, quality management is crucial to maintaining the company’s reputation as a trusted partner and its position as a quality leader in the marketplace. ADVA’s quality management system is based on carefully controlled business processes and dynamic, continuous improvement. To ensure high-quality products, customer satisfaction and sustainability, it takes a top-down approach and its quality management team reports directly to the executive management. To eliminate weaknesses in all areas, ADVA’s quality management team also deals with cross-functional quality planning and monitoring.
In 2020, ADVA undertook its recertification audit according to the international telecommunications quality management standards TL 9000:R6.2/R5.7 and ISO 9001:2015 as well as ISO 22301:2019 business continuity management, ISO 14001:2015 for environmental management and ISO 50001:2018 for energy management. Once again, ADVA passed with outstanding results. Glossary: page 154
ADVA takes a holistic approach to quality assurance. This begins with a clear focus on optimizing product development, continues into excellence in operations through close collaboration with our suppliers and manufacturing partners, and continues into the shipping of products to customers and the provision of technical support. Regarding operation activities, supplier quality is a vitally important component of quality management. Compliance with stringent quality standards and continued improvement are ensured through thorough selection of suppliers, periodic evaluation through audits and systematic inspection of incoming goods. This is also supported by cross-functional commodity teams and the ever-increasing involvement of ADVA’s suppliers in the development process.
Compliance with ADVA’s quality management process is driven by the quality management team, which takes a proactive approach to problem solving as well as to advanced quality planning for new products in development and optimization of business processes across the entire value chain. ADVA’s quality management process is underpinned by strong customer orientation and a clear focus on customer experience. This results in greater efficiency and high customer satisfaction ratings. During 2020, ADVA received a Net Promoter Score of 50%. This very good result represents a significant improvement compared to the previous year’s value of 44%. The company did not only to stop the downward trend of recent years, but also achieved an impressive turnaround, which is not least due to the improvement program launched in 2019.
ADVA overviewBusiness overview
34 ADVA – Annual report 2020
To identify weaknesses and opportunities in order to optimize cross-functional business processes, ADVA reviews outcomes based on Lean Six Sigma methodologies. This ensures all aspects of the business can be measured and analyzed so that waste can be eliminated from every process.
In 2020, performance indicators for product-line quality such as early return indicators (ERIs), yearly return rate (YRR) and long-term return rate (LTR) were again below the industry average for the company’s packet edge technologies and exceeded even stricter internal targets. Products based on WDM technology showed slightly elevated ERI figures. Intensive work is being done to improve these early failures. For the YRR and LTR return rates, the figures for WDM are industry average and meet internal targets.
TIA (formerly the QuEST Forum), the global organization dedicated to quality and sustainability in the ICT community, has praised ADVA for having “developed a culture of continuous improvement in many areas.” Members of ADVA’s quality management team continue to share best practices at TIA events around the world.
IT STRATEGYGlobal crises such as the Covid-19 pandemic highlight how much business continuity depends on a modern IT infrastructure. ADVA’s continuous investments in recent years in digitization and the targeted use of new IT services and innovative technologies have therefore paid off. Thanks in particular to targeted investments in the digital workplace, the company was already well prepared before the crisis with a team used to using collaboration tools for communication and working both internally and externally.
Today, important business processes and major changes, such as those resulting from acquisitions, or crises must be quickly merged into the company’s existing IT infrastructure and application framework, enabling the transition from an infrastructure-oriented, purely cost-driven organization to a business-service-oriented organization.
In the digital age, IT services are becoming a differentiator and an enabler of new business models. The growing need for agility to stay competitive and to be more efficient across organizational borders demands a paradigm shift and the adoption of new practices.
ADVA’s IT team is well aware of the disruptive market changes caused by digitalization. Through its business-process and applications teams, ADVA has been taking targeted action since 2017 to successfully manage its digital transformation and move towards its goal of harnessing automation and becoming a digital leader in the industry.
The data center has evolved a great deal in recent years due to the growth in cloud technology. The move to software-defined networking and storage architecture has enabled ADVA to quickly provision new IT services. The company is also changing its internal service structure to benchmark service costs with cloud services. This allows it to quickly decide where to move services in a hybrid cloud environment.
In addition to the excellent unified IT infrastructure, ADVA benefits from its highly integrated and standardized applications landscape, which enables it to integrate acquisitions within just a few months.
ADVA’s vision of IT in the future is characterized by the following points:
y Data analytics center of excellence (CoE)Establishing this CoE enables the company to build up and bundle analytics capabilities under one common platform
y Robotic process automation (RPA)This involves the automation of routine business practices with “software robots” that perform recurring tasks automatically
y IoT platformAllows ADVA to connect with customer network management systems for the purpose of identifying, coordinating, prototyping, and implementing digital business models and services related to IoT topics as well as using AI/ML technology to support customers and internal business units with predictive maintenance and advanced data visualization
y Collaboration platforms (Enterprise 2.0)Collaboration between different departments as well as external partners, suppliers and customers is a key requirement. ADVA’s IT team continues to evolve the company’s collaboration platform, combining the newest on-premises and cloud solutions into one core platform
y Unified communicationA state-of-the-art communication platform allows ADVA employees to quickly communicate and exchange information on any device, helping the company to drive team innovation across sites
y Advanced security Extended rights management and encryption protects critical business information and personal data. ADVA uses cloud-based machine learning and AI to identify threats to its environment; extended multifactor authentication simplifies access to ADVA data for employees
y Hybrid cloudADVA extends its hybrid cloud to support all R&D software development processes with a cost-optimized solution
ADVA – Annual report 2020
ADVA overviewBusiness overview
35
Going forward, ADVA’s IT team will continue to analyze and rapidly incorporate any new technology trends that can benefit the company’s service offerings. Emerging trends like microservices and robotic process automation have already been tested and will allow ADVA to become even more agile. This will also help the company to control and adjust service cost.
COMPLIANCE AND SUSTAINABILITY Corporate ethics and complianceIntegrity and ethical decision making are central requirements for the sustainable success of ADVA. The group recognizes its responsibility to comply with national and international laws and regulations, internal policies and ethical standards – otherwise known as compliance. Its commitment to compliance is continuously communicated and reinforced not only by the management board but also by the group’s (line) managers. It is based on ADVA’s core values, which translate into a holistic code of conduct and a range of group-wide policies that govern the group’s business operations and are mandatory for all employees to follow.
ADVA’s code of conduct and group-wide policies are embedded into a robust compliance management system, which is structured according to the legal requirements and best practices of the group’s key countries of operation, as well as common international standards. The following elements are covered:
y Strong “tone from the top”
y Periodic risk assessments
y Proportionate risk-mitigating processes and controls
y Periodic compliance training and regular communication
y Means for in-person as well as anonymous reporting
y Proportionate responses to compliance violations
y Continuous improvement of all compliance procedures
The group’s compliance management system is supported by a central compliance department and currently six regional compliance officers. Activities are coordinated by ADVA’s chief compliance officer who reports to the chief executive officer and the supervisory board. Whenever employees have questions or suggestions related to compliance or suspect incidents of non-compliance, they are encouraged to speak up. In addition to clearly defined and actively communicated internal points of contact, an external ombudsman (this role is currently covered by Frank Fischer, tax lawyer and former member of ADVA’s supervisory board) and an externally operated ethics and compliance helpline enable confidential and anonymous reporting.
ADVA overviewBusiness overview
36 ADVA – Annual report 2020
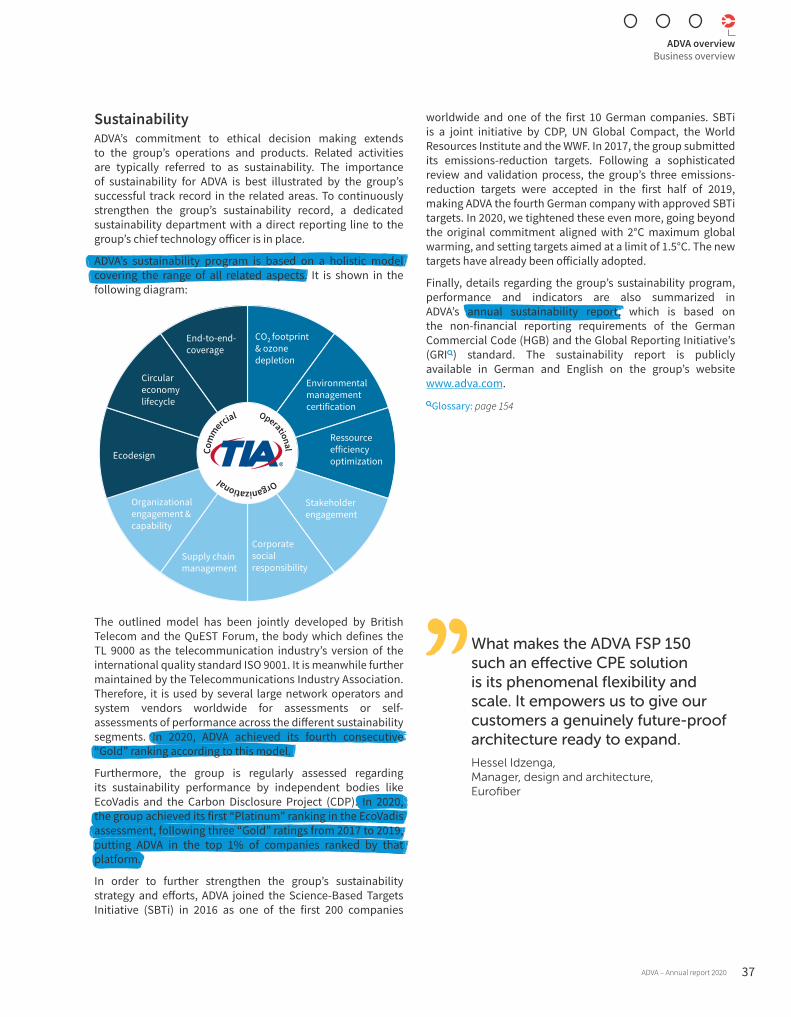
What makes the ADVA FSP 150 such an effective CPE solution is its phenomenal flexibility and scale. It empowers us to give our customers a genuinely future-proof architecture ready to expand.Hessel Idzenga, Manager, design and architecture, Eurofiber
SustainabilityADVA’s commitment to ethical decision making extends to the group’s operations and products. Related activities are typically referred to as sustainability. The importance of sustainability for ADVA is best illustrated by the group’s successful track record in the related areas. To continuously strengthen the group’s sustainability record, a dedicated sustainability department with a direct reporting line to the group’s chief technology officer is in place.
ADVA’s sustainability program is based on a holistic model covering the range of all related aspects. It is shown in the following diagram:
CO2 footprint & ozone depletion
Environmental management certification
Ressourceefficiency optimization
Stakeholderengagement
Corporatesocial responsibility
Supply chain management
Organizational engagement & capability
Ecodesign
Circular economy lifecycle
End-to-end-coverage
The outlined model has been jointly developed by British Telecom and the QuEST Forum, the body which defines the TL 9000 as the telecommunication industry’s version of the international quality standard ISO 9001. It is meanwhile further maintained by the Telecommunications Industry Association. Therefore, it is used by several large network operators and system vendors worldwide for assessments or self-assessments of performance across the different sustainability segments. In 2020, ADVA achieved its fourth consecutive “Gold” ranking according to this model.
Furthermore, the group is regularly assessed regarding its sustainability performance by independent bodies like EcoVadis and the Carbon Disclosure Project (CDP). In 2020, the group achieved its first “Platinum” ranking in the EcoVadis assessment, following three “Gold” ratings from 2017 to 2019, putting ADVA in the top 1% of companies ranked by that platform.
In order to further strengthen the group’s sustainability strategy and efforts, ADVA joined the Science-Based Targets Initiative (SBTi) in 2016 as one of the first 200 companies
worldwide and one of the first 10 German companies. SBTi is a joint initiative by CDP, UN Global Compact, the World Resources Institute and the WWF. In 2017, the group submitted its emissions-reduction targets. Following a sophisticated review and validation process, the group’s three emissions-reduction targets were accepted in the first half of 2019, making ADVA the fourth German company with approved SBTi targets. In 2020, we tightened these even more, going beyond the original commitment aligned with 2°C maximum global warming, and setting targets aimed at a limit of 1.5°C. The new targets have already been officially adopted.
Finally, details regarding the group’s sustainability program, performance and indicators are also summarized in ADVA’s annual sustainability report, which is based on the non-financial reporting requirements of the German Commercial Code (HGB) and the Global Reporting Initiative’s (GRI) standard. The sustainability report is publicly available in German and English on the group’s website www.adva.com.Glossary: page 154
ADVA – Annual report 2020
ADVA overviewBusiness overview
37

Basis of preparation 40
Forward-looking statements 40
Strategy and control design 40
General economic and market conditions 40
Business development and Operational performance of the group 42
Net assets and financial position of the group 46
Performance of ADVA Optical Networking SE 50
Events after the balance sheet date 52
Disclosures under takeover law in accordance withSection § 289a (1) HGB and Section § 315a (1) HGB 52
Remuneration of the management and the supervisory board 54
Employees 56
Risk and opportunity report 57
Outlook 68
Declaration on corporate governance 70
Combined management report
BASIS OF PREPARATIONThis report combines the group management report of ADVA Optical Networking group (“the group”, “ADVA Optical Networking” or “ADVA”), comprising ADVA Optical Networking SE (hereafter also referred to as “the company”, “ADVA Optical Networking SE” or “ADVA SE”) and its consolidated subsidiaries, and the management report of ADVA Optical Networking SE.
The combined management report of ADVA Optical Networking SE was prepared in accordance with sections 289, 315 and 315e of the German Commercial Code (Handelsgesetzbuch, HGB) and German Accounting Standards (Deutsche Rechnungslegungsstandards) No. 17 and 20 (DRS 17 and 20).
All information contained in this report relates to the status on December 31, 2020, or the financial year ending on that date, unless stated otherwise.
FORWARD-LOOKING STATEMENTSThe combined management report of ADVA Optical Networking SE contains forward-looking statements using words such as “believes”, “anticipates” and “expects” to describe expected revenues, costs and earnings, anticipated demand for optical networking solutions and anticipated liquidity from which internal estimates may be inferred. These forward-looking statements are based on the beliefs of the Management Board and respective assumptions made, and involve a number of unknown risks, uncertainties and other factors, many of which are beyond ADVA Optical Networking’s control. If one or more of these uncertainties or risks materializes, or if the underlying assumptions of the Management Board prove incorrect, actual results can differ materially from those described in or inferred from forward-looking statements and information. Unknown risks and uncertainties are discussed in the “risk and opportunity report” section further below.
STRATEGY AND CONTROL DESIGNADVA’s strategic goals are focused on growth & profitability, innovation, operational excellence, individual development of our employees and customer experience. The strategic goals are reviewed by both the management board and the supervisory board on a yearly basis and amended where appropriate. Each of these goals are defined in detail and then broken down into specific departmental and individual targets. The strategic goals are traced to each individual employee so that each employee can focus and be evaluated on his/her individual performance and contribution to ADVA Optical Networking’s overall performance.
ADVA measures the accomplishment of its strategic goals against revenues, pro forma operating income, net debt and as a non-financial criterion customer experience measured by the net promoter score. These metrics represent the group’s key performance indicators. The management board sets target values for all four metrics for the coming year and measures actual values against the target values on a monthly basis for revenues and pro forma operating income, on a quarterly basis for net debt and on a yearly basis for the net promoter score. In case of deviations from plan, corrective action can be taken quickly. This information is summarized and communicated to the management board in monthly, quarterly and yearly reports.Glossary: page 154
GENERAL ECONOMIC AND MARKET CONDITIONSThe global economy at the beginning of 2021In its December 2020 edition of the World Economic Outlook (WEO), the International Monetary Fund (IMF) provided the following view on the state of the global economy:
In its latest World Economic Outlook, the IMF raised its outlook for global economic growth this year by 0.3 percentage points. For 2021, the IMF expects a global growth of 5.5%. The IMF has even raised its outlook for the USA by 2.0 percentage points (+5.1%). Things look worse for the euro zone, where the IMF revised its outlook down by 1.0 percentage points to 4.2%. The outlook for China is only slightly adjusted from 8.2% to 8.1%. The IMF emphasizes that the forecasts still consist a relatively high degree of uncertainty. Although recent vaccine approvals have raised the hope of a trend reversal in the pandemic, resurgent waves of infections and new mutations of the virus are cause for concern. The strength of the recovery is expected to vary significantly from country to country. Various factors, such as access to vaccines and the effectiveness of political measures against the pandemic, will determine whether national economies will recover.
Combined management reportBasis of preparation
40 ADVA – Annual report 2020
Economic experts from various banks confirm the uncertainties driven by Covid-19. The economy is currently suffering from a harsh winter, characterized by extensive corona restrictions. For the euro area, a sustained decline in infection rates is not expected until late spring. The vaccination measures could lead to sufficient immunization of the population by Autumn. Accordingly, the experts expect the euro area to recover during Q2 2021. In addition, private consumers could spend some of the savings that were made during the corona restrictions. According to Commerzbank estimates, this amount is around 5% of disposable income in the euro area.
The development in Germany, however, is also subject to the results of the suspension of the bankruptcy filing obligation in 2020. The deadline was recently extended to April 2021. Some economic experts criticize the fact that various companies are being kept alive with external financing and assume that Germany will experience a massive wave of insolvencies in 2021.
The U.S. economy reached its low in April 2020 and rebounded as contact restrictions eased as the virus was initially contained. This recovery continued in the final months of 2020 but lost its momentum. The growth drivers include both, private consumption and, above all, residential construction, which is benefiting from the low interest rates. For USA additional consumption through “involuntary” savings is also expected to begin in spring 2021. Nevertheless, many experts anticipate another wave of infections, which is why many states have tightened their measures to fight the pandemic. Economic experts therefore only expect solid growth in Q1 2021 but an increasing dynamic in the second half of the year, when vaccinations, similar to the euro area, speed up.
The current crisis has once again pointed out the importance of an efficient telecommunications infrastructure. Despite all challenges in the stability of the supply chain, ADVA has proven its good market position with one of its most successful financial years. The main pandemic-related challenges that prevailed in the first wave of infections persist during the huge second wave. These are mainly securing the supply chain and a possible recession-related decrease in demand. Europe and EMEA are major sales markets for ADVA - so the global development of the pandemic and the impact on the global economy are relevant. However, the network equipment industry has been shown to be less susceptible to recessive trends. ADVA mastered the Covid-19-related challenges very well in 2020 and the company is confident that it will be able to supply its customers with innovative solutions in a timely and top-quality manner in 2021.
Market environment for ADVAThe addressable market for ADVA is determined by the digitization of ecosystems and the resulting increase in demand for cloud-based solutions and the underlying communication networks. The rapid adoption of digital processes across all industries, the creation and use of artificial intelligence, and the ubiquitous use of high-definition video over mobile and fixed networks are important and sustainable growth drivers for the market.
The tension between high development costs and tough competition has led to a strong selection of network equipment providers, and only a few providers have been able to assert themselves. Market participants with insufficient innovative strength or business models that are not profitable have largely disappeared from the market. This has led to changed market conditions. In addition, the Covid-19 pandemic has significantly changed the way we see the importance of network infrastructure. Politicians and businesses have realized that a high-performance communication infrastructure is vital for economies and companies in the age of home offices, video conferences and virtual collaboration. We are also experiencing a market environment in which security and trust are becoming increasingly important. As a result of growing security threats and a greater appreciation of the dangers, numerous manufacturers from the Far East are currently being pushed out of western networks.
In recent years, ADVA has consistently invested in the development of innovative solutions and has brought excellent solutions in the field of secure data transmission to the market. ADVA’s network technology enables the construction of a high-performance communication infrastructure that serves as the basis for the digital economy, the industrial internet of things (industrial IoT) – often referred to as Industry 4.0 in Germany – and the digitization of ecosystems. The company addresses important applications in this growth market. Fiber optic transmission technology delivers scalable bandwidth for network operators’ infrastructure and the data center interconnect (DCI) networks of large enterprises and internet content providers. At the edge of the network, the company’s cloud access technology with virtualization enables fast and flexible provision of cloud services. In addition, the company’s synchronization technology provides timing solutions required for the construction of mobile broadband networks and globally distributed data centers. Especially in Europe, there still is a backlog in the expansion of communication infrastructure. The introduction of 5G mobile technology has further intensified the investment pressure.Glossary: page 154
Combined management reportGeneral economic and market conditions
ADVA – Annual report 2020 41
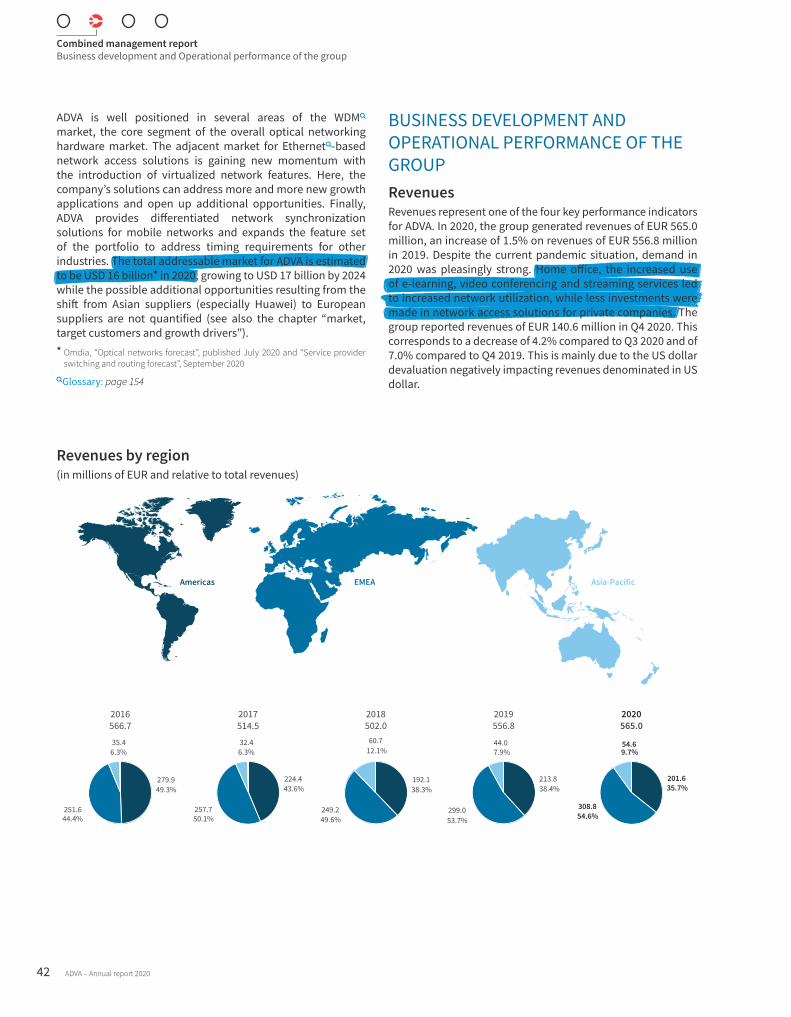
ADVA is well positioned in several areas of the WDM market, the core segment of the overall optical networking hardware market. The adjacent market for Ethernet-based network access solutions is gaining new momentum with the introduction of virtualized network features. Here, the company’s solutions can address more and more new growth applications and open up additional opportunities. Finally, ADVA provides differentiated network synchronization solutions for mobile networks and expands the feature set of the portfolio to address timing requirements for other industries. The total addressable market for ADVA is estimated to be USD 16 billion* in 2020, growing to USD 17 billion by 2024 while the possible additional opportunities resulting from the shift from Asian suppliers (especially Huawei) to European suppliers are not quantified (see also the chapter “market, target customers and growth drivers”). * Omdia, “Optical networks forecast”, published July 2020 and “Service provider
switching and routing forecast”, September 2020
Glossary: page 154
BUSINESS DEVELOPMENT AND OPERATIONAL PERFORMANCE OF THE GROUPRevenuesRevenues represent one of the four key performance indicators for ADVA. In 2020, the group generated revenues of EUR 565.0 million, an increase of 1.5% on revenues of EUR 556.8 million in 2019. Despite the current pandemic situation, demand in 2020 was pleasingly strong. Home office, the increased use of e-learning, video conferencing and streaming services led to increased network utilization, while less investments were made in network access solutions for private companies. The group reported revenues of EUR 140.6 million in Q4 2020. This corresponds to a decrease of 4.2% compared to Q3 2020 and of 7.0% compared to Q4 2019. This is mainly due to the US dollar devaluation negatively impacting revenues denominated in US dollar.
Revenues by region(in millions of EUR and relative to total revenues)
279.9
251.6
35.4
49.3%
44.4%
6.3%
2016566.7
224.4
257.7
32.4
43.6%
50.1%
6.3%
2017514.5
192.1
249.2
60.7
38.3%
49.6%
12.1%
2018502.0
213.8
299.0
44.0
38.4%
53.7%
7.9%
2019556.8
201.6
308.8
54.6
35.7%
54.6%
9.7%
2020565.0
Americas EMEA Asia-Pacific
Combined management reportBusiness development and Operational performance of the group
42 ADVA – Annual report 2020
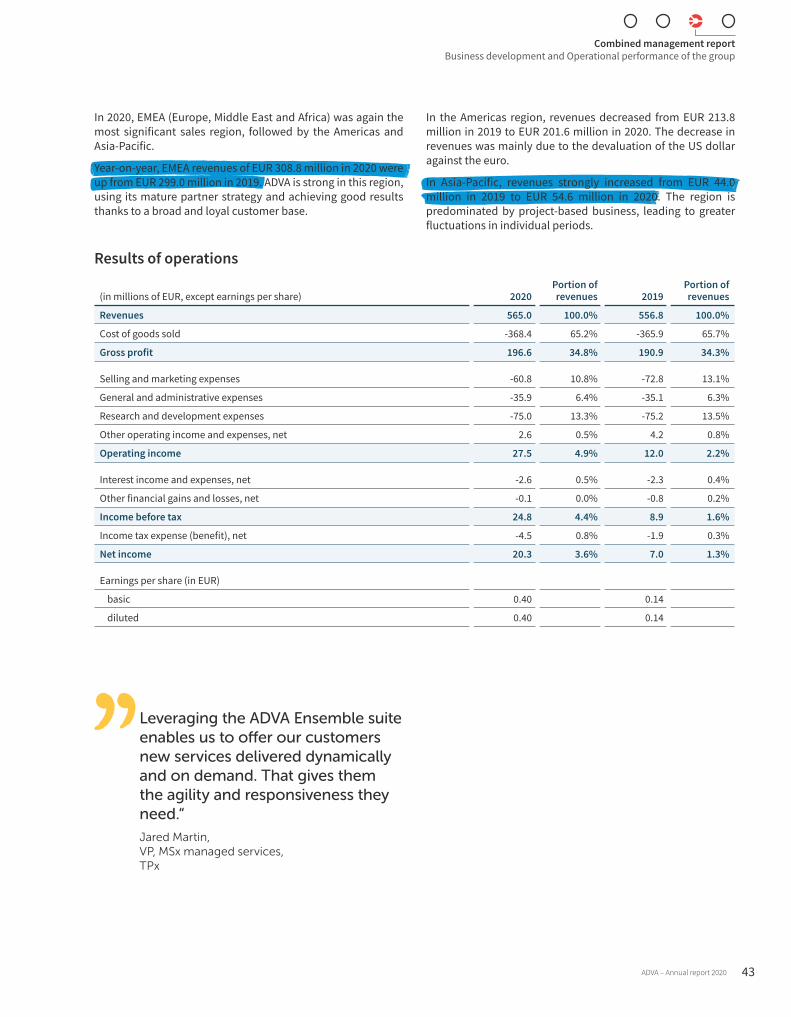
Leveraging the ADVA Ensemble suite enables us to offer our customers new services delivered dynamically and on demand. That gives them the agility and responsiveness they need.“Jared Martin, VP, MSx managed services, TPx
In 2020, EMEA (Europe, Middle East and Africa) was again the most significant sales region, followed by the Americas and Asia-Pacific.
Year-on-year, EMEA revenues of EUR 308.8 million in 2020 were up from EUR 299.0 million in 2019. ADVA is strong in this region, using its mature partner strategy and achieving good results thanks to a broad and loyal customer base.
In the Americas region, revenues decreased from EUR 213.8 million in 2019 to EUR 201.6 million in 2020. The decrease in revenues was mainly due to the devaluation of the US dollar against the euro.
In Asia-Pacific, revenues strongly increased from EUR 44.0 million in 2019 to EUR 54.6 million in 2020. The region is predominated by project-based business, leading to greater fluctuations in individual periods.
Results of operations
(in millions of EUR, except earnings per share) 2020Portion of revenues 2019
Portion of revenues
Revenues 565.0 100.0% 556.8 100.0%
Cost of goods sold -368.4 65.2% -365.9 65.7%
Gross profit 196.6 34.8% 190.9 34.3%
Selling and marketing expenses -60.8 10.8% -72.8 13.1%
General and administrative expenses -35.9 6.4% -35.1 6.3%
Research and development expenses -75.0 13.3% -75.2 13.5%
Other operating income and expenses, net 2.6 0.5% 4.2 0.8%
Operating income 27.5 4.9% 12.0 2.2%
Interest income and expenses, net -2.6 0.5% -2.3 0.4%
Other financial gains and losses, net -0.1 0.0% -0.8 0.2%
Income before tax 24.8 4.4% 8.9 1.6%
Income tax expense (benefit), net -4.5 0.8% -1.9 0.3%
Net income 20.3 3.6% 7.0 1.3%
Earnings per share (in EUR)
basic 0.40 0.14
diluted 0.40 0.14
Combined management reportBusiness development and Operational performance of the group
ADVA – Annual report 2020 43
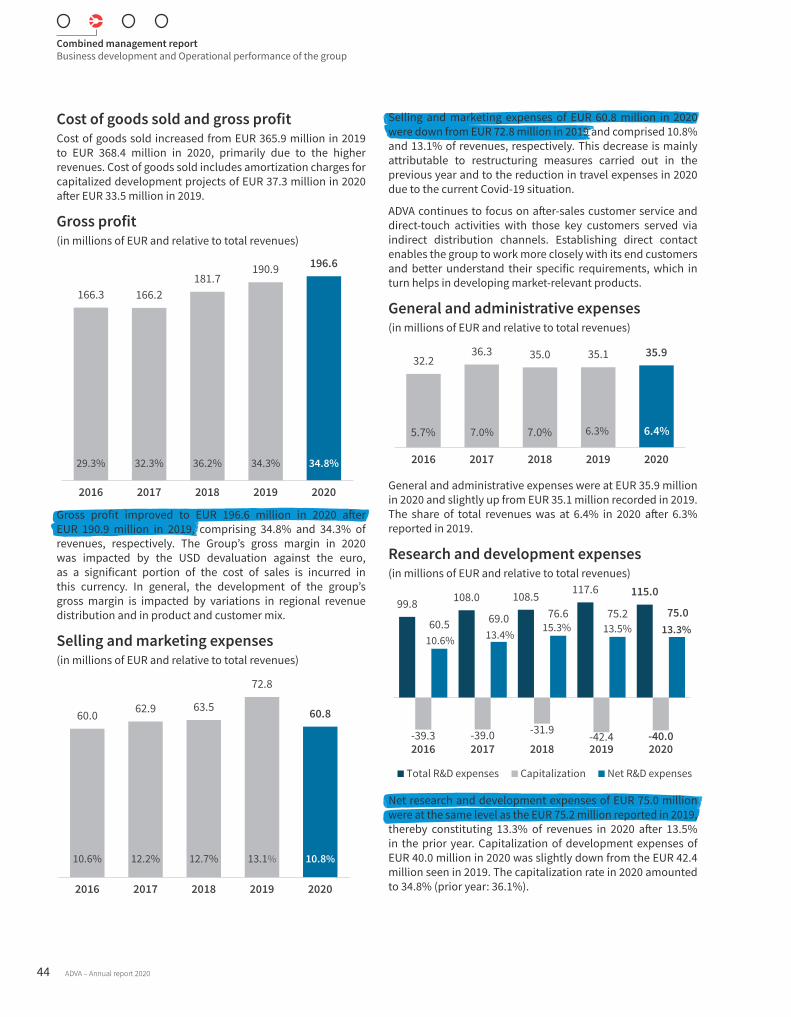
Cost of goods sold and gross profitCost of goods sold increased from EUR 365.9 million in 2019 to EUR 368.4 million in 2020, primarily due to the higher revenues. Cost of goods sold includes amortization charges for capitalized development projects of EUR 37.3 million in 2020 after EUR 33.5 million in 2019.
Gross profit(in millions of EUR and relative to total revenues)
166.3 166.2181.7
190.9 196.6
29.3% 32.3% 36.2% 34.3% 34.8%
2016 2017 2018 2019 2020
Gross profit improved to EUR 196.6 million in 2020 after EUR 190.9 million in 2019, comprising 34.8% and 34.3% of revenues, respectively. The Group’s gross margin in 2020 was impacted by the USD devaluation against the euro, as a significant portion of the cost of sales is incurred in this currency. In general, the development of the group’s gross margin is impacted by variations in regional revenue distribution and in product and customer mix.
Selling and marketing expenses(in millions of EUR and relative to total revenues)
60.0 62.9 63.5
72.8
60.8
10.6% 12.2% 12.7% 13.1% 10.8%
2016 2017 2018 2019 2020
Selling and marketing expenses of EUR 60.8 million in 2020 were down from EUR 72.8 million in 2019 and comprised 10.8% and 13.1% of revenues, respectively. This decrease is mainly attributable to restructuring measures carried out in the previous year and to the reduction in travel expenses in 2020 due to the current Covid-19 situation.
ADVA continues to focus on after-sales customer service and direct-touch activities with those key customers served via indirect distribution channels. Establishing direct contact enables the group to work more closely with its end customers and better understand their specific requirements, which in turn helps in developing market-relevant products.
General and administrative expenses(in millions of EUR and relative to total revenues)
32.236.3 35.0 35.1 35.9
5.7% 7.0% 7.0% 6.3% 6.4%
2016 2017 2018 2019 2020
General and administrative expenses were at EUR 35.9 million in 2020 and slightly up from EUR 35.1 million recorded in 2019. The share of total revenues was at 6.4% in 2020 after 6.3% reported in 2019.
Research and development expenses(in millions of EUR and relative to total revenues)
99.8 108.0 108.5 117.6 115.0
-39.3 -39.0 -31.9 -42.4 -40.0
60.5 69.0 76.6 75.2 75.0
10.6% 13.4%15.3% 13.5% 13.3%
2016 2017 2018 2019 2020
Total R&D expenses Capitalization Net R&D expenses
Net research and development expenses of EUR 75.0 million were at the same level as the EUR 75.2 million reported in 2019, thereby constituting 13.3% of revenues in 2020 after 13.5% in the prior year. Capitalization of development expenses of EUR 40.0 million in 2020 was slightly down from the EUR 42.4 million seen in 2019. The capitalization rate in 2020 amounted to 34.8% (prior year: 36.1%).
Combined management reportBusiness development and Operational performance of the group
44 ADVA – Annual report 2020
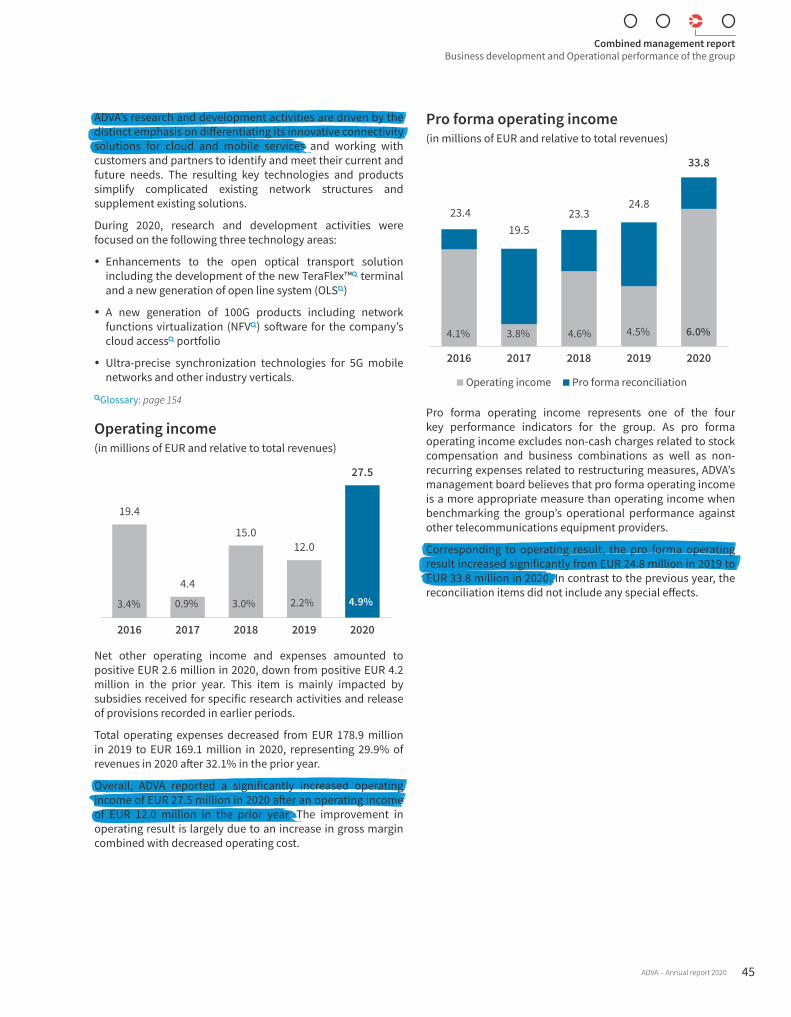
ADVA’s research and development activities are driven by the distinct emphasis on differentiating its innovative connectivity solutions for cloud and mobile services and working with customers and partners to identify and meet their current and future needs. The resulting key technologies and products simplify complicated existing network structures and supplement existing solutions.
During 2020, research and development activities were focused on the following three technology areas:
y Enhancements to the open optical transport solution including the development of the new TeraFlex™ terminal and a new generation of open line system (OLS)
y A new generation of 100G products including network functions virtualization (NFV) software for the company’s cloud access portfolio
y Ultra-precise synchronization technologies for 5G mobile networks and other industry verticals.
Glossary: page 154
Operating income(in millions of EUR and relative to total revenues)
19.4
4.4
15.012.0
27.5
3.4% 0.9% 3.0% 2.2% 4.9%
2016 2017 2018 2019 2020
Net other operating income and expenses amounted to positive EUR 2.6 million in 2020, down from positive EUR 4.2 million in the prior year. This item is mainly impacted by subsidies received for specific research activities and release of provisions recorded in earlier periods.
Total operating expenses decreased from EUR 178.9 million in 2019 to EUR 169.1 million in 2020, representing 29.9% of revenues in 2020 after 32.1% in the prior year.
Overall, ADVA reported a significantly increased operating income of EUR 27.5 million in 2020 after an operating income of EUR 12.0 million in the prior year. The improvement in operating result is largely due to an increase in gross margin combined with decreased operating cost.
Pro forma operating income(in millions of EUR and relative to total revenues)
23.419.5
23.324.8
33.8
4.1% 3.8% 4.6% 4.5% 6.0%
2016 2017 2018 2019 2020
Operating income Pro forma reconciliation
Pro forma operating income represents one of the four key performance indicators for the group. As pro forma operating income excludes non-cash charges related to stock compensation and business combinations as well as non-recurring expenses related to restructuring measures, ADVA’s management board believes that pro forma operating income is a more appropriate measure than operating income when benchmarking the group’s operational performance against other telecommunications equipment providers.
Corresponding to operating result, the pro forma operating result increased significantly from EUR 24.8 million in 2019 to EUR 33.8 million in 2020. In contrast to the previous year, the reconciliation items did not include any special effects.
Combined management reportBusiness development and Operational performance of the group
ADVA – Annual report 2020 45
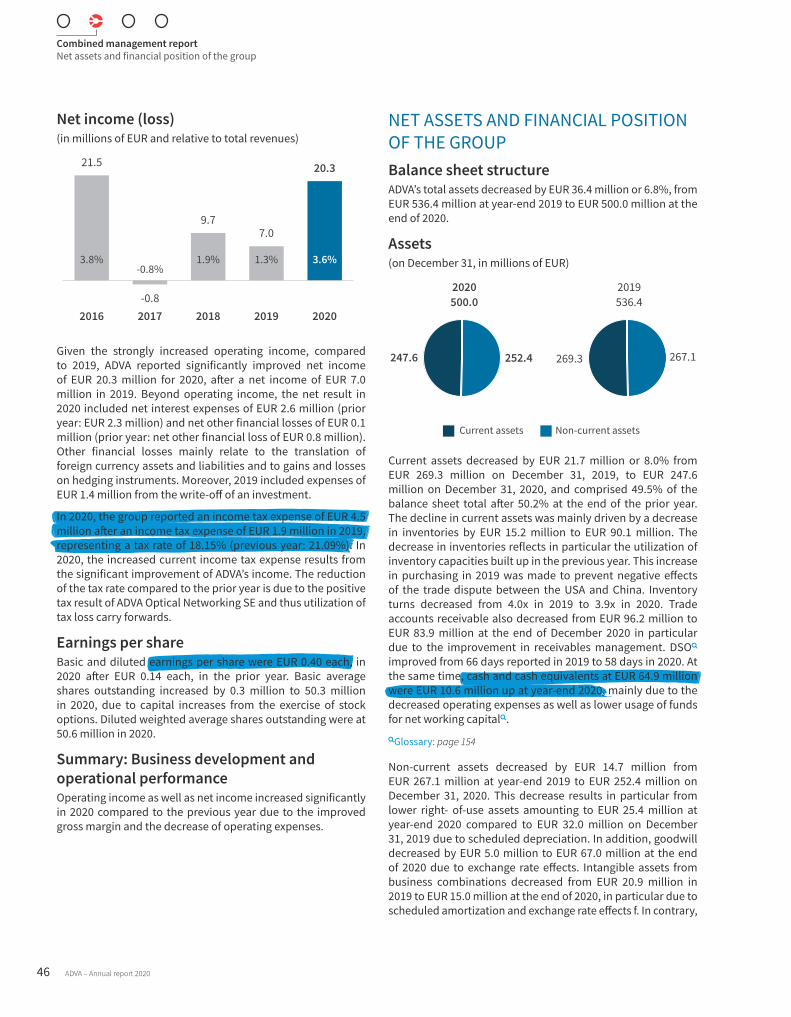
Net income (loss)(in millions of EUR and relative to total revenues)
21.5
-0.8
9.77.0
20.3
3.8%-0.8%
1.9% 1.3% 3.6%
2016 2017 2018 2019 2020
Given the strongly increased operating income, compared to 2019, ADVA reported significantly improved net income of EUR 20.3 million for 2020, after a net income of EUR 7.0 million in 2019. Beyond operating income, the net result in 2020 included net interest expenses of EUR 2.6 million (prior year: EUR 2.3 million) and net other financial losses of EUR 0.1 million (prior year: net other financial loss of EUR 0.8 million). Other financial losses mainly relate to the translation of foreign currency assets and liabilities and to gains and losses on hedging instruments. Moreover, 2019 included expenses of EUR 1.4 million from the write-off of an investment.
In 2020, the group reported an income tax expense of EUR 4.5 million after an income tax expense of EUR 1.9 million in 2019, representing a tax rate of 18.15% (previous year: 21.09%). In 2020, the increased current income tax expense results from the significant improvement of ADVA’s income. The reduction of the tax rate compared to the prior year is due to the positive tax result of ADVA Optical Networking SE and thus utilization of tax loss carry forwards.
Earnings per shareBasic and diluted earnings per share were EUR 0.40 each, in 2020 after EUR 0.14 each, in the prior year. Basic average shares outstanding increased by 0.3 million to 50.3 million in 2020, due to capital increases from the exercise of stock options. Diluted weighted average shares outstanding were at 50.6 million in 2020.
Summary: Business development and operational performanceOperating income as well as net income increased significantly in 2020 compared to the previous year due to the improved gross margin and the decrease of operating expenses.
NET ASSETS AND FINANCIAL POSITION OF THE GROUPBalance sheet structureADVA’s total assets decreased by EUR 36.4 million or 6.8%, from EUR 536.4 million at year-end 2019 to EUR 500.0 million at the end of 2020.
Assets (on December 31, in millions of EUR)
252.4247.6
2020500.0
267.1269.3
2019536.4
Current assets Non-current assets
Current assets decreased by EUR 21.7 million or 8.0% from EUR 269.3 million on December 31, 2019, to EUR 247.6 million on December 31, 2020, and comprised 49.5% of the balance sheet total after 50.2% at the end of the prior year. The decline in current assets was mainly driven by a decrease in inventories by EUR 15.2 million to EUR 90.1 million. The decrease in inventories reflects in particular the utilization of inventory capacities built up in the previous year. This increase in purchasing in 2019 was made to prevent negative effects of the trade dispute between the USA and China. Inventory turns decreased from 4.0x in 2019 to 3.9x in 2020. Trade accounts receivable also decreased from EUR 96.2 million to EUR 83.9 million at the end of December 2020 in particular due to the improvement in receivables management. DSO improved from 66 days reported in 2019 to 58 days in 2020. At the same time, cash and cash equivalents at EUR 64.9 million were EUR 10.6 million up at year-end 2020, mainly due to the decreased operating expenses as well as lower usage of funds for net working capital. Glossary: page 154
Non-current assets decreased by EUR 14.7 million from EUR 267.1 million at year-end 2019 to EUR 252.4 million on December 31, 2020. This decrease results in particular from lower right- of-use assets amounting to EUR 25.4 million at year-end 2020 compared to EUR 32.0 million on December 31, 2019 due to scheduled depreciation. In addition, goodwill decreased by EUR 5.0 million to EUR 67.0 million at the end of 2020 due to exchange rate effects. Intangible assets from business combinations decreased from EUR 20.9 million in 2019 to EUR 15.0 million at the end of 2020, in particular due to scheduled amortization and exchange rate effects f. In contrary,
Combined management reportNet assets and financial position of the group
46 ADVA – Annual report 2020

capitalized development projects increased from EUR 96.2 million to EUR 98.6 million at the end of 2020. Deferred tax assets increased by EUR 0.9 million to EUR 7.2 million at the end of 2020. Deferred tax assets and liabilities are presented net in accordance with relevant netting requirements.
Meaningful additional assets belonging to ADVA are the broad and global customer base of several hundred service providers and thousands of enterprises, the ADVA, Oscilloquartz and Ensemble brands, the vendor and partner relationships and a highly motivated and skilled global team. These assets are not recognized in the balance sheet. Customer satisfaction as measured by the net promoter score represents one of the group’s four key performance indicators.Glossary: page 154
Liabilities (on December 31, in millions of EUR)
130.7
106.1
263.2
2020500.0
159.2
121.4
255.8
2019536.4
Stockholder’s equity
Current liabilities Non-current liabilities
With respect to equity and liabilities, current liabilities decreased by EUR 28.5 million from EUR 159.2 million at year-end 2019 to EUR 130.7 million at the end of 2020. The decrease is mainly due to the significant reduction in trade accounts payables by EUR 29.2 million to EUR 44.2 million at the end of 2020. DPO decreased to 55 days in 2020 compared to 63 days in the previous year. The reduction in trade accounts payable resulted in particular from demand-oriented purchases of materials as well as from premature settlement of trade payables to strengthen the supply chain. These measures were essential due to various bottlenecks in the availability of components.Glossary: page 154
Non-current liabilities at EUR 106.1 million at year-end 2020 were also down from EUR 121.4 million reported at prior year-end. Non-current liabilities to banks decreased by EUR 14.6 million to EUR 47.1 million at the end of 2020 due to scheduled repayments. Financial liabilities are explained in more detail in a separate section below. In addition, non-current liabilities from leases were EUR 6.4 million lower at EUR 22.0 million.
Stockholders’ equity increased by EUR 7.4 million from EUR 255.8 million at year-end 2019 to EUR 263.2 million at the end of 2020, mainly due to net income partly offset by negative
effects from currency translation in other comprehensive income. In 2020, capital increases totaling EUR 1.3 million from the exercise of stock options, and stock compensation expenses totaling EUR 1.2 million were reported.
Balance sheet ratiosThe equity ratio improved to 52.6% at the end of 2020, after 47.7% at year-end 2019. The non-current assets ratio amounted to 104.3% on December 31, 2020, with stockholders’ equity fully covering the non-current assets.
(on December 31, in %) 2020 2019
Equity ratioStockholders’ equity
52.6 47.7Total assets
Non-current asset ratioStockholders’ equity
104.3 95.8Non-current assets
Liability structureCurrent liabilities
55.2 56.7Total liabilities
Capital expendituresCapital expenditures for additions to property, plant and equipment in 2020 amounted to EUR 13.6 million, down from EUR 16.9 million in 2019, largely reflecting lower investments in land and equipment.
Capital expenditures for intangible assets of EUR 44.7 million in 2020 were up from EUR 43.6 million in the prior year. This total consists of capitalized development projects of EUR 39.9 million in 2020 after EUR 42.4 million in 2019, and investments in concessions and software licenses and other intangible assets of EUR 4.8 million in 2020 after EUR 1.1 million in 2019. Investments in capitalized development projects are mainly driven by development activities for open optical transmission technology including the new TeraFlex™ terminal and the new generation of 100G products.
Combined management reportNet assets and financial position of the group
ADVA – Annual report 2020 47
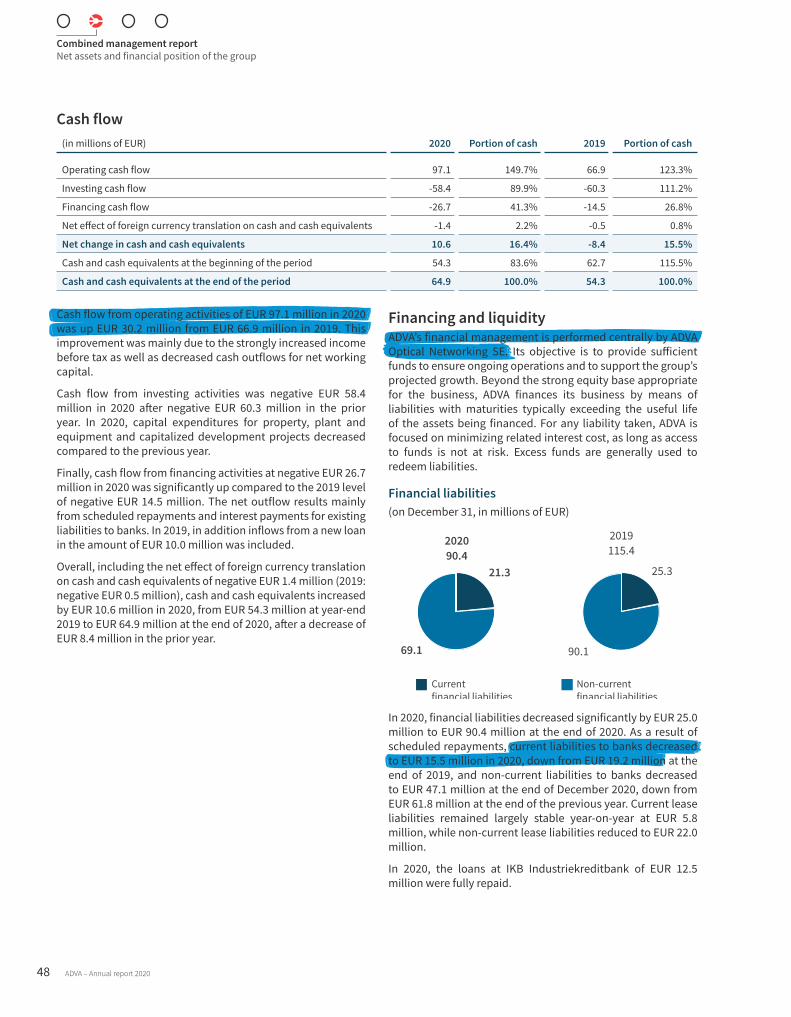
Cash flow(in millions of EUR) 2020 Portion of cash 2019 Portion of cash
Operating cash flow 97.1 149.7% 66.9 123.3%
Investing cash flow -58.4 89.9% -60.3 111.2%
Financing cash flow -26.7 41.3% -14.5 26.8%
Net effect of foreign currency translation on cash and cash equivalents -1.4 2.2% -0.5 0.8%
Net change in cash and cash equivalents 10.6 16.4% -8.4 15.5%
Cash and cash equivalents at the beginning of the period 54.3 83.6% 62.7 115.5%
Cash and cash equivalents at the end of the period 64.9 100.0% 54.3 100.0%
Cash flow from operating activities of EUR 97.1 million in 2020 was up EUR 30.2 million from EUR 66.9 million in 2019. This improvement was mainly due to the strongly increased income before tax as well as decreased cash outflows for net working capital.
Cash flow from investing activities was negative EUR 58.4 million in 2020 after negative EUR 60.3 million in the prior year. In 2020, capital expenditures for property, plant and equipment and capitalized development projects decreased compared to the previous year.
Finally, cash flow from financing activities at negative EUR 26.7 million in 2020 was significantly up compared to the 2019 level of negative EUR 14.5 million. The net outflow results mainly from scheduled repayments and interest payments for existing liabilities to banks. In 2019, in addition inflows from a new loan in the amount of EUR 10.0 million was included.
Overall, including the net effect of foreign currency translation on cash and cash equivalents of negative EUR 1.4 million (2019: negative EUR 0.5 million), cash and cash equivalents increased by EUR 10.6 million in 2020, from EUR 54.3 million at year-end 2019 to EUR 64.9 million at the end of 2020, after a decrease of EUR 8.4 million in the prior year.
Financing and liquidityADVA’s financial management is performed centrally by ADVA Optical Networking SE. Its objective is to provide sufficient funds to ensure ongoing operations and to support the group’s projected growth. Beyond the strong equity base appropriate for the business, ADVA finances its business by means of liabilities with maturities typically exceeding the useful life of the assets being financed. For any liability taken, ADVA is focused on minimizing related interest cost, as long as access to funds is not at risk. Excess funds are generally used to redeem liabilities.
Financial liabilities (on December 31, in millions of EUR)
21.3
69.1
202090.4
25.3
90.1
2019115.4
Current financial liabilities
Non-current financial liabilities
In 2020, financial liabilities decreased significantly by EUR 25.0 million to EUR 90.4 million at the end of 2020. As a result of scheduled repayments, current liabilities to banks decreased to EUR 15.5 million in 2020, down from EUR 19.2 million at the end of 2019, and non-current liabilities to banks decreased to EUR 47.1 million at the end of December 2020, down from EUR 61.8 million at the end of the previous year. Current lease liabilities remained largely stable year-on-year at EUR 5.8 million, while non-current lease liabilities reduced to EUR 22.0 million.
In 2020, the loans at IKB Industriekreditbank of EUR 12.5 million were fully repaid.
Combined management reportNet assets and financial position of the group
48 ADVA – Annual report 2020
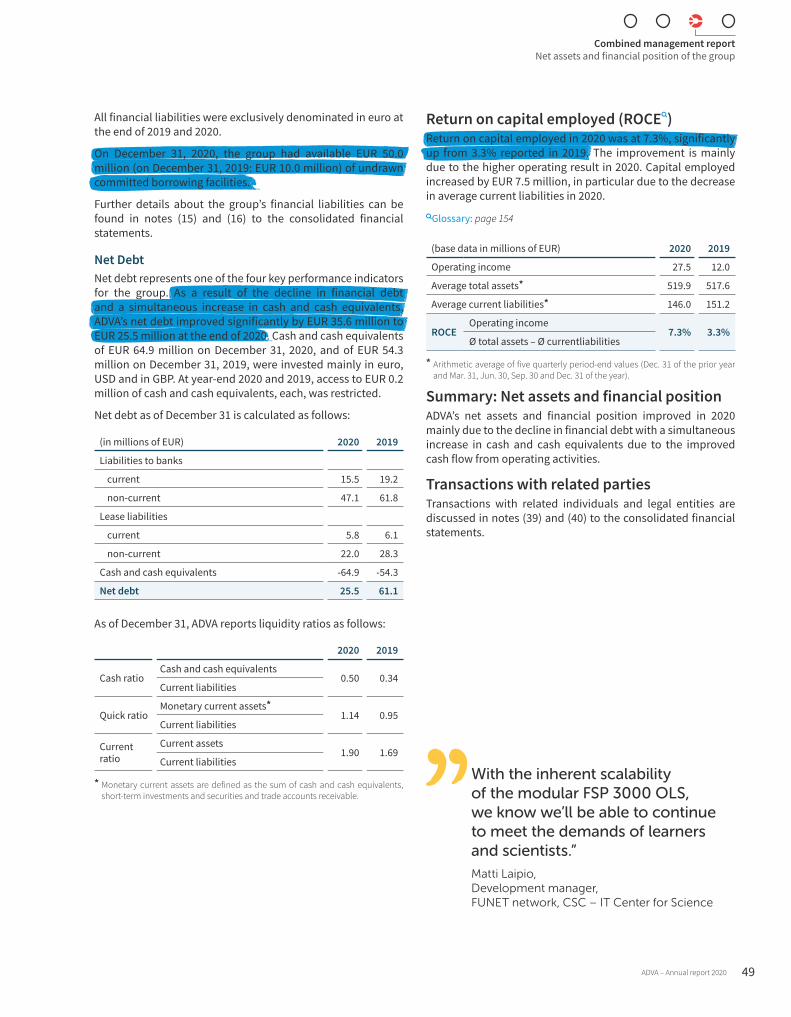
With the inherent scalability of the modular FSP 3000 OLS, we know we’ll be able to continue to meet the demands of learners and scientists.”Matti Laipio, Development manager, FUNET network, CSC – IT Center for Science
All financial liabilities were exclusively denominated in euro at the end of 2019 and 2020.
On December 31, 2020, the group had available EUR 50.0 million (on December 31, 2019: EUR 10.0 million) of undrawn committed borrowing facilities.
Further details about the group’s financial liabilities can be found in notes (15) and (16) to the consolidated financial statements.
Net DebtNet debt represents one of the four key performance indicators for the group. As a result of the decline in financial debt and a simultaneous increase in cash and cash equivalents, ADVA’s net debt improved significantly by EUR 35.6 million to EUR 25.5 million at the end of 2020. Cash and cash equivalents of EUR 64.9 million on December 31, 2020, and of EUR 54.3 million on December 31, 2019, were invested mainly in euro, USD and in GBP. At year-end 2020 and 2019, access to EUR 0.2 million of cash and cash equivalents, each, was restricted.
Net debt as of December 31 is calculated as follows:
(in millions of EUR) 2020 2019
Liabilities to banks
current 15.5 19.2
non-current 47.1 61.8
Lease liabilities
current 5.8 6.1
non-current 22.0 28.3
Cash and cash equivalents -64.9 -54.3
Net debt 25.5 61.1
As of December 31, ADVA reports liquidity ratios as follows:
2020 2019
Cash ratioCash and cash equivalents
0.50 0.34Current liabilities
Quick ratioMonetary current assets*
1.14 0.95Current liabilities
Current ratio
Current assets 1.90 1.69
Current liabilities
* Monetary current assets are defined as the sum of cash and cash equivalents, short-term investments and securities and trade accounts receivable.
Return on capital employed (ROCE)Return on capital employed in 2020 was at 7.3%, significantly up from 3.3% reported in 2019. The improvement is mainly due to the higher operating result in 2020. Capital employed increased by EUR 7.5 million, in particular due to the decrease in average current liabilities in 2020.Glossary: page 154
(base data in millions of EUR) 2020 2019
Operating income 27.5 12.0
Average total assets* 519.9 517.6
Average current liabilities* 146.0 151.2
ROCEOperating income
7.3% 3.3%Ø total assets – Ø currentliabilities
* Arithmetic average of five quarterly period-end values (Dec. 31 of the prior year and Mar. 31, Jun. 30, Sep. 30 and Dec. 31 of the year).
Summary: Net assets and financial positionADVA’s net assets and financial position improved in 2020 mainly due to the decline in financial debt with a simultaneous increase in cash and cash equivalents due to the improved cash flow from operating activities.
Transactions with related partiesTransactions with related individuals and legal entities are discussed in notes (39) and (40) to the consolidated financial statements.
Combined management reportNet assets and financial position of the group
ADVA – Annual report 2020 49
PERFORMANCE OF ADVA OPTICAL NETWORKING SEIn addition to reporting on the ADVA Optical Networking group, the following sections provide information on the performance of ADVA Optical Networking SE.
ADVA Optical Networking SE is the parent company of the group and performs the group’s management and corporate functions. It undertakes essentially all group-wide responsibilities such as finance and accounting, corporate compliance and risk management, strategic and product-oriented R&D activities as well as corporate and marketing communications worldwide.
ADVA Optical Networking SE’s individual financial statements are prepared in accordance with the German Commercial Code. The related individual financial statements are published separately.
Offices and organizationThe company maintains its registered office in Meiningen, Germany. This is also the location of the main production and development facility of the company. In Martinsried/Munich, the company maintains its headquarter with all central functions and the sales and marketing organization. Furthermore, ADVA maintains some small to midsize national and international offices.
Operational performanceIn 2020, ADVA Optical Networking SE generated revenues of EUR 378.3 million, an increase of 5.3% compared to prior year’s revenues of EUR 359.3 million. Despite the current pandemic situation, demand in 2020 was pleasingly strong.
EMEA remained the most important sales region in 2020, followed by the Americas and Asia-Pacific. Sales in EMEA increased by 4.4% from EUR 245.9 million to EUR 256.6 million. The share of total revenues decreased slightly from 68.4% in 2019 to 67.8% in 2020. ADVA SE is strong in the EMEA region and leveraging its mature partner strategy and achieving good results thanks to a broad and loyal customer base. In the Americas region, revenue decreased by 1.8%, from EUR 77.3 million in 2019 to EUR 75.8 million in 2020. The regional share of total annual revenue decreased to 20.1% in 2020 from 21.5% in 2019. In Asia-Pacific, revenue increased by 27.1% from EUR 36.1 million in 2019 to EUR 45.9 million in 2020. The region is predominated by project-based business, leading to greater fluctuations in individual periods. The Asia-Pacific region contributed 12.1% to total revenue in 2020, after 10.0% in 2019.
Cost of goods sold increased from EUR 222.0 million in 2019 to EUR 231.6 million in 2020. The corresponding share in total revenue of 61.2% reduced compared to 2019 (61.8%).
Consequently, gross profit increased from EUR 137.3 million or 38.2% of revenues in 2019 to EUR 146.7 million or 38.8% of revenues in 2020. The development of the gross margin is impacted by variations in regional revenue distribution and in product and customer mix.
Selling and marketing expenses significantly decreased from EUR 38.6 million in 2019 to EUR 28.8 million in 2020. This decrease is mainly due to intragroup license agreements with subsidiaries expiring in 2019 as well as decreased costs due to restructuring measures implemented in the prior year and a reduction in travel costs in 2020 due to the current Covid-19 situation.
General and administrative expenses increased to EUR 18.4 million from EUR 15.2 million in 2019. This was mainly due to higher expenses for cloud-based software applications as well as higher costs for patent legal support.
Considering the decrease in capitalization of development expenses from EUR 42.4 million in 2019 to EUR 40.0 million in 2020, research and development expenses totalled EUR 92.7 million or 24.5% from revenues compared to EUR 91.8 million or 25.6% from revenues in the prior year.
Other operating result (other operating income less other operating expenses) decreased due to increased foreign currency losses to EUR 0.2 million from EUR 1.6 million in 2019.
Furthermore in 2020, EUR 49.8 million was distributed to the company from affiliated companies (previous year: EUR 4.0 million), positively impacting the result after taxes to EUR 54.7 million after the negative EUR 6.3 million seen in the previous year.
Combined management reportPerformance of ADVA Optical Networking SE
50 ADVA – Annual report 2020
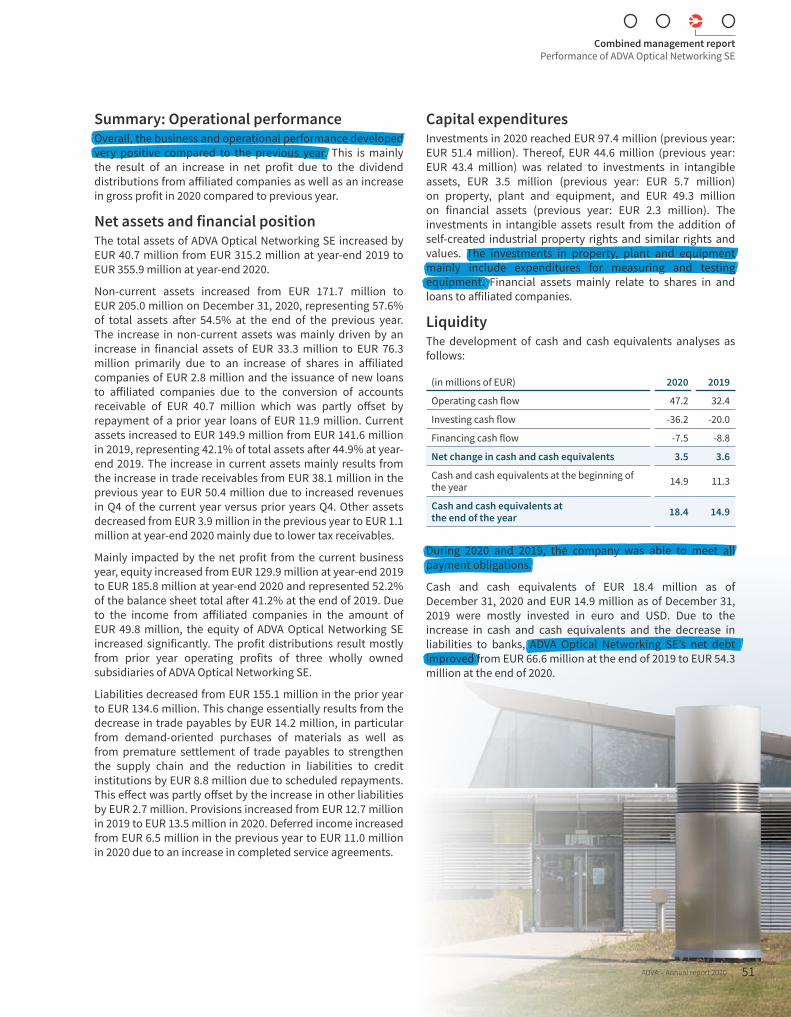
Summary: Operational performanceOverall, the business and operational performance developed very positive compared to the previous year. This is mainly the result of an increase in net profit due to the dividend distributions from affiliated companies as well as an increase in gross profit in 2020 compared to previous year.
Net assets and financial positionThe total assets of ADVA Optical Networking SE increased by EUR 40.7 million from EUR 315.2 million at year-end 2019 to EUR 355.9 million at year-end 2020.
Non-current assets increased from EUR 171.7 million to EUR 205.0 million on December 31, 2020, representing 57.6% of total assets after 54.5% at the end of the previous year. The increase in non-current assets was mainly driven by an increase in financial assets of EUR 33.3 million to EUR 76.3 million primarily due to an increase of shares in affiliated companies of EUR 2.8 million and the issuance of new loans to affiliated companies due to the conversion of accounts receivable of EUR 40.7 million which was partly offset by repayment of a prior year loans of EUR 11.9 million. Current assets increased to EUR 149.9 million from EUR 141.6 million in 2019, representing 42.1% of total assets after 44.9% at year-end 2019. The increase in current assets mainly results from the increase in trade receivables from EUR 38.1 million in the previous year to EUR 50.4 million due to increased revenues in Q4 of the current year versus prior years Q4. Other assets decreased from EUR 3.9 million in the previous year to EUR 1.1 million at year-end 2020 mainly due to lower tax receivables.
Mainly impacted by the net profit from the current business year, equity increased from EUR 129.9 million at year-end 2019 to EUR 185.8 million at year-end 2020 and represented 52.2% of the balance sheet total after 41.2% at the end of 2019. Due to the income from affiliated companies in the amount of EUR 49.8 million, the equity of ADVA Optical Networking SE increased significantly. The profit distributions result mostly from prior year operating profits of three wholly owned subsidiaries of ADVA Optical Networking SE.
Liabilities decreased from EUR 155.1 million in the prior year to EUR 134.6 million. This change essentially results from the decrease in trade payables by EUR 14.2 million, in particular from demand-oriented purchases of materials as well as from premature settlement of trade payables to strengthen the supply chain and the reduction in liabilities to credit institutions by EUR 8.8 million due to scheduled repayments. This effect was partly offset by the increase in other liabilities by EUR 2.7 million. Provisions increased from EUR 12.7 million in 2019 to EUR 13.5 million in 2020. Deferred income increased from EUR 6.5 million in the previous year to EUR 11.0 million in 2020 due to an increase in completed service agreements.
Capital expendituresInvestments in 2020 reached EUR 97.4 million (previous year: EUR 51.4 million). Thereof, EUR 44.6 million (previous year: EUR 43.4 million) was related to investments in intangible assets, EUR 3.5 million (previous year: EUR 5.7 million) on property, plant and equipment, and EUR 49.3 million on financial assets (previous year: EUR 2.3 million). The investments in intangible assets result from the addition of self-created industrial property rights and similar rights and values. The investments in property, plant and equipment mainly include expenditures for measuring and testing equipment. Financial assets mainly relate to shares in and loans to affiliated companies.
LiquidityThe development of cash and cash equivalents analyses as follows:
(in millions of EUR) 2020 2019
Operating cash flow 47.2 32.4
Investing cash flow -36.2 -20.0
Financing cash flow -7.5 -8.8
Net change in cash and cash equivalents 3.5 3.6
Cash and cash equivalents at the beginning of the year 14.9 11.3
Cash and cash equivalents at the end of the year 18.4 14.9
During 2020 and 2019, the company was able to meet all payment obligations.
Cash and cash equivalents of EUR 18.4 million as of December 31, 2020 and EUR 14.9 million as of December 31, 2019 were mostly invested in euro and USD. Due to the increase in cash and cash equivalents and the decrease in liabilities to banks, ADVA Optical Networking SE’s net debt improved from EUR 66.6 million at the end of 2019 to EUR 54.3 million at the end of 2020.
Combined management reportPerformance of ADVA Optical Networking SE
ADVA – Annual report 2020 51
FinancingLiabilities to banks decreased from EUR 81.5 million at year-end 2019 to EUR 72.7 million at the end of 2020 due to scheduled repayments. All liabilities to banks were exclusively denominated in euro and USD at the end of 2019 and 2020. Liabilities for factoring relates to a repayment obligation from a new factoring agreement whereby the significant credit risks were not transferred.
On December 31, 2020, the company had available EUR 50.0 million (on December 31, 2019: EUR 10.0 million) of undrawn committed borrowing facilities.
The following table provides an overview of the maturity of each liability to banks at year-end 2020:
(in millions of EUR)
Maturity
≤ 12 months
13 – 36 months
> 36 months
Loan of Deutsche Bank 10.0 – 10.0 –
Syndicated loan 53.0 15.0 38.0 –
Factoring 9.7 9.7 – –
Total 72.7 24.7 48.0 –
Dividend paymentsIn 2020 there were no dividend payments for 2019 (prior year: nil for 2018). ADVA Optical Networking SE does not plan to pay out a dividend for 2020.
Summary: Net assets and financial positionDue to the significant increase in accumulated profit, the company’s equity could be strengthened massively. In addition, the decrease in financial liabilities and the simultaneous increase in cash led to a significant improvement of ADVA Optical Networking SE’s net assets and financial position.
EVENTS AFTER THE BALANCE SHEET DATEThere were no events after the balance sheet date that materially impacted the net assets and financial position of the group and ADVA Optical Networking SE on December 31, 2020, and the groups and the company’s financial performance for 2020. Similarly, there were no events considered material for disclosure.
DISCLOSURES UNDER TAKEOVER LAW IN ACCORDANCE WITH SECTION § 289A (1) HGB AND SECTION § 315A (1) HGBShare capital and shareholder structureOn December 31, 2020, ADVA Optical Networking SE had issued 50,496,692 no-par value bearer shares (December 31, 2019: 50,181,966). The common shares entitle the holder to vote at the Annual Shareholders’ Meeting and to receive dividends in case of a distribution. No restrictions are attached to the common shares. No other class of shares had been issued during the reporting period.
At year-end 2020, EGORA Holding GmbH with registered office in Fraunhoferstrasse 22, 82152 Martinsried/Munich, Germany held a total of 7,456,749 shares or 14.77%* of all ADVA Optical Networking SE shares outstanding (at year-end 2019: 7,456,749 shares or 14.86% of all shares outstanding). Additionally, at year-end 2020, Teleios Capital Partners LLC, registered office Baarerstraße 12 in 6300 Zug, Switzerland, held 9,760,828 shares or 19.38%** of all ADVA Optical Networking SE shares outstanding (at year-end 2019: 11,217,927 shares or 22.36%). No other shareholder has filed with the company to have held more than 10% of the company’s shares outstanding on December 31, 2020. Further details on share capital and shareholder structure are disclosed in note (21) to the consolidated financial statements.* Capital shares refer to the total number of shares held in relation to the share
capital as of December 31, 2020.** Capital shares refer to the total number of voting rights of the latest respective
notification prior to December 31, 2020. A change in the total number of voting rights after the notification date was not taken into account.
Restriction of voting rights and share transfersAt year-end 2020, the management board of ADVA Optical Networking SE had no knowledge of any restrictions related to voting rights or share transfers.
Appointment and dismissal of management board membersThe appointment and dismissal of members of the management board of ADVA Optical Networking SE follows the direction of the German Stock Corporation Act (Aktiengesetz, AktG), the German SE Implementation Act (SE-Ausführungsgesetz, SEAG) as well as the provisions in section 6 of the company’s current articles of association as of May 13, 2020. According to these articles, in principle the supervisory board appoints the members of the management board and does so for a maximum period of five years. However, it is the company’s practice to appoint the members of the management board for two years only. Repeated appointment is possible. According to the company’s statutes, the management board of ADVA Optical Networking SE shall
Combined management reportEvents after the balance sheet date
52 ADVA – Annual report 2020
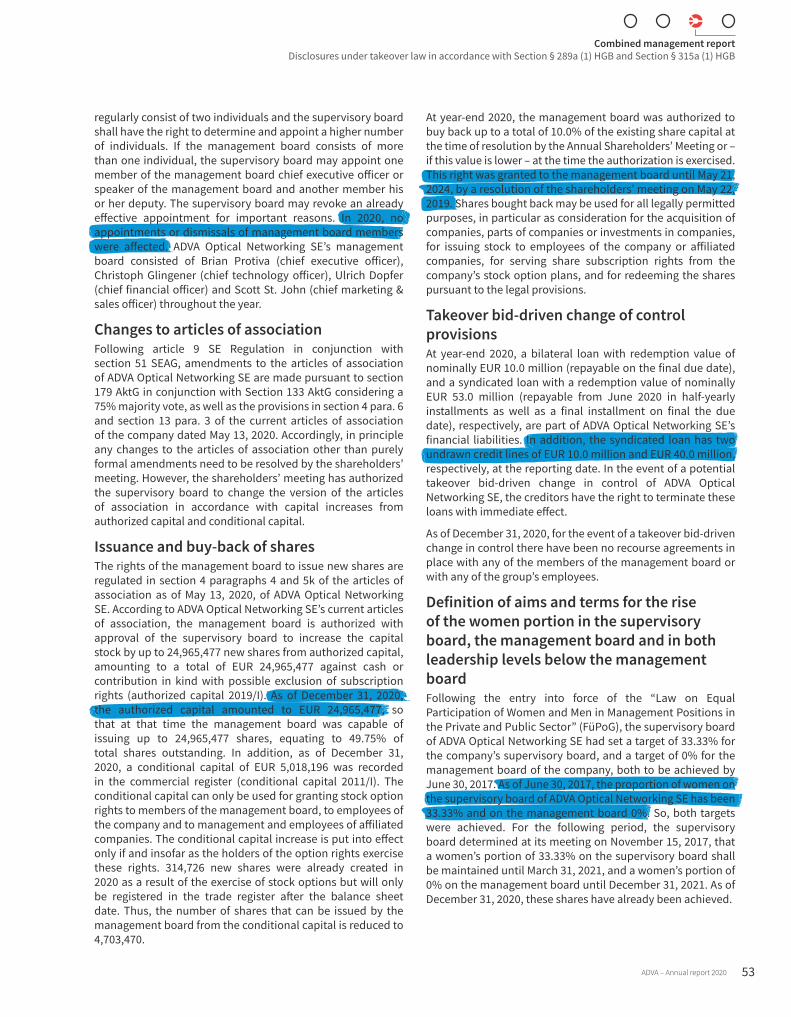
regularly consist of two individuals and the supervisory board shall have the right to determine and appoint a higher number of individuals. If the management board consists of more than one individual, the supervisory board may appoint one member of the management board chief executive officer or speaker of the management board and another member his or her deputy. The supervisory board may revoke an already effective appointment for important reasons. In 2020, no appointments or dismissals of management board members were affected. ADVA Optical Networking SE’s management board consisted of Brian Protiva (chief executive officer), Christoph Glingener (chief technology officer), Ulrich Dopfer (chief financial officer) and Scott St. John (chief marketing & sales officer) throughout the year.
Changes to articles of associationFollowing article 9 SE Regulation in conjunction with section 51 SEAG, amendments to the articles of association of ADVA Optical Networking SE are made pursuant to section 179 AktG in conjunction with Section 133 AktG considering a 75% majority vote, as well as the provisions in section 4 para. 6 and section 13 para. 3 of the current articles of association of the company dated May 13, 2020. Accordingly, in principle any changes to the articles of association other than purely formal amendments need to be resolved by the shareholders’ meeting. However, the shareholders’ meeting has authorized the supervisory board to change the version of the articles of association in accordance with capital increases from authorized capital and conditional capital.
Issuance and buy-back of sharesThe rights of the management board to issue new shares are regulated in section 4 paragraphs 4 and 5k of the articles of association as of May 13, 2020, of ADVA Optical Networking SE. According to ADVA Optical Networking SE’s current articles of association, the management board is authorized with approval of the supervisory board to increase the capital stock by up to 24,965,477 new shares from authorized capital, amounting to a total of EUR 24,965,477 against cash or contribution in kind with possible exclusion of subscription rights (authorized capital 2019/I). As of December 31, 2020, the authorized capital amounted to EUR 24,965,477, so that at that time the management board was capable of issuing up to 24,965,477 shares, equating to 49.75% of total shares outstanding. In addition, as of December 31, 2020, a conditional capital of EUR 5,018,196 was recorded in the commercial register (conditional capital 2011/I). The conditional capital can only be used for granting stock option rights to members of the management board, to employees of the company and to management and employees of affiliated companies. The conditional capital increase is put into effect only if and insofar as the holders of the option rights exercise these rights. 314,726 new shares were already created in 2020 as a result of the exercise of stock options but will only be registered in the trade register after the balance sheet date. Thus, the number of shares that can be issued by the management board from the conditional capital is reduced to 4,703,470.
At year-end 2020, the management board was authorized to buy back up to a total of 10.0% of the existing share capital at the time of resolution by the Annual Shareholders’ Meeting or – if this value is lower – at the time the authorization is exercised. This right was granted to the management board until May 21, 2024, by a resolution of the shareholders’ meeting on May 22, 2019. Shares bought back may be used for all legally permitted purposes, in particular as consideration for the acquisition of companies, parts of companies or investments in companies, for issuing stock to employees of the company or affiliated companies, for serving share subscription rights from the company’s stock option plans, and for redeeming the shares pursuant to the legal provisions.
Takeover bid-driven change of control provisionsAt year-end 2020, a bilateral loan with redemption value of nominally EUR 10.0 million (repayable on the final due date), and a syndicated loan with a redemption value of nominally EUR 53.0 million (repayable from June 2020 in half-yearly installments as well as a final installment on final the due date), respectively, are part of ADVA Optical Networking SE’s financial liabilities. In addition, the syndicated loan has two undrawn credit lines of EUR 10.0 million and EUR 40.0 million, respectively, at the reporting date. In the event of a potential takeover bid-driven change in control of ADVA Optical Networking SE, the creditors have the right to terminate these loans with immediate effect.
As of December 31, 2020, for the event of a takeover bid-driven change in control there have been no recourse agreements in place with any of the members of the management board or with any of the group’s employees.
Definition of aims and terms for the rise of the women portion in the supervisory board, the management board and in both leadership levels below the management boardFollowing the entry into force of the “Law on Equal Participation of Women and Men in Management Positions in the Private and Public Sector” (FüPoG), the supervisory board of ADVA Optical Networking SE had set a target of 33.33% for the company’s supervisory board, and a target of 0% for the management board of the company, both to be achieved by June 30, 2017. As of June 30, 2017, the proportion of women on the supervisory board of ADVA Optical Networking SE has been 33.33% and on the management board 0%. So, both targets were achieved. For the following period, the supervisory board determined at its meeting on November 15, 2017, that a women’s portion of 33.33% on the supervisory board shall be maintained until March 31, 2021, and a women’s portion of 0% on the management board until December 31, 2021. As of December 31, 2020, these shares have already been achieved.
Combined management reportDisclosures under takeover law in accordance with Section § 289a (1) HGB and Section § 315a (1) HGB
ADVA – Annual report 2020 53
ADVA‘s Ensemble Harmony Ecosystem is key to creating the openness and interoperability needed in the new age of software-based telecommunication networks.“Mark Vondemkamp, VP, Products, SD-WAN and SASE Business, VMware
Following the entry into force of the FüPoG, the management board of ADVA Optical Networking SE had set an 8% women’s share for the first management level and a 30% women’s share for the second management level below the management board; both to be achieved by June 30, 2017. As of June 30, 2017, the women’s portion on the first management level has been 7%, and 32% on the second management level, exceeding the self-imposed target on the second management level, but slightly missing the self-imposed target of the first management level. This was due to an in-house change of a reporting line that lifted a male executive from the second to the first management level; besides that, the management structure and team remained unchanged at both management levels. For the following period, ADVA Optical Networking SE’s management board has set a target of 7% for the women’s share on the first level of management and of 30% on the second level of management below management board, both to be achieved until June 30, 2022. As of December 31, 2020, the women’s portion on the first management level has been 5% and at the second management level 39%. This exceeded the self-set target on the second management level, although it was slightly below the target on the first management level. The reason for this was the departure of two women on the first management level, with a replacement by a woman on the second management level. The other position was not filled.
Separate nonfinancial reportIn order to facilitate public access to all respective data, ADVA decided to publish a separate nonfinancial report on the sustainability page in the About Us section of its website www.adva.com simultaneously with the publication of the annual report on February 25, 2021.
REMUNERATION OF THE MANAGEMENT AND THE SUPERVISORY BOARDThe compensation of ADVA’s management board members consists of fixed and variable components. In addition to a fixed salary, the members of the management board receive two kinds of variable compensation which are assessed based either on short-term aspects or on long-term criteria focusing on the sustainable development of the group. As additional long-term variable compensation, the management board members receive stock options within the scope of ADVA’s stock option program. The variable compensation for the members of the management board includes capped components (short-term variable compensation, long-term variable compensation, newly issued options), and provides upper and lower limits for the four targets of the short-term variable compensation.
In 2020, the fixed salaries of all members of the management board remained unchanged. The short-term variable compensation of all four members of the management board was based on the group’s pro forma operating income (40%), the group’s revenues (20%), and the group’s net debt (20%)
as well as individual goals agreed with each member of the management board at the beginning of the year (20%). The short-term variable compensation is determined annually as compensation for the current year at the discretion of the supervisory board. Furthermore, a long-term variable compensation of EUR 808 thousand for the management board focusing on the sustainable development of the group during 2020 to 2022 was agreed which will be paid to the members of the management board after three years, provided that a year-by-year increased minimum group pro forma operating income is met for each of the three years. All members of the management board additionally receive a company car or a car allowance. Moreover, these benefits are partially taxable by the members of the management board as non-cash benefits. In addition, ADVA grants stock options to members of the management board. These option rights authorize the members of the management board to purchase a set number of shares in the company once a fixed vesting period has elapsed and the goal to increase the share price by at least 20% has been reached.
During both years, there were no long-term service contracts in the sense of IAS 19 for any member of the management board. In 2020 and 2019, no loans were granted to the members of the management board. As of December 31, 2020, there was a receivable from one member of the management board in the amount of EUR 6 thousand (previous year: none). There were no receivables from the other members of the management board (December 31, 2019: none).
Total management board compensation payable according to section 314 paragraph 1 no. 6a HGB for 2020 and 2019 was EUR 2,224 thousand and EUR 1,695 thousand, respectively. The following tables show the benefits granted and paid to the members of the management board for the reporting period in accordance with the German Corporate Governance Code in the version dated February 7, 2017.
Combined management reportRemuneration of the management and the supervisory board
54 ADVA – Annual report 2020
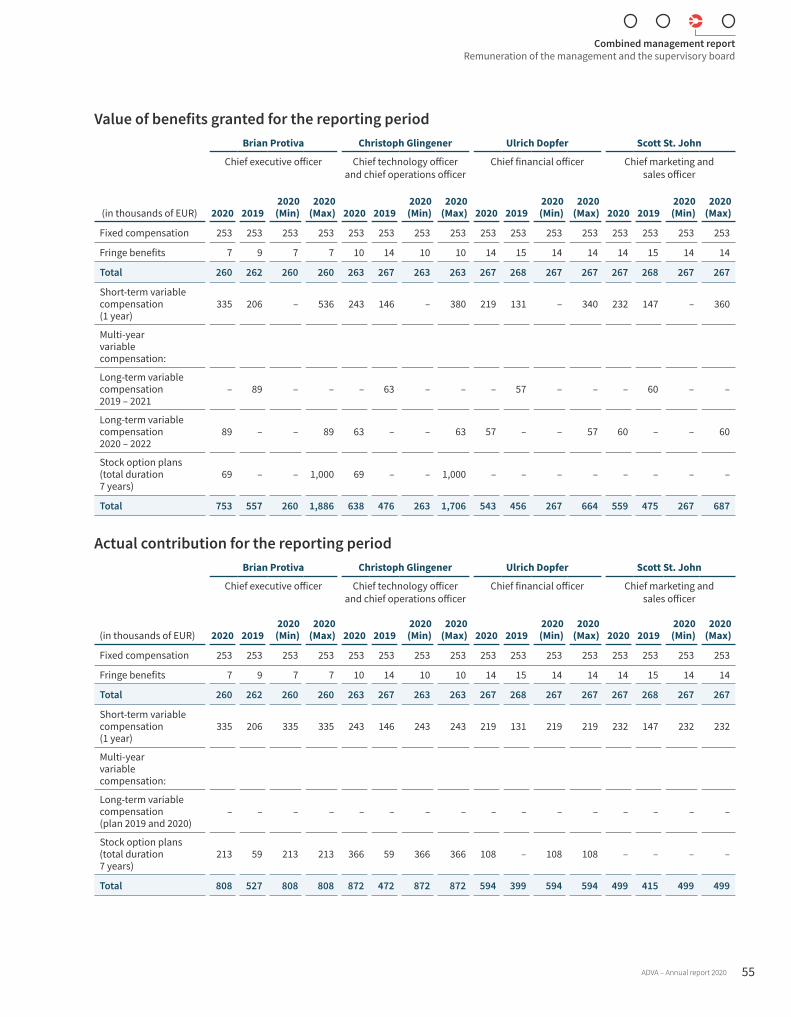
Value of benefits granted for the reporting period
(in thousands of EUR)
Brian Protiva Christoph Glingener Ulrich Dopfer Scott St. John
Chief executive officer Chief technology officer and chief operations officer
Chief financial officer Chief marketing and sales officer
2020 20192020 (Min)
2020 (Max) 2020 2019
2020 (Min)
2020 (Max) 2020 2019
2020 (Min)
2020 (Max) 2020 2019
2020 (Min)
2020 (Max)
Fixed compensation 253 253 253 253 253 253 253 253 253 253 253 253 253 253 253 253
Fringe benefits 7 9 7 7 10 14 10 10 14 15 14 14 14 15 14 14
Total 260 262 260 260 263 267 263 263 267 268 267 267 267 268 267 267
Short-term variable compensation (1 year)
335 206 – 536 243 146 – 380 219 131 – 340 232 147 – 360
Multi-year variable compensation:
Long-term variable compensation 2019 – 2021
– 89 – – – 63 – – – 57 – – – 60 – –
Long-term variable compensation 2020 – 2022
89 – – 89 63 – – 63 57 – – 57 60 – – 60
Stock option plans (total duration 7 years)
69 – – 1,000 69 – – 1,000 – – – – – – – –
Total 753 557 260 1,886 638 476 263 1,706 543 456 267 664 559 475 267 687
Actual contribution for the reporting period
(in thousands of EUR)
Brian Protiva Christoph Glingener Ulrich Dopfer Scott St. John
Chief executive officer Chief technology officer and chief operations officer
Chief financial officer Chief marketing and sales officer
2020 20192020 (Min)
2020 (Max) 2020 2019
2020 (Min)
2020 (Max) 2020 2019
2020 (Min)
2020 (Max) 2020 2019
2020 (Min)
2020 (Max)
Fixed compensation 253 253 253 253 253 253 253 253 253 253 253 253 253 253 253 253
Fringe benefits 7 9 7 7 10 14 10 10 14 15 14 14 14 15 14 14
Total 260 262 260 260 263 267 263 263 267 268 267 267 267 268 267 267
Short-term variable compensation (1 year)
335 206 335 335 243 146 243 243 219 131 219 219 232 147 232 232
Multi-year variable compensation:
Long-term variable compensation (plan 2019 and 2020)
– – – – – – – – – – – – – – – –
Stock option plans (total duration 7 years)
213 59 213 213 366 59 366 366 108 – 108 108 – – – –
Total 808 527 808 808 872 472 872 872 594 399 594 594 499 415 499 499
Combined management reportRemuneration of the management and the supervisory board
ADVA – Annual report 2020 55
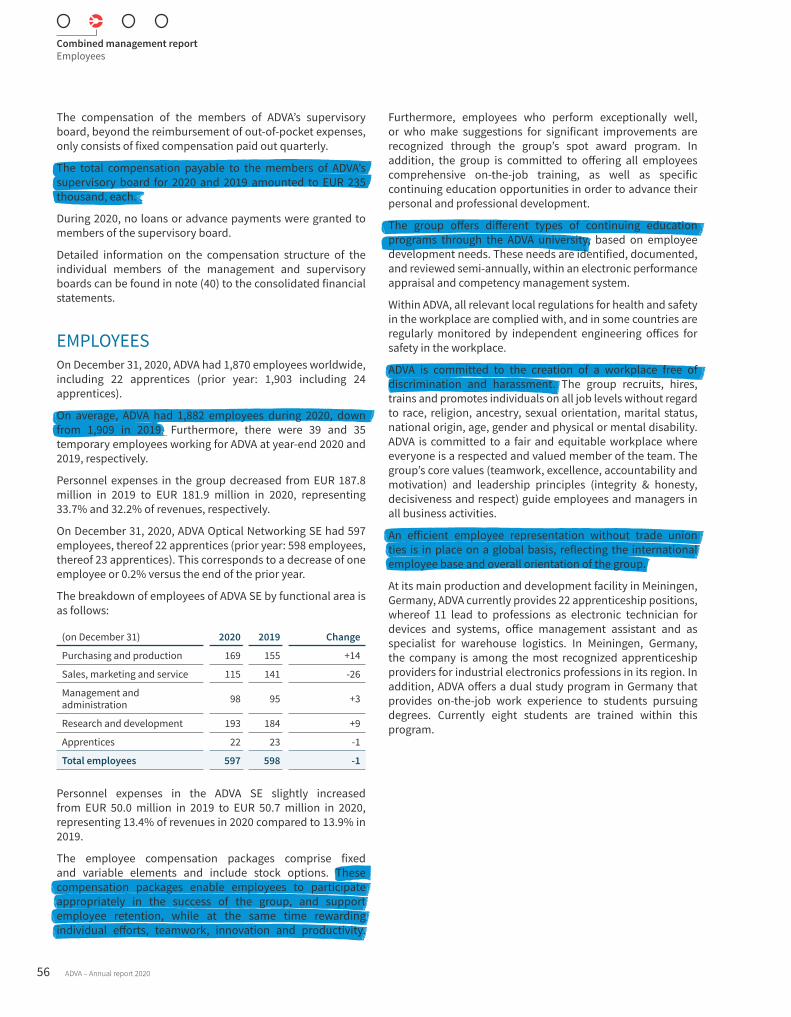
The compensation of the members of ADVA’s supervisory board, beyond the reimbursement of out-of-pocket expenses, only consists of fixed compensation paid out quarterly.
The total compensation payable to the members of ADVA’s supervisory board for 2020 and 2019 amounted to EUR 235 thousand, each.
During 2020, no loans or advance payments were granted to members of the supervisory board.
Detailed information on the compensation structure of the individual members of the management and supervisory boards can be found in note (40) to the consolidated financial statements.
EMPLOYEESOn December 31, 2020, ADVA had 1,870 employees worldwide, including 22 apprentices (prior year: 1,903 including 24 apprentices).
On average, ADVA had 1,882 employees during 2020, down from 1,909 in 2019. Furthermore, there were 39 and 35 temporary employees working for ADVA at year-end 2020 and 2019, respectively.
Personnel expenses in the group decreased from EUR 187.8 million in 2019 to EUR 181.9 million in 2020, representing 33.7% and 32.2% of revenues, respectively.
On December 31, 2020, ADVA Optical Networking SE had 597 employees, thereof 22 apprentices (prior year: 598 employees, thereof 23 apprentices). This corresponds to a decrease of one employee or 0.2% versus the end of the prior year.
The breakdown of employees of ADVA SE by functional area is as follows:
(on December 31) 2020 2019 Change
Purchasing and production 169 155 +14
Sales, marketing and service 115 141 -26
Management and administration 98 95 +3
Research and development 193 184 +9
Apprentices 22 23 -1
Total employees 597 598 -1
Personnel expenses in the ADVA SE slightly increased from EUR 50.0 million in 2019 to EUR 50.7 million in 2020, representing 13.4% of revenues in 2020 compared to 13.9% in 2019.
The employee compensation packages comprise fixed and variable elements and include stock options. These compensation packages enable employees to participate appropriately in the success of the group, and support employee retention, while at the same time rewarding individual efforts, teamwork, innovation and productivity.
Furthermore, employees who perform exceptionally well, or who make suggestions for significant improvements are recognized through the group’s spot award program. In addition, the group is committed to offering all employees comprehensive on-the-job training, as well as specific continuing education opportunities in order to advance their personal and professional development.
The group offers different types of continuing education programs through the ADVA university, based on employee development needs. These needs are identified, documented, and reviewed semi-annually, within an electronic performance appraisal and competency management system.
Within ADVA, all relevant local regulations for health and safety in the workplace are complied with, and in some countries are regularly monitored by independent engineering offices for safety in the workplace.
ADVA is committed to the creation of a workplace free of discrimination and harassment. The group recruits, hires, trains and promotes individuals on all job levels without regard to race, religion, ancestry, sexual orientation, marital status, national origin, age, gender and physical or mental disability. ADVA is committed to a fair and equitable workplace where everyone is a respected and valued member of the team. The group’s core values (teamwork, excellence, accountability and motivation) and leadership principles (integrity & honesty, decisiveness and respect) guide employees and managers in all business activities.
An efficient employee representation without trade union ties is in place on a global basis, reflecting the international employee base and overall orientation of the group.
At its main production and development facility in Meiningen, Germany, ADVA currently provides 22 apprenticeship positions, whereof 11 lead to professions as electronic technician for devices and systems, office management assistant and as specialist for warehouse logistics. In Meiningen, Germany, the company is among the most recognized apprenticeship providers for industrial electronics professions in its region. In addition, ADVA offers a dual study program in Germany that provides on-the-job work experience to students pursuing degrees. Currently eight students are trained within this program.
Combined management reportEmployees
56 ADVA – Annual report 2020
RISK AND OPPORTUNITY REPORTADVA’s future development offers a broad variety of opportunities. It is however also subject to risks, which in certain cases could endanger the group’s continued existence. The management board has implemented a comprehensive risk management and internal control system that enables the detection of risks in a timely manner and allows the group to take corrective action and to benefit from identified opportunities. An integral aspect of the group’s strategy is its ability to anticipate developments in the marketplace and future customer needs. Special emphasis is given to product development, the quality of the group’s products and the validation, selection and oversight of key business partners.
Risk management systemSince ADVA was founded in 1994, its business has become more diversified. The group markets its products and solutions in part via a variety of distribution partners but has become less dependent over the years due to continued investment in a direct distribution model in core geographies. Beyond focusing on enhancing revenue and profit predictability, a comprehensive risk management system has been established which is coordinated by the Internal Audit and Risk Management function.
Being a globally operating company, ADVA implemented its risk management system on the basis of applicable laws and regulations such as Germany’s BilMoG and KonTraG and by considering common international standards and best practices such as the COSO framework and the ISO 31000 auditing standard. It is closely integrated with supporting management systems such as the group’s compliance management system. The management board nevertheless recognizes that a risk management system cannot in all cases prevent the occurrence of events that may cause material damage to the group.Glossary: page 154
ADVA’s strategic goals are the basis for its risk management system. These goals are organized into five areas, growth and profitability, innovation, operational excellence, people and customer experience. The strategic goals are reviewed by the management board and the supervisory board on a yearly basis and amended where appropriate. They also constitute the basis for the group’s three-year business plan, which is reviewed and updated annually. Each of these goals is defined in detail and then broken down into specific departmental and individual targets. The strategic goals are traced to each employee so that every individual can focus and be evaluated on his/her own performance and contribution to ADVA’s overall success.
ADVA measures the accomplishment of its strategic goals against revenues, pro forma operating income and net debt as well as the non-financial criterion of customer satisfaction measured by the net promoter score. These metrics represent the group’s key performance indicators. The management
board sets target values for all four metrics for the year to come and measures actual values against the target values: revenues, pro forma operating income and net debt on a monthly basis and the net promoter score on an annual basis. Corrective action is taken quickly should a deviation from the plan occur or be reasonably predicted to occur. This information is summarized and communicated to the management board in monthly, quarterly and yearly reports.
Moreover, budgets are reviewed on a monthly basis and adjustments are made if necessary. The group’s accounting, controlling and treasury departments provide globally consolidated reports on available cash funds and the development of margins and current assets (e.g., inventories and receivables) on a monthly and quarterly basis. These reports also include budgeted, forecasted and actual revenues and expenditures. The structure and content of these reports is continuously adapted to the most current requirements.
ADVA regularly monitors the creditworthiness of its customers and updates credit limits as needed. Material expenditures and investments must be approved in advance through an electronic purchase order system. In conjunction with continuously updated revenue and cash forecasts, a detailed monthly preview of the anticipated group development within the next three to twelve months is put together and communicated to the management board. Moreover, the group’s accounting, controlling and legal departments review potential legal and litigation risks on a quarterly basis in order to obtain a reliable estimate of the potential loss, considering all relevant information and expectations. Finally, ADVA’s management board discusses all significant business transactions with the supervisory board and obtains its approval if necessary.
In order to ensure observance of all applicable laws and regulations and to support the group’s ongoing growth and internationalization, the management board implemented a compliance management system. Key compliance measures include a code of conduct, a range of group-wide policies, the training of employees and the active encouragement to report suspected incidents of non-compliance and to seek support in case of uncertainties or questions.
All implemented measures and processes of the risk management system as well as of the compliance management system are continuously reviewed and improved.
ADVA differentiates between two main categories of risks and opportunities – those considered major and those considered non-material. A risk or opportunity is considered major if its expected net impact on the group’s pro forma operating income is or exceeds EUR 3 million in terms of ADVA’s three-year business plan (in 2019 this threshold was EUR 1 million). If not attributable to the pro forma operating income, the group’s net income is used as reference. The expected net impact is calculated by multiplying the potential net impact of a particular risk or opportunity with its net likelihood of occurrence.
Combined management reportRisk and opportunity report
ADVA – Annual report 2020 57
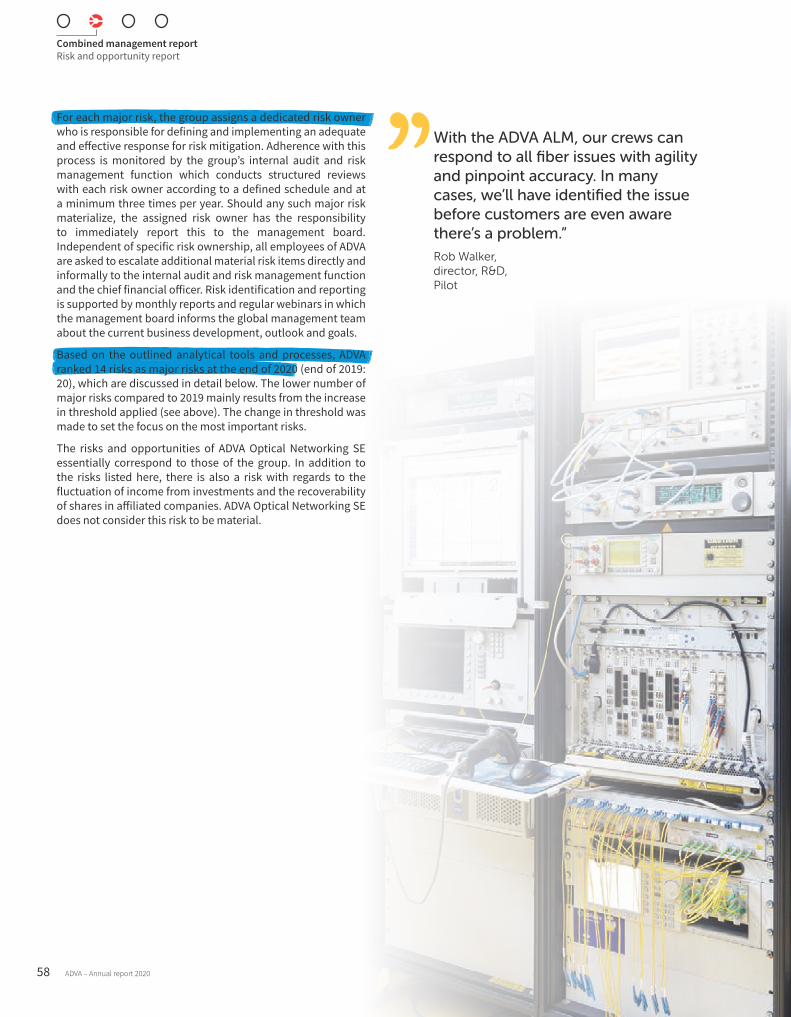
With the ADVA ALM, our crews can respond to all fiber issues with agility and pinpoint accuracy. In many cases, we’ll have identified the issue before customers are even aware there’s a problem.” Rob Walker, director, R&D, Pilot
For each major risk, the group assigns a dedicated risk owner who is responsible for defining and implementing an adequate and effective response for risk mitigation. Adherence with this process is monitored by the group’s internal audit and risk management function which conducts structured reviews with each risk owner according to a defined schedule and at a minimum three times per year. Should any such major risk materialize, the assigned risk owner has the responsibility to immediately report this to the management board. Independent of specific risk ownership, all employees of ADVA are asked to escalate additional material risk items directly and informally to the internal audit and risk management function and the chief financial officer. Risk identification and reporting is supported by monthly reports and regular webinars in which the management board informs the global management team about the current business development, outlook and goals.
Based on the outlined analytical tools and processes, ADVA ranked 14 risks as major risks at the end of 2020 (end of 2019: 20), which are discussed in detail below. The lower number of major risks compared to 2019 mainly results from the increase in threshold applied (see above). The change in threshold was made to set the focus on the most important risks.
The risks and opportunities of ADVA Optical Networking SE essentially correspond to those of the group. In addition to the risks listed here, there is also a risk with regards to the fluctuation of income from investments and the recoverability of shares in affiliated companies. ADVA Optical Networking SE does not consider this risk to be material.
Combined management reportRisk and opportunity report
58 ADVA – Annual report 2020
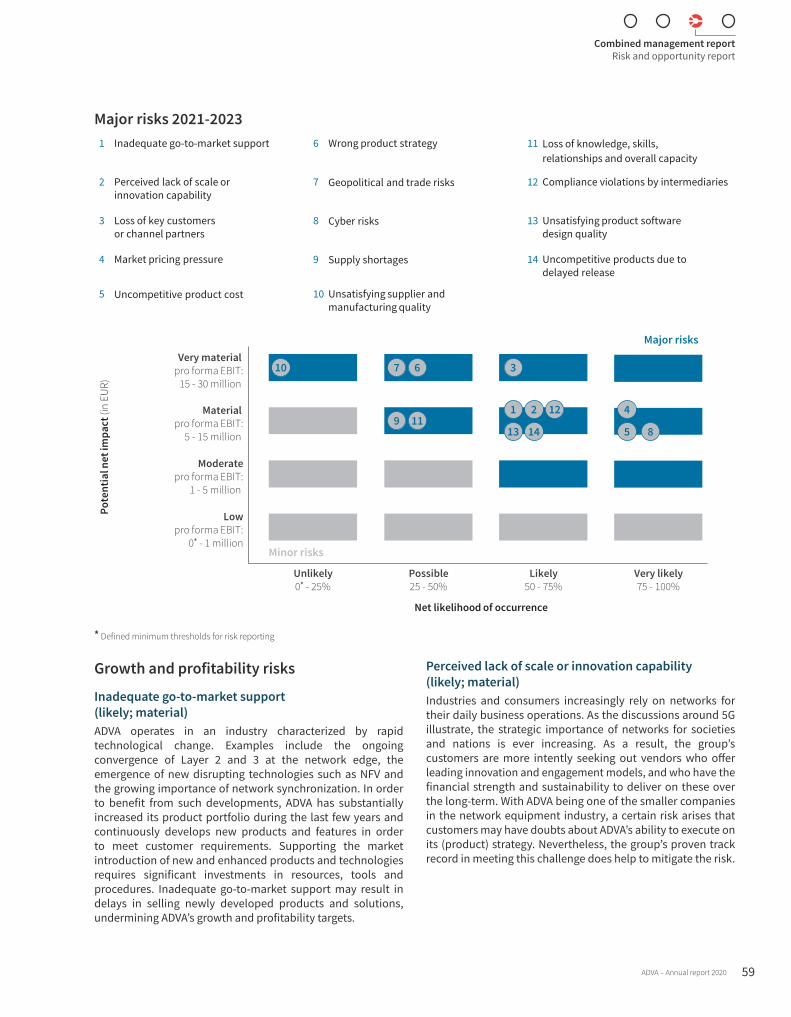
Major risks 2021-2023Po
tent
ial n
et im
pact
(in
EUR)
Very material pro forma EBIT:
15 - 30 million
Material pro forma EBIT:
5 - 15 million
Moderate pro forma EBIT:
1 - 5 million
Lowpro forma EBIT:
0* - 1 million
Unlikely0* - 25%
Possible 25 - 50%
Likely 50 - 75%
Very likely 75 - 100%
Net likelihood of occurrence
Minor risks
Major risks
2
3
41
7 610
98
1211
13 14 5
1 Inadequate go-to-market support 6 Wrong product strategy 11 Loss of knowledge, skills,relationships and overall capacity
2 Perceived lack of scale or innovation capability
7 Geopolitical and trade risks 12 Compliance violations by intermediaries
3 Loss of key customers or channel partners
8 Cyber risks 13 Unsatisfying product softwaredesign quality
4 Market pricing pressure 9 Supply shortages 14 Uncompetitive products due todelayed release
5 Uncompetitive product cost 10 Unsatisfying supplier andmanufacturing quality
* Defined minimum thresholds for risk reporting
Growth and profitability risks
Inadequate go-to-market support (likely; material)ADVA operates in an industry characterized by rapid technological change. Examples include the ongoing convergence of Layer 2 and 3 at the network edge, the emergence of new disrupting technologies such as NFV and the growing importance of network synchronization. In order to benefit from such developments, ADVA has substantially increased its product portfolio during the last few years and continuously develops new products and features in order to meet customer requirements. Supporting the market introduction of new and enhanced products and technologies requires significant investments in resources, tools and procedures. Inadequate go-to-market support may result in delays in selling newly developed products and solutions, undermining ADVA’s growth and profitability targets.
Perceived lack of scale or innovation capability (likely; material)Industries and consumers increasingly rely on networks for their daily business operations. As the discussions around 5G illustrate, the strategic importance of networks for societies and nations is ever increasing. As a result, the group’s customers are more intently seeking out vendors who offer leading innovation and engagement models, and who have the financial strength and sustainability to deliver on these over the long-term. With ADVA being one of the smaller companies in the network equipment industry, a certain risk arises that customers may have doubts about ADVA’s ability to execute on its (product) strategy. Nevertheless, the group’s proven track record in meeting this challenge does help to mitigate the risk.
Combined management reportRisk and opportunity report
ADVA – Annual report 2020 59
Loss of key customers or channel partners (likely; very material)The loss of key customers or channel partners would have significant impact on ADVA’s business and may arise from changes in customer demands and the group’s ability to meet them, or mergers and acquisitions of existing customers that result in the decision to consolidate vendors and technology partners in a way that either reduces or eliminates ADVA’s share of the consolidated entity’s spend. However, for most key revenue customers, the group has deployed thousands of systems over a multi-year period which are integrated in operational workflows and processes and, as a result, there is a certain dependency on ADVA and its products. For key customers and channel partners, the group furthermore ensures continuous performance and satisfaction through a dedicated team of professionals. While Covid-19 had some short-term stimulating effects on the telecommunications industry, the long-term impact depends on many factors, particularly how long the pandemic will last and how long and deep any associated economic recession will be. The UK is a highly important sales market for ADVA with one of its main customers operating there. Preventive measures were taken to avoid delays in deliveries due to Brexit and to maintain the same service levels as in the past. It is unclear though what impact the Brexit will have on the UK and on ADVA’s customers’ businesses on the long term.
Market pricing pressure (very likely; material)Procurement is a key focus area for customers and their cost-saving initiatives. Purchases, especially for multi-year projects, are often conditioned on gradual price decreases. In addition, several products are essentially being commoditized with many competing vendors. The group has many preventive action plans in place. Most important is its focus on innovation. In order to successfully defend higher prices, the group consistently pushes the limits of new technology in its products, improves its processes, and communicates the value, reliability, scalability, cost-effectiveness, performance and technological leadership of its solutions to all of its customers.
Innovation risksUncompetitive product cost (very likely; material)ADVA achieves cost advantages through its ability to scale economically and through the optimization of product design. The loss of competitive product cost would drastically reduce the group’s success in winning new business and would have a negative effect on gross and operating margins. The significant pricing pressure for innovative connectivity solutions must be met strategically by improving processes, controls and technology while maintaining adequate R&D budgets, as well as operationally by achieving cost leadership in sourcing product components. A dedicated team identifies competitive price and cost targets for new products, monitors product cost changes throughout the development process and negotiates, tracks and forecasts product and related component costs. Achievement of the group’s annual cost reduction targets for sourcing components is monitored by monthly and quarterly status reports to the group’s management board. The establishment of parallel production lines in different territories to mitigate geopolitical and supply chain risks (see below) leads to an increase in capital expenditures and operational cost. ADVA diligently assesses the advantages and disadvantages of second sources and parallel production lines versus the additional cost incurred.
Wrong product strategy (possible; very material)The market for innovative connectivity solutions for cloud and mobile services is highly competitive and subject to rapid technological change. Competition in this market is characterized by various factors, such as price, functionality, service, scalability and the ability of systems to meet customers’ immediate and future network requirements. Another competitive factor which is gaining importance is sustainability. Should ADVA be unable to quickly adapt to changing market conditions, customer requirements or industry standards, the group’s development would be impacted negatively. Since some of the group’s competitors operate in a broader market and have considerably more resources available due to their greater size, ADVA must continue to focus its efforts on those technologies and features that are expected to supersede the current ones. The likelihood of wrong development decisions is minimized by a series of preventive actions that include running advanced technology projects, running a team of navigators to decide on strategic direction, industry and competitor analysis, keeping the group’s development roadmap up-to-date, testing product visions with customers, monitoring and influencing standardization and staying close to customers in order to identify differentiating technology opportunities. In addition, the group has implemented a highly flexible and adaptive development organization and processes to quickly adjust to changing requirements.
Combined management reportRisk and opportunity report
60 ADVA – Annual report 2020
Operational excellence risksGeopolitical and trade risks (possible; very material) The U.S.-China trade conflict has evolved to be more than a dispute over the existing bilateral trade imbalance, but also the future technology leadership (5G technology, computing, semiconductors, etc.) and national security concerns. Growing trade tensions emerged also between the U.S. and the European Union (EU) and may result in higher tariffs and more non-tariff barriers that could be slowing down trade on both sides. Uncertainty also exists with regards to the Brexit and the short and mid-term implications on the UK’s economic growth and trade volume with the EU. With tariffs and other forms of trade barriers being increasingly used as tools to enforce a political agenda, a flexible supply chain and manufacturing process that is less dependable on and can react swiftly in response to political decisions is key in preparing ADVA for 2021 and beyond. It is part of ADVA’s plan to lessen the dependency on China which is followed through with additional qualifying contract manufacturing sites in Southeast Asia. Since more customers are asking for products originating from TAA designated countries, ADVA is also planning to significantly increase its European manufacturing operations. The expected increase in manufacturing unit cost due to the higher labour cost in Europe, is planned to be reduced by higher grades of automation and robotics.Glossary: page 154
Cyber risks (very likely; material) The integrity, confidentiality and availability of our information systems and data is key for the functioning of our business processes and consequently for the company’s success. Cyber-attacks against organizations are increasing worldwide in both, quantity and quality, and attackers are more frequently targeting midsize companies like ADVA. Cyber-crimes are committed by a wide range of perpetrators ranging from single hackers to professional organizations partially operating on behalf of national governments. The motives for cyber-attacks are similarly wide ranging from ransom extortion to industrial espionage and sabotage. Preventing from, and combatting cyber threats is a never-ending challenge which in ADVA is accomplished by a series of measures. These include among others the continuous monitoring of the information security risk landscape, making staff aware for cyber threats through adequate trainings, fast patch management, restrictive access right management, a centralized information technology function which enforces rigid and global security policies, regular review of the information technology disaster recovery plan and incident management as well as network, system and application monitoring. Although information security measures are continuously improved and adapted to combat new threat profiles, there is no guarantee that the measures will prevent ADVA from cyber-crimes.
Supply shortages (possible; material) ADVA sources product components either based on forecasts or upon receipt of a customer purchase order. Any shortage in the required material can thus have a significant negative impact on the group’s performance. This may be caused by natural disasters which are expected to occur in higher frequency and at larger scales due to the climate change, pandemics, political conflicts, or specific problems of a supplier. Some components undergo strongly varying demand cycles. Particularly semi-conductor capacities notoriously fluctuate between supply shortages and over-capacities. The unexpected strong recovery of the China economy after the Covid-19 downturn coupled with the growing demand for electric cars and consumer goods, is likely to result in capacity shortages at semiconductor foundries and in extended lead times and rising prices. For mitigation, ADVA implemented tool-based processes for demand forecasting as well as the structured identification and consistent monitoring of suppliers, in particular suppliers of single source components. This includes the introduction of alternatives during the design phase of a new product. Since the breakout of Covid-19, supply chain management closely monitors the development of infections and political agendas in the countries ADVA is doing business in or is sourcing materials or manufacturing products to early identify potential interruptions and derive mitigating activities. ADVA also prepared itself for the expected interruptions caused by the Brexit. Among other measures ADVA built up buffer stocks for UK customers in British territory. It is unclear though whether these measures will be sufficient to fully satisfy customer demands.
Unsatisfying supplier and manufacturing quality (unlikely; very material)ADVA’s product quality is significantly influenced by its suppliers and contract manufacturers. Failure of a single part may cause the whole system to be dysfunctional. Early detection of component as well as production deficiencies is thus critical for the group’s success. Deteriorating quality levels could not only lead to delays in installation, return of products or cancellation of orders, but also to penalties and lawsuits, contract terminations and liability claims. Preventive actions to avoid quality deterioration include close collaboration with key suppliers during the development of critical components, structured and tool-based processes for supplier and manufacturer identification and qualification, robust contracting including adequate indemnifications, and regular audits of key suppliers and all manufacturers.
Combined management reportRisk and opportunity report
ADVA – Annual report 2020 61
People risksLoss of knowledge, skills, relationships and overall capacity (possible; material)The digital transformation continues at a rapid pace and has led to a permanent shortage of skilled workers within the technology industry. While particularly intense in developed countries, competition for talent is fierce all over the globe. As a result, the group is continuously challenged to retain and nurture its employees in order not to lose their knowledge, skills and relationships required to develop, sell and maintain the group’s innovative products and solutions. The global economic downturn due to Covid-19 followed by hiring freezes and layoffs seen in organizations worldwide slowed down the battle for talent. However, we assume this effect to be of temporary nature, only.
Compliance violations by intermediaries (likely; material)ADVA markets its products and solutions in part via a variety of distribution partners due to required economies of scale, local (legal) requirements and in order to benefit from existing contractual as well as personal relationships and post-sale support organizations and capabilities. While the group’s ability to control the partners’ activities are limited, compliance violations by intermediaries may, under specific circumstances, be attributed to ADVA. For mitigation, ADVA implemented robust risk-based due diligence procedures including upfront vetting of new intermediaries and periodic reviews and updates. In addition, ADVA’s sales agreements contain clauses in which the intermediaries guarantee compliance with the rules. Existing commission-based compensation is tightly controlled and new contracts are avoided where possible.
Customer ExperienceUnsatisfying product software design quality (likely; material)ADVA develops, manufactures and sells solutions for a modern telecommunication infrastructure. While mostly hardware based, it is increasingly software that drives the product performance and feature set. In order to support ADVA’s growth targets by addressing a maximum number of customer needs, the group’s limited R&D resources need to support a growing number of features. To enable this, the group applies a software development methodology commonly referred to as “Agile.” It is embedded into a tool-assisted development and release process supported by continuous transparency and reporting on the achieved quality levels.
Uncompetitive products due to delayed release (likely; material)High competition and rapid technological change are the decisive characteristics of the market for innovative connectivity solutions for cloud and mobile services. Continuous success not only requires the identification of innovative solutions for future network and customer requirements by maintaining cost leadership, but to also release such innovations at the projected time as delays may undermine their competitiveness. As a result, ADVA implemented a joint development and operations organization (DevOps) clustered into technology value streams to maximize effectiveness and break up barriers. All value streams operate according to one common tool-supported development process. Glossary: page 154
Combined management reportRisk and opportunity report
62 ADVA – Annual report 2020

Minor and financial risksBeyond the discussed 14 major risks, there is a broad range of minor risks that can also have a negative impact on ADVA. These uncertainties include financial risks such as the inability to secure financing, the risk of early maturity of loans due to the breach of material contractual obligations in connection with loan agreements totaling EUR 63.0 million and committed borrowing facilities totaling EUR 50.0 million as well as the risk of customer defaults, foreign currency risks despite of ADVA’s efforts to reduce the exposure by natural hedging and by the partial hedging of excess foreign currency flows, balance sheet risks such as the impairment of intangible assets and changes in interest rate levels. Uncertainties also exist with regards to the timing of carrier investment cycles and to distribution partnerships, to legal risks pertaining to potential claims under product and warranty liabilities as well as patent rights, to people related risks including bribery, corruption, harassment and discrimination and to secure confidentiality of personal and business sensitive data. Moreover, to general macro-economic risks and risks related to acquisitions. However, the management board of ADVA does not consider any of these or other uncertainties to have a major impact on the group in case of their occurrence. Glossary: page 154
Changes to the overall risk situation and classified major risks in 2020During 2020, the number of ADVA’s major risks decreased by six mainly due to the increased threshold for risks classified as major risk (EUR 3 million and higher versus EUR 1 million and higher before). Cyber risks are newly reported as a major risk taking into account the higher risk exposure for mid-size companies described above. The risk “global tariffs” evolved into the broader risk “geopolitical and trade”. In summary, twelve risks remained largely unchanged, one risk was added, and one was extended in scope. Seven risks reported as major risks so far are now considered as minor risks due to the changed thresholds. The group’s Net Promoter Score recovered in 2020 and met the target of 50% (2019: 44%). The Covid-19 pandemic marked the most important change in the overall risk situation in 2020 compared to 2019. Particularly the risk of interruptions of the supply chain was omnipresent and required close monitoring of the Covid-19 situation in the countries in which ADVA purchased, manufactured and sold its products. The ADVA staff was protected from the very beginning by extensive hygiene measures and home office use. The direct and indirect impact of Covid-19 on ADVA’s business results was marginal though.
Opportunity identificationThe identification of opportunities is largely identical to the processes, tools and concepts as described in the “risk management system” section above. The annual definition of the group’s opportunities is supported by the management board, which has regular discussions with key customers and industry thought leaders in order to identify new opportunities and technological trends. Throughout the group, agile processes maximize the group’s ability to take advantage of newly identified trends. Current major opportunities are as follows:
Market share gains in europe (very likely; very material)The Covid-19 pandemic has highlighted the economic importance of digitization and a high-performance communications infrastructure and has prompted a rethink in politics and business. The use of device technology with questionable origin is now viewed very negatively, especially with regards to the expansion of 5G and the industrial applications associated with it. In many industrialized nations of the Western world, the dependence on large Chinese network equipment suppliers, in particular Huawei, is perceived as a serious threat. After the USA, the affected network operators in Europe are now also working on concepts to free themselves from this dependency and are actively looking for alternatives. For ADVA, as an established company headquartered in Europe, the new dynamics create additional opportunities.
Acquisition of new key customers and distributors in the U.S. (very likely; very material)Telecom equipment customers typically enter into long-term relationships with their suppliers. Their installed systems usually have a deep impact on their operating processes and procedures, and a complete switch to a new supplier often involves considerable expenditure of time and money. Nevertheless, customers sometimes switch suppliers, whether for better prices, improved quality, to further develop networks, or because of corporate policy decisions. The political headwinds facing Chinese vendors, especially Huawei, in Europe and the United States present a major opportunity for ADVA to win new customers over the next 24 months. The US government launched a USD 1.9 billion program to replace Huawei and ZTE network equipment in communications networks. The program targets around 50 communications network operators who, if they are not already ADVA customers, represent potential new customers for ADVA. The Rural Digital Opportunity Fund (RDOF) provides USD 20 billion to US network operators for rural broadband expansion. This is another great opportunity for ADVA to acquire new customers. ADVA will systematically exploit these opportunities using an appropriate methodology.
Combined management reportRisk and opportunity report
ADVA – Annual report 2020 63
Portfolio cross-selling based on unified network management software (likely; material)ADVA operates in three distinct technology segments: open optical transmission technology, programmable cloud access solutions and high-precision network synchronization. In addition to a variety of opportunities in each of these technology areas, the group sees a high likelihood of cross-selling between technologies supported by common network management software and cross-product security concepts. In recent years, ADVA has consolidated several previously separate software platforms into a common architecture that supports all technology areas. As this platform is used by several hundred of the group’s customers, who typically have requirements for all three technology areas but are existing customers in only one or two areas, there are significant cross-selling opportunities.
Additional demand for packet-based access solutions with increasing software content (likely; material)With the introduction of 5G and the emergence of edge computing solutions, CSPs are redefining their strategies in the network access space. ADVA has invested heavily in expanding its cloud access portfolio to help CSPs find new revenue streams. As a result, ADVA has the world’s most comprehensive portfolio of fiber-based Ethernet access and aggregation solutions that enable industry-leading data transmission. In addition to FSP 150 hardware, ADVA’s Ensemble software portfolio provides virtual network solutions that enable CSPs to offer new services to enterprise IT departments. NFV enables CSPs to quickly create and deploy new services anywhere in the world. Driven by close partnerships with some of the world’s leading enterprise IT suppliers, the group sees the potential for numerous new customer wins and a higher share of software revenue in this area.Glossary: page 154
Additional demand for services through use of machine learning (ML) and artificial intelligence (AI) (likely; material) In the past fiscal year, ADVA was able to further increase its contribution to revenues through services. More and more customers are using the company’s range of services in the planning, construction and commissioning of their networks. In addition, there are contracts for the maintenance and protection of networks already in operation. ADVA is continuously expanding its service catalog, for example using ML and AI to offer new services for improved network resilience. The pandemic has increased demand for all services and further significant revenue increases are possible.
Information technology security (highly likely; material)Large enterprises and government agencies are concerned about the security of their data and business processes and are therefore building new data backup and data storage solutions, which in turn require transmission technology to link sites. In addition, the EU’s General Data Protection Regulation (GDPR), which came into force in 2019, is leading to increased data protection requirements for all companies operating in Europe. A few years ago, network technology primarily had to provide cost-effective bandwidth. Today, the focus is increasingly on security. This inevitably has an impact on the technical realization of the cloud as well as customers’ selection of manufacturers. ADVA is the one remaining European specialist in optical transmission technology and a reliable partner for thousands of companies. Its ConnectGuard™ security portfolio offers customers comprehensive protection in different network scenarios and brings numerous competitive advantages. ADVA, as a European company with strong visibility and presence with data center and network operators worldwide, anticipates a positive market environment with additional opportunities in security-related infrastructure. Glossary: page 154
New markets for synchronization solutions (very likely; material)In addition to mobile network operators’ increasing demands for high-precision synchronization solutions, ADVA’s Oscilloquartz technology is gaining traction in other applications. Synchronization of global databases of internet content providers, accuracy of timestamps for financial trading, synchronization of power grids with distributed generation, time distribution in digital infrastructure deployment, and synchronization of media networks all offer additional opportunities for this technology segment.
Expansion of addressable market and share gains through decarbonization (possible; material)According to current knowledge, climate change and the resulting threats to our planet are largely due to high CO2 emissions worldwide. The transport of goods and people has played a not insignificant role in this. In addition, of course, the energy consumption of communication networks is also increasing as data traffic grows. This creates opportunities for ADVA: on the one hand, the lockdown in many parts of the world has shown that numerous economic processes, as well as processes of daily life, function with significantly less mobility. Home office and video conferencing have significantly reduced the need for business travel. The aspect of “green thanks to ICT” – i.e., more resource-efficient processes through the use of communications technology to replace the need for trips and flights – is stimulating digitization efforts around the world and having a positive effect on the growth of ADVA’s addressable market. On the other hand, ADVA’s activities in the
Combined management reportRisk and opportunity report
64 ADVA – Annual report 2020

area of sustainability are highly advanced. These are described in detail in the separately published sustainability report. The company’s efforts to sustainably reduce the energy efficiency of its products as well as its own operational processes have been recognized by numerous organizations and go well beyond the commitment of direct competitors, especially from the US and the Far East. The company’s innovation can reduce the energy consumption of communications networks. ADVA’s customers, some of whom have set very ambitious climate targets, benefit from these improvements and appreciate the company’s efforts. Now that some countries even require CO2 levies to be paid, this also creates an economic advantage for network operators and, in turn, a competitive advantage for ADVA.
Additional sales opportunities from ongoing market consolidation (possible; material)Vendor consolidation in optical transmission technology will continue. In 2019, an Israeli competitor of the group was acquired by a US technology company. This acquisition further reduces the number of independent companies focusing on optical network solutions. ADVA is the remaining European specialist in this technology and has built a positive reputation among its customer base. Through the acquisition of Overture in 2016 and the acquisition of MRV in 2017, the group itself has contributed to the ongoing industry consolidation and gained strength and relevance. A consolidated competitive landscape can lead to slower market price erosion and new opportunities for ADVA to win additional customers as a primary or secondary supplier.
Vertical integration for cost reductions in product components and new markets (likely; moderate)ADVA is increasingly investing in the development of component technologies. These investments enable greater vertical integration and greater independence from suppliers. On the one hand, this leads to an improved cost structure for certain functions in ADVA’s systems. On the other hand, ADVA benefits from an expansion of the total addressable market (TAM). The newly launched MicroMux family of pluggable transceivers will make a positive contribution to consolidated revenues and margins in 2021 and beyond, with strong growth potential.
Changes to the overall opportunity situation and the classified major opportunities in 2020Compared to the previous year, the company believes that its opportunities have increased in all aspects: number, likelihood as well as materiality. Particularly the efforts of the western developed countries to remove Huawei and ZTE equipment from their networks provide new opportunities in a consolidating market. Coupled with increasing demands driven by information security requirements, high-precision synchronization required by new customer groups as well as its new range of software and service offerings, ADVA has a strong foundation for great performance.
Overall opportunity and risk assessmentBased on careful inspection of the group’s opportunity and risk profile at the time of the preparation of the combined management report, the management board of ADVA believes that the group’s opportunities in the market for innovative connectivity solutions for cloud and mobile services outweigh the risks identified. The management board has not identified any risks that pose a danger to ADVA’s survival or endanger the future of the group. Apart from the direct and indirect threats of the persistent Covid-19 pandemic, ADVA’s overall balance between opportunity and risk has improved compared to the time of the publication of the 2019 combined management report. The management board has not identified any risk which would endanger the going concern of the ADVA group.
Combined management reportRisk and opportunity report
ADVA – Annual report 2020 65
Internal controls related to financial reportingThe management board of ADVA is responsible for establishing and maintaining an adequate system of internal controls. It has implemented an internal control system that enables the management board to ensure completeness, accuracy and reliability of financial reporting at group and legal entity level. When designing its internal control system, ADVA used the COSO framework as a key reference and source of guidance. The internal control over financial reporting is designed to provide reasonable assurance regarding the reliability of financial reporting. No system of internal control over financial reporting, including one determined to be effective, may prevent or detect all misstatements.
Control environmentThe control environment is the foundation of the internal control system in every organization. ADVA fosters an environment of openness and integrity with a clear commitment to excellence, competence and the development of its employees. The group’s leadership principles of integrity/honesty, decisiveness and respect are based on this philosophy, and the culture is reflected in the overall tone set by the management board. ADVA has a clear organizational structure with well-defined authorities and responsibilities. The bodies charged with the governance and control of the group actively participate in the running and steering of the business. The business is managed on a global basis and run via functional areas. Financial steering of the group and financial stewardship for individual legal entities is handled by the chief financial officer, under the audit committee’s control.
Risk assessmentAs part of the internal controls related to financial reporting, the risk assessment follows the process described in the “risk management system” section.
Control activitiesAt an individual entity level, ADVA’s larger and more complex business units use an integrated enterprise resource planning solution, which also serves as general ledger system. Information technology controls have been implemented to restrict user access, ensure proper authorization of changes to the system and efficient handling of user help desk requests. Specific processes are defined and applied for the following reporting cycles in these business units: cash reporting, revenue recognition, accounts payable, capitalization of development expenses and recognition of subsidies for research, inventory reporting, fixed assets, payroll and provisions. ADVA carries out monthly analytical reviews and quarterly balance sheet reviews based on a four-eye principle between the local accounting and the consolidation functions.
For the consolidated financial statements, the balance sheet and income statement positions requiring a significant degree of judgment and estimation when being valued are determined and analyzed with the involvement of management. This is the case for impairment testing reviews (annual or when a triggering event occurs), capitalization of development projects (when the industrialization stage is reached) and tax reporting, specifically deferred taxes (quarterly). ADVA additionally carries out monthly intercompany reconciliations as part of the consolidation process and analytical reviews of actual vs. expected results based on a four-eye principle between the financial planning and the consolidation functions.
All business units follow a set of global accounting policies and reporting guidelines applying to the whole group. The financial statements preparation process is monitored globally via a calendar that is communicated to all involved parties on a monthly basis. Checklists are completed both in the individual business units and at the consolidation level to ensure completeness of all closing steps. Periodic reviews by group management are conducted to detect errors and omissions.
Information and communication toolsThe internal control system at ADVA is supported by tools to store and exchange information, enabling the management board to make informed business decisions about financial reports and disclosures. The following components ensure proper information and communication for financial reporting:
y Accounting systems for individual entities are matched to the degree of complexity of the business unit. For most entities, an integrated enterprise resource planning system, which also serves as general ledger system, is in place. All local accounts are mapped to the group chart of accounts, which is used group-wide.
y The group consolidation is supported by a database tool which is linked to the enterprise resource planning and financial planning systems via interfaces. The global financial planning system is used extensively in analyzing actual vs. expected results and thus monitoring the results of the consolidation.
y There are global accounting policies for the more complex financial statement positions of the group and a group chart of accounts for all other positions. Accounting policies are updated regularly and are implemented only after a thorough internal review and training.
Combined management reportRisk and opportunity report
66 ADVA – Annual report 2020
ADVA’s ConnectGuard™ Cloud technology ensures rigorous data protection for both our branches and our cloud locations. And, because it works without large additional data ballast, it also improves network utilization and reduces cost-per-encrypted-bit.“Karsten Geise, Head of business and product development, dacoso
Internal monitoringAs part of the ongoing monitoring, the chief financial officer is informed about all material misstatements and control breakdowns at group and business unit level on a quarterly basis in the executive summary to the financial statements. The reporting of deficiencies follows the principles of open and transparent communication. Follow-up is ensured through regular meetings where corrective actions are presented.
Internal financial auditADVA maintains an internal audit function to regularly assess financial processes and systems.
Based on an annual risk assessment, the internal audit function develops an audit plan proposal for the upcoming year. The proposed plan is presented to, aligned with, and finally ratified by the audit committee. The internal audit function performs internal audit reviews throughout the year according to the audit plan. Audit results are discussed with responsible managers. In case of identified process or system weaknesses, the internal audit function makes recommendations and improvement actions are defined and agreed with the responsible manager(s). The progress of these and their success in removing the identified weaknesses is reviewed by the audit function. The state of internal auditing is reported quarterly to the audit committee and includes feedback about the progress of audits performed versus the audit plan, about the results of terminated audit reviews and about improvements resulting from actions taken.
Combined management reportRisk and opportunity report
ADVA – Annual report 2020 67
OUTLOOKThe statements in this chapter apply to the ADVA group as well as to ADVA Optical Networking SE. Further details on the projected market environment, as well as the resulting opportunities, can be found in the “General economic and market conditions” section and in the “Business overview” section.
The year 2020 was overshadowed by the global Covid-19 pandemic. With the rising spread of infection rates at the beginning of the year, uncertainties for the global economy began to grow. At the beginning of the Covid-19 crisis, ADVA was one of the first companies to point out in the 2019 management report that the city of Wuhan in China is a center for optoelectronic components and that supply constraints were to be expected due to lockdowns and plant closings that were being imposed. After the virus spread globally, the greatest risks for ADVA were the maintenance of supply chains and a possible decrease in demand. The company reacted swiftly and transferred around 80% of its workforce to a home-office environment. In addition, the company developed a strategy to absorb potential production and supply constraints due to a possible site closure by relocating to another site. Since there were only temporary interruptions in the supply chain, the delays in customer deliveries were largely made up in the third quarter, before further delays occurred in the fourth quarter due to renewed tightened lockdown measures. In addition, the management analyzed and selectively used government subsidy measures at an early stage and concluded a KfW credit line that can be used in the event of a significantly worsening Covid-19 crisis scenario.Glossary: page 154
Like many other companies, ADVA decided to suspend its annual guidance for 2020 due to the high level of uncertainty. However, it quickly became obvious that the telecommunication industry would be less affected by the crisis than other industries. The importance of a functioning telecommunication infrastructure was increasing over time and it became even more evident during the lockdowns. ADVA’s technologies and services are critical to some of the world’s most critical network infrastructures and formed the foundation for secure and reliable data traffic during the crisis. Many system-relevant functions such as emergency communication, remote working and e-learning use ADVA’s technology. As a result, the demand from network operators and internet content providers was pleasingly robust. Only certain reluctance with private enterprise customers was experienced. The management board decided to publish new guidance in October, after revenues and profitability increased sequentially in the second and third quarter and visibility improved over the remainder of the 2020 financial year. The management board now expected revenues between EUR 565 and EUR 580 million and a pro forma operating income margin between 5% and 6%.
ADVA reached the guidance with revenues of EUR 565 million and a pro forma operating income margin of 6%. While revenues were at the lower end of the guidance corridor, the pro forma operating income margin met the upper end of the guidance corridor.
The opposing trends in revenues and profitability were partly due to the further weakening of the US dollar against the euro, which was particularly noticeable in the second half of the year. Nonetheless, total revenues increased by 1.5% compared to the previous year.
At the beginning of the financial year, the company suffered high losses due to additional costs of maintaining the supply chain, shifting high-margin revenues to the following quarter and additional expenses resulting from the cost-reduction program. However, ADVA was able to make up for these effects in the second quarter and further increased profitability over the course of the year. The cost improvement measures took effect and demand for higher-margin products increased. The software and service stake in particular grew to over 20% of total sales for the first time. The network synchronization technology area also had a successful business year. The pro forma operating income also benefited from less travel and marketing activities and a weaker US dollar. Finally, the pro forma operating income margin increased by 1.5 percentage points compared to the previous year. In absolute terms, the pro forma operating income was EUR 33.8 million, an impressive increase of 36.4% compared to 2019 (2019: EUR 24.8 million).
Net debt stood at EUR 25.5 million at the end of 2020, a significant improvement of 58.2% compared to 2019 (EUR 61.1 million). This exceeded the original goal of reducing net debt in the single-digit percentage range. Moreover, excluding the application of IFRS 16, the company achieved a net liquidity position of EUR 2.3 million. This is particularly due to significantly higher profitability compared to 2019. In addition, the company made scheduled repayments of EUR 18.5 million and fully repaid the revolving credit facility, which, as risk mitigation measure had been fully utilized by EUR 10.0 million in the meantime. Consequently. With a leverage below one ADVA improved its very solid balance sheet position and financial headroom. Against this background, the management decided in January 2021 to prematurely terminate the KfW credit line for the amount of EUR 40.0 million.Glossary: page 154
As for customer satisfaction, ADVA uses the net promoter score to track progress. With just over 50%, the company was able to significantly improve the value from the previous year (44%) and was again able to exceed the high positive level of at least 40% aimed at by the management board. Customer.guru (https://customer.guru/net-promoter-score) - a net promoter score survey and benchmarking tool - provides estimates for ADVA’s peer group. According to this portal, ADVA’s net promoter score is more than 10 percentage points higher than the best score in this peer group.
Combined management reportOutlook
68 ADVA – Annual report 2020
Looking at the Covid-19 pandemic, economic experts expect the economy to recover in the course of the second quarter of 2021 and assume a sufficient immunization of the population through the vaccination measures from autumn at the earliest. Nevertheless, the medium and long-term consequences for individual economies cannot yet be assessed. Consequently, the risks to supply chains and on the demand side will remain. However, the current crisis substantially changed the view of the importance and relevance of various industries and has shown that high-performance communication networks are systemically relevant. Politics and business recognized that communication infrastructure plays an essential role in solving major social and economic problems and in shaping a sustainable future. ADVA is the only remaining European specialist in optical transmission technology and network synchronization. Growing security concerns with foreign manufacturers have created new opportunities and unique selling points for ADVA that will further strengthen the company’s market position in the future. With the investments made in recent years, ADVA’s technological set-up is well prepared for the transformation of networks with respect to cloud, mobility, 5G, automation and security. In addition to the high-quality performance features of optical data transmission, precise network synchronization technology and programmable cloud access solutions, the service portfolio also provides increasing added value. ADVA develops, manufactures and supplies communication technology for the digital future. The addressable market for ADVA is expanding steadily and reached approximately USD 16 billion in 2020. According to estimates by industry analysts, it will grow to USD 17 billion by 2024, while the possible additional opportunities resulting from the shift from Asian suppliers (especially Huawei) to European suppliers are not quantified (see also the chapter “market, target customers and growth drivers”).
The company established a mid-term strategy aiming on accelerating sales growth and further increasing profitability. The strategy is based on three pillars:
y Increase software and service contribution from currently 23% to over 30%
y Expansion into new markets with differentiated solutions in the areas of network synchronization and Ensemble software solutions. This will result in an increase in revenues with customers outside the group of traditional communication service providers from currently 30% to 40% of total revenues.
y Verticalization in technological value creation with a 15% revenue contribution from the business with optical submodules.
Glossary: page 154
In combination with continued stringent cost management, the management board expects in the mid-term a stable pro forma operating income margin in the high single-digit percentage range.
Against this background and taking into account the planning parameters, personnel and exchange rates, the management board expects annual revenues of between EUR 580 and 610 million for 2021. In addition, the management board expects to further increase pro forma operating income and expects a margin of between 6% and 9% in relation to revenues for 2021. At the end of 2020, net debt after the application of IFRS 16 accounting standards reached EUR 25.5 million. The aim of the company is to ensure rapid debt relief and consistent compliance with the defined objectives of capital management, which are described in Note (34) to the consolidated financial statements. For the financial year 2021, the management board expects a net debt in the single-digit million range.
The group will continue to selectively invest in product development, technology and revenue-generating opportunities. In addition, the management board expects, due to the continued focus on innovation, quality and service, that customer satisfaction measured by the net promoter score will once again be at high positive levels of at least 40%. Actual results may differ materially from expectations if risks materialize or the underlying assumptions prove unrealistic. The major risks facing ADVA are discussed in the “risk and opportunity report” section.
Combined management reportOutlook
ADVA – Annual report 2020 69
DECLARATION ON CORPORATE GOVERNANCECompliance with the rules of proper corporate governance is of great importance to ADVA - it is the foundation for the group’s success. According to section 289f and § 315d of the German Commercial Code (Handelsgesetzbuch, HGB) in connection with Principle 22 of the German Corporate Governance Code in the version dated December 16, 2019, ADVA Optical Networking SE is obliged to publish a “declaration on corporate governance”. ADVA publishes the “declaration on corporate governance” on the corporate governance page in the About us/Investors section of its website www.adva.com.
Meiningen, February 23, 2021
Brian Protiva Christoph Glingener
Ulrich Dopfer Scott St. John
Combined management reportDeclaration on corporate governance
70 ADVA – Annual report 2020

ADVA – Annual report 2020 71

Consolidated statement of financial position as of December 31, 2020 74
Consolidated income statement for the period January 1 to December 31, 2020 76
Consolidated statement of comprehensive income 77
Consolidated cash flow statement 78
Consolidated statement of changes in stockholders’ equity 80
Notes to the consolidated financial statements 82
Notes to the consolidated statement of financial position 97
Notes to the consolidated income statement 116
Other disclosures 121
Declaration of compliance with the German Corporate Governance Code 139
Affirmative declaration of the legal representatives 139
Independent auditor’s report 140

IFRS consolidated
financial statements
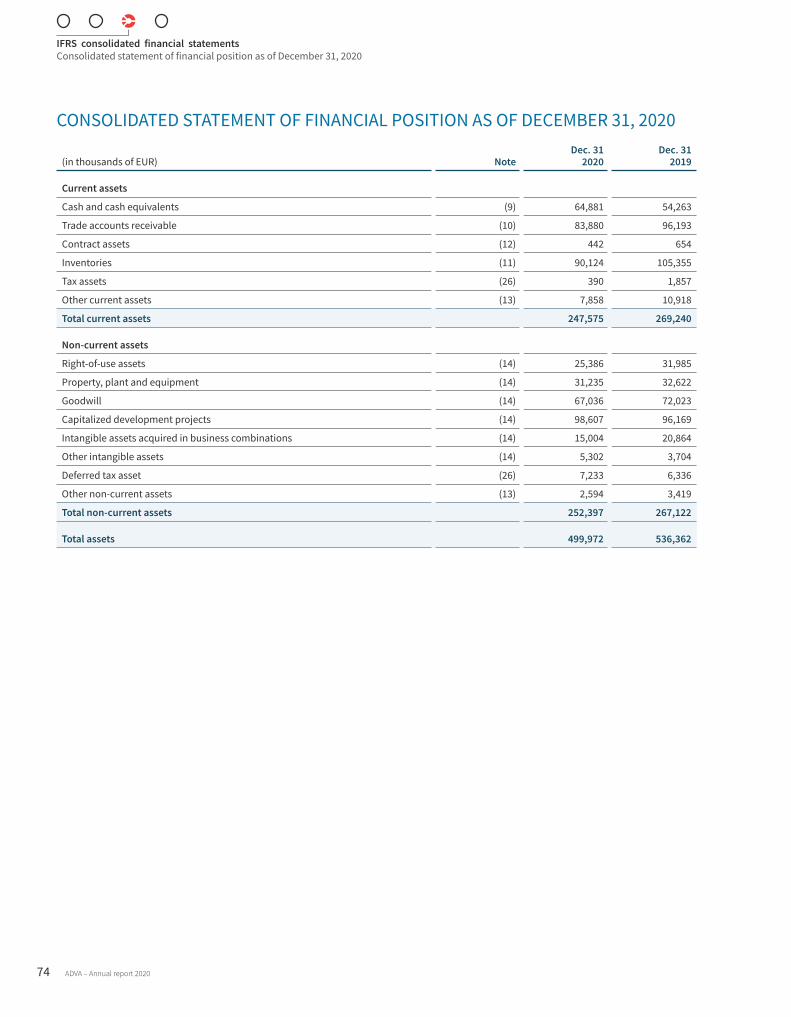
CONSOLIDATED STATEMENT OF FINANCIAL POSITION AS OF DECEMBER 31, 2020
(in thousands of EUR) NoteDec. 31
2020Dec. 31
2019
Current assets
Cash and cash equivalents (9) 64,881 54,263
Trade accounts receivable (10) 83,880 96,193
Contract assets (12) 442 654
Inventories (11) 90,124 105,355
Tax assets (26) 390 1,857
Other current assets (13) 7,858 10,918
Total current assets 247,575 269,240
Non-current assets
Right-of-use assets (14) 25,386 31,985
Property, plant and equipment (14) 31,235 32,622
Goodwill (14) 67,036 72,023
Capitalized development projects (14) 98,607 96,169
Intangible assets acquired in business combinations (14) 15,004 20,864
Other intangible assets (14) 5,302 3,704
Deferred tax asset (26) 7,233 6,336
Other non-current assets (13) 2,594 3,419
Total non-current assets 252,397 267,122
Total assets 499,972 536,362
IFRS consolidated financial statementsConsolidated statement of financial position as of December 31, 2020
74 ADVA – Annual report 2020

(in thousands of EUR) NoteDec. 31,
2020Dec. 31,
2019
Equity and liabilities
Current liabilities
Current lease liabilities (15) 5,807 6,082
Current liabilities to banks (16) 15,492 19,221
Trade accounts payable (17) 44,151 73,398
Current provisions (19) 14,407 14,379
Tax liabilities (26) 1,808 1,686
Current contract liabilities (20) 16,377 12,448
Refund liabilities (20) 633 709
Other current liabilities (17) 31,963 31,217
Total current liabilities 130,638 159,140
Non-current liabilities
Non-current lease liabilities (15) 21,998 28,348
Non-current liabilities to banks (16) 47,129 61,758
Provisions for pensions and similar employee benefits (18) 8,545 7,756
Other non-current provisions (19) 1,558 1,380
Deferred tax liabilities (26) 13,522 12,307
Non-current contract liabilities (20) 10,551 7,070
Other non-current liabilities (17) 2,813 2,811
Total non-current liabilities 106,116 121,430
Total liabilities 236,754 280,570
Stockholders’ equity entitled to the owners of the parent company (21)
Share capital 50,497 50,182
Capital reserve 320,715 318,568
Accumulated deficit -114,648 -121,693
Net income 20,314 7,045
Accumulated other comprehensive income -13,660 1,690
Total stockholders’ equity 263,218 255,792
Total equity and liabilities 499,972 536,362
IFRS consolidated financial statementsConsolidated statement of financial position as of December 31, 2020
ADVA – Annual report 2020 75
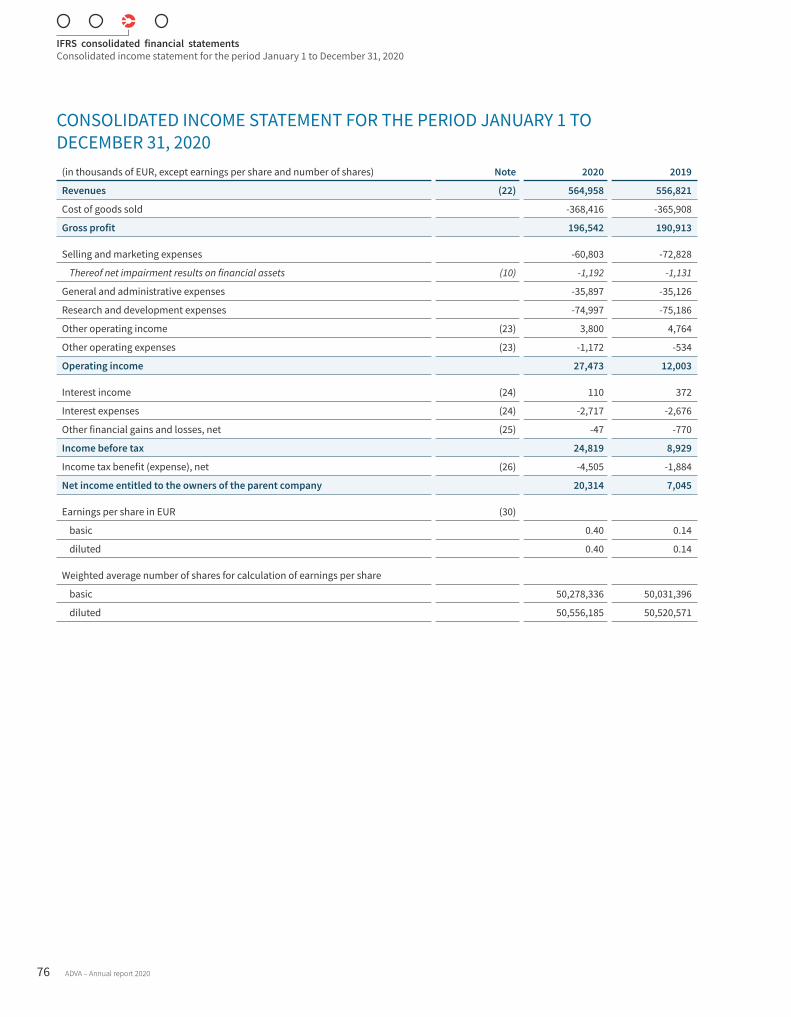
CONSOLIDATED INCOME STATEMENT FOR THE PERIOD JANUARY 1 TO DECEMBER 31, 2020
(in thousands of EUR, except earnings per share and number of shares) Note 2020 2019
Revenues (22) 564,958 556,821
Cost of goods sold -368,416 -365,908
Gross profit 196,542 190,913
Selling and marketing expenses -60,803 -72,828
Thereof net impairment results on financial assets (10) -1,192 -1,131
General and administrative expenses -35,897 -35,126
Research and development expenses -74,997 -75,186
Other operating income (23) 3,800 4,764
Other operating expenses (23) -1,172 -534
Operating income 27,473 12,003
Interest income (24) 110 372
Interest expenses (24) -2,717 -2,676
Other financial gains and losses, net (25) -47 -770
Income before tax 24,819 8,929
Income tax benefit (expense), net (26) -4,505 -1,884
Net income entitled to the owners of the parent company 20,314 7,045
Earnings per share in EUR (30)
basic 0.40 0.14
diluted 0.40 0.14
Weighted average number of shares for calculation of earnings per share
basic 50,278,336 50,031,396
diluted 50,556,185 50,520,571
IFRS consolidated financial statementsConsolidated income statement for the period January 1 to December 31, 2020
76 ADVA – Annual report 2020
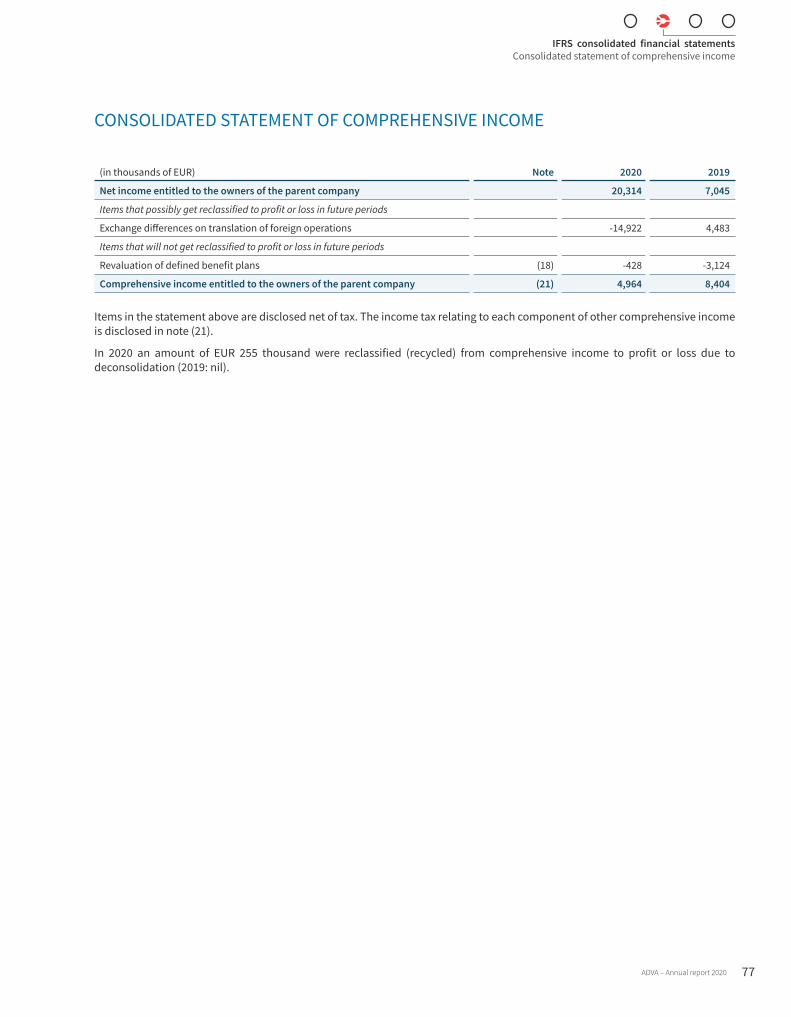
CONSOLIDATED STATEMENT OF COMPREHENSIVE INCOME
(in thousands of EUR) Note 2020 2019
Net income entitled to the owners of the parent company 20,314 7,045
Items that possibly get reclassified to profit or loss in future periods
Exchange differences on translation of foreign operations -14,922 4,483
Items that will not get reclassified to profit or loss in future periods
Revaluation of defined benefit plans (18) -428 -3,124
Comprehensive income entitled to the owners of the parent company (21) 4,964 8,404
Items in the statement above are disclosed net of tax. The income tax relating to each component of other comprehensive income is disclosed in note (21).
In 2020 an amount of EUR 255 thousand were reclassified (recycled) from comprehensive income to profit or loss due to deconsolidation (2019: nil).
IFRS consolidated financial statementsConsolidated statement of comprehensive income
ADVA – Annual report 2020 77
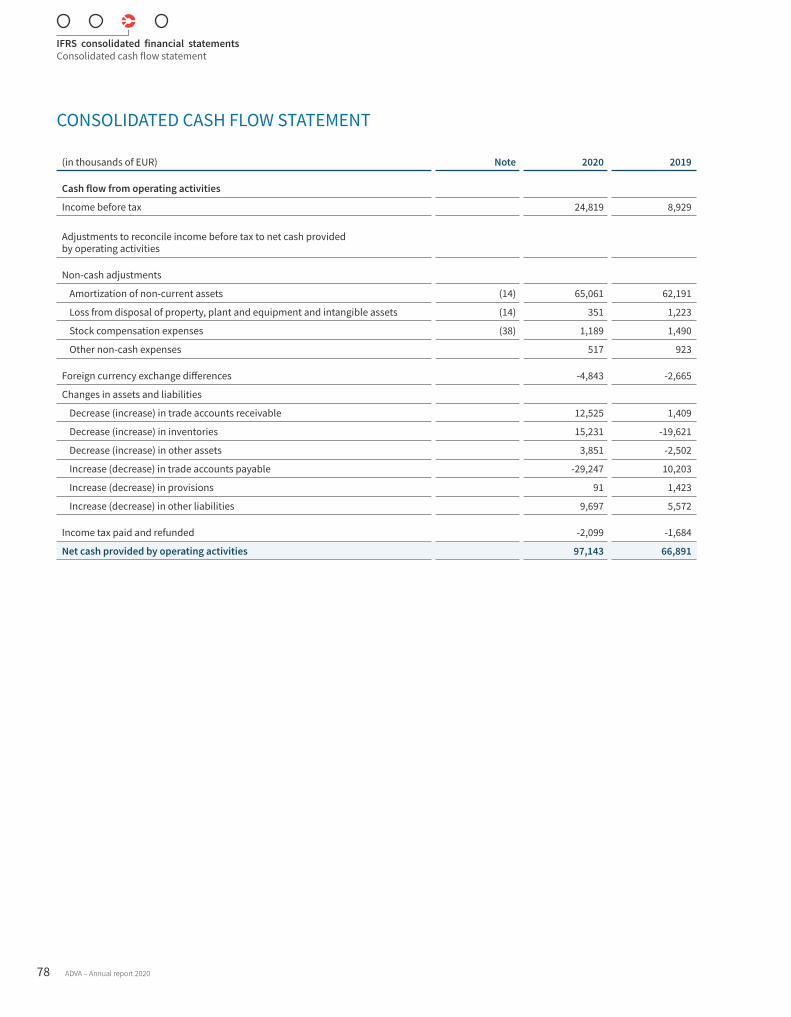
CONSOLIDATED CASH FLOW STATEMENT
(in thousands of EUR) Note 2020 2019
Cash flow from operating activities
Income before tax 24,819 8,929
Adjustments to reconcile income before tax to net cash provided by operating activities
Non-cash adjustments
Amortization of non-current assets (14) 65,061 62,191
Loss from disposal of property, plant and equipment and intangible assets (14) 351 1,223
Stock compensation expenses (38) 1,189 1,490
Other non-cash expenses 517 923
Foreign currency exchange differences -4,843 -2,665
Changes in assets and liabilities
Decrease (increase) in trade accounts receivable 12,525 1,409
Decrease (increase) in inventories 15,231 -19,621
Decrease (increase) in other assets 3,851 -2,502
Increase (decrease) in trade accounts payable -29,247 10,203
Increase (decrease) in provisions 91 1,423
Increase (decrease) in other liabilities 9,697 5,572
Income tax paid and refunded -2,099 -1,684
Net cash provided by operating activities 97,143 66,891
IFRS consolidated financial statementsConsolidated cash flow statement
78 ADVA – Annual report 2020
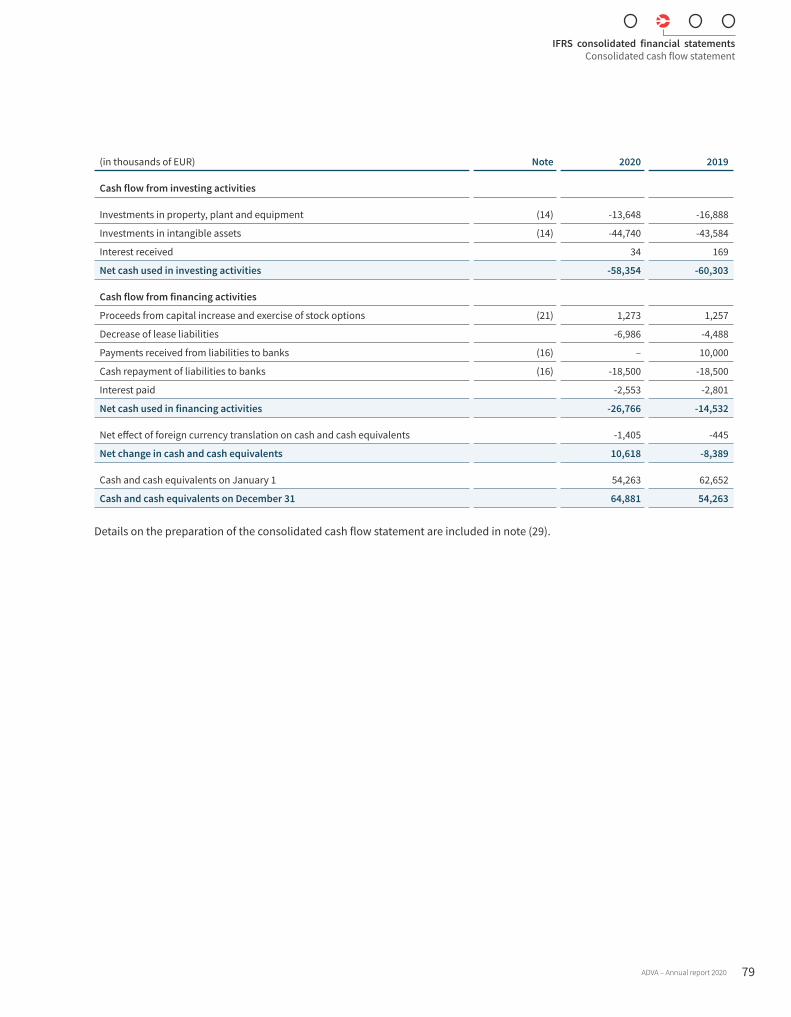
(in thousands of EUR) Note 2020 2019
Cash flow from investing activities
Investments in property, plant and equipment (14) -13,648 -16,888
Investments in intangible assets (14) -44,740 -43,584
Interest received 34 169
Net cash used in investing activities -58,354 -60,303
Cash flow from financing activities
Proceeds from capital increase and exercise of stock options (21) 1,273 1,257
Decrease of lease liabilities -6,986 -4,488
Payments received from liabilities to banks (16) – 10,000
Cash repayment of liabilities to banks (16) -18,500 -18,500
Interest paid -2,553 -2,801
Net cash used in financing activities -26,766 -14,532
Net effect of foreign currency translation on cash and cash equivalents -1,405 -445
Net change in cash and cash equivalents 10,618 -8,389
Cash and cash equivalents on January 1 54,263 62,652
Cash and cash equivalents on December 31 64,881 54,263
Details on the preparation of the consolidated cash flow statement are included in note (29).
IFRS consolidated financial statementsConsolidated cash flow statement
ADVA – Annual report 2020 79
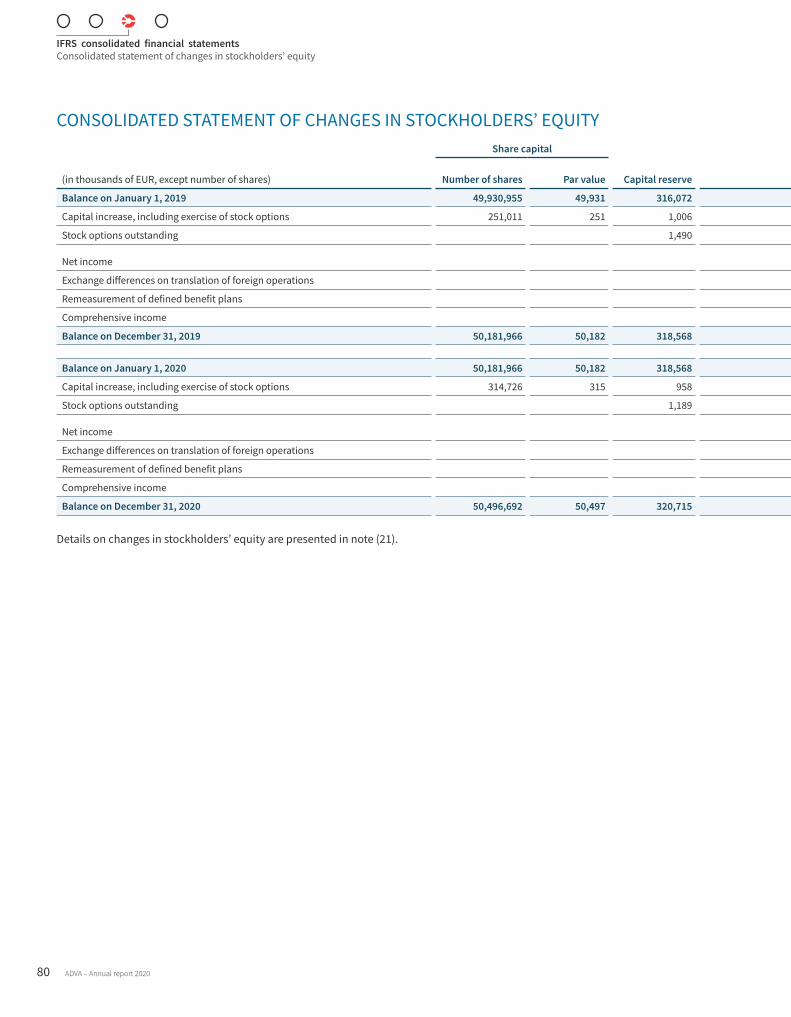
CONSOLIDATED STATEMENT OF CHANGES IN STOCKHOLDERS’ EQUITY
(in thousands of EUR, except number of shares)
Share capital
Number of shares Par value Capital reserve Net income (loss) and accumulated deficitAccumulated
other comprehensive income (loss)Total stockholders’ equity entitled to the
owners of the parent company
Balance on January 1, 2019 49,930,955 49,931 316,072 -121,693 331 244,641
Capital increase, including exercise of stock options 251,011 251 1,006 1,257
Stock options outstanding 1,490 1,490
Net income 7,045 7,045
Exchange differences on translation of foreign operations 4,483 4,483
Remeasurement of defined benefit plans -3,124 -3,124
Comprehensive income 7,045 1,359 8,404
Balance on December 31, 2019 50,181,966 50,182 318,568 -114,648 1,690 255,792
Balance on January 1, 2020 50,181,966 50,182 318,568 -114,648 1,690 255,792
Capital increase, including exercise of stock options 314,726 315 958 1,273
Stock options outstanding 1,189 1,189
Net income 20,314 20,314
Exchange differences on translation of foreign operations -14,922 -14,922
Remeasurement of defined benefit plans -428 -428
Comprehensive income 20,314 -15,350 4.964
Balance on December 31, 2020 50,496,692 50,497 320,715 -94,334 -13,660 263,218
Details on changes in stockholders’ equity are presented in note (21).
IFRS consolidated financial statementsConsolidated statement of changes in stockholders’ equity
80 ADVA – Annual report 2020
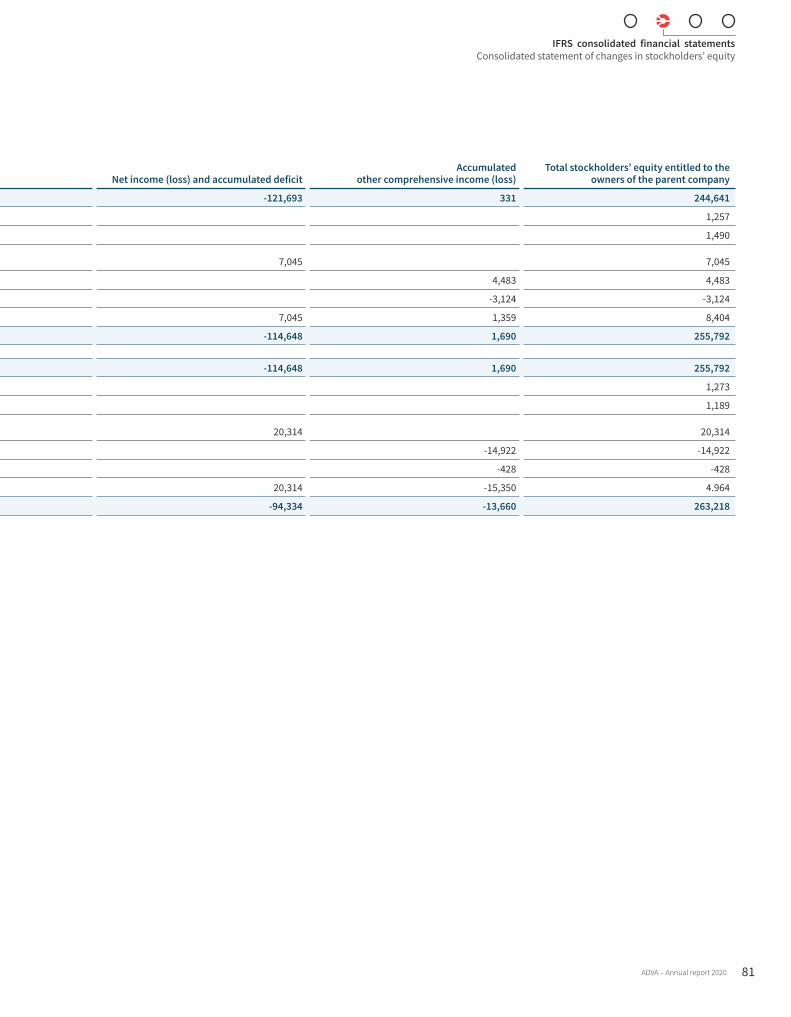
CONSOLIDATED STATEMENT OF CHANGES IN STOCKHOLDERS’ EQUITY
(in thousands of EUR, except number of shares)
Share capital
Number of shares Par value Capital reserve Net income (loss) and accumulated deficitAccumulated
other comprehensive income (loss)Total stockholders’ equity entitled to the
owners of the parent company
Balance on January 1, 2019 49,930,955 49,931 316,072 -121,693 331 244,641
Capital increase, including exercise of stock options 251,011 251 1,006 1,257
Stock options outstanding 1,490 1,490
Net income 7,045 7,045
Exchange differences on translation of foreign operations 4,483 4,483
Remeasurement of defined benefit plans -3,124 -3,124
Comprehensive income 7,045 1,359 8,404
Balance on December 31, 2019 50,181,966 50,182 318,568 -114,648 1,690 255,792
Balance on January 1, 2020 50,181,966 50,182 318,568 -114,648 1,690 255,792
Capital increase, including exercise of stock options 314,726 315 958 1,273
Stock options outstanding 1,189 1,189
Net income 20,314 20,314
Exchange differences on translation of foreign operations -14,922 -14,922
Remeasurement of defined benefit plans -428 -428
Comprehensive income 20,314 -15,350 4.964
Balance on December 31, 2020 50,496,692 50,497 320,715 -94,334 -13,660 263,218
Details on changes in stockholders’ equity are presented in note (21).
IFRS consolidated financial statementsConsolidated statement of changes in stockholders’ equity
ADVA – Annual report 2020 81

NOTES TO THE CONSOLIDATED FINANCIAL STATEMENTSGeneral information(1) Information about the company and the group
ADVA Optical Networking SE (hereinafter also referred to as the “company” or “ADVA SE”) is a Societas Europaea domiciled in Meiningen, Germany, with its registered office at Märzenquelle 1–3, 98617 Meiningen, and is registered as HRB 508155 at the commercial register in Jena. The management board authorized the consolidated financial statements for the year ended December 31, 2020 for issuance on February 23, 2021.
The ADVA Optical Networking group (hereinafter also referred to as “ADVA Optical Networking”, “the group” or “ADVA”) develops, manufactures and sells optical and Ethernet-based networking solutions to telecommunications carriers and enterprises to deliver data, storage, voice and video services.
Telecommunications service providers, private companies, universities and government agencies worldwide use the group’s systems. ADVA sells its product portfolio both directly and through an international network of distribution partners.Glossary: page 154
Significant accounting policies(2) Basic principles for the preparation of the
consolidated annual financial statements
The group’s consolidated annual financial statements for the financial years ended December 31, 2020, and December 31, 2019, are prepared in accordance with the International Financial Reporting Standards (IFRS) published by the International Accounting Standards Board (IASB), as applicable in the European Union (EU) in consideration of interpretations of the Financial Reporting Interpretations Committee (IFRIC) and the applicable additional German statutory regulations according to § 315e Abs. 1 HGB. The consolidated financial statements have been prepared on a historical cost basis, except for the fair value measurement through profit or loss of certain financial instruments and share-based payments.
The financial year correlates with the calendar year. The consolidated annual financial statements are presented in euro. Unless otherwise stated, all amounts quoted are in thousands of euro. The balance sheet is separated into current and non-current assets and liabilities. The classification of income and expenses in the income statement is based on their function within the entity. When items on the balance sheet and in the income statement are summarized in the interest of clarity, this is explained in the notes to the consolidated financial statements.
The annual financial statements of the individual subsidiaries of the holding company ADVA Optical Networking SE, as subsumed in the consolidated annual financial statements, are all prepared using the same accounting and valuation policies and the same balance sheet date.
IFRS consolidated financial statementsNotes to the consolidated financial statements
82 ADVA – Annual report 2020
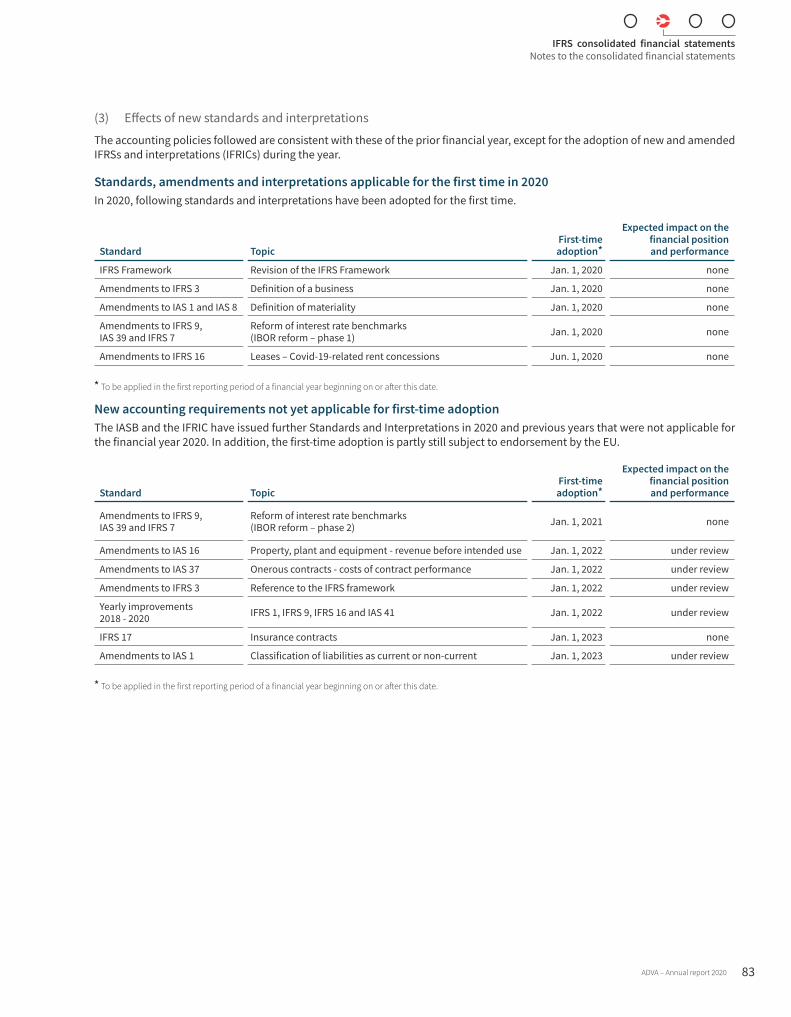
(3) Effects of new standards and interpretations
The accounting policies followed are consistent with these of the prior financial year, except for the adoption of new and amended IFRSs and interpretations (IFRICs) during the year.
Standards, amendments and interpretations applicable for the first time in 2020In 2020, following standards and interpretations have been adopted for the first time.
Standard TopicFirst-time adoption*
Expected impact on the financial position and performance
IFRS Framework Revision of the IFRS Framework Jan. 1, 2020 none
Amendments to IFRS 3 Definition of a business Jan. 1, 2020 none
Amendments to IAS 1 and IAS 8 Definition of materiality Jan. 1, 2020 none
Amendments to IFRS 9, IAS 39 and IFRS 7
Reform of interest rate benchmarks (IBOR reform – phase 1) Jan. 1, 2020 none
Amendments to IFRS 16 Leases – Covid-19-related rent concessions Jun. 1, 2020 none
* To be applied in the first reporting period of a financial year beginning on or after this date.
New accounting requirements not yet applicable for first-time adoptionThe IASB and the IFRIC have issued further Standards and Interpretations in 2020 and previous years that were not applicable for the financial year 2020. In addition, the first-time adoption is partly still subject to endorsement by the EU.
Standard TopicFirst-time adoption*
Expected impact on the financial position and performance
Amendments to IFRS 9, IAS 39 and IFRS 7
Reform of interest rate benchmarks (IBOR reform – phase 2) Jan. 1, 2021 none
Amendments to IAS 16 Property, plant and equipment - revenue before intended use Jan. 1, 2022 under review
Amendments to IAS 37 Onerous contracts - costs of contract performance Jan. 1, 2022 under review
Amendments to IFRS 3 Reference to the IFRS framework Jan. 1, 2022 under review
Yearly improvements 2018 - 2020 IFRS 1, IFRS 9, IFRS 16 and IAS 41 Jan. 1, 2022 under review
IFRS 17 Insurance contracts Jan. 1, 2023 none
Amendments to IAS 1 Classification of liabilities as current or non-current Jan. 1, 2023 under review
* To be applied in the first reporting period of a financial year beginning on or after this date.
IFRS consolidated financial statementsNotes to the consolidated financial statements
ADVA – Annual report 2020 83

(4) Recognition and measurement
InventoriesInventories are valued at the lower of cost or net realizable value. The cost of purchase is determined by the average method. Production costs include direct unit costs, an appropriate portion of necessary manufacturing overheads and production-related depreciation that can be directly assigned to the production process. Administrative and social insurance charges that can be assigned to production are also taken into account. Financing charges are not classified as part of the at-cost base. The net realizable value is the estimated selling price that could be realized on the closing date in the context of ordinary business activity, less estimated costs of completion and costs necessary to make the sale.
Inventory depreciation covers risks relating to slow-moving items or technical obsolescence. Where the reasons for previous write-downs no longer apply, these write-downs are reversed.
Property, plant and equipmentProperty, plant and equipment is stated at historic cost less accumulated depreciation and accumulated impairment losses, if any. The present value of the expected cost for the decommissioning of the asset after its use is included in the cost of the respective asset if the recognition criteria for a provision are met.
Subsequent costs are included in the asset’s carrying amount or recognized as separateasset only when it is probable that future economic benefits associated with this item will flow to the group and the cost can be measured reliably. All other repairs and maintenance costs are charged to the income statement during the financial period in which they are incurred.
Depreciation on property, plant and equipment is calculated on a straight-line basis over the estimated useful economic lives of the assets as follows:
y Buildings 20 to 25 years
y Technical equipment and machinery 3 to 4 years
y Factory and office equipment 3 to 10 years
No regular depreciation applies for land and similar rights.
Leasehold improvements are capitalized and depreciated over the expected useful life on a straight-line basis.
An item of property, plant and equipment is derecognized upon disposal or when no future economic benefits are expected from its use or disposal. Any gain or loss arising on derecognition of the asset (calculated as the difference between the net disposal proceeds and the carrying amount of the asset) is included in the income statement when the asset is derecognized.
The assets’ residual values, useful economic lives and methods of depreciation are reviewed at each financial year-end and adjusted prospectively, if appropriate.
Intangible assets Intangible assets acquired separately are measured on initial recognition at cost. The cost of intangible assets acquired in a business combination is their fair value on the date of acquisition. Following initial recognition, intangible assets are carried at cost less any accumulated amortization and any accumulated impairment losses. Internally generated intangible assets, excluding capitalized development costs, are not capitalized, and expenditure is reflected in profit or loss in the year in which the expenditure is incurred.
The useful economic lives of intangible assets are assessed to be either finite or indefinite.
Intangible assets with finite lives are amortized on a straight-line basis over the expected useful economic lives of the assets as follows:
y Capitalized development projects 3 to 5 years
y Intangible assets acquired in business combinations 4 to 9 years
y Software and other intangible assets 3 to 6 years
Intangible assets with finite useful economic lives are assessed for impairment whenever there is an indication that the intangible asset may be impaired. The amortization period and the amortization method for an intangible asset with a finite useful life is reviewed at each financial year-end. The amortization expense on intangible assets with finite lives is recognized in profit or loss in the expense category consistent with the function of the intangible asset.
Intangible assets with an indefinite useful life are not amortized. An impairment loss is recognized for the amount by which the asset’s carrying amount exceeds its recoverable amount. The recoverable amount is the higher of an asset’s fair value less costs of disposal and value in use. The useful life of an intangible asset with an indefinite life is reviewed at least annually to determine whether the indefinite life assessment continues to be applicable. If not, the change in the useful life assessment from indefinite to finite is made on a prospective basis. There are no intangible assets with indefinite lives other than goodwill and development projects in progress.
Gains or losses arising from derecognition of an intangible asset are measured as the difference between the fair value less costs to sell and the carrying amount of the asset, and they are recognized in the income statement when the asset is derecognized.
IFRS consolidated financial statementsNotes to the consolidated financial statements
84 ADVA – Annual report 2020
GoodwillAn unlimited useful life is assumed for goodwill acquired in the context of business combinations. Impairment reviews are performed at the cash generating unit level on the balance sheet date or when there is an indication that the goodwill may be impaired in accordance with IAS 36. Impairment losses on goodwill recognized in prior periods are not reversed. See note (14).
Intangible assets acquired in business combinationsIntangible assets acquired in business combinations have a finite useful life. They are recognized at cost and amortized on a straight-line basis over estimated useful economic lives of five to nine years. They are tested for impairment if an indication exists that the recoverable amount of the asset may have decreased.
The breakdown of intangible assets into individual items is included in note (14).
Capitalized development projectsDevelopment expenses for new products are capitalized as development projects if
y they can be unambiguously assigned to these products,
y the products under development are technically feasible and can be marketed,
y there is reasonable certainty that the development activity will result in future cash inflows,
y ADVA intends and is able to complete and use the development project and
y there is the availability of adequate technical, financial and other resources to complete the development and to use or sell the intangible asset.
Capitalized development projects include all costs that can be directly assigned to the development process. Financing charges are capitalized if the development project represents a qualifying asset in the sense of IAS 23.
After initial recognition of a development project as an asset, measurement is at historical cost, less accumulated amortization and impairment. The straight-line method of amortization is used from the start of production through the estimated selling periods for the products developed (generally between three and five years). Completed as well as ongoing development projects are tested for impairment on the balance sheet date or when there is an indication of potential impairment. Impairment losses are recognized if appropriate.
Research costs are expensed as incurred according to IAS 38.
Impairment of non-financial assetsIntangible assets with indefinite useful economic lives are tested for impairment annually and whenever there is an indication for potential impairment, either individually or at the cash generating unit level.
Intangible assets with finite useful economic lives are tested for impairment if an indication exists that the assets may have been impaired. An impairment loss is recognized for the amount by which the asset’s carrying amount exceeds its recoverable amount. The recoverable amount is the higher of an asset’s fair value less costs of disposal and value in use. Prior impairments of non-financial assets (other than goodwill) are reviewed for possible reversal at each reporting date.
Government grantsADVA recognizes government grants for fixed assets as well as for grants related to research projects.
Government grants are recognized where there is reasonable assurance that the grant will be received, and all attached conditions will be met. When the grant relates to an expense item, it is recognized as income over the period necessary to match the grant on a systematic basis to the costs that it is intended to compensate. Where the grant relates to fixed assets, it is recognized as a reduction of purchase costs and released as a reduction of depreciation expense over the expected useful life of the related asset.
Borrowing CostsBorrowing costs directly attributable to the acquisition, construction or production of an asset that necessarily takes a substantial period to get ready for its intended use or sale (qualifying asset) are capitalized as part of the cost of the respective assets. If borrowing costs cannot be directly attributed to the acquisition, construction or production of an asset, an assessment is made on whether general borrowing costs should be recognized that would have been avoided if the asset was not acquired, constructed or produced. All other borrowing costs are expensed in the period they occur. Borrowing costs consist of interest and other costs that an entity incurs in connection with the borrowing of funds.
IFRS consolidated financial statementsNotes to the consolidated financial statements
ADVA – Annual report 2020 85
LeasingThe group leases various properties and cars. Rental contracts are typically made for fixed periods of 3 to 5 years but may have extension options as described below. Lease terms are negotiated on an individual basis and contain a wide range of different terms and conditions. The lease agreements do not impose any covenants, but leased assets may not be used as security for borrowing purposes.
Leases are recognized as a right-of-use asset and a corresponding liability at the date at which the leased asset is available for use by the group. Each lease payment is allocated between the liability and finance cost. The finance cost is charged to profit or loss over the lease period so as to produce a constant periodic rate of interest on the remaining balance of the liability for each period. The right-of-use asset is depreciated over the shorter of the asset’s useful life and the lease term on a straight-line basis. If a purchase option is considered probable, the amortization period corresponds to the economic life.
Assets and liabilities arising from a lease are initially measured on a present value basis. Lease liabilities include the net present value of the following lease payments:
y fixed payments (including in-substance fixed payments), less any lease incentives receivable
y variable lease payment that are based on an index or a rate
y amounts expected to be payable by the lessee under residual value guarantees
y the exercise price of a purchase option if the lessee is reasonably certain to exercise that option, and
y payments of penalties for early termination of the lease if the exercise of a termination option is considered probable.
The lease payments are discounted using the interest rate implicit in the lease, if that rate can be determined, or the group’s incremental borrowing rate.
Right-of-use assets are measured at cost comprising the following:
y the amount of the initial measurement of lease liability
y any lease payments made at or before the commencement date less any lease incentives received
y any initial direct costs, and
y restoration costs.
Payments associated with short-term leases and leases of low-value assets are recognized on a straight-line basis as an expense in profit or loss. Short-term leases are leases with a lease term of 12 months or less. Low-value assets comprise IT-equipment and small items of office furniture.
Extension and termination options are included in a number of property and equipment leases across the group. These terms are used to maximize operational flexibility in terms of managing contracts. The majority of extension and termination options held are exercisable only by the group and not by the respective lessor.
To optimize lease costs during the contract period, the group sometimes provides residual value guarantees in relation to car leases. The group initially estimates and recognizes amounts expected to be payable under residual value guarantees as part of the lease liability. The amounts are reviewed, and adjusted if appropriate, at the end of each reporting period.
Post-employment benefitsADVA maintains defined benefit plans in three countries based on the pensionable compensation of its employees and their length of service. Some of these pension plans are financed through external pension funds. Provisions for pensions are actuarially measured using the projected unit credit method for defined benefit pension plans, taking into account not only the pension obligations and vested pension rights known at the reporting date, but also expected future salary and benefit increases. The interest rate used to determine the present value of the obligations is generally set based on the yields on high-quality corporate bonds or government bonds in the respective currency area. The return on existing plan assets and expenses for interest added to obligations are reported in finance costs. Service cost is classified as operating expenses. Past service cost not recognized due to a change in the pension plan shall immediately be recognized in the period in which the change took effect. Gains and losses arising from adjustments and changes in actuarial assumptions are recognized immediately and in full in the period in which they occur within other comprehensive income. Further details on recognition and measurement of employee benefits are included in note (18).
In addition, ADVA grants defined contribution plans to employees of some group entities in accordance with statutory or contractual requirements. The payments are made to state or private pension insurance funds. Under defined contribution plans, the employer does not assume any other obligations beyond the payment of contributions to an external fund. The amount of the future pension payments will exclusively depend on the contribution made by the employer (and their employees, if applicable) to the external fund, including income from the investment of such contributions. The amounts payable are expensed when the obligation to pay the amounts is established and classified as operating expenses.
IFRS consolidated financial statementsNotes to the consolidated financial statements
86 ADVA – Annual report 2020
Share-based compensation transactionsEmployees (including senior executives) of ADVA receive remuneration in the form of share-based compensation transactions, whereby employees render services as consideration for equity instruments (equity-settled transactions) or they are granted stock appreciation rights, which are settled in cash (cash-settled transactions). Share-based compensation transactions are reported and valued in accordance with IFRS 2.
Share-based compensation transactions between different entities of ADVA are considered as either equity-settled or cash-settled share-based compensation transactions in the individual financial statements of ADVA Optical Networking SE. The group entities employing the beneficiaries measure the received services as an equity-settled share-based compensation transaction. No repayment arrangements have been set up between the entities of the group.
Equity-settled transactionsThe cost of equity-settled transactions with employees is measured by reference to the fair value on the grant date. The fair value is determined by an external expert using an appropriate pricing model. See note (38) for further details.
The cost of equity-settled transactions is recognized, together with the corresponding increase in equity, straight-line over the period in which the relevant employees become fully entitled to the award (vesting date). Vesting period ends with the first exercise possibility. From that day, the employee is entitled to benefit. No expense is recognized for awards that do not ultimately vest, except for awards where vesting is conditional upon market condition, which are treated as vesting irrespective of whether or not market condition is satisfied, if all other performance conditions are satisfied.
Where the terms of an equity-settled transaction award are modified, the minimum expense recognized is the expense as if the terms had not been modified, if the original terms of the award are met. An additional expense is recognized for any modification that increases the total fair value of the share-based compensation transaction or is otherwise beneficial to the employee as measured on the date of modification.
Where an equity-settled award is cancelled, it is treated as if it vested on the date of cancellation, and any expense not yet recognized for the award is recognized immediately. This includes any award where non-vesting conditions within the control of either the entity or the employee are not met. However, if a new award is substituted for the cancelled award and designated as a replacement award on the date that it is granted, the cancelled and new awards are treated as if they were a modification of the original award, as described in the previous paragraph. All cancellations of equity-settled transactions are treated equally.
The dilutive effect of outstanding options is reflected in the computation of earnings per share. See note (30).
Cash-Settled transactionsThe cost of cash-settled transactions is measured initially at fair value on the grant date. The fair value is expensed straight-line over the vesting period with recognition of a corresponding provision. The provision is re-measured on each balance sheet date up to and including the settlement date, with changes in the fair value recognized in profit or loss.
ProvisionsProvisions are recognized when the group has a present obligation (legal or constructive) as a result of a past event, when it is probable that an outflow of resources embodying economic benefits will be required to settle the obligation and a reliable estimate can be made of the amount of the obligation. The amount recognized as a provision represents the best estimate of the expenditure required to settle the present obligation.
Where the group expects some or all of a provision to be reimbursed, for example under an insurance contract, the reimbursement is recognized as a separate asset but only when the reimbursement is virtually certain. The expense related to any provision is presented in profit or loss, net of any reimbursement. If the effect of the time value of money is material, provisions are discounted using a current pre-tax rate that reflects, where appropriate, the risks specific to the liability. Where discounting is used, the increase in the provision over time is recognized in other financial gains and losses, net.
IFRS consolidated financial statementsNotes to the consolidated financial statements
ADVA – Annual report 2020 87
Common stockCommon stock is disclosed in stockholder’s equity.
Incremental costs directly attributable to the issuance of new ordinary shares or options are shown in equity as a deduction, net of tax, from the proceeds.
Where any group company purchases the company’s equity share capital (treasury shares), the consideration paid, including any directly attributable incremental costs, is deducted from equity until the shares are cancelled or reissued. Where such shares are subsequently reissued, any consideration received, net of any directly attributable incremental transaction costs, is included in equity.
Financial instrumentsFinancial instruments are contracts that give rise to a financial asset in one entity and a financial liability or equity instrument in another entity. ADVA recognizes financial assets and financial liabilities in the balance sheet when a company in the group becomes a contractual party to the financial instrument.
All customary purchases and sales of financial assets are recognized on the trading date, i.e. the date on which ADVA enters into the obligation to purchase the asset.
Financial assets and financial liabilities are generally reported at gross value. Netting only applies if the offsetting of the amounts is legally enforceable and it is intended to actually offset them. In general, ADVA does not intend to offset any amounts.
Financial assetsADVA’s financial assets include, in addition to trade receivables, cash and cash equivalents, other receivables, other investments and derivative financial instruments.
ClassificationFinancial assets are initially allocated to one of the following measurement categories in accordance with IFRS 9:
1. measured at amortized cost
2. measured at fair value through profit or loss
3. measured at fair value through other comprehensive income (debt instruments)
4. measured at fair value through other comprehensive income (equity instruments)
Financial assets that are debt instruments according to IAS 32 are classified based on the business model for managing the financial assets and the contractually agreed cash flows. Debt instruments are classified as amortized cost if the business model “hold to collect” applies and contractual cash flows solely consist of principal and interest on the outstanding redemption. If the business model is based on the collection of contractual cash flows as well as on the sale of the instruments, the financial assets are classified at fair value through other comprehensive income (FVOCI). Financial assets held for sale and derivative financial instruments that are not designated as hedges are classified as at fair value through profit or loss (FVTPL).
Debt instruments are reclassified if the business model for managing those assets changes.
Financial assets with embedded derivatives are considered at their entirety when determining whether their cash flows are solely repayment of the principal and interest.
For investments in equity instruments that are not held for trading, an irrevocable option to account for the equity investments at fair value through comprehensive income (FVOCI) at the time of initial recognition is available. ADVA has not made use of this option.
ADVA classifies receivables that are not subject to factoring, cash and cash equivalents, and rent deposits as financial assets, which are carried at amortized cost. Trade receivables for which a factoring agreement is in place are classified as financial assets at fair value through profit or loss.
The group has not made use of the option to classify financial assets at fair value through profit or loss upon initial recognition.
Initial measurementAt initial recognition, the group measures a financial asset at its fair value plus, in the case of a financial asset at fair value through other comprehensive income, transactions costs that
IFRS consolidated financial statementsNotes to the consolidated financial statements
88 ADVA – Annual report 2020
are directly attributable to the acquisition of the financial asset. Transaction costs of financial assets carried at fair value through profit or loss are expensed immediately.
Subsequent measurement The subsequent measurement of ADVA’s financial assets is based on their classification:
1. at amortized cost: Interest income from these financial assets is reported in the financial income using the effective interest method. Gains and losses on derecognition as well as impairment gains and losses are recorded in the income statement and reported under other operating income and expenses,
2. at fair value through profit or loss: Gains or losses on debt instruments, which are subsequently measured at fair value through profit or loss, are included in the income statement as other operating income or expenses in the period in which they arise.
The group subsequently measures all equity instruments at fair value. Changes in fair value are recognized in other gains (losses) in the income statement as applicable.
ImpairmentThe group assesses expected future credit losses associated with its debt instruments measured at amortized cost based on future expectations. A respective risk provision or, in case of an actual loss that already occurred, an impairment loss is recognized.
General approachGenerally, financial assets are considered as having a low default risk at initial recognition resulting in a 12-month expected credit loss provision. In case of a significant increase in credit risk, the lifetime expected credit losses are recognized. Amongst others debtor’s payment delays of more than 30 days are considered an indicator for increase in default risk.
ADVA assesses expected credit losses using the general approach for cash and cash equivalents and other financial assets, except for trade receivables.
Simplified approachFor trade receivables and contract assets with no significant financing component the group applies the simplified approach, which requires lifetime expected credit losses to be recognized from initial recognition of the receivables.
In order to measure expected credit losses, trade receivables are summarized on the basis of common credit risk characteristics and overdue days. The expected credit losses are based on customers’ historical payment behavior for a period of three years as well as on historical defaults. These are reviewed once a year and adjusted to take current and future information on macroeconomic elements (e.g. geopolitical events, currency fluctuations, inflation, trade wars, state
subsidies) into account, that have an influence on customers’ ability to meet their financial obligations.
Contract assets relate to work in progress that has not been invoiced and bears essentially the same risk characteristics as trade receivables. The group has therefore concluded that the expected loss rates for trade receivables are a reasonable approximation of the loss ratios for contract assets.
Financial assets are considered to be impacted by credit worthiness and are written off if there is objective evidence of impairment. An indication of impairment is, inter alia, if debtor payments are delayed more than two years. If, based on reasonable estimates, it is not expected to receive the respective payment, financial assets are derecognized. One indicator for this is the failure of the debtor to commit to a repayment plan.
DerecognitionADVA derecognizes financial assets (or parts of their financial assets where applicable) when the rights to receive cash flows from the financial asset have expired or have been transferred and the group substantially transferred all opportunities and risks associated with the ownership.
In the case of sales of trade receivables the requirements for a receivable transfer according to IFRS 9.3.2.1 are met. Receivables are derecognized if substantially all risks and rewards are transferred. If the receivables are transferred in accordance to IFRS 9.3.2.4 a) and the review of IFRS 9.3.2.6 shows that neither substantially all risks and rewards have been transferred nor retained, ADVA recognizes the remaining continuing involvement in accordance with IFRS 9.3.2.16. ADVA continues to manage the receivables sold (servicing). ADVA retains control of disposal over the receivables sold.
IFRS consolidated financial statementsNotes to the consolidated financial statements
ADVA – Annual report 2020 89

Financial liabilitiesThe financial liabilities of ADVA include trade payables and other liabilities, bank overdrafts, loans and derivative financial instruments. The accounting treatment of lease liabilities is dealt with separately as presented in the section “Leasing”.
ClassificationFinancial liabilities are initially assigned to one of the following valuation categories in accordance with IFRS 9:
1. measured at amortized cost
2. measured at fair value through profit or loss.
The group has not used the option to designate financial liabilities as “at fair value through profit or loss” on initial recognition of financial assets.
Subsequent measurementThe measurement of financial liabilities of ADVA depends on their classification as follows:
1. Financial liabilities at fair value through profit or loss: This category includes derivative financial instruments that are not designated as hedging instruments in accordance with IFRS 9 hedge accounting rules. Gains and losses are recognized in the income statement.
2. Financial liabilities measured at amortized cost: This category includes trade payables and interest-bearing loans. After initial recognition, these are measured at amortized cost using the effective interest method. Gains and losses are recognized in profit or loss when the liabilities are derecognized as well as in case of amortization using the effective interest method. Amortization according to the effective interest method is included in interest expenses in the profit and loss account.
DerecognitionA financial liability is derecognized when the obligation under the liability is settled, cancelled or expired. When an existing financial liability is replaced by another from the same lender on substantially different terms, or the terms of an existing liability are substantially modified, this exchange or modification is treated as a derecognition of the original liability and the recognition of a new liability. In case of minor changes in conditions a change in the present value will be considered in profit or loss.
Derivative financial instruments and hedging activitiesThe group entered into forward rate agreements to hedge foreign currency exposure of expected future cash flows in foreign currency.
Derivatives are initially recognized at fair value on the date a derivative contract is entered into and are subsequently re-measured to their fair value at the end of each reporting
period. The accounting for subsequent changes in the fair value depend on whether the derivative is designated as a hedging instrument.
The group did not apply hedge accounting rules according to IFRS 9 during the years ended December 31, 2020 and 2019. Thus, changes in fair value of the derivatives are recognized in profit or loss immediately.
Contracts with customers
Revenue recognitionRevenue is recognized when a performance obligation is satisfied, i.e. when control of the goods or services is transferred to the customer. Control is passed either at a point in time or over time.
When hardware is sold control is transferred at a point in time depending on the delivery terms. Software licenses are either sold together with the hardware or sold separately. Control in case of software is transferred when the customer is able to use the software.
In case of service level agreements or maintenance contracts as well as period-related software licenses revenue is recognized over a period of time provided that further services are to be rendered during the term of the contract. The customer receives and uses all services at the same time as they are provided by the company.
Bill-and-hold arrangements or consignment stores are recognized when the performance obligation to transfer a product are met and the customer obtains control. Glossary: page 154
Transaction priceIn general, the transaction price is the price from the order further considering the specific arrangements of the underlying contract. For contracts that contain multiple performance obligations, the transaction price is allocated to the individual performance obligations based on the relative individual selling price. A consideration to be paid to a customer is recorded as a reduction in the transaction price, hence reducing revenues, unless the payment relates to a specific delivery of goods by the customer or service provided by the customer.
The transaction price from a contract may contain fixed and/or variable components.
With regard to financial components, the practical remedy of not taking into account the effects of a financing component is applied if the maximum duration of the period between transfer of goods or services and payment by the customer does not exceed one year.
The group does not adjust any of the transaction prices for the time value of money.
IFRS consolidated financial statementsNotes to the consolidated financial statements
90 ADVA – Annual report 2020
Contract assets and liabilitiesA contract asset is recognized when ADVA has transferred the goods or services. The contract asset is recognized as a receivable if an unconditional payment entitlement of the company exists.
A contract liability is recognized if the company receives the consideration before it has delivered the goods or services. This applies in particular to advance payments for service level agreements and maintenance contracts.
Contract assets and liabilities related to one contract are netted and shown as either contract assets or contract liability.
Volume discounts are incentive programs that offer the customer the option to receive free or discounted goods or services.
In addition, certain customers have the benefit of customer loyalty programs which result in the recognition of a contract liability and reduction of revenues based on the relative individual selling price.
Volume rebates can be identified as incentive programs where the company makes a payment to the customer once a specified sales volume has been achieved with the customer. Volume rebates are not related to separate performance obligations but are considered as a variable component of the transaction price.
Rights of return are considered in the transaction price on the basis of the historical selling price.
The company has made use of the option to recognize all costs in relation to conclude and extend a contract which would be amortized over a period of maximum one year upon activation, directly in profit and loss. This concerns all such costs.
WarrantiesExclusively all warranties are so-called “assurance type” warranties and therefore do not form separate performance obligations. For these essentially legal warranties, accruals according to IAS 37 are considered.
Cost of goods soldThe cost of goods sold comprises the costs incurred in the production and rendering of services. This item subsumes both the direct cost of materials and production directly assignable to a product and indirect (overhead) costs, including the depreciation of production equipment, amortization of production related intangible assets and write-downs on inventories. The cost of goods sold also includes appropriation to the warranty provision and amortization of purchased technologies. Income from the reversal of write-downs on inventories reduces the cost of goods sold.
Interest income and expensesFor all financial instruments measured at amortized cost, interest income or expenses are recorded using the effective interest rate, which is the rate that exactly discounts the estimated future cash payments or receipts through the expected life of the financial instrument or a shorter period, where appropriate, to the net carrying amount of the financial asset or liability.
Taxes
Current income taxCurrent income tax assets and liabilities for the current and prior periods are measured at the amount expected to be recovered from or paid to the taxation authorities. The tax rates and tax laws used to compute the amount are these that are enacted or substantively enacted on the respective balance sheet date.
Deferred income taxDeferred tax is provided using the liability method on temporary differences at the balance sheet date between the tax bases of assets and liabilities and their carrying amounts for financial reporting purposes.
Deferred tax liabilities are recognized for all taxable temporary differences, except:
y where the deferred income tax liability arises from the initial recognition of goodwill or of an asset or liability in a transaction that is not a business combination and, at the time of the transaction, affects neither the accounting profit nor taxable profit or loss; and
y in respect to taxable temporary differences associated with investments in subsidiaries, where the timing of the reversal of the temporary differences can be controlled and it is probable that the temporary differences will not reverse in the near future.
Deferred tax assets are recognized for all deductible temporary differences, carry forward of unused tax credits and unused tax losses, to the extent that it is probable that taxable profit will be available against which the deductible temporary differences, and the carry forward of unused tax credits and unused tax losses can be utilized, except:
IFRS consolidated financial statementsNotes to the consolidated financial statements
ADVA – Annual report 2020 91
y where the deferred tax asset related to the deductible temporary difference arises from the initial recognition of an asset or liability in a transaction that is not a business combination and, at the time of the transaction, affects neither the accounting profit nor taxable profit or loss; and
y in respect of deductible temporary differences associated with investments in subsidiaries, deferred tax assets are recognized only to the extent that it is probable that the temporary differences will not reverse in the foreseeable future and no taxable profit will be available against which the temporary differences can be utilized.
The carrying amount of deferred tax assets is reviewed on each balance sheet date and reduced to the extent that it is no longer probable that sufficient taxable profit will be available to allow all or part of the deferred tax asset to be utilized. Unrecognized deferred tax assets are reassessed on each balance sheet date and are recognized to the extent that it has become probable that future taxable profit will allow the deferred tax asset to be utilized.
Deferred tax assets and liabilities are measured at the tax rates that are expected to apply to the year when the asset is realized or the liability is settled, based on tax rates (and tax laws) that have been enacted or substantively enacted on the balance sheet date. Future changes in tax rates are recognized on the balance sheet date if their impact is materially certain as part of the tax legislation process.
According to IAS 12.74 deferred tax assets and liabilities have been set off in 2020 insofar as offsetting qualifications apply.
The best estimate for any uncertain current and deferred income tax items to be recognized is the expected tax payment.
Earnings per shareThe group calculates basic and diluted earnings per share in accordance with IAS 33. Basic earnings per share are calculated based on the weighted average number of no- par value shares outstanding during the reporting period. Diluted earnings per share are calculated based on the weighted average number of no-par value shares outstanding during the reporting period, but also including the number of no-par value shares that could come into existence if all stock options were exercised on the balance sheet date.
(5) Significant accounting judgments, estimates and assumptions
The preparation of the group’s financial statements requires management to make judgments, estimates and assumptions that affect the reported amounts of revenues, expenses, assets and liabilities and the disclosure of contingent liabilities on the reporting date. However, uncertainty about these assumptions and estimates could result in outcomes that could require a material adjustment to the carrying amount of the asset or liability affected in the future. Assumptions used to make estimates are regularly reviewed. Changes in estimates only affecting one accounting period are only taken into account in that accounting period. In the case of changes in estimates that affect the current and future accounting periods, these are taken into account appropriately in the current and subsequent accounting periods.
Discussed below are the key judgments and assumptions concerning the future and other key sources of estimation and uncertainty on the balance sheet date that have a significant risk of causing a material adjustment to the carrying amounts of assets and liabilities within the next financial year.
Development expensesDevelopment expenses are capitalized in accordance with the accounting policy described in note (4). Initial capitalization of costs is based on management’s judgment that technological and economic feasibility is confirmed, usually when a product development project has reached a defined milestone according to an established project management model. In determining the amounts to be capitalized, management makes assumptions regarding the expected future cash generation of the assets, discount rates to be applied and the expected period of benefits. See note (14) for the carrying amounts involved.
Impairment of non-financial assetsThe group assesses whether there are any indicators of impairment for all non-financial assets on each reporting date. Goodwill and other indefinite life intangibles are tested for impairment annually and at other times when such indicators exist. Other non-financial assets are tested for impairment when there are indicators that the carrying amounts may not be recoverable. When value-in-use calculations are undertaken, management must estimate the expected future cash flows from the asset or cash generating unit and choose a suitable discount rate in order to calculate the present value of these cash flows. See note (14) for the carrying amounts involved.
IFRS consolidated financial statementsNotes to the consolidated financial statements
92 ADVA – Annual report 2020
Pension obligationsPension and similar post-employment obligations as well as the related expenses are recognized based on actuarial calculations. The actuarial valuation of the present value of pension obligations depends on a number of assumptions regarding the discount rate, the expected salary increase rate, the expected pension trend, and life expectancy. In the event that changes in the assumptions regarding the valuation parameters are required, the future amounts of the pension obligations as well as the pension benefit costs may be affected materially. For further details on the valuation of pension obligations, see note (18).
Share-based compensation transactionsThe group measures the cost of equity-settled and cash-settled transactions with employees by reference to the fair value of the equity instruments on the date at which they are granted or on the balance sheet date. Estimating fair value requires determining the most appropriate valuation model for a grant of equity instruments, which is dependent on the terms and conditions of the grant. This also requires determining the expected life of the option, volatility and dividend yield, as well as further assumptions. See note (38) for the carrying amounts involved.
ProvisionsSignificant estimates are involved in the determination of provisions related to warranty costs and legal proceedings. The estimate of warranty claims is based on historic data and is extrapolated into the future. Legal proceedings often involve complex legal issues and are subject to substantial uncertainties. Accordingly, management exercises considerable judgment in determining whether there is a present obligation as a result of a past event at the end of the reporting period, whether it is more likely than not that such a proceeding will result in an outflow of resources and whether the amount of the obligation can be reliably estimated. Other provisions are described in note (19).
Transaction price for customer loyalty programsPoints accumulated for purchases provide a material right to customers that they would not receive without entering into a contract. The transaction price is allocated to the product and the points on a relative stand-alone selling price basis. Management estimates the selling price per point on the basis of the discount granted when the points are redeemed and on the basis of the likelihood of redemption, based on past experience.
LeasesIn determining the lease term, management considers all facts and circumstances that create an economic incentive to exercise an extension option, or not exercise a termination option. Extension options (or periods after termination options) are only included in the lease term if the lease is reasonably certain to be extended (or not terminated).
TaxesUncertainties exist with respect to the interpretation of complex tax regulations and the amount and timing of future taxable income. Given the wide range of international business relationships and the long-term nature and complexity of existing contractual agreements, differences arising between the actual results and the assumptions made, or future changes to such assumptions, could necessitate future adjustments to tax income and expenses already recorded. The group establishes provisions, based on reasonable estimates, for possible consequences of audits by the tax authorities of the respective countries in which it operates. The amount of such provisions is based on various factors, such as experience of previous tax audits and differing interpretations of tax regulations by the taxable entity and the responsible tax authority. Such differences of interpretation may arise on a wide variety of issues depending on the conditions prevailing in the respective group company’s domicile.
Deferred tax assets are recognized for all unused tax losses to the extent that it is probable that taxable profit will be available to utilize these losses. Significant management judgment is required to determine the amount of deferred tax assets that can be recognized, based upon the likely timing and level of future taxable profits together with future tax planning strategies. See note (26) for the carrying amounts involved.
IFRS consolidated financial statementsNotes to the consolidated financial statements
ADVA – Annual report 2020 93
(6) Covid-19 effects
Against the background of the continuing crisis in connection with the global spreading of the Covid-19 virus, ADVA management has dealt in detail with the resulting risks and the relevant effects on accounting in 2020.
In the opinion of the management, there is no sign of an increased default risk for trade receivables and contract assets. Therefore, no impact on the expected credit losses pursuant to IFRS 9 has been considered.
The current crisis constitutes an indication for potential impairment in accordance with IAS 36.12. In accordance with the usual procedure, an impairment test was carried out at the end of 2020, taking into account the current cost of capital and a current 4-year plan. As of December 31, 2020, no impairment of goodwill or other non-current non-financial assets was required.
The German federal government as well as governments of other countries in which ADVA operates or maintains subsidiaries or branches have introduced economic stimulus measures and other bridging measures to overcome the Covid-19 crisis. ADVA makes use of such measures as far as possible and reasonable.
A key measure was the raising of a EUR 40 million KfW backup line under the “KfW Entrepreneur Loan” special program 2020. The contract was signed on July 21, 2020. So far the borrowing facilities have not been used. In January 2021, the group decided to early terminate the KfW credit line.
The utilization of other government support measures in connection with Covid-19, such as the waiver of social security contributions and the postponement of tax payments and the payment of social security contributions, resulted in positive liquidity effects over the financial year which reduced to zero by the end of the year. Furthermore individual activities led to a slight improvement in earnings in 2020.
ADVA recognizes deferred tax assets in respect of unused tax losses and other deductible temporary differences at the level of the relevant entities only to the extent as sufficient deferred tax liabilities are available. Beyond that ADVA did not recognize any additional deferred tax assets. Therefore, a possible adverse impact of current global situation on the future profits of ADVA group should not trigger any need for impairment of deferred tax assets.
(7) Principles of consolidation, scope of consolidation and shareholdings
Subsidiaries are all entities over which ADVA Optical Networking SE directly or indirectly has control. Subsidiaries are fully consolidated from the date on which control is transferred to the group. They are deconsolidated at the date when the control ends. ADVA Optical Networking SE controls an entity when it is exposed to or has the rights to variable returns from its involvement and has the ability to affect those returns through its power to direct the activities of the entity.
Intercompany revenues, expenses, income, receivables and payables within the group are netted.
Intercompany profits that arise from deliveries of products and services provided within the group are eliminated.
Business combinationsBusiness combinations from January 1, 2010 are accounted for using the acquisition method. The cost of an acquisition is measured as the aggregate of the consideration transferred, measured at acquisition date fair value and the amount of any non-controlling interest in the acquiree. For each business combination, the acquirer measures the non-controlling interest in the acquiree either at fair value or at the proportionate share of the acquiree’s identifiable net assets. Acquisition costs incurred are expensed.
When a group company acquires a business, it assesses the financial assets and liabilities acquired for appropriate classification and designation in accordance with the contractual terms, economic circumstances and relevant conditions on the acquisition date. This includes the separation of embedded derivatives in host contracts by the acquiree.
If the business combination is achieved in stages, the acquisition date fair value of the acquirer’s previously held equity interest in the acquiree is re-measured to fair value on the acquisition date through profit and loss.
Any contingent consideration to be transferred by the acquirer will be recognized at fair value on the acquisition date. Subsequent changes to the fair value of the contingent consideration that is deemed an asset or liability will be recognized in accordance with IAS 39 either in profit or loss or as a change to other comprehensive income. Subsequent changes in the fair value of contingent considerations that represent an asset or liability are recognized in the income statement in accordance with IFRS 9.
Goodwill is initially measured at cost being the excess of the consideration transferred over the group’s net identifiable assets acquired and liabilities assumed. If this consideration is lower than the fair value of the net assets of the company acquired, the difference is recognized in profit or loss after reassessment.
IFRS consolidated financial statementsNotes to the consolidated financial statements
94 ADVA – Annual report 2020
After initial recognition, goodwill is measured at cost less any accumulated impairment losses. For the purpose of impairment testing, goodwill acquired in a business combination is, from the acquisition date, allocated to each of the group’s cash generating units that are expected to benefit from the combination, irrespective of whether other assets or liabilities of the acquiree are assigned to those units.
Where goodwill forms part of a cash-generating unit and where part of the operation within that unit is disposed of, the goodwill associated with the operation disposed of is included in the carrying amount of the operation when determining the gain or loss on disposal of the operation. Goodwill disposed of in this circumstance is measured based on the relative values of the operation disposed of and the portion of the cash-generating unit retained.
Investments in associates and in joint venturesThe equity method according to IAS 28 (Investments in Associates) is used to account for investments in entities in which ADVA Optical Networking SE holds 20% to 50% of the voting rights, either directly or indirectly, and over whose operating and financial policy decisions ADVA Optical Networking SE exercises significant influence (associated companies). The investment is initially recognized at cost, and the carrying amount is increased or decreased to recognize the investor’s share of the profit or loss generated. The group share of the profit or loss of investments accounted for by the equity method is recognized in the consolidated income statement, whereas the share of changes in the equity of investments accounted for by the equity method that has not been recognized in profit or loss is shown in the reserves of the consolidated equity. In case the group share of losses exceeds the carrying amount of the investment accounted for by the equity method, no further losses are recognized at group level. Goodwill relating to an investment accounted for by the equity method is included in the carrying amount of the investment. Upon loss of significant influence over an associate, the group measures and recognizes any retaining investment at its fair value. Upon loss of significant influence, any difference between the carrying amount of the associate and the fair value of the retaining investment and proceeds from disposal are recognized in profit or loss.
As of December 31, 2020, ADVA Optical Networking has no interests in associates and joint ventures.
IFRS consolidated financial statementsNotes to the consolidated financial statements
ADVA – Annual report 2020 95
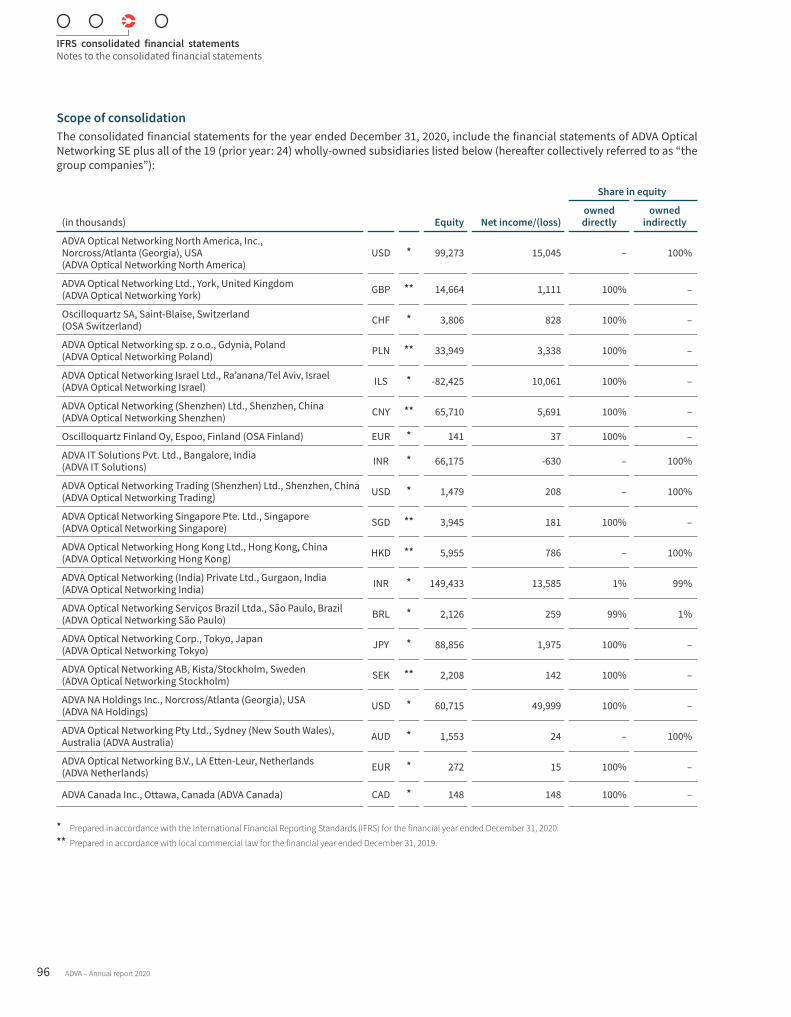
Scope of consolidation The consolidated financial statements for the year ended December 31, 2020, include the financial statements of ADVA Optical Networking SE plus all of the 19 (prior year: 24) wholly-owned subsidiaries listed below (hereafter collectively referred to as “the group companies”):
(in thousands) Equity Net income/(loss)
Share in equity
owned directly
owned indirectly
ADVA Optical Networking North America, Inc., Norcross/Atlanta (Georgia), USA (ADVA Optical Networking North America)
USD * 99,273 15,045 – 100%
ADVA Optical Networking Ltd., York, United Kingdom (ADVA Optical Networking York) GBP ** 14,664 1,111 100% –
Oscilloquartz SA, Saint-Blaise, Switzerland (OSA Switzerland) CHF * 3,806 828 100% –
ADVA Optical Networking sp. z o.o., Gdynia, Poland (ADVA Optical Networking Poland) PLN ** 33,949 3,338 100% –
ADVA Optical Networking Israel Ltd., Ra’anana/Tel Aviv, Israel (ADVA Optical Networking Israel) ILS * -82,425 10,061 100% –
ADVA Optical Networking (Shenzhen) Ltd., Shenzhen, China (ADVA Optical Networking Shenzhen) CNY ** 65,710 5,691 100% –
Oscilloquartz Finland Oy, Espoo, Finland (OSA Finland) EUR * 141 37 100% –
ADVA IT Solutions Pvt. Ltd., Bangalore, India (ADVA IT Solutions) INR * 66,175 -630 – 100%
ADVA Optical Networking Trading (Shenzhen) Ltd., Shenzhen, China (ADVA Optical Networking Trading) USD * 1,479 208 – 100%
ADVA Optical Networking Singapore Pte. Ltd., Singapore (ADVA Optical Networking Singapore) SGD ** 3,945 181 100% –
ADVA Optical Networking Hong Kong Ltd., Hong Kong, China (ADVA Optical Networking Hong Kong) HKD ** 5,955 786 – 100%
ADVA Optical Networking (India) Private Ltd., Gurgaon, India (ADVA Optical Networking India) INR * 149,433 13,585 1% 99%
ADVA Optical Networking Serviços Brazil Ltda., São Paulo, Brazil (ADVA Optical Networking São Paulo) BRL * 2,126 259 99% 1%
ADVA Optical Networking Corp., Tokyo, Japan (ADVA Optical Networking Tokyo) JPY * 88,856 1,975 100% –
ADVA Optical Networking AB, Kista/Stockholm, Sweden (ADVA Optical Networking Stockholm) SEK ** 2,208 142 100% –
ADVA NA Holdings Inc., Norcross/Atlanta (Georgia), USA (ADVA NA Holdings) USD * 60,715 49,999 100% –
ADVA Optical Networking Pty Ltd., Sydney (New South Wales), Australia (ADVA Australia) AUD * 1,553 24 – 100%
ADVA Optical Networking B.V., LA Etten-Leur, Netherlands (ADVA Netherlands) EUR * 272 15 100% –
ADVA Canada Inc., Ottawa, Canada (ADVA Canada) CAD * 148 148 100% –
* Prepared in accordance with the International Financial Reporting Standards (IFRS) for the financial year ended December 31, 2020.** Prepared in accordance with local commercial law for the financial year ended December 31, 2019.
IFRS consolidated financial statementsNotes to the consolidated financial statements
96 ADVA – Annual report 2020
Changes in the scope of consolidationIn August 2020, the liquidation of MRV Communications GmbH was completed and the company was deleted from the commercial register.
In November 2020, the liquidation of Charlotte’s Web Ltd., NBase Communications Ltd., Jolt Ltd. and NBase Fibronics Ltd., in Israel, four entities that have been inactive since 2017, was started. As these companies do not show any relations to companies or persons outside the ADVA group, the management assumes that the liquidation will take place without further adjustments. The companies were therefore deconsolidated in Q4 2020.
The deconsolidation resulted in reclassifications in the amount of EUR 255 thousand from other comprehensive income to the financial result in the income statement. No other material effects on earnings and in the balance sheet were recognized.
In 2020, there were no other changes in the scope of consolidation.
(8) Foreign currency translation
The functional currency of each group company is the currency of the main economic environment in which the company operates. The reporting currency of ADVA Optical Networking’s consolidated financial statements is the functional currency of the parent company, ADVA Optical Networking SE (euro).
Transactions in foreign currencies are initially recorded by the group entities at their respective functional currency rates prevailing on the date of the transaction. Monetary assets and liabilities denominated in foreign currencies are retranslated at the functional currency spot rate of exchange ruling on the reporting date. Non-monetary items that are measured in terms of historical cost in a foreign currency are translated using the exchange rates on the dates of the initial transactions. Non-monetary items measured at fair value in a foreign currency are translated using the exchange rates on the date when the fair value is determined. The exchange differences arising from the translation are recognized in profit or loss in financial income/expense.
The assets and liabilities of foreign operations are translated into euro at the rate of exchange prevailing on the reporting date, and their income statements are translated at the average rate for the reporting period. The exchange differences arising from the translation are recognized in accumulated other comprehensive income. On disposal of a foreign operation, the component of accumulated other comprehensive income related to that particular foreign operation is recognized in the income statement.
Any goodwill arising on the acquisition of a foreign operation and any fair value adjustments to the carrying amount of assets and liabilities arising on acquisition are treated as assets and liabilities of the foreign operation and translated at the closing rate.
The relevant currency translation rates to euro are listed below:
Closing rate
Dec. 31, 2020
Closing rate
Dec. 31, 2019
Average rate Jan. 1 to
Dec. 31, 2020
Average rate Jan. 1 to Dec. 31,
2019
AUD 1.6025 1.5992 1.6555 1.6104
BRL 6.3574 4.5128 5.8810 4.4147
CAD 1.5701 1.4621 1.5291 1.4860
CHF 1.0857 1.0871 1.0704 1.1127
CNY 8.0134 7.8175 7.8692 7.7329
GBP 0.9031 0.8521 0.8892 0.8775
HKD 9.5210 8.7133 8.8496 8.7717
ILS 3.9429 3.8749 3.9233 3.9913
INR 89.8824 79.8120 84.5604 78.8157
JPY 126.5700 122.1900 121.7478 122.0648
PLN 4.5565 4.2567 4.4431 4.2970
SEK 10.0568 10.4400 10.4902 10.5851
SGD 1.6257 1.5088 1.5731 1.5272
USD 1.2281 1.1189 1.1410 1.1196
NOTES TO THE CONSOLIDATED STATEMENT OF FINANCIAL POSITION(9) Cash and cash equivalents
Cash and cash equivalents include current funds as well as current financial assets with an original remaining maturity that does not exceed three months.
On December 31, 2020 and 2019, cash and cash equivalents include EUR 222 thousand and EUR 175 thousand, respectively, to which ADVA has only limited access.
Moreover, on December 31, 2020, cash of EUR 1,472 thousand (December 31, 2019: EUR 1,763 thousand) is held in China and is subject to local exchange control regulations. These local exchange control regulations provide for restrictions on exporting capital from the country, other than through normal dividends.
Cash at banks earns interest at floating rates based on daily bank deposit rates.
Cash equivalents are invested for varying periods of between one day and three months, depending on the immediate cash requirements of the group, and earn interest at the respective short-term deposit rates.
IFRS consolidated financial statementsNotes to the consolidated statement of financial position
ADVA – Annual report 2020 97

(10) Trade accounts receivable
Trade accounts receivable are non-interest-bearing and are due within 30 to 120 days in general. For specific projects, other payment terms may be agreed.
Gross and net trade accounts receivable are as follows:
(in thousands of EUR)Dec. 31,
2020Dec. 31,
2019
Gross trade accounts receivable 86,593 97,884
Depreciation -2,713 -1,691
Net trade accounts receivable 83,880 96,193
A reconciliation of the risk provision for trade accounts receivable carried at amortized cost is included in the table below:
(in thousands of EUR) 2020 2019
Jan. 1 1,691 638
Increase of risk provision 73 –
Release of risk provision – -204
Addition of specific allowances 1,119 1,335
Usage -7 -89
Foreign currency translation effects -163 11
Dec. 31 2,713 1,691
Further information on default risk from trade accounts receivable is included in note (33) on financial risk management.
The group has a supplier finance agreement, which entitles the transfer of trade receivables from a specific customer. Credit risks and settlement risks are transferred to the financing institution. The group paid an annual fee amounting to LIBOR plus 0.75% on the volume of receivables transferred. In 2020, the group incurred interest expenses of EUR 30 thousand pertaining to this arrangement (prior year: EUR 303 thousand).
In Q2 2020, the group concluded another revolving factoring agreement with a maximum annual volume of EUR 20,000 thousand. The contract entitles to transfer uninsured trade receivables with certain customers. The agreement has no maturity date. The risks relevant to the risk assessment in relation to the receivables sold are the default risk and the late payment risk. As of December 31, 2020, receivables amounting to EUR 10,622 thousand were sold, of which EUR 891 thousand was not paid out as reserve. These reserves are recognized in other assets.
The group accounts for the sold trade receivables in the amount of their continuing involvement. On December 31, 2020 the continuing involvement in the amount of EUR 391 thousand was recognized as a liability and includes the maximum loss for the default and late payment risk for ADVA. The fair value of the guarantee or the interest payments to be
made were recognized in the profit and loss statement and also recognized as other liabilities in the amount of EUR 71 thousand.
On December, 2020, trade accounts receivable include receivables of EUR 24,559 thousand related to the existing sale of receivables agreement (December 31, 2019: EUR 10,321 thousand), for which no transfer had taken place as of year-end 2020.
(11) Inventories
The table below summarizes the composition of inventories on December 31:
(in thousands of EUR) 2020 2019
Raw materials and supplies 16,303 20,547
Work in progress 3,428 3,385
Finished goods 70,393 81,423
90,124 105,355
In 2020, depreciation of inventories amounting to EUR 5,420 thousand (prior year: EUR 5,761 thousand) was recognized as an expense within cost of goods sold. This amount includes reversals of earlier write-downs amounting to EUR 332 thousand (prior year: EUR 541 thousand) due to higher selling and input prices.
In 2020, provisions for advance replacements of defective parts amounting to EUR 1,237 thousand were reclassified to depreciation of inventories in order to present them as an inventory write-down. A corresponding reclassification in 2019 would have resulted in a decrease in inventories of EUR 910 thousand.
In 2020 and 2019, material costs of EUR 259,938 thousand and EUR 262,633 thousand, respectively, have been recognized.
IFRS consolidated financial statementsNotes to the consolidated statement of financial position
98 ADVA – Annual report 2020
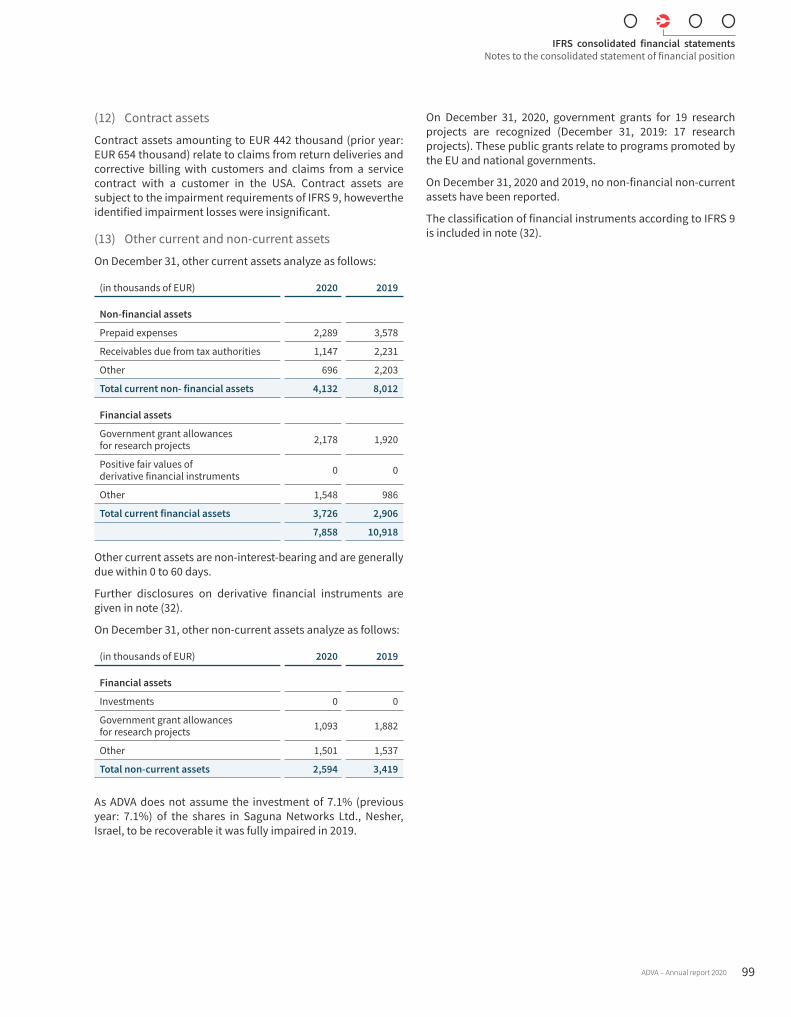
(12) Contract assets
Contract assets amounting to EUR 442 thousand (prior year: EUR 654 thousand) relate to claims from return deliveries and corrective billing with customers and claims from a service contract with a customer in the USA. Contract assets are subject to the impairment requirements of IFRS 9, howeverthe identified impairment losses were insignificant.
(13) Other current and non-current assets
On December 31, other current assets analyze as follows:
(in thousands of EUR) 2020 2019
Non-financial assets
Prepaid expenses 2,289 3,578
Receivables due from tax authorities 1,147 2,231
Other 696 2,203
Total current non- financial assets 4,132 8,012
Financial assets
Government grant allowances for research projects 2,178 1,920
Positive fair values of derivative financial instruments 0 0
Other 1,548 986
Total current financial assets 3,726 2,906
7,858 10,918
Other current assets are non-interest-bearing and are generally due within 0 to 60 days.
Further disclosures on derivative financial instruments are given in note (32).
On December 31, other non-current assets analyze as follows:
(in thousands of EUR) 2020 2019
Financial assets
Investments 0 0
Government grant allowances for research projects 1,093 1,882
Other 1,501 1,537
Total non-current assets 2,594 3,419
As ADVA does not assume the investment of 7.1% (previous year: 7.1%) of the shares in Saguna Networks Ltd., Nesher, Israel, to be recoverable it was fully impaired in 2019.
On December 31, 2020, government grants for 19 research projects are recognized (December 31, 2019: 17 research projects). These public grants relate to programs promoted by the EU and national governments.
On December 31, 2020 and 2019, no non-financial non-current assets have been reported.
The classification of financial instruments according to IFRS 9 is included in note (32).
IFRS consolidated financial statementsNotes to the consolidated statement of financial position
ADVA – Annual report 2020 99
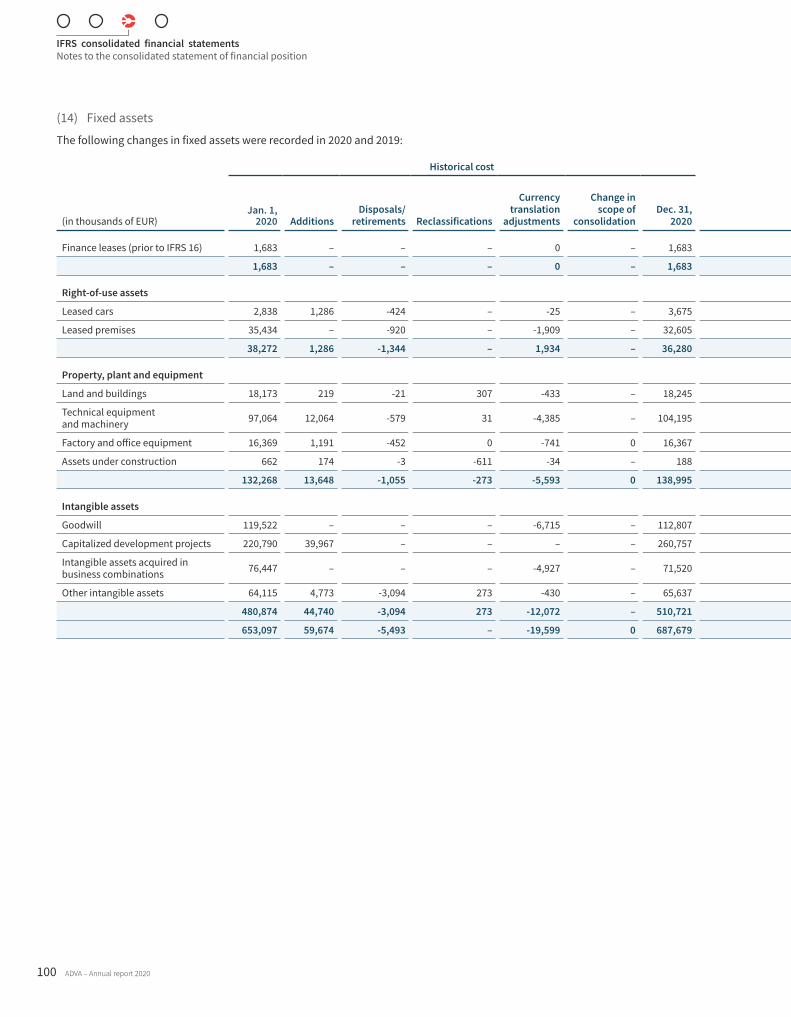
(14) Fixed assets
The following changes in fixed assets were recorded in 2020 and 2019:
(in thousands of EUR)
Historical cost Accumulated depreciation Net book values
Jan. 1, 2020 Additions
Disposals/ retirements Reclassifications
Currency translation
adjustments
Change in scope of
consolidationDec. 31,
2020Jan. 1,
2020
Deprecia-
tion of the period
Im- pairment
of the period
Deprecia- tion on
disposals/ retirements Reclassifications
Currency translation
adjustments
Change in scope of
consolidationDec. 31,
2020Dec. 31,
2020Dec. 31,
2019
Finance leases (prior to IFRS 16) 1,683 – – – 0 – 1,683 1,683 – – – – 0 – 1,683 – –
1,683 – – – 0 – 1,683 1,683 – – – – 0 – 1,683 – –
Right-of-use assets
Leased cars 2,838 1,286 -424 – -25 – 3,675 964 1,160 – -424 – -11 – 1,689 1,986 1,874
Leased premises 35,434 – -920 – -1,909 – 32,605 5,323 4,919 332 -905 – -464 – 9,205 23,400 30,111
38,272 1,286 -1,344 – 1,934 – 36,280 6,287 6,079 332 -1,329 – -475 – 10,894 25,386 31,985
Property, plant and equipment
Land and buildings 18,173 219 -21 307 -433 – 18,245 11,200 1,179 – -21 – -324 – 12,034 6,211 6,973
Technical equipment and machinery 97,064 12,064 -579 31 -4,385 – 104,195 74,960 10,970 – -376 – -3,682 – 81,872 22,323 22,104
Factory and office equipment 16,369 1,191 -452 0 -741 0 16,367 13,486 1,454 – -443 – -643 0 13,854 2,513 2,883
Assets under construction 662 174 -3 -611 -34 – 188 – 188 662
132,268 13,648 -1,055 -273 -5,593 0 138,995 99,646 13,603 – -840 – -4,649 0 107,760 31,235 32,622
Intangible assets
Goodwill 119,522 – – – -6,715 – 112,807 47,499 – – – – -1,728 – 45,771 67,036 72,023
Capitalized development projects 220,790 39,967 – – – – 260,757 124,621 37,341 – – – 188 – 162,150 98,607 96,169
Intangible assets acquired in business combinations 76,447 – – – -4,927 – 71,520 55,583 4,439 – – – -3,506 – 56,516 15,004 20,864
Other intangible assets 64,115 4,773 -3,094 273 -430 – 65,637 60,411 3,267 – -2,985 – -358 – 60,335 5,302 3,704
480,874 44,740 -3,094 273 -12,072 – 510,721 288,114 45,047 – -2,985 – -5,404 – 324,772 185,949 192,760
653,097 59,674 -5,493 – -19,599 0 687,679 395,730 64,729 332 -5,154 – -10,528 0 445,109 242,570 257,367
IFRS consolidated financial statementsNotes to the consolidated statement of financial position
100 ADVA – Annual report 2020
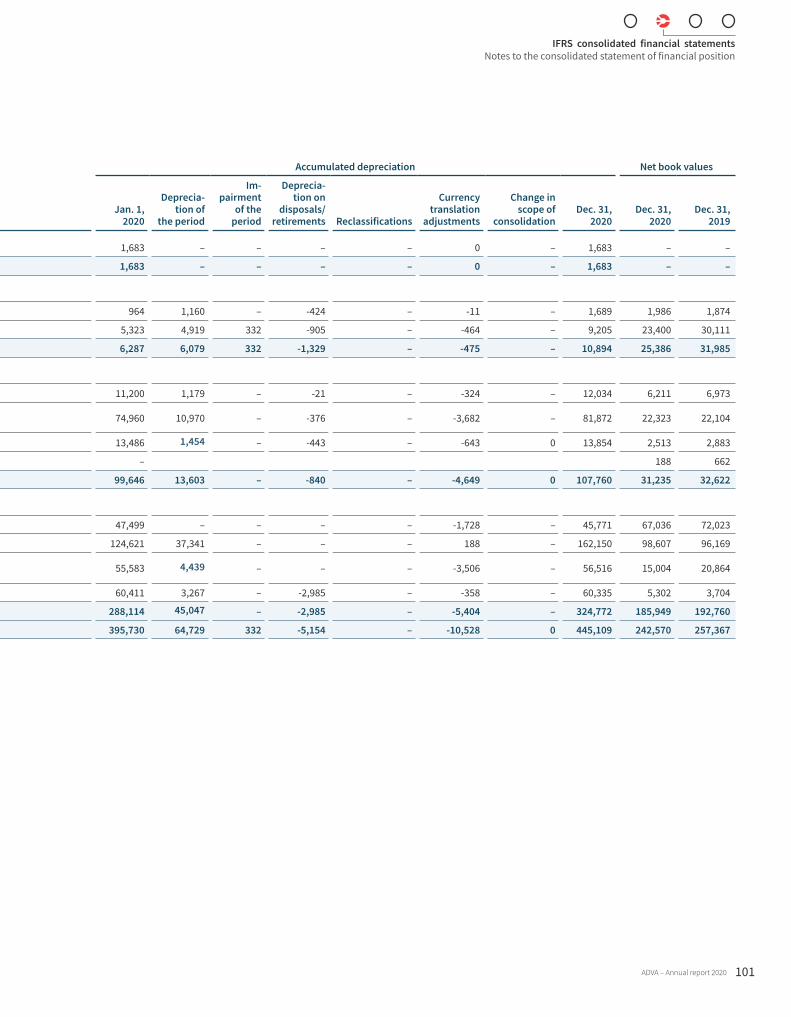
(14) Fixed assets
The following changes in fixed assets were recorded in 2020 and 2019:
(in thousands of EUR)
Historical cost Accumulated depreciation Net book values
Jan. 1, 2020 Additions
Disposals/ retirements Reclassifications
Currency translation
adjustments
Change in scope of
consolidationDec. 31,
2020Jan. 1,
2020
Deprecia-
tion of the period
Im- pairment
of the period
Deprecia- tion on
disposals/ retirements Reclassifications
Currency translation
adjustments
Change in scope of
consolidationDec. 31,
2020Dec. 31,
2020Dec. 31,
2019
Finance leases (prior to IFRS 16) 1,683 – – – 0 – 1,683 1,683 – – – – 0 – 1,683 – –
1,683 – – – 0 – 1,683 1,683 – – – – 0 – 1,683 – –
Right-of-use assets
Leased cars 2,838 1,286 -424 – -25 – 3,675 964 1,160 – -424 – -11 – 1,689 1,986 1,874
Leased premises 35,434 – -920 – -1,909 – 32,605 5,323 4,919 332 -905 – -464 – 9,205 23,400 30,111
38,272 1,286 -1,344 – 1,934 – 36,280 6,287 6,079 332 -1,329 – -475 – 10,894 25,386 31,985
Property, plant and equipment
Land and buildings 18,173 219 -21 307 -433 – 18,245 11,200 1,179 – -21 – -324 – 12,034 6,211 6,973
Technical equipment and machinery 97,064 12,064 -579 31 -4,385 – 104,195 74,960 10,970 – -376 – -3,682 – 81,872 22,323 22,104
Factory and office equipment 16,369 1,191 -452 0 -741 0 16,367 13,486 1,454 – -443 – -643 0 13,854 2,513 2,883
Assets under construction 662 174 -3 -611 -34 – 188 – 188 662
132,268 13,648 -1,055 -273 -5,593 0 138,995 99,646 13,603 – -840 – -4,649 0 107,760 31,235 32,622
Intangible assets
Goodwill 119,522 – – – -6,715 – 112,807 47,499 – – – – -1,728 – 45,771 67,036 72,023
Capitalized development projects 220,790 39,967 – – – – 260,757 124,621 37,341 – – – 188 – 162,150 98,607 96,169
Intangible assets acquired in business combinations 76,447 – – – -4,927 – 71,520 55,583 4,439 – – – -3,506 – 56,516 15,004 20,864
Other intangible assets 64,115 4,773 -3,094 273 -430 – 65,637 60,411 3,267 – -2,985 – -358 – 60,335 5,302 3,704
480,874 44,740 -3,094 273 -12,072 – 510,721 288,114 45,047 – -2,985 – -5,404 – 324,772 185,949 192,760
653,097 59,674 -5,493 – -19,599 0 687,679 395,730 64,729 332 -5,154 – -10,528 0 445,109 242,570 257,367
IFRS consolidated financial statementsNotes to the consolidated statement of financial position
ADVA – Annual report 2020 101
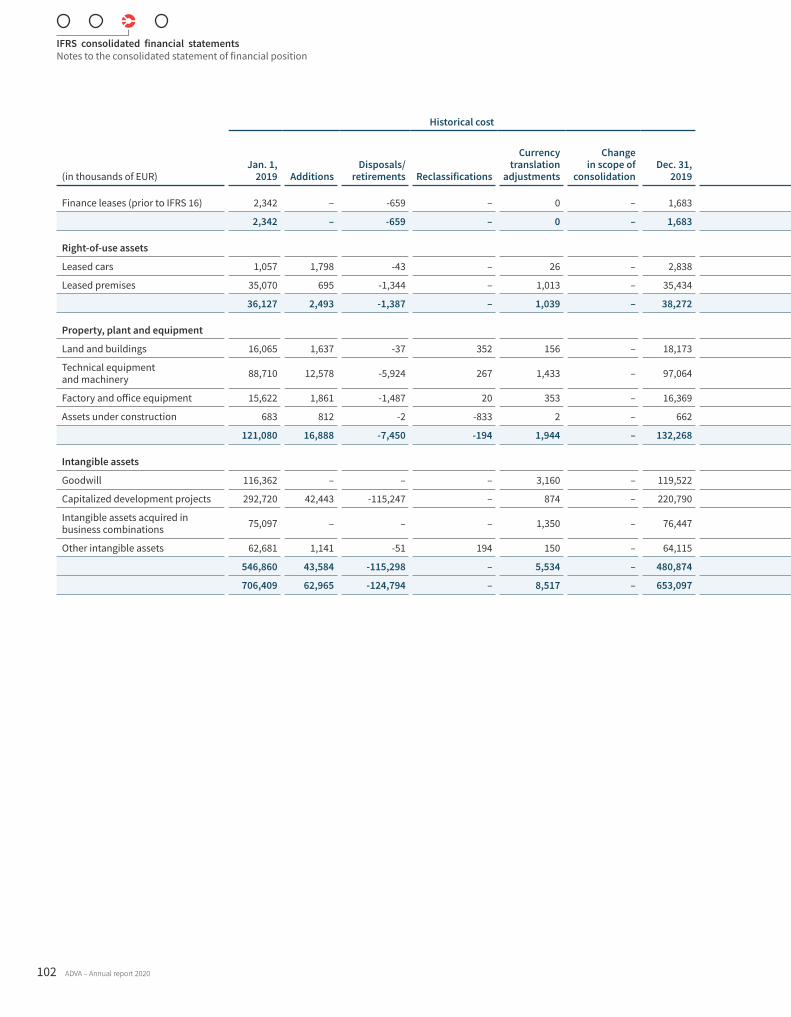
(in thousands of EUR)
Historical cost Accumulated depreciation Net book values
Jan. 1, 2019 Additions
Disposals/ retirements Reclassifications
Currency translation
adjustments
Changein scope of
consolidationDec. 31,
2019Jan. 1,
2019
Deprecia-
tion of the period
Im- pairment
of the period
Deprecia- tion on
disposals/ retirements Reclassifications
Currency translation
adjustments
Change in scope of
consolidationDec. 31,
2019Dec. 31,
2019Dec. 31,
2018
Finance leases (prior to IFRS 16) 2,342 – -659 – 0 – 1,683 2,342 – – -659 – 0 – 1,683 – –
2,342 – -659 – 0 – 1,683 2,342 – – -659 – 0 – 1,683 – –
Right-of-use assets
Leased cars 1,057 1,798 -43 – 26 – 2,838 – 963 – -10 – 11 – 964 1,874 n/a
Leased premises 35,070 695 -1,344 – 1,013 – 35,434 – 5,558 – -270 – 35 – 5,323 30,111 n/a
36,127 2,493 -1,387 – 1,039 – 38,272 – 6,521 – -280 – 46 – 6,287 31,985 n/a
Property, plant and equipment
Land and buildings 16,065 1,637 -37 352 156 – 18,173 9,869 1,229 – -12 – 114 – 11,200 6,973 6,196
Technical equipment and machinery 88,710 12,578 -5,924 267 1,433 – 97,064 69,094 10,502 – -5,712 – 1,076 – 74,960 22,104 19,616
Factory and office equipment 15,622 1,861 -1,487 20 353 – 16,369 13,065 1,590 – -1,467 – 298 – 13,486 2,883 2,557
Assets under construction 683 812 -2 -833 2 – 662 – – – – – – – – 662 683
121,080 16,888 -7,450 -194 1,944 – 132,268 92,028 13,321 – -7,191 – 1,488 – 99,646 32,622 29,052
Intangible assets
Goodwill 116,362 – – – 3,160 – 119,522 45,962 – – – – 1,537 – 47,499 72,023 70,400
Capitalized development projects 292,720 42,443 -115,247 – 874 – 220,790 204,794 33,484 – -114,531 – 874 – 124,621 96,169 87,926
Intangible assets acquired in business combinations 75,097 – – – 1,350 – 76,447 49,085 5,663 – – – 835 – 55,583 20,864 26,012
Other intangible assets 62,681 1,141 -51 194 150 – 64,115 57,169 3,202 – -51 – 91 – 60,411 3,704 5,512
546,860 43,584 -115,298 – 5,534 – 480,874 357,010 42,349 – -114,582 – 3,337 – 288,114 192,760 189,850
706,409 62,965 -124,794 – 8,517 – 653,097 451,380 62,191 – -122,712 – 4,871 – 395,730 257,367 218,902
IFRS consolidated financial statementsNotes to the consolidated statement of financial position
102 ADVA – Annual report 2020
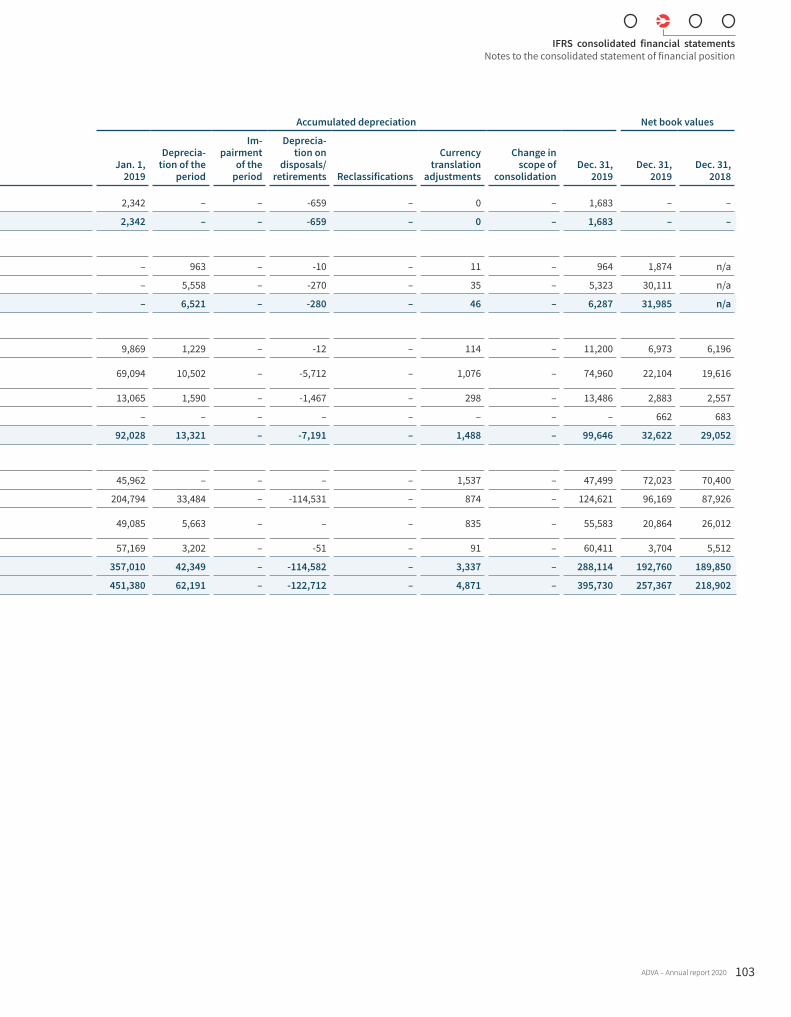
(in thousands of EUR)
Historical cost Accumulated depreciation Net book values
Jan. 1, 2019 Additions
Disposals/ retirements Reclassifications
Currency translation
adjustments
Changein scope of
consolidationDec. 31,
2019Jan. 1,
2019
Deprecia-
tion of the period
Im- pairment
of the period
Deprecia- tion on
disposals/ retirements Reclassifications
Currency translation
adjustments
Change in scope of
consolidationDec. 31,
2019Dec. 31,
2019Dec. 31,
2018
Finance leases (prior to IFRS 16) 2,342 – -659 – 0 – 1,683 2,342 – – -659 – 0 – 1,683 – –
2,342 – -659 – 0 – 1,683 2,342 – – -659 – 0 – 1,683 – –
Right-of-use assets
Leased cars 1,057 1,798 -43 – 26 – 2,838 – 963 – -10 – 11 – 964 1,874 n/a
Leased premises 35,070 695 -1,344 – 1,013 – 35,434 – 5,558 – -270 – 35 – 5,323 30,111 n/a
36,127 2,493 -1,387 – 1,039 – 38,272 – 6,521 – -280 – 46 – 6,287 31,985 n/a
Property, plant and equipment
Land and buildings 16,065 1,637 -37 352 156 – 18,173 9,869 1,229 – -12 – 114 – 11,200 6,973 6,196
Technical equipment and machinery 88,710 12,578 -5,924 267 1,433 – 97,064 69,094 10,502 – -5,712 – 1,076 – 74,960 22,104 19,616
Factory and office equipment 15,622 1,861 -1,487 20 353 – 16,369 13,065 1,590 – -1,467 – 298 – 13,486 2,883 2,557
Assets under construction 683 812 -2 -833 2 – 662 – – – – – – – – 662 683
121,080 16,888 -7,450 -194 1,944 – 132,268 92,028 13,321 – -7,191 – 1,488 – 99,646 32,622 29,052
Intangible assets
Goodwill 116,362 – – – 3,160 – 119,522 45,962 – – – – 1,537 – 47,499 72,023 70,400
Capitalized development projects 292,720 42,443 -115,247 – 874 – 220,790 204,794 33,484 – -114,531 – 874 – 124,621 96,169 87,926
Intangible assets acquired in business combinations 75,097 – – – 1,350 – 76,447 49,085 5,663 – – – 835 – 55,583 20,864 26,012
Other intangible assets 62,681 1,141 -51 194 150 – 64,115 57,169 3,202 – -51 – 91 – 60,411 3,704 5,512
546,860 43,584 -115,298 – 5,534 – 480,874 357,010 42,349 – -114,582 – 3,337 – 288,114 192,760 189,850
706,409 62,965 -124,794 – 8,517 – 653,097 451,380 62,191 – -122,712 – 4,871 – 395,730 257,367 218,902
IFRS consolidated financial statementsNotes to the consolidated statement of financial position
ADVA – Annual report 2020 103
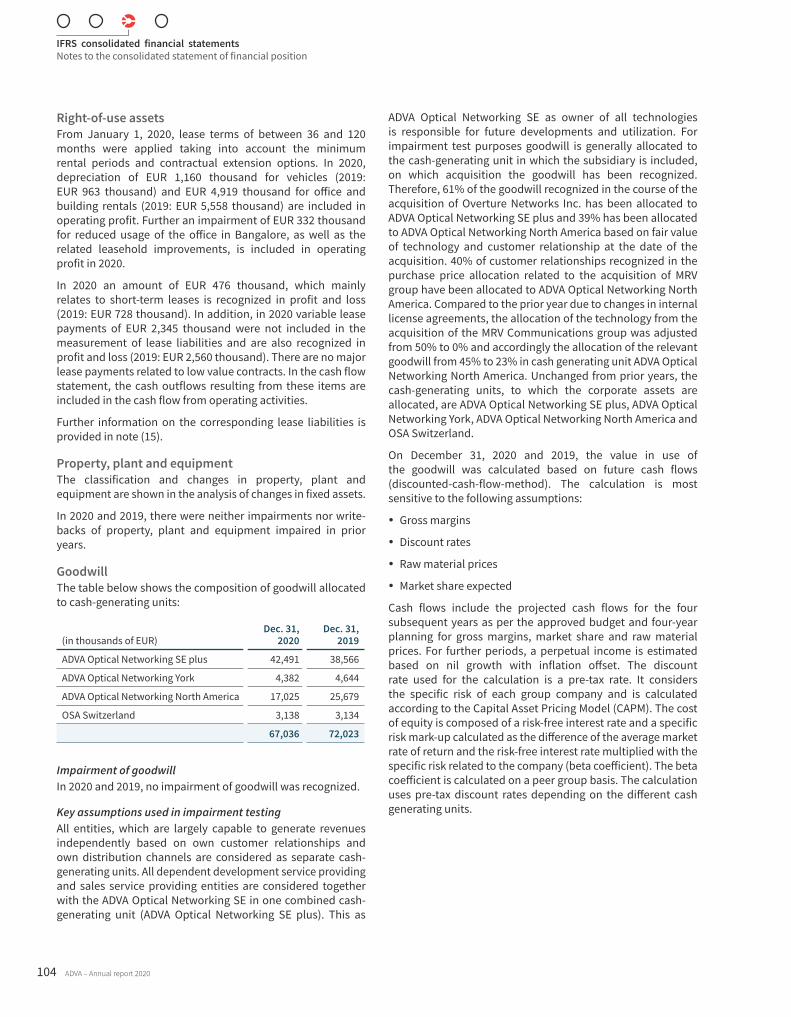
Right-of-use assets From January 1, 2020, lease terms of between 36 and 120 months were applied taking into account the minimum rental periods and contractual extension options. In 2020, depreciation of EUR 1,160 thousand for vehicles (2019: EUR 963 thousand) and EUR 4,919 thousand for office and building rentals (2019: EUR 5,558 thousand) are included in operating profit. Further an impairment of EUR 332 thousand for reduced usage of the office in Bangalore, as well as the related leasehold improvements, is included in operating profit in 2020.
In 2020 an amount of EUR 476 thousand, which mainly relates to short-term leases is recognized in profit and loss (2019: EUR 728 thousand). In addition, in 2020 variable lease payments of EUR 2,345 thousand were not included in the measurement of lease liabilities and are also recognized in profit and loss (2019: EUR 2,560 thousand). There are no major lease payments related to low value contracts. In the cash flow statement, the cash outflows resulting from these items are included in the cash flow from operating activities.
Further information on the corresponding lease liabilities is provided in note (15).
Property, plant and equipmentThe classification and changes in property, plant and equipment are shown in the analysis of changes in fixed assets.
In 2020 and 2019, there were neither impairments nor write-backs of property, plant and equipment impaired in prior years.
GoodwillThe table below shows the composition of goodwill allocated to cash-generating units:
(in thousands of EUR)Dec. 31,
2020Dec. 31,
2019
ADVA Optical Networking SE plus 42,491 38,566
ADVA Optical Networking York 4,382 4,644
ADVA Optical Networking North America 17,025 25,679
OSA Switzerland 3,138 3,134
67,036 72,023
Impairment of goodwill In 2020 and 2019, no impairment of goodwill was recognized.
Key assumptions used in impairment testingAll entities, which are largely capable to generate revenues independently based on own customer relationships and own distribution channels are considered as separate cash-generating units. All dependent development service providing and sales service providing entities are considered together with the ADVA Optical Networking SE in one combined cash-generating unit (ADVA Optical Networking SE plus). This as
ADVA Optical Networking SE as owner of all technologies is responsible for future developments and utilization. For impairment test purposes goodwill is generally allocated to the cash-generating unit in which the subsidiary is included, on which acquisition the goodwill has been recognized. Therefore, 61% of the goodwill recognized in the course of the acquisition of Overture Networks Inc. has been allocated to ADVA Optical Networking SE plus and 39% has been allocated to ADVA Optical Networking North America based on fair value of technology and customer relationship at the date of the acquisition. 40% of customer relationships recognized in the purchase price allocation related to the acquisition of MRV group have been allocated to ADVA Optical Networking North America. Compared to the prior year due to changes in internal license agreements, the allocation of the technology from the acquisition of the MRV Communications group was adjusted from 50% to 0% and accordingly the allocation of the relevant goodwill from 45% to 23% in cash generating unit ADVA Optical Networking North America. Unchanged from prior years, the cash-generating units, to which the corporate assets are allocated, are ADVA Optical Networking SE plus, ADVA Optical Networking York, ADVA Optical Networking North America and OSA Switzerland.
On December 31, 2020 and 2019, the value in use of the goodwill was calculated based on future cash flows (discounted-cash-flow-method). The calculation is most sensitive to the following assumptions:
y Gross margins
y Discount rates
y Raw material prices
y Market share expected
Cash flows include the projected cash flows for the four subsequent years as per the approved budget and four-year planning for gross margins, market share and raw material prices. For further periods, a perpetual income is estimated based on nil growth with inflation offset. The discount rate used for the calculation is a pre-tax rate. It considers the specific risk of each group company and is calculated according to the Capital Asset Pricing Model (CAPM). The cost of equity is composed of a risk-free interest rate and a specific risk mark-up calculated as the difference of the average market rate of return and the risk-free interest rate multiplied with the specific risk related to the company (beta coefficient). The beta coefficient is calculated on a peer group basis. The calculation uses pre-tax discount rates depending on the different cash generating units.
IFRS consolidated financial statementsNotes to the consolidated statement of financial position
104 ADVA – Annual report 2020
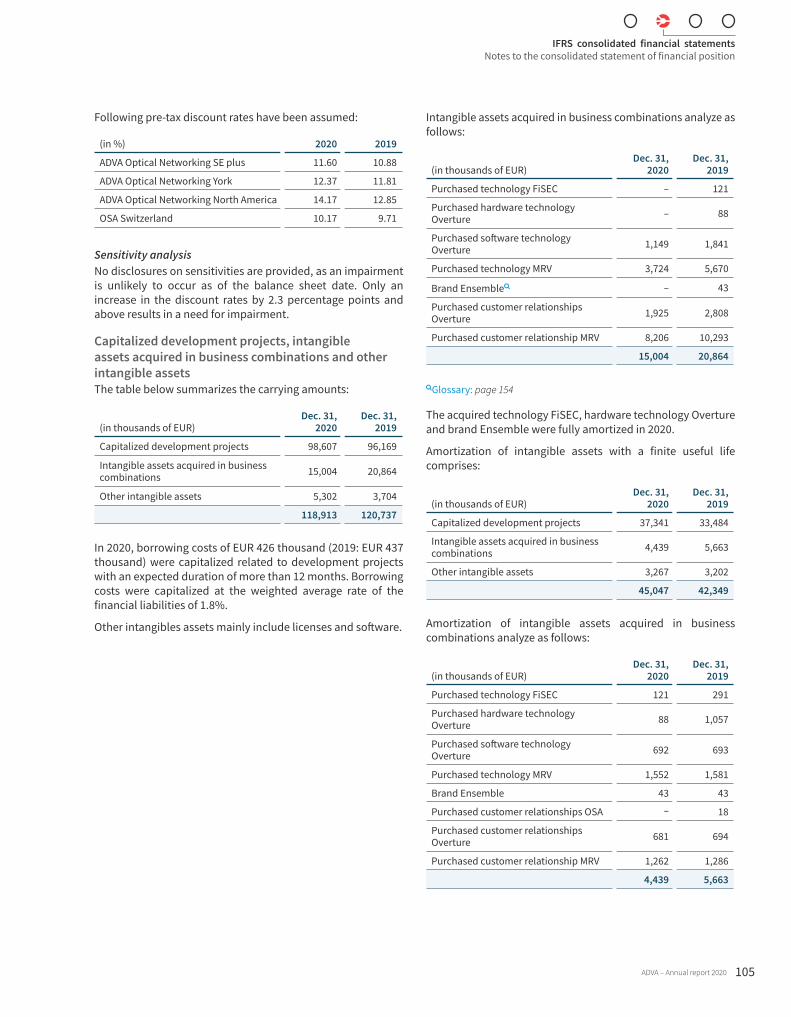
Following pre-tax discount rates have been assumed:
(in %) 2020 2019
ADVA Optical Networking SE plus 11.60 10.88
ADVA Optical Networking York 12.37 11.81
ADVA Optical Networking North America 14.17 12.85
OSA Switzerland 10.17 9.71
Sensitivity analysisNo disclosures on sensitivities are provided, as an impairment is unlikely to occur as of the balance sheet date. Only an increase in the discount rates by 2.3 percentage points and above results in a need for impairment.
Capitalized development projects, intangible assets acquired in business combinations and other intangible assetsThe table below summarizes the carrying amounts:
(in thousands of EUR)Dec. 31,
2020Dec. 31,
2019
Capitalized development projects 98,607 96,169
Intangible assets acquired in business combinations 15,004 20,864
Other intangible assets 5,302 3,704
118,913 120,737
In 2020, borrowing costs of EUR 426 thousand (2019: EUR 437 thousand) were capitalized related to development projects with an expected duration of more than 12 months. Borrowing costs were capitalized at the weighted average rate of the financial liabilities of 1.8%.
Other intangibles assets mainly include licenses and software.
Intangible assets acquired in business combinations analyze as follows:
(in thousands of EUR)Dec. 31,
2020Dec. 31,
2019
Purchased technology FiSEC – 121
Purchased hardware technology Overture – 88
Purchased software technology Overture 1,149 1,841
Purchased technology MRV 3,724 5,670
Brand Ensemble – 43
Purchased customer relationships Overture 1,925 2,808
Purchased customer relationship MRV 8,206 10,293
15,004 20,864
Glossary: page 154
The acquired technology FiSEC, hardware technology Overture and brand Ensemble were fully amortized in 2020.
Amortization of intangible assets with a finite useful life comprises:
(in thousands of EUR)Dec. 31,
2020Dec. 31,
2019
Capitalized development projects 37,341 33,484
Intangible assets acquired in business combinations 4,439 5,663
Other intangible assets 3,267 3,202
45,047 42,349
Amortization of intangible assets acquired in business combinations analyze as follows:
(in thousands of EUR)Dec. 31,
2020Dec. 31,
2019
Purchased technology FiSEC 121 291
Purchased hardware technology Overture 88 1,057
Purchased software technology Overture 692 693
Purchased technology MRV 1,552 1,581
Brand Ensemble 43 43
Purchased customer relationships OSA – 18
Purchased customer relationships Overture 681 694
Purchased customer relationship MRV 1,262 1,286
4,439 5,663
IFRS consolidated financial statementsNotes to the consolidated statement of financial position
ADVA – Annual report 2020 105
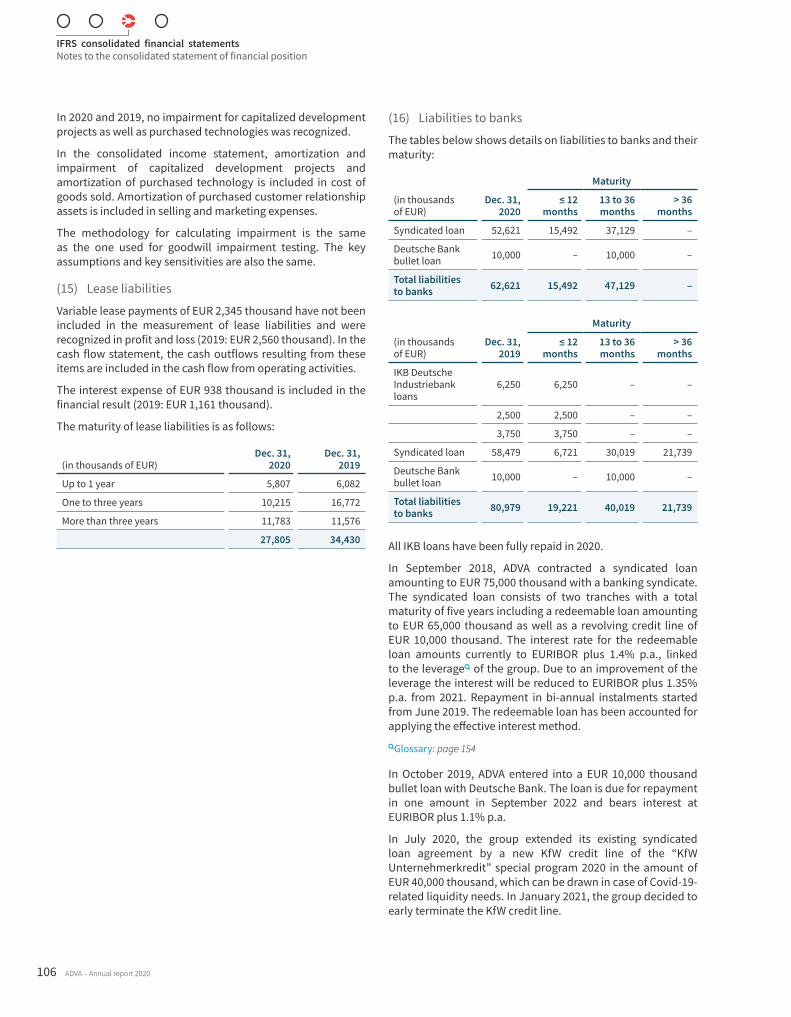
In 2020 and 2019, no impairment for capitalized development projects as well as purchased technologies was recognized.
In the consolidated income statement, amortization and impairment of capitalized development projects and amortization of purchased technology is included in cost of goods sold. Amortization of purchased customer relationship assets is included in selling and marketing expenses.
The methodology for calculating impairment is the same as the one used for goodwill impairment testing. The key assumptions and key sensitivities are also the same.
(15) Lease liabilities
Variable lease payments of EUR 2,345 thousand have not been included in the measurement of lease liabilities and were recognized in profit and loss (2019: EUR 2,560 thousand). In the cash flow statement, the cash outflows resulting from these items are included in the cash flow from operating activities.
The interest expense of EUR 938 thousand is included in the financial result (2019: EUR 1,161 thousand).
The maturity of lease liabilities is as follows:
(in thousands of EUR)Dec. 31,
2020Dec. 31,
2019
Up to 1 year 5,807 6,082
One to three years 10,215 16,772
More than three years 11,783 11,576
27,805 34,430
(16) Liabilities to banks
The tables below shows details on liabilities to banks and their maturity:
(in thousands of EUR)
Dec. 31, 2020
Maturity
≤ 12 months
13 to 36 months
> 36 months
Syndicated loan 52,621 15,492 37,129 –
Deutsche Bank bullet loan 10,000 – 10,000 –
Total liabilities to banks 62,621 15,492 47,129 –
(in thousands of EUR)
Dec. 31, 2019
Maturity
≤ 12 months
13 to 36 months
> 36 months
IKB Deutsche Industriebank loans
6,250 6,250 – –
2,500 2,500 – –
3,750 3,750 – –
Syndicated loan 58,479 6,721 30,019 21,739
Deutsche Bank bullet loan 10,000 – 10,000 –
Total liabilities to banks 80,979 19,221 40,019 21,739
All IKB loans have been fully repaid in 2020.
In September 2018, ADVA contracted a syndicated loan amounting to EUR 75,000 thousand with a banking syndicate. The syndicated loan consists of two tranches with a total maturity of five years including a redeemable loan amounting to EUR 65,000 thousand as well as a revolving credit line of EUR 10,000 thousand. The interest rate for the redeemable loan amounts currently to EURIBOR plus 1.4% p.a., linked to the leverage of the group. Due to an improvement of the leverage the interest will be reduced to EURIBOR plus 1.35% p.a. from 2021. Repayment in bi-annual instalments started from June 2019. The redeemable loan has been accounted for applying the effective interest method. Glossary: page 154
In October 2019, ADVA entered into a EUR 10,000 thousand bullet loan with Deutsche Bank. The loan is due for repayment in one amount in September 2022 and bears interest at EURIBOR plus 1.1% p.a.
In July 2020, the group extended its existing syndicated loan agreement by a new KfW credit line of the “KfW Unternehmerkredit” special program 2020 in the amount of EUR 40,000 thousand, which can be drawn in case of Covid-19-related liquidity needs. In January 2021, the group decided to early terminate the KfW credit line.
IFRS consolidated financial statementsNotes to the consolidated statement of financial position
106 ADVA – Annual report 2020
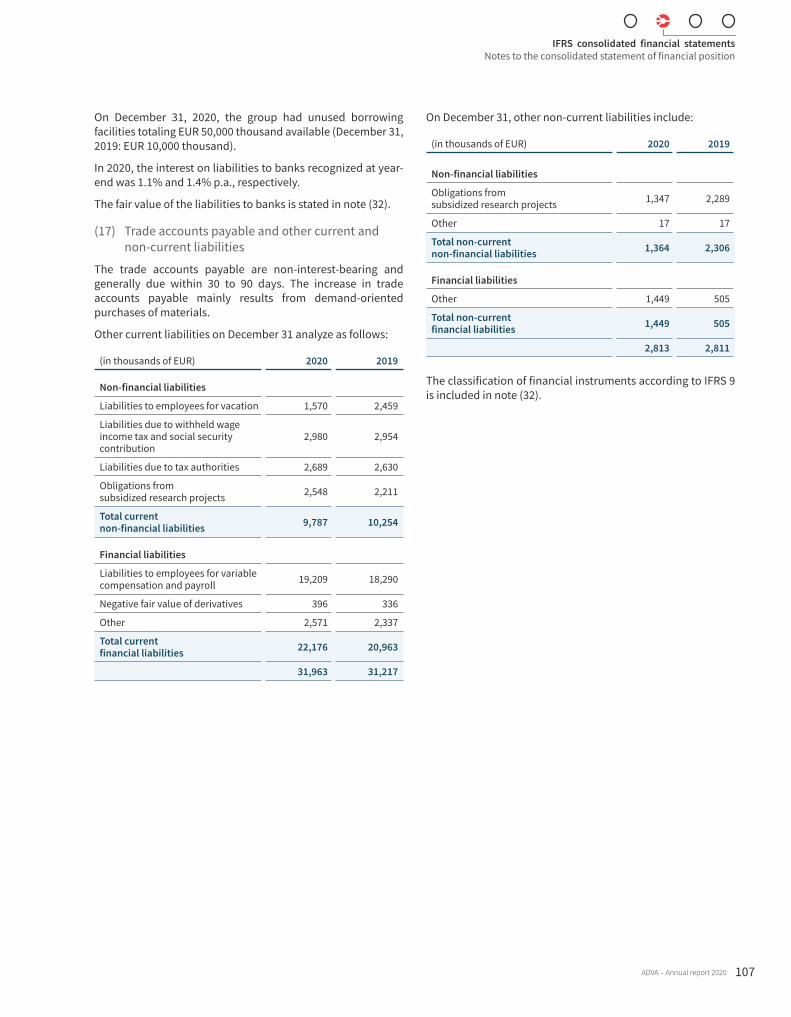
On December 31, 2020, the group had unused borrowing facilities totaling EUR 50,000 thousand available (December 31, 2019: EUR 10,000 thousand).
In 2020, the interest on liabilities to banks recognized at year-end was 1.1% and 1.4% p.a., respectively.
The fair value of the liabilities to banks is stated in note (32).
(17) Trade accounts payable and other current and non-current liabilities
The trade accounts payable are non-interest-bearing and generally due within 30 to 90 days. The increase in trade accounts payable mainly results from demand-oriented purchases of materials.
Other current liabilities on December 31 analyze as follows:
(in thousands of EUR) 2020 2019
Non-financial liabilities
Liabilities to employees for vacation 1,570 2,459
Liabilities due to withheld wage income tax and social security contribution
2,980 2,954
Liabilities due to tax authorities 2,689 2,630
Obligations from subsidized research projects 2,548 2,211
Total current non-financial liabilities 9,787 10,254
Financial liabilities
Liabilities to employees for variable compensation and payroll 19,209 18,290
Negative fair value of derivatives 396 336
Other 2,571 2,337
Total current financial liabilities 22,176 20,963
31,963 31,217
On December 31, other non-current liabilities include:
(in thousands of EUR) 2020 2019
Non-financial liabilities
Obligations from subsidized research projects 1,347 2,289
Other 17 17
Total non-current non-financial liabilities 1,364 2,306
Financial liabilities
Other 1,449 505
Total non-current financial liabilities 1,449 505
2,813 2,811
The classification of financial instruments according to IFRS 9 is included in note (32).
IFRS consolidated financial statementsNotes to the consolidated statement of financial position
ADVA – Annual report 2020 107

(18) Provisions for pensions and similar employee benefits
Post-employment benefit plans are classified as either defined contribution or defined benefit plans.
Plan assets related to defined contribution plans are managed separately from the assets of the relevant company by a trustee. For such plans, the company pays fixed contributions into a separate entity or a fund and does not assume any other obligations. Payment obligations to defined contribution plans are recognized in profit or loss when they occur. Payment to government managed pension plans with fixed contributions are considered as defined contribution plans. ADVA group maintains defined contribution plans in different group companies. In 2020, total expenses related to defined contribution plans amount to EUR 8,346 thousand (prior year: EUR 8,197 thousand).
Under defined benefit plans the company is required to pay agreed benefits granted to present and past employees. Defined benefit plans may be funded or unfunded. The group maintains defined benefit plans in Switzerland, Italy, India and Israel.
The defined benefit plans in Switzerland and Israel are final salary related plans which in the case of Switzerland include a guaranteed minimum rate of return additionally. Benefits paid in conjunction with these plans comprise old-age retirement pensions as well as invalidity and surviving dependents’ benefits. Trustees according to local statutory regulations administer the assets of these pension plans. The Italian and Indian defined benefit plans are unfunded and consider final salary assumptions. In Switzerland, in addition to the regular case pension payments on reaching retirement age, vested benefits and payments in connection with the use of home ownership incentives may also be paid out from the pension fund. In Italy, Israel and India, a one-time lump-sum payment is usually made upon retirement.
On December 31, 2020, ADVA reports provisions for pensions amounting to EUR 8,545 thousand (December 31, 2019: EUR 7,756 thousand).
At year-end, the carrying amount analyzes as follows:
(in thousands of EUR) 2020 2019
Present value of defined benefit obligations 26,846 24,448
Fair value of plan assets -18,301 -16,692
Provisions for pensions and similar employee benefits 8,545 7,756
IFRS consolidated financial statementsNotes to the consolidated statement of financial position
108 ADVA – Annual report 2020
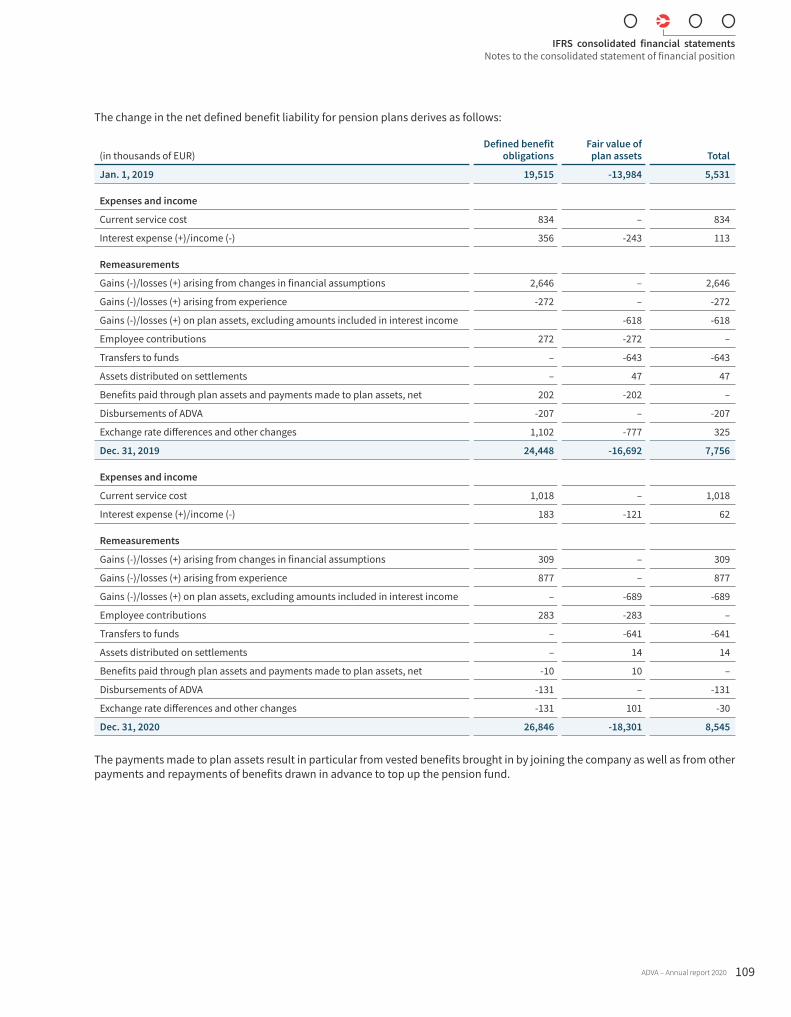
The change in the net defined benefit liability for pension plans derives as follows:
(in thousands of EUR)Defined benefit
obligationsFair value of
plan assets Total
Jan. 1, 2019 19,515 -13,984 5,531
Expenses and income
Current service cost 834 – 834
Interest expense (+)/income (-) 356 -243 113
Remeasurements
Gains (-)/losses (+) arising from changes in financial assumptions 2,646 – 2,646
Gains (-)/losses (+) arising from experience -272 – -272
Gains (-)/losses (+) on plan assets, excluding amounts included in interest income -618 -618
Employee contributions 272 -272 –
Transfers to funds – -643 -643
Assets distributed on settlements – 47 47
Benefits paid through plan assets and payments made to plan assets, net 202 -202 –
Disbursements of ADVA -207 – -207
Exchange rate differences and other changes 1,102 -777 325
Dec. 31, 2019 24,448 -16,692 7,756
Expenses and income
Current service cost 1,018 – 1,018
Interest expense (+)/income (-) 183 -121 62
Remeasurements
Gains (-)/losses (+) arising from changes in financial assumptions 309 – 309
Gains (-)/losses (+) arising from experience 877 – 877
Gains (-)/losses (+) on plan assets, excluding amounts included in interest income – -689 -689
Employee contributions 283 -283 –
Transfers to funds – -641 -641
Assets distributed on settlements – 14 14
Benefits paid through plan assets and payments made to plan assets, net -10 10 –
Disbursements of ADVA -131 – -131
Exchange rate differences and other changes -131 101 -30
Dec. 31, 2020 26,846 -18,301 8,545
The payments made to plan assets result in particular from vested benefits brought in by joining the company as well as from other payments and repayments of benefits drawn in advance to top up the pension fund.
IFRS consolidated financial statementsNotes to the consolidated statement of financial position
ADVA – Annual report 2020 109
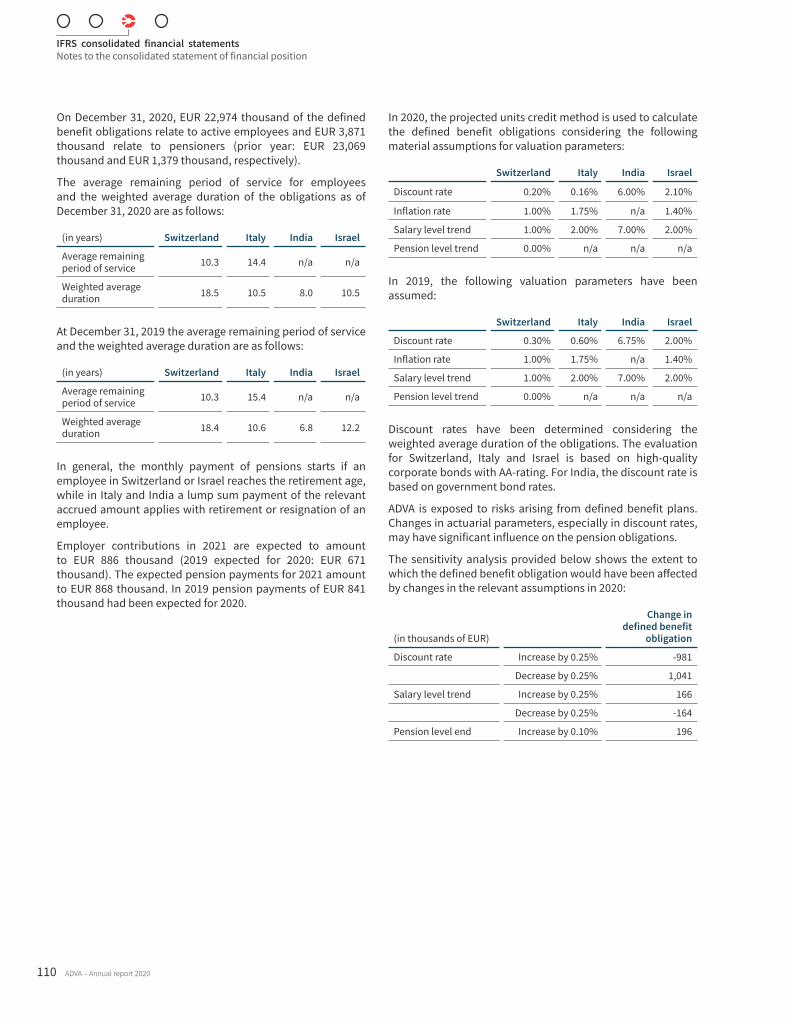
On December 31, 2020, EUR 22,974 thousand of the defined benefit obligations relate to active employees and EUR 3,871 thousand relate to pensioners (prior year: EUR 23,069 thousand and EUR 1,379 thousand, respectively).
The average remaining period of service for employees and the weighted average duration of the obligations as of December 31, 2020 are as follows:
(in years) Switzerland Italy India Israel
Average remaining period of service 10.3 14.4 n/a n/a
Weighted average duration 18.5 10.5 8.0 10.5
At December 31, 2019 the average remaining period of service and the weighted average duration are as follows:
(in years) Switzerland Italy India Israel
Average remaining period of service 10.3 15.4 n/a n/a
Weighted average duration 18.4 10.6 6.8 12.2
In general, the monthly payment of pensions starts if an employee in Switzerland or Israel reaches the retirement age, while in Italy and India a lump sum payment of the relevant accrued amount applies with retirement or resignation of an employee.
Employer contributions in 2021 are expected to amount to EUR 886 thousand (2019 expected for 2020: EUR 671 thousand). The expected pension payments for 2021 amount to EUR 868 thousand. In 2019 pension payments of EUR 841 thousand had been expected for 2020.
In 2020, the projected units credit method is used to calculate the defined benefit obligations considering the following material assumptions for valuation parameters:
Switzerland Italy India Israel
Discount rate 0.20% 0.16% 6.00% 2.10%
Inflation rate 1.00% 1.75% n/a 1.40%
Salary level trend 1.00% 2.00% 7.00% 2.00%
Pension level trend 0.00% n/a n/a n/a
In 2019, the following valuation parameters have been assumed:
Switzerland Italy India Israel
Discount rate 0.30% 0.60% 6.75% 2.00%
Inflation rate 1.00% 1.75% n/a 1.40%
Salary level trend 1.00% 2.00% 7.00% 2.00%
Pension level trend 0.00% n/a n/a n/a
Discount rates have been determined considering the weighted average duration of the obligations. The evaluation for Switzerland, Italy and Israel is based on high-quality corporate bonds with AA-rating. For India, the discount rate is based on government bond rates.
ADVA is exposed to risks arising from defined benefit plans. Changes in actuarial parameters, especially in discount rates, may have significant influence on the pension obligations.
The sensitivity analysis provided below shows the extent to which the defined benefit obligation would have been affected by changes in the relevant assumptions in 2020:
(in thousands of EUR)
Change in defined benefit
obligation
Discount rate Increase by 0.25% -981
Decrease by 0.25% 1,041
Salary level trend Increase by 0.25% 166
Decrease by 0.25% -164
Pension level end Increase by 0.10% 196
IFRS consolidated financial statementsNotes to the consolidated statement of financial position
110 ADVA – Annual report 2020
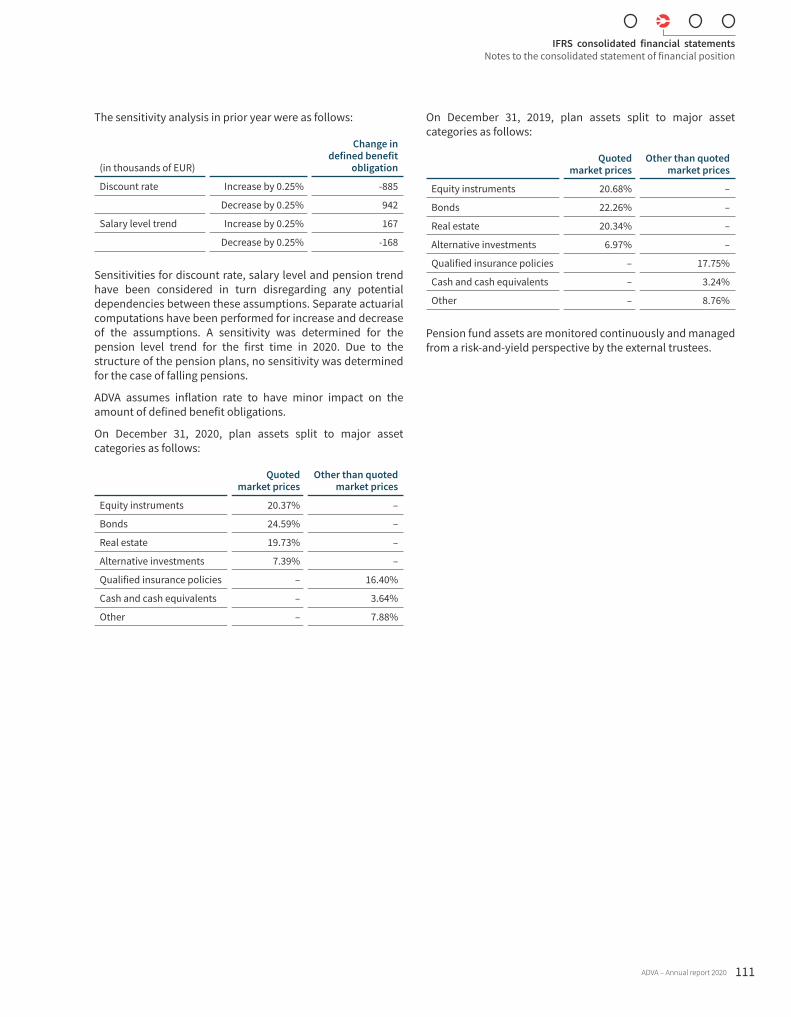
The sensitivity analysis in prior year were as follows:
(in thousands of EUR)
Change in defined benefit
obligation
Discount rate Increase by 0.25% -885
Decrease by 0.25% 942
Salary level trend Increase by 0.25% 167
Decrease by 0.25% -168
Sensitivities for discount rate, salary level and pension trend have been considered in turn disregarding any potential dependencies between these assumptions. Separate actuarial computations have been performed for increase and decrease of the assumptions. A sensitivity was determined for the pension level trend for the first time in 2020. Due to the structure of the pension plans, no sensitivity was determined for the case of falling pensions.
ADVA assumes inflation rate to have minor impact on the amount of defined benefit obligations.
On December 31, 2020, plan assets split to major asset categories as follows:
Quoted market prices
Other than quoted market prices
Equity instruments 20.37% –
Bonds 24.59% –
Real estate 19.73% –
Alternative investments 7.39% –
Qualified insurance policies – 16.40%
Cash and cash equivalents – 3.64%
Other – 7.88%
On December 31, 2019, plan assets split to major asset categories as follows:
Quoted market prices
Other than quoted market prices
Equity instruments 20.68% –
Bonds 22.26% –
Real estate 20.34% –
Alternative investments 6.97% –
Qualified insurance policies – 17.75%
Cash and cash equivalents – 3.24%
Other – 8.76%
Pension fund assets are monitored continuously and managed from a risk-and-yield perspective by the external trustees.
IFRS consolidated financial statementsNotes to the consolidated statement of financial position
ADVA – Annual report 2020 111
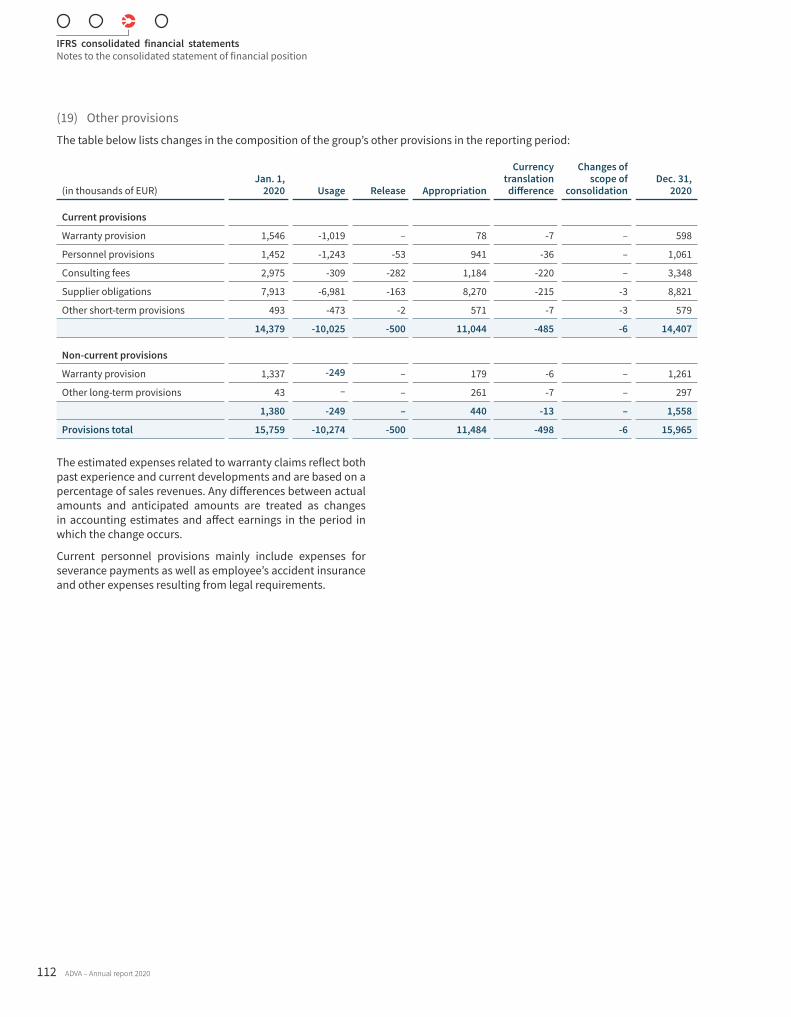
(19) Other provisions
The table below lists changes in the composition of the group’s other provisions in the reporting period:
(in thousands of EUR)Jan. 1,
2020 Usage Release Appropriation
Currency translation
difference
Changes of scope of
consolidationDec. 31,
2020
Current provisions
Warranty provision 1,546 -1,019 – 78 -7 – 598
Personnel provisions 1,452 -1,243 -53 941 -36 – 1,061
Consulting fees 2,975 -309 -282 1,184 -220 – 3,348
Supplier obligations 7,913 -6,981 -163 8,270 -215 -3 8,821
Other short-term provisions 493 -473 -2 571 -7 -3 579
14,379 -10,025 -500 11,044 -485 -6 14,407
Non-current provisions
Warranty provision 1,337 -249 – 179 -6 – 1,261
Other long-term provisions 43 – – 261 -7 – 297
1,380 -249 – 440 -13 – 1,558
Provisions total 15,759 -10,274 -500 11,484 -498 -6 15,965
The estimated expenses related to warranty claims reflect both past experience and current developments and are based on a percentage of sales revenues. Any differences between actual amounts and anticipated amounts are treated as changes in accounting estimates and affect earnings in the period in which the change occurs.
Current personnel provisions mainly include expenses for severance payments as well as employee’s accident insurance and other expenses resulting from legal requirements.
IFRS consolidated financial statementsNotes to the consolidated statement of financial position
112 ADVA – Annual report 2020

In 2020, provisions for the advance replacement of non-functioning parts amounting to EUR 1,237 thousand were reclassified to impairment losses on inventories. A corresponding reclassification already in 2019 would have resulted in a EUR 910 thousand decrease in provisions.
(20) Contract liabilities and refund liabilities
On December 31, contract and refund liabilities analyze as follows:
(in thousands of EUR)Dec. 31,
2020Dec. 31,
2019
Current contract liabilities
Outstanding credit notes – –
Advance payments received 81 185
Current contract liabilities related to customer loyalty programs 839 481
Current deferred revenues related to service level agreements 15,457 11,782
16,377 12,448
Current refund liabilities 633 709
633 709
Non-current contract liabilities
Non-current deferred revenues related to service level agreements 10,551 7,070
10,551 7,070
27,561 20,227
Current contract liabilities related to customer loyalty programs include mainly expected volume discounts and refunds to customers.
The revenues generated in the reporting period from contract liabilities existing at the beginning of the period amounted to EUR 11,782 thousand (previous year: EUR 14,061 thousand).
Management expects that 61% of the outstanding or partially outstanding benefit obligations as of December 31, 2020, will be recognized as revenue in the 2021 financial year. The remaining 39% is expected to be recognized as sales in the financial year 2022. The amount stated does not include variable compensation components which are limited.
(21) Stockholders’ equity
Common stock and share capitalOn December 31, 2020, ADVA Optical Networking SE had issued 50,496,692 (prior year: 50,181,966) no par value bearer shares (hereinafter “common shares”), each representing a notional amount of share capital of EUR 1.00.
The common shares entitle the holder to vote at the annual general meeting and to receive dividends in case of a distribution. No restrictions are attached to the common shares.
Capital transactionsIn connection with the exercise of stock options, 314,726 shares were issued to employees of the company and its affiliates out of conditional capital in 2020 (in 2019 in connection with the exercise of stock options 251,011 shares). The par value of EUR 315 thousand (prior year: EUR 251 thousand) was appropriated to share capital, whereas the premium resulting from the exercise of stock options of EUR 958 thousand (prior year: EUR 1,006 thousand) was recognized within capital reserve.
Other information on the share option programs is included in note (38).
Authorized capitalAccording to the company’s articles of association, the management board is authorized, subject to the consent of the supervisory board, to increase subscribed capital until May 21, 2024, only once or in successive tranches by a maximum of EUR 24,965 thousand by issuing new common shares in return for cash or non-cash contributions (conditional capital 2019/I). Subject to the consent of the supervisory board, the management board is further authorized to decide whether to exclude stockholders’ subscription rights. Stockholders’ subscription rights can be excluded for capital increases for cash contributions as well as contributions in kind if during the term of this authorization and in exclusion of shareholder subscription rights, the shares issued against contributions in cash or in kind do not exceed 20% of the share capital.
Conditional capitalThe annual shareholder´s meeting on May 13, 2020, resolved the increase of conditional capital 2011/I by EUR 276 thousand to EUR 5,018 thousand. The resolution was registered in the commercial register on May 28, 2020.
Considering the above described capital transactions, the total conditional capital on December 31, 2020 amounts to EUR 4,703 thousand.
IFRS consolidated financial statementsNotes to the consolidated statement of financial position
ADVA – Annual report 2020 113
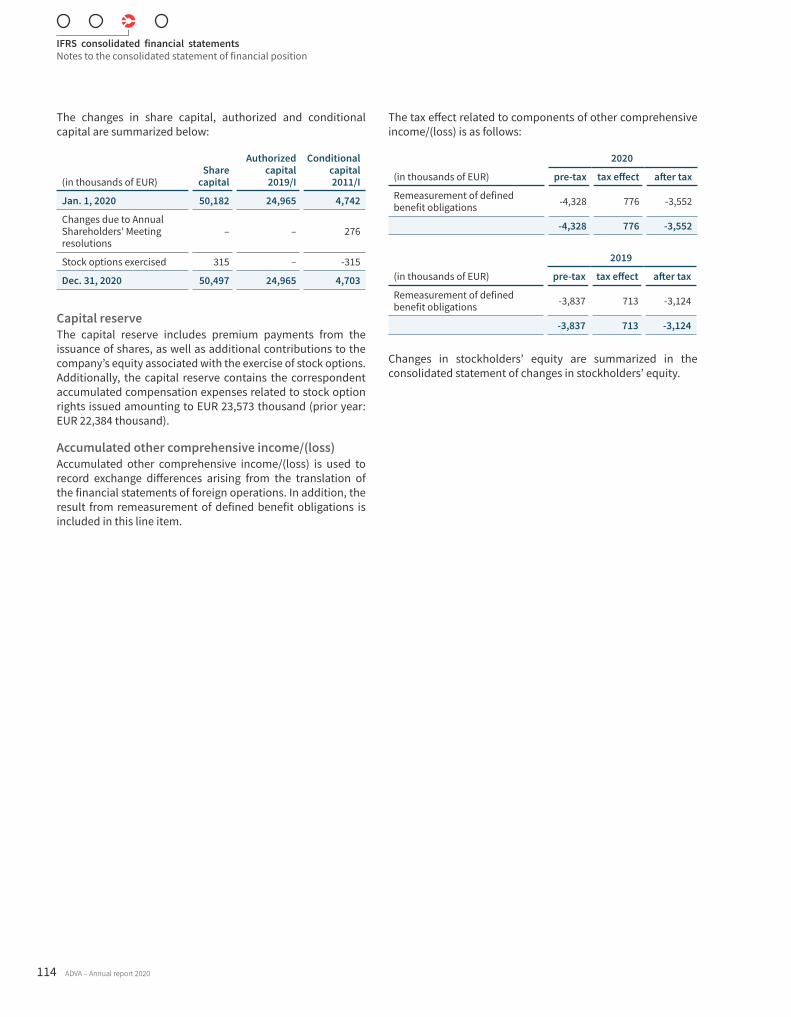
The changes in share capital, authorized and conditional capital are summarized below:
(in thousands of EUR)Share
capital
Authorized capital 2019/I
Conditional capital 2011/I
Jan. 1, 2020 50,182 24,965 4,742
Changes due to Annual Shareholders’ Meeting resolutions
– – 276
Stock options exercised 315 – -315
Dec. 31, 2020 50,497 24,965 4,703
Capital reserveThe capital reserve includes premium payments from the issuance of shares, as well as additional contributions to the company’s equity associated with the exercise of stock options. Additionally, the capital reserve contains the correspondent accumulated compensation expenses related to stock option rights issued amounting to EUR 23,573 thousand (prior year: EUR 22,384 thousand).
Accumulated other comprehensive income/(loss)Accumulated other comprehensive income/(loss) is used to record exchange differences arising from the translation of the financial statements of foreign operations. In addition, the result from remeasurement of defined benefit obligations is included in this line item.
The tax effect related to components of other comprehensive income/(loss) is as follows:
(in thousands of EUR)
2020
pre-tax tax effect after tax
Remeasurement of defined benefit obligations -4,328 776 -3,552
-4,328 776 -3,552
(in thousands of EUR)
2019
pre-tax tax effect after tax
Remeasurement of defined benefit obligations -3,837 713 -3,124
-3,837 713 -3,124
Changes in stockholders’ equity are summarized in the consolidated statement of changes in stockholders’ equity.
IFRS consolidated financial statementsNotes to the consolidated statement of financial position
114 ADVA – Annual report 2020
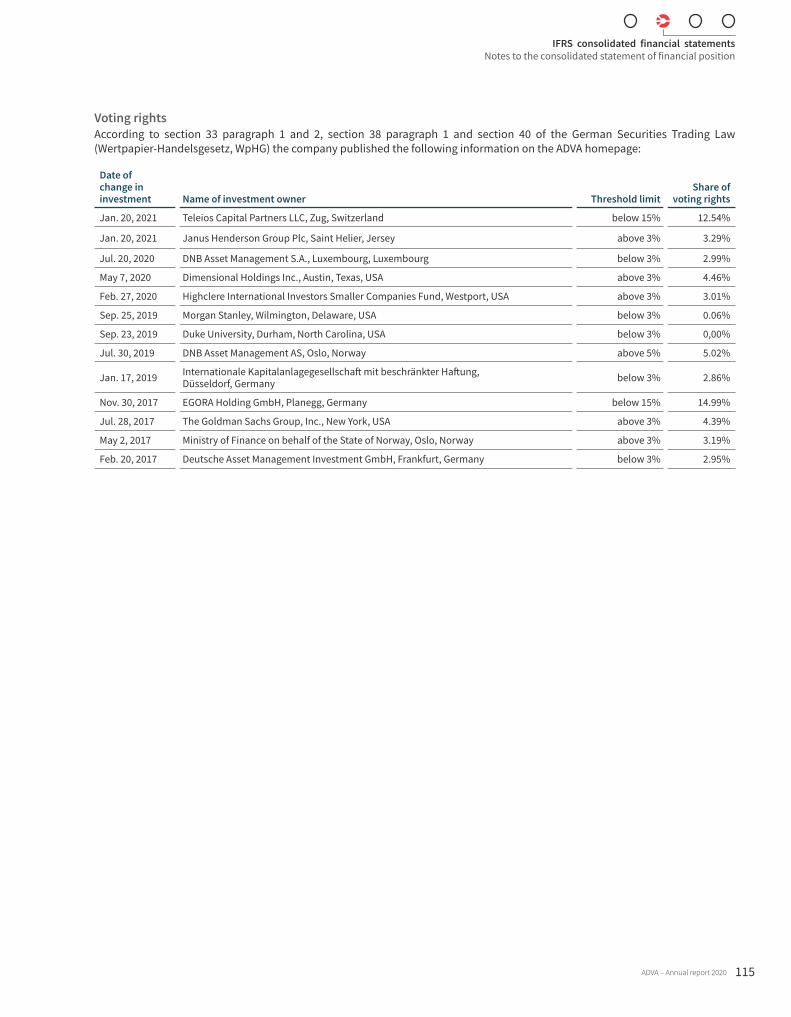
Voting rightsAccording to section 33 paragraph 1 and 2, section 38 paragraph 1 and section 40 of the German Securities Trading Law (Wertpapier-Handelsgesetz, WpHG) the company published the following information on the ADVA homepage:
Date of change in investment Name of investment owner Threshold limit
Share of voting rights
Jan. 20, 2021 Teleios Capital Partners LLC, Zug, Switzerland below 15% 12.54%
Jan. 20, 2021 Janus Henderson Group Plc, Saint Helier, Jersey above 3% 3.29%
Jul. 20, 2020 DNB Asset Management S.A., Luxembourg, Luxembourg below 3% 2.99%
May 7, 2020 Dimensional Holdings Inc., Austin, Texas, USA above 3% 4.46%
Feb. 27, 2020 Highclere International Investors Smaller Companies Fund, Westport, USA above 3% 3.01%
Sep. 25, 2019 Morgan Stanley, Wilmington, Delaware, USA below 3% 0.06%
Sep. 23, 2019 Duke University, Durham, North Carolina, USA below 3% 0,00%
Jul. 30, 2019 DNB Asset Management AS, Oslo, Norway above 5% 5.02%
Jan. 17, 2019 Internationale Kapitalanlagegesellschaft mit beschränkter Haftung, Düsseldorf, Germany below 3% 2.86%
Nov. 30, 2017 EGORA Holding GmbH, Planegg, Germany below 15% 14.99%
Jul. 28, 2017 The Goldman Sachs Group, Inc., New York, USA above 3% 4.39%
May 2, 2017 Ministry of Finance on behalf of the State of Norway, Oslo, Norway above 3% 3.19%
Feb. 20, 2017 Deutsche Asset Management Investment GmbH, Frankfurt, Germany below 3% 2.95%
IFRS consolidated financial statementsNotes to the consolidated statement of financial position
ADVA – Annual report 2020 115
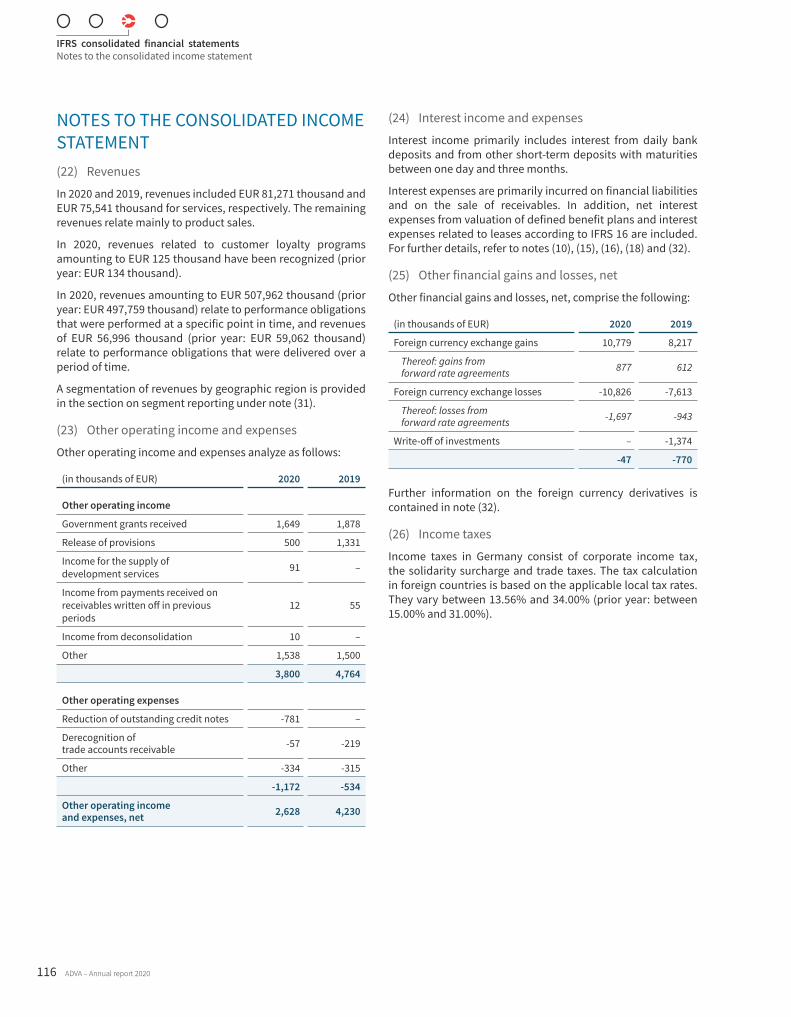
NOTES TO THE CONSOLIDATED INCOME STATEMENT(22) Revenues
In 2020 and 2019, revenues included EUR 81,271 thousand and EUR 75,541 thousand for services, respectively. The remaining revenues relate mainly to product sales.
In 2020, revenues related to customer loyalty programs amounting to EUR 125 thousand have been recognized (prior year: EUR 134 thousand).
In 2020, revenues amounting to EUR 507,962 thousand (prior year: EUR 497,759 thousand) relate to performance obligations that were performed at a specific point in time, and revenues of EUR 56,996 thousand (prior year: EUR 59,062 thousand) relate to performance obligations that were delivered over a period of time.
A segmentation of revenues by geographic region is provided in the section on segment reporting under note (31).
(23) Other operating income and expenses
Other operating income and expenses analyze as follows:
(in thousands of EUR) 2020 2019
Other operating income
Government grants received 1,649 1,878
Release of provisions 500 1,331
Income for the supply of development services 91 –
Income from payments received on receivables written off in previous periods
12 55
Income from deconsolidation 10 –
Other 1,538 1,500
3,800 4,764
Other operating expenses
Reduction of outstanding credit notes -781 –
Derecognition of trade accounts receivable -57 -219
Other -334 -315
-1,172 -534
Other operating income and expenses, net 2,628 4,230
(24) Interest income and expenses
Interest income primarily includes interest from daily bank deposits and from other short-term deposits with maturities between one day and three months.
Interest expenses are primarily incurred on financial liabilities and on the sale of receivables. In addition, net interest expenses from valuation of defined benefit plans and interest expenses related to leases according to IFRS 16 are included. For further details, refer to notes (10), (15), (16), (18) and (32).
(25) Other financial gains and losses, net
Other financial gains and losses, net, comprise the following:
(in thousands of EUR) 2020 2019
Foreign currency exchange gains 10,779 8,217
Thereof: gains from forward rate agreements 877 612
Foreign currency exchange losses -10,826 -7,613
Thereof: losses from forward rate agreements -1,697 -943
Write-off of investments – -1,374
-47 -770
Further information on the foreign currency derivatives is contained in note (32).
(26) Income taxes
Income taxes in Germany consist of corporate income tax, the solidarity surcharge and trade taxes. The tax calculation in foreign countries is based on the applicable local tax rates. They vary between 13.56% and 34.00% (prior year: between 15.00% and 31.00%).
IFRS consolidated financial statementsNotes to the consolidated income statement
116 ADVA – Annual report 2020
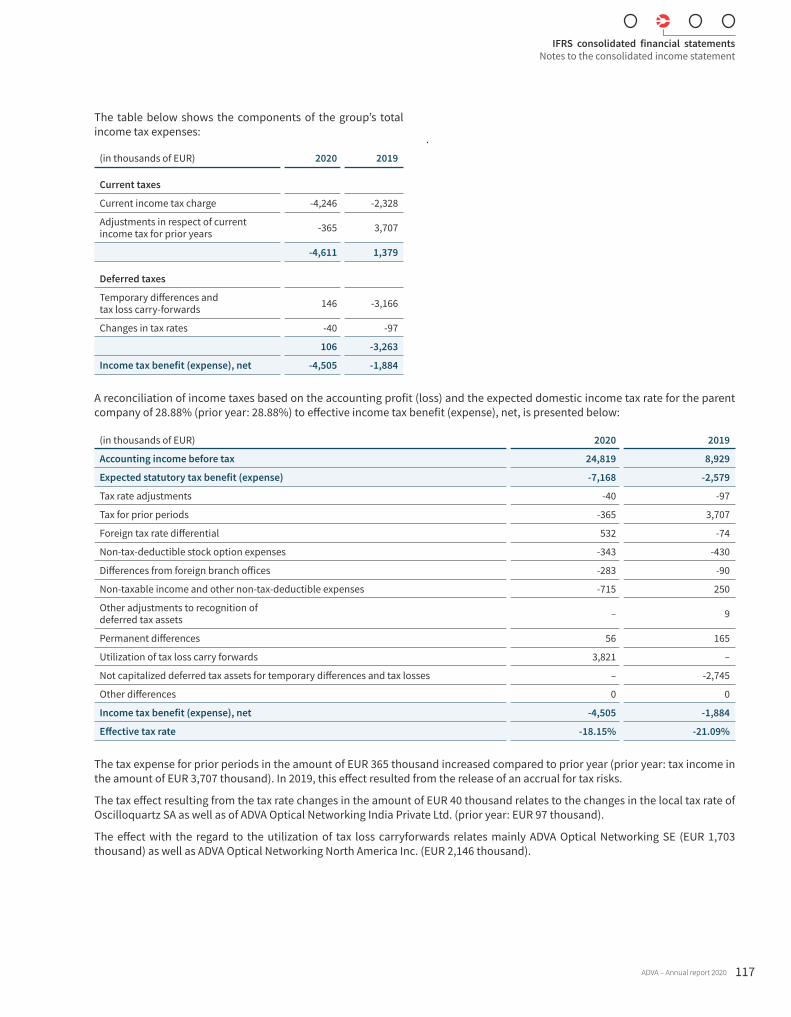
The table below shows the components of the group’s total income tax expenses:
(in thousands of EUR) 2020 2019
Current taxes
Current income tax charge -4,246 -2,328
Adjustments in respect of current income tax for prior years -365 3,707
-4,611 1,379
Deferred taxes
Temporary differences and tax loss carry-forwards 146 -3,166
Changes in tax rates -40 -97
106 -3,263
Income tax benefit (expense), net -4,505 -1,884
.
A reconciliation of income taxes based on the accounting profit (loss) and the expected domestic income tax rate for the parent company of 28.88% (prior year: 28.88%) to effective income tax benefit (expense), net, is presented below:
(in thousands of EUR) 2020 2019
Accounting income before tax 24,819 8,929
Expected statutory tax benefit (expense) -7,168 -2,579
Tax rate adjustments -40 -97
Tax for prior periods -365 3,707
Foreign tax rate differential 532 -74
Non-tax-deductible stock option expenses -343 -430
Differences from foreign branch offices -283 -90
Non-taxable income and other non-tax-deductible expenses -715 250
Other adjustments to recognition of deferred tax assets – 9
Permanent differences 56 165
Utilization of tax loss carry forwards 3,821 –
Not capitalized deferred tax assets for temporary differences and tax losses – -2,745
Other differences 0 0
Income tax benefit (expense), net -4,505 -1,884
Effective tax rate -18.15% -21.09%
The tax expense for prior periods in the amount of EUR 365 thousand increased compared to prior year (prior year: tax income in the amount of EUR 3,707 thousand). In 2019, this effect resulted from the release of an accrual for tax risks.
The tax effect resulting from the tax rate changes in the amount of EUR 40 thousand relates to the changes in the local tax rate of Oscilloquartz SA as well as of ADVA Optical Networking India Private Ltd. (prior year: EUR 97 thousand).
The effect with the regard to the utilization of tax loss carryforwards relates mainly ADVA Optical Networking SE (EUR 1,703 thousand) as well as ADVA Optical Networking North America Inc. (EUR 2,146 thousand).
IFRS consolidated financial statementsNotes to the consolidated income statement
ADVA – Annual report 2020 117
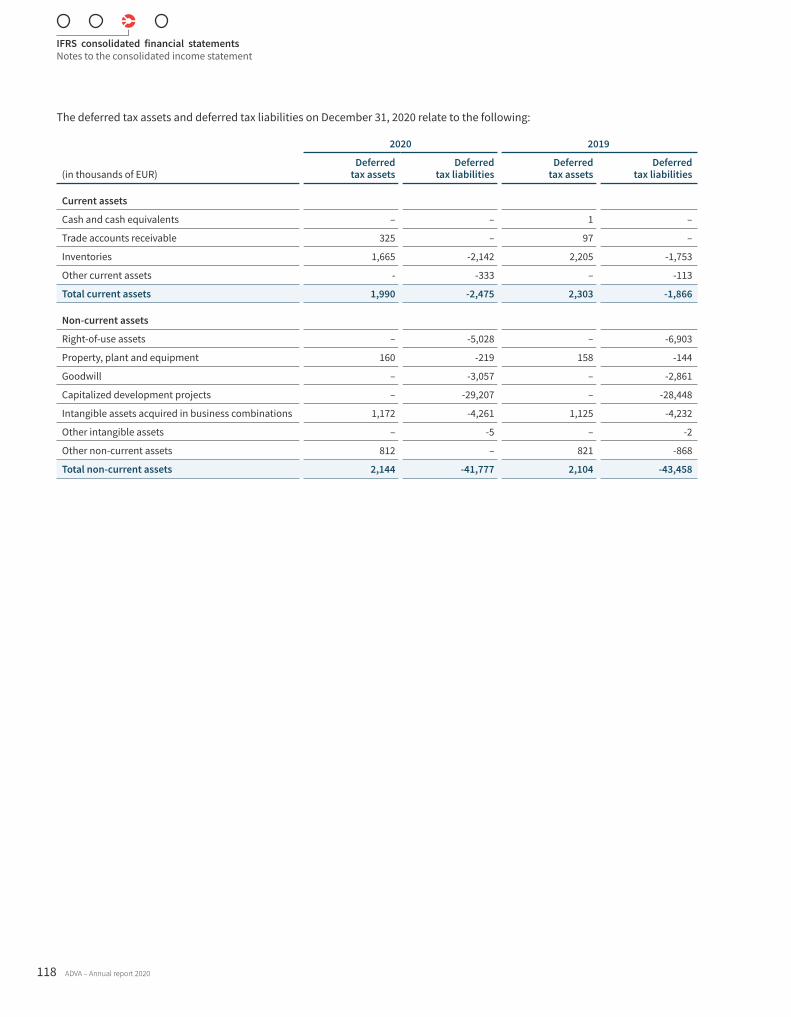
The deferred tax assets and deferred tax liabilities on December 31, 2020 relate to the following:
(in thousands of EUR)
2020 2019
Deferred tax assets
Deferred tax liabilities
Deferred tax assets
Deferred tax liabilities
Current assets
Cash and cash equivalents – – 1 –
Trade accounts receivable 325 – 97 –
Inventories 1,665 -2,142 2,205 -1,753
Other current assets - -333 – -113
Total current assets 1,990 -2,475 2,303 -1,866
Non-current assets
Right-of-use assets – -5,028 – -6,903
Property, plant and equipment 160 -219 158 -144
Goodwill – -3,057 – -2,861
Capitalized development projects – -29,207 – -28,448
Intangible assets acquired in business combinations 1,172 -4,261 1,125 -4,232
Other intangible assets – -5 – -2
Other non-current assets 812 – 821 -868
Total non-current assets 2,144 -41,777 2,104 -43,458
IFRS consolidated financial statementsNotes to the consolidated income statement
118 ADVA – Annual report 2020
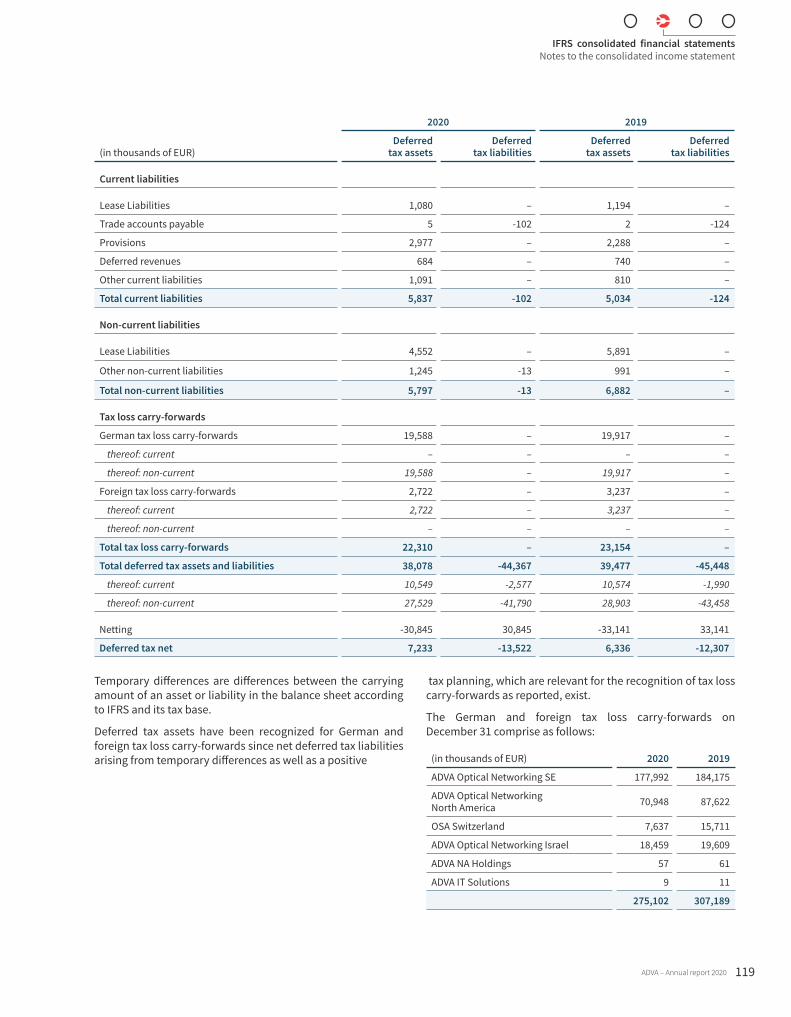
(in thousands of EUR)
2020 2019
Deferred tax assets
Deferred tax liabilities
Deferred tax assets
Deferred tax liabilities
Current liabilities
Lease Liabilities 1,080 – 1,194 –
Trade accounts payable 5 -102 2 -124
Provisions 2,977 – 2,288 –
Deferred revenues 684 – 740 –
Other current liabilities 1,091 – 810 –
Total current liabilities 5,837 -102 5,034 -124
Non-current liabilities
Lease Liabilities 4,552 – 5,891 –
Other non-current liabilities 1,245 -13 991 –
Total non-current liabilities 5,797 -13 6,882 –
Tax loss carry-forwards
German tax loss carry-forwards 19,588 – 19,917 –
thereof: current – – – –
thereof: non-current 19,588 – 19,917 –
Foreign tax loss carry-forwards 2,722 – 3,237 –
thereof: current 2,722 – 3,237 –
thereof: non-current – – – –
Total tax loss carry-forwards 22,310 – 23,154 –
Total deferred tax assets and liabilities 38,078 -44,367 39,477 -45,448
thereof: current 10,549 -2,577 10,574 -1,990
thereof: non-current 27,529 -41,790 28,903 -43,458
Netting -30,845 30,845 -33,141 33,141
Deferred tax net 7,233 -13,522 6,336 -12,307
Temporary differences are differences between the carrying amount of an asset or liability in the balance sheet according to IFRS and its tax base.
Deferred tax assets have been recognized for German and foreign tax loss carry-forwards since net deferred tax liabilities arising from temporary differences as well as a positive
tax planning, which are relevant for the recognition of tax loss carry-forwards as reported, exist.
The German and foreign tax loss carry-forwards on December 31 comprise as follows:
(in thousands of EUR) 2020 2019
ADVA Optical Networking SE 177,992 184,175
ADVA Optical Networking North America 70,948 87,622
OSA Switzerland 7,637 15,711
ADVA Optical Networking Israel 18,459 19,609
ADVA NA Holdings 57 61
ADVA IT Solutions 9 11
275,102 307,189
IFRS consolidated financial statementsNotes to the consolidated income statement
ADVA – Annual report 2020 119
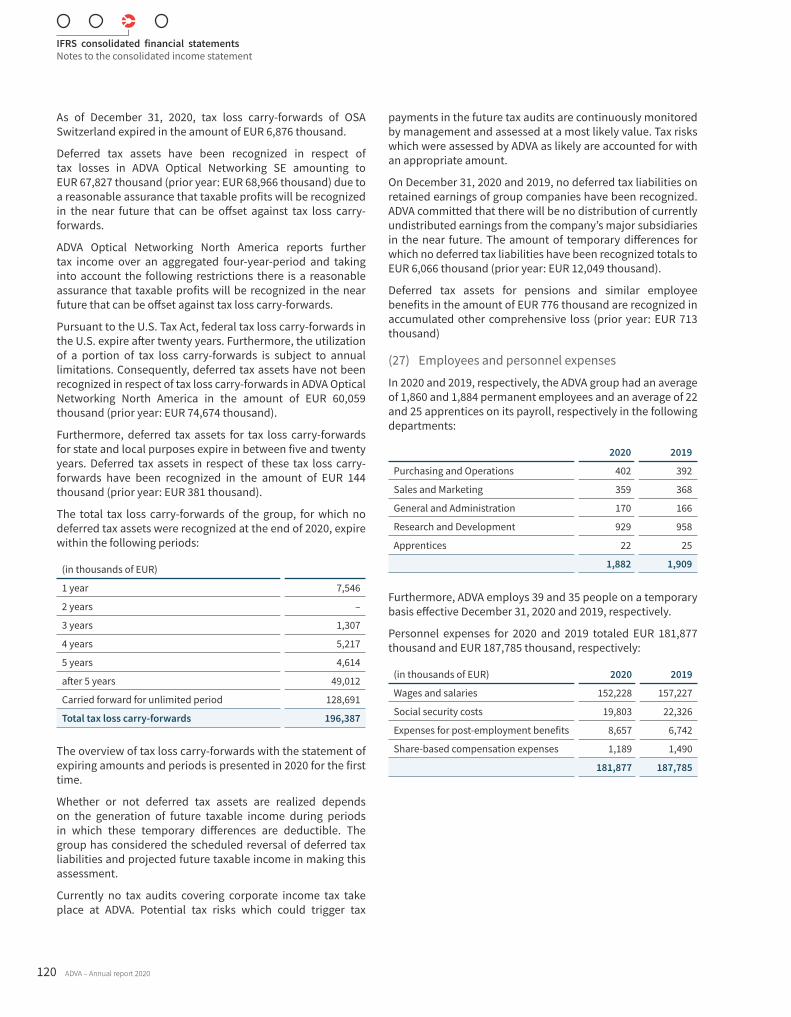
As of December 31, 2020, tax loss carry-forwards of OSA Switzerland expired in the amount of EUR 6,876 thousand.
Deferred tax assets have been recognized in respect of tax losses in ADVA Optical Networking SE amounting to EUR 67,827 thousand (prior year: EUR 68,966 thousand) due to a reasonable assurance that taxable profits will be recognized in the near future that can be offset against tax loss carry-forwards.
ADVA Optical Networking North America reports further tax income over an aggregated four-year-period and taking into account the following restrictions there is a reasonable assurance that taxable profits will be recognized in the near future that can be offset against tax loss carry-forwards.
Pursuant to the U.S. Tax Act, federal tax loss carry-forwards in the U.S. expire after twenty years. Furthermore, the utilization of a portion of tax loss carry-forwards is subject to annual limitations. Consequently, deferred tax assets have not been recognized in respect of tax loss carry-forwards in ADVA Optical Networking North America in the amount of EUR 60,059 thousand (prior year: EUR 74,674 thousand).
Furthermore, deferred tax assets for tax loss carry-forwards for state and local purposes expire in between five and twenty years. Deferred tax assets in respect of these tax loss carry-forwards have been recognized in the amount of EUR 144 thousand (prior year: EUR 381 thousand).
The total tax loss carry-forwards of the group, for which no deferred tax assets were recognized at the end of 2020, expire within the following periods:
(in thousands of EUR)
1 year 7,546
2 years –
3 years 1,307
4 years 5,217
5 years 4,614
after 5 years 49,012
Carried forward for unlimited period 128,691
Total tax loss carry-forwards 196,387
The overview of tax loss carry-forwards with the statement of expiring amounts and periods is presented in 2020 for the first time.
Whether or not deferred tax assets are realized depends on the generation of future taxable income during periods in which these temporary differences are deductible. The group has considered the scheduled reversal of deferred tax liabilities and projected future taxable income in making this assessment.
Currently no tax audits covering corporate income tax take place at ADVA. Potential tax risks which could trigger tax
payments in the future tax audits are continuously monitored by management and assessed at a most likely value. Tax risks which were assessed by ADVA as likely are accounted for with an appropriate amount.
On December 31, 2020 and 2019, no deferred tax liabilities on retained earnings of group companies have been recognized. ADVA committed that there will be no distribution of currently undistributed earnings from the company’s major subsidiaries in the near future. The amount of temporary differences for which no deferred tax liabilities have been recognized totals to EUR 6,066 thousand (prior year: EUR 12,049 thousand).
Deferred tax assets for pensions and similar employee benefits in the amount of EUR 776 thousand are recognized in accumulated other comprehensive loss (prior year: EUR 713 thousand)
(27) Employees and personnel expenses
In 2020 and 2019, respectively, the ADVA group had an average of 1,860 and 1,884 permanent employees and an average of 22 and 25 apprentices on its payroll, respectively in the following departments:
2020 2019
Purchasing and Operations 402 392
Sales and Marketing 359 368
General and Administration 170 166
Research and Development 929 958
Apprentices 22 25
1,882 1,909
Furthermore, ADVA employs 39 and 35 people on a temporary basis effective December 31, 2020 and 2019, respectively.
Personnel expenses for 2020 and 2019 totaled EUR 181,877 thousand and EUR 187,785 thousand, respectively:
(in thousands of EUR) 2020 2019
Wages and salaries 152,228 157,227
Social security costs 19,803 22,326
Expenses for post-employment benefits 8,657 6,742
Share-based compensation expenses 1,189 1,490
181,877 187,785
IFRS consolidated financial statementsNotes to the consolidated income statement
120 ADVA – Annual report 2020
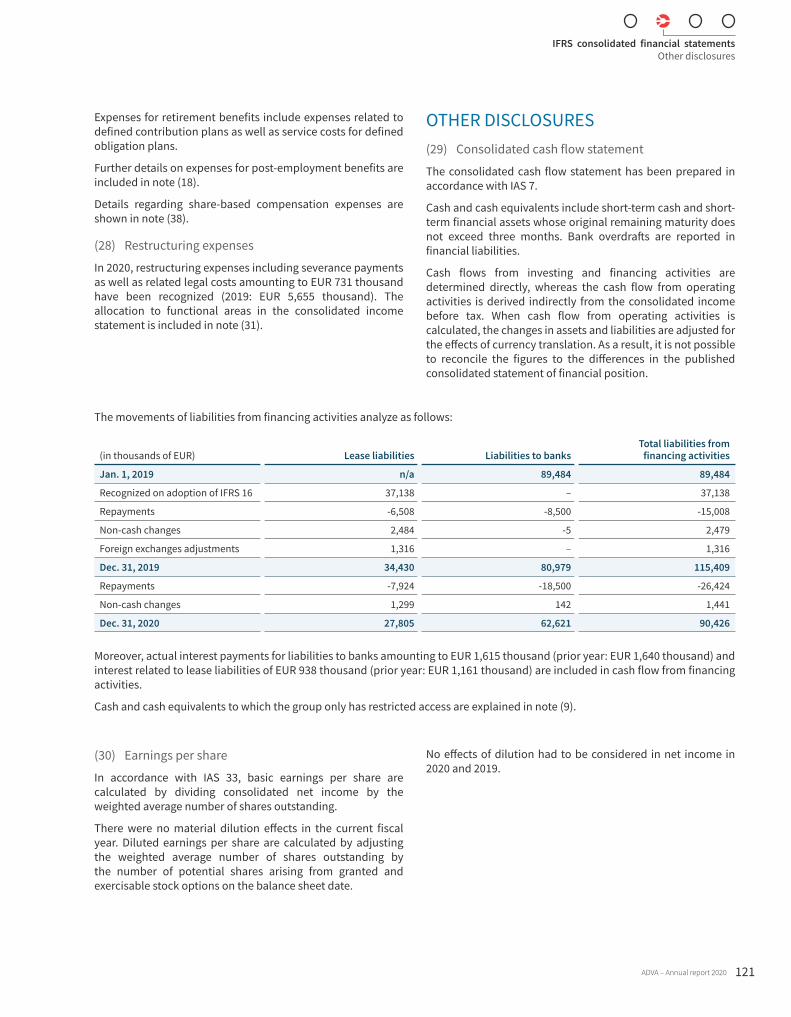
Expenses for retirement benefits include expenses related to defined contribution plans as well as service costs for defined obligation plans.
Further details on expenses for post-employment benefits are included in note (18).
Details regarding share-based compensation expenses are shown in note (38).
(28) Restructuring expenses
In 2020, restructuring expenses including severance payments as well as related legal costs amounting to EUR 731 thousand have been recognized (2019: EUR 5,655 thousand). The allocation to functional areas in the consolidated income statement is included in note (31).
OTHER DISCLOSURES(29) Consolidated cash flow statement
The consolidated cash flow statement has been prepared in accordance with IAS 7.
Cash and cash equivalents include short-term cash and short-term financial assets whose original remaining maturity does not exceed three months. Bank overdrafts are reported in financial liabilities.
Cash flows from investing and financing activities are determined directly, whereas the cash flow from operating activities is derived indirectly from the consolidated income before tax. When cash flow from operating activities is calculated, the changes in assets and liabilities are adjusted for the effects of currency translation. As a result, it is not possible to reconcile the figures to the differences in the published consolidated statement of financial position.
The movements of liabilities from financing activities analyze as follows:
(in thousands of EUR) Lease liabilities Liabilities to banksTotal liabilities from
financing activities
Jan. 1, 2019 n/a 89,484 89,484
Recognized on adoption of IFRS 16 37,138 – 37,138
Repayments -6,508 -8,500 -15,008
Non-cash changes 2,484 -5 2,479
Foreign exchanges adjustments 1,316 – 1,316
Dec. 31, 2019 34,430 80,979 115,409
Repayments -7,924 -18,500 -26,424
Non-cash changes 1,299 142 1,441
Dec. 31, 2020 27,805 62,621 90,426
Moreover, actual interest payments for liabilities to banks amounting to EUR 1,615 thousand (prior year: EUR 1,640 thousand) and interest related to lease liabilities of EUR 938 thousand (prior year: EUR 1,161 thousand) are included in cash flow from financing activities.
Cash and cash equivalents to which the group only has restricted access are explained in note (9).
(30) Earnings per share
In accordance with IAS 33, basic earnings per share are calculated by dividing consolidated net income by the weighted average number of shares outstanding.
There were no material dilution effects in the current fiscal year. Diluted earnings per share are calculated by adjusting the weighted average number of shares outstanding by the number of potential shares arising from granted and exercisable stock options on the balance sheet date.
No effects of dilution had to be considered in net income in 2020 and 2019.
IFRS consolidated financial statementsOther disclosures
ADVA – Annual report 2020 121
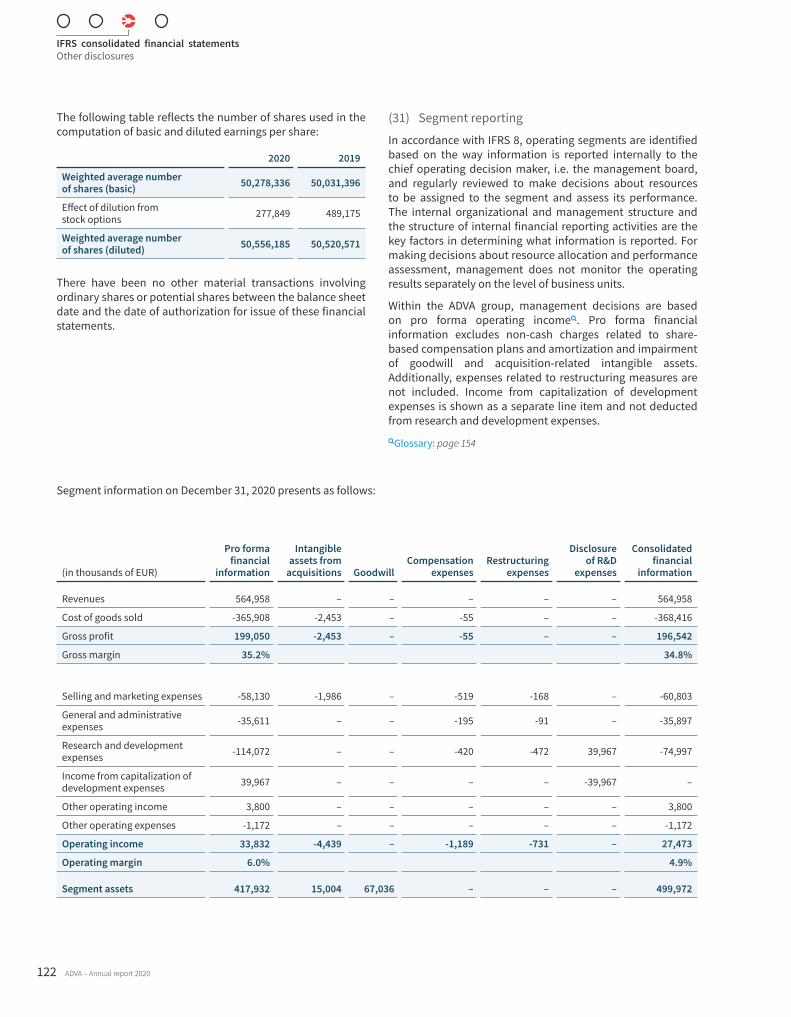
The following table reflects the number of shares used in the computation of basic and diluted earnings per share:
2020 2019
Weighted average number of shares (basic) 50,278,336 50,031,396
Effect of dilution from stock options 277,849 489,175
Weighted average number of shares (diluted) 50,556,185 50,520,571
There have been no other material transactions involving ordinary shares or potential shares between the balance sheet date and the date of authorization for issue of these financial statements.
(31) Segment reporting
In accordance with IFRS 8, operating segments are identified based on the way information is reported internally to the chief operating decision maker, i.e. the management board, and regularly reviewed to make decisions about resources to be assigned to the segment and assess its performance. The internal organizational and management structure and the structure of internal financial reporting activities are the key factors in determining what information is reported. For making decisions about resource allocation and performance assessment, management does not monitor the operating results separately on the level of business units.
Within the ADVA group, management decisions are based on pro forma operating income. Pro forma financial information excludes non-cash charges related to share-based compensation plans and amortization and impairment of goodwill and acquisition-related intangible assets. Additionally, expenses related to restructuring measures are not included. Income from capitalization of development expenses is shown as a separate line item and not deducted from research and development expenses.Glossary: page 154
Segment information on December 31, 2020 presents as follows:
(in thousands of EUR)
Pro forma financial
information
Intangible assets from
acquisitions GoodwillCompensation
expensesRestructuring
expenses
Disclosure of R&D
expenses
Consolidated financial
information
Revenues 564,958 – – – – – 564,958
Cost of goods sold -365,908 -2,453 – -55 – – -368,416
Gross profit 199,050 -2,453 – -55 – – 196,542
Gross margin 35.2% 34.8%
Selling and marketing expenses -58,130 -1,986 – -519 -168 – -60,803
General and administrative expenses -35,611 – – -195 -91 – -35,897
Research and development expenses -114,072 – – -420 -472 39,967 -74,997
Income from capitalization of development expenses 39,967 – – – – -39,967 –
Other operating income 3,800 – – – – – 3,800
Other operating expenses -1,172 – – – – – -1,172
Operating income 33,832 -4,439 – -1,189 -731 – 27,473
Operating margin 6.0% 4.9%
Segment assets 417,932 15,004 67,036 – – – 499,972
IFRS consolidated financial statementsOther disclosures
122 ADVA – Annual report 2020
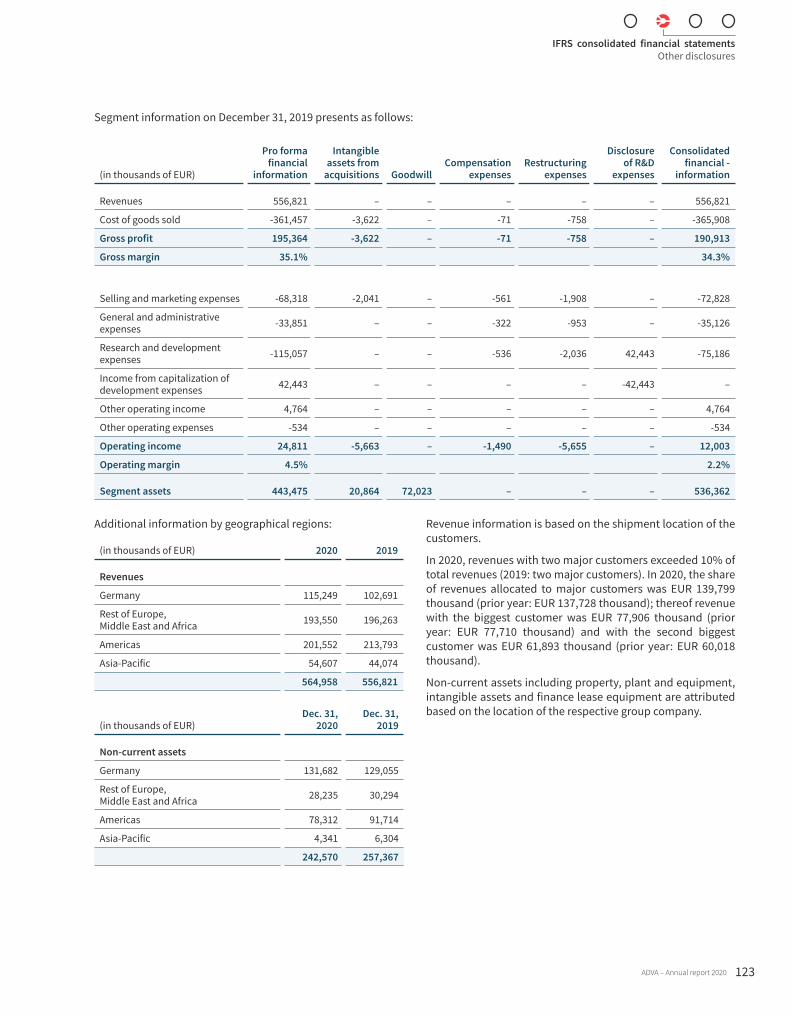
Segment information on December 31, 2019 presents as follows:
(in thousands of EUR)
Pro forma financial
information
Intangible assets from
acquisitions GoodwillCompensation
expensesRestructuring
expenses
Disclosure of R&D
expenses
Consolidated financial -
information
Revenues 556,821 – – – – – 556,821
Cost of goods sold -361,457 -3,622 – -71 -758 – -365,908
Gross profit 195,364 -3,622 – -71 -758 – 190,913
Gross margin 35.1% 34.3%
Selling and marketing expenses -68,318 -2,041 – -561 -1,908 – -72,828
General and administrative expenses -33,851 – – -322 -953 – -35,126
Research and development expenses -115,057 – – -536 -2,036 42,443 -75,186
Income from capitalization of development expenses 42,443 – – – – -42,443 –
Other operating income 4,764 – – – – – 4,764
Other operating expenses -534 – – – – – -534
Operating income 24,811 -5,663 – -1,490 -5,655 – 12,003
Operating margin 4.5% 2.2%
Segment assets 443,475 20,864 72,023 – – – 536,362
Additional information by geographical regions:
(in thousands of EUR) 2020 2019
Revenues
Germany 115,249 102,691
Rest of Europe, Middle East and Africa 193,550 196,263
Americas 201,552 213,793
Asia-Pacific 54,607 44,074
564,958 556,821
(in thousands of EUR)Dec. 31,
2020Dec. 31,
2019
Non-current assets
Germany 131,682 129,055
Rest of Europe, Middle East and Africa 28,235 30,294
Americas 78,312 91,714
Asia-Pacific 4,341 6,304
242,570 257,367
Revenue information is based on the shipment location of the customers.
In 2020, revenues with two major customers exceeded 10% of total revenues (2019: two major customers). In 2020, the share of revenues allocated to major customers was EUR 139,799 thousand (prior year: EUR 137,728 thousand); thereof revenue with the biggest customer was EUR 77,906 thousand (prior year: EUR 77,710 thousand) and with the second biggest customer was EUR 61,893 thousand (prior year: EUR 60,018 thousand).
Non-current assets including property, plant and equipment, intangible assets and finance lease equipment are attributed based on the location of the respective group company.
IFRS consolidated financial statementsOther disclosures
ADVA – Annual report 2020 123
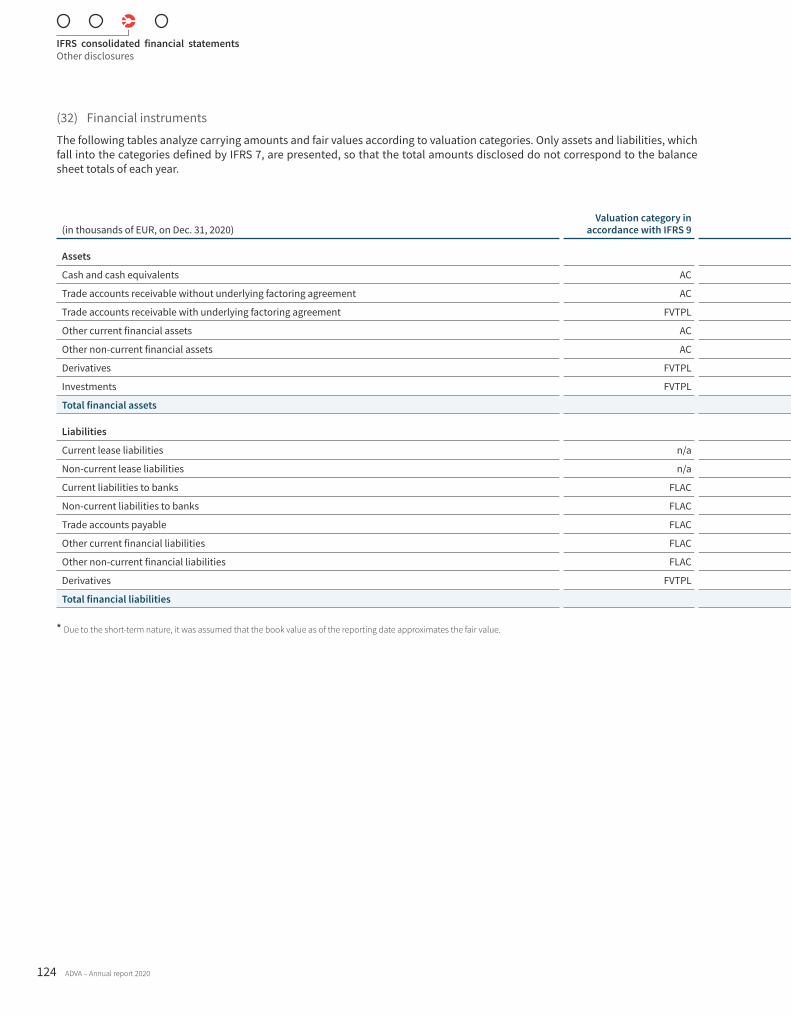
(32) Financial instruments
The following tables analyze carrying amounts and fair values according to valuation categories. Only assets and liabilities, which fall into the categories defined by IFRS 7, are presented, so that the total amounts disclosed do not correspond to the balance sheet totals of each year.
(in thousands of EUR, on Dec. 31, 2020)Valuation category in
accordance with IFRS 9
Categories recognized according to IFRS 9
Carrying amount Amortized cost
Fair value recognized in profit and loss Fair value Hierarchy of fair values
Assets
Cash and cash equivalents AC 64,881 64,881 – n/a* n/a*
Trade accounts receivable without underlying factoring agreement AC 59,321 59,321 – n/a* n/a*
Trade accounts receivable with underlying factoring agreement FVTPL 24,559 – 24,559 24,559 Level 2
Other current financial assets AC 3,726 3,726 – n/a* n/a*
Other non-current financial assets AC 2,594 2,594 – 2,594 Level 2
Derivatives FVTPL 0 – 0 0 Level 2
Investments FVTPL 0 – – 0 Level 3
Total financial assets 155,081 130,522 24,559 27,153
Liabilities
Current lease liabilities n/a 5,807 5,807 – n/a n/a
Non-current lease liabilities n/a 21,998 21,998 – n/a n/a
Current liabilities to banks FLAC 15,492 15,492 – 15,543 Level 2
Non-current liabilities to banks FLAC 47,129 47,129 – 47,531 Level 2
Trade accounts payable FLAC 44,151 44,151 – n/a* n/a*
Other current financial liabilities FLAC 22,176 22,176 – n/a* n/a*
Other non-current financial liabilities FLAC 1,449 1,449 – 1,449 Level 2
Derivatives FVTPL 396 – 396 396 Level 2
Total financial liabilities 158,598 158,202 396 64,919
* Due to the short-term nature, it was assumed that the book value as of the reporting date approximates the fair value.
IFRS consolidated financial statementsOther disclosures
124 ADVA – Annual report 2020
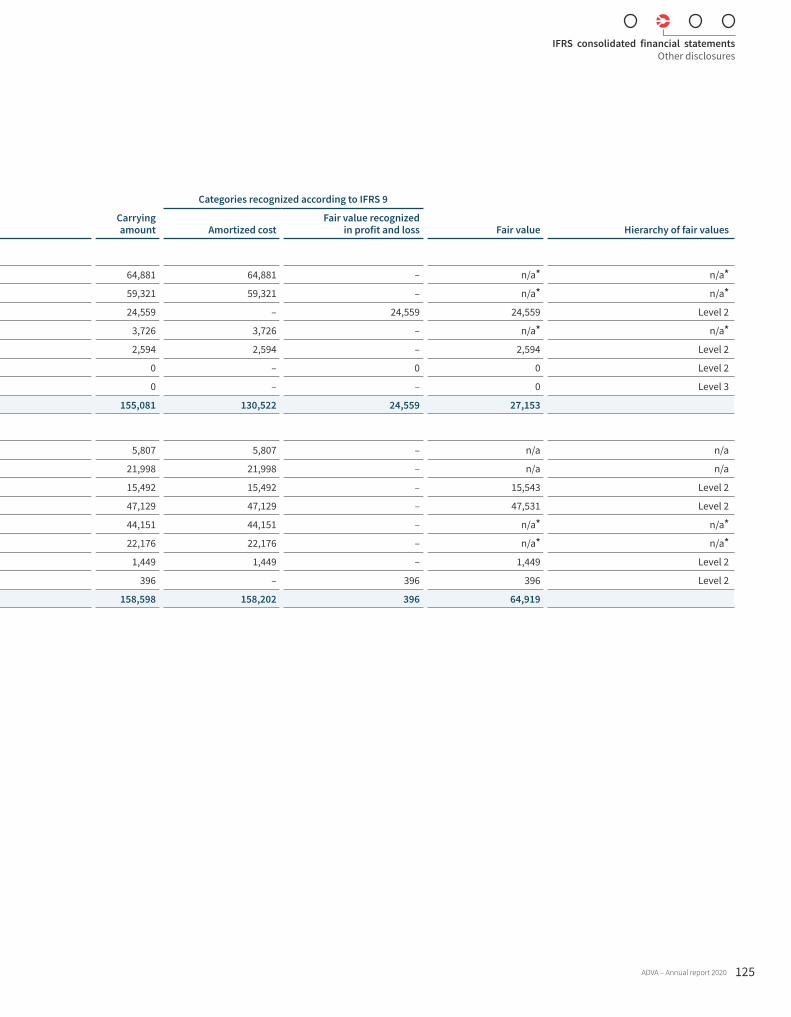
The following tables analyze carrying amounts and fair values according to valuation categories. Only assets and liabilities, which fall into the categories defined by IFRS 7, are presented, so that the total amounts disclosed do not correspond to the balance sheet totals of each year.
(in thousands of EUR, on Dec. 31, 2020)Valuation category in
accordance with IFRS 9
Categories recognized according to IFRS 9
Carrying amount Amortized cost
Fair value recognized in profit and loss Fair value Hierarchy of fair values
Assets
Cash and cash equivalents AC 64,881 64,881 – n/a* n/a*
Trade accounts receivable without underlying factoring agreement AC 59,321 59,321 – n/a* n/a*
Trade accounts receivable with underlying factoring agreement FVTPL 24,559 – 24,559 24,559 Level 2
Other current financial assets AC 3,726 3,726 – n/a* n/a*
Other non-current financial assets AC 2,594 2,594 – 2,594 Level 2
Derivatives FVTPL 0 – 0 0 Level 2
Investments FVTPL 0 – – 0 Level 3
Total financial assets 155,081 130,522 24,559 27,153
Liabilities
Current lease liabilities n/a 5,807 5,807 – n/a n/a
Non-current lease liabilities n/a 21,998 21,998 – n/a n/a
Current liabilities to banks FLAC 15,492 15,492 – 15,543 Level 2
Non-current liabilities to banks FLAC 47,129 47,129 – 47,531 Level 2
Trade accounts payable FLAC 44,151 44,151 – n/a* n/a*
Other current financial liabilities FLAC 22,176 22,176 – n/a* n/a*
Other non-current financial liabilities FLAC 1,449 1,449 – 1,449 Level 2
Derivatives FVTPL 396 – 396 396 Level 2
Total financial liabilities 158,598 158,202 396 64,919
* Due to the short-term nature, it was assumed that the book value as of the reporting date approximates the fair value.
IFRS consolidated financial statementsOther disclosures
ADVA – Annual report 2020 125
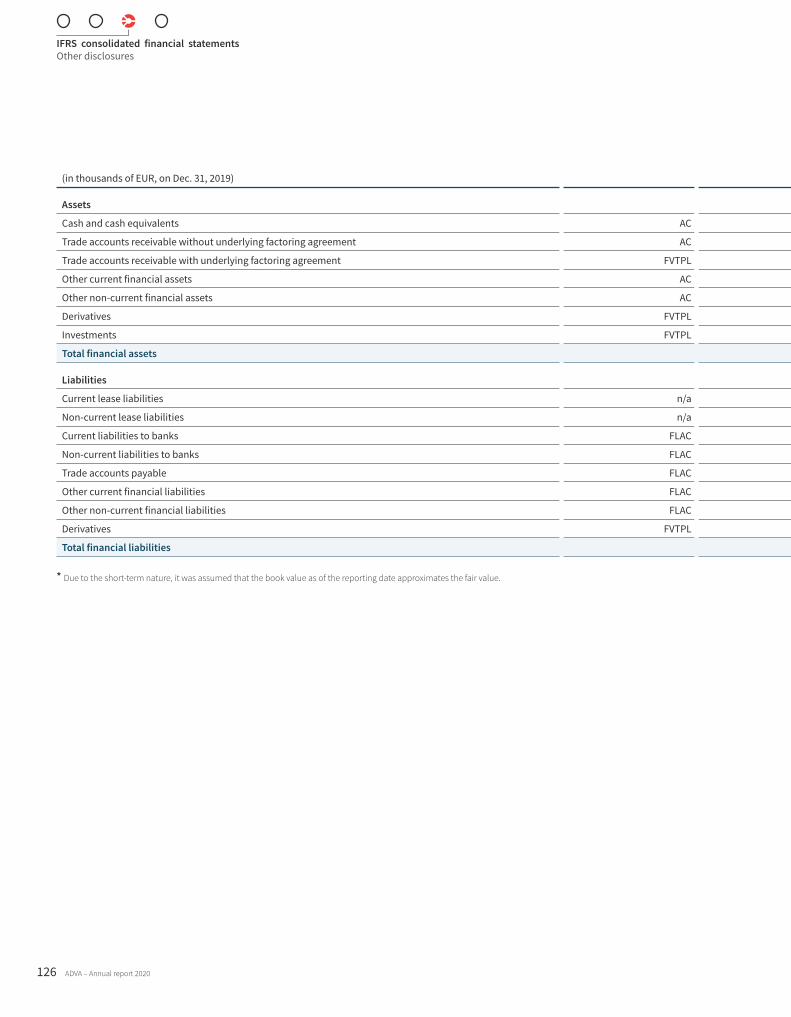
(in thousands of EUR, on Dec. 31, 2019)
Amounts recognized according to IFRS 9
Carrying amount Amortized cost
Fair value recognized in profit and loss Fair value Hierarchy of fair values
Assets
Cash and cash equivalents AC 54,263 54,263 – n/a* n/a*
Trade accounts receivable without underlying factoring agreement AC 85,872 85,872 – n/a* n/a*
Trade accounts receivable with underlying factoring agreement FVTPL 10,321 – 10,321 10,321 Level 2
Other current financial assets AC 2,906 2,906 – n/a* n/a*
Other non-current financial assets AC 3,419 3,419 – 3,419 Level 2
Derivatives FVTPL 0 – 0 0 Level 2
Investments FVTPL 0 – – 0 Level 3
Total financial assets 156,781 146,460 10,321 13,740
Liabilities
Current lease liabilities n/a 6,082 n/a – n/a n/a
Non-current lease liabilities n/a 28,348 n/a – n/a n/a
Current liabilities to banks FLAC 19,221 19,221 – 18,500 Level 2
Non-current liabilities to banks FLAC 61,758 61,758 – 63,000 Level 2
Trade accounts payable FLAC 73,398 73,398 – n/a* n/a*
Other current financial liabilities FLAC 20,627 20,627 – n/a* n/a*
Other non-current financial liabilities FLAC 505 505 – 505 Level 2
Derivatives FVTPL 336 – 336 336 Level 2
Total financial liabilities 210,275 175,509 336 82,341
* Due to the short-term nature, it was assumed that the book value as of the reporting date approximates the fair value.
IFRS consolidated financial statementsOther disclosures
126 ADVA – Annual report 2020
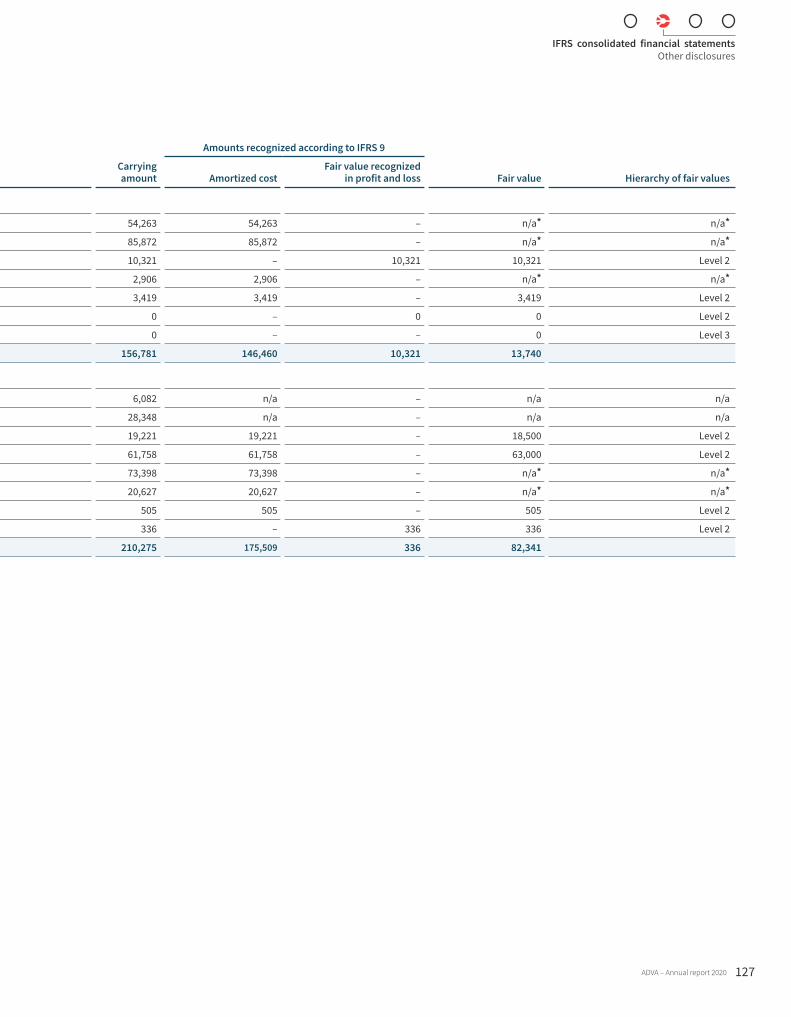
(in thousands of EUR, on Dec. 31, 2019)
Amounts recognized according to IFRS 9
Carrying amount Amortized cost
Fair value recognized in profit and loss Fair value Hierarchy of fair values
Assets
Cash and cash equivalents AC 54,263 54,263 – n/a* n/a*
Trade accounts receivable without underlying factoring agreement AC 85,872 85,872 – n/a* n/a*
Trade accounts receivable with underlying factoring agreement FVTPL 10,321 – 10,321 10,321 Level 2
Other current financial assets AC 2,906 2,906 – n/a* n/a*
Other non-current financial assets AC 3,419 3,419 – 3,419 Level 2
Derivatives FVTPL 0 – 0 0 Level 2
Investments FVTPL 0 – – 0 Level 3
Total financial assets 156,781 146,460 10,321 13,740
Liabilities
Current lease liabilities n/a 6,082 n/a – n/a n/a
Non-current lease liabilities n/a 28,348 n/a – n/a n/a
Current liabilities to banks FLAC 19,221 19,221 – 18,500 Level 2
Non-current liabilities to banks FLAC 61,758 61,758 – 63,000 Level 2
Trade accounts payable FLAC 73,398 73,398 – n/a* n/a*
Other current financial liabilities FLAC 20,627 20,627 – n/a* n/a*
Other non-current financial liabilities FLAC 505 505 – 505 Level 2
Derivatives FVTPL 336 – 336 336 Level 2
Total financial liabilities 210,275 175,509 336 82,341
* Due to the short-term nature, it was assumed that the book value as of the reporting date approximates the fair value.
IFRS consolidated financial statementsOther disclosures
ADVA – Annual report 2020 127
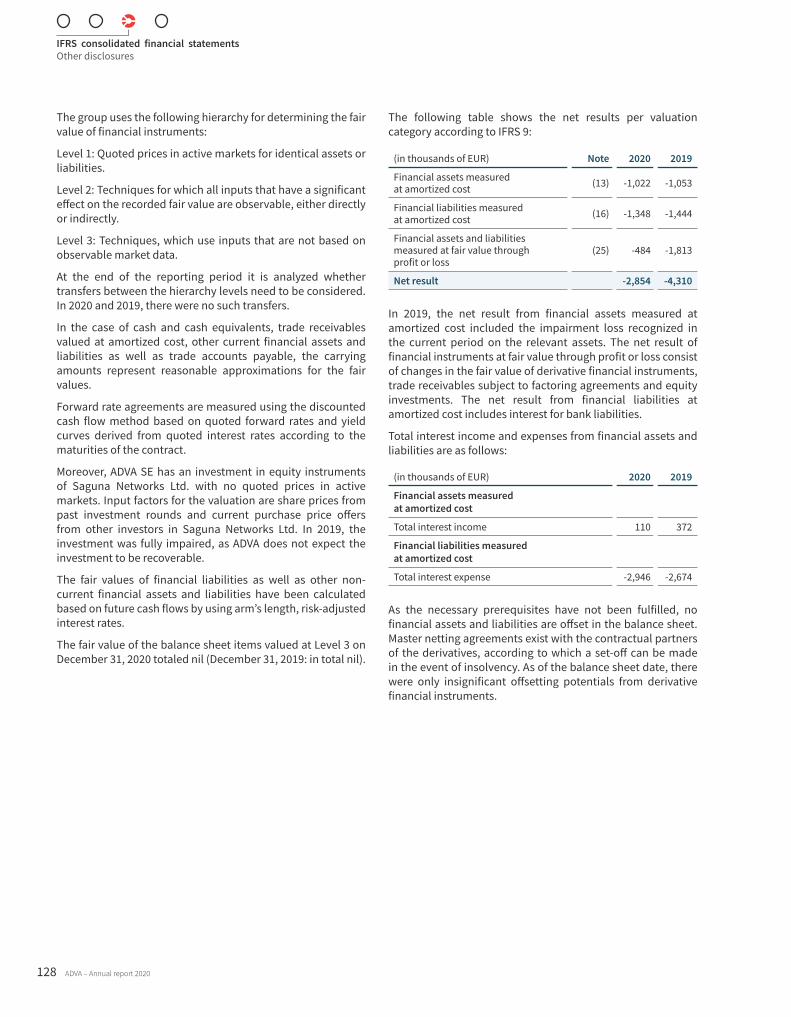
The group uses the following hierarchy for determining the fair value of financial instruments:
Level 1: Quoted prices in active markets for identical assets or liabilities.
Level 2: Techniques for which all inputs that have a significant effect on the recorded fair value are observable, either directly or indirectly.
Level 3: Techniques, which use inputs that are not based on observable market data.
At the end of the reporting period it is analyzed whether transfers between the hierarchy levels need to be considered. In 2020 and 2019, there were no such transfers.
In the case of cash and cash equivalents, trade receivables valued at amortized cost, other current financial assets and liabilities as well as trade accounts payable, the carrying amounts represent reasonable approximations for the fair values.
Forward rate agreements are measured using the discounted cash flow method based on quoted forward rates and yield curves derived from quoted interest rates according to the maturities of the contract.
Moreover, ADVA SE has an investment in equity instruments of Saguna Networks Ltd. with no quoted prices in active markets. Input factors for the valuation are share prices from past investment rounds and current purchase price offers from other investors in Saguna Networks Ltd. In 2019, the investment was fully impaired, as ADVA does not expect the investment to be recoverable.
The fair values of financial liabilities as well as other non-current financial assets and liabilities have been calculated based on future cash flows by using arm’s length, risk-adjusted interest rates.
The fair value of the balance sheet items valued at Level 3 on December 31, 2020 totaled nil (December 31, 2019: in total nil).
The following table shows the net results per valuation category according to IFRS 9:
(in thousands of EUR) Note 2020 2019
Financial assets measured at amortized cost (13) -1,022 -1,053
Financial liabilities measured at amortized cost (16) -1,348 -1,444
Financial assets and liabilities measured at fair value through profit or loss
(25) -484 -1,813
Net result -2,854 -4,310
In 2019, the net result from financial assets measured at amortized cost included the impairment loss recognized in the current period on the relevant assets. The net result of financial instruments at fair value through profit or loss consist of changes in the fair value of derivative financial instruments, trade receivables subject to factoring agreements and equity investments. The net result from financial liabilities at amortized cost includes interest for bank liabilities.
Total interest income and expenses from financial assets and liabilities are as follows:
(in thousands of EUR) 2020 2019
Financial assets measured at amortized cost
Total interest income 110 372
Financial liabilities measured at amortized cost
Total interest expense -2,946 -2,674
As the necessary prerequisites have not been fulfilled, no financial assets and liabilities are offset in the balance sheet. Master netting agreements exist with the contractual partners of the derivatives, according to which a set-off can be made in the event of insolvency. As of the balance sheet date, there were only insignificant offsetting potentials from derivative financial instruments.
IFRS consolidated financial statementsOther disclosures
128 ADVA – Annual report 2020
(33) Financial risk management
The following section describes the group’s position with regard to risks arising from financial instruments and their potential future impact on the net assets, financial position and operational results. The classification into material and immaterial financial risks considered in the risk and opportunity report has been disregarded.
Goals, guidelines and processes of the group’s risk management system are discussed in detail in the risk and opportunity report within the management report. ADVA’s capital management is described in note (34).
The management board establishes principles for overall risk management and decides on the use of derivative financial instruments and the investment of excess liquidity. The compliance department is responsible for group-wide monitoring of observance of the processes and guidelines of the risk management system defined by the ADVA management board.
Foreign currency risksRisk exposureADVA is exposed to foreign currency risks as investments, financing and operations are carried out in several currencies. This results in foreign currency risks from future transactions as well as from recognized assets and liabilities denominated in a currency other than the functional currency of the respective group company. As part of the reporting date analysis of balance sheet exposures and exchange rate sensitivities, the currency pairs USD/ILS, EUR/USD, EUR/CHF and USD/SGD were identified as relevant. The risks from the currency pairs EUR/ILS, and EUR/CNY considered in 2019 are insignificant on the balance sheet date. The relevance of the different currencies can vary depending on the reporting date.
The foreign currency risk of ADVA on the basis of the underlying operating activities at the end of 2020 in the major currencies is as follows:
(in thousands) USD
Trade accounts receivable 16,174
Trade accounts payable 19,213
There were no receivables from or liabilities to third parties in ILS, CHF and SGD on the reporting date.
At the end of 2019, the foreign currency risk in the major currencies was as follows:
(in thousands) USD
Trade accounts receivable 8,062
Trade accounts payable 35,110
The group’s risk with regard to other currency fluctuations was insignificant at the reporting date.
Risk managementADVA’s risk management framework considers operational business risks to the business that affect the income statement. Specific hedging transactions are only concluded if larger non-recurring foreign exchange risks are expected (e.g. due to a planned M&A transaction). Regarding intercompany payments, the treasury department is closely involved in order to optimize the cash flows with regard to currencies and separate hedging considerations. Foreign currency risks from recognized financial assets and liabilities are only considered by ADVA’s risk management in specific cases.
In 2019 and 2020, the group recorded significant external net cash inflows in GBP and significant external net cash outflows in USD. In order to mitigate these material risks from operating activities and as a means to offset cash flow fluctuations, ADVA’s Treasury Department has been hedging some of its net cash flows in USD versus GBP through the use of forward foreign exchange agreements in GBP already in 2019. These transactions became due in the current year and resulted in a net loss of EUR 424 thousand (2019: net gain of EUR 5 thousand).
To hedge exchange rate risks from future cash flows, the group entered into derivatives that will mature in the first quarter of 2021. The fair value of these foreign exchange agreements is recognized in other current assets or other current liabilities. The related fair values amounted to positive EUR 0 thousand and negative EUR 396 thousand, respectively (December 31, 2019: positive EUR 0 thousand and negative EUR 336 thousand). As of December 31, 2020, the nominal value of these derivatives amounted to EUR 13,745 thousand (December 31, 2019: EUR 14,951 thousand). The nominal value is the accounting value from which payments are derived.
IFRS consolidated financial statementsOther disclosures
ADVA – Annual report 2020 129
Sensitivity analysisThe foreign exchange rate sensitivity of the most relevant currency pairs with respect to balance sheet risks on earnings after tax at the end of the reporting period is illustrated below. The analysis does not take into account effects from the translation of the financial statements of the group’s foreign subsidiaries into euro the company’s reporting currency.
If, at the balance sheet date, the relevant exchange rates would have appreciated or depreciated by 10% relative to the base currency in the relevant currency relations (base currency/spot currency), the following impact on earnings after tax from the currency translation of reported primary financial instruments would have to be considered:
(in Tausend EUR, on December 31) 2020
+10% -10%
USD/ILS 2,185 -2,671
EUR/USD 389 -476
EUR/CHF -345 422
EUR/SGD -290 354
As described in the section on foreign currency risk positions, the relevant currency pairs have changed in 2020 compared to 2019. In the previous year, the following sensitivities were reported for the currency relations relevant in 2019:
(in Tausend EUR, on December 31) 2019
+10% -10%
USD/ILS 2,036 -2,489
EUR/USD -1,483 1,813
EUR/ILS -387 473
EUR/CNY -353 432
In addition, the currency pair USD/GBP is relevant for risk management considerations. The currency pairs USD/GBP and USD/EUR are hedged by using forward contracts. If, at the balance sheet date, the spot currency GBP had appreciated or depreciated by 10% against the base currency USD, the following effects would have been recognized in profit or loss:
(in Tausend EUR, on December 31) 2020
GBP +10% GBP -10%
USD/GBP 1,001 -820
EUR +10% EUR -10%
USD/EUR -122 -525
The following sensitivities have been reported in 2019:
(in Tausend EUR, on December 31) 2019
GBP +10% GBP -10%
USD/GBP 1,142 -934
EUR +10% EUR -10%
USD/EUR -462 444
Interest rate riskRisk exposureThe interest rate risk is the risk that fair values or future interest payments on existing and future interest-bearing financial instruments will fluctuate due to changes in market interest rates. ADVA increased its cash position from EUR 54,263 thousand in 2019 to EUR 64,881 thousand in 2020. With increasing liquidity, the risk of having to pay negative interest on bank balances also increases.
In addition to medium- and long-term financial instruments with fixed interest rates, ADVA Optical Networking SE has a variable rate loan of nominal EUR 53,000 thousand as well as another variable-interest bullet loan of EUR 10,000 thousand to finance its investments, which fundamentally results in an interest rate risk. Additionally, there are two outstanding credit lines of EUR 10,000 thousand and EUR 40,000 thousand, respectively, which have not been drawn as of December 31, 2020. The interest on a loan drawn under these credit lines is also dependent on EURIBOR. Further information on existing financial liabilities can be found in note (16).
Risk managementThe treasury department regularly analyzes the existing interest rate risk and, in the event of a material risk, makes proposals for the use of appropriate hedging instruments. As part of risk management to limit interest rate risks, derivative financial instruments such as interest rate caps and interest rate swaps can be used. Due to the continued expansive interest rate policy of the European Central Bank, the EURIBOR interest rate is negative at the reporting date. Due to low economic forecasts and low core inflation, ADVA does not expect any significant interest rate spreads change in the euro area and thus rates the interest rate risk as low as at December 31, 2020.
Sensitivity analysisThe interest rate sensitivity of the result after taxes is shown below. As of December 31, 2020, the 3-month EURIBOR was negative. Due to the floor agreed in the loan agreement, a reduction in EURIBOR as at December 31, 2020 would have had no effect on the interest rate. An EURIBOR increase of 0.5% would also have had no effect on the interest expense. (prior year: EUR 54 thousand).
IFRS consolidated financial statementsOther disclosures
130 ADVA – Annual report 2020
Default riskRisk exposureThe default risk arising from financial assets involves the risk of the default of a contractual partner and thus includes at maximum the amount of the related recognized carrying amounts. At ADVA default risks arise from cash at banks, contract assets and contractual cash flows from debt instruments that are measured at amortized cost or at fair value through profit or loss, including outstanding trade receivables.
Risk managementAll default risks are managed at group level. The default risk is mitigated by various measures, depending on the class of financial assets. In addition, the credit risk from non-derivative financial assets is taken into account by means of risk provisioning and bad debt allowances.
ADVA enters into transactions with creditworthy banks and financial institutions. To assess the creditworthiness of banks and financial institutions, ADVA uses current credit ratings from rating agencies (S&P, Moody’s or Fitch) as well as current default rates (credit default swaps). Based on the capital market ratings, ADVA divided the banks into three internal rating classes, determining their exposure at default and calculating the expected loss at default as of December 31, 2020 and 2019. Due to immateriality, no risk provisions were recognized at the balance sheet date.
The gross carrying amounts (risk positions) by rating class on 31 December are as follows:
(in thousands of EUR) 2020 2019
Rating class 1 64,623 54,209
Rating class 2 258 12
Rating class 3 0 42
Total 64,881 54,263
ADVA has distributed its investments to more than 10 international credit institutions. As of December 31, 2020, one bank was responsible for approximately 87% of all investments (as of December 31, 2019: for approximately 91%). This results in a risk exposure of EUR 56,558 thousand. (2019: EUR 49,345 thousand).
When concluding contracts with clients, the creditworthiness and credit quality of the client is assessed on the basis of independent ratings (e.g. Duns & Bradstreet), audited financial statements, or historical experience. Depending on the risk assessment, deliveries are made solely only under reasonable payment terms, which may include down payments or advance payments.
The group uses the simplified approach under IFRS 9 to measure the expected credit losses on trade receivables carried at amortized cost and contract assets. Trade receivables are summarized on the basis of common credit risk characteristics and overdue days.
As of December 31, 2020 and 2019, the expected loss ratios are based on historical payment profiles of receivables and the corresponding historical defaults. There are adjusted to reflect up-to-date and forward-looking information on macroeconomic factors (such as geopolitical events, currency fluctuations, inflation, trade conflicts, state subsidies) that may affect clients’ solvency. Contract assets relate to work that has not yet been invoiced, and accordingly have the same risk characteristics as trade receivables of the underlying contracts.
In addition, ADVA applies a specified valuation if certain criteria are met.
IFRS consolidated financial statementsOther disclosures
ADVA – Annual report 2020 131
The following table shows the overdue structure of gross carrying amounts of trade accounts receivable and contract assets by as of December 31, 2020:
(in thousands of EUR) Not yet dueOverdue up
to 90 days
90 – 180 days
overdue
180 days to 1 year overdue
more than 1 year
overduehigh
default risk Total
Trade accounts receivable (simplified approach) 71,098 10,824 1,231 643 1,059 1,738 86,593
Contract assets 442 – – – – – 442
As of 31 December 2019, the overdue structure of gross carrying amounts of trade receivables and contract assets were as follows:
(in thousands of EUR) Not yet dueOverdue up
to 90 days
90 – 180 days
overdue
180 days to 1 year overdue
more than 1 year
overduehigh
default risk Total
Trade accounts receivable 83,346 9,779 744 1,170 353 2,492 97,884
Contract assets 654 – – – – – 654
Due to immateriality, no valuation allowances were recognized relating to contract assets as of December 31, 2020 and 2019. The reconciliation of risk provisions for trade receivables is shown in note (10).
For other financial assets carried at amortized cost with a total carrying amount of EUR 6,320 thousand (prior year: EUR 6,325 thousand), the group analyzes the risk on a case-by-case basis. As of December 31, 2020 and 2019, there were no significant default risks. Therefore, no valuation allowances were recognized.
Liquidity riskRisk exposureIn general, the inability to meet its financial obligations, such as servicing its debts, composes the liquidity risk of ADVA.
Risk managementManagement uses rolling forecasts to monitor the group’s liquidity reserves, consisting of cash and cash equivalents based on expected cash flows and unused credit lines. To manage liquidity, ADVA considers compliance with internally defined operating liquidity at all times.
The group’s liquidity management policies include the forecast of cash flows in the major currencies and the assessment of required cash in these currencies, the monitoring of balance sheet liquidity ratios and the management of debt financing plans. In general, ADVA pursues a conservative and risk-avoiding strategy.
Financing agreementsThe loan agreements contain restrictions and covenants that restrict the financial and operating scope of ADVA. A breach of these agreements would result in a compulsory early repayment of the loans. The company estimates this risk as low as at the reporting date and the prior year-end, as all agreements have been complied in the reporting period.
At the end of the reporting period, ADVA had financing agreements with various banks. This includes a syndicated loan of a nominal amount of EUR 53,000 thousand with maturity in September 2023 and a bilateral bullet term loan of EUR 10,000 thousand due in September 2022. In addition, the syndicated loan has two undrawn revolving credit facilities over EUR 10,000 thousand and EUR 40,000 thousand, respectively. See also note (16) on liabilities to banks.
IFRS consolidated financial statementsOther disclosures
132 ADVA – Annual report 2020
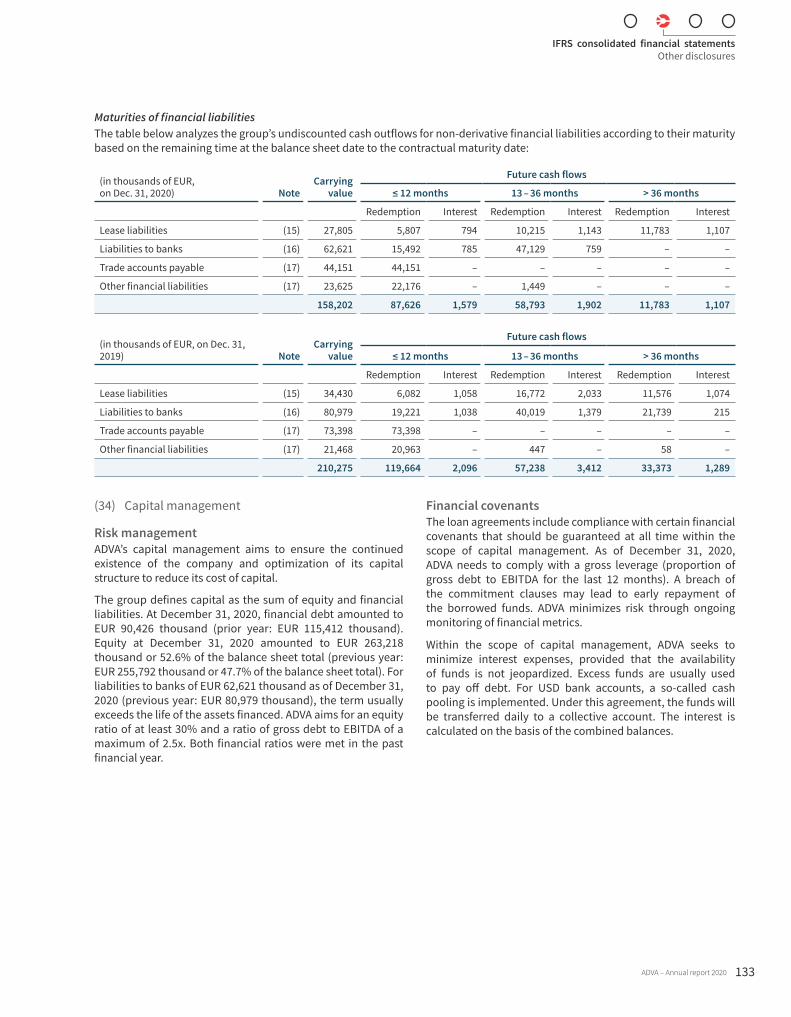
Maturities of financial liabilitiesThe table below analyzes the group’s undiscounted cash outflows for non-derivative financial liabilities according to their maturity based on the remaining time at the balance sheet date to the contractual maturity date:
(in thousands of EUR, on Dec. 31, 2020) Note
Carryingvalue
Future cash flows
≤ 12 months 13 – 36 months > 36 months
Redemption Interest Redemption Interest Redemption Interest
Lease liabilities (15) 27,805 5,807 794 10,215 1,143 11,783 1,107
Liabilities to banks (16) 62,621 15,492 785 47,129 759 – –
Trade accounts payable (17) 44,151 44,151 – – – – –
Other financial liabilities (17) 23,625 22,176 – 1,449 – – –
158,202 87,626 1,579 58,793 1,902 11,783 1,107
(in thousands of EUR, on Dec. 31, 2019) Note
Carryingvalue
Future cash flows
≤ 12 months 13 – 36 months > 36 months
Redemption Interest Redemption Interest Redemption Interest
Lease liabilities (15) 34,430 6,082 1,058 16,772 2,033 11,576 1,074
Liabilities to banks (16) 80,979 19,221 1,038 40,019 1,379 21,739 215
Trade accounts payable (17) 73,398 73,398 – – – – –
Other financial liabilities (17) 21,468 20,963 – 447 – 58 –
210,275 119,664 2,096 57,238 3,412 33,373 1,289
(34) Capital management
Risk managementADVA’s capital management aims to ensure the continued existence of the company and optimization of its capital structure to reduce its cost of capital.
The group defines capital as the sum of equity and financial liabilities. At December 31, 2020, financial debt amounted to EUR 90,426 thousand (prior year: EUR 115,412 thousand). Equity at December 31, 2020 amounted to EUR 263,218 thousand or 52.6% of the balance sheet total (previous year: EUR 255,792 thousand or 47.7% of the balance sheet total). For liabilities to banks of EUR 62,621 thousand as of December 31, 2020 (previous year: EUR 80,979 thousand), the term usually exceeds the life of the assets financed. ADVA aims for an equity ratio of at least 30% and a ratio of gross debt to EBITDA of a maximum of 2.5x. Both financial ratios were met in the past financial year.
Financial covenantsThe loan agreements include compliance with certain financial covenants that should be guaranteed at all time within the scope of capital management. As of December 31, 2020, ADVA needs to comply with a gross leverage (proportion of gross debt to EBITDA for the last 12 months). A breach of the commitment clauses may lead to early repayment of the borrowed funds. ADVA minimizes risk through ongoing monitoring of financial metrics.
Within the scope of capital management, ADVA seeks to minimize interest expenses, provided that the availability of funds is not jeopardized. Excess funds are usually used to pay off debt. For USD bank accounts, a so-called cash pooling is implemented. Under this agreement, the funds will be transferred daily to a collective account. The interest is calculated on the basis of the combined balances.
IFRS consolidated financial statementsOther disclosures
ADVA – Annual report 2020 133
(35) Other financial obligations and financial commitments
On December 31, 2020, the group had purchase commitments totaling EUR 57,128 thousand (on December 31, 2019: EUR 45,473 thousand) in respect to suppliers.
Group entities have issued guarantees in favor of customers. On December 31, 2020, performance bonds with a maximum guaranteed amount of EUR 414 thousand were issued (on December 31, 2019: EUR 2,422 thousand). At year-end 2020, ADVA does not expect claims from these guarantees.
With respect to various financing agreements there are certain guarantee obligations from ADVA North America Inc. and ADVA Ltd. to ADVA Optical Networking SE.
(36) Contingent liabilities
In the normal course of business, claims may be asserted, or lawsuits filed against the company and its subsidiaries from time to time. On December 31, 2020, ADVA does not expect that potential titles or litigations in detail or in total will have a material impact on its financial position or operating performance.
(37) Auditor’s fees and other services from auditors
Since June 9, 2010, PricewaterhouseCoopers GmbH Wirtschaftsprüfungsgesellschaft (PwC), Munich, Member of the German Wirtschaftsprüfungskammer in Berlin, is the auditor of the company and the group. After internal rotation in 2014, Holger Graßnick is the responsible certified accountant for the company.
In 2020 and 2019, the following fees charged by the legal auditor were recognized as expenses:
(in thousands of EUR) 2020 2019
Year-end audit 474 385
Other consulting services 50 74
524 459
In 2020, other consulting services mainly include services in relation to the separate nonfinancial report.
(38) Stock option programs
To date, the company has issued stock options for employees (Plan XIV) and for management board (Plan XIVa and Plan XVIa). The new Plan XVIa results from a decision of the Supervisory Board of ADVA SE on February 18, 2020. Generally, Plan XIV and Plan XVIa are still available for issuance of share-based compensation instruments.
All contracts stipulate a general four-year vesting period and a total contractual life of seven years for the respective rights issue. The rights may only be exercised if the volume weighted average of the company share closing prices on the ten stock exchange trading days before the first day of each exercise period in which the option is exercised is at least 120% of the purchase price. In addition, options issued to the management board from Plan XIVa and from the new Plan XVIa introduced in 2020 include a profit limitation.
All option rights are non-transferable. They may only be exercised as long as the entitled person is employed on a permanent contract by the company or by a company in which ADVA Optical Networking SE has direct or indirect interest. Option rights issued to apprentices may only be exercised if the apprentices are hired by the company or by an affiliated company on a permanent contract. All option rights expire upon termination of the employment contract. In the event that the person entitled dies, becomes unable to work or retires, special provisions come into force.
The group of people to whom option rights can be issued is defined separately for each stock option program. According to the resolution on May 13, 2020, 35.0% of option rights - in total 1,756,369 options rights - authorized pursuant to Plan XIV and Plan XIVa could be issued to members of the management board, 5.0% - in total 250,910 options rights - to the management of affiliated companies, 22.5% - in total 1,129,094 options rights - to company employees, and 37.5% - in total 1,881,823 options rights - to employees of affiliated companies. The management board specifies the exact group of people entitled to exercise rights and the scope of each offer. Options rights awarded to the management board are approved by supervisory board.
Subject to the conditions under which option rights are issued, each option right entitles the individual to purchase one common share in the company. The conditions of issue specify the term, the exercise price (strike price), any qualifying periods and the defined exercise periods.
Exercise periods are regularly linked to key business events in the company’s calendar and each have a defined term. Certain other business events can lead to blocking periods, during which option rights cannot be exercised. Insofar as regular exercise periods overlap with such blocking periods, the exercise deadline shall be extended by the corresponding number of exercise days immediately after the end of such a blocking period. Option rights may be exercised only on days on which commercial banks are open in Frankfurt am Main, Germany.
IFRS consolidated financial statementsOther disclosures
134 ADVA – Annual report 2020
The new Plan XVIa for the management board introduced in 2020 takes into account an automated exercise process in addition to the conditions as described above. The process of automated exercise of the option rights includes an immediate sale of the shares received via the stock exchange (“exersale”). The automated exercise and the immediate sale take place after the expiration of the general vesting period of 4 years in eight regularl equal tranches, distributed over eight consecutive exercise windows on days determined or determinable in advance. The specific waiting period depends on the respective tranche. In the event that stock options cannot be exercised during the exercise window, the exersales are postponed to the respective subsequent exercise window. If they cannot be exercised within the term of the agreement, the options forfeit at the end of the last available exercise window.
With the introduction of the new Plan XVIa, the supervisory board also decided to amend Plan XIVa accordingly. The introduction of the automated exercise process as described above in Plan XVIa became effective on July 1, 2020 for all outstanding options and resulted in modification of the actual vesting period for stock options already issued before 2020. The purpose of this modification is to simplify the disposal of exercised options and reduce administrative expenses due to insider trading rules. The modification resulted in a revaluation of these expenses. If the newly determined fair values per tranche exceed the fair value at the modification date, the additional fair value is accrued over the remaining vesting period (see IFRS 2.27).
The fair value of stock options was valued using a Monte Carlo simulation. For the calculation of the fair value of options, ADVA assumed that no dividends will be paid to stockholders.
The following computation parameters apply for option rights issued in 2020:
Plan XIV Plan XVIa
Weighted average share price (in EUR) 5.73 5.52
Weighted average strike price (in EUR) 5.91 5.76
Weighted expected volatility (in % per year) 47.88% 46.99%
Term (in years) 7 7
Weighted risk-free interest rate (in % per year) -0.72% -0.74%
The volatility is specified as fluctuation of the share price compared to the average share price of the period. In each case, expected volatility is calculated based on historic share prices (historic volatility). The risk-free interest rate is based on information on risk-free investments with corresponding terms.
The tables below present changes in the number of option rights outstanding.
Stock option program 2011 (Plan XIV)
Number of options
Weighted average strike price
(in EUR)
Options outstanding on Jan. 1, 2019 2,165,212 6.91
Granted options 436,000 7.07
Exercised options -151,011 4.98
Forfeited options -212,300 7.41
Expired options -3,001 5.05
Options outstanding on Dec. 31, 2019 2,234,900 7.03
Granted options 107,500 5.91
Exercised options -49,726 3.78
Forfeited options -143,100 7.49
Expired options -3,674 3.90
Options outstanding on Dec. 31, 2020 2,145,900 7.02
Of which exercisable 650,400 8.58
The weighted average remaining contractual life for option rights outstanding on December 31, 2020 is 4.06 years (December 31, 2019: 4.82 years). The strike price for these options is between EUR 2.87 and EUR 10.16 (2019: between EUR 2.87 and EUR 10.16).
Stock options exercised in 2020 had an average share price of EUR 7.14 on the exercise date.
The average fair value of option rights granted in 2020 is EUR 2.37 (December 31, 2019: EUR 3.14).
IFRS consolidated financial statementsOther disclosures
ADVA – Annual report 2020 135
Stock option program 2011 for the management board (Plan XIVa)
Number of options
Weighted average strike price
(in EUR)
Options outstanding on Jan. 1, 2019 1,166,667 6.20
Granted options – –
Exercised options -100,000 5.05
Forfeited options – –
Expired options – –
Options outstanding on Dec. 31, 2019 1,066,667 6.31
Granted options – –
Exercised options -265,000 4.09
Forfeited options – –
Expired options – –
Options outstanding on Dec. 31, 2020 801,667 7.04
Of which exercisable 476,667 8.14
The weighted average remaining contractual life for option rights outstanding on December 31, 2020, is 3.10 years (December 31, 2019: 3.46 years). The strike price for these options is between EUR 4.98 and EUR 8.70 (2019: between EUR 3.19 and EUR 8.70).
Stock options exercised in 2020 had an average share price of EUR 6.68 on the exercise date.
The revaluation due to the modification of the plan as of July 1, 2020 resulted in an additional weighted average fair value of the affected stock options of EUR 0.17 (incremental fair value).
Stock option program 2020 for the management board (Plan XVIa)
Number of options
Weighted average strike price
(in EUR)
Options outstanding on Dec. 31, 2019 – –
Granted options 100,000 5.76
Exercised options – –
Forfeited options – –
Expired options – –
Options outstanding on Dec. 31, 2020 100,000 5.76
Of which exercisable – –
The weighted average remaining contractual life for option rights outstanding on December 31, 2020, is 6.47 years. The strike price for these options is at EUR 5.76.
The average fair value of option rights granted in 2020 is EUR 2.82.
Compensation expenses arising from share-based compensation programs included in operating income were as follows:
(in thousands of EUR) 2020 2019
Plan XIV 878 1,023
Plan XIVa 276 467
thereof expense from modification 16 –
Plan XVIa 35 –
1,189 1,490
(39) Related party transactions
Teleios Capital Partners LLC Zug, Switzerland, EGORA Holding GmbH, Martinsried/Munich, and its subsidiaries (the EGORA group), Saguna Networks Ltd., Nesher, Israel, Arista Networks, Santa Clara, USA, Fraunhofer Heinrich Hertz Institute, Berlin, Harmonic Inc., San Jose, USA, AB Interactive Solutions (Biscuit), Raana, Israel and all members of the company’s governing bodies and their relatives qualify as related parties to ADVA on December 31, 2020, in the sense of IAS 24.
Teleios Capital Partners LLC is an investment company based in Zug, Switzerland. On December 31, 2020, Teleios Capital Partners LLC and its subsidiaries held a 19.38% share in the equity of ADVA. No business relations existed with Teleios Capital Partners LLC.
On December 31, 2020, the EGORA group held a 14.77% share in the equity of ADVA Optical Networking SE.
ADVA Optical Networking SE holds 7.1% of the shares of Saguna Networks Ltd., Nesher, Israel. A service agreement with Saguna Networks Ltd. exists regarding the provision of development services for the companies of ADVA group.
In 2020, ADVA acquired components with an amount of EUR 11 thousand from the EGORA group (2019: EUR 12 thousand.) In 2020 and 2019, ADVA did not sell any products to the EGORA group.
ADVA has entered into several agreements with the EGORA group under which ADVA is entitled to make use of certain facilities and services of the EGORA group. In 2020 and 2019, these agreements were not utilized.
On December 31, 2020 and 2019, no trade accounts payable and provision existed in respect to EGORA group.
In 2020 and 2019, Saguna Networks Ltd. has not performed development services for the group.
IFRS consolidated financial statementsOther disclosures
136 ADVA – Annual report 2020
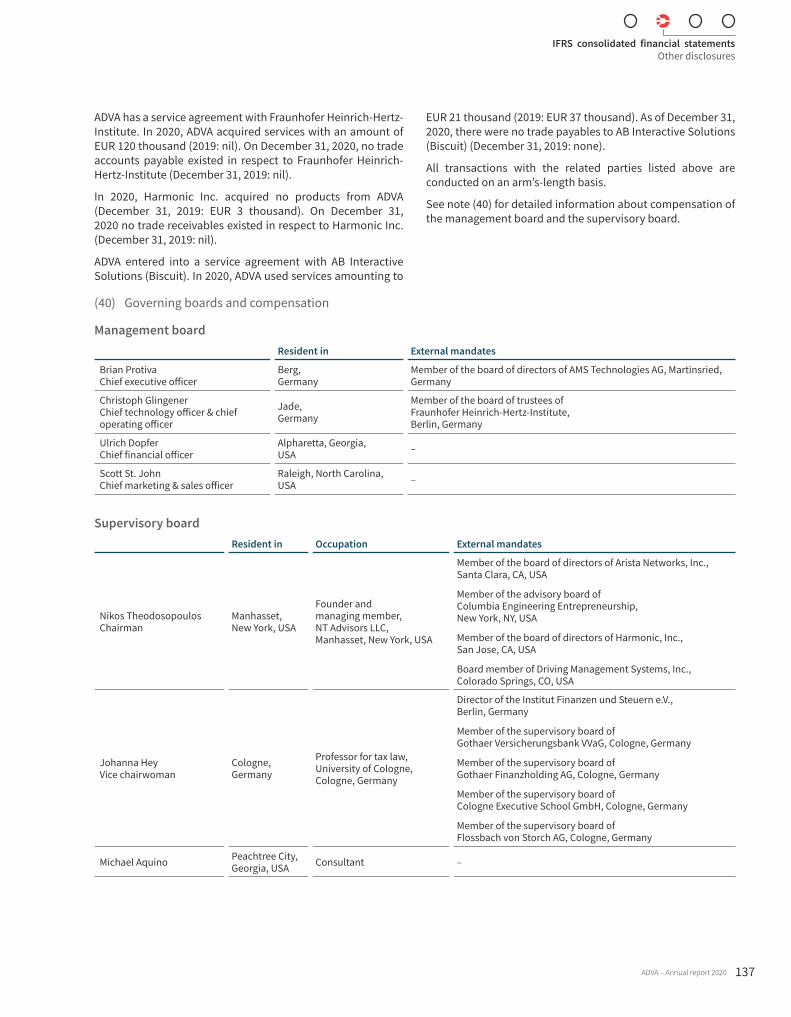
ADVA has a service agreement with Fraunhofer Heinrich-Hertz-Institute. In 2020, ADVA acquired services with an amount of EUR 120 thousand (2019: nil). On December 31, 2020, no trade accounts payable existed in respect to Fraunhofer Heinrich-Hertz-Institute (December 31, 2019: nil).
In 2020, Harmonic Inc. acquired no products from ADVA (December 31, 2019: EUR 3 thousand). On December 31, 2020 no trade receivables existed in respect to Harmonic Inc. (December 31, 2019: nil).
ADVA entered into a service agreement with AB Interactive Solutions (Biscuit). In 2020, ADVA used services amounting to
EUR 21 thousand (2019: EUR 37 thousand). As of December 31, 2020, there were no trade payables to AB Interactive Solutions (Biscuit) (December 31, 2019: none).
All transactions with the related parties listed above are conducted on an arm’s-length basis.
See note (40) for detailed information about compensation of the management board and the supervisory board.
(40) Governing boards and compensation
Management boardResident in External mandates
Brian Protiva Chief executive officer
Berg, Germany
Member of the board of directors of AMS Technologies AG, Martinsried, Germany
Christoph Glingener Chief technology officer & chief operating officer
Jade, Germany
Member of the board of trustees of Fraunhofer Heinrich-Hertz-Institute, Berlin, Germany
Ulrich Dopfer Chief financial officer
Alpharetta, Georgia, USA –
Scott St. John Chief marketing & sales officer
Raleigh, North Carolina, USA –
Supervisory boardResident in Occupation External mandates
Nikos Theodosopoulos Chairman
Manhasset, New York, USA
Founder and managing member, NT Advisors LLC, Manhasset, New York, USA
Member of the board of directors of Arista Networks, Inc., Santa Clara, CA, USA
Member of the advisory board of Columbia Engineering Entrepreneurship, New York, NY, USA
Member of the board of directors of Harmonic, Inc., San Jose, CA, USA
Board member of Driving Management Systems, Inc., Colorado Springs, CO, USA
Johanna Hey Vice chairwoman
Cologne, Germany
Professor for tax law, University of Cologne, Cologne, Germany
Director of the Institut Finanzen und Steuern e.V., Berlin, Germany
Member of the supervisory board of Gothaer Versicherungsbank VVaG, Cologne, Germany
Member of the supervisory board of Gothaer Finanzholding AG, Cologne, Germany
Member of the supervisory board of Cologne Executive School GmbH, Cologne, Germany
Member of the supervisory board of Flossbach von Storch AG, Cologne, Germany
Michael Aquino Peachtree City, Georgia, USA Consultant –
IFRS consolidated financial statementsOther disclosures
ADVA – Annual report 2020 137
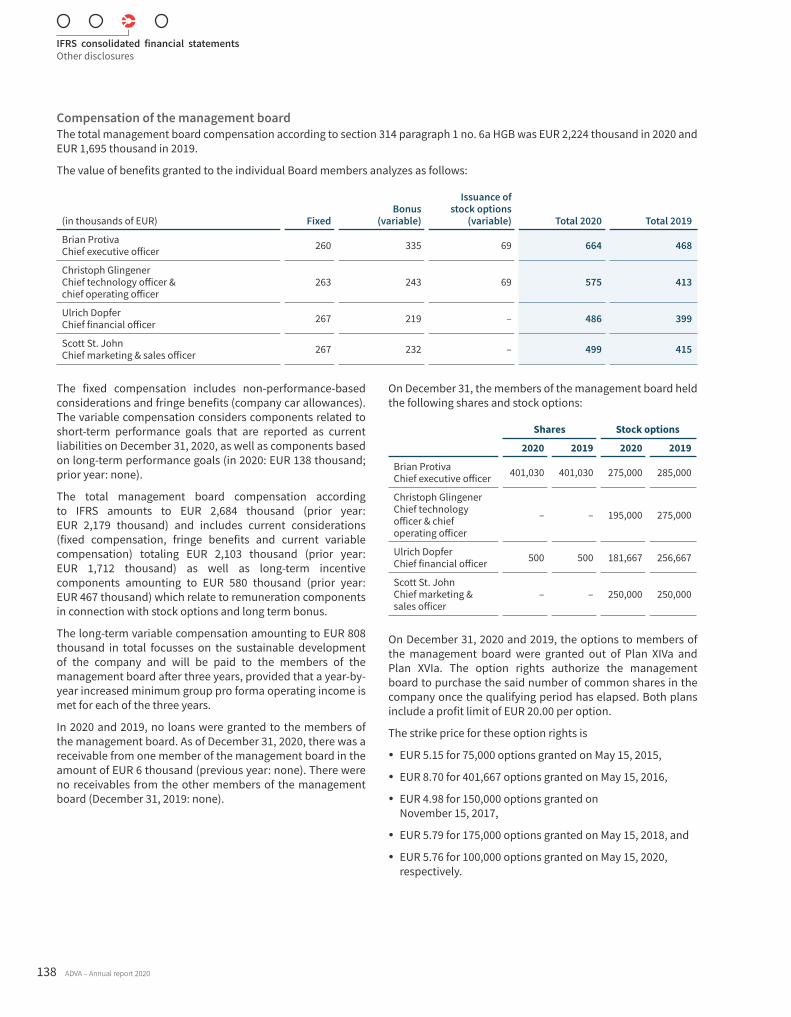
Compensation of the management boardThe total management board compensation according to section 314 paragraph 1 no. 6a HGB was EUR 2,224 thousand in 2020 and EUR 1,695 thousand in 2019.
The value of benefits granted to the individual Board members analyzes as follows:
(in thousands of EUR) FixedBonus
(variable)
Issuance of stock options
(variable) Total 2020 Total 2019
Brian Protiva Chief executive officer 260 335 69 664 468
Christoph Glingener Chief technology officer & chief operating officer
263 243 69 575 413
Ulrich Dopfer Chief financial officer 267 219 – 486 399
Scott St. John Chief marketing & sales officer 267 232 – 499 415
The fixed compensation includes non-performance-based considerations and fringe benefits (company car allowances). The variable compensation considers components related to short-term performance goals that are reported as current liabilities on December 31, 2020, as well as components based on long-term performance goals (in 2020: EUR 138 thousand; prior year: none).
The total management board compensation according to IFRS amounts to EUR 2,684 thousand (prior year: EUR 2,179 thousand) and includes current considerations (fixed compensation, fringe benefits and current variable compensation) totaling EUR 2,103 thousand (prior year: EUR 1,712 thousand) as well as long-term incentive components amounting to EUR 580 thousand (prior year: EUR 467 thousand) which relate to remuneration components in connection with stock options and long term bonus.
The long-term variable compensation amounting to EUR 808 thousand in total focusses on the sustainable development of the company and will be paid to the members of the management board after three years, provided that a year-by-year increased minimum group pro forma operating income is met for each of the three years.
In 2020 and 2019, no loans were granted to the members of the management board. As of December 31, 2020, there was a receivable from one member of the management board in the amount of EUR 6 thousand (previous year: none). There were no receivables from the other members of the management board (December 31, 2019: none).
On December 31, the members of the management board held the following shares and stock options:
Shares Stock options
2020 2019 2020 2019
Brian Protiva Chief executive officer 401,030 401,030 275,000 285,000
Christoph Glingener Chief technology officer & chief operating officer
– – 195,000 275,000
Ulrich Dopfer Chief financial officer 500 500 181,667 256,667
Scott St. John Chief marketing & sales officer
– – 250,000 250,000
On December 31, 2020 and 2019, the options to members of the management board were granted out of Plan XIVa and Plan XVIa. The option rights authorize the management board to purchase the said number of common shares in the company once the qualifying period has elapsed. Both plans include a profit limit of EUR 20.00 per option.
The strike price for these option rights is
y EUR 5.15 for 75,000 options granted on May 15, 2015,
y EUR 8.70 for 401,667 options granted on May 15, 2016,
y EUR 4.98 for 150,000 options granted on November 15, 2017,
y EUR 5.79 for 175,000 options granted on May 15, 2018, and
y EUR 5.76 for 100,000 options granted on May 15, 2020, respectively.
IFRS consolidated financial statementsOther disclosures
138 ADVA – Annual report 2020
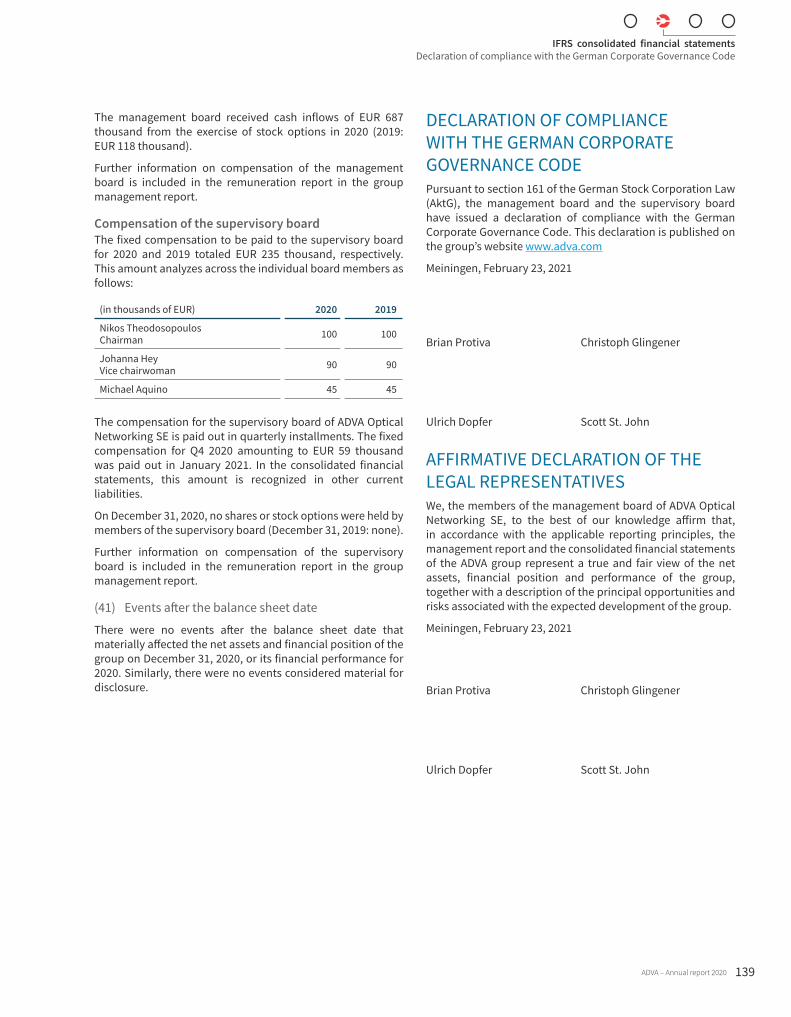
The management board received cash inflows of EUR 687 thousand from the exercise of stock options in 2020 (2019: EUR 118 thousand).
Further information on compensation of the management board is included in the remuneration report in the group management report.
Compensation of the supervisory board The fixed compensation to be paid to the supervisory board for 2020 and 2019 totaled EUR 235 thousand, respectively. This amount analyzes across the individual board members as follows:
(in thousands of EUR) 2020 2019
Nikos Theodosopoulos Chairman 100 100
Johanna Hey Vice chairwoman 90 90
Michael Aquino 45 45
The compensation for the supervisory board of ADVA Optical Networking SE is paid out in quarterly installments. The fixed compensation for Q4 2020 amounting to EUR 59 thousand was paid out in January 2021. In the consolidated financial statements, this amount is recognized in other current liabilities.
On December 31, 2020, no shares or stock options were held by members of the supervisory board (December 31, 2019: none).
Further information on compensation of the supervisory board is included in the remuneration report in the group management report.
(41) Events after the balance sheet date
There were no events after the balance sheet date that materially affected the net assets and financial position of the group on December 31, 2020, or its financial performance for 2020. Similarly, there were no events considered material for disclosure.
DECLARATION OF COMPLIANCE WITH THE GERMAN CORPORATE GOVERNANCE CODEPursuant to section 161 of the German Stock Corporation Law (AktG), the management board and the supervisory board have issued a declaration of compliance with the German Corporate Governance Code. This declaration is published on the group’s website www.adva.com
Meiningen, February 23, 2021
Brian Protiva Christoph Glingener
Ulrich Dopfer Scott St. John
AFFIRMATIVE DECLARATION OF THE LEGAL REPRESENTATIVESWe, the members of the management board of ADVA Optical Networking SE, to the best of our knowledge affirm that, in accordance with the applicable reporting principles, the management report and the consolidated financial statements of the ADVA group represent a true and fair view of the net assets, financial position and performance of the group, together with a description of the principal opportunities and risks associated with the expected development of the group.
Meiningen, February 23, 2021
Brian Protiva Christoph Glingener
Ulrich Dopfer Scott St. John
IFRS consolidated financial statementsDeclaration of compliance with the German Corporate Governance Code
ADVA – Annual report 2020 139
The following copy of the auditor’s report also includes a „Report on the audit of the electronic renderings of the financial statements and the management report prepared for disclosure purposes in accordance with § 317 Abs. 3b HGB“ („Separate report on ESEF conformity“). The subject matter (ESEF documents to be audited) to which the separate report on ESEF conformity relates is not attached. The audited ESEF documents can be inspected in or retrieved from the Federal Gazette.
“INDEPENDENT AUDITOR’S REPORT To ADVA Optical Networking SE, Meiningen
REPORT ON THE AUDIT OF THE CONSOLIDATED FINANCIAL STATEMENTS AND OF THE GROUP MANAGEMENT REPORT Audit OpinionsWe have audited the consolidated financial statements of ADVA Optical Networking SE, Meiningen, and its subsidiaries (the Group), which comprise the consolidated statement of financial position as at December 31, 2020, and the consolidated statement of comprehensive income, consolidated statement of profit or loss, consolidated statement of changes in equity and consolidated statement of cash flows for the financial year from January 1 to December 31, 2020, and notes to the consolidated financial statements, including a summary of significant accounting policies. In addition, we have audited the group management report of ADVA Optical Networking SE, which is combined with the Company’s management report, for the financial year from January 1 to December 31, 2020. We have not audited the content of those parts of the group management report listed in the “Other Information” section of our auditor’s report.
In our opinion, on the basis of the knowledge obtained in the audit,
the accompanying consolidated financial statements comply, in all material respects, with the IFRSs as adopted by the EU, and the additional requirements of German commercial law pursuant to §315e Abs.1 HGB [ and, in compliance with these requirements, give a true and fair view of the assets, liabilities, and financial position of the Group as at December 31, 2020, and of its financial performance for the financial year from January 1 to December 31, 2020, and
the accompanying group management report as a whole provides an appropriate view of the Group’s position. In all material respects, this group management report is consistent with the consolidated financial statements, complies with German legal requirements and appropriately presents the opportunities and risks of future development. Our audit opinion on the group management report does not cover the content of those parts of the group management report listed in the “Other Information” section of our auditor’s report.
Pursuant to § 322 Abs. 3 Satz 1 HGB, we declare that our audit has not led to any reservations relating to the legal compliance of the consolidated financial statements and of the group management report.
Basis for the Audit OpinionsWe conducted our audit of the consolidated financial statements and of the group management report in accordance with § 317 HGB and the EU Audit Regulation (No. 537/2014, referred to subsequently as “EU Audit Regulation”) and in compliance with German Generally Accepted Standards for Financial Statement Audits promulgated by the Institut der Wirtschaftsprüfer [Institute of Public Auditors in Germany] (IDW). Our responsibilities under those requirements and principles are further described in the “Auditor’s Responsibilities for the Audit of the Consolidated Financial Statements and of the Group Management Report” section of our auditor’s report. We are independent of the group entities in accordance with the requirements of European law and German commercial and professional law, and we have fulfilled our other German professional responsibilities in accordance with these requirements. In addition, in accordance with Article 10 (2) point (f) of the EU Audit Regulation, we declare that we have not provided non-audit services prohibited under Article 5 (1) of the EU Audit Regulation. We believe that the audit evidence we have obtained is sufficient and appropriate to provide a basis for our audit opinions on the consolidated financial statements and on the group management report.
Key Audit Matters in the Audit of the Consolidated Financial Statements Key audit matters are those matters that, in our professional judgment, were of most significance in our audit of the consolidated financial statements for the financial year from January 1 to December 31, 2020. These matters were addressed in the context of our audit of the consolidated financial statements as a whole, and in forming our audit opinion thereon; we do not provide a separate audit opinion on these matters.
In our view, the matters of most significance in our audit were as follows:
1) Recoverability of goodwill
2) Accounting treatment of internally generated intangible assets
3) Accounting treatment and valuation of deferred taxes
Our presentation of these key audit matters has been structured in each case as follows:
1. Matter and issue
2. Audit approach and findings
3. Reference to further information
Hereinafter we present the key audit matters:
IFRS consolidated financial statements“Independent auditor’s report
140 ADVA – Annual report 2020
1) Recoverability of goodwill
1. In the Company’s consolidated financial statements goodwill amounting to EUR 67,036 thousand is reported under the balance sheet item “Goodwill”. Goodwill is tested for impairment by the Company once a year or when there are indications of impairment to determine any possible need for write-downs. The impairment test is carried out at the level of the groups of cash-generating units to which the relevant goodwill is allocated. The carrying amount of the relevant cash generating units, including goodwill, is compared with the corresponding recoverable amount in the context of the impairment test. The recoverable amount is generally determined using the value in use. The present value of the future cash flows from the respective group of cash-generating units normally serves as the basis of valuation. Present values are calculated using discounted cash flow models. For this purpose, the adopted medium-term business plan of the Group forms the starting point which is extrapolated based on assumptions about long-term rates of growth. Expectations relating to future market developments and assumptions about the development of macroeconomic factors are also taken into account. The discount rate used is the weighted average cost of capital for the relevant group of cash-generating units. The impairment test determined that no write-downs were necessary.
The outcome of this valuation is dependent to a large extent on the estimates made by the executive directors with respect to the future cash inflows from the respective group of cash-generating units, the discount rate used, the rate of growth and other assumptions, and is therefore subject to considerable uncertainty. Against this background and due to the complex nature of the valuation, this matter was of particular significance in the context of our audit.
2. As part of our audit, we assessed the methodology employed for the purposes of performing the impairment test, among other things. After matching the future cash inflows used for the calculation against the adopted medium-term business plan of the Group, we assessed the appropriateness of the calculation, in particular by reconciling it with general and sector-specific market expectations. In addition, we assessed the appropriate consideration of the costs for Group functions. In the knowledge that even relatively small changes in the discount rate applied can have a material impact on the value in use calculated in this way, we focused our testing in particular on the parameters used to determine the discount rate applied and assessed the calculation model. In order to reflect the uncertainty inherent in the projections, we evaluated the sensitivity analyses performed by the Company.
Overall, the valuation parameters and assumptions used by the executive directors are in line with our expectations and are within the ranges considered by us to be reasonable.
3. The Company’s disclosures on goodwill are contained in sections (4) Recognition and measurement, (5) Significant accounting judgments, estimates and assumptions and
(14) Fixed assets in the notes to the consolidated financial statements.
2) Accounting treatment of internally generated intangible assets
1. In the Company’s consolidated financial statements an amount of EUR 98,607 thousand is reported under the balance sheet item “capitalized development projects”. This item represents development costs incurred for new products, which have been capitalized in accordance with the provisions of IAS 38 and have already been partially amortized in line with their useful lives. An impairment test is carried out at least once annually for projects still under development in accordance with IAS 36. Own expenses capitalized in accordance with these provisions during the financial year amounted to EUR 39,967 thousand, representing a reduction in the expenses charged to profit or loss. The eligibility of the development expenses for capitalization depends on the criteria established by IAS 38.57 and includes considerable scope for judgment, for example with respect to future cash inflows or the expected useful lives of the products developed. Against this background and due to the underlying complexity of the methodological requirements relating to measurement and eligibility for capitalization, this matter was of particular significance for our audit.
2. As part of our audit, we evaluated the internal processes and controls for recording the development projects, among other things. We also assessed the methodology used to calculate the expenses eligible for capitalization. We assessed the eligibility for capitalization of material projects on the basis of the criteria set out in IAS 38.57. We evaluated the stage of progress of the particular project by means of discussions with members of staff in the R&D controlling department and inspection of the project documentation. We assessed the amount of the development costs capitalized and the recoverability of the development expenditure on the basis of suitable supporting evidence. In our view, the methodology applied by the Company for capitalizing development projects is appropriate, and the stage of completion of the projects and the development costs capitalized have been clearly documented.
3. The Company’s disclosures on internally generated intangible assets are contained in sections (4) Recognition and measurement, (5) Significant accounting judgments, estimates and assumptions, (14) Fixed assets, (26) Income taxes and (31) Segment reporting in the notes to the consolidated financial statements.
3) Accounting treatment and valuation of deferred taxes
1. After netting, deferred tax assets amounting to EUR 7,233 thousand and deferred tax liabilities of EUR 13,522 thousand are reported in the Company’s consolidated financial statements. Deferred tax assets were recognized to the extent that the executive directors consider it probable that taxable profit will be available in the foreseeable future which will
IFRS consolidated financial statements“Independent auditor’s report
ADVA – Annual report 2020 141
enable the deductible temporary differences and unused tax losses to be utilized. For this purpose, insofar as sufficient deferred tax liabilities are not available, future taxable profits are projected on the basis of the business plan. No deferred tax assets were recognized in respect of unused tax losses and other deductible temporary differences amounting in total to EUR 196,387 thousand, since it is currently not probable that they will be utilized for tax purposes by means of offsetting against taxable profits. Deferred tax liabilities mainly arise from differences between the carrying amounts of the development projects as well as the goodwill recognized at company level in accordance with IFRSs and their tax bases in accordance with the applicable tax laws. From our point of view, the accounting treatment and valuation of deferred taxes was of particular significance in the context of our audit, as it depends to a large extent on the estimates and assumptions made by the executive directors and is therefore subject to uncertainties.
2. As part of our audit, we assessed, among other things, the internal processes and controls for recording tax matters as well as the methodology used for the determination, accounting treatment and measurement of deferred taxes. We also assessed the recoverability of the deferred tax assets relating to deductible temporary differences and unused tax losses on the basis of the Company’s internal forecasts of its future earnings situation, and the appropriateness of the underlying estimates and assumptions.
Based on our audit procedures, we were able to satisfy ourselves that the estimates and assumptions made by the executive directors are substantiated and sufficiently documented.
3. The Company’s disclosures on deferred taxes are contained in sections (4) Recognition and measurement, (5) Significant accounting judgments, estimates and assumptions and (26) Income taxes in the notes to the consolidated financial statements.
Other InformationThe executive directors are responsible for the other information. The other information comprises the following non-audited parts of the group management report:
y the statement on corporate governance pursuant to § 289f HGB and § 315d HGB
y the separate non-financial report pursuant to § 289b Abs. 3 HGB and § 315b Abs. 3 HGB.
The other information comprises further the remaining parts of the annual report – excluding cross-references to external information – with the exception of the audited consolidated financial statements, the audited group management report and our auditor’s report.
Our audit opinions on the consolidated financial statements and on the group management report do not cover the other information, and consequently we do not express an audit opinion or any other form of assurance conclusion thereon.
In connection with our audit, our responsibility is to read the other information and, in so doing, to consider whether the other information
y is materially inconsistent with the consolidated financial statements, with the group management report or our knowledge obtained in the audit, or
y otherwise appears to be materially misstated.
Responsibilities of the Executive Directors and the Supervisory Board for the Consolidated Financial Statements and the Group Management ReportThe executive directors are responsible for the preparation of the consolidated financial statements that comply, in all material respects, with IFRSs as adopted by the EU and the additional requirements of German commercial law pursuant to § 315e Abs. 1 HGB and that the consolidated financial statements, in compliance with these requirements, give a true and fair view of the assets, liabilities, financial position, and financial performance of the Group. In addition the executive directors are responsible for such internal control as they have determined necessary to enable the preparation of consolidated financial statements that are free from material misstatement, whether due to fraud or error.
In preparing the consolidated financial statements, the executive directors are responsible for assessing the Group’s ability to continue as a going concern. They also have the responsibility for disclosing, as applicable, matters related to going concern. In addition, they are responsible for financial reporting based on the going concern basis of accounting unless there is an intention to liquidate the Group or to cease operations, or there is no realistic alternative but to do so.
Furthermore, the executive directors are responsible for the preparation of the group management report that, as a whole, provides an appropriate view of the Group’s position and is, in all material respects, consistent with the consolidated financial statements, complies with German legal requirements, and appropriately presents the opportunities and risks of future development. In addition, the executive directors are responsible for such arrangements and measures (systems) as they have considered necessary to enable the preparation of a group management report that is in accordance with the applicable German legal requirements, and to be able to provide sufficient appropriate evidence for the assertions in the group management report.
The supervisory board is responsible for overseeing the Group’s financial reporting process for the preparation of the consolidated financial statements and of the group management report.
IFRS consolidated financial statements“Independent auditor’s report
142 ADVA – Annual report 2020
Auditor’s Responsibilities for the Audit of the Consolidated Financial Statements and of the Group Management Report Our objectives are to obtain reasonable assurance about whether the consolidated financial statements as a whole are free from material misstatement, whether due to fraud or error, and whether the group management report as a whole provides an appropriate view of the Group’s position and, in all material respects, is consistent with the consolidated financial statements and the knowledge obtained in the audit, complies with the German legal requirements and appropriately presents the opportunities and risks of future development, as well as to issue an auditor’s report that includes our audit opinions on the consolidated financial statements and on the group management report.
Reasonable assurance is a high level of assurance, but is not a guarantee that an audit conducted in accordance with § 317 HGB and the EU Audit Regulation and in compliance with German Generally Accepted Standards for Financial Statement Audits promulgated by the Institut der Wirtschaftsprüfer (IDW) will always detect a material misstatement. Misstatements can arise from fraud or error and are considered material if, individually or in the aggregate, they could reasonably be expected to influence the economic decisions of users taken on the basis of these consolidated financial statements and this group management report.
We exercise professional judgment and maintain professional skepticism throughout the audit. We also:
Identify and assess the risks of material misstatement of the consolidated financial statements and of the group management report, whether due to fraud or error, design and perform audit procedures responsive to those risks, and obtain audit evidence that is sufficient and appropriate to provide a basis for our audit opinions. The risk of not detecting a material misstatement resulting from fraud is higher than for one resulting from error, as fraud may involve collusion, forgery, intentional omissions, misrepresentations, or the override of internal control.
Obtain an understanding of internal control relevant to the audit of the consolidated financial statements and of arrangements and measures (systems) relevant to the audit of the group management report in order to design audit procedures that are appropriate in the circumstances, but not for the purpose of expressing an audit opinion on the effectiveness of these systems.
Evaluate the appropriateness of accounting policies used by the executive directors and the reasonableness of estimates made by the executive directors and related disclosures.
Conclude on the appropriateness of the executive directors’ use of the going concern basis of accounting and, based on the audit evidence obtained, whether a material uncertainty exists related to events or conditions that may cast significant doubt on the Group’s ability to continue as a going concern. If we
conclude that a material uncertainty exists, we are required to draw attention in the auditor’s report to the related disclosures in the consolidated financial statements and in the group management report or, if such disclosures are inadequate, to modify our respective audit opinions. Our conclusions are based on the audit evidence obtained up to the date of our auditor’s report. However, future events or conditions may cause the Group to cease to be able to continue as a going concern.
Evaluate the overall presentation, structure and content of the consolidated financial statements, including the disclosures, and whether the consolidated financial statements present the underlying transactions and events in a manner that the consolidated financial statements give a true and fair view of the assets, liabilities, financial position and financial performance of the Group in compliance with IFRSs as adopted by the EU and the additional requirements of German commercial law pursuant to § 315e Abs. 1 HGB.
Obtain sufficient appropriate audit evidence regarding the financial information of the entities or business activities within the Group to express audit opinions on the consolidated financial statements and on the group management report. We are responsible for the direction, supervision and performance of the group audit. We remain solely responsible for our audit opinions.
Evaluate the consistency of the group management report with the consolidated financial statements, its conformity with German law, and the view of the Group’s position it provides.
Perform audit procedures on the prospective information presented by the executive directors in the group management report. On the basis of sufficient appropriate audit evidence we evaluate, in particular, the significant assumptions used by the executive directors as a basis for the prospective information, and evaluate the proper derivation of the prospective information from these assumptions. We do not express a separate audit opinion on the prospective information and on the assumptions used as a basis. There is a substantial unavoidable risk that future events will differ materially from the prospective information.
We communicate with those charged with governance regarding, among other matters, the planned scope and timing of the audit and significant audit findings, including any significant deficiencies in internal control that we identify during our audit.
We also provide those charged with governance with a statement that we have complied with the relevant independence requirements, and communicate with them all relationships and other matters that may reasonably be thought to bear on our independence, and where applicable, the related safeguards.
From the matters communicated with those charged with governance, we determine those matters that were of most significance in the audit of the consolidated financial
IFRS consolidated financial statements“Independent auditor’s report
ADVA – Annual report 2020 143
statements of the current period and are therefore the key audit matters. We describe these matters in our auditor’s report unless law or regulation precludes public disclosure about the matter.
OTHER LEGAL AND REGULATORY REQUIREMENTSAssurance Report in Accordance with § 317 Abs. 3b HGB on the Electronic Reproduction of the Consolidated Financial Statements and the Group Management Report Prepared for Publication PurposesReasonable Assurance ConclusionWe have performed an assurance engagement in accordance with § 317 Abs. 3b HGB to obtain reasonable assurance about whether the reproduction of the consolidated financial statements and the group management report (hereinafter the “ESEF documents”) contained in the attached electronic file [ADVA_SE_KA+KLB_ESEF-2021-02-23.zip] and prepared for publication purposes complies in all material respects with the requirements of § 328 Abs. 1 HGB for the electronic reporting format (“ESEF format”). In accordance with German legal requirements, this assurance engagement only extends to the conversion of the information contained in the consolidated financial statements and the group management report into the ESEF format and therefore relates neither to the information contained within this reproduction nor to any other information contained in the above-mentioned electronic file.
In our opinion, the reproduction of the consolidated financial statements and the group management report contained in the above-mentioned attached electronic file and prepared for publication purposes complies in all material respects with the requirements of § 328 Abs. 1 HGB for the electronic reporting format. We do not express any opinion on the information contained in this reproduction nor on any other information contained in the above-mentioned electronic file beyond this reasonable assurance conclusion and our audit opinion on the accompanying consolidated financial statements and the accompanying group management report for the financial year from January 01, 2020 to December 31, 2020 contained in the “Report on the Audit of the Consolidated Financial Statements and on the Group Management Report” above.
Basis for the Reasonable Assurance ConclusionWe conducted our assurance engagement on the reproduction of the consolidated financial statements and the group management report contained in the above-mentioned attached electronic file in accordance with § 317 Abs. 3b HGB and the Exposure Draft of IDW Assurance Standard: Assurance in Accordance with § 317 Abs. 3b HGB on the
Electronic Reproduction of Financial Statements and Management Reports Prepared for Publication Purposes (ED IDW AsS 410) [if considered to be beneficial for the understanding of the separate report on ESEF compliance in an international context: and the International Standard on Assurance Engagements 3000 (Revised)]. Accordingly, our responsibilities are further described below in the “Group Auditor’s Responsibilities for the Assurance Engagement on the ESEF Documents” section. Our audit firm has applied the IDW Standard on Quality Management: Requirements for Quality Management in the Audit Firm (IDW QS 1).
Responsibilities of the Executive Directors and the Supervisory Board for the ESEF DocumentsThe executive directors of the Company are responsible for the preparation of the ESEF documents including the electronic reproduction of the consolidated financial statements and the group management report in accordance with § 328 Abs. 1 Satz 4 Nr. 1 HGB and for the tagging of the consolidated financial statements in accordance with § 328 Abs. 1 Satz 4 Nr. 2 HGB.
In addition, the executive directors of the Company are responsible for such internal control as they have considered necessary to enable the preparation of ESEF documents that are free from material non-compliance with the requirements of § 328 Abs. 1 HGB for the electronic reporting format, whether due to fraud or error.
The executive directors of the Company are also responsible for the submission of the ESEF documents together with the auditor’s report and the attached audited consolidated financial statements and audited group management report as well as other documents to be published to the operator of the German Federal Gazette [Bundesanzeiger].
The supervisory board is responsible for overseeing the preparation of the ESEF documents as part of the financial reporting process.
Group Auditor’s Responsibilities for the Assurance Engagement on the ESEF DocumentsOur objective is to obtain reasonable assurance about whether the ESEF documents are free from material non-compliance with the requirements of § 328 Abs. 1 HGB, whether due to fraud or error. We exercise professional judgment and maintain professional skepticism throughout the assurance engagement. We also:
y Identify and assess the risks of material non-compliance with the requirements of § 328 Abs. 1 HGB, whether due to fraud or error, design and perform assurance procedures responsive to those risks, and obtain assurance evidence that is sufficient and appropriate to provide a basis for our assurance conclusion.
y Obtain an understanding of internal control relevant to the assurance engagement on the ESEF documents in order to design assurance procedures that are appropriate in the
IFRS consolidated financial statements“Independent auditor’s report
144 ADVA – Annual report 2020

circumstances, but not for the purpose of expressing an assurance conclusion on the effectiveness of these controls.
y Evaluate the technical validity of the ESEF documents, i.e., whether the electronic file containing the ESEF documents meets the requirements of the Delegated Regulation (EU) 2019/815 in the version applicable as at the balance sheet date on the technical specification for this electronic file.
y Evaluate whether the ESEF documents enables a XHTML reproduction with content equivalent to the audited consolidated financial statements and to the audited group management report.
y Evaluate whether the tagging of the ESEF documents with Inline XBRL technology (iXBRL) enables an appropriate and complete machine-readable XBRL copy of the XHTML reproduction.
Further Information pursuant to Article 10 of the EU Audit RegulationWe were elected as group auditor by the annual general meeting on May 13, 2020. We were engaged by the supervisory board on November 10, 2020. We have been the group auditor of the ADVA Optical Networking SE, Meiningen, without interruption since the financial year 2010.
We declare that the audit opinions expressed in this auditor’s report are consistent with the additional report to the audit committee pursuant to Article 11 of the EU Audit Regulation (long-form audit report).
German public auditor responsible for the engagementThe German Public Auditor responsible for the engagement is Holger Graßnick.”
Meiningen, February 23, 2021
PricewaterhouseCoopers GmbH Wirtschaftsprüfungsgesellschaft
Holger GraßnickWirtschaftsprüfer (German Public Auditor)
ppa. Sonja KnöschWirtschaftsprüferin (German Public Auditor)
IFRS consolidated financial statements“Independent auditor’s report
ADVA – Annual report 2020 145


Additional information
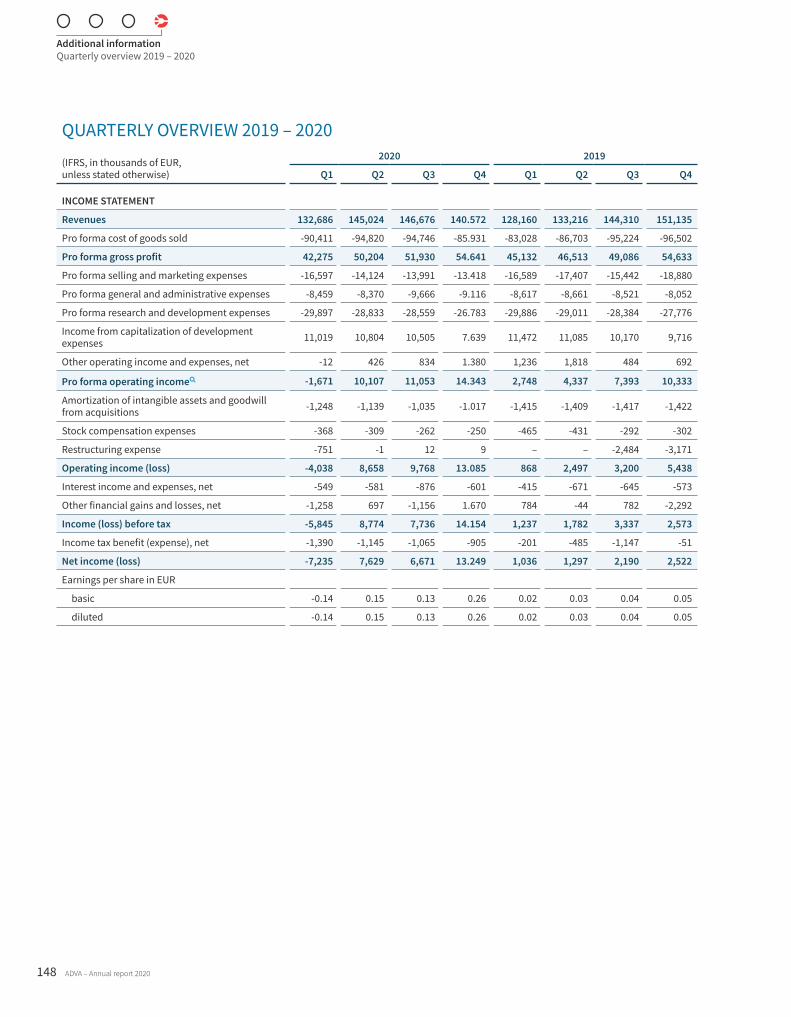
QUARTERLY OVERVIEW 2019 – 2020
(IFRS, in thousands of EUR, unless stated otherwise)
2020 2019
Q1 Q2 Q3 Q4 Q1 Q2 Q3 Q4
INCOME STATEMENT
Revenues 132,686 145,024 146,676 140.572 128,160 133,216 144,310 151,135
Pro forma cost of goods sold -90,411 -94,820 -94,746 -85.931 -83,028 -86,703 -95,224 -96,502
Pro forma gross profit 42,275 50,204 51,930 54.641 45,132 46,513 49,086 54,633
Pro forma selling and marketing expenses -16,597 -14,124 -13,991 -13.418 -16,589 -17,407 -15,442 -18,880
Pro forma general and administrative expenses -8,459 -8,370 -9,666 -9.116 -8,617 -8,661 -8,521 -8,052
Pro forma research and development expenses -29,897 -28,833 -28,559 -26.783 -29,886 -29,011 -28,384 -27,776
Income from capitalization of development expenses 11,019 10,804 10,505 7.639 11,472 11,085 10,170 9,716
Other operating income and expenses, net -12 426 834 1.380 1,236 1,818 484 692
Pro forma operating income -1,671 10,107 11,053 14.343 2,748 4,337 7,393 10,333
Amortization of intangible assets and goodwill from acquisitions -1,248 -1,139 -1,035 -1.017 -1,415 -1,409 -1,417 -1,422
Stock compensation expenses -368 -309 -262 -250 -465 -431 -292 -302
Restructuring expense -751 -1 12 9 – – -2,484 -3,171
Operating income (loss) -4,038 8,658 9,768 13.085 868 2,497 3,200 5,438
Interest income and expenses, net -549 -581 -876 -601 -415 -671 -645 -573
Other financial gains and losses, net -1,258 697 -1,156 1.670 784 -44 782 -2,292
Income (loss) before tax -5,845 8,774 7,736 14.154 1,237 1,782 3,337 2,573
Income tax benefit (expense), net -1,390 -1,145 -1,065 -905 -201 -485 -1,147 -51
Net income (loss) -7,235 7,629 6,671 13.249 1,036 1,297 2,190 2,522
Earnings per share in EUR
basic -0.14 0.15 0.13 0.26 0.02 0.03 0.04 0.05
diluted -0.14 0.15 0.13 0.26 0.02 0.03 0.04 0.05
Additional informationQuarterly overview 2019 – 2020
148 ADVA – Annual report 2020
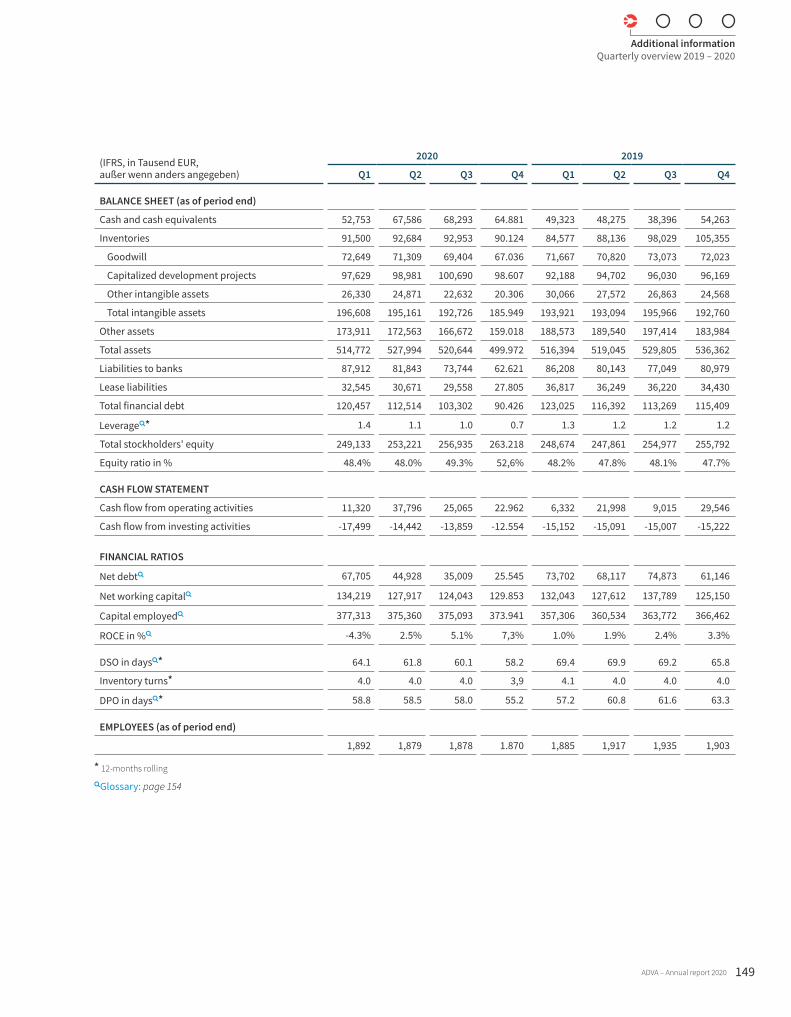
(IFRS, in Tausend EUR, außer wenn anders angegeben)
2020 2019
Q1 Q2 Q3 Q4 Q1 Q2 Q3 Q4
BALANCE SHEET (as of period end)
Cash and cash equivalents 52,753 67,586 68,293 64.881 49,323 48,275 38,396 54,263
Inventories 91,500 92,684 92,953 90.124 84,577 88,136 98,029 105,355
Goodwill 72,649 71,309 69,404 67.036 71,667 70,820 73,073 72,023
Capitalized development projects 97,629 98,981 100,690 98.607 92,188 94,702 96,030 96,169
Other intangible assets 26,330 24,871 22,632 20.306 30,066 27,572 26,863 24,568
Total intangible assets 196,608 195,161 192,726 185.949 193,921 193,094 195,966 192,760
Other assets 173,911 172,563 166,672 159.018 188,573 189,540 197,414 183,984
Total assets 514,772 527,994 520,644 499.972 516,394 519,045 529,805 536,362
Liabilities to banks 87,912 81,843 73,744 62.621 86,208 80,143 77,049 80,979
Lease liabilities 32,545 30,671 29,558 27.805 36,817 36,249 36,220 34,430
Total financial debt 120,457 112,514 103,302 90.426 123,025 116,392 113,269 115,409
Leverage* 1.4 1.1 1.0 0.7 1.3 1.2 1.2 1.2
Total stockholders' equity 249,133 253,221 256,935 263.218 248,674 247,861 254,977 255,792
Equity ratio in % 48.4% 48.0% 49.3% 52,6% 48.2% 47.8% 48.1% 47.7%
CASH FLOW STATEMENT
Cash flow from operating activities 11,320 37,796 25,065 22.962 6,332 21,998 9,015 29,546
Cash flow from investing activities -17,499 -14,442 -13,859 -12.554 -15,152 -15,091 -15,007 -15,222
FINANCIAL RATIOS
Net debt 67,705 44,928 35,009 25.545 73,702 68,117 74,873 61,146
Net working capital 134,219 127,917 124,043 129.853 132,043 127,612 137,789 125,150
Capital employed 377,313 375,360 375,093 373.941 357,306 360,534 363,772 366,462
ROCE in % -4.3% 2.5% 5.1% 7,3% 1.0% 1.9% 2.4% 3.3%
DSO in days* 64.1 61.8 60.1 58.2 69.4 69.9 69.2 65.8
Inventory turns* 4.0 4.0 4.0 3,9 4.1 4.0 4.0 4.0
DPO in days* 58.8 58.5 58.0 55.2 57.2 60.8 61.6 63.3
EMPLOYEES (as of period end)
1,892 1,879 1,878 1.870 1,885 1,917 1,935 1,903
* 12-months rolling
Glossary: page 154
Additional informationQuarterly overview 2019 – 2020
ADVA – Annual report 2020 149
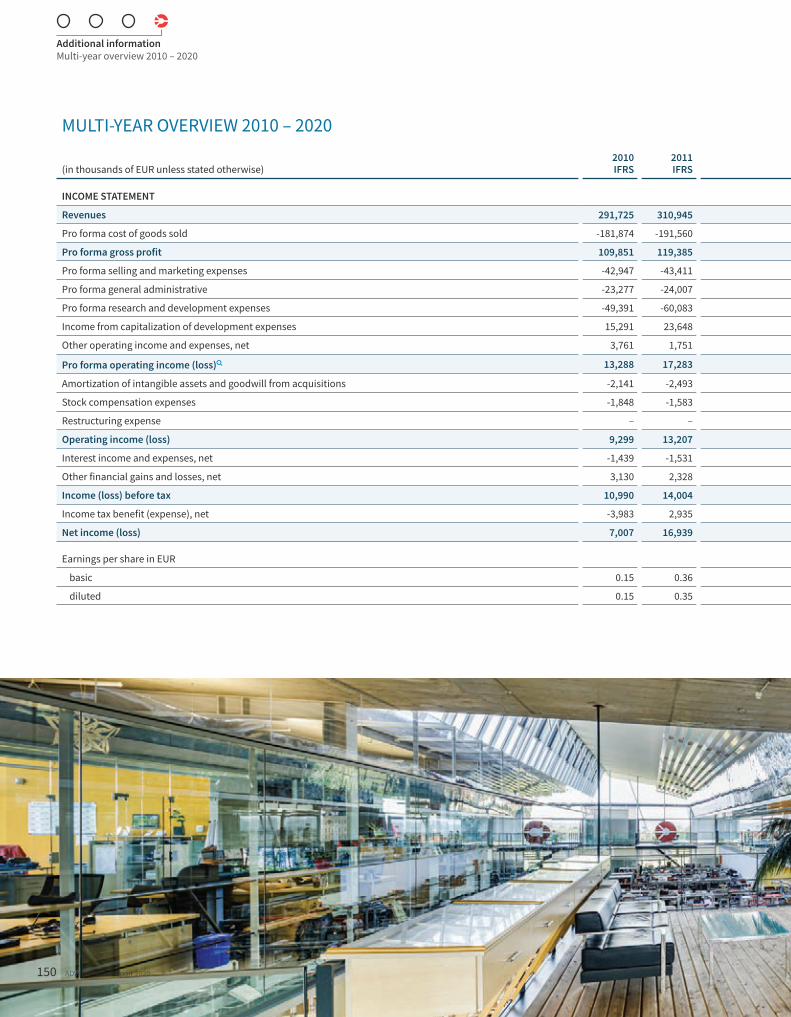
MULTI-YEAR OVERVIEW 2010 – 2020
(in thousands of EUR unless stated otherwise)2010IFRS
2011IFRS
2012IFRS
2013IFRS
2014IFRS
2015IFRS
2016IFRS
2017IFRS
2018IFRS
2019IFRS
2020IFRS
Change2020 vs. 2019
INCOME STATEMENT
Revenues 291,725 310,945 330,069 310,702 339,168 441,938 566,686 514,471 501,981 556,821 564.958 1%
Pro forma cost of goods sold -181,874 -191,560 -196,820 -188,561 -220,408 -284,521 -398,161 -340,094 -316,360 -361,457 -365.908 1%
Pro forma gross profit 109,851 119,385 133,249 122,141 118,760 157,417 168,525 174,377 185,621 195,364 199.050 2%
Pro forma selling and marketing expenses -42,947 -43,411 -46,259 -46,717 -48,003 -55,296 -58,970 -60,513 -61,010 -68,318 -58.130 -15%
Pro forma general administrative -23,277 -24,007 -25,725 -26,225 -27,151 -30,114 -31,974 -3,398 -34,494 -33,851 -35.611 5%
Pro forma research and development expenses -49,391 -60,083 -65,055 -65,649 -67,461 -78,493 -99,260 -105,746 -107,165 -115,057 -114.072 -1%
Income from capitalization of development expenses 15,291 23,648 23,529 22,490 27,108 32,071 39,282 39,033 31,872 42,443 39.967 -6%
Other operating income and expenses, net 3,761 1,751 2,059 2,531 6,214 4,392 5,812 6,369 8,442 4,230 2.628 -38%
Pro forma operating income (loss) 13,288 17,283 21,798 8,571 9,467 29,977 23,415 19,522 23,266 24,811 33.832 36%
Amortization of intangible assets and goodwill from acquisitions -2,141 -2,493 -1,620 -683 -733 -346 -2,997 -4,426 -5,526 -5,663 -4.439 -22%
Stock compensation expenses -1,848 -1,583 -1,344 -913 -382 -2,876 -1,051 -1,259 -1,413 -1,490 -1.189 -20%
Restructuring expense – – – – – – – -9,434 -1,338 -5,655 -731 -87%
Operating income (loss) 9,299 13,207 18,834 6,975 8,352 26,755 19,367 4,403 14,989 12,003 27.473 129%
Interest income and expenses, net -1,439 -1,531 -1,163 -1,144 -1,267 -838 -60 -785 -1,408 -2,304 -2.607 13%
Other financial gains and losses, net 3,130 2,328 834 -1,475 1,142 2,159 -292 -3,809 -1,096 -770 -47 -94%
Income (loss) before tax 10,990 14,004 18,505 4,356 8,227 28,076 19,015 -191 12,485 8,929 24.819 178%
Income tax benefit (expense), net -3,983 2,935 -1,783 7,279 148 -1,228 2,517 -4,037 -2,807 -1,884 -4.505 139%
Net income (loss) 7,007 16,939 16,722 11,635 8,375 26,848 21,532 -4,228 9,678 7,045 20.314 188%
Earnings per share in EUR
basic 0.15 0.36 0.35 0.24 0.17 0.55 0.44 -0.09 0.19 0.14 0,40 186%
diluted 0.15 0.35 0.34 0.24 0.17 0.55 0.43 -0.09 0.19 0.14 0,40 186%
Additional informationMulti-year overview 2010 – 2020
150 ADVA – Annual report 2020
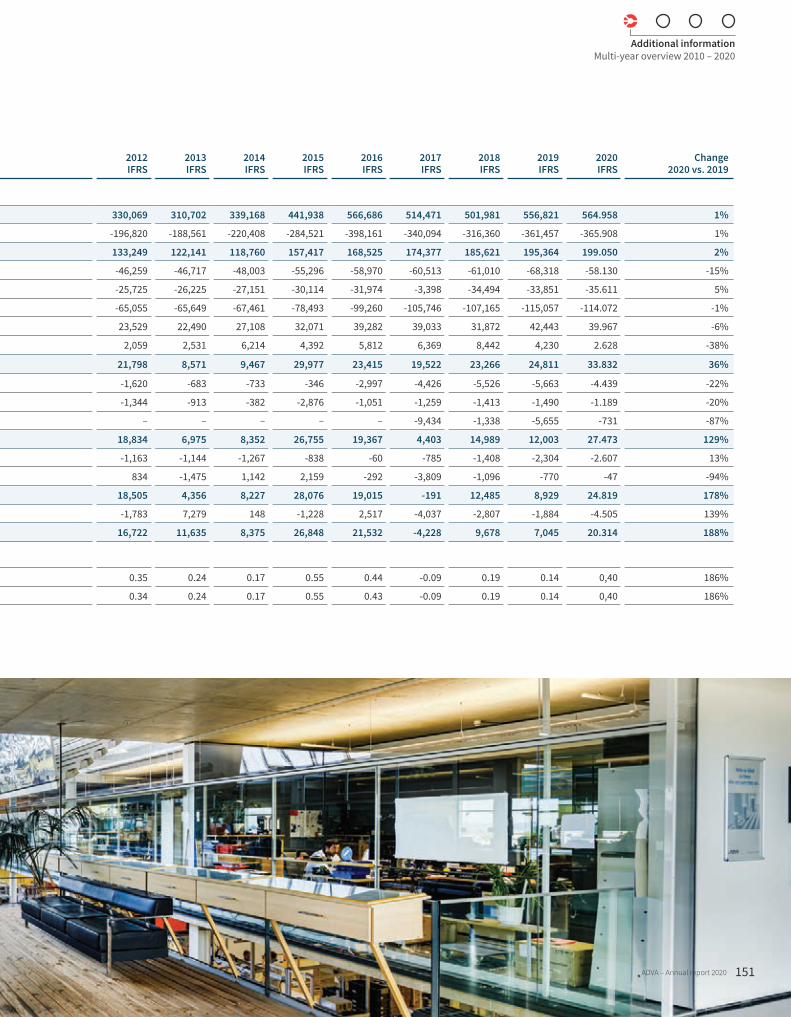
MULTI-YEAR OVERVIEW 2010 – 2020
(in thousands of EUR unless stated otherwise)2010IFRS
2011IFRS
2012IFRS
2013IFRS
2014IFRS
2015IFRS
2016IFRS
2017IFRS
2018IFRS
2019IFRS
2020IFRS
Change2020 vs. 2019
INCOME STATEMENT
Revenues 291,725 310,945 330,069 310,702 339,168 441,938 566,686 514,471 501,981 556,821 564.958 1%
Pro forma cost of goods sold -181,874 -191,560 -196,820 -188,561 -220,408 -284,521 -398,161 -340,094 -316,360 -361,457 -365.908 1%
Pro forma gross profit 109,851 119,385 133,249 122,141 118,760 157,417 168,525 174,377 185,621 195,364 199.050 2%
Pro forma selling and marketing expenses -42,947 -43,411 -46,259 -46,717 -48,003 -55,296 -58,970 -60,513 -61,010 -68,318 -58.130 -15%
Pro forma general administrative -23,277 -24,007 -25,725 -26,225 -27,151 -30,114 -31,974 -3,398 -34,494 -33,851 -35.611 5%
Pro forma research and development expenses -49,391 -60,083 -65,055 -65,649 -67,461 -78,493 -99,260 -105,746 -107,165 -115,057 -114.072 -1%
Income from capitalization of development expenses 15,291 23,648 23,529 22,490 27,108 32,071 39,282 39,033 31,872 42,443 39.967 -6%
Other operating income and expenses, net 3,761 1,751 2,059 2,531 6,214 4,392 5,812 6,369 8,442 4,230 2.628 -38%
Pro forma operating income (loss) 13,288 17,283 21,798 8,571 9,467 29,977 23,415 19,522 23,266 24,811 33.832 36%
Amortization of intangible assets and goodwill from acquisitions -2,141 -2,493 -1,620 -683 -733 -346 -2,997 -4,426 -5,526 -5,663 -4.439 -22%
Stock compensation expenses -1,848 -1,583 -1,344 -913 -382 -2,876 -1,051 -1,259 -1,413 -1,490 -1.189 -20%
Restructuring expense – – – – – – – -9,434 -1,338 -5,655 -731 -87%
Operating income (loss) 9,299 13,207 18,834 6,975 8,352 26,755 19,367 4,403 14,989 12,003 27.473 129%
Interest income and expenses, net -1,439 -1,531 -1,163 -1,144 -1,267 -838 -60 -785 -1,408 -2,304 -2.607 13%
Other financial gains and losses, net 3,130 2,328 834 -1,475 1,142 2,159 -292 -3,809 -1,096 -770 -47 -94%
Income (loss) before tax 10,990 14,004 18,505 4,356 8,227 28,076 19,015 -191 12,485 8,929 24.819 178%
Income tax benefit (expense), net -3,983 2,935 -1,783 7,279 148 -1,228 2,517 -4,037 -2,807 -1,884 -4.505 139%
Net income (loss) 7,007 16,939 16,722 11,635 8,375 26,848 21,532 -4,228 9,678 7,045 20.314 188%
Earnings per share in EUR
basic 0.15 0.36 0.35 0.24 0.17 0.55 0.44 -0.09 0.19 0.14 0,40 186%
diluted 0.15 0.35 0.34 0.24 0.17 0.55 0.43 -0.09 0.19 0.14 0,40 186%
Additional informationMulti-year overview 2010 – 2020
ADVA – Annual report 2020 151
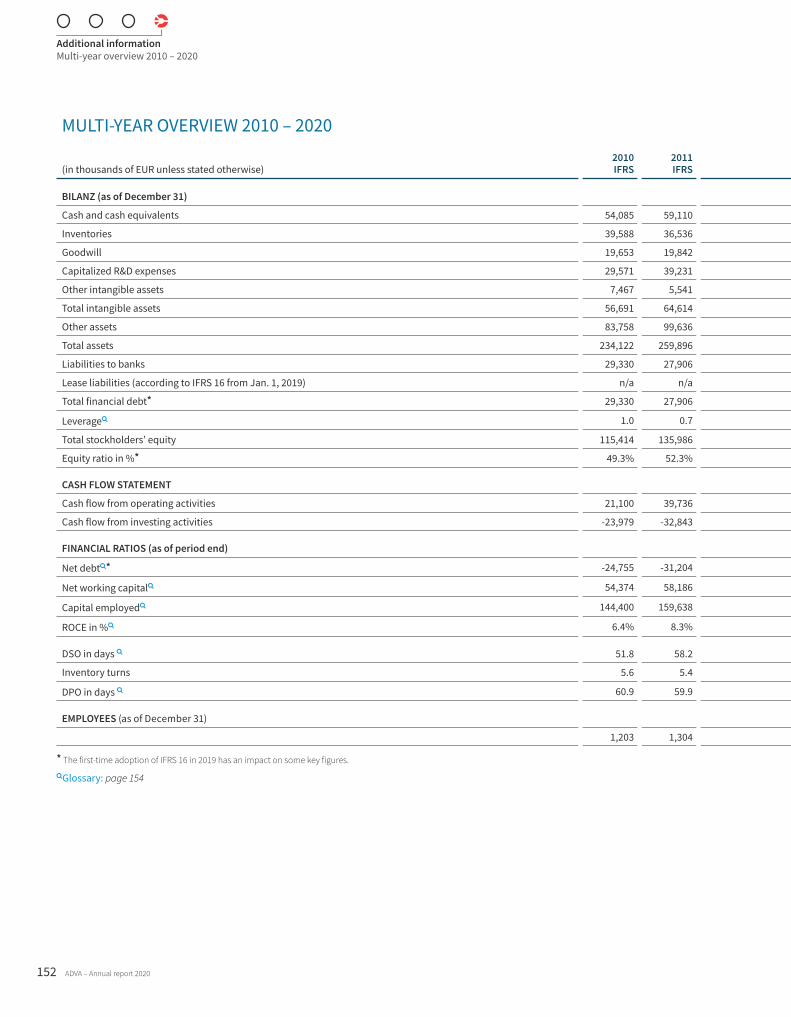
MULTI-YEAR OVERVIEW 2010 – 2020
(in thousands of EUR unless stated otherwise)2010IFRS
2011IFRS
2012IFRS
2013IFRS
2014IFRS
2015IFRS
2016IFRS
2017IFRS
2018IFRS
2019IFRS
2020IFRS
Change2020 vs. 2019
BILANZ (as of December 31)
Cash and cash equivalents 54,085 59,110 70,625 80,934 83,877 93,850 84,871 58,376 62,652 54,263 64,881 20%
Inventories 39,588 36,536 41,339 40,074 46,982 72,950 92,800 81,694 85,734 105,355 90,124 -14%
Goodwill 19,653 19,842 19,876 19,875 23,581 24,881 41,538 68,036 70,400 72,023 67,036 -7%
Capitalized R&D expenses 29,571 39,231 47,497 52,080 56,438 62,439 76,263 85,175 87,926 96,169 98,607 3%
Other intangible assets 7,467 5,541 3,586 2,699 2,861 4,238 16,429 36,785 31,524 24,568 20,306 -17%
Total intangible assets 56,691 64,614 70,959 74,654 82,880 91,558 134,230 189,996 189,850 192,760 185,949 -4%
Other assets 83,758 99,636 101,172 103,544 111,098 133,177 132,651 133,822 148,302 183,984 159,018 -14%
Total assets 234,122 259,896 284,095 299,206 324,837 391,535 444,552 463,888 486,538 536,362 499,972 -7%
Liabilities to banks 29,330 27,906 28,984 39,196 34,983 42,669 59,365 96,591 89,484 80,979 62,621 -23%
Lease liabilities (according to IFRS 16 from Jan. 1, 2019) n/a n/a n/a n/a n/a n/a n/a n/a n/a 34,430 27,805 -19%
Total financial debt* 29,330 27,906 28,984 39,196 34,983 42,669 59,365 96,591 89,484 115,409 90,426 -22%
Leverage 1.0 0.7 0.6 1.1 0.8 0.7 1.0 1.9 1.4 1.2 0.7 -42%
Total stockholders’ equity 115,414 135,986 153,909 163,948 177,114 215,921 238,947 227,021 244,641 255,792 263,218 3%
Equity ratio in %* 49.3% 52.3% 54.2% 54.8% 54.5% 55.1% 51.1% 48.9% 50.3% 47.7% 52.6% 4,9
CASH FLOW STATEMENT
Cash flow from operating activities 21,100 39,736 45,156 31,413 46,186 39,415 61,350 27,134 60,360 66,891 97,143 45%
Cash flow from investing activities -23,979 -32,843 -34,793 -29,931 -38,742 -41,311 -86,373 -90,538 -48,061 -60,303 -58,354 -3%
FINANCIAL RATIOS (as of period end)
Net debt* -24,755 -31,204 -41,641 -41,738 -48,894 -51,181 -25,506 38,215 26,832 61,146 25,545 -58%
Net working capital 54,374 58,186 58,725 66,298 67,984 99,608 97,984 123,828 120,475 128,150 129,853 1%
Capital employed 144,400 159,638 188,746 211,066 230,791 257,812 307,679 315,598 309,317 366,462 373,941 2%
ROCE in % 6.4% 8.3% 10.0% 3.3% 3.6% 10.4% 6.3% 1.4% 4.8% 3.3% 7.3% 4,0
DSO in days 51.8 58.2 58.7 64.0 62.0 58.1 60.2 60.5 67.8 65.8 58,2 -12%
Inventory turns 5.6 5.4 5.2 4.6 5.2 4.4 5.2 4.1 4.0 4.0 3,9 -3%
DPO in days 60.9 59.9 61.9 64.8 55.9 62.4 63.4 58.7 55.5 63.3 55,2 -13%
EMPLOYEES (as of December 31)
1,203 1,304 1,378 1,425 1,491 1,524 1,764 1,894 1,886 1,903 1,870 -2%
* The first-time adoption of IFRS 16 in 2019 has an impact on some key figures.
Glossary: page 154
Additional informationMulti-year overview 2010 – 2020
152 ADVA – Annual report 2020

MULTI-YEAR OVERVIEW 2010 – 2020
(in thousands of EUR unless stated otherwise)2010IFRS
2011IFRS
2012IFRS
2013IFRS
2014IFRS
2015IFRS
2016IFRS
2017IFRS
2018IFRS
2019IFRS
2020IFRS
Change2020 vs. 2019
BILANZ (as of December 31)
Cash and cash equivalents 54,085 59,110 70,625 80,934 83,877 93,850 84,871 58,376 62,652 54,263 64,881 20%
Inventories 39,588 36,536 41,339 40,074 46,982 72,950 92,800 81,694 85,734 105,355 90,124 -14%
Goodwill 19,653 19,842 19,876 19,875 23,581 24,881 41,538 68,036 70,400 72,023 67,036 -7%
Capitalized R&D expenses 29,571 39,231 47,497 52,080 56,438 62,439 76,263 85,175 87,926 96,169 98,607 3%
Other intangible assets 7,467 5,541 3,586 2,699 2,861 4,238 16,429 36,785 31,524 24,568 20,306 -17%
Total intangible assets 56,691 64,614 70,959 74,654 82,880 91,558 134,230 189,996 189,850 192,760 185,949 -4%
Other assets 83,758 99,636 101,172 103,544 111,098 133,177 132,651 133,822 148,302 183,984 159,018 -14%
Total assets 234,122 259,896 284,095 299,206 324,837 391,535 444,552 463,888 486,538 536,362 499,972 -7%
Liabilities to banks 29,330 27,906 28,984 39,196 34,983 42,669 59,365 96,591 89,484 80,979 62,621 -23%
Lease liabilities (according to IFRS 16 from Jan. 1, 2019) n/a n/a n/a n/a n/a n/a n/a n/a n/a 34,430 27,805 -19%
Total financial debt* 29,330 27,906 28,984 39,196 34,983 42,669 59,365 96,591 89,484 115,409 90,426 -22%
Leverage 1.0 0.7 0.6 1.1 0.8 0.7 1.0 1.9 1.4 1.2 0.7 -42%
Total stockholders’ equity 115,414 135,986 153,909 163,948 177,114 215,921 238,947 227,021 244,641 255,792 263,218 3%
Equity ratio in %* 49.3% 52.3% 54.2% 54.8% 54.5% 55.1% 51.1% 48.9% 50.3% 47.7% 52.6% 4,9
CASH FLOW STATEMENT
Cash flow from operating activities 21,100 39,736 45,156 31,413 46,186 39,415 61,350 27,134 60,360 66,891 97,143 45%
Cash flow from investing activities -23,979 -32,843 -34,793 -29,931 -38,742 -41,311 -86,373 -90,538 -48,061 -60,303 -58,354 -3%
FINANCIAL RATIOS (as of period end)
Net debt* -24,755 -31,204 -41,641 -41,738 -48,894 -51,181 -25,506 38,215 26,832 61,146 25,545 -58%
Net working capital 54,374 58,186 58,725 66,298 67,984 99,608 97,984 123,828 120,475 128,150 129,853 1%
Capital employed 144,400 159,638 188,746 211,066 230,791 257,812 307,679 315,598 309,317 366,462 373,941 2%
ROCE in % 6.4% 8.3% 10.0% 3.3% 3.6% 10.4% 6.3% 1.4% 4.8% 3.3% 7.3% 4,0
DSO in days 51.8 58.2 58.7 64.0 62.0 58.1 60.2 60.5 67.8 65.8 58,2 -12%
Inventory turns 5.6 5.4 5.2 4.6 5.2 4.4 5.2 4.1 4.0 4.0 3,9 -3%
DPO in days 60.9 59.9 61.9 64.8 55.9 62.4 63.4 58.7 55.5 63.3 55,2 -13%
EMPLOYEES (as of December 31)
1,203 1,304 1,378 1,425 1,491 1,524 1,764 1,894 1,886 1,903 1,870 -2%
* The first-time adoption of IFRS 16 in 2019 has an impact on some key figures.
Glossary: page 154
Additional informationMulti-year overview 2010 – 2020
ADVA – Annual report 2020 153

GLOSSARY
AALM (advanced link monitoring)ALM is a device that provides non-intrusive monitoring of fiber access networks independent of the services running over that fiber.
BBare metal switchBare metal switches allow hardware and software to be separated in the network. This enables the user to operate a uniform software environment without having to be tied to a specific switch manufacturer. Bare metal switches are not only much cheaper than the corresponding, mostly identical, models with pre-installed software, but also offer improved management options, especially in the area of monitoring and scalability. ADVA’s Ensemble Activator software was developed as a network operating system for bare metal switches and turns generic switching hardware into a so-called cell site gateway. See also: cellcite gateway.
CCapital employedThe capital employed is the difference between the average balance sheet total and the average current liabilities of the period, calculated as the arithmetic average of the quarterly balance sheet date values.
CarrierCarriers, in general, are companies that build and maintain communications networks for commercial use. Beyond incumbent telephony companies, these also include new alternative carriers, which were established during the deregulation of the telecommunications market, and special service providers, which offer outsourced services (e.g., software applications or data storage) for enterprise customers.
CE (Carrier Ethernet)Ethernet is a protocol of packet-based data transfer that was originally developed and used for local area networks. Carriers require additional features for data transmission in wide area networks that go beyond traditional Ethernet. The CE protocol resulting from these requirements has become the dominant data link protocol in carrier infrastructure.
Cesium clocksMany network services and applications require the availability of a highly accurate primary frequency reference. This can be achieved using cesium atomic clocks. Unlike off-air receivers, cesium clocks are autonomous, self-contained primary references immune to external influences.
CloudCloud in the context of IT describes a concept where applications no longer run on the user’s in-house IT infrastructure (for example, a server) but are outsourced to a service provider whose IT infrastructure is not visible or known in detail – as if it was hidden in a cloud. A typical example is the use of software as a service, where the software is not stored on the user’s machine, but on servers of the software service provider.
Cloud accessThis marketing term is often used as an umbrella for technologies that play a role in accessing the cloud.
ConnectGuard™Brand name for ADVA’s encryption technology, implemented in many of the company’s products.
COSO frameworkFive major accounting organizations formed a group known as COSO (Committee of Sponsoring Organizations of the Treadway Commission) to provide guidance on evaluating internal control. They issued this guidance as the COSO Internal Control Framework.
CSG (Cell site gateway)The mobile network is organized in cells. When connecting a cell site to the fixed network, gateways are used, which manage and control of the data streams. The industry has started to embrace open solutions, so mobile network operators can reduce the dependency on individual suppliers. The disaggregated cell site gateway (DCSG) defined by TIP uspports such open architectures. ADVA offers the Ensemble Activator network operating system for this application, which turns a so-called (see also:) bare metal switch into a CSG.
CSP (communication service provider)CSPs are companies that build and maintain large-scale networks to offer communication services.
DDCI (data center interconnect)Network that connects geographically dispersed data centers.
DevOps (development and operations)The term DevOps has its origins in software development. It describes a methodology that stresses communication,
Additional informationGlossary
154 ADVA – Annual report 2020
collaboration and cooperation between software developers and other information technology (IT) professionals. In a broader sense DevOps refers to the tight alignment between product development teams and operational teams responsible for product introduction.
DPO (days payable outstanding)The key figure indicates the average number of days between receipt of invoice and outgoing payment.
DSO (days sales outstanding)The key figure describes the average number of days between invoicing and receipt of payment.
DSL (digital subscriber line)DSL is a technology that provides fast digital data transmission over the copper wires of a local telephone network. The advantage of DSL is that broadband services like fast internet access and internet television signals can be delivered over the same twisted pair of copper wires that was originally deployed for phone service only.
EEMS (electronics manufacturing services)ADVA works with EMS partners that specialize in the volume production of electronic components and sub-assemblies.
EnsembleEnsemble is a trademark used by ADVA for the company’s software solutions.
Ensemble ConnectorEnsemble Connector is a family of software packages that enables communication service providers to provide the data path and virtual hosting functionality at a location of their choice. Additional information
EthernetEthernet is a packet-based data transmission protocol with a data rate of 10Mbit/s. Fast Ethernet provides a data rate of 100Mbit/s, Gigabit Ethernet 1Gbit/s and 10 Gigabit Ethernet 10Gbit/s. Today also 40, 100 and 400 Gigabit Ethernet solutions are commercially available with data rates of 40Gbit/s, 100Gbit/s and 400Gbit/s, respectively.
FFSP (Fiber Service Platform)The Fiber Service Platform is ADVA’s comprehensive product portfolio that provides carriers and enterprises with innovative connectivity solutions for access, metro and long-haul networks.
GGbit/s or G (Gigabit per second)Bits are binary symbols of zero or one and are the standard unit by which data is stored and processed by computers. “Giga” stands for one billion (1,000,000,000). Bit/s is the basic unit of a data rate, which describes how many bits per second are being transmitted. One Gbit/s or G is therefore a data rate that transmits one billion bits of data per second.
GDPR (global data protection regulation)GDPR is a regulation in EU law on data protection and privacy in the European Union (EU).
GNSS (global navigation satellite system)GNSS refers to a constellation of satellites transmitting positioning and timing data from space. GNSS receivers determine their location by using that data. By definition, a GNSS provides global coverage.
GRI (global reporting initiative)GRI is an independent, multi-stakeholder network dedicated to developing globally applicable sustainability reporting guidelines.
IICP (internet content provider)Internet content providers are entities whose primary business is the creation, storage and dissemination of digital information. ICPs are also commonly referred to as over-the-top (OTT), web 2.0 and digital media companies.
IoT (internet of things)Network of devices such as vehicles and home appliances that contain electronics, software, sensors, actuators, and connectivity which allows these things to connect, interact and exchange data.
ISO (international organisation for standardization)ISO is an organization that defines and publishes internationally valid standards. Several of the ISO standards are relevant to ADVA, including 9001 (quality management), 14001 (environmental management system), 22301 (business continuity management), 31000 (risk management) and 50001 (energy management).
Additional informationGlossary
ADVA – Annual report 2020 155
LLeverageThe leverage shows the liabilities to banks in relation to the EBITDA of the last 12 months. EBITDA is calculated as if the accounting approach had been unchanged, i.e., without taking IFRS 16 into account. The leverage is thus determined explicitly without taking into account the accounting effects in accordance with IFRS 16. This is a new ratio from 2018 onwards due to covenant requirements. Prior period information in the multi-year overview has been calculated accordingly.
LTE (long term evolution)/ LTE-Advanced/ LTE-TDDLTE is the project name of a high-performance air interface for cellular mobile communication systems. It is often used as the synonym for the 4th generation (4G) of radio technologies designed to increase the capacity and speed of mobile networks. LTE-Advanced provides further enhancements to the LTE technology, enabling operators to deliver even more bandwidth to more mobile users. The TDD (time division duplex) version of the standard uses a single frequency for uploading and downloading data, alternating between the two through time.
MMbit/s (Megabit per second)Bits “Mega” stands for one million (1,000,000). Bit/s is the basic unit of a data rate, which describes how many bits per second are being transmitted. One Mbit/s is therefore a data rate that transmits one million bits of data per second.are binary symbols of zero or one and are the standard unit by which data is stored and processed by computers.
MSO (multiple service operator)The term MSO emerged in the 1990s when cable television companies, mainly in the US, started to offer telecom services in addition to their traditional television and video offerings. Technically, most telecom service providers today could be called multiservice operators, but the term MSO still implies the historical roots in the cable television space.
NNet debtNet debt is calculated by subtracting cash and cash equivalents from total financial debt comprising of current and non-current liabilities to banks and current and non-current lease liabilities according to IFRS 16 Leases (since 2019).
Net liquidityNet liquidity is calculated by subtracting current and non-current financial liabilities as well as current and non-current finance lease obligations from cash and cash equivalents.
Net promoter score (NPS)The NPS is obtained by asking customers a single question on a 0 to 10 rating scale: „How likely is it that you would recommend our company to a friend or colleague?“ Based on their responses, customers are categorized into one of three groups: promoters (9–10 rating), passives (7–8 rating), and detractors (0–6 rating). The percentage of detractors is then subtracted from the percentage of promoters to obtain a net promoter score.
NFV (network functions virtualization)NFV is an alternative design approach for building complex IT applications, particularly in the telecommunications and service provider industries. NFV virtualizes entire classes of functions into building blocks that may be connected, or chained, together to create services. With the introduction of NFV, the architecture of service provider networks will change. Functions that were previously tied to a particular network element can now be hosted centrally leading to a new distribution of hardware and software functionality across networks.
NFVI (network functions virtualization infrastructure)NFVI includes both the hardware and software components for the network, which are necessary for the support and operation of virtual network functions (VNF) in carrier networks. NFVI resources include, for example, ADVA’s Ensemble Connector, an operating system (software) that converts a generic server (hardware) into a high-performance network termination device. Jointly NFVI elements form platforms to support NFV and host VNFs. NFVI can span multiple locations. In such a case, the networks connecting these locations are also part of the overall NFVI.
NOC (network operation center)A NOC, also known as a network management center, is one or more locations from which network monitoring and control are exercised over a telecommunication network.
NTP (network timing protocol)NTP is a networking protocol for clock synchronization between computer systems over packet-switched, variable-latency data networks.
Additional informationGlossary
156 ADVA – Annual report 2020
OOEM (original equipment manufacturer)OEM partners purchase products from other companies to fill gaps in their portfolio and offer an end-to-end solution. They typically re-label and market the products under their own brand name.
OLS (open line system), OT (open terminal)An optical transmission system basically consists of two main components. The terminal generates and receives the optical signals. The line system bundles wavelengths and amplifies the signal power. In an open system architecture, terminals and line systems can be deployed independently and openly combined with third-party equipment.
OptoelectronicsUmbrella term for technologies that contain both optical (photonic) functions and electronic functions. Prominent examples for optoelectronic components are optical transmit and receive diodes, also called transceivers.
PPhotonic integration Integrating multiple functions on a single chip (integrated circuit, IC) provides significant advantages in high-speed electronics. Similar concepts apply to photonics, where efforts are made to integrate multiple optical functions on a single chip. This reduces total space and power consumption and improves the performance characteristics of the overall system.
Pro forma operating incomePro forma operating income is calculated prior to non-cash charges related to the stock compensation programs and amortization and impairment of goodwill and acquisition-related intangible assets. Additionally, non-recurring expenses related to restructuring measures are not included.
ProtocolA protocol defines the “language” elements that networks use to communicate with each other.
RRAN (radio access network)A radio access network is part of a mobile telecommunication network. Conceptually, it resides between the mobile device such as a smart phone and the core network.
ROCE (return on capital employed)ROCE is the operating result for the current period divided by the capital employed.
RouterA router is a networking device that forwards data packets between networks. Routers perform the traffic directing functions on the Internet and use for their forwarding functions layer 3 (IP) information.
SSFP (small form-factor pluggable)The SFP is a standardized, compact, pluggable transceiver used for both telecommunication and data communications applications.
SLA (service level agreement)Commitment between a service provider and a client. Aspects of the service such as quality and availability are agreed between the service provider and the service user.
SSU (synchronization supply unit)Many services running on digital telecommunication networks require accurate synchronization for correct operation. Telecommunication networks rely on the use of highly accurate primary reference clocks (see also cesium Clocks), which are distributed network wide using synchronization links and synchronization supply units.
Switch/SwitchingA switch is a network element that ensures that data packets (so-called frames) arrive at their destination. Most commonly used are Ethernet frames from network layer 2.
TTAA (Trade Agreements Act)The TAA is a federal law applicable to all federal supply schedule contracts. It prohibits federal agencies from acquiring products made in certain countries. A product created in a foreign country and containing components from foreign countries must meet the “substantial transformation” test as outlined in Federal Acquisition Regulation (FAR) 25.001(c)(2) in order to be considered compliant. This test determines whether the country where the product underwent the “substantial transformation” is on the list of TAA-compliant countries.
Additional informationGlossary
ADVA – Annual report 2020 157
TeraFlex™Brand name for ADVA’s high-speed terminal, which generates data rates of up to 600Gbit/s per wavelength. TeraFlex™ is a so-called open terminal (OT) and part of the ADVA FSP 3000 platform.
TL 9000: R6.2/R5.7TL 9000:R6.2/R5.7 is a quality management system standard defined specifically for the telecommunications industry. It standardizes the quality system requirements for the design, development, delivery, installation and maintenance of telecommunication products and services, and it also defines the performance metrics required to measure the situation at the time of the implementation of the standard as well as progress made.
UuCPE (universal customer premise equipment)A CPE is a terminal unit located at a subscriber’s premises and connected with a carrier’s telecommunication network. The CPE provides demarcation functionality between the network domains of the service provider and his client. In the context of NFV, certain functions of the CPE can be virtualized and hosted centrally in the service provider network. This software package defining the CPE function is called virtual CPE (vCPE). In this architecture, CSPs can define a universally usable CPE (hardware) to define different services via software.
VVAR (value-added reseller)VAR partners combine products from a number of different vendors together with their own services to offer customers a complete and comprehensive solution.
VerticalizationVerticalization refers to the integration of upstream and downstream stages of the value creation process. This means that the roles and responsibilities of manufacturers and sellers, which were previously clearly separated, are increasingly overlapping and boundaries are becoming more fluid. In the networking equipment industry, verticalization often refers to the usage of optoelectronic components that are developed in-house.
WWDM (wavelength division multiplexing)WDM expands the capacity of networks by allowing a greater number of signals to be transmitted over a single fiber. WDM enables numerous channels of data to be multiplexed into unique color bands, and then to be combined and transmitted over a single fiber and de-multiplexed at the other end.
Working capitalWorking capital is defined as trade accounts receivable plus inventories minus trade accounts payable.
Additional informationGlossary
158 ADVA – Annual report 2020
CORPORATE INFORMATIONCorporate headquartersADVA Optical Networking SE Campus Martinsried Fraunhoferstrasse 9a 82152 Martinsried/Munich Germany
t +49 89 890 665 0
Registered head officeMaerzenquelle 1–3 98617 Meiningen-Dreissigacker Germany
t +49 3693 450 0
Americas officeADVA Optical Networking North America, Inc. 5755 Peachtree Industrial Boulevard Norcross, Georgia 30092 USA
t +1 678 728 8600
Asia-Pacific officeADVA Optical Networking (Shenzhen) Ltd. 18/F, Maoye Times Square Haide 2nd Road Nanshan District Shenzhen 518054 China
t +86 755 2354 6800
ADVA on the webMore information about ADVA, including solutions, technologies and products, can be found on the company’s website at www.adva.com.
PDF files of this annual report, as well as quarterly reports, presentations and general investor information, are also located on the company’s website and can be downloaded in both English and German. Quarterly conference calls are conducted on the day of earnings announcements. Related PDF, audio and transcript files are available for download in the investor relations section of the group’s website, www.adva.com.
AuditorPricewaterhouseCoopers GmbH Wirtschaftsprüfungsgesellschaft, Munich, Germany
Legal counselsHogan Lovells, Munich, Germany
Tax advisersDeloitte, Munich, Germany
FINANCIAL CALENDAR 2021
Publication of quarterly statement Q1 2021
April 22, 2021 Martinsried/Munich, Germany
Annual shareholders’ meeting May 19, 2021 Meiningen, Germany
Publication of six-month report 2021
July 22, 2021 Martinsried/Munich, Germany
Publication of quarterly statement Q3 2021
October 21, 2021 Martinsried/Munich, Germany
Additional informationCorporate information
ADVA – Annual report 2020 159