annual report - parliament
TRANSCRIPT
COMPETITION EXTENDEDWARRANTIES
GREEN& CLEAN
CONSUMER
REGULATION
G.34
ANNUAL REPORT2017

Commerce Commission Annual Report 20172
CONTENTSOverview 3
Introduction 3
Year in review 4
Report from the Chairman 5
Report from the Chief Executive 7
Competition and consumer 8
Accountability framework 8
Review of year 9
Measuring our performance 15
Finances 18
Regulation 19
Accountability framework 19
Review of year 19
Measuring our performance 23
Finances 27
Major litigation 34
Organisation capability and health 36
Our values and vision 36
Developing improved capabilities 37
Being a good employer 38
Evaluating our capability and health 39
Profile of our people 40
Environmental sustainability 40
Governance 41
Board and Commissioner responsibilities 41
Commission Members profiles 42
Senior leadership team profiles 44
Commonly used terms 45
Financial performance 47
Financial statements overview 47
Statement of responsibility 49
Independent auditor’s report 50
Financial statements 53
Statement of accounting policies 57
Notes to the financial statements 60
Financial statements glossary 78
Presented to the House of Representatives pursuant to section 150(3) of the Crown Entities Act 2004.
© Crown Copyright
This work is licensed under the Creative Commons Attribution 3.0 New Zealand license. In essence, you are free to copy, distribute and adapt the work, as long as you attribute the work to the Commerce Commission and abide by the other license terms. To view a copy of this license, visit http://creativecommons.org/licenses/by/3.0/nz
LEGISLATION ENFORCED BY THE COMMERCE COMMISSION• Commerce Act 1986 (Commerce Act)• Credit Contracts and Consumer Finance Act 2003 (CCCF Act)• Dairy Industry Restructuring Act 2001 (DIR Act)• Fair Trading Act 1986 (FT Act)• Telecommunications Act 2001 (Telecommunications Act)

Commerce Commission Annual Report 2017 3
OVERVIEW
IntroductionThe Commerce Commission is New Zealand’s competition, consumer and regulatory agency. We are responsible for enforcing laws relating to competition, fair trading, and consumer credit contracts, and have regulatory responsibilities in the electricity lines, gas pipelines, telecommunications, dairy and airport sectors.
In October 2016 we launched our organisation-wide vision and strategy for the next 5 years. Ultimately our overarching goal is to make New Zealanders better off. We aim to do this by playing our part in ensuring markets work well and consumers and businesses are confident participants in those markets.
As an effective competition agency and regulator we help to ensure:
→ there is a level playing field for competitors – the rules are known and players are monitored
→ cartel behaviour is addressed
→ the level of competition in a market is not substantially lessened by mergers or agreements between businesses
→ market power is not taken advantage of for an anti-competitive purpose
→ consumers are protected, and clear and accurate information is provided to them
→ consumers are protected when accessing credit
→ regulated businesses face incentives to provide long-term benefits for consumers.
Competition is a key driver for delivering greater productivity and growth in the economy. It drives lower prices and improved quality outcomes for consumers. It incentivises firms to innovate and rewards efficiencies in business. Through regulation we seek to achieve comparable outcomes in markets with little or no competition.
The Commission is an Independent Crown Entity. This independence requires us to be an impartial promoter and enforcer of the law. We are primarily accountable to the Minister of Commerce and Consumer Affairs and the Minister for Communications for our performance but are not subject to direction from the Government in carrying out our activities.
This annual report provides an overview of the Commission’s activity for the past financial year. It details our performance against our accountability frameworks, as set out in our 2016-2020 Statement of Intent (SOI), and the performance measures and budgets set out in our Statement of Performance Expectations (SPE) 2016/17.

OCTOBER
FEBRUARY
MAY
JUNE
Year in review October 2016New organisation-wide
strategy launched
December 20164 real estate head
offices fined $9.8 million for price fixing
December 2016Youi fined $320,000 for
misleading sales techniques
December 2016Input methodologies review
final decisions released
February 2016Reckitt Benckiser fined $1 million over Nurofen
specific pain range
February 2016Bike Barn fined $800,000 for exaggerated discounts
February 2016Sky/Vodafone
clearance declined
May 2017First jail sentence in a Commission case
May 2017Highest fine under
Fair Trading Act against a director
May 2017Gas default price-quality path 2017-22 released
June 2017Season 2 of animated series
It’s All Good released
June 2017Study shows 90% of reduction
in regulated wholesale broadband prices had flowed
through to consumers
May 2017NZME/Fairfax
authorisation declined
Commerce Commission Annual Report 20164

Commerce Commission Annual Report 2017 5
Report from the ChairmanIn a year that marked the 30th anniversary of the Fair Trading Act (FT Act), we have continued to deliver outcomes designed to ensure ‘fair trading’ and make New Zealanders better off. We have achieved regulatory milestones, decided significant merger applications, and undertaken investigations and advocacy work to protect and empower consumers.
Protecting and empowering consumersPart of empowering consumers is to ensure they have the information they need to make informed decisions. We released the second series of our animations It’s All Good, with a greater focus on consumer rights. This has been very well received so far, with the six episodes being viewed more than 500,000 times across a range of online platforms. To ensure we are reaching a wide range of New Zealanders, we have also started translating our key guidance into seven different languages.
In protecting consumers, we have seen a tangible increase in the number of cases going to court over the past 2 years, filing 38 cases in court under the Fair Trading and Credit Contracts and Consumer Finance Acts. This compares with 10 prosecutions filed in the 2 years before that. Much of this litigation work has stemmed from our focus on mobile traders, more commonly known as ‘truck shops’. We have now prosecuted 13 truck shop operators, leading to fines totalling nearly $900,000 to date, with one individual also being imprisoned, a first in a Commission case.
In our FT Act cases, we have prosecuted behaviour ranging from misleading marketing campaigns and false labelling claims to misrepresentations about building products and the origins of bee pollen. Some of our prosecutions this year have attracted the highest fines ever imposed under the FT Act and our prosecutions have received increasingly widespread media coverage and public interest.
Deciding complex mergersOur merger and authorisation work is a key part of our competition law activity. This work is demand driven and as a result we can sometimes experience peaks in merger cases. Over the last year we have faced particularly high demands, with a number of major complex merger cases. These cases, especially Vodafone/Sky and NZME/Fairfax, have been among the most challenging we have ever had. We declined both applications as we were not able to exclude the real chance that they would substantially lessen competition in affected markets. We also completed an authorisation assessment for NZME/Fairfax, applying the public benefit test, and declined to grant authorisation. NZME and Fairfax have appealed our decision to the High Court.
Regulatory maturityThe input methodologies (IMs) regime reached a new point of maturity and certainty following the IM review in 2016. The IMs are the upfront rules, requirements and processes that apply to regulation under Part 4 of the Commerce Act. Markets currently regulated under Part 4 include specified airport services, electricity distribution and transmission, and gas pipelines. IMs must be reviewed every 7 years.
We worked hard to ensure effective stakeholder consultation during the review process and received positive feedback on our approach, which included using workshops and roundtables. We were pleased that the IMs needed little modification, giving greater certainty for all involved.

Commerce Commission Annual Report 20176
The regime is now bedded in, providing increased stability. It means that lines companies, for example, are better equipped to think long term about how they can best meet consumer needs.
Our December decisions have already flowed through to the price paths announced for gas distribution and transmission businesses in May this year. They will next be put to use when we take a look at Auckland and Christchurch airports’ pricing decisions later this year.
Legislation changesOn 15 August 2017 the Commerce (Cartels and Other Matters) Amendment Bill was passed into law. The key changes include an express prohibition against cartel provisions (fixing prices, restricting output or allocating markets), and a tenfold increase in penalties for misleading the Commission. The new Act also introduces a suite of exceptions for specified types of agreements, including a clearance regime that enables parties involved in a collaborative activity to seek clearance from the Commission for that arrangement.
In June the outcome of a review of the Commerce Act was announced by the Minister of Commerce and Consumer Affairs. This included an intention to give the Commission the power to conduct market studies when directed by the Minister. The changes also propose to repeal the existing cease and desist regime and replace it with enforceable undertakings similar to those already available under the FT Act.
The Government undertook a review of the Telecommunications Act to ensure we have the right framework for New Zealand. The resulting amendment Bill has had its first reading in Parliament and has been referred to Select Committee. We are continuing to work collaboratively with the Ministry of Business, Innovation and Employment on implementation matters for this, as the Commission will be responsible for implementing the new regime from 2020. There will be a significant amount of work for us to do in the coming years to prepare for the changes.
Priorities for the year aheadAt our July 2017 conference we outlined our priority focus areas for the 2018 financial year. These areas, along with our enduring priorities, help us to focus our activity and limited resources. Retail telecommunications will be a cross-business focus area for us in 2018, with the aim to improve the consumer experience by increasing trader compliance and providing consumers with more information.
Other focus areas include responsible lending, country of origin and claims about product characteristics, a review of our merger processes and work on Powerco’s customised price-quality path application. We also want to improve our understanding of investment levels and associated incentives in the electricity lines sector, as well as providing data in a more usable format for stakeholders. Implementing the Government’s proposed changes to the Telecommunications Act as mentioned above is also a priority for us.
I believe the Commission is well positioned to deliver on our strategy, our priorities and our vision. I am proud of our achievements to date. We have a great team of people, who work tirelessly towards making New Zealanders better off. I look forward to the year ahead.
Dr Mark BerryChairman

Commerce Commission Annual Report 2017 7
Report from the Chief ExecutiveOur role is essential in ensuring markets are competitive, consumers are protected and markets with limited competition are appropriately regulated. Making the right decisions as part of our role is important to us. We understand the potential impact that our decisions can have on consumers and businesses in New Zealand. We also understand the need to be as efficient as possible and strive for continuous improvement, both in what we do and in how we do it.
Strategy driving our focusIn October 2016 we announced our new 5-year strategy, which has become a way of thinking about the future and a touchstone for strategic discussion, planning and prioritisation. The strategy is focused around a vision of New Zealanders being better off because markets work well and consumers and businesses are confident market participants. This has been very helpful in focusing our work and forming a part of our prioritisation decisions. In developing our business plan and priorities for the 2018 financial year we kept coming back to the vision, strategic objectives and strategies to ensure alignment. We have also made a commitment to develop improved measures of our performance for use internally and externally.
Investment in systemsOver the past year we have made a significant investment in systems that are designed to make us more effective and efficient. We have launched a software and process solution which replaces our existing system for recording complaints and enquiries.
We also launched a new evidence management system and in its short time in operation it has already delivered significant improvements in efficiency. We have also started a project to redevelop our website to enhance the user experience with better search functionality, more accessible content and mobile capability.
Importance of staff engagementBeing able to continue to attract and retain high-calibre staff is vital. Without that, our ability to deliver on our strategy and vision is compromised. We have invested a lot of thought and time in attracting the right people to the Commission and also in ensuring they are happy and engaged once they are here.
We have increased our strong overall engagement score over the last year and continue to perform well above the State Sector Benchmark in all areas. I am particularly pleased at the increase in well-being, which is now our second highest score. We have invested time and resource in our staff wellness programme, as well as in modernising our office spaces. It is great to see these initiatives having an impact.
It has been a busy year for us and I am proud of the high standards we have continued to achieve in the face of that.
Brent AldertonChief Executive

Commerce Commission Annual Report 20178
COMPETITION AND CONSUMERAccountability framework
NOTE: This is our accountability framework for the 2017 financial year. It has been amended for the 2018 financial year as shown in our Statement of Intent 2017-2022.

Commerce Commission Annual Report 2017 9
Review of yearOur work in the consumer and competition areas is centred on our strategic objective that markets are more competitive and consumers’ interests are protected. We use a combination of education and enforcement to ensure that:
→ businesses compete lawfully
→ consumers understand how their interests are protected by the laws we enforce
→ businesses represent goods and service accurately, comply with consumer information and product safety standards, and provide credit responsibly.
Minimising harm to consumers through early interventionAs part of our work to protect consumers, we aim to minimise harm by detecting and stopping non-compliant behaviour as early as possible. Over the last year we have done this by:
→ undertaking a range of proactive compliance work with traders in relation to identified areas of potential concern; for example, an open letter about pricing claims was sent to thousands of retailers around the country
→ using media releases and social media to make consumers aware of potential scams and issues of concern to us
→ increasing our intelligence work to identify and analyse emerging or escalating areas of non-compliance.
Retailers put on alert about misleading pricingComplaints about pricing were the single biggest category of complaint received by the Commission in the 2017 financial year. Observing that some retailers’ marketing strategies placed significant reliance on the use of price promotions to drive sales, we were concerned these retailers may be misleading consumers about the savings they offer. So we decided to try something different. In May 2017 we distributed an open letter to retailers highlighting pricing practices which might breach the law and offering guidance on how to avoid them. The open letter was published on our website, sent to several thousand retailers via Retail NZ, and distributed to 200,000 businesses and advisers via business.govt.nz’s e-newsletter.
We issued a one-page ‘Price Promotion Tips’ with the letter as a resource for retailers to use with staff who make pricing decisions. The tips, along with the letter, were translated into other languages to ensure maximum reach. We also produced a short video for retailers on discount claims and the usual selling price.
First jail sentence in a Commission caseIn March 2017 mobile trader Vikram Mehta was sentenced to 2 years in jail under the Crimes Act 1961 for taking money from customers with no intention to supply goods. This was the first jail sentence handed down in a prosecution initiated by the Commission. Mr Mehta was convicted as a party to his company Flexi Buy’s conduct. He was the sole shareholder and director of the company during the period of its offending. Flexi Buy told customers that their goods would be supplied once they had made a set number of payments, when it knew they would not be. Flexi Buy entered into over 300 consumer credit contracts during the offending period, but only nine customers received their goods. Instead Mr Mehta used Flexi Buy income for his personal use, including rent on his Auckland apartment and at least $22,000 on a 2013 trip to India.
Commerce Commission Annual Report 201710
Protecting New Zealanders from unsafe goodsProduct safety cases are an enduring priority for the Commission. This year we have continued our proactive programme of inspections of retailers and suppliers of products covered by the product safety standards we enforce, such as cots, children’s toys and nightwear. Our focus this year has been on the Auckland, Manawatu, Nelson, Marlborough and Wellington regions. Across those areas we have carried out more than 150 inspections with the aim of educating retailers and suppliers and taking enforcement action where appropriate. We have translated specific product safety guidance for retailers into several languages and are now providing copies when we visit stores.
During our 150 inspections we found a range of non-compliant goods which resulted in some being withdrawn from sale and recalled. In January Baby City was fined $39,000 for selling cots which failed to comply with the packaging and labelling requirements of the safety standard. 123 Mart Limited (123 Mart) was found guilty of supplying seven types of toys that did not comply with the safety standard for children’s toys. 123 Mart also pleaded guilty to charges of supplying children’s nightwear and clothing that did not meet the safety standard for these types of garments. The company was due to be sentenced in October 2017.
Priority area – constructionWe prioritise cases that involve significant harm to consumers or have the potential for significant harm. This includes construction cases, because they can have a significant safety and financial impact on consumers. Since July 2016 we have completed six investigations into false and misleading representations in the steel mesh industry. Twenty-nine charges have been filed against Steel and Tube. Timber King Limited and NZ Steel Distributor Limited (jointly investigated) have pleaded guilty to 10 charges and are awaiting sentencing. United Steel and Pacific Steel received compliance advice and Fletcher Steel a warning. An investigation into one other company is ongoing.
We also filed charges against four individuals associated with the Cavan Forde Group (CFG) of companies, alleging they represented that the autoclaved aerated concrete products they were supplying were an internationally
renowned brand known as Hebel, when consumers were actually receiving a Chinese substitute. One individual has pleaded guilty to nine charges. The cases against the others, as well as several other investigations in the construction sector, are ongoing.
Tackling issues in consumer credit Consumer credit has been a focus area for us due to the impact that non-compliant lending practices have on New Zealanders. In June 2017 we released our Consumer Credit Fees Guidelines to provide guidance for lenders in setting credit fees. Our draft guidelines were first issued in 2009 but we had been unable to finalise them until the outcome of the long-running Sportzone/MTF case in May 2016. In that case the Supreme Court made clear that credit fees should only cover transaction-specific costs. The Supreme Court’s backing of our approach to setting credit fees put us in a position to provide clear guidance to credit providers. The guidelines set out the general principles that lenders should take into account when setting fees and give examples of how these principles might apply in practice. They also give guidance on whether or not particular types of costs can be included in fees.
As part of building and maintaining our relationships and connection with the community we hold annual community credit forums in Auckland, Wellington and Christchurch. These events provide updates on the Commission’s work, raise awareness about borrowers’ rights, and provide an opportunity for those working in the community to talk about current issues in credit markets. This year more than 150 budget advisers, consumer advocates and others involved in the sector attended the events around the country, which focused on the launch of our Red Flags initiative (see separate box opposite).
We have continued our enforcement of the credit laws updated in 2015. Many of these cases related to non-disclosure, including Ace Marketing Limited, which received the highest penalty imposed upon a mobile

Commerce Commission Annual Report 2017 11
trader ($150,000) for failing to provide customers with key information about their loans. The company also admitted to breaching the FT Act by misleading customers about their rights under the Consumer Guarantees Act. Other cases related to unreasonable fees include internet-based lender Rapid Loans NZ Limited, which agreed to compensate borrowers approximately $1.4 million after we found they had charged unreasonable fees on more than 6000 loans.
In July 2016 finance companies Budget Loans Limited and Evolution Finance Limited were found guilty on 106 charges under the FT Act relating to their repossession and debt collection practices. The companies were found to have misled borrowers about their rights to repossess consumer goods. They also told borrowers they had to make loan payments at a higher rate than had been set by the Court and misrepresented to borrowers the benefits of refinancing their loans. The companies unsuccessfully appealed to the High Court against their convictions. The Commission also charged the companies with misrepresenting their right to charge interest and fees after they had repossessed and sold consumer goods. These charges were initially dismissed by the District Court but, on appeal, the High Court reinstated the charges and they have been remitted to the District Court for consideration. The companies have now sought leave to appeal their conviction to the Court of Appeal.
We often undertake projects to understand more about behaviours in sectors for which we receive a disproportionate number of complaints, especially where the potential impact of harm is great. In recent years we have undertaken projects on both the mobile trader and high-cost short-term loan (HCSTL) (often referred to as payday lenders) sectors. Our focus on these two sectors continued this year.
Our main focus in the HCSTL sector is assessing compliance with the responsible lending rules. We have investigated compliance with disclosure laws within the sector. We are considering matters such as HCSTLs being used as a long-term borrowing solution, high rates of default and the high costs of borrowing (interest rates can exceed 800% per annum). We have now completed six investigations into disclosure, with a range of outcomes, including infringement notices, a warning and $118,000 in costs of borrowing being returned to borrowers. We currently have an additional five open investigations in the sector.
We have asked the High Court, under section 100A of the Commerce Act, for its opinion about how the CCCF Act applies to Harmoney’s platform fee and, specifically,
whether this fee is a credit fee under the Act. If the platform fee is a credit fee it is required to be reasonable. The Court’s decision will provide clarity on important legal issues that will assist peer-to-peer lenders and the credit industry generally.
Red FlagsThe Red Flags project is a targeted reporting initiative and tool for the consumer credit advisory sector. The aim of the project is to help budget advisers and those working in the community to better identify illegal behaviour by lenders and to tell us about it. We recognise that not all borrowers may know what to do or have the confidence to come forward to the right authorities when something goes wrong. We value the contribution from the consumer credit advisory sector, who are in a position to alert us to behaviours that may not come to our attention otherwise. There are currently seven Red Flag information sheets, which outline potential areas of non-compliance with consumer credit laws concern and what information should be provided to us. Helping those working in the community to better identify illegal behaviour will help us to stop harm, and longer term it may even help to prevent it.

Commerce Commission Annual Report 201712
Misleading claimsConsumers should be able to rely on the claims made by traders when making a purchasing decision. Misleading claims is one of our largest areas of complaint from consumers and resulted in a range of investigations being undertaken this year, including two that resulted in some of the highest fines ever handed down under the FT Act.
Discount strategies and pricing claims are common practice among retailers in New Zealand. It is important that those deals offer a real saving and are not promoted in a way that entices consumers to make a purchase under misleading circumstances. Our investigation into bicycle retailer Bike Barn led to the joint operators of the company being fined $800,000 for creating misleading impressions. Bike Barn used exaggerated discounting strategies that gave customers the impression that they were purchasing bikes at significant mark-downs from the normal retail price – typically 50% off. It also advertised clearance specials that created an impression that the discounts were available for a limited time only. Neither was true. The discounted prices were actually Bike Barn’s usual selling prices. Out of nearly 6,000 bike sales we analysed during our investigation, only 30 were sold at the so-called full price.
We also had several cases involving misleading claims that were not related to pricing. Insurance retailer Youi was fined $320,000 for misleading sales techniques when attempting to sell policies to consumers who were seeking a quote. Mobile trader Sales Concepts Limited was fined $145,000 for selling ‘Christmas Deal Bundles’ of electronic goods with a promise the goods would be delivered in time for Christmas, when in fact customers only received one item in the bundle by Christmas.
$1.08 million fine for misleading pain relief claimsTraders must promote their products truthfully. This is particularly important when consumers have little opportunity to verify the claims being made. One of our most high-profile cases resulted in a fine of $1.08 million for Reckitt Benckiser (RBNZ), the makers of Nurofen. RBNZ admitted that product packaging and representations on their website were liable to mislead consumers about the nature, characteristics and suitability of their Nurofen specific pain range products. Consumers were given the impression that the products were targeted to relieve a specific kind of pain, when in fact they all contained the same ingredients and were not specifically formulated to treat a particular area of pain.
TelecommunicationsWe continue to observe an ongoing level of non-compliance in the telecommunications sector. Product offerings in this sector are often complex and can be confusing for consumers. The cases we have taken include one against Trustpower’s bundled product offering, which resulted in a $390,000 fine, and a case against Vodafone New Zealand Limited relating to its ‘Red Essentials’ plan, for which it was fined $165,000.
During the period we have refined our telecommunications consumer strategy, opened new investigations into the area and engaged with the industry on the marketing of gigabit speeds.
Country of origin and product composition claimsIncreasingly products are marketed to consumers based on having some performance characteristics or qualities, such as country of origin, that cannot be independently assessed or verified by consumers. Consumers rely on traders’ representations to make an informed choice. We have focused on reducing misleading claims about country of origin and product composition.
In May 2017 Topline International Ltd and its director Jeffrey Bernard Cook were convicted under the FT Act of claiming that bee pollen was New Zealand made when it was produced and processed in China. The company was fined $405,000 and Mr Cook was fined $121,500. The fine against Mr Cook is one of the highest fines imposed against a director under the FT Act.
During the year the Commission concluded a series of cases relating to misrepresentations of wool duvets. We achieved total fines of over $1.5 million across 11 cases against companies and individuals who made false claims about the composition of alpaca, merino and cashmere duvets. In another case, frozen yoghurt retailer Yoghurt Story was fined $70,000 for misleading the public about the nature and characteristics of products it was marketing as frozen yoghurt.

Commerce Commission Annual Report 2017 13
Unfair contract termsSince the prohibition against unfair contract terms was introduced into the FT Act, we have completed reviews of the telecommunications and retail energy sectors’ standard form consumer contracts. The energy retail sector was chosen as our second focus because it is an essential service for New Zealanders. Many of the terms were common across the contracts, particularly those that limited the liability of the company, allowed the company to unilaterally vary the contract or automatically renewed fixed-term contracts unless the customer opted out.
We have recently completed a review of the standard form consumer contracts used in the gym sector. We are also following up on further issues identified in the telecommunications sector arising out of our February 2016 review.
It’s All Good Season 2 – Aunty and Herman returnIn March 2016 we released an animated show titled It’s All Good, featuring Aunty and Herman Faleafa. The show aimed to provide consumers with information on borrowers’ rights following the amendment of credit laws in 2015. Following the success of the first series, Aunty and Herman returned in 2017 to raise awareness of consumer rights.
Season 2 sees Aunty and Herman deal with a series of common purchasing scenarios, including buying a car, returning a faulty TV, and working through sales interactions with door-to-door sellers and mobile traders. It outlines issues consumers experience in a range of purchasing transactions and highlights the protections that the Consumer Guarantees Act and FT Act provide in those situations. We worked with the Ministry of Business, Innovation and Employment (MBIE) on two of the episodes which involved the Consumer Guarantees Act, as this complemented other consumer work MBIE was doing at the time.
Feedback on this entertaining and engaging format has been excellent, with the episodes being viewed more than 500,000 times across various online platforms. It’s All Good is also being used by teachers, community advocates and other stakeholders around the country.
DeterminationsOur merger work has the potential to have a significant impact on markets and the New Zealand economy. We decided six merger clearance applications and three merger authorisations during the year. We also initiated a number of section 47 investigations into merger activity which was not notified to us for clearance. Our workload in this area was significant because of the complexity of applications received, in particular Vodafone NZ/Sky Television and NZME/Fairfax.
Vodafone and Sky TelevisionIn June 2016 we received applications from Vodafone and Sky proposing acquisitions that would have resulted in Vodafone Group directly or indirectly owning 51% of the shares in Sky, which in turn would own 100% of Vodafone NZ. We considered the applications and in February 2017 declined to grant clearance for the proposed merger. We were not able to exclude the real chance that the merger would substantially lessen competition.
The proposed merger would have created a vertically integrated pay-TV and full service telecommunications provider in New Zealand owning all premium sports content. Around half of all households in New Zealand have Sky TV and a large number of those are Sky Sport customers. We were concerned that the merged entity would be in a position to leverage its control over premium live sports content to substantially lessen competition in telecommunications markets. The merged entity could have bundled its pay-TV and telecommunications services in a way that rivals would not be able to match at a critical time during the rollout of Ultra-Fast Broadband (UFB) programme, when many consumers were likely to be open to switching service providers. A consequent loss of scale for key players, such as Vocus and 2degrees, would have undermined their ability to constrain the merged entity. We considered consumers would also be less likely to switch back to rivals once on bundles with the merged entity and following the UFB rollout window.
In March 2017 Sky and Vodafone appealed our decision to the High Court. This appeal was withdrawn in June and the merger agreement terminated.

Commerce Commission Annual Report 201714
NZME and FairfaxIn May 2016 NZME and Fairfax sought authorisation to merge their respective New Zealand media operations. Authorisation applications follow a two-step process. We must first assess whether the merger would be likely to substantially lessen competition in a market. If we are satisfied that it will not, we can clear the merger at the first step. If we are not satisfied, then the second step is to determine whether the merger should be authorised applying the public benefit test. We must authorise a merger if we are satisfied that the merger will result in such a benefit to the public that it should be permitted.
Our final decision was issued in May 2017 and we declined to grant authorisation. In our view the merger would be likely to substantially lessen competition in advertising and reader markets – specifically Sunday newspapers, online news, and community newspapers in 10 regions. In looking at the second step of the authorisation process, we did not consider that there was such a benefit to the public that authorisation should be granted. We were concerned that this merger would be likely to reduce both the quality of news produced and the diversity of voices (plurality) available for New Zealanders.
The merger would have created extremely concentrated media ownership and influence, as well as providing the scope to control a large share of the news consumed by the majority of New Zealanders. This level of influence by a single media organisation creates a risk of causing harm to New Zealand’s democracy and to the public. NZME and Fairfax have appealed our decision to the High Court.
Last year we authorised Cavalier Wool Holdings Limited to acquire New Zealand Wool Services International Limited’s wool-scouring business and assets. We authorised the merger due to the need for the local scourer to be internationally competitive in a declining wool industry. Godfrey Hirst appealed the decision to the Court of Appeal after its appeal to the High Court was unsuccessful. In November the Court of Appeal dismissed the appeal, upholding our decision to authorise the merger.
Cartels and anti-competitive conductLike most of the areas we work in, we take both an educative and enforcement approach to address issues and prevent harm. To better equip those working in public procurement with the tools they need to detect and deter bid rigging and to improve their knowledge of the Commerce Act, we undertook a procurement outreach project. This included staff presenting to various local and central government agencies around the country.
Our leniency policy continues to be effective in detecting cartels and anti-competitive conduct, and we received several applications during the year. We have also undertaken work with other agencies on bid rigging to help detect and deter anti-competitive conduct. We are currently reviewing the leniency policy to ensure it is as effective as possible. We have continued to take enforcement action against cartel conduct. Over the last year we have obtained penalties of more than $16 million imposed on parties involved in anti-competitive agreements in the real estate and livestock industries.
We have opened several section 47 investigations into mergers that have taken place in New Zealand that we consider may have adversely affected competition. Section 47 of the Commerce Act prohibits the acquisition of a business or shares if it would, or would be likely to, have the effect of substantially lessening competition in a market. The merger clearance regime in New Zealand is voluntary, but we can investigate companies that have not sought formal clearance if we consider the merger may have adversely affected competition.
Price fixing in the real estate industryIn December 2015 we brought three separate sets of proceedings concerning price fixing of real estate marketing fees: a nationwide case, and regional Hamilton and Manawatu cases. These cases are nearly complete. In the national case, fines imposed against the head offices of Barfoot & Thompson, Harcourts, LJ Hooker, Ray White and Bayleys totalled more than $12 million. In the Manawatu case, the four defendants were collectively fined $4 million. In the Hamilton case, one defendant was fined $1.05 million. The remaining Hamilton case is ongoing as some of the defendants have elected to go to trial, which is scheduled for September 2017.
Commerce Commission Annual Report 2017 15
Measuring our performanceThis section reports on the performance measures contained in our Statement of Intent (SOI) 2016-2020 and our Statement of Performance Expectations (SPE) 2016/17, as well as the Estimates of Appropriations 2016/17 under the Vote Business, Science and Innovation: Enforcement of General Market Regulation appropriation.
In October 2016 we released our new organisational strategy, supported by new performance measures, which were set out in the SPE 2017/18. These new performance measures will not be reported on until next year’s annual report.
Measuring our strategic objectives
Impact measure 1: The percentage of businesses and consumers that are confident that the Commission is appropriately enforcing the legislation we are responsible for increases over time
2017 Business survey result
39.5%
2017 Consumer survey result
39.8%During 2017 MBIE conducted a new survey of businesses and consumers to establish baseline results for future performance measurement. The results were obtained from 864 business respondents and 1,233 consumer respondents. Currently both businesses and consumers have a similar level of confidence that the Commission is appropriately enforcing the legislation we are responsible for. The Commission will look to increase both business and consumer confidence that we are appropriately enforcing the legislation we are responsible for over time by exploring new ways of educating businesses on their obligations.
Impact measure 2: The percentage of businesses and consumers that are aware of/understand our role and powers relating to the Acts we enforce increases over time
2017 Business survey result
32.1%
2017 Consumer survey result
12.5%This measure helps our understanding of whether businesses and consumers know what the Commission is responsible for and which Acts we enforce. The Commission will look to increase both business and consumer awareness and understanding of our role and powers over time by exploring new ways of educating businesses on their obligations and consumers on their rights.
We consulted with MBIE on the new survey measures for business and consumer confidence and we are planning a targeted advocacy campaign for traders to address areas where there is low understanding of our role. The first of this work is our Red Flags programme, launched in May 2017 with the Ministry of Social Development and budget advisory groups, and our pricing-focused letter to Retail NZ for its stakeholders and follow-up video. We continue to work with MBIE, including through the Consumer Protection Network, to consider the best cross-government uses of resources.
Commerce Commission Annual Report 201716
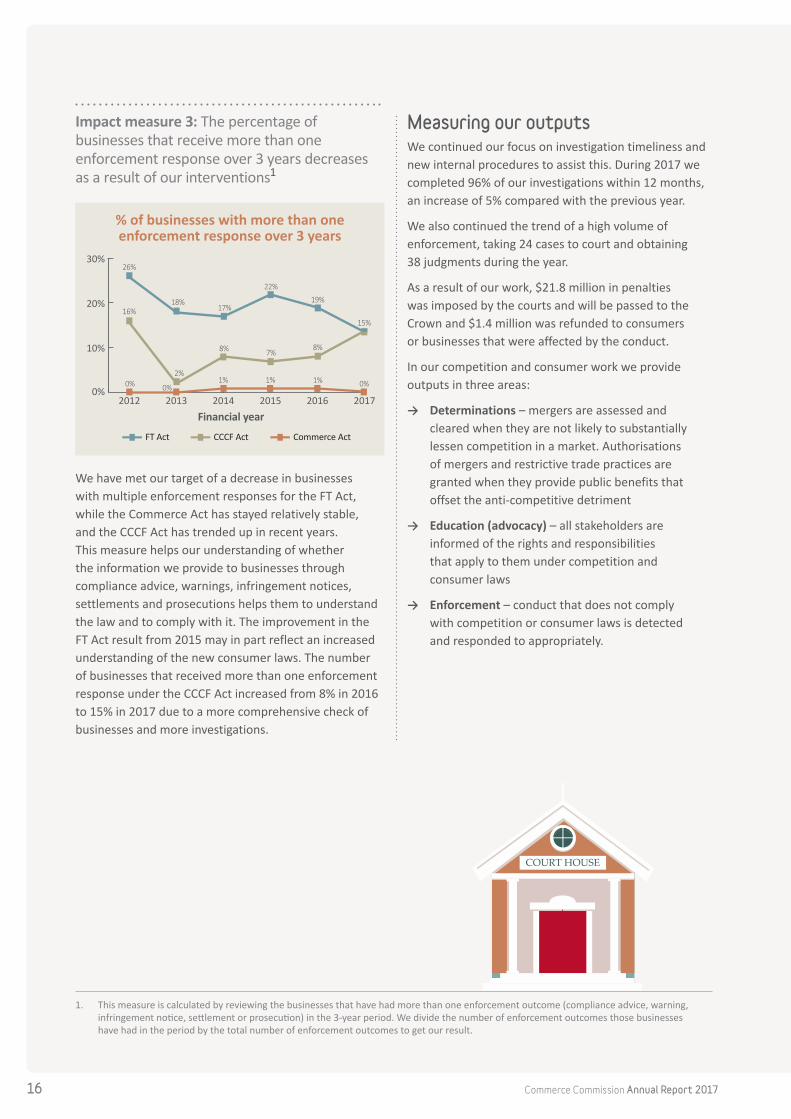
Impact measure 3: The percentage of businesses that receive more than one enforcement response over 3 years decreases as a result of our interventions1
FT Act
% of businesses with more than oneenforcement response over 3 years
0%
10%
20%
30%
Financial year2012 2013 2014 2015 20172016
Commerce ActCCCF Act
26%
18%17%
22%
19%
1%
8%
2%
0%
7%8%
1% 1%
16%15%
0%0%
We have met our target of a decrease in businesses with multiple enforcement responses for the FT Act, while the Commerce Act has stayed relatively stable, and the CCCF Act has trended up in recent years. This measure helps our understanding of whether the information we provide to businesses through compliance advice, warnings, infringement notices, settlements and prosecutions helps them to understand the law and to comply with it. The improvement in the FT Act result from 2015 may in part reflect an increased understanding of the new consumer laws. The number of businesses that received more than one enforcement response under the CCCF Act increased from 8% in 2016 to 15% in 2017 due to a more comprehensive check of businesses and more investigations.
Measuring our outputsWe continued our focus on investigation timeliness and new internal procedures to assist this. During 2017 we completed 96% of our investigations within 12 months, an increase of 5% compared with the previous year.
We also continued the trend of a high volume of enforcement, taking 24 cases to court and obtaining 38 judgments during the year.
As a result of our work, $21.8 million in penalties was imposed by the courts and will be passed to the Crown and $1.4 million was refunded to consumers or businesses that were affected by the conduct.
In our competition and consumer work we provide outputs in three areas:
→ Determinations – mergers are assessed and cleared when they are not likely to substantially lessen competition in a market. Authorisations of mergers and restrictive trade practices are granted when they provide public benefits that offset the anti-competitive detriment
→ Education (advocacy) – all stakeholders are informed of the rights and responsibilities that apply to them under competition and consumer laws
→ Enforcement – conduct that does not comply with competition or consumer laws is detected and responded to appropriately.
1. This measure is calculated by reviewing the businesses that have had more than one enforcement outcome (compliance advice, warning, infringement notice, settlement or prosecution) in the 3-year period. We divide the number of enforcement outcomes those businesses have had in the period by the total number of enforcement outcomes to get our result.
Commerce Commission Annual Report 2017 17
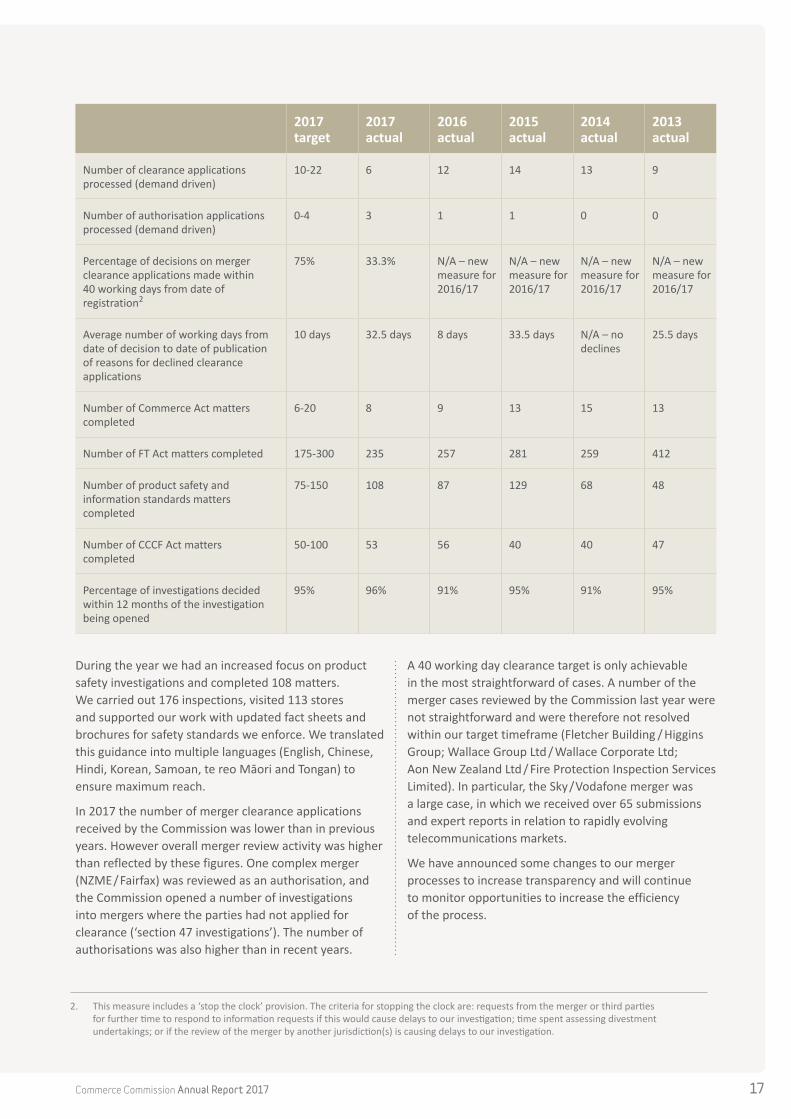
2. This measure includes a ‘stop the clock’ provision. The criteria for stopping the clock are: requests from the merger or third parties for further time to respond to information requests if this would cause delays to our investigation; time spent assessing divestment undertakings; or if the review of the merger by another jurisdiction(s) is causing delays to our investigation.
2017 target
2017 actual
2016 actual
2015 actual
2014 actual
2013 actual
Number of clearance applications processed (demand driven)
10-22 6 12 14 13 9
Number of authorisation applications processed (demand driven)
0-4 3 1 1 0 0
Percentage of decisions on merger clearance applications made within 40 working days from date of registration2
75% 33.3% N/A – new measure for 2016/17
N/A – new measure for 2016/17
N/A – new measure for 2016/17
N/A – new measure for 2016/17
Average number of working days from date of decision to date of publication of reasons for declined clearance applications
10 days 32.5 days 8 days 33.5 days N/A – no declines
25.5 days
Number of Commerce Act matters completed
6-20 8 9 13 15 13
Number of FT Act matters completed 175-300 235 257 281 259 412
Number of product safety and information standards matters completed
75-150 108 87 129 68 48
Number of CCCF Act matters completed
50-100 53 56 40 40 47
Percentage of investigations decided within 12 months of the investigation being opened
95% 96% 91% 95% 91% 95%
During the year we had an increased focus on product safety investigations and completed 108 matters. We carried out 176 inspections, visited 113 stores and supported our work with updated fact sheets and brochures for safety standards we enforce. We translated this guidance into multiple languages (English, Chinese, Hindi, Korean, Samoan, te reo Māori and Tongan) to ensure maximum reach.
In 2017 the number of merger clearance applications received by the Commission was lower than in previous years. However overall merger review activity was higher than reflected by these figures. One complex merger (NZME/Fairfax) was reviewed as an authorisation, and the Commission opened a number of investigations into mergers where the parties had not applied for clearance (‘section 47 investigations’). The number of authorisations was also higher than in recent years.
A 40 working day clearance target is only achievable in the most straightforward of cases. A number of the merger cases reviewed by the Commission last year were not straightforward and were therefore not resolved within our target timeframe (Fletcher Building / Higgins Group; Wallace Group Ltd / Wallace Corporate Ltd; Aon New Zealand Ltd / Fire Protection Inspection Services Limited). In particular, the Sky/Vodafone merger was a large case, in which we received over 65 submissions and expert reports in relation to rapidly evolving telecommunications markets.
We have announced some changes to our merger processes to increase transparency and will continue to monitor opportunities to increase the efficiency of the process.

Commerce Commission Annual Report 201718
FinancesOur competition and consumer work is primarily funded by the Crown, through the Vote Business, Science and Innovation: Enforcement of General Market Regulation appropriation.
We also receive revenue which funds this work from third-party application fees, interest revenue, cost
awards from successful litigation cases, and cost recoveries for shared corporate services with other state sector agencies.
The table below outlines the income and expenditure relating to the delivery of the competition and consumer outputs:
The $811,000 surplus for the competition and consumer output class was higher than budget, as we recruited staff and made appropriate long-term resourcing decisions following the Cabinet decision to increase funding. Other revenue was lower than budget, mainly as a result of lower interest and application fee income. Determinations expenditure was higher than budget due to increased staff activity that resulted from the number and complexity of authorisations and clearances received. This overspend was offset by lower staff salary costs in the enforcement and advocacy areas as staff vacancies and turnover were higher than in previous years.
Appropriation fundingThe table below shows the funding made available by the Crown through the Estimates and Supplementary Estimates compared with that recognised by the Commission in the year for the appropriation Vote Business, Science and Innovation: Enforcement of General Market Regulation.
Estimates$000
Supplementary Estimates
$000
Actual$000
Difference vs Supplementary
Estimates$000
Crown revenue 17,485 17,823 17,485 (338)
Total 17,485 17,823 17,485 (338)
2017 Actual $000
2017 Budget $000
Operating revenueCrown revenue
Other revenue
17,485
873
17,485
1,004
Total operating revenue 18,358 18,489
Operating expensesDeterminations
Enforcement cases
Advocacy
Reports to ministers
4,129
10,838
2,462
118
3,984
11,240
2,999
263
Total operating expenses 17,547 18,486
SURPLUS 811 3
Commerce Commission Annual Report 2017 19
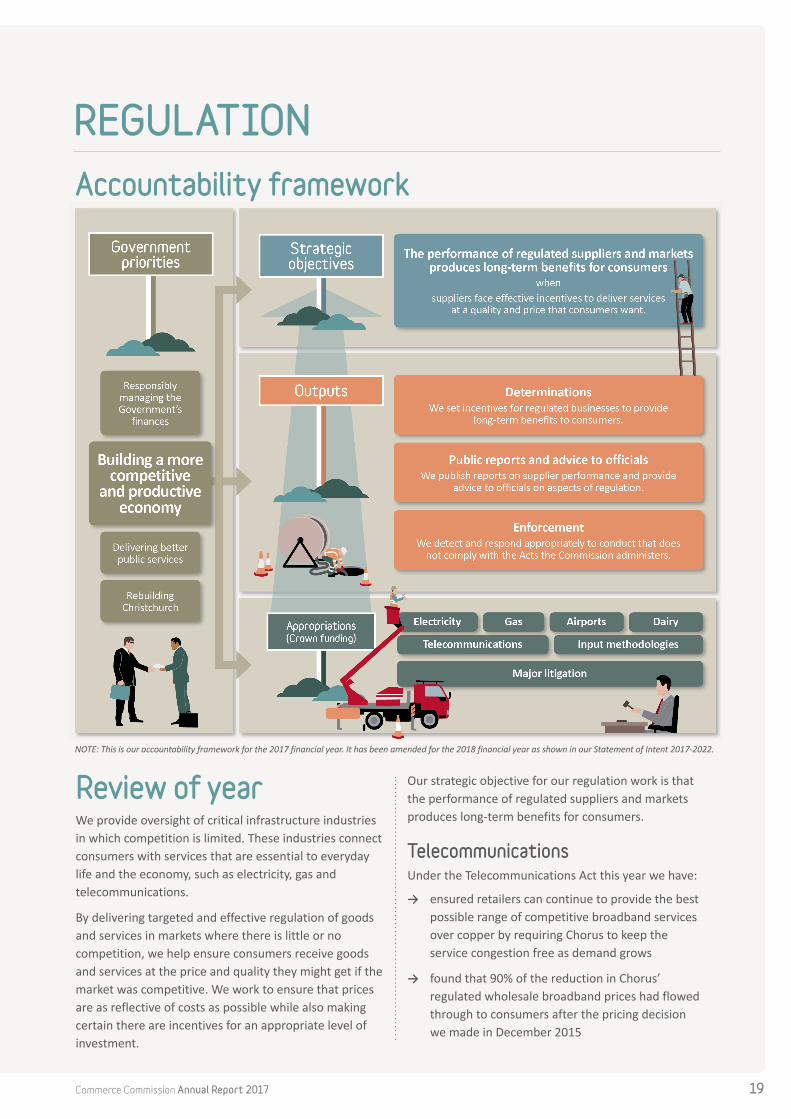
REGULATIONAccountability framework
NOTE: This is our accountability framework for the 2017 financial year. It has been amended for the 2018 financial year as shown in our Statement of Intent 2017-2022.
Review of yearWe provide oversight of critical infrastructure industries in which competition is limited. These industries connect consumers with services that are essential to everyday life and the economy, such as electricity, gas and telecommunications.
By delivering targeted and effective regulation of goods and services in markets where there is little or no competition, we help ensure consumers receive goods and services at the price and quality they might get if the market was competitive. We work to ensure that prices are as reflective of costs as possible while also making certain there are incentives for an appropriate level of investment.
Our strategic objective for our regulation work is that the performance of regulated suppliers and markets produces long-term benefits for consumers.
TelecommunicationsUnder the Telecommunications Act this year we have:
→ ensured retailers can continue to provide the best possible range of competitive broadband services over copper by requiring Chorus to keep the service congestion free as demand grows
→ found that 90% of the reduction in Chorus’ regulated wholesale broadband prices had flowed through to consumers after the pricing decision we made in December 2015

Commerce Commission Annual Report 201720
→ maintained the ability of New Zealanders to keep their local and mobile phone numbers when switching providers, which promotes retail competition
→ completed our recommendation to the Minister on whether to deregulate certain services that allow other providers to rebrand and on-sell Spark’s voice products as a rival service.
Highlights from the year have also included engagement with MBIE on its review of the Telecommunications Act, as well as our ongoing monitoring and reporting on the development of telecommunications markets in New Zealand.
Congestion-free copper broadband on Chorus networkIn March 2017 we released the final decision in our review of the non price features of the regulated wholesale broadband service provided by Chorus. The aim of our review was to ensure that retailers could continue to provide the best possible range of competitive broadband services over copper.
The main change arising from our decision has been to require Chorus to keep the service free of congestion as consumer demand grows. This is important because, while the new fibre network is progressing rapidly, the copper network will remain a key part of the retail broadband service for some time yet, particularly in areas beyond the reach of the ultrafast broadband initiative.
Wholesale broadband price drop passed through to consumersIn June a study we commissioned found that 90% of the reduction in Chorus’ regulated wholesale broadband prices had flowed through to consumers following the pricing decision we made in December 2015. This saving is worth around $200 million in total over a 5-year period, or $4 per month for an average consumer.
Our decision in December 2015 focused on the price that Chorus can charge retailers for use of its local copper lines and broadband service over the following 5 years. This year’s study showed that consumers are benefiting from the pass-through of our pricing decision by telecommunication retailers.
Phone number portability to stayIn December 2016 we decided to continue to require number portability for both local and mobile telephone numbers for another 5 years. Number portability
removes a barrier to consumers switching providers, because it allows them to keep the same telephone number, and this promotes retail competition.
The ability of New Zealanders to keep their phone number when switching providers has been regulated for nearly a decade now and is a service consumers have embraced. According to the Telecommunications Forum, in the year to 30 June 2017 there were over 100,000 local numbers ported and over 80,000 mobile numbers ported.
The regulation we are responsible for limits the time gap in service and the price the telecommunications companies pay each other for the switchover.
Recommendations on whether to deregulate certain resale voice servicesIn December, we completed our recommendation to the Minister for Communications on whether to deregulate certain resale voice services. These services allow other providers to rebrand and on-sell Spark’s voice products as a rival service.
Retail service providers currently buy these services by commercial agreement. However under the current arrangements we could compel Spark to supply these services – at a margin less than its own retail price – if commercial arrangements fail in a way that threatens competition.
Our investigation found that Spark is facing increasingly effective competition for its resale voice services, but retail service providers are still constrained from quickly switching to other options. This constraint on switching is expected to diminish in the near future and we therefore recommended that the Minister defers the decision so we can revisit our recommendation again in 2 years. The Minister accepted this recommendation.
Engagement with MBIE on review of Telecommunications ActAs well as performing our role under the Telecommunications Act, this year we have continued to engage with MBIE officials on their legislative review of the Act. The aim of the review is to make sure New Zealand has the right laws for communications networks after 2020, to meet the needs of consumers and businesses and to help keep our economy growing.
The support we have provided to MBIE has taken a variety of forms, including a number of secondments and input on matters relevant to the proposed amendments.

Commerce Commission Annual Report 2017 21
Energy Networks and Airports (Part 4 of the Commerce Act)In anticipation of major pricing decisions due in the final quarter of this financial year in the gas and airports sector, we brought forward almost all parts of the statutory review of the upfront rules, requirements and processes for regulation (collectively known as input methodologies). The statutory requirement was for this review to be completed by December 2017.
The timeframe we worked towards for the review meant we were able to review all the relevant IMs before they were applied in setting revenue limits for gas pipeline businesses. The IMs were also amended and then applied in revised disclosure requirements that Auckland and Christchurch Airports were required to use to disclose information about recent price-setting events.
Review of the rules, requirements and processes of regulation (input methodologies)The Part 4 regime that applies to energy networks and airports is now delivering improvements in predictability and certainty as envisaged by policymakers. During our review of input methodologies, we therefore signalled early our expectation that only targeted changes would be needed, and stakeholders provided feedback consistent with that view.
Ultimately we found that the input methodologies were generally fit for purpose and did not need to change. However we did make a small number of substantive changes and some refinements to better promote the purpose of regulation, enhance the certainty provided by the input methodologies, and reduce compliance costs.
In the electricity sector, for example, we made changes in recognition of the potential for significant change to arise from the improving capabilities of new technology, new business models, and evolving consumer preferences. We also made changes to make the process of applying for a customised price-quality path more efficient and effective.
In undertaking the review, we placed significant emphasis on involving stakeholders throughout the process and used a wide range of channels, to ensure we better understood their views and concerns. Stakeholder feedback on the process was positive and no appeals were lodged against the Commission’s decisions.
Five-year revenue limits and quality standards for regulated gas pipeline businesses Following the review of input methodologies, we set limits on the revenue that regulated gas pipeline businesses can recover from users between 2017 and 2022, and set minimum standards for service quality over that period. These default price-quality paths (DPPs) started on 1 October 2017 when the current paths came to an end.
The pass-through of our DPP reset for regulated gas pipeline businesses will result in consumer savings of more than $150 million over a 5-year period. This is equivalent to a reduction in average household consumer bills for gas of approximately 6% in the 2018 financial year, although the exact price impact will vary for consumers across different regions.
In reaching our final decision, we made an effort to set price paths that were more tailored to the businesses’ particular circumstances. By basing our assessment on the businesses’ own asset management plans, we have been able to ensure the allowable revenues better reflect their individual investment needs and operating costs. This means we are in a better position to ensure consumers are charged prices that are aligned with the reasonable cost of the services they receive.
Disclosure requirements for airports amended in time for price-setting eventsAlongside the review of input methodologies, we completed associated amendments to the information disclosure requirements that apply to airport price-setting events. These changes have already helped to improve transparency of the returns being targeted by Auckland and Christchurch Airports in their 2017 price-setting events. They will also apply to Wellington Airport’s price-setting event due in 2019.
Approval of $10.6 million of expenditure by Transpower New ZealandIn June we published a decision to allow Transpower to spend $10.6 million on its Central Park/Wilton B project, which was around $15 million less than Transpower had initially estimated. This project was not sufficiently certain when the Commission determined revenue limits for Transpower in 2014, and was therefore identified for consideration at a later date. Following initial discussions with the Commission, Transpower revised its initial estimate down from $26 million.

Commerce Commission Annual Report 201722
High level snapshots for electricity lines companiesIn June we published high-level snapshots of key performance measures for each of New Zealand’s 29 regional electricity distributors. Electricity is distributed to almost all households and businesses, so the information is designed to help stakeholders better understand the performance of the sector.
The one-page summaries are relatively technical in nature, but provide an overview on each company’s profitability, capital and operating expenditure, revenue and network reliability. They also highlight the challenges facing some companies, including the condition of their assets, such as poles, lines and substations.
The snapshots are intended to make it easier for industry, government agencies and consumers to understand and compare lines companies. This type of exposure in itself is expected to create further pressure from stakeholders to help improve sector performance.
Warning to Wellington Electricity for breach of quality standardsIn September we issued a warning letter to Wellington Electricity Lines Limited (WELL) after it failed to comply with minimum standards for network reliability in 2013 and 2014. The reason we set quality standards is to encourage electricity distributors to maintain and improve the reliability of the service delivered to consumers.
The quality standards limit the maximum number and length of power outages that the average consumer should experience in a year. Our investigation found that while WELL had breached its quality standard there was no serious fault on its part.
We have also continued to investigate other instances of non-compliance by businesses, including non-compliance with quality standards by Aurora Energy, Alpine Energy, and Vector Limited.
DairyEach year Fonterra calculates the base milk price it will pay dairy farmers for raw milk based on the methodology set out in its milk price manual. Our monitoring in the dairy sector is targeted to enable efficient review of the annual milk price calculation and manual processes. These reviews are of interest to a large number of stakeholders in the dairy industry.
In keeping with previous years, our final reports found that:
→ Fonterra’s milk price manual for the 2016/17 season was largely consistent with the purpose of the milk price monitoring regime
→ Fonterra’s calculation of the 2015/16 base milk price was largely consistent with both the efficiency and contestability purposes of the Dairy Industry Restructuring Act 2001 (DIR Act).
Since then we have responded to a small number of points raised by stakeholders to help improve the transparency of the milk price calculation.

Commerce Commission Annual Report 2017 23
Measuring our performanceThis section reports on the performance measures contained in our SOI 2016-2020, our SPE 2016/17, and the measures in the Estimates of Appropriations 2016/17 under Vote Business, Science and Innovation:3
→ Economic Regulation of Electricity Lines Services 2014-2019 (multi-year appropriation)
→ Economic Regulation of Gas Pipeline Services 2014-2019 (multi-year appropriation)
→ Economic Regulation of Specified Airport Services 2014-2019 (multi-year appropriation)
→ Enforcement of Dairy Sector Regulation and Auditing of Milk Price Setting
→ Enforcement of Telecommunications Sector Regulation.
In October 2016 we released our new organisational strategy, supported by new performance measures which were set out in the SPE 2017/18. These new performance measures will not be reported on until next year’s annual report.
Measuring our strategic objectives
Impact measure 1: New Zealand’s position in the OECD ranking improves for fixed broadband services (connections per 100 of the New Zealand population)
15 15 15
14
15
2012 2013 2014 2015 2016
New Zealand’s position in the OECDfor fixed broadband services
13
14
15
16
Year ended 31 December
Rank
ing
Fixed broadband services
The target of an increased OECD ranking for fixed broadband services has not been met. New Zealand’s position in the OECD’s ranking fell one place year-on-year, from 14th to 15th, based on fixed broadband connections per 100 of the New Zealand population.
During the 2016 calendar year the penetration rate of fixed broadband connections in New Zealand increased to 32.9 per 100 people, representing an increase of 3.3% on a year earlier. This increase in the penetration rate
was greater than it was for 12 of the 14 countries above New Zealand in the OECD ranking. Although New Zealand did not reach the target of a year-on-year increase in the OECD ranking for fixed broadband services, the penetration rate in New Zealand still appears to be trending in the right direction.4
Greece moved ahead of New Zealand in the ranking as a result of a fall in the assumed Greek population combined with a rise in the New Zealand population. This was despite the number of fixed broadband connections in New Zealand increasing by more than Greece.
The increase in the penetration rate is likely due in part to the reductions in price that resulted from the Commission’s decision in 2015 to reduce the wholesale price for broadband over Chorus’ copper network, in line with the requirements of the Telecommunications Act. Our finding this year was that 90% of this reduction was passed onto end users as a result of retail competition.
Differences in penetration rates across countries are also affected by a variety of factors that are outside the Commission’s control, including national income, income inequality, household size and population size.
3. Not every measure is included under each appropriation. Sector-specific measures are identified under the relevant sector appropriation.
4. Annual Telecommunications Monitoring Report May 2017, p 3.
Commerce Commission Annual Report 201724
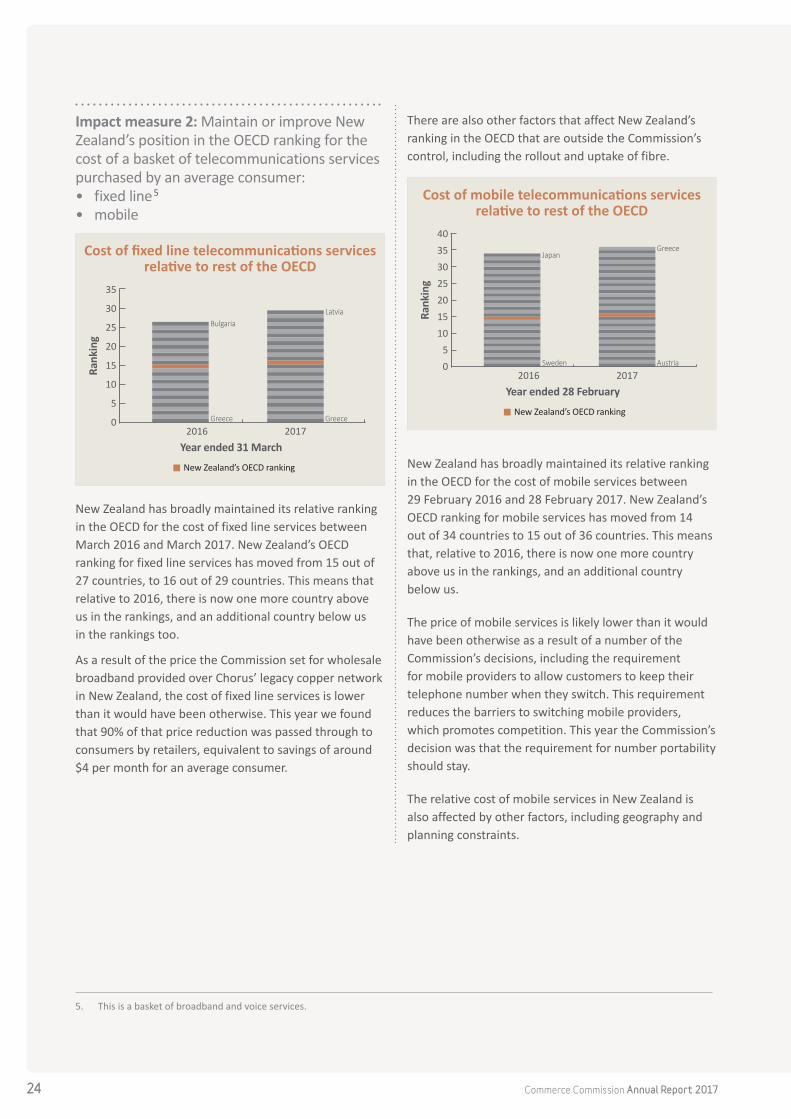
Impact measure 2: Maintain or improve New Zealand’s position in the OECD ranking for the cost of a basket of telecommunications services purchased by an average consumer: • fixed line5 • mobile
Latvia
Greece
Bulgaria
Greece
2016 2017
Cost of fixed line telecommunications servicesrelative to rest of the OECD
0
15
25
35
30
20
10
5
Year ended 31 March
Rank
ing
New Zealand’s OECD ranking
New Zealand has broadly maintained its relative ranking in the OECD for the cost of fixed line services between March 2016 and March 2017. New Zealand’s OECD ranking for fixed line services has moved from 15 out of 27 countries, to 16 out of 29 countries. This means that relative to 2016, there is now one more country above us in the rankings, and an additional country below us in the rankings too.
As a result of the price the Commission set for wholesale broadband provided over Chorus’ legacy copper network in New Zealand, the cost of fixed line services is lower than it would have been otherwise. This year we found that 90% of that price reduction was passed through to consumers by retailers, equivalent to savings of around $4 per month for an average consumer.
There are also other factors that affect New Zealand’s ranking in the OECD that are outside the Commission’s control, including the rollout and uptake of fibre.
Greece
Austria
Japan
Sweden
2016 2017
Cost of mobile telecommunications servicesrelative to rest of the OECD
0
15
25
403530
20
105
Year ended 28 February
Rank
ing
New Zealand’s OECD ranking
New Zealand has broadly maintained its relative ranking in the OECD for the cost of mobile services between 29 February 2016 and 28 February 2017. New Zealand’s OECD ranking for mobile services has moved from 14 out of 34 countries to 15 out of 36 countries. This means that, relative to 2016, there is now one more country above us in the rankings, and an additional country below us.
The price of mobile services is likely lower than it would have been otherwise as a result of a number of the Commission’s decisions, including the requirement for mobile providers to allow customers to keep their telephone number when they switch. This requirement reduces the barriers to switching mobile providers, which promotes competition. This year the Commission’s decision was that the requirement for number portability should stay.
The relative cost of mobile services in New Zealand is also affected by other factors, including geography and planning constraints.
5. This is a basket of broadband and voice services.

Commerce Commission Annual Report 2017 25
Impact measure 3: An increase in New Zealand’s average broadband download speed
New Zealand’s average broadbanddownload speed
0 1413121110876421 3 95
Cale
ndar
yea
r
Mbps
2015
9.3
2016
12.9
New Zealand met the target of increasing the average broadband download speed and reached 12.9Mbps at 31 December 2016. This measure is affected by a range of factors, including the rollout of technologies such as fibre.
In future years we would expect that speeds will be faster than they would have been otherwise as a result of the non-price terms we determined for Chorus’ legacy copper network.
Impact measure 4: Breaches of quality standards by businesses reduce over time6
Price-quality regulation applies to suppliers of electricity distribution, electricity transmission, and gas pipeline services. This type of regulation aims to limit the ability of suppliers to earn excessive profits, while also ensuring that required standards for service quality are met.
2015
2016
2014
2013
Number of quality standards breached
0 1 2 43
Fina
ncia
l yea
r
Number of breaches
1
2
2
4
20173
We have met our target, with the number of breaches one less during the 2017 financial year than during 2016. The total number of breaches has remained reasonably stable over the past 5 years.
The three breaches of the quality standards were by Aurora Energy, Transpower New Zealand and Vector Limited and were self-identified by the businesses in their compliance statements. We will be investigating the causes and conduct associated with these breaches, and taking enforcement action where appropriate.
Further instances of non-compliance with the requirements for the assessment periods above may be identified at a later stage by the Commission.
6. Quality standards are determined for the default or customised price-quality paths that apply to certain electricity distributors and gas pipeline businesses, as well as for the individual price-quality path that applies to Transpower New Zealand. The measure for this year therefore differs from that of last year, which was for default price-quality paths only.
Commerce Commission Annual Report 201726
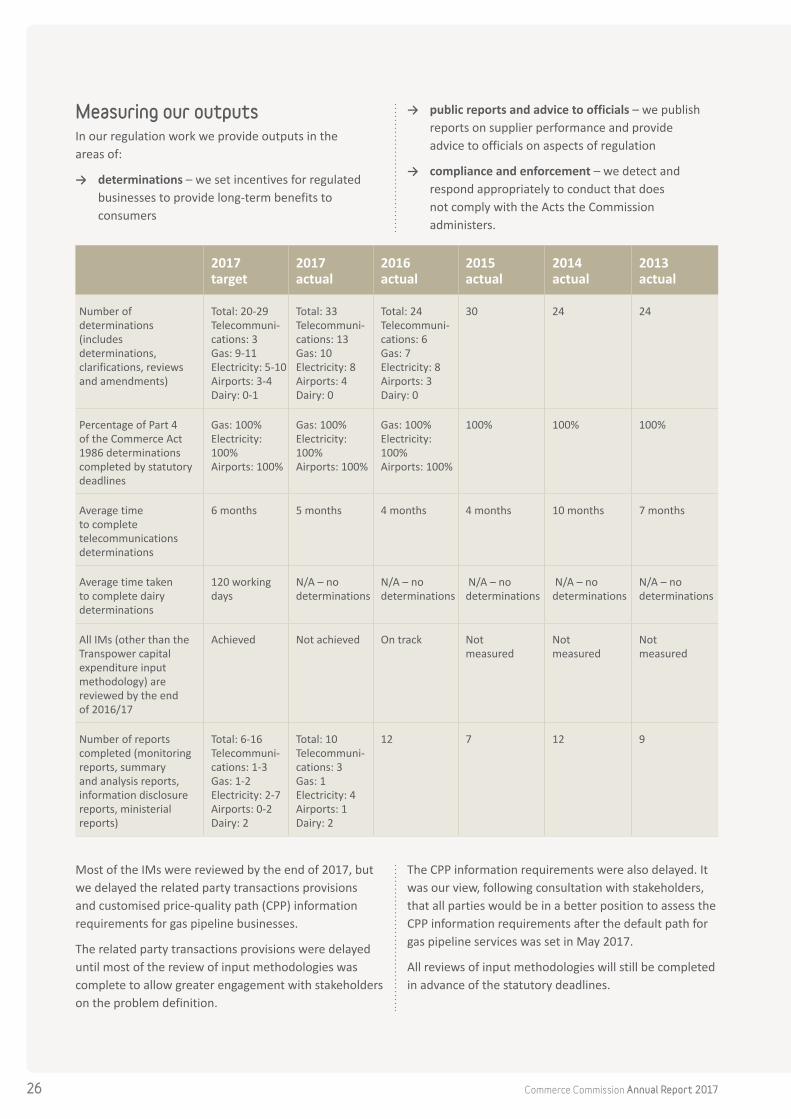
Measuring our outputsIn our regulation work we provide outputs in the areas of:
→ determinations – we set incentives for regulated businesses to provide long-term benefits to consumers
→ public reports and advice to officials – we publish reports on supplier performance and provide advice to officials on aspects of regulation
→ compliance and enforcement – we detect and respond appropriately to conduct that does not comply with the Acts the Commission administers.
2017 target
2017 actual
2016 actual
2015 actual
2014 actual
2013 actual
Number of determinations (includes determinations, clarifications, reviews and amendments)
Total: 20-29 Telecommuni-cations: 3 Gas: 9-11 Electricity: 5-10 Airports: 3-4 Dairy: 0-1
Total: 33 Telecommuni-cations: 13 Gas: 10 Electricity: 8 Airports: 4 Dairy: 0
Total: 24 Telecommuni-cations: 6 Gas: 7 Electricity: 8 Airports: 3 Dairy: 0
30 24 24
Percentage of Part 4 of the Commerce Act 1986 determinations completed by statutory deadlines
Gas: 100% Electricity: 100% Airports: 100%
Gas: 100% Electricity: 100% Airports: 100%
Gas: 100% Electricity: 100% Airports: 100%
100% 100% 100%
Average time to complete telecommunications determinations
6 months 5 months 4 months 4 months 10 months 7 months
Average time taken to complete dairy determinations
120 working days
N/A – no determin ations
N/A – no determin ations
N/A – no determin ations
N/A – no determin ations
N/A – no determin ations
All IMs (other than the Transpower capital expenditure input methodology) are reviewed by the end of 2016/17
Achieved Not achieved On track Not measured
Not measured
Not measured
Number of reports completed (monitoring reports, summary and analysis reports, information disclosure reports, ministerial reports)
Total: 6-16 Telecommuni-cations: 1-3 Gas: 1-2 Electricity: 2-7 Airports: 0-2 Dairy: 2
Total: 10 Telecommuni-cations: 3 Gas: 1 Electricity: 4 Airports: 1 Dairy: 2
12 7 12 9
Most of the IMs were reviewed by the end of 2017, but we delayed the related party transactions provisions and customised price-quality path (CPP) information requirements for gas pipeline businesses.
The related party transactions provisions were delayed until most of the review of input methodologies was complete to allow greater engagement with stakeholders on the problem definition.
The CPP information requirements were also delayed. It was our view, following consultation with stakeholders, that all parties would be in a better position to assess the CPP information requirements after the default path for gas pipeline services was set in May 2017.
All reviews of input methodologies will still be completed in advance of the statutory deadlines.

Commerce Commission Annual Report 2017 27
Consolidated regulation finances
2017 Actual $000
2017 Budget $000
Operating revenueCrown revenue
Other revenue
15,070732
17,136560
Total operating revenue 15,802 17,696
Operating expensesDeterminations
Compliance and enforcement
Public reports and advice to officials
9,8501,0644,888
11,273998
5,425
Total operating expenses 15,802 17,696
SURPLUS 0 0
FinancesOur regulation work is primarily funded by the Crown through five appropriations, with our work under Part 4 of the Commerce Act funded by three multi-year appropriations, each for an initial 5-year period (2014-2019).
Vote Business, Science and Innovation:
→ Economic Regulation of Electricity Lines Services 2014-2019 (multi-year appropriation)
→ Economic Regulation of Gas Pipeline Services 2014-2019 (multi-year appropriation)
→ Economic Regulation of Specified Airport Services 2014-2019 (multi-year appropriation)
→ Enforcement of Dairy Sector Regulation and Auditing of Milk Price Setting
→ Enforcement of Telecommunications Sector Regulation.
We also receive revenue for this work from cost recoveries for shared corporate services with other state sector agencies, and cost recoveries for specific determinations applied for by third parties.
Consolidated financial information for our regulation area is shown below, along with sector-specific financial information. For the sectors funded by multi-year appropriations, we have also provided graphs showing the proportion of the Crown funding drawn down in 2017.

Commerce Commission Annual Report 201728
Telecommunications
2017 Actual $000
2017 Budget $000
Operating revenueCrown revenue
Other revenue
4,918577
5487503
Total operating revenue 5,495 5,990
Operating expensesDeterminations
Compliance and enforcement
Public reports and advice to officials
1,791131
3,573
2,295190
3,505
Total operating expenses 5,495 5,990
SURPLUS 0 0
Expenditure in the Telecommunications output class was below budget for 2017. This underspend was planned as we obtained approval for expense transfers7 to help support preparatory work planned during the 2018 financial year that is necessary ahead of future changes to the Telecommunications Act. There was a small overspend in the public reports and advice to officials work stream due to higher than budgeted external expenditure associated with broadband performance testing. There was also higher than anticipated staff activity in this area due in part to work associated with the review of the Telecommunications Act. This overspend was offset by lower expenditure in the determinations and compliance areas.
Other revenue included $0.5 million from invoicing applicants for a portion of the final pricing principle (FPP) costs.
7. A $0.5 million expense transfer and a further $0.25 million in-principle expense transfer were obtained to move Crown funding from 2017 into 2018.

Commerce Commission Annual Report 2017 29
Electricity lines services
2017 Actual $000
2017 Budget $000
Operating revenueCrown revenue
Other revenue
4,585111
5,15326
Total operating revenue 4,696 5,179
Operating expensesDeterminations
Compliance and enforcement
Public reports and advice to officials
3,275813608
3,700640839
Total operating expenses 4,696 5,179
SURPLUS 0 0
Expenditure in the Electricity output class was less than budget. Compliance and enforcement expenditure was more than budget due to higher than anticipated staff activity and external consultants assessing potential non-compliance with price-quality paths. Higher compliance costs were offset by underspends in the determinations and public reports work streams.
Crown funding used and remainingbetween 2015 and 2109
2015-2017 Actual
Remaining funding(2017–2019)
$00015,304
13,007

Commerce Commission Annual Report 201730
Natural gas pipeline services
2017 Actual $000
2017 Budget $000
Operating revenueCrown revenue
Other revenue
3,12029
3,47718
Total operating revenue 3,149 3,495
Operating expensesDeterminations
Compliance and enforcement
Public reports and advice to officials
2,822111216
2,983134378
Total operating expenses 3,149 3,495
SURPLUS 0 0
Gas output class expenditure was less than budget. Expenditure in the determinations work stream was below budget due to lower than expected expenditure on the default price-quality path (DPP) reset project. There were also lower than budgeted costs in the compliance and public reports areas.
Crown funding used and remainingbetween 2015 and 2109
2015-2017 Actual
Remaining funding(2018–2019)
$000
6,483
3,201
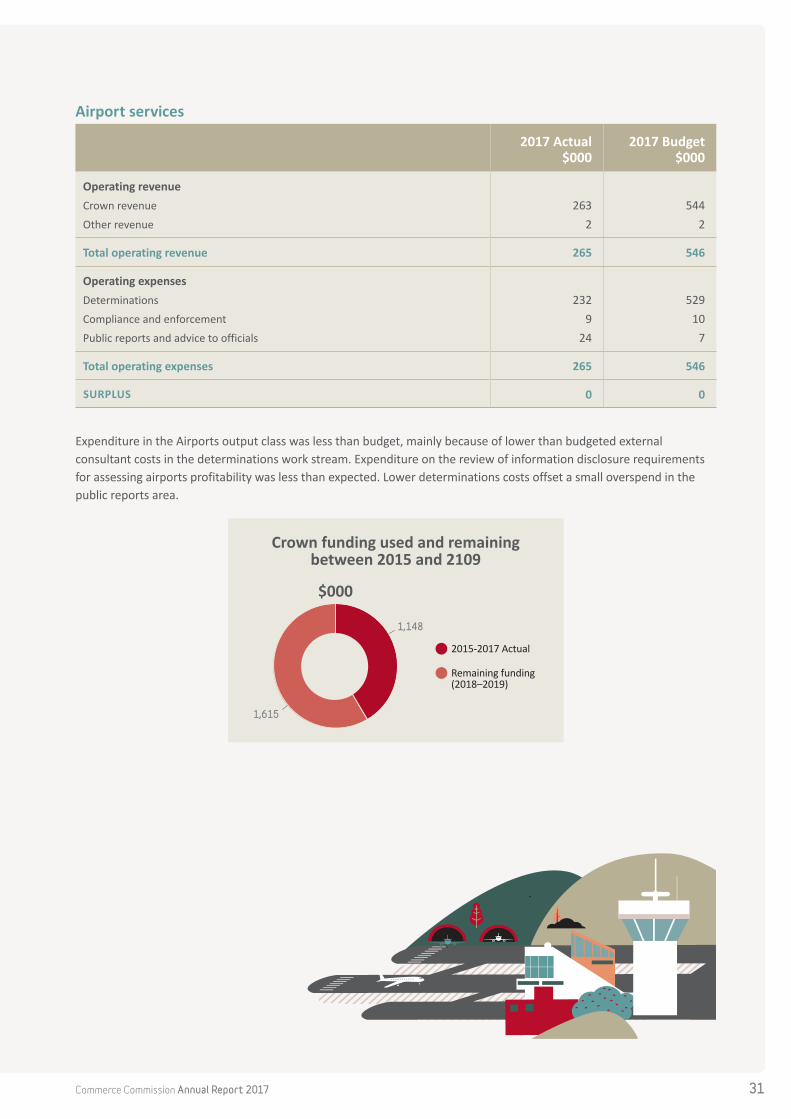
Commerce Commission Annual Report 2017 31
Airport services
2017 Actual $000
2017 Budget $000
Operating revenueCrown revenue
Other revenue
2632
5442
Total operating revenue 265 546
Operating expensesDeterminations
Compliance and enforcement
Public reports and advice to officials
2329
24
52910
7
Total operating expenses 265 546
SURPLUS 0 0
Expenditure in the Airports output class was less than budget, mainly because of lower than budgeted external consultant costs in the determinations work stream. Expenditure on the review of information disclosure requirements for assessing airports profitability was less than expected. Lower determinations costs offset a small overspend in the public reports area.
Crown funding used and remainingbetween 2015 and 2109
2015-2017 Actual
Remaining funding(2018–2019)
$000
1,148
1,615

Commerce Commission Annual Report 201732
Input methodologies
2017 Actual $000
2017 Budget $000
Operating revenueCrown revenue
Other revenue
1,7228
1,722 8
Total operating revenue 1,730 1,730
Operating expensesDeterminations
1,730
1,730
Total operating expenses 1,730 1,730
SURPLUS 0 0
Expenditure in the Input Methodologies output class was in line with budget. Higher than budgeted internal staff costs were offset by lower external consultant and contractor expenditure. The final determinations were published in December 2016.
Dairy
2017 Actual $000
2017 Budget $000
Operating revenueCrown revenue
Other revenue
4625
7533
Total operating revenue 467 756
Operating expensesDeterminations
Compliance and enforcement
Public reports and advice to officials
00
467
2436
696
Total operating expenses 467 756
SURPLUS 0 0
Expenditure in the Dairy output class was below budget in all areas. Expenditure related to the 2016/17 season reviews of Fonterra’s milk price manual and base milk price calculation was less than budget. There were no determinations required during the year and no compliance inquiries were received.

Commerce Commission Annual Report 2017 33
Appropriation fundingThe table below shows the funding made available by the Crown through the Estimates and Supplementary Estimates compared with that recognised by the Commission in the year for each of our regulation appropriations.
Estimates$000
Supplementary Estimates
$000
Actual$000
Difference vs Supplementary
Estimates$000
Vote Commerce and Consumer Affairs: Enforcement of Telecommunications Sector Regulation
Crown revenue 6,000 5,500 4,918 (582)
Vote Commerce and Consumer Affairs: Input Methodologies for Economic Regulation
Crown revenue 1,758 1,758 1,722 (36)
Vote Commerce and Consumer Affairs: Enforcement of Dairy Sector Regulation and Auditing of Milk Price Setting
Crown revenue 1,245 757 462 (295)
Vote Commerce and Consumer Affairs: Economic Regulation of Electricity Lines Services 2014-2019 (MYA)
Cumulative funding to 1 July 2016 11,774 11,501 11,501 0
Crown revenue 5,161 5,161 4,585 (576)
Cumulative funding to 30 June 2017 16,935 16,662 16,086 (576)Remaining appropriation 12,158 12,431 13,007 576
Total appropriation 29,093 29,093 29,093 0
Vote Commerce and Consumer Affairs: Economic Regulation of Gas Pipeline Services 2014-2019 (MYA)
Cumulative funding to 1 July 2016 3,624 3,545 3,545 0
Crown revenue 3,484 3,484 3,120 (364)
Cumulative funding to 30 June 2017 7,108 7,029 6,665 (364)Remaining appropriation 2,758 2,837 3,201 364
Total appropriation 9,866 9,866 9,866 0
Vote Commerce and Consumer Affairs: Economic Regulation of Specified Airport Services 2014-2019 (MYA)
Cumulative funding to 1 July 2016 993 1,012 1,012 0
Crown revenue 545 545 263 (282)
Cumulative funding to 30 June 2017 1,538 1,557 1,275 (282)Remaining appropriation 1,352 1,333 1,615 282
Total appropriation 2,890 2,890 2,890 0

Commerce Commission Annual Report 201734
MAJOR LITIGATIONWe undertake litigation across both our competition and consumer and our regulation functions where we believe this is likely to achieve the most effective outcome. Major litigation funding is used where cases meet the conditions for accessing the fund.
Our litigation workload varies considerably each year based on the:
→ number and types of cases we choose to litigate or which are brought against us
→ appeals we defend
→ complexity of the cases we have before us
→ court timetables
→ parties’ approaches towards the litigation.
Major litigation is funded by the Crown out of the multi-category appropriation Vote Business, Science and Innovation: Commerce Commission Litigation Fund. The internally-sourced litigation category is used to meet the costs of resourcing litigation from our internal capability, while the externally-sourced litigation category is used to meet the external direct costs of resourcing major litigation activity. For our internally-sourced litigation we also receive a share of the revenue from shared services cost recoveries.
2017 Actual
$000
2017 Budget
$000
Externally-sourced litigation
Operating revenueCrown revenue 3,105 6,238
Total operating revenue 3,105 6,238
Operating expensesCompetitive markets
FT Act
CCCF Act
Regulation
1,738963220184
4,3141,181
443300
Total operating expenses 3,105 6,238
SURPLUS 0 0
Internally-sourced litigation
Operating revenueCrown revenue
Other revenue
2,74324
3,40522
Total operating revenue 2,767 3,427
Operating expensesCompetitive markets
FT Act
CCCF Act
Regulation
1,2891,002
283193
1,7251,151
384167
Total operating expenses 2,767 3,427
SURPLUS 0 0

Commerce Commission Annual Report 2017 35
Externally-sourced litigation expenditure was below budget as the Commission successfully reached settlements and resolved matters more quickly than expected. The Commission budgets for litigation based on the planned court process at the start of the year. In addition to successfully concluding planned litigation more quickly than expected, the budgeted provision for new cases was greater than anticipated.
Internally-sourced litigation expenditure was also less than budget. The early settlement of some cases meant that less time was spent on litigation than expected.
Appropriation fundingThe table below shows the funding made available by the Crown through the Estimates and Supplementary Estimates compared with that recognised by the Commission in the year for the appropriation Vote Business, Science and Innovation: Commerce Commission Litigation Funds MCA.
Estimates$000
Supplementary Estimates
$000
Actual$000
Difference vs Supplementary
Estimates$000
Commerce Commission externally-sourced litigation
Crown revenue 7,000 7,000 3,105 (3,895)
Commerce Commission internally-sourced litigation
Crown revenue 3,500 3,500 2,743 (757)
Total 10,500 10,500 5,848 (4,652)

Commerce Commission Annual Report 201736
ORGANISATION HEALTH AND CAPABILITY
Our values and visionThe Commission strives for excellence across our organisation. Our values, shown here, are well established and we aim to uphold them in all our actions. Our values

Commerce Commission Annual Report 2017 37
Developing improved capabilitiesMaintaining and improving organisational health and capability is essential in helping us to achieve our outcomes. We continue to focus our capability improvement around three themes – connect,
people and efficiency. Providing the right environment, tools, support and leadership enables our people to do their jobs effectively and grow our capability as an organisation.
Connect → Launched the second series of an animation series titled It’s All Good to increase awareness of consumer rights
→ Continued our annual stakeholder briefings
→ Held stakeholder functions to mark 30 years of the Commerce and FT Acts
→ Held credit roundtables in Auckland, Wellington and Christchurch
→ Held analyst and media briefings on key regulation decisions and determinations
→ Engaged with international competition, consumer and regulatory agencies
→ Continued to develop our educative outreach function, using a variety of media
→ Produced more of our guidance in multiple languages
→ Focused on stakeholder engagement as part of the regulatory review of input methodologies
People → Delivered a range of health initiatives to support and maximise employees’ health and wellbeing
→ Continued to score above the medium-term State Sector Benchmark average for employee engagement
→ Delivered management development workshops
→ Conducted a series of te reo Māori sessions
→ Started a review of our performance management framework, as well as developing an approach to managing our talent
→ Started work on a range of tailored internal programmes and workshops to improve our organisation-wide capability
Efficiency → Rolled out improved video conferencing and collaboration tools
→ Implemented a shared IT disaster recovery facility with the Electricity Authority
→ Implemented Diligent Board Management Software
→ Progressed Streamline, a project which aims to make the Commission’s business processes standardised and more efficient, and provide greater access to information for staff and management
→ Implemented an improved evidence management solution, which is more efficient and effective
New Zealanders are better offbecause markets work well
and consumers and businesses are confident market participants.
Our visionWe believe that New Zealanders are better off when consumers and businesses are confident participants in well-functioning markets.

Commerce Commission Annual Report 201738
Being a good employer We maintain a focus on leadership, workforce development, management of people and performance, and engagement with our employees. We have also made the most of the diverse talent pool currently at the Commission by promoting
equal employment opportunities (EEO).
The table below outlines our achievements against the seven key elements of being a good employer, as set out by the New Zealand Human Rights Commission.
Elements Initiatives
Leadership, Accountability and Culture
We conducted our sixth annual employee survey in March 2017. There were noticeable improvements in our scores for vision and leadership, our physical work environment/wellbeing and employee involvement areas. Overall we remain well placed against the medium-term State Sector Benchmark average.
We continue to strengthen our leadership capability. All managers and team leaders have completed a management development or people leader programme. We continue to support managers through coaching and other development initiatives.
We have an EEO programme and policy which links to our values. We also have a programme underway to promote cultural awareness and are delivering a series of te reo Māori workshops.
We provide opportunities for all employees to participate in developing and maintaining a positive, safe, professional and enjoyable workplace. We continue to review and implement new internal policies to support our people and culture.
Recruitment, Induction and Selection
We are focused on making strategic hiring decisions to enable us to be well placed for the future. We continue to aim to attract and retain high-calibre and capable people.
We have a comprehensive induction programme in place to support our staff in their new positions and working environment.
Employee Development, Promotion and Exit
Our learning and development framework continues to support our organisational capability. We are currently reviewing our performance management framework and developing an approach to managing our talent. Our Commission-wide training programme provides development opportunities for all staff. This is supplemented with targeted development programmes for individuals. As part of our capability process, all employees have a development plan that is agreed annually.
We continue to provide progression and promotion opportunities for our staff.
Flexibility and Work Design
We have a Flexible Working Policy, and continue to accommodate and support flexible working arrangements to suit personal needs and circumstances. The deployment of mobile devices to all staff and Commissioners is a key part of the overall drive for improved staff mobility and flexible working arrangements.
Remuneration, Recognition and Conditions
We adhere to the Government’s expectations for Pay and Employment Conditions in the State Sector. Our remuneration strategy is reviewed each year to ensure this supports our recruitment and retention strategies.
Harassment and Bullying Prevention
Our organisational values, together with our Code of Conduct and our Harassment Policy, detail our expected behaviours. We continue to reinforce and promote our values, and we have a zero tolerance of harassment and bullying.
Safe and Healthy Work Environment
We have embedded our new health, safety and wellness framework to ensure we maintain a healthy and safe work environment, and comply with the new workplace health and safety laws.
We have processes and practices in place that ensure the Commission provides a healthy and safe work environment, including safe operating procedures for a number of potential risks specific to our business.
Our induction programme, trained health and safety representatives, and ongoing health and safety education programmes ensure all employees are well informed about their health and safety.
We have a wellness programme in place which offers a range of health initiatives to help support and maximise employees’ health and wellbeing.
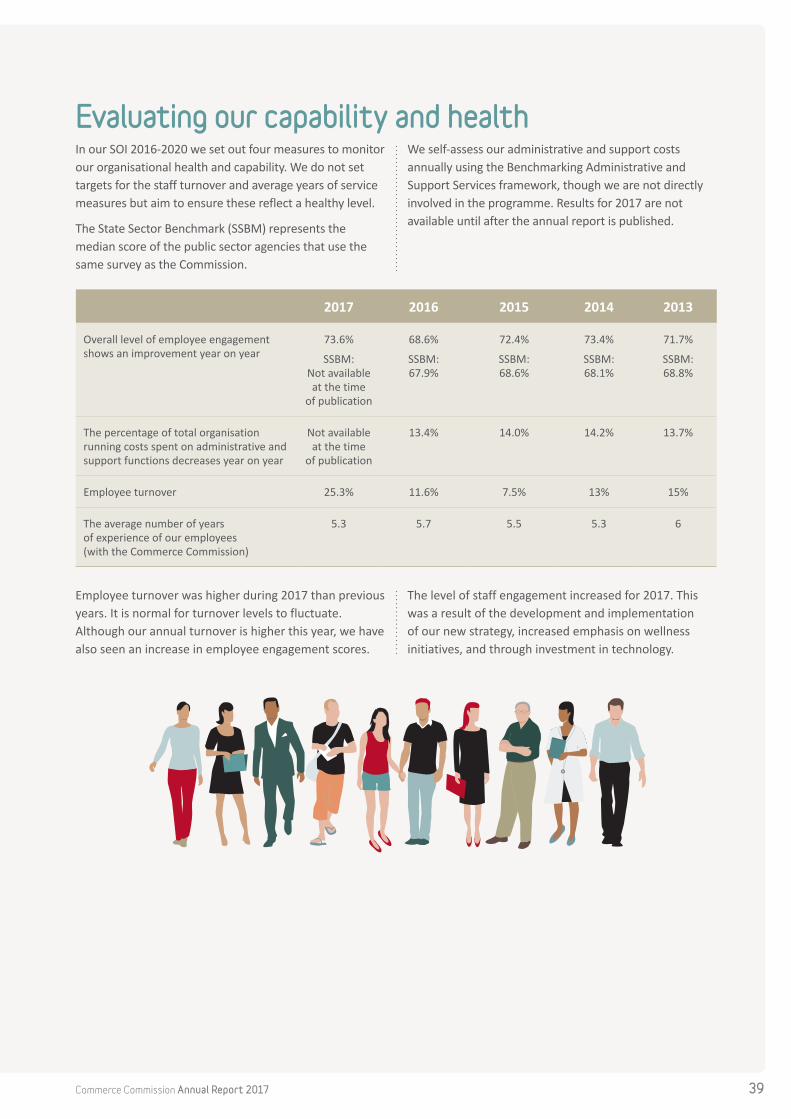
Commerce Commission Annual Report 2017 39
Evaluating our capability and healthIn our SOI 2016-2020 we set out four measures to monitor our organisational health and capability. We do not set targets for the staff turnover and average years of service measures but aim to ensure these reflect a healthy level.
The State Sector Benchmark (SSBM) represents the median score of the public sector agencies that use the same survey as the Commission.
We self-assess our administrative and support costs annually using the Benchmarking Administrative and Support Services framework, though we are not directly involved in the programme. Results for 2017 are not available until after the annual report is published.
2017 2016 2015 2014 2013
Overall level of employee engagement shows an improvement year on year
73.6%
SSBM: Not available at the time
of publication
68.6%
SSBM: 67.9%
72.4%
SSBM: 68.6%
73.4%
SSBM: 68.1%
71.7%
SSBM: 68.8%
The percentage of total organisation running costs spent on administrative and support functions decreases year on year
Not available at the time
of publication
13.4% 14.0% 14.2% 13.7%
Employee turnover 25.3% 11.6% 7.5% 13% 15%
The average number of years of experience of our employees (with the Commerce Commission)
5.3 5.7 5.5 5.3 6
Employee turnover was higher during 2017 than previous years. It is normal for turnover levels to fluctuate. Although our annual turnover is higher this year, we have also seen an increase in employee engagement scores.
The level of staff engagement increased for 2017. This was a result of the development and implementation of our new strategy, increased emphasis on wellness initiatives, and through investment in technology.

Commerce Commission Annual Report 201740
Disability profile:We are currently supporting employees with disabilities and a disability register is held in case of emergency.
Ethnicity profile:
3%
6%
3%2%1%
85%European/PākehāMāoriAsianIndianPacific peoplesOther/not stated
Age profile:
31%
8%
6%
31%
24%
20–3031-4041-5051-6060+
Profile of our peopleat 30 June 2017
2017 2016 2015 2014 2013
Number of employees (FTE)
189 195 198 178 173
Male 56% 58% 58% 55% 54%
Female 44% 42% 42% 45% 46%
Percentage of employees on flexible working arrangements
10% 15% 14% 11% 14%
Occupation profile:
10% 15%
Adviser
Economist25%
20%5%
15%
10%
Environmental sustainability We are committed to sustainability and to minimising our impact on the environment. We monitor our flight, paper and energy use and have implemented or are planning initiatives with sustainability benefits.
We have installed energy efficient lighting in our accommodation; and we have upgraded our after-hours air conditioning system to allow staff to activate this only for the area in which they are sitting.
25
20
15
10
5
02013 2014 2015 2016 2017
Paper usage per FTE (number of reams – 000s)
3000
2000
1000
02013 2014 2015 2016 2017
kWh by FTE (main office in Wellington)
0 2000 4000 6000 8000
2017
2016
2015
2014
2013
Km flown per FTE
Reduced paper use Between 2013 and 2017 we have managed to halve our paper use. This has saved significant amount of money and limited our environmental impact. This change was achieved through a range of initiatives, including the rollout of ‘Follow-You’ printing, the introduction of mobile devices and technology, default duplex printing, greater support for flexible working arrangements, and enhanced filing protocols.

Commerce Commission Annual Report 2017 41
GOVERNANCE
Board and Commissioner responsibilities The Governor-General, on the recommendation of the Minister of Commerce and Consumer Affairs, appoints Commission Members for their knowledge of, and experience in, areas relevant to the Commission’s responsibilities. The Telecommunications Commissioner is appointed on the recommendation of the Minister for Communications. Associate Commissioners are appointed by the Minister of Commerce and Consumer Affairs.
Decision makingThe Commission’s functions and powers are conferred and limited by legislation. The Board has a wide range of formal decision-making powers and makes decisions or determinations that determine or otherwise significantly affect the legal rights, duties and interests of others.
Governance of the organisationThe Board discharges the functions and requirements of the Commission in several ways, including:
→ monitoring the Commission’s performance and planning our strategic direction
→ establishing sub-groups of the Board (Commission Divisions) that administer and enforce discrete statutes
→ using delegations to make our work more efficient, including delegating authority to the Chief Executive
→ using advisory committees to the Board, such as the Audit, Finance and Risk Management Committee (AFRM)
→ overseeing a broad variety of strategies, policies, processes, systems, frameworks and analytical approaches that help ensure effective decision making.
Managing riskWe actively manage risk at the Commission to increase the likelihood of achieving our objectives. The Board is responsible for reviewing and approving our risk management framework but delegates day-to-day management of risk to the Chief Executive. This delegation ensures that risk is seen as part of the overall business process, with a robust framework of identification, evaluation, monitoring and control in place.
Health and safetyThe Board has overall responsibility for managing health and safety, including exercising due diligence to ensure the Commission complies with its duties under the workplace health and safety laws and actively engaging in matters affecting the health and safety and wellness of staff.
Conflicts of interestThe Board maintains a register of interests, which ensures Board members are aware of their obligation to declare interests under the relevant provisions of the Crown Entities Act 2004.
Ministerial directionsThe Minister of State Services and the Minister of Finance have communicated the following directions to the Commission under section 107 of the Crown Entities Act:
→ Procurement functional leadership (New Zealand Gazette, 19 June 2014). We have continued to comply with the Government Rules of Sourcing in support of a whole-of-government approach to procurement.
→ Support for a whole-of-government approach to the New Zealand Business Number (NZBN) (New Zealand Gazette, 14 July 2016). We have integrated the NZBN as the primary identifier for relevant businesses in our core system, Streamline. In May 2017 we implemented lookup functions bringing business data into the system from the NZBN database via MBIE’s online interfaces.

Commerce Commission Annual Report 201742
Commission Member profiles
Dr Mark BerryChairmanMark Berry was appointed Chairman in April 2009 and his term expires in March 2019. He is a former partner of law firm Bell Gully and former consultant with Chapman Tripp. Mark has been in practice as a barrister sole since 2002 and holds a doctorate from Columbia University, New York. He is a former member of the faculty at Otago University Law School, and is a member of the International Advisory Board at the Institute for Consumer Antitrust Studies at Loyola University Chicago School of Law. Mark is also an Associate Member of the Australian Competition and Consumer Commission, a position he will hold until 31 March 2019.
Sue BeggDeputy ChairSue Begg was appointed as a Commissioner in June 2009 and Deputy Chair in July 2010. Her term was renewed for a further 5 years in June 2014. She was also appointed as an Associate Member of the Australian Competition and Consumer Commission in April 2016. Sue is an economist, whose previous roles include director of the consultancy company Impetus Group Limited, Vice-President and head of the economic advisory unit of the investment banking division of Credit Suisse First Boston NZ Limited (and its predecessor companies) and manager of the Macroeconomic Policy section at the Treasury.
Dr Stephen GaleTelecommunications CommissionerStephen Gale was appointed as the Telecommunications Commissioner in July 2012 and his term was renewed for a further 3 years in June 2017. Prior to July 2012, he was an Associate Commissioner for 2 years. Stephen has specialised for some years in infrastructure economics (energy, telco and transport) and competition proceedings at the consulting firm Castalia. Before that he was at the New Zealand Institute of Economic Research. He holds a PhD from the University of Cambridge.
Anna RawlingsCommissionerAnna Rawlings was appointed as a Commissioner in June 2014. She was previously a partner in the dispute resolution division of Minter Ellison Rudd Watts, where she specialised in contentious and non-contentious aspects of competition, regulatory and consumer law. Anna holds a BA/LLB (Hons) from the University of Auckland and an LLM from the University of Toronto, where her work focused on law and economics.
(L-R): Dr Stephen Gale, Elisabeth Welson, Anna Rawlings, Dr Mark Berry, Graham Crombie, Dr Jill Walker, Sue Begg.
Commerce Commission Annual Report 2017 43
Elisabeth WelsonCommissionerElisabeth Welson was appointed in September 2012 as Associate Commissioner and as a Commissioner on 19 August 2013. Before joining the Commission, she was a senior commercial partner at Simpson Grierson, where she co-led the competition and regulatory group and headed the energy, natural resources and utilities market group. Elisabeth holds an LLB (Hons) from the University of Auckland and has practised as a Barrister and Solicitor in New Zealand as well as a Solicitor of the Supreme Court of Queensland and Solicitor of the Supreme Court of New South Wales.
Dr Jill WalkerCommissionerJill Walker began her term as a Commissioner on 1 December 2015, following her appointment as an Associate Commissioner in November 2010. She was a Commissioner of the Australian Competition and Consumer Commission (ACCC) in Australia from September 2009 to April 2016. Before joining the ACCC, Jill was a Member of the Australian Competition Tribunal and worked as an economic consultant. She holds a BA in Economics and a PhD in Land Economy from the University of Cambridge. She also holds a Masters degree in Economics from the University of Massachusetts.
Graham CrombieAssociate CommissionerGraham Crombie was appointed in July 2015 as an Associate Commissioner for a 5-year term. Graham is a Fellow of Chartered Accountants ANZ and a Chartered Fellow of the Institute of Directors. He is a previous president and chairman of the New Zealand Institute of Chartered Accountants. Graham has a Bachelor of Commerce from Otago University and was awarded a Master of Design Enterprise. He has 30 years’ experience in professional services firms specialising in audit and consulting. Since 2013 he has been acting as an independent director to a range of organisations in both the private and public sector.
Sarah CourtAssociate Commissioner
Sarah Court was cross-appointed from the ACCC as an Associate Commissioner in December 2015. She has been a Commissioner of the ACCC since April 2008, being reappointed for a further five-year term in 2013. She is a former
senior executive lawyer and director with the Australian Government Solicitor. She has extensive experience in Commonwealth legal work, including restrictive trade practices, consumer protection and law enforcement litigation. As Chair of the ACCC’s Enforcement Committee, Ms Court oversees the agency’s enforcement and litigation programme. Sarah also sits on the ACCC’s Merger Review Committee, Adjudication Committee and the Infrastructure Committee.
The Hon Sir Bruce Robertson KNZM and Michael Behrens QC are Cease and Desist Commissioners.
Fred Hutchings is our external Convenor of the Audit, Finance and Risk Management Committee. Fred was a partner with PricewaterhouseCoopers and now holds several governance roles, including as Chairman of Seeka Kiwifruit Industries Ltd and Tui Products Limited, Chairman of the OAG Audit and Risk Committee, and former Chairman of the MFAT Audit and Risk Committee. He is also a Past President of Chartered Accountants Australia and New Zealand.
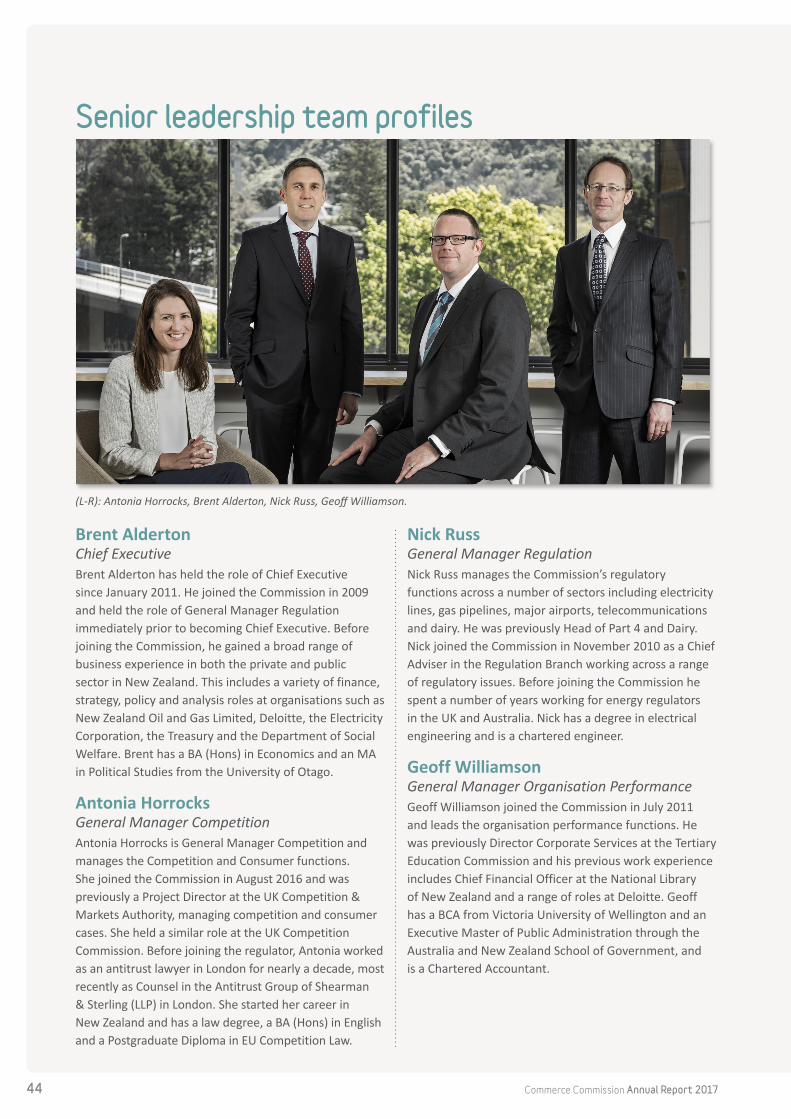
Commerce Commission Annual Report 201744
Senior leadership team profiles
Brent AldertonChief ExecutiveBrent Alderton has held the role of Chief Executive since January 2011. He joined the Commission in 2009 and held the role of General Manager Regulation immediately prior to becoming Chief Executive. Before joining the Commission, he gained a broad range of business experience in both the private and public sector in New Zealand. This includes a variety of finance, strategy, policy and analysis roles at organisations such as New Zealand Oil and Gas Limited, Deloitte, the Electricity Corporation, the Treasury and the Department of Social Welfare. Brent has a BA (Hons) in Economics and an MA in Political Studies from the University of Otago.
Antonia HorrocksGeneral Manager Competition Antonia Horrocks is General Manager Competition and manages the Competition and Consumer functions. She joined the Commission in August 2016 and was previously a Project Director at the UK Competition & Markets Authority, managing competition and consumer cases. She held a similar role at the UK Competition Commission. Before joining the regulator, Antonia worked as an antitrust lawyer in London for nearly a decade, most recently as Counsel in the Antitrust Group of Shearman & Sterling (LLP) in London. She started her career in New Zealand and has a law degree, a BA (Hons) in English and a Postgraduate Diploma in EU Competition Law.
Nick RussGeneral Manager Regulation Nick Russ manages the Commission’s regulatory functions across a number of sectors including electricity lines, gas pipelines, major airports, telecommunications and dairy. He was previously Head of Part 4 and Dairy. Nick joined the Commission in November 2010 as a Chief Adviser in the Regulation Branch working across a range of regulatory issues. Before joining the Commission he spent a number of years working for energy regulators in the UK and Australia. Nick has a degree in electrical engineering and is a chartered engineer.
Geoff WilliamsonGeneral Manager Organisation PerformanceGeoff Williamson joined the Commission in July 2011 and leads the organisation performance functions. He was previously Director Corporate Services at the Tertiary Education Commission and his previous work experience includes Chief Financial Officer at the National Library of New Zealand and a range of roles at Deloitte. Geoff has a BCA from Victoria University of Wellington and an Executive Master of Public Administration through the Australia and New Zealand School of Government, and is a Chartered Accountant.
(L-R): Antonia Horrocks, Brent Alderton, Nick Russ, Geoff Williamson.

Commerce Commission Annual Report 2017 45
Commonly used termsAppropriation A parliamentary authorisation for Ministers of the Crown or an Office of Parliament to incur
expenses or capital expenditure.
Authorisation Under the Commerce Act, certain agreements and mergers are prohibited as they can lead to anti-competitive outcomes, such as increased prices or lack of choice. However, the Commerce Act recognises that in some circumstances an anti-competitive transaction may lead to sufficient public benefits that would outweigh the competitive harm. In this case the Commission can grant an authorisation for the agreement or merger to proceed.
Base milk price The term used in the Dairy Industry Restructuring Act 2001 to refer to the farm gate milk price that is set by Fonterra. The farm gate milk price is the price paid by dairy processors to dairy farmers for raw milk. The purchase of raw milk from farmers at the base milk price is Fonterra’s largest input cost.
Clearance Under the Commerce Act, the Commission can grant a clearance for a proposed merger if we are satisfied that it is not likely to substantially lessen competition in a market.
Commerce Act 1986 (Parts 2, 3 and 5)
Prohibits anti-competitive behaviour and acquisitions that substantially lessen competition. Provides for a clearance and authorisation regime allowing businesses to apply for pre-approval of a merger or certain restrictive trade practices.
Commerce Act 1986 (Part 4)
Part 4 provides for the regulation of price and quality of goods and services in markets where there is little or no competition, and little or no likelihood of a substantial increase in competition. Sectors that are currently subject to the provisions of Part 4 are electricity distribution and transmission, gas pipelines, and selected airport services.
Credit Contracts and Consumer Finance Act 2003 (CCCF Act)
Protects the interests of consumers in relation to consumer credit contracts, consumer leases and buy-back transactions of land. It includes provisions relating to disclosure, responsible lending, and unforeseen hardship, and sets out rules about interest, payments and credit fees.
Dairy Industry Restructuring Act 2001 (DIR Act)
Promotes the efficient operation of dairy markets in New Zealand by regulating the activities of Fonterra to ensure New Zealand markets for dairy goods and services are contestable.
Determination A formal and binding decision made by the Commission under the legislation it administers.
Enforceable undertakings
Enforceable undertakings are a form of out-of-court agreement where a business commits to altering its behaviour. The Commission may seek enforceable undertakings where it believes a business is not complying with the law. These are a very useful tool to quickly stop potentially non-compliant conduct. If the business does not comply with the undertaking, the Commission can apply to the court to enforce it.
Fair Trading Act 1986 Prohibits false and misleading behaviour by traders and a range of other unfair business practices. It also requires that consumers are given specified information about certain products and promotes product safety.
FPP Final pricing principle as per the Telecommunications Act 2001.
Impact Contribution made to an outcome by a specified set of outputs, or actions, or both.
Infringement notices The Commission can issue infringement notices with fines of up to $2,000 for certain offences under the FT and CCCF Acts. We can also issue civil infringement notices for certain contraventions of the Telecommunications Act with a prescribed penalty of $2,000.
Information disclosure
Under Part 4 of the Commerce Act (subpart 4), sufficient information is to be readily available to interested persons so that they can assess whether the purpose of Part 4 is being met.
Input methodologies This involves setting upfront regulatory rules, processes and requirements applying to regulation under Part 4, and for undertaking Part 4 inquiries (eg, rules for valuing assets and calculating the cost of capital).
Market structure cases
Investigations into mergers that might substantially lessen competition in a market and that do not have the protection of a clearance.

Commerce Commission Annual Report 201746
Merger A merger is a combination of two or more business enterprises. Colloquially, mergers also include business acquisitions that involve the acquisition of assets or shares of a business, including partial acquisitions.
Outcomes State or condition of society, the economy or the environment; includes a change in that state or condition.
Output class An output class is a grouping of outputs or activities with similar objectives. A reportable class of outputs is a class of outputs that the Crown entity proposes to supply in the financial year and that is directly funded (in whole or in part) by the Crown. The Commission’s output classes are primarily funded by appropriations from the Crown via MBIE.
Outputs Goods or services provided by the Commission.
Part 4 Part 4 of the Commerce Act. Under Part 4 of the Commerce Act, the Commission has a role regulating the price and quality of goods or services in markets where there is little or no competition and little prospect of future competition.
Price-quality path Under Part 4 of the Commerce Act (subparts 9 and 10), non-exempt suppliers of electricity lines services and suppliers of gas pipeline services are subject to default/customised price-quality regulation. A default price-quality path (DPP) is the way the Commission determines appropriate price and quality controls for applicable regulated industries under Part 4 of the Commerce Act. A regulated business can apply for a customised price-quality path (CPP) when it has a specific need that is not met by the DPP.
Product safety and information standards cases
Investigations of products such as bikes, cots and children’s toys that might be unsafe, as well as the incorrect labelling of footwear and clothing, and failure to display required information on motor vehicles offered for sale.
Regulated supplier A supplier of goods or services regulated under either the Commerce Act or the Telecommunications Act.
Substantial lessening of competition
A substantial lessening of competition concerns a real or substantial impact on a market in the way of a lessening, hindering or preventing of the process of workable or effective competition.
Substantiation Businesses that make claims or imply something about their goods or services must have reasonable grounds for making those claims.
Telecommunications Act 2001
Regulates the supply of certain wholesale telecommunications services in New Zealand.
UBA Unbundled bitstream access. Regulated service giving wholesale access to Chorus’ Digital Subscriber Line (DSL) full speed broadband service. It allows telecommunications businesses to supply broadband services to customers without the need to replicate Chorus’ electronics or software.
UCLL Unbundled copper local loop. Wholesale access to the copper line connecting a phone user to the local exchange.
Unilateral conduct cases
Investigations into prohibited conduct by a single person or business, including taking advantage of a substantial degree of market power for an anti-competitive purpose, or specifying a minimum price at which its goods or services can be sold by another.
Vote A grouping of one or more appropriations that are the responsibility of one or more Ministers of the Crown and are administered by one department.
Weighted average cost of capital (WACC)
The cost of capital is the financial return investors require from an investment given its risk.
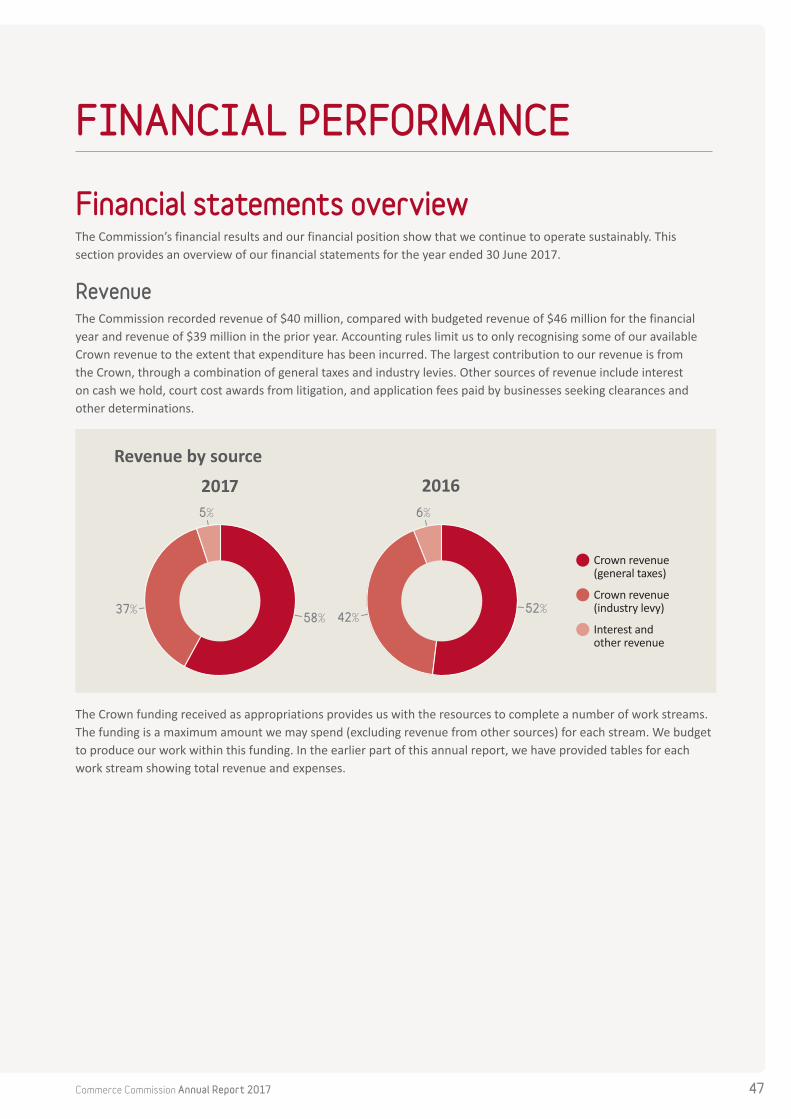
Commerce Commission Annual Report 2017 47
FINANCIAL PERFORMANCE
Financial statements overviewThe Commission’s financial results and our financial position show that we continue to operate sustainably. This section provides an overview of our financial statements for the year ended 30 June 2017.
RevenueThe Commission recorded revenue of $40 million, compared with budgeted revenue of $46 million for the financial year and revenue of $39 million in the prior year. Accounting rules limit us to only recognising some of our available Crown revenue to the extent that expenditure has been incurred. The largest contribution to our revenue is from the Crown, through a combination of general taxes and industry levies. Other sources of revenue include interest on cash we hold, court cost awards from litigation, and application fees paid by businesses seeking clearances and other determinations.
Crown revenue(general taxes)
Crown revenue(industry levy)
Interest and other revenue
Revenue by source2017 20165%
58%37%
6%
52%42%
The Crown funding received as appropriations provides us with the resources to complete a number of work streams. The funding is a maximum amount we may spend (excluding revenue from other sources) for each stream. We budget to produce our work within this funding. In the earlier part of this annual report, we have provided tables for each work stream showing total revenue and expenses.

Commerce Commission Annual Report 201748
ExpenditureThis year we spent a little over $39 million, compared with a budgeted spend of $46 million and a prior year spend of $39 million. The graphs below show a breakdown of our expenditure by nature.
4%4%4%
3%
68%
17%
Members andpersonnel
Legal and otherprofessional fees
Computer, information, and information technologyOccupancy
Depreciation andamortisation
Other expenditure
Expenditure breakdown
2017 20163%3%5%
2%
69%
18%
As an entity our focus is on the delivery of services, such as determinations and enforcement, by highly skilled people. Our expenditure on personnel makes up over two-thirds of our total expenditure. We also spend another 15% on legal and other professional consultants who provide support to us with specialist expertise. The remainder is attributable to costs such as accommodation, information technology, and travel.
Financial position
Litigation fund reserve
Litigation costs reserve
General funds
Commission reserves
$000
2013
2014
2015
2016
0 15,000 20,00010,0005,000
2017
We maintain reserves at a level which allows us to manage litigation risks and other financial risks. These risks are diverse, but can involve large unanticipated expenditures in a relatively short timeframe. For instance, if we lose a large multi-party litigation case, we may have to pay large adverse cost awards to the winning parties. Alternatively, we may have to incur unplanned expenditure on a Part 4 inquiry or a large merger clearance or authorisation (including legal costs) while continuing to deliver our business as usual activities.
The Commission’s equity (or reserves) at 30 June 2017 was $15.1 million, an increase of $800,000 from 30 June 2016. This increase is a result of a surplus in our competition and consumer output class. As our litigation costs reserve has reached its $3 million cap last year and we were not required to pay any cost awards this year, there was no movement in this reserve.

Commerce Commission Annual Report 2017 49
Statement of responsibility Under the Crown Entities Act 2004, the Board of the Commerce Commission is responsible for the preparation of the Commission’s financial statements and statement of performance, and for the judgements made in them.
We are also responsible for any end-of-year performance information provided by the Commission under section 19A of the Public Finance Act 1989.
The Commission’s Board is also responsible for establishing, and has established, a system of internal controls designed to provide reasonable assurance of the integrity and reliability of our financial reporting.
In the Board’s opinion, these financial statements and the statement of performance reflect a true and fair view of the financial position, and results of the operations, of the Commission for the year ended 30 June 2017.
Signed on behalf of the Board:
Dr Mark Berry Chairman – Commerce Commission
31 October 2017
Sue Begg Deputy Chair – Commerce Commission
31 October 2017

Commerce Commission Annual Report 201750
Independent auditor’s reportTo the readers of the Commerce Commission’s financial statements and performance information for the year ended 30 June 2017.
The Auditor General is the auditor of the Commerce Commission (the Commission). The Auditor General has appointed me, Ajay Sharma, using the staff and resources of Audit New Zealand, to carry out the audit of the financial statements and the performance information, including the performance information for appropriations, of the Commission on his behalf.
Opinion We have audited:
→ the financial statements of the Commission on pages 53 to 77, that comprise the statement of financial position as at 30 June 2017, the statement of comprehensive revenue and expense, statement of changes in equity, statement of cash flows and statement of accounting policies for the year ended on that date and the notes to the financial statements including other explanatory information; and
→ the performance information of the Commission on pages 15 to 18 and 23 to 33.
In our opinion:
→ the financial statements of the Commission on pages 53 to 77:
> present fairly, in all material respects:
− its financial position as at 30 June 2017; and
− its financial performance and cash flows for the year then ended; and
> comply with generally accepted accounting practice in New Zealand in accordance with Public Benefit Entity Reporting Standards.
→ the performance information on pages 15 to 18 and 23 to 33:
> presents fairly, in all material respects, the Commission’s performance for the year ended 30 June 2017, including:
− for each class of reportable outputs:
− its standards of delivery performance achieved as compared with forecasts included in the statement of performance expectations for the financial year; and
− its actual revenue and output expenses as compared with the forecasts included in the statement of performance expectations for the financial year; and
− what has been achieved with the appropriations; and
− the actual expenses or capital expenditure incurred compared with the appropriated or forecast expenses or capital expenditure.
> complies with generally accepted accounting practice in New Zealand.
Our audit was completed on 31 October 2017. This is the date at which our opinion is expressed.
The basis for our opinion is explained below. In addition, we outline the responsibilities of the Members of the Commission (the Commissioners) and our responsibilities relating to the financial statements and the performance information, we comment on other information, and we explain our independence.

Commerce Commission Annual Report 2017 51
Basis for our opinionWe carried out our audit in accordance with the Auditor General’s Auditing Standards, which incorporate the Professional and Ethical Standards and the International Standards on Auditing (New Zealand) issued by the New Zealand Auditing and Assurance Standards Board. Our responsibilities under those standards are further described in the Responsibilities of the auditor section of our report.
We have fulfilled our responsibilities in accordance with the Auditor General’s Auditing Standards.
We believe that the audit evidence we have obtained is sufficient and appropriate to provide a basis for our audit opinion.
Responsibilities of the Commissioners for the financial statements and the performance informationThe Commissioners are responsible on behalf of the Commission for preparing financial statements and performance information that are fairly presented and comply with generally accepted accounting practice in New Zealand. The Commissioners are responsible for such internal control as they determine is necessary to enable them to prepare financial statements and performance information that are free from material misstatement, whether due to fraud or error.
In preparing the financial statements and the performance information, the Commissioners are responsible on behalf of the Commission for assessing the Commission’s ability to continue as a going concern. The Commissioners are also responsible for disclosing, as applicable, matters related to going concern and using the going concern basis of accounting, unless there is an intention to merge or to terminate the activities of the Commission, or there is no realistic alternative but to do so.
The Commissioner’s responsibilities arise from the Crown Entities Act 2004 and the Public Finance Act 1989.
Responsibilities of the auditor for the audit of the financial statements and the performance informationOur objectives are to obtain reasonable assurance about whether the financial statements and the performance information, as a whole, are free from material misstatement, whether due to fraud or error, and to issue an auditor’s report that includes our opinion.
Reasonable assurance is a high level of assurance, but is not a guarantee that an audit carried out in accordance with the Auditor General’s Auditing Standards will always detect a material misstatement when it exists. Misstatements are differences or omissions of amounts or disclosures, and can arise from fraud or error. Misstatements are considered material if, individually or in the aggregate, they could reasonably be expected to influence the decisions of readers, taken on the basis of these financial statements and the performance information.
For the budget information reported in the financial statements and the performance information, our procedures were limited to checking that the information agreed to the Commission’s statement of performance expectations.
We did not evaluate the security and controls over the electronic publication of the financial statements and the performance information.
As part of an audit in accordance with the Auditor General’s Auditing Standards, we exercise professional judgement and maintain professional scepticism throughout the audit. Also:
→ We identify and assess the risks of material misstatement of the financial statements and the performance information, whether due to fraud or error, design and perform audit procedures responsive to those risks, and obtain audit evidence that is sufficient and appropriate to provide a basis for our opinion. The risk of not detecting a material misstatement resulting from fraud is higher than for one resulting from error, as fraud may involve collusion, forgery, intentional omissions, misrepresentations, or the override of internal control.
→ We obtain an understanding of internal control relevant to the audit in order to design audit procedures that are appropriate in the circumstances, but not for the purpose of expressing an opinion on the effectiveness of the Commission’s internal control.

Commerce Commission Annual Report 201752
→ We evaluate the appropriateness of accounting policies used and the reasonableness of accounting estimates and related disclosures made by the Commissioners.
→ We evaluate the appropriateness of the reported performance information within the Commission’s framework for reporting its performance.
→ We conclude on the appropriateness of the use of the going concern basis of accounting by the Commissioners and, based on the audit evidence obtained, whether a material uncertainty exists related to events or conditions that may cast significant doubt on the Commission’s ability to continue as a going concern. If we conclude that a material uncertainty exists, we are required to draw attention in our auditor’s report to the related disclosures in the financial statements and the performance information or, if such disclosures are inadequate, to modify our opinion. Our conclusions are based on the audit evidence obtained up to the date of our auditor’s report. However, future events or conditions may cause the Commission to cease to continue as a going concern.
→ We evaluate the overall presentation, structure and content of the financial statements and the performance information, including the disclosures, and whether the financial statements and the performance information represent the underlying transactions and events in a manner that achieves fair presentation.
We communicate with the Commissioners regarding, among other matters, the planned scope and timing of the audit and significant audit findings, including any significant deficiencies in internal control that we identify during our audit.
Our responsibilities arise from the Public Audit Act 2001.
Other informationThe Commissioners are responsible for the other information. The other information comprises the information included on pages 3 to 14, 19 to 22 and 34 to 48 but does not include the financial statements and the performance information, and our auditor’s report thereon.
Our opinion on the financial statements and the performance information does not cover the other information and we do not express any form of audit opinion or assurance conclusion thereon.
In connection with our audit of the financial statements and the performance information, our responsibility is to read the other information. In doing so, we consider whether the other information is materially inconsistent with the financial statements and the performance information or our knowledge obtained in the audit, or otherwise appears to be materially misstated. If, based on our work, we conclude that there is a material misstatement of this other information, we are required to report that fact. We have nothing to report in this regard.
IndependenceWe are independent of the Commission in accordance with the independence requirements of the Auditor General’s Auditing Standards, which incorporate the independence requirements of Professional and Ethical Standard 1 (Revised): Code of Ethics for Assurance Practitioners issued by the New Zealand Auditing and Assurance Standards Board.
Other than in our capacity as auditor, we have no relationship with, or interests, in the Commission.
Ajay Sharma Audit New Zealand On behalf of the Auditor General Wellington, New Zealand

Commerce Commission Annual Report 2017 53
Financial Statements Statement of comprehensive revenue and expensefor the year ended 30 June 2017
Notes 2017 Actual
$000
2017 Budget
$000
2016 Actual
$000
Operating revenue
Revenue from non-exchange transactions
Crown revenue 38,403 44,264 37,353
Court cost awards 16 50 135
Total revenue from non-exchange transactions 38,419 44,314 37,488
Revenue from exchange transactions
Fees and recoveries 620 526 831
Interest 684 800 873
Other revenue 309 210 282
Total revenue from exchange transactions 1,613 1,536 1,986
Total operating revenue 40,032 45,850 39,474
Operating expenses
Members and personnel 1 26,480 28,880 27,200
Legal and other professional fees 2 6,639 10,569 6,929
Computer, information, and information technology 1,051 878 598
Occupancy 3 1,759 1,832 1,962
Depreciation and amortisation 1,560 1,741 972
Other expenditure 4 1,732 1,947 1,679
Total operating expenses 39,221 45,847 39,340
Surplus 811 3 134
TOTAL COMPREHENSIVE REVENUE AND EXPENSE 811 3 134
The accompanying statement of accounting policies and notes to the financial statements on pages 57-77 form part of the financial statements.

Commerce Commission Annual Report 201754
Statement of changes in equity for the year ended 30 June 2017
2017 Actual
$000
2017 Budget
$000
2016Actual
$000
Balance at 1 July 14,311 17,106 17,177
Comprehensive revenue and expense
Surplus/(deficit) 811 3 134
Total comprehensive revenue and expense 811 3 134
Transactions with owner
Repayment of reserves to the Crown 0 0 (3,000)
Total transactions with owner 0 0 (3,000)
BALANCE AT 30 JUNE 15,122 17,109 14,311
The accompanying statement of accounting policies and notes to the financial statements on pages 57-77 form part of the financial statements.
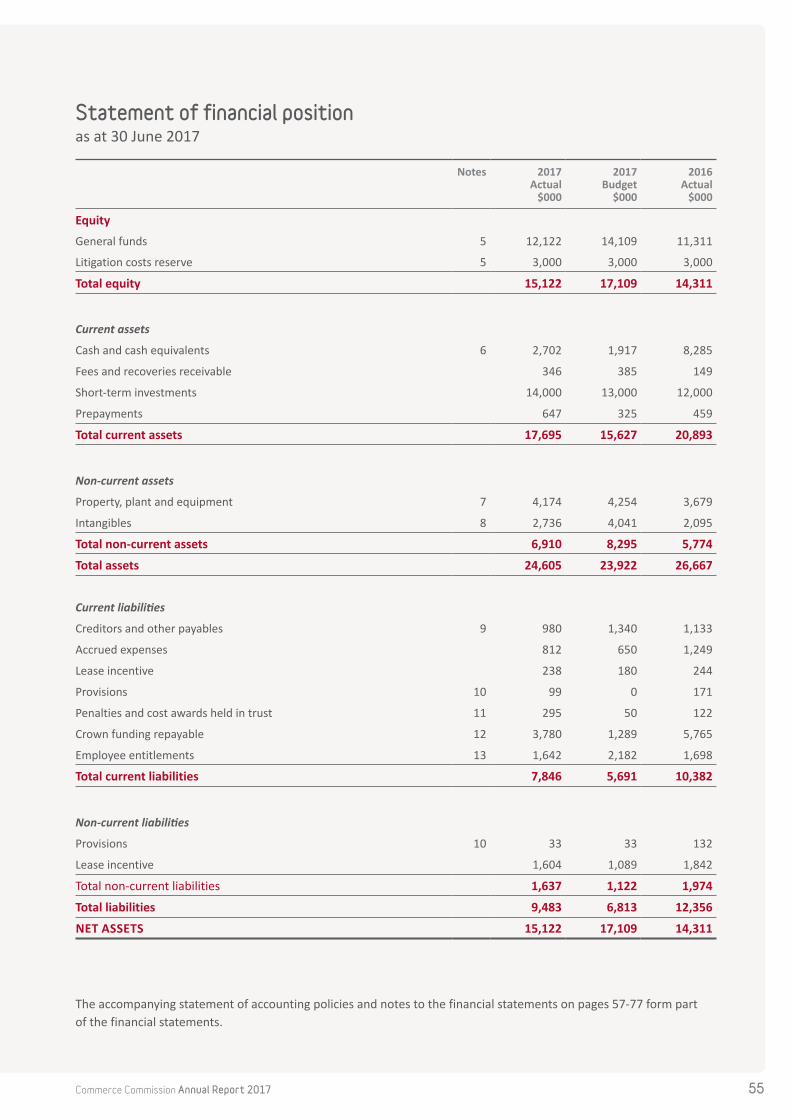
Commerce Commission Annual Report 2017 55
Statement of financial position as at 30 June 2017
Notes 2017 Actual
$000
2017 Budget
$000
2016Actual
$000
EquityGeneral funds 5 12,122 14,109 11,311
Litigation costs reserve 5 3,000 3,000 3,000
Total equity 15,122 17,109 14,311
Current assets
Cash and cash equivalents 6 2,702 1,917 8,285
Fees and recoveries receivable 346 385 149
Short-term investments 14,000 13,000 12,000
Prepayments 647 325 459
Total current assets 17,695 15,627 20,893
Non-current assets
Property, plant and equipment 7 4,174 4,254 3,679
Intangibles 8 2,736 4,041 2,095
Total non-current assets 6,910 8,295 5,774
Total assets 24,605 23,922 26,667
Current liabilities
Creditors and other payables 9 980 1,340 1,133
Accrued expenses 812 650 1,249
Lease incentive 238 180 244
Provisions 10 99 0 171
Penalties and cost awards held in trust 11 295 50 122
Crown funding repayable 12 3,780 1,289 5,765
Employee entitlements 13 1,642 2,182 1,698
Total current liabilities 7,846 5,691 10,382
Non-current liabilities
Provisions 10 33 33 132
Lease incentive 1,604 1,089 1,842
Total non-current liabilities 1,637 1,122 1,974
Total liabilities 9,483 6,813 12,356
NET ASSETS 15,122 17,109 14,311
The accompanying statement of accounting policies and notes to the financial statements on pages 57-77 form part of the financial statements.

Commerce Commission Annual Report 201756
Statement of cash flows for the year ended 30 June 2017
Notes 2017 Actual
$000
2017 Budget
$000
2016Actual
$000
Cash flows from operating activities
Crown funding received 45,202 45,553 43,099
Fees and recoveries received 800 786 3,285
Receipts and payment of penalties (net) 192 0 (300)
Interest received 603 800 1,037
Member and employee payments (26,545) (28,806) (27,635)
Supplier payments (11,812) (15,486) (10,843)
Repayment of Crown funding (8,765) (1,027) (3,870)
Goods and services tax (net) (15) 19 (199)
Net cash inflow from operating activities 14 (340) 1,839 4,574
Cash flows from investing activities
Investments receipts/(deposits) (2,000) 2,000 7,000
Property, plant and equipment sale proceeds (9) 0 (5)
Property, plant and equipment purchases (1,892) (2,234) (2,329)
Intangible asset purchases (1,342) (2,595) (760)
Net cash inflow/(outflow) from investing activities (5,243) (2,829) 3,906
Cash flows from financing activities
Reserves returned to the Crown 0 0 (3,000)
Net cash (outflow) from financing activities 0 0 (3,000)
Net increase/(decrease) in cash and cash equivalents (5,583) (990) 5,480
Opening cash and cash equivalents 8,285 2,907 2,805
CLOSING CASH AND CASH EQUIVALENTS 6 2,702 1,917 8,285
The GST (net) component of operating activities reflects the net GST paid and received from the Inland Revenue Department (IRD). We have presented the GST component on a net basis, as the gross amounts do not provide meaningful information for financial statement purposes.
We have presented receipts and payment of penalties and cost awards as a net item because the Commission holds these funds in trust in accordance with agreements.
The accompanying statement of accounting policies and notes to the financial statements on pages 57-77 form part of the financial statements.

Commerce Commission Annual Report 2017 57
Statement of accounting policiesfor the year ended 30 June 2017
Reporting entityThe Commerce Commission is a Crown entity (as defined by the Crown Entities Act 2004), established under the Commerce Act 1986, and operating solely within New Zealand. The ultimate parent of the Commission is the New Zealand Crown.
The Commission’s main objective is to provide services to the New Zealand public, instead of making a financial return. We provide public services to meet our responsibilities under the Commerce Act 1986, the Fair Trading Act 1986, the Dairy Industry Restructuring Act 2001, the Telecommunications Act 2001 and the Credit Contracts and Consumer Finance Act 2003.
We are a public sector public benefit entity (PBE) for the purposes of the Accounting Standards Framework issued by the New Zealand External Reporting Board, because we are a public entity as defined in the Public Audit Act 2001.
Measurement base and statement of complianceWe have prepared these financial statements to comply with the requirements of the Crown Entities Act. We prepared these financial statements on a historical cost basis for a going concern to comply with New Zealand Generally Accepted Accounting Practice (GAAP). The Commission authorised the financial statements for issue on 31 October 2017.
The financial statements have been prepared in accordance and comply with Tier 1 PBE accounting standards.
Functional and presentation currencyThe Commission’s functional currency is the New Zealand dollar, so we have presented these financial statements in New Zealand dollars (rounded to the nearest thousand).
Significant accounting policiesWe have applied the accounting policies that significantly affect the measurement of comprehensive revenue and expenditure, financial position and cash flows consistently for all reporting periods covered by these financial statements, including the comparative (prior year and budget) information. These are the significant accounting policies:
Revenue – Revenue is measured at the fair value of consideration (eg, money) received or receivable. We earn revenue from providing specific services (known as outputs) for the Crown, for services to other third parties, court cost award recoveries and interest revenue.
Crown revenue – The Commission receives funding via appropriations from the Crown. Crown revenue is a form of non-exchange transaction, because there is no direct relationship between the services we provide (funded through taxation and levies) and the general public we ultimately provide the services to. Our funding is restricted in its use for the purpose of meeting the Commission’s objectives and the scope of the relevant appropriations. Crown revenue we receive but do not spend is refunded to the Crown after year end for all output classes except Vote Business, Science and Innovation – General Markets, which the Commission is allowed to retain as reserves. Also, we may retain specific ring-fenced revenue provided to build up our ability to meet the cost of adverse cost awards.
Revenue from the Crown is initially recognised as a liability when received, and then as revenue when we have provided services which entitle us to the funding.
Expenditure – All expenditure we incur in providing services for the Crown or other third parties is recognised in the statement of comprehensive revenue and expense when an obligation to pay arises on an accruals basis.
Foreign currency transactions – Transactions in foreign currencies are converted into the Commission’s functional currency (New Zealand Dollars) at exchange rates on the dates of the transactions. Monetary liabilities in foreign

Commerce Commission Annual Report 201758
currencies at the reporting date are converted to New Zealand Dollars at the exchange rate on that date.
Leases – The Commission is party to various operating leases as a lessee. As the lessors retain substantially all of the risk and rewards of ownership of the leased property, plant and equipment, the operating lease payments are recognised as expenses only in the period in which they arise. Any lease incentives received or obligations to reinstate the condition of leased premises are recognised in the statement of comprehensive revenue and expense over the term of the lease. At balance date, we recognise any unamortised lease incentive and outstanding obligation for reinstatement as a liability.
Depreciation and impairment – Depreciation (and amortisation for intangible assets) is provided on a straight-line basis on all assets to allocate the cost of the asset (less any estimated residual value) over its useful life. The residual values and remaining useful lives of property, plant and equipment components are reviewed at least annually. All property, plant and equipment are subject to an annual test of impairment to test the recoverable amount. Any impairment losses are recorded as an expense in the period in which they are first identified. The estimated useful lives of the major asset classes are:
Taxation – The Commission is exempt from income tax under section CW 38 of the Income Tax Act 2007.
Cost allocation – Direct costs are charged directly to outputs. Personnel costs are allocated to outputs based on time records. The indirect costs of support groups, and corporate overhead costs are charged to outputs based on the budgeted relative time records of each output.
Goods and services tax (GST) – All items in the financial statements are presented exclusive of GST, except for receivables, payables, and unearned Crown revenue received in advance, which are presented on a GST-inclusive basis. Where we cannot claim a portion of GST, we recognise the GST portion as part of the related asset or expense.
The net GST recoverable from, or payable to, the IRD is included as part of receivables or creditors in the statement of financial position, and classified as an operating cash flow in the statement of cash flows.
Equity – Equity is the Crown’s ownership interest in the Commission and is measured as the difference between total assets and total liabilities. We have classified equity into components and disclosed these separately to allow clearer recognition of the specified uses that we have for our equity.
Cash and cash equivalents – Cash and cash equivalents are our cash on hand, transactional cash balances in bank accounts, and some term deposits with maturities of less than 90 days held with New Zealand registered banks.
Investments – Investments are term deposits issued by New Zealand registered banks with maturities of more than 90 days. Loans and receivables are initially measured at the amount invested. After initial recognition, investments are re-measured at amortised cost using the effective interest rate method.
Property, plant and equipment – All items of property, plant and equipment owned are recorded at historical cost of purchase, less accumulated depreciation and any impairment losses. An item of property, plant and equipment acquired in stages is not depreciated until the item of property, plant and equipment is in its final state and ready for its intended use. Any later expenditure that extends the useful life or enhances the service potential of an existing item of property, plant and equipment is also capitalised and depreciated.
All other costs we incur in maintaining the useful life or service potential of an existing item of property, plant and equipment are recognised as expenditure when incurred. Any gain or loss arising from the sale or disposal of an item
Computer and office equipment 3-4 years
Furniture and fittings Up to 5 years
Leasehold improvements For the period of the lease
Motor vehicles Up to 5 years
Software and other intangible assets Up to 5 years
The estimated useful lives of the major asset classes are:

Commerce Commission Annual Report 2017 59
of property, plant and equipment is recognised in the period in which the item of property, plant and equipment is sold or disposed of.
Intangible assets – Computer software that is not integral to the operation of the hardware is recorded as an intangible asset, less accumulated amortisation.
Employee entitlements – Employee entitlements are unpaid salaries, bonuses, and annual leave which we owe to our personnel. At balance date, any unpaid employee entitlements are recognised as a liability and charged as an expense. Entitlements are calculated on an actual entitlement basis using current salary rates.
Contingencies – As the Commission is a quasi-judicial body, it is engaged in litigation activity which may result in costs being ordered against or in favour of the Commission. The outcome of an order for costs may not be certain until all appeal processes are completed. Therefore, the possibility of a costs award being incurred or received is disclosed firstly as either a contingent liability or contingent asset respectively. An award for costs, whether for or against the Commission, is only recognised in the statement of comprehensive revenue and expense when it is probable that there will be a payment or receipt of resources (eg, cash) and we can measure the amount reliably.
Comparatives – To ensure consistency with the current year, all comparative information including the budget has been restated or reclassified where appropriate. The budget comparatives are those approved by the Commission at the beginning of the year for inclusion as prospective financial statements in our statement of performance expectations. We prepared the budget to comply with GAAP, and used accounting policies consistent with what we have used to prepare these financial statements.
Changes in accounting policiesThe accounting policies adopted are consistent with the previous year.
Changes to applicable reporting standards and interpretationsDuring 2017, the XRB issued:
→ the PBE Conceptual Framework, which is an Authoritative Notice that replaces the existing PBE Framework. The Conceptual Framework establishes the concepts that support financial reporting by public benefit entities, and is effective for reporting periods beginning on or after 1 January 2017. We will apply the Conceptual Framework (together with consequential amendments to standards) in our next set of financial statements. There will be no changes to accounting policies as a result of applying the new Conceptual Framework
→ the 2016 Omnibus Amendments to PBE Standards. These amendments apply to PBEs with reporting periods beginning on or after 1 January 2017, making a series of minor amendments and clarifications of existing requirements, mainly to amend the standard suite so it uses the same language found in the new PBE Conceptual Framework. We will apply these amendments in our next set of financial statements. There will be no effect on our accounts in applying these amendments
→ the Approved Budget Amendments to PBE IPSAS 1, which amends PBE IPSAS 1 Presentation of Financial Statements by removing references to a term defined in a standard not issued in New Zealand and replaces it with references to prospective financial statements. These amendments apply to PBEs with reporting periods beginning on or after 1 January 2018, with early application permitted. We will apply these amendments in our next set of financial statements. There will be no effect on our accounts in applying these amendments
→ PBE IFRS 9 Financial Instruments, which establishes principles for recognising and measuring financial assets, financial liabilities, and some contracts to buy or sell non-financial items. The standard is effective from reporting periods beginning on or after 1 January 2021, with early application permitted. We have not yet assessed the effect of applying the new standard on our accounts, and expect to adopt this standard in line with the wider government sector
→ PBE IPSAS 38 Employee Benefits, which replaces the current PBE IPSAS 25 Employee Benefits standard for reporting periods beginning on or after 1 January 2019, with early adoption permitted. The accounting and disclosure requirements of the new standard are substantially the same as the current standard and we do not expect any major effect on our accounts, but we have not yet completed a full assessment of any effect from applying the new standard. At this stage we do not expect to apply the new standard early.
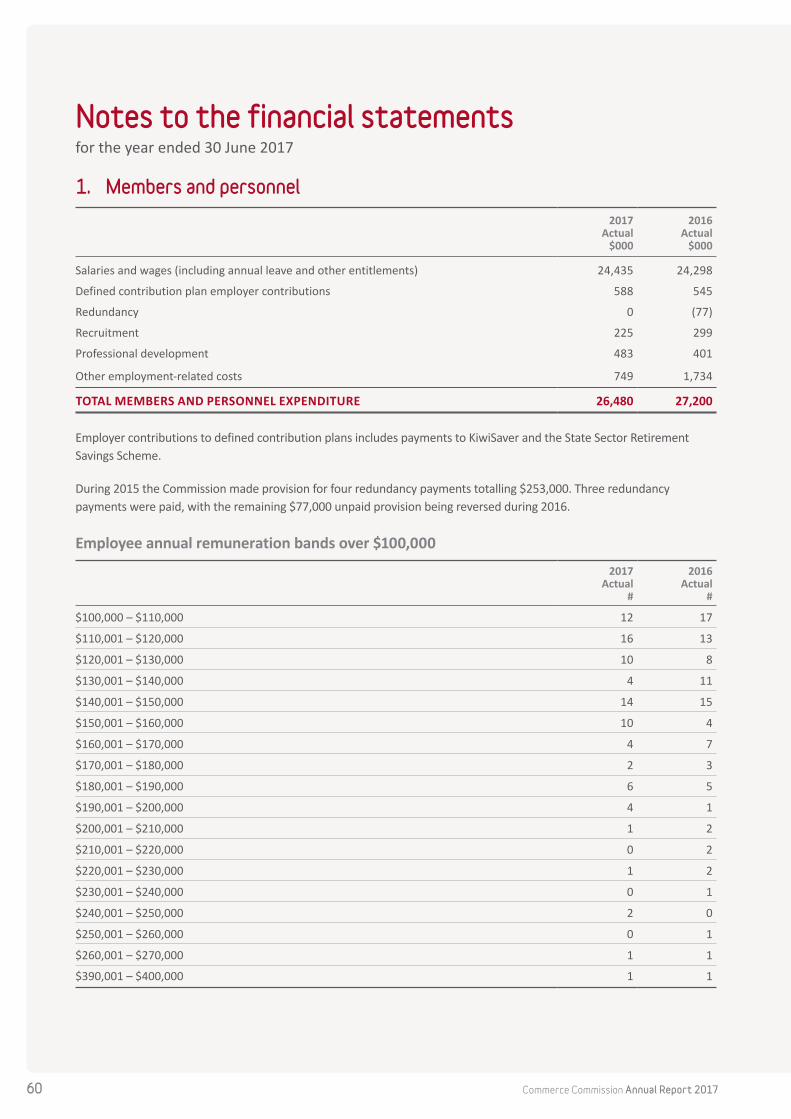
Commerce Commission Annual Report 201760
Notes to the financial statementsfor the year ended 30 June 2017
1. Members and personnel
2017 Actual
$000
2016Actual
$000
Salaries and wages (including annual leave and other entitlements) 24,435 24,298
Defined contribution plan employer contributions 588 545
Redundancy 0 (77)
Recruitment 225 299
Professional development 483 401
Other employment-related costs 749 1,734
TOTAL MEMBERS AND PERSONNEL EXPENDITURE 26,480 27,200
Employer contributions to defined contribution plans includes payments to KiwiSaver and the State Sector Retirement Savings Scheme.
During 2015 the Commission made provision for four redundancy payments totalling $253,000. Three redundancy payments were paid, with the remaining $77,000 unpaid provision being reversed during 2016.
Employee annual remuneration bands over $100,000
2017 Actual
#
2016Actual
#
$100,000 – $110,000 12 17
$110,001 – $120,000 16 13
$120,001 – $130,000 10 8
$130,001 – $140,000 4 11
$140,001 – $150,000 14 15
$150,001 – $160,000 10 4
$160,001 – $170,000 4 7
$170,001 – $180,000 2 3
$180,001 – $190,000 6 5
$190,001 – $200,000 4 1
$200,001 – $210,000 1 2
$210,001 – $220,000 0 2
$220,001 – $230,000 1 2
$230,001 – $240,000 0 1
$240,001 – $250,000 2 0
$250,001 – $260,000 0 1
$260,001 – $270,000 1 1
$390,001 – $400,000 1 1
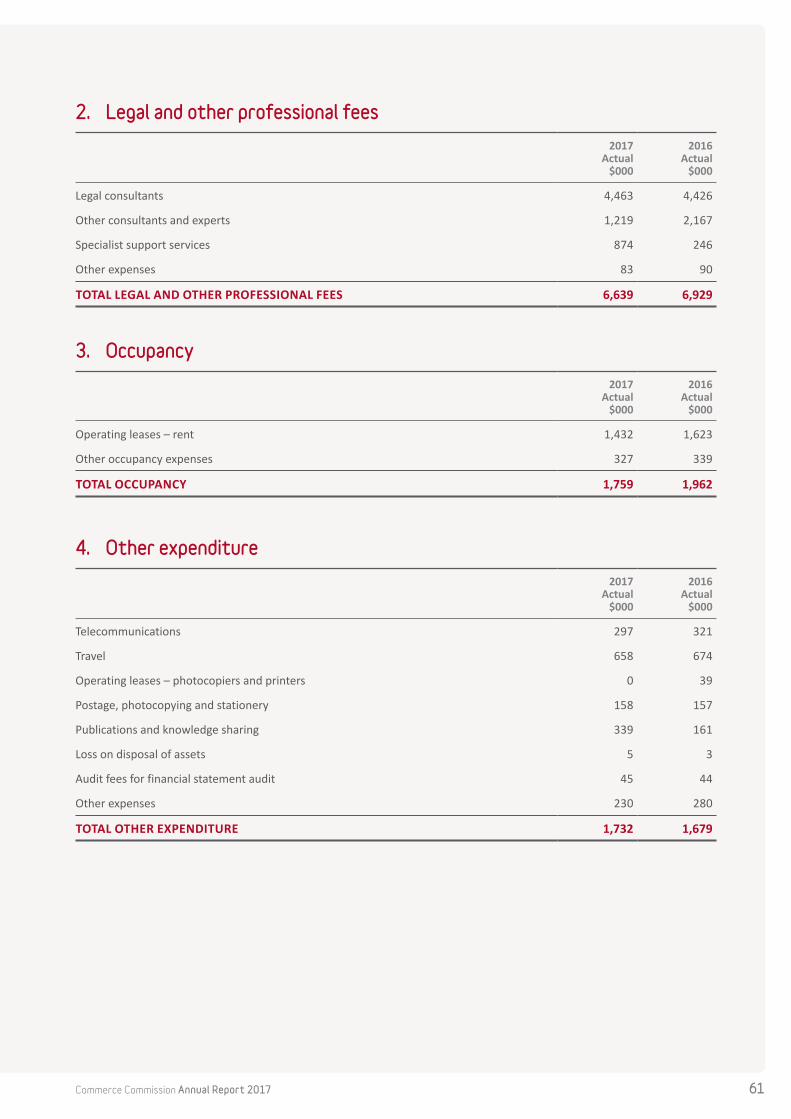
Commerce Commission Annual Report 2017 61
2. Legal and other professional fees
2017 Actual
$000
2016Actual
$000
Legal consultants 4,463 4,426
Other consultants and experts 1,219 2,167
Specialist support services 874 246
Other expenses 83 90
TOTAL LEGAL AND OTHER PROFESSIONAL FEES 6,639 6,929
3. Occupancy
2017 Actual
$000
2016Actual
$000
Operating leases – rent 1,432 1,623
Other occupancy expenses 327 339
TOTAL OCCUPANCY 1,759 1,962
4. Other expenditure
2017 Actual
$000
2016Actual
$000
Telecommunications 297 321
Travel 658 674
Operating leases – photocopiers and printers 0 39
Postage, photocopying and stationery 158 157
Publications and knowledge sharing 339 161
Loss on disposal of assets 5 3
Audit fees for financial statement audit 45 44
Other expenses 230 280
TOTAL OTHER EXPENDITURE 1,732 1,679

Commerce Commission Annual Report 201762
5. EquityThe Commission’s total comprehensive revenue and expenses for the year of $0.811 million (2016: $0.134 million) flows to both our general funds and our litigation costs reserve. The respective increase or decrease in both reserves equal the Commission’s total comprehensive revenue and expense for the year.
General funds
2017 Actual
$000
2016Actual
$000
Balance at 1 July 11,311 14,588
Total comprehensive revenue and expense attributable 811 (277)
Return of reserves to the Crown 0 (3,000)
BALANCE AT 30 JUNE 12,122 11,311
The Commission’s general funds are funds held in reserve as a result of past surpluses in certain output classes, plus an initial capital contribution from the Crown. The Commission is allowed to retain surpluses from our competition and consumer output class.
Litigation costs reserve
2017 Actual
$000
2016Actual
$000
Balance at 1 July 3,000 2,589
Total comprehensive revenue and expense attributable 0 411
BALANCE AT 30 JUNE 3,000 3,000
The Commission undertakes major litigation for alleged breaches of legislation, and also defends regulations and rulings it sets under the Acts it administers. The litigation costs reserve is a contingency fund established to manage the impact of adverse cost awards from these cases. The Commission receives up to $0.5 million in funding per year to build a contingency fund of up to $3.0 million to help meet adverse cost awards. The Commission offsets this funding against any adverse cost awards it must pay to other parties during the year.
During the year the Commission did not have to pay any adverse cost awards (2016: the Commission did not have to pay any adverse cost awards). As the fund has reached its $3.0 million cap, there was no change in the total of the litigation costs reserve (2016: $0.411 million increase).

Commerce Commission Annual Report 2017 63
6. Cash and cash equivalents
2017 Actual
$000
2016Actual
$000
Cash on hand and at bank 2,415 8,166
Cash held in trust 287 119
TOTAL CASH AND CASH EQUIVALENTS 2,702 8,285
The Commission holds unspent Crown funding received, which is subject to restrictions on how it may be spent, and when. We also hold cost awards in trust, a portion of which is payable to the Crown or Commission, while a further portion is held in trust for various parties. As part of the Commission’s financial management, portions of these funds may be placed on term deposit or held as cash at bank. See notes 11 and 12 for the relevant amounts.
7. Property, plant and equipmentCost and valuation:
Computer and office equipment
$000
Furniture and fittings
$000
Leasehold improvements
$000
Motor vehicles
$000
Total
$000
Balance at 1 July 2015 2,260 882 1,714 45 4,901
Additions 205 481 2,692 0 3,378
Disposals (666) (489) (20) 0 (1,175)
BALANCE AT 30 JUNE 2016 1,799 874 4,386 45 7,104
Computer and office equipment
$000
Furniture and fittings
$000
Leasehold improvements
$000
Motor vehicles
$000
Total
$000
Balance at 1 July 2016 1,799 874 4,386 45 7,104
Additions 518 252 652 29 1,451
Disposals (214) (121) (1,501) (23) (1,859)
BALANCE AT 30 JUNE 2017 2,103 1,005 3,537 51 6,696
Property, plant and equipment not yet commissioned at 30 June 2017 totalled $Nil (2016: $696,000, comprising $692,000 of leasehold improvements and $4,000 of furniture and fittings).

Commerce Commission Annual Report 201764
Depreciation and impairment losses:
Computer and office equipment
$000
Furniture and fittings
$000
Leasehold improvements
$000
Motor vehicles
$000
Total
$000
Balance at 1 July 2015 1,630 815 1,574 31 4,050
Depreciation expense 327 53 159 4 543
Elimination on disposal (660) (488) (20) 0 (1,168)
BALANCE AT 30 JUNE 2016 1,297 380 1,713 35 3,425
Computer and office equipment
$000
Furniture and fittings
$000
Leasehold improvements
$000
Motor vehicles
$000
Total
$000
Balance at 1 July 2016 1,297 380 1,713 35 3,425
Depreciation expense 372 157 416 5 950
Elimination on disposal (212) (121) (1,497) (23) (1,853)
BALANCE AT 30 JUNE 2017 1,457 416 632 17 2,522
Carrying amounts:
Computer and office equipment
$000
Furniture and fittings
$000
Leasehold improvements
$000
Motor vehicles
$000
Total
$000
At 1 July 2015 630 67 140 14 851
At 30 June and 1 July 2016 502 494 2,673 10 3,679
AT 30 JUNE 2017 646 589 2,905 34 4,174
There is no restriction over the title of the Commission’s assets. No property, plant and equipment assets are pledged as security for liabilities.
8. IntangiblesCost:
TSLRIC models
$000
Acquired software
$000
Total
$000
Balance at 1 July 2015 1,544 1,994 3,538
Additions 361 399 760
BALANCE AT 30 JUNE 2016 1,905 2,393 4,298
TSLRIC models
$000
Acquired software
$000
Total
$000
Balance at 1 July 2016 1,905 2,393 4,298
Additions 0 1,252 1,252
Disposals 0 (112) (112)
BALANCE AT 30 JUNE 2017 1,905 3,533 5,438
Intangible assets not yet commissioned at 30 June 2017 totalled $Nil (2016: $362,000 for acquired software).

Commerce Commission Annual Report 2017 65
Accumulated amortisation and impairment losses:
TSLRIC models
$000
Acquired software
$000
Total
$000
Balance at 1 July 2015 0 1,774 1,774
Amortisation expense 277 152 429
Disposals 0 0 0
BALANCE AT 30 JUNE 2016 277 1,926 2,203
TSLRIC models
$000
Acquired software
$000
Total
$000
Balance at 1 July 2016 277 1,926 2,203
Amortisation expense 476 134 610
Disposals 0 (111) (111)
BALANCE AT 30 JUNE 2017 753 1,949 2,702
Carrying amounts:
TSLRIC models
$000
Acquired software
$000
Total
$000
At 1 July 2015 1,544 220 1,764
At 30 June and 1 July 2016 1,628 467 2,095
AT 30 JUNE 2017 1,152 1,584 2,736
The Commission holds licenses for use of certain software applications for which it does not hold title. For other software applications, there is no restriction over the title of the Commission’s assets. No intangible assets are pledged as security for liabilities.
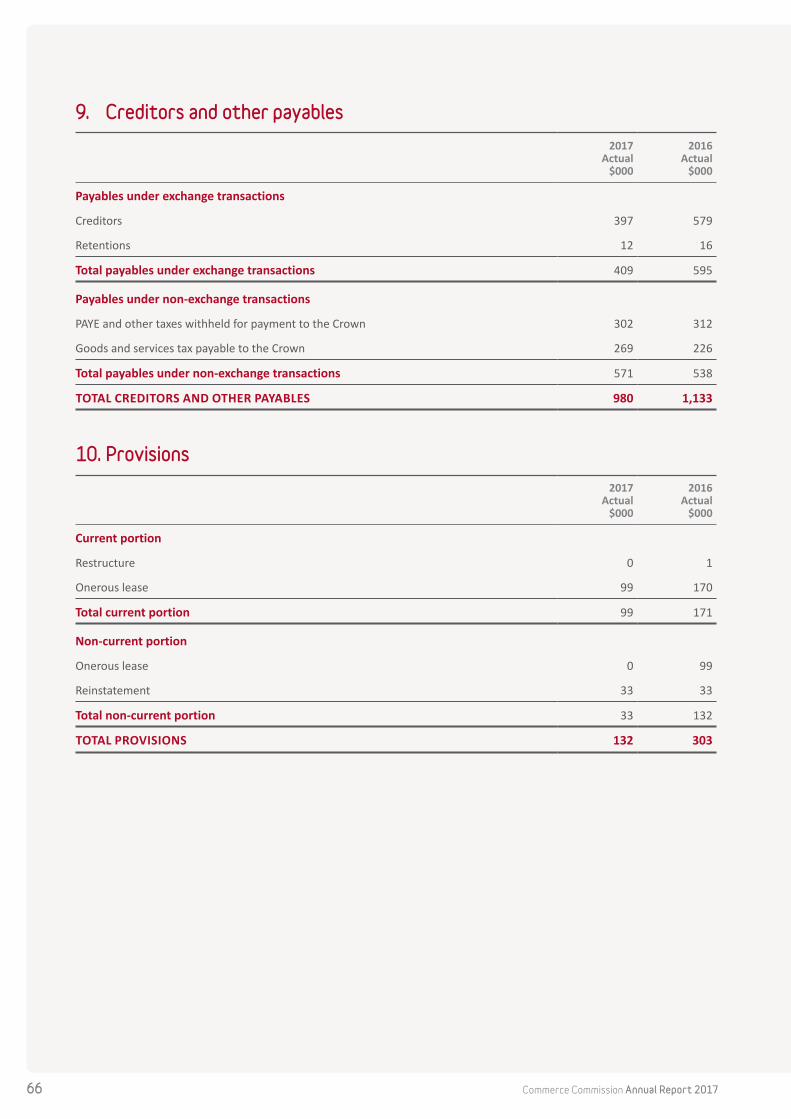
Commerce Commission Annual Report 201766
9. Creditors and other payables
2017 Actual
$000
2016Actual
$000
Payables under exchange transactions
Creditors 397 579
Retentions 12 16
Total payables under exchange transactions 409 595
Payables under non-exchange transactions
PAYE and other taxes withheld for payment to the Crown 302 312
Goods and services tax payable to the Crown 269 226
Total payables under non-exchange transactions 571 538
TOTAL CREDITORS AND OTHER PAYABLES 980 1,133
10. Provisions
2017 Actual
$000
2016Actual
$000
Current portion
Restructure 0 1
Onerous lease 99 170
Total current portion 99 171
Non-current portion
Onerous lease 0 99
Reinstatement 33 33
Total non-current portion 33 132
TOTAL PROVISIONS 132 303
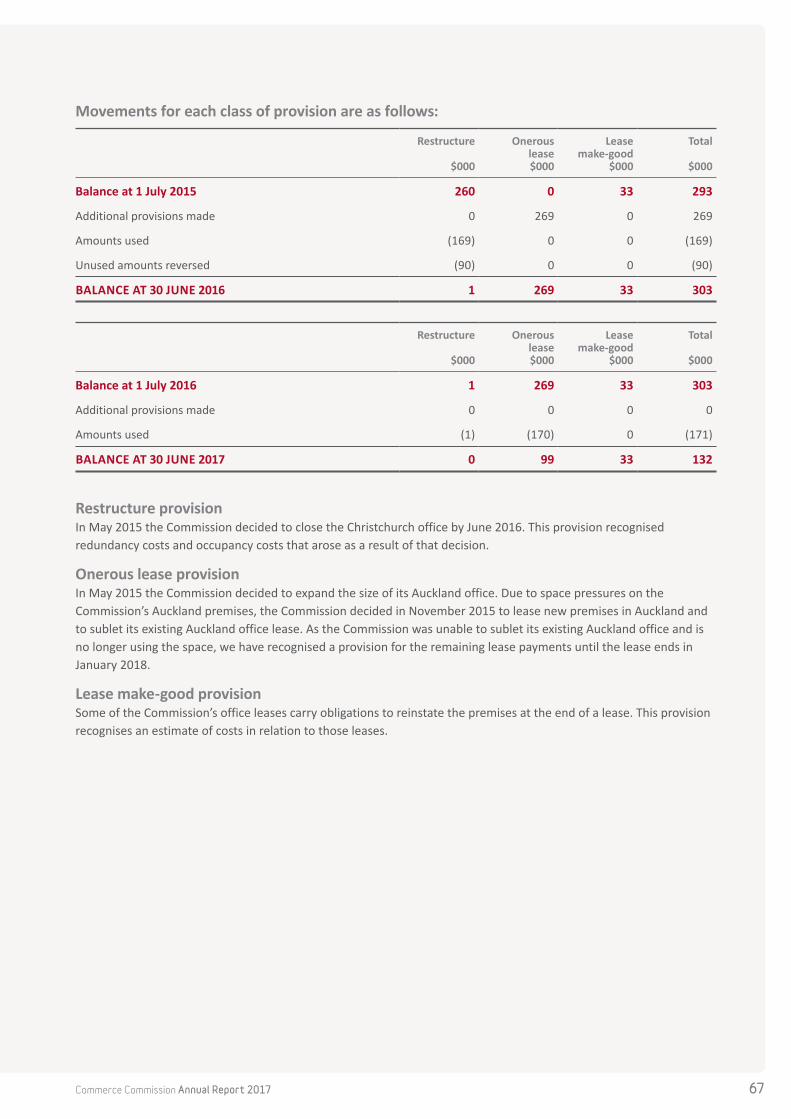
Commerce Commission Annual Report 2017 67
Movements for each class of provision are as follows:
Restructure
$000
Onerous lease $000
Lease make-good
$000
Total
$000
Balance at 1 July 2015 260 0 33 293
Additional provisions made 0 269 0 269
Amounts used (169) 0 0 (169)
Unused amounts reversed (90) 0 0 (90)
BALANCE AT 30 JUNE 2016 1 269 33 303
Restructure
$000
Onerous lease $000
Lease make-good
$000
Total
$000
Balance at 1 July 2016 1 269 33 303
Additional provisions made 0 0 0 0
Amounts used (1) (170) 0 (171)
BALANCE AT 30 JUNE 2017 0 99 33 132
Restructure provisionIn May 2015 the Commission decided to close the Christchurch office by June 2016. This provision recognised redundancy costs and occupancy costs that arose as a result of that decision.
Onerous lease provisionIn May 2015 the Commission decided to expand the size of its Auckland office. Due to space pressures on the Commission’s Auckland premises, the Commission decided in November 2015 to lease new premises in Auckland and to sublet its existing Auckland office lease. As the Commission was unable to sublet its existing Auckland office and is no longer using the space, we have recognised a provision for the remaining lease payments until the lease ends in January 2018.
Lease make-good provisionSome of the Commission’s office leases carry obligations to reinstate the premises at the end of a lease. This provision recognises an estimate of costs in relation to those leases.

Commerce Commission Annual Report 201768
11. Penalties and cost awards held in trust
2017 Actual
$000
2016Actual
$000
Balance at the beginning of the year 122 554
Court cost awards compensation received (or recognised as receivable), and interest earned 260 719
Penalties received and paid to the Crown (net) 0 0
Infringement fees received (or receivable) and paid to the Crown (net) 7 (1)
Court cost awards, compensation, and interest paid out (94) (1,150)
BALANCE AT THE END OF THE YEAR 295 122
Penalties and cost awards held in trust are civil penalties and cost awards received by the Commission but payable to another party. This is generally the Crown, but can also be compensation received for third parties, or civil penalties and cost awards held in trust while a litigation case continues. The Commission may also be entitled to a portion of court cost awards received. The Commission is not entitled to any of the penalties received, but acts as an agent for the Crown in collecting and forwarding the penalties received.
Infringement fees are issued to various parties for breaches of legislation we enforce. The Crown receives the proceeds of the infringements issued. Any Fair Trading Act infringements unpaid after a certain length of time are transferred to the Ministry of Justice for collection. Infringements issued under the Telecommunications Act 2001 are collected by the Commission.
The Commission receives cost awards and compensation for third parties through our investigations and litigation activities. Cost awards are split between the Crown and the Commission, in proportion to the funding each contributes to the costs of pursuing the investigation or litigation. This split occurs once the investigation or litigation is complete and we know the total cost of the case. Interest is earned and paid on all cost awards and settlements received.
Components of penalties and cost awards held in trust:
2017 Actual
$000
2016Actual
$000
Infringement fees due to the Crown (including receivable) 20 13
Court cost awards and compensation due to Crown or other parties 275 109
BALANCE AT THE END OF THE YEAR 295 122
In general, penalties received by the Commission must be paid to the Crown within 7 days of receipt, unless the penalties received are subject to an arrangement while litigation continues.
Where there are cases involving a number of parties, we can receive settlements from some parties while others continue to defend. As a result, we are unable to reliably estimate what amount of total cost awards or settlements are due to the Crown, as this estimate can change substantially as the case progresses. In these situations, the Commission records a provision for the cost awards due to the Commission or the Crown which equals any cost awards received for that case. Once a case is finished and we know the total cost of the case and funds to distribute, we recognise the amount receivable by us and the remainder becomes a payable due to the Crown, instead of a provision.
If we receive compensation settlements to pay to a number of third parties (eg, customers of a business we investigate), we recognise the whole amount as a payable to third parties when we receive the settlement.
Infringement fees are paid to the Crown every 4 months, after receipt.

Commerce Commission Annual Report 2017 69
12. Crown funding repayable
2017 Actual
$000
2016Actual
$000
Airports 325 0
Dairy 338 456
Electricity 663 314
Gas 419 91
Input methodologies 41 0
Telecommunications 669 578
Litigation fund 1,325 4,326
TOTAL CROWN FUNDING REPAYABLE 3,780 5,765
13. Employee entitlements
2017 Actual
$000
2016Actual
$000
Accrued salaries and wages 178 81
Annual leave 1,152 1,270
Accrued performance and at-risk incentives 312 347
TOTAL EMPLOYEE ENTITLEMENTS 1,642 1,698

Commerce Commission Annual Report 201770
14. Reconciliation of operating surplus for the year to net cash inflows from operating activities
2017 Actual
$000
2016Actual
$000
Operating surplus for the year 811 134
Plus non-cash items:
Depreciation and amortisation 1,560 972
Loss on sale of property, plant and equipment 5 3
Lease incentives recognised (244) (142)
Restructuring provision (1) (259)
Onerous lease provision (170) 269
Employee entitlements (56) 77
Total non-cash items 1,094 920
Plus change in working capital items:
Fees and recoveries receivable (219) 506
Prepayments 22 (38)
Creditors (1,985) 180
Accrued expenses 14 (160)
Lease incentives received 0 1,591
Crown revenue receivable 22 (22)
Crown funding repayable (1,985) 1,895
Penalties and cost awards held in trust 173 (432)
Total change in working capital items (2,245) 3,520
NET CASH INFLOWS FROM OPERATING ACTIVITIES (340) 4,574

Commerce Commission Annual Report 2017 71
15. Critical accounting judgements and estimatesIn authorising these financial statements for issue, the Commission has ensured that:
→ we have disclosed the specific accounting policies needed to properly understand these financial statements
→ all of our adopted accounting policies are appropriate for our activities
→ our accounting policies were applied consistently throughout the year.
When applying the accounting policies, the Commission is required to make certain judgements and estimates. The Commission has considered the following critical judgements and estimates to be appropriate.
ContingenciesThe Commission is party to several significant litigation cases and appeals as a result of its enforcement and quasi-judicial role. In undertaking significant litigation the Commission is faced with the risk of losing, and as a result having to pay a multi-million dollar cost award.
The Commission has assessed the likelihood of the appeals being successful and of costs being awarded against, or in favour of, the Commission.
Cost awards that are likely to result in a future receipt or payment of cost awards have been recognised as at 30 June 2017 in the statement of comprehensive revenue and expense. The Commission has also disclosed its contingent liabilities and assets as a result of cost awards that may possibly result in a future receipt or payment of costs as at 30 June 2017 (see note 16). We continue to monitor all our current litigation cases, and assess whether they give rise to contingent liabilities or assets.
16. Contingent liabilities and assetsContingent liabilities as at 30 June 2017:There are no contingent liabilities.
Contingent liabilities as at 30 June 2016:There were no contingent liabilities.
Contingent assets as at 30 June 2017:There are no contingent assets.
Contingent assets as at 30 June 2016:Godfrey Hirst AppealIn November 2015, the Commission issued its final determination approving Cavalier Wool Holdings’ application to acquire New Zealand Wool Services International’s wool scouring business and assets.
Godfrey Hirst appealed against the determination seeking to have the Commission’s determination overturned. The Commission disclosed a contingent asset for costs.
In June 2016, the High Court made a decision which rejected Godfrey Hirst’s appeal. Godfrey Hirst appealed the High Court decision to the Court of Appeal. In November 2016 the Court of Appeal dismissed Godfrey Hirst’s appeal against earlier decisions by the Commerce Commission and the High Court.
In the 2016 Annual Report, the Commission disclosed a contingent asset for court awarded costs.

Commerce Commission Annual Report 201772
Real Estate Fees and Livestock Scanning FeesThe Commission commenced separate proceedings against a number of parties alleging price fixing arrangements in various real estate and livestock scanning markets. We had reached agreements in principle to settle with several parties in these proceedings, which if approved by the Courts would result in the awarding of penalties to the Crown and also some small awards of costs in the Commission’s favour. A contingent asset was recorded in the 2016 in relation to these.
As the agreements and amounts were confidential and other parties continued to defend their positions, we could not provide further detail in last year’s annual report.
A number of parties have paid penalties or agreed settlement in relation to the Real Estate Fees cases. The remaining defendants went to trial in September 2017.
All parties have now settled in the Livestock Scanning Fees case.
17. Financial instrumentsThe carrying amounts of each class of financial assets and liabilities are:
Monetary assets:
2017 Actual
$000
2016Actual
$000
Loans and receivables
Cash and cash equivalents 2,702 8,285
Fees and recoveries receivable 346 149
Short-term investments 14,000 12,000
TOTAL MONETARY ASSETS 17,048 20,434
Monetary liabilities:
2017 Actual
$000
2016Actual
$000
Financial liabilities measured at amortised cost
Creditors 980 1,133
Penalties and cost awards held in trust 295 122
Crown revenue repayable 3,870 5,765
TOTAL MONETARY LIABILITIES 5,145 7,020
Financial instruments include cash and cash equivalents, receivables, investments and payables resulting from day-to-day operations. There are risks inherent with all financial instruments and risk management policies are used to mitigate the exposure to market risk comprising liquidity risk, credit risk, interest rate risk and currency risk.
Liquidity riskLiquidity risk is the risk of not having enough liquid funds (eg, cash) available, leading to difficulty in making debt payments on their due date. As Crown funding is received quarterly in advance, the Commission does not have a material risk in meeting its day-to-day obligations as they fall due.
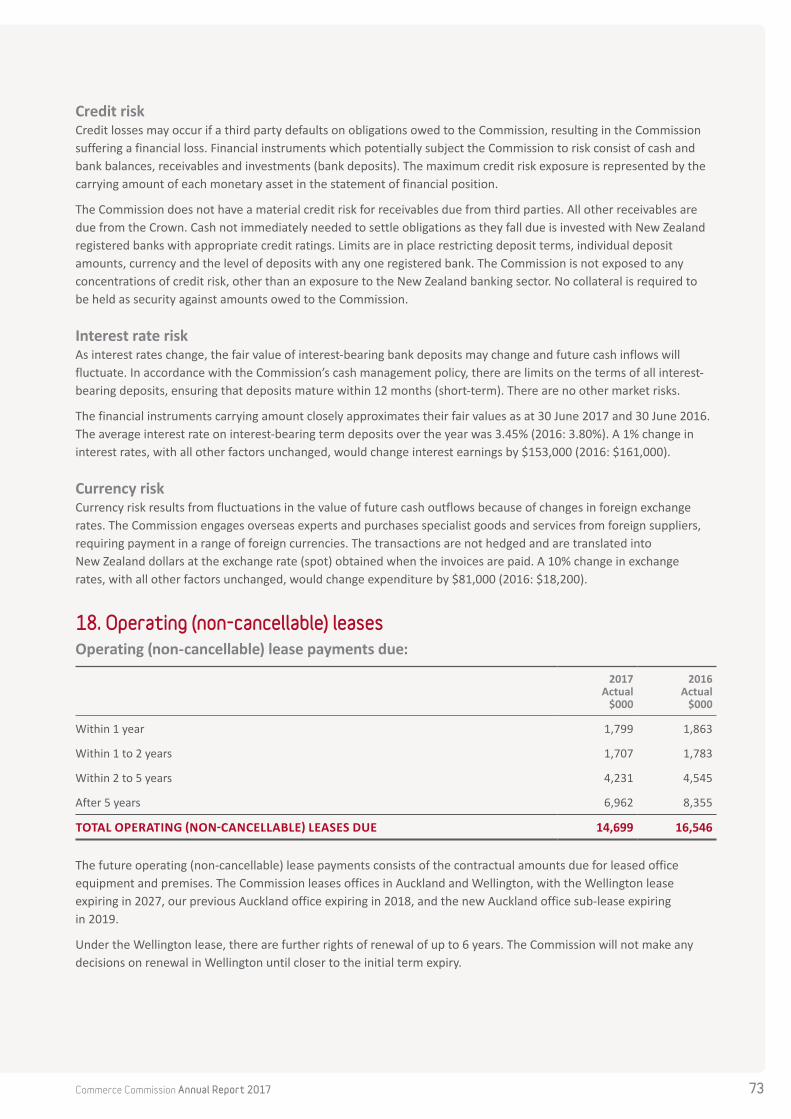
Commerce Commission Annual Report 2017 73
Credit riskCredit losses may occur if a third party defaults on obligations owed to the Commission, resulting in the Commission suffering a financial loss. Financial instruments which potentially subject the Commission to risk consist of cash and bank balances, receivables and investments (bank deposits). The maximum credit risk exposure is represented by the carrying amount of each monetary asset in the statement of financial position.
The Commission does not have a material credit risk for receivables due from third parties. All other receivables are due from the Crown. Cash not immediately needed to settle obligations as they fall due is invested with New Zealand registered banks with appropriate credit ratings. Limits are in place restricting deposit terms, individual deposit amounts, currency and the level of deposits with any one registered bank. The Commission is not exposed to any concentrations of credit risk, other than an exposure to the New Zealand banking sector. No collateral is required to be held as security against amounts owed to the Commission.
Interest rate riskAs interest rates change, the fair value of interest-bearing bank deposits may change and future cash inflows will fluctuate. In accordance with the Commission’s cash management policy, there are limits on the terms of all interest-bearing deposits, ensuring that deposits mature within 12 months (short-term). There are no other market risks.
The financial instruments carrying amount closely approximates their fair values as at 30 June 2017 and 30 June 2016. The average interest rate on interest-bearing term deposits over the year was 3.45% (2016: 3.80%). A 1% change in interest rates, with all other factors unchanged, would change interest earnings by $153,000 (2016: $161,000).
Currency riskCurrency risk results from fluctuations in the value of future cash outflows because of changes in foreign exchange rates. The Commission engages overseas experts and purchases specialist goods and services from foreign suppliers, requiring payment in a range of foreign currencies. The transactions are not hedged and are translated into New Zealand dollars at the exchange rate (spot) obtained when the invoices are paid. A 10% change in exchange rates, with all other factors unchanged, would change expenditure by $81,000 (2016: $18,200).
18. Operating (non-cancellable) leasesOperating (non-cancellable) lease payments due:
2017 Actual
$000
2016Actual
$000
Within 1 year 1,799 1,863
Within 1 to 2 years 1,707 1,783
Within 2 to 5 years 4,231 4,545
After 5 years 6,962 8,355
TOTAL OPERATING (NON-CANCELLABLE) LEASES DUE 14,699 16,546
The future operating (non-cancellable) lease payments consists of the contractual amounts due for leased office equipment and premises. The Commission leases offices in Auckland and Wellington, with the Wellington lease expiring in 2027, our previous Auckland office expiring in 2018, and the new Auckland office sub-lease expiring in 2019.
Under the Wellington lease, there are further rights of renewal of up to 6 years. The Commission will not make any decisions on renewal in Wellington until closer to the initial term expiry.

Commerce Commission Annual Report 201774
19. Capital expenditure commitments
2017 Actual
$000
2016Actual
$000
Property, plant and equipment 0 911
Intangible assets 140 66
TOTAL CAPITAL EXPENDITURE COMMITMENTS 140 977
20. Related party transactionsThe Commission is an Independent Crown Entity, primarily monitored by the Ministry of Business, Innovation, and Employment (MBIE) on behalf of the Minister of Commerce and Consumer Affairs and the Minister for Communications.
We have not disclosed related party transactions with other government entities (eg, Crown entities or government departments) that are related parties, where the transactions are within a normal supplier relationship on normal commercial terms, or normal operating arrangements between government agencies made on the same terms.
There were no other related party transactions during the year (2016: $Nil).
Key management personnel
2017 Actual
$000
2016Actual
$000
Members’ remuneration 2,401 2,353
Senior leadership team remuneration 1,216 1,223
TOTAL KEY MANAGEMENT PERSONNEL REMUNERATION 3,617 3,576
2017Actual
2016Actual
Members’ full-time equivalents 5.75 5.69
Senior Leadership Team full-time equivalents 4 4
TOTAL KEY MANAGEMENT PERSONNEL FULL-TIME EQUIVALENTS 9.75 9.69
Key management personnel comprise all members of the Board, the Chief Executive Officer, and the members of the Senior Leadership Team.

Commerce Commission Annual Report 2017 75
21. Members’ remuneration
2017 Actual
$000
2016Actual
$000
M Berry (Chairman) 551 553
S Begg (Deputy Chair) 364 427
S Gale (Telecommunications Commissioner) 433 415
P Duignan (Commissioner until 2 December 2015) 0 129
E Welson (Commissioner) 333 312
A Rawlings (Commissioner) 248 252
G Crombie (Associate Commissioner from 20 July 2015) 112 79
J Walker (Commissioner from 1 December 2015) 360 186
TOTAL MEMBERS’ REMUNERATION 2,401 2,353
The Chairman, Dr Mark Berry, and the Telecommunications Commissioner, Dr Stephen Gale, are in full-time positions and receive leave entitlements. The dollar value of the movement in any accrued leave entitlement is included in the remuneration total above. All other Commissioners are paid for service on a daily rate set by the Remuneration Authority as follows:
Members’ daily rates:
2017 $
2016$
Deputy Chair 1,850 1,835
Commissioners and Associates 1,565 1,550
Cease and Desist Commissioners 1,565 1,550
Members’ additional remunerationMost Members are entitled to additional pay above the daily rate if the number of hours worked on any day exceeds eight hours. The daily rate includes any annual and sick leave entitlement, and no additional payments are made on account of annual leave or sick leave. The Chairman and Telecommunications Commissioner are salaried appointments, and receive annual leave and sick leave entitlements in addition to their salary. The Chairman and Telecommunications Commissioner are not entitled to additional pay for additional hours worked.
Other payments in respect of MembersThe Commission paid $8,500 to an Audit, Finance and Risk Management Committee member appointed by the Board who is not a Board member during the year (2016: $12,000 to an Audit, Finance and Risk Management Committee member appointed by the Board who is not a Board member).
The Commission has provided a Deed of Indemnity to Members for certain activities undertaken in the performance of the Commission's functions.
The Commission has taken out Directors' and Officers' Liability and Professional Indemnity insurance cover during the financial year in respect of the liability or costs of Members and employees.
No Members received compensation or other benefits in relation to cessation (2016: $Nil).

Commerce Commission Annual Report 201776
22. Capital managementThe Commission’s capital is its equity, which is made up of general funds and other reserves as disclosed in note 5. Equity is represented by net assets.
The Commission is subject to the financial management and accountability provisions of the Crown Entities Act, which impose restrictions on borrowings, acquisition of securities, issuing guarantees and indemnities, and the use of derivatives.
The Commission manages its equity as a by-product of prudently managing revenues, expenses, assets, liabilities, investments and general financial dealings to ensure the Commission effectively achieves its objectives and purpose, while remaining a going concern.
23. Significant events after balance dateAs an enforcement agency and regulator, the Commission is regularly involved in litigation and often has a large number of matters before the court. A number of financially insignificant matters have been progressed or finalised by 31 October 2017.
There were no significant events after balance date.

Commerce Commission Annual Report 2017 77
24. Explanation of significant variances against budgetSignificant variations from the budgeted figures in the Statement of Performance Expectations 2016/17 are set out in the table below. Explanations for each variance are found underneath.
Note Actual $000
Budget$000
Actual$000
Statement of comprehensive revenue and expenseCrown revenue 1 38,403 44,264 (5,861)
Members and personnel 2 26,480 28,880 (2,400)
Legal and other professional fees 3 6,639 10,569 (3,930)
Statement of financial positionTotal equity 4 15,122 17,109 (1,987)
Short-term investments 5 14,000 13,000 1,000
Intangibles 6 2,736 4,041 (1,305)
Crown funding repayable 7 3,780 1,289 2,491
Statement of cash flows
Member and employee payments 8 26,545 28,806 (2,261)
Supplier payments 9 11,812 15,486 (3,674)
Repayment of Crown funding 10 8,765 1,027 7,738
Investment receipts/(deposits) 11 (2,000) 2,000 (4,000)
Intangible asset purchases 12 1,251 2,595 (1,344)
Explanatory notes1 Crown revenue was $5.861 million less than budget due to significantly less litigation fund revenue recognised
because of settlements and favourable court judgments in the Commission’s cases, reducing litigation expenditure on external counsel and experts.
2 Members and personnel expenditure was $2.4 million under budget primarily due to staff vacancies across the Commission, and less use of temporary staff and contractors than budgeted.
3 Legal and other professional fees were $3.93 million under budget primarily due to reduced expenditure on litigation related costs arising from settlements and favourable judgments in several major litigation cases, and less expenditure than budgeted on external consultants within our other output classes.
4 Total equity was $1.987 million less than budget due to a $2.795 million lesser than budgeted opening equity balance, and a partially offsetting $0.808 million greater than budgeted result in our competition and consumer output class.
5 Short-term investments were $1.0 million greater than budget as we managed our cash funds differently to the high level assumptions made when setting our 2017 budget.
6 Intangibles were $1.3 million less than budget due to revision of the schedule for development and deployment of new software systems.
7 Crown funding repayable was $2.491 million greater than budgeted as funding received in advance from a number of appropriations to fund our classes of outputs, especially the litigation fund appropriation, was greater than our expenditure against those output classes.
8 Member and employee payments were $2.261 million less than budget because of staff vacancies across the Commission and less use of temporary staff and contractors than budgeted.
9 Payments to suppliers were $3.674 million less than budgeted due to lower than budgeted expenditure as reflected in the statement of comprehensive revenue and expense.
10 Repayment of Crown funding was $7.738 million greater than budget as prior year expenditure was less than forecast when establishing the 2017 budget, and we repaid some Crown funding received in 2017 before the end of the financial year.
11 Investment receipts were $4 million less than budget as we placed fewer Short-term investments than budgeted and started with a higher than budgeted Short-term investment balance.
12 Intangible asset purchases were $1.344 million less than budget due to revision of the schedule for development and deployment of new software systems.

Commerce Commission Annual Report 201778
Financial Statements Glossary The following table provides definitions for some terms used in our financial statements. Please note that these definitions are only provided as a help to readers, and are not part of the financial statements, or necessarily reflect the way that we interpret and apply accounting standards.
Accounts payable Debts owed to somebody (eg, a company) for goods or services provided to us which we have not yet paid at balance date.
Accounts receivable
Debts owed to us by somebody (eg, a company) for a service we have provided, where we have not been paid at balance date.
Asset An asset is something which we own, expect to receive in the future, or control.
Amortisation Amortisation is basically the same as depreciation (see below), except it is applied to intangible assets (eg, software).
Balance date The date at which a set of accounts are prepared. For the Commission, that date is 30 June of each year.
Cash equivalents Cash equivalents are assets like term deposits which share most of the characteristics of cash. They are cash equivalent because we can quickly turn them into cash, but they are technically not cash in a bank account or in the hand.
Comprehensive revenue and expense
Comprehensive revenue and expense is a broader concept of revenue which includes a surplus (or loss) from an entity’s operations, and movements in parts of equity that aren’t the result of surpluses or owner transactions. An example is a revaluation gain on the value of assets, which increases equity by increasing the value of an asset revaluation reserve.
Current asset (or liability)
A current asset is an asset which can be converted into cash or used to pay a liability within 12 months. A current liability is a liability which we expect to repay within 12 months.
Depreciation Depreciation is the charge of an asset’s cost over a certain time period. Depreciation recognises that assets decline in their value and usefulness over time.
Equity Equity represents the value of an entity to its owners, and is the amount left over after deducting all liabilities from all assets. It is also known as net assets.
Financial instruments
Financial instruments are assets or liabilities which are tradable in some way, such as cash, shares, or loans. Other financial instruments include ‘derivatives,’ which are traded securities that get their value from an underlying asset (like a future oil shipment or a future foreign currency purchase).
Generally accepted accounting practice (GAAP)
GAAP is shorthand for the series of standards, interpretations, and concepts which are followed by accountants. NZ GAAP is defined by law to include standards issued by the External Reporting Board, and where that (or a specific law) does not cover a matter, accounting policies considered authoritative by the accounting profession in New Zealand.

Going concern An assumption made by an entity that it will continue to operate into the foreseeable future. If this is incorrect, then the entity has to prepare its accounts as if it is being wound up.
Intangible assets Intangible assets are assets which do not have a physical substance, and are not cash.
Liability A liability is something we owe, expect to pay in the future, or may have to pay in the future.
Monetary assets Monetary assets are assets which are cash, or will become cash in a short timeframe; (eg, bank account balances, term deposits, accounts receivable).
Monetary liabilities Monetary liabilities are debts owed to another party, such as accounts payable, loans or unpaid salaries.
Non-current asset (or liability)
A non-current asset is an asset which we cannot ordinarily turn into cash within 12 months. A non-current liability is a liability which we would not ordinarily have to repay within 12 months.
Output class An output class is a grouping of similar outputs or activities with similar objectives. The Commission’s output classes are primarily funded by appropriations from the Crown via MBIE.
Provision An estimate of an amount that an entity may (or will) have to pay as a result of an obligation the entity has to another party.
Public benefit entity
An entity which aims to provide goods or services to the general public to meet a specific need, rather than to make a profit for its owners.
Related party Another person or entity which is related to us because of, for example, a common owner or person in a position of authority (eg, director, senior management).
Statement of cash flows
A statement which shows how much cash we have received from various sources (investments, operating activities, cash injections received from the Crown) and cash payments we have made (expenses, salaries, repayment of money to the Crown).
Statement of comprehensive revenue and expense
A statement which shows our surplus or deficit from our operating activities, plus or less any movements in non-owner equity items (see comprehensive revenue and expense above).
Statement of financial position
A statement which shows what assets we own or control, what liabilities we have, and the remainder (equity) at the balance date.

www.comcom.govt.nz
Phone: 0800 943 600Write: Contact Centre, PO Box 2351, Wellington 6140Email: [email protected]
ISSN 1179-495X (Online) ISSN 1179-4941 (Print)