annual report 2018–19 - parliament of victoria
TRANSCRIPT

Annual Report2018–19

Published byPublic Transport Development Authority operating as Public Transport Victoria750 Collins Street, Docklands VIC 3008.© State of Victoria. Public Transport Victoria 2019This publication is copyright. No part may be reproduced by any process except in accordance with the Provisions of the Copyright Act 1968.ISSN 2202-5375 (Print)Print managed by Finsbury Green, Level 9, 124 Exhibition Street, Melbourne VIC 3000.This document is available in an accessible format at ptv.vic.gov.au

1
Public Transport VictoriaAnnual Report 2018–19
2018–19 Annual Report Accountable Officer’s declaration 3
Report of operations 4Section 1Year in review 5
Section 2Governance and organisational structure 39
Section 3Workforce data 47
Section 4Other disclosures 53
Financial statements 69
Appendix 132

2 Public Transport Victoria Annual Report 2018–19
Abbreviations
AAS Australian Accounting Standards AASB Australian Accounting Standards Board AEE annualised employee equivalentAUD Australian dollarATO Australian Taxation OfficeBAU business as usualCCTV closed circuit televisionCEO Chief Executive OfficerCNPL Civic Nexus Pty LtdCSO community service obligationcyl cylinderDAP data analytics platformDEDJTR Department of Economic Development,
Jobs, Transport and ResourcesDELWP Department of Environment, Land, Water
and PlanningDET Department of Education and TrainingDHHS Department of Health and Human
ServicesDoT Department of TransportDTF Department of Treasury and FinanceDWG Designated Working GroupFOI Freedom of InformationFRD Financial Reporting DirectionFTE full time equivalentGPT General Property TrustGST Goods and Services TaxHSR Health and Safety RepresentativeHSW Health, Safety and WellbeingIBAC Independent Broad-based Anti-corruption
CommissionICT information communications technologyIRP Issue Resolution ProcedureISO International Organisation for
StandardisationKMP key management personnel kg kilogramkm kilometre
LPG liquefied petroleum gasLSL long service leaveMBSC Melbourne bus services contractsMJ megajouleMP Member of ParliamentMPSG Major Project Skills GuaranteeMTIA Major Transport and Infrastructure
AuthorityMTM Metro Trains Melbournen/a not applicableNPV net present valueNTT Nippon Telegraph and Telephone NXP Next Experience PhilipsOHS occupational health and safety OVIC Office of the Victorian Information
Commissioner PPE property, plant and equipment PPP Public Private PartnershipPS principal scientistPSO Protective Service OfficerPTV Public Transport VictoriaRTW return to workSDA Services and Development AgreementSTS senior technical specialistt CO2 e tonnes of carbon dioxide equivalentTCV Treasury Corporation of VictoriaTfV Transport for VictoriaUITP Union International des Transports PublicsVAGO Victorian Auditor-General’s OfficeVGV Valuer-General VictoriaVicFleet Victorian State Government vehicle poolVicTrack Victorian Rail Track CorporationVIPP Victorian Industry Participation PolicyV/Line V/Line CorporationVMIA Victorian Managed Insurance AuthorityVPS Victorian Public ServiceVWA Victorian WorkCover Authorityyr year

3
2018–19 Annual Report Accountable Officer’s declaration24 September 2019The Hon Melissa Horne MPMinister for Public Transport1 Spring StreetMelbourne VIC 3000
Dear Minister
Annual Report 2018–19In accordance with the Financial Management Act 1994, I am pleased to present Public Transport Development Authority’s Annual Report for the year ending 30 June 2019.
Jeroen WeimarChief ExecutivePublic Transport Development Authority operating as Public Transport Victoria

4 Public Transport Victoria Annual Report 2018–19
Report of Operations

Section 1 Year in review 5
Section 1Year in review
Chief Executive’s foreword 8
Purpose and functions 12
About PTV 12
Achievements this year 13
2018–19 Overview 14
Every Victorian can connect and participate 16
Victoria is prosperous and sustainable 23
Every Victorian travels safely 30
Delivering value and expertise for Victorians 32
Organisation changes 34
Direct costs attributable to machinery of government changes 34
PTV’s current year financial review 35

VisionA public transport service that Victorians value and choose to use.
PurposeWe get people where they want to go by providing a safe, reliable and inclusive public transport network.
ValuesPTV operates according to the Victorian Public Sector Values.
6 Public Transport Victoria Annual Report 2018–19

Passenger firstWe put the passenger first. Passenger safety is paramount and we innovate to transform the passenger experience.
PassionWe enthusiastically advocate for public transport use.
Delivery excellenceWe uphold high professional standards in how we manage our work, ensuring we achieve results while working safely.
CollaborationWe are united by common goals, not defined by reporting lines and organisational structure.
IntegrityIn our interactions with each other, our partners and our customers we will be reliable, open and transparent.
PTV also promotes the values of:
Section 1 Year in review 7

8 Public Transport Victoria Annual Report 2018–19
It’s visible in the increased service frequency at the neighbourhood bus stop; to the newly-accessible tram stop at the local shopping strip; to the metropolitan and regional train stations undergoing significant upgrades and maintenance; and everywhere in between.Recent figures reflect that over 70 per cent of Victorians have used public transport at least once in the last three months, contributing to over 600 million passenger trips on our network in the past year – record patronage supported by nearly 2,300 new weekly services introduced across all modes.Throughout the 2018–19 year, PTV has continued to keep passengers at the centre of everything we do and in doing so, has delivered some key improvements for the network.In August 2018, a new eight-kilometre rail extension to Mernda opened for service – the culmination of nearly 18 months of construction works, and a great example of the cross-agency collaboration within the transport portfolio.That cross-agency collaboration has also been critical in a time of major disruption on the network, as the Major Transport Infrastructure Authority continues to work towards the delivery of major multi-year transport projects and infrastructure – including the Metro Tunnel, the removal of level crossings across the network, and the Regional Rail Revival.Across 2018–19, PTV worked with operators and agencies to minimise disruption impacts and keep passengers moving through several construction blitzes – facilitating the operation of hundreds of replacement buses and a major cross-agency communications strategy aimed at keeping commuters informed and aware of their alternative transport options.As our passengers seek to remain connected to one another and to key services in a growing digital space, we’ve responded with improved ways to engage with our products and services.In January, we launched a refreshed PTV website with design and functionality informed by a seven-month period of public beta testing. Through 80,000 visits across more than 40,000 unique users, we iterated and tweaked based on user activity and direct feedback. Since launch, we’ve seen substantial growth in traffic, particularly on mobile devices – a great outcome for this collaborative design process.
Chief Executive’s forewordAs a connector to life – be it employment, education, essential services or recreation - public transport continues to form an integral component of the Victorian community.
Jeroen WeimarChief Executive

Section 1 Year in review 9
In March, we unveiled our next-generation digital ticketing solution – Mobile myki – on Android devices, with Victoria being one of the first in the world to make use of new technology powered by Google. The passenger response to this new way to travel has been phenomenal – with over 100,000 Mobile mykis already in use, and an average 650 added every day.The iconic Flinders Street Station, one of the network’s busiest, was the first to benefit from updated passenger and digital wayfinding, making use of our new colour-coded route signage and new-look passenger information displays. We’re also continuing to make improvements to the broader network to ensure that it meets the diverse needs of our passengers. Our work to make Route 96 Melbourne’s first-fully accessible tram route saw the delivery of three new easy-access stops on Nicholson Street, with a further six scheduled for early 2020.We want our network to be inclusive and accessible to all Victorians. Our ongoing engagement with the disability community continues to foster greater awareness among our staff and stakeholders on the barriers many of our passengers face on the network every day. Initiatives like Travelling in the Shoes of Others, in which participants experience the network with a simulated disability or mobility restriction; Try Before You Ride, which creates a safe and open environment for those with individual needs to practice boarding and alighting trains, trams, buses, coaches and taxis; and regular meetings of the Public Transport Access Committee (PTAC) whose inputs have informed the designs of the upcoming High Capacity Metro Trains, and the five new Metro Tunnel stations. In order to meet the transport needs of a growing State, we need a team of driven, passionate and capable individuals, and the people of PTV continue to look at greater ways to improve the passenger experience. A strong focus on, and investment into leadership, organisational culture, and systems and processes have delivered improved engagement and throughput.As Victoria’s public transport network enters a period of significant transformation, so too does Public Transport Victoria.In April 2019, the formation of a new Department of Transport was announced – bringing together resources and staff from PTV and VicRoads, alongside those at the current Department.
This announcement is the fuller realisation of the Transport Integration Act under which PTV was originally formed – to provide an integrated approach to the way Victoria plans, develops and maintains its transport system.By coming together as a single transport entity for the State, we will support the ongoing development and delivery of simple, connected journeys for all Victorians – allowing them to live their lives, regardless of their transport choices.The 2018–19 PTV Annual Report provides a snapshot of the activities of our collective achievements over the last 12 months, but more broadly, the spirit of the organisation and its people over the past seven years, and the passenger commitment – to providing an inclusive public transport service that all Victorians value and choose to use – that we’ll take with us as part of the new Department of Transport.
Jeroen WeimarChief Executive

10 Public Transport Victoria Annual Report 2018–19
543full time equivalent employees
32%of trips are concession fares
104,515mobile myki users
45,000Twitter followers
440,000website users/week
1.1Mcall centre calls
43%of employees identify as female
Diversityof age in workforce 20% > 15–34 66% > 35–54 14% > 55+
Our passengers
Serving our passengers
Our people
605M+trips taken
1M+daily myki touch ons
27,000Facebook followers
514,000app users/week
557,000PTV Hub visits

Section 1 Year in review 11
16,000+service contracts
2,100customer service staff across the network
28,000+stations and stops
3,300trains, trams and buses
8,500+train, tram and bus drivers
2,296new weekly services added 2018–19 on trains, trams and buses
16tourist and heritage operators supported
Our network
Delivering our services

12 Public Transport Victoria Annual Report 2018–19
Purpose and functionsThe Public Transport Development Authority, operating as Public Transport Victoria (PTV), commenced operations on 2 April 2012 following an amendment to the Transport Integration Act 2010. The object of Public Transport Victoria is to plan, coordinate, provide, operate and maintain a safe, punctual, reliable and clean public transport system consistent with the vision statement and the transport system objectives.PTV’s object includes:
– ensuring that the public transport system operates as part of an integrated transport system which seeks to meet the needs of all transport system users
– managing the public transport system to support a sustainable Victoria
– contributing to social wellbeing by providing access to opportunities and supporting liveable communities
– promoting economic prosperity though efficient and reliable movement of public transport users while also supporting rail freight services
– working with its partners to improve the safety of public transport for public transport users.
PTV supports the Minister for Public Transport, Hon. Melissa Horne MP.
About PTVAs a result of a machinery-of-government change effective on 1 January 2019, the Department of Economic Development, Jobs, Transport and Resources (DEDJTR) became the Department of Transport. The Department of Transport assumed the transport portfolios of DEDJTR, and the non-transport portfolios were transferred to the newly established Department of Jobs, Precincts and Regions. From 1 January 2019, the Department of Transport became the lead department for PTV.
The integrated transport portfolio is working to enable an optimised network where transport modes work in harmony to move people and freight in the most effective and efficient way, with each mode being used when and where it is best suited.
Every day more than two million trips are taken on Victoria’s trains, trams and buses. PTV has a fundamental role in helping people get to work and school, access critical services, as well as socialise, shop and participate in some of the world’s best cultural, artistic and sporting events.
PTV’s role is to keep people moving on a reliable, safe and inclusive public transport network – and to deliver improvements to the network.
In practical terms, this means PTV is responsible for managing the public transport and service contracts; managing network integrity; implementing network changes; and delivering user-focused passenger services.

Section 1 Year in review 13
Achievements this yearDuring 2018–19, patronage continued to increase with more than 605 million trips made on Victoria’s train, tram and bus networks. Victoria continues to face high levels of population growth with the state’s population forecast to reach 10 million by 2050. To support Victoria through this growth, and enable economic prosperity, PTV aims to provide a safe, reliable and inclusive public transport system that meets the community’s needs.
PTV’s planning framework works towards delivering on four outcomes:
– every Victorian can connect and participate – Victoria is prosperous and sustainable – every Victorian travels safely – delivering value and expertise.

14 Public Transport Victoria Annual Report 2018–19
Every Victorian can connect and participate
2018–19 Overview
Victoria is prosperous and sustainable
OutcomeTransport is a critical lever for Victoria’s prosperity. Investment in transport infrastructure and the expenditure on transport operations generates broad and positive benefits across the economy. Public transport that is efficient, resilient and sustainable supports Victoria’s social, environmental and economic growth and development.
ObjectivesImprove network performance and coordinate network service changes.Ensure Victoria receives value-for-money from services contracts.Maintain and improve network assets and align capital investments with network requirements.
What success looks likePeople are linked to places, goods and services through an efficient transport network that provides value for money to Victorians.
Progress towards successThe Plenty Valley community is now better connected to jobs services and social events with the extension of the South Morang rail line to Mernda. Three stations have been added and connecting train and bus services have increased patronage. As the whole network undergoes transformation, passengers were kept moving through the highest level of disruption seen on the network.
OutcomeAll Victorians benefit from accessible, reliable and connected public transport where services are regular and easy to use, timetables are integrated, interchanges are seamless and service information is available when and where it is needed. Transport is vital to creating a connected, inclusive, liveable community. For people to connect and participate, the whole journey experience is considered including the interface with other transport modes and associated technology.
ObjectivesEnsure day-to-day passenger experience is reliable and consistent.Deliver a more inclusive transport network.Improve information to aid travel choices and assist passengers to keep moving through disruptions.
What success looks likePTV’s products and services are intuitive and fit for purpose.Passengers travel with confidence due to the provision of accessible services, timely and accurate information and service connectivity to get them where they want to go.
Progress towards successMore passengers are using digital information channels more often and they are now easier to use. The accessibility of products and services is increasing with the implementation of new wayfinding standards and the roll out of Mobile myki. New service contracts for Western Port ferry and metro bus services are improving service quality.

Section 1 Year in review 15
Every Victorian travels safely
Delivering value and providing expertise
OutcomeA safe network is at the core of the transport service. People expect that when they use Victoria’s transport services they will be safe throughout their journey. People who build the network and support service delivery must also be safe at work. People’s perception of safety and personal security effects their willingness to use public transport services.
ObjectivesImprove safety and security of the network.Ensure personal security on the public transport network.
What success looks likeThe system causes zero harm.People use the system as they feel safe.
Progress towards successOur operators, working with Victoria Police, delivered a variety of youth outreach programs to schools to help students to understand how to travel safely on the network. People are more protected on the rail network with the roll out of digital closed-circuit television at stations which is complimented by the presence of Protective Service Officers at all metro stations in the evenings. In addition, Protective Service Officers now have the authority to roam the network and surrounds.A public information campaign, Safety You Can See, raised public awareness about personal safety and security initiatives on public transport.
OutcomeThe Victorian Government and the community have confidence that PTV delivers effective and efficient services for Victorians. PTV is committed to delivering value to Victorians through good governance, integrity, planning and risk management. PTV will do this by developing strong relations with community leaders, by working closely with our colleagues across government to deliver government policies and through developing its people and systems to ensure service excellence.
ObjectivesCollaborate with department and portfolio agencies to develop the transport business of the future.
What success looks likeEfficient, effective and collaborative organisation supporting successful service delivery and transformation of the network.
Progress towards successWith the continuation of our business transformation program, PTV staff have been trained in Lean Six Sigma to empower process improvements across the business. PTV’s technical teams continued to support stakeholders across the transport portfolio to deliver a people focused network.

16 Public Transport Victoria Annual Report 2018–19
Every Victorian can connect and participateAll Victorians benefit from accessible, reliable and connected public transport where services are regular and easy to use, timetables are integrated, interchanges are seamless and service information is available when and where it is needed. Transport is vital to creating a connected, inclusive, liveable community. For people to connect and participate, the whole journey experience is considered including the interface with other transport modes and associated technology.
Objectives – Ensure the day-to-day passenger experience is
reliable and consistent. – Deliver a more inclusive transport network. – Improve information to aid travel choices and assist
passengers to keep moving during disruptions.
2018–19 AchievementsMobile mykiPTV ran a nine-month trial and launched an android version of myki during 2018–19. As Victorians’ technological expectations increase, PTV needed to respond with a convenient digital alternative to myki smartcards. There are 12.8 million myki smartcards and most passengers have more than one. The ticketing service provider NTT Data provided a proposal to introduce a digital myki. NTT Data leveraged its relationships with the chip supplier for myki smartcards, NXP Semiconductors, and Google to offer digital myki on Android smartphones via the Google Pay app.Some 4,000 passengers took part in a trial. On 28 March 2019, Mobile myki was launched.
Mobile myki is a digital ticket available for full fare, child, senior and general concession users with a compatible Android smartphone. It offers the same functionality of the existing smartcard and interacts within the same fare payment business rules. Its features include fast top up and balance check.PTV aimed for a customer satisfaction score of 75 per cent but the trial had an 80 per cent rating. Since launch, 104,515 Mobile mykis have been bought and more than $6.8 milion has been spent on top ups. Within two months, Mobile myki exceeded its 12–month forecast take-up.The project demonstrated that PTV, its service provider and suppliers could deliver a project with agility and flexibility. Passengers report that they love the convenience of being able to check their myki balance quickly and easily.
Flinders Street WayfindingPTV wanted to improve wayfinding at Flinders Street Station by making it more intuitive, provide better accessibility and ease congestion. We worked with Metro Trains Melbourne and looked at site constraints, safety issues and evaluated pedestrian behaviour. We needed a solution that was passenger-focused and would transfer across the network.User testing showed passengers either had a familiar or unfamiliar mindset and they had different needs. This insight formed the basis for the new wayfinding and signage trial. The trial also used universal design principles.The new wayfinding system was implemented and tested at one of Victoria’s busiest stations, Flinders Street Station, which had more than 26 million touch ons in 2018.Passengers at Flinders Street Station now have a more unified system of information to plan and connect to public transport services.
PTV website refreshPTV’s website has about 1.5 million unique users per month, making it a key information channel. However, the website was out-dated and myki information was on a separate website. About two out of three users were accessing the site through their mobile but it did not work as well on mobiles as passengers expected.

Section 1 Year in review 17
The website was redesigned based on analytics, user-testing and feedback. A test version of the site was launched in May 2018. This test site was visited 80,000 times by more than 40,000 unique users and more than 2,000 pieces of feedback were submitted. This information was used to refine the site.We collaborated with operators and stakeholders on the project. The first phase of the new website was launched in January 2019 and included, a single search field, improved disruption information and dynamic mapping. It was also fully-optimised for mobile devices. Fare estimates have now been included in the journey planner.Since its launch, there has been a substantial increase in the number of users accessing pages displaying real-time information – 27 per cent of website users in February–April 2019, compared to 7 per cent for the same period the previous year.There has also been an increase in users accessing disruptions pages – 9 per cent of website users in February–April 2019, up from 8 per cent the same period last year. Feedback about disruptions information has also decreased by 60 per cent , indicating the website is better meeting our passenger’s needs.
Route 96 tram stop upgradesWork is underway on Melbourne’s busiest tram route, Route 96, which runs from St Kilda to Brunswick East. These upgrades will improve accessibility, safety and operational efficiency. During 2018–19, planning work and some construction took place to upgrade Route 96 tram stops.The Disability Standards for Accessible Public Transport 2002 sets out the minimum accessibility requirements that providers and operators of public transport must comply with to ensure that access to transport is consistently improved.The Victorian Government is committed to constant access improvements to the public transport network. In May 2019, easy access stops 23, 24 and Stop 25 northbound side platform were built on the northern end of Nicholson Street. Planning for construction of stops 16 to 22 is also underway with construction due to start early 2020. We engaged with Nicolson Street locals between Rose and Victoria streets, from October to December 2018. In February 2019, we engaged with residents, businesses and schools at the northern end of Nicholson Street. After feedback from local traders, construction of stops 16 to 22 has been moved to January 2020 – a quieter trade period.
PTV has worked with VicRoads on the project and Moreland, Yarra and Melbourne City Councils. The project in collaboration with Yarra Trams.
Morewell bus stop – accessibility improvementA local disability advocacy group highlighted offices for two disabilities service providers, The Tipping Foundation and Interchange Gippsland, were on the other side of the road from a key bus stop on Commercial Road. Disability self-advocacy group, New Wave, made a video calling for a pedestrian crossing at the site, saying that 20 people with cognitive disability had to cross the busy road daily to access the bus stop.PTV, Regional Roads Victoria, Department of Economic Development, Jobs, Transport and Resources and Latrobe City Council funded the $150,000 upgrade, which was completed in November 2018.The safety upgrade includes a pedestrian refuge island and new line markings, an upgraded bus shelter and pedestrian path to the shelter, an indented bus bay, new bus stop hard stand, pram crossings and a pedestrian hard stand.The changes have made it easier for people with wheelchairs or walkers to cross the road and use the bus stop.
Regional bus improvementsIn January 2019, PTV began a trial of a regular bus service which operates fortnightly between Echuca and Barmah. The service provides regular public transport service for the Indigenous community of Cummeragunja, allowing them to travel into Barmah, Echuca or Moama.The 12–month trial will better connect the indigenous community with two return services running every second Thursday from Barmah, Cummeragunja, Moama and Echuca. The vehicle is a 35–seat bus with underfloor storage for luggage and bikes.The Yorta Yorta National Aboriginal Corporation, Dysons (Moama depot) and Murray River Council in New South Wales were also involved in setting up the trial route. The trial will be assessed in January 2020.

18 Public Transport Victoria Annual Report 2018–19
Helping understand accessibilityWe are working to improve awareness about the challenges people with a disability face when trying to access public transport.PTV again facilitated the half-day workshops: Travelling in the Shoes of Others. The monthly workshops were open to people who work in public transport. Participants spent half a day on public transport with a simulated disability or mobility restriction. They experience some of the challenges that people with different needs face on public transport. The workshop highlights the need to build good design and accessibility principles into public transport planning, infrastructure and passengers service. The workshop is run with help from Guide Dogs Victoria, Vision Australia, Yooralla, Spina Bifida Foundation Victoria and Travellers Aid. Some 150 people from seven organisations participated in 2018–19 and all participants rated the workshop as either ‘extremely valuable’ or ‘very valuable’.PTV also ran Try Before You Ride, an annual event which was held in October 2018. The event aimed to help people of all abilities, including people with a disability, seniors or parents with children feel more confident using public transport. Attendees were able to practice getting on and off an accessible train, tram, bus, coach or accessible taxi – without the pressure of boarding a live service. Organisations involved in the event included Metro Trains, Yarra Trams, Bus Association of Victoria, Transdev Melbourne, V/Line, Commercial Passenger Vehicles Victoria and Travellers Aid. About 150 people attended the event in Box Hill.
Engagement with disability stakeholdersThe Public Transport Access Committee provides independent strategic advice to the Minister for Public Transport and PTV on issues related to transport accessibility. The committee provided a direct community voice for inclusive and accessible public transport, advocating for the needs of people with disabilities, older people and vulnerable groups.
During the committee’s three-year term, it had input into the design of the next generation of the High Capacity Metro Trains which has resulted in significant improvements to the accessibility features of the train and the design of the five new Melbourne Metro tunnel stations.
The committee has had input into the Accessible Public Transport Action Plan 2019–23, and the monitoring of operators’ performance against their contracted accessibility targets. The committee has also increased engagement with disability community through consultations on a range of issues, from mobile myki to a survey on the effect of disruptions on passengers with accessibility needs.
Other Projects Bus Passenger Information Displays Implementation ProgramPTV continued to improve bus passenger information displays during 2018–19. This year we re-built the passenger information display architecture to support 1,200 units and enable the deployment of future passenger information displays on the public transport network. This will allow us to manage passenger information display content via a web portal. In addition, we commissioned, supplied and installed five passenger information displays in Frankston, three in Cranbourne and two in Craigieburn. The project was successfully completed during 2018–19.
Bus Tracking System (formerly the Real Time Bus Program)Upgrade of the bus tracking system to provide improved bus prediction information to users and to enable enhanced performance monitoring. During 2018–19, the improved prediction engine was released, the previous two bus tracking systems were consolidated into one, and a new contract was awarded for the management of the bus Passenger Information Displays system.

Section 1 Year in review 19
E-Class tram programThis multifaceted program includes the procurement of 90 new high capacity, low-floor E-Class trams and associated enabling infrastructure such as power supply. PTV is responsible for delivering the enabling infrastructure works. During 2018–19, Bundoora RMIT tram stop was upgraded and 10 level access stops were constructed, planning permits were approved for route 96 stop upgrades and procurement activities continued. The route 58 terminus at Melville Road, Pascoe Vale is also being upgraded to a dual-track turnaround and fully accessible platform stop.
Flinders Street Station – better passenger experienceRefresh and upgrades were done to Flinders Street station to improve the passenger experience including lighting, CCTV, passenger information displays, amenities, access and ticketing. During 2018–19, design work was undertaken, coloured passenger information displays were commissioned, additional signage installed, and station upgrades were completed. The project is due for completion in late 2019.
Mobile myki expansionDevelop a custom-built smartphone ticketing payments solution using near-field communication technology to integrate with existing myki ticket barriers and card readers across multiple transport modes. The solution was developed, trialled and released for Android devices in 2018–19. Discussions and technical assessments are being carried out to determine a way forward to expand Mobile myki to other smartphone platforms.
PTV Next Gen AppThe Next Gen App will focus on optimising the experience of high frequency tasks including: journey planning, real time departures, timetables, integration of myki functionality and fare estimation, disruption information, personalisation and push notifications. The requirements document has been developed and a procurement tender is underway.
Watergardens Station accessibility improvementsThe 2018–19 State Budget provided funding for installation of three additional lifts, and associated works at Watergardens Station. The geotechnical site investigations were completed, and design development is underway.
South Yarra Station UpgradeUpgrades to South Yarra train station and tram stop are underway to improve passenger flow and accessibility. Train station functional design has been finalised and a planning permit submitted for approval.
Tram Route 19 Stop 19 Accessible StopTram stop 19 on route 19 was upgraded to meet accessibility standards. Construction of the stop was completed in July 2018.
PerformancePatronageTotal Victorian patronage is at 1.4 per cent year on year growth for the year ending June 2019, slightly lower than the year ending June 2018 when year on year growth was at 1.6 per cent.Patronage growth on the metropolitan network increased overall year on year at 1.1 per cent for the year ending June 2019. Patronage on metropolitan train and metropolitan bus has grown, while tram patronage is flat. Peak patronage continues to show moderate growth on train and bus, but a slight decline year-on-year for tram. Regional network patronage continues to show strong growth at 6.5 per cent, particularly in peri-urban areas since the opening of the Regional Rail Link. Regional bus is also showing growth since measurement on myki-enabled regional buses commenced in January 2016.

20 Public Transport Victoria Annual Report 2018–19
2018–19 patronage results
Million boardings
Year on year growth rate
Metropolitan bus 121.8 3.7%
Metropolitan train 243.2 1.1%
Tram services 205.4 -0.3%
Regional bus services 13.1 5.1%
Regional train services 21.0 7.9%
Coach services 1.3 -0.5%
Total 605.9 1.4%
Note: patronage results are rounded and therefore the total official Victorian result is not exactly the sum of the modes.
Metropolitan patronage
2016–17 2017–18 2018–19
237 241
206
118
243
205
122
204
118
Metropolitan bus Tram Metropolitan train
Regional patronage
2016–17 2017–18 2018–19
19.5
1.3
21
1.3
11.8
1.4
17.9
12.5 13.1
Coach Regional bus Regional train
Customer satisfactionMore than 600 million passenger trips are taken on Victoria’s public transport network each year. To better understand how people experience public transport services and what is important to them we regularly monitor sentiment through a Customer Satisfaction Monitor. The surveys assist us to continuously improve services by focusing on what matters most to users. Survey samples for the metropolitan area are obtained by randomly selecting fixed line phone numbers within postcodes from the metropolitan areas in Melbourne served by public transport. The sample for the buses survey also includes outer suburban areas that only have bus services.The V/Line survey samples are selected at random from households with a fixed line in postcodes that include, or are close to, V/Line train routes across the state.Overall, about 10,000 people are surveyed across Victoria each year.
2018–19 Customer satisfaction resultsCustomer satisfaction continues to improve on all modes. In December 2018, we recorded record customer satisfaction on the three metropolitan modes – train, tram and buses. Satisfaction with V/Line train services is increasing after hitting a low for the quarter ending June 2018. 2018–19 results trended upwards and are just short of the annual result for the previous year (74.9 and 75.1 respectively). Key drivers of customer satisfaction on V/Line are punctual and reliable services, design, space and comfort, and personal security. Regional train punctuality improved from 83.9% in 2017–18 to 86.8% in 2018–19.
2016–17 2017–18 2018–19
Metropolitan bus services 76.3 76.9 77.6
Metropolitan train services 72.6 73.6 74.4
Tram services 76.0 76.6 76.8
Coach services 81.5 82.4 82.3
Regional train services 75.6 75.1 74.9

Section 1 Year in review 21
Quarterly Customer Satisfaction Results
Metropolitan Bus Services (%)
Tram Services (%)
Coach Services (%)
77
Jul–
Sep
2016
Oct–
Dec
2016
Jan–
Mar
201
7
Apr–
Jun
2017
Jul–
Sep
2017
Oct–
Dec
2017
Jan–
Mar
201
8
Apr–
Jun
2018
Jul–
Sep
2018
Oct–
Dec
2018
Jan–
Mar
201
9
Apr–
Jun
2019
76 77 76 77 77 77 7777 77 78 79
75
Jul–
Sep
2016
Oct–
Dec
2016
Jan–
Mar
201
7
Apr–
Jun
2017
Jul–
Sep
2017
Oct–
Dec
2017
Jan–
Mar
201
8
Apr–
Jun
2018
Jul–
Sep
2018
Oct–
Dec
2018
Jan–
Mar
201
9
Apr–
Jun
2019
76 76 76 77 76 78 7676 77 77 78
81
Jul–
Sep
2016
Oct–
Dec
2016
Jan–
Mar
201
7
Apr–
Jun
2017
Jul–
Sep
2017
Oct–
Dec
2017
Jan–
Mar
201
8
Apr–
Jun
2018
Jul–
Sep
2018
Oct–
Dec
2018
Jan–
Mar
201
9
Apr–
Jun
2019
80 83 83 79 82 86 8083 85 80 84
72
Jul–
Sep
2016
Oct–
Dec
2016
Jan–
Mar
201
7
Apr–
Jun
2017
Jul–
Sep
2017
Oct–
Dec
2017
Jan–
Mar
201
8
Apr–
Jun
2018
Jul–
Sep
2018
Oct–
Dec
2018
Jan–
Mar
201
9
Apr–
Jun
2019
73 74 73 73 74 73 7475 74 75 75
76
Jul–
Sep
2016
Oct–
Dec
2016
Jan–
Mar
201
7
Apr–
Jun
2017
Jul–
Sep
2017
Oct–
Dec
2017
Jan–
Mar
201
8
Apr–
Jun
2018
Jul–
Sep
2018
Oct–
Dec
2018
Jan–
Mar
201
9
Apr–
Jun
2019
76 77 74 75 77 75 7674 74 74 76
Metropolitan Train Services (%)
Regional Train Services (%)
Targets 2016–17 target – 77%2017–18 target – 77%2018–19 target – 77%
Targets 2016–17 target – 76%2017–18 target – 76%2018–19 target – 76.5%
Targets 2016–17 target – 84%2017–18 target – 84%2018–19 target – 84%
Targets 2016–17 target – 72.2%2017–18 target – 73%2018–19 target – 75%
Targets 2016–17 target – 77%2017–18 target – 78%2018–19 target – 78%

22 Public Transport Victoria Annual Report 2018–19
Drivers of customer satisfactionThe primary driver of customer satisfaction for all modes is running of services which includes service frequency, services running on time, journey travel time, number of cancelations and ability to get on first arriving service.
Results for June 2019 quarter
Drivers of satisfaction Metro Yarra Bus V/Line
Running of services
Personal security
Design, space and comfort
Authorised Officers
Bus Stops
Conductors
Information
myki
Other Staff
Price
Ticketing
Train Stations
Tram Stops
Importance Primary Secondary Tertiary
Low contribution or N/A
myki myki is the ticketing system used to pay for travel on public transport across the metropolitan train, tram and bus network and in larger regional centres. The system uses smart-card technology for network access. In March 2019, Mobile myki was launched for Android devices allowing people to purchase myki cards, top up and touch on and off using their mobile device.Before traveling on public transport, users must have a valid ticket. Topping-up can be done at train stations, larger tram stops, retailers, such as 7-Eleven or online. Fare validation is done by a device at a station, stop, or onboard a bus or tram. There are around 24,000 myki devices deployed across the network to allow public transport users to touch on before they travel.Ensuring that people can travel with a valid ticket requires high myki device availability at stations, stops and onboard. Device availability is measure as the percentage of myki devices that are operational for the period.The myki device availability for 2018–19 was 99.7 per cent with a target set at 99.5 per cent.
2016
–201
7
2017
–201
8
2018
–201
999.7%99.7%99.5%
Targets 2016–17 target – 99.5%2017–18 target – 99.5%2018–19 target – 99.5%

Victoria is prosperous and sustainableTransport is a critical lever for Victoria’s prosperity. Investment in transport infrastructure and the expenditure on transport operations generates broad and positive benefits across the economy. Public transport that is efficient, resilient and sustainable supports Victoria’s social, environmental and economic growth and development.
Our objectives – Improve network performance and coordinate
network service changes. – Ensure Victoria receives value for money from
service contracts. – Maintain and improve network assets and align
capital investments with network requirements.
2018–19 AchievementsMernda – new stations, new bus and train servicesIn August 2018, a new eight-kilometre rail extension to Mernda opened to passengers. The $600 million project, delivered by the Level Crossing Removal Authority, also included the construction of three new stations at Mernda, Hawkstowe and Middle Gorge. The project was an outstanding example of transport bodies, including PTV, working together to deliver for the Victorian community.The three new stations cater for up to 8,000 commuters a day, with approximately 2,000 new car parks to help ease congestion along Plenty Road. New shared walking and cycling paths connect the stations and provide alternative transport options. Three new community spaces have been built at Hawkstowe Station, The Parkway and Mernda Station, which also includes a much-anticipated skate park. Mernda Station gives passengers access to 982 services to the city every week, with two new and seven realigned bus routes connecting passengers with the three new stations on the Mernda line.
The new line was the result of almost 18 months of construction work along the rail corridor and saw 1,200 construction jobs created and more than 1,800 jobs created in other industries. More than 100 young apprentices, cadets and trainees have worked on site, many for whom this has been their first role in the industry. In addition, 33 new train drivers were hired to operate the new timetable, as well as 16 new customer service staff for the new Mernda, Hawkstowe and Middle Gorge Stations.Plenty Valley bus services were also expanded and adjusted to coordinate with trains at the new stations to ensure the community has better integration between buses and trains. Existing routes 381, 382, 383, 384, 385, 386 and 387 were realigned. The new Route 388 and 389 loop services go around Mernda and Doreen, linking Laurimar town centre, Mernda Village Shopping Centre and Mernda Station.The Mernda rail opening is a testament to the work being done by PTV and transport bodies across the Victorian Government. We now have an effective assurance process, which managed the integration of the new infrastructure into our network. Our timetable development and implementation process introduced 190 additional weekly metropolitan train services into the timetable. And our marketing and passenger information teams ensured our passengers had all the information to plan their new journeys.
Managing planned disruptionsPTV ensured the disruptions for major public transport projects during 2018–19 were planned and delivered effectively. The coordination of these disruptions involved extensive preparation works across all operators and project agencies to minimise the overall disruption to passengers. An overarching communications strategy was also used to inform the community of disruption periods.Planned disruptions included Level Crossing Removals, preparation works for the introduction of High Capacity Metro Trains, extensive Melbourne Metro Tunnel works and a significant portion of maintenance and renewal works across the network. The Ballarat Line upgrade works also resulted in disruption for regional Ballarat services. During the Summer and Winter Blitz periods, some 600 plus replacement buses were in operation to keep passengers moving during the major upgrades to our transport infrastructure.
Section 1 Year in review 23

Supporting special eventsPTV plays a major role in supporting special events by assisting Victorians travel to more than 1,550 special events during 2018–19. These events included:
– White Night Melbourne and White Night Ballarat – New Year’s Eve – Spring Racing Carnival events at three racecourses – the Royal Melbourne Show – the St Kilda Festival – stadium concerts for international artists.
In addition, PTV also provided 646 bus shuttle services to support the numerous cruise ships arriving into Melbourne across a 35–day period. The specialty 109 City Express Bus Shuttle service carried 35,524 passengers from the Port of Melbourne to the city, providing passengers with a simple and effective option to explore the city and surrounds. This was on top of a full calendar of sporting events, including the Australian Open, international soccer and rugby matches, Australian Football League, National Rugby League, cricket and various fun runs throughout the city.Yarra Trams operated more than 20,221 extra trips, while Metro Trains Melbourne operated more than 6,429 additional services. To support regional passengers, V/Line operated approximately 603 additional services, and a significant number of extra buses services were also provided to assist in getting passengers to and from various events.
Hybrid busesThe first of 50 new hybrid-technology buses started operating on Melbourne’s bus network in April 2019. The new Victorian-built buses will be progressively rolled out by 2022. They will operate on bus routes in Wyndham, Oakleigh and Sunshine.The buses will reduce fuel consumption and the impact on the environment, while improving passenger experience with a quieter and smoother ride. The order is the single biggest order of hybrid buses in Australia. The body construction and fit-out for the new buses is being carried out in Dandenong by Volgren. This will support Victorian jobs and help develop new capability and innovation in the automotive sector. All buses will feature low-floor layouts and are Euro 6 emission standard, the highest and cleanest level for commercial vehicles worldwide.
Hybrid technology uses the electric battery when idling and travelling under 20 kilometres per hour. The bus noise is significantly reduced when idling at stops and departing from stops. Trials in Victoria have found hybrid buses use 30 per cent less fuel.
Unplanned disruptionsDuring 2018–19, PTV responded to a number of unplanned disruptions on the network. In July and August 2018, we liaised with bus operators to ensure school and special needs services remained operational during protected industrial action. A critical incident in Bourke Street in November 2018 caused significant disruption to numerous tram routes and prompted a multi-modal recovery plan to ensure people were able to get home during the Friday evening peak. We actively liaised with Victoria Police to prioritise the return of trams to Swanston St to reduce disruption to the evening peak. Severe weather events and bushfires dominated our coordination activities throughout the summer period, with multiple severe storms and significant bushfires in Little River, Gembrook and Gippsland. We also worked with the Environmental Protection Authority and other agencies when factory fires fuelled by dangerously-stored chemicals burned close to the network, causing evacuations and disruption to many services.Metropolitan trains were impacted by major disruptions on the Werribee line, due to overhead infrastructure failures near Laverton causing line suspensions for a number of days.At all times, our priority is the safety of passengers and staff, while ensuring services resume as quickly as possible. We reviewed all incidents and lessons learned were shared throughout the sector.
Transdev new busesA project to replace 100 buses was kicked off in 2018–19. It will see ageing state-owned buses operated by Transdev under the Melbourne Metropolitan Bus Franchise replaced from June 2019 to July 2020.By 30 June 2019, 15 buses were delivered which will improve fleet reliability and service delivery. The new buses have WiFi capability, USB charging ports, enhanced CCTV and use the latest engine emissions technology, which will minimise environmental impact. The buses are being built in Dandenong by Volgren and in Ballarat by Gemilang.
24 Public Transport Victoria Annual Report 2018–19

Solar TramsAs part of the Victorian Government’s initiative to reduce carbon emissions by 15–20 per cent below 2005 levels by 2020, the Solar Trams project was announced in January 2017.The Solar Trams project is being delivered under the renewable certificate purchasing initiative, through Victoria’s Renewable Energy Action Plan. It is a joint project between the Victorian Government and Yarra Trams.The electricity the tram network uses will be offset by certificates purchased from 35 megawatts of solar generation from Bannerton Solar Park and the Numurkah Solar Farm.The 88 megawatt Bannerton Solar Park near Robinvale in central Victoria is operational and the 100 megawatt Numurkah Solar Farm near Shepparton was officially opened in July 2019. Trams have been fully offset for 8 months, since November 2018. This has saved more than 60,000 tonnes of CO2-e so far with an expected annual CO2-e saving of more than 80,000 tonnes. The project will reduce the total Victorian public transport emissions footprint by 10 per cent.
Recycled plastic railway sleepersIn June 2019, 200 recycled plastic railway sleepers were laid at Richmond. The sleepers are part of an 18 month trial, by Metro Trains Melbourne, to test the viability of the sleepers.Currently, the sleepers on our transport network are either made from timber or concrete. The Department of Transport and our Operators will continue to work together to explore opportunities to trial and adopt alternative, more sustainable sleeper materials in the future. There may also be opportunities to work with other stakeholders, including Sustainability Victoria and Universities, to test and verify the sustainability of different products.
Active Projects Craigieburn Station car park extension (Stages 2, 3 and 4)The project involved the construction of a total of 150 new car parks at Craigieburn train station. The final stage, which saw construction of 35 car parks completed in June 2019.
Electrical Power Supply ResilienceDesign has been completed ready for upgrade works to commence for the train substation at Burnley.
Metropolitan Train Control ReplacementAn upgrade to the metropolitan trains signalling train control system is underway to improve operations. The final software stage has been released into operation in December 2018.
Privatised Arrangement Support System (PASS) Assets RemediationPASS Assets is a register of the fixed train and tram infrastructure and provides tools and functionality to search, view and locate train and tram assets. This project will ensure that the PASS Assets environment is acceptably secure against security vulnerabilities and that the PASS Assets environments are running on modern, fully supported versions of hardware and software.
Rolling Stock Cascade – Cranbourne/Pakenham Line Upgrade Program Package 3This project primarily sees an upgrade of power systems to support the rolling stock cascade following the high capacity metro trains deployed on the Cranbourne/ Pakenham line. Two substations at Sandringham and Surrey Hills were built in 2018 -19. Construction of the third substation at Holmesglen is underway.
Uninterruptible power supply upgradeInstallation of uninterruptible power supply systems to support the signalling power supply at North Melbourne, Southern Cross and Burnley substations was completed in March 2019. Following the commission of the North Melbourne uninterruptible power supply in March 2019 the project reached practical completion.
Section 1 Year in review 25

PerformanceNetwork PerformanceOverall network performance has remained steady over the past three years for most modes. The steady state is a positive result given the extensive construction works causing disruption across the network, and at a time of patronage growth. Every effort is made to reduce the impact of network transformational works on users.Daily train, tram and bus services can be affected by a variety of factors that impact performance. These include external factors, such as special events, protests, road congestion, police operations, adverse weather (heat, storms, floods), ill passengers, trespasses, and vandalism of vehicles and infrastructure. Network related events include faulty rolling stock, tracks and signals, availability of drivers and vehicles in the correct starting position and crowding that increases dwell times.
2018–19 Network performance results
Punctuality Services delivered
Actual Target Actual Target
Metropolitan bus 82.6% 82.0% 99.8% 99.9%
Metropolitan train 91.1% 92.5% 98.4% 99.0%
Regional bus 93.3% 92.0% 99.9% 99.0%
Regional train 86.8% 92.0% 96.4% 98.5%
Tram 83.1% 82.9% 98.5% 99.2%
Long-term network performance is available on the PTV website. Short-term results (1 to 3 years) follow.
Metropolitan train Punctuality and services delivered on the metropolitan train network remain steady at 91.1 per cent and 98.4 respectively. Metropolitan train fell short of published targets for punctuality (1.4 per cent) and services delivered (0.6 per cent) for the year. Operational and signalling issues together with faulty trains were the main contributors to unplanned disruptions on the metropolitan train network. Passenger compensation was payable in March and June when performance fell short of the compensation threshold.
2016
–201
7
2017
–201
8
2018
–201
9
91.1%91.9%91.8%
Punctuality (%)
Targets 2016–19 target – 92.5%
2016
–201
7
2017
–201
8
2018
–201
9
98.4%98.8%98.8%
Scheduled services delivered (%)
Targets 2016–19 target – 99%
26 Public Transport Victoria Annual Report 2018–19

TramPunctuality and services delivered on the tram network have remained steady at 83.1 per cent and 98.5 per cent respectively. Tram exceeded the published target for punctuality (82.9 per cent) by 0.2 per cent. It fell short of the published target (99.2 per cent) for services delivered by 0.7 per cent.The impact of network improvement works and summer heat waves were the main contributors to poor performance on the tram network.Passenger compensation was payable in December, January and March when performance fell short of the compensation threshold.
2016
–201
7
2017
–201
8
2018
–201
9
83.1%83.3%83.9%
Punctuality (%)
Targets 2016–19 target – 82.9%
2016
–201
7
2017
–201
8
2018
–201
9
98.5%98.5%98.6%
Scheduled services delivered (%)
Targets 2016–19 target – 99.2%
Metropolitan busPunctuality on metropolitan bus services was 82.6 per cent for the year ended 30 June. The published bus punctuality target (82.0 per cent) was exceeded by 0.6 per cent. The 2018–19 result is a significant improvement on the previous two years.Part of the 2018–19 improvement is due to new performance contracts that were rolled out between July and September 2018. Bus operators also benefited from new bus tracking data which assists them to monitor actual performance. This has enabled operating adjustments to be made so that buses can achieve better punctuality.The methodology for bus punctuality has historically been based on the timeliness of departures from timing points. From 2019–20 the methodology for published performance will change to include arrival as well as departure timeliness. In future, services that depart no more than 59 seconds early and arrive no more than 4 minutes and 59 seconds late will be considered on time. By considering arrival time in the methodology passenger experience is better represented. This methodology is included in new bus service contracts.Services delivered remained steady for the year at 99.8 per cent, falling short of published targets by 0.1 per cent.
2016
–201
7
2017
–201
8
2018
–201
982.6%80.8%80.6%
Punctuality (%)
Targets 2016–19 target – 82%
2016
–201
7
2017
–201
8
2018
–201
9
99.8%99.9%99.9%
Scheduled services delivered (%)
Targets 2016–19 target – 99.9%
Section 1 Year in review 27

Regional BusPunctuality on regional bus services was 93.3 per cent for the year ended 30 June. The published bus punctuality target (92.0 per cent) was exceeded by 1.3 per cent.Services delivered have remained steady for the year at 99.9 per cent for regional bus.
2016
–201
7
2017
–201
8
2018
–201
9
93.3%94.2%94.6%
Punctuality (%)
Targets 2016–19 target – 92%
2016
–201
7
2017
–201
8
2018
–201
9
99.9%100%100%
Scheduled services delivered (%)
Targets 2016–19 target – 99%
Regional TrainPunctuality on the regional train services is up 2.9 per cent (to 86.8 per cent) for the year ended 30 June but remains below the published target (92.0 per cent).Scheduled services delivered was down 0.6 per cent (to 96.4 per cent) for the year ended 30 June. The 2018–19 result was 2.1 per cent short of the published target. Faulty trains, crowding and operational factors were the main contributors to unplanned disruptions on the regional train network.Passenger compensation was payable for each month of the year for one or more lines.
2016
–201
7
2017
–201
8
2018
–201
9
86.8%83.9%85.3%
Punctuality (%)
Targets 2016–19 target – 92%
2016
–201
7
2017
–201
8
2018
–201
9
96.4%97.0%97.8%
Scheduled services delivered (%)
Targets 2016–19 target – 98.5%
28 Public Transport Victoria Annual Report 2018–19

Fare complianceFare compliance remains high on Melbourne’s metropolitan trains, trams and buses, with the overall result up (0.9 percent) to 96.2 per cent on the same period in 2018. In May 2019, we recorded a record high in fare compliance for metropolitan Melbourne. On average there are about one million myki touch ons each day across the public transport network. Authorised Officers check tickets to ensure everyone is paying their way. They also help keep public transport running smoothly by assisting passengers with information and assisting during service disruptions and special events.
2016
–201
7
2017
–201
8
95.3%
2018
–201
9
96.2%95.5%
Fare compliance – metropolitan network
Targets 2016–19 target – 96.5%
Section 1 Year in review 29

Every Victorian travels safelyA safe network is at the core of the transport service. People expect that when they use Victoria’s transport services they will be safe throughout their journey. People who build the network and support service delivery must be safe at work. In addition, people’s perception of safety and personal security affects their willingness to use public transport services.
Our objectives – Improve safety and security of the network. – Ensure personal security on the public
transport network.
2018–19 AchievementsSafety programsPTV and Victoria Police worked with Metro Trains, Yarra Trams and V/Line to run more than 30 joint operations in 2018. The operations improved safety at various locations, including Doncaster, South Morang, Werribee, Dandenong, Frankston, Ringwood, Boronia, Northland, Broadmeadows, Sunshine and Southland.More than 600 authorised officers were employed across the network to keep public transport running smoothly and ensure passengers are paying their way. Authorised officers check tickets, provide information and improve safety and help during special events and disruptions.In addition, Victoria Police conducts visible and plain-clothes patrols across the public transport network. There are also specialist police who investigate offences and conduct major operations to deter and apprehend offenders on the public transport network.
Platform gap mitigationIn 2017–18, the Victorian Government approved a program of works to reduce or mitigate the gap between the platform and the train at key locations. PTV has led the project to develop the platform prioritisation framework, working with the department and Metro Trains.
Stage 1 of delivery works on platform 3 at Camberwell station were completed in March 2019. Works were scheduled on weekend to avoid inconveniencing weekday public transport users. The platform is now safer and more accessible for the thousands of passengers who use the station each day. The program will continue in 2019–20 with works planned at South Yarra and Glenferrie stations.
Rail crossing safetyMultiple transport authorities and agencies share responsibility for improving safety at rail crossings. These safety improvements are to technology, infrastructure, behaviour and regulation. In order to provide a more coordinated approach to rail crossing safety in Victoria, the Victorian Railway Crossing Safety Strategy 2018–2027 was launched by the Victorian Railway Crossing Safety Steering Committee (VRCSSC) in August 2018.During 2018–19 PTV also conducted behavioural assessments to understand the effectiveness of controls at level crossings and surveyed 506 level crossings using the Australian Level Crossing Assessment Model to assess risks at level crossings. In addition, the ‘Stop Before You Cross’ pedestrian safety campaign was delivered. This was PTV’s first marketing campaign based on behavioural research conducted by the VRCSSC. The campaign was recalled by almost 21 percent of Victorians within the campaign area and led to a decline of an estimated 25,000 people carrying out dangerous behaviours.During 2018–19, upgrades were completed at 18 crossings, as part of the Safer Country Crossings and Statewide Railway Crossing Upgrade programs. They are in addition to the Level Crossing Removals program delivered by the Level Rail Removal Project.
30 Public Transport Victoria Annual Report 2018–19

Active Projects Bus stop safety upgradesImplementation of up to 70 bus stop safety upgrades to ensure legislative compliance. Prioritisation of the upgrades will be based on targeted risk assessments. Planning and development is on track.
North Fitzroy Bus Depot – replacement of bus service pitThe scope of the project is to address the flooding issue and non-compliant bus service pit at North Fitzroy Bus Depot. The works were completed in June 2019.
Safer country crossings programProgram of work to upgrade road level crossings from passive to flashing lights and boom barriers and upgrade of pedestrian crossings with automatic gates and emergency exit gate latches. During 2018–19, 11 road and one pedestrian crossings were upgraded.
Statewide railway crossing upgrade programProgram of work to upgrade road level crossings from passive to flashing lights and boom barriers and upgrade of pedestrian crossings with automatic gates and emergency exit gate latches. During 2018–19 one pedestrian crossing was upgraded. Design development for a further 10 crossings is underway.
Train protection warning system The installation of train protection warning system on 84 signals (74 metropolitan, 10 regional) to provide automatic stop enforcement in the event of a V/Line train Signal Passed At Danger event, is underway to mitigate the risk of train-to-train collision. During 2018–19 two regional sites were completed with the remaining scheduled for completion late 2019. The metropolitan sites are progressing through the procurement phase and due to commence during 2019-20.
Victorian Book of RulesThe current Victorian Book of Rules, which sets out the rules for train drivers, was published in 1994. It will be rationalised and restructured so it more accurately targets the skill sets of the end users, and is clearly aligned with the operational principles and the national rules. PTV is leading the development of a revised Book of Rules in collaboration with the rail infrastructure managers.
PerformancePassenger injuriesPassenger injuries per million scheduled kilometres decreased in 2018–19, almost a 20 per cent decrease from 2017–18. This improvement was achieved through:
– A reduction in injuries on trams in response to campaigns encouraging passengers to hold on (Tram coach), the stop before you cross campaign and upgrades to tram stop infrastructure.
– Continued work on the train network to improve safety including level crossing removal program, railway crossing upgrades, rebuilding train platforms (through programs such as Platform Gap Mitigation Project).
Passenger injuries per scheduled km
2017
–201
8*
2018
–201
9
4.545.61
Targets 2017–18 target – <6.772018–19 target – <6.64
* There has been a methodology change since 2017–18. The above table reflects the new methodology. Excludes regional bus and coach.
Section 1 Year in review 31
Delivering value and expertise for VictoriansThe Victorian Government and the community have confidence that PTV delivers effective and efficient services for Victorians. PTV is committed to delivering value to Victorians through good governance, integrity, planning and risk management. We will do this by developing strong relations with community leaders, by working closely with our colleagues across government to deliver government policies and through developing our people and systems to ensure service excellence.
Our objectiveCollaborating with the department and transport portfolio agencies to develop the transport business of the future, through:
– delivering for government – capability, culture and service excellence – collaboration and partnerships.
AchievementsImproving myki refunds to passengersPTV worked to improve the way it refunds passengers due to lost or stolen cards. We receive about 320 refund requests every day. The process used to take several days to complete. A correction to the process was started to improve the outcome for our passengers.We first looked at the process to understand the constraints and pain points and then a new process was created. This was trialled at the contact centre and regional hubs. The new process saw processing times reduce by 60 per cent allowing passengers to get a quicker refund. The change in process has also reduced the operating cost of processing refunds.
Preparing for the international public transport summit in 2021Melbourne will host the Global Public Transport Summit in 2021. The summit is run by the Union Internationale des Transports Publics (UITP), the peak international body of public transport organisations.Delegates from the Victorian Government, including PTV staff, attended the 2019 UITP summit in Stockholm in June. As host of the next summit in 2021, the Victorian Government was required to attend and exhibit at the event as part of its contract with UITP.During the three-day summit, the Victorian Government exhibition stand had more than 16,000 interactions, allowing delegates to promote Melbourne’s transport industry and destination appeal to global officials in the transport sector.Senior delegates conducted trade meetings, in collaboration with AusTrade and Global Victoria, with key international transport companies to share knowledge and encourage participation in the Victorian market.Victoria was also represented on a number of global committees before and during the summit, presenting to world leaders in transport security, design and culture, and marketing.It will be the first time in 30 years that the summit is coming to the southern hemisphere, so it is important to create global interest and investment opportunities.The international public transport summit is expected to generate more than $9.4 million in economic benefits from tourism expenditure at the 2021 conference.The UITP Global Public Transport Summit brings together global leaders in the international public transport and sustainable mobility sector to share knowledge on best practice and emerging technologies and trends.
32 Public Transport Victoria Annual Report 2018–19

School Bus Management SystemStudents living in rural and regional Victoria may be able to get free transport to school through the Victorian school bus program. The program includes about 1,480 school bus contracts. These are funded by the Victorian Government and are valued at about $200 million. The contracts carry up to 70,000 passengers to and from school each day. The School Bus Program is administered by the Department of Education and Training and 320 Network Coordinators based in the schools. The School Bus Management System was established by PTV and the Department of Education and Training to improve and streamline the administrative processes for the School Bus Program. After consultation with schools, 11 school bus networks were selected to participate in a trial of the system in 2016.The new School Bus Management System has been found to provide better reports on the usage and performance of the network – as well as keeping better track of students. It has also been found to improve fare compliance for students who are not eligible for free travel, with fare revenue collected increasing rom about $1,600 per network to about $10,600 for each of the 11 networks under the trial.In January 2019 the trial of the School Bus Management System was rolled out to the latest network, Bendigo, which is the third biggest school bus network in Victoria.
Network Configuration BaselinePTV established a heavy rail network configuration baseline that will support governance and decision making. It provided an integrated approach to better understand the consequences of changes introduced by projects onto the public transport network. The network configuration baseline project gives an overall understanding of all the heavy rail projects planned or in delivery in Victoria. It also provides clear network performance parameters supporting planning activities and allowing delivery agencies to scope against this baseline.
Analysing transport dataPTV has continued to improve its network performance data management capabilities in 2018–19. Parts of PTV and the department are now data-rich and are using it to make data and evidence-driven decision making. The data management capability improvements have allowed us to treat data as an asset, and measure and manage data. During 2018–19, we established an Enterprise Data Strategy and a Data Governance Council.Part of the strategy is to deliver value to the organisation and our passengers. To deliver this, an Enterprise Data Model and Enterprise Data Standards were implemented across our organisation and on all new projects. They will allow for the quick and easy sharing of information and it fosters valuable and constructive transport discussions across transport bodies.Our Data Analytics Platform (DAP) has been improved during 2018–19. Data can be viewed through a tool where end users can request access to data and create their own dashboard to view the data they need.DAP now has a bus data dashboard capable of producing insights of inferred passenger loads for each bus and each bus stop. It can analyse timeliness of service, time of day, seasonality and geospatial information for mapping routes. We are now providing this self-serving dashboard information for trams and ticketing.The self-serving capability of DAP will transform us into a more data-driven organisation, allowing us to make informed, evidence-based decisions. Our increased ability to interpret data will allow the Victorian Government to invest money where it will generate the most positive impact and help minimise the impact of disruptions on passengers.
Contract management frameworkPTV improved its procurement processes during 2018–19 to make it easier for staff to buy goods and services. To streamline the needs of business users, we looked at technology-based solutions to make the process simpler.The new e-Procurement system, Zycus, went live in May 2019 and manages all procurement requests, contract variations and request for tender requirements so users have a one-stop-shop and can track the progress of procurement activities.About 70 per cent of staff attended the procurement, contract management and Zycus training sessions. Since its introduction, there has been a greater awareness of process requirements and a better acceptance of Zycus.
Section 1 Year in review 33

Mystery shopper surveysA PTV program where a team of 25 anonymous commuters conduct about 2,000 observational surveys on the train and tram network every month is showing Melbourne passengers are benefiting from new tram and train contracts.The Mystery Shopper program, which has been running since January 2018, shows Melbourne trains and trams are cleaner and passengers are getting better service information.The mystery shoppers survey the network in proportion to patronage and monitor issues of concern to passengers, including graffiti, litter, window scratching, cleanliness and quality of travel information. The results are published quarterly.The April–June 2019 quarter figures showed 100 per cent of trains mystery shopped were free of offensive graffiti and scratching on board, like swear words or inappropriate drawings. Scratching on train windows significantly improved, with 81 per cent of windows meeting the defined target set by PTV compared to last year’s result of 58 per cent when the survey first began. Since January–March 2018, announcements at stations providing passengers with clear service information increased by 19 per cent. Information on board trains that supports passengers connecting to other services at major stations also improved by 11 per cent.The mystery shopper surveys are one way PTV enforces contracts with the tram and train operators.
Active Projects Rail Operational Performance ProjectThe objective of the new Rail Operational Performance Project solution is to provide an efficient, future proof system that supports compliance with the contracts with Melbourne’s train and tram operators and the enterprise approach to rationalise the data management processes. Requirements have been developed, and procurement strategy is underway.
Operator payments system modernisationImplementation of a new operator payment system to replace the existing obsolete systems and associated manual processes and spreadsheets. The new system has been processing tram and metropolitan train payments since 2017. Following final user acceptance testing in early 2018–19, the management of bus, regional rail and southern cross station operators was transferred to the new system.
PerformanceEmployee EngagementPTV launched a new staff engagement survey in July 2018. The survey was open for 2 weeks and the response rate was 89 per cent.Staff were asked to respond to 90 items across 21 survey categories which were designed to reflect PTV’s strategic and cultural engagement and track key employee experience outcomes. The total favourable engagement score for the 2018 survey was 78, exceeding the Australian National Norm and Transportation Norm. A strong focus and investment in leadership, organisational culture as well as systems and process improvements are attributed to the high scores in staff engagement. Programs and initiatives run by Onboard2020 and People and Culture have helped raise staff engagement include:
– launch of the Health, Safety and Wellbeing Strategy – programs to help parents, such as Bring Our Kids to
Work program – human resources improvements such as a revamp of
the induction program, launch of a graduate program, improvements in recruitment practices and the launch of the Diversity and Inclusion Committee
– development of PTV’s Capability Framework – leadership and management programs – flexible work arrangements – corporate games and staff barbeques.
Organisation changesPTV did not have any major organisational change or any changes to objectives or output structure during 2018–19. However, effective 1 July 2019, PTV and VicRoads came together as part of a new integrated Department of Transport.
Direct costs attributable to machinery of government changesThere were no direct costs to PTV that were attributable to the machinery of government change in 2018–19.
34 Public Transport Victoria Annual Report 2018–19

PTV’s current year financial reviewOverviewThe financial statements presented later in this report are prepared in accordance with the Financial Management Act 1994 and applicable Australian Accounting Standards.The table below shows PTV’s five-year financial summary
2019 2018 2017 2016 2015
Group* $M Group* $M Group* $M Group* $M Group* $M
Grants from government 5,261.0 4,784.8 4,304.4 4,080.0 3,868.9
Total income from transactions 5,708.9 5,176.6 4,634.9 4,396.9 4,127.9
Total expenses from transactions (5,749.8) (5,099.2) (4,669.7) (4,450.9) (4,152.2)
Net result from transactions (40.9) 77.4 (34.9) (53.9) (24.3)
Total other economic flows included in net results (2.2) (4.8) 0.4 (0.9) (45.7)
Net results (43.1) 72.6 (34.4) (54.9) (70.0)
Net cash flows from/(used in) operating activities 155.8 334.8 95.9 22.9 (17.6)
Total assets 1,968.7 1,990.8 1,958.5 2,000.3 2,060.0
Total liabilities (1,601.5) (1,500.5) (1,423.6) (1,499.6) (1,504.2)
Net assets 367.2 490.3 534.8 500.7 555.8
*The group result relates to the financial information of PTV and Franchise Asset Holdings.
The 2018–19 Annual Report includes PTV’s seventh full year financial statements. This year’s statements include Franchise Asset Holdings Pty Ltd (AssetCo), an entity established as a result of the bus franchise arrangements with Transdev. As a controlled entity, AssetCo financial information has been consolidated with PTV and is represented in the consolidated financial statements.
As a government agency, PTV is fully funded for its operating and capital expenditure, therefore the net operating result will reflect accounting transactions that do not require government funding and where revenue has been received but has been used for capital purposes. For 2018–19, the net result was a deficit of $43.1 million which reflects operating funding received for capital purposes of $105 million and Growth Area Infrastructure Contribution revenue received from the Department of Environment, Land, Water and Planning of $30 million, offset by expenses that are not required to be funded by government of $178 million.
Section 1 Year in review 35

Financial performance – operating statementPTV’s income is primarily sourced from government grants, share of fare receipts, licence fees from advertising panels at bus shelters, myki card sales and contributions from the operators for marketing and communications.PTV’s total operating expenses in 2018–19 were $5.7 billion. The majority of PTV’s expenditure was for payments to the transport service providers including $1.8 billion for metropolitan and regional train services, $0.3 billion for metropolitan tram services, $2.1 billion for the Government’s capital assets charge for rail infrastructure and $1.0 billion for bus services.
Financial position – balance sheetTotal assets decreased by $22 million over the year to $1.97 billion, mainly due to an increase in grants receivables from the Department of Transport (DoT) of $92 million, offset by a decrease of $40 million in prepayments for operator’s maintenance and renewal works, a decrease in myki card inventory of $10 million and a further decrease of $64 million in fixed assets due to additions, disposals and depreciation.Total liabilities increased by $100 million to $1.6 billion mainly due to an increase in the deposits repayable to the operators of $42 million and an increase in operator employee entitlements provision of $85 million, offset by repayment of finance lease liability of $17 million and reversal of a $10 million provision.
Cash flowsThe cash balance increased by $2 million to $38 million compared to the previous year. Net cash inflows from operating activities decreased by $179 million due to timing of receipts and payments. Net cash outflows for investing activities decreased by $88 million due to the lower expenditure on capital projects. The net cash inflows from financing activities increased by $90 million due to high volume of payments that required contributed capital funding.
Capital expenditurePTV’s capital expenditure for 2018–2019 was $0.43 billion on major projects including network renewal and franchisee projects, E-class trams and supporting infrastructure, city loop fire and safety upgrade, Rolling Stock Cascade and Flinders Street Station Precinct.Rail assets created by PTV’s capital expenditure are transferred by way of equity (refer to note 4.1.1 to the financial statements) to VicTrack as the entity responsible for reporting the State’s transport infrastructure network.
Subsequent eventsOn 1 July 2019, the Public Transport Development Authority, operating as Public Transport Victoria (PTV) and VicRoads came together as part of a new integrated DoT. The new department will deliver an integrated, user-focussed approach to tackling transport opportunities. Many of the functions of PTV and related agreements have been transferred to the Head, Transport for Victoria (TfV) within DoT with effect from 1 July 2019. The transfer was effected by an Order in Council made under section 66B of the Transport Integration Act 2010 and published in the Victorian Government Gazette on 26 June 2019. The PTV employees transferred to DoT on 1 July 2019. This transfer was effected by an Instrument by the Secretary, Department of Transport, made under section 66N of the Transport Integration Act 2010. Although the bus services contracts remain with PTV, effective control of all PTV functions has been transferred to DoT and TfV. It is therefore expected that all transactions, assets and liabilities will be reported by DoT from 1 July 2019. It is also expected that a section 53 application under the Financial Management Act 1994 will be lodged to request an exemption from the requirement for PTV to lodge a separate Annual Report after 1 July 2019, and therefore the PTV Annual Report at 30 June 2019 is expected to be the last PTV Annual Report.
36 Public Transport Victoria Annual Report 2018–19

Section 1 Year in review 37

38 Public Transport Victoria Annual Report 2018–19

Section 2 Governance and Organisation Structure 39
Section 2Governance and Organisation Structure
Organisation structure 40
Governance committees 42
Occupational health and safety 42

40 Public Transport Victoria Annual Report 2018–19
Organisation structureMinister for Public TransportThe Minister for Public Transport oversees the delivery of public transport in Victoria.The Hon. Melissa Horne MP was appointed as the Minister for Public Transport on 29 November 2018. She is also the Minister for Ports and Freight. Between 1 July 2018 and 28 November 2018, the Hon Jacinta Allan MP was Minister for Public Transport.
Chief Executive, PTVJeroen Weimar joined PTV in 2015 as Executive Director, Performance and Contract Management and was appointed Chief Executive Officer in 2016. As Chief Executive of PTV, Jeroen oversees the management of Victoria’s public transport network, leading a team of passionate and dedicated staff. Jeroen was appointed Chair of the V/Line Board in July 2018. As Chair, Jeroen provides oversight of V/Line’s strategic direction and service delivery to the thousands of Victorians who rely on the regional network every day.A graduate of the London School of Economics, Jeroen first began his career in management consulting, working with clients in the United Kingdom, Europe and the United States.He then held several high-profile roles during ten years with Transport for London before moving to the private sector to take up senior roles for Serco Group and FirstGroup.
PTV’s division responsibilitiesCorporate ServicesProvide professional services to enable an agile, efficient and engaged PTV, including:
– information and communication technology – corporate operations – financial management – governance and Legal – accessibility advice and assurance – human resource management – procurement.
Customer ServicesDeliver services that are easy to access, use and understand so our passengers can get to where they want to go, including:
– passenger information, marketing and digital – media and communications – ticketing services – retail.
Franchise Operator ManagementManage the franchisee and service contracts to extract the maximum benefits, services include:
– contract management – franchise governance and risk – asset performance analysis – commercial analysis – asset configuration and drawings.
Network Integrity and Project AssuranceImprove systems and service resilience through prudent asset management, standards and assurance, services include:
– technical services – asset management – project delivery – program monitoring and performance – network integrity assurance.
Network Service DeliveryOversee the public transport network’s day-to-day operations, including:
– overseeing service delivery – assuring readiness for special events – emergency management – implementing service changes – network performance reporting and analysis.
Office of Chief Executive OfficerInterface between the Chief Executive and key portfolio stakeholders including the Minister’s office. Services include:
– ministerial services – stakeholder management.

Jeroen WeimarChief Executive
Laura Lo Bianco–Smith/ Dean Purkis
Executive Director (Job share) Network Service Delivery
Alan FeddaExecutive Director
Franchise Operator Management/ Deputy Chief Executive Officer
VacantExecutive Director
Network Integrity and Project AssuranceActing: Gary Lampard
Marika HarveyDirector
Office of the Chief Executive Officer
Dean TillotsonExecutive DirectorCorporate Services
Susan KelsoExecutive DirectorCustomer Service
Fred CiliaChief Financial Officer
VacantDirector, Governance and Legal
Acting: George Karaisaridis
VacantChief Engineer
Acting: Chris Van Berendonck
Section 2 Governance and Organisation Structure 41
PTV’s senior executivesPTV’s organisation structure as at 30 June 2018:

Governance CommitteesPTV Executive BoardThe Executive Board was established as a senior advisory and internal decision-making body that makes recommendations to the Chief Executive on the exercise of a power, duty or function of PTV under the Transport Integration Act 2010 or any other Act, regulation or direction.The Executive Board came into effect on 11 April 2017, being the commencement of the amended Transport Integration Act 2010. The committee members include executive direct reports to the Chief Executive. The Executive Board meets monthly.
Audit, Safety, Risk and Assurance CommitteeThe PTV Chief Executive established the Audit, Safety, Risk and Assurance Committee as an independent committee of PTV. The purpose of the committee is to provide independent assurance to the Chief Executive on PTV’s financial and performance reporting responsibilities, safety, risk oversight and management, and systems of internal control.The committee consists of at least three and no more than five members all of whom are non-executive members (independent). The Chair has authority to have direct access to the Chief Executive to discuss any matters the Chair deems necessary. The committee must report to the Chief Executive and does not have any executive powers to commit the Chief Executive or PTV or management generally.The functions of the committee are to:
– provide oversight of financial reporting, performance reporting, systems of risk oversight and management, systems of internal control and the internal audit function
– review and approve PTV’s annual Standing Directions compliance report, internal audit charter, strategic internal audit plan, annual audit work program and scope documents for internal audits
– periodically review PTV’s governance arrangements as determined by the Chief Executive
– undertake other related functions as requested by the Chief Executive.
Audit, Safety, Risk and Assurance Committee membership and rolesThe Audit, Safety, Risk and Assurance Committee membership consists of the following members:
– Doug Bartley, Chairman (independent member)
– Gaye Mason, (independent member) – David Cochrane, (independent member) – Jonathan Metcalfe, (independent member).
Audit, Safety, Risk and Assurance Committee attendance 2018–19
Committee Member
Audit, Safety, Risk and Assurance Committee
Attended Maximum possible
Doug Bartley 7 7
Gaye Mason 7 7
David Cochrane 4 4
Jonathan Metcalfe 5 5
Occupational health and safetyPTV’s health, safety and wellbeing (HSW) vision is to build a healthy and safe environment where employees are mentally and physically safe and healthy. A three-year HSW policy and strategy has been implemented focusing on creating a culture of care, encouraging staff participation, identifying and managing risks, mental health and wellbeing initiatives and supporting staff with injuries and illnesses.In August 2018, the new HSW Program was launched, which included the introduction of an online incident management system and a wellbeing portal emphasizing proactive health management.During the year, five HSW commitments were developed based on information gathered from focus groups, PTV’s risk profile, Health and Safety Representatives and legislative obligations. The HSW commitments are key areas for action to improve HSW at PTV and include:
– See something, say something: report all workplace hazards, near misses and incidents
– Pause, think and assess the risk: take 5 to stop and think, look for risks, make the change and do the job safely
– Are you ok?: ask if someone is ok. Respect and support each other – reach out
– Relate to safety and wellbeing: leaders to open all meetings with a HSW moment
– Don’t be distracted: hold onto the hand rail while using the stairs.
42 Public Transport Victoria Annual Report 2018–19

During 2018–19, 1,597 employees participated in the HSW program. Initiatives included:
– Employee assistance live chat function – Working Well sessions – PTV get moving activity challenge – Health and wellbeing checks – Executive HSW walkabouts.
Incident managementIncidents for 100 full time equivalent (FTE) staff across PTV increased by over 35 per cent in 2018–19, up from 38 to 52. However, this is still significantly below the average of about 200 incidents in similar organisations. Incidents include injuries, illnesses, near misses and identified workplace hazards. While reported incidents were up, the number of incidents which resulted in injury decreased from 17 in 2017–18 to 14 in 2018–19.
2016–2017 2017–2018 2018–2019
71.52
7.8 9.6
38
52
Incidents Rate per 100 FTE
The increase was driven by the continued focused on incident reporting and the introduction of a new online incident management system which has significantly increased reporting across PTV.There was one notifiable incident that occurred at PTV. Notifiable incidents are those which require the Health and Safety Regulator to be notified when they occur.
WorkCover claims The total number of WorkCover claims lodged decreased by four in 2018–19. The number of standard claims remained the same in 2018–19. PTV has introduced a number of proactive programs to help leaders support and manage staff with injuries and illnesses including ergonomic assessments, injury or illness management guidelines and early intervention practices. The average cost per claim increased from $45,730 to $47,515.
Standard claims
2016–2017 2017–2018 2018–2019
10.21
0.62 0.55
3 3
Standard claim Rate per 100 FTE
Claims exceeding 13 weeks
2016–2017 2017–2018 2018–2019
1
0.220.41
0
2
0
Claims exceeding 13 weeks Rate per 100 FTE
Lost time injury claims
2016–2017 2017–2018 2018–2019
00
1.44
0
7
0
Lost time injury claims Rate per 100 FTE
WorkCover premium PTV’s WorkCover premium increased in 2018–19. This is due to a long-term claim with no return-to- work capacity.
Section 2 Governance and Organisation Structure 43

PTV’s performance against OHS management measures
Measures and key performance indicators 2016–17 2017–18 2018–19
Incidents
No. of reported incidents 7 38 52
Rate per 100 FTE 1.52 7.80 9.57
No. of incidents requiring first aid and or further medical treatment 3 17 14
Claims(i)
No. of standard claims(ii) 1 3 3
Rate per 100 FTE 0.21 0.62 0.55
No. of claims exceeding 13 weeks(iii) 1 2 0
Rate per 100 FTE 0.22 .41 0
No. of lost time injury claims (iv) 0 7 0
Rate per 100 FTE 0 1.44 0
Fatalities
Fatality claims 0 0 0
Claim costs(i)
Average cost per standard claim $48,866 $45,730 $47,515
Return to work
Percentage of claims with RTW plan <30 days – – –
Management commitment
Evidence of OHS policy statement, OHS objectives, regular reporting to senior management of OHS, and OHS plans (signed by CEO or equivalent) completed completed completed
Evidence of OHS criteria in purchasing guidelines (including goods, services and personnel) completed completed completed
Consultation and participation
Evidence of agreed structure of designated workgroups (DWGs), health and safety representatives (HSRs), and issue resolution procedures (IRPs)
partially completed completed completed
Compliance with agreed structure on DWGs, HSRs, and IRPs partially completed completed completed
Risk management
Number of quarterly OHS meetings N/A 4 4
Percentage of audits/inspections completed as planned N/A 70% 100%
Percentage of reported incidents investigated N/A 65% 70%
Percentage of issues identified actioned arising from:
– internal audits 100% 87% 93%
– HSR improvement notices – – –
– WorkSafe Notice. – – –
No. of Improvement Notices issued across PTV by WorkSafe Inspector – – –
44 Public Transport Victoria Annual Report 2018–19

Measures and key performance indicators 2016–17 2017–18 2018–19
Training
Percentage of managers and staff that have received OHS training:
– induction 77% 87% 100%
– management training 77% 87% 77%
– contractors, temporary staff, and visitors. n/a n/a 100%
Percentage of HSRs trained:
– acceptance of role 100% 100% 100%
– re training (refresher) 94% 100% 100%
– reporting of incidents and injuries. 0% 100% 100%
Notes: (i) Data sourced from Victorian WorkCover Authority (VWA).(ii) Standard claims are those that have exceeded the employee excess (days or dollars) or are registered as a standard claim and are open with payments at
the time of extraction. Fatality claims are also based on the same definition of standardised claims. Under-threshold claims are excluded from this figure. (iii) The 13–week claims is a measure of the number of claims exceeding 13–week compensation based on a derived day count. The 13–week measure
begins at day one (that is: employer excess and VWA payments). (iv) A lost time claim is one with one (1) or more days compensated by the Victorian Work Cover Authority (VWA) Insurer (that is, once the employer has paid
the 10–day excess) at the time of extraction. Lost time claims are a subset of standardised claims. Under-threshold claims are excluded from this figure.
Section 2 Governance and Organisation Structure 45

46 Public Transport Victoria Annual Report 2018–19

Section 3 Workforce data 47
Section 3Workforce data
Public administration and employment principles 48
Comparative workforce data 48
Diversity and inclusion 50

48 Public Transport Victoria Annual Report 2018–19
Public administration and employment principlesPTV recently reviewed all policies with respect to upholding public sector conduct to promote adherence to public sector values on commencement and during employment. PTV’s online mandatory learning modules were reviewed and updated in line with legislation where employees are mandated to complete ongoing refresher training on key policies on an annual basis.
Comparative workforce dataDetails of employment levels in June 2018 and June 2019
June 2019 June 2018
All employees Ongoing Fixed term and casual All employees Ongoing Fixed term and casual
Number
(headcount) FTEFull-time
(headcount)Part-time
(headcount) FTENumber
(headcount) FTENumber
(headcount) FTEFull-time
(headcount)Part-time
(headcount) FTENumber
(headcount) FTE
Dem
ogra
phic
dat
a
Gender
Male 314 308 246 27 248 65 60 282 277 222 2 223 58 54
Female 249 236 162 3 181 60 55 222 209 151 19 165 52 44
Self-described n n n n n n n n n n n n
Age
15–24 9 7 3 0 3 6 4 4 4 2 0 2 2 2
25–34 108 103 69 5 72 34 31 109 104 71 6 75 32 28
35–44 218 213 164 14 174 40 39 184 180 140 9 147 35 34
45–54 149 146 114 7 119 28 27 135 131 105 3 107 27 23
55–64 72 68 55 3 57 14 11 64 61 51 3 53 10 8
65+ 7 6 3 1 4 3 2 8 7 4 0 4 4 3
Clas
sifi
catio
n da
ta
VPS 1–6 grades 460 443 324 26 341 110 101 407 392 291 19 305 97 87
VPS 1 2 1 0 0 2 1 0 0 0 0 0 0 0
VPS 2 3 3 3 0 3 0 0 1 1 0 0 0 1 1
VPS 3 56 49 28 4 31 24 18 58 50 37 6 41 15 9
VPS 4 120 115 86 10 92 24 23 113 109 85 9 92 19 18
VPS 5 145 142 108 8 113 29 28 113 111 86 1 87 26 24
VPS 6 134 133 99 4 102 31 31 122 121 83 3 86 36 36
Senior employees 103 102 84 4 88 15 14 97 95 82 2 84 13 11
STS 50 49 35 2 37 13 12 41 39 30 0 30 11 9
PS 15 15 13 0 13 2 2 15 15 13 0 13 2 2
Executives 38 38 36 2 38 0 0 41 41 39 2 41 0 0
Other 0 0 0 0 0 0 0 0 0 0 0 0 0 0
Total employees 563 543 408 30 429 125 115 504 487 373 21 389 110 98
Note:(i) Figures in accordance with FRD29C and reflect employment levels during the last full pay period in June of each year.(ii) FTE numbers are rounded to the nearest whole number therefore minor discrepancies may appear when comparing FTE by gender, age or classification.(iii) June 2019: There are two VPS 6 employees acting as STSs under long-term acting arrangements. There are two VPS 6 employees acting as executives
under long-term acting arrangements.

Section 3 Workforce data 49
June 2019 June 2018
All employees Ongoing Fixed term and casual All employees Ongoing Fixed term and casual
Number
(headcount) FTEFull-time
(headcount)Part-time
(headcount) FTENumber
(headcount) FTENumber
(headcount) FTEFull-time
(headcount)Part-time
(headcount) FTENumber
(headcount) FTE
Dem
ogra
phic
dat
a
Gender
Male 314 308 246 27 248 65 60 282 277 222 2 223 58 54
Female 249 236 162 3 181 60 55 222 209 151 19 165 52 44
Self-described n n n n n n n n n n n n
Age
15–24 9 7 3 0 3 6 4 4 4 2 0 2 2 2
25–34 108 103 69 5 72 34 31 109 104 71 6 75 32 28
35–44 218 213 164 14 174 40 39 184 180 140 9 147 35 34
45–54 149 146 114 7 119 28 27 135 131 105 3 107 27 23
55–64 72 68 55 3 57 14 11 64 61 51 3 53 10 8
65+ 7 6 3 1 4 3 2 8 7 4 0 4 4 3
Clas
sifi
catio
n da
ta
VPS 1–6 grades 460 443 324 26 341 110 101 407 392 291 19 305 97 87
VPS 1 2 1 0 0 2 1 0 0 0 0 0 0 0
VPS 2 3 3 3 0 3 0 0 1 1 0 0 0 1 1
VPS 3 56 49 28 4 31 24 18 58 50 37 6 41 15 9
VPS 4 120 115 86 10 92 24 23 113 109 85 9 92 19 18
VPS 5 145 142 108 8 113 29 28 113 111 86 1 87 26 24
VPS 6 134 133 99 4 102 31 31 122 121 83 3 86 36 36
Senior employees 103 102 84 4 88 15 14 97 95 82 2 84 13 11
STS 50 49 35 2 37 13 12 41 39 30 0 30 11 9
PS 15 15 13 0 13 2 2 15 15 13 0 13 2 2
Executives 38 38 36 2 38 0 0 41 41 39 2 41 0 0
Other 0 0 0 0 0 0 0 0 0 0 0 0 0 0
Total employees 563 543 408 30 429 125 115 504 487 373 21 389 110 98
Note:(i) Figures in accordance with FRD29C and reflect employment levels during the last full pay period in June of each year.(ii) FTE numbers are rounded to the nearest whole number therefore minor discrepancies may appear when comparing FTE by gender, age or classification.(iii) June 2019: There are two VPS 6 employees acting as STSs under long-term acting arrangements. There are two VPS 6 employees acting as executives
under long-term acting arrangements.

50 Public Transport Victoria Annual Report 2018–19
Annualised total salary by $20,000 bands, for executive and other senior non-executive staff
Income band (salary) Executives
Senior technical
specialistsPrincipal
scientists
< $160,000
$160,000 – $179,999 1 19^^^^ 5
$180,000 – $199,999 3 18^^^ 7^^^^^
$200,000 – $219,999 11 13^^ 3
$220,000 – $239,999 10
$240,000 – $259,999 4
$260,000 – $279,999
$280,000 – $299,999 4^
$300,000 – $319,999 1
$320,000 – $339,999 3
$340,000 – $359,999
$360,000 – $379,999
$380,000 – $399,999
$400,000 – $419,999
$420,000 – $439,999 1
$440,000 – $459,999
$460,000 – $479,999
$480,000 – $499,999
Total 38 50 15
Note: The salaries reported above is for the full financial year, at a 1–FTE rate, and excludes superannuation.^ 2 employees employed at the rate of 0.8 FTE^^ 2 Employees employed at the rate of 0.6 FTE^^^ 1 Employee employed at 0.9 FTE, 1 Employee employed at 0.6 FTE^^^^ 1 Employee employed at 0.8 FTE^^^^^ 1 Employee employed at 0.8 FTE
Diversity and inclusion Bring our kids to work day In January, PTV ran the ‘bring our kids to work’ day. The aim of the program was to give kids a fun introduction to the world of public transport, show the next generation what we do to keep Victoria moving and introduce our kids to our worlds of work with minimal disruption from the work day.
Women in Transport Mentoring Program PTV had serval mentees and mentors participated in the Women in Transport 2019 mentoring program which consisted of a six-month, industry-wide initiative which gave mentees a fresh avenue for development as they progress their career in transport and for mentors to share their expertise and experience.
Unity and diversity month During March 2019, PTV hosted a range of events to inform, shine the spotlight on and celebrate the things that make us all unique. This period was used to celebrate the diversity of our organisation and reflect on how we can continue to strive towards an inclusive place for all.
Harmony Day staff barbequePTV held an all staff barbeque to celebrate harmony day and to continue celebrating diversity, inclusiveness, respect and message of ‘Everyone belongs’.
Diwali celebration PTV held an afternoon tea to participate in the Diwali festival, which is also known as the festival of lights. A crowd filled the kitchen to learn all about the Indian festival and enjoy some traditional sweets and snacks.
Lunar New Year 2019 The Chinese festival is traditionally celebrated with visits to family and friends, delicious food, fireworks and plenty of gift giving. At PTV the Lunar New Year was celebrated with friends and traditional foods.
GEN44 Intern Program PTV hosted four indigenous interns for a 12–week period over the summer. The interns contributed to a number of activities involving customer service, ministerial services and people experience.

Section 3 Workforce data 51

52 Public Transport Victoria Annual Report 2018–19

Section 4 Other disclosures 53
Section 4Other disclosures
Local Jobs First 54
Social Procurement 55
Disclosure of Victorian Government advertising expenditure 56
Consultancy expenditure 58
Information and communications technology expenditure 58
Disclosure of major contracts compliance 58
Protected Disclosure Act 2012 58
Freedom of information summary 59
Compliance with the Building Act 1993 61
Competitive neutrality policy 61
Environment 61
Additional information available 65
Financial Management Compliance Attestation Statement 66

54 Public Transport Victoria Annual Report 2018–19
Local Jobs First The Local Jobs First Act 2003 introduced in August 2018 brings together the Victorian Industry Participation Policy (VIPP) and Major Project Skills Guarantee (MPSG) policy which were previously administered separately. Departments and public sector bodies are required to apply the Local Job first policy in all projects valued at $3 million or more in Metropolitan Melbourne or for statewide projects, or $1 million or more for projects in regional Victoria.MPSG applies to all construction projects valued at $20 million or more.The MPSG guidelines and VIPP guidelines will continue to apply to MPSG applicable and VIPP applicable projects respectively where contracts have been entered prior to 15 August 2018.
Projects Commenced – Local Jobs First StandardDuring 2018-19, PTV commenced fourteen Local Jobs First Standard projects totalling $818.748 million. Of those projects, two projects had commitments of 93 per cent and 95 per cent local jobs, with a further two projects committing to 100 per cent. Five projects were commenced that occurred statewide. The MSPG applied to none of these projects.The outcomes expected from the implementation of the Local Jobs First policy to these projects where information was provided are as follows:
– an average of 97 per cent of local content commitment was made
– a total of 33 jobs (annualised employee equivalent [AEE]) were committed, including the creation of nine new jobs and the retention of nine existing jobs (AEE)
– a total of two positions for apprentices, trainees and cadets were committed, including the creation of four new apprenticeships, traineeships, and cadets
– the retention of the remaining two existing apprenticeships, traineeships and cadets.
Projects completed – Local Jobs First StandardDuring 2018-19, PTV completed no Local Jobs First Standard projects. (These projects only commenced as were not in contract at end of financial year).
Projects commenced – Local Jobs First StrategicDuring 2018-19, PTV commenced one Local Jobs First Strategic Project, valued at $50 million. The project was based in Statewide representing 95 per cent of estimated local content. The MPSG did not apply to this project.The outcomes reported from the implementation of the policy where information was provided, were as follows:
– expected outcome of 95 per cent of local content outcome was recorded
– a total of 30 AEE positions were created – two new apprenticeships, and traineeship
were created – two existing apprenticeships and traineeships
retained.
Projects completed – Local Jobs First StrategicDuring 2018-19, PTV completed no Local Jobs First Strategic projects. (These projects only commenced as were not in contract at end of financial year).
Reporting requirements – grantsNo grants were provided during 2018–19.
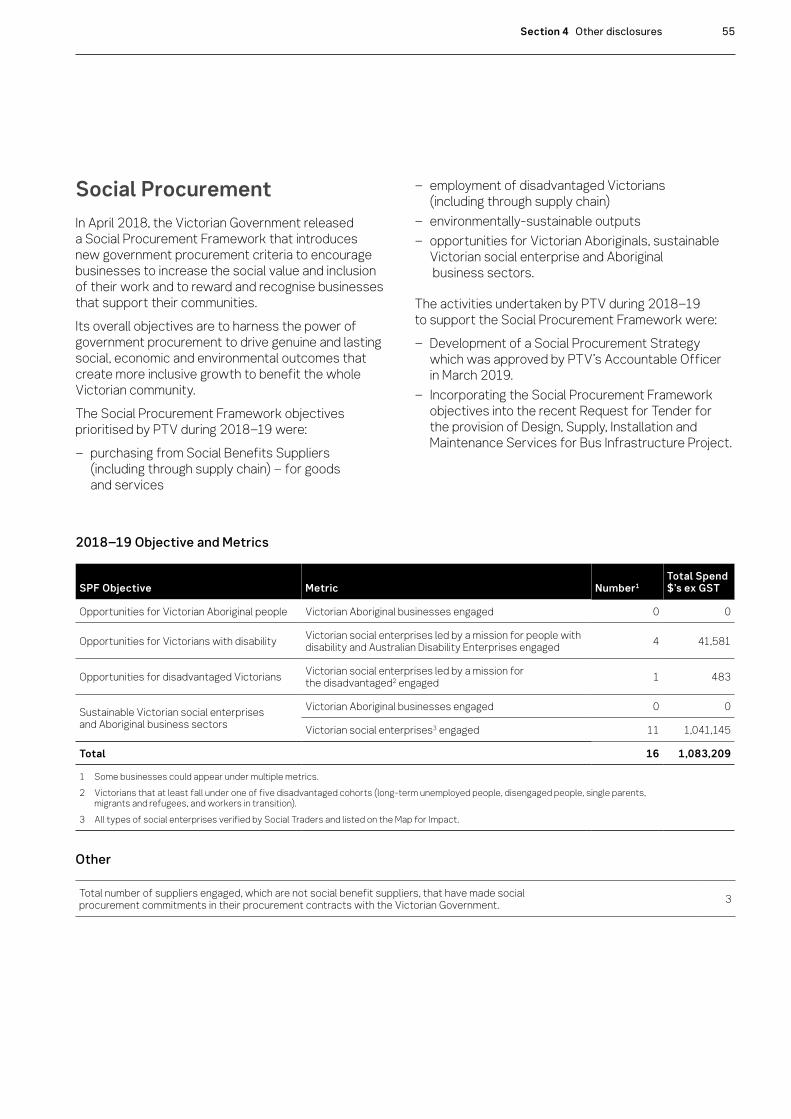
Section 4 Other disclosures 55
Social ProcurementIn April 2018, the Victorian Government released a Social Procurement Framework that introduces new government procurement criteria to encourage businesses to increase the social value and inclusion of their work and to reward and recognise businesses that support their communities.Its overall objectives are to harness the power of government procurement to drive genuine and lasting social, economic and environmental outcomes that create more inclusive growth to benefit the whole Victorian community.The Social Procurement Framework objectives prioritised by PTV during 2018–19 were:
– purchasing from Social Benefits Suppliers (including through supply chain) – for goods and services
– employment of disadvantaged Victorians (including through supply chain)
– environmentally-sustainable outputs – opportunities for Victorian Aboriginals, sustainable
Victorian social enterprise and Aboriginal business sectors.
The activities undertaken by PTV during 2018–19 to support the Social Procurement Framework were:
– Development of a Social Procurement Strategy which was approved by PTV’s Accountable Officer in March 2019.
– Incorporating the Social Procurement Framework objectives into the recent Request for Tender for the provision of Design, Supply, Installation and Maintenance Services for Bus Infrastructure Project.
2018–19 Objective and Metrics
SPF Objective Metric Number1Total Spend $’s ex GST
Opportunities for Victorian Aboriginal people Victorian Aboriginal businesses engaged 0 0
Opportunities for Victorians with disability Victorian social enterprises led by a mission for people with disability and Australian Disability Enterprises engaged 4 41,581
Opportunities for disadvantaged Victorians Victorian social enterprises led by a mission for the disadvantaged2 engaged 1 483
Sustainable Victorian social enterprises and Aboriginal business sectors
Victorian Aboriginal businesses engaged 0 0
Victorian social enterprises3 engaged 11 1,041,145
Total 16 1,083,209
1 Some businesses could appear under multiple metrics.2 Victorians that at least fall under one of five disadvantaged cohorts (long-term unemployed people, disengaged people, single parents,
migrants and refugees, and workers in transition).3 All types of social enterprises verified by Social Traders and listed on the Map for Impact.
Other
Total number of suppliers engaged, which are not social benefit suppliers, that have made social procurement commitments in their procurement contracts with the Victorian Government. 3

56 Public Transport Victoria Annual Report 2018–19
Disclosure of Victorian Government advertising expenditureDetails of PTV advertising expenditure (campaigns with a media spend of $100,000 or greater)
Expenditure (excluding GST)
Name of Campaign Campaign summary Start End dateAdvertising
(media)
Creative and campaign
development Research and
evaluation Print and
collateral Other campaign
Safety You Can See – Protective Service Officers
Phase 1This campaign responded to the Public Safety on Victoria’s Train System report by the Victorian Auditor General’s Office. The February 2016 report recommended PTV and Victoria Police should address the lack of public awareness of personal safety and security initiatives on public transport. Safety You Can See (See you at 6pm) was launched in July 2018 and aimed to educate about the presence and role of Protective Services Officers (PSOs). Secondary messages aimed to improve awareness of key safety infrastructure across the network, such as CCTV and Safety Zones.
27/7/2018 2/9/2018 $372,479.20 $57,642 $21,850 –
Safety Way to Cross – Pedestrians
Phase 1Rail crossing behaviour has been singled out as a key issue lacking in public education and awareness across Victoria. The campaign targeted pedestrians and unsafe behaviour, including texting, day dreaming and using a mobile phone. It aimed to reduce the number of incidents (collisions and near misses) that occur near rail crossings by asking commuters to stop ignoring signs and signals at rail crossings.
5/8/2018 8/9/2018 $251,805.72 $35,400 – – –
Mobile myki The campaign introduced Victorians to mobile ticketing technology available on Android devices. The campaign aimed to ensure passengers were aware of the new technology. Secondary objectives focused on the timesaving benefits of Mobile myki such as ‘topping up on the go’ and checking your balance in real time.
31/3/2019 22/06/2019 $489,353.34 $133,145 – $104,763 –

Section 4 Other disclosures 57
Expenditure (excluding GST)
Name of Campaign Campaign summary Start End dateAdvertising
(media)
Creative and campaign
development Research and
evaluation Print and
collateral Other campaign
Safety You Can See – Protective Service Officers
Phase 1This campaign responded to the Public Safety on Victoria’s Train System report by the Victorian Auditor General’s Office. The February 2016 report recommended PTV and Victoria Police should address the lack of public awareness of personal safety and security initiatives on public transport. Safety You Can See (See you at 6pm) was launched in July 2018 and aimed to educate about the presence and role of Protective Services Officers (PSOs). Secondary messages aimed to improve awareness of key safety infrastructure across the network, such as CCTV and Safety Zones.
27/7/2018 2/9/2018 $372,479.20 $57,642 $21,850 –
Safety Way to Cross – Pedestrians
Phase 1Rail crossing behaviour has been singled out as a key issue lacking in public education and awareness across Victoria. The campaign targeted pedestrians and unsafe behaviour, including texting, day dreaming and using a mobile phone. It aimed to reduce the number of incidents (collisions and near misses) that occur near rail crossings by asking commuters to stop ignoring signs and signals at rail crossings.
5/8/2018 8/9/2018 $251,805.72 $35,400 – – –
Mobile myki The campaign introduced Victorians to mobile ticketing technology available on Android devices. The campaign aimed to ensure passengers were aware of the new technology. Secondary objectives focused on the timesaving benefits of Mobile myki such as ‘topping up on the go’ and checking your balance in real time.
31/3/2019 22/06/2019 $489,353.34 $133,145 – $104,763 –

58 Public Transport Victoria Annual Report 2018–19
Consultancy expenditureDetails of consultancies valued at $10,000 or greaterIn 2018–19, there were 75 consultancies where the total fees payable to the consultants were $10,000 or greater. Total expenditure incurred in 2018–19 in relation to these consultancies was $9,950,592 (excluding GST).
Details of consultancies under $10,000In 2018–19, there were no consultant contracts with a value of less than $10,000.A full list of PTV contractors and consultants engaged in 2018–19, as defined by FRD 22F, can be found in the Additional Information to this Annual report, online at ptv.vic.gov.au.
Information and communications technology expenditureFor the 2018–19 reporting period, PTV had a total information and communications technology (ICT) expenditure of $22.4 million with the details shown below.
ICT expenditure ($ ‘000’s)
Business as usual (BAU) ICT expenditure 22,403.00
Non-business as usual operational expenditure 11,407.29
Non-business as usual capital expenditure 2,095.43
Total non-business as usual expenditure 13,502.72
ICT expenditure refers to the PTV’s costs in providing business-enabling ICT services within the current reporting period. It comprises business as usual (BAU) ICT expenditure and non-business as usual (non-BAU) ICT expenditure. Non-BAU ICT expenditure relates to extending or enhancing the PTV’s current ICT capabilities. BAU ICT expenditure is all remaining ICT expenditure which primarily relates to ongoing activities to operate and maintain the current ICT capability.
Disclosure of major contracts compliancePTV has disclosed, in accordance with the requirements of Victorian Government policy and accompanying guidelines, all contracts greater than $10 million in value that it entered into during the year ended 30 June 2019. Details of contracts that have been disclosed in the Victorian Government contracts publishing system can be viewed online at tenders.vic.gov.au.
Protected Disclosure Act 2012The following information is required in the annual report in accordance with the Protected Disclosure Act 2012 (Vic).The Protected Disclosure Act encourages and assists people in making disclosures of improper or corrupt conduct by public officers and public bodies. The Act provides protection to people who make disclosures in accordance with the Act and establishes a system for the matters disclosed to be investigated and rectifying action to be taken.The Independent Broad-based Anti-corruption Commission (IBAC) has a key role in receiving, assessing and investigating disclosures about corrupt or improper conduct and police personnel conduct as well as responsibility for preparing and publishing guidelines to assist public bodies to interpret and comply with the protected disclosures regime.PTV does not tolerate improper conduct by employees, or the taking of reprisals against those who come forward to disclose such conduct. PTV is committed to ensuring transparency and accountability in its administrative and management practices and supports the making of disclosures that reveal corrupt conduct, conduct involving a substantial mismanagement of public resources, or conduct involving a substantial risk to public health and safety, or the environment.PTV will take all reasonable steps to protect people who make such disclosures from any detrimental action in reprisal for making the disclosure. It will also afford natural justice to the person who is the subject of the disclosure to the extent it is legally possible.

Section 4 Other disclosures 59
Reporting proceduresPTV is not authorised to receive protected disclosures.Protected disclosures about PTV or any of its employees and/or officers must be made directly to IBAC:Independent Broad-based Anti-corruption Commission Level 1, North Tower, 459 Collins Street Melbourne VIC 3000Toll free: 1300 735 135Internet: www.ibac.vic.gov.au/general/contact-usEmail: Please see above website.
IBAC will determine whether a disclosure is a protected disclosure or not. If IBAC determines that a disclosure is a protected disclosure, it must deal with the disclosure in accordance with the Independent Broad-based Anti-corruption Commission Act 2011.
Further informationWritten procedures outlining the system for reporting disclosures of improper conduct or detrimental action by PTV, or any of its employees and/or officers, are available on PTV’s website.
Freedom of information summaryThe Freedom of Information Act 1982 (Vic) allows the public a right of access to documents held by PTV. The purpose of the Act is to extend as far as possible the right of the community to access information held by government departments, local councils, Ministers and other bodies subject to the Act.An applicant has a right to apply for access to documents held by PTV. This comprises documents both created by PTV or supplied to PTV by an external organisation or individual, and may also include maps, films, microfiche, photographs, computer printouts, computer discs, tape recordings and videotapes. Information about the type of material produced by PTV is available on PTV’s website under its Part II Information Statement.
The Act allows PTV to refuse access, either fully or partially, to certain documents or information. Examples of documents that may not be accessed include: cabinet documents; some internal working documents; law enforcement documents; documents covered by legal professional privilege, such as legal advice; personal information about other people; and information provided to PTV in-confidence.From 1 September 2017, the Act was amended to reduce the Freedom of Information processing time for requests received from 45 to 30 days. However, when external consultation is required the processing time automatically reverts to 45 days. Processing time may also be extended by periods of 30 days, in consultation with the applicant. With the applicant’s agreement this may occur any number of times. If an applicant is not satisfied with a decision made by PTV, they have the right to seek a review by the Office of the Victorian Information Commissioner (OVIC) within 28 days of receiving a decision letter pursuant to section 49A of the Act.Details of PTV’s freedom of information activities over the financial year are provided in the table below.
Making a requestSection 17 of the Act lists the requirements for making a Freedom of Information request. In summary, a Freedom of Information request:
– must be in writing – should identify as clearly as possible which
document is being requested – should be accompanied by the appropriate
application fee (the fee may be waived in certain circumstances).
Requests for documents in the possession of PTV should be addressed to:Freedom of Information Officer Public Transport Victoria PO Box 4724 MELBOURNE VIC 3001Email: [email protected]

60 Public Transport Victoria Annual Report 2018–19
Freedom of Information Activity 2017–18
Requests received(i)
Member of Parliament 3
Media 14
Others(ii) 37
Total 54
Decisions made
Full access 9
Part access 22
Denied access 4
No documents 5
Transferred/Withdrawn(iii) 12
Total 52
Processing time
Average decision time 37 days
Decisions made within the time requirements of section 21 of the FOI Act 52
Decisions made outside the time requirements of section 21 of the FOI Act 0
Office of the Victorian Information Commissioner review/complaints received
Member of Parliament 2
Media 2
Others 5
Total 9
Outcome of Office of the Victorian Information Commissioner review/complaints
Request for review withdrawn by applicant 1
Dismissed/ fresh decision by PTV 2
Original decision affirmed 0
Decision varied – further material released 1
Decision pending 6
Total 10
Victorian Civil and Administrative Tribunal appeals received
Member of Parliament 0
Media 0
Others 0
Total 0
Victorian Civil and Administrative Tribunal appeals decided
Withdrawn 0
Struck out 0
Original decision confirmed 0
Original decision varied 0
Total 0
(i) Lists all requests received by PTV, including five (5) requests which, after consultation, were transferred to another agency for processing.
(ii) Includes solicitors, companies/organisations, private persons and lobby groups.
(iii) Includes requests transferred, withdrawn, not processed, not proceeded with and where the Freedom of Information Act does not apply.

Section 4 Other disclosures 61
Compliance with the Building Act 1993 PTV does not own or control any government buildings and consequently is exempt from notifying its compliance with the building and maintenance provisions of the Building Act 1993 (Vic).
Competitive neutrality policyCompetitive neutrality requires government businesses to ensure where services compete, or potentially compete with the private sector, any advantage arising solely from their government ownership be removed if it is not in the public interest. Victorian Government businesses are required to cost and price these services as if they were privately owned. Competitive neutrality policy supports fair competition between public and private businesses and provides government businesses with a tool to enhance decisions on resource allocation. This policy does not override other policy objectives of government and focuses on efficiency in the provision of service.PTV is working to ensure Victoria fulfils its requirements on competitive neutrality reporting for technological based businesses against the enhanced principles as required under the Competition Principles Agreement and Infrastructure Reform Agreement.
EnvironmentOffice-based environmental impactsPTV has committed to a number of environmental initiatives as a result of the Victorian Auditor-General’s report, Managing the Environmental Impacts of Transport, published in 2014. PTV has developed an Environment and Sustainability Strategy (2015–2020) to provide broad guidance on key environmental initiatives to be addressed in the medium term in accordance with the PTV Corporate Plan 2014–18.PTV also recognises the emission reduction targets set by the Victorian Government in the Climate Change Act 2017 and is committed to reducing our emissions to achieve zero net emissions by 2050.
Key initiatives to be addressed that are relevant to office-based impacts include:
– developing and implementing an Environmental Management System based on ISO 14001 to be integrated with the Safety Management System
– completing an environmental footprint to understand impacts
– developing and implementing a monitoring and evaluation framework for PTV targeted at understanding the baseline performance of public transport
– integrating whole-of-lifecycle considerations into the procurement process
– promoting energy and transport technologies that have the least impact
– developing and implementing sustainability specifications.
PTV’s Environment Management System was set up to meet Victorian Government expectations and to reduce the impact on the environment. Our initial focus was on our office based activities in the areas of energy consumption, transportation, waste generation, water consumption, and procurement.The Environmental Management System objectives include:
– adopting an environmental management system based on ISO 14001
– communicating environmental performance through regular reporting
– encouraging staff to reduce environmental impacts – reducing the amount of waste, and maximising the
amount reused and recycled – reducing vehicle fleet emissions – making environmentally-sound purchasing decisions
for capital items and consumables.
Improving the sustainability performance and resilience-to-climate-change-impacts of our transport networks is a key priority for PTV.

62 Public Transport Victoria Annual Report 2018–19
EnergyPTV consumes energy for many different uses including office facilities and passenger services (such as PTV Hubs).The data presented was collected through energy retailer billing information for the corporate office and PTV Hubs. PTV is continuing to develop systems to more comprehensively collect data regarding expenditure of natural gas and green power, particularly at operational facilities.
Indicator
2018–19
ElectricityNatural
gasGreen power
Total energy usage segmented by primary source (MJ) 3,092,318 Not
known 0
Greenhouse gas emissions associated with energy use, segmented by primary source and offsets (t CO2-e)
919 Not known 0
Percentage of electricity purchased as green power 0% Not
known 0
Units of energy used per FTE (MJ/FTE) 5695 Not
known 0
Units of energy used per unit of office area (MJ/m2) 286 Not
known 0
Actions undertaken
Reducing Energy Use
Communications informing staff of energy saving techniques
Procurement of more energy efficienct computer equipment
Centralisation of printing equipment
Target – 10 per cent energy intensity reduction, measured
as MJ/m2, from 2015–16 values (265MJ/m2) by 30 June 2019 — not met.
WasteThe waste generated by processes within PTV is divided into four general classes: landfill, organics, paper and card and commingled recycling. Waste at 750 Collins St is managed by the building’s owner and manager, General Property Trust (GPT).The data presented below is derived from GPT Waste Profiling Report – PTV Tenancy.
Indicator
2018–19
LandfillRecycled
Waste Organics
Total units of waste disposed of by destination (kg/yr) 12,165.82 9586.91 3514.91
Units of waste disposed of per FTE by destinations (kg/FTE) 22.4 17.66 6.47
Recycling rate (percentage of total waste) 31.04
Greenhouse gas emissions associated with waste disposal (t CO2-e)
17
E-waste
PTV’s e-waste totalled 5615.36kg/yr, equating to 10.34kg/FTE and 18.19% of PTV’s total waste stream. 4130.005kgs were re-used; 1395.74kgs were recycled; and 90.62kgs were sent to landfill
Actions undertaken
Avoidance to landfill
Communication to staff helping them identify which is the correct bin to put waste in
Increased organics waste measures
Target – Increase per cent of waste avoiding landfill to 50 per
cent by 30 June 2019 — met – Waste to landfill has reduced but not to 50 per cent.
Explanatory notesWaste greenhouse gas emissions calculations have been determined from the National Greenhouse Accounts Factors (2018) for waste disposed to landfill. They are measured in tonnes of carbon dioxide equivalent (t CO2-e).

Section 4 Other disclosures 63
Paper
Indicator 2018–19
Total units of copy paper used (reams – 500 sheets per ream) 3290
Units of copy paper used per FTE (reams/FTE) 6.06
Percentage of 75–100% recycled content copy paper purchased 99
Percentage of 50–74% recycled content copy paper purchased 0
Percentage of 0–49% recycled content copy paper purchased 1
Actions undertaken
Reducing paper use
Default settings for paper reduction
Increased relaible data on actual paper use.
Target – Reduce total units of A4 equivalent copy paper used
(reams) by 5 per cent based on 2015–16 baseline by 30 June 2019 — met
– Total units of paper used has reduced by greater than 5 per cent.
WaterThis data is based on water meter readings from the tenancy. The building is a five-star rated building.
Indicator 2018–19
Total units of metered water consumed by usage types (kilolitres) 3027
Units of metered water consumed in offices per FTE (kilolitres/FTE) 5.5
Units of metered water consumed in offices per unit of office area (kilolitres/m2) 2.7
Actions undertaken
Water-saving features
Communicated to staff about reducing water use.
Target – 10 per cent reduction in water consumption based
on 2015–16 baseline (litres per FTE) by 30 June 2019 — not met
– Water usage has increased.
Explanatory notesWater data is provided by building management team (GPT) as per the lease requirements for the entire 750 Collins Street building. Water usage for PTV is calculated by dividing the total water consumed at 750 Collins Street by the number of floors occupied by PTV.

64 Public Transport Victoria Annual Report 2018–19
TransportIn 2018–19, PTV chose to use VicFleet exclusively for its vehicle use and no longer uses PTV-owned vehicles. This has led to a greater reliability of data and the target will now be benchmarked from the present financial year as it reflects a more accurate picture of fleet emissions.
Actions undertaken
Reduce fleet emissions
Use of VicFleet-only vehicles (greater data reliability and greater percentage of hybrid/non-diesel vehicles).
Encouraged staff to travel using public transport with the provision of staff travel passes and the removal of staff car parking spaces at PTV offices.
Target – Investigate efficiencies to reduce consumption
of fuels used by PTV’s passenger vehicle fleet compared with 2016–17 to reduce emissions by 10 per cent by 30 June 2019 — not met.
Reporting period 2018–19
Vehicle type 4 cyl 6 cyl
Total energy consumption by vehicles (Mj) 1,560,000 354,000
Diesel 467,000 0
LPG 0 0
Unleaded 373,000 354,000
Hybrid 627,000 0
Total vehicle travel associated with entity operations (km) 252,260 38,236
Diesel 69,822 0
LPG 0 0
Unleaded 72,376 38,236
Hybrid 111,062 0
Total greenhouse gas emissions from vehicle fleet (t CO2-e) 110 24
Diesel 33 0
LPG 0 0
Unleaded 29 24
Hybrid 42 0
Greenhouse gas emissions from vehicle fleet per 1,000 km travelled (t CO2-e)
Diesel 0.5 0
LPG 0 0
Unleaded 0.4 0.6
Hybrid 0.3 0
Work-related flights
Total distance travelled by
aeroplane (km)Greenhouse gas
(CO2e)
2018–19 672718.82 237

Section 4 Other disclosures 65
Greenhouse gas emissionsThe emissions disclosed below are taken from the previous sections and combined here to show PTV’s greenhouse footprint measured in tonnes of carbon dioxide equivalent (t CO2-e).
Indicator 2018–19
Total greenhouse gas emissions associated with energy use (t CO2-e) 919
Total greenhouse gas emissions associated with vehicle fleet (t CO2-e) 134
Total greenhouse gas emissions associated with air travel (t CO2-e) 0*
Total greenhouse gas emissions associated with waste production (t CO2-e) 17
Greenhouse gas emissions offsets purchased (t CO2-e) 0
Target – To investigate options to reduce PTV’s environmental
footprint — met. Emissions reduced to 1070 t CO2-e. – *PTV offset all 2018–19 international and domestic
flight related emissions at the time of making flight bookings. This saved 237 T CO2-e and reduced PTV’s total emission to 1070 T CO2-e
– PTV intends to offset future years emissions sources in line with the setting of a science-based target to ensure that offsetting and emissions reductions are monitored and planned in line with current best practice.
Explanatory notesPTV has recently assessed its environmental footprint, creating a baseline from which to investigate efficiencies to reduce our carbon footprint. Some emissions sources are managed centrally through our building owner and without increased sub-metering in place to provide better data, PTV is unable to target resource use as effectively as it could. PTV will be moving to a new building in November 2019 and has confirmed that increased sub metering will be in place. This will allow for more accurate PTV energy and water use monitoring, which will better inform the effectiveness of future reduction programs.
Additional information availableThe Directions of the Minister for Finance, pursuant to the Financial Management Act 1994 require a range of information to be prepared in relation to the financial year.This material is itemised below, and where not published in this report, is published on the PTV website as Additional Information, on the same page as the Annual Report:
– a statement that declarations of pecuniary interests have been duly completed by all relevant officers
– details of shares held by a senior officer as nominee or held beneficially in a statutory authority or subsidiary
– details of publications produced by the entity about the entity and how these can be obtained
– details of changes in prices, fees, charges, rates and levies charged by the entity
– details of any major external reviews carried out on the entity
– details of major research and development activities undertaken by the entity
– details of overseas visits undertaken including a summary of the objectives and outcomes of each visit
– details of major promotional, public relations and marketing activities undertaken by the entity to develop community awareness of the entity and its services
– details of assessments and measures undertaken to improve the occupational health and safety of employees
– general statement on industrial relations within the entity and details of time lost through industrial accidents and disputes
– list of major committees sponsored by the entity, the purposes of each committee and the extent to which the purposes have been achieved
– details of all consultancies and contractors including: – consultants/contractors engaged – services provided – expenditure committed to for each engagement.

66 Public Transport Victoria Annual Report 2018–19
Financial Management Compliance Attestation StatementI, Jeroen Weimar, Chief Executive, on behalf of the Responsible Body, certify that Public Transport Victoria has complied with the applicable Standing Directions of the Minister for Finance under the Financial Management Act 1994 and Instructions.
Jeroen WeimarChief ExecutivePublic Transport Victoria10 September 2019

Section 4 Other disclosures 67

68 Public Transport Victoria Annual Report 2018–19

Section 5 Consolidated financial statements 69
Section 5Consolidated financial statements
Accountable Officer’s and Chief Financial Officer’s Declaration 72
Victorian Auditor – General’s Report 73
Consolidated comprehensive operating statement 75
Consolidated balance sheet 76
Consolidated cash flow statement 77
Consolidated statement of changes in equity 78
Notes to the consolidated financial statements 79
These consolidated financial statements for the year ended 30 June 2019 are prepared for the Public Transport Development Authority (operating as Public Transport Victoria) and its controlled entity.A description of the nature of PTV’s operations and its principal activities are included in the report of operations.For queries in relation to these consolidated financial statements please visit ptv.vic.gov.au.

70 Public Transport Victoria Annual Report 2018–19
Public Transport Victoria – Consolidated financial statements
How this report is structuredPublic Transport Victoria (PTV) has presented its audited general purpose consolidated financial statements for the financial year ended 30 June 2019 in the following structure to provide users with information about PTV’s stewardship of resources entrusted to it.
Consolidated Financial StatementsConsolidated comprehensive operating statement 75Consolidated balance sheet 76Consolidated cash flow statement 77Consolidated statement of changes in equity 78
Notes to the consolidated financial statements 791. About this report 79 The basis on which the financial statements have been prepared
and compliance with reporting regulations80
2. Funding delivery of services 81 Revenue recognised from grants from the Victorian Government,
provision for services and other sources2.1 Income that funds the delivery of services 81
3. The cost of delivering services 82 Operating expenses of PTV3.1 Expenses incurred in delivery of services 823.2 Capital asset charge 873.3 Other operating expenses 87
4. Disaggregated financial information 88 Fixed asset transfers4.1 Fixed asset transfers 88
5. Key assets available to support output delivery 89 Land, buildings, infrastructure, plant and equipment, leasehold improvement,
vehicles, cultural assets and intangible assets5.1 Property, plant and equipment 895.2 Intangible assets 94

Section 5 Consolidated financial statements 71
6. Other assets and liabilities 95 Working capital balances, and other key assets and liabilities6.1 Receivables 956.2 Payables 956.3 Inventories 966.4 Other non-financial assets 966.5 Other provisions 97
7. Financing operations 97 Borrowings, cash flow information and leases7.1 Borrowings 987.2 Leases 1017.3 Cash flow information and balances 1027.4 Commitments for expenditure 102
8. Risks, contingencies and valuation judgements 106 Financial risk management, contingent assets and liabilities and fair value determination8.1 Financial instruments specific disclosures 1068.2 Contingent assets and contingent liabilities 1168.3 Fair value determination 117
9. Other disclosures 1239.1 Ex-gratia expenses(i) 1239.2 Other economic flows included in net result 1239.3 Change in accounting policies 1239.4 Responsible persons 1249.5 Remuneration of executives 1249.6 Related parties 1259.7 Remuneration of auditors 1269.8 Fare and cardholder funds administration 1279.9 Subsequent events 1279.10 Other accounting policies 1279.11 Australian Accounting Standards issued that are not yet effective 1279.12 Glossary of technical terms 1299.13 Style conventions 131

72 Public Transport Victoria Annual Report 2018–19
Accountable Officer’s and Chief Financial Officer’s DeclarationThe attached consolidated financial statements for the Public Transport Development Authority have been prepared in accordance with Direction 5.2 of the Standing Directions of the Assistant Treasurer under the Financial Management Act 1994, applicable Financial Reporting Directions, Australian Accounting Standards including Interpretations, and other mandatory professional reporting requirements.We further state that, in our opinion, the information set out in the consolidated comprehensive operating statement, consolidated balance sheet, consolidated statement of changes in equity, consolidated cash flow statement and accompanying notes, presents fairly the financial transactions during the year ended 30 June 2019 and financial position of the Public Transport Development Authority and its controlled entity as at 30 June 2019.At the time of signing, we are not aware of any circumstance which would render any particulars included in the financial statements to be misleading or inaccurate.We authorise the attached consolidated financial statements for issue on 20 September 2019.
Jeroen WeimarChief Executive
Melbourne20 September 2019
Fred CiliaChief Financial Officer
Melbourne20 September 2019

Section 5 Consolidated financial statements 73
Victorian Auditor – General’s Report
Independent Auditor’s Report To the Chief Executive of the Public Transport Development Authority
Opinion I have audited the consolidated financial report of the Public Transport Development Authority (the authority) and its controlled entities (together the consolidated entity), which comprises the:
• consolidated balance sheet as at 30 June 2019 • consolidated comprehensive operating statement for the year then ended • consolidated statement of changes in equity for the year then ended • consolidated cash flow statement for the year then ended • notes to the financial statements, including significant accounting policies • accountable officer's and chief financial officer's declaration.
In my opinion, the financial report presents fairly, in all material respects, the financial positions of the consolidated entity and the authority as at 30 June 2019 and their financial performance and cash flows for the year then ended in accordance with the financial reporting requirements of Part 7 of the Financial Management Act 1994 and applicable Australian Accounting Standards.
Basis for Opinion
I have conducted my audit in accordance with the Audit Act 1994 which incorporates the Australian Auditing Standards. I further describe my responsibilities under that Act and those standards in the Auditor’s Responsibilities for the Audit of the Financial Report section of my report.
My independence is established by the Constitution Act 1975. My staff and I are independent of the authority and the consolidated entity in accordance with the ethical requirements of the Accounting Professional and Ethical Standards Board’s APES 110 Code of Ethics for Professional Accountants (the Code) that are relevant to my audit of the financial report in Victoria. My staff and I have also fulfilled our other ethical responsibilities in accordance with the Code.
I believe that the audit evidence I have obtained is sufficient and appropriate to provide a basis for my opinion.
Chief Executive’s responsibilities for the financial report
The Chief Executive of the authority is responsible for the preparation and fair presentation of the financial report in accordance with Australian Accounting Standards and the Financial Management Act 1994, and for such internal control as the Chief Executive determines is necessary to enable the preparation and fair presentation of a financial report that is free from material misstatement, whether due to fraud or error.
In preparing the financial report, the Chief Executive is responsible for assessing the authority and the consolidated entity’s ability to continue as a going concern, disclosing, as applicable, matters related to going concern and using the going concern basis of accounting unless it is inappropriate to do so.

74 Public Transport Victoria Annual Report 2018–19
2
Auditor’s responsibilities for the audit of the financial report
As required by the Audit Act 1994, my responsibility is to express an opinion on the financial report based on the audit. My objectives for the audit are to obtain reasonable assurance about whether the financial report as a whole is free from material misstatement, whether due to fraud or error, and to issue an auditor’s report that includes my opinion. Reasonable assurance is a high level of assurance, but is not a guarantee that an audit conducted in accordance with the Australian Auditing Standards will always detect a material misstatement when it exists. Misstatements can arise from fraud or error and are considered material if, individually or in the aggregate, they could reasonably be expected to influence the economic decisions of users taken on the basis of this financial report.
As part of an audit in accordance with the Australian Auditing Standards, I exercise professional judgement and maintain professional scepticism throughout the audit. I also:
• identify and assess the risks of material misstatement of the financial report, whether due to fraud or error, design and perform audit procedures responsive to those risks, and obtain audit evidence that is sufficient and appropriate to provide a basis for my opinion. The risk of not detecting a material misstatement resulting from fraud is higher than for one resulting from error, as fraud may involve collusion, forgery, intentional omissions, misrepresentations, or the override of internal control.
• obtain an understanding of internal control relevant to the audit in order to design audit procedures that are appropriate in the circumstances, but not for the purpose of expressing an opinion on the effectiveness of the authority and the consolidated entity’s internal control
• evaluate the appropriateness of accounting policies used and the reasonableness of accounting estimates and related disclosures made by the Chief Executive
• conclude on the appropriateness of the Chief Executive's use of the going concern basis of accounting and, based on the audit evidence obtained, whether a material uncertainty exists related to events or conditions that may cast significant doubt on the authority and the consolidated entity’s ability to continue as a going concern. If I conclude that a material uncertainty exists, I am required to draw attention in my auditor’s report to the related disclosures in the financial report or, if such disclosures are inadequate, to modify my opinion. My conclusions are based on the audit evidence obtained up to the date of my auditor’s report. However, future events or conditions may cause the authority and the consolidated entity to cease to continue as a going concern.
• evaluate the overall presentation, structure and content of the financial report, including the disclosures, and whether the financial report represents the underlying transactions and events in a manner that achieves fair presentation
• obtain sufficient appropriate audit evidence regarding the financial information of the entities or business activities within the authority and consolidated entity to express an opinion on the financial report. I remain responsible for the direction, supervision and performance of the audit of the authority and the consolidated entity. I remain solely responsible for my audit opinion.
I communicate with the Chief Executive regarding, among other matters, the planned scope and timing of the audit and significant audit findings, including any significant deficiencies in internal control that I identify during my audit.
MELBOURNE 20 September 2019
Simone Bohan as delegate for the Auditor-General of Victoria

Section 5 Consolidated financial statements 75
Consolidated comprehensive operating statementFor the financial year ended 30 June 2019
Note
($ thousand)
2019 2018
Continuing operations
Income from transactions
Grants from Victorian Government 2.1.1 5,260,989 4,784,812
Supply of transport services 2.1.2 331,973 284,341
Fair value of assets and resources received free of charge 2.1.3 60,774 57,503
Operators’ contribution for marketing and communications 2.1.4 9,648 7,561
Issuance fee of myki cards 2.1.5 14,120 14,135
Licence fee from advertising panels at bus shelters 2.1.6 22,074 21,236
Interest 3,100 2,986
Other income 6,175 4,022
Total income from transactions 5,708,853 5,176,596
Expenses from transactions
Service providers and transport agencies 3.1.1 (5,460,098) (4,844,312)
Supplies and services 3.3 (70,595) (71,593)
Fair value of assets and services provided free of charge 3.3 (25,883) (33,433)
Employee benefit expenses 3.1.2 (59,846) (51,223)
Depreciation and amortisation 5.1.1 (84,308) (48,728)
Interest expense 7.1 (39,829) (41,512)
Capital asset charge 3.2 (9,169) (8,355)
Total expenses from transactions (5,749,728) (5,099,156)
Net result from transactions (net operating balance) (40,875) 77,440
Other economic flows included in net result
Net loss on non-financial assets 9.2 (313) (657)
Net loss on financial instruments 9.2 (1,324) (4,097)
Other loss from other economic flows 9.2 (578) (39)
Total other economic flows included in net result (2,215) (4,793)
Net result from continuing operations (43,090) 72,647
Other economic flows – other comprehensive income
Changes in physical asset revaluation surplus 5.1.2 – 31,598
Total other economic flows – other comprehensive income – 31,598
Comprehensive result (43,090) 104,245
The consolidated comprehensive operating statement should be read in conjunction with the notes to the consolidated financial statements.

76 Public Transport Victoria Annual Report 2018–19
Consolidated balance sheet As at 30 June 2019
Note
($ thousand)
2019 2018
Assets
Financial assets
Cash and deposits 7.3 37,987 36,217
Receivables 6.1 587,638 495,815
Total financial assets 625,625 532,032
Non-financial assets
Inventories 6.3 6,266 16,168
Property, plant and equipment 5.1 1,324,618 1,388,405
Intangible assets 5.2 11,417 12,579
Other non-financial assets 6.4 798 41,614
Total non-financial assets 1,343,099 1,458,766
Total assets 1,968,724 1,990,798
Liabilities
Payables 6.2 603,628 562,004
Borrowings 7.1 484,291 501,669
Employee related provisions 3.1.3 508,299 422,697
Other provisions 6.5 5,324 14,173
Total liabilities 1,601,542 1,500,543
Net assets 367,182 490,255
Equity
Contributed capital 161,623 241,606
Accumulated deficit (46,995) (3,905)
Physical asset revaluation surplus 252,554 252,554
Net worth 367,182 490,255
The consolidated balance sheet should be read in conjunction with the notes to the consolidated financial statements.

Section 5 Consolidated financial statements 77
Consolidated cash flow statement For the financial year ended 30 June 2019
Note
($ thousand)
2019 2018
Cash flows from operating activities
Receipts
Receipts from Government 5,219,016 4,896,090
Fare receipts 949,135 917,413
Goods and Services Tax recovered from the ATO(i) 358,263 336,174
Receipts from operators 9,648 7,561
Interest received 3,252 2,964
Other receipts 38,572 53,516
Total receipts 6,577,886 6,213,718
Payments
Payments to service providers and transport agencies (3,481,343) (3,095,700)
Fare receipts (remitted to transport operators) (619,972) (633,057)
Payments to suppliers and employees (127,322) (122,985)
Interest and other costs of finance paid (39,829) (41,512)
Capital asset charge (2,153,640) (1,985,685)
Total payments (6,422,106) (5,878,939)
Net cash flows from operating activities 7.3.1 155,780 334,779
Cash flows from investing activities
Payments for non-financial assets (444,452) (532,516)
Proceeds from disposals of non-financial assets 65 129
Net cash flows used in investing activities (444,387) (532,387)
Cash flows from financing activities
Proceeds from capital contributions by DEDJTR/DoT 307,754 216,943
Repayment of loans (9,903) (9,235)
Proceeds from loans 6,661 4,336
Repayments of finance lease liabilities (14,135) (13,347)
Net cash flows provided by financing activities 290,377 198,697
Net increase in cash and cash equivalents 1,770 1,089
Cash and cash equivalents at the beginning of the financial year 36,217 35,128
Cash and cash equivalents at the end of the financial year 7.3 37,987 36,217
(i) GST paid to the Australian Taxation Office is presented on a net basis.The consolidated cash flow statement should be read in conjunction with the notes to the consolidated financial statements.

78 Public Transport Victoria Annual Report 2018–19
Consolidated statement of changes in equity For the financial year ended 30 June 2019
Note
($ thousand)
Contributions by Owner
Accumulated Surplus/(Deficit)
Physical Asset Revaluation
Surplus Total
Balance at 30 June 2017 390,426 (76,552) 220,956 534,830
Net result from continuing operations – 72,647 – 72,647
Capital contributions funding from DEDJTR/ DoT during the period 343,741 – – 343,741
Capital transfer to VicTrack 4.1.1 (492,561) – – (492,561)
Other economic flows – other comprehensive income 5.1.2 – – 31,598 31,598
Balance at 30 June 2018 241,606 (3,905) 252,554 490,255
Net result from continuing operations – (43,090) – (43,090)
Capital contributions funding from DEDJTR/DoT during the period 341,845 – – 341,845
Capital transfer to VicTrack 4.1.1 (419,288) – – (419,288)
Capital transfer to DoT 4.1.2 (2,540) – – (2,540)
Balance at 30 June 2019 161,623 (46,995) 252,554 367,182
The consolidated statement of changes in equity should be read in conjunction with the notes to the consolidated financial statements.

Section 5 Consolidated financial statements 79
Notes to the consolidated financial statements1. About this reportPublic Transport Development Authority, operating as Public Transport Victoria (PTV) is a statutory authority of the State of Victoria, established under the Transport Integration Act 2010. The legislation to establish the Public Transport Development Authority was passed by the Parliament on 8 November 2011 and received Royal Assent on 15 December 2011. Operations for PTV commenced on 2 April 2012. The Transport Integration Amendment Act 2017, which commenced in April 2017, amended the statutory charter of PTV. This included establishing the Chief Executive Officer of PTV as the Responsible Body and the Accountable Officer.Its principal address is 750 Collins Street, Docklands, Victoria 3008.The financial statements include all the controlled activities of PTV.A description of the nature of PTV’s operations and its principal activities is included in the Report of operations, which does not form part of the consolidated financial statements.
Basis of preparationThese financial statements are in Australian dollars and the historical cost convention is used unless a different measurement basis is specifically disclosed in the note associated with the item measured on a different basis.The accrual basis of accounting has been applied in preparing these financial statements, whereby assets, liabilities, equity, income and expenses are recognised in the reporting period to which they relate, regardless of when cash is received or paid.Consistent with the requirements of AASB 1004 Contributions, contributions by owners (that is, contributed capital and its repayment) are treated as equity transactions and, therefore, do not form part of the income and expenses of PTV.Additions to net assets which have been designated as contributions by owners are recognised as contributed capital. Other transfers that are in the nature of contributions to or distributions by owners have also been designated as contributions by owners.
Judgements, estimates and assumptions are required to be made about financial information being presented. The significant judgements made in the preparation of these financial statements are disclosed in the notes where amounts affected by those judgements are disclosed. Estimates and associated assumptions are based on professional judgements derived from historical experience and various other factors that are believed to be reasonable under the circumstances. Actual results may differ from these estimates.These consolidated financial statements cover PTV as an individual reporting entity and include all the controlled activities of PTV.In accordance with AASB 10 Consolidated Financial Statements, the consolidated financial statements of PTV incorporate assets and liabilities of a reporting entity controlled by PTV as at 30 June 2019, and its income and expenses for that part of the reporting period in which control existed.PTV is considered to have control over Franchise Asset Holdings Pty Ltd (“Franchise Asset Holdings”) from 4 August 2013. Franchise Asset Holdings is a special purpose entity for the purpose of acquisition and financing of buses and development of bus depots as part of the franchise arrangement with Transdev Melbourne Pty Ltd. The results of Franchise Asset Holdings are included in the consolidated comprehensive operating statement from 4 August 2013, the date on which control commenced. The only reporting entity controlled by PTV as at 30 June 2019 and 30 June 2018 was Franchise Asset Holdings.In the process of preparing consolidated financial statements for PTV, all material transactions and balances between the consolidated entities are eliminated. The consolidated and parent financial statements are the same, with the exception of those items described in section 7.1, 7.2 and 7.3.The financial statements have been prepared on a going concern basis, despite the negative working capital position of $9.8 million (2018: negative working capital position of $15.6 million). The going concern assumption has been made as PTV is fully funded by government grants and capital contributions in accordance with the approved budget. On 1 July 2019, PTV and VicRoads came together as part of a new integrated Department of Transport (DoT). Effective control of all PTV functions has been transferred to DoT, which will deliver an integrated, user-focussed approach to tackling transport opportunities. It is therefore expected that all transactions, assets and liabilities will be reported by DoT from 1 July 2019. It is also expected that a section

80 Public Transport Victoria Annual Report 2018–19
53 application under the Financial Management Act 1994 will be lodged to request an exemption from the requirement for PTV to lodge a separate Annual Report after 1 July 2019, and therefore the PTV Annual Report at 30 June 2019 is expected to be the last PTV Annual Report (refer to Note 9.9). The Chief Executive and management are satisfied that DoT will be able to meet the PTV financial obligations as and when they fall due for 12 months after the signing of this annual report.All amounts in the consolidated financial statements have been rounded to the nearest $1,000 unless otherwise stated.
Compliance informationThese general purpose financial statements have been prepared in accordance with the Financial Management Act 1994 (Vic) and applicable Australian Accounting Standards (AASs) which include Interpretations, issued by the Australian Accounting Standards Board (AASB). In particular, they are presented in a manner consistent with the requirements of AASB 1049 Whole of Government and General Government Sector Financial Reporting.Where appropriate, those paragraphs in AASs applicable to not-for-profit entities have been applied. Accounting policies selected and applied in these financial statements ensure that the resulting financial information satisfies the concepts of relevance and reliability, thereby ensuring that the substance of the underlying transactions or other events is reported.

Section 5 Consolidated financial statements 81
2. Funding delivery of services
IntroductionPTV’s overall objective is to coordinate, provide, operate and maintain a safe, punctual, reliable and clean public transport system.To enable PTV to fulfil its objective and provide outputs as described in Section 3, it received grants from the Department of Economic Development, Jobs, Transport and Resources (DEDJTR) until 31 December 2018. Grants were received from the Department of Transport (DoT) from 1 January 2019 onwards.
Structure2.1 Income that funds the delivery of services 81
2.1 Income that funds the delivery of services Income is recognised to the extent it is probable the economic benefits will flow to PTV and the income can be reliably measured at fair value. Where applicable, amounts disclosed as income are net of taxes.
2.1.1 Grants from Victorian GovernmentIncome from grants from the Victorian Government is recognised when PTV obtains control over the grants, or the right to receive the grants.
2.1.2 Supply of transport servicesSupply of transport services is recognised when the service is provided. The income is recognised when the amount of income and transaction costs incurred can be reliably measured, and it is probable that the economic benefits associated with the transaction will flow to PTV.
2.1.3 Fair value of assets and resources received free of chargeContributions of resources received free of charge or for nominal consideration are recognised at fair value when control is obtained over them, irrespective of whether these contributions are subject to restrictions or conditions over their use. Contributions in the form of services are only recognised when a fair value can be reliably determined and the services would have been purchased if not received as a donation.
PTV received $60,505,000 (2018: $54,912,000) use of ticketing assets free of charge from VicTrack. Fair value of the use of ticketing assets free of charge is determined as the depreciation and amortisation charge of ticketing assets. In addition, PTV received other assets worth $269,000 (2018: $2,591,000) free of charge.
2.1.4 Operators’ contribution for marketing and communicationsUnder the current franchise agreements in relation to provision of transport services for train and tram, operators are required to make a contribution towards the costs of marketing and communications. The contribution is recognised as revenue when the deduction for the contribution is made from payments to the transport service operators.
2.1.5 Issuance fee of myki cardsIssuance fee of myki cards is recognised at the time of the sale of myki cards.
2.1.6 Licence fee from advertising panels at bus sheltersA license fee is charged for the right to advertise on panels at bus shelters. This fee is paid by the bus shelter provider and is recognised on a straight-line basis over the term of the contract.

82 Public Transport Victoria Annual Report 2018–19
3. The cost of delivering servicesIntroductionThis section provides an account of the expenses incurred by PTV in delivering services and outputs. In Section 2, the funds that enable the provision of services were disclosed and in this note the cost associated with provision of services are recorded.
Structure3.1 Expenses incurred in delivery of services 823.2 Capital asset charge 873.3 Other operating expenses 87
3.1 Expenses incurred in delivery of services
Consolidated Note
($ thousand)
2019 2018
Service providers and transport agencies 3.1.1 5,460,098 4,844,312
Employee benefit expenses 3.1.2 59,846 51,223
Capital asset charges 3.2 9,169 8,355
Other operating expenses 3.3 96,478 105,026
Total expenses incurred in delivery of services 5,625,591 5,008,916
3.1.1 Service providers and transport agencies
Consolidated Note
($ thousand)
2019 2018
Service providers and transport agencies
Rail system operation and related services(i) 2,118,412 1,716,797
Grants for capital asset charge 2,144,471 1,977,330
Total rail services 4,262,883 3,694,127
Bus services 1,067,128 1,035,425
Ticketing service operating costs 69,582 59,848
Fair value of free use of ticketing assets 2.1.3 60,505 54,912
Service providers and transport agencies 5,460,098 4,844,312
(i) Of the balance in rail system operation and related services, $18,905,000 (2018: $22,385,000) related to operating and maintenance of the Southern Cross Station building contracted under the Public Private Partnership (PPP) arrangement.

Section 5 Consolidated financial statements 83
Payments to service providers and transport agencies are recognised as an expense in the reporting period in which they are paid or payable. They include transactions such as grants, subsidies and other transfer payments to other agencies.
3.1.2 Employee benefit expenses in the comprehensive operating statement
Consolidated
($ thousand)
2019 2018
Salaries and wages 40,786 34,840
Annual leave and long service leave expense 8,126 6,182
Defined contribution superannuation expenses (excluding salary sacrifice) 6,410 5,573
Termination benefits 584 1,218
Other on-costs (fringe benefits tax, payroll tax and WorkCover premium) 3,940 3,397
Ex-gratia expense(i) – 13
Total employee benefit expenses 59,846 51,223
(i) Ex-gratia expense is also presented in Note 9.1.
Employee benefit expenses include all costs related to employment including wages and salaries, fringe benefits tax, leave entitlements, termination payments and WorkCover premiums.The amount recognised in the consolidated comprehensive operating statement in relation to superannuation is employer contributions for members of both defined benefit and defined contribution superannuation plans that are paid or payable during the reporting period. PTV does not recognise any defined benefit liabilities because it has no legal or constructive obligation to pay future benefits relating to its employees. Instead, the Department of Treasury and Finance (DTF) discloses in its annual financial statements the net defined benefit cost related to the members of these plans as an administered liability (on behalf of the State as the sponsoring employer).
Termination benefits are payable when employment is terminated before normal retirement date, or when an employee accepts an offer of benefits in exchange for the termination of employment. Termination benefits are recognised when PTV is demonstrably committed to terminating the employment of current employees according to a detailed formal plan without possibility of withdrawal or providing termination benefits as a result of an offer made to encourage voluntary redundancy. Employee benefit expenses arising directly from the construction or acquisition of property, plant and equipment of $20,839,000 (2018: $19,485,000) have been capitalised and have not been included above.
3.1.3 Employee benefits in the balance sheetProvision is made for benefits accruing to employees in respect of wages and salaries, annual leave and long service leave (LSL) for services rendered to the reporting date and recorded as an expense during the period the services are delivered.

84 Public Transport Victoria Annual Report 2018–19
Consolidated
($ thousand)
2019 2018
Current provisions
Annual leave (i)
Unconditional and expected to settle within 12 months (ii) 2,897 2,533
Unconditional and expected to settle after 12 months (iii) 2,587 2,232
Long service leave (i)
Unconditional and expected to settle within 12 months (ii) 1,082 947
Unconditional and expected to settle after 12 months (iii) 3,592 3,144
Total employee benefits 10,158 8,856
Provisions for on-costs
Unconditional and expected to settle within 12 months (ii) 600 526
Unconditional and expected to settle after 12 months (iii) 933 815
Total provision for on-costs 1,533 1,341
Other provisions
Performance bonus provision – 777
Provision for the employee entitlements of rail operators (iv) 6,328 5,500
Total other provisions 6,328 6,277
Total current provisions for employee benefits 18,019 16,474
Non-current provisions
Employee benefits and on-costs
Employee benefits (v) 2,724 1,683
On-costs 408 253
Total employee benefits and on-costs 3,132 1,936
Other provisions
Provision for employee entitlements of rail operators (iv) 487,148 404,287
Total other provisions 487,148 404,287
Total non-current provisions for employee benefits 490,280 406,223
Total provisions for employee benefits 508,299 422,697
(i) Provisions for employee benefits consist of amounts for annual leave, long service leave, not including on-costs.(ii) The amounts disclosed are nominal amounts.(iii) The amounts disclosed are discounted to present values.(iv) PTV assumes liabilities for the employee entitlements of the employees of the metropolitan rail operators.(v) The amounts disclosed represents long service leave entitlements for employees with less than seven years of continuous service
discounted to present value.

Section 5 Consolidated financial statements 85
Reconciliation of movement in provisions
Consolidated
($ thousand)
Annual leave
provision
Long service
leave provision On-costs
Performance bonus
provision
Rail operators’ employee
benefits Total
Opening balance at 1 July 2018 4,765 5,774 1,594 777 409,787 422,697
Additional provisions recognised 5,904 2,634 419 825 84,641 94,423
Additions due to transfer in 38 215 – – – 253
Reductions transfer out (86) (46) – – – (132)
Reductions arising from payments/other sacrifices of future economic benefits (5,137) (698) – (1,602) (952) (8,389)
Unwinding of discount and effect of changes in the discount rate – (481) (72) – – (553)
Closing balance at 30 June 2019 5,484 7,398 1,941 – 493,476 508,299
Current 5,484 4,674 1,533 – 6,328 18,019
Non-current – 2,724 408 – 487,148 490,280
Wages and salaries, annual leave and sick leaveLiabilities for wages and salaries (including non-monetary benefits, annual leave and on-costs) are recognised as part of the employee benefit provision as current liabilities, because PTV does not have an unconditional right to defer settlements of these liabilities.The liability for salaries and wages are recognised in the balance sheet at remuneration rates which are current at the reporting date. As PTV expects the liabilities to be wholly settled within 12 months of reporting date, they are measured at undiscounted amounts.The annual leave liability is classified as a current liability and measured at the undiscounted amount expected to be paid, as PTV does not have an unconditional right to defer settlement of the liability for at least 12 months after the end of the reporting period.No provision has been made for sick leave as all sick leave is non-vesting and it is not considered probable that the average sick leave taken in the future will be greater than the benefits accrued in the future. As sick leave is non-vesting, an expense is recognised in the consolidated comprehensive operating statement as it is taken. Employment on-costs such as payroll tax, workers compensation and superannuation are disclosed separately as a component of the provision for employee benefits when the employment to which they relate has occurred.
Unconditional LSL is disclosed as a current liability; even where PTV does not expect to settle the liability within 12 months because it will not have the unconditional right to defer the settlement of the entitlement should an employee take leave within 12 months.The components of this current LSL liability are measured at:
– undiscounted value – if PTV expects to wholly settle within 12 months; or
– present value – if PTV does not expect to wholly settle within 12 months.
Conditional LSL is disclosed as a non-current liability. There is an unconditional right to defer the settlement of the entitlement until the employee has completed the requisite years of service. This non-current LSL is measured at present value.Any gain or loss following revaluation of the present value of non-current LSL liability is recognised as a transaction, except to the extent that a gain or loss arises due to changes in bond interest rates for which it is then recognised as an ‘other economic flow’ in the net result.

86 Public Transport Victoria Annual Report 2018–19
Provision for employee entitlements of metropolitan rail operators PTV assumes the liabilities for the employee entitlements of the metropolitan rail operators. The current portion of the operator employee entitlements represents amounts expected to be paid to the operators within the next 12 months. The remainder of the operator employee entitlements provision is disclosed as a non-current liability, as the contracts with the public transport operators are not expected to be terminated within the next 12 months. The non-current liability is measured at present value.
3.1.4 Superannuation contributionsEmployees of PTV are entitled to receive superannuation benefits and PTV contributes to both defined benefit and defined contribution plans. The defined benefit plans provide benefits based on years of service and final average salary.The defined benefit liability is recognised in DTF as an administered liability. However, superannuation contributions paid or payable for the reporting period are included as part of employee benefits in the comprehensive operating statement of PTV.
Consolidated
($ thousand)
Paid contribution for the year
Contributions outstanding at year end
2019 2018 2019 2018
Defined benefit plans (i)
State Superannuation Fund – revised and new 88 83 2 1
Transport Superannuation Fund 59 64 1 1
Total defined benefit plans 147 147 3 2
Defined contribution plans
VicSuper 2,961 2,295 78 42
Various others 3,141 3,023 80 64
Total defined contribution plans 6,102 5,318 158 106
Total superannuation plans 6,249 5,465 161 108
(i) The basis for determining the level of contributions is determined by the various actuaries of the defined benefit superannuation plans.

Section 5 Consolidated financial statements 87
3.2 Capital asset chargeA capital asset charge is a charge levied on the written down value of controlled non-current physical asset in PTV’s balance sheet. It aims to attribute to PTV outputs, a cost of capital used in service delivery. Imposing this charge provides incentives for PTV to identify and dispose of underutilised or surplus non-current physical asset.
3.3 Other operating expenses
Consolidated
($ thousand)
2019 2018
Supplies and services
Grants for community and social benefits 7,553 7,553
Communications, marketing and information technology 46,604 40,969
Accommodation 6,936 6,421
Insurance, legal and internal audit fees 1,402 1,650
Contractors for services 7,830 14,692
Audit fee 270 308
Total supplies and services 70,595 71,593
Fair value of assets and services provided free of charge 25,883 33,433
Total other operating expenses 96,478 105,026
Other operating expenses generally represent the day-to-day running costs incurred in normal operations. Supplies and services are recognised as an expense in the reporting period in which they are incurred. The carrying amounts of any inventories held for distribution are expensed when the inventories are distributed.Fair value of services provided free of charge or for nominal consideration are recognised at their fair value when the recipient obtains control over the resources, irrespective of whether restrictions or conditions are imposed over the use of the contributions. The exception to this would be when the resource is received from another government department (or agency) as a consequence of a
restructuring of administrative arrangements, in which case such a transfer will be recognised at its carrying value in the transferring department or agency. Contributions in the form of services are only recognised when a fair value can be reliably determined and the services would have been purchased if not donated. PTV provided the services of myki ticketing system maintenance free of charge to VicTrack. Fair value of the asset maintenance services $25,883,000 (2018: $33,433,000) is recognised as services provided free of charge.

88 Public Transport Victoria Annual Report 2018–19
4. Disaggregated financial information IntroductionThis section provides information on PTV asset transfers
Structure4.1 Fixed asset transfers 88
4.1 Fixed asset transfersPTV had the following asset transfers:
4.1.1 Transfer of rail infrastructure assets from PTV to VicTrackOn 30 June 2019 and 30 June 2018 rail infrastructure assets under construction were transferred from PTV to VicTrack as a capital contribution.
Consolidated
($ thousand)
2019 2018
Assets
Infrastructure assets under construction 419,288 492,561
Net assets transferred to VicTrack (i) 419,288 492,561
(i) Under Transport Integration Act 2010, VicTrack is to act as the custodian and asset manager of the non-operational transport-related land, infrastructure and assets and any other land, infrastructure and assets identified by the Minister.
4.1.2 Transfer of bus stop infrastructure from PTV to DoTOn 30 June 2019, bus stop infrastructure assets under construction were transferred from PTV to DoT as a return of contributions by owners.
Consolidated
($ thousand)
2019 2018
Assets
Bus stop infrastructure 2,540 –
Net assets transferred to DoT 2,540 –

Section 5 Consolidated financial statements 89
5. Key assets available to support output deliveryIntroductionPTV controls property, plant and equipment, and intangible assets that are utilised in fulfilling its objectives and conducting its activities. They represent the resources that have been entrusted to PTV to be utilised for delivery of those outputs.
Structure5.1 Property, plant and equipment 89 5.2 Intangible assets 94
5.1 Property, plant and equipment
Consolidated
($ thousand)
Gross carrying amount Accumulated depreciation Net carrying amount
2019 2018 2019 2018 2019 2018
Land at fair value(i) 512,035 512,035 – – 512,035 512,035
Building at fair value(i)(ii) 518,918 518,918 (53,677) (40,255) 465,241 478,663
Infrastructure at fair value(i) 298,954 244,558 (55,834) (106) 243,120 244,452
Plant and equipment at fair value 376 376 (321) (296) 55 80
Leasehold improvement at fair value 4,745 4,745 (4,422) (3,782) 323 963
Vehicles at fair value 111,724 105,411 (38,004) (27,291) 73,720 78,120
Cultural assets at fair value 2,238 2,238 (97) (73) 2,141 2,165
Assets under construction at cost 27,983 71,927 – – 27,983 71,927
Net carrying amount 1,476,973 1,460,208 (152,355) (71,803) 1,324,618 1,388,405
(i) PTV conducted a management fair value assessment at the end of 2017–18 financial year which indicated that the movement in fair value of land and infrastructure assets since the last scheduled revaluation maybe material. Therefore, PTV engaged Valuer-General Victoria to conduct an interim revaluation as at 30 June 2018. Revaluation amounts are included in section 5.1.2. PTV conducted a management fair value assessment at the end of 2018–19 financial year and it indicated that no revaluation is required by Valuer-General Victoria.
(ii) Of the balance in buildings, $453,009,000 (2018: $454,845,000 ) is attributable to the Southern Cross Station building contracted under PPP arrangement.
Initial recognition: Items of property, plant and equipment, are measured initially at cost and subsequently revalued at fair value less accumulated depreciation and impairment. Where an asset is acquired for no or nominal cost, the cost is its fair value at the date of acquisition. Assets transferred as part of a machinery of government change are transferred at their carrying amount. The cost of constructed non-financial physical assets includes the cost of all materials used in construction, direct labour on the project and an appropriate proportion of variable and fixed overheads.
The cost of leasehold improvements is capitalised and depreciated over the shorter of the remaining term of the lease or their estimated useful lives.The initial cost for non-financial physical assets under a finance lease is measured at amounts equal to the fair value of the leased asset or, if lower, the present value of the minimum lease payments, each determined at the inception of the lease. Certain assets are acquired under finance leases, which may form part of service concession arrangements (Public Private Partnership).

90 Public Transport Victoria Annual Report 2018–19
Subsequent measurement: Property, plant and equipment (PPE) is subsequently measured at fair value less accumulated depreciation and impairment. Fair value is determined with regard to the asset’s highest and best use (considering legal or physical restrictions imposed on the asset, public announcements or commitments made in relation to the intended use of the asset) and is summarised above by asset category.Land and buildings: All PTV land and buildings are specialised. The market approach is used for specialised land, although it is adjusted for the community service obligation (CSO) to reflect the specialised nature of the land being valued. The CSO adjustment is a reflection of the valuer’s assessment of the impact of restrictions associated with an asset to the extent that is also equally applicable to market participants. For PTV’s specialised buildings, the depreciated replacement cost method is used, adjusting for the associated depreciation. Infrastructure: is valued using the depreciated replacement cost method. This cost generally represents the replacement cost of the asset after applying depreciation on a useful life basis. Cultural assets: For heritage and iconic assets, the cost may be the reproduction cost rather than the replacement cost if those assets’ service potential could only be replaced by reproducing them with the same materials.Vehicles: are valued using the depreciated replacement cost method. PTV acquires new vehicles and at times disposes of them before the end of their economic life. The process of acquisition, use and disposal in the market is managed by experienced fleet managers in PTV who set relevant depreciation rates during use to reflect the utilisation of the vehicles.Refer to Note 8.3 for additional information on fair value determination of property, plant and equipment.
5.1.1 Depreciation and amortisationCharge for the period
Consolidated
($ thousand)
2019 2018
Depreciation and amortisation of property, plant and equipment
Buildings 13,422 13,882
Infrastructure 55,783 24,674
Plant and equipment 25 26
Leasehold improvements 640 640
Vehicles 11,195 9,482
Cultural assets 24 24
Total for property, plant and equipment 81,089 48,728
Amortisation
Intangible assets 3,219 –
Total for intangible assets 3,219 –
Total depreciation and amortisation 84,308 48,728
All infrastructure assets, buildings, plant and equipment and other non-financial physical assets that have finite useful lives, are depreciated. Depreciation is calculated on a straight-line basis, at rates that allocate the asset’s value, less any estimated residual value, over its estimated useful life. Typical estimated useful lives for the different asset classes for current and prior years are included in the following table:

Section 5 Consolidated financial statements 91
Asset category
Estimated useful life (years)
2019 2018
Buildings 22–80 22–80
Infrastructure 5–100 5–100
Plant and equipment
– Furniture and fittings 10 10
– Computer equipment 3–4 3–4
– Field plant and scientific equipment 10–30 10–30
– Office machines and equipment 5 5
– IT infrastructure 4 4
Leasehold improvements 5–15 5–15
Vehicles (Cars) 3 3
Vehicles (Buses) 18 18
Cultural assets 20–100 20–100
The estimated useful lives, residual values and depreciation method are reviewed at the end of each annual reporting period, and adjustments made where appropriate. There have been no changes in the current year.Indefinite life assets: Land, which is considered to have an indefinite life, is not depreciated. Depreciation is not recognised in respect of land because its service potential has not, in any material sense, been consumed during the reporting period.

92 Public Transport Victoria Annual Report 2018–19
5.1.2 Reconciliation of movements in carrying amount of property, plant and equipment
Consolidated Note
($ thousand) ($ thousand)
Land Buildings InfrastructurePlant and
equipmentLeasehold
improvement Vehicles Cultural assetsAssets under construction Total
Carrying amount at 30 June 2017 503,734 508,212 223,096 106 1,603 83,244 2,189 71,876 1,394,060
Additions – – 5,017 – – 4,598 – 499,571 509,187
Disposals/write-offs – – (545) – – (240) – (6,958) (7,743)
Depreciation expense 5.1.1 – (13,882) (24,674) (26) (640) (9,482) (24) – (48,728)
Assets provided as contributed capital 4.1 – – – – – – – (492,561) (492,561)
Assets received free of charge – – 2,592 – – – – – 2,592
Net revaluation increments/(decrements) 8,301 (15,668) 38,965 – – – – – 31,598
Carrying amount at 30 June 2018 512,035 478,663 244,452 80 963 78,120 2,165 71,927 1,388,405
Additions – – 4,250 – – 6,917 – 432,035 443,202
Disposals/write-offs – – (308) – – (71) – (3,910) (4,289)
Depreciation expense 5.1.1 – (13,422) (55,783) (25) (640) (11,195) (24) – (81,089)
Assets provided as contributed capital 4.1 – – – – – – – (421,828) (421,828)
Assets received free of charge – – 268 – – – – – 268
Assets provided free of charge – – – – – (51) – – (51)
Transfer between classes – – 50,241 – – – – (50,241) –
Carrying amount at 30 June 2019 512,035 465,241 243,120 55 323 73,720 2,141 27,983 1,324,618

Section 5 Consolidated financial statements 93
5.1.2 Reconciliation of movements in carrying amount of property, plant and equipment
Consolidated Note
($ thousand) ($ thousand)
Land Buildings InfrastructurePlant and
equipmentLeasehold
improvement Vehicles Cultural assetsAssets under construction Total
Carrying amount at 30 June 2017 503,734 508,212 223,096 106 1,603 83,244 2,189 71,876 1,394,060
Additions – – 5,017 – – 4,598 – 499,571 509,187
Disposals/write-offs – – (545) – – (240) – (6,958) (7,743)
Depreciation expense 5.1.1 – (13,882) (24,674) (26) (640) (9,482) (24) – (48,728)
Assets provided as contributed capital 4.1 – – – – – – – (492,561) (492,561)
Assets received free of charge – – 2,592 – – – – – 2,592
Net revaluation increments/(decrements) 8,301 (15,668) 38,965 – – – – – 31,598
Carrying amount at 30 June 2018 512,035 478,663 244,452 80 963 78,120 2,165 71,927 1,388,405
Additions – – 4,250 – – 6,917 – 432,035 443,202
Disposals/write-offs – – (308) – – (71) – (3,910) (4,289)
Depreciation expense 5.1.1 – (13,422) (55,783) (25) (640) (11,195) (24) – (81,089)
Assets provided as contributed capital 4.1 – – – – – – – (421,828) (421,828)
Assets received free of charge – – 268 – – – – – 268
Assets provided free of charge – – – – – (51) – – (51)
Transfer between classes – – 50,241 – – – – (50,241) –
Carrying amount at 30 June 2019 512,035 465,241 243,120 55 323 73,720 2,141 27,983 1,324,618

94 Public Transport Victoria Annual Report 2018–19
5.2 Intangible assets
Consolidated
($ thousand)
Capitalised software development
Work in progress (software) Total
Note 2019 2018 2019 2018 2019 2018
Gross carrying amount
Opening balance 8,726 8,726 12,579 5,801 21,305 14,527
Additions 320 – 1,737 12,579 2,057 12,579
Disposals/write-offs – – – (5,801) – (5,801)
Transfer between classes 12,554 – (12,554) – –
Closing balance 21,600 8,726 1,762 12,579 23,362 21,305
Accumulated amortisation and impairment
Opening balance (8,726) (8,726) – – (8,726) (8,726)
Amortisation expense 5.1.1 (3,219) – – – (3,219) –
Closing balance (11,945) (8,726) – – (11,945) (8,726)
Net book value at the end of the financial year 9,655 – 1,762 12,579 11,417 12,579
Initial recognitionPurchased intangible assets are initially recognised at cost. When the recognition criteria in AASB 138 Intangible Assets is met, internally generated intangible assets are recognised at cost. Subsequently, intangible assets with finite useful lives are carried at cost less accumulated amortisation and accumulated impairment losses. Depreciation and amortisation begins when the asset is available for use, that is, when it is in the location and condition necessary for it to be capable of operating in the manner intended by management. An internally generated intangible asset arising from development (or from the development phase of an internal project) is recognised if, and only if, all of the following are demonstrated:(a) the technical feasibility of completing the intangible
asset so that it will be available for use or sale;(b) an intention to complete the intangible asset and
use or sell it;(c) the ability to use or sell the intangible asset; (d) the intangible asset will generate probable future
economic benefits;(e) the availability of adequate technical, financial and
other resources to complete the development and to use or sell the intangible asset; and
(f) the ability to measure reliably the expenditure attributable to the intangible asset during its development.
Subsequent measurementIntangible produced assets with finite useful lives, are amortised as an ‘expense from transactions’ on a straight-line basis over their useful lives. Produced intangible assets have useful lives of between 3 and 5 years.
Impairment of intangible assetsIntangible assets with finite useful lives are tested for impairment whenever an indication of impairment is identified.
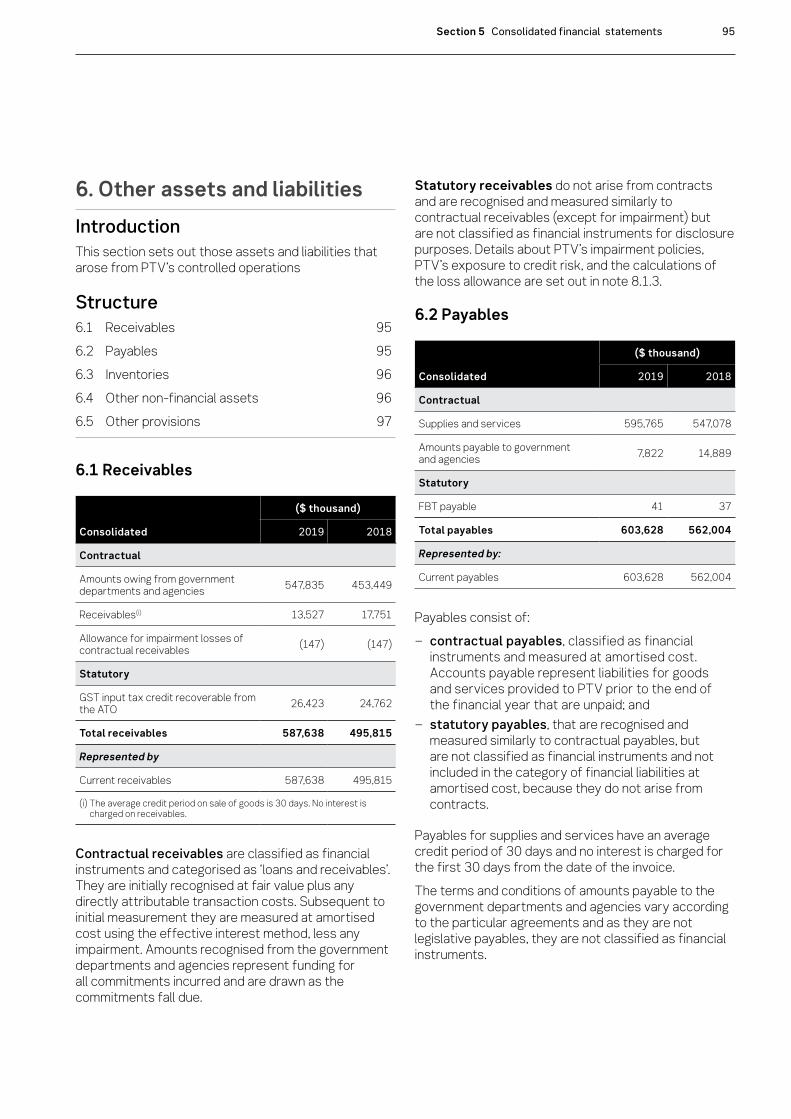
Section 5 Consolidated financial statements 95
6. Other assets and liabilitiesIntroductionThis section sets out those assets and liabilities that arose from PTV’s controlled operations
Structure6.1 Receivables 956.2 Payables 956.3 Inventories 966.4 Other non-financial assets 966.5 Other provisions 97
6.1 Receivables
Consolidated
($ thousand)
2019 2018
Contractual
Amounts owing from government departments and agencies 547,835 453,449
Receivables(i) 13,527 17,751
Allowance for impairment losses of contractual receivables (147) (147)
Statutory
GST input tax credit recoverable from the ATO 26,423 24,762
Total receivables 587,638 495,815
Represented by
Current receivables 587,638 495,815
(i) The average credit period on sale of goods is 30 days. No interest is charged on receivables.
Contractual receivables are classified as financial instruments and categorised as ‘loans and receivables’. They are initially recognised at fair value plus any directly attributable transaction costs. Subsequent to initial measurement they are measured at amortised cost using the effective interest method, less any impairment. Amounts recognised from the government departments and agencies represent funding for all commitments incurred and are drawn as the commitments fall due.
Statutory receivables do not arise from contracts and are recognised and measured similarly to contractual receivables (except for impairment) but are not classified as financial instruments for disclosure purposes. Details about PTV’s impairment policies, PTV’s exposure to credit risk, and the calculations of the loss allowance are set out in note 8.1.3.
6.2 Payables
Consolidated
($ thousand)
2019 2018
Contractual
Supplies and services 595,765 547,078
Amounts payable to government and agencies 7,822 14,889
Statutory
FBT payable 41 37
Total payables 603,628 562,004
Represented by:
Current payables 603,628 562,004
Payables consist of: – contractual payables, classified as financial
instruments and measured at amortised cost. Accounts payable represent liabilities for goods and services provided to PTV prior to the end of the financial year that are unpaid; and
– statutory payables, that are recognised and measured similarly to contractual payables, but are not classified as financial instruments and not included in the category of financial liabilities at amortised cost, because they do not arise from contracts.
Payables for supplies and services have an average credit period of 30 days and no interest is charged for the first 30 days from the date of the invoice.The terms and conditions of amounts payable to the government departments and agencies vary according to the particular agreements and as they are not legislative payables, they are not classified as financial instruments.

96 Public Transport Victoria Annual Report 2018–19
Maturity analysis of contractual payables
Consolidated
($ thousand)
Carrying amount
Nominal amount
Maturity dates
Less than 1 month
1 – 3 months
3 months – 1 year
1 – 5 years 5+ years
2019
Payables (i)
Supplies and services 595,765 595,765 595,739 26 – – –
Amounts payable to government departments and agencies 7,822 7,822 7,822 – – – –
Total 603,587 603,587 603,561 26 – – –
2018
Payables (i)
Supplies and services 547,078 547,078 547,078 – – – –
Amounts payable to government departments and agencies 14,889 14,889 14,889 – – – –
Total 561,967 561,967 561,967 – – – –
(i) The amount in payables disclosed excludes statutory payables.
6.3 Inventories
Consolidated
($ thousand)
2019 2018
Current inventories
Card inventories held for sale at cost 19,230 25,394
Provision for card obsolescence (12,964) (9,226)
Total inventories 6,266 16,168
Inventories are for consumption in the ordinary course of business operations. Inventories are measured at the lower of cost and net realisable value. Basis used in assessing loss of service potential for inventories held for distribution include depreciated replacement cost and technical or functional obsolescence. Technical obsolescence occurs when an item still functions for some or all of the tasks it was originally acquired to do, but no longer matches existing technologies. Functional obsolescence occurs when an item no longer functions the way it did when it was first acquired.
6.4 Other non-financial assets
Consolidated
($ thousand)
2019 2018
Other Current Assets
Prepayments 798 41,614
Total other non-financial assets 798 41,614
Other non-financial assets include prepayments, which represent payments in advance of receipt of goods or services or that part of expenditure made in one accounting period covering a term extending beyond that period. In the prior year the majority of the prepayments balance represented contractual payments required for metropolitan train and tram operators where capital works were not yet completed. In the current year, the contractual payments were materially aligned with the completion of works.

Section 5 Consolidated financial statements 97
6.5 Other provisions
Consolidated
($ thousand)
2019 2018
Other provisions
Current provision for myki negative card balance 5,324 4,000
Total current provisions 5,324 4,000
Non-current provisions
Non-current provision for train replacement – 10,173
Total non-current provisions – 10,173
Total other provisions 5,324 14,173
Other provisions are recognised when PTV has a present obligation, the future sacrifice of economic benefits is probable, and the amount of the provision can be measured reliably. The amount recognised as a provision is the best estimate of the consideration required to settle the present obligation at reporting date, taking into account the risks and uncertainties surrounding the obligation.Where a provision is measured using the cash flows estimated to settle the present obligation, its carrying amount is the present value of those cash flows, using a discount rate that reflects the time, value of money and risks specific to the provision.The provision for myki negative card balances has been calculated based on the balance of expired myki cards with negative balances.
Reconciliation of movement in other provisions
Consolidated
($ thousand)
Train replacement
myki negative
card Total
Opening balance at 30 June 2018 10,173 4,000 14,173
Additional provisions recognised – 1,324 1,324
Reductions resulting from settlement without cost (10,173) – (10,173)
Closing balance at 30 June 2019 – 5,324 5,324
7. Financing operationsIntroductionThis section provides information on the sources of finance utilised by PTV during its operations, along with interest expenses (the cost of borrowings) and other information related to financing activities of PTV. This section includes disclosure of the balances of the parent, as they are different to the consolidated entity. The differences arise due to treatment of the borrowings for the buses and bus depots held by the controlled entity “Franchise Asset Holdings”. There is a finance lease in place between the parent and the controlled entity, and an external loan in the controlled entity. The finance lease is eliminated upon consolidation and therefore the consolidated entity shows only the external loan. The total borrowings of the parent and consolidated entity are the same.
This section includes disclosures of balances that are financial instruments (such as borrowings and cash balances). Notes 8.1 provides additional, specific financial instrument disclosures.
Structure7.1 Borrowings 987.2 Leases 1017.3 Cash flow information and balances 1027.4 Commitments for expenditure 102

98 Public Transport Victoria Annual Report 2018–19
7.1 Borrowings
($ thousand)
Consolidated Parent
2019 2018 2019 2018
Current borrowings
Advances from government(i) – 9,903 – 9,903
Loan 9,964 8,987 – –
Motor vehicle & bus depot finance lease liabilities(ii) 249 200 10,213 9,187
Southern Cross Station Transport Interchange Facility finance lease liabilities 5,169 3,892 5,169 3,892
Total current borrowings 15,382 22,982 15,382 22,982
Non-current borrowings
Loan 105,146 109,745 – –
Motor vehicle & bus depot finance lease liabilities(ii) 341 351 105,488 110,096
Southern Cross Station Transport Interchange Facility finance lease liabilities 363,422 368,591 363,422 368,591
Total non-current borrowings 468,909 478,687 468,909 478,687
Total borrowings 484,291 501,669 484,291 501,669
(i) These are unsecured loans which bear no interest. The term of a loan is generally agreed by the Minister at the time the advance was provided.(ii) Secured by the assets leased. Finance leases are effectively secured as the rights to the leased assets revert to the lessor in the event of default.
‘Borrowings’ refer to non-interest bearing liabilities from the Victorian Government and interest bearing liabilities from financial lease arrangements. Borrowings are classified as financial instruments. All interest bearing borrowings are initially recognised at the fair value of the consideration received less directly attributable transaction costs. The measurement basis subsequent to initial recognition depends on whether PTV has categorised its interest bearing liabilities as either ‘financial liabilities designated at fair value through profit or loss’, or financial liabilities at ‘amortised cost’. The classification depends on the nature and purpose of the interest bearing liabilities. PTV determines the classification of its interest bearing liabilities at initial recognition. Defaults and breaches: during the current and prior year, there were no defaults or breaches of any of the loans.

Section 5 Consolidated financial statements 99
Maturity analysis of borrowings
($ thousand)
Carrying amount
Nominal amount
Maturity dates
Less than 1 month
1 – 3 months
3 months – 1 year
1 – 5 years 5+ years
Consolidated
2019
Loan 115,110 138,937 1,488 2,874 12,821 121,753 –
Finance lease liabilities – motor vehicles 590 616 25 37 168 386 –
Finance lease liabilities – Southern Cross Station Transport Interchange Facility 368,591 714,996 – 9,138 27,755 157,030 521,073
Total 484,291 854,549 1,513 12,049 40,745 279,169 521,073
2018
Advances from government 9,903 9,903 – – 9,903 – –
Loan 118,732 150,191 1,530 2,891 12,992 67,724 65,054
Finance lease liabilities – motor vehicles 551 576 58 20 136 362 –
Finance lease liabilities – Southern Cross Station Transport Interchange Facility 372,483 750,990 – 8,915 27,078 153,200 561,797
Total 501,669 911,660 1,588 11,826 50,109 221,286 626,851
Parent
2019
Finance lease liabilities – motor vehicles & bus depots 115,700 139,553 1,513 2,911 12,990 122,139 –
Finance lease liabilities – Southern Cross Station Transport Interchange Facility 368,591 714,996 – 9,138 27,755 157,030 521,073
Total 484,291 854,549 1,513 12,049 40,745 279,169 521,073
2018
Advances from government 9,903 9,903 – – 9,903 – –
Finance lease liabilities – motor vehicles & bus depots 119,283 150,767 1,588 2,911 13,128 68,086 65,054
Finance lease liabilities – Southern Cross Station Transport Interchange Facility 372,483 750,990 – 8,915 27,078 153,200 561,797
Total 501,669 911,660 1,588 11,826 50,109 221,286 626,851

100 Public Transport Victoria Annual Report 2018–19
Interest expenses
($ thousand)
Consolidated Parent
2019 2018 2019 2018
Interest on loan 7,713 9,130 – –
Interest on finance leases(i) 32,116 32,382 39,829 41,512
Total interest expenses 39,829 41,512 39,829 41,512
(i) Of the balance in interest on finance leases, $32,102,000 (2018: $32,375,000) relates to Southern Cross Station contracted under the Public Private Partnership (PPP) arrangement.
‘Interest expense’ includes costs incurred in connection with the borrowing of funds and includes interest on short term and long term borrowings and interest component of finance leases repayments.Interest expense is recognised in the period in which it is incurred.

Section 5 Consolidated financial statements 101
7.2 Leases7.2.1 Finance lease liabilities (PTV as lessee)
($ thousand)
Minimum future lease payments(i)Present value of minimum
future lease payments
Consolidated Parent Consolidated Parent
2019 2018 2019 2018 2019 2018 2019 2018
Commissioned PPP related finance lease liabilities payable
Not longer than one year 36,893 35,993 36,893 35,993 5,169 3,892 5,169 3,892
Longer than one year and not longer than five years 157,030 153,200 157,030 153,200 36,391 29,776 36,391 29,776
Longer than five years 521,073 561,797 521,073 561,797 327,031 338,815 327,031 338,815
Other finance lease liabilities payable(ii)
Not longer than one year 230 214 17,414 17,627 249 200 10,213 9,187
Longer than one year and not longer than five years 386 362 122,139 68,086 341 351 105,487 44,750
Longer than five years – – – 65,054 – – – 65,346
Minimum future lease payments 715,612 751,566 854,549 901,757 369,181 373,034 484,291 491,766
Less future finance charges (346,431) (378,532) (370,258) (409,991) – – – –
Present value of minimum lease payments 369,181 373,034 484,291 491,766 369,181 373,034 484,291 491,766
Included in the financial statements as:
Current borrowings 5,417 4,092 15,381 13,079
Non-current borrowings 363,764 368,942 468,910 478,687
Total interest bearing liabilities 369,181 373,034 484,291 491,766
(i) Minimum future lease payments include the aggregate of all lease payments and any guaranteed residual.(ii) Other finance lease liabilities include obligations that are recognised on the balance sheet; the future payments related to operating lease commitments are
disclosed in Note 7.4.
Leasing arrangements – Commissioned Public Private PartnershipThe Services and Development Agreement for the redevelopment of Southern Cross Station with Civic Nexus Pty Ltd (CNPL) as disclosed in Note 7.4.2 is deemed a finance lease as it effectively transfers the risks and benefits incidental to ownership of the leased assets to the State.Until 2014, the actual cash payments to CNPL were less than the deemed finance lease interest expense. The finance lease liability increased to approximately $378 million in 2014 when the cash payments began to exceed interest.
Other finance lease liabilitiesThe other finance leases entered into by PTV relate to buses with a lease term of the same duration as the franchise term of seven years with an option to extend for a further three years; and motor vehicles with lease terms of three years or 60,000 kilometres, whichever occurs first.Franchise Asset Holdings as lessorAmount due from PTV as lessee under finance lease is recorded as a receivable. The finance lease receivable is initially recorded at an amount equal to the present value of the minimum lease payments receivable. Finance lease receipts are apportioned between periodic interest income and reduction of the lease receivable over the term of the lease in order to reflect a constant periodic rate of return on the net investment outstanding in respect of the lease.

102 Public Transport Victoria Annual Report 2018–19
In preparing the consolidated balance sheet, finance lease receivable and payable between the consolidated entities are eliminated.
7.3 Cash flow information and balancesDue to the State’s investment policy and funding arrangements, PTV does not hold a large cash reserve in its bank accounts. Cash and deposits, including cash equivalents, comprise cash on hand, cash at bank, and deposits at call with the Treasury Corporation of Victoria with maturity of three months or less. These are held for meeting short-term cash commitments rather than for investment purposes, and are readily convertible to known amounts of cash and are subject to an insignificant risk of change in value.
Consolidated
($ thousand)
2019 2018
Cash and bank deposits 37,987 25,991
Deposits with Treasury Corporation of Victoria – 10,226
Balance as per cash flow statement 37,987 36,217
7.3.1 Reconciliation of net result for the period to cash flow from operating activities
Consolidated
($ thousand)
2019 2018
Net result from continuing operations for the period (43,090) 72,647
Non-cash movements
Loss on disposal of non-financial assets 313 657
Depreciation and amortisation of non-financial assets 84,308 48,728
Net fair value of assets and services received and provided free of charge (34,891) (24,070)
Revaluation of long service leave liabilities due to changes in bond rates 578 39
Movements in assets and liabilities
Decrease/(increase) in receivables (60,859) 126,181
Decrease/(increase) in other non-financial assets 17,951 (41,259)
Decrease in inventories 9,902 9,235
Increase in payables 104,812 130,535
Increase in provisions 76,756 12,086
Net cash flows from operating activities 155,780 334,779
7.3.2 Non-cash financing and investing activities
($ thousand)
Consolidated Parent
2019 2018 2019 2018
Acquisition of property, plant and equipment by means of finance leases
6,917 4,598 256 262
Total Non-cash financing and investing activities 6,917 4,598 256 262
7.3.3 Cashflow statement of the parentThe cashflow statement of the parent is the same as the consolidated cashflow statement, with the exception of the following items. The amounts represent the parent cashflow:
Parent
($ thousand)
2019 2018
Proceeds from loans – –
Repayment of finance lease liability (7,474) (9,011)
The net cashflow from financing activities and the net increase in cash is the same for the parent and the consolidated entity.
7.4 Commitments for expenditureCommitments for future expenditure include operating and capital commitments arising from contracts. These commitments are recorded on the following page at their nominal value and inclusive of GST. Where it is considered appropriate and provides additional relevant information to users, the net present values of significant individual projects are stated. These future expenditures cease to be disclosed as commitments once the related liabilities are recognised in the balance sheet.

Section 5 Consolidated financial statements 103
7.4.1 Total commitments payable(i)
Consolidated
($ thousand)
2019 Nominal value 2018 Nominal value
Rail service commitments payable
Less than 1 year 2,061,974 2,053,098
Longer than 1 year but not longer than 5 years 6,938,614 7,518,135
5 years or more 667,113 2,017,554
Total rail service commitments 9,667,701 11,588,787
Bus service commitments payable
Less than 1 year 1,047,752 844,217
Longer than 1 year but not longer than 5 years 2,650,073 1,665,606
5 years or more 976,505 758,129
Total bus service commitments 4,674,330 3,267,952
Ticketing and call centre service commitments payable
Less than 1 year 119,537 110,392
Longer than 1 year but not longer than 5 years 409,382 484,441
5 years or more – 45,252
Total ticketing and call centre service commitments 528,919 640,085
Operating lease commitments payable(ii)
Less than 1 year 10,180 10,959
Longer than 1 year but not longer than 5 years 40,019 4,607
5 years or more 64,161 –
Total operating lease commitments 114,360 15,566
Capital expenditure commitments payable
Less than 1 year 399,890 505,113
Longer than 1 year but not longer than 5 years 137,182 340,815
5 years or more 32,400 37,348
Total capital expenditure commitments 569,472 883,276
PPP operation and maintenance commitments
Minimum lease payments for non-cancellable leases payable
Less than 1 year 25,575 20,697
Longer than 1 year but not longer than 5 years 106,224 103,079
5 years or more 390,933 421,315
Total lease commitments 522,732 545,091

104 Public Transport Victoria Annual Report 2018–19
Consolidated
($ thousand)
2019 Nominal value 2018 Nominal value
Total commitments
Total commitments (inclusive of GST) 16,077,514 16,940,757
Less: GST recoverable from the Australian Tax Office (1,461,592) (1,540,069)
Total commitments (exclusive of GST) 14,615,922 15,400,688
(i) For future finance lease and non-cancellable operating lease payments that are recognised on the balance sheet, refer to Note 7.2 Leases.(ii) Operating lease commitments relate to office and retail facilities with lease terms between one and ten years. These contracts do not allow
PTV to purchase the facilities after the lease ends.
7.4.2 Southern Cross Station public private partnership commitmentsOn 2 July 2002 the Southern Cross Station Authority and Civic Nexus Pty Ltd (CNPL) entered into a Services and Development Agreement (SDA) for the redevelopment of Southern Cross Station (Station). Under the SDA, CNPL had to design, construct and commission the Station. Construction commenced in September 2002 and on 1 August 2006, CNPL was granted a 30 year lease over the Station and has an obligation to operate and maintain the Station, until the end of the 30 year period, at which time these rights and obligations will transfer back to the State.Upon formation of PTV, the contract commitments to CNPL, as part of the Public Private Partnership (PPP) arrangement, were transferred from the Director of Public Transport to PTV. These commitments include operating and finance lease interest costs that extend until 30 June 2036.
PTV makes quarterly payments over a 30 year operating period which commenced on 27 April 2005. These future payments are subject to abatement in accordance with the terms and conditions of the SDA. The quarterly payments reimburse CNPL for the annual operating, maintenance and insurance costs. The Net Present Value (NPV) is calculated using a discount rate of 8.65 per cent (2018: 8.65 per cent) per annum and an inflation rate of 2.5 per cent (2018: 2.5 per cent) per annum or actual inflation, whichever is higher.The nominal amounts for the operation and maintenance commitment on the following page represents the charges payable under the SDA at the end of the reporting period.

Section 5 Consolidated financial statements 105
Consolidated
($ thousand)
2019 2018
Commissioned Public Private Partnership(i) (ii) (iii) (iv)Net Present
ValueNominal
ValueNet Present
ValueNominal
Value
Southern Cross Station operation and maintenance commitments 259,164 522,732 258,337 545,091
Total PPP operation and maintenance commitment 259,164 522,732 258,337 545,091
(i) The present values of the minimum lease payments for commissioned PPP are recognised on the balance sheet and are not disclosed as commitments.(ii) The year on year decrease in the nominal amounts of the commitments mainly reflects the payments made, the additional operating and maintenance
requirements, and the impact of changes in estimates of future inflation rates.(iii) The year on year increase in the present values of the commitments mainly reflects the payments made, the additional operating and maintenance
requirements, the impact of changes in estimates of future inflation rates and the discounting period being one reporting period shorter.(iv) The total commitments do not equal the sum of the minimum lease payments and other commitments because they are discounted, whereas total
commitments are at nominal value.
7.4.3 Commitments other than Public Private Partnership (i)
Consolidated
($ thousand)
2019 Nominal value 2018 Nominal value
Rail service commitments
Transport service provided by rail operators 9,667,701 11,588,787
Total rail service commitments 9,667,701 11,588,787
Bus service commitments
Transport service provided by bus operators 4,674,330 3,267,952
Total bus service commitments 4,674,330 3,267,952
Ticketing and call centre service commitments
Ticketing and call centre services provided by operators 528,919 640,085
Total ticketing and call centre service commitments 528,919 640,085
Operating lease commitments
Office & Retail 114,360 15,566
Total operating lease commitments 114,360 15,566
Capital expenditure commitments
Transport infrastructure and rolling stock 569,472 883,276
Total capital expenditure commitments 569,472 883,276
Total commitments other than public private partnerships 15,554,782 16,395,666
(i) Figures presented are inclusive of GST.

106 Public Transport Victoria Annual Report 2018–19
Metropolitan rail and bus commitmentsPTV entered into a number of contracts with private operators to provide Victoria’s train, tram and bus services. The current contracts with Metro Trains Melbourne (MTM) and Yarra Trams commenced on 30 November 2017 and have an initial franchise period of seven years (with the possibility of up to three years extension at the option of the State). Under the terms of these franchise contracts, subsidies are provided for transport services and capital commitments.The commitments with MTM and Yarra Trams have been calculated up to the end of the franchise period with the exception of the rolling stock lease payments for which PTV is legally committed beyond the initial franchise period.Bus services are covered by long term service contracts established with the bus service operators. Commitments of the bus service contracts are determined from the service fees payable during the term of the service contracts. The 2008 metropolitan bus services contracts (MBSCs) expired on 30 June 2018 and new 2018 MBSC contracts commenced from July 2018.
V/Line rail services A partnership agreement was signed between PTV and V/Line to provide regional train and coach services, effective from 1 January 2018 to 1 January 2023. PTV have the option to extend the agreement for 2 further 5 year periods.
Capital expenditure commitmentsCapital expenditure commitments include contracts for capital projects relating to infrastructure and transport related projects separate and in addition to the commitments entered into through the partnership agreements (which include rolling stock and branding projects). These contracts for commitments were signed prior to 30 June 2019 and have established a legal and binding obligation on PTV to make future payments.
Operating lease commitmentsOperating lease commitments include contracts for office and retail accommodation.
Ticketing and call centre service commitmentsThe current myki ticketing system services contract commenced on 1 January 2017. The contract will improve service delivery and meet customer demand by providing strong incentives to maximise the availability of the system for customer use, rapidly respond to system outages and focus on system presentation and throughput. In addition, the new contract will also allow for overall public transport growth and the flexibility to implement changes to the ticketing system.
8. Risks, contingencies and valuation judgementsIntroductionPTV is exposed to risk from its activities and outside factors. In addition, it is often necessary to make judgements and estimates associated with recognition and measurement of items in the financial statements. This section sets out financial instrument specific information, (including exposures to financial risks) as well as those items that are contingent in nature or require a higher level of judgement to be applied.
Structure8.1 Financial instruments specific disclosures 1068.2 Contingent assets and contingent liabilities 1168.3 Fair value determination 117
8.1 Financial instruments specific disclosuresFinancial instruments arise out of contractual agreements that give rise to a financial asset of one entity and a financial liability or equity instrument of another entity. Due to the nature of PTV’s activities, certain financial assets and financial liabilities arise under statute rather than a contract (for example taxes). Such assets and liabilities do not meet the definition of financial instruments in AASB 132 Financial Instruments: Presentation.From 1 July 2018, PTV applies AASB 9 and classifies all of its financial assets based on the business model for managing the assets and the asset’s contractual terms.

Section 5 Consolidated financial statements 107
Categories of financial assets under AASB 9Financial assets at amortised costFinancial assets are measured at amortised costs if both of the following criteria are met and the assets are not designated as fair value through net result:
– the assets are held by PTV to collect the contractual cash flows, and
– the assets’ contractual terms give rise to cash flows that are solely payments of principal and interest.
These assets are initially recognised at fair value plus any directly attributable transaction costs and subsequently measured at amortised cost using the effective interest method less any impairment.PTV recognises the following assets in this category:
– cash and deposits; – receivables (excluding statutory receivables); – term deposits.
Categories of financial assets previously under AASB 139Loans, receivables and cash are financial instrument assets with fixed and determinable payments that are not quoted on an active market. These assets and liabilities are initially recognised at fair value plus any directly attributable transaction costs. Subsequent to initial measurement, loans and receivables are measured at amortised cost using the effective interest method (and for assets, less any impairment). PTV recognises the following assets in this category:
– cash and deposits; – receivables (excluding statutory receivables); – term deposits.
Categories of financial liabilities under AASB 9 and previously under AASB 139Financial liabilities at amortised cost are initially recognised on the date they are originated. They are initially measured at fair value plus any directly attributable transaction costs. Subsequent to initial recognition, these financial instruments are measured at amortised cost with any difference between the initial recognised amount and the redemption value being recognised in profit and loss over the period of the interest-bearing liability, using the effective interest rate method. PTV recognises the following liabilities in this category:
– payables (excluding statutory payables); and – borrowings (including finance lease liabilities).
Derecognition of financial assets: A financial asset (or, where applicable, a part of a financial asset or part of a group of similar financial assets) is derecognised when:
– the rights to receive cash flows from the asset have expired; or
– PTV has transferred its rights to receive cash flows from the asset and either;
– has transferred substantially all the risks and rewards of the asset; or
– has neither transferred nor retained substantially all the risks and rewards of the asset, but has transferred control of the assets.
Impairment of financial assets: At the end of each reporting period, PTV assesses whether there is objective evidence that a financial asset or group of financial assets is impaired. All financial instrument assets are subject to annual review for impairment.The allowance is the difference between the financial asset’s carrying amount and the present value of estimated future cash flows, discounted at the effective interest rate. In assessing impairment of statutory (non-contractual) financial assets, which are not financial instruments, professional judgement is applied in assessing materiality using estimates, averages and other computational methods in accordance with AASB 136 Impairment of Assets.Derecognition of financial liabilities: A financial liability is derecognised when the obligation under the liability is discharged, cancelled or expires.

108 Public Transport Victoria Annual Report 2018–19
8.1.1 Financial instruments: CategorisationContractual receivables previously classified as other loans and receivables under AASB 139 are now reclassified as financial assets at amortised cost under AASB 9.
Consolidated
($ thousand)
Cash and Deposits
Financial assets at amortised cost
Financial liabilities at amortised cost Total
2019
Contractual financial assets
Cash and deposits 37,987 – – 37,987
Receivables(i)
Amounts owing from government departments and agencies – 547,835 – 547,835
Receivables – current – 13,380 – 13,380
Total contractual financial assets 37,987 561,215 – 599,202
Contractual financial liabilities
Payables
Supplies and services – – 595,765 595,765
Amounts payable to government departments and agencies – – 7,822 7,822
Borrowings
Advances from government – – – –
Loan – – 115,110 115,110
Finance lease liabilities – motor vehicles – – 590 590
Finance lease liabilities – Southern Cross Station Transport Interchange Facility – – 368,591 368,591
Total contractual financial liabilities – – 1,087,878 1,087,878
(i) The total amount disclosed here exclude statutory amounts (e.g. Amounts owing from Victorian Government and GST Input tax credit recoverable and taxes payable).

Section 5 Consolidated financial statements 109
Consolidated
($ thousand)
Cash and Deposits
Contractual financial assets
Contractual financial liabilities at
amortised cost Total
2018
Contractual financial assets
Cash and deposits 36,217 – – 36,217
Receivables(i)
Amounts owing from government departments and agencies – 453,449 – 453,449
Receivables – current – 17,604 – 17,604
Total contractual financial assets 36,217 471,053 – 507,270
Contractual financial liabilities
Payables
Supplies and services – – 547,078 547,078
Amounts payable to government departments and agencies – – 14,889 14,889
Borrowings
Advances from government – – 9,903 9,903
Loan – – 118,732 118,732
Finance lease liabilities – motor vehicles – – 551 551
Finance lease liabilities – Southern Cross Station Transport Interchange Facility – – 372,483 372,483
Total contractual financial liabilities – – 1,063,636 1,063,636
(i) The total amount disclosed here exclude statutory amounts (e.g. Amounts owing from Victorian Government and GST Input tax credit recoverable and taxes payable).

110 Public Transport Victoria Annual Report 2018–19
8.1.2 Financial instruments – Net holding gain/(loss) on financial instruments by category
Consolidated
Total interest income/ (expense)
($ thousand)
2019 2018
Contractual financial assets
Financial assets at amortised cost 922 1,055
Total contractual financial assets 922 1,055
Contractual financial liabilities
Financial liabilities at amortised cost(i) (39,829) (41,512)
Total contractual financial liabilities (39,829) (41,512)
(i) Includes interest for Southern Cross Station Transport Interchange Facility.
The net holding gain/(loss) disclosed above is determined as follows:
– for financial assets – cash and deposit, the net gain is the interest income.
– for financial liabilities measured at amortised cost, the loss is the interest expense.
8.1.3 Financial risk management objectives and policies
Credit risk Liquidity risk Market risk
Financial risks
Interest rate risk
As a whole, PTV’s financial risk management program seeks to manage these risks and the associated volatility of its financial performance. Details of the significant accounting policies and methods adopted, including the criteria for recognition, the basis of measurement, and the basis on which income and expenses are recognised, with respect to each class of financial asset, financial liability and equity instrument above are disclosed in Note 8.3 to the financial statements.The main purpose in holding financial instruments is to prudentially manage PTV’s financial risks within the government policy parameters.
PTV’s main financial risks include credit risk, liquidity risk and interest rate risk. PTV manages these financial risks in accordance with its financial risk management policy. PTV uses different methods to measure and manage the different risks to which it is exposed. Primary responsibility for the identification and management of financial risks rests with the Accountable Officer of PTV.
Financial instruments: Credit risk Credit risk refers to the possibility that a borrower will default on its financial obligations as and when they fall due. PTV’s exposure to credit risk arises from the potential default of a counter party on their contractual obligations resulting in financial loss to PTV. Credit risk is measured at fair value and is monitored on a regular basis.Credit risk associated with PTV’s contractual financial assets is minimal because the main debtor is the Victorian Government. For debtors other than the Government, it is PTV’s policy to only deal with entities with high credit ratings of a minimum triple-B rating and to obtain sufficient collateral or credit enhancements, where appropriate.In addition, PTV does not engage in hedging for its contractual financial assets and mainly obtains contractual financial assets that are on fixed interest, except for cash and deposits, which are mainly cash at bank. As with the policy for debtors, PTV’s policy is to only deal with banks with high credit ratings.Provision of impairment for contractual financial assets is recognised when there is objective evidence that PTV will not be able to collect a receivable. Objective evidence includes financial difficulties of the debtor, default payments, debts that are more than 60 days overdue, and changes in debtor credit ratings. Contractual financial assets are written off against the carrying amount when there is no reasonable expectation of recovery. Bad debt written off by mutual consent is classified as a transaction expense. Bad debt written off following a unilateral decision is recognised as other economic flows in the net result.Except as otherwise detailed in the following table, the carrying amount of contractual financial assets recorded in the financial statements, net of any allowances for losses, represents PTV’s maximum exposure to credit risk without taking account of the value of any collateral obtained.There has been no material change to PTV’s credit risk profile in 2018–19.

Section 5 Consolidated financial statements 111
Credit quality of financial assets
Consolidated
($ thousand)
Financial Institution
(triple–A credit rating)
Government agencies (triple–A
credit rating)
Other (min triple–B credit rating) Total
2019
Financial assets
Financial assets with loss allowance measured at 12–month expected credit loss
Cash and deposits (not assessed for impairment due to materiality) 37,982 – 5 37,987
Statutory receivables (with no impairment loss recognised) – 547,835 – 547,835
Financial assets with loss allowance measured at lifetime expected credit loss:
Contractual receivables applying the simplified approach for impairment – – 13,380 13,380
Total financial assets 37,982 547,835 13,385 599,202
Credit quality of contractual financial assets that are neither past due nor impaired
Consolidated
($ thousand)
Financial Institution
(triple–A credit rating)
Government agencies (triple–A
credit rating)
Other (min triple–B credit
rating) Total
2018
Financial assets
Cash and deposits 25,991 10,226 – 36,217
Amounts owing from government departments and agencies – 453,449 – 453,449
Receivables – current – – 17,604 17,604
Total contractual financial assets 25,991 463,675 17,604 507,270
Impairment of financial assets under AASB 9 – applicable from 1 July 2018From 1 July 2018, PTV has been recording the allowance for expected credit loss for the relevant financial instruments, replacing AASB 139’s incurred loss approach with AASB 9’s Expected Credit Loss approach.
Contractual receivables at amortised costPTV applies AASB 9 simplified approach for all contractual receivables to measure expected credit losses using a lifetime expected loss allowance based on the assumptions about risk of default and expected loss rates. PTV has grouped contractual receivables
on shared credit risk characteristics and days past due and select the expected credit loss rate based on the PTV’s past history, existing market conditions, as well as forward-looking estimates at the end of the financial year.

112 Public Transport Victoria Annual Report 2018–19
On this basis, PTV determines the opening loss allowance on initial application date of AASB 9 and the closing loss allowance at end of the financial year as follows:
1–Jul–18
($ thousand)
CurrentLess than
1 Month 1–3 Months3 months
– 1 year 1–5 years Total
Expected loss rate 0% 2% 14% 57% 100%
Gross carrying amount of contractual receivables 469,044 1,738 347 21 50 471,200
Loss allowance – 38 47 12 50 147
30–Jun–19
($ thousand)
CurrentLess than
1 Month 1–3 Months3 months
– 1 year 1–5 years Total
Expected loss rate 0% 0% 42% 0% 22%
Gross carrying amount of contractual receivables 560,597 162 220 136 247 561,362
Loss allowance – – 93 – 54 147
Consolidated
($ thousand)
2018 2017
Balance at beginning of the year (147) –
Opening retained earnings adjustment on adoption of AASB9 – –
Opening Loss Allowance (147) –
Increase in provision recognised in the net result (93) (147)
Reversal of provision of receivables written off during the year as uncollectible – –
Reversal of unused provision recognised in the net result 93 –
Balance at end of the year (147) (147)
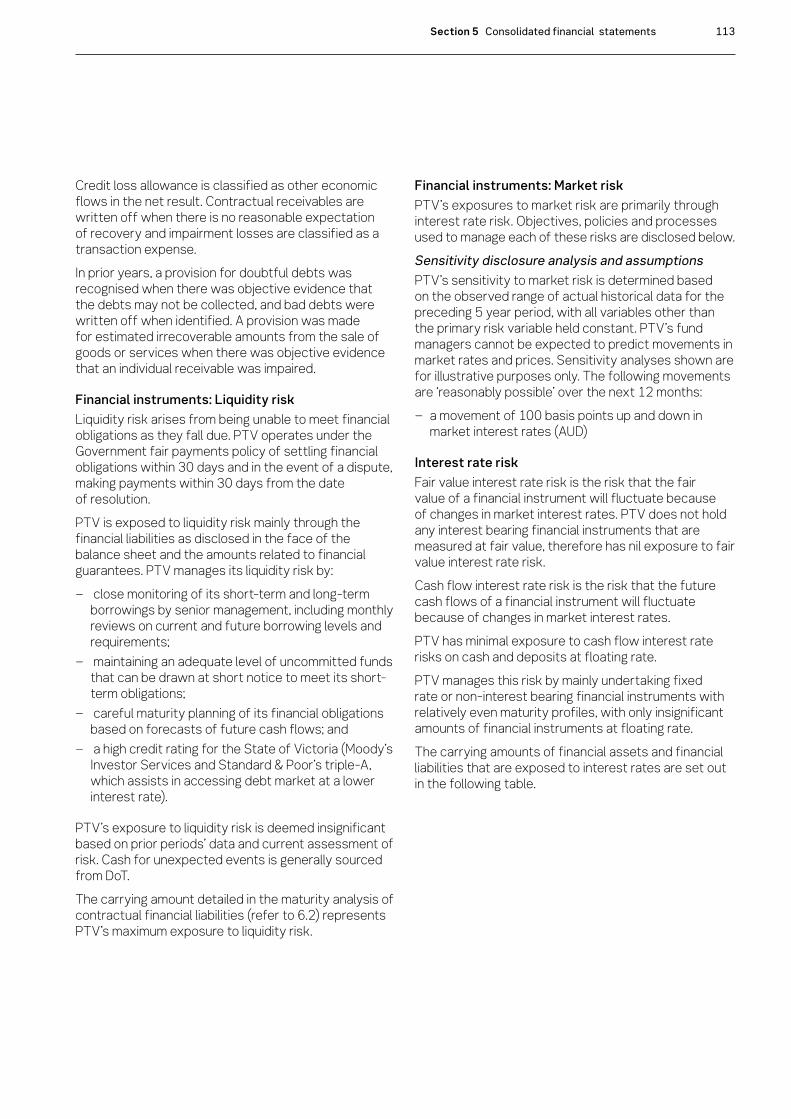
Section 5 Consolidated financial statements 113
Credit loss allowance is classified as other economic flows in the net result. Contractual receivables are written off when there is no reasonable expectation of recovery and impairment losses are classified as a transaction expense. In prior years, a provision for doubtful debts was recognised when there was objective evidence that the debts may not be collected, and bad debts were written off when identified. A provision was made for estimated irrecoverable amounts from the sale of goods or services when there was objective evidence that an individual receivable was impaired.
Financial instruments: Liquidity risk Liquidity risk arises from being unable to meet financial obligations as they fall due. PTV operates under the Government fair payments policy of settling financial obligations within 30 days and in the event of a dispute, making payments within 30 days from the date of resolution. PTV is exposed to liquidity risk mainly through the financial liabilities as disclosed in the face of the balance sheet and the amounts related to financial guarantees. PTV manages its liquidity risk by:
– close monitoring of its short-term and long-term borrowings by senior management, including monthly reviews on current and future borrowing levels and requirements;
– maintaining an adequate level of uncommitted funds that can be drawn at short notice to meet its short-term obligations;
– careful maturity planning of its financial obligations based on forecasts of future cash flows; and
– a high credit rating for the State of Victoria (Moody’s Investor Services and Standard & Poor’s triple-A, which assists in accessing debt market at a lower interest rate).
PTV’s exposure to liquidity risk is deemed insignificant based on prior periods’ data and current assessment of risk. Cash for unexpected events is generally sourced from DoT.The carrying amount detailed in the maturity analysis of contractual financial liabilities (refer to 6.2) represents PTV’s maximum exposure to liquidity risk.
Financial instruments: Market riskPTV’s exposures to market risk are primarily through interest rate risk. Objectives, policies and processes used to manage each of these risks are disclosed below.Sensitivity disclosure analysis and assumptionsPTV’s sensitivity to market risk is determined based on the observed range of actual historical data for the preceding 5 year period, with all variables other than the primary risk variable held constant. PTV’s fund managers cannot be expected to predict movements in market rates and prices. Sensitivity analyses shown are for illustrative purposes only. The following movements are ‘reasonably possible’ over the next 12 months:
– a movement of 100 basis points up and down in market interest rates (AUD)
Interest rate riskFair value interest rate risk is the risk that the fair value of a financial instrument will fluctuate because of changes in market interest rates. PTV does not hold any interest bearing financial instruments that are measured at fair value, therefore has nil exposure to fair value interest rate risk.Cash flow interest rate risk is the risk that the future cash flows of a financial instrument will fluctuate because of changes in market interest rates.PTV has minimal exposure to cash flow interest rate risks on cash and deposits at floating rate.PTV manages this risk by mainly undertaking fixed rate or non-interest bearing financial instruments with relatively even maturity profiles, with only insignificant amounts of financial instruments at floating rate. The carrying amounts of financial assets and financial liabilities that are exposed to interest rates are set out in the following table.

114 Public Transport Victoria Annual Report 2018–19
Interest rate exposure of financial instruments
Consolidated
($ thousand)
Interest rate exposure
Weighted average
effective interest
rate %Carrying
amount
Fixed interest
rate
Variable interest
rate
Non-interest bearing
2019
Financial assets
Cash and deposits 1.46% 37,987 – 37,982 5
Receivable(i)
Amounts owing from government departments and agencies 547,835 – – 547,835
Receivables – current 13,380 – – 13,380
599,202 – 37,982 561,220
Financial liabilities
Payables(i)
Supplies and services 595,765 – – 595,765
Amounts payable to government departments and agencies 7,822 – – 7,822
Borrowings
Advances from government – – – –
Loan(ii) 5.59% 115,110 115,110 – –
Finance lease liabilities – motor vehicles 3.25% 590 590 – –
Finance lease liabilities – Southern Cross Station Transport Interchange Facility 8.65% 368,591 368,951 – –
1,087,878 484,291 – 603,587

Section 5 Consolidated financial statements 115
Consolidated
($ thousand)
Interest rate exposure
Weighted average
effective interest
rate %Carrying
amount
Fixed interest
rate
Variable interest
rate
Non-interest bearing
2018
Financial assets
Cash and deposits 1.55% 36,217 10,226 25,986 5
Receivable(i)
Amounts owing from government departments and agencies 453,449 – – 453,449
Receivables – current 17,604 – – 17,604
507,270 10,226 25,986 471,058
Financial liabilities
Payables(i)
Supplies and services 547,078 – – 547,078
Amounts payable to government departments and agencies 14,889 – – 14,889
Borrowings
Advances from government 9,903 – – 9,903
Loan(ii) 5.69% 118,732 118,732 – –
Finance lease liabilities – motor vehicles 3.36% 551 551 – –
Finance lease liabilities – Southern Cross Station Transport Interchange Facility 8.65% 372,483 372,483 – –
1,063,636 491,766 – 571,870
(i) The carrying amounts disclosed here exclude statutory amounts (e.g. GST input tax credit recoverable).(ii) For the parent entity, the amount disclosed as loan above is included within finance lease liabilities (refer to section 7.1).
Interest rate sensitivityTaking into account past performance, future expectations and economic forecasts, PTV believes that interest rate movements, a parallel shift of +1.0 per cent and -1.0 per cent in market interest rates from year-end rates, will not have a material impact on its financial position. PTV’s management cannot be expected to predict movement in market rates and prices; sensitivity analysis shown is for illustrative purposes only.The following table discloses the impact on PTV’s net result and equity for each category of financial instrument held by PTV at year-end as presented to key management personnel, if the above movements were to occur.

116 Public Transport Victoria Annual Report 2018–19
Consolidated
($ thousand)
Carrying amount
Interest rate
-100 basis points +100 basis points
Net result Equity Net result Equity
2019
Contractual financial assets
Cash and deposits(i) 37,982 (380) (380) 380 380
Total impact (380) (380) 380 380
2018
Contractual financial assets
Cash and deposits(i) 36,212 (362) (362) 362 362
Total impact (362) (362) 362 362
(i) Cash and deposits include deposits of $37,982 thousand (2018: $36,212 thousand) that is exposed to floating rate movements. Sensitivities to these movements are calculated as follows:– 2019: $37,982 thousand x -0.01 = -$380 thousand; and $37,982 thousand x 0.01 = $380 thousand; and – 2018: $36,212 thousand x -0.01 = -$362 thousand; and $36,212 thousand x 0.01 = $362 thousand.
8.2 Contingent assets and contingent liabilitiesContingent assets and contingent liabilities are not recognised in the balance sheet but are disclosed and, if quantifiable, are measured at nominal value.Contingent assets and liabilities are presented inclusive of GST receivable or payable respectively.
Contingent liabilities Contingent liabilities are:
– possible obligations that arise from past events. Existence will be confirmed only by the occurrence or non-occurrence of one or more uncertain future events not wholly within the control of the entity; or
– present obligations that arise from past events but are not recognised because:
– it is not probable that an outflow of resources embodying economic benefits will be required to settle the obligations; or
– the amount of the obligations cannot be measured with sufficient reliability.
Contingent liabilities are also classified as either quantifiable or non-quantifiable.
Non-quantifiable contingent liabilitiesPTV has a possible liability relating to a claim from a contractor with regards to the Target Capacity threshold for patronage at Southern Cross station. A validation of passenger flow has indicated that the contractual Target Capacity has been exceeded. Although this does not compromise safe operations of the station, it initiates a process to assess whether modifications to the station or compensation to the contractor are required. Options available to address the increased passenger flow include: additional payment to the contractor to continue to meet service standards, modification of the service standards, modification of facilities, or a combination of the above. Until a detailed claim has been submitted and substantiated by the contractor, it is not possible to estimate the financial effect of the claim.
Public transport rail partnership agreementsPTV is party to partnership contractual arrangements with franchisees to operate metropolitan rail transport services in the State, operative from 30 November 2017 until 30 November 2024. The following summarises the major contingent liabilities arising from the contractual arrangements in the event of early termination or expiry of the partnership contractual agreement, which are:

Section 5 Consolidated financial statements 117
Partnership assetsTo maintain continuity of services, at early termination or expiry of the franchise contract, assets will revert to PTV or a successor. In the case of some assets, a reversion back to PTV would entail those assets being purchased.
Unfunded SuperannuationAt the early termination or expiry of the contract, PTV will assume any unfunded superannuation amounts (apart from contributions the operator is required to pay over the contract term) to the extent that the State becomes the successor operator.
8.3 Fair value determinationThis section sets out information on how PTV determined fair value for financial reporting purposes. Fair value is the price that would be received to sell an asset or paid to transfer a liability in an orderly transaction between market participants at the measurement date. The following assets and liabilities are carried at fair value:
– land, buildings, infrastructure, plant and equipment
In addition, the fair values of other assets and liabilities that are carried at amortised cost, also need to be determined for disclosure purposes. PTV determines the policies and procedures for determining fair values for both financial and non-financial assets and liabilities as required.
Fair value hierarchyIn determining fair values a number of inputs are used. To increase consistency and comparability in the financial statements, these inputs are categorised into three levels, also known as the fair value hierarchy. The levels are as follows:
– Level 1 – quoted (unadjusted) market prices in active markets for identical assets or liabilities;
– Level 2 – valuation techniques for which the lowest level input that is significant to the fair value measurement is directly or indirectly observable; and
– Level 3 – valuation techniques for which the lowest level input that is significant to the fair value measurement is unobservable.
PTV determines whether transfers have occurred between levels in the hierarchy by reassessing categorisation (based on the lowest level input that is significant to the fair value measurement as a whole) at the end of each reporting period. The Valuer-General Victoria (VGV), as PTV’s independent valuation agency, monitors changes in the fair value of each asset through relevant data sources to determine whether revaluation is required.
How this section is structuredFor those assets and liabilities for which fair values are determined, the following disclosures are provided:
– carrying amount and the fair value (which would be the same for those assets measured at fair value);
– which level of the fair value hierarchy was used to determine the fair value; and
– in respect of those assets and liabilities subject to fair value determination using Level 3 inputs:
– a reconciliation of the movements in fair values from the beginning of the year to the end; and
– details of significant unobservable inputs used in the fair value determination.
This section is divided between disclosures in connection with fair value determination for financial assets and liabilities (see Note 8.3.1) and non-financial physical assets (see Note 8.3.2).
8.3.1 Fair value determination of financial assets and liabilitiesThe fair values and net fair values of financial assets and liabilities are determined as follows:
– Level 1 – the fair value of financial instrument with standard terms and conditions and traded in active liquid markets are determined with reference to quoted market prices;
– Level 2 – the fair value is determined using inputs other than quoted prices that are observable for the financial asset or liability, either directly or indirectly; and
– Level 3 – the fair value is determined in accordance with generally accepted pricing models based on discounted cash flow analysis using unobservable market inputs.

118 Public Transport Victoria Annual Report 2018–19
PTV currently holds a range of financial instruments that are recorded in the financial statements where the carrying amounts are a reasonable approximation of fair value, either due to their short-term nature or with the expectation that they will be paid in full by the end of the 2018–19 reporting period. Non-current financial liabilities are recorded at fair value (refer to section 7.1).These financial instruments include:
Financial assets
Cash and deposits
Receivables
– Sale of goods and services
–Amounts owing from government departments and agencies
Financial liabilities
Payables
– Supplies and services
– Amounts payable to government departments and agencies
Borrowings
– Loan
– Finance lease liabilities
Fair value of financial assets and liabilities PTV considers that the carrying amount of financial assets and financial liabilities recorded in the financial statements approximates their fair values.

Section 5 Consolidated financial statements 119
8.3.2 Fair value determination: Non-financial physical assetsFair value measurement hierarchy
Consolidated
($ thousand)
Carrying amountFair value measurement at end of
reporting period using Level 3
2019 2018 2019 2018
Land at fair value 512,035 512,035 512,035 512,035
Buildings at fair value 465,241 478,663 465,241 478,663
Infrastructure at fair value 243,120 244,452 243,120 244,452
Plant and equipment at fair value 55 80 55 80
Leasehold improvement at fair value 323 963 323 963
Vehicles at fair value 73,720 78,120 73,720 78,120
Cultural assets at fair value 2,141 2,165 2,141 2,165
Net carrying amount of property, plant and equipment 1,296,635 1,316,478 1,296,635 1,316,478
PTV conducted a management fair value assessment at the end of the 2017–18 financial year which indicated that the movement in fair value of land and infrastructure assets since the last scheduled revaluation may be material. Therefore, PTV engaged Valuer-General Victoria to conduct an Interim revaluation as at 30 June 2018. Revaluation amounts are included in Note 5.1.2.
Land and buildingsAll PTV land and buildings are specialised. The market approach is used for specialised land, although it is adjusted for the Community Service Obligation (CSO) to reflect the specialised nature of the land being valued. The CSO adjustment is a reflection of the valuer’s assessment of the impact of restrictions associated with an asset to the extent that is also equally applicable to market participants. This approach is in light of the highest and best use consideration required for fair value measurement, and takes into account the use of the asset that is physically possible, legally permissible, and financially feasible. As adjustments of CSO are considered as significant unobservable inputs, specialised land would be classified as Level 3 assets. The CSO adjustment for Southern Cross Station was 50% and for other land was between 25% and 50%.For specialised buildings, the depreciated replacement cost method is used, adjusting for the associated depreciation. As depreciation adjustments are considered as significant, unobservable inputs in nature, specialised buildings are classified as Level 3 fair value measurements.
Infrastructure and cultural assetsInfrastructure and cultural assets are valued using the depreciated replacement cost method or reproduction cost (refer Note 5.1). As depreciation adjustments are considered as significant, unobservable inputs in nature, infrastructure and cultural assets are classified as Level 3 fair value measurements.
VehiclesVehicles are valued using the depreciated replacement cost method. PTV has control over buses under an arrangement with Transdev Melbourne Pty Ltd and Franchise Asset Holdings Pty Ltd. Depreciation rates of buses are agreed by the parties to the arrangement and the disposal of buses will be at their net book value. As a result, the fair value of vehicles approximates the depreciated replacement cost.
Plant and equipmentPlant and equipment is held at fair value. When plant and equipment is specialised in use, such that it is rarely sold other than as part of a going concern, fair value is determined using the depreciated replacement cost method. There were no changes in valuation techniques throughout the year to 30 June 2019.For all assets measured at fair value, the current use is considered the highest and best use.

120 Public Transport Victoria Annual Report 2018–19
Reconciliation of level 3 fair value movements
Consolidated ($ thousand) ($ thousand)
Land Buildings Infrastructure Plant and equipment Leasehold improvement Vehicles Cultural assets Total
Opening balance as at 30 June 2017 503,734 508,212 223,096 106 1,603 83,244 2,189 1,322,184
Additions – – 5,018 – – 4,598 – 9,616
Disposals/write-offs – – (545) – – (240) – (785)
Depreciation expense – (13,882) (24,674) (26) (640) (9,482) (24) (48,728)
Assets received free of charge – – 2,592 – – – – 2,592
Net revaluation increments/decrements 8,301 (15,668) 38,965 – – – – 31,598
Carrying balance as at 30 June 2018 512,035 478,663 244,452 80 963 78,120 2,165 1,316,478
Additions – – 4,250 – – 6,917 – 11,167
Disposals/write-offs – – (308) – – (71) – (379)
Depreciation expense – (13,422) (55,783) (25) (640) (11,195) (24) (81,089)
Assets received free of charge – – 268 – – – – 268
Assets provided free of charge – – – – – (51) – (51)
Transfer between classes – – 50,241 – – – – 50,241
Closing balance as at 30 June 2019 512,035 465,241 243,120 55 323 73,720 2,141 1,296,635
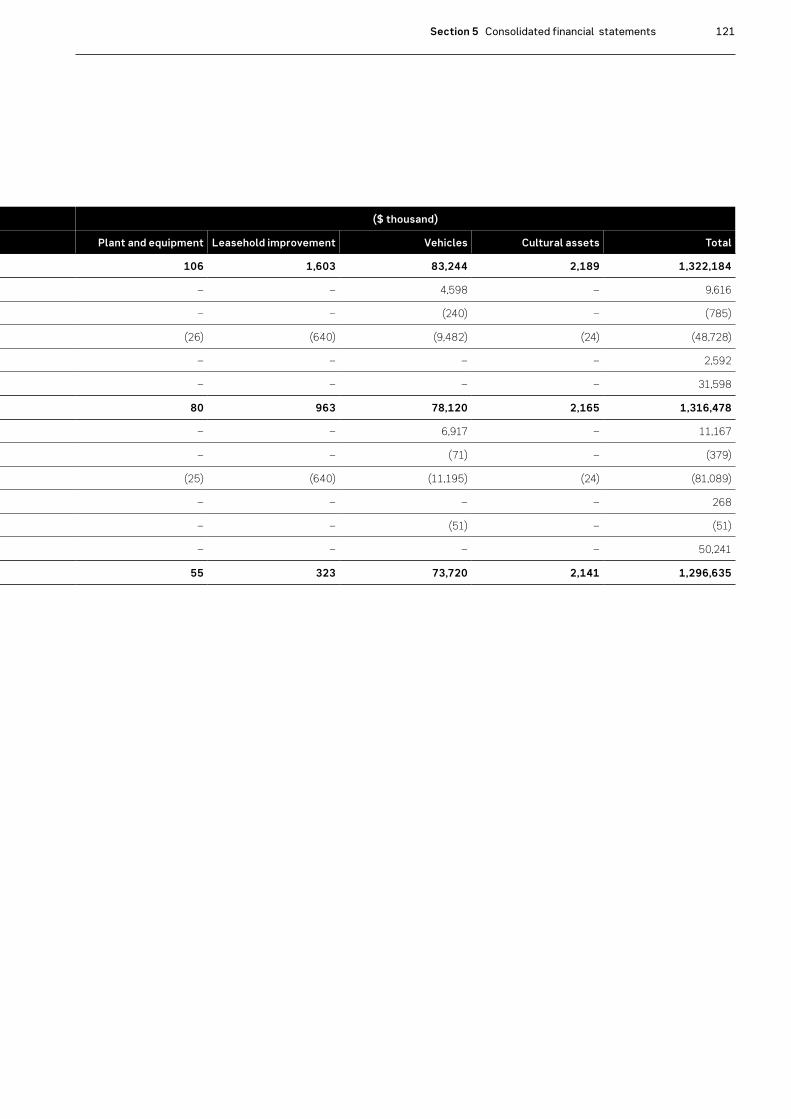
Section 5 Consolidated financial statements 121
Reconciliation of level 3 fair value movements
Consolidated ($ thousand) ($ thousand)
Land Buildings Infrastructure Plant and equipment Leasehold improvement Vehicles Cultural assets Total
Opening balance as at 30 June 2017 503,734 508,212 223,096 106 1,603 83,244 2,189 1,322,184
Additions – – 5,018 – – 4,598 – 9,616
Disposals/write-offs – – (545) – – (240) – (785)
Depreciation expense – (13,882) (24,674) (26) (640) (9,482) (24) (48,728)
Assets received free of charge – – 2,592 – – – – 2,592
Net revaluation increments/decrements 8,301 (15,668) 38,965 – – – – 31,598
Carrying balance as at 30 June 2018 512,035 478,663 244,452 80 963 78,120 2,165 1,316,478
Additions – – 4,250 – – 6,917 – 11,167
Disposals/write-offs – – (308) – – (71) – (379)
Depreciation expense – (13,422) (55,783) (25) (640) (11,195) (24) (81,089)
Assets received free of charge – – 268 – – – – 268
Assets provided free of charge – – – – – (51) – (51)
Transfer between classes – – 50,241 – – – – 50,241
Closing balance as at 30 June 2019 512,035 465,241 243,120 55 323 73,720 2,141 1,296,635

122 Public Transport Victoria Annual Report 2018–19
Description of significant unobservable inputs to Level 3 valuations for 2019 and 2018
Category Valuation technique(i) Significant unobservable inputs(i)
Land Market approach Community Service Obligation (CSO) adjustment
Buildings Current replacement costDirect cost per square metre
Useful life of buildings
Infrastructure Current replacement costCost per unit
Useful life of the infrastructure
Plant and equipment Current replacement costCost per unit
Useful life of plant and equipment
Leasehold improvement Current replacement costCost per unit
Useful life of leasehold improvement
Vehicles Current replacement costCost per unit
Useful life of vehicles
Cultural assets Reproduction costCost per unit
Useful life of culture assets
(i) Illustrations on the valuation techniques, significant unobservable inputs are indictive and should not be directly used without consultation with the PTV’s independent valuer.
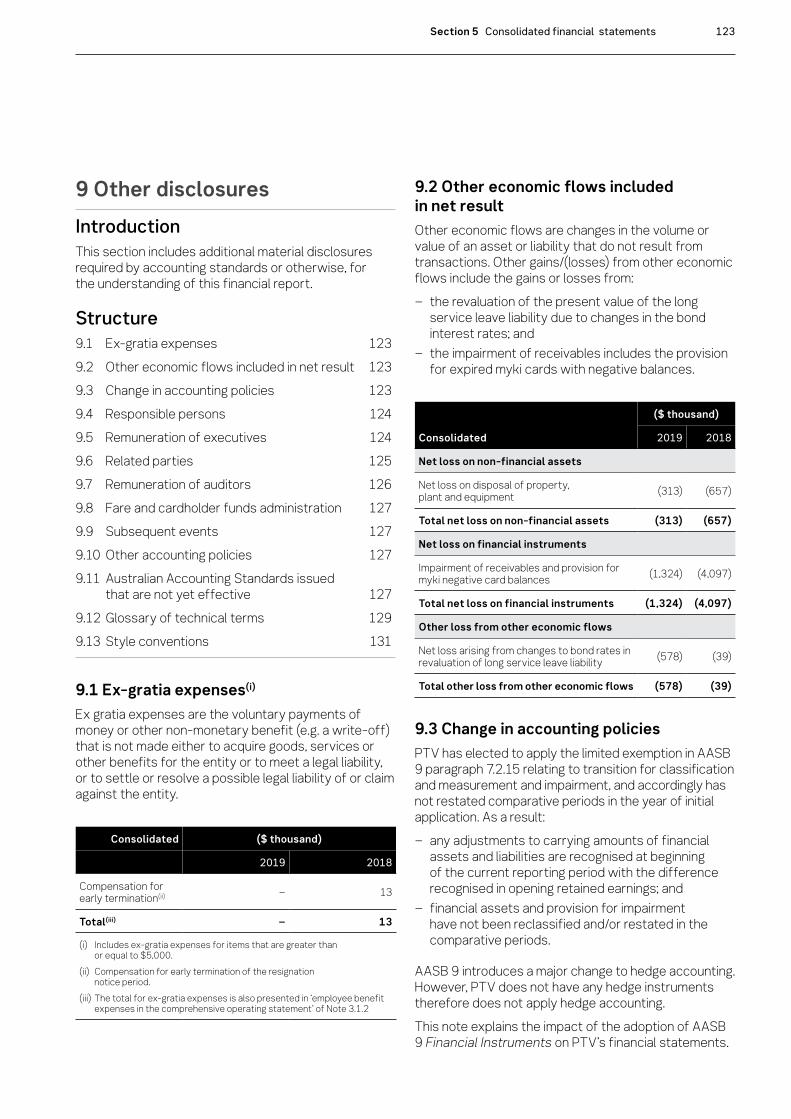
Section 5 Consolidated financial statements 123
9 Other disclosuresIntroductionThis section includes additional material disclosures required by accounting standards or otherwise, for the understanding of this financial report.
Structure9.1 Ex-gratia expenses 1239.2 Other economic flows included in net result 1239.3 Change in accounting policies 1239.4 Responsible persons 1249.5 Remuneration of executives 1249.6 Related parties 1259.7 Remuneration of auditors 1269.8 Fare and cardholder funds administration 1279.9 Subsequent events 1279.10 Other accounting policies 1279.11 Australian Accounting Standards issued
that are not yet effective 1279.12 Glossary of technical terms 1299.13 Style conventions 131
9.1 Ex-gratia expenses(i)
Ex gratia expenses are the voluntary payments of money or other non-monetary benefit (e.g. a write-off) that is not made either to acquire goods, services or other benefits for the entity or to meet a legal liability, or to settle or resolve a possible legal liability of or claim against the entity.
Consolidated ($ thousand)
2019 2018
Compensation for early termination(ii) – 13
Total(iii) – 13
(i) Includes ex-gratia expenses for items that are greater than or equal to $5,000.
(ii) Compensation for early termination of the resignation notice period.
(iii) The total for ex-gratia expenses is also presented in ‘employee benefit expenses in the comprehensive operating statement’ of Note 3.1.2
9.2 Other economic flows included in net resultOther economic flows are changes in the volume or value of an asset or liability that do not result from transactions. Other gains/(losses) from other economic flows include the gains or losses from:
– the revaluation of the present value of the long service leave liability due to changes in the bond interest rates; and
– the impairment of receivables includes the provision for expired myki cards with negative balances.
Consolidated
($ thousand)
2019 2018
Net loss on non-financial assets
Net loss on disposal of property, plant and equipment (313) (657)
Total net loss on non-financial assets (313) (657)
Net loss on financial instruments
Impairment of receivables and provision for myki negative card balances (1,324) (4,097)
Total net loss on financial instruments (1,324) (4,097)
Other loss from other economic flows
Net loss arising from changes to bond rates in revaluation of long service leave liability (578) (39)
Total other loss from other economic flows (578) (39)
9.3 Change in accounting policiesPTV has elected to apply the limited exemption in AASB 9 paragraph 7.2.15 relating to transition for classification and measurement and impairment, and accordingly has not restated comparative periods in the year of initial application. As a result:
– any adjustments to carrying amounts of financial assets and liabilities are recognised at beginning of the current reporting period with the difference recognised in opening retained earnings; and
– financial assets and provision for impairment have not been reclassified and/or restated in the comparative periods.
AASB 9 introduces a major change to hedge accounting. However, PTV does not have any hedge instruments therefore does not apply hedge accounting.This note explains the impact of the adoption of AASB 9 Financial Instruments on PTV’s financial statements.
124 Public Transport Victoria Annual Report 2018–19
9.3.1 Changes to classification and measurementOn initial application of AASB 9 on 1 July 2018, PTV’s management has assessed for all financial assets and liabilities. The accounting remains largely the same as it was under AASB 139.
9.3.2 Changes to the impairment of financial assetsFor contractual receivables, PTV applies the AASB 9 simplified approach to measure expected credit losses based on the change in the ECLs over the life of the asset. Refer to note 8.1.3 for application of the lifetime ECL allowance calculation.
9.4 Responsible persons In accordance with the Ministerial Directions issued by the Assistant Treasurer under the Financial Management Act 1994, the following disclosures are made regarding responsible persons for the reporting period.
NamesThe persons who held the positions of Ministers, Director of the Board and Accountable Officer in PTV are as follows:
Responsible Minister:Hon. Jacinta Allan MP, Minister for Public Transport (1 July 2018 to 28 November 2018)Hon. Melissa Horne MP, Minister for Public Transport (29 November 2018 to 30 June 2019)
Accountable Officer:The Transport Integration Amendment Act 2017 (Head, Transport for Victoria and Other Governance Reforms), which commenced in April 2017, amended the statutory charter of PTV. This included establishing the Chief Executive Officer of PTV as the Responsible Body and the Accountable Officer.Mr Jeroen Weimar – Chief Executive Officer (1 July 2018 to 30 June 2019)
RemunerationThe compensation detailed below excludes the salaries and benefits the Portfolio Minister receives. The Minister’s remuneration and allowances is set by the Parliamentary Salaries and Superannuation Act 1968 and is reported within the Department of Parliamentary Services’ Financial Report.Remuneration received or receivable by the responsible persons in connection with the management of PTV during the reporting period was in the range: $480,000 – $489,000 ($430,000 – $439,000 in 2017–18).
9.5 Remuneration of executives9.5.1 Remuneration of executivesThe number of executive officers, other than the Minister and accountable officers, and their total remuneration during the reporting period are shown in the table below. Total annualised employee equivalents provide a measure of full time equivalent executive officers over the reporting period.Remuneration comprises employee benefits (as defined in AASB 119 Employee Benefits) in all forms of consideration paid, payable or provided by the entity, or on behalf of the entity, in exchange for services rendered. Accordingly, remuneration is determined on an accrual basis, and is disclosed in the following categories. Short-term employee benefits include amounts such as wages, salaries, annual leave or sick leave that are usually paid or payable on a regular basis, as well as non-monetary benefits such as allowances and free or subsidised goods or services.Post-employment benefits include pensions and other retirement benefits paid or payable on a discrete basis when employment has ceased. Other long-term benefits include long service leave, other long service benefits or deferred compensation. Termination benefits include termination of employment payments, such as severance packages.

Section 5 Consolidated financial statements 125
Consolidated ($ thousand)
Remuneration of executive officers (including Key Management Personnel disclosed in (Note 9.5)) 2019 2018
Short-term employee benefits 8,568 7,762
Post-employment benefits 757 695
Other long-term benefits 191 176
Termination benefits 321 813
Total remuneration(i) (ii) 9,837 9,446
Total number of executives 45 48
Total annualised employee equivalents(iii) 36.23 35.15
(i) The total number of executive officers includes persons who meet the definition of Key Management Personnel (KMP) of the entity under AASB 124 Related Party Disclosures and are also reported within the related parties note disclosure (see Note 9.6).
(ii) The total remuneration of executive officers includes the remuneration of executive officers acting in the position of the accountable officer during the reporting period.
(iii) Annualised employee equivalent is based on the time fraction worked over the reporting period.
9.6 Related parties PTV is a wholly owned and controlled entity of the State of Victoria. Related parties of PTV include:
– all key management personnel and their close family members and personal business interests (controlled entities, joint ventures and entities they have significant influence over);
– all Cabinet Ministers and their close family members; and
– all departments and public sector entities that are controlled and consolidated into the whole of state consolidated financial statements.
All related party transactions have been entered into on an arm’s length basis.
Significant transactions with government- related entities During 2018–19 financial year, PTV had the following material transactions with other government-related entities with value greater than $1 million (excl. GST):
– DEDJTR/DoT: PTV received operating grants of $5 billion and capital grants of $308 million and received $1.9 million for miscellaneous invoices. PTV also has a grant receivable of $510 million from DoT. PTV paid $1.2 million to DoT for the provision of financial and administrative services based on a service
level agreement. PTV transferred $2.5 million bus infrastructure assets via contributed capital.
– VicTrack: PTV transferred $419 million of assets to VicTrack, provided grants for capital asset charge of $2.1 billion, provided grants to cover leased rolling stock repayment of $235.6 million and provided grants to cover various construction works related to rail improvements of $3.5 million. PTV also used the myki system which is owned by VicTrack therefore PTV received a service provided free of charge of $61 million and PTV has a service provided free of charge to VicTrack of $26 million for the maintenance of the myki system.
– V/Line: PTV made franchise payments of $560 million to V/Line and received payments of $3.2 million from V/line.
– Department of Health and Human Services (DHHS): PTV received $168 million from DHHS relating to fare concession for aged pensioners and health card holders of which $14 million is still a receivable.
– Department of Environment, Land, Water and Planning (DELWP): PTV received $29.4 million from DELWP for growth area infrastructure projects.
– Major Transport and Infrastructure Authority (MTIA): PTV has a receivable of $21 million from MTIA for train drivers’ training.
– Department of Education and Training (DET): PTV received $13.7 million from DET relating to fare concession for students, of which $1.1 million is still a receivable.
– Victorian Managed Insurance Authority (VMIA – an agency of DTF): PTV paid VMIA $11 million in rail insurance premium and $1.2 million for myki asset insurance premium.
– Treasury Corporation of Victoria: PTV withdrew $10 million term deposit from TCV.
– CenITex (an agency of DTF): PTV paid CenITex $5 million for workplace and application hosting IT services.
Key Management Personnel (KMP):Portfolio Minister, the Hon. Jacinta Allan MP (1 July 2018 – 28 November 2018), the Hon. Melissa Horne MP, Minister for Public Transport (29 November 2018 to 30 June 2019), the Chief Executive Officer, Mr Jeroen Weimar, members of the Senior Executive Board, and some other members from the Senior Executive Leadership Team.

126 Public Transport Victoria Annual Report 2018–19
Members of the Senior Executive Board: – Executive Director Corporate Services
Mr Dean Tillotson – Executive Director Network Service Delivery
(shared responsibility) Ms Laura Lo Bianco-Smith, and Mr Dean Purkis
– Executive Director Franchise Operator Management Mr Alan Fedda
– Executive Director Customer Services Ms Fiona Adamson (1 July 2019 – 12 October 2018), Ms Kate Matson (acting, 13 October 2018 – 26 May 2019), and Ms Susan Kelso (27 May 2019 – 30 June 2019)
– Executive Director Network Integrity and Project Assurance Mr Michael Chadwick (1 July 2018 – 18 April 2019), and Mr Gary Lampard (acting, 19 April 2019 – 30 June 2019)
– Director, Office of the Chief Executive Ms Marika Harvey (1 July 2018 – 28 April 2019), and Mr Daniel Zugna (acting, 29 April 2019 – 30 June 2019)
Other members from the senior executive leadership team:
– Chief Financial Officer Mr Fred Cilia
– Director, Governance and Legal Mr Edward Byrden (1 July 2018 – 31 August 2018), and Mr George Karaisaridis (acting, 1 September 2018 – 30 June 2019)
Remuneration of key management personnelThe compensation detailed below excludes the salaries and benefits of the Portfolio Minister. The Minister’s remuneration and allowances is set by the Parliamentary Salaries and Superannuation Act 1968 and is reported within the Department of Parliamentary Services’ Financial Report.
Consolidated ($ thousand)
Compensation of KMPs 2019 2018
Short-term employee benefits 2,797 2,923
Post-employment benefits 197 226
Other long-term benefits 61 67
Termination benefits 7 –
Total(i)(ii)(iii) 3,062 3,216
(i) KMPs are also reported in the disclosure of remuneration of executive officers (see Note 9.5.1).
(ii) The temporary higher duties expenses of non-KMP have not been included in the remuneration disclosure, as remuneration of the substantive KMP has already been reported.
(iii) Where an employee is acting in a KMP position that is vacant, remuneration for the acting period has been disclosed.
Transactions and balances with key management personnel and other related partiesThe chief executive officer of PTV, Jeroen Weimar was also the chair of the V/Line Corporation from 1 July 2018 to 30 June 2019.Given the breadth and depth of State government activities, related parties transact with the Victorian public sector in a manner consistent with other members of the public e.g. stamp duty and other government fees and charges. Further employment of processes within the Victorian public sector occur on terms and conditions consistent with the Public Administration Act 2004 and Codes of Conduct and Standards issued by the Victorian Public Sector Commission. Procurement processes occur on terms and conditions consistent with the Victorian Government Procurement Board requirements. Outside of normal citizen type transactions with PTV, there were no related party transactions that involved key management personnel, their close family members and their personal business interests. No provision has been required, nor any expense recognised, for impairment of receivables from related parties.
9.7 Remuneration of auditors
Consolidated
($ thousand)
2019 2018
Victorian Auditor General’s Office
Audit or review of the financial statements 270 308
Total remuneration of auditors 270 308

Section 5 Consolidated financial statements 127
9.8 Fare and cardholder funds administrationFor the year ended 30 June 2019, the total metropolitan and regional farebox revenue and non-farebox receipts (money received by transport operators derived from the sale of goods or services other than NTS tickets including: locker hire, map sales etc.) was $982,444,244 (2018: $947,998,055) of which $619,972,397 (2018: $633,057,314) was distributed from the myki ticketing system to V/Line and franchisees.As at 30 June 2019, the following amounts were held in PTV managed bank accounts:
– for distribution to rail franchisees $ 13,307,719 (2018: $12,707,644)
– myki cardholder funds $ 142,867,783 (2018: $126,671,926)
PTV also receives and manages myki customer money balances which are not included in the PTV balance sheet. These balances come from various channels including ticketing machines, railway stations, retail outlets, the internet and the PTV hubs. PTV performs the accounts receivable function for the ticketing system and administers the agreement with the contractor NTT Data Payment Services Victoria to ensure cash collection services and payments via the banking system are managed effectively.PTV manages the revenue audit function which focuses on reviewing and reporting on controls around farebox revenue collection and distribution processes within transport operators. Formal planned revenue audits are undertaken by PTV at metropolitan and V/Line train stations, as well as metropolitan and regional bus depots.
9.9 Subsequent events On 1 July 2019, the Public Transport Development Authority, operating as Public Transport Victoria (PTV) and VicRoads came together as part of a new integrated Department of Transport (DoT). The new department will deliver an integrated, user-focussed approach to tackling transport opportunities. Many of the functions of PTV and related agreements have been transferred to the Head, Transport for Victoria (TfV) within DoT with effect from 1 July 2019. The transfer was effected by an Order in Council made under section 66B of the Transport Integration Act 2010 and published in the Victorian Government Gazette on 26 June 2019. The PTV employees transferred to DoT on 1 July 2019. This transfer was effected by an Instrument by the Secretary, Department of Transport, made under section 66N of the Transport Integration Act 2010.
Although the bus services contracts remain with PTV, effective control of all PTV functions has been transferred to DoT and TfV. It is therefore expected that all transactions, assets and liabilities will be reported by DoT from 1 July 2019. It is also expected that a section 53 application under the Financial Management Act 1994 will be lodged to request an exemption from the requirement for PTV to lodge a separate Annual Report after 1 July 2019, and therefore the PTV Annual Report at 30 June 2019 is expected to be the last PTV Annual Report.
9.10 Other accounting policiesContributions by ownersConsistent with the requirements of AASB 1004 Contributions, contributions by owners (that is, contributed capital and its repayment) are treated as equity transactions and, therefore, do not form part of the income and expenses of PTV.Additions to net assets that have been designated as contributions by owners are recognised as contributed capital. Other transfers that are in the nature of contributions to or distributions by owners have also been designated as contributions by owners.Transfers of net assets arising from administrative restructurings are treated as distributions to or contributions by owners. Transfers of net liabilities arising from administrative restructurings are treated as distributions to owners.
9.11 Australian Accounting Standards issued that are not yet effectiveThe following AASs become effective for reporting periods commencing after 1 July 2019:
– AASB 1059 Service Concession Arrangements: Grantor;
– AASB 16 Leases; – AASB 15 Revenue from Contract with
Customers; and – AASB 1058 Income of Not-for-Profit Entities.
Service concession arrangementsPrior to the issuance of AASB 1059, there was no definitive accounting guidance in Australia for service concession arrangements, which include a number of Public Private Partnership (PPP) arrangements. The AASB issued the new standard to address the lack of specific accounting guidance and based the content thereof broadly on its international equivalent: International Public Sector Accounting Standard 32: Service Concession Arrangements: Grantor.

128 Public Transport Victoria Annual Report 2018–19
For arrangements within the scope of AASB 1059, the public sector grantor will be required to record the asset(s) used in the service concession arrangement at current replacement cost in accordance with cost approach to Fair Value under AASB 13: Fair Value Measurement (AASB 13), with a related liability, which could be a financial liability, an accrued revenue liability (referred to as the “Grant Of A Right To The Operator” or GORTO liability) or a combination of both. The AASB recently announced a one-year deferral on the new accounting requirements for public sector grantors in service concession arrangements. As a result, AASB 1059 will apply to annual periods beginning on or after 1 January 2020, rather than 1 January 2019. However, PTV intends to early adopt AASB 1059 in line with the original adoption date of 1 January 2019, i.e. the 2019–20 financial year. PTV will apply the standard using a full retrospective approach to prior reporting periods from 1 July 2018 (“transition date”). As a result, all comparative information in the 30 June 2020 financial statements will be prepared as if AASB 1059 had always been in effect with a cumulative adjustment between the recognition of service concession assets and financial recognised in accumulated surplus as at 1 July 2018.The impact assessment at PTV is not yet finalised.
LeasesAASB 16 Leases replaces AASB 117 Leases, AASB Interpretation 4 Determining whether an Arrangement contains a Lease, AASB Interpretation 115 Operating Leases-Incentives and AASB Interpretation 127 Evaluating the Substance of Transactions Involving the Legal Form of a Lease. AASB 16 sets out the principles for the recognition, measurement, presentation and disclosure of leases and requires lessees to account for all leases on the balance sheet by recording a Right-Of-Use (RoU) asset and a lease liability except for leases that are shorter than 12 months and leases where the underlying asset is of low value (deemed to be below $10,000). AASB 16 also requires the lessees to separately recognise the interest expense on the lease liability and the depreciation expense on the right-of-use asset, and remeasure the lease liability upon the occurrence of certain events (e.g. a change in the lease term, a change in future lease payments resulting from a change in an index or rate used to determine those payments). The amount of the remeasurement of the lease liability will generally be recognised as an adjustment to the RoU asset.
Lessor accounting under AASB 16 is substantially unchanged from AASB 117. Lessors will continue to classify all leases using the same classification principle as in AASB 117 and distinguish between two types of leases: operating and finance leases.The effective date is for annual reporting periods beginning on or after 1 January 2019. PTV intends to adopt AASB 16 in 2019–20 financial year when it becomes effective. PTV will apply the standard using a modified retrospective approach with the cumulative effect of initial application recognised as an adjustment to the opening balance of accumulated surplus at 1 July 2019, with no restatement of comparative information.Various practical expedients are available on adoption to account for leases previously classified by a lessee as operating leases under AASB 117. PTV will elect to use the exemptions for all short-term leases (lease term less than 12 months) and low value leases (deemed to be below $10,000). In addition, AASB 2018–8 – Amendments to Australian Accounting Standards – Right-of-Use Assets (RoU) of Not-for-Profit Entities allows a temporary option for not-for-profit entities to not measure RoU assets at initial recognition at fair value in respect of leases that have significantly below-market terms, since further guidance is expected to be developed to assist not-for-profit entities in measuring RoU assets at fair value. The Standard requires an entity that elects to apply the option (i.e. measures a class or classes of such RoU assets at cost rather than fair value) to include additional disclosures. PTV intends to choose the temporary relief to value the RoU asset at the present value of the payments required (at cost).The impact assessment at PTV is not yet finalised.
Revenue and IncomeAASB 15 supersedes AASB 118 Revenue, AASB 111 Construction Contracts and related Interpretations and it applies, with limited exceptions, to all revenue arising from contracts with its customers. AASB 15 establishes a five-step model to account for revenue arising from an enforceable contract that imposes a sufficiently specific performance obligation on an entity to transfer goods or services. AASB 15 requires entities to only recognise revenue upon the fulfilment of the performance obligation. Therefore, entities need to allocate the transaction price to each performance obligation in a contract and recognise the revenue only when the related obligation is satisfied.

Section 5 Consolidated financial statements 129
To address specific concerns from the ‘not-for-profit’ sector in Australia, the AASB also released the following standards and guidance:
– AASB 2016–8 Amendments to Australian Accounting Standards – Australian implementation guidance for NFP entities (AASB 2016–8), to provide guidance on application of revenue recognition principles under AASB 15 in the not-for-profit sector.
– AASB 2018–4 Amendments to Australian Accounting Standards – Australian Implementation Guidance for Not-for-Profit Public-Sector Licensors (2018–4), to provide guidance on how to distinguish payments received in connection with the access to an asset (or other resource) or to enable other parties to perform activities as tax and non-IP licence. It also provides guidance on timing of revenue recognition for non-IP licence payments.
– AASB 1058 Income of Not-for-Profit Entities, to supplement AASB 15 and provide criteria to be applied by not-for-profit entities in establishing the timing of recognising income for government grants and other types of contributions previously contained within AASB 1004 Contributions.
AASB 15, AASB 1058 and the related guidance will come into effect for not-for-profit entities for annual reporting periods beginning on or after 1 January 2019. PTV intends to adopt these standards in 2019–20 financial year when it becomes effective. PTV will apply the standard using a modified retrospective approach with the cumulative effect of initial application recognised as an adjustment to the opening balance of accumulated surplus at 1 July 2019, with no restatement of comparative information.The impact assessment at PTV is not yet finalised.
9.12 Glossary of technical termsThe following is a summary of the major technical terms used in this report.Administered item generally refers to a public-sector agency lacking the capacity to benefit from that item in the pursuit of the entity’s objectives and to deny or regulate the access of others to that benefit.Amortisation is the expense which results from the consumption, extraction or use over time of a non-produced physical or intangible asset. This expense is classified as an ‘other economic flow’.Borrowings refers to interest bearing liabilities mainly from public borrowings raised through the Treasury Corporation of Victoria, finance leases and other interest bearing arrangements. Borrowings also include non-interest bearing advances from government that are acquired for policy purposes.
Commitments includes those operating, capital and other outsourcing commitments arising from non-cancellable contractual or statutory sources.Comprehensive result is the amount included in the operating statement representing total change in net worth other than transactions with owners as owners.Capital Asset Charge is levied on the written down value of controlled non current physical assets in a public sector agency’s balance sheet which aims to: attribute to agency outputs the opportunity cost of capital used in service delivery; and provide incentives to agency to identify and dispose of underutilised or surplus assets in a timely manner. Commitments include those operating, capital and other outsourcing commitments arising from non-cancellable contractual or statutory sources.Controlled item generally refers to the capacity of a public sector agency to benefit from that item in the pursuit of the entity’s objectives and to deny or regulate the access of others to that benefit.Current grants are amounts payable or receivable for current purposes for which no economic benefits of equal value are receivable or payable in return.Depreciation is an expense that arises from the consumption through wear or time of a produced physical or intangible asset. This expense is classified as a ‘transaction’ and so reduces the ‘net result from transaction’.Employee benefits expenses include all costs related to employment including wages and salaries, leave entitlements, redundancy payments and superannuation contributions.Ex gratia expenses mean the voluntary payment of money or other non-monetary benefit (e.g. a write-off) that is not made either to acquire goods, services or other benefits for the entity or to meet a legal liability, or to settle or resolve a possible legal liability or claim against the entity.Financial asset is any asset that is:(a) cash;(b) an equity instrument of another entity;(c) a contractual right:
– to receive cash or another financial asset from another entity; or
– to exchange financial assets or financial liabilities with another entity under conditions that are potentially favourable to the entity; or

130 Public Transport Victoria Annual Report 2018–19
(d) a contract that will or may be settled in the entity’s own equity instruments and is:
– a non-derivative for which the entity is or may be obliged to receive a variable number of the entity’s own equity instruments; or
– a derivative that will or may be settled other than by the exchange of a fixed amount of cash or another financial asset for a fixed number of the entity’s own equity instruments.
Financial instrument is any contract that gives rise to a financial asset of one entity and a financial liability or equity instrument of another entity. Financial liability is any liability that is:(a) a contractual obligation:
– to deliver cash or another financial asset to another entity; or
– to exchange financial assets or financial liabilities with another entity under conditions that are potentially unfavourable to the entity; or
(b) a contract that will or may be settled in the entity’s own equity instruments and is:
– a non-derivative for which the entity is or may be obliged to deliver a variable number of the entity’s own equity instruments; or
– a derivative that will or may be settled other than by the exchange of a fixed amount of cash or another financial asset for a fixed number of the entity’s own equity instruments. For this purpose the entity’s own equity instruments do not include instruments that are themselves contracts for the future receipt or delivery of the entity’s own equity instruments.
Financial statements in the report comprises:(a) a balance sheet as at the end of the period;(b) a comprehensive operating statement for
the period;(c) a statement of changes in equity for the period;(d) a cash flow statement for the period;(e) notes, comprising a summary of significant
accounting policies and other explanatory information;
(f) comparative information in respect of the preceding period as specified in paragraphs 38 of AASB 101 Presentation of Financial Statements; and
(g) a statement of financial position as at the beginning of the preceding period when an entity applies an accounting policy retrospectively or makes a retrospective restatement of items in its financial statements, or when it reclassifies items in its financial statements in accordance with paragraphs 41 of AASB 101.
Grant expenses and other transfers are transactions in which one unit provides goods, services, assets (or extinguishes a liability) or labour to another unit without receiving approximately equal value in return. Grants can either be operating or capital in nature. While grants to governments may result in the provision of some goods or services to the transferor, they do not give the transferor a claim to receive directly benefits of approximately equal value. For this reason, grants are referred to by AASB as involuntary transfers and are termed non-reciprocal transfers. Receipt and sacrifice of approximately equal value may occur, but only by coincidence. For example, governments are not obliged to provide commensurate benefits in the form of goods or services, to particular taxpayer in return for their taxes. Grants can be paid as general purpose grants, which refer to grants that are not subject to conditions regarding their use. Alternatively, they may be paid as specific purpose grants, which are paid for a particular purpose and/or have conditions attached regarding their use.Grants for on-passing are grants paid to one institutional sector (e.g. a State general government entity) to be passed on to another institutional sector (e.g. local government or a private non-profit institution).Interest expense represents costs incurred in connection with borrowings. It includes interest on advances, loans, overdrafts, bonds and bills, deposits, interest components of finance lease repayments, and amortisation of discounts or premiums in relation to borrowings.Interest income includes unwinding over time of discounts on financial assets and interest received on bank term deposits and other investments.Leases are rights to use an asset for an agreed period of time in exchange for payment. Leases are classified at their inception as either operating or finance leases based on the economic substance of the agreement so as to reflect the risks and rewards incidental to ownership. Leases of infrastructure, property, plant and equipment are classified as finance leases whenever the terms of the lease transfer substantially all the risks and rewards of ownership from the lessor to the lessee. All other leases are classified as operating leases.

Section 5 Consolidated financial statements 131
Net acquisition of non-financial assets (from transactions) are purchases (and other acquisitions) of non-financial assets less sales (or disposals) of non-financial assets less depreciation plus changes in inventories and other movements in non-financial assets. It includes only those increases or decreases in non-financial assets resulting from transactions and therefore excludes write-offs, impairment write-downs and revaluations.Net result is a measure of financial performance of the operations for the period. It is the net result of items of revenue, gains and expenses (including losses) recognised for the period, excluding those that are classified as ‘other non-owner movements in equity’.Net worth is calculated as assets less liabilities, which is an economic measure of wealth.Non-financial assets are all assets that are not financial assets. It includes inventories, land, buildings, infrastructure, plant and equipment, cultural and heritage assets and intangibles.Operating result is a measure of financial performance of the operations for the period. It is the net result of items of revenue, gains and expenses (including losses) recognised for the period, excluding those that are classified as ‘other non-owner movement in equity’. Refer also ‘net result’.Other economic flows included in net result are changes in the volume or value of an asset or liability that do not result from transactions. In simple terms, other economic flows are changes arising from market remeasurements. They include gains and losses from disposals, revaluations and impairments of non-current physical and intangible assets; fair value changes of financial instruments and agricultural assets; and depletion of natural assets (non-produced) from their use or removal.Payables includes short and long-term trade debt and accounts payable, grants, taxes and interest payable.Receivables includes amounts owing from government through appropriation receivable, short and long-term trade credit and accounts receivable, accrued investment income, grants, taxes and interest receivable.Sales of goods and services refers to income from the direct provision of goods and services and includes fees and charges for services rendered, sales of goods and services, fees from regulatory services, work done as an agent for private enterprises. It also includes rental income under operating leases and on produced assets such as buildings and entertainment, but excludes rent income from the use of non-produced assets such as land. User charges includes sale of goods and services income.
Supplies and services generally represent cost of goods sold and the day-to-day running costs, including maintenance costs, incurred in the normal operations of PTV. Transactions are those economic flows that are considered to arise as a result of policy decisions, usually an interaction between two entities by mutual agreement. They also include flows into an entity such as depreciation, where the owner is simultaneously acting as the owner of the depreciating asset and as the consumer of the service provided by the asset. Taxation is regarded as mutually agreed interactions between the government and taxpayers. Transactions can be in kind (e.g. assets provided/given free of charge or for nominal consideration) or where the final consideration is cash. In simple terms, transactions arise from the policy decisions of the Government.
9.13 Style conventionsFigures in the tables and in the text have been rounded. Discrepancies in tables between totals and sums of components reflect rounding. Percentage variations in all tables are based on the underlying unrounded amounts.The notions used in the tables is as follows:– zero, or rounded to zero(xxx.x) negative numbers200x year200x 0x year period
The financial statements and notes are presented based on the illustration for a government department in the 2018–19 Model Report for Victorian Government Departments. The presentation of other disclosures is generally consistent with the other disclosures made in earlier publication of PTV’s annual report.

132 Public Transport Victoria Annual Report 2018–19
Disclosure indexThe PTV Annual Report is prepared in accordance with all relevant Victorian legislation and pronouncements. This index has been prepared to help identify PTV’s compliance with statutory disclosure requirements.
Ministerial Directions
Legislation Requirement Page
Ministerial Directions and Financial Reporting Directions
Report of operations
Charter and purpose
FRD 22H Manner of establishment and the relevant Ministers 12
FRD 22H Purpose, functions, powers and duties 12
FRD 8D Departmental objectives, indicators and outputs 14–34
FRD 22H Key initiatives and projects 14–34
FRD 22H Nature and range of services provided 12
Management and structure
FRD 22H Organisational structure 40–41
Financial and other information
FRD 8D Performance against output performance measures 14–34
FRD 8D Budget portfolio outcomes 14–34
FRD 10A Disclosure index 132–133
FRD 12B Disclosure of major contracts 58
FRD 22H Employment and conduct principles 48
FRD 22H Occupational health and safety policy 42–45
FRD 22H Summary of the financial results for the year 35–36
FRD 22H Significant changes in financial position during the year 35–36
FRD 22H Major changes or factors affecting performance 35–36
FRD 22H Subsequent events 127
FRD 22H Application and operation of Freedom of Information Act 1982 59–60
FRD 22H Compliance with building and maintenance provisions of Building Act 1993 61
FRD 22H Statement on National Competition Policy 61
FRD 22H Application and operation of the Protected Disclosure Act 2012 58–59
FRD 22H Details of consultancies over $10,000 58
FRD 22H Details of consultancies under $10,000 58
FRD 22H Disclosure of government advertising expenditure 56–57
FRD 22H Disclosure of ICT expenditure 58
FRD 22H Statement of availability of other information 65
FRD 24C Reporting of office based environmental impacts 61–65
Appendix
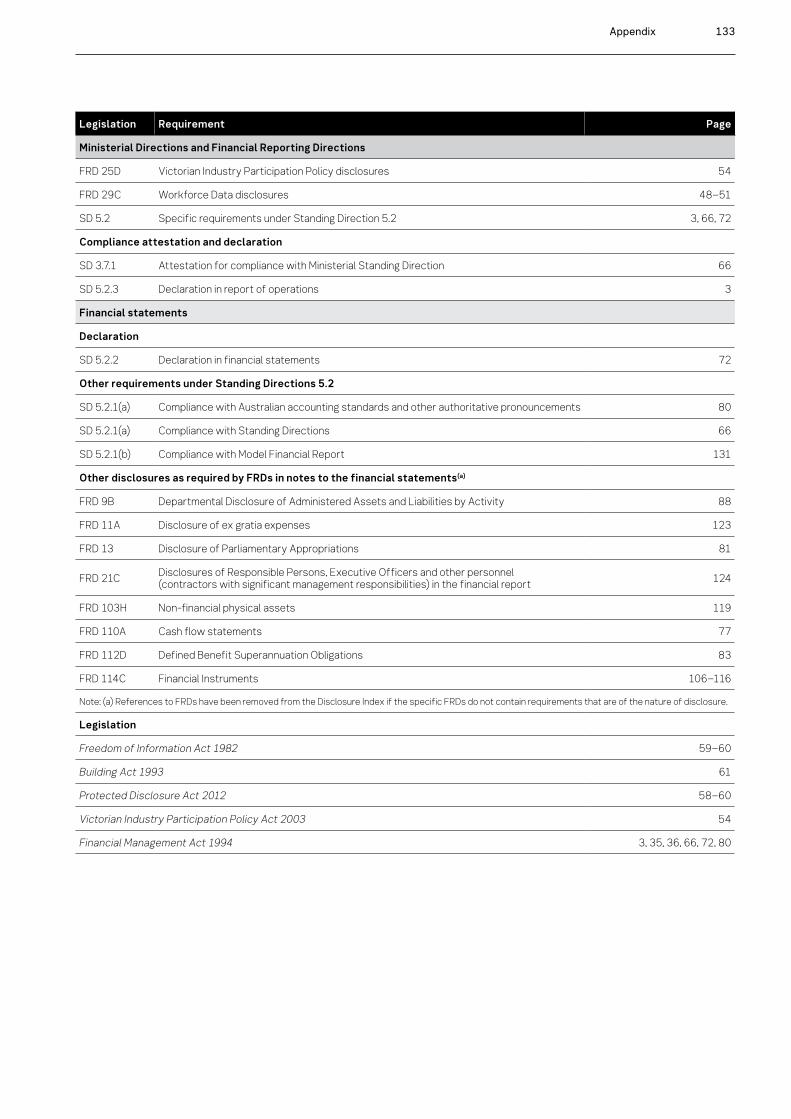
Appendix 133
Legislation Requirement Page
Ministerial Directions and Financial Reporting Directions
FRD 25D Victorian Industry Participation Policy disclosures 54
FRD 29C Workforce Data disclosures 48–51
SD 5.2 Specific requirements under Standing Direction 5.2 3, 66, 72
Compliance attestation and declaration
SD 3.7.1 Attestation for compliance with Ministerial Standing Direction 66
SD 5.2.3 Declaration in report of operations 3
Financial statements
Declaration
SD 5.2.2 Declaration in financial statements 72
Other requirements under Standing Directions 5.2
SD 5.2.1(a) Compliance with Australian accounting standards and other authoritative pronouncements 80
SD 5.2.1(a) Compliance with Standing Directions 66
SD 5.2.1(b) Compliance with Model Financial Report 131
Other disclosures as required by FRDs in notes to the financial statements(a)
FRD 9B Departmental Disclosure of Administered Assets and Liabilities by Activity 88
FRD 11A Disclosure of ex gratia expenses 123
FRD 13 Disclosure of Parliamentary Appropriations 81
FRD 21C Disclosures of Responsible Persons, Executive Officers and other personnel (contractors with significant management responsibilities) in the financial report 124
FRD 103H Non-financial physical assets 119
FRD 110A Cash flow statements 77
FRD 112D Defined Benefit Superannuation Obligations 83
FRD 114C Financial Instruments 106–116
Note: (a) References to FRDs have been removed from the Disclosure Index if the specific FRDs do not contain requirements that are of the nature of disclosure.
Legislation
Freedom of Information Act 1982 59–60
Building Act 1993 61
Protected Disclosure Act 2012 58–60
Victorian Industry Participation Policy Act 2003 54
Financial Management Act 1994 3, 35, 36, 66, 72, 80


Public Transport Victoria 750 Collins Street Docklands Victoria 3008 AustraliaOnline: ptv.vic.gov.auTelephone: 1800 800 007International: +61 3 9662 2505Postal address: PO Box 4724 Melbourne Victoria 3001
Contact

For other languages visit ptv.vic.gov.au/languages or call 9321 5450.
For more information visit ptv.vic.gov.au or call 1800 800 007.If you are deaf, or have a hearing or speech impairment, you can contact us directly or through the National Relay Service and request to call 1800 800 007.
PTVH4043/19. Authorised by the Victorian Government, 1 Spring Street, Melbourne.