cohuna - parliament of victoria
TRANSCRIPT

n o r t h
16,0008,0000 32,000
metres
scale – 1:650,000
campaspe
coliban
goulburn
groundwater
sewer
water
non potable water (untreated)
recycled water
loddon
murray
wimmera
legendwater supply systems
lake eppalock
murray river
cam
pasp
e ri
ver
lod
do
n r
iver
avoca river
malmsburylauriston
upper coliban
Mitiamo
Dingee
Cohuna
Macorna
Pyramid Hill
Lockington
Rochester
Boort
Mysia
Borung
Korong Vale
Wedderburn
Wychitella
Jarklin
Serpentine
InglewoodBridgewater
Bealiba
Dunolly
Tarnagulla
Laanecoorie
Maldon Harcourt
Campbells Creek
Newstead
CastlemaineChewton
Tylden
Trentham
Heathcote
Guildford
FryerstownElphinstone
Taradale
Malmsbury
Kyneton
Tooborac
Goornong
Elmore
Echuca
Gunbower
Leitchville
Raywood
Sebastian
Marong
Bendigo
Axedale
Disclaimer: This illustration is provided as a guide only.Coliban Water reserves the right to alter information at any time. © v5 210914 Coliban Water.
ll
r
vi
restehcoR
hCh t
adraT
s
aineemtlsaC
eotathcHe
onnetyK
COLIBAN WATER | ANNUAL REPORT | 2014–15 PAGE | 1
A B O U T T H I S R E P O RT
C O N T E N T S
Coliban Water Service Region Diagram inside cover
Introduction 2
Chairman And Managing Director’s Message 3
Our Strategic Direction 4
Customers And Community Engagement 6
Water Security 9
Capital Projects 16
Water Quality and Reliability 17
Wastewater System 22
People and Development 25
Environmental Sustainability 27
Social Sustainability 30
Governance and Risk 31
Statutory Performance 35
Performance Report 39
Director’s Certification 39
Independent Auditor’s Report 43
Disclosure Index 45
Financial Performance Summary 47
Financial Overview 48
Understanding the Financial Statements 49
Financial Statements 51
Independent Auditor’s Report 87
V I S I O N Water to live, grow and enjoy.
P U R P O S EWe deliver water services for community needs now and into thefuture.
O U R P R O F I L EColiban Region Water Authority was established on 1 July 1992under the Water Act 1989 as a Regional Urban Water Authority.The Authority became the Coliban Region Water Corporation on 1 July 2007 and operates as Coliban Water. Our shareholder isthe Victorian Government. Our responsible Minister for theperiod of 1 July 2014 until 3 December 2014 was The Hon. PeterWalsh MLA, Minister for Water. For the period 4 December 2014until 30 July 2015 it was The Hon. Lisa Neville MP, Minister forEnvironment, Climate Change and Water.
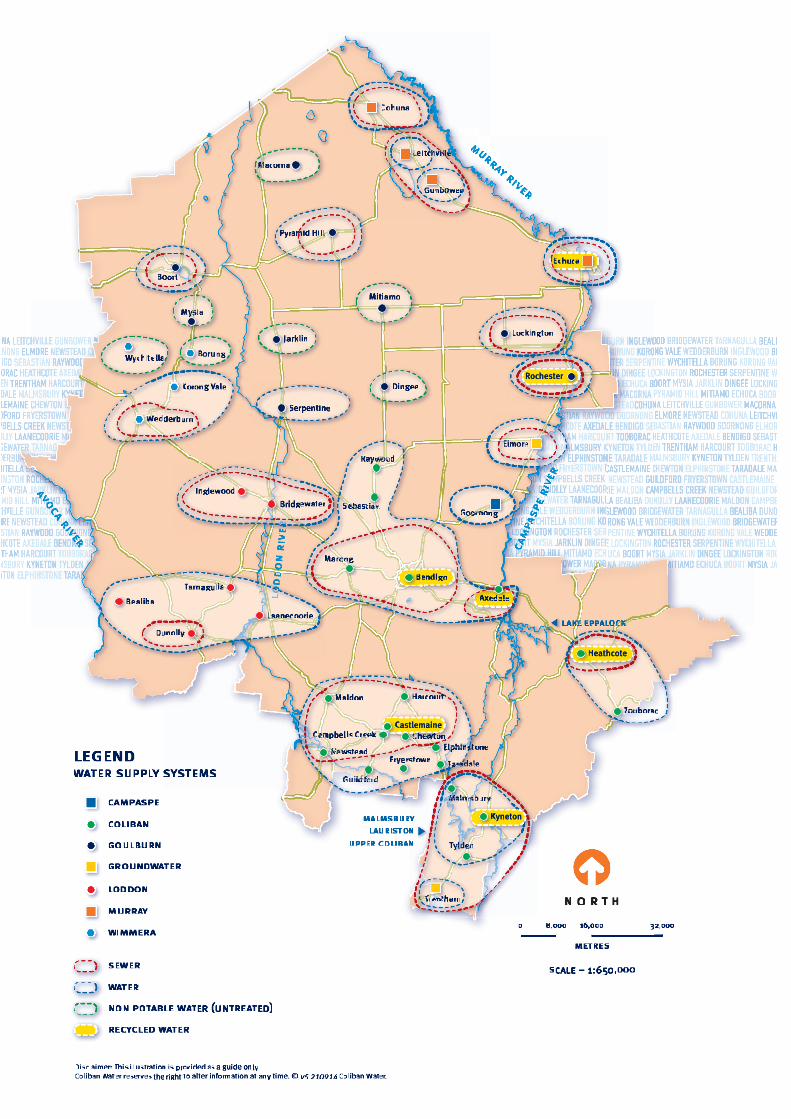
We provide water and wastewater services to a region with apopulation of approximately 146,000 people, across 16,500square kilometres of Central and Northern Victoria. Our servicearea covers 49 towns in nine separate supply systems,extending from Cohuna and Echuca in the north to Kyneton andTrentham in the south; and from Boort, Wedderburn, Bealibaand Dunolly in the west to Heathcote and Tooborac in the east.
© State of Victoria, Coliban Region Water Corporation 2015.This publication is copyright. No part may be reproduced by anyprocess except in accordance with the provisions of theCopyright Act 1968.
T H I S A N N UA L R E P O RT D E S C R I B E S T H E P R O G R A M S , I N I T I AT I V E S A N D AC T I O N S W E U N D E RTO O K B E T W E E N 1 J U LY2 0 1 4 A N D 3 0 J U N E 2 0 1 5 . I T R E P O RT S O N O U R P R O G R E S S I N I M P L E M E N T I N G O U R 2 0 1 4 – 1 5 C O R P O R AT E P L A N

I N T R O D U C T I O N
COLIBAN WATER | ANNUAL REPORT | 2014–15PAGE | 2
C O N N E CT I O N S
S E RV I C E S
We provide urban water and wastewater services in accordancewith the provisions of Part 8 – Water supply and Part 9 –Sewerage, of the Water Act 1989. Rural customers are suppliedunder Part 4 Division 2 Section 51 of the Act.
Our services include:
> Water harvesting
> Water storage
> Water treatment
> Water distribution
> Urban wastewater collection
> Treatment, re-use and disposal, including trade waste
> Water purchase
> Recycled water
> Rural water supply
A S S E T S N A P S H OT
The assets we manage to deliver our services include:
> 2,174 kilometres of water mains (potable and non-potable)
> 46 kilometres of recycled water infrastructure
> 1,885 kilometres of sewer mains
> 423 kilometres of rural channels
> 67 kilometres of main channels
> 16 water treatment plants + 3 operated by Veolia Water(Bendigo, Castlemaine and Kyneton) as a BOOT(1) partner
> 14 water reclamation plants + 2 operated by ETE Coliban PtyLtd (Echuca and Rochester) as a BOOT(1) partner
> 36 water reservoirs and service basins + 4 operated by VeoliaWater as a BOOT (1) partner
> 1 recycled water factory
> 177 wastewater pump stations
> 63 water pump stations
Some variances to the 2014 Annual Report figures are a result of assetdata verification and reclassification completed during the year.
Connection 30 June 2015 30 June 2014
Residential 65,372 64,195
Non-residential 6,754 6,691
Rural licences 1,355 1,360
Asset valuesNet book value
(000’s)
Land 44,660
Buildings 3,352
Corporate assets 9,520
Water infrastructure 319,111
Water distribution infrastructure 128,863
Sewer infrastructure 382,249
Recycling infrastructure 51,889
Rural infrastructure 23,495
Headworks infrastructure 170,583
BOOT schemes infrastructure (1) 93,969
Works in progress 43,027
total 1,270,718
(1) BOOT – Build Own Operate Transfer.These assets are owned by our BOOT partners

COLIBAN WATER | ANNUAL REPORT | 2014–15 PAGE | 3
C H A I R M A N A N D M A N AG I N G D I R E C TO R ’ S M E S S AG E
On behalf of Coliban Water, we are pleased to present our2014/15 Annual Report detailing our business performance forthe reporting year, and this report contains our audited financialstatements, statutory disclosures and other information.
Coliban Water is committed to providing essential water andsewerage services to meet the current and future needs of ourcustomers. Strategically, we see our role as providing support forsocial, environmental and economic development of thecommunities we serve and in which we operate. As such, it isimportant that Coliban Water has the capacity and the capabilityto collaboratively and meaningfully participate in the futuregrowth and sustainability of our region.
This year, Coliban Water further strengthened its financialcapacity, performance and position, building on the steppedimprovement achieved and reported for the previous 2013/14year. Last year, we foreshadowed an anticipated improvement inour financial sustainability risk rating as independentlydetermined by the Victorian Auditor-General’s Office (VAGO). InFebruary 2015, VAGO reported to the Victorian Parliament thatour rating had changed from a long-standing high risk or ‘redlight’ status to a low risk, ‘green light’ status. Further to this, wedelivered at the end of this reporting year a net operating resultbefore tax of $5.786 million, which is the first time since 2002that Coliban Water has achieved an operating surplus.
The significantly improved risk rating and positive operatingresult were financial and capability goals we set ourselves toachieve within the 2013–18 regulatory period for water prices,and so delivering these outcomes inside the first two years ofthis five year regulatory period is noteworthy. Our third and finalfinancial goal is to peak our debt levels within the regulatoryperiod. We anticipate achieving this in 2016, at which point wecan commence our long term plan of repaying the debt we haveaccumulated through loans raised over the last decade that wereneeded over that period to fund critical infrastructure and waterentitlement purchases and to finance the delivery of ouressential services.
Coliban Water recognises that we have a role to play inimproving the capacity, capability and social fabric of our region.Achieving financial sustainability and resilience is an importantstep in enabling us to contribute to the growth of our region andtake advantage of future regional opportunities.
Our water resources were secure throughout the year, althoughseasonal allocation from the Wimmera Mallee system waslimited to 48 per cent of our bulk entitlement volume. Weensured supply to the four towns supplied from this system bysupplementing the volume allocated in the year with unusedbulk water that we had carried over from previous years. Thestorage operator for the Wimmera Mallee system hasforeshadowed very low opening allocations for 2015/16 and,given the emergence of El Nino conditions during the reportingyear, our water supply planning is taking into account theprospect of again receiving limited allocations from that systemnext year.
Permanent Water Savings Rules were in place for all urbansupplies, and our rural customers received full allocations for the2014/15 season. We continued to trade temporary waterentitlements that were not required for current or future supplyneeds, and this provided much-needed water for buyers seekingwater through the water market over the summer and autumnperiod when seasonal conditions remained dry and demand forrural water was high. The revenue we received from these tradesalso contributed to our positive financial result.
Capital investment for the reporting year was $27.76 million, witha key focus being the continued advancement of our most
significant capital project, the modernisation of the Harcourtrural water system that commenced in late 2013, towardscompletion within this reporting year. However, the leadcontractor for the project brought the works to a standstill inNovember 2014 with around two-thirds of the works constructed,and what followed was a protracted period where no substantialprogress was made. This led to us taking the difficult butnecessary step in June 2015 of taking the works out the hands ofthe contractor and concluding their involvement in the project.We have put in place a plan that will enable the timelycompletion of the works that remain to be constructed. However,with the time lost to date, and the additional time needed toimplement the plan, the completion of the project will bedelayed until well into 2016.
We apologise for the unfortunate situation that arose atHarcourt, and we are working with Harcourt rural customers todeliver their supply next season via the existing rural channelsystem. Further, we wish to reaffirm the importance of theHarcourt project in not only servicing the local area’s ruralcustomers, but in also providing a critical long-term componentof pipeline infrastructure that, with future extensions, will enableus to address the impact of climate change and provide for theneeds of growing populations in our southern communities.
During the year, two of our high profile capital projects werenominated for awards in recognition of the technical innovationutilised in new infrastructure delivered under these projects. The$8 million upgrade of the Rochester Water Treatment Plant was afinalist in the Infrastructure Project Innovation Award category atthe Australian Water Association’s Victorian Water Awards heldin December 2014. In September 2014, the newly constructed$9.5 million water reclamation plant at Rochester was a finalistin the Infrastructure Projects Up To $20 Million category in theVictorian Engineering Excellence Awards. Business innovationremains a strong focus and passion in and across all aspects ofour business.
We were also judged as a finalist in the Commitment to a HealthyWorkplace/Business category at the 2014 Bendigo BusinessExcellence Awards, which is an acknowledgement of ourcommitment to the wellbeing of our team and to providing a safeplace of work for our staff and those employed by partnerbusinesses servicing our organisation.
We consider 2014/15 to be a year of significant achievement atColiban Water, as we continually strive to enhance our capabilityand capacity to support current and future needs of ourcustomers, improve our performance and deliver even betterresults in order to benefit our customers, our local communities,the region we serve and the Victorian Government representingthe State of Victoria as our shareholder.
We wish to sincerely thank our fellow directors, our staff, ourbusiness partners and the agencies that we work with for theircommitment, support and contribution throughout the year,which has been crucial to what we have achieved.
When we at Coliban Water think about and talk about water, tous it is about always having water – to live, grow and enjoy!
In accordance with the Financial Management Act 1994, we arepleased to attest that Coliban Water’s 2014/15 Annual Report iscompliant with all statutory reporting requirements.
Jeff Rigby Andrew CairnsManaging Director Chairman

O U R ST R AT E G I C D I R E C T I O N
COLIBAN WATER | ANNUAL REPORT | 2014–15PAGE | 4
We continue to engage and collaborate with our stakeholders,encourage innovation and continuous improvement andoptimise our resources and capabilities.
In pursuit of our strategic direction, we identified a number ofoutcomes and initiatives which we then set out to deliver over arange of timeframes (short, medium and long term). Thesestrategic outcomes and initiatives also align with our identifiedKey Result Areas (KRAs).
The table below provides a summary of all our short termstrategic outcomes, the medium term and long term strategicoutcomes commenced and the progress achieved for the year.
Strategic outcome Short term key deliverables Progress
KRA 1 Engage with the community and stakeholders to understand and meet their water cycle needs
Strengthening our stakeholder relationships through engagement and understanding
Highly valued products andservices
> Connecting with customers through existing channels includingYour Town visits across the region
Ongoing
Building brand equity> Establish our Corporate Identity – who we are and what we stand
for as an essential service providerIn progress
A trusted monopoly enterprise and economic partner
Strong and effective relations withregulators
> Identify all regulatory bodies, confirm scope of responsibilitiesand dependencies
Completed
> Survey regulators to establish and measure how they rate us Completed
> Explore how each party can work together to make regulation ofthe business easier and more effective to reduce red tape
Nearing completion
KRA 2 Build, operate and maintain sustainable water cycle infrastructure to meet the needs of our community for now
and into the future utilising best practice
Enabling our stakeholders to manage their risks and achieve their goals
Stakeholder engagement andcorporate leadership
> Confirm key stakeholder requirements and expectations andincorporate into our Value Proposition
Nearing completion
> Clarify responsibilities and accountabilities for stewardship ofdeliverables to all stakeholders
Nearing completion
Maximising benefits through optimal decisions and solutions
Greater rigour in justifying andprioritising projects
> Further develop capital investment prioritisation tool that isaligned with critical business drivers and incorporatesassessment of risk mitigation benefits
In progress
Enhanced value from our asset base and capital structure
Efficient and effective managementof asset base and debt portfolio
> Align our debt repayment profile with the profile of our assetresidual lives
Nearing completion
> Implement strategy of debt repayment Nearing completion
> Identify and prepare plans to dispose of surplus land assets Nearing completion
O U R V I S I O N I S ‘ WAT E R TO L I V E , G R OW A N D E N J OY ’
COLIBAN WATER | ANNUAL REPORT | 2014–15 PAGE | 5
O U R ST R AT E G I C D I R E C T I O N
Strategic outcome Short term key deliverables Progress
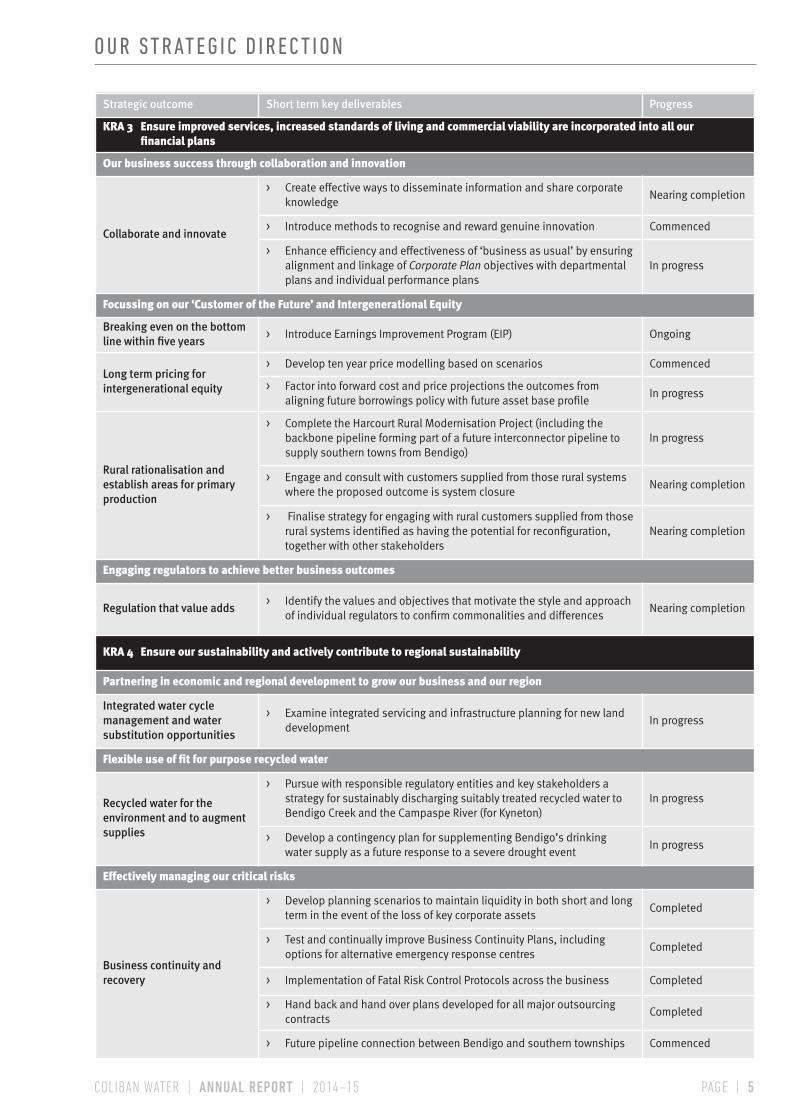
KRA 3 Ensure improved services, increased standards of living and commercial viability are incorporated into all our
financial plans
Our business success through collaboration and innovation
Collaborate and innovate
> Create effective ways to disseminate information and share corporateknowledge
Nearing completion
> Introduce methods to recognise and reward genuine innovation Commenced
> Enhance efficiency and effectiveness of ‘business as usual’ by ensuringalignment and linkage of Corporate Plan objectives with departmentalplans and individual performance plans
In progress
Focussing on our ‘Customer of the Future’ and Intergenerational Equity
Breaking even on the bottomline within five years
> Introduce Earnings Improvement Program (EIP) Ongoing
Long term pricing forintergenerational equity
> Develop ten year price modelling based on scenarios Commenced
> Factor into forward cost and price projections the outcomes fromaligning future borrowings policy with future asset base profile
In progress
Rural rationalisation andestablish areas for primaryproduction
> Complete the Harcourt Rural Modernisation Project (including thebackbone pipeline forming part of a future interconnector pipeline tosupply southern towns from Bendigo)
In progress
> Engage and consult with customers supplied from those rural systemswhere the proposed outcome is system closure
Nearing completion
> Finalise strategy for engaging with rural customers supplied from thoserural systems identified as having the potential for reconfiguration,together with other stakeholders
Nearing completion
Engaging regulators to achieve better business outcomes
Regulation that value adds> Identify the values and objectives that motivate the style and approach
of individual regulators to confirm commonalities and differencesNearing completion
KRA 4 Ensure our sustainability and actively contribute to regional sustainability
Partnering in economic and regional development to grow our business and our region
Integrated water cyclemanagement and watersubstitution opportunities
> Examine integrated servicing and infrastructure planning for new landdevelopment
In progress
Flexible use of fit for purpose recycled water
Recycled water for theenvironment and to augmentsupplies
> Pursue with responsible regulatory entities and key stakeholders astrategy for sustainably discharging suitably treated recycled water toBendigo Creek and the Campaspe River (for Kyneton)
In progress
> Develop a contingency plan for supplementing Bendigo’s drinkingwater supply as a future response to a severe drought event
In progress
Effectively managing our critical risks
Business continuity andrecovery
> Develop planning scenarios to maintain liquidity in both short and longterm in the event of the loss of key corporate assets
Completed
> Test and continually improve Business Continuity Plans, includingoptions for alternative emergency response centres
Completed
> Implementation of Fatal Risk Control Protocols across the business Completed
> Hand back and hand over plans developed for all major outsourcingcontracts
Completed
> Future pipeline connection between Bendigo and southern townships Commenced

C U STO M E R S A N D C O M M U N I T Y E N GAG E M E N T
COLIBAN WATER | ANNUAL REPORT | 2014–15PAGE | 6
C U S TO M E R S U P P O RT
G R A D E O F S E RV I C EOur Customer Contact Centre achieved a 91.28 per cent Grade ofService. This Essential Services Commission (ESC) target is toanswer of 90 per cent of calls within 30 seconds during businesshours.
The target increased from 85 per cent to 90 per cent in 2011.
A total of 88,026 calls were recorded for the year. This is a 3.8 per cent increase in call volume since last year.
The Customer Contact Centre (and broader Customer SupportTeam) has made significant operational changes over the past 3years to find efficiencies without compromising customerexperience. Our focus continues to be on resolving customerenquiries in a single call.
In total the team handled 156,129 contacts for the yearcompared to 126,724 in the previous year. This includestelephone, email and over-the-counter contact.
C U S TO M E R S E RV I C E A N D S AT I S FACT I O N
C O N TACT C E N T R E B E N C H M A R K I N GWe participated in Customer Service Benchmarking Australiawhich benchmarks our Customer Contact Centre against otherwater corporations, utilities and various organisations such asbanks, insurance companies, internet service providers, anduniversities. The benchmarking includes a series of telephonecalls over three months into our Customer Contact Centre toassess our performance.
For the second year running we have ranked fifth out of 24 watercorporations compared to sixth in 2013 and eighth in 2012, withour performance continuing to outperform not only Water Sectoraverages but averages from all industries surveyed.
Our overall customer satisfaction score increased to 171. This is25 points higher than the sector average. This benchmarkingreport is used to identify ongoing opportunities for improvementin customer experience.
C U S TO M E R S AT I S FACT I O N S U RV E YIn June we engaged an independent market researcher toconduct a satisfaction survey of residential customers. 400telephone interviews were conducted to understand customerexperiences, perceptions and overall satisfaction with ColibanWater and our services. Overall customer satisfaction was 89 per cent.
E N E R GY A N D WAT E R O M B U D S M A N
The Energy and Water Ombudsman Victoria (EWOV) receives,investigates and facilitates resolution of customer complaintsabout electricity, gas and water.
During the year 85 complaints were made to EWOV compared to80 last year, representing a nominal six per cent increase incomplaint levels. Fourteen of these complaints were referred onfor investigation and review by an EWOV conciliator.
Issues taken to EWOV continue to focus on water use volumes(17 cases) and billing charges (42 cases). Other matters raisedincluded rural operational issues, and Land Developmentprocesses and projects.
EWOV referred the equivalent of 1.2 complaints for every 1,000customers to us for action during 2014/15, compared to theESC’s target of two per 1,000 customers.
We believe cost of living pressures are a key factor for theincreased number of cases.
C O M P L E X E N Q U I R I E S
Our Customer Contact Centre aims to resolve the customerenquiry at their first point of contact with us. Where the enquiryneeds more investigation it is referred to our Complex EnquiriesTeam. We had 569 enquiries referred for further review andinvestigation, a 9 per cent reduction compared to last year.
Consumption related enquiries accounted for about one third ofall complex enquiries. Operational issues accounted for a further40 per cent and were made up of sewer odours, sewer overflows,sewer blockages, water leaks and issues with Coliban Waterassets. Tariffs, billing and meter enquiries accounted for 17 per cent of all investigations.
We investigate all reports of breaches of the Water Act 1989,Water Restriction By-Law and Permanent Water Saving Rules(PWSR). We received 11 PWSR breach reports during the year. All were investigated and no action taken.
U N D E R STA N D I N G O U R C U STO M E R S A N D C O M M U N I T I E S A N D ST R E N GT H E N I N G O U R STA K E H O L D E R R E L AT I O N S H I P S
Year 2015 2014 2013 2012 2011
Result 91.28% 90.32% 85.9% 83.34% 88.85%
2014/15
Unassistedreferrals
Assistedreferrals
Real timeresolution Investigations Total
16 49 6 14 85
Investigation summary 2014/15 Number
Consumption 173
Revenue (Billing, Meters, Tariffs) 102
Operational issues, site restoration, compensationclaims, water leaks and sewer intrusions
236
EWOV cases 47
PWSR offender investigation 11
Penalty infringement notices issued 0
Restrictors applied for breach of water restrictions 0
total actions 569

COLIBAN WATER | ANNUAL REPORT | 2014–15 PAGE | 7
C U STO M E R S A N D C O M M U N I T Y E N GAG E M E N T
C O M M U N I T Y I N C LU S I V E N E S S
We comply with the Victorian Government’s policy framework onmulticultural and gender issues and youth and indigenousaffairs. We respect the diversity of our customers and ouremployees and try to deliver culturally appropriatecommunications that meet their needs and expectations.
We offer telephone interpreter and text telephone (TTY) servicesto assist non-English speaking and speech and hearing impairedcustomers.
S TA N D P I P E S A N D WAT E R CA RT E R S
In 2014/15 we had 1,578 private and commercial water cartersregistered for potable water carting. This is an increase of over29 per cent over the last year. There was however a decrease inthe number of recycled water carters which is down from 38 tojust 21. Water carting permits allow customers to take waterfrom various standpipes within our region, of which ColibanWater directly controls 15.
A total of 160.4 megalitres was taken from the Coliban Watermanaged standpipes for the year. This was an increase on theprevious year’s total of 146.6 megalitres, which will most likelyhave been driven by a drier autumn with lower than expectedrainfall since mid-January 2015.
C O M M U N I T Y R E L AT I O N S A N D C O M M U N I CAT I O N
C U S TO M E R A N D C O M M U N I T Y C O M M I T T E E SIn addition to working with our customer committees we look foropportunities to engage with local interest groups includingtown progress associations. Our committees and involvementwith community groups helps us understand and learn moreabout the towns and communities where we provide services.
O U R C O M M I T T E E S :> Rural Customer Advisory Group which met four times this
year. The focus was on rural engagement, rural operations,water trading rules and the process for evaluating theviability and future needs of each rural system
> Harcourt Water Services Committee which met once this yearand has been updated on a fortnightly basis about theHarcourt Rural Modernisation Project
> Cockatoo Hill Rural Reference Group was retired this year dueto the successful delivery of the Raywood/Sebastianpipeline and interests that were closely aligned to that of theRural Customer Advisory Group. One member of this group isnow a member of our Rural Customer Advisory Group torepresent the interests of this area
YO U R TOW N C O M M U N I T Y V I S I T S P R O G R A MOur commitment to visiting communities within our regionthrough the Your Town program continued this year, providingour customers an opportunity to meet with our CustomerSupport Team as well as staff from across our business. Thisprogram is promoted through bill inserts and offers a face-to-face informal opportunity for us to chat to learn more about ourcustomers, understand issues at a local level and to proactivelyrespond to customer enquiries.
We visited ten towns this year and met with over 200 customers.
This program will continue for 2015/16.
S C H O O L A N D C O M M U N I T Y E D U CAT I O N We have a targeted school and community education program.During the year we visited 26 schools and reachedapproximately 1,100 students.
We deliver educational programs based around our corebusiness functions of water and wastewater treatment anddelivery, with specifically developed activities that cater fromearly childhood to tertiary groups. Newly developed activitiesthis year included an interactive quiz based on wastewatertreatment, a kinetic sandpit catchment activity and a waterfiltration role play demonstration.
The state-wide National Water Week poster competition hadapproximately 300 entries from students representing 11 schoolsin our region. We presented certificates and prizes at each of theparticipating schools.
We collaborate with the North Central Catchment ManagementAuthority and the City of Greater Bendigo on activities duringNational Water Week and we are a sponsor of the North CentralWaterwatch Program.
I N F O R M AT I O N A N D E D U CAT I O NWe have continued our approach to communicate directly withour customers about things that are relevant to them or thestreet, suburb or community in which they live or work.
Most information is provided by via post, letterbox drop, email orin person. We also have information on our website forcustomers who have internet access.
A N N UA L P U B L I C M E E T I N GOur Annual Public Meeting was held on Thursday 17 July, 2014.Our guest speaker was Denis Flett from the VictorianEnvironmental Water Holder. We presented our operational andfinancial performance for the 2013/14 financial year andpresented targets for our 2014/15 Corporate Plan. As this eventhas limited customer attendance we are looking at alternativeways for customers to meet our Board and to access theinformation provided.
C O M M U N I T Y E N GAG E M E N T F O R CA P I TA L P R OJ E CT SWe develop community relations programs for our capitalprojects. This includes identifying and engaging stakeholders aspart of our projects. Our largest community relations projects forthe year included the Harcourt Rural Modernisation Project andthe Pine Safety Removal Project at Lauriston and MalmsburyReservoirs near Kyneton.
H A R C O U RT R U R A L M O D E R N I S AT I O N P R OJ E CTThe Harcourt Rural Modernisation Project will connectapproximately 160 landowners to a new rural piped system inthe agricultural area of Harcourt. The new pipe network willreplace an historic open channel system that currently suppliesthe area and will provide our Harcourt rural customers a greaterlevel of reliability.
Landowner, customer and community engagement has focussedon in-person contact with landowners and customers, andpostal updates to landowners and customers. Our HarcourtWater Services Committee continues to be an important part ofour community engagement for this project.

C U STO M E R S A N D C O M M U N I T Y E N GAG E M E N T
COLIBAN WATER | ANNUAL REPORT | 2014–15PAGE | 8
P I N E S A F E T Y R E M OVA L P R OJ E CT
27 hectares of pine plantations exist around our catchmentstorages near Kyneton – a total of nine stands. Due to the age ofthe trees and the impact of severe drought and storms, thesestands have become a safety risk to staff and visitors to the areaand have therefore been fenced off.
In the previous year we removed the pine trees surrounding therecreation areas at Lauriston and Malmsbury Reservoirs. Prior tothe works we contacted customers and landowners in the areaand kept them informed throughout the works.
A community planting day following harvesting was a part ofrevegetation program for the recreation areas. A survey wasconducted late last year to understand community views onrecreation area facilities. The greatest interest was in areashaving shade and picnic facilities.
Over the next two years, there will be an installation of morepicnic areas including tables, chairs, barbeques, shading andshelters for community use. A previously closed toilet block willbe reopened in a refurbished condition. There are further pinesto be removed and the areas will be revegetated with nativeplant species.
I N D I G E N O U S C O N S U LTAT I O N
H A R C O U RT R U R A L M O D E R N I S AT I O N P R OJ E CTUnder the requirements of the Aboriginal Heritage Act (2006) weengaged cultural heritage consultants during the projectplanning and delivery stages to identify and assess sites ofAboriginal cultural heritage significance along the pipeline routeand to prepare a Cultural Heritage Management Plan (CHMP).The CHMP, approved by the local Registered Aboriginal Party (DjaDja Wurrung Clans), set out recommendations for each site ofsignificance to manage and protect the Aboriginal culturalheritage prior to, during and following construction.
A total of nine sites of Aboriginal cultural heritage significancerequired salvage excavations to be undertaken by the CulturalHeritage Advisor and Dja Dja Wurrung members, to recover andprotect heritage material prior to construction. These works werecompleted, with more than 1,646 artefacts analysed andcatalogued. The artefacts will be returned to the ground at theend of construction.
Ongoing monitoring of the work will help to ensure that artefactsstill remaining can be preserved during construction works.
L A N D U S E ACT I V I T Y AG R E E M E N T ( LUA A )Under the requirements outlined in the LUAA, we have workedwith the Dja Dja Wurrung Corporation on the following activities:
> Negotiation B Activity for a new access track at Green GullyReservoir
• The track is required to enable improved access for staffto the Green Gully Reservoir and the Lockwood Channelnearby
• This will be finalised in early in the 2015/16 reportingyear
> Negotiation B Activity for a new access track and mechanicaltrash grate at our Coliban Main Channel at Sutton Grange
• The track is for Occupational Health and Safety purposesdue to a blind corner at the previously used access point
• The mechanical trash grate is for Occupational Healthand Safety purposes to improve manual handlingconditions for staff
• Notification occurred in early 2015, the process will befinalised in the next reporting year
> Negotiation B Activity for the Diamond Gully Road sewerproject in Castlemaine
• Notification occurred in 2014/2015, the process will befinalised in early 2015/16
> Advisory Activity regarding new grazing licences for issue atGreen Gully Reservoir

COLIBAN WATER | ANNUAL REPORT | 2014–15 PAGE | 9
WAT E R S E C U R I T Y
WAT E R S U P P LY SYS T E M S
Our overall water supply system consists of 26 separate urban(potable) supplies within nine water systems. This includes twoseparate groundwater sources for Elmore and Trentham. TheColiban System Northern can be supplemented with supply fromthe Waranga Western Channel (via the Goldfields Superpipe)and Lake Eppalock, whilst the Coliban System Southern is solelysupplied by our Coliban River catchment storages. For furtherdetail see our region map on the inside front cover.
Our three Coliban River catchment storages (Upper Coliban,Lauriston and Malmsbury), located near Kyneton, started theyear at 47,885 megalitres (69 per cent of capacity), reaching amaximum of 59,926 megalitres (86 per cent of capacity) on 28August 2014. The storages then slowly decreased to 42,311megalitres (61 per cent of capacity) on 30 June 2015.
Our share of Lake Eppalock at the start of the financial year was49,935 megalitres (91 per cent of full capacity) and at 30 June2014 was 34,154 megalitres (62 per cent of full capacity).
During the year, inflows did not exceed storage capacity andthere was no spilling water from both our Coliban Rivercatchment storages and from our share of Lake Eppalock. We,however, spilled 50 megalitres from our spillable water accountsattached to our Murray supply system.
We started the year with our Coliban System Southern storagesholding more than the 45 gigalitre reserve trigger level that wasin place at the time. In October 2014 the trigger level was revised(based on storage volumes, inflow, climate data andpredictions) to 50 gigalitres. Whenever the storage levels arebelow this trigger, transfer of water to Bendigo ceases. Given thegenerally dry season experienced and uncertainty of additionalinflows late in the season, transfers to Bendigo ceased ahead ofthe trigger and pumping commenced from Lake Eppalock in earlyOctober 2014, using our share of water stored in Lake Eppalockas the alternate source to supply Bendigo. For the year, wepumped a total of 12,529 megalitres for Coliban Water and 534megalitres on behalf of Central Highlands Water from LakeEppalock. In addition 32 megalitres of water was pumped forColiban Water and 118 megalitres on behalf of Central HighlandsWater from the Waranga Channel at Colbinabbin.
During 2014 we have actively reviewed our method forforecasting water demand on a system by system basis. We havealso established four separate levels for the volumetric triggerfor our major storages in order to better manage the balance ofthe raw water supply between our northern and southernsystems having regard to annual inflow and projections onclimate indicators.
As a
t 30
June
201
4M
egal
itre
s (M
L)
As a
t 30
June
201
5
Meg
alit
res
(ML)
% fu
ll 30
June
201
5
Storage volume in our region
Coliban System Northern –Sandhurst Reservoir
1,505 2,072 80
Coliban System Northern –Caledonia Reservoir
174 162 76
Coliban System Northern – LakeEppalock (Coliban Water share)
49,926 34,154 62
Coliban Rural Northern – SpringGully Reservoir (recycled water)
702 842 50
Coliban System Southern – UpperColiban Reservoir
25,810 20,441 54
Coliban System Southern –Lauriston Reservoir
15,780 17,390 88
Coliban System Southern –Malmsbury Reservoir
6,138 4,480 37
Coliban System Southern – McCay Reservoir
1,184 1,168 86
Coliban System Southern –Barkers Creek Reservoir (rural)
0 1,060 63
Groundwater – Trentham storages 69 69 76
total 101,288 81,838 62
Available water in other systems
Campaspe System BulkEntitlement – held in LakeEppalock
331 313 n/a
Campaspe System Water Shares –held in Lake Eppalock
260 3,075 n/a
Coliban System Northern WaterShares – held in Lake Eildon
3,475 2,858 n/a
Goulburn System Bulk Entitlement– held in Lake Eildon
881 762 n/a
Loddon System Bulk Entitlement –held in Loddon storages
390 332 n/a
Murray System Bulk Entitlement(and share) – held in Murray Riverstorages
250 994 n/a
Wimmera System Bulk Entitlement– held in Grampians storages
297 185 n/a
total 5,884 8,519 n/a
TOTAL 107,172 90,357 n/a
WAT E R S TO R AG E VO LU M E S
Water storage volume notes:
1. The volume of water held in our storages at 30 June 2015 was 81,838 megalitres which is 19,450 megalitres less than water held in storage atthe end of June 2014. The amount stored in the Coliban catchment storages was 5,417 megalitres less largely due to low inflow particularly in Julyand August 2014.
2. 91 per cent of our total water resource of 90,357 megalitres, is held in our storages, including our share of Lake Eppalock. The remaining 8,519megalitres is held in storages controlled by Goulburn-Murray Water (G-MW) and Grampians Wimmera Mallee Water.

WAT E R S E C U R I T Y
COLIBAN WATER | ANNUAL REPORT | 2014–15PAGE | 10
R A I N FA L L A N D WAT E R I N F LOWS
We received 467 millimetres of rainfall at Malmsbury Reservoir for the year. This is 25 per cent lessthan the average for the past ten years of 622 millimetres and 36 per cent less than the historicalaverage of 724 millimetres. We received below average rainfall in all months except January whichwas above average and July and May were just equal to average.
We received 100 per cent of our water allocations across our region from our bulk water suppliers,with the exception of Grampians Wimmera Mallee Water where we received 48 per cent.
Our catchment storages received below average inflows of 20,759 megalitres (82 per cent of theaverage for the past 10 years of 25,445 megalitres).
300
350
400
450
500
550
600
650
700
750
800
0
10
20
30
40
50
60
70
80
90
JUL AUG SEP OCT NOV DEC JAN FEB MAR APR MAY JUN
ANNU
AL R
AINF
ALL
– M
M
MON
THLY
RAI
NFAL
L –
MM
MONTHLY RAINFALL AVERAGE MONTHLY RAINFALL — LAST 10 YEARS
HISTORICAL AVERAGE ANNUAL RAINFALL ANNUAL RAINFALL 2014–15 AVERAGE ANNUAL RAIN – LAST 10 YEARS
622 mm Average Annual Rainfall - Last 10 Years
723 mm Historical Average Annual Rainfall
467 mm Annual Rainfall 2014/15
M A L M S B U RY R E S E RVO I R M O N T H LY R A I N FA L L 2 0 1 4 / 1 5

COLIBAN WATER | ANNUAL REPORT | 2014–15 PAGE | 11
WAT E R S E C U R I T Y
0
5,000
10,000
15,000
20,000
25,000
30,000
0
1,000
2,000
3,000
4,000
5,000
6,000
7,000
8,000
9,000
JUL AUG SEP OCT NOV DEC JAN FEB MAR APR MAY JUN
ANNU
AL F
LOW
— M
EGAL
ITRE
S (M
L)
MON
TLY
INFL
OW —
MEG
ALIT
RES
(ML)
MONTLY INFLOW 2014/15 AVERAGE MONTHLY INFLOW OF LAST 10 YEARS
20,759 ML Annual Inflow 2013/14
25,445 ML Average Annual Inflow Over Last 10 Years
C O L I BA N H E A DWO R KS S TO R AG E S > M O N T H LY I N F LOW 2 0 1 4 / 1 5CO
NTEN
T�–
GIGA
LITR
ES�(G
L)
0
5
10
15
20
25
30
35
40
45
50
55
60
65
70
75
80
JUL 2
005
NOV
2005
MAR
2006
JUL 2
006
NOV
2006
MAR
2007
JUL 2
007
NOV
2007
MAR
2008
JUL 2
008
NOV
2008
MAR
2009
JUL 2
009
NOV
2009
MAR
2010
JUL 2
010
NOV
2010
MAR
2011
JUL 2
011
NOV
2011
MAR
2012
JUL 2
012
NOV
2012
MAR
2013
JUL 2
013
NOV
2013
MAR
2014
JUL 2
014
NOV
2014
MAR
2015
JUL 2
015
16,713�MLAT�30�JUNE�
2010
67,750�MLAT�30�JUNE�
2011
58,728�MLAT 30�JUNE�
2012
46,900�MLAT�30�JUNE�
2013
47,728MLAT�30�JUNE�
2014
42,311�MLAT�30�JUNE�
2015
C O L I BA N S TO R AG E C O N T E N T S > U P P E R C O L I BA N , L AU R I S TO N & M A L M S B U RY R E S E RVO I R S

WAT E R S E C U R I T Y
COLIBAN WATER | ANNUAL REPORT | 2014–15PAGE | 12
B U L K WAT E R E N T I T L E M E N T S
We hold Bulk Water Entitlements for surface water in the Campaspe, Coliban, Goulburn, Loddon, Murray and Wimmera systems. ForTrentham we hold a Bulk Entitlement and groundwater extraction licence, and for Elmore only a groundwater extraction licence. We alsohold water shares (high and low reliability) in the Campaspe, Goulburn and Murray Systems.
The volumes taken during 2014/15 were as follows:
Supply systemSourceof supply Bu
lk E
ntitl
emen
tvo
lum
eM
egal
itres
Bulk
Ent
itlem
ent
allo
catio
nM
egal
itres
Bala
nce
1 Ju
ly 2
014
Meg
alitr
es
Raw
wat
ervo
lum
e ta
ken
Meg
alitr
es
Bala
nce
30 Ju
ne 2
015
Meg
alitr
es
Reporting requirements in accordance with Bulk Entitlement (BE) clause
Campaspe Campaspe River
Bulk Entitlement reference: Bulk Entitlement (Axedale, Goornong & part Rochester ) Conversion Order 1999
Axedale &Goornong
215 215 204 57 186 12.1(b) – Annual volume taken – 57 megalitres12.1(c) – Any credits granted – Nil12.1(d) – Metering program – Nil
Rochester 134 134 127 0 127 12.1(e) – Temporary or permanent transfer of all or part of BE – Nil12.1(f) – Period of restriction – Nil 12.1(g) & (h) – Any amendment to BE, or new BE for Axedale, Goornong & Rochester – Nil12.1(i) – Any failure to comply with BE – Nil12.1 (j) – Difficulties in complying – Nil
Coliban Coliban River,Campaspe River
Bulk Entitlement reference: Bulk Entitlement (Campaspe System – Coliban Water) Conversion Order 1999
Bendigo area,Castlemainearea, Kyneton area, Heathcote area& Coliban Rural
Coliban RiverReservoirs: Upper Coliban,Malmsbury & Lauriston andLake Eppalock
50,260 N/A N/A 31,569 N/A 18.1(f) – Annual volume taken – See Notes 1, 2 & 318.1(g) – Annual evaporation loss – from our headworks is 7,554 megalitres and from our share of Lake Eppalock is 6,636 megalitres18.1(h) – Internal spill in Lake Eppalock to G-MW share – Nil18.1(i) – Passing flow compliance record – see Note 418.1(j) – Any credits granted – Nil18.1(k) – Temporary or permanent transfer of bulk entitlement – Nil18.1(l) – Bulk entitlement or licence transferred to CW – Nil18.1(m) – Period of restriction – Nil18.1(n) – Alteration to primary entitlements – Nil18.1(o) – Transfer of primary entitlements – Nil18.1(p) – Annual volume supplied to primary entitlements – 31,569 megalitres18.1(q) – Any amendment to bulk entitlement – Nil18.1(r) – Any new bulk entitlement – Nil18.1(s) – Implementation of environmental and metering programs – Nil – See Note 5 regarding metering.18.1(t) – Any failure to comply with BE – Nil18.1(u) – Difficulties in complying – Nil18.1(v) – Passing flows less than specified – Nil
GoulburnWaranga WesternChannel
Bulk Entitlement (Goulburn Channel System – Coliban Water) Order 2012
Boort 156 15.1(b) – Annual volume taken – 1,574 megalitres15.1(c) – Volume from other locations – Nil15.1(d) – Any credit granted – Nil15.1(e) – Metering program – Nil – See Note 5, bulk meters managed by G-MW15.1(f) – Temporary or permanent transfer of all or part of BE – Nil15.1(g) – Assignment or transfer to Coliban Water – Nil15.1(h) – Amendments to BE – Nil15.1(i) – New BE – Nil15.1(j) – Failure to comply – Nil15.1(k) – Difficulties in complying – Nil
Dingee 58
Jarklin 1
Lockington 90
Macorna 6
Mitiamo 20
Mysia 1
Pyramid Hill 124
Rochester 1,088
Serpentine 32
total 2,420 2,420 881 1,574 762
Groundwater Groundwater Licence
Elmore Bore 284 284 N/A 122 N/A
Bulk Entitlement reference: Bulk Entitlement (Trentham) Conversion Order 2012
Trentham Spring Water 120 120 N/A 100 N/A 12.1(b) – Annual volume taken – 121 megalitres12.1(c) – Average annual amount taken over three years – 102 megalitres12.1(e) – Metering program – see Note 512.1(f) – Transfer or assignment of allocation – Nil12.1(g) – Any amendments of transfers with respect to Order – Nil12.1(h) – Any failure to comply with order – Nil12.1(i) – Any difficulties complying with Order – Nil
Bore 48 48 N/A 21 N/A

COLIBAN WATER | ANNUAL REPORT | 2014–15 PAGE | 13
WAT E R S E C U R I T Y
Supply systemSourceof supply Bu
lk E
ntitl
emen
tvo
lum
eM
egal
itres
Bulk
Ent
itlem
ent
allo
catio
nM
egal
itres
Bala
nce
1 Ju
ly 2
014
Meg
alitr
es
Raw
wat
ervo
lum
e ta
ken
Meg
alitr
es
Bala
nce
30 Ju
ne 2
015
Meg
alitr
es
Reporting requirements in accordance with Bulk Entitlement (BE) clause
Loddon Loddon River
Bulk Entitlement (Loddon System- Coliban Water) Conversion Order 2005
Bridgewater &Inglewood
252 13.1(b) – Annual volume taken – 381 megalitres13.1(c) – Any credits granted – Nil13.1(d) – Metering program – Nil – see Note 5, bulk meters managed by G-WM13.1(e) – Temporary or permanent transfer of all or part of BE – Nil13.1(f) – Period of restriction – Nil13.1(g) – Any amendment to BE – Nil13.1(h) – New BE granted – Nil13.1(i) – Any failure to comply with BE – Nil13.1(j) – Difficulties in complying – Nil
Laanecoorie,Dunolly,Bealiba &Tarnagulla
129
total 820 820 390 381 332
Wimmera Wimmera Channel
Bulk Entitlement (Wimmera and Glenelg Rivers – Coliban Water) Order 2010
Korong Vale &Wedderburn
215.1 13.1(b) – Annual volume taken – 222.8 megalitres13.1(c) – Amount and location of water taken from other than specified point – Nil13.1(e) – Metering program – Nil – see Note 5, bulk meters managed by G-WM Water13.1(f) – Temporary or permanent transfer of all or part of BE – Nil13.1(g) – Any BE or other entitlement transferred to Coliban Water under this order – Nil13.1(h) – Any amendment to BE – Nil13.1(i) – New BE granted – Nil13.1(j) – Any failure to comply with BE – Nil13.1(k) – Difficulties in complying – Nil
Borung 4.1
Wychitella 3.6
total 300 144 297 222.8 185
Murray Murray River
Bulk Entitlement (River Murray – Coliban Water) Conversion Order 1999
Cohuna 740 20.1(b) – Annual volume taken – 4,292.5 megalitres20.1(c) – New off-take points – Nil20.1(d) – Water returned – Nil, at any of the specified points20.1(e) – Metering Program – Nil – see Note 5, bulk meters managed by G-MW20.1(f) – Allocation traded: 8,585 (Sourced from other Allocation Bank Accounts)20.1(g) – Any BE or other entitlement transferred to supply primary entitlements under this order –Nil20.1(h) – Amended as per September 201420.1(i) – New BE granted – Nil20.1(j) – Any failure to comply with BE – Nil20.1(k) – Difficulties in complying – Nil
Echuca 3,274
Gunbower 61
Leitchville 217.5
total 6,285 6,285 224 4,292.5 919
Goulburn Waranga WesternChannel
Coliban SystemNorthern
Water Shares High Reliability
22,801 22,801
3,475 23,669 2,858
Allocation purchase – 0 megalitres
Water Shares Low Reliability
2,861 0 Allocation traded: 16,615 megalitres
Campaspe Lake Eppalock
Coliban SystemNorthern
Water Shares High Reliability
2,591 2,591
260 1,531 3,705
Allocation purchase – 0 megalitres
Water Shares Low Reliability
646 297
Murray Murray River
Cohuna,Echuca
Water Shares High Reliability
55 55
26 0 75
Allocation purchase – 0 megalitres
Gunbower,Leitchville
Water Shares Low Reliability
24 0Allocation trade – 0 megalitresPreviously unreported
Note 1: 15,761 megalitres discharged from Malmsbury Reservoir toColiban Main Channel.
Note 2: 887 megalitres discharged from Lauriston Reservoir to Kynetonsystem.
Note 3: 12,930 megalitres discharged from Lake Eppalock to Bendigopipeline and Heathcote and 534 megalitres to Central Highlands Water.
Note 4: 1,991 megalitres Malmsbury environmental flow and no naturalspilling. Malmsbury Passing Flows account balance was 473 megalitresas at 30/06/2015. Flows in the Coliban River are recorded daily and
provided weekly to the North Central Catchment Management Authority(CMA). At the request of the North Central CMA the minimum passingflow has been varied to 4 megalitres per day. The rationale is toaccumulate environmental reserves to provide for larger 'fresher' flowsduring dry periods. By request of North Central CMA, 301 megalitresdischarged to Coliban River for summer fresh river flush. G-MW, as storagemanager for Lake Eppalock, are responsible for meeting the passingflow requirements on the Campaspe River downstream of Lake Eppalock.
Note 5: Field validation of all of our metering locations is in progress.

WAT E R S E C U R I T Y
COLIBAN WATER | ANNUAL REPORT | 2014–15PAGE | 14
WAT E R A L LO CAT I O N
A total of 12,930 megalitres of water stored in Lake Eppalock wasused to supply our customers in Bendigo, Heathcote and theColiban rural system. Water in our Coliban catchment reservoirswas used to supply our customers in Castlemaine and Kynetonareas (Coliban System Southern) and a 100 per cent allocationwas made to Coliban Water rural network customers.Announcements on rural allocation are made in early July eachyear to help rural customers better plan for future rural seasons.
WAT E R P U R C H A S E S
There was no purchase or sale of permanent water entitlementduring 2014/15. During the year 25,200 megalitres of temporarywater from the Goulburn and Campaspe system allocations wassold on the water market.
WAT E R R E S T R I CT I O N S
At the start of the 2014/15 all towns in our region were onPermanent Water Saving Rules. This was still the case at the endof the reporting period.
Sources of water 2014/15 Megalitres
Direct river extractions 3,712
Groundwater 243
Draw from dams/reservoirs 31,569
Channel supplies 2,933
total 38,457
Channel name
Num
ber
rura
l lic
ence
s
Bas
een
titl
emen
t(M
egal
itre
s)
Num
ber
licen
ces
supp
lied
Volu
me
deliv
ered
(Meg
alit
res)
Abbotts 103 391.0 83 214.5
Ascot 37 819.9 25 509.5
Axe Creek 70 391.1 43 123.0
Campbells Creek 1 6.1 1 6.1
Cockatoo Hill 29 106.7 21 66.8
Coliban Main(1) 144 6,251.7 65 370.0
Cominis 8 51.9 6 11.2
Diamond Hill 12 64.3 8 26.8
Eagles 18 72.4 13 37.0
Ellesmere 42 150.6 34 106.5
Emu No. 1 14 81.6 14 65.9
Emu No. 2 16 136.4 11 45.5
Emu Valley No. 1 82 354.6 61 154.5
Emu Valley No. 2 64 379.3 44 97.8
Eppalock Pipeline 77 822.3 66 350.9
Gaol Hill(2) 0 0.0 0 0.0
Goornong 15 352.2 10 108.4
Harcourt Main 87 1,467.6 41 807.6
Huntly 2 21.6 2 13.7
Ironstone 6 12.7 5 5.1
Jackass Flat 2 2.0 1 1.2
Kangaroo 1 9.4 0 0
Lauriston Reservoir 5 10.0 1 0.3
Lockwood 123 588.5 78 176.7
Maiden Gully 43 356.2 24 175.7
Malmsbury Reservoir 2 4.0 0 0.0
Mannes 14 93.8 10 23.5
Marong 30 258.8 21 141.2
Myers Flat 16 116.0 10 51.5
Neilborough 10 31.5 10 24.8
Poverty Gully 14 33.2 6 8.3
Ranters(2) 0 0.0 0 0.0
Raywood 60 304.8 43 196.0
Sebastian 7 59.7 7 25.3
South LockwoodPipeline 46 397.3 43 155.1
Sparrowhawk 1 5.3 1 2.2
Speciman Gully 13 167.0 6 77.9
Speciman Hill 34 307.6 22 53.8
Spring Gully 33 159.3 24 64.6
Strathfieldsaye 2 5.0 2 1.2
Trust 7 71.8 5 25.2
Warrens 27 318.0 13 149.5
White Hills 7 257.7 5 191.4
Wilsons Hill 31 250.9 25 86.7
total 1,355 15,741.8 910 4,753.1
Rural usage notes
(1) CW licence volume at end ofseason – 5,096.8 megalitres.
(2) Channel closed.
R U R A L U S AG E
Our rural customers had 100 per cent allocation for the 2014/15season.

COLIBAN WATER | ANNUAL REPORT | 2014–15 PAGE | 15
WAT E R S E C U R I T Y
WAT E R S O U R C E S
R U R A L SYS T E M T R A D I N G BY O U R C U S TO M E R S
Sources Number ofcustomers supplied
Supplied volume(Megalitres)
Raw 753 3,510.63
Recycled 157 1,242.48
These figures do not include the 25 licence volumes surrendered toColiban Water. A total of 191.8 megalitres was surrendered.
R E C YC L E D WAT E R P R O D U CT I O N A N D U S AG E
Recycled water was produced and used from the following waterreclamation plants during the year:
A X E DA L EThe Axedale Water Reclamation Plant (WRP) produces Class Brecycled water, which is supplied to the Axedale Golf Club forirrigation use.
B E N D I G OThe Bendigo WRP produces Class B and Class C recycled water,which is used for on-site irrigation, and it is also supplied to off-site users, such as the Fosterville Gold Mine, the BendigoLivestock Exchange and three neighbouring farmers foragricultural use.
The Bendigo recycled water scheme uses Class A recycled waterproduced at the Bendigo Recycled Water Factory and/or rawwater supplied into the scheme from the Coliban channel systemunder a water quality framework approved by the Department ofHealth and Human Services and the Environment ProtectionAuthority. The Class A recycled water is available via the recycledwater pipeline, two standpipes in Bendigo and some ruralchannels. The pipeline water is used for sporting facilities, parksand gardens, primary schools, rural customers, car washing,road works and commercial customers for dust suppression.
B O O RTThe Boort WRP produces Class C recycled water which is used foron-site irrigation.
CAS T L E M A I N EThe Castlemaine WRP produces Class C recycled water, which issupplied to the Castlemaine Golf Course via a pipeline, and to anearthworks company for dust suppression and constructionworks via tanks located at the plant.
D U N O L LYThe Dunolly WRP produces Class C recycled water which is usedfor on-site irrigation.
E C H U CAThe Echuca WRP produces Class C recycled water which ispumped to a storage (Singers Road Storage) located betweenEchuca and Rochester and is supplied to local irrigators.
R O C H E S T E RA new mechanical treatment plant at Rochester has been builtand was commissioned in 2014. The WRP produces Class Brecycled water which is pumped to a storage (Singers RoadStorage) located between Echuca and Rochester and is suppliedto local irrigators.
H E AT H C OT EThe Heathcote WRP produces Class C recycled water which issupplied to the Heathcote Golf Club for irrigation use.
K Y N E TO NThe Kyneton WRP produces Class B and Class C recycled water.The Class C water is supplied to an on-site irrigator. The Class Brecycled water is supplied to Kyneton Racecourse and theMacedon Ranges Shire Council for the watering of local sportsgrounds and the Botanical Gardens in Kyneton.
W E D D E R B U R NThe Wedderburn WRP produces Class C recycled water which isused for on-site irrigation.
R E C YC L E D WAT E R M A N AG E M E N T
All customers using recycled water must comply withmanagement requirements contained in the Site ManagementPlan or Environment Improvement Plan for each site. Wemonitor every recycled water customer’s managementpractices, water uses and volumes annually to ensurecompliance with these plans.
Permanent trade Temporary trade Trade as part ofland transfers
Numberof trades
Volumemegalitres
Numberof trades(sales)
Volumemegalitres(sales)
Numberof trades
Volumemegalitres
34 245.7 34 166.6 57 275.8
Water Reclamation Plant Recycled water usagevolume (Megalitres)
2014/15 2013/14
Axedale 11.9 7.3
Bendigo
Class A 0.0 0
Class B and C 1,089.1 1,633.6
Boort 17.9 21.5
Bridgewater 0.0 0
Castlemaine 117.6 81.8
Cohuna 0.0 0
Dunolly 0.0 11.3
Echuca* 1,463.7 811.3
Elmore 0.0 0
Gunbower 15.0 0
Heathcote 114.9 104.7
Kyneton 329.6 277.4
Lockington 0.0 0
Pyramid Hill 14.0 0
Rochester 0.0 0
Wedderburn 23.9 6.8
total 3,197.5 2,955.7
*Note that recycled water reuse volume from the Echuca WRP for theyear 2014/15 also includes recycled water pumped from theRochester WRP.

C A P I TA L P R OJ E C T S
COLIBAN WATER | ANNUAL REPORT | 2014–15PAGE | 16
The Water Treatment program had a total 2014/15 spend of$2.0 million and delivered the following key achievements:
> Water treatment plant and network maintenance (non-metrovarious*): completed an annual program ($0.57 million)including; replacement and upgrade of assets, purchase of avalve maintenance trailer
> Water systems booster disinfection (non-metro various*):completed installation of booster disinfection units ($0.49million) to four water reticulation systems with a high risk ofE.coli detection
The Water Reticulation program had a total 2014/15 spend of$1.87 million and delivered the following key achievements:
> Water main renewals (non-metro various*): completedannual program ($1.08 million) of water mains renewals toensure security of supply to customers and reduce waterlosses from burst and leaking mains
The Sewer Treatment program had a total 2014/15 spend of$2.47 million and delivered the following key achievements:
> Rebuild Cohuna Water Reclamation Plant (Cohuna):commenced refurbishment works and detailed investigation($1.15 million) to improve performance and meetEnvironment Protection Authority requirements
The Sewer Collection program had a total 2014/15 spend of$4.95 million and delivered the following key achievements:
> Spring Gully sewerage network augmentation (Bendigo):completed the Spring Gully sewerage network augmentation($1.15 million) to improve system capacity and reduceenvironmental issues in flood events
> Sewer Main Renewals (non-metro various*): completedannual program ($0.89 million) of sewer main renewals toimprove operational efficiencies and reduce blockages andoverflows to the environment
> Rochester to Echuca Water Reclamation Plant (Rochester):completed lagoon desludging and defects works($0.56 million) as part of decommissioning of the plant
The Rural program had a total 2014/15 spend of $7.94 millionand delivered the following key achievements:
> Rural system reconfiguration (Harcourt): commenced project($7.59 million) including; part construction of 65 kilometresof rural pipeline throughout the Harcourt area to replace theaged gravity channel system and completion of constructionof balancing storage tanks
This was the second year of our five year capital portfolio target of $171.9 million, bringing our two year cumulative total to $65.91million. During 2014/15 our project teams delivered a total of $27.76 million of works across various programs.
0 1,000 2,000 3,000 4,000 5,000 6,000 7,000 8,000 9,000
ADMINISTRATIONHEADWORKS
OPERATIONS SUPPORT
RAW WATER TRANSFER
RECYCLED WATER
RURAL
SEWER COLLECTION
SEWER TREATMENT
WATER RETICULATION
WATER TREATMENT
The Recycled Water program had a total 2014/15 spend of $0.42 million and delivered the following key achievements:
> Recycled water to Jackass Flat Phase B (Bendigo): completedconstruction ($0.24 million) of recycled water supply to anew residential development is Jackass Flat area
The Raw Water Transfer program had a total 2014/15 spend of$0.41 million and delivered the following key achievements:
> Coliban Main Channel renewals (Coliban Region):commenced construction of works ($0.24 million) includingflume replacement, erosion control and leakage control
The Operations Support program had a total 2014/15 spend of$2.46 million and delivered the following key achievements:
> Telemetry replacement (non-metro various*): completedannual program ($0.59 million) for the replacement andupgrade of digital network of telemetry assets
> Occupational Health and Safety upgrades of main channelofftakes (non-metro various): completed annual program ofworks ($0.38 million) to address hazards to staff and publicon the Coliban Main Channel
The Headworks program had a total 2014/15 spend of $0.75 million and delivered the following key achievements:
> Pine removal and revegetation (non-metro various*):continued progress of removing aged pine trees fromrecreation areas ($0.36 million) at catchment storages forsafety reasons. Revegetation at Lauriston and MalmsburyReservoirs completed
The Administration program had a total 2014/15 spend of$4.49 million and delivered the following key achievements:
> Echuca West Land Development (Echuca): completed theconstruction of water and sewerage services ($1.86 million)and sale of land for the Echuca West Land Development tothe Victorian Department of Education
> Planned corrective and reactive maintenance (non-metrovarious): completed annual program of renewals andrefurbishment of water, recycled water and sewer assets($1.03 million) to ensure levels of service are maintained
> Information technology improvements (non-metro various):completed implementation of the first year ($0.97 million*)of a three year strategy which aims to establish robustsystems and practices, and improve data integrity for use inthe preparation of innovative and transformational projectsin future years to come
2 0 1 4 / 1 5 CA P I TA L E X P E N D I T U R E ( $ ’ 0 0 0 s )
* Non-metro various indicates the project will deliver outcomes to more than one town and/or system in the Coliban Water Region.

COLIBAN WATER | ANNUAL REPORT | 2014–15 PAGE | 17
WAT E R Q UA L I T Y A N D R E L I A B I L I T Y
CUSTOMER SERVICE OBJECTIVES – WATER RETICULATION
There are 14 service standards that are reported to the EssentialServices Commission (ESC). These service standards relate tothe number and duration of supply interruptions, the responsetime to attend to pipeline bursts and leaks and the amount ofunaccounted for water.
Compliance was achieved with all 14 service standards, this is animprovement on only achieving compliance with 11 servicesstandards last financial year.
The improvement in the service we provide our customers can beattributed to continued efforts of both Coliban Water and ourservice providers to improve the management of our assets(especially our water main renewal works) and the reactiveresponse to incidents. Part of the improvement in theinterruption time indicator was due to previous misinterpretationof the ESC indicator by field operators which was clarified duringthe year through internal training.
WAT E R M A I N R E N E WA L
We replaced approximately three kilometres of water mainsacross ten sites in our region as part of our on-going water mainsrenewal program, at a cost of $1.08 million.
Sites are identified for replacement through a range of criteriaincluding the criticality, risk to customers, number of failures,number of supply interruptions, number of customers impactedand the assessed remaining useful life of the asset.
C H LO R I N AT E D F LU S H I N G P R O G R A MDuring the year, we undertook a chlorination flushing programthroughout Bendigo, Castlemaine and Kyneton. This programensures chlorine residuals are maintained across our network,assists in protecting the integrity of the system and that thedrinking water we supply to customers continues to meet therequired standards.
B E N D I G O WAT E R N E T WO R K C O N T I N G E N C Y P L A N SWe develop and maintain water network contingency plans toensure reliability of supply and pressure for our customers.Throughout the year, we were required to implementcontingency plans on two occasions:
> Edwards Road Tank supplies drinking water to over 5,000properties in Bendigo. The tank was taken offline for routinemaintenance over a period of two months
> Specimen Hill Storage supplies drinking water to cover22,000 properties in Bendigo. The storage was taken offlineduring planned works for four days
The successful implementation of network contingency plansensured both customer supply and pressures were maintained,and the planned work can be completed within set timeframes.
I N S TA L L AT I O N O F WAT E R F LOW M E T E R SIt is important to note that not all drinking water leaving theWater Treatment Plants are provided to customers. This water isreferred to as non-revenue water and is often the result ofleakage within ageing infrastructure. When leaks are identified,we initiate planned works to rectify the leaks and reduce anyfurther water loss. During the year, 12 new flow meters wereinstalled in the network to obtain accurate location pointswhere water loss is occurring. This has allowed us to easilylocate potential problem areas, carry out preventative works toreduce water loss and maximise water supplies for future useby customers.
WAT E R M A I N C O N D I T I O N A S S E S S M E N TDuring the year, a new approach was implemented to thecondition assessment of water pipes. Water mains throughoutour region were previously replaced following a predeterminedservice period and assessment of the criticality and impact tocustomers. The new method, developed this year with input fromnational and international industry associates, applies aperformance criteria to water main renewals. The new methodidentifies water mains requiring renewal, based on the level ofservice they provide to customers rather than the age. Themethod ensures renewals only occur on an as needed basis,reducing supply interruptions to our customers and improvingthe overall standard of service.
S A F E D R I N K I N G WAT E R ACT 2 0 0 3
Our water quality performance results for 2014/15 reflect theimprovements that have been implemented over the past fewyears, and indicate that these improvements are achieving thedesired outcome, with Coliban Water achieving 100 per centcompliance with the Escherichia coli (E.coli) water qualitystandard, as well as issuing no ‘Boil Water Notices’ during theyear.
In addition to achieving 100 per cent compliance with the E.coliwater quality standard, Coliban Water also achieved 100 per centcompliance with the turbidity and disinfection by-product (i.e.total trihalomethanes, haloacetic acids, bromate andformaldehyde) water quality standards, while four watersampling localities returned non-compliant results against thealuminium standard.
After receiving each non-compliant aluminium result, the watertreatment plants supplying the affected water samplinglocalities had their treatment processes investigated. Theassociated testing that was undertaken across the treatmentprocesses showed that the drinking water leaving these plantscomplied with the aluminium standard. In three cases,resampling at the sample point where the initial non-compliantresults were recorded returned compliant aluminium results. Thefourth test required some flushing to lower the concentration ofaluminium, as the point where the detection occurred was at theend of a long section of pipe with minimal flow. Follow-upresampling returned aluminium results that were compliant.
We commenced 2014/15 with two open undertakings with theDepartment of Health and Human Services (DHHS), undersection 30 of the Safe Drinking Water Act 2003. The firstundertaking, which dealt with the improved management of ourdrinking water supply systems in order to minimise E. colidetections, was due for completion by 31 December 2014. Anextension of the due date, to 31 May 2015, was requestedbecause of delays with the completion of capital worksassociated with the installation of new booster chlorinationunits, and DHHS approved the extension in December 2014. Thefinal report for the undertaking was submitted to DHHS by theamended due date requesting closure. We are currently awaitingthe Department’s response.
The second undertaking, which dealt with improved riskmanagement processes and procedures, had a completion dateof 31 December 2015. We were able to fulfill all the requirementsof the undertaking early, and our request for closure wasapproved in December 2014.
W E P R OV I D E WAT E R TO 7 2 , 1 2 6 P R O P E RT I E S I N O U R R E G I O N A N DW I T H O U R PA RT N E R S W E O P E R AT E 1 9 WAT E R T R E AT M E N T P L A N T S

WAT E R Q UA L I T Y A N D R E L I A B I L I T Y
COLIBAN WATER | ANNUAL REPORT | 2014–15PAGE | 18
WAT E R Q UA L I T YThe following table shows the compliance of our potable watersampling localities with the water quality standards specified inthe Schedule 2 of Safe Drinking Water Regulations 2005.
The townships of Borung, Dingee, Jarklin, Macorna, Mitiamo,Mysia and Wychitella were supplied with regulated water (i.e.non-potable water) during 2014/15.
Notes to water quality table:
1. Bendigo (Southern) and Bendigo (Spring Gully) localities are bothsupplied with drinking water from the Bendigo Water TreatmentPlant (WTP). Other samples taken within the Bendigo system onthe same day were all compliant with the aluminium water qualitystandard. A review was undertaken of the aluminium results withinthe treatment process at the Bendigo WTP and all were compliant.Resampling occured at the two sample points, and other pointswithin the same area, and all returned compliant results.
2. Aluminum is not used for coagulation, and chlorine is not used fordisinfection, at Elmore. Therefore, the risk of non-compliant levelsof aluminum and disinfection by-products being present in thedrinking water supplied by Coliban Water to Elmore is extremelylow, and hence these parameters are not part of Coliban Water’sroutine monitoring program.
3. The Gunbower water sampling locality recorded one weeklysample that exceeded the aluminum water quality standard listedin Schedule 2 of the Safe Drinking Water Regulations 2005. Twoother samples taken in the same system on the same day were wellbelow the standard. The sample point which returned the elevatedresult is located on a long, outlying pipeline, which has low flow.The pipeline was flushed until a resample was taken that returneda result below the standard.
4. The Laanecoorie WTP supplies water to the towns of Laanecoorie,Bealiba, Tarnagulla and Dunolly. All towns were sampled on thesame day, with only Laanecoorie returning a non-compliant resultfor aluminium. The sample results taken during the watertreatment process by the operator were all reviewed and found tobe compliant. Resampling was undertaken and these returnedcompliant results.
Water sampling
locality
E. c
oli (
orgs
/100
mL)
(>98
% s
ampl
es fr
eeof
E. c
oli)
Alum
iniu
m (m
g/L)
(aci
d so
lubl
e al
umin
ium
<=0.
2mg/
L)
Turb
idit
y (N
TU)
(95%
upp
er c
onfid
ence
limit
of m
ean
<5N
TU)
Dis
infe
ctio
n by
-pro
duct
s(m
g/L)
(all
resu
lts le
ssth
an s
tand
ard)
Bealiba ✓ ✓ ✓ ✓
Bendigo (Axedale) ✓ ✓ ✓ ✓
Bendigo (Northern) ✓ ✓ ✓ ✓
Bendigo (Raywood) ✓ ✓ ✓ ✓
Bendigo (Sebastian) ✓ ✓ ✓ ✓
Bendigo (Southern) ✓ ✘1 ✓ ✓
Bendigo (Spring Gully) ✓ ✘1 ✓ ✓
Big Hill ✓ ✓ ✓ ✓
Boort ✓ ✓ ✓ ✓
Bridgewater ✓ ✓ ✓ ✓
Castlemaine ✓ ✓ ✓ ✓
Cohuna (Rural) ✓ ✓ ✓ ✓
Cohuna (Urban) ✓ ✓ ✓ ✓
Dunolly ✓ ✓ ✓ ✓
Echuca ✓ ✓ ✓ ✓
Elmore ✓ N/A2 ✓ N/A2
Epsom-Huntly ✓ ✓ ✓ ✓
Fryerstown ✓ ✓ ✓ ✓
Goornong ✓ ✓ ✓ ✓
Guildford ✓ ✓ ✓ ✓
Gunbower ✓ ✘3 ✓ ✓
Harcourt ✓ ✓ ✓ ✓
Heathcote ✓ ✓ ✓ ✓
Inglewood ✓ ✓ ✓ ✓
Junortoun ✓ ✓ ✓ ✓
Korong Vale ✓ ✓ ✓ ✓
Kyneton ✓ ✓ ✓ ✓
Laanecoorie ✓ ✘4 ✓ ✓
Leitchville (Rural) ✓ ✓ ✓ ✓
Leitchville (Urban) ✓ ✓ ✓ ✓
Lockington ✓ ✓ ✓ ✓
Maiden Gully – Marong ✓ ✓ ✓ ✓
Maldon ✓ ✓ ✓ ✓
Malmsbury ✓ ✓ ✓ ✓
Newstead ✓ ✓ ✓ ✓
Pyramid Hill ✓ ✓ ✓ ✓
Rochester ✓ ✓ ✓ ✓
Serpentine ✓ ✓ ✓ ✓
Strathfieldsaye ✓ ✓ ✓ ✓
Taradale/Elphinstone ✓ ✓ ✓ ✓
Tarnagulla ✓ ✓ ✓ ✓
Tooborac ✓ ✓ ✓ ✓
Trentham ✓ ✓ ✓ ✓
Tylden ✓ ✓ ✓ ✓
Wedderburn ✓ ✓ ✓ ✓

COLIBAN WATER | ANNUAL REPORT | 2014–15 PAGE | 19
WAT E R Q UA L I T Y A N D R E L I A B I L I T Y
System
(Water
Treatment
Plant)
Water sampling
locality
Treatment process Added substances
Coag
ula
tion
Cla
rifi
cati
on
Filtr
ati
on
Tast
e /
od
ou
r /
alg
ae
toxin
rem
ova
l
pH
corr
ecti
on
Dis
infe
cti
on
Alu
m /
AC
H/
Poly
mer
Ble
nd
Poly
ele
ctr
oly
te
Acti
vate
d c
arb
on
Ozo
ne
Ult
ravi
ole
t
Lim
e /
sod
a a
sh /
cau
stic
sod
a /
carb
on
dio
xid
e /
sulp
hu
ric
aci
d
Ch
lori
ne
Am
mon
ia
Flu
ori
de
Bendigo
AxedaleBendigo NorthernBendigo Spring GullyBendigo SouthernBig HillEpsom – HuntlyJunortounMaiden Gully – MarongRaywood SebastianStrathfieldsaye
✓ M ✓ ✓ ✓ ✓ ✓ ✓ ✓ ✓ ✓ ✓
Boort Boort ✓ ✓ ✓ ✓ ✓ ✓ ✓ ✓ ✓
Bridgewater BridgewaterInglewood ✓ ✓ ✓ ✓ ✓ ✓ ✓ ✓ ✓ ✓ ✓
Castlemaine
CastlemaineFryerstownGuildfordHarcourt Maldon NewsteadTaradale – Elphinstone
✓ M ✓ ✓ ✓ ✓ ✓ ✓ ✓ ✓ ✓ ✓
Cohuna Cohuna (Rural)Cohuna (Urban) ✓ ✓ ✓ ✓ ✓ ✓ ✓ ✓ ✓ ✓ ✓
Echuca Echuca ✓ ✓ ✓ ✓ ✓ ✓ ✓ P ✓ ✓ ✓ ✓
Elmore Elmore ✓ ✓ ✓ ✓
Goornong Goornong ✓ ✓ ✓ ✓ ✓ ✓ ✓ ✓
Gunbower Gunbower ✓ ✓ M ✓ ✓ ✓ ✓ ✓ ✓ ✓ ✓
Heathcote HeathcoteTooborac ✓ ✓ ✓ ✓ ✓ ✓ ✓ ✓ ✓ ✓
Korong Vale Korong ValeWedderburn ✓ ✓ ✓ ✓ ✓ ✓ ✓ ✓ ✓ ✓
KynetonKynetonMalmsburyTylden
✓ M ✓ ✓ ✓ ✓ ✓ ✓ ✓ ✓ ✓ ✓
Laanecoorie
BealibaDunollyLaanecoorieTarnagulla
✓ ✓ ✓ ✓ ✓ ✓ ✓ ✓ ✓ ✓ ✓ ✓
Leitchville Leitchville (Rural)Leitchville (Urban) ✓ ✓ M ✓ ✓ ✓ ✓ P ✓ ✓ ✓
Lockington Lockington ✓ ✓ ✓ ✓ ✓ ✓ P ✓ ✓
Pyramid Hill Pyramid Hill ✓ ✓ ✓ ✓ ✓ ✓ ✓ ✓ P ✓ ✓
Rochester Rochester ✓ ✓ M ✓ ✓ ✓ ✓ P ✓ ✓ ✓ ✓
Serpentine Serpentine ✓ ✓ ✓ ✓ ✓ ✓ ✓ ✓ P ✓ ✓
Trentham Trentham M ✓ ✓ ✓ ✓ ✓ ✓
Legend: P = periodic as required, M = membrane filtration Please refer to our website www.coliban.com.au for further informationon our treatment process and the substances that we add to the water totreat it to a drinking water standard.
WAT E R T R E AT M E N T P R O C E S S E S
The following table shows how we treat our water to make it safe to drink.

COLIBAN WATER | ANNUAL REPORT | 2014–15PAGE | 20
Water SupplySystem
Wastewater Treated Water
C O N N E CT I O N S C O N N E CT I O N S U S AG E ( M L ) USAGE (KL/CONNECTION)
RESIDENTIALNON
RESIDENTIALTOTAL RESIDENTIAL
NONRESIDENTIAL
TOTAL RESIDENTIAL NON
RESIDENTIALTOTAL
5 YEARAVERAGE
RESIDENTIAL NON
RESIDENTIAL
Campaspe
Goornong N/A N/A N/A 149 25 174 30 9 39 34 201 360Total 0 0 0 149 25 174 30 9 39 34 201 360
Coliban Northern
Bendigo * 39,551 3,156 42,707 41,749 3,357 45,106 7,725 2,783 10,508 9,526 185 829Heathcote 736 103 839 1,060 128 1,188 142 90 232 201 134 703Axedale 108 11 119 113 17 130 23 5 28 23 204 294Raywood N/A N/A N/A 78 15 93 16 6 22 17 205 400Sebastian N/A N/A N/A 68 5 73 15 10 25 17 221 2,000Tooborac N/A N/A N/A 47 6 53 9 2 11 10 191 333Total 40,395 3,270 43,665 43,115 3,528 46,643 7,930 2,896 10,826 9,794 184 821
Coliban Southern
Castlemaine 3,917 349 4,266 4,631 403 5,034 732 708 1,440 1,296 158 1,757Kyneton 2,269 373 2,642 2,477 420 2,897 386 340 726 656 156 810Maldon 630 85 715 924 121 1,045 147 56 203 172 159 463Newstead 286 36 322 326 43 369 51 12 63 54 156 279Chewton 258 15 273 327 18 345 50 6 56 48 153 333Malmsbury 255 21 276 282 23 305 41 17 58 54 145 739Harcourt 190 17 207 248 25 273 49 11 60 55 198 440Taradale N/A N/A N/A 129 11 140 22 1 23 21 171 91Guildford N/A N/A N/A 125 9 134 19 2 21 19 152 222Tylden 135 9 144 114 11 125 17 12 29 23 149 1,091Fryerstown N/A N/A N/A 90 4 94 13 0 13 12 144 0Elphinstone N/A N/A N/A 78 7 85 12 5 17 17 154 714Total 7,940 905 8,845 9,751 1,095 10,846 1,539 1,170 2,709 2,427 158 1,068
Goulburn
Rochester 1,203 143 1,346 1,335 176 1,511 369 628 997 999 276 3,568Boort 377 71 448 393 92 485 101 33 134 115 257 359Pyramid Hill 246 36 282 255 49 304 52 28 80 75 204 571Lockington 185 25 210 190 32 222 39 12 51 42 205 375Serpentine N/A N/A N/A 63 21 84 13 3 16 15 206 143Mitiamo ** N/A N/A N/A 41 9 50 9 2 11 9 220 222Dingee ** N/A N/A N/A 29 11 40 5 3 8 7 172 273Macorna ** N/A N/A N/A 8 2 10 1 0 1 1 125 0Mysia ** N/A N/A N/A 8 1 9 0 0 0 1 0 0Total 2,011 275 2,286 2,322 393 2,715 589 709 1,298 1,264 254 1,804
Groundwater
Trentham 466 62 528 515 65 580 62 20 82 74 120 308Elmore 335 46 381 371 65 436 67 42 109 101 181 646Total 801 108 909 886 130 1,016 129 62 191 175 146 477
Loddon
Dunolly 331 52 383 395 59 454 53 15 68 59 134 254Inglewood 320 35 355 394 42 436 59 30 89 75 150 714Bridgewater 170 27 197 190 33 223 26 15 41 40 137 455Tarnagulla N/A N/A N/A 106 14 120 11 4 15 12 104 286Bealiba N/A N/A N/A 76 12 88 10 6 16 12 132 500Laanecoorie N/A N/A N/A 36 4 40 5 0 5 5 139 0Jarklin ** N/A N/A N/A 6 1 7 1 0 1 2 167 0Total 821 114 935 1,203 165 1,368 165 70 235 205 137 424
Murray
Echuca 5,736 789 6,525 5,979 839 6,818 1,656 1,348 3,004 2,659 277 1,607Cohuna 965 132 1,097 1,083 357 1,440 319 276 595 533 295 773Leitchville 142 30 172 155 119 274 46 111 157 162 297 933Gunbower 145 21 166 145 30 175 36 12 48 43 248 400Total 6,988 972 7,960 7,362 1,345 8,707 2,057 1,747 3,804 3,397 279 1,299
Wimmera
Wedderburn 388 54 442 440 60 500 64 34 98 79 145 567Korong Vale N/A N/A N/A 113 8 121 16 3 19 16 142 375Borung ** N/A N/A N/A 20 2 22 3 0 3 3 150 0Wychitella ** N/A N/A N/A 11 3 14 2 1 3 2 182 333Total 388 54 442 584 73 657 85 38 123 100 146 521
Grand Total 59,344 5,698 65,042 65,372 6,754 72,126 12,524 6,701 19,225 17,396 192 992
* Includes the areas of Eaglehawk, Huntly, Kangaroo Flat, Maiden Gully, Marong and Strathfieldsaye** Indicates non-treated water supply
WAT E R , WA S T E WAT E R C U S TO M E R S A N D WAT E R U S AG E BY SYS T E M

COLIBAN WATER | ANNUAL REPORT | 2014–15 PAGE | 21
WAT E R Q UA L I T Y A N D R E L I A B I L I T Y
MonthWeek 1 Week 2 Week 3 Week 4
K I LO L I T R E S P E R C O N N E CT I O N
July 2.8 2.9 3.0 3.0
August 3.0 3.1 3.2 3.2
September 3.3 3.3 3.4 3.5
October 3.6 3.8 4.1 4.2
November 4.6 4.8 4.8 4.9
December 5.2 5.3 5.6 6.0
January 5.6 5.5 5.2 5.2
February 5.0 5.4 5.3 5.2
March 4.8 4.5 4.3 4.2
April 4.1 3.8 3.6 3.4
May 3.2 3.0 3.0 2.9
June 2.9 2.9 2.8 2.8
Water Supply SystemTreated Water Non-
RevenueWater
(ML)Supplied
(ML)Usage(ML)
Campaspe 41 39 2
Coliban Northern 12,106 10,826 1,280
Coliban Southern 3,041 2,709 332
Goulburn 1,498 1,298 200
Groundwater 207 191 16
Loddon 318 235 83
Murray 4,290 3,804 486
Wimmera 204 123 81
total 21,705 19,225 2,480
W E E K LY H O U S E H O L D D R I N K I N G WAT E R C O N S U M P T I O N
M A J O R N O N - R E S I D E N T I A L WAT E R U S E R S
We had five non-residential water users within the range ofannual reporting.
M A J O R N O N - R E S I D E N T I A L C U S TO M E R S BY VO LU M E R A N G E
Usage range – megalitres per year (ML) Number ofcustomers
Equal to or greater than 200 MLand less than 300 ML 1
Equal to or greater than 300 MLand less than 400 ML 1
Equal to or greater than 400 MLand less than 500 ML 2
Equal to or greater than 500 MLand less than 750 ML 1
Equal to or greater than 750 MLand less than 1,000 ML 0
Greater than 1,000 ML 0
total 5
N O N - R E V E N U E WAT E R
The term non-revenue water is the difference between thevolume of bulk water that leaves our treatment plants (treatedwater supplied) and the volume of water for which we billcustomers (treated water usage). It has also been known asunaccounted for water.
Non-revenue water for 2014/15 was calculated to be 2,480megalitres (11.4 per cent). The Essential Services Commissiontarget of less than or equal to 15 per cent non-revenue water wasachieved.
WaterSupplySystem
Recycled Water
C O N N E CT I O N S U S AG E ( M L )
RESIDENTIALNON
RESIDENTIALTOTAL RESIDENTIAL
NONRESIDENTIAL
TOTAL
Bendigo 473 26 499 21 300 321
R E C YC L E D WAT E R C U S TO M E R S A N D U S AG E
The table above illustrates the indicative water consumptionpattern for a representative customer in our region.
Coliban Water supplies recycled water to third pipe customers inthe Bendigo region. In 2014/15 we supplied 21 megalitres toresidential customers and 300 megalitres to non-residentialcustomers.
M A J O R N O N - R E S I D E N T I A L C U S TO M E R S
• Hazeldenes Chicken Farm Pty Ltd
• Kagome Foods Australia Pty Ltd
• Murray Goulburn Co-operative Co Ltd
• N&C Enterprises Pty Ltd
• Parmalat Australia Ltd
We work with all our major water users to develop andimplement water conservation plans and principles.

COLIBAN WATER | ANNUAL REPORT | 2014–15PAGE | 22
Servicestandard
Actual
Sewerage blockages(per 100 kilometres)
53 63.20
Average time to attend sewer spillsand blockages (minutes)
30 30.45
Average time to rectify a sewerblockage (minutes)
80 79.02
Spills contained within five hours(per cent)
99% 100%
Customers receiving more than threesewer blockages in the year (number)
2 2
WA ST E WAT E R SYST E M
WAT E R R E C L A M AT I O N – SEWERAGE INFLUENT AND TREATED EFFLUENT VOLUMES
Water reclamation plants treat the sewage influent to a specifiedquality and then discharge the treated effluent for either reuseas recycled water or to waterways.
The following volumes were treated and discharged during2014/15.
This year improvements have been made at the following plants;
> Renewal works on the sludge treatment train at the BendigoWater Reclamation Plant
> Installed a discharge pumping station at the Kyneton WaterReclamation Plant
> Implemented flow meter and control modifications to theWedderburn Water Reclamation Plant
Ongoing desludging of lagoon based water reclamation plants toimprove their operational efficiency is required. Lagoondesludging works have been completed at Cohuna andRochester Water Reclamation Plants. Biosolids from the abovedesludging works as well as from previous desludging worksundertaken at the Kyneton Water Reclamation Plant has beenreused via application to farming land under EnvironmentProtection Authority (EPA) approvals.
*26.4 megalitres of unlicensed discharge from the Heathcote WaterReclamation Plant (WRP) winter storage lagoon to McIvor Creek wasperformed in a controlled manner as a precautionary measure to avoidthe uncontrolled release of excess water due to stormwater infiltrationto the WRP and lack of irrigation opportunities during the wet weatherperiod. This is not included in this data table due to Essential ServicesCommission (ESC) reporting requirements.
C U S TO M E R S S E RV I C E O BJ E CT I V E S – S E W E R AG E C O L L E CT I O N
Our Customer Charter contains five service standards that arereported to the Essential Services Commission (ESC). Theseservice standards relate to sewerage blockages (number per 100kilometers), average time to attend sewer spills and blockages,average time to rectify blockages, percentage of sewage spillscontained within five hours and number of customers receivingmore than three sewer blockages in a year. Compliance wasachieved with three of the five ESC service standards.Performance against each of the standards is included in thetable below.
W E P R OV I D E WA ST E WAT E R S E RV I C E S TO 6 5 , 0 4 2 P R O P E RT I E S I N O U R R E G I O NA N D W I T H O U R PA RT N E R S W E O P E R AT E 1 6 WAT E R R E C L A M AT I O N P L A N T S
Town
Sew
erag
e in
fluen
tM
egal
itre
s (m
l)
Tota
l effl
uent
disc
harg
edM
egal
itre
s (m
l)
Efflu
ent d
isch
arge
dto
wat
erw
ays
Meg
alit
res
(ml)
Efflu
ent d
isch
arge
dfo
r reu
seM
egal
itre
s (m
l)
Axedale 12.7 11.9 0 11.9
Bendigo 7,080.1 5,169.9 4,080.8 1,089.1
Boort 81.4 17.9 0 17.9
Bridgewater 56.6 0 0 0
Castlemaine 1,151.1 1,174.9 1,057.2 117.6
Cohuna 236.6 0 0 0
Dunolly 28.3 0 0 0
Echuca 1,929.7 1,463.7 0 1,463.7
Elmore 23.8 0 0 0
Gunbower 52.2 15 0 15
Heathcote 164.4 114.9 0* 114.9
Kyneton 704.3 620.8 291.1 329.6
Lockington 20.5 0 0 0
Pyramid Hill 38.2 14 0 14
Rochester 222.9 0 0 0
Wedderburn 32.7 23.9 0 23.9
total 11,835.5 8,626.7 5,429.2 3,197.5
Improved performance on sewer mains has been achievedcompared to the previous years. This is a direct result of theinvestment of resources into prevention maintenance programsand initiatives, including:
> Continuing our blockage prevention program (Stop theBlock) which proactively targets potential blockages in oursewer networks – completing around 780 preventative sewercleaning tasks, the equivalent of approximately 38 kilometersof sewer mains
> Targeting poor performing areas using CCTV technology
> Carrying out chemical treatment in 400 meters of sewermains which experienced repeat tree root blockages. It isplanned to expand this program in the coming year.
> Trialing a rapid sewer condition assessment programutilising acoustic technologies
> Undertaking relining works
With the introduction of the Water Supply and SewerageRegulations 2014, the responsibility for our sewerage assetschanged. The new regulations require all water corporations tomanage the section of the sanitary drain up to the connectionpoint within the property. Sanitary drains include all pipes andfittings for conveying sewage or trade waste from a customer tothe sewer main.
This new responsibility generally commences one meter insidethe property boundary and continues to the connection point tothe sewerage main. With the change in responsibility, blockagesin these assets are now included in our performance statistics.As these short sections of pipe are prone to blockages there hasbeen an adverse impact on the performance of a number ofindicators.

COLIBAN WATER | ANNUAL REPORT | 2014–15 PAGE | 23
WA ST E WAT E R SYST E M
S E W E R B LO C K AG E S
Blockage rates follow a seasonal trend, lowering over the summer months and peaking in the wintermonths. The blockage rates that occurred decreased from 13/14 figures, approaching our bestresults that were experienced in 2011. We are now well placed to continually improve ourperformance during the 2015/16 period.
The Blockage Rate Chart below now includes blockages that occurred within the sanitary drainsection, reflecting the recent change to regulations (discussed on page 22). Taking the regulationchanges into consideration, the sewer main blockage rate has declined over the 2014/15 periodcompared with the 2013/14 period. This is a direct result of greater investment of resources intosewer blockage prevention programs and initiatives.
S E W E R M A I N R E N E WA L
Our program for sewer main condition assessment and renewal has continued this year, prioritisedbased on criticality (risk), age and structural condition.
A total of 107 sewer main sections have been renewed during the year equivalent to approximatelyfive kilometers of sewerage main, as well as assessing and inspecting around 200 associated sewermanholes. Major renewals included the replacement of a trunk main in Spring Gully, required as aresult of wet weather issues and frequent blockages and the replacement of a 900 millimetres mainnear the Bendigo Water Reclamation Plant due to poor condition.
0
20
40
60
80
100
120
140
JUN
2006
SEP
2006
DEC
2006
MAR
2007
JUN
2007
SEP
2007
DEC
2007
MAR
2008
JUN
2008
SEP
2008
DEC
2008
MAR
2009
JUN
2009
SEP
2009
DEC
2009
MAR
2010
JUN
2010
SEP
2010
DEC
2010
MAR
2011
JUN
2011
SEP
2011
DEC
2011
MAR
2012
JUN
2012
SEP
2012
DEC
2012
MAR
2013
JUN
2013
SEP
2013
DEC
2013
MAR
2014
JUN
2014
SEP
2014
DEC
2014
MAR
2015
JUN
2015
BENDIGO WORK ORDERS BLOCKAGE PER 100KM (BENDIGO)
SANITARYDRAINSECTION NOWINCLUDED
BLOCKAGE PER 100KM (SYSTEM TOTAL)

WA ST E WAT E R SYST E M
O D O U R M A N AG E M E N T
A total of 112 odour complaints in relation to our assets werereceived in 2014/15. Approximately 12 per cent of these wereunable to be verified as part of either investigations orinspections. The majority of the complaints related to odour fromthe sewer network or odour from sewerage pumping stations.
We continued to operate our existing odour control facilities andmonitor odours at critical sites within our sewer networks. Newodour control facilities were installed on one of our Castlemainetrade waste mains and an investigation into the odour controlfacility upgrade at one of our Bendigo Sewer Pumping Stationswas completed.
We are continually improving our understanding of the impactsof corrosive sewer gases on our network to improve long-termasset management. This has included odour logging andsampling throughout our sewer network with particular focus onthe Bendigo and Echuca systems
T R A D E WA S T E
We maintained our active program to control potential impactson our wastewater network and water reclamation plants fromtrade waste customers.
During the year we have:
> Renewed trade waste agreements with majority of our majortrade waste customers, including the new Bendigo Hospital.This will ensure improved control of discharges into oursewer systems
> Continued to improve our trade waste monitoring program.This has provided us with greater understanding of inputsinto our system and provides our customers with moretimely information to help them to improve performance andreduce trade waste costs
INFLOW AND INFILTRATION STRATEGY IMPLEMENTATION
Inflow and Infiltration is the ingress of stormwater andgroundwater into the sewer systems. The additional flowsimpact on the performance of our sewerage network and waterreclamation plants. Implementation continued for the Inflow andInfiltration Strategy in the 2014/15 period. The works completedincluded flow monitoring, manhole inspections, CCTVinvestigations and smoke testing in the Kyneton and Bendigosewerage systems.
RAPID GRAVITY SEWER AND MANHOLE ASSESSMENT TRIAL
An innovative trial to improve our preventative maintenanceprograms through better prioritisation of resources wasundertaken. The trial utilised innovative assessment tools andtechniques including purchasing acoustic technology(SewerBATT) and refining our procedures for manhole conditionassessment. Trials have been carried out in the Kyneton andBendigo sewer systems.
COLIBAN WATER | ANNUAL REPORT | 2014–15PAGE | 24
0
20
40
60
80
100
120
140
0
5
10
15
20
25
30
JUL 2
007
OCT
2007
JAN
2008
APR
2008
JUL 2
008
OCT
2008
JAN
2009
APR
2009
JUL 2
009
OCT
2009
JAN
2010
APR
2010
JUL 2
010
OCT
2010
JAN
2011
APR
2011
JUL 2
011
OCT
2011
JAN
2012
APR
2012
JUL 2
012
OCT
2012
JAN
2013
APR
2013
JUL 2
013
OCT
2013
JAN
2014
APR
2014
JUL 2
014
OCT
2014
JAN
2015
APR
2015
TOTA
L YE
ARLY
COM
PLAI
NTS
NUM
BER
OF M
ONTH
LY C
OMPL
AINT
S
TOTAL YEARLY COMPLAINTSNUMBER OF MONTHLY COMPLAINTS

COLIBAN WATER | ANNUAL REPORT | 2014–15 PAGE | 25
P E O P L E A N D D E V E LO P M E N T
WO R K F O R C E I N C LU S I O N
Coliban Water performs better than industry average for keydemographic indicators.
We have a rich cultural diversity with 13 per cent of our workforcenot born in Australia and 11 per cent who speak languages otherthan English at home.
The number of females employed by Coliban Water continues togrow, up from 32 per cent in 2013/14 to 36 per cent in 2014/15.
We will formalise our approach to being an inclusive employer in2015/16 with the development of a Workforce Diversity Policy.
O U R T R A D E M A R K B E H AV I O U R S
Our trademark behaviours guide our interactions with eachother, our customers and our stakeholders. Our trademarkbehaviours are:
> Trust – the team and the people within Coliban Water
> Honesty – always be honest in all situations, good or bad
> Unified – one consistent message
> Committed – do what it takes to achieve the best outcomes
D E V E LO P I N G O U R P E O P L E
We have continued our ongoing commitment to developing ourpeople. Highlights during the year have included:
> The design and successful implementation of the ‘Bring YourBest Self to Work’ program. This ensures that all ColibanWater employees understand and model the behaviours andvalues set out in the Code of Conduct for Victorian PublicSector Employees, Coliban Water’s trademark behavioursand Equal Employment Opportunity legislation.
> The expansion of our in-sourced Education and ProfessionalDevelopment Programs has provided an efficient deliverymodel to provide opportunities for all employees to developtheir leadership, management, computing, communications,business writing and incident management capability. Wecontinue to achieve valuable time and cost savings, and thisprogram will be tailored to meet the future developmentneeds of our people.
> Improving the health and overall wellbeing of our workforcethrough the implementation of our Employee WellbeingProgram.
Employees 2014/15 2013/14
Executive Officers 7 7
Senior Managers 21 19
Office-based staff 144 137
Field Staff 23 25
total 195 188
Full-time 175 166
Part-time 19 19
Casual 1 3
total 195 188
Full-time equivalent 190.43 182.1
Male 124 126
Female 71 62
total 195 188
E M P LOY E E S TAT I S T I C S
Our Corporate Structure can be found on page 33.
WO R K I N G AT C O L I BA N WAT E R
Our employees have expertise and experience in a variety ofdisciplines including Customer Support, Engineering, WaterQuality, Environmental Science, Project Management, Plumbing,Accounting, Economics, Human Resources, CorporateCommunications, Governance and Administration.
E M P LOY E E R E L AT I O N SIn June 2015 we implemented a new Enterprise Agreement.
Our Employee Consultative Committee includes representativesfrom staff and management and has a charter to oversee theimplementation of the Enterprise Agreement.
This committee will be instrumental to ensuring the EnterpriseAgreement encourages and enables our workforce to achieveimproved business performance.
There was no time lost due to industrial disputes during the year.
E M P LOY E E T R A I N I N G A N D D E V E LO P M E N TAll employees participate in our Performance DevelopmentProgram (PDP). This process aligns individual expectations withbusiness objectives and enables staff and managers to identifyopportunities for formal training and professional development.
We continue to support employees who wish to undertakeformal study at undergraduate and postgraduate levels andcurrently have several staff combining their work with part-timetertiary education, and those who wish to participate inprofessional development opportunities available within thewater industry sector.
Professional developmentactivities 2014/15 2013/14
Total training hours 6,935 5,891
Total training investment $509,553 $429,957

P E O P L E A N D D E V E LO P M E N T
AT T R ACT I O N A N D R E T E N T I O N
We have adopted the Victorian Public Sector employmentprinciples of:
> Fair and reasonable treatment
> Equal opportunity
> Merit in employment
> Reasonable avenue of redress against unfair andunreasonable treatment
These principles underpin our human resources policies andpractice.
Employers must ensure that:
> Decisions are based on merit
> Employees are treated fairly and reasonably
> Equal employment opportunity is provided
> Reasonable avenues of redress against unfair orunreasonable treatment
Employees must:
> Act with impartiality
> Display integrity, including avoiding real or apparentconflicts of interest
> Be accountable for their actions
> Provide responsive service
Together with our business partners, we provide employment for284 people throughout the region.
O U R B U S I N E S S PA RT N E R S
On 1 July 2013 Coliban Water’s new Operations and MaintenanceServices Contract commenced. This contract was awarded toLendlease Services Pty Ltd for a period of four years, withoptions for two further 5 year terms.
The scope of this contract includes operations and maintenanceof water and wastewater assets in our region, excluding watertreatment at Bendigo, Castlemaine and Kyneton, and wastewatertreatment at Echuca and Rochester.
We also manage two public private partnerships:
> Aqua 2000 – Bendigo Water Services Pty Ltd (BWS) BWS is owned by Veolia Water Australia. The company owns
and operates water treatment plants for Bendigo,Castlemaine and Kyneton areas under a 25 year Build OwnOperate Transfer (BOOT) contract that started in June 2002.
> Campaspe Water Reclamation Scheme – ETE Coliban Pty Ltd (ETEC) ETEC is owned by Pentair Water Operations Australia Pty Ltd.
The company owns and operates the Echuca and RochesterWater Reclamation Plants under a 25 year Build Own OperateTransfer (BOOT) contract that commenced in September2004.
We also have a joint venture with Central Highlands Water (CHW)to operate and maintain the Goldfields Superpipe, constructedfrom Colbinabbin – Bendigo – Ballarat in 2007/08. Veolia Wateris contracted to operate the Superpipe on the joint venture’sbehalf.
COLIBAN WATER | ANNUAL REPORT | 2014–15PAGE | 26

COLIBAN WATER | ANNUAL REPORT | 2014–15 PAGE | 27
E N V I R O N M E N TA L S U STA I N A B I L I T Y
We engage with regional stakeholders including the Departmentof Environment, Land, Water and Planning (DELWP), EnvironmentProtection Authority (EPA), North Central CatchmentManagement Authority (CMA), Goulburn-Murray Water, ParksVictoria, traditional land owners and the nine local governmentareas covering the region in which we operate.
Our certified Environmental Management System helps usdeliver positive environmental outcomes and manage impactsassociated with our activities.
This, along with our Sustainability Strategy, embedssustainability as part of our contribution to regionaldevelopment.
Key initiatives for the year includes:
> Review of electricity demand management opportunities
> Promotion and support of urban water cycle initiatives in the region
> Implementation of our Drinking Water Storage and LandManagement Plan for our three Coliban River storages
> Biological monitoring of waterways impacted by waterdischarges from our Bendigo, Castlemaine and KynetonWater Reclamation Plants
S U S TA I N A B L E WAT E R U S E
We are continuing to manage for sustainable water use acrossour region.
We manage our water resources consistent with the watersecurity outlook, as well as relevant operational plans.
The objective is to ensure that water is appropriately stored forfuture years and to minimise evaporation losses. Likewise, ourbulk water accounts with external water storage managers aremanaged to ensure the long term sustainability of our watersupplies.
Our water supply leak detection and water mains replacementprogram continues, as does the program to minimise the loss ofwater at water treatment plants, including the implementation ofwashwater recycling at Heathcote Water Treatment Plant.
During 2014/15, the then Victorian Government made fundingcommitments for projects under its Living Victoria programme, todeliver Whole-of-Water-Cycle management outcomes in Bendigo.
The projects include:
> $966,985 for the City of Bendigo to harvest and treatstormwater at the newly-redeveloped Bendigo Airport toflush toilets and irrigate newly landscaped areas
> $62,000 to trial an innovative way of treating recycled waterat the Axedale Golf Club to improve soil quality and waterefficiency
> $759,112 to the Marist College new school development thatwill incorporate Whole-of-Water-Cycle management tocapture and re-use all water on-site
SUSTAINABLE AND RESILIENT WATER SERVICES SYSTEMS
We continue to work with our stakeholders to ensure sustainableand resilient water services systems.
The Harcourt Rural Modernisation Project is proceeding, as partof our broader rural services efficiency program.
We continue to work with developers and other stakeholders toinvestigate options for more decentralised provisioning of waterand wastewater services.
Coliban Water is strongly supporting DELWP’s work to engage onoptions to minimise impacts and maximise benefits ofBendigo’s rising groundwater.
During 2014/15, we launched the Choose Tap initiative in ourregion, which promotes the benefits of drinking tap water as partof a healthy lifestyle, as a positive alternative to bottled water.
E N E R GY M A N AG E M E N T
We continue to strengthen our approach to energy managementin the business. This strategic approach encompassesprocurement, demand-side management, energy efficiencyinitiatives and industry partnerships.
The main office is currently in the process of having an LEDlighting retrofit. This project is expected to reduce electricityconsumption of the lighting by 50 per cent.
B I O D I V E R S I T Y
We manage approximately 4,585 hectares of land across fivebioregions in North Central Victoria.
During the year, we updated our register of threatened flora andfauna, which now includes 25 plant and 28 fauna species. Asurvey of the Bendigo Water Reclamation Plant again recorded athriving population of the threatened Growling Grass Frog.
Community members continue to help us by surveying andphotographing bird species at the Bendigo Water ReclamationPlant, with a total of 118 bird species being sighted so far.
L A N D A N D CATC H M E N T S
We manage land across our catchments and operational area toprotect water quality in our storages, enhance river health, aswell as meet biodiversity, fire hazard and pest managementobligations. Further to this we give considerations to theprinciples set out in the Regional Catchment Strategy, VictorianWaterway Management Strategy and the State EnvironmentalProtection Policy.
During 2014/15, our land and catchment group continued withpest plant management programs around Malmsbury, Lauristonand Upper Coliban storages, as well as Barkers Creek andTrentham reservoirs.
Our pest plant management activities for rural channels focus oninvasive weeds, such as gorse and blackberries, that impact onour adjoining landowners, as well as on aquatic weeds such asnut-grass and umbrella sedge, which can restrict flows tocustomers.
We continue to reduce fuel loads through slashing programs andinspections of potentially hazardous trees, to minimise risks toadjacent landowners and public areas. We engaged specialistcontractors to prune hazardous trees at Barker Creek Reservoir,to minimise the risk of limb shed and retain aerial habitat.
W E A R E C O M M I T T E D TO B E I N G A N AC T I V E L E A D E R I N S U STA I N A B I L I T Y P E R F O R M A N C E AC R O S S O U R R E G I O N

E N V I R O N M E N TA L S U STA I N A B I L I T Y
We have completed revegetation at Malmsbury and LauristonReservoir Recreation Reserves, with contributions from twosuccessful community planting events. Macedon Ranges ShireCouncil has approved plans for the removal and revegetation ofthe remaining pine stands at all three Coliban River storages,with a view to the work going to tender in 2015/16.
In February 2015, we released our Water Drinking Water Storagesand Land Management Plan at a community informationsession. The session was attended by 38 people. Manylandholders with property adjoining the Upper Coliban,Lauriston and Malmsbury Reservoirs are now taking up thefencing and off storage watering incentives. 2,300 metres offencing is currently being installed along the boundary of one ofour largest neighbouring properties at Malmsbury Reservoir.
Coliban Water has partnered with the Department of Economic,Development, Jobs, Transport and Resources (DEDJTR) on aseries of land management workshops. Four workshops arebeing offered to landholders and community membersneighbouring Coliban River storages. A fifth workshop, focusedon computer based farm mapping to assist with landownerplanning and budgeting, may also be arranged.
CATC H M E N T P L A N N I N G A N D P R OT E CT I O N
We are responsible for providing statutory and strategic land useplanning engagement with municipalities where sewer is notconnected.
As part of our role in declared water supply catchments, we haveprovided responses to planning permit applications referred tous from local government under clause 66.02-5 of the ‘SpecialWater Supply Catchment’ of relevant planning schemes.
Our responses provide support with conditions to applicationsfor use and development of privately owned land in open watersupply catchments, to ensure minimal impacts on the qualityand quantity of water to the environment. On occasion, we havealso objected to the issuing of a planning permit, where weconsider there is potential for adverse impacts.
E N V I R O N M E N TA L C O M P L I A N C E
We have continued to increase compliance with our EnvironmentProtection Authority (EPA) Licence in 2014/15. This includescompliance with the odour requirements from traditionalsources and the management of discharge volumes from theBendigo and Kyneton Water Reclamation Plants, which havehistorically affected our performance.
Constraints on plant capacities led to challenges in managingtreated water storage volumes at Kyneton and Heathcote WaterReclamation Plants (WRP). Due to recent changes in the EPA’smanagement of licensed wastewater treatment facilities andemergency discharges, a Section 30A emergency discharge is nolonger deemed an appropriate approval process for unlicenseddischarges of this nature.
EPA Licences for water reclamation plants have been amendedto enable emergency discharges, provided the prescribed criteriaare met. During 2014/15, the Heathcote WRP was unable tocomply with these criteria, resulting in the occurrence ofunlicensed discharges.
A preventative action plan has been implemented as part of ourongoing operations to minimise the likelihood of emergencydischarges from our facilities. Investigations and project workswill be completed to achieve short and long term improvements.
Our Annual Performance Statement for 2014/15 will include thefollowing four non-compliances against our licence:
On 26 November 2014, following an unlicensed discharge fromthe Heathcote WRP, the EPA served Coliban Water with aPollution Abatement Notice (PAN). This required us to provideEPA with project plans for the mitigation of capacity constraintsthat otherwise would have prevented future unlicenseddischarges. We have complied and the PAN was revoked on 17 April 2015.
On 18 December 2014, an Official Warning was also servedregarding this discharge from the Heathcote WRP.
We carried out desludging and other works at Cohuna WRP, inpreparation for future actions to protect the integrity of storagelagoon embankments, pursuant to a PAN issued in 2013/14.
During 2014/15, the EPA was also notified of 20 environmentally-significant spills from our sewer catchment systems. We provideimmediate response and priority clean-up in such cases,particularly in areas of unrestricted public access or sensitiveland uses. Our operators utilise standard operating proceduresdesigned to protect public health and minimise theenvironmental impact of spills.
COLIBAN WATER | ANNUAL REPORT | 2014–15PAGE | 28
Requirement Location Date Description
LI_G1HeathcoteWRP
5/8/2014Discharge from WinterStorage to McIvor Creek
LI_G1EpsomWRP
28/1/2015Discharge of Class CRecycled Water to WallenjoeRoad
LI_A1EpsomWRP
7–9/3/2015Discharge of offensive odourfrom Brine Lagoon
LI_DW2.10KynetonWRP
9/4/2015
Discharge under approvedsection 30A forcommissioning ofpump station

COLIBAN WATER | ANNUAL REPORT | 2014–15 PAGE | 29
E N V I R O N M E N TA L S U STA I N A B I L I T Y
G R E E N H O U S E GAS E M I S S I O N S A N D N E T E N E R GY C O N S U M P T I O N
We generate two types of emissions as a result of providing water and wastewater services:
> Direct (‘Scope 1’) emissions from ‘on-site’ sources at water reclamation plants – includingemissions from biosolids stockpiles, lagoons, sewerage treatment processes and fuelconsumption.
> Indirect (‘Scope 2’) emissions from the generation of the electricity we consume through ournetworks, plants and buildings, including water treatment and supply
For the year, our emissions were as follows:
Our business activities generated approximately 44,005.8 tonnes of CO2 equivalent emissions. Thisincludes electricity used for our Build Own Operate Transfer (BOOT) schemes for Bendigo,Castlemaine and Kyneton Water Treatment Plants and Wastewater treatment Scope 1 emissions.
Our Greener Office Program includes the purchase and lease of lower emission vehicles, promotionof reduce-reuse-recycle material within the office, collection of redundant electrical equipment anduse of stationery items with recycled paper content.
C O R P O R AT E WAT E R C O N S U M P T I O N
At our Bendigo head office, we consumed 4.24 kilolitres per year per Full-Time Equivalent (FTE) staffmember working, or 225L/m2 in terms of floor area.
2014/15 2013/14 2012/13 2011/12 2010/11
Sewerage Treatment andSupply (tonnes CO2-eq)
23,925.5 27,351 20,148 20,985.3 21,420.7
Water Treatment and Supply(tonnes CO2-eq)
18,500.6 10,407.4 6,778.6 10,480.1 9,626.6
Depots and Offices(tonnes CO2-eq)
629.2 662.2 797.4 622.7 641
Transport (tonnes CO2-eq) 950.5 932 1,045.8 1,036.8 985.7
total 44,005.8 39,352.6 28,769.8 33,124.9 32,674
Note: Sewerage Treatment and Supply is 2914.5 tonnes of CO2-eq (Scope 1) and 18713.3 tonnes ofCO2-eq (Scope 2).
2014/15 2013/14 2012/13 2011/12 2010/11
Sewerage Treatment andSupply (MJ/ML)
5,416 4,220.2 N/A N/A N/A
Water Treatment and Supply(MJ/ML)
2,646.8 786.1 N/A N/A N/A
Head office water consumption 2014/15 2013/14 2012/13
Total water consumption (kilolitres) 808 802 668
Full-time equivalent (FTE) staff 190.43 182 165
Volume per FTE (kilolitres) 4.24 4.41 4.05
Total water consumption applies to 30 & 37–45 Bridge Street Bendigo
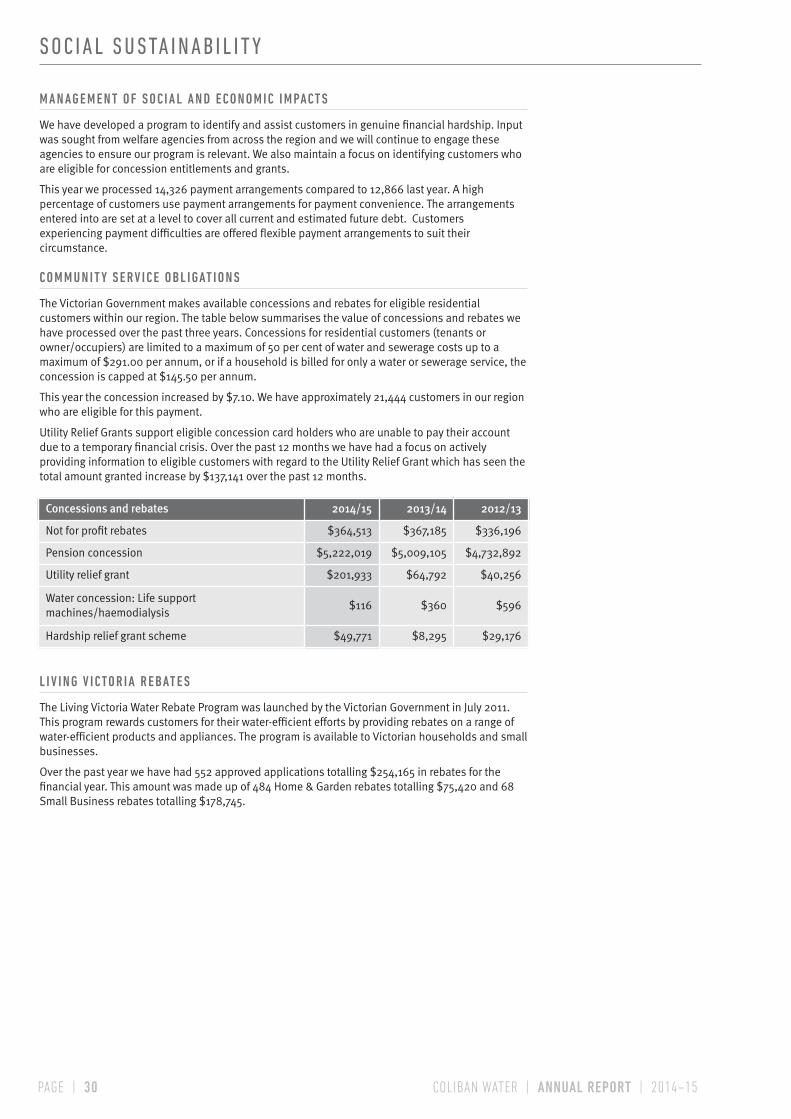
S O C I A L S U STA I N A B I L I T Y
M A N AG E M E N T O F S O C I A L A N D E C O N O M I C I M PACT S
We have developed a program to identify and assist customers in genuine financial hardship. Inputwas sought from welfare agencies from across the region and we will continue to engage theseagencies to ensure our program is relevant. We also maintain a focus on identifying customers whoare eligible for concession entitlements and grants.
This year we processed 14,326 payment arrangements compared to 12,866 last year. A highpercentage of customers use payment arrangements for payment convenience. The arrangementsentered into are set at a level to cover all current and estimated future debt. Customersexperiencing payment difficulties are offered flexible payment arrangements to suit theircircumstance.
C O M M U N I T Y S E RV I C E O B L I GAT I O N S
The Victorian Government makes available concessions and rebates for eligible residentialcustomers within our region. The table below summarises the value of concessions and rebates wehave processed over the past three years. Concessions for residential customers (tenants orowner/occupiers) are limited to a maximum of 50 per cent of water and sewerage costs up to amaximum of $291.00 per annum, or if a household is billed for only a water or sewerage service, theconcession is capped at $145.50 per annum.
This year the concession increased by $7.10. We have approximately 21,444 customers in our regionwho are eligible for this payment.
Utility Relief Grants support eligible concession card holders who are unable to pay their accountdue to a temporary financial crisis. Over the past 12 months we have had a focus on activelyproviding information to eligible customers with regard to the Utility Relief Grant which has seen thetotal amount granted increase by $137,141 over the past 12 months.
L I V I N G V I CTO R I A R E BAT E S
The Living Victoria Water Rebate Program was launched by the Victorian Government in July 2011.This program rewards customers for their water-efficient efforts by providing rebates on a range ofwater-efficient products and appliances. The program is available to Victorian households and smallbusinesses.
Over the past year we have had 552 approved applications totalling $254,165 in rebates for thefinancial year. This amount was made up of 484 Home & Garden rebates totalling $75,420 and 68Small Business rebates totalling $178,745.
COLIBAN WATER | ANNUAL REPORT | 2014–15PAGE | 30
Concessions and rebates 2014/15 2013/14 2012/13
Not for profit rebates $364,513 $367,185 $336,196
Pension concession $5,222,019 $5,009,105 $4,732,892
Utility relief grant $201,933 $64,792 $40,256
Water concession: Life supportmachines/haemodialysis
$116 $360 $596
Hardship relief grant scheme $49,771 $8,295 $29,176

COLIBAN WATER | ANNUAL REPORT | 2014–15 PAGE | 31
G OV E R N A N C E A N D R I S K
A N D R E W CA I R N S
ChairmanBEng (Electrical), Assoc Fellow AIM, MAICD.
Andrew Cairns was appointed as a Director of the Board inOctober 2007 and as Chairperson in October 2011.
He is currently the Head of Customer Led Connections atBendigo and Adelaide Bank Ltd (2012 - current) and waspreviously the Head of Community Solutions and Partnering forBendigo and Adelaide Bank Ltd (2010 - 2012). He has heldsenior management positions with a range of private sectororganisations including as Chief Executive Officer of CommunityTelco Australia Pty Ltd (2001 – 2010). Mr Cairns is a Boardmember of Community Telco Australia and Loddon MalleeHousing Services and Bendigo Affordable Housing Company.
Mr Cairns has a Bachelor of Engineering (Electrical) and hascompleted the Australian Institute of Company Directors Course.
J E F F R I G BY
Managing DirectorBEng (Civil), MEngSc, MBA, CPEng, FIEAust, FAICD, FGIA, FCIS.
Jeff Rigby was appointed by the Board and commenced atColiban Water in December 2011.
Mr Rigby has 30 years of experience in the water industry,including 14 years in executive management roles. He waspreviously the Managing Director of Grampians Wimmera MalleeWater from 2007 until joining Coliban Water in 2011. Mr Rigby iscurrently a Board Director of the Grampians Central West Wasteand Resource Recovery Group and Chairman of the Group’sAudit Committee.
He is a past member and a former Chairman of both the Loddon-Mallee Regional Council and the Grampians Regional Council forAdult, Community and Further Education (2009 to 2014), and heserved as a Board member for two regionally-based, not-forprofit disability enterprises (2000 to 2010), including a term asthe Chairman of one of those organisations (2008 to 2010).
Mr Rigby is a chartered professional engineer and charteredsecretary. He is a Fellow of Engineers Australia, the AustralianInstitute of Company Directors and the Governance Institute ofAustralia.
R U S S E L L A WA L K E R
Deputy ChairmanFCPA, MAICD, DipBus (Acc), GradDip (Govt Acc).
Russell Walker was appointed to the Board on 1 July 2010 andelected Deputy Chairman in November 2013.
Mr Walker has extensive experience in both the not-for-profit andpublic sectors. He was a former Assistant Auditor General forVictoria, a Commissioner on the Victorian Commission of Audit,and has undertaken a number of consultancies, including for theVictorian Parliament’s Public Accounts and Estimates Committee.
He is President of Guide Dogs Victoria, Board member of RoyalGuide Dogs Australia and Macedon Ranges Health, and formerChair of a Western Bulldogs Football Club fundraising group. MrWalker has a Diploma of Business Accounting, GraduateDiploma in Government Accounting, Member of AICD and Fellowof CPA Australia.
R O D N E Y T H O M S O NBEng (Mech), Grad Dip Bus. Admin.
Appointed to the Board on 1 October 2011, Mr Thomson is theowner and Managing Director of Bendigo Pottery and has workedin a number of manufacturing businesses in different industries.
He has been a director of Bendigo Business Council, The BendigoTrust, Bendigo Tourism Board, Chair of Goldfields Tourism Inc.and is currently a member of Bendigo Manufacturing Group andAustralian Industry Group Regional Committee.
L I N DA V E R O N E S E BComm (Melb), CPA, GAICD, PMIIA
Linda Veronese was appointed to the Board on 1 October 2012.
Ms Veronese is the Head of Group Assurance at the Bendigo andAdelaide Bank with a strong background in public and privatesector risk management, compliance and auditing.
Ms Veronese previously held positions with the Victorian AuditorGeneral Office (including two years as a Director) and theDepartment of Transport.
She is a member of CPA, professional member of the Institute ofInternal Audit (PMIIA), a member of the Bendigo RegionalCommittee of the AICD and member of the Audit and RiskCommittee of the IIA.
A S A P U B L I C S E C TO R O R GA N I S AT I O N , I T I S I M P O RTA N T T H AT W E P R O M OT E A N DI N ST I L L A C U LT U R E O F O P E N N E S S , T R A N S PA R E N C Y A N D G O O D G OV E R N A N C E .
B OA R D R E S P O N S I B I L I T I E S
Our Board comprises eight Directors, seven Non-Executive Directors that are appointed by the Victorian Minister for Water, and aManaging Director appointed by the Board.
The Board is responsible for the overall strategy and corporate governance of the business, which includes:
> setting the strategic direction for the business
> monitoring the performance of the business against objectives and targets
> monitoring the strategic risks of the business
> setting the executive remuneration policy
The Board also establishes policies and procedures to ensure we meet all of our regulatory and legal responsibilities.
A Statement of Obligations outlining the service, accountability and reporting obligations of our Board is available from our website.
The Board meets formally each month, and convenes informally as required to discuss specific issues and projects.
In the past year there have been no new appointments to the Board.
B OA R D D I R E CTO R S A S AT 3 0 J U N E 2 0 1 5

G OV E R N A N C E A N D R I S K
D E B O R A H H A M B L E TO NBA, Bachelor of Laws (Hons), GAICD
Appointed to the Board on 1 October 2013, Ms Hambleton is apart time legal consultant at Bendigo and Adelaide Bank andpreviously Group General Counsel. She has held a number ofsenior roles including at Deutsche Bank, ASX and ArthurRobinson and Hedderwicks.
Ms Hambleton is a non-executive director of Kyneton DistrictHealth Service, a member of the Bendigo Regional Committee ofAICD and a member of a number of professional committees,including with the Law Council of Australia and GovernanceInstitute of Australia.
A P R I L M E R R I C KBAgSci(Hons), Grad Cert Climate Change for Primary Industries, GAICD.
April Merrick was appointed to the Board on 1 October 2013. MsMerrick is the principal consultant and joint director of CreeklinePty Ltd and was previously the Executive Officer of Bjarne K DahlTrust (2011 – 2014). Ms Merrick has a background as a scientistand previously held positions with the North Central CMA andwas a Senior Research Scientist with the Victorian Department ofPrimary Industries. Ms Merrick is the Treasurer of ConnectingCountry Committee of Management (2012 – current) and is aTrustee of Live and Learn Environmental Education. Ms Merrickhas also been a member of the Winton Wetlands Committee ofManagement (2012 – 2014).
Ms Merrick has a Bachelor of Agricultural Science (Honours), aPost Graduate Certificate in Climate Change for PrimaryIndustries and is a graduate of the Australian Institute ofCompany Directors.
DAV I D R I C H A R D S O NBA, MBA, GAICD
David Richardson was appointed as a Director of the Board inMay 2014. Mr Richardson is Chief Executive Officer of Strategem(2007 – current), a Bendigo and Melbourne based Accounting,Advisory and Wealth Management Company. David hasextensive experience in a wide number of executivemanagement roles and has worked for the Department ofPrimary Industries (2002 – 2007) and the University ofMelbourne (2000 – 2002).
Mr Richardson is also a Director of the Bendigo Art Gallery (2014to present), has been Chairman of the Victorian Employers’Chamber of Commerce & Industry, Small Business Council (2010to 2014) and is a member of the VECCI Executive Council (2013 –current). He has also been Chairman of the Bendigo ProfessionalServices Group for the City of Greater Bendigo (2009 to 2013)and Vice Chair of La Trobe University Bendigo’s RegionalAdvisory Board (2012 to present).
Mr Richardson holds a Bachelor of Arts, a Masters of BusinessAdministration and is a Diploma graduate of the AustralianInstitute of Company Directors program.
C O M M I T T E E S O F T H E B OA R D
Committees of the Board are established to review items ofimportance on behalf of the Board and make recommendationsto the Board. Each committee has a Charter describing its roleand responsibilities consistent with best practice corporategovernance principles.
AU D I T A N D R I S K C O M M I T T E EThe Audit and Risk Committee meets quarterly and at othertimes as required. It is responsible for making recommendationsto the Board on matters including:
> risk management
> external reporting
> internal audit
> budgeting, and policies and processes
Members of the committee are Russell Walker (Chair), LindaVeronese and David Richardson. All committee members areindependent.
S U S TA I N A B I L I T Y C O M M I T T E EThe Sustainability Committee meets quarterly and at other timesas required. It is responsible for making recommendations to theBoard on matters including:
> sustainability strategy and principles
> strategies and initiatives that contribute to long-termregional development
Members of the Sustainability Committee are Rodney Thomson(Chair), Deborah Hambleton and April Merrick. All committeemembers are independent.
R E M U N E R AT I O N C O M M I T T E EThe Remuneration Committee meets on at least two occasionsper year, and is responsible for making recommendations to theBoard on:
> Executive remuneration policies and practices
> Evaluation of the Managing Director’s performance
All Non-Executive Board Directors are members of thecommittee. The Board Chair, Andrew Cairns, is also the Chair ofthe Remuneration Committee.
COLIBAN WATER | ANNUAL REPORT | 2014–15PAGE | 32
From left to right: Deborah Hambleton, Rodney Thomson, Linda Veronese, Russell Walker, Andrew Cairns, Jeff Rigby (ManagingDirector), April Merrick and David Richardson.

COLIBAN WATER | ANNUAL REPORT | 2014–15 PAGE | 33
DRINKING WATER QUALITY PERFORMANCE
RECYCLED WATER QUALITY PERFORMANCE
ENVIRONMENTAL DISCHARGE PERFORMANCE
REGULATORY COMPLIANCE
WATER AND SEWER RISK MANAGEMENT AND AUDITING
PLANNING
CAPITAL WORKS
DELIVERY
STRATEGIC OPERATIONS
ASSET MANAGEMENT
INFRASTRUCTURE
LAND DEVELOPMENT
WATER RESOURCES
HEADWORKS
CORPORATE COMMUNICATIONS
COMMUNITY ENGAGEMENT
CUSTOMER SUPPORT
STAKEHOLDER RELATIONS
MEDIA SERVICES
EDUCATION
ACCOUNTING & FINANCIAL SERVICES
TREASURY
ASSET ACCOUNTING
WATER PRICING & ECONOMIC REGULATION
PROJECT MANAGEMENT OFFICE
CAPITAL & OPERATING EXPENDITURE CONTROL
REVENUE MANAGEMENT
PEOPLE & DEVELOPMENT
FACILITIES ADMINISTRATION
INFORMATION & SYSTEMS
GOVERNANCE, RISK & COMPLIANCE
BOARD SECRETARIAT
GENERAL MANAGER WATER QUALITY PERFORMANCE AND REGULATION
GENERAL MANAGER SERVICE DELIVERY& INFRASTRUCTURE(CHIEF OPERATING OFFICER)
GENERAL MANAGER STAKEHOLDER SERVICES
MANAGING DIRECTOR
BOARD
David Sheehan Neville Pearce Roslyn Wai Peter Leersen
GENERAL MANAGER FINANCE & PRICING(CHIEF FINANCIAL OFFICER)
Jeff Rigby
GENERAL MANAGER CORPORATE SERVICES(CORPORATE SECRETARY)
Andrew Cooney
GENERAL MANAGER STRATEGY & BUSINESS INNOVATION
Jon Anstey
CORPORATE STRATEGY
SUSTAINABILITY & BIODIVERSITY STRATEGY
CARBON & ENERGY MANAGEMENT
STATE & LOCAL PLANNING
REGIONAL GROWTH PLANS
G OV E R N A N C E A N D R I S K
The number of meetings of the Board of Directors and Committees of the Board held during the year ended 30 June 2015 and thenumber of meetings attended by each Director were:
Board of Directors Audit & RiskCommittee
SustainabilityCommittee
RemunerationCommittee
Director Eligible toAttend Attended Eligible to
Attend Attended Eligible toAttend Attended Eligible to
Attend Attended
Andrew Cairns 10 9 – – – – 2 2
Russell Walker 10 10 6 6 – – 2 2
Deborah Hambleton 10 10 – – 4 4 2 2
Rodney Thomson 10 10 – – 4 4 2 2
April Merrick 10 10 – – 4 4 2 2
David Richardson 10 10 6 6 – – 2 2
Jeff Rigby 10 10 – – – – – –
Linda Veronese 10 9 6 6 – – 2 2
Note: The number of meetings includes ordinary meetings, special meetings and resolutions outside of meetings.
R I S K M A N AG E M E N T S TAT E M E N T
I, Andrew Cairns certify that Coliban Water has complied with the Ministerial Standing Direction 4.5.5 – Risk Management Frameworkand Processes. The Coliban Water Board verifies this.
Andrew Cairns Chairman
Date: 14 August 2015
C O R P O R AT E S T R U CT U R E

G OV E R N A N C E A N D R I S K
O U R E M E R G E N C Y M A N AG E M E N T SYS T E M
We have continued to mature our emergency managementcapabilities and capacity by providing training to staff in theAustralasian Inter-service Incident Management System (AIIMS)and upskilling our on call duty managers to a nationallyrecognised standard of Level 2 Incident Controller.
The AIIMS structure is commonly used by all Victorian emergencyresponse agencies to provide a common framework formanaging all types of incidents. Locally we actively participatein all nine municipal council meetings across our service regionto build community resilience through discussing andaddressing vulnerabilities and operational interdependencies.
At a state and national level we also participate in two waterspecific focus groups being the Security & Continuity Network,chaired by the Department Environment, Land, Water andPlanning, and the Water Sector Services Group.
Testing our policies, procedures and training of staff is importantto validate our readiness.
In September 2014, we conducted a multi-agency exercise withlocal emergency workers to test our response capability to aterrorist related event that contaminated our southern waterstorages.
This was successfully evaluated and approved by the CriticalInfrastructure Protection Unit, in accordance with an annualregulatory obligation under part six of the Counter Terrorism(community protection) Act 2003.
O C C U PAT I O N A L H E A LT H & S A F E T Y ( O H & S )
We have continued our commitment to providing a safe andhealthy work environment for staff, contractors and visitorsduring the year. This commitment is demonstrated at all levels ofthe organisation, including the Board, as we aim for a workplacesafety environment that complies with our legislative complianceand achieves best practice injury prevention and management.
O H & S C U LT U R EWe continue to examine the way we do business and identifyopportunities that ensure we minimise the risk of harm.
Our commitment to the safety and wellbeing of our workforce isdriven through all levels of the business, including our Board,who continue to provide exceptional OH&S leadership andstrategic direction.
O H & S C O M M I T T E E As part of our OH&S objectives and targets, we held four OH&Scommittee meetings and 45 Toolbox meetings within our ninedesignated work groups. We achieved 100 per cent staffattendance at these meetings. Four new OH&S representativesjoined the OH&S Committee during the year.
E X T E R N A L AU D I T – I N T E G R AT E D M A N AG E M E N T SYS T E M SIn May 2015 BSI Group conducted an onsite assessment of ourthree certified management systems.
> AS/NZS ISO 14001:2004: Environmental: Recertification Audit
> AS/NZS 4801:2001: Occupational Health & Safety:Surveillance Audit
> AS/NZS ISO 9001:2008: Quality: Surveillance Audit
H A Z A R D R E P O RT I N GTo ensure the health, safety and wellbeing of our employees andcontractors it is important for them to report all accidents,incidents and near misses, as well as report all known orobserved hazards. Some activities implemented during the yearwere:
> OH&S site audits of contractors in conjunction with ProjectManagers
> Update online OH&S induction modules for all newemployees and re-induction of existing employees
> Review of all safety manuals for projects over $250,000
> In conjunction with our strategic partners, upgrade assets tocurrent OH&S standards through our hazard rectificationprogram
> Role specific training and annual re-training completed by allstaff
H E A LT H A N D W E L L- B E I N G A S S E S S M E N T SWe undertook the following measures during the year to ensurehealth, safety and welfare of our employees:
> Provided OH&S programs for first aid services
> Employer funded immunisations (Influenza and Hepatitis B)
> Provided training, awareness seminars and OH&S guidancematerial on safety related topics
> Provided health and wellbeing seminars such as men’s andwomen’s health luncheons
> Sponsored employee participation in Bendigo’s BiggestWinner (weight loss competition run by Bendigo CommunityHealth Service)
COLIBAN WATER | ANNUAL REPORT | 2014–15PAGE | 34
2014/15 2013/14 2012/13 2011/12 2010/11
Incidents reported to Coliban Water (1) 57 60 29 29 43
Worksafe reportable incidents (1) 0 2 0 0 5
Workers compensation claims (2) 2 1 2 1 1
Injuries resulting in days lost (2) 2 2 1 1 2
Lost time due to injuries (days) (2) 9 81 30 137 75
Lost time injury frequency rate (3) 4 3.7 4.9 4.8 12.93
Average lost time rate (4) 4.5 40.5 9.39 103 37.5
O H & S P E R F O R M A N C E M E A S U R E M E N T A N D R E P O RT I N G
Notes to OH&S performance measurement and reporting table:(1) Includes project contractors; (2) Coliban Water employees only; (3) Number of lost time injuries per million hours worked; (4) Average number of days lost per lost time injury

COLIBAN WATER | ANNUAL REPORT | 2014–15 PAGE | 35
STAT U TO RY P E R F O R M A N C E
F R E E D O M O F I N F O R M AT I O N ( F O I )
The Freedom of Information Act 1982 allows public access todocuments held by government entities. All requests must be inwriting to the Authorised Officer at Coliban Water, PO Box 2770Bendigo DC 3554, or via email at [email protected] andaccompanied by a fee of $27.20 as of 1 July 2015
The following officers have been appointed under the Freedomof Information Act 1982:
> Principal Officer – Managing Director
> Authorised Officer – Corporate Secretary
During 2014/15 we have processed two FOI applications inaccordance with the Freedom of Information Act 1982.
C O M P E T I T I O N P O L I C Y
We have implemented our National Competition Policy. We havehad ‘pay for use’ water pricing, consisting of a fixed and avariable (volumetric) charge for many years, and cross subsidiesbetween business units are transparent and are disclosedthrough the Annual Report.
Vertical structural and financial separation of business functionshas been in place for several years and the performance ofbusiness functions is reported separately in our annual financialstatements. We have introduced competition in service deliveryby the involvement of the private sector through competitivelybid Public-Private Partnership contracts for infrastructureprojects and by outsourcing other functions.
We continue to monitor developments in National CompetitionPolicy.
TA X AT I O N
In common with the rest of the water industry, we are subject toa National Tax Equivalent Regime. This means we are subject tothe Income Tax Assessment Act 1997, managed through theAustralian Taxation Office, to ensure we do not gain acompetitive advantage over private industry in taxation matters.
E X T E R N A L F I N A N C I N G
Under the Borrowing and Investment Powers Act 1987, we mayonly source debt funding from Treasury Corporation Victoria andwe are subject to a Financial Accommodation Levy (FAL). As aVictorian Government Agency, our borrowings carry an implicitState Government guarantee that commands lower borrowingprices in financial markets.
To offset this advantage, a FAL is levied on all borrowings, usinga formula based on business credit ratings, to ensure we do notobtain an unfair advantage when compared against the privatesector.
P E R F O R M A N C E B E N C H M A R K I N G
We participate in annual performance benchmarking studiesthrough:
> National Water Commission – National PerformanceFramework
> Essential Services Commission – Service standards auditingand reporting
> Department of Health and Human Services – Water Quality
> Water Services Association of Australia (WSAA)– AssetManagement, Customer Service, Civil Maintenance andMechanical and Electrical Maintenance
These processes measure the successful implementationimprovements and practices using risk managementframeworks, standards of service and encourage continuousimprovement. All these activities help identify areas whereperformance can be improved.
This year we commenced participation in the WSAA EfficiencyBenchmarking project. This project will benchmark the businessacross its full function and responsibility with twenty other watercorporations nationally. The results of the benchmarking isanticipated next financial year.
M E M B E R S H I P O F I N D U S T RY A S S O C I AT I O N S
Our industry and business association memberships helpenhance our organisational capability through collaboration,benchmarking, networking and training. Involvement in thesegroups also allows us to participate in the review anddevelopment of industry codes of practice.
We are active members of the following groups:
> Water Services Association of Australia (WSAA)
> Victorian Water Industry Association (VWIA)
> Institute of Water Administration (IWA)
> International Water Association (IWA)
> Australian Water Association (AWA)
> Water Services Sector Group (WSSG)
> Australian National Committee on Large Dams (ANCOLD)
> Water Industry Operators Association of Australia (WIOA)
> Australian Institute of Management (AIM)
> Australian Institute of Project Management (AIPM)
> Australian Institute of Company Directors (AICD).
I N F O R M AT I O N P R I VAC Y ACT 2 0 0 0
The Information Privacy Act 2000 regulates the responsiblecollection and handling of personal information in the VictorianPublic Sector. Our employees understand the importance ofprivacy and what is required to comply with our Privacy Policyand the Act.
B U I L D I N G ACT 1 9 9 3
We met all relevant compliance provisions of the Building Act1993 in our building and maintenance activities during the year.
G OV E R N M E N T A DV E RT I S I N G E X P E N D I T U R E
We did not produce any advertising campaigns valued at$150,000 or greater during the year.

STAT U TO RY P E R F O R M A N C E
Coliban Water is not able to receive disclosuresunder section 13 of the Act. However, the Act requiresus to establish procedures under section 58 of theAct setting out how we will protect people againstdetrimental action that might be taken against themin reprisal for making a protected disclosure.
We have not received any complaints or disclosuresconsidered to be Protected Disclosures inaccordance with the Act.
For further information and how to make a protected disclosure contact:
Andrew Cooney
Corporate Secretary – Coliban WaterPO Box 2770 Bendigo VIC 3554Phone: 1300 363 200Website: www.coliban.com.au
Independent Broad-Based Anti-Corruption Commission (IBAC) Victoria
Level 1, 459 Collins Street Melbourne VIC 3000Phone: 1300 735 135Website: www.ibac.vic.gov.au
M A J O R C O N S U LTA N C I E S
A consultant is a particular type of contractor that is engaged primarily to perform a discrete task for an entity that facilitates decisionmaking through: provision of expert analysis and advice; and/or development of a written report or other intellectual output.
During 2014/15 we engaged 40 separate consultants with a value over $10,000. The total cost, excluding GST, incurred during thisperiod for major capital consultancies was $2,551,102 (2013/14: $2,054,900) and major operational consultancies was $1,235,031(2013/14: $639,949).
O P E R AT I O N A L
COLIBAN WATER | ANNUAL REPORT | 2014–15PAGE | 36
P R OT E CT E D D I S C LO S U R E ACT 2 0 1 2
Details of individual consultants
Start date End date
Totalapprovedproject fee(Exc GST)(‘000)
Expenditure(Exc GST)(‘000)
Futureexpenditure(Exc GST)(‘000)
Consultant Purpose of consultancy
37 South Pty Ltd SCADA telemetry review 1/07/2014 30/06/2015 10.74 10.74 –
AFS & Associates Pty Ltd Financial assessments and advice 1/07/2014 30/06/2015 25.00 25.00 –
Australian Dams & WaterConsultants Pty Ltd Dam safety benchmarking 1/07/2014 30/06/2015 10.38 10.38 –
Beca Pty Ltd Project management and engineering services 1/07/2012 30/06/2015 677.86 677.86 –
Ch2M Hill Australia Pty Ltd Asset modelling tasks and reporting 1/07/2014 30/06/2016 130.50 100.54 29.96
Customer Service BenchmarkingAust Pty Ltd Customer service assessments 1/07/2014 30/06/2015 10.40 10.40 –
DJ O’Brien & Associates Pty Ltd Strategic planning 1/07/2014 30/06/2015 15.30 15.30 –
Ernst & Young Accounting and valuation advice 1/07/2014 30/06/2015 68.50 68.50 –
ESS Earth Sciences Pty Ltd Seismic monitoring services 1/07/2014 30/06/2015 15.50 15.50 –
Grant Thornton Australia Ltd Income tax review 1/07/2014 30/06/2015 16.95 16.95 –
Insync Surveys Pty Ltd Customer and stakeholder research 1/07/2014 30/06/2015 18.50 18.50 –
Integrity Governance Board performance review 1/07/2014 30/06/2016 34.19 25.76 8.43
Leading Teams Australia Pty Ltd Ongoing performance improvement program 1/07/2014 30/06/2015 24.00 24.00 –
Odysseus–imc Pty Ltd Development of risk framework 1/07/2014 30/06/2016 19.09 14.60 4.49
PBJ & Associates Technical advice 1/07/2014 30/06/2016 127.52 119.20 8.32
SMEC Australia Pty Ltd Dam safety surveillance 1/07/2014 30/06/2015 38.94 38.94 –
The Corporate Executive BoardCompany IT leadership exchange 1/07/2014 20/05/2017 22.50 16.88 5.62
Workwell Consulting Pty Ltd Board performance review and innovationworkshop 1/07/2014 30/06/2015 26.00 26.00 –
1,291.87 1,235.05 56.82

COLIBAN WATER | ANNUAL REPORT | 2014–15 PAGE | 37
STAT U TO RY P E R F O R M A N C E
Details of individual consultants
Start date End date
Totalapprovedproject fee(Exc GST)(‘000)
Expenditure(Exc GST)(‘000)
Futureexpenditure(Exc GST)(‘000)
Consultant Purpose of consultancy
37 South Pty Ltd SCADA telemetry upgrade 1/07/2014 10/09/2015 554.71 460.18 94.53
Advisian Pty Ltd Project assessments 1/07/2014 30/06/2016 218.04 201.33 16.71
AFS & Associates Pty Ltd Financial assessments and advice 1/07/2014 30/06/2015 42.46 42.46 –
Beca Pty Ltd Project management and engineeringservices 1/07/2014 30/06/2016 1,393.90 1,023.56 370.34
CEE Pty Ltd Environmental investigations 1/07/2014 30/09/2015 56.50 22.60 33.90
Corrcon Pty Ltd Asset condition assessments 1/07/2014 30/06/2015 13.40 13.40 –
Country Wide Valuers Harcourt project valuations 1/07/2014 22/12/2016 25.73 10.98 14.75
Curtain Control Systems Pty Ltd SCADA telemetry upgrades 1/07/2014 14/07/2015 19.54 10.69 8.85
Department of Transport,Planning & Local Infrastructure Valuation services 1/07/2014 30/06/2015 50.82 50.82 –
Ernst & Young BOOT contract accounting advice 1/07/2014 30/06/2015 11.88 11.88 –
ESRI Australia Pty Ltd GIS functionality upgrades 1/07/2014 30/06/2015 15.95 15.95 –
GHD Pty Ltd Environmental audit assessments 1/07/2014 20/12/2016 88.90 41.40 47.50
Hay Property Services Pty Ltd Harcourt project valuations 1/07/2014 30/06/2015 24.83 24.83 –
IMPO Pty Ltd Project server implementation 1/07/2014 30/06/2015 51.66 51.66 –
Infor Global Solutions (ANZ)Pty Ltd
Technical support for asset managementsystem upgrades 1/07/2014 31/08/2015 16.61 16.61 –
Linktech Solutions Pty Ltd Document management systemimplementation advice 1/07/2014 30/06/2015 27.98 27.98 –
Melissa Carroll Portfolio management system implementation 1/07/2014 30/06/2015 64.03 64.03 –
Microflite Helicopter Services Aerial imagery 1/07/2014 30/06/2015 19.88 19.88 –
PBJ & Associates Project strategy support 1/07/2014 30/06/2015 12.51 12.51 –
PT Tomkinson & Associates Pty Ltd Surveying and design services 1/07/2014 30/06/2016 16.11 12.12 3.99
RMCG Consulting Group Agricultural assessments 1/07/2014 30/06/2016 135.51 65.77 69.74
Safegroup Pty Ltd SCADA engineering support 1/07/2014 30/06/2015 20.38 20.38 –
SJ Street & Associates Pty Ltd Design, review and inspection services 1/07/2014 30/06/2015 43.51 43.51 –
SMEC Australia Pty Ltd Environmental supervision services 1/07/2014 31/08/2015 194.27 127.87 66.40
Spatial Scientific Pty Ltd Aerial imagery 1/07/2014 30/06/2015 18.18 18.18 –
Spiire Australia Pty Ltd Design and project management of theEchuca West Land Development 1/07/2014 30/06/2016 141.52 119.10 22.42
3,278.81 2,529.68 749.13
M I N O R C O N S U LTA N C I E S
During the year there were 46 minor consultancies at a cost ofless than $10,000 each. The total cost, excluding GST, of theseminor consultancies was $350,274 (2013/14: $400,984).
D I S C LO S U R E O F M A J O R C O N T R ACT S
Two major contracts greater than $10 million were continuedthrough the 2014/15 financial year, being:
> Construction of pipeline and pump stations for the HarcourtRural Modernisation project. This contract is due forcompletion in late 2016; and
> Operational and Maintenance Services for our treatmentplants and networks. The initial term of the contract is duefor review by July 2017.
CA P I TA L

STAT U TO RY P E R F O R M A N C E
V I CTO R I A N I N D U S T RY PA RT I C I PAT I O N P O L I C Y ( V I P P )
In accordance with the Victorian Industry Participation Policy Act 2003, we are required to apply theVictorian Industry Participation Policy (VIPP) in all procurement activities valued at $1 million orabove as we are located in regional Victoria.
During 2014/15, 15 small to medium sized businesses prepared a VIPP Plan for Coliban Water.
During 2014/15 Coliban Water commenced one contract totaling $4.23 million to which a VIPP Planwas required, occurring in regional Victoria, representing 100 per cent of estimated local content.The total VIPP Plan commitments include; five new jobs, and benefit to the Victorian economy interms of skills and/or technology transfer outcomes includes the development of apprentices.
During 2014/15 Coliban Water completed nine contracts totaling $36.65 million to which a VIPP Planwas required and occurred in regional Victoria. The total VIPP Plan commitments achieved as aresult of contracts completed include:
> an average of 82 per cent of local content outcome was recorded;
> 35 new jobs and 239 retained jobs;
> six new apprenticeships/traineeships and eight retained apprenticeships/traineeships; and
> benefits to the Victorian economy in terms of skills and/or technology transfer outcomes ofenvironment awareness, on the job training, development of tank design and enhancing skillsof apprentices
COLIBAN WATER | ANNUAL REPORT | 2014–15PAGE | 38

COLIBAN WATER | ANNUAL REPORT | 2014–15 PAGE | 39
P E R F O R M A N C E R E P O RT
F O R T H E R E P O RT I N G P E R I O D E N D E D 3 0 J U N E 2 0 1 5
C E RT I F I CAT I O N
We certify that the accompanying Performance Report of Coliban Region Water Corporation in respect of the reporting period ended 30June 2015 is presented fairly in accordance with the Financial Management Act 1994.
The Performance Report outlines the relevant performance indicators for the financial year as determined by the responsible Ministerfor Environment, Climate Change and Water, and as set out in the 2014/15 Corporate Plan. We have reported our actual andcomparative results achieved for the financial year against predetermined performance targets and these indicators. We have reportedan explanation of any significant variance between the actual results and performance targets and/or between the actual results in thecurrent year and the previous year.
At the date of signing, we are not aware of any circumstances which would render any particulars in the Performance Report to bemisleading or inaccurate.
Signed at Bendigo on the 14th day of August, 2015, on behalf of the Board
Andrew Cairns
Chairman
Jeff Rigby
Managing Director
Peter Leersen
Chief Financial officer

P E R F O R M A N C E R E P O RT
COLIBAN WATER | ANNUAL REPORT | 2014–15PAGE | 40
F I N A N C I A L P E R F O R M A N C E I N D I CATO R S
KPINo. Key Performance Indicator
2013/14Result
2014/15Result
2014/15Target
Varianceto prior
yearNotes
Varianceto target
%Notes
F1Cash Interest CoverNet operating cash flows before net interest and tax / netinterest payments
1.7 1.8 1.5 5.9% 16.6% 1b
F2 Gearing RatioTotal debt (including finance leases) / total assets * 100 33.3% 33.9% 35.4% 1.8% -4.3%
F3Internal Financing RatioNet operating cash flow less dividends / net capitalexpenditure * 100
49.7% 85.3% 39.5% 71.6% 2a 115.9% 3b
F4Current RatioCurrent assets / current liabilities (excluding long-termemployee provisions and revenue in advance)
1.4times
1.8times
1.4times 28.6% 4a 31.0% 5b
F5 Return on AssetsEarnings before net interest and tax / average assets * 100 1.9% 2.7% 1.8% 42.1% 6a 51.4% 7b
F6 Return on EquityNet profit after tax / average total equity * 100 -0.6% 0.6% -1.0% -200.0% 8a -158.8% 9b
F7EBITDA MarginEarnings before interest, tax, depreciation and amortisation /total revenue * 100
50.6% 54.5% 50.6% 7.7% 7.8%
Reasons for variations greater than 10 per cent compared to that budgeted or significant variations to prior year actual result
1b Compared to that budgeted our cash interest cover has favourably exceeded the target due to the strengthening net operating cash inflowsagainst budget as a result of increased services charges, water consumption and temporary water sales, and improvement in debt collectionprocesses. Less interest payments against budget were also incurred due to less reliance on borrowings to fund capital expenditure. Theindicator displays a favourable trend that is budgeted to continue.
2a Our internal financing ratio improved compared to that achieved last year due to our net operating cash inflows increasing by $3.9 million whileour payments for capital expenditure reduced by $11.4 million. The reduction in capital expenditure was a result of re-prioritisation anddeferred delivery. This indicator is improving as we become less reliant on borrowings to fund capital expenditure.
3b There has been a significant improvement in our internal financing ratio due to a $7.2 million increase in net operating cash inflows and a$14.3 million reduction in capital expenditure for the year compared to that budgeted.
4a Our current ratio has improved on what was achieved last year due to our strengthening operating cash inflows contributing to an increase incash held at the end of the financial year. This increase in cash held contributed to the increase in current assets of $3.8 million while ourcurrent liabilities, excluding long-term employee provisions, reduced by $1.9 million as a result of a reduction in payables and accruals at yearend.
5b Our current ratio improved compared to that budgeted due to the $5.0 million increase in current assets as a result of a $6.2 million increase incash on hand at year end and a $0.2 million decrease in current liabilities, excluding long-term employee provisions, as a result of lesspayables and accruals at year end.
6a The improvement to our net result to that achieved last year has favourably impacted our return on assets ratio. Our earnings before net interestand tax increased by $13.3 million due to increased revenue from service charges and water consumption while our expenditure remained inline with the previous year. During this period, our asset holdings only increased by $6.4 million. Compared to previous years this indicator hascontinued to improve in line with the improvement in our operating performance.
7b Compared to that budgeted our return on assets ratio was favourable. Our earnings before net interest and tax compared to budget improved by$11.8 million due to higher revenue and lower expenditure. The ratio was favourably impacted compared to budget by a lower average assetbase as a result of less capital expenditure incurred during the year due to the re-phasing of capital projects.
8a Our return on equity ratio improved compared to that achieved last year as a result of a $12.0 million increase in our net profit after tax due toincreased revenue and expenditure remaining in line with the prior year.
9b Our return on equity ratio compared to that budgeted improved substantially due to a $13.8 million increase in net profit after tax.

COLIBAN WATER | ANNUAL REPORT | 2014–15 PAGE | 41
P E R F O R M A N C E R E P O RT
KPINo. Key Performance Indicator
2013/14Result
2014/15Result
2014/15Target
Varianceto prior
yearNotes
Varianceto target
%Notes
WS1Unplanned water supply interruptionsNo. of customers receiving (5) unplanned interruptions in the year /total number of water (domestic and non-domestic) customers * 100
0.00% 0.00% 0.03% 0.0% -100.0% 10b
WS2 Interruption timeAverage duration of unplanned water supply interruptions
162.4minutes
114.9minutes
120.0minutes -29.3% 11a -4.3%
WS3Restoration of unplanned water supplyUnplanned water supply interruptions restored within (5) hours /total unplanned water supply interruptions * 100
95.9% 98.0% 98.0% 2.2% 0.0%
SS1Containment of sewer spillsSewer spills from reticulation and branch sewers contained within 5hours / total sewer spills from reticulation and branch sewers * 100
99.0% 100.0% 99.0% 1.0% 1.0%
SS2Sewer spill interruptionsNo. of residential sewerage customers affected by sewerageinterruptions restored within 5 hours
98.4% 99.7% 99.0% 1.3% 0.7%
WAT E R A N D S E W E R AG E S E RV I C E P E R F O R M A N C E I N D I CATO R S
Note: The 2014/15 Corporate Plan target for average duration time of unplanned water supply interruptions was 12 minutes but has been correctedto 120 minutes as reported in WS2 above.
Reasons for variations greater than 5 per cent compared to that budgeted or significant variations to prior year actual result
10b The improvement in asset performance and the proactive management of water networks has contributed to this positive outcome. This resultis also in line with the previous year.
11a A single event triggered the non-compliance for this performance indicator last financial year. The favourable variance is due to an abnormalevent not occurring this year and the proactive management of our water networks.
KPINo. Key Performance Indicator
2013/14Result
2014/15Result
2014/15Target
Varianceto prior
yearNotes
Varianceto target
%Notes
CR1 Water quality complaints (colour, taste, odour, other)No. of complaints per 100 customers 0.30 0.34 0.48 13.3% 12a -29.2% 13b
CR2 Sewerage service quality complaintsNo. of complaints per 100 customers 0.010 0.006 0.010 0.0% -40.0% 14b
CR3 Sewerage odour complaintsNo. of complaints per 100 customers 0.17 0.19 0.18 11.8% 15a 5.6% 16b
CR4 Billing complaintsNo. of complaints per 100 customers 0.04 0.01 0.04 -75.0% 17a -75.0% 18b
C U S TO M E R R E S P O N S I V E N E S S P E R F O R M A N C E I N D I CATO R S
Reasons for variations greater than 5 per cent compared to that budgeted or significant variations to prior year actual result
12a There was an increase of 34 water quality complaints for the year compared with the previous year. The majority of this increase related to anincrease in taste complaints in Heathcote due to a change in the water supply reservoirs. The water quality team held discussion with thoseresidents and continues to actively monitor this system, with no prevailing issues expected.
13b The improved water quality analysis by the Water Quality and Performance team and the continued emphasis on achieving positive waterquality outcomes for our customers resulted in less complaints being received compared to that budgeted.
14b There has only been four sewerage service quality complaints received in 2014/15 compared to 7 budgeted which has resulted in a favourablevariance for the year.
15a Compared to that achieved last year there has been an additional 17 sewer odour complaints which were localised to known areas in Bendigoand Echuca. Coliban Water plans to undertake works aimed at minimising the impacts of these odour issues across our network.
16b Compared to that budgeted there has been an additional 10 sewer odour complaints for the year. As stated in 15a above, Coliban Water isplanning to undertake works to alleviate the impacts of these odour issues.
17a The number of billing complaints fell significantly to that obtained last year due to minimal price increase for 2014/15 compared to theprevious period, which was the first of the regulatory period and included an up-front price increase.
18b Compared to that budgeted the number of billing complaints received was less as a result of the minimal price increase for 2014/15.

COLIBAN WATER | ANNUAL REPORT | 2014–15PAGE | 42
E N V I R O N M E N TA L P E R F O R M A N C E I N D I CATO R S
Reasons for variations greater than 5 per cent compared to that budgeted or significant variations to prior year actual result
19a The recycled water re-use percentage was higher than that achieved last year which is largely attributable to increases in industrial reuse.
20b The recycled water re-use percentage is below that targeted due to high winter flows into the wastewater treatment plants and lower demandsfrom irrigators to use recycled water. Although irrigation is heavily climate dependant, Coliban Water is addressing this impact through anirrigation scheduling strategy to optimise reuse.
21a The annual increase in total net CO2 emissions is attributable to an increase in water transfers due to the extensive operation of the Superpipe(Lake Eppalock to Bendigo) to meet water supply demand. An increase in wastewater volumes to our plants further increased emissions relatedto wastewater treatment. Coliban Water is in the process of developing an energy management strategy to identify opportunities for energysavings.
22b The total net CO2 emissions exceeded that budgeted due to an increase in water transfers driven by the extensive operation of the Superpipe(Lake Eppalock to Bendigo) to meet water supply demand. The increase in wastewater volumes to our plants further increased emissionsrelated to wastewater treatment compared to that budgeted. As stated in 21a above, Coliban Water is developing an energy managementstrategy to identify opportunities for energy savings.
KPINo. Key Performance Indicator
2013/14Result
2014/15Result
2014/15Target
Varianceto prior
yearNotes
Varianceto target
%Notes
E1 Effluent re-use volume (end use)Percentage recycled for each category 33.8% 37.1% 42.0% 9.8% 19a -11.7% 20b
E2 Total net CO2 emissionsNet tonnes CO2 equivalent 31,627 41,091 32,913 29.9% 21a 24.8% 22b
P E R F O R M A N C E R E P O RT

COLIBAN WATER | ANNUAL REPORT | 2014–15 PAGE | 43
I N D E P E N D E N T AU D I TO R ’ S R E P O RT

COLIBAN WATER | ANNUAL REPORT | 2014–15PAGE | 44

COLIBAN WATER | ANNUAL REPORT | 2014–15 PAGE | 45
D I S C LO S U R E I N D E X
Report of Operations
Legislation Requirement Page number
Charter and purpose
FRD 22F Manner of establishment and the relevant Ministers 1
FRD 22F Purpose, functions, powers and duties 1
FRD 8C Departmental objectives, indicators and outputs 2
FRD 22F Initiatives and key achievements 3–5
FRD 22F Nature and range of services provided 2
Management and structure
FRD 22F Organisational structure 33
FRD 22F Names of Board Members, audit committee membership and Board committees 31–34
Financial and other information
FRD 8C Consistency of budget and departmental reporting 1–86
FRD 10 Disclosure index 45–46
FRD 11A Disclosure of ex-gratia payments 86
FRD 12A Disclosure of major contracts 36–37
FRD 14 Public sector superannuation schemes 79–80
FRD 15B Executive officer disclosures 78
FRD 22F Significant achievements for the reporting period 3
FRD 22F Operational and budgetary objectives and performance against objectives 4–86
FRD 22F Occupational Health and Safety policy 34
FRD 22F Summary of the financial results for the year 47–50
FRD 22F Significant changes in financial position for the year 49
FRD 22F Major changes or factors affecting performance 48
FRD 22F Subsequent events 86
FRD 22F Details of consultancies over $10,000 36–37
FRD 22F Details of consultancies under $10,000 36–37
FRD 22F Application and operation of the Freedom of Information Act 1982 35
FRD 22F Compliance with building and maintenance provisions of the Building Act 1993 35
FRD 22F Application and operation of the Protected Disclosure Act 2012 36
FRD 22F Statement of availability of other information 46
FRD 22F Statement on National Competition Policy 35
FRD 22F Summary of environmental performance 27–29
FRD 22F Government advertising expenditure 35
FRD 22F Standard disclosure in Report of Operations 46
FRD 24C Reporting of office-based environmental impacts 29
FRD 25B Victorian Industry Participation Policy disclosures 38
FRD 27C Presentation and reporting of performance information 39–42
FRD 29A Workforce data disclosures 25
FRD 30A Standard requirements for the design and print of the annual report 1–88
SD 4.5.5 Risk management compliance attestation 33
Ministerial Directions
MRD 01 Performance Reporting 39–42
MRD 02 Reporting on water consumption and drought response 9–15, 19–20, 29
MRD 03 Environmental and social sustainability reporting 27–30
MRD 04 Disclosure of information on bulk entitlements 12–15
MRD 05 Annual reporting on non-residential major water users 21
Financial statements required under Part 7 of the FMA
SD 4.2 (a) Statement of changes in equity 54
SD 4.2 (b) Comprehensive operating statement 52
SD 4.2 (b) Balance sheet 53
SD 4.2 (b) Cash flow statement 55
SD 4.2 (b) Notes to the financial statements 56–86

PAGE | 46
D I S C LO S U R E I N D E X
Borrowing and Investment Powers Act 1987 35, 60 Freedom of Information Act 1982 35, 46
Water Act 1989 1, 2, 6 Environment Protection Act 1970 28
Safe Drinking Water Act 2003 17 Financial Management Act 1994 3, 39, 51, 56
Multicultural Victoria Act 2004 7–8 Protected Disclosures Act 2012 36
Copyright Act 1968 1, cover Information Privacy Act 2000 35
Public Authorities Dividend Act 1983 62 Victorian Industry Participation Policy Act 2003 38
Building Act 1993 35 Income Tax Assessment Act 1997 35
Counter Terrorism (Community Protection) Act 2003 34 Water Industry (Environmental Contributions) Act 2004 58, 83
Water Industry Act 1994 58 Aboriginal Heritage Act 2006 8
Constitution Act 1975 44, 88 Audit Act 1994 43, 87
Financial Statements
Legislation Requirement Page number
Other requirements under Standing Directions 4.2
SD 4.2 (c) Compliance with Australian Accounting Standards and other authoritative pronouncements 51, 56
SD 4.2 (c) Compliance with Ministerial Directions 56
SD 4.2 (c) Accountable officer declaration 51
SD 4.2 (d) Rounding of amounts 51
SD 4.2 (e) Audit committee 32
SD 4.2 (f) Compliance with Model Financial Report 51
SD 4.2 (g) Specific information requirement 46
SD 4.2 (j) Sign off requirements 39, 51
Other disclosures as required by FRDs in notes to the financial statements
FRD 03A Accounting for dividends 62
FRD 07A Early adoption of authoritative accounting pronouncements 56
FRD 17B Wage inflation and discount rates for employee benefits 60, 75
FRD 19 Private provision of public infrastructure 59, 84
FRD 20A Accounting for state motor vehicle lease arrangements prior 1 February 2004 NA
FRD 21B Responsible person and executive officer disclosures 78
FRD 26A Accounting for VicFleet Motor vehicle lease arrangements on or after 1 February 2004 NA
FRD 100 Financial Reporting Directions – Framework 39, 86
FRD 101 First-time adoption 56–57
FRD 102 Inventories 59
FRD 103F Non current physical assets 59
FRD 104 Foreign currency 56
FRD 105A Borrowing costs 58, 60
FRD 106 Impairment of assets 58
FRD 107A Investment properties NA
FRD 109 Intangible assets 60
FRD 110 Cash flow statements 56
FRD 112D Defined benefit superannuation obligations 77
FRD 113 Investment in subsidiaries, jointly controlled entities and associates 64, 85
FRD 114A Finanical instruments – general government entities and public non financial corporations 61, 82
FRD 115 Non current physical assets – first time adoption NA
FRD 119 Contribution by owners 61, 77
FRD 119A Transfers through contributed capital 77
FRD 120I Accounting and reporting pronouncements applicable for 2014/15 reporting period 63–64
Legislation
F U RT H E R I N F O R M AT I O N A B O U T O P E R AT I O N S A N D P E R F O R M A N C EInformation about our operations and performance is available in the following sources; Water Plan 2013–2018, previous AnnualReports, the Customer Charter, and our website at www.coliban.com.au
Printed copies of all publications are available from our offices at 37–45 Bridge Street, Bendigo.
Further information listed in Reporting Direction 22F is held at the Corporation’s office and is available to the relevant Minister, Memberof Parliament or the public on request, subject to the provisions of the Freedom of Information Act 1982.

COLIBAN WATER | FINANCIAL REPORT | 2014–15 PAGE | 47
F I N A N C I A L P E R F O R M A N C E S U M M A RY
F I N A N C I A L S U M M A RY
Financial ResultPlan
2014/15Actual
2014/15Actual
2013/14Actual
2012/13Actual
2011/12Actual
2010/11
Performance Indicator
R E V E N U EService charges 65,270 65,899 61,185 49,362 46,897 42,746Usage charges 38,016 44,796 40,909 36,183 34,056 25,875Contributions and gifted assets 12,285 14,566 11,880 11,367 9,847 6,603Other 1,388 1,625 1,449 1,440 2,519 856Interest received 67 83 74 63 54 26
Total revenue 117,026 126,969 115,497 98,415 93,373 76,106
E X P E N S E SOperations, administration & employee 54,560 54,184 53,655 53,466 50,447 45,153Depreciation 34,796 32,705 33,141 35,295 32,697 26,241Finance charges 32,976 31,022 29,753 29,107 27,082 24,469Environmental contribution 3,272 3,272 3,272 2,031 2,031 2,031
Total expenditure 125,604 121,183 119,821 119,899 112,257 97,894
Net result before tax (8,578) 5,786 (4,324) (21,484) (18,884) (21,788)
Net result for the year (6,005) 4,931 (4,700) (15,087) (13,126) (16,922)
A S S E T STotal current assets 27,176 32,189 28,423 25,847 23,247 21,537Total non-current assets 1,362,126 1,332,020 1,323,061 1,307,404 1,307,724 1,285,653
Total Assets 1,389,303 1,364,209 1,351,484 1,333,251 1,330,971 1,307,190
L I A B I L I T I E STotal current liabilities 21,575 20,150 23,090 20,541 20,380 26,460Total non-current liabilities 545,037 501,178 490,294 469,910 446,197 408,375
Total liabilities 566,612 521,328 513,384 490,451 466,577 434,835
Total net assets 822,691 842,881 838,100 842,800 864,394 872,355
Net cash inflows from operations 17,632 24,878 20,942 2,550 2,721 2,466Payments for infrastructure assets, property, plant and equipment (43,421) (29,161) (40,595) (34,807) (43,441) (37,555)
Internal Financing Ratio 39.5% 85.3% 49.7% 7.3% 6.3% 6.6%Gearing Ratio 35.4% 33.9% 33.3% 32.2% 29.7% 27.2%EBIDTA Margin 50.6% 54.5% 50.6% 43.5% 30.1% 10.9%Cash Interest Cover 1.5 1.8 1.7 1.1 1.1 1.1Return on Assets 1.8% 2.7% 1.9% 0.6% 0.6% 0.2%Return on Equity (1.0%) 0.6% (0.6%) (1.8%) (4.4%) (2.8%)

F I N A N C I A L O V E RV I E W
COLIBAN WATER | FINANCIAL REPORT | 2014–15PAGE | 48
Coliban Water achieved a net profit of $4.9 million for the2014/15 financial year, which is the first positive result in 13financial years. This result is $9.6 million higher than in 2013/14and $10.9 million ahead of Corporate Plan budget.
This was a significant improvement in financial performance andposition this year as the actions from the Board’s financialviability strategy, which was implemented at the commencementof the 2013/14 year, continued to deliver better-than-plannedresults. The significantly improved financial sustainability riskrating and positive operating result were based on financial andcapability goals we set ourselves to achieve within the 2013–18regulatory period. Delivering these outcomes inside the first twoyears of this five year regulatory period is noteworthy. Our thirdand final financial goal is to peak our debt levels within theregulatory period. We anticipate achieving this in 2015/16, atwhich point we can commence our long term plan of repayingthe debt we have accumulated through borrowings raised overthe last decade that was needed over that period to fund criticalinfrastructure, water entitlement purchases and to finance thedelivery of our essential services.
Our performance indicators summarise our improvement overthe years due to our strengthening financial performanceresulting from our financial viability strategy, businesstransformation and tariff reforms implemented on 1 July 2013.
Our cash interest cover has favourably exceeded what wasachieved last year and our target in the Corporate Plan due to thestrengthening net operating cash inflows from increasedservices charges, water consumption, and improvement in debtcollection processes. Less interest payments were also incurreddue to less reliance on borrowings to fund capital expenditure.
Our internal financing ratio also improved on what was achievedlast year and to that budgeted in the Corporate Plan due to ourstrengthening net operating cash inflows while our payments forcapital expenditure reduced as a result of re-prioritised projectdelivery.
Our gearing ratio also improved compared to that budgeted withless borrowings needed to fund the capital expenditure duringthe year as a result of our improved financial performance,although it slightly worsened to that achieved last year becauseof the increase in total borrowings.
These indicators will continue to improve as we become lessreliant on borrowings to fund capital expenditure. We arebudgeting to peak debt during the next financial year andcommence repaying borrowings in 2016/17 which will furtherimprove our financial performance and these indicators.
Our current ratio has improved on what was achieved last yearand to the budgeted target in the Corporate Plan due to ourstrengthening operating cash inflows contributing to an increasein cash held at the end of the financial year. This increase incash held contributed to the increase in current assets while ourcurrently liabilities reduced as a result of a reduction in payablesand accruals at year end.
The improvement to our net result to that achieved last year hasincreased our return on assets ratio. Our earnings before netinterest and tax has improved due to increased revenue fromservice charges and water consumption while our expenditureremained in line with the previous year.
Likewise our return on equity ratio improvement to that achievedlast year is a result of the increase in net profit after tax which isdue to revenue increasing and expenditure remaining in linewith the prior year.
S I G N I F I CA N T C H A N G E S O R FACTO R S A F F E CT I N G F I N A N C I A LP E R F O R M A N C EThe total net result for the year was a profit of $4.9 millionattributed to an increase in revenue over the five years but alsothrough a concerted effort to minimise expenditure.
The increase of $11.5 million in total revenue from the previousyear is the major factor improving our performance to CorporatePlan. Increases in operating revenue from service and usagecharges were the primary reason for revenue growth compared toprevious years and were in line with the Essential ServicesCommission’s (ESC) 2013 water price determination. Waterusage revenue increased $4.2 million as average waterconsumption per household of 191 kilolitres was 26 kilolitreshigher to that budgeted. Revenue from service charges alsoincreased $4.7 million from last year as a result of the tariffreform approved by the ESC and implemented on 1 July 2013.The higher revenue from fixed service charges better aligns tothe expenditure profile and provides a more evenly distributedcash flow throughout the year.
Contributions and gifted assets continued to increase fromprevious years ($2.7 million or 22.6 per cent) due to thesustained level of development occurring in Bendigo,Castlemaine and Echuca.
Total expenditure increased only $1.4 million or 1.1 per centcompared to the previous year and was down $4.4 million toCorporate Plan.
Operations, administration and employee expenditure hasremained consistent for the last three financial years due toColiban Water’s transformation of the business throughreconfiguring our business model, the re-contracting of coreservices to a new private sector provider, repatriating functionsthat were previously outsourced back into the business andrestructuring the organisation to align to the new model. Theimproved financial performance resulting from these changeshave ensured we are:
1) More in control of strategic elements of our business;
2) Increasing our organisational knowledge and capability;
3) Highly involved with our servicing partners in the delivery ofservices and water products to customers;
4) Driving innovation and efficiency in our operations andoptimising our systems and processes; and
5) A more integrated business with adaptive planningmechanisms.
Coliban Water completed the extensive review of asset usefullives for below-ground water and sewer infrastructure assets anda full condition assessment of all above-ground infrastructureassets. The outcome of this extensive review has contributed tothe decrease in depreciation expense in the current year by $0.4 million to last year and $2.1 million compared to CorporatePlan.
Compared to the previous year, financing charges haveincreased $1.3 million as a result of a full year impact of lastyear’s borrowings and increase in financial accommodation levyto 279 basis points in that year. Borrowings also increased $9.6million this year to fund the $29.2 million in capital expenditurewith the financial accommodation levy reduced to 210 basispoints.

COLIBAN WATER | FINANCIAL REPORT | 2014–15 PAGE | 49
F I N A N C I A L O V E RV I E W
S I G N I F I CA N T C H A N G E S I N F I N A N C I A L P O S I T I O N – BA L A N C E S H E E TCompared to that achieved last year, Coliban Water’s net assetsincreased by $4.8 million to $842.9 million, mainly due toincreases in total assets of $12.7 million being offset by anincrease in total liabilities of $7.9 million.
Total current assets continued to improve due to thestrengthening of cash assets with operating cash flowsincreasing by $3.9 million to last year and $7.2 million toCorporate Plan as a result of higher than budgeted service andusage revenue.
Total non-current assets increased $9.0 million compared to lastyear and was significantly down to the Corporate Plan by $30.1 million. We are continuing with our major capital worksprogram and delivered an additional $29.2 million in newcapital expenditure for the year which was significantly down tolast year and to that budgeted in the Corporate Plan. This is dueto a delay in the Harcourt Rural Modernisation project. Thisincrease in new capital expenditure was however offset by theincrease in accumulated depreciation for the year.
Issues with the lead contractor for the Harcourt RuralModernisation Project brought the works to a standstill inNovember 2014 with around two-thirds of the works constructedand led to us taking the difficult but necessary step in June 2015of taking the works out the hands of the contractor andconcluding their involvement in the project. We have put in placea plan that will enable the timely completion of the works thatremain to be constructed. However, with the time lost to date,and the additional time needed to implement the plan, thecompletion of the project will be delayed until well into 2016.
Total liabilities increased $7.9 million from last year but aresignificantly down ($45.3 million) to that budgeted in theCorporate Plan.
Total current liabilities decreased due to a reduction in tradecreditors and accruals held at 30 June 2015.
Compared to last year, total non-current liabilities increased$10.9 million as a result of total borrowings required to partiallyfund new capital expenditure for the year. However due to theimproved operating performance and delay in major capitalexpenditure, total borrowings were $29.4 million less than thatin the Corporate Plan.
Our improvement in total equity compared to last year and thetarget in the Corporate Plan is attributed to our significantlyimproved operating performance for the year.
S I G N I F I CA N T C H A N G E S I N CAS H F LOWThe overall cash surplus of $9.1 million for the 2014/15 financialyear was a net increase of $4.7 million compared to the previousyear. This additional cash was the result of an improvement inour net cash inflows from operating activities.
Total receipts increased $11.2 million to that achieved last yearand $6.7 million to the target in the Corporate Plan due to morereceipts from service and usages charges and the improvementin our debt collection processes. Compared to last year, totalreceipts were partially offset by a $7.3 million increase inpayments to suppliers and employees and additional borrowingcosts and finance charges but were in line with budgetedpayments.
Net cash inflows from investing activities decreased by $14.8 million due to less payments for infrastructure assets,property, plant and equipment as a result of less capitalexpenditure incurred during the year compared to previous yearsand to that budgeted in the Corporate Plan. We also increasedour proceeds from the sale of infrastructure assets, property,plant and equipment due to the sale of land in Echuca to theDepartment of Education.
Net cash inflows from financing activities significantly decreaseddue to less borrowings required to fund capital expenditure thisyear and compared to that budgeted in the Corporate Plan. Themain reasons for this decrease is our strong operatingperformance and the re-prioritising of capital projects to nextyear.
P O S T BA L A N C E DAT E E V E N T SThe following matters and/or circumstances have arisen sincethe end of the reporting period which significantly affect or maysignificantly affect the operations of Coliban Water, the results ofthose operations, or the state of affairs of Coliban Water in futurefinancial years:
> On the 8 April 2015, the Minister for Environment, ClimateChange and Water, the Hon Lisa Neville MP, announced areview of all 135 Victorian water corporation board directorpositions. Expressions of interest were invited during April and May 2015 with new boards to be in place by 1 October 2015
> Water corporations remain governed by a properlyconstituted board of directors and will do so following 1 October 2015 when any new appointments are due tocommence

U N D E R STA N D I N G T H E F I N A N C I A L STAT E M E N T S
COLIBAN WATER | FINANCIAL REPORT | 2014–15PAGE | 50
O P E R AT I N G S TAT E M E N TThe Comprehensive Operating Statement measures ourperformance over the year and shows if a surplus or deficit hasbeen made in delivering products and services. The statementincludes all sources of income less all expenses incurred inearning that income.
For the year ending 30 June 2015, we made a net profit for theyear of $4.9 million.
BA L A N C E S H E E TThe Balance Sheet sets out our net accumulated financial worthat the end of the financial year. It shows the assets we own aswell as liabilities or claims against those assets.
Both assets and liabilities are expressed as current or non-current. Current are assets or liabilities that are expected to beconverted to cash within the next twelve months. Non-currentassets or liabilities are longer-term.
Equity is total capital, and reserves and accumulated profits thathave been reinvested in the business over the years.
S TAT E M E N T O F C H A N G E S I N E Q U I T YThe Statement of Changes in Equity shows the changes in equityfrom last year to this year.
The total overall change in equity during a financial yearcomprises the net result for the year after tax items chargeddirectly to the equity account from revaluation of assets.
CAS H F LOW S TAT E M E N TThe Cash Flow Statement summarises our cash receipts andpayments for the financial year and the net cash position at theend of the year. It differs from the Comprehensive OperatingStatement in that it excludes non-cash expenses such asdepreciation and the accruals taken into account in theComprehensive Operating Statement. It includes payments orreceipts in relation to capital items and any financing activitiessuch as movements in borrowings by us.
For the year ending 30 June 2015, we had a net cash inflow fromoperating activities of $24.9 million.
N OT E S TO T H E F I N A N C I A L S TAT E M E N T SThe Notes to the Financial Statements provide furtherinformation about how the Financial Statements are prepared aswell as additional information and detail about specific itemswithin them.
The Notes also describe any changes to accounting standards,policy or legislation that may affect the way the statements areprepared. Information in the Notes is particularly helpful if therehas been a significant change from the previous year’scomparative figures.
S TATUTORY CERTIF ICAT ION AND AUDITOR GENERAL’S REPORTThese provide the reader with a written undertaking that theFinancial Statements are correct. The Report from the AuditorGeneral provides an independent view and describes any issuesof concern.
C O N T E N T S
Financial Statements
Statutory Certification 51
Comprehensive Operating Statement 52
Balance Sheet 53
Statement of Changes in Equity 54
Cash Flow Statement 55
Notes to the Financial StatementsNote 1: Accounting Policies 56
Note 2: Comprehensive Operating Statement Disclosures 65
Note 3: Cash and Cash Equivalents 66
Note 4: Receivables 66
Note 5: Other Financial Assets 67
Note 6: Inventories 67
Note 7: Assets Held For Sale 67
Note 8: Infrastructure Assets, Property, Plant and Equipment 68
Note 9: Intangible Assets 74
Note 10: Payables 74
Note 11: Borrowings 74
Note 12: Provisions and Employee Benefits 75
Note 13: Income Tax 75
Note 14: Net Deferred Tax 76
Note 15: Contributed Capital 77
Note 16: Reserves 77
Note 17: Reconciliation of Net Result/(Deficit) for the yearto Net Cash Inflows from Operating Activities 77
Note 18: Responsible Persons and Executive Officer Disclosures 78
Note 19: Superannuation 79
Note 20: Financial Risk Management Objectives and Policies 80
Note 21: Financial Instruments 82
Note 22: Commitments 83
Note 23: Finance Lease Liabilities — BOOT Schemes 84
Note 24: Operating Lease Commitments 84
Note 25: Joint Operations 85
Note 26: Financing Facilities 85
Note 27: Contingent Assets and Contingent Liabilities 85
Note 28: Auditors Remuneration 85
Note 29: Events Occurring after the Balance Date 86
Note 30: Ex-Gratia Expenses 86
Auditor-General’s Report 87

COLIBAN WATER | FINANCIAL REPORT | 2014–15 PAGE | 51
F I N A N C I A L STAT E M E N T S
S TAT U TO RY C E RT I F I CAT I O N
We certify that the attached financial statements for Coliban Region Water Corporation have been prepared in accordance withStatutory Direction 4.2 of the Financial Management Act 1994, applicable Financial Reporting Directions, applicable AustralianAccounting Standards including interpretations and other mandatory professional reporting requirements.
We further state that, in our opinion, the information set out in the Comprehensive Operating Statement, Balance Sheet, Statement ofChanges in Equity, Cash Flow Statement and the accompanying notes, presents fairly the financial transactions during the financialyear ended 30 June 2015 and the financial position of Coliban Region Water Corporation as at 30 June 2015.
At the date of signing, we are not aware of any circumstance which would render any particulars included in the financial statements tobe misleading or inaccurate.
We authorise the attached financial statements for issue on 14 August 2015.
F O R T H E Y E A R E N D E D 3 0 J U N E 2 0 1 5
Andrew CairnsChairmanColiban Region Water Corporation
Jeff RigbyManaging DirectorColiban Region Water Corporation
Peter LeersenChief Financial OfficerColiban Region Water Corporation

COLIBAN WATER | FINANCIAL REPORT | 2014–15PAGE | 52
C O M P R E H E N S I V E O P E R AT I N G STAT E M E N TF O R T H E Y E A R E N D E D 3 0 J U N E 2 0 1 5
Notes2015
($’000)2014
($’000)
R E V E N U E
Service charges 2(a) 65,899 61,185
Usage charges 2(a) 44,796 40,909
Government grants 26 –
Interest received 83 74
Contributions and gifted assets 2(a) 14,566 11,880
Other income 1,599 1,449
Total revenue 126,969 115,497
E X P E N S E S
Operating and administration expenses 2(b) 38,558 39,408
Employee expenses 2(b) 15,626 14,247
Borrowing costs 2(b) 24,042 22,687
Depreciation 2(b) 32,705 33,141
Finance charges 6,980 7,066
Environmental contributions 1(vi), 22(c) 3,272 3,272
Total expenses 121,183 119,821
Net result/(deficit) before tax and other economic flows 5,786 ( 4,324)
Income tax (expense)/benefit 13(b) ( 513) 1,305
Net result/(deficit) before other economic flows 5,273 ( 3,019)
OT H E R E C O N O M I C F LOWS I N C LU D E D I N T H E N E T R E S U LT
Net gain/(loss) on disposal of assets ( 414) ( 2,167)
Fair value increase/(decrease) in other financial instruments 12 6
Other gains/(losses) from other economic flows ( 86) ( 240)
Income tax benefit relating to components of other economic flows 13(c) 146 720
Total other economic flows net of tax ( 342) ( 1,681)
Net result/(deficit) for the year 4,931 ( 4,700)
Other comprehensive income for the year – –
Total comprehensive result/(deficit) for the year 4,931 ( 4,700)
The above comprehensive operating statement should be read in conjunction with the accompanying notes.

COLIBAN WATER | FINANCIAL REPORT | 2014–15 PAGE | 53
B A L A N C E S H E E TA S AT 3 0 J U N E 2 0 1 5
Notes2015
($’000)2014
($’000)
A S S E T S
C U R R E N T A S S E T S
Cash and cash equivalents 3 9,134 4,390
Receivables 4 21,486 21,739
Inventories 6 1,005 1,097
Prepayments 564 409
Assets held for sale 7 – 788
Total current assets 32,189 28,423
N O N - C U R R E N T A S S E T S
Receivables 4 1,172 1,235
Other financial assets 5 78 66
Infrastructure assets, property, plant and equipment 8 1,270,718 1,261,708
Intangible assets 9 60,052 60,052
Total non-current assets 1,332,020 1,323,061
TOTAL ASSETS 1,364,209 1,351,484
L I A B I L I T I E S
C U R R E N T L I A B I L I T I E S
Payables 10 10,986 16,283
Borrowings 11 5,512 3,839
Employee benefits 12 3,652 2,968
Total current liabilities 20,150 23,090
N O N - C U R R E N T L I A B I L I T I E S
Payables 10 581 464
Borrowings 11 456,620 446,309
Net deferred tax 14 43,451 43,084
Employee benefits 12 526 437
Total non-current liabilities 501,178 490,294
TOTAL LIABILITIES 521,328 513,384
NET ASSETS 842,881 838,100
E Q U I T Y
Contributed capital 15 308,429 308,579
Reserves 16 188,968 188,968
Accumulated funds 345,484 340,553
TOTAL EQUITY 842,881 838,100
Commitments for expenditure 22, 23, 24
Contingent assets and contingent liabilities 27
The above balance sheet should be read in conjunction with the accompanying notes.

COLIBAN WATER | FINANCIAL REPORT | 2014–15PAGE | 54
STAT E M E N T O F C H A N G E S I N E Q U I T YF O R T H E Y E A R E N D E D 3 0 J U N E 2 0 1 5
Notes
Contributed
Capital($’000)
Reserves
($’000)
Accumulated
funds
($’000)
Total
($’000)
BA L A N C E AT 1 J U LY 2 0 1 3 308,579 188,968 345,253 842,800
Total comprehensive result/(deficit) for the year – – ( 4,700) ( 4,700)
Transactions with the State in its capacity as owner:
Contributed capital transfer 15 – – – –
BA L A N C E AT 3 0 J U N E 2 0 1 4 308,579 188,968 340,553 838,100
Total comprehensive result/(deficit) for the year – – 4,931 4,931
Transactions with the State in its capacity as owner:
Contributed capital transfer 15 ( 150) – – ( 150)
BA L A N C E AT 3 0 J U N E 2 0 1 5 308,429 188,968 345,484 842,881
The above statement of changes in equity should be read in conjunction with the accompanying notes.

COLIBAN WATER | FINANCIAL REPORT | 2014–15 PAGE | 55
Notes2015
($’000)2014
($’000)
CAS H F LOWS F R O M O P E R AT I N G ACT I V I T I E S
R E C E I P T S
Service and usage charges 106,977 96,508
Other customer revenue 9,108 6,963
Receipts from Government 26 –
GST received from the ATO (i) 6,757 8,192
Interest received 84 74
122,952 111,737
PAY M E N T S
Payments to suppliers and employees ( 63,918) ( 58,298)
Borrowing costs and finance charges ( 30,884) ( 29,225)
Environmental contributions ( 3,272) ( 3,272)
( 98,074) ( 90,795)
Net cash inflows from operating activities 17 24,878 20,942
CAS H F LOWS F R O M I N V E S T I N G ACT I V I T I E S
Payments for infrastructure assets, property, plant and equipment ( 29,161) ( 40,595)
Proceeds from sale of infrastructure assets, property, plant and equipment 3,444 93
Net cash outflows from investing activities ( 25,717) ( 40,502)
CAS H F LOWS F R O M F I N A N C I N G ACT I V I T I E S
Proceeds from borrowings 9,589 22,565
Outflow from contributions of owners ( 150) –
Repayment of finance lease liabilities ( 3,856) ( 3,425)
Net cash inflows from financing activities 5,583 19,140
Net increase/(decrease) in cash and cash equivalents 4,744 ( 420)
Cash and cash equivalents at the beginning of the financial year 4,390 4,810
Cash and cash equivalents at the end of the financial year 3 9,134 4,390
C A S H F L O W STAT E M E N TF O R T H E Y E A R E N D E D 3 0 J U N E 2 0 1 5
The above cash flow statement should be read in conjunction with the accompanying notes.
(i) Goods and Services Tax paid to the ATO is presented on a net basis.

COLIBAN WATER | FINANCIAL REPORT | 2014–15PAGE | 56
N OT E 1 : AC C O U N T I N G P O L I C I E S
i BAS I S O F AC C O U N T I N G
General
This financial report of Coliban Region Water Corporation (ColibanWater) is a general purpose financial report that consists of aComprehensive Operating Statement, Balance Sheet, Statement ofChanges in Equity, Cash Flow Statement and notes accompanyingthese statements. The financial statements for Coliban Water havebeen prepared in accordance with Statutory Direction 4.2 of theFinancial Management Act 1994, applicable Financial ReportingDirections, Australian Accounting Standards (AAS) includinginterpretations and other mandatory professional reportingrequirements.
Coliban Water is classified for the purpose of financial reporting asnot-for-profit. This financial report has been prepared on an accrualand going concern basis.
The annual financial statements were authorised for issue by theBoard of Coliban Water on 14th August 2015.
Functional and presentation currency
Items included in this financial report are measured using thecurrency of the primary economic environment in which ColibanWater operates (‘the functional currency’). The financial statementsare presented in Australian dollars, which is Coliban Water’sfunctional and presentation currency.
Classification between current and non-current
In the determination of whether an asset or liability is current ornon-current, consideration is given to the time when each asset orliability is expected to be realised or paid. The asset or liability isclassified as current if it is expected to be turned over within thenext twelve months, being Coliban Water’s operational cycle – seeNote 1(ixx) Employee Benefits for a variation in relation to employeebenefits.
Rounding
Unless otherwise stated, amounts in the report have been roundedto the nearest thousand dollar.
Historical cost convention
These financial statements have been prepared under the historicalcost convention, as modified by the revaluation of financial assetsand all classes of infrastructure assets, property, plant andequipment.
Fair value measurement
Consistent with AASB 13 Fair Value Measurement, Coliban Waterdetermines the policies and procedures for both recurring fair valuemeasurements such as infrastructure, property, plant andequipment, and financial instruments and for non-recurring fairvalue measurements such as non-financial physical assets held forsale, in accordance with the requirements of AASB 13 and therelevant Financial Reporting Directions.
All assets for which fair value is measured or disclosed in thefinancial statements are categorised within the fair value hierarchy,described as follows, based on the lowest level input that issignificant to the fair value measurement as a whole:
Level 1: Quoted (unadjusted) market prices in active markets foridentical assets
Level 2: Valuation techniques for which the lowest level input that issignificant to the fair value measurement is directly or indirectlyobservable; and
Level 3: Valuation techniques for which the lowest level input that issignificant to the fair value measurement is unobservable.
For the purpose of fair value disclosures, Coliban Water hasdetermined classes of assets on the basis of the nature,characteristics and risks of the asset or liability and the level of thefair value hierarchy as explained above.
In addition, Coliban Water determines whether transfers haveoccurred between levels in the hierarchy by re-assessingcategorisation (based on the lowest level input that is significant tothe fair value measurement as a whole) at the end of each reportingperiod.
The Valuer General Victoria (VGV) is Coliban Water’s independentvaluation agency in relation to the valuation of infrastructure assets,property, plant and equipment.
Coliban Water, in conjunction with VGV, monitors changes in the fairvalue of infrastructure assets, property, plant and equipment throughrelevant data sources to determine whether revaluation is required.
Accounting estimates and judgements
The preparation of financial statements in conformity with the AASrequires the use of certain critical accounting estimates andjudgements that affect the application of accounting policies and thereported amounts of assets, liabilities, income and expenses. Actualresults may differ from these estimates and judgements. It alsorequires management to exercise its judgement in the process ofapplying the entity’s accounting policies.
The most significant accounting estimates and judgementsundertaken are:
> estimation of assets useful lives> impairment of assets> recognition of deferred tax balances> employee benefits provision> contingent assets and liabilities> fair value of infrastructure assets, property, plant and equipment> actuarial assumptions of the defined benefits superannuation> accrued revenue and expenses
i i C H A N G E S I N AC C O U N T I N G P O L I C I E S Unless otherwise stated, all accounting policies applied are
consistent with those of the prior year.
Subsequent to the 2013/14 reporting period, the following new andrevised Standards have been adopted in the current period withtheir financial impact detailed as below.
AASB 10 Consolidated Financial Statements
AASB 10 provides a new approach to determine whether an entityhas control over an entity, and therefore must present consolidatedfinancial statements. The new approach requires the satisfaction ofall three criteria for control to exist over an entity for financialreporting purposes:
(a) The investor has power over the investee;(b) The investor has exposure, or rights to variable returns from its
involvement with the investee; and(c) The investor has the ability to use its power over the investee to
affect the amount of investor’s returns.
Coliban Water has assessed the new approach under AASB 10 andconclude that no control exists over another entity, therefore noconsolidated financial statements will be generated.
AASB 11 Joint Arrangements
In accordance with AASB 11, there are two types of jointarrangements, i.e. joint operations and joint ventures. Jointoperations arise where the investors have rights to the assets andobligations for the liabilities of an arrangement. A joint operatoraccounts for its share of the assets, liabilities, revenue andexpenses. Joint ventures arise where the investors have rights to
N O T E S T O T H E F I N A N C I A L STAT E M E N T SF O R T H E Y E A R E N D E D 3 0 J U N E 2 0 1 5

COLIBAN WATER | FINANCIAL REPORT | 2014–15 PAGE | 57
the net assets of the arrangement; joint ventures are accounted forunder the equity method. Proportionate consolidation of a jointventure is no longer permitted.
Coliban Water has reviewed its existing contractual arrangementswith other entities to ensure they are aligned with the newclassifications under AASB 11. Coliban Water has concluded that theexisting classification for the current joint arrangement remainsappropriate and therefore no adjustment is required to the financialstatements. Refer Note 25 for full disclosure.
AASB 12 Disclosure of Interests in Other Entities
AASB 12 prescribes the disclosure requirements for an entity’sinterests in subsidiaries, associates and joint arrangements, andextends to the entity’s association with unconsolidated structuredentities.
Coliban Water has disclosed information about its interests in itsjoint operation in Note 25, including any significant judgements andassumptions used in determining the type of joint arrangement inwhich it has an interest.
Coliban Water has reviewed its current contractual arrangements todetermine if there are any unconsolidated structured entities that ithas involvement with. Coliban Water has not identified anyunconsolidated structured entities during the assessment.
iii C H A N G E S I N AC C O U N T I N G E ST I M AT E S A N D J U D G E M E N T S Revisions to accounting estimates and judgements are recognised
in the period in which the estimate or judgement is revised and alsoin future periods that are affected by the revision.
In 2014/15 Coliban Water updated all infrastructure asset usefullives with the latest available and more reliable information whichimproved our judgement and estimation of asset useful lives. Thefollowing revisions were applied:
At 1 July 2014 Coliban Water revised the useful lives of undergroundinfrastructure assets by aligning the accounting life with theengineering life in order to ensure that useful lives represent realityas closely as possible. The revised methodology for estimatinguseful lives takes into consideration historical performance,operational data, location, soil types and other factors. This resultedin revisions to the remaining useful life of approximately 90% ofboth water and sewer underground assets and reduced annualdepreciation expense by almost $3.3 million in the 2014/15 financialyear. It is estimated that this depreciation benefit will continue tohave a similar impact in future financial years.
At 1 February 2015 Coliban Water revised the useful lives of aboveground infrastructure assets, which included plant and equipment,based on condition assessments derived from the physicalinspection of over 90% of assets in this category. Through thisprocess assets were broken down into lower, more accuratecomponent levels where they were allocated more realistic usefullives. These judgement changes have resulted in a reduction inannual depreciation expense by almost $0.5 million in the 2014/15financial year with an estimated future annual impact of $1.3 million.
Asset useful lives are reviewed on an annual basis and revised asrequired which may impact future years by differing amounts thanstated above.
In 2014/15 Coliban Water revised the taxation treatment for threefinancial items based on the latest available and more reliableinformation. The following revisions were implemented from 1 July2014:
• Included for assessment, for the first time, was the estimatedaccrued revenue in respect of water rates and charges for whichmeters have been read at year end but not invoiced per ‘ATOInterpretative Decision 2012/15’. This transitioning from theinvoice to supply basis has decreased deferred tax liabilities by$2.3 million (refer Note 14(b))
• Included for deduction for the first time, was the accrued intereston loans which has decreased the deferred tax assets by $1.3 million (refer Note 14(a))
• Adjusted the deduction, for the first time, to reflect only thedepreciation component relating to low value pool assetpurchases which were expensed during the year whichincreased deferred tax assets by $8,000 (refer Note 14(a))
iv C O M PA R AT I V E A M O U N T S Where appropriate, comparative figures have been amended to
align with current presentation and disclosure in accordance withAASB 101 Presentation of Financial Statements.
v R E V E N U E F R O M O P E R AT I N G AC T I V I T I E S
Service and usage charges
Service charges are recognised as revenue when services havebeen provided or when a rate levy has been charged.
Usage charges are recognised as revenue when the service hasbeen supplied. Meter reading is scheduled quarterly and thereforean estimation is made at the end of each accounting period of waterservices used that are recorded on meters which have not beenread. The estimation is made by multiplying the number of dayssince the last reading by an adjusted reading for an equivalent priorperiod.
Trade waste charges are recognised as revenue at the end of theservice delivery period. Volume meters are read and appropriatecharges levied in accordance with the trade waste agreements.Major trade waste customer meters are read monthly with accountssent monthly. All minor trade waste customer meters are readquarterly with accounts sent quarterly. An estimation is made bymultiplying the number of days since the last reading by an adjustedreading for an equivalent prior period.
On 18 January 2014, the former Victorian Government announcedthe Victorian Government Efficiency Initiative (VGEI) formally knownas Fairer Water Bills. The objective of this reform is to lowerhousehold water bills by delivering efficiencies and system-widecost reductions that are to be passed onto customers. From 1 July2014 through to 30 June 2018, Coliban Water will pass on the VGEIsavings through tariffs that are lower than those approved by theEssential Services Commission.
Government Grants and Contributions
Government grants and contributions are recognised as operatingrevenue on receipt or when the entity obtains control of thecontribution and meets certain other criteria as outlined by AASB1004 Contributions, whichever is the sooner, and disclosed in theComprehensive Operating Statement as government grants andcontributions. However, grants and contributions received from theVictorian State Government, which were originally appropriated bythe Parliament as additions to net assets or where the Minister forFinance and the Minister for Environment, Climate Change andWater have indicated are in the nature of owners’ contributions, areaccounted for as Equity – Contributions by Owners in accordancewith FRD 119A Transfers through Contributed Capital.
Interest
Interest is recognised as revenue when earned or when the servicehas been provided.
Contributions and gifted assets
New customer contributions paid by developers to connect newdevelopments to existing water supply and sewerage systems arerecognised as revenue when the contributions are received.
Assets received free of charge from developers and others arerecognised at their fair value as revenue upon their acceptance byColiban Water for maintenance in perpetuity. Water and wastewatermains within estate developments are often constructed andfinanced by property developers and on completion, the ownershipof the mains are transferred to Coliban Water as a gifted asset.
Other income
Other income associated with rentals, leases, informationstatements, rechargeable and miscellaneous charges arerecognised when earned or when the service has been provided.

COLIBAN WATER | FINANCIAL REPORT | 2014–15PAGE | 58
vi E X P E N S E S
Operating and administration expenses
Operating expenses relating to general operating costs, routinemaintenance, repair costs and minor renewal costs are expensed asincurred. Where the works include the replacement of a componentof an asset and the cost exceeds the capitalisation threshold, thecost is capitalised and depreciated.
Administration expenses relating to supplies and service costs arerecognised as an expense in the reporting period in which they areincurred, and are reported in the financial year to which they relate.
Employee expenses
These expenses include all costs related to employment includingwages and salaries, superannuation, fringe benefits tax, leaveentitlements, redundancy payments and work cover premiums.
Superannuation
The amount recognised in the Comprehensive Operating Statementin respect of superannuation represents contributions made or dueby Coliban Water to the relevant superannuation plans in respect tothe services of Coliban Water’s staff (both past and present).Superannuation contributions are made to the plans based on therelevant rules of each plan and any relevant compulsorysuperannuation requirements that Coliban Water is required tocomply with.
Borrowing costs
Borrowing costs are recognised as expenses in the financial periodin which they are incurred. Borrowing costs include interest on bankoverdrafts, short term and long term borrowings, and amortisation ofancillary costs incurred in connection with finance leases.
Depreciation of non-current assets
All non-current physical assets that have a limited useful life aredepreciated. Where assets have separate identifiable componentsthat have distinct useful lives and/or residual values, a separatedepreciation rate is determined for each component.
Land is not depreciated. Depreciation on all infrastructure assets,buildings, plant and equipment, and other non-current physicalassets is calculated using the straight line method to allocate theircosts or revalued amounts, net of their residual values, over theirestimated useful lives, commencing from the time the asset isavailable and ready for use. The assets residual values and usefullives are reviewed, and adjusted if appropriate, at each balancesheet date.
Depreciation rates used are listed below and include a comparisonto the prior year.
During the year Coliban Water made changes in accountingestimates and judgements relating to the useful lives ofinfrastructure assets. Refer to Note 1(iii) for a detailed explanation.
Finance charges
Coliban Water has entered into two contractual arrangements tobuild, own and operate water and wastewater treatment facilities inthe region (see Note 23). The interest element of finance leases ischarged to the Comprehensive Operating Statement over the leaseperiod.
Environmental contributions
The Water Industry (Environmental Contributions) Act 2004 (the Act)amended the Water Industry Act 1994 to make provision forenvironmental contributions to be paid by water corporations.
The Act established an obligation for Coliban Water to pay into theconsolidated fund annual contributions for the first period, from 1October 2004 to 30 June 2008 in accordance with the pre-established schedule of payments, which set out the amountspayable. The contribution period was extended to 30 June 2016.
The purpose of the environmental contribution is set out in the Act,and the funding may be used for the purpose of funding initiativesthat seek to promote the sustainable management of water oraddress water-related initiatives.
Coliban Water has a statutory requirement to pay an environmentalcontribution to the Department of Environment, Land, Water andPlanning (DELWP). This contribution is recognised as an expenseduring the reporting period as incurred.
vii OT H E R E C O N O M I C F LOWS
Impairment of assets
Intangible assets with indefinite useful lives are tested annually as towhether their carrying value exceeds their recoverable amount. Allother assets are assessed annually for indicators of impairment,except for:
> inventories;> deferred tax assets;> financial instrument assets; and> non-current assets held for sale.
If there is an indication of impairment, the assets concerned aretested as to whether their carrying value exceeds the recoverableamount. Where an assets carrying amount exceeds the recoverableamount, the difference is written-off by a charge to theComprehensive Operating Statement except to the extent that thewrite-down can be debited to an asset revaluation reserve amountapplicable to that class of asset.
The recoverable amount for non-financial assets is measured at thehigher of value in use and fair value less costs to disposal. AsColiban Water is a not-for-profit entity, value in use is based ondepreciated replacement cost where the future economic benefits ofthe asset are not primarily dependent on the asset’s ability togenerate cash flows and where in the event of the loss of an asset,the future economic benefits arising from the use of the asset willbe replaced.
A reversal of an impairment loss on a revalued asset is crediteddirectly to equity under the heading asset revaluation reserve.However, to the extent that an impairment loss on the same class ofasset was previously recognised in the Comprehensive OperatingStatement, a reversal of that impairment loss is recognised in theComprehensive Operating Statement.
For Coliban Water’s permanent water entitlements the value in use(VIU) at the cash generating unit (CGU) level has been applied indetermining the recoverable amount as at 30 June 2015 on thebasis that the future economic benefits of the asset are primarilydependent on the asset’s ability to generate cash flows consistentwith the prior year. Where the VIU of the CGU is higher than itscarrying value, the fair value less costs to sell is not required to becalculated. As the VIU at CGU is higher than the carrying amount asat 30 June 2015 no impairment of the permanent waterentitlements has been recognised for the financial year ended 30June 2015 (30 June 2014, no impairment recognised).
Asset2014–15
Useful Life
2013–14
Useful Life
Buildings and LeaseholdImprovements
20 to 50 years 20 to 50 years
Plant and Equipment 1 to 40 years 1 to 20 years
Infrastructure 5 to 400 years 10 to 300 years
BOOT SchemesInfrastructure
25 to 60 years 25 to 60 years
COLIBAN WATER | FINANCIAL REPORT | 2014–15 PAGE | 59
viii CAS H A N D CAS H E Q U I VA L E N T S For the purposes of the Cash Flow Statement, cash and cash
equivalents include cash on hand, cash in bank and bank overdrafts.Bank overdrafts are shown within interest bearing liabilities on thebalance sheet.
ix R E C E I VA B L E S Receivables consist of:
> contractual receivables, such as debtors in relation to goods andservices, accrued investment income, and finance leasereceivables; and
> statutory receivables, such as amounts owing from the VictorianGovernment and Goods and Services Tax (GST) input tax creditsrecoverable.
Contractual receivables are classified as financial instruments andcategorised as loans and receivables.
Statutory receivables, are recognised and measured similarly tocontractual receivables (except for impairment), but are notclassified as financial instruments because they do not arise from acontract.
Contractual receivables are recognised initially at fair value andsubsequently measured at amortised cost, less any provision forimpaired receivables. Trade receivables for water utility debtors andother debtors are due for settlement no more than 28 days from thedate of recognition.
Collectability of contractual receivables is reviewed on an ongoingbasis. Receivables which are known to be uncollectible are writtenoff. A provision for doubtful receivables is established when there isobjective evidence that Coliban Water will not be able to collect allamounts due according to the original terms of receivables. Theamount of the provision is recognised as an expense in theComprehensive Operating Statement.
x I N V E N TO R I E S Inventories include goods held for distribution at no or nominal cost.
Inventories held for distribution are measured at cost, adjusted forany loss of service potential. The basis used in assessing loss ofservice potential for inventories held for distribution include currentreplacement cost and technical or functional obsolescence.Technical obsolescence occurs when an item still functions for someor all of the tasks it was originally acquired to do, but no longermatches existing technologies. Functional obsolescence occurswhen an item no longer functions the way it did when it was firstacquired.
xi P R E PAY M E N T S Prepayments represent payments in advance of receipt of goods or
services or that part of expenditure made in one accounting periodcovering a term extending beyond that period.
xii I N F R A ST R U C T U R E A S S E T S , P R O P E RT Y, P L A N T A N D E Q U I P M E N T
Recognition and measurement of assets
Infrastructure assets, property, plant and equipment represent non-current physical assets comprising land, buildings, water andsewerage infrastructure assets, plant, equipment, motor vehicles,and BOOT scheme infrastructure used by Coliban Water in itsoperations. Items with a cost value in excess of $1,000 (2013/14:$1,000) and a useful life of more than one year are recognised as anasset. All other assets acquired are expensed. Where assets areconstructed by Coliban Water, the cost at which they are recordedincludes an appropriate share of fixed and variable overheads.Assets acquired at no cost or for nominal consideration by ColibanWater are recognised at fair value at the date of acquisition.
Leasehold improvements
Leasehold improvements are recognised at fair value and areamortised over the unexpired period of the lease or the estimateduseful life of the improvement, whichever is the shorter. At balancedate, leasehold improvements are amortised over a 20 year and 5year period consistent with the terms of the two leases (2013/14: 20year and 5 year period).
Measurement of non-current physical assets
All non-current physical assets are recognised initially at cost andsubsequently revalued at fair value less accumulated depreciationand impairment in accordance with the requirements of FinancialReporting Direction (FRD) 103F – Non-Current Physical Assets.
Revaluations are conducted in accordance with FRD 103F.Scheduled revaluations are undertaken every five years with anannual assessment of fair value to determine if it is materiallydifferent to the carrying value. If the difference to carrying value isgreater than 10 per cent, a management revaluation is undertakenwhile a movement greater than 40 per cent will normally involve anapproved valuer (usually the Valuer General of Victoria) to perform adetailed assessment of the fair value. If the movement in fair valuesince the last revaluation is less than or equal to 10 per cent, thenno change is made to the carrying amounts.
For the plant, equipment and motor vehicles asset classes, whereColiban Water is able to demonstrate that there is no evidence that areliable market-based fair value (or other fair value indicators) existfor these assets, depreciated replacement cost is used to representfair value.
In accordance with FRD 103F Non-Current Physical Assets, at boththe entity reporting level and whole of government reporting level,infrastructure assets, property, plant and equipment are measuredat fair value less accumulated depreciation and impairment. Theseassets comprise substructures or underlying systems held tofacilitate harvesting, storage, treatment and transfer of water tomeet customer needs. They also include sewerage and drainagesystems.
The initial fair value assessment for infrastructure occurred as at 30June 2011 and was undertaken with involvement from ValuerGeneral of Victoria (VGV), under the instructions of Department ofTreasury and Finance (DTF). The assessment was performed on aportfolio basis for various categories of water infrastructures.
Revaluations of non-current physical assets
Revaluation increments are credited directly to equity in the assetrevaluation reserve, except when an increment reverses arevaluation decrement in respect of that class of asset previouslyrecognised as an expense in determining the net result, theincrement is then recognised as revenue in determining the netresult.
Revaluation decrements are recognised immediately as expenses inthe net result, except that, to the extent that a credit balance existsin the asset revaluation reserve in respect of the same class ofassets, they are then debited to the asset revaluation reserve.Revaluation increases and revaluation decreases relating toindividual assets within a class of infrastructure assets, property,plant and equipment are offset against one another within that classbut are not offset in respect of assets in different classes. Assetrevaluation reserves are not transferred to accumulated funds onderecognition of the relevant asset.
Assets held for sale
Assets classified as held for sale are measured at the lower of theircarrying amount and fair value less costs to sell, as their carryingamount will be recovered principally through a sale transaction,rather than through continuing use. Coliban Water considers that thesale is highly probable, the asset is available for immediate sale inits present condition and the sale is expected to be completed within12 months from the date of classification. Assets are notdepreciated or amortised while they are classified as held for sale.Assets classified as held for sale are classified as current assets.

COLIBAN WATER | FINANCIAL REPORT | 2014–15PAGE | 60
xiii I N TA N G I B L E S Intangible assets represent identifiable non-monetary assets without
physical substance. Intangible assets are recognised at cost. Costsincurred subsequent to initial acquisition are capitalised when it isexpected that additional future economic benefits will flow toColiban Water.
Intangible Assets are represented by permanent water entitlementspurchased and capitalised under the provisions of AASB 138Intangible Assets.
Permanent water entitlements purchased are treated as anintangible asset on the Balance Sheet at cost (in accordance withAASB 138 Intangible Assets and FRD 109 Intangible Assets), and willnot be subject to amortisation, as the permanent water entitlementshave an indefinite life. Permanent water entitlements will be testedannually for impairment.
Permanent water entitlements are tested for impairment at eitherindividually or at the cash generating unit (CGU) level by comparingthe assets or CGUs recoverable amount with its carrying amountannually. Whenever there is an indication that the impairment exists,any excess of the carrying amount over the recoverable amount isrecognised as an impairment loss in the Comprehensive OperatingStatement (refer to Note 1 (vii) for further detail).
xiv B O OT S C H E M E S I N F R A ST R U C T U R E Coliban Water has entered into contractual arrangements with
Bendigo Water Services Pty Ltd to build, own and operate watertreatment facilities in Bendigo, Castlemaine and Kyneton and withETE Coliban Pty Ltd to build, own and operate a wastewatertreatment facility in Echuca and Rochester, over a 25 year period inexchange for a stream of payments. At the end of the contractperiod, the assets are transferred to Coliban Water at no cost. Asownership of the asset is transferred to Coliban Water at the end ofthe contractual term and this term is for the major part of theeconomic life of the asset, Coliban Water accounts for the assetunder the BOOT Scheme as a finance lease.
Finance leases are capitalised at the lease’s inception at the lowerof the fair value of the leased property and the present value of theminimum lease payments. Each stream of lease payment isallocated between the liability and finance costs. The interestelement of the finance cost is charged to the ComprehensiveOperating Statement over the lease period so as to produce aconstant periodic rate of interest on the remaining balance of theliability for each period. The assets acquired in a BOOT Scheme thatmeet the classification of a finance lease are depreciated over theasset’s useful life.
xv L E A S E S
Operating leases
Leases in which a significant portion of the risks and rewards ofownership are retained by the lessor are classified as operatingleases. Payments made under operating leases (net of anyincentives received from the lessor) are charged to theComprehensive Operating Statement when incurred during theperiod of the lease, as this represents the pattern of benefits derivedfrom the leased assets.
xvi PAYA B L E S Payables consist of:
> contractual payables, such as accounts payable, and unearnedincome. Accounts payable represent liabilities for goods andservices provided to Coliban Water prior to the end of thefinancial year that are unpaid, and arise when Coliban Waterbecomes obliged to make future payments in respect of thepurchase of those goods and services; and
> statutory payables, such as goods and services tax and fringebenefits tax payables.
Contractual payables are classified as financial instruments andcategorised as financial liabilities at amortised cost. Statutorypayables are recognised and measured similarly to contractualpayables, but are not classified as financial instruments and notincluded in the category of financial liabilities at amortised cost,because they do not arise from a contract.
The contractual payables are unsecured and are usually paid within30 days of recognition.
xvii P R OV I S I O N S Provisions are recognised when Coliban Water, as a result of a past
event, has a legal or constructive obligation that can be estimatedreliably, and it is probable that an outflow of economic benefits willbe required to settle the obligation.
The amount recognised as a provision is the best estimate of theconsideration required to settle the present obligation at the end ofthe reporting period, taking into account the risks and uncertaintiessurrounding the obligation.
xviii B O R R OW I N G S Borrowings in respect to loans held with Treasury Corporation of
Victoria are initially recognised at fair value, net of transaction costs.Subsequent to initial recognition, borrowings are measured atamortised cost with any difference between the initial recognisedamount and the redemption amount being recognised in theComprehensive Operating Statement over the period of theborrowings using the effective interest rate method.
Borrowings are classified as current liabilities unless Coliban Waterhas an unconditional right to defer settlement of the liability for atleast 12 months after the balance sheet date.
Coliban Water has classified borrowings which mature within 12months as non-current liabilities on the basis that the entity will andhas discretion to refinance or rollover these loans with the TreasuryCorporation of Victoria, pursuant to section 8 of the Borrowings andInvestment Powers Act 1987. Borrowings known as 11am debt areclassified as current borrowings.
ixx E M P LOY E E B E N E F I T S
Wages, salaries and annual leave
Liabilities for wages, salaries and annual leave to be wholly settledwithin 12 months of the reporting date are recognised in employeebenefits liabilities in respect of employee services up to thereporting date and are measured at the amounts expected to bepaid when the liabilities are settled, at their nominal values.Employee benefits which are not expected to be wholly settledwithin 12 months are measured at the present value of theestimated future cash outflows to be made by the entity, in respectof services rendered by employees up to the reporting date.Regardless of the expected timing of settlements, provisions madein respect of employee benefits are classified as a current liability,unless there is an unconditional right to defer the settlement of theliability for at least 12 months after the reporting date, in which caseit would be classified as a non-current liability.
Long service leave (LSL)
Current liability – unconditional LSL (representing 7 or more years ofcontinuous service) is disclosed as a current liability even whereColiban Water does not expect to wholly settle the liability within 12months because it does not have the unconditional right to defer thesettlement of the entitlement should an employee take leave within12 months.
The components of this current liability for long service leave aremeasured at:
> Present value – component that Coliban Water does not expectto wholly settle within 12 months; and
> Nominal value – component that Coliban Water expects to whollysettle within 12 months.
COLIBAN WATER | FINANCIAL REPORT | 2014–15 PAGE | 61
Non-current liability – conditional LSL (representing less than 7years of continuous service) is disclosed as a non-current liability.There is an unconditional right to defer the settlement of theentitlement until the employee has completed the requisite years ofservice. Conditional LSL is required to be measured at presentvalue.
In calculating present value, consideration is given to expectedfuture wage and salary levels, experience of employee departuresand periods of service. Expected future payments are discountedusing market yields at the reporting date based on nationalgovernment bonds with terms to maturity and currency that match,as closely as possible, the estimated future cash outflows.
Superannuation
The amount charged to the Comprehensive Operating Statement inrespect of superannuation represents the contributions made or dueby Coliban Water to the relevant superannuation plans in respect tothe services of Coliban Water’s staff (both past and present).Superannuation contributions are made to the plans based on therelevant rules of each plan and any relevant compulsorysuperannuation requirements that Coliban Water is required tocomply with.
The amount charged to the Comprehensive Operating Statement inrespect of superannuation represents the contributions made to thesuperannuation plan, adjusted by the movement in the definedbenefit plan liability or surplus. The statutory contributions made byColiban Water to all superannuation plans make up thesuperannuation expense for the reporting period and are detailed inNote 19.
Employee benefit on-costs
Employee benefit on-costs, including superannuation, payroll taxand workers compensation are recognised and included inemployee benefit liabilities and costs when the employee benefits towhich they relate are recognised as liabilities.
Performance payments
Performance based bonus payments for Coliban Water’s ExecutiveOfficers, when approved, are based on an agreed percentage of theannual salary package provided under their contracts ofemployment. A liability is recognised and is measured as theaggregate of the amounts accrued under the terms of the contractsto balance date.
xx C O N T R I B U T E D CA P I TA L The individual circumstances of a particular entity may require that
certain State Government capital contributions, normally thoseassociated with major asset acquisition programs, be accounted foras equity contributions. In such instances, the Minister forEnvironment, Climate Change and Water, after consultation with theMinister for Finance, direct that such contributions be recognised asEquity – Contributed Capital.
xxi F I N A N C I A L I N ST R U M E N T S
Recognition
Financial instruments are initially measured at fair value, plustransaction costs except where the instrument is classified ‘at fairvalue through the profit or loss’ in which case transaction costs areexpensed to the Comprehensive Operating Statement immediately.Subsequent to initial recognition, the financial instruments aremeasured as set out below.
Financial assets at fair value through the Comprehensive
Operating Statement
Financial assets at fair value through the Comprehensive OperatingStatement are financial assets held for trading or designated at fairvalue through the Comprehensive Operating Statement on initialrecognition when doing so results in more relevant information. Afinancial asset is classified in this category if acquired principally forthe purpose of selling in the short term. Assets in this category areclassified as current assets. Gains and losses arising from changesin fair value are recognised in the Comprehensive OperatingStatement.
Other financial instruments at fair value through
Comprehensive Operating Statement
Other financial assets are valued at their market value at 30 June2015 and are classified as non-current assets based on maturitydates of individual investments. All gains and losses of otherfinancial assets are recorded in other economic flows in theComprehensive Operating Statement.
Loans and receivables
Loans and receivables are non-derivative financial assets with fixedor determinable payments that are not quoted in an active market.They are included in current assets, except for those with maturitiesgreater than 12 months after the reporting date which are classifiedas non-current assets. Loans and receivables are included inreceivables in the Balance Sheet. Loans and receivables arerecorded at amortised cost less impairment.
Fair value
Fair value is determined based on current bid prices for all quotedinvestments. Valuation techniques are applied to determine the fairvalue for all unlisted securities, including recent arm’s lengthtransactions with reference to similar instruments and option pricingmodels.
Impairment of financial assets
Coliban Water assesses at the end of each reporting period whetherthere is objective evidence that a financial asset or group offinancial assets is impaired. All financial assets, except thosemeasured at fair value through the Comprehensive OperatingStatement, are subject to annual review for impairment.
Bad and doubtful receivables for financial assets are assessed on aregular basis. Those bad debts considered as written off by mutualconsent are classified as an operating and administration expense.
In assessing impairment of statutory (non-contractual) financialassets which are not financial instruments, Coliban Water appliesprofessional judgement in assessing materiality in accordance withAASB 136 Impairment of Assets.

COLIBAN WATER | FINANCIAL REPORT | 2014–15PAGE | 62
xxii TA X AT I O N Coliban Water is subject to the National Tax Equivalent Regime
(NTER) which is administered by the Australian Taxation Office (ATO).
Deferred tax assets and liabilities are recognised for temporarydifferences at the tax rates expected to apply when the assets arerecovered or liabilities are settled, based on those tax rates whichare enacted or substantially enacted. The relevant tax rates areapplied to the cumulative amounts of deductible and taxabletemporary differences to measure the deferred tax asset or liability.No deferred tax asset or liability is recognised in relation to thesetemporary differences if they arose in a transaction that at the timeof the transaction did not affect either accounting profit or taxableprofit or loss. Deferred tax assets are recognised for deductibletemporary differences and unused tax losses only if it is probablethat future taxable amounts will be available to utilise thosetemporary differences and losses.
Coliban Water’s deferred tax liabilities exceed the level of deferredtax assets and therefore it is required to bring to account taxexpense, tax assets and tax liabilities in the ComprehensiveOperating Statement, Balance Sheet and Statement of Changes inEquity as Coliban Water’s projections show it is likely to generate taxprofits in the foreseeable future against which unused tax lossescan be utilised.
xxiii C O M M I T M E N T S Commitments for future expenditure include operating and capital
commitments arising from contracts. These commitments aredisclosed by way of a note (see Note 22) at their nominal value andinclusive of the goods and services tax (GST) payable. In addition,where it is considered appropriate and provides additional relevantinformation to users, the net present values of significant individualprojects are stated. These future expenditures cease to be disclosedas commitments once the related liabilities are recognised in theBalance Sheet.
xxiv C O N T I N G E N T A S S E T S A N D C O N T I N G E N T L I A B I L I T I E S Contingent assets and contingent liabilities are not recognised in the
Balance Sheet, but are disclosed by way of a note (refer to Note 27)and, if quantifiable, are measured at nominal value. Contingentassets and liabilities are presented inclusive of GST receivable orpayable respectively.
xxv D I V I D E N D P O L I CY Any dividend payable is based on a prescribed percentage of the
previous years’ adjusted net profit. An obligation to pay a dividendonly arises after consultation between the Board and the Minister forEnvironment, Climate Change and Water and the Treasurer.Following this consultation a formal determination is made by theTreasurer.
The process to determine the dividend applicable to the 2014/15financial year has not yet been completed at the reporting datehowever it is anticipated that no dividend will be payable. There wasno dividend payable last year.
xxvi G O O D S A N D S E RV I C E S TA X Revenues, expenses and assets are recognised net of goods and
services tax (GST), except where the amount of GST is notrecoverable from the ATO. In these circumstances, the GST isrecognised as part of the cost of acquisition of the asset or as partof an item of expense.
Receivables, payables and commitments are stated inclusive of GST.The net amount of GST recoverable from, or payable to, the ATO isincluded as a current asset or liability in the Balance Sheet. Cashflows arising from operating activities are disclosed in the Cash FlowStatement on a gross basis – i.e. inclusive of GST. The GSTcomponent of cash flows arising from investing and financingactivities which is recoverable or payable to the taxation authority isclassified as operating cash flows.

COLIBAN WATER | FINANCIAL REPORT | 2014–15 PAGE | 63
xxvii N E W AC C O U N T I N G STA N DA R D S A N D I N T E R P R E TAT I O N S As at 30 June 2015, the following applicable standards and interpretations had been issued but were not mandatory for the financial year ending 30
June 2015. Coliban Water has not and does not intend to adopt these standards early.
Standard/
InterpretationSummary
Applicable forannual reportingperiods beginningon or after
Impact on financial statements
AASB 9
Financial Instruments
The key changes include the simplified requirements for theclassification and measurement of financial assets, a newhedging accounting model and a revised impairment loss modelto recognise impairment losses earlier, as opposed to the currentapproach that recognises impairment only when incurred.
01/01/2018
Based on preliminary assessment, ColibanWater does not have these financialinstruments therefore it will not beimpacted by AASB 9.
AASB 14
Regulatory Deferral Accounts
AASB 14 permits first-time adopters of Australian AccountingStandards who conduct rate-regulated activities to continue toaccount for amounts related to rate regulation in accordancewith their previous GAAP.
01/01/2016
The AASB does not expect the proposedinterim standard, if it were to beincorporated into Australian AccountingStandards, would have an impact onentities in Australia as the standard couldconceivably only affect entities that adoptAustralian Accounting Standards for thefirst time and have recognised regulatorydeferral account balances under theirprevious GAAP accounting policies.Based on a preliminary assessment, therewill be no impact of this change on theaccounts.
AASB 15
Revenue from Contracts withCustomers
The core principle of AASB 15 requires an entity to recogniserevenue when the entity satisfies a performance obligation bytransferring a promised good or service to a customer.
01/01/2017(Exposure Draft263 – potential
deferral to 01/01/2018)
The changes in revenue recognitionrequirements in AASB 15 may result inchanges to the timing and amount ofrevenue recorded in the financialstatements. The Standard requiresadditional disclosures on service revenueand contract modifications. Based on a preliminary assessment, theremay be a limited impact on the accounts.
AASB 2014 4
Amendments to AustralianAccounting Standards –Clarification of AcceptableMethods of Depreciation andAmortisation[AASB 116 & AASB 138]
Amends AASB 116 Property, Plant and Equipment and AASB 138Intangible Assets to:> establish the principle for the basis of depreciation and
amortisation as being the expected pattern of consumption ofthe future economic benefits of an asset;
> prohibit the use of revenue based methods to calculate thedepreciation or amortisation of an asset, tangible or intangible,because revenue generally reflects the pattern of economicbenefits that are generated from operating the business,rather than the consumption through the use of the asset.
01/01/2016
Based on a preliminary assessment, it isnot expected that there will be an impactas the revenue-based method is not usedfor depreciation and amortisation.
AASB 2014 9
Amendments to AustralianAccounting Standards –Equity Method in SeparateFinancial Statements [AASB 1, 127 & 128]
Amends AASB 127 Separate Financial Statements to allowentities to use the equity method of accounting for investments insubsidiaries, joint ventures and associates in their separatefinancial statements.
01/01/2016
Based on a preliminary assessment, it isnot expected that there will be an impactas Coliban Water will continue to accountfor the investments in subsidiaries, jointventures and associates using the costmethod as mandated if separate financialstatements are presented in accordancewith FRD 113A.
AASB 2014 10
Amendments to AustralianAccounting Standards – Saleor Contribution of Assetsbetween an Investor and itsAssociate or Joint Venture[AASB 10 & AASB 128]
AASB 2014-10 amends AASB 10 Consolidated FinancialStatements and AASB 128 Investments in Associates to ensureconsistent treatment in dealing with the sale or contribution ofassets between an investor and its associate or joint venture. Theamendments require that:> a full gain or loss to be recognised by the investor when a
transaction involves a business (whether it is housed in asubsidiary or not); and
> a partial gain or loss to be recognised by the parent when atransaction involves assets that do not constitute a business,even if these assets are housed in a subsidiary.
01/01/2016
Based on a preliminary assessment, therewill be a limited impact, as the revisionsto AASB 10 and AASB 128 are guidance innature.Coliban Water is yet to assess the fullimpact of this change on the accounts.
AASB 2015 6
Amendments to AustralianAccounting Standards –Extending Related PartyDisclosures to Not-for-ProfitPublic Sector Entities[AASB 10, AASB 124 & AASB1049]
The Amendments extend the scope of AASB 124 Related PartyDisclosures to not-for-profit public sector entities. A guidance hasbeen included to assist the application of the Standard by not-for-profit public sector entities.
01/01/2016
The amending standard will result inextended disclosures on the entity’s keymanagement personnel, and the relatedparty transactions. The extended disclosure will have a minorimpact on the accounts..

COLIBAN WATER | FINANCIAL REPORT | 2014–15PAGE | 64
In addition to the new standards and amendments above, the AASB has issued a list of other amending standardsthat are not effective for the 2014/15 reporting period (as listed below). In general, these amending standardsinclude editorial and references changes that are expected to have insignificant impacts on public sector reporting.
> AASB 2010-7 Amendments to Australian Accounting Standards arising from AASB 9 (December 2010).
> AASB 2013-9 Amendments to Australian Accounting Standards – Conceptual Framework, Materiality andFinancial Instruments
> AASB 2014-1 Amendments to Australian Accounting Standards [PART D – Consequential Amendments arisingfrom AASB 14 Regulatory Deferral Accounts only]
> AASB 2014-3 Amendments to Australian Accounting Standards – Accounting for Acquisitions of Interests in JointOperations [AASB 1 & AASB 11]
> AASB 2014-5 Amendments to Australian Accounting Standards arising from AASB 15
> AASB 2014-7 Amendments to Australian Accounting Standards arising from AASB 9 (December 2014)
> AASB 2014-8 Amendments to Australian Accounting Standards arising from AASB 9 (December 2014) –Application of AASB 9 (December 2009) and AASB 9 (December 2010) [AASB 9 (2009 & 2010)]
> AASB 2015-2 Amendments to Australian Accounting Standards – Disclosure Initiative: Amendments to AASB 101[AASB 7, AASB 101, AASB 134 & AASB 1049]
> AASB 2015-3 Amendments to Australian Accounting Standards arising from the Withdrawal of AASB 1031Materiality
xxviii J O I N T LY C O N T R O L L E D A S S E T S Joint operations are contractual arrangements between the entity and one or more other parties to undertake
an economic activity that is subject to joint control. Joint control only exists when the strategic financial andoperating decisions relating to the activity require the unanimous consent of the parties sharing control.
Jointly controlled operations and assets are accounted for using proportionate consolidation.
Investments in jointly controlled operations and assets, in respect of any interest in jointly controlled assets,Coliban Water recognises in the financial statements:
> its share of jointly controlled assets;> any liabilities that it had incurred;> its share of liabilities incurred jointly by the joint operation;> any income earned from the selling or using of its share of the output from the joint operation; and> any expenses incurred in relation to being an investor in the joint operation.
Coliban Water recognises its direct right to the assets, liabilities, revenues and expenses of joint operationsand its share of any jointly held or incurred assets, liabilities, revenues and expenses. These have beenincorporated in the financial statements under the appropriate headings. Details of the joint operation are setout in Note 25.

COLIBAN WATER | FINANCIAL REPORT | 2014–15 PAGE | 65
Notes2015
($’000)2014
($’000)
N OT E 2 : C O M P R E H E N S I V E O P E R AT I N G S TAT E M E N T D I S C LO S U R E S
( a ) I N C O M E F R O M O P E R AT I N G ACT I V I T I E S
S E RV I C E C H A R G E S :
Water service charges 17,271 16,008
Rural water service charges 2,299 2,189
Sewerage service charges 42,083 38,820
Trade waste charges 4,174 4,103
Recycled water service charges 72 65
65,899 61,185
U S AG E C H A R G E S :
Water usage charges 37,471 33,311
Rural water usage charges 1,329 965
Sewerage usage charges 1,121 996
Trade waste usage charges 1,076 905
Recycled water usage charges 559 481
Temporary water sales 3,240 4,251
44,796 40,909
C O N T R I B U T I O N S A N D G I F T E D A S S E T S :
Developer contributions and gifted assets 10,694 9,119
New customer contributions 3,872 2,761
14,566 11,880
( b ) E X P E N S E S F R O M O P E R AT I N G ACT I V I T I E S
O P E R AT I N G A N D A D M I N I S T R AT I O N E X P E N S E S :
Partnership contract expenses 15,210 15,332
Water purchases 1,815 1,591
General services 6,175 5,641
Electricity 3,741 3,951
BOOT toll service payments 6,348 7,060
Other operating and administration expenses 5,269 5,833
38,558 39,408
E M P LOY E E E X P E N S E S :
Salaries and wages 12,471 11,226
Annual leave 1,034 997
Accrued days off 524 486
Long service leave 142 178
Superannuation 19 1,455 1,360
15,626 14,247
B O R R OW I N G C O S T S :
Borrowing Costs - Treasury Corporation Victoria 19,455 18,693
Borrowing Costs - Financial Accommodation Levy 4,587 3,994
24,042 22,687
D E P R E C I AT I O N :
Buildings and leasehold improvements 429 285
Plant & equipment 2,282 1,180
Infrastructure 26,377 28,310
BOOT schemes infrastructure 3,617 3,366
32,705 33,141

COLIBAN WATER | FINANCIAL REPORT | 2014–15PAGE | 66
Notes2015
($’000)2014
($’000)
N OT E 3 : CAS H A N D CAS H E Q U I VA L E N T SCash at bank 9,134 4,390
Total cash and cash equivalents 9,134 4,390
N OT E 4 : R E C E I VA B L E S
C U R R E N T R E C E I VA B L E S
Contractual:
Rates and charges receivables 8,630 10,288
Sundry customer receivables 1,150 1,380
Accrued revenue 9,964 7,891
Provision for doubtful receivables ( 16) ( 80)
Statutory:
Amount owing from the Victorian Government 907 1,015
GST receivables 851 1,245
21,486 21,739
N O N - C U R R E N T R E C E I VA B L E S
Contractual:
Customer receivables 1,172 1,235
1,172 1,235
Total receivables 22,658 22,974
( a ) AG E I N G A N A LYS I S O F R E C E I VA B L E S
The ageing at 30 June 2015 includes current rates and charges receivables, sundry customer receivables, amount owing from VictorianGovernment and non-current customer receivables. Accruals, provision for doubtful receivables and GST receivables are excluded.
Current (up to 1 month) 7,550 9,375
1 to 3 months 1,940 1,723
3 to 12 months 1,197 1,586
More than 12 months 1,172 1,235
11,859 13,919
As at 30 June 2015, receivables net of provision for doubtful receivables past due (older than 1 month) but not impaired totalled $4,292,654(2013/14: $4,464,079). These relate to a number of independent customers for whom there is no recent history of default.The ageing of these receivables is as follows:
Current (up to 1 month) – –
1 to 3 months 1,940 1,724
3 to 12 months 1,181 1,506
More than 12 months 1,172 1,234
Total receivables past due but not impaired 4,293 4,464
( b ) P R OV I S I O N F O R D O U B T F U L R E C E I VA B L E S
As at 30 June 2015, receivables of Coliban Water with a nominal value of $16,161 (2013/14: $80,276) were impaired and a provision for doubtfulreceivables has been raised for this amount. The individually impaired receivables mainly relate to customers, which are in difficult economicsituations and hence, assumed recoverability is low. The ageing of these receivables is as follows:
Current (up to 1 month) – –
1 to 3 months – –
3 to 12 months ( 16) ( 80)
More than 12 months – –
Total receivables ( 16) ( 80)
Movement in the doubtful receivables provision is as follows:
Opening provision balance at 1 July ( 80) ( 70)
Provision recognised during the year 214 156
Receivables written off during the year as uncollectable ( 150) ( 166)
Closing provision balance at 30 June ( 16) ( 80)
The creation and release of the provision for doubtful receivables has been included in other economic flows in the Comprehensive OperatingStatement. Amounts charged to the provision account are generally written off when there is no expectation of recovering additional cash.
( c ) N AT U R E A N D E X T E N T O F R I S K A R I S I N G F R O M R E C E I VA B L E S
Refer to Note 20 for the nature and extent of risks arising from receivables.

COLIBAN WATER | FINANCIAL REPORT | 2014–15 PAGE | 67
Notes2015
($’000)2014
($’000)
N OT E 5 : OT H E R F I N A N C I A L A S S E T S
Shares in Bendigo Community Telco Limited – fair value 78 66
Total other financial assets 78 66
Coliban Water purchased 20,000 Shares @ $1.00 each in Bendigo Community Telco Limited in April 2000. Approval for purchase of the shareswas granted by the Minister for Finance.A one for one bonus share issue was made by Bendigo Community Telco Limited in February 2005. As a result Coliban Water now holds 40,000Shares in Bendigo Community Telco Limited. Their value is reported as the share value at 30 June 2015.
a ) AG E I N G A N A LYS I S O F OT H E R F I N A N C I A L A S S E T S
Refer to Note 21 for the ageing analysis of other financial assets.
b ) N AT U R E A N D E X T E N T O F R I S K A R I S I N G F R O M OT H E R F I N A N C I A L A S S E T S
Refer to Note 20 for the nature and extent of risks arising from other financial assets.
N OT E 6 : I N V E N TO R I E SInventories held for distribution 1,005 1,097
Total current inventories 1,005 1,097
N OT E 7 : A S S E T S H E L D F O R S A L EFreehold land – 788
Total current assets held for sale – 788
Carrying
amount as at
30 June 2015
Fair value measurement at end of reporting period
using:
Level 1(i) Level 2(i) Level 3(i)
($’000) ($’000) ($’000) ($’000)
Freehold land held for sale – – – –
Carrying
amount as at
30 June 2014
Fair value measurement at end of reporting period
using:
Level 1(i) Level 2(i) Level 3(i)
($’000) ($’000) ($’000) ($’000)
Freehold land held for sale 788 – 788 –(i) Classified in accordance with the fair value hierarchy, see Note 1(i)
Land held for sale was independently valued at 30 June 2011 by Valuer General Victoria (VGV) using the market approach. Under this valuationmethod, the assets are compared to recent comparable sales. As there were no significant unobservable adjustments the assets are classified asLevel 2 using the market approach.The freehold land held for sale in the 2013/14 financial year was disposed of in 2014/15. Refer Note 8(b).
FA I R VA LU E M E A S U R E M E N T H I E R A R C H Y

COLIBAN WATER | FINANCIAL REPORT | 2014–15PAGE | 68
2015($’000)
2014($’000)
N OT E 8 : I N F R A S T R U CT U R E A S S E T S , P R O P E RT Y, P L A N T A N D E Q U I P M E N T
( a ) C L A S S E S O F I N F R A S T R U CT U R E A S S E T S , P R O P E RT Y, P L A N T A N D E Q U I P M E N T
L A N D
At fair value 44,660 40,709
B U I L D I N G S
At fair value 1,853 1,721
Less: accumulated depreciation ( 369) ( 287)
1,484 1,434
B U I L D I N G S – L E A S E H O L D
At fair value 4,326 4,099
Less: accumulated depreciation ( 2,458) ( 2,111)
1,868 1,988
P L A N T A N D E Q U I P M E N T
At fair value 18,701 15,153
Less: accumulated depreciation ( 9,181) ( 7,329)
9,520 7,824
WAT E R I N F R A S T R U CT U R E
At fair value 363,826 334,879
Less: accumulated depreciation ( 44,715) ( 33,862)
319,111 301,017
WAT E R D I S T R I B U T I O N A S S E T S
At fair value 140,467 137,735
Less: accumulated depreciation ( 11,604) ( 9,322)
128,863 128,413
WAS T E WAT E R I N F R A S T R U CT U R E
At fair value 426,180 413,398
Less: accumulated depreciation ( 43,931) ( 34,945)
382,249 378,453
R E C YC L I N G I N F R A S T R U CT U R E
At fair value 57,558 52,819
Less: accumulated depreciation ( 5,669) ( 4,259)
51,889 48,560
R U R A L I N F R A S T R U CT U R E
At fair value 26,763 25,860
Less: accumulated depreciation ( 3,268) ( 2,537)
23,495 23,323
H E A DWO R KS I N F R A S T R U CT U R E
At fair value 175,589 172,682
Less: accumulated depreciation ( 5,006) ( 3,262)
170,583 169,420
Total Infrastructure Assets 1,076,190 1,049,186
B O OT S C H E M E S I N F R A S T R U CT U R E
At fair value 132,404 116,653
Less: accumulated depreciation ( 38,435) ( 34,818)
93,969 81,835
WO R KS I N P R O G R E S S
At cost 43,027 78,732
43,027 78,732
Total infrastructure assets, property, plant
and equipment1,270,718 1,261,708
Land, Buildings and Infrastructure Assets were independentlyvalued at 30 June 2011 by VGV.
At 30 June 2015 Coliban Water assessed land and buildingindex movements using indices from the VGV. Both land andbuilding cost indexation factors for financial year 2014/15were applied. It was determined that there was no materialmovement that required a managerial revaluation.
At 30 June 2015 Coliban Water assessed infrastructure andBOOT scheme infrastructure asset movements using the dualindex system. The Road and Bridge Construction (Victoria)Indices was applied to pipelines, dams/reservoirs andchannels and the Stage of Production-Final Domestic CapitalIndices was applied to all other asset classes. It wasdetermined that there was no material movement thatrequired a managerial revaluation.

COLIBAN WATER | FINANCIAL REPORT | 2014–15 PAGE | 69
( b ) M OV E M E N T S D U R I N G T H E R E P O RT I N G P E R I O D
2014–2015Opening WDV
at 1 July
2014
AdditionsDisposals /
Writeoffs
Transfers in
(out) of
assets under
construction
Transfers
between
categories
Fair value of
assets
received free
of charge
(1)
Depreciation
Closing WDV
at 30 June
2015
($’000) ($’000) ($’000) ($’000) ($’000) ($’000) ($’000) ($’000)
L A N D ( 2 )
At fair value 40,709 – ( 2,403) 5,566 788 – – 44,660
B U I L D I N G S
At fair value 1,434 – – 132 – – ( 82) 1,484
B U I L D I N G S – L E A S E H O L D
At fair value 1,988 – – 227 – – ( 347) 1,868
P L A N T & E Q U I P M E N T
At fair value 7,824 – ( 80) 4,058 – – ( 2,282) 9,520
I N F R A S T R U CT U R E ( 3 )
At fair value 1,049,186 – ( 1,291) 54,672 – – ( 26,377) 1,076,190
B O OT S C H E M E S
At fair value 81,835 6,251 – 9,500 – – ( 3,617) 93,969
WO R KS I N P R O G R E S S
At cost 78,732 27,757 – ( 74,155) – 10,694 – 43,027
Totals 1,261,708 34,008 ( 3,774) – 788 10,694 ( 32,705) 1,270,718
2013–2014Opening WDV
at 1 July
2013
AdditionsDisposals /
Writeoffs
Transfers in
(out) of
assets under
construction
Transfers
between
categories
Fair value of
assets
received free
of charge
(1)
Depreciation
Closing WDV
at 30 June
2014
($’000) ($’000) ($’000) ($’000) ($’000) ($’000) ($’000) ($’000)
L A N D ( 2 )
At fair value 40,652 57 – – – – – 40,709
B U I L D I N G S
At fair value 1,517 – – – – – ( 83) 1,434
B U I L D I N G S – L E A S E H O L D
At fair value 1,962 – – 228 – – ( 202) 1,988
P L A N T & E Q U I P M E N T
At fair value 8,518 – ( 81) 567 – – ( 1,180) 7,824
I N F R A S T R U CT U R E ( 3 )
At fair value 1,067,869 – ( 2,179) 11,749 57 – ( 28,310) 1,049,186
B O OT S C H E M E S
At fair value 83,658 1,543 – – – – ( 3,366) 81,835
WO R KS I N P R O G R E S S
At cost 41,731 41,378 – ( 12,544) (215) 8,382 – 78,732
Totals 1,245,907 42,978 ( 2,260) – (158) 8,382 ( 33,141) 1,261,708
(1) Aggregate depreciation recognised as an expense during the year, refer to Note 2(b).(2) Land with a book value of $2.4 million was sold, resulting in profit on sale of $869k. The profit on sale is disclosed as part of the net gain/(loss) on
disposal of assets under ‘Other economic flows included in the net result” in the Comprehensive Operating Statement. Land held for sale in 2013/14totalled $788k. Refer Note 7.
(3) All infrastructure asset classes have been aggregated when comparing to Note 8(a).

COLIBAN WATER | FINANCIAL REPORT | 2014–15PAGE | 70
2013–2014
Carrying amount
as at 30 June 2014
Fair value measurement at end of reporting period using:
Level 1(i) Level 2(i) Level 3(i)
($’000) ($’000) ($’000) ($’000)
L A N D AT FA I R VA LU E
Specialised 40,709 – – 40,709
40,709 – – 40,709
B U I L D I N G S AT FA I R VA LU E
Specialised 1,434 – – 1,434
1,434 – – 1,434
B U I L D I N G S – L E A S E H O L D AT FA I R VA LU E
Specialised 1,988 – – 1,988
1,988 – – 1,988
P L A N T A N D E Q U I P M E N T AT FA I R VA LU E
Specialised 7,824 – – 7,824
7,824 – – 7,824
I N F R A S T R U CT U R E AT FA I R VA LU E
Specialised Water Infrastructure 301,017 – – 301,017
Specialised Water Distribution Assets 128,413 – – 128,413
Specialised Wastewater Infrastructure 378,453 – – 378,453
Specialised Recycling Infrastructure 48,560 – – 48,560
Specialised Rural Infrastructure 23,323 – – 23,323
Specialised Headworks Infrastructure 169,420 – – 169,420
1,049,186 – – 1,049,186
B O OT S C H E M E I N F R A S T R U CT U R E AT FA I R VA LU E
Specialised 81,835 – – 81,835
81,835 – – 81,835
Total assets at fair value (excluding works in progress) 1,182,976 – – 1,182,976
(i) Classified in accordance with the fair value hierarchy, see Note 1(i).
2014–2015
Carrying amount
as at 30 June 2015
Fair value measurement at end of reporting period using:
Level 1(i) Level 2(i) Level 3(i)
($’000) ($’000) ($’000) ($’000)
L A N D AT FA I R VA LU E
Specialised 44,660 – – 44,660
44,660 – – 44,660
B U I L D I N G S AT FA I R VA LU E
Specialised 1,484 – – 1,484
1,484 – – 1,484
B U I L D I N G S – L E A S E H O L D AT FA I R VA LU E
Specialised 1,868 – – 1,868
1,868 – – 1,868
P L A N T A N D E Q U I P M E N T AT FA I R VA LU E
Specialised 9,520 – – 9,520
9,520 – – 9,520
I N F R A S T R U CT U R E AT FA I R VA LU E
Specialised Water Infrastructure 319,111 – – 319,111
Specialised Water Distribution Assets 128,863 – – 128,863
Specialised Wastewater Infrastructure 382,249 – – 382,249
Specialised Recycling Infrastructure 51,889 – – 51,889
Specialised Rural Infrastructure 23,495 – – 23,495
Specialised Headworks Infrastructure 170,583 – – 170,583
1,076,190 – – 1,076,190
B O OT S C H E M E I N F R A S T R U CT U R E AT FA I R VA LU E
Specialised 93,969 – – 93,969
93,969 – – 93,969
Total assets at fair value (excluding works in progress) 1,227,691 – – 1,227,691
( c ) FA I R VA LU E M E A S U R E M E N T H I E R A R C H Y F O R A S S E T S A S AT 3 0 J U N E 2 0 1 5
Refer Note 1(i) for the accounting policy relating to disclosure of the fair value measurement hierarchy. Coliban Water has no assets or liabilitiesmeasured at fair value on a non-recurring basis in the current reporting period.

COLIBAN WATER | FINANCIAL REPORT | 2014–15 PAGE | 71
There have been no transfers between levels during the period.
For all assets measured at fair value, the current use is considered thehighest and best use.
S P E C I A L I S E D L A N D, S P E C I A L I S E D B U I L D I N G S A N DS P E C I A L I S E D B U I L D I N G S — L E A S E H O L DFor the majority of Coliban Water’s specialised buildings andspecialised buildings – leasehold, the depreciated replacement costmethod is used, adjusted for associated depreciation. As depreciationadjustments are considered as significant unobservable inputs innature, specialised buildings are classified as Level 3 for fair valuemeasurements.
The market approach is used for specialised land, although is adjustedfor the community service obligation (CSO) to reflect the specialisednature of the land being valued.
The CSO adjustment is a reflection of the valuer’s assessment of theimpact of restrictions associated with an asset to the extent that it isalso equally applicable to market participants. This approach is in lightof the highest and best use consideration required for fair valuemeasurement, and takes into account the use of the asset that isphysically possible, legally permissible, and financially feasible. Asadjustments of CSO are considered as significant unobservable inputs,specialised land would be classified as Level 3 for fair valuemeasurements.
An independent valuation of Coliban Water’s specialised land,specialised buildings and specialised buildings – leasehold wasperformed by the Valuer-General Victoria (VGV). The valuation wasperformed using the market approach adjusted for CSO. The effectivedate of the valuation was 30 June 2011.
A review of fair value indicators by Coliban Water which included theapplication of VGV Land and Building indices, indicated that there wasnot a material movement in Land and Buildings for the financial yearended 30 June 2015.
I N F R A S T R U CT U R EInfrastructure is valued using the depreciated replacement costmethod. This cost represents the replacement cost of thebuilding/component after applying depreciation rates on a useful lifebasis. Replacement costs relate to costs to replace the current servicecapacity of the asset. Economic obsolescence has also been factoredinto the depreciated replacement cost calculation.
Where it has not been possible to examine hidden works such asstructural frames and floors, the use of reasonable materials andmethods of construction have been assumed bearing in mind the ageand nature of the building. The estimated cost of reconstructionincludes structure services and finishes as applicable.
An independent valuation of Coliban Water’s infrastructure wasperformed by AECOM on behalf of the VGV. The valuation wasperformed using the depreciated replacement cost of the assets, basedon the condition assessment of aboveground assets, age and materialfor underground assets and remaining useful lives. The effective dateof the valuation was 30 June 2011.
There is an absence of an active market for these assets. Asdepreciation adjustments are considered as significant unobservableinputs in nature, infrastructure assets are classified as Level 3 for fairvalue measurements.
Coliban Water used a dual index system to determine the movement infair value assessments, in accordance with guidance issued by theDepartment of Treasury and Finance (DTF).
The dual index system is the application of the Road and BridgeConstruction (Victoria) to pipeline, dams/reservoirs and channel assets,with all other assets applying the Stage of Production – Final DomesticCapital (Australia) index. The Road and Bridge Construction (Victoria)index involves a comparable construction of infrastructure using similarmaterials used in the majority of water industry assets such asconcrete and steel and associated earthworks. This review hasindicated that there was not a material movement in the fair valueassessments.
V E H I C L E SColiban Water acquires new vehicles and at times disposes of thembefore the end of their economic life. The process of acquisition, useand disposal in the market is managed by experienced fleet managerswithin Coliban Water who set relevant depreciation rates during use toreflect the utilisation of the vehicles. Coliban Water uses depreciatedreplacement cost for vehicles hence they are classified as Level 3 forfair value measurements.
P L A N T A N D E Q U I P M E N TPlant and equipment is held at fair value. When plant and equipment isspecialised in use, such that it is rarely sold other than as part of agoing concern, fair value is determined using the depreciatedreplacement cost method hence they are classified as Level 3 for fairvalue measurements.
There were no changes in valuation techniques throughout the periodto 30 June 2015.
N OT E 8 : I N F R A S T R U CT U R E A S S E T S , P R O P E RT Y, P L A N T A N D E Q U I P M E N T ( C O N T I N U E D )

COLIBAN WATER | FINANCIAL REPORT | 2014–15PAGE | 72
( d ) R E C O N C I L I AT I O N O F L E V E L 3 AT FA I R VA LU E
2014–2015Specialised
land
Specialised
buildings
Specialised
buildings –
leasehold
Specialised
plant and
equipment
Specialised
infrastructure(1)
Specialised
BOOT
Schemes
($’000) ($’000) ($’000) ($’000) ($’000) ($’000)
FA I R VA LU EOpening balance 40,709 1,434 1,988 7,824 1,049,186 81,835
Purchases (sales) 3,951 132 227 3,978 53,381 15,751
Transfers in (out) of level 3 – – – – – –
Gains or losses recognised in net result
Depreciations – ( 82) ( 347) ( 2,282) ( 26,377) ( 3,617)
Impairment loss – – – – – –
44,660 1,484 1,868 9,520 1,076,190 93,969
2013–2014Specialised
land
Specialised
buildings
Specialised
buildings –
leasehold
Specialised
plant and
equipment
Specialised
infrastructure(1)
Specialised
BOOT
Schemes
($’000) ($’000) ($’000) ($’000) ($’000) ($’000)
FA I R VA LU EOpening balance 40,652 1,517 1,962 8,518 1,067,869 83,658
Purchases (sales) 57 – 228 486 9,627 1,543
Transfers in (out) of level 3 – – – – – –
Gains or losses recognised in net result
Depreciations – ( 83) ( 202) ( 1,180) ( 28,310) ( 3,366)
Impairment loss – – – – – –
40,709 1,434 1,988 7,824 1,049,186 81,835
(1) All infrastructure asset classes have been aggregated when comparing to Note 8(a).

COLIBAN WATER | FINANCIAL REPORT | 2014–15 PAGE | 73
(i) Illustrations on the valuation techniques, significant unobservable inputs and the relatedquantitative range of those inputs are indicative and should not be directly used withoutconsultation with the entities’ independent valuers, but only once authorisation fromColiban Water is obtained.
(ii) CSO adjustments of 20% were applied to reduce the market approach value for ColibanWater’s specialised land
(iii) These useful lives refer to the residual usual lives within this asset class.
( e ) D E S C R I P T I O N O F S I G N I F I CA N T U N O B S E RVA B L E I N P U T S TO L E V E L 3 VA LUAT I O N S
Asset ClassValuation
technique (i)Significant unobservable
inputs (i)Weighted average
cost per unit (i)Sensitivity of fair value measurement to changes in significant
unobservable inputs
S P E C I A L I S E D L A N D
Land Market approach Community Service Obligation(CSO) adjustment 20%(ii) A significant increase or decrease in the CSO adjustment would
result in a significantly higher or lower fair value.
S P E C I A L I S E D B U I L D I N G S
Buildings(36 Buildings, 3,651 m2) Depreciated
replacement cost
Direct cost per square metre $36 to $2,084(Average $401)
A significant increase or decrease in the cost per square metrewould result in a significantly higher or lower fair value.
Useful life of specialisedassets(iii)
4 to 47 years(Average 28 years)
A significant increase or decrease in the estimated useful life ofthese assets would result in a significantly higher or lower valuation.
S P E C I A L I S E D B U I L D I N G S – L E A S E H O L D I M P R OV E M E N T S
Leasehold Improvements(2 Buildings, 3,750 m2)
Depreciatedreplacement cost
Direct cost per square metre $3 to $1,096(Average $485)
A significant increase or decrease in the cost per square metrewould result in a significantly higher or lower fair value.
Useful life of LeaseholdImprovements(iii)
2 to 30 years(Average 17 years)
A significant increase or decrease in the estimated useful life ofthese assets would result in a significantly higher or lower valuation.
P L A N T A N D E Q U I P M E N T
Plant and Equipment Depreciatedreplacement cost
Cost per unit $550 to $1,850,512(Average $13,713)
A significant increase or decrease in the cost per unit would result ina significantly higher or lower fair value.
Useful life of Plant andEquipment
1 to 37 years(Average 10 years)
A significant increase or decrease in the estimated useful life ofthese assets would result in a significantly higher or lower valuation.
WAT E R I N F R A S T R U CT U R E
Water Mains(2,174,284 metres)
Depreciatedreplacement cost(20ml – 1350ml)
Cost per metre $50 to $1,450(Average $98)
A significant increase or decrease in the cost per metre would resultin a significantly higher or lower fair value.
Useful life of theInfrastructure
50 to 145 years(Average 82 years)
A significant increase or decrease in the estimated useful life ofthese assets would result in a significantly higher or lower valuation.
Water Treatment Plants (16 in total)
Depreciatedreplacement cost
Average cost per treatmentplant $5,062,272 A significant increase or decrease in the cost per treatment plant
would result in a significantly higher or lower fair value.Useful life of theInfrastructure
5 to 200 years(Average 47 years)
A significant increase or decrease in the estimated useful life ofthese assets would result in a significantly higher or lower valuation.
WAS T E WAT E R I N F R A S T R U CT U R E
Wastewater Mains(1,884,535 metres)
Depreciatedreplacement cost
Cost per metre $81 to $5,009(Average $169)
A significant increase or decrease in the cost per metre would resultin a significantly higher or lower fair value.
Useful life of theInfrastructure
50 to 110 years(Average 80 years)
A significant increase or decrease in the estimated useful life ofthese assets would result in a significantly higher or lower valuation.
Wastewater Treatment Plant(14 in total)
Depreciatedreplacement cost
Average cost per treatmentplant $3,381,207 A significant increase or decrease in the cost per treatment plant
would result in a significantly higher or lower fair value.Useful life of theInfrastructure
5 to 250 years(Average 49 years)
A significant increase or decrease in the estimated useful life ofthese assets would result in a significantly higher or lower valuation.
WAT E R D I S T R I B U T I O N I N F R A S T R U CT U R E
Distribution Mains(91,937 metres)
Depreciatedreplacement cost(50ml – 1350ml)
Cost per metre $50 to $1,450(Average $975)
A significant increase or decrease in the cost per metre would resultin a significantly higher or lower fair value.
Useful life of theInfrastructure
50 to 110 years(Average 85 years)
A significant increase or decrease in the estimated useful life ofthese assets would result in a significantly higher or lower valuation.
Distribution Channel(67,493 metres)
Depreciatedreplacement cost
Cost per metre $25 to $287,743(Average $502)
A significant increase or decrease in the cost per metre would resultin a significantly higher or lower fair value.
Useful life of theInfrastructure
5 to 255 years(Average 185 years)
A significant increase or decrease in the estimated useful life ofthese assets would result in a significantly higher or lower valuation.
R E C YC L I N G I N F R A S T R U CT U R E
Recycled Water Mains(45,711 metres)
Depreciatedreplacement cost(40ml – 1050ml)
Cost per metre $50 to $1,450(Average $325)
A significant increase or decrease in the cost per metre would resultin a significantly higher or lower fair value.
Useful life of theInfrastructure
50 to 125 years(Average 102 years)
A significant increase or decrease in the estimated useful life ofthese assets would result in a significantly higher or lower valuation.
Recycled Water Factory(1 in total)
Depreciatedreplacement cost
Average cost per recycledwater factory $36,439,465 A significant increase or decrease in the cost of the recycled water
factory would result in a significantly higher or lower fair value.Useful life of theInfrastructure 63 years A significant increase or decrease in the estimated useful life of
these assets would result in a significantly higher or lower valuation.
R U R A L I N F R A S T R U CT U R E
Channels(422,829 metres)
Depreciatedreplacement cost
Cost per metre $4 to $3,156(Average $32)
A significant increase or decrease in the cost per metre would resultin a significantly higher or lower fair value.
Useful life of theInfrastructure
5 to 188 years(Average 159 years)
A significant increase or decrease in the estimated useful life ofthese assets would result in a significantly higher or lower valuation.
Mains(25,827 metres)
Depreciatedreplacement cost(50ml – 1350ml)
Cost per metre $50 to $1,450(Average $357)
A significant increase or decrease in the cost per metre would resultin a significantly higher or lower fair value.
Useful life of theInfrastructure
50 to 150 years(Average 65 years)
A significant increase or decrease in the estimated useful life ofthese assets would result in a significantly higher or lower valuation.
H E A DWO R KS I N F R A S T R U CT U R E
Reservoirs & Basins(36 in total)
Depreciatedreplacement cost
Average cost per Reservoir $4,726,231 A significant increase or decrease in the cost per reservoir wouldresult in a significantly higher or lower fair value.
Useful life of theInfrastructure
5 to 300 years(Average 195 years)
A significant increase or decrease in the estimated useful life ofthese assets would result in a significantly higher or lower valuation.
B O OT S C H E M E I N F R A S T R U CT U R E
Treatment Plants(5 in total)
Depreciatedreplacement cost
Average cost per treatmentplant $18,912,600 A significant increase or decrease in the cost per treatment plant
would result in a significantly higher or lower fair value.Useful life of theInfrastructure
25 to 100 years(Average 48 years)
A significant increase or decrease in the estimated useful life ofthese assets would result in a significantly higher or lower valuation.

COLIBAN WATER | FINANCIAL REPORT | 2014–15PAGE | 74
2015($’000)
2014($’000)
N OT E 9 : I N TA N G I B L E A S S E T S
Permanent water entitlements at cost 60,052 60,052
Total intangible assets 60,052 60,052
Movements during the year
Opening balance at 1 July 60,052 60,052
Closing balance at 30 June 60,052 60,052
In accordance with AASB 136 Impairment of Assets, ColibanWater has reviewed the carrying value of water entitlementsat 30 June 2015. The entitlements were tested forimpairment using value in use (VIU) at the cash generatingunit (CGU) level. The VIU of the CGU was higher than thecarrying value, therefore there is no impairment of thepermanent water entitlements.
In determining VIU, the permanent water entitlements havebeen allocated to the Echuca CGU and Bendigo CGU. Therecoverable amount of each CGU has been determinedbased on a VIU calculation using cash flow projections fromthe five year approved Corporate Plan. Cash flows beyondthe final year forecast period in the Corporate Plan havebeen extrapolated using a 2.5% growth rate (2013/14: 2.5%growth rate).
The carrying amount of the intangible asset with anindefinite useful life allocated to each CGU and thesignificant assumptions used in the calculation of the VIU isas follows:
Bendigo Echuca
Permanent water entitlementsallocated to the CGU ($ millions)
$59.63 $0.42
Pre-tax discount rate (%) 6.88 8.38
Water use per customer (kilolitres) 177 177
Growth rate (%) 2.50 2.50
Headroom ($ million) $98.54 $15.08
Discount Rate: Represents the current market assessmentof the risks specific to each CGU, taking into considerationthe time value of money and individual risks of theunderlying assets that have been incorporated into the cashflow estimates. The weighted average cost of capitaldiscount rate calculation is based on specific circumstancesrelating to Coliban Water.
Growth rate: Estimates are based on CPI level price rises.
Water use per customer: Based on historical averages ofwater usage for customers within the regions covered by theCGUs.
Sensitivity to key assumptions: Management hasperformed an assessment and consider that no reasonablepossible change in a key assumption would cause either theBendigo CGU or the Echuca CGU carrying amount to exceedits recoverable amount.
Notes2015
($’000)2014
($’000)
N OT E 1 0 : PAYA B L E S
C U R R E N T PAYA B L E S
Contractual:
Trade payables 1,041 4,502
Amounts payable to government andagencies
121 3
Accrued expenses 9,314 10,882
Other payables 499 885
Statutory:
FBT payable 11 11
10,986 16,283
N O N - C U R R E N T PAYA B L E S
Contractual:
Retention and advance deposits 581 464
581 464
Total payables 11,567 16,747
( a ) M AT U R I T Y A N A LYS I S O F PAYA B L E S
The ageing analysis of payables at 30June 2015 is as follows:
1 month 8,562 11,802
2 to 3 months 2,218 1,235
4 to 12 months 206 3,246
More than 12 months 581 464
11,567 16,747
N OT E 1 1 : B O R R OW I N G S
C U R R E N T B O R R OW I N G S
Loans from Treasury Corporation Victoria 1,332 243
Finance lease liabilities – BOOT Schemes 23 4,180 3,596
5,512 3,839
N O N - C U R R E N T B O R R OW I N G S
Loans from Treasury Corporation Victoria 371,500 363,000
Finance lease liabilities – BOOT Schemes 23 85,120 83,309
456,620 446,309
Total borrowings 462,132 450,148
( a ) M AT U R I T Y A N A LYS I S O F B O R R OW I N G S
Refer to Note 21 for the maturity analysis of borrowings.
(b ) NATURE AND EXTENT OF RISK ARISING FROM BORROWINGS
Refer to Note 20 for the nature and extent of risks arising from borrowings.
( c ) D E FAU LT S A N D B R E AC H E S
During the current and prior period, there were no defaults or breaches ofany of the loans.
( d ) F I N A N C I N G FAC I L I T I E S
Refer to Note 26 for financing facilities arrangements.

COLIBAN WATER | FINANCIAL REPORT | 2014–15 PAGE | 75
2015($’000)
2014($’000)
NOTE 12: PROVISIONS AND EMPLOYEE BENEFITS
C U R R E N T P R OV I S I O N S
Employee benefits – annual leave:
Unconditional and expected to be paidwithin 12 months
1,128 1,064
Employee benefits – accrued days off
leave:
Unconditional and expected to be paidwithin 12 months
143 94
Employee benefits – long service leave:
Unconditional and expected to settle within12 months
208 82
Unconditional and expected to settle after12 months
1,678 1,308
3,157 2,548
On-costs relating to employee benefits
Unconditional and expected to be paidwithin 12 months
228 202
Unconditional and expected to be paidafter 12 months
267 218
495 420
3,652 2,968
N O N - C U R R E N T P R OV I S I O N S
Employee benefits 454 375
On-costs relating to employee benefits 72 62
526 437
Total provisions and employee benefits 4,178 3,405
( a ) E M P LOY E E B E N E F I T S A N D O N - C O S T S
C U R R E N T E M P LOY E E B E N E F I T S
Annual leave 1,128 1,064
Accrued days off leave 143 94
Long service leave 1,886 1,390
3,157 2,548
N O N C U R R E N T E M P LOY E E B E N E F I T S
Long service leave 454 375
454 375
3,611 2,923
Current on costs 495 420
Non current on costs 72 62
567 482
Total employee benefits and on-costs 4,178 3,405
Employee numbers at end of financial year 190 182
The following assumptions were adopted in measuring the
present value of long service leave entitlements:
Weighted average increase in employeecosts
4.44% 4.44%
Weighted average discount rates 3.03% 3.57%
Weighted average settlement period 7 years 7 years
Notes2015
($’000)2014
($’000)
N OT E 1 3 : I N C O M E TA X
( a ) C O M P O N E N T S O F I N C O M E TA X ( E X P E N S E ) / B E N E F I T :
Current tax ( 2,672) 1,611
Deferred tax relating to timing differences 2,302 ( 817)
Adjustments for current tax of prior periods 3 1,231
( 367) 2,025
Income tax (expense)/benefit is attributable to:
Loss (profit) from continuing operations ( 513) 1,305
Other economic flows included in net result 146 720
Aggregate income tax (expense)/benefit ( 367) 2,025
Deferred tax (expense)/benefit included inincome tax expense comprises:
(Decrease)/increase in deferred tax assets 1(iii), 14 ( 800) ( 415)
Decrease/(increase) in deferred taxliabilities
1(iii), 14 3,103 ( 402)
2,303 ( 817)
( b ) P R I M A FAC I E TA X PAYA B L E
Net result/(deficit) before tax 5,786 ( 4,324)
Prima facie tax calculated at 30%(2013/14: 30%)
( 1,736) 1,297
Tax effect of non-deductible/(non-taxable)amounts in calculating taxable income
• Non deductible expenses (1) –
• Assessable income ( 1) ( 1)
Previously not recognised tax losses nowrecognised to decrease current tax expense
• Tax losses brought to account 3 1,231
Previously recognised tax losses now notrecognised to increase current tax expense
• Tax losses not brought to account 1,222 ( 1,222)
Income tax (expense)/benefit
attributable to profit( 513) 1,305
Coliban Water will not pay income tax for 2014/15. Tax losses have beenbrought to account.
( c ) I N C O M E TA X ( E X P E N S E ) / B E N E F I T R E L AT I N G TO C O M P O N E N T S O F OT H E R E C O N O M I C F LOWS
Net gain/(loss) on revaluation ofinfrastructure assets, property, plant andequipment
– –
Net gain/(loss) on disposal of assets 124 650
Fair value increase/(decrease) in otherfinancial assets
22 70
Total income tax benefit relating to
components of other economic flows146 720

COLIBAN WATER | FINANCIAL REPORT | 2014–15PAGE | 76
Notes2015
($’000)2014
($’000)
N OT E 1 4 : N E T D E F E R R E D TA X
D E F E R R E D TA X A S S E T / ( L I A B I L I T Y )
( a ) D E F E R R E D TA X A S S E T S
The balance comprises temporary differences attributable to:
Amounts recognised in the Comprehensive Operating Statement
Doubtful receivables 5 24
Book differences in depreciable asset values 19 9
Low value asset pool 1(iii) 8 –
Accruals 1(iii) 1,528 3,276
Employee benefits 1,253 1,022
BOOT Scheme finance leases 26,790 26,072
Tax losses 58,636 61,306
Total deferred tax assets 88,239 91,709
M OV E M E N T S
Opening balance at 1 July 91,709 89,282
Credited/(debited) to the Comprehensive Operating Statement 13(a) ( 800) ( 415)
Credited/(debited) to the operating statement relating to tax losses ( 2,670) 2,842
Credited/(debited) to other comprehensive income – –
Closing balance at 30 June 88,239 91,709
Deferred tax assets to be recovered after more than 12 months 85,426 87,378
Deferred tax assets to be recovered within 12 months 2,813 4,331
Ending Balance at 30 June 88,239 91,709
( b ) D E F E R R E D TA X L I A B I L I T I E S
The balance comprises temporary differences attributable to:
Amounts recognised in the Comprehensive Operating Statement
Accrued rates and charges 1(iii) – 2,367
Interest and other income receivables 172 180
Book differences in depreciable asset values 107,383 107,682
BOOT scheme assets 24,118 24,550
Other financial assets at fair value through profit and loss 17 14
Amounts recognised directly in equity
Revaluation of infrastructure, property, plant and equipment – –
Total deferred tax liabilities 131,690 134,793
M OV E M E N T S
Opening balance 1 July 134,793 134,391
Credited/(debited) to the Comprehensive Operating Statement 13(a) ( 3,106) 400
Credited/(debited) to other economic flows 13(a) 3 2
Closing balance at 30 June 131,690 134,793
Deferred tax liabilities to be recovered within 12 months 189 2,561
Deferred tax liabilities to be recovered after more than 12 months 131,501 132,232
131,690 134,793
Total net deferred tax asset/(liability) ( 43,451) ( 43,084)
AASB 112 Income Tax requires deferred tax assets arising from temporary differences to be offset against deferred tax liabilities on the basis thatthe deferred tax assets will be fully utilised against the deferred tax liabilities. Coliban Water’s deferred tax liabilities exceed the level of deferredtax assets at 30 June 2015 and therefore a net tax liability has been disclosed in the Balance Sheet.

COLIBAN WATER | FINANCIAL REPORT | 2014–15 PAGE | 77
Notes2015
($’000)2014
($’000)
N OT E 1 5 : C O N T R I B U T E D CA P I TA L
Opening balance at 1 July 308,579 308,579
Contributions from the Victorian Government (i) (150) –
Closing balance at 30 June 308,429 308,579
(i) An initial transfer of funds of $1.15 million was made to Coliban Water from the former Department of Environment and Primary Industries ascontributed capital for the Country Town Water Supply and Sewerage Program. A subsequent transfer of $150k was made to Grampians WimmeraMallee Water Corporation (GWMW) to deliver a point of entry trial at GWMW under this program.
N OT E 1 6 : R E S E RV E S
A S S E T R E VA LUAT I O N R E S E RV E : L A N D
Opening balance at 1 July 29,122 29,122
Closing balance at 30 June 29,122 29,122
A S S E T R E VA LUAT I O N R E S E RV E : B U I L D I N G S
Opening balance at 1 July 827 827
Closing balance at 30 June 827 827
A S S E T R E VA LUAT I O N R E S E RV E : I N F R A S T R U CT U R E
Opening balance at 1 July 159,019 159,019
Closing balance at 30 June 159,019 159,019
Total reserves 188,968 188,968
NOTE 17 : RECONCIL IAT ION OF NET RESULT/ (DEF IC IT ) FOR THE YEAR TO NET CASH INFLOWS FROM OPERATING ACT IV IT IES
Net result/(deficit) for the year after income tax 4,931 ( 4,700)
A D D / ( L E S S ) N O N - CA S H M OV E M E N T S I N N E T R E S U LT / ( D E F I C I T )
Add: Depreciation 2(b) 32,705 33,141
Net (gain)/loss on disposal of non-current assets 414 2,167
Fair value (increase)/decrease in other financial assets ( 12) ( 6)
Payments for fixed assets in payables movement 1,321 53
Less: Non cash developer contributions & gifted assets ( 10,694) ( 9,119)
Income tax (expense)/benefit 13(a) 367 ( 2,025)
29,032 19,511
M OV E M E N T S I N A S S E T S A N D L I A B I L I T I E S
Decrease/(increase) in receivables 316 ( 3,004)
Decrease/(increase) in inventories 92 170
Decrease/(increase) in prepayments ( 155) ( 11)
(Decrease)/increase in payables ( 5,180) 4,055
(Decrease)/increase in employee benefits 773 221
Net cash inflows from operating activities 24,878 20,942

COLIBAN WATER | FINANCIAL REPORT | 2014–15PAGE | 78
N OT E 1 8 : R E S P O N S I B L E P E R S O N S A N D E X E C U T I V E O F F I C E R D I S C LO S U R E S
( a ) R E S P O N S I B L E P E R S O N S R E L AT E D PA RT Y D I S C LO S U R E S
The names of ministers and persons who were responsible persons at any time during the financial year were:
Person’s Name Position Period
The Hon. Peter Walsh MLA Minister for Water 01 Jul 2014 03 Dec 2014
The Hon. Lisa Neville MP Minister for Environment, Climate Change and Water 04 Dec 2014 30 Jun 2015
Andrew Cairns Director (Chairperson) 01 Jul 2014 30 Jun 2015
Russell Walker Director 01 Jul 2014 30 Jun 2015
Rodney Thomson Director 01 Jul 2014 30 Jun 2015
Linda Veronese Director 01 Jul 2014 30 Jun 2015
April Merrick Director 01 Jul 2014 30 Jun 2015
Deborah Hambleton Director 01 Jul 2014 30 Jun 2015
David Richardson Director 01 Jul 2014 30 Jun 2015
Jeff Rigby Managing Director 01 Jul 2014 30 Jun 2015
( b ) R E S P O N S I B L E P E R S O N S R E M U N E R AT I O N
The number of Responsible Persons whose remuneration forthe year ended 30 June 2015 falls within the following bandsare:
Income band ($) Total Remuneration
2015 2014
No. No. (1)
0 – 9,999 – 3
10,000 – 19,999 – 1
20,000 – 29,999 – 2
30,000 – 39,999 6 3
60,000 – 69,999 1 1
260,000 – 269,999 1 1
Total Numbers 8 11
(1) The terms of three directors concluded in 2013/14. They wereAndrew Skewes (1 July 2013 to 30 November 2013), JeanSutherland (1 July 2013 to 30 September 2013) and David Beard(1 July 2013 to 30 September 2013).
R E M U N E R AT I O N O F R E S P O N S I B L E P E R S O NRemuneration paid to the Ministers is reported in the AnnualReport of the Department of Premier and Cabinet. Otherrelevant interests are declared in the Register of Members’Interests which each Member of Parliament completes.Total remuneration received, or due and receivable, during2014/15 by Responsible Persons including the ManagingDirector from Coliban Water in connection with themanagement of the Corporation was $547,230 (2013/14:$530,437).
R E L AT E D PA RT Y T R A N S ACT I O N SDuring the financial year ended 30 June 2015, there were notransactions between Coliban Water and responsible personsand their related parties.
( c ) E X E C U T I V E O F F I C E R S ’ R E M U N E R AT I O N
The numbers of executive officers (excluding the Manager Director, referNote 18b) and their total remuneration during the reporting period are shownin the first two columns in the table below in their relevant income bands.The base remuneration of executive officers is shown in the third and fourthcolumns. Base remuneration is exclusive of bonus payments, long-serviceleave payments, redundancy payments and retirement benefits. The totalannualised employee equivalent provides a measure of full time equivalentexecutive officers over the reporting period.
Factors that have affected the total remuneration payable to executivesinclude a number of executives receiving an indexation increase to their totalremuneration and performance based bonus payments during the year.
The number of executive officers reporting to the Managing Director is six. Inthe comparative year an executive officer commenced midway through theprevious year, replacing an outgoing executive officer who left theorganisation in the same year (refer to Annualised Employee Equivalentbelow).
The number of executive officers whose remuneration received for the yearended 30 June 2015 falls within the following bands are:
Income band ($) Total Remuneration Base Remuneration
2015 2014 2015 2014
No. No. No. No.
Less than 100,000 – 1 – 2
140,000 – 149,999 – 1 – –
150,000 – 159,999 – 1 1 1
160,000 – 169,999 2 1 2 2
170,000 – 179,999 1 1 1 –
180,000 – 189,999 1 – – 1
190,000 – 199,999 – 1 2 1
200,000 – 209,999 1 1 – –
210,000 – 219,999 1 – – –
Total Numbers 6 7 6 7
Total Annualised
Employee Equivalent
(AEE) (1)
6.00 5.68 6.00 5.68
Total Amount 1,108,261 1,114,091 1,056,261 976,305
(1) Annualised employee equivalent is based on paid working hours of 38 ordinaryhours per week over the 52 weeks for a reporting period.
( d ) R E M U N E R AT I O N O F OT H E R P E R S O N N E L
Coliban Water does not engage any contractors or consultants that arecharged with significant management responsibilities.

COLIBAN WATER | FINANCIAL REPORT | 2014–15 PAGE | 79
Coliban Water makes the majority of its employer superannuationcontributions in respect of its employees to the Local AuthoritiesSuperannuation Fund (the Fund). This Fund has two categories ofmembership, accumulation and defined benefit, each of which isfunded differently. Obligations for contributions to the Fund arerecognised as an expense in the Comprehensive Operating Statementwhen they are made or become due.
( a ) AC C U M U L AT I O NThe Fund’s accumulation categories, Vision MySuper/Vision SuperSaver, receives both employer and employee contributions on aprogressive basis. Employer contributions are normally based on afixed percentage of employee earnings (for the year ended 30 June2015, this was 9.5 per cent required under Superannuation Guaranteelegislation (for 2013/14, this was 9.25 per cent).
( b ) D E F I N E D B E N E F I TColiban Water does not use defined benefit accounting for its definedbenefit obligations under the Fund’s defined benefit category. This isdue to the Fund’s Defined Benefit category being a multi-employersponsored plan.
There is no proportional split of the defined benefit liabilities, assets orcosts between the participating employers as the defined benefitobligation is a floating obligation between the participating employersand the only time that the aggregate obligation is allocated to specificemployers is when a call is made by the Fund. As a result, the level ofparticipation of Coliban Water in the Fund cannot be measured as apercentage compared with other participating employers. Therefore,the Actuary is unable to allocate benefit liabilities, assets and costsbetween employers for the purposes of AASB 119.
F U N D I N G A R R A N G E M E N T SColiban Water makes employer contributions to the defined benefitcategory of the Fund at rates determined by the Trustee on the adviceof the Fund’s Actuary.
The Fund’s latest actuarial investigation was held as at 30 June 2014and it was determined that the vested benefit index (VBI) of the definedbenefit category of which Coliban Water is a contributing employer was103.4 per cent. To determine the VBI, the fund Actuary used thefollowing long-term assumptions:
Net Investment Return 7.50% p.a.
Salary Inflation 4.25% p.a.
Price Inflation 2.75% p.a.
Vision Super has advised that the estimated VBI at March 2015 quarterend was 108.5 per cent.
The VBI is to be used as the primary funding indicator. Because the VBIwas above 100 per cent, the actuarial investigation determined thedefined benefit category was in a satisfactory financial position andthat no change was necessary to the defined benefit category’s fundingarrangements from prior years.
E M P LOY E R C O N T R I B U T I O N S
(i) Regular contributions
On the basis of the results of the most recent full actuarial investigationconducted by the Fund’s Actuary as at 30 June 2014, Coliban Watermakes employer contributions to the Fund’s defined benefit category atrates determined by the Fund’s Trustee. For the year ended 30 June2015, this rate was 9.5 per cent of members’ salaries. This rate willincrease in line with any increase to the Superannuation Guarantee(SG) contribution rate.
In addition, Coliban Water reimburses the Fund to cover the excess ofthe benefits paid as a consequence of retrenchment above that fundedfor resignation or retirement benefit purposes.
(ii) Funding calls
If the defined benefit category is in an unsatisfactory financial positionthen as determined by an actuarial investigation, or the category’s VBIis below its shortfall limit at any time other than at the date of theactuarial investigation, the Fund is required to put a plan in place sothat the shortfall is fully funded within three years of the shortfalloccurring. The Fund monitors its VBI on a quarterly basis and the Fundhas set its shortfall limit at 97 per cent.
In the event that the Fund Actuary determines that there is a shortfallbased on the above requirement, the Fund’s participating employers(including Coliban Water) are required to make an employercontribution to cover the shortfall.
Using the agreed methodology, the shortfall amount is apportionedbetween the participating employers based on the pre-1 July 1993 andpost-30 June 1993 service liabilities of the Fund’s defined benefitcategory, together with the employer’s payroll at 30 June 1993 and atthe date the shortfall has been calculated.
Due to the nature of the contractual obligations between theparticipating employers and the Fund, and that the Fund includeslifetime pensioners and their reversionary beneficiaries, it is unlikelythat the Fund will be wound up.
If there is a surplus in the Fund, the surplus cannot be returned to theparticipating employers.
In the event that a participating employer is wound-up, the definedbenefit obligations of that employer will be transferred to thatemployer’s successor.
L AT E S T ACT UA R I A L I N V E S T I GAT I O N S U R P LU S A M O U N T SThe Fund’s latest actuarial investigation as at 30 June 2014 identifiedthe following in the defined benefit category of which Coliban Water isa contributing employer:
> A VBI surplus of $77.1 million; and
> A total service liability surplus of $236 million.
The VBI surplus means that the market value of the fund’s assetssupporting the defined benefit obligations exceed the vested benefitsthat the defined benefit members would have been entitled to if theyhad all exited on 30 June 2014.
The total service liability surplus means that the current value of theassets in the Fund’s defined benefit category plus expected futurecontributions exceeds the value of expected future benefits andexpenses.
Coliban Water was notified of the results of the latest actuarialinvestigation during January 2015.
N OT E 1 9 : S U P E R A N N UAT I O N

COLIBAN WATER | FINANCIAL REPORT | 2014–15PAGE | 80
The principal financial instruments comprise of cash assets,receivables (excluding statutory receivables), payables (excludingstatutory payables), borrowings and finance lease liabilities.
The activities of Coliban Water expose it to a variety of financial risks,market risk, credit risk and liquidity risk. This note presents informationabout Coliban Water’s exposure to each of these risks, and theobjectives, policies and processes for measuring and managing risk.
The Board of Coliban Water has the overall responsibility for theestablishment and oversight of the risk management framework. Allborrowings are sourced through Treasury Corporation of Victoria (TCV)and Coliban Water’s total borrowing limit is regulated by Department ofTreasury and Finance (DTF) via approval from the Treasurer. ColibanWater operates within the risk management requirements that areimposed by TCV and DTF over these borrowings.
The overall risk management program seeks to minimise potentialadverse effects on the financial performance of Coliban Water. ColibanWater uses different methods to measure different types of risk towhich it is exposed. These methods include sensitivity analysis in thecase of interest rate, other price risks and ageing analysis for credit.
Risk management is carried out by Coliban Water’s Management underpolicies approved by the Board of Directors. The finance department ofColiban Water identifies, evaluates and hedges financial risks in closeco-operation with Coliban Water’s operating units. The Board provideswritten principles for overall risk management, as well as policiescovering specific areas, such as foreign exchange risk, interest raterisks, credit risk and non-derivative financial instruments, andinvestment of excess liquidity.
( c ) S U P E R A N N UAT I O N C O N T R I B U T I O N S
Contributions by Coliban Water to the various superannuation plans for the financial year ended 30 June 2015 are detailed below:
Scheme Type of Scheme Rate2015
($’000)
2014
($’000)
Vision Super Defined Benefits 9.5%–12.5% 46 50
Vision Super Accumulated Contribution 9.5% 662 640
Emergency Services & State Superannuation Defined Benefits 9.5%–10.3% 29 37
VicSuper Scheme Accumulated Contribution 9.5% 82 60
Other Superannuation Funds Accumulated Contribution 9.5% 585 530
Employee Personal Superannuation Funds Accumulated Contribution 9.5% 51 43
Total contributions to all funds 1,455 1,360
Coliban Water was not required to pay any unfunded liability payments to Vision Super during 2014/15 (2013/14 $nil).There were $nil contributions outstanding and $nil loans issued from or to the above schemes as at 30 June 2015 (2013/14: $nil contributionsoutstanding and $nil loans issued).The expected contributions to be paid to the defined benefit category of Emergency Services & State Superannuation and Vision Super for theyear ending 30 June 2016 is $39,618.
N OT E 2 0 : F I N A N C I A L R I S K M A N AG E M E N T O BJ E CT I V E S A N D P O L I C I E S
The carrying amounts of the contractual financial assets and financial liabilities by category are disclosed below:
2014–2015
Contractualfinancial assets
– loans andreceivables
Contractualfinancial
liabilities atamortised cost
Total
C O N T R ACT UA L F I N A N C I A L A S S E T S
Cash and Deposits 9,134 9,134
Receivables(1)
Rates and charges receivable 10,936 – 10,936
Accrued revenue 9,964 – 9,964
Other financial assets 78 – 78
Total contractual financial assets 30,112 – 30,112
C O N T R ACT UA L F I N A N C I A L L I A B I L I T I E S
Payables(2)
Trade payables – 10,355 10,355
Amounts payable to government and agencies – 121 121
Other payables – 1,080 1,080
Borrowings
Finance lease liabilities – 89,300 89,300
Loans from TCV – 372,832 372,832
Total contractual financial liabilities – 473,688 473,688
(1) The total amounts disclosed here exclude statutory amounts (e.g. amounts owing from Victorian Government and GST input tax credit recoverable and tax payable).
(2) The total amount disclosed excludes FBT payable.

M A R K E T R I S K S E N S I T I V I T Y A N A LYS I SThe sensitivity analysis below has taken into consideration past performance, future expectations, economic forecasts and management’sknowledge and experience of the financial markets. The table below shows the impact before tax and only includes financial instruments subjectto variable interest. Coliban Water believes that a movement of 1% in interest rates is reasonable over the next 12 months.
2014–2015
Carrying
Amount
Interest Rate Risk
-1% +1%
($’000)Result
($’000)
Equity
($’000)
Result
($’000)
Equity
($’000)
F I N A N C I A L A S S E T S
Cash and cash equivalents 9,134 ( 91) ( 91) 91 91
Total financial assets 9,134 ( 91) ( 91) 91 91
F I N A N C I A L L I A B I L I T I E S
Borrowings – floating interest rate loans 1,332 13 13 ( 13) ( 13)
Total financial liabilities 1,332 13 13 ( 13) ( 13)
Total increase/(decrease) ( 78) ( 78) 78 78
2013–2014
Carrying
Amount
Interest Rate Risk
-1% +1%
($’000)Result
($’000)
Equity
($’000)
Result
($’000)
Equity
($’000)
F I N A N C I A L A S S E T S
Cash and cash equivalents 4,390 ( 44) ( 44) 44 44
Total financial assets 4,390 ( 44) ( 44) 44 44
F I N A N C I A L L I A B I L I T I E S
Borrowings – floating interest rate loans 243 2 2 ( 2) ( 2)
Total financial liabilities 243 2 2 ( 2) ( 2)
Total increase/(decrease) ( 42) ( 42) 42 42
( b ) C R E D I T R I S K
Credit risk is the risk of financial loss to Coliban Water as a result of a customer or counterparty to a financial instrument failing to meet itscontractual obligations. Credit risk arises principally from receivables.Coliban Water minimises concentrations of credit risk by undertaking transactions with a large number of customers. The receivables balanceconsists of a large number of residential and business customers which are spread across a diverse range of industries. Coliban Water istherefore not materially exposed to any individual customer. Receivable balances recognised on the balance sheet are the carrying amount net ofany provision for doubtful debts. An analysis of the ageing of Coliban Water’s receivables as at the reporting date has been provided in Note 4.
( c ) L I Q U I D I T Y R I S K
Liquidity Risk is the risk that Coliban Water will not be able to meet its financial obligations as they fall due. Coliban Water’s policy is to settlefinancial obligations within 30 days and in the event of dispute make payments within 30 days from the date of resolution. Coliban Watermanages liquidity risk by maintaining adequate reserves, banking facilities and reserve borrowing facilities by continuously monitoring forecastand actual cash flows and matching the maturity profiles of financial assets and financial liabilities.Coliban Water’s financial liability maturities have been disclosed in Note 21.
COLIBAN WATER | FINANCIAL REPORT | 2014–15 PAGE | 81
R I S K E X P O S U R E SThe main risks that Coliban Water is exposed to through its financialinstruments are as follows:
( a ) M A R K E T R I S KMarket risk is the risk that changes in market prices will affect the fairvalue or future cash flows of Coliban Water’s financial instruments.Market risk comprises of foreign exchange risk, interest rate risk andother price risk. Coliban Water’s exposure to market risk is primarilythough interest rate risk. There is no exposure to foreign exchange riskand there is insignificant exposure to other price risks.Objectives, policies and processes used to manage these risks aredisclosed in the paragraphs below:
(i) Interest rate risk
Coliban Water’s exposure to market interest rates relates primarily toColiban Water’s long term borrowings and funds invested on the moneymarket.
Coliban Water minimises its exposure to interest rate changes on itsborrowings by holding a mix of fixed and floating rate debt. Long termborrowings are fixed rate interest only loans. Short term borrowings arevariable rate interest only loans. Debt is sourced from TCV as approvedby the Treasurer and is managed within a range of Board approvedlimits with debt levels and interest rates being monitored regularly.Coliban Water has minimal exposure to interest rate risk through itsholding of cash assets and other financial assets.
(ii) Other price risk
Coliban Water has no significant exposure to other price risk. ColibanWater holds 40,000 shares in Bendigo Community Telco Limited.Bendigo Community Telco Limited are listed on the National StockExchange of Australia and therefore the reported value of the shares at30 June 2015 of $78,000 (2013/14: $66,000) are based on their sharevalue as at that date.
N OT E 2 0 : F I N A N C I A L R I S K M A N AG E M E N T O BJ E CT I V E S A N D P O L I C I E S ( C O N T I N U E D )

COLIBAN WATER | FINANCIAL REPORT | 2014–15PAGE | 82
N OT E 2 1 : F I N A N C I A L I N S T R U M E N T S
I N T E R E S T R AT E E X P O S U R E SThe following table sets out Coliban Water’s exposure to interest rate risk, including the contractual repricing dates and the effective weightedaverage interest rate by maturity periods. Exposures arise predominantly from liabilities bearing variable interest rates as Coliban Water to dateholds fixed interest rate liabilities to maturity.As the financial assets and financial liabilities are at amortised value the carrying amount equals fair value.
2014–2015Floating
Interest
Rate
Fixed Interest Rate Maturing
Non-
interest
Bearing
Total
Weighted
Average
Interest
Rate
1 year or
less
(’000)
1 to 2years
(’000)
2 to 3years
(’000)
3 to 4years
(’000)
4 to 5years
(’000)
Over 5years
(’000)
F I N A N C I A L A S S E T S
Cash and cash equivalents 9,132 – – – – – – 2 9,134 1.23%
Receivables(excl. statutory receivables)
– – – – – – – 20,900 20,900 n/a
Other financial assets – – – – – – – 78 78 n/a
Total financial assets 9,132 – – – – – – 20,980 30,112
F I N A N C I A L L I A B I L I T I E S
Payables(excl. statutory payables)
– – – – – – – 11,556 11,556 n/a
Finance lease liabilities – 4,180 4,518 4,882 5,275 5,727 64,718 – 89,300 7.77%
Loans from TCV 1,332 – 25,000 30,000 25,000 30,000 261,500 – 372,832 5.15%
Total financial liabilities 1,332 4,180 29,518 34,882 30,275 35,727 326,218 11,556 473,688
Net financial liabilities 7,800 ( 4,180) ( 29,518) ( 34,882) ( 30,275) ( 35,727) ( 326,218) 9,424 ( 443,576)
2013–2014Floating
Interest
Rate
Fixed Interest Rate Maturing
Non-
interest
Bearing
Total
Weighted
Average
Interest
Rate
1 year or
less
(’000)
1 to 2years
(’000)
2 to 3years
(’000)
3 to 4years
(’000)
4 to 5years
(’000)
Over 5years
(’000)
F I N A N C I A L A S S E T S
Cash and cash equivalents 4,388 – – – – – – 2 4,390 1.61%
Receivables(excl. statutory receivables)
– – – – – – – 20,714 20,795 n/a
Other financial assets – – – – – – – 66 66 n/a
Total financial assets 4,388 – – – – – – 20,782 25,251
F I N A N C I A L L I A B I L I T I E S
Payables(excl. statutory payables)
– – – – – – – 16,736 16,736 n/a
Finance lease liabilities – 3,596 3,882 4,192 4,526 4,887 65,822 – 86,905 7.67%
Loans from TCV 243 – 24,000 25,000 30,000 25,000 259,000 – 363,243 5.36%
Total financial liabilities 243 3,596 27,882 29,192 34,526 29,887 324,822 16,736 466,884
Net financial liabilities 4,145 ( 3,596) ( 27,882) ( 29,192) ( 34,526) ( 29,887) ( 324,822) 4,045 ( 441,634)

COLIBAN WATER | FINANCIAL REPORT | 2014–15 PAGE | 83
2015($’000)
2014($’000)
N OT E 2 2 : C O M M I T M E N T S
( a ) CA P I TA L E X P E N D I T U R E C O M M I T M E N T S
The nominal value of capital expenditure commitments including GST outstanding as at 30 June 2015 totalled $4.2 million (2013/14: $11.8 million).
CA P I TA L E X P E N D I T U R E C O M M I T M E N T S
Not later than one year 3,922 2,804
Later than one year and not later than five years 272 8,947
Total capital expenditure commitments 4,194 11,751
( b ) O P E R AT I N G S E RV I C E C O M M I T M E N T S
The nominal value of operating service commitments including GST as at 30 June 2015 totalled $118.3 million (2013/14: $142.7 million). Thisamount is represented by three major operations contracts. Two of these contracts are for the service component of the BOOT schemes deliveredas part of Victoria’s Public Private Partnership process for the provision of wastewater and water treatment services. Refer to Note 23 for moredetails of these schemes. The third contract is a four year contract for operations and maintenance to be provided to Coliban Water. Operatingexpenditure commitments are due and payable as follows:
O P E R AT I N G E X P E N D I T U R E C O M M I T M E N T S
Not later than one year 19,339 18,244
Later than one year and not later than five years 40,246 52,349
Later than five years 58,763 72,086
Total operating expenditure commitments 118,348 142,679
( c ) E N V I R O N M E N TA L C O N T R I B U T I O N L E V Y C O M M I T M E N T S
There were environmental contribution levy commitments as at 30 June 2015 of $3.3 million (2013/14: $6.5 million). The purpose of theenvironmental contribution is set out in the Water Industry (Environmental Contributions) Act 2004, and the funding may be used for the purposeof funding initiatives that seek to promote the sustainable management of water or address water-related initiatives. See Note 1(vi) for a fullexplanation of these commitments.
E N V I R O N M E N TA L C O N T R I B U T I O N L E V Y C O M M I T M E N T S
Not later than one year 3,272 3,272
Later than one year and not later than five years – 3,272
Total environmental contribution levy commitments 3,272 6,544
The Environmental Contribution levy in the current year totalled $3.3 million (2013/14: $3.3 million). The last payment of this levy will be made in 2015/16.

COLIBAN WATER | FINANCIAL REPORT | 2014–15PAGE | 84
N OT E 2 3 : F I N A N C E L E A S E L I A B I L I T I E S — B O OT S C H E M E S
Coliban Water has signed two Build Own Operate Transfer (BOOT) contracts.A contract deed was signed on 5 May 1999 with Bendigo Water Services Pty Ltd for provision of water treatment services for Bendigo,Castlemaine and Kyneton. Commercial acceptance of this facility was granted on 1 June 2002.Coliban Water signed a contract deed on 26 November 2002 with ETE Coliban Pty Ltd for the provision of water reclamation and reuse servicesfor Echuca and Rochester. Commercial acceptance of this facility was granted on 28 September 2004.The above contracts, which comprise both fixed and variable components, commit Coliban Water to the payment of tolls over the 25 year contractperiods.As ownership of the asset(s) will be transferred to Coliban Water at the end of the contractual term and this term is for the major part of theeconomic life of the asset(s), Coliban Water accounts for the asset(s) under the BOOT Schemes as a finance lease.
VA LU E O F E X P E CT E D F U T U R E O B L I GAT I O N S
( a ) F I N A N C E L E A S E C O M M I T M E N T S
Commitments for minimum lease payments (excluding the GST of $8.9 million as at 30 June 2015 and $8.7 million as at 30 June 2014), inrelation to finance leases are payable as follows:
C O M M I S S I O N E D B O OT S C H E M E S R E L AT E D TO F I N A N C E L E A S E L I A B I L I T I E S
Notes
Minimum future lease
payments (i)Present value of minimum
future lease payments
2015
($’000)
2014
($’000)
2015
($’000)
2014
($’000)
Not later than one year 10,971 10,159 4,180 3,596
Later than one year and not later than five years 43,913 40,637 20,402 17,486
Later than five years 87,164 91,737 64,718 65,823
142,048 142,533 89,300 86,905
Less future interest charges 52,748 55,628 – –
Total finance lease commitments 89,300 86,905 89,300 86,905
Included in the financial statements as:
Current lease liability 11 – – 4,180 3,596
Non-current lease liability 11 – – 85,120 83,309
Total finance lease liabilities – BOOT schemes – – 89,300 86,905
(i) Minimum future lease payments include the aggregate of all base payments and any guaranteed residual.
(b) COMMISSIONED BOOT OPERATING COMMITMENTS (NOTINCLUDING FUTURE INTEREST CHARGES BUT INCLUDING GST)CONTRACTED FOR BUT NOT RECOGNISED AS LIABILITIES.
Notes
Nominal Present Value
2015
($’000)
2014
($’000)
2015
($’000)
2014
($’000)
Not later than one year 6,762 6,712 5,614 6,261
Later than one year and not later than five years 29,186 29,065 18,963 21,141
Later than five years 65,215 72,086 25,260 30,661
101,163 107,863 49,837 58,063
N OT E 2 4 : O P E R AT I N G L E A S E C O M M I T M E N T S
a ) O P E R AT I N G L E A S E O N H E A D O F F I C E B U I L D I N G
Coliban Water signed an Operating Lease agreement on 20 September 2000 for the lease of the Coliban Water head office building at BridgeStreet Bendigo. The operating lease is for a period of twenty (20) years commencing 1 September 2000 with lease payments commencing1 November 2002.Coliban Water signed another Operating Lease agreement on 24 December 2010 for the lease of a second head office building at 30 BridgeStreet Bendigo. The operating lease is for a period of five (5) years commencing 1 March 2011.Total lease payments over the remaining periods of the leases including GST are expected to be $1.2 million (2013/14: $1.4 million).
O P E R AT I N G L E A S E E X P E N D I T U R E C O M M I T M E N T S 2015
($’000)
2014
($’000)
Not later than one year 380 389
Later than one year and not later than five years 763 843
Later than five years 6 216
1,169 1,448
b) O P E R AT I N G L E A S E S O N M OTO R V E H I C L E S
Coliban Water also has a number of Cancellable Operating Leases for the lease of motor vehicles. Operating lease rentals paid (including GST) for2014/15 totalled $584,231 (2013/14: $491,713) have been included in operating and administration expenses in the determination of theoperating result for the accounting period.

COLIBAN WATER | FINANCIAL REPORT | 2014–15 PAGE | 85
N OT E 2 5 : J O I N T O P E R AT I O N S
On 6 May 2008, Coliban Water established with Central Highlands Water (CHW) a joint operation for the development, operation and maintenanceof the pipelines and infrastructure associated with the Goldfields Superpipe. The joint operation involves the use of assets and other resources ofboth parties. Each party uses its own assets and incurs its own expenses and liabilities.
Under the agreement, the assets will be jointly owned as tenants in common in their respective percentage interests. Coliban Water’s capitalshare has been determined by the total expenditure on the Goldfields Superpipe less the incremental proportion of capital expenditure thatrelates to the additional capacity required to service CHW. The incremental proportion has been funded by CHW.
Coliban Water's operational costs share are to be calculated on a combination of fixed component based on capacity share, a variable componentbased on volumes of water pumped and an energy charges share based on volumes stored or pumped from Lake Eppalock.
P R I N C I PA L ACT I V I T Y 2 0 1 4 / 1 5 InterestWater Distribution
(i) ($’000)Operational Costs
(ii) ($’000)
Operation and maintenance of pipelines and associated infrastructure:
> Waranga Channel to Lake Eppalock 2/3 61,755 1,293
> Lake Eppalock to Sandhurst Reservoir 2/3 33,237 191
> Sandhurst Reservoir to White Swan Reservoir 100% CHW – –
P R I N C I PA L ACT I V I T Y 2 0 1 3 / 1 4 InterestWater Distribution
(i) ($’000)Operational Costs
(ii) ($’000)
Operation and maintenance of pipelines and associated infrastructure:
> Waranga Channel to Lake Eppalock 2/3 59,994 1,173
> Lake Eppalock to Sandhurst Reservoir 2/3 33,630 164
> Sandhurst Reservoir to White Swan Reservoir 100% CHW – –
(i)Disclosed as Water Distribution Assets. Refer to Note 8.(ii)Disclosed as part of other operating and administration expenses. Refer to Note 2(b).
As at 30 June 2015, there were $nil outstanding liabilities incurred by Coliban Water and the joint operation (as at 30 June 2014, $nil).
N OT E 2 6 : F I N A N C I N G FAC I L I T I E S
The bank overdraft limit of Coliban Water is $400,000. This facility is subject to annual review and at 30 June 2015 the amount of unused creditwas $400,000 (2013/14: $400,000). The bank overdraft is secured by way of mortgage over the revenue of Coliban Water.Loan facilities from TCV have various maturity dates through to 2029 and may be extended by mutual agreement.
N OT E 2 7 : C O N T I N G E N T A S S E T S A N D C O N T I N G E N T L I A B I L I T I E S
There were no material contingent assets or liabilities at 30 June 2015 (2013/14: $nil).Of significance however is the termination of Coliban Water’s contract with Redline Mining & Infrastructure Pty Ltd (RMI) for the Harcourt RuralModernisation Project. Coliban Water took all remaining work out of RMI’s hands in June 2015. Amongst other reasons, this occurred due tosubstantial delays by RMI for which RMI had no satisfactory explanation. Coliban Water is making arrangements to complete the project withother contractors.At the time of preparing this statement, a court winding up order has been made with respect to RMI, and liquidators have been appointed to it.Coliban Water expects to incur additional costs of completing capital work that RMI failed to complete, and that the performance securityprovided by RMI will not be sufficient to cover those costs. For this reason, Coliban Water does not expect to receive a claim by the liquidatorsand nor does Coliban Water expect to have any liability to RMI or the liquidators. It is not possible at this time to estimate what Coliban Water’sunsecured loss will be (if any), nor whether there will be any significant return to unsecured creditors (including Coliban Water) in the liquidation of RMI.
N OT E 2 8 : AU D I TO R S R E M U N E R AT I O N
The fee for auditing the financial statements of Coliban Water excluding GST for 2014/15 has been set at $84,300 (2013/14: $84,360) by theVictorian Auditor-General Office. No other benefits were received or are receivable by the Victorian Auditor-General Office.

COLIBAN WATER | FINANCIAL REPORT | 2014–15PAGE | 86
N OT E 2 9 : E V E N T S O C C U R R I N G A F T E R T H E BA L A N C E DAT E
The following matters and/or circumstances have arisen since theend of the reporting period which significantly affect or maysignificantly affect the operations of the Corporation, the results ofthose operations, or the state of affairs of the Corporation in futurefinancial years:
On the 8 April 2015, the Minister for Environment, Climate Changeand Water, the Hon Lisa Neville MP, announced a review of all 135Victorian water corporation board director positions. Expressions ofinterest were invited during April and May 2015 with new boards tobe in place by 1 October 2015.
Water corporations remain governed by a properly constitutedboard of directors and will do so following 1 October 2015 whenany new appointments are due to commence.
N OT E 3 0 : E X- G R AT I A E X P E N S E S
The total forgiveness or waiver of debt at 30 June 2015 was$149,665 (2013/14: $165,960).
This includes ex-gratia expenses greater than or equal to $5,000 orthose considered material in nature. These ex-gratia expensesrelate to debt that has been deemed to be uncollectible anduneconomical to pursue. Refer also to Note 4(b).

COLIBAN WATER | FINANCIAL REPORT | 2014–15 PAGE | 87

COLIBAN WATER | FINANCIAL REPORT | 2014–15PAGE | 88


issn: 2200-9752