annual report 2018profile mitsubishi ufj investor services & banking (luxembourg) s.a. (mibl) is...
TRANSCRIPT
Mitsubishi UFJ Investor Services & Banking (Luxembourg) S.A.
Annual Report2018
1
Annual Report2018
TABLE OF CONTENTS
Message from Management 3
CSR Today 4
Performance Highlight 6
Financial Highlight 8
Profile 10
Board of Directors 12
Corporate Governance Structures 16
Organization Chart 17
Annual Accounts
• Management Report 18
• Report of the Réviseur d’entreprises agréé 22
• Balance Sheet and Off Balance Sheet Items 28
• Profit and Loss account 31
• Notes to the Accounts 32
Appendixes of the Annual Report (non audited information) 54
• Appendix 1 IFRS Report (non audited information) 54
• Appendix 2 Basel III Disclosure (non audited information) 56
3
Annual Report2018
MESSAGE FROM MANAGEMENT
Mitsubishi UFJ Investor Services & Banking (Luxembourg) S.A. (MIBL) is a bank with a universal banking license located in Luxembourg, and a member of «MUFG Investor Services» which is a global brand of Mitsubishi UFJ Financial Group (MUFG).
The Bank has been focusing on Global Custody services as well as Fund Administration services since the establishment. And we have enhanced banking services since 2015 according to the expansion plan of the MUFG Investor Services.
By cooperating with MUFG Investor Services network, the Bank will continue enhancing our services for both investor services products and banking products, in order to meet client expectations.
Sota SUZUKI Chief Executive Officer
May 1, 2019
4 5
Annual Report2018
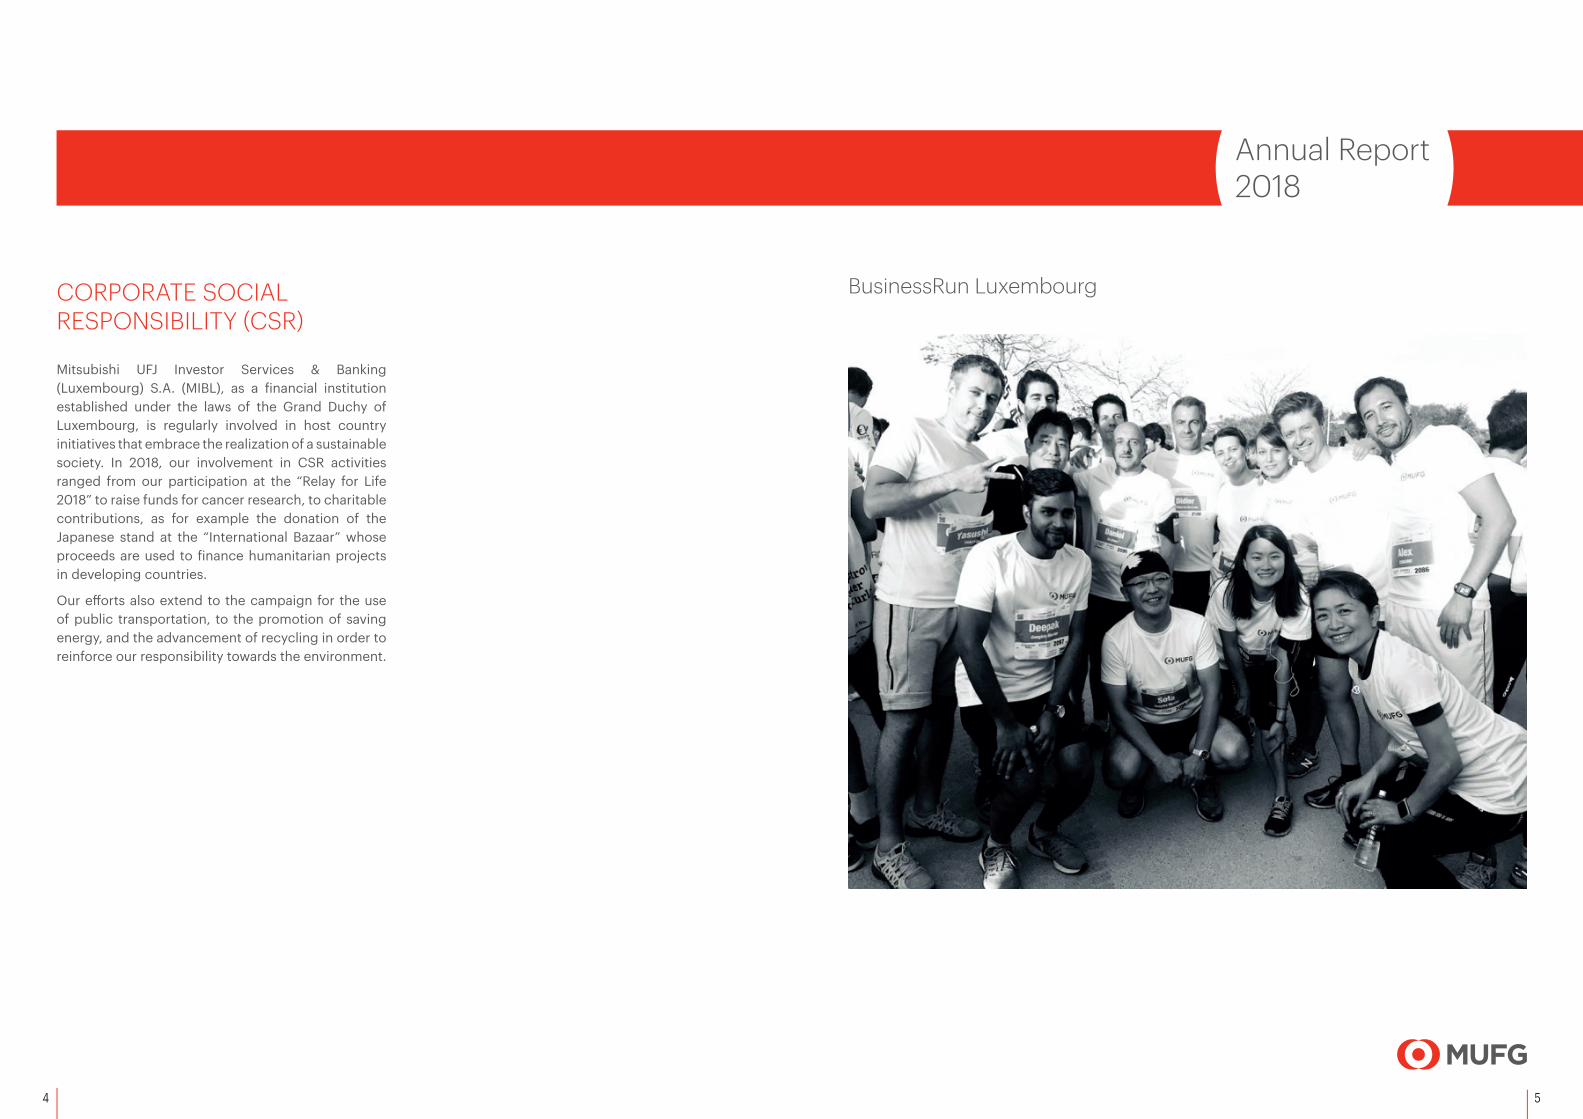
CORPORATE SOCIAL RESPONSIBILITY (CSR)
Mitsubishi UFJ Investor Services & Banking (Luxembourg) S.A. (MIBL), as a financial institution established under the laws of the Grand Duchy of Luxembourg, is regularly involved in host country initiatives that embrace the realization of a sustainable society. In 2018, our involvement in CSR activities ranged from our participation at the “Relay for Life 2018” to raise funds for cancer research, to charitable contributions, as for example the donation of the Japanese stand at the “International Bazaar” whose proceeds are used to finance humanitarian projects in developing countries.
Our efforts also extend to the campaign for the use of public transportation, to the promotion of saving energy, and the advancement of recycling in order to reinforce our responsibility towards the environment.
BusinessRun Luxembourg
6 7
Annual Report2018
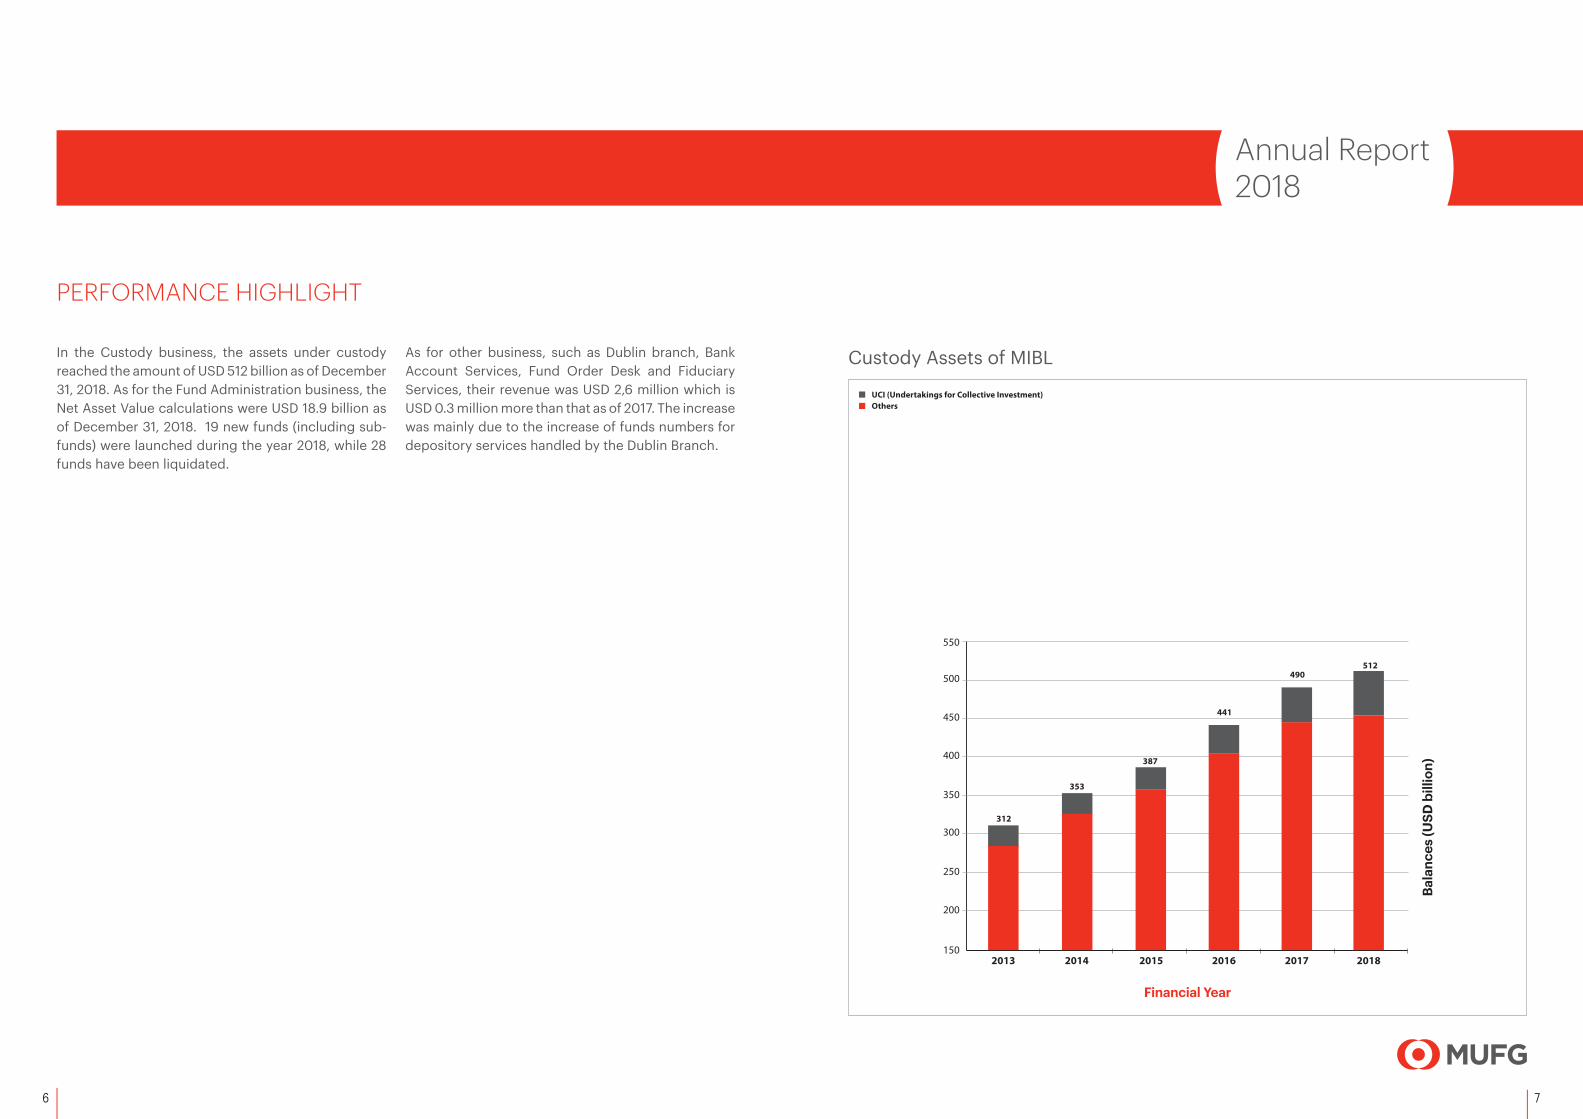
Custody Assets of MIBL
PERFORMANCE HIGHLIGHT
In the Custody business, the assets under custody reached the amount of USD 512 billion as of December 31, 2018. As for the Fund Administration business, the Net Asset Value calculations were USD 18.9 billion as of December 31, 2018. 19 new funds (including sub-funds) were launched during the year 2018, while 28 funds have been liquidated.
As for other business, such as Dublin branch, Bank Account Services, Fund Order Desk and Fiduciary Services, their revenue was USD 2,6 million which is USD 0.3 million more than that as of 2017. The increase was mainly due to the increase of funds numbers for depository services handled by the Dublin Branch.
150
200
250
300
350
400
450
500
201620152014201320122011
2010 2011 2012 2013 2014
UCI (Undertakings for Collective Investment)Others
20151.000
1.500
2.000
2.500
3.500
3.000
Total Value of Funds
Total Number of Funds
Tota
l Num
ber
2.500
3.000
3.500
4.000
4.500
236
Bala
nces
(USD
bill
ion)
Tota
l Val
ue (E
UR
billi
on)
4.000
Financial Year
306 312
353
387
441
Financial Year
Bala
nces
(USD
bill
ion)
150
200
250
300
350
400
450
500
550
2016201520142013
UCI (Undertakings for Clollective Investment)Others
Bala
nces
(USD
bill
ion)
Financial Year
312
353
387
441
2017 2018
490512
8 9
Annual Report2018
FINANCIAL HIGHLIGHT
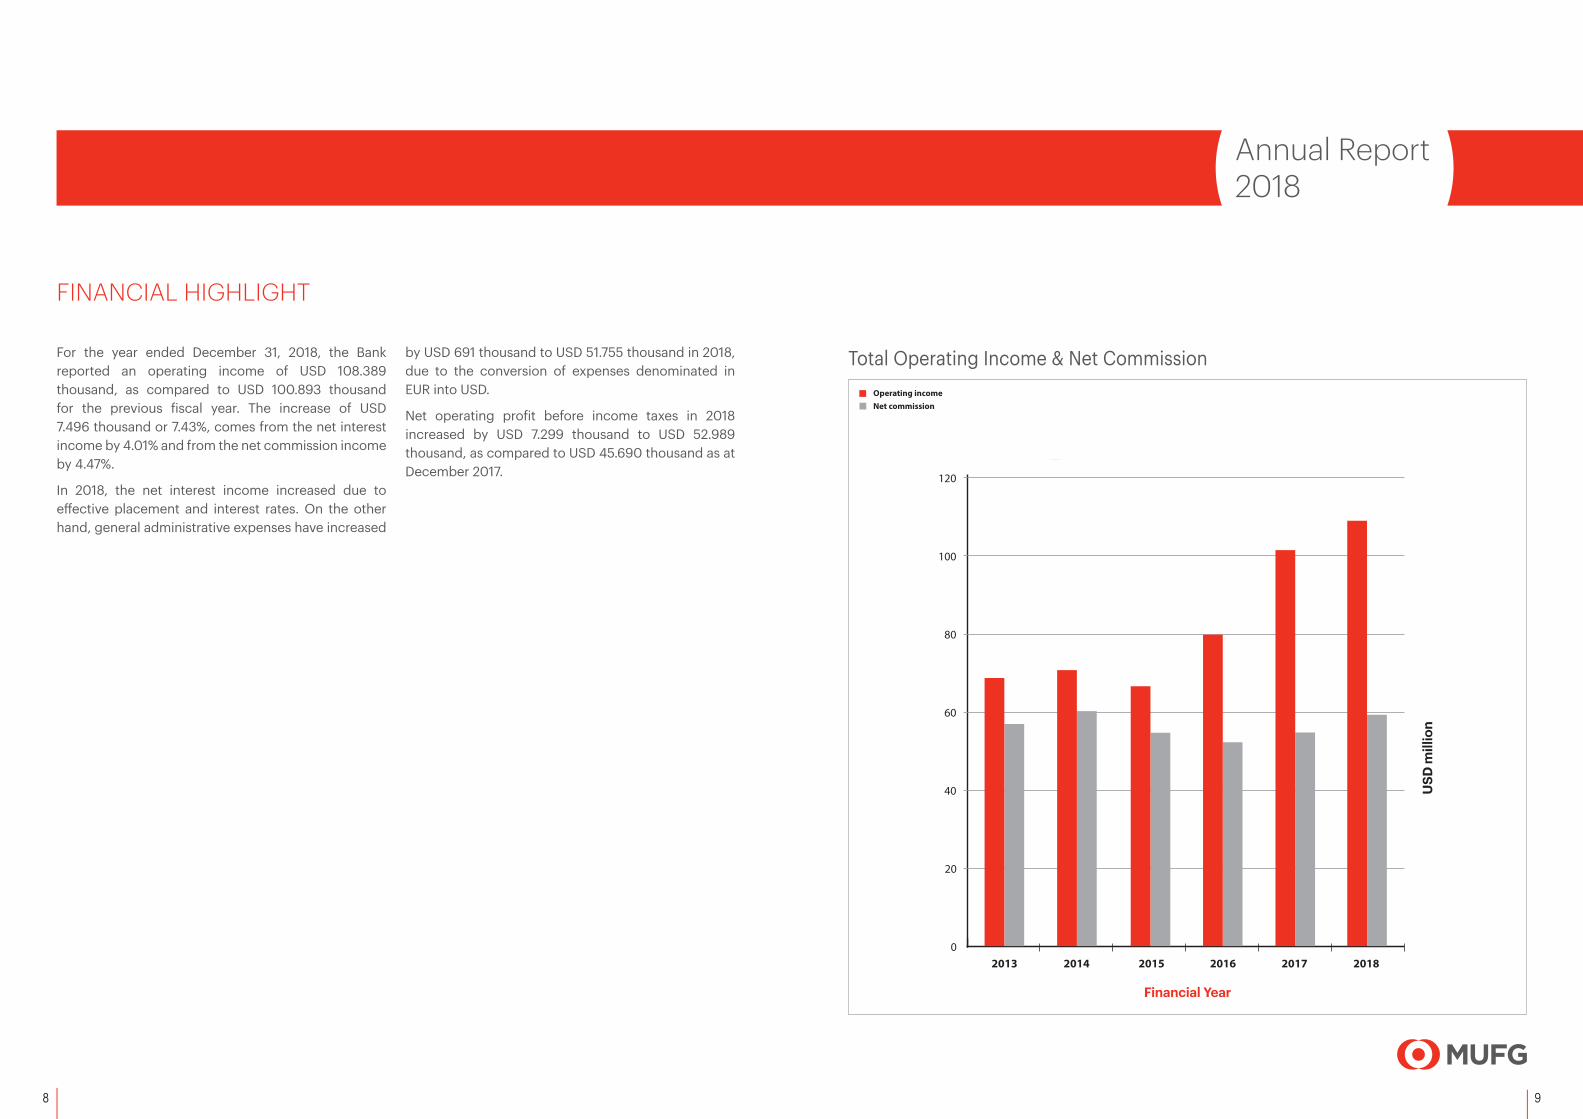
For the year ended December 31, 2018, the Bank reported an operating income of USD 108.389 thousand, as compared to USD 100.893 thousand for the previous fiscal year. The increase of USD 7.496 thousand or 7.43%, comes from the net interest income by 4.01% and from the net commission income by 4.47%.
In 2018, the net interest income increased due to effective placement and interest rates. On the other hand, general administrative expenses have increased
by USD 691 thousand to USD 51.755 thousand in 2018, due to the conversion of expenses denominated in EUR into USD.
Net operating profit before income taxes in 2018 increased by USD 7.299 thousand to USD 52.989 thousand, as compared to USD 45.690 thousand as at December 2017.
Total Operating Income & Net Commission
Financial Year
Operating incomeNet commission
0
20
40
60
80
20162013 2014 2015 2017
100
120
2018
Operating incomeNet commission
0
20
40
60
80
20162013 2014 2015 2017
100
120
2018
USD
mill
ion

10 11
Annual Report2018
PROFILE
Mitsubishi UFJ Investor Services & Banking (Luxembourg) S.A. (MIBL) is a member of the MUFG Investor Services, which is a global brand of Mitsubishi UFJ Financial Group (MUFG), one of the largest financial groups worldwide.
For more than 40 years, MIBL has been providing a wide range of services to institutional investors including:
1. Global Custody Services
2. Investment Funds Administration
3. Fiduciary and Trust Administration
4. Listing on the Stock Exchange
5. Other direct or indirect related services (Cash Management, Foreign Exchange, Bank Account service and Fund Order desk for funds etc.)
EuropeFrance, Germany,...
(33 Nations)
AfricaRep. of South Africa, Egypt,... (13 Nations)
AsiaChina, India,...
(27 Nations)
OceaniaAustralia & NewZealand
(2 Nations)
North AmericaUSA, Canada,...
(4 Nations)
South AmericaBrazil, Chile,...
(11 Nations)
Mitsubishi UFJ Investor Services & Banking (Luxembourg) S.A.
Mitsubishi UFJ Financial Group (MUFG)
Mitsubishi UFJ Trust & Banking
MitsubishiUFJ Trust
International Limited
CAPITAL ALLIANCE
MIBL Global Market Coverage
MUFG Fund Services Limited
MUFG LuxManagement Company S.A.
12 13
Annual Report2018
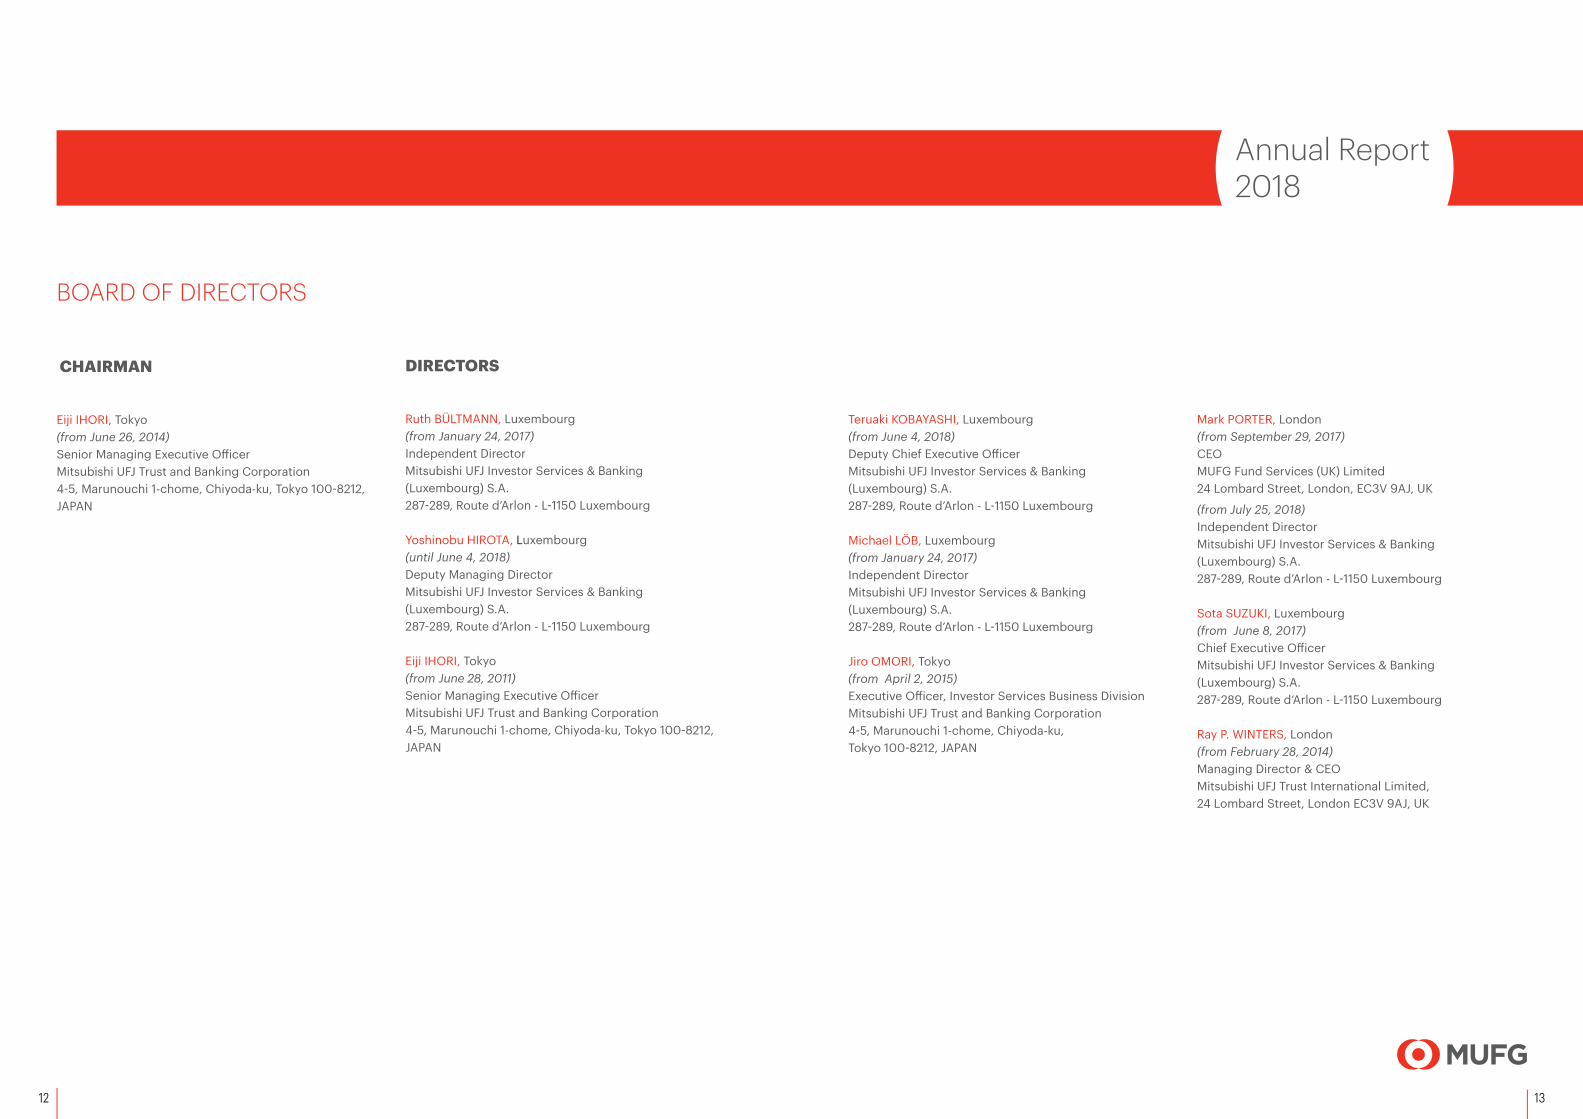
BOARD OF DIRECTORS
CHAIRMAN
Eiji IHORI, Tokyo (from June 26, 2014)Senior Managing Executive OfficerMitsubishi UFJ Trust and Banking Corporation4-5, Marunouchi 1-chome, Chiyoda-ku, Tokyo 100-8212, JAPAN
DIRECTORS
Ruth BÜLTMANN, Luxembourg (from January 24, 2017)Independent Director Mitsubishi UFJ Investor Services & Banking (Luxembourg) S.A.287-289, Route d’Arlon - L-1150 Luxembourg
Yoshinobu HIROTA, Luxembourg (until June 4, 2018)Deputy Managing Director Mitsubishi UFJ Investor Services & Banking (Luxembourg) S.A.287-289, Route d’Arlon - L-1150 Luxembourg
Eiji IHORI, Tokyo (from June 28, 2011)Senior Managing Executive OfficerMitsubishi UFJ Trust and Banking Corporation4-5, Marunouchi 1-chome, Chiyoda-ku, Tokyo 100-8212, JAPAN
Teruaki KOBAYASHI, Luxembourg (from June 4, 2018) Deputy Chief Executive OfficerMitsubishi UFJ Investor Services & Banking (Luxembourg) S.A.287-289, Route d’Arlon - L-1150 Luxembourg
Michael LÖB, Luxembourg (from January 24, 2017) Independent DirectorMitsubishi UFJ Investor Services & Banking (Luxembourg) S.A.287-289, Route d’Arlon - L-1150 Luxembourg
Jiro OMORI, Tokyo (from April 2, 2015)Executive Officer, Investor Services Business DivisionMitsubishi UFJ Trust and Banking Corporation4-5, Marunouchi 1-chome, Chiyoda-ku, Tokyo 100-8212, JAPAN
Mark PORTER, London (from September 29, 2017)CEOMUFG Fund Services (UK) Limited24 Lombard Street, London, EC3V 9AJ, UK
(from July 25, 2018)Independent Director Mitsubishi UFJ Investor Services & Banking (Luxembourg) S.A.287-289, Route d’Arlon - L-1150 Luxembourg
Sota SUZUKI, Luxembourg (from June 8, 2017) Chief Executive Officer Mitsubishi UFJ Investor Services & Banking (Luxembourg) S.A.287-289, Route d’Arlon - L-1150 Luxembourg
Ray P. WINTERS, London (from February 28, 2014)Managing Director & CEOMitsubishi UFJ Trust International Limited,24 Lombard Street, London EC3V 9AJ, UK
14 15
Annual Report2018
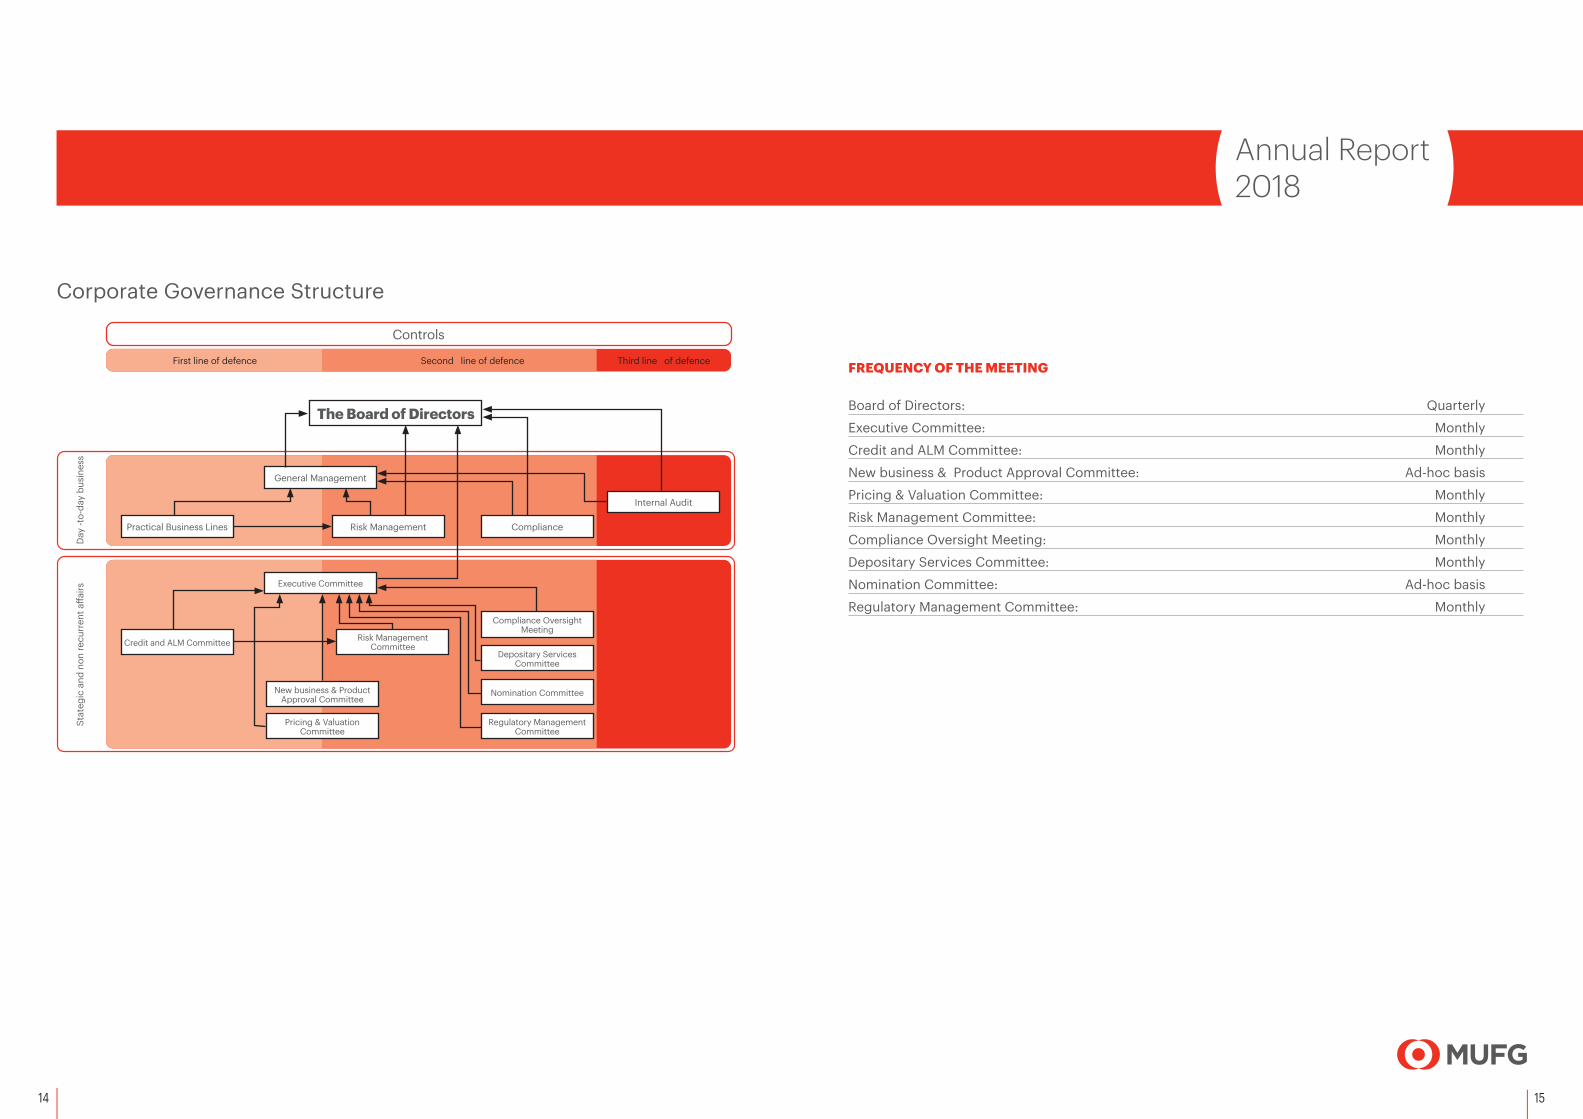
FREQUENCY OF THE MEETING
Board of Directors: Quarterly
Executive Committee: Monthly
Credit and ALM Committee: Monthly
New business & Product Approval Committee: Ad-hoc basis
Pricing & Valuation Committee: Monthly
Risk Management Committee: Monthly
Compliance Oversight Meeting: Monthly
Depositary Services Committee: Monthly
Nomination Committee: Ad-hoc basis
Regulatory Management Committee: Monthly
Corporate Governance Structure
The Board of Directors
General Management
Practical Business Lines Risk Management Compliance
Internal Audit
Executive Committee
Credit and ALM Committee Risk Management Committee
Compliance Oversight Meeting
Depositary Services Committee
Nomination Committee
Regulatory ManagementCommittee
New business & ProductApproval Committee
Pricing & ValuationCommittee
First line of defence Second line of defence Third line of defence
Controls
Day
-to-
day
busi
ness
Stat
egic
and
non
recu
rren
t affa
irs
16 17
Annual Report2018
CORPORATE GOVERNANCE STRUCTURES
The General Meeting of Shareholders is the highest decision-making body in the Bank. By adopting the articles of incorporation, the shareholders have agreed to transfer the most extensive administrative powers, including the power to delegate, to the Board of Directors, keeping for themselves only the powers reserved by law to the shareholders meeting.
The Board of Directors has in turn delegated the day-to-day management of the company to the General Management (“Authorized Management”), presently composed of one Chief Executive Officer and 3 Deputy Executive Officers. General Management has organized the Bank into such business lines as is necessary to meet legal requirements and to accomplish the Bank’s day-to-day objectives.
In order to further strengthen corporate governance and to improve active risk management, as is necessary for a sound organization, the Board of Directors decided in 2010 to reorganize the Bank’s committee structure by more clearly defining committees’ subjects to be treated, duties, and reporting lines, and by creating a management committee in charge of all strategic and non-recurrent affairs of the Bank, named the “Executive Committee.”
The business of the Bank is subject to a three-level control system. The first line of defense occurs within the business lines themselves, which have primary responsibility for any action undertaken, and as a consequence, have been organized in such a manner that each action is carefully checked before being released.
The second line is formed by the support functions, including the Compliance and the Risk Control Functions.
The Risk Management Function comprises the Risk Management Department, the Risk Management Committee, which is overseeing Credit Risk Management, Market Risk Management, Operational Risk Management, Business Continuity Management and Information Security Management, the Credit and ALM Committee, which is overseeing Credit Management, Asset & Liability Management and Liquidity Risk Management and the New Business & Product Approval Committee, which is overseeing the approval of new business and new products. The regular Risk Management Report is delivered for approval to the Board of Directors each quarter.
The Compliance Function is subdivided into the Compliance Department, Regulatory Management Committee and the regular Compliance Oversight Meeting. It ensures the Bank’s recognition of and adherence to all applicable laws and regulations, as well as to rules issued by other relevant entities. This function has the authority to contact at will, and reports directly to, the Board of Directors.
General Management and the Executive Committee are part of, and supervise, the first two levels of controls. They also supervise insofar as necessary and required the third level control.
The third-level consists of the Internal Audit Function, which in turns provides an independent, objective, and critical review of the first two lines of defense.
The third level of control, in cooperation with General Management and the Executive Committee, has to ensure the soundness and appropriateness of the Bank’s activity. It has the authority to report directly, in case of need or if so required, to the Board of Directors and to regulatory authorities and external auditors, in addition to the Head Office.
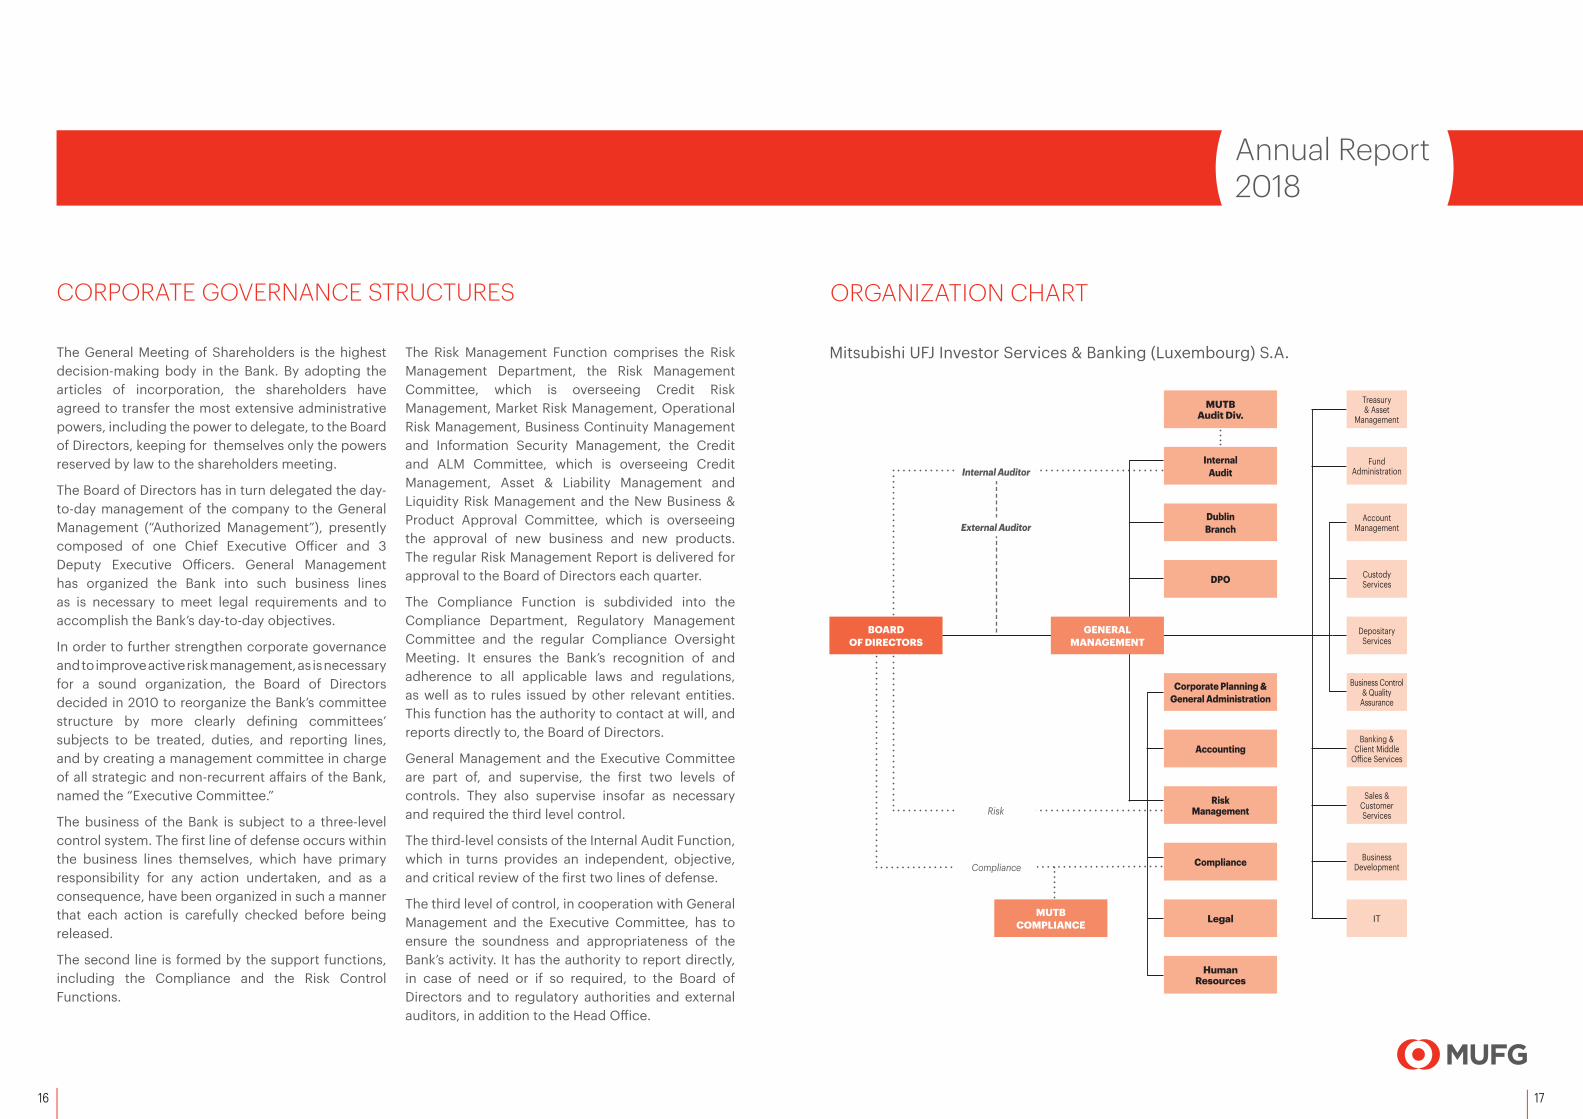
ORGANIZATION CHART
MUTB COMPLIANCE
Corporate Planning & General Administration
Accounting
RiskManagement
Compliance
Legal
HumanResources
Treasury & Asset
Management
Fund Administration
AccountManagement
Custody Services
Depositary Services
Business Control & Quality
Assurance
Banking & Client Middle
Office Services
Sales & Customer Services
Business Development
IT
MUTBAudit Div.
Internal Audit
Dublin Branch
BOARD OF DIRECTORS
External Auditor
Compliance
Risk
GENERAL MANAGEMENT
Internal Auditor
Mitsubishi UFJ Investor Services & Banking (Luxembourg) S.A.
DPO

18 19
Annual Report2018
Mitsubishi UFJ Investor Services & Banking (Luxembourg) S.A. (the “Bank”) Financial Results 2018For the year ended December 31, 2018, the Bank reported an operating income of USD 108.389 thousand, as compared to USD 100.893 thousand for the previous fiscal year. The increase of USD 7.496 thousand or 7,43%, comes from the net interest income by 4,01% and from the net commission income by 4,47%.
In 2018, the net interest income increased due to effective placement and interest rates. On the other hand, general administrative expenses have increased by USD 691 thousand to USD 51.755 thousand in 2018, due to the conversion of expenses denominated in EUR into USD.
Net operating profit before income taxes in 2018 increased by USD 7.299 thousand to USD 52.989 thousand, as compared to USD 45.690 thousand as at December 2017.
As of December 31, 2018, the total balance sheet amounted to USD 7.288,8 million versus USD 6.403,0 million as at December 2017. The Liquidity Coverage Ratio (LCR) introduced by the regulation (EU) No 575/2013 of the European Parliament, was 188,06% in December 2018. The Solvency Ratio amounted to 33,31% (after the payment of the dividend). Both ratios are well above the statutory minimum requirements. The Return on Assets (ROA) ratio was 0,55% as at December 31, 2018.
The Board of Directors will propose, at the Ordinary Meeting of Shareholders, that the amount of USD 42.924.404,75 consisting of the profit brought forward of USD 3.259,44, the available reserve for Net Worth Tax from the year 2013 of USD 3.101.000,00, and the net profit of the financial year ended December 31, 2018 of USD 39.820.145,31 be allocated as follows:
Allocation to other reserve (Net Worth Tax 2019) USD 9.981.000,00Allocation to free reserve USD 30.894.000,00Allocation to legal reserve USD 1.991.008,00Dividends Class A Shares dividend USD 0,00Class B Shares dividend USD 57.409,07Profit carried forward USD 987,68Total USD 42.924.404,75
As of December 31, 2018, the Bank had not acquired any of its own shares.
Business Circumstances in 2018The world economy showed the continuous recovery in total, mainly led by the U.S.. The other markets such as Eurozone, UK, Japan and China experienced a slowdown.
In the Equity market, most of the markets showed negative yearly return. The approval of U.S. Tax reform in December 2017 and the outlook of U.S. economy brought the positive impact while the uncertainty of Brexit and trade tariff between the U.S. and China, and the slowdown of other markets’ economy brought the negative impact on the market.
Federal Reserve Bank (FRB) raised the benchmark rate four times throughout 2018, European Central Bank (ECB) announced the end of quantitative easing in December as signalled in June. The Bank of Japan (BOJ) announced the introduction of forward guidance for policy rates and enhancement of quantitative and qualitative monetary easing with Yield Curve Control.
In terms of the foreign exchange market, the U.S. dollar depreciated against EUR and especially against JPY in the 1st Quarter, however it started to show the trend of appreciation afterward.
Under such market environment, the Bank’s assets under administration have been increased.
Business Achievement in 2018The Bank’s profit increased 18% compared to 2017 mainly due to the increase of custody asset and net interest income.
In the Custody business, the assets under custody reached the amount of USD 512 billion as of December 31, 2018, which indicates an increase of 4% compared to December 31, 2017.
As for the Fund Administration business, the Net Asset Value calculations as of December 31, 2018 were USD 18.9 billion which is USD 1.2 billion less than that as of 2017. 19 new funds (including sub-funds) were launched during the year 2018, while 28 funds have been liquidated.
As for other business, Dublin branch, Bank Account Services, Fund order desk and Fiduciary Services, their revenue was USD 2.6 million which is USD 0.3 million more than that as of 2017. The increase was mainly due to the increase of funds numbers for depository services handled by the Dublin Branch.
Risk Management (Risk Control Function)In 2018, the core business strategy of the Bank remained further Japan-centred, with the vast majority of the Bank’s clients still being located in Japan. However, the bank started and continues to increase its business toward non-Japanese clients. As Fund Administration and Custody, along with ancillary activities in the provision of hedging services for clients, remained the Bank’s main business lines, the Bank continues to mitigate the risks associated with these activities.
Given this environment, the Management’s major objective is, in addition to monitoring and controlling the Bank’s business-related risks (e.g. credit, market, liquidity and operational risk), to foresee, prevent or mitigate these risks before they have an impact.
To accomplish these objectives, the Risk Management Department is continuously strengthening its current controls and strives to implement improved measures.
Some of the comprehensive risk categories that are of utmost relevance to the Bank are the following:
Credit Risk
The Risk Control Function is in charge of monitoring counterparty and credit risk on a daily basis through the monitoring of exposures towards the Bank’s counterparties. A thorough risk management process is in place to monitor limit breaches, apply appropriate corrective measures when breaches occur, and escalate these events when necessary, to Management or to the Regulator.
Funding Liquidity Risk
The Treasury Department is responsible for controlling and managing funding operations, whereas Risk Control is in charge of monitoring on a daily basis compliance with internal standards for appropriate control and management of Funding Liquidity Risk. In particular, Risk Control monitors the daily development of the Liquidity Coverage Ratio (LCR: internal minimum level for the LCR is 120 %, regulatory level is 100%). The regular calculation of the NSFR (internal minimum threshold 120%) and of the Leverage Ratio (internal minimum 3.5%) started in 2017.
MANAGEMENT REPORTDecember 31, 2018
20 21
Annual Report2018
Market Risk
As of December 31, 2018, the Bank’s exposure to market risk was limited; there were no speculative positions. In addition, the Bank assures a careful control over the FX Risk and Interest Rate Risk via the calculation of an assets and liabilities duration gap, from both the mark-to-market perspective, and an earnings point of view.
Operational Risk
Operational Risk is the risk category the Bank dedicates the most effort to. It can be defined as the risk of an inadequate or failed process. It is monitored on a regular basis and it was a major part of the Bank’s Risk Management plans in 2016, 2017 and 2018. Important Operational Risks in the Bank are as follows:
<Operations Risk> The Bank ensures a detailed focus on the effectiveness of its Operations Risk Management, by using the Operational Risk Self-Assessment (ORSA) and the Operational Risk Quality Assessment (ORQA) to increase the quality of the Operational Risk Management and other tools. In addition, the Bank incorporates the impacts of external changes (e.g. new regulations or added complexity to our business due to client requests) in the Bank’s risk policies and procedures.
<Settlement Risk> It is the risk of non-receipt of funds from counterparties, or an associated risk with settlements. As an example, internal system developments have significantly improved the performance of the Bank’s automated intra-day cash reconciliation.
<Information Security>The main objective of the Information Security Risk Assessment is to assess the Bank’s risk exposure to the mishandling of its (confidential) information and therefore ensure that its efforts to mitigate this
risk are properly targeting potential vulnerabilities. The Bank has established proper measurement in its controls, trained its staff, issued an information security handbook, and revamped the quarterly security questionnaire that all staff should fill-in. Logical security tools and techniques are administered to restrict access to programs, data and other information resources. User rights per software platform are reviewed on a regular basis by the IT Manager, the Internal Auditor and the Information Security Officer.
<Outsourcing Risk>Outsourcing Risk is regularly discussed in the planned meetings of the Risk Management Committee in order to closely monitor this type of risk. Further, the bank performs due diligence visits to outsourced providers with a high residual risk. Additionally, RMD conducts every year a quantitative outsource risk inventory and risk analysis.
Risk Strategy
In compliance with the legal and regulatory mandates and for the purpose of protecting the institution and its reputation, the Bank’s Board of Directors approves notably the Bank’s risk strategy, including its risk appetite, risk tolerance and the guiding principles governing risk identification, measurement, reporting, treatment, and monitoring.
ICAAP/ILAAP and Business Recovery Plan
In line with regulatory rule and guidelines, the bank conducts Stress Tests in the major risk types (credit, market, operational, liquidity) for the yearly ICAAP/ILAAP Report and setup bi-yearly a Business Recovery Plan according the Business Recovery and Resolution Directive (BRRD). Based on Reverse Stress Tests (extreme stress scenarios for the bank), the Recovery Plan allows the bank to take actions for a business recovery in case of a severe business or economic downturn which hits the bank severely and avoids bankruptcy and resolution of the bank. For this,
recovery options are defined that the bank could take in order to restore its capital base, liquidity position or profitability. Given the results of the ICLAAP Stress Tests and the setup of the Business Recovery Plan, the bank is quite stable in particular in case of sudden economic downturns.
Business Plan for 2019
[Client business]
The Bank will continuously focus on revenue increases from clients outside Japan with collaboration and cooperation under MUFG Investor Service brand.
And the Bank continues to intend to provide various services related to a wider range of alternative funds, such as private equity and infrastructure, in addition to traditional funds through arrangements with MUFG group companies.
[Cash Investment]
Cash investment has been one of core revenues of the Bank since 2016 after FRB started to raise the benchmark rate and also under the circumstance of continuous increase of U.S. dollar client cash. The Bank foresees the favorable market environment and high volume of U.S. dollar client cash will continue in 2019, and it will contribute as the Bank’s core revenue.
Strengthening collaboration and cooperation under MUFG Investor Services brand, the Bank will continue in enhancing the client businesses for both investor services products and banking products, in order to meet client expectations.
Furthermore, there have been no events in 2018 which had a material impact on the financial figures of the Bank.
Sota SUZUKI
Chief Executive Officer
March 7, 2019
22 23
Annual Report2018
REPORT OF THE REVISEUR D’ENTREPRISES AGRÉÉReport on the Audit of the annual accounts
Opinion
We have audited the annual accounts of MITSUBISHI UFJ INVESTOR SERVICES & BANKING (LUXEMBOURG) S.A. (the “Bank”), which comprise the balance sheet as at December 31, 2018, and the profit and loss account for the year then ended, and notes to the annual accounts, including a summary of significant accounting policies.
In our opinion, the accompanying annual accounts present fairly, in all material respects, the financial position of the Bank as at December 31, 2018 and the results of its operations for the year then ended in accordance with Luxembourg legal and regulatory requirements relating to the preparation and presentation of the annual accounts.
Basis for Opinion
We conducted our audit in accordance with the EU Regulation No 537/2014, the Law of July 23, 2016 and with International Standards on Auditing (ISAs) as adopted for Luxembourg by the Commission de Surveillance du Secteur Financier (CSSF). Our responsibilities under those Regulation, Law and standards are further described in the “Responsibilities of the Réviseur d’Entreprises Agréé for the Audit of the annual accounts” section of our report. We are
also independent of the Bank in accordance with the International Ethics Standards Board for Accountants’ Code of Ethics for Professional Accountants (IESBA Code) as adopted for Luxembourg by the CSSF together with the ethical requirements that are relevant to our audit of the annual accounts, and have fulfilled our other ethical responsibilities under those ethical requirements. We believe that the audit evidence we have obtained is sufficient and appropriate to provide a basis for our opinion.
Key Audit Matters
Key audit matters are those matters that, in our professional judgment, were of most significance in our audit of the annual accounts of the current period. These matters were addressed in the context of the audit of the annual accounts as a whole, and in forming our opinion thereon, and we do not provide a separate opinion on these matters.
Revenues recognition – Commission receivable
Why the matter was considered to be one of most significant in the audit
We refer to Summary of significant accounting policies - Note 2.14 - Revenue Recognition and Note 21 on Commission Receivable of the annual accounts.
Commission receivable amounted to USD 115,660,720 as of December 31, 2018. Commission receivable mainly derives from fund administration, fiduciary and global custody operations.
Different underlying bases and rates are applicable depending on the underlying investments, agreed terms and services provided.
The process of commission receivable recognition for the Bank includes significant manual interventions.
Accordingly, the calculation of commission receivable are considered to be a key audit matter due to the significance of the amounts involved, combined with the complexity and operational risk associated with determining the calculation of the commission receivable.
How the matter was addressed in the audit
We obtained an understanding of the commission receivable recognition process, and we reviewed key controls in the process. Due to deficiencies identified related to the manual processing of commission receivable, we did not use a control reliance approach and our assurance was obtained based on substantive audit procedures, consisting of a combination of tests of details and substantive analytical procedures.
We developed expectations for the aggregate amounts per type of commission income and we compared the expectations to the amounts recorded by the Bank.
For a sample of the different types of commissions:
• we tested commission receivable by performing independent recalculation of the commissions. This also included the reconciliation of the underlying basis to external evidence;
• we agreed the receipt of the commissions to subsequent payments.

24 25
Annual Report2018
• Identify and assess the risks of material misstatement of the annual accounts, whether due to fraud or error, design and perform audit procedures responsive to those risks, and obtain audit evidence that is sufficient and appropriate to provide a basis for our opinion. The risk of not detecting a material misstatement resulting from fraud is higher than for one resulting from error, as fraud may involve collusion, forgery, intentional omissions, misrepresentations, or the override of internal control.
• Obtain an understanding of internal control relevant to the audit in order to design audit procedures that are appropriate in the circumstances, but not for the purpose of expressing an opinion on the effectiveness of the Bank’s internal control.
• Evaluate the appropriateness of accounting policies used and the reasonableness of accounting estimates and related disclosures made by the Board of Directors.
• Conclude on the appropriateness of the Board of Directors’ use of the going concern basis of accounting and, based on the audit evidence obtained, whether a material uncertainty exists related to events or conditions that may cast significant doubt on the Bank’s ability to continue as a going concern. If we conclude that a material uncertainty exists, we are required to draw attention in our report of the Réviseur d’Entreprises Agréé to the related disclosures in the annual accounts or, if such disclosures are inadequate, to modify our opinion. Our conclusions are based on the audit evidence obtained up to the date of our report of the Réviseur d’Entreprises Agréé. However, future
events or conditions may cause the Bank to cease to continue as a going concern.
• Evaluate the overall presentation, structure and content of the annual accounts, including the disclosures, and whether the annual accounts represent the underlying transactions and events in a manner that achieves fair presentation.
We communicate with those charged with governance regarding, among other matters, the planned scope and timing of the audit and significant audit findings, including any significant deficiencies in internal control that we identify during our audit.
We also provide those charged with governance with a statement that we have complied with relevant ethical requirements regarding independence, and to communicate with them all relationships and other matters that may reasonably be thought to bear on our independence, and where applicable, related safeguards.
From the matters communicated with those charged with governance, we determine those matters that were of most significance in the audit of the annual accounts of the current period and are therefore the key audit matters. We describe these matters in our report unless law or regulation precludes public disclosure about the matter.
Other information
The Board of Directors is responsible for the other information. The other information comprises the information stated in the management report but does not include the annual accounts and our report of the Réviseur d’Entreprises Agréé thereon.
Our opinion on the annual accounts does not cover the other information and we do not express any form of assurance conclusion thereon.
In connection with our audit of the annual accounts, our responsibility is to read the other information and, in doing so, consider whether the other information is materially inconsistent with the annual accounts or our knowledge obtained in the audit or otherwise appears to be materially misstated. If, based on the work we have performed, we conclude that there is a material misstatement of this other information, we are required to report this fact. We have nothing to report in this regard.
Responsibilities of the Board of Directors and Those Charged with Governance for the annual accounts
The Board of Directors is responsible for the preparation and fair presentation of the annual accounts in accordance with Luxembourg legal and regulatory requirements relating to the preparation and presentation of the annual accounts, and for such internal control as the Board of Directors determines is necessary to enable the preparation of annual accounts that are free from material misstatement, whether due to fraud or error.
In preparing the annual accounts, the Board of Directors is responsible for assessing the Bank’s
ability to continue as a going concern, disclosing, as applicable, matters related to going concern and using the going concern basis of accounting unless the Board of Directors either intends to liquidate the Bank or to cease operations, or has no realistic alternative but to do so.
Those charged with governance are responsible for overseeing the Bank’s financial reporting process.
Responsibilities of the Réviseur d’Entreprises Agréé for the Audit of the annual accounts
The objectives of our audit are to obtain reasonable assurance about whether the annual accounts as a whole are free from material misstatement, whether due to fraud or error, and to issue a report of the Réviseur d’Entreprises Agréé that includes our opinion. Reasonable assurance is a high level of assurance, but is not a guarantee that an audit conducted in accordance with the EU Regulation No 537/2014, the Law of July 23, 2016 and with ISAs as adopted for Luxembourg by the CSSF will always detect a material misstatement when it exists. Misstatements can arise from fraud or error and are considered material if, individually or in the aggregate, they could reasonably be expected to influence the economic decisions of users taken on the basis of these annual accounts.
As part of an audit in accordance with the EU Regulation No 537/2014, the Law of July 23, 2016 and with ISAs as adopted for Luxembourg by the CSSF, we exercise professional judgment and maintain professional skepticism throughout the audit. We also:
26 27
Annual Report2018
Report on Other Legal and Regulatory Requirements
We have been appointed as Réviseur d’Entreprises Agréé by the Board of Directors on March 9, 2018 and the duration of our uninterrupted engagement, including previous renewals and reappointments, is 44 years.
The management report is consistent with the annual accounts and has been prepared in accordance with legal requirements.
We confirm that the prohibited non-audit services referred to in the EU Regulation No 537/2014, on the audit profession were not provided and that we remain independent of the Bank in conducting the audit.
For Deloitte Audit, Cabinet de Révision Agréé
Martin Flaunet, Réviseur d’Entreprises Agréé
Partner
March 8, 2019
28 29
Annual Report2018
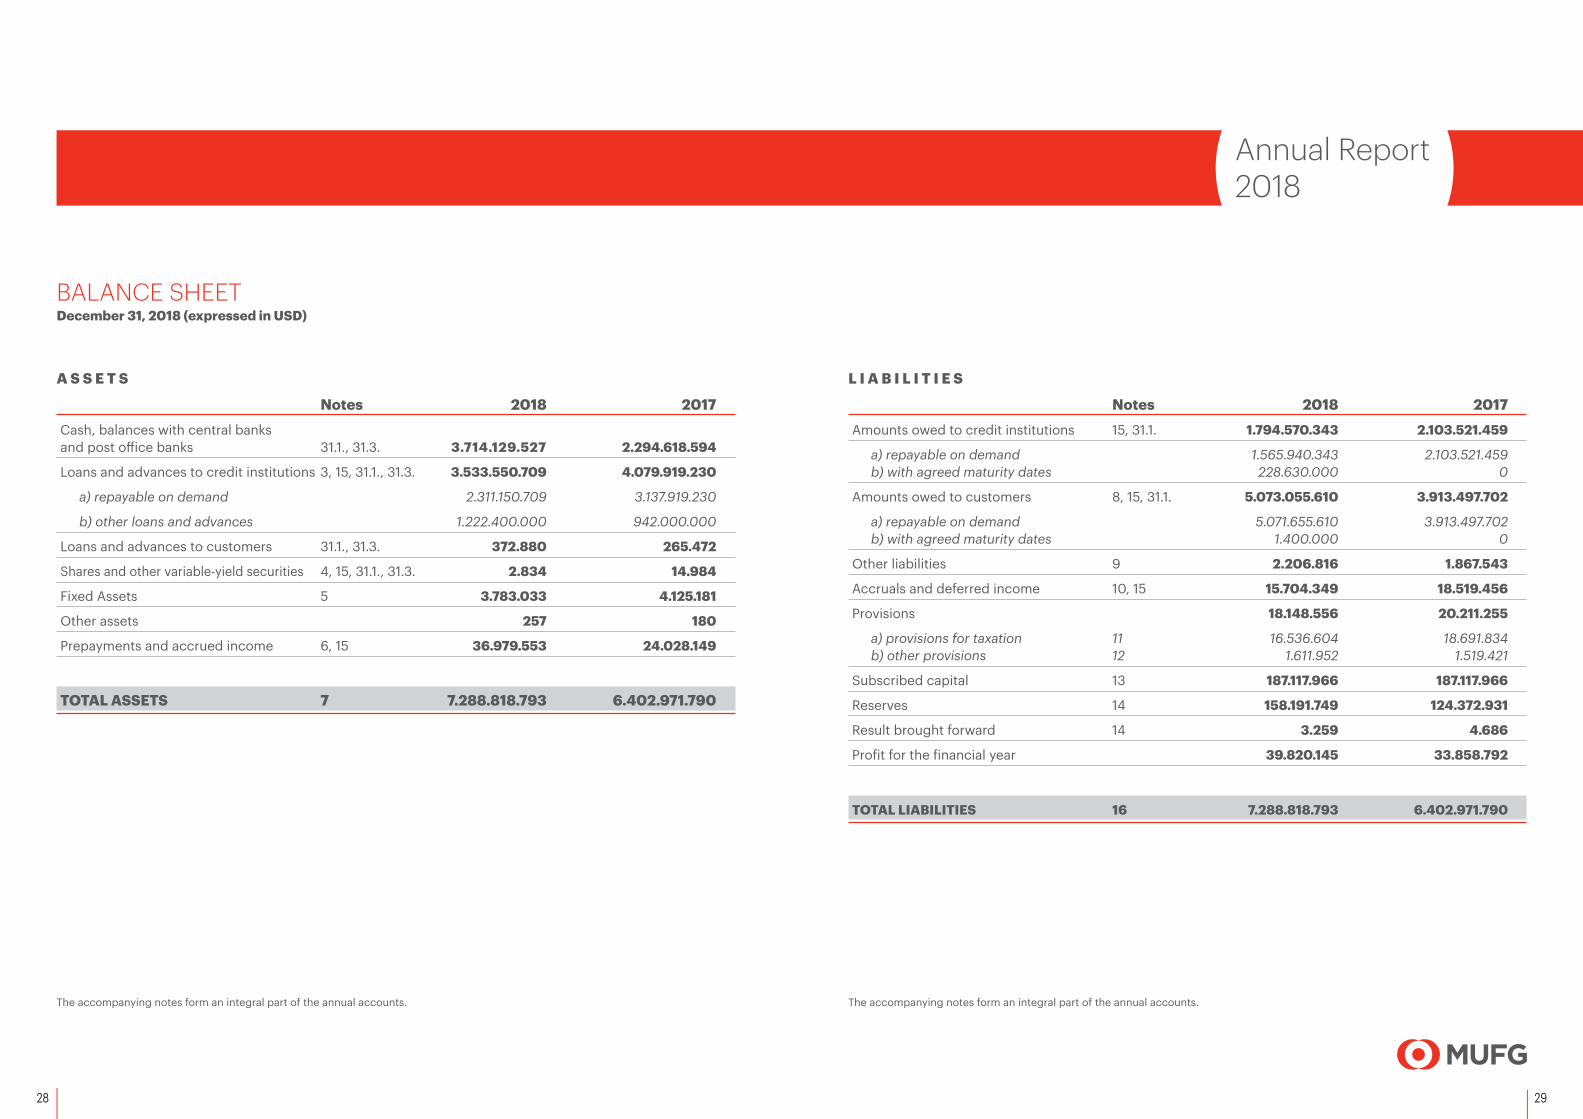
BALANCE SHEET December 31, 2018 (expressed in USD)
A S S E T S
Notes 2018 2017Cash, balances with central banks and post office banks 31.1., 31.3. 3.714.129.527 2.294.618.594
Loans and advances to credit institutions 3, 15, 31.1., 31.3. 3.533.550.709 4.079.919.230
a) repayable on demand 2.311.150.709 3.137.919.230
b) other loans and advances 1.222.400.000 942.000.000
Loans and advances to customers 31.1., 31.3. 372.880 265.472
Shares and other variable-yield securities 4, 15, 31.1., 31.3. 2.834 14.984
Fixed Assets 5 3.783.033 4.125.181
Other assets 257 180
Prepayments and accrued income 6, 15 36.979.553 24.028.149
TOTAL ASSETS 7 7.288.818.793 6.402.971.790
L I A B I L I T I E S
Notes 2018 2017Amounts owed to credit institutions 15, 31.1. 1.794.570.343 2.103.521.459
a) repayable on demand 1.565.940.343 2.103.521.459 b) with agreed maturity dates 228.630.000 0
Amounts owed to customers 8, 15, 31.1. 5.073.055.610 3.913.497.702
a) repayable on demand 5.071.655.610 3.913.497.702 b) with agreed maturity dates 1.400.000 0
Other liabilities 9 2.206.816 1.867.543
Accruals and deferred income 10, 15 15.704.349 18.519.456
Provisions 18.148.556 20.211.255
a) provisions for taxation 11 16.536.604 18.691.834b) other provisions 12 1.611.952 1.519.421
Subscribed capital 13 187.117.966 187.117.966
Reserves 14 158.191.749 124.372.931
Result brought forward 14 3.259 4.686
Profit for the financial year 39.820.145 33.858.792
TOTAL LIABILITIES 16 7.288.818.793 6.402.971.790
The accompanying notes form an integral part of the annual accounts. The accompanying notes form an integral part of the annual accounts.

30 31
Annual Report2018
OFF BALANCE SHEET ITEMS December 31, 2018 (expressed in USD)
PROFIT AND LOSS ACCOUNT Year ended December 31, 2018 (expressed in USD)
Notes 2018 2017Contingent liabilities 17, 31.1. 541.339 578.509
of which: guarantees and assets pledged as collateral security 541.339 578.509
FIDUCIARY OPERATIONS 20 92.427.954.484 81.804.130.253
Notes 2018 2017Interest receivable and similar income 81.824.073 54.056.442
of which: - Negative interest received on deposits 5.448.991 2.221.669 - Interest Gain from foreign currency swap 31.789.988 27.650.438
Interest payable and similar charges (40.218.579) (16.495.414) of which: - Negative interest paid on loans and advances (12.070.732) (9.439.648)
- Interest Loss from foreign currency swap (392.542) (254.716) Income from securities 92 750.200
Income from shares and other variable yield securities 92 750.200
Commission receivable 21 115.660.720 106.256.230
Commission payable (56.930.365) (52.040.385)
Net profit on financial operations 4.336.416 6.388.924
Other operating income 22 4.322.262 2.484.563
General administrative expenses (51.755.210) (51.064.124) a) staff costs 24, 25 (20.839.657) (20.806.005)
of which: - wages and salaries (16.818.051) (16.838.247) - social security costs (2.632.035) (2.420.642)
of which: - social security costs relating to pensions (1.596.915) (1.541.426)
b) other administrative expenses 26, 30 (30.915.553) (30.258.119)
Value adjustments in respect of tangible and intangible assets (1.767.494) (2.589.398)
Other operating charges 23 (605.778) (507.993)
Tax on profit on ordinary activities 11, 27.1. (13.169.369) (11.831.429)
Profit on ordinary activities after tax 41.696.768 35.407.616
Other taxes not shown under the preceding items 27.2. (1.876.623) (1.548.824)
PROFIT FOR THE FINANCIAL YEAR 39.820.145 33.858.792
The accompanying notes form an integral part of the annual accounts.
32 33
Annual Report2018
NOTE 1 - GENERAL
1.1. Corporate mattersMITSUBISHI UFJ INVESTOR SERVICES & BANKING (LUXEMBOURG) S.A. (the “Bank”) was incorporated in Luxembourg on April 11, 1974 as a société anonyme.
On April 1, 1996, the Parent Bank, The Bank of Tokyo, Ltd., merged with The Mitsubishi Bank, Limited to form The Bank of Tokyo-Mitsubishi Ltd., and Bank of Tokyo (Luxembourg) S.A. changed its name to Bank of Tokyo-Mitsubishi (Luxembourg) S.A..
On October 1, 2005, the indirect shareholder, Mitsubishi Tokyo Financial Group, Inc. (MTFG) merged with UFJ Holdings, Inc. (UFJ) and formed a new financial group, Mitsubishi UFJ Financial Group (MUFG).
On January 1, 2006, the Parent Bank, The Bank of Tokyo-Mitsubishi, Ltd. merged with UFJ Bank Limited to form The Bank of Tokyo-Mitsubishi UFJ Ltd., and Bank of Tokyo-Mitsubishi (Luxembourg) S.A. changed its name to Bank of Tokyo-Mitsubishi UFJ (Luxembourg) S.A..
On April 2, 2007, the Bank became a jointly capitalized subsidiary of Mitsubishi UFJ Trust and Banking Corporation by 70% and Bank of Tokyo-Mitsubishi UFJ Ltd. by 30%, which are under the same holding company Mitsubishi UFJ Financial Group (MUFG). Consequently, Bank of Tokyo-Mitsubishi UFJ (Luxembourg) S.A. changed its name to MITSUBISHI UFJ Global Custody S.A. (MUGC).
On April 28, 2008, MITSUBISHI UFJ Global Custody S.A., has issued 49.080 new shares and the capital of the Bank has been increased by USD 1.817.968,52. The total subscribed share capital is currently set at USD 37.117.968,52. The two major shareholders of the Bank hold 92,25% of the capital, Mitsubishi UFJ Trust and Banking Corporation by 63,72% and Bank of Tokyo-Mitsubishi UFJ Ltd. by 28,53%.
On August 7, 2014, MITSUBISHI UFJ Global Custody S.A. has established an external branch located at Ormonde House, 12-13 lower Lesson Street, Dublin 2, Ireland. Mitsubishi UFJ Global Custody S.A., Dublin Branch is registered as credit institution pursuant to UE Regulation, 1993, under the number 907648.
On May 1, 2016, MITSUBISHI UFJ Global Custody S.A. has changed its name to MITSUBISHI UFJ INVESTOR SERVICES & BANKING (LUXEMBOURG) S.A. (MIBL).
On May 31, 2017, Mitsubishi UFJ Trust and Banking Corporation obtained 100% of the voting shares of Mitsubishi UFJ Investor Services & Banking (Luxembourg) S.A..
The members of the Board of Directors are Senior Executives of Mitsubishi UFJ Trust and Banking Corporation Group and Independent Directors. The business policy and valuation principles, unless prescribed by the legal requirements existing in Luxembourg, are determined and monitored by the Board of Directors in accordance with those applied in Mitsubishi UFJ Financial Group.
1.2. Nature of businessThe object of the Bank is the undertaking for its own account, as well as for the account of third parties either within or outside the Grand-Duchy of Luxembourg, of any banking or financial operations, as well as all other operations, whether industrial or commercial or in real estate, which directly or indirectly relate to the main object described above.
More specifically, the Bank concentrates its activities on investment management services.
A significant volume of the Bank’s transactions is concluded directly or indirectly with companies of Mitsubishi UFJ Financial Group.
1.3. Annual accountsThe Bank prepares its annual accounts in US Dollars (USD), the currency in which the capital is expressed. The Bank’s accounting year coincides with the calendar year.
NOTE 2 - SUMMARY OF SIGNIFICANT ACCOUNTING POLICIES
The Bank prepares its annual accounts under the historical cost principle in accordance with the laws and regulations in force in the Grand-Duchy of Luxembourg and on the basis of accounting principles generally accepted in the banking sector in the Grand-Duchy of Luxembourg.
In observing these, the following significant accounting policies are applied.
2.1. The date of recording of transactions in the balance sheet
Assets and liabilities are stated in the balance sheet on the date the amounts concerned become cleared funds, that is, on their date of effective transfer.
2.2. Foreign currenciesThe Bank maintains a multi-currency accounting system which records all transactions in the currency or currencies of the transaction, on the day on which the contract is concluded.
Assets and liabilities are converted into USD at the spot exchange rates applicable at the balance sheet date. Both realised and unrealised profits and losses arising on revaluation are accounted for in the profit and loss account for the year, except for those resulting from items specifically covered by a forward foreign exchange contract (swap and hedging forward foreign exchange contract) which are recorded at historical exchange rates.
Revenues and expenses in foreign currencies are translated into USD daily at the prevailing exchange rates.
At the year-end, all unsettled forward transactions are translated into USD at the forward rate prevailing on the Balance Sheet date for the remaining maturities.
Results on unsettled forward transactions linked to spot transactions and on swap transactions are accrued at the balance sheet date. In case of
unrealised results on position covered by foreign exchange swap, these are neutralized at year end.
2.3. Financial instruments derivativesThe Bank’s commitments deriving from the derivatives financial instruments such as interest rate swaps, forward rate agreements, financial futures and options are recorded on the transaction date among the off balance sheet items.
At the year-end, where necessary, a provision is set up in respect of individual unrealised losses resulting from the revaluation of the Bank’s commitments at market value. There is no provision for unrealized losses on forward deals recorded for the year 2018 (2017: USD nil).
No provision is set up in those cases where a financial instrument clearly covers an asset or a liability and economic unity is established or where a financial instrument is hedged by a reverse transaction so that no open position exists.
2.4. Specific value adjustments in respect of doubtful and irrecoverable debts
It is the Bank’s policy to establish specific value adjustments in respect of doubtful and irrecoverable debts, as deemed appropriate by the Board of Directors.
Value adjustments, if any, are deducted from the assets to which they relate.
2.5. Value adjustments for possible losses on bills, loans and advances and leasing transactions
The value adjustments for possible losses on loans and advances, if any, are deducted from the assets to which they relate.
NOTES TO THE ACCOUNTSDecember 31, 2018
34 35
Annual Report2018
2.6. Lump-sum provision for risk exposuresIn accordance with the Luxembourg tax legislation, the Bank can establish a lump-sum provision for risk exposures, as defined in the legislation governing prudential supervision of banks. The purpose of the provision is to take account of risks which are likely to crystallise but which have not yet been identified as at the date of preparation of the annual accounts.
Pursuant to the Instructions issued by the Directeur des Contributions on December 16, 1997, this provision should be made before taxation and should not exceed 1,25% of the Bank’s risk exposures.
The Bank has not constituted any provision as of December 31, 2018 (2017: USD 0).
2.7. Transferable securitiesTransferable securities are recorded initially at their purchase price. The average cost method is used for initial recognition. Value adjustments, calculated as described in note 2.5. or arising from a diminution of value, are deducted from the account balance.
2.8. Tangible and intangible assetsTangible and intangible assets are valued at purchase price. The value of tangible and intangible fixed assets with limited useful economic lives is reduced by value adjustments calculated to write off the value of such assets systematically over their useful economic lives as follows:
> Hardware equipment: 4 years;
> Software: 4 years and 5 years;
> Other intangible assets: 5 years;
> Other tangible assets: 10 years.
2.9. Shares in affiliated undertakingsAt the Balance Sheet date, shares in affiliated undertakings held as financial fixed assets are stated at the lower of cost or market value.
2.10. TaxesTaxes are accounted for on an accruals basis in the accounts of the year to which they relate.
2.11. Prepayment and accrued incomeThis asset item includes expenditure incurred during the financial year but relating to a subsequent financial year.
2.12. Accruals and deferred incomeThis liability item includes income received during the financial year but relating to a subsequent financial year.
2.13. ProvisionsProvisions are intended to cover losses or debts the nature of which is clearly defined and which, at the date of the balance sheet are either likely to be incurred or certain to be incurred but uncertain as to their amount or as to the date on which they will arise.
2.14. Revenue recognitionThe Bank’s main streams of revenue are comprised of interests and commissions income. The Bank earns fee and commission income from a wide range of services it provides to its customers.
Revenue is generally recognized when the related services are performed or recognized over the period that the services are provided.
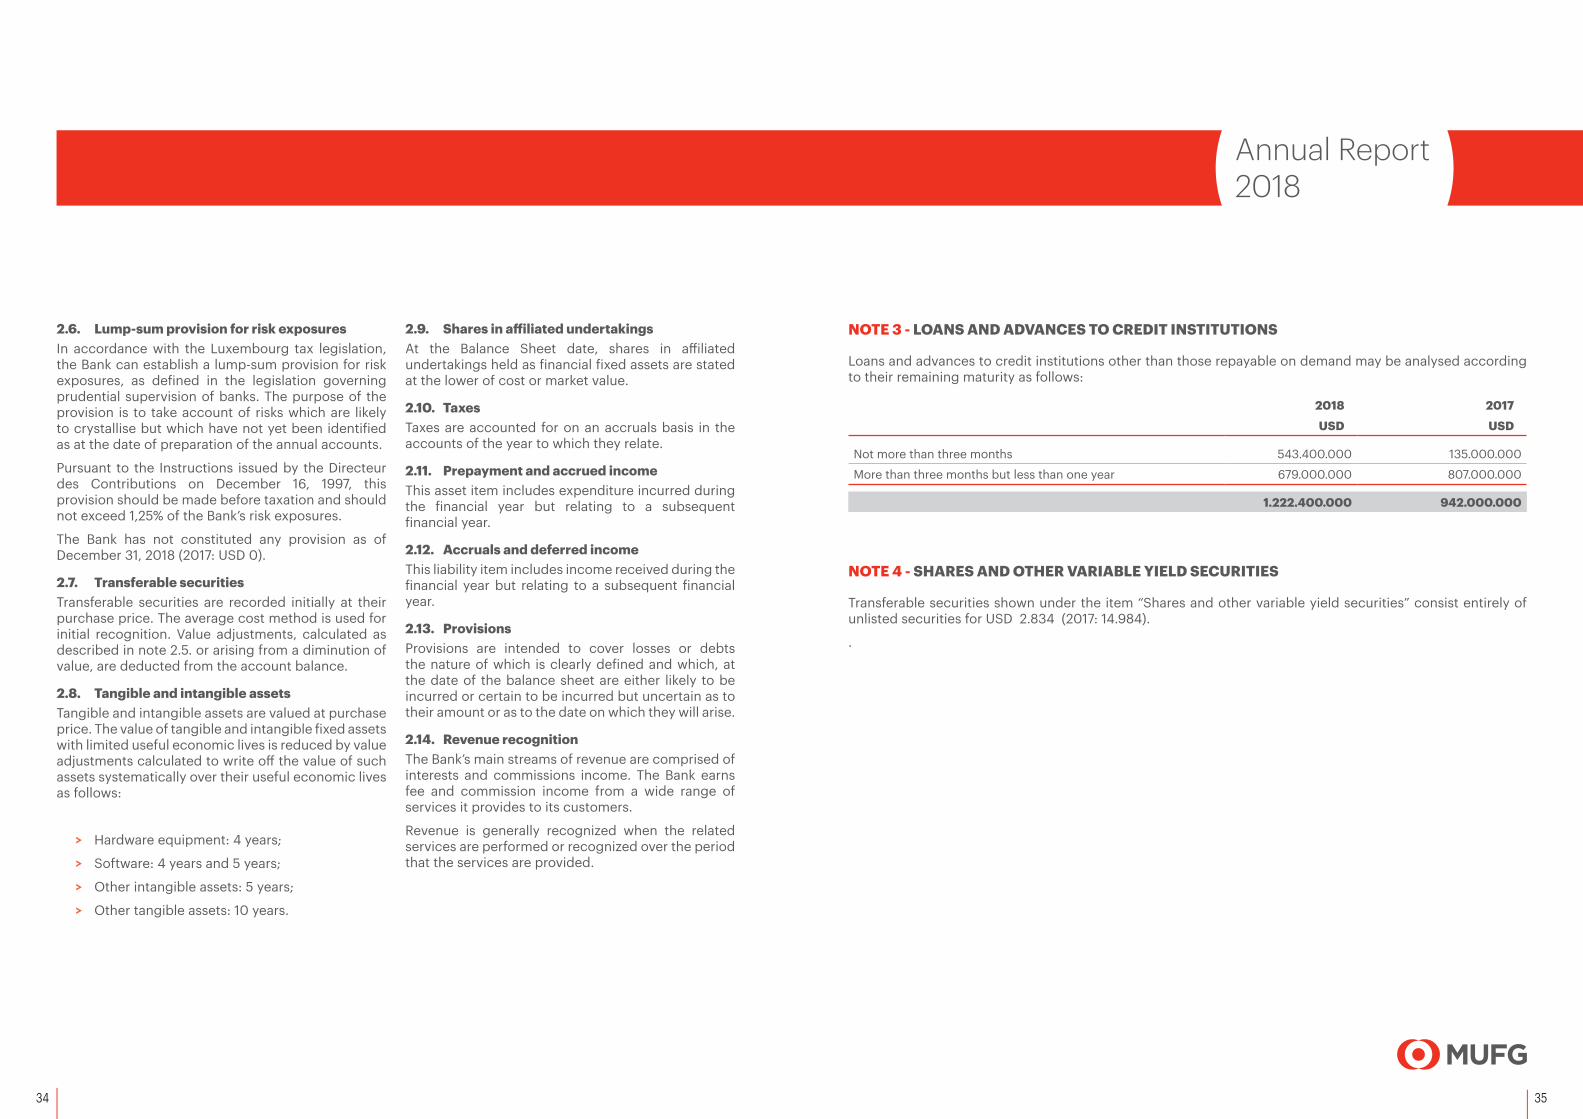
NOTE 3 - LOANS AND ADVANCES TO CREDIT INSTITUTIONS
Loans and advances to credit institutions other than those repayable on demand may be analysed according to their remaining maturity as follows:
2018 2017
USD USD
Not more than three months 543.400.000 135.000.000
More than three months but less than one year 679.000.000 807.000.000
1.222.400.000 942.000.000
NOTE 4 - SHARES AND OTHER VARIABLE YIELD SECURITIES
Transferable securities shown under the item “Shares and other variable yield securities” consist entirely of unlisted securities for USD 2.834 (2017: 14.984).
.
37
Annual Report2018
36
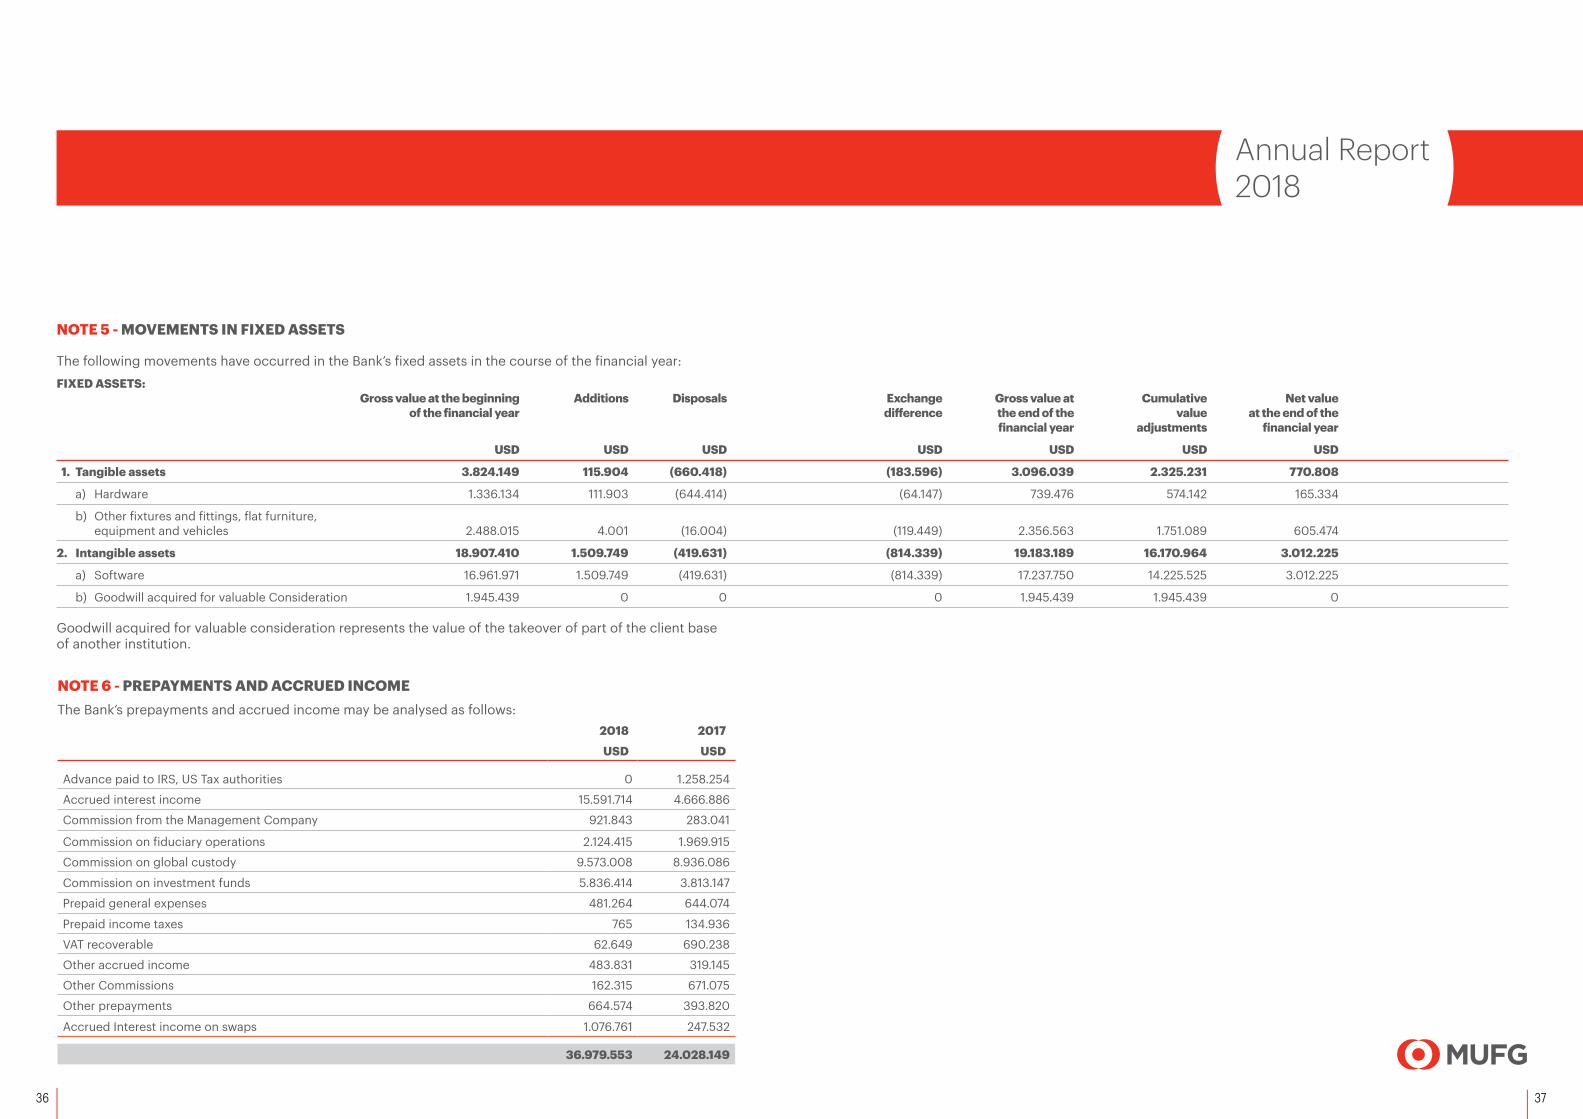
NOTE 5 - MOVEMENTS IN FIXED ASSETS
The following movements have occurred in the Bank’s fixed assets in the course of the financial year:
FIXED ASSETS: Gross value at the beginning Additions Disposals Exchange Gross value at Cumulative Net value of the financial year difference the end of the value at the end of the financial year adjustments financial year
USD USD USD USD USD USD USD
1. Tangible assets 3.824.149 115.904 (660.418) (183.596) 3.096.039 2.325.231 770.808
a) Hardware 1.336.134 111.903 (644.414) (64.147) 739.476 574.142 165.334
b) Other fixtures and fittings, flat furniture, equipment and vehicles 2.488.015 4.001 (16.004) (119.449) 2.356.563 1.751.089 605.474
2. Intangible assets 18.907.410 1.509.749 (419.631) (814.339) 19.183.189 16.170.964 3.012.225
a) Software 16.961.971 1.509.749 (419.631) (814.339) 17.237.750 14.225.525 3.012.225
b) Goodwill acquired for valuable Consideration 1.945.439 0 0 0 1.945.439 1.945.439 0
Goodwill acquired for valuable consideration represents the value of the takeover of part of the client base of another institution.
NOTE 6 - PREPAYMENTS AND ACCRUED INCOMEThe Bank’s prepayments and accrued income may be analysed as follows:
2018 2017
USD USD
Advance paid to IRS, US Tax authorities 0 1.258.254
Accrued interest income 15.591.714 4.666.886
Commission from the Management Company 921.843 283.041
Commission on fiduciary operations 2.124.415 1.969.915
Commission on global custody 9.573.008 8.936.086
Commission on investment funds 5.836.414 3.813.147
Prepaid general expenses 481.264 644.074
Prepaid income taxes 765 134.936
VAT recoverable 62.649 690.238
Other accrued income 483.831 319.145
Other Commissions 162.315 671.075
Other prepayments 664.574 393.820
Accrued Interest income on swaps 1.076.761 247.532
36.979.553 24.028.149
39
Annual Report2018
38
NOTE 7 - FOREIGN CURRENCY ASSETS
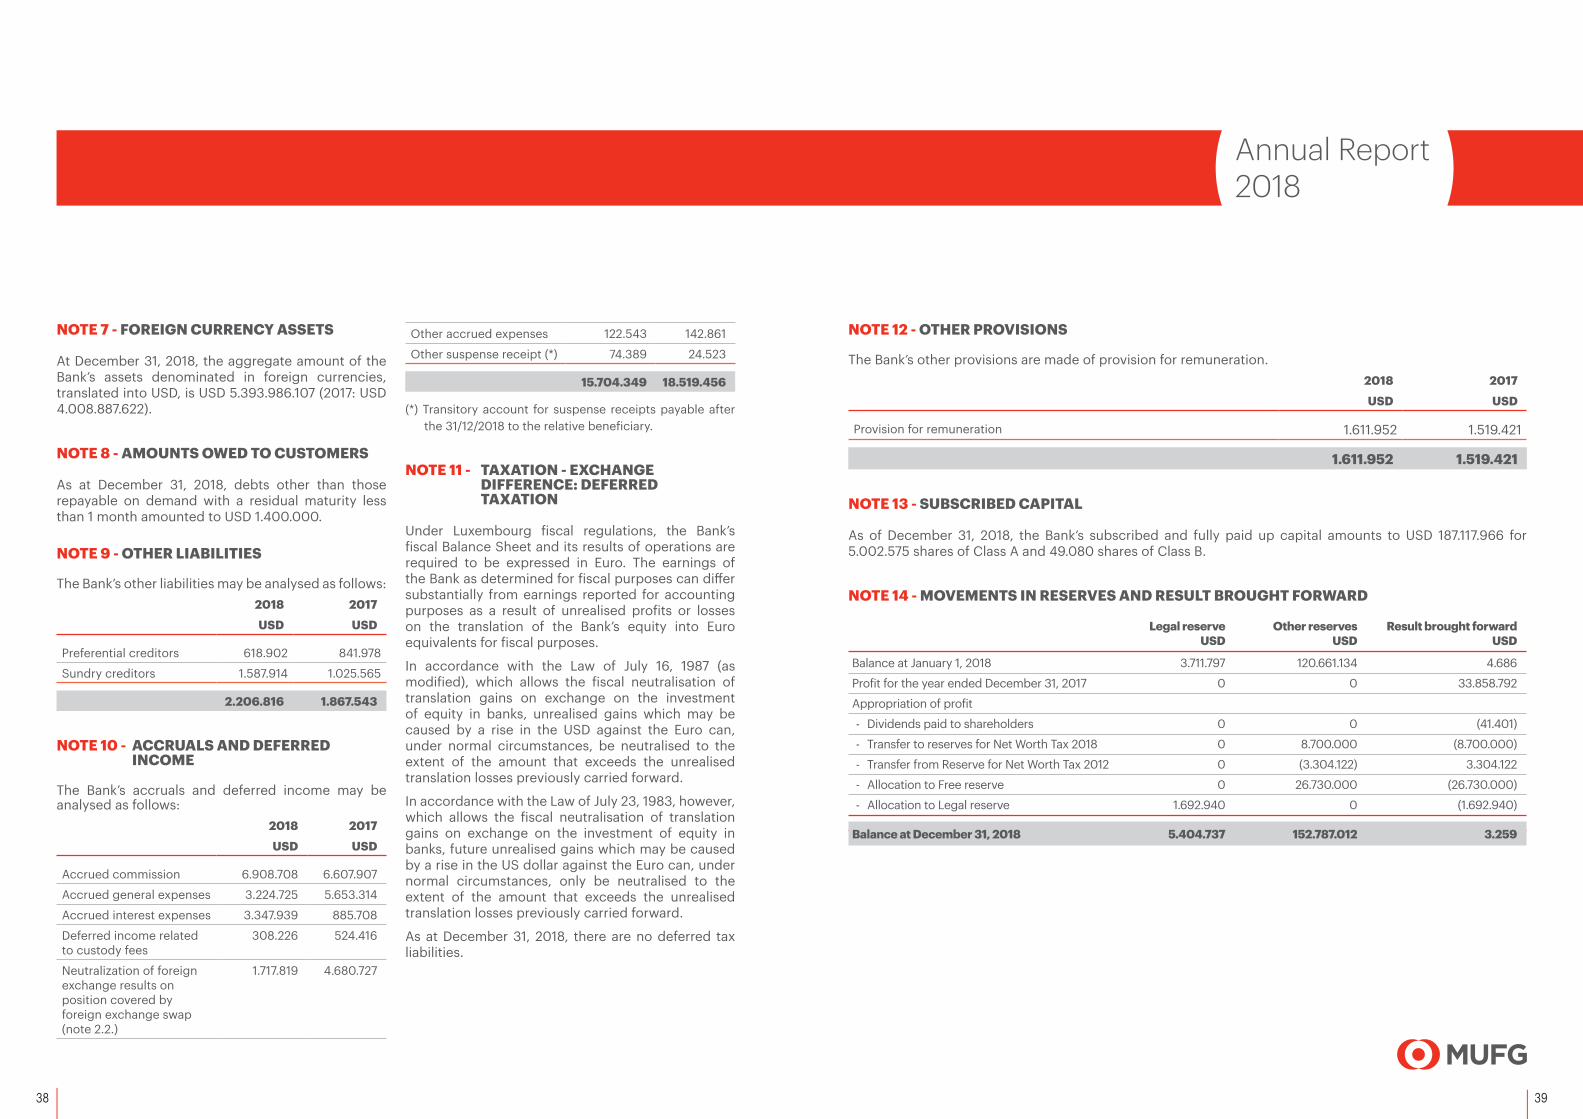
At December 31, 2018, the aggregate amount of the Bank’s assets denominated in foreign currencies, translated into USD, is USD 5.393.986.107 (2017: USD 4.008.887.622).
NOTE 8 - AMOUNTS OWED TO CUSTOMERS
As at December 31, 2018, debts other than those repayable on demand with a residual maturity less than 1 month amounted to USD 1.400.000.
NOTE 9 - OTHER LIABILITIES
The Bank’s other liabilities may be analysed as follows:2018 2017
USD USD
Preferential creditors 618.902 841.978
Sundry creditors 1.587.914 1.025.565
2.206.816 1.867.543
NOTE 10 - ACCRUALS AND DEFERRED INCOME
The Bank’s accruals and deferred income may be analysed as follows:
2018 2017
USD USD
Accrued commission 6.908.708 6.607.907
Accrued general expenses 3.224.725 5.653.314
Accrued interest expenses 3.347.939 885.708
Deferred income related to custody fees
308.226 524.416
Neutralization of foreign exchange results on position covered by foreign exchange swap (note 2.2.)
1.717.819 4.680.727
Other accrued expenses 122.543 142.861
Other suspense receipt (*) 74.389 24.523
15.704.349 18.519.456
(*) Transitory account for suspense receipts payable after the 31/12/2018 to the relative beneficiary.
NOTE 11 - TAXATION - EXCHANGE DIFFERENCE: DEFERRED TAXATION
Under Luxembourg fiscal regulations, the Bank’s fiscal Balance Sheet and its results of operations are required to be expressed in Euro. The earnings of the Bank as determined for fiscal purposes can differ substantially from earnings reported for accounting purposes as a result of unrealised profits or losses on the translation of the Bank’s equity into Euro equivalents for fiscal purposes.
In accordance with the Law of July 16, 1987 (as modified), which allows the fiscal neutralisation of translation gains on exchange on the investment of equity in banks, unrealised gains which may be caused by a rise in the USD against the Euro can, under normal circumstances, be neutralised to the extent of the amount that exceeds the unrealised translation losses previously carried forward.
In accordance with the Law of July 23, 1983, however, which allows the fiscal neutralisation of translation gains on exchange on the investment of equity in banks, future unrealised gains which may be caused by a rise in the US dollar against the Euro can, under normal circumstances, only be neutralised to the extent of the amount that exceeds the unrealised translation losses previously carried forward.
As at December 31, 2018, there are no deferred tax liabilities.
NOTE 12 - OTHER PROVISIONS
The Bank’s other provisions are made of provision for remuneration.2018 2017
USD USD
Provision for remuneration 1.611.952 1.519.421
1.611.952 1.519.421
NOTE 13 - SUBSCRIBED CAPITAL
As of December 31, 2018, the Bank’s subscribed and fully paid up capital amounts to USD 187.117.966 for 5.002.575 shares of Class A and 49.080 shares of Class B.
NOTE 14 - MOVEMENTS IN RESERVES AND RESULT BROUGHT FORWARD
Legal reserve Other reserves Result brought forward USD USD USD
Balance at January 1, 2018 3.711.797 120.661.134 4.686
Profit for the year ended December 31, 2017 0 0 33.858.792
Appropriation of profit
- Dividends paid to shareholders 0 0 (41.401)
- Transfer to reserves for Net Worth Tax 2018 0 8.700.000 (8.700.000)
- Transfer from Reserve for Net Worth Tax 2012 0 (3.304.122) 3.304.122
- Allocation to Free reserve 0 26.730.000 (26.730.000)
- Allocation to Legal reserve 1.692.940 0 (1.692.940)
Balance at December 31, 2018 5.404.737 152.787.012 3.259

40 41
Annual Report2018
Under Luxembourg law, the Bank must appropriate to a legal reserve an amount equivalent to at least 5% of the annual net profit until such reserve is equal to 10% of the share capital. This appropriation is made in the following year. Distribution of the legal reserve is restricted. This requirement is satisfied as the Bank has reached 10% of the issued subscribed capital.
Based on the Luxembourg tax law, the Bank has elected to get a tax credit for all or part of the net worth tax due for that year. This tax credit is however, limited to the amount of the corporate income tax due for the previous year before the imputation of any tax credits. In order to profit from this credit, the Bank must commit itself to post before the end of the subsequent year an amount equal to five times the net worth tax credit to a special reserve, which has to be maintained for a period of five years.
The Circular I. Fort. N° 47bis issued by the Luxembourg Tax Authorities on November 19, 2015, provides for a dedicated rule allowing the taxpayer to create only one net wealth tax reserve to fully benefit from the Net Wealth Tax reduction for both 2014 and 2015. This reserve should correspond to five times the amount of the highest reduction available for 2014 and 2015 (transitional measure). The special reserve for net worth tax is included in the Bank’s other reserve for a total amount of USD 22.444.927 (2017: USD 17.049.049).
As resolved in the Annual General Meeting dated March 23, 2018, the Bank has allocated an amount of USD 8.700.000 to special reserve for Net Worth Tax 2018 and reversed the available special reserve for Net Worth Tax constituted in 2012 which amounted to USD 3.304.122.
The accumulated balance of special reserve for Net Worth Taxes states as follows as at December 31, 2018.
2018 Reserve for Net Worth Tax Years USD
2013 3.101.000
2014 -2015 3.019.136
2016 3.348.440
2017 4.276.351
2018 8.700.000
Balance at December 31, 2018 22.444.927
NOTE 15 - RELATED PARTY BALANCES
As at December 31, 2018, the following balances with related parties are outstanding:
ASSETS 2018 2017 USD USD
Loans and advances to credit institutions 3.314.382.591 3.789.891.462
Prepayments and accrued income 24.033.836 10.791.736
3.338.416.427 3.800.683.198
LIABILITIES 2018 2017 USD USD
Amounts owed to credit institutions 1.787.952.744 2.098.463.451
Amounts owed to customers 1.001.503.360 659.726.748
Accruals and deferred income 5.654.686 4.972.871
2.795.110.790 2.763.163.070
The Bank has not entered into any significant transactions with related parties as defined in International Accounting Standards 24 “Related Party Disclosures” which were not made on terms equivalent to those that prevail in arm’s length transactions as of December 31, 2018 and for the year then ended.
At the request of the Bank, the CSSF has granted a total exemption for the exposures towards the group (Mitsubishi UFJ Financial Group) in the calculation of large exposure limits, in accordance with the Regulation (EU) No 575/2013 of June 26, 2013 (Part IV).
As at December 31, 2018, the amount towards the group falling under this exemption amounts to USD 3.450.572.108 and can be analysed as follows:
2018 USD
Loans and advances to credit institutions 3.313.256.918
Prepayments and accrued income 15.595.810
Foreign exchange transactions (Market Risk method) 121.719.380
3.450.572.108
NOTE 16 - FOREIGN CURRENCY LIABILITIES
At December 31, 2018, the aggregate amounts of liabilities denominated in foreign currencies translated into USD is USD 3.951.265.679 (2017: USD 2.973.768.077).

42 43
Annual Report2018
NOTE 17 - CONTINGENT LIABILITIES
The Bank’s contingent liabilities may be analysed as follows:
2018 2017 USD USD
Counter-guarantees issued 541.339 578.509
As at the year-end, there were no related party balances.
NOTE 18 - COMMITMENTS
The Bank has entered into certain commitments which are not disclosed neither in the Balance Sheet nor in the Off Balance Sheet Items, but which are significant for the purposes of assessing the financial situation of the Bank. Details of such commitments are as follows:
2018 2017 USD USD
Commitments in respect of fixed rental payments contracted on buildings 6.499.120 521.191
As at the year-end, there are no related party balances.
NOTE 19 - OPERATIONS LINKED TO CURRENCY EXCHANGE RATES, INTEREST RATES AND OTHER MARKET RATES
The following types of forward transactions are outstanding as at December 31, 2018 and 2017:
Operations linked to currency exchange rates
• Forward exchange transactions (swaps, outrights).
Operations linked to the foreign currency exchange rates are made to a large extent for the purposes of covering the existing positions.
NOTE 20 - INVESTMENT MANAGEMENT SERVICES AND UNDERWRITING FUNCTIONS
Management and agency services provided by the Bank include:
• Custody and administration of transferable securities;
• Fiduciary representations;• Agency functions;• Portfolio management and advice.
NOTE 21 - COMMISSIONS RECEIVABLE
2018 2017 USD USD
Fees on Investment Funds 21.506.351 19.403.089
Fees on Global custody from Institutional customers 80.663.753 74.948.090
Fees on Fiduciary transactions 11.772.959 10.347.746
Fees on Services to Management Company 921.843 1.003.474
Other fees and commissions 795.814 553.831
115.660.720 106.256.230
Commissions receivable consist of the following:
Fees on Investment Funds consist of fees and commissions charged to Investment Funds for custody services, central administration, depositary and other services. The fees are calculated on the basis of the value of net assets of the funds under administration.
Fees on global custody from Institutional customers consist of fees and commissions charged to institutional customers for global custody services including securities trade management, settlement, corporate actions, income collection and proxy voting. The fees are calculated on the basis of the assets held under custody and the number of transactions.
Fees on Fiduciary transactions consist of fees and commissions earned on fiduciary assets including custody transactions, cash management and fiduciary notes issuance. The fees are calculated on the basis of the assets held under management and the number of transactions.
Fees on Services to Management Company include fees covering functional expenditures and fees for support services in accordance with the Service Level Agreement.
Other fees and commissions include various fees such as listing agent fees, guarantee fees, banking services fees and fund order desk services fees.
44 45
Annual Report2018
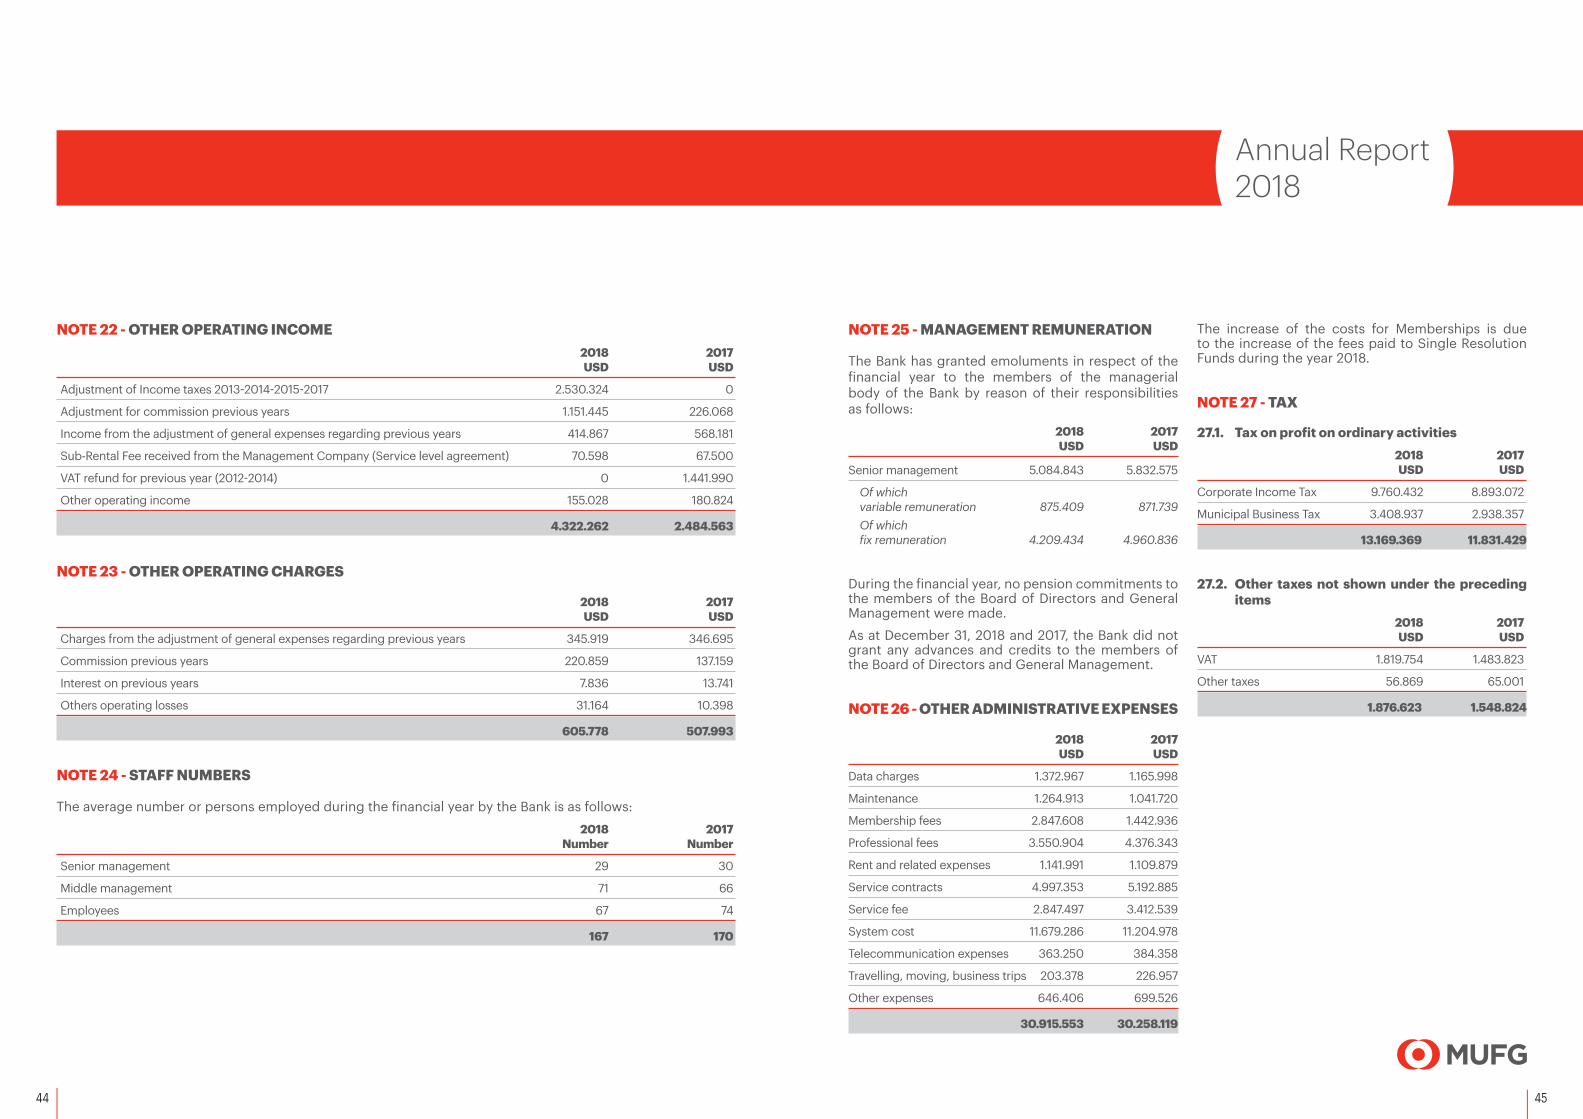
NOTE 25 - MANAGEMENT REMUNERATION
The Bank has granted emoluments in respect of the financial year to the members of the managerial body of the Bank by reason of their responsibilities as follows:
2018 2017 USD USD
Senior management 5.084.843 5.832.575
Of which variable remuneration 875.409 871.739Of which fix remuneration 4.209.434 4.960.836
During the financial year, no pension commitments to the members of the Board of Directors and General Management were made.
As at December 31, 2018 and 2017, the Bank did not grant any advances and credits to the members of the Board of Directors and General Management.
NOTE 26 - OTHER ADMINISTRATIVE EXPENSES
2018 2017 USD USD
Data charges 1.372.967 1.165.998
Maintenance 1.264.913 1.041.720
Membership fees 2.847.608 1.442.936
Professional fees 3.550.904 4.376.343
Rent and related expenses 1.141.991 1.109.879
Service contracts 4.997.353 5.192.885
Service fee 2.847.497 3.412.539
System cost 11.679.286 11.204.978
Telecommunication expenses 363.250 384.358
Travelling, moving, business trips 203.378 226.957
Other expenses 646.406 699.526
30.915.553 30.258.119
The increase of the costs for Memberships is due to the increase of the fees paid to Single Resolution Funds during the year 2018.
NOTE 27 - TAX
27.1. Tax on profit on ordinary activities 2018 2017 USD USD
Corporate Income Tax 9.760.432 8.893.072
Municipal Business Tax 3.408.937 2.938.357
13.169.369 11.831.429
27.2. Other taxes not shown under the preceding items
2018 2017 USD USD
VAT 1.819.754 1.483.823
Other taxes 56.869 65.001
1.876.623 1.548.824
NOTE 22 - OTHER OPERATING INCOME 2018 2017 USD USD
Adjustment of Income taxes 2013-2014-2015-2017 2.530.324 0
Adjustment for commission previous years 1.151.445 226.068
Income from the adjustment of general expenses regarding previous years 414.867 568.181
Sub-Rental Fee received from the Management Company (Service level agreement) 70.598 67.500
VAT refund for previous year (2012-2014) 0 1.441.990
Other operating income 155.028 180.824
4.322.262 2.484.563
NOTE 23 - OTHER OPERATING CHARGES
2018 2017 USD USD
Charges from the adjustment of general expenses regarding previous years 345.919 346.695
Commission previous years 220.859 137.159
Interest on previous years 7.836 13.741
Others operating losses 31.164 10.398
605.778 507.993
NOTE 24 - STAFF NUMBERS
The average number or persons employed during the financial year by the Bank is as follows:
2018 2017 Number Number
Senior management 29 30
Middle management 71 66
Employees 67 74
167 170
46 47
Annual Report2018
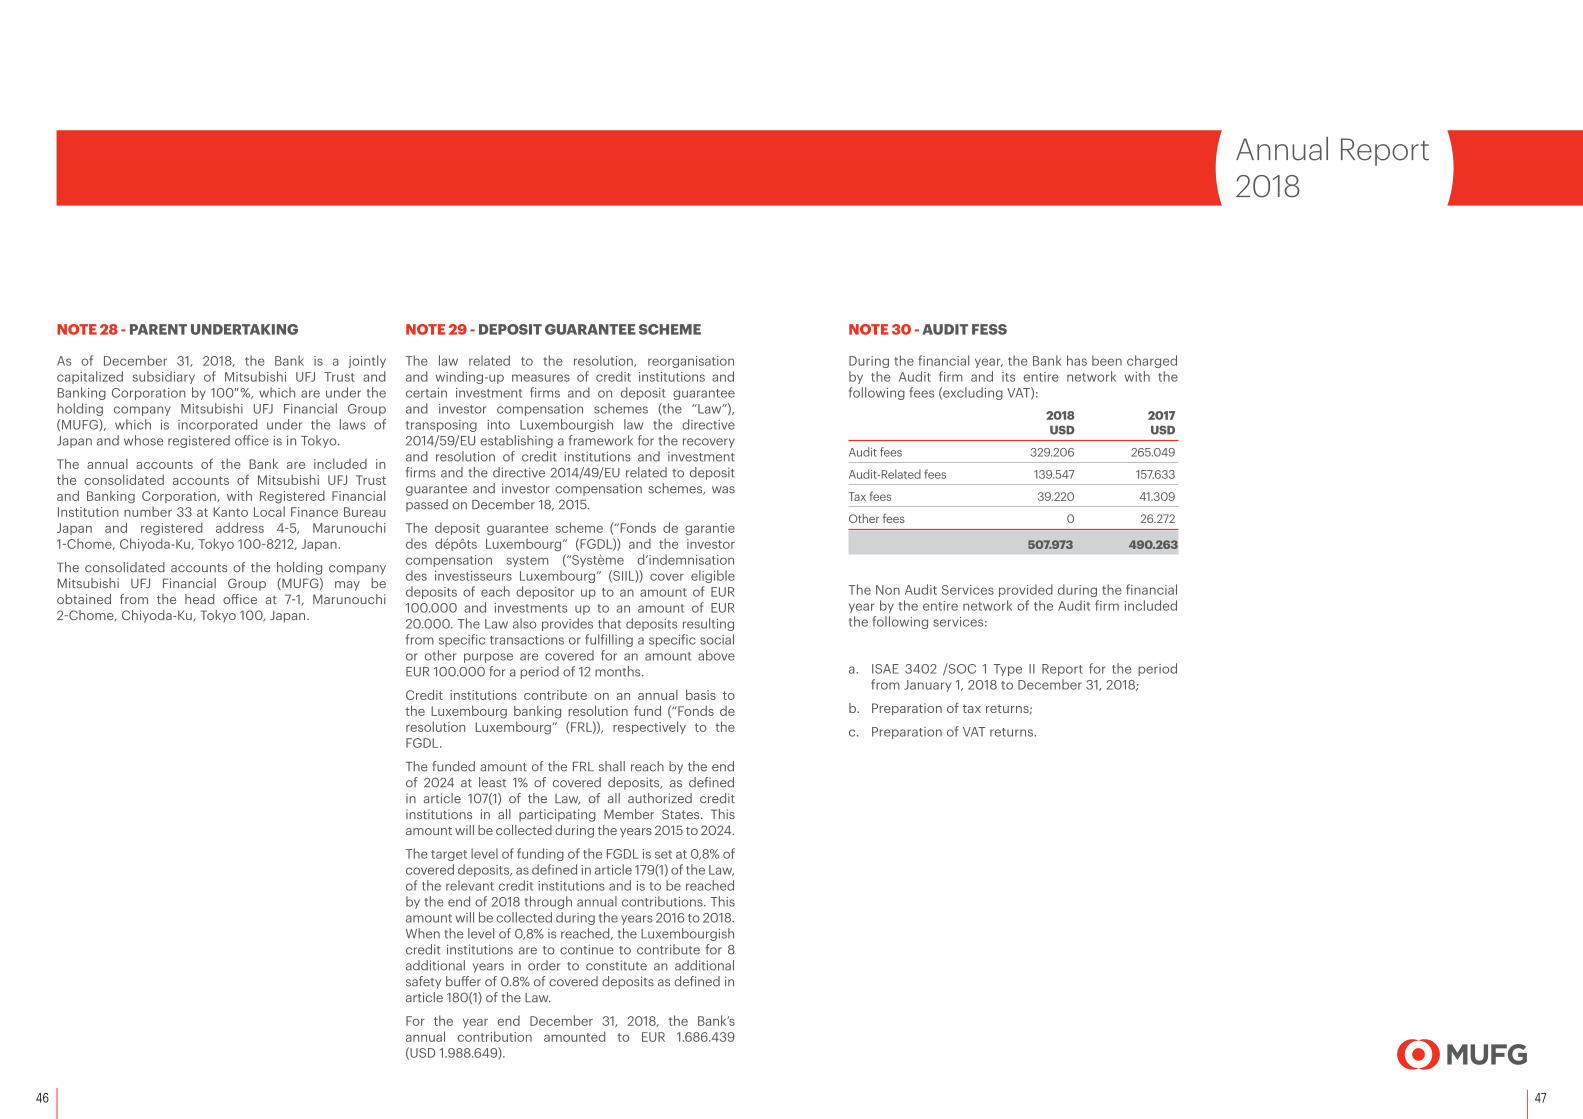
NOTE 28 - PARENT UNDERTAKING
As of December 31, 2018, the Bank is a jointly capitalized subsidiary of Mitsubishi UFJ Trust and Banking Corporation by 100 %, which are under the holding company Mitsubishi UFJ Financial Group (MUFG), which is incorporated under the laws of Japan and whose registered office is in Tokyo.
The annual accounts of the Bank are included in the consolidated accounts of Mitsubishi UFJ Trust and Banking Corporation, with Registered Financial Institution number 33 at Kanto Local Finance Bureau Japan and registered address 4-5, Marunouchi 1-Chome, Chiyoda-Ku, Tokyo 100-8212, Japan.
The consolidated accounts of the holding company Mitsubishi UFJ Financial Group (MUFG) may be obtained from the head office at 7-1, Marunouchi 2-Chome, Chiyoda-Ku, Tokyo 100, Japan.
NOTE 29 - DEPOSIT GUARANTEE SCHEME
The law related to the resolution, reorganisation and winding-up measures of credit institutions and certain investment firms and on deposit guarantee and investor compensation schemes (the “Law”), transposing into Luxembourgish law the directive 2014/59/EU establishing a framework for the recovery and resolution of credit institutions and investment firms and the directive 2014/49/EU related to deposit guarantee and investor compensation schemes, was passed on December 18, 2015.
The deposit guarantee scheme (“Fonds de garantie des dépôts Luxembourg” (FGDL)) and the investor compensation system (“Système d’indemnisation des investisseurs Luxembourg” (SIIL)) cover eligible deposits of each depositor up to an amount of EUR 100.000 and investments up to an amount of EUR 20.000. The Law also provides that deposits resulting from specific transactions or fulfilling a specific social or other purpose are covered for an amount above EUR 100.000 for a period of 12 months.
Credit institutions contribute on an annual basis to the Luxembourg banking resolution fund (“Fonds de resolution Luxembourg” (FRL)), respectively to the FGDL.
The funded amount of the FRL shall reach by the end of 2024 at least 1% of covered deposits, as defined in article 107(1) of the Law, of all authorized credit institutions in all participating Member States. This amount will be collected during the years 2015 to 2024.
The target level of funding of the FGDL is set at 0,8% of covered deposits, as defined in article 179(1) of the Law, of the relevant credit institutions and is to be reached by the end of 2018 through annual contributions. This amount will be collected during the years 2016 to 2018. When the level of 0,8% is reached, the Luxembourgish credit institutions are to continue to contribute for 8 additional years in order to constitute an additional safety buffer of 0.8% of covered deposits as defined in article 180(1) of the Law.
For the year end December 31, 2018, the Bank’s annual contribution amounted to EUR 1.686.439 (USD 1.988.649).
NOTE 30 - AUDIT FESS
During the financial year, the Bank has been charged by the Audit firm and its entire network with the following fees (excluding VAT):
2018 2017 USD USD
Audit fees 329.206 265.049
Audit-Related fees 139.547 157.633
Tax fees 39.220 41.309
Other fees 0 26.272
507.973 490.263
The Non Audit Services provided during the financial year by the entire network of the Audit firm included the following services:
a. ISAE 3402 /SOC 1 Type II Report for the period from January 1, 2018 to December 31, 2018;
b. Preparation of tax returns;
c. Preparation of VAT returns.

48 49
Annual Report2018
As at December 31, 2017, the analysis of primary non-trading financial instruments (the Bank has no trading portfolio) by class and residual maturity is the following:
≤ 3 months > 3 months > 1 year > 5 years Total ≤ 1 year ≤ 5 years
At carrying amount in USD USD USD USD USD USD
FINANCIAL ASSETSInstrument classBalances with the BCL 2.294.618.594 0 0 0 2.294.618.594
Loans and advances to credit institutions 3.272.919.230 807.000.000 0 0 4.079.919.230
Loans and advances to customers 265.472 0 0 0 265.472
Shares and other variable yield securities 0 0 0 14.984 14.984
Total Financial Assets 5.567.803.296 807.000.000 0 14.984 6.374.818.280
FINANCIAL LIABILITIESInstrument classAmounts owed to credit institutions 2.103.521.459 0 0 0 2.103.521.459
Amounts owed to customers 3.913.497.702 0 0 0 3.913.497.702
Total Financial Liabilities 6.017.019.161 0 0 0 6.017.019.161
Off-balance sheet items disclosed as contingencies Guarantees 578.509 0 0 0 578.509
Total Guarantees 578.509 0 0 0 578.509
NOTE 31 - FINANCIAL INSTRUMENT DISCLOSURES
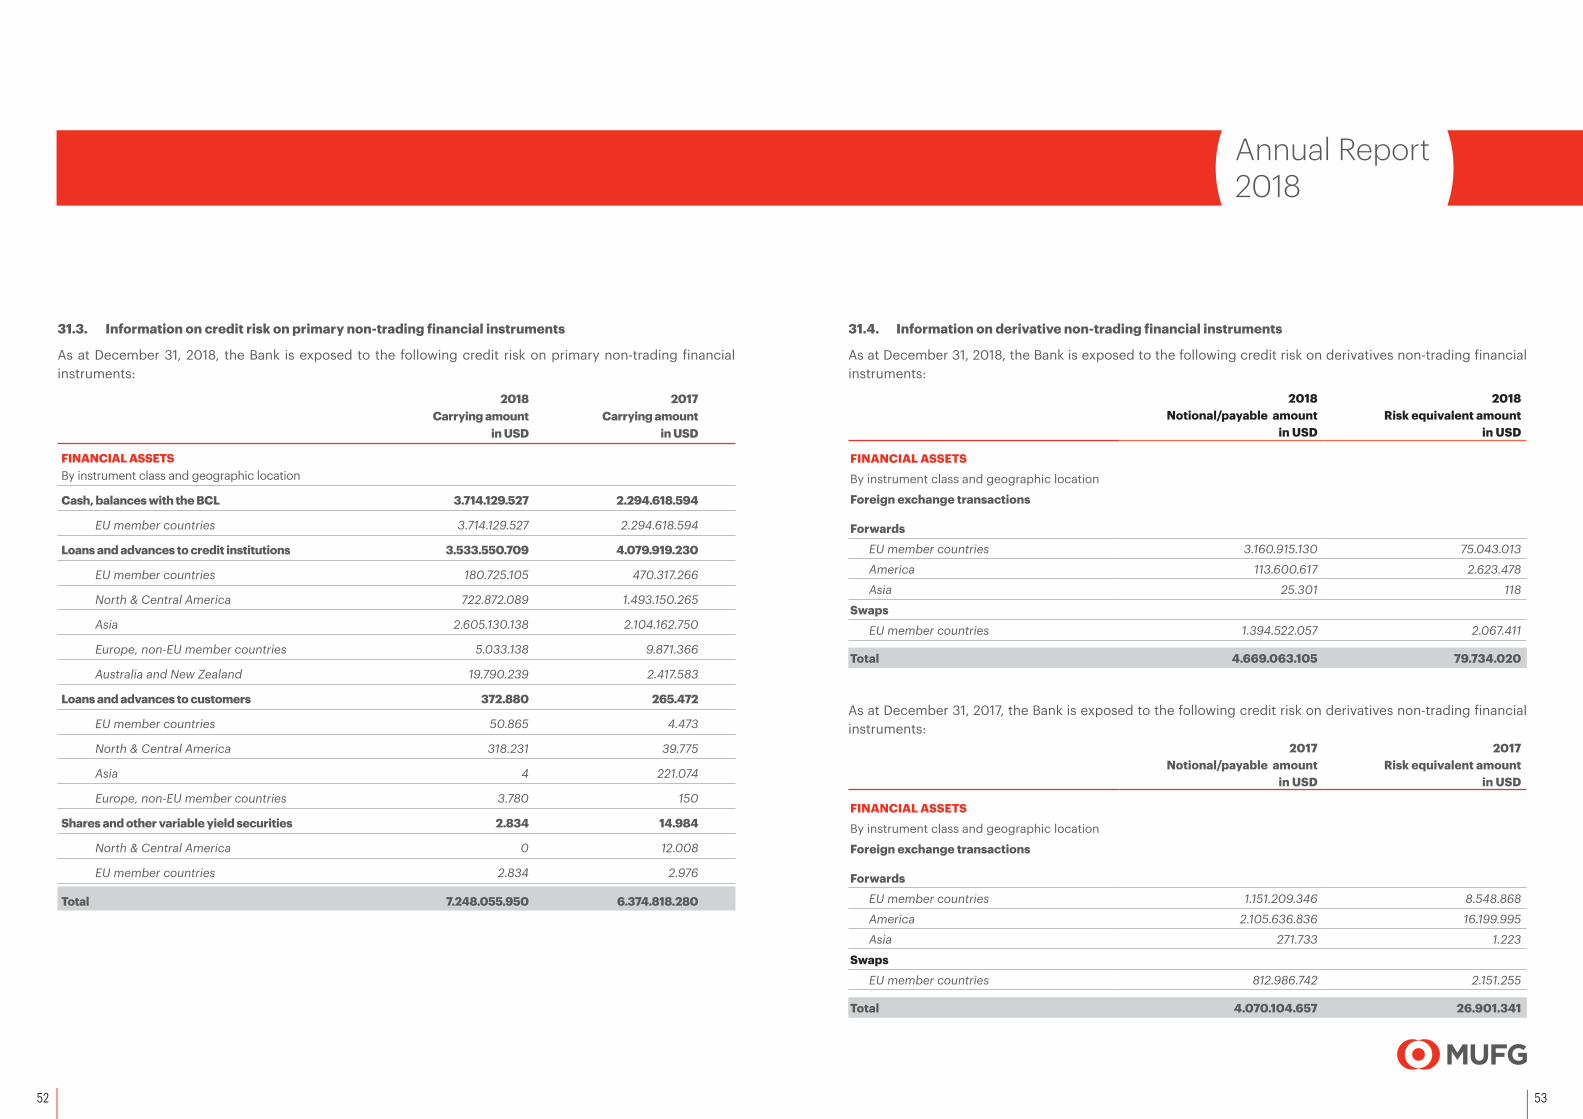
31.1. Primary non-trading financial instruments
As at December 31, 2018, the analysis of primary non-trading financial instruments (the Bank has no trading portfolio) by class and residual maturity is the following:
≤ 3 months > 3 months > 1 year > 5 years Total ≤ 1 year ≤ 5 years
At carrying amount in USD USD USD USD USD USD
FINANCIAL ASSETSInstrument classBalances with the BCL 3.714.129.527 0 0 0 3.714.129.527
Loans and advances to credit institutions 2.854.550.709 679.000.000 0 0 3.533.550.709
Loans and advances to customers 372.880 0 0 0 372.880
Shares and other variable yield securities 0 0 0 2.834 2.834
Total Financial Assets 6.569.053.116 679.000.000 0 2.834 7.248.055.950
FINANCIAL LIABILITIESInstrument classAmounts owed to credit institutions 1.794.570.343 0 0 0 1.794.570.343
Amounts owed to customers 5.073.055.610 0 0 0 5.073.055.610
Total Financial Liabilities 6.867.625.953 0 0 0 6.867.625.953
Off-balance sheet items disclosed as contingencies Guarantees 541.339 0 0 0 541.339
Total Guarantees 541.339 0 0 0 541.339

50 51
Annual Report2018
As at December 31, 2017, the analysis of OTC derivative non-trading financial instruments (the Bank has no trading portfolio) by class and residual maturity is the following:
≤ 3 months > 3 months > 1 year > 5 years Total Fair value
≤ 1 year ≤ 5 years
At notional payable amount in USD USD USD USD USD USD USD
FINANCIAL ASSETSInstrument class
Foreign exchange transactions
Forwards 3.257.117.915 0 0 0 3.257.117.915 24.750.086
Swaps 812.986.742 0 0 0 812.986.742 2.151.255
Total 4.070.104.657 0 0 0 4.070.104.657 26.901.341
FINANCIAL LIABILITIESInstrument classForeign exchange transactions
Forwards 3.057.118.085 0 0 0 3.057.118.085 22.397.245
Swaps 2.201.155.324 0 0 0 2.201.155.324 8.610.571
Total 5.258.273.409 0 0 0 5.258.273.409 31.007.816
These amounts include OTC derivative non-trading financial instruments with a trade date before December 31, 2017 and a value date after December 31, 2017.
31.2. Derivative non-trading financial instruments
As at December 31, 2018, the analysis of OTC derivative non-trading financial instruments (the Bank has no trading portfolio) by class and residual maturity is the following:
≤ 3 months > 3 months > 1 year > 5 years Total Fair value
≤ 1 year ≤ 5 years
At notional payable amount in USD USD USD USD USD USD USD
FINANCIAL ASSETSInstrument class
Foreign exchange transactions
Forwards 3.271.219.543 3.321.504 0 0 3.274.541.047 77.666.609
Swaps 1.394.522.057 0 0 0 1.394.522.057 2.067.411
Total 4.665.741.600 3.321.504 0 0 4.669.063.104 79.734.020
FINANCIAL LIABILITIESInstrument classForeign exchange transactions
Forwards 3.303.598.230 3.270.027 0 0 3.306.868.257 76.992.277
Swaps 854.553.985 0 0 0 854.553.985 2.708.455
Total 4.158.152.215 3.270.027 0 0 4.161.422.242 79.700.732
These amounts include OTC derivative non-trading financial instruments with a trade date before December 31, 2018 and a value date after December 31, 2018.
52 53
Annual Report2018
31.4. Information on derivative non-trading financial instruments
As at December 31, 2018, the Bank is exposed to the following credit risk on derivatives non-trading financial instruments:
2018 2018Notional/payable amount Risk equivalent amount
in USD in USD
FINANCIAL ASSETSBy instrument class and geographic location
Foreign exchange transactions Forwards
EU member countries 3.160.915.130 75.043.013
America 113.600.617 2.623.478
Asia 25.301 118
SwapsEU member countries 1.394.522.057 2.067.411
Total 4.669.063.105 79.734.020
As at December 31, 2017, the Bank is exposed to the following credit risk on derivatives non-trading financial instruments:
2017 2017Notional/payable amount Risk equivalent amount
in USD in USD
FINANCIAL ASSETSBy instrument class and geographic location
Foreign exchange transactions Forwards
EU member countries 1.151.209.346 8.548.868
America 2.105.636.836 16.199.995
Asia 271.733 1.223
SwapsEU member countries 812.986.742 2.151.255
Total 4.070.104.657 26.901.341
31.3. Information on credit risk on primary non-trading financial instruments
As at December 31, 2018, the Bank is exposed to the following credit risk on primary non-trading financial instruments:
2018 2017 Carrying amount Carrying amount in USD in USD
FINANCIAL ASSETS By instrument class and geographic location
Cash, balances with the BCL 3.714.129.527 2.294.618.594
EU member countries 3.714.129.527 2.294.618.594
Loans and advances to credit institutions 3.533.550.709 4.079.919.230
EU member countries 180.725.105 470.317.266
North & Central America 722.872.089 1.493.150.265
Asia 2.605.130.138 2.104.162.750
Europe, non-EU member countries 5.033.138 9.871.366
Australia and New Zealand 19.790.239 2.417.583
Loans and advances to customers 372.880 265.472
EU member countries 50.865 4.473
North & Central America 318.231 39.775
Asia 4 221.074
Europe, non-EU member countries 3.780 150
Shares and other variable yield securities 2.834 14.984
North & Central America 0 12.008
EU member countries 2.834 2.976
Total 7.248.055.950 6.374.818.280
54 55
Annual Report2018
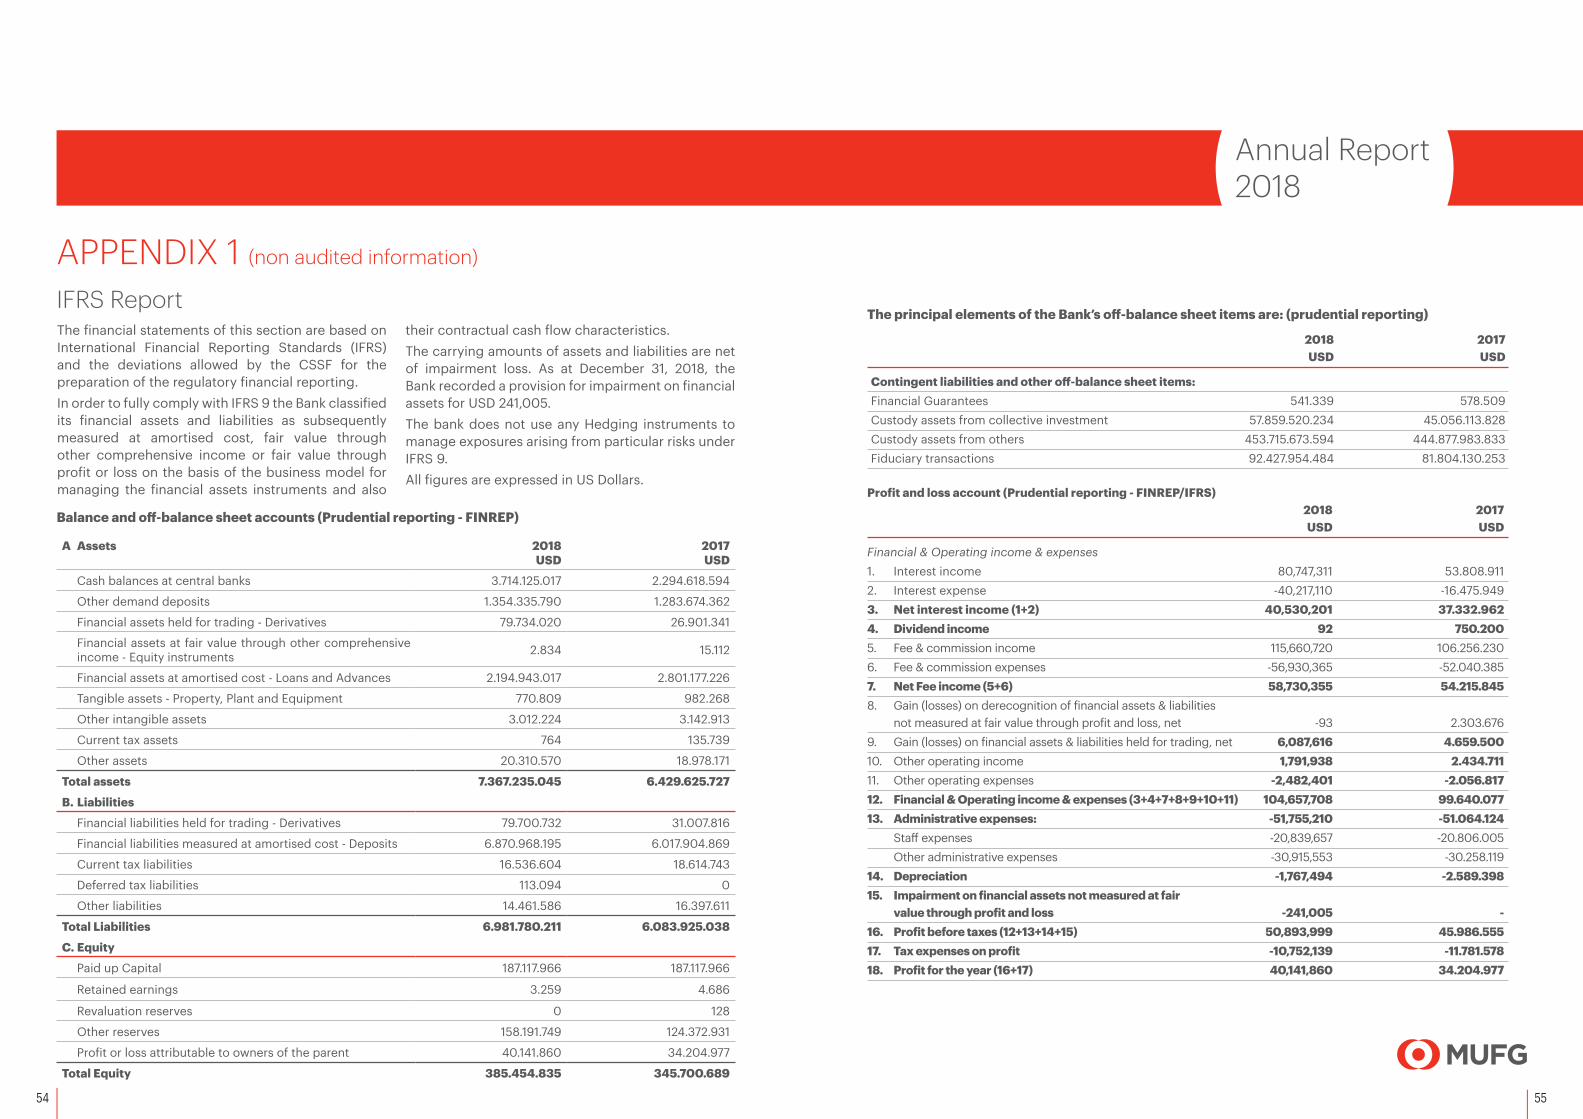
The principal elements of the Bank’s off-balance sheet items are: (prudential reporting)
2018 2017 USD USD
Contingent liabilities and other off-balance sheet items: Financial Guarantees 541.339 578.509Custody assets from collective investment 57.859.520.234 45.056.113.828 Custody assets from others 453.715.673.594 444.877.983.833Fiduciary transactions 92.427.954.484 81.804.130.253
Profit and loss account (Prudential reporting - FINREP/IFRS) 2018 2017
USD USD
Financial & Operating income & expenses 1. Interest income 80,747,311 53.808.9112. Interest expense -40,217,110 -16.475.9493. Net interest income (1+2) 40,530,201 37.332.9624. Dividend income 92 750.2005. Fee & commission income 115,660,720 106.256.2306. Fee & commission expenses -56,930,365 -52.040.3857. Net Fee income (5+6) 58,730,355 54.215.8458. Gain (losses) on derecognition of financial assets & liabilities
not measured at fair value through profit and loss, net -93 2.303.6769. Gain (losses) on financial assets & liabilities held for trading, net 6,087,616 4.659.50010. Other operating income 1,791,938 2.434.71111. Other operating expenses -2,482,401 -2.056.81712. Financial & Operating income & expenses (3+4+7+8+9+10+11) 104,657,708 99.640.07713. Administrative expenses: -51,755,210 -51.064.124
Staff expenses -20,839,657 -20.806.005Other administrative expenses -30,915,553 -30.258.119
14. Depreciation -1,767,494 -2.589.39815. Impairment on financial assets not measured at fair
value through profit and loss -241,005 -16. Profit before taxes (12+13+14+15) 50,893,999 45.986.55517. Tax expenses on profit -10,752,139 -11.781.57818. Profit for the year (16+17) 40,141,860 34.204.977
APPENDIX 1 (non audited information)
IFRS Report
Balance and off-balance sheet accounts (Prudential reporting - FINREP)
A Assets 2018USD
2017USD
Cash balances at central banks 3.714.125.017 2.294.618.594
Other demand deposits 1.354.335.790 1.283.674.362
Financial assets held for trading - Derivatives 79.734.020 26.901.341
Financial assets at fair value through other comprehensive income - Equity instruments 2.834 15.112
Financial assets at amortised cost - Loans and Advances 2.194.943.017 2.801.177.226
Tangible assets - Property, Plant and Equipment 770.809 982.268
Other intangible assets 3.012.224 3.142.913
Current tax assets 764 135.739
Other assets 20.310.570 18.978.171
Total assets 7.367.235.045 6.429.625.727
B. Liabilities
Financial liabilities held for trading - Derivatives 79.700.732 31.007.816
Financial liabilities measured at amortised cost - Deposits 6.870.968.195 6.017.904.869
Current tax liabilities 16.536.604 18.614.743
Deferred tax liabilities 113.094 0
Other liabilities 14.461.586 16.397.611
Total Liabilities 6.981.780.211 6.083.925.038
C. Equity
Paid up Capital 187.117.966 187.117.966
Retained earnings 3.259 4.686
Revaluation reserves 0 128
Other reserves 158.191.749 124.372.931
Profit or loss attributable to owners of the parent 40.141.860 34.204.977
Total Equity 385.454.835 345.700.689
The financial statements of this section are based on International Financial Reporting Standards (IFRS) and the deviations allowed by the CSSF for the preparation of the regulatory financial reporting. In order to fully comply with IFRS 9 the Bank classified its financial assets and liabilities as subsequently measured at amortised cost, fair value through other comprehensive income or fair value through profit or loss on the basis of the business model for managing the financial assets instruments and also
their contractual cash flow characteristics.The carrying amounts of assets and liabilities are net of impairment loss. As at December 31, 2018, the Bank recorded a provision for impairment on financial assets for USD 241,005.The bank does not use any Hedging instruments to manage exposures arising from particular risks under IFRS 9.All figures are expressed in US Dollars.
56 57
Annual Report2018
APPENDIX 2 (non audited information)
Basel III Disclosure
I. IntroductionThis report has been created in compliance with E.U. Directive 2013/36/EU of June 26, 2013, and E.U. Regulation 575/2013 of the same date.
Basel III differentiates between three so-called pillars, which are expected to be mutually reinforcing:
• Pillar 1 is centred on the capital requirements related to the credit, market and operational risks that banks run;
• Under Pillar 2, banks are expected to produce their own assessment of capital adequacy, based on the risks that they face in their activities, including additional risk types such as market risk in the banking book. Pillar 2 also lays out the interaction between the banks’ own assessments and the banking supervisors’ response;
• Pillar 3 leverages the ability of market discipline to motivate prudent management by enhancing the degree of transparency in banks’ public reporting. It sets out the public disclosures that banks must make that lend greater insight into the adequacy of their capitalization. The purpose of Pillar 3 is to complement the minimum capital requirements (Pillar 1) and the supervisory review process (Pillar 2).
Pillar 3 disclosures comprise of:
• Quantitative disclosures relating primarily to actual risk exposures
• Qualitative disclosures relating primarily to risk management practices
Additional qualitative disclosures are applied by enclosing a summary of the Remuneration Policy.
As at December 31, 2018, this disclosure Statement includes the measures required by the full adoption of the Basel III capital reforms. Basel III is a global regulatory standard on bank capital adequacy, stress testing and market liquidity risk, intended to strengthen bank capital requirements and introduces new regulatory requirements on bank liquidity and bank leverage.
Mitsubishi UFJ Investor Services & Banking (Luxembourg) S.A. (hereafter “MIBL” or “the Bank”), a member of Mitsubishi UFJ Financial Group (hereafter “MUFG”), whose Head Office
(a financial holding company) is located in Japan, has undertaken to carry out the full disclosure required by the above mentioned regulations. Disclosure will be made on an annual basis.
The report may be obtained after the publication of the Annual Accounts, from the following address: Mitsubishi UFJ Investor Services & Banking (Luxembourg) S.A. 287-289, route d’Arlon, L-1150 Luxembourg.
II. OverviewDue to various changes in the global market and current trends in investment funds, it is constantly necessary to adapt the business model. As per client requests, new client services have been implemented which further broaden the scope of oversight and the importance of Risk Management at MIBL.
The Bank updates and implements in its policies, procedures, and processes, methods to identify, categorize, measure, monitor, and mitigate the risks linked to its business lines. The Bank remains risk averse and does not engage in proprietary trading for its own account.
III. Risk ClassificationThe Bank has identified the following risks present in its businesses and operations:
1. Credit RiskCredit Risk defined as the risk to incur losses due to a decline in, or a total loss of, the value of assets (including off-balance sheet assets) as a result of a counterparty failing to meet its obligations in accordance with agreed terms. Given the nature of MIBL business, credit risk is mainly defined by two sub-categories:
• Counterparty (default) risk covering: settlement risk, counterparty default on FX market exposure (generating replacement costs) or cash placements at risk due to counterparty default.
• Country risk - arising from uncertainties in economic, social, political or other external factors that could have an impact, such as a downgrade of the credit rating.
2. Concentration RiskThe risk of an accumulation of exposure(s) within or across different risk categories of an institution that have the potential to produce either losses large enough to threaten the institution’s health and/or ability to maintain its operations, or to produce a material change in an institution’s risk profile.
The Bank reports on monthly basis the analysis concerning the concentration risk during its Risk Management Committee. The analysis draws attention to the credit and market exposures that the Bank needs to face, sorting the exposures by counterparty, type, rating, and currency.
3. Market RiskMarket Risk defined as the risk of financial loss due to a decline in the value of assets, or the increase in the value of liabilities, including off-balance sheet items, as a result of fluctuations in market rates (FX rates, interest rates), prices, indices, and volatilities. The Bank has defined two general sub-categories of Market Risk, namely:
• Interest Rate Risk – arises as a result of changes in interest rates; both assets and liabilities may impact the profitability of the Bank;Foreign Exchange Rate Risk – defined as the risk of a loss following changes in the market foreign exchange rate on the Bank’s transactions.
• Credit Value Adjustment – arises as the risk of decreasing mark to market value of the derivatives. The derivatives done in 2018 by the Bank were mainly FX Forwards and FX Swaps.
The Bank does not hold any proprietary positions.
4. Liquidity RiskThe Bank has identified two types of liquidity risk: market liquidity risk and funding liquidity risk.
• Market Liquidity Risk – defined as the risk of sustaining a loss due to the inability to trade required quantities at a reasonable price, caused, for instance, by market turmoil or a lack of trade volume in the market.
• Funding Liquidity Risk – defined as the risk of sustaining a loss due to the inability to obtain the necessary funds required for trading or settlement of obligations, or the need to acquire funds at disadvantageous terms, caused by deterioration in market conditions and/or in the Bank’s financial standing.
5. Operational Risk
Operational Risk is defined as the risk of direct or indirect loss resulting from inadequate or failed internal process, people, and systems, or from external events. This includes:
• Operations Risk – defined as the risk of incurring losses caused by negligence of correct operational processing or by incidents or misconduct by officers or staff.
• IT Risk – defined as the risk of sustaining a loss due to IT system destruction, disruption, leakage, errors or similar events.
• Outsourcing Risk – defined as the risk of sustaining a loss due to a failure in delegated activities, because they were not carried out properly or not in accordance with contractual arrangements.
6. Compliance & Legal RiskCompliance and Legal risks are defined as the risks of loss due to a failure to conduct the business in accordance with applicable laws, rules and standards or due to inappropriate or insufficient response to regulatory changes. It covers a variety of component risks such as litigations, sanctions, together with certain aspects of Operational Risks, across the complete range of the Bank’s business activities.
7. Reputational RiskThe Bank defines reputation risk as the risk of sustaining a loss due to an impaired reputation, caused, for instance, by negative perceptions and rumours among the Bank’s clients and in the general marketplace, or by an inadequate response of the Bank to events arisen within the course of the Bank’s business activities. This affects the Bank’s ability to establish new relationships or services or to continue existing servicing relationships.

58 59
Annual Report2018
8. Remuneration and Personnel RiskPersonnel risk is defined as the risk of loss due to high turnover of human resources, lack of training, lack of ethics and degradation of morale, as well as other similar behaviors. Remuneration risk is triggered by an inappropriate remuneration policy of the Bank, allowing abusive personnel compensations that are not tied to the financial results of the Bank or to the performance of its employees.
The Bank reviews the Remuneration Policy at least once a year to ensure that the principles, objectives, and methods of the policy are followed as they have been adopted. The Bank’s Remuneration Policy adheres to the principles laid down in E.U. Directive 2013/36/EU, the Commission Delegated Regulations no. 604/2014 of March 4, 2014 and no. 527/2014 of March 12, 2014. The Board of Directors approved the last reviewed Remuneration Policy on January 30, 2018.
IV. The Strategies and Processes of Risk Management
1. One of the basic functions of the Bank’s Risk Control is to monitor the risks linked to the Bank’s activities and business strategies that are within the control of the Board of Directors, and to the greatest extent possible to predict, mitigate, and manage the risks of the Bank using a pre-defined standard or method whenever possible.
2. The major objective of comprehensive risk control is not only to maintain preventive measures against business risks, but also to include all departments in its analysis and thereby to improve operations through more efficient processes and systems. Other aims are to identify all potential risks the Bank may face, evaluate the scope and the appropriateness of the controls put in place to assess these risks, and determine an action plan to eliminate weaknesses.
3. The Risk Management Department utilizes and has documented detailed methods in the Bank’s policies, procedures, written rules, and other documents in its efforts to monitor and manage the risks noted above. The departments where these risks are generated periodically review these written papers, and amend or abolish them in accordance with changes in the Bank’s operating environment.
V. The Structure and Organization of the Risk Management Function
1. The Board of Directors and General Management
The Board of Directors is responsible for deciding and approving the basic framework and strategies of the Bank’s internal risk control management, implemented throughout the Bank, and to confirm its implementation.
The Board of Directors determines the usefulness and efficiency of the risk controls in place using risk control reports delivered regularly, and judges if the controls comply with the approved limits and measures.
On behalf of the Board of Directors, General Management creates a risk verification and management framework, which remains independent from the Bank’s profit-earning units, and allocates the skilled management resources required for carrying out the necessary controls and functions. For this purpose, General Management establishes policies, standards, and procedures for risk control and management.
In addition, General Management reviews risk control and management plans, organization structures, policies, and procedures so that the Bank’s risk management framework evolves consistently with changes in the Bank’s businesses, international markets, and “Best Practices” in Risk Management.
Employees are assigned to departments and tasks according to their professional experience and academic background. These assignments are approved by the General Management.
Chief Risk Officer
The Chief Risk Officer (hereafter “CRO”) title is assigned to the director carrying out supervisory management of the Risk Management Department (hereafter the “RMD”), which is the department responsible for comprehensive Risk Management, encompassing all risk categories. The CRO is responsible for a complete assessment of MIBL’s risks, and for managing these risks adequately. The CRO reports risk control and management methods and plans the Bank’s overall risk status to the Board of Directors, General Management, and to the Risk Management Committee.
2. Risk Management Department (RMD)The RMD is responsible for the selection and execution of an adequate risk management structure. On a daily basis, the department identifies, measures, controls, and monitors all risks within defined and controllable limits. These actions attenuate risks across MIBL’s businesses, and thereby provide stability to earnings and risk awareness in the allocation of resources.
3. Risk Management CommitteeThe primary responsibility of the Risk Management Committee is to review, discuss, and approve the Bank’s Risk Management activities. In particular, and in congruence with the Bank’s businesses, the Committee discusses Financial Risk (Credit & Market Risk) and Operational Risk and puts forth policies to avoid losses due to these risks. Its members discuss quantitative, as well as qualitative, methods of managing the Bank’s risks.
4. Credit and ALM Committee (For Credit Risk, Market Risk, and Liquidity Risk)The primary responsibility of the Credit and ALM Committee is to establish an appropriate implementation and a functioning management structure for Credit Risk, Market Risk, and Liquidity Risk. On a monthly basis, its members monitor, and if necessary make decisions regarding, both MIBL clients’ assets and the Bank’s assets.
VI. The Scope and Nature of Risk Reporting and Measurement Systems
The Bank’s process for control and managing its diverse categories of risk comprises several levels and phases. A non-exhaustive description of its methodology follows:
1. Detection of RisksThis step includes the identification of the characteristics of the Bank’s individual risks, which include, but are not limited to, their type(s), location(s), source(s), and interdependency (ies).
2. Risk Assessment and ComputationThis step includes a comprehensive evaluation of the source of risk, using both quantitative and non-numerical methods, at the transaction, portfolio, and overall structure levels of the individual risk.
3. Risk ControlRisk Control at MIBL involves the process of examining and updating approvals, limits, thresholds, operational processes (for example, standing instructions), escalation processes (and exceptional treatment rules), and risk attenuation methods (haircuts, collateral, netting calculations, ratings, etc.). These are contained and updated in MIBL policies, rules, procedures, and practices. MIBL’s Head Office, E.U. regulations, CSSF circulars and regulations, and Luxembourg laws also act as inputs into MIBL’s policies.
4. Risk Monitoring and ReportingThe Risk Management Department is in charge of updating the risk processes, monitoring of the risk status and exceptional treatment of individual risks, and reports to General Management and Risk Management Committee. The Committee reports to the Board of Directors on a quarterly basis.
VII. The Policies for Mitigating Risk and the Process for Monitoring Risks
1. Credit Risk MonitoringThe Bank is exposed to counterparty risk, as major component of credit risk, via: overdrafts, money market and foreign exchange market transactions. Potential losses are mitigated via the following methods:
• active follow-up of failed transactions• active follow-up of overdrafts• reconciliation of nostro accounts• development of an active approach towards cash
management.The Pillar 1 capital requirement sufficiently covers the Credit Risk profile of the Bank.
Credit Exposure and Limit MonitoringThe Bank’s credit risk monitoring framework allows RMD to verify on-demand the Bank’s credit exposures and their impact on authorized credit limits. The RMD carries out verifications of the current credit exposure compared to the approved credit limit. The report indicates a “warning,” e.g. a color signal, when the usage of the limit is above 80% of the total limit amount. In this event, the RMD transmits a message
60 61
Annual Report2018
to the appropriate department to take remedial action as soon as possible. If the limit is breached, a report is forwarded to the General Management.
The Bank uses a banking system which allows an on-demand monitoring of credit limits. All transactions that would transgress the relevant credit limit put in place cannot be processed without the express authorization of the Risk Management Department. The control on credit limit breaches is made possible through the “Visa Control” system put in place by the Bank. In the event the RMD is requested to approve using Visa Control, an exhaustive analysis of the credit limit breach is carried out. The result of this analysis will be transmitted to General Management before releasing or rejecting the transaction.
Credit Limit by CounterpartsThe Bank applies for limits to Mitsubishi UFJ Trust and Banking Corporation (hereafter “MUTB”), following the Managing Director’s approval.
Credit Limit ControlThe RMD controls the Bank’s credit limits. Once the credit limit has been authorized by MUTB, the RMD forwards the approval to the General Management. All approved limits are set up in the Banking system. The RMD reviews these limits once a year, or more frequently as necessary (e.g., in case of breach).
Monitoring Credit Rating for CounterpartsThe Bank verifies the credit ratings of all counterparts that have a deal or custody agreement with the Bank.
Credit Risk Stress TestingThe Bank put in place a Credit Risk Stress Test model, using macro-economic and financial market data (e.g. GDP, unemployment rates, interest rates, FX rates, exchange indices, bankruptcy indices etc.) to infer stress factors applied on the Probability of Defaults (PDs) and create a credit loss distribution.
For the stress test, hypothetical and historical scenarios (including concentration risk) are considered and applied on the banking credit portfolio: mild recession scenario occurring by assumption once in 10 years, the severe recession scenario occurring once in 50 years, the historical “9/11” event, the historical “Lehman bankruptcy”.
Country Risk MonitoringThe RMD monitors the counterparts’ country risk by checking country ratings using a Bloomberg Station.
Capital requirementsThe Bank uses the Standardized Approach for Credit Risk, wherein each exposure is assigned to an exposure class as detailed in CSSF Circular 14/583. The application of risk weights is based on the exposure class to which the exposure is assigned and its credit quality.
The Credit Risk Pillar II is derived primarily from the transactions in cash placement, the overdrafts (occurred mainly by settlement failures) and FX Forwards (the latter are undertaken to mitigate client Foreign Exchange Risk at the request of the customer).
For 2018 Pillar II credit risk capital requirements the scenario with the maximum loss was considered, with an amount of USD 11,544,090.
2. Market Risk Monitoring
Interest Rate Risk
Interest Rate Risk may be defined as the risk of loss due to the “gap” (i.e. difference) between assets and liabilities on the Balance Sheet that are exposed to interest rate fluctuations. Interest rates are influenced by a variety of factors, such as politics, international news, and the general economic climate of countries.
The Bank’s Interest Rate Risk exposure arises from the normal course of its banking activities, such as accepting deposits, placing funds with credit institutions. The objective of the Bank regarding Interest Rate Risk is to minimize potential losses by monitoring fixed rate interest positions. The Bank has just the risk of an opportunity cost for its gap (i.e. cash) placement (i.e. not being able to re-invest at higher interest rates should they occur during a previously contracted fixed-rate loan).
The Bank has adopted a full cover principle for all interest rate-related contracts. The maximum risk allowed is determined by the Authorized Management.
The Bank performs sensitivity analysis on its economic values taking into account positive and negative shifts on all interest rates (200bp parallel shift of yield curves) as defined by CSSF Circular 08/338 as amended by
CSSF Circular 16/642. The aim of this analysis is to determine to which extent Interest Rate Risk is likely to result in a decline in the economic value of the institution. The Bank applies interest rate shocks to all its treasury flows taking into account the following parameters: residual maturity, contract rate, market rate, and nominal amount.
International changes, such as the trend toward the liberalization of interest rates in the developing world and large money movements into speculative funds in recent years, have added a higher variability to interest rates than they showed in previous years. This has caused Asset & Liability Management to take on a relative position of importance in the area of Risk Management.
Foreign Exchange Rate RiskThe Bank enters into foreign exchange positions as a result of opening FX trades on behalf of its clients. These trades are then hedged in the Interbank Market at the same time without taking on any market risk. Thus, Currency Risk is managed on a timely basis on spot and forward markets. The Bank’s policy is to maintain a “full cover” of all transactions. The RMD carries out daily verifications to ensure that all of the Bank’s positions are fully hedged.
Daily ControlIn general, the total foreign exchange position of the Bank is equal to 0 (or “squared”) at the end-of-business each day. A maximum net position of 500,000 USD is allowed at day’s end when, due to client transactions, this amount could not be squared. As a matter of practice, the Bank seeks to have the entire FX position squared to the furthest extent possible.
As part of its daily controls, the RMD issues the “Forex Forward Net Short Position Report” (showing the Bank’s forward transactions with clients) and the “Net Short Position Report” (for Spot transactions).
As a matter of practice, and due to its risk-averse stance in its businesses, the Bank has virtually no other market risks, i.e. no stock prices risk, commodity price risk, or market liquidity risk.
The Bank has also put in place a FX Stress test that quantifies the potential losses that could be incurred by the Bank in case of significant variation of the FX
rates and lack of hedging strategy. The FX stress test is defined using different scenarios where a depreciation of the USD is always assumed using different magnitudes with respect to other currencies.
3. Liquidity Risk MonitoringThe Bank’s transactions are continuously monitored with respect to their adherence to its internal liquidity rules and to the current regulations in place.
Introduced by the regulation (EU) No 575/2013 of the European Parliament, the liquidity coverage requirement was gradually implemented starting with October 2015, with a first minimum requirement fixed at 60%. As from 1st of January 2018 the minimum requirement is 100%.
The Liquidity Coverage Ratio (LCR) ensures that banks have an adequate stock of unencumbered high-quality liquid assets (HQLA) that can be converted easily and immediately in private markets into cash to meet their liquidity needs for a 30 calendar day liquidity stress scenario.
During the year 2018, the Bank has reported to the CSSF the liquidity coverage ratio on a monthly basis. Pursuant to article 415 CRR IV, the Bank has reported the LCR per currency for liabilities exceeding 5% of the total liabilities, mainly in USD, EUR, GBP, JPY and AUD. There is no minimum requirement for a ratio by currency.
During the 2018, the Liquidity Coverage ratio in USD was well above the minimum requirement.
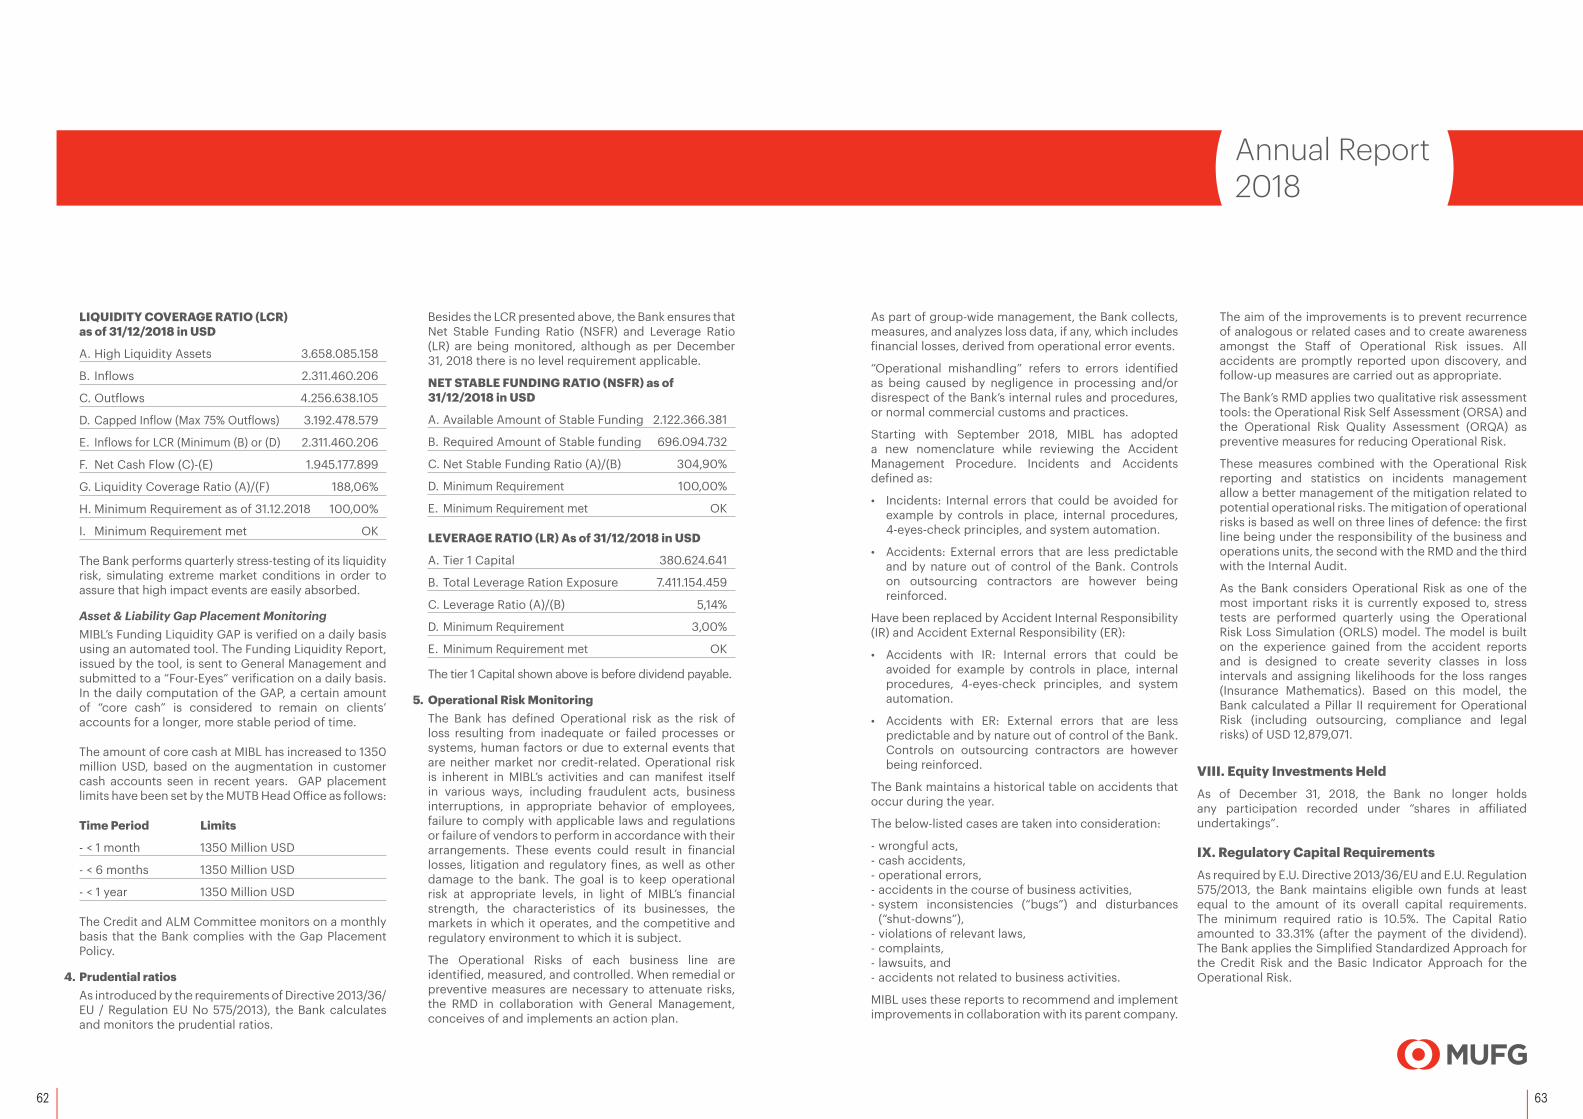
62 63
Annual Report2018
LIQUIDITY COVERAGE RATIO (LCR) as of 31/12/2018 in USD
A. High Liquidity Assets 3.658.085.158
B. Inflows 2.311.460.206
C. Outflows 4.256.638.105
D. Capped Inflow (Max 75% Outflows) 3.192.478.579
E. Inflows for LCR (Minimum (B) or (D) 2.311.460.206
F. Net Cash Flow (C)-(E) 1.945.177.899
G. Liquidity Coverage Ratio (A)/(F) 188,06%
H. Minimum Requirement as of 31.12.2018 100,00%
I. Minimum Requirement met OK
The Bank performs quarterly stress-testing of its liquidity risk, simulating extreme market conditions in order to assure that high impact events are easily absorbed.
Asset & Liability Gap Placement Monitoring MIBL’s Funding Liquidity GAP is verified on a daily basis using an automated tool. The Funding Liquidity Report, issued by the tool, is sent to General Management and submitted to a “Four-Eyes” verification on a daily basis. In the daily computation of the GAP, a certain amount of “core cash” is considered to remain on clients’ accounts for a longer, more stable period of time.
The amount of core cash at MIBL has increased to 1350 million USD, based on the augmentation in customer cash accounts seen in recent years. GAP placement limits have been set by the MUTB Head Office as follows:
Time Period Limits
- < 1 month 1350 Million USD
- < 6 months 1350 Million USD
- < 1 year 1350 Million USD
The Credit and ALM Committee monitors on a monthly basis that the Bank complies with the Gap Placement Policy.
4. Prudential ratiosAs introduced by the requirements of Directive 2013/36/EU / Regulation EU No 575/2013), the Bank calculates and monitors the prudential ratios.
Besides the LCR presented above, the Bank ensures that Net Stable Funding Ratio (NSFR) and Leverage Ratio (LR) are being monitored, although as per December 31, 2018 there is no level requirement applicable.
NET STABLE FUNDING RATIO (NSFR) as of 31/12/2018 in USD
A. Available Amount of Stable Funding 2.122.366.381
B. Required Amount of Stable funding 696.094.732
C. Net Stable Funding Ratio (A)/(B) 304,90%
D. Minimum Requirement 100,00%
E. Minimum Requirement met OK
LEVERAGE RATIO (LR) As of 31/12/2018 in USD
A. Tier 1 Capital 380.624.641
B. Total Leverage Ration Exposure 7.411.154.459
C. Leverage Ratio (A)/(B) 5,14%
D. Minimum Requirement 3,00%
E. Minimum Requirement met OK
The tier 1 Capital shown above is before dividend payable.
5. Operational Risk MonitoringThe Bank has defined Operational risk as the risk of loss resulting from inadequate or failed processes or systems, human factors or due to external events that are neither market nor credit-related. Operational risk is inherent in MIBL’s activities and can manifest itself in various ways, including fraudulent acts, business interruptions, in appropriate behavior of employees, failure to comply with applicable laws and regulations or failure of vendors to perform in accordance with their arrangements. These events could result in financial losses, litigation and regulatory fines, as well as other damage to the bank. The goal is to keep operational risk at appropriate levels, in light of MIBL’s financial strength, the characteristics of its businesses, the markets in which it operates, and the competitive and regulatory environment to which it is subject.
The Operational Risks of each business line are identified, measured, and controlled. When remedial or preventive measures are necessary to attenuate risks, the RMD in collaboration with General Management, conceives of and implements an action plan.
As part of group-wide management, the Bank collects, measures, and analyzes loss data, if any, which includes financial losses, derived from operational error events.
“Operational mishandling” refers to errors identified as being caused by negligence in processing and/or disrespect of the Bank’s internal rules and procedures, or normal commercial customs and practices.
Starting with September 2018, MIBL has adopted a new nomenclature while reviewing the Accident Management Procedure. Incidents and Accidents defined as:
• Incidents: Internal errors that could be avoided for example by controls in place, internal procedures, 4-eyes-check principles, and system automation.
• Accidents: External errors that are less predictable and by nature out of control of the Bank. Controls on outsourcing contractors are however being reinforced.
Have been replaced by Accident Internal Responsibility (IR) and Accident External Responsibility (ER):
• Accidents with IR: Internal errors that could be avoided for example by controls in place, internal procedures, 4-eyes-check principles, and system automation.
• Accidents with ER: External errors that are less predictable and by nature out of control of the Bank. Controls on outsourcing contractors are however being reinforced.
The Bank maintains a historical table on accidents that occur during the year.
The below-listed cases are taken into consideration:
- wrongful acts,- cash accidents,- operational errors,- accidents in the course of business activities,- system inconsistencies (“bugs”) and disturbances
(“shut-downs”),- violations of relevant laws,- complaints,- lawsuits, and- accidents not related to business activities.
MIBL uses these reports to recommend and implement improvements in collaboration with its parent company.
The aim of the improvements is to prevent recurrence of analogous or related cases and to create awareness amongst the Staff of Operational Risk issues. All accidents are promptly reported upon discovery, and follow-up measures are carried out as appropriate.
The Bank’s RMD applies two qualitative risk assessment tools: the Operational Risk Self Assessment (ORSA) and the Operational Risk Quality Assessment (ORQA) as preventive measures for reducing Operational Risk.
These measures combined with the Operational Risk reporting and statistics on incidents management allow a better management of the mitigation related to potential operational risks. The mitigation of operational risks is based as well on three lines of defence: the first line being under the responsibility of the business and operations units, the second with the RMD and the third with the Internal Audit.
As the Bank considers Operational Risk as one of the most important risks it is currently exposed to, stress tests are performed quarterly using the Operational Risk Loss Simulation (ORLS) model. The model is built on the experience gained from the accident reports and is designed to create severity classes in loss intervals and assigning likelihoods for the loss ranges (Insurance Mathematics). Based on this model, the Bank calculated a Pillar II requirement for Operational Risk (including outsourcing, compliance and legal risks) of USD 12,879,071.
VIII. Equity Investments HeldAs of December 31, 2018, the Bank no longer holds any participation recorded under “shares in affiliated undertakings”.
IX. Regulatory Capital RequirementsAs required by E.U. Directive 2013/36/EU and E.U. Regulation 575/2013, the Bank maintains eligible own funds at least equal to the amount of its overall capital requirements. The minimum required ratio is 10.5%. The Capital Ratio amounted to 33.31% (after the payment of the dividend). The Bank applies the Simplified Standardized Approach for the Credit Risk and the Basic Indicator Approach for the Operational Risk.
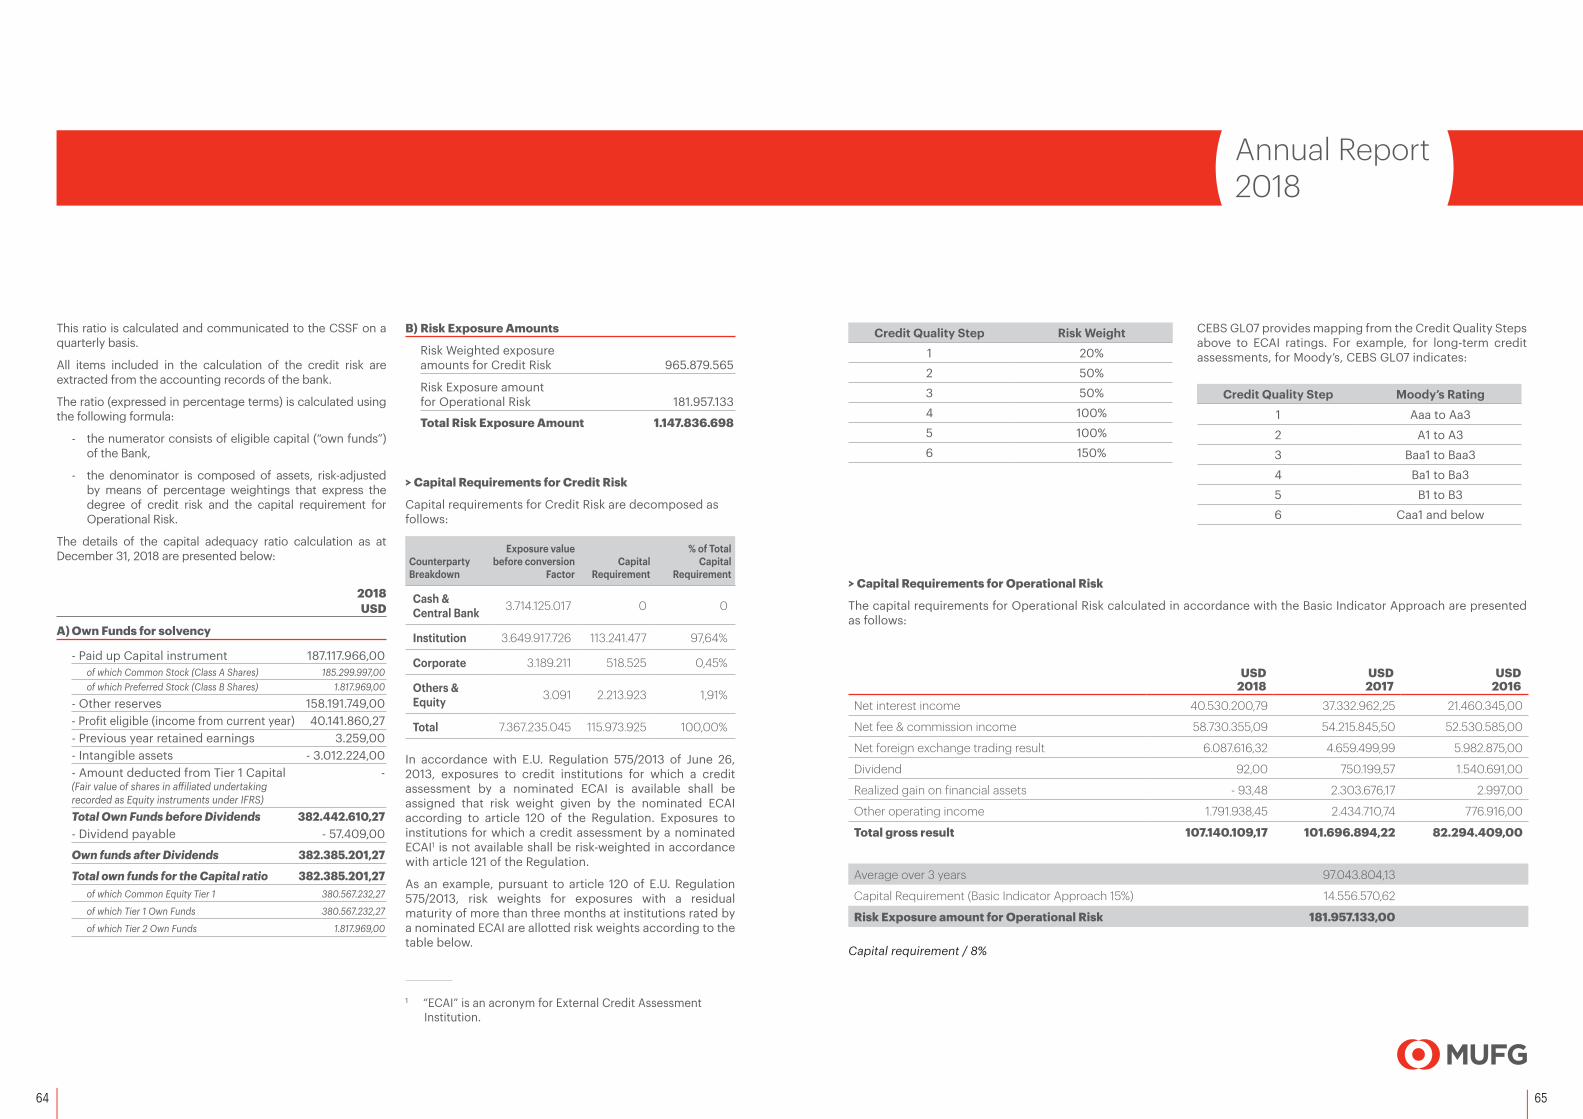
64 65
Annual Report2018
Credit Quality Step Risk Weight1 20%
2 50%
3 50%
4 100%
5 100%
6 150%
CEBS GL07 provides mapping from the Credit Quality Steps above to ECAI ratings. For example, for long-term credit assessments, for Moody’s, CEBS GL07 indicates:
Credit Quality Step Moody’s Rating
1 Aaa to Aa3
2 A1 to A3
3 Baa1 to Baa3
4 Ba1 to Ba3
5 B1 to B3
6 Caa1 and below
This ratio is calculated and communicated to the CSSF on a quarterly basis.
All items included in the calculation of the credit risk are extracted from the accounting records of the bank.
The ratio (expressed in percentage terms) is calculated using the following formula:
- the numerator consists of eligible capital (“own funds”) of the Bank,
- the denominator is composed of assets, risk-adjusted by means of percentage weightings that express the degree of credit risk and the capital requirement for Operational Risk.
The details of the capital adequacy ratio calculation as at December 31, 2018 are presented below:
2018 USD
A) Own Funds for solvency
- Paid up Capital instrument 187.117.966,00 of which Common Stock (Class A Shares) 185.299.997,00 of which Preferred Stock (Class B Shares) 1.817.969,00
- Other reserves 158.191.749,00 - Profit eligible (income from current year) 40.141.860,27 - Previous year retained earnings 3.259,00 - Intangible assets - 3.012.224,00- Amount deducted from Tier 1 Capital - (Fair value of shares in affiliated undertaking recorded as Equity instruments under IFRS)Total Own Funds before Dividends 382.442.610,27 - Dividend payable - 57.409,00
Own funds after Dividends 382.385.201,27
Total own funds for the Capital ratio 382.385.201,27of which Common Equity Tier 1 380.567.232,27
of which Tier 1 Own Funds 380.567.232,27
of which Tier 2 Own Funds 1.817.969,00
B) Risk Exposure Amounts
Risk Weighted exposure amounts for Credit Risk 965.879.565
Risk Exposure amount for Operational Risk 181.957.133
Total Risk Exposure Amount 1.147.836.698
> Capital Requirements for Credit Risk
Capital requirements for Credit Risk are decomposed as follows:
Counterparty Breakdown
Exposure value before conversion
FactorCapital
Requirement
% of Total Capital
Requirement
Cash & Central Bank 3.714.125.017 0 0
Institution 3.649.917.726 113.241.477 97,64%
Corporate 3.189.211 518.525 0,45%
Others & Equity 3.091 2.213.923 1,91%
Total 7.367.235.045 115.973.925 100,00%
In accordance with E.U. Regulation 575/2013 of June 26, 2013, exposures to credit institutions for which a credit assessment by a nominated ECAI is available shall be assigned that risk weight given by the nominated ECAI according to article 120 of the Regulation. Exposures to institutions for which a credit assessment by a nominated ECAI1 is not available shall be risk-weighted in accordance with article 121 of the Regulation.
As an example, pursuant to article 120 of E.U. Regulation 575/2013, risk weights for exposures with a residual maturity of more than three months at institutions rated by a nominated ECAI are allotted risk weights according to the table below.
1 “ECAI” is an acronym for External Credit Assessment Institution.
> Capital Requirements for Operational Risk
The capital requirements for Operational Risk calculated in accordance with the Basic Indicator Approach are presented as follows:
USD USD USD2018 2017 2016
Net interest income 40.530.200,79 37.332.962,25 21.460.345,00
Net fee & commission income 58.730.355,09 54.215.845,50 52.530.585,00
Net foreign exchange trading result 6.087.616,32 4.659.499,99 5.982.875,00
Dividend 92,00 750.199,57 1.540.691,00
Realized gain on financial assets - 93,48 2.303.676,17 2.997,00
Other operating income 1.791.938,45 2.434.710,74 776.916,00
Total gross result 107.140.109,17 101.696.894,22 82.294.409,00
Average over 3 years 97.043.804,13
Capital Requirement (Basic Indicator Approach 15%) 14.556.570,62
Risk Exposure amount for Operational Risk 181.957.133,00
Capital requirement / 8%
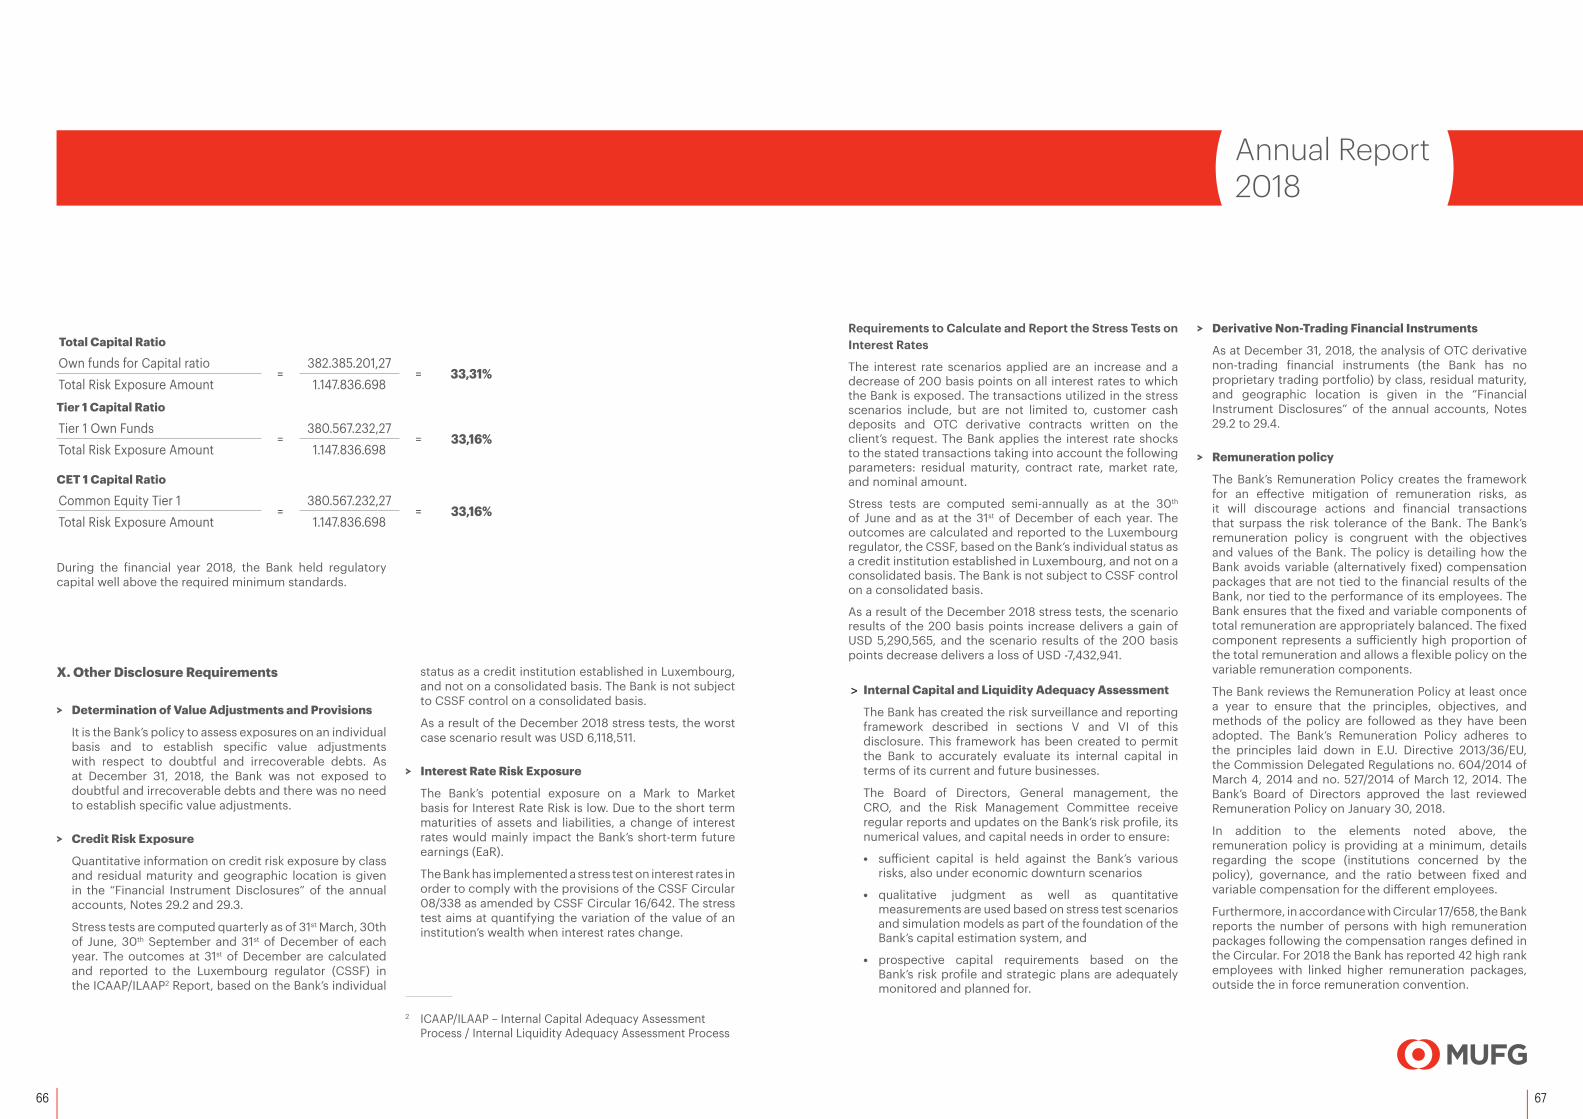
66 67
Annual Report2018
Total Capital Ratio
Own funds for Capital ratio =
382.385.201,27= 33,31%
Total Risk Exposure Amount 1.147.836.698
Tier 1 Capital Ratio
Tier 1 Own Funds=
380.567.232,27= 33,16%
Total Risk Exposure Amount 1.147.836.698
CET 1 Capital Ratio
Common Equity Tier 1=
380.567.232,27= 33,16%
Total Risk Exposure Amount 1.147.836.698
During the financial year 2018, the Bank held regulatory capital well above the required minimum standards.
X. Other Disclosure Requirements
> Determination of Value Adjustments and Provisions
It is the Bank’s policy to assess exposures on an individual basis and to establish specific value adjustments with respect to doubtful and irrecoverable debts. As at December 31, 2018, the Bank was not exposed to doubtful and irrecoverable debts and there was no need to establish specific value adjustments.
> Credit Risk Exposure
Quantitative information on credit risk exposure by class and residual maturity and geographic location is given in the “Financial Instrument Disclosures” of the annual accounts, Notes 29.2 and 29.3.
Stress tests are computed quarterly as of 31st March, 30th of June, 30th September and 31st of December of each year. The outcomes at 31st of December are calculated and reported to the Luxembourg regulator (CSSF) in the ICAAP/ILAAP2 Report, based on the Bank’s individual
status as a credit institution established in Luxembourg, and not on a consolidated basis. The Bank is not subject to CSSF control on a consolidated basis.
As a result of the December 2018 stress tests, the worst case scenario result was USD 6,118,511.
> Interest Rate Risk Exposure
The Bank’s potential exposure on a Mark to Market basis for Interest Rate Risk is low. Due to the short term maturities of assets and liabilities, a change of interest rates would mainly impact the Bank’s short-term future earnings (EaR).
The Bank has implemented a stress test on interest rates in order to comply with the provisions of the CSSF Circular 08/338 as amended by CSSF Circular 16/642. The stress test aims at quantifying the variation of the value of an institution’s wealth when interest rates change.
Requirements to Calculate and Report the Stress Tests on Interest Rates
The interest rate scenarios applied are an increase and a decrease of 200 basis points on all interest rates to which the Bank is exposed. The transactions utilized in the stress scenarios include, but are not limited to, customer cash deposits and OTC derivative contracts written on the client’s request. The Bank applies the interest rate shocks to the stated transactions taking into account the following parameters: residual maturity, contract rate, market rate, and nominal amount.
Stress tests are computed semi-annually as at the 30th of June and as at the 31st of December of each year. The outcomes are calculated and reported to the Luxembourg regulator, the CSSF, based on the Bank’s individual status as a credit institution established in Luxembourg, and not on a consolidated basis. The Bank is not subject to CSSF control on a consolidated basis.
As a result of the December 2018 stress tests, the scenario results of the 200 basis points increase delivers a gain of USD 5,290,565, and the scenario results of the 200 basis points decrease delivers a loss of USD -7,432,941.
> Internal Capital and Liquidity Adequacy Assessment
The Bank has created the risk surveillance and reporting framework described in sections V and VI of this disclosure. This framework has been created to permit the Bank to accurately evaluate its internal capital in terms of its current and future businesses.
The Board of Directors, General management, the CRO, and the Risk Management Committee receive regular reports and updates on the Bank’s risk profile, its numerical values, and capital needs in order to ensure:
• sufficient capital is held against the Bank’s various risks, also under economic downturn scenarios
• qualitative judgment as well as quantitative measurements are used based on stress test scenarios and simulation models as part of the foundation of the Bank’s capital estimation system, and
• prospective capital requirements based on the Bank’s risk profile and strategic plans are adequately monitored and planned for.
> Derivative Non-Trading Financial Instruments
As at December 31, 2018, the analysis of OTC derivative non-trading financial instruments (the Bank has no proprietary trading portfolio) by class, residual maturity, and geographic location is given in the “Financial Instrument Disclosures” of the annual accounts, Notes 29.2 to 29.4.
> Remuneration policy
The Bank’s Remuneration Policy creates the framework for an effective mitigation of remuneration risks, as it will discourage actions and financial transactions that surpass the risk tolerance of the Bank. The Bank’s remuneration policy is congruent with the objectives and values of the Bank. The policy is detailing how the Bank avoids variable (alternatively fixed) compensation packages that are not tied to the financial results of the Bank, nor tied to the performance of its employees. The Bank ensures that the fixed and variable components of total remuneration are appropriately balanced. The fixed component represents a sufficiently high proportion of the total remuneration and allows a flexible policy on the variable remuneration components.
The Bank reviews the Remuneration Policy at least once a year to ensure that the principles, objectives, and methods of the policy are followed as they have been adopted. The Bank’s Remuneration Policy adheres to the principles laid down in E.U. Directive 2013/36/EU, the Commission Delegated Regulations no. 604/2014 of March 4, 2014 and no. 527/2014 of March 12, 2014. The Bank’s Board of Directors approved the last reviewed Remuneration Policy on January 30, 2018.
In addition to the elements noted above, the remuneration policy is providing at a minimum, details regarding the scope (institutions concerned by the policy), governance, and the ratio between fixed and variable compensation for the different employees.
Furthermore, in accordance with Circular 17/658, the Bank reports the number of persons with high remuneration packages following the compensation ranges defined in the Circular. For 2018 the Bank has reported 42 high rank employees with linked higher remuneration packages, outside the in force remuneration convention.
2 ICAAP/ILAAP – Internal Capital Adequacy Assessment Process / Internal Liquidity Adequacy Assessment Process

68
287-289, route d’Arlon,L-1150 LuxembourgRC Luxembourg B-11937

287-289, route d’Arlon,L-1150 LuxembourgRC Luxembourg B-11937