annual report - baltagroup.com€¦ · providing leading innovation and great ... other...
TRANSCRIPT

ANNUAL report
2017
STRATEGIC REPORT 4
HIGHLIGHTS 20178
THE KEY TO OUR SUCCESS10
THE GROUP AT A GLANCE12
CFO FINANCIAL REVIEW20
NON-FINANCIAL KEY PERFORMANCE INDICATORS24
CORPORATE GOVERNANCE 34
SUMMARY OF MAIN RISKS 52
FINANCIAL STATEMENTS 54
GLOSSARY 112
INVESTOR RELATIONS 113
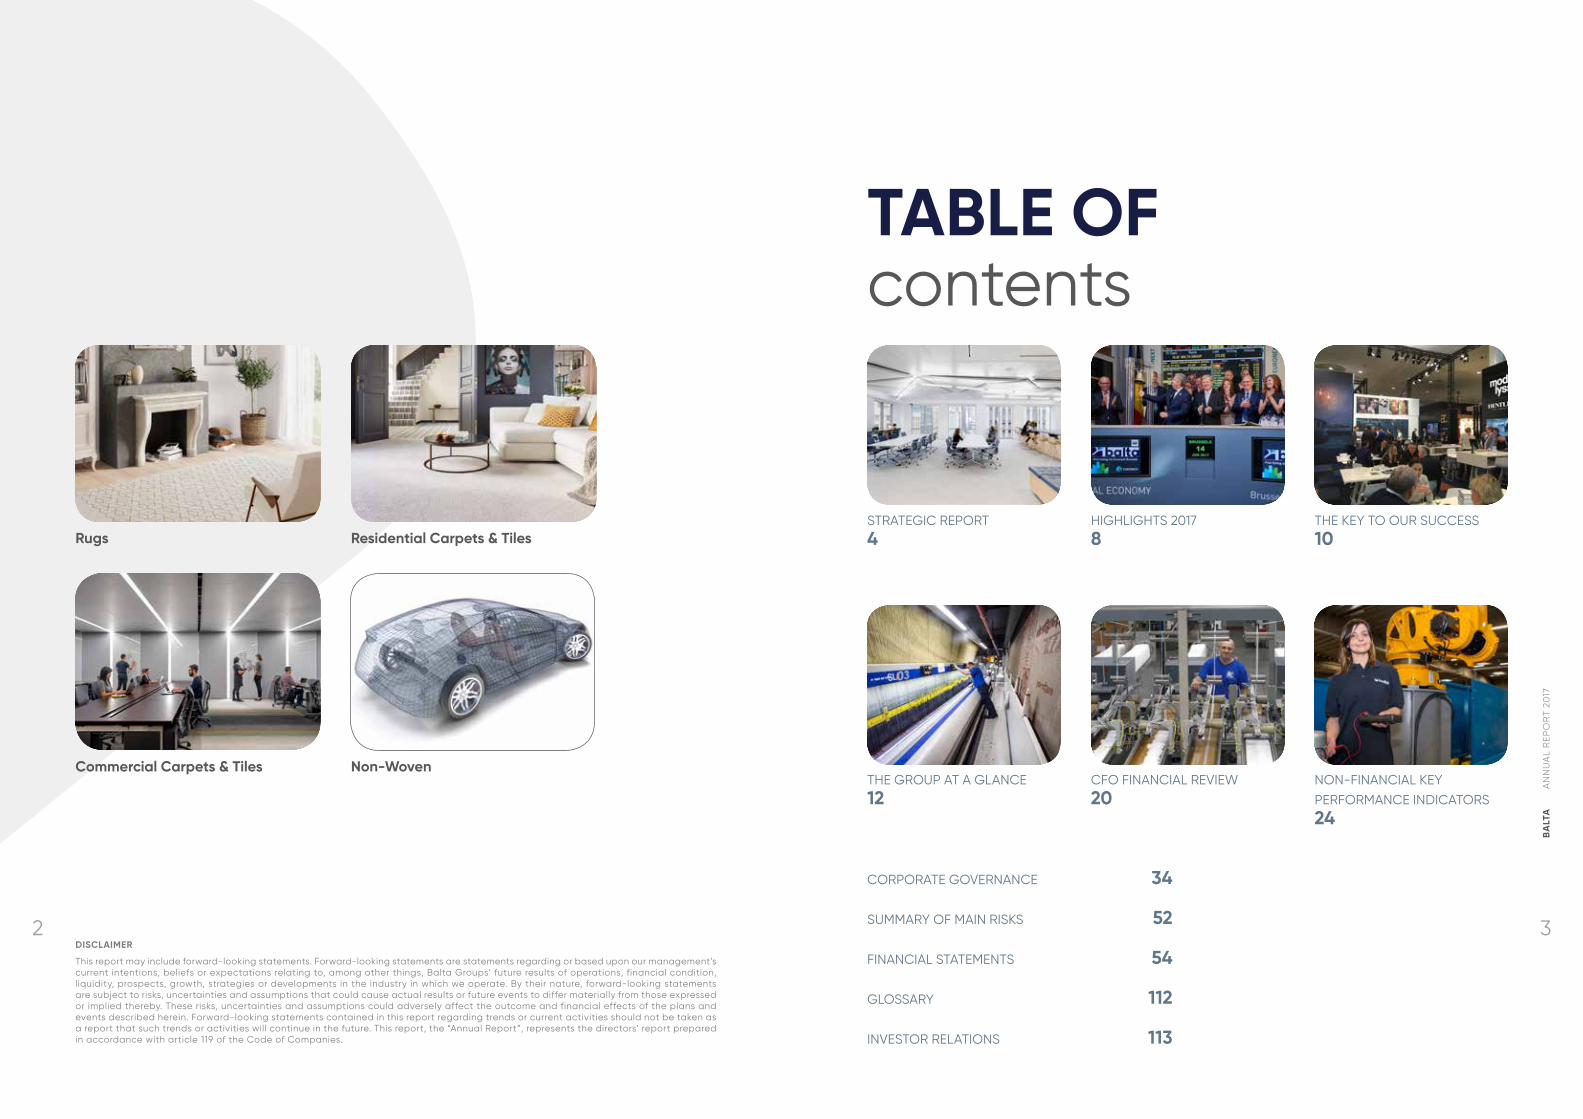
TABLE OF contents
Commercial Carpets & Tiles Non-Woven
Rugs Residential Carpets & Tiles
DISCLAIMER
This report may include forward-looking statements. Forward-looking statements are statements regarding or based upon our management’s current intentions, beliefs or expectations relating to, among other things, Balta Groups’ future results of operations, financial condition, liquidity, prospects, growth, strategies or developments in the industry in which we operate. By their nature, forward-looking statements are subject to risks, uncertainties and assumptions that could cause actual results or future events to differ materially from those expressed or implied thereby. These risks, uncertainties and assumptions could adversely affect the outcome and financial effects of the plans and events described herein. Forward-looking statements contained in this report regarding trends or current activities should not be taken as a report that such trends or activities will continue in the future. This report, the “Annual Report”, represents the directors’ report prepared in accordance with article 119 of the Code of Companies.
BA
LTA
AN
NU
AL
REP
OR
T 20
17
32

STR
ATE
GIC
REP
OR
T
STRATEGIC reportChief Executive Officer
OUR STRATEGYOur vision is to bring beautiful design at affordable prices to the mid-seg-ment mass markets. As a manufacturer with extensive vertical integration, we leverage our innovation capabilities and operational excellence, to target large segments with attractive margin opportunities. Also, our Bentley brand caters to the top end of the US com-mercial market. We see ourselves as the preferred partner to our customers, providing leading innovation and great customer service.
In the Rugs division, our goal is to be the global innovation and design leader in machine-made rugs. In Commer-cial, Balta is the growing challenger in the North American and European commercial carpet and tiles segment. Finally in Residential, we aim to be the
leading carpet manufacturer in Europe. The execution of these goals is based on a three pillar strategy:• strengthen our leading position across
core segments• continue to focus on Operational
Excellence• selectively seek complementary ac-
quisition opportunities
We are clear how we will execute these strategies and in the last year we have made good progress.
STRENGTHEN OUR LEADING POSITION ACROSS CORE SEGMENTSWe have proven that a strong focus on product development and launching new innovation is a profitable way for Balta to grow sales and margin. We are also mindful that we have to invest
to expand our sales reach and capabilities for future growth in the attractive Rugs and Com-mercial divisions.
The Rugs division achieved full year organic revenue growth of 8.1%, which is ahead of our growth trend since 2012. The first half growth of 12.9% was supported by a very strong pro-gramme of new product development launched with customers; and we saw continued growth during the third quarter of 8.7%. As of quarter four, we have been impacted by a reduction in the ‘share of wallet’ of this season’s outdoor rugs collections with two US home improvement customers.
We have been growing our outdoor rugs busi-ness very successfully in the US over the last five years, with a focus on a small number of large retail chains. We are now broadening our customer reach in the US while extending our indoor rugs offering. This is enabled by the continued investment we have made during 2017 to increase our sales and distribution infra-structure; including a new warehouse in Georgia, USA, which also supports our customers in their e-commerce channels.
Commercial Europe had a strong year growing organic revenue at 8.0%. The growth was evenly split across both halves of the year, despite performance in quarter three being impacted by the start-up issues resulting from the full automation of our commercial tile line in the Zele plant, Belgium. In the US, we continue to gain market share while integrating the Bentley business within the Balta group.
At Bentley, in the USA, we increased our sales force to address geographic areas where we see opportunity to grow our market share. For example, in San Francisco we have seen great results and anticipate that we will double our revenue in that region within twelve to eighteen months of the extra sales investment. Within
Europe we have been investing in sales teams focussed on the architecture and design com-munity to further build our specification business. Given the production constraints during quarter three, returns from this 2017 investment will only start in 2018.
Within Residential, one important element of our strategy is to grow the proportion of our revenues from the relatively higher margin broadloom products such as the latest super soft qualities. I am pleased to report we have increased sales this year by a third compared to the previous year; these products currently represent 20% of Residential sales versus 15% a year ago and 7% two years ago. However, sig-nificant raw material cost price increases and the decline in the GBP have more than offset these achievements resulting in a stronger than expected margin decline.
CONTINUE TO FOCUS ON OPERATIONAL EXCELLENCEIn a capital intensive manufacturing industry such as ours, ‘Operational Excellence’ is a key ingredient of success. There are three parts to how we do this. First we continue to automate our rugs and commercial production processes to lower the cost of manufacturing. Secondly where our products cannot benefit from auto-mation, we have been increasing capacity in our Turkish facilities where we can manufacture labour intensive products at competitive pric-es. Thirdly we constantly strive to optimise our infrastructure to changes in the markets that we operate in.
In 2017 we continued with the annual programme of ‘Operational Excellence’ initiatives to com-pensate for cost inflation from wage, energy and transportation costs. With the headwinds experienced in the second half of 2017, we have developed an extended programme for imple-mentation in 2018, which will mostly benefit the second half of the year.
Tom Debusschere, CEO
BA
LTA
AN
NU
AL
REP
OR
T 20
17
54

Additionally, we have invested in expanding pro-duction capacity at our Turkish plant by around 10%, providing increased cost competitiveness in products that are difficult to automate and have a higher labour cost component. We are continuing to grow our Turkish operation in 2018.
At our Zele plant in Belgium we have invested in fully automating the commercial tile plant. The automation moves a roll of broadloom carpet all the way through the process to a wrapped pallet of cardboard boxes with cut-to-size carpet tiles ready for shipment to customers. All without one human hand touching the prod-uct. This investment builds increased capacity to support our growth, while at the same time increasing our cost competitiveness.
Finally we announced the restructuring of the operational infrastructure in Belgium within our Residential business, by consolidating the Oudenaarde facility into our two fully vertical-ly integrated factories in the region. We have completed the consultation and negotiation stages, have activated a full project man-agement office to deliver the full annualised run rate EBITDA benefit of €8.3m in 2019. As a result of the progress we have made, we now expect to finish the move ahead of schedule by the summer of 2018 and expect the benefits to commence early in the second half of the financial year.
SELECTIVELY SEEKING COMPLEMENTARY ACQUISITION OPPORTUNITIESOur focus has been to deliver the shareholder value from the Bentley acquisition made in 2017. The Bentley acquisition has progressed well, the business integration is complete, we have increased sales resources and the expected revenue synergies are on track with specified orders received for modulyss tiles. Furthermore our integration work has created operational and procurement synergies of around $2m that will largely benefit during 2018.
Our short term focus is to deleverage by growing both EBITDA and cash generation; enabling us to
continue evaluating complimentary acquisition opportunities with attractive shareholder returns.
PERFORMANCE IN 2017The business had a transformational year with the IPO in June and we made good progress in executing the strategy. However market con-ditions we faced became increasingly difficult and a strong first half financial performance was offset by the difficult conditions in the second half of the year.
We had expected negative currency move-ments and raw material increases, but not to the level we actually experienced. The pressure on Balta’s margin was greater than faced by some of our peers because of the movement of currency rates relative to our Euro cost base and Euro reporting currency. As a result, we were not able to realise price increases and other compensating actions to fully offset the currency and raw materials effect.
We expect the headwinds faced in 2017 will even out over time. However, with the near term outlook still looking challenging, we are taking action on costs and pricing to underpin 2018 performance and strengthen our business for the recovery phase.
The external challenges were exacerbated by start-up issues in our Commercial tile plant in the Zele, Belgium facility, creating a shortfall in revenue, profit and cashflow in the second half of the year. The tile plant has been fully operational since quarter four. Following the strong growth of our Rugs division over many years, late in 2017 we could not retain a propor-tion of this season’s outdoor rugs programme with two US home improvement retailers. This impacted our Rugs division late in the fourth quarter and will be a drag on performance in the first half of 2018. Winning and losing ‘share of wallet’ with a customer is part of the normal cycle of the business and I am confident that in the course of 2018, we will again win ‘share of wallet’ with the same or other customers restoring our successful growth in US rugs. In doing so, we expect to broaden our customer
base with a focus on increasing our share in the indoor rugs segment.
Our financial performance is explained in more detail on page 20.
2018 PRIORITIESWe have laid out our six key priorities for deliv-ering improved performance with much of the benefits being realised in the second half of 2018 and the full run rate in 2019.
Grow profitable revenue1. Continue to grow rugs sales in North America,
by increasing our channel penetration and broadening our channel reach, underpinned by our 2017 investment in sales and distribution infrastructure, with benefits beginning in the second half of 2018
2. Continue sales growth in the Commercial division, leveraging the increased capacity of our new automated commercial manufac-turing line in Europe and our 2017 investment in increasing our sales force, both in Europe and the US. Acceleration of the cross selling of modulyss products through Bentley’s sales force, with new end market opportunities in national accounts
3. Further improve the Residential product mix by growing sales of higher margin products and by capturing the right value for our products and services through a strategic pricing excel-lence project that we have recently launched
Deliver increased level of cost savings4. Deliver the full benefits of the restructuring
of the operational footprint in Residential of €8.3m EBITDA in 2019, commencing early in the second half of 2018
5. Execute the already started expanded Op-erational Excellence programme, delivering an increased run rate of cost savings from the second half of 2018
6. Execute the planned operational and pro-curement synergies between our European and US Commercial business.
2018 OUTLOOKFollowing the adverse raw material and FX movements, we expect the trends of the second half of 2017 to continue in the first half of 2018. Due to the strong comparative in the first half of 2017 and the timing effect of gains and losses in customers’ ‘share of wallet’, we expect the Rugs division to have mid-teens revenue decline in the first half of 2018; followed by a return to growth in the second half of the year. Together with our growing Commercial division, both in Europe and the US, we are confident that the measures and actions we are taking will deliver a significantly stronger second half run rate.
As a result, with external factors remaining un-changed, we expect 2018 EBITDA to be between €82m and €87m.
Balta is a strong business with a track record of generating revenue growth at good margins, which I have every confidence will continue.
Tom Debusschere, CEO Balta
STR
ATE
GIC
REP
OR
T
Anthem, premium carpet tiles by Bentley®.
BA
LTA
AN
NU
AL
REP
OR
T 20
17
76

HIG
HLI
GH
TS 2
017
HIGHLIGHTS 2017
JANUARY:Balta brands have a successful Domotex fair in Hanover, Ger-many, introducing innovations in rugs, residential and com-mercial broadloom and tiles.
FEBRUARY:Balta starts the roll-out of a new corporate identity with a new logo that looks more modern, younger and fresh, underlining the dynamic, no-nonsense spirit of Balta.
MARCH:10 March: Balta announces agreement to acquire Bentley Mills, a California (USA) based manufacturer of high-end modular carpet tiles, strength-ening our position in the US enabling the cross selling of European modulyss commercial carpet tiles.
APRIL:Balta home USA (Rugs Division) hosts all of their existing and potentially new customers dur-ing the New York Textile Market in their 5th Avenue showroom in New York. This market focuses on “big box retail”.
MAY:25 May: US President Trump officially opens the new NATO headquarters in Brussels. 80,000m2 of Millenium100 carpet tiles from modulyss were fitted throughout the impressive building. According to the project’s lead architect, the environment and sustain-ability were among the most important considerations in the design.
31 May: Balta Group NV announces the launch of its initial public offering (IPO) on Euronext Brussels.
JUNE:14 June: Balta lists on Euronext Brussels. It is the largest IPO on Euronext Brussels since 2014. The company raised € 145m new capital to improve the debt position and further invest.
Bentley and modulyss, our respective US and European commercial companies, show-case their products jointly for the first time at the NeoCon trade fair in Chicago.
Expansion of our Turkish pro-duction platform with a 5,900m2 new building to support our growth ambitions in rugs.
JULY:5 July: modulyss launches a new website www.modulyss.com, the perfect resource for architects, designers and specifiers to discover how our carpet tiles bring high style and performance to commercial interiors.
Balta home introduces new in-novative collections and hosts a large part of its European and international customers in the Belgian showrooms.
SEPTEMBER:24 September: More than 2,000 group employees and their families visit Balta Avel-gem, discovering the high degree of automation and state-of-the-art machinery used in the production of wo-ven area rugs.
NOVEMBER:7 November: Balta announces the plan to absorb the Resi-dential carpet production from the Oudenaarde plant into our two other Residential plants in Belgium to optimize the oper-ational footprint.
16 November: Balta home USA opens new 330,000ft2 distribu-tion center in Rome, Georgia to support our future growth ambi-tions and provide the infrastruc-ture to support our customers more effectively in their growing e-commerce sales channels.
OCTOBER:Positive reaction to modulyss carpet tiles introduced in our recently acquired US commer-cial business, Bentley, with first specified orders now received. Commercial tile production in Belgium now fully automated and operational.
DECEMBER:Rebranding of our product offer in residential carpet tiles as LCT, Luxury Carpet Tiles.
BA
LTA
AN
NU
AL
REP
OR
T 20
17
98

THE
KEY
TO
OU
R S
UC
CES
S
THE KEY to our success MOST RELIABLE PARTNERHere at Balta we know that reliable partners are the key to success. That’s why we strive to be the most dependable manufacturer for all stakeholders in the sectors that we operate in. With manufacturing excellence driving products of the highest quality and exceptional service vouching for dependability in everyday business, we pride ourselves on being the best possible partner.
CONSTANT INNOVATION Creativity and innovation are key ingredients in any new product launch, with colours and designs driven by market demands. Product development teams, within each division at Balta, keep a close eye on international trends to ensure the company stays one step ahead of the market. As a market leader, Balta is not only seen as a trend setter in rugs, broadloom carpet and carpet tiles, but also as a pioneer in new flooring technologies and solutions.
ALWAYS BETTERWith vertically integrated factories, Balta is constantly looking to improve its manufacturing with its “Operational Excellence” programme applying the Six Sigma lean manufacturing principles. A Total Quality Management system across all plants ensures that products manufactured are of the highest quality and perform to exacting standards.
SUSTAINABILITY – THE 3 P’s: PEOPLE, PLANET AND PROSPERITY People. We believe in people first. Within Balta there is mutual respect and we are striving for zero accidents - every colleague who starts his or her working day returns home safe and sound. As a major employer we take our responsibility towards the community seriously, sponsoring local charity events and organisations.
Planet. We are continuously reducing our ecological footprint: less water, less energy, less waste, more recycling. The company has installed one of the largest solar panel projects in the Benelux region supplying renewable energy to its production facilities.
Prosperity. We are also committed to doing business in a responsible and sustainable manner benefitting all stakeholders.
Patchwork carpet tiles by modulyss® Domotex in Hanover, Jan. 2018
10 11
BA
LTA
AN
NU
AL
REP
OR
T 20
17

THE
GR
OU
P A
T A
GLA
NC
E
Modern face-fo-face weaving looms in Balta Waregem
THE GROUP at a glance
Balta is the largest producer of textile floor coverings in Europe.With a consolidated revenue of €689m (PF1 2017), its products are exported to more than 130 countries worldwide. In June 2017, Balta Group became a public company listed on Euronext Brussels
REPORTING SEGMENTS
carpet tiles
RUGS RESIDENTIAL COMMERCIAL NON-WOVEN
Balta has four distinct reporting segments:
• rugs: woven and tufted area rugs, known under the brand Balta home.
• residential: wall-to-wall carpet and carpet tiles for private use, with the brands Balta carpets, ITC and Balta carpet tiles.
• commercial: wall-to-wall carpet and carpet tiles for commercial use with the brands, mod-ulyss, Bentley and Arc Edition.
• non-woven: needle felt, carpet backing and technical non-wovens under the Captiqs brand.
Our traditional core markets include the United States, the United Kingdom, Germany, France, and an important presence in Central and Eastern Europe.
34%Residential
29%Commercial
4%Non-Woven
33%Rugs
R E V E N U E
PF1 Revenue 2017 per reporting segment
23%Residential
31%Commercial
3%Non-Woven
43%Rugs
A D J U S T E D E B I T D A
PF1 Adjusted EBITDA 2017 per reporting segment
1 see Glossary on page 112 for the definition of Pro Forma.
BA
LTA
AN
NU
AL
REP
OR
T 20
17
1312

RUGSBalta homeMarket position: N° 1 in Europe, N° 2 worldwide and a market leader in the outdoor rugs seg-ment in the United States.Production plants: 3 in Belgium (Avelgem, Sint-Baafs-Vijve & Waregem) and 2 in Turkey (Uşak).Distribution centres: 2 in Belgium (Avelgem & Sint-Baafs-Vijve), 1 in Turkey (Uşak) and 1 in the USA (Rome, Georgia).Distribution channels: major international retailers (such as home improvement, furniture, specialist, discount and DIY stores) and wholesalers, with whom we have long-lasting relationships.Brands: Line A®, Berclon®
www.balta-home.com
Balta home is a global player in machine-woven and tufted rugs for indoor and outdoor use, exporting to more than 100 countries world-wide. Rugs serve a home decoration purpose and as such we believe the rugs market to be a non-cyclical, consumer and lifestyle driven market. An experienced development team is continuously developing new market-oriented collections, designs and colours to meet the re-quirements of all our customers. At Balta home, we are experts in creating rugs in all kinds of
different colours, designs and constructions: from flat-woven via low-pile to high-pile plush rugs, from soft, washable indoor to sustainable, reversible outdoor rugs. From the idea, via the production of raw materials, to the finished prod-ucts; at Balta, every step of the development and production process takes place in-house. This vertical integration enables us to control our high quality standards during every step of the production process. Balta home, with highly automated state-of-the-art production and distribution facilities in Belgium, Turkey and the USA, is well known throughout the world for its creativity, know-how, innovation, quality, service delivery and its broad product range.
RESIDENTIALBalta carpets & ITCMarket position: market leader in Europe with top positions in the UK (Balta carpets), Germany and CEE (ITC).Production plants: Sint-Baafs-Vijve, Tielt and Oudenaarde2 in Belgium.Distribution centres: Sint-Baafs-Vijve and Tielt in Belgium.Distribution channels: major retailers and whole-salers, such as specialized carpet, home im-provement and furniture chains, DIY stores,
independent retailers and carpet fitters.Brands Balta carpets: Stainsafe®, Leonis®, X-Tron®, Made in Heaven®, Woolmaster®
Brands ITC: Satino®, Imprel®, Odyssey®, Wild Luxury®, Amaize®
www.balta-carpets.com and www.itccarpets.com
Balta carpets is the European market leader in the production of tufted and woven broadloom carpet in polypropylene. The market as such is predominantly renovation-driven and to a lesser extent driven by new-build. Key market is the United Kingdom, one of the largest residential carpet markets globally, with a strong traditional preference for carpets as a flooring solution, where we believe we are market leader by volume.
ITC is the European market leader in the pro-duction of tufted broadloom polyamide carpet. ITC produces high-quality products for premi-um residential applications in which creativity, design, appearance, durability and resistance to wear are important. All quality and safety aspects are certified by independent bodies such as PRODIS, GUT and TUV.
Yarn processing at Balta Tielt
Outdoor rug by Balta home
2 November 2017: Balta announced its intention to move residential carpet tufting from Oudenaarde to Sint-Baafs-Vijve and Tielt, and the integration of the Sint-Niklaas warehouse in existing sites.
THE
GR
OU
P A
T A
GLA
NC
E
BA
LTA
AN
NU
AL
REP
OR
T 20
17
1514

Balta carpet tilesProduction plant & distribution centre: Zele in BelgiumDistribution channels: major retailers and whole-salers, such as specialized carpet, home im-provement and furniture chains, DIY stores, independent retailers and carpet fitters.Brand: LCT First® (Luxury Carpet Tiles)
With balta carpet tiles, we can offer a wide range of multi-functional carpet tiles for use in homes. This modular application is clearly on the rise due to its advantages of being easy to transport, fit and replace. Unique laying patterns and exciting combinations are made possible through these carpet tiles.
COMMERCIALmodulyssMarket position: N° 3 in Europe.Production plant & distribution centre: Zele in Belgium.Distribution channels: architects, designers, contractors and distributors (offices, education, health care and hospitality).Brands: modulyss®, LCT Pro® www.modulyss-pureair100.comwww.modulyss.com
modulyss designs and manufactures modular carpet tiles for the international contract market and targets architects and designers looking for high-quality and trend-setting floor coverings. Thanks to the sophisticated manufacturing process, modulyss carpet tiles exceed the limits of performance and design, putting them in a class of their own. In 2017 modulyss invested in a completely new automatic tile-cutting and packaging line doubling capacity. modulyss carpet tiles are available in a variety of colours, structures and patterns. With their endless cre-ative possibilities, modulyss carpet tiles are the ideal solution to give a floor style and exclusivity. The market as such is mainly renovation-driven and to a lesser extent driven by new-build.
BentleyMarket position: a market leader in the premium US commercial segment.Production plant & distribution centre: Los An-geles in the USA.Distribution channels: architects, designers and contractors (offices, education, health care and hospitality).Brand: Bentley®
www.bentleymills.com
Style. Service. Quality. Partnership. For more than 30 years, these tenets have been the driving forces behind Bentley, California’s largest carpet design and manufacturing company. Backed by an industry-leading design team recognized for consistent innovation and with a proven new product success track record, Bentley is a leading producer of award-winning, premium carpet tile and broadloom for commercial inte-riors. It is an iconic brand, chosen by specifiers, architects, designers and end users. Its success is driven by long-term support of the design community, a focus on sustainability and a broad global platform for its end-user clients. Bentley’s impressive growth path is fuelled by significant investments in its highly efficient LEED (Leadership in Energy and Environmental Design) Gold production facilities.
This is Bentley. A visionary carpet manufac-turing vanguard, Bentley began pushing back boundaries in 1979, setting new standards for the flooring industry. Steeped in our Los Angeles’ (California) heritage and frontrunners in style and culture, we employ conscious sensibilities. At the core of our company is our commitment to establish and maintain distinctive, long-term relationships with our partners and to make products inspiring our customers.
Arc EditionMarket position: one of the market leaders in Europe, with a top position in CEE.Production plant & distribution centre: Tielt in Belgium.Distribution channels: commercial custom-ers (including offices, education, health care and hospitality), specialized retail groups and wholesale.Brand: arc edition®
www.arcedition.com
Arc edition defines innovative high-quality broadloom carpet for commercial environments, enabling flooring professionals, architects, de-signers and specifiers to explore the creative potential of performance flooring. This brand provides a wide choice of in-stock textile floor-coverings suitable for use in demanding com-mercial environments with the service collection, as well as the freedom and unlimited potential of tailor made bespoke, chromojet-printed, carpet creations.
NON-WOVENCaptiqsMarket position: European mid-level player.Production plant: Oudenaarde in Belgium.Distribution centre: Sint-Niklaas2 in Belgium.Distribution channels: specialized B2B converters, event organizers and traditional distributors.Brand: Captiqs®
www.captiqs.com
Captiqs offers durable, non-woven solutions for a wide variety of applications such as automo-tive, buildings, events, insulation, lining, carpet backing and advertising banners. Through innovation and a dynamic approach, we pro-duce needle-punched, breathable, bonded and calendered non-wovens perfectly meeting our customers’ needs.
2 see footnote page 15
THE
GR
OU
P A
T A
GLA
NC
E
BA
LTA
AN
NU
AL
REP
OR
T 20
17
1716

USALOS ANGELES, CA
USAROME, GA
TURKEYUŞAK
AVELGEM OUDENAARDE ST.-NIKLAAS
TIELT WAREGEM ZELE
BELGIUMSINT-BAAFS-VIJVE
(head office)
61,150Solar panels on 5 factory roofs in Belgium
4,053Total number of employees (31/12/17)
more than 1.5 millionboxes of carpet tiles/year.
130+countries we sell into
70,000rugs / working day
33.7 haFactory roof
67Football fields
12.8 million kWh per yearThe electricity consumption of 4,600 Belgian families
-4.75 million kgCO2 per year
40Number of nationalities
752,000 m2
Total manufacturing footprint = 150 football pitches
€ 689 mPro Forma revenue 2017
Balta Avelgem Solar panels on the factory roof of Balta Sint-Baafs-Vijve
THE
GR
OU
P A
T A
GLA
NC
E
BA
LTA
AN
NU
AL
REP
OR
T 20
17
1918

CFO
FIN
AN
CIA
L R
EVIE
W
CFOFinancial Review
On a Pro Forma basis, including Bentley for both the current and prior year, full year revenue grew 3.1% (organic 4.6%) to €689.0m and Adjusted EBITDA declined 10.3% (organic -3.9%) to €87.3m.
FINANCIAL REVIEW BY DIVISIONRugsThe Rugs division achieved full year organic reve-nue growth of 8.1%, spread across all three regions of Europe, North America and Rest of the World.
The very strong first half organic growth of 12.9% was supported by a successful programme of new product developments launched with customers. We saw continued organic growth during the third quarter of 8.7%.
In the fourth quarter organic revenue was down 2.4%. Some orders moved to January and we had a reduction in orders for our outdoor rugs collections with two US home improvement cus-tomers, which will impact revenue in the first half of 2018. A weakening US dollar to Euro, negatively impacted our Consolidated Revenue by 3.4%, leading to a decline of 5.9%.
During 2017, we have invested to strengthen our position for future growth by increasing our US sales and distribution infrastructure. This includes a new warehouse to better support existing cus-tomers and increase our reach to new customers and channels for both indoor and outdoor rugs. As a result we have increased our full year fixed costs by €1.7m.
Full year Consolidated Adjusted EBITDA declined by €0.4m to €37.6m with margins at 16.5% (Q4 margin 14.7%). The margin reduction from 17.7% in 2016, reflects the time delay between higher raw material prices and the actions required to compensate, including price increases. Full year EBITDA was impacted negatively by 1.3% from currency movements, which were higher in quarter four at 2.5%.
CommercialFull year Consolidated Revenue increased by 114.5% to €171.7m, driven by the acquisition of Bentley at the end of quarter one 2017 and the
8.0% organic growth of our European Commercial business. Quarter four organic revenue was up 14.8%, reflecting the return of full supply in our European tile business.
In the US, whilst integrating the Bentley business within the Balta group we have continued to take market share, enabled by our increased invest-ment in sales resource. The acquisition has allowed us to reach a wider pool of customers in North America using Bentley’s customer relationships and a differentiated product portfolio including both Balta’s modulyss products and Bentley’s own premium tile range. In quarter four we won a national US retailer account for modulyss tiles, which provides Balta with a platform to grow revenue and profit in a new channel.
Also in Europe, we have continued to invest in our commercial sales resource, and with the start-up issues we experienced in 2017 now resolved, the return will start being delivered in 2018.
Consolidated full year Adjusted EBITDA increased by 98.5% to €23.9m although organic EBITDA was lower by 7.9%. Quarter four organic EBITDA was lower by 38.4% due to negative product mix including the lower margins of our new customer in the US, and the incremental costs associated with resupplying our European customer base following the resolution of the supply issues.
ResidentialFull year Consolidated Revenue of €234.8m, declined by 0.8%, with organic growth of 0.6% impacted by negative currency of 1.4%. The performance reflected a challenging residen-tial market environment in continental Europe and stable total volumes in the UK. Quarter four revenue was a consolidated growth of 1.6%, with organic growth of 2.4% outweighing the negative currency impact of 0.8%.
Residential EBITDA margins continued to be under pressure with quarter four at 7.3% (full year: 8.6%). The drivers of this are the continued adverse effects of currency movements and raw material inflation which have not been fully offset with price increases.
In 2017 Balta delivered group Consolidated Revenue of €661.3m, up 18.6% and Adjusted EBITDA of €84.4m up 3.7%, both versus last year. EBITDA margin of 12.8% was down 183bps, reflecting the impact to earnings from currency movements and raw material infla-tion which was not sufficiently offset by pricing and other compensating actions in the financial year. These results include the contribution from Bentley which was consolidated into the group’s results from 1 April 2017.
Heatsetting nylon yarn in Balta Tielt
BA
LTA
AN
NU
AL
REP
OR
T 20
17
2120

Full year organic EBITDA reduction of 12.6% com-bined with a negative currency impact of 16.2% resulted in a consolidated Adjusted EBITDA of €20.2m, down €8.2m versus the prior year.
The strategy to grow sales of higher margin new broadloom products led to sales increasing by a third compared to last year, currently representing about 20% of Residential sales versus 15% a year ago and 7% two years ago.
The benefits from the optimisation of the Residen-tial operational footprint are ahead of schedule and will deliver the full run rate benefits of €8.3m EBITDA in FY19, resulting in a recurring cashflow improvement of €9.9m with exceptional one off costs of €12.4m. As a result of the progress we have made, we now expect to finish the move ahead of schedule and expect the benefits to commence early in the second half of the 2018 financial year.
OTHER FINANCIAL ITEMS REVIEWNon-Recurring Items2017 was characterized by several one off events with a material impact on our P&L. The impact of these events on 2017 profit for the period is equal to a net expense off €13.8m (€0.38 per share). In contrast, the profit realized in 2016 was characterized by a net benefit of €8.3m, mainly as a result of the one-off recognition of deferred tax assets (€10.8m).
The non-recurring events of 2017 are:• purchase price accounting adjustments fol-
lowing the acquisition of Bentley in March 2017. These adjustments have an impact of €2.9m on EBITDA and €1.8m on the profit for the period
• integration and restructuring expenses of €11.4m impacting EBITDA, of which €8.2m is in con-nection with the optimisation of the Residen-tial operational footprint. As a reminder, the
expected total one off cost for the Residential optimisation is €12.4m
• finance expenses of €9.3m relating to (i) expenses of €5.4m in connection with the debt financed acquisition of Bentley, which was fully repaid in June 2017 from the IPO proceeds, and (ii) expenses in connection with the partial early redemption of the Senior Secured Notes (€3.9m)
• €8.6m tax benefit relating to events that are not reflective of Balta’s normal business operations, including the re-measurement of deferred tax assets and liabilities following changes in tax legislation.
Net Financing CostsThe net finance expense amounted to €28m, excluding €9.3m of pre-IPO capital structure and one-off financing fees which are non-recurring. In addition, the full year financing cost does not reflect the run rate benefit of the repayment of €21.2m Senior Secured Notes in June 2017 using the proceeds of the IPO and the refinancing of €35m of Senior Secured Notes executed in September 2017. These two transactions have reduced our run rate finance expenses to ap-proximately €23m.
TaxationThe reported income tax expense of the year is a credit of €2.7m which includes two items totaling €8.6m which we have treated as non-recurring.
Firstly, we have recognized a positive effect of €10.3m linked to tax reforms, of which €8.8m is linked to the Belgian tax reform which has been substantially enacted on 22 December 2017. The highlight of the corporate tax reform is the reduction of the corporate tax rate from 33.99% to 29.58% in 2018 (including crisis contribution, lowered from 3% to 2%) and to 25% as from 2020 (abolishment of crisis contribution). As a conse-quence, deferred tax assets and liabilities have
been adjusted to reflect the new tax rates that are expected to apply to the period when the asset is realized or the liability is settled.
Secondly, the deferred tax assets relating to tax credits and loss carryforwards have been adjusted to reflect changes in the probability that these can be used in the future.
When normalizing for all exceptional events of 2017, the Adjusted Effective Tax Rate is equal to approximately 30%. Following the enactment of the tax reform in Belgium, and based on the same scope of activity and financing structure, we anticipate that our future effective tax rate will be between 25% and 27% on a like for like basis.
Earnings per shareFull year Adjusted Earnings per Share is equal to €0.47 in 2017, unchanged versus the prior year. The impact of the non-recurring items results in reported 2017 earnings per share of €0.08.
DividendAs disclosed at the IPO, the Company intends to pay a dividend of between 30% and 40% of net profit. For 2017, the dividend is calculated pro rata such that the Company only pays a dividend in respect of the portion of the financial year for which its shares were listed on Euronext Brussels. In order to determine the amount, the full year profit for the period has been adjusted to exclude the adverse impact of (i) purchase price accounting adjustments, (ii) integration and restructuring expenses and (iii) exceptional finance expenses. In order to determine the adjusted profit for the period, we have applied our normalized effective tax rate of 30%. We have then taken a pro rata of the normalized full year earnings to reflect the earnings of the post-IPO period.
On this basis, the Board will propose a dividend of €0.08 per share, which is subject to the approval of the annual general meeting.
Cashflow and net debtNet debt at the end of December 2017 is equal to €253.5m, €15.0m lower versus the end of 2016. Leverage has decreased from 3.3x Adjusted EBITDA at the end of 2016 to 2.9x Adjusted EBIT-DA at the end of 2017. The reduction in net debt has been achieved by reducing gross debt. As a reminder, a portion of the primary proceeds of the IPO were used to redeem €21.2m of the Senior Secured Notes. An additional €33.9m of Senior Secured Notes were repaid in the course of the third quarter and replaced with a €35m Senior Term Loan facility at a margin of 1.4%, reducing annual interest expenses by €2.1m. Following these transactions, gross debt at the end of 2017 is equal to €290.8m (excluding capitalized financing fees), of which €240.3m Senior Secured Notes, €35.0 million Senior Term Loan Facility and €15.5 million of finance leases.
Business combination accountingIn connection with our acquisition of Bentley Mills, accounting rules require us to adjust various balance sheet accounts, including inventory, to fair value at the time of acquisition. The fair value adjustment is mainly related to inventory and rep-resents a one-off, non-recurring, expense of €2.9m on the operational result of 2017. The after-tax impact of business combination accounting on the net result of 2017 is equal to €1.8m.
Following the completion of the purchase price allocation, goodwill in connection with the Bentley acquisition has been reduced from €81.3m to €74m and annual depreciation charges will increase as from 2018 by an estimated €0.4m.
CFO
FIN
AN
CIA
L R
EVIE
W
BA
LTA
AN
NU
AL
REP
OR
T 20
17
2322

NON-FINANCIALKey Performance Indicators
Balta is committed to responsible and sustaina-ble business practices. Embedding sustainability throughout Balta Group is a shared responsibility, protecting and enhancing our global license to oper-ate and helping to make our business more resilient and competitive.
The UN (United Nations) aims to drive global action through seventeen Sus-tainable Development Goals (SDGs) launched in September 2015. Reflecting the biggest challenges facing our plan-et, these goals aim to create a fairer and more sustainable world. We have mapped our Planet, People and Pros-perity sustainability strategy against the nine SDGs that we can positively influence.
While the strategic and financial reports outline our strategy and the progress we have made, the topics discussed in this section are key to our current and future performance. Balta’s approach to managing sustainability opportunities and risks focuses on integrating the SDGs into individual divisional business strategies. Looking to the future, we intend to develop an overarching group sustainability policy, shaping our goals and targets.
PEOPLE PLANET PROSPERITY BA
LTA
AN
NU
AL
REP
OR
T 20
17
2524

PLANETBalta is investing significant effort into reducing resource use and the impact we have on the environment. Increasing en-vironmental regulations puts us at risk of incurring significant costs and disruption to our business, possibly even impacting our license to operate and our reputation. Assuming a leading role in conserving the environment is the only way for Balta to sustainably create value for its stakeholders and potentially gain a competitive advantage for the company. Whilst Balta has not yet set targets, we intend to move in this direction in the future.
As a leading soft flooring producer, we retain and win custom-ers by supporting their growth with innovative, sustainable and high-performance products. Leveraging our know-how, we are increasingly supporting more sustainable consumption by reduc-ing the environmental footprint of our products and providing customers and consumers with eco-labels to help them make more sustainable choices.
Our approach is to define strategies and key goals in the annual business plans. Together with some of our strategic customers, we are developing joint long-term goals increasingly focused on
environmental factors, creating a commercial need to provide innovative solutions.
Balta uses the following standards to work to-wards environmental sustainability:
In our Belgian and Turkish production plants we are fully ISO 14001-compliant creating strong foundations to implement our environmental initiatives. Internal and external audits are help-ing us to continuously improve our performance in this area.
In the US, our Bentley business has a LEED ‘Gold’ label accreditation. LEED stands for Leadership in Energy and Environmental Design and is the most widely used green building rating system in the world. The renewal of the LEED certification is foreseen for 2018.
Balta is reducing its impact on the planet by limiting pollution from its production process and reducing consumption of natural resources, whilst operating as efficiently as possible. There are five key areas upon which we believe we can have the most impact:
Pollution: Balta has comprehensive policies and systems for eliminating pollution and toxins across all production sites. We comply with the requirements on dangerous substances and VOC’s (Volatile Organic Compounds), as set out in REACH and the harmonized standard EN14041 (CE-labelling), including the requirements of vol-untary labelling scheme’s such as GUT/PRODIS. We have spent 2017 designing new products that can be fully recycled, as well as modifying existing products to now be made of only one raw material, thereby supporting their recycling.
Our European Commercial carpet tile brand modulyss has partnerships with both Healthy Seas and CO2 Logic, with the aim of reducing the life-cycle impact of each product. modulyss is producing increasing numbers of carpet tiles with low CO2 emissions in our CO2RE carbon offset initiative. Find out more on the modulyss website https://www.modulyss.com/en_gb/co2re
Balta fully supports the January 2018 decision of the European Carpet and Rug Association (ECRA), of which Balta is a member, to sign the
NO
N-F
INA
NC
IAL
KEY
PER
FOR
MA
NC
E IN
DIC
ATO
RS
modulyss has decided to join Healthy Seas, a cross-sec-tor initiative for tackling the problem of marine litter, as an associated member. Healthy Seas not only recovers discarded fishing nets but makes sure they are recy-cled and regenerated into Econyl nylon 6 yarn. In 2017 modulyss produced 529,067m2 of carpet tiles made from Econyl yarns, reducing its eco-footprint by 20%.
Every credit we purchase to offset CO2 emissions during production cur-rently goes to the Par-adigm project in Kenya created to positively im-pact poverty. Reducing greenhouse gas emis-sions, this social climate project contributes pos-itively to many UN Sus-tainable Development Goals (SDGs).
FROM FISHING NETS TO CARPET TILES
AN ENTERPRISING SOLUTION
BA
LTA
AN
NU
AL
REP
OR
T 20
17
2726

Code of conduct:The code of conduct sets the framework within which our people have the freedom to act and operate in their daily work and, by doing so, contribute to the Balta Group success story. It reinforces our core values and behaviours and sets the standards under which we operate as individuals and together as a company. The code of conduct was developed in 2017 and is currently being discussed with our senior lead-ership team. In 2018 it will be fully implemented across the organisation.
Building a climate of open communication and employee commitment:Throughout 2017, we have seen the development of increased levels of communication in the form of a weekly CEO’s blog, intranet, LinkedIn, Face-book and Twitter. The leadership team meets on a quarterly basis to review the alignment of our actions with our strategy and the progress we are making. It has agreed principles for promoting transparent, open and timely communication through the organisation.
We have also been working on defining the Balta employee brand to drive a stronger cor-porate engagement with our employees and
to increase our followers’ and supporters’ base inside and outside Balta. There is a strong link to social responsibility here.
Social responsibility:At Balta, we embrace our corporate social responsibility by supporting good causes. In 2017, amongst others we arranged employee blood-donating sessions and raised money and attention for charity projects such as de ‘Warmste Week’. We have an active year-round programme of events for our employ-ees and their families. For example in 2017 we arranged for several Balta teams to take part in the Ekiden team marathon in Brussels, and sponsored nights at the opera, family days at our factories in Zele and Avelgem and health and wellbeing sessions.
Diversity:We believe that diversity leads to better gov-ernance and performance. A diverse manage-ment and Board reduce the risk of ‘groupthink’, bringing insightful perspectives, leading to a better understanding of our customer base and the environment in which Balta operates, and thus paying greater attention to controlling risks and improving performance.
European Plastics Industry Circular Economy Voluntary Commitment to recycle 50% of plas-tics waste by 2040. This is a big step and one that we will be working on in the coming years.
Energy: We have a voluntary commitment to the Flemish Government’s “Energy agreement” (as of 2003) to reduce carbon emissions. Each year we invest in a number of energy studies resulting in energy reduction projects. For example, in 2017 we invested in low-pressure compressed air networks and in generating hot water via a heat exchanger based on process heat. Our vol-untary commitment will be extended by signing the “Energy agreement” to 2022, committing Balta to further reducing its carbon footprint.
Waste: Balta Group has mostly zero production waste to landfill. We recycle ‘waste’ from yarn extrusions for use in the end-products of our Non-Woven division. Additionally, we have re-designed our manufacturing processes to sort waste into over sixty-five individual categories that can be recycled. Our aim is to achieve 100% recycling by sorting our waste efficiently and effectively.
Transportation: The more we can do to reduce the number of road miles, the better it is for the environment and for our costs. In 2017, we announced a reorganisation of our Belgium operational footprint, establishing two vertical-ly-integrated Residential factories and closing a standalone warehouse. As a result, there will be less need to move materials and finished goods, leading to a 25% reduction in road miles between these factories and our warehousing facilities in 2018.
Water: In several of our plants we rely on closed-loop water cooling systems which re-use wa-ter and better control temperatures in heat- demanding equipment, translating into water and energy savings. We have also invested in a system for monitoring water usage, with work-
ing groups defining measures to reduce water consumption. Looking to the future, we aim to improve water efficiency via a roadmap of projects to be identified and underpinned with targets.
PEOPLE The basic expectations are that we provide a safe, motivating and rewarding workplace. How-ever, to achieve our corporate growth ambitions, stronger engagement between the company and its employees will be a key enabler. On the journey towards achieving this, key strategies have been developed in 2017 to improve com-munication throughout the company, improve our people management capability and develop stronger talent management processes.
People are our core asset in delivering our busi-ness strategy. Not making progress in our people strategy incurs the risks of low employee com-mitment and an inability to attract, motivate and retain the best people and achieve our business strategy. This is especially relevant in Flanders, Belgium, which has very low unemployment and where 69% of our workforce is based.
Our last employee satisfaction survey was in October 2016 (Belgium only) and resulted in a convincing score of 82%. The results were dis-cussed throughout 2017, leading to a number of measures being agreed, such as the organ-isation of wellbeing sessions accessible to all employees. We will be repeating this survey in either 2018 or 2019, targeting an improvement in our score.
2018 will see the embedding of the 2017 strate-gies and the rolling out of the code of conduct policy, along with an organisational review. The main objectives of this review will be to align the organisational structure with the company’s operating model in line with future needs.
There are six key aspects to our employee strategy.
NO
N-F
INA
NC
IAL
KEY
PER
FOR
MA
NC
E IN
DIC
ATO
RS
BA
LTA
AN
NU
AL
REP
OR
T 20
17
2928

Balta’s management is composed of individuals with different skills, backgrounds, information and influence, meaning that each contributes in a different way to the overall set-up required for effective management.
Of Balta’s global workforce of 4,053 employees, 2,777 are based in Flanders, Belgium and we have over 40 different nationalities represented. 25% of the ‘blue collars’ in Belgium are female, whilst at ‘white collar’ level, 48% are female. Our diversity policy is based on the concept that skills and experience are the sole factors determining the best individual qualified for the job.
This is similarly reflected at Board level. In our view, the expertise, age, gender, competencies, professional background and life experience of the individual Board members are well-diver-sified. As of the IPO in June 2017, we meet the legal requirement that at least one-third of directors are of an opposite gender.
Balta will continue to pay attention to the implementation of diversification in general. In the years to come, the Remuneration and Nomination Committee will give consideration to diversity with reference to the competencies
required for the Board, senior management and directors, taking into account its business nature as well as its strategies.
Human rights:While we naturally comply with applicable laws in all countries that we operate in, we also re-spect and promote human rights in accordance with the UN Guiding Principles on Business and Human Rights. The risk of non-compliance is reputational damage, business interruption and penalties, resulting from a lack of awareness by our employees or within our indirect supply chain.
Balta is committed to:• providing equal employment opportuni-
ties, respecting the rights of each employee throughout his/her career at Balta
• guaranteeing equal treatment in the recruit-ment, remuneration, career development and training of its employees based on qualifications and experience only
• prohibiting any form of harassment, intimida-tion, reprisal or violence and not conducting business with those who do
• recognising and appreciating the existence of different values and cultural standards in the countries in which we operate
• recognising the individual right to freedom of association and collective bargaining
NO
N-F
INA
NC
IAL
KEY
PER
FOR
MA
NC
E IN
DIC
ATO
RS
• the total non-acceptance of child labour and fully supporting the United Nations Convention on the Rights of the Children
To support our policy, we operate a zero-tol-erance policy, with any violation resulting in dismissal; furthermore if a law is breached, the local authorities will be informed.
Balta has a number of controls in place. With regard to child labour for example, we require documents showing the date of birth or other documentary evidence of age of every worker before starting work.
In 2018 we will be training all our employees in the code of conduct and will continue auditing our production facilities and key suppliers on a rolling basis.
Health and safety:With its large operating footprint of ten produc-tion and warehousing locations across three continents, Balta requires high standards of health and safety to support an efficient and growing business. There is a very clear link to the second pillar of our strategy of Operational Excellence.
Consequently, health and safety is a key priority. In 2017, Balta invested in its strong commitment to putting safety first with the aim of improving its lagging safety indicator, the frequency of work-related safety incidents and their severity. After many years of no fatal accidents, in 2017 we regrettably had one in our Tielt factory.
In 2017, the long-term trend of declining numbers of accidents reversed vis-à-vis the Belgian textile industry. This led us to appoint an independent safety consultant to conduct a study on the safety behaviour and culture at all Belgian plants, interviewing more than 300 employees. Using this as a basis, we developed an action plan, reviewed our health and safety policy and created a communication plan for all production managers led by the CEO and the Management Committee to achieve the required improvement in 2018. Our ambition is clear for all employees: “Every colleague who starts the work day or shift returns home safe and healthy.”
To achieve this, we have established a pro-gramme of measures supporting the three pillars of our health and safety policy:• technical safety - continuously improving the
operating safety of our machines
Family day in Balta Zele Top left: Ekiden Brussels • Top right: Balta cycling • Bottom left: Soup for life (Warmste Week) Bottom right: Blood donation at Balta Tielt
BA
LTA
AN
NU
AL
REP
OR
T 20
17
3130

• organisational safety – continuously improving safety procedures
• safety behaviour and culture – invest-ing in training, communication and awareness to translate our interven-tions into routine behaviour.
This programme is led by a new Group Health and Safety Manager appointed in 2017, reporting weekly to the CEO and updating the Board. Some of the key priorities being worked on and set to continue in 2018 are:• information campaigns at all levels
of the organisation to raise aware-ness, provide clear direction on Balta’s safety rules and give training to the employees concerned
• to integrate health and safety across all relevant business processes, en-suring that every individual in the business understands their role and
impact towards realising our ambition• for all leaders and managers to lead
by example and help others on our journey, including safety champions on the factory floor
• continuous evaluation of our progress by means of audits and detailed in-vestigations into issues
• improving our risk management pro-cess to proactively recognize hazards and risks
• to enhance and standardise our safety performance reporting across the group (including Bentley)
PROSPERITYOur current business and financial per-formance, the proposed dividend to shareholders and future prospects are outlined in the CEO Strategic Re-view and in the CFO Financial Report. The satisfaction of our customers and suppliers is often determined by how we grow their businesses and by the long-term relationships we have devel-oped. We are also committed to doing business in a responsible and sustain-able manner benefiting all parties. Our responsibility to government and other regulatory bodies is to comply with all local laws and to pay our fair share of taxes due. Our businesses operate within local communities where we play an active role and participate in supporting good causes.
Compliance is an important subject at Balta, giving us the freedom to grow our business for the benefit of all our stakeholders. Based on the risks identi-fied and industry regulation, in 2017 we reviewed and formalised our anti-fraud and anti-corruption policy, our gift and entertainment policy and our non-au-dit services policy. At the beginning of 2018, we created policies for economic sanctions, anti-money laundering and anti-trust. Furthermore, we are in the process of drawing up a data protec-tion policy meeting the General Data Protection Regulation (GDPR).
In 2017, a revised anti-fraud and an-ti-corruption policy addressing the US Foreign Corrupt Practices Act and the UK Bribery Act was approved. It covers every form of corruption or bribery, charity donations and sponsorship, relationships with officials and behaviour in public tendering, as well as lobbying.
The key risks to future prosperity are that Balta could be affected by a range of legal and regulatory compliance risks, with the highest risks addressed by the policies referred to above. In addition, Balta uses agents and other interme-diaries acting on its behalf and based in different geographic locations. Balta will enhance awareness to this topic via communication and training in 2018 for all employees and intermediaries. We will require a formal acknowledgement from management staff that these poli-cies have been understood. In addition, we will also be firmly establishing our policies in the code of conduct to be communicated to all employees in 2018.
Balta operates a zero-tolerance policy towards fraud, bribery and corruption. The Group Compliance Officer is the central contact person for whistleblow-ers and the investigation of possible policy infringements.
NO
N-F
INA
NC
IAL
KEY
PER
FOR
MA
NC
E IN
DIC
ATO
RS
0
5
10
15
20
25
30
35
20172016201520142013201220112010200920082007
FREQUENCY RATE BALTA GROUP (INCL. BENTLEY FOR 2017 ONLY)
FREQUENCY RATE BELGIAN TEXTILE INDUSTRY (NACE 13)
Frequency Rate = Work related accidents with loss time/1,000,000 hours
Weaving in Balta Waregem
BA
LTA
AN
NU
AL
REP
OR
T 20
17
3332

This chapter provides information on Balta Group nv’s
(hereinafter also referred to as “Balta” or the “Company”)
corporate governance.
Corporate governance charterBalta is committed to high standards of corporate gov-
ernance and relies – pursuant to article 96 § 2, 1° of the
Belgian Companies Code – on the Belgian Code on
Corporate Governance of March 12, 2009 (the “Corporate
Governance Code”) as a reference code. The Corporate
Governance Code can be found on the website of the
Belgian Corporate Governance Committee (www.corporat-
egovernancecommittee.be). As the Corporate Governance
Code is based on a “comply or explain” approach, the
Board of Directors intends to comply with the Corporate
Governance Code, except with respect to the following:
1) the Articles of Association allow the Company to grant
shares, stock options and other securities vesting earlier
than three years after their grant;
2) certain members of the Management Committee are
entitled in certain circumstances to severance pay higher
than 12 months of remuneration; and
3) the group of directors appointed at the nomination of
LSF9 Balta Holdco S.à r.l. constitute a majority of the
directors (5 out of 9) as a consequence of the majority
of shares held by that company.
The exception under 2 is a contractual constraint which
was already applicable before the public offering of
Balta shares.
As a Belgian headquartered listed company with a com-
mitment to high standards of corporate governance, the
Board adopted a Corporate Governance Charter in May
2017, as required by the Corporate Governance Code.
This Corporate Governance Charter is updated regu-
larly and can be found on the Company website (www.
baltagroup.com).
On June 20, 2017, the Company received a transparency
declaration from LSF9 Balta Holdco S.à r.l. stating that,
on June 14, 2017, LSF9 Balta Holdco S.à r.l. held 18,169,759
shares of the Company, representing 50.55% of the shares
of the Company.
On July 10, 2017, the Company received a transparency
declaration from LSF9 Balta Holdco S.à r.l. stating that,
on July 4, 2017, LSF9 Balta Holdco S.à r.l. after the end of
the stabilisation period had crossed the threshold of 55%
and held 20,303,957 shares of the Company, representing
56.49% of the shares of the Company.
On July 6, 2017 the Company received a transparency
declaration from Tocqueville Finance SA, a management
company exercising the voting rights attached to the
securities held by several OPCVM (Organisme de place-
ment collectif en valeurs mobilières), stating that it holds
2,387,964 or 6.64% voting rights linked to securities since
June 14, 2017. On July 20, 2017, the Company received
a revised version of the transparency declaration from
Tocqueville Finance SA.
Shareholder structureThe following table shows the shareholder structure on
December 31, 2017 based on the notifications made to
the Company and the Belgian Financial Services and
Markets Authority (FSMA) by the shareholders listed below
in accordance with article 6 of the Belgian law of May
2, 2007 on the notification of significant shareholdings:
Shareholding
Number %
LSF9 Balta Holdco S.à r.l. 20,303,957 56.5%
Tocqueville Finance SA 2,387,964 6.6%
No transactions by persons discharging managerial re-
sponsibilities have been notified since the admission to
trading on Euronext Brussels.
Dividend policySubject to the availability of distributable reserves and
any material external growth opportunities, the Company
intends to pay a dividend of between 30% to 40% of its
net profits for the year based on its consolidated IFRS
Financial Statements. The amount of any dividend and
the determination of whether to pay the dividend in any
year may be affected by a number of factors, including
the Company’s business prospects, cash requirements,
and any material growth opportunities.
Capital and shareholders structureCapital and capital evolutionsThe capital of the Company amounts to €260,589,621 as
at December 31, 2017 represented by 35,943,396 shares
without nominal value. Each share carries one vote.
The following capital movements took place in 2017:
On March 1, 2017, the Company was incorporated with
a capital of €61,500, represented by 61,500 shares, each
representing an identical fraction of the Company’s share
capital. 61,499 shares were subscribed by LSF9 Balta Midco
S.à r.l. and one share by LSF9 Balta Holdco S.à r.l.
On June 16, 2017, as part of the Company’s IPO, the capital
was increased to €260,589,621, represented by 35,943,396
shares, as follows:
- a capital increase by a contribution in kind of all ordinary
shares of LSF9 Balta Issuer S.à r.l. by LSF9 Balta Holdco
S.à r.l. for €331,250,000 in exchange for 25,000,000 shares;
- a capital decrease which resulted in €150,000,000 of
distributable reserves being created ;
- a capital decrease of €61,500 by cancellation of the 61,500
shares of the Company subscribed by its founders, i.e.
LSF9 Balta Midco S.à r.l. and LSF9 Balta Holdco S.à r.l.; and
- a capital increase by a contribution in cash for €144,999,997
through the issuance of 10,943,396 shares to the public.
Shareholder evolutionsThe applicable successive thresholds pursuant to the Law
of May 2, 2007 on the disclosure of significant sharehold-
ings in issuers whose shares are admitted to trading on
a regulated market and other provisions are set at 5% of
the total voting rights, and 10%, 15%, 20% and so on at
incremental intervals of 5%.
In the course of 2017, the Company received the following
transparency declarations:
For the 2017 financial year, the amount of dividend is calcu-
lated based on normalised full year earnings, pro-rated for
the post-IPO period to reflect that portion of the financial
year for which the shares were listed on Euronext Brussels.
Shareholders’ meetingsIn 2017, before the IPO, four extraordinary shareholders’
meetings were held, approving the appointment of di-
rectors, a modification to the Articles of Association, a
capital decrease and a capital increase by a contribution
in kind (as referred to above) and the remuneration of the
Statutory Auditor.
Dealing codeOn August 29, 2017, the Board approved the Company’s
Dealing Code in accordance with the EU Market Abuse
Regulation EU 596/2014 of the European Parliament and of
the Council of April 16, 2014 on market abuse. The Dealing
Code restricts transactions in Balta Group nv securities
by members of the Board and the Management Com-
mittee, senior management and certain other persons
during closed and prohibited periods. The Dealing Code
also contains rules concerning the disclosure of intended
and executed transactions by leading managers and
their closely associated persons through a notification
to the Company and to the FSMA. The General Counsel
is the Compliance Officer for the purposes of the Balta
Dealing Code.
The Board and CommitteesBalta Group nv has a Board of Directors, a Management
Committee, an Audit Committee and a Remuneration and
Nomination Committee.
Board of DirectorsMandate of the board
The Board of Directors is vested with the power to perform
all acts that are necessary or useful for the realisation of
the Company’s purpose, except for those actions that are
specifically reserved by law or the Articles of Association
for the Shareholders’ Meeting or other corporate bodies.
In particular, the Board of Directors is responsible for:
• defining the general policy strategy of the Company
and its subsidiaries;
• deciding on all major strategic, financial and operational
matters of the Company;
CORPORATE Governance
BA
LTA
AN
NU
AL
REP
OR
T 20
17
3534
CO
RP
OR
ATE
Go
vern
anc
e
• overseeing the management by the Chief Executive
Officer (CEO) and other members of the Management
Committee; and
• all other matters reserved to and obligations imposed
(including disclosure obligations) on the Board of Directors
by law or the Articles of Association.
On March 2, 2017, the Board of Directors appointed Kairos
Management bvba, permanently represented by Tom
Debusschere, as CEO of the Company, in accordance with
article 17 of the Articles of Association. He has all powers
related to the daily management as well as the powers
set out in the Articles of Association.
Composition of the Board of Directors
Pursuant to the Articles of Association, the Board of Directors
must comprise at least five (5) members. On December 31,
2017 the Board of Directors consisted of nine (9) members.
The Articles of Association entitle LSF9 Balta Holdco
S.à r.l., as long as it holds at least 50% of the total number
of shares issued by the Company (which is the case), to
nominate at least five (5) members to be appointed by
the Shareholders’ Meeting.
In accordance with the independence criteria set out in the
Belgian Companies Code and the Corporate Governance
Code, three (3) members are independent non-executives.
The CEO is the only executive member of the Board.
Although the term of office of directors under Belgian
law is limited to six years (renewable), the Corporate
Governance Code recommends that it be limited to four
years. The Articles of Association limit the term of office
of directors to four years.
The appointment and renewal of directors is based on a
recommendation of the Remuneration and Nomination
Committee to the Board of Directors and is subject to
approval by the Shareholders’ Meeting, taking into account
the nomination rights described above.
Manager, Vice President of Operations, Vice President of
Supply Chain & IT and Director of Logistics & IT.
Mr. Debusschere holds a Master of Science in Electro-
mechanical Engineering (magna cum laude) from the
University of Ghent.
• Michael Kolbeck is Managing Director and Head of
Corporate at Hudson Advisors UK Limited, which advises
Lone Star and the Funds which it administers, including
Lone Star Fund IX, an investor in the Company. Prior to
his post at Hudson since January 2017, he was Managing
Director at Lone Star Germany Acquisitions GmbH. Prior
to joining Lone Star and Hudson in 2004, Mr. Kolbeck
worked several years for Allianz Group as an investment
manager.
Mr. Kolbeck holds a Master’s degree in Business Administra-
tion from Ludwig-Maximilians University, Munich, Germany.
• Nicolas Vanden Abeele is currently part of the execu-
tive team of Barco, heading the Entertainment Division.
Before joining Barco, he spent six years as a member of
the executive committee at building materials company,
Etex Group, where he headed one of its divisions and also
served as a director for several Etex Group companies.
Prior to Etex Group, he held various executive positions in
the technology industry with Alcatel-Lucent and strategy
consulting with Arthur Andersen in Europe, the Americas
and Asia.
Mr. Vanden Abeele holds Master’s degrees in Business Ad-
ministration (K.U. Louvain, Belgium), International Business
and European Economics (College of Europe, Belgium) and
Management (Solvay School of Management/ULB, Belgium).
• Sarah Hedger was employed by General Electric for
twelve years, prior to retiring in March 2017. She held
leadership positions in its Corporate, Aviation and Capital
business development teams, leaving General Electric
as Leader of Business Development and M&A for its GE
Capital division. While at General Electric, she served
as a non-executive director of GE Money Bank AB from
2011 to 2014, prior to its sale to Santander Group, as well
as GE Capital EMEA Services Limited from 2011 to 2017.
Before General Electric, Ms. Hedger worked at Lazard &
Co., Limited for 11 years, leaving as Director Corporate
Finance and spent five years as an auditor at Pricewa-
terhouseCoopers.
Ms. Hedger holds a Master’s degree in Electrical & Electronic
Engineering and Business Studies from Imperial College,
London University and is a qualified chartered accountant.
• Karoline Graeubig is Director Asset Management at
Hudson Advisors UK Limited.
Ms. Graeubig holds a Master’s degree in International
Business Administration from Eberhard-Karls University,
Tuebingen, Germany.
• Hannah Strong is Vice President, Legal Counsel at Hudson
Advisors UK Limited.
Ms. Strong holds a Bachelor’s degree in Jurisprudence
from Oxford University.
• Jeremy Fryzuk is Vice President Underwriting at Hudson
Advisors UK Limited. He is currently a Board Observer of
MRH (GB) Limited, a leading independent petrol filling
station operator in the UK.
Mr. Fryzuk holds a Bachelor of Commerce with a major
in Finance from Dalhousie University, Halifax, Canada.
• Patrick Lebreton is Managing Director, Asset Manage-
ment at Hudson Advisors UK Limited. Prior to his post
at Hudson, between 2012 and 2015 he was the Director
(Operating Partner) of Montague Associates, advising
the Montague Private Equity Fund. From 2004 to 2012, he
was an Executive Vice President in the Portfolio Group at
Bain Capital. He has also held executive posts at General
Electric, was a manager at Accenture, and is a retired
U.S. Army First Lieutenant , having served in Operation
Desert Storm. He is currently a director of Arioneo, which
provides equine health and performance solutions, and
MRH (GB) Limited, a leading independent petrol filling
station operator in the UK; and was previously a director
of Ideal Standard, a world leader in bathroom equipment,
fittings and accessories from 2009 to 2012.
Mr. Lebreton holds a Bachelor of Science in International
Economics and Finance from Georgetown University
and a Master’s degree in Business Administration from
Harvard Business School.
Evolution in composition during 2017
On March 1, 2017, on the date of the incorporation of the
Company, the shareholders appointed Kairos Manage-
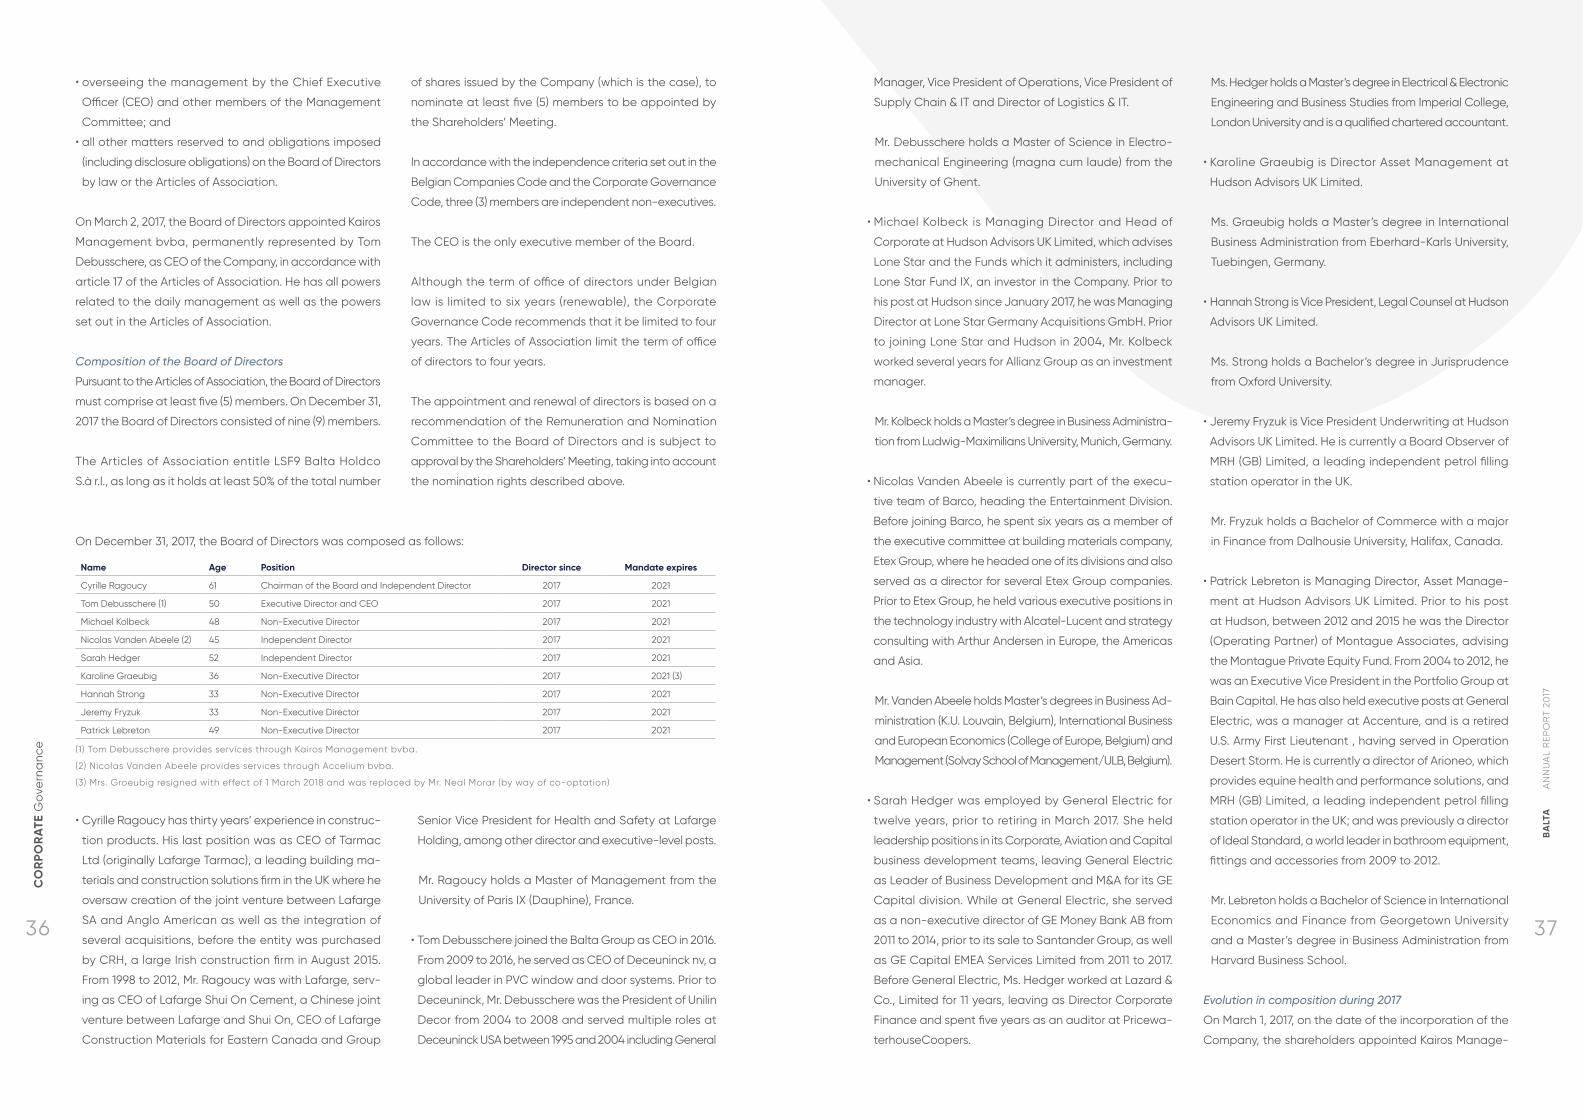
On December 31, 2017, the Board of Directors was composed as follows:
Name Age Position Director since Mandate expires
Cyrille Ragoucy 61 Chairman of the Board and Independent Director 2017 2021
Tom Debusschere (1) 50 Executive Director and CEO 2017 2021
Michael Kolbeck 48 Non-Executive Director 2017 2021
Nicolas Vanden Abeele (2) 45 Independent Director 2017 2021
Sarah Hedger 52 Independent Director 2017 2021
Karoline Graeubig 36 Non-Executive Director 2017 2021 (3)
Hannah Strong 33 Non-Executive Director 2017 2021
Jeremy Fryzuk 33 Non-Executive Director 2017 2021
Patrick Lebreton 49 Non-Executive Director 2017 2021
(1) Tom Debusschere provides services through Kairos Management bvba.
(2) Nicolas Vanden Abeele provides services through Accelium bvba.
(3) Mrs. Groeubig resigned with effect of 1 March 2018 and was replaced by Mr. Neal Morar (by way of co-optation)
• Cyrille Ragoucy has thirty years’ experience in construc-
tion products. His last position was as CEO of Tarmac
Ltd (originally Lafarge Tarmac), a leading building ma-
terials and construction solutions firm in the UK where he
oversaw creation of the joint venture between Lafarge
SA and Anglo American as well as the integration of
several acquisitions, before the entity was purchased
by CRH, a large Irish construction firm in August 2015.
From 1998 to 2012, Mr. Ragoucy was with Lafarge, serv-
ing as CEO of Lafarge Shui On Cement, a Chinese joint
venture between Lafarge and Shui On, CEO of Lafarge
Construction Materials for Eastern Canada and Group
Senior Vice President for Health and Safety at Lafarge
Holding, among other director and executive-level posts.
Mr. Ragoucy holds a Master of Management from the
University of Paris IX (Dauphine), France.
• Tom Debusschere joined the Balta Group as CEO in 2016.
From 2009 to 2016, he served as CEO of Deceuninck nv, a
global leader in PVC window and door systems. Prior to
Deceuninck, Mr. Debusschere was the President of Unilin
Decor from 2004 to 2008 and served multiple roles at
Deceuninck USA between 1995 and 2004 including General
BA
LTA
AN
NU
AL
REP
OR
T 20
17
3736
CO
RP
OR
ATE
Go
vern
anc
e

ment bvba, with Mr Tom Debusschere as its permanent
representative, Mr Michael Kolbeck and Mr Luca Destito
as board members of the Company.
On May 29, 2017, the shareholders acknowledged the
resignation of Mr Luca Destito, and appointed Ms Karo-
line Graeubig, Ms Hannah Strong, Mr Jeremy Fryzuk and
Mr Patrick Lebreton as directors of the Company with
immediate effect.
On May 30, 2017, the shareholders appointed Mr Cyrille
Ragoucy, Accelium bvba, with Mr Nicolas Vanden Abeele
as its permanent representative, and Ms Sarah Hedger as
independent directors, subject to and with effect from the
closing of the IPO, on June 16, 2017.
Functioning of the Board of Directors
In principle, the Board of Directors meets at least five (5)
times a year. Additional meetings may be called with ap-
propriate notice at any time to address specific business
needs. In 2017 the Board met on six (6) occasions, including
two (2) after the closing of the IPO. On one occasion the
Board also took decisions by unanimous written consent.
Name Position Mandate since Mandate expires
Jeremy Fryzuk Chairman of the Committee, Non-Executive Director 2017 2021
Accelium bvba, represented by Nicolas Vanden Abeele
Member, Independent Director 2017 2021
Sarah Hedger Member, Independent Director 2017 2021
Name Boards Attendance rate
Kairos Management bvba, represented by Tom Debusschere 6/6 100%
Michael Kolbeck 6/6 100%
Luca Destito 2/2 100%
Jeremy Fryzuk 4/4 100%
Karoline Graeubig 4/4 100%
Hannah Strong 4/4 100%
Patrick Lebreton 4/4 100%
Cyrille Ragoucy 2/2 100%
Accelium bvba, represented by Nicolas Vanden Abeele 2/2 100%
Sarah Hedger 2/2 100%
The major matters discussed by the Board during 2017
included, amongst others:
- The Initial Public Offering and the necessary steps re-
lated to this;
- The Corporate Governance Charter;
- The approval of the half year and quarterly Financial
Statements and financial report
- The refinancing project, as described under note 25 of
the Financial Statements;
- General strategic, financial and operational matters of
the Company;
- The Company’s safety and health strategy;
- The new market abuse regime and the dealing and
disclosure code;
- The approval of the intention to reorganize the Resi-
dential division; and
- The approval of compliance policies such as anti-fraud
and anti-corruption, gifts and entertainment, reserved
matters and non-audit services.
The Board of Directors is convened by the Chairman or the
CEO whenever the interest of the Company so requires,
or at the request of two (2) directors.
Under the lead of its Chairman, the Board will regularly
(on an annual basis) evaluate its scope, composition and
performance and those of its Committees, as well as its
interaction with the executive management.
Gender diversity
Since the IPO, the Board meets the requirement that at
least one-third of the directors are of an opposite gender.
For the broader aspects of diversity, reference is made to
the section Diversity in the “Non-Financial Key Performance
Indicators” chapter.
Audit Committee In accordance with article 526bis of the Belgian Compa-
nies Code and provision 5.2 of the Corporate Governance
Code, the Board of Directors of Balta has established an
Audit Committee.
On December 31, 2017, the Audit Committee consisted of
three (3) members, all being non-executive directors and
a majority of them being independent directors.
In the course of 2017 the Audit Committee met three (3)
times. All members attended all meetings.
As required by the Belgian Companies Code, Jeremy Fryzuk,
chairman of the Audit Committee possesses appropriate
expertise and experience in this field. Reference is made
to his biography in the “Board of Directors” section above.
The Chairman reported the outcome of each meeting to
the Board of Directors.
The CEO and the Chief Financial Officer (CFO) are not
members of the Committee, but are invited to attend
its meetings. This guarantees the essential interaction
between the Committee and the Management. As ap-
propriate, also other Board members are invited to attend
the Committee meetings.
The Statutory Auditor attended two meetings during which
it presented the audit plan, reported on the main findings
resulting from its interim audit procedures and highlighted
specific points of attention.
In addition to its statutory powers and its power under
the Corporate Governance Charter, the Audit Committee
discussed the following main subjects: the quarterly Finan-
cial Statements, the compliance approach and related
policies, the Balta Group’s FX exposure, the closing and
forecasting process and the budget.
Remuneration and Nomination CommitteeIn accordance with article 526quater of the Belgian Com-
panies Code and provision 5.3 and 5.4 of the Corporate
Governance Code, the Board of Directors of Balta Group
has installed a Remuneration and Nomination Committee.
On December 31, 2017, the Remuneration and Nomina-
tion Committee consisted of three (3) members, all being
non-executive directors and a majority of them being
independent directors.
Name Position Mandate since Mandate expires
Michael Kolbeck Chairman and Non-Executive Director 2017 2021
Accelium bvba, represented by Nicolas Vanden Abeele
Member and Independent Director 2017 2021
Cyrille Ragoucy Member and Independent Director 2017 2021
In 2017 the Remuneration and Nomination Committee met
two (2) times. All members attended all meetings.
The CEO and the CFO are not members of the Committee,
but are invited to attend its meetings, unless the members
of the Committee want to meet separately (eg when
discussing remuneration). This guarantees the essential
interaction between the Committee and the Management.
In addition to its statutory powers and its powers under
the Corporate Governance Charter, the Committee
discussed the following main subjects: the recruitment
of senior management, long-term incentive grants, the
compensation and benefits package for the CEO and
other members of the Management Committee and the
variable remuneration for the CEO and other members of
the Management Committee.
Chief Executive OfficerKairos Management bvba with Tom Debusschere as its
permanent representative, has been appointed CEO by
the Board of Directors and reports directly to it. The CEO
has direct operational responsibility for the Company and
oversees the organisation and day-to-day management
of the Company and its subsidiaries.
The CEO is responsible for the execution and management
of the outcome of all Board of Directors decisions.
BA
LTA
AN
NU
AL
REP
OR
T 20
17
3938
CO
RP
OR
ATE
Go
vern
anc
e
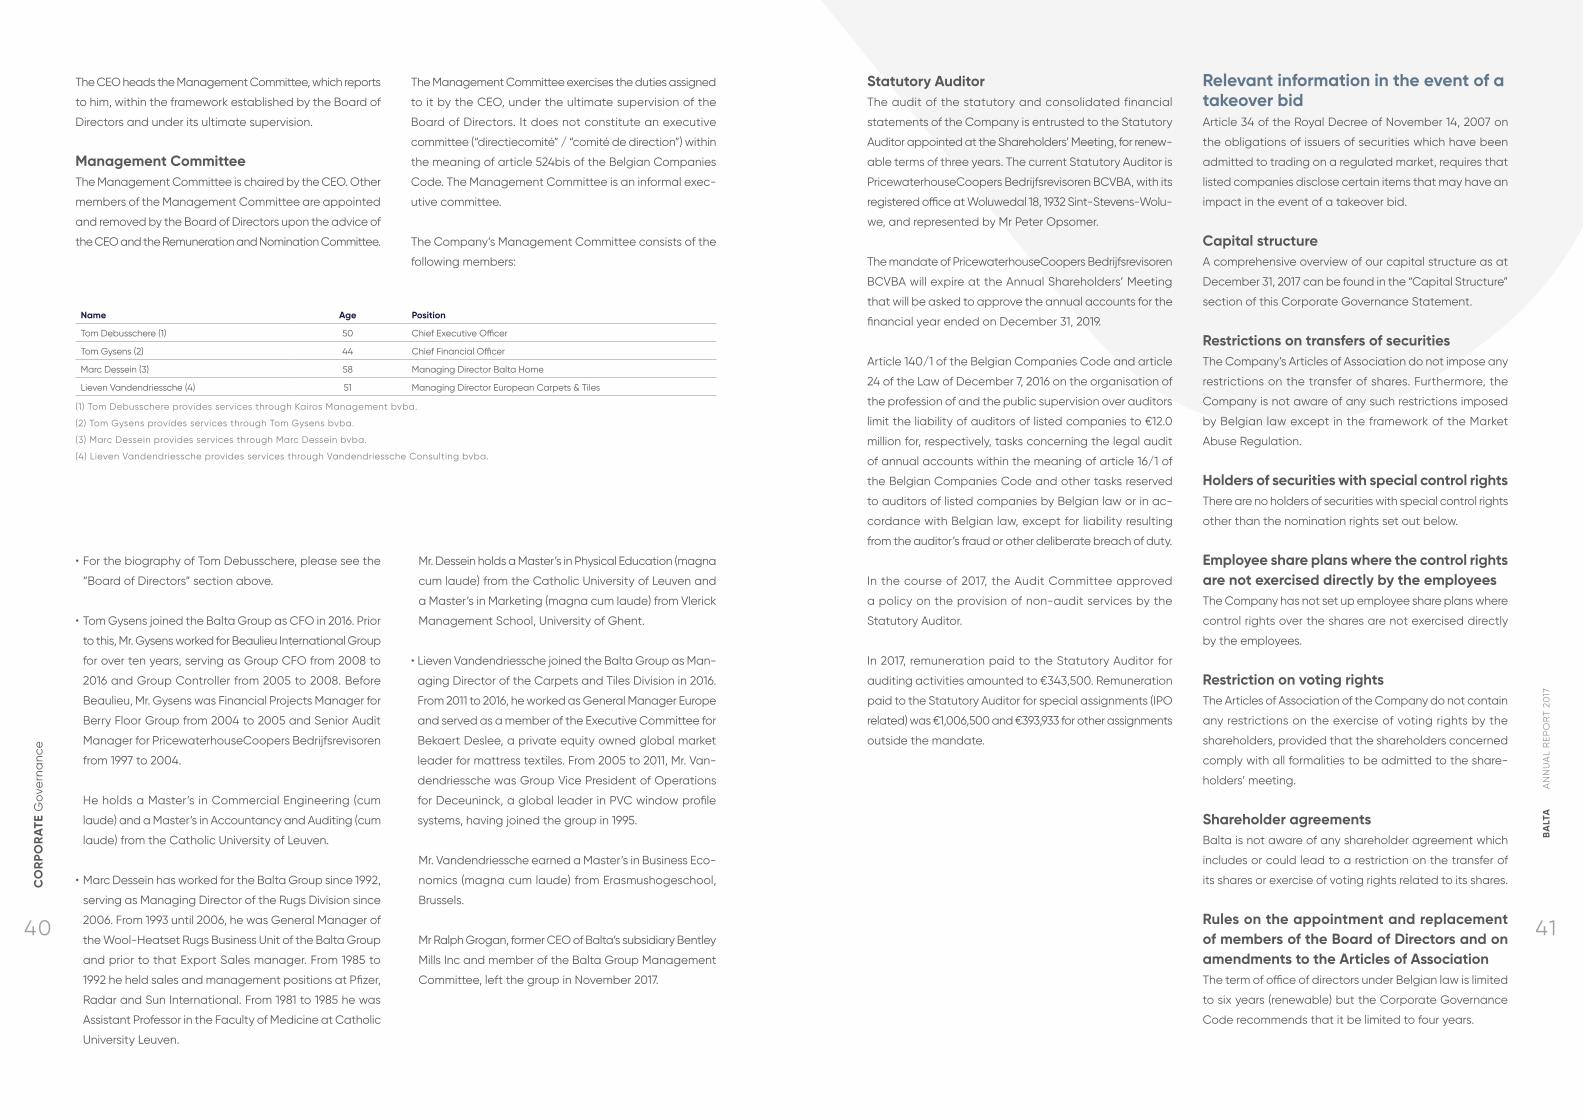
The CEO heads the Management Committee, which reports
to him, within the framework established by the Board of
Directors and under its ultimate supervision.
Management CommitteeThe Management Committee is chaired by the CEO. Other
members of the Management Committee are appointed
and removed by the Board of Directors upon the advice of
the CEO and the Remuneration and Nomination Committee.
The Management Committee exercises the duties assigned
to it by the CEO, under the ultimate supervision of the
Board of Directors. It does not constitute an executive
committee (“directiecomité” / “comité de direction”) within
the meaning of article 524bis of the Belgian Companies
Code. The Management Committee is an informal exec-
utive committee.
The Company’s Management Committee consists of the
following members:
Name Age Position
Tom Debusschere (1) 50 Chief Executive Officer
Tom Gysens (2) 44 Chief Financial Officer
Marc Dessein (3) 58 Managing Director Balta Home
Lieven Vandendriessche (4) 51 Managing Director European Carpets & Tiles
(1) Tom Debusschere provides services through Kairos Management bvba.
(2) Tom Gysens provides services through Tom Gysens bvba.
(3) Marc Dessein provides services through Marc Dessein bvba.
(4) Lieven Vandendriessche provides services through Vandendriessche Consulting bvba.
• For the biography of Tom Debusschere, please see the
“Board of Directors” section above.
• Tom Gysens joined the Balta Group as CFO in 2016. Prior
to this, Mr. Gysens worked for Beaulieu International Group
for over ten years, serving as Group CFO from 2008 to
2016 and Group Controller from 2005 to 2008. Before
Beaulieu, Mr. Gysens was Financial Projects Manager for
Berry Floor Group from 2004 to 2005 and Senior Audit
Manager for PricewaterhouseCoopers Bedrijfsrevisoren
from 1997 to 2004.
He holds a Master’s in Commercial Engineering (cum
laude) and a Master’s in Accountancy and Auditing (cum
laude) from the Catholic University of Leuven.
• Marc Dessein has worked for the Balta Group since 1992,
serving as Managing Director of the Rugs Division since
2006. From 1993 until 2006, he was General Manager of
the Wool-Heatset Rugs Business Unit of the Balta Group
and prior to that Export Sales manager. From 1985 to
1992 he held sales and management positions at Pfizer,
Radar and Sun International. From 1981 to 1985 he was
Assistant Professor in the Faculty of Medicine at Catholic
University Leuven.
Mr. Dessein holds a Master’s in Physical Education (magna
cum laude) from the Catholic University of Leuven and
a Master’s in Marketing (magna cum laude) from Vlerick
Management School, University of Ghent.
• Lieven Vandendriessche joined the Balta Group as Man-
aging Director of the Carpets and Tiles Division in 2016.
From 2011 to 2016, he worked as General Manager Europe
and served as a member of the Executive Committee for
Bekaert Deslee, a private equity owned global market
leader for mattress textiles. From 2005 to 2011, Mr. Van-
dendriessche was Group Vice President of Operations
for Deceuninck, a global leader in PVC window profile
systems, having joined the group in 1995.
Mr. Vandendriessche earned a Master’s in Business Eco-
nomics (magna cum laude) from Erasmushogeschool,
Brussels.
Mr Ralph Grogan, former CEO of Balta’s subsidiary Bentley
Mills Inc and member of the Balta Group Management
Committee, left the group in November 2017.
Statutory AuditorThe audit of the statutory and consolidated financial
statements of the Company is entrusted to the Statutory
Auditor appointed at the Shareholders’ Meeting, for renew-
able terms of three years. The current Statutory Auditor is
PricewaterhouseCoopers Bedrijfsrevisoren BCVBA, with its
registered office at Woluwedal 18, 1932 Sint-Stevens-Wolu-
we, and represented by Mr Peter Opsomer.
The mandate of PricewaterhouseCoopers Bedrijfsrevisoren
BCVBA will expire at the Annual Shareholders’ Meeting
that will be asked to approve the annual accounts for the
financial year ended on December 31, 2019.
Article 140/1 of the Belgian Companies Code and article
24 of the Law of December 7, 2016 on the organisation of
the profession of and the public supervision over auditors
limit the liability of auditors of listed companies to €12.0
million for, respectively, tasks concerning the legal audit
of annual accounts within the meaning of article 16/1 of
the Belgian Companies Code and other tasks reserved
to auditors of listed companies by Belgian law or in ac-
cordance with Belgian law, except for liability resulting
from the auditor’s fraud or other deliberate breach of duty.
In the course of 2017, the Audit Committee approved
a policy on the provision of non-audit services by the
Statutory Auditor.
In 2017, remuneration paid to the Statutory Auditor for
auditing activities amounted to €343,500. Remuneration
paid to the Statutory Auditor for special assignments (IPO
related) was €1,006,500 and €393,933 for other assignments
outside the mandate.
Relevant information in the event of a takeover bidArticle 34 of the Royal Decree of November 14, 2007 on
the obligations of issuers of securities which have been
admitted to trading on a regulated market, requires that
listed companies disclose certain items that may have an
impact in the event of a takeover bid.
Capital structureA comprehensive overview of our capital structure as at
December 31, 2017 can be found in the “Capital Structure”
section of this Corporate Governance Statement.
Restrictions on transfers of securitiesThe Company’s Articles of Association do not impose any
restrictions on the transfer of shares. Furthermore, the
Company is not aware of any such restrictions imposed
by Belgian law except in the framework of the Market
Abuse Regulation.
Holders of securities with special control rightsThere are no holders of securities with special control rights
other than the nomination rights set out below.
Employee share plans where the control rights are not exercised directly by the employeesThe Company has not set up employee share plans where
control rights over the shares are not exercised directly
by the employees.
Restriction on voting rightsThe Articles of Association of the Company do not contain
any restrictions on the exercise of voting rights by the
shareholders, provided that the shareholders concerned
comply with all formalities to be admitted to the share-
holders’ meeting.
Shareholder agreementsBalta is not aware of any shareholder agreement which
includes or could lead to a restriction on the transfer of
its shares or exercise of voting rights related to its shares.
Rules on the appointment and replacement of members of the Board of Directors and on amendments to the Articles of AssociationThe term of office of directors under Belgian law is limited
to six years (renewable) but the Corporate Governance
Code recommends that it be limited to four years.
BA
LTA
AN
NU
AL
REP
OR
T 20
17
4140
CO
RP
OR
ATE
Go
vern
anc
e

According to the Articles of Association, the Company
is managed by a Board of Directors that shall consist of
a minimum of five directors. These are appointed by the
Shareholders’ Meeting for a maximum term of four years
and may be reappointed. Their mandate may be revoked
at any time by the Shareholders’ Meeting.
Should any of the directors’ mandates become vacant, for
whatever reason, the remaining directors may temporarily
fill such vacancy until the next Shareholders’ Meeting
appoints a new director.
For as long as LSF9 Balta Holdco S.à r.l. (“LSF9”) or a com-
pany affiliated therewith within the meaning of article 11
of the Belgian Companies Code (a “company affiliated
therewith”), directly or indirectly, holds at least 50% of the
total number of shares issued by the Company – which
was the case in 2017 – it is entitled to nominate at least five
directors to be appointed by the Shareholders’ Meeting.
For as long as LSF9 or a company affiliated therewith,
directly or indirectly, holds less than 50% but at least 40%
of the total number of shares issued by the Company, it
is entitled to nominate four directors to be appointed by
the Shareholders’ Meeting.
For as long as LSF9 or a company affiliated therewith,
directly or indirectly, holds less than 40% but at least 30%
of the total number of shares issued by the company, it is
entitled to nominate three directors to be appointed by
the Shareholders’ Meeting.
For as long as LSF9 or a company affiliated therewith,
directly or indirectly, holds less than 30% but at least 20%
of the total number of shares issued by the Company, it
is entitled to nominate two directors to be appointed by
the Shareholders’ Meeting.
For as long as LSF9 or a company affiliated therewith,
directly or indirectly, holds less than 20% but at least 10%
of the total number of shares issued by the Company, it
is entitled to nominate one director to be appointed by
the Shareholders’ Meeting.
If the direct or indirect shareholding of LSF9 or a company
affiliated therewith in the Company falls below one of the
aforementioned thresholds, LSF9 shall cause a director
appointed upon its nomination to tender its, his or her
resignation as director with effect as of the date of the next
Annual Shareholders’ Meeting, failing which the mandate
of the director who was most recently appointed upon
LSF9’s nomination, shall automatically terminate on the
date of the next Annual Shareholders’ Meeting.
The CEO is vested with the day-to-day management of
the Company and the representation of the Company
in respect of such management. The Board of Directors
appoints and removes the CEO.
Within the limits of the powers granted to him/her by
or pursuant to the Articles of Association, the CEO may
delegate special and limited powers to a Management
Committee, other than within the meaning of article 524bis
of the Belgian Companies Code, or any other person.
Save for capital increases decided by the Board of Directors
within the limits of the authorized capital, only an Extraor-
dinary Shareholders’ Meeting is authorized to amend the
Company’s Articles of Association. A Shareholders’ Meeting
is the only body which can deliberate on amendments to
the Articles of Association, in accordance with the articles
of the Belgian Companies Code.
Authorised capital and acquisition of own sharesAuthorised capital
According to art. 6 of the Articles of Association, the
Board of Directors may increase the share capital of the
Company once or several times by a (cumulated) amount
of maximum 100% of the amount of the share capital as
such amount was recorded immediately after the closing
of the Initial Public Offering of the shares of the Company
on June 16, 2017.
This authorisation may be renewed in accordance with
the relevant legal provisions. The Board of Directors can
exercise this power for a period of five (5) years as from the
date of publication in the Annexes to the Belgian State
Gazette of the amendment to the Articles of Association
approved by the Extraordinary Shareholders’ Meeting of
May 30, 2017.
Any capital increases which can be decided pursuant to
this authorisation will take place in accordance with the
modalities to be determined by the Board of Directors
and may be made (i) by means of a contribution in cash
or in kind (where appropriate including a non-distributable
share premium), (ii) through conversion of reserves, whether
available or unavailable for distribution, and issuance
premiums, with or without issuance of new shares with or
without voting rights. The Board of Directors can also use
this authorisation for the issuance of convertible bonds,
warrants or bonds to which warrants or other tangible
values are connected, or other securities.
When exercising its authorisation within the framework of
the authorized capital, the Board of Directors can limit or
cancel the preferential subscription right of the shareholders
in the interest of the Company, subject to the limitations
and in accordance with the conditions provided for by
the Belgian Companies Code. This limitation or cancel-
lation can also occur to the benefit of the employees of
the Company or its subsidiaries or to the benefit of one
or more specific persons even if these are not employees
of the Company or its subsidiaries.
The Board of Directors is expressly empowered to proceed
with a capital increase in any and all form, including but
not limited to a capital increase accompanied by the
restriction or withdrawal of the preferential subscription
right, even after receipt by the Company of a notification
by the FSMA of a takeover bid for the Company’s shares.
Where this is the case, however, the capital increase must
comply with the additional terms and conditions laid
down in article 607 of the Belgian Companies Code. The
powers hereby conferred on the Board of Directors remain
in effect for a period of three years from the date of the
completion of the condition precedent of the amendment
to the Articles of Association approved by the Extraordinary
Shareholders’ Meeting of May 30, 2017. These powers may
be renewed for a further period of three years by resolution
of the Shareholders’ Meeting, deliberating and deciding in
accordance with applicable rules. If the Board of Directors
decides upon an increase of authorized capital pursuant
to this authorisation, this increase will be deducted from
the remaining part of the authorized capital specified in
the first paragraph.
In the course of 2017, the Board of Directors did not make
use of its mandate to increase Balta’s capital as stated
in article 6 of the Articles of Association.
Acquisition of own shares
According to its Articles of Association, the Board of
Directors may, without any prior authorisation of the
Shareholders’ Meeting, in accordance with articles 620
ff. of the Belgian Companies Code and within the limits
set out in these provisions, acquire, on or outside a reg-
ulated market, up to 20% of the Company’s own shares,
profit-sharing certificates or associated certificates for a
price which will respect the legal requirements, but which
will in any case not be more than 10% below the lowest
closing price in the last thirty trading days preceding the
transaction and not more than 10% above the highest
closing price in the last thirty trading days preceding the
transaction. This authorisation is valid for five years from
the date of the completion of the condition precedent of
the amendment to the Articles of Association approved
by the Extraordinary Shareholders’ Meeting of May 30,
2017. This authorisation covers the acquisition on or out-
side a regulated market by a direct subsidiary within the
meaning and the limits set out by article 627, indent 1 of
the Belgian Companies Code. If the acquisition is made
by the Company outside a regulated market, even from
a subsidiary, the Company shall comply with article 620,
§1, 5° of the Belgian Companies Code.
The Company is authorised, subject to compliance with
the provisions of the Belgian Companies Code, to acquire
for the Company’s account the Company’s own shares,
profit-sharing certificates or associated certificates if such
acquisition is necessary to avoid serious and imminent
harm to the Company. Such authorisation is valid for three
years as from the date of publication of the completion
of the condition precedent of the amendment of the
Articles of Association, approved by the Extraordinary
Shareholders’ Meeting of May 30, 2017, in the Annexes to
the Belgian State Gazette.
By resolution of the Extraordinary Shareholders’ Meeting
held on May 30, 2017 the Board of Directors is authorized
to divest itself of part of or all the Company’s shares,
profit-sharing certificates or associated certificates at any
time and at a price it determines, on or outside the stock
market or in the framework of its remuneration policy to
employees, directors or consultants of the Company or to
prevent any serious and imminent harm to the Company.
The authorisation covers the divestment of the Company’s
shares, profit-sharing certificates or associated certificates
by a direct subsidiary within the meaning of article 627,
indent 1 of the Belgian Companies Code. The authorisation
is valid without any time restriction, irrespective of whether
the divestment is to prevent any serious and imminent
harm for the Company or not.
BA
LTA
AN
NU
AL
REP
OR
T 20
17
4342
CO
RP
OR
ATE
Go
vern
anc
e

Material agreements to which Balta or certain of its subsidiaries is a party containing change of control provisionsSenior Secured Notes
On August 3, 2015, LSF9 Balta Issuer S.à r.l. (the “Issuer”)
issued €290,000,000 in aggregate principal amount of
7.75% Senior Secured Notes due 2022 of which €234,900,000
remained after the partial redemptions mid last year.
Upon the occurrence of a change of control (as defined in
the Senior Secured Notes Indenture), the Senior Secured
Notes Indenture requires the Issuer to offer to repurchase the
Senior Secured Notes at 101% of their aggregate principal
amount, plus accrued and unpaid interests and additional
amounts, if any, to the date of purchase.
Revolving Credit Facility
On August 3, 2015, the Issuer and LSF9 Balta Investments
S.à r.l. entered into a revolving credit facility agreement,
which currently provides for €68,000,000 of committed
financing.
The Revolving Credit Facility Agreement requires manda-
tory prepayment in full or in part in certain circumstances
including upon a change of control (as defined in the
Revolving Credit Facility Agreement).
Senior Term Loan
On August 29, 2017, LSF9 Balta Issuer S.à r.l. entered into a
€35,000,000 Senior Term Loan Facility due in September
2020.
The Senior Term Loan Facility Agreement requires manda-
tory prepayment in full or in part in certain circumstances
including upon a change of control (as defined in the
Senior Term Loan Facility Agreement).
Severance pay pursuant to the termination of contract of Board members or employees pursuant to a takeover bidThe Company has not concluded any agreement with
its Board members or employees which would result in
the payment of specific severance pay if, pursuant to a
takeover bid, the Board members or employees resign, are
dismissed or their employment agreements are terminated.
Please see section “Provisions concerning individual sev-
erance payments for Management Committee members
/ Termination Provisions” of this Corporate Governance
Statement on termination provisions of the members of
the Board of Directors and the Management Committee
in general.
Conflicts of InterestDirectors’ Conflicts of InterestArticle 523 of the Belgian Companies Code provides for
a special procedure if a director of the Company, save
for certain exempted decisions or transactions, directly or
indirectly has a personal financial interest that conflicts
with a decision or transaction that falls within the Board
of Directors’ powers. The director concerned must inform
the other directors before any decision of the Board of
Directors is taken and the Statutory Auditor must also be
notified. For listed companies, the director thus conflicted
may not participate in the deliberation or vote on the
conflicting decision or transaction.
On May 30, 2017 a potential conflict of interest was de-
clared. The relevant section of the minutes can be found
below in its entirety:
“Before the deliberation started, the following directors
declared that they had a potential conflict of interest, as
defined in article 523 of the Belgian Company Code (the
BCC), concerning the items on the agenda as follows.
These directors will inform the Statutory Auditor of their
conflict of interests.
Re the IPO:
“Kairos Management bvba and Michael Kolbeck declared
that they had a potential conflict of interest, as defined in
article 523 of the BCC, concerning all items on the agenda,
as all items relate to the IPO.
The potential conflict of interest arises for Kairos Manage-
ment bvba because the manager who provides services on
behalf of the aforementioned director is entitled to receive
Shares(1) and a cash bonus from the Selling Shareholder(2)
upon or following completion of the Offering(3) pursuant
to existing management incentive schemes with Lone
Star entities. In addition, the aforementioned director is
entitled to a share-related bonus payment from Balta
nv pursuant to a phantom share bonus scheme which
operates by reference to the value of a number of shares
in the Company at the pay-out date. Both entitlements
will depend on the Offer Price(4) and the final size of the
Offering, as set out in the Prospectus(5) (see section “Man-
agement and Corporate Governance”).
The potential conflict of interest arises for Michael Kolbeck
because he has a private equity type of carried interest
arrangement with Lone Star, which will be impacted by
the realisation and the terms of the Offering.
As set out above, the envisaged IPO and subsequent
Listing(6) are, among other things, with a view to obtaining
additional resources to finance the group’s activities and
its further growth and development. Those are aimed at
increasing the group’s capitalisation and financial flexibility.
Hence, the board of directors is of the opinion that the IPO
will strengthen the financial structure of the group. As all
agenda items of this meeting relate to the contemplated
IPO and subsequent Listing, these are therefore justified.
For the expected financial impact of the IPO, reference
is made to the Prospectus. As set out above, the IPO will
strengthen the financial structure of the Company and
the group.
The board decided to approve all items on the agenda
relating to the IPO.”
Re the Insurance Policy:
“All directors declared that they had a potential conflict
of interest, as defined in article 523 of the BCC, concern-
ing an item on the agenda, as this item relates to the
approval of an insurance policy for, among other things,
directors’ liability.
This potential conflict of interest arises because each
director is insured under the Insurance Policy(7).
With a view to the Company’s Listing, the board of directors
suggested that the Company will take out prospectus
liability insurance. In accordance with market practice,
it was also suggested to insure, amongst other persons,
the members of the board of directors against directors’
liability. The board of directors is of the opinion that this
is in accordance with market practice and necessary to
attract and retain directors and ensure their effective
decision-making.
The Company will pay insurance premiums as set out in the
Insurance Policy. Subject to certain franchise thresholds and
for an amount equal to the insurance amounts as set out in
the Insurance Policy, at least the Company, its subsidiaries
and all directors de jure, de facto and external mandates
of the insured companies will be covered against certain
claims in relation to prospectus and directors’ liability as
set out in the Insurance Policy.
The board of directors decided to approve the insurance
policy for directors’ liability”.
(1) ordinary shares of the Company
(2) LSF9 Balta Holdco S.à r.l.
(3) the offering consisted of (i) the issuance of the Company of new shares and (ii) the offering of existing shares (the Offer Shares)
(4) the final price per Offer Share
(5) the English version of the final prospectus
(6) the listing of the Company’s new and existing shares on Euronext Brussels
(7) the insurance policy relating to directors’ liability and prospectus liability
Remuneration reportProcedures for developing the remuneration policy and for determining the remuneration granted to individual directors The remuneration of the independent members of the
Board of Directors was decided by the Shareholders’
Meeting dated May 30, 2017 as follows:
• director fee for independent directors: annual fee of
€40,000 gross;
• additional fee for Committee membership (per Commit-
tee): annual fee of €10,000 gross; and
• additional fee applicable to the Chairman of the Board
of Directors: annual fee of €70,000 gross.
The remuneration of the Chairman of the Board of Directors
is capped at €120,000 gross.
In order to ensure the independence of the Board of Di-
rectors in its supervisory function over the Management
Committee, the remuneration system for the Board of
Directors does not contain any performance-related
components. It takes into account the responsibilities and
BA
LTA
AN
NU
AL
REP
OR
T 20
17
4544
CO
RP
OR
ATE
Go
vern
anc
e

the commitment of the Board members to develop the
Company and is intended to attract and retain individuals
who have the necessary experience and competencies
for this role.
No director fee is paid to the executive director and the
non-executive directors appointed upon nomination by
LSF9 Balta Holdco S.à r.l.. No attendance fees are granted.
The remuneration policy will be reviewed on a regular basis
by the Remuneration and Nomination Committee and the
Board of Directors in line with prevailing market conditions
for listed companies in Belgium. It will submit proposals in
this regard to the General Shareholders Meeting for decision.
The Board of Directors will also meet annually in a non-ex-
ecutive session (i.e. without the CEO being present) in
order to discuss and review the performance of the CEO.
This will take place for the first time in 2018, as the IPO
took place in June 2017.
Relative importance of the different components of
remuneration
The remuneration of individual Management Committee
members is made up of a fixed annual fee and a variable
annual fee.
The fixed annual fee is defined on the basis of various
criteria, such as the market value of the role, the scope of
the position and the profile of the incumbent in terms of
skill set and professional experience. The purpose of the
guaranteed fixed fee is to compensate the management
for time and competence at a market-related rate.
The aim of the variable fee is to create a high-performance
culture through a cash bonus linked to performance against
contracted deliverables with due regard to preventing
excessive risk taking. This Short-Term Incentive Plan (STIP) is
harmonized throughout the organisation. It is designed to
reward the performance of the Company and its divisions
over a one-year time horizon.
Characteristics of performance-related bonuses in the form
of shares, options, or any other rights to acquire shares
There are no performance-related bonuses in the form
of shares, options or any other rights to acquire shares.
Remuneration policy for the next two financial years
On February 28, 2018, the Board of Directors agreed to set
up a Long Term Incentive Plan (LTIP) to create alignment
between a manager’s and shareholders’ interests.
The purpose of the LTIP is to drive the performance and
long-term growth of the Balta Group by offering long-term
incentives to managers who contribute to such perfor-
mance and growth. The LTIP is also intended to facilitate
recruiting and retaining personnel of outstanding ability.
The LTIP consists of Performance Stock Units (PSUs). The
PSUs will vest to relevant managers that still provide ser-
vices to the Balta Group on the 3rd anniversary of their
award, to the extent that the Company’s share price has
reached a defined target.
Going forward, the remuneration policy will be reviewed
on a regular basis by the Remuneration and Nomination
Committee in line with prevailing market conditions for
listed companies in Belgium and companies of similar
scale and business characteristics.
Characteristics of performance-related bonuses of members of the Management CommitteeThe STIP rewards the realisation of key financial performance
indicators against targets approved by the Remuneration
and Nomination Committee for the period from January
1, 2017 to December 31, 2017.
For the CEO and the CFO, the STIP is based on group
financial targets: 70% on group-adjusted EBITDA and 30%
on seasonality adjusted net debt. For other members of
the Management Committee the STIP is based on the
realisation of divisional financial targets: 70% on Divisional
EBITDA and 30% on Divisional Working Capital.
The Remuneration and Nomination Committee evaluated
the achievement of the 2017 objectives for the members
of the Management Committee and proposed to the
Board of Directors the calculation of a short-term variable
remuneration based on the 2017 performance criteria.
The variable remuneration is not spread over time.
The target STIP is 80% of the fixed annual remuneration for
the CEO and, on average, 42% of annual fixed remunera-
tion for other members of the Management Committee.
Remuneration awarded to the Chief Execu-tive Officer as a member of the Management Committee For the year ended December 31, 2017, the remuneration
is comprised of the following elements:
• base salary (gross remuneration): €560,000;
• variable remuneration (relating to performance in 2017,
paid out in 2018): €nil
The CEO has voluntarily transferred the bonus pay-
ment he was to receive regarding 2017 to 2018. This
amount will be added to his target bonus for 2018 and
paid out in 2019, subject to his meeting specific perfor-
mance criteria set for 2018.
• other compensation components (representation al-
lowances): €24,000.
Actual remuneration granted to non-executive directors in 2017:
NameRemuneration for board members
Remuneration for AC members
Remuneration for RNC members
Total
Cyrille Ragoucy €59,583 - €5,417 €65,000
Michael Kolbeck €0 - €0 €0
Jeremy Fryzuk €0 €0 - €0
Nicolas Vanden Abeele (1) €21,667 €5,417 €5,417 €32,500
Sarah Hedger €21,667 €5,417 - €27,084
Karoline Graeubig €0 - - €0
Hannah Strong €0 - - €0
Patrick Lebreton €0 - - €0
(1) Nicolas Vanden Abeele provides services through Accelium BVBA.
Procedures for developing the remuneration policy and for determining the remunera-tion granted to members of the Management CommitteeThe remuneration policy for the CEO and the Management
Committee takes account of prevailing legislation, the
Corporate Governance Code and market data.
It is monitored by the Remuneration and Nomination Com-
mittee – with the assistance of specialist members of staff
– to see whether it complies with the law, the Corporate
Governance Code and prevailing market practices and
trends. The Chairman of the Remuneration and Nomination
Committee informs the Board of Directors of the Commit-
tee’s activities and advises it of any proposed changes to
the remuneration policy and its practical implementation.
On the basis of advice obtained from the Remuneration
and Nomination Committee, the Board of Directors deter-
mines the remuneration to be granted to the CEO and the
members of the Management Committee and will assess
this amount at regular intervals. The amount in question is
split into a fixed component and a performance-related
component.
Remuneration policy regarding the remunera-tion granted to members of the Management CommitteeFor the remuneration related to 2017, the following principles
were applied for members of the Board of Directors, the
CEO and the members of the Management Committee:
Principles to determine the remuneration
Balta’s remuneration philosophy is to ensure that all em-
ployees are rewarded fairly and appropriately for their
contribution. In setting remuneration levels, the Remu-
neration and Nomination Committee takes appropriate
market benchmarks into account, ensuring an emphasis
on pay for performance. This approach helps to attract,
engage, retain, and motivate key management, while
ensuring their behaviour remains consistent with its values
and strategy.
A review of the performance of each member of the
Management Committee will be conducted annually
by the CEO and discussed with the Remuneration and
Nomination Committee. The results will be presented to
and discussed by the Board of Directors.
BA
LTA
AN
NU
AL
REP
OR
T 20
17
4746
CO
RP
OR
ATE
Go
vern
anc
e

• As part of the IPO process, the CEO is entitled to a
share-related bonus payment pursuant to a phantom
share bonus scheme with Balta nv representing the value
of 84,544 shares at the payout date. The bonus is only
payable if the CEO still provides services to the Company
on the second anniversary of the IPO. If services cease
to be provided for any reason prior to the second anni-
versary, the bonus arrangement for the CEO is forfeited.
Remuneration awarded to the other Manage-ment Committee membersFor the year ended December 31, 2017, the total remuner-
ation of the Management Committee members (including
Mr Ralph Grogan, who left the company on November 10,
2017) was as follows:
• base salary (gross remuneration): €1,532,852;
• variable remuneration (relating to performance in 2017,
paid out in 2018): €174,400
Certain members of the Management Committee
have voluntarily transferred the bonus payment they
were to receive regarding 2017 to 2018. This amount
will be added to their target bonus for 2018 and paid
out in 2019, subject to them meeting specific perfor-
mance criteria set for 2018.
• pension and death in service and disability coverage:
€1,244;
• as part of the IPO process, the members of the Manage-
ment Committee (excluding the CEO) are entitled to a
share related bonus payment pursuant to a phantom
share bonus scheme with Balta nv representing the
value of 86,361 shares at the payout date. The bonus
is only payable if the manager still provides services to
the Balta Group on the second anniversary of the IPO.
If services cease to be provided for any reason prior to
the second anniversary, the bonus arrangement for that
manager is forfeited.
Remuneration awarded in the context of the IPOIn the context of the IPO, certain managers received shares
and a cash bonus from LSF9 Balta Midco S.à r.l pursuant
to existing management incentive schemes with Lone
Star entities.
The number of shares granted to the members of the
Management Committee and the current general man-
ager of Bentley Mills Inc is 1,127,362 shares in total. 232,284
shares were acquired upon completion of the IPO and,
of the remainder, 50% (447,541 shares) would vest on the
first anniversary of the IPO and 50% (447,537 shares) on
its second anniversary . A manager who leaves the Balta
Group voluntarily or is dismissed for cause prior to a vesting
date will lose his entitlement to unvested shares.
The Company has not yet granted any stock options or
other rights to acquire shares to members of the Man-
agement Committee.
Provisions concerning individual severance payments for Management Committee mem-bers / Termination ProvisionsOther than in the case of termination in certain events of
breach of contract, the CEO is entitled to a notice period
of 12 months or a termination fee equal to his fixed fee for a
period of 12 months. The CEO is subject to a non-compe-
tition clause for a period of up to one year from the date
of termination or resignation restricting his ability to work
for competitors. A non-compete compensation of 50%
of his fixed fee is due if this non-compete is not waived
within 30 days of the agreement ending.
Other than in the case of termination in certain events of
breach of contract, the CFO is entitled to a notice period
of 12 months or a termination fee equal to his fixed fee for
a period of 12 months. The CFO is subject to a non-com-
petition clause for a period of up to one year from the
date of termination or resignation restricting his ability to
work for competitors.
Other than in the case of termination in certain events of
breach of contract, Mr. Lieven Vandendriessche is entitled
to a notice period of 12 months or a termination fee equal
to his fixed fee for a period of 12 months. Mr. Lieven Van-
dendriessche is subject to a non-competition clause for
a period of up to one year from the date of termination or
resignation, restricting his ability to work for competitors.
A non-compete compensation of 50% of his fixed fee is
due if this non-compete is not waived within 30 days of
the agreement ending.
The above-mentioned termination provisions were included
in management agreements dated before the IPO.
Other than in certain cases of termination for breach of
contract, Mr. Marc Dessein is entitled to a notice period of
18 months and a termination fee equal to the relevant por-
tion of his fixed and variable fee paid out in the preceding
calendar year for early termination of the notice period.
Mr. Dessein is subject to a non-competition clause for a
period of up to one year from the date of termination or
resignation, restricting his ability to work for competitors.
He is entitled to receive compensation in an amount equal
to up to €162,500 of remuneration if this non-competition
clause is applied.
The termination provision was included in Mr. Marc Des-
sein’s management agreement dated before the IPO and
is justified given his skills and seniority.
Severance payments for Management Com-mittee members who left in 2017No severance payments were made to the Management
Committee member leaving the Company in 2017.
Clawback provision regarding members of the Management CommitteeThere are no clawback provisions if remuneration is paid
on the basis of inaccurate data. Grants will be based on
audited financial information.
Changes to the remuneration policy since the end of 2017The LTIP, as described above, was developed during 2017.
It was proposed by the Remuneration and Nomination
Committee to the Board of Directors and approved on
February 28, 2018. It will be implemented in 2018.
Risk management and internal control frameworkIntroductionBalta Group operates a risk management and control
framework in accordance with the Belgian Companies
Code and the Corporate Governance Code.
Balta Group is exposed to a wide variety of risks within
the context of its business operations, possibly resulting
in its objectives being affected or potentially not being
achieved. Controlling such risks is a core task of the Board
of Directors, the Management Committee and all other
employees with managerial responsibilities.
The risk management and control system has been set
up to achieve the following goals: achieving Balta Group’s
objectives, achieving operational excellence, ensuring
correct and timely financial reporting and ensuring com-
pliance with all applicable laws and regulations.
Control environmentThe control environment constitutes the basis of the in-
ternal control and risk management system. The control
environment is defined by a mix of formal and informal
rules and corporate culture on which the operation of
the business relies.
Three lines of defence
Balta Group applies the “three lines of defence model”
to clarify roles, responsibilities and accountabilities, and
to enhance communication within the area of risk and
control. Within this model, the lines of defence to respond
to risks are:
- first line of defence: line management is the first body
responsible for assessing risks on a day-to-day basis
and implementing controls in response of these risks;
- second line of defence: oversight functions like Finance,
Controlling, Quality, Compliance and Legal oversee and
challenge risk management as executed by the first
line of defence. Those constituting the second line of
defence provide guidance and direction and develop
a risk management framework;
- third line of defence: independent assurance providers,
like external auditors, challenge the risk management
processes as executed by the first and second line of
defence.
Policies, procedures and processes
Corporate culture is sustained by the implementation
of different company-wide policies, procedures and
processes such as the Balta Group compliance charter,
the anti-fraud and anti-corruption policy, the gift and
entertainment policy, the non-audit services policy, the
reserved matters policy and the quality management
system. Both the Board of Directors and the Management
Committee fully endorse these initiatives. Employees will
be regularly informed and trained on these subjects in
order to develop sufficient risk management and control
at all levels and in all areas of the organisation.
Group-wide ERP system
The majority of Balta’s entities operate the same group-
wide ERP system which is managed centrally. This system
embeds the roles and responsibilities defined at group
level. Through this system, the main flows are standardized,
CO
RP
OR
ATE
Go
vern
anc
e
BA
LTA
AN
NU
AL
REP
OR
T 20
17
4948

key internal controls are enforced and regular testing is
carried out by the corporate finance department. The
system also allows detailed monitoring of activities and
direct central access to data.
Risk managementSound risk management starts with identifying and as-
sessing the risks associated with the business, in order to
minimize such risks on the organisation’s ability to achieve
its objectives and to create value for its stakeholders.
All Balta Group employees are accountable for the timely
identification and qualitative assessment of the risks within
their area of responsibility.
Balta has identified and analysed its key corporate risks
as disclosed under the “Summary of main risks” chapter
of this Annual Report.
Control activitiesControl measures are in place to minimize the effect of risk
on Balta Group’s ability to achieve its objectives. These
control activities are embedded in the Balta Group’s key
processes and systems to ensure that the risk responses
and the Balta Group’s overall objectives are carried out
as designed. Control activities are conducted throughout
the organisation, at all levels and within all departments.
The following control measures have been implemented
at Balta Group: an authorisation cascade system in the
computer system, access and monitoring systems in the
buildings, payment authorities, cycle counts of inventories,
identification of machinery and equipment, daily moni-
toring of the cash position, an internal reporting system
by means of which both financial data and operational
data are reported on a regular basis. All deviations against
budgets and previous reference periods are carefully
analyzed and explained. Great importance is attached
to security of all data stored in various computer systems.
Information and communicationBalta recognizes the importance of timely, complete and
accurate communication and information both top-down
as well as bottom-up. The Company therefore commu-
nicates operational and financial information at both
divisional and group level. The general principle is to ensure
consistent and timely communication to all stakeholders
of all information impacting their area of responsibility.
All key business processes in a majority of the subsidiaries
are managed through the ERP system. This not only offers
extensive functionality with regard to internal reporting
and communication, but also the ability to manage and
audit access rights and authorisation management on
a centralized basis.
The Management Committee also discusses the results
on a monthly basis. The corporate finance department
directs the information and communication process. For
both internal and external reporting and communication,
a financial calendar exists in which all reporting dates are
set out and which is communicated to all parties involved.
Supervision and monitoring of control mech-anismsSupervision and monitoring is mainly performed by the
Board of Directors through the work of the Audit Com-
mittee and the Management Committee. Moreover, the
Statutory Auditor, in the context of reviewing the annual
accounts, reports to the Audit Committee on their review
of internal controls and risk management systems. In so
doing, the Statutory Auditor focuses on the design and
effectiveness of internal controls and systems relevant for
the preparation of the Financial Statements.
Risk management and internal control with regard to financial reportingThe accurate and consistent application of accounting
rules throughout the Company is ensured by means of
Finance and Accounting procedures & guidelines.
The accounting teams are responsible for producing the
accounting figures, whereas the controlling teams check
their validity. These checks include consistency tests, com-
paring current figures with historical and budget figures,
as well as sample checks of transactions according to
their materiality.
Specific internal control activities with respect to financial
reporting are in place, including the use of a periodic
closing and reporting checklist. This checklist ensures clear
communication of timelines, the completeness of tasks,
and the clear assignment of responsibilities.
Uniform reporting of financial information throughout the
organisation ensures a consistent flow of information, in
turn allowing potential anomalies to be detected. The
group-wide ERP system and management information
tools give the central controlling team direct access to
disaggregated financial and non-financial information.
An external financial calendar is planned in consultation with
the Board of Directors and the Management Committee,
and this calendar is announced to external stakeholders
via the Company’s website www.baltagroup.com/en/
Investors. The objective of this external financial report-
ing is to provide Balta stakeholders with the information
necessary for making sound business decisions.
BA
LTA
AN
NU
AL
REP
OR
T 20
17
5150
CO
RP
OR
ATE
Go
vern
anc
e

SUMMARYof main risks For Balta, risk management is an inherent part of doing
business. The summary below, though not exhaustive,
provides an overview of the main risks we have identified1.
While we take mitigating actions, there can be no guar-
antee that such risks will not materialize.
Market CompetitionThe global flooring market is competitive and each of
our divisions faces competition from other soft flooring
manufacturers as well as hard flooring alternatives.
Key to our competitiveness is our ability to identify and
respond to rapidly changing consumer preferences, re-
quiring us to frequently renew our designs and product
mix and to innovate.
Customer Dependency Our main customers are large retailers and wholesalers
with substantial buying power. Our top three customers
accounted for 20.3% of our 2017 revenues. We may not
be successful at retaining our key customers, which could
have an adverse impact on our sales. In addition, we are
dependent on the success of our customers.
In line with normal industry practice, we have no formal
contracts with the majority of our customers. We typically
deal with our customers on a non-exclusive basis without
minimum purchase obligations.
General Macro-economic and Geopolitical Events & Trade RegulationsDemand for our products depends significantly on con-
sumer confidence and factors impacting the residential
and commercial renovation and construction markets.
With production and distribution facilities in Belgium,
Turkey and the United States and sales to more than 130
countries, we are exposed to geopolitical risk on both the
demand and supply side.
Political uncertainty caused by events such as Brexit or
upcoming elections may weigh on consumer demand in
certain geographies. Management closely monitors the
political and economic situation in all countries where
we do business.
Increased import duties or sanctions against the importing
of certain goods in certain countries could pose barriers
for us to successfully do business.
Legal & ComplianceFailure to comply with the laws of the countries we do
business in may result in a delay or temporary suspension
of our sales and operations, and may impact our financial
position.
Publicity and reputationWe may be affected by product recall or liability claims
or otherwise be subject to adverse publicity.
EmployeesOur ability to successfully execute our strategy depends
on our success in attracting, retaining and developing
our employees.
If the relationship with our employees or trade unions
were to deteriorate, this could have an adverse impact
on our business.
Raw Materials & Supply ChainWe use large quantities of raw materials for which we de-
pend on a limited number of suppliers. Most of our suppliers
are large companies and can exert substantial supplier
power. As is common in the industry, we have no formal
contracts with the majority of our raw material suppliers.
In 2017, raw materials expenses represented 46.7% of our
revenues. The key raw materials used were polypropylene,
yarn, latex and polyamide, which together represented
70.3% of our total raw material expenses.
Raw material prices can be volatile and depend on a
number of factors that are often beyond our control
including, but not limited to, local supply and demand
balance, general economic conditions and fluctuations in
commodity prices. The majority of our price agreements
with customers do not include raw materials price index-
ation mechanisms.
Production & LogisticsThe ability to produce and deliver products on time is key
to attracting new and retaining existing customers.
Disruptions at our manufacturing or distribution facilities
may occur and could result in temporary shortfalls in pro-
duction and late or incomplete deliveries or increase our
cost of sales. We may incur losses that are completely or
partially uninsured.
We do not have our own transportation facilities and
depend on third-party service providers for the timely
delivery of our products to our customers.
ITFailure of our IT platform could hamper our ability to pro-
cess orders in time. We use our IT platform to manage our
operations (including sales, customer service, logistics and
admin). We have a complex and heterogeneous application
landscape that in part consists of certain systems from
prior acquisitions that have only been partially integrated,
which could trigger operational risks.
We are also contending with an increasing number of
cybercrime-related incidents, which require us to maintain
adequate cybersecurity. Any failure to do so may adversely
affect our operations.
FinancialOur activities expose us to a variety of financial risks in-
cluding, but not limited to, currency risk, interest rate risk,
credit risk and liquidity risk.
Part of our sales and purchases are denominated in
currencies other than Euro. Other key currencies include
Pound Sterling, US Dollar and Turkish Lira. The fluctuation
of these currencies versus the Euro may impact our results.
Some of our external borrowings carry interest at a var-
iable rate.
Not all of the credit risk exposure towards our customers
is covered by our external credit insurance agreements.
Our external financing agreements include obligations,
restrictions and covenants, which may have an adverse
effect on our business, financial situation and results of
operations if we are unable to meet these.
Changes in tax legislation or accounting rules could affect
future results.
Changes in assumptions underlying the carrying value of
our assets could result in an impairment of such assets,
including intangible assets such as goodwill.
Reference is made to the risk factors referred to in note 30
of the section financial risk management in the Financial
Statements.
M&AThere is no guarantee of success in acquiring any preferred
target companies in line with our acquisition strategy.
We may fail to successfully integrate acquisitions as
expeditiously as expected and may not be able to fully
realize anticipated cost savings, synergies, future earnings
or benefits that we intend to achieve from acquisitions.
1 The order in which the risks are listed is not indication of the potential impact nor the probability of occurrence
BA
LTA
AN
NU
AL
REP
OR
T 20
17
5352
SUM
MA
RY
of
ma
in r
isks

I.1. Consolidated statement of comprehensive income for the period ended December 31
(€ thousands)
Note For the year ended December 311
2017 2016
I. CONSOLIDATED INCOME STATEMENT
Revenue Note 4 661,320 557,685
Raw material expenses (310,391) (259,472)
Changes in inventories Note 17 (3,359) 6,055
Employee benefit expenses Note 8 (151,334) (130,054)
Other income Note 9 7,112 8,171
Other expenses Note 9 (121,869) (101,017)
Depreciation / amortization Note 10 (32,499) (28,666)
Adjusted Operating Profit 2 48,980 52,701
Gains on asset disposals - 1,610
Integration and restructuring expenses Note 11 (11,368) (5,128)
Operating profit / (loss) 2 37,611 49,183
Finance income 41 57
Finance expenses Note 12 (37,327) (28,608)
Net finance expenses (37,285) (28,552)
Profit / (loss) before income taxes 326 20,632
Income tax benefit / (expense) Note 13 2,654 4,713
Profit / (loss) for the period from continuing operations 2,980 25,345
Profit / (loss) for the period from discontinued operations - -
Profit / (loss) for the period 2,980 25,345
Attributable to:
Equity holders 2,946 -
Non-controlling interest 34 -
II. CONSOLIDATED OTHER COMPREHENSIVE INCOME
Items in other comprehensive income that may be subsequently reclassified to P&L
Exchange differences on translating foreign operations (13,522) (8,013)
Changes in fair value of hedging instruments qualifying for cash flow hedge accounting
123 (116)
Items in other comprehensive income that will not be reclassified to P&L
- -
Changes in deferred taxes (457) 285
Changes in employee defined benefit obligations 1,005 (882)
Other comprehensive income for the period, net of tax (12,850) (8,727)
Total comprehensive income for the period (9,870) 16,618
Basic and diluted earnings per share from continuing operations attributable to the ordinary equity holders of the company3
Note 37 0.08 0.71
(1) Predecessor: Balta Group NV was incorporated on 1 March 2017. The financial information relating to 2016 has been extracted from the consolidated financial statement of LSF9 Balta Issuer S.à r.l.
(2) Adjusted Operating Profit / Operating profit/(loss) are non-GAAP measures as defined in note 1.25 and include impact purchase price accounting in statement above.
(3) For 2017, the dividend is calculated on a pro rata basis starting from the IPO date.
The accompanying notes form an integral part of these Consolidated Financial Statements.
I.2. Consolidated statement of financial position as at December 31
(€ thousands)
Note For the year ended December 311
2017 2016
Property, plant and equipment
Land and buildings Note 15 162,103 169,203
Plant and machinery Note 15 130,977 115,016
Other fixtures and fittings, tools and equipment Note 15 18,080 15,019
Goodwill Note 7 198,814 124,673
Intangible assets Note 14 12,218 2,376
Deferred income tax asset Note 16 4,747 18,950
Trade and other receivables Note 18 1,165 138
Total non-current assets 528,104 445,375
Inventories Note 17 147,868 135,320
Derivative financial instruments Note 29 - 46
Trade and other receivables Note 18 61,539 54,930
Current income tax assets 3,434 34
Cash and cash equivalents Note 19 37,338 45,988
Total current assets 250,179 236,318
Total assets 778,283 681,693
Share capital Note 20 252,950 171
Share premium Note 20 65,660 1,260
Preferred Equity Certificates Note 23 - 138,600
Other comprehensive income Note 21 (19,913) (7,063)
Retained earnings Note 22 6,297 3,351
Other reserves (39,878) -
Total equity 265,116 136,319
Senior Secured Notes Note 24 228,130 279,277
Senior Term Loan Facility Note 25 34,782 -
Bank and Other Borrowings Note 26 13,310 15,388
Deferred income tax liabilities Note 16 54,471 69,775
Provisions for other liabilities and charges Note 33 2,335 -
Employee benefit obligations Note 31 4,127 5,079
Total non-current liabilities 337,155 369,519
Senior Secured Notes Note 24 3,425 4,234
Senior Term Loan Facility Note 25 (108) -
Bank and Other Borrowings Note 26 2,361 2,614
Provisions for other liabilities and charges Note 33 7,316 64
Derivative financial instruments Note 29 2 162
Other payroll and social related payables Note 32 33,373 31,246
Trade and other payables Note 34 126,375 131,562
Income tax liabilities 3,265 5,974
Total current liabilities 176,010 175,856
Total liabilities 513,165 545,374
Total equity and liabilities 778,283 681,693
(1) Predecessor: Balta Group NV was incorporated on 1 March 2017. The financial information relating to 2016 has been extracted from the consolidated financial statement of LSF9 Balta Issuer S.à r.l.
The accompanying notes form an integral part of these Consolidated Financial Statements
FINANCIAL STATEMENTS
BA
LTA
AN
NU
AL
REP
OR
T 20
17
5554
FIN
AN
CIA
L St
ate
me
nts

I.3. Consolidated statement of cash flows for the period ended December 31
(€ thousands)
Note For the year ended December 311
2017 2016
I. CASH FLOW FROM OPERATING ACTIVITIES
Net profit / (loss) for the period 2,980 25,345
Adjustments for:
Reclass of capital increase expenses to cashflow from financing activities (gross)
132 -
Income tax expense/(income) Note 13 (2,654) (4,713)
Finance income (41) (57)
Financial expense Note 12 37,327 28,608
Depreciation, amortisation Note 10 32,499 28,666
Movement in provisions 7,252 -
(Gain) / loss on disposal of non-current assets (58) (1,610)
Fair value of derivatives 8 786
Non-cash impact of purchase price allocation Note 6 2,902 -
Cash generated before changes in working capital 80,347 77,025
Changes in working capital:
Inventories Note 17 (4,280) (5,883)
Trade receivables Note 18 1,913 (8,433)
Trade payables Note 34 (15,460) 10,485
Other working capital (2,248) (5,459)
Cash generated after changes in working capital 60,272 67,735
Net income tax (paid) (5,344) (1,478)
Net cash generated / (used) by operating activities 54,928 66,257
II. CASH FLOW FROM INVESTING ACTIVITIES
Acquisition & disposal of property, plant and equipment Note 15 (38,261) (36,483)
Acquisition of intangibles Note 14 (1,673) (1,494)
Proceeds from non-current assets 912 2,408
Acquisition of subsidiary Note 6 (68,752) -
Net cash used by investing activities (107,775) (35,569)
III. CASH FLOW FROM FINANCING ACTIVITIES
Interest and other finance charges paid, net (32,388) (27,814)
Proceeds from borrowings with third parties Note 26 110,000 -
IPO Proceeds Note 20 145,000 -
Incremental costs paid directly attributable to IPO Note 5 (7,772) -
Repayments of borrowings with third parties Note 20, 26 (171,987) (2,349)
Proceeds from contribution in kind 1,343 -
Net cash generated / (used) by financing activities 44,196 (30,163)
NET INCREASE/ (DECREASE ) IN CASH AND BANK OVERDRAFTS (8,650) 526
Cash, cash equivalents and bank overdrafts at the beginning of the period
45,988 45,462
Cash, cash equivalents and bank overdrafts at the end of the period
Note 19 37,338 45,988
(1) Predecessor: Balta Group NV was incorporated on 1 March 2017. The financial information relating to 2016 has been extracted from the consolidated financial statement of LSF9 Balta Issuer S.à r.l.
The accompanying notes form an integral part of these Consolidated Financial Statements
I.4. Consolidated statement of changes in equity for the year ended December 31
(€ thousands) Sha
re c
ap
ital
Sha
re p
rem
ium
Pref
erre
d E
qui
ty
Cer
tific
ate
s
Oth
er
com
pre
hens
ive
inco
me
Reta
ined
ea
rnin
gs
Oth
er re
serv
es
Tota
l
Non
-con
trol
ling
in
tere
st
Tota
l eq
uity
Balance at January 1 2016 171 1,260 - 1,664 (21,995) - (18,900) - (18,900)
Recognition of PECs as equity instrument
- - 138,600 - - - 138,600 138,600
Profit / (loss) for the period - - - - 25,345 - 25,345 - 25,345
Other comprehensive income
Exchange differences on translating foreign operations
- - - (8,013) - - (8,013) - (8,013)
Changes in fair value of hedging instruments qualifying for cash flow hedge accounting
- - - (116) - - (116) - (116)
Cumulative changes in deferred taxes
- - - 285 - - 285 - 285
Cumulative changes in employee defined benefit obligations
- - - (882) - - (882) - (882)
Total comprehensive income for the period
- - - (8,727) 25,345 - 16,618 - 16,618
Balance at December 31 2016 (1) 171 1,260 138,600 (7,063) 3,351 136,319 - 136,319
BA
LTA
AN
NU
AL
REP
OR
T 20
17
5756
FIN
AN
CIA
L St
ate
me
nts

(€ thousands)
Sha
re c
ap
ital
Sha
re p
rem
ium
Pref
ered
Eq
uity
C
erti
fica
tes
Oth
er
com
pre
hens
ive
inco
me
Reta
ined
ea
rnin
gs
Oth
er re
serv
es
Tota
l
Non
-con
trol
ling
in
tere
st
Tota
l eq
uity
Balance at January 1 2017 171 1,260 138,600 (7,063) 3,351 - 136,319 - 136,319
Profit / (loss) for the period - - - - 2,946 - 2,946 34 2,980
Other comprehensive income
Exchange differences on translating foreign operations
- - - (13,522) - - (13,522) - (13,522)
Changes in fair value of hedging instruments qualifying for cash flow hedge accounting
- - - 123 - - 123 - 123
Cumulative changes in deferred taxes
- - - (457) - - (457) - (457)
Cumulative changes in employee defined benefit obligations
- - - 1,005 - - 1,005 - 1,005
Total comprehensive income for the period
- - - (12,850) 2,946 - (9,904) 34 (9,870)
Incorporation of founders' share 62 - - - - - 62 - 62
Capital contribution Bentley Management Buy-out
1,343 - - - - - 1,343 (34) 1,309
Contribution in kind of LSF9 Balta Issuer S.à r.l.
331,250 - - - - - 331,250 - 331,250
Transfer of share capital to other reserves
(150,000) - - - - 150,000 - - -
Cancellation of founders' share (62) - - - - - (62) - (62)
Contribution of net proceeds from the Primary Tranche of the IPO
79,340 65,660 - - - - 145,000 - 145,000
IPO expenses attributed to the Primary tranche of the IPO
(7,640) - - - - - (7,640) - (7,640)
Capital reorganisation under common control
(1,514) (1,260) (138,600) - - (189,878) (331,252) - (331,252)
Total transactions with the owners 252,779 64,400 (138,600) - - (39,878) 138,701 (34) 138,667
Balance at December 31 2017 (1) 252,950 65,660 - (19,913) 6,297 (39,878) 265,116 - 265,116
(1) Predecessor: Balta Group NV was incorporated on 1 March 2017. The financial information relating to 2016 has been extracted from the consolidated financial statement of LSF9 Balta Issuer S.à r.l.
The accompanying notes form an integral part of these Consolidated Financial Statements.
I.5. Notes to the Consolidated Financial Statements
Note 1. Accounting policiesThe principal accounting policies applied in the preparation
of these Consolidated Financial Statements are set out
below. These policies have been consistently applied to
the year presented, unless otherwise stated.
Note 1.1. Basis of preparation
Basis of preparation
These Consolidated Financial Statements of Balta Group NV
(“the Company” or “Balta Group”), registered at Wakken-
steenweg 2, 8710 Sint-Baafs-Vijve, Belgium (Registration
number 0671.974.626) and its subsidiaries (“the Group”)
have been prepared in accordance with International
Financial Reporting Standards as adopted by the European
Union (“IFRS”). These include all IFRS standards and IFRIC
interpretations issued and effective at December 31 2017.
The Financial Statements of the Company for the period 1
January 2017 to 31 December 2017 comprise the Company
and its subsidiaries (together referred to as the “Group”
and individually as “Group entities”).
These Consolidated Financial Statements are presented
in Euro, which is the Group’s presentation currency and
the functional currency of the Company. All amounts in
these Consolidated Financial Statements are presented
in thousands of Euro, unless otherwise stated. Rounding
adjustments have been made in calculating some of
the financial information included in these Consolidated
Financial Statements.
These Financial Statements are prepared on a going
concern basis, i.e. assuming that operations will continue
in the foreseeable future.
Any events and/or transactions significant to an under-
standing of the changes since December 31 2016 have
been included in these notes to the Consolidated Financial
Statements and mainly relate to the Initial Public Offering
(IPO) of the Group in 2017 and relate to the acquisition of
the Bentley Mills Group of companies which was completed
on March 22 2017.
In preparation of the IPO of the Group in 2017, Balta Group
NV was incorporated on March 1 2017 for the purpose
of acquiring LSF9 Balta Issuer S.à r.l and its subsidiaries,
which occurred on May 30 2017 through a contribution in
kind in the Share Capital of the Company. Balta Group
NV was established by the same shareholders as those
of LSF9 Balta Issuer S.à r.l. Since the shareholders of LSF9
Balta Issuer S.à r.l. before the reorganisation have the
same absolute and relative interest in the net assets of
the Group and the new group immediately before and
after the reorganisation, the transactions for the IPO
constitute a capital reorganisation under common control.
Consequently, these transactions are recognized in the
Financial Statements using the predecessor value method.
This means:
1. That the assets/liabilities of Balta Issuer S.à r.l. have been
recognized at book value in the Financial Statements of
Balta Group, as established in accordance with IFRS. LSF9
Balta Issuer S.à r.l has always since its creation, prepared
Consolidated Financial Statements in accordance with
IFRS, and therefore IFRS 1 is not applicable;
2. That the other comprehensive income, retained earn-
ings and other reserves recognized in the Consolidated
Financial Statements are the other comprehensive
income, retained earnings and other reserves of LSF9
Balta Issuer S.à r.l. and the difference between the con-
sideration for the contribution in kind of the shares of LSF9
Balta Issuer S.à r.l. and the eliminated share capital of
LSF9 Balta Issuer S.à r.l. is recognized in “Other reserves”;
3. That the income statement and statement of cash
flows for the twelve months ended December 31 2017
spans twelve months, notwithstanding the fact that
the financial year of Balta Group NV as a legal entity
is shorter (March 1 to December 31 2017);
4. That the comparative information presented in the con-
solidated financial statements is the information of LSF9
Balta Issuer S.à r.l. Management has taken this decision in
order to ensure the continuity of the financial information.
The preparation of Financial Statements in conformity with
IFRS requires the use of certain critical accounting estimates.
It also requires management to exercise its judgement in the
process of applying the Group’s accounting policies. The ar-
eas involving a higher degree of judgement or complexity, or
areas where assumptions and estimates are significant to the
Consolidated Financial Statements are disclosed in Note 2.
New standards and amendments to standards
The following interpretations and amendments to stand-
ards are mandatory for the first time for the financial year
beginning 1 January 2017 and have been endorsed by the
BA
LTA
AN
NU
AL
REP
OR
T 20
17
5958
FIN
AN
CIA
L St
ate
me
nts
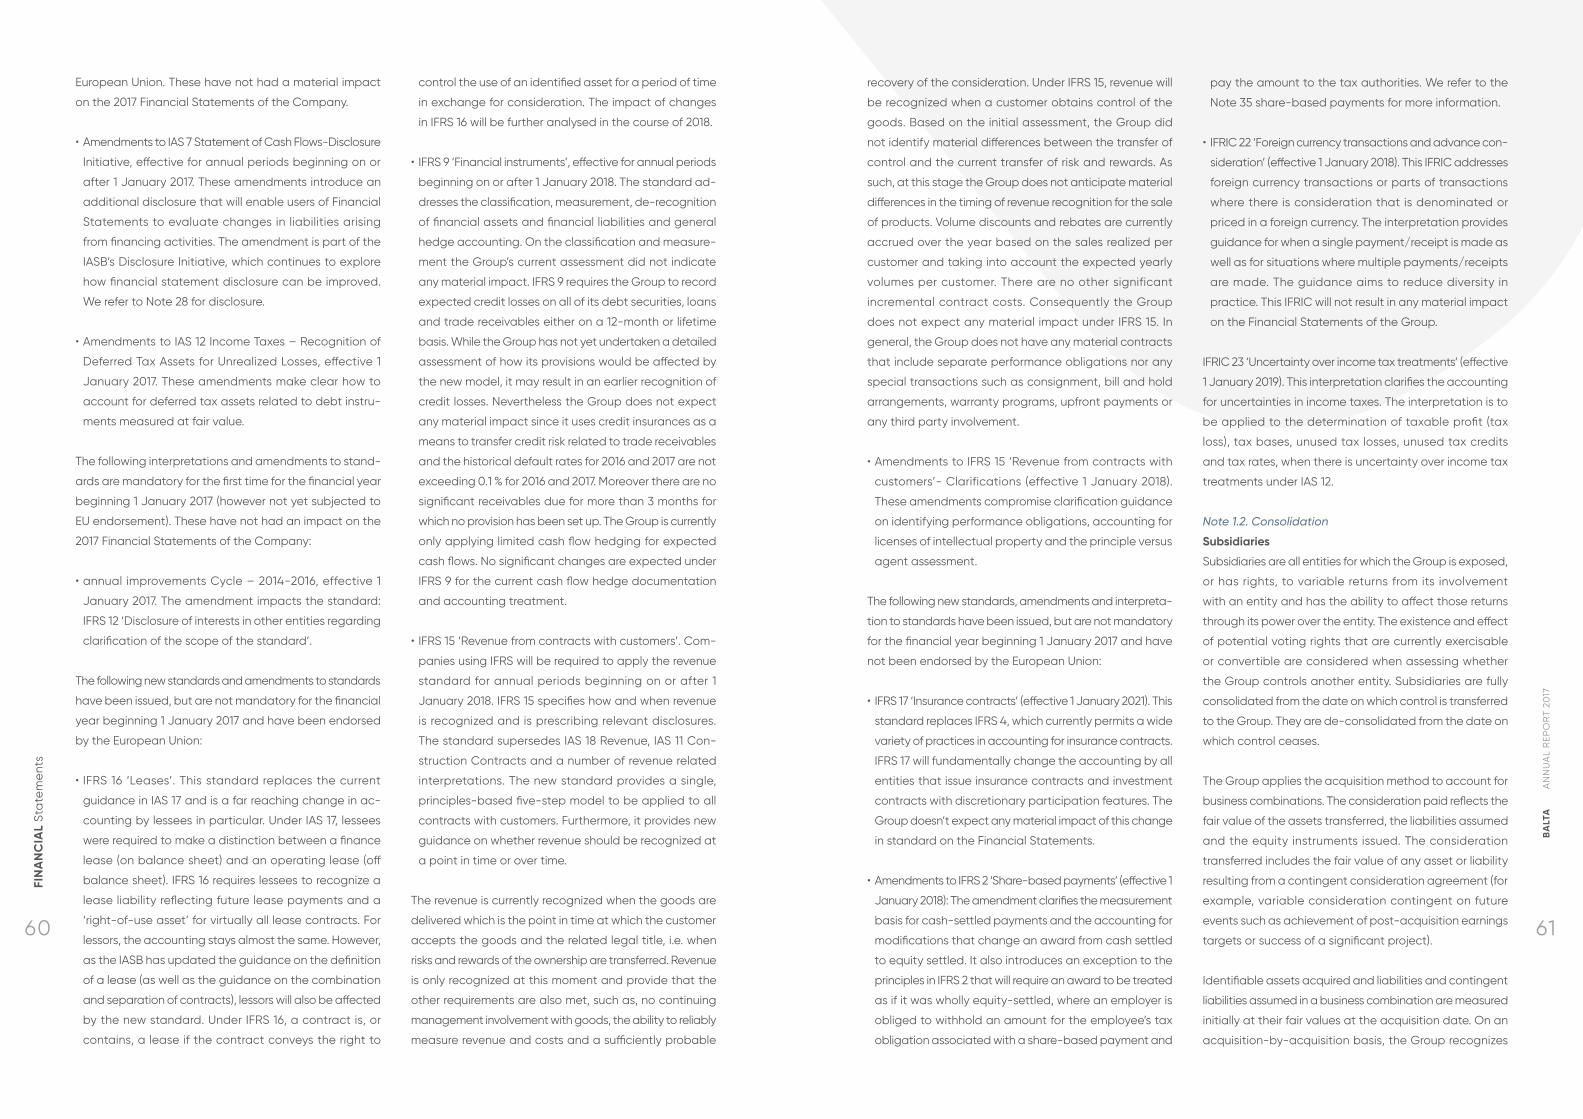
European Union. These have not had a material impact
on the 2017 Financial Statements of the Company.
• Amendments to IAS 7 Statement of Cash Flows-Disclosure
Initiative, effective for annual periods beginning on or
after 1 January 2017. These amendments introduce an
additional disclosure that will enable users of Financial
Statements to evaluate changes in liabilities arising
from financing activities. The amendment is part of the
IASB’s Disclosure Initiative, which continues to explore
how financial statement disclosure can be improved.
We refer to Note 28 for disclosure.
• Amendments to IAS 12 Income Taxes – Recognition of
Deferred Tax Assets for Unrealized Losses, effective 1
January 2017. These amendments make clear how to
account for deferred tax assets related to debt instru-
ments measured at fair value.
The following interpretations and amendments to stand-
ards are mandatory for the first time for the financial year
beginning 1 January 2017 (however not yet subjected to
EU endorsement). These have not had an impact on the
2017 Financial Statements of the Company:
• annual improvements Cycle – 2014-2016, effective 1
January 2017. The amendment impacts the standard:
IFRS 12 ‘Disclosure of interests in other entities regarding
clarification of the scope of the standard’.
The following new standards and amendments to standards
have been issued, but are not mandatory for the financial
year beginning 1 January 2017 and have been endorsed
by the European Union:
• IFRS 16 ‘Leases’. This standard replaces the current
guidance in IAS 17 and is a far reaching change in ac-
counting by lessees in particular. Under IAS 17, lessees
were required to make a distinction between a finance
lease (on balance sheet) and an operating lease (off
balance sheet). IFRS 16 requires lessees to recognize a
lease liability reflecting future lease payments and a
‘right-of-use asset’ for virtually all lease contracts. For
lessors, the accounting stays almost the same. However,
as the IASB has updated the guidance on the definition
of a lease (as well as the guidance on the combination
and separation of contracts), lessors will also be affected
by the new standard. Under IFRS 16, a contract is, or
contains, a lease if the contract conveys the right to
control the use of an identified asset for a period of time
in exchange for consideration. The impact of changes
in IFRS 16 will be further analysed in the course of 2018.
• IFRS 9 ‘Financial instruments’, effective for annual periods
beginning on or after 1 January 2018. The standard ad-
dresses the classification, measurement, de-recognition
of financial assets and financial liabilities and general
hedge accounting. On the classification and measure-
ment the Group’s current assessment did not indicate
any material impact. IFRS 9 requires the Group to record
expected credit losses on all of its debt securities, loans
and trade receivables either on a 12-month or lifetime
basis. While the Group has not yet undertaken a detailed
assessment of how its provisions would be affected by
the new model, it may result in an earlier recognition of
credit losses. Nevertheless the Group does not expect
any material impact since it uses credit insurances as a
means to transfer credit risk related to trade receivables
and the historical default rates for 2016 and 2017 are not
exceeding 0.1 % for 2016 and 2017. Moreover there are no
significant receivables due for more than 3 months for
which no provision has been set up. The Group is currently
only applying limited cash flow hedging for expected
cash flows. No significant changes are expected under
IFRS 9 for the current cash flow hedge documentation
and accounting treatment.
• IFRS 15 ‘Revenue from contracts with customers’. Com-
panies using IFRS will be required to apply the revenue
standard for annual periods beginning on or after 1
January 2018. IFRS 15 specifies how and when revenue
is recognized and is prescribing relevant disclosures.
The standard supersedes IAS 18 Revenue, IAS 11 Con-
struction Contracts and a number of revenue related
interpretations. The new standard provides a single,
principles-based five-step model to be applied to all
contracts with customers. Furthermore, it provides new
guidance on whether revenue should be recognized at
a point in time or over time.
The revenue is currently recognized when the goods are
delivered which is the point in time at which the customer
accepts the goods and the related legal title, i.e. when
risks and rewards of the ownership are transferred. Revenue
is only recognized at this moment and provide that the
other requirements are also met, such as, no continuing
management involvement with goods, the ability to reliably
measure revenue and costs and a sufficiently probable
recovery of the consideration. Under IFRS 15, revenue will
be recognized when a customer obtains control of the
goods. Based on the initial assessment, the Group did
not identify material differences between the transfer of
control and the current transfer of risk and rewards. As
such, at this stage the Group does not anticipate material
differences in the timing of revenue recognition for the sale
of products. Volume discounts and rebates are currently
accrued over the year based on the sales realized per
customer and taking into account the expected yearly
volumes per customer. There are no other significant
incremental contract costs. Consequently the Group
does not expect any material impact under IFRS 15. In
general, the Group does not have any material contracts
that include separate performance obligations nor any
special transactions such as consignment, bill and hold
arrangements, warranty programs, upfront payments or
any third party involvement.
• Amendments to IFRS 15 ‘Revenue from contracts with
customers’- Clarifications (effective 1 January 2018).
These amendments compromise clarification guidance
on identifying performance obligations, accounting for
licenses of intellectual property and the principle versus
agent assessment.
The following new standards, amendments and interpreta-
tion to standards have been issued, but are not mandatory
for the financial year beginning 1 January 2017 and have
not been endorsed by the European Union:
• IFRS 17 ‘Insurance contracts’ (effective 1 January 2021). This
standard replaces IFRS 4, which currently permits a wide
variety of practices in accounting for insurance contracts.
IFRS 17 will fundamentally change the accounting by all
entities that issue insurance contracts and investment
contracts with discretionary participation features. The
Group doesn’t expect any material impact of this change
in standard on the Financial Statements.
• Amendments to IFRS 2 ‘Share-based payments’ (effective 1
January 2018): The amendment clarifies the measurement
basis for cash-settled payments and the accounting for
modifications that change an award from cash settled
to equity settled. It also introduces an exception to the
principles in IFRS 2 that will require an award to be treated
as if it was wholly equity-settled, where an employer is
obliged to withhold an amount for the employee’s tax
obligation associated with a share-based payment and
pay the amount to the tax authorities. We refer to the
Note 35 share-based payments for more information.
• IFRIC 22 ‘Foreign currency transactions and advance con-
sideration’ (effective 1 January 2018). This IFRIC addresses
foreign currency transactions or parts of transactions
where there is consideration that is denominated or
priced in a foreign currency. The interpretation provides
guidance for when a single payment/receipt is made as
well as for situations where multiple payments/receipts
are made. The guidance aims to reduce diversity in
practice. This IFRIC will not result in any material impact
on the Financial Statements of the Group.
IFRIC 23 ‘Uncertainty over income tax treatments’ (effective
1 January 2019). This interpretation clarifies the accounting
for uncertainties in income taxes. The interpretation is to
be applied to the determination of taxable profit (tax
loss), tax bases, unused tax losses, unused tax credits
and tax rates, when there is uncertainty over income tax
treatments under IAS 12.
Note 1.2. Consolidation
Subsidiaries
Subsidiaries are all entities for which the Group is exposed,
or has rights, to variable returns from its involvement
with an entity and has the ability to affect those returns
through its power over the entity. The existence and effect
of potential voting rights that are currently exercisable
or convertible are considered when assessing whether
the Group controls another entity. Subsidiaries are fully
consolidated from the date on which control is transferred
to the Group. They are de-consolidated from the date on
which control ceases.
The Group applies the acquisition method to account for
business combinations. The consideration paid reflects the
fair value of the assets transferred, the liabilities assumed
and the equity instruments issued. The consideration
transferred includes the fair value of any asset or liability
resulting from a contingent consideration agreement (for
example, variable consideration contingent on future
events such as achievement of post-acquisition earnings
targets or success of a significant project).
Identifiable assets acquired and liabilities and contingent
liabilities assumed in a business combination are measured
initially at their fair values at the acquisition date. On an
acquisition-by-acquisition basis, the Group recognizes
BA
LTA
AN
NU
AL
REP
OR
T 20
17
6160
FIN
AN
CIA
L St
ate
me
nts

any non-controlling interest in the acquiree either at fair
value or at the non-controlling interest’s proportionate
share of the acquiree’s net assets.
Acquisition related costs are expensed in the income
statement. The cost of an acquisition is measured as the
aggregate of the consideration transferred, measured
at acquisition date fair value and the amount of any
non-controlling interest and previously held interest in
the entity acquired. For each business combination, the
Group measures the non-controlling interest in the ac-
quiree either at fair value or at the proportionate share
of the acquiree’s identifiable net assets. The excess of
the aggregate of the consideration transferred and the
amount recognized for non-controlling interest over the
net recognized amount (generally at fair value) of the
identifiable assets acquired and liabilities assumed is
recognized as goodwill. Negative goodwill is recognized
immediately in the income statement.
Inter-company transactions, balances and unrealized
gains on transactions between group companies are
eliminated on consolidation. Unrealized losses are also
eliminated unless the transaction provides evidence of an
impairment of the asset transferred in which case the asset
is impaired through the income statement. Accounting
policies of subsidiaries are changed where necessary to
ensure consistency with the policies adopted by the Group.
Segment reporting
Note 4 provides the Group’s segment information, in line
with IFRS 8. The Group operates its business through four
segments, which are organized by product and sales
channel. The Rugs segment designs, manufactures and
distributes a broad range of machine-made rugs to major
retailers (such as home improvement, furniture, specialist,
discount and DIY stores) and wholesalers. The Residential
segment designs, manufactures and distributes branded
broadloom carpets (Balta Broadloom and ITC brands) and
tiles to major retailers and wholesalers. The Commercial
segment designs, manufactures and distributes modular
carpet tiles mainly for offices and public projects through
the Group’s modulyss brand in Europe (Commercial Eu-
rope), the Bentley Brand in the US (Commercial US) and
broadloom carpets mainly for the hospitality sector through
its arc edition brand to architects, designers, contractors
and distributors. Finally, the Non-Woven segment designs,
manufactures and distributes soft flooring for events such
as fairs and expositions and specialized fabrics for insu-
lation, lining, cars, carpet backing and banners through
its Captiqs brand.
Operating segments are reported in a manner consistent
with the internal reporting provided to the Board and the
Management Committee. Items that are provided on a
monthly basis to the Management Committee are revenues,
Adjusted EBITDA, net inventory, accounts receivable and
capital expenditure. The segment information provided
in Note 4 has been selected on this basis. It follows that
other items such as total assets and liabilities per segment
are not reviewed internally and hence not disclosed. In-
terest income, interest expense and taxes are managed
centrally and accordingly such items are not presented
by segment as they are excluded from the measure of
segment profitability.
Note 1.3. Foreign currency translation
Functional and presentation currency
Items included in the Financial Statements of each of
the Group’s entities are measured using the currency of
the primary economic environment in which the entity
operates (“the functional currency”). The Consolidated
Financial Statements are presented in Euro, which is the
Group’s functional and the Group’s presentational cur-
rency. All amounts are stated in thousands of Euro unless
otherwise stated.
Transactions and balances
Foreign currency transactions are translated into the
functional currency using the exchange rates prevailing
at the dates of the transactions or date of valuation, in
case of items that are re-measured at the reporting date.
Foreign exchange gains and losses resulting from the
settlement of such transactions and from the translation
at year-end exchange rates of monetary assets and lia-
bilities denominated in foreign currencies are recognized
in the income statement.
Foreign exchange gains and losses that relate to cash and
cash equivalents and borrowings, including borrowings,
payables and receivables between group companies that
do not qualify as a net investment in a foreign operation are
presented in income statement within “Finance income and
expense”. All other foreign exchange gains and losses are
presented in the income statement within “Other income”
or “Other expenses” which is part of the operating profit.
The principal exchange rates that have been used to
prepare these Financial Statements are as follows:
December 31 2017 December 31 2016
Closing Average Closing Average
USD 1.1993 1.1297 1.0541 1.1069
TRY 4.5155 4.1159 3.7099 3.3375
GBP 0.8872 0.8767 0.8562 0.8195
As the Bentley group of companies was only acquired as
from 22 March 2017, the income statement was included
in the Financial Statements using the average USD/EUR
rate from March 22 2017 to December 31 2017. The Business
combination was included using the closing rate per 31
March 2017. As a result the figures of the Bentley Mills Group
are included using the following rates.
December 31 2017 March 31 2017
Closing Average Closing
USD 1.1993 1.1519 1.0691
Group companies
The results and financial position of all the Group’s entities
(none of which has the currency of a hyper-inflationary
economy) that have a functional currency different from
the presentation currency are translated into the pres-
entation currency as follows:
• assets and liabilities for each statement of financial
position presented are translated at the closing or
year-end rate;
• income and expenses for each income statement are
translated at average exchange rates (unless this aver-
age is not a reasonable approximation of the cumulative
effect of the rates prevailing on the transaction dates, in
which case income and expenses are translated at the
rate on the dates of the transactions); and
• all resulting exchange differences are recognized in
“Other comprehensive income”.
On consolidation, exchange differences arising from the
translation of the net investment in foreign operations, and
of borrowings and other currency instruments designated
as hedges of such investments (if any), are taken to “Other
comprehensive income”. When a foreign operation is par-
tially disposed of or sold, exchange differences that were
recorded in equity are recognized in the income statement
as part of the gain or loss on sale.
Foreign exchange gains and losses that relate to bor-
rowings and transactions between group companies in
a different currency compared to the functional currency,
are presented in the income statement within “Finance
income and expense”, if these borrowings do not qualify
as a net investment in a foreign operation.
Goodwill and fair value adjustments arising on the acqui-
sition of a foreign entity are treated as assets and liabilities
of the foreign entity and translated at the closing rate.
Note 1.4. Property, plant and equipment
Property, plant and equipment are carried at acquisition
cost less any accumulated depreciation and less any
accumulated impairment loss. Cost of property, plant and
equipment also includes the estimated cost of dismantling
and removing the asset and restoring the site, to the extent
that the provision is recognized under IAS 37 “Provisions,
Contingent Liabilities and Contingent Assets”.
Subsequent costs are included in the asset’s carrying
amount or recognized as a separate asset, as appropriate,
only when it is probable that future economic benefits as-
sociated with the item will flow to the Group and the cost
of the item can be measured reliably. The carrying amount
of the replaced part is derecognized. All other repairs and
maintenance are charged to the income statement during
the financial period in which they are incurred.
Freehold land is not depreciated. Depreciation on other
assets is calculated using the straight-line method, to
allocate the costs over the estimated remaining useful
lives, as follows:
Industrial and administrative Buildings
- Structural work 40-50 years
- Other elements 10-25 years
Machinery 10-33 years
Vehicles, transport equipment 5 years
Furniture, fittings and equipment 5-15 years
Cars are depreciated to a residual value of 20% of the
initial cost.
Spare parts purchased for particular items of plant are
capitalized and depreciated over the useful life not ex-
ceeding 4 years. Samples of products are capitalized and
depreciated over 2-3 years.
The assets’ residual values and useful lives are reviewed,
and adjusted if appropriate, at the end of each reporting
period. An asset’s carrying amount is written down imme-
BA
LTA
AN
NU
AL
REP
OR
T 20
17
6362
FIN
AN
CIA
L St
ate
me
nts

diately to its recoverable amount if the asset’s carrying
amount is greater than its estimated recoverable amount.
Fair value adjustments as a result of Business Combinations
are depreciated over the estimated remaining useful life
of the applicable assets.
Gains and losses on disposals are determined by com-
paring the proceeds with the carrying amount and are
recognized within “Other income” or “Other expenses” in
the income statement.
Note 1.5. Goodwill
Goodwill on acquisitions of subsidiaries is allocated to those
cash-generating units or groups of cash-generating units
that are expected to benefit from the business combination
in which the goodwill arose. Goodwill is tested annually for
impairment and carried at cost in the underlying currency
less accumulated impairment losses. Impairment losses on
goodwill are not reversed. Gains and losses on the disposal
of a cash-generating unit include the carrying amount of
goodwill relating to the cash-generating unit sold
Note 1.6. Other Intangible assets
Trademarks
Trademarks acquired in a business combination are recog-
nized at fair value at the acquisition date. The fair market
value is determined on the basis of a net present value
calculation corrected for the cost to be taken to further
support the trademarks in the market. Trademarks have a
finite useful life and are carried at cost less accumulated
amortisation. Amortisation is calculated using the straight-
line method to allocate the cost of the trademarks over
the shortest of their estimated useful lives or the period
of the legal right.
Internally generated software and other development cost
Costs associated with maintaining computer software
programs are recognized as an expense as incurred. De-
velopment costs that are directly attributable to the design
and testing of identifiable and unique software products
controlled by the Group are recognized as intangible
assets when the following criteria are met:
• it is technically feasible to complete the software product
so that it will be available for use;
• management intends to complete the software product
and use or sell it;
• there is an ability to use or sell the software product;
• it can be demonstrated how the software product will
generate probable future economic benefits;
• adequate technical, financial and other resources to
complete the development and to use or sell the software
product are available; and
• the expenditure attributable to the software product
during its development can be reliably measured.
Directly attributable costs that are capitalized as part of
the software product include the software development
employee costs and an appropriate portion of directly
attributable overheads.
Other development expenditures that do not meet these
criteria are recognized as an expense as incurred. Devel-
opment costs previously recognized as an expense are
not recognized as an asset in a subsequent period.
Computer software development costs recognized as
assets are amortized over their estimated useful lives,
which in general is equal to 4 years.
Note 1.7. Impairment of assets
Goodwill and intangible assets that have an indefinite
useful life are not subject to amortisation and are tested
annually for impairment, or more frequently if events or
changes in circumstances indicate that they might be
impaired. Other assets are tested for impairment when-
ever events or changes in circumstances indicate that the
carrying amount may not be recoverable. An impairment
loss is recognised for the amount by which the asset’s
carrying amount exceeds its recoverable amount. The
recoverable amount is the higher of an asset’s fair value
less costs of disposal and value in use. These values are
generally determined based on discounted cash flow
calculations. For the purposes of assessing impairment,
assets are grouped at the lowest levels for which there
are separately identifiable cash inflows which are largely
independent of the cash inflows from other assets or
groups of assets (cash-generating units). Non-financial
assets other than goodwill that suffered an impairment
are reviewed for possible reversal of the impairment at
the end of each reporting period.
Note 1.8. Derivative financial instruments
Derivatives are initially recognized at fair value on the date
a derivative contract is entered into and are subsequently
re-measured at their fair value. The Group records all gains
or losses resulting from changes in fair value of derivatives
in the income statement within “Other income” or “Other
expenses” to the extent that they relate to operating
activities and within “Finance income” or “Finance costs”
to the extent that they relate to the financing activities
of the Group.
Derivative financial instruments used to hedge the expo-
sure to variability in future cash flows are designated as
hedges under cash-flow hedge accounting. The effective
portion of changes in fair value as from the designation
date of the cash flow hedge are recorded in the cash flow
hedge reserve, part of “Other comprehensive income”.
Amounts recorded in the cash flow hedge reserve will be
recognized in the income statement in the same period
or periods during which the hedged forecast transaction
affects the income statement. In case of the hedge of a
forecast sales transaction, this coincides with the date
upon which the revenue and trade receivable is recognised.
When the underlying hedged transactions no longer meet
the criteria for hedge accounting, the cumulative gain or
loss on the hedging instrument that has been recognized
in other comprehensive income from the period when the
hedge was effective shall be reclassified from equity to
profit or loss as a reclassification adjustment.
When the underlying hedged transaction is no longer
expected to occur, the cumulative gains or loss on the
hedging instrument that has been recognized in “Other
comprehensive income” from the period when the hedge
was effective shall be reclassified from equity to profit or
loss as a reclassification adjustment.
Note 1.9. Inventories
Inventories are stated at the lower of cost and net re-
alisable value. These net realisable value adjustments
are reviewed on a regular basis and updated to reflect
the estimated selling price less selling expenses, based
on historical data and expectations. Cost is determined
using the first-in, first-out (“FIFO”) method. The cost of
finished goods and work in progress comprises amongst
other design costs, raw materials, direct labor, other di-
rect costs and related production overheads (based on
normal operating capacity). Net realisable value is the
estimated selling price in the ordinary course of business,
less applicable variable selling expenses.
Based on a quantified methodology, provisions against
the carrying value of inventories are recorded taking qual-
itative aspects into account including the lower of cost
versus net realisable value assessment. These provisions
are reviewed by management.
Note 1.10. Trade receivables
Trade receivables are amounts due from customers for
goods sold or services performed in the ordinary course of
business. If collection is expected in one year or less, they
are classified as current assets. If not, they are presented
as non-current assets.
Trade receivables are recognized initially at fair value
and subsequently measured at amortized cost using the
effective interest method, less bad debt allowance.
Trade receivables are reviewed on a continuing basis. A
bad debt allowance is recorded when collectability of
the receivable is questionable. The bad debt allowance
covers the net estimated risk for the Group and is calcu-
lated by taking into account the coverage expected to
be received from credit insurance.
Note 1.11. Cash and cash equivalents
Cash and cash equivalents includes cash on hand, de-
posits held at call with banks, other short-term highly
liquid investments and bank overdrafts. Bank overdrafts
are shown within borrowings in current liabilities on the
statement of financial position.
Note 1.12. Share capital
Ordinary shares are classified as equity. Incremental costs
directly attributable to the issue of new shares or options
are shown in equity as a deduction, net of tax, from the
proceeds.
Note 1.13. Government grants
Government grants are recognized at their fair value
when there is a reasonable assurance that the grant will
be received and the Group will comply with all attached
conditions.
Government grants relating to costs are deferred and
recognized in the income statement within “Other income”
over the period necessary to match them with the costs
that they are intended to compensate.
Government grants relating to property, plant and equip-
ment are included in non-current liabilities as deferred
government grants and are credited to the income state-
BA
LTA
AN
NU
AL
REP
OR
T 20
17
6564
FIN
AN
CIA
L St
ate
me
nts

ment on a straight-line basis over the expected useful
lives of the related assets.
Note 1.14. Trade payables
Trade payables are obligations to pay for goods or ser-
vices that have been acquired in the ordinary course of
business from suppliers. Trade payables are classified as
current liabilities if payment is due within one year or less
(or in the normal operating cycle of the business if longer).
If not, they are presented as non-current liabilities.
Trade payables are recognized initially at fair value and
subsequently measured at amortized cost using the ef-
fective interest method.
Supplier finance arrangements are recognized as a financial
liability unless the original trade payable is extinguished
or its terms are significantly modified to the extent that
it qualifies for de-recognition under IAS 39 (we refer to
de-recognition of financial assets and liabilities Note 1.17).
Note 1.15. Financial liabilities measured at fair value
through profit or loss
Some instruments that have the legal form of a liability are,
in substance, equity. A financial instrument is classified as a
financial liability or an equity instrument depending on the
substance of the arrangement rather than the legal form.
Liabilities arise when the issuer is contractually obligated
to deliver cash or another financial asset to the holder.
An instrument is an equity instrument only if the issuer has
no such obligation, i.e. it has an unconditional right to
avoid settlement in cash or another financial asset. The
ability to defer payment is not enough to achieve equity
classification, unless payment can be deferred indefinitely.
Generally an obligation for the entity to deliver its own
shares is not a financial liability because an entity’s own
shares are not considered its financial assets. An exception
to this is where an entity is obliged to deliver a variable
number of its own equity instruments.
Note 1.16. Senior Secured Notes and Bank and other
borrowings
Senior Secured Notes, Bank and other Borrowings are
recognized initially at fair value, net of transaction costs
incurred. They are subsequently carried at amortized cost;
any difference between the proceeds (net of transaction
costs) and the redemption value is recognized in the in-
come statement over the period of the borrowings using
the effective interest method.
Note 1.17. De-recognition of financial assets and liabilities
A financial asset (or, where applicable, a part of a finan-
cial asset or part of a group of similar financial assets) is
derecognized when:
• the rights to receive cash flows from the asset have expired;
• the Group retains the right to receive cash flows from
the asset, but has assumed an obligation to pay them
in full without material delay to a third party under a
“pass through” arrangement; or
• the Group has transferred its rights to receive cash flows
from the asset and either (a) has transferred substantially
all the risks and rewards of the asset, or (b) has neither
transferred nor retained substantially all the risks and
rewards of the asset, but has transferred control of the
asset.
Where IAS 39 de-recognition criteria are not met, the
receivables continue to be recognized in the statement
of financial position, while the proceeds received by the
Group under any financing/factoring arrangements are
recognized as a financial liability.
A financial liability is de-recognized when the obligation
under the liability is discharged or cancelled or expires.
Where an existing financial liability is replaced by another
from the same lender on substantially different terms, or
when the existing liability is transferred to a different lend-
er and the Group obtains a legal release from the initial
lender, or the terms of an existing liability are substantially
modified, such an exchange or modification is treated as
a de-recognition of the original liability and the recogni-
tion of a new liability, and the difference in the respective
amounts is recognized in the income statement.
The terms are substantially different if the discounted pres-
ent value of the cash flows under the new terms, including
any fees paid net of any fees received and discounted
using the original effective interest rate, is at least ten
per cent different from the discounted present value of
the remaining cash flows of the original financial liability.
Note 1.18. Current and deferred income tax
The tax expense for the period comprises current and
deferred tax. Tax is recognized in the income statement,
except to the extent that it relates to items recognized in
“Other comprehensive income” or directly in equity. In this
case the tax is also recognized in “Other comprehensive
income” or directly in equity, respectively.
The current income tax charge is calculated on the ba-
sis of the tax laws enacted or substantively enacted at
the statement of financial position date in the countries
where the Company’s subsidiaries operate and generate
taxable income. In line with paragraph 46 of IAS 12 ‘income
taxes’, management periodically evaluates positions
taken in tax returns with respect to situations in which
applicable tax regulation is subject to interpretation. It
establishes provisions where appropriate on the basis of
amounts expected to be paid to the tax authorities. This
evaluation is made for tax periods open for audit by the
competent authorities.
Deferred income tax is recognized, using the liability
method, on temporary differences arising between the tax
bases of assets and liabilities and their carrying amounts
in the Consolidated Financial Statements. However, the
deferred income tax is not accounted for if it arises from
initial recognition of an asset or liability in a transaction
other than a business combination that at the time of the
transaction affects neither accounting nor taxable profit
nor loss. Deferred income tax is determined using tax
rates (and laws) that have been enacted or substantially
enacted by the “Statement of financial position” date
and are expected to apply when the related deferred
income tax asset is realized or the deferred income tax
liability is settled.
Deferred income tax assets are recognized only to the
extent that it is probable that future taxable profit will
be available against which the temporary differences
can be utilized.
Deferred income tax is provided on temporary differenc-
es arising on investments in subsidiaries and associates,
except where the timing of the reversal of the temporary
difference is controlled by the Group and it is probable
that the temporary difference will not reverse in the fore-
seeable future.
Deferred income tax assets and liabilities are offset when
there is a legally enforceable right to offset current tax
assets against current tax liabilities and when the deferred
income taxes assets and liabilities relate to income taxes
levied by the same taxation authority on either the tax-
able entity or different taxable entities where there is an
intention to settle the balances on a net basis. Deferred
tax is not discounted.
Note 1.19. Provisions
Provisions for restructuring expenses, legal claims, service
warranties and make good obligations are recognised when
the group has a present legal or constructive obligation
as a result of past events, it is probable that an outflow
of resources will be required to settle the obligation and
the amount can be reliably estimated. Provisions are not
recognised for future operating losses.
Where there are a number of similar obligations, the
likelihood that an outflow will be required in settlement is
determined by considering the class of obligations as a
whole. A provision is recognised even if the likelihood of
an outflow with respect to any one item included in the
same class of obligations may be small.
Provisions are measured at the present value of manage-
ment’s best estimate of the expenditure required to settle
the present obligation at the end of the reporting period.
The discount rate used to determine the present value is
a pre-tax rate that reflects current market assessments
of the time value of money and the risks specific to the
liability. The increase in the provision due to the passage
of time is recognised as interest expense.
Note 1.20. Employee benefits
Pension obligations
IAS 19 distinguishes two types of post-employment ben-
efit plans:
• Defined contribution plans (DC plans) are post-employ-
ment benefit plans under which an enterprise pays fixed
contributions into a separate entity (a fund or group
insurance contract) and will have no legal or constructive
obligation to pay further contributions if the fund does
not hold sufficient assets to pay all employee benefits
relating to employee service in the current or prior periods;
• Defined benefit plans (DB plans) are post-employment
benefit plans other than defined contribution plans.
Group companies operate one defined benefit plan for a
group of managers and various pension schemes funded
through payments to insurance companies. Because of
the Belgian legislation applicable to 2nd pillar pension
plans (so-called “Law Vandenbroucke”), all Belgian Defined
Contribution plans have to be considered under IFRS as
Defined Benefit plans. Law Vandenbroucke states that in
the context of defined contribution plans, the employers
must guarantee a minimum return of 3.75% on employ-
ee contributions and 3.25% on employer contributions.
BA
LTA
AN
NU
AL
REP
OR
T 20
17
6766
FIN
AN
CIA
L St
ate
me
nts

However, shortly before year-end 2015, a change in the
Belgian Law was enacted resulting in a decrease of the
guaranteed return from 3.25% to a minimum interest rate
defined based upon the Belgian 10-year interest rate but
within the range 1.75% - 3.25%. The new rate (1.75% per
December 31 2017 and per December 31 2016) applies for
the years after 2015 on future contributions and also on
the accumulated past contributions as from 31 December
2015 if the financing organisation does not guarantee a
certain result on contributions until retirement age. If the
organisation does guarantee such a result, the historical
rates still apply.
Because of this minimum guaranteed return, the employer
is exposed to a financial risk: further contributions could be
required if the return on the assets is not sufficient to reach
the minimum benefits to be paid. The group has plans that
are financed through insurance contracts. The projected unit
credit method has been used as the actuarial technique
to measure the defined benefit obligation. Note that for
the bonus plans, a simplified approach is applied as it is
not possible to predict future bonuses (which define future
contributions). The fair value of the plan assets is based
on §113 of IAS 19 and is defined as the present value of the
retirement capitals guaranteed by the insurance company
(using the tariffs as set out by the insurance company). The
discount rate used takes into account the investment risk of
financial institutions by referring to financial single A bonds.
Therefore an additional gap is added to the Defined Benefit
Obligation (“DBO”) discount rate which reflects the difference
between double AA corporate bonds and single A financial
bonds. At December 31 2017 this gap was 25 basis points.
Other post-employment obligations
The Group does not have other post-employment ob-
ligations.
Termination benefits
Termination benefits are payable when employment is ter-
minated by the Group before the normal retirement date,
or whenever an employee accepts voluntary redundancy
in exchange for these benefits. The Group recognizes a
liability and expense for termination benefits at the earlier
of the following dates: (a) when the Group can no longer
withdraw the offer of those benefits; and (b) when the Group
recognizes costs for a restructuring that is within the scope
of IAS 37 and involves the payment of termination benefits.
Benefits falling due more than 12 months after the end of
the reporting period are discounted to their present value.
In Belgium, the system of early retirement pensions ensures
that elderly people who are dismissed by their employer
or who are encouraged to terminate their employment
and who fulfill certain conditions, are eligible to receive
supplementary unemployment allowance and paid by their
former employer on top of the unemployment allowances
paid by social security. This benefit is generally paid until
normal retirement age, which is 65 years.
Within the Group, several former employees benefit from
the system of “early retirement fee or pension”, based
on several Belgian Collective Labor Agreements (CLAs)
in place for the sector (textielnijverheid en breiwerk/ in-
dustrie textile et de la bonneterie) or specifically for the
Group. These CLAs describe the different possibilities for
employees in the sector to benefit from “early retirement
fee or pension”, the creation of a sector fund (fonds voor
bestaanszekerheid/ fonds de sécurité d’existence), part-
time work, education and training etc. Certain CLAs exist
for blue collar workers and others for white collar workers.
For those early retirement fees or pensions which are
directly paid out by the employer, a provision should be
made under IAS 19. It has been determined as the pres-
ent value of the best estimate of future cash flows. The
discount rate used is based on the return on high quality
corporate bonds (AA rated) of a maturity equivalent to
the duration of the liabilities. The changes in pension li-
abilities are accounted for through other comprehensive
income when the changes relate to a change in actuarial
assumptions from one year to another.
Bonus plans
Bonuses received by company employees and management
are based on pre-defined Group and individual target
achievement. The estimated amount of the bonus is rec-
ognized as an expense in the period the bonus is earned.
Share Based payments
An equity-settled share-based payment transaction is
a transaction in which the Group receives services as
consideration for its own shares (or share options). The fair
value of the services received in exchange for the grant
of the shares (or share options) measured by reference to
the grant date fair value of the shares (or share options),
is recognised as an expense over the vesting period.
When share-based payment plans are cash-settled: the
goods or services acquired and the liability are measured
at the fair value of the liability. Until the liability is settled,
the fair value of the liability is re-measured at the end
of each reporting period and at the date of settlement
with any changes in fair value recognised in profit and
loss for the period.
Note 1.21. Revenue recognition
Revenue comprises the fair value of the consideration
received or receivable for the sale of goods and services
in the ordinary course of the Group’s activities. Revenue
is shown net of value-added tax, returns, rebates and
discounts and after eliminating sales within the Group.
The Group recognizes revenue when the amount of rev-
enue can be reliably measured, it is probable that future
economic benefits will flow to the entity and when specific
criteria have been met for each of the Group’s activities as
described below. When estimating the rebates payable,
the Group uses all available information, including historical
and forecast results and takes into consideration the type
of customer, the type of transaction and the specifics of
each arrangement.
Sales of goods
Sales of goods are recognized when the risks and rewards
are transferred to the customers, in most cases when the
goods are made available for collection at the Group’s
premises (factory, warehouse) on the date agreed upon
with the customer and the customer accepted the goods
in accordance with the sales contract.
Amounts billed to the customer in respect of transporta-
tion of product to the customer’s premises are included
in revenue. Associated transportation costs incurred by
the Group are included in other expenses.
Interest income
Interest income is recognized using the effective inter-
est method. When a receivable is impaired, the Group
reduces the carrying amount to its recoverable amount,
being the estimated future cash flow discounted at the
original effective interest rate, and continues unwinding the
discount as interest income. Interest income on impaired
loans and receivables are recognized using the original
effective interest rate.
Dividend income
Dividend income is recognised when the right to receive
payment is established.
Note 1.22. Leases
The Group leases certain property, plant and equipment.
Leases in which a significant portion of the risks and rewards
of ownership are retained by the lessor are classified as
operating leases. Payments made under operating leases
(net of any incentives received from the lessor) are charged
to the income statement on a straight-line basis over the
period of the lease.
Leases of property, plant and equipment where the Group
has substantially all the risks and rewards of ownership are
classified as finance leases. Finance leases are capitalized
at the lease’s commencement at the lower of the fair value
of the leased asset and the present value of the minimum
lease payments.
Each lease payment is allocated between the liability and
finance charges. The corresponding rental obligations,
net of finance charges, purchase option (when there is
reasonable certainty that the lessee will obtain ownership
by the end of the lease term), are included in “Borrowings”.
The interest element of the finance cost is charged to the
income statement over the lease period so as to produce a
constant periodic rate of interest on the remaining balance
of the liability for each period. The property, plant and
equipment acquired under finance leases are depreciated
over the useful life of the asset or if there is no reasonable
certainty that the lessee will obtain ownership by the end
of the lease term, the asset shall be fully depreciated over
the shorter of the lease term and its useful life.
Note 1.23. Dividend distribution
Dividend distribution to the Company’s shareholders is
recognized as a liability in the Group’s Financial Statements
in the period in which the dividends are approved by the
Company’s shareholders.
Note 1.24. Cash flow statement
The cash flows of the Group are presented using the
indirect method. This method reconciles the movement
in cash for the reporting period by adjusting net profit for
the year for any non-cash items and changes in working
capital, and identifying investing and financing cash flows
for the reporting period.
Note 1.25. Non-GAAP measures
The following alternative performance measures (non-IFRS)
have been used as management believes that they are
BA
LTA
AN
NU
AL
REP
OR
T 20
17
6968
FIN
AN
CIA
L St
ate
me
nts

widely used by certain investors, securities analysts and
other interested parties as supplemental measures of
performance and liquidity. The alternative performance
measures are unaudited and may not be comparable to
similarly titled measures of other companies, have limi-
tations as analytical tools and should not be considered
in isolation or as a substitute for analysis of our operating
results, our performance or our liquidity under IFRS.
Adjusted Operating Profit is defined as operating profit /
(loss) adjusted for (i) the impact of the purchase price
allocation mainly on changes in inventories, (ii) gains on
asset disposals, (iii) integration and restructuring expenses
and (iv) impairment and write-off.
Adjusted EBITDA is defined as operating profit / (loss)
adjusted for (i) the impact of the purchase price allocation
mainly on change in inventories, (ii) gains on asset disposals,
(iii) integration and restructuring expenses, (iv) depreciation
/ amortisation and (v) impairment and write-off.
Adjusted Earnings per Share is defined as profit / (loss) for
the period adjusted for (i) the impact of the purchase price
allocation mainly on changes in inventory, (ii) gains on asset
disposals, (iii) integration and restructuring expenses, (iv)
non-recurring finance expenses and (v) non-recurring tax
effects, divided by the number of shares of Balta Group NV.
The Adjusted Earnings per Share for 2016 is a pro forma
number that has been included for comparison purposes,
assuming the total number of shares was equal to the
current number of shares of Balta Group NV.
Net Debt is defined as (i) Senior Secured Notes adjusted
for the financing fees included in the carrying amount, (ii)
Senior Term Loan Facility adjusted for capitalized financing
fees, (iii) Bank and other borrowings adjusted for capital-
ized financing fees and (iv) cash and cash equivalents.
Leverage is defined as the ratio of Net Debt to Pro Forma
Adjusted EBITDA.
Pro Forma Adjusted EBITDA is included, for illustrative
purposes. The figure incorporates the acquisition effect of
Bentley under the assumption that the transaction took
place as of the start of the prior financial year. This informa-
tion is intended to help investors to analyse and compare
historical financial information. It is important to note that
the acquisition of Bentley was completed on 22 March 2017
and consolidated in the Group’s results from the 1 April 2017.
Adjusted Effective Tax Rate is defined as the ratio of income
tax expenses, plus or minus the tax effect of integration and
restructuring expenses, the tax effect of exceptional items
within the finance charges, the tax effect attributable to
the re-measurement of deferred tax assets and liabilities
and the tax effect of the purchase price accounting ad-
justments, divided by earnings from continuing operations
before income taxes plus integration and restructuring
expenses plus exceptional finance expenses and excluding
the impact of purchase price accounting adjustments.
Note 2. Critical accounting estimates and judgementsThe amounts presented in the Financial Statements involve
the use of estimates and assumptions about the future.
Estimates and judgements are continually evaluated and
are based on historical experience and other factors,
including expectations of future events that are believed
to be reasonable under the circumstances. The estimates
and assumptions will seldom equal the related actual re-
sults. The estimates and assumptions that could have an
impact on the Financial Statements are discussed below.
Determination of fair values in business combinations
The Group has applied estimates and judgements in
order to determine the fair value of assets acquired and
liabilities assumed by way of a business combination.
The value of assets, liabilities and contingent liabilities
recognized at the acquisition date are recognized at fair
value. In determining the fair value, the Group has utilized
valuation methodologies including discounted cash flow
analysis. The Group’s estimates are based upon assump-
tions believed to be reasonable, but which are inherently
uncertain and unpredictable. These valuations require
the use of management’s assumptions, which would not
reflect unanticipated events and circumstances that may
occur. Any significant change in key assumptions may
cause the acquisition accounting to be revised including
the recognition of additional goodwill or a discount on
acquisition. All significant changes in key assumptions
have been considered when completing the fair value
analysis of the assets and liabilities acquired from the
Bentley group of companies.
Goodwill
The amount of goodwill initially recognized as a result of a
business combination is dependent on the allocation of the
purchase price to the fair value of the identifiable assets
acquired and the liabilities assumed. The determination
of the fair value of the assets and liabilities is based, to
a considerable extent, on management’s judgement.
Allocation of the purchase price affects the results of the
Group as finite life intangible assets are amortized, where-
as indefinite life intangible assets, including goodwill, are
not amortized and could result in differing amortization
charges based on the allocation to indefinite life and finite
life intangible assets.
Impairment testing
IFRS requires management to undertake an annual test for
impairment of indefinite life assets and, for finite life assets,
to test for impairment if events or changes in circumstances
indicate that the carrying amount of an asset may not be
recoverable. Impairment testing is an area involving man-
agement judgement, requiring assessment as to whether
the carrying value of assets can be supported by the net
present value of future cash flows derived from such assets
using cash flow projections which have been discounted at
an appropriate rate. In calculating the net present value of
the future cash flows, certain assumptions are required to
be made in respect of highly uncertain matters including
management’s expectations of:
• growth in EBITDA, calculated as adjusted operating profit
before depreciation and amortisation;
• timing and quantum of future capital expenditure;
• long-term growth rates; and
• the selection of discount rates to reflect the risks involved.
Changing the assumptions selected by management, in
particular the discount rate and growth rate assumptions
used in the cash flow projections, could significantly affect
the Group’s impairment evaluation and hence results.
The Group’s review includes the key assumptions related
to sensitivity in the cash flow projections. Further details
are provided in Note 7.
Income taxes
The Group operates in various tax jurisdictions and therefore
has to determine tax positions under respective local tax
laws and tax authorities’ views which can be complex and
subject to different interpretations of tax payers and local
tax authorities. The Group incurs costs centrally which are
allocated to subsidiaries in different jurisdictions and which
exposes the Group to inherent tax risks, as is the case for
all companies operating in an international context. Based
on these tax risks, management performed a detailed
assessment for uncertain tax positions which resulted in
provisions recorded for these uncertainties.
The Group has tax credits in respect of losses carried
forward, Dividend Received Deduction (relief for dividend
payments by qualifying EU subsidiaries to qualifying EU
parent companies, to avoid double taxation of dividend
income), and Notional Interest Deduction (“NID”). These
tax credits can be used to offset against future taxable
profits. The valuation of this asset depends on a number
of judgemental assumptions regarding the future taxable
profits of different Group subsidiaries in different juris-
dictions and on the outcome of tax planning strategies.
These estimates are made prudently based on current
knowledge and reasonable long-term projections. Where
circumstances to change and the final tax outcome would
be different from the amounts that were initially recorded,
such differences will impact the income tax and deferred
tax provisions in the period in which such determination
is made.
Trade receivables
The Group makes significant judgements in determining
the bad debt allowance with respect to trade receivables
when there is objective evidence that the Group will not be
able to collect all amounts due according to the original
terms of receivables. The assessment is performed on an
individual basis in consideration of various factors such as
historical experience, credit quality, age of the accounts
receivables and economic conditions that may affect a
customer’s ability to pay.
The amount of the bad debt allowance is the difference
between the asset’s carrying amount and the present
value of estimated future cash flows, discounted at the
original effective interest rate. The estimated future cash
flow is determined based upon the significant financial
difficulties of the debtor, probability that the debtor will
enter bankruptcy or financial reorganisation, and default
or delinquency in payments are considered indicators that
the trade receivable is impaired.
Customer rebates
The Group also needs to make some judgements in deter-
mining accruals for customer rebates as presented in the
“Other payables” section. When estimating the rebates
payable, the Group uses all available information, including
historical and forecast results and takes into consideration
the type of customer, the type of transaction and the
specifics of each arrangement. We also refer to revenue
recognition, Note 1.21.
BA
LTA
AN
NU
AL
REP
OR
T 20
17
7170
FIN
AN
CIA
L St
ate
me
nts
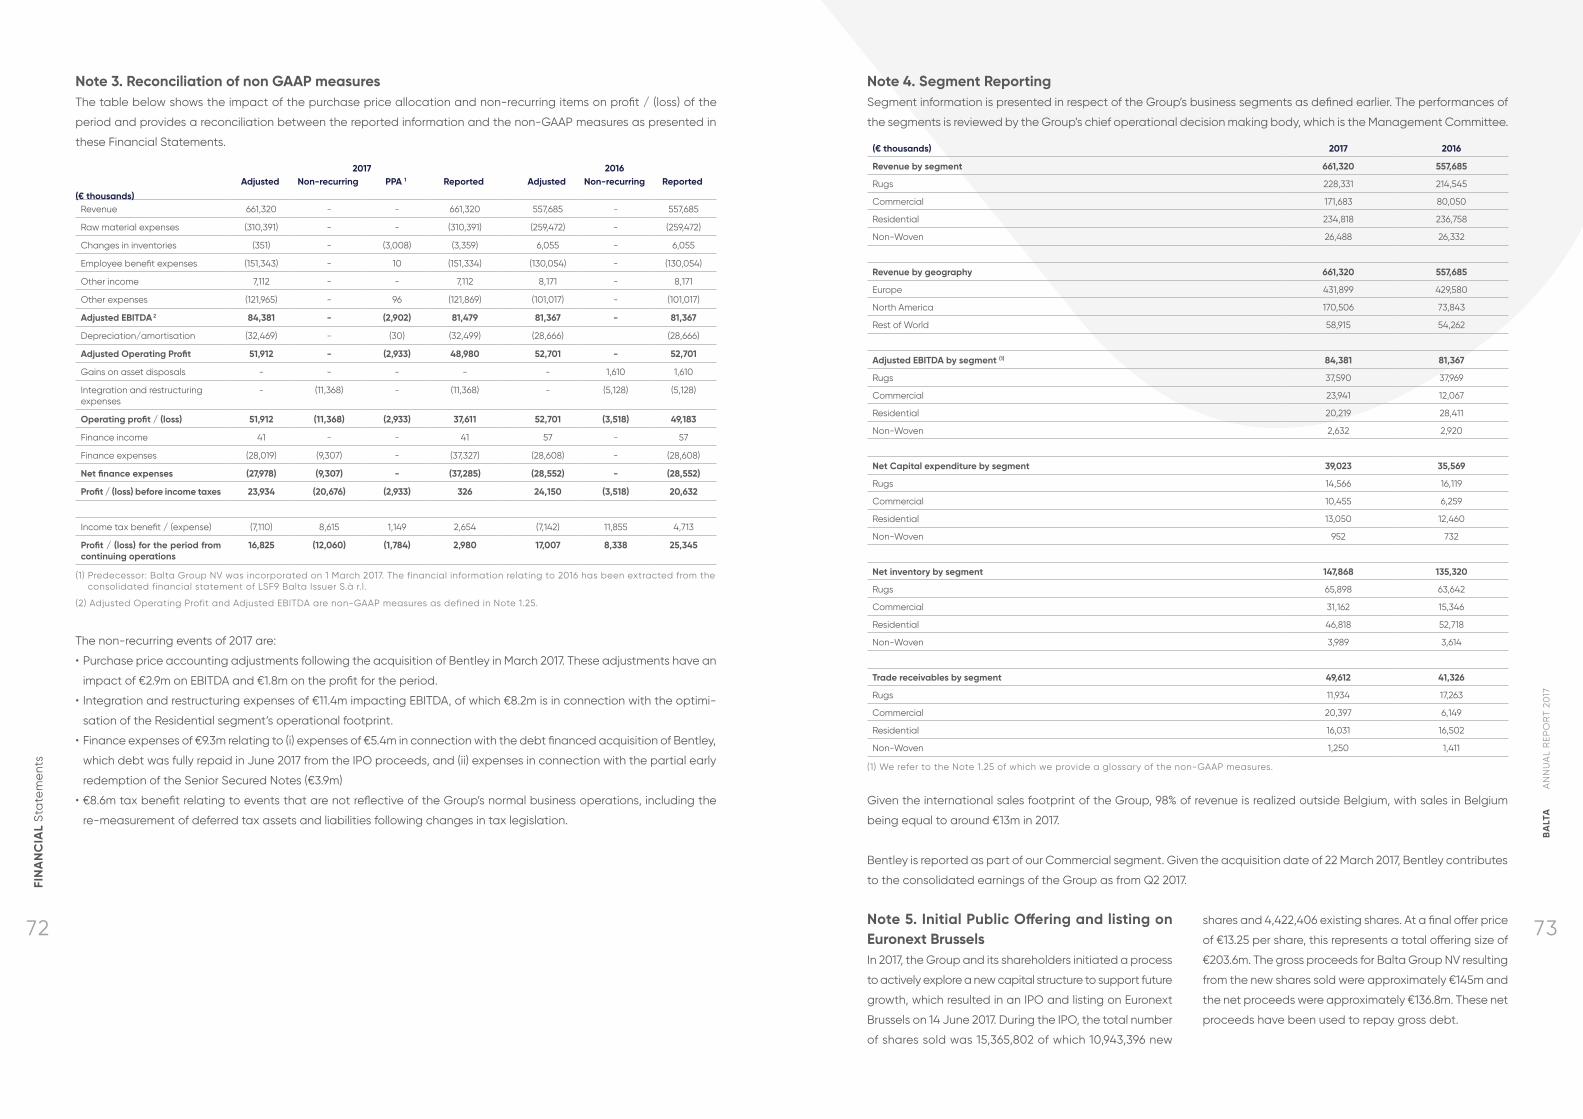
Note 3. Reconciliation of non GAAP measuresThe table below shows the impact of the purchase price allocation and non-recurring items on profit / (loss) of the
period and provides a reconciliation between the reported information and the non-GAAP measures as presented in
these Financial Statements.
2017 2016
(€ thousands)
Adjusted Non-recurring PPA 1 Reported Adjusted Non-recurring Reported
Revenue 661,320 - - 661,320 557,685 - 557,685
Raw material expenses (310,391) - - (310,391) (259,472) - (259,472)
Changes in inventories (351) - (3,008) (3,359) 6,055 - 6,055
Employee benefit expenses (151,343) - 10 (151,334) (130,054) - (130,054)
Other income 7,112 - - 7,112 8,171 - 8,171
Other expenses (121,965) - 96 (121,869) (101,017) - (101,017)
Adjusted EBITDA 2 84,381 - (2,902) 81,479 81,367 - 81,367
Depreciation/amortisation (32,469) - (30) (32,499) (28,666) (28,666)
Adjusted Operating Profit 51,912 - (2,933) 48,980 52,701 - 52,701
Gains on asset disposals - - - - - 1,610 1,610
Integration and restructuring expenses
- (11,368) - (11,368) - (5,128) (5,128)
Operating profit / (loss) 51,912 (11,368) (2,933) 37,611 52,701 (3,518) 49,183
Finance income 41 - - 41 57 - 57
Finance expenses (28,019) (9,307) - (37,327) (28,608) - (28,608)
Net finance expenses (27,978) (9,307) - (37,285) (28,552) - (28,552)
Profit / (loss) before income taxes 23,934 (20,676) (2,933) 326 24,150 (3,518) 20,632
Income tax benefit / (expense) (7,110) 8,615 1,149 2,654 (7,142) 11,855 4,713
Profit / (loss) for the period from continuing operations
16,825 (12,060) (1,784) 2,980 17,007 8,338 25,345
(1) Predecessor: Balta Group NV was incorporated on 1 March 2017. The financial information relating to 2016 has been extracted from the consolidated financial statement of LSF9 Balta Issuer S.à r.l.
(2) Adjusted Operating Profit and Adjusted EBITDA are non-GAAP measures as defined in Note 1.25.
The non-recurring events of 2017 are:
• Purchase price accounting adjustments following the acquisition of Bentley in March 2017. These adjustments have an
impact of €2.9m on EBITDA and €1.8m on the profit for the period.
• Integration and restructuring expenses of €11.4m impacting EBITDA, of which €8.2m is in connection with the optimi-
sation of the Residential segment’s operational footprint.
• Finance expenses of €9.3m relating to (i) expenses of €5.4m in connection with the debt financed acquisition of Bentley,
which debt was fully repaid in June 2017 from the IPO proceeds, and (ii) expenses in connection with the partial early
redemption of the Senior Secured Notes (€3.9m)
• €8.6m tax benefit relating to events that are not reflective of the Group’s normal business operations, including the
re-measurement of deferred tax assets and liabilities following changes in tax legislation.
Note 4. Segment ReportingSegment information is presented in respect of the Group’s business segments as defined earlier. The performances of
the segments is reviewed by the Group’s chief operational decision making body, which is the Management Committee.
(€ thousands) 2017 2016
Revenue by segment 661,320 557,685
Rugs 228,331 214,545
Commercial 171,683 80,050
Residential 234,818 236,758
Non-Woven 26,488 26,332
Revenue by geography 661,320 557,685
Europe 431,899 429,580
North America 170,506 73,843
Rest of World 58,915 54,262
Adjusted EBITDA by segment (1) 84,381 81,367
Rugs 37,590 37,969
Commercial 23,941 12,067
Residential 20,219 28,411
Non-Woven 2,632 2,920
Net Capital expenditure by segment 39,023 35,569
Rugs 14,566 16,119
Commercial 10,455 6,259
Residential 13,050 12,460
Non-Woven 952 732
Net inventory by segment 147,868 135,320
Rugs 65,898 63,642
Commercial 31,162 15,346
Residential 46,818 52,718
Non-Woven 3,989 3,614
Trade receivables by segment 49,612 41,326
Rugs 11,934 17,263
Commercial 20,397 6,149
Residential 16,031 16,502
Non-Woven 1,250 1,411
(1) We refer to the Note 1.25 of which we provide a glossary of the non-GAAP measures.
Given the international sales footprint of the Group, 98% of revenue is realized outside Belgium, with sales in Belgium
being equal to around €13m in 2017.
Bentley is reported as part of our Commercial segment. Given the acquisition date of 22 March 2017, Bentley contributes
to the consolidated earnings of the Group as from Q2 2017.
Note 5. Initial Public Offering and listing on Euronext BrusselsIn 2017, the Group and its shareholders initiated a process
to actively explore a new capital structure to support future
growth, which resulted in an IPO and listing on Euronext
Brussels on 14 June 2017. During the IPO, the total number
of shares sold was 15,365,802 of which 10,943,396 new
shares and 4,422,406 existing shares. At a final offer price
of €13.25 per share, this represents a total offering size of
€203.6m. The gross proceeds for Balta Group NV resulting
from the new shares sold were approximately €145m and
the net proceeds were approximately €136.8m. These net
proceeds have been used to repay gross debt.
BA
LTA
AN
NU
AL
REP
OR
T 20
17
7372
FIN
AN
CIA
L St
ate
me
nts

The IPO of Balta Group NV impacts the Financial State-
ments of the Group in the following manner:
• Increase of equity
• Decrease of financial debt
• Incurrence of transaction expenses
Increase of equity
Equity of the Group has increased from €136.3m at
December 31 2016 to €265.1m at December 31 2017. This
increase of €129.0m is driven by (i) capital increase of
€145.0m, from which €7.6m transaction expenses net of
taxes have been deducted, (ii) capital increase of €1.3m
by means of a contribution in kind, and (iii) (€9.9m) impact
of net comprehensive result for the period.
Further details on the breakdown of movements within
equity can be found in Note 20.
Decrease of financial debt
The net proceeds of the IPO have been used to reduce
gross debt. The debt that has been repaid includes (i)
repayment in full of a Senior Term Loan Facility at the level
of Bentley for an amount of $33. 0m capital plus accrued
interest (€29.4m) when converted at a rate of $1.1222 per
Euro, (ii) partial repayment of a revolving credit facility at
the level of Bentley for an amount of $11.1m plus accrued
interest (€9.9m) when converted at a rate of $1.1222 per
Euro, (iii) repayment in full of the Senior Term Loan Facility
for an amount of €75.0m plus accrued interest, and (iv)
partial repayment of €21.2m of the Senior Secured Notes
plus accrued interest and redemption premium of 3%.
Further details on the movement in bank and other bor-
rowings can be found in Note 26.
Incurrence of transaction expenses
All fees and expenses related to the IPO have been divided
pro rata between the Group and the Selling Shareholder
based on the respective sizes of the Primary Tranche and
Secondary Tranche. The total expense for the Group is
equal to €7.8m. Transaction costs that are incremental
and directly attributable to the issue of new shares as a
result of the IPO have been recognized as a deduction
of share capital (€7.6m net of taxes). The costs incurred in
relation to the listing of the existing shares (€0.2m) have
been expensed as part of integration and restructuring
expenses in the income statement (see Note 11).
Note 6. Business combinationsFor the purpose of this disclosure, amounts in USD have
been converted to EUR at a rate of 1.0691 USD/EUR which
is the closing rate per 31 March 2017. Where used herein
“Bentley” refers to Bentley Mills, Inc. or where the context
requires, the Bentley Group of companies.
Details of the business combination
On December 1 2016, Lone Star Fund IX agreed to acquire
Bentley, a leader in premium commercial tiles and broad-
loom carpets for commercial interiors in the US market,
from Dominus Capital, L.P. The acquisition was completed
on February 1 2017. Lone Star Fund IX acquired 98.39% of
the class A unit voting rights whilst Bentley Management
acquired the remaining 1.61% of the class A unit voting
rights. On 22 March LSF9 Balta Issuer S.à r.l. acquired 98.39%
from Lone Star Fund IX.
Balta NV, a member of the Balta Group subsequently
acquired the remaining 1.61% of the Class A unit voting
rights from Bentley Management on May 31 2017 which
results in a 100% ownership as per May 31 2017.
The consideration paid to the original share and option
holders was equal to €88.3m ($94.3m). In order to finance
(i) the consideration paid, (ii) the repayment in full of leg-
acy debt at the level of Bentley and (iii) the payment of
transaction fees and expenses, the following sources of
financing were raised:
• an equity contribution of €68.8m ($74m) by LSF9 Renais-
sance Super Holdings LP;
• a management contribution of €1.1m ($1.2m) in equity;
• the issuance of a term loan of €30.9m ($33.0m) at the
level of BPS Parent Inc;
• a drawdown of €10.4m ($11.1m) on a revolving credit
facility of €16.8m ($18.0m) at the level of BPS Parent Inc.
On March 22 2017, LSF9 Balta Issuer S.à r.l. acquired from
LSF9 Renaissance Super Holdings, L.P. its interests in LSF9
Renaissance Holdings LLC and LSF9 Renaissance Acqui-
sitions LLC. This acquisition was originally financed by the
issuance of a Senior Term Loan Facility for an amount of
€75.0m at the level of LSF9 Balta Issuer S.à r.l. (see Note 25
for a description hereof). Subsequently, on March 23 2017,
Balta NV replaced LSF9 Balta Issuer S.à r.l. and acquired
the interest in LSF9 Renaissance Holdings LLC. As a result
of these transactions, Balta NV currently controls Bentley.
On May 31 2017, Balta NV acquired the remaining class A
unit voting shares of the Bentley group of companies from
LSF9 Balta Holdco S.à r.l. which indirectly acquired the
minority stake from Bentley’s management. The related
party debt which resulted from this transaction was sub-
sequently contributed in the capital of LSF9 Balta Issuer
S.à r.l. As a result of this transaction, Balta NV gained a
100% control over Bentley.
Balta will continue to support the Bentley brand, and will
make use of Bentley’s sale force and market access to ac-
celerate the growth of its European carpet tiles in the USA.
Transaction overview and allocation of purchase price paid
The acquisition made by LSF9 Balta Issuer S.à r.l. is a
transaction under a common control, and the accounting
policy election was made to account for such a transac-
tion in accordance with IFRS 3, Business Combinations.
We refer to Note 41 in which we provide an overview of
the related party transactions of the Group during the
year. As a result, previous Goodwill was reversed in order
to calculate the net assets, and the final goodwill was
recognized as the difference between the consideration
paid and such net assets.
The purchase price allocation required under IFRS 3 Busi-
ness Combinations has been reflected in the Consolidated
Financial Statements per 31 December 2017. As a result,
the purchase price has been allocated to the identifiable
assets and liabilities acquired, based on the estimated
fair values at the date of acquisition.
The total purchase price paid in cash was equal to €68.8m,
as compared to a net asset value of Bentley Mills of (€12.5m)
at completion date before purchase price allocation. There
is no contingent consideration outstanding in relation to
the acquisition as of December 31 2017. Consequently, the
preliminary goodwill – before purchase price allocation
- was equal to €81.3m. As a result of the purchase price
allocation, €7.0m of the preliminary goodwill was allocat-
ed to identifiable assets and liabilities resulting in a final
goodwill of €74.3m.
The final purchase price paid of €68.8m and correspond-
ing goodwill before purchase price allocation of €81.3m is
determined as follows:
The initial purchase price paid in cash was equal to
€68.3m, as compared to a net asset value of Bentley of
(€12.5)m at 22 March 2017 (the “Acquisition Date”), of which
(€13.3)m attributable to LSF9 Balta Issuer S.à r.l. and €1.0m
attributable to the non-controlling interest held by Bentley
management. Consequently, the provisional goodwill –
before purchase price allocation - was equal to €82.0m
on 22 March 2017.
The non-controlling interest held by Bentley management
was acquired on May 31 2017 for an amount of €1.3m
having a corresponding net asset value at that time of
€1.2m. Consequently the provisional goodwill paid for
the Bentley Group of companies – before purchase price
allocation – increased by €0.2m as from May 31 2017 and
was equal to €82.2m at that time.
On July 20 2017, a final agreement on the purchase price
was agreed with Dominus Capital, L.P. resulting in a de-
crease of the original purchase price paid of €0.9m ($1.1m)
through the final release of the escrow account resulting in
a decrease in goodwill of €0.9m to finally become €81.3m
before purchase price allocation.
The table below provides an overview of the net assets
recognized as a result of the acquisition before and after
the allocation of goodwill.
BA
LTA
AN
NU
AL
REP
OR
T 20
17
7574
FIN
AN
CIA
L St
ate
me
nts

(€ thousands)Net assets at Completion Date
before allocation goodwillFair value adjustments Net assets at Completion Date
after allocation goodwill
Assets acquired 50,726 12,412 63,138
Property, plant & equipment 14,267 1,807 16,074
Intangible assets 2,726 8,453 11,179
Trade and other receivables 744 164 908
Total non-current assets 17,737 10,425 28,162
Inventories 15,935 2,281 18,216
Trade and other receivables 13,874 (294) 13,580
Current income tax asset 3,180 - 3,180
Total current assets 32,989 1,987 34,976
Liabilities assumed (63,270) (5,396) (68,666)
Bank and other borrowings (38,471) - (38,471)
Deferred income tax liabilities (1,842) (4,460) (6,302)
Provisions for other liabilities and charges
(2,045) (935) (2,980)
Employee Benefit Obligations (347) - (347)
Total non-current liabilities (42,705) (5,396) (48,100)
Bank and Other Borrowings (1,325) - (1,325)
Employee Benefit Obligations (1,695) (0) (1,695)
Trade and other payables (17,545) 0 (17,545)
Total current liabilities (20,565) (0) (20,565)
Purchase Price Paid in Cash 68,752 - 68,752
Identifiable assets and liabilities (12,544) 7,016 (5,528)
Goodwill 81,296 (7,016) 74,280
Purchase price allocation
The original goodwill of €81.3m has been allocated over
the assets acquired and liabilities assumed leading to
a fair value adjustment of the identifiable assets and
liabilities of €7.0m. The remaining goodwill arising from
the acquisition will mainly consist of the synergies and
the economies of scale expected from combining the
operations of Bentley and Balta.
None of the remaining goodwill recognized is expected
to be deductible for income tax purposes.
The main fair value adjustments can be summarized as
follows:
The fair value adjustment of property, plant and equipment
of €1.8m is mainly driven by a revaluation of the existing
machinery, installations and equipment. This fair value
adjustment was determined on the basis of valuation
reports and market appraisals on the valuation of the
machines. As a result of this exercise, remaining useful lives
of the property, plant and equipment were updated and
depreciation rules were aligned with the Group policies.
The fair value step up is amortized over the remaining
useful life of the machines.
The fair value adjustment of the intangible assets mainly
relates to an adjustment of the value of the trade name
of Bentley (€8.4m). The Bentley trade name is well known
in the US market and provides additional support in sell-
ing the products to the market. The “relief from royalty”
method has been used to determine the fair value of the
trade name using level 3 valuation techniques. As a result,
the fair value of the trade name was determined based
on the estimated present value of the future net returns
increased by a tax amortisation benefit. The trade names
are further amortized over a period of 10 years.
The carrying amount of the “Non-current trade and other
receivables” has been increased by €0.2m and reflects the
fair value of the existing operating lease contracts which
mainly relate to the leasing of some land and buildings.
The fair value correction on inventory was based on com-
putations which considered many factors, including the
estimated average selling price of the inventory and the
sales effort required to bring the products to the market.
In addition the fair value of the work in progress (“WIP”)
has been determined by allocating the margin taking
into account the percentage of completion of the related
product. The total net fair value correction of inventory
amounted to €2.3m and has been fully reversed over a
period of 3 months in the income statement which corre-
sponds with the expected rotation rate of the inventory.
The carrying amount of the current trade receivables
was reduced by €0.3m in order to reflect the probability
that certain trade receivables may not be fully collected
in later periods.
Bentley has recognized an additional provision for other
liabilities and charges for €0.9m which mainly relates to an
estimation of the asset retirement obligation which exists
for the buildings which are currently leased. The asset
retirement obligation reflects the net present value of the
expected costs to be made to bring the leased property
in its original condition when the lease agreements are
ended in the future.
The net fair value step up of the assets and liabilities will
result in an adjustment of the pre-tax income in future
periods. As a result, the related deferred tax effect of
the fair value adjustments needs to be reflected in the
opening balance and results in an increase of deferred
tax liabilities of €4.5m.
The excess of the purchase price over the amounts allocated
to identifiable assets and liabilities is equal to €74.3m and
has been included in goodwill. Goodwill will be tested for
impairment on an annual basis, as described in Note 7.
Details of acquired receivables
The non-current and current trade and other receivables
acquired from Bentley in March 2017 amounted to €14.5m
and relate to trade receivables (€13.2m), other receivables
(€0.9m), accruals (€0.2m) and deferrals (€0.3m). The trade
receivables included a bad debt provision of €0.6m to cover
for receivables that are assumed to be difficult to collect.
Details of non-controlling interests
The amount of non-controlling interest recognized amount-
ed to €1.0m at the acquisition date and represented the
1.61% stake management owned in the net assets of Bentley.
The non-controlling interest disappeared as a result of
the acquisition of the remaining share portion on May 31
2017 by the Balta Group. The Profit / (Loss) for the period
which was attributed to the Non-controlling interest for the
period March 23 2017 until May 31 2017 amounted to €34k.
Impact of acquisition on amounts reported in the state-
ment of comprehensive income
The acquisition of Bentley by Balta was completed on
March 22 2017. Because the closing date was near the
end of the first quarter, management believes that the
amount of revenue and profit or loss since the acquisition
date to be included in the consolidated statement of
comprehensive income for the period to the end of March
2017 is not material. As a result, the comprehensive income
of Bentley was taken into account as of April 1 2017 and
only included for 9 months in the twelve months ended
December 31 2017 figures.
If Bentley had been consolidated from January 1 2017,
Bentley would have contributed €113.6m of revenue from
January 1 2017 to December 31 2017. The profit of the year
from continuing operations would have been equal to €6.2m
on a pro forma basis, i.e. taking into account the effects
of the new capitalisation structure of the Group, after
elimination of transaction expenses incurred by Bentley
and after elimination of the purchase price adjustment
effect on inventories.
Note 7. GoodwillThe goodwill represents, amongst other things, the value
of the longstanding customer relationships, the Group’s
market position, brand and reputation, as well as the value
of the Group’s workforce.
The goodwill impairment test is performed at the level of
a cash-generating unit (“CGUs”) or a group of cash-gen-
erating units, which is the lowest level at which goodwill is
monitored for internal management purposes. Our CGUs
are generally in line with our segments, with our Residential
segment broken down into two CGUs, Balta Broadloom
(polypropylene broadloom) and ITC (polyamide broadloom)
whilst our commercial segment is broken down into our
European activity and our US activity.
BA
LTA
AN
NU
AL
REP
OR
T 20
17
7776
FIN
AN
CIA
L St
ate
me
nts

For the purpose of impairment testing, goodwill acquired
in a business combination is allocated to the cash-gen-
erating units that are expected to benefit most from the
business combination. Consequently, the goodwill arising
from the acquisition of Balta Finance (€124.7m) has been
solely allocated to Rugs (€94.3m) and Commercial Europe
(€30.4m), whilst the goodwill arising from the acquisition
of Bentley has been allocated to Commercial US (€74.3m).
Whilst no goodwill has been allocated to Residential, the
assets of this CGU have been tested for impairment using
the same approach as the impairment testing for goodwill.
The impairment testing has been performed on September
30 2017. The assets and liabilities comprising the CGU have
not changed significantly since the most recent calculation.
Based on the comparison of the “value in use” (derived using
discounted cash flow analysis) and the carrying amount
(book value of capital employed) per CGU at September
30 2017, the Group has been able to demonstrate that
the recoverable amount exceeds the carrying amount
and hence the goodwill is not impaired. The “value in
use” calculations use cash flow projections (which include
EBITDA, working capital movements, capital expenditure
and taxes) and are based on financial projections covering
a three-year period. Estimates beyond this three-year
period are calculated with a growth rate that reflects the
long-term growth rate applicable to the CGU, moderat-
ed to reflect management’s view of long-term earnings
across the cycle.
Key assumptions on which management has based its
determinations of the “value in use” include terminal value
growth rates of 2% for Rugs, 1% for Commercial Europe and
Commercial US (2016: 2% for all CGU’s) and an after-tax
discount rate of 7.9% (2016: 7.9%).
The “value in use” is mainly driven by the terminal value
which is particularly sensitive to changes in the assump-
tions on the terminal value growth rate and discount
rate. Discount rates are based on the weighted average
cost of capital. Terminal value growth rates take into
consideration external macroeconomic sources of data
and industry specific trends. The table below includes the
CGUs to which goodwill has been allocated and presents
the extent in which these two assumptions would need to
change in absolute terms in order to reduce the “value in
use” to the carrying amount.
Decrease in growth rate
Increase in discount rate
Rugs 1,3% 1,1%
Commercial Europe 6,7% 5,3%
Commercial US 3,8% 3,1%
Note 8. Employee benefit expensesThe following table sets forth employee benefit expenses for the years ended December 31 2016 and 2017:
(€ thousands) 2017 2016
Total employee benefit expenses 151,334 130,054
Wages and salaries 105,682 92,289
Social security costs 32,180 29,974
Pension costs 4,026 1,603
Other employee benefit expenses 9,445 6,188
Employee benefit expenses increased by €21.3m as compared to December 31 2016 of which €19.4m is driven by the
acquisition of Bentley.
The average number of employees in 2017 and 2016 was equal to 3,714 (in full time equivalents and of which 376 full
time equivalents relate to Bentley) and 3,238 respectively. Part-time employees are included on a proportionate basis.
2017 2016
Average number of total employees 3,714 3,238
Average number of employees - blue collar 3,045 2,694
Average number of employees - white collar 669 544
Note 9. Other income and expense
(€ thousands) 2017 2016
Other income 7,112 8,171
Foreign exchange gains 1,087 1,493
Foreign exchange forward contracts 1,295 2,307
Rental income from solar rooftop installations 1,383 1,410
Sales of energy certificates 961 -
Grants 454 602
Recharge of costs 328 755
Other 1,604 1,603
Other expenses 121,869 101,017
Services and other goods 78,990 67,772
Selling expenses 39,591 28,824
Foreign exchange losses 712 2,253
Real estate tax 2,524 2,156
Other 52 12
Other income includes gains realized on the settlement of
FX forward hedge agreements (see Note 21 on cash flow
hedge accounting), rental payments received from third
parties who lease the space to install solar panels, and the
sales of green energy certificates to which we are eligible
thanks to the combined generation of heat and power.
Some costs can be recharged to external parties for which
the income was presented under “Other income”. As a re-
sult of some changes in rental agreements, the recharges
to external parties decreased in comparison to last year.
The increase of “Other expenses” mainly relates to the
acquisition of Bentley (€18.3m). The main component of
other expenses is services and other goods which mainly
includes electricity and gas, maintenance and repair and
interim blue collars. Selling expenses mainly include freight
and commissions.
The costs of research and development are also included
within “Other expenses”.
The Group incurred €7.0m of research and development
expenses during the 12 months ended in December 31 2017
compared to the €5.5m of research and development
expenses during the 12 months ended December 31 2016.
One of the competitive advantages of our business is our
long history of creativity and innovation. The Group aims
to leverage research and development to continually
optimize the production capacity and provide designs
that appeal to our customers. Trends in product design
and innovation are closely monitored through continuous
testing and analysis, with a focus on anticipating customers’
preferences and market developments.
Note 10. Depreciation/amortisationThe components of depreciations and amortisations can
be summarized as follows:
(€ thousands) 2017 2016
Depreciation/amortisation 32,499 28,666
Amortisation of intangible assets 1,923 785
Depreciation property, plant and equipment
31,972 29,276
Release deferred revenu sale & lease back
(1,395) (1,395)
Depreciation/amortisation increased by €3.8m as com-
pared to December 31 2016, mainly driven by the acqui-
sition of Bentley. Excluding the impact of Bentley, the
depreciation/amortisation for December 31 2017, would
have been €28.8m.
The release of deferred revenue sale and lease back
relates to the gradual recognition of the capital gain
realized on the sale and lease back of one of the Group’s
manufacturing facilities in 2014. This deferred revenue is
recognized on a straight line basis over a 12 year period
as partial offset to depreciation charges over the period
of the lease. The annual amount recognized in the income
statement is €1.4m, with the balance of deferred income
equal to €11.5m as at December 31 2017.
BA
LTA
AN
NU
AL
REP
OR
T 20
17
7978
FIN
AN
CIA
L St
ate
me
nts

Note 11. Integration and restructuring expensesThe total integration and restructuring expenses incurred
in 2017 amount to €11.4m (2016: €5.1m). This comprises
various items which are considered by management as
non-recurring or unusual by nature.
(€ thousands) 2017 2016
Integration and restructuring expenses 11,368 5,128
Corporate restructuring - 1,920
Business restructuring 8,248 670
Acquistion related expenses 1,334 -
Idle IT costs 776 703
Strategic advisory services 595 1,324
Other 414 512
The main component of the integration and restruc-
turing expenses is the €8.2m provision in relation to the
optimisation of the Residential operational footprint.
The acquisition-related expenses of €1.3m have been
incurred in relation to the acquisition of Bentley in March
2017. Incremental (idle) IT costs in relation to a legacy IT
system amounted to €0.8m. The replacement of the legacy
system was completed in the course of 2017 and there-
fore these costs will no longer be incurred. The strategic
advisory services amount to €0.6m and are driven by the
portion of the IPO expenses that are not considered to
be directly attributable to the issue of new shares and
therefore not eligible for deduction from equity. The other
expenses mainly relate to accrued expenses in connection
with the phantom share bonus scheme. The bonus is only
payable if the managers still provide services to the Group
on the second anniversary of the completion of the IPO.
If services cease to be provided for any reason prior to
the second anniversary, the bonus arrangement for that
manager is forfeited.
In 2016, €1.9m of corporate restructuring expenses were
incurred in relation to changes in the senior management
team. The business restructuring expenses of €0.7m related
to a fee paid to terminate an agency agreement in the
UK, as part of the strategy to further develop our modu-
lyss brand in Europe through a direct sales approach. In
addition, given the minor share of wool in our raw material
mix, the decision was taken to close the wool spinning
department and, going forward, to buy wool yarns from
third party suppliers.
Strategic advisory fees amounted to €1.3m in relation to
non-recurring tax, legal and financial advisory services.
Note 12. Finance expense
(€ thousands) 2017 2016
Total finance expenses 37,327 28,608
Interest expense on Senior Secured Notes
26,783 24,897
Interest expense on Senior Term Loan Facility (€35m)
204 -
Interest expense on Senior Term Loan Facility (€75m)
3,289 -
Interest expense on Senior Term Loan Facility Bentley
2,025 -
Interest expense on Bank borrowings (including leasing)
425 504
Other finance costs 2,521 2,244
Foreign exchange result on interco transactions
2,080 962
The Group’s finance expenses increased from €28.6m
in 2016 to €37.3m in 2017. This increase is mainly driven
by €9.3m of non-recurring finance expenses, of which (i)
€5.4m in connection with the debt financed acquisition of
Bentley, which was fully repaid in June 2017 from the IPO
proceeds and (ii) €3.9m expenses in connection with the
early redemption of the Senior Secured Notes.
The remaining finance expenses are driven by interest
charges on the Senior Secured Notes, the Senior Term
Loan Facility of €35m, the Super Senior Revolving Credit
Facility, the other Revolving Credit Facilities and on the
finance leasing obligations. We refer to Notes 24, 25 and
26 for a description of these facilities. Other finance costs
mainly relate to factoring, commitment fees and other
bank related charges. The effective interest expense
of the Senior Secured Notes comprises a cash interest
of €20.7m (€22.5m in 2016), an early redemption fee of
€1.7m and the amortization of capitalized financing fees
of €4.4m (€2.4m in 2016).
Note 13. Income tax benefit / expense
(€ thousands) 2017 2016
Income tax benefit / (expense) 2,654 4,713
Current tax (2,615) (3,014)
Deferred tax 5,269 7,727
(€ thousands) 2017 2016
Income tax benefit / (expense) 2,654 4,713
Income tax calculated at Luxembourg tax rate (31.47%) - (6,495)
Income tax calculated at Belgian tax rate (33.99%) (111) -
Rate differential due to transactions with foreign entities 702 1,000
Disallowed expenses (1,945) (730)
Tax-exempted revenues 738 323
Deferred tax assets recognised - 10,789
Tax losses for which no deferred tax asset is recognized (398) (2,878)
Deferred tax asset derecognized (10,671) -
Impact tax reforms 10,255 -
Utilisation of previously not recognized tax assets - 3,153
Impact intercompany financing 3,234 -
Other 851 (449)
Income taxes represent a ‘benefit’ in both 2017 and 2016,
driven by the net positive deferred tax income.
The reported income tax expense of the year is a credit
of €2.7m which includes two items which we have treated
as non-recurring.
Firstly, we have recognized a positive effect of €10.3m
linked to tax reforms, of which €8.8m is linked to the Belgian
tax reform which has been substantially enacted on 22
December 2017. The highlight of the corporate tax reform
is the reduction of the corporate tax rate from 33.99% to
29.58% in 2018 (including crisis contribution, lowered from
3% to 2%) and to 25% as from 2020 (abolishment of crisis
contribution). As a consequence, deferred tax assets and
liabilities have been adjusted to reflect the new tax rates
that are expected to apply to the period when the asset
is realized or the liability is settled.
Secondly, the deferred tax assets relating to tax credits
and loss carryforwards have been adjusted by €10.7m to
reflect changes in the probability that these can be used in
the future as a result of the restructuring of the operational
infrastructure in Belgium within the Residential business,
by the consolidation of the Oudenaarde facility into the
Group’s two fully vertically integrated factories in the region.
When normalizing for all exceptional events of 2017, the
Adjusted Effective Tax Rate 1 is equal to approximately 30%.
In 2016 the income tax benefit is driven by the recognition
of a deferred tax asset of €10.8m in relation to tax cred-
its for which the recognition criteria were previously not
met. This benefit was offset by certain tax losses subject
to significant limitations (tax losses for which no deferred
tax asset is recognized). For those losses, deferred tax
assets have not been recognized, as it is not probable
that taxable profit will be generated to offset those losses.
In assessing whether deferred tax assets should be rec-
ognized, management considers the extent to which it is
probable that the deferred tax asset will be realized. The
ultimate realisation of deferred tax assets is dependent
upon the generation of future taxable profits during the
periods in which those temporary differences and tax losses
carried forward become deductible. Management con-
siders the expected reversal of deferred tax liabilities and
projected future taxable income in making this assessment.
1 We refer to note 1.25 where we provide a glossary of the non-GAAP measures and note 3.
BA
LTA
AN
NU
AL
REP
OR
T 20
17
8180
FIN
AN
CIA
L St
ate
me
nts

Note 14. Other Intangible assets
(€ thousands)Trademarks Software and
licencesInternally generated
intangible assetsTotal
Opening net book value - 534 1,132 1,667
Additions - 829 665 1,494
Transfers - 15 (15) -
Amortisation charge - (257) (528) (785)
Closing net book value - 1,121 1,255 2,376
At December 31 2016
Cost or valuation - 5,206 8,080 13,286
Accumulated amortisation, impairment and other adjustments
- (4,085) (6,825) (10,910)
Closing net book value - 1,121 1,255 2,376
Opening net book value - 1,121 1,255 2,376
Business combinations 10,913 266 - 11,179
Additions - 799 875 1,673
Disposals
Transfers
Amortisation charge (730) (619) (598) (1,923)
Exchange differences (1,184) 97 - (1,087)
Closing net book value 8,999 1,663 1,532 12,218
At December 31 2017
Cost or valuation 9,728 9,292 8,955 29,922
Accumulated amortisation, impairment and other adjustments
(730) (7,604) (7,423) (17,704)
Closing net book value 8,999 1,688 1,532 12,218
The trademark of €9.0m relates to the acquisition of Bentley.
More information can be found in the note regarding busi-
ness combinations. We refer to Note 6 for further details.
The internal and external software development costs are
capitalized under internally generated intangible assets.
These projects are mainly related to SAP implementation,
SAP upgrades and the automation of production processes.
The total amortisation expense of €1.9m (2016: €0.8m) is
included in the line “Depreciation, amortisation and im-
pairment” in the income statement and mainly increased
as a result of the acquisition of Bentley.
Note 15. Property, plant and equipment
(€ thousands) Land and buildings Plant and machinery Other Equipment Total
Opening net book value 175,734 108,584 15,012 299,332
Additions 1,446 23,787 11,249 36,483
Revaluation surplus
Disposals - (1,543) (234) (1,777)
Transfers
Depreciation charge (5,854) (12,499) (10,923) (29,276)
Impairment charge
Exchange differences (2,124) (3,314) (86) (5,523)
Closing net book value 169,203 115,016 15,019 299,237
At December 31 2016
Cost or valuation 232,628 528,504 46,983 808,115
Accumulated depreciation, impairment and other adjustments
(63,426) (413,488) (31,964) (508,877)
Closing net book value 169,203 115,016 15,019 299,237
Opening net book value 169,203 115,016 15,019 299,237
Business combinations 700 10,740 4,634 16,074
Additions 665 23,138 14,458 38,261
Disposals (0) (463) (391) (854)
Transfers 284 2,375 (2,659) 0
Depreciation charge (5,977) (13,736) (12,258) (31,972)
Exchange differences (2,771) (6,093) (724) (9,587)
Closing net book value 162,103 130,977 18,080 311,160
At December 31 2017
Cost or valuation 231,256 516,930 47,446 795,633
Accumulated depreciation, impairment and other adjustments
(69,153) (385,953) (29,367) (484,474)
Closing net book value 162,103 130,977 18,080 311,160
A total of €16.1m of property, plant and equipment was
acquired in the context of the business combination with
Bentley. Refer to Note 6 for further details.
A total of €38.3m (€36.5m in 2016) has been invested, in
particular in plant, machinery and equipment.
The total depreciation expense of €32.0m (€29.3m in 2016)
has been charged in the line “Depreciation and amorti-
sation” in the income statement.
The Group’s assets which are pledged as security for the
borrowings are described in Note 24 and 26.
Exchange differences (2017: €9.6m and 2016: €5.5m) relate
to fluctuations in the closing exchange rate of our Turkish
entities and US entities which have a significant amount of
Property Plant and Equipment recorded on the statement
of financial position.
BA
LTA
AN
NU
AL
REP
OR
T 20
17
8382
FIN
AN
CIA
L St
ate
me
nts

Note 16. Deferred income tax assets and lia-bilitiesIFRS requires the deferred taxes for each jurisdiction to be
presented as a net asset or liability. Offsetting of deferred
tax liabilities from one jurisdiction against deferred tax as-
sets of another jurisdiction is not allowed. The table below
presents the net deferred tax position in accordance with
these presentation principles.
(€ thousands) 2017 2016
Deferred tax assets: 4,747 18,950
Deferred tax assets to be reversed after more than 12 months 4,215 18,111
Deferred tax assets to be reversed within 12 months 532 839
Deferred tax liabilities: (54,471) (69,775)
Deferred tax liabilities to be reversed after more than 12 months (51,048) (64,491)
Deferred tax liabilities to be reversed within 12 months (3,423) (5,283)
Net deferred tax liabilities (49,724) (50,825)
The movement in the net deferred tax liabilities can be summarized as follows:
(€ thousands) 2017 2016
Beginning of period (50,825) (59,306)
Business combination (6,302) -
Income statement charge 5,269 7,727
Other comprehensive income (457) 285
Deferred taxes on IPO expenses attributed to the Primary tranche of the IPO 1,553 -
Exchange differences 1,037 469
December 31 (49,724) (50,825)
In contrast to the table above, the table below shows the
movement in deferred taxes on a gross basis, i.e. without
netting deferred tax liabilities and deferred tax assets
within the same jurisdiction.
Deferred tax assets
(€ thousands) Tax
loss
es c
arr
ied
forw
ard
Def
erre
d in
com
e sa
le a
nd
lea
seb
ack
Inta
ngib
le a
sset
s
Borr
owin
gs
Emp
loye
e b
enefi
ts
Inve
ntor
y
Oth
er
Tota
l
January 1 2016 9,416 4,859 2,867 1,903 1,612 683 1,044 22,384
(Charged)/credited to the income statement 9,451 (474) (956) - (22) 325 (987) 7,338
Other comprehensive income - - - - 285 - - 285
Exchange differences 12 - - - - - - 12
December 31 2016 18,879 4,385 1,911 1,903 1,875 1,007 57 30,018
January 1 2017 18,879 4,385 1,911 1,903 1,875 1,007 57 30,018
Business combinations 193 - - - 248 - 1,098 1,539
(Charged)/credited to the income statement (10,781) (1,381) (1,080) (515) (232) 52 (433) (14,370)
Movement to share capital 1,553 - - - - - - 1,553
Exchange differences (166) - - - - - - (166)
Other comprehensive income - - - - (457) - - (457)
December 31 2017 9,678 3,004 832 1,388 1,434 1,059 722 18,117
In assessing the realizability of deferred tax assets, man-
agement considers the extent to which it is probable
that the deferred tax asset will be realized. The ultimate
realization of deferred tax assets is dependent upon the
generation of future taxable profits during the periods in
which those temporary differences and tax loss carryfor-
wards become deductible. Management considers the
expected reversal of deferred tax liabilities and projected
future taxable income in making this assessment. Based
upon the level of historical taxable income and projections
for future taxable income over the periods in which the
deferred tax assets are deductible, management believes
it is probable the Group will realize the benefits of these
deductible differences. As of December 31 2017, the Group
has certain tax losses subject to significant limitations. For
those losses, deferred tax assets are not recognized, as
it is not probable that gains will be generated to offset
those losses. Uncertain tax positions, as described in Note
2, are taken into account when recognizing deferred tax
assets and liabilities.
As of December 31 2017 total tax credits amounted to
€497.1m, resulting in a potential deferred tax asset of
€123.7m of which the Group only recognized €9.7m in
2017. As of December 31 2016 total tax credits amounted
to €453.6m, resulting in a potential deferred tax asset of
€151m of which the Group only recognized €18.9m. The
decrease in potential deferred tax assets mainly relates to
the decrease of corporate income tax rates in Belgium and
US as a result of the tax reforms enacted before year end
2017 and also reflects changes in the probability that tax
losses can be further used in the future as a result of the
restructuring of the operational infrastructure in Belgium
within the Residential business, by the consolidation of the
Oudenaarde facility into the Group’s two fully vertically
integrated factories in the region. The majority of the tax
credits in 2016 and 2017 are incurred at the level of the
Belgian legal entities where - with the exception of the
tax credits in relation to the Notional Interest Deduction
- there is no expiry date regarding the tax credits.
Deferred tax liabilities
(€ thousands)Property, plant and equipment
Inventory Income tax liability
Intangible assets
Other Total
January 1 2016 (76,430) (2,394) (1,404) (420) (1,040) (81,689)
Charged/(credited) to the income statement
(1,636) (388) 1,404 (31) 1,041 390
Exchange differences 457 - - - - 457
December 31 2016 (77,610) (2,782) - (451) 1 (80,843)
January 1 2017 (77,610) (2,782) - (451) 1 (80,843)
Business combinations (4,664) (549) (2,628) (7,841)
Charged/(credited) to the income statement
17,652 870 - 1,123 (3) 19,642
Exchange differences 1,201 - - - - 1,201
December 31 2017 (63,420) (2,461) - (1,956) (2) (67,841)
Deferred income tax liabilities have not been recognized
for the withholding tax and other taxes that would be
payable on the unremitted earnings of certain subsidiaries.
Such amounts are permanently reinvested. Aggregate
unremitted earnings are equal to €158.8m as of Decem-
ber 31 2017 (as compared to €150.1m as of December 31
2016). The deferred tax liabilities resulting from property,
plant and equipment mainly decreased as a result of a
decrease in tax rates driven by the tax reforms enacted
in Belgium before 31 December 2017.
When we add up the gross amounts of deferred tax as-
sets (€18.1m) and gross amount of deferred tax liabilities
(€67.8m) we arrive at a net deferred tax position per 31
December 2017 of €49.7m.
Note 17. InventoriesThe table below provides a breakdown of total inventories
as of December 31 2017 and December 31 2016:
(€ thousands)December 31
2017December 31
2016
Total inventories 147,868 135,320
Raw materials and consumables 64,948 60,564
Work in progress 22,892 19,087
Finished goods 60,029 55,670
Inventories increased by €12.5m to €147.9m for the year
ended December 31 2017 from €135.3m for the year ended
December 31 2016. The increase is mainly driven by the
acquisition of Bentley (€14.8m) and a decrease of inventory
by the rest of the Group (€2.3m).
BA
LTA
AN
NU
AL
REP
OR
T 20
17
8584
FIN
AN
CIA
L St
ate
me
nts

The movement in ‘Work in progress’ and ‘Finished goods’
is detailed as follows:
(€ thousands)December 31
2017December 31
2016
Beginning of period 74,757 68,701
Business combinations 11,523 -
Income statement (3,359) 6,055
Of which: impact purchase price allocation
(3,008) -
Of which: actual movements in inventory
(351) 6,055
December 31 82,921 74,757
The Group decreased the provision for obsolete inventory
in 2017 with €1.4m compared to a decrease of €0.3m in 2016
which is included in “Raw materials used” and “Changes
in inventories of finished goods and work in progress”
respectively related to raw materials and finished goods
(including work in progress). The impact of the Bentley
acquistion on the year-end provision for obsolete inventory
is equal to €3.8m.
The sum of the raw material expenses and the changes
in inventories recognized as expenses in 2017 amounts to
€313.8m as compared to €253.4m in 2016.
The Group’s assets which are pledged as security for the
borrowings and Senior Secured Notes are described in
Notes 24 to 26.
Note 18. Trade and other receivables
(€ thousands)December 31
2017December 31
2016
Total Trade and other receivables 62,704 55,068
Trade and other receivables (non-current)
1,165 138
Other amounts receivable 1,165 138
Trade and other receivables (current) 61,539 54,930
Net trade receivables 49,612 41,325
Trade receivables 50,577 42,658
Less: Bad debt allowance (965) (1,333)
Prepayments and accrued income 1,026 1,945
Other amounts receivable 10,901 11,661
The fair value of the trade and other receivables approxi-
mates their carrying amount as the impact of discounting
is not significant.
As part of its normal course of business, the Group has
entered into non-recourse factoring agreements with fi-
nancial parties. The Group has derecognized the accounts
receivable for which substantially all risk and rewards of
ownership have been transferred.
Current trade and other receivables increased by €6.6m
to €61.5m as of December 31 2017, compared to €54.9m
as of December 31 2016. This increase is mainly driven
by the acquisition of Bentley. The net trade receivables
owned by Bentley amount to €15.5m. Excluding the impact
of the acquisition, current trade and other receivables
decreased by €8.9m.
As of December 31 2017 trade receivables that were past
due amounted to €5.2m compared to €3.2m at December
31 2016. The increase is driven by the acquisition of Bentley
and some customers having surpassed the due date of
their invoices at December 31 2017 compared to 2016. The
increase in past due receivables did not impact the bad
debt allowance because the majority of overdue invoices
were settled shortly after year end.
The Group has one external customer representing just
more than 10% of the Group’s revenue.
The Group uses credit insurance as a means to transfer
the credit risk related to trade receivables. Furthermore,
our trade receivables portfolio is very diversified, in terms
of both segmentation and client base, which mitigates
the credit risk. The credit quality of the trade receivables
that are neither past due nor impaired is good.
The assessment to set up a bad debt allowance is per-
formed on an individual basis in consideration of various
factors such as historical experience, credit quality, age of
the accounts receivables and economic conditions that
may affect a customer’s ability to pay. For the year ended
December 31 2017 there are some receivables past due
more than 3 months for which provision has been set up.
The carrying amounts of the Group’s trade and other
receivables are denominated in the following currencies:
(€ thousands)December 31
2017December 31
2016
Total trade and other receivables 62,704 55,068
EUR 28,465 32,650
USD 19,306 9,723
GBP 5,697 2,352
TRY 9,236 10,344
Movements in the Group’s bad debt allowance with respect
to trade receivables are as follows:
2017 2016
As at January 1 (1,333) (2,535)
Business combination (547) -
Impairment loss recognized (42) (39)
Receivables written off during the year as uncollectible
383 761
Unused amounts reversed 516 479
Fx difference 58 -
As at 31 December (965) (1,333)
The creation and release of allowances for impaired re-
ceivables has been included in “Other income/expenses” in
the income statement. Amounts charged to the allowance
account are generally written off when there is no expectation
of recovering additional cash. As a result of the acquisition
of Bentley, the allowance for bad debt increased with €0.6m
on 31 March 2017 to reflect the probability that certain trade
receivables may not be fully collected.
The other classes within trade and other receivables do
not contain impaired assets.
The maximum exposure to credit risk at the reporting date
is the carrying value of each class of receivable mentioned
above. As per December 31 2017 the Group holds collateral
(letters of credit and corporate or bank guarantees) for an
amount of €0.5m (as compared to €0.3m as of December
31 2016).
Note 19. Cash and cash equivalents
(€ thousands)December 31
2017December 31
2016
Total cash and cash equivalents 37,338 45,988
Cash at bank and on hands 26,876 38,553
Short-term bank deposits 3,127 2,035
Cash from local financing 7,335 5,400
The cash from local financing relates to cash and cash
equivalent balances held by subsidiaries that operate in
countries where legal restrictions apply and as such the
cash and cash equivalents are not directly available for
general use by the parent or other subsidiaries.
The credit quality of the banks and financial institutions
is disclosed in Note 30. The Group’s assets which are
pledged as security for the borrowings are described in
Notes 24 to 26.
Note 20. Share capital and share premiumShare capital and share premium have increased from
€1.4m to €318.6m as a result of the following events:
• capital increase in cash resulting from the subscription of
the sale of primary shares in the IPO. The shareholders of
the Company have issued 10,943,396 new shares at a price
of €13.25 per share for a total amount of €145.0m. This has
been allocated to capital (€7.25 per share, i.e. €79.3m) and
share premium (€6.0 per share, i.e. €65.7m). Transaction
costs that are directly attributable to the issue of new
shares as a result of the IPO have been recognized as a
deduction of share capital (€7.6m net of taxes).
• capital increase by means of a contribution in kind. LSF9
Balta Holdco S.à r.l. contributed all the shares it held in
LSF9 Balta Issuer S.à r.l to the share capital of the Company
by means of a contribution in kind, in exchange for 25m
shares. As a result of this contribution in kind, and prior
to the IPO, the Company held all equity interests in LSF9
Balta Issuer S.à r.l. The shares have been contributed at
€13.25 per share and hence represent a value of €331.3m.
• capital reduction to create distributable reserves. Im-
mediately following the capital increase as described
above, the capital of the Company has been decreased
by €150.0m to create distributable reserves. Accordingly,
the Company will be entitled to make distributions to
shareholders out of these distributable reserves even in
the absence of Belgian GAAP annual net profit for the
relevant year.
• Bentley Management Buy-Out: Prior to the IPO, Bentley
management owned a minority equity stake (of less than
2% of the total interest) in the Bentley group of companies.
This minority equity stake has been acquired by LSF9 Balta
Midco S.à r.l., who in turn has rolled-down the stake into
Balta NV in a cash-less manner, such that the full owner-
ship in Bentley is centralized in Balta NV. This integration
of the Bentley management equity stake has resulted
in an equity increase at the level of the Group of €1.3m.
• capital reduction to cancel the founders’ shares. Capital
of the Company has been reduced by €61,500 by (i) can-
cellation of the 61,500 shares of the Company subscribed
to by its founders at incorporation on March 1 2017 and (ii)
repayment of the contributions made at the Company’s
incorporation by these founders. The new shareholders
do not benefit from this distribution.
BA
LTA
AN
NU
AL
REP
OR
T 20
17
8786
FIN
AN
CIA
L St
ate
me
nts

Note 21. Other comprehensive incomeComponents of “Other comprehensive income” (“OCI”) are
items of income and expenses (including reclassification
adjustments) that are not recognized in the profit or loss
as required or permitted by other IFRSs. The Group has
other comprehensive income which mainly relates to the
re-measurements of post-employee defined benefit ob-
ligations, the gains and losses arising from translating the
Financial Statements of foreign entities and the changes
in the fair value of hedging instruments.
The movements in other comprehensive income are summarized in the table below:
(€ thousands) 2017 2016
Items in OCI that may be subsequently reclassified to P&L (20,807) (7,409)
Cumulative translation reserves as of December 31 (20,814) (7,293)
Cumulative translation reserves at beginning of the period (7,293) 720
Exchange differences on translating foreign operations (13,522) (8,013)
Cumulative changes in fair value of hedging instruments as of December 31 7 (116)
Cumulative changes in fair value of hedging instruments at beginning of the period (116) -
Changes in fair value of hedging instruments during the period 123 (116)
Items in OCI that will not be reclassified to P&L 895 346
Changes in deferred tax at December 31 (604) (147)
Changes in deferred taxes at beginning of the period (147) (432)
Changes in deferred taxes during the period (457) 285
Changes in employee defined benefit obligations at December 31 1,498 493
Changes in employee defined benefit obligations at beginning of the period 493 1,375
Changes in employee defined benefit obligations during the period 1,005 (882)
Total other comprehensive income at December 31 (19,913) (7,063)
Cash flow hedge accounting
The movement schedule below summarizes the amounts
recorded into the cash flow hedge reserve and the portion
that was recognized in the income statement in relation
to contracts that were settled in December 2017. The
amounts recognised in the income statement have been
presented as “other income” – see Note 9.
(€ thousands)December 31
2017December 31
2016
Cash flow hedge reserve, ending bal-ance
7 (116)
Opening balance (116) -
Amounts recorded in the cash flow hedge reserve
1,418 2,190
Amounts recognized in the income statement
(1,295) (2,307)
Employee defined benefit obligations
The Group operates defined benefit pension plans. The
changes in pension liabilities are accounted for through
other comprehensive income when the changes relate to a
change in actuarial assumptions from one year to another.
In the recent past, several insurance companies have
decided to reduce the technical interest rate on group
insurance contracts to a level below the minimum return
guaranteed by law for Belgian defined contribution pen-
sion plans. Because the employer has to guarantee the
statutory minimum return on these plans, not all actuarial
and investment risks relating to these plans are transferred
to the insurance company or pension fund managing the
plans. Therefore these plans do not meet the definition
of defined contribution plans under IFRS and should by
default be classified as defined benefit plans. Refer to
Note 31 for further details.
The liability has been measured using a discount rate of
1.35% for 2017 and 1.31% for 2016.
Deferred Taxes
The changes in pension liabilities also affect deferred
taxes. When the change in pension liabilities are recorded
through other comprehensive income, the related deferred
tax charge is also recorded in other comprehensive income
Note 22. Retained earnings (€ thousands) 2017 2016
Beginning of period 3,351 (21,995)
Profit / (loss) for the year allocated to equity owners
2,946 25,345
At 31 December 6,297 3,351
The retained earnings may be distributed to shareholders
upon the decision of a general meeting of shareholders,
taking into account the restrictions as defined in the
financing agreements and the restrictions which are
imposed by law.
Note 23. Preferred Equity CertificatesAs a result of the capital reorganization the Preferred Equity
Certificates (“PECs”), which remained outstanding on 31
December 2016, have been converted into share capital
of LSF9 Balta Issuer S.à r.l.
Note 24. Senior Secured Notes
(€ thousands) December 31 2017 December 31 2016
Total Senior Secured Notes 231,555 283,510
Non-Current portion 228,130 279,277
Of which: gross debt 234,900 290,000
Of which: capitalised financing fees (6,770) (10,723)
Current portion 3,425 4,234
Of which: accrued interest 5,360 6,618
Of which: capitalised financing fees (1,935) (2,384)
On August 3 2015, LSF9 Balta Issuer S.à r.l. issued €290.0m
aggregate principal amount of Senior Secured Notes with an
interest rate of 7.75% as part of the financing of the acquisition
of Balta Finance S.à r.l. and its subsidiairies. The maturity
date of the Senior Secured Notes is September 15 2022.
Interest on the Senior Secured Notes accrue at the rate of
7.75% per annum and are payable semi-annually in arrears
on March 15 and September 15 of each year, commencing
on March 15 2016.
Costs related to the issuance of Senior Secured Notes have
been included in the carrying amount and are amortized
into profit or loss over the term of the debt in accordance
with the effective interest method. It follows that the amount
of capitalized financing fees expensed during 2017 is equal
to €4.4m. This amount contains €2.2m of financing fees
that were recycled to the income statement as a result
of the partial repayment of the Senior Secured Notes in
June, July and September 2017.
The current portion of the debt associated with the Senior
Secured Notes relates to accrued interest payable at the
next interest payment date and the portion of the cap-
italized financing fee that will be amortized into profit or
loss over the next 12 months.
In June, July and September 2017, the Group performed a
partial repayment of the Senior Secured Notes of €21.2m,
€7.8m and €26.1m. As a result, the non-current portion of
the gross debt decreased by €55.1m which also reduced
the accrued interest remaining open at year end com-
pared to 2016. The capitalized financing fees were also
decreased by €2.2m as a result of the early redemption.
Security agreements have been entered into which col-
lectively secure the Senior Secured Notes and accrued
interest on the Senior Secured Notes. Under the Senior
Secured Notes indenture, The Group is subject to quarterly
reporting requirements and certain limitations on restrict-
ed payments and debt incurrence. The Senior Secured
Notes are secured by first-ranking security interests over
a number of assets and mainly relate to shares of the
guarantors and certain intra-group loans and receivables
of the guarantors.The Group retains full ownership and
operating rights for the assets pledged. In the event of
a default of repayment of the Senior Secured Notes and
related interest payments, the noteholders may enforce
against the pledged assets.
The collateral also secures the Super Senior Revolving
Credit Facility (see Note 26) and Senior Term Loan Facil-
ity (see Note 25) and certain hedging obligations. Under
BA
LTA
AN
NU
AL
REP
OR
T 20
17
8988
FIN
AN
CIA
L St
ate
me
nts

the terms of the Intercreditor Agreement, in the event of
enforcement of the security over the collateral, holders of
the Senior Secured Notes will receive proceeds from the
enforcement of the collateral only after indebtedness in
respect of the Super Senior Revolving Credit Facility and
certain hedging obligations have been repaid in full.
Any such proceeds will, after all obligations under the
Super Senior Revolving Credit Facility and such hedging
obligations have been repaid from such recoveries, be
applied pro rata in repayment of all obligations under the
Indenture and any other obligations that are permitted
to be secured over the Collateral under the Indenture on
an equal and ratable basis.
We confirm that we have complied with all covenants
over the reporting period.
Note 25. Senior Term Loan Facility
(€ thousands)December 31
2017December 31
2016
Total Senior Term Loan Facility 34,674 -
Non-Current portion 34,782 -
Of which: gross debt 35,000 -
Of which: capitalised financing fees (218) -
Current portion (108) -
Of which: acrrued interests 23 -
Of which: capitalized financing fees (131) -
Senior Term Loan Facility of €75m
On March 16 2017, LSF9 Balta Issuer S.à r.l. and certain of
its subsidiaries entered into a senior term loan agreement
(the “Senior Term Loan Agreement of €75m”), which pro-
vided for a €75.0m senior term loan facility (the “Senior
Term Loan of 75m”). The proceeds of the initial drawings
of the Senior Term Loan Facility of €75m were used to
repay certain subordinated loans incurred by LSF9 Balta
Issuer S.à r.l. to finance the acquisition of Bentley and to
pay related fees and expenses.
The Senior Term Loan Facility of €75m was repaid in full
in June 2017 using a portion of the capital contribution
received from Balta Group NV.
Senior Term Loan Facility of €35m
LSF9 Balta Issuer S.à r.l. entered into a €35.0m Senior
Term Loan Facility (the “Senior Term Loan agreement”)
maturing September 15, 2020, at Euribor + 1.40% margin
per annum. The facility ranks pari passu with the Senior
Secured Notes. The net proceeds were used to finance a
partial redemption of the Senior Secured Notes in July and
September 2017. The Senior Term Loan Facility agreement
is dated August 29 2017 and the principal amount was
released at completion date which was September 5 2017.
Similar to for the Super Senior Revolving Credit Facility,
The Group is subject to quarterly reporting requirements
and an annual guarantor coverage test.
Interest on the Senior Term Loan Facility accrues at the rate
of Euribor + 1.40% margin per annum and is payable quarterly
in arrears on March 15, June 15, September 15 and December
15 of each year, commencing on September 15 2017.
Costs related to the issuance of Senior Term Loan Facil-
ity have been included in the carrying amount and are
amortized into profit or loss over the term of the debt in
accordance with the effective interest method.
The current portion of the debt associated with the Senior
Term Loan Facility relates to accrued interest payables
at the next interest payment date and the portion of the
capitalized financing fee that will be amortized into profit
or loss over the next 12 months.
Note 26. Bank and other borrowings The table below provides an overview of the bank and
other borrowings that continue to exist on December 31
2016 and 2017:
(€ thousands)December 31
2017December 31
2016
Total Bank and other borrowings 15,670 18,002
Non-current portion 13,310 15,388
Finance lease liabilities 13,310 15,388
Current portion 2,361 2,614
Finance lease liabilities 2,225 2,494
Commitment fees 136 120
Bank borrowings
On August 3 2015, LSF9 Balta Issuer S.à r.l. and LSF9 Balta
Investments S.à r.l. entered into a six-year Revolving Credit
Facility Agreement providing for a €40.0m European Super
Senior Revolving Credit Facility; which was increased to
€45.0m in 2016 and to €68.0m in 2017.
On 18 July 2017, Balta has also renegotiated and obtained
more favorable commercial terms in respect of its European
Super Senior Revolving Credit Facility, including a reduction
of the margin from the original 3.75% p.a. in August 2015 to
an average margin below 1.80% p.a. at current leverage.
The Super Senior Revolving Credit Facility is secured by
first-ranking security interests over the collateral, which
also secures the Senior Secured Notes and the Guaran-
tees. Under the Super Senior Revolving Credit Facility, a
lender may make available an ancillary facility, such as
overdrafts, guarantees, short-term loan facilities, derivatives
or foreign exchange facilities subject to the satisfaction of
certain conditions precedent, to a Borrower or an Affiliate
of a Borrower in place of all or part of its unutilized com-
mitment under the Super Senior Revolving Credit Facility.
Amounts drawn under the Super Senior Revolving Credit
Facility may be used for working capital and other general
corporate purposes of the Restricted Group, operational
restructurings or permitted reorganisations of the Group.
The Revolving Credit Facility Agreement contains customary
and certain deal specific affirmative loan style covenants and
restrictive covenants such as a springing financial covenant
(based on total net leverage ratio) and an annual guarantor
coverage test. The Super Senior Revolving Credit Facility is
also guaranteed by each Guarantor. Under the terms of the
Intercreditor Agreement, in the event of enforcement of the
security over the collateral, holders of the Senior Secured
Notes and Senior Term Loan Facility will receive proceeds
from the enforcement of the collateral only after indebted-
ness in respect of the Super Senior Revolving Credit Facility
and certain hedging obligations have been repaid in full.
We confirm that we have complied with all covenants
over the reporting period.
Bentley Financing Arrangements
BPS Parent, Inc. and other subsidiaries entered into a $51.0m
syndicated credit facility (the “Fifth Third Credit Agreement”)
with Fifth Third Bank and other financial institutions (the
“Lenders”) on February 1 2017. The credit facilities under
the Fifth Third Credit Agreement consist of: (i) a five year
revolving credit facility of $18.0m which will be due and
payable on January 31 2022, and availability is governed
by a borrowing base, and (ii) a five year Senior Term Loan
Facility of $33.0m (“Bentley Term Loan”), also scheduled to
mature on January 31 2022, requiring quarterly payments.
Obligations under the Fifth Third Credit Agreement are
secured by a security interest on substantially all assets of
BPS Parent, Inc. and its subsidiaries in favor of the Lenders.
The Fifth Third Credit Agreement contains affirmative and
negative covenants with respect to BPS Parent, Inc. and
its subsidiaries and other payment restrictions. Certain of
the covenants limit indebtedness and investments of BPS
Parent, Inc. and its subsidiaries and require the mainte-
nance of certain financial ratios defined in the Fifth Third
Credit Agreement.
In June 2017, a portion of the proceeds of the primary
tranche of the IPO were used to (i) fully repay the five year
term loan facility, and (ii) to partially reduce the amounts
drawn under the revolving credit facility. In August 2017 the
remaining amount of the five year revolving credit facility
was repaid and no amounts have been drawn since then.
Factoring
As part of its normal course of business, The Group has en-
tered into non-recourse receivables factoring agreements,
whereby it may sell trade receivables arising from the normal
course of business at face value less certain reserves and
fees. The insolvency risk related to the factored receivables
has been transferred to the factoring company, who in turn
has transferred this risk to a credit insurance company.
Under the non-recourse agreements, the Group collects
payments from its customers on behalf of the factoring
company to which it has factored its receivables. Given
that substantially all of the risks and rewards of ownership
has been transferred, the trade receivables assigned to
the factoring companies have been derecognized from
the statement of financial position.
Whilst the factoring program described above relates to a
portfolio of credit insured trade receivables, the Group has
also entered into a forfaiting agreement where a financial
institution agrees to purchase (forfait) on a revolving basis
the receivables from individually identified debtors. The
credit risk related to these receivables is fully transferred
from the Group to the financial institution and as a result
thereof, the financial institution bears the risk of non-pay-
ment by the debtor. The Group has been mandated to
collect the forfeited receivables for the account of and
on behalf of the financial institution. The eligible portion
of the trade receivables that have been transferred and
financed under this agreement have been derecognized
from the Group’s statement of financial position. The Group
continues to recognize a portion of the receivables to the
extent of its continuing involvement, in accordance with IAS
39 “Financial instruments: recognition and measurement”.
The Group is also party to an Accounts Receivables Purchase
Agreement with a financial institution, in the framework
of a supply chain financing program offered by a large
customer. Under the agreement, the Group offers to sell
BA
LTA
AN
NU
AL
REP
OR
T 20
17
9190
FIN
AN
CIA
L St
ate
me
nts

some or all of its accounts receivable due from this cus-
tomer to the financial institution. Given the non-recourse
nature of the agreement, the accounts receivables are
derecognized on the moment the cash is received.
Note 27. LeasesFinance lease liabilities
The table below shows the net book amount of the “land
and buildings” and “plant and machinery” which are subject
to a finance lease agreement:
(€ thousands) December 31 2017 December 31 2016
Net book value - Land and Buildings 12,658 14,193
Cost - Capitalised finance leases 18,412 18,412
Accumulated depreciation (5,754) (4,219)
Net book value - Plant and machinery 5,227 5,558
Cost - Capitalised finance leases 6,608 6,608
Accumulated depreciation (1,381) (1,050)
Net book value - Total leased Property, Plant & Equipment 17,886 19,751
Cost - Capitalised finance leases 25,020 25,020
Accumulated depreciation (7,134) (5,270)
The finance lease liabilities have decreased from €17.8m as
of December 31 2016 to €15.5m as of December 31 2017. No
material new financial lease contracts have been signed
during the period.
The gross investment in leases and the present value of
minimum future lease payments are due as follows:
(€ thousands) December 31 2017 December 31 2016
Gross finance lease liabilities - minimum lease payments 17,468 20,293
No later than 1 year 2,430 2,824
Later than 1 year and no later than 5 years 5,336 6,479
Later than 5 years 9,703 10,990
(€ thousands) December 31 2017 December 31 2016
Total present value of finance lease liabilities 15,447 17,787
No later than 1 year 2,137 2,399
Later than 1 year and no later than 5 years 4,235 5,263
Later than 5 years 9,075 10,125
Operating leases
The Group leases various buildings, equipment, machinery
and vehicles under operating lease agreements. The lease
terms are between 1 and 12 years.
The future aggregate minimum lease payments under
non-cancellable operating leases are as follows:
(€ thousands) December 31 2017 December 31 2016
Total present value of operating lease commitments 46,855 10,460
No later than 1 year 7,157 3,358
Later than 1 year and no later than 5 years 21,845 5,595
Later than 5 years 17,853 1,507
The operating lease commitments increased by €36.4m
as at December 31 2017, mainly due to the commitment
of €17.0m of operating leases at the level of Bentley which
mainly relate to the lease of buildings and new lease
contracts entered into by Balta Home USA (€20.8m), which
moved to a new 330,000 square feet distribution facility
in Rome, Georgia, to provide more capacity for its North
American business.
Note 28. Net debt ReconciliationThe following table sets out an analysis of net debt and
the movements in net debt:
Other assets
Liabilities from financing activities Total
(€ thousands)
Cash and Cash
equiva-lents
Senior Secured
Notes due after 1 year
Senior Secured
Notes due
within 1 year
Senior Term Loan
Facility (€75m)
due after 1 year
Senior Term Loan
Facility due after
1 year
Senior Term
Loan Fa-cility due within 1
year
Bentley Financ-
ing arrange-
ments due after
1 year
Bentley Financ-
ing arrange-
ments due
within 1 year
Finance Lease
liabilities due after
1 year
Finance Lease liabili-
ties due within 1
year
Net debt as at January 1 2017
45,988 (290,000) (6,618) - - - - - (15,388) (2,494) (268,511)
Cashflows (8,650) - 1,258 - - (23) - - - 6 (7,410)
Proceeds of borrow-ings with third parties
- - - (75,000) (35,000) - - - - - (110,000)
Business combinations - - - - - - (40,030) (1,325) - - (41,355)
Foreign exchange adjustments
- - - - - - 1,741 68 - - 1,809
Repayments of bor-rowings with third parties
- 55,100 - 75,000 - - 38,289 1,257 - 2,341 171,987
O t h e r n o n - c a s h movements
- - - - - - - - 2,078 (2,078) -
Net debt as at December 31 2017
37,338 (234,900) (5,360) - (35,000) (23) - - (13,310) (2,225) (253,480)
Note 29. Additional disclosures on financial instrumentsThe following table presents the carrying amounts and fair
values of each category of financial assets and financial
liabilities:
(€ thousands)Fair value hierarchy
December 31 2017
December 31 2017
December 31 2016
December 31 2016
Carrying amount
Fair value Carrying amount
Fair value
ASSETS AS PER STATEMENT OF FINANCIAL POSITIONS 100,041 100,041 101,102 101,102
Loans and receivables 100,041 100,041 101,056 101,056
Trade and other receivables 62,704 62,704 55,068 55,068
Cash and cash equivalents Level 1 37,338 37,338 45,988 45,988
Assets at fair value through OCI - - 46 46
Foreign exchange derivative financial instruments Level 2 - - 46 46
LIABILITIES AS PER STATEMENT OF FINANCIAL POSITIONS 408,277 428,587 433,237 468,726
Financial liabilities measured at amortised cost - 408,275 428,585 433,075 468,564
Senior Secured Notes Level 1 231,555 251,864 283,511 319,000
Senior Term Loan Facility Level 1 34,674 34,674 - -
Bank and other borrowings Level 2 15,671 15,671 18,002 18,002
Trade and other payables 126,375 126,375 131,562 131,562
Financial liabilities measured at fair value through OCI 2 2 162 162
Foreign exchange derivative financial instruments Level 2 2 2 162 162
BA
LTA
AN
NU
AL
REP
OR
T 20
17
9392
FIN
AN
CIA
L St
ate
me
nts
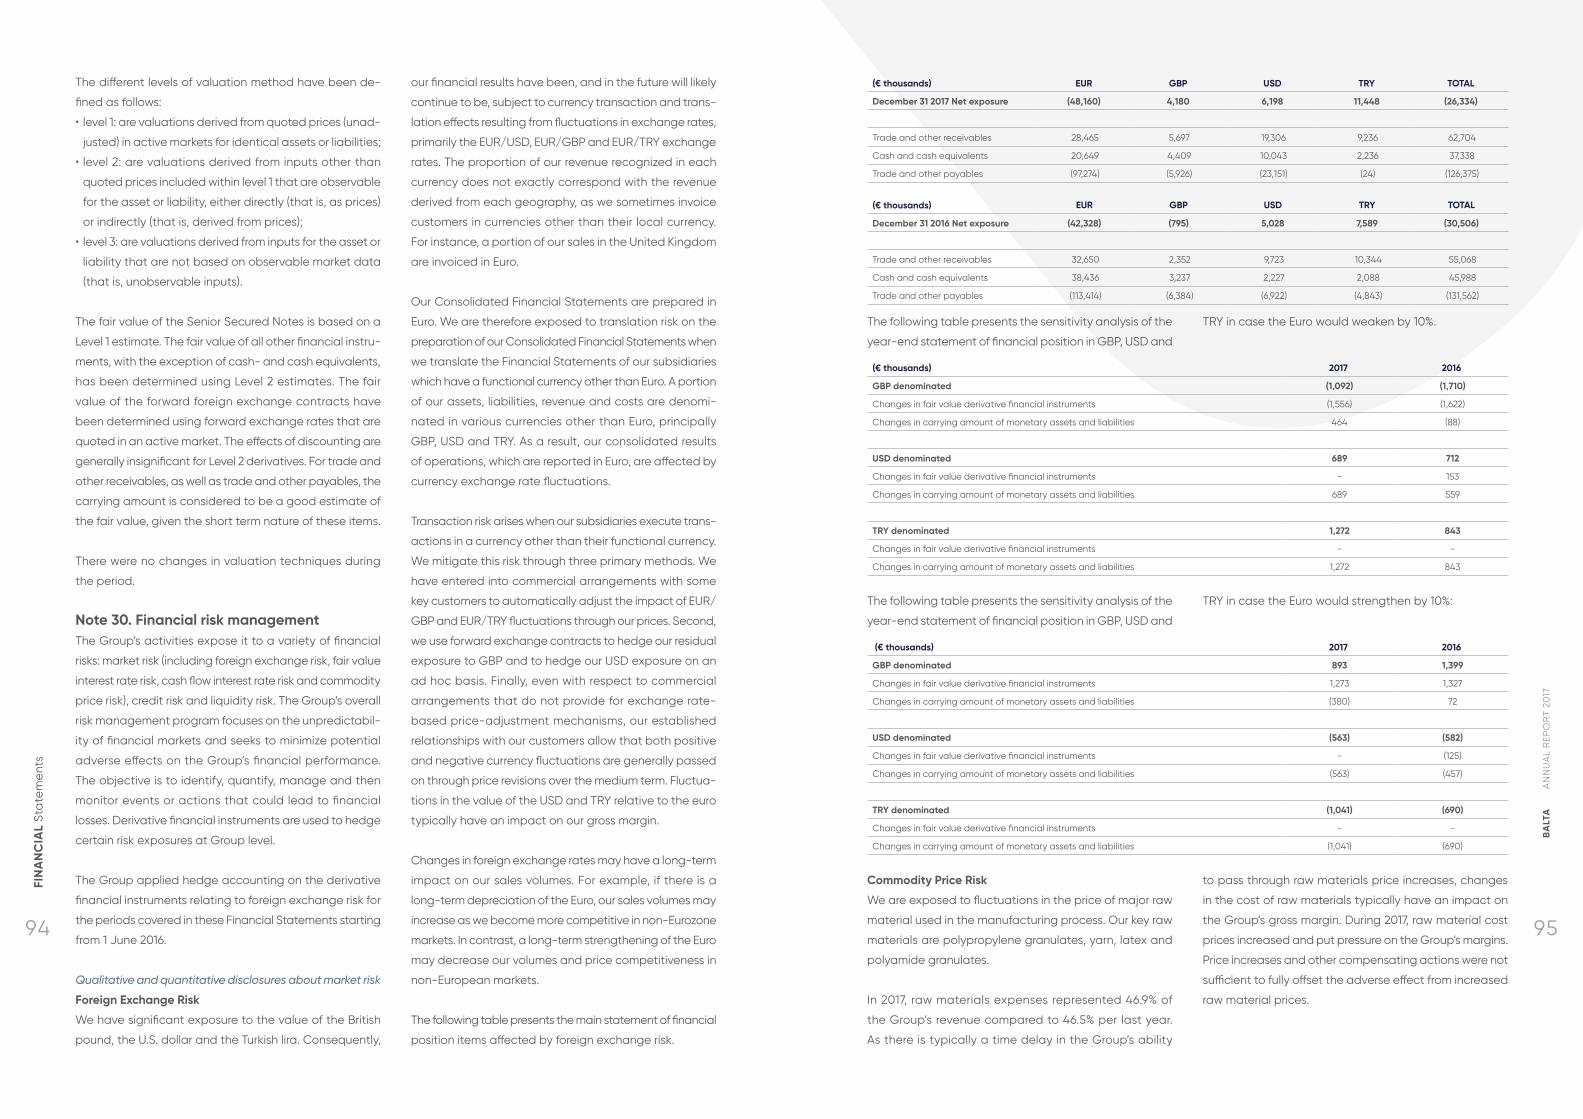
The different levels of valuation method have been de-
fined as follows:
• level 1: are valuations derived from quoted prices (unad-
justed) in active markets for identical assets or liabilities;
• level 2: are valuations derived from inputs other than
quoted prices included within level 1 that are observable
for the asset or liability, either directly (that is, as prices)
or indirectly (that is, derived from prices);
• level 3: are valuations derived from inputs for the asset or
liability that are not based on observable market data
(that is, unobservable inputs).
The fair value of the Senior Secured Notes is based on a
Level 1 estimate. The fair value of all other financial instru-
ments, with the exception of cash- and cash equivalents,
has been determined using Level 2 estimates. The fair
value of the forward foreign exchange contracts have
been determined using forward exchange rates that are
quoted in an active market. The effects of discounting are
generally insignificant for Level 2 derivatives. For trade and
other receivables, as well as trade and other payables, the
carrying amount is considered to be a good estimate of
the fair value, given the short term nature of these items.
There were no changes in valuation techniques during
the period.
Note 30. Financial risk managementThe Group’s activities expose it to a variety of financial
risks: market risk (including foreign exchange risk, fair value
interest rate risk, cash flow interest rate risk and commodity
price risk), credit risk and liquidity risk. The Group’s overall
risk management program focuses on the unpredictabil-
ity of financial markets and seeks to minimize potential
adverse effects on the Group’s financial performance.
The objective is to identify, quantify, manage and then
monitor events or actions that could lead to financial
losses. Derivative financial instruments are used to hedge
certain risk exposures at Group level.
The Group applied hedge accounting on the derivative
financial instruments relating to foreign exchange risk for
the periods covered in these Financial Statements starting
from 1 June 2016.
Qualitative and quantitative disclosures about market risk
Foreign Exchange Risk
We have significant exposure to the value of the British
pound, the U.S. dollar and the Turkish lira. Consequently,
our financial results have been, and in the future will likely
continue to be, subject to currency transaction and trans-
lation effects resulting from fluctuations in exchange rates,
primarily the EUR/USD, EUR/GBP and EUR/TRY exchange
rates. The proportion of our revenue recognized in each
currency does not exactly correspond with the revenue
derived from each geography, as we sometimes invoice
customers in currencies other than their local currency.
For instance, a portion of our sales in the United Kingdom
are invoiced in Euro.
Our Consolidated Financial Statements are prepared in
Euro. We are therefore exposed to translation risk on the
preparation of our Consolidated Financial Statements when
we translate the Financial Statements of our subsidiaries
which have a functional currency other than Euro. A portion
of our assets, liabilities, revenue and costs are denomi-
nated in various currencies other than Euro, principally
GBP, USD and TRY. As a result, our consolidated results
of operations, which are reported in Euro, are affected by
currency exchange rate fluctuations.
Transaction risk arises when our subsidiaries execute trans-
actions in a currency other than their functional currency.
We mitigate this risk through three primary methods. We
have entered into commercial arrangements with some
key customers to automatically adjust the impact of EUR/
GBP and EUR/TRY fluctuations through our prices. Second,
we use forward exchange contracts to hedge our residual
exposure to GBP and to hedge our USD exposure on an
ad hoc basis. Finally, even with respect to commercial
arrangements that do not provide for exchange rate-
based price-adjustment mechanisms, our established
relationships with our customers allow that both positive
and negative currency fluctuations are generally passed
on through price revisions over the medium term. Fluctua-
tions in the value of the USD and TRY relative to the euro
typically have an impact on our gross margin.
Changes in foreign exchange rates may have a long-term
impact on our sales volumes. For example, if there is a
long-term depreciation of the Euro, our sales volumes may
increase as we become more competitive in non-Eurozone
markets. In contrast, a long-term strengthening of the Euro
may decrease our volumes and price competitiveness in
non-European markets.
The following table presents the main statement of financial
position items affected by foreign exchange risk.
(€ thousands) EUR GBP USD TRY TOTAL
December 31 2017 Net exposure (48,160) 4,180 6,198 11,448 (26,334)
Trade and other receivables 28,465 5,697 19,306 9,236 62,704
Cash and cash equivalents 20,649 4,409 10,043 2,236 37,338
Trade and other payables (97,274) (5,926) (23,151) (24) (126,375)
(€ thousands) EUR GBP USD TRY TOTAL
December 31 2016 Net exposure (42,328) (795) 5,028 7,589 (30,506)
Trade and other receivables 32,650 2,352 9,723 10,344 55,068
Cash and cash equivalents 38,436 3,237 2,227 2,088 45,988
Trade and other payables (113,414) (6,384) (6,922) (4,843) (131,562)
The following table presents the sensitivity analysis of the
year-end statement of financial position in GBP, USD and
TRY in case the Euro would weaken by 10%.
(€ thousands) 2017 2016
GBP denominated (1,092) (1,710)
Changes in fair value derivative financial instruments (1,556) (1,622)
Changes in carrying amount of monetary assets and liabilities 464 (88)
USD denominated 689 712
Changes in fair value derivative financial instruments - 153
Changes in carrying amount of monetary assets and liabilities 689 559
TRY denominated 1,272 843
Changes in fair value derivative financial instruments - -
Changes in carrying amount of monetary assets and liabilities 1,272 843
The following table presents the sensitivity analysis of the
year-end statement of financial position in GBP, USD and
TRY in case the Euro would strengthen by 10%:
(€ thousands) 2017 2016
GBP denominated 893 1,399
Changes in fair value derivative financial instruments 1,273 1,327
Changes in carrying amount of monetary assets and liabilities (380) 72
USD denominated (563) (582)
Changes in fair value derivative financial instruments - (125)
Changes in carrying amount of monetary assets and liabilities (563) (457)
TRY denominated (1,041) (690)
Changes in fair value derivative financial instruments - -
Changes in carrying amount of monetary assets and liabilities (1,041) (690)
Commodity Price Risk
We are exposed to fluctuations in the price of major raw
material used in the manufacturing process. Our key raw
materials are polypropylene granulates, yarn, latex and
polyamide granulates.
In 2017, raw materials expenses represented 46.9% of
the Group’s revenue compared to 46.5% per last year.
As there is typically a time delay in the Group’s ability
to pass through raw materials price increases, changes
in the cost of raw materials typically have an impact on
the Group’s gross margin. During 2017, raw material cost
prices increased and put pressure on the Group’s margins.
Price increases and other compensating actions were not
sufficient to fully offset the adverse effect from increased
raw material prices.
BA
LTA
AN
NU
AL
REP
OR
T 20
17
9594
FIN
AN
CIA
L St
ate
me
nts

If the commodity prices of polypropylene and polyamide
had been 10% higher (lower), profit after tax would have
been €4.6m lower (higher) in the absence of any mitigat-
ing actions taken by management. This impact has been
determined by multiplying the volumes of both granulates
and yarns purchased on an annual basis with a 10% vari-
ance on the average purchase price of polypropylene and
polyamide for the year. The sensitivity calculation takes
into account the typical time lag between purchasing
polypropylene and polyamide and recognizing the raw
material expenses against sales.
When we hedge, we might do so by entering into fixed
price contracts with our suppliers. No such arrangements
were entered into in 2017 or 2016.
Interest Rate Risk
Our interest rate risk principally relates to external indebted-
ness that bears interest at variable rates. Only the amounts
that we borrow under the (Super Senior) Revolving Credit
Facilities, our capital leases of buildings, our Senior Term
Loan and use under our factoring and forfaiting arrange-
ments are subject to variable interest rates, as the Senior
Secured Notes carry interest at a fixed rate. We therefore
did not use interest rate swaps in respect of our financing
during the current reporting period. The following table
presents the sensitivity analysis of the interest expenses
and income when there is an 25% shift in the € yield curve.
(€ thousands)
25 bps downward shift in EUR yield curve
"25 bps upward
Total impact on interest expenses/income
63 (63)
Non-derivative floating rate financial liabilities
63 (63)
Qualitative and quantitative disclosures about credit risk
Our credit risk is managed on a Group-wide basis. We
assess the credit quality of the customer, taking into
account its financial position, past experience and other
factors. Individual credit limits are set based on historical
experience, in-depth knowledge of the customer and in
close cooperation with the business unit manager. These
credit limits are regularly reviewed by the business unit
managers and by finance management. In addition, we
have obtained credit insurance to cover a large portion of
the credit default risk. Finally, credit risk is also mitigated
through non-recourse factoring and forfaiting of the trade
receivables where the insolvency risk has been transferred
to the counterparty. Trade receivables are spread over a
number of countries and counterparties. There is no large
concentration of trade receivables. For derivative financial
assets, credit quality has been assessed based on the
Fitch rating of the counterparty. All our forward exchange
contracts are over the counter with a financial institution
as counterparty. Our fixed price purchase commitments
are entered into with the counterparty of our long term
procurement contracts.
Historical default rates did not exceed 0.1% for 2016 and 2017.
Excess liquidities are invested for very short periods and
are spread over a limited number of banks, all enjoying
a satisfactory credit rating. For cash at bank and short-
term bank deposits, the table below gives an overview of
credit ratings for banks used by the Group.
(€ thousands)December 31
2017December 31
2016
Total cash and bank equivalents 37,338 45,988
A rating 32,860 42,493
BBB Rating 1,199 3,495
BB Rating 3,278 -
Qualitative and quantitative disclosures about liquidity risk
We monitor cash flow forecasts and liquidity requirements
centrally, ensuring that we have sufficient cash to meet
operational needs while maintaining sufficient headroom
on our undrawn committed borrowing facilities at all times
so that we do not breach borrowing limits or covenants
on any of our borrowing facilities.
The operating activities of our subsidiaries and their cash
inflows are our main source of liquidity. Our cash pooling
system enables us to benefit from the surplus funds of
certain subsidiaries to cover the financial requirements of
other subsidiaries. We invest surplus cash in interest-bearing
current accounts and short-term cash deposits, select-
ing instruments with appropriate maturities or sufficient
liquidity to provide sufficient headroom as determined by
the above-mentioned forecasts.
In order to meet our cash outflow obligations, we use
cash flows generated from operating activities and credit
facilities with financial institutions if necessary. In addition,
we have entered into factoring agreements with financial
institutions where cash is made available to us in con-
sideration for certain trade receivables generated by us.
The principal financing arrangements that are in place
at December 31 2017 and at December 31 2016 are the
Senior Secured Notes, the Senior Term Loan Facility, the
Super Senior Revolving Credit Facility, the Bentley Mills
Revolving Credit Facility and capital lease agreements.
The following table reflects all contractually fixed pay-offs
for settlement, repayments and interest resulting from
recognized financial liabilities. The amounts disclosed are
undiscounted net cash outflows, based on the market
conditions existing at December 31 2017.
(€ thousands)
Less than 6 months
Between 6 months and 1
year
Between 1 and 2 years
Between 2 and 5 years
Over 5 years
Total as of December 31 2017 (137,109) (10,421) (20,100) (328,826) (9,703)
Senior Secured Notes (9,102) (9,102) (18,205) (289,514) -
Senior Term Loan Facility (248) (249) (497) (35,374) -
Finance lease liabilities (1,360) (1,069) (1,398) (3,938) (9,703)
Trade and other payables (126,375) - - - -
Gross settled derivative financial instruments - outflows (14,004) - - - -
Gross settled derivative financial instruments - inflows 13,981 - - - -
The following table reflects all contractually fixed pay-offs
for settlement, repayments and interest resulting from
recognized financial liabilities. The amounts disclosed are
undiscounted net cash outflows, based on the market
conditions existing at December 31 2016.
(€ thousands)
Less than 6 months
Between 6 months and 1
year
Between 1 year and 2
years
Between 2 and 5 years
Over 5 years
Total as of December 31 2016 (144,357) (12,647) (24,905) (71,474) (323,465)
Senior Secured Notes (11,238) (11,238) (22,475) (67,425) (312,475)
Finance lease liabilities (1,414) (1,409) (2,430) (4,049) (10,990)
Trade and other payables (131,562) - - - -
Gross settled derivative financial instruments - outflows (15,925) - - - -
Gross settled derivative financial instruments - inflows 15,782 - - - -
A key factor in maintaining a strong financial profile is our
credit rating which is affected by, among other factors,
our capital structure, profitability, ability to generate cash
flows, geographic and customer diversification and our
competitive position. Our current corporate credit ratings
from Moody’s Investor Service (Moody’s) and Standard &
Poor’s Ratings Services (S&P) are noted as follows:
December 31 2017 December 31 2017 December 31 2016 December 31 2016
Moody's S&P Moody's S&P
Long-term issue rating Senior Secured Notes B1 B+ B2 B
Corporate rating B1 B+ B2 B
On August 10 2015, Moody’s assigned a B2 rating to the
€290m Senior Secured Notes issued by LSF9 Balta Issuer
S.à r.l., the previous parent holding company of the Group,
following a review of the final bond documentation. In
June 2017, following the IPO, the ratings were upgraded
to B1 to reflect the strengthening of the Group’s financial
profile, increased transparancy as a public company,
strengtherend corporate governance arrangements and
enhanced access to equity capital markets.
On September 14 2015, S&P assigned its ‘B’ long-term
corporate credit rating to LSF9 Balta Investments S.à r.l. At
the same time, S&P assigned its ‘B’ long-term issue rating
to LSF9 Balta Issuer S.à r.l.’s €290m Senior Secured Notes
and its ‘BB-’ long-term issue rating to the €68m Super
Senior Revolving Credit Facility. In July 2017, the corporate
rating was increased to B+ to reflect the improvements in
the Group’s financial credit metrics following the use of net
proceeds from the IPO to repay part of the Group’s debt.
BA
LTA
AN
NU
AL
REP
OR
T 20
17
9796
FIN
AN
CIA
L St
ate
me
nts

Capital risk management
The Group’s objectives when managing capital are to
safeguard the Group’s ability to continue as a going
concern in order to provide returns for shareholders and
benefits for other stakeholders and to maintain an optimal
capital structure to reduce the cost of capital.
In order to maintain or adjust the capital structure, the
Group may adjust the amount of dividends paid to share-
holders, issue new shares or sell assets to reduce debt.
The Group is closely monitoring its financial performance
to comply with financial covenants. Refer to Notes 24 to
26 for further details.
Brexit
The United Kingdom held a referendum on June 23 2016, to
determine whether the United Kingdom should leave the
European Union (the “EU”) or remain as a member state, and
the outcome of that referendum was in favor of leaving the
EU (commonly referred to as “Brexit”). The effects of Brexit
will depend on any agreements the United Kingdom makes
to retain access to EU markets, and, while such impacts
are difficult to predict, Belgian exports may be negatively
affected. In the year ended December 31 2017, our sales in
the United Kingdom represented €147.9 m, or 22.4% of our
revenue, of which €126.1m was in our Residential segment
where the United Kingdom represents just above half of sales.
Any reduction in consumers’ willingness or ability to spend
due to Brexit-related changes in the economic environments
of the United Kingdom and Europe could materially affect
our revenue. In addition, lack of clarity about future UK laws
and regulations, as the United Kingdom determines which
EU laws to replace or replicate in the event of a withdrawal,
may increase costs associated with operating in either or
both of the United Kingdom and Europe.
Note 31. Employee benefit obligationsThe Group operates a pension plan and provides for
pension liabilities. These benefits have been measured in
compliance with IAS 19 revised and in accordance with
the Group accounting policies described in Note 1.20. The
liability was measured using a discount rate of 1.35% and
1.31% in 2017 and 2016, respectively. The annual pension
cost, relating to the pension plan is disclosed in Note 8.
The Group foresees termination benefits (including early
retirement) for its working and retired personnel. The lia-
bility was measured using a discount rate of 0.83% in 2017
and 0.62% in 2016.
The employee benefit obligations recognized in the Fi-
nancial Statements are detailed below:
(€ thousands)December 31
2017December 31
2016
Total employee benefit obligations 4,127 5,079
Pension plans 1,810 2,815
Provisions early retirement pension 1,710 2,071
Provision for pensions 608 193
Pension plans: overview
A pension plan has been put in place for management
and is financed through employer contributions which in-
crease depending on seniority (base contribution of 3.75%
of pensionable salary, increasing by 0.5% for every 5 years
of service rendered within the Group up to a maximum
contribution rate of 5.75%). This plan also includes a “death
in service” benefit amounting to twice pensionable salary.
Several pension plans are in place for white collar workers
and are financed through fixed employer contributions.
In addition, as part of the bonus policy for members of
management, a portion of the bonus is awarded via em-
ployer contributions to a pension plan scheme.
The liability recognized in the balance sheet in respect
of defined benefit pension plans is the present value of
the defined benefit obligation at the end of the reporting
period less the fair value of plan assets.
Pension plans: valuation methodology
The pension and bonus plans as described above have
been classified as defined benefits. The valuation of the
pension and bonus plans have been performed in ac-
cordance with IAS 19.
We refer to Note 1.20 concerning the valuation method-
ology which has been used. The liability is based on the
difference between the present value of the “defined benefit
obligation”, taking into account the minimum return and
a discount factor, less the fair value of any plan assets at
date of closing.
Pension plans: main valuation assumptions
The main assumptions used to perform the valuation are
described below:
December 31 2017
December 31 2016
Discount rate 1.35% 1.31%
Retirement age 65 years 65 years
Mortality MR/FR-5 MR/FR-5
Pension plans: reported figures
For the year ended December 31 2017, the defined benefit obligation taking into account the tax effect amounts to
€15.6m (December 31 2016: €10.1m), offset by plan assets of €13.8m (December 31 2016: €7.3m) as at December 31 2017.
Note 32. Other payroll and social related payables
(€ thousands) December 31 2017 December 31 2016
Total other payroll and social related payables 33,373 31,246
Holiday pay 15,302 14,136
Social security taxes 7,499 7,365
Salaries and wages payable 5,430 5,137
Early retirement provision 636 628
Group insurance 586 557
Withholding taxes 874 886
Other 3,046 2,539
Other payroll and social related payables increased from
€31.2m as of December 31 2016 to €33.4m at December
31 2017.
The increase mainly relates to other payroll and social
related payables in relation to the acquisition of Bentley
(€3.8m).
Note 33. Provisions for other liabilities and charges
(€ thousands)Asset Retirement
ObligationRestructuring Warranty Other Total
At January 1 2017 - - - 64 64
Business combinations 935 - 2,045 - 2,980
Additional provisions made and increases to existing provisions
- 7,252 - - 7,252
Unused amounts reversed - - (111) - (111)
Exchange differences (102) - (209) - (310)
Amounts used - - (223) - (223)
At December 31 2017 834 7,252 1,502 64 9,652
Analysis of total provisions: 31 Dec 2017
Non-current 2,335
Current 7,316
9,652
The provision for other liabilities and charges increased
by €9.6m to €9.7m for the year ended December 31 2017.
The Group has announced the restructuring of the op-
erational infrastructure in Belgium within the Residential
business, by consolidating the Oudenaarde facility into
our two fully vertically integrated factories in the region.
The Group completed the consultation and negotiation
stages, has activated a full project management office to
deliver an increased run rate EBITDA benefit as from 2019.
A provision for restructuring was set up in accordance with
IAS 37 for an amount of €7.3m as at December 31 2017.
The acquisition of Bentley resulted in the increase of a
warranty provision by €2.0m on 31 March 2017 which further
decreased to a provision of €1.5m at the end of the year.
Moreover, Bentley also rents some buildings for which an
asset retirement obligation of €0.8m was recognized.
BA
LTA
AN
NU
AL
REP
OR
T 20
17
9998
FIN
AN
CIA
L St
ate
me
nts
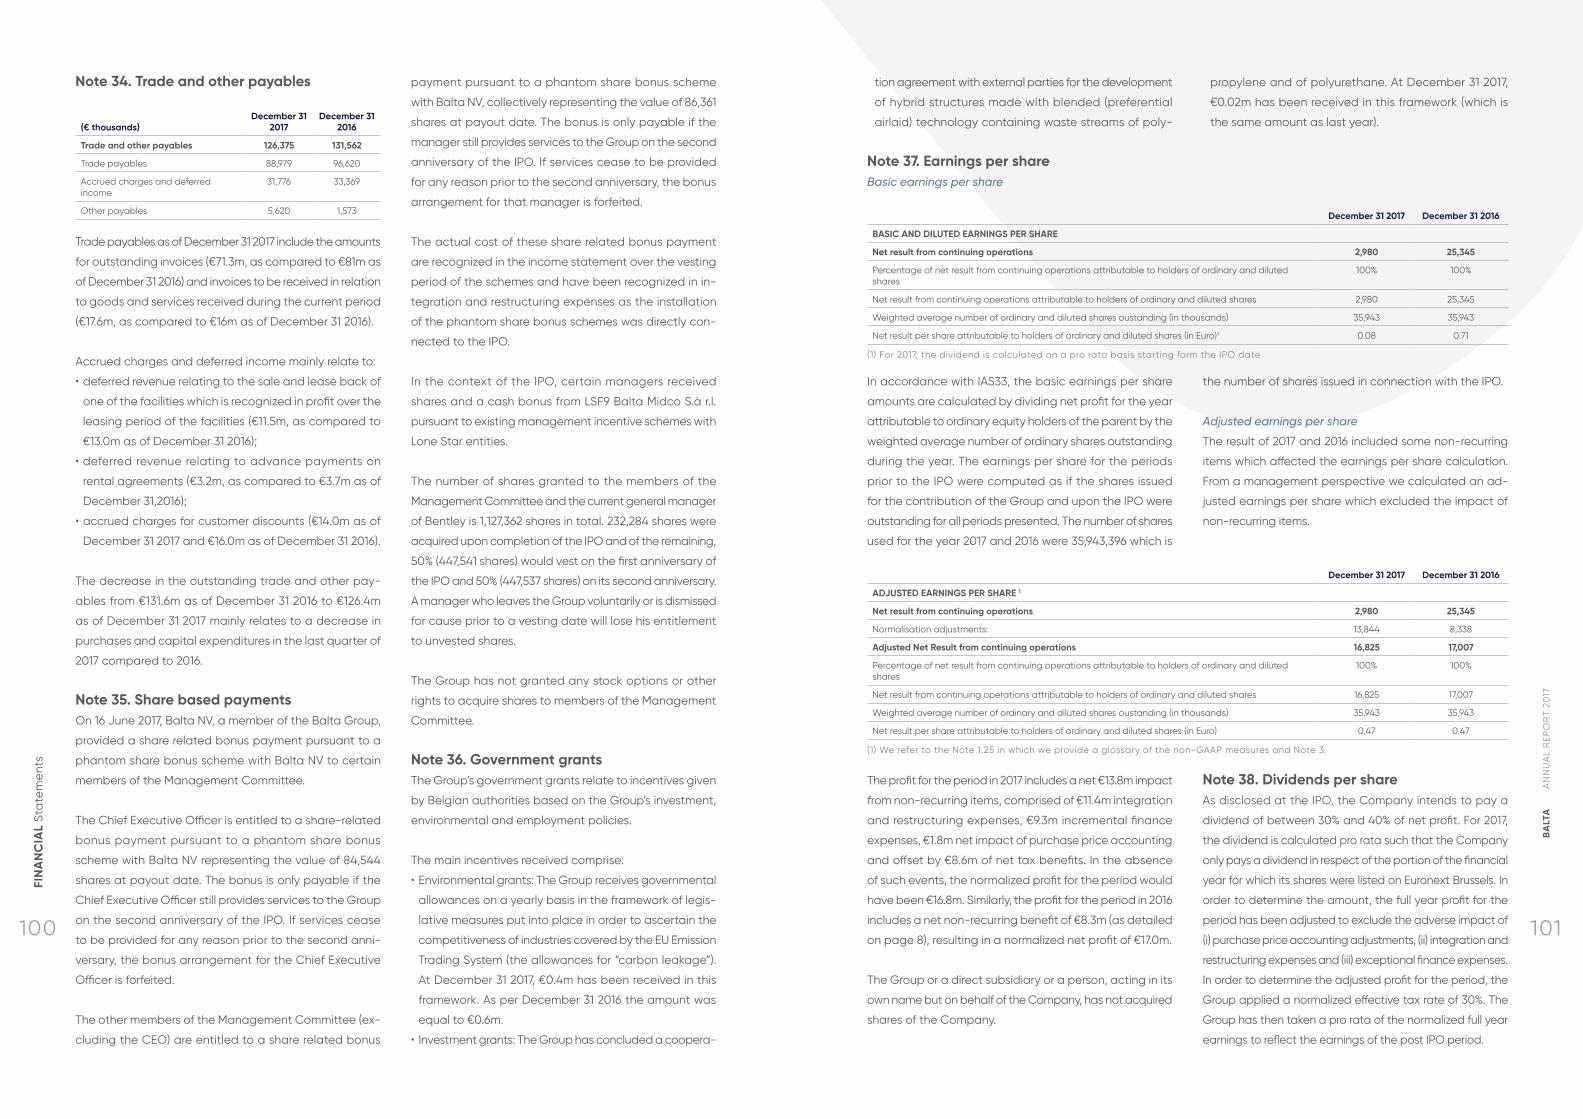
Note 34. Trade and other payables
(€ thousands)December 31
2017December 31
2016
Trade and other payables 126,375 131,562
Trade payables 88,979 96,620
Accrued charges and deferred income
31,776 33,369
Other payables 5,620 1,573
Trade payables as of December 31 2017 include the amounts
for outstanding invoices (€71.3m, as compared to €81m as
of December 31 2016) and invoices to be received in relation
to goods and services received during the current period
(€17.6m, as compared to €16m as of December 31 2016).
Accrued charges and deferred income mainly relate to:
• deferred revenue relating to the sale and lease back of
one of the facilities which is recognized in profit over the
leasing period of the facilities (€11.5m, as compared to
€13.0m as of December 31 2016);
• deferred revenue relating to advance payments on
rental agreements (€3.2m, as compared to €3.7m as of
December 31,2016);
• accrued charges for customer discounts (€14.0m as of
December 31 2017 and €16.0m as of December 31 2016).
The decrease in the outstanding trade and other pay-
ables from €131.6m as of December 31 2016 to €126.4m
as of December 31 2017 mainly relates to a decrease in
purchases and capital expenditures in the last quarter of
2017 compared to 2016.
Note 35. Share based paymentsOn 16 June 2017, Balta NV, a member of the Balta Group,
provided a share related bonus payment pursuant to a
phantom share bonus scheme with Balta NV to certain
members of the Management Committee.
The Chief Executive Officer is entitled to a share-related
bonus payment pursuant to a phantom share bonus
scheme with Balta NV representing the value of 84,544
shares at payout date. The bonus is only payable if the
Chief Executive Officer still provides services to the Group
on the second anniversary of the IPO. If services cease
to be provided for any reason prior to the second anni-
versary, the bonus arrangement for the Chief Executive
Officer is forfeited.
The other members of the Management Committee (ex-
cluding the CEO) are entitled to a share related bonus
payment pursuant to a phantom share bonus scheme
with Balta NV, collectively representing the value of 86,361
shares at payout date. The bonus is only payable if the
manager still provides services to the Group on the second
anniversary of the IPO. If services cease to be provided
for any reason prior to the second anniversary, the bonus
arrangement for that manager is forfeited.
The actual cost of these share related bonus payment
are recognized in the income statement over the vesting
period of the schemes and have been recognized in in-
tegration and restructuring expenses as the installation
of the phantom share bonus schemes was directly con-
nected to the IPO.
In the context of the IPO, certain managers received
shares and a cash bonus from LSF9 Balta Midco S.à r.l.
pursuant to existing management incentive schemes with
Lone Star entities.
The number of shares granted to the members of the
Management Committee and the current general manager
of Bentley is 1,127,362 shares in total. 232,284 shares were
acquired upon completion of the IPO and of the remaining,
50% (447,541 shares) would vest on the first anniversary of
the IPO and 50% (447,537 shares) on its second anniversary.
A manager who leaves the Group voluntarily or is dismissed
for cause prior to a vesting date will lose his entitlement
to unvested shares.
The Group has not granted any stock options or other
rights to acquire shares to members of the Management
Committee.
Note 36. Government grantsThe Group’s government grants relate to incentives given
by Belgian authorities based on the Group’s investment,
environmental and employment policies.
The main incentives received comprise:
• Environmental grants: The Group receives governmental
allowances on a yearly basis in the framework of legis-
lative measures put into place in order to ascertain the
competitiveness of industries covered by the EU Emission
Trading System (the allowances for “carbon leakage”).
At December 31 2017, €0.4m has been received in this
framework. As per December 31 2016 the amount was
equal to €0.6m.
• Investment grants: The Group has concluded a coopera-
tion agreement with external parties for the development
of hybrid structures made with blended (preferential
airlaid) technology containing waste streams of poly-
propylene and of polyurethane. At December 31 2017,
€0.02m has been received in this framework (which is
the same amount as last year).
Note 37. Earnings per shareBasic earnings per share
December 31 2017 December 31 2016
BASIC AND DILUTED EARNINGS PER SHARE
Net result from continuing operations 2,980 25,345
Percentage of net result from continuing operations attributable to holders of ordinary and diluted shares
100% 100%
Net result from continuing operations attributable to holders of ordinary and diluted shares 2,980 25,345
Weighted average number of ordinary and diluted shares oustanding (in thousands) 35,943 35,943
Net result per share attributable to holders of ordinary and diluted shares (in Euro)1 0.08 0.71
(1) For 2017, the dividend is calculated on a pro rata basis starting form the IPO date
In accordance with IAS33, the basic earnings per share
amounts are calculated by dividing net profit for the year
attributable to ordinary equity holders of the parent by the
weighted average number of ordinary shares outstanding
during the year. The earnings per share for the periods
prior to the IPO were computed as if the shares issued
for the contribution of the Group and upon the IPO were
outstanding for all periods presented. The number of shares
used for the year 2017 and 2016 were 35,943,396 which is
the number of shares issued in connection with the IPO.
Adjusted earnings per share
The result of 2017 and 2016 included some non-recurring
items which affected the earnings per share calculation.
From a management perspective we calculated an ad-
justed earnings per share which excluded the impact of
non-recurring items.
December 31 2017 December 31 2016
ADJUSTED EARNINGS PER SHARE 1
Net result from continuing operations 2,980 25,345
Normalisation adjustments: 13,844 8,338
Adjusted Net Result from continuing operations 16,825 17,007
Percentage of net result from continuing operations attributable to holders of ordinary and diluted shares
100% 100%
Net result from continuing operations attributable to holders of ordinary and diluted shares 16,825 17,007
Weighted average number of ordinary and diluted shares oustanding (in thousands) 35,943 35,943
Net result per share attributable to holders of ordinary and diluted shares (in Euro) 0.47 0.47
(1) We refer to the Note 1.25 in which we provide a glossary of the non-GAAP measures and Note 3.
The profit for the period in 2017 includes a net €13.8m impact
from non-recurring items, comprised of €11.4m integration
and restructuring expenses, €9.3m incremental finance
expenses, €1.8m net impact of purchase price accounting
and offset by €8.6m of net tax benefits. In the absence
of such events, the normalized profit for the period would
have been €16.8m. Similarly, the profit for the period in 2016
includes a net non-recurring benefit of €8.3m (as detailed
on page 8), resulting in a normalized net profit of €17.0m.
The Group or a direct subsidiary or a person, acting in its
own name but on behalf of the Company, has not acquired
shares of the Company.
Note 38. Dividends per shareAs disclosed at the IPO, the Company intends to pay a
dividend of between 30% and 40% of net profit. For 2017,
the dividend is calculated pro rata such that the Company
only pays a dividend in respect of the portion of the financial
year for which its shares were listed on Euronext Brussels. In
order to determine the amount, the full year profit for the
period has been adjusted to exclude the adverse impact of
(i) purchase price accounting adjustments, (ii) integration and
restructuring expenses and (iii) exceptional finance expenses.
In order to determine the adjusted profit for the period, the
Group applied a normalized effective tax rate of 30%. The
Group has then taken a pro rata of the normalized full year
earnings to reflect the earnings of the post IPO period.
BA
LTA
AN
NU
AL
REP
OR
T 20
17
101100
FIN
AN
CIA
L St
ate
me
nts

On this basis, the Board proposed a dividend of €0.08
per share, which is subject to the approval of the annual
general meeting.
Note 39. CommitmentsEnergy
Our fixed price purchase commitments for electricity
and gas, for deliveries in 2018, are equal to €8.6m as of
December 31 2017 compared to an amount of €11.5m as
of December 31 2016.
Raw material
Our fixed price purchase commitments for raw materials,
for deliveries in 2018, are equal to €65m as of December
31 2017 compared to an amount of €66m as of December
31 2016.
Capital expenditures
As of December 31 2017 €1.7m capital commitments are
outstanding compared to €2.4m as of December 31 2016.
Note 40. List of consolidated companiesThe subsidiaries and jointly controlled entities of Balta
Group NV, the Group’s percentage of interest and the
Group’s percentage of control of the active companies
are presented below.
December 31 2017 December 31 2016
% of interest % of control % of interest % of control
Belgium
Balta NV 100% 100% 100% 100%
Balta Industries NV 100% 100% 100% 100%
Balta Trading Comm.V 100% 100% 100% 100%
Modulyss NV 100% 100% 100% 100%
Balta Oudenaarde NV 95% 100% 95% 100%
Balta M BVBA (liquidated on December 13 2017) 100% 100% 100% 100%
Balfid BVBA 100% 100% 100% 100%
Luxembourg
LSF9 Balta Issuer S.à r.l. (1) 100% 100% 100% 100%
Balfin Services S.à r.l. 100% 100% 100% 100%
LSF9 Balta Luxembourg S.à r.l. (incorporated December 1 2016) 100% 100% 100% 100%
LSF9 Balta Investment S.à r.l. 100% 100% 100% 100%
Turkey
Balta Orient Tekstil Sanayi Ve Ticaret A.S. 100% 100% 100% 100%
Balta Floorcovering Yer Dös, emeleri San.ve Tic A.S. 100% 100% 100% 100%
USA
Balta USA Inc 100% 100% 100% 100%
LSF9 Renaissance Holdings LLC 100% 100% - -
LSF9 Renaissance Acquisitions LLC 100% 100% - -
BPS Parent, Inc. 100% 100% - -
Bentley Prince Street Holdings, Inc. 100% 100% - -
Bentley Mills, Inc. 100% 100% - -
Prince Street, Inc. 100% 100% - -
(1) On 14 June 2017, The Company’s corporate form changed from S.A. (société anonyme) to S.à r.l. (société à responsabilité limitée). All references to LSF9 Balta Issuer S.A have been replaced by LSF9 Balta Issuer S.à r.l. in this document.
Note 41. Related party transactionsThe Company may enter into transactions with its share-
holders and other entities owned by its shareholders in the
ordinary course of business. Those transactions include,
among others, financing agreements and professional,
advisory, consulting and other corporate services.
The Company has entered into arrangements with a
number of its subsidiaries and affiliated companies in
the course of its business. These arrangements relate
to manufacturing, sales transactions, service transac-
tions and financing agreements and were conducted
at market prices. Transactions between the Company
and its subsidiaries, which are related parties, have been
eliminated in the consolidation and are accordingly not
disclosed in this note.
Bentley Mills Acquisition
As noted before, on February 1 2017, Lone Star Fund IX
acquired BPS Parent, Inc., the indirect parent company of
Bentley Mills, Inc. and the Bentley Group, from its share-
holders, including Dominus Capital, L.P. The following series
of transactions then occurred, with the ultimate effect
of Balta NV acquiring control over the Bentley Group of
companies:
• on March 22 2017, pursuant to an agreement dated March
10 2017, LSF9 Balta Issuer S.à r.l. together with LSF9 Balta
investments S.à r.l completed the acquisition of the Bent-
ley group of companies and brought (other than certain
minority interests held by the Bentley management team)
the Bentley group of companies within the Group.
• on March 23 2017, in view of the integration of the Bentley
group of companies into the operational group within
the Group, Balta NV acquired the interests in the Bentley
group of companies – from LSF9 Balta Issuer S.à r.l., for
a consideration of €21,119,243.77 and $51,000,000.00
which remained outstanding on the intercompany ac-
count (for the purposes of this paragraph, the “Balta NV
Consideration”).
The limited partnership interest acquired by LSF9 Balta
Issuer S.à r.l. and subsequently by Balta NV represented at
the time of the acquisition over 98% of the total interests
in the Bentley group of companies with the remaining
partnership interests held by members of the Bentley
management team. As part of the reorganization, the
Bentley management was bought out as explained in
“Note 6, Business combinations” for €1,343k.
The push down in the Group structure of the former par-
ticipation of Bentley management team in the Bentley
group of companies to Balta NV following the buy-out
of the Bentley management was financed through the
issuance of intra-group notes, as follows:
• following the buy-out of Bentley management by LSF9
Balta Midco S.à r.l. and a subsequent transfer of the Bentley
management equity stake to LSF9 Balta Holdco S.à r.l.,
LSF9 Balta Holdco S.à r.l. transferred the newly acquired
interests in the Bentley group of companies to Balta NV
against the issuance by Balta NV of a new note to LSF9
Balta Holdco S.à r.l. (the “BM Note 1”);
• the BM Note 1 was assigned by LSF9 Balta Holdco S.à r.l.
to LSF9 Balta Issuer S.à r.l. against the issuance of a new
note by the latter (the “BM Note 2”); and
• subsequently, LSF9 Balta Issuer S.à r.l. in turn assigned
this BM Note 1 to LSF9 Balta Investments S.à r.l. against
the issuance of another new note (the “BM Note 3”).The
Group simplified the intragroup financing between the
Luxembourg holding companies and Balta NV by means
of different debt-to-equity conversions by the contribution
of the BM Notes into the equity (capital reserve) of their
respective issuers by LSF9 Balta Holdco S.à r.l. and LSF9
Balta Issuer S.à r.l. which resulted in an equity increase
of €1.3m in LSF9 Balta Issuer S.à r.l.
Shares
Until February 22 2017, 100% of shares of LSF9 Balta Issuer
S.à r.l. were owned by LSF9 Balta Midco S.à r.l. As a result
of a sales and purchase agreement dated February 22
2017, 100% of the shares of LSF9 Balta Issuer S.à r.l. were
sold to LSF9 Balta Holdco S.à r.l.
LSF9 Balta Holdco S.à r.l. contributed 100% of the shares
of LSF9 Balta Issuer S.à r.l. to the share capital of Balta
Group NV by means of a contribution in kind in exchange
for 25m shares. This contribution was described in an
agreement dated May 30 2017 and was subject to the
IPO described in Note 5.
Following the IPO, Lone Star Fund IX, through intermediate
holding companies, controls approximately 56.5% of the
issued share capital of Balta Group NV.
Contributions in the capital and reserves of LSF9 Balta
Issuer S.à r.l.
As described in Note 20, LSF9 Balta Holdco S.à r.l. contrib-
uted an intercompany loan of €1.3m in the share capital of
LSF9 Balta Issuer S.à r.l. and a participation in the Bentley
group of companies to integrate the former Bentley
management equity stake in the Group prior to the IPO.
As described in Note 20 PECs issued by LSF9 Balta Issuer
S.à r.l. and owned by LSF9 Balta Holdco S.à r.l. were con-
tributed in the share capital of LSF9 Balta Issuer S.à r.l. for
an amount of €152.9m prior to the IPO.
Key management compensation
Key management means the Group’s Management Com-
mittee, which consists of people having authority and
responsibility for planning, directing and controlling the
activities of the Group. Key management compensation
includes all fixed and variable remuneration and other
BA
LTA
AN
NU
AL
REP
OR
T 20
17
103102
FIN
AN
CIA
L St
ate
me
nts

benefits which are presented in other expenses and long-
term employee benefits which are presented in integration
and restructuring.
(€ thousands) December 31 2017 December 31 2016
Total key management compensation
2,937 4,098
Short-term employee benefits
2,410 2,785
Long-term employee benefits
403 -
Board compensation 125 -
Termination benefits - 1,313
Share-based payments
- -
We also refer to the ‘Corporate Governance Chapter’ earlier
in this report for information with respect to remuneration
of directors and members of the Group’s Management
Committee.
Other transactions with related parties
Year-end balances arising from daily operations:
(€ thousands) December 31 2017 December 31 2016
Other payables to related parties
(292) 54
The year-end balances mainly arise from current account
positions as a result of payments which have been per-
formed on behalf of Group entities. These current accounts
are respectively reflected in “Trade and other receivables”
and in “Trade and other payables”.
Note 42. Fees paid to the Group’s auditors
(€ thousands) 2017 2016
Audit services 1,350 354
Audit of the Group pursuant to legislation 344 300
Other audit-related services 1,007 54
Non-audit services 394 798
Tax services 184 798
Other services 210 -
Total fees paid to the Group's auditor 1,744 1,152
Note 43. Events after the reporting periodFollowing the Board of Directors meeting of 28 February
2018, Balta announced that a dividend of €0.08 per share
would be proposed to the Annual Shareholders meeting
for the year ending December 31 2017.
I.6. Condensed statutory financial statement
The statutory statement of financial position and the
statutory statement of comprehensive income for the
period ended December 31 2017 of Balta Group NV are
given below in summarised form.
In accordance with the Company code, the annual ac-
counts of Balta Group NV, together with the management
report and the statutory auditor’s report will be deposited
with the National Bank of Belgium.
(€ thousands)Period ended
December 31 2017
Fixed assets 468,927
Financial assets 468,927
Total non-current assets 468,927
Amounts receivable within one year 7,879
Cash and cash equivalents 156
Total current assets 8,035
Total assets 476,962
Share capital 260,590
Share premium 65,660
Other reserves 147,125
Retained earnings (2,363)
Total equity 471,012
Trade and other payables 5,950
Total current liabilities 5,950
Total equity and liabilities 476,962
(€ thousands)Period ended
December 31 2017
Other income 9,831
Other expenses (12,191)
Operating profit / (loss) (2,360)
Finance expenses (3)
Profit / (loss) for the period (2,363) BA
LTA
AN
NU
AL
REP
OR
T 20
17
105104
FIN
AN
CIA
L St
ate
me
nts

1.7. Audit reportBALTA GROUP NV
Statutory auditor’s report to the general shareholders’
meeting on the consolidated accounts for the year ended
31 December 2017
18 April 2018
STATUTORY AUDITOR’S REPORT TO THE GENERAL SHAREHOLDERS’ MEETING OF THE COMPANY BALTA GROUP NV ON THE CONSOLIDATED ACCOUNTS FOR THE YEAR ENDED 31 DECEMBER 2017We present to you our statutory auditor’s report in the
context of our statutory audit of the consolidated accounts
of Balta Group NV (the “Company”) and its subsidiaries
(jointly “the Group”). This report includes our report on the
audit of the consolidated accounts, as well as the report
on other legal and regulatory requirements. These reports
form part of an integrated whole and are indivisible.
We have been appointed as statutory auditor by the
shareholders’ general meeting of 1 March 2017, following
the proposal formulated by the Board of Directors and
following the recommendation by the audit committee.
Our mandate will expire on the date of the shareholders’
general meeting which will deliberate on the consolidat-
ed accounts for the year ended 31 December 2019. We
have performed the statutory audit of the consolidated
accounts of Balta Group NV for the first year.
Report on the audit of the consolidated accounts
Unqualified opinionWe have performed the statutory audit of the Group’s
consolidated accounts, which comprise the consolidated
statement of financial position as at 31 December 2017,
the consolidated statement of comprehensive income,
the consolidated statement of changes in equity and the
consolidated statement of cash flows for the year then
ended, and notes to the consolidated financial statements,
including a summary of significant accounting policies and
other explanatory information, and which is characterised
by a consolidated statement of financial position total of
EUR (000) 778,283 and a profit for the year (Group share)
of EUR (000) 2,946.
In our opinion, the consolidated accounts give a true and
fair view of the Group’s net equity and consolidated state-
ment of financial position as at 31 December 2017, and of its
consolidated financial performance and its consolidated
cash flows for the year then ended, in accordance with
International Financial Reporting Standards as adopted
by the European Union and with the legal and regulatory
requirements applicable in Belgium.
Basis for unqualified opinionWe conducted our audit in accordance with International
Standards on Auditing (ISAs). Our responsibilities under
those standards are further described in the “Statutory
auditor’s responsibilities for the audit of the consolidated
accounts” section of our report. We have fulfilled our ethical
responsibilities in accordance with the ethical require-
ments that are relevant to our audit of the consolidated
accounts in Belgium, including the requirements related
to independence.
We have obtained from the Board of Directors and Com-
pany officials the explanations and information necessary
for performing our audit.
We believe that the audit evidence we have obtained is
sufficient and appropriate to provide a basis for our opinion.
Key audit mattersKey audit matters are those matters that, in our profes-
sional judgment, were of most significance in our audit of
the consolidated accounts of the current period. These
matters were addressed in the context of our audit of
the consolidated accounts as a whole, and in forming
our opinion thereon, and we do not provide a separate
opinion on these matters.
Acquisitions
Key audit matter
The acquisition of Bentley Mills’ Group was of most signifi-
cance to our audit due to the size and significant judgments
and assumptions involved in the purchase price allocation
for Bentley Mills, mainly in relation to the valuation of tangi-
ble assets, intangible fixed assets such as the trade name
and the remaining goodwill balance. At the acquisition
date, 22 March 2017, the increase in the intangible assets
recognized under goodwill and other intangibles related
to Bentley Mills amounted to respectively EUR (000) 74,280
and EUR (000) 11,179 as disclosed in Note 6.
How our audit addressed the key audit matter
With respect to the accounting for the Bentley Mills’ ac-
quisition described in Note 6, we have, amongst others,
read the share purchase agreement, ensured the correct
accounting treatment has been applied and appropriate
disclosure has been made; assessed the valuation and
accounting for the consideration payable and traced pay-
ments to bank statements; audited the identification and
determination of the fair value of the assets and liabilities
the Group acquired including any GAAP and fair value
adjustments; and assessed the valuation assumptions
such as discount and tax rates by recalculating these,
evaluating and challenging assumptions used in such
calculations amongst others based on external evidence.
In doing so we have utilized valuation specialists to as-
sist with the audit of the identification and valuation of
the assets and liabilities acquired. We also assessed the
adequacy of the disclosures in Note 6.
Our findings
We found the methodologies and the assumptions applied
to be in line with our expectations, and the acquisition
accounting and related disclosure in line with the share
purchase agreement.
Uncertain tax positions
Key audit matter
Income tax was of most significance to our audit because
the assessment process is complex and the amounts in-
volved are material to the financial statements as a whole.
The company went through several capital market transac-
tions over the last years and has operations in different tax
and legal jurisdictions where transfer pricing assessments
can be challenged by the tax authorities. The accounting
for the tax positions comprise significant judgement by
the company mainly in the area of the recognition and
measurement of uncertain tax positions and deferred taxes.
Referring to Note 2, management performed a detailed
assessment for uncertain tax positions which resulted in
provisions recorded for these uncertainties.
How our audit addressed the key audit matter
We have tested the completeness and accuracy of the
amounts reported for current and deferred taxes, including
the assessment of the uncertain tax positions and deferred
taxes, based on the developments in 2017. In addition
we have evaluated the tax opinions of the companies’
experts on the respective cases. We also involved our
local subsidiaries’ auditors as well as tax specialists in
those subsidiaries determined to be the regions with
significant tax risks. In respect of deferred tax assets, we
analysed and tested the companies’ assumptions used
to determine the probability that deferred tax assets will
be recoverable. During our procedures, we use amongst
others budgets, forecasts and tax laws.
Our findings
We found the Companies’ judgements in respect of the
Group’s position on uncertain tax items to be consistent
and in line with our expectations.
Valuation of goodwill and other (in)tangible fixed assets
Key audit matter
Balta carries a significant amount of goodwill, amounting
to EUR (000) 198,814 and detailed in Note 7, and other (in)
tangible fixed assets on the consolidated statement of
financial position. Under EU-IFRS, the Company is required
to test the amount of goodwill for impairment at least
annually. The impairment tests were significant to our audit
due to the complexity of the assessment process and
judgments and assumptions involved which are affected
by expected future market and economic developments.
The most important assumptions concern the growth rates
of revenue and anticipated profit improvements.
BA
LTA
AN
NU
AL
REP
OR
T 20
17
107106
FIN
AN
CIA
L St
ate
me
nts
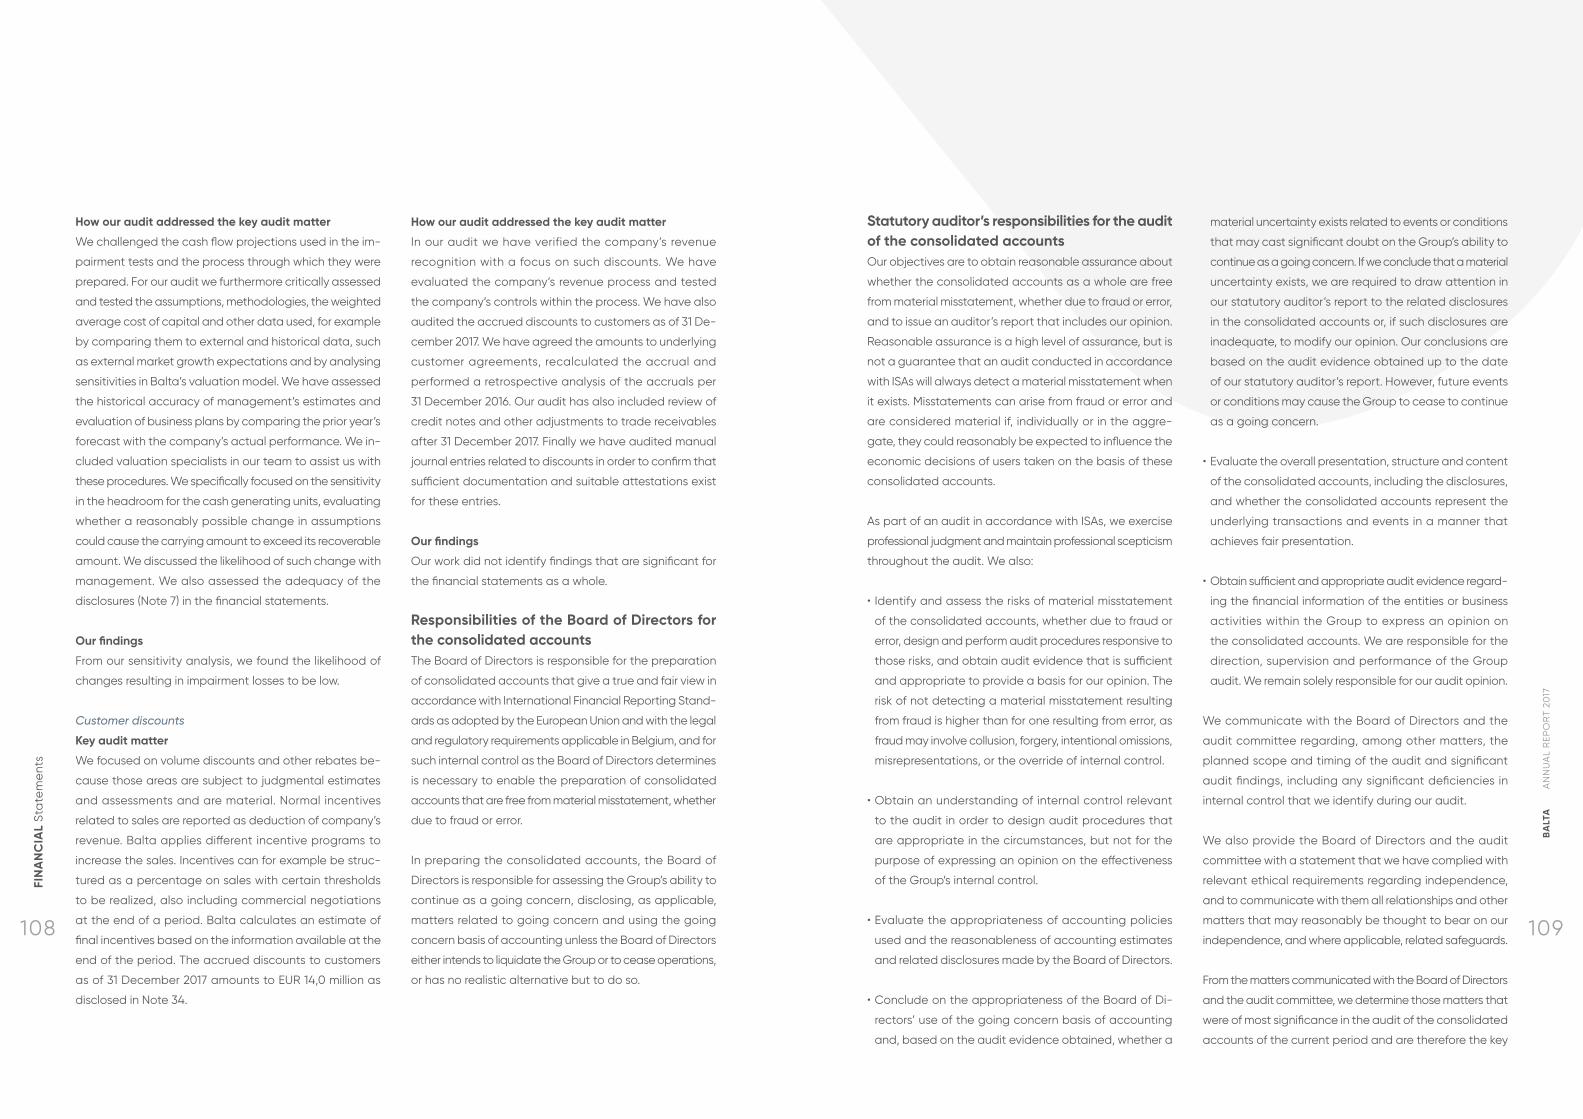
How our audit addressed the key audit matter
We challenged the cash flow projections used in the im-
pairment tests and the process through which they were
prepared. For our audit we furthermore critically assessed
and tested the assumptions, methodologies, the weighted
average cost of capital and other data used, for example
by comparing them to external and historical data, such
as external market growth expectations and by analysing
sensitivities in Balta’s valuation model. We have assessed
the historical accuracy of management’s estimates and
evaluation of business plans by comparing the prior year’s
forecast with the company’s actual performance. We in-
cluded valuation specialists in our team to assist us with
these procedures. We specifically focused on the sensitivity
in the headroom for the cash generating units, evaluating
whether a reasonably possible change in assumptions
could cause the carrying amount to exceed its recoverable
amount. We discussed the likelihood of such change with
management. We also assessed the adequacy of the
disclosures (Note 7) in the financial statements.
Our findings
From our sensitivity analysis, we found the likelihood of
changes resulting in impairment losses to be low.
Customer discounts
Key audit matter
We focused on volume discounts and other rebates be-
cause those areas are subject to judgmental estimates
and assessments and are material. Normal incentives
related to sales are reported as deduction of company’s
revenue. Balta applies different incentive programs to
increase the sales. Incentives can for example be struc-
tured as a percentage on sales with certain thresholds
to be realized, also including commercial negotiations
at the end of a period. Balta calculates an estimate of
final incentives based on the information available at the
end of the period. The accrued discounts to customers
as of 31 December 2017 amounts to EUR 14,0 million as
disclosed in Note 34.
How our audit addressed the key audit matter
In our audit we have verified the company’s revenue
recognition with a focus on such discounts. We have
evaluated the company’s revenue process and tested
the company’s controls within the process. We have also
audited the accrued discounts to customers as of 31 De-
cember 2017. We have agreed the amounts to underlying
customer agreements, recalculated the accrual and
performed a retrospective analysis of the accruals per
31 December 2016. Our audit has also included review of
credit notes and other adjustments to trade receivables
after 31 December 2017. Finally we have audited manual
journal entries related to discounts in order to confirm that
sufficient documentation and suitable attestations exist
for these entries.
Our findings
Our work did not identify findings that are significant for
the financial statements as a whole.
Responsibilities of the Board of Directors for the consolidated accountsThe Board of Directors is responsible for the preparation
of consolidated accounts that give a true and fair view in
accordance with International Financial Reporting Stand-
ards as adopted by the European Union and with the legal
and regulatory requirements applicable in Belgium, and for
such internal control as the Board of Directors determines
is necessary to enable the preparation of consolidated
accounts that are free from material misstatement, whether
due to fraud or error.
In preparing the consolidated accounts, the Board of
Directors is responsible for assessing the Group’s ability to
continue as a going concern, disclosing, as applicable,
matters related to going concern and using the going
concern basis of accounting unless the Board of Directors
either intends to liquidate the Group or to cease operations,
or has no realistic alternative but to do so.
Statutory auditor’s responsibilities for the audit of the consolidated accountsOur objectives are to obtain reasonable assurance about
whether the consolidated accounts as a whole are free
from material misstatement, whether due to fraud or error,
and to issue an auditor’s report that includes our opinion.
Reasonable assurance is a high level of assurance, but is
not a guarantee that an audit conducted in accordance
with ISAs will always detect a material misstatement when
it exists. Misstatements can arise from fraud or error and
are considered material if, individually or in the aggre-
gate, they could reasonably be expected to influence the
economic decisions of users taken on the basis of these
consolidated accounts.
As part of an audit in accordance with ISAs, we exercise
professional judgment and maintain professional scepticism
throughout the audit. We also:
• Identify and assess the risks of material misstatement
of the consolidated accounts, whether due to fraud or
error, design and perform audit procedures responsive to
those risks, and obtain audit evidence that is sufficient
and appropriate to provide a basis for our opinion. The
risk of not detecting a material misstatement resulting
from fraud is higher than for one resulting from error, as
fraud may involve collusion, forgery, intentional omissions,
misrepresentations, or the override of internal control.
• Obtain an understanding of internal control relevant
to the audit in order to design audit procedures that
are appropriate in the circumstances, but not for the
purpose of expressing an opinion on the effectiveness
of the Group’s internal control.
• Evaluate the appropriateness of accounting policies
used and the reasonableness of accounting estimates
and related disclosures made by the Board of Directors.
• Conclude on the appropriateness of the Board of Di-
rectors’ use of the going concern basis of accounting
and, based on the audit evidence obtained, whether a
material uncertainty exists related to events or conditions
that may cast significant doubt on the Group’s ability to
continue as a going concern. If we conclude that a material
uncertainty exists, we are required to draw attention in
our statutory auditor’s report to the related disclosures
in the consolidated accounts or, if such disclosures are
inadequate, to modify our opinion. Our conclusions are
based on the audit evidence obtained up to the date
of our statutory auditor’s report. However, future events
or conditions may cause the Group to cease to continue
as a going concern.
• Evaluate the overall presentation, structure and content
of the consolidated accounts, including the disclosures,
and whether the consolidated accounts represent the
underlying transactions and events in a manner that
achieves fair presentation.
• Obtain sufficient and appropriate audit evidence regard-
ing the financial information of the entities or business
activities within the Group to express an opinion on
the consolidated accounts. We are responsible for the
direction, supervision and performance of the Group
audit. We remain solely responsible for our audit opinion.
We communicate with the Board of Directors and the
audit committee regarding, among other matters, the
planned scope and timing of the audit and significant
audit findings, including any significant deficiencies in
internal control that we identify during our audit.
We also provide the Board of Directors and the audit
committee with a statement that we have complied with
relevant ethical requirements regarding independence,
and to communicate with them all relationships and other
matters that may reasonably be thought to bear on our
independence, and where applicable, related safeguards.
From the matters communicated with the Board of Directors
and the audit committee, we determine those matters that
were of most significance in the audit of the consolidated
accounts of the current period and are therefore the key
BA
LTA
AN
NU
AL
REP
OR
T 20
17
109108
FIN
AN
CIA
L St
ate
me
nts

I.8. Statement of the Board of Directors
We, the Board of Directors, hereby certify that, to the best
of our knowledge, the Consolidated Financial Statements
as of 31 December 2017, prepared in accordance with
International Financial Reporting Standards, as adopted
by the European Union, and with the legal requirements
applicable in Belgium, give a true and fair view of the
assets, liabilities, financial position and profit or loss of the
Group and the undertakings included in the consolidation
taken as a whole, and that the management report in-
cludes a fair review of the development and performance
of the business and the position of the Group and the
undertakings included in the consolidation taken as a
whole, together with a description of the principal risks
and uncertainties that they face.
audit matters. We describe these matters in our auditor’s
report unless law or regulation precludes public disclosure
about the matter or when, in extremely rare circumstances,
we determine that a matter should not be communicated
in our report because the adverse consequences of doing
so would reasonably be expected to outweigh the public
interest benefits of such communication.
Report on other legal and regulatory requirements
Responsibilities of the Board of DirectorsThe Board of Directors is responsible for the preparation
and the content of the directors’ report on the consoli-
dated accounts.
Statutory auditor’s responsibilitiesIn the context of our mandate and in accordance with the
Belgian standard (revised) which is complementary to the
International Standards on Auditing (ISAs) as applicable
in Belgium, our responsibility is to verify, in all material re-
spects, the directors’ report on the consolidated accounts
and to report on these matters.
Aspects related to the directors’ report on the consolidated accountsIn our opinion, after having performed specific procedures
in relation to the directors’ report on the consolidated
accounts, this report is consistent with the consolidated
accounts for the year under audit, and it is prepared in
accordance with article 119 of the Companies’ Code.
In the context of our audit of the consolidated accounts,
we are also responsible for considering, in particular
based on the knowledge acquired resulting from the
audit, whether the directors’ report on the consolidated
accounts is materially misstated or contains information
which is inadequately disclosed or otherwise misleading.
In light of the procedures we have performed, there are
no material misstatements we have to report to you. We
do not express any form of assurance conclusion on this
directors’ report.
The non-financial information is included in the directors’
report on the consolidated accounts. The Group has pre-
pared the non-financial information, based on seventeen
sustainable development goals. However, in this report, we
do not express an opinion as to whether the non-financial
information has been prepared, in all material aspects, in
accordance with the seventeen sustainable development
goals as disclosed in the consolidated accounts. Further-
more, we do not express assurance on individual elements
included in this non-financial information.
Statement related to independence• We did not provide services which are incompatible
with the statutory audit of the consolidated accounts
and we remained independent of the Company in the
course of our mandate.
• The fees for additional services which are compatible
with the statutory audit of the consolidated accounts
referred to in article 134 of the Companies’ Code are
correctly disclosed and itemized in the notes to the
consolidated accounts.
Other statements• This report is consistent with the additional report to
the audit committee referred to in article 526 bis §6 4°
of the Companies Code referring to 11 of Regulation (EU)
N° 537/2014.
Gent, 18 April 2018
The statutory auditor
PwC Bedrijfsrevisoren bcvba
Represented by
Peter Opsomer
Registered Auditor
BA
LTA
AN
NU
AL
REP
OR
T 20
17
111110
FIN
AN
CIA
L St
ate
me
nts

GLOSSARY INVESTOR RELATIONS OVERVIEWOur aim is to provide transparent, clear and timely in-
formation on Balta’s strategy, business and financial
performance to all financial market players. Since our
IPO in June 2017, we have been building up our investor
relations programme, including the recruitment of a senior
and experienced Corporate Development and Investor
Relations Director in the last quarter of 2017.
Since the IPO we have met with investors in roadshows
and conferences in several locations across Europe and
have hosted a number of site visits both to our head
office and production facilities in Belgium and to our US
subsidiary, Bentley.
SHAREHOLDER STRUCTUREThe shareholder structure of Balta Group NV, based on
the declarations received in the period up to 31 December
2017, is as follows:
Shareholder Number of Shares %1
LSF9 Balta Holdco S.à r.l. 20,303,957 56.49%
Tocqueville Finance SA 2,387,964 6.64%
1 at the time of the declaration
SHARE PERFORMANCEBalta shares are listed on Euronext Brussels. The calendar
year ended with a share price of € 8.70, below the IPO
price of € 13.25 but above the low of € 7.52 following the
unplanned earnings downgrade on 24 November.
ANALYST COVERAGEBalta was covered by 6 analysts as of 31 December 2017.
Details are available in the Investor Relations section of
our corporate website (www.baltagroup.com).
FINANCIAL CALENDAR2
First Quarter Results 3 May 2018
Annual General Meeting of
Shareholders 22 May 2018
Half Year Results 28 August 2018
Third Quarter Results 7 November 20182 dates are provisional
INVESTOR CONTACTSRupen Shah
Corporate Development and Investor Relations Director
PRESS CONTACTSGeert Vanden Bossche
Marketing Director
GENERAL COUNSELAnnelies Willemyns
0
20
40
60
80
100
29/1
2/17
14/1
2/17
14/1
1/17
13/1
0/17
14/0
9/17
14/0
8/17
14/0
7/17
14/0
6/17
INDEX
The following alternative performance measures (non-
IFRS) have been used as management believes that they
are widely used by certain investors, securities analysts
and other interested parties as supplemental measure of
performance and liquidity. The alternative performance
measures are unaudited and may not be comparable to
similarly titled measures of other companies, have limi-
tations as analytical tools and should not be considered
in isolation or as a substitute for analysis of our operating
results, our performance or our liquidity under IFRS.
Organic Growth: is defined as growth at constant currency
and excluding M&A.
Pro Forma revenue and Pro Forma Adjusted EBITDA are
included, for illustrative purposes. These figures incorporate
the acquisition effect of Bentley under the assumption
that the transaction took place as of the start of the prior
financial year. This information is intended to help investors
to analyse and compare historical financial information.
It is important to note that the acquisition of Bentley was
completed on 22 March 2017 and consolidated in the
Group’s results from 1 April 2017.
Adjusted Operating Profit is defined as operating profit /
(loss) adjusted for (i) the impact of the purchase price
allocation mainly on changes in inventories, (ii) gains on
asset disposals, (iii) integration and restructuring expenses
and (iv) impairment and write-off.
Adjusted EBITDA is defined as operating profit / (loss)
adjusted for (i) the impact of the purchase price allocation
mainly on change in inventories, (ii) gains on asset disposals,
(iii) integration and restructuring expenses, (iv) depreciation /
amortisation and (v) impairment and write-off.
Adjusted Earnings per Share is defined as profit/ (loss) for
the period adjusted for (i) the impact of the purchase price
allocation mainly on changes in inventory, (ii) gains on asset
disposals, (iii) integration and restructuring expenses, (iv)
non-recurring finance expenses and (v) non-recurring tax
effects, divided by the number of shares of Balta Group
NV. The Adjusted Earnings per Share for 2016 is a pro forma
number that has been included for comparison purposes,
assuming the total number of shares was equal to the
current number of shares of Balta Group NV.
Net Debt is defined as (i) Senior Secured Notes adjusted
for the financing fees included in the carrying amount, (ii)
Senior Term Loan Facility adjusted for capitalised financing
fees, (iii) Bank and other borrowings adjusted for capitalized
financing fees and (iv) cash and cash equivalents
Leverage is defined as the ratio of Net Debt to Pro Forma
Adjusted EBITDA
Adjusted Effective Tax Rate is defined as the ratio of
income tax expenses, plus or minus the tax effect of
integration and restructuring expenses, the tax effect
of exceptional items within the finance charges, the tax
effect attributable to the re-measurement of deferred tax
assets and liabilities and the tax effect of the purchase
price accounting adjustments, divided by earnings from
continuing operations before income taxes plus integra-
tion and restructuring expenses plus exceptional finance
expenses and excluding the impact of purchase price
accounting adjustments.
Alternative Performance Measures
BA
LTA
AN
NU
AL
REP
OR
T 20
17
113112
GLO
SSA
RY

Balta Group NVWakkensteenweg 2, 8710 Sint-Baafs-Vijve Belgium
Tel +32 (0)56 62 22 11 [email protected] www.baltagroup.com
Indoor & Outdoor Rugs Commercial Carpets & Tiles Residential Carpets & Tiles