annual report - Ülker · style, organizational structure, processes and products has the vision to...
TRANSCRIPT

A N N U A L R E P O R T
GIDA SANAY‹ VE T‹CARET A.fi.


Message from the Chairman 3Statement from the Managing Director 5Board of Directors & Audit Committee 6The Members of The Board of Directors 6The Members of The Audit Committee 6History 7Financial Highlights 8Ülker G›da on The Istanbul Stock Exchange (ISE) 9Shareholder Structure of Ülker G›da 9General Overview 10Production at ‹stanbul Topkap› & Ankara Factories 11The Year in Review-Investments 12Organizational Restructuring 13Research & Development 13Quality Assurance (QA) 14Human Resources (HR) 14Environment & Workplace Safety 15Operations 15Subsidiaries 16Production Subsidiaries-Birlik Pazarlama (Birlik Pazarlama A.fi.) 17‹deal G›da (‹deal G›da Sanayii ve Ticaret A.fi.) 18Biskot Bisküvi (Biskot Bisküvi Sanayii ve Ticaret A.fi.) 19Distribution Subsidiaries-‹stanbul G›da (‹stanbul G›da D›fl Ticaret A.fi.) &(Birleflik D›fl Ticaret A.fi.) 21Atlas G›da Pazarlama (Atlas G›da Pazarlama Sanayii ve Ticaret A.fi.) 22Other Subsidiaries and Associates 23Community Involvement 25Education 25Environment 26Health 26Arts & Culture 26Sports 27Other Administrative Notices 28The Profit Distribution Proposal 28The Auditors’ Report 29 Corporate Governance Compliance Report 30Independent Auditors’ Report 35Financial Statements and Notes to The Financial Statements 35
T A B L E O F C O N T E N T S


Message from the Chairman
I remember the first days of our biscuit business, more than62 years ago. It was 1944, and post-war Turkey was strugglingwith the challenges of unifying as a new republic, as well aswith industrialization.
In the face of tremendous adversities, it fills me with a greatsense of pride to reflect upon the persistent efforts of a nationand to reflect on how much Turkey has achieved. Today ourcountry competes with the giants of the global marketplace.Turkish industry has matured with remarkable speed andcompetency. And we, as Ülker, have played a significantleadership role as one of the flagships of the Turkish foodmanufacturing sector over the course of these years.
I have worked at Ülker for 62 years, starting when ourproduction capacity was at 200 kg of biscuits per day. Today,we are blessed with the capacity to produce thousands oftons. We are no longer just a biscuit brand. Remaining loyalto our founding principles and values, Ülker has grown froma biscuit workshop into a diversified food conglomerate.Ülker has successfully evolved from a family business into apublic partnership.
We measure our success not just by our production volumes,our revenues or our growth, but by what the public has to sayabout our company’s performance. In 2005, Ülker was rankedfirst as “the food company that is most admired” and rankedsecond overall under “brands recalled” and “the brand youfeel closest to.”
Notwithstanding these independent public survey results, itis also a great honour for me to have been awarded with the“Lifetime Success Award,” presented by the EuropeanMarketing Research Centre.
Ülker’s founding principles and values underlie theseachievements. For us, it is not just about customersatisfaction. Everything we do at Ülker is about consumerhappiness. Our aim has always been to develop the highestquality products at the most affordable prices, making simplepleasures accessible to most people. Leveraging the latesttechnologies has helped us achieve these goals while nevermaking concessions over quality and hygiene.
It is so exciting for me to watch the third generation ofexecutives taking over leadership at Ülker. There is a strongtradition of transparent management that preserves a familyatmosphere within a very strong corporate structure. I havededicated 62 years of my life for this company, nurturing itsgrowth as if it were my first child. We worked very hard toreach today’s position, sacrificing a lot from our personallives for the success of the company. Throughout this journey,I did my best to convey to my family and all of the employeesin the Ülker Group that these efforts were part of our duty inservice to our country.
I believe that the secret to enjoying such a long businesscareer is having focus. In my role as a mentor to the youngergenerations, I urge them to remain faithful to our modestprinciples and values, while bolstering their courage toembrace innovations and adopt the most modernmanagement methods.
I am honoured to transfer my duties to the next generationof business leaders. I feel inner peace, pride and contentmentas I witness them fulfilling their obligations with the samediligent loyalty to our founding principles of modesty,consumer respect and world vision.
I am confident that Ülker’s next generation of leaders willcontinue to introduce wonderful tastes to the marketplace,and celebrate the success that comes from delivering thesesmall pleasures that make a big difference to Turkey and theworld.
Sabri ÜlkerChairman of the Board
3

Sabri Ülker, the Founder and Honorary Chairman of the ÜlkerGroup, was awarded the “Lifetime Success Award” by theEuropean Marketing Research Center (EMRC). The award ispresented to organizations, institutions or state agencies thatdemonstrate exceptional success, specifically in support ofinternational development through creative economiccollaborations.
The Ülker Group was also recognized as “Europe’sConfectionary Producer of the Year”. One of Turkey’s leadingholding companies, the Ülker Group ranks number 16 amongthe world’s largest food producers.
In addition to EMRC, many prestigious institutions such as theEuropean Bank for Reconstruction and Development (EBRD),the International Finance Corporation (IFC), and the Inter-American Development Bank (IADB) participated in the awardsceremony held at the Euro-Market Forum in December 2005.
The “Lifetime Success Award” was accepted by Ali Ülker, Headof the Ülker Biscuit-Chocolate-Candy Group, on behalf of hisgrandfather Sabri Ülker who was unable to attend theceremonies held in Brussels due to health problems.
4
“Lifetime Success Award” for Sabri Ülker

5
As part of our mission to constantly improve and produceever more healthy, tasty and nutritious products, the R&DDepartments of our ‹stanbul and Ankara factories havelaunched 22 new products and 6 re-launches in the biscuitcategory in 2005. An additional 56 new product projectsinitiated in 2005 will continue to be developed in 2006.Launches of these new products to the marketplacecontributed to the increase of our sales volumes in 2005.
Branding investments form an inseparable component ofour product launch and distribution success. Our brandinginvestments for biscuits manufactured in our factories in2005 amounted to YTL 15.3 million. As a result of ourinvestments in branding, Ülker was ranked among the topnames according to independently conducted sectorresearch for 2005, tracking criteria such as “Brand RecalledFirst”, “Company Recalled First”, “Biscuit Brand RecalledFirst” and “Brand Which Consumers Feel Closest to.”
With great confidence in product quality, affordability andaccessibility, we are committed to remaining top-of-mindamongst consumers and we will continue to make significantinvestments in branding in 2006 to maintain and furtherenhance this level of consumer familiarity and trust.
To gain competitive advantage and increase penetration ofour products in the cracker segment of the marketplace,we will pursue branding strategies. As a part of this goal,the distribution of the existing cracker products will beundertaken by the dynamic sales team of Esas G›daPazarlama A.fi. which markets and distributes beveragecategory products such as Cola Turka. In addition to thisstrategic approach, a new organization will be created tohandle the distribution of selected premium biscuit brands.
In a world where global competition is increasing daily,an essential part of our success has been to maintain teamspirit at every level of our organization. I would like to takethis opportunity to thank our personnel who have beeninstrumental in achieving all of our business targets.I would also like to express my heartfelt joy to our customerswho have let us become a part of their everyday lives, as thecompany which they remember first and feel closest too.And finally, I would like to extend my sincere gratitude toall our shareholders.
Ali Ülker
Managing Director
Ülker G›da Sanayii ve Ticaret A.fi., shouldering theresponsibility of being the market leader in the biscuitsector, is at the forefront of market innovation and sets thepace of development in this sector. Our company with itspremium standards for employees, differentiated businessstyle, organizational structure, processes and products hasthe vision to be a role model organization not only withinthe Ülker Group of Companies or Turkish industry as awhole, but indeed anywhere in the world.
Ülker G›da San.ve Tic. A.fi. increased its annual sales by 5%compared to the previous year, with a total production of120,368 tons of biscuits and wafers in its ‹stanbul and Ankarafactories. Our consolidated net income increased by 19%from YTL 55.64 million for the year endingDecember 31, 2004 to YTL 66.22 million for the year endingDecember 31, 2005, contrary to the decrease in netconsolidated revenues. The main reason for the decreasein net consolidated revenues is due to the outsourcing oflogistic services and deconsolidation of Netlog LojistikHizmetleri A.fi. from the beginning of 2006.
We increased our sales performance through noteworthyimprovements in our biscuit and wafers sector productivity,without any additional savings in personnel costs. Thesenoteworthy improvements in our productivity weresupported with new investments which also enableddecreases in direct labour and raw material costs, as well asincreases in quality and capacity. We made YTL 4.9 millioncapital expenditure in the year 2005. In particular,investments made for the conversion of our energy sourceto natural gas enabled us to utilize more efficient andcheaper energy. Our investment to convert to natural gaswill continue in 2006 and we aim to use natural gas energyin all our furnaces by the end of 2006.
To Our Valued Shareholders...
6
The Board of Directors & Audit CommitteeTHE MEMBERS OF THE BOARD OF DIRECTORS
Name & Surname Position
Sabri ÜLKER Chairman of the Board
Murat ÜLKER Vice Chairman of the Board
Orhan ÖZOKUR Member
Ali ÜLKER Member & Managing Director
Hilmi DURMAZ Member
Necdet BUZBAfi Member
THE MEMBERS OF THE AUDIT COMMITTEE
Name & Surname Position
Ataman YILDIZ Auditor
Nurettin AL‹Z Auditor
Yalç›n ÖNER Auditor

7
HistoryÜlker G›da was established by Mr. Sabri Ülker in theEminönü district of ‹stanbul in 1944, with only threeemployees producing 200 kg of biscuits per day. In afew years the company relocated to a factory in theTopkap› district with four 20 square meter furnaceovens, a considerable production capacity for the times. In 1948, Ülker G›da achieved an annual biscuitproduction capacity of 225 tons per year by building acustom-designed factory.
In 1955, Ülker G›da made a bold strategic decision todistribute its products nationwide at factory prices,without invoicing for transportation costs. This strategytriggered a huge surge in demand and productioncapacity utilization. Indeed, the supporting strategy ofÜlker placers stocking every corner store and streetvendor with Ülker biscuits and chocolates was truly arevolutionary sales and marketing approach.
In 1970, Anadolu G›da (Anadolu G›da Sanayii ve TicaretA.fi.) was established in Ankara as a multipleshareholder company and Ülker G›da’s biscuitproduction capacity as doubled. Anadolu G›da waslater merged with Ülker G›da (in 2003). By 1974, ÜlkerG›da had met two milestone goals by realizing its firstexports which were made to the Middle East, andsecondly by establishing a formal Research &Development Department focused on competing inthe international arena. In 1979, Ülker G›da pioneeredcellophane-based packaging to launch a whole newstandard for packaging concepts.
Over 61 years Ülker G›da has evolved from a smallbiscuit workshop into an integrated group ofcompanies. Today, Ülker G›da continues to serve as acorporate role model and locomotive for growth forthe entire Ülker Group of Companies.
NOSTALGIA / AN ÜLKER COMMERCIAL DATING BACK TO THE 60’S

Financial Highlights
SALE VOLUME* (TONS/YEAR)
120,368
114,579
100,000 106,000 112,000 118,000 124,000
2004
2005
SHAREHOLDERS’ EQUITY (YTL)
554,487,489
485,522,588
300,000,000 375,000,000 450,000,000 525,000,000 600,000,000
*Total sales of ‹stanbul and Ankara factories of Ülker G›da San. ve Tic. A.fi.
2004
2005
EBITDA (YTL)
143,425,750
113,751,584
70,000,000 90,000,000 110,000,000 130,000,000 150,000,000
NET INCOME FOR THE PERIOD (YTL)
66,226,253
55,646,845
30,000,000 40,000,000 50,000,000 60,000,000 70,000,000
2004
2005
2004
2005
GROSS OPERATING PROFIT (YTL)
309,526,082
293,831,110
200,000,000 235,000,000 270,000,000 305,000,000 340,000,000
NET OPERATING PROFIT (YTL)
104,328,216
79,725,650
30,000,000 52,500,000 75,000,000 97,500,000 120,000,000
2004
2005
2004
2005
8
9
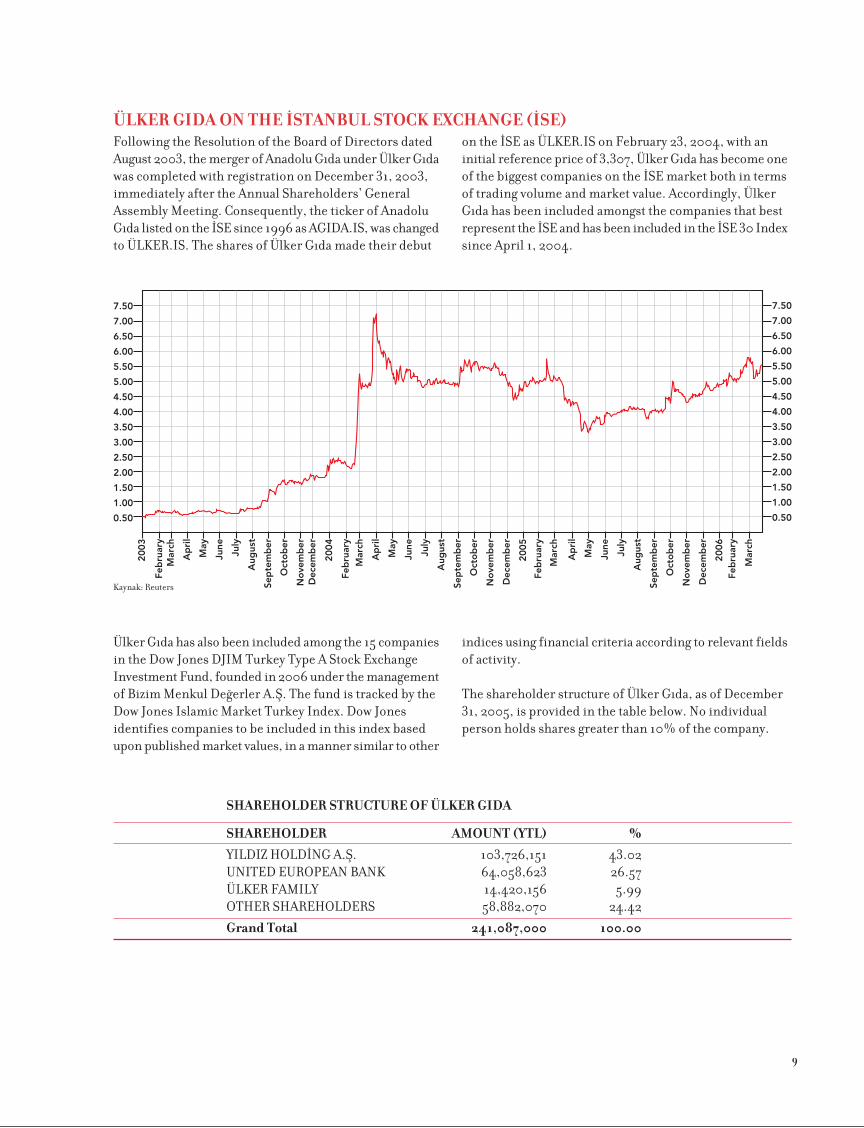
SHAREHOLDER STRUCTURE OF ÜLKER GIDA
SHAREHOLDER AMOUNT (YTL) %
YILDIZ HOLD‹NG A.fi. 103,726,151 43.02UNITED EUROPEAN BANK 64,058,623 26.57ÜLKER FAMILY 14,420,156 5.99OTHER SHAREHOLDERS 58,882,070 24.42
Grand Total 241,087,000 100.00
Following the Resolution of the Board of Directors datedAugust 2003, the merger of Anadolu G›da under Ülker G›dawas completed with registration on December 31, 2003,immediately after the Annual Shareholders’ GeneralAssembly Meeting. Consequently, the ticker of AnadoluG›da listed on the ‹SE since 1996 as AGIDA.IS, was changedto ÜLKER.IS. The shares of Ülker G›da made their debut
on the ‹SE as ÜLKER.IS on February 23, 2004, with aninitial reference price of 3,307, Ülker G›da has become oneof the biggest companies on the ‹SE market both in termsof trading volume and market value. Accordingly, ÜlkerG›da has been included amongst the companies that bestrepresent the ‹SE and has been included in the ‹SE 30 Indexsince April 1, 2004.
ÜLKER GIDA ON THE ‹STANBUL STOCK EXCHANGE (‹SE)
Ülker G›da has also been included among the 15 companiesin the Dow Jones DJIM Turkey Type A Stock ExchangeInvestment Fund, founded in 2006 under the managementof Bizim Menkul De¤erler A.fi. The fund is tracked by theDow Jones Islamic Market Turkey Index. Dow Jonesidentifies companies to be included in this index basedupon published market values, in a manner similar to other
indices using financial criteria according to relevant fieldsof activity.
The shareholder structure of Ülker G›da, as of December31, 2005, is provided in the table below. No individualperson holds shares greater than 10% of the company.
Kaynak: Reuters
20
03
0.50
1.00
1.50
2.00
2.50
3.00
3.50
4.00
4.50
5.00
5.50
6.00
6.50
7.00
7.50
0.50
1.00
1.50
2.00
2.50
3.00
3.50
4.00
4.50
5.00
5.50
6.00
6.50
7.00
7.50
Feb
ruar
yM
arch
Ap
ril
May
June
July
Aug
ust
Sep
tem
ber
Oct
ob
er
No
vem
ber
Dec
emb
er
20
04
Feb
ruar
yM
arch
Ap
ril
May
June
July
Aug
ust
Sep
tem
ber
Oct
ob
er
No
vem
ber
Dec
emb
er
20
05
Feb
ruar
y
Mar
ch
Ap
ril
May
June
July
Aug
ust
Sep
tem
ber
Oct
ob
er
No
vem
ber
Dec
emb
er
20
06
Feb
ruar
y
Mar
ch

10
The first company established by the Ülker Group ofCompanies was Ülker G›da which started as a small biscuitworkshop and evolved over 61 years into a company thatproduces hundreds of biscuit varieties. Today, underprofessional management, Ülker G›da produces biscuits,chocolate-coated biscuits, crackers and wafers in tworegions, the ‹stanbul Topkap› and the Ankara factories.
Ülker G›da operates both its own factories and works withsubsidiary companies which all rank as sector leaders intheir independent categories. Apart from the ‹stanbulTopkap› and Ankara factories, production for Ülker G›daalso takes place at the facilities of ‹deal G›da (‹deal G›daSanayii ve Ticaret A.fi.) and Biskot G›da (Biskot G›da Sanayiive Ticaret A.fi.) which are subsidiaries of Ülker G›da, locatedin Gebze and Karaman respectively. Furthermore, rawmaterials of processing for wheat, flours and otheringredients are managed at the facilities of Birlik G›da(Birlik G›da Sanayii ve Ticaret A.fi.) which is also asubsidiary, located in Ankara and sharing the same propertywith Ülker G›da’s Ankara factory.
The domestic distribution of Ülker G›da’s biscuit, crackerand wafer products is coordinated by its subsidiary, AtlasG›da Pazarlama (Atlas G›da Pazarlama Sanayii ve TicaretA.fi.) which is one of Turkey’s strongest distributioncompanies, with access to the greatest number of vendors.Domestic distribution of Ülker G›da’s chocolate andchocolate-coated biscuits is carried out by a specializedsubsidiary of Atlas G›da Pazarlama called Atlantik G›daPazarlama, which was established in 2005.
International sales to almost 100 countries are supportedby two other Ülker G›da subsidiary companies, namely‹stanbul G›da (‹stanbul G›da D›fl Ticaret A.fi.) and BirleflikD›fl Ticaret (Birleflik D›fl Ticaret A.fi.). Ülker G›da currentlyexports to an extensive area spanning the USA, WesternEurope, the Balkan Republics, the Turkic Republics, theMiddle East, Africa and Far East Countries.
Apart from contributing to Turkey’s foreign trade balancethrough our exports, Ülker G›da is a Turkish brand that isproud to represent Turkish quality standards in thesecountries. Ülker G›da’s goal is to help nurture a positiveexperience with Turkish brands, so customers gainfamiliarity and develop a preference for the internationalquality standards of Turkish products.
The numerous quality assurance certificates and productawards demonstrate to the whole world Ülker G›da’sunwavering dedication to food quality and safety.Ülker G›da’s in-house Research & Development laboratoriesare staffed with world-class specialists workingindependently on new product developments as well asproduction process innovations.
Most recently, Ülker G›da was awarded first place in aretailers’ evaluation, scoring highest overall when gradedon product quality, distribution, sales organization andfinancial-commercial criteria. According to independentstudies conducted by ACNielsen in 2005, Ülker G›da is thebiscuit brand customers feel closest to. Ülker G›da’s greatestinspiration and challenge comes from the general public,who consistently rank Ülker G›da as the most admiredcompany in the Turkish food sector.
General Overview
Maintaining our leadership role is a critical motivator for Ülker G›da leading to continuous improvements in productsas well as production processes and distribution services to meet customer and vendor expectations.
Ülker G›da According to an ACNielsen Public Survey 2005:
Ülker’s 2005 Biscuits Category Market Share = 59.7%
Ülker “Product” Brands Recall = 2nd place
Ülker “Company” Brand Recall = 5th place
Overall “Brand Consumers Feel Closest To” = 2nd place
Biscuit Category “Brand Consumers Feel Closest To” = 1st place
Biscuits Category Brand Recall:
Ülker G›da = 1st place = 53.0%
Biskrem = 3rd place = 8.8%
Han›meller = 5th place = 1.7%
‹kram = 7th place = 1.2%

11
PRODUCTION AT ‹STANBUL TOPKAPI & ANKARA FACTORIESAll production in the Ülker G›da’s factories leverages the latest automation and robot technology, with no human contactduring any process including parcelling, packaging and storage. As of 1996, Ülker G›da’s factories were awarded TS/EN/ISO9002 Certification relating to quality assurance standards in production. In 2001, Ülker G›da’s factories were also awardedHACCP Certification for food safety quality standards. Ülker G›da underpinned its commitment to quality once more byreceiving the “High Level” standard, the highest level awarded by the BRC, a European quality of origin certification body.
Viewed in an international context, the Ankara factory has one of the largest biscuit production and storage facilities inthe Middle East with its current operational capacity. The advanced technology and computerized automation systemsin the Ankara factory provide the most comprehensive integration available within the biscuit category.
There are a total of 30 lines in both facilities, of which 26 are dedicated to production and four are dedicated to packaging. The ‹stanbul Topkap› and Ankara facilities operate on a system of three shifts to achieve an average capacity utilizationof 87% and 61% respectively, reaching a 100% capacity during peak production periods. More than 27 products and theirvariants are produced in these two facilities.
‹stanbul Topkap› Factory Ankara Factory
Lines Total 13 Lines Total 17 linesProduction 9 Production biscuit 13Packaging 4 Production wafers 4
Production 2005 47,168 tons produced 66,536 tons produced51,446 tons sold 68,922 tons soldAv. cap. utilization 87% Av. cap. utilization 61%

12
InvestmentsIn 2005 Ülker G›da made significant investments in the expansion and modernization of its production facilities, bothto achieve larger production capacity to meet growing demand and for reduced labour and energy inputs, with sustainedquality. These investments have immediately produced a positive financial return. We are very happy to celebrate ourability to lower production costs and increase our production capacity, without making any concessions on quality orreducing employment.
The Year in Review
2005 Investments ‹stanbul Topkap› Factory Ankara Factory
Expansion & Modernization 1,800,000 YTL n/aRepair, Renewal & Upgrade n/a 3,100,000 YTLInvestment Discounts 705,000 YTL 1,200,000 YTLDepreciation & Special 4,700,000 YTL 4,400,000 YTLCost Payment Expensesfor Furniture & FixturesRegistered Under Assets
Ülker G›da made investments of YTL 1.8 million for expansion and modernization of the ‹stanbul Topkap› facilities andYTL 3.1 million for repairs, renewal and upgrade of the Ankara facilities in 2005. The focus of investments specificallyincluded the purchase of biscuit production machinery and conversion of furnaces to natural gas.
Furthermore, in December 2004 Ülker G›da purchased half of the buildings and infrastructure located on propertytotalling 29,716 square meters in the Zeytinburnu district of ‹stanbul, near the location of Ülker G›da’s first productionfacilities, through a financial leasing agreement valued at US$ 28 million. This is the first step in a strategy to consolidateownership of the biscuit production facilities under the same roof. This consolidation strategy is being financed byreinvesting earnings into property assets.
Investment budgets pertaining to capacity expansion and modernization initiatives for 2006 have also been prepared andapproved.

13
During 2005, the Research & Development Department of the ‹stanbul and Ankara factories launched 22 new productsin the biscuits, wafers and crackers group through vigorous product developments, modifications and improvements.Under the leadership of the Topkap› Research & Development Department, 56 projects are currently being prepared forimplementation in 2006 using new equipment.
In 2005, the Research & Development Departments of Ülker G›da successfully completed the following projects including:
Turkish English
Kat Kat Tat Tahinli Kremal› Milföy Layer Layer Flavour Mille-Feuille with Sesame Paste & CreamAlpella ‹ki Renkli Pötibör Alpella Double-Coloured Petite BeurreAlpella Çikolatal› Kremal› Sandviç Bisküvi Alpella Chocolate & Cream Biscuit SandwichKitymilk: Çikolatal› Kremal› Sandviç Bisküvi & Kittymilk: Chocolate & Cream Biscuit Sandwich &Çikolata-Kapl› Sandviç Bisküvi Chocolate-Coated Biscuit SandwichNew Tempo New Tempo
Mavi Yeflil Light Çokosandviç Blue & Green Light Choco-SandwichMavi Yeflil Light Kay›s›l› Lifli Bisküvi Blue & Green Light High Fiber Biscuit with ApricotMavi Yeflil Light Keten Tohumlu Bisküvi Blue & Green Light Linen Seed BiscuitYeni Baflak New Baflak (wheat crackers)Studio Salzcracker Studio Salzcracker
Birben Rulo, 25 g single, Duo Bag & 2x2 Birben Roll: 25 g Single, Duo Bag & 2x2Prebiyotik Bebe: 100 g, 175 g, 400 g, 1000 g saklama kapl›, Prebiotic Baby: 100 g, 175 g, 400 g, 1000 g with storage cup,1000g paket, 1200 g ekonomik boy 1000 g bag, 1200 g economy size bagPrebiyotikli Ball›-Muzlu Bebe 175 g Probiotic Baby with Honey-Banana 175 g
Organizational RestructuringDuring 2005 Ülker G›da made a conscious decision to adopt a more innovative management and organizational structure.As part of this restructuring initiative, Mr. Ali Ülker who is the head of the biscuits, chocolate and candy group was alsoappointed as the new Managing Director of Ülker G›da. Mr. Mehmet Tütüncü, the previous Managing Director of ÜlkerG›da was transferred to the head of the food group to lead extensive restructuring within that business unit.
The organizational restructuring initiative is focused on streamlining business units, including merging some departmentswhile also creating some new ones. An important element of this initiative is the “Team-Learning and Learning OrganizationProgram” which involves rotating selected employees across various departments to encourage networking and organizationalknowledge-sharing. The goal of this program is to achieve greater efficiency and optimize productivity specifically relatedto production process within Ülker G›da. Two significant outcomes have been the reduction of procurement-relatedlosses, and staff professional development benefits, gained through experiential learning via participation in teamsworking on actual business cases.
Research & Development

During 2005, the QA Departments of Ülker G›da in the ‹stanbul and Ankara factories conducted a variety of tests andanalysis related to raw material, packaging, semi-final and final products. These studies focused on microbiologicalanalysis, CP checks, shelf-time analysis and equipment calibrations. Ülker G›da renewed its ISO and HACCP certificatesduring the year. Additional benchmarking and productivity studies were conducted related to cost savings throughcardboard box and OPP packaging material costs reductions. Systematic reviews of customer complaints received throughthe Customer Call Center were also addressed to ensure maximum customer satisfaction. These reviews includedsite inspections as well as point-of-problem origin hypothesis testing in cooperation with the all supply chain partners.
14
Quality Assurance (QA)
The HR Department of Ülker G›da continuously designs training and development programs for Ülker employees in the‹stanbul and Ankara facilities. Programs targeting customer-oriented working, team working, effective problem solving,goal-oriented thinking, continuous performance development, effective change management and innovative strategicthinking are being specially designed. Additional orientation and technical tools training programs on topics such asorientation, benchmarking, EFQM quality and disaster-readiness are on-going.
The HR Department has also implemented a comprehensive career development and performance management programto support employee motivation and loyalty. Departmental and personal targets are identified within the company.In addition to using traditional internal communication tools to encourage networking, cooperation and involvement,special opportunities are also leveraged. These opportunities are designed to bring Ülker G›da employees together,whether on occasions such as the national and international basketball games of the Ülkerspor basketball team (sponsoredby Ülker G›da), or for events such as company summer picnics and community involvement activities.
Human Resources (HR)

15
One of the most important Ülker G›da training programs is “Operator Training” conducted for employee instruction ontopics such as occupational health and safety, HACCP, hygiene and environmental health. All environmental and hygieneinspections and monitoring are performed regularly by specially trained teams who are authorized to initiate essentialprecautions in a timely manner.
Environment & Workplace Safety
Ülker G›da departments of raw materials, packaging and technical procurement and materials planning have collaboratedto conduct studies to significantly improve the competitive quality, supply, storage and protection of raw and strategicmaterials to ensure continuous and uninterrupted production. These studies focused specifically upon the identificationof alternative material suppliers, training and orientation of suppliers, material market prices and monitoringpractices to support the development of competitive strategies for the Ülker Group of Companies.
The Biscuit Production Department conducts weekly meetings with all parties to the production and sales process in orderto evaluate purchase orders, ensure effective production and delivery capacity planning. Significant improvements weremade in almost all production performance indicators and ratios in 2005. The Production, Material, Procurement,Technical, Production Planning, Personnel, Quality Control and Research & Development Departments work in closecollaboration and efficient cooperation in order to produce and deliver our biscuits, crackers and wafers to Ülker’s highquality standards.
Operations

Ülker G›da is at our core, working both as the locomotive company and as a firm foundation for the full Ülker Group ofCompanies. Our company has created a very strong portfolio of subsidiaries and affiliates by adopting a horizontal andvertical integration strategy within the Ülker Group of Companies. Each company is a leader in its own sector, creatingsignificant synergies within this structure. In addition to the biscuit production facilities across Turkey, Ülker G›da hasalso established a dynamic presence in the general food sector ranging from quality flour production to oil and packaging.
The list of the subsidiaries and affiliates of Ülker G›da is provided below, listed in accordance to the magnitude ofownership:
The Subsidiaries and Affiliates of Ülker G›da
Subsidiaries & Affiliates Field of Activity Percentage of OwnershipBirlik Pazarlama A.fi. Flour production 99.0%‹deal G›da San. & Tic. A.fi. Biscuits & cracker production 97.5%‹stanbul G›da D›fl Tic. A.fi. International marketing & distribution 83.8%Atlas G›da Paz. San. & Tic. A.fi. Domestic marketing 73.5%Birleflik D›fl Ticaret A.fi. Foreign trade 68.0%Biskot Bisküvi San. & Tic. A.fi. Production of biscuit & chocolate-coated biscuits 50.5%PNS Pendik Niflasta A.fi. Production of starch & starch-based sugar 23.0%Sa¤lam GMYO A.fi. Real estate investment trust 21.4%Datateknik A.fi. Production of computers & information technology services 19.0%Netlog Lojistik A.fi. Transport & logistics 12.5%Fresh Cake A.fi. Cake production 10.0%Besler G›da A.fi. Oil & margarine production 7.0%Tire Kutsan A.fi. Paper & cardboard box production 5.4%Berk Enerji A.fi. Energy production 0.1%
16
Subsidiaries

17
Birlik Pazarlama is one of the most important subsidiariesof Ülker G›da. It produces the wheat flour for specialbiscuits, soy flour, soy semolina, oats paste, special bran,rye flour, barley flour, rice flour, yellow maize flour, oatsflour and white maize flour used by the Ülker Group ofCompanies. Furthermore, it mills, sells and markets non-packaged wheat flour and rice flour to the market. The wheatflour for biscuits is a critical raw material of strategicimportance for our company. As a subsidiary, BirlikPazarlama’s flour milling capabilities provide a vitalcompetitive advantage in terms of both quality of wheatflour and reliable access to flour ingredients. Ülker G›da isthe biggest shareholder of Birlik Pazarlama, holding 99%of shares of the company.
Founded in 1978, Birlik Pazarlama’s principal office wasrelocated to Ankara in 1992. Sharing property with theAnkara factory of Ülker G›da, Birlik Pazarlama operatesthree flour factories; one processing factory for soy, oatsand other cereals; one rice plant in a covered area ofapproximately 24,000 m2 built on a property of 63,032 m2.Birlik Pazarlama also operates a fourth flour factory locatedin the province of Karaman.
The cumulative total wheat grinding capacity is 870 tons/day(of which headquarters facilities account for 700 tons/dayand the Karaman branch accounts for 170 tons/day), 19tons/day of rice processing capacity, 7.5 tons/day of soyprocessing capacity and 2 tons/day of oats processingcapacity. There are 21 vertical steel hoppers, including 13hoppers of 1600 tons and 8 hoppers of 525 tons, and5 horizontal concrete hoppers in Ankara. These hoppershave the raw material storage capacity of 30,280 tons intotal with the storage capacities of 30,000 tons for wheat,200 tons for soy and 80 tons for oats.
As of 2002, Birlik Pazarlama started to produce flour inbags of 1, 2, 4, 5 and 10 kg for use in any kind of pastry work.In 2003, Birlik Pazarlama introduced rice flour in bags of250 and 500 kg for the domestic market. Corn, maize, barley,rye, yellow maize, oats and white maize flour also started tobe produced in 2003. The company works with an average90-100 day wheat stock to meet milling requirements. In2005, a total of 208,786 tons of raw materials, including207,173 tons of wheat, 914 tons of soy and oats and 699 tonsof rice, were processed at Birlik Pazarlama for theÜlker Group of Companies and the domestic market.
Working productively and efficiently, Birlik Pazarlamaperformed exceptionally in 2005 to meet the needs of theÜlker Group of Companies without any interruptions insupply. Birlik Pazarlama continues to make new investmentsinto its facilities and capacity in order to continue providingthe highest quality milled flour products at the mostcompetitive prices.
Birlik Pazarlama, which is accredited TSE-ISO-EN 9000and TSE HACCP TS 13001 Certificates, produced specialflour, called BCAN, as a result of 2005 research anddevelopment activities aiming to reduce the scrap quantityand production period for Canpare biscuits. Furthermore,increased sales of special bran and rice flour resulted fromimprovements in their production processes enabling theproduction of better quality related products.
As of end-2005, a total of 146 personnel were employed atBirlik Pazarlama, including 110 production personnel,30 administrative personnel and 6 technical personnel.
Birlik Pazarlama took 387th place in the general ranking ofthe 500 largest industrial companies in Turkey issued by‹stanbul Chamber of Industry in 2004.
Production SubsidiariesB‹RL‹K PAZARLAMA (B‹RL‹K PAZARLAMA A.fi.)

18
‹deal G›da, a subsidiary of Ülker G›da, was founded in 1997.It started to produce biscuits and wafers actively in 2000 inthe facilities established in the Gebze Organized IndustrialZone, in the Province of Kocaeli. The biggest shareholder of‹deal G›da, which has a branch in the Çatalca Free TradeZone, is Ülker G›da with a holding of 97.5% of the company’sshares. From the date of its founding the company hasexpanded its production capacity with continuous additionalinvestments to the existing machinery park and plants.Capacity-building investments continue while ‹deal G›dacurrently produces biscuits and crackers along six productionlines.
‹deal G›da which operates on covered land of 26,000 m2 onproperty of 85,000 m2 in the Gebze Organized IndustrialZone, took 356th place in the list of Turkey’s 500 largestindustrial companies issued by ‹stanbul Chamber of Industryin 2004. ‹deal G›da is engaged in production for four mainproduct groups for both domestic and international marketsincluding the production of cracker varieties includingsesame, spices, cheese, hot, mini salt, çizi with cheese andplain bar crackers for the cracker biscuits group; Biskremfor the cream biscuits group; Han›meller with nut, Damlaand Negrita for the pastry biscuit group; Pötibör biscuit,cacao biscuit and double dried biscuit for the plain biscuitgroup. Continual production for both the local market andexportation is achieved with machinery and equipment thatis fully automated.
The production capacity of ‹deal G›da changes according tothe product produced, the number of shifts and the specificproduction line. The overall capacity utilization rate hasincreased consistently over the last three years, reaching95.43% in 2005. Capacity utilization has peaked over 100%in some facilities due to overtime work on Sundays. Thedomestic market utilized 68.73% of the existing production
capacity while 26.70% was used for export production.
The quantity of biscuits and crackers production, which was30,654 tons in 2003, reached up to 37,770 tons in 2004 and41,338 tons in 2005. There are 330 people employed at thecompany. The total domestic and international sales volumeof the company grew from 30.622 tons in 2003, to 35,588tons in 2004 and 43,718 tons in 2005. The increase of salesby 23% in correlation with an increase in 2005 productioncapacity, clearly demonstrates the growth trend for thecompany performance. Sales from production during theoperating period were valued at YTL 111,409,806.
Many product trials were carried out at the Research &Development Department of ‹deal G›da in 2005, and six newproducts were introduced to the market. These productsinclude Blue & Green Light bar cracker, 50 and 250 gr. minibar cracker, hot bar cracker, mixed bar crackers for over-bench stands and Clip salty bar crackers. All production linesare in compliance with ISO 9000-2001, HACCP, BRC andIFS certificates and standards.
‹deal G›da, 97.5% of whose shares are owned by Ülker G›da,stated that it would hold a public offering, with the acquiredcapital to be used for capacity-building and new investments.The primary goal of this public offering strategy is to increasemarket share and turnover to meet the production,investment, sales and product development resolutionsagreed upon in the 2005 Shareholder’s General AssemblyMeeting held on February 24, 2006, where it was stated that:
“It is hereby unanimously resolved to fully authorize theBoard of Directors to offer our company to the public, todetermine the agency for this process, to determine theindependent auditors, to make the necessary applicationswith the Capital Markets Board and ‹stanbul Stock Exchangeas well as to make the other applications and to follow up theoverall process.”
Plans for ‹deal G›da to complete its public offering proceduresand be quoted on the ‹SE will proceed in 2006.
GEBZE FACTORY (TON/YEAR)
2004 2005Production 37.770 41.338Sales 35.588 43.718
50.000
37.500
25.000
12.500
0
‹DEAL GIDA (‹DEAL GIDA SANAY‹‹ VE T‹CARET A.fi.)
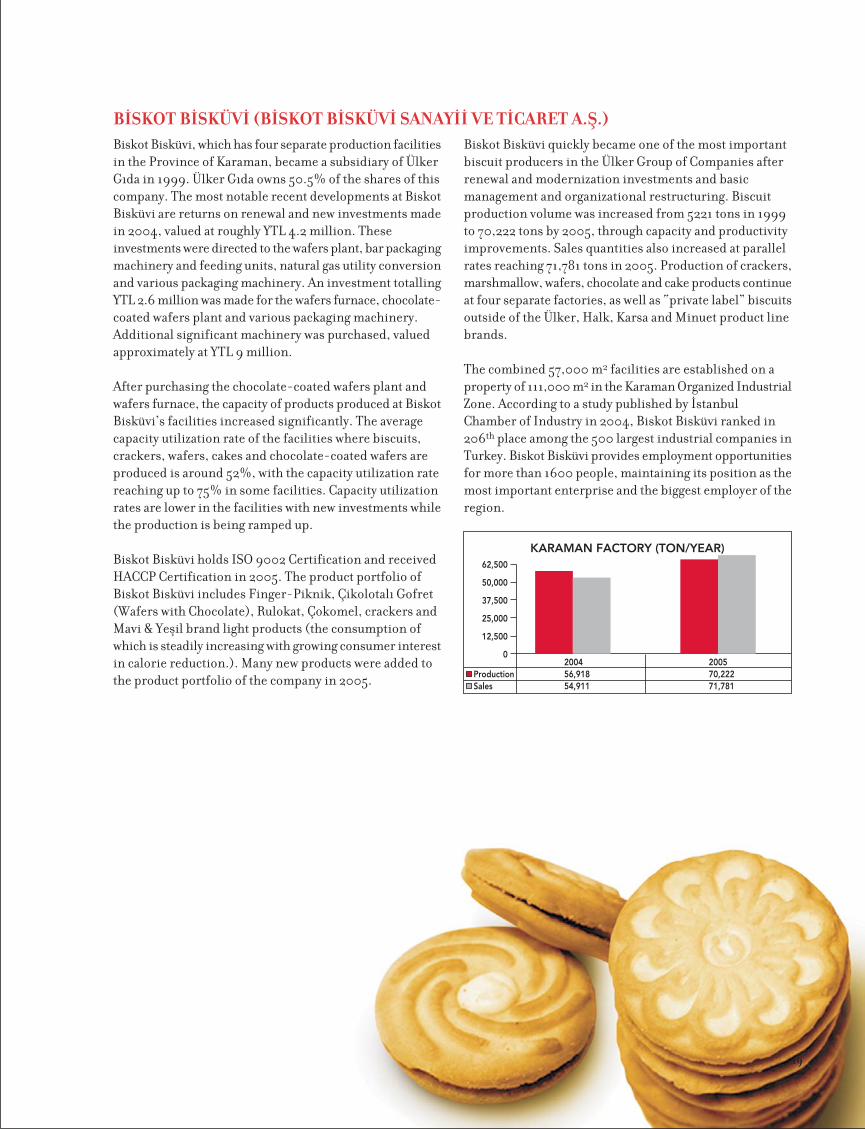
Biskot Bisküvi, which has four separate production facilitiesin the Province of Karaman, became a subsidiary of ÜlkerG›da in 1999. Ülker G›da owns 50.5% of the shares of thiscompany. The most notable recent developments at BiskotBisküvi are returns on renewal and new investments madein 2004, valued at roughly YTL 4.2 million. Theseinvestments were directed to the wafers plant, bar packagingmachinery and feeding units, natural gas utility conversionand various packaging machinery. An investment totallingYTL 2.6 million was made for the wafers furnace, chocolate-coated wafers plant and various packaging machinery.Additional significant machinery was purchased, valuedapproximately at YTL 9 million.
After purchasing the chocolate-coated wafers plant andwafers furnace, the capacity of products produced at BiskotBisküvi’s facilities increased significantly. The averagecapacity utilization rate of the facilities where biscuits,crackers, wafers, cakes and chocolate-coated wafers areproduced is around 52%, with the capacity utilization ratereaching up to 75% in some facilities. Capacity utilizationrates are lower in the facilities with new investments whilethe production is being ramped up.
Biskot Bisküvi holds ISO 9002 Certification and receivedHACCP Certification in 2005. The product portfolio ofBiskot Bisküvi includes Finger-Piknik, Çikolotal› Gofret(Wafers with Chocolate), Rulokat, Çokomel, crackers andMavi & Yeflil brand light products (the consumption ofwhich is steadily increasing with growing consumer interestin calorie reduction.). Many new products were added tothe product portfolio of the company in 2005.
Biskot Bisküvi quickly became one of the most importantbiscuit producers in the Ülker Group of Companies afterrenewal and modernization investments and basicmanagement and organizational restructuring. Biscuitproduction volume was increased from 5221 tons in 1999to 70,222 tons by 2005, through capacity and productivityimprovements. Sales quantities also increased at parallelrates reaching 71,781 tons in 2005. Production of crackers,marshmallow, wafers, chocolate and cake products continueat four separate factories, as well as “private label” biscuitsoutside of the Ülker, Halk, Karsa and Minuet product linebrands.
The combined 57,000 m2 facilities are established on aproperty of 111,000 m2 in the Karaman Organized IndustrialZone. According to a study published by ‹stanbulChamber of Industry in 2004, Biskot Bisküvi ranked in206th place among the 500 largest industrial companies inTurkey. Biskot Bisküvi provides employment opportunitiesfor more than 1600 people, maintaining its position as themost important enterprise and the biggest employer of theregion.
B‹SKOT B‹SKÜV‹ (B‹SKOT B‹SKÜV‹ SANAY‹‹ VE T‹CARET A.fi.)
KARAMAN FACTORY (TON/YEAR)
2004 2005Production 56,918 70,222Sales 54,911 71,781
62,500
50,000
37,500
25,000
12,500
0
19

Ülker G›da Subsidiary Production Capabilities Snapshot
Birlik ‹deal Biskot
Ülker food shares 99.0% 97.5% 50.5%Date of affiliation 1978 1997 1999Location Ankara & Karaman branch Gebze Organized Industrial Zone Karaman Organized
Kocaeli & Çatalca Free Zone Branch Industrial ZoneFacilities 4 flour 6 production lines for 4 main groups: 4 factories
1 soy/oats Cracker biscuits1 rice Cream biscuits
Pastry biscuitsPlain biscuits
Capacity Wheat 870 tons/day Biscuits/crackers 41.338 tons Biscuits 70.222 tonsSoy 7.5 tons/day produced in 2005 at 95.43% capacity produced in 2005Oats 2 tons/dayRice 19 tons/day
Employees Total 146 Total 330 Total 1600+‹stanbul Chamber 2004 387/500 356/500 201/500national rankingCertifications TSE-ISO-EN 9000 ISO 9000-2001 ISO 9002
TES HACCP TS 13001 HACCP HACCPBRCIFS
20

Distribution Subsidiaries‹STANBUL GIDA (‹STANBUL GIDA DIfi T‹CARET A.fi.) &
B‹RLEfi‹K DIfi T‹CARET (B‹RLEfi‹K DIfi T‹CARET A.fi.)
‹stanbul G›da was founded in 1987 to lead the internationalsales and marketing of all products produced by the ÜlkerGroup of Companies. ‹stanbul G›da coordinates the importoperations of the subsidiaries of the Group in addition tomanaging their export activities. ‹stanbul G›da is alsoresponsible for conducting international field research onpotential new markets for Ülker brand products, byleveraging its widespread sale and distribution network.Once a new target market is approved, ‹stanbul G›daestablishes sales and distribution organizations in thosecountries.
Birleflik D›fl Ticaret is a secondary export company foundedby the Ülker Group of Companies in the Tuzla Free TradeZone in 1999, with a branch located in the Atatürk AirportFree Trade Zone.
Ülker G›da, the largest shareholder of ‹stanbul G›da withits holding of 83.8% of shares, is also the primaryshareholder of Birleflik D›fl Ticaret holding 68% of theshares. Both companies are mainly focused on the exportof food products. Principle exports include chocolate andproducts with chocolate, biscuit, wafers, candy and gum.In addition to these products, cake, oil, milk products,liquid drinks, ready soups, raw materials and packagingmaterials are also exported.
These two companies export Ülker products to roughly100 countries including USA, Western Europe, the BalkanRepublics, the Turkic Republics, the Middle East, Africaand Far East countries through strong sales and distributionchannels. An important outcome of these exports is foreigncurrency earnings that contribute significantly both to ourcompany and to the Turkish economy.
21

22
Atlas G›da Pazarlama, one of the strongest companies ofthe Ülker Group of Companies, started its operations in1987. Atlas G›da Pazarlama has become the role model forother marketing companies in the Ülker Group ofCompanies with its efficient, widespread and strongdistribution network in the domestic market. Ülker G›dais the major shareholder of Atlas G›da Pazarlama holding73.5% of the company shares.
Atlas G›da Pazarlama is one of the strongest distributioncompanies in Turkey with its access to most of the salespoints in the retail food sector, across the entire country.Atlas G›da Pazarlama operates its efficient and widespreaddistribution and marketing activities on a national fiveregion basis, with its headquarters in ‹stanbul. The structureof its distribution channels is as follows:
• Distributors: Atlas G›da Pazarlama has 125 primarydistributors each having defined regions and sales points.Distributors market products purchased from Atlas G›daPazarlama by tradesmen or employee placers through theirindependent sales organizations. Initial product deliveryis made to distributor-owned warehouses.
• Chain stores: Atlas G›da Pazarlama sells directly to leadingretail chain stores. Atlas G›da Pazarlama currently sells itsproducts through 17 chain stores.
• Convenience stores (direct shops): Atlas G›da Pazarlamasells directly to selected local shops.
• Placers: There are a total of 398 placers working under thecoordination of Atlas, including 191 placers in ‹stanbul,156 placers in Ankara and 51 placers in ‹zmir. Placerspurchase products from Atlas G›da Pazarlama and sell theseproducts to their defined sales points using vehicles rentedfrom Atlas G›da Pazarlama.
Atlas G›da Pazarlama conducts regular and systematic visits,with a planned and scheduled working system, toapproximately 200,000 sales points throughout Turkeythrough the distribution channels described above.
The selection of marketing and distribution channels alterssignificantly according to the nature of the product. Criteriasuch as shelf-life, promotion and marketing efforts,advertisement strategies and logistic differences are veryimportant for food products, becoming critical successfactors significantly affecting the productivity of marketingand distribution activities. Two primary goals includedeveloping more comprehensive performance - measuring
practices to continuously monitor the activities of thisdistribution network, and expanding product portfoliosacross sales points.
To address these two goals, the marketing and distributionof selected products such as baby food, milk, cacao, cake,chocolate-coated products, candy, gum, cream chocolate,jam, cereal crisp, tea, coffee, powder drinks and batteries,which were previously under the management of Atlas G›daPazarlama have been transferred to Atlantik G›da (AtlantikG›da A.fi., established in the 3rd quarter of 2005).
As of 2005, Atlas G›da Pazarlama, with 73.5% of its sharesheld by Ülker G›da, is now focusing its resources solely onthe distribution of biscuit products under this neworganizational strategy. Not only does Atlas G›da Pazarlamaown 20% of Atlantik G›da, it also provides this new companyaccess to its distribution network and marketing expertise.Within this alliance structure, Atlas has gained the flexibilityto implement different promotion and consumer activitiesfor numerous product categories; provide more focusedattention to the rapidly developing product portfolio; designlogistics and storage strategies on a product basis and tostrengthen its distributor performance assessmentcapabilities.
Based on the success of this model plans will beimplemented in 2006 to assign separate companies tocoordinate the sales and marketing of high-growth productsegments, such as crackers and wafers, both to both reducethe costs of management and to better support sales andcapacity planning activities.
ATLAS GIDA PAZARLAMA (ATLAS GIDA PAZARLAMA SANAY‹‹ VE T‹CARET A.fi.)

Besides the companies mentioned above, other importantaffiliates of Ülker G›da include:
• Besler G›da that produces oil, the main raw material forwafers production• PNS Pendik Niflasta, one of the biggest companies in thecorn and starch sector• Fresh Cake, an international partnership• Datateknik, a computer production and data processingcompany• Sa¤lam GMYO engages in real estate investment andproperty development partnership activities• Tire Kutsan, which is a publicly traded company producingpaper and cardboard boxes• Netlog Logistics, which is involved in transportation andlogistic activities
Selected developments in 2005 related to Ülker G›da’sinvolvement in these companies are briefly described below.
In the meeting held on February 18, 2005 The Board ofDirectors of Ülker G›da resolved to invest YTL 1,500,000,corresponding to 21.43% of the YTL 7,000,000 nominalcapital of Sa¤lam GMYO (Real Estate Investments Trust(REIT)), in Sa¤lam GMYO. REITs are subject to the CapitalMarkets Board regulations and accordingly must go publicwithin a certain amount of time after their incorporation.The incorporation of Sa¤lam GMYO was finalized on October4, 2005, and a resolution to hold the initial public offeringin 2006 was taken by The Board of Directors.
REITs are legally considered to be capital marketcorporations that can invest in real estate and capital marketinstruments based upon real estate assets, real estateprojects, rights based on real estate and other capital marketinstruments, with the inherent authority to establish jointventures in order to realize specific projects. The mainobjectives of REITs in Turkey is to address financingproblems in the real estate sector by providing capitalresources, as well as to make it possible to realize complexreal estate projects that may generate high income byattracting the savings of individual and corporate investorsinto a common pool. The variety of investment instrumentsin Turkey is limited and REITs have been regarded as asound and popular investment tool for investors over thelong term. The participation of Ülker G›da in a publiclytraded REIT increases investor confidence in the long-termprofitability of related projects and benefits Ülker in termsof access to financial resources to pursue such projects.
Golden Logistics (Golden Lojistik Akaryak›t ve Ticaret A.fi.),an affiliate of Ülker G›da, was renamed as Netlog LogisticsServices (Netlog Lojistik Hizmetleri A.fi.) during theShareholders General Assembly Meeting held on April 8,2005. Ülker G›da’s 12.45% shareholding in Golden Lojistikare duly reserved under Netlog Logistics Services. GoldenLogistics resolved to grow within the framework of this neworganization named Netlog, a company dedicated toproviding logistics-related data processing infrastructureand the supply of new vehicles in the field of transport.
The plans to expand business scope in 2005 motivated thedecision to issue new shares with the purpose of increasingshare capital from YTL 2,000,000 to YTL 6,837,607 andwith the goal of attracting new shareholders. Therefore thepre-emptive rights of the existing shareholders to purchasethese new shares was restricted. As a result of the neworganization, Ülker G›da’s participation was reduced from42.56% in Golden Logistics to 12.45% in Netlog Logistics,although the participation value of Ülker G›da remainedthe same. The main objective in the re-organization ofGolden Logistics to Netlog Logistics is to convert logisticsfrom a significant expenditure item into a profitable itemas the company develops a leadership position in theMiddle East and Balkan markets.
Other Subsidiaries and Associates
23

24

Community Involvement
25
The Ülker biscuits, chocolates and crackers business grewout of Sabri Ülker’s belief that simple pleasures make a bigdifference, that everyone has the right to happiness and aconviction that Ülker G›da could help make high qualitytreats affordable and accessible to the public. In many ways,the foundation of Ülker G›da was motivated by altruism.Indeed, Ülker does not only want to be the most recognizedand preferred brand by consumers. Ülker strives to helpcreate, share or celebrate happy moments for consumers.
All of the Ülker Group of Companies support the social andeconomic development of Turkey by investments ininfrastructure and capacity-building through capital grants,project grants and event sponsorships. Each area ofcorporate philanthropy is aligned with goals and objectivesof the related ministries, local government and leadingNGOs. Ülker tends to support initiatives that have a long-term and widespread community benefit or which provideopportunities linked with proven individual leadershippotential.
Education
Every child deserves the right to a happy childhood andeducation.
The Ülker Group of Companies have made grants to buildschools, libraries and computer laboratories. All of thesecorporate donations are rendered pursuant to the laws andpermission of the Ministry of National Education. Someexamples of Ülker’s educational grants include the following:
• Construction of the Ülker Primary School with acapacity of 850 students in Ankara/Pursaklar• Construction of the Ali Ülker Primary School inBayrampafla named after the deceased son of Sabri Ülker• Construction of the Sabri Ülker Primary School with acapacity of 600 students in Batman with gymnasium andscience laboratory, inaugurated on the 75th anniversary ofthe Republic of Turkey• Construction of the Ülker Primary School inAlibeyköy/‹stanbul with laboratory and library• Construction of a dormitory built in Erzurum andtransferred to the Ministry of Education
Ülker also supports initiatives that improve the humanfactor in the education system of the country. Coming frommany cities across the country, 250 schools and 20,000parents, teachers and principals have participated in a threepart seminar series.
Ülker initiated the “Ülker Parents’ School Program” to helpparents communicate with their children and take a moreeffective role in educating them. The program was designedand managed by experts in the fields of psychology andeducation. Subsequently, the “Ülker Teacher ChatsProgram” was initiated under the supervision of specializedacademics. These meetings help teachers understand anddiscuss issues related to their own personal and professionaldevelopment. Finally, the “Ülker Principal Chats Program”was realized with the participation of high level authoritiesin education.

Environment
We celebrate life everyday by protecting the environmentthat sustains us.
Sabri Ülker is one of the founding members of the TEMAFoundation (Turkish Foundation to Prevent Erosionthrough Forestation and the Protection of Natural Habitats).Ülker has contributed and continues to contribute tonumerous TEMA initiatives including the on-going “10 Billion Oaks” tree-planting campaign andsponsorship of the Edirne-Alatl› Village PastureRehabilitation Project initiated in 2003.
Ülker also provides emergency disaster support grants suchas the funding for the construction of 40 prefabricatedbuildings in the ‹zmit region as a response to the urgenthousing need after the devastating 1999 earthquake. Thesehomes were donated to victims who lost their homes.
Health
Health is the cornerstone of prosperity for individuals, forfamilies and for communities.
Ülker makes critical capacity-building grants to supporthealth services in Turkey. Ülker grants include:
• Construction of the operating theatre at the ‹stanbul HasekiHospital• Construction of outpatient wards and additional floorsfor Çapa, Cerrahpafla and many other hospitals• Support for social health schemes• Founding grant and on-going key benefactor support forthe ‹stanbul Child Foundation
Arts & Culture
We respect arts and culture to better understand yesterday,today and tomorrow.
Ülker has traditionally been an important benefactor forTurkish arts and artists, primarily through the support ofpublications prepared and printed by Ülker Publicationsincluding:
• Atatürk'ün Mektup ve Hat›ralar› (Atatürk’s Letters andMemoirs), 2002• Dünyaya Bak›fl (A Perspective on the World), GültekinÇizgen, 2000• Geleneksel "Kaat›" Sanat› (Traditional “Kaat›” Art), MeliheAltay, 2000• Merhaba Basketbol (Hello Basketball), 2000• Ana-Baba Okulu El Kitab› (Parents School Manual), 1999• Depremin Psikolojik Etkilerinden Nas›l Korunuruz? (HowCan We Protect Ourselves from the Psychological Effectsof Earthquakes?), 1999• Çocuklu¤unuzun ‹lk 6 Y›l› (First 6 Years of YourChildhood), Prof. Dr. Haluk Yavuzer, 1998• Türkiye'ye Bak›fl (A Perspective on Turkey), GültekinÇizgen, 1998, published for the 75th anniversary of theRepublic of Turkey
Ülker is also honoured to support artistic activities forpublic access through sponsorships such as:
• The International ‹stanbul Music Festival, coordinatedby the ‹stanbul Culture and Arts Foundation• Ülker Classic Turkish Music Days, hosted annually since2003• Ülker Mozart Days, hosted annually since 2002• Ülker International Puppet Festival, held in ‹stanbul andhosted annually since 2000
26

27
SportsOur favourite view is from the summit!
Ülkerspor is one of the leading professional basketballteams in Turkey, having won three championships, sixPresidency Cups, three Turkish Cups and six Turkish Leaguefinals in its proud history. Ülkerspor was acquired from theNasafl Sports Club in 1993. The team succeeded in reachingthe play-offs in its first year under Ülker management.When Ülkerspor succeeds on the European level, it is a greatsource of pride not only for our company, but also for ourcountry.
The Ülker Group of Companies also sponsors amateurbasketball teams to contribute to the development ofcompetitive athletes, infrastructure and the promotion andrecognition of basketball in Turkey. Examples of Ülkergrants include funding for the construction of athleticfacilities for fiehremini High School and sponsorship ofthe ‹stanbulspor Basketball Team.
The Ülker Group of Companies acted as major sponsors ofBefliktafl, Galatasaray and Fenerbahçe basketball teams in2005. These teams were renamed as Befliktafl Cola Turkaand Galatasaray Café Crown. Cola Turka also became thechest area sponsor of Befliktafl football team’s player outfitsand Café Crown has become the arm area sponsor of theGalatasaray Club. Ülker proudly supports 60 football teamsin Anatolia through such sponsorships of the team colours.
At the individual level, Ülker regularly supports promisingsports figures to represent Turkey, including:
• O¤uzhan Tüzün and Birol Topuz who became worldchampions in their fields of sport (shooting and kick boxrespectively).• Hakan Dinç, the race car driver, who took the second placein the general category in 28th Turkish Rally, held in 1999.• Adem Vazgeçer, the captain of Turkey’s National SkiingTeam, who won the Turkish championship in 2002.
And finally, in addition to promoting basketball as a nationalsport, Ülker is also an avid sponsor of yachting in Turkey.Turkey’s expansive coastline and growing tourism industrymakes yachting a promising tool for economic development.
28
Other Administrative NoticesA Mass Employment Contract for the period January 1, 2005 to December 31, 2005 was signed with the Öz G›da TradeUnion in January 2004. The outstanding severance and notice pay of Ülker G›da total YTL 4,817,629, includingYTL 2,245,338 for the ‹stanbul Topkap› factory and YTL 2,572,291 for the Ankara factory, as of December 31, 2005.
The total number of employees working at Ülker G›da was 1 347 as of the end of 2005, including 463 workers in the‹stanbul Topkap› factory and 884 workers in Ankara factory.
During the 2005 operating period, the Managing Director and the Accounting Manager of Ülker G›da were changed.Ali Ülker was appointed as the Managing Director of Ülker G›da and ‹lhan Turan Usta became the Accounting Managerof the company.
At the board meeting no 457, held on 04.04.2006, it was resolved to distribute dividends in cash against Dividend CouponsNo: 3 for the founding shares and Dividend Coupons 2005 for the Group A, B, C and D shares. The profit distribution wasresolved based on the CMB Decree 7/242, dated 25 February 2005, related to 2005 profit distribution and the consolidatedincome statement which was subject to independent audit in accordance with Communiqués Serial XI,No: 25 of CMB.
Subsequently, it was resolved to propose to our shareholders in the ordinary Shareholders’ General Assembly meetingto distribute dividends in cash at the gross and net amounts of 27,176,100 and 24,458,490 respectively. Based on the 31st
article, related to profit distribution of our Article of Incorporation, the gross amount of YTL 21,000,000 (net YTL18,900,000) of dividends to the ordinary shares, gross amount of YTL 3,706,500 (net YTL 3,335,850) of dividends toGroup A and B shares, and the gross amount of YTL 2,469,600 (net YTL 2,222,640) of dividends to the founding shareswould be proposed for distribution. Dividend distribution per ordinary shares with a nominal value of 1 YTL would amountto gross YTL 0.08711 (8.711%) and net YTL 0.07838 (7.839%).
The Profit Distribution Proposal

We have reviewed the accounts and transactions of ÜLKER GIDA SANAY‹ VE T‹CARET A.fi. for period 01/01/2005 -31/12/2005 in compliance with the Turkish Commercial Law, Articles of Incorporation and generally accepted accountancyprinciples and standards under the other relevant legislation.
In our opinion, the annexed balance sheet dated 31/12/2005, of which we have recognized the contents, reflects thefinancial status of the cited company while the income statement for 01/01/2005 - 31/12/2005 reflects the results ofactivities in the mentioned period accurately and correctly, and the profit is in compliance with the laws and articles ofincorporation for partnership before the distribution of profit.
In conclusion, we hereby kindly request you to consider and vote for approving the balance sheet and income statementand discharging the Board of Directors.
Auditor Auditor AuditorAtaman YILDIZ Nurettin AZ‹Z Yalç›n ÖNER
The Auditors’ Report
* Title : ÜLKER GIDA SANAY‹ VE T‹CARET A.fi.* Principal Office : ‹STANBUL* Capital : YTL 241,087,000* Field of Activity : Production of biscuits, chocolate coated products and wafers.
Companies:
Names and surnames of the auditor(s), : Ataman YILDIZ, Nurettin AZ‹Z, Yalç›n ÖNERterms of offices, whether they are Their term of office is 1 year.shareholders or personnel of company The auditors are neither shareholders nor personnel of the company.
Number of meetings of Board of Directors : Participated in meetings of Board of Directors 4 times and meetings ofparticipated and Meetings of Board of Board of Auditors were held every month in 2005.Auditors held
Scope, dates and conclusion of reviews : The accounts, books and documents of company were duly reviewed atconducted on the shareholder accounts, the end of every month and it has been revealed that the essential booksbooks and documents have been kept and the company has complied with the provisions of
Articles of Incorporation and Turkish Commercial Law in its book-keeping.
Dates and results of counts at company : The pay desk of company was audited at the end of every month inpay desk as per item 4 of par. 1 of 2005 and it has been revealed that the counts are in compliance with the Art. 353 of Turkish Commercial Law cash accounts.
Dates and results of reviews as per item 4 of : The essential reviews were conducted at the end of every month and thepar. 1 of Art. 353 of Turkish Commercial Law securities and negotiable instruments have been revealed in accordance
with the records and other duties assigned to the auditors in the other paragraphs of the same article have been fulfilled.
Complaints and corruptions received and : We haven’t received any written or verbal complaint and corruptionthe related actions taken: during our term of office.
29
30
1. Declaration of Compliance with Corporate Governance
Principles
Our company takes utmost care to implement the CorporateGovernance Principles published by the Capital MarketsBoard (CMB). Please find below the evaluations and findingsof our Company in respect to the level of compliance with theCorporate Governance Principle, as well as its opinions onimproving the level of compliance in terms of scope andnature.
SECTION I - SHAREHOLDERS
2. The Investor Relations Unit
Relations with the shareholders are undertaken by Mr. ErdalAtak and Ms. Fatma Gül Yücelay who report to the Departmentof Financial Affairs. The said persons not only reply to theapplications in writing or via Internet made by ourshareholders, but also ensure written correspondences with‹stanbul Stock Exchange, Capital Markets Board andTakasbank.
3. Shareholders’ Right to Obtain Information
The written or verbal information requests sent by ourshareholders in the period have been answered with theexception of information considered confidential or a tradesecret. All information which is necessary for the shareholdersto exercise their right is provided in our annual reports,publicly disclosed information, and through individualrequests. In addition, all information of interest toshareholders is made available to our shareholders on ourwebsite at: www.ulker.com.tr/ulkerportal/kurumsal/
yatirimci_iliskileri/ulker/
4. The General Shareholders’ Meeting
One General Shareholders’ Meeting was held in 2005, whichwas the Ordinary General Shareholders’ Meeting of the yearof 2004 held on 16.05.2005. The said meeting was held withapproximately 74% attendance. The meeting was notparticipated in by any stakeholders or the media.
The invitation to the General Shareholders’ meetingcontaining the venue, date, time, agenda of the meeting andthe proxy forms were made through announcement in TurkishTrade Registers Gazette No: 6292 dd. 28 April 2005 andeditions dd. 26 April 2005 of Dünya and Referans Newspapers,that are published on a daily basis, posted on the Internetwebsite and sent via registered and prepaid letters to theshareholders addressed by name and in a way to include the
agenda as stipulated in the law and articles of incorporation.
The annual report, the financial statements and reports, profitdistribution proposals, information document prepared inrelation to the items on the agenda of the GeneralShareholders’ meeting, other documents constituting thebasis for the items of the agenda as well as the latest versionof the articles of incorporation and the amendment text, andgrounds thereof for any proposed amendment to the articlesof incorporation are made available to our shareholders forreview at the company headquarters and branches of ourcompany as from the date of announcement for invitation tothe general meeting.
5. Voting Rights and Minority Rights
Every share has one voting right as per our articles ofincorporation.
Capital of our company consists of group (A), (B), (C) and(D) shares. Four Members of the Board of Directors can beelected among the candidates nominated by the absolutemajority of the Group (A) shareholders, and one member canbe elected among the candidates nominated by absolutemajority of group (D) shareholders, and the other shareholdercan be elected among the candidates to be designatedaccording to the general provisions. There are no cases ofcross ownership associated with a controlling relationshipbetween any of our shareholders and our company.
There are no provisions in our Articles of Incorporationpreventing non-holders to vote by proxy as an appointedrepresentative.
6. Profit Distribution Policy and Timing
Within the scope of the Corporate Governance Principles setforth by the CMB, our Board of Directors has adopted thedividend distribution policy mentioned below as the profitdistribution policy to be proposed to the GeneralShareholders’ meetings.
Accordingly, our company has adopted the principle ofdetermining the amount of dividend, being not less than therate and amount fixed by the CMB, and distributing it withinthe legal periods designated by CMB according to theresolution taken in the General Shareholders’ meeting withinthe framework of the Turkish Commercial Code, CMBregulations and provisions laid down in our Articles ofIncorporation.
Corporate Governance Compliance Report

31
The profit distribution proposals made by our Board ofDirectors in the General Shareholders’ meeting aredetermined in view of the sensitive balance between theexpectations of our shareholders and the requirement ofour company to grow in consideration of the prevailingeconomic conditions of the country and the sector of ourcompany.
The dividend distribution may be paid out in full as cashand/or as a bonus issue, and the A and B Group shares andfounder shares have privileges in receiving dividends fromthe profit at the rates laid down in our Articles ofIncorporation. Furthermore, there is the practice of payingperformance-based bonuses to employees according to ourArticles of Incorporation.
Finally, there is also a provision regarding payment ofadvance dividends in our Articles of Incorporation, althoughthis option has never been exercised to date.
7. Transfer of Shares
There are provisions regarding transfer of shares writtento names in Article 10 of our Articles of Incorporation.According to the said article, the shares written to namescan be transferred in principle. The transfer shall beeffective from delivery of share to the transferee and officialregistration of the share transfer as such. The companyreserves the right to denounce registering the transfer intothe share book without indicating any grounds.
SECTION II - PUBLIC DISCLOSURE AND
TRANSPARENCY
8. Company Disclosure Policy
It has been adopted as a basic principle to make available,upon request, any kind of information which is not generallyavailable to the public in the shortest period possible. Inaddition, if the shareholders request any information,Mr. Erdal Atak and Ms. Fatma Gül Yücelay, who report tothe Finance Department, are duly authorized to provideinformation in written or verbal format. In the event ofdevelopments of importance requiring publicizing withinthe year, the essential special event announcements aremade in a timely manner. Our detailed Annual Report isprepared annually to ensure public access to any informationregarding the activities of the company.
9. Special Event Announcements
In 2004, 34 special event announcements were made byour company pursuant to CMB regulations. Additional
explanations and announcements were requested by CMBin reference to the special event regarding the sale of realestate to our subsidiary ‹deal G›da A.fi. in 2005, and thenecessary information was provided. To date all requestsfor special event announcements have always been madein a timely manner.
10. Company Website and Content
All data related to informing shareholders in relation toour activities is available at our company website:www.ulker.com.tr. The website contains the detailedinformation on corporate identity, the latest edition of ourArticles of Incorporation, special event announcements,annual reports, periodic financial statements and reports,agendas regarding general shareholders’ meetings, list ofparticipants, meeting minutes and forms to be used forexercising votes by proxy.
11. Public Disclosure of Ultimate Controlling Individual
Shareholder(s)
Our company does not have any ultimate controllingindividual shareholder. Our shareholding structure isprovided in our annual report.
12. Disclosure of Individuals with Access to Insider
Information
All essential precautions have been taken to prevent use ofinsider information by the executives of our company inany manner that could affect the value of capital marketinstruments as well as the transactions with third partiesfrom which it procures services. All executives are publiclylisted in our annual report.
SECTION III - STAKEHOLDERS
13. Disclosure to Stakeholders
In the event that the rights of stakeholders are not regulatedin legislation or by contract, the interests of these partiesshall be protected within the framework of the rules ofgoodwill and by safeguarding the prestige of our companyto the extent permitted by the possibilities andcapabilities of our company.
14. Participation of Stakeholders in Management
The Board of Directors consists of 6 members as per ourArticles of Incorporation. These members are elected uponproposals of various shareholders according to theprovisions provided in the Articles of Incorporation.

28
15. Human Resources Policy
The fundamental policy of human resources is to establisha team with the potential for high performance who will beprovided with on-going professional and personaldevelopment opportunities related to the requirements ofeach role and the organization as a whole. The humanresources policies adopted by our company are also appliedto all of the companies within the Ülker Group. Thesepolicies are available on our website at: www.ulker.com.tr
16. Information Regarding Customer and Supplier
Relations
Our company observes continuity of service quality andstandards at all stages of production. Utmost care is takento maintain the confidentiality of information provided bycustomers and/or suppliers within the scope of bestbusiness practices.
17. Social Responsibility
A summary of our social responsibility activities areprovided in our annual report as well as on our website at:www.ulker.com.tr
SECTION IV - BOARD OF DIRECTORS
18. The Structure, Formation of the Board of Directors
and Independent Members
The members of the Board of Directors and their positionsare given below:
Name - Surname Title
Sabri ÜLKER Chairman of the BoardMurat ÜLKER Vice Chairman of the BoardOrhan ÖZOKUR MemberAli ÜLKER Member and Managing DirectorHilmi DURMAZ MemberNecdet BUZBAfi Member
There are no independent members in the Board ofDirectors.
19. Qualifications of the Members of the Board
The basic qualifications required for election as a memberof our Board of Directors meet CMB Corporate GovernancePrinciples Section IV, articles 3.1.1., 3.1.2. and 3.1.5. Thereisn’t an additional separate provision regarding theminimum qualifications required for the election ofmembers in our Articles of Incorporation. Our Board ofDirectors consists of 6 members to ensure efficientorganization of the activities of the Board of Directors.
20. Mission and Vision of the Company and Strategic
Objectives
Our company and all of the companies within the ÜlkerGroup have been founded with the belief that “every personis entitled to have a happy childhood no matter whichcountry she or he may live in.” The Ülker brand was foundedwith the dream of achieving this vision 61 years ago. Thisconviction guides our path, emerging from the dream topresent the simple pleasures enjoyed by children indeveloped nations to Turkish people, as well as to the restof the world. Quality, accessibility, affordability and varietyare our main critical success factors. A significant portionof our net profits are always reinvested into building abusiness model and brands that are full of innovationssupporting our strategy to deliver small pleasures that makea big difference. One of our main goals is to ensure that thelegacy of our name in society is associated with great taste,good health and balanced nutrition. The extended visionand mission of our companies are available at:www.ulker.com.tr
21. Risk Management and Internal Control Mechanism
Activities regarding risk management are carried out by aformal Audit Steering Committee within the scope ofInternal Control Regulation. Furthermore, our company isregularly audited by internal audit units of Y›ld›z Holding,the main partner of our company and by independentauditing companies. They submit the findings of their auditsto the members of the Audit Steering Committee and relatedmembers of the Board of Directors. Business flows,procedures, authorities and responsibilities of ouremployees are subject to constant supervision within theframework of risk management.
22. Authorities and Responsibilities of the Board of
Directors and Management
The authority and responsibilities of the Board of Directorsand Executives are clearly set forth in the Articles ofIncorporation available at: www.ulker.com.tr. Our Boardof Directors exercises its powers with consideration of allrelevant information, prudently and within the frameworkof rules of goodwill to ensure the complete fulfillment oftheir duties.
32

33
23. Principles of Activity of Board of Directors
Our Board of Directors conducted 34 meetings in 2005.Utmost care is taken to determine meeting schedules toaccommodate the attendance of all members. Our Board ofDirectors meets regularly, at least once a month andirrespective of the pre-scheduled meetings in cases whereit is deemed necessary.
24. Prohibition on Conducting Business and Competing
with the Company
Members of our Board of Directors do not conduct anytransactions or activities that may be within the scope ofprohibited endeavours and/or in competition with ourcompany. In the event that a potential conflict of interestwould arise, permission would be required by majority voteof shareholders at the Shareholders’ General Assemblymeeting.
25. Ethical Rules
Ülker G›da, and all the companies of the Ülker Group, arededicated to producing quality and healthy food products,respecting employees, protecting the rights of shareholders,suppliers and customers, and honouring the rule of law.The Ülker Group of Companies consciously strives tocontribute to the development of society and work withinthe values of society. The social responsibility of Ülker
includes all of its stakeholder group, its products, processesand performance. All Ülker companies have adoptedmanagement principles based on the highest regard for itsexecutives, employees, suppliers and customers. The valuesof cooperation, high working performance, honesty,consistency, respect, confidence, responsibility andcontinuous improvement are integrated into everydayoperations. The ethical policies adopted by the ÜlkerGroup of Companies are available at for public reference.
26. The Number, Structure and Independence of
Committees Formed by the Board of Directors
Mr. Hilmi Durmaz and Mr. Necdet Buzbafl have beenassigned as members of the Audit Steering Committee asper Communiqué Serial: X, No: 16 of CMB from within ourBoard of Directors.
27. Financial Benefits Granted to the Board of Directors
The wages of the members of Board of Directors aredetermined separately for each post according to thefinancial status of the company at the General Shareholders’meeting. It has been resolved to pay monthly gross wagesat the amount of the national minimum wage for 1 monthon the date when the wage accrues for each of the membersof Board of Directors in 2005, pursuant to the resolutiontaken in the General Shareholders’ meeting.
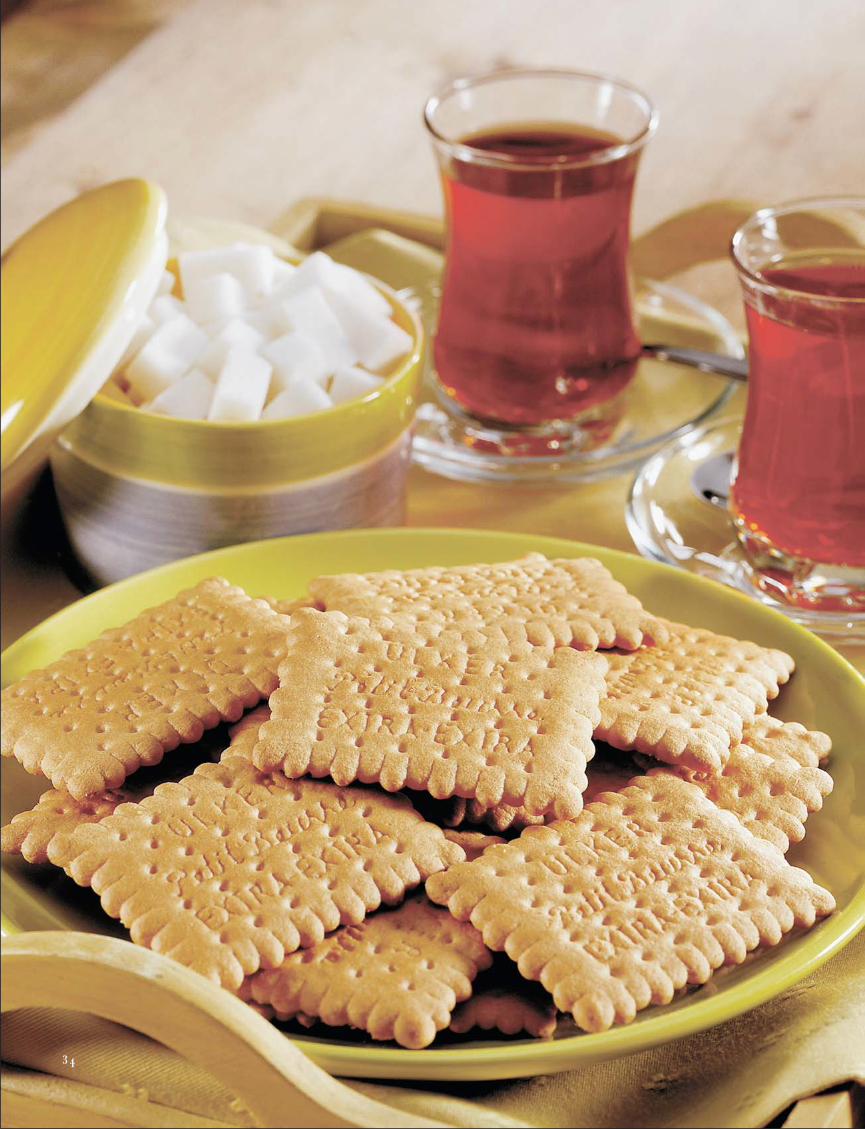
3 4

35
ÜLKER GIDA SANAY‹ VE T‹CARET A.fi.AND ITS SUBSIDIARIES
CONSOLIDATED FINANCIAL STATEMENTSFOR THE PERIOD BETWEEN
1 JANUARY 2005 AND 31 DECEMBER 2005WITH
INDEPENDENT AUDITORS’ REPORT
TABLE OF CONTENTS PAGE
AUDITORS’ REPORT 1CONSOLIDATED BALANCE SHEETS 2-3CONSOLIDATED INCOME STATEMENT….. 4CONSOLIDATED CASH FLOW STATEMENT….. 5CONSOLIDATED STATEMENT OF CHANGES IN SHAREHOLDERS’ EQUITY 6NOTES TO THE CONSOLIDATED FINANCIAL STATEMENTS 7-54NOTE 1 ORGANISATION AND NATURE OF OPERATIONS 7-8NOTE 2 BASIS OF PRESENTATION OF FINANCIAL STATEMENTS 8-12NOTE 3 SUMMARY OF SIGNIFICANT ACCOUNTING POLICIES 12-19NOTE 4 CASH AND CASH EQUIVALENTS 19-20NOTE 5 MARKETABLE SECURITIES 20NOTE 6 FINANCIAL LIABILITIES 20-21NOTE 7 TRADE RECEIVABLES AND PAYABLES 21-22NOTE 8 FINANCE LEASE RECEIVABLES AND PAYABLES 22-23NOTE 9 BALANCES AND TRANSACTIONS WITH RELATED PARTIES 23-28NOTE 10 OTHER RECEIVABLES AND PAYABLES 28-29NOTE 11 BIOLOGICAL ASSETS 29NOTE 12 INVENTORIES 29NOTE 13 RECEIVABLES FROM ONGOING CONSTRUCTION PROJECTS 29NOTE 14 DEFERRED TAX ASSETS AND LIABILITIES 30NOTE 15 OTHER CURRENT/NON-CURRENT ASSETS AND LIABILITIES 30-31NOTE 16 FINANCIAL ASSETS 31-32NOTE 17 POSITIVE / NEGATIVE GOODW‹LL 32NOTE 18 INVESTMENT PROPERTY 32NOTE 19 PROPERTY, PLANT AND EQUIPMENT 33-34NOTE 20 INTANGIBLE FIXED ASSETS 34-35NOTE 21 ADVANCES RECEIVED 35NOTE 22 EMPLOYEE PENSION PLANS 35NOTE 23 PROVISIONS 35-36NOTE 24 MINORITY INTEREST 36NOTE 25 SHARE CAPITAL/ADJUSTMENTS TO SHARE CAPITAL 37NOTE 26 CAPITAL RESERVES 37-38NOTE 27 PROFIT RESERVES 38NOTE 28 RETAINED EARNINGS / ACCUMULATED (DEFICIT) 39-40NOTE 29 FOREIGN CURRENCY POSITION 40-42NOTE 30 GOVERNMENT INCENTIVES 43NOTE 31 PROVISIONS, CONTINGENT ASSETS AND LIABILITIES 43-45NOTE 32 MERGERS AND ACQUISITIONS 45NOTE 33 SEGMENT REPORTING 46NOTE 34 SUBSEQUENT EVENTS 47NOTE 35 DISCONTINUED OPERATIONS 47NOTE 36 OPERATING INCOME 47NOTE 37 OPERATING EXPENSES 47-48NOTE 38 OTHER OPERATING INCOME AND EXPENSES 49-50NOTE 39 FINANCE EXPENSES 50NOTE 40 NET MONETARY GAIN/LOSS 50NOTE 41 TAXATION 51NOTE 42 EARNINGS PER SHARE 52NOTE 43 CASH FLOW STATEMENT 53NOTE 44 OTHER ISSUES TO BE DISCLOSED 53NOTE 45 ELIMINATED ITEMS DURING CONSOLIDATION PROCESS 54
36

To the Board of Directors;
We have audited the accompanying consolidated balance sheet of Ülker G›da Sanayive Ticaret A.fi. (the Company) as of December 31, 2005 and the related consolidatedincome statement for the period then ended. Our examination was made in accordancewith the auditing principles, bases and standards issued by the Capital Market Board(CMB) and accordingly included examination of accounting records related to accountsand transactions and other auditing techniques we considered necessary.
Communiqué No XI-25 (“Communiqué”) has taken effect from the first interim financialstatements as of 1 January 2005 and in accordance with Article 717 that Communiqué,the Company has not prepared consolidated statements of income, changes inshareholders’ equity and cash flow as of 31 December 2005 in comparison with that of31 December 2004. For the purpose of comparison with consolidated financialstatement of 31 December 2005, the Company has presented financial statement of31 December 2004 and related notes in accordance with above mentioned article.
In our opinion, the consolidated financial statements, present fairly, in all materialrespects, the financial position and cash flows of Ülker G›da Sanayi ve Ticaret A.fi. asof December 31, 2005 and the results of its operations for the year then ended inaccordance with the rules and principles as explained in “Communiqué Related toAccounting Principles on Capital Markets” No XI-25 issued by CMB.
‹stanbul, 30 March 2006
KAP‹TAL YEM‹NL‹ MAL‹ MÜfiAV‹RL‹K A.fi.Correspondent Firm of RSM International
Celal PamukçuPartner in Charge
INDEPENDENT AUDITORS’ REPORT OFÜLKER GIDA SANAY‹ VE T‹CARET A.fi. AND ITS SUBSIDIARIES
FOR THE PERIOD BETWEEN 1 JANUARY 2005 AND 31 DECEMBER 2005
37

ÜLKER GIDA SANAY‹ VE T‹CARET ANON‹M fi‹RKET‹CONSOLIDATED BALANCE SHEET AS OF DECEMBER 31, 2005
(Amounts expressed in New Turkish Liras (YTL))
Notes DECEMBER 31, 2005 DECEMBER 31, 2004ASSETS
Current Assets:Cash and Cash Equivalents Note 4 179,774,019 104,199,148Marketable Securities (net) Note 5 9,995,888 48,123,004Trade Receivables (net) Note 7 215,289,304 150,179,716Finance Lease Receivables (net) 0 0Receivables from Related Parties (net) Note 9 143,798,817 104,051,467Other Receivables (net) Note 10 12,990,004 11,750,670Biological Assets (net) 0 0Inventories (net) Note 12 131,564,869 192,348,268Receivables from Ongoing Construction Projects (net) 0 0Deferred Tax Assets 0 0Other Current Assets Note 15 40,334,791 25,055,305Total Current Assets 733,747,692 635,707,578
Noncurrent Assets:Trade Receivables (net) Note 7 45,302 58,066Finance Lease Receivables (net) 0 0Receivables from Related Parties (net) 0 0Other Receivables (net) 0 0Financial Assets (net) Note 16 56,213,527 56,623,579Positive Goodwill (net) Note 17 115,084,884 118,191,872Investment Property (net) 0 0Property, Plant and Equipment (net) Note 19 300,397,620 313,926,089Intangible Fixed Assets (Net) Note 20 13,686,437 16,349,407Other Noncurrent Assets Note 15 6,588 558,568Total Noncurrent Assets 485,434,358 505,707,581TOTAL ASSETS 1,219,182,050 1,141,415,159
38

ÜLKER GIDA SANAY‹ VE T‹CARET ANON‹M fi‹RKET‹CONSOLIDATED BALANCE SHEET AS OF DECEMBER 31, 2005
(Amounts expressed in New Turkish Liras (YTL))
Notes December 31, 2005 December 31, 2004
LIABILITIES AND SHAREHOLDERS EQUITY
Current LiabilitiesShort Term Bank Borrowings Note 6 255,198,053 250,285,303Finance Lease Payables (net) Note 8 40,744,650 20,295,010Other Financial Liabilities 0 0Trade Payables (net) Note 7 56,059,019 90,077,828Due to Related Parties (net) Note 9 126,947,616 108,594,885Advances Received Note 21 3,862,867 4,624,479Ongoing Construction Projects Payments (net) 0 0Provisions Note 23 41,861,774 24,702,858Deferred Tax Liabilities Note 14 46,964,965 48,028,340Other Current Liabilities (net) Note 10 11,596,321 15,191,636Total Current Liabilities 583,235,264 561,800,339
Noncurrent Liabilities:Long Term Bank Borrowings Note 6 11,112,500 20,390,457Finance Lease Payables (net) Note 8 20,799,785 28,348,756Other Financial Liabilities (net) 0 0Trade Payables (net) Note 7 889,238 628,398Due to Related Parties (net) 0 0Advances Received 0 0Provisions Note 23 6,175,362 6,428,830Other Noncurrent Liabilities (net) Note 10 112,685 1,646,109Total Noncurrent Liabilities 39,089,570 57,442,550TOTAL LIABILITIES 622,324,834 619,242,889
Minority Interest 42,369,727 36,649,682
SHAREHOLDERS EQUITY
Share Capital Note 25 241,087,000 238,700,000Capital Reserves Note 26 158,478,250 161,423,832Share Premium 0 0Revaluation Surplus on Stock Exchange 4,317,597 6,997,243Revaluation Differences on Associates 7,896,188 7,896,188Inflation Adjustment on Equity Items 146,264,465 146,530,401Profit Reserves Note 27 52,939,219 9,089,473Legal Reserves 7,889,131 4,523,966Other Reserves 3,858,862 0Extraordinary Reserves 14,554,258 4,565,507Profit from Immovable Sales Added to Share Capital 26,636,968 0Net Income/Loss 66,226,253 55,646,845Retained Earning/Accumulated (deficit) Note 28 35,756,767 20,662,438Total Shareholders Equity 554,487,489 485,522,588TOTAL LIABILITIES AND SHAREHOLDERS EQUITY 1,219,182,050 1,141,415,159
39

ÜLKER GIDA SANAY‹ VE T‹CARET ANON‹M fi‹RKET‹FOR THE PERIOD BETWEEN JANUARY, 01 - DECEMBER 31, 2005
(Amounts expressed in New Turkish Liras (YTL))
January 01 - October 01 -Notes December 31, 2005 December 31, 2005
OPERATING INCOMESales (net) Note 36 1,294,733,151 388,391,539Cost of Sales ( ) Note 36 (1,049,363,328) (311,566,456)Service Income 0 0Other Operating Income 64,156,259 2,021,656
GROSS OPERATING PROFIT/(LOSS) 309,526,082 78,846,739Operating Expenses ( ) Note 37 (205,197,866) (56,508,815)
NET OPERATING PROFIT/(LOSS) 104,328,216 22,337,924Income from Other Operations Note 38 100,179,821 13,933,594Expenses from Other Operations ( ) Note 38 (46,859,967) (668,666)Finance Expenses ( ) Note 39 (44,373,978) (9,751,295)
OPERATING PROFIT/(LOSS) 113,274,092 25,851,557
MINORITY INTEREST Note 24 (14,294,634) (3,919,988)
INCOME/LOSS BEFORE TAX 98,979,458 21,931,569
TAXATION (32,753,205) (11,105,816)Current Period Tax Provision Note 41 (33,816,580) (7,310,011)Deferred Tax Provision Note 14 1,063,375 3,795,805
NET INCOME/(LOSS) 66,226,253 10,825,753
EARNINGS PER SHARE Note 28 0,00275 0.00045
The accompanying explanatory notes form an integral part of the consolidated financial statements.
40

ÜLKER GIDA SANAY‹ VE T‹CARET ANON‹M fi‹RKET‹CONSOLIDATED CASH FLOW STATEMENT FOR THE PERIOD BETWEEN
JANUARY 01 - DECEMBER 31, 2005 (Amounts expressed in New Turkish Liras (YTL))
JANUARY 01-DECEMBER 31, 2005NET CURRENT PROFIT/(LOSS) 66,226,253
Adjustments 74,533,6031 Depreciation and Amortization (+) 39,097,5342 Changes in Provisions (+) 31,118,9023 Interest Expenses (+) 4,317,167
NET CASH PRIOR TO CHANGES IN ASSETS AND LIABILITIES 140,759,856
Changes in Assets and Liabilities (82,147,5801 Change in Trade Receivables ( ) (65,109,588)2 Change in Receivables from Related Parties ( ) (39,747,350)3 Change in Marketable Securities (+) 38,127,1164 Change in Other Receivables ( ) (1,239,334)5 Change in Other Assets (+) 46,068,6576 Change in Payables to Related Parties (+) 18,352,7317 Change in Trade Payables (+) (33,757,972)8 Change in Other Payables (+) 543,4999 Prepaid Taxes (19,593,996)10 Prepaid Dividends (25,882,000)11 Cash Arising from Increase in Share Capital 90,657
NET CASH PROVIDED BY OPERATING ACTIVITIES 58,612,276
Net Cash Stemmed from Investment Activities 8,427,1341 Purchase of Property, Plant and Equipment ( ) (61,393,646)2 Sales of Property, Plant and Equipment (+) 69,820,780
Net Cash Stemmed from Financing Activities 8,535,462
INCREASE/DECREASE IN CASH AND CASH EQUIVALENTS 75,574,871
CASH AND CASH EQUIVALENTS AT THE BEGINNING OF THE YEAR 104,199,148
CASH AND CASH EQUIVALENTS AT THE END OF THE YEAR 179,774,019
41

42
ÜLK
ER
GID
A S
AN
AY
‹ VE
T‹C
AR
ET
AN
ON
‹M fi
‹RK
ET‹
CO
NSO
LID
ATE
D S
TATE
ME
NT
OF
CH
AN
GE
S IN
SH
AR
EH
OLD
ER
S’ E
QU
ITY
FO
R T
HE
PE
RIO
D E
ND
ED
DE
CE
MB
ER
31, 2005
(Am
ount
s ex
pre
ssed
in N
ew T
urki
sh L
iras
(YTL
))
Rev
alua
tion
Infla
tion
Rev
alua
tion
Prof
it f
rom
Ret
aine
dSu
rplu
s on
Ad
just
men
tsD
iffer
ence
sIm
mov
able
Net
Cur
rent
Ear
ning
s/Sh
are
Stoc
kon
Eq
uity
on E
qui
tyLe
gal
Extr
aord
inar
ySa
les
Ad
ded
To
Oth
erPr
ofit
Acu
mul
ated
Cap
ital
Exc
hang
eIt
ems
Item
sR
eser
ves
Res
erve
sSh
are
Cap
ital
Res
erve
s/(
Loss
)D
efic
it)
Tota
l
As
of D
ecem
ber
31,
200
423
8,70
0,00
06,
997,
243
146,
530,
401
7,89
6,18
84,
523,
966
4,56
5,50
7-
-55
,646
,845
20,6
62,4
3848
5,52
2,58
8
Cas
h In
crea
se in
Sha
re C
apita
l-
--
--
--
--
--
Tran
sfer
s2,
296,
343
--
--
(173
,393
)-
-(5
5,64
6,84
5)59
,523
,895
-
Tran
sfer
s to
Res
erve
s fro
mRe
tain
ed E
arni
ngs
--
--
3,36
5,16
510
,162
,144
--
-(1
3,52
7,30
9)-
Reva
luat
ion
Surp
lus
on S
tock
Exc
hang
e-
(2,6
79,6
46)
--
--
--
--
(2,6
79,6
46)
Inte
rest
of S
hare
hold
ers
Excl
uded
from
Con
solid
atio
n-
-(2
65,9
36)
--
--
--
194,
244
(71,
692)
Reva
luat
ion
Fund
on
Fixe
d A
sset
s90
,657
--
--
-26
,636
,968
3,85
8,86
2-
-(3
0,58
6,48
7)
Div
iden
d Pa
ymen
t-
--
--
--
--
(25,
882,
000)
(25,
882,
000)
Oth
er (*
)-
--
--
--
--
785,
501
785,
501
Net
Cur
rent
Per
iod
Prof
it/(L
oss)
--
--
--
--
66,2
26,2
53-
66,2
26,2
53
As
of D
ecem
ber
31,
200
524
1,08
7,00
04,
317,
597
146,
264,
465
7,89
6,18
87,
889,
131
14,5
54,2
5826
,636
,968
3,85
8,86
266
,226
,253
35,7
56,7
6755
4,48
7,48
9
Oth
er (*
): Ta
x pr
ovis
ion
calc
ulat
ed in
inde
pend
ent a
udit
repo
rt o
f 31
Dec
embe
r 200
4 w
as b
ased
on
prov
isio
ns d
eriv
ed fr
om p
repa
id ta
x re
turn
s of
the
grou
p co
mpa
nies
.To
tal a
mou
nt o
f cor
pora
tion
tax
is Y
TL 7
85,5
01 le
ss th
an ta
x lia
bilit
ies
of a
ll gr
oup
com
pani
es.

43
ÜLKER GIDA SANAY‹ VE T‹CARET ANON‹M fi‹RKET‹ ANDITS SUBSIDIARIES NOTES TO THE CONSOLIDATED FINANCIAL STATEMENTS
AS OF DECEMBER 31, 2005(Amounts expressed in New Turkish Liras (”YTL”) unless otherwise indicated)
NOTE 1 - ORGANIZATION AND NATURE OF OPERATIONS
1.1. Organization and Shareholders
The headquarter of Ülker G›da Sanayi ve Ticaret Anonim fiirketi, which was established in 1944 and transformed to a corporationcompany in 1970, dealing with manufacturing of biscuits, chocolates and its derivatives, are located in Topkap›, ‹stanbul.The Company is registered to the ‹stanbul Trade Registry with registration number of 41603/21952.
As of December 31, 2003, Ülker G›da ve Ticaret Anonim fiirketi, which is registered by Capital Market Board, merged under itsown title with one of the group companies, namely Anadolu G›da Sanayi A.fi., whose shares have been traded in ‹stanbul StockExchange Market since October 30, 1996. As of December 31, 2005, 26% of its shares are currently quoted to ‹stanbul StockExchange Market. Number of average personnel working is 1,086 (in consolidated companies, the overall number is 3,683).
As of December 31, 2005, the names and percentage of shareholders more than 10% of shares are as follows:
Name Amount PercentageY›ld›z Holding A.fi. 103,726,151 43.02%United European Bank Dynamic Growth Fund (*) 64,058,623 26.57%Other 73,302,226 30.41%Total 241,087,000 100%
(*) 21.78% portion of the shares owned by United European Bank Dynamic Growth Fund represents nonpublic shares,whereas 4.79% portion of those shares is traded in stock exchange.
1.2. Consolidated Associates and Subsidiaries
Accompanying financial statements are the consolidated financial statements of Ülker G›da Sanayi ve Ticaret A.fi. and companieswhich are directly controlled by the Company and indirectly via its subsidiaries.
As of December 31, 2005, nature of operations and total capital shares (direct and indirect) of the subsidiaries (“Subsidiaries”)which are included in consolidation are as follows:
Subsidiaries Total Capital Share (%) Nature of Operations‹deal G›da Sanayi ve Ticaret A.fi. 97.6 ProductionBiskot Bisküvi G›da San. ve Tic. A.fi. 51.0 Production‹stanbul G›da D›fl Ticaret A.fi. 83.8 MarketingAtlas G›da Pazarlama San. ve Tic. A.fi. 73.5 MarketingBirleflik D›fl Ticaret A.fi. 69.0 MarketingBirlik Pazarlama San. ve Tic. A.fi. 99.0 ProductionAtlantik G›da Pazarlama ve Ticaret A.fi. (*) 20.0 Marketing
(*)Atlantik G›da Pazarlama ve Ticaret A.fi. has been directly controlled by the Company despite 20% capital share.
‹deal G›da Sanayi ve Ticaret A.fi. and Biskot Bisküvi G›da San. ve Tic. A.fi. manufacture and sell the same products withthose of Ülker G›da Sanayi ve Ticaret A.fi. Additionally, ‹stanbul G›da D›fl Ticaret A.fi., Atlas G›da Pazarlama Sanayi veTicaret A.fi., Birleflik D›fl Ticaret A.fi. and Atlantik G›da Pazarlama ve Ticaret A.fi. are dealing with trading of these products andthe other kinds of products purchased from the markets. Birlik Pazarlama Sanayi ve Tic. A.fi. provides raw materials to manufacturingcompanies.

44
Atlas G›da Pazarlama A.fi. in which the company participated at the rate of 73,5% has participated in newly establishedAtlantik G›da with share of 20% and establishment of Atlantik Pazarlama A.fi. was registered on 24 February 2005 and madepublic in Trade Registry Gazette on 1 March 2005. In order to enhance the productivity and effectiveness of present distributionnetwork of Ülker Group in parallel with everdeveloping production portfolio, products other than biscuits are distributed byAtlantik Pazarlama A.fi. which has launched its operations since July 2005.
Also, as of December 31, 2004 and December 31, 2005, subsidiaries listed below have not been held subject to consolidationdue to their immaterial commercial activities.
Subsidiaries Total Capital Share % Nature of OperationsDünya Gümrükleme A.fi. 94.9% TradeBasic Commodities 99.9% TradeAnadolu G›da A.fi. 99.9% Production
The associates (“associates”) of Ülker G›da Sanayi ve Ticaret A.fi. consolidated through equity method (explained on note 2) areas follows:
Associates Total Capital Share % Nature of OperationsPendik Niflasta Sanayi ve Ticaret A.fi. 24% ProductionHero G›da Sanayi ve Ticaret A.fi. 40% Production
NOTE 2 - BASIS OF PRESENTATION OF FINANCIAL STATEMENTS
Summary of Significant Accounting Policies
The accompanying financial statements are prepared in conformity with Communiqué No: XI25 “Accounting Standards at CapitalMarkets Board (CMB) of Turkey” which is compatible with International Financial Reporting Standards. The bases of the preparationof the accompanying financial statements are as follows:
The Group maintains its books of account and prepares its statutory financial statements in New Turkish Lira (YTL) in tune withthe Turkish Commercial Code, Capital Market Board Regulations and Turkish Tax Legislation. The accompanying financialstatements are based on the statutory records denominated in New Turkish Liras (YTL) with adjustments and reclassificationsfor the purpose of fair presentation in accordance with Communiqué No: XI25. These adjustments mainly resulted from valuationand accounting of tangible and intangible assets and related depreciation and amortization of those assets and provision foremployment termination benefits in accordance with Communiqué No: XI25. The Group has applied all compulsory standardsas of December 31, 2005 and no standards have been put into effect before the effective date.
At 15 November 2003, Capital Market Board of Turkey published Communiqué No: XI25 regarding “Accounting Standards atCapital Markets”. This Communiqué has become effective for the preparation of the interim and annual financial statementssubsequent to 1 January 2005. However, companies prefer to prepare their annual and interim financial statements in accordancewith this Communiqué as of 31 December 2003 and subsequent periods. The Group has applied the Communiqué No: X125for the first time as of 31 March 2005.
The Company has prepared its consolidated financial statements for the first time for the period between 1 January and31 December 2005 in accordance with Communiqué No: XI25 of CMB of Turkey. Besides, balance sheets as of December 31,2004 are adjusted in accordance with the above mentioned Communiqué for the purpose of comparison. But, the accompanyinginterim consolidated income statement, cash flow statement and statement of changes in shareholders’ equity have not beenprepared comparatively.
The Company has prepared its financial statements in consolidation with its associates and subsidiaries. The Group has compliedwith Article 13 of Communiqué No: XI25 and financial statements of the associate have been adapted to the above mentionedarticle.

45
Adjustment of Financial Statements in Hyperinflationary Periods
CMB has announced in March 17, 2005 that companies, which are established in Turkey and which prepares its financial statementsaccording to Accounting Standards of CMB, are not subject to inflation accounting policies effective from January 1, 2005.Therefore, accompanying financial statements have not been subject to inflation adjustment since January 1, 2005.
Basis of ConsolidationConsolidated financial statements include the financial statements of the main company “Ülker G›da Sanayi ve Ticaret A..”, itsSubsidiaries and its associates (they are referred to as “Group”). The financial statements of the associates are based on thestatutory records with adjustments and reclassifications for the purpose of fair presentation in tune with accounting policies ofThe Group and CMB of Turkey.
a) The control relation is normally evidenced when the Company (a) owns, either directly or indirectly, more than 50% of thevoting rights of a company’s share capital or (b) owns less than 50% of the voting rights but dominates financial and operatingpolicies and is able to govern the financial and operating policies of an enterprise so as to benefit from its activities.
As of December 31, 2005, subsidiaries, shares owned and share percentages are as follows:
Name of the Consolidated Companies Direct Share (%) Indirect Share (%) Total Voting (%)‹deal G›da Sanayi ve Ticaret A.fi. 97.5 0.1 97.6Biskot Bisküvi G›da San. ve Tic. A.fi. 50.5 0.5 51.0‹stanbul G›da D›fl Ticaret A.fi. 83.8 - 83.8Atlas G›da Pazarlama San. ve Tic. A.fi. 73.5 - 73.5Birleflik D›fl Ticaret A.fi. 68.0 1.0 69.0Birlik Pazarlama San. ve Tic. A.fi. 99.0 - 99.0Atlantik G›da Pazarlama ve Ticaret A.fi. - 20.0 20.0
Percentage of shares of the Company in Golden Lojistik Akaryak›t ve Ticaret A.fi. has decreased from 42.56% to 12.45% sincethe Company has not participated in the share capital increase of Golden Lojistik Akaryak›t ve Ticaret A.fi., which was includedin consolidation for the year 2004. Therefore above mentioned company has been excluded from consolidation. Also, percentageof shares of Taç Yat›r›m Ortakl›¤› A.fi., which was included in consolidation for the year 2004, has decreased from 46,67% to0,06% as a result of sale. Therefore, abovementioned company has also been excluded from consolidation.
Balance sheets and income statements of Subsidiaries are consolidated under full consolidation method and the book value ofshares owned by the Group and Subsidiaries are nettedoff from the corresponding share capital. Transactions and balancesbetween the Group and the Subsidiaries are eliminated. Finance expenses and dividends of shares owned by the Group andthe Subsidiaries in those subsidiaries are deducted from share capital and corresponding period earnings, respectively.
b) Associates are consolidated under equity method. Associates are the company on which the Group has a voting right ofbetween 20-50% or has a significant effect but not the right to control. Unrealized profits arising from transactions between theGroup and the associates are eliminated in parallel with the associate share of the Group; unrealized profits are eliminated incase of a lack of evidence about impairment for the asset transferred. Changes in net assets of the Associates are reflected tothe consolidated financial statements by increasing or decreasing which in turn indicate portion of the Company and disclosedin income statements as associate profit or loss. The Group, unless undertaking a liability related to associates, abandons usageof equity method when the book value of the Associates is zero. The book value of an associate is regarded as cost value afterthe significant effect mentioned above disappears.
As of December 31, 2005 associates, shares owned and share percentages are as follows:
Name of the Consolidated Companies Participation Share (%)Pendik Niflasta Sanayi ve Ticaret A.fi. 24Hero G›da Sanayi ve Ticaret A.fi. 40

46
Pendik Niflasta Sanayi ve Ticaret Anonim fiirketi deals with manufacturing and selling starch and derivative products. Hero G›daSanayi ve Ticaret A.fi. is engaged in manufacturing and selling infant foods. Related associates have been consolidated underequity method.
Shares of the shareholders owning minority interest disclosed in net assets and operating results of the subsidiaries are reflectedto the consolidated balance sheet and consolidated income statement as ‘Minority Interest’.
Consolidation Methods
i Full Consolidation Method
All the companies (subsidiaries) on which the main company either directly or indirectly has more than 50% of shares or 50% ofvoting rights or rights to elect of the majority of board of directors through its associates and subsidiaries are subject to fullconsolidation.
Ülker G›da Sanayi ve Ticaret A.fi.’s list of the consolidated subsidiaries has been presented in section “1.2. Consolidated Associatesand Subsidiaries”. The financial statements belonging to Ülker G›da Sanayi ve Ticaret A.fi. and its subsidiaries have beenconsolidated in line with the following basis:
a) All intergroup receivables and liabilities have been eliminated. Order advances received and advances given for purchasesare eliminated. For the tangible assets which have changed hands among group companies, the net book value prior to salesare kept, in case they have not been totally depreciated. Those assets are subsequently depreciated over the calculated value.However, among those assets which have been sold after they have totally been depreciated prior to the consolidation dateand whose gains on sales have been added to shareholder’s equity are not subject to elimination.
b) The book value of investments in a subsidiary is deducted from equity items of the subsidiary except for the profit. If the bookvalue of the investments in a subsidiary exceeds the share of the parent company within the subsidiary’s equity, the differenceis considered ‘positive goodwill’; otherwise it has been considered ‘negative goodwill’. Goodwill is included in the financialstatements in the ‘Intangible Fixed Assets’. The group minority shares which have been calculated at that point are presentedunder ‘Minority Interest’ account in the balance sheet. Both negative and positive goodwill items are subject to amortizationsince a company became a subsidiary. Amortization period has been determined as 20 years. Goodwill amortization expense isclassified under a separate item as ‘Goodwill Amortization’ within Operational Expenses.
c) Reciprocal sales and purchases are deducted from total sales and purchases of the group. As a result of the assumption thatall inventories be sold, unrealized profits derived from unsold inventories are not eliminated. Expenses of finance, consultancyand services which group companies have provided each other are also eliminated from total expenses of the group.
d) Shares of the shareholders out of the group are calculated and reflected to the income statement as ‘Minority Interest Expense’and to the balance sheet as ‘Minority Interest’.
ii Equity Method
The companies (associates), in which the major shareholder has a permanent association through the exercise of determiningthe financial and operating policies and/or through direct or indirect relationship regarding equity and management or in whichthe major shareholder has more than 20% but not exceeding 50% of the shares and voting rights, are consolidated throughequity method. Under equity method, associates are disclosed under consolidated balance sheet with their net asset values and‘Major Shareholder Share’ computed as a result of operations is added to the consolidated income statement.
The list of the associates of Ülker G›da Sanayi ve Ticaret A.fi. which have been consolidated under equity method has beenpresented under Basis of Consolidation’.
OffsettingFinancial assets and liabilities are offset and the net amount reported in the consolidated balance sheet when there is a legallyenforceable right to set off the recognized amounts and there is an intention to settle on a net basis or realize the asset and settlethe liability simultaneously.
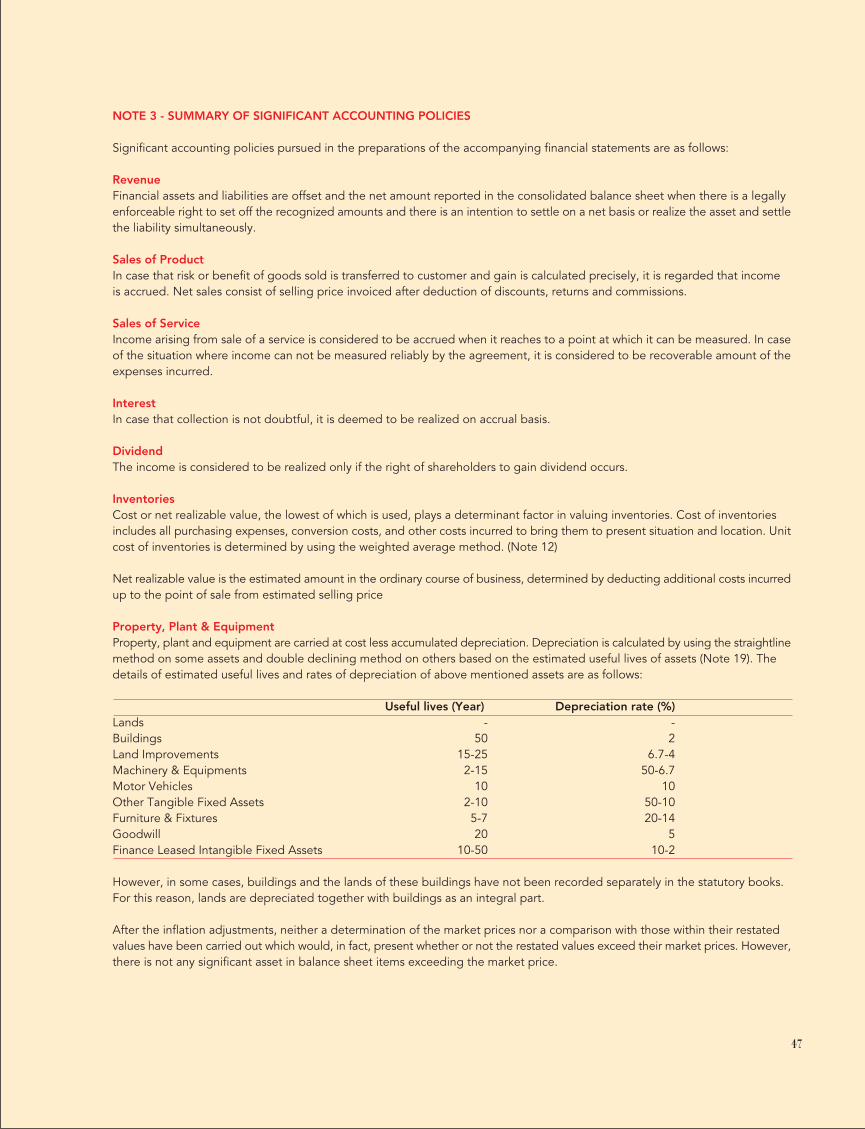
47
NOTE 3 - SUMMARY OF SIGNIFICANT ACCOUNTING POLICIES
Significant accounting policies pursued in the preparations of the accompanying financial statements are as follows:
RevenueFinancial assets and liabilities are offset and the net amount reported in the consolidated balance sheet when there is a legallyenforceable right to set off the recognized amounts and there is an intention to settle on a net basis or realize the asset and settlethe liability simultaneously.
Sales of ProductIn case that risk or benefit of goods sold is transferred to customer and gain is calculated precisely, it is regarded that incomeis accrued. Net sales consist of selling price invoiced after deduction of discounts, returns and commissions.
Sales of ServiceIncome arising from sale of a service is considered to be accrued when it reaches to a point at which it can be measured. In caseof the situation where income can not be measured reliably by the agreement, it is considered to be recoverable amount of theexpenses incurred.
InterestIn case that collection is not doubtful, it is deemed to be realized on accrual basis.
DividendThe income is considered to be realized only if the right of shareholders to gain dividend occurs.
InventoriesCost or net realizable value, the lowest of which is used, plays a determinant factor in valuing inventories. Cost of inventoriesincludes all purchasing expenses, conversion costs, and other costs incurred to bring them to present situation and location. Unitcost of inventories is determined by using the weighted average method. (Note 12)
Net realizable value is the estimated amount in the ordinary course of business, determined by deducting additional costs incurredup to the point of sale from estimated selling price
Property, Plant & EquipmentProperty, plant and equipment are carried at cost less accumulated depreciation. Depreciation is calculated by using the straightlinemethod on some assets and double declining method on others based on the estimated useful lives of assets (Note 19). Thedetails of estimated useful lives and rates of depreciation of above mentioned assets are as follows:
Useful lives (Year) Depreciation rate (%)Lands - -Buildings 50 2Land Improvements 15-25 6.7-4Machinery & Equipments 2-15 50-6.7Motor Vehicles 10 10Other Tangible Fixed Assets 2-10 50-10Furniture & Fixtures 5-7 20-14Goodwill 20 5Finance Leased Intangible Fixed Assets 10-50 10-2
However, in some cases, buildings and the lands of these buildings have not been recorded separately in the statutory books.For this reason, lands are depreciated together with buildings as an integral part.
After the inflation adjustments, neither a determination of the market prices nor a comparison with those within their restatedvalues have been carried out which would, in fact, present whether or not the restated values exceed their market prices. However,there is not any significant asset in balance sheet items exceeding the market price.

48
Intangible AssetsIntangible assets representing rights and leasehold improvements are carried at cost less accumulated amortization. Amortizationis calculated by using straightline method over expected useful lives. In case that any impairment exists, the carrying amount ofany intangible assets is written down to its recoverable amount.
Useful lives (Year) Depreciation rate (%)Rights 2-10 50-10Research & Development Expenses 10 10Leasehold Improvements 5-10 20-10Other Intangible Fixed Assets 5-12 20-8.3
The commodities produced under Ülker’s label are traded abroad, as well. It is not clear to what extent companies can benefitfrom the registration fees related to sales paid in other countries. Therefore, the related fees are not capitalized but recognizedas expense under Marketing & Selling Expenses within the same period. Additionally, as it is not determined to what extent theeconomic benefits of advertisements under Ülker’s label will benefit to the Group, 75% of the mentioned costs are amortizedwithin the first year. The remaining part is amortized in the second year. Other intangible assets are amortized by using normaland doubledeclining methods. (Note 20)
ImpairmentIn case that book value of Tangible and Intangible Assets is above its recoverable value, related asset is written down to itsrecoverable amount; and impairment calculated is associated with expense accounts.
Borrowing CostsIn case of existence of assets taking a significant time period to make ready for use and sale, all interest costs associated withpurchase or production are added to cost until they are made ready for usage or sale. Other financial expenses are directly writtenoff in the period they exist.
Financial AssetsThe Group has classified its financial assets for the purpose of investment in two categories: “Trading Securities” and “Held toMaturity Securities”.Trading Securities are classified as assets saleable to meet liquidity needs without a maturity term specified. The Group makesthis classification properly at the date of purchase. Trading Securities, when they first purchased, are carried to financial statementsat cost including purchasing expenses and held subject to valuation at fair values for the consecutive periods subsequent topurchasing date. Gains or losses arising from valuation are included in profit/loss accounts.
Interest income earnings arising from Trading Securities held are recorded as interest income in the first place and dividendsearned are represented in income from dividends in the second place.
Purchasing and selling transactions of Trading Securities are recognized or derecognized in relation to “delivery date”.
“HeldtoMaturity Securities” are the assets including a specified maturity structure and a payment plan having certain amountsand the Group management is willing and able to hold until a fixed maturity. Heldtomaturity Securities are presented withdiscounted values by using effective interest rate.
All financial assets are presented at cost including the purchasing expenses. Financial assets classified as ‘Trading Securities’ aredisclosed at their fair values after being carried to financial statements so long as their fair values are reliably calculated.
Financial Instruments and Risk ManagementThe Company’s main financial instruments are heldtomaturity securities, bank loans, leasing, cash on hand and shortterm bankdeposits. Main purpose to use those instruments is to finance the Group’s operations. The Group also has financial instrumentsas trade receivables and payables arising from direct commercial operations.
Risks stemming from usage of those instruments are interest rate risk, exchange rate risk, liquidity risk and credit risk. The Groupmanages those risks as follows:

49
Price RiskPrice risk forming a combination of foreign currency risk, interest risk and market risks is naturally managed by way of coveringreceivables with payables, both of which is denominated in the same currency and covering interestbearing assets withinterestbearing liabilities.
Credit RiskCredit risk is the risk that one party to a financial instrument will fail to discharge an obligation and cause the other party to incura financial loss. The Group tries to manage credit risk by continuously assessing reliability of related parties and restrictingtransactions with certain parties.
Credit risk concentration is related to operation of certain companies in similar business segments, operating activities in similargeographical areas and effects of changes in economic, political and other resembling situations on liabilities of those companiesarising from business contracts around parallel economic conditions. Credit risk concentration represents sensitivity of operationperformance of the companies to developments affecting a certain business sector or geographical area.
The Company handles credit risk by allocating its marketing activities to a wide range of area and by avoiding concentrationon individuals and groups from certain sectors or areas. The Company also receives letters of guarantee from customers asrequired.
Liquidity RiskLiquidity risk is probability of failing to fulfill net funding liabilities of the Company. Liquidity risk is reduced by way of balancingcash inflows with cash outflows on the back of credit limits furnished by reliable credit agencies.
Foreign Exchange RiskForeign exchange fluctuations arising from foreign currency denominated assets and liabilities and foreign currency denominatedpurchasing and selling commitments represent foreign exchange risk. Foreign exchange risk stemming from loss or gain in valueof New Turkish Liras (YTL) against other foreign currencies is handled through tracking of foreign currency position by topmanagement and through taking position within the range of approved limits.
Interest Rate RiskThe Company is exposed to interest rate risk through the impact of changes in interest rates on interestbearing assets andliabilities. The group manages that risk by balancing assets with liabilities sensitive to interest rate in common ways.
Fair Values of Financial InstrumentsFair value is the amount at which a financial instrument could be exchanged in a current transaction between willing parties, otherthan in a forced sale or liquidation, and is best evidenced by a quoted market price, if one exists.
Effects of Exchange Rate
Functional currencyConsolidated financial statements have been presented in New Turkish Liras (YTL) as the functional currency of the Group.
Foreign Currency Transactions and BalancesIncome and expenses arising in foreign currencies during the year have been converted at the exchange rates prevailing at thedates of the transactions. Monetary assets and liabilities denominated in foreign currencies have been translated at the exchangerates prevailing at the balance sheet dates. Exchange gains or losses arising from the settlement and translation of foreign currencyitems have been included in the related income and expense accounts as appropriate.
Foreign currency denominated assets and liabilities have been revalued at buying exchange rates of CB prevailing at the balancesheet dates of December 31, 2005 (for current balances and transactions) and December 31, 2004 (for the balances and transactionsbelonging to previous period) and exchange rate differences are carried to related income and expense accounts as a loss orgain. (Note 29)

50
USD/ YTL EUR/YTLExchange RateDecember 31, 2004 1342,100 1826,800December 31, 2005 1341,800 1587,500
Earnings per ShareEarnings per share presented at consolidated income statement are determined by dividing net profit occurred after consolidationprocess by weighted average number of shares outstanding.
Provisions, Contingent Assets and Liabilities
ProvisionsA provision is set forth in the financial statements if a legal liability exists as a result of past events in which the liability amountcan be estimated reliably and if it is probable that the economically beneficial assets are to be liquidated in order to compensatethat liability.
Provisions are disclosed at discounted values of expenses likely to be incurred in following periods as long as loss in value ofmoney over time has significant effect. In case that those discounted values are used, increments in provisions occurring overtime are recorded as interest expense.
i-Tax Provisions
Tax provision comprises current period and deferred tax provisions taken into consideration to calculate net profit or loss.
Deferred tax assets and liabilities are recognized using the liability method in respect of material temporary differences arisingfrom different treatment of items for accounting and taxation purposes. Deferred tax liabilities are recognized for all taxabletemporary differences.
Deferred income tax assets are recognized for all deductible temporary differences, carryforward and unused accumulated losses, tothe extent that it is probable that taxable profit will be available against the deductible temporary differences and accumulated losses.
The carrying amount of deferred income tax assets is reviewed at each balance sheet date and reduced to the extent that it is nolonger probable that sufficient taxable profit will be available to allow all or part of the deferred income tax asset to be utilized.
Deferred income tax assets and liabilities are measured at the tax rates that are expected to apply to the period when the assetis realized or the liability is settled, based on tax rates (and tax laws) that have been enacted or substantively enacted at thebalance sheet date.
ii-Reserve for Employee Termination Benefits
In accordance with existing social legislation, the Group is required to make lump sum termination indemnities to each employeewho has completed one year of service with the company and whose employment is terminated due to retirement or for reasonsother than resignation or misconduct.
In the consolidated financial statements, the Group has reflected a liability calculated using “Projected Unit Credit Method” andbased upon factors derived using the Group’s experience of personnel terminating their services and being eligible to receivebenefits, discounted by using the current market yield at the balance sheet date on government bonds. All gains and lossescalculated are reflected in the income statement.
Reserve for Employee Termination Benefits is disclosed at “Provisions” under LongTerm Liabilities in consolidated financialstatements. (Note 23)
Contingent Assets and LiabilitiesPossible assets or obligations that arise from past events and whose existence will be confirmed only by the occurrence ornonoccurrence of one or more uncertain future events and not within the control of the company are not included in financialstatements and treated as contingent assets or liabilities. (Not 31)

51
Finance LeasesAssets acquired through finance leases are recognized in the balance sheet by accounting for an asset and liability equal to thelower of present value of minimum lease payments or the fair value of leased assets at the inception of the lease. Lease liabilitiesare reduced by repayments of principal, while the finance charge component of the lease payment is charged directly to thestatement of loss. Capitalized leased assets are amortized over estimated useful lives of those assets. (Note 8)
Related PartiesFor the purpose of the accompanying consolidated financial statements, shareholders, subsidiaries, associates and key executivesof the Company are considered as related parties. (Not 9)
Tax at Corporate ProfitsTax provision comprises current period and deferred tax provisions taken into consideration to calculate net profit or loss. Deferredtax provision represents in the paragraph of Provisions, Contingent Assets and Liabilities.
GoodwillGoodwill arising on consolidation represents the difference between the acquisition price and the attributable share in the fairvalue of the underlying net assets of the associates or subsidiaries.
Since a partnership within consolidation gains a status of a subsidiary and being effective only for one time with regard to thesubsequent share trading; the historical cost of shares that a major shareholder has within capital of a subsidiary is offset fromthe subsidiary’s equity presented in the balance sheet that is restated according to the fair value. The difference computed infavour of a book value is a positive goodwill presented as a separate asset item in the consolidated balance sheet. The mentioneddifference is amortized over a period not exceeding 20 years provided that the stated amortization period does not exceed theuseful life of the economic item to which goodwill attributes. The difference computed in disadvantage of the book value ispresented as a separate negative item in assets of the balance sheet and amortized over a period not exceeding 20 years.
Goodwill represents the difference between the acquisition price and the attributable share in the fair value of the underlyingnet assets acquired. If the difference is in favour of net assets (namely, if net assets is higher than acquisition price in value), it isnamed as Negative Goodwill which is carried to financial statements as an income by considering estimated weighted averageof useful fives of those assets. (Note 17)
NOTE 4 – CASH AND CASH EQUIVALENTS
As of December 31, 2005 the breakdown of cash and cash equivalents is as follows:
31 December 2005 31 December 2004Cash in Hand 93,290 135,776- YTL 93,290 116,804- USD 17,587- EURO 1,385Banks Deposits 179,210,041 103,567,622Demand Deposits 101,109,676 72,667,070- YTL 83,764,528 45,514,745- USD 9,566,607 19,874,341- EURO 6,204,716 5,522,469- GBP 1,573,825 1,752,770- CHF 2,745Time Deposits 78,100,365 30,900,552- YTL 74,119,948 400,000- USD 3,742,153 30,225,938- EURO 238,264 274,614Other Cash Equivalents 470,688 495,750Credit Cards Slips (*) 470,688 495,750Total 179,774,019 104,199.148

52
As of December 31, 2005, all the bank deposits have maturity of less than one year. The annual interest rate of bank depositsdenominated in New Turkish Liras (YTL) ranges from 13,97% to 19,5% and the interest rate of bank deposits denominated inforeign currency ranges from 2.04% to 3.43%.
(*) The amount of credit card receivable is from the Related Party, Türkiye Finans Kat›l›m Bankas› A.fi.
NOTE 5 - MARKETABLE SECURITIES
The breakdown of Marketable Securities consisting of availableforsales financial instruments is as follows:
31 December 2005 31 December 2004Share Certificate 2,579,290 5,681,497Government Bonds 5,234,951 38,105,277Other Marketable Securities (*) 2,492,945 4,411,315Provision for Marketable Securities (311,298) (75,085)Total 9,995,888 48,123,004
(*) Other Marketable Securities represents domestic and overseas investment funds.
NOTE 6 - FINANCIAL LIABILITIES
Short-Term Bank Credits 31 December 2005Foreign Currency YTL Equivalent Interest % Maturity
USD 184,100,000 247,025,380 4.99 - 7.03 January 2006 - September 2006EURO 4,934,260 7,833,137 2.25 - 5.27 April 2006 - September 2006SPOT - 339,536 - -Total 255,198,053
Long-Term Bank Credits 31 December 2005Foreign Currency YTL Equivalent Interest % Maturity
EURO 7,000,000 11,112,500 4.88 - 7.03 March 2007 - April 2007Total 11,112,500
Short-Term Bank Credits 31 December 2004Foreign Currency YTL Equivalent Interest % Maturity
YTL - 20,748,851 6 - 22 January 2005 - December 2005USD 156,384,392 209,886,511 3.3 - 5.5 January 2005 - December 2005EURO 9,788,290 17,881,246 2.25 - 5.5 January 2005 - December 2005SPOT 1,703,795 1,768,695 - -Total 250,285,303
Long-Term Bank Credits 31 December 2004Foreign Currency YTL Equivalent Interest % Maturity
YTL - 1,784,233 24.0 February 2007EURO 6,934,260 12,667,505 2.92 - 5.18 May 2006 - September 2007USD 4,422,897 5,938,719 4.88 August 2006 - January 2007Total 20,390,457

53
NOTE 7 - TRADE RECEIVABLES AND PAYABLES
a) The breakdown of Short-Term Trade Receivables is as follows:
Short-Term Trade Receivables 31 December 2005 31 December 2004Trade Receivables 126,719,262 89,129,010Notes Receivable 90,933,962 63,606,968Rediscount on Notes Receivables (-) (579,518) (1,177,990)Rediscount on Trade Receivables (-) (1,786,402) (1,378,272)Doubtful Trade Receivables 3,926,638 3,025,422Provision for Doubtful Trade Receivables (-) (3,926,638) (3,025,422)Guarantee and Deposits Given 2,000 -Trade Receivables (Net) 215,289,304 150,179,716
Trade receivables are disclosed at discounted net realizable values using the effective yield method. Net realizable value hasbeen calculated over discount rate of 15% based on sales for cash.
b) The breakdown of LongTerm Trade Receivables is as follows:
Long-Term Trade Receivables 31 December 2005 31 December 2004Guarantees and Deposits Given 22,919 58,066Advances Given 22,383 -Trade Receivables (Net) 45,302 58,066
c) The breakdown of ShortTerm Trade Payables is as follows:
Short-Term Trade Payables 31 December 2005 31 December 2004Trade Payables 57,267,714 91,360,462Rediscount on Trade Payables (-) (1,208,695) (1,282,634)Trade Payables (Net) 56,059,019 90,077,828
d) The breakdown of LongTerm Trade Payables is as follows:
Long-Term Trade Payables 31 December 2005 31 December 2004Guarantees and Deposits Received 889,238 628,398Trade Payables (Net) 889,238 628,398
NOTE 8 - FINANCE LEASE RECEIVABLES AND PAYABLES
a) The breakdown of ShortTerm Financial Lease Payables is as follows:
Short-Term Finance Lease Payables 31 December 2005 31 December 2004Finance Lease Payables 45,416,456 25,495,080Cost of Deferred Fin. Lease Payables (-) (4,671,806) (5,200,070)Financial Lease Payables ( Net ) 40,744,650 20,295,010
b) The breakdown of Long-Term Financial Lease Payables is as follows:
Long-Term Finance Lease Payables 31 December 2005 31 December 2004Finance Lease Payables 21,974,076 34,043,231Cost of Deferred Financial Lease Payables (-) (1,174,291) (5,694,475)Finance Lease Payables (Net) 20,799,785 28,348,756

54
As of December 31, 2005, the breakdown of Financial Lease Payables classified in parallel with their maturities is as fallows:
0-1 year 1-5 years Over 5 yearsFinance Lease Payables 45,416,456 21,974,076 -Cost of Deferred Financial Lease Payables ( - ) (4,671,806) (1,174,291) -Total 40,744,650 20,799,785 -
As of December 31, 2004, the breakdown of Financial Lease Payables classified in parallel with their maturities is as fallows:
0-1 year 1-5 years Over 5 yearsFinancial Lease Payables 25,495,080 34,043,231 -Cost of Deferred Financial Lease Payables ( - ) (5,200,070) (5,694,475) -Total 20,295,010 28,348,756 -
NOTE 9 - BALANCES AND TRANSACTIONS WITH RELATED PARTIES
a) The breakdown of Receivables from Related Parties is as follows:
31 December 2005 31 December 2004Receivables from Personnel 52,446 96,387Trade Receivables 92,476,348 64,012,117Non-Trade Receivables 51,270,023 39,942,963Total 143,798,817 104,051,467
The breakdown of Trade Receivables and NonTrade Receivables is as follows:
31 December 2005 31 December 2004Trade Non-Trade Trade Non-Trade
Receivables Receivables Receivables ReceivablesShareholders 24,598,139 42,565,386 33,514,349 35,860,918Y›ld›z Holding A.fi. 24,598,139 34,699,287 3,075,736 14,399,820Üstün G›da A.fi. - 7,866,099 30,438,613 21,461,098
Associates 236,793 1,544,765 -Besler G›da A.fi. - - 1,544,765 -Hero G›da A.fi. - 236,793 3,169,138 -
Other Related Parties 67,878,209 8,467,844 28,953,003 4,082,045Ak G›da A.fi. 7,812,257 - 1,797,432 -Bizim Toplu Tüketim A.fi. 9,498,602 3,459 5,914,220 -Doruk G›da Kimya Amb. A.fi. - - 8,029,368 -Ekol Otomotiv A.fi. 891,561 - - 2,247,065Eksper A.fi. 405,180 - - -Esas Pazarlama A.fi. 507,170 725 4,487,992 -Fresh Cake G›da A.fi. - - 2,549,318 160,942Merkez G›da Paz. A.fi. 513,221 165,441 1,684,893 -Mavi Yeflil Ltd. Sti. 4,229,252 - - 1,185,006Natura G›da A.fi. 55,603 8,051,288 - -Pakya¤ A.fi. 51,985 25 - -Pri-Pack Ambalaj A.fi. 73,294 - - -Rekor G›da Paz. A.fi. 22,057,949 3,987 - -Önem G›da A.fi. 21,754,473 - - -Renk G›da A.fi. 4,168 10,633 - -Oyafl A.fi. - - - -Türkiye Finans Kat›l›m Bankas› A.fi. - 215,560 - -Other associated Companies 23,494 16,726 1,320,642 489,032Total 92,476,348 51,270,023 64,012,117 39,942,963

55
b) The breakdown of Payables to Related Parties is as follows:
Short-Term Payables 31 December 2005 31 December 2004Due to Personnel 1,222,418 1,842,061Trade Payables 124,725,737 101,477,211Non-Trade Payables 999,461 5,275,613Total 126,947,616 108,594,885
The breakdown of Trade Payables and NonTrade Payables is as follows:
31 December 2005 31 December 2004Trade Non-Trade Trade Non-Trade
Receivables Receivables Receivables ReceivablesShareholders 67,638,880 - 49,915,913 4,931,755Y›ld›z Holding A.fi. - - - 4,931,755 Üstün G›da A.fi. 67,638,880 - 49,915,913 -
Associates 16,840,437 - 16,864,723 -Hero G›da A.fi. 6,128,197 - 6,045,344 -Besler G›da A.fi. 3,437,019 - 3,848,528 -Tire Kutsan A.fi. 1,955,873 - 2,907,543 -Pendik Niflasta A.fi. 3,052,984 - 4,063,308 -Golden Lojistik A.fi. (Netlog) 1,661,196 - - -Dura G›da A.fi. 426,999 - - -Datateknik Bilgisayar A.fi. 178,169 - - -
Other related Parties 40,246,420 999,461 34,696,575 343,858Baycan Ciklet A.fi. 9,308,770 - 13,690,328 -Ak G›da A.fi. - - 7,193,732 -Polinas Plastik A.fi. 6,159,027 - 5,718,577 -Doruk G›da Kimya Amb. A.fi. - - 616,116 -Esas Pazarlama A.fi. - - - 343,858Oyas Okyanus G›da A.fi. 1,042,206 - - -Fresh Cake G›da A.fi. 21,321,561 - - -Farmamak Ambalaj A.fi. 370,316 - - -Topkap› Makine A.fi. 208,451 - - -‹zsal Akaryak›t A.fi. 1,206,754 - - -‹nter Kombi Nakliyat A.fi. 284,413 -Seher G›da A.fi. 255,256 - - -Other Payables 89,666 69,439 7,477,822 -Royalties - 930,022 - -Total 124,725,737 999,461 101,477,211 5,275,613

56
c) Selling and Purchasing Transactions with Related Parties:
31 December 2005Purchases Sales
Shareholders 616,129,398 209,306,997Y›ld›z Holding A.fi. 38,773,910 24,808,726Üstün G›da A.fi. 577,355,488 184,498,271
Associates 275,304,760 148,096,380Besler G›da A.fi. 51,734,857 3,130,587Tire Kutsan A.fi. 17,252,421 279,142Rekor G›da Paz. A.fi. 10,834,419 72,821,185Datateknik Bilgisayar A.fi. 251,030 12,052Fresh Cake G›da A.fi. 104,580,742 29,581,844Pendik Niflasta A.fi. 7,560,752 138,898Dura G›da A.fi. 4,602,681 23,137Hero G›da A.fi. 52,152,579 40,464,754Golden Lojistik (Netlog) A.fi. 26,335,279 1,644,781
Related Parties 208,205,614 129,159,147Baycan Ciklet A.fi. 69,411,479 19,539,279Ak G›da A.fi. 31,049,709 9,587,181Doruk G›da A.fi. 24,219,020 7,535,231Önem G›da A.fi. 16,611,192 14,574,355Mavi Yeflil Ltd. fiti. 7,508,062 7,169,450Merkez G›da Paz. A.fi. 7,220,633 18,003,571Bizim Toplu Tüketim A.fi. 7,826,052 36,553,946Mersa Elektronik A.fi. 1,775,013 118,632Polinas Plastik A.fi. 14,271,859 738,423Örgen G›da A.fi. 1,801,617 135,072Farmamak A.fi. 1,271,203 177,728Oyafl A.fi. 3,720,724 19,920Pripack Ambalaj A.fi. 2,199,264 822,733Della G›da A.fi. 1,148,486 393,946Topkap› Makine A.fi. 2,275,864 48,547‹zsal Akaryak›t A.fi. 2,727,733 152,660Natura G›da A.fi. 3,017,164 3,406,175Seher G›da A.fi. 611,086 826,270Esas Pazarlama A.fi. 7,633,971 4,196,184Ekol Otomotiv A.fi. (*) 199,136 498,236Eksper A.fi. 463,561 702,274Pakya¤ A.fi. 372,066 1,207,379Other Related Companies 870,721 2,751,955Total 1,099,639,772 486,562,524

57
d) The breakdown of Balances of Interest, Rent and others with Related Parties is as follows:
As of December 31, 2005
Rent Revenue Rent Expense Service Revenue Interest Revenue Interest ExpenseAk Gıda A.fi. - - 18,238 - -Atlas Gıda A.fi. 945,286 - 642,366 - -Baycan Gıda A.fi. - - 10,121 - -Besler Gıda A.fi. - - 38,145 34,493 -Birlik Pazarlama A.fi. 207,008 - 509,351 - -Biskot Bisküvi Gıda A.fi. 804,220 1,530 63,518 - -Bizim Toplu Tüketim A.fi. 1,800 - 635 - -Della Gıda A.fi. - - 9,690 - -Doruk Gıda A.fi. 1,140 - 227,865 - -Dura Gıda A.fi. - 1,341 - -Ekol Otomotiv A.fi. (*) - 10,400 - -Eksper A.fi. 500 - 919 - -Esas Pazarlama A.fi. 5,635 - - - -Fresh Cake Gıda A.fi. - - 5,310 - -Golden Lojistik A.fi. - - - 21,659 -‹deal Gıda A.fi. 4,474,601 - 3,945 - -‹ntercombi Nakliyat A.fi. - - - - -‹stanbul Gıda A.fi. 13,913 - 9,960 - 1,410,889Merkez Gıda Paz. A.fi. 87,708 1,068 145,923 - -Natura Gıda A.fi. 119,145 - 13,902 - -Netlog A.fi. 235,815 - 503,997 - -Önem Gıda A.fi. 1,140 - - - -PNS Pendik Niflasta A.fi. - - 57,890 - -Polinas Plastik A.fi. 2,706 - 152,831 - -Pripack Ambalaj A.fi. 237,786 - 18,279 - -Rekor Gıda Paz. A.fi. 8,748 - 23,735 - -Renk Gıda A.fi. 113,218 - - - -Seher Gıda A.fi. 270,838 - 103,738 - -Tek Özel Gıda A.fi. 4,361 - - - -Tire Kutsan A.fi. - - 27,433 - -Topkap› Makine A.fi. - - 521 - -Üstün Gıda A.fi. 169,330 5,535 127,844 - -Y›ld›z Holding A.fi. 32,012 - 590,126 13,827,073 -Total 7,736,910 18,533 3,307,623 13,883,225 1,410,889
(*) Ekol Otomotiv A.fi. excluded from related parties due to sale on October 4, 2005. The amount of balance consists of theamount before selling.
As of December 31, 2004, amount of rent revenue, interest revenue, other revenue were 9,797,900 YTL, 13,804,769 YTL,3,227,732 YTL and amount of rent expenses, interest expenses were 19,783 YTL, 4,263,358 YTL, respectively.

58
e) The amount of liabilities as guarantees, commitments and advances given in favour of related parties are classified as follows(shown in original currencies):
As of 31 December 2005:Shareholders Associates Subsidiaries Related Parties
YTL 46,034 1,242,896 250,936 9,978,865USD 20,075,000 296,200 42,210,000 33,272,500EURO 8,250,000 - - 5,161,743CHF - - - 1,010,626
As of 31 December 2004:Shareholders Associates Subsidiaries Related Parties
YTL 10,628,500 1,269,896 5,436,345 15,977,574USD 2,245,822 302,246 36,393,600 67,437,021EURO - - - 11,700,000CHF - - - 2,085,857
NOTE 10 - OTHER RECEIVABLES AND PAYABLES
a) The breakdown of Other ShortTerm Receivables is as follows:
31 December 2005 31 December 2004Receivables from Central Bank of Turkey 16,592 16,592Receivables from Sezginler Holding (*) 9,015,834 9,303,776Resident Ltd. 2,532,365 -Güven Tafleronluk Ltd. fiti. 200,000 -Sezgin Elmas 111,075 -Other 1,114,138 2,430,302Total 12,990,004 11,750,670
(*) The mentioned amount is the lawsuit launched against Sezginler Holding and has been settled in favour of the Company.Therefore, by converting the mortgage at the amount of YTL 13.910.000 to cash, the legal followup has been continued andfixed assets have been subject to reassessment. Transactions related to conversion of mortgage to money have been continuing.
b) The breakdown of Other ShortTerm Payables is as follows:
31 December 2005 31 December 2004Taxes Payable 7,243,107 9,924,046Social Security Withholdings Payable 1,394,032 -Overdue, Deferred or Installed Taxes Payable 271,231 356,285Other Advances Received - 418,415Ülker Gençlik ve Spor Kulübü - 200,647Çaml›ca Kültür Vakf› 199,550 137,091Other Payables 20 1,514,231Other Value Added Taxes (VAT) 2,098,263 2,635,188Expenses Payable 390,118 5,733Total 11,596,321 15,191,636
c) The breakdown of Other LongTerm Payables is as follows:
31 December 2005 31 December 2004Deferred or Installed Payables to Public Institutions 82,927 188,303Expense Accruals 29,758 1,457,806Total 112,685 1,646,109

59
NOTE 11 - BIOLOGICAL ASSETS
None ( 31 December 2004- None)
NOTE 12 - INVENTORIES
The breakdown of Inventories is as follows:
31 December 2005 31 December 2004Raw Materials 39,658,751 54,655,163Work in Process 1,460,605 149,278Finished Goods 55,823,010 32,278,039Merchandises 22,305,845 13,898,650Other Inventories 5,641,601 4,094,476Advances Given 6,675,057 87,272,662Total 131,564,869 192,348,268
NOTE 13 - RECEIVEBLES FROM ONGOING CONSTRUCTION PROJECTS
None (31 December 2004- None)
NOTE 14 - DEFERRED TAX ASSETS AND LIABILITIES
31 December 2005 31 December 2004Cumulative Deferred Cumulative DeferredTemporary Tax assets / Temporary Tax assets /
Assets Differences (Liabilities) Differences (Liabilities)Trade Receivables (5,511,170) 1,653,351 (1,475,212) 442,564Fixed Assets 154,170,351 (46,251,105) 169,666,884 (50,900,065)Marketable Securities 447,460 (134,238) (58,212) 17,464Notes Receivable 2,158,647 (647,594) (1,797,800) 539,338Total Assets (45,379,586) (49,900,699)
LiabilitiesTrade Payables 3,949,275 (1,184,782) 5,120,903 (1,536,271)Provision for Employment Termination Benefits (2,249,002) 674,700 (5,308,529) 1,592,559Finance Lease Payables - - (6,053,571) 1,816,071Notes Payable 3,584,324 (1,075,297) - -Total Liabilities (1,585,379) 1,872,359Deferred tax assets/(liabilities) –Net (46,964,965) (48,028,340)
31 December 2004 Provisions for Deferred Taxes 48,028,34031 December 2005 Provisions for Deferred Taxes 46,964,965Difference for Deferred Tax Provision for the Current Year 1,063,375
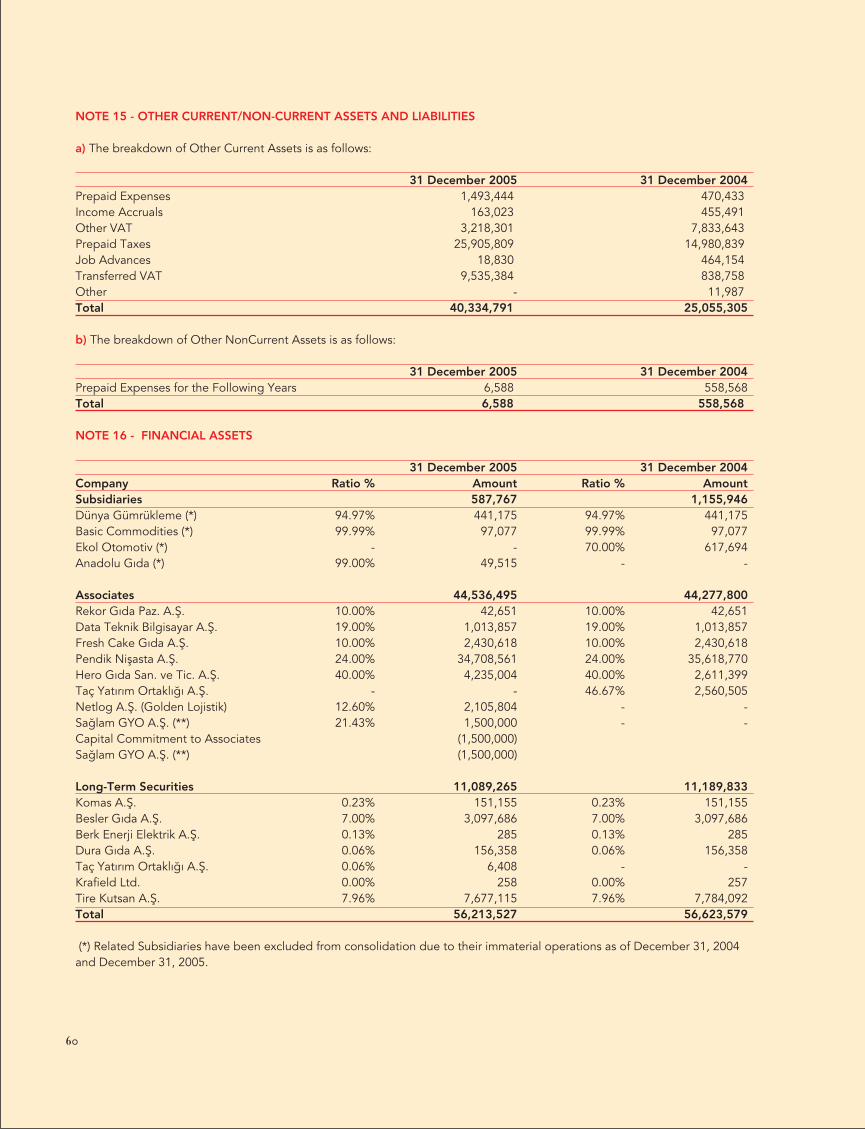
60
NOTE 15 - OTHER CURRENT/NON-CURRENT ASSETS AND LIABILITIES
a) The breakdown of Other Current Assets is as follows:
31 December 2005 31 December 2004Prepaid Expenses 1,493,444 470,433Income Accruals 163,023 455,491Other VAT 3,218,301 7,833,643Prepaid Taxes 25,905,809 14,980,839Job Advances 18,830 464,154Transferred VAT 9,535,384 838,758Other - 11,987Total 40,334,791 25,055,305
b) The breakdown of Other NonCurrent Assets is as follows:�
31 December 2005 31 December 2004Prepaid Expenses for the Following Years 6,588 558,568Total 6,588 558,568
NOTE 16 - FINANCIAL ASSETS
31 December 2005 31 December 2004Company Ratio % Amount Ratio % AmountSubsidiaries 587,767 1,155,946Dünya Gümrükleme (*) 94.97% 441,175 94.97% 441,175Basic Commodities (*) 99.99% 97,077 99.99% 97,077Ekol Otomotiv (*) - - 70.00% 617,694Anadolu G›da (*) 99.00% 49,515 - -
Associates 44,536,495 44,277,800Rekor G›da Paz. A.fi. 10.00% 42,651 10.00% 42,651Data Teknik Bilgisayar A.fi. 19.00% 1,013,857 19.00% 1,013,857Fresh Cake G›da A.fi. 10.00% 2,430,618 10.00% 2,430,618Pendik Niflasta A.fi. 24.00% 34,708,561 24.00% 35,618,770Hero G›da San. ve Tic. A.fi. 40.00% 4,235,004 40.00% 2,611,399Taç Yat›r›m Ortakl›¤› A.fi. - - 46.67% 2,560,505Netlog A.fi. (Golden Lojistik) 12.60% 2,105,804 - -Sa¤lam GYO A.fi. (**) 21.43% 1,500,000 - -Capital Commitment to Associates (1,500,000)Sa¤lam GYO A.fi. (**) (1,500,000)
Long-Term Securities 11,089,265 11,189,833Komas A.fi. 0.23% 151,155 0.23% 151,155Besler G›da A.fi. 7.00% 3,097,686 7.00% 3,097,686Berk Enerji Elektrik A.fi. 0.13% 285 0.13% 285Dura G›da A.fi. 0.06% 156,358 0.06% 156,358Taç Yat›r›m Ortakl›¤› A.fi. 0.06% 6,408 - -Krafield Ltd. 0.00% 258 0.00% 257Tire Kutsan A.fi. 7.96% 7,677,115 7.96% 7,784,092Total 56,213,527 56,623,579
(*) Related Subsidiaries have been excluded from consolidation due to their immaterial operations as of December 31, 2004and December 31, 2005.

61
(**) According to the company’s board of directors in 18 February 2005 and with the Article 423, Sa¤lam Gayrimenkul Yat›r›mOrtakl›¤› A.fi. with capital 7,000,000 YTL has the decision to participate with sharing 21,43% (1,500,000 YTL) and the articles ofassociation has been registered in Trade Resisting Gazette dated on 10 October 2005 with proceeding the establishment ofcooperation. The amount 1,500,000 YTL has been paid to associates presents in Financial Statement as of December 31, 2005according to Capital Commitments Report.
NOTE 17 - POSITIVE-NEGATIVE GOODWILL
31 December 2005Current Period Prior Periods’
Partnership Amortization AmortizationCompany Name Goodwill Date Charge Charge Net GoodwillBiskot Gıda San. ve Tic. A.fi. 3,385,583 January, 1999 169,279 1,862,070 1,354,234Istanbul Gıda Dis Tic. A.fi. 40,285,328 June, 2003 2,014,266 4,028,533 34,242,528Atlas Gıda Paz. San.ve Tic. A.fi. 35,380,813 January, 2002 1,769,041 8,845,203 24,766,569Birleflik D›fl Ticaret A.fi. (730,079) June , 2003 (36,504) (73,008) (620,567)Birlik Paz. Sanayi Tic. A.fi. 56,423,255 June , 2003 2,821,162 5,642,326 47,959,766‹deal Gıda San. ve Tic. A.fi. 8.685,122 June, 2003 434,256 868,512 7,382,354Total 143,430,022 7,171,500 21,173,636 115,084,884
December 31st, 2004Current Period Previous Years
Partnership Amortization AmortizationCompany Name Goodwill Date Charge Charge Net GoodwillBiskot Gıda San. ve Tic. A.fi. 3,385,583 January, 1999 169,279 1,692,791 1,523,513‹stanbul Gıda Dis Tic. A.fi. 40,285,328 June, 2003 2,014,266 2,014,266 36,256,796Atlas Gıda Paz. San. ve Tic. A.fi. 35,380,813 January, 2002 1,769,042 7,076,162 26,535,609Birleflik D›fl Ticaret A.fi. (730,079) June, 2003 (36,504) (36,504) (657,071)Birlik Paz. Sanayi Tic. A.fi. 56,423,255 June, 2003 2,821,163 2,821,163 50,780,929Golden Lojistik San. ve Tic. A.fi. (3,860,759) June, 2003 (193,038) (193,038) (3,474,683)Taç Yat›r›m Ortakl›¤› A.fi. (2,359,326) January, 1997 (117,966) (1,651,528) (589,831)‹deal Gıda San. ve Tic. A.fi. 8,685,122 June, 2003 434,256 434,256 7,816,610Total 137.209.937 6,860,498 12,157,567 118,191,872
NOTE 18 - INVESTMENT PROPERTY
None (31 December 2004)
NOTE 19 - PROPERTY, PLANT AND EQUIPMENT
The movements of the Tangible Fixed Assets for the period between 01,01,2005 and 31,12,2005 are as follows:
Cost 01,01,2005 Additions Disposals TransferOther Disposals (*) 31,12,2005Lands 3,714,185 - (884,820) - (697,280) 2,132,085Land Improvements 2,078,888 2,751,273 - - - 4,830,161Buildings 67,578,505 95,328 (11,658,644) 19,608,278 - 75,623,468Machinery and Equipment 196,679,031 1,433,696 (11,742,632) 4,596,035 - 190,966,130Furniture and Fixtures 35,549,770 1,397,596 (467,257) 142,830 (5,144,834) 31,478,105Vehicles 32,729,753 561,643 (1,815,264) 137,308 (20,684,718) 10,928,121Finance LeasedFix Assets 147,544,631 41,689,790 - (19,608,278) - 169,626,142Other Tangible Fixed Assets 17,277,907 1,503,428 - - - 18,781,335Construction in Progress 280,796 7,494,074 (822,186) (4,964,841) - 1,987,844Advances Given 12,651,124 480,706 (4,838,930) - - 8,292,899Total 516,084,590 514,646,890

62
Accumulated DepreciationLands - - - - - -Land Improvements (311,132 ) (87,736) - - - (398,868)Buildings (15,186,378) (1,213,067) 1,892,891 (1,761,295) - (16,267,849)Machinery and Equipment (121,731,145) (15,921,373) 4,618,070 - - (133,034,447)Furniture and Fixtures (26,114,582) (2,019,647) 120,813 - 1,900,092 (26,113,324)Vehicles (13,997,006) (1,016,471) 1,015,103 - 8,569,861 (5,428,514)Finance LeasedFix Assets (11,671,327) (6,381,184) - 1,761,295 - (16,291,216)Other Tangible Fixed Assets (13,146,931) (3,568,121) - - - (16,715,052)Total (202,158,501) (214,249,270)Net Book Value 313,926,089 300,397,620
(*) The main part of those disposals consisted of the fixed assets of Golden Lojistik A.fi. and Taç Yat›r›m Ortakl›¤› A.fi. which wereexcluded from consolidation due to decrease in interest share of the Company ‘‘Ülker G›da A.fi.’’.
Total Insurance Coverage on Assets is as follows:
31 December 2005 31 December 2004YTL 1,740,440 81,737,739USD - 207,570,370EURO 236,643,959 -
Main company Ülker G›da Sanayi Ve Ticareti A.fi. had the decision to increase the share capital due to profit raised from salesof property that factory building and land situated in Gebze, Kocaeli sold to the related real estate company Fon Finansal KiralamaA.fi. against payment 25,000,000 USD in exchange 33,820,000 YTL. This property cost was 8,380,364 YTL (33,986,000 YTL.estimated by Gayrimenkul Ekspertiz De¤erlendirme A.fi.), and the sales profit of 24,564,698 YTL has been presented under theaccount of Tangible Fixed Assets Revaluation Funds on Equity Item in the Financial Statement. This Real Estate was transferredto subsidiary ‹deal G›da Sanayi ve Ticaret A.fi. with the financial leasing method .This real estate, factory building and land hadbeen used by ‹deal G›da Sanayi ve Ticaret A.fi. as leasing property before selling.
NOTE 20 - INTANGIBLE FIXED ASSETS
The movements of the Intangible Fixed Assets for the period between 01,01,2005 and 31,12,2005 are as follows:
Cost 01,01,2005 Additions Disposals Other Disposals (*) Transfer (**) 31,12,2005Rights 1,080,728 1,396,754 - - - 2,477,482Research & Development Expenses 7,249 - - - - 7,249Special Cost 19,580,479 304,953 (1,671,407) (1,821,980) 88,668 16,480,713Other Intangible Assets 1,418,629 13,555 - (51,216) - 1,380,968Computer Software 17,826 1,257 - - - 19,083Total 22,104,911 20,365,495
Accumulated AmortizationRights (221,677) (343,981) - - - (565,658)Research and Developments (2,283) (725) - - - (3,008)Leasehold Improvements (4,555,980) (977,451) 366,483 138,543 - (5,028,404)Other Intangible Fixed Assets (970,604) (111,057) - 8,428 - (1,073,233)Software (4,960) (3,796) - - - (8,756)Total (5,755,504) (6,679,058)Net Book Value 16,349,407 13,686,437

63
(*) Those disposals consisted of the intangible fixed assets of Golden Lojistik A.fi. and Taç Yat›r›m Ortakl›¤› A.fi. which wereexcluded from consolidation due to decrease in interest share of the Company ‘‘Ülker G›da A.fi.’’.
(**) This amount was transferred from construction in progress to leasehold improvements.
NOTE 21 - ADVANCES RECEIVED
31 December 2005 31 December 2004Advances Received 3,862,867 4,624,479Total 3,862,867 4,624,479
NOTE 22 - EMPLOYEE PENSION PLANS
None (31 December 2004- None)
NOTE 23 - PROVISIONS
a) Short-Term Provisions
31 December 2005 31 December 2004Provision for Bonus Payable - 316,611Provision for Corporate Tax 33,816,580 19,593,996Provision for Accrued Salaries - 57,142Provision for Expenses of December - 149,742Provision for Consultancy Expenses - 11,621Interest Accruals of Bank Loans 7,070,766 2,753,599Provision for Performance Premium 709,798 680,494Provisions for Fuel Aid Expenses - -Provision for Turnover Premium - 181,832Expense Accruals 109,895 595,832Others 30,298 360,231Provision for Costs 124,437 1,758Total 41,861,774 24,702,858
b) Long-Term Provisions
31 December 2005 31 December 2004Provision for Employment Termination Benefits 5,862,501 6,428,830Expense Accruals 312.861Total 6,175,362 6,428,830
Under Turkish Labour Law, The Company is required to pay termination benefits to each employee who has completed one yearof service and whose employment is terminated without due cause, is called up for military service, dies or who retires aftercompleting 25 years of service (20 years for women) and reaches the retirement age (58 for women and 60 for men). Since thelegislation was changed on 23 May 2002 there are no certain transitional provisions relating to length of service prior to retirement.The payable amount consists of one month’s salary limited to a maximum of 172,715 YTL (31 December 2004: 157,474 YTL) foreach year of service as of 31 December 2005.
There are no any regulations regarding pension commitments except abovementioned legal procedures.The liability is not funded, as there is no funding requirement.The reserve has been calculated by estimating the present value of the future probable obligation of the Company arising fromthe retirement of the employees.

64
International Accounting Standards require actuarial valuation methods to be developed to estimate the Company’s obligationunder defined benefit plans. Accordingly, actuarial assumptions and legal obligations are used in the calculation of the totalliability.
The movement of the Provision for Employment Termination Benefits during the related period is as follows:
Balance at January 1, 2005 6,428,830Provision for the Current Period 1,441,740Cancelled Provision for the Current Period (*) (2,008,069)Balance at December 31, 2005 5,862,501
(*) 1.120.299 YTL of the abovementioned amount consists of provisions of Golden Lojistik A.fi. (1.084.317 YTL) and Taç Yat›r›mOrtakl›¤› A.fi. (35.982 YTL), both of which was excluded from consolidation as of 31 December 2005 but had been included inconsolidation as of 31 December 2004.
NOTE 24 - MINORITY INTEREST
Company Name Minority Share Minority Share in Net Profit / (Loss)‹deal G›da Sanayi ve Ticaret A.fi. 2.40% 235,567Biskot Bisküvi G›da San. ve Tic. A.fi. 49.00% 8,303,788‹stanbul G›da D›fl Ticaret A.fi. 16.20% 350,491Atlas G›da Pazarlama San. ve Tic. A.fi. 26.50% (678,505)Birleflik D›fl Ticaret A.fi. 31.00% (54,912)Birlik Pazarlama San. ve Tic. A.fi. 1.00% 51,814Atlantik G›da Paz. ve San.Tic. A.fi. 80.00% 6,086,391Total 14,294,634
NOTE 25 - SHARE CAPITAL/ADJUSTMENTS TO SHARE CAPITAL
Board of Directors of the Company have decided to increase its share capital from 238,700,000 YTL to 241,087,000 YTL throughprofit from sales of associates amounting to 173,393 YTL, profit from sales of real state equal to 90,657 YTL and inflation adjustmenton equity items totaling 2,122,950 YTL in accordance with the decision dated on November 10, 2005 and that capital increasewas registered to the ‹stanbul Trade Registry with registration number 6460 dated December 26, 2005. The registered paidinshare capital of the Company is 241,087,000 YTL (31 December 2004: 238,700,000 YTL). As of 31 December 2005, the Company’sshare capital consists of 24,108,700,000 YTL shares with New Kurus(Ykr) 1 par value each.(31 December 2004: 23,870,000,000 YTL)
Subsequent to the acquisition of Anadolu G›da Sanayi A.fi., the Company increased its share capital ceiling to 500,000,000 YTLwith the permission of Capital Market Board dated January 23, 2004 and numbered 1301.
Considering additional profit share distribution, Group A and B share certificate owners have been granted a privilege out ofthe primary dividend at a rate of 17.65%. Additionally, the owners of 22,171 bonus certificates not included in the capital structurehave been granted privilege out of the primary dividend at the rate of 11.76%. Group A and Group D share certificate ownershave also been granted privilege for 4 and 1 vote respectively, for appointing candidates for board of directors.
As of 31 December 2005, the breakdown of issued and paidin share capital of the Company is as follows:
ShareholderS Share Amount Share PercentageY›ld›z Holding A.fi. 103,726,151 43,02%United European Bank Dynamic Growth Fund (*) 64,058,623 26,57%Other 73,302,226 30,41%Total 241,087,000 100%
(*) Shares of United European Bank Dynamic Growth Fund consist of publicly traded shares (4.79%) and nontraded shares (21.78%).

65
NOTE 26 - CAPITAL RESERVES
‘’Inflation Adjustment on Equity Items’’ is disclosed under capital reserves.
The breakdown of Capital Reserves is as follows:
31 December 2005 31 December 2004Revaluation Fund on Associates 7,896,188 7,896,188Revaluation Surplus on Stock Exchange 4,317,597 6,997,243Adjustment on Equity Items (*) 146,264,465 146,530,401Total 158,478,250 161,423,832
(*) The detail of abovementioned amounts is as follows:
Historic Cost Inflation Adjustment Amounts Adjusted to InflationShare Capital 238,700,000 107,536,225 346,236,225Legal Reserves 4,523,966 16,333,259 20,857,224Extraordinary Reserves 4,565,507 5,495,756 10,061,263Profit from Previous year 27,496,646 17,165,161 44,661,807
Amount at 31 December 2004 275,286,119 146,530,401 421,816,519
Interest of Shareholdersexcluded from Consolidation - (265,936) -
Amount at 31 December 2005 146,264,465
NOTE 27 - PROFIT RESERVES
The legal reserves consist of first and second reserves, appropriated in accordance with The Turkish Commercial Code (TCC).The TCC stipulates that the first legal reserve to be appropriated out of statutory profits at the rate of 5% per annum, until thetotal reserve reaches 20% of the Company’s paidin capital. The second legal reserve is appropriated at the rate of 10% perannum of all cash distributions in excess of 5% the paidin capital. Under the TCC, the legal reserves can only be used to offsetlosses and are not available for any other usage unless they exceed 50% of paidin capital.
The breakdown of Profit Reserves is as follows:
Profit Reserves 31 December 2005 31 December 2004Legal Reserves 7,889,131 4,523,966Extraordinary Reserves 14,554,258 4,565,507Other Reserves (*) 3,858,862 -Profit from immovable sales added to share capital (**) 26,636,968 -Total 52,939,219 9,089,473
(*) This amount represents sale profits from fixed assets sold for the purpose of renewal and depreciation of those assets havebeen deducted from that amount.
(**)As explained on NOTE 19, profit amounted to 24,564,698 YTL gained from the sale of factory building and lands in Gebze,used by subsidiary ‹deal G›da Sanayi A.fi. via financial lease, has not been associated with current year income since this amountwas planned to be added to share capital. The remaining balance equal to 2,072,270 YTL is related to profit from sales otherimmovable assets.
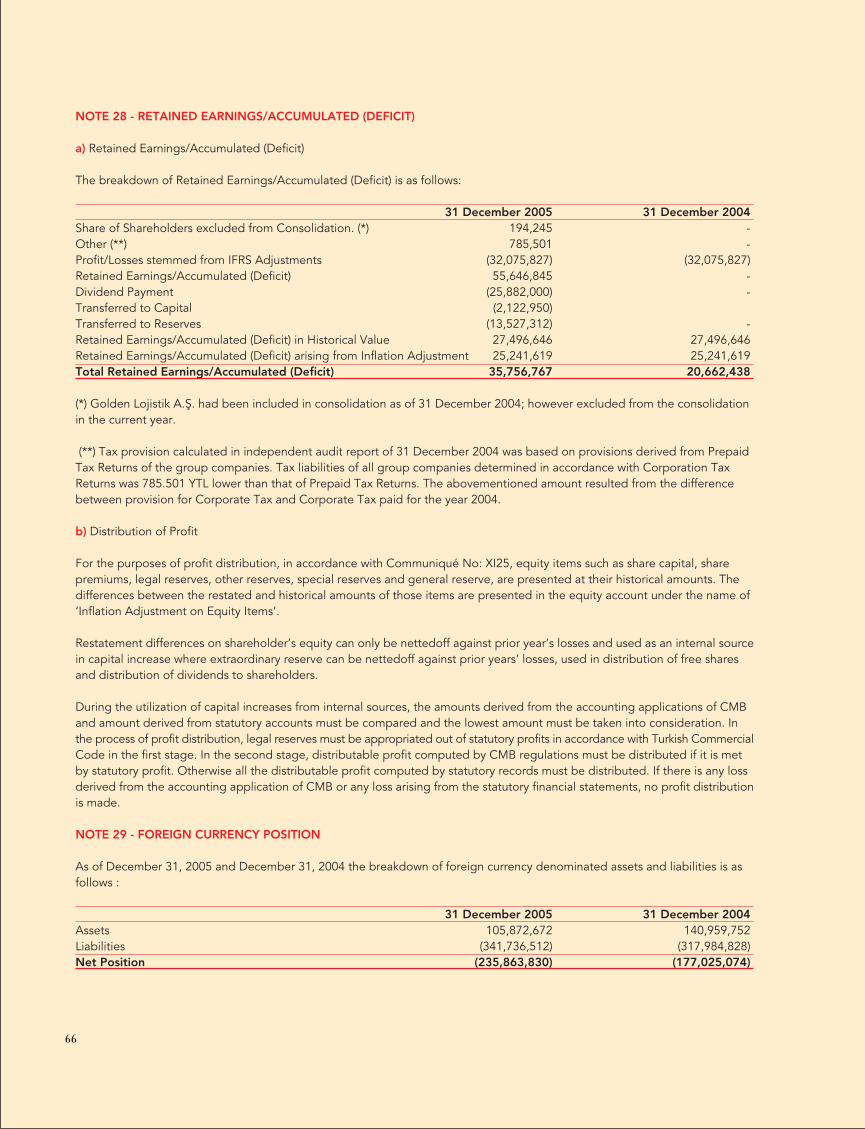
66
NOTE 28 - RETAINED EARNINGS/ACCUMULATED (DEFICIT)
a) Retained Earnings/Accumulated (Deficit)
The breakdown of Retained Earnings/Accumulated (Deficit) is as follows:�
31 December 2005 31 December 2004Share of Shareholders excluded from Consolidation. (*) 194,245 -Other (**) 785,501 -Profit/Losses stemmed from IFRS Adjustments (32,075,827) (32,075,827)Retained Earnings/Accumulated (Deficit) 55,646,845 -Dividend Payment (25,882,000) -Transferred to Capital (2,122,950)Transferred to Reserves (13,527,312) -Retained Earnings/Accumulated (Deficit) in Historical Value 27,496,646 27,496,646Retained Earnings/Accumulated (Deficit) arising from Inflation Adjustment 25,241,619 25,241,619Total Retained Earnings/Accumulated (Deficit) 35,756,767 20,662,438
(*) Golden Lojistik A.fi. had been included in consolidation as of 31 December 2004; however excluded from the consolidationin the current year.
(**) Tax provision calculated in independent audit report of 31 December 2004 was based on provisions derived from PrepaidTax Returns of the group companies. Tax liabilities of all group companies determined in accordance with Corporation TaxReturns was 785.501 YTL lower than that of Prepaid Tax Returns. The abovementioned amount resulted from the differencebetween provision for Corporate Tax and Corporate Tax paid for the year 2004.
b) Distribution of Profit
For the purposes of profit distribution, in accordance with Communiqué No: XI25, equity items such as share capital, sharepremiums, legal reserves, other reserves, special reserves and general reserve, are presented at their historical amounts. Thedifferences between the restated and historical amounts of those items are presented in the equity account under the name of‘Inflation Adjustment on Equity Items’.
Restatement differences on shareholder’s equity can only be nettedoff against prior year’s losses and used as an internal sourcein capital increase where extraordinary reserve can be nettedoff against prior years’ losses, used in distribution of free sharesand distribution of dividends to shareholders.
During the utilization of capital increases from internal sources, the amounts derived from the accounting applications of CMBand amount derived from statutory accounts must be compared and the lowest amount must be taken into consideration. Inthe process of profit distribution, legal reserves must be appropriated out of statutory profits in accordance with Turkish CommercialCode in the first stage. In the second stage, distributable profit computed by CMB regulations must be distributed if it is metby statutory profit. Otherwise all the distributable profit computed by statutory records must be distributed. If there is any lossderived from the accounting application of CMB or any loss arising from the statutory financial statements, no profit distributionis made.
NOTE 29 - FOREIGN CURRENCY POSITION
As of December 31, 2005 and December 31, 2004 the breakdown of foreign currency denominated assets and liabilities is asfollows :
31 December 2005 31 December 2004Assets 105,872,672 140,959,752Liabilities (341,736,512) (317,984,828)Net Position (235,863,830) (177,025,074)

67
As of December 31, 2005
Assets USD EURO GBP Other TotalLiquid Assets 13,308,760 6,442,980 1,573,825 - 21,325,565Marketable Securities (Net) 1,043,920 - - - 1,043,920Short-Term Trade Receivables (Net) 54,360,976 13,581,446 217,900 - 68,160,322Receivables from Related Parties 3,464,343 1,042 - - 3,465,385Other Receivables 11,444,264 - - - 11,444,264Advances Given 383,850 31,440 - - 415,290Other Current Assets 1,342 - - - 1,342Long-Term Trade Receivables (Net) 16,594 - - - 16,594Total 84,024,049 20,056,908 1,791,725 - 105,872,672
Liabilities USD EURO GBP Other TotalShort-Term Financial Liabilities (247,025,380) (8,077,755) - - (255,103,135)Trade Payables (Net) (13,026,097) (1,728,816) (2,880) (398,472) (15,156,265)Due from Related Parties (2,376,565) (1,920,751) - - (4,297,316)Short-Term Finance Lease Payables (Net) (29,883,696) (295,179) - - (30,178,875)Long-Term Financial Payables - (11,112,500) - - (11,112,500)Long-Term Finance Lease Payables (Net) (18,801,909) (393,685) - - (19,195,594)Advances Received (3,572,063) (109,939) - - (3,682,002)Provisions for Liabilities and Expenses (2,908,289) (102,536) - - (3,010,825)Total (317,593,999) (23,741,161) (2,880) (398,472) (341,736,512)Net Foreign Currency Position (233,569,950) (3,684,253) 1,788,845 (398,472) (235,863,830)
As of December 31, 2004;
Assets USD EURO GBP Other TotalLiquid Assets 50,117,866 5,798,468 1,752,770 2,745 57,671,849Marketable Securities (Net) 991,409 1,277,283 - - 2,268,692Short-Term Trade Receivables (Net) 61,879,940 8,769,355 263,112 - 70,912,407Other Receivables 307 - - - 307Inventories 340,518 - - - 340,518Long-Term Trade Receivables (Net) 15,971 - - - 15,971Other Current Assets 9,750,008 - - - 9,750,008Total 123,096,019 15,845,106 2,015,882 2,745 140,959,752
Liabilities USD EURO GBP Other TotalShort-Term Financial Liabilities (79,978,423) (17,881,246) - - (97,859,669)Trade Payables (Net) (33,009,666) (1,729,325) (6,915) (992,399) (35,738,305)Short-Term Finance Lease Payables (Net) (29,250,918) - - - (29,250,918)Long-Term Financial Payables (134,650,063) (12,667,506) - - (147,317,569)Long-Term Finance Lease Payables (Net) (1,141,126) - - - (1,141,126)Advances Received (2,570,937) (1,417,045) (129,820) - (4,117,802)Provisions for Liabilities and Expenses (2,281,544) (273,435) - - (2,554,979)Other Liabilities (315) (4,143) - - (4,458)Total (282,882,992) (33,972,700) (136,735) (992,399) (317,984,826)Net Foreign Currency Position (159,786,973) (18,127,594) 1,879,147 (989,654) (177,025,074)

68
NOTE 30 - GOVERNMENT INCENTIVES
The amount of investment allowances utilized in current and previous periods by the Company is summarized as follows:
31 December 2005 31 December 2004Utilized Investment Allowances 3,234,826 3,993,726Unutilized Investment Allowances - -
The Company has also received tax refund amounting to 394,518 YTL as of 31 December 2005 in line with The Decision No:20/6 of the Board of Money and Credit Coordination based on the Communiqué No: 2000/5 related to “Reimbursement forExport of Agricultural Products” of that board.
NOTE 31 - PROVISIONS, CONTINGENT ASSETS AND LIABILITIES
a) Guarantees Received and Given
aa) As of 31 December 2005;
Guarantees Received 31 December 2005USD (YTL) EURO (YTL) GBP (YTL) TOTAL CURRENCY YTL TOTAL
Letters of Guarantee 21,965,266 1,011,238 256,643 23,233,147 61,967,099 85,200,246Guarantee Cheques 167,725 - - 167,725 2,155,958 2,323,683Notes 9,280,292 317,500 - 9,597,792 7,146,691 16,744,483Other Letters of Guarantee - - - - 40,000 40,000Mortgages - - - - 61,538,136 61,538,136Common Stocks - - - - 20,372,201 20,372,201Total 31,413,283 1,328,738 256,643 32,998,664 153,220,085 186,218,748
Guarantees Given 31 December 2005USD (YTL) EURO (YTL) GBP (YTL) TOTAL CURRENCY YTL TOTAL
Letters of Guarantee (8,872,787) - - (8,872,787) (42,381,416) (51,254,203)Guarantee Cheques (18,785,200) - - (18,785,200) - (18,785,200)Export Commitments (113,218,120) - (113,218,120) - (113,218,120)Total (140,876,106) - - (140,876,106) (42,381,416) (183,257,523)
31 December 2005Assets 32,998,664Liabilities (140,876,106)Off-Balance Sheet Foreign Currency Position (net) (107,877,442)

69
ab) As of December 31 2004;
Guarantees Received 31 December 2004USD (YTL) EURO (YTL) GBP (YTL) TOTAL CURRENCY YTL TOTAL
Letters of Guarantee 17,515,989 - - 17,515,989 51,871,752 69,387,741Guarantee Cheques 100,000 - - 100,000 1,593,236 1,693,236Notes 926,730 70,000 - 996,730 13,598,603 14,595,333Other Letters of Guarantee - - - - 40,000 40,000Mortgages - - - - 54,567,466 54,567,466Common Stocks - - - - 26,051,100 26,051,100Total 18,542,719 70,000 - 18,612,719 147,722,157 166,334,876
Guarantees Given 31 December 2004USD (YTL) EURO (YTL) GBP (YTL) TOTAL CURRENCY YTL TOTAL
Letters of Guarantee 10,599,839 - - 10,599,839 32,308,295 42,908,134Guarantee Cheques 14,000,000 - - 14,000,000 - 14,000,000Export Commitments 100,117,030 - - 100,117,030 - 100,117,030Total 124,716,869 - - 124,716,869 32,308,295 157,025,164
31 December 2004Assets 18,612,719Liabilities (124,716,869)Balance Sheet Foreign Currency Position (net) (106,104,150)
b) Lawsuits launched by and against company
ba) As of 31 December 2005;
Lawsuits launched by the Company:YTL USD
Lawsuits for Severance Payment 1,050,000 -Enforcement Lawsuits 150,000 (*)9,218,166Tax Lawsuits 1,003 -Claim Lawsuits 95,936 -Total 1,269,939 9,218,166
(*) The above mentioned amount is the lawsuit against Sezginler Holding and has been settled in favour of the Company.Therefore, by converting the mortgage at the amount of 13,910,000 YTL to cash, the legal followup has been continued andfixed assets have been subject to reassessment. Under the procedure of converting the mortgages to cash the transactions havebeen continued.
Lawsuits launched against the Company:YTL USD
Claim Lawsuits 12,000 -Lawsuit for Severance Payment 1,103,900 536,720Total 1,115,900 536,720
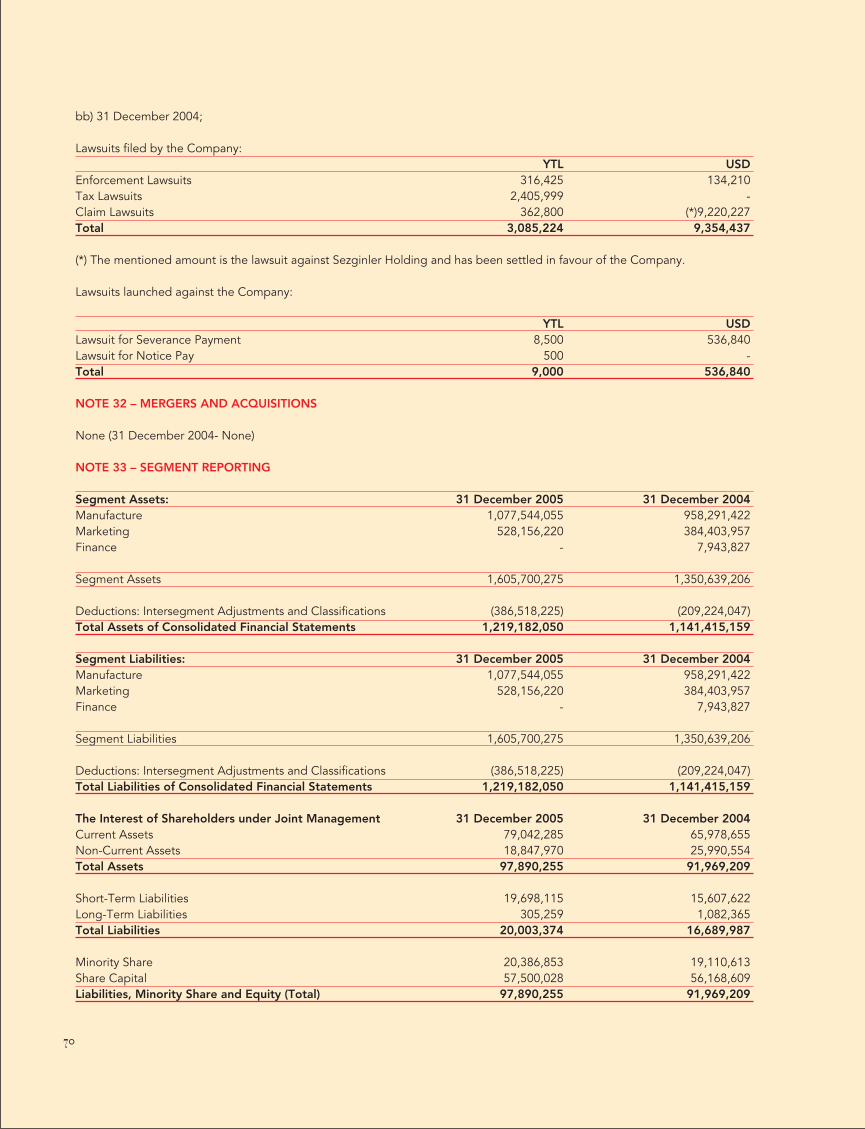
70
bb) 31 December 2004;
Lawsuits filed by the Company:YTL USD
Enforcement Lawsuits 316,425 134,210Tax Lawsuits 2,405,999 -Claim Lawsuits 362,800 (*)9,220,227Total 3,085,224 9,354,437
(*) The mentioned amount is the lawsuit against Sezginler Holding and has been settled in favour of the Company.
Lawsuits launched against the Company:
YTL USDLawsuit for Severance Payment 8,500 536,840Lawsuit for Notice Pay 500 -Total 9,000 536,840
NOTE 32 – MERGERS AND ACQUISITIONS
None (31 December 2004- None)
NOTE 33 – SEGMENT REPORTING
Segment Assets: 31 December 2005 31 December 2004Manufacture 1,077,544,055 958,291,422Marketing 528,156,220 384,403,957Finance - 7,943,827
Segment Assets 1,605,700,275 1,350,639,206
Deductions: Intersegment Adjustments and Classifications (386,518,225) (209,224,047)Total Assets of Consolidated Financial Statements 1,219,182,050 1,141,415,159
Segment Liabilities: 31 December 2005 31 December 2004Manufacture 1,077,544,055 958,291,422Marketing 528,156,220 384,403,957Finance - 7,943,827
Segment Liabilities 1,605,700,275 1,350,639,206
Deductions: Intersegment Adjustments and Classifications (386,518,225) (209,224,047)Total Liabilities of Consolidated Financial Statements 1,219,182,050 1,141,415,159
The Interest of Shareholders under Joint Management 31 December 2005 31 December 2004Current Assets 79,042,285 65,978,655Non-Current Assets 18,847,970 25,990,554Total Assets 97,890,255 91,969,209
Short-Term Liabilities 19,698,115 15,607,622Long-Term Liabilities 305,259 1,082,365Total Liabilities 20,003,374 16,689,987
Minority Share 20,386,853 19,110,613Share Capital 57,500,028 56,168,609Liabilities, Minority Share and Equity (Total) 97,890,255 91,969,209

71
NOTE 34 - SUBSEQUENT EVENTS
a) ‹deal G›da San. ve Tic. A.fi., the consolidated subsidiary with share of 97.5% of Ülker G›da Sanayi ve Ticaret A.fi. has decidedon 24 February 2006 to issue publicly traded shares for the year 2005.
b) As of the reporting date of Sa¤lam GYO A.fi., the registered paidin share capital of the Company has taken into considerationto consolidate after current period.
NOTE 35 - DISCONTINUED OPERATIONS
None (31 December 2004: None)
NOTE 36 - OPERATING INCOME
The breakdown of Operating Income is as follows:
1 January-31 December 2005 1 October-31 December 2005Domestic Sales 1,445,940,143 334,746,399Export Sales 232,200,841 68,759,756Sales Returns ( - ) (41,980,652) (552,408)Sales Discounts ( - ) (341,415,312) (14,562,208)Other Discounts ( - ) (11,869) -Sales Income ( Net ) 1,294,733,151 388,391,539Costs of Sales ( - ) (1,049,363,328) (311,566,456)Other Operating Income 64,156,259 2,021,656Operating Income / Loss (Net) 309,526,082 78,846,739
NOTE 37 – OPERATING EXPENSES
The breakdown of Operating Expenses is as follows:1 January-31 December 2005 1 October-31 December 2005
Research and Development Expenses (*) 1,042,858 254,172Sales and Marketing Expenses (**) 165,480,984 45,654,808General and Administrative Expenses (***) 38,674,024 10,599,835Total 205,197,866 56,508,815
(*) Research and Development Expenses 1 January-31 December 2005 1 October-31 December 2005Personnel Expenses 430,541 105,717Expenses of Raw Materials 305,038 36,334Depreciation Expenses 26,838 14,859Other 280,441 97,262Total 1,042,858 254,172
(**) Sales and Marketing Expenses 1 January-31 December 2005 1 October-31 December 2005Personnel Expenses 23,949,844 6,156,081Operating Expenses 131,911,514 37,340,957Depreciation Expenses 7,739,414 445,491Other 1,880,212 1,712,279Total 165,480,984 45,654,808
(***) General and Administrative Expenses 1 January-31 December 2005 1 October-31 December 2005Personnel Expenses 16,338,290 3,387,364Operating Expenses 9,378,161 4,172,261Depreciation Expenses 1,765,084 534,241Goodwill Amortization Expenses 7,452,924 1,863,231Consultancy Expenses 2,258,649 272,463Other 1,480,916 370,275Total 38,674,024 10,599,835

72
NOTE 38 - OTHER OPERATING INCOME AND EXPENSES
a) The breakdown of Other Operating Income is as follows:
1 January-31 December 2005 1 October-31 December 2005Interest Income 40,197,785 9,599,211- Interest Income from Repo Transactions 7,073 2,873- Interest Income from Related Parties 36,663,245 9,243,317- Interest Income from Bank Deposits 3,527,467 353,021Dividend Income 3,758,624 -Provisions No Longer Required 1,270,445 (236,400)Discount Interest Gains 11,452,315 (2,348,432)Foreign Exchange Gains 29,832,514 4,310,581Other Operating Income and Gain 8,715,979 1,882,005- Rental Income 2,514,235 445,013- Service Income 4,034,830 855,449- Income from Sale of Scraps 616,650 231,951- Income from Increase in Stock Exchange 541,754 41,254- Income from Rental Vehicle 522,259 266,389- Others 486,251 41,949Other Extraordinary Gains and Profits 829,258 (148,685)Income and Gain from Previous Period 71,954 -Gains on Sales of Marketable Securities 154,907 24,597Income from Subsidiaries 3,896,040 850,717Total 100,179,821 13,933,594
b) The breakdown of Other Operating Expenses is as follows:
1 January-31 December 2005 1 October-31 December 2005Discount Interest Losses 8,834,534 (4,583,546)Commission Expenses 54,982 40,022Foreign Exchange Losses 18,744,318 1,324,639Provision Expenses 3,415,417 (3,179)Other Operating Expenses and Losses 2,333,924 595,100Expenses and Losses in Previous Period 14,662 8,518Depreciation Expenses 2,129,301 532,326Other 189,961 54,256Other Extraordinary Expenses and Losses 13,476,792 3,295,630Non–Operating Department Expenses 2,527,104 454,040Inflation Adjustment on Fixed Assets 1,087,137 2,638,689Loss on Sales of Subsidiaries 2,305,791 202,901Other 7,556,760Total 46,859,967 668,666
NOTE 39 - FINANCE EXPENSES
The breakdown of Finance Expenses is as follows;1 January-31 December 2005 1 October-31 December 2005
Interest Expenses 25,918,119 5,300,779Foreign Exchange Losses 16,614,485 3,906,848Mortgage Expenses 391,038 277,955Commission Expenses 924,709 200,562Letter of Credit Expenses 280,484 10Other 245,143 65,141Total 44,373,978 9,751,295

73
NOTE 40 - NET MONETARY GAIN / LOSS
None
NOTE 41 - TAXATION
The breakdown of Tax Liability is as follows;31 December 2005
Corporate and Income Taxes Payable (33,816,580)
Under the Turkish Taxation System, the major company can not give tax return based on consolidated financial statements; forthat reason, provision for taxes reflected to the consolidated financial statements has been calculated separately for all consolidatedcompanies.
Corporation tax rate of the fiscal year is 30% (2004: 33%). Corporation tax is payable at a rate of 30% on the total income ofthe Company after adjusting for certain disallowable expenses, exempt income and investment and other allowances. No furthertax is payable unless the profits is distributed.
Dividends paid to nonresident corporations which have a place of business in Turkey, or resident corporations are not subjectto withholding tax. Otherwise, dividends paid are subject to with holding tax at the rate of 10%. An increase in capital via issuingbonus shares is not considered a profit distribution and thus does not incur withholding tax.
Corporations are required to pay prepaid corporation tax quarterly at the rate of 30% (33% for the year 2004) on their corporateincome. Prepaid tax is payable by the 17th of the second month following each calendar quarter end. Prepaid tax paid bycorporation is credited against other liabilities to the government.
Capital gains derived from the sale of equity investments and immovable assets held for not less than two years are tax exempt,if such gains are added to paidin capital in the year in which they are sold.
Capital expenditures, with some exceptions, over 10,000 YTL are eligible for investment incentive allowance of 40%, which isdeductible from taxable income prior to calculation of the corporate income tax, without the requirement of an investmentincentive certificate, and the amount of allowance is not subject to withholding tax. Investment allowances utilized within thescope of investment incentive certificates granted prior to 24 April 2003 are subject to withholding tax at the rate of 19.8%,irrespective of profit distribution.
Under the Turkish Taxation System, tax losses can be carried forward to offset against future taxable income for up to 5 years.Tax losses can not be carried back to offset profits from previous periods.
Companies file their tax returns within the 15th of the fourth month following the close of the financial year to which they relate.Tax returns are open for 5 years from the beginning of the year that follows the date of filing during which time the tax authoritieshave the right to audit tax returns, and the related accounting records on which they are based, and may issue reassessmentsbased on their findings.
NOTE 42 - EARNINGS PER SHARE
Earnings per share disclosed in the statement of income are calculated by dividing net earnings by the weighted average numberof shares that have been outstanding during the related year.
In Turkey, companies can increase their share capital by making a prorata distribution of shares (Bonus Shares) to existingshareholders from retained earnings and revaluation surplus. For the purpose of earnings per share computations, the weightedaverage number of shares outstanding during the year has been adjusted in respect of bonus shares issues without a correspondingchange in resources, by giving them retroactive effect for the year in which they were issued and each earlier year.

74
Earnings per share are determined by dividing net income by the weighted average number of shares issued.
31 December2005Number of Common Stock Outstanding as of 1 January 23,870,000,000Exported Bonus Shares 238,700,000Shares issued in return for CashNumber of Common Stock Outstanding as of 31 December 2005 24,108,700,000
Weighted Number of Common Stock Outstanding 24,108,700,000Net Income 66,226,253Basic Earnings Per Share (1YKrs par value each) 0,00275
According to Board decision related to distribution of earnings No: 7/242 (25,02,2005) of CMB, distributable income calculatedwith respect to Board’s adjustments has to be taken; besides provided that reserves are allocated from legal records kept inrespect to Turkish Commercial Code;
In case that value calculated according to arrangements for minimum obligatory profit distribution out of net distributable incomecan be covered by income in legal records completely, distribution all of that amount;
In case that value calculated according to arrangements for minimum obligatory profit distribution out of net distributable incomecan not be covered by income in legal records completely, distribution of earning in legal records;
In case that a loss in legal records or financial statements which are prepared with respect to Board’ s arrangements occurs ,nondistribution of income is required. On the other hand, in case the associates and subsidiaries consolidated in accordancewith Communiqué No:XI25 had the decision to distribute profit in general meeting; provided that profit perceiving to consolidatedfinancial statements of main company from financial statements of above mentioned companies is the upper limit, perceivingprofits to main company from mentioned companies have to be taken into consideration in distributable earning of the maincompany.
NOTE 43 - CASH FLOW STATEMENT
The breakdown of Cash and Cash Equivalents is as follows;
End of the Period Beginning of thePeriodCash 93,290 135,776Bank Deposits 179,210,041 103,567,622Other Cash Equivalents 470,688 495,750Total 179,774,019 104,199,148
NOTE 44 - OTHER ISSUES TO BE DISCLOSED
a) Effective from 1 January 2005, through the enactment of the Law numbered 5083 concerning the “Currency of the Republicof Turkey” in the Official Gazette dated 30 January 2004, New Turkish Lira (YTL) and the New Turkish Kurus (YKr) have beenintroduced as the new currency of the Republic of Turkey. The hundredth part of the YTL is the YKr (1 YTL= 100 YKr). The priorcurrency, Turkish Lira (TL), values are converted into YTL, as one million TL (1,000,000 TL) is equivalent to one YTL (1 YTL).Accordingly, currency of the Republic of Turkey is simplified by removing 6 zeros from the TL. In line with the announcement ofCMB dated 1 December 2004, the accompanying financial statements together with prior period figures are presented in YTL.
b) With the Decision No: 11/367 taken on 17 March 2005, the CMB has announced that, effective from 1 January 2005, theapplication of inflation accounting is no longer required as conditions specified in the Communiqué No: XI20 and No: XI25 havedisappeared. The financial statements of the Company presented for the comparison purposes had been expressed in thepurchasing power of YTL at 31 December 2004. However, interim financial statements prepared as of 31 December 2005 havenot been held subject to inflation adjustment.

75
c) The Company has decided that products under the names of “Çubuk Kraker”, “Kat Kat Tad”, “9 Kat Gofret” and “Çokosandviç”,produced by the Company and sold by its consolidated subsidiary Atlas G›da Pazarlama San. ve Tic. A.fi., will also be sold byEsas Pazarlama ve Ticret A.fi. to other selling channels except for chain market channels so as to increase sales at cafetarias andother highly consumed outlets for the purpose of reducing costs with higher selling and production capacity as ofFebruary 01, 2006. There is no relationship in the form of subsidiary or associate between the Company and Esas Pazarlama veTicaret A.fi. The share of above mentioned products in total sales amounts to 2,93%.
d) ‹deal G›da San. ve Tic. A.fi., a subsidiary of the Company at the rate of 97.5%, has decided to go public by quoting its shareson ‹stanbul Stock Exchange through increasing share capital on its Regular Meeting dated 24 February 2006.
ÜLKER GIDA SANAY‹ VE T‹CARET ANON‹M fi‹RKET‹ AND ITS SUBSIDIARIESNOTES TO THE CONSOLIDATED FINANCIAL STATEMENTS AS OF DECEMBER 31, 2005(Amounts expressed in New Turkish Liras (“YTL”) unless otherwise indicated)
NOTE 45 - ELIMINATED ITEMS DURING CONSOLIDATION PROCESS
Account Name Debit CreditGOODWILL 115,084,884DUE TO RELATED PARTIES (Net) 268,454,043SHARE CAPITAL 64,775,000REVALUATION DIFFERENCES ON TANGIBLE FIXED ASSETS 3,806REVALUATION SURPLUS ON STOCK EXCHANGE 17,248INFLATION ADJUSTMENTS ON EQUITY ITEMS 33,592,920LEGAL RESERVES 1,868,152EXTRAORDINARY RESERVES 28,433,725PRIOR YEAR’S PROFIT 14,362,987OTHER RESERVES 2,139,685SALES INCOME 795,609,399OTHER OPERATING INCOME AND PROFIT 12,721,059MINORITY INTEREST PROFIT/LOSSES 14,294,634OTHER OPERATING EXPENSES AND LOSSES 2,031,981FINANCIAL ASSETS 230,376,106RECEIVABLES FROM RELATED PARTIES (Net) 268,454,043TANGIBLE FIXED ASSETS (Net) 2,772,958MINORITY INTEREST 42,369,727REVALUATION DIFFERENCES ON EQUITY ITEMS 7,896,188COST OF GOODS SOLD 755,654,097OPERATING EXPENSES 43,703,668FINANCE EXPENSES 2,162,736Total 1,353,389,523 1,353,389,523


NOSTALJ‹
AN ÜLKER BISCUIT BOX STICKER FROM THE 1960’s
NOSTALJ‹
AN ÜLKER BISCUIT BOX STICKER FROM THE 1960’s