annual results presentation - euro disney...
TRANSCRIPT

Annual ResultsPresentationFiscal Year 2013
November 7, 2013

Philippe GASChief Executive Officer

Looking ahead into 2014
© Disney.Pixar
Continued Renovationof our Hotels
Opening of RatatouilleEnhance Booking
Conversion and Materialization of
New Markets

Mark STEADChief Financial Officer

2013 highlights
1% decline in total revenues despite a very challenging economic environment- Higher spending in both our parks and hotels
- Continued focus on rate vs volume
- Strength of base demand
Resort costs and expenses grew below inflation rate
Net loss narrowed by €22M, reflectingthe positive impact of the 2012 refinancing
Continued focus on long term strategyto drive guest spending through improved experience

Revenues
750
519
9
46
FY 2012 FY 2013
1,324
738
510
41
20
1,309
(4.7) Other Revenues
+11.1 Real Estate Development
(12.9) Theme Parks
(8.4) Hotels & Disney Village
(€ in millions)

Revenues - Theme parks
750
FY 2012 FY 2013
1,324
738
1,309
(49) 36
Average Spending per Guestat 48.1€
Attendanceat 14.9M
(7%)
+4%
(€ in millions)

14.9MILLION VISITS
SPAIN 8%
UK 13%
52%
Fiscal Year
2012
FRANCE
8%
14%
51%
Fiscal Year
2013
2%3%GERMANY
ITALY 3%3%
FRANCE
UNITED-KINGDOM
SPAIN
BELGIUM
NETHERLANDS
ITALY
GERMANY
REST OF THE WORLD
Breakdown of attendance by country
14%
6%
6%
8%
3%3%
9%
51%

Revenues - Hotels & Disney Village
519
FY 2012 FY 2013
1,324 1,309
+2%
(4.7 ppt)
(24) 6
Average Spendingper Roomat 235.0€
Hotel Occupancy
at 79%
Disney Village & Other
510
(€ in millions)
9

Revenues
750
519
9
46
FY 2012 FY 2013
1,324
738
510
41
20
1,309
(4.7) Other Revenues
+11.1 Real Estate Development
(12.9) Theme Parks
(8.4) Hotels & Disney Village
(€ in millions)

2511
107 (12)
Costs and expenses
1,321
1,337
FY 2012 FY 2013
Real EstateCost of Sales
LaborRate
Impact ofNew Content
Productivity& Other
Resort Segment : 5M€
+0,3%
(€ in millions)
Fiscal Year2013
Fiscal Year2012
Variance 12/13
€ %
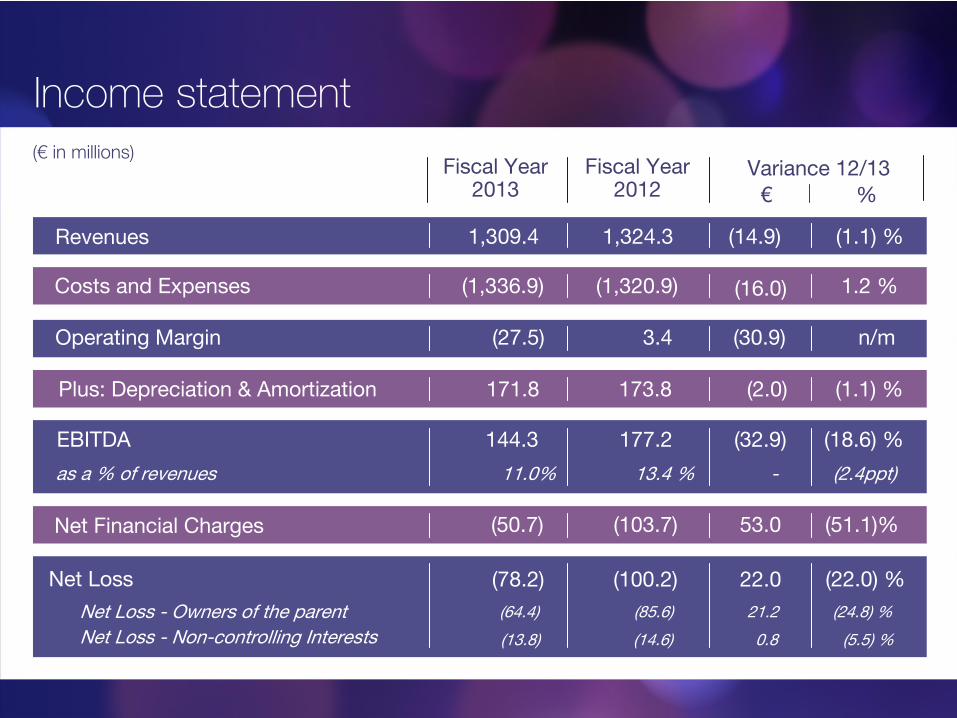
Revenues 1,324.3 (14.9) (1.1) %1,309.4
Operating Margin 3.4 (30.9) n/m(27.5)
Plus: Depreciation & Amortization 173.8 (2.0) (1.1) %171.8
Net Financial Charges (103.7) 53.0 (51.1)%(50.7)
EBITDA 177.2 (32.9) (18.6) %
as a % of revenues 13.4 % (2.4ppt)-
144.3
11.0%
Costs and Expenses (1,320.9) (16.0) 1.2 %(1,336.9)
Net Loss - Owners of the parent
(14.6) 0.8 (5.5) %Net Loss - Non-controlling Interests
(85.6) 21.2 (24.8) %
Net Loss (100.2) 22.0
(13.8)
(64.4)
(78.2) (22.0) %
Income statement(€ in millions)

Variance12/13
Beginning Cash and Cash Equivalents 366.1114.3 (251.8)
Cash Flow from Operating Activities 144.095.0
Cash Flow used in Investing Activities (153.3)(126.1) 27.2
Cash Flow used in Financing Activities (242.5)(5.2) 237.3
Ending Cash and Cash Equivalents 78.0
(49.0)
114.3
Free Cash Flow Used (9.3)(31.1) (21.8)
(36.3)
Fiscal Year2013
Fiscal Year2012
Cash flows(€ in millions)

Delivering on long term strategy
1% decline in total revenues despitea very challenging economic environment
Limited cost and expense growth
Net loss narrowed by 22M€
Continued focus on long term strategyto drive guest spending through improved guest experience
Growth projects for 2014 and beyond

Questions
Answers&

Annual ResultPresentationFiscal Year 2013
November 7, 2013