annual results report guidance office of ......annual results report guidance office of food for...
TRANSCRIPT

ANNUAL RESULTS REPORT GUIDANCE OFFICE OF FOOD FOR PEACE Development Food Security Activities
Fiscal Year 2019
MORGANA WINGARD FOR USAID


1 USAID.GOV
TABLE OF CONTENTS TABLE OF CONTENTS 1
ACRONYMS 2
PURPOSE AND APPLICABILITY 4
ARR PACKAGE 6
ARR: DOCUMENTS TO UPLOAD 7
A. ARR Narrative 7
B. Indicator Performance Tracking Table (IPTT) 11
C. IPTT Indicator Data Collection Method Descriptions 12
D. Baseline/Evaluation, Assessments and Study Reports 12
E. Success Stories 12
ARR - DIRECT DATA ENTRY 13
FFP Partner Reporting Tool (PRT) 13
PRT Home Page 13
ARR Base Page 14
Submitting the completed ARR 15
Document Upload 16
IDP and Refugee Participants 16
Monitoring Indicators 16
Baseline and Final Evaluation Indicators 17
Technical Sector Survey 17
Unique and Direct Participants 18
Specialized Foods Distribution 19
LRIP and Modality Actuals 20
ANNEX A: DEFINITIONS FOR FFP ARR 25
ANNEX B: REPORTING FY 2019 INDICATOR RESULTS IN IPTT AND PRT 33
ANNEX C: INDICATOR PERFORMANCE TRACKING TABLE CHECKLIST IN ARR 41
ANNEX D: ARR NARRATIVE QUALITY REVIEW CHECKLIST 42
ANNEX E: INTEGRATING GENDER, YOUTH AND SOCIAL DYNAMICS IN ARR 45
ANNEX F: INTEGRATING ENVIRONMENT IN ARR 47
ANNEX G: SUCCESS STORY WRITING 10 49
ANNEX H: REFERENCE DOCUMENTS AND WEBSITES 52

USAID.GOV 2
ACRONYMS
ADS Automated Directives System
AOR Agreement Officer’s Representative
APS Annual Program Statement
ARR Annual Results Report
BEHT Bill Emerson Humanitarian Trust
DFSA Development Food Security Activity
DEC Development Experience Clearinghouse
DNA Disaggregates Not Available
EFSP Emergency Food Security Program
FANTA Food and Nutrition Technical Assistance III Project
FFP Office of Food for Peace
FFPMIS Food for Peace Management Information System
FFPIB Food for Peace Information Bulletin
FFW Food for Work
FTF Feed the Future Presidential Initiative
FY Fiscal year (October 1 – September 30)
GAM Global Acute Malnutrition
HDDS Household Dietary Diversity Score
IDA International Disaster Assistance
IDP Internally Displaced Person
IFRP International Food Relief Partnership
IPTT Indicator Performance Tracking Table
ITSH Internal Transportation, Storage, and Handling
IR Intermediate result
LOA Life of Award (same as Life of Program in FFPMIS until updated)
LRIP Local, Regional, and International Procurement

3 USAID.GOV
MT Metric Ton
NGO Non-governmental Organization
OCO Overseas Contingency Operations
OMB Office of Management and Budget
PDM Post Distribution Monitoring
PRT Partner Reporting Tool
PVO Private Voluntary Organization
R Required (indicator or ARR component)
RiA Required if Applicable (indicator or ARR component)
SO Strategic Objectives
USAID U.S. Agency for International Development
USG United States Government

USAID.GOV 4
PURPOSE AND APPLICABILITY The Annual Results Report (ARR) is an annual reporting requirement for the current and recently closed Office of Food for Peace (FFP) awards implemented by U.S. or non-U.S. non-governmental organizations (NGOs), including private voluntary organizations (PVOs). FFP awardees that receive funding from the Food for Peace Act (Title II), International Disaster Assistance (IDA) account, Overseas Contingency Operations (OCO) account, and/or Community Development Funds (CDF) are required to submit ARRs. These include emergency, non-emergency, and international food relief partnership (IFRP) awards. ARRs assist FFP with: (1) understanding, assessing, and managing the performance of FFP activities at all levels; (2) meeting statutory requirements and management needs in compliance with the Government Performance and Results Act Modernization Act (GPRAMA) of 2010 and other external policies; and (3) providing information to relevant stakeholders, such as U.S. Agency for International Development (USAID) missions and/or regional offices, the United States Government (USG) Feed the Future (FTF) Presidential Initiative, U.S. Congress, Department of State’s Office of U.S. Foreign Assistance Resources, and the Office of Management and Budget (OMB). ARR replaces the fourth quarter quarterly report presenting progress and results for the entire reporting FY1—not just the final quarter. NGO and PVO awardees must submit ARR for each fiscal year (FY) during which activities were implemented, except for awards that were signed in the last quarter (July 1- September 30) of the reporting FY. Awardees must report even if the activity began late, ended early in the FY having implemented few interventions, or achieved limited or no results. If activities were not implemented during the reporting FY, awardees should discuss with the agreement officer’s representative (AOR) which components of the ARR to be submitted. In situations where the activity’s final performance report is due within three months of the ARR submission, an awardee may request the AOR for a combined report that includes ARR and Final Performance Report. On approval, the awardee must follow the ARR guidance for the combined reporting and submit the report within the ARR submission deadline. Awardees will have to report on the current FY as well as cumulative (LoA) achievements in ARR Narrative Report. Additionally, awardees will be required to present key overarching challenges and successes. As a reminder, awardees should useg lessons learned in the ARR to guide their Environmental Status Report (ESR), M&E Plan updates, and changes to the Indicator Performance Tracking Table (IPTT), which should be submitted at least 2 months before the Pipeline and Resources Estimate Proposal (PREP) is submitted. Note that FFP development awards are part of the FTF Initiative and indicator results are reported to FTF by FFP/Washington; awardees and/or USAID Missions should not report this data directly to Feed the Future Monitoring System.
1 FY runs from October 1 through September 30

5 USAID.GOV
Please read the following list while preparing for the FY 2019 ARR:
1. The FY 2019 ARR submission deadline is November 4, 2019, 12:00 pm Eastern Standard Time. 2. Awardees must submit ARR in FFP Partner Reporting Tool (FFP PRT) 2. Please direct
questions or problems only related to FFP PRT website to [email protected] 3. Awards that end prior to the end of the FY and prior to the release of any updated guidance, if
applicable, should follow the previous year’s ARR guidance for reporting, however, provide entry and upload data in the FFP PRT.
4. Awardees must submit the complete ARR package by the above-stated deadline or within 90 days of the date of the award’s expiration, whichever comes first.
5. Within approximately one week of submitting ARR, awardees should receive an ARR submission acknowledgment from FFP.
6. Once an ARR is submitted, FFP PRT does not automatically notify awardees when the submission status changes. Awardees must login to the site to see the current status of submission.
7. Awardees are required to upload all survey data (including post distribution monitoring, food security monitoring surveys and the baseline/endline survey data, when applicable) collected during the reporting FY to the Development Data Library (DDL).
8. Awardees are required to upload all FFP approved final reports from baseline/final evaluation and any research activities conducted during the reporting FY 3 to both FFP PRT and the Development Experience Clearinghouse (DEC), even when these activities are conducted by third-party firms. If final reports for evaluation and research activities are not finalized or approved by FFP at the time of ARR submission, awardees should note this in the ARR narrative and request to modify the ARR in FFP PRT at a later date in order to upload them. This will not affect the approval status of the ARR.
9. Awardees must submit the ARR documents to the DEC within 30 days of AOR approval. The submission should include the ARR narrative, indicator table, and the success stories and lessons learned. For more information on DEC submission requirements, please refer to USAID ADS 540, DEC, and/or the AOR. When submitting the ARR package to the DEC, awardees should do the following: ● under Document Type, select “Annual Report;” ● under Primary Subject, select “Food Aid Programs;” and ● under Additional Information, include the following text: “Add the following USAID
Thesaurus Terms and Tags: Food for Peace Title II, Food Security, Nutrition Security” 10. After submitting the ARR package to the DEC, awardees are responsible for sending the link of
the uploaded document(s) to the AOR.
2 https://arr-prt.net/ 3 Per the 2019 APS, USAID/FFP requires all awards that are 12 months or longer in duration to conduct a baseline study and mixed
methods final evaluation.

USAID.GOV 6
ARR PACKAGE Awardees must submit ARR in FFP PRT via direct data entry and document upload. A complete ARR will include the applicable components listed in tables 1 and 2. Documents should be written in English language and formatted in a printer-friendly format. TABLE 1: UPLOAD AS DOCUMENTS
Document Requirement
ARR Narrative R
Indicator Table R
IPTT Indicator Data Collection Method Descriptions R
Baseline, Evaluation, Assessments, and Research Reports R
Success Stories O
R=Required; O=Optional; RiA= Required if Applicable; N/A= Not applicable TABLE 2: DIRECT DATA ENTRY
ARR Section Requirement
IDP and Refugee Participants RiA
Unique and Direct Participants R
Monitoring Indicators R
Baseline/Final Evaluation Indicators R
Technical Sector Survey R
LRIP and Modality Actuals RiA
Specialized Foods Distribution RiA
R=Required; O=Optional; RiA= Required if Applicable; N/A= Not applicable

7 USAID.GOV
ARR: DOCUMENTS TO UPLOAD A. ARR NARRATIVE The ARR narrative comprises the analysis successes and challenges faced in activity implementation during the reporting FY, and their effect on award’s strategic objectives, purposes, and outputs etc. The narrative should include a reflection on lessons learned, and how that learning will inform current/future interventions, for example, revising targets. The cover page of the ARR narrative must include the following table: TABLE 3: ARR NARRATIVE COVER PAGE
Reporting fiscal year FY 20XX
Awardee name
Host/implementation country
Award number
Activity name
Activity start date
Activity end date
Submission date (mm/dd/yyyy)
List of ARR documents uploaded in FFP PRT
Awardee HQ contact person Name, Email, Phone, Office Address
Awardee host country contact person Name, Email, Phone, Office Address
1. The ARR narrative should be no more than 23 pages in length, excluding cover page, list of
acronyms, photos, and attachments. 2. ARR narrative should be prepared in Microsoft Word in 12-point, Gill Sans font with one-inch
margins, left justification, and a footer on each page with the page number, date of submission, award number, and food security activity name.
3. Include an acronym list. 4. Avoid using jargon and technical terms specific to the award. The full audience of the report
may not be familiar with the particular terms. 5. Spreadsheets should be prepared in Microsoft Excel in 10-point, Gills Sans font, with print areas
set to 8.5 x 11-inch, letter-sized paper. In the ARR Narrative, please provide a list of all partner uploaded documents in FFP PRT, such as baseline report, evaluation report, and any other study report. Please also include the links if those documents were uploaded to the DEC and any data sets were uploaded to DDL.

USAID.GOV 8
EXECUTIVE SUMMARY
As part of reporting requirements for the Global Food Security Strategy, FFP requests awardees provide a brief summary describing the operating context during the FY, geographic location, purpose of the activity, key approaches and interventions, goals and main target participants, and how gender and youth issues are integrated in program implementation. Please indicate the proportion of women, men, youth (disaggregated by sex), girls, and boys that the activity targeted in FY19. This should be no more than one short paragraph.
THEORY OF CHANGE
The ARR should include a brief section on the Theory of Change (ToC). Based on the analysis of the annual performance indicator data, the awardees are requested to review the likelihood of achieving the desired outcomes. This section should include a concise description of changes made to the ToC during the reporting FY. It is possible for an awardee to achieve FY targets, but have annual monitoring show only a marginal achievement of the desired outcome due to a variety of reasons: the quality of implementation might be an issue (e.g., poor or insufficient training, etc.), and/or contextual factors might have influenced the intermediate outcomes negatively (e.g., drought, unavailable/inaccessible high quality inputs, etc.), and/or the conditions identified on the pathway of change might not be sufficient (e.g., farm-size is too small to produce enough food). The awardee should also revisit and validate, the assumptions made by the activity design team. The awardee should also provide a brief overview of which gender and youth issues have been prioritized with regard to the theory of change and specific purposes, if the ToC has changed as a result of these gender and youth issues and how, and how this has affected aspects of program implementation (for example activities may be modified, undertaken at different times, or dropped if women or youth cannot participate as planned). ACTIVITY INTERVENTIONS AND RESULTS
Awardee should present the achieved results against targets for the reporting FY. Awardees should not overload the narrative with indicator results; the purpose of this section is to analyze and explain the activity’s progress over the past year using select indicators that help tell the story. Gender and youth issues should be discussed throughout the narrative describing: 1) what the gender and youth issues of concern are by purpose, 2) how the project addressed these issues, 3) how this impacted implementation of activities under each purpose, 4) and how gender and youth issues were integrated in program implementation of each purpose (what was done for example in terms of type of activity, targeting of activity, to women and youth, timing of activity etc.). While discussing the gender and youth issues, FFP encourages awardees to synthesize and discuss findings from FFP RiA monitoring indicators M3, M6, M11, M14, M16, M17, M32, M34, and M35. The synthesis should highlight the indicator estimates disaggregated by sex and age wherever possible. During the analysis and in the narrative, reference any sex-disaggregated results, making sure to address any significant discrepancies in actuals across sexes and by age groups, e.g., if significantly more women were reached than men (and vice versa), or significantly more older women than younger women were reached, and discuss the implication on achieving purposes and sub-purposes. Discuss how data will influence technical strategies, activities, underlying assumptions or the activity’s ability to achieve key outputs, outcomes, where applicable.

9 USAID.GOV
Organize the narrative by the components of the Results Framework (i.e. by SO, intermediate results (IR), and sub intermediate results (Sub IR) or LogFrame (i.e. by goal, purpose, sub-purposes, intermediate outcomes, and outputs). Awards that are organized by Results Framework only (awarded before FY 2014) are not required to include a ToC. For awards made during and after FY 2014, use the updated ToC as the basis for reporting.
Illustrative analysis example: In “x” award, there is Purpose 1.3, Diversification of income sources in men and women increased. The ToC is “not only is it necessary that families increase their production for access to food, but also to increase their income to procure a variety of foods.” The hypothesis is that “when families increase their income sources, they are more likely to also increase diversification of and access to food.” Using this example, awardees should consider the following illustrative questions and present the analysis in the ARR narratives. What are the most relevant indicators in the IPTT within Purpose 1.3 during the reporting year? Do the results demonstrate progress or lack of progress towards achieving planned intermediate outcomes - and why? Have income sources increased or decreased and what happened to men and women’s participation as a result of the change? What contextual, underlying assumptions, programming changes, technical strategies or key interventions led to the changes? What does that imply about the technical approach, quality of the intervention, targeting, gender dynamics or other factors? During this year of the activity, is there evidence that the hypothesis is working or not? Is there a logical progression from outputs to outcomes? Based on all the above and any other evidence (quantitative or qualitative) including analysis of annual surveys, comparison against the last FY, participant feedback, what is the level of progress towards achieving the IR? Present the analysis and conclusion in the ARR narrative. Illustrative example on identifying the most relevant indicator: For example, an awardee can tell a story about increased yield and sales using the following indicators.
1. M13 - Number of individuals who have received USG supported short-term agricultural sector productivity or food security training
2. M16 - Number of individuals in the agriculture system who have applied improved management practices or technologies with USG assistance
3. M12 - Number of hectares under improved management practices or technologies that promote improved climate risk reduction and/or natural resources management with USG assistance
4. M15 - Yield of targeted agricultural commodities among program participants with USG assistance 5. M33 - Value of annual sales of farms and firms receiving USG assistance
ENVIRONMENT INTEGRATION
Refer to Annex G on how to integrate environmental risk analysis into the narrative rather than discussing as a separate cross-cutting section. Make sure to explain how significant environmental indicator results from environmental mitigation and monitoring plan (EMMP) reporting are being reflected in the overall M&E performance indicator results.
GENDER INTEGRATION
In addition to integrating gender and youth issues in the narrative of the ARR, use the gender checklist provided in Annex E to review and check the ARR narrative to ensure gender and youth issues are appropriately and adequately integrated throughout the narrative. It is important for awardees to provide a clear analysis of how gender and youth issues are integrated in the project, specifying what the

USAID.GOV 10
gender and youth issues are and how these have affected project outcomes or how these were addressed by the project to achieve targets and objectives. Make sure to explain any significant gender differences or gaps in the results being reported. MARKET, LRIP, AND MODALITY ACTUALS
Analyze and present the results from market assessments and monitoring (for both source and last mile markets). Analyze and present the data reported in the ILRP and Modality Actuals Table in ARR. Some questions to consider are: what were the delivery challenges and how were they addressed? Were the transfers always on time? Why not? What was the extent of the delay? How did the delayed transfer affect the food security/welfare of the participating households? Did the transfer achieve intended objectives and intended benefits? For example, targeting women has an implicit objective, but experience shows that in many cases women do not get to decide or control the use of the transfer. Were there any problems redeeming vouchers, and what was the effect on the local market? In the case of local and/or regional procurement (LRP), how did it affect the market? Analyze and present results from market assessments and monitoring (for both source and last mile markets). Discuss trends and potential programming impacts. If the reported prices change over time, comparisons should be made to any regular seasonal changes of prices. Unexpected market impacts or disincentives to local production should be explained in the ARR, along with course corrections made. N/A for IFRP awards. IMPLEMENTATION QUALITY AND CHALLENGES
Describe the systems used by the activity to identify implementation challenges and addressed the issues. How did the activity assess implementation quality? Describe how award management facilitated implementation, and discuss any major challenges, including consortium management, that might have hindered implementation during the reporting year. Report on new initiatives, innovations (e.g., approaches, methods, tools, and processes), and collaborations with other stakeholders and briefly describe the implications and challenges. DEVELOPMENT FOOD SECURITY ACTIVITIES RESPONDING TO EMERGENCY NEEDS
During the FY, if a development award implemented emergency intervention to respond to a shock, the awardee needs to describe the interventions and outputs. In this section, the ARR should also indicate whether the current resources were used, or new emergency funding was received. In addition, the section should also describe the overall effect on planned development interventions as a result of the shock.
Often FFP partners implement multi sectoral activities, where several participants receive more than one sectoral service. From the summary tables of participant count for each sector, it is difficult to ascertain the total count of unique participants for the whole activity. FFP requests that awardees analyze, and report participants count in the following illustrative table (table 4) by sector (SO/Purpose). This table helps FFP in assessing how well the interventions are integrated at the participating household level. In cases where integration was not planned or feasible, please state this briefly in the narrative. Note that this is different from the analysis of unique and direct participants.

11 USAID.GOV
TABLE 4: NUMBER OF DIRECT PARTICIPATING HOUSEHOLDS RECEIVING MULTIPLE INTERVENTIONS BY SECTOR (SO/PURPOSE)
Total unique direct participating households
SO/P 1 only
SO/P 1 & 2
SO/P 2 only
SO/P 2 & 3
SO/P 3 only
SO/P 1 & 3
SO/P 1, 2, 3
Count of HHs
If there are more than three purposes, add columns to report data for additional purposes and participation. Describe how the awardees count direct unique participants for each SO/P and multiple SO/Ps. CHALLENGES, SUCCESSES, AND LESSONS LEARNED
Present a brief summary of key challenges encountered, notable successes, and lessons learned during the FY. This section should focus on the following: Challenges: Describe the obstacles, factors contributing to the obstacles, timing and means of identification, and steps taken (or in the process of being taken) to address those. Successes: Describe the successes, factors contributing to the success, and how the program will build on or leverage the success for future activities. Lessons learned: Describe the lessons learned such as realizing that literacy programs need to be incorporated because they are essential to creating and sustaining women's cooperatives, or such as how the activity became aware of additional gender or environmental gaps in its approach. Note: It is important to share how the lesson(s) learned have been or will be applied to the project in the following year(s). FFP is also interested in learning of any plans to institutionalize the learning.
B. INDICATOR PERFORMANCE TRACKING TABLE (IPTT) Development awardees should include a complete IPTT with indicator results added for the reporting FY. The IPTT must include targets for the next three future FYs. For example, an IPTT submitted for FY 2019 would include targets for FY 2020, 2021, and 2022. (Activities with fewer than three years remaining in their awards should include targets for the remaining FYs and LOA.) The IPTT must include results and targets for each disaggregated indicator by category. Please ensure there are no discrepancies in the data reported across the narrative, IPTT and ARR Monitoring Indicator Section. Refer to the IPTT checklist in Annex D for further guidance. Note: FFP regularly makes changes in some standard indicators. Please refer to FFP’s Development Policy and Guidance, Indicator handbooks 1 and 2, and Annex B of this document to see the most recent changes.

USAID.GOV 12
C. IPTT INDICATOR DATA COLLECTION METHOD DESCRIPTIONS Awardees should discuss data collection methods (routine monitoring or annual surveys), timing of collection, data processing and data analysis. If using a survey, the sampling strategy and sample weighting process must be presented and explained. For indicators that are presented as percentages, the number of activity participants, sites, and/or households sampled for each indicator (i.e., the denominator) should be presented.
D. BASELINE/EVALUATION, ASSESSMENTS AND STUDY REPORTS As part of the ARR, awardees must submit the baseline report/final evaluation (when applicable), final comprehensive activity report with all annexes, and any assessment, study, or research such as internal DQA, gender assessment etc. conducted by the awardee or commissioned by the awardee to a third-party firm during the reporting FY. If the reports are not finalized and approved by FFP at the time of ARR submission, awardees should note in the ARR narrative that these activities were conducted during the FY and, at a later date, request to modify the ARR and upload them.
E. SUCCESS STORIES As per USG guidance, success stories are optional; however, they are very valuable in telling FFP’s story. Awardees are encouraged to provide this input for public diplomacy and outreach purposes. Refer to the Success Stories guidance in Annex H for further information.

13 USAID.GOV
ARR - DIRECT DATA ENTRY FFP PARTNER REPORTING TOOL (PRT) For FY19 ARR, all awardees should go to FFP Partner Reporting Tool (https://arr-prt.net/). FFP authorizes and creates users accounts in PRT for each awardee organization. Please note that for FY19 ARR, each organization will receive only one set of PRT login id and password. TABLE 5: FFP PRT LOGISTICS
FFP PRT website https://arr-prt.net
Partner login credentials Each awardee will have only one set of user id and password. FFP will create user accounts for each awardee organization.
Forgot password
Awardees can use Forgot password link at the bottom of FFP PRT webpage to receive password reset link. Please note the password reset link will be sent to the email id used to create the user account in question.
Contact FFP For technical or process difficulties in using FFP PRT website
Awardees can use Contact us link at the bottom of FFP PRT webpage for asking questions. Please note that this link should only be used for questions related to FFP PRT website and not for the ARR requirements for an award. For questions on ARR requirements for an award, awardees should contact the respective AOR and consult FFP FY19 APS.
ARR approval status
ARR public status on for each award will reflect the current public ARR Status: Open/ Under review/ Rejected/ Accepted by FFP.
PRT HOME PAGE Immediately after PRT login, a Home Page will present the list of all FFP funded activities/awards. FFP reviewers can see all awards but awardees can only see their own. For example, ABC organization cannot see activities implemented by other awardees and vice versa. On this page, the user should identify the award for ARR and click on ‘Go to report’. This action will direct the user to the ARR Base Page. FIGURE1: PRT HOME PAGE
USAID.GOV 14
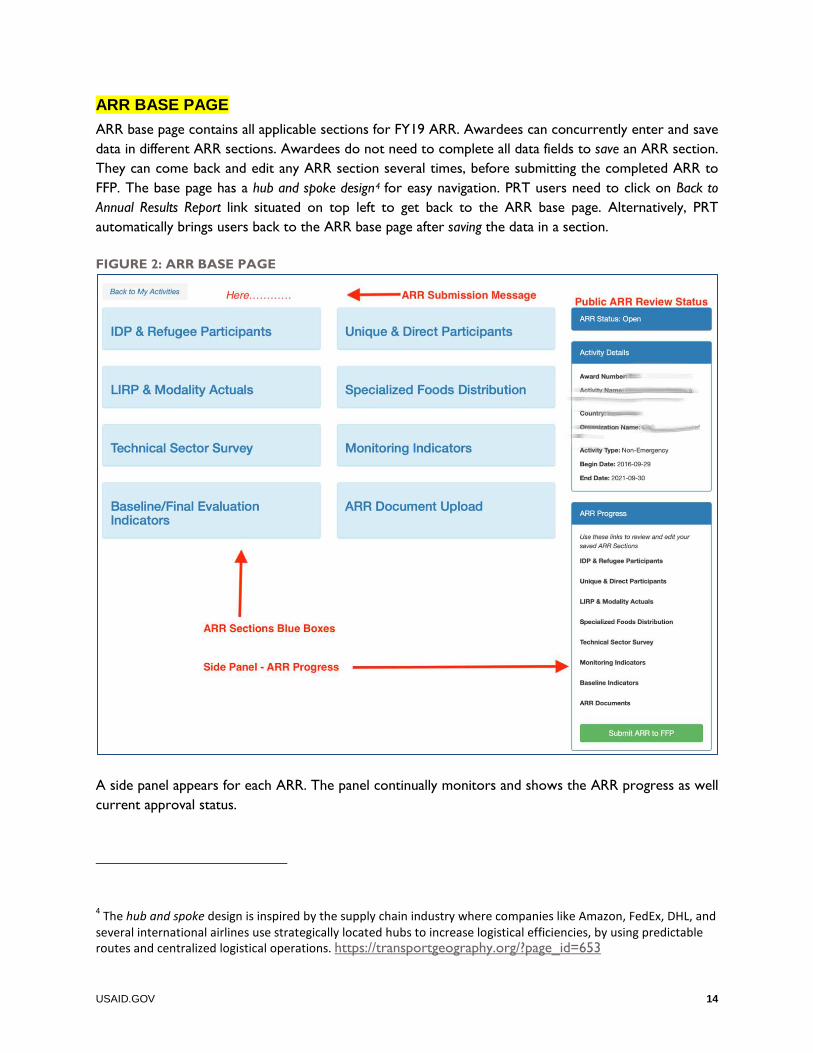
ARR BASE PAGE ARR base page contains all applicable sections for FY19 ARR. Awardees can concurrently enter and save data in different ARR sections. Awardees do not need to complete all data fields to save an ARR section. They can come back and edit any ARR section several times, before submitting the completed ARR to FFP. The base page has a hub and spoke design4 for easy navigation. PRT users need to click on Back to Annual Results Report link situated on top left to get back to the ARR base page. Alternatively, PRT automatically brings users back to the ARR base page after saving the data in a section. FIGURE 2: ARR BASE PAGE
A side panel appears for each ARR. The panel continually monitors and shows the ARR progress as well current approval status.
4 The hub and spoke design is inspired by the supply chain industry where companies like Amazon, FedEx, DHL, and several international airlines use strategically located hubs to increase logistical efficiencies, by using predictable routes and centralized logistical operations. https://transportgeography.org/?page_id=653

15 USAID.GOV
SIDE PANEL: STATUS
The ARR approval status for each ARR is visible to all users. This status is displayed at the top of the side panel and can only be changed by an FFP reviewer. The default ARR status for all awards is Open. PRT users can see the status anytime they open an ARR. SIDE PANEL: ARR PROGRESS
As soon as an ARR section is saved, a View/Edit Section link will appear for that section on the side panel. The side panel will turn into a summarized version of ARR highlighting all completed/edited sections. Realistically, awardees complete a given ARR over a few days. PRT users can see the data entry progress in the side panel without visiting each ARR section. Please note all ARR sections can be edited and saved from the ARR Base Page blue boxes ONLY for the FIRST TIME. Any subsequent edits or review by all users MUST be made by clicking on the View/Edit Section links in the side panel otherwise the tool will not allow users to hit save button. After FFP reviews an ARR, the side panel will show the accepted and rejected signs the side panel next to the View/Edit Section links for each reviewed ARR section. SUBMITTING THE COMPLETED ARR To submit the completed ARRs, awardees should hit the Submit ARR to FFP button on the side panel. Awardees can use the same button to resubmit an ARR that was previously rejected by FFP. Please note that a submission message will pop up on the award’s ARR Base Page as soon as an ARR is submitted or resubmitted. The message will show the award number and date/time of the submission. FIGURE 4: ARR SUBMISSION MESSAGE

USAID.GOV 16
DOCUMENT UPLOAD The document upload section allows users to upload required and optional documents, one file at a time. Any single document must not exceed 10 MB in size, and must be in one of the following formats: TABLE 6: TYPE OF DOCUMENTS TO UPLOAD IN PRT
PDF Documents .pdf
MS Word Documents .doc and .docx
MS Excel Documents .xls and .xlsx
IDP AND REFUGEE PARTICIPANTS Awardees must report the count of unique refugees and IDPs who received support from the activity. Please note that both planned and actual numbers should be for the reporting FY as well as the life of award (LoA). MONITORING INDICATORS This section was formerly known as SAPQ. FFP has decided to call it Monitoring Indicators and discontinue the legacy word SAPQ. The monitoring indicators section allows awardees to enter data on all R and RiA monitoring indicators. This section shows a list of currently active standard FFP monitoring indicators (M1 to M40) and archived indicators that a few DFSAs are still using. Each standard indicator has its own reporting page, but the archived indicators are grouped together and given generic reporting templates. Awardees should report on overall and disaggregated data for all R and RiA indicators relevant to their award. Please note that PRT doesn’t perform any calculation and the awardees have to manually write overall estimates. Each indicator asks for target and actual values for the reporting fiscal years as well as target values for next three years. Please refer to FFP DFSA Indicators Handbook 2 for detailed PIRS. FIGURE 5: MONITORING INDICATOR TEMPLATE

17 USAID.GOV
BASELINE AND FINAL EVALUATION INDICATORS The baseline and evaluation indicator section allows awardees to enter data on all R and RiA baseline indicators. This section shows a list of currently active standard FFP baseline indicators (BL1 to BL38) and some archived indicators that a few DFSAs are still using. Each standard indicator has its own reporting page, but archived indicators are grouped together and given generic reporting templates. Awardees should report on overall and disaggregated data for all R and RiA indicators relevant to their award. Please note that the awardees have to select if they are reporting baseline or evaluation estimates, before providing any data for an indicator. Please refer to FFP DFSA Indicators Handbook 1 for detailed PIRS. FIGURE 6: BASELINE INDICATOR TEMPLATE
TECHNICAL SECTOR SURVEY Technical sector survey has questions on the sectoral intervention implementation in emergency programs. FFP uses the data from this survey to understand implementation trends and coverage. The survey questions cover nutrition, food security, agriculture, livelihoods, WASH, markets, and cross cutting technical areas like gender and youth. The technical survey is mandatory for non-emergency activities. However, not all questions in the survey are applicable to all activities. FFP expects partners to use their best judgement while answering the survey questions. Note: This survey used to be in google forms for the last few years. In order to reduce partner confusion, FFP has decided to integrate it in PRT starting FY19 reporting period.

USAID.GOV 18
UNIQUE AND DIRECT PARTICIPANTS Awardees must report the count of unique activity participants disaggregated both by the sex and age categories. Please note that both the planned and actual values should be for the reporting FY, not the life of award (LoA). In addition to the reporting FY numbers, non-emergency activities must report additional numbers for next three-year targets. Awardees must provide deviation narrative in the comment box if the reporting FY actual value is +/- 10% of the target value, explaining the causes for deviation. In addition to the participant count, awardees should report on implementation geography, at admin 1 (state/region) and admin 2 (district) levels. FFP PRT reporting template allows reporting a maximum of 5 states/regions and 7 districts in each state/region. FIGURE 7: UNIQUE AND DIRECT PARTICIPANTS

19 USAID.GOV
SPECIALIZED FOODS DISTRIBUTION Awardees must report on the following table if their award distributed specialized food products. The table contains a fixed set of FFP recommended food items that can be chosen using a dropdown list. PRT allows to report on a maximum of 10 food items for each ARR. Awardees can choose the same food item more than once if the purpose of aid was different (general food distribution/prevention/treatment) . FIGURE 7: SPECIALIZED FOOD COMMODITIES
Please see the definitions of each column name: TABLE 7: SPECIALIZED FOOD COMMODITY DATA DEFINITIONS
Specialized Food Item Select the food item from the drop-down list.
Purpose of Aid Select whether the food item was distributed for general food distribution, prevention, or treatment.
Males Reached Count of male participants reached for the given combination: food item + purpose of aid.
Females Reached Count of female participants reached for the given combination: food item + purpose of aid.
Quantity Procured Provide the quantity in Metric Tons (MT).
Quantity Distributed Provide the quantity in Metric Tons (MT).

USAID.GOV 20
LRIP AND MODALITY ACTUALS LRIP stands for local, international, and regional procurement. The following table explains FFP’s definition for each term: TABLE 8: LIR PROCUREMENT DEFINITIONS
Local commodities procured in the same country in which they are distributed.
Regional commodities procured on the same continent as where they are distributed.
International commodities procured on a different continent than where distributed.
Awardees must complete the LRIP and Modality Actuals section, in PRT if the activity has distributed food via in-kind, cash, and/or voucher modalities. There are four tables in this section: commodity procurement table, commodity delivery table, report on in-kind modality, and report on cash/voucher modality. COMMODITY PROCUREMENT TABLE
Awardees should use the following table for reporting on the in-kind food commodities procurement. The table allows reporting on up to 10 commodities for each ARR. Awardees can use separate rows for the same commodity if purchased from multiple geographies (local, regional, international). FIGURE 8: PROCUREMENT TABLE
Please see the definitions of each column name:

21 USAID.GOV
TABLE 9: COMMODITY PROCUREMENT DATA DEFINITIONS nope Allows partner to write any commodity name.
Procurement type: Choose the type of procurement from the drop-down list.
Quantity procured: Provide the quantity in Metric Tons (MT).
Procurement value: Provide the procurement cost in US$.
Transport cost: Provide the total cost of shipping and any inland transportation.
Total cost per MT: Procurement + Transport cost per MT.
Purchase date: The date on which the commodity was purchased, or a contract was put in place for purchase in the case of one purchase with multiple deliveries.
Source country:
The country from which a commodity is shipped to the cooperating/recipient country or the cooperating/recipient country itself if the commodity is located therein at the time of the purchase, irrespective of the place of manufacture or production, unless it is a prohibited source country. Where, however, a commodity is shipped from a free port or bonded warehouse in the form in which received therein, “source” means the country from which the commodity was shipped to the free port or bonded warehouse. (22 CFR § 228.01)
Origin country:
The country where a commodity is mined, grown, or produced. A commodity is produced when, through manufacturing, processing, or substantial and major assembling of components, a commercially recognized new commodity results that is significantly different in basic characteristics or in purpose of utility from its components.
Price per MT: 2 weeks prior to purchase.
Price per MT: 2 weeks after purchase.

USAID.GOV 22
COMMODITY DELIVERY TABLE
Awardees should use the following table for reporting on the in-kind food distribution. The table allows reporting on up to 10 commodities for each ARR. FIGURE9: DELIVERY TABLE
Please see the definitions of data columns: TABLE 10: COMMODITY DELIVERY DATA DEFINITIONS
Commodity delivered Allows partner to write any commodity name.
Quantity delivered Provide the quantity in Metric Tons (MT).
Unique participants
Count of unique individuals benefited even when the distributions were made for households. This count should provide the total count of individuals living in the benefitted households which can come from counting actual family members or using a local cluster accepted average household size..
Unique HH Count of unique households benefited by commodity.
MODALITY REPORT: CASH AND/OR VOUCHER
Awardees should use the following table for reporting on the cash/voucher modality. The table allows the user to choose both conditionality (cash for work, unconditional etc.) and modality (cash/voucher) types for each data row. Partners can report on the same modality more than once for different conditionalities and vice-versa.

23 USAID.GOV
FIGURE 10: CASH/VOUCHER MODALITY REPORT
Please see the definitions of each column name: TABLE 11: CASH AND VOUCHER MODALITY DATA DEFINITIONS
Conditionality Choose the conditionality type from the dropdown menu. If no conditions were used, use option ‘Unconditional’.
Modality Choose between cash and voucher as modality. There can be multiple food baskets designed under each modality. Partners can use separate rows for each basket.
Total money distributed Provide the sum in US$.
Number of unique HH Count of unique households benefited.
Number of unique participants
Count of unique individuals benefited even when the distributions were made for households. This count should provide the total count of individuals living in the benefitted households which can come from counting actual family members or using a local cluster accepted average household size.
Number of ration days
This refers to the Total number of days per family covered with a ration using FFP funding. Another way to describe is the total count of days a HH is fed using a particular food basket. This should be calculated as: Ration days = Number of rations distributed during all distributions X number of days for which a household’s dietary needs covered by a ration.
Total transfer cost in US$ Cost of delivering the transfer.
Total redeemed value in US$ for vouchers or cash transfers, the amount used by beneficiaries, not the total amount distributed to beneficiaries.
Percentage of household daily dietary needs
Provide the percentage of daily dietary needs met by a particular food basket.

USAID.GOV 24
MODALITY REPORT: IN-KIND
Awardees should use the following table for reporting on the in-kind modality. The table allows the user to choose conditionality (cash for work, unconditional etc.) types for each data row. FIGURE 11: IN-KIND MODALITY REPORT
Please see the definitions of each column name: TABLE 12: IN-KIND DISTRIBUTION DATA DEFINITIONS
Conditionality Choose the conditionality type from the dropdown menu. If no conditions were used, use option ‘Unconditional’.
Modality Choose between cash and voucher as modality. There can be multiple food baskets designed under each modality. Partners can use separate rows for each basket.
Number of unique HH Count of unique households benefited.
Number of unique participants
Count of unique individuals benefited even when the distributions were made for households. This count should provide the total count of individuals living in the benefitted households which can come from counting actual family members or using a local cluster accepted average household size.
Number of ration days
This refers to the Total number of days per family covered with a ration using FFP funding. Another way to describe is the total count of days a HH is fed using a particular food basket. This should be calculated as: Ration days = Number of rations distributed during all distributions X number of days for which a household’s dietary needs covered by a ration.
Percentage of household daily dietary needs
Provide the percentage of daily dietary needs met by a particular food basket.

25 USAID.GOV
ANNEX A: DEFINITIONS FOR FFP ARR Agriculture Technologies Agriculture technologies refer to a number of techniques, tools, and practices employed in: 1) combining land, labor, capital, and knowledge to 2) produce, market, distribute, utilize, and trade 3) food, feed, and fiber products. Illustrative sustainable agriculture technologies may include, but are not limited to, low-input approaches, crop rotation, i.e., for soil fertility enhancement and/or pest management, intercropping, integrated farm systems (for example, tree-crop-fish pond-livestock systems), reforestation, water conservation and harvesting, cover cropping, green manure, effective composting, erosion control, improved seed varieties, non-invasive species, and integrated pest management. PVOs are free to define technology. One approach, however, is to say that agricultural technologies are transferred as a package of technologies that, when used in combination, have a proven desired outcome, such as increased yield or reduced soil erosion or a decrease in post-harvest losses. For instance, an Integrated Rice System is a package designed to increase rice yields that consists of five technologies: seed selection, transplanting, water control, weeding, and fertilizing. Research shows that a 50 percent increase in yield if all five technologies are used, while the use of three or four of the technologies will increase yield, but not by 50 percent. Basic Drinking Water Service Basic drinking water services, according to the Joint Monitoring Program (JMP), are defined as improved sources or delivery points that by nature of their construction or through active intervention are protected from outside contamination, in particular from outside contamination with fecal matter, and where collection time is no more than 30 minutes for a roundtrip including queuing. Drinking water sources meeting this criterion include piped drinking water supply on premises; public tap/stand post; tube well/borehole; protected dug well; protected spring; rainwater; and/or bottled water (when another basic service is used for hand washing, cooking or other basic personal hygiene purposes). Basic Sanitation Facility A basic sanitation facility service, defined according to the Joint Monitoring Program (JMP), is a sanitation facility that hygienically separates human excreta from human contact, and that is not shared with other households. Sanitation facilities meeting these criteria include flush or pour/flush facility connected to a piped sewer system; a septic system or a pit latrine with slab; composting toilets; or ventilated improved pit latrines (with slab). All other sanitation facilities do not meet this definition and are considered “unimproved.” Unimproved sanitation includes flush or pour/flush toilets without a sewer connection; pit latrines without slab/open pit; bucket latrines; or hanging toilets/latrines. Households that use a facility shared with other households are not counted as using a basic sanitation facility. All other services are considered to be “unimproved”, including: unprotected dug well, unprotected spring, cart with small tank/drum, tanker truck, surface water (river, dam, lake, pond, stream, canal, irrigation channel), and bottled water (unless basic services are being used for hand washing, cooking and other basic personal hygiene purposes). Carryover In-kind food commodities or funds unused during a FY that are transferred to the budget or planning levels for the following financial or reporting year.

USAID.GOV 26
Climate Integration Under USAID policies and procedures described in 22 CFR 216 and Mandatory Reference for ADS Chapter 201 (Climate Change in USAID Country/Regional Strategies (201mat) and Climate Risk Management for USAID Projects and Activities (201mal)), integration of climate and environmental risks in strategies, projects, and activities includes assessing and addressing climate risks and opportunities across the project life cycle. Since global drivers of climate change are already threatening natural resource-based components of food security, project managers must consider the best available climate data and adaptation measures in designing activities. How these climate stressors interact with the natural capital base upon which livelihoods depend reinforces the importance of incorporating environmental safeguards across the FFP award. Following Mandatory Reference for ADS 201malt, USAID design teams must identify relevant climate risks, qualitatively assess them as low, moderate, or high, and determine appropriate risk management measures for those climate risks rated as moderate or high. This climate risk management (CRM) screening should be integrated throughout the environmental compliance process, including detailed coverage in a screening table and narrative within the project/activity Initial Environmental Examination (IEE). In addition, implementing partners compare relevant IPTT indicators with the approved award-level EMMP, which includes climate threats and opportunities. This comparison contextualizes IPTT indicators to local environmental baseline conditions. More information can be found in ADS 204, ADS 201mat, ADS 201mal, as well as in USAID’s Office for Food for Peace Policy and Guidance for Monitoring and Evaluation and Reporting for Development Food Security Activities. Details on climate change indicators and integration of climate risk management into monitoring, evaluation, learning, and knowledge management can be found here. Communities This is intentionally left undefined so that awards may use their own definition of what constitutes a community. A community could be a village, but it doesn't necessarily have to be. A community is meant to be a geographic grouping (e.g., neighborhood, village, or commune) and does not refer to a group of people who all have a similar characteristic, like women or farmers. Community Capacity In this context, community capacity refers to a community’s ability to govern itself; to organize, analyze, plan, manage, problem-solve, implement actions, and represent its interests and participate in broader fora. This goes beyond targeted efforts to strengthen communities in nutrition, agriculture, infrastructure, early warning, or other topics covered elsewhere in FFP guidance. Direct Distribution Food Aid Commodities In-kind food commodities that are provided directly to activity participants as in-kind take home rations or for on-site feeding (versus in-kind food commodities sold for MTZ proceeds). Direct Participants For the purposes of reporting, direct participants are defined as individuals who come into direct contact with the set of interventions (goods or services) provided by the activity in each technical area. Individuals who receive training or benefit from activity-supported technical assistance or service provision are considered direct participants, as are those who receive a ration or another type of good. Services include training and technical assistance provided directly by activity staff, and training and

27 USAID.GOV
technical assistance provided by people who have been trained by activity staff, (e.g., agricultural extension agents, village health workers). In a Food-for-Training activity, the direct activity participants are those trained under the program. In a Food-for-Work (FFW) or Food for Assets activity implemented as a stand-alone, (e.g., not as part of a wider set of interventions in the technical sector), direct project participants are those who directly participate in the activity, (e.g., receive a ration, not all of those who use or benefit from the infrastructure/asset created, e.g., a road). If a FFW or Food for Assets activity forms part of a set of activities in a technical sector, (e.g., FFW to build irrigation infrastructure, accompanied by technical assistance in new cultivation techniques and water management to a targeted group of farmers), the direct participants include FFW participants and farmers receiving technical assistance, and the two groups may overlap. In the case of food rations, direct participants include the individual recipient in the case of individual rations, and the recipient plus his/her family members in the case of family rations. Direct participants do not include those who benefit indirectly from the goods and services provided to the project participants, (e.g., members of the household of a farmer who received technical assistance, seeds and tools, other inputs, credit, livestock; farmers from a neighboring community who might observe the effects of the training and demonstration plots in the target community and decide to adopt or model the new practices themselves; the population of all of the communities in a valley that uses a road improved by FFW; or all individuals who may have heard a radio message about prices, but who did not receive the other elements of an agricultural intervention necessary to increase incomes.) Such individuals are considered indirect participants (see definition). Environmental Assessment Triggered by a positive determination as identified in the project IEE, the Environmental Assessment is a detailed study of the reasonably foreseeable significant effects, both beneficial and adverse, of a proposed action on the environment. It is preceded by a Scoping Statement, in which a thorough stakeholder consultation process with community members, government, research, private, and non-profit institutions, serves to identify significant environmental issues that need to be assessed in the study. Environmental Mitigation and Monitoring Plan An EMMP is a document that establishes the set of actions that seek to avoid, mitigate, or compensate for the reasonably foreseeable impacts of award interventions identified by environmental impact analysis. The EMMP also sets out the indicators or criteria that will be used to monitor (1) whether the mitigation actions have been implemented, and (2) whether they are effective and efficient. The EMMP also specifies the parties responsible for these actions and the schedule for these tasks. Exclusive Breastfeeding Exclusive breastfeeding means that an infant received breast milk (including milk expressed or from a wet nurse) and might have received properly prepared oral rehydration solution (ORS), vitamins, minerals, and/or medicines, but did not receive any other food or liquid. A proxy measure is the percentage of children under 6 months exclusively breastfed during the day preceding the survey. Female Empowerment When women and girls acquire the power to act freely, exercise their rights, and fulfill their potential as full and equal members of society. While empowerment often comes from within, and individuals empower themselves, cultures, societies, and institutions create conditions that facilitate or undermine

USAID.GOV 28
the possibilities for empowerment. More information can be found in ADS 205, Integrating Gender Equality and Female Empowerment in USAID’s Program Cycle. FFP Funding Sources - Development Resources Development resources are used in development awards for interventions that target chronically food insecure populations. These interventions include long-term safety nets and activities to enhance human capacities, livelihood capabilities, and community resiliency and capacity. Interventions may also include disaster risk reduction and early warning activities. FFP Funding Sources - Emergency Resources FFP resources used to fund emergency response and disaster risk reduction-type interventions. Emergency resources may be used in a development project for expanded safety net and asset protection activities that target populations suffering from transitory food insecurity during a shock or transition from an emergency situation, as well as to fund disaster risk reduction and early warning activities. Financial Services Financial services refer to services provided by formal or non-formal groups for the management of money. This includes credit (loans), savings, and insurance schemes run by for-profit, non-profit, and governmental organizations. Gender Analysis A gender analysis is an analytic, social science tool that is used to identify, understand, and explain gaps between males and females that exist in households, communities, and countries, and the relevance of gender norms and power relations in a specific context. Such analysis typically involves examining differences in the status of women and men and their differential access to assets, resources, opportunities and services; the influence of gender roles and norms on the division of time between paid employment, unpaid work (including subsistence production and care for family members), and volunteer activities; the influence of gender roles and norms on leadership roles and decision-making; constraints, opportunities, and entry points for narrowing gender gaps and empowering females; and potential differential impacts of development policies and programs on males and females, including unintended or negative consequences. More information can be found in ADS 205. Gender Equality Gender equality concerns fundamental social transformation, working with men and boys, women and girls to bring about changes in attitudes, behaviors, roles and responsibilities at home, in the workplace, and in the community. Genuine equality means expanding freedoms and improving overall quality of life so that equality is achieved without sacrificing gains for males or females. More information can be found in ADS 205. Gender Equity Gender equity is the process of being fair to women and men. To ensure fairness, measures must often be available to compensate for historical and social disadvantages that prevent women and men from otherwise operating on a level playing field. Equity leads to equality. More information can be found in ADS Chapters 200 - 201.

29 USAID.GOV
Gender Integration Gender integration refers to identifying and addressing gender inequalities during strategy and program design, implementation, and monitoring and evaluation. Since the roles and power relations between men and women affect how an activity is implemented, it is essential that project managers address these issues on an ongoing basis. More information can be found in ADS 205. Gender-Sensitive Indicators Gender-sensitive indicators highlight to what extent and in what ways awards/activities achieved results related to gender equality and whether and how reducing gaps between males and females and empowering women leads to better activity/development outcomes. Importantly, this refers not only to differences between men and women by sex disaggregation but also refers to differences by age within sexes, age and sex, and gendered household types. More information can be found in ADS 205. Hand Washing Stations A handwashing station refers to a designated place where household members and guests can find soap or other cleansing agents and water for washing their hands. The prevalence of households with hand washing stations with soap (or other cleansing agent) and water is a measure of progress toward improved hygiene practices. HIV Programming Resources used for activities directly targeting people infected or affected by HIV or that use HIV-related factors, such as chronic illness, as part of the vulnerability criteria used for project entry/eligibility. This includes People Living with HIV (PLHIV), such as children; clients of Prevention of Mother to Child Transmission activities; Orphans and Vulnerable Children (OVC); the families and caregivers of PLHIV and OVC; and service providers supported through Food-for-Training (e.g., peer educators, home-based care volunteers, etc.). Note: Orphans are defined as children under the age of 18 years who have lost one or both parents to AIDS, and vulnerable children are those affected by HIV through the illness of a parent or principal caregiver. If there is a national-level definition of OVC, awardees should use the national definition instead. Household Dietary Diversity Score (HDDS) HDDS is a proxy measure of household socioeconomic status. It is derived from the number of different food groups consumed by a household over a 24-hour recall period. It is not a measure of dietary quality. Data are collected through a household questionnaire consisting of one single question, using 12 standard food groups, asked of the person responsible for food preparation in the household. For additional information on HDDS, refer to the FFP Indicators Handbook, Part I: Indicators for Baseline and Final Evaluation Surveys. Initial Environmental Examination The initial environmental examination is the first review of the reasonably foreseeable effects of a proposed action on the environment. Its function is to provide a brief statement of the factual basis for a Threshold Decision as to whether an Environmental Assessment will be required. Improved Storage Practices Improved storage techniques are methods for storing seeds, grains, animal feed, and aquaculture products that are cost-effective and allow for long-term storage. These techniques allow a farmer to

USAID.GOV 30
safely store excess harvest from the plot where the farmer has decision-making power for subsequent sale, consumption, and/or propagative plant material, (e.g., seeds for future planting). Improved storage techniques should minimize post-harvest losses and maximize profits by allowing farmers to sell their products later in the season when excess product supply has diminished. Indirect participants Indirect project participants are those who benefit indirectly from the goods and services provided to the direct project participants (as defined below). For example, indirect project participants include members of the household of a farmer who received technical assistance, seeds, and tools, other inputs, credit, and livestock; farmers from a neighboring community who might observe the effects of the training and demonstration plots in the target community and decide to adopt or model the new practices themselves; the population of all of the communities in a valley that uses a road improved by a food for work activity; or all individuals who may have heard a radio message about prices, but who did not receive the other elements of an agricultural activity necessary to increase incomes. Local system Local system refers to those interconnected sets of actors—governments, civil society, the private sector, universities, individual citizens and others—that jointly contribute to produce a particular development outcome. The “local” in a local system refers to actors in a partner country. As these actors jointly produce an outcome, they are “local” to it. And as development outcomes may occur at many levels, local systems can be national, provincial or community-wide. It is extremely important to work with local systems to sustain development outcomes. Examples of local systems may include market-based agriculture extension system, health services delivery system, and community-based disaster preparedness system. Mean Depth of Poverty of the poor Mean depth of poverty measures how deep the poverty is. The depth of poverty of the poor measures, on average, how far below a person is from the $1.90 (2011 PPP) poverty threshold computed using per person per day consumption expenditure. Metric ton(s) MT is the standard unit of measurement for Title II commodities. One MT equals 1,000 kilograms. Minimum Acceptable Diet (MAD) MAD is a measure of nutritional status of children that considers both frequency and diversity of diet. The method of measurement depends on the age of the child. If a child meets the minimum feeding frequency and minimum dietary diversity for his or her age group and breastfeeding status, then the child is considered to be receiving a minimum acceptable. Monetization (MTZ) MTZ is the sale of food aid commodities to obtain cash for use to support activity implementation. Awardees monetize USG-donated food commodities to generate cash resources (proceeds) to cover expenses associated with implementing development awards. MTZ can be conducted by direct negotiation or through sealed-bid auctions. Typical buyers include governments, parastatals, wholesalers and mid-level merchants.

31 USAID.GOV
Pesticide Evaluation Report and Safe Use Action Plan (PERSUAP) The USAID regulatory analysis of any and all pesticides proposed for promotion, procurement, transport, storage or disposal. It evaluates the risk each proposed pesticide poses to human health and the environment, authorizes pesticides for specific uses and establishes mandatory conditions for safe use. Pipeline and Resource Estimate Proposal (PREP) A PREP describes an awardee’s food aid resource needs and activities for an award over the course of the upcoming FY, even if additional resources will not be requested. PREPs must be submitted annually for every development award on a date negotiated by the awardee, FFP/Washington and the FFP/Mission and/or Regional Office, as appropriate. Prevalence of Poverty Prevalence of poverty is the proportion of a population expending less than $1.25 per day, converted into local currency at 2005 “Purchasing Power Parity” (PPP) exchange rates, for food and other essential consumables, as opposed to durable assets. Measurement is based on the value of average daily consumption expenditure per person. Food and other items that a household produces for consumption are counted as if the household purchased those items at market prices. Safety Net Safety net is a system to transfer cash and or in-kind transfers to extremely poor and vulnerable households, with the goal of protecting families from the impact of seasonal food shortage, economic shocks, natural disasters, and other crises. Stunting Stunting is a condition of slowed growth due to chronic malnutrition that has permanent effects on physical and intellectual capacity. It is identified using measure of height for age compared to a standard, sex-specific, reference group of children. Sustainable Agriculture The term sustainable agriculture (U.S. Code Title 7, Section 3103) refers to an integrated system of plant and animal production practices having a site-specific application that will over the long-term:
● Satisfy human food and fiber needs. ● Enhance environmental quality and the natural resource base upon which the agriculture
economy depends. ● Make the most efficient use of nonrenewable resources and on-farm resources and integrate,
where appropriate, natural biological cycles and controls. ● Sustain the economic viability of farm operations. ● Enhance the quality of life for farmers and society as a whole.
Sustainable agriculture seeks to sustain farmers, resources and communities by promoting farming practices and methods that are profitable, environmentally sound and good for communities. Underweight Underweight is a condition of weighing less than is considered nutritionally healthy—either due to slowed growth (stunting) or thinness (wasting). For FFP, the condition of underweight for children

USAID.GOV 32
under 5 years of age is determined by comparing an individual’s weight to an age- and sex-specific standard group of children. Underweight among Women of Reproductive Age For women, underweight is based on having a body mass index < 18.5 kg/m2. The prevalence of underweight women indicator measures the percent of non-pregnant women of reproductive age (15-49 years). To calculate an individual’s BMI, weight and height data are needed. Body mass index is equal to weight (in kg) divided by height squared (in meters) multiplied by a correction factor. The data for this indicator is collected through the household questionnaire in a population-based survey. The population-based survey is usually conducted during the hungry season, on all the households selected in a representative sample. The questionnaire and instructions for data collection, tabulation, and analysis can be found in the Performance Indicators Reference Sheets for FFP Indicators. Value Chain Activities Value chain activities in agriculture are defined as a set of actors and activities that bring a basic agricultural product from production in the field to market, where at each stage value is added to the product. The primary intent of a value chain activity is to add value to market the commodity, either through minimizing production cost, increasing value post harvest, or adjusting with the cultivation or harvest time when the value chain actor can fetch a premium price. A value chain can be a vertical linking or a network between various independent business organizations and can involve processing, packaging, storage, transport and distribution (reference). Value chain activities include, but are not limited to, pre- and post-harvest activities, such as joint purchase of inputs, bulking transporting, sorting, grading, processing, trading/marketing (wholesale, retail, export). Awards for which this indicator is applicable need to pre-identify a list of value chain activities that the project will be promoting during the award so that the baseline survey is able to measure the percentage of farmers that are already practicing these specific value chain activities. This will later be compared to the percentage of farmers practicing these value chain activities during the final evaluation survey at the end of the award. More on value chain activities can be found at the USAID’s value chain wiki link. Vulnerable Children According to the PL 109-95 Implementation Strategy (May 2006), highly vulnerable children are “children and youth who are under 18 years whose safety, wellbeing, growth and development are at significant risk due to inadequate care, protection, or access to essential services.” Refer to [www.childreninadversity.gov] for further information. Women’s Dietary Diversity Score Women’s dietary diversity score is a measure of the micronutrient adequacy of the diet based on the mean number of food groups consumed in the previous day by women of reproductive age (15–49 years). Data is tabulated by averaging the number of food groups consumed out of the specified nine food groups across all women of reproductive age in the sample with data on dietary diversity.

33 USAID.GOV
ANNEX B: REPORTING FY 2019 INDICATOR RESULTS IN IPTT AND PRT Annex provides information on new baseline/endline and monitoring indicators, and changes for FY19 reporting. Awardees are required to make the following changes to their IPTT and PIRS, and follow the instructions for PRT entry. Updated Handbook, Part I: Baseline/Endline Indicators with the revised and new PIRS is forthcoming. Awardees should note the following uniform changes:
● Indicator numbering. FFP has renumbered all active indicators starting with “BL1”. The new numbering system replaces both old FFP indicator numbers (i.e. FFP 2a, 17, etc.) and the temporary numbers for the new indicators added in FY 2018 (i.e. TBD-1, TBD-2 etc.)
● Applicability criteria. Applicability criteria were redefined for many indicators. Check the applicability column in the FFP Indicators List. This will not affect any activities awarded through 2017.
● Select indicator title. Select indicators with Proportion or Percentage in title were updated to Percent.
● Gender indicators. After analysis of gender indicators from awardees since FY14, some gender indicators were revised and removed to reflect indicator usefulness and effectiveness.
Reporting Baseline/Endline Indicator Specific Instructions Development awards signed in FY 2014 and FY 2015 should report R and RiA indicators from their approved IPTT in PRT. In addition, these awards must comply with indicator changes as per previous ARR guidance in the IPTT (if applicable).
● These awards are required to report on applicable impact and outcome indicators in the FYs in which the final evaluation is conducted.
● Deviation narratives are required for each indicator where the FY 2019 result achieved is +/- 10 percentage points off from the target. As required by OMB, the deviation narrative must specifically state the problems encountered and describe what will be done to address challenges and overcome difficulties for meeting the target, or conversely, the reasons as to why it was exceeded. Deviation narratives should be entered in FFP PRT, and also in the appropriate IPTT column.
Development awards signed in FY 2016 (Ethiopia and DRC) should report R and RiA indicators from their approved IPTT in PRT. These awards must comply with indicator changes as per FY18 ARR guidance in the IPTT (if applicable). In addition, these awards must comply with the following baseline/endline indicator changes to title and disaggregation in the the IPTT and PIRS (if applicable).
● These awards are required to report on applicable impact and outcome indicators in the FY in which the baseline was conducted.
● Deviation narratives are required for each indicator where the FY 2019 result achieved is +/- 10 percentage points off from the target. As required by OMB, the deviation narrative must specifically state the problems encountered and describe what will be done to address challenges and overcome difficulties for meeting the target, or conversely, the reasons as to why it was exceeded. Deviation narratives should be entered in FFP PRT, and also in the appropriate IPTT column.

USAID.GOV 34
● Title Only Change
o BL11 (4, HL9.1-d) Percent of women of reproductive age consuming a diet of minimum diversity. Changed Prevalence to Percent.
o BL14 (38) Percent of children under age five who had diarrhea in the prior two weeks. Changed Percentage to Percent.
o BL15 (39) Percent of children under five years old with diarrhea treated with Oral Rehydration Therapy (ORT), Changed Percentage to Percent.
o BL17 (42, HL8.2-5) Percent of households with soap and water at a handwashing station on premises. Changed Percentage to Percent. Revised indicator title “on premises.”
o BL26 (52) Percent of births receiving at least 4 antenatal care (ANC) visits during pregnancy. Changed Percentage to Percent.
o BL28 (17) Percent of farmers who used improved storage practices in the past 12 months. Changed Percentage to Percent.
o BL29 (21) Percent of farmers who used financial services (savings, agricultural credit, and/or agricultural insurance) in the past 12 months. Changed Percentage to Percent.
o BL30 (22) Percent of farmers who practiced the value chain interventions promoted by the activity in the past 12 months. Changed Percentage to Percent. Revised indicator.
● Title and Disaggregation Change
o BL6 (85, EG-e) Prevalence of moderate and severe food insecurity in the population, based on the Food Insecurity Experience Scale (FIES). Revised indicator title. Added Level of Severity disaggregates: moderate, severe. Enter the values in the appropriate disaggregate in the IPTT and PRT. Revise IPTT.
o BL16 (40) Percent of households using basic drinking water services. Changed Percentage to Percent. Added distance/time from service disaggregates: on premise, 31+ minute roundtrip, >=30 minute roundtrip. Enter the values in the appropriate disaggregate in the IPTT and PRT. Revise IPTT.
Development awards signed since FY 2017 (Uganda, Niger and Burkina Faso) are required to include the following new R and RiA baseline/endline indicators in their IPTT and PIRS (if applicable). In addition, these awards must comply with the above baseline/endline indicator changes to title and disaggregation and add the following new indicators to their IPTT and PIRS (if applicable).
● Awardees are required to report on applicable impact and outcome indicators in the FY in which the baseline was conducted.
● FY18 awards are not required to report baseline/endline indicators in PRT because the baseline is planned for FY20.
● Deviation narratives are required for each indicator where the FY 2019 result achieved is +/- 10 percentage points off from the target. As required by OMB, the deviation narrative must specifically state the problems encountered and describe what will be done to address challenges and overcome difficulties for meeting the target, or conversely, the reasons as to why it was exceeded. Deviation narratives should be entered in FFP PRT, and also in the appropriate IPTT column.

35 USAID.GOV
New Baseline/Endline Indicators
Indicator Number
New Baseline/Endline Indicator R or RiA
Applicable Awardees
Note
BL2 (TBD-2, EG-h)
Depth of Poverty of the Poor: Mean percentage shortfall of the poor relative to the $1.90/day 2011 PPP poverty line
R
FY17 Uganda, FY18 Niger and Burkina Faso
Replacing old FFP 3a
BL5 (TBD-1, HL.9-i)
Prevalence of healthy weight (WHZ < 2 and > -2) among children under five (0-59 months)
R Replacing old FFP 1
BL10 (TBD-3) Percentage of households with poor, borderline, and adequate food consumption score (FCS)
R FY18 Niger and Burkina Faso
NEW
BL21 (TBD-7, EG.3.2-a)
Percent of producers who have applied targeted improved management practices or technologies
RiA NEW
BL22 (TBD-10, EG.3-h)
Yield of targeted agricultural commodities within target areas
RiA NEW
BL23 (TBD-14, RESIL-a)
Ability to recover from shocks and stresses index R FY17 Uganda, FY18 Niger and Burkina Faso
NEW
BL24 (TBD-15, RESIL-c)
Percent of households that believe local government will respond effectively to future shocks and stresses
R FY18 Niger and Burkina Faso
NEW
BL27 (TBD-18, HL.8.2-a)
Percent of households with access to a basic sanitation service
RiA FY17 Uganda, FY18 Niger and Burkina Faso
NEW
BL31 (TBD-21, EG.4.2-a)
Percent of households participating in group-based savings, micro-finance or lending programs
RiA NEW
BL32 (61a) Percent of men and women in union who earned cash in the past 12 months
R Replacing old FFP 61
BL33 (62a) Percent of women in union and earning cash who report participation in decisions about the use of self-earned cash
R Replacing old FFP 62
BL34 (63a) Percent of women in union and earning cash who report participation in decisions about the use of spouse/partner's self-earned cash
R Replacing old FFP 63
BL35 (63b) Percent of men in union and earning cash who report spouse/partner participation in decisions about the use of
R Replacing old FFP 63

USAID.GOV 36
Indicator Number
New Baseline/Endline Indicator R or RiA
Applicable Awardees
Note
self-earned cash
BL36 (n/a) Percent of women in union who have knowledge of modern family planning methods that can be used to delay or avoid pregnancy
R FY18 Niger and Burkina Faso
NEW
BL37 (n/a) Percent of women in union who make decisions about modern family planning methods
R NEW
BL38 (TBD-26, RESIL-b)
Index of social capital at the household level R FY17 Uganda, FY18 Niger and Burkina Faso
NEW
Updated Handbook, Part II: Annual Monitoring Indicators with the revised PIRS is available on FFP website. Awardees should update their PIRS accordingly. Note the following uniform changes:
● Indicator numbering. FFP has renumbered all active indicators starting with “M 1.” The new numbering system replaces both old FFP indicator numbers (i.e. FFP 11a, 77 etc.) and the temporary numbers for the new indicators added in FY 2018 (i.e. TBD-1, TBD-2 etc.)
● Applicability criteria. Applicability criteria were redefined for many indicators. Check the applicability column in the FFP Indicators List.
● Reporting Guidance. An additional section was added at the end of each active PIRS with guidance on reporting the indicator in the IPTT.
● Cumulative and Non-cumulative. This designation has been removed and replaced with “new” and “continuing” disaggregates wherever applicable (for active indicators). For all indicators, awardees should report results from the fiscal year.
● Select indicator title. Select indicators with Proportion or Percentage in title were updated to Percent.
Reporting Monitoring Indicators Specific Instructions
Development awards should report R and RiA indicators from their approved IPTT in PRT. In addition, these awards must comply with indicator changes as per current and previous ARR guidance, and Regional M&E Advisor guidance in the IPTT and PRT (if applicable).
● These awards are required to report on applicable monitoring indicators per applicability criteria.
● Deviation narratives are required for each indicator where the FY 2019 result achieved is +/- 10 percentage points off from the target. As required by OMB, the deviation narrative must specifically state the problems encountered and describe what will be done to address challenges and overcome difficulties for meeting the target, or conversely, the reasons as to why it was exceeded. Deviation narratives should be entered in the appropriate IPTT column and PRT indicator comment box.

37 USAID.GOV
Development awards signed in FY 2018 (Niger, Burkina Faso) must report on ARR. They are not required to provide monitoring indicator data for FY 2018, however, must include three out year targets in IPTT and PRT. All development awards must adjust the FFP indicators and make the changes to the existing R and RiA indicators listed below to their IPTT and PIRS, and follow the specific instructions (if applicable): New Indicators
● M40 (CBLD-9) Percent of USG-assisted organizations with increased performance. Replaced M39 when changed unit of measurement from Number to Percent. Type of organization: ● Education (higher education, secondary, primary) ● Research institutions (non-degree granting) ● Cooperative (formal and registered private sector firm that serves members voluntarily united to meet common needs and aspirations through joint ownership and democratically controlled business) ● Producer group (informal, unregistered group of producers who aggregate product to access markets) ● Faith based organizations ● Governmental agencies (at national or sub-national levels) ● Health service delivery sites (hospital, clinic, community, pharmacies) ● Private sector firms ● Non-governmental and not-for profit organizations ● Other Provide FY19 result if available. Provide three out year targets in the IPTT and PRT.
Disaggregation Only Change ● M1 (TBD-4, EG.3-2) Number of individuals participating in USG food security programs.
Removed Producer from second level; only one level disaggregation: Sex (male, female, n/a); Age (school-aged children, 15-29, 30+, n/a); Type of individual (Parents/caregivers, Household members, People in government, People in USG-assisted private sector firms, People in civil society, Laborers (Non-producer diversified livelihoods participants), Producers - smallholder, Producers - non-smallholder, Producer - Not Applicable (for aquaculture), Producer - Disaggregate Not Available, Not Applicable, Disaggregate Not Available); Duration (New, Continuing). Added duration disaggregates: new, continuing.
o For producer smallholder and non-smallholder, enter value in the appropriate disaggregate.
o For the duration disaggregation, awardees should provide the value if data is available, otherwise, enter the value in DNA in the IPTT and PRT.
o Provide three out year targets in the IPTT and PRT.
● M2 (57, HL.9-1) Number of children under five (0-59 months) reached with nutrition-specific interventions through USG-supported programs. Revised Intervention Type: Children whose parents/caretakers received social and behavior change (SBC) interventions that promote essential infant and young child feeding (IYCF) behaviors, Received vitamin A supplementation in the past 6 months, Received zinc supplementation during an episode of diarrhea, Received multiple micronutrient powder supplementation, Admitted for treatment of SAM, Admitted for treatment of MAM, Received direct food assistance of fortified/specialized food products
o Revise IPTT.

USAID.GOV 38
● M3 (80, HL.9-3) Number of pregnant women reached with nutrition-specific interventions through USG-supported programs. Revised Intervention Type: Receiving iron and folic acid (IFA) supplementation, Receiving individual or group counseling on maternal and/or child nutrition, Receiving calcium supplementation, Receiving multiple micronutrient supplementation, Receiving direct food assistance of fortified /specialized food products
o Revise IPTT.
● M9 (TBD-8, EG.3.2-25) Number of hectares under improved management practices or technologies with USG assistance. Note for Sex and Age disaggregates, only extensive agriculture-related management practices and technologies can be counted as association-applied, and not associations on crop lands, cultivated pasture, or aquaculture.
o If applicable, for association-applied disaggregates, enter values for Sex and Age association-applied disaggregates with this new understanding, otherwise do not leave these disaggregates blank in the IPTT and PRT.
o Revise IPTT as needed.
● M13 (11a, EG.3.2-1) Number of individuals who have received USG-supported short-term agricultural sector productivity or food security training. Added Duration disaggregates: New, Continuing.
o For the Duration disaggregation, awardees should provide the value if data is available, otherwise, enter the value in DNA in the IPTT and PRT.
o Provide three out year targets in the IPTT and PRT.
● M15 (TBD-11, EG.3-10,11,12) Yield of targeted agricultural commodities among program participants with USG assistance. Revised Production system disaggregation for Livestock: Production system (Rangelands; Mixed crop-livestock; Urban/peri-urban; Intensive commercial).
o Revise IPTT.
● M18 (32, 3.3.3-9) Number of people benefiting from USG-supported social assistance programming. Added Duration disaggregates: New, Continuing.
o For the Duration disaggregation, awardees should provide the value if data is available, otherwise, enter the value in DNA in the IPTT and PRT.
o Provide three out year targets in the IPTT and PRT.
● M19 (33, ES.5-1) Number of USG social assistance beneficiaries participating in productive safety nets. Added Duration disaggregates: New, Continuing. Added age disaggregates: 15-29, 30+.
o For the Duration disaggregation, awardees should provide the value if data is available, otherwise, enter the value in DNA in the IPTT and PRT.
o Provide three out year targets in the IPTT and PRT.
o For the Age disaggregation, awardees should provide the value if data is available, otherwise, enter the value in DNA in the IPTT and PRT.
o Provide three out year targets in the IPTT and PRT.
● M21 (47, HL8.1-1) Number of people gaining access to basic drinking water services as a result of USG assistance. Revised Residence disaggregates: Urban to Urban/peri-urban.
o Revise IPTT.
● M22 (48, HL.8.2-2) Number of people gaining access to a basic sanitation service as a result of USG assistance. Revised Residence disaggregates: Urban to Urban/peri-urban.

39 USAID.GOV
o Revise IPTT.
● M28 (TBD-20, RESIL-1) Number of host government or community-derived risk management plans formally proposed, adopted, implemented, or institutionalized with USG assistance. Reorganized the levels: First Level - Type: Government, Community; Second Level - Management plan type: Disaster risk, Natural resource, Environment risk; Third Level - Phase of development: Proposed, Adopted, Implemented, Institutionalized.
o Enter the values in the appropriate level and disaggregates in the IPTT and PRT.
Title Only Change
● M6 (75, EG.3.3-10) Percent of female direct beneficiaries of USG nutrition-sensitive agriculture activities consuming a diet of minimum diversity. Change percentage to percent.
● M27 (TBD-19) Percent of referred acute malnutrition cases treated. Changed percentage to percent.
● M34 (60, GNDR 2) Percent of participants in USG-assisted programs designed to increase access to productive economic resources (assets, credit, income or employment) who are female. Change percentage to percent.M22 (TBD-24, EG.3.2-26) Value of annual sales of producers and firms receiving USG assistance. Changed from “farms” to “producers”.
● M35 (TBD-25, YOUTH-3) Percent of participants in USG-assisted programs designed to increase access to productive economic resources who are youth (15-29). Changed percentage to percent.
● M37 (TBD-28) Percent of community members participating in collective actions. Changed percentage to percent.
Disaggregation and Title Change
● M4 (TBD-5 ,HL.8.2-5) Percent of households with soap and water at a handwashing station on premises. Changed percentage to percent. Changed “commonly used by family members” to “on premises.” Revised Residence disaggregates: Urban to Urban/peri-urban.
o Enter the values in the appropriate disaggregate in the IPTT and PRT. o Revise IPTT.
● M31 (TBD-22. EG.3.2-27) Value of agriculture-related financing accessed as a result of USG assistance. Reorganized the levels to only include FFP relevant disaggregation. First level - Type of financing accessed: Debt, Non-debt; Second level - Type of debt: Cash, In-kind; Type of recipient: Individuals/microenterprises, Small and medium enterprises, Large enterprises and corporation; Sex of producer or proprietor(s): Male, Female, Mixed; Age: 15-29, 30+, Mixed
o Enter the values in the appropriate level and disaggregates in the IPTT and PRT. o Revise the IPTT.
Archived/Dropped Indicators
● M8 (TBD 6, HL.9-15) Percent of participants of community-level nutrition interventions who practice promoted infant and young child feeding behaviors. Indicator was dropped after recent assessment of the FY18 results. Awardees should drop and not report this indicator.
● M39 (TBD-30, CBLD-8) Number of USG-assisted organizations with increased performance.
Archived and replaced by new indicator, see M40. For awardees who adopted the indicator as “Percent”, please provide FY19 result in M40 if possible. Otherwise, provide “Number” value in archived indicator M39. Adopt M40 moving forward. Revise the IPTT.

USAID.GOV 40
How to count LOA Change ● M2 (57, HL.9-1) Number of children under five (0-59 months) reached with nutrition-specific
interventions through USG-supported programs. Changed the LOA intervention type disaggregation, from “the aggregate is the sum of the annual numbers.” to “the counts should be the unique individuals within each disaggregate.”
● M3 (80, HL.9-3) Number of pregnant women reached with nutrition-specific interventions through USG-supported programs. Changed the LOA intervention type disaggregation, from “the aggregate is the sum of the annual numbers.” to “the counts should be the unique individuals within each disaggregate.”
● M11 (77, EG.11-6) Number of people using climate information or implementing risk-reducing actions to improve resilience to climate change as supported by USG assistance. Changed How to Count LOA from “Projects are strongly encouraged to maintain a training database as part of routine monitoring throughout the project to record the types of training received by individuals and the dates of training. This will facilitate the LOA count of unique individuals who received any training throughout the award without double counting. In the exceptional case when a database is not maintained, the LOA should be calculated based on the annual counts with adjustments based on the duration of series of trainings and recommended combinations of trainings for the same beneficiary groups that span multiple years. In all cases, the LOA must not exceed the sum of the annual reported numbers.“ to “Awardees are encouraged to maintain a database throughout the activity to record the use of climate information or implementation of risk-reducing actions by individual participants and date of use or implementation. This will facilitate the LOA count of unique individuals who use climate information or implement risk-reducing actions throughout the award, without double counting. In the exceptional case when a database is not maintained and annual numbers are extrapolated from the results of annual participant-based sample surveys, the LOA should be calculated based on the annual counts, but adjusted in consideration of participants who use climate change or implement risk-reducing action, and were counted in multiple years. In all cases, the LOA must not exceed the sum of the annual reported numbers.”
● M26 (78, HL.9-4). Number of individuals receiving nutrition-related professional training through USG-supported programs. Changed How to count LOA from “The LOA value is the same as the final year’s value, i.e., the individuals receiving nutrition-related professional training at the end of the project.” to “The LOA is the unique number of individuals receiving nutrition-related professional training at the end of the activity. Activity should maintain a training database as part of routine monitoring throughout the activity to record the types of professional training received, individuals completed the training, partner institutions (if applicable), and the dates of training. This will facilitate the annual and LOA counts of unique individuals who were trained without double counting.”

41 USAID.GOV
ANNEX C: INDICATOR PERFORMANCE TRACKING TABLE CHECKLIST IN ARR
To examine the completeness and quality of your IPTT, review the IPTT and answer the following questions.
Yes No Note further
actions needed
Overall Quality of the IPTT
1. Is all the required disaggregation in the IPTT? Is each individual-level indicator sex and age disaggregated as appropriate?
2. Where appropriate, do the disaggregation(s) add up to the overall indicator total? (Where there is disaggregate “Total with one or more …”, the disaggregation does not sum up.)
3. Is the formula for complex indicator(s) with multiple data points available for review in the formula box? Is the formula correct?
4. Are targets set for three out-years from the reporting FY?
5. Do all targets match their indicator in units of measurement?
6. Are the base values entered?
7. There are no blanks.
8. Do LOA targets and calculations follow PIRS LOA guidance? Confirm Relationship between Indicators
9. M12 is a subset of M9. Ensure that M12 values are unique hectares, while in M9, the associated disaggregates can over lap.
10. M16 and M9: The producers in M16 are the cultivators of the number of hectares in M9. Check that the average producer per hectare is reasonable and realistic.
11. M15 Farm size – smallholder producer disaggregate and M33 Producer type/Firm size – smallholder producer disaggregate: Further analyze crop yield and value of annual sales to better understand smallholder change in income, handling of production, they can be counted under FFP #9, Number of farmers and others applying improved technologies.

USAID.GOV 42
ANNEX D: ARR NARRATIVE QUALITY REVIEW CHECKLIST
To ensure that key ARR components are effectively organized, analyzed and presented in the narrative, consider the following:
Yes
No
Issue to address
Additional topic to include
Overall report organization
1. Is the narrative organized by the components of the Results Framework (SO, IR, and Sub IR) or LogFrame (purpose, sub-purposes, intermediate outcomes, and outputs)?
Reporting results 2. Are the operational environment and enabling factors
that facilitated or hindered the achievements of planned results and interventions explained (e.g. environmental conditions or contextual factors including government policies, stakeholder coordination, management issues)?
3. Are any major challenges to implementation highlighted and explained? This might include: quality of services (i.e. training, other inputs), technical challenges, sub-optimal design of interventions, missing complementary services, or other critical barriers that are yet to be addressed.
4. Does the narrative describe concisely how the activity will address any issue/challenge identified and the lessons learned during the FY?
5. Does the narrative address key management issues that have impacted the award during the FY (including partnership, staff turnover, inconsistent leadership, inadequate staff training, frequent breakdown of the resource pipeline, less than optimum gender equitable staff management)?
6. Are any deviations from the original or most-recently approved activity design identified?
7. (If applicable) Did the development activity receive emergency funds for interventions during the FY? Does the ARR narrative include a description of these emergency interventions and the implications of the emergency/shock on the development interventions and results?
Data presentation and analysis 8. Does the report present and interpret the analysis of the
most relevant indicators for this FY (including performance trends) to tell the story?
9. Are interventions and outcomes for this FY analyzed against planned interventions and output/outcome targets to demonstrate how the award performed against the targets and the ToC?

43 USAID.GOV
To ensure that key ARR components are effectively organized, analyzed and presented in the narrative, consider the following:
Yes
No
Issue to address
Additional topic to include
10. Does the analysis highlight important differences in results across geographic areas, sex or age of project participants, or other relevant sub-groups?
11. Is there an analysis, corrective action, and explanation for the need to adjust future targets (if applicable)? Is this information included in the deviation narrative?
Technical interventions 12. Does the narrative describe the quality of interventions,
technical strategies and linkages to the level of adoption of desired behaviors or practices?
13. Does the narrative identify which targeted group(s) did or did not benefit as planned from interventions during the FY? Does the narrative explain why?
14. Does the narrative describe the status of the sustainability strategy including what interventions were implemented during the FY to promote sustainability and how any challenges to sustainability were addressed?
Cross-cutting 15. Is sex and age disaggregation and gender analysis
integrated throughout the narrative? Refer to checklist for integrating gender.
16. Is environmental protection integrated throughout the narrative? Refer to the checklist for environmental integration.
17. Is conflict sensitivity integrated throughout the narrative?
18. Is community participation integrated throughout the narrative?
19. Does the narrative describe the progress in strengthening local systems – local government, CBOs, community groups, and the private sector who contributes to the anticipated outcome?
20. Does the narrative describe the progress during the reporting period to continue the critical services (e.g., agriculture extension, nutrition knowledge and services, health services, financial services, access to inputs, marketing services, etc.) beyond the LOA?
21. Does the narrative describe the use and results of performance and process monitoring, and evaluation (if occurred during the reporting year), what adjustments were made because of the monitoring and evaluation, the challenges, and corrective measures taken?
References, sources and attachments

USAID.GOV 44
To ensure that key ARR components are effectively organized, analyzed and presented in the narrative, consider the following:
Yes
No
Issue to address
Additional topic to include
22. Does the narrative identify sources and methods used to obtain the information reported including participant/stakeholder feedback, PDM, and/or survey results?
23. Are indicators referenced by IPTT # in the narrative?
24. Are the most relevant and useful references and attachments included in the report and uploaded to the FFP PRT?
25. Are interventions and results against planned interventions and targets analyzed for activity outputs, processes, or outcomes quantitatively and qualitatively (including PDM feedback mechanisms, market assessments, and final assessments)?
Overall 26. Does the report tell stories and help the reader
understand how the interventions led to the outcomes, what the challenges were, and how the activity overcame them during the FY?

45 USAID.GOV
ANNEX E: INTEGRATING GENDER, YOUTH AND SOCIAL DYNAMICS IN ARR
To determine the key gender, youth, and social dynamics issues to report on in the ARR and ensure they are effectively presented in the narrative, consider the following.
Yes No
Issue to Explore
Further or Address
Successes, Challenges,
Programmatic Changes, Other to
Report in ARR Changes in & Consequences of Gender, Youth, and Social Dynamics - have you
1. Reviewed the gender analysis to recall the gender, youth, and social dynamics concerns and opportunities identified within the ToC, or each Purpose/Sub-purpose, and ensure award is addressing issues and implementing recommendations?
2. Discussed with colleagues and stakeholders their perception of whether women, girls, boys and men are all benefiting from interventions and their potential is being tapped across activity components? ● Ways in which gender roles and relations may be aiding
or impeding interventions and outcomes? ● Whether interventions are changing- for better or for
worse- gender norms, roles and relations between women and men, among older and younger men and women?
● How interventions are affecting women’s time and what, if anything, can be done about it? Are there any important differences or considerations by women’s age?
● If the attempt to empower women is creating excessive friction in households with the risk (or actual result) of triggering Gender-Based Violence? Are there any important differences or considerations by women’s age?
Data Presentation, Analysis & Interpretation - have you 3. Indicated where targets versus actuals for sex and age disaggregated data presented in the IPTT/SAPQ differ significantly and provided possible explanations why?
4. Provided a visual presentation of select indicators by sex and, if possible, age (e.g., graphs, charts, tables) that is useful to the reader to put the results from the FY in context with progression towards the FY targets?
5. Used qualitative and quantitative data to explain gender differences/ gaps related to the results being described in the narrative?
Programmatic Implications & Actions – have you

USAID.GOV 46
To determine the key gender, youth, and social dynamics issues to report on in the ARR and ensure they are effectively presented in the narrative, consider the following.
Yes No
Issue to Explore
Further or Address
Successes, Challenges,
Programmatic Changes, Other to
Report in ARR 6. Discussed the implications (the "so what?") of the results being reported as it relates to achieving outcomes for men and women, girls and boys?
7. Identified where changes should be considered (activity implementation, ToC) to make the award more sensitive to gender, youth, and social dynamics issues?
8. Considered specific actions that could be taken by the award to address gender and youth gaps revealed by the annual monitoring results?
In Summary – have you 9. Provided a reflection/introspection on how the award is integrating gender, youth, and social dynamics to promote gender equality in order to achieve activity/FFP objectives (e.g., is it working, does it need to be adjusted)?

47 USAID.GOV
ANNEX F: INTEGRATING ENVIRONMENT IN ARR
To determine the key environmental risks and opportunities to report on in the ARR and ensure they are effectively presented in the narrative, consider:
Yes No Issue to Explore Further
or Address
Successes, Challenges,
Other to Report in
ARR
Changes in Natural Resources Risk & Impact - have you
1. Reviewed biodiversity, tropical forestry, climate and geological hazard risk analyses, environmental compliance documentation, and relevant Pesticide Evaluation and Safer Use Action Plan or Environmental Assessment for nature-based risks and impacts? Strategically addressed climate and environmental risks and opportunities via incorporation into the ToC, indicators, Purposes/Sub-purposes and/ or EMMP?
2. Discussed with colleagues and stakeholders their perception of:
How the activity has avoided causing detrimental impacts to the environment (e.g., activity-derived deforestation)?
How the activity can improve community resilience to environmental degradation and weather risks (e.g., water quality and supply)?
How the activity can work with the community to rehabilitate degraded natural resources relevant to food security (e.g., poor soil fertility)?
How the activity can strengthen knowledge, and change attitudes among target participants to better manage communal natural resources (e.g., eradication of invasive plants)?
How the activity can improve community resilience to environmental degradation and weather risks (e.g., water quality and supply)?
Data Presentation, Analysis & Interpretation - have you
3. Indicated where targets versus actuals for climate indicator data presented in the IPTT/SAPQ differ significantly and provided possible explanations why?

USAID.GOV 48
To determine the key environmental risks and opportunities to report on in the ARR and ensure they are effectively presented in the narrative, consider:
Yes No Issue to Explore Further
or Address
Successes, Challenges,
Other to Report in
ARR
4. Interpreted the results (e.g., in livelihoods or safety nets) to ensure that short-term annual gains are not at odds with longer term sustainability described in the project’s EMMP?
5. Used qualitative and quantitative data to explain hydro-meteorological, geohazard risks and impacts to natural resources related to the results being described in the narrative?
Programmatic Implications & Actions – have you
6. Discussed the implications (the "so what?") of the results being reported as it relates to achieving activity outcomes that do no harm to the environment?
7. Involved the community in making the activity more environmentally sensitive while increasing management of weather-related risks?
8. Considered specific actions that could be taken by the activity to address environmental risks revealed by the annual monitoring results?
In Summary – have you
9. Provided a reflection on how the activity is integrating perspectives of environmental impacts and risks in order to achieve activity/FFP objectives (e.g., is it working, does it need to be adjusted)?

49 USAID.GOV
ANNEX G: SUCCESS STORY WRITING 10 Why are success stories necessary? Success stories are helpful to further educate the public about food assistance activities, particularly to demonstrate the impact that they have on peoples’ lives around the world. The stories should describe the food assistance activities in non-technical language and explain the results or benefit (where feasible). What type of stories is FFP expecting? FFP seeks descriptions of successes that go beyond the specifics of how much food was delivered and focus on progress made in reducing food insecurity in the populations receiving food assistance. In other words, they should showcase broad-scale sustainable development awards and/or highlight new, cutting edge innovations. FFP would like success stories from all regions, and for both emergency and development awards. We welcome stories that focus on transformational impacts of our development awards – for example:
● Reducing stunting ● Raising household incomes ● Increased agricultural productivity ● Regenerating watersheds or other natural resources ● Improving and maintaining community infrastructure ● Empowering women and youth ● Mitigating future disasters or existing threats ● Demonstrating outcomes and results. Note: We know this is a much more difficult ask than
simple output information (e.g. number of people trained vs. how that training changed a person’s behavior), but to the extent possible, USAID encourages partners to submit stories with this information.
● Highlighting new opportunities and impacts for participants as a result of FFP and BFS-funded projects (or other USAID projects including OFDA projects) running together or in close proximity to each other.
We also welcome compelling stories of:
● Early response that clearly prevents loss of life or mitigates impacts of disasters ● Lives saved and suffering alleviated ● Documented reductions in malnutrition or other key indicators ● Food for asset and other interventions that protect and/or advance livelihoods while saving lives ● Creative approaches applying technology or other tools that clearly improve response ● Strategic application of multiple resources to improve overall impact (e.g., sequencing EFSP and
Title II awards that demonstrate the benefits of both resources and the improved response that results because both are available)
● Resilience building as part of an emergency response The most effective success stories focus on the following:
● Individuals empowered to help themselves ● Sustainable change rather than one-off successes ● Permanent “leave behinds” created, such as new infrastructure, skills that have a lasting
impact, or reduced need for outside help in the future due to program results ● A “new” approach to aid, one that empowers targeted groups and works to avoid

USAID.GOV 50
dependency Also keep in mind that moral and ethical imperatives are a central part of the motivation for supporting assistance. Americans believe that the U.S. must act as a world leader to live up to its founding ideals. Try to factor this motivation into your story. Just remember, all success stories should point to results! How will my success story be used? Selected stories may be included on the USAID website, in FFP annual reports and in other communications products that highlight the work of FFP and its awardees. What does a great success story look like? Success stories should including the following sections (text does not have to be in this order):
1. Title or Heading (approximately 5-10 words including country and/or region of award) 2. 1-2 sentences (approximately 50 words) briefly describing the situation in the country that
required FFP assistance. 3. 3-4 sentences (approximately 100-150 words) describing the award being implemented in
country. 4. 1-2 sentences (approximately 25-50 words) describing why that activity was the most
appropriate response to the situation described.
5. 1-2 sentences (approximately 25-50 words) describing the results and success of the implemented award.
What are some DOs and DON’Ts of writing Success Stories? DO…
● DO include quotes as much as possible. Some USAID communications platforms will not post stories without quotes.
● DO include a beneficiary or person involved in the activity. For beneficiaries, include complete information – name, age, village, family information. Most USAID platforms require this information. Note: if the beneficiary does not want their name or location used for security reasons, please state that.
● DO use powerful statistics ● DO lead with results ● DO tell stories that demonstrate sustainable change ● DO create emotional/personal connections that bring viewers into the scene ● DO think big picture ● DO include at least one good photo. All USAID platforms require at least one photo.
Note: When including a picture, use .jpg or .tiff format and a file that is at least 300 dots per inch (dpi). The photo caption should include the photographer’s name and organization as well as a caption of 25 words or less summarizing what is occurring in the photo, including date, location, and names of person(s) in the photo. For all participants named or photographed, verbal consent must be obtained prior to being featured within the story. USAID understands that participants may ask to use a different name to remain anonymous. This is especially true in situations where naming or photographing individuals accepting U.S. Government assistance poses a potential threat to their life. If this is the case, please note this within the submission.

51 USAID.GOV
DON’T…
● DON’T use acronyms ● DON’T use technical speak ● DON’T use statistics that present numbers or percentages with no sense of context or scale ● DON’T lead with $$ amounts
Last but not least, remember that success stories are a way to tell the world about the great work that USAID and our partners accomplish every day!

USAID.GOV 52
ANNEX H: REFERENCE DOCUMENTS AND WEBSITES Development Data Library (DDL). https://data.usaid.gov Development Experience Clearinghouse (DEC). https://dec.usaid.gov/dec/home/Default.aspx FANTA Anthropometric Indicators Measurement Guide. http://www.fantaproject.org/tools/anthropometry-guide Feed the Future Agricultural Indicators Guide. https://agrilinks.org/library/feed-the-future-ag-indicators-guide Feed the Future Indicator Handbook. https://www.agrilinks.org/sites/default/files/ftf-indicator-handbook-march-2018-508.pdf FFP Information Bulletins. https://www.usaid.gov/food-assistance/resources/food-peace-information-bulletins FFP Indicators Handbook, Part I: Indicators for Baseline and Final Evaluation Surveys https://www.usaid.gov/food-assistance/partner-with-us/implementation-and-reporting FFP Indicators Handbook, Part II: Annual Monitoring Indicators. https://www.usaid.gov/documents/1866/ffp-indicators-handbook-part-ii-annual-monitoring-indicators USAID’s ADS 201mat Climate Change in USAID Country/Regional Strategies. https://www.usaid.gov/sites/default/files/documents/1876/201mat.pdf
USAID’s 201 mal CRM for USAID Projects and Activities. https://www.usaid.gov/sites/default/files/documents/1868/201mal_042817.pdf
PEPFAR Guidance for Orphans and Vulnerable Children Programming. http://www.pepfar.gov/reports/guidance/c53568.htm USAID’s ADS 201. https://www.usaid.gov/ads/policy/200/201 USAID’s ADS 205. https://www.usaid.gov/ads/policy/200/205 USAID’s ADS 540. http://www.usaid.gov/ads/policy/500/540 USAID Thesaurus. http://pdf.usaid.gov/pdf_docs/pnaea100.pdf