annual survey 2016/2017... · factor winner alexandra burke who delighted audiences with a...
TRANSCRIPT

ANNUAL SURVEY
2016/2017

2
CONTENTS
Introduction Page 3 - 4 - From Chief Executive, Stephen Crocker
Ticket Sales Page 5 - 21 - Ticket sales, performances and productions, broken down by event type, the value of tickets sold and
the average price paid Ticket Sales by Geo-Political District Page 22 - 27 - Tickets sold and the value of those tickets, broken down by geo-political district, and the average
spend and number of tickets per transaction Friends of the Theatre Royal Page 28 - 39 - Total number of Friends and where they live, the value of tickets sold to Friends, as well as a list of
Corporate Club Members and their ticket sales for the year Concessions Page 40 - 44 - A breakdown of the value of concessions given to each concession category and the quantity of tickets
sold to each category Charitable Collections Page 45 - 46 - A breakdown of collections on behalf of other charities and prize vouchers sent out
Theatre Royal Income and Expenditure Page 47 - 53 - The Theatre Royal’s net income and expenditure as a comparison of the last three years, payments to
local suppliers for the current year, the Touring Theatre’s Survey for 2016/2017 and the overall economic impact of Norwich Theatre Royal in 2016/2017

3
INTRODUCTION 2016/17 was a year of great change for the Theatre Royal as Peter Wilson stepped down after 25 years as Chief Executive at the end of December 2016, and I took over the role in January 2017. I pay great tribute to Peter for his tenure as Chief Executive which did not see the organisation stand still. He oversaw an incredible period of growth and development and I am thrilled to have now grasped that baton and to be leading our continued growth and development over the coming years. In addition to a change of leadership, another significant development in this year was the completion of our new purpose-built £3.5 million Learning & Participation centre, Stage Two. This important development has seen a whole new area of potential work and ambition for Theatre Royal open up and has further cemented Learning & Participation at the core of our mission. In light of this, Trustees made the decision to designate unrestricted funds in the year to close the remaining capital funding gap on Stage Two and to allow organisational resources and fundraising strategy to focus on supporting new programmes of work into the future. Alongside all this change and development, it is a tribute to the experience, skills, resilience and boundless energy of the staff and volunteers of the Theatre Royal and Norwich Playhouse that the Trust returned its best business results ever, producing an operating surplus before depreciation in excess of £700k. The stability and high quality of our thriving and diverse theatre programme, underpinned by the loyalty and appetite of our audiences and supporters, enables us to plan for the future with confidence. It provides a secure foundation for our ambitious plans for developing the artistic programme and our learning and participation work which are, of course, central to our work as a charity. Artistic Programme The Theatre Royal’s artistic programme was as packed as ever, covering 409 performances of 91 separate productions, and achieving ticket sales of just under 400,000, which averaged out at 76% of seat capacity filled. Highlights in April included a pre-West End run for Harold Brighouse’s robust, proto-feminist play, Hobson’s Choice which featured a barnstorming performance from Martin Shaw, and the Royal Shakespeare Company’s celebratory production of A Midsummer Night’s Dream: A Play for the Nation, commemorating 400 years since Shakespeare’s death. Uniquely, this was a co-production between the RSC and local amateur theatre company The Common Lot, whose members played the roles of the Mechanicals alongside the RSC’s professional cast. It was an opportunity they grasped with wit, skill and disciplined abandon. More high quality drama arrived in May, in the shape of the National Theatre of Scotland’s trilogy The James Plays, telling the turbulent tale of 15th century Scottish history in a thrilling modern idiom. Presented with our partner Norfolk & Norwich Festival, this was an internationally-acclaimed production, epic in scale and ambition, and we were proud to host it in Norfolk. May and June were straddled by a two week run of the West End hit musical The Bodyguard, starring X-Factor winner Alexandra Burke who delighted audiences with a powerhouse vocal performance, and which completely sold out. The summer was occupied almost entirely by the latest production to visit Norwich from the stable of the world’s most successful theatre producer, Cameron Mackintosh. Mary Poppins ran for 35 performances

4
over nearly five weeks. More than 42,000 people saw it here, filling over 92% of the seats, and it took £1.99m at the Box Office, more than any other single show in the Theatre Royal’s history. Two home-grown productions of very different kinds occupied August. A lively and colourful youth theatre musical High School Prom Queen provided over 200 local young people the chance to shine on our main stage, whilst local favourites The Nimmo Twins provided their customary blend of edgy locally inspired comedy in a show which celebrated their 20th anniversary. Autumn brought a welcome return of Gilbert & Sullivan with The National Gilbert & Sullivan Opera Company. That it featured our resident pantomime writer and director, Richard Gauntlett, was a particular bonus for us. We also welcomed back The Rocky Horror Show, Rambert, The Full Monty, The Sound Of Music, Northern Ballet, Chicago and Glyndebourne Touring Opera. Familiarity, balanced with the new, has always been a hallmark of the Theatre Royal’s programme. Proven quality and success are necessary ingredients to achieve a balance in appealing to both new and existing audiences. For the fourth successive year, over 60,000 people attended our own produced pantomime, in this case an innovative Wild-West-set Jack And The Beanstalk. Written, directed by, and starring Richard Gauntlett, we achieved new heights of excellence, reflected in the record advance bookings for the 17/18 pantomime season. Theatre Royal is rightly very proud of its pantomimes, particularly as they provide the most entertaining and exciting experience for many small first-time theatregoers. January brought a slight change of pace with Bill Kenwright’s new lavish production of La Cage Aux Folles. This was quickly followed by two of the highlights of the year which rounded it off with great style. The first was Sir Matthew Bourne’s The Red Shoes, a tale about artistic obsession from one of our greatest artists, celebrating his 30th year as a choreographer and director in consummate style. This was followed by the first visit to Norwich of the global hit musical MAMMA MIA! Both were completely sold out – a fitting way to end one of the busiest and most successful years the Theatre Royal has ever had.
Stephen Crocker Chief Executive November 2017

5
TICKET SALES
• List of Productions and Event Types 2016/2017
• Number of Ticket Sales, Performances and Productions – three-year comparison
• Number of Performances by Event Type – three-year comparison
• Number of Productions by Event Type – three-year comparison
• Seat Occupancy by Event Type – three-year comparison
• Source of Ticket Sales by Quantity and Value
• Average Price Paid by Event Type – three-year comparison
• Average Price Asked Against Average Price Paid by Event Type – 2016/2017
• Potential Value Against Actual Value Sold by Event Type – 2016/2017
• Potential Occupancy Against Actual Number of Tickets Sold – 2016/2017
• Seat Occupancy – comparison with previous year
• Price Band Analysis – three-year comparison
• Comparative Annual Ticket Sales – from 1983/1984 to present
• Target and Actual Box Office Income Retained by the Theatre Royal by Event Type – 2016/2017

6
LIST OF PRODUCTIONS AND EVENT TYPES – 2016/2017 Show Name Start Date No.
Genre
The Ukulele Orchestra of Great Britain 2016 05/04/2016 1 Personality Concerts That'll be the Day 2016 06/04/2016 1 Concerts My First Ballet 08/04/2016 5 Dance Russell Watson 2016 10/04/2016 1 Personality Concerts Hobson's Choice 2016 12/04/2016 7 Quality Drama Julian Clary - The Joy of Mincing 17/04/2016 1 Standup Comedy Swan Lake 2016 19/04/2016 7 Dance Tortoise & the Hare 22/04/2016 2 Family Children A Midsummer Night's Dream 2016 26/04/2016 7 Quality Drama Stepping into Stardom 01/05/2016 2 Amateur Guys & Dolls 03/05/2016 8 Musicals Buddy Holly & the Cricketers 08/05/2016 1 Concerts Opera & Ballet International 09/05/2016 2 Opera Solid Silver Sixties 11/05/2016 1 Personality Concerts The James Plays 14/05/2016 6 Quality Drama The James Plays On Stage Seating 14/05/2016 6 Quality Drama Sans Objet 17/05/2016 2 Dance Max Richter Ensemble 19/05/2016 1 Big Band Orchestral Magical Mystery Tour 20/05/2016 1 Concerts Lisa Fischer 21/05/2016 1 Personality Concerts The Bodyguard 24/05/2016 16 Musicals Charlie Landsborough 2016 05/06/2016 1 Personality Concerts Dancing in the Streets 07/06/2016 1 Concerts Samantha Barks & Band 08/06/2016 1 Personality Concerts All Or Nothing 09/06/2016 4 Musicals Some Guys Have All The Luck 12/06/2016 1 Concerts Ian Bostridge directs 19/06/2016 1 Big Band Orchestral Rhythm of the Dance 2016 20/06/2016 1 Dance Jamie Raven Live 21/06/2016 1 Personality Concerts Bowie Experience 22/06/2016 1 Concerts Sleeping Beauty 2016 24/06/2016 3 Dance Sleeping Beauty 2016 Dress Rehearsal 24/06/2016 1 Dance Mary Poppins 29/06/2016 37 Musicals High School Prom Queen 03/08/2016 5 Family Children Abba Mania 2016 07/08/2016 1 Concerts Sarah Millican: Outsider 08/08/2016 1 Standup Comedy The Joe Ringer Band 2016 09/08/2016 1 Personality Concerts The Nimmo Twins 2016 10/08/2016 4 Standup Comedy

7
Show Name Start Date No.
Genre Killer Queen 2016 28/08/2016 1 Concerts Peppa Pig's Surprise 31/08/2016 4 Family Children The National Gilbert & Sullivan Opera
02/09/2016 3 Opera
Sue Perkins Live! 04/09/2016 1 Standup Comedy That's Entertainment 05/09/2016 8 Musicals Aspects of Alice 11/09/2016 1 Amateur The Rocky Horror Show 2016 12/09/2016 8 Musicals Joan Collins 18/09/2016 1 Personality Concerts Sally Morgan 2016 19/09/2016 1 Personality Concerts The Blues Brothers 2016 20/09/2016 1 Musicals Daniel O'Donnell 2016 21/09/2016 2 Personality Concerts Dr Hook 24/09/2016 1 Personality Concerts Pride and Prejudice 27/09/2016 7 Quality Drama Rambert 2016 06/10/2016 3 Dance The Hollies 2016 08/10/2016 1 Personality Concerts Ross Noble Brain Dump 09/10/2016 1 Standup Comedy The Full Monty 2016 10/10/2016 8 Popular Comedy
May Contain Nuts 16/10/2016 1 Concerts The Sound of Music 2016 18/10/2016 8 Musicals Al Murray 2016 23/10/2016 1 Standup Comedy Beauty & The Beast 2016 26/10/2016 6 Dance Chicago 2016 31/10/2016 8 Musicals Norfolk Schools Project - Madama Butterfly 06/11/2016 1 NR Schools Project A Room With A View 07/11/2016 8 Quality Drama An Afternoon With Sir Roger Moore 13/11/2016 1 Personality Concerts Breakfast at Tiffany's 14/11/2016 8 Quality Drama An Evening with Pam Ayres 2016 20/11/2016 1 Personality Concerts The Glyndebourne Tour 2016 22/11/2016 5 Opera The Commitments 28/11/2016 8 Musicals The RAF in Concert 2016 04/12/2016 1 Big Band Orchestral Arabian Nights 08/12/2016 3 Studio Jack & The Beanstalk Dress Rehearsal 2016 12/12/2016 1 Pantomime Jack & The Beanstalk 2016 13/12/2016 56 Pantomime Candide 15/12/2016 3 Studio A Vision of Elvis 18/12/2016 1 Concerts Beyond The Barricade 2017 05/01/2017 1 Concerts Miles Jupp Songs of Freedom 09/01/2017 1 Standup Comedy La Cage aux Folles 17/01/2017 8 Musicals Classic Rock Show 22/01/2017 1 Concerts Nathan Carter 25/01/2017 1 Personality Concerts

8
Show Name Start Date No.
Genre Russian State Ballet of Siberia 2017 26/01/2017 4 Dance The Witches of Eastwick 2017 31/01/2017 7 Amateur Brendan Cole - All Night Long 05/02/2017 2 Dance Whitney Queen of the Night 06/02/2017 1 Concerts Stewart Lee Content Provider 07/02/2017 1 Standup Comedy Richard Alston Dance Company 2017 10/02/2017 2 Dance Rumours of Fleetwood Mac 2017 12/02/2017 1 Concerts Thriller Live 2017 13/02/2017 8 Musicals Matthew Bourne's The Red Shoes 21/02/2017 7 Dance MAMMA MIA! 28/02/2017 33 Musicals Extremism 02/03/2017 3 Studio Abigail's Party 2017 27/03/2017 8 Quality Drama Burying your Brother in the Pavement 2017 30/03/2017 3 Studio

9
NUMBER OF TICKET SALES, PERFORMANCES AND PRODUCTIONS – three-year comparison This section of the report looks at the number of tickets sold, the number of performances and the number of productions for each of the three years under review.
95
92
91
89
90
91
92
93
94
95
96
2014/2015 2015/2016 2016/2017
No.
of P
rodu
ctio
ns
Productions
387,165
401,153 399,792
380,000
385,000
390,000
395,000
400,000
405,000
2014/2015 2015/2016 2016/2017
No.
of T
icke
ts S
old
Ticket Sales
415
445
409
390
400
410
420
430
440
450
2014/2015 2015/2016 2016/2017
No.
Of
Perf
orm
ance
s
Performances

10
NUMBER OF PERFORMANCES BY EVENT TYPE – three-year comparison This page shows the number of performances per year by event type. Event Type 2014/2015 2015/2016 2016/2017 Amateur 11 17 10 Big Band/Orchestral 4 2 3 Concerts 8 3 14 Dance 52 47 43 Family/Children 28 32 11 Musicals 103 129 155 Norfolk Schools Project 1 2 1 Opera 15 8 10 Pantomime 53 58 57 Personality Concerts 18 20 17 Popular/Comedy Drama 30 24 8 Quality Drama 64 69 57 Standup Comedy 12 13 11 Studio 16 21 12 Grand Total 415 445 409
0
20
40
60
80
100
120
140
160
180
Number of Performances by Event Type 2015/2016 2016/2017 2016/2017

11
NUMBER OF PRODUCTIONS BY EVENT TYPE – three-year comparison This page shows the number of productions per year by event type. Event Type 2014/2015 2015/2016 2016/2017 Amateur 3 7 3 Big Band Orchestral 4 2 3 Concerts 7 3 14 Dance 11 10 12 Family Children 10 7 3 Musicals 9 13 13 Norfolk Schools Project 1 2 1 Opera 4 2 3 Pantomime 1 1 1 Personality Concerts 17 14 16 Popular/Comedy Drama 4 3 1 Quality Drama 9 9 8 Standup Comedy 10 12 8 Studio 5 7 4
Grand Total 95 92 91
02468
101214161820
Number of Productions by Event Type 2014/2015 2015/2016 2016/2017

12
SEAT OCCUPANCY BY EVENT TYPE – three-year comparison The following table shows the percentage occupancy broken down by event type as a comparison between the last three years. Event Type 2014/2015 2015/2016 2016/2017 Amateur 84% 58% 55% Big Band/Orchestral 51% 52% 62% Concerts 80% 77% 83% Dance 71% 71% 70% Family/Children 69% 55% 63% Musicals 83% 83% 87% Norfolk Schools Project 72% 69% 64% Opera 63% 71% 79% Pantomime 89% 87% 85% Personality Concerts 84% 86% 78% Popular/Comedy Drama 76% 43% 86% Quality Drama 53% 59% 66% Standup Comedy 94% 97% 97% Studio 79% 84% 86% Average Per Event 75% 71% 76%
0%10%20%30%40%50%60%70%80%90%
100%
Seat Occupancy by Event Type
2014/2015 2015/2016 2016/2017

13
SOURCE OF TICKET SALES – Quantity
Type Internet Phone Sales Other (In person,
post, fax) Amateur 46% 17% 37% Concerts 49% 20% 31% Dance 44% 22% 35% Family Children 47% 20% 34% Musicals 50% 22% 28% NR Schools Project 0% 7% 93% Opera 39% 22% 39% Pantomime 41% 25% 34% Personality Concerts 48% 22% 30% Popular Comedy Drama 54% 21% 24% Quality Drama 41% 25% 35% Standup Comedy 60% 14% 26% Studio 48% 14% 37% Average 44% 19% 37% SOURCE OF TICKET SALES – Value
Type Internet Phone Sales Other (In person, post,
fax) Amateur 47% 35% 18% Concerts 52% 28% 20% Dance 47% 32% 21% Family Children 53% 28% 20% Musicals 53% 26% 21% NR Schools Project 0% 0% 0% Opera 42% 34% 24% Pantomime 45% 30% 24% Personality Concerts 48% 29% 22% Popular Comedy Drama 56% 22% 21% Quality Drama 43% 33% 24% Standup Comedy 60% 26% 14% Studio 51% 33% 16% Average 46% 27% 19%

14
AVERAGE PRICE PAID BY EVENT TYPE – three-year comparison This section looks at the average ticket price paid of each of the event types over the three years in question.
Event Type 2014/2015 2015/2016 2016/17 Amateur £16.11 £14.96 £16.37 Big Band/Orchestral £18.02 £15.61 £20.24 Concerts £17.95 £20.00 £20.68 Dance £22.87 £24.79 £25.44 Family/Children £11.32 £14.20 £11.29 Musicals £29.10 £32.57 £37.70 Opera £35.61 £35.97 £33.82 Pantomime £16.16 £16.49 £17.42 Personality Concerts £23.23 £29.30 £25.23 Popular/Comedy Drama £19.44 £17.37 £24.84 Quality Drama £16.30 £16.49 £20.21 Standup Comedy £21.61 £21.07 £20.26 Studio £7.66 £7.73 £8.57 Variations in the average price paid are often closely related to specific productions or specific artists coming to the theatre in particular years.

15
AVERAGE PRICE ASKED AGAINST AVERAGE PRICE PAID BY EVENT TYPE – 2016/2017 The following spreadsheet shows the average price asked for tickets in each event type for 2016/2017 against the average price paid.
Event Type Average Price
Asked Average Price
Paid Difference % Difference
Amateur £15.80 £16.37 -£0.58 -3.52% Big Band Orchestral £22.07 £20.24 £1.84 9.07% Concerts £21.03 £20.68 £0.36 1.72% Dance £26.83 £25.44 £1.40 5.49% Family Children £12.51 £11.29 £1.22 10.80% Musicals £39.33 £37.70 £1.62 4.30% Opera £34.62 £33.82 £0.80 2.37% Pantomime £18.55 £17.42 £1.14 6.52% Personality Concerts £25.46 £25.23 £0.23 0.90% Popular Comedy Drama £25.76 £24.84 £0.91 3.68% Quality Drama £24.96 £20.21 £4.75 23.48% Standup Comedy £20.82 £20.26 £0.56 2.75% Studio £9.50 £8.57 £0.93 10.84%
£0.00
£5.00
£10.00
£15.00
£20.00
£25.00
£30.00
£35.00
£40.00
Average Price Asked Against Average Price Paid by Event Type 2016/2017
Average Price Asked Average Price Paid

16
POTENTIAL VALUE AGAINST ACTUAL VALUE SOLD BY EVENT TYPE – 2016/2017 The following spreadsheet shows the potential value of tickets in each event type for 2016/2017 against the actual value sold.
Genre Potential
Value Actual Value Actual Value
as % Difference % Difference
Amateur £ 217,037.50 £ 114,253.35 53% £102,784 47%
Big Band Orchestral £ 88,858.00 £ 48,551.10 55% £40,307 45%
Concerts £ 393,454.50 £ 307,013.10 78% £86,441 22%
Dance £ 1,470,452.50 £ 975,679.00 66% £494,774 34%
Family Children £ 169,927.00 £ 98,675.00 58% £71,252 42%
Musicals £ 7,610,959.00 £ 6,430,241.75 84% £1,180,717 16%
Opera £ 451,666.50 £ 338,030.95 75% £113,636 25%
Pantomime £ 1,431,815.00 £ 1,087,670.50 76% £344,145 24%
Personality Concerts £ 565,171.00 £ 433,030.15 77% £132,141 23%
Popular Comedy Drama £ 283,062.00 £ 223,187.48 79% £59,875 21%
Quality Drama £ 1,602,581.50 £ 883,883.05 55% £718,698 45%
Standup Comedy £ 304,674.00 £ 282,681.45 93% £21,993 7%
Studio £ 9,660.00 £ 7,114.00 74% £2,546 26%
Grand Total inc averages £14,599,319 £11,230,011 71% £3,369,308 29% *The total monetary difference is made up of Total Unsold £1,945,983 (See page 18 - seat occupancy) and Total Concessions £908,686 (see page 41 - concessions) for more information.
£0
£1,000,000
£2,000,000
£3,000,000
£4,000,000
£5,000,000
£6,000,000
£7,000,000
£8,000,000
Potential Value Against Actual Value Sold by Event Type 2016/2017
Potential Value Actual Value

17
POTENTIAL OCCUPANCY AGAINST ACTUAL OCCUPANCY SOLD BY EVENT TYPE – 2016/2017 The following spreadsheet shows the potential occupancy of tickets in each event type for 2016/2017 against the actual number of tickets sold.
Event Type
Potential Occupancy
(100%) Actual Tickets
Sold Actual
Occupancy as % Difference % Difference Amateur 12,656 6,978 55% 5,678 45% Big Band Orchestral 3,867 2,399 62% 1,468 38% Concerts 17,979 14,848 83% 3,131 17% Dance 54,788 38,359 70% 16,429 30% Family Children 13,866 8,739 63% 5,127 37% Musicals 195,820 170,550 87% 25,270 13% NR Schools Project 1,290 821 64% 469 36% Opera 12,673 9,996 79% 2,677 21% Pantomime 73,530 62,442 85% 11,088 15% Personality Concerts 21,957 17,161 78% 4,796 22% Popular Comedy Drama 10,464 8,985 86% 1,479 14% Quality Drama 65,974 43,730 66% 22,244 34% Standup Comedy 14,352 13,954 97% 398 3% Studio 966 830 86% 136 14% Grand Total (inc Avgs) 500,182 399,792 76% 100,390 24%
020,00040,00060,00080,000
100,000120,000140,000160,000180,000200,000
Potential Occupancy vs Actual Tickets Sold by Event Type 2016/2017
Potential Occupancy (100%) Actual Tickets Sold

18
SEAT OCCUPANCY – comparison with 2015/2016
2015/2016
2015/2016 2016/2017
2016/2017 as % as %
Productions that played to more than 95% capacity 26 39% 39 43%
2015/2016
2015/2016 2016/2017
2016/2017 as % as %
Performances that played to more than 95% capacity 161 36% 206 50%
Performances that sold out 61 14% 90 22% The following table shows the value and quantity of unsold tickets in the past three years:
2014/2015 2015/2016 2016/2017 % change
compared to 2015/2016
Value of Unsold Tickets £2,565,621 £2,927,014 £1,945,983 -33.52%
Quantity of Unsold Tickets 127,622 124,385 80812 -35.03%

19
PRICE BAND ANALYSIS – three-year comparison
Price Band 2014/2015 2014/2015 % 2015/2016 2015/2016 % 2016/2017 2016/2017 % Tickets Sold A 185,242
82% 193,839
81% 183921
87% Average Price Paid
£24.58 £26.72 £31.52
Tickets Sold B 102,456 72%
103,183 68%
103847 77% Average
Price Paid £22.02 £24.35 £28.80
Tickets Sold C 43,002 62%
45,136 61%
45873 68% Average
Price Paid £20.26 £22.14 £26.91
Tickets Sold D 34,042 67%
36,009 67%
37314 74% Average
Price Paid £17.41 £19.31 £23.15
Tickets Sold E 22,323 89%
22,986 86%
21988 89% Average
Price Paid £6.12 £7.64 £7.71
A B C D E2014/2015 % 82% 72% 62% 67% 89%2015/2016 % 81% 68% 61% 67% 86%2016/2017 % 87% 77% 68% 74% 89%
0%
10%
20%
30%
40%
50%
60%
70%
80%
90%
100%
% of tickets Sold by Price Band in the last 3years

20
COMPARATIVE ANNUAL TICKET SALES – from 1983/1984 to present
Year No. of
Performances Tickets Sold % Occupancy Value Sold Average
Price Paid 1983/84 439 323,361 56% £1,096,096 £3.39 1984/85 460 323,152 54% £1,151,432 £3.56 1985/86 469 324,207 53% £1,107,981 £3.42 1986/87 473 295,683 49% £1,097,408 £3.71 1987/88 471 318,567 53% £1,565,507 £4.91 1988/89 502 295,171 46% £1,504,334 £5.10 1989/90 468 298,406 50% £1,896,450 £6.36 Average 1983/90
469 311,221 52% £1,324,601 £4.32
1990/93 Incomplete data 1993/94 430 357,436 64% £3,764,942 £10.53 1994/95 432 397,832 71% £4,130,708 £10.38 1995/96 413 346,886 64% £3,681,206 £10.61 1996/97 415 340,270 64% £3,694,744 £10.86 1997/98 412 349,700 65% £3,393,566 £9.70 1998/99 420 364,121 66% £3,846,476 £10.56 1999/00 422 322,576 60% £3,215,755 £9.97 2000/01 462 345,589 63% £3,978,751 £11.51 2001/02 430 338,373 67% £4,300,427 £12.71 2002/03 423 341,777 66% £4,373,295 £12.80 2003/04 423 343,454 67% £4,757,337 £13.85 2004/05 396 344,568 72% £4,982,157 £14.46 2005/06 423 363,648 71% £5,544,538 £15.25 2006/07 433 376,818 72% £6,393,306 £16.97 2007/08 195 165,584 78% £2,713,536 £16.39 2008/09 412 377,030 78% £8,212,576 £19.87 2009/10 426 370,470 71% £7,893,843 £17.65 2010/11 423 379,476 76% £7,105,082 £18.02 2011/12 444 391,483 75% £8,067,418 £17.56 2012/13 428 404,089 77% £9,432,284 £19.54 2013/14 433 415,403 76% £8,869,055 £18.04 2014/15 415 387,165 75% £8,419,262 £19.65 2015/16 445 401,153 73% £9,563,035 £20.03 2016/17 409 399,792 76% £11,230,011 £21.70
Average 1993/2017*
425 367,787 70% £5,800,898 £14.88
work *2007/2008 was not a full trading year being closed April 1 to November 13 due to the building modernisation work.

21
TARGET AND ACTUAL BOX OFFICE INCOME RETAINED BY THE THEATRE ROYAL BY EVENT TYPE – 2016/2017 This section looks at the target figures for each event type throughout the year and the amount that the theatre actually retained from those event types, once producers’ expenses and credit card charges have been paid. These figures do not include PRS payments or other internal adjustments. Event Type Target retention Actual retention
Amateur £39,594 £36,382 Big Band Orchestral £10,751 £11,026 Concerts £72,622 £73,239 Dance £218,086 £226,733 Family Children £22,981 £23,024 Musicals £837,098 £876,000 Opera £60,800 £59,132 Pantomime £518,774 £527,024 Personality Concerts £98,879 £97,297 Popular Comedy Drama £30,792 £33,478 Quality Drama £195,812 £159,671 Standup Comedy £66,983 £69,653
Grand Total £2,173,172 £2,192,659 The difference between the actual retention of £2,192,659 and the target retention of £2,173,172 is £19,488 (1%).

22
TICKET SALES BY GEO-POLITICAL DISTRICT
• Map overview of Ticket Sales
• Value of Tickets Sold Broken Down by Geo-Political District – three-year comparison
• Quantity of Tickets Sold Broken Down by Geo-Political District – three-year comparison
• Average Spend Per Transaction Broken Down by Geo-Political District – comparison with previous year
• Average Tickets Per Transaction Broken Down by Geo-Political District – comparison with previous
year

23
MAP OVERVIEW OF TICKET SALES 2016-2017 Ticket Sales per Postcode District – darker area indicates higher ticket sales

24
VALUE OF TICKETS SOLD BROKEN DOWN BY GEO-POLITICAL DISTRICT – Three-year comparison 2013/2014 2015/2016 2016/2017
Norwich £1,563,650 £1,609,995 £1,791,015 Broadland £1,698,843 £1,753,924 £2,128,281
South Norfolk £1,463,730 £1,578,508 £1,805,616 Breckland £867,578 £924,689 £1,081,160
North Norfolk £847,271 £791,468 £940,806
Great Yarmouth £502,047 £529,471 £645,526 West Norfolk £293,881 £338,550 £373,879
Other £1,632,056 £2,036,427 £2,350,746 Grand Total £8,869,056 £9,563,034 £11,117,029
Norwich 16%
Broadland 19%
South Norfolk 16% Breckland
10%
North Norfolk 9%
Great Yarmouth 6%
West Norfolk 3%
Other 21%
Value of Tickets sold to each Geo-Political District as a % of the total value sold in 2016/17

25
QUANTITY OF TICKETS SOLD BROKEN DOWN BY GEO-POLITICAL DISTRICT – three-year comparison 2013/2014 2015/2016 2016/2017
Norwich 83,657 78,074 74,922 Broadland 83,873 77,393 79,977
South Norfolk 69,710 67,285 67,303 Breckland 40,234 37,797 38,358
North Norfolk 34,241 32,675 32,990
Great Yarmouth 22,809 20,482 20,814 West Norfolk 12,913 12,380 11,400
Other 67,966 75,067 74,028 Grand Total 415,403 401,153 399,792
Norwich 19%
Broadland 20%
South Norfolk 17%
Breckland 10%
North Norfolk 8%
Great Yarmouth 5%
West Norfolk 3%
Other 18%
Quantity of Tickets sold to each Geo-Political District as a % of the total value sold in 2016/17

26
AVERAGE SPEND PER TRANSACTION BROKEN DOWN BY GEO-POLITICAL DISTRICT – comparison with previous year The spreadsheet below shows the average spend per transaction for each geo-political district for 2015/2016 and 2016/2017, broken down by event type. Average Spend Per Transaction Broken Down by Geo-Political District 2016/2017
Event Type Norwich Broadland South
Breckland North Gt West
Other Norfolk Norfolk Yarmouth Norfolk
Amateur £43.85 £42.22 £54.85 £52.87 £57.84 £49.24 £56.34 £40.17 Big Band Orchestral £36.61 £45.79 £45.93 £49.17 £45.78 £39.73 £52.33 £45.91 Concerts £43.66 £48.70 £49.02 £51.79 £52.71 £51.51 £52.18 £51.93 Dance £54.20 £59.09 £61.38 £63.00 £65.76 £64.44 £71.06 £75.80 Family Children £34.96 £44.30 £42.18 £43.82 £44.66 £43.84 £36.18 £38.22 Musicals £95.14 £96.01 £99.33 £101.56 £107.17 £103.81 £119.97 £114.64 Opera £67.14 £68.35 £71.74 £76.05 £89.51 £70.40 £108.88 £97.54 Pantomime £80.45 £85.44 £88.16 £88.79 £96.85 £86.11 £116.04 £109.23 Personality Concerts £49.90 £53.54 £57.41 £59.59 £57.48 £58.19 £73.01 £62.70 Popular Comedy Drama £60.74 £67.09 £67.93 £68.58 £82.24 £75.10 £78.48 £74.93 Quality Drama £40.41 £42.16 £44.12 £48.11 £47.36 £44.28 £60.11 £54.23 Standup Comedy £53.12 £49.88 £51.23 £50.88 £64.47 £52.01 £47.52 £47.89 Studio £15.31 £19.42 £24.27 £16.93 £19.74 £17.10 £27.00 £17.67
Avg. per geo- political district £51.96 £55.54 £58.27 £59.32 £63.97 £58.14 £69.16 £63.91
Average Spend Per Transaction Broken Down by Geo-Political District 2015/2016
Event Type Norwich Broadland South Norfolk Breckland North
Norfolk Gt
Yarmouth West
Norfolk Other
Amateur £36.30 £42.59 £41.93 £39.55 £50.93 £44.09 £42.08 £44.92
Big Band Orchestral £33.06 £36.27 £38.37 £35.00 £48.70 £42.06 £40.26 £41.16
Concerts £40.00 £45.20 £44.19 £51.87 £47.60 £46.31 £59.42 £60.76
Dance £53.08 £57.43 £59.53 £65.16 £64.20 £62.86 £68.98 £75.82
Family Children £43.19 £43.29 £48.43 £45.50 £45.66 £57.79 £54.97 £80.80
Musicals £75.78 £76.90 £79.51 £93.33 £99.23 £101.50 £130.22 £97.08
Opera £66.34 £57.77 £74.20 £67.00 £84.70 £69.26 £118.94 £154.30
Pantomime £77.98 £80.10 £78.30 £66.87 £89.69 £71.91 £88.97 £109.88
Personality Concerts £59.06 £68.74 £65.88 £67.21 £50.84 £54.01 £49.51 £76.40
Popular Comedy Drama £35.20 £35.27 £38.94 £41.49 £42.93 £45.77 £56.59 £50.39
Quality Drama £40.82 £38.37 £41.93 £46.17 £43.51 £45.21 £52.29 £73.54
Standup Comedy £50.84 £50.97 £51.21 £57.83 £48.19 £52.18 £62.00 £47.73
Studio £21.31 £17.07 £20.06 £9.19 £16.28 £21.11 £15.12 £15.75
Avg. per geo- political district £48.69 £50.00 £52.50 £52.78 £56.26 £55.00 £63.26 £71.43

27
AVERAGE TICKETS PER TRANSACTION BROKEN DOWN BY GEO-POLITICAL DISTRICT – comparison with previous year The spreadsheet below shows the average number of tickets bought per transaction for each geo-political district for 2015/2016 and 2016/2017, broken down by event type. Average Tickets Per Transaction Broken Down by Geo-Political District 2016/2017
Event Type Norwich Broadland South Norfolk Breckland North
Norfolk Gt
Yarmouth West
Norfolk Other
Amateur 2.85 2.74 3.41 3.04 3.20 2.80 3.00 2.33 Big Band Orchestral 1.95 2.15 2.12 2.28 2.13 2.03 2.27 2.08 Concerts 2.26 2.39 2.33 2.41 2.44 2.48 2.39 2.46 Dance 2.36 2.34 2.38 2.44 2.47 2.45 2.60 2.89 Family Children 3.19 4.18 3.59 3.95 3.86 3.92 2.79 3.20 Musicals 2.77 2.65 2.67 2.68 2.80 2.69 2.96 2.84 Opera 2.18 2.14 2.12 2.35 2.45 2.17 2.85 2.51 Pantomime 5.15 4.81 4.97 4.94 5.30 4.63 6.39 6.03 Personality Concerts 2.17 2.24 2.29 2.30 2.25 2.28 2.42 2.30 Popular Comedy Drama 2.77 2.76 2.74 2.70 3.21 2.95 2.95 2.84 Quality Drama 2.18 2.20 2.21 2.32 2.29 2.20 2.91 2.42 Standup Comedy 2.72 2.56 2.55 2.55 3.12 2.50 2.39 2.27 Studio 2.04 2.12 2.67 1.86 2.18 1.80 3.00 1.89 Avg. per geo - political district 2.66 2.72 2.77 2.76 2.90 2.69 2.99 2.77
Average Tickets Per Transaction Broken Down by Geo-Political District 2015/2016
Event Type Norwich Broadland South Norfolk Breckland North
Norfolk Gt Yarmouth West Norfolk Other
Amateur 2.64 2.88 2.77 2.50 3.18 4.06 3.48 2.67
Big Band Orchestral 1.75 1.79 2.02 2.04 2.07 2.10 1.00 2.20
Concerts 2.19 2.39 2.41 2.50 2.37 2.36 2.14 2.10
Dance 2.41 2.62 2.55 2.31 2.34 2.50 3.27 3.01
Family Children 3.31 3.14 3.57 3.04 3.66 3.41 4.47 5.49
Musicals 2.55 2.54 2.48 2.76 2.58 2.72 3.09 3.74
Opera 2.10 1.82 2.13 2.00 2.62 2.00 5.43 4.56
Pantomime 5.11 4.90 4.47 3.94 5.67 5.73 7.64 8.13
Personality Concerts 2.30 2.33 2.26 2.21 2.47 2.54 2.69 2.35
Popular Comedy Drama 2.26 2.23 2.32 2.47 2.15 2.28 2.57 2.37
Quality Drama 2.57 2.50 2.46 2.49 2.32 2.37 2.36 4.63
Standup Comedy 2.43 2.46 2.38 2.44 2.58 2.53 2.43 3.34
Studio 3.01 2.16 2.5 1.00 2.64 3.08 4.40 2.00
Avg. per geo -political district 2.66 2.60 2.64 2.44 2.82 2.90 3.46 3.58
28
FRIENDS OF THE THEATRE ROYAL
• Total Number of Friends – three-year comparison
• Categories of Memberships – three-year comparison
• Value of Memberships – three-year comparison
• Value of Ticket Sales to Friends – three-year comparison
• Quantity of Ticket Sales to Friends – three-year comparison
• Distribution of Friends Broken Down by Geo-Political District – three-year comparison
• Corporate Club Members – 2016/2017
• Value of Ticket Sales to Corporate Club Members – three-year comparison
• Quantity of Ticket Sales to Corporate Club Members – three-year comparison
29
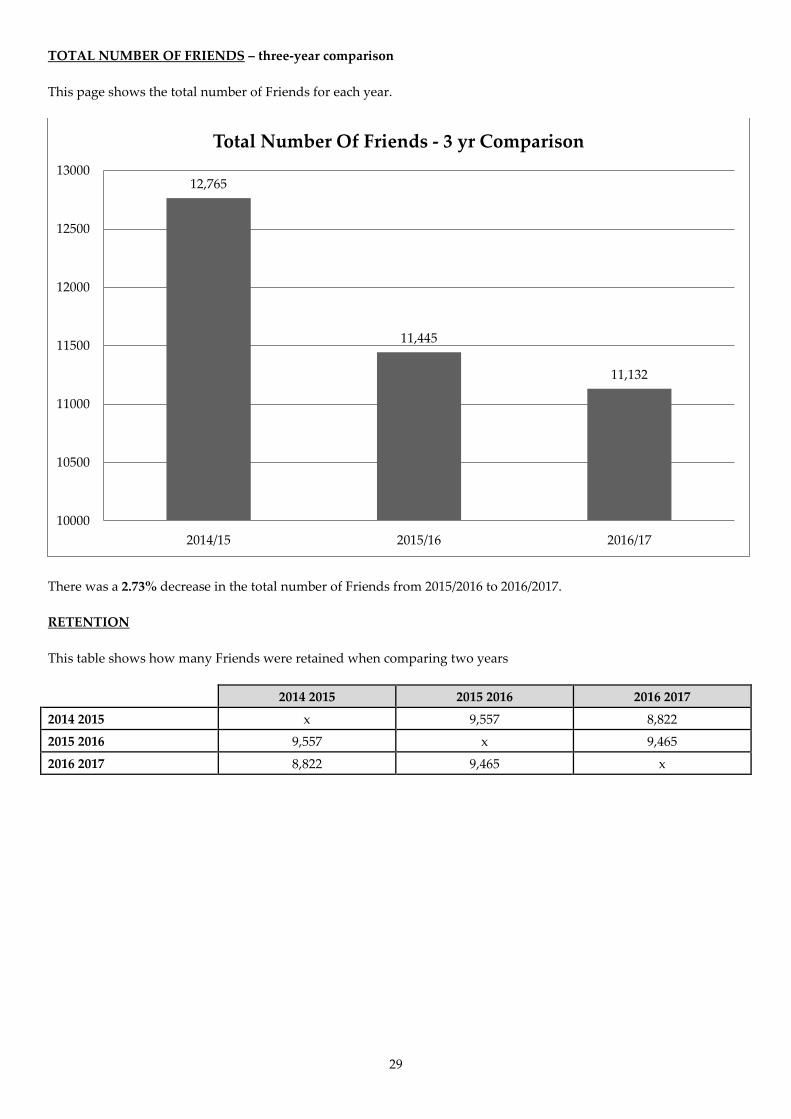
TOTAL NUMBER OF FRIENDS – three-year comparison This page shows the total number of Friends for each year.
There was a 2.73% decrease in the total number of Friends from 2015/2016 to 2016/2017. RETENTION This table shows how many Friends were retained when comparing two years
2014 2015 2015 2016 2016 2017
2014 2015 x 9,557 8,822 2015 2016 9,557 x 9,465 2016 2017 8,822 9,465 x
12,765
11,445
11,132
10000
10500
11000
11500
12000
12500
13000
2014/15 2015/16 2016/17
Total Number Of Friends - 3 yr Comparison

30
CATEGORIES OF MEMBERSHIPS – three-year comparison This page shows the different categories of Friends’ memberships available and the number of each type of Friend from 2014/2015 to 2016/2017.
Personal Gold Group Family Senior Student 2014/2015 3,127 70 10 217 9,170 81 2015/2016 2,829 62 10 225 8,228 101 2016/2017 2,735 71 10 225 8,007 84
0
1,000
2,000
3,000
4,000
5,000
6,000
7,000
8,000
9,000
10,000
Personal Gold Group Family Senior Student
Categories Of Membership - Three Year Comparison
2014/2015
2015/2016
2016/2017

31
VALUE OF MEMBERSHIPS – three-year comparison This page shows the value of each category of Friends’ membership, whether paid by direct debit or by cash, cheque or credit card.
Cash, Cheque, Credit Card Direct Debit
Personal Friend £33.50 £34.00
Gold Friend £150.00 £135.00
Group Friend £190.00 £180.00
Family Friend £46.00 £44.50
Senior Friend £18.50 £17.50
Student Friend £15.00 N/A 2014/2015 2015/2016 2016/2017
Personal Friend £103,559 £98,013 £94,823
Gold Friend £9,565 £8,700 £10,005
Group Friend £1,820 £1,880 £1,870
Family Friend £9,232 £10,143 £10,149
Senior Friend £141,853 £147,651 £143,657
Student Friend £1,013 £1,515 £1,260
Total £262,667 £267,041 £261,764
There was a 2.02% decrease in the value of Friends’ memberships from 2015/2016 to 2016/2017.

32
VALUE OF TICKET SALES TO FRIENDS – three-year comparison This section shows the value of tickets sold to Friends of the Theatre as a percentage of the total value of tickets sold each year from 2014/2015 to 2016/2017.
Total Value Friends Value Value %
2014/2015 £8,419,262 £2,427,458 29%
2015/2016 £9,563,034 £2,233,985 23%
2016/2017 £11,230,110 £2,083,559 19%
Dance 11%
Musicals 52%
Opera 6%
Popular Comedy Drama
1%
Amateur 1%
Pantomime 5%
Quality Drama 12%
Studio 0.04%
Standup Comedy 3%
Concerts 3%
Personality Concerts 5%
Big Band Orchestral 1%
Family Children 0%
Value Of Tickets sold to Friends By Event Type 2016/17

33
QUANTITY OF TICKET SALES TO FRIENDS – three-year comparison This section shows the quantity of tickets sold to Friends of the Theatre as a percentage of the total number of tickets sold each year from 2014/2015 to 2016/2017.
Total Quantity Friends Quantity Quantity % 2014/2015 387,165 110,974 29% 2015/2016 401,153 93,468 23% 2016/2017 399,792 75,106 19% Quantity of Tickets Sold to Friends by Event Type 2016/2017
Dance 11%
Musicals 41%
Opera 5%
Popular Comedy Drama
1%
Amateur 2%
Pantomime 8%
Quality Drama 18%
Studio 0.12%
Standup Comedy 3%
Concerts 4%
Personality Concerts 5%
Big Band Orchestral 1%
Family Children 1%
Quantity Of Tickets sold to Friends By Event Type 2016/17

34
DISTRIBUTION OF FRIENDS BROKEN DOWN BY GEO-POLITICAL DISTRICT – 2016/2017
Norwich Broadland South
Norfolk Breckland
North Norfolk
Gt Yarmouth
West Norfolk
Other Total
No. of Friends 1,705 2,543 2,302 1,231 1,214 572 283 1,285 11,135
Breckland 11%
Broadland 23%
Great Yarmouth 5%
King's Lynn and West Norfolk
3% North Norfolk
11%
Norwich 15%
Other 11%
South Norfolk 21%
Distribution of Friends by Geo-Political District 2016/17

35
CORPORATE CLUB MEMBERS – 2016/2017 There were 51 Corporate Club members at 01/04/2017
Admin RE Larking Gowen Adnams Southwold Leathes Prior Solicitors Alan Boswell Group Loveday and Partners Almary Green Investments Ltd Lovewell Blake Anglian Group PLC M&A Partners Archant Marsh Arnolds Keys Mayday Integrated Office Systems Barclays Mills and Reeve Birketts LLP Norfolk Country Cottages Broadland Business Park Norse Commercial Services City College Norwich North Norfolk Theatre Goers Computer Service Centre Norwich Print Solutions Ltd Contract Personnel Ltd NPS Property Consultants Copy IT Digital Solutions Ltd Nuffied Health Dipple & Conway NW Brown Group Ltd Elizabeths the Florist Persimmon Homes Grant Thornton PricewaterhouseCoopers Hatch Brenner LLP RG Carter Holdings Ltd Howes Percival LLP Rogers and Norton Solicitors Hugh J Boswell (ACB) Savills (UK) Ltd InTouch Systems Sinclair International Ltd Intu Chapelfield Smith & Pinching Jarrolds Steeles Law Solicitors Ltd Kettle Foods The Forum Trust Knowlden Titlow Insurance Brokers Virgin Money Lambda Films

38
VALUE OF CORPORATE CLUB MEMBERSHIPS Joining the Theatre Royal Corporate Club costs £800 +VAT per year Business Benefits
• Exclusive networking opportunities • Exclusive editorial in ShowBiz e-magazine • Regular invitations to Theatre Royal guest evenings with the opportunity to meet
Chief Executive, Trustees and other Corporate Managers • Free use of function rooms for entertaining, with catering • Discounted meeting rooms for staff, staff training, seminars etc • One stop personal contact with the Corporate Club Manager for all group bookings
and corporate hospitality • A personal host to welcome guests and assist throughout your function • Free Theatre Royal programmes for each pair of seats booked for a function with
catering Staff Benefits
• A discount of £2 per ticket on up to 40 tickets for every production (excluding the lowest Price) and for each week of the pantomime.
• Half price tickets on the first nights of dramas (excludes cheapest rate and special prices)
• 15% discount on all post show drinks in the Theatre's Bars, just show your ticket • A Corporate Club direct dial identification telephone number. This is not a hotline
number but will allow callers to be identified as Corporate members • Meal/ticket packages exclusive to Corporate members • For parties of 20+ 10% discount on every ticket to every performance including
Fridays and Saturdays PLUS new group rates on marked performances • A day's priority booking ahead of the Friends of the Theatre and priority booking
ahead of the public for the best seats in the Theatre Royal, PLUS advance notice of each season
Please contact Jess Cook, Development Officer for more details (01603) 598525
2016/2017
Total Income
£43,600

39
VALUE AND QUANTITY OF TICKET SALES TO CORPORATE CLUB MEMBERS – three-year comparison Total Value Corporate Club Value Value %
2014/2015 £8,419,262 £319,459 3.8% 2015/2016 £9,563,034 £290,815 3.0% 2016/2017 £11,230,011 £378,040 3.4% Total Quantity Corporate Club Quantity Quantity % 2014/2015 387,165 12,238 3.2% 2015/2016 402,153 12,723 3.2% 2016/2017 399,792 12,972 3.2%

40
CONCESSIONS
“Value” (i.e. the amount we gave away) and Quantity of Individual Concession Categories – three-year comparison

41
“VALUE” AND QUANTITY OF INDIVIDUAL CONCESSION CATEGORIES – three-year comparison This section shows the “value” and quantity of the concessions given to each category as a comparison of the past three years. Concession Summary 2016/2017 Concession Description Quantity If Full Price Paid Actual Price Paid Value of Discount
Comps/Special Discounts 9,360 £208,658 £97,064 £111,593 Corporate Club 12,946 £433,904 £377,451 £56,453
Disabled 8,074 £260,088 £132,342 £127,746
Friends 81,063 £2,620,647 £2,368,082 £252,565 Groups 10,451 £276,541 £204,527 £72,014
Miscellaneous 2,604 £58,601 £42,580 £16,021 Over 60's 28,261 £992,604 £806,874 £185,730
Young People 12,580 £293,521 £206,955 £86,566 Total "Value" of Concessions 165,339 £5,144,562 £4,235,876 £908,686 Concession Summary 2015/2016 Concession Description Quantity If Full Price Paid Actual Price Paid Value of Discount Comps/Special Discounts 9,476 £197,977 £81,457 £116,521 Corporate Club 11,326 £330,182 £286,376 £43,807
Disabled 7,526 £213,790 £109,117 £104,673 Friends 72,024 £2,071,622 £1,818,257 £253,365
Groups 10,640 £219,719 £158,768 £60,951
Miscellaneous 6,102 £143,019 £98,583 £44,437 Over 60's 36,543 £1,156,453 £909,632 £246,822
Young People 27,070 £606,309 £374,964 £231,345 Total "Value" of Concessions 180,707 £4,939,074 £3,837,154 £1,101,918 Concession Summary 2014/2015 Concession Description Quantity If Full Price Paid Actual Price Paid Value of Discount Comps/Special Discounts 4,522 £114,244 £2,183 £112,061 Corporate Club 11,939 £313,240 £269,215 £44,025
Disabled 7,066 £183,892 £93,632 £90,259 Friends 81,289 £2,239,707 £1,980,456 £259,250
Groups 9,587 £208,305 £157,171 £51,134
Miscellaneous 6,023 £133,646 £99,222 £34,424 Over 60's 36,142 £1,099,986 £835,446 £264,540
Young People 26,253 £507,597 £324,965 £182,632 Total "Value" of Concessions 182,821 £4,800,616 £3,762,290 £1,038,325

42
“VALUE” AND QUANTITY OF INDIVIDUAL CONCESSION CATEGORIES – three-year comparison cont.
Year Comps/ Special
Corporate Club
People with disabilities Friends Groups Misc. Over 60s
Young People
2014/15 £112,061 £44,024 £90,259 £259,250 £51,134 £34,423 £264,539 £182,632 2015/16 £116,521 £43,807 £104,672 £253,366 £60,951 £44,437 £246,821 £231,345 2016/17 £111,103 £56,453 £127,746 £252,565 £72,014 £16,100 £185,730 £83,673
£0
£50,000
£100,000
£150,000
£200,000
£250,000
£300,000
Comps/Special
CorporateClub
People withdisabilities
Friends Groups Misc. Over 60s YoungPeople
Value of Concessions - 3yr Comparison 2014/15 2015/16 2016/17
43
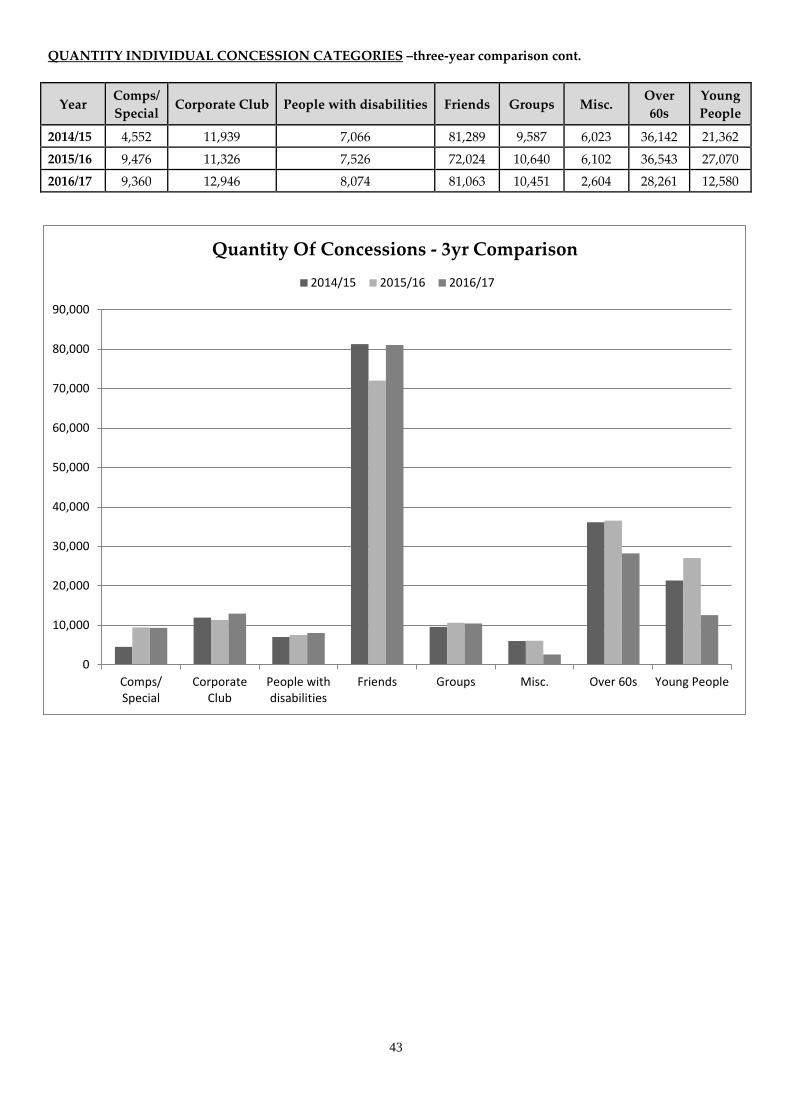
QUANTITY INDIVIDUAL CONCESSION CATEGORIES –three-year comparison cont.
Year Comps/ Special
Corporate Club People with disabilities Friends Groups Misc. Over 60s
Young People
2014/15 4,552 11,939 7,066 81,289 9,587 6,023 36,142 21,362 2015/16 9,476 11,326 7,526 72,024 10,640 6,102 36,543 27,070 2016/17 9,360 12,946 8,074 81,063 10,451 2,604 28,261 12,580
0
10,000
20,000
30,000
40,000
50,000
60,000
70,000
80,000
90,000
Comps/Special
CorporateClub
People withdisabilities
Friends Groups Misc. Over 60s Young People
Quantity Of Concessions - 3yr Comparison 2014/15 2015/16 2016/17

44
This page is intentionally blank

45
CHARITABLE COLLECTIONS – 2016/2017 Throughout 201/2017 various collections were made on behalf of other charities. The dates and amounts below give details.
Dates Show Charity Amount
01 April 2016 Hairspray The Samaritans £ 425.00
30 May 2016 to 04 June 2016 The Bodyguard Norwich Food Bank £ 1,210.77 24-Sep-16 Dr Hook Teenage Cancer Trust £ 518.47
26 Oct 2016 to 29 Oct 2016 NB Beauty and The Beast Acting for others £ 467.19 07 Nov 2016 to 12 Nov 2016 A Room with a View Age UK Norfolk £ 1,119.35 28 Nov 2016 to 03 Dec 2016 The Commitments Benjamin Foundation £ 1,198.98
12-Dec-16 Dress Jack and Beanstalk Addenbrookes £ 1,150.85 13 Feb 2017 to 18 Feb 2017 Thriller Live BEAT £ 307.67
Total £ 6,398.28
CHARITABLE COLLECTIONS in Aid of Norwich Theatre Royal – 2016/2017
Dates Show Charity Amount
03 May 2016 to 07 May 2016 Guys and Dolls Assisted performances £ 3,635.52
12/05/16 and 16/10/2016 May Contain Nuts &
Hobsons Choice Stage Two £ 7,750.27
18 Oct 2016 to 22 Oct 2016 The Sound of Music Assisted performances £ 654.64 13 Dec 2016 to 15 Jan 2017 Jack and the Beanstalk Stage Two £ 10,422.87
Total £ 14,713.03
46
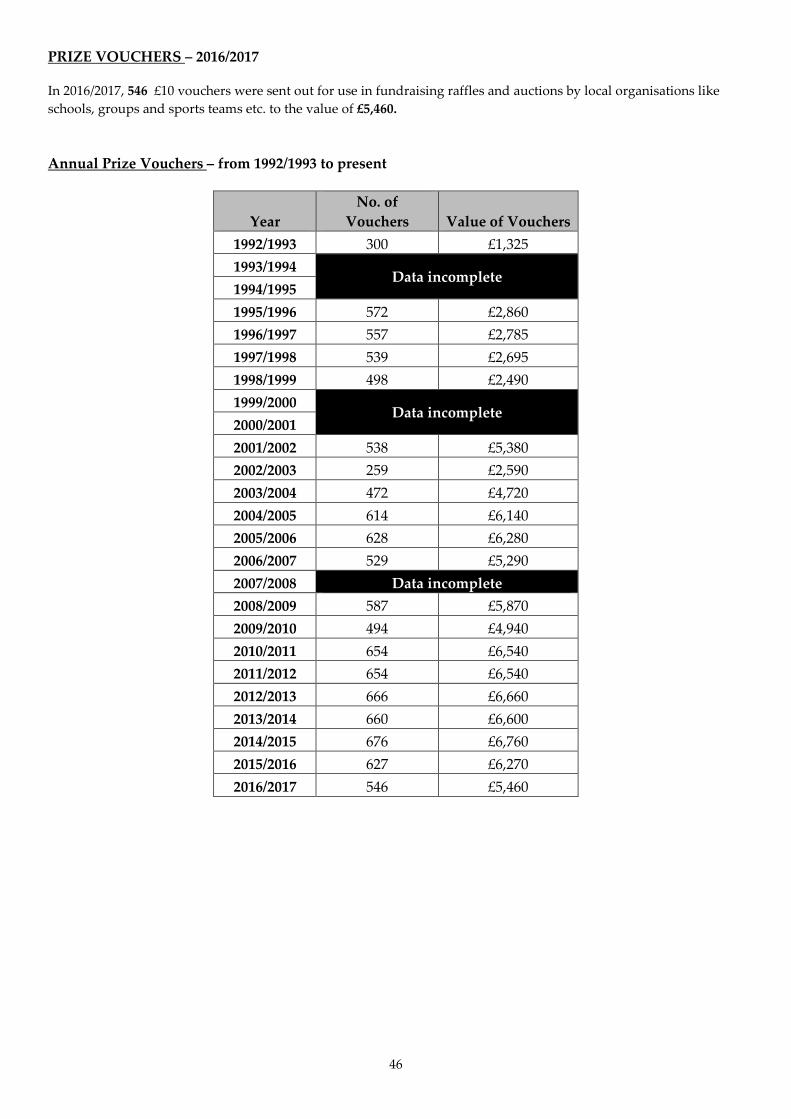
PRIZE VOUCHERS – 2016/2017 In 2016/2017, 546 £10 vouchers were sent out for use in fundraising raffles and auctions by local organisations like schools, groups and sports teams etc. to the value of £5,460. Annual Prize Vouchers – from 1992/1993 to present
Year No. of
Vouchers Value of Vouchers 1992/1993 300 £1,325 1993/1994
Data incomplete 1994/1995 1995/1996 572 £2,860 1996/1997 557 £2,785 1997/1998 539 £2,695 1998/1999 498 £2,490 1999/2000
Data incomplete 2000/2001 2001/2002 538 £5,380 2002/2003 259 £2,590 2003/2004 472 £4,720 2004/2005 614 £6,140 2005/2006 628 £6,280 2006/2007 529 £5,290 2007/2008 Data incomplete 2008/2009 587 £5,870 2009/2010 494 £4,940 2010/2011 654 £6,540 2011/2012 654 £6,540 2012/2013 666 £6,660 2013/2014 660 £6,600 2014/2015 676 £6,760 2015/2016 627 £6,270 2016/2017 546 £5,460

47
THEATRE ROYAL INCOME AND EXPENDITURE
• Theatre Royal Net Income – three-year comparison
• Theatre Royal Expenditure – three-year comparison
• Payments to Local Suppliers – 2016/2017
• Touring Theatre Survey – 2016/2017
• Overall Economic Impact – 2016/2017

48
THEATRE ROYAL INCOME AND EXPENDITURE – three-year comparison 2014/2015 2015/2016 2016/2017
Income Source Value Percentage Value Percentage Value Percentage Arts Course -£69,028 -3% -£69,765 -2.3% £0 0.0% Bars £174,641 7% £217,742 7.0% £412,686 11.7% Box Office £1,875,961 70% £2,181,132 70.5% £2,380,889 67.3% Business Support £38,947 1% £36,680 1.2% £39,709 1.1% Catering £11,277 0% £18,257 0.6% £22,087 0.6% Confectionery £35,781 1% £42,019 1.4% £36,842 1.0% Friends £160,816 6% £167,384 5.4% £150,391 4.3% Grants £23,680 1% £12,500 0.4% £2,394 0.1% Ices £133,430 5% £150,899 4.9% £170,970 4.8% Bank Interest £18,267 1% £19,133 0.6% £9,946 0.3% Merchandising £12,551 0% £18,314 0.6% £9,310 0.3% Other £185,885 7% £236,046 7.6% £226,892 6.4% Programmes £73,610 3% £57,234 1.8% £68,911 1.9% Scenery & Wardrobe £6,115 0% £7,775 0.3% £6,463 0.2% Total £2,681,933 100% £3,095,349 100% £3,537,491 100%
Annual Surplus(Deficit)
£31,846
£419,124
£572,072
2014/2015 2015/2016 2016/2017
Expenditure Source Value Percentage Value Percentage Value Percentage Education/L&P* £136,476 5% £129,645 4.8% £273,746 9.2% Depreciation £125,377 5% £132,142 4.9% £139,411 4.7% Establishment £191,538 7% £188,099 7.0% £209,896 7.1% Marketing £312,734 12% £247,901 9.3% £249,788 8.4% Premises £361,196 14% £366,007 13.7% £353,525 11.9% Staff £1,516,408 57% £1,617,586 60.4% £1,698,370 57.3% Supplies -£10,609 0% -£5,910 -0.2% £15,682 0.5% Exceptional Expenditure £16,967 1% £754 0.0% £25,000 0.8% Total £2,650,087 100% £2,676,225 100% £2,965,418 100%
*NB. In previous years TAC & Education that were shown separately, are now included in L&P

49
BREAKDOWN OF INCOME AND EXPENDITURE – 2014 to 2017
NB. In previous years TAC & Education that were shown separately are now included in L&P
-£50,000
£450,000
£950,000
£1,450,000
£1,950,000
£2,450,000
£2,950,000
Theatre Royal Income 2014 - 2017
2014/2015 2015/2016 2016/2017
-£100,000£100,000£300,000£500,000£700,000£900,000
£1,100,000£1,300,000£1,500,000£1,700,000£1,900,000
Theatre Royal Expenditure 2014 - 2017
2014/2015 2015/2016 2016/2017

50
PAYMENTS TO LOCAL SUPPLIERS – 2016/2017 Payments have been made to these local suppliers: A C Leigh Ltd Factory 1st (East) Ltd Norwich Traffic Control A P C Pest Control Falcon Publications Norwich Waste Disposal A W CUSHION Feast Norfolk NPSS Security Services ABC Taxis Fine Hart Window Cleaning Number 15 Accent Fresh First Edition Oak Street Fabrications Adcock Refrigeration Ltd Freshpac Teas & Coffees Ltd Off The Wall Imaging Ltd Adnams plc Future Projects Off The Wall Outdoor Adrian Lever G L Lifts Office Water Supplies AEM International Giller Pianos OnePress Publising AID Sign & Graphics Gleniston Facilities Ltd Open Youth Trust Allies Computing Ltd Global Assett Management Ptners Ltd Outline Magazine Ancient House Printing Group Gnaw Chocolate Ltd P J Roofe AndAction Projects Golden Guide P&V Plant Ltd Anglia Culinary Suppliers Ltd Graham Corney Peaker Pattinson Ltd Anglia Fire Assessments Grain Brewery Pepperell's Meats Ltd Anglia Shopfitting Ltd Green Jack Brewing Co Ltd Perfect Pie Anglian Chemicals Ltd H2Creative Media Ltd Pilgrim Foodservice Ltd Ann Bryson Hannah-Rose Wiltshire Porselli Anna Lawrence M.A Hatch Brenner Power Lift UK Apple Interiors Hedley & Ellis Precision Marketing Group Ltd Archant Community Media Hollinger Print Prelude Records Archway Cards Howes Percival LLP Production Bureau Ltd Arts Marketing Association Hunstanton Newsletter Prospect Handling Ltd Arts Round Up Hussey Knights Ltd Pulsar Light Asbestos Survey Solutions Ltd Ian N Gray Pye Baker of Norwich ATHE Ltd Iceni Lifts Ltd Quentor ltd Audiotree Ida-Belle Catering Ltd R G Carter Awesome Sandwich Ideas Centre Group Rainbow International Baileys of Norwich Inn-Training Rainbow Whole Foods Baker & Nixon Intouch Systems Read Brothers Ltd Barton & Co J K Brock Real Consulting Bastard Prompt Jarretts Transport Ltd Redwell Brewery BBC Fire Protection Ltd Jarrold Training Reform Flooring BD & H Ltd Jeanette Durrant Roadrunner Express Couriers Ltd Best4Promotions Jenny Higgins Roberta Hammond Bishy B Industries Ltd Jim Lawrance Roche Chartered Surveyors Blackwell Print JML Refrigeration Ronaldo Ices Ltd Blockbuster Drain Service JMS Group Ltd S J Easter Upholstery BOLD Directories Ltd Joe Durant Savoy Catering Supplies Booker Ltd Julian Claxton Photography Scenic Pantomines Ltd Boudicca Brewing Co. Just Regional Publishing Scenic Projects Broadland Heating & Plumbing Karen Smith Shield Health & Safety Bullards (independant Gin Co Ltd) Katie Keates Shortts Farm Brewery Bullards Craft Beers KL Publications Ltd Shred Station Buy Local Kofra Ltd Signs Express Ltd C Ledbury Plumbing & Heating Lacons Simon Finlay Calvors Brewery Larking Gowen Simon Floyd Camplings Ltd Lauren Davies Sonata Security Camtrak Ltd Lee Chapman Sound Wave Marketing Cat Chapman Leonards Ltd South East Coffee Company CEG Productions Lorna Fay Shipley South Side Guide Cellair Ltd M G N Label Company Spectrum Hygiene Ltd Central School of Dancing Makro Ltd Sprowston Village Directory Chameleon Cleaning Martin Field workshop St Giles House
51
Chapel Doors ltd Martin Land Sewing Machine Co St Peters Brewery Charles Caine Media Managers Ltd Steve Adams Photographer Cheese Truckle Millar West & Co Stevensons of Norwich City Saw & Knife Services Mills & Reeve Style Seating Clark & Ravenscroft Momentum Norfolk Summit Supplies Coach House Monarch Signs Suzanne Biesty Colour Print Morvend Ltd Swallowtail Print Community News Mountain Bakery TGH Commercial Ltd Cooks Blinds & Shutters Ltd MRL Systems Ltd The Connection Magazine Copper Crayon Mukunda Raj Shrestha The Garage Countrywide Publications Multi Maintenance Services The Norfolk Brewhouse CQ Cleaning Ltd Musicology The Photographic Unit Creative Arts East NEG Services The Shift Norwich Criterion Ices Ltd Nemco Utilities Thorns & Co Crown Confectionery Nethergate Wines Thorpe Industrial Cleaners D D Health & Safety Supplies Ltd New Atlantic Country Superstore Tipples Brewery D J Harvey News Direct (Norfolk) Today Magazines Ltd Daniel Burgess Nic Jackman Tony Cooper Arts Management David Burrows Norfolk and Suffolk Tourist Attractions Uniquely Magazines Dee Crafter Norfolk Community Foundation Unit Mate Ltd Direct Access Supplies Ltd Norfolk County Council Useful Print Co Dispatch Magazine Norfolk Drain Services ltd Vanilla Dozen Artisan Bakery Ltd Norfolk Safety CIC Viewing Online Ltd Dunham Cash Registers Ltd Norfolk Sloe Company Viking Stage Lighting East Anglian Stars Norfolk Tourist Attractions Assoc Village People East Coast Radio Ltd Norse Commercial Services Ltd VisitNorwich Ltd Eastern Business Systems Ltd Norwich 99.9 Voluntary Norfolk Eastern Cash Register (Norwich) Ltd Norwich Cathedral Enterprises Ltd Waveney Security Ltd Eastern Voice & Date Hosted Norwich City College Wensum Print Easters Norwich City Council Wightman Fishing Co Ltd T/A LG Roberts ECO Colour Print Norwich City Football Club Wilkinsons of Norwich ECS Power & Control Ltd Norwich Electrical Company Winters Brewing Company Ltd Elizabeths Norwich Glass Com ltd Wolf Brewery Elmtree Beers Norwich Instrument Services Ltd Woodford Norfolk Ales Emotive Sound & Light Ltd Norwich Pest Control Ltd Wroxham and Coltishall Book Employmentor Norwich Screen Art Wroxham Exteriors Express Pest Control Norwich Security Specialists Ltd
Facit Testing Norwich Sunblinds
Total Payments £4,150,628,85 (This also includes payments from The Playhouse)

52
TOURING THEATRE SURVEY 2016/2017 Each year Norwich Theatre Royal compares a series of performance indicators with 14 other theatres of its size and type elsewhere in the UK. We use these figures as a benchmark to assess our performance. Below are the average indicators for the rest of the group, set against the Theatre Royal’s own figures, and the difference between the two sets of figures. Average Norwich Theatre Royal Difference*
Average Capacity 1,186 1,300 114 Number Of Live Performances 413 409 -4 Annual Capacity 466,878 500,182 33,304
Seats Sold 293,899 399,792 105,893 % Capacity Filled 64% 76% 12% Net Box Office £7,697,508 £11,230,011 3,532,503
Average Ticket Price paid £23.45 £21.70 -1.75 Seats Sold Online £157,625.63 £187,314 29,688 % Seats Sold Online 54% 47% -7%
Payments to Companies £5,661,377 £8,562,866 £2,901,489 Retention as % Of Income 31% 24% -7% Programme Profit £50,556 £68,910 £18,354 Prog Profit Per Admission £0.15 £0.17 £0 Merchandise Profit £31,791 £9,310 -£22,481
Catering Profit £257,951 £252,311 -£5,640 Confectionery & Ices £181,155 £207,811 £26,656 Total Ancillary Profit £502,183 £538,342 £36,159
Ancillary Profit Per Admission £1.37 £1.35 -£0.02 Salaries & Wages Costs £2,306,882 £2,988,918 £682,036
Full Time Equivalent Posts 90 118 28 Staff Training £18,902 £10,053 -£8,849 Marketing Expenditure £487,795 £471,292 -£16,503
Marketing Spend Per Seat Sold £1.52 £1.18 -£0.34 Friends Membership Numbers 2655.2 11,135 8480
Friends Membership Income £70,337 £261,764 £191,427 Business Rates £29,982 £35,667 £5,685
Maintenance Costs £188,502 £134,673 -£53,829 Capital Finance Charges £29,941 £0 -£29,941 Capital Expenditure £301,617 £2,279,038 £1,977,421
Sponsorship Income £43,408 £53,739 £10,331 Corporate Membership Income £36,124 £43,600 £7,476 Grants £28,791 £186,000 £157,209
Local Authority Support £323,717 £45,000 -£278,717 LA support per seat sold £1.10 £0.11 -£0.99
*Some venues have supplied figures relating to two theatres or concert halls and have not been able to break out the figures for one theatre space.

53
OVERALL ECONOMIC IMPACT – 2016/2017 The Theatre Royal contributes to the value of the local economy in two ways: direct and indirect. Its direct impact is made up of its own spending locally: for example, the amount spent on purchasing supplies locally, or the amount spent on resident staff wages which is then spent on housing, food, clothes etc. locally. The indirect impact takes into account the ‘knock-on’ effect which is generated by the direct impact, where money spent results in more money being spent: for example, the purchase of supplies from a local company results in that company spending on their staff wages, other supplies they purchase etc. All that expenditure builds up in the local economy, helping to preserve and create jobs, and grow the economy. The following formula is used by the Arts Councils of England, Wales & Northern Ireland, and Creative Scotland to calculate a theatre’s economic impact and was used in the first UK-wide study of the economic impact of theatres, finding that this impact in 2002/03 exceeded £2.6 billion. The formula used to calculate economic impact is: Economic impact = [1. Turnover + 2. Overseas earnings + 3. Additional visitor spend + 4. Salaries + 5. Subsistence allowances + 6. Supplies purchased locally] x 1.5 (to take into account the knock-on effect in the local economy) 1. For 2016/17, the Theatre Royal’s turnover was £16,874,313 2. There were no overseas earnings in the year. 3. Additional visitor spend is the money spent by people attending the theatre to see a performance, over and above any money spent on tickets or in the theatre itself, and covers travel, accommodation (if visiting the area specifically to go to the theatre), domestic costs (e.g. babysitter) and any food and drink purchased outside the home. For 2016/17, the amounts were as follows: Travel £599,688 Accommodation £147,923 Domestic costs £107,944 Food & drink £2,302,802 Sub-total £3,158,357 4. £1,698,370 was spent on locally resident staff wages during the year. 5. Subsistence allowances are paid to all performers and support staff, visiting the Theatre Royal with each production, to cover the cost of travel, accommodation, food and other living expenses. In the year 2016/17, over 1,800 performers and support staff visited the theatre, making up over 10,000 overnight stays. At a very conservative estimate of only £27 per head per overnight stay, this represents £273,375 of expenditure. 6. Supplies purchased locally totalled £4,150,628 So the total impact of Norwich Theatre Royal on the local economy for 2016/17 was £39,232,564, an increase of 16% on the previous year (£33,848,185)