annual transactions of the nordic … transactions of the nordic rheology society, vol. 23, 2015...
TRANSCRIPT

ANNUAL TRANSACTIONS OF THE NORDIC RHEOLOGY SOCIETY, VOL. 23, 2015
ABSTRACT
In the oil industry the ISO 10416/ISO
10414-2 standards, which are used for
determination of rheological properties of
oil-based drilling fluids, do not in detail
specify how the fluids should be pretreated
before measurements. In this study, a
systematic approach is used to quantify the
influence of waiting time and/or pre-
shearing on measurements of viscosity and
other rheological properties of an oil-based
drilling fluid.
INTRODUCTION
Oil-based drilling fluids (OBDFs) are
thixotropic fluids, meaning that their
properties may change with time. One also
knows that the fluid properties of OBDFs
are highly dependent on shear history. As a
result of this, it is important to have a
consistent procedure for how to treat the
fluids prior to measurements. This is vital in
order to be able to compare experimentally
determined flow properties, not only in this
project but also to enable comparison of
results between labs.
Fluids involved in oil-industry drilling
operations range from sea water and drilling
fluids to well cements. Well cements are
chemically reactive, with a pump ability
time that has to be adjusted to the practical
pumping operation. Therefore, in order to
evaluate viscous properties of the well
cement slurries strict preconditioning
procedures exist to simulate the shear
history of a cement prior to entering the
annulus. These procedures include how to
mix the cements slurry followed by a
detailed procedure on how to measure the
viscosity. These procedures can be found in
publications by Guillot1 and by Dargaud and
Boukhelifa2 or in API Recommended
Practices3.
For the drilling fluid industry, a similar
degree of detailed procedures does not exist
for determination of the fluid viscosity
values. The ISO 10414-2/ API 13B-24 and
ISO 10416/API 13I5 standards are used for
determination of viscosity and gel strength
of drilling fluids by use of direct-indicating
viscometers (Fann 35 viscometers).
However, the drilling fluid standards do not
in detail specify how the fluids should be
pretreated before measurements. Often the
pretreatment only consists of simply
shearing the sample for a specific time at
1022 s-1
, as performed by for example
Maxey et al.6 who sheared the sample for
Establishing an Experimental Preconditioning Procedure for Rheological
Characterization of Oil-Based Drilling Fluids
Dias Assembayev1, Velaug Myrseth
2, Benjamin Werner
1, Knud Richard Gyland
3, Arild
Saasen4,5
, Zalpato Ibragimova6, Jan David Ytrehus
2
1Norwegian University of Science and Technology, Trondheim, Norway
2SINTEF Petroleum Research, Bergen and Trondheim, Norway 3Schlumberger Norge AS, M-I SWACO, Stavanger, Norway
4Det Norske, Oslo, Norway
5University of Stavanger, Stavanger, Norway
6Statoil, Bergen, Norway
Simultaneous In-situ Analysis of Instabilities and First Normal StressDifference during Polymer Melt Extrusion Flows
Roland Kádár1,2, Ingo F. C. Naue2 and Manfred Wilhelm2
1 Chalmers University of Technology, 41258 Gothenburg, Sweden2 Karlsruhe Institute of Technology - KIT, 76128 Karlsruhe, Germany
ANNUAL TRANSACTIONS OF THE NORDIC RHEOLOGY SOCIETY, VOL. 24, 2016
ABSTRACTA high sensitivity system for capillaryrheometry capable of simultaneously de-tecting the onset and propagation of insta-bilities and the first normal stress differ-ence during polymer melt extrusion flowsis here presented. The main goals of thestudy are to analyse the nonlinear dynam-ics of extrusion instabilities and to deter-mine the first normal stress difference inthe presence of an induced streamline cur-vature via the so-called ’hole effect’. Anoverview of the system, general analysisprinciples, preliminary results and overallframework are herein discussed.
INTRODUCTIONCapillary rheometry is the preferredrheological characterisation method forpressure-driven processing applications,e.g. extrusion, injection moulding. Themain reason is that capillary rheometry isthe only method of probing material rheo-logical properties in processing-like condi-tions, i.e. high shear rate, nonlinear vis-coelastic regime, albeit in a controlledenvironment and using a comparativelysmall amount of material.1 Thus, it isof paramount importance to develop newtechniques to enhance capillary rheome-ters for a more comprehensive probing ofmaterial properties. Extrusion alone ac-counts for the processing of approximately35% of the worldwide production of plas-tics, currently 280⇥ 106 tons (Plastics Eu-rope, 2014). This makes it the most im-portant single polymer processing opera-
tion for the industry and can be found ina variety of forms in many manufacturingoperations. Extrusion throughput is lim-ited by the onset of instabilities, i.e. prod-uct defects. Comprehensive reviews on thesubject of polymer melt extrusion insta-bilities can be found elsewhere.4,6 A re-cent method proposed for the detectionand analysis of these instabilities is that ofa high sensitivity in-situ mechanical pres-sure instability detection system for cap-illary rheometry.8,10 The system consistsof high sensitivity piezoelectric transducersplaced along the extrusion slit die. In thisway all instability types detectable, thusopening new means of scientific inquiry. Asa result, new insights into the nonlinear dy-namics of the flow have been provided.9,14
Moreover, the possibility of investigatingthe reconstructed nonlinear dynamics wasconsidered, whereby a reconstructed phasespace is an embedding of the original phasespace.2,14 It was shown that a positive Lya-punov exponent was detected for the pri-mary and secondary instabilities in lin-ear and linear low density polyethylenes,LDPE and LLDPE,.14 Furthermore, it wasdetermined that Lyapunov exponents aresensitive to the changes in flow regime andbehave qualitatively different for the iden-tified transition sequences.14 It was alsoshown that it is possible to transfer thehigh sensitivity instability detection sys-tem to lab-sized extruders for inline ad-vanced processing control and quality con-trol systems.13
A very recent possibility considered
223

two minutes at their measurement temperature. Further, if one wants to compare results from Fann 35 viscometers to measurements done on a rheometer, it is even more important to have a consistent pretreatment of the fluids. The questions one seeks to answer in the present study are: i) how large is the effect of preshearing/no preshearing/rest?; ii) is preshearing or rest the most preferable in order to get reproducible results? These questions are likely to become even more important if other rheological properties than viscosity are evaluated.
Bui et al.7 presented a study concerning rheological properties of oil-based drilling fluids. The preparation procedures are not thoroughly described in the article. However, in another work Bui8 presented this preparation in some more detail. In summary his procedure was to blend the drilling fluid portion, shear it at 1000 s-1 for 10 minutes and then let it rest statically for a definite time period. This time period was determined by measuring the linear viscoelastic properties to determine the time to reach an accepted level of stationary values. This time was then used in the other experiments.
Understanding the effect on rheological properties of drilling fluids based on activities performed before the measurements are taken is important also in the field. In practice fluid data are taken during different activities such as: drilling and circulation (high shear), tripping in/out (low shear), reserve volume preparations (low to no shear), etc. These data are often put in the same context and one searches for changes to the fluid based on trend analyses. Also knowing that the activity level on a drilling rig is high, the time from sampling until the measurements are done in the laboratory is varying and rarely documented. In this work, effects that may increase the variance of the data and also lead to wrong interpretation of data and trends are identified.
In the following, a methodical study is presented in which the effects of waiting time and/or preshearing on measurements of viscosity and other rheological properties of an oil-based drilling fluid are quantified in a systematic way. These results give a foundation for a suggestion for an experimental preconditioning procedure for rheological characterization of oil-based drilling fluids.
EXPERIMENTAL Drilling fluid design
The fluid selection was based on previous work9 and delivered by M-I SWACO. The oil-based drilling fluid (OBDF) was a field fluid which had been used during actual drilling operations. Prior to delivery, the fluid was cleaned, reconditioned and shipped to the research facilities of SINTEF. The OBDF is an emulsion of high-alkaline brine droplets in the continuous phase of base oil, and enriched with barite weight material as well as clay (Bentone128), emulsifier and fluid loss material. Bentone128 was used as the primary viscosifier. The original ratio of base oil to water, before clay addition, was 85/15. The fluid was used for circulation in a full scale flow loop, and while running through the sand removal filters of the circulation unit both sand, clay and small amounts of water were filtered out on each circulation. This, together with evaporation effects, lead to loss of water and a change in the oil/water ratio (OWR) over time. This dewatering effect was noticed over a few days of operation, but it was decided to continue with the operation and keep the viscosity expressed with Fann 35 measurements more or less constant. Bentone128 was added to compensate for the loss in viscosity, and at the respective time of sampling for the data measurements in this work, the OWR of the fluid was 91/9 for the first batch and 95/5 for the last batch.
D. Assembayev et al.
224

Fluid characterization Three batches of the OBDF were sampled from the flow loop at different times. The first two batches were sampled on March 20th (OWR 91/9) and April 8th 2015 and used for experiments on the Fann 35 viscometer. The third batch was sampled on April 20th 2015 (OWR 95/5) and used for measurements in the Anton Paar Physica MCR302. It should be emphasized that even though the three fluid batches might have slightly different OWR, the rheological properties of the batches are nearly identical.
Density measurements for the OBDFs were done by a standard Brand pycnometer. All three batches were measured to 1,26±0,01 g/ml.
OWR was measured by retort analysis, ref to ISO 10414-2/API 13B-24. The effects of waiting time and/or pre-shearing were studied using the following time test matrix for measurements: immediately and after 1 hr, 2 hr, 4 hr, 6 hr, 8 hr and 24 hr resting. All measurements were performed both at 28 ⁰C and at 50 ⁰C, and the samples for 28 °C testing were stored at room temperature (approx. 20 °C), and the samples for 50 °C testing were stored in a heat cabinet at 38-42 °C. The whole matrix was repeated a second time with 10 min pre-shear preceding each measurement. The full test matrix was conducted both using a Fann 35 viscometer and an Anton Paar Physica MCR302 rheometer. For the Fann 35 viscometer measurements were started immediately after sampling from the active flow loop. The measuring cup was heated to the required temperature by use of OFITE Thermocup 130-38-25. Temperature was at all times observed by use of Eurotherm 2408i Indicator unit, with precision down to 0,01 ⁰C. Viscosity and gel strength were measured following the ISO 10414-2/API 13B-24 and ISO 10416/20085 (600 -300-200-100-6-3 rpm, 10 sec and 10 min gel). For the preshearing measurement sequence, a shear rate of 600 rpm was applied for 10
min before starting the measuring sequence. The MCR302 rheometer is equipped
with an electrically heated temperature chamber. Before each test, the temperature was set with an accuracy of 0.01 ⁰C. To ensure temperature equilibrium an additional 7-8 minutes waiting time was added before start of measurements. A concentric cylinder measuring system (CC27) was chosen to avoid evaporation at 50 ⁰C, and the sample was changed for each new measurement. The fluid batches were mixed thoroughly every morning in a Hamilton Beach blender, at appr. 13000 rpm for 10 minutes. The measuring sequences following the previously described test matrix were then conducted immediately after mixing (for both 28 and 50 ⁰C). For each slot in the test matrix, flow curves and amplitude sweeps were performed. Flow curves (controlled shear rate) were recorded from shear rate 1 to 1200 s-1. The amplitude sweep tests were conducted with a constant frequency of 10 s-1 and with increasing strain from 0.001 to 100 %. The whole test sequence was then repeated with a 10 min preshear at 1000 s-1 before each measurement. This shear rate corresponds to 600 rpm shear in the Fann viscometer. RESULTS Figures 1 and 3 show dial readings in the Fann 35 viscometer for 28 and 50 ⁰C, respectively, with no preshearing. For both temperatures, dial readings are slightly increasing with increasing waiting time, especially for rotational speeds of 600 to 100 rpm. A maximum structure build-up of 9 % for the 600 rpm reading at 28 ⁰C and 12 % at 50 ⁰C can be seen for the 24 hour time period. For the readings of 300, 200 and 100 rpm the structure build-up accounts to 2 – 10 %. The 6 and 3 rpm measurements appear rather stable as well as the 10 sec and 10 min gel strength measurements. This may be explained by the fact that at the time of these last readings, the fluid has already
Simultaneous In-situ Analysis of Instabilities and First Normal StressDifference during Polymer Melt Extrusion Flows
Roland Kádár1,2, Ingo F. C. Naue2 and Manfred Wilhelm2
1 Chalmers University of Technology, 41258 Gothenburg, Sweden2 Karlsruhe Institute of Technology - KIT, 76128 Karlsruhe, Germany
ANNUAL TRANSACTIONS OF THE NORDIC RHEOLOGY SOCIETY, VOL. 24, 2016
ABSTRACTA high sensitivity system for capillaryrheometry capable of simultaneously de-tecting the onset and propagation of insta-bilities and the first normal stress differ-ence during polymer melt extrusion flowsis here presented. The main goals of thestudy are to analyse the nonlinear dynam-ics of extrusion instabilities and to deter-mine the first normal stress difference inthe presence of an induced streamline cur-vature via the so-called ’hole effect’. Anoverview of the system, general analysisprinciples, preliminary results and overallframework are herein discussed.
INTRODUCTIONCapillary rheometry is the preferredrheological characterisation method forpressure-driven processing applications,e.g. extrusion, injection moulding. Themain reason is that capillary rheometry isthe only method of probing material rheo-logical properties in processing-like condi-tions, i.e. high shear rate, nonlinear vis-coelastic regime, albeit in a controlledenvironment and using a comparativelysmall amount of material.1 Thus, it isof paramount importance to develop newtechniques to enhance capillary rheome-ters for a more comprehensive probing ofmaterial properties. Extrusion alone ac-counts for the processing of approximately35% of the worldwide production of plas-tics, currently 280⇥ 106 tons (Plastics Eu-rope, 2014). This makes it the most im-portant single polymer processing opera-
tion for the industry and can be found ina variety of forms in many manufacturingoperations. Extrusion throughput is lim-ited by the onset of instabilities, i.e. prod-uct defects. Comprehensive reviews on thesubject of polymer melt extrusion insta-bilities can be found elsewhere.4,6 A re-cent method proposed for the detectionand analysis of these instabilities is that ofa high sensitivity in-situ mechanical pres-sure instability detection system for cap-illary rheometry.8,10 The system consistsof high sensitivity piezoelectric transducersplaced along the extrusion slit die. In thisway all instability types detectable, thusopening new means of scientific inquiry. Asa result, new insights into the nonlinear dy-namics of the flow have been provided.9,14
Moreover, the possibility of investigatingthe reconstructed nonlinear dynamics wasconsidered, whereby a reconstructed phasespace is an embedding of the original phasespace.2,14 It was shown that a positive Lya-punov exponent was detected for the pri-mary and secondary instabilities in lin-ear and linear low density polyethylenes,LDPE and LLDPE,.14 Furthermore, it wasdetermined that Lyapunov exponents aresensitive to the changes in flow regime andbehave qualitatively different for the iden-tified transition sequences.14 It was alsoshown that it is possible to transfer thehigh sensitivity instability detection sys-tem to lab-sized extruders for inline ad-vanced processing control and quality con-trol systems.13
A very recent possibility considered
225
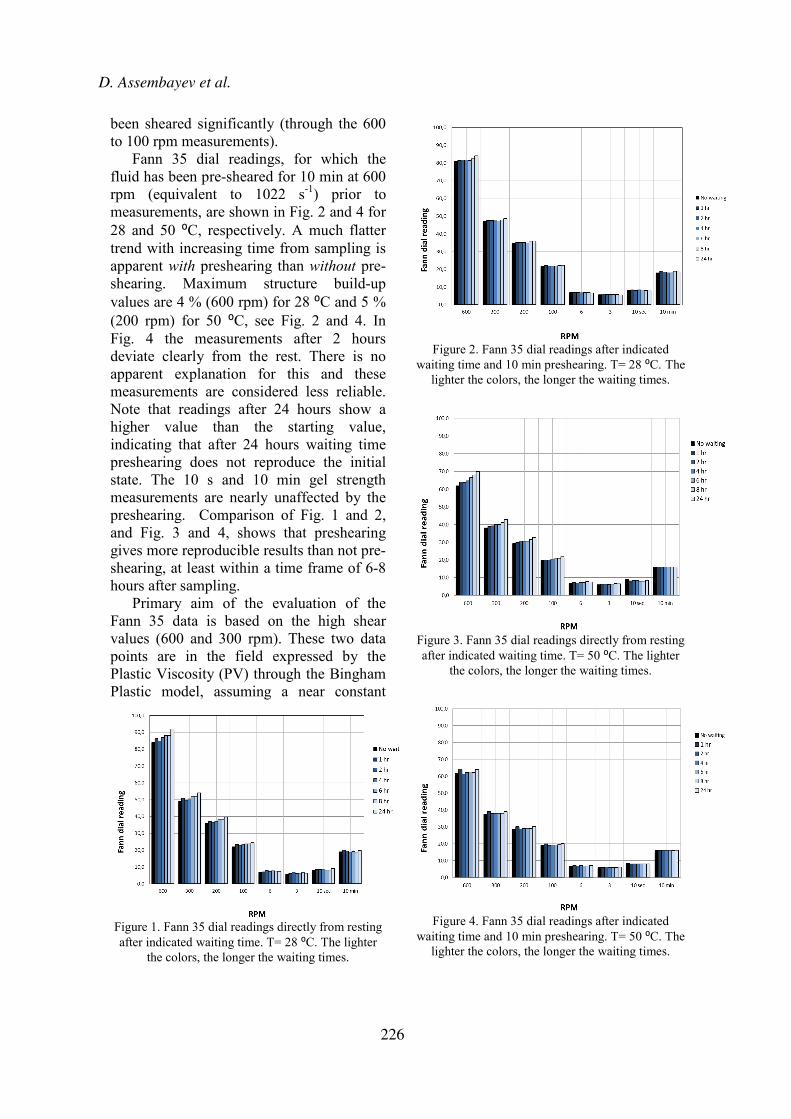
been sheared significantly (through the 600 to 100 rpm measurements).
Fann 35 dial readings, for which the fluid has been pre-sheared for 10 min at 600 rpm (equivalent to 1022 s-1) prior to measurements, are shown in Fig. 2 and 4 for 28 and 50 ⁰C, respectively. A much flatter trend with increasing time from sampling is apparent with preshearing than without pre-shearing. Maximum structure build-up values are 4 % (600 rpm) for 28 ⁰C and 5 % (200 rpm) for 50 ⁰C, see Fig. 2 and 4. In Fig. 4 the measurements after 2 hours deviate clearly from the rest. There is no apparent explanation for this and these measurements are considered less reliable. Note that readings after 24 hours show a higher value than the starting value, indicating that after 24 hours waiting time preshearing does not reproduce the initial state. The 10 s and 10 min gel strength measurements are nearly unaffected by the preshearing. Comparison of Fig. 1 and 2, and Fig. 3 and 4, shows that preshearing gives more reproducible results than not pre-shearing, at least within a time frame of 6-8 hours after sampling.
Primary aim of the evaluation of the Fann 35 data is based on the high shear values (600 and 300 rpm). These two data points are in the field expressed by the Plastic Viscosity (PV) through the Bingham Plastic model, assuming a near constant
Figure 1. Fann 35 dial readings directly from resting after indicated waiting time. T= 28 ⁰C. The lighter
the colors, the longer the waiting times.
Figure 2. Fann 35 dial readings after indicated
waiting time and 10 min preshearing. T= 28 ⁰C. The lighter the colors, the longer the waiting times.
Figure 3. Fann 35 dial readings directly from resting after indicated waiting time. T= 50 ⁰C. The lighter
the colors, the longer the waiting times.
Figure 4. Fann 35 dial readings after indicated
waiting time and 10 min preshearing. T= 50 ⁰C. The lighter the colors, the longer the waiting times.
D. Assembayev et al.
226

Figure 5. Plastic viscosity (mPas) plotted against
resting time (h) for the non-presheared (diamonds) and the presheared (triangles) data, for 50 ⁰C. A
linear fit is made to both data sets.
viscosity at high shear rates. The PV of a drilling fluid is described physically as the forces/friction between the interactions of non-continuous particles in the invert fluid, solids & brine droplets, creating a weak structure. Plotting the PV of the fluids towards the waiting time (see Fig. 5) shows for the 50 °C non-sheared measurements an increasing trend (3 whole digits) the first 8 hours and then a flattening trend up to 24 hours. For the 28 °C measurements, this flattening trend after some hours is not that evident (figure not shown). Preshearing removes this effect seen at 50 °C, but for both temperatures the presheared fluids show a linear increase in PV over 1 digit approximately (the 1 hour value at 50 ⁰C preshared disclaimed as an outlier). As the PV is believed to describe the friction of the particles at high shear, content, shape and, in particular, size will have an impact. It is not believed that the weighting material or other solids in this short period of time is aggregating to form larger sized particles. However, the internal phase consists of droplets that are highly attractive to each other, and kept dispersed in the continuous phase by the emulsifier in the system. If the emulsion is weakened over this period due to the lack of shear, the size of the internal phase droplets will increase due to aggregation of the water phase. This can
lead to a higher friction between the droplets and hence a higher PV.
Figures 6 and 7 show flow curves measured in the Anton Paar rheometer, at 28 and 50 ⁰C, respectively. The top bunch of lines in the figures represent flow curves with no preshearing. In Fig. 6, the structure build-up with no preshear at 28 ⁰C is clearly visible with increasing waiting times. The lower bunch of lines, representing measurements with preshear fall almost on top of each other, i.e. the same trend is apparent here as for the Fann measurements. The measurement for 8 hour rest and preshear clearly deviates from the rest and is considered an outlier.
Figure 7 shows the same measurements done at 50 ⁰C. At this temperature the structure regeneration with no preshear is much less pronounced, and the difference between the presheared and not presheared measurements is small. In other words, at 50 ⁰C preshearing has no significant influence on the flow curves. Figure 8 shows the storage (G') and loss modulus (G'') of a strain sweep performed at a frequency of 10 Hz at 28 ⁰C, with no preshear. The measurement made immediately after mixing deviates from the others. Comparison with Fig. 9, showing the same measurement with 10 min preshearing at 1000 s-1, reveals that preshearing gives more reproducible results, even after 24 hours waiting time. Preshearing has no effect on the G'/G'' cross-over point (flow point) but the end of the linear viscoelastic range (LVER) is moved to higher strain values, i.e. the fluid tolerates a higher strain after preshearing before the structure starts to break down than it does with no preshear. For 50 ⁰C (Figs. 10 and 11), the picture is slightly different. Preshearing produces results much more similar than does no pre- shearing, but G'/G'' cross-over point is moved significantly to higher strain values.
Simultaneous In-situ Analysis of Instabilities and First Normal StressDifference during Polymer Melt Extrusion Flows
Roland Kádár1,2, Ingo F. C. Naue2 and Manfred Wilhelm2
1 Chalmers University of Technology, 41258 Gothenburg, Sweden2 Karlsruhe Institute of Technology - KIT, 76128 Karlsruhe, Germany
ANNUAL TRANSACTIONS OF THE NORDIC RHEOLOGY SOCIETY, VOL. 24, 2016
ABSTRACTA high sensitivity system for capillaryrheometry capable of simultaneously de-tecting the onset and propagation of insta-bilities and the first normal stress differ-ence during polymer melt extrusion flowsis here presented. The main goals of thestudy are to analyse the nonlinear dynam-ics of extrusion instabilities and to deter-mine the first normal stress difference inthe presence of an induced streamline cur-vature via the so-called ’hole effect’. Anoverview of the system, general analysisprinciples, preliminary results and overallframework are herein discussed.
INTRODUCTIONCapillary rheometry is the preferredrheological characterisation method forpressure-driven processing applications,e.g. extrusion, injection moulding. Themain reason is that capillary rheometry isthe only method of probing material rheo-logical properties in processing-like condi-tions, i.e. high shear rate, nonlinear vis-coelastic regime, albeit in a controlledenvironment and using a comparativelysmall amount of material.1 Thus, it isof paramount importance to develop newtechniques to enhance capillary rheome-ters for a more comprehensive probing ofmaterial properties. Extrusion alone ac-counts for the processing of approximately35% of the worldwide production of plas-tics, currently 280⇥ 106 tons (Plastics Eu-rope, 2014). This makes it the most im-portant single polymer processing opera-
tion for the industry and can be found ina variety of forms in many manufacturingoperations. Extrusion throughput is lim-ited by the onset of instabilities, i.e. prod-uct defects. Comprehensive reviews on thesubject of polymer melt extrusion insta-bilities can be found elsewhere.4,6 A re-cent method proposed for the detectionand analysis of these instabilities is that ofa high sensitivity in-situ mechanical pres-sure instability detection system for cap-illary rheometry.8,10 The system consistsof high sensitivity piezoelectric transducersplaced along the extrusion slit die. In thisway all instability types detectable, thusopening new means of scientific inquiry. Asa result, new insights into the nonlinear dy-namics of the flow have been provided.9,14
Moreover, the possibility of investigatingthe reconstructed nonlinear dynamics wasconsidered, whereby a reconstructed phasespace is an embedding of the original phasespace.2,14 It was shown that a positive Lya-punov exponent was detected for the pri-mary and secondary instabilities in lin-ear and linear low density polyethylenes,LDPE and LLDPE,.14 Furthermore, it wasdetermined that Lyapunov exponents aresensitive to the changes in flow regime andbehave qualitatively different for the iden-tified transition sequences.14 It was alsoshown that it is possible to transfer thehigh sensitivity instability detection sys-tem to lab-sized extruders for inline ad-vanced processing control and quality con-trol systems.13
A very recent possibility considered
227

ANNUAL TRANSACTIONS OF THE NORDIC RHEOLOGY SOCIETY, VOL. 23, 2015
Figure 6. Flow curves of the OBDF for the non-presheared and the presheared samples at 28 ⁰C. The
lighter colors represent longer waiting times.
Figure 7. Flow curves of the OBDF for the non-presheared and the presheared samples at 50 ⁰C. The
lighter colors represent longer waiting times.
Figure 8. Amplitude sweeps of the OBDF for the non-presheared sample, at 28 ⁰C. Storage modulus
(G') and loss modulus (G'') are marked in the figure. The lighter colors represent longer waiting times.
End of LVER is also moved to higher strain values with preshear than with no preshear.
In other words, amplitude sweeps at 50 ⁰C
are more sensitive to preshear than at 28 ⁰C.
05
10152025303540455055
0 200 400 600 800 1000 1200
Shea
r str
ess [
Pa]
Shear rate [1/s]
No waiting1 hr rest2 hr rest4 hr rest6 hr rest8 hr rest24 hr restNo waiting, preshear1 hr rest, preshear2 hr rest, preshear4 hr rest, preshear6 hr rest, preshear8 hr rest, preshear24 hr rest, preshear
Without preshear
With preshear
05
101520253035
0 200 400 600 800 1000 1200
Shea
r str
ess [
Pa]
Shear rate [1/s]
No waiting1 hr rest2 hr rest4 hr rest6 hr rest8 hr rest24 hr restNo waiting, preshear1 hr rest, preshear2 hr rest, preshear4 hr rest, preshear6 hr rest, preshear8 hr rest, preshear24 hr rest, preshear
With preshear
Without preshear
1
10
100
0,005 0,05 0,5 5 50
Stor
age
mod
ulus
and
Lo
ss m
odul
us [P
a]
Strain [%]
G' 28C No waitingG' 28C 1 hr restG' 28C 2 hr restG' 28C 4 hr restG' 28C 6 hr restG' 28C 8 hr restG' 28C 24 hr restG'' 28C No waitingG'' 28C 1 hr restG'' 28C 2 hr restG'' 28C 4 hr restG'' 28C 6 hr restG'' 28C 8 hr restG'' 28C 24 hr rest
G``
G`
D. Assembayev et al.
228

ANNUAL TRANSACTIONS OF THE NORDIC RHEOLOGY SOCIETY, VOL. 23, 2015
Figure 9. Amplitude sweeps of the OBDF for the presheared sample, at 28 ⁰C. Storage modulus (G')
and loss modulus (G'') are marked in the figure. The lighter colors represent longer waiting times.
Figure 10. Amplitude sweeps of the OBDF for the non-presheared sample, at 50 ⁰C. Storage modulus
(G') and loss modulus (G'') are marked in the figure. The lighter colors represent longer waiting times.
Figure 11. Amplitude sweeps of the OBDF for the presheared sample, at 50 ⁰C. Storage modulus (G')
and loss modulus (G'') are marked in the figure. The lighter colors represent longer waiting times.
DISCUSSION
In this study, the samples have been
exposed to 10 min preshearing at 1000 s-1
.
The effect of preshearing for a shorter or
longer time or at a different shear stress has
not been tested. It is possible that shearing
1
10
100
0,005 0,05 0,5 5 50
Stor
age
mod
ulus
and
Lo
ss m
odul
us [P
a]
Strain [%]
G' 28C No waiting, preshearG' 28C 1 hr rest, preshearG' 28C 2 hr rest, preshearG' 28C 4 hr rest, preshearG' 28C 6 hr rest, preshearG' 28C 8 hr rest, preshearG' 28C 24 hr rest, preshearG'' 28C No waiting, preshearG'' 28C 1 hr rest, preshearG'' 28C 2 hr rest, preshearG'' 28C 4 hr rest, preshearG'' 28C 6 hr rest, preshearG'' 28C 8 hr rest, preshearG'' 28C 24 hr rest, preshear
G``
G`
1
10
100
0,005 0,05 0,5 5 50Stor
age
mod
ulus
and
Lo
ss m
odul
us [P
a]
Strain [%]
G' 50C No waitingG' 50C 1 hr restG' 50C 2 hr restG' 50C 4 hr restG' 50C 6 hr restG' 50C 8 hr restG' 50C 24 hr restG'' 50C No waitingG'' 50C 1 hr restG'' 50C 2 hr restG'' 50C 4 hr restG'' 50C 6 hr restG'' 50C 8 hr rest
G``
G`
1
10
100
0,005 0,05 0,5 5 50
Stor
age
mod
ulus
and
Lo
ss m
odul
us [P
a]
Strain [%]
G' 50C No waiting, preshearG' 50C 1 hr rest, preshearG' 50C 2 hr rest, preshearG' 50C 4 hr rest, preshearG' 50C 6 hr rest, preshearG' 50C 8 hr rest, preshearG' 50C 24 hr rest, preshearG'' 50C No waiting, preshearG'' 50C 1 hr rest, preshearG'' 50C 2 hr rest, preshearG'' 50C 4 hr rest, preshearG'' 50C 6 hr rest, preshearG'' 50C 8 hr rest, preshearG'' 50C 24 hr rest, preshear
G``
G`
Simultaneous In-situ Analysis of Instabilities and First Normal StressDifference during Polymer Melt Extrusion Flows
Roland Kádár1,2, Ingo F. C. Naue2 and Manfred Wilhelm2
1 Chalmers University of Technology, 41258 Gothenburg, Sweden2 Karlsruhe Institute of Technology - KIT, 76128 Karlsruhe, Germany
ANNUAL TRANSACTIONS OF THE NORDIC RHEOLOGY SOCIETY, VOL. 24, 2016
ABSTRACTA high sensitivity system for capillaryrheometry capable of simultaneously de-tecting the onset and propagation of insta-bilities and the first normal stress differ-ence during polymer melt extrusion flowsis here presented. The main goals of thestudy are to analyse the nonlinear dynam-ics of extrusion instabilities and to deter-mine the first normal stress difference inthe presence of an induced streamline cur-vature via the so-called ’hole effect’. Anoverview of the system, general analysisprinciples, preliminary results and overallframework are herein discussed.
INTRODUCTIONCapillary rheometry is the preferredrheological characterisation method forpressure-driven processing applications,e.g. extrusion, injection moulding. Themain reason is that capillary rheometry isthe only method of probing material rheo-logical properties in processing-like condi-tions, i.e. high shear rate, nonlinear vis-coelastic regime, albeit in a controlledenvironment and using a comparativelysmall amount of material.1 Thus, it isof paramount importance to develop newtechniques to enhance capillary rheome-ters for a more comprehensive probing ofmaterial properties. Extrusion alone ac-counts for the processing of approximately35% of the worldwide production of plas-tics, currently 280⇥ 106 tons (Plastics Eu-rope, 2014). This makes it the most im-portant single polymer processing opera-
tion for the industry and can be found ina variety of forms in many manufacturingoperations. Extrusion throughput is lim-ited by the onset of instabilities, i.e. prod-uct defects. Comprehensive reviews on thesubject of polymer melt extrusion insta-bilities can be found elsewhere.4,6 A re-cent method proposed for the detectionand analysis of these instabilities is that ofa high sensitivity in-situ mechanical pres-sure instability detection system for cap-illary rheometry.8,10 The system consistsof high sensitivity piezoelectric transducersplaced along the extrusion slit die. In thisway all instability types detectable, thusopening new means of scientific inquiry. Asa result, new insights into the nonlinear dy-namics of the flow have been provided.9,14
Moreover, the possibility of investigatingthe reconstructed nonlinear dynamics wasconsidered, whereby a reconstructed phasespace is an embedding of the original phasespace.2,14 It was shown that a positive Lya-punov exponent was detected for the pri-mary and secondary instabilities in lin-ear and linear low density polyethylenes,LDPE and LLDPE,.14 Furthermore, it wasdetermined that Lyapunov exponents aresensitive to the changes in flow regime andbehave qualitatively different for the iden-tified transition sequences.14 It was alsoshown that it is possible to transfer thehigh sensitivity instability detection sys-tem to lab-sized extruders for inline ad-vanced processing control and quality con-trol systems.13
A very recent possibility considered
229
for a longer time would give even more reproducible results10. At the same time, waiting before testing is a non-productive time, which would increase inefficiency and costs, especially in the field. Also, given that 10 min preshear is given in ISO/API standards, we suppose that 10 min preshear is a good compromise. Results from this study are generally in accordance with expectations, although to our knowledge there are no publications so far where the effects have been systematically quantified. The results from this study are proposed as practical guidelines to measurements of viscosity and other rheological properties. The effect of waiting time and/or pre-shear should be tested for each individual fluid, but it is expected that these results will be valid for most oil-based drilling fluids. CONCLUSIONS For both 28 and 50 ⁰C, one gets more reproducible results with preshearing, except for the 24 h measurements. Even with preshearing, sample readings change after 8 hours and/or 24 hours. Viscoelastic properties are even more sensitive to preshearing at 50 ⁰C than at 28 ⁰ C, while this is not the case for purely viscous properties. For comparative data, preshearing is recommended to achieve more reproducible results. For in-depth characterization of rheological properties, preshearing is not recommended as viscoelastic properties are significantly affected by preshear, especially for higher temperatures. Most findings are according to expectations, but the effects are now quantified for both simple viscosity measurements (direct-reading viscometer) and for measurements of visco-elastic properties (rheometer). The findings may serve as a methodic reference work and a practical guide for rheological characterization of oil-based drilling fluids.
ACKNOWLEDGMENTS
This work is carried out at the SINTEF fluid laboratories in Bergen and Trondheim. Financial support from the Norwegian research council (NRC), Det Norske and Statoil is gratefully acknowledged. The project "Hole Cleaning Performance" is financed through the PETROMAKS2 research program in NRC. The authors thank M-I Swaco for providing chemicals and technical advice. REFERENCES 1. Guillot, D., "Rheology and Flow of Well Cement Slurries". In Nelson, E. and Guillot D. (eds) (2006), Well Cementing, Schlumberger, Sugar Land, Texas. Chapter 4. 2. Dargaud, B. and Boukhelifa, L., "Laboratory Testing, Evaluation, and Analysis of Well Cements". In Nelson, E. and Guillot D. (eds) (2006), Well Cementing, Schlumberger, Sugar Land, Texas. Appendix B. 3. American Petroleum Inst., Recommended Practice for Testing Well Cements, API RP 10B, 22nd ed., Washington D.C., 1999. 4. ISO, Petroleum and natural gas industries- Field testing of drilling fluids- Part 2: Oil-based fluids, ISO 10414-2:2011/ API 13B-2, 2nd ed., Geneva, 2011. 5. American Petroleum Inst, Recommended Practice for Laboratory Testing of Drilling fluids, API 13I/ ISO 10416:2008, 8th ed., Washington D.C., 2009. 6. Maxey, J., McKinley, G., Ewoldt, R. and Winter, P. (2008), "Yield Stress: What is the "True" Value?", Paper AADE-08-DF-HO-27, presented at the AADE Fluids Conference and Exhibition, Houston, Texas, April 8-9. 7. Bui, B., Saasen, A., Maxey, J., Ozbayoglu, M.E., Miska, S.Z., Yu, M. and Takach, N.E. (2012), "Viscoelastic Properties of Oil-Based Drilling Fluids", Ann. Trans Nordic Rheol. Soc., 20, 33-47. 8. Bui, B. (2012), "Determination of Viscoelastic Properties of Drilling Fluids". M.Sc. thesis, University of Tulsa. 9. Oltedal, V.M., Werner, B., Lund, B., Saasen, A., and Ytrehus, J.D. (2015), "Rheological properties of oil based drilling fluids and base oils", Paper OMAE2015-41911, presented at the OMAE conference, St Johns, Canada, May 30- June 5. 10. Barnes, H.A., Hutton, J.F., and Walters, K. (1989), An Introduction to Rheology, Elsevier, Amsterdam, pp. 37-54.
D. Assembayev et al.
230